UNITED STATES
SECURITIES AND EXCHANGE COMMISSION
Washington, D.C. 20549
FORM N-CSR
CERTIFIED SHAREHOLDER REPORT OF REGISTERED
MANAGEMENT INVESTMENT COMPANIES
|
| | | | | | |
| Investment Company Act file number | 811-07822 |
| | |
| AMERICAN CENTURY INVESTMENT TRUST |
| (Exact name of registrant as specified in charter) |
| | |
| 4500 MAIN STREET, KANSAS CITY, MISSOURI | 64111 |
| (Address of principal executive offices) | (Zip Code) |
| | |
CHARLES A. ETHERINGTON 4500 MAIN STREET, KANSAS CITY, MISSOURI 64111 |
| (Name and address of agent for service) |
| | |
| Registrant’s telephone number, including area code: | 816-531-5575 |
| | |
| Date of fiscal year end: | 03-31 |
| | |
| Date of reporting period: | 03-31-2019 |
ITEM 1. REPORTS TO STOCKHOLDERS.
|
| |
| | |
| | Annual Report |
| | |
| | March 31, 2019 |
| | |
| | Core Plus Fund |
| | Investor Class (ACCNX) |
| | I Class (ACCTX) |
| | A Class (ACCQX) |
| | C Class (ACCKX) |
| | R Class (ACCPX) |
| | R5 Class (ACCUX) |
Beginning on January 1, 2021, as permitted by regulations adopted by the Securities and Exchange Commission, paper copies of the fund’s shareholder reports like this one will no longer be sent by mail, unless you specifically request paper copies of the reports from the fund or from your financial intermediary, such as a broker-dealer or bank. Instead, the reports will be made available on a website, and you will be notified by mail each time a report is posted and provided with a website link to access the report.
If you already elected to receive shareholder reports electronically, you will not be affected by this change and you need not take any action. You may elect to receive shareholder reports and other communications from the fund or your financial intermediary electronically by calling or sending an email request to your appropriate contacts as listed on the back cover of this report.
You may elect to receive all future reports in paper free of charge. You can inform the fund or your financial intermediary that you wish to continue receiving paper copies of your shareholder reports by calling or sending an email request to your appropriate contacts as listed on the back cover of this report. Your election to receive reports in paper will apply to all funds held with the fund complex/your financial intermediary.
|
| | |
| President’s Letter | 2 |
|
| Performance | 3 |
|
| Portfolio Commentary | |
|
| Fund Characteristics | |
|
| Shareholder Fee Example | |
|
| Schedule of Investments | |
|
| Statement of Assets and Liabilities | |
|
| Statement of Operations | |
|
| Statement of Changes in Net Assets | |
|
| Notes to Financial Statements | |
|
| Financial Highlights | |
|
| Report of Independent Registered Public Accounting Firm | |
|
| Management | |
|
| Additional Information | |
|
Any opinions expressed in this report reflect those of the author as of the date of the report, and do not necessarily represent the opinions of American Century Investments® or any other person in the American Century Investments organization. Any such opinions are subject to change at any time based upon market or other conditions and American Century Investments disclaims any responsibility to update such opinions. These opinions may not be relied upon as investment advice and, because investment decisions made by American Century Investments funds are based on numerous factors, may not be relied upon as an indication of trading intent on behalf of any American Century Investments fund. Security examples are used for representational purposes only and are not intended as recommendations to purchase or sell securities. Performance information for comparative indices and securities is provided to American Century Investments by third party vendors. To the best of American Century Investments’ knowledge, such information is accurate at the time of printing.
 Jonathan Thomas
Dear Investor:
Thank you for reviewing this annual report for the period ended March 31, 2019. Annual reports help convey important information about fund returns, including market factors that affected performance during the reporting period. For additional, updated investment and market insights, we encourage you to visit our website, americancentury.com.
Markets Ended Roller-Coaster Period on Upswing
For the first half of the period, U.S. stocks climbed higher, while bond returns headed lower. Robust economic growth, bolstered by federal tax and regulatory reform, and record corporate earnings results fueled risk-on sentiment that drove stock prices higher. Meanwhile, the combination of strong economic data, the Federal Reserve’s (Fed’s) ongoing rate-hike campaign and an uptick in inflation pushed investment-grade bond returns lower.
Market trends began changing in late 2018. Mounting investor concerns about slowing global economic and earnings growth, U.S.-China trade tensions and rising interest rates triggered widespread volatility. Stock prices plunged as investors sought safe-haven investments, including U.S. Treasuries. Furthermore, the Fed issued another rate hike in December, its fourth of the year, and maintained its hawkish outlook. Investors feared the December rate increase and the Fed’s plans for two more rate hikes in 2019 were too aggressive, and risk-off investing remained in favor.
January brought a renewed sense of stability to the markets. Investors’ concerns about growth and trade eased, and the Fed changed course, pausing its rate-hike campaign amid moderating global growth and inflation. Valuations appeared attractive after the late-2018 sell-off, and risk-on investing resumed. In March, the Fed held rates steady again, hinting additional tightening was off the table for 2019. This news drove stock and bond returns higher and left both asset classes on an upward track to end the period. Overall, stocks (S&P 500 Index) overcame their late-2018 nosedive to gain 9.50% for the period. Bonds (Bloomberg Barclays U.S. Aggregate Bond Index) bounced back from losses early in the period to return 4.48%.
We expect volatility to remain a formidable factor as investors react to global growth trends, central bank policy and geopolitical developments. We believe this scenario underscores the importance of using professionally managed portfolios in pursuit of investment goals. We appreciate your continued trust and confidence in us.
Sincerely,
Jonathan Thomas
President and Chief Executive Officer
American Century Investments
|
| | | | | | |
| Total Returns as of March 31, 2019 | | |
| | | | Average Annual Returns | |
| | Ticker Symbol | 1 year | 5 years | 10 years | Since Inception | Inception Date |
| Investor Class | ACCNX | 3.55% | 2.78% | 4.11% | — | 11/30/06 |
| Bloomberg Barclays U.S. Aggregate Bond Index | — | 4.48% | 2.74% | 3.76% | — | — |
| I Class | ACCTX | 3.76% | — | — | 2.74% | 4/10/17 |
| A Class | ACCQX | | | | | 11/30/06 |
| No sales charge | | 3.30% | 2.53% | 3.85% | — | |
| With sales charge | | -1.36% | 1.58% | 3.38% | — | |
| C Class | ACCKX | 2.62% | 1.76% | 3.08% | — | 11/30/06 |
| R Class | ACCPX | 3.04% | 2.27% | 3.59% | — | 11/30/06 |
| R5 Class | ACCUX | 3.86% | 2.99% | 4.32% | — | 11/30/06 |
Average annual returns since inception are presented when ten years of performance history is not available.
Fund returns would have been lower if a portion of the fees had not been waived.
Sales charges include initial sales charges and contingent deferred sales charges (CDSCs), as applicable. A Class shares have a 4.50% maximum initial sales charge and may be subject to a maximum CDSC of 1.00%. C Class shares redeemed within 12 months of purchase are subject to a maximum CDSC of 1.00%. The SEC requires that mutual funds provide performance information net of maximum sales charges in all cases where charges could be applied.
Data presented reflect past performance. Past performance is no guarantee of future results. Current performance may be higher or lower than the performance shown. Total returns for periods less than one year are not annualized. Investment return and principal value will fluctuate, and redemption value may be more or less than original cost. Data assumes reinvestment of dividends and capital gains, and none of the charts reflect the deduction of taxes that a shareholder would pay on fund distributions or the redemption of fund shares. To obtain performance data current to the most recent month end, please call 1-800-345-2021 or visit americancentury.com. For additional information about the fund, please consult the prospectus.
|
|
| Growth of $10,000 Over 10 Years |
| $10,000 investment made March 31, 2009 |
Performance for other share classes will vary due to differences in fee structure.
|
|
| |
| Value on March 31, 2019 |
| | Investor Class — $14,961 |
| |
| | Bloomberg Barclays U.S. Aggregate Bond Index — $14,472 |
| |
Ending value of Investor Class would have been lower if a portion of the fees had not been waived.
|
| | | | | |
| Total Annual Fund Operating Expenses |
| Investor Class | I Class | A Class | C Class | R Class | R5 Class |
| 0.67% | 0.57% | 0.92% | 1.67% | 1.17% | 0.47% |
The total annual fund operating expenses shown is as stated in the fund’s prospectus current as of the date of this report. The prospectus may vary from the expense ratio shown elsewhere in this report because it is based on a different time period, includes acquired fund fees and expenses, and, if applicable, does not include fee waivers or expense reimbursements.
Data presented reflect past performance. Past performance is no guarantee of future results. Current performance may be higher or lower than the performance shown. Total returns for periods less than one year are not annualized. Investment return and principal value will fluctuate, and redemption value may be more or less than original cost. Data assumes reinvestment of dividends and capital gains, and none of the charts reflect the deduction of taxes that a shareholder would pay on fund distributions or the redemption of fund shares. To obtain performance data current to the most recent month end, please call 1-800-345-2021 or visit americancentury.com. For additional information about the fund, please consult the prospectus.
Portfolio Managers: Bob Gahagan, Hando Aguilar, Jeff Houston, Brian Howell and Charles Tan
Effective October 31, 2018, Charles Tan joined the portfolio management team, replacing Dave MacEwen, who left the team ahead of his December 31, 2018, retirement.
Performance Summary
Core Plus returned 3.55%* for the 12 months ended March 31, 2019. By comparison, the Bloomberg Barclays U.S. Aggregate Bond Index gained 4.48%. Fund returns reflect operating expenses, while index returns do not.
Returns for the fund and the index reflect a generally positive, albeit challenging, environment for investment-grade bonds. The 12-month period witnessed a marked shift in Federal Reserve (Fed) policy and investor sentiment toward the U.S. and global economic growth outlook, which influenced performance in the fixed-income market. In the first several months of the period, robust economic growth, rising inflation and the Fed’s steady rate-tightening strategy drove Treasury yields higher. Investment-grade bond returns were generally flat to slightly negative. Meanwhile, risk-on investing remained in favor, and higher-yielding securities outperformed. The environment reversed sharply in late 2018, as worries about future economic and corporate earnings growth, U.S.-China trade negotiations and a surprisingly bullish Fed outlook triggered severe volatility in the equity markets. After climbing to a reporting period high of 3.24% in early November (according to Bloomberg), the 10-year U.S. Treasury yield plunged to 2.68% by the end of December 2018, as investors fled risk assets in favor of perceived safe-haven investments.
The new year brought a new sense of stability to the financial markets. Progress with U.S.-China trade negotiations and better-than-feared U.S. economic and earnings data helped restore some investor optimism. Additionally, the Fed paused its rate-hike campaign in January, seemingly acknowledging its December plan for two rate hikes in 2019 may have been too aggressive. Investors responded enthusiastically to this backdrop, and risk assets returned to favor. Meanwhile, Treasury yields moved modestly lower. Then, at its March monetary policy meeting, the Fed held rates steady and suggested additional tightening was likely off the table for 2019. This news triggered a sharp rally among Treasuries, and the 10-year Treasury note ended March 2019 yielding 2.41%, compared with 2.74% a year earlier.
Overall, the Treasury market rally of late 2018 and early 2019 supported broad U.S. fixed-income gains for the entire 12-month period. Longer-maturity Treasuries and corporate bonds were top performers overall. Core Plus’ out-of-index exposure to global interest rate movements primarily accounted for the fund’s underperformance relative to the index.
Global Interest Rates Position Detracted
Throughout most of 2018, we held a non-index position designed to take advantage of differences in global interest rates. As part of this strategy, we held short positions in European government bond futures, a neutral position in U.S. Treasury futures and a long position in local-currency emerging markets bonds. Initially, we expected European rates to rise from their unusually low
*All fund returns referenced in this commentary are for Investor Class shares. Fund returns would have been lower if a portion of the fees had not been waived. Performance for other share classes will vary due to differences in fee structure; when Investor Class performance exceeds that of the index, other share classes may not. See page 3 for returns for all share classes.
levels and converge with U.S. rates. We also expected select emerging markets rates to remain stable or decline. However, yields in Europe steadily declined, weighing on our short positions in European governments. Additionally, mounting investor concerns about the sustainability of synchronized global growth combined with country-specific issues pressured emerging markets
assets. With the global economy showing signs of slowing and leading central banks maintaining dovish policies, we exited our global rates trade in late 2018.
Sector Allocation, Security Selection, Out-of-Index Positions Aided Performance
We continued to underweight Treasuries and government agencies relative to the index in favor of spread (non-Treasury) sectors, including corporate credit and securitized bonds. This strategy was a key contributor to portfolio performance. In addition, security selection within these allocations generally aided results. Within the corporate sector, our selections among bonds with BBB credit ratings delivered notable performance, largely due to the rally late in the reporting period, which favored riskier securities. Similarly, our out-of-index allocation to high-yield corporate bonds was a top contributor, particularly in the early 2019 risk rally. Within the securitized sector, our selections among non-agency collateralized mortgage obligations and asset-backed securities added value.
Portfolio Positioning
We expect the U.S. economy to continue to grow, but at a more moderate pace (2.0% to 2.5% annualized). However, we expect U.S. economic growth to remain more robust than growth in Europe and Japan. We expect headline inflation to eventually converge with core inflation near 2%. These factors should enable the Fed to remain on hold throughout the remainder of 2019. Against a backdrop of slowing global growth, geopolitical uncertainties (mainly Brexit) and a dovish Fed, we expect the 10-year Treasury yield to fluctuate within a near-term range of 2.35% to 2.80%.
We do not believe the dramatic flattening (and brief) inversion of the yield curve late in the reporting period is an indication of a looming recession. Instead, we believe the curve flattened in response to the Fed’s unexpected pivot to dovish monetary policy. We believe the Fed’s change of course is more reflective of a lack of inflation than a lack of growth. Given the yield curve’s notable flattening, we initiated a position designed to take advantage of our outlook for the curve between two and five years to steepen.
Additionally, we expect to maintain our preference for spread sectors versus Treasuries, remaining mindful of market conditions. For example, in light of the strong rally in risk assets in the final months of the reporting period, we took profits in and reduced exposure to investment-grade and high-yield corporate bonds. We also took profits in credit-sensitive mortgage-backed securities that participated in the rally. We will continue to look for opportunities to tactically add exposure to riskier corporate and securitized securities, as valuations, fundamentals and market conditions dictate. However, from a longer-term, strategic perspective, we plan to reduce spread sector risk, given the potential for spread widening as the credit cycle matures. As always, we favor a bottom-up approach to portfolio management, emphasizing careful security selection.
|
| |
| MARCH 31, 2019 | |
| Portfolio at a Glance | |
| Average Duration (effective) | 5.7 years |
| Weighted Average Life to Maturity | 7.7 years |
| | |
| Types of Investments in Portfolio | % of net assets |
| Corporate Bonds | 28.2% |
| U.S. Treasury Securities | 22.9% |
| U.S. Government Agency Mortgage-Backed Securities | 16.9% |
| Asset-Backed Securities | 8.3% |
| Collateralized Mortgage Obligations | 7.1% |
| Commercial Mortgage-Backed Securities | 4.8% |
| Collateralized Loan Obligations | 4.5% |
| Bank Loan Obligations | 1.9% |
| Sovereign Governments and Agencies | 1.6% |
| Municipal Securities | 1.6% |
| Temporary Cash Investments | 3.3% |
| Other Assets and Liabilities | (1.1)% |
Fund shareholders may incur two types of costs: (1) transaction costs, including sales charges (loads) on purchase payments and redemption/exchange fees; and (2) ongoing costs, including management fees; distribution and service (12b-1) fees; and other fund expenses. This example is intended to help you understand your ongoing costs (in dollars) of investing in your fund and to compare these costs with the ongoing cost of investing in other mutual funds.
The example is based on an investment of $1,000 made at the beginning of the period and held for the entire period from October 1, 2018 to March 31, 2019.
Actual Expenses
The table provides information about actual account values and actual expenses for each class. You may use the information, together with the amount you invested, to estimate the expenses that you paid over the period. First, identify the share class you own. Then simply divide your account value by $1,000 (for example, an $8,600 account value divided by $1,000 = 8.6), then multiply the result by the number under the heading “Expenses Paid During Period” to estimate the expenses you paid on your account during this period.
If you hold Investor Class shares of any American Century Investments fund, or I Class shares of the American Century Diversified Bond Fund, in an American Century Investments account (i.e., not a financial intermediary or retirement plan account), American Century Investments may charge you a $12.50 semiannual account maintenance fee if the value of those shares is less than $10,000. We will redeem shares automatically in one of your accounts to pay the $12.50 fee. In determining your total eligible investment amount, we will include your investments in all personal accounts (including American Century Investments Brokerage accounts) registered under your Social Security number. Personal accounts include individual accounts, joint accounts, UGMA/UTMA accounts, personal trusts, Coverdell Education Savings Accounts and IRAs (including traditional, Roth, Rollover, SEP-, SARSEP- and SIMPLE-IRAs), and certain other retirement accounts. If you have only business, business retirement, employer-sponsored or American Century Investments Brokerage accounts, you are currently not subject to this fee. If you are subject to the Account Maintenance Fee, your account value could be reduced by the fee amount.
Hypothetical Example for Comparison Purposes
The table also provides information about hypothetical account values and hypothetical expenses based on the actual expense ratio of each class of your fund and an assumed rate of return of 5% per year before expenses, which is not the actual return of a fund’s share class. The hypothetical account values and expenses may not be used to estimate the actual ending account balance or expenses you paid for the period. You may use this information to compare the ongoing costs of investing in your fund and other funds. To do so, compare this 5% hypothetical example with the 5% hypothetical examples that appear in the shareholder reports of the other funds.
Please note that the expenses shown in the table are meant to highlight your ongoing costs only and do not reflect any transactional costs, such as sales charges (loads) or redemption/exchange fees. Therefore, the table is useful in comparing ongoing costs only, and will not help you determine the relative total costs of owning different funds. In addition, if these transactional costs were included, your costs would have been higher.
|
| | | | |
| | Beginning
Account Value
10/1/18 | Ending
Account Value
3/31/19 | Expenses Paid
During Period(1)
10/1/18 - 3/31/19 | Annualized
Expense Ratio(1) |
| Actual | | | | |
| Investor Class | $1,000 | $1,037.60 | $2.79 | 0.55% |
| I Class | $1,000 | $1,039.10 | $2.29 | 0.45% |
| A Class | $1,000 | $1,036.30 | $4.06 | 0.80% |
| C Class | $1,000 | $1,032.40 | $7.85 | 1.55% |
| R Class | $1,000 | $1,035.00 | $5.33 | 1.05% |
| R5 Class | $1,000 | $1,039.60 | $1.78 | 0.35% |
| Hypothetical | | | | |
| Investor Class | $1,000 | $1,022.19 | $2.77 | 0.55% |
| I Class | $1,000 | $1,022.69 | $2.27 | 0.45% |
| A Class | $1,000 | $1,020.94 | $4.03 | 0.80% |
| C Class | $1,000 | $1,017.20 | $7.80 | 1.55% |
| R Class | $1,000 | $1,019.70 | $5.29 | 1.05% |
| R5 Class | $1,000 | $1,023.19 | $1.77 | 0.35% |
| |
| (1) | Expenses are equal to the class's annualized expense ratio listed in the table above, multiplied by the average account value over the period, multiplied by 182, the number of days in the most recent fiscal half-year, divided by 365, to reflect the one-half year period. Annualized expense ratio reflects actual expenses, including any applicable fee waivers or expense reimbursements and excluding any acquired fund fees and expenses. |
MARCH 31, 2019
|
| | | | | | | |
| | | Principal Amount | Value |
| CORPORATE BONDS — 28.2% | | | |
| Aerospace and Defense — 0.1% | | | |
| Lockheed Martin Corp., 3.80%, 3/1/45 | | $ | 90,000 |
| $ | 89,023 |
|
| United Technologies Corp., 6.05%, 6/1/36 | | 95,000 |
| 113,260 |
|
| | | | 202,283 |
|
| Air Freight and Logistics — 0.2% | | | |
| FedEx Corp., 4.40%, 1/15/47 | | 70,000 |
| 66,066 |
|
| United Parcel Service, Inc., 2.80%, 11/15/24 | | 150,000 |
| 150,975 |
|
| | | | 217,041 |
|
| Auto Components — 0.1% | | | |
ZF North America Capital, Inc., 4.00%, 4/29/20(1) | | 150,000 |
| 150,120 |
|
| Automobiles — 0.8% | | | |
| Ford Motor Credit Co. LLC, 8.125%, 1/15/20 | | 100,000 |
| 103,663 |
|
| Ford Motor Credit Co. LLC, 5.875%, 8/2/21 | | 270,000 |
| 279,837 |
|
| Ford Motor Credit Co. LLC, 2.98%, 8/3/22 | | 200,000 |
| 191,306 |
|
| General Motors Co., 4.20%, 10/1/27 | | 70,000 |
| 67,254 |
|
| General Motors Co., 5.15%, 4/1/38 | | 100,000 |
| 91,658 |
|
| General Motors Financial Co., Inc., 3.20%, 7/6/21 | | 210,000 |
| 209,196 |
|
| General Motors Financial Co., Inc., 5.25%, 3/1/26 | | 150,000 |
| 155,051 |
|
| | | | 1,097,965 |
|
| Banks — 5.3% | | | |
| Banco Santander SA, 3.50%, 4/11/22 | | 200,000 |
| 202,054 |
|
| Bank of America Corp., MTN, 4.20%, 8/26/24 | | 30,000 |
| 31,085 |
|
| Bank of America Corp., MTN, 4.00%, 1/22/25 | | 100,000 |
| 102,175 |
|
| Bank of America Corp., MTN, VRN, 3.82%, 1/20/28 | | 150,000 |
| 152,331 |
|
| Bank of America Corp., MTN, VRN, 3.97%, 3/5/29 | | 100,000 |
| 102,214 |
|
| Bank of America Corp., MTN, VRN, 4.44%, 1/20/48 | | 30,000 |
| 31,493 |
|
| Bank of America Corp., VRN, 3.00%, 12/20/23 | | 325,000 |
| 324,301 |
|
| Bank of America N.A., 6.00%, 10/15/36 | | 250,000 |
| 310,548 |
|
| Barclays plc, 4.375%, 1/12/26 | | 200,000 |
| 201,451 |
|
BPCE SA, 5.15%, 7/21/24(1) | | 200,000 |
| 208,939 |
|
| CIT Group, Inc., 5.00%, 8/15/22 | | 150,000 |
| 156,563 |
|
| Citibank N.A., 3.65%, 1/23/24 | | 250,000 |
| 258,212 |
|
| Citigroup, Inc., 2.90%, 12/8/21 | | 340,000 |
| 339,936 |
|
| Citigroup, Inc., 4.05%, 7/30/22 | | 80,000 |
| 82,452 |
|
| Citigroup, Inc., 4.45%, 9/29/27 | | 510,000 |
| 525,121 |
|
| Citigroup, Inc., VRN, 3.52%, 10/27/28 | | 180,000 |
| 177,211 |
|
| Cooperatieve Rabobank UA, 3.95%, 11/9/22 | | 250,000 |
| 254,820 |
|
| Fifth Third BanCorp., 4.30%, 1/16/24 | | 80,000 |
| 83,878 |
|
| HSBC Holdings plc, 2.95%, 5/25/21 | | 200,000 |
| 200,043 |
|
| HSBC Holdings plc, 4.30%, 3/8/26 | | 200,000 |
| 207,871 |
|
| HSBC Holdings plc, 4.375%, 11/23/26 | | 200,000 |
| 205,223 |
|
| HSBC Holdings plc, VRN, 3.26%, 3/13/23 | | 200,000 |
| 200,641 |
|
|
| | | | | | | |
| | | Principal Amount | Value |
| Huntington Bancshares, Inc., 2.30%, 1/14/22 | | $ | 140,000 |
| $ | 137,965 |
|
| JPMorgan Chase & Co., 4.625%, 5/10/21 | | 230,000 |
| 238,726 |
|
| JPMorgan Chase & Co., 3.875%, 9/10/24 | | 350,000 |
| 359,238 |
|
| JPMorgan Chase & Co., 3.125%, 1/23/25 | | 250,000 |
| 250,474 |
|
| JPMorgan Chase & Co., VRN, 3.54%, 5/1/28 | | 100,000 |
| 100,242 |
|
| JPMorgan Chase & Co., VRN, 3.88%, 7/24/38 | | 80,000 |
| 78,771 |
|
| JPMorgan Chase & Co., VRN, 3.96%, 11/15/48 | | 140,000 |
| 136,975 |
|
| JPMorgan Chase & Co., VRN, 3.90%, 1/23/49 | | 30,000 |
| 29,106 |
|
| PNC Financial Services Group, Inc. (The), 4.375%, 8/11/20 | | 70,000 |
| 71,671 |
|
| QNB Finansbank AS, MTN, 6.25%, 4/30/19 | | 200,000 |
| 200,030 |
|
| Regions Financial Corp., 2.75%, 8/14/22 | | 100,000 |
| 99,313 |
|
| Regions Financial Corp., 3.80%, 8/14/23 | | 100,000 |
| 102,897 |
|
| Royal Bank of Canada, 2.15%, 10/26/20 | | 210,000 |
| 208,686 |
|
| SunTrust Bank, 3.30%, 5/15/26 | | 200,000 |
| 198,566 |
|
| U.S. Bancorp, MTN, 3.60%, 9/11/24 | | 70,000 |
| 72,273 |
|
| U.S. Bank N.A., 2.80%, 1/27/25 | | 250,000 |
| 249,429 |
|
UniCredit SpA, VRN, 5.86%, 6/19/32(1) | | 200,000 |
| 184,564 |
|
| Wells Fargo & Co., 3.07%, 1/24/23 | | 80,000 |
| 80,172 |
|
| Wells Fargo & Co., 3.00%, 4/22/26 | | 90,000 |
| 88,102 |
|
| Wells Fargo & Co., MTN, 3.75%, 1/24/24 | | 110,000 |
| 113,302 |
|
| Wells Fargo & Co., MTN, 4.10%, 6/3/26 | | 300,000 |
| 307,223 |
|
| Wells Fargo & Co., MTN, 4.65%, 11/4/44 | | 115,000 |
| 118,515 |
|
| | | | 7,784,802 |
|
| Beverages — 0.4% | | | |
Anheuser-Busch Cos. LLC / Anheuser-Busch InBev Worldwide, Inc., 4.90%, 2/1/46(1) | | 270,000 |
| 271,746 |
|
| Anheuser-Busch InBev Worldwide, Inc., 4.75%, 1/23/29 | | 150,000 |
| 159,866 |
|
| Constellation Brands, Inc., 4.75%, 12/1/25 | | 140,000 |
| 149,481 |
|
| | | | 581,093 |
|
| Biotechnology — 1.0% | | | |
| AbbVie, Inc., 3.60%, 5/14/25 | | 280,000 |
| 281,062 |
|
| AbbVie, Inc., 4.70%, 5/14/45 | | 90,000 |
| 86,930 |
|
| Amgen, Inc., 4.66%, 6/15/51 | | 138,000 |
| 139,353 |
|
| Biogen, Inc., 3.625%, 9/15/22 | | 210,000 |
| 213,495 |
|
| Celgene Corp., 3.25%, 8/15/22 | | 200,000 |
| 202,230 |
|
| Celgene Corp., 3.875%, 8/15/25 | | 110,000 |
| 113,023 |
|
| Gilead Sciences, Inc., 4.40%, 12/1/21 | | 100,000 |
| 103,978 |
|
| Gilead Sciences, Inc., 3.65%, 3/1/26 | | 230,000 |
| 234,955 |
|
| Gilead Sciences, Inc., 4.15%, 3/1/47 | | 50,000 |
| 48,420 |
|
| | | | 1,423,446 |
|
| Building Products — 0.1% | | | |
| Masco Corp., 4.45%, 4/1/25 | | 100,000 |
| 102,840 |
|
| Capital Markets — 1.6% | | | |
| Goldman Sachs Group, Inc. (The), 2.30%, 12/13/19 | | 310,000 |
| 309,028 |
|
| Goldman Sachs Group, Inc. (The), 3.50%, 1/23/25 | | 100,000 |
| 99,784 |
|
| Goldman Sachs Group, Inc. (The), 3.50%, 11/16/26 | | 360,000 |
| 355,827 |
|
| Goldman Sachs Group, Inc. (The), 5.15%, 5/22/45 | | 40,000 |
| 42,473 |
|
| Goldman Sachs Group, Inc. (The), VRN, 2.88%, 10/31/22 | | 70,000 |
| 69,454 |
|
|
| | | | | | | |
| | | Principal Amount | Value |
| Goldman Sachs Group, Inc. (The), VRN, 3.81%, 4/23/29 | | $ | 120,000 |
| $ | 119,064 |
|
| Jefferies Group LLC / Jefferies Group Capital Finance, Inc., 4.15%, 1/23/30 | | 120,000 |
| 110,096 |
|
| Morgan Stanley, 5.00%, 11/24/25 | | 180,000 |
| 193,235 |
|
| Morgan Stanley, 4.375%, 1/22/47 | | 40,000 |
| 41,375 |
|
| Morgan Stanley, MTN, 5.625%, 9/23/19 | | 410,000 |
| 415,352 |
|
| Morgan Stanley, MTN, 3.70%, 10/23/24 | | 60,000 |
| 61,115 |
|
| Morgan Stanley, MTN, 4.00%, 7/23/25 | | 370,000 |
| 381,410 |
|
| Morgan Stanley, MTN, VRN, 3.77%, 1/24/29 | | 120,000 |
| 120,899 |
|
| | | | 2,319,112 |
|
| Chemicals — 0.1% | | | |
NOVA Chemicals Corp., 4.875%, 6/1/24(1) | | 20,000 |
| 19,725 |
|
| Westlake Chemical Corp., 4.375%, 11/15/47 | | 90,000 |
| 80,008 |
|
| | | | 99,733 |
|
| Commercial Services and Supplies — 0.2% | | | |
Nielsen Finance LLC / Nielsen Finance Co., 5.00%, 4/15/22(1) | | 80,000 |
| 79,600 |
|
| Republic Services, Inc., 3.55%, 6/1/22 | | 190,000 |
| 194,360 |
|
| Waste Management, Inc., 4.75%, 6/30/20 | | 70,000 |
| 71,809 |
|
| | | | 345,769 |
|
| Consumer Finance — 0.8% | | | |
| Ally Financial, Inc., 4.625%, 3/30/25 | | 100,000 |
| 102,125 |
|
| American Express Co., 3.00%, 10/30/24 | | 50,000 |
| 49,846 |
|
| American Express Credit Corp., MTN, 2.20%, 3/3/20 | | 100,000 |
| 99,561 |
|
| American Express Credit Corp., MTN, 2.25%, 5/5/21 | | 270,000 |
| 268,389 |
|
| Capital One Bank USA N.A., 3.375%, 2/15/23 | | 250,000 |
| 250,127 |
|
| Capital One Financial Corp., 3.75%, 7/28/26 | | 120,000 |
| 117,088 |
|
| Discover Financial Services, 3.75%, 3/4/25 | | 200,000 |
| 199,600 |
|
| Synchrony Financial, 3.95%, 12/1/27 | | 100,000 |
| 94,647 |
|
| | | | 1,181,383 |
|
| Containers and Packaging — 0.5% | | | |
Ardagh Packaging Finance plc / Ardagh Holdings USA, Inc., 6.00%, 2/15/25(1) | | 200,000 |
| 200,500 |
|
| Ball Corp., 4.00%, 11/15/23 | | 60,000 |
| 60,600 |
|
| Berry Global, Inc., 5.125%, 7/15/23 | | 130,000 |
| 132,437 |
|
| Crown Americas LLC / Crown Americas Capital Corp. IV, 4.50%, 1/15/23 | | 30,000 |
| 30,375 |
|
| International Paper Co., 4.40%, 8/15/47 | | 60,000 |
| 56,389 |
|
Reynolds Group Issuer, Inc. / Reynolds Group Issuer LLC / Reynolds Group Issuer Lu, 5.125%, 7/15/23(1) | | 280,000 |
| 284,900 |
|
| | | | 765,201 |
|
| Diversified Consumer Services — 0.1% | | | |
| CommonSpirit Health, 2.95%, 11/1/22 | | 100,000 |
| 99,408 |
|
| Diversified Financial Services — 0.4% | | | |
| Credit Suisse Group Funding Guernsey Ltd., 3.45%, 4/16/21 | | 250,000 |
| 252,743 |
|
UBS Group Funding Switzerland AG, 3.49%, 5/23/23(1) | | 200,000 |
| 201,114 |
|
| Voya Financial, Inc., 5.70%, 7/15/43 | | 90,000 |
| 104,839 |
|
| | | | 558,696 |
|
|
| | | | | | | |
| | | Principal Amount | Value |
| Diversified Telecommunication Services — 0.9% | | | |
| AT&T, Inc., 3.875%, 8/15/21 | | $ | 180,000 |
| $ | 184,702 |
|
| AT&T, Inc., 3.40%, 5/15/25 | | 130,000 |
| 128,843 |
|
| AT&T, Inc., 4.10%, 2/15/28 | | 160,000 |
| 161,855 |
|
| AT&T, Inc., 5.25%, 3/1/37 | | 50,000 |
| 52,777 |
|
| AT&T, Inc., 4.85%, 3/1/39 | | 80,000 |
| 80,565 |
|
| AT&T, Inc., 5.15%, 11/15/46 | | 70,000 |
| 72,081 |
|
| Orange SA, 4.125%, 9/14/21 | | 100,000 |
| 103,475 |
|
| Telefonica Emisiones SA, 5.46%, 2/16/21 | | 100,000 |
| 104,607 |
|
| Verizon Communications, Inc., 3.38%, 2/15/25 | | 80,000 |
| 81,186 |
|
| Verizon Communications, Inc., 2.625%, 8/15/26 | | 70,000 |
| 66,876 |
|
| Verizon Communications, Inc., 4.75%, 11/1/41 | | 60,000 |
| 63,573 |
|
| Verizon Communications, Inc., 5.01%, 8/21/54 | | 170,000 |
| 182,468 |
|
| | | | 1,283,008 |
|
| Electric Utilities — 0.6% | | | |
| AEP Transmission Co. LLC, 3.75%, 12/1/47 | | 50,000 |
| 49,335 |
|
| Duke Energy Corp., 3.55%, 9/15/21 | | 80,000 |
| 81,287 |
|
| Duke Energy Corp., 2.65%, 9/1/26 | | 50,000 |
| 47,696 |
|
| Duke Energy Florida LLC, 6.35%, 9/15/37 | | 70,000 |
| 93,001 |
|
| Duke Energy Progress LLC, 3.70%, 10/15/46 | | 50,000 |
| 48,982 |
|
| Exelon Corp., 5.15%, 12/1/20 | | 130,000 |
| 134,074 |
|
| Exelon Corp., 4.45%, 4/15/46 | | 60,000 |
| 62,039 |
|
| FirstEnergy Corp., 4.25%, 3/15/23 | | 100,000 |
| 104,415 |
|
| Georgia Power Co., 4.30%, 3/15/42 | | 70,000 |
| 69,747 |
|
NextEra Energy Operating Partners LP, 4.50%, 9/15/27(1) | | 100,000 |
| 97,875 |
|
| Progress Energy, Inc., 3.15%, 4/1/22 | | 80,000 |
| 80,619 |
|
| Xcel Energy, Inc., 3.35%, 12/1/26 | | 30,000 |
| 30,084 |
|
| | | | 899,154 |
|
| Energy Equipment and Services — 0.1% | | | |
| Halliburton Co., 3.80%, 11/15/25 | | 80,000 |
| 81,892 |
|
| Halliburton Co., 4.85%, 11/15/35 | | 60,000 |
| 63,063 |
|
| | | | 144,955 |
|
| Entertainment — 0.3% | | | |
| Activision Blizzard, Inc., 2.30%, 9/15/21 | | 80,000 |
| 78,932 |
|
| Viacom, Inc., 3.125%, 6/15/22 | | 50,000 |
| 49,926 |
|
| Viacom, Inc., 4.25%, 9/1/23 | | 140,000 |
| 145,685 |
|
| Viacom, Inc., 4.375%, 3/15/43 | | 50,000 |
| 44,957 |
|
Walt Disney Co. (The), 6.90%, 8/15/39(1) | | 70,000 |
| 99,017 |
|
Walt Disney Co. (The), 4.75%, 9/15/44(1) | | 40,000 |
| 45,994 |
|
| | | | 464,511 |
|
| Equity Real Estate Investment Trusts (REITs) — 0.8% | | | |
| American Tower Corp., 3.375%, 10/15/26 | | 50,000 |
| 48,817 |
|
| AvalonBay Communities, Inc., MTN, 3.20%, 1/15/28 | | 100,000 |
| 99,307 |
|
| Boston Properties LP, 3.65%, 2/1/26 | | 180,000 |
| 181,087 |
|
| Crown Castle International Corp., 5.25%, 1/15/23 | | 200,000 |
| 214,959 |
|
| Essex Portfolio LP, 3.625%, 8/15/22 | | 170,000 |
| 173,081 |
|
| Essex Portfolio LP, 3.25%, 5/1/23 | | 50,000 |
| 50,006 |
|
|
| | | | | | | |
| | | Principal Amount | Value |
| GLP Capital LP / GLP Financing II, Inc., 5.75%, 6/1/28 | | $ | 140,000 |
| $ | 150,843 |
|
| Hospitality Properties Trust, 4.65%, 3/15/24 | | 80,000 |
| 81,603 |
|
| Kilroy Realty LP, 3.80%, 1/15/23 | | 44,000 |
| 44,750 |
|
| Kimco Realty Corp., 2.80%, 10/1/26 | | 90,000 |
| 84,835 |
|
| VEREIT Operating Partnership LP, 4.125%, 6/1/21 | | 50,000 |
| 50,858 |
|
| | | | 1,180,146 |
|
| Food and Staples Retailing — 0.1% | | | |
| Kroger Co. (The), 3.875%, 10/15/46 | | 100,000 |
| 83,506 |
|
| Walmart, Inc., 4.05%, 6/29/48 | | 90,000 |
| 96,110 |
|
| | | | 179,616 |
|
| Food Products — 0.2% | | | |
| Conagra Brands, Inc., 4.60%, 11/1/25 | | 130,000 |
| 136,913 |
|
Lamb Weston Holdings, Inc., 4.625%, 11/1/24(1) | | 170,000 |
| 172,125 |
|
Post Holdings, Inc., 5.00%, 8/15/26(1) | | 50,000 |
| 48,813 |
|
| | | | 357,851 |
|
| Gas Utilities — 0.8% | | | |
| Andeavor Logistics LP / Tesoro Logistics Finance Corp., 5.50%, 10/15/19 | | 100,000 |
| 101,012 |
|
| Andeavor Logistics LP / Tesoro Logistics Finance Corp., 4.25%, 12/1/27 | | 50,000 |
| 50,460 |
|
| Enterprise Products Operating LLC, 4.85%, 3/15/44 | | 150,000 |
| 159,742 |
|
| Plains All American Pipeline LP / PAA Finance Corp., 3.65%, 6/1/22 | | 160,000 |
| 161,125 |
|
| Sabine Pass Liquefaction LLC, 5.625%, 3/1/25 | | 255,000 |
| 280,638 |
|
| Sunoco Logistics Partners Operations LP, 3.45%, 1/15/23 | | 230,000 |
| 231,155 |
|
| Sunoco Logistics Partners Operations LP, 4.00%, 10/1/27 | | 50,000 |
| 49,677 |
|
| Targa Resources Partners LP / Targa Resources Partners Finance Corp., 5.00%, 1/15/28 | | 150,000 |
| 147,938 |
|
| | | | 1,181,747 |
|
| Health Care Equipment and Supplies — 0.3% | | | |
| Becton Dickinson and Co., 3.73%, 12/15/24 | | 190,000 |
| 193,130 |
|
| Medtronic, Inc., 3.50%, 3/15/25 | | 150,000 |
| 155,041 |
|
| Medtronic, Inc., 4.375%, 3/15/35 | | 100,000 |
| 109,412 |
|
| | | | 457,583 |
|
| Health Care Providers and Services — 1.2% | | | |
| Aetna, Inc., 2.75%, 11/15/22 | | 60,000 |
| 59,253 |
|
| Anthem, Inc., 3.65%, 12/1/27 | | 60,000 |
| 59,967 |
|
| Anthem, Inc., 4.65%, 1/15/43 | | 89,000 |
| 92,343 |
|
| CVS Health Corp., 3.50%, 7/20/22 | | 70,000 |
| 70,954 |
|
| CVS Health Corp., 4.30%, 3/25/28 | | 250,000 |
| 253,778 |
|
| CVS Health Corp., 4.78%, 3/25/38 | | 60,000 |
| 59,593 |
|
| CVS Health Corp., 5.05%, 3/25/48 | | 70,000 |
| 70,662 |
|
| DaVita, Inc., 5.125%, 7/15/24 | | 200,000 |
| 198,000 |
|
| HCA, Inc., 5.00%, 3/15/24 | | 30,000 |
| 31,802 |
|
| HCA, Inc., 5.375%, 2/1/25 | | 150,000 |
| 159,375 |
|
| Northwell Healthcare, Inc., 4.26%, 11/1/47 | | 50,000 |
| 50,605 |
|
| Tenet Healthcare Corp., 4.375%, 10/1/21 | | 70,000 |
| 71,568 |
|
| Tenet Healthcare Corp., 5.125%, 5/1/25 | | 220,000 |
| 221,661 |
|
| UnitedHealth Group, Inc., 2.875%, 12/15/21 | | 80,000 |
| 80,458 |
|
|
| | | | | | | |
| | | Principal Amount | Value |
| UnitedHealth Group, Inc., 3.75%, 7/15/25 | | $ | 140,000 |
| $ | 146,367 |
|
| UnitedHealth Group, Inc., 4.75%, 7/15/45 | | 60,000 |
| 68,014 |
|
Universal Health Services, Inc., 4.75%, 8/1/22(1) | | 100,000 |
| 101,125 |
|
| | | | 1,795,525 |
|
| Hotels, Restaurants and Leisure — 0.2% | | | |
1011778 BC ULC / New Red Finance, Inc., 4.625%, 1/15/22(1) | | 110,000 |
| 110,793 |
|
| McDonald's Corp., MTN, 3.375%, 5/26/25 | | 160,000 |
| 163,110 |
|
| Royal Caribbean Cruises Ltd., 5.25%, 11/15/22 | | 70,000 |
| 74,946 |
|
| | | | 348,849 |
|
| Household Durables — 0.1% | | | |
| Lennar Corp., 4.75%, 11/29/27 | | 100,000 |
| 100,422 |
|
| Toll Brothers Finance Corp., 4.35%, 2/15/28 | | 100,000 |
| 94,000 |
|
| | | | 194,422 |
|
| Household Products — 0.1% | | | |
| Spectrum Brands, Inc., 5.75%, 7/15/25 | | 80,000 |
| 81,000 |
|
| Insurance — 1.2% | | | |
| AerCap Ireland Capital DAC / AerCap Global Aviation Trust, 5.00%, 10/1/21 | | 150,000 |
| 155,733 |
|
| Allstate Corp. (The), VRN, 5.75%, 8/15/53 | | 120,000 |
| 122,277 |
|
| American International Group, Inc., 4.125%, 2/15/24 | | 350,000 |
| 361,587 |
|
| Berkshire Hathaway Finance Corp., 4.20%, 8/15/48 | | 40,000 |
| 41,586 |
|
| Chubb INA Holdings, Inc., 3.15%, 3/15/25 | | 60,000 |
| 60,615 |
|
| Chubb INA Holdings, Inc., 3.35%, 5/3/26 | | 40,000 |
| 40,773 |
|
CNP Assurances, VRN, 4.00%(2) | EUR | 100,000 |
| 119,857 |
|
| Hartford Financial Services Group, Inc. (The), 5.95%, 10/15/36 | | $ | 60,000 |
| 71,709 |
|
| Markel Corp., 4.90%, 7/1/22 | | 212,000 |
| 223,872 |
|
| MetLife, Inc., 4.125%, 8/13/42 | | 110,000 |
| 111,373 |
|
| Prudential Financial, Inc., 3.94%, 12/7/49 | | 160,000 |
| 154,966 |
|
| Prudential Financial, Inc., MTN, 5.70%, 12/14/36 | | 45,000 |
| 53,788 |
|
| Prudential Financial, Inc., VRN, 5.875%, 9/15/42 | | 100,000 |
| 105,923 |
|
| WR Berkley Corp., 4.625%, 3/15/22 | | 100,000 |
| 104,523 |
|
| | | | 1,728,582 |
|
| IT Services — 0.1% | | | |
| Fidelity National Information Services, Inc., 3.00%, 8/15/26 | | 160,000 |
| 153,562 |
|
| Life Sciences Tools and Services — 0.1% | | | |
| Thermo Fisher Scientific, Inc., 3.60%, 8/15/21 | | 50,000 |
| 50,845 |
|
| Thermo Fisher Scientific, Inc., 2.95%, 9/19/26 | | 160,000 |
| 154,469 |
|
| | | | 205,314 |
|
| Media — 1.5% | | | |
| AMC Networks, Inc., 4.75%, 8/1/25 | | 210,000 |
| 208,950 |
|
| CBS Corp., 4.85%, 7/1/42 | | 60,000 |
| 59,895 |
|
| CCO Holdings LLC / CCO Holdings Capital Corp., 5.25%, 9/30/22 | | 100,000 |
| 102,063 |
|
CCO Holdings LLC / CCO Holdings Capital Corp., 5.125%, 5/1/27(1) | | 65,000 |
| 65,569 |
|
| Charter Communications Operating LLC / Charter Communications Operating Capital, 4.91%, 7/23/25 | | 290,000 |
| 306,070 |
|
|
| | | | | | | |
| | | Principal Amount | Value |
| Charter Communications Operating LLC / Charter Communications Operating Capital, 6.48%, 10/23/45 | | $ | 90,000 |
| $ | 101,121 |
|
| Comcast Corp., 4.40%, 8/15/35 | | 30,000 |
| 31,411 |
|
| Comcast Corp., 6.40%, 5/15/38 | | 80,000 |
| 102,773 |
|
| Comcast Corp., 4.60%, 10/15/38 | | 210,000 |
| 225,524 |
|
| Comcast Corp., 4.75%, 3/1/44 | | 150,000 |
| 163,122 |
|
CSC Holdings LLC, 5.50%, 4/15/27(1) | | 200,000 |
| 204,730 |
|
| Globo Comunicacao e Participacoes SA, 4.84%, 6/8/25 | | 200,000 |
| 197,400 |
|
Sirius XM Radio, Inc., 5.375%, 4/15/25(1) | | 110,000 |
| 113,300 |
|
| Warner Media LLC, 2.95%, 7/15/26 | | 190,000 |
| 180,151 |
|
| Warner Media LLC, 3.80%, 2/15/27 | | 100,000 |
| 99,581 |
|
| | | | 2,161,660 |
|
| Metals and Mining — 0.2% | | | |
| Steel Dynamics, Inc., 5.00%, 12/15/26 | | 230,000 |
| 235,463 |
|
| Multi-Utilities — 1.1% | | | |
| AmeriGas Partners LP / AmeriGas Finance Corp., 5.875%, 8/20/26 | | 100,000 |
| 100,250 |
|
| Berkshire Hathaway Energy Co., 3.80%, 7/15/48 | | 70,000 |
| 67,150 |
|
| CenterPoint Energy, Inc., 4.25%, 11/1/28 | | 110,000 |
| 114,141 |
|
Cometa Energia SA de CV, 6.375%, 4/24/35(1) | | 296,100 |
| 291,585 |
|
| Consolidated Edison Co. of New York, Inc., 3.95%, 3/1/43 | | 110,000 |
| 109,552 |
|
| Dominion Energy, Inc., 2.75%, 9/15/22 | | 130,000 |
| 128,999 |
|
| Dominion Energy, Inc., 4.90%, 8/1/41 | | 100,000 |
| 106,907 |
|
| Exelon Generation Co. LLC, 5.60%, 6/15/42 | | 80,000 |
| 84,370 |
|
FirstEnergy Transmission LLC, 4.55%, 4/1/49(1) | | 70,000 |
| 71,809 |
|
| Florida Power & Light Co., 4.125%, 2/1/42 | | 50,000 |
| 53,098 |
|
| MidAmerican Energy Co., 4.40%, 10/15/44 | | 140,000 |
| 153,298 |
|
| NiSource, Inc., 5.65%, 2/1/45 | | 80,000 |
| 93,242 |
|
| Sempra Energy, 2.875%, 10/1/22 | | 130,000 |
| 128,223 |
|
| Sempra Energy, 3.25%, 6/15/27 | | 70,000 |
| 67,096 |
|
| Sempra Energy, 4.00%, 2/1/48 | | 40,000 |
| 36,562 |
|
| | | | 1,606,282 |
|
| Oil, Gas and Consumable Fuels — 3.3% | | | |
| Antero Resources Corp., 5.125%, 12/1/22 | | 220,000 |
| 221,991 |
|
| Apache Corp., 4.75%, 4/15/43 | | 40,000 |
| 37,843 |
|
| BP Capital Markets America, Inc., 4.50%, 10/1/20 | | 80,000 |
| 82,135 |
|
| Cimarex Energy Co., 4.375%, 6/1/24 | | 150,000 |
| 156,007 |
|
| CNOOC Nexen Finance 2014 ULC, 4.25%, 4/30/24 | | 70,000 |
| 73,265 |
|
| Concho Resources, Inc., 4.375%, 1/15/25 | | 110,000 |
| 113,162 |
|
| Continental Resources, Inc., 3.80%, 6/1/24 | | 170,000 |
| 171,800 |
|
| Continental Resources, Inc., 4.375%, 1/15/28 | | 150,000 |
| 154,527 |
|
| Diamondback Energy, Inc., 5.375%, 5/31/25 | | 100,000 |
| 104,625 |
|
| Encana Corp., 6.50%, 2/1/38 | | 80,000 |
| 94,121 |
|
| Energy Transfer Operating LP, 5.25%, 4/15/29 | | 130,000 |
| 139,748 |
|
| Energy Transfer Operating LP, 6.50%, 2/1/42 | | 140,000 |
| 155,988 |
|
| Energy Transfer Operating LP, 6.00%, 6/15/48 | | 70,000 |
| 75,805 |
|
| EnLink Midstream Partners LP, 4.85%, 7/15/26 | | 110,000 |
| 109,587 |
|
| Exxon Mobil Corp., 3.04%, 3/1/26 | | 100,000 |
| 101,555 |
|
|
| | | | | | | |
| | | Principal Amount | Value |
| Hess Corp., 6.00%, 1/15/40 | | $ | 50,000 |
| $ | 52,228 |
|
| Kinder Morgan Energy Partners LP, 5.30%, 9/15/20 | | 60,000 |
| 62,031 |
|
| Kinder Morgan Energy Partners LP, 6.50%, 9/1/39 | | 130,000 |
| 152,789 |
|
| Kinder Morgan, Inc., 5.55%, 6/1/45 | | 80,000 |
| 87,680 |
|
| Marathon Oil Corp., 3.85%, 6/1/25 | | 190,000 |
| 192,650 |
|
| MPLX LP, 4.875%, 6/1/25 | | 180,000 |
| 191,909 |
|
| MPLX LP, 4.50%, 4/15/38 | | 50,000 |
| 47,682 |
|
| MPLX LP, 5.20%, 3/1/47 | | 40,000 |
| 40,721 |
|
| Newfield Exploration Co., 5.75%, 1/30/22 | | 200,000 |
| 213,695 |
|
| Newfield Exploration Co., 5.375%, 1/1/26 | | 100,000 |
| 108,224 |
|
| Noble Energy, Inc., 4.15%, 12/15/21 | | 220,000 |
| 225,435 |
|
| Petroleos Mexicanos, 6.00%, 3/5/20 | | 67,000 |
| 68,621 |
|
| Petroleos Mexicanos, 4.875%, 1/24/22 | | 50,000 |
| 50,550 |
|
| Petroleos Mexicanos, 6.625%, 6/15/35 | | 100,000 |
| 94,750 |
|
| Petroleos Mexicanos, 5.50%, 6/27/44 | | 80,000 |
| 65,600 |
|
| Phillips 66, 4.30%, 4/1/22 | | 60,000 |
| 62,632 |
|
Sinopec Group Overseas Development 2015 Ltd., 2.50%, 4/28/20(1) | | 200,000 |
| 199,105 |
|
| Sunoco LP / Sunoco Finance Corp., 5.50%, 2/15/26 | | 150,000 |
| 148,875 |
|
Tullow Oil plc, 7.00%, 3/1/25(1) | | 200,000 |
| 201,890 |
|
| Williams Cos., Inc. (The), 4.125%, 11/15/20 | | 280,000 |
| 284,562 |
|
| Williams Cos., Inc. (The), 4.55%, 6/24/24 | | 105,000 |
| 110,954 |
|
| Williams Cos., Inc. (The), 5.10%, 9/15/45 | | 80,000 |
| 82,474 |
|
| YPF SA, 8.75%, 4/4/24 | | 200,000 |
| 201,500 |
|
| | | | 4,738,716 |
|
| Paper and Forest Products — 0.1% | | | |
Georgia-Pacific LLC, 5.40%, 11/1/20(1) | | 180,000 |
| 187,202 |
|
| Pharmaceuticals — 0.5% | | | |
| Allergan Finance LLC, 3.25%, 10/1/22 | | 60,000 |
| 60,069 |
|
| Allergan Funding SCS, 3.85%, 6/15/24 | | 100,000 |
| 101,349 |
|
| Allergan Funding SCS, 4.55%, 3/15/35 | | 100,000 |
| 98,222 |
|
Bausch Health Cos., Inc., 7.00%, 3/15/24(1) | | 150,000 |
| 159,075 |
|
| Shire Acquisitions Investments Ireland DAC, 2.40%, 9/23/21 | | 140,000 |
| 138,467 |
|
| Teva Pharmaceutical Finance Netherlands III BV, 3.15%, 10/1/26 | | 140,000 |
| 114,598 |
|
| Zoetis, Inc., 3.00%, 9/12/27 | | 70,000 |
| 67,394 |
|
| | | | 739,174 |
|
| Road and Rail — 0.4% | | | |
| Burlington Northern Santa Fe LLC, 4.95%, 9/15/41 | | 100,000 |
| 114,666 |
|
| Burlington Northern Santa Fe LLC, 4.45%, 3/15/43 | | 120,000 |
| 130,018 |
|
| Burlington Northern Santa Fe LLC, 4.15%, 4/1/45 | | 50,000 |
| 52,205 |
|
| CSX Corp., 3.25%, 6/1/27 | | 150,000 |
| 148,334 |
|
| Union Pacific Corp., 3.60%, 9/15/37 | | 50,000 |
| 48,010 |
|
| Union Pacific Corp., 4.05%, 11/15/45 | | 110,000 |
| 107,405 |
|
| | | | 600,638 |
|
| Semiconductors and Semiconductor Equipment — 0.3% | | | |
NXP BV / NXP Funding LLC, 3.875%, 9/1/22(1) | | 200,000 |
| 203,326 |
|
|
| | | | | | | |
| | | Principal Amount | Value |
Sensata Technologies UK Financing Co. plc, 6.25%, 2/15/26(1) | | $ | 200,000 |
| $ | 213,000 |
|
| | | | 416,326 |
|
| Software — 0.4% | | | |
| Microsoft Corp., 2.70%, 2/12/25 | | 150,000 |
| 150,260 |
|
| Microsoft Corp., 3.45%, 8/8/36 | | 100,000 |
| 100,648 |
|
| Microsoft Corp., 4.25%, 2/6/47 | | 150,000 |
| 167,787 |
|
| Oracle Corp., 3.25%, 11/15/27 | | 170,000 |
| 171,204 |
|
| | | | 589,899 |
|
| Specialty Retail — 0.5% | | | |
Ashtead Capital, Inc., 4.125%, 8/15/25(1) | | 200,000 |
| 197,500 |
|
| Home Depot, Inc. (The), 3.00%, 4/1/26 | | 150,000 |
| 150,919 |
|
| Home Depot, Inc. (The), 5.95%, 4/1/41 | | 170,000 |
| 218,698 |
|
| United Rentals North America, Inc., 5.75%, 11/15/24 | | 150,000 |
| 154,688 |
|
| | | | 721,805 |
|
| Technology Hardware, Storage and Peripherals — 0.8% | | | |
| Apple, Inc., 2.75%, 1/13/25 | | 60,000 |
| 59,718 |
|
| Apple, Inc., 2.50%, 2/9/25 | | 130,000 |
| 127,844 |
|
| Apple, Inc., 2.45%, 8/4/26 | | 90,000 |
| 87,033 |
|
| Apple, Inc., 2.90%, 9/12/27 | | 250,000 |
| 246,919 |
|
Dell International LLC / EMC Corp., 6.02%, 6/15/26(1) | | 270,000 |
| 290,659 |
|
Dell International LLC / EMC Corp., 4.90%, 10/1/26(1) | | 130,000 |
| 132,587 |
|
| Hewlett Packard Enterprise Co., 3.60%, 10/15/20 | | 270,000 |
| 272,613 |
|
| | | | 1,217,373 |
|
| Trading Companies and Distributors — 0.1% | | | |
| International Lease Finance Corp., 5.875%, 8/15/22 | | 100,000 |
| 107,907 |
|
| Wireless Telecommunication Services — 0.2% | | | |
| America Movil SAB de CV, 3.125%, 7/16/22 | | 55,000 |
| 55,474 |
|
| T-Mobile USA, Inc., 4.75%, 2/1/28 | | 160,000 |
| 159,200 |
|
| | | | 214,674 |
|
TOTAL CORPORATE BONDS
(Cost $40,746,997) | | | 41,121,836 |
|
| U.S. TREASURY SECURITIES — 22.9% | | | |
| U.S. Treasury Bonds, 3.50%, 2/15/39 | | 500,000 |
| 567,754 |
|
| U.S. Treasury Bonds, 4.375%, 11/15/39 | | 700,000 |
| 891,406 |
|
| U.S. Treasury Bonds, 4.625%, 2/15/40 | | 200,000 |
| 263,144 |
|
| U.S. Treasury Bonds, 3.125%, 11/15/41 | | 400,000 |
| 426,531 |
|
| U.S. Treasury Bonds, 3.125%, 2/15/42 | | 300,000 |
| 319,600 |
|
| U.S. Treasury Bonds, 3.00%, 5/15/42 | | 1,900,000 |
| 1,981,381 |
|
| U.S. Treasury Bonds, 2.875%, 5/15/43 | | 450,000 |
| 458,016 |
|
U.S. Treasury Bonds, 3.125%, 8/15/44(3) | | 400,000 |
| 425,047 |
|
| U.S. Treasury Bonds, 3.00%, 11/15/44 | | 1,250,000 |
| 1,299,390 |
|
| U.S. Treasury Bonds, 2.50%, 2/15/45 | | 800,000 |
| 756,703 |
|
| U.S. Treasury Bonds, 3.00%, 5/15/45 | | 1,200,000 |
| 1,247,930 |
|
| U.S. Treasury Bonds, 3.00%, 11/15/45 | | 600,000 |
| 624,281 |
|
| U.S. Treasury Bonds, 3.375%, 11/15/48 | | 900,000 |
| 1,004,150 |
|
| U.S. Treasury Notes, 1.625%, 10/15/20 | | 1,200,000 |
| 1,187,203 |
|
| U.S. Treasury Notes, 2.25%, 2/15/21 | | 600,000 |
| 599,543 |
|
|
| | | | | | | |
| | | Principal Amount | Value |
| U.S. Treasury Notes, 2.75%, 9/15/21 | | $ | 4,700,000 |
| $ | 4,757,006 |
|
| U.S. Treasury Notes, 2.625%, 12/15/21 | | 3,500,000 |
| 3,536,709 |
|
| U.S. Treasury Notes, 1.875%, 1/31/22 | | 3,000,000 |
| 2,971,055 |
|
| U.S. Treasury Notes, 2.375%, 3/15/22 | | 1,800,000 |
| 1,808,613 |
|
| U.S. Treasury Notes, 2.00%, 11/30/22 | | 500,000 |
| 496,172 |
|
| U.S. Treasury Notes, 2.375%, 2/29/24 | | 900,000 |
| 906,469 |
|
| U.S. Treasury Notes, 2.125%, 11/30/24 | | 1,000,000 |
| 992,285 |
|
| U.S. Treasury Notes, 2.625%, 12/31/25 | | 700,000 |
| 713,945 |
|
| U.S. Treasury Notes, 2.50%, 2/28/26 | | 400,000 |
| 404,812 |
|
| U.S. Treasury Notes, 3.125%, 11/15/28 | | 4,500,000 |
| 4,779,053 |
|
TOTAL U.S. TREASURY SECURITIES
(Cost $32,737,583) | | | 33,418,198 |
|
| U.S. GOVERNMENT AGENCY MORTGAGE-BACKED SECURITIES — 16.9% | |
| Adjustable-Rate U.S. Government Agency Mortgage-Backed Securities — 1.0% | | | |
| FHLMC, VRN, 4.47%, (12-month LIBOR plus 1.78%), 2/1/38 | | 67,383 |
| 70,568 |
|
| FHLMC, VRN, 4.51%, (12-month LIBOR plus 1.85%), 6/1/38 | | 46,495 |
| 48,911 |
|
| FHLMC, VRN, 4.14%, (12-month LIBOR plus 1.78%), 9/1/40 | | 67,324 |
| 69,752 |
|
| FHLMC, VRN, 4.23%, (12-month LIBOR plus 1.88%), 5/1/41 | | 21,848 |
| 22,822 |
|
| FHLMC, VRN, 3.69%, (12-month LIBOR plus 1.89%), 7/1/41 | | 149,757 |
| 153,426 |
|
| FHLMC, VRN, 2.32%, (12-month LIBOR plus 1.65%), 2/1/43 | | 294,567 |
| 293,892 |
|
| FHLMC, VRN, 4.70%, (12-month LIBOR plus 1.64%), 2/1/43 | | 41,527 |
| 43,031 |
|
| FHLMC, VRN, 4.25%, (12-month LIBOR plus 1.62%), 6/1/43 | | 11,028 |
| 11,401 |
|
| FHLMC, VRN, 4.27%, (12-month LIBOR plus 1.65%), 6/1/43 | | 33,654 |
| 34,814 |
|
| FHLMC, VRN, 3.07%, (12-month LIBOR plus 1.64%), 9/1/47 | | 249,764 |
| 253,131 |
|
| FNMA, VRN, 4.27%, (6-month LIBOR plus 1.57%), 6/1/35 | | 27,438 |
| 28,350 |
|
| FNMA, VRN, 4.82%, (12-month LIBOR plus 1.69%), 1/1/40 | | 15,995 |
| 16,830 |
|
| FNMA, VRN, 3.62%, (12-month LIBOR plus 1.79%), 8/1/40 | | 125,179 |
| 129,281 |
|
| FNMA, VRN, 3.92%, (12-month LIBOR plus 1.77%), 10/1/40 | | 98,551 |
| 101,770 |
|
| FNMA, VRN, 3.19%, (12-month LIBOR plus 1.61%), 3/1/47 | | 114,448 |
| 115,830 |
|
| | | | 1,393,809 |
|
| Fixed-Rate U.S. Government Agency Mortgage-Backed Securities — 15.9% | | | |
| FHLMC, 4.50%, 6/1/21 | | 3,581 |
| 3,647 |
|
| FHLMC, 5.50%, 1/1/38 | | 6,401 |
| 7,041 |
|
| FHLMC, 5.50%, 4/1/38 | | 38,398 |
| 42,116 |
|
| FHLMC, 3.00%, 2/1/43 | | 522,514 |
| 523,190 |
|
| FNMA, 3.50%, TBA | | 500,000 |
| 506,973 |
|
| FNMA, 5.00%, 7/1/20 | | 8,121 |
| 8,314 |
|
| FNMA, 5.00%, 7/1/31 | | 337,668 |
| 357,269 |
|
| FNMA, 4.50%, 10/1/33 | | 163,719 |
| 173,155 |
|
|
| | | | | | | |
| | | Principal Amount | Value |
| FNMA, 5.00%, 11/1/33 | | $ | 364,022 |
| $ | 391,921 |
|
| FNMA, 6.00%, 12/1/33 | | 230,271 |
| 254,152 |
|
| FNMA, 5.50%, 4/1/34 | | 94,281 |
| 103,436 |
|
| FNMA, 5.50%, 4/1/34 | | 281,385 |
| 309,755 |
|
| FNMA, 5.00%, 8/1/34 | | 45,497 |
| 48,976 |
|
| FNMA, 5.50%, 8/1/34 | | 89,533 |
| 98,559 |
|
| FNMA, 5.00%, 4/1/35 | | 219,376 |
| 236,119 |
|
| FNMA, 5.00%, 8/1/35 | | 14,764 |
| 15,882 |
|
| FNMA, 4.50%, 9/1/35 | | 17,556 |
| 18,548 |
|
| FNMA, 5.50%, 7/1/36 | | 12,384 |
| 13,565 |
|
| FNMA, 5.50%, 12/1/36 | | 24,090 |
| 26,501 |
|
| FNMA, 6.00%, 7/1/37 | | 61,578 |
| 67,916 |
|
| FNMA, 6.00%, 8/1/37 | | 37,592 |
| 41,475 |
|
| FNMA, 6.50%, 8/1/37 | | 6,616 |
| 7,214 |
|
| FNMA, 6.00%, 9/1/37 | | 50,681 |
| 55,895 |
|
| FNMA, 6.00%, 11/1/37 | | 46,994 |
| 51,740 |
|
| FNMA, 5.00%, 3/1/38 | | 82,401 |
| 88,583 |
|
| FNMA, 6.50%, 9/1/38 | | 130,137 |
| 146,435 |
|
| FNMA, 5.50%, 1/1/39 | | 94,588 |
| 103,866 |
|
| FNMA, 5.00%, 2/1/39 | | 220,281 |
| 237,918 |
|
| FNMA, 4.50%, 4/1/39 | | 77,699 |
| 82,804 |
|
| FNMA, 4.50%, 5/1/39 | | 193,464 |
| 206,097 |
|
| FNMA, 6.50%, 5/1/39 | | 3,010 |
| 3,452 |
|
| FNMA, 4.50%, 10/1/39 | | 333,954 |
| 355,967 |
|
| FNMA, 4.00%, 10/1/40 | | 343,628 |
| 358,940 |
|
| FNMA, 4.50%, 11/1/40 | | 295,845 |
| 314,262 |
|
| FNMA, 4.00%, 8/1/41 | | 508,466 |
| 531,170 |
|
| FNMA, 4.50%, 9/1/41 | | 278,190 |
| 293,917 |
|
| FNMA, 3.50%, 5/1/42 | | 410,989 |
| 419,991 |
|
| FNMA, 3.50%, 6/1/42 | | 487,668 |
| 498,350 |
|
| FNMA, 3.50%, 9/1/42 | | 339,624 |
| 347,064 |
|
| FNMA, 3.50%, 5/1/45 | | 990,242 |
| 1,009,252 |
|
| FNMA, 3.50%, 5/1/46 | | 849,553 |
| 864,220 |
|
| FNMA, 3.00%, 11/1/46 | | 1,870,469 |
| 1,863,379 |
|
| FNMA, 3.50%, 2/1/47 | | 2,449,734 |
| 2,496,284 |
|
| FNMA, 6.50%, 8/1/47 | | 1,225 |
| 1,311 |
|
| FNMA, 6.50%, 9/1/47 | | 1,559 |
| 1,660 |
|
| FNMA, 6.50%, 9/1/47 | | 75 |
| 80 |
|
| FNMA, 6.50%, 9/1/47 | | 819 |
| 873 |
|
| FNMA, 3.00%, 4/1/48 | | 1,168,717 |
| 1,166,628 |
|
| FNMA, 4.00%, 6/1/48 | | 2,925,766 |
| 3,018,385 |
|
| GNMA, 3.00%, TBA | | 650,000 |
| 653,174 |
|
| GNMA, 4.00%, TBA | | 1,250,000 |
| 1,291,162 |
|
| GNMA, 5.50%, 12/15/32 | | 98,129 |
| 107,967 |
|
| GNMA, 6.00%, 9/20/38 | | 28,016 |
| 30,993 |
|
| GNMA, 5.50%, 12/20/38 | | 68,405 |
| 74,263 |
|
| GNMA, 4.50%, 6/15/39 | | 421,775 |
| 445,597 |
|
|
| | | | | | | |
| | | Principal Amount | Value |
| GNMA, 4.50%, 1/15/40 | | $ | 178,812 |
| $ | 188,246 |
|
| GNMA, 4.50%, 4/15/40 | | 273,087 |
| 288,537 |
|
| GNMA, 4.00%, 11/20/40 | | 568,807 |
| 592,775 |
|
| GNMA, 3.50%, 6/20/42 | | 605,913 |
| 622,082 |
|
| GNMA, 2.50%, 7/20/46 | | 512,115 |
| 501,935 |
|
| GNMA, 2.50%, 2/20/47 | | 593,950 |
| 582,134 |
|
| | | | 23,153,112 |
|
TOTAL U.S. GOVERNMENT AGENCY MORTGAGE-BACKED SECURITIES
(Cost $24,414,011) | 24,546,921 |
|
| ASSET-BACKED SECURITIES — 8.3% | | | |
Avis Budget Rental Car Funding AESOP LLC, Series 2015-2A, Class B, 3.42%, 12/20/21(1) | | 250,000 |
| 249,750 |
|
BRE Grand Islander Timeshare Issuer LLC, Series 2017-1A, Class A SEQ, 2.94%, 5/25/29(1) | | 130,011 |
| 129,050 |
|
Colony Starwood Homes, Series 2016-2A, Class A, VRN, 3.73%, (1-month LIBOR plus 1.25%), 12/17/33(1) | | 324,841 |
| 325,137 |
|
Enterprise Fleet Financing LLC, Series 2016-2, Class A2 SEQ, 1.74%, 2/22/22(1) | | 127,608 |
| 127,318 |
|
Goodgreen, Series 2018-1A, Class A, VRN, 3.93%, 10/15/53(1) | | 319,661 |
| 327,054 |
|
Hilton Grand Vacations Trust, Series 2013-A, Class A SEQ, 2.28%, 1/25/26(1) | | 20,344 |
| 20,293 |
|
Hilton Grand Vacations Trust, Series 2014-AA, Class A SEQ, 1.77%, 11/25/26(1) | | 89,746 |
| 88,854 |
|
Hilton Grand Vacations Trust, Series 2017-AA, Class A SEQ, 2.66%, 12/26/28(1) | | 119,717 |
| 118,863 |
|
Hilton Grand Vacations Trust, Series 2017-AA, Class B, 2.96%, 12/26/28(1) | | 195,900 |
| 193,215 |
|
Invitation Homes Trust, Series 2018-SFR1, Class B, VRN, 3.43%, (1-month LIBOR plus 0.95%), 3/17/37(1) | | 725,000 |
| 716,846 |
|
Invitation Homes Trust, Series 2018-SFR2, Class C, VRN, 3.76%, (1-month LIBOR plus 1.28%), 6/17/37(1) | | 575,000 |
| 572,136 |
|
Invitation Homes Trust, Series 2018-SFR3, Class B, VRN, 3.63%, (1-month LIBOR plus 1.15%), 7/17/37(1) | | 550,000 |
| 551,309 |
|
MVW Owner Trust, Series 2013-1A, Class A SEQ, 2.15%, 4/22/30(1) | | 68,103 |
| 67,591 |
|
MVW Owner Trust, Series 2015-1A, Class A SEQ, 2.52%, 12/20/32(1) | | 64,098 |
| 63,456 |
|
MVW Owner Trust, Series 2017-1A, Class B, 2.75%, 12/20/34(1) | | 943,187 |
| 928,913 |
|
MVW Owner Trust, Series 2018-1A, Class B, 3.60%, 1/21/36(1) | | 399,006 |
| 404,772 |
|
Progress Residential Trust, Series 2016-SFR2, Class A SEQ, VRN, 3.88%, (1-month LIBOR plus 1.40%), 1/17/34(1) | | 224,778 |
| 225,485 |
|
Progress Residential Trust, Series 2017-SFR1, Class A SEQ, 2.77%, 8/17/34(1) | | 373,799 |
| 370,940 |
|
Progress Residential Trust, Series 2017-SFR2, Class A SEQ, 2.90%, 12/17/34(1) | | 850,000 |
| 843,815 |
|
Progress Residential Trust, Series 2018-SFR1, Class B, 3.48%, 3/17/35(1) | | 325,000 |
| 325,085 |
|
Progress Residential Trust, Series 2018-SFR2, Class C, 4.04%, 8/17/35(1) | | 675,000 |
| 683,846 |
|
Progress Residential Trust, Series 2018-SFR3, Class B, 4.08%, 10/17/35(1) | | 1,000,000 |
| 1,018,949 |
|
Progress Residential Trust, Series 2018-SFR3, Class C, 4.18%, 10/17/35(1) | | 675,000 |
| 686,918 |
|
|
| | | | | | | |
| | | Principal Amount | Value |
Sierra Timeshare Conduit Receivables Funding LLC, Series 2017-1A, Class A SEQ, 2.91%, 3/20/34(1) | | $ | 104,346 |
| $ | 103,607 |
|
Sierra Timeshare Receivables Funding LLC, Series 2015-1A, Class A SEQ, 2.40%, 3/22/32(1) | | 128,787 |
| 128,246 |
|
Sierra Timeshare Receivables Funding LLC, Series 2016-1A, Class A SEQ, 3.08%, 3/21/33(1) | | 98,619 |
| 98,483 |
|
Sierra Timeshare Receivables Funding LLC, Series 2016-2A, Class A SEQ, 2.33%, 7/20/33(1) | | 97,269 |
| 95,960 |
|
Sierra Timeshare Receivables Funding LLC, Series 2018-2A, Class B, 3.65%, 6/20/35(1) | | 426,345 |
| 430,555 |
|
| Towd Point Mortgage Trust, Series 2017-3, Class M1, VRN, 3.50%, 7/25/57 | | 500,000 |
| 493,348 |
|
Towd Point Mortgage Trust, Series 2017-6, Class A1, VRN, 2.75%, 10/25/57(1) | | 602,666 |
| 592,129 |
|
Towd Point Mortgage Trust, Series 2018-4, Class A1, VRN, 3.00%, 6/25/58(1) | | 235,823 |
| 233,894 |
|
| US Airways Pass-Through Trust, Series 2013-1, Class A, 3.95%, 5/15/27 | | 71,835 |
| 72,947 |
|
VSE VOI Mortgage LLC, Series 2016-A, Class A SEQ, 2.54%, 7/20/33(1) | | 205,464 |
| 203,284 |
|
VSE VOI Mortgage LLC, Series 2017-A, Class B, 2.63%, 3/20/35(1) | | 286,083 |
| 281,541 |
|
VSE VOI Mortgage LLC, Series 2018-A, Class B, 3.72%, 2/20/36(1) | | 318,198 |
| 322,836 |
|
TOTAL ASSET-BACKED SECURITIES
(Cost $12,099,004) | | | 12,096,425 |
|
| COLLATERALIZED MORTGAGE OBLIGATIONS — 7.1% | | | |
| Private Sponsor Collateralized Mortgage Obligations — 5.0% | | | |
| Bear Stearns Adjustable Rate Mortgage Trust, Series 2004-12, Class 2A1, VRN, 4.34%, 2/25/35 | | 67,433 |
| 68,290 |
|
| Bear Stearns Adjustable Rate Mortgage Trust, Series 2006-1, Class A1, VRN, 4.91%, (1-year H15T1Y plus 2.25%), 2/25/36 | | 126,333 |
| 127,746 |
|
| Citigroup Mortgage Loan Trust, Inc., Series 2004-UST1, Class A4, VRN, 4.45%, 8/25/34 | | 35,034 |
| 34,272 |
|
| Citigroup Mortgage Loan Trust, Inc., Series 2005-4, Class A, VRN, 4.48%, 8/25/35 | | 141,121 |
| 143,249 |
|
| Countrywide Home Loan Mortgage Pass-Through Trust, Series 2004-4, Class A19, 5.25%, 5/25/34 | | 94,294 |
| 96,088 |
|
| Countrywide Home Loan Mortgage Pass-Through Trust, Series 2005-17, Class 1A11, 5.50%, 9/25/35 | | 1,443 |
| 1,406 |
|
| Credit Suisse First Boston Mortgage-Backed Pass-Through Certificates, Series 2005-3, Class 1A1, VRN, 5.39%, 7/25/35 | | 144,854 |
| 150,148 |
|
Credit Suisse Mortgage Trust, Series 2017-HL1, Class A3 SEQ, VRN, 3.50%, 6/25/47(1) | | 198,101 |
| 198,851 |
|
Credit Suisse Mortgage Trust, Series 2017-HL2, Class A3 SEQ, VRN, 3.50%, 10/25/47(1) | | 169,790 |
| 170,539 |
|
| First Horizon Alternative Mortgage Securities Trust, Series 2004-AA4, Class A1, VRN, 4.37%, 10/25/34 | | 57,276 |
| 56,923 |
|
| First Horizon Mortgage Pass-Through Trust, Series 2005-AR3, Class 4A1, VRN, 4.39%, 8/25/35 | | 75,423 |
| 76,074 |
|
| First Horizon Mortgage Pass-Through Trust, Series 2006-AR4, Class 1A2, VRN, 4.68%, 1/25/37 | | 98,755 |
| 88,442 |
|
Flagstar Mortgage Trust, Series 2017-1, Class 1A5 SEQ, VRN, 3.50%, 3/25/47(1) | | 201,762 |
| 202,274 |
|
|
| | | | | | | |
| | | Principal Amount | Value |
| GSR Mortgage Loan Trust, Series 2005-AR6, Class 2A1, VRN, 4.52%, 9/25/35 | | $ | 101,954 |
| $ | 104,270 |
|
| JPMorgan Mortgage Trust, Series 2005-A4, Class 2A1, VRN, 4.13%, 7/25/35 | | 59,401 |
| 59,442 |
|
| JPMorgan Mortgage Trust, Series 2005-A6, Class 7A1, VRN, 4.32%, 8/25/35 | | 225,552 |
| 218,970 |
|
| JPMorgan Mortgage Trust, Series 2005-S2, Class 3A1, VRN, 7.16%, 2/25/32 | | 14,418 |
| 14,785 |
|
| MASTR Adjustable Rate Mortgages Trust, Series 2004-13, Class 3A7, VRN, 4.47%, 11/21/34 | | 61,792 |
| 63,780 |
|
| Merrill Lynch Mortgage Investors Trust, Series 2005-3, Class 2A, VRN, 4.36%, 11/25/35 | | 125,501 |
| 124,952 |
|
Mill City Mortgage Loan Trust, Series 2017-2, Class A1, VRN, 2.75%, 7/25/59(1) | | 155,682 |
| 154,221 |
|
New Residential Mortgage Loan Trust, Series 2017-2A, Class A3, VRN, 4.00%, 3/25/57(1) | | 156,293 |
| 160,396 |
|
New Residential Mortgage Loan Trust, Series 2017-5A, Class A1, VRN, 3.99%, (1-month LIBOR plus 1.50%), 6/25/57(1) | | 307,072 |
| 312,672 |
|
Sequoia Mortgage Trust, Series 2017-CH1, Class A1, VRN, 4.00%, 8/25/47(1) | | 259,631 |
| 264,601 |
|
Sequoia Mortgage Trust, Series 2017-CH2, Class A10 SEQ, VRN, 4.00%, 12/25/47(1) | | 469,178 |
| 474,730 |
|
Sequoia Mortgage Trust, Series 2018-2, Class A4 SEQ, VRN, 3.50%, 2/25/48(1) | | 678,874 |
| 681,942 |
|
Sequoia Mortgage Trust, Series 2018-CH2, Class A12 SEQ, VRN, 4.00%, 6/25/48(1) | | 120,516 |
| 122,396 |
|
| Structured Adjustable Rate Mortgage Loan Trust, Series 2004-8, Class 2A1, VRN, 4.47%, 7/25/34 | | 70,419 |
| 70,965 |
|
| Thornburg Mortgage Securities Trust, Series 2006-4, Class A2B, VRN, 4.72%, 7/25/36 | | 132,333 |
| 128,260 |
|
| WaMu Mortgage Pass-Through Certificates, Series 2005-AR7, Class A3, VRN, 4.10%, 8/25/35 | | 92,779 |
| 93,902 |
|
| Wells Fargo Mortgage-Backed Securities Trust, Series 2005-17, Class 2A1, 5.50%, 1/25/36 | | 103,240 |
| 104,351 |
|
| Wells Fargo Mortgage-Backed Securities Trust, Series 2005-18, Class 1A1, 5.50%, 1/25/36 | | 76,669 |
| 76,391 |
|
| Wells Fargo Mortgage-Backed Securities Trust, Series 2005-AR4, Class 2A1, VRN, 5.09%, 4/25/35 | | 36,911 |
| 37,467 |
|
| Wells Fargo Mortgage-Backed Securities Trust, Series 2006-10, Class A4 SEQ, 6.00%, 8/25/36 | | 130,972 |
| 130,355 |
|
| Wells Fargo Mortgage-Backed Securities Trust, Series 2006-4, Class 2A1, 6.00%, 4/25/36 | | 315,893 |
| 311,804 |
|
| Wells Fargo Mortgage-Backed Securities Trust, Series 2006-6, Class 1A16 SEQ, 5.75%, 5/25/36 | | 80,537 |
| 78,524 |
|
| Wells Fargo Mortgage-Backed Securities Trust, Series 2006-7, Class 3A1 SEQ, 6.00%, 6/25/36 | | 356,275 |
| 355,433 |
|
| Wells Fargo Mortgage-Backed Securities Trust, Series 2006-AR10, Class 1A1, VRN, 4.70%, 7/25/36 | | 91,323 |
| 91,961 |
|
| Wells Fargo Mortgage-Backed Securities Trust, Series 2006-AR10, Class 2A1, VRN, 4.66%, 7/25/36 | | 82,374 |
| 83,431 |
|
| Wells Fargo Mortgage-Backed Securities Trust, Series 2006-AR10, Class 4A1, VRN, 5.18%, 7/25/36 | | 182,054 |
| 183,416 |
|
| Wells Fargo Mortgage-Backed Securities Trust, Series 2006-AR10, Class 5A6 SEQ, VRN, 4.54%, 7/25/36 | | 104,313 |
| 104,834 |
|
| Wells Fargo Mortgage-Backed Securities Trust, Series 2006-AR12, Class 1A1, VRN, 4.71%, 9/25/36 | | 128,850 |
| 130,097 |
|
|
| | | | | | | |
| | | Principal Amount | Value |
| Wells Fargo Mortgage-Backed Securities Trust, Series 2006-AR15, Class A1, VRN, 4.73%, 10/25/36 | | $ | 53,812 |
| $ | 53,285 |
|
| Wells Fargo Mortgage-Backed Securities Trust, Series 2006-AR16, Class A1, VRN, 4.70%, 10/25/36 | | 113,200 |
| 112,024 |
|
| Wells Fargo Mortgage-Backed Securities Trust, Series 2006-AR19, Class A1, VRN, 4.86%, 12/25/36 | | 67,217 |
| 66,138 |
|
| Wells Fargo Mortgage-Backed Securities Trust, Series 2006-AR5, Class 2A1, VRN, 5.08%, 4/25/36 | | 121,320 |
| 120,904 |
|
| Wells Fargo Mortgage-Backed Securities Trust, Series 2007-10, Class 2A9, 6.00%, 7/25/37 | | 98,090 |
| 95,124 |
|
| Wells Fargo Mortgage-Backed Securities Trust, Series 2007-11, Class A3 SEQ, 6.00%, 8/25/37 | | 104,412 |
| 104,257 |
|
| Wells Fargo Mortgage-Backed Securities Trust, Series 2007-11, Class A36, 6.00%, 8/25/37 | | 114,405 |
| 114,235 |
|
| Wells Fargo Mortgage-Backed Securities Trust, Series 2007-13, Class A1, 6.00%, 9/25/37 | | 122,333 |
| 121,964 |
|
| Wells Fargo Mortgage-Backed Securities Trust, Series 2007-14, Class 2A2, 5.50%, 10/25/22 | | 12,861 |
| 13,076 |
|
| Wells Fargo Mortgage-Backed Securities Trust, Series 2007-16, Class 1A1, 6.00%, 12/28/37 | | 32,378 |
| 32,207 |
|
| Wells Fargo Mortgage-Backed Securities Trust, Series 2007-2, Class 3A2, SEQ, 5.25%, 3/25/37 | | 37,902 |
| 38,962 |
|
| Wells Fargo Mortgage-Backed Securities Trust, Series 2007-8, Class 1A5 SEQ, 6.00%, 7/25/37 | | 160,910 |
| 159,995 |
|
| Wells Fargo Mortgage-Backed Securities Trust, Series 2007-AR10, Class 1A1, VRN, 4.91%, 1/25/38 | | 59,313 |
| 57,224 |
|
| | | | 7,242,045 |
|
| U.S. Government Agency Collateralized Mortgage Obligations — 2.1% | | | |
| FHLMC, Series 2015-HQ2, Class M3, VRN, 5.74%, (1-month LIBOR plus 3.25%), 5/25/25 | | 175,000 |
| 189,774 |
|
| FHLMC, Series 2017-DNA2, Class M1, VRN, 3.69%, (1-month LIBOR plus 1.20%), 10/25/29 | | 413,252 |
| 415,628 |
|
| FHLMC, Series 2018-DNA1, Class M2, VRN, 4.29%, (1-month LIBOR plus 1.80%), 7/25/30 | | 100,000 |
| 97,774 |
|
| FHLMC, Series 3397, Class GF, VRN, 2.98%, (1-month LIBOR plus 0.50%), 12/15/37 | | 101,459 |
| 101,672 |
|
| FNMA, Series 2014-C02, Class 1M2, VRN, 5.09%, (1-month LIBOR plus 2.60%), 5/25/24 | | 350,000 |
| 367,229 |
|
| FNMA, Series 2014-C02, Class 2M2, VRN, 5.09%, (1-month LIBOR plus 2.60%), 5/25/24 | | 218,892 |
| 227,373 |
|
| FNMA, Series 2016-C03, Class 2M2, VRN, 8.39%, (1-month LIBOR plus 5.90%), 10/25/28 | | 189,289 |
| 214,311 |
|
| FNMA, Series 2017-C03, Class 1M2, VRN, 5.49%, (1-month LIBOR plus 3.00%), 10/25/29 | | 225,000 |
| 237,688 |
|
| FNMA, Series 2017-C05, Class 1M2, VRN, 4.69%, (1-month LIBOR plus 2.20%), 1/25/30 | | 300,000 |
| 303,948 |
|
| FNMA, Series 2017-C06, Class 2M2, VRN, 5.29%, (1-month LIBOR plus 2.80%), 2/25/30 | | 750,000 |
| 775,843 |
|
| FNMA, Series 2017-C07, Class 1M2, VRN, 4.89%, (1-month LIBOR plus 2.40%), 5/25/30 | | 150,000 |
| 153,346 |
|
| | | | 3,084,586 |
|
TOTAL COLLATERALIZED MORTGAGE OBLIGATIONS
(Cost $10,223,792) | | | 10,326,631 |
|
| | | | |
| | | | |
|
| | | | | | | |
| | | Principal Amount | Value |
| COMMERCIAL MORTGAGE-BACKED SECURITIES — 4.8% | | |
Bank of America Merrill Lynch Commercial Mortgage Securities Trust, Series 2015-200P, Class B, 3.49%, 4/14/33(1) | | $ | 450,000 |
| $ | 454,751 |
|
| Commercial Mortgage Pass-Through Certificates, Series 2014-CR15, Class B, VRN, 4.69%, 2/10/47 | | 370,000 |
| 395,598 |
|
| Commercial Mortgage Pass-Through Certificates, Series 2014-LC17, Class B, VRN, 4.49%, 10/10/47 | | 400,000 |
| 417,140 |
|
| Commercial Mortgage Pass-Through Certificates, Series 2016-CR28, Class B, VRN, 4.65%, 2/10/49 | | 300,000 |
| 320,725 |
|
| Commercial Mortgage Trust, Series 2015-CR22, Class B, VRN, 3.93%, 3/10/48 | | 400,000 |
| 404,986 |
|
Commercial Mortgage Trust, Series 2017-PANW, Class A SEQ, 3.24%, 10/10/29(1) | | 325,000 |
| 328,118 |
|
Core Industrial Trust, Series 2015-CALW, Class C, 3.56%, 2/10/34(1) | | 310,000 |
| 312,854 |
|
Core Industrial Trust, Series 2015-TEXW, Class B, 3.33%, 2/10/34(1) | | 250,000 |
| 251,991 |
|
| GS Mortgage Securities Trust, Series 2016-GS2, Class B, VRN, 3.76%, 5/10/49 | | 400,000 |
| 407,052 |
|
Hudson Yards Mortgage Trust, Series 2016-10HY, Class B, VRN, 2.98%, 8/10/38(1) | | 525,000 |
| 513,674 |
|
| JPMBB Commercial Mortgage Securities Trust, Series 2014-C21, Class B, VRN, 4.34%, 8/15/47 | | 320,000 |
| 330,825 |
|
| JPMorgan Chase Commercial Mortgage Securities Trust, Series 2013-C16, Class C, VRN, 5.03%, 12/15/46 | | 260,000 |
| 275,047 |
|
| JPMorgan Chase Commercial Mortgage Securities Trust, Series 2016-JP2, Class B, 3.46%, 8/15/49 | | 779,000 |
| 772,190 |
|
| Morgan Stanley Bank of America Merrill Lynch Trust, Series 2017-C34, Class A3 SEQ, 3.28%, 11/15/52 | | 500,000 |
| 503,375 |
|
Morgan Stanley Capital I Trust, Series 2014-CPT, Class C, VRN, 3.45%, 7/13/29(1) | | 325,000 |
| 326,879 |
|
| UBS Commercial Mortgage Trust, Series 2017-C1, Class A3 SEQ, 3.20%, 6/15/50 | | 400,000 |
| 400,832 |
|
| Wells Fargo Commercial Mortgage Trust, Series 2017-C38, Class A4 SEQ, 3.19%, 7/15/50 | | 500,000 |
| 499,613 |
|
TOTAL COMMERCIAL MORTGAGE-BACKED SECURITIES
(Cost $6,947,896) | | 6,915,650 |
|
| COLLATERALIZED LOAN OBLIGATIONS — 4.5% | | | |
Ares XXXIIR CLO Ltd., Series 2014-32RA, Class A2A, VRN, 4.23%, (3-month LIBOR plus 1.55%), 5/15/30(1) | | 325,000 |
| 320,943 |
|
Bean Creek CLO Ltd., Series 2015-1A, Class BR, VRN, 4.21%, (3-month LIBOR plus 1.45%), 4/20/31(1) | | 250,000 |
| 244,744 |
|
Carlyle Global Market Strategies CLO Ltd., Series 2014-2RA, Class A3, VRN, 4.18%, (3-month LIBOR plus 1.50%), 5/15/31(1) | | 200,000 |
| 196,609 |
|
Carlyle Global Market Strategies CLO Ltd., Series 2014-1A, Class A1R2, VRN, 3.74%, (3-month LIBOR plus 0.97%), 4/17/31(1) | | 350,000 |
| 345,170 |
|
CBAM Ltd., Series 2018-5A, Class A, VRN, 3.79%, (3-month LIBOR plus 1.02%), 4/17/31(1) | | 200,000 |
| 196,712 |
|
CBAM Ltd., Series 2018-5A, Class B1, VRN, 4.17%, (3-month LIBOR plus 1.40%), 4/17/31(1) | | 400,000 |
| 387,209 |
|
CIFC Funding Ltd., Series 2013-3RA, Class A2, VRN, 4.18%, (3-month LIBOR plus 1.40%), 4/24/31(1) | | 300,000 |
| 293,972 |
|
Dryden 41 Senior Loan Fund, Series 2015-41A, Class AR, VRN, 3.76%, (3-month LIBOR plus 0.97%), 4/15/31(1) | | 225,000 |
| 221,174 |
|
|
| | | | | | | |
| | | Principal Amount | Value |
Dryden 64 CLO Ltd., Series 2018-64A, Class B, VRN, 4.18%, (3-month LIBOR plus 1.40%), 4/18/31(1) | | $ | 450,000 |
| $ | 439,885 |
|
Goldentree Loan Management US CLO 3 Ltd., Series 2018-3A, Class B1, VRN, 4.31%, (3-month LIBOR plus 1.55%), 4/20/30(1) | | 250,000 |
| 246,513 |
|
Goldentree Loan Opportunities X Ltd., Series 2015-10A, Class AR, VRN, 3.88%, (3-month LIBOR plus 1.12%), 7/20/31(1) | | 150,000 |
| 148,786 |
|
KKR CLO Ltd., Series 22A, Class A, VRN, 3.91%, (3-month LIBOR plus 1.15%), 7/20/31(1) | | 200,000 |
| 198,513 |
|
KKR CLO Ltd., Series 22A, Class B, VRN, 4.36%, (3-month LIBOR plus 1.60%), 7/20/31(1) | | 300,000 |
| 294,702 |
|
LCM XIV LP, Series 2014A, Class BR, VRN, 4.34%, (3-month LIBOR plus 1.58%), 7/20/31(1) | | 300,000 |
| 297,000 |
|
LoanCore Issuer Ltd., Series 2018-CRE1, Class AS, VRN, 3.98%, (1-month LIBOR plus 1.50%), 5/15/28(1) | | 353,000 |
| 353,440 |
|
Madison Park Funding XIII Ltd., Series 2014-13A, Class AR2, VRN, 3.71%, (3-month LIBOR plus 0.95%), 4/19/30(1) | | 150,000 |
| 148,883 |
|
Madison Park Funding XIII Ltd., Series 2014-13A, Class BR2, VRN, 4.26%, (3-month LIBOR plus 1.50%), 4/19/30(1) | | 275,000 |
| 272,363 |
|
Magnetite VIII Ltd., Series 2014-8A, Class AR2, VRN, 3.77%, (3-month LIBOR plus 0.98%), 4/15/31(1) | | 250,000 |
| 247,185 |
|
Magnetite VIII Ltd., Series 2014-8A, Class BR2, VRN, 4.29%, (3-month LIBOR plus 1.50%), 4/15/31(1) | | 250,000 |
| 247,105 |
|
Sounds Point CLO IV-R Ltd., Series 2013-3RA, Class A, VRN, 3.93%, (3-month LIBOR plus 1.15%), 4/18/31(1) | | 150,000 |
| 148,562 |
|
Sounds Point CLO IV-R Ltd., Series 2013-3RA, Class B, VRN, 4.53%, (3-month LIBOR plus 1.75%), 4/18/31(1) | | 200,000 |
| 199,973 |
|
Symphony CLO XIX Ltd., Series 2018-19A, Class A, VRN, 3.74%, (3-month LIBOR plus 0.96%), 4/16/31(1) | | 500,000 |
| 491,961 |
|
Treman Park CLO Ltd., Series 2015-1A, Class ARR, VRN, 3.83%, (3-month LIBOR plus 1.07%), 10/20/28(1) | | 150,000 |
| 149,796 |
|
Voya CLO Ltd., Series 2013-2A, Class A2AR, VRN, 4.17%, (3-month LIBOR plus 1.40%), 4/25/31(1) | | 350,000 |
| 342,913 |
|
Voya CLO Ltd., Series 2013-3A, Class A2RR, VRN, 4.48%, (3-month LIBOR plus 1.70%), 10/18/31(1) | | 150,000 |
| 149,545 |
|
TOTAL COLLATERALIZED LOAN OBLIGATIONS
(Cost $6,674,136) | | | 6,583,658 |
|
BANK LOAN OBLIGATIONS(4) — 1.9% | | | |
| Diversified Telecommunication Services — 0.5% | | | |
| CenturyLink, Inc., 2017 Term Loan B, 5.25%, (1-month LIBOR plus 2.75%), 1/31/25 | | 142,933 |
| 140,432 |
|
| Level 3 Financing, Inc., 2017 Term Loan B, 4.74%, (3-month LIBOR plus 2.25%), 2/22/24 | | 200,000 |
| 197,937 |
|
| Sprint Communications, Inc., 1st Lien Term Loan B, 5.00%, (1-month LIBOR plus 2.50%), 2/2/24 | | 148,861 |
| 145,288 |
|
| Zayo Group, LLC, 2017 Incremental Term Loan, 4.75%, (1-month LIBOR plus 2.25%), 1/19/24 | | 250,000 |
| 248,975 |
|
| | | | 732,632 |
|
| Health Care Providers and Services — 0.4% | | | |
Acadia Healthcare Company, Inc., 2018 Term Loan B4, 2/16/23(5) | | 200,000 |
| 198,750 |
|
| HCA Inc., 2018 Term Loan B10, 4.50%, (1-month LIBOR plus 2.00%), 3/13/25 | | 346,500 |
| 346,529 |
|
| | | | 545,279 |
|
| | | | |
|
| | | | | | | |
| | | Principal Amount | Value |
| Hotels, Restaurants and Leisure — 0.5% | | | |
| 1011778 B.C. Unlimited Liability Company, Term Loan B3, 4.75%, (1-month LIBOR plus 2.25%), 2/16/24 | | $ | 165,186 |
| $ | 162,846 |
|
| 1011778 B.C. Unlimited Liability Company, Term Loan B3, 4.75%, (1-month LIBOR plus 2.25%), 2/16/24 | | 133,164 |
| 131,277 |
|
| Caesars Resort Collection, LLC, 2017 1st Lien Term Loan B, 5.25%, (1-month LIBOR plus 2.75%), 12/22/24 | | 38,997 |
| 38,544 |
|
| Hilton Worldwide Finance, LLC, Term Loan B2, 4.24%, (1-month LIBOR plus 1.75%), 10/25/23 | | 319,292 |
| 249,000 |
|
| MGM Growth Properties Operating Partnership LP, 2016 Term Loan B, 4.50%, (1-month LIBOR plus 2.00%), 3/21/25 | | 227,653 |
| 224,910 |
|
| | | | 806,577 |
|
| Pharmaceuticals — 0.3% | | | |
| Catalent Pharma Solutions Inc., USD Term Loan B, 4.75%, (1-month LIBOR plus 2.25%), 5/20/24 | | 174,908 |
| 174,390 |
|
| Valeant Pharmaceuticals International, Inc., 2018 Term Loan B, 5.48%, (1-month LIBOR plus 3.00%), 6/2/25 | | 259,000 |
| 257,636 |
|
| | | | 432,026 |
|
| Technology Hardware, Storage and Peripherals — 0.2% | | | |
| Dell International LLC, 2017 Term Loan B, 4.50%, (1-month LIBOR plus 2.00%), 9/7/23 | | 149,244 |
| 147,740 |
|
| Western Digital Corporation, 2018 Term Loan B4, 4.25%, (1-month LIBOR plus 1.75%), 4/29/23 | | 147,714 |
| 144,083 |
|
| | | | 291,823 |
|
TOTAL BANK LOAN OBLIGATIONS
(Cost $2,841,988) | | | 2,808,337 |
|
| SOVEREIGN GOVERNMENTS AND AGENCIES — 1.6% | | | |
| Brazil — 0.1% | | | |
| Brazilian Government International Bond, 4.875%, 1/22/21 | | 190,000 |
| 196,272 |
|
| Colombia — 0.2% | | | |
| Colombia Government International Bond, 4.375%, 7/12/21 | | 330,000 |
| 339,652 |
|
| Dominican Republic — 0.2% | | | |
| Dominican Republic International Bond, 5.95%, 1/25/27 | | 200,000 |
| 210,500 |
|
| Indonesia — 0.1% | | | |
| Perusahaan Penerbit SBSN Indonesia III, 4.15%, 3/29/27 | | 200,000 |
| 202,400 |
|
| Jordan — 0.1% | | | |
| Jordan Government International Bond, 7.375%, 10/10/47 | | 200,000 |
| 197,474 |
|
| Mexico — 0.2% | | | |
| Mexico Government International Bond, 4.125%, 1/21/26 | | 200,000 |
| 204,825 |
|
| Panama — 0.2% | | | |
| Panama Government International Bond, 9.375%, 4/1/29 | | 200,000 |
| 292,800 |
|
| Peru — 0.1% | | | |
| Peruvian Government International Bond, 5.625%, 11/18/50 | | 90,000 |
| 115,695 |
|
| Philippines — 0.1% | | | |
| Philippine Government International Bond, 4.00%, 1/15/21 | | 100,000 |
| 102,123 |
|
| Poland — 0.1% | | | |
| Republic of Poland Government International Bond, 5.125%, 4/21/21 | | 60,000 |
| 62,954 |
|
| Republic of Poland Government International Bond, 3.00%, 3/17/23 | | 100,000 |
| 100,758 |
|
| | | | 163,712 |
|
|
| | | | | | | |
| | | Principal Amount | Value |
| Russia — 0.1% | | | |
| Russian Foreign Bond - Eurobond, 5.25%, 6/23/47 | | $ | 200,000 |
| $ | 202,522 |
|
| Uruguay — 0.1% | | | |
| Uruguay Government International Bond, 4.125%, 11/20/45 | | 80,000 |
| 78,400 |
|
TOTAL SOVEREIGN GOVERNMENTS AND AGENCIES
(Cost $2,290,086) | | | 2,306,375 |
|
| MUNICIPAL SECURITIES — 1.6% | | | |
| Bay Area Toll Authority Rev., 6.92%, 4/1/40 | | 180,000 |
| 250,567 |
|
| Chicago GO, 7.05%, 1/1/29 | | 50,000 |
| 55,816 |
|
| Houston GO, 3.96%, 3/1/47 | | 50,000 |
| 51,414 |
|
| Metropolitan Transportation Authority Rev., 6.69%, 11/15/40 | | 80,000 |
| 108,137 |
|
| Metropolitan Transportation Authority Rev., 6.81%, 11/15/40 | | 50,000 |
| 68,265 |
|
| Missouri Highway & Transportation Commission Rev., 5.45%, 5/1/33 | | 50,000 |
| 59,747 |
|
| New Jersey Turnpike Authority Rev., 7.10%, 1/1/41 | | 40,000 |
| 58,394 |
|
| Ohio Water Development Authority Water Pollution Control Loan Fund Rev., 4.88%, 12/1/34 | | 80,000 |
| 91,014 |
|
| Pennsylvania Turnpike Commission Rev., 5.56%, 12/1/49 | | 65,000 |
| 84,282 |
|
| Port Authority of New York & New Jersey Rev., 4.93%, 10/1/51 | | 75,000 |
| 90,656 |
|
| Rutgers The State University of New Jersey Rev., 5.67%, 5/1/40 | | 175,000 |
| 217,296 |
|
| Sacramento Municipal Utility District Rev., 6.16%, 5/15/36 | | 150,000 |
| 193,186 |
|
| Salt River Project Agricultural Improvement & Power District Rev., 4.84%, 1/1/41 | | 85,000 |
| 102,430 |
|
| San Antonio Electric & Gas Systems Rev., 5.99%, 2/1/39 | | 50,000 |
| 66,798 |
|
| San Francisco Public Utilities Commission Water Rev., 6.00%, 11/1/40 | | 50,000 |
| 63,220 |
|
| San Francisco Public Utilities Commission Water Rev., 6.95%, 11/1/50 | | 35,000 |
| 51,224 |
|
| Santa Clara Valley Transportation Authority Rev., 5.88%, 4/1/32 | | 100,000 |
| 119,880 |
|
| State of California GO, 6.65%, 3/1/22 | | 40,000 |
| 44,031 |
|
| State of California GO, 4.60%, 4/1/38 | | 10,000 |
| 10,661 |
|
| State of California GO, 7.55%, 4/1/39 | | 130,000 |
| 197,674 |
|
| State of California GO, 7.30%, 10/1/39 | | 5,000 |
| 7,243 |
|
| State of California GO, 7.60%, 11/1/40 | | 25,000 |
| 38,862 |
|
| State of Illinois GO, 5.10%, 6/1/33 | | 40,000 |
| 39,336 |
|
| State of Kansas Department of Transportation Rev., 4.60%, 9/1/35 | | 45,000 |
| 50,642 |
|
| State of Oregon Department of Transportation Rev., 5.83%, 11/15/34 | | 40,000 |
| 51,646 |
|
| State of Washington GO, 5.14%, 8/1/40 | | 90,000 |
| 109,375 |
|
TOTAL MUNICIPAL SECURITIES
(Cost $1,830,580) | | | 2,281,796 |
|
| TEMPORARY CASH INVESTMENTS — 3.3% | | | |
Bennington Stark Capital Co. LLC, 2.55%, 4/1/19 (LOC: Societe Generale SA)(1)(6) | | 1,823,000 |
| 1,822,620 |
|
Societe Generale SA, 2.50%, 4/1/19(1)(6) | | 1,000,000 |
| 999,800 |
|
|
| | | | | | | |
| | | Principal Amount/Shares | Value |
| Repurchase Agreement, BMO Capital Markets Corp., (collateralized by various U.S. Treasury obligations, 0.125% - 2.875%, 9/30/19 - 2/15/44, valued at $67,388), in a joint trading account at 2.35%, dated 3/29/19, due 4/1/19 (Delivery value $66,055) | | | $ | 66,041 |
|
| State Street Institutional U.S. Government Money Market Fund, Premier Class | | 16,882 |
| 16,882 |
|
U.S. Treasury Bills 2.54%, 2/27/20(6) | | $ | 2,000,000 |
| 1,957,169 |
|
TOTAL TEMPORARY CASH INVESTMENTS
(Cost $4,860,495) | | | 4,862,512 |
|
TOTAL INVESTMENT SECURITIES — 101.1%
(Cost $145,666,568) | | | 147,268,339 |
|
| OTHER ASSETS AND LIABILITIES — (1.1)% | | | (1,627,472 | ) |
| TOTAL NET ASSETS — 100.0% | | | $ | 145,640,867 |
|
FORWARD FOREIGN CURRENCY EXCHANGE CONTRACTS |
| | | | | | | | |
| Currency Purchased | Currency Sold | Counterparty | Settlement Date | Unrealized Appreciation
(Depreciation) |
| CAD | 483,380 | USD | 364,918 | Morgan Stanley | 6/19/19 | $ | (2,500 | ) |
| CAD | 2,443,614 | USD | 1,824,818 | Morgan Stanley | 6/19/19 | 7,301 |
|
| CLP | 469,379,622 | USD | 689,554 | Goldman Sachs & Co. | 6/19/19 | 181 |
|
| USD | 700,640 | CLP | 469,379,622 | Goldman Sachs & Co. | 6/19/19 | 10,905 |
|
| CZK | 16,571,974 | USD | 728,663 | UBS AG | 6/19/19 | (6,937 | ) |
| USD | 724,189 | CZK | 16,571,974 | UBS AG | 6/19/19 | 2,463 |
|
| EUR | 163,858 | USD | 185,446 | JPMorgan Chase Bank N.A. | 6/19/19 | (426 | ) |
| USD | 1,485,243 | EUR | 1,303,817 | JPMorgan Chase Bank N.A. | 6/19/19 | 13,047 |
|
| USD | 691,382 | HUF | 193,295,190 | UBS AG | 6/19/19 | 12,493 |
|
| USD | 768,169 | HUF | 214,272,961 | UBS AG | 6/19/19 | 15,602 |
|
| IDR | 10,351,685,316 | USD | 718,717 | Goldman Sachs & Co. | 6/19/19 | (824 | ) |
| USD | 716,776 | IDR | 10,351,685,316 | Goldman Sachs & Co. | 6/19/19 | (1,117 | ) |
| KZT | 533,575,204 | USD | 1,389,157 | Goldman Sachs & Co. | 6/19/19 | (7,882 | ) |
| USD | 692,955 | KZT | 266,787,602 | Goldman Sachs & Co. | 6/19/19 | 2,317 |
|
| MXN | 104,999 | USD | 5,319 | Morgan Stanley | 6/19/19 | 23 |
|
| MYR | 5,777,351 | USD | 1,414,908 | Goldman Sachs & Co. | 6/19/19 | 1,032 |
|
| USD | 689,904 | MYR | 2,819,636 | Goldman Sachs & Co. | 6/19/19 | (1,146 | ) |
| NOK | 12,334,604 | USD | 1,424,665 | Goldman Sachs & Co. | 6/19/19 | 9,732 |
|
| NOK | 6,779,733 | USD | 785,355 | Goldman Sachs & Co. | 6/19/19 | 3,064 |
|
| NOK | 12,304,836 | USD | 1,437,412 | Goldman Sachs & Co. | 6/19/19 | (6,477 | ) |
| USD | 363,729 | NOK | 3,099,102 | Goldman Sachs & Co. | 6/19/19 | 3,333 |
|
| USD | 778,815 | NOK | 6,626,355 | Goldman Sachs & Co. | 6/19/19 | 8,233 |
|
| NZD | 1,014,317 | USD | 695,984 | UBS AG | 6/19/19 | (4,206 | ) |
| USD | 693,986 | NZD | 1,014,317 | UBS AG | 6/19/19 | 2,208 |
|
| USD | 724,398 | PEN | 2,402,755 | Goldman Sachs & Co. | 6/19/19 | 2,665 |
|
| PHP | 37,335,786 | USD | 706,114 | Goldman Sachs & Co. | 6/19/19 | (2,412 | ) |
| USD | 710,495 | PHP | 37,335,786 | Goldman Sachs & Co. | 6/19/19 | 6,792 |
|
| PLN | 1,373,881 | USD | 365,297 | Goldman Sachs & Co. | 6/19/19 | (6,581 | ) |
| PLN | 2,718,317 | USD | 722,774 | Goldman Sachs & Co. | 6/19/19 | (13,032 | ) |
| USD | 3,589,498 | PLN | 13,709,370 | Goldman Sachs & Co. | 6/19/19 | 10,033 |
|
| USD | 732,013 | PLN | 2,742,780 | Goldman Sachs & Co. | 6/19/19 | 15,884 |
|
| SEK | 40,408,852 | USD | 4,324,230 | Goldman Sachs & Co. | 6/19/19 | 47,501 |
|
| USD | 653,091 | SEK | 6,089,813 | Goldman Sachs & Co. | 6/19/19 | (5,750 | ) |
| USD | 1,883,419 | SEK | 17,473,043 | Goldman Sachs & Co. | 6/19/19 | (6,945 | ) |
| THB | 23,011,676 | USD | 726,493 | Goldman Sachs & Co. | 6/19/19 | 87 |
|
| USD | 726,493 | THB | 23,011,676 | Goldman Sachs & Co. | 6/19/19 | (87 | ) |
| | | | | | | $ | 108,574 |
|
|
| | | | | | | | | | | |
| FUTURES CONTRACTS PURCHASED |
| Reference Entity | Contracts | Expiration Date | Notional Amount | Underlying Contract Value | Unrealized Appreciation (Depreciation) |
| U.S. Treasury 2-Year Notes | 97 | June 2019 | $ | 19,400,000 |
| $ | 20,670,094 |
| $ | 69,235 |
|
| U.S. Treasury 5-Year Notes | 1 | June 2019 | $ | 100,000 |
| 115,828 |
| 1,155 |
|
| U.S. Treasury Long Bonds | 10 | June 2019 | $ | 1,000,000 |
| 1,496,562 |
| 38,235 |
|
| U.S. Treasury Ultra Bonds | 8 | June 2019 | $ | 800,000 |
| 1,344,000 |
| 47,794 |
|
| | | | | | $ | 23,626,484 |
| $ | 156,419 |
|
|
| | | | | | | | | | | | | | | |
| CENTRALLY CLEARED CREDIT DEFAULT SWAP AGREEMENTS | |
| Reference Entity | Type‡ | Fixed Rate
Received
(Paid) | Termination
Date | Notional Amount | Premiums Paid (Received) | Unrealized Appreciation
(Depreciation) | Value^ |
| Markit CDX North America High Yield Index Series 31 | Buy | (5.00)% | 12/20/23 | $ | 2,450,000 |
| $ | (143,594 | ) | $ | (23,632 | ) | $ | (167,226 | ) |
| Markit CDX North America Investment Grade Index Series 30 | Sell | 1.00% | 6/20/23 | $ | 1,500,000 |
| 20,848 |
| 9,234 |
| 30,082 |
|
| | | | | | $ | (122,746 | ) | $ | (14,398 | ) | $ | (137,144 | ) |
‡The maximum potential amount the fund could be required to deliver as a seller of credit protection if a credit event occurs as defined under the terms of the agreement is the notional amount. The maximum potential amount may be partially offset by any recovery values of the reference entities and upfront payments received upon entering into the agreement.
^The value for credit default swap agreements serve as an indicator of the current status of the payment/performance risk and represent the likelihood of an expected liability or profit at the period end. Increasing values in absolute terms when compared to the notional amount of the credit default swap agreement represent a deterioration of the referenced entity's credit soundness and an increased likelihood or risk of a credit event occurring as defined in the agreement.
|
| | |
| NOTES TO SCHEDULE OF INVESTMENTS |
| CAD | - | Canadian Dollar |
| CDX | - | Credit Derivatives Indexes |
| CLP | - | Chilean Peso |
| CZK | - | Czech Koruna |
| EUR | - | Euro |
| FHLMC | - | Federal Home Loan Mortgage Corporation |
| FNMA | - | Federal National Mortgage Association |
| GNMA | - | Government National Mortgage Association |
| GO | - | General Obligation |
| H15T1Y | - | Constant Maturity U.S. Treasury Note Yield Curve Rate Index |
| HUF | - | Hungarian Forint |
| IDR | - | Indonesian Rupiah |
| KZT | - | Kazakhstani Tenge |
| LIBOR | - | London Interbank Offered Rate |
| LOC | - | Letter of Credit |
| MTN | - | Medium Term Note |
| MXN | - | Mexican Peso |
| MYR | - | Malaysian Ringgit |
| NOK | - | Norwegian Krone |
| NZD | - | New Zealand Dollar |
| PEN | - | Peruvian Sol |
| PHP | - | Philippine Peso |
| PLN | - | Polish Zloty |
| SEK | - | Swedish Krona |
| SEQ | - | Sequential Payer |
| TBA | - | To-Be-Announced. Security was purchased on a forward commitment basis with an approximate principal amount and maturity date. Actual principal amount and maturity date will be determined upon settlement. |
| THB | - | Thai Baht |
| USD | - | United States Dollar |
| VRN | - | Variable Rate Note. The rate adjusts periodically based upon the terms set forth in the security’s offering documents. The rate shown is effective at the period end and the reference rate and spread, if any, is indicated. |
| |
| (1) | Security was purchased pursuant to Rule 144A or Section 4(2) under the Securities Act of 1933 and may be sold in transactions exempt from registration, normally to qualified institutional investors. The aggregate value of these securities at the period end was $30,675,384, which represented 21.1% of total net assets. |
| |
| (2) | Perpetual maturity with no stated maturity date. |
| |
| (3) | Security, or a portion thereof, has been pledged at the custodian bank or with a broker for collateral requirements on forward commitments, forward foreign currency exchange contracts, futures contracts and/or swap agreements. At the period end, the aggregate value of securities pledged was $252,635. |
| |
| (4) | The interest rate on a bank loan obligation adjusts periodically based on a predetermined schedule. Rate shown is effective at period end. The maturity date on a bank loan obligation may be less than indicated as a result of contractual or optional prepayments. These prepayments cannot be predicted with certainty. |
| |
| (5) | The interest rate will be determined upon settlement of the bank loan obligation after period end. |
| |
| (6) | The rate indicated is the yield to maturity at purchase. |
See Notes to Financial Statements.
|
|
| Statement of Assets and Liabilities |
|
| | | |
| MARCH 31, 2019 | |
| Assets | |
| Investment securities, at value (cost of $145,666,568) | $ | 147,268,339 |
|
| Receivable for investments sold | 91,469 |
|
| Receivable for capital shares sold | 293,399 |
|
| Unrealized appreciation on forward foreign currency exchange contracts | 174,896 |
|
| Interest receivable | 931,781 |
|
| | 148,759,884 |
|
| | |
| Liabilities | |
| Payable for investments purchased | 2,855,032 |
|
| Payable for capital shares redeemed | 80,662 |
|
| Payable for variation margin on futures contracts | 28,195 |
|
| Payable for variation margin on swap agreements | 7,531 |
|
| Unrealized depreciation on forward foreign currency exchange contracts | 66,322 |
|
| Accrued management fees | 64,837 |
|
| Distribution and service fees payable | 6,499 |
|
| Dividends payable | 9,939 |
|
| | 3,119,017 |
|
| | |
| Net Assets | $ | 145,640,867 |
|
| | |
| Net Assets Consist of: | |
| Capital paid in | $ | 149,356,726 |
|
| Distributable earnings | (3,715,859 | ) |
| | $ | 145,640,867 |
|
|
| | | | | |
| | Net Assets | Shares Outstanding | Net Asset Value Per Share |
| Investor Class |
| $109,759,663 |
| 10,392,149 | $10.56 |
| I Class |
| $6,268,759 |
| 593,729 | $10.56 |
| A Class |
| $15,629,794 |
| 1,479,654 | $10.56* |
| C Class |
| $3,456,942 |
| 327,325 | $10.56 |
| R Class |
| $615,304 |
| 58,259 | $10.56 |
| R5 Class |
| $9,910,405 |
| 938,773 | $10.56 |
*Maximum offering price $11.06 (net asset value divided by 0.955).
See Notes to Financial Statements.
|
| | | |
| YEAR ENDED MARCH 31, 2019 | |
| Investment Income (Loss) | |
| Income: | |
| Interest | $ | 5,351,873 |
|
| | |
| Expenses: | |
| Management fees | 894,705 |
|
| Distribution and service fees: | |
| A Class | 36,452 |
|
| C Class | 41,197 |
|
| R Class | 2,922 |
|
| Trustees' fees and expenses | 9,958 |
|
| Other expenses | 3,993 |
|
| | 989,227 |
|
Fees waived(1) | (93,848 | ) |
| | 895,379 |
|
| | |
| Net investment income (loss) | 4,456,494 |
|
| | |
| Realized and Unrealized Gain (Loss) | |
| Net realized gain (loss) on: | |
| Investment transactions | (2,829,377 | ) |
| Forward foreign currency exchange contract transactions | 1,225,907 |
|
| Futures contract transactions | (560,584 | ) |
| Swap agreement transactions | 232,563 |
|
| Foreign currency translation transactions | (83,414 | ) |
| | (2,014,905 | ) |
| | |
| Change in net unrealized appreciation (depreciation) on: | |
| Investments | 1,936,504 |
|
| Forward foreign currency exchange contracts | 234,217 |
|
| Futures contracts | 287,103 |
|
| Swap agreements | (3,358 | ) |
| Translation of assets and liabilities in foreign currencies | (3,207 | ) |
| | 2,451,259 |
|
| | |
| Net realized and unrealized gain (loss) | 436,354 |
|
| | |
| Net Increase (Decrease) in Net Assets Resulting from Operations | $ | 4,892,848 |
|
| |
| (1) | Amount consists of $71,700, $2,980, $9,950, $2,495, $358 and $6,365 for Investor Class, I Class, A Class, C Class, R Class and R5 Class, respectively. |
See Notes to Financial Statements.
|
|
| Statement of Changes in Net Assets |
|
| | | | | | |
| YEARS ENDED MARCH 31, 2019 AND MARCH 31, 2018 |
| Increase (Decrease) in Net Assets | March 31, 2019 | March 31, 2018 |
| Operations | | |
| Net investment income (loss) | $ | 4,456,494 |
| $ | 3,814,144 |
|
| Net realized gain (loss) | (2,014,905 | ) | 557,714 |
|
| Change in net unrealized appreciation (depreciation) | 2,451,259 |
| (2,256,819 | ) |
| Net increase (decrease) in net assets resulting from operations | 4,892,848 |
| 2,115,039 |
|
| | | |
| Distributions to Shareholders | | |
| From earnings: | | |
| Investor Class | (4,155,744 | ) | (3,309,250 | ) |
| I Class | (154,831 | ) | (72,476 | ) |
| A Class | (515,469 | ) | (426,476 | ) |
| C Class | (113,890 | ) | (118,460 | ) |
| R Class | (18,805 | ) | (28,086 | ) |
| R5 Class | (383,124 | ) | (191,965 | ) |
| Decrease in net assets from distributions | (5,341,863 | ) | (4,146,713 | ) |
| | | |
| Capital Share Transactions | | |
| Net increase (decrease) in net assets from capital share transactions (Note 5) | (5,088,125 | ) | 29,557,142 |
|
| | | |
| Net increase (decrease) in net assets | (5,537,140 | ) | 27,525,468 |
|
| | | |
| Net Assets | | |
| Beginning of period | 151,178,007 |
| 123,652,539 |
|
| End of period | $ | 145,640,867 |
| $ | 151,178,007 |
|
See Notes to Financial Statements.
|
|
| Notes to Financial Statements |
MARCH 31, 2019
1. Organization
American Century Investment Trust (the trust) is registered under the Investment Company Act of 1940, as amended (the 1940 Act), as an open-end management investment company and is organized as a Massachusetts business trust. Core Plus Fund (the fund) is one fund in a series issued by the trust. The fund’s investment objective is to seek to maximize total return. As a secondary objective, the fund seeks a high level of income.
The fund offers the Investor Class, I Class, A Class, C Class, R Class and R5 Class. The A Class may incur an initial sales charge. The A Class and C Class may be subject to a contingent deferred sales charge. Sale of the I Class commenced on April 10, 2017.
2. Significant Accounting Policies
The following is a summary of significant accounting policies consistently followed by the fund in preparation of its financial statements. The fund is an investment company and follows accounting and reporting guidance in accordance with accounting principles generally accepted in the United States of America. This may require management to make certain estimates and assumptions at the date of the financial statements. Actual results could differ from these estimates. Management evaluated the impact of events or transactions occurring through the date the financial statements were issued that would merit recognition or disclosure.
Investment Valuations — The fund determines the fair value of its investments and computes its net asset value per share at the close of regular trading (usually 4 p.m. Eastern time) on the New York Stock Exchange (NYSE) on each day the NYSE is open. The Board of Trustees has adopted valuation policies and procedures to guide the investment advisor in the fund’s investment valuation process and to provide methodologies for the oversight of the fund’s pricing function.
Fixed income securities are valued at the evaluated mean as provided by independent pricing services or at the mean of the most recent bid and asked prices as provided by investment dealers. Corporate bonds, U.S. Treasury and Government Agency securities, convertible bonds, bank loan obligations, municipal securities, and sovereign governments and agencies are valued using market models that consider trade data, quotations from dealers and active market makers, relevant yield curve and spread data, creditworthiness, trade data or market information on comparable securities, and other relevant security specific information. Mortgage-related and asset-backed securities are valued based on models that consider trade data, prepayment and default projections, benchmark yield and spread data and estimated cash flows of each tranche of the issuer. Collateralized loan obligations are valued based on discounted cash flow models that consider trade and economic data, prepayment assumptions and default projections. Commercial paper is valued using a curve-based approach that considers money market rates for specific instruments, programs, currencies and maturity points from a variety of active market makers. Fixed income securities initially expressed in local currencies are translated into U.S. dollars at the mean of the appropriate currency exchange rate at the close of the NYSE as provided by an independent pricing service.
Open-end management investment companies are valued at the reported net asset value per share. Repurchase agreements are valued at cost, which approximates fair value. Exchange-traded futures contracts are valued at the settlement price as provided by the appropriate exchange. Swap agreements are valued at an evaluated mean as provided by independent pricing services or independent brokers. Forward foreign currency exchange contracts are valued at the mean of the appropriate forward exchange rate at the close of the NYSE as provided by an independent pricing service. Investments initially expressed in local currencies are translated into U.S. dollars at the mean of the appropriate currency exchange rate at the close of the NYSE as provided by an independent pricing service.
If the fund determines that the market price for an investment is not readily available or the valuation methods mentioned above do not reflect an investment’s fair value, such investment is valued as determined in good faith by the Board of Trustees or its delegate, in accordance with policies and procedures adopted by the Board of Trustees. In its determination of fair value, the fund may review several factors including, but not limited to, market information regarding the specific investment or comparable investments and correlation with other investment types, futures indices or general market indicators. Circumstances that may cause the fund to use these procedures to value an investment include, but are not limited to: an investment has been declared in default or is distressed; trading in a security has been suspended during the trading day or a security is not actively trading on its principal exchange; prices received from a regular pricing source are deemed unreliable; or there is a foreign market holiday and no trading occurred.
The fund monitors for significant events occurring after the close of an investment’s primary exchange but before the fund’s net asset value per share is determined. Significant events may include, but are not limited to: corporate announcements and transactions; governmental action and political unrest that could impact a specific investment or an investment sector; or armed conflicts, natural disasters and similar events that could affect investments in a specific country or region.
Security Transactions — Security transactions are accounted for as of the trade date. Net realized gains and losses are determined on the identified cost basis, which is also used for federal income tax purposes.
Investment Income — Interest income is recorded on the accrual basis and includes paydown gain (loss) and accretion of discounts and amortization of premiums. Inflation adjustments related to inflation-linked debt securities are reflected as interest income.
Foreign Currency Translations — All assets and liabilities initially expressed in foreign currencies are translated into U.S. dollars at prevailing exchange rates at period end. The fund may enter into spot foreign currency exchange contracts to facilitate transactions denominated in a foreign currency. Purchases and sales of investment securities, dividend and interest income, spot foreign currency exchange contracts, and expenses are translated at the rates of exchange prevailing on the respective dates of such transactions. Net realized and unrealized foreign currency exchange gains or losses related to investment securities are a component of net realized gain (loss) on investment transactions and change in net unrealized appreciation (depreciation) on investments, respectively.
Repurchase Agreements — The fund may enter into repurchase agreements with institutions that American Century Investment Management, Inc. (ACIM) (the investment advisor) has determined are creditworthy pursuant to criteria adopted by the Board of Trustees. The fund requires that the collateral, represented by securities, received in a repurchase transaction be transferred to the custodian in a manner sufficient to enable the fund to obtain those securities in the event of a default under the repurchase agreement. ACIM monitors, on a daily basis, the securities transferred to ensure the value, including accrued interest, of the securities under each repurchase agreement is equal to or greater than amounts owed to the fund under each repurchase agreement.
Joint Trading Account — Pursuant to an Exemptive Order issued by the Securities and Exchange Commission, the fund, along with certain other funds in the American Century Investments family of funds, may transfer uninvested cash balances into a joint trading account. These balances are invested in one or more repurchase agreements that are collateralized by U.S. Treasury or Agency obligations.
Forward Commitments — The fund may engage in securities transactions on a forward commitment basis. In these transactions, the securities’ prices and yields are fixed on the date of the commitment. The fund may sell a to-be-announced (TBA) security and at the same time make a commitment to purchase the same security at a future date at a specified price. Conversely, the fund may purchase a TBA security and at the same time make a commitment to sell the same security at a future date at a specified price. These types of transactions are known as “TBA roll” transactions and are accounted for as purchases and sales. The fund will segregate cash, cash equivalents or other appropriate liquid securities on its records in amounts sufficient to meet the purchase price.
Segregated Assets — In accordance with the 1940 Act, the fund segregates assets on its books and records to cover certain types of investment securities and other financial instruments. ACIM monitors, on a daily basis, the securities segregated to ensure the fund designates a sufficient amount of liquid assets, marked-to-market daily. The fund may also receive assets or be required to pledge assets at the custodian bank or with a broker for collateral requirements.
Income Tax Status — It is the fund’s policy to distribute substantially all net investment income and net realized gains to shareholders and to otherwise qualify as a regulated investment company under provisions of the Internal Revenue Code. Accordingly, no provision has been made for income taxes. The fund files U.S. federal, state, local and non-U.S. tax returns as applicable. The fund's tax returns are subject to examination by the relevant taxing authority until expiration of the applicable statute of limitations, which is generally three years from the date of filing but can be longer in certain jurisdictions. At this time, management believes there are no uncertain tax positions which, based on their technical merit, would not be sustained upon examination and for which it is reasonably possible that the total amounts of unrecognized tax benefits will significantly change in the next twelve months.
Multiple Class — All shares of the fund represent an equal pro rata interest in the net assets of the class to which such shares belong, and have identical voting, dividend, liquidation and other rights and the same terms and conditions, except for class specific expenses and exclusive rights to vote on matters affecting only individual classes. Income, non-class specific expenses, and realized and unrealized capital gains and losses of the fund are allocated to each class of shares based on their relative net assets.
Distributions to Shareholders — Distributions from net investment income, if any, are declared daily and paid monthly. Distributions from net realized gains, if any, are generally declared and paid annually.
Indemnifications — Under the trust’s organizational documents, its officers and trustees are indemnified against certain liabilities arising out of the performance of their duties to the fund. In addition, in the normal course of business, the fund enters into contracts that provide general indemnifications. The maximum exposure under these arrangements is unknown as this would involve future claims that may be made against a fund. The risk of material loss from such claims is considered by management to be remote.
3. Fees and Transactions with Related Parties
Certain officers and trustees of the trust are also officers and/or directors of American Century Companies, Inc. (ACC). The trust's investment advisor, ACIM, the trust's distributor, American Century Investment Services, Inc. (ACIS), and the trust's transfer agent, American Century Services, LLC, are wholly owned, directly or indirectly, by ACC.
Management Fees — The trust has entered into a management agreement with ACIM, under which ACIM provides the fund with investment advisory and management services in exchange for a single, unified management fee (the fee) per class. The agreement provides that all expenses of managing and operating the fund, except distribution and service fees, brokerage expenses, taxes, interest, fees and expenses of the independent trustees (including legal counsel fees), and extraordinary expenses, will be paid by ACIM. The fee is computed and accrued daily based on each class's daily net assets and paid monthly in arrears. The difference in the fee among the classes is a result of their separate arrangements for non-Rule 12b-1 shareholder services. It is not the result of any difference in advisory or custodial fees or other expenses related to the management of the fund’s assets, which do not vary by class. The fee consists of (1) an Investment Category Fee based on the daily net assets of the fund and certain other accounts managed by the investment advisor that are in the same broad investment category as the fund and (2) a Complex Fee based on the assets of all the funds in the American Century Investments family of funds. From August 1, 2018 through March 31, 2019, the investment advisor agreed to waive 0.10% of the fund's management fee. The investment advisor expects this waiver to continue until July 31, 2019 and cannot terminate it prior to such date without the approval of the Board of Trustees.
The Investment Category Fee range, the Complex Fee range and the effective annual management fee before and after waiver for each class for the period ended March 31, 2019 are as follows:
|
| | | | |
| | | | Effective Annual Management Fee |
| | Investment Category Fee Range | Complex Fee Range | Before Waiver | After Waiver |
| Investor Class | 0.3425%
to 0.4600% | 0.2500% to 0.3100% | 0.64% | 0.57% |
| I Class | 0.1500% to 0.2100% | 0.54% | 0.47% |
| A Class | 0.2500% to 0.3100% | 0.64% | 0.57% |
| C Class | 0.2500% to 0.3100% | 0.64% | 0.57% |
| R Class | 0.2500% to 0.3100% | 0.64% | 0.57% |
| R5 Class | 0.0500% to 0.1100% | 0.44% | 0.37% |
Distribution and Service Fees — The Board of Trustees has adopted a separate Master Distribution and Individual Shareholder Services Plan for each of the A Class, C Class and R Class (collectively the plans), pursuant to Rule 12b-1 of the 1940 Act. The plans provide that the A Class will pay ACIS an annual distribution and service fee of 0.25%. The plans provide that the C Class will pay ACIS an annual distribution and service fee of 1.00%, of which 0.25% is paid for individual shareholder services and 0.75% is paid for distribution services. The plans provide that the R Class will pay ACIS an annual distribution and service fee of 0.50%. The fees are computed and accrued daily based on each class’s daily net assets and paid monthly in arrears. The fees are used to pay financial intermediaries for distribution and individual shareholder services. Fees incurred under the plans during the period ended March 31, 2019 are detailed in the Statement of Operations.
Trustees’ Fees and Expenses — The Board of Trustees is responsible for overseeing the investment advisor’s management and operations of the fund. The trustees receive detailed information about the fund and its investment advisor regularly throughout the year, and meet at least quarterly with management of the investment advisor to review reports about fund operations. The fund’s officers do not receive compensation from the fund.
Interfund Transactions — The fund may enter into security transactions with other American Century Investments funds and other client accounts of the investment advisor, in accordance with the 1940 Act rules and procedures adopted by the Board of Trustees. The rules and procedures require, among other things, that these transactions be effected at the independent current market price of the security. There were no interfund transactions during the period.
4. Investment Transactions
Purchases of investment securities, excluding short-term investments, for the period ended March 31, 2019 totaled $206,016,720, of which $177,587,761 represented U.S. Treasury and Government Agency obligations.
Sales of investment securities, excluding short-term investments, for the period ended March 31, 2019 totaled $221,865,792, of which $164,700,716 represented U.S. Treasury and Government Agency obligations.
5. Capital Share Transactions
Transactions in shares of the fund were as follows (unlimited number of shares authorized):
|
| | | | | | | | | | |
| | Year ended
March 31, 2019 | Year ended March 31, 2018(1) |
| | Shares | Amount | Shares | Amount |
| Investor Class | | | | |
| Sold | 3,567,664 |
| $ | 36,936,228 |
| 6,140,417 |
| $ | 66,171,749 |
|
| Issued in reinvestment of distributions | 384,507 |
| 3,987,347 |
| 293,625 |
| 3,163,844 |
|
| Redeemed | (4,737,909 | ) | (49,084,300 | ) | (3,117,106 | ) | (33,617,792 | ) |
| | (785,738 | ) | (8,160,725 | ) | 3,316,936 |
| 35,717,801 |
|
| I Class | | | | |
| Sold | 441,715 |
| 4,590,990 |
| 411,246 |
| 4,460,774 |
|
| Issued in reinvestment of distributions | 14,325 |
| 148,384 |
| 5,752 |
| 61,787 |
|
| Redeemed | (187,407 | ) | (1,948,190 | ) | (91,902 | ) | (984,924 | ) |
| | 268,633 |
| 2,791,184 |
| 325,096 |
| 3,537,637 |
|
| A Class | | | | |
| Sold | 428,625 |
| 4,450,885 |
| 699,222 |
| 7,587,825 |
|
| Issued in reinvestment of distributions | 48,810 |
| 505,965 |
| 38,296 |
| 412,763 |
|
| Redeemed | (333,272 | ) | (3,462,658 | ) | (1,969,049 | ) | (21,228,270 | ) |
| | 144,163 |
| 1,494,192 |
| (1,231,531 | ) | (13,227,682 | ) |
| C Class | | | | |
| Sold | 16,872 |
| 175,567 |
| 31,834 |
| 343,401 |
|
| Issued in reinvestment of distributions | 9,998 |
| 103,642 |
| 9,942 |
| 107,149 |
|
| Redeemed | (188,805 | ) | (1,960,272 | ) | (202,061 | ) | (2,181,265 | ) |
| | (161,935 | ) | (1,681,063 | ) | (160,285 | ) | (1,730,715 | ) |
| R Class | | | | |
| Sold | 31,923 |
| 331,978 |
| 21,897 |
| 235,997 |
|
| Issued in reinvestment of distributions | 1,760 |
| 18,262 |
| 2,498 |
| 26,967 |
|
| Redeemed | (48,598 | ) | (505,905 | ) | (88,669 | ) | (962,216 | ) |
| | (14,915 | ) | (155,665 | ) | (64,274 | ) | (699,252 | ) |
| R5 Class | | | | |
| Sold | 256,751 |
| 2,670,346 |
| 849,590 |
| 9,193,981 |
|
| Issued in reinvestment of distributions | 36,883 |
| 382,195 |
| 17,916 |
| 191,965 |
|
| Redeemed | (235,302 | ) | (2,428,589 | ) | (317,284 | ) | (3,426,593 | ) |
| | 58,332 |
| 623,952 |
| 550,222 |
| 5,959,353 |
|
| Net increase (decrease) | (491,460 | ) | $ | (5,088,125 | ) | 2,736,164 |
| $ | 29,557,142 |
|
| |
| (1) | April 10, 2017 (commencement of sale) through March 31, 2018 for the I Class. |
6. Fair Value Measurements
The fund’s investments valuation process is based on several considerations and may use multiple inputs to determine the fair value of the investments held by the fund. In conformity with accounting principles generally accepted in the United States of America, the inputs used to determine a valuation are classified into three broad levels.
| |
| • | Level 1 valuation inputs consist of unadjusted quoted prices in an active market for identical investments. |
| |
| • | Level 2 valuation inputs consist of direct or indirect observable market data (including quoted prices for comparable investments, evaluations of subsequent market events, interest rates, prepayment speeds, credit risk, etc.). These inputs also consist of quoted prices for identical investments initially expressed in local currencies that are adjusted through translation into U.S. dollars. |
| |
| • | Level 3 valuation inputs consist of unobservable data (including a fund’s own assumptions). |
The level classification is based on the lowest level input that is significant to the fair valuation measurement. The valuation inputs are not necessarily an indication of the risks associated with investing in these securities or other financial instruments.
The following is a summary of the level classifications as of period end. The Schedule of Investments provides additional information on the fund’s portfolio holdings.
|
| | | | | | | | |
| | Level 1 | Level 2 | Level 3 |
| Assets | | | |
| Investment Securities | | | |
| Corporate Bonds | — |
| $ | 41,121,836 |
| — |
|
| U.S. Treasury Securities | — |
| 33,418,198 |
| — |
|
| U.S. Government Agency Mortgage-Backed Securities | — |
| 24,546,921 |
| — |
|
| Asset-Backed Securities | — |
| 12,096,425 |
| — |
|
| Collateralized Mortgage Obligations | — |
| 10,326,631 |
| — |
|
| Commercial Mortgage-Backed Securities | — |
| 6,915,650 |
| — |
|
| Collateralized Loan Obligations | — |
| 6,583,658 |
| — |
|
| Bank Loan Obligations | — |
| 2,808,337 |
| — |
|
| Sovereign Governments and Agencies | — |
| 2,306,375 |
| — |
|
| Municipal Securities | — |
| 2,281,796 |
| — |
|
| Temporary Cash Investments | $ | 16,882 |
| 4,845,630 |
| — |
|
| | $ | 16,882 |
| $ | 147,251,457 |
| — |
|
| Other Financial Instruments | | | |
| Futures Contracts | $ | 156,419 |
| — |
| — |
|
| Swap Agreements | — |
| $ | 30,082 |
| — |
|
| Forward Foreign Currency Exchange Contracts | — |
| 174,896 |
| — |
|
| | $ | 156,419 |
| $ | 204,978 |
| — |
|
| | | | |
| Liabilities | | | |
| Other Financial Instruments | | | |
| Swap Agreements | — |
| $ | 167,226 |
| — |
|
| Forward Foreign Currency Exchange Contracts | — |
| 66,322 |
| — |
|
| | — |
| $ | 233,548 |
| — |
|
7. Derivative Instruments
Credit Risk — The fund is subject to credit risk in the normal course of pursuing its investment objectives. The value of a bond generally declines as the credit quality of its issuer declines. Credit default swap agreements enable a fund to buy/sell protection against a credit event of a specific issuer or index. A fund may attempt to enhance returns by selling protection or attempt to mitigate credit risk by buying protection. The buyer/seller of credit protection against a security or basket of securities may pay/receive an up-front or periodic payment to compensate for/against potential default events. Changes in value, including the periodic amounts of interest to be paid or received on swap agreements, are recorded as unrealized appreciation (depreciation) on swap agreements. Upon entering into a centrally cleared swap, a fund is required to deposit cash or securities (initial margin) with a financial intermediary in an amount equal to a certain percentage of the notional amount. Subsequent payments (variation margin) are made or received daily, in cash, by a fund. The variation margin is equal to the daily change in the value and is a component of unrealized gains and losses. Realized gain or loss is recorded upon receipt or payment of a periodic settlement or termination of swap agreements. Net realized and unrealized gains or losses occurring during the holding period of swap agreements are a component of net realized gain (loss) on swap agreement transactions and change in net unrealized appreciation (depreciation) on swap agreements, respectively. The risks of entering into swap agreements include the possible lack of liquidity, failure of the counterparty to meet its obligations, and that there may be unfavorable changes in the underlying investments or instruments. The fund's average notional amount held during the period was $3,043,333.
Foreign Currency Risk — The fund is subject to foreign currency exchange rate risk in the normal course of pursuing its investment objectives. The value of foreign investments held by a fund may be significantly affected by changes in foreign currency exchange rates. The dollar value of a foreign security generally decreases when the value of the dollar rises against the foreign currency in which the security is denominated and tends to increase when the value of the dollar declines against such foreign currency. A fund may enter into forward foreign currency exchange contracts to reduce a fund's exposure to foreign currency exchange rate fluctuations or to gain exposure to the fluctuations in the value of foreign currencies. The net U.S. dollar value of foreign currency underlying all contractual commitments held by a fund and the resulting unrealized appreciation or depreciation are determined daily. Realized gain or loss is recorded upon the termination of the contract. Net realized and unrealized gains or losses occurring during the holding period of forward foreign currency exchange contracts are a component of net realized gain (loss) on forward foreign currency exchange contract transactions and change in net unrealized appreciation (depreciation) on forward foreign currency exchange contracts, respectively. A fund bears the risk of an unfavorable change in the foreign currency exchange rate underlying the forward contract. Additionally, losses, up to the fair value, may arise if the counterparties do not perform under the contract terms. The fund's average U.S. dollar exposure to foreign currency risk derivative instruments held during the period was $29,342,645.
Interest Rate Risk — The fund is subject to interest rate risk in the normal course of pursuing its investment objectives. A fund may enter into futures contracts or interest rate swap agreements in order to manage its exposure to changes in market conditions. The value of bonds generally declines as interest rates rise. The risks of entering into interest rate risk derivative instruments include the possible lack of liquidity, failure of the counterparty to meet its obligations, and that there may be unfavorable changes in the underlying investments or instruments.
A fund may enter into futures contracts based on a bond index or a specific underlying security. A fund may purchase futures contracts to gain exposure to increases in market value or sell futures contracts to protect against a decline in market value. Upon entering into a futures contract, a fund will segregate cash, cash equivalents or other appropriate liquid securities on its records in amounts sufficient to meet requirements. Subsequent payments (variation margin) are made or received daily, in cash, by a fund. The variation margin is equal to the daily change in the contract value and is recorded as unrealized gains and losses. A fund recognizes a realized gain or loss when the futures contract is closed or expires. Net realized and unrealized gains or losses occurring during the holding period of futures contracts are a component of net realized gain (loss) on futures contract transactions and change in net unrealized appreciation (depreciation) on futures contracts, respectively. The fund's average notional exposure to these interest rate risk derivative instruments held during the period was $16,209,856 futures contracts purchased and $16,120,934 futures contracts sold.
A fund may enter into interest rate swap agreements to gain exposure to declines in interest rates, to protect against increases in interest rates, or to maintain its ability to generate income at prevailing interest rates. A fund will segregate cash, cash equivalents or other appropriate liquid securities on its records in amounts sufficient to meet requirements. Changes in value, including the periodic amounts of interest to be paid or received on swap agreements, are recorded as unrealized appreciation (depreciation) on swap agreements. Upon entering into a centrally cleared swap, a fund is required to deposit cash or securities (initial margin) with a financial intermediary in an amount equal to a certain percentage of the notional amount. Subsequent payments (variation margin) are made or received daily, in cash, by a fund. The variation margin is equal to the daily change in the value and is a component of unrealized gains and losses. Realized gain or loss is recorded upon receipt or payment of a periodic settlement or termination of swap agreements. Net realized and unrealized gains or losses occurring during the holding period of swap agreements are a component of net realized gain (loss) on swap agreement transactions and change in net unrealized appreciation (depreciation) on swap agreements, respectively. The fund's average notional amount on interest rate swap agreements held during the period was $3,238,104.
Other Contracts — A fund may enter into total return swap agreements in order to attempt to obtain or preserve a particular return or spread at a lower cost than obtaining a return or spread through purchases and/or sales of instruments in other markets or gain exposure to certain markets in the most economical way possible. A fund will segregate cash, cash equivalents or other appropriate liquid securities on its records in amounts sufficient to meet requirements. Changes in value, including the periodic amounts of interest to be paid or received on swap agreements, are recorded as unrealized appreciation (depreciation) on swap agreements. Upon entering into a centrally cleared swap, a fund is required to deposit cash or securities (initial margin) with a financial intermediary in an amount equal to a certain percentage of the notional amount. Subsequent payments (variation margin) are made or received daily, in cash, by a fund. The variation margin is equal to the daily change in the value and is a component of unrealized gains and losses. Realized gain or loss is recorded upon receipt or payment of a periodic settlement or termination of swap agreements. Net realized and unrealized gains or losses occurring during the holding period of swap agreements are a component of net realized gain (loss) on swap agreement transactions and change in net unrealized appreciation (depreciation) on swap agreements, respectively. The risks of entering into swap agreements include the possible lack of liquidity, failure of the counterparty to meet its obligations, and that there may be unfavorable changes in the underlying investments or instruments, including inflationary risk. The fund's average notional amount held during the period was $5,400,000.
|
| | | | | | | | |
Value of Derivative Instruments as of March 31, 2019
|
| | Asset Derivatives | Liability Derivatives |
| Type of Risk Exposure | Location on Statement of Assets and Liabilities | Value | Location on Statement of Assets and Liabilities | Value |
| Credit Risk | Receivable for variation margin on swap agreements* | – |
| Payable for variation margin on swap agreements* | $ | 7,531 |
|
| Foreign Currency Risk | Unrealized appreciation on forward foreign currency exchange contracts | $ | 174,896 |
| Unrealized depreciation on forward foreign currency exchange contracts | 66,322 |
|
| Interest Rate Risk | Receivable for variation margin on futures contracts* | – |
| Payable for variation margin on futures contracts* | 28,195 |
|
| | | $ | 174,896 |
| | $ | 102,048 |
|
| |
| * | Included in the unrealized appreciation (depreciation) on futures contracts or centrally cleared swap agreements, as applicable, as reported in the Schedule of Investments. |
|
| | | | | | | | |
| Effect of Derivative Instruments on the Statement of Operations for the Year Ended March 31, 2019 |
| | Net Realized Gain (Loss) | Change in Net Unrealized Appreciation (Depreciation) |
| Type of Risk Exposure | Location on Statement of Operations | Value | Location on Statement of Operations | Value |
| Credit Risk | Net realized gain (loss) on swap agreement transactions | $ | 146,438 |
| Change in net unrealized appreciation (depreciation) on swap agreements | $ | 32,833 |
|
| Foreign Currency Risk | Net realized gain (loss) on forward foreign currency exchange contract transactions | 1,225,907 |
| Change in net unrealized appreciation (depreciation) on forward foreign currency exchange contracts | 234,217 |
|
| Interest Rate Risk | Net realized gain (loss) on futures contract transactions | (560,584 | ) | Change in net unrealized appreciation (depreciation) on futures contracts | 287,103 |
|
| Interest Rate Risk | Net realized gain (loss) on swap agreement transactions | 19,247 |
| Change in net unrealized appreciation (depreciation) on swap agreements | – |
|
| Other Contracts | Net realized gain (loss) on swap agreement transactions | 66,878 |
| Change in net unrealized appreciation (depreciation) on swap agreements | (36,191 | ) |
| | | $ | 897,886 |
| | $ | 517,962 |
|
8. Risk Factors
There are certain risks involved in investing in foreign securities. These risks include those resulting from political events (such as civil unrest, national elections and imposition of exchange controls), social and economic events (such as labor strikes and rising inflation), and natural disasters. Securities of foreign issuers may be less liquid and more volatile. Investing in emerging markets or a significant portion of assets in one country or region may accentuate these risks.
The fund’s investment process may result in high portfolio turnover, which could mean high transaction costs, affecting both performance and capital gains tax liabilities to investors.
9. Federal Tax Information
The tax character of distributions paid during the years ended March 31, 2019 and March 31, 2018 were as follows:
|
| | | | | | |
| | 2019 | 2018 |
| Distributions Paid From | | |
| Ordinary income | $ | 5,341,863 |
| $ | 4,146,713 |
|
| Long-term capital gains | — |
| — |
|
The book-basis character of distributions made during the year from net investment income or net realized gains may differ from their ultimate characterization for federal income tax purposes. These differences reflect the differing character of certain income items and net realized gains and losses for financial statement and tax purposes, and may result in reclassification among certain capital accounts on the financial statements.
As of period end, the federal tax cost of investments and the components of distributable earnings on a tax-basis were as follows:
|
| | | |
| Federal tax cost of investments | $ | 145,690,355 |
|
| Gross tax appreciation of investments | $ | 2,525,004 |
|
| Gross tax depreciation of investments | (947,020 | ) |
| Net tax appreciation (depreciation) of investments | 1,577,984 |
|
| Net tax appreciation (depreciation) on derivatives and translation of assets and liabilities in foreign currencies | (11,401 | ) |
| Net tax appreciation (depreciation) | $ | 1,566,583 |
|
| Other book-to-tax adjustments | $ | (3,612 | ) |
| Undistributed ordinary income | — |
|
| Accumulated short-term capital losses | $ | (3,308,094 | ) |
Accumulated long-term capital losses
| $ | (1,424,478 | ) |
| Late-year ordinary loss deferral | $ | (546,258 | ) |
The difference between book-basis and tax-basis unrealized appreciation (depreciation) is attributable primarily to the realization for tax purposes of unrealized gains (losses) on futures contracts. Other book-to-tax adjustments are attributable primarily to the tax deferral of losses on straddle positions.
Accumulated capital losses represent net capital loss carryovers that may be used to offset future realized capital gains for federal income tax purposes. The capital loss carryovers may be carried forward for an unlimited period. Future capital loss carryover utilization in any given year may be subject to Internal Revenue Code limitations.
Loss deferrals represent certain qualified losses that the fund has elected to treat as having been incurred in the following fiscal year for federal income tax purposes.
10. Recently Issued Accounting Standards
In March 2017, the Financial Accounting Standards Board (FASB) issued Accounting Standards Update No. 2017-08, “Receivables - Nonrefundable Fees and Other Costs (Subtopic 310-20), Premium Amortization on Purchased Callable Debt Securities” (ASU 2017-08). ASU 2017-08 amends the amortization period for certain purchased callable debt securities held at a premium, shortening such period to the earliest call date. The amendments are effective for fiscal years, and interim periods within those fiscal years, beginning after December 15, 2018. Management is currently evaluating the impact that adopting ASU 2017-08 will have on the financial statements.
|
| | | | | | | | | | | | | | | |
| For a Share Outstanding Throughout the Years Ended March 31 (except as noted) |
| Per-Share Data | | | | | | Ratios and Supplemental Data | |
| | | Income From Investment Operations: | | | | Ratio to Average Net Assets of: | | |
| | Net Asset
Value,
Beginning
of Period | Net
Investment
Income
(Loss)(1) | Net
Realized
and
Unrealized
Gain (Loss) | Total From
Investment
Operations | Distributions from Net
Investment
Income | Net Asset
Value,
End
of Period | Total
Return(2) | Operating
Expenses | Operating
Expenses
(before
expense
waiver) | Net
Investment
Income
(Loss) | Net
Investment
Income
(Loss)
(before
expense
waiver) | Portfolio
Turnover
Rate | Net
Assets,
End of
Period
(in thousands) |
| Investor Class | | | | | | | | | | | | |
| 2019 | $10.59 | 0.33 | 0.03 | 0.36 | (0.39) | $10.56 | 3.55% | 0.58% | 0.65% | 3.17% | 3.10% | 139% |
| $109,760 |
|
| 2018 | $10.71 | 0.30 | (0.09) | 0.21 | (0.33) | $10.59 | 1.92% | 0.63% | 0.65% | 2.80% | 2.78% | 144% |
| $118,329 |
|
| 2017 | $10.82 | 0.27 | (0.08) | 0.19 | (0.30) | $10.71 | 1.76% | 0.62% | 0.65% | 2.52% | 2.49% | 150% |
| $84,193 |
|
| 2016 | $11.02 | 0.27 | (0.16) | 0.11 | (0.31) | $10.82 | 1.02% | 0.63% | 0.65% | 2.53% | 2.51% | 145% |
| $90,012 |
|
| 2015 | $10.75 | 0.27 | 0.34 | 0.61 | (0.34) | $11.02 | 5.73% | 0.65% | 0.65% | 2.51% | 2.51% | 119% |
| $90,251 |
|
| I Class | | | | | | | | | | | | |
| 2019 | $10.58 | 0.34 | 0.04 | 0.38 | (0.40) | $10.56 | 3.76% | 0.48% | 0.55% | 3.27% | 3.20% | 139% |
| $6,269 |
|
2018(3) | $10.73 | 0.31 | (0.13) | 0.18 | (0.33) | $10.58 | 1.65% | 0.53%(4) | 0.55%(4) | 2.97%(4) | 2.95%(4) | 144%(5) |
| $3,441 |
|
| A Class | | | | | | | | | | | | |
| 2019 | $10.59 | 0.30 | 0.04 | 0.34 | (0.37) | $10.56 | 3.30% | 0.83% | 0.90% | 2.92% | 2.85% | 139% |
| $15,630 |
|
| 2018 | $10.71 | 0.27 | (0.09) | 0.18 | (0.30) | $10.59 | 1.67% | 0.88% | 0.90% | 2.55% | 2.53% | 144% |
| $14,139 |
|
| 2017 | $10.82 | 0.25 | (0.09) | 0.16 | (0.27) | $10.71 | 1.51% | 0.87% | 0.90% | 2.27% | 2.24% | 150% |
| $27,498 |
|
| 2016 | $11.02 | 0.24 | (0.16) | 0.08 | (0.28) | $10.82 | 0.77% | 0.88% | 0.90% | 2.28% | 2.26% | 145% |
| $28,220 |
|
| 2015 | $10.75 | 0.25 | 0.33 | 0.58 | (0.31) | $11.02 | 5.46% | 0.90% | 0.90% | 2.26% | 2.26% | 119% |
| $29,532 |
|
|
| | | | | | | | | | | | | | | |
| For a Share Outstanding Throughout the Years Ended March 31 (except as noted) |
| Per-Share Data | | | | | | Ratios and Supplemental Data | |
| | | Income From Investment Operations: | | | | Ratio to Average Net Assets of: | | |
| | Net Asset
Value,
Beginning
of Period | Net
Investment
Income
(Loss)(1) | Net
Realized
and
Unrealized
Gain (Loss) | Total From
Investment
Operations | Distributions from Net
Investment
Income | Net Asset
Value,
End
of Period | Total
Return(2) | Operating
Expenses | Operating
Expenses
(before
expense
waiver) | Net
Investment
Income
(Loss) | Net
Investment
Income
(Loss)
(before
expense
waiver) | Portfolio
Turnover
Rate | Net
Assets,
End of
Period
(in thousands) |
| C Class | | | | | | | | | | | | |
| 2019 | $10.58 | 0.23 | 0.04 | 0.27 | (0.29) | $10.56 | 2.62% | 1.58% | 1.65% | 2.17% | 2.10% | 139% |
| $3,457 |
|
| 2018 | $10.71 | 0.19 | (0.10) | 0.09 | (0.22) | $10.58 | 0.81% | 1.63% | 1.65% | 1.80% | 1.78% | 144% |
| $5,179 |
|
| 2017 | $10.82 | 0.17 | (0.09) | 0.08 | (0.19) | $10.71 | 0.76% | 1.62% | 1.65% | 1.52% | 1.49% | 150% |
| $6,955 |
|
| 2016 | $11.01 | 0.16 | (0.15) | 0.01 | (0.20) | $10.82 | 0.11% | 1.63% | 1.65% | 1.53% | 1.51% | 145% |
| $8,618 |
|
| 2015 | $10.75 | 0.16 | 0.33 | 0.49 | (0.23) | $11.01 | 4.58% | 1.65% | 1.65% | 1.51% | 1.51% | 119% |
| $10,563 |
|
| R Class | | | | | | | | | | | | |
| 2019 | $10.59 | 0.28 | 0.03 | 0.31 | (0.34) | $10.56 | 3.04% | 1.08% | 1.15% | 2.67% | 2.60% | 139% |
| $615 |
|
| 2018 | $10.71 | 0.24 | (0.09) | 0.15 | (0.27) | $10.59 | 1.41% | 1.13% | 1.15% | 2.30% | 2.28% | 144% |
| $775 |
|
| 2017 | $10.82 | 0.22 | (0.08) | 0.14 | (0.25) | $10.71 | 1.26% | 1.12% | 1.15% | 2.02% | 1.99% | 150% |
| $1,472 |
|
| 2016 | $11.01 | 0.22 | (0.16) | 0.06 | (0.25) | $10.82 | 0.61% | 1.13% | 1.15% | 2.03% | 2.01% | 145% |
| $2,649 |
|
| 2015 | $10.75 | 0.22 | 0.32 | 0.54 | (0.28) | $11.01 | 5.11% | 1.15% | 1.15% | 2.01% | 2.01% | 119% |
| $2,762 |
|
| R5 Class | | | | | | | | | | | | |
| 2019 | $10.58 | 0.35 | 0.04 | 0.39 | (0.41) | $10.56 | 3.86% | 0.38% | 0.45% | 3.37% | 3.30% | 139% |
| $9,910 |
|
| 2018 | $10.71 | 0.33 | (0.11) | 0.22 | (0.35) | $10.58 | 2.03% | 0.43% | 0.45% | 3.00% | 2.98% | 144% |
| $9,315 |
|
| 2017 | $10.82 | 0.30 | (0.09) | 0.21 | (0.32) | $10.71 | 1.97% | 0.42% | 0.45% | 2.72% | 2.69% | 150% |
| $3,535 |
|
| 2016 | $11.02 | 0.29 | (0.16) | 0.13 | (0.33) | $10.82 | 1.23% | 0.43% | 0.45% | 2.73% | 2.71% | 145% |
| $1,224 |
|
| 2015 | $10.75 | 0.30 | 0.33 | 0.63 | (0.36) | $11.02 | 5.94% | 0.45% | 0.45% | 2.71% | 2.71% | 119% |
| $1,051 |
|
|
| | | | |
| Notes to Financial Highlights | | |
| |
| (1) | Computed using average shares outstanding throughout the period. |
| |
| (2) | Total returns are calculated based on the net asset value of the last business day and do not reflect applicable sales charges, if any. Total returns for periods less than one year are not annualized. |
| |
| (3) | April 10, 2017 (commencement of sale) through March 31, 2018. |
| |
| (5) | Portfolio turnover is calculated at the fund level. Percentage indicated was calculated for the year ended March 31, 2018. |
See Notes to Financial Statements.
|
|
| Report of Independent Registered Public Accounting Firm |
To the Board of Trustees of American Century Investment Trust and Shareholders of Core Plus Fund:
Opinion on the Financial Statements
We have audited the accompanying statement of assets and liabilities, including the schedule of investments, of Core Plus Fund (one of the funds constituting American Century Investment Trust, referred to hereafter as the “Fund”) as of March 31, 2019, the related statement of operations for the year ended March 31, 2019, the statement of changes in net assets for each of the two years in the period ended March 31, 2019, including the related notes, and the financial highlights for each of the periods indicated therein (collectively referred to as the “financial statements”). In our opinion, the financial statements present fairly, in all material respects, the financial position of the Fund as of March 31, 2019, the results of its operations for the year then ended, the changes in its net assets for each of the two years in the period ended March 31, 2019 and the financial highlights for each of the periods indicated therein in conformity with accounting principles generally accepted in the United States of America.
Basis for Opinion
These financial statements are the responsibility of the Fund’s management. Our responsibility is to express an opinion on the Fund’s financial statements based on our audits. We are a public accounting firm registered with the Public Company Accounting Oversight Board (United States) (“PCAOB”) and are required to be independent with respect to the Fund in accordance with the U.S. federal securities laws and the applicable rules and regulations of the Securities and Exchange Commission and the PCAOB.
We conducted our audits of these financial statements in accordance with the standards of the PCAOB. Those standards require that we plan and perform the audit to obtain reasonable assurance about whether the financial statements are free of material misstatement, whether due to error or fraud.
Our audits included performing procedures to assess the risks of material misstatement of the financial statements, whether due to error or fraud, and performing procedures that respond to those risks. Such procedures included examining, on a test basis, evidence regarding the amounts and disclosures in the financial statements. Our audits also included evaluating the accounting principles used and significant estimates made by management, as well as evaluating the overall presentation of the financial statements. Our procedures included confirmation of securities owned as of March 31, 2019 by correspondence with the custodian and brokers; when replies were not received from brokers, we performed other auditing procedures. We believe that our audits provide a reasonable basis for our opinion.
/s/ PricewaterhouseCoopers LLP
Kansas City, Missouri
May 17, 2019
We have served as the auditor of one or more investment companies in American Century Investments since 1997.
Board of Trustees
The individuals listed below serve as trustees of the funds. Each trustee will continue to serve in this capacity until death, retirement, resignation or removal from office. The board has adopted a mandatory retirement age for trustees who are not “interested persons,” as that term is defined in the Investment Company Act (independent trustees). Independent trustees shall retire on December 31 of the year in which they reach their 75th birthday; provided, however, that on or after January 1, 2022, independent trustees shall retire on December 31 of the year in which they reach their 76th birthday.
Mr. Thomas is an “interested person” because he currently serves as President and Chief Executive Officer of American Century Companies, Inc. (ACC), the parent company of American Century Investment Management, Inc. (ACIM or the advisor). The other trustees (more than three-fourths of the total number) are independent. They are not employees, directors or officers of, and have no financial interest in, ACC or any of its wholly owned, direct or indirect, subsidiaries, including ACIM, American Century Investment Services, Inc. (ACIS) and American Century Services, LLC (ACS), and they do not have any other affiliations, positions or relationships that would cause them to be considered “interested persons” under the Investment Company Act. The trustees serve in this capacity for eight (in the case of Jonathan S. Thomas, 16; and Ronald J. Gilson, 9) registered investment companies in the American Century Investments family of funds.
The following table presents additional information about the trustees. The mailing address for each trustee other than Jonathan S. Thomas is 1665 Charleston Road, Mountain View, California 94043. The mailing address for Jonathan S. Thomas is 4500 Main Street, Kansas City, Missouri 64111.
|
| | | | | |
Name
(Year of Birth) | Position(s) Held with Funds | Length of Time Served | Principal Occupation(s) During Past 5 Years | Number of American Century Portfolios Overseen by Trustee | Other Directorships Held During Past 5 Years |
| Independent Trustees |
|
|
Tanya S. Beder
(1955) | Trustee | Since 2011 | Chairman and CEO, SBCC Group Inc. (independent advisory services) (2006 to present) | 45 | CYS Investments, Inc.; Nabors Industries Ltd. |
Jeremy I. Bulow
(1954) | Trustee | Since 2011 | Professor of Economics, Stanford University, Graduate School of Business (1979 to present) | 45 | None |
Anne Casscells
(1958) | Trustee | Since 2016 | Co-Chief Executive Officer and Chief Investment Officer, Aetos Alternatives Management (investment advisory firm) (2001 to present); Lecturer in Accounting, Stanford University, Graduate School of Business (2009 to 2017) | 45 | None |
Ronald J. Gilson
(1946) | Trustee and Chairman of the Board | Since 1995
(Chairman since 2005) | Charles J. Meyers Professor of Law and Business, Emeritus, Stanford Law School (1979 to 2016); Marc and Eva Stern Professor of Law and Business, Columbia University School of Law (1992 to present) | 50 | None |
|
| | | | | |
Name
(Year of Birth) | Position(s) Held with Funds | Length of Time Served | Principal Occupation(s) During Past 5 Years | Number of American Century Portfolios Overseen by Trustee | Other Directorships Held During Past 5 Years |
| Independent Trustees |
|
|
Frederick L. A. Grauer
(1946) | Trustee | Since 2008 | Senior Advisor, Credit Sesame, Inc. (credit monitoring firm) (2018 to present); Senior Advisor, Course Hero (an educational technology company) (2015 to present); Senior Advisor, iShares by BlackRock, Inc. (investment management firm) (2013 to 2015)
| 45 | None |
Jonathan D. Levin
(1972) | Trustee | Since 2016 | Philip H. Knight Professor and Dean, Graduate School of Business, Stanford University (2016 to present); Professor, Stanford University, (2000 to present); Chair, Department of Economics, Stanford University (2011 to 2014) | 45 | None |
Peter F. Pervere
(1947) | Trustee | Since 2007 | Retired | 45 | None |
John B. Shoven
(1947) | Trustee | Since 2002 | Charles R. Schwab Professor of Economics, Stanford University (1973 to present) | 45 | Cadence Design Systems; Exponent; Financial Engines |
| Interested Trustee |
|
|
Jonathan S. Thomas
(1963) | Trustee and President | Since 2007 | President and Chief Executive Officer, ACC (2007 to present). Also serves as Chief Executive Officer, ACS; Executive Vice President, ACIM; Director, ACC, ACIM and other ACC subsidiaries | 117 | BioMed Valley Discoveries, Inc. |
The Statement of Additional Information has additional information about the fund's trustees and is available without charge, upon request, by calling 1-800-345-2021.
Officers
The following table presents certain information about the executive officers of the funds. Each officer serves as an officer for 16 (in the case of Robert J. Leach, 15) investment companies in the American Century family of funds, unless otherwise noted. No officer is compensated for his or her service as an officer of the funds. The listed officers are interested persons of the funds and are appointed or re-appointed on an annual basis. The mailing address for each of the officers listed below is 4500 Main Street, Kansas City, Missouri 64111.
|
| | |
Name
(Year of Birth) | Offices with the Funds | Principal Occupation(s) During the Past Five Years |
Jonathan S. Thomas
(1963) | Trustee and President since 2007 | President and Chief Executive Officer, ACC (2007 to present). Also serves as Chief Executive Officer, ACS; Executive Vice President, ACIM; Director, ACC, ACIM and other ACC subsidiaries |
R. Wes Campbell
(1974)
| Chief Financial Officer and Treasurer since 2018
| Investment Operations and Investment Accounting, ACS (2000 to present) |
Amy D. Shelton
(1964) | Chief Compliance Officer and Vice President since 2014 | Chief Compliance Officer, American Century funds, (2014 to present); Chief Compliance Officer, ACIM (2014 to present); Chief Compliance Officer, ACIS (2009 to present); Vice President, Client Interactions and Marketing, ACIS (2013 to 2014). Also serves as Vice President, ACIS |
Charles A. Etherington
(1957) | General Counsel since 2007 and Senior Vice President since 2006 | Attorney, ACC (1994 to present); Vice President, ACC (2005 to present); General Counsel, ACC (2007 to present). Also serves as General Counsel, ACIM, ACS, ACIS and other ACC subsidiaries; and Senior Vice President, ACIM and ACS |
C. Jean Wade
(1964) | Vice President since 2012 | Senior Vice President, ACS (2017 to present); Vice President ACS (2000 to 2017) |
Robert J. Leach
(1966) | Vice President since 2006 | Vice President, ACS (2000 to present) |
David H. Reinmiller
(1963) | Vice President since 2000 | Attorney, ACC (1994 to present) Also serves as Vice President, ACIM and ACS |
Ward D. Stauffer
(1960) | Secretary since 2005 | Attorney, ACC (2003 to present) |
Retirement Account Information
As required by law, distributions you receive from certain retirement accounts are subject to federal income tax withholding, unless you elect not to have withholding apply*. Tax will be withheld on the total amount withdrawn even though you may be receiving amounts that are not subject to withholding, such as nondeductible contributions. In such case, excess amounts of withholding could occur. You may adjust your withholding election so that a greater or lesser amount will be withheld.
If you don’t want us to withhold on this amount, you must notify us to not withhold the federal income tax. You may notify us in writing or in certain situations by telephone or through other electronic means. For systematic withdrawals, your withholding election will remain in effect until revoked or changed by filing a new election. You have the right to revoke your election at any time and change your withholding percentage for future distributions.
Remember, even if you elect not to have income tax withheld, you are liable for paying income tax on the taxable portion of your withdrawal. If you elect not to have income tax withheld or you don’t have enough income tax withheld, you may be responsible for payment of estimated tax. You may incur penalties under the estimated tax rules if your withholding and estimated tax payments are not sufficient. You can reduce or defer the income tax on a distribution by directly or indirectly rolling such distribution over to another IRA or eligible plan. You should consult your tax advisor for additional information.
State tax will be withheld if, at the time of your distribution, your address is within one of the mandatory withholding states and you have federal income tax withheld (or as otherwise required by state law). State taxes will be withheld from your distribution in accordance with the respective state rules.
*Some 403(b), 457 and qualified retirement plan distributions may be subject to 20% mandatory withholding, as they are subject to special tax and withholding rules. Your plan administrator or plan sponsor is required to provide you with a special tax notice explaining those rules at the time you request a distribution. If applicable, federal and/or state taxes may be withheld from your distribution amount.
Proxy Voting Policies
Descriptions of the principles and policies that the fund's investment advisor uses in exercising the voting rights associated with the securities purchased and/or held by the fund are available without charge, upon request, by calling 1-800-345-2021 or visiting the "About Us" page of American Century Investments’ website at americancentury.com. A description of the policies is also available on the Securities and Exchange Commission’s website at sec.gov. Information regarding how the investment advisor voted proxies relating to portfolio securities during the most recent 12-month period ended June 30 is available on the "About Us" page at americancentury.com. It is also available at sec.gov.
Quarterly Portfolio Disclosure
The fund files its complete schedule of portfolio holdings with the Securities and Exchange Commission (SEC) for the first and third quarters of each fiscal year on Form N-Q or as an exhibit to its reports on Form N-PORT. The fund’s Forms N-Q and Form N-PORT reports are available on the SEC’s website at sec.gov. The fund also makes its complete schedule of portfolio holdings for the most recent quarter of its fiscal year available on its website at americancentury.com and, upon request, by calling 1-800-345-2021.
|
| | |
| |
| | | |
| Contact Us | americancentury.com | |
| Automated Information Line | 1-800-345-8765 | |
| Investor Services Representative | 1-800-345-2021 or 816-531-5575 | |
| Investors Using Advisors | 1-800-378-9878 | |
| Business, Not-For-Profit, Employer-Sponsored Retirement Plans | 1-800-345-3533 | |
| Banks and Trust Companies, Broker-Dealers, Financial Professionals, Insurance Companies | 1-800-345-6488 | |
| Telecommunications Relay Service for the Deaf | 711 | |
| | | |
| American Century Investment Trust | |
| | | |
Investment Advisor: American Century Investment Management, Inc. Kansas City, Missouri | |
| | | |
| This report and the statements it contains are submitted for the general information of our shareholders. The report is not authorized for distribution to prospective investors unless preceded or accompanied by an effective prospectus. | |
| | | |
©2019 American Century Proprietary Holdings, Inc. All rights reserved.
CL-ANN-92279 1905 | |

|
| |
| | |
| | Annual Report |
| | |
| | March 31, 2019 |
| | |
| | Diversified Bond Fund |
| | Investor Class (ADFIX) |
| | I Class (ACBPX) |
| | Y Class (ADVYX) |
| | A Class (ADFAX) |
| | C Class (CDBCX) |
| | R Class (ADVRX) |
| | R5 Class (ADRVX) |
| | R6 Class (ADDVX) |
Beginning on January 1, 2021, as permitted by regulations adopted by the Securities and Exchange Commission, paper copies of the fund’s shareholder reports like this one will no longer be sent by mail, unless you specifically request paper copies of the reports from the fund or from your financial intermediary, such as a broker-dealer or bank. Instead, the reports will be made available on a website, and you will be notified by mail each time a report is posted and provided with a website link to access the report.
If you already elected to receive shareholder reports electronically, you will not be affected by this change and you need not take any action. You may elect to receive shareholder reports and other communications from the fund or your financial intermediary electronically by calling or sending an email request to your appropriate contacts as listed on the back cover of this report.
You may elect to receive all future reports in paper free of charge. You can inform the fund or your financial intermediary that you wish to continue receiving paper copies of your shareholder reports by calling or sending an email request to your appropriate contacts as listed on the back cover of this report. Your election to receive reports in paper will apply to all funds held with the fund complex/your financial intermediary.
|
| | |
| President’s Letter | 2 |
|
| Performance | 3 |
|
| Portfolio Commentary | |
|
| Fund Characteristics | |
|
| Shareholder Fee Example | |
|
| Schedule of Investments | |
|
| Statement of Assets and Liabilities | |
|
| Statement of Operations | |
|
| Statement of Changes in Net Assets | |
|
| Notes to Financial Statements | |
|
| Financial Highlights | |
|
| Report of Independent Registered Public Accounting Firm | |
|
| Management | |
|
| Additional Information | |
|
Any opinions expressed in this report reflect those of the author as of the date of the report, and do not necessarily represent the opinions of American Century Investments® or any other person in the American Century Investments organization. Any such opinions are subject to change at any time based upon market or other conditions and American Century Investments disclaims any responsibility to update such opinions. These opinions may not be relied upon as investment advice and, because investment decisions made by American Century Investments funds are based on numerous factors, may not be relied upon as an indication of trading intent on behalf of any American Century Investments fund. Security examples are used for representational purposes only and are not intended as recommendations to purchase or sell securities. Performance information for comparative indices and securities is provided to American Century Investments by third party vendors. To the best of American Century Investments’ knowledge, such information is accurate at the time of printing.
Jonathan Thomas
Dear Investor:
Thank you for reviewing this annual report for the period ended March 31, 2019. Annual reports help convey important information about fund returns, including market factors that affected performance during the reporting period. For additional, updated investment and market insights, we encourage you to visit our website, americancentury.com.
Markets Ended Roller-Coaster Period on Upswing
For the first half of the period, U.S. stocks climbed higher, while bond returns headed lower. Robust economic growth, bolstered by federal tax and regulatory reform, and record corporate earnings results fueled risk-on sentiment that drove stock prices higher. Meanwhile, the combination of strong economic data, the Federal Reserve’s (Fed’s) ongoing rate-hike campaign and an uptick in inflation pushed investment-grade bond returns lower.
Market trends began changing in late 2018. Mounting investor concerns about slowing global economic and earnings growth, U.S.-China trade tensions and rising interest rates triggered widespread volatility. Stock prices plunged as investors sought safe-haven investments, including U.S. Treasuries. Furthermore, the Fed issued another rate hike in December, its fourth of the year, and maintained its hawkish outlook. Investors feared the December rate increase and the Fed’s plans for two more rate hikes in 2019 were too aggressive, and risk-off investing remained in favor.
January brought a renewed sense of stability to the markets. Investors’ concerns about growth and trade eased, and the Fed changed course, pausing its rate-hike campaign amid moderating global growth and inflation. Valuations appeared attractive after the late-2018 sell-off, and risk-on investing resumed. In March, the Fed held rates steady again, hinting additional tightening was off the table for 2019. This news drove stock and bond returns higher and left both asset classes on an upward track to end the period. Overall, stocks (S&P 500 Index) overcame their late-2018 nosedive to gain 9.50% for the period. Bonds (Bloomberg Barclays U.S. Aggregate Bond Index) bounced back from losses early in the period to return 4.48%.
We expect volatility to remain a formidable factor as investors react to global growth trends, central bank policy and geopolitical developments. We believe this scenario underscores the importance of using professionally managed portfolios in pursuit of investment goals. We appreciate your continued trust and confidence in us.
Sincerely,
Jonathan Thomas
President and Chief Executive Officer
American Century Investments
|
| | | | | | |
| Total Returns as of March 31, 2019 | |
| | | | Average Annual Returns | |
| | Ticker Symbol | 1 year | 5 years | 10 years | Since Inception | Inception Date |
| Investor Class | ADFIX | 3.15% | 2.28% | 3.51% | — | 12/3/01 |
| Bloomberg Barclays U.S. Aggregate Bond Index | — | 4.48% | 2.74% | 3.76% | — | — |
| I Class | ACBPX | 3.43% | 2.50% | 3.72% | — | 4/1/93 |
| Y Class | ADVYX | 3.46% | — | — | 2.17% | 4/10/17 |
| A Class | ADFAX | | | | | 12/3/01 |
| No sales charge | | 3.02% | 2.05% | 3.27% | — | |
| With sales charge | | -1.65% | 1.12% | 2.80% | — | |
| C Class | CDBCX | 2.24% | 1.29% | 2.50% | — | 1/31/03 |
| R Class | ADVRX | 2.69% | 1.76% | 3.00% | — | 7/29/05 |
| R5 Class | ADRVX | 3.45% | — | — | 2.15% | 4/10/17 |
| R6 Class | ADDVX | 3.58% | 2.57% | — | 2.68% | 7/26/13 |
Average annual returns since inception are presented when ten years of performance history is not available. Fund returns would have been lower if a portion of the fees had not been waived.
Sales charges include initial sales charges and contingent deferred sales charges (CDSCs), as applicable. A Class shares have a 4.50% maximum initial sales charge and may be subject to a maximum CDSC of 1.00%. C Class shares redeemed within 12 months of purchase are subject to a maximum CDSC of 1.00%. The SEC requires that mutual funds provide performance information net of maximum sales charges in all cases where charges could be applied.
Data presented reflect past performance. Past performance is no guarantee of future results. Current performance may be higher or lower than the performance shown. Total returns for periods less than one year are not annualized. Investment return and principal value will fluctuate, and redemption value may be more or less than original cost. Data assumes reinvestment of dividends and capital gains, and none of the charts reflect the deduction of taxes that a shareholder would pay on fund distributions or the redemption of fund shares. To obtain performance data current to the most recent month end, please call 1-800-345-2021 or visit americancentury.com. For additional information about the fund, please consult the prospectus.
|
|
| Growth of $10,000 Over 10 Years |
| $10,000 investment made March 31, 2009 |
Performance for other share classes will vary due to differences in fee structure.
|
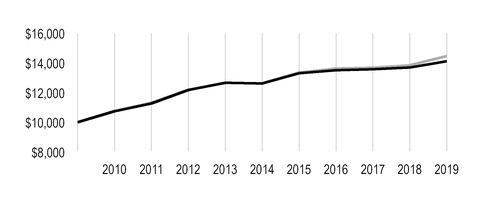
|
| |
| Value on March 31, 2019 |
| | Investor Class — $14,123 |
| |
| | Bloomberg Barclays U.S. Aggregate Bond Index — $14,472 |
| |
Ending value of Investor Class would have been lower if a portion of the fees had not been waived.
|
| | | | | | | |
| Total Annual Fund Operating Expenses |
| Investor Class | I Class | Y Class | A Class | C Class | R Class | R5 Class | R6 Class |
| 0.60% | 0.40% | 0.37% | 0.85% | 1.60% | 1.10% | 0.40% | 0.35% |
The total annual fund operating expenses shown is as stated in the fund’s prospectus current as of the date of this report. The prospectus may vary from the expense ratio shown elsewhere in this report because it is based on a different time period, includes acquired fund fees and expenses, and, if applicable, does not include fee waivers or expense reimbursements.
Data presented reflect past performance. Past performance is no guarantee of future results. Current performance may be higher or lower than the performance shown. Total returns for periods less than one year are not annualized. Investment return and principal value will fluctuate, and redemption value may be more or less than original cost. Data assumes reinvestment of dividends and capital gains, and none of the charts reflect the deduction of taxes that a shareholder would pay on fund distributions or the redemption of fund shares. To obtain performance data current to the most recent month end, please call 1-800-345-2021 or visit americancentury.com. For additional information about the fund, please consult the prospectus.
Portfolio Managers: Bob Gahagan, Hando Aguilar, Jeff Houston, Brian Howell and Charles Tan
Effective October 31, 2018, Charles Tan joined the portfolio management team, replacing Dave MacEwen, who left the team ahead of his December 31, 2018 retirement.
Performance Summary
Diversified Bond returned 3.15%* for the 12 months ended March 31, 2019. By comparison, the Bloomberg Barclays U.S. Aggregate Bond Index returned 4.48%. Fund returns reflect operating expenses, while index returns do not.
Returns for the fund and the index reflect a generally positive, albeit challenging, environment for investment-grade bonds. The 12-month period witnessed a marked shift in Federal Reserve (Fed) policy and investor sentiment toward the U.S. and global economic growth outlook, which influenced performance in the fixed-income market. In the first several months of the period, robust economic growth, rising inflation and the Fed’s steady rate-tightening strategy drove Treasury yields higher. Investment-grade bond returns were generally flat to slightly negative. Meanwhile, risk-on investing remained in favor, and higher-yielding securities outperformed. The environment reversed sharply in late 2018, as worries about future economic and corporate earnings growth, U.S.-China trade negotiations and a surprisingly bullish Fed outlook triggered severe volatility in the equity markets. After climbing to a reporting period high of 3.24% in early November (according to Bloomberg), the 10-year U.S. Treasury yield plunged to 2.68% by the end of December 2018, as investors fled risk assets in favor of perceived safe-haven investments.
The new year brought a new sense of stability to the financial markets. Progress with U.S.-China trade negotiations and better-than-feared U.S. economic and earnings data helped restore some investor optimism. Additionally, the Fed paused its rate-hike campaign in January, seemingly acknowledging its December plan for two rate hikes in 2019 may have been too aggressive. Investors responded enthusiastically to this backdrop, and risk assets returned to favor. Meanwhile, Treasury yields moved modestly lower. Then, at its March monetary policy meeting, the Fed held rates steady and suggested additional tightening was likely off the table for 2019. This news triggered a sharp rally among Treasuries, and the 10-year Treasury note ended March 2019 yielding 2.41%, compared with 2.74% a year earlier.
Overall, the Treasury market rally of late 2018 and early 2019 supported broad U.S. fixed-income gains for the entire 12-month period. Longer-maturity Treasuries and corporate bonds were top performers. Diversified Bond’s out-of-index exposure to global interest rate movements primarily accounted for the fund’s underperformance relative to the index.
Global Interest Rates Position Detracted
Throughout most of 2018, we held a non-index position designed to take advantage of differences in global interest rates. As part of this strategy, we held short positions in European government bond futures, a neutral position in U.S. Treasury futures and a long position in local-currency
*All fund returns referenced in this commentary are for Investor Class shares. Performance for other share classes will vary due to differences in fee structure; when Investor Class performance exceeds that of the index, other share classes may not. See page 3 for returns for all share classes.
emerging markets bonds. Initially, we expected European rates to rise from their unusually low levels and converge with U.S. rates. We also expected select emerging markets rates to remain stable or decline. However, yields in Europe steadily declined, weighing on our short positions in European governments. Additionally, mounting investor concerns about the sustainability of synchronized global growth combined with country-specific issues pressured emerging markets assets. With the global economy showing signs of slowing and leading central banks maintaining dovish policies, we exited our global rates trade in late 2018.
Sector Allocation, Security Selection Were Mixed
We continued to underweight Treasuries and government agencies relative to the index in favor of spread (non-Treasury) sectors, including corporate credit and securitized bonds. This strategy delivered mixed results. Our overweight position in the securitized sector contributed to relative results, while our overweight to investment-grade corporate bonds modestly detracted.
Security selection within these allocations also was mixed. Within the investment-grade corporate sector, our selections contributed to results. In particular, our corporate bond holdings with BBB credit ratings delivered robust performance late in the reporting period. Conversely, our selections in the securitized sector detracted from results.
Meanwhile, our out-of-index allocation to high-yield corporate bonds was flat, as positive performance in the first half of the reporting period combined with the early 2019 risk rally offset the effects of the high-yield sell-off in late 2018.
Portfolio Positioning
We expect the U.S. economy to continue to grow, but at a more moderate pace (2.0% to 2.5% annualized). However, we expect U.S. economic growth to remain more robust than growth in Europe and Japan. We expect headline inflation to eventually converge with core inflation near 2%. These factors should enable the Fed to remain on hold throughout the remainder of 2019. Against a backdrop of slowing global growth, geopolitical uncertainties (mainly Brexit) and a dovish Fed, we expect the 10-year Treasury yield to fluctuate within a near-term range of 2.35% to 2.80%.
We do not believe the dramatic flattening (and brief) inversion of the yield curve late in the reporting period is an indication of a looming recession. Instead, we believe the curve flattened in response to the Fed’s unexpected pivot to dovish monetary policy. We believe the Fed’s change of course is more reflective of a lack of inflation than a lack of growth. Given the yield curve’s notable flattening, we initiated a position designed to take advantage of our outlook for the curve between two and five years to steepen.
Additionally, we expect to maintain our preference for spread sectors versus Treasuries, remaining mindful of market conditions. For example, in light of the strong rally in risk assets in the final months of the reporting period, we took profits in and reduced exposure to investment-grade and high-yield corporate bonds. We also took profits in credit-sensitive mortgage-backed securities that participated in the rally. We will continue to look for opportunities to tactically add exposure to riskier corporate and securitized securities, as valuations, fundamentals and market conditions dictate. However, from a longer-term, strategic perspective, we plan to reduce spread sector risk, given the potential for spread widening as the credit cycle matures. As always, we favor a bottom-up approach to portfolio management, emphasizing careful security selection.
|
| |
| MARCH 31, 2019 | |
| Portfolio at a Glance | |
| Average Duration (effective) | 5.7 years |
| Weighted Average Life to Maturity | 7.3 years |
| | |
| Types of Investments in Portfolio | % of net assets |
| Corporate Bonds | 28.3% |
| U.S. Government Agency Mortgage-Backed Securities | 23.4% |
| U.S. Treasury Securities | 21.9% |
| Asset-Backed Securities | 8.0% |
| Collateralized Mortgage Obligations | 5.3% |
| Commercial Mortgage-Backed Securities | 4.4% |
| Collateralized Loan Obligations | 4.1% |
| Municipal Securities | 1.6% |
| Bank Loan Obligations | 1.2% |
| Sovereign Governments and Agencies | 0.7% |
| U.S. Government Agency Securities | 0.4% |
| Temporary Cash Investments | 1.3% |
| Other Assets and Liabilities | (0.6)% |
Fund shareholders may incur two types of costs: (1) transaction costs, including sales charges (loads) on purchase payments and redemption/exchange fees; and (2) ongoing costs, including management fees; distribution and service (12b-1) fees; and other fund expenses. This example is intended to help you understand your ongoing costs (in dollars) of investing in your fund and to compare these costs with the ongoing cost of investing in other mutual funds.
The example is based on an investment of $1,000 made at the beginning of the period and held for the entire period from October 1, 2018 to March 31, 2019.
Actual Expenses
The table provides information about actual account values and actual expenses for each class. You may use the information, together with the amount you invested, to estimate the expenses that you paid over the period. First, identify the share class you own. Then simply divide your account value by $1,000 (for example, an $8,600 account value divided by $1,000 = 8.6), then multiply the result by the number under the heading “Expenses Paid During Period” to estimate the expenses you paid on your account during this period.
If you hold Investor Class shares of any American Century Investments fund, or I Class shares of the American Century Diversified Bond Fund, in an American Century Investments account (i.e., not a financial intermediary or retirement plan account), American Century Investments may charge you a $12.50 semiannual account maintenance fee if the value of those shares is less than $10,000. We will redeem shares automatically in one of your accounts to pay the $12.50 fee. In determining your total eligible investment amount, we will include your investments in all personal accounts (including American Century Investments Brokerage accounts) registered under your Social Security number. Personal accounts include individual accounts, joint accounts, UGMA/UTMA accounts, personal trusts, Coverdell Education Savings Accounts and IRAs (including traditional, Roth, Rollover, SEP-, SARSEP- and SIMPLE-IRAs), and certain other retirement accounts. If you have only business, business retirement, employer-sponsored or American Century Investments Brokerage accounts, you are currently not subject to this fee. If you are subject to the Account Maintenance Fee, your account value could be reduced by the fee amount.
Hypothetical Example for Comparison Purposes
The table also provides information about hypothetical account values and hypothetical expenses based on the actual expense ratio of each class of your fund and an assumed rate of return of 5% per year before expenses, which is not the actual return of a fund’s share class. The hypothetical account values and expenses may not be used to estimate the actual ending account balance or expenses you paid for the period. You may use this information to compare the ongoing costs of investing in your fund and other funds. To do so, compare this 5% hypothetical example with the 5% hypothetical examples that appear in the shareholder reports of the other funds.
Please note that the expenses shown in the table are meant to highlight your ongoing costs only and do not reflect any transactional costs, such as sales charges (loads) or redemption/exchange fees. Therefore, the table is useful in comparing ongoing costs only, and will not help you determine the relative total costs of owning different funds. In addition, if these transactional costs were included, your costs would have been higher.
|
| | | | |
| Beginning
Account Value
10/1/18 | Ending
Account Value
3/31/19 | Expenses Paid
During Period(1)
10/1/18 - 3/31/19 |
Annualized
Expense Ratio(1) |
| Actual | | | | |
| Investor Class | $1,000 | $1,036.60 | $3.05 | 0.60% |
| I Class | $1,000 | $1,038.40 | $2.03 | 0.40% |
| Y Class | $1,000 | $1,038.50 | $1.88 | 0.37% |
| A Class | $1,000 | $1,035.60 | $4.31 | 0.85% |
| C Class | $1,000 | $1,032.60 | $8.11 | 1.60% |
| R Class | $1,000 | $1,034.60 | $5.58 | 1.10% |
| R5 Class | $1,000 | $1,038.40 | $2.03 | 0.40% |
| R6 Class | $1,000 | $1,038.60 | $1.78 | 0.35% |
| Hypothetical | | | | |
| Investor Class | $1,000 | $1,021.94 | $3.02 | 0.60% |
| I Class | $1,000 | $1,022.94 | $2.02 | 0.40% |
| Y Class | $1,000 | $1,023.09 | $1.87 | 0.37% |
| A Class | $1,000 | $1,020.69 | $4.28 | 0.85% |
| C Class | $1,000 | $1,016.95 | $8.05 | 1.60% |
| R Class | $1,000 | $1,019.45 | $5.54 | 1.10% |
| R5 Class | $1,000 | $1,022.94 | $2.02 | 0.40% |
| R6 Class | $1,000 | $1,023.19 | $1.77 | 0.35% |
| |
| (1) | Expenses are equal to the class's annualized expense ratio listed in the table above, multiplied by the average account value over the period, multiplied by 182, the number of days in the most recent fiscal half-year, divided by 365, to reflect the one-half year period. Annualized expense ratio reflects actual expenses, including any applicable fee waivers or expense reimbursements and excluding any acquired fund fees and expenses. |
MARCH 31, 2019
|
| | | | | | |
| | Principal Amount | Value |
| CORPORATE BONDS — 28.3% | | |
| Aerospace and Defense — 0.1% | | |
| United Technologies Corp., 6.05%, 6/1/36 | $ | 1,868,000 |
| $ | 2,227,041 |
|
| Air Freight and Logistics — 0.1% | | |
| FedEx Corp., 4.40%, 1/15/47 | 2,580,000 |
| 2,435,025 |
|
| Automobiles — 1.2% | | |
| Ford Motor Credit Co. LLC, 2.68%, 1/9/20 | 6,190,000 |
| 6,164,779 |
|
| Ford Motor Credit Co. LLC, 8.125%, 1/15/20 | 3,500,000 |
| 3,628,192 |
|
| Ford Motor Credit Co. LLC, 5.875%, 8/2/21 | 5,810,000 |
| 6,021,675 |
|
| Ford Motor Credit Co. LLC, 2.98%, 8/3/22 | 3,820,000 |
| 3,653,947 |
|
| General Motors Co., 5.15%, 4/1/38 | 2,150,000 |
| 1,970,655 |
|
| General Motors Financial Co., Inc., 3.15%, 1/15/20 | 6,350,000 |
| 6,359,995 |
|
| General Motors Financial Co., Inc., 3.20%, 7/6/21 | 4,620,000 |
| 4,602,320 |
|
| General Motors Financial Co., Inc., 5.25%, 3/1/26 | 5,740,000 |
| 5,933,266 |
|
| | | 38,334,829 |
|
| Banks — 5.6% | | |
| Banco Santander SA, 3.50%, 4/11/22 | 4,200,000 |
| 4,243,141 |
|
| Bank of America Corp., MTN, 4.20%, 8/26/24 | 9,400,000 |
| 9,739,881 |
|
| Bank of America Corp., MTN, 4.00%, 1/22/25 | 5,000,000 |
| 5,108,730 |
|
| Bank of America Corp., MTN, VRN, 2.37%, 7/21/21 | 6,270,000 |
| 6,230,088 |
|
| Bank of America Corp., MTN, VRN, 3.97%, 3/5/29 | 3,540,000 |
| 3,618,360 |
|
| Bank of America Corp., MTN, VRN, 4.44%, 1/20/48 | 2,450,000 |
| 2,571,966 |
|
| Bank of America Corp., VRN, 3.00%, 12/20/23 | 3,772,000 |
| 3,763,887 |
|
| Bank of America N.A., 6.00%, 10/15/36 | 3,330,000 |
| 4,136,501 |
|
Banque Federative du Credit Mutuel SA, 2.00%, 4/12/19(1) | 2,960,000 |
| 2,959,330 |
|
| Barclays Bank plc, 5.14%, 10/14/20 | 3,230,000 |
| 3,317,914 |
|
| Barclays plc, 4.375%, 1/12/26 | 2,700,000 |
| 2,719,588 |
|
BNP Paribas SA, 4.375%, 9/28/25(1) | 2,950,000 |
| 3,025,193 |
|
BPCE SA, 3.00%, 5/22/22(1) | 4,760,000 |
| 4,713,742 |
|
BPCE SA, 5.15%, 7/21/24(1) | 2,380,000 |
| 2,486,377 |
|
BPCE SA, 3.50%, 10/23/27(1) | 800,000 |
| 775,740 |
|
| Citigroup, Inc., 2.90%, 12/8/21 | 6,200,000 |
| 6,198,836 |
|
| Citigroup, Inc., 2.75%, 4/25/22 | 5,530,000 |
| 5,510,971 |
|
| Citigroup, Inc., 3.20%, 10/21/26 | 6,500,000 |
| 6,377,704 |
|
| Citigroup, Inc., 4.45%, 9/29/27 | 13,315,000 |
| 13,709,769 |
|
| Citigroup, Inc., VRN, 3.52%, 10/27/28 | 2,240,000 |
| 2,205,289 |
|
| Cooperatieve Rabobank UA, 3.95%, 11/9/22 | 4,970,000 |
| 5,065,826 |
|
| Discover Bank, 3.35%, 2/6/23 | 2,200,000 |
| 2,213,420 |
|
| Discover Bank, 3.45%, 7/27/26 | 5,790,000 |
| 5,617,300 |
|
| Fifth Third Bank, 2.875%, 10/1/21 | 2,210,000 |
| 2,213,136 |
|
| HSBC Holdings plc, 4.30%, 3/8/26 | 2,680,000 |
| 2,785,467 |
|
| HSBC Holdings plc, 4.375%, 11/23/26 | 4,800,000 |
| 4,925,347 |
|
| HSBC Holdings plc, VRN, 3.26%, 3/13/23 | 4,900,000 |
| 4,915,714 |
|
|
| | | | | | |
| | Principal Amount | Value |
| Huntington Bancshares, Inc., 2.30%, 1/14/22 | $ | 3,480,000 |
| $ | 3,429,414 |
|
| JPMorgan Chase & Co., 4.625%, 5/10/21 | 6,700,000 |
| 6,954,189 |
|
| JPMorgan Chase & Co., 3.25%, 9/23/22 | 5,020,000 |
| 5,095,536 |
|
| JPMorgan Chase & Co., 3.875%, 9/10/24 | 3,575,000 |
| 3,669,361 |
|
| JPMorgan Chase & Co., 3.125%, 1/23/25 | 10,400,000 |
| 10,419,725 |
|
| JPMorgan Chase & Co., VRN, 3.96%, 11/15/48 | 3,300,000 |
| 3,228,702 |
|
| PNC Financial Services Group, Inc. (The), 4.375%, 8/11/20 | 2,400,000 |
| 2,457,299 |
|
| Regions Financial Corp., 2.75%, 8/14/22 | 3,690,000 |
| 3,664,636 |
|
| Regions Financial Corp., 3.80%, 8/14/23 | 3,100,000 |
| 3,189,799 |
|
| Synchrony Bank, 3.00%, 6/15/22 | 2,330,000 |
| 2,301,128 |
|
| U.S. Bancorp, MTN, 3.60%, 9/11/24 | 2,820,000 |
| 2,911,557 |
|
| Wells Fargo & Co., 3.07%, 1/24/23 | 3,770,000 |
| 3,778,101 |
|
| Wells Fargo & Co., 4.125%, 8/15/23 | 2,170,000 |
| 2,250,881 |
|
| Wells Fargo & Co., 5.61%, 1/15/44 | 3,300,000 |
| 3,814,323 |
|
| Wells Fargo & Co., MTN, 3.75%, 1/24/24 | 1,670,000 |
| 1,720,136 |
|
| Wells Fargo & Co., MTN, 4.10%, 6/3/26 | 2,850,000 |
| 2,918,616 |
|
| | | 182,952,620 |
|
| Beverages — 0.4% | | |
Anheuser-Busch Cos. LLC / Anheuser-Busch InBev Worldwide, Inc., 4.90%, 2/1/46(1) | 5,320,000 |
| 5,354,408 |
|
| Anheuser-Busch InBev Worldwide, Inc., 4.75%, 1/23/29 | 4,610,000 |
| 4,913,196 |
|
| Constellation Brands, Inc., 4.75%, 12/1/25 | 1,700,000 |
| 1,815,127 |
|
| | | 12,082,731 |
|
| Biotechnology — 1.6% | | |
| AbbVie, Inc., 2.90%, 11/6/22 | 5,270,000 |
| 5,261,496 |
|
| AbbVie, Inc., 3.60%, 5/14/25 | 3,970,000 |
| 3,985,055 |
|
| AbbVie, Inc., 4.40%, 11/6/42 | 810,000 |
| 754,437 |
|
| AbbVie, Inc., 4.70%, 5/14/45 | 2,325,000 |
| 2,245,705 |
|
| Amgen, Inc., 2.65%, 5/11/22 | 6,080,000 |
| 6,064,646 |
|
| Amgen, Inc., 4.66%, 6/15/51 | 3,170,000 |
| 3,201,073 |
|
| Celgene Corp., 3.25%, 8/15/22 | 5,180,000 |
| 5,237,762 |
|
| Celgene Corp., 3.875%, 8/15/25 | 7,450,000 |
| 7,654,725 |
|
| Gilead Sciences, Inc., 4.40%, 12/1/21 | 6,230,000 |
| 6,477,859 |
|
| Gilead Sciences, Inc., 3.65%, 3/1/26 | 9,510,000 |
| 9,714,871 |
|
| | | 50,597,629 |
|
| Building Products — 0.1% | | |
| Masco Corp., 4.45%, 4/1/25 | 1,800,000 |
| 1,851,114 |
|
| Capital Markets — 1.4% | | |
| Goldman Sachs Group, Inc. (The), 3.50%, 1/23/25 | 5,710,000 |
| 5,697,653 |
|
| Goldman Sachs Group, Inc. (The), 3.50%, 11/16/26 | 8,120,000 |
| 8,025,871 |
|
| Goldman Sachs Group, Inc. (The), VRN, 3.27%, 9/29/25 | 3,000,000 |
| 2,964,201 |
|
| Goldman Sachs Group, Inc. (The), VRN, 3.81%, 4/23/29 | 3,600,000 |
| 3,571,931 |
|
| Jefferies Group LLC / Jefferies Group Capital Finance, Inc., 4.15%, 1/23/30 | 1,850,000 |
| 1,697,314 |
|
| Morgan Stanley, 2.75%, 5/19/22 | 5,110,000 |
| 5,083,116 |
|
| Morgan Stanley, 5.00%, 11/24/25 | 2,830,000 |
| 3,038,085 |
|
| Morgan Stanley, MTN, 3.70%, 10/23/24 | 9,830,000 |
| 10,012,756 |
|
| Morgan Stanley, MTN, 4.00%, 7/23/25 | 4,700,000 |
| 4,844,932 |
|
|
| | | | | | |
| | Principal Amount | Value |
| Morgan Stanley, VRN, 3.97%, 7/22/38 | $ | 1,880,000 |
| $ | 1,853,475 |
|
| | | 46,789,334 |
|
| Chemicals — 0.1% | | |
| Westlake Chemical Corp., 4.375%, 11/15/47 | 2,030,000 |
| 1,804,635 |
|
| Commercial Services and Supplies — 0.1% | | |
| Republic Services, Inc., 3.55%, 6/1/22 | 2,170,000 |
| 2,219,793 |
|
| Consumer Finance — 0.4% | | |
| Capital One Bank USA N.A., 3.375%, 2/15/23 | 4,900,000 |
| 4,902,486 |
|
| Capital One Financial Corp., 3.75%, 7/28/26 | 4,205,000 |
| 4,102,942 |
|
| PNC Bank N.A., 3.80%, 7/25/23 | 3,100,000 |
| 3,192,331 |
|
| | | 12,197,759 |
|
Containers and Packaging† | | |
| International Paper Co., 4.40%, 8/15/47 | 1,610,000 |
| 1,513,094 |
|
| Diversified Consumer Services — 0.2% | | |
| Board of Trustees of The Leland Stanford Junior University (The), 3.46%, 5/1/47 | 1,600,000 |
| 1,603,181 |
|
| CommonSpirit Health, 2.95%, 11/1/22 | 2,420,000 |
| 2,405,674 |
|
| George Washington University (The), 3.55%, 9/15/46 | 1,805,000 |
| 1,746,270 |
|
| | | 5,755,125 |
|
| Diversified Financial Services — 0.7% | | |
| Credit Suisse Group Funding Guernsey Ltd., 3.125%, 12/10/20 | 6,090,000 |
| 6,112,451 |
|
| Credit Suisse Group Funding Guernsey Ltd., 3.45%, 4/16/21 | 5,500,000 |
| 5,560,352 |
|
UBS Group Funding Switzerland AG, 3.49%, 5/23/23(1) | 8,150,000 |
| 8,195,386 |
|
| Voya Financial, Inc., 5.70%, 7/15/43 | 1,900,000 |
| 2,213,273 |
|
| | | 22,081,462 |
|
| Diversified Telecommunication Services — 0.8% | | |
| AT&T, Inc., 3.875%, 8/15/21 | 3,160,000 |
| 3,242,543 |
|
| AT&T, Inc., 3.40%, 5/15/25 | 3,530,000 |
| 3,498,595 |
|
| AT&T, Inc., 5.25%, 3/1/37 | 2,000,000 |
| 2,111,068 |
|
| AT&T, Inc., 4.85%, 3/1/39 | 1,220,000 |
| 1,228,623 |
|
| AT&T, Inc., 5.15%, 11/15/46 | 2,321,000 |
| 2,390,013 |
|
| Verizon Communications, Inc., 3.38%, 2/15/25 | 4,000,000 |
| 4,059,286 |
|
| Verizon Communications, Inc., 2.625%, 8/15/26 | 6,150,000 |
| 5,875,551 |
|
| Verizon Communications, Inc., 5.01%, 8/21/54 | 3,350,000 |
| 3,595,698 |
|
| | | 26,001,377 |
|
| Electric Utilities — 0.7% | | |
| AEP Transmission Co. LLC, 3.75%, 12/1/47 | 1,020,000 |
| 1,006,443 |
|
| American Electric Power Co., Inc., 3.20%, 11/13/27 | 2,050,000 |
| 2,010,301 |
|
| Duke Energy Corp., 3.55%, 9/15/21 | 2,686,000 |
| 2,729,225 |
|
| Duke Energy Florida LLC, 6.35%, 9/15/37 | 307,000 |
| 407,875 |
|
| Duke Energy Florida LLC, 3.85%, 11/15/42 | 2,070,000 |
| 2,080,249 |
|
| Duke Energy Progress LLC, 4.15%, 12/1/44 | 1,100,000 |
| 1,149,355 |
|
| Duke Energy Progress LLC, 3.70%, 10/15/46 | 2,280,000 |
| 2,233,581 |
|
| Exelon Corp., 5.15%, 12/1/20 | 1,700,000 |
| 1,753,275 |
|
| Exelon Corp., 4.45%, 4/15/46 | 1,842,000 |
| 1,904,587 |
|
| FirstEnergy Corp., 4.25%, 3/15/23 | 1,810,000 |
| 1,889,905 |
|
NextEra Energy Operating Partners LP, 4.50%, 9/15/27(1) | 3,340,000 |
| 3,269,025 |
|
| Southern Co. Gas Capital Corp., 3.95%, 10/1/46 | 1,570,000 |
| 1,477,916 |
|
|
| | | | | | |
| | Principal Amount | Value |
| Xcel Energy, Inc., 3.35%, 12/1/26 | $ | 780,000 |
| $ | 782,187 |
|
| | | 22,693,924 |
|
| Energy Equipment and Services — 0.1% | | |
| Halliburton Co., 3.80%, 11/15/25 | 1,800,000 |
| 1,842,570 |
|
| Halliburton Co., 4.85%, 11/15/35 | 2,030,000 |
| 2,133,631 |
|
| | | 3,976,201 |
|
| Entertainment — 0.3% | | |
| Viacom, Inc., 3.125%, 6/15/22 | 1,690,000 |
| 1,687,479 |
|
| Viacom, Inc., 4.25%, 9/1/23 | 2,100,000 |
| 2,185,277 |
|
| Viacom, Inc., 4.375%, 3/15/43 | 2,230,000 |
| 2,005,099 |
|
Walt Disney Co. (The), 6.90%, 8/15/39(1) | 2,680,000 |
| 3,790,942 |
|
Walt Disney Co. (The), 4.75%, 9/15/44(1) | 1,000,000 |
| 1,149,846 |
|
| | | 10,818,643 |
|
| Equity Real Estate Investment Trusts (REITs) — 1.1% | | |
| American Tower Corp., 5.05%, 9/1/20 | 2,000,000 |
| 2,061,496 |
|
| American Tower Corp., 3.375%, 10/15/26 | 1,330,000 |
| 1,298,541 |
|
| Boston Properties LP, 3.65%, 2/1/26 | 4,900,000 |
| 4,929,591 |
|
| Crown Castle International Corp., 5.25%, 1/15/23 | 3,240,000 |
| 3,482,339 |
|
| Essex Portfolio LP, 3.625%, 8/15/22 | 3,120,000 |
| 3,176,554 |
|
| Essex Portfolio LP, 3.25%, 5/1/23 | 1,712,000 |
| 1,712,191 |
|
| GLP Capital LP / GLP Financing II, Inc., 5.75%, 6/1/28 | 1,860,000 |
| 2,004,057 |
|
| Hospitality Properties Trust, 4.65%, 3/15/24 | 1,870,000 |
| 1,907,464 |
|
| Kilroy Realty LP, 3.80%, 1/15/23 | 3,380,000 |
| 3,437,589 |
|
| Kimco Realty Corp., 2.80%, 10/1/26 | 3,910,000 |
| 3,685,614 |
|
| Ventas Realty LP, 4.125%, 1/15/26 | 2,600,000 |
| 2,673,292 |
|
| VEREIT Operating Partnership LP, 4.125%, 6/1/21 | 4,538,000 |
| 4,615,849 |
|
| | | 34,984,577 |
|
| Food and Staples Retailing — 0.1% | | |
| Kroger Co. (The), 3.30%, 1/15/21 | 1,235,000 |
| 1,242,784 |
|
| Kroger Co. (The), 3.875%, 10/15/46 | 2,080,000 |
| 1,736,937 |
|
| Walmart, Inc., 4.05%, 6/29/48 | 1,940,000 |
| 2,071,695 |
|
| | | 5,051,416 |
|
| Gas Utilities — 0.8% | | |
| Andeavor Logistics LP / Tesoro Logistics Finance Corp., 5.25%, 1/15/25 | 2,950,000 |
| 3,066,170 |
|
| Enterprise Products Operating LLC, 4.85%, 3/15/44 | 5,480,000 |
| 5,835,907 |
|
| Plains All American Pipeline LP / PAA Finance Corp., 3.65%, 6/1/22 | 3,440,000 |
| 3,464,193 |
|
| Sabine Pass Liquefaction LLC, 5.625%, 3/1/25 | 8,040,000 |
| 8,848,362 |
|
| Sunoco Logistics Partners Operations LP, 3.45%, 1/15/23 | 3,750,000 |
| 3,768,822 |
|
| Targa Resources Partners LP / Targa Resources Partners Finance Corp., 5.00%, 1/15/28 | 1,390,000 |
| 1,370,888 |
|
| | | 26,354,342 |
|
| Health Care Equipment and Supplies — 0.4% | | |
| Becton Dickinson and Co., 3.73%, 12/15/24 | 4,671,000 |
| 4,747,943 |
|
| Medtronic, Inc., 3.50%, 3/15/25 | 4,590,000 |
| 4,744,263 |
|
| Medtronic, Inc., 4.375%, 3/15/35 | 3,010,000 |
| 3,293,303 |
|
| | | 12,785,509 |
|
|
| | | | | | |
| | Principal Amount | Value |
| Health Care Providers and Services — 1.1% | | |
| Aetna, Inc., 2.75%, 11/15/22 | $ | 1,540,000 |
| $ | 1,520,828 |
|
| Anthem, Inc., 3.65%, 12/1/27 | 2,800,000 |
| 2,798,481 |
|
| Anthem, Inc., 4.65%, 1/15/43 | 1,625,000 |
| 1,686,043 |
|
| CVS Health Corp., 3.50%, 7/20/22 | 5,400,000 |
| 5,473,579 |
|
| CVS Health Corp., 4.30%, 3/25/28 | 3,810,000 |
| 3,867,584 |
|
| CVS Health Corp., 4.78%, 3/25/38 | 1,480,000 |
| 1,469,950 |
|
| Duke University Health System, Inc., 3.92%, 6/1/47 | 3,085,000 |
| 3,197,118 |
|
| Johns Hopkins Health System Corp. (The), 3.84%, 5/15/46 | 1,860,000 |
| 1,889,817 |
|
| Kaiser Foundation Hospitals, 4.15%, 5/1/47 | 1,570,000 |
| 1,663,556 |
|
| Northwell Healthcare, Inc., 4.26%, 11/1/47 | 2,180,000 |
| 2,206,389 |
|
| Stanford Health Care, 3.80%, 11/15/48 | 1,760,000 |
| 1,774,705 |
|
| UnitedHealth Group, Inc., 2.875%, 3/15/22 | 4,060,000 |
| 4,087,030 |
|
| UnitedHealth Group, Inc., 3.75%, 7/15/25 | 2,000,000 |
| 2,090,959 |
|
Universal Health Services, Inc., 4.75%, 8/1/22(1) | 3,700,000 |
| 3,741,625 |
|
| | | 37,467,664 |
|
| Hotels, Restaurants and Leisure — 0.1% | | |
| McDonald's Corp., MTN, 4.70%, 12/9/35 | 2,270,000 |
| 2,442,155 |
|
| Household Durables — 0.4% | | |
| D.R. Horton, Inc., 2.55%, 12/1/20 | 2,420,000 |
| 2,405,367 |
|
| Lennar Corp., 4.75%, 4/1/21 | 3,290,000 |
| 3,359,912 |
|
| Lennar Corp., 4.75%, 11/29/27 | 680,000 |
| 682,868 |
|
| Toll Brothers Finance Corp., 6.75%, 11/1/19 | 2,620,000 |
| 2,685,369 |
|
| Toll Brothers Finance Corp., 4.35%, 2/15/28 | 3,620,000 |
| 3,402,800 |
|
| TRI Pointe Group, Inc. / TRI Pointe Homes, Inc., 4.375%, 6/15/19 | 1,460,000 |
| 1,465,475 |
|
| | | 14,001,791 |
|
| Insurance — 1.3% | | |
| AerCap Ireland Capital DAC / AerCap Global Aviation Trust, 3.75%, 5/15/19 | 6,670,000 |
| 6,675,671 |
|
| AerCap Ireland Capital DAC / AerCap Global Aviation Trust, 5.00%, 10/1/21 | 6,320,000 |
| 6,561,559 |
|
| American International Group, Inc., 4.125%, 2/15/24 | 7,680,000 |
| 7,934,254 |
|
| American International Group, Inc., 4.50%, 7/16/44 | 550,000 |
| 528,447 |
|
| Berkshire Hathaway Finance Corp., 3.00%, 5/15/22 | 2,030,000 |
| 2,065,257 |
|
| Berkshire Hathaway Finance Corp., 4.20%, 8/15/48 | 1,620,000 |
| 1,684,256 |
|
| Chubb INA Holdings, Inc., 3.15%, 3/15/25 | 1,700,000 |
| 1,717,415 |
|
| Hartford Financial Services Group, Inc. (The), 5.95%, 10/15/36 | 1,190,000 |
| 1,422,224 |
|
| Markel Corp., 4.90%, 7/1/22 | 3,120,000 |
| 3,294,719 |
|
| MetLife, Inc., 4.875%, 11/13/43 | 1,075,000 |
| 1,201,391 |
|
Metropolitan Life Global Funding I, 3.00%, 1/10/23(1) | 2,220,000 |
| 2,237,424 |
|
| Prudential Financial, Inc., 3.94%, 12/7/49 | 3,500,000 |
| 3,389,894 |
|
| Prudential Financial, Inc., MTN, 5.70%, 12/14/36 | 975,000 |
| 1,165,404 |
|
| WR Berkley Corp., 4.625%, 3/15/22 | 1,875,000 |
| 1,959,801 |
|
| | | 41,837,716 |
|
| Internet and Direct Marketing Retail — 0.3% | | |
| Alibaba Group Holding Ltd., 2.50%, 11/28/19 | 3,900,000 |
| 3,896,092 |
|
| Alibaba Group Holding Ltd., 3.60%, 11/28/24 | 5,000,000 |
| 5,130,794 |
|
| | | 9,026,886 |
|
|
| | | | | | |
| | Principal Amount | Value |
| IT Services — 0.1% | | |
| Fidelity National Information Services, Inc., 3.00%, 8/15/26 | $ | 3,050,000 |
| $ | 2,927,281 |
|
| Life Sciences Tools and Services — 0.1% | | |
| Thermo Fisher Scientific, Inc., 3.30%, 2/15/22 | 2,157,000 |
| 2,186,403 |
|
| Thermo Fisher Scientific, Inc., 2.95%, 9/19/26 | 2,000,000 |
| 1,930,865 |
|
| | | 4,117,268 |
|
| Media — 1.1% | | |
| Charter Communications Operating LLC / Charter Communications Operating Capital, 4.91%, 7/23/25 | 9,730,000 |
| 10,269,186 |
|
| Charter Communications Operating LLC / Charter Communications Operating Capital, 6.48%, 10/23/45 | 2,780,000 |
| 3,123,528 |
|
| Comcast Corp., 6.40%, 5/15/38 | 2,270,000 |
| 2,916,183 |
|
| Comcast Corp., 4.60%, 10/15/38 | 4,280,000 |
| 4,596,396 |
|
| Comcast Corp., 4.75%, 3/1/44 | 4,540,000 |
| 4,937,166 |
|
Globo Comunicacao e Participacoes SA, 5.125%, 3/31/27(1) | 600,000 |
| 582,750 |
|
| Interpublic Group of Cos., Inc. (The), 4.00%, 3/15/22 | 2,370,000 |
| 2,420,212 |
|
| TEGNA, Inc., 5.125%, 7/15/20 | 4,450,000 |
| 4,466,688 |
|
| Warner Media LLC, 2.95%, 7/15/26 | 3,500,000 |
| 3,318,576 |
|
| | | 36,630,685 |
|
| Metals and Mining — 0.1% | | |
| Steel Dynamics, Inc., 4.125%, 9/15/25 | 3,160,000 |
| 3,104,700 |
|
| Multi-Utilities — 1.0% | | |
| Berkshire Hathaway Energy Co., 3.50%, 2/1/25 | 3,900,000 |
| 3,999,292 |
|
| Berkshire Hathaway Energy Co., 3.80%, 7/15/48 | 2,700,000 |
| 2,590,082 |
|
| CenterPoint Energy, Inc., 4.25%, 11/1/28 | 2,500,000 |
| 2,594,104 |
|
| Consolidated Edison Co. of New York, Inc., 3.95%, 3/1/43 | 1,530,000 |
| 1,523,774 |
|
| Dominion Energy, Inc., 4.90%, 8/1/41 | 2,920,000 |
| 3,121,691 |
|
| Exelon Generation Co. LLC, 5.60%, 6/15/42 | 710,000 |
| 748,786 |
|
FirstEnergy Transmission LLC, 4.55%, 4/1/49(1) | 1,570,000 |
| 1,610,567 |
|
| MidAmerican Energy Co., 4.40%, 10/15/44 | 2,100,000 |
| 2,299,463 |
|
| NextEra Energy Capital Holdings, Inc., 3.55%, 5/1/27 | 1,860,000 |
| 1,874,170 |
|
| NiSource, Inc., 5.65%, 2/1/45 | 2,080,000 |
| 2,424,298 |
|
| Potomac Electric Power Co., 3.60%, 3/15/24 | 1,700,000 |
| 1,758,977 |
|
| Sempra Energy, 2.875%, 10/1/22 | 1,820,000 |
| 1,795,120 |
|
| Sempra Energy, 3.25%, 6/15/27 | 1,700,000 |
| 1,629,481 |
|
| Sempra Energy, 4.00%, 2/1/48 | 1,500,000 |
| 1,371,063 |
|
| Southwestern Public Service Co., 3.70%, 8/15/47 | 1,880,000 |
| 1,821,781 |
|
| | | 31,162,649 |
|
| Oil, Gas and Consumable Fuels — 3.4% | | |
| Antero Resources Corp., 5.00%, 3/1/25 | 1,150,000 |
| 1,137,063 |
|
| Cimarex Energy Co., 4.375%, 6/1/24 | 2,480,000 |
| 2,579,308 |
|
| CNOOC Finance Ltd., 4.25%, 1/26/21 | 4,975,000 |
| 5,082,002 |
|
| CNOOC Nexen Finance 2014 ULC, 4.25%, 4/30/24 | 2,000,000 |
| 2,093,278 |
|
| Concho Resources, Inc., 4.375%, 1/15/25 | 3,210,000 |
| 3,302,272 |
|
| Continental Resources, Inc., 4.375%, 1/15/28 | 4,730,000 |
| 4,872,747 |
|
| Ecopetrol SA, 5.875%, 5/28/45 | 1,220,000 |
| 1,268,800 |
|
| Encana Corp., 6.50%, 2/1/38 | 3,450,000 |
| 4,058,963 |
|
| Energy Transfer Operating LP, 7.50%, 10/15/20 | 2,120,000 |
| 2,257,938 |
|
|
| | | | | | |
| | Principal Amount | Value |
| Energy Transfer Operating LP, 4.25%, 3/15/23 | $ | 4,740,000 |
| $ | 4,872,542 |
|
| Energy Transfer Operating LP, 5.25%, 4/15/29 | 3,200,000 |
| 3,439,943 |
|
| Energy Transfer Operating LP, 4.90%, 3/15/35 | 3,470,000 |
| 3,307,564 |
|
| Energy Transfer Operating LP, 6.50%, 2/1/42 | 880,000 |
| 980,496 |
|
| Energy Transfer Operating LP, 6.00%, 6/15/48 | 1,050,000 |
| 1,137,072 |
|
| Hess Corp., 6.00%, 1/15/40 | 1,590,000 |
| 1,660,843 |
|
| Kinder Morgan Energy Partners LP, 5.30%, 9/15/20 | 3,040,000 |
| 3,142,909 |
|
| Kinder Morgan Energy Partners LP, 6.50%, 9/1/39 | 4,250,000 |
| 4,995,029 |
|
| Kinder Morgan, Inc., 5.55%, 6/1/45 | 1,160,000 |
| 1,271,354 |
|
| Marathon Oil Corp., 3.85%, 6/1/25 | 3,390,000 |
| 3,437,274 |
|
| MPLX LP, 4.875%, 6/1/25 | 3,800,000 |
| 4,051,409 |
|
| MPLX LP, 4.50%, 4/15/38 | 2,130,000 |
| 2,031,256 |
|
| MPLX LP, 5.20%, 3/1/47 | 1,480,000 |
| 1,506,686 |
|
| Newfield Exploration Co., 5.75%, 1/30/22 | 3,450,000 |
| 3,686,245 |
|
| Noble Energy, Inc., 4.15%, 12/15/21 | 2,080,000 |
| 2,131,387 |
|
| Petroleos Mexicanos, 6.00%, 3/5/20 | 2,291,000 |
| 2,346,442 |
|
| Petroleos Mexicanos, 4.875%, 1/24/22 | 2,160,000 |
| 2,183,782 |
|
| Petroleos Mexicanos, 4.625%, 9/21/23 | 4,200,000 |
| 4,147,542 |
|
| Petroleos Mexicanos, 6.50%, 3/13/27 | 3,800,000 |
| 3,825,498 |
|
| Petroleos Mexicanos, 6.625%, 6/15/35 | 1,000,000 |
| 947,500 |
|
| Petroleos Mexicanos, 6.50%, 6/2/41 | 1,760,000 |
| 1,597,534 |
|
| Petroleos Mexicanos, 5.50%, 6/27/44 | 700,000 |
| 574,000 |
|
| Petroleos Mexicanos, 6.35%, 2/12/48 | 1,200,000 |
| 1,063,980 |
|
| Petronas Capital Ltd., 5.25%, 8/12/19 | 6,254,000 |
| 6,316,615 |
|
| Phillips 66, 4.30%, 4/1/22 | 2,670,000 |
| 2,787,143 |
|
| Shell International Finance BV, 2.375%, 8/21/22 | 3,100,000 |
| 3,081,481 |
|
| Shell International Finance BV, 3.625%, 8/21/42 | 1,780,000 |
| 1,742,748 |
|
| Sinopec Group Overseas Development Ltd., 1.75%, 9/29/19 | 2,600,000 |
| 2,587,780 |
|
| Williams Cos., Inc. (The), 4.125%, 11/15/20 | 5,003,000 |
| 5,084,511 |
|
| Williams Cos., Inc. (The), 4.55%, 6/24/24 | 3,330,000 |
| 3,518,842 |
|
| | | 110,109,778 |
|
| Pharmaceuticals — 0.4% | | |
| Allergan Finance LLC, 3.25%, 10/1/22 | 6,880,000 |
| 6,887,921 |
|
| Shire Acquisitions Investments Ireland DAC, 2.40%, 9/23/21 | 4,785,000 |
| 4,732,592 |
|
| | | 11,620,513 |
|
| Road and Rail — 0.6% | | |
| Burlington Northern Santa Fe LLC, 3.60%, 9/1/20 | 3,310,000 |
| 3,351,595 |
|
| Burlington Northern Santa Fe LLC, 4.95%, 9/15/41 | 3,850,000 |
| 4,414,655 |
|
| Burlington Northern Santa Fe LLC, 4.15%, 4/1/45 | 1,070,000 |
| 1,117,179 |
|
| CSX Corp., 3.40%, 8/1/24 | 2,840,000 |
| 2,896,388 |
|
| CSX Corp., 3.25%, 6/1/27 | 3,490,000 |
| 3,451,239 |
|
| Union Pacific Corp., 3.60%, 9/15/37 | 1,730,000 |
| 1,661,161 |
|
| Union Pacific Corp., 4.75%, 9/15/41 | 2,480,000 |
| 2,687,211 |
|
| Union Pacific Corp., 4.05%, 11/15/45 | 1,600,000 |
| 1,562,250 |
|
| | | 21,141,678 |
|
| Semiconductors and Semiconductor Equipment — 0.1% | | |
NXP BV / NXP Funding LLC, 3.875%, 9/1/22(1) | 3,950,000 |
| 4,015,689 |
|
|
| | | | | | |
| | Principal Amount | Value |
| Software — 0.6% | | |
| Microsoft Corp., 2.70%, 2/12/25 | $ | 9,320,000 |
| $ | 9,336,162 |
|
| Microsoft Corp., 3.45%, 8/8/36 | 2,140,000 |
| 2,153,880 |
|
| Microsoft Corp., 4.25%, 2/6/47 | 3,060,000 |
| 3,422,853 |
|
| Oracle Corp., 3.625%, 7/15/23 | 3,070,000 |
| 3,188,458 |
|
| | | 18,101,353 |
|
| Specialty Retail — 0.4% | | |
Ashtead Capital, Inc., 4.125%, 8/15/25(1) | 3,750,000 |
| 3,703,125 |
|
| Home Depot, Inc. (The), 3.75%, 2/15/24 | 3,000,000 |
| 3,153,496 |
|
| Home Depot, Inc. (The), 3.00%, 4/1/26 | 2,560,000 |
| 2,575,691 |
|
| Home Depot, Inc. (The), 3.90%, 6/15/47 | 2,750,000 |
| 2,791,410 |
|
| United Rentals North America, Inc., 4.625%, 7/15/23 | 1,920,000 |
| 1,957,200 |
|
| | | 14,180,922 |
|
| Technology Hardware, Storage and Peripherals — 0.7% | | |
| Apple, Inc., 2.50%, 2/9/25 | 7,550,000 |
| 7,424,792 |
|
| Apple, Inc., 2.45%, 8/4/26 | 3,780,000 |
| 3,655,372 |
|
Dell International LLC / EMC Corp., 6.02%, 6/15/26(1) | 6,950,000 |
| 7,481,769 |
|
Dell International LLC / EMC Corp., 4.90%, 10/1/26(1) | 3,320,000 |
| 3,386,071 |
|
| Hewlett Packard Enterprise Co., 3.60%, 10/15/20 | 2,230,000 |
| 2,251,580 |
|
| | | 24,199,584 |
|
| Trading Companies and Distributors — 0.1% | | |
| International Lease Finance Corp., 5.875%, 8/15/22 | 1,670,000 |
| 1,802,038 |
|
| Wireless Telecommunication Services — 0.1% | | |
| America Movil SAB de CV, 3.125%, 7/16/22 | 2,230,000 |
| 2,249,214 |
|
TOTAL CORPORATE BONDS
(Cost $903,400,677) | | 915,647,744 |
|
| U.S. GOVERNMENT AGENCY MORTGAGE-BACKED SECURITIES — 23.4% |
| Adjustable-Rate U.S. Government Agency Mortgage-Backed Securities — 1.7% |
| FHLMC, VRN, 4.58%, (1-year H15T1Y plus 2.25%), 4/1/37 | 404,698 |
| 425,392 |
|
| FHLMC, VRN, 4.51%, (12-month LIBOR plus 1.85%), 6/1/38 | 970,229 |
| 1,020,653 |
|
| FHLMC, VRN, 4.63%, (12-month LIBOR plus 1.88%), 7/1/40 | 726,163 |
| 760,671 |
|
| FHLMC, VRN, 4.14%, (12-month LIBOR plus 1.78%), 9/1/40 | 1,211,835 |
| 1,255,532 |
|
| FHLMC, VRN, 3.81%, (12-month LIBOR plus 1.78%), 2/1/41 | 1,009,212 |
| 1,038,269 |
|
| FHLMC, VRN, 4.23%, (12-month LIBOR plus 1.88%), 5/1/41 | 291,311 |
| 304,288 |
|
| FHLMC, VRN, 3.69%, (12-month LIBOR plus 1.89%), 7/1/41 | 2,096,594 |
| 2,147,970 |
|
| FHLMC, VRN, 4.08%, (12-month LIBOR plus 1.87%), 7/1/41 | 1,290,028 |
| 1,338,827 |
|
| FHLMC, VRN, 2.32%, (12-month LIBOR plus 1.65%), 2/1/43 | 6,797,709 |
| 6,782,133 |
|
| FHLMC, VRN, 4.06%, (12-month LIBOR plus 1.63%), 5/1/43 | 624,813 |
| 643,195 |
|
| FHLMC, VRN, 4.25%, (12-month LIBOR plus 1.62%), 6/1/43 | 303,280 |
| 313,517 |
|
| FHLMC, VRN, 4.27%, (12-month LIBOR plus 1.65%), 6/1/43 | 709,063 |
| 733,511 |
|
| FHLMC, VRN, 3.18%, (12-month LIBOR plus 1.62%), 6/1/44 | 2,002,055 |
| 2,030,171 |
|
| FHLMC, VRN, 2.45%, (12-month LIBOR plus 1.57%), 10/1/44 | 3,754,263 |
| 3,828,237 |
|
| FHLMC, VRN, 2.37%, (12-month LIBOR plus 1.63%), 8/1/46 | 3,174,902 |
| 3,172,585 |
|
| FNMA, VRN, 4.70%, (12-month LIBOR plus 1.71%), 12/1/37 | 298,064 |
| 312,626 |
|
| FNMA, VRN, 4.82%, (12-month LIBOR plus 1.69%), 1/1/40 | 349,891 |
| 368,159 |
|
| FNMA, VRN, 3.62%, (12-month LIBOR plus 1.79%), 8/1/40 | 1,575,553 |
| 1,627,178 |
|
| FNMA, VRN, 3.92%, (12-month LIBOR plus 1.77%), 10/1/40 | 2,189,330 |
| 2,260,840 |
|
| FNMA, VRN, 4.50%, (12-month LIBOR plus 1.75%), 8/1/41 | 786,379 |
| 819,322 |
|
|
| | | | | | |
| | Principal Amount | Value |
| FNMA, VRN, 3.32%, (12-month LIBOR plus 1.82%), 9/1/41 | $ | 823,527 |
| $ | 839,209 |
|
| FNMA, VRN, 4.56%, (12-month LIBOR plus 1.56%), 3/1/43 | 596,924 |
| 616,005 |
|
| FNMA, VRN, 2.82%, (12-month LIBOR plus 1.58%), 1/1/45 | 4,323,611 |
| 4,447,593 |
|
| FNMA, VRN, 2.60%, (12-month LIBOR plus 1.60%), 4/1/46 | 8,566,814 |
| 8,601,429 |
|
| FNMA, VRN, 3.26%, (12-month LIBOR plus 1.62%), 5/1/47 | 9,994,201 |
| 10,165,024 |
|
| | | 55,852,336 |
|
| Fixed-Rate U.S. Government Agency Mortgage-Backed Securities — 21.7% |
| FHLMC, 5.00%, 1/1/21 | 224,821 |
| 228,578 |
|
| FHLMC, 5.00%, 4/1/21 | 46,125 |
| 46,938 |
|
| FHLMC, 7.00%, 9/1/27 | 1,538 |
| 1,713 |
|
| FHLMC, 6.50%, 1/1/28 | 2,431 |
| 2,693 |
|
| FHLMC, 7.00%, 2/1/28 | 409 |
| 447 |
|
| FHLMC, 6.50%, 3/1/29 | 15,489 |
| 17,218 |
|
| FHLMC, 6.50%, 6/1/29 | 16,286 |
| 18,045 |
|
| FHLMC, 7.00%, 8/1/29 | 1,636 |
| 1,762 |
|
| FHLMC, 5.00%, 4/1/31 | 2,178,159 |
| 2,314,345 |
|
| FHLMC, 5.00%, 5/1/31 | 3,062,592 |
| 3,254,070 |
|
| FHLMC, 6.50%, 5/1/31 | 12,686 |
| 14,054 |
|
| FHLMC, 6.50%, 6/1/31 | 586 |
| 649 |
|
| FHLMC, 6.50%, 6/1/31 | 1,420 |
| 1,573 |
|
| FHLMC, 5.50%, 12/1/33 | 203,854 |
| 225,803 |
|
| FHLMC, 6.00%, 9/1/35 | 2,945,206 |
| 3,249,216 |
|
| FHLMC, 5.50%, 12/1/37 | 187,973 |
| 205,455 |
|
| FHLMC, 5.50%, 1/1/38 | 356,640 |
| 392,280 |
|
| FHLMC, 6.00%, 2/1/38 | 1,553,274 |
| 1,713,494 |
|
| FHLMC, 5.50%, 4/1/38 | 479,974 |
| 526,452 |
|
| FHLMC, 6.00%, 8/1/38 | 121,827 |
| 134,034 |
|
| FHLMC, 3.00%, 2/1/43 | 15,675,430 |
| 15,695,694 |
|
FNMA, 3.50%, TBA(2) | 31,500,000 |
| 31,939,278 |
|
| FNMA, 4.50%, 5/1/19 | 666 |
| 678 |
|
| FNMA, 6.50%, 1/1/26 | 11,512 |
| 12,722 |
|
| FNMA, 7.00%, 12/1/27 | 2,726 |
| 2,927 |
|
| FNMA, 7.50%, 4/1/28 | 16,594 |
| 18,004 |
|
| FNMA, 7.00%, 5/1/28 | 15,600 |
| 15,944 |
|
| FNMA, 7.00%, 6/1/28 | 267 |
| 271 |
|
| FNMA, 6.50%, 1/1/29 | 2,521 |
| 2,827 |
|
| FNMA, 6.50%, 4/1/29 | 10,474 |
| 11,575 |
|
| FNMA, 7.00%, 7/1/29 | 1,532 |
| 1,540 |
|
| FNMA, 7.50%, 7/1/29 | 15,738 |
| 16,880 |
|
| FNMA, 7.50%, 9/1/30 | 5,377 |
| 6,324 |
|
| FNMA, 5.00%, 6/1/31 | 2,344,971 |
| 2,480,888 |
|
| FNMA, 5.00%, 7/1/31 | 3,856,455 |
| 4,080,314 |
|
| FNMA, 7.00%, 9/1/31 | 30,054 |
| 32,513 |
|
| FNMA, 6.50%, 1/1/32 | 7,953 |
| 8,790 |
|
| FNMA, 6.50%, 8/1/32 | 36,938 |
| 41,766 |
|
| FNMA, 6.50%, 8/1/32 | 1,753 |
| 1,936 |
|
| FNMA, 5.50%, 2/1/33 | 1,704,506 |
| 1,849,338 |
|
|
| | | | | | |
| | Principal Amount | Value |
| FNMA, 5.00%, 6/1/33 | $ | 1,957,939 |
| $ | 2,107,712 |
|
| FNMA, 5.50%, 6/1/33 | 108,083 |
| 118,170 |
|
| FNMA, 5.50%, 7/1/33 | 637,791 |
| 696,008 |
|
| FNMA, 5.00%, 8/1/33 | 279,550 |
| 300,949 |
|
| FNMA, 5.50%, 8/1/33 | 225,148 |
| 247,006 |
|
| FNMA, 5.50%, 9/1/33 | 340,315 |
| 377,178 |
|
| FNMA, 5.00%, 11/1/33 | 1,249,785 |
| 1,345,568 |
|
| FNMA, 6.00%, 12/1/33 | 902,147 |
| 995,707 |
|
| FNMA, 5.50%, 1/1/34 | 354,420 |
| 389,829 |
|
| FNMA, 5.50%, 2/1/34 | 1,026,109 |
| 1,124,801 |
|
| FNMA, 5.00%, 3/1/34 | 728,610 |
| 784,363 |
|
| FNMA, 4.50%, 1/1/35 | 6,091,766 |
| 6,439,905 |
|
| FNMA, 5.00%, 4/1/35 | 1,718,446 |
| 1,849,601 |
|
| FNMA, 5.00%, 6/1/35 | 1,286,129 |
| 1,384,432 |
|
| FNMA, 5.00%, 7/1/35 | 2,485,870 |
| 2,676,084 |
|
| FNMA, 5.00%, 8/1/35 | 76,255 |
| 82,033 |
|
| FNMA, 4.50%, 9/1/35 | 297,159 |
| 313,948 |
|
| FNMA, 5.00%, 10/1/35 | 579,887 |
| 623,594 |
|
| FNMA, 5.50%, 12/1/35 | 3,608,040 |
| 3,972,403 |
|
| FNMA, 5.00%, 2/1/36 | 434,398 |
| 469,933 |
|
| FNMA, 5.50%, 4/1/36 | 456,813 |
| 502,726 |
|
| FNMA, 5.50%, 5/1/36 | 913,595 |
| 1,005,475 |
|
| FNMA, 5.50%, 7/1/36 | 192,920 |
| 211,317 |
|
| FNMA, 5.50%, 2/1/37 | 116,603 |
| 128,273 |
|
| FNMA, 5.50%, 5/1/37 | 187,963 |
| 206,437 |
|
| FNMA, 6.00%, 8/1/37 | 342,279 |
| 377,633 |
|
| FNMA, 6.50%, 8/1/37 | 157,716 |
| 171,963 |
|
| FNMA, 6.00%, 9/1/37 | 1,519,424 |
| 1,675,720 |
|
| FNMA, 6.00%, 11/1/37 | 1,677,011 |
| 1,846,406 |
|
| FNMA, 5.50%, 12/1/37 | 1,037,273 |
| 1,127,181 |
|
| FNMA, 5.50%, 2/1/38 | 225,953 |
| 248,031 |
|
| FNMA, 5.50%, 6/1/38 | 476,624 |
| 518,194 |
|
| FNMA, 6.00%, 9/1/38 | 128,742 |
| 133,174 |
|
| FNMA, 5.50%, 12/1/38 | 941,544 |
| 1,029,057 |
|
| FNMA, 5.00%, 1/1/39 | 641,283 |
| 691,618 |
|
| FNMA, 5.50%, 1/1/39 | 4,459,138 |
| 4,896,519 |
|
| FNMA, 4.50%, 2/1/39 | 1,286,220 |
| 1,359,698 |
|
| FNMA, 5.00%, 2/1/39 | 2,636,699 |
| 2,847,816 |
|
| FNMA, 4.50%, 4/1/39 | 2,261,416 |
| 2,410,004 |
|
| FNMA, 4.50%, 5/1/39 | 5,713,073 |
| 6,086,127 |
|
| FNMA, 6.50%, 5/1/39 | 1,174,642 |
| 1,347,368 |
|
| FNMA, 5.00%, 8/1/39 | 2,706,878 |
| 2,925,894 |
|
| FNMA, 4.50%, 10/1/39 | 9,861,148 |
| 10,511,159 |
|
| FNMA, 4.00%, 10/1/40 | 10,075,643 |
| 10,524,625 |
|
| FNMA, 4.50%, 11/1/40 | 8,746,592 |
| 9,291,096 |
|
| FNMA, 4.00%, 8/1/41 | 9,910,308 |
| 10,352,827 |
|
| FNMA, 4.50%, 9/1/41 | 5,365,090 |
| 5,668,408 |
|
|
| | | | | | |
| | Principal Amount | Value |
| FNMA, 3.50%, 10/1/41 | $ | 12,033,145 |
| $ | 12,296,718 |
|
| FNMA, 5.00%, 1/1/42 | 4,238,226 |
| 4,572,073 |
|
| FNMA, 3.50%, 2/1/42 | 7,452,231 |
| 7,615,312 |
|
| FNMA, 3.50%, 6/1/42 | 23,108,914 |
| 23,615,090 |
|
| FNMA, 3.50%, 8/1/42 | 2,109,517 |
| 2,155,729 |
|
| FNMA, 3.50%, 8/1/42 | 9,033,832 |
| 9,231,734 |
|
| FNMA, 3.50%, 8/1/43 | 6,968,586 |
| 7,109,745 |
|
| FNMA, 3.50%, 5/1/45 | 11,882,904 |
| 12,111,021 |
|
| FNMA, 3.50%, 11/1/45 | 15,534,209 |
| 15,800,011 |
|
| FNMA, 3.50%, 11/1/45 | 15,462,210 |
| 15,726,779 |
|
| FNMA, 4.00%, 11/1/45 | 18,256,451 |
| 18,888,920 |
|
| FNMA, 4.00%, 11/1/45 | 4,920,270 |
| 5,090,557 |
|
| FNMA, 3.50%, 2/1/46 | 17,898,992 |
| 18,240,809 |
|
| FNMA, 4.00%, 2/1/46 | 14,189,212 |
| 14,677,788 |
|
| FNMA, 3.50%, 3/1/46 | 17,260,730 |
| 17,534,654 |
|
| FNMA, 4.00%, 4/1/46 | 19,311,624 |
| 19,974,993 |
|
| FNMA, 3.50%, 5/1/46 | 16,991,061 |
| 17,284,404 |
|
| FNMA, 3.00%, 11/1/46 | 49,879,174 |
| 49,690,099 |
|
| FNMA, 3.50%, 2/1/47 | 28,171,938 |
| 28,707,270 |
|
| FNMA, 6.50%, 8/1/47 | 29,211 |
| 31,248 |
|
| FNMA, 6.50%, 9/1/47 | 1,785 |
| 1,905 |
|
| FNMA, 6.50%, 9/1/47 | 19,531 |
| 20,802 |
|
| FNMA, 6.50%, 9/1/47 | 37,153 |
| 39,562 |
|
| FNMA, 3.00%, 4/1/48 | 33,245,141 |
| 33,185,717 |
|
| FNMA, 4.00%, 6/1/48 | 34,797,738 |
| 35,899,303 |
|
| FNMA, 4.50%, 2/1/49 | 14,966,062 |
| 15,633,097 |
|
| GNMA, 3.00%, TBA | 33,000,000 |
| 33,161,133 |
|
| GNMA, 7.00%, 11/15/22 | 4,524 |
| 4,675 |
|
| GNMA, 7.00%, 4/20/26 | 1,717 |
| 1,904 |
|
| GNMA, 7.50%, 8/15/26 | 3,518 |
| 3,885 |
|
| GNMA, 8.00%, 8/15/26 | 1,523 |
| 1,646 |
|
| GNMA, 7.50%, 5/15/27 | 3,327 |
| 3,444 |
|
| GNMA, 8.00%, 6/15/27 | 8,695 |
| 8,824 |
|
| GNMA, 7.50%, 11/15/27 | 1,412 |
| 1,429 |
|
| GNMA, 7.00%, 2/15/28 | 1,990 |
| 1,992 |
|
| GNMA, 7.50%, 2/15/28 | 1,540 |
| 1,542 |
|
| GNMA, 6.50%, 3/15/28 | 4,488 |
| 4,927 |
|
| GNMA, 7.00%, 4/15/28 | 1,271 |
| 1,273 |
|
| GNMA, 6.50%, 5/15/28 | 119 |
| 131 |
|
| GNMA, 6.50%, 5/15/28 | 20,482 |
| 22,499 |
|
| GNMA, 7.00%, 12/15/28 | 2,307 |
| 2,309 |
|
| GNMA, 7.00%, 5/15/31 | 18,213 |
| 20,797 |
|
| GNMA, 4.50%, 8/15/33 | 1,028,897 |
| 1,080,701 |
|
| GNMA, 6.00%, 9/20/38 | 616,343 |
| 681,853 |
|
| GNMA, 5.50%, 11/15/38 | 1,526,643 |
| 1,654,587 |
|
| GNMA, 5.50%, 11/15/38 | 531,148 |
| 577,742 |
|
| GNMA, 6.00%, 1/20/39 | 186,812 |
| 206,188 |
|
|
| | | | | | |
| | Principal Amount | Value |
| GNMA, 5.00%, 3/20/39 | $ | 1,325,881 |
| $ | 1,418,971 |
|
| GNMA, 4.50%, 4/15/39 | 1,590,309 |
| 1,673,893 |
|
| GNMA, 4.50%, 11/15/39 | 12,240,479 |
| 12,930,917 |
|
| GNMA, 4.50%, 1/15/40 | 894,059 |
| 941,228 |
|
| GNMA, 4.00%, 7/15/40 | 1,905,992 |
| 1,981,525 |
|
| GNMA, 4.00%, 11/20/40 | 16,655,706 |
| 17,357,529 |
|
| GNMA, 4.50%, 12/15/40 | 3,957,775 |
| 4,174,028 |
|
| GNMA, 4.50%, 7/20/41 | 6,211,506 |
| 6,542,386 |
|
| GNMA, 3.50%, 6/20/42 | 6,028,838 |
| 6,189,718 |
|
| GNMA, 3.50%, 7/20/42 | 9,234,240 |
| 9,472,098 |
|
| GNMA, 2.50%, 7/20/46 | 19,696,742 |
| 19,305,192 |
|
| GNMA, 2.50%, 8/20/46 | 12,126,946 |
| 11,885,777 |
|
| GNMA, 2.50%, 2/20/47 | 12,868,912 |
| 12,612,898 |
|
| | | 702,027,979 |
|
TOTAL U.S. GOVERNMENT AGENCY MORTGAGE-BACKED SECURITIES
(Cost $759,057,663) | 757,880,315 |
|
| U.S. TREASURY SECURITIES — 21.9% | | |
U.S. Treasury Bills, 2.54%, 1/30/20(5) | 15,000,000 |
| 14,705,246 |
|
U.S. Treasury Bills, 2.52%, 2/27/20(5) | 80,000,000 |
| 78,286,757 |
|
| U.S. Treasury Bonds, 4.375%, 11/15/39 | 4,550,000 |
| 5,794,141 |
|
| U.S. Treasury Bonds, 4.625%, 2/15/40 | 6,950,000 |
| 9,144,272 |
|
| U.S. Treasury Bonds, 4.375%, 5/15/41 | 6,500,000 |
| 8,308,701 |
|
| U.S. Treasury Bonds, 3.125%, 11/15/41 | 21,000,000 |
| 22,392,891 |
|
| U.S. Treasury Bonds, 3.125%, 2/15/42 | 25,000,000 |
| 26,633,301 |
|
| U.S. Treasury Bonds, 3.00%, 5/15/42 | 25,000,000 |
| 26,070,801 |
|
| U.S. Treasury Bonds, 2.75%, 11/15/42 | 9,500,000 |
| 9,476,064 |
|
| U.S. Treasury Bonds, 2.875%, 5/15/43 | 8,500,000 |
| 8,651,406 |
|
| U.S. Treasury Bonds, 2.50%, 2/15/45 | 22,000,000 |
| 20,809,336 |
|
| U.S. Treasury Bonds, 3.00%, 5/15/45 | 9,000,000 |
| 9,359,473 |
|
| U.S. Treasury Bonds, 3.00%, 11/15/45 | 2,300,000 |
| 2,393,078 |
|
| U.S. Treasury Bonds, 3.375%, 11/15/48 | 45,000,000 |
| 50,207,520 |
|
U.S. Treasury Notes, 1.50%, 5/31/20(3) | 15,000,000 |
| 14,848,535 |
|
| U.S. Treasury Notes, 2.25%, 2/15/21 | 40,000,000 |
| 39,969,531 |
|
| U.S. Treasury Notes, 2.625%, 5/15/21 | 20,000,000 |
| 20,146,875 |
|
U.S. Treasury Notes, 1.125%, 8/31/21(3) | 16,000,000 |
| 15,580,625 |
|
| U.S. Treasury Notes, 2.75%, 9/15/21 | 70,000,000 |
| 70,849,024 |
|
| U.S. Treasury Notes, 2.625%, 12/15/21 | 40,000,000 |
| 40,419,531 |
|
| U.S. Treasury Notes, 1.875%, 1/31/22 | 55,000,000 |
| 54,469,336 |
|
| U.S. Treasury Notes, 2.375%, 3/15/22 | 45,600,000 |
| 45,818,203 |
|
| U.S. Treasury Notes, 2.00%, 11/30/22 | 30,000,000 |
| 29,770,313 |
|
| U.S. Treasury Notes, 2.375%, 2/29/24 | 18,000,000 |
| 18,129,375 |
|
| U.S. Treasury Notes, 2.125%, 11/30/24 | 15,000,000 |
| 14,884,277 |
|
| U.S. Treasury Notes, 3.125%, 11/15/28 | 49,000,000 |
| 52,038,574 |
|
TOTAL U.S. TREASURY SECURITIES
(Cost $689,024,941) | | 709,157,186 |
|
| ASSET-BACKED SECURITIES — 8.0% | | |
| Argent Securities, Inc., Series 2004-W8, Class M1, VRN, 3.31%, (1-month LIBOR plus 0.83%), 5/25/34 | 9,491,513 |
| 9,482,126 |
|
|
| | | | | | |
| | Principal Amount | Value |
BRE Grand Islander Timeshare Issuer LLC, Series 2017-1A, Class A SEQ, 2.94%, 5/25/29(1) | $ | 6,356,086 |
| $ | 6,309,120 |
|
Colony Starwood Homes, Series 2016-2A, Class A, VRN, 3.73%, (1-month LIBOR plus 1.25%), 12/17/33(1) | 6,951,378 |
| 6,957,708 |
|
Goodgreen, Series 2018-1A, Class A, VRN, 3.93%, 10/15/53(1) | 12,786,431 |
| 13,082,145 |
|
Hilton Grand Vacations Trust, Series 2013-A, Class A SEQ, 2.28%, 1/25/26(1) | 720,771 |
| 718,964 |
|
Hilton Grand Vacations Trust, Series 2014-AA, Class A SEQ, 1.77%, 11/25/26(1) | 2,512,881 |
| 2,487,914 |
|
Invitation Homes Trust, Series 2017-SFR2, Class A, VRN, 3.33%, (1-month LIBOR plus 0.85%), 12/17/36(1) | 22,768,482 |
| 22,703,844 |
|
Invitation Homes Trust, Series 2018-SFR1, Class A, VRN, 3.18%, (1-month LIBOR plus 0.70%), 3/17/37(1) | 30,764,029 |
| 30,398,322 |
|
Invitation Homes Trust, Series 2018-SFR2, Class B, VRN, 3.56%, (1-month LIBOR plus 1.08%), 6/17/37(1) | 21,275,000 |
| 21,143,916 |
|
Invitation Homes Trust, Series 2018-SFR3, Class A, VRN, 3.48%, (1-month LIBOR plus 1.00%), 7/17/37(1) | 27,176,528 |
| 27,171,137 |
|
MVW Owner Trust, Series 2013-1A, Class A SEQ, 2.15%, 4/22/30(1) | 2,007,248 |
| 1,992,160 |
|
MVW Owner Trust, Series 2014-1A, Class A SEQ, 2.25%, 9/22/31(1) | 3,493,281 |
| 3,454,602 |
|
MVW Owner Trust, Series 2015-1A, Class A SEQ, 2.52%, 12/20/32(1) | 2,474,165 |
| 2,449,413 |
|
MVW Owner Trust, Series 2016-1A, Class A SEQ, 2.25%, 12/20/33(1) | 4,359,960 |
| 4,286,244 |
|
MVW Owner Trust, Series 2017-1A, Class A SEQ, 2.42%, 12/20/34(1) | 12,387,188 |
| 12,160,442 |
|
MVW Owner Trust, Series 2018-1A, Class A SEQ, 3.45%, 1/21/36(1) | 13,300,201 |
| 13,499,835 |
|
Progress Residential Trust, Series 2016-SFR2, Class A SEQ, VRN, 3.88%, (1-month LIBOR plus 1.40%), 1/17/34(1) | 8,301,812 |
| 8,327,894 |
|
Progress Residential Trust, Series 2018-SFR1, Class A SEQ, 3.26%, 3/17/35(1) | 11,975,000 |
| 11,995,621 |
|
Progress Residential Trust, Series 2018-SFR3, Class A SEQ, 3.88%, 10/17/35(1) | 10,000,000 |
| 10,295,410 |
|
Sierra Timeshare Conduit Receivables Funding LLC, Series 2017-1A, Class A SEQ, 2.91%, 3/20/34(1) | 5,470,235 |
| 5,431,535 |
|
Sierra Timeshare Receivables Funding LLC, Series 2015-1A, Class A SEQ, 2.40%, 3/22/32(1) | 1,487,494 |
| 1,481,239 |
|
Sierra Timeshare Receivables Funding LLC, Series 2016-1A, Class A SEQ, 3.08%, 3/21/33(1) | 3,796,812 |
| 3,791,598 |
|
Towd Point Mortgage Trust, Series 2016-1, Class A1, VRN, 3.50%, 2/25/55(1) | 4,013,450 |
| 4,031,692 |
|
Towd Point Mortgage Trust, Series 2017-2, Class A1, VRN, 2.75%, 4/25/57(1) | 3,221,248 |
| 3,192,491 |
|
Towd Point Mortgage Trust, Series 2018-4, Class A1, VRN, 3.00%, 6/25/58(1) | 3,678,844 |
| 3,648,752 |
|
| US Airways Pass-Through Trust, Series 2013-1, Class A, 3.95%, 5/15/27 | 2,355,463 |
| 2,391,914 |
|
VSE VOI Mortgage LLC, Series 2016-A, Class A SEQ, 2.54%, 7/20/33(1) | 8,218,560 |
| 8,131,355 |
|
VSE VOI Mortgage LLC, Series 2017-A, Class A SEQ, 2.33%, 3/20/35(1) | 7,623,266 |
| 7,492,543 |
|
VSE VOI Mortgage LLC, Series 2018-A, Class B, 3.72%, 2/20/36(1) | 10,759,065 |
| 10,915,887 |
|
TOTAL ASSET-BACKED SECURITIES
(Cost $259,615,953) | | 259,425,823 |
|
| | | |
| | | |
| | | |
|
| | | | | | |
| | Principal Amount | Value |
| COLLATERALIZED MORTGAGE OBLIGATIONS — 5.3% | | |
| Private Sponsor Collateralized Mortgage Obligations — 4.6% | | |
| Adjustable Rate Mortgage Trust, Series 2004-4, Class 4A1, VRN, 4.33%, 3/25/35 | $ | 1,994,139 |
| $ | 2,020,841 |
|
Agate Bay Mortgage Loan Trust, Series 2016-2, Class A3, VRN, 3.50%, 3/25/46(1) | 6,621,532 |
| 6,617,414 |
|
Agate Bay Mortgage Trust, Series 2016-3, Class A3, VRN, 3.50%, 8/25/46(1) | 6,940,512 |
| 6,966,560 |
|
| Banc of America Mortgage Trust, Series 2004-E, Class 2A6 SEQ, VRN, 4.39%, 6/25/34 | 1,262,073 |
| 1,263,843 |
|
| Bear Stearns Adjustable Rate Mortgage Trust, Series 2004-12, Class 2A1, VRN, 4.34%, 2/25/35 | 1,726,289 |
| 1,748,232 |
|
| Bear Stearns Adjustable Rate Mortgage Trust, Series 2004-8, Class 2A1, VRN, 4.23%, 11/25/34 | 1,687,302 |
| 1,648,800 |
|
| Citicorp Mortgage Securities Trust, Series 2007-8, Class 1A3, 6.00%, 9/25/37 | 766,091 |
| 806,144 |
|
| Citigroup Mortgage Loan Trust, Inc., Series 2004-UST1, Class A4, VRN, 4.45%, 8/25/34 | 1,868,493 |
| 1,827,836 |
|
| Citigroup Mortgage Loan Trust, Inc., Series 2004-UST1, Class A5, VRN, 4.43%, 8/25/34 | 5,332,747 |
| 5,315,665 |
|
| Citigroup Mortgage Loan Trust, Inc., Series 2005-4, Class A, VRN, 4.48%, 8/25/35 | 689,235 |
| 699,631 |
|
| Countrywide Home Loan Mortgage Pass-Through Trust, Series 2004-4, Class A19, 5.25%, 5/25/34 | 1,257,258 |
| 1,281,170 |
|
| Countrywide Home Loan Mortgage Pass-Through Trust, Series 2004-5, Class 2A4, 5.50%, 5/25/34 | 527,665 |
| 534,553 |
|
| Countrywide Home Loan Mortgage Pass-Through Trust, Series 2005-17, Class 1A11, 5.50%, 9/25/35 | 62,035 |
| 60,448 |
|
| Credit Suisse First Boston Mortgage-Backed Trust, Series 2004-AR6, Class 2A1, VRN, 4.21%, 10/25/34 | 380,407 |
| 382,309 |
|
| First Horizon Alternative Mortgage Securities Trust, Series 2004-AA4, Class A1, VRN, 4.37%, 10/25/34 | 3,675,237 |
| 3,652,540 |
|
| First Horizon Mortgage Pass-Through Trust, Series 2005-AR3, Class 4A1, VRN, 4.39%, 8/25/35 | 1,257,046 |
| 1,267,907 |
|
| GSR Mortgage Loan Trust, Series 2004-7, Class 3A1, VRN, 3.84%, 6/25/34 | 1,065,498 |
| 1,057,141 |
|
| GSR Mortgage Loan Trust, Series 2004-AR5, Class 3A3, VRN, 4.44%, 5/25/34 | 1,858,790 |
| 1,905,602 |
|
| GSR Mortgage Loan Trust, Series 2005-AR1, Class 3A1, VRN, 4.02%, 1/25/35 | 2,301,568 |
| 2,281,692 |
|
| GSR Mortgage Loan Trust, Series 2005-AR6, Class 2A1, VRN, 4.52%, 9/25/35 | 4,483,158 |
| 4,584,991 |
|
| GSR Mortgage Loan Trust, Series 2005-AR6, Class 3A1, VRN, 4.39%, 9/25/35 | 3,661,475 |
| 3,712,543 |
|
| GSR Mortgage Loan Trust, Series 2005-AR6, Class 4A5, VRN, 4.41%, 9/25/35 | 1,503,370 |
| 1,524,016 |
|
| JPMorgan Mortgage Trust, Series 2005-A4, Class 1A1, VRN, 4.33%, 7/25/35 | 759,144 |
| 765,208 |
|
| JPMorgan Mortgage Trust, Series 2005-A4, Class 2A1, VRN, 4.13%, 7/25/35 | 1,645,694 |
| 1,646,842 |
|
| JPMorgan Mortgage Trust, Series 2005-A6, Class 7A1, VRN, 4.32%, 8/25/35 | 1,652,753 |
| 1,604,518 |
|
| JPMorgan Mortgage Trust, Series 2006-A3, Class 7A1, VRN, 4.69%, 4/25/35 | 1,140,244 |
| 1,158,964 |
|
JPMorgan Mortgage Trust, Series 2013-1, Class 2A2 SEQ, VRN, 2.50%, 3/25/43(1) | 1,418,390 |
| 1,397,522 |
|
|
| | | | | | |
| | Principal Amount | Value |
JPMorgan Mortgage Trust, Series 2018-6, Class 1A4 SEQ, VRN, 3.50%, 12/25/48(1) | $ | 6,250,482 |
| $ | 6,284,513 |
|
| MASTR Adjustable Rate Mortgages Trust, Series 2004-13, Class 3A7, VRN, 4.47%, 11/21/34 | 882,745 |
| 911,149 |
|
| Merrill Lynch Mortgage Investors Trust, Series 2005-3, Class 2A, VRN, 4.36%, 11/25/35 | 2,066,042 |
| 2,057,001 |
|
| Merrill Lynch Mortgage Investors Trust, Series 2005-A2, Class A1, VRN, 4.45%, 2/25/35 | 1,874,356 |
| 1,904,284 |
|
| Merrill Lynch Mortgage Investors Trust, Series 2005-A2, Class A2, VRN, 4.45%, 2/25/35 | 937,178 |
| 971,635 |
|
New Residential Mortgage Loan Trust, Series 2017-1A, Class A1, VRN, 4.00%, 2/25/57(1) | 4,282,960 |
| 4,374,950 |
|
New Residential Mortgage Loan Trust, Series 2017-2A, Class A3, VRN, 4.00%, 3/25/57(1) | 4,157,391 |
| 4,266,538 |
|
New Residential Mortgage Loan Trust, Series 2017-5A, Class A1, VRN, 3.99%, (1-month LIBOR plus 1.50%), 6/25/57(1) | 4,145,473 |
| 4,221,070 |
|
Sequoia Mortgage Trust, Series 2017-CH1, Class A1, VRN, 4.00%, 8/25/47(1) | 8,901,648 |
| 9,072,029 |
|
Sequoia Mortgage Trust, Series 2017-CH2, Class A10 SEQ, VRN, 4.00%, 12/25/47(1) | 6,881,275 |
| 6,962,712 |
|
Sequoia Mortgage Trust, Series 2018-7, Class A4, VRN, 4.00%, 9/25/48(1) | 4,595,513 |
| 4,688,844 |
|
Sequoia Mortgage Trust, Series 2018-CH2, Class A12 SEQ, VRN, 4.00%, 6/25/48(1) | 3,615,493 |
| 3,671,885 |
|
Sofi Mortgage Trust, Series 2016-1A, Class 1A4 SEQ, VRN, 3.00%, 11/25/46(1) | 4,403,313 |
| 4,303,934 |
|
| Structured Adjustable Rate Mortgage Loan Trust, Series 2004-8, Class 2A1, VRN, 4.47%, 7/25/34 | 2,444,092 |
| 2,463,067 |
|
| Thornburg Mortgage Securities Trust, Series 2004-3, Class A, VRN, 3.23%, (1-month LIBOR plus 0.74%), 9/25/44 | 4,212,129 |
| 4,159,899 |
|
| WaMu Mortgage Pass-Through Certificates, Series 2003-S11, Class 3A5, 5.95%, 11/25/33 | 449,640 |
| 450,926 |
|
| WaMu Mortgage Pass-Through Certificates, Series 2005-AR3, Class A1, VRN, 4.47%, 3/25/35 | 2,494,268 |
| 2,462,689 |
|
| Wells Fargo Mortgage-Backed Securities Trust, Series 2004-A, Class A1, VRN, 5.01%, 2/25/34 | 495,148 |
| 515,911 |
|
| Wells Fargo Mortgage-Backed Securities Trust, Series 2004-DD, Class 2A6, VRN, 5.01%, 1/25/35 | 1,101,744 |
| 1,143,352 |
|
| Wells Fargo Mortgage-Backed Securities Trust, Series 2004-H, Class A1, VRN, 4.44%, 6/25/34 | 2,237,362 |
| 2,296,265 |
|
| Wells Fargo Mortgage-Backed Securities Trust, Series 2004-S, Class A1, VRN, 4.62%, 9/25/34 | 1,345,276 |
| 1,385,588 |
|
| Wells Fargo Mortgage-Backed Securities Trust, Series 2004-Z, Class 2A2, VRN, 4.98%, 12/25/34 | 1,903,515 |
| 1,947,164 |
|
| Wells Fargo Mortgage-Backed Securities Trust, Series 2005-9, Class 1A11, 5.50%, 10/25/35 | 1,080,069 |
| 1,094,396 |
|
| Wells Fargo Mortgage-Backed Securities Trust, Series 2005-9, Class 2A6, 5.25%, 10/25/35 | 1,003,953 |
| 1,027,755 |
|
| Wells Fargo Mortgage-Backed Securities Trust, Series 2005-AR10, Class 1A1, VRN, 4.73%, 6/25/35 | 2,270,989 |
| 2,405,985 |
|
| Wells Fargo Mortgage-Backed Securities Trust, Series 2005-AR12, Class 2A6, VRN, 4.88%, 6/25/35 | 1,403,208 |
| 1,445,816 |
|
| Wells Fargo Mortgage-Backed Securities Trust, Series 2005-AR13, Class A1, SEQ, VRN, 2.79%, (1-month LIBOR plus 0.30%), 5/25/35 | 3,689,764 |
| 3,533,072 |
|
| Wells Fargo Mortgage-Backed Securities Trust, Series 2005-AR7, Class 1A1, VRN, 4.44%, 5/25/35 | 1,122,112 |
| 1,155,171 |
|
| Wells Fargo Mortgage-Backed Securities Trust, Series 2006-10, Class A4 SEQ, 6.00%, 8/25/36 | 1,616,465 |
| 1,608,857 |
|
|
| | | | | | |
| | Principal Amount | Value |
| Wells Fargo Mortgage-Backed Securities Trust, Series 2006-13, Class A5, 6.00%, 10/25/36 | $ | 1,543,080 |
| $ | 1,526,577 |
|
| Wells Fargo Mortgage-Backed Securities Trust, Series 2006-9, Class 1A9 SEQ, 6.00%, 8/25/36 | 623,089 |
| 616,414 |
|
| Wells Fargo Mortgage-Backed Securities Trust, Series 2006-AR15, Class A1, VRN, 4.73%, 10/25/36 | 483,628 |
| 478,894 |
|
| Wells Fargo Mortgage-Backed Securities Trust, Series 2007-13, Class A1, 6.00%, 9/25/37 | 655,614 |
| 653,637 |
|
| Wells Fargo Mortgage-Backed Securities Trust, Series 2007-14, Class 2A2, 5.50%, 10/25/22 | 394,489 |
| 401,101 |
|
| Wells Fargo Mortgage-Backed Securities Trust, Series 2007-16, Class 1A1, 6.00%, 12/28/37 | 437,109 |
| 434,798 |
|
| Wells Fargo Mortgage-Backed Securities Trust, Series 2007-AR10, Class 1A1, VRN, 4.91%, 1/25/38 | 1,228,618 |
| 1,185,346 |
|
| Wells Fargo Mortgage-Backed Securities Trust, Series 2008-1, Class 4A1, 5.75%, 2/25/38 | 1,155,550 |
| 1,217,442 |
|
| | | 147,033,598 |
|
| U.S. Government Agency Collateralized Mortgage Obligations — 0.7% |
| FHLMC, Series 3397, Class GF, VRN, 2.98%, (1-month LIBOR plus 0.50%), 12/15/37 | 946,955 |
| 948,944 |
|
| FNMA, Series 1989-35, Class G SEQ, 9.50%, 7/25/19 | 35 |
| 35 |
|
| FNMA, Series 2014-C02, Class 1M2, VRN, 5.09%, (1-month LIBOR plus 2.60%), 5/25/24 | 5,535,000 |
| 5,807,466 |
|
| FNMA, Series 2014-C02, Class 2M2, VRN, 5.09%, (1-month LIBOR plus 2.60%), 5/25/24 | 6,759,766 |
| 7,021,668 |
|
| FNMA, Series 2016-C04, Class 1M1, VRN, 3.94%, (1-month LIBOR plus 1.45%), 1/25/29 | 2,595,668 |
| 2,605,926 |
|
| FNMA, Series 2016-C05, Class 2M1, VRN, 3.84%, (1-month LIBOR plus 1.35%), 1/25/29 | 601,048 |
| 601,620 |
|
| FNMA, Series 2017-C03, Class 1M1, VRN, 3.44%, (1-month LIBOR plus 0.95%), 10/25/29 | 1,802,838 |
| 1,806,642 |
|
| FNMA, Series 2018-C02, Class 2M1, VRN, 3.14%, (1-month LIBOR plus 0.65%), 8/25/30 | 2,421,718 |
| 2,421,183 |
|
| GNMA, Series 2007-5, Class FA, VRN, 2.63%, (1-month LIBOR plus 0.14%), 2/20/37 | 1,910,091 |
| 1,899,523 |
|
| | | 23,113,007 |
|
TOTAL COLLATERALIZED MORTGAGE OBLIGATIONS
(Cost $168,643,533) | | 170,146,605 |
|
| COMMERCIAL MORTGAGE-BACKED SECURITIES — 4.4% | | |
Bank of America Merrill Lynch Commercial Mortgage Securities Trust, Series 2015-200P, Class B, 3.49%, 4/14/33(1) | 8,525,000 |
| 8,615,010 |
|
BX Trust, Series 2018-MCSF, Class A, VRN, 3.06%, (1-month LIBOR plus 0.58%), 4/15/35(1) | 11,600,000 |
| 11,437,797 |
|
| Commercial Mortgage Pass-Through Certificates, Series 2014-CR15, Class AM, VRN, 4.43%, 2/10/47 | 10,691,000 |
| 11,302,087 |
|
| Commercial Mortgage Pass-Through Certificates, Series 2014-LC17, Class AM, VRN, 4.19%, 10/10/47 | 10,000,000 |
| 10,469,253 |
|
| Commercial Mortgage Pass-Through Certificates, Series 2014-UBS5, Class AM, VRN, 4.19%, 9/10/47 | 14,000,000 |
| 14,632,260 |
|
| Commercial Mortgage Pass-Through Certificates, Series 2015-CR22, Class AM, VRN, 3.60%, 3/10/48 | 15,000,000 |
| 15,110,679 |
|
| Commercial Mortgage Pass-Through Certificates, Series 2016-CR28, Class B, VRN, 4.65%, 2/10/49 | 5,000,000 |
| 5,345,415 |
|
| GS Mortgage Securities Trust, Series 2015-GC28, Class AS, 3.76%, 2/10/48 | 9,000,000 |
| 9,232,861 |
|
|
| | | | | | |
| | Principal Amount | Value |
| JPMBB Commercial Mortgage Securities Trust, Series 2014-C21, Class B, VRN, 4.34%, 8/15/47 | $ | 10,000,000 |
| $ | 10,338,284 |
|
| JPMDB Commercial Mortgage Securities Trust, Series 2017-C5, Class A4 SEQ, 3.41%, 3/15/50 | 10,000,000 |
| 10,210,064 |
|
| JPMorgan Chase Commercial Mortgage Securities Trust, Series 2016-JP3, Class AS, 3.14%, 8/15/49 | 10,000,000 |
| 9,851,472 |
|
| Morgan Stanley Bank of America Merrill Lynch Trust, Series 2017-C34, Class A3 SEQ, 3.28%, 11/15/52 | 12,500,000 |
| 12,584,370 |
|
| UBS Commercial Mortgage Trust, Series 2017-C1, Class A3 SEQ, 3.20%, 6/15/50 | 13,170,000 |
| 13,197,388 |
|
TOTAL COMMERCIAL MORTGAGE-BACKED SECURITIES
(Cost $141,961,152) | | 142,326,940 |
|
| COLLATERALIZED LOAN OBLIGATIONS — 4.1% | | |
ARES LI CLO Ltd., Series 2019-51A, Class B, VRN, 4.35%, (3-month LIBOR plus 1.85%), 4/15/31(1) | 9,800,000 |
| 9,810,506 |
|
Bean Creek CLO Ltd., Series 2015-1A, Class AR, VRN, 3.78%, (3-month LIBOR plus 1.02%), 4/20/31(1) | 8,200,000 |
| 8,094,687 |
|
Carlyle Global Market Strategies CLO Ltd., Series 2014-5A, Class A1RR, VRN, 3.93%, (3-month LIBOR plus 1.14%), 7/15/31(1) | 7,500,000 |
| 7,434,724 |
|
CBAM 2019-9 Ltd., Series 2019-9A, Class A, VRN, 4.01%, (3-month LIBOR plus 1.28%), 2/12/30(1) | 13,000,000 |
| 12,990,132 |
|
CBAM 2019-9 Ltd., Series 2019-9A, Class B1, VRN, 4.63%, (3-month LIBOR plus 1.90%), 2/12/30(1) | 7,500,000 |
| 7,500,418 |
|
CBAM Ltd., Series 2018-5A, Class A, VRN, 3.79%, (3-month LIBOR plus 1.02%), 4/17/31(1) | 7,575,000 |
| 7,450,452 |
|
CIFC Funding 2019-I Ltd., Series 2019-1A, Class B, VRN, 4.43%, (3-month LIBOR plus 1.80%), 4/20/32(1) | 12,325,000 |
| 12,316,077 |
|
| CIFC Funding Ltd., Series 2013-3RA, Class A1, VRN, 3.76%, (3-month LIBOR plus 0.98%), 4/24/31 | 5,000,000 |
| 4,919,176 |
|
Dryden 71 CLO Ltd., Series 2018-71A, Class B, VRN, 4.59%, (3-month LIBOR plus 1.90%), 1/15/29(1) | 7,525,000 |
| 7,537,032 |
|
Goldentree Loan Opportunities X Ltd., Series 2015-10A, Class AR, VRN, 3.88%, (3-month LIBOR plus 1.12%), 7/20/31(1) | 6,550,000 |
| 6,496,987 |
|
KKR CLO Ltd., Series 11, Class AR, VRN, 3.97%, (3-month LIBOR plus 1.18%), 1/15/31(1) | 5,650,000 |
| 5,607,483 |
|
KKR CLO Ltd., Series 22A, Class A, VRN, 3.91%, (3-month LIBOR plus 1.15%), 7/20/31(1) | 7,175,000 |
| 7,121,640 |
|
LoanCore Issuer Ltd., Series 2018-CRE1, Class AS, VRN, 3.98%, (1-month LIBOR plus 1.50%), 5/15/28(1) | 5,000,000 |
| 5,006,235 |
|
Madison Park Funding XIII Ltd., Series 2014-13A, Class AR2, VRN, 3.71%, (3-month LIBOR plus 0.95%), 4/19/30(1) | 7,150,000 |
| 7,096,736 |
|
Magnetite VIII Ltd., Series 2014-8A, Class AR2, VRN, 3.77%, (3-month LIBOR plus 0.98%), 4/15/31(1) | 4,555,000 |
| 4,503,708 |
|
Sounds Point CLO IV-R Ltd., Series 2013-3RA, Class A, VRN, 3.93%, (3-month LIBOR plus 1.15%), 4/18/31(1) | 7,500,000 |
| 7,428,104 |
|
Treman Park CLO Ltd., Series 2015-1A, Class ARR, VRN, 3.83%, (3-month LIBOR plus 1.07%), 10/20/28(1) | 4,250,000 |
| 4,244,232 |
|
Voya CLO Ltd., Series 2013-2A, Class A1R, VRN, 3.74%, (3-month LIBOR plus 0.97%), 4/25/31(1) | 4,420,000 |
| 4,346,796 |
|
Voya CLO Ltd., Series 2013-3A, Class A1RR, VRN, 3.93%, (3-month LIBOR plus 1.15%), 10/18/31(1) | 4,400,000 |
| 4,361,776 |
|
TOTAL COLLATERALIZED LOAN OBLIGATIONS
(Cost $135,043,740) | | 134,266,901 |
|
| MUNICIPAL SECURITIES — 1.6% | | |
| Bay Area Toll Authority Rev., 6.92%, 4/1/40 | 2,189,000 |
| 3,047,176 |
|
| Houston GO, 3.96%, 3/1/47 | 1,615,000 |
| 1,660,656 |
|
|
| | | | | | |
| | Principal Amount | Value |
| Los Angeles Community College District GO, 6.75%, 8/1/49 | $ | 1,000,000 |
| $ | 1,513,860 |
|
| Metropolitan Transportation Authority Rev., 6.69%, 11/15/40 | 1,235,000 |
| 1,669,362 |
|
| Metropolitan Transportation Authority Rev., 6.81%, 11/15/40 | 1,070,000 |
| 1,460,871 |
|
| New Jersey Turnpike Authority Rev., 7.41%, 1/1/40 | 1,180,000 |
| 1,774,519 |
|
| Ohio Water Development Authority Water Pollution Control Loan Fund Rev., 4.88%, 12/1/34 | 2,330,000 |
| 2,650,794 |
|
| Pennsylvania Turnpike Commission Rev., 5.56%, 12/1/49 | 1,385,000 |
| 1,795,860 |
|
| Port Authority of New York & New Jersey Rev., 4.93%, 10/1/51 | 1,750,000 |
| 2,115,313 |
|
| Rutgers The State University of New Jersey Rev., 5.67%, 5/1/40 | 2,715,000 |
| 3,371,188 |
|
| Sacramento Municipal Utility District Rev., 6.16%, 5/15/36 | 2,385,000 |
| 3,071,665 |
|
| San Antonio Electric & Gas Systems Rev., 5.99%, 2/1/39 | 1,000,000 |
| 1,335,960 |
|
| San Diego County Regional Airport Authority Rev., 5.59%, 7/1/43 | 1,000,000 |
| 1,103,610 |
|
| San Francisco Public Utilities Commission Water Rev., 6.00%, 11/1/40 | 2,375,000 |
| 3,002,950 |
|
| San Jose Redevelopment Agency Successor Agency Tax Allocation, 3.375%, 8/1/34 | 1,145,000 |
| 1,145,126 |
|
| Santa Clara Valley Transportation Authority Rev., 5.88%, 4/1/32 | 2,990,000 |
| 3,584,412 |
|
| State of California GO, 6.65%, 3/1/22 | 1,660,000 |
| 1,827,278 |
|
| State of California GO, 4.60%, 4/1/38 | 1,000,000 |
| 1,066,140 |
|
| State of California GO, 7.55%, 4/1/39 | 2,000,000 |
| 3,041,140 |
|
| State of California GO, 7.30%, 10/1/39 | 2,005,000 |
| 2,904,583 |
|
| State of Illinois GO, 5.10%, 6/1/33 | 3,462,000 |
| 3,404,566 |
|
| State of Kansas Department of Transportation Rev., 4.60%, 9/1/35 | 1,665,000 |
| 1,873,741 |
|
| University of California Rev., 5.95%, 5/15/45 | 1,630,000 |
| 2,121,706 |
|
TOTAL MUNICIPAL SECURITIES
(Cost $42,169,189) | | 50,542,476 |
|
BANK LOAN OBLIGATIONS(4) — 1.2% | | |
| Diversified Telecommunication Services — 0.3% | | |
| Level 3 Financing Inc., 2017 Term Loan B, 4.74%, (3-month LIBOR plus 2.25%), 2/22/24 | 3,940,000 |
| 3,899,359 |
|
| Zayo Group, LLC, 2017 Incremental Term Loan, 4.75%, (1-month LIBOR plus 2.25%), 1/19/24 | 4,600,000 |
| 4,581,140 |
|
| | | 8,480,499 |
|
| Food Products — 0.1% | | |
| Post Holdings Inc., 2017 Series A Incremental Term Loan, 4.49%, (1-month LIBOR plus 2.00%), 5/24/24 | 824,197 |
| 818,341 |
|
| Post Holdings Inc., 2017 Series A Incremental Term Loan, 4.49%, (1-month LIBOR plus 2.00%), 5/24/24 | 2,662,994 |
| 2,644,073 |
|
| | | 3,462,414 |
|
| Health Care Providers and Services — 0.3% | | |
| DaVita, Inc., Term Loan B, 5.25%, (1-month LIBOR plus 2.75%), 6/24/21 | 4,476,501 |
| 4,480,016 |
|
| HCA Inc., 2018 Term Loan B10, 4.50%, (1-month LIBOR plus 2.00%), 3/13/25 | 5,487,031 |
| 5,487,497 |
|
| | | 9,967,513 |
|
| Hotels, Restaurants and Leisure — 0.3% | | |
| Hilton Worldwide Finance, LLC, Term Loan B2, 4.24%, (1-month LIBOR plus 1.75%), 10/25/23 | 4,373,522 |
| 4,368,405 |
|
| MGM Growth Properties Operating Partnership LP, 2016 Term Loan B, 4.50%, (1-month LIBOR plus 2.00%), 3/21/25 | 5,123,784 |
| 5,062,043 |
|
| | | 9,430,448 |
|
| | | |
|
| | | | | | |
| | Principal Amount | Value |
| Media — 0.1% | | |
| Charter Communications Operating, LLC, 2017 Term Loan B, 4.50%, (1-month LIBOR plus 2.00%), 4/30/25 | $ | 3,979,849 |
| $ | 3,958,218 |
|
| Technology Hardware, Storage and Peripherals — 0.1% | | |
| Dell International LLC, 2017 Term Loan B, 4.50%, (1-month LIBOR plus 2.00%), 9/7/23 | 1,615,608 |
| 1,599,323 |
|
| Western Digital Corporation, 2018 Term Loan B4, 4.25%, (1-month LIBOR plus 1.75%), 4/29/23 | 3,084,386 |
| 3,008,556 |
|
| | | 4,607,879 |
|
TOTAL BANK LOAN OBLIGATIONS
(Cost $40,293,144) | | 39,906,971 |
|
| SOVEREIGN GOVERNMENTS AND AGENCIES — 0.7% | | |
| Chile — 0.1% | | |
| Chile Government International Bond, 3.25%, 9/14/21 | 1,180,000 |
| 1,201,535 |
|
| Chile Government International Bond, 3.625%, 10/30/42 | 1,200,000 |
| 1,200,540 |
|
| | | 2,402,075 |
|
| Colombia — 0.1% | | |
| Colombia Government International Bond, 4.375%, 7/12/21 | 1,810,000 |
| 1,862,943 |
|
| Colombia Government International Bond, 6.125%, 1/18/41 | 1,200,000 |
| 1,420,812 |
|
| | | 3,283,755 |
|
| Panama — 0.1% | | |
| Panama Government International Bond, 6.70%, 1/26/36 | 1,700,000 |
| 2,227,000 |
|
| Peru — 0.1% | | |
| Peruvian Government International Bond, 6.55%, 3/14/37 | 680,000 |
| 918,850 |
|
| Peruvian Government International Bond, 5.625%, 11/18/50 | 1,640,000 |
| 2,108,220 |
|
| | | 3,027,070 |
|
| Philippines — 0.1% | | |
| Philippine Government International Bond, 4.00%, 1/15/21 | 3,170,000 |
| 3,237,283 |
|
| Philippine Government International Bond, 6.375%, 10/23/34 | 1,840,000 |
| 2,457,340 |
|
| | | 5,694,623 |
|
| Poland — 0.1% | | |
| Republic of Poland Government International Bond, 3.00%, 3/17/23 | 1,290,000 |
| 1,299,778 |
|
| Republic of Poland Government International Bond, 5.125%, 4/21/21 | 1,400,000 |
| 1,468,936 |
|
| | | 2,768,714 |
|
| Uruguay — 0.1% | | |
| Uruguay Government International Bond, 4.375%, 10/27/27 | 980,000 |
| 1,035,493 |
|
| Uruguay Government International Bond, 4.125%, 11/20/45 | 1,030,000 |
| 1,009,400 |
|
| | | 2,044,893 |
|
TOTAL SOVEREIGN GOVERNMENTS AND AGENCIES
(Cost $20,225,886) | | 21,448,130 |
|
| U.S. GOVERNMENT AGENCY SECURITIES — 0.4% | | |
FNMA, 6.625%, 11/15/30
(Cost $11,074,686) | 8,900,000 |
| 12,281,197 |
|
| TEMPORARY CASH INVESTMENTS — 1.3% | | |
Bennington Stark Capital Co. LLC, 2.55%, 4/1/19 (LOC: Societe Generale SA)(1)(5) | 26,452,000 |
| 26,446,489 |
|
| | | |
| | | |
| | | |
|
| | | | | | |
| | Principal Amount | Value |
Societe Generale SA, 2.50%, 4/1/19(1)(5) | $ | 15,000,000 |
| $ | 14,996,992 |
|
| Repurchase Agreement, BMO Capital Markets Corp., (collateralized by various U.S. Treasury obligations, 0.125% - 2.875%, 9/30/19 - 2/15/44, valued at $541,704), in a joint trading account at 2.35%, dated 3/29/19, due 4/1/19 (Delivery value $530,987) | | 530,883 |
|
TOTAL TEMPORARY CASH INVESTMENTS
(Cost $41,982,883) | | 41,974,364 |
|
TOTAL INVESTMENT SECURITIES — 100.6%
(Cost $3,212,493,447) | | 3,255,004,652 |
|
| OTHER ASSETS AND LIABILITIES — (0.6)% | | (20,715,565 | ) |
| TOTAL NET ASSETS — 100.0% | | $ | 3,234,289,087 |
|
|
| | | | | | | | | | | | |
| FUTURES CONTRACTS PURCHASED |
| Reference Entity | Contracts | Expiration Date | Notional Amount | Underlying Contract Value | Unrealized Appreciation (Depreciation) |
| U.S. Treasury 10-Year Notes | 647 |
| June 2019 | $ | 64,700,000 |
| $ | 80,369,531 |
| $ | 508,466 |
|
| U.S. Treasury 10-Year Ultra Notes | 351 |
| June 2019 | $ | 35,100,000 |
| 46,606,219 |
| 531,867 |
|
| U.S. Treasury 2-Year Notes | 1,383 |
| June 2019 | $ | 276,600,000 |
| 294,708,656 |
| 834,366 |
|
| U.S. Treasury 5-Year Notes | 479 |
| June 2019 | $ | 47,900,000 |
| 55,481,672 |
| 300,297 |
|
| U.S. Treasury Long Bonds | 265 |
| June 2019 | $ | 26,500,000 |
| 39,658,906 |
| 715,716 |
|
| U.S. Treasury Ultra Bonds | 130 |
| June 2019 | $ | 13,000,000 |
| 21,840,000 |
| 690,708 |
|
| | | | | $ | 538,664,984 |
| $ | 3,581,420 |
|
|
| | |
| NOTES TO SCHEDULE OF INVESTMENTS |
| FHLMC | - | Federal Home Loan Mortgage Corporation |
| FNMA | - | Federal National Mortgage Association |
| GNMA | - | Government National Mortgage Association |
| GO | - | General Obligation |
| H15T1Y | - | Constant Maturity U.S. Treasury Note Yield Curve Rate Index |
| LIBOR | - | London Interbank Offered Rate |
| LOC | - | Letter of Credit |
| MTN | - | Medium Term Note |
| SEQ | - | Sequential Payer |
| TBA | - | To-Be-Announced. Security was purchased on a forward commitment basis with an approximate principal amount and maturity date. Actual principal amount and maturity date will be determined upon settlement. |
| VRN | - | Variable Rate Note. The rate adjusts periodically based upon the terms set forth in the security’s offering documents. The rate shown is effective at the period end and the reference rate and spread, if any, is indicated. |
† Category is less than 0.05% of total net assets.
| |
| (1) | Security was purchased pursuant to Rule 144A or Section 4(2) under the Securities Act of 1933 and may be sold in transactions exempt from registration, normally to qualified institutional investors. The aggregate value of these securities at the period end was $563,702,776, which represented 17.4% of total net assets. Of these securities, 1.5% of total net assets were deemed illiquid under policies approved by the Board of Trustees. |
| |
| (2) | Collateral has been received at the custodian for collateral requirements on forward commitments. At the period end, the aggregate value of securities received was $759,596. |
| |
| (3) | Security, or a portion thereof, has been pledged at the custodian bank or with a broker for collateral requirements on forward commitments and/or futures contracts. At the period end, the aggregate value of securities pledged was $3,717,463. |
| |
| (4) | The interest rate on a bank loan obligation adjusts periodically based on a predetermined schedule. Rate shown is effective at period end. The maturity date on a bank loan obligation may be less than indicated as a result of contractual or optional prepayments. These prepayments cannot be predicted with certainty. |
| |
| (5) | The rate indicated is the yield to maturity at purchase. |
See Notes to Financial Statements.
|
|
| Statement of Assets and Liabilities |
|
| | | |
| MARCH 31, 2019 | |
| Assets | |
| Investment securities, at value (cost of $3,212,493,447) | $ | 3,255,004,652 |
|
| Cash | 31,553 |
|
| Foreign currency holdings, at value (cost of $93,527) | 96,484 |
|
| Receivable for investments sold | 195,125,908 |
|
| Receivable for capital shares sold | 1,868,485 |
|
| Interest receivable | 18,127,377 |
|
| | 3,470,254,459 |
|
| | |
| Liabilities | |
| Payable for investments purchased | 230,393,873 |
|
| Payable for capital shares redeemed | 3,118,553 |
|
| Payable for variation margin on futures contracts | 839,867 |
|
| Accrued management fees | 1,561,400 |
|
| Distribution and service fees payable | 51,679 |
|
| | 235,965,372 |
|
| | |
| Net Assets | $ | 3,234,289,087 |
|
| | |
| Net Assets Consist of: | |
| Capital paid in | $ | 3,304,700,941 |
|
| Distributable earnings | (70,411,854 | ) |
| | $ | 3,234,289,087 |
|
|
| | | | |
| | Net Assets | Shares Outstanding | Net Asset Value Per Share |
| Investor Class | $1,646,933,901 | 155,154,656 |
| $10.61 |
| I Class | $993,543,081 | 93,548,186 |
| $10.62 |
| Y Class | $152,412,194 | 14,350,454 |
| $10.62 |
| A Class | $98,899,362 | 9,314,261 |
| $10.62* |
| C Class | $31,480,785 | 2,967,618 |
| $10.61 |
| R Class | $8,747,647 | 824,104 |
| $10.61 |
| R5 Class | $419,164 | 39,474 |
| $10.62 |
| R6 Class | $301,852,953 | 28,409,518 |
| $10.63 |
*Maximum offering price $11.12 (net asset value divided by 0.955).
See Notes to Financial Statements.
|
| | | |
| YEAR ENDED MARCH 31, 2019 | |
| Investment Income (Loss) | |
| Income: | |
| Interest | $ | 164,332,102 |
|
| | |
| Expenses: | |
| Management fees | 23,027,362 |
|
| Distribution and service fees: | |
| A Class | 369,332 |
|
| C Class | 393,397 |
|
| R Class | 46,789 |
|
| Trustees' fees and expenses | 344,316 |
|
| Other expenses | 83,077 |
|
| | 24,264,273 |
|
| | |
| Net investment income (loss) | 140,067,829 |
|
| | |
| Realized and Unrealized Gain (Loss) | |
| Net realized gain (loss) on: | |
| Investment transactions | (119,472,299 | ) |
| Forward foreign currency exchange contract transactions | 43,364,024 |
|
| Futures contract transactions | (21,780,786 | ) |
| Swap agreement transactions | (123,853 | ) |
| Foreign currency translation transactions | (2,005,583 | ) |
| | (100,018,497 | ) |
| | |
| Change in net unrealized appreciation (depreciation) on: | |
| Investments | 63,167,954 |
|
| Forward foreign currency exchange contracts | 5,896,143 |
|
| Futures contracts | 9,649,613 |
|
| Swap agreements | (430,955 | ) |
| Translation of assets and liabilities in foreign currencies | (111,091 | ) |
| | 78,171,664 |
|
| | |
| Net realized and unrealized gain (loss) | (21,846,833 | ) |
| | |
| Net Increase (Decrease) in Net Assets Resulting from Operations | $ | 118,220,996 |
|
See Notes to Financial Statements.
|
|
| Statement of Changes in Net Assets |
|
| | | | | | |
| YEARS ENDED MARCH 31, 2019 AND MARCH 31, 2018 |
| Increase (Decrease) in Net Assets | March 31, 2019 | March 31, 2018 |
| Operations | | |
| Net investment income (loss) | $ | 140,067,829 |
| $ | 144,994,901 |
|
| Net realized gain (loss) | (100,018,497 | ) | (22,354,092 | ) |
| Change in net unrealized appreciation (depreciation) | 78,171,664 |
| (59,419,715 | ) |
| Net increase (decrease) in net assets resulting from operations | 118,220,996 |
| 63,221,094 |
|
| | | |
| Distributions to Shareholders | | |
| From earnings: | | |
| Investor Class | (45,125,218 | ) | (62,152,148 | ) |
| I Class | (50,762,670 | ) | (59,845,056 | ) |
| Y Class | (8,254,043 | ) | (8,862,381 | ) |
| A Class | (3,199,293 | ) | (5,456,025 | ) |
| C Class | (572,506 | ) | (665,347 | ) |
| R Class | (171,380 | ) | (220,384 | ) |
| R5 Class | (6,073 | ) | (3,899 | ) |
| R6 Class | (7,061,411 | ) | (7,005,353 | ) |
| From tax return of capital: | | |
| Investor Class | (3,901,075 | ) | — |
|
| I Class | (4,940,428 | ) | — |
|
| Y Class | (394,094 | ) | — |
|
| A Class | (234,667 | ) | — |
|
| C Class | (54,444 | ) | — |
|
| R Class | (17,350 | ) | — |
|
| R5 Class | (1,029 | ) | — |
|
| R6 Class | (774,024 | ) | — |
|
| Decrease in net assets from distributions | (125,469,705 | ) | (144,210,593 | ) |
| | | |
| Capital Share Transactions | | |
| Net increase (decrease) in net assets from capital share transactions (Note 5) | (2,947,658,348 | ) | (227,459,489 | ) |
| | | |
| Net increase (decrease) in net assets | (2,954,907,057 | ) | (308,448,988 | ) |
| | | |
| Net Assets | | |
| Beginning of period | 6,189,196,144 |
| 6,497,645,132 |
|
| End of period | $ | 3,234,289,087 |
| $ | 6,189,196,144 |
|
See Notes to Financial Statements.
|
|
| Notes to Financial Statements |
MARCH 31, 2019
1. Organization
American Century Investment Trust (the trust) is registered under the Investment Company Act of 1940, as amended (the 1940 Act), as an open-end management investment company and is organized as a Massachusetts business trust. Diversified Bond Fund (the fund) is one fund in a series issued by the trust. The fund’s investment objective is to seek a high level of income by investing in non-money market debt securities.
The fund offers the Investor Class, I Class, Y Class, A Class, C Class, R Class, R5 Class and R6 Class. The A Class may incur an initial sales charge. The A Class and C Class may be subject to a contingent deferred sales charge. Sale of the Y Class and R5 Class commenced on April 10, 2017.
2. Significant Accounting Policies
The following is a summary of significant accounting policies consistently followed by the fund in preparation of its financial statements. The fund is an investment company and follows accounting and reporting guidance in accordance with accounting principles generally accepted in the United States of America. This may require management to make certain estimates and assumptions at the date of the financial statements. Actual results could differ from these estimates. Management evaluated the impact of events or transactions occurring through the date the financial statements were issued that would merit recognition or disclosure.
Investment Valuations — The fund determines the fair value of its investments and computes its net asset value per share at the close of regular trading (usually 4 p.m. Eastern time) on the New York Stock Exchange (NYSE) on each day the NYSE is open. The Board of Trustees has adopted valuation policies and procedures to guide the investment advisor in the fund’s investment valuation process and to provide methodologies for the oversight of the fund’s pricing function.
Fixed income securities are valued at the evaluated mean as provided by independent pricing services or at the mean of the most recent bid and asked prices as provided by investment dealers. Corporate bonds, U.S. Treasury and Government Agency securities, convertible bonds, bank loan obligations, municipal securities, and sovereign governments and agencies are valued using market models that consider trade data, quotations from dealers and active market makers, relevant yield curve and spread data, creditworthiness, trade data or market information on comparable securities, and other relevant security specific information. Mortgage-related and asset-backed securities are valued based on models that consider trade data, prepayment and default projections, benchmark yield and spread data and estimated cash flows of each tranche of the issuer. Collateralized loan obligations are valued based on discounted cash flow models that consider trade and economic data, prepayment assumptions and default projections. Commercial paper is valued using a curve-based approach that considers money market rates for specific instruments, programs, currencies and maturity points from a variety of active market makers. Fixed income securities initially expressed in local currencies are translated into U.S. dollars at the mean of the appropriate currency exchange rate at the close of the NYSE as provided by an independent pricing service.
Open-end management investment companies are valued at the reported net asset value per share. Repurchase agreements are valued at cost, which approximates fair value. Exchange-traded futures contracts are valued at the settlement price as provided by the appropriate exchange. Swap agreements are valued at an evaluated mean as provided by independent pricing services or independent brokers. Forward foreign currency exchange contracts are valued at the mean of the appropriate forward exchange rate at the close of the NYSE as provided by an independent pricing service. Investments initially expressed in local currencies are translated into U.S. dollars at the mean of the appropriate currency exchange rate at the close of the NYSE as provided by an independent pricing service.
If the fund determines that the market price for an investment is not readily available or the valuation methods mentioned above do not reflect an investment’s fair value, such investment is valued as determined in good faith by the Board of Trustees or its delegate, in accordance with policies and procedures adopted by the Board of Trustees. In its determination of fair value, the fund may review several factors including, but not limited to, market information regarding the specific investment or comparable investments and correlation with other investment types, futures indices or general market indicators. Circumstances that may cause the fund to use these procedures to value an investment include, but are not limited to: an investment has been declared in default or is distressed; trading in a security has been suspended during the trading day or a security is not actively trading on its principal exchange; prices received from a regular pricing source are deemed unreliable; or there is a foreign market holiday and no trading occurred.
The fund monitors for significant events occurring after the close of an investment’s primary exchange but before the fund’s net asset value per share is determined. Significant events may include, but are not limited to: corporate announcements and transactions; governmental action and political unrest that could impact a specific investment or an investment sector; or armed conflicts, natural disasters and similar events that could affect investments in a specific country or region.
Security Transactions — Security transactions are accounted for as of the trade date. Net realized gains and losses are determined on the identified cost basis, which is also used for federal income tax purposes.
Investment Income — Interest income is recorded on the accrual basis and includes paydown gain (loss) and accretion of discounts and amortization of premiums. Inflation adjustments related to inflation-linked debt securities are reflected as interest income.
Foreign Currency Translations — All assets and liabilities initially expressed in foreign currencies are translated into U.S. dollars at prevailing exchange rates at period end. The fund may enter into spot foreign currency exchange contracts to facilitate transactions denominated in a foreign currency. Purchases and sales of investment securities, dividend and interest income, spot foreign currency exchange contracts, and expenses are translated at the rates of exchange prevailing on the respective dates of such transactions. Net realized and unrealized foreign currency exchange gains or losses related to investment securities are a component of net realized gain (loss) on investment transactions and change in net unrealized appreciation (depreciation) on investments, respectively.
Forward Commitments — The fund may engage in securities transactions on a forward commitment basis. In these transactions, the securities’ prices and yields are fixed on the date of the commitment. The fund may sell a to-be-announced (TBA) security and at the same time make a commitment to purchase the same security at a future date at a specified price. Conversely, the fund may purchase a TBA security and at the same time make a commitment to sell the same security at a future date at a specified price. These types of transactions are known as “TBA roll” transactions and are accounted for as purchases and sales. The fund will segregate cash, cash equivalents or other appropriate liquid securities on its records in amounts sufficient to meet the purchase price.
Repurchase Agreements — The fund may enter into repurchase agreements with institutions that American Century Investment Management, Inc. (ACIM) (the investment advisor) has determined are creditworthy pursuant to criteria adopted by the Board of Trustees. The fund requires that the collateral, represented by securities, received in a repurchase transaction be transferred to the custodian in a manner sufficient to enable the fund to obtain those securities in the event of a default under the repurchase agreement. ACIM monitors, on a daily basis, the securities transferred to ensure the value, including accrued interest, of the securities under each repurchase agreement is equal to or greater than amounts owed to the fund under each repurchase agreement.
Joint Trading Account — Pursuant to an Exemptive Order issued by the Securities and Exchange Commission, the fund, along with certain other funds in the American Century Investments family of funds, may transfer uninvested cash balances into a joint trading account. These balances are invested in one or more repurchase agreements that are collateralized by U.S. Treasury or Agency obligations.
Segregated Assets — In accordance with the 1940 Act, the fund segregates assets on its books and records to cover certain types of investment securities and other financial instruments. ACIM monitors, on a daily basis, the securities segregated to ensure the fund designates a sufficient amount of liquid assets, marked-to-market daily. The fund may also receive assets or be required to pledge assets at the custodian bank or with a broker for collateral requirements.
Income Tax Status — It is the fund’s policy to distribute substantially all net investment income and net realized gains to shareholders and to otherwise qualify as a regulated investment company under provisions of the Internal Revenue Code. Accordingly, no provision has been made for income taxes. The fund files U.S. federal, state, local and non-U.S. tax returns as applicable. The fund's tax returns are subject to examination by the relevant taxing authority until expiration of the applicable statute of limitations, which is generally three years from the date of filing but can be longer in certain jurisdictions. At this time, management believes there are no uncertain tax positions which, based on their technical merit, would not be sustained upon examination and for which it is reasonably possible that the total amounts of unrecognized tax benefits will significantly change in the next twelve months.
Multiple Class — All shares of the fund represent an equal pro rata interest in the net assets of the class to which such shares belong, and have identical voting, dividend, liquidation and other rights and the same terms and conditions, except for class specific expenses and exclusive rights to vote on matters affecting only individual classes. Income, non-class specific expenses, and realized and unrealized capital gains and losses of the fund are allocated to each class of shares based on their relative net assets.
Distributions to Shareholders — Distributions from net investment income, if any, are declared daily and paid monthly. Distributions from net realized gains, if any, are generally declared and paid annually.
Indemnifications — Under the trust’s organizational documents, its officers and trustees are indemnified against certain liabilities arising out of the performance of their duties to the fund. In addition, in the normal course of business, the fund enters into contracts that provide general indemnifications. The maximum exposure under these arrangements is unknown as this would involve future claims that may be made against a fund. The risk of material loss from such claims is considered by management to be remote.
3. Fees and Transactions with Related Parties
Certain officers and trustees of the trust are also officers and/or directors of American Century Companies, Inc. (ACC). The trust's investment advisor, ACIM, the trust's distributor, American Century Investment Services, Inc. (ACIS), and the trust's transfer agent, American Century Services, LLC, are wholly owned, directly or indirectly, by ACC. Various funds issued by American Century Asset Allocation Portfolios, Inc. own, in aggregate, 21% of the shares of the fund.
Management Fees — The trust has entered into a management agreement with ACIM, under which ACIM provides the fund with investment advisory and management services in exchange for a single, unified management fee (the fee) per class. The agreement provides that all expenses of managing and operating the fund, except distribution and service fees, brokerage expenses, taxes, interest, fees and expenses of the independent trustees (including legal counsel fees), and extraordinary expenses, will be paid by ACIM. The fee is computed and accrued daily based on each class's daily net assets and paid monthly in arrears. The difference in the fee among the classes is a result of their separate arrangements for non-Rule 12b-1 shareholder services. It is not the result of any difference in advisory or custodial fees or other expenses related to the management of the fund’s assets, which do not vary by class. The fee consists of (1) an Investment Category Fee based on the daily net assets of the fund and certain other accounts managed by the investment advisor that are in the same broad investment category as the fund and (2) a Complex Fee based on the assets of all the funds in the American Century Investments family of funds.
The Investment Category Fee range, the Complex Fee range and the effective annual management fee for each class for the period ended March 31, 2019 are as follows:
|
| | | |
| | Investment Category Fee Range | Complex Fee Range | Effective Annual Management Fee |
| Investor Class | 0.2925%
to 0.4100%
| 0.2500% to 0.3100% | 0.59% |
| I Class | 0.0500% to 0.1100% | 0.39% |
| Y Class | 0.0200% to 0.0800% | 0.36% |
| A Class | 0.2500% to 0.3100% | 0.59% |
| C Class | 0.2500% to 0.3100% | 0.59% |
| R Class | 0.2500% to 0.3100% | 0.59% |
| R5 Class | 0.0500% to 0.1100% | 0.39% |
| R6 Class | 0.0000% to 0.0600% | 0.34% |
Distribution and Service Fees — The Board of Trustees has adopted a separate Master Distribution and Individual Shareholder Services Plan for each of the A Class, C Class and R Class (collectively the plans), pursuant to Rule 12b-1 of the 1940 Act. The plans provide that the A Class will pay ACIS an annual distribution and service fee of 0.25%. The plans provide that the C Class will pay ACIS an annual distribution and service fee of 1.00%, of which 0.25% is paid for individual shareholder services and 0.75% is paid for distribution services. The plans provide that the R Class will pay ACIS an annual distribution and service fee of 0.50%. The fees are computed and accrued daily based on each class’s daily net assets and paid monthly in arrears. The fees are used to pay financial intermediaries for distribution and individual shareholder services. Fees incurred under the plans during the period ended March 31, 2019 are detailed in the Statement of Operations.
Trustees’ Fees and Expenses — The Board of Trustees is responsible for overseeing the investment advisor’s management and operations of the fund. The trustees receive detailed information about the fund and its investment advisor regularly throughout the year, and meet at least quarterly with management of the investment advisor to review reports about fund operations. The fund’s officers do not receive compensation from the fund.
Interfund Transactions — The fund may enter into security transactions with other American Century Investments funds and other client accounts of the investment advisor, in accordance with the 1940 Act rules and procedures adopted by the Board of Trustees. The rules and procedures require, among other things, that these transactions be effected at the independent current market price of the security. There were no interfund transactions during the period.
4. Investment Transactions
Purchases of investment securities, excluding short-term investments, for the period ended March 31, 2019 totaled $9,472,982,257, of which $8,581,337,105 represented U.S. Treasury and Government Agency obligations.
Sales of investment securities, excluding short-term investments, for the period ended March 31, 2019 totaled $13,119,552,026, of which $10,082,673,640 represented U.S. Treasury and Government Agency obligations.
5. Capital Share Transactions
Transactions in shares of the fund were as follows (unlimited number of shares authorized):
|
| | | | | | | | | | |
| | Year ended
March 31, 2019 | Year ended
March 31, 2018(1) |
| | Shares | Amount | Shares | Amount |
| Investor Class | | | | |
| Sold | 31,325,261 |
| $ | 324,292,830 |
| 59,363,301 |
| $ | 637,342,177 |
|
| Issued in reinvestment of distributions | 4,675,136 |
| 48,466,228 |
| 5,702,664 |
| 61,217,549 |
|
| Redeemed | (141,109,875 | ) | (1,467,307,574 | ) | (75,936,255 | ) | (816,187,082 | ) |
| | (105,109,478 | ) | (1,094,548,516 | ) | (10,870,290 | ) | (117,627,356 | ) |
| I Class | | | | |
| Sold | 49,180,608 |
| 509,555,656 |
| 94,988,987 |
| 1,020,760,843 |
|
| Issued in reinvestment of distributions | 4,857,472 |
| 50,339,677 |
| 4,974,661 |
| 53,433,785 |
|
| Redeemed | (178,388,008 | ) | (1,859,706,777 | ) | (144,359,287 | ) | (1,558,436,468 | ) |
| | (124,349,928 | ) | (1,299,811,444 | ) | (44,395,639 | ) | (484,241,840 | ) |
| Y Class | | | | |
| Sold | 5,869,446 |
| 60,949,056 |
| 60,619,899 |
| 657,926,259 |
|
| Issued in reinvestment of distributions | 827,203 |
| 8,594,073 |
| 829,133 |
| 8,862,381 |
|
| Redeemed | (49,627,198 | ) | (516,289,263 | ) | (4,168,029 | ) | (44,622,021 | ) |
| | (42,930,549 | ) | (446,746,134 | ) | 57,281,003 |
| 622,166,619 |
|
| A Class | | | | |
| Sold | 2,683,206 |
| 27,891,724 |
| 4,113,616 |
| 44,297,328 |
|
| Issued in reinvestment of distributions | 316,082 |
| 3,276,539 |
| 490,752 |
| 5,275,532 |
|
| Redeemed | (12,333,087 | ) | (127,677,174 | ) | (24,756,091 | ) | (265,973,314 | ) |
| | (9,333,799 | ) | (96,508,911 | ) | (20,151,723 | ) | (216,400,454 | ) |
| C Class | | | | |
| Sold | 189,966 |
| 1,972,112 |
| 359,659 |
| 3,861,432 |
|
| Issued in reinvestment of distributions | 51,732 |
| 536,171 |
| 52,305 |
| 561,538 |
|
| Redeemed | (1,865,057 | ) | (19,337,878 | ) | (2,035,896 | ) | (21,887,355 | ) |
| | (1,623,359 | ) | (16,829,595 | ) | (1,623,932 | ) | (17,464,385 | ) |
| R Class | | | | |
| Sold | 262,652 |
| 2,711,815 |
| 284,099 |
| 3,045,386 |
|
| Issued in reinvestment of distributions | 18,060 |
| 187,177 |
| 20,364 |
| 218,695 |
|
| Redeemed | (517,869 | ) | (5,367,549 | ) | (583,458 | ) | (6,244,777 | ) |
| | (237,157 | ) | (2,468,557 | ) | (278,995 | ) | (2,980,696 | ) |
| R5 Class | | | | |
| Sold | 56,075 |
| 581,596 |
| 19,719 |
| 213,345 |
|
| Issued in reinvestment of distributions | 680 |
| 7,022 |
| 363 |
| 3,899 |
|
| Redeemed | (37,363 | ) | (387,005 | ) | — |
| — |
|
| | 19,392 |
| 201,613 |
| 20,082 |
| 217,244 |
|
| R6 Class | | | | |
| Sold | 8,078,618 |
| 83,884,165 |
| 7,387,159 |
| 79,278,161 |
|
| Issued in reinvestment of distributions | 743,782 |
| 7,709,361 |
| 650,210 |
| 6,981,536 |
|
| Redeemed | (7,958,961 | ) | (82,540,330 | ) | (9,021,848 | ) | (97,388,318 | ) |
| | 863,439 |
| 9,053,196 |
| (984,479 | ) | (11,128,621 | ) |
| Net increase (decrease) | (282,701,439 | ) | $ | (2,947,658,348 | ) | (21,003,973 | ) | $ | (227,459,489 | ) |
| |
| (1) | April 10, 2017 (commencement of sale) through March 31, 2018 for the Y Class and R5 Class. |
6. Fair Value Measurements
The fund’s investments valuation process is based on several considerations and may use multiple inputs to determine the fair value of the investments held by the fund. In conformity with accounting principles generally accepted in the United States of America, the inputs used to determine a valuation are classified into three broad levels.
| |
| • | Level 1 valuation inputs consist of unadjusted quoted prices in an active market for identical investments. |
| |
| • | Level 2 valuation inputs consist of direct or indirect observable market data (including quoted prices for comparable investments, evaluations of subsequent market events, interest rates, prepayment speeds, credit risk, etc.). These inputs also consist of quoted prices for identical investments initially expressed in local currencies that are adjusted through translation into U.S. dollars. |
| |
| • | Level 3 valuation inputs consist of unobservable data (including a fund’s own assumptions). |
The level classification is based on the lowest level input that is significant to the fair valuation measurement. The valuation inputs are not necessarily an indication of the risks associated with investing in these securities or other financial instruments.
The following is a summary of the level classifications as of period end. The Schedule of Investments provides additional information on the fund’s portfolio holdings.
|
| | | | | | | | |
| | Level 1 | Level 2 | Level 3 |
| Assets | | | |
| Investment Securities | | | |
| Corporate Bonds | — |
| $ | 915,647,744 |
| — |
|
| U.S. Government Agency Mortgage-Backed Securities | — |
| 757,880,315 |
| — |
|
| U.S. Treasury Securities | — |
| 709,157,186 |
| — |
|
| Asset-Backed Securities | — |
| 259,425,823 |
| — |
|
| Collateralized Mortgage Obligations | — |
| 170,146,605 |
| — |
|
| Commercial Mortgage-Backed Securities | — |
| 142,326,940 |
| — |
|
| Collateralized Loan Obligations | — |
| 134,266,901 |
| — |
|
| Municipal Securities | — |
| 50,542,476 |
| — |
|
| Bank Loan Obligations | — |
| 39,906,971 |
| — |
|
| Sovereign Governments and Agencies | — |
| 21,448,130 |
| — |
|
| U.S. Government Agency Securities | — |
| 12,281,197 |
| — |
|
| Temporary Cash Investments | — |
| 41,974,364 |
| — |
|
| | — |
| $ | 3,255,004,652 |
| — |
|
| Other Financial Instruments | | | |
| Futures Contracts | $ | 3,581,420 |
| — |
| — |
|
7. Derivative Instruments
Credit Risk — The fund is subject to credit risk in the normal course of pursuing its investment objectives. The value of a bond generally declines as the credit quality of its issuer declines. Credit default swap agreements enable a fund to buy/sell protection against a credit event of a specific issuer or index. A fund may attempt to enhance returns by selling protection or attempt to mitigate credit risk by buying protection. The buyer/seller of credit protection against a security or basket of securities may pay/receive an up-front or periodic payment to compensate for/against potential default events. Changes in value, including the periodic amounts of interest to be paid or received on swap agreements, are recorded as unrealized appreciation (depreciation) on swap agreements. Upon entering into a centrally cleared swap, a fund is required to deposit cash or securities (initial margin) with a financial intermediary in an amount equal to a certain percentage of the notional amount. Subsequent payments (variation margin) are made or received daily, in cash, by a fund. The variation margin is equal to the daily change in the value and is a component of unrealized gains and losses. Realized gain or loss is recorded upon receipt or payment of a periodic settlement or termination of swap agreements. Net realized and unrealized gains or losses occurring during the holding period of swap agreements are a component of net realized gain (loss) on swap agreement transactions and change in net unrealized appreciation (depreciation) on swap agreements, respectively. The risks of entering into swap agreements include the possible lack of liquidity, failure of the counterparty to meet its obligations, and that there may be unfavorable changes in the underlying investments or instruments. The fund's average notional amount held during the period was $77,000,000.
Foreign Currency Risk — The fund is subject to foreign currency exchange rate risk in the normal course of pursuing its investment objectives. The value of foreign investments held by a fund may be significantly affected by changes in foreign currency exchange rates. The dollar value of a foreign security generally decreases when the value of the dollar rises against the foreign currency in which the security is denominated and tends to increase when the value of the dollar declines against such foreign currency. A fund may enter into forward foreign currency exchange contracts to reduce a fund's exposure to foreign currency exchange rate fluctuations. The net U.S. dollar value of foreign currency underlying all contractual commitments held by a fund and the resulting unrealized appreciation or depreciation are determined daily. Realized gain or loss is recorded upon the termination of the contract. Net realized and unrealized gains or losses occurring during the holding period of forward foreign currency exchange contracts are a component of net realized gain (loss) on forward foreign currency exchange contract transactions and change in net unrealized appreciation (depreciation) on forward foreign currency exchange contracts, respectively. A fund bears the risk of an unfavorable change in the foreign currency exchange rate underlying the forward contract. Additionally, losses, up to the fair value, may arise if the counterparties do not perform under the contract terms. The fund's average U.S. dollar exposure to foreign currency risk derivative instruments held during the period was $582,081,144.
Interest Rate Risk — The fund is subject to interest rate risk in the normal course of pursuing its investment objectives. A fund may enter into futures contracts or interest rate swap agreements in order to manage its exposure to changes in market conditions. The value of bonds generally declines as interest rates rise. The risks of entering into interest rate risk derivative instruments include the possible lack of liquidity, failure of the counterparty to meet its obligations, and that there may be unfavorable changes in the underlying investments or instruments.
A fund may enter into futures contracts based on a bond index or a specific underlying security. A fund may purchase futures contracts to gain exposure to increases in market value or sell futures contracts to protect against a decline in market value. Upon entering into a futures contract, a fund will segregate cash, cash equivalents or other appropriate liquid securities on its records in amounts sufficient to meet requirements. Subsequent payments (variation margin) are made or received daily, in cash, by a fund. The variation margin is equal to the daily change in the contract value and is recorded as unrealized gains and losses. A fund recognizes a realized gain or loss when the futures contract is closed or expires. Net realized and unrealized gains or losses occurring during the holding period of futures contracts are a component of net realized gain (loss) on futures contract transactions and change in net unrealized appreciation (depreciation) on futures contracts, respectively. The fund's average notional exposure to these interest rate risk derivative instruments held during the period was $435,504,688 futures contracts purchased and $585,829,300 futures contracts sold.
A fund may enter into interest rate swap agreements to gain exposure to declines in interest rates, to protect against increases in interest rates, or to maintain its ability to generate income at prevailing interest rates. A fund will segregate cash, cash equivalents or other appropriate liquid securities on its records in amounts sufficient to meet requirements. Changes in value, including the periodic amounts of interest to be paid or received on swap agreements, are recorded as unrealized appreciation (depreciation) on swap agreements. Upon entering into a centrally cleared swap, a fund is required to deposit cash or securities (initial margin) with a financial intermediary in an amount equal to a certain percentage of the notional amount. Subsequent payments (variation margin) are made or received daily, in cash, by a fund. The variation margin is equal to the daily change in the value and is a component of unrealized gains and losses. Realized gain or loss is recorded upon receipt or payment of a periodic settlement or termination of swap agreements. Net realized and unrealized gains or losses occurring during the holding period of swap agreements are a component of net realized gain (loss) on swap agreement transactions and change in net unrealized appreciation (depreciation) on swap agreements, respectively. The fund's average notional amount on interest rate swap agreements held during the period was $152,550,095.
Other Contracts — A fund may enter into total return swap agreements in order to attempt to obtain or preserve a particular return or spread at a lower cost than obtaining a return or spread through purchases and/or sales of instruments in other markets or gain exposure to certain markets in the most economical way possible. A fund will segregate cash, cash equivalents or other appropriate liquid securities on its records in amounts sufficient to meet requirements. Changes in value, including the periodic amounts of interest to be paid or received on swap agreements, are recorded as unrealized appreciation (depreciation) on swap agreements. Upon entering into a centrally cleared swap, a fund is required to deposit cash or securities (initial margin) with a financial intermediary in an amount equal to a certain percentage of the notional amount. Subsequent payments (variation margin) are made or received daily, in cash, by a fund. The variation margin is equal to the daily change in the value and is a component of unrealized gains and losses. Realized gain or loss is recorded upon receipt or payment of a periodic settlement or termination of swap agreements. Net realized and unrealized gains or losses occurring during the holding period of swap agreements are a component of net realized gain (loss) on swap agreement transactions and change in net unrealized appreciation (depreciation) on swap agreements, respectively. The risks of entering into swap agreements include the possible lack of liquidity, failure of the counterparty to meet its obligations, and that there may be unfavorable changes in the underlying investments or instruments, including inflationary risk. The fund's average notional amount held during the period was $195,650,000.
Value of Derivative Instruments as of March 31, 2019
|
| | | | | | | |
| | Asset Derivatives | Liability Derivatives |
| Type of Risk Exposure | Location on Statement of Assets and Liabilities | Value | Location on Statement of Assets and Liabilities | Value |
| Interest Rate Risk | Receivable for variation margin on futures contracts* | — |
| Payable for variation margin on futures contracts* | $ | 839,867 |
|
* Included in the unrealized appreciation (depreciation) on futures contracts as reported in the Schedule of Investments.
Effect of Derivative Instruments on the Statement of Operations for the Year Ended March 31, 2019
|
| | | | | | | | |
| | Net Realized Gain (Loss) | Change in Net Unrealized Appreciation (Depreciation) |
| Type of Risk Exposure | Location on Statement of Operations | Value | Location on Statement of Operations | Value |
| Credit Risk | Net realized gain (loss) on swap agreement transactions | $ | 1,241,402 |
| Change in net unrealized appreciation (depreciation) on swap agreements | — |
|
| Foreign Currency Risk | Net realized gain (loss) on forward foreign currency exchange contract transactions | 43,364,024 |
| Change in net unrealized appreciation (depreciation) on forward foreign currency exchange contracts | $ | 5,896,143 |
|
| Interest Rate Risk | Net realized gain (loss) on futures contract transactions | (21,780,786 | ) | Change in net unrealized appreciation (depreciation) on futures contracts | 9,649,613 |
|
| Interest Rate Risk | Net realized gain (loss) on swap agreement transactions | (3,151,217 | ) | Change in net unrealized appreciation (depreciation) on swap agreements | — |
|
| Other Contracts | Net realized gain (loss) on swap agreement transactions | 1,785,962 |
| Change in net unrealized appreciation (depreciation) on swap agreements | (430,955 | ) |
| | | $ | 21,459,385 |
| | $ | 15,114,801 |
|
8. Risk Factors
The fund’s investment process may result in high portfolio turnover, which could mean high transaction costs, affecting both performance and capital gains tax liabilities to investors.
9. Federal Tax Information
The tax character of distributions paid during the years ended March 31, 2019 and March 31, 2018 were as follows:
|
| | | | | | |
| | 2019 | 2018 |
| Distributions Paid From | | |
| Ordinary income | $ | 115,152,594 |
| $ | 144,210,593 |
|
| Long-term capital gains | — |
| — |
|
| Tax return of capital | $ | 10,317,111 |
| — |
|
The book-basis character of distributions made during the year from net investment income or net realized gains may differ from their ultimate characterization for federal income tax purposes. These differences reflect the differing character of certain income items and net realized gains and losses for financial statement and tax purposes, and may result in reclassification among certain capital accounts on the financial statements.
As of period end, the federal tax cost of investments and the components of distributable earnings on a tax-basis were as follows: |
| | | |
| Federal tax cost of investments | $ | 3,213,001,903 |
|
| Gross tax appreciation of investments | $ | 62,770,997 |
|
| Gross tax depreciation of investments | (20,768,248 | ) |
| Net tax appreciation (depreciation) of investments | 42,002,749 |
|
| Net tax appreciation (depreciation) on derivatives and translation of assets and liabilities in foreign currencies | 2,957 |
|
| Net tax appreciation (depreciation) | $ | 42,005,706 |
|
| Other book-to-tax adjustments | $ | (88,031 | ) |
| Undistributed ordinary income | — |
|
| Accumulated short-term capital losses | $ | (49,396,574 | ) |
Accumulated long-term capital losses
| $ | (60,384,677 | ) |
| Late-year ordinary loss deferral | $ | (2,548,278 | ) |
The difference between book-basis and tax-basis unrealized appreciation (depreciation) is attributable primarily to the realization for tax purposes of unrealized gains (losses) on futures contracts. Other book-to-tax adjustments are attributable primarily to the tax deferral of losses on straddle positions.
Accumulated capital losses represent net capital loss carryovers that may be used to offset future realized capital gains for federal income tax purposes. The capital loss carryovers may be carried forward for an unlimited period. Future capital loss carryover utilization in any given year may be subject to Internal Revenue Code limitations.
Loss deferrals represent certain qualified losses that the fund has elected to treat as having been incurred in the following fiscal year for federal income tax purposes.
10. Recently Issued Accounting Standards
In March 2017, the Financial Accounting Standards Board (FASB) issued Accounting Standards Update No. 2017-08, “Receivables - Nonrefundable Fees and Other Costs (Subtopic 310-20), Premium Amortization on Purchased Callable Debt Securities” (ASU 2017-08). ASU 2017-08 amends the amortization period for certain purchased callable debt securities held at a premium, shortening such period to the earliest call date. The amendments are effective for fiscal years, and interim periods within those fiscal years, beginning after December 15, 2018. Management is currently evaluating the impact that adopting ASU 2017-08 will have on the financial statements.
|
| | | | | | | | | | | | | | | | |
| For a Share Outstanding Throughout the Years Ended March 31 (except as noted) | | | | | | | | |
| Per-Share Data | | | | | | | | | | Ratios and Supplemental Data |
| | | Income From Investment Operations: | Distributions From: | | | Ratio to Average Net Assets of: | | |
| | Net Asset
Value,
Beginning
of Period | Net
Investment
Income
(Loss)(1) | Net Realized and
Unrealized
Gain (Loss) | Total From
Investment
Operations | Net
Investment
Income | Net
Realized
Gains | Tax Return of Capital | Total
Distributions | Net Asset
Value, End
of Period | Total
Return(2) | Operating
Expenses | Net
Investment
Income
(Loss) | Portfolio
Turnover
Rate | Net Assets,
End of
Period (in thousands) |
| Investor Class | | | | | | | | | | | | | |
| 2019 | $10.54 | 0.29 | 0.03 | 0.32 | (0.23) | — | (0.02) | (0.25) | $10.61 | 3.15% | 0.60% | 2.80% | 184% |
| $1,646,934 |
|
| 2018 | $10.68 | 0.23 | (0.14) | 0.09 | (0.23) | — | — | (0.23) | $10.54 | 0.86% | 0.60% | 2.19% | 179% |
| $2,742,374 |
|
| 2017 | $10.88 | 0.22 | (0.17) | 0.05 | (0.24) | (0.01) | — | (0.25) | $10.68 | 0.51% | 0.60% | 2.02% | 133% |
| $2,895,840 |
|
| 2016 | $11.01 | 0.22 | (0.06) | 0.16 | (0.29) | — | — | (0.29) | $10.88 | 1.49% | 0.60% | 2.04% | 174% |
| $2,122,636 |
|
| 2015 | $10.69 | 0.23 | 0.35 | 0.58 | (0.26) | — | — | (0.26) | $11.01 | 5.47% | 0.60% | 2.10% | 153% |
| $2,060,908 |
|
| I Class | | | | | | | | | | | | | |
| 2019 | $10.54 | 0.31 | 0.04 | 0.35 | (0.24) | — | (0.03) | (0.27) | $10.62 | 3.43% | 0.40% | 3.00% | 184% |
| $993,543 |
|
| 2018 | $10.68 | 0.25 | (0.13) | 0.12 | (0.26) | — | — | (0.26) | $10.54 | 1.06% | 0.40% | 2.39% | 179% |
| $2,296,395 |
|
| 2017 | $10.88 | 0.24 | (0.16) | 0.08 | (0.27) | (0.01) | — | (0.28) | $10.68 | 0.71% | 0.40% | 2.22% | 133% |
| $2,801,686 |
|
| 2016 | $11.01 | 0.24 | (0.06) | 0.18 | (0.31) | — | — | (0.31) | $10.88 | 1.69% | 0.40% | 2.24% | 174% |
| $2,240,569 |
|
| 2015 | $10.69 | 0.25 | 0.35 | 0.60 | (0.28) | — | — | (0.28) | $11.01 | 5.68% | 0.40% | 2.30% | 153% |
| $2,626,563 |
|
| Y Class | | | | | | | | | | | | | |
| 2019 | $10.54 | 0.31 | 0.04 | 0.35 | (0.24) | — | (0.03) | (0.27) | $10.62 | 3.46% | 0.37% | 3.03% | 184% |
| $152,412 |
|
2018(3) | $10.70 | 0.26 | (0.17) | 0.09 | (0.25) | — | — | (0.25) | $10.54 | 0.84% | 0.37%(4) | 2.52%(4) | 179%(5) |
| $603,691 |
|
|
| | | | | | | | | | | | | | | | |
| For a Share Outstanding Throughout the Years Ended March 31 (except as noted) | | | | | | | | |
| Per-Share Data | | | | | | | | | | Ratios and Supplemental Data |
| | | Income From Investment Operations: | Distributions From: | | | Ratio to Average Net Assets of: | | |
| | Net Asset
Value,
Beginning
of Period | Net
Investment
Income
(Loss)(1) | Net Realized and
Unrealized
Gain (Loss) | Total From
Investment
Operations | Net
Investment
Income | Net
Realized
Gains | Tax Return of Capital | Total
Distributions | Net Asset
Value, End
of Period | Total
Return(2) | Operating
Expenses | Net
Investment
Income
(Loss) | Portfolio
Turnover
Rate | Net Assets,
End of
Period (in thousands) |
| A Class | | | | | | | | | | | | | |
| 2019 | $10.54 | 0.27 | 0.04 | 0.31 | (0.21) | — | (0.02) | (0.23) | $10.62 | 3.02% | 0.85% | 2.55% | 184% |
| $98,899 |
|
| 2018 | $10.68 | 0.20 | (0.13) | 0.07 | (0.21) | — | — | (0.21) | $10.54 | 0.61% | 0.85% | 1.94% | 179% |
| $196,563 |
|
| 2017 | $10.89 | 0.19 | (0.17) | 0.02 | (0.22) | (0.01) | — | (0.23) | $10.68 | 0.17% | 0.85% | 1.77% | 133% |
| $414,571 |
|
| 2016 | $11.02 | 0.19 | (0.06) | 0.13 | (0.26) | — | — | (0.26) | $10.89 | 1.24% | 0.85% | 1.79% | 174% |
| $454,565 |
|
| 2015 | $10.69 | 0.20 | 0.36 | 0.56 | (0.23) | — | — | (0.23) | $11.02 | 5.30% | 0.85% | 1.85% | 153% |
| $418,741 |
|
| C Class | | | | | | | | | | | | | |
| 2019 | $10.54 | 0.19 | 0.04 | 0.23 | (0.14) | — | (0.02) | (0.16) | $10.61 | 2.24% | 1.60% | 1.80% | 184% |
| $31,481 |
|
| 2018 | $10.68 | 0.13 | (0.14) | (0.01) | (0.13) | — | — | (0.13) | $10.54 | (0.14)% | 1.60% | 1.19% | 179% |
| $48,386 |
|
| 2017 | $10.89 | 0.11 | (0.17) | (0.06) | (0.14) | (0.01) | — | (0.15) | $10.68 | (0.57)% | 1.60% | 1.02% | 133% |
| $66,394 |
|
| 2016 | $11.01 | 0.11 | (0.05) | 0.06 | (0.18) | — | — | (0.18) | $10.89 | 0.57% | 1.60% | 1.04% | 174% |
| $81,039 |
|
| 2015 | $10.69 | 0.12 | 0.35 | 0.47 | (0.15) | — | — | (0.15) | $11.01 | 4.42% | 1.60% | 1.10% | 153% |
| $83,655 |
|
| R Class | | | | | | | | | | | | | |
| 2019 | $10.54 | 0.24 | 0.04 | 0.28 | (0.19) | — | (0.02) | (0.21) | $10.61 | 2.69% | 1.10% | 2.30% | 184% |
| $8,748 |
|
| 2018 | $10.68 | 0.18 | (0.14) | 0.04 | (0.18) | — | — | (0.18) | $10.54 | 0.36% | 1.10% | 1.69% | 179% |
| $11,186 |
|
| 2017 | $10.89 | 0.16 | (0.17) | (0.01) | (0.19) | (0.01) | — | (0.20) | $10.68 | (0.08)% | 1.10% | 1.52% | 133% |
| $14,318 |
|
| 2016 | $11.02 | 0.17 | (0.07) | 0.10 | (0.23) | — | — | (0.23) | $10.89 | 0.98% | 1.10% | 1.54% | 174% |
| $20,362 |
|
| 2015 | $10.70 | 0.18 | 0.34 | 0.52 | (0.20) | — | — | (0.20) | $11.02 | 4.94% | 1.10% | 1.60% | 153% |
| $21,041 |
|
| R5 Class | | | | | | | | | | | | | |
| 2019 | $10.54 | 0.32 | 0.03 | 0.35 | (0.24) | — | (0.03) | (0.27) | $10.62 | 3.45% | 0.40% | 3.00% | 184% |
| $419 |
|
2018(3) | $10.70 | 0.26 | (0.17) | 0.09 | (0.25) | — | — | (0.25) | $10.54 | 0.81% | 0.40%(4) | 2.46%(4) | 179%(5) |
| $212 |
|
|
| | | | | | | | | | | | | | | | |
| For a Share Outstanding Throughout the Years Ended March 31 (except as noted) | | | | | | | | |
| Per-Share Data | | | | | | | | | | Ratios and Supplemental Data |
| | | Income From Investment Operations: | Distributions From: | | | Ratio to Average Net Assets of: | | |
| | Net Asset
Value,
Beginning
of Period | Net
Investment
Income
(Loss)(1) | Net Realized and
Unrealized
Gain (Loss) | Total From
Investment
Operations | Net
Investment
Income | Net
Realized
Gains | Tax Return of Capital | Total
Distributions | Net Asset
Value, End
of Period | Total
Return(2) | Operating
Expenses | Net
Investment
Income
(Loss) | Portfolio
Turnover
Rate | Net Assets,
End of
Period (in thousands) |
| R6 Class | | | | | | | | | | | | | |
| 2019 | $10.54 | 0.32 | 0.05 | 0.37 | (0.25) | — | (0.03) | (0.28) | $10.63 | 3.58% | 0.35% | 3.05% | 184% |
| $301,853 |
|
| 2018 | $10.68 | 0.26 | (0.14) | 0.12 | (0.26) | — | — | (0.26) | $10.54 | 1.11% | 0.35% | 2.44% | 179% |
| $290,390 |
|
| 2017 | $10.89 | 0.24 | (0.17) | 0.07 | (0.27) | (0.01) | — | (0.28) | $10.68 | 0.67% | 0.35% | 2.27% | 133% |
| $304,836 |
|
| 2016 | $11.01 | 0.25 | (0.06) | 0.19 | (0.31) | — | — | (0.31) | $10.89 | 1.83% | 0.35% | 2.29% | 174% |
| $93,751 |
|
| 2015 | $10.69 | 0.24 | 0.37 | 0.61 | (0.29) | — | — | (0.29) | $11.01 | 5.73% | 0.35% | 2.35% | 153% |
| $96,829 |
|
|
| | | | |
| Notes to Financial Highlights | | |
| |
| (1) | Computed using average shares outstanding throughout the period. |
| |
| (2) | Total returns are calculated based on the net asset value of the last business day and do not reflect applicable sales charges, if any. Total returns for periods less than one year are not annualized. |
| |
| (3) | April 10, 2017 (commencement of sale) through March 31, 2018. |
| |
| (5) | Portfolio turnover is calculated at the fund level. Percentage indicated was calculated for the year ended March 31, 2018. |
See Notes to Financial Statements.
|
|
| Report of Independent Registered Public Accounting Firm |
To the Board of Trustees of American Century Investment Trust and Shareholders of Diversified Bond Fund:
Opinion on the Financial Statements
We have audited the accompanying statement of assets and liabilities, including the schedule of investments, of Diversified Bond Fund (one of the funds constituting American Century Investment Trust, referred to hereafter as the “Fund”) as of March 31, 2019, the related statement of operations for the year ended March 31, 2019, the statement of changes in net assets for each of the two years in the period ended March 31, 2019, including the related notes, and the financial highlights for each of the periods indicated therein (collectively referred to as the “financial statements”). In our opinion, the financial statements present fairly, in all material respects, the financial position of the Fund as of March 31, 2019, the results of its operations for the year then ended, the changes in its net assets for each of the two years in the period ended March 31, 2019 and the financial highlights for each of the periods indicated therein in conformity with accounting principles generally accepted in the United States of America.
Basis for Opinion
These financial statements are the responsibility of the Fund’s management. Our responsibility is to express an opinion on the Fund’s financial statements based on our audits. We are a public accounting firm registered with the Public Company Accounting Oversight Board (United States) (“PCAOB”) and are required to be independent with respect to the Fund in accordance with the U.S. federal securities laws and the applicable rules and regulations of the Securities and Exchange Commission and the PCAOB.
We conducted our audits of these financial statements in accordance with the standards of the PCAOB. Those standards require that we plan and perform the audit to obtain reasonable assurance about whether the financial statements are free of material misstatement, whether due to error or fraud.
Our audits included performing procedures to assess the risks of material misstatement of the financial statements, whether due to error or fraud, and performing procedures that respond to those risks. Such procedures included examining, on a test basis, evidence regarding the amounts and disclosures in the financial statements. Our audits also included evaluating the accounting principles used and significant estimates made by management, as well as evaluating the overall presentation of the financial statements. Our procedures included confirmation of securities owned as of March 31, 2019 by correspondence with the custodian and brokers; when replies were not received from brokers, we performed other auditing procedures. We believe that our audits provide a reasonable basis for our opinion.
/s/ PricewaterhouseCoopers LLP
Kansas City, Missouri
May 17, 2019
We have served as the auditor of one or more investment companies in American Century Investments since 1997.
Board of Trustees
The individuals listed below serve as trustees of the funds. Each trustee will continue to serve in this capacity until death, retirement, resignation or removal from office. The board has adopted a mandatory retirement age for trustees who are not “interested persons,” as that term is defined in the Investment Company Act (independent trustees). Independent trustees shall retire on December 31 of the year in which they reach their 75th birthday; provided, however, that on or after January 1, 2022, independent trustees shall retire on December 31 of the year in which they reach their 76th birthday.
Mr. Thomas is an “interested person” because he currently serves as President and Chief Executive Officer of American Century Companies, Inc. (ACC), the parent company of American Century Investment Management, Inc. (ACIM or the advisor). The other trustees (more than three-fourths of the total number) are independent. They are not employees, directors or officers of, and have no financial interest in, ACC or any of its wholly owned, direct or indirect, subsidiaries, including ACIM, American Century Investment Services, Inc. (ACIS) and American Century Services, LLC (ACS), and they do not have any other affiliations, positions or relationships that would cause them to be considered “interested persons” under the Investment Company Act. The trustees serve in this capacity for eight (in the case of Jonathan S. Thomas, 16; and Ronald J. Gilson, 9) registered investment companies in the American Century Investments family of funds.
The following table presents additional information about the trustees. The mailing address for each trustee other than Jonathan S. Thomas is 1665 Charleston Road, Mountain View, California 94043. The mailing address for Jonathan S. Thomas is 4500 Main Street, Kansas City, Missouri 64111.
|
| | | | | |
Name
(Year of Birth) | Position(s) Held with Funds | Length of Time Served | Principal Occupation(s) During Past 5 Years | Number of American Century Portfolios Overseen by Trustee | Other Directorships Held During Past 5 Years |
| Independent Trustees |
|
|
Tanya S. Beder
(1955) | Trustee | Since 2011 | Chairman and CEO, SBCC Group Inc. (independent advisory services) (2006 to present) | 45 | CYS Investments, Inc.; Nabors Industries Ltd. |
Jeremy I. Bulow
(1954) | Trustee | Since 2011 | Professor of Economics, Stanford University, Graduate School of Business (1979 to present) | 45 | None |
Anne Casscells
(1958) | Trustee | Since 2016 | Co-Chief Executive Officer and Chief Investment Officer, Aetos Alternatives Management (investment advisory firm) (2001 to present); Lecturer in Accounting, Stanford University, Graduate School of Business (2009 to 2017) | 45 | None |
Ronald J. Gilson
(1946) | Trustee and Chairman of the Board | Since 1995
(Chairman since 2005) | Charles J. Meyers Professor of Law and Business, Emeritus, Stanford Law School (1979 to 2016); Marc and Eva Stern Professor of Law and Business, Columbia University School of Law (1992 to present) | 50 | None |
|
| | | | | |
Name
(Year of Birth) | Position(s) Held with Funds | Length of Time Served | Principal Occupation(s) During Past 5 Years | Number of American Century Portfolios Overseen by Trustee | Other Directorships Held During Past 5 Years |
| Independent Trustees |
|
|
Frederick L. A. Grauer
(1946) | Trustee | Since 2008 | Senior Advisor, Credit Sesame, Inc. (credit monitoring firm) (2018 to present); Senior Advisor, Course Hero (an educational technology company) (2015 to present); Senior Advisor, iShares by BlackRock, Inc. (investment management firm) (2013 to 2015)
| 45 | None |
Jonathan D. Levin
(1972) | Trustee | Since 2016 | Philip H. Knight Professor and Dean, Graduate School of Business, Stanford University (2016 to present); Professor, Stanford University, (2000 to present); Chair, Department of Economics, Stanford University (2011 to 2014) | 45 | None |
Peter F. Pervere
(1947) | Trustee | Since 2007 | Retired | 45 | None |
John B. Shoven
(1947) | Trustee | Since 2002 | Charles R. Schwab Professor of Economics, Stanford University (1973 to present) | 45 | Cadence Design Systems; Exponent; Financial Engines |
| Interested Trustee |
|
|
Jonathan S. Thomas
(1963) | Trustee and President | Since 2007 | President and Chief Executive Officer, ACC (2007 to present). Also serves as Chief Executive Officer, ACS; Executive Vice President, ACIM; Director, ACC, ACIM and other ACC subsidiaries | 117 | BioMed Valley Discoveries, Inc. |
The Statement of Additional Information has additional information about the fund's trustees and is available without charge, upon request, by calling 1-800-345-2021.
Officers
The following table presents certain information about the executive officers of the funds. Each officer serves as an officer for 16 (in the case of Robert J. Leach, 15) investment companies in the American Century family of funds, unless otherwise noted. No officer is compensated for his or her service as an officer of the funds. The listed officers are interested persons of the funds and are appointed or re-appointed on an annual basis. The mailing address for each of the officers listed below is 4500 Main Street, Kansas City, Missouri 64111.
|
| | |
Name
(Year of Birth) | Offices with the Funds | Principal Occupation(s) During the Past Five Years |
Jonathan S. Thomas
(1963) | Trustee and President since 2007 | President and Chief Executive Officer, ACC (2007 to present). Also serves as Chief Executive Officer, ACS; Executive Vice President, ACIM; Director, ACC, ACIM and other ACC subsidiaries |
R. Wes Campbell
(1974)
| Chief Financial Officer and Treasurer since 2018
| Investment Operations and Investment Accounting, ACS (2000 to present) |
Amy D. Shelton
(1964) | Chief Compliance Officer and Vice President since 2014 | Chief Compliance Officer, American Century funds, (2014 to present); Chief Compliance Officer, ACIM (2014 to present); Chief Compliance Officer, ACIS (2009 to present); Vice President, Client Interactions and Marketing, ACIS (2013 to 2014). Also serves as Vice President, ACIS |
Charles A. Etherington
(1957) | General Counsel since 2007 and Senior Vice President since 2006 | Attorney, ACC (1994 to present); Vice President, ACC (2005 to present); General Counsel, ACC (2007 to present). Also serves as General Counsel, ACIM, ACS, ACIS and other ACC subsidiaries; and Senior Vice President, ACIM and ACS |
C. Jean Wade
(1964) | Vice President since 2012 | Senior Vice President, ACS (2017 to present); Vice President ACS (2000 to 2017) |
Robert J. Leach
(1966) | Vice President since 2006 | Vice President, ACS (2000 to present) |
David H. Reinmiller
(1963) | Vice President since 2000 | Attorney, ACC (1994 to present) Also serves as Vice President, ACIM and ACS |
Ward D. Stauffer
(1960) | Secretary since 2005 | Attorney, ACC (2003 to present) |
Retirement Account Information
As required by law, distributions you receive from certain retirement accounts are subject to federal income tax withholding, unless you elect not to have withholding apply*. Tax will be withheld on the total amount withdrawn even though you may be receiving amounts that are not subject to withholding, such as nondeductible contributions. In such case, excess amounts of withholding could occur. You may adjust your withholding election so that a greater or lesser amount will be withheld.
If you don’t want us to withhold on this amount, you must notify us to not withhold the federal income tax. You may notify us in writing or in certain situations by telephone or through other electronic means. For systematic withdrawals, your withholding election will remain in effect until revoked or changed by filing a new election. You have the right to revoke your election at any time and change your withholding percentage for future distributions.
Remember, even if you elect not to have income tax withheld, you are liable for paying income tax on the taxable portion of your withdrawal. If you elect not to have income tax withheld or you don’t have enough income tax withheld, you may be responsible for payment of estimated tax. You may incur penalties under the estimated tax rules if your withholding and estimated tax payments are not sufficient. You can reduce or defer the income tax on a distribution by directly or indirectly rolling such distribution over to another IRA or eligible plan. You should consult your tax advisor for additional information.
State tax will be withheld if, at the time of your distribution, your address is within one of the mandatory withholding states and you have federal income tax withheld (or as otherwise required by state law). State taxes will be withheld from your distribution in accordance with the respective state rules.
*Some 403(b), 457 and qualified retirement plan distributions may be subject to 20% mandatory withholding, as they are subject to special tax and withholding rules. Your plan administrator or plan sponsor is required to provide you with a special tax notice explaining those rules at the time you request a distribution. If applicable, federal and/or state taxes may be withheld from your distribution amount.
Proxy Voting Policies
Descriptions of the principles and policies that the fund's investment advisor uses in exercising the voting rights associated with the securities purchased and/or held by the fund are available without charge, upon request, by calling 1-800-345-2021 or visiting the "About Us" page of American Century Investments’ website at americancentury.com. A description of the policies is also available on the Securities and Exchange Commission’s website at sec.gov. Information regarding how the investment advisor voted proxies relating to portfolio securities during the most recent 12-month period ended June 30 is available on the "About Us" page at americancentury.com. It is also available at sec.gov.
Quarterly Portfolio Disclosure
The fund files its complete schedule of portfolio holdings with the Securities and Exchange Commission (SEC) for the first and third quarters of each fiscal year on Form N-Q or as an exhibit to its reports on Form N-PORT. The fund’s Forms N-Q and Form N-PORT reports are available on the SEC’s website at sec.gov. The fund also makes its complete schedule of portfolio holdings for the most recent quarter of its fiscal year available on its website at americancentury.com and, upon request, by calling 1-800-345-2021.
|
| | |
| |
| | | |
| Contact Us | americancentury.com | |
| Automated Information Line | 1-800-345-8765 | |
| Investor Services Representative | 1-800-345-2021 or 816-531-5575 | |
| Investors Using Advisors | 1-800-378-9878 | |
| Business, Not-For-Profit, Employer-Sponsored Retirement Plans | 1-800-345-3533 | |
| Banks and Trust Companies, Broker-Dealers, Financial Professionals, Insurance Companies | 1-800-345-6488 | |
| Telecommunications Relay Service for the Deaf | 711 | |
| | | |
| American Century Investment Trust | |
| | | |
Investment Advisor: American Century Investment Management, Inc. Kansas City, Missouri | |
| | | |
| This report and the statements it contains are submitted for the general information of our shareholders. The report is not authorized for distribution to prospective investors unless preceded or accompanied by an effective prospectus. | |
| | | |
©2019 American Century Proprietary Holdings, Inc. All rights reserved.
CL-ANN-92280 1905 | |
|
| |
| | |
| | Annual Report |
| | |
| | March 31, 2019 |
| | |
| | High Income Fund |
| | Investor Class (AHIVX) |
| | I Class (AHIIX) |
| | Y Class (NPHIX) |
| | A Class (AHIAX) |
| | R5 Class (AHIEX) |
| | R6 Class (AHIDX) |
Beginning on January 1, 2021, as permitted by regulations adopted by the Securities and Exchange Commission, paper copies of the fund’s shareholder reports like this one will no longer be sent by mail, unless you specifically request paper copies of the reports from the fund or from your financial intermediary, such as a broker-dealer or bank. Instead, the reports will be made available on a website, and you will be notified by mail each time a report is posted and provided with a website link to access the report.
If you already elected to receive shareholder reports electronically, you will not be affected by this change and you need not take any action. You may elect to receive shareholder reports and other communications from the fund or your financial intermediary electronically by calling or sending an email request to your appropriate contacts as listed on the back cover of this report.
You may elect to receive all future reports in paper free of charge. You can inform the fund or your financial intermediary that you wish to continue receiving paper copies of your shareholder reports by calling or sending an email request to your appropriate contacts as listed on the back cover of this report. Your election to receive reports in paper will apply to all funds held with the fund complex/your financial intermediary.
|
| |
| President's Letter | |
| Performance | |
| Portfolio Commentary | |
| Fund Characteristics | |
| Shareholder Fee Example | |
| Schedule of Investments | |
| Statement of Assets and Liabilities | |
| Statement of Operations | |
| Statement of Changes in Net Assets | |
| Notes to Financial Statements | |
| Financial Highlights | |
| Report of Independent Registered Public Accounting Firm | |
| Management | |
| Additional Information | |
Any opinions expressed in this report reflect those of the author as of the date of the report, and do not necessarily represent the opinions of American Century Investments® or any other person in the American Century Investments organization. Any such opinions are subject to change at any time based upon market or other conditions and American Century Investments disclaims any responsibility to update such opinions. These opinions may not be relied upon as investment advice and, because investment decisions made by American Century Investments funds are based on numerous factors, may not be relied upon as an indication of trading intent on behalf of any American Century Investments fund. Security examples are used for representational purposes only and are not intended as recommendations to purchase or sell securities. Performance information for comparative indices and securities is provided to American Century Investments by third party vendors. To the best of American Century Investments’ knowledge, such information is accurate at the time of printing.
Jonathan Thomas
Dear Investor:
Thank you for reviewing this annual report for the period ended March 31, 2019. Annual reports help convey important information about fund returns, including market factors that affected performance during the reporting period. For additional, updated investment and market insights, we encourage you to visit our website, americancentury.com.
Markets Ended Roller-Coaster Period on Upswing
For the first half of the period, U.S. stocks climbed higher, while bond returns headed lower. Robust economic growth, bolstered by federal tax and regulatory reform, and record corporate earnings results fueled risk-on sentiment that drove stock prices higher. Meanwhile, the combination of strong economic data, the Federal Reserve’s (Fed’s) ongoing rate-hike campaign and an uptick in inflation pushed investment-grade bond returns lower.
Market trends began changing in late 2018. Mounting investor concerns about slowing global economic and earnings growth, U.S.-China trade tensions and rising interest rates triggered widespread volatility. Stock prices plunged as investors sought safe-haven investments, including U.S. Treasuries. Furthermore, the Fed issued another rate hike in December, its fourth of the year, and maintained its hawkish outlook. Investors feared the December rate increase and the Fed’s plans for two more rate hikes in 2019 were too aggressive, and risk-off investing remained in favor.
January brought a renewed sense of stability to the markets. Investors’ concerns about growth and trade eased, and the Fed changed course, pausing its rate-hike campaign amid moderating global growth and inflation. Valuations appeared attractive after the late-2018 sell-off, and risk-on investing resumed. In March, the Fed held rates steady again, hinting additional tightening was off the table for 2019. This news drove stock and bond returns higher and left both asset classes on an upward track to end the period. Overall, stocks (S&P 500 Index) overcame their late-2018 nosedive to gain 9.50% for the period. Bonds (Bloomberg Barclays U.S. Aggregate Bond Index) bounced back from losses early in the period to return 4.48%.
We expect volatility to remain a formidable factor as investors react to global growth trends, central bank policy and geopolitical developments. We believe this scenario underscores the importance of using professionally managed portfolios in pursuit of investment goals. We appreciate your continued trust and confidence in us.
Sincerely,
Jonathan Thomas
President and Chief Executive Officer
American Century Investments
|
| | | | | |
| Total Returns as of March 31, 2019 | |
| | | | Average Annual Returns | |
| | Ticker Symbol | 1 year | 5 years | Since Inception | Inception Date |
| Y Class | NPHIX | 4.97% | 4.24% | 5.81% | 12/27/12 |
| ICE BofAML U.S. High Yield Constrained Index | — | 5.93% | 4.70% | 5.43% | — |
| Investor Class | AHIVX | 4.65% | — | 3.29% | 10/2/17 |
| I Class | AHIIX | 4.86% | — | 3.39% | 10/2/17 |
| A Class | AHIAX | | | | 10/2/17 |
| No sales charge | | 4.50% | — | 3.03% | |
| With sales charge | | -0.16% | — | -0.12% | |
| R5 Class | AHIEX | 4.96% | — | 3.49% | 10/2/17 |
| R6 Class | AHIDX | 5.02% | — | 3.55% | 10/2/17 |
Y Class returns would have been lower if a portion of the fees had not been waived.
Sales charges include initial sales charges and contingent deferred sales charges (CDSCs), as applicable. A Class shares have a 4.50% maximum initial sales charge and may be subject to a maximum CDSC of 1.00%. The SEC requires that mutual funds provide performance information net of maximum sales charges in all cases where charges could be applied.
The fund acquired the net assets and assumed the historical performance of the Nomura High Yield Fund, a series of The Advisors’ Inner Circle Fund III on October 2, 2017. Accordingly, the performance shown for periods prior to October 2, 2017 represents the performance of Class I shares of the Nomura High Yield Fund. In addition, the Nomura High Yield Fund acquired the net assets and assumed the historical performance of the High Yield Fund, a series of Nomura Partners Funds, Inc. on December 8, 2014. Accordingly, the performance shown for periods before December 8, 2014 represents the performance of Class I shares of the High Yield Fund. The Nomura High Yield Fund and the High Yield Fund returns in the table have not been adjusted to reflect the fund’s expenses. If the Nomura High Yield Fund and the High Yield Fund performance information had been adjusted to reflect the fund’s expenses, the performance may have been higher or lower for a given period depending on the expenses incurred by the Nomura High Yield Fund and the High Yield Fund for that period.
Data presented reflect past performance. Past performance is no guarantee of future results. Current performance may be higher or lower than the performance shown. Total returns for periods less than one year are not annualized. Investment return and principal value will fluctuate, and redemption value may be more or less than original cost. Data assumes reinvestment of dividends and capital gains, and none of the charts reflect the deduction of taxes that a shareholder would pay on fund distributions or the redemption of fund shares. To obtain performance data current to the most recent month end, please call 1-800-345-2021 or visit americancentury.com. For additional information about the fund, please consult the prospectus.
|
|
| Growth of $10,000 Over Life of Class |
| $10,000 investment made December 27, 2012 |
Performance for other share classes will vary due to differences in fee structure.
|
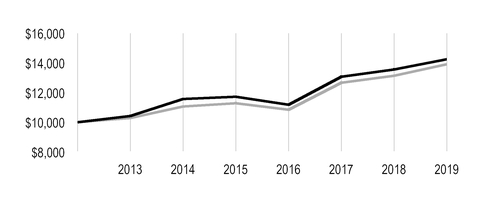
|
| |
| Value on March 31, 2019 |
| | Y Class — $14,245 |
| |
| | ICE BofAML U.S. High Yield Constrained Index — $13,922 |
| |
Ending value of Y Class would have been lower if a portion of the fees had not been waived.
|
| | | | | |
| Total Annual Fund Operating Expenses |
| Investor Class | I Class | Y Class | A Class | R5 Class | R6 Class |
| 0.79% | 0.69% | 0.59% | 1.04% | 0.59% | 0.54% |
The total annual fund operating expenses shown is as stated in the fund’s prospectus current as of the date of this report. The prospectus may vary from the expense ratio shown elsewhere in this report because it is based on a different time period, includes acquired fund fees and expenses, and, if applicable, does not include fee waivers or expense reimbursements.
Data presented reflect past performance. Past performance is no guarantee of future results. Current performance may be higher or lower than the performance shown. Total returns for periods less than one year are not annualized. Investment return and principal value will fluctuate, and redemption value may be more or less than original cost. Data assumes reinvestment of dividends and capital gains, and none of the charts reflect the deduction of taxes that a shareholder would pay on fund distributions or the redemption of fund shares. To obtain performance data current to the most recent month end, please call 1-800-345-2021 or visit americancentury.com. For additional information about the fund, please consult the prospectus.
Investment Advisor: American Century Investment Management, Inc.
Subadvisor: Nomura Corporate Research and Asset Management Inc.
Portfolio Managers: Steve Kotsen and David Crall
Performance Summary
High Income returned 4.97%* for the 12-month period ended March 31, 2019. By comparison, the ICE BofAML U.S. High Yield Constrained Index returned 5.93%. Fund returns reflect operating expenses, while index returns do not.
The U.S. high-yield market began the fiscal year on an upbeat note. The U.S. economy was robust, corporate fundamentals were strong, commodity prices were improving and the default environment was benign. These factors provided an ideal setting for credit risk taking. U.S. real gross domestic product hovered near 4% during the second quarter of 2018. At the same time, the U.S. market showed signs of decoupling from global markets, as the U.S. economy continued to grow at a solid pace due to tax reform, deregulation and, to a lesser degree, government spending. For the first half of the fiscal year, lower-quality segments of the market outperformed their higher-quality, more duration-sensitive counterparts, but this trend would ultimately reverse by the end of 2018. Yields on the U.S. 10-year Treasury note began the fiscal year at 2.74% and rose to 3.24% in early November. The U.S. Federal Reserve (Fed) continued to normalize short-term interest rates with four increases of 25 basis points (bps) each in 2018. Rising interest rates provided a modest headwind for fixed-income securities for much of the year.
Market sentiment started to sour in October 2018, beginning with an underwhelming start to the third-quarter earnings season, compounded by negative narratives surrounding U.S.-China trade relations, softening growth in emerging markets and the eurozone, and geopolitical concerns involving Brexit, Italy’s budget, Saudi Arabia and Iran. These concerns, coupled with the lack of clarity about waivers for Iran oil production, led to a precipitous decline in West Texas Intermediate crude oil prices from a peak of $73 to $45 per barrel to end 2018. This had an immediate impact on the high-yield energy sector. Mounting global growth concerns led to a sell-off in risky assets, and the 10-year Treasury yield ended 2018 at 2.69%. Alongside the sharpest decline for the S&P 500 Index since September 2011, the U.S. high-yield market also came under pressure. The average option-adjusted spread (OAS) on high-yield bonds widened more than 200 bps, from 316 bps to 544 bps, over this period. Despite grinding out positive returns for most of 2018, the U.S. high-yield market gave everything back and then some in the final quarter of 2018.
Many of the fears that drove the negative fourth-quarter sentiment quickly dissipated in January. The Fed shifted course at its January policy meeting, with key changes to the post-meeting statement and new balance sheet normalization guidance. The Fed also ruled out returning to a small balance sheet, confirming its intention to continue to control short-term interest rates by paying interest on reserves and maintaining an ample supply of reserves. At its March 2019 meeting, the Fed moved from the pause in rate hikes it signaled in January to essentially preclude the possibility of any rate increases in 2019. The European Central Bank also lowered its growth outlook and pushed back its first interest rate hike. In the first quarter of 2019, markets responded positively to more dovish central bank policies, strong corporate earnings and further progress on U.S.-China trade talks along with an outlook for steady growth.
*All fund returns referenced in this commentary are for Y Class shares. Performance for other share classes will vary due to differences in fee structure; when Y Class performance exceeds that of the index, other share classes may not. See page 3 for returns for all share classes.
Security Selection Detracted, Sector Allocation Contributed
Overall, security selection detracted from performance relative to the index. Specifically, our selections within the chemicals, metals and mining (excluding steel), specialty retail, wireless telecommunication and energy exploration and production sectors weighed on results. Our selections in these areas offset the effects of positive security selection among the telecommunication satellite, automobile parts and equipment, integrated electric, pharmaceuticals and consumer/commercial/lease financing sectors.
Meanwhile, sector allocation had an overall positive effect on the portfolio’s relative performance. Specifically, our allocations to the oil field equipment and services (underweight), gaming (overweight), pharmaceuticals (overweight), automobile parts and equipment (underweight) and telecommunication wireline (underweight) sectors aided relative results. Overweight positions in the energy exploration and production sector and underweight positions in the cable and satellite TV and specialty retail sectors detracted from relative performance.
Portfolio Positioning and Market Outlook
We believe U.S. high-yield bonds can perform well in a slow-growth economy coupled with target-level inflation and other supportive influences. Recession fears are slowly fading, as U.S. economic strength holds up against a backdrop of slowing global growth. This factor is alleviating concerns about the credit cycle ending and a potential surge in default rates and/or significant downgrades from investment-grade bonds into the high-yield market. Interest rate risk, a modest headwind for the high-yield market for most of 2018, remains subdued because of the economic slowdown and dovish Fed policy. The default rate is very low on a trailing 12-month basis, and while we expect it to increase modestly in 2019, we still expect defaults to remain below historical averages.
|
| |
| MARCH 31, 2019 | |
| Types of Investments in Portfolio | % of net assets |
| Corporate Bonds | 87.3% |
| Bank Loan Obligations | 3.6% |
| Preferred Stocks | 1.5% |
| Convertible Bonds | 0.5% |
| Common Stocks | 0.2% |
| Escrow Interests | —* |
| Warrants | —* |
| Rights | —* |
| Temporary Cash Investments | 5.5% |
| Other Assets and Liabilities | 1.4% |
*Category is less than 0.05% of total net assets.
Fund shareholders may incur two types of costs: (1) transaction costs, including sales charges (loads) on purchase payments and redemption/exchange fees; and (2) ongoing costs, including management fees; distribution and service (12b-1) fees; and other fund expenses. This example is intended to help you understand your ongoing costs (in dollars) of investing in your fund and to compare these costs with the ongoing cost of investing in other mutual funds.
The example is based on an investment of $1,000 made at the beginning of the period and held for the entire period from October 1, 2018 to March 31, 2019.
Actual Expenses
The table provides information about actual account values and actual expenses for each class. You may use the information, together with the amount you invested, to estimate the expenses that you paid over the period. First, identify the share class you own. Then simply divide your account value by $1,000 (for example, an $8,600 account value divided by $1,000 = 8.6), then multiply the result by the number under the heading “Expenses Paid During Period” to estimate the expenses you paid on your account during this period.
If you hold Investor Class shares of any American Century Investments fund, or I Class shares of the American Century Diversified Bond Fund, in an American Century Investments account (i.e., not a financial intermediary or retirement plan account), American Century Investments may charge you a $12.50 semiannual account maintenance fee if the value of those shares is less than $10,000. We will redeem shares automatically in one of your accounts to pay the $12.50 fee. In determining your total eligible investment amount, we will include your investments in all personal accounts (including American Century Investments Brokerage accounts) registered under your Social Security number. Personal accounts include individual accounts, joint accounts, UGMA/UTMA accounts, personal trusts, Coverdell Education Savings Accounts and IRAs (including traditional, Roth, Rollover, SEP-, SARSEP- and SIMPLE-IRAs), and certain other retirement accounts. If you have only business, business retirement, employer-sponsored or American Century Investments Brokerage accounts, you are currently not subject to this fee. If you are subject to the Account Maintenance Fee, your account value could be reduced by the fee amount.
Hypothetical Example for Comparison Purposes
The table also provides information about hypothetical account values and hypothetical expenses based on the actual expense ratio of each class of your fund and an assumed rate of return of 5% per year before expenses, which is not the actual return of a fund’s share class. The hypothetical account values and expenses may not be used to estimate the actual ending account balance or expenses you paid for the period. You may use this information to compare the ongoing costs of investing in your fund and other funds. To do so, compare this 5% hypothetical example with the 5% hypothetical examples that appear in the shareholder reports of the other funds.
Please note that the expenses shown in the table are meant to highlight your ongoing costs only and do not reflect any transactional costs, such as sales charges (loads) or redemption/exchange fees. Therefore, the table is useful in comparing ongoing costs only, and will not help you determine the relative total costs of owning different funds. In addition, if these transactional costs were included, your costs would have been higher.
|
| | | | |
| | Beginning
Account Value
10/1/18 | Ending
Account Value
3/31/19 | Expenses Paid
During Period(1)
10/1/18 - 3/31/19 |
Annualized
Expense Ratio(1) |
| Actual | | | | |
| Investor Class | $1,000 | $1,009.90 | $3.91 | 0.78% |
| I Class | $1,000 | $1,011.50 | $3.41 | 0.68% |
| Y Class | $1,000 | $1,012.00 | $2.91 | 0.58% |
| A Class | $1,000 | $1,009.70 | $5.16 | 1.03% |
| R5 Class | $1,000 | $1,011.90 | $2.91 | 0.58% |
| R6 Class | $1,000 | $1,012.20 | $2.66 | 0.53% |
| Hypothetical | | | | |
| Investor Class | $1,000 | $1,021.04 | $3.93 | 0.78% |
| I Class | $1,000 | $1,021.54 | $3.43 | 0.68% |
| Y Class | $1,000 | $1,022.04 | $2.92 | 0.58% |
| A Class | $1,000 | $1,019.80 | $5.19 | 1.03% |
| R5 Class | $1,000 | $1,022.04 | $2.92 | 0.58% |
| R6 Class | $1,000 | $1,022.29 | $2.67 | 0.53% |
| |
| (1) | Expenses are equal to the class's annualized expense ratio listed in the table above, multiplied by the average account value over the period, multiplied by 182, the number of days in the most recent fiscal half-year, divided by 365, to reflect the one-half year period. Annualized expense ratio reflects actual expenses, including any applicable fee waivers or expense reimbursements and excluding any acquired fund fees and expenses. |
MARCH 31, 2019
|
| | | | | | |
| | Principal Amount/Shares | Value |
| CORPORATE BONDS — 87.3% | | |
| Aerospace and Defense — 2.5% | | |
| Arconic, Inc., 5.125%, 10/1/24 | $ | 550,000 |
| $ | 564,611 |
|
| Arconic, Inc., 5.90%, 2/1/27 | 770,000 |
| 800,311 |
|
| Arconic, Inc., 5.95%, 2/1/37 | 300,000 |
| 296,813 |
|
Bombardier, Inc., 6.00%, 10/15/22(1) | 625,000 |
| 633,594 |
|
Bombardier, Inc., 6.125%, 1/15/23(1) | 350,000 |
| 355,687 |
|
Bombardier, Inc., 7.50%, 12/1/24(1) | 100,000 |
| 104,125 |
|
Bombardier, Inc., 7.875%, 4/15/27(1) | 575,000 |
| 593,687 |
|
BWX Technologies, Inc., 5.375%, 7/15/26(1) | 50,000 |
| 51,000 |
|
Pioneer Holdings LLC / Pioneer Finance Corp., 9.00%, 11/1/22(1) | 100,000 |
| 101,750 |
|
TransDigm UK Holdings plc, 6.875%, 5/15/26(1) | 200,000 |
| 199,500 |
|
| TransDigm, Inc., 6.00%, 7/15/22 | 1,625,000 |
| 1,655,192 |
|
| TransDigm, Inc., 6.50%, 5/15/25 | 100,000 |
| 101,885 |
|
TransDigm, Inc., 6.25%, 3/15/26(1) | 300,000 |
| 312,000 |
|
| TransDigm, Inc., 6.375%, 6/15/26 | 175,000 |
| 173,880 |
|
TransDigm, Inc., 7.50%, 3/15/27(1) | 375,000 |
| 384,844 |
|
| Triumph Group, Inc., 4.875%, 4/1/21 | 25,000 |
| 24,500 |
|
| Triumph Group, Inc., 7.75%, 8/15/25 | 150,000 |
| 143,625 |
|
| | | 6,497,004 |
|
| Air Freight and Logistics — 0.5% | | |
XPO Logistics, Inc., 6.50%, 6/15/22(1) | 1,113,000 |
| 1,141,660 |
|
XPO Logistics, Inc., 6.125%, 9/1/23(1) | 200,000 |
| 202,000 |
|
| | | 1,343,660 |
|
| Airlines — 0.4% | | |
Air Canada, 7.75%, 4/15/21(1) | 675,000 |
| 726,469 |
|
American Airlines Group, Inc., 4.625%, 3/1/20(1) | 175,000 |
| 176,645 |
|
| United Continental Holdings, Inc., 6.00%, 12/1/20 | 25,000 |
| 25,969 |
|
| United Continental Holdings, Inc., 4.25%, 10/1/22 | 50,000 |
| 50,203 |
|
| | | 979,286 |
|
| Auto Components — 0.8% | | |
| American Axle & Manufacturing, Inc., 6.625%, 10/15/22 | 102,000 |
| 104,678 |
|
Cooper-Standard Automotive, Inc., 5.625%, 11/15/26(1) | 100,000 |
| 88,300 |
|
| Dana, Inc., 6.00%, 9/15/23 | 375,000 |
| 385,781 |
|
Delphi Technologies plc, 5.00%, 10/1/25(1) | 275,000 |
| 242,825 |
|
Exide Technologies, 11.00% Cash or 7.00% PIK, 4/30/20 (Acquired 4/30/15 - 12/1/18, Cost $222,336)(2)(8) | 225,883 |
| 177,318 |
|
Panther BF Aggregator 2 LP / Panther Finance Co., Inc., 6.25%, 5/15/26(1)(3) | 175,000 |
| 178,937 |
|
Panther BF Aggregator 2 LP / Panther Finance Co., Inc., 8.50%, 5/15/27(1)(3) | 525,000 |
| 527,625 |
|
| Tenneco, Inc., 5.375%, 12/15/24 | 225,000 |
| 203,625 |
|
| Tenneco, Inc., 5.00%, 7/15/26 | 25,000 |
| 20,125 |
|
|
| | | | | | |
| | Principal Amount/Shares | Value |
| Titan International, Inc., 6.50%, 11/30/23 | $ | 175,000 |
| $ | 162,094 |
|
| | | 2,091,308 |
|
| Automobiles — 0.4% | | |
Tesla, Inc., 5.30%, 8/15/25(1) | 1,100,000 |
| 957,000 |
|
| Banks — 0.3% | | |
Barclays plc, VRN, 8.00%(4) | 200,000 |
| 204,750 |
|
Block Communications, Inc., 6.875%, 2/15/25(1) | 100,000 |
| 104,125 |
|
| CIT Group, Inc., 4.125%, 3/9/21 | 150,000 |
| 152,250 |
|
| CIT Group, Inc., 5.00%, 8/15/22 | 200,000 |
| 208,750 |
|
| CIT Group, Inc., 5.00%, 8/1/23 | 25,000 |
| 26,281 |
|
| | | 696,156 |
|
| Building Products — 0.5% | | |
American Woodmark Corp., 4.875%, 3/15/26(1) | 125,000 |
| 122,813 |
|
Builders FirstSource, Inc., 5.625%, 9/1/24(1) | 355,000 |
| 351,006 |
|
| Griffon Corp., 5.25%, 3/1/22 | 350,000 |
| 345,625 |
|
Masonite International Corp., 5.75%, 9/15/26(1) | 75,000 |
| 76,875 |
|
Northwest Hardwoods, Inc., 7.50%, 8/1/21(1) | 50,000 |
| 31,250 |
|
NWH Escrow Corp., 7.50%, 8/1/21(1) | 50,000 |
| 30,875 |
|
PGT Escrow Issuer, Inc., 6.75%, 8/1/26(1) | 275,000 |
| 286,687 |
|
| | | 1,245,131 |
|
| Capital Markets — 0.6% | | |
| Donnelley Financial Solutions, Inc., 8.25%, 10/15/24 | 325,000 |
| 328,250 |
|
Lions Gate Capital Holdings LLC, 6.375%, 2/1/24(1) | 650,000 |
| 682,500 |
|
Lions Gate Capital Holdings LLC, 5.875%, 11/1/24(1) | 100,000 |
| 103,500 |
|
MSCI, Inc., 5.25%, 11/15/24(1) | 425,000 |
| 441,915 |
|
MSCI, Inc., 4.75%, 8/1/26(1) | 100,000 |
| 103,000 |
|
| | | 1,659,165 |
|
| Chemicals — 1.4% | | |
Alpha 3 BV / Alpha US Bidco, Inc., 6.25%, 2/1/25(1) | 200,000 |
| 194,000 |
|
| Blue Cube Spinco LLC, 10.00%, 10/15/25 | 125,000 |
| 143,631 |
|
| CF Industries, Inc., 7.125%, 5/1/20 | 449,000 |
| 469,766 |
|
| CF Industries, Inc., 5.375%, 3/15/44 | 450,000 |
| 407,250 |
|
Element Solutions, Inc., 5.875%, 12/1/25(1) | 225,000 |
| 226,654 |
|
GCP Applied Technologies, Inc., 5.50%, 4/15/26(1) | 50,000 |
| 51,125 |
|
Hexion, Inc., 10.375%, 2/1/22(1)(7) | 175,000 |
| 147,438 |
|
Hexion, Inc., 13.75%, 2/1/22(1)(7) | 200,000 |
| 70,000 |
|
Hexion, Inc. / Hexion Nova Scotia Finance ULC, 9.00%, 11/15/20(7) | 300,000 |
| 76,500 |
|
Kissner Holdings LP / Kissner Milling Co. Ltd. / BSC Holding, Inc. / Kissner USA, 8.375%, 12/1/22(1) | 100,000 |
| 104,750 |
|
NOVA Chemicals Corp., 5.00%, 5/1/25(1) | 100,000 |
| 98,375 |
|
Nufarm Australia Ltd. / Nufarm Americas, Inc., 5.75%, 4/30/26(1) | 100,000 |
| 93,000 |
|
OCI NV, 6.625%, 4/15/23(1) | 200,000 |
| 208,400 |
|
| Olin Corp., 5.00%, 2/1/30 | 150,000 |
| 147,562 |
|
PQ Corp., 5.75%, 12/15/25(1) | 25,000 |
| 24,469 |
|
| Scotts Miracle-Gro Co. (The), 5.25%, 12/15/26 | 50,000 |
| 49,375 |
|
SPCM SA, 4.875%, 9/15/25(1) | 200,000 |
| 196,310 |
|
TPC Group, Inc., 8.75%, 12/15/20(1) | 275,000 |
| 272,250 |
|
|
| | | | | | |
| | Principal Amount/Shares | Value |
Trinseo Materials Operating SCA / Trinseo Materials Finance, Inc., 5.375%, 9/1/25(1) | $ | 400,000 |
| $ | 380,500 |
|
Tronox Finance plc, 5.75%, 10/1/25(1) | 200,000 |
| 186,250 |
|
Tronox, Inc., 6.50%, 4/15/26(1) | 100,000 |
| 95,815 |
|
| Valvoline, Inc., 5.50%, 7/15/24 | 25,000 |
| 25,500 |
|
Venator Finance S.a.r.l. / Venator Materials LLC, 5.75%, 7/15/25(1) | 50,000 |
| 44,125 |
|
| | | 3,713,045 |
|
| Commercial Services and Supplies — 2.9% | | |
| ADT Security Corp. (The), 5.25%, 3/15/20 | 375,000 |
| 380,625 |
|
| ADT Security Corp. (The), 6.25%, 10/15/21 | 125,000 |
| 131,756 |
|
Aptim Corp., 7.75%, 6/15/25(1) | 275,000 |
| 213,812 |
|
| Aramark Services, Inc., 5.125%, 1/15/24 | 763,000 |
| 786,844 |
|
Aramark Services, Inc., 5.00%, 4/1/25(1) | 100,000 |
| 102,650 |
|
Aramark Services, Inc., 5.00%, 2/1/28(1) | 640,000 |
| 638,963 |
|
Brand Industrial Services, Inc., 8.50%, 7/15/25(1) | 175,000 |
| 157,937 |
|
Garda World Security Corp., 7.25%, 11/15/21(1) | 100,000 |
| 99,750 |
|
Garda World Security Corp., 8.75%, 5/15/25(1) | 225,000 |
| 215,437 |
|
Harland Clarke Holdings Corp., 6.875%, 3/1/20(1) | 25,000 |
| 24,750 |
|
Harland Clarke Holdings Corp., 9.25%, 3/1/21(1) | 125,000 |
| 125,156 |
|
Harland Clarke Holdings Corp., 8.375%, 8/15/22(1) | 250,000 |
| 226,675 |
|
KAR Auction Services, Inc., 5.125%, 6/1/25(1) | 150,000 |
| 149,063 |
|
Matthews International Corp., 5.25%, 12/1/25(1) | 150,000 |
| 144,375 |
|
Midas Intermediate Holdco II LLC / Midas Intermediate Holdco II Finance, Inc., 7.875%, 10/1/22(1) | 75,000 |
| 71,063 |
|
Multi-Color Corp., 6.125%, 12/1/22(1) | 50,000 |
| 51,625 |
|
Nielsen Co. Luxembourg SARL (The), 5.50%, 10/1/21(1) | 400,000 |
| 402,000 |
|
| Nielsen Finance LLC / Nielsen Finance Co., 4.50%, 10/1/20 | 25,000 |
| 25,031 |
|
Nielsen Finance LLC / Nielsen Finance Co., 5.00%, 4/15/22(1) | 125,000 |
| 124,375 |
|
Prime Security Services Borrower LLC / Prime Finance, Inc., 9.25%, 5/15/23(1) | 1,954,000 |
| 2,056,585 |
|
Prime Security Services Borrower LLC / Prime Finance, Inc., 5.25%, 4/15/24(1)(3) | 150,000 |
| 150,375 |
|
Ritchie Bros Auctioneers, Inc., 5.375%, 1/15/25(1) | 175,000 |
| 179,156 |
|
Star Merger Sub, Inc., 6.875%, 8/15/26(1) | 175,000 |
| 179,266 |
|
Star Merger Sub, Inc., 10.25%, 2/15/27(1) | 825,000 |
| 849,750 |
|
TMS International Corp., 7.25%, 8/15/25(1) | 75,000 |
| 72,827 |
|
Waste Pro USA, Inc., 5.50%, 2/15/26(1) | 75,000 |
| 72,563 |
|
| | | 7,632,409 |
|
| Communications Equipment — 0.5% | | |
Anixter, Inc., 6.00%, 12/1/25(1) | 100,000 |
| 105,250 |
|
CommScope Finance LLC, 5.50%, 3/1/24(1) | 200,000 |
| 205,058 |
|
CommScope Finance LLC, 6.00%, 3/1/26(1) | 225,000 |
| 233,296 |
|
CommScope Finance LLC, 8.25%, 3/1/27(1) | 325,000 |
| 338,000 |
|
CommScope Technologies LLC, 6.00%, 6/15/25(1) | 25,000 |
| 24,399 |
|
CommScope, Inc., 5.00%, 6/15/21(1) | 125,000 |
| 125,375 |
|
| Nokia of America Corp., 6.45%, 3/15/29 | 150,000 |
| 147,375 |
|
| Nokia Oyj, 3.375%, 6/12/22 | 25,000 |
| 24,781 |
|
|
| | | | | | |
| | Principal Amount/Shares | Value |
ViaSat, Inc., 5.625%, 4/15/27(1) | $ | 150,000 |
| $ | 153,016 |
|
| | | 1,356,550 |
|
| Construction and Engineering — 0.2% | | |
| Great Lakes Dredge & Dock Corp., 8.00%, 5/15/22 | 50,000 |
| 52,562 |
|
New Enterprise Stone & Lime Co., Inc., 10.125%, 4/1/22(1) | 400,000 |
| 407,000 |
|
New Enterprise Stone & Lime Co., Inc., 6.25%, 3/15/26(1) | 125,000 |
| 121,889 |
|
| | | 581,451 |
|
| Construction Materials — 0.9% | | |
BMC East LLC, 5.50%, 10/1/24(1) | 450,000 |
| 443,812 |
|
CPG Merger Sub LLC, 8.00%, 10/1/21(1) | 100,000 |
| 100,000 |
|
James Hardie International Finance DAC, 4.75%, 1/15/25(1) | 200,000 |
| 198,000 |
|
Standard Industries, Inc., 5.375%, 11/15/24(1) | 325,000 |
| 334,344 |
|
Standard Industries, Inc., 4.75%, 1/15/28(1) | 200,000 |
| 191,500 |
|
| Summit Materials LLC / Summit Materials Finance Corp., 6.125%, 7/15/23 | 125,000 |
| 128,231 |
|
Summit Materials LLC / Summit Materials Finance Corp., 5.125%, 6/1/25(1) | 75,000 |
| 72,563 |
|
Summit Materials LLC / Summit Materials Finance Corp., 6.50%, 3/15/27(1) | 100,000 |
| 101,000 |
|
TerraForm Power Operating LLC, 4.25%, 1/31/23(1) | 125,000 |
| 124,124 |
|
TerraForm Power Operating LLC, 5.00%, 1/31/28(1) | 175,000 |
| 169,531 |
|
TerraForm Power Operating LLC, VRN, 6.625%, 6/15/25(1) | 25,000 |
| 26,281 |
|
| US Concrete, Inc., 6.375%, 6/1/24 | 450,000 |
| 459,000 |
|
| | | 2,348,386 |
|
| Consumer Finance — 3.2% | | |
4finance SA, 10.75%, 5/1/22(1) | 200,000 |
| 191,197 |
|
| Ally Financial, Inc., 3.75%, 11/18/19 | 100,000 |
| 100,500 |
|
| Ally Financial, Inc., 8.00%, 3/15/20 | 100,000 |
| 104,750 |
|
| Ally Financial, Inc., 4.125%, 3/30/20 | 400,000 |
| 403,636 |
|
| Ally Financial, Inc., 7.50%, 9/15/20 | 25,000 |
| 26,563 |
|
| Ally Financial, Inc., 4.125%, 2/13/22 | 100,000 |
| 101,125 |
|
| Ally Financial, Inc., 5.125%, 9/30/24 | 75,000 |
| 79,031 |
|
| Ally Financial, Inc., 8.00%, 11/1/31 | 525,000 |
| 654,281 |
|
ASP AMC Merger Sub, Inc., 8.00%, 5/15/25(1) | 475,000 |
| 216,125 |
|
Cardtronics, Inc. / Cardtronics USA, Inc., 5.50%, 5/1/25(1) | 75,000 |
| 73,688 |
|
Credit Acceptance Corp., 6.625%, 3/15/26(1) | 150,000 |
| 152,625 |
|
FirstCash, Inc., 5.375%, 6/1/24(1) | 50,000 |
| 51,376 |
|
goeasy Ltd., 7.875%, 11/1/22(1) | 100,000 |
| 105,250 |
|
Ladder Capital Finance Holdings LLLP / Ladder Capital Finance Corp., 5.875%, 8/1/21(1) | 300,000 |
| 306,750 |
|
Ladder Capital Finance Holdings LLLP / Ladder Capital Finance Corp., 5.25%, 3/15/22(1) | 175,000 |
| 178,062 |
|
| Navient Corp., 5.00%, 10/26/20 | 25,000 |
| 25,406 |
|
| Navient Corp., 5.875%, 3/25/21 | 425,000 |
| 440,406 |
|
| Navient Corp., 6.625%, 7/26/21 | 50,000 |
| 52,375 |
|
| Navient Corp., 6.50%, 6/15/22 | 125,000 |
| 130,586 |
|
| Navient Corp., 7.25%, 9/25/23 | 275,000 |
| 291,500 |
|
| Navient Corp., 5.875%, 10/25/24 | 75,000 |
| 72,938 |
|
|
| | | | | | |
| | Principal Amount/Shares | Value |
| Navient Corp., 6.75%, 6/25/25 | $ | 150,000 |
| $ | 149,108 |
|
| Navient Corp., 6.75%, 6/15/26 | 675,000 |
| 648,000 |
|
| Navient Corp., MTN, 4.875%, 6/17/19 | 34,000 |
| 34,064 |
|
| Navient Corp., MTN, 8.00%, 3/25/20 | 350,000 |
| 364,875 |
|
| Navient Corp., MTN, 6.125%, 3/25/24 | 550,000 |
| 552,062 |
|
Refinitiv US Holdings, Inc., 6.25%, 5/15/26(1) | 300,000 |
| 304,875 |
|
Refinitiv US Holdings, Inc., 8.25%, 11/15/26(1) | 250,000 |
| 245,937 |
|
| Springleaf Finance Corp., 6.00%, 6/1/20 | 25,000 |
| 25,813 |
|
| Springleaf Finance Corp., 8.25%, 12/15/20 | 25,000 |
| 26,906 |
|
| Springleaf Finance Corp., 6.125%, 5/15/22 | 25,000 |
| 26,000 |
|
| Springleaf Finance Corp., 8.25%, 10/1/23 | 175,000 |
| 193,812 |
|
| Springleaf Finance Corp., 6.125%, 3/15/24 | 50,000 |
| 51,249 |
|
| Springleaf Finance Corp., 6.875%, 3/15/25 | 873,000 |
| 903,555 |
|
| Springleaf Finance Corp., 7.125%, 3/15/26 | 750,000 |
| 764,996 |
|
Verscend Escrow Corp., 9.75%, 8/15/26(1) | 475,000 |
| 475,594 |
|
| | | 8,525,016 |
|
| Containers and Packaging — 2.2% | | |
ARD Finance SA, 7.125% Cash or 7.875% PIK, 9/15/23(5) | 400,000 |
| 400,500 |
|
Ardagh Packaging Finance plc / Ardagh Holdings USA, Inc., 4.25%, 9/15/22(1) | 200,000 |
| 200,500 |
|
Ardagh Packaging Finance plc / Ardagh Holdings USA, Inc., 4.625%, 5/15/23(1) | 400,000 |
| 403,500 |
|
Ardagh Packaging Finance plc / Ardagh Holdings USA, Inc., 7.25%, 5/15/24(1) | 500,000 |
| 528,600 |
|
Ardagh Packaging Finance plc / Ardagh Holdings USA, Inc., 6.00%, 2/15/25(1) | 400,000 |
| 401,000 |
|
| Ball Corp., 4.375%, 12/15/20 | 250,000 |
| 254,375 |
|
| Berry Global, Inc., 6.00%, 10/15/22 | 500,000 |
| 516,250 |
|
BWAY Holding Co., 5.50%, 4/15/24(1) | 125,000 |
| 124,569 |
|
BWAY Holding Co., 7.25%, 4/15/25(1) | 575,000 |
| 556,669 |
|
Cascades, Inc., 5.50%, 7/15/22(1) | 25,000 |
| 25,250 |
|
Flex Acquisition Co., Inc., 6.875%, 1/15/25(1) | 50,000 |
| 48,000 |
|
Flex Acquisition Co., Inc., 7.875%, 7/15/26(1) | 150,000 |
| 145,125 |
|
| Greif, Inc., 7.75%, 8/1/19 | 200,000 |
| 203,500 |
|
Greif, Inc., 6.50%, 3/1/27(1) | 175,000 |
| 179,375 |
|
OI European Group BV, 4.00%, 3/15/23(1) | 100,000 |
| 98,375 |
|
Owens-Brockway Glass Container, Inc., 5.00%, 1/15/22(1) | 50,000 |
| 51,438 |
|
Owens-Brockway Glass Container, Inc., 5.375%, 1/15/25(1) | 125,000 |
| 127,656 |
|
Owens-Brockway Glass Container, Inc., 6.375%, 8/15/25(1) | 500,000 |
| 526,250 |
|
Plastipak Holdings, Inc., 6.25%, 10/15/25(1) | 75,000 |
| 70,500 |
|
| Reynolds Group Issuer, Inc. / Reynolds Group Issuer LLC / Reynolds Group Issuer Lu, 5.75%, 10/15/20 | 969,108 |
| 971,530 |
|
Reynolds Group Issuer, Inc. / Reynolds Group Issuer LLC / Reynolds Group Issuer Lu, 5.125%, 7/15/23(1) | 50,000 |
| 50,875 |
|
Sealed Air Corp., 5.125%, 12/1/24(1) | 50,000 |
| 52,048 |
|
| Silgan Holdings, Inc., 4.75%, 3/15/25 | 25,000 |
| 24,656 |
|
| | | 5,960,541 |
|
|
| | | | | | |
| | Principal Amount/Shares | Value |
| Distributors — 0.1% | | |
American Builders & Contractors Supply Co., Inc., 5.75%, 12/15/23(1) | $ | 125,000 |
| $ | 128,594 |
|
| Diversified Consumer Services — 0.2% | | |
frontdoor, Inc., 6.75%, 8/15/26(1) | 25,000 |
| 25,625 |
|
Graham Holdings Co., 5.75%, 6/1/26(1) | 100,000 |
| 105,250 |
|
| Service Corp., International/US, 5.375%, 5/15/24 | 150,000 |
| 154,313 |
|
Sotheby's, 4.875%, 12/15/25(1) | 100,000 |
| 97,625 |
|
Weight Watchers International, Inc., 8.625%, 12/1/25(1) | 275,000 |
| 248,875 |
|
| | | 631,688 |
|
| Diversified Financial Services — 2.2% | | |
Arrow Bidco LLC, 9.50%, 3/15/24(1) | 75,000 |
| 74,719 |
|
Camelot Finance SA, 7.875%, 10/15/24(1) | 400,000 |
| 424,000 |
|
CNG Holdings, Inc., 9.375%, 5/15/20(1) | 150,000 |
| 148,500 |
|
Cornerstone Chemical Co., 6.75%, 8/15/24(1) | 175,000 |
| 165,375 |
|
Exela Intermediate LLC / Exela Finance, Inc., 10.00%, 7/15/23(1) | 350,000 |
| 357,700 |
|
HUB International Ltd., 7.00%, 5/1/26(1) | 475,000 |
| 471,437 |
|
| Icahn Enterprises LP / Icahn Enterprises Finance Corp., 6.00%, 8/1/20 | 1,100,000 |
| 1,111,825 |
|
| Icahn Enterprises LP / Icahn Enterprises Finance Corp., 5.875%, 2/1/22 | 300,000 |
| 304,839 |
|
| Icahn Enterprises LP / Icahn Enterprises Finance Corp., 6.25%, 2/1/22 | 755,000 |
| 776,404 |
|
| Icahn Enterprises LP / Icahn Enterprises Finance Corp., 6.75%, 2/1/24 | 175,000 |
| 183,094 |
|
| Icahn Enterprises LP / Icahn Enterprises Finance Corp., 6.375%, 12/15/25 | 150,000 |
| 153,937 |
|
Jefferies Finance LLC / JFIN Co-Issuer Corp., 7.375%, 4/1/20(1) | 200,000 |
| 200,500 |
|
Jefferies Finance LLC / JFIN Co-Issuer Corp., 7.25%, 8/15/24(1) | 200,000 |
| 198,000 |
|
| Nationstar Mortgage LLC / Nationstar Capital Corp., 6.50%, 6/1/22 | 150,000 |
| 147,938 |
|
Oxford Finance LLC / Oxford Finance Co-Issuer II, Inc., 6.375%, 12/15/22(1) | 75,000 |
| 77,250 |
|
Solera LLC / Solera Finance, Inc., 10.50%, 3/1/24(1) | 125,000 |
| 136,115 |
|
Tempo Acquisition LLC / Tempo Acquisition Finance Corp., 6.75%, 6/1/25(1) | 150,000 |
| 151,875 |
|
Trident Merger Sub, Inc., 6.625%, 11/1/25(1) | 50,000 |
| 47,000 |
|
Vantiv LLC / Vantiv Issuer Corp., 4.375%, 11/15/25(1) | 400,000 |
| 413,252 |
|
VFH Parent LLC / Orchestra Co-Issuer, Inc., 6.75%, 6/15/22(1) | 75,000 |
| 77,537 |
|
Werner FinCo LP / Werner FinCo, Inc., 8.75%, 7/15/25(1) | 200,000 |
| 173,320 |
|
| | | 5,794,617 |
|
| Diversified Telecommunication Services — 5.6% | | |
Altice France SA, 6.25%, 5/15/24(1) | 400,000 |
| 404,500 |
|
Altice France SA, 7.375%, 5/1/26(1) | 400,000 |
| 393,000 |
|
Altice France SA, 8.125%, 2/1/27(1) | 1,300,000 |
| 1,316,250 |
|
| CenturyLink, Inc., 5.625%, 4/1/20 | 75,000 |
| 76,721 |
|
| CenturyLink, Inc., 6.45%, 6/15/21 | 200,000 |
| 208,750 |
|
| CenturyLink, Inc., 5.80%, 3/15/22 | 250,000 |
| 256,563 |
|
| CenturyLink, Inc., 6.75%, 12/1/23 | 450,000 |
| 470,812 |
|
| CenturyLink, Inc., 7.50%, 4/1/24 | 175,000 |
| 185,500 |
|
|
| | | | | | |
| | Principal Amount/Shares | Value |
| CenturyLink, Inc., 7.60%, 9/15/39 | $ | 475,000 |
| $ | 419,187 |
|
Cogent Communications Group, Inc., 5.375%, 3/1/22(1) | 300,000 |
| 308,250 |
|
| Frontier Communications Corp., 10.50%, 9/15/22 | 1,575,000 |
| 1,208,812 |
|
| Frontier Communications Corp., 11.00%, 9/15/25 | 175,000 |
| 116,186 |
|
Frontier Communications Corp., 8.50%, 4/1/26(1) | 100,000 |
| 93,125 |
|
Frontier Communications Corp., 8.00%, 4/1/27(1) | 325,000 |
| 336,375 |
|
| Hughes Satellite Systems Corp., 6.625%, 8/1/26 | 250,000 |
| 245,625 |
|
Intelsat Connect Finance SA, 9.50%, 2/15/23(1) | 1,150,000 |
| 1,023,845 |
|
Intelsat Jackson Holdings SA, 8.00%, 2/15/24(1) | 75,000 |
| 78,375 |
|
Intelsat Jackson Holdings SA, 8.50%, 10/15/24(1) | 575,000 |
| 562,062 |
|
Intelsat Jackson Holdings SA, 9.75%, 7/15/25(1) | 900,000 |
| 918,270 |
|
| Intelsat Luxembourg SA, 8.125%, 6/1/23 | 300,000 |
| 210,000 |
|
| Level 3 Financing, Inc., 5.375%, 8/15/22 | 125,000 |
| 125,938 |
|
| Level 3 Financing, Inc., 5.625%, 2/1/23 | 700,000 |
| 709,625 |
|
| Level 3 Financing, Inc., 5.375%, 1/15/24 | 50,000 |
| 51,055 |
|
| Qwest Corp., 6.75%, 12/1/21 | 75,000 |
| 79,839 |
|
| Sprint Capital Corp., 6.875%, 11/15/28 | 400,000 |
| 385,500 |
|
| Sprint Capital Corp., 8.75%, 3/15/32 | 1,950,000 |
| 2,062,320 |
|
Virgin Media Finance plc, 6.00%, 10/15/24(1) | 400,000 |
| 414,992 |
|
Virgin Media Finance plc, 5.75%, 1/15/25(1) | 200,000 |
| 204,250 |
|
Windstream Holding of the Midwest, Inc., 6.75%, 4/1/28(7) | 50,000 |
| 39,500 |
|
Windstream Services LLC / Windstream Finance Corp., 7.75%, 10/15/20(7) | 275,000 |
| 71,500 |
|
Windstream Services LLC / Windstream Finance Corp., 10.50%, 6/30/24(1)(7) | 175,000 |
| 129,938 |
|
Windstream Services LLC / Windstream Finance Corp., 8.625%, 10/31/25(1)(7) | 193,000 |
| 184,074 |
|
| Zayo Group LLC / Zayo Capital, Inc., 6.00%, 4/1/23 | 900,000 |
| 915,750 |
|
| Zayo Group LLC / Zayo Capital, Inc., 6.375%, 5/15/25 | 275,000 |
| 277,406 |
|
Zayo Group LLC / Zayo Capital, Inc., 5.75%, 1/15/27(1) | 375,000 |
| 375,112 |
|
| | | 14,859,007 |
|
| Electric Utilities — 1.0% | | |
NextEra Energy Operating Partners LP, 4.25%, 9/15/24(1) | 75,000 |
| 74,719 |
|
NextEra Energy Operating Partners LP, 4.50%, 9/15/27(1) | 175,000 |
| 171,281 |
|
Pacific Gas & Electric Co., 3.50%, 10/1/20(6)(7) | 50,000 |
| 46,250 |
|
Pacific Gas & Electric Co., 6.05%, 3/1/34(6)(7) | 700,000 |
| 698,250 |
|
Pacific Gas & Electric Co., 5.80%, 3/1/37(6)(7) | 300,000 |
| 292,500 |
|
Pacific Gas & Electric Co., 5.40%, 1/15/40(6)(7) | 200,000 |
| 191,000 |
|
Pacific Gas & Electric Co., 5.125%, 11/15/43(6)(7) | 250,000 |
| 227,344 |
|
Vistra Operations Co. LLC, 5.50%, 9/1/26(1) | 550,000 |
| 573,375 |
|
Vistra Operations Co. LLC, 5.625%, 2/15/27(1) | 250,000 |
| 260,625 |
|
| | | 2,535,344 |
|
Electronic Equipment, Instruments and Components† | | |
Itron, Inc., 5.00%, 1/15/26(1) | 25,000 |
| 24,656 |
|
TTM Technologies, Inc., 5.625%, 10/1/25(1) | 75,000 |
| 72,282 |
|
| | | 96,938 |
|
| Energy Equipment and Services — 2.6% | | |
| Apergy Corp., 6.375%, 5/1/26 | 50,000 |
| 50,813 |
|
|
| | | | | | |
| | Principal Amount/Shares | Value |
Archrock Partners LP / Archrock Partners Finance Corp., 6.875%, 4/1/27(1) | $ | 225,000 |
| $ | 229,995 |
|
Basic Energy Services, Inc., 10.75%, 10/15/23(1) | 75,000 |
| 60,375 |
|
Bristow Group, Inc., 8.75%, 3/1/23(1) | 75,000 |
| 54,375 |
|
Calfrac Holdings LP, 8.50%, 6/15/26(1) | 275,000 |
| 214,500 |
|
| CSI Compressco LP / CSI Compressco Finance, Inc., 7.25%, 8/15/22 | 50,000 |
| 44,000 |
|
| Diamond Offshore Drilling, Inc., 7.875%, 8/15/25 | 175,000 |
| 169,750 |
|
| Ensco plc, 7.75%, 2/1/26 | 125,000 |
| 106,094 |
|
| Exterran Energy Solutions LP / EES Finance Corp., 8.125%, 5/1/25 | 125,000 |
| 128,125 |
|
| FTS International, Inc., 6.25%, 5/1/22 | 400,000 |
| 389,000 |
|
| Global Marine, Inc., 7.00%, 6/1/28 | 25,000 |
| 21,688 |
|
Jonah Energy LLC / Jonah Energy Finance Corp., 7.25%, 10/15/25(1) | 125,000 |
| 66,875 |
|
KCA Deutag UK Finance plc, 9.625%, 4/1/23(1) | 200,000 |
| 168,250 |
|
McDermott Technology Americas, Inc. / McDermott Technology US, Inc., 10.625%, 5/1/24(1) | 250,000 |
| 208,750 |
|
| Nabors Industries, Inc., 5.00%, 9/15/20 | 50,000 |
| 50,500 |
|
| Nabors Industries, Inc., 4.625%, 9/15/21 | 75,000 |
| 74,438 |
|
| Nabors Industries, Inc., 5.75%, 2/1/25 | 50,000 |
| 45,062 |
|
Nine Energy Service, Inc., 8.75%, 11/1/23(1) | 125,000 |
| 129,688 |
|
| Noble Holding International Ltd., 7.75%, 1/15/24 | 63,000 |
| 57,037 |
|
Noble Holding International Ltd., 7.875%, 2/1/26(1) | 350,000 |
| 325,937 |
|
| Noble Holding International Ltd., 6.20%, 8/1/40 | 25,000 |
| 15,938 |
|
| Precision Drilling Corp., 5.25%, 11/15/24 | 25,000 |
| 23,500 |
|
Precision Drilling Corp., 7.125%, 1/15/26(1) | 100,000 |
| 99,656 |
|
| Rowan Cos., Inc., 7.375%, 6/15/25 | 125,000 |
| 110,000 |
|
| SESI LLC, 7.125%, 12/15/21 | 250,000 |
| 225,312 |
|
| SESI LLC, 7.75%, 9/15/24 | 225,000 |
| 187,312 |
|
Shelf Drilling Holdings Ltd., 8.25%, 2/15/25(1) | 350,000 |
| 333,375 |
|
Transocean Guardian Ltd., 5.875%, 1/15/24(1) | 354,375 |
| 361,462 |
|
Transocean Pontus Ltd., 6.125%, 8/1/25(1) | 94,500 |
| 96,154 |
|
Transocean Poseidon Ltd., 6.875%, 2/1/27(1) | 225,000 |
| 234,562 |
|
| Transocean, Inc., 5.80%, 10/15/22 | 225,000 |
| 221,625 |
|
Transocean, Inc., 9.00%, 7/15/23(1) | 250,000 |
| 267,500 |
|
Transocean, Inc., 7.25%, 11/1/25(1) | 250,000 |
| 247,812 |
|
Transocean, Inc., 7.50%, 1/15/26(1) | 250,000 |
| 248,125 |
|
| Transocean, Inc., 7.50%, 4/15/31 | 125,000 |
| 107,500 |
|
| Transocean, Inc., 6.80%, 3/15/38 | 50,000 |
| 39,500 |
|
| Transocean, Inc., 9.35%, 12/15/41 | 100,000 |
| 94,125 |
|
| USA Compression Partners LP / USA Compression Finance Corp., 6.875%, 4/1/26 | 175,000 |
| 179,812 |
|
USA Compression Partners LP / USA Compression Finance Corp., 6.875%, 9/1/27(1) | 275,000 |
| 280,844 |
|
| Weatherford International LLC, 9.875%, 3/1/25 | 150,000 |
| 106,875 |
|
| Weatherford International Ltd., 5.125%, 9/15/20 | 150,000 |
| 132,750 |
|
| Weatherford International Ltd., 8.25%, 6/15/23 | 125,000 |
| 89,063 |
|
| Weatherford International Ltd., 9.875%, 2/15/24 | 700,000 |
| 507,500 |
|
|
| | | | | | |
| | Principal Amount/Shares | Value |
| Weatherford International Ltd., 6.50%, 8/1/36 | $ | 25,000 |
| $ | 14,250 |
|
| | | 6,819,804 |
|
| Entertainment — 1.6% | | |
| AMC Entertainment Holdings, Inc., 5.75%, 6/15/25 | 75,000 |
| 70,391 |
|
| AMC Entertainment Holdings, Inc., 5.875%, 11/15/26 | 400,000 |
| 362,000 |
|
| AMC Entertainment Holdings, Inc., 6.125%, 5/15/27 | 250,000 |
| 227,187 |
|
| Cinemark USA, Inc., 5.125%, 12/15/22 | 225,000 |
| 229,219 |
|
| Cinemark USA, Inc., 4.875%, 6/1/23 | 150,000 |
| 152,895 |
|
Live Nation Entertainment, Inc., 5.375%, 6/15/22(1) | 50,000 |
| 50,750 |
|
Live Nation Entertainment, Inc., 5.625%, 3/15/26(1) | 500,000 |
| 517,500 |
|
| Netflix, Inc., 5.375%, 2/1/21 | 200,000 |
| 208,188 |
|
| Netflix, Inc., 5.50%, 2/15/22 | 225,000 |
| 236,812 |
|
| Netflix, Inc., 4.875%, 4/15/28 | 225,000 |
| 223,312 |
|
Netflix, Inc., 5.875%, 11/15/28(1) | 525,000 |
| 555,844 |
|
Netflix, Inc., 6.375%, 5/15/29(1) | 775,000 |
| 839,906 |
|
WMG Acquisition Corp., 5.00%, 8/1/23(1) | 50,000 |
| 51,063 |
|
Ziggo Bond Co. BV, 6.00%, 1/15/27(1) | 300,000 |
| 288,750 |
|
Ziggo BV, 5.50%, 1/15/27(1) | 300,000 |
| 297,750 |
|
| | | 4,311,567 |
|
| Equity Real Estate Investment Trusts (REITs) — 1.1% | | |
| CyrusOne LP / CyrusOne Finance Corp., 5.00%, 3/15/24 | 25,000 |
| 25,594 |
|
| CyrusOne LP / CyrusOne Finance Corp., 5.375%, 3/15/27 | 25,000 |
| 25,930 |
|
| Equinix, Inc., 5.375%, 1/1/22 | 375,000 |
| 385,575 |
|
| Equinix, Inc., 5.375%, 4/1/23 | 350,000 |
| 357,437 |
|
| Equinix, Inc., 5.75%, 1/1/25 | 125,000 |
| 130,078 |
|
| Equinix, Inc., 5.875%, 1/15/26 | 275,000 |
| 290,386 |
|
| Equinix, Inc., 5.375%, 5/15/27 | 150,000 |
| 157,500 |
|
ESH Hospitality, Inc., 5.25%, 5/1/25(1) | 200,000 |
| 199,250 |
|
| FelCor Lodging LP, 6.00%, 6/1/25 | 450,000 |
| 465,187 |
|
| GEO Group, Inc. (The), 6.00%, 4/15/26 | 25,000 |
| 21,125 |
|
| GLP Capital LP / GLP Financing II, Inc., 5.25%, 6/1/25 | 75,000 |
| 78,761 |
|
| GLP Capital LP / GLP Financing II, Inc., 5.375%, 4/15/26 | 50,000 |
| 52,370 |
|
| Iron Mountain, Inc., 5.75%, 8/15/24 | 125,000 |
| 126,563 |
|
| iStar, Inc., 4.625%, 9/15/20 | 75,000 |
| 76,031 |
|
MGM Growth Properties Operating Partnership LP / MGP Finance Co-Issuer, Inc., 5.75%, 2/1/27(1) | 75,000 |
| 77,719 |
|
| RHP Hotel Properties LP / RHP Finance Corp., 5.00%, 4/15/23 | 25,000 |
| 25,250 |
|
| Sabra Health Care LP / Sabra Capital Corp., 5.50%, 2/1/21 | 275,000 |
| 278,266 |
|
| SBA Communications Corp., 4.00%, 10/1/22 | 200,000 |
| 201,720 |
|
Uniti Group LP / Uniti Fiber Holdings, Inc. / CSL Capital LLC, 7.125%, 12/15/24(1) | 50,000 |
| 43,250 |
|
| | | 3,017,992 |
|
| Food and Staples Retailing — 0.2% | | |
| Albertsons Cos. LLC / Safeway, Inc. / New Albertson's, LP / Albertson's LLC, 6.625%, 6/15/24 | 125,000 |
| 126,875 |
|
| Albertsons Cos. LLC / Safeway, Inc. / New Albertson's, LP / Albertson's LLC, 5.75%, 3/15/25 | 200,000 |
| 190,750 |
|
| Ingles Markets, Inc., 5.75%, 6/15/23 | 50,000 |
| 51,188 |
|
|
| | | | | | |
| | Principal Amount/Shares | Value |
| Rite Aid Corp., 7.70%, 2/15/27 | $ | 25,000 |
| $ | 15,750 |
|
US Foods, Inc., 5.875%, 6/15/24(1) | 250,000 |
| 256,875 |
|
| | | 641,438 |
|
| Food Products — 1.0% | | |
| B&G Foods, Inc., 5.25%, 4/1/25 | 100,000 |
| 96,250 |
|
Chobani LLC / Chobani Finance Corp., Inc., 7.50%, 4/15/25(1) | 50,000 |
| 45,063 |
|
Clearwater Seafoods, Inc., 6.875%, 5/1/25(1) | 75,000 |
| 74,531 |
|
Cooke Omega Investments, Inc. / Alpha VesselCo Holdings, Inc., 8.50%, 12/15/22(1) | 225,000 |
| 221,287 |
|
Darling Ingredients, Inc., 5.25%, 4/15/27(1)(3) | 100,000 |
| 101,687 |
|
HLF Financing Sarl LLC / Herbalife International, Inc., 7.25%, 8/15/26(1) | 150,000 |
| 154,687 |
|
JBS Investments GmbH, 7.25%, 4/3/24(1) | 200,000 |
| 205,750 |
|
Pilgrim's Pride Corp., 5.75%, 3/15/25(1) | 175,000 |
| 177,625 |
|
Pilgrim's Pride Corp., 5.875%, 9/30/27(1) | 225,000 |
| 227,250 |
|
Post Holdings, Inc., 5.50%, 3/1/25(1) | 350,000 |
| 355,250 |
|
Post Holdings, Inc., 5.00%, 8/15/26(1) | 50,000 |
| 48,813 |
|
Post Holdings, Inc., 5.75%, 3/1/27(1) | 775,000 |
| 781,781 |
|
Post Holdings, Inc., 5.625%, 1/15/28(1) | 50,000 |
| 49,813 |
|
Sigma Holdco BV, 7.875%, 5/15/26(1) | 200,000 |
| 185,500 |
|
| | | 2,725,287 |
|
| Gas Utilities — 2.3% | | |
American Midstream Partners LP / American Midstream Finance Corp., 9.50%, 12/15/21(1) | 100,000 |
| 92,500 |
|
| Andeavor Logistics LP / Tesoro Logistics Finance Corp., 5.25%, 1/15/25 | 25,000 |
| 25,985 |
|
| Antero Midstream Partners LP / Antero Midstream Finance Corp., 5.375%, 9/15/24 | 325,000 |
| 329,160 |
|
Antero Midstream Partners LP / Antero Midstream Finance Corp., 5.75%, 3/1/27(1) | 200,000 |
| 203,500 |
|
Blue Racer Midstream LLC / Blue Racer Finance Corp., 6.125%, 11/15/22(1) | 240,000 |
| 244,800 |
|
Blue Racer Midstream LLC / Blue Racer Finance Corp., 6.625%, 7/15/26(1) | 50,000 |
| 51,250 |
|
| Cheniere Corpus Christi Holdings LLC, 7.00%, 6/30/24 | 350,000 |
| 395,955 |
|
| Cheniere Corpus Christi Holdings LLC, 5.875%, 3/31/25 | 125,000 |
| 136,250 |
|
| Cheniere Corpus Christi Holdings LLC, 5.125%, 6/30/27 | 250,000 |
| 262,812 |
|
CNX Midstream Partners LP / CNX Midstream Finance Corp., 6.50%, 3/15/26(1) | 150,000 |
| 145,875 |
|
| Crestwood Midstream Partners LP / Crestwood Midstream Finance Corp., 6.25%, 4/1/23 | 535,000 |
| 551,050 |
|
| Crestwood Midstream Partners LP / Crestwood Midstream Finance Corp., 5.75%, 4/1/25 | 100,000 |
| 103,000 |
|
DCP Midstream Operating LP, 5.35%, 3/15/20(1) | 150,000 |
| 152,812 |
|
DCP Midstream Operating LP, 4.75%, 9/30/21(1) | 170,000 |
| 173,400 |
|
| DCP Midstream Operating LP, 4.95%, 4/1/22 | 50,000 |
| 51,313 |
|
| DCP Midstream Operating LP, 5.375%, 7/15/25 | 575,000 |
| 600,875 |
|
| Delek Logistics Partners LP / Delek Logistics Finance Corp., 6.75%, 5/15/25 | 75,000 |
| 74,625 |
|
| Genesis Energy LP / Genesis Energy Finance Corp., 6.50%, 10/1/25 | 50,000 |
| 48,875 |
|
|
| | | | | | |
| | Principal Amount/Shares | Value |
| Genesis Energy LP / Genesis Energy Finance Corp., 6.25%, 5/15/26 | $ | 50,000 |
| $ | 47,500 |
|
Holly Energy Partners LP / Holly Energy Finance Corp., 6.00%, 8/1/24(1) | 75,000 |
| 77,775 |
|
NGPL PipeCo LLC, 4.375%, 8/15/22(1) | 125,000 |
| 127,188 |
|
NGPL PipeCo LLC, 4.875%, 8/15/27(1) | 75,000 |
| 76,031 |
|
| PBF Logistics LP / PBF Logistics Finance Corp., 6.875%, 5/15/23 | 425,000 |
| 434,562 |
|
Rockies Express Pipeline LLC, 6.875%, 4/15/40(1) | 100,000 |
| 107,827 |
|
| SemGroup Corp. / Rose Rock Finance Corp., 5.625%, 7/15/22 | 75,000 |
| 74,531 |
|
| Summit Midstream Holdings LLC / Summit Midstream Finance Corp., 5.50%, 8/15/22 | 200,000 |
| 199,000 |
|
| Summit Midstream Holdings LLC / Summit Midstream Finance Corp., 5.75%, 4/15/25 | 50,000 |
| 47,438 |
|
Superior Plus LP / Superior General Partner, Inc., 7.00%, 7/15/26(1) | 50,000 |
| 51,063 |
|
Tallgrass Energy Partners LP / Tallgrass Energy Finance Corp., 4.75%, 10/1/23(1) | 200,000 |
| 201,938 |
|
Tallgrass Energy Partners LP / Tallgrass Energy Finance Corp., 5.50%, 9/15/24(1) | 75,000 |
| 77,250 |
|
| Targa Resources Partners LP / Targa Resources Partners Finance Corp., 4.25%, 11/15/23 | 225,000 |
| 224,719 |
|
| Targa Resources Partners LP / Targa Resources Partners Finance Corp., 6.75%, 3/15/24 | 25,000 |
| 26,281 |
|
| Targa Resources Partners LP / Targa Resources Partners Finance Corp., 5.125%, 2/1/25 | 75,000 |
| 76,875 |
|
Targa Resources Partners LP / Targa Resources Partners Finance Corp., 5.875%, 4/15/26(1) | 125,000 |
| 132,750 |
|
Targa Resources Partners LP / Targa Resources Partners Finance Corp., 6.50%, 7/15/27(1) | 100,000 |
| 108,125 |
|
| Targa Resources Partners LP / Targa Resources Partners Finance Corp., 5.00%, 1/15/28 | 225,000 |
| 221,917 |
|
Targa Resources Partners LP / Targa Resources Partners Finance Corp., 6.875%, 1/15/29(1) | 125,000 |
| 136,406 |
|
| TransMontaigne Partners LP / TLP Finance Corp., 6.125%, 2/15/26 | 75,000 |
| 70,875 |
|
| | | 6,164,088 |
|
| Health Care Equipment and Supplies — 0.5% | | |
Avantor, Inc., 6.00%, 10/1/24(1) | 100,000 |
| 104,000 |
|
Avantor, Inc., 9.00%, 10/1/25(1) | 550,000 |
| 597,438 |
|
Mallinckrodt International Finance SA / Mallinckrodt CB LLC, 5.75%, 8/1/22(1) | 200,000 |
| 189,000 |
|
Mallinckrodt International Finance SA / Mallinckrodt CB LLC, 5.625%, 10/15/23(1) | 50,000 |
| 41,750 |
|
Ortho-Clinical Diagnostics, Inc. / Ortho-Clinical Diagnostics SA, 6.625%, 5/15/22(1) | 400,000 |
| 381,000 |
|
| | | 1,313,188 |
|
| Health Care Providers and Services — 4.7% | | |
| Centene Corp., 4.75%, 5/15/22 | 125,000 |
| 127,500 |
|
| Centene Corp., 6.125%, 2/15/24 | 250,000 |
| 262,262 |
|
| Centene Corp., 4.75%, 1/15/25 | 100,000 |
| 102,250 |
|
Centene Corp., 5.375%, 6/1/26(1) | 775,000 |
| 809,875 |
|
| CHS / Community Health Systems, Inc., 6.875%, 2/1/22 | 221,000 |
| 148,070 |
|
CHS / Community Health Systems, Inc., 8.625%, 1/15/24(1) | 125,000 |
| 125,469 |
|
CHS / Community Health Systems, Inc., 8.125%, 6/30/24(1) | 71,000 |
| 53,271 |
|
|
| | | | | | |
| | Principal Amount/Shares | Value |
CHS / Community Health Systems, Inc., 8.00%, 3/15/26(1) | $ | 275,000 |
| $ | 263,807 |
|
CHS / Community Health Systems, Inc., VRN, 11.00%, 6/30/23(1) | 125,000 |
| 102,579 |
|
| DaVita, Inc., 5.75%, 8/15/22 | 50,000 |
| 51,063 |
|
| DaVita, Inc., 5.125%, 7/15/24 | 125,000 |
| 123,750 |
|
| DaVita, Inc., 5.00%, 5/1/25 | 50,000 |
| 48,100 |
|
| Encompass Health Corp., 5.75%, 11/1/24 | 425,000 |
| 431,906 |
|
Envision Healthcare Corp., 8.75%, 10/15/26(1) | 1,125,000 |
| 1,005,469 |
|
| HCA Healthcare, Inc., 6.25%, 2/15/21 | 275,000 |
| 289,671 |
|
| HCA, Inc., 7.50%, 2/15/22 | 350,000 |
| 386,855 |
|
| HCA, Inc., 5.375%, 2/1/25 | 300,000 |
| 318,750 |
|
| HCA, Inc., 5.875%, 2/15/26 | 225,000 |
| 243,563 |
|
| HCA, Inc., 5.375%, 9/1/26 | 650,000 |
| 685,750 |
|
| HCA, Inc., 5.625%, 9/1/28 | 1,125,000 |
| 1,192,500 |
|
| HCA, Inc., MTN, 7.58%, 9/15/25 | 1,250,000 |
| 1,418,750 |
|
MEDNAX, Inc., 6.25%, 1/15/27(1) | 125,000 |
| 126,719 |
|
MPH Acquisition Holdings LLC, 7.125%, 6/1/24(1) | 275,000 |
| 275,000 |
|
Polaris Intermediate Corp., 8.50% Cash or 9.25% PIK, 12/1/22(1)(5) | 350,000 |
| 346,587 |
|
| Select Medical Corp., 6.375%, 6/1/21 | 1,035,000 |
| 1,040,175 |
|
Surgery Center Holdings, Inc., 10.00%, 4/15/27(1)(3) | 100,000 |
| 101,750 |
|
| Tenet Healthcare Corp., 6.00%, 10/1/20 | 935,000 |
| 971,231 |
|
| Tenet Healthcare Corp., 8.125%, 4/1/22 | 325,000 |
| 350,870 |
|
| Tenet Healthcare Corp., 6.75%, 6/15/23 | 400,000 |
| 413,500 |
|
| Tenet Healthcare Corp., 4.625%, 7/15/24 | 75,000 |
| 75,469 |
|
Tenet Healthcare Corp., 6.25%, 2/1/27(1) | 225,000 |
| 233,719 |
|
WellCare Health Plans, Inc., 5.375%, 8/15/26(1) | 225,000 |
| 235,969 |
|
| | | 12,362,199 |
|
| Hotels, Restaurants and Leisure — 7.3% | | |
1011778 BC ULC / New Red Finance, Inc., 4.625%, 1/15/22(1) | 400,000 |
| 402,884 |
|
1011778 BC ULC / New Red Finance, Inc., 5.00%, 10/15/25(1) | 925,000 |
| 916,027 |
|
| Boyd Gaming Corp., 6.875%, 5/15/23 | 350,000 |
| 364,875 |
|
| Boyd Gaming Corp., 6.375%, 4/1/26 | 1,325,000 |
| 1,376,344 |
|
| Boyd Gaming Corp., 6.00%, 8/15/26 | 750,000 |
| 771,562 |
|
Boyne USA, Inc., 7.25%, 5/1/25(1) | 175,000 |
| 188,125 |
|
Caesars Resort Collection LLC / CRC Finco, Inc., 5.25%, 10/15/25(1) | 785,000 |
| 759,487 |
|
| Carrols Restaurant Group, Inc., 8.00%, 5/1/22 | 75,000 |
| 76,819 |
|
| Cedar Fair LP / Canada's Wonderland Co. / Magnum Management Corp., 5.375%, 6/1/24 | 150,000 |
| 153,929 |
|
Churchill Downs, Inc., 5.50%, 4/1/27(1) | 175,000 |
| 177,625 |
|
Churchill Downs, Inc., 4.75%, 1/15/28(1) | 200,000 |
| 191,250 |
|
Downstream Development Authority of the Quapaw Tribe of Oklahoma, 10.50%, 2/15/23(1) | 250,000 |
| 259,687 |
|
| Eldorado Resorts, Inc., 7.00%, 8/1/23 | 150,000 |
| 157,337 |
|
| Eldorado Resorts, Inc., 6.00%, 4/1/25 | 475,000 |
| 483,312 |
|
| Eldorado Resorts, Inc., 6.00%, 9/15/26 | 350,000 |
| 357,000 |
|
Enterprise Development Authority (The), 12.00%, 7/15/24(1) | 150,000 |
| 153,000 |
|
Gateway Casinos & Entertainment Ltd., 8.25%, 3/1/24(1) | 380,000 |
| 400,425 |
|
Golden Nugget, Inc., 6.75%, 10/15/24(1) | 850,000 |
| 856,375 |
|
|
| | | | | | |
| | Principal Amount/Shares | Value |
Golden Nugget, Inc., 8.75%, 10/1/25(1) | $ | 850,000 |
| $ | 894,625 |
|
Hilton Domestic Operating Co., Inc., 5.125%, 5/1/26(1) | 500,000 |
| 508,750 |
|
Inn of the Mountain Gods Resort & Casino, 9.25% Cash or 9.25% PIK, 11/30/20(5) | 134,811 |
| 134,137 |
|
IRB Holding Corp., 6.75%, 2/15/26(1) | 275,000 |
| 259,188 |
|
Jack Ohio Finance LLC / Jack Ohio Finance 1 Corp., 6.75%, 11/15/21(1) | 375,000 |
| 387,187 |
|
Jack Ohio Finance LLC / Jack Ohio Finance 1 Corp., 10.25%, 11/15/22(1) | 100,000 |
| 107,750 |
|
Jacobs Entertainment, Inc., 7.875%, 2/1/24(1) | 175,000 |
| 183,750 |
|
KFC Holding Co. / Pizza Hut Holdings LLC / Taco Bell of America LLC, 5.00%, 6/1/24(1) | 600,000 |
| 613,500 |
|
KFC Holding Co. / Pizza Hut Holdings LLC / Taco Bell of America LLC, 5.25%, 6/1/26(1) | 105,000 |
| 106,247 |
|
LTF Merger Sub, Inc., 8.50%, 6/15/23(1) | 1,525,000 |
| 1,572,656 |
|
Marriott Ownership Resorts, Inc. / ILG LLC, 6.50%, 9/15/26(1) | 150,000 |
| 157,718 |
|
Merlin Entertainments plc, 5.75%, 6/15/26(1) | 200,000 |
| 206,750 |
|
| MGM Resorts International, 5.25%, 3/31/20 | 175,000 |
| 178,719 |
|
| MGM Resorts International, 6.625%, 12/15/21 | 425,000 |
| 455,281 |
|
| MGM Resorts International, 7.75%, 3/15/22 | 450,000 |
| 498,375 |
|
| MGM Resorts International, 6.00%, 3/15/23 | 1,325,000 |
| 1,401,187 |
|
| MGM Resorts International, 5.75%, 6/15/25 | 50,000 |
| 52,063 |
|
MGM Resorts International, 5.50%, 4/15/27(3) | 175,000 |
| 178,063 |
|
Mohegan Gaming & Entertainment, 7.875%, 10/15/24(1) | 325,000 |
| 324,187 |
|
Nathan's Famous, Inc., 6.625%, 11/1/25(1) | 200,000 |
| 195,250 |
|
NCL Corp. Ltd., 4.75%, 12/15/21(1) | 396,000 |
| 401,445 |
|
| Scientific Games International, Inc., 6.25%, 9/1/20 | 100,000 |
| 100,500 |
|
| Scientific Games International, Inc., 6.625%, 5/15/21 | 75,000 |
| 76,125 |
|
| Scientific Games International, Inc., 10.00%, 12/1/22 | 518,000 |
| 547,137 |
|
Silversea Cruise Finance Ltd., 7.25%, 2/1/25(1) | 125,000 |
| 135,813 |
|
Station Casinos LLC, 5.00%, 10/1/25(1) | 250,000 |
| 246,875 |
|
Viking Cruises Ltd., 6.25%, 5/15/25(1) | 25,000 |
| 25,500 |
|
Viking Cruises Ltd., 5.875%, 9/15/27(1) | 725,000 |
| 706,875 |
|
VOC Escrow Ltd., 5.00%, 2/15/28(1) | 25,000 |
| 24,438 |
|
Wynn Las Vegas LLC / Wynn Las Vegas Capital Corp., 5.25%, 5/15/27(1) | 350,000 |
| 331,625 |
|
Wynn Macau Ltd., 4.875%, 10/1/24(1) | 200,000 |
| 195,618 |
|
Wynn Macau Ltd., 5.50%, 10/1/27(1) | 200,000 |
| 192,000 |
|
| | | 19,445,397 |
|
| Household Durables — 2.2% | | |
Ashton Woods USA LLC / Ashton Woods Finance Co., 6.75%, 8/1/25(1) | 75,000 |
| 68,625 |
|
| Beazer Homes USA, Inc., 8.75%, 3/15/22 | 100,000 |
| 104,850 |
|
| Beazer Homes USA, Inc., 7.25%, 2/1/23 | 13,000 |
| 12,545 |
|
| Beazer Homes USA, Inc., 6.75%, 3/15/25 | 227,000 |
| 215,650 |
|
Brookfield Residential Properties, Inc., 6.375%, 5/15/25(1) | 100,000 |
| 96,500 |
|
Brookfield Residential Properties, Inc. / Brookfield Residential US Corp., 6.125%, 7/1/22(1) | 75,000 |
| 75,656 |
|
| Century Communities, Inc., 6.875%, 5/15/22 | 175,000 |
| 178,937 |
|
|
| | | | | | |
| | Principal Amount/Shares | Value |
| Century Communities, Inc., 5.875%, 7/15/25 | $ | 100,000 |
| $ | 95,500 |
|
FXI Holdings, Inc., 7.875%, 11/1/24(1) | 50,000 |
| 46,625 |
|
Jeld-Wen, Inc., 4.625%, 12/15/25(1) | 50,000 |
| 47,625 |
|
K Hovnanian Enterprises, Inc., 13.50%, 2/1/26(1) | 26,000 |
| 25,155 |
|
K Hovnanian Enterprises, Inc., 5.00%, 2/1/40(1) | 26,000 |
| 10,790 |
|
| KB Home, 7.00%, 12/15/21 | 125,000 |
| 134,219 |
|
| KB Home, 7.625%, 5/15/23 | 50,000 |
| 54,687 |
|
| KB Home, 6.875%, 6/15/27 | 200,000 |
| 206,500 |
|
| Lennar Corp., 6.25%, 12/15/21 | 50,000 |
| 52,813 |
|
| Lennar Corp., 4.125%, 1/15/22 | 175,000 |
| 176,969 |
|
| Lennar Corp., 5.375%, 10/1/22 | 275,000 |
| 287,719 |
|
| Lennar Corp., 5.25%, 6/1/26 | 25,000 |
| 25,813 |
|
| Lennar Corp., 5.00%, 6/15/27 | 200,000 |
| 201,250 |
|
Mattamy Group Corp., 6.50%, 10/1/25(1) | 25,000 |
| 24,789 |
|
| Meritage Homes Corp., 7.15%, 4/15/20 | 25,000 |
| 25,969 |
|
| Meritage Homes Corp., 6.00%, 6/1/25 | 550,000 |
| 580,250 |
|
Shea Homes LP / Shea Homes Funding Corp., 6.125%, 4/1/25(1) | 400,000 |
| 383,000 |
|
| Taylor Morrison Communities, Inc., 6.625%, 5/15/22 | 175,000 |
| 181,562 |
|
| Toll Brothers Finance Corp., 5.875%, 2/15/22 | 525,000 |
| 554,269 |
|
TopBuild Corp., 5.625%, 5/1/26(1) | 175,000 |
| 173,250 |
|
| TRI Pointe Group, Inc., 5.25%, 6/1/27 | 475,000 |
| 437,594 |
|
| TRI Pointe Group, Inc. / TRI Pointe Homes, Inc., 5.875%, 6/15/24 | 50,000 |
| 50,375 |
|
| Weekley Homes LLC / Weekley Finance Corp., 6.00%, 2/1/23 | 175,000 |
| 169,312 |
|
| Weekley Homes LLC / Weekley Finance Corp., 6.625%, 8/15/25 | 275,000 |
| 264,000 |
|
| William Lyon Homes, Inc., 7.00%, 8/15/22 | 125,000 |
| 125,625 |
|
| William Lyon Homes, Inc., 6.00%, 9/1/23 | 150,000 |
| 145,875 |
|
| William Lyon Homes, Inc., 5.875%, 1/31/25 | 125,000 |
| 118,125 |
|
Williams Scotsman International, Inc., 7.875%, 12/15/22(1) | 175,000 |
| 180,687 |
|
Williams Scotsman International, Inc., 6.875%, 8/15/23(1) | 225,000 |
| 225,562 |
|
| | | 5,758,672 |
|
| Household Products — 0.4% | | |
| Central Garden & Pet Co., 6.125%, 11/15/23 | 75,000 |
| 78,656 |
|
| Central Garden & Pet Co., 5.125%, 2/1/28 | 75,000 |
| 69,000 |
|
Energizer Holdings, Inc., 5.50%, 6/15/25(1) | 700,000 |
| 695,625 |
|
Energizer Holdings, Inc., 6.375%, 7/15/26(1) | 50,000 |
| 51,375 |
|
Energizer Holdings, Inc., 7.75%, 1/15/27(1) | 175,000 |
| 187,032 |
|
| Spectrum Brands, Inc., 6.125%, 12/15/24 | 25,000 |
| 25,375 |
|
| | | 1,107,063 |
|
| Independent Power and Renewable Electricity Producers — 0.9% |
Calpine Corp., 6.00%, 1/15/22(1) | 725,000 |
| 735,875 |
|
| Calpine Corp., 5.375%, 1/15/23 | 450,000 |
| 451,687 |
|
Calpine Corp., 5.875%, 1/15/24(1) | 75,000 |
| 77,063 |
|
| Calpine Corp., 5.50%, 2/1/24 | 75,000 |
| 74,813 |
|
| Calpine Corp., 5.75%, 1/15/25 | 175,000 |
| 174,562 |
|
Calpine Corp., 5.25%, 6/1/26(1) | 150,000 |
| 149,813 |
|
| NRG Energy, Inc., 6.25%, 5/1/24 | 25,000 |
| 25,844 |
|
| NRG Energy, Inc., 6.625%, 1/15/27 | 200,000 |
| 216,000 |
|
|
| | | | | | |
| | Principal Amount/Shares | Value |
Pattern Energy Group, Inc., 5.875%, 2/1/24(1) | $ | 100,000 |
| $ | 102,250 |
|
| Vistra Energy Corp., 7.375%, 11/1/22 | 326,000 |
| 339,040 |
|
| Vistra Energy Corp., 5.875%, 6/1/23 | 25,000 |
| 25,656 |
|
| Vistra Energy Corp., 7.625%, 11/1/24 | 74,000 |
| 78,441 |
|
| | | 2,451,044 |
|
| Industrial Conglomerates — 0.7% | | |
DAE Funding LLC, 4.00%, 8/1/20(1) | 450,000 |
| 452,250 |
|
DAE Funding LLC, 5.25%, 11/15/21(1) | 375,000 |
| 383,437 |
|
DAE Funding LLC, 4.50%, 8/1/22(1) | 225,000 |
| 227,531 |
|
DAE Funding LLC, 5.00%, 8/1/24(1) | 400,000 |
| 406,000 |
|
Grinding Media, Inc. / Moly-Cop AltaSteel Ltd., 7.375%, 12/15/23(1) | 150,000 |
| 144,750 |
|
JPW Industries Holding Corp., 9.00%, 10/1/24(1) | 75,000 |
| 73,500 |
|
Koppers, Inc., 6.00%, 2/15/25(1) | 25,000 |
| 24,563 |
|
RBS Global, Inc. / Rexnord LLC, 4.875%, 12/15/25(1) | 125,000 |
| 124,063 |
|
| | | 1,836,094 |
|
| Insurance — 0.8% | | |
Acrisure LLC / Acrisure Finance, Inc., 8.125%, 2/15/24(1) | 150,000 |
| 155,705 |
|
Acrisure LLC / Acrisure Finance, Inc., 7.00%, 11/15/25(1) | 200,000 |
| 181,000 |
|
| Aircastle Ltd., 5.125%, 3/15/21 | 75,000 |
| 77,424 |
|
Ardonagh Midco 3 plc, 8.625%, 7/15/23(1) | 200,000 |
| 172,000 |
|
Ardonagh Midco 3 plc, 8.625%, 7/15/23(1) | 200,000 |
| 172,000 |
|
AssuredPartners, Inc., 7.00%, 8/15/25(1) | 100,000 |
| 93,000 |
|
Fidelity & Guaranty Life Holdings, Inc., 5.50%, 5/1/25(1) | 175,000 |
| 176,532 |
|
| Genworth Holdings, Inc., 7.70%, 6/15/20 | 575,000 |
| 576,426 |
|
| Genworth Holdings, Inc., 7.625%, 9/24/21 | 75,000 |
| 72,750 |
|
MBIA Insurance Corp., VRN, 14.05%, (3-month LIBOR plus 11.26%), 1/15/33(1)(6)(7) | 125,000 |
| 82,031 |
|
| MBIA, Inc., 7.15%, 7/15/27 | 25,000 |
| 23,125 |
|
NFP Corp., 6.875%, 7/15/25(1) | 175,000 |
| 168,000 |
|
| Prudential Financial, Inc., VRN, 5.70%, 9/15/48 | 50,000 |
| 50,676 |
|
USIS Merger Sub, Inc., 6.875%, 5/1/25(1) | 200,000 |
| 194,750 |
|
| | | 2,195,419 |
|
| Interactive Media and Services — 0.7% | | |
| Match Group, Inc., 6.375%, 6/1/24 | 1,185,000 |
| 1,250,175 |
|
Match Group, Inc., 5.625%, 2/15/29(1) | 150,000 |
| 152,437 |
|
Rackspace Hosting, Inc., 8.625%, 11/15/24(1) | 350,000 |
| 312,683 |
|
| | | 1,715,295 |
|
| IT Services — 0.6% | | |
Banff Merger Sub, Inc., 9.75%, 9/1/26(1) | 225,000 |
| 218,813 |
|
| CDW LLC / CDW Finance Corp., 5.00%, 9/1/23 | 25,000 |
| 25,656 |
|
| CDW LLC / CDW Finance Corp., 5.50%, 12/1/24 | 200,000 |
| 211,250 |
|
| CDW LLC / CDW Finance Corp., 5.00%, 9/1/25 | 275,000 |
| 282,906 |
|
First Data Corp., 5.00%, 1/15/24(1) | 375,000 |
| 384,234 |
|
First Data Corp., 5.75%, 1/15/24(1) | 350,000 |
| 361,200 |
|
Gartner, Inc., 5.125%, 4/1/25(1) | 150,000 |
| 151,980 |
|
| | | 1,636,039 |
|
|
| | | | | | |
| | Principal Amount/Shares | Value |
| Leisure Products — 0.1% | | |
Constellation Merger Sub, Inc., 8.50%, 9/15/25(1) | $ | 200,000 |
| $ | 182,000 |
|
| Mattel, Inc., 5.45%, 11/1/41 | 25,000 |
| 18,625 |
|
| | | 200,625 |
|
| Life Sciences Tools and Services — 0.4% | | |
Charles River Laboratories International, Inc., 5.50%, 4/1/26(1) | 450,000 |
| 468,000 |
|
IQVIA, Inc., 4.875%, 5/15/23(1) | 250,000 |
| 255,650 |
|
IQVIA, Inc., 5.00%, 10/15/26(1) | 200,000 |
| 205,376 |
|
| | | 929,026 |
|
| Machinery — 1.1% | | |
Allison Transmission, Inc., 5.875%, 6/1/29(1) | 150,000 |
| 152,063 |
|
Cleaver-Brooks, Inc., 7.875%, 3/1/23(1) | 50,000 |
| 46,375 |
|
Cloud Crane LLC, 10.125%, 8/1/24(1) | 300,000 |
| 323,250 |
|
Colfax Corp., 6.00%, 2/15/24(1) | 125,000 |
| 130,625 |
|
Colfax Corp., 6.375%, 2/15/26(1) | 75,000 |
| 79,922 |
|
EnPro Industries, Inc., 5.75%, 10/15/26(1) | 150,000 |
| 151,500 |
|
JB Poindexter & Co., Inc., 7.125%, 4/15/26(1) | 125,000 |
| 125,979 |
|
Manitowoc Co., Inc. (The), 9.00%, 4/1/26(1) | 100,000 |
| 101,500 |
|
Mueller Water Products, Inc., 5.50%, 6/15/26(1) | 100,000 |
| 101,750 |
|
Navistar International Corp., 6.625%, 11/1/25(1) | 250,000 |
| 255,312 |
|
SPX FLOW, Inc., 5.625%, 8/15/24(1) | 50,000 |
| 50,500 |
|
SPX FLOW, Inc., 5.875%, 8/15/26(1) | 50,000 |
| 50,500 |
|
Stevens Holding Co., Inc., 6.125%, 10/1/26(1) | 150,000 |
| 155,250 |
|
| Tennant Co., 5.625%, 5/1/25 | 50,000 |
| 50,625 |
|
Vertiv Group Corp., 9.25%, 10/15/24(1) | 425,000 |
| 425,000 |
|
Vertiv Intermediate Holding Corp., 12.00% Cash or 13.00% PIK, 2/15/22(1)(5) | 550,000 |
| 532,812 |
|
Wabash National Corp., 5.50%, 10/1/25(1) | 250,000 |
| 234,375 |
|
| | | 2,967,338 |
|
Marine† | | |
| Martin Midstream Partners LP / Martin Midstream Finance Corp., 7.25%, 2/15/21 | 50,000 |
| 48,750 |
|
| Media — 6.3% | | |
Altice Luxembourg SA, 7.75%, 5/15/22(1) | 1,700,000 |
| 1,704,250 |
|
| AMC Networks, Inc., 4.75%, 12/15/22 | 275,000 |
| 277,750 |
|
| AMC Networks, Inc., 5.00%, 4/1/24 | 350,000 |
| 352,590 |
|
| Cablevision Systems Corp., 8.00%, 4/15/20 | 100,000 |
| 104,750 |
|
| CCO Holdings LLC / CCO Holdings Capital Corp., 5.25%, 3/15/21 | 250,000 |
| 251,251 |
|
| CCO Holdings LLC / CCO Holdings Capital Corp., 5.25%, 9/30/22 | 225,000 |
| 229,641 |
|
| CCO Holdings LLC / CCO Holdings Capital Corp., 5.125%, 2/15/23 | 425,000 |
| 433,500 |
|
CCO Holdings LLC / CCO Holdings Capital Corp., 4.00%, 3/1/23(1) | 450,000 |
| 450,697 |
|
CCO Holdings LLC / CCO Holdings Capital Corp., 5.125%, 5/1/23(1) | 725,000 |
| 743,843 |
|
| CCO Holdings LLC / CCO Holdings Capital Corp., 5.75%, 9/1/23 | 100,000 |
| 102,250 |
|
| CCO Holdings LLC / CCO Holdings Capital Corp., 5.75%, 1/15/24 | 25,000 |
| 25,719 |
|
CCO Holdings LLC / CCO Holdings Capital Corp., 5.875%, 4/1/24(1) | 175,000 |
| 183,332 |
|
CCO Holdings LLC / CCO Holdings Capital Corp., 5.375%, 5/1/25(1) | 125,000 |
| 129,375 |
|
CCO Holdings LLC / CCO Holdings Capital Corp., 5.75%, 2/15/26(1) | 700,000 |
| 735,000 |
|
|
| | | | | | |
| | Principal Amount/Shares | Value |
CCO Holdings LLC / CCO Holdings Capital Corp., 5.50%, 5/1/26(1) | $ | 175,000 |
| $ | 181,125 |
|
CCO Holdings LLC / CCO Holdings Capital Corp., 5.875%, 5/1/27(1) | 350,000 |
| 364,105 |
|
Clear Channel International BV, 8.75%, 12/15/20(1) | 25,000 |
| 25,781 |
|
| Clear Channel Worldwide Holdings, Inc., 6.50%, 11/15/22 | 900,000 |
| 923,625 |
|
| Clear Channel Worldwide Holdings, Inc., 6.50%, 11/15/22 | 150,000 |
| 154,312 |
|
Clear Channel Worldwide Holdings, Inc., 9.25%, 2/15/24(1) | 350,000 |
| 371,875 |
|
Cogent Communications Finance, Inc., 5.625%, 4/15/21(1) | 75,000 |
| 76,125 |
|
| CSC Holdings LLC, 6.75%, 11/15/21 | 50,000 |
| 53,563 |
|
CSC Holdings LLC, 5.125%, 12/15/21(1) | 560,000 |
| 562,100 |
|
CSC Holdings LLC, 5.125%, 12/15/21(1) | 25,000 |
| 25,094 |
|
CSC Holdings LLC, 5.375%, 7/15/23(1) | 200,000 |
| 204,250 |
|
CSC Holdings LLC, 6.50%, 2/1/29(1) | 1,000,000 |
| 1,066,250 |
|
| DISH DBS Corp., 5.125%, 5/1/20 | 100,000 |
| 100,875 |
|
| DISH DBS Corp., 5.875%, 11/15/24 | 75,000 |
| 63,281 |
|
| DISH DBS Corp., 7.75%, 7/1/26 | 575,000 |
| 501,687 |
|
| Embarq Corp., 8.00%, 6/1/36 | 725,000 |
| 709,594 |
|
EW Scripps Co. (The), 5.125%, 5/15/25(1) | 150,000 |
| 143,250 |
|
Gray Television, Inc., 5.125%, 10/15/24(1) | 530,000 |
| 532,650 |
|
Gray Television, Inc., 5.875%, 7/15/26(1) | 300,000 |
| 306,060 |
|
Gray Television, Inc., 7.00%, 5/15/27(1) | 300,000 |
| 319,500 |
|
iHeartCommunications, Inc., 12.00% Cash plus 2.00% PIK, 2/1/21(6)(7) | 105,607 |
| 14,521 |
|
Lamar Media Corp., 5.75%, 2/1/26(1) | 50,000 |
| 52,438 |
|
| Level 3 Parent LLC, 5.75%, 12/1/22 | 125,000 |
| 126,600 |
|
| Mediacom Broadband LLC / Mediacom Broadband Corp., 5.50%, 4/15/21 | 6,000 |
| 6,027 |
|
Midcontinent Communications / Midcontinent Finance Corp., 6.875%, 8/15/23(1) | 200,000 |
| 209,057 |
|
Nexstar Broadcasting, Inc., 6.125%, 2/15/22(1) | 50,000 |
| 50,875 |
|
Nexstar Broadcasting, Inc., 5.625%, 8/1/24(1) | 300,000 |
| 305,250 |
|
Qualitytech LP / QTS Finance Corp., 4.75%, 11/15/25(1) | 125,000 |
| 121,563 |
|
| Quebecor Media, Inc., 5.75%, 1/15/23 | 50,000 |
| 52,375 |
|
Radiate Holdco LLC / Radiate Finance, Inc., 6.625%, 2/15/25(1) | 200,000 |
| 194,000 |
|
Salem Media Group, Inc., 6.75%, 6/1/24(1) | 25,000 |
| 22,750 |
|
| Sinclair Television Group, Inc., 6.125%, 10/1/22 | 225,000 |
| 229,500 |
|
Sinclair Television Group, Inc., 5.125%, 2/15/27(1) | 75,000 |
| 72,188 |
|
Sirius XM Radio, Inc., 3.875%, 8/1/22(1) | 539,000 |
| 537,652 |
|
Sirius XM Radio, Inc., 4.625%, 5/15/23(1) | 250,000 |
| 254,062 |
|
Sirius XM Radio, Inc., 5.00%, 8/1/27(1) | 100,000 |
| 100,435 |
|
TEGNA, Inc., 4.875%, 9/15/21(1) | 25,000 |
| 25,125 |
|
| TEGNA, Inc., 6.375%, 10/15/23 | 50,000 |
| 51,875 |
|
Telenet Finance Luxembourg Notes Sarl, 5.50%, 3/1/28(1) | 200,000 |
| 197,101 |
|
Townsquare Media, Inc., 6.50%, 4/1/23(1) | 150,000 |
| 144,187 |
|
| Tribune Media Co., 5.875%, 7/15/22 | 75,000 |
| 76,922 |
|
Univision Communications, Inc., 6.75%, 9/15/22(1) | 436,000 |
| 444,720 |
|
UPC Holding BV, 5.50%, 1/15/28(1) | 200,000 |
| 200,000 |
|
Videotron Ltd., 5.375%, 6/15/24(1) | 300,000 |
| 314,250 |
|
|
| | | | | | |
| | Principal Amount/Shares | Value |
Virgin Media Secured Finance plc, 5.25%, 1/15/26(1) | $ | 500,000 |
| $ | 505,000 |
|
| | | 16,717,523 |
|
| Metals and Mining — 4.0% | | |
| AK Steel Corp., 7.625%, 10/1/21 | 125,000 |
| 125,937 |
|
Alcoa Nederland Holding BV, 6.75%, 9/30/24(1) | 200,000 |
| 212,500 |
|
Alcoa Nederland Holding BV, 7.00%, 9/30/26(1) | 200,000 |
| 216,624 |
|
Alcoa Nederland Holding BV, 6.125%, 5/15/28(1) | 400,000 |
| 413,000 |
|
Aleris International, Inc., 10.75%, 7/15/23(1) | 250,000 |
| 263,125 |
|
| ArcelorMittal, 5.25%, 8/5/20 | 25,000 |
| 25,695 |
|
Baffinland Iron Mines Corp. / Baffinland Iron Mines LP, 8.75%, 7/15/26(1) | 150,000 |
| 151,323 |
|
Big River Steel LLC / BRS Finance Corp., 7.25%, 9/1/25(1) | 150,000 |
| 157,170 |
|
| Cleveland-Cliffs, Inc., 5.75%, 3/1/25 | 400,000 |
| 384,000 |
|
| Coeur Mining, Inc., 5.875%, 6/1/24 | 200,000 |
| 193,250 |
|
| Commercial Metals Co., 5.75%, 4/15/26 | 75,000 |
| 75,000 |
|
| Commercial Metals Co., 5.375%, 7/15/27 | 50,000 |
| 48,250 |
|
Compass Minerals International, Inc., 4.875%, 7/15/24(1) | 75,000 |
| 70,500 |
|
Constellium NV, 5.75%, 5/15/24(1) | 250,000 |
| 251,250 |
|
Constellium NV, 6.625%, 3/1/25(1) | 250,000 |
| 255,625 |
|
First Quantum Minerals Ltd., 7.00%, 2/15/21(1) | 40,000 |
| 40,750 |
|
First Quantum Minerals Ltd., 7.25%, 5/15/22(1) | 200,000 |
| 202,000 |
|
First Quantum Minerals Ltd., 6.50%, 3/1/24(1) | 1,400,000 |
| 1,321,250 |
|
First Quantum Minerals Ltd., 7.50%, 4/1/25(1) | 200,000 |
| 193,000 |
|
First Quantum Minerals Ltd., 6.875%, 3/1/26(1) | 200,000 |
| 186,250 |
|
FMG Resources August 2006 Pty Ltd., 4.75%, 5/15/22(1) | 50,000 |
| 50,188 |
|
| Freeport-McMoRan, Inc., 4.00%, 11/14/21 | 150,000 |
| 151,312 |
|
| Freeport-McMoRan, Inc., 3.55%, 3/1/22 | 75,000 |
| 74,344 |
|
| Freeport-McMoRan, Inc., 3.875%, 3/15/23 | 375,000 |
| 370,541 |
|
| Freeport-McMoRan, Inc., 4.55%, 11/14/24 | 100,000 |
| 98,250 |
|
| Freeport-McMoRan, Inc., 5.40%, 11/14/34 | 250,000 |
| 228,750 |
|
| Freeport-McMoRan, Inc., 5.45%, 3/15/43 | 850,000 |
| 748,008 |
|
| Hecla Mining Co., 6.875%, 5/1/21 | 225,000 |
| 225,422 |
|
Hillman Group, Inc. (The), 6.375%, 7/15/22(1) | 25,000 |
| 22,438 |
|
Hudbay Minerals, Inc., 7.25%, 1/15/23(1) | 50,000 |
| 51,937 |
|
Hudbay Minerals, Inc., 7.625%, 1/15/25(1) | 175,000 |
| 180,250 |
|
IAMGOLD Corp., 7.00%, 4/15/25(1) | 75,000 |
| 76,312 |
|
| Kinross Gold Corp., 5.125%, 9/1/21 | 50,000 |
| 51,625 |
|
| Kinross Gold Corp., 4.50%, 7/15/27 | 50,000 |
| 47,625 |
|
Mountain Province Diamonds, Inc., 8.00%, 12/15/22(1) | 75,000 |
| 75,094 |
|
Northwest Acquisitions ULC / Dominion Finco, Inc., 7.125%, 11/1/22(1) | 75,000 |
| 66,187 |
|
Novelis Corp., 6.25%, 8/15/24(1) | 365,000 |
| 374,125 |
|
Novelis Corp., 5.875%, 9/30/26(1) | 100,000 |
| 99,750 |
|
| Park-Ohio Industries, Inc., 6.625%, 4/15/27 | 275,000 |
| 275,000 |
|
Petra Diamonds US Treasury plc, 7.25%, 5/1/22(1) | 200,000 |
| 187,500 |
|
| Steel Dynamics, Inc., 5.125%, 10/1/21 | 100,000 |
| 101,000 |
|
Taseko Mines Ltd., 8.75%, 6/15/22(1) | 300,000 |
| 277,500 |
|
|
| | | | | | |
| | Principal Amount/Shares | Value |
| Teck Resources Ltd., 4.50%, 1/15/21 | $ | 75,000 |
| $ | 76,125 |
|
| Teck Resources Ltd., 4.75%, 1/15/22 | 200,000 |
| 205,149 |
|
| Teck Resources Ltd., 3.75%, 2/1/23 | 25,000 |
| 25,003 |
|
| Teck Resources Ltd., 6.125%, 10/1/35 | 200,000 |
| 213,614 |
|
| Teck Resources Ltd., 6.00%, 8/15/40 | 450,000 |
| 468,906 |
|
| Teck Resources Ltd., 6.25%, 7/15/41 | 425,000 |
| 455,370 |
|
| Teck Resources Ltd., 5.20%, 3/1/42 | 100,000 |
| 96,849 |
|
| Teck Resources Ltd., 5.40%, 2/1/43 | 150,000 |
| 149,174 |
|
| United States Steel Corp., 6.875%, 8/15/25 | 150,000 |
| 147,375 |
|
| United States Steel Corp., 6.25%, 3/15/26 | 225,000 |
| 211,239 |
|
Zekelman Industries, Inc., 9.875%, 6/15/23(1) | 25,000 |
| 26,641 |
|
| | | 10,695,102 |
|
Mortgage Real Estate Investment Trusts (REITs)† | | |
| Starwood Property Trust, Inc., 4.75%, 3/15/25 | 25,000 |
| 24,938 |
|
| Multi-Utilities — 0.4% | | |
| AmeriGas Partners LP / AmeriGas Finance Corp., 5.50%, 5/20/25 | 125,000 |
| 125,156 |
|
| AmeriGas Partners LP / AmeriGas Finance Corp., 5.75%, 5/20/27 | 100,000 |
| 99,250 |
|
Clearway Energy Operating LLC, 5.75%, 10/15/25(1) | 175,000 |
| 176,313 |
|
| Clearway Energy Operating LLC, 5.00%, 9/15/26 | 150,000 |
| 143,625 |
|
| GenOn Energy, Inc. / NRG Americas, Inc., VRN, 9.39%, (6-month LIBOR plus 6.50%), 12/1/23 | 22,043 |
| 21,988 |
|
LBC Tank Terminals Holding Netherlands BV, 6.875%, 5/15/23(1) | 200,000 |
| 190,500 |
|
Talen Energy Supply LLC, 9.50%, 7/15/22(1) | 100,000 |
| 108,000 |
|
Talen Energy Supply LLC, 10.50%, 1/15/26(1) | 200,000 |
| 209,400 |
|
| | | 1,074,232 |
|
| Multiline Retail — 0.1% | | |
JC Penney Corp., Inc., 8.625%, 3/15/25(1) | 250,000 |
| 147,500 |
|
| JC Penney Corp., Inc., 6.375%, 10/15/36 | 125,000 |
| 44,375 |
|
Neiman Marcus Group Ltd. LLC, 8.00%, 10/15/21(1) | 50,000 |
| 26,750 |
|
Neiman Marcus Group Ltd. LLC, 8.75% Cash or 9.50% PIK, 10/15/21(1)(5) | 124,505 |
| 65,988 |
|
| | | 284,613 |
|
| Oil, Gas and Consumable Fuels — 9.3% | | |
| Alta Mesa Holdings LP / Alta Mesa Finance Services Corp., 7.875%, 12/15/24 | 250,000 |
| 95,000 |
|
| Antero Resources Corp., 5.375%, 11/1/21 | 75,000 |
| 75,563 |
|
Ascent Resources Utica Holdings LLC / ARU Finance Corp., 10.00%, 4/1/22(1) | 236,000 |
| 259,671 |
|
Ascent Resources Utica Holdings LLC / ARU Finance Corp., 7.00%, 11/1/26(1) | 175,000 |
| 169,094 |
|
| Brazos Valley Longhorn LLC / Brazos Valley Longhorn Finance Corp., 6.875%, 2/1/25 | 275,000 |
| 278,781 |
|
Bruin E&P Partners LLC, 8.875%, 8/1/23(1) | 625,000 |
| 598,437 |
|
| California Resources Corp., 5.00%, 1/15/20 | 50,000 |
| 47,250 |
|
California Resources Corp., 8.00%, 12/15/22(1) | 1,300,000 |
| 1,024,140 |
|
| Callon Petroleum Co., 6.125%, 10/1/24 | 675,000 |
| 681,750 |
|
| Callon Petroleum Co., 6.375%, 7/1/26 | 50,000 |
| 50,375 |
|
| Carrizo Oil & Gas, Inc., 6.25%, 4/15/23 | 1,150,000 |
| 1,135,648 |
|
Centennial Resource Production LLC, 5.375%, 1/15/26(1) | 75,000 |
| 72,281 |
|
|
| | | | | | |
| | Principal Amount/Shares | Value |
Chaparral Energy, Inc., 8.75%, 7/15/23(1) | $ | 300,000 |
| $ | 207,000 |
|
| Cheniere Energy Partners LP, 5.25%, 10/1/25 | 200,000 |
| 205,250 |
|
| Chesapeake Energy Corp., 6.625%, 8/15/20 | 361,000 |
| 372,281 |
|
| Chesapeake Energy Corp., 6.875%, 11/15/20 | 300,000 |
| 309,750 |
|
| Chesapeake Energy Corp., 5.375%, 6/15/21 | 75,000 |
| 75,000 |
|
| Chesapeake Energy Corp., 8.00%, 1/15/25 | 475,000 |
| 486,875 |
|
Citgo Holding, Inc., 10.75%, 2/15/20(1) | 925,000 |
| 950,622 |
|
CITGO Petroleum Corp., 6.25%, 8/15/22(1) | 50,000 |
| 49,875 |
|
Cloud Peak Energy Resources LLC / Cloud Peak Energy Finance Corp., 12.00%, 11/1/21(6)(7) | 125,000 |
| 22,813 |
|
Cloud Peak Energy Resources LLC / Cloud Peak Energy Finance Corp., 6.375%, 3/15/24(6)(7) | 500,000 |
| 30,000 |
|
| CNX Resources Corp., 5.875%, 4/15/22 | 196,000 |
| 196,490 |
|
CONSOL Energy, Inc., 11.00%, 11/15/25(1) | 100,000 |
| 113,750 |
|
| Continental Resources, Inc., 4.90%, 6/1/44 | 25,000 |
| 25,536 |
|
Covey Park Energy LLC / Covey Park Finance Corp., 7.50%, 5/15/25(1) | 275,000 |
| 256,355 |
|
CrownRock LP / CrownRock Finance, Inc., 5.625%, 10/15/25(1) | 425,000 |
| 409,594 |
|
| CVR Refining LLC / Coffeyville Finance, Inc., 6.50%, 11/1/22 | 50,000 |
| 50,750 |
|
Denbury Resources, Inc., 9.00%, 5/15/21(1) | 534,000 |
| 521,985 |
|
| Denbury Resources, Inc., 6.375%, 8/15/21 | 850,000 |
| 663,000 |
|
Denbury Resources, Inc., 9.25%, 3/31/22(1) | 86,000 |
| 83,420 |
|
Denbury Resources, Inc., 7.50%, 2/15/24(1) | 175,000 |
| 150,281 |
|
| Energy Transfer Operating LP, 7.50%, 10/15/20 | 50,000 |
| 53,253 |
|
| Energy Transfer Operating LP, 4.25%, 3/15/23 | 525,000 |
| 539,680 |
|
| Energy Transfer Operating LP, 5.25%, 4/15/29 | 25,000 |
| 26,875 |
|
| Energy Transfer Operating LP, 6.25%, 4/15/49 | 25,000 |
| 28,060 |
|
| EnLink Midstream Partners LP, 4.40%, 4/1/24 | 175,000 |
| 173,906 |
|
| EnLink Midstream Partners LP, 4.85%, 7/15/26 | 350,000 |
| 348,687 |
|
| EnLink Midstream Partners LP, 5.60%, 4/1/44 | 50,000 |
| 45,000 |
|
| EnLink Midstream Partners LP, 5.05%, 4/1/45 | 75,000 |
| 65,063 |
|
| EnLink Midstream Partners LP, 5.45%, 6/1/47 | 150,000 |
| 134,250 |
|
| EP Energy LLC / Everest Acquisition Finance, Inc., 9.375%, 5/1/20 | 462,000 |
| 212,520 |
|
| EP Energy LLC / Everest Acquisition Finance, Inc., 6.375%, 6/15/23 | 525,000 |
| 107,625 |
|
EP Energy LLC / Everest Acquisition Finance, Inc., 9.375%, 5/1/24(1) | 1,792,000 |
| 654,080 |
|
EP Energy LLC / Everest Acquisition Finance, Inc., 8.00%, 2/15/25(1) | 50,000 |
| 17,500 |
|
Extraction Oil & Gas, Inc., 7.375%, 5/15/24(1) | 50,000 |
| 42,000 |
|
Extraction Oil & Gas, Inc., 5.625%, 2/1/26(1) | 225,000 |
| 173,812 |
|
| Ferrellgas LP / Ferrellgas Finance Corp., 6.50%, 5/1/21 | 75,000 |
| 66,094 |
|
| Ferrellgas LP / Ferrellgas Finance Corp., 6.75%, 1/15/22 | 25,000 |
| 21,938 |
|
| Ferrellgas Partners LP / Ferrellgas Partners Finance Corp., 8.625%, 6/15/20 | 50,000 |
| 37,938 |
|
| Ferrellgas Partners LP / Ferrellgas Partners Finance Corp., 8.625%, 6/15/20 | 50,000 |
| 37,938 |
|
| Gulfport Energy Corp., 6.625%, 5/1/23 | 73,000 |
| 71,175 |
|
| Gulfport Energy Corp., 6.00%, 10/15/24 | 125,000 |
| 114,080 |
|
| Gulfport Energy Corp., 6.375%, 5/15/25 | 75,000 |
| 68,156 |
|
|
| | | | | | |
| | Principal Amount/Shares | Value |
| Gulfport Energy Corp., 6.375%, 1/15/26 | $ | 100,000 |
| $ | 89,000 |
|
| Halcon Resources Corp., 6.75%, 2/15/25 | 150,000 |
| 90,750 |
|
Hess Infrastructure Partners LP / Hess Infrastructure Partners Finance Corp., 5.625%, 2/15/26(1) | 200,000 |
| 204,500 |
|
| HighPoint Operating Corp., 7.00%, 10/15/22 | 50,000 |
| 47,250 |
|
Hilcorp Energy I LP / Hilcorp Finance Co., 6.25%, 11/1/28(1) | 400,000 |
| 403,000 |
|
Indigo Natural Resources LLC, 6.875%, 2/15/26(1) | 200,000 |
| 178,000 |
|
| Jagged Peak Energy LLC, 5.875%, 5/1/26 | 350,000 |
| 348,792 |
|
Jones Energy Holdings LLC / Jones Energy Finance Corp., 6.75%, 4/1/22(6)(7) | 75,000 |
| 2,625 |
|
Jones Energy Holdings LLC / Jones Energy Finance Corp., 9.25%, 3/15/23(6)(7) | 75,000 |
| 2,625 |
|
Jones Energy Holdings LLC / Jones Energy Finance Corp., 9.25%, 3/15/23(1)(6)(7) | 150,000 |
| 82,875 |
|
| Laredo Petroleum, Inc., 5.625%, 1/15/22 | 350,000 |
| 321,562 |
|
Lonestar Resources America, Inc., 11.25%, 1/1/23(1) | 100,000 |
| 97,500 |
|
Magnolia Oil & Gas Operating LLC / Magnolia Oil & Gas Finance Corp., 6.00%, 8/1/26(1) | 150,000 |
| 152,250 |
|
| Matador Resources Co., 5.875%, 9/15/26 | 150,000 |
| 150,375 |
|
MEG Energy Corp., 6.375%, 1/30/23(1) | 400,000 |
| 371,500 |
|
Moss Creek Resources Holdings, Inc., 7.50%, 1/15/26(1) | 375,000 |
| 347,812 |
|
| Murphy Oil Corp., 4.45%, 12/1/22 | 100,000 |
| 101,312 |
|
| Murphy Oil Corp., 6.875%, 8/15/24 | 750,000 |
| 794,516 |
|
| Murphy Oil Corp., 5.75%, 8/15/25 | 100,000 |
| 103,356 |
|
Murray Energy Corp., 11.25%, 4/15/21(1) | 150,000 |
| 80,250 |
|
Murray Energy Corp., 9.00% Cash plus 3.00% PIK, 4/15/24(1) | 866,713 |
| 368,353 |
|
| Newfield Exploration Co., 5.75%, 1/30/22 | 50,000 |
| 53,424 |
|
Northern Oil and Gas, Inc., 8.50% Cash or 8.50% Cash plus 1.00% PIK, 5/15/23(8) | 150,375 |
| 156,390 |
|
| Oasis Petroleum, Inc., 6.50%, 11/1/21 | 375,000 |
| 372,187 |
|
| Oasis Petroleum, Inc., 6.875%, 3/15/22 | 100,000 |
| 101,250 |
|
Oasis Petroleum, Inc., 6.25%, 5/1/26(1) | 250,000 |
| 238,750 |
|
Parkland Fuel Corp., 6.00%, 4/1/26(1) | 50,000 |
| 50,703 |
|
Parsley Energy LLC / Parsley Finance Corp., 6.25%, 6/1/24(1) | 125,000 |
| 129,531 |
|
Parsley Energy LLC / Parsley Finance Corp., 5.625%, 10/15/27(1) | 25,000 |
| 25,063 |
|
| PDC Energy, Inc., 6.125%, 9/15/24 | 100,000 |
| 100,250 |
|
Peabody Energy Corp., 6.00%, 3/31/22(1) | 175,000 |
| 176,969 |
|
| QEP Resources, Inc., 5.625%, 3/1/26 | 100,000 |
| 91,000 |
|
| Range Resources Corp., 5.875%, 7/1/22 | 50,000 |
| 50,750 |
|
| Range Resources Corp., 5.00%, 8/15/22 | 400,000 |
| 398,000 |
|
| Range Resources Corp., 5.00%, 3/15/23 | 25,000 |
| 24,594 |
|
Rockpoint Gas Storage Canada Ltd., 7.00%, 3/31/23(1) | 75,000 |
| 74,719 |
|
| Sanchez Energy Corp., 7.75%, 6/15/21 | 475,000 |
| 68,281 |
|
| Sanchez Energy Corp., 6.125%, 1/15/23 | 775,000 |
| 108,500 |
|
| SemGroup Corp., 6.375%, 3/15/25 | 100,000 |
| 94,500 |
|
| SemGroup Corp., 7.25%, 3/15/26 | 100,000 |
| 97,500 |
|
Seven Generations Energy Ltd., 6.875%, 6/30/23(1) | 150,000 |
| 155,250 |
|
Seven Generations Energy Ltd., 5.375%, 9/30/25(1) | 150,000 |
| 147,187 |
|
| SM Energy Co., 6.125%, 11/15/22 | 550,000 |
| 552,750 |
|
|
| | | | | | |
| | Principal Amount/Shares | Value |
| SM Energy Co., 5.625%, 6/1/25 | $ | 325,000 |
| $ | 302,133 |
|
Southern Star Central Corp., 5.125%, 7/15/22(1) | 75,000 |
| 75,188 |
|
| Southwestern Energy Co., 6.20%, 1/23/25 | 646,000 |
| 637,925 |
|
| SRC Energy, Inc., 6.25%, 12/1/25 | 125,000 |
| 112,225 |
|
| Suburban Propane Partners LP / Suburban Energy Finance Corp., 5.50%, 6/1/24 | 75,000 |
| 73,433 |
|
| Sunoco LP / Sunoco Finance Corp., 4.875%, 1/15/23 | 431,000 |
| 438,930 |
|
| Sunoco LP / Sunoco Finance Corp., 5.50%, 2/15/26 | 50,000 |
| 49,625 |
|
Sunoco LP / Sunoco Finance Corp., 6.00%, 4/15/27(1) | 325,000 |
| 326,625 |
|
| Sunoco LP / Sunoco Finance Corp., 5.875%, 3/15/28 | 50,000 |
| 49,750 |
|
Vine Oil & Gas LP / Vine Oil & Gas Finance Corp., 8.75%, 4/15/23(1) | 225,000 |
| 180,000 |
|
Vine Oil & Gas LP / Vine Oil & Gas Finance Corp., 9.75%, 4/15/23(1) | 400,000 |
| 332,000 |
|
Warrior Met Coal, Inc., 8.00%, 11/1/24(1) | 198,000 |
| 206,910 |
|
| Whiting Petroleum Corp., 5.75%, 3/15/21 | 850,000 |
| 864,025 |
|
| Williams Cos., Inc. (The), 7.875%, 9/1/21 | 75,000 |
| 82,935 |
|
| Williams Cos., Inc. (The), 4.55%, 6/24/24 | 350,000 |
| 369,848 |
|
| WPX Energy, Inc., 6.00%, 1/15/22 | 19,000 |
| 19,808 |
|
| WPX Energy, Inc., 8.25%, 8/1/23 | 250,000 |
| 282,500 |
|
| | | 24,717,858 |
|
| Paper and Forest Products — 0.2% | | |
| Mercer International, Inc., 6.50%, 2/1/24 | 175,000 |
| 179,813 |
|
Mercer International, Inc., 7.375%, 1/15/25(1) | 175,000 |
| 184,187 |
|
Schweitzer-Mauduit International, Inc., 6.875%, 10/1/26(1) | 150,000 |
| 151,875 |
|
| | | 515,875 |
|
Personal Products† | | |
First Quality Finance Co., Inc., 5.00%, 7/1/25(1) | 25,000 |
| 24,376 |
|
High Ridge Brands Co., 8.875%, 3/15/25(1) | 50,000 |
| 20,250 |
|
Prestige Brands, Inc., 6.375%, 3/1/24(1) | 25,000 |
| 25,562 |
|
| Revlon Consumer Products Corp., 6.25%, 8/1/24 | 100,000 |
| 52,250 |
|
| | | 122,438 |
|
| Pharmaceuticals — 2.4% | | |
Bausch Health Americas, Inc., 8.50%, 1/31/27(1) | 275,000 |
| 292,187 |
|
Bausch Health Cos., Inc., 5.50%, 3/1/23(1) | 97,000 |
| 97,832 |
|
Bausch Health Cos., Inc., 5.875%, 5/15/23(1) | 205,000 |
| 207,819 |
|
Bausch Health Cos., Inc., 7.00%, 3/15/24(1) | 50,000 |
| 53,025 |
|
Bausch Health Cos., Inc., 6.125%, 4/15/25(1) | 975,000 |
| 967,687 |
|
Bausch Health Cos., Inc., 9.00%, 12/15/25(1) | 1,900,000 |
| 2,071,095 |
|
Bausch Health Cos., Inc., 5.75%, 8/15/27(1) | 75,000 |
| 77,063 |
|
Eagle Holding Co. II LLC, 7.625% Cash or 8.375% PIK, 5/15/22(1)(5) | 550,000 |
| 556,187 |
|
Elanco Animal Health, Inc., 3.91%, 8/27/21(1) | 25,000 |
| 25,432 |
|
Elanco Animal Health, Inc., 4.27%, 8/28/23(1) | 50,000 |
| 51,584 |
|
Endo Dac / Endo Finance LLC / Endo Finco, Inc., 6.00%, 7/15/23(1) | 1,023,000 |
| 792,825 |
|
Endo Dac / Endo Finance LLC / Endo Finco, Inc., 6.00%, 2/1/25(1) | 400,000 |
| 292,000 |
|
Par Pharmaceutical, Inc., 7.50%, 4/1/27(1) | 50,000 |
| 50,813 |
|
Syneos Health, Inc. / inVentiv Health, Inc. / inVentiv Health Clinical, Inc., 7.50%, 10/1/24(1) | 202,000 |
| 213,615 |
|
| Teva Pharmaceutical Finance Netherlands III BV, 6.00%, 4/15/24 | 400,000 |
| 401,762 |
|
|
| | | | | | |
| | Principal Amount/Shares | Value |
West Street Merger Sub, Inc., 6.375%, 9/1/25(1) | $ | 100,000 |
| $ | 97,750 |
|
| | | 6,248,676 |
|
| Real Estate Management and Development — 0.7% | | |
Five Point Operating Co. LP / Five Point Capital Corp., 7.875%, 11/15/25(1) | 50,000 |
| 48,000 |
|
Greystar Real Estate Partners LLC, 5.75%, 12/1/25(1) | 75,000 |
| 75,375 |
|
Howard Hughes Corp. (The), 5.375%, 3/15/25(1) | 275,000 |
| 275,000 |
|
Hunt Cos., Inc., 6.25%, 2/15/26(1) | 250,000 |
| 233,750 |
|
| Kennedy-Wilson, Inc., 5.875%, 4/1/24 | 150,000 |
| 149,812 |
|
| Newmark Group, Inc., 6.125%, 11/15/23 | 150,000 |
| 154,807 |
|
Realogy Group LLC / Realogy Co-Issuer Corp., 5.25%, 12/1/21(1) | 200,000 |
| 201,750 |
|
Realogy Group LLC / Realogy Co-Issuer Corp., 4.875%, 6/1/23(1) | 525,000 |
| 490,875 |
|
Realogy Group LLC / Realogy Co-Issuer Corp., 9.375%, 4/1/27(1) | 100,000 |
| 102,625 |
|
| | | 1,731,994 |
|
| Road and Rail — 0.3% | | |
Avolon Holdings Funding Ltd., 5.25%, 5/15/24(1) | 100,000 |
| 103,250 |
|
Park Aerospace Holdings Ltd., 3.625%, 3/15/21(1) | 100,000 |
| 99,500 |
|
Park Aerospace Holdings Ltd., 5.25%, 8/15/22(1) | 500,000 |
| 513,700 |
|
Park Aerospace Holdings Ltd., 5.50%, 2/15/24(1) | 125,000 |
| 130,000 |
|
| | | 846,450 |
|
| Semiconductors and Semiconductor Equipment — 1.2% | | |
| Advanced Micro Devices, Inc., 7.50%, 8/15/22 | 298,000 |
| 333,387 |
|
| Advanced Micro Devices, Inc., 7.00%, 7/1/24 | 317,000 |
| 332,653 |
|
| Amkor Technology, Inc., 6.375%, 10/1/22 | 100,000 |
| 101,940 |
|
Amkor Technology, Inc., 6.625%, 9/15/27(1) | 100,000 |
| 101,688 |
|
Entegris, Inc., 4.625%, 2/10/26(1) | 125,000 |
| 124,375 |
|
| Micron Technology, Inc., 4.64%, 2/6/24 | 50,000 |
| 51,350 |
|
| Micron Technology, Inc., 5.50%, 2/1/25 | 400,000 |
| 414,444 |
|
| Micron Technology, Inc., 4.98%, 2/6/26 | 50,000 |
| 50,985 |
|
| Micron Technology, Inc., 5.33%, 2/6/29 | 25,000 |
| 25,728 |
|
NXP BV / NXP Funding LLC, 4.125%, 6/1/21(1) | 400,000 |
| 408,504 |
|
NXP BV / NXP Funding LLC, 4.625%, 6/15/22(1) | 200,000 |
| 207,420 |
|
NXP BV / NXP Funding LLC, 4.625%, 6/1/23(1) | 400,000 |
| 416,400 |
|
Qorvo, Inc., 5.50%, 7/15/26(1) | 475,000 |
| 491,672 |
|
Versum Materials, Inc., 5.50%, 9/30/24(1) | 50,000 |
| 52,688 |
|
| | | 3,113,234 |
|
| Software — 1.1% | | |
ACI Worldwide, Inc., 5.75%, 8/15/26(1) | 125,000 |
| 128,437 |
|
Ascend Learning LLC, 6.875%, 8/1/25(1) | 50,000 |
| 49,875 |
|
Ascend Learning LLC, 6.875%, 8/1/25(1) | 150,000 |
| 149,625 |
|
| CDK Global, Inc., 5.875%, 6/15/26 | 275,000 |
| 288,750 |
|
Change Healthcare Holdings LLC / Change Healthcare Finance, Inc., 5.75%, 3/1/25(1) | 150,000 |
| 148,980 |
|
Fair Isaac Corp., 5.25%, 5/15/26(1) | 25,000 |
| 25,875 |
|
Infor Software Parent LLC / Infor Software Parent, Inc., 7.125% Cash or 7.875% PIK, 5/1/21(1)(5) | 450,000 |
| 452,862 |
|
| Infor US, Inc., 6.50%, 5/15/22 | 710,000 |
| 722,425 |
|
Informatica LLC, 7.125%, 7/15/23(1) | 50,000 |
| 51,188 |
|
|
| | | | | | |
| | Principal Amount/Shares | Value |
RP Crown Parent LLC, 7.375%, 10/15/24(1) | $ | 150,000 |
| $ | 154,125 |
|
SS&C Technologies, Inc., 5.50%, 9/30/27(1) | 625,000 |
| 632,422 |
|
Veritas US, Inc. / Veritas Bermuda Ltd., 10.50%, 2/1/24(1) | 200,000 |
| 180,000 |
|
| | | 2,984,564 |
|
| Specialty Retail — 1.1% | | |
Ahern Rentals, Inc., 7.375%, 5/15/23(1) | 325,000 |
| 301,031 |
|
Ashtead Capital, Inc., 5.625%, 10/1/24(1) | 200,000 |
| 207,500 |
|
Carlson Travel, Inc., 9.50%, 12/15/24(1) | 202,000 |
| 195,435 |
|
Carvana Co., 8.875%, 10/1/23(1) | 75,000 |
| 77,062 |
|
Cumberland Farms, Inc., 6.75%, 5/1/25(1) | 150,000 |
| 156,375 |
|
DriveTime Automotive Group, Inc. / Bridgecrest Acceptance Corp., 8.00%, 6/1/21(1) | 25,000 |
| 25,313 |
|
| Group 1 Automotive, Inc., 5.00%, 6/1/22 | 75,000 |
| 75,469 |
|
Group 1 Automotive, Inc., 5.25%, 12/15/23(1) | 25,000 |
| 25,250 |
|
Herc Rentals, Inc., 7.50%, 6/1/22(1) | 45,000 |
| 47,025 |
|
Herc Rentals, Inc., 7.75%, 6/1/24(1) | 282,000 |
| 299,977 |
|
| L Brands, Inc., 5.25%, 2/1/28 | 25,000 |
| 22,313 |
|
| L Brands, Inc., 6.75%, 7/1/36 | 250,000 |
| 211,250 |
|
Lithia Motors, Inc., 5.25%, 8/1/25(1) | 50,000 |
| 50,438 |
|
| Penske Automotive Group, Inc., 3.75%, 8/15/20 | 50,000 |
| 50,000 |
|
| Penske Automotive Group, Inc., 5.75%, 10/1/22 | 275,000 |
| 280,844 |
|
PriSo Acquisition Corp., 9.00%, 5/15/23(1) | 75,000 |
| 74,906 |
|
| Sonic Automotive, Inc., 5.00%, 5/15/23 | 75,000 |
| 72,375 |
|
| Sonic Automotive, Inc., 6.125%, 3/15/27 | 175,000 |
| 159,687 |
|
| United Rentals North America, Inc., 5.75%, 11/15/24 | 50,000 |
| 51,562 |
|
| United Rentals North America, Inc., 5.875%, 9/15/26 | 225,000 |
| 233,437 |
|
| United Rentals North America, Inc., 6.50%, 12/15/26 | 350,000 |
| 369,250 |
|
| United Rentals North America, Inc., 5.50%, 5/15/27 | 25,000 |
| 25,313 |
|
| | | 3,011,812 |
|
| Technology Hardware, Storage and Peripherals — 1.9% | | |
Dell International LLC / EMC Corp., 5.875%, 6/15/21(1) | 1,125,000 |
| 1,146,547 |
|
Dell International LLC / EMC Corp., 7.125%, 6/15/24(1) | 350,000 |
| 371,142 |
|
| Diebold Nixdorf, Inc., 8.50%, 4/15/24 | 75,000 |
| 67,125 |
|
| EMC Corp., 2.65%, 6/1/20 | 1,300,000 |
| 1,290,560 |
|
Everi Payments, Inc., 7.50%, 12/15/25(1) | 219,000 |
| 227,760 |
|
j2 Cloud Services LLC / j2 Global Co-Obligor, Inc., 6.00%, 7/15/25(1) | 450,000 |
| 469,125 |
|
| NCR Corp., 5.875%, 12/15/21 | 25,000 |
| 25,514 |
|
| NCR Corp., 6.375%, 12/15/23 | 300,000 |
| 309,204 |
|
| Western Digital Corp., 4.75%, 2/15/26 | 1,115,000 |
| 1,066,219 |
|
| | | 4,973,196 |
|
| Textiles, Apparel and Luxury Goods — 0.1% | | |
Eagle Intermediate Global Holding BV/Ruyi US Finance LLC, 7.50%, 5/1/25(1) | 150,000 |
| 148,500 |
|
William Carter Co. (The), 5.625%, 3/15/27(1) | 75,000 |
| 77,813 |
|
| | | 226,313 |
|
| Thrifts and Mortgage Finance — 0.3% | | |
| MGIC Investment Corp., 5.75%, 8/15/23 | 200,000 |
| 212,000 |
|
|
| | | | | | |
| | Principal Amount/Shares | Value |
Nationstar Mortgage Holdings, Inc., 8.125%, 7/15/23(1) | $ | 250,000 |
| $ | 258,125 |
|
Nationstar Mortgage Holdings, Inc., 9.125%, 7/15/26(1) | 250,000 |
| 254,375 |
|
| Radian Group, Inc., 5.25%, 6/15/20 | 30,000 |
| 30,862 |
|
| Radian Group, Inc., 7.00%, 3/15/21 | 25,000 |
| 26,563 |
|
| Radian Group, Inc., 4.50%, 10/1/24 | 100,000 |
| 99,000 |
|
| | | 880,925 |
|
Tobacco† | | |
Vector Group Ltd., 6.125%, 2/1/25(1) | 75,000 |
| 66,960 |
|
| Trading Companies and Distributors — 0.5% | | |
| Beacon Roofing Supply, Inc., 6.375%, 10/1/23 | 75,000 |
| 78,375 |
|
Beacon Roofing Supply, Inc., 4.875%, 11/1/25(1) | 275,000 |
| 262,281 |
|
| Fly Leasing Ltd., 6.375%, 10/15/21 | 200,000 |
| 203,000 |
|
Fortress Transportation & Infrastructure Investors LLC, 6.75%, 3/15/22(1) | 125,000 |
| 127,500 |
|
Fortress Transportation & Infrastructure Investors LLC, 6.50%, 10/1/25(1) | 175,000 |
| 173,250 |
|
| H&E Equipment Services, Inc., 5.625%, 9/1/25 | 325,000 |
| 325,407 |
|
| International Lease Finance Corp., 5.875%, 4/1/19 | 25,000 |
| 25,000 |
|
| | | 1,194,813 |
|
| Transportation Infrastructure — 0.1% | | |
Algeco Global Finance 2 plc, 10.00%, 8/15/23(1) | 200,000 |
| 201,000 |
|
BCD Acquisition, Inc., 9.625%, 9/15/23(1) | 50,000 |
| 53,250 |
|
Resideo Funding, Inc., 6.125%, 11/1/26(1) | 100,000 |
| 103,500 |
|
| | | 357,750 |
|
| Wireless Telecommunication Services — 1.7% | | |
| Digicel Group One, Ltd., 8.25%, 12/30/22 | 514,000 |
| 317,395 |
|
Digicel Group Two Ltd., 8.25%, 9/30/22(1) | 486,000 |
| 166,455 |
|
Digicel Group Two Ltd., 7.125% Cash plus 0.856% PIK, 4/1/24(1) | 200,000 |
| 55,000 |
|
| Level 3 Financing, Inc., 5.125%, 5/1/23 | 200,000 |
| 202,500 |
|
| Sprint Communications, Inc., 9.25%, 4/15/22 | 25,000 |
| 29,313 |
|
| Sprint Communications, Inc., 6.00%, 11/15/22 | 250,000 |
| 252,575 |
|
| Sprint Corp., 7.25%, 9/15/21 | 275,000 |
| 289,438 |
|
| Sprint Corp., 7.875%, 9/15/23 | 525,000 |
| 552,562 |
|
| Sprint Corp., 7.125%, 6/15/24 | 475,000 |
| 483,312 |
|
| Sprint Corp., 7.625%, 3/1/26 | 325,000 |
| 330,688 |
|
| T-Mobile USA, Inc., 4.00%, 4/15/22 | 75,000 |
| 76,031 |
|
| T-Mobile USA, Inc., 6.00%, 3/1/23 | 1,225,000 |
| 1,261,750 |
|
| T-Mobile USA, Inc., 6.00%, 4/15/24 | 175,000 |
| 182,875 |
|
| T-Mobile USA, Inc., 5.125%, 4/15/25 | 25,000 |
| 25,688 |
|
| T-Mobile USA, Inc., 4.50%, 2/1/26 | 325,000 |
| 326,041 |
|
| T-Mobile USA, Inc., 4.75%, 2/1/28 | 25,000 |
| 24,875 |
|
Xplornet Communications, Inc., 9.625% Cash or 10.625% PIK, 6/1/22(1)(8) | 29,207 |
| 30,229 |
|
| | | 4,606,727 |
|
TOTAL CORPORATE BONDS
(Cost $235,338,831) | | 231,674,614 |
|
|
| | | | | | |
| | Principal Amount/Shares | Value |
BANK LOAN OBLIGATIONS(9) — 3.6% | | |
Building Products† | | |
| NCI Building Systems, Inc., 2018 Term Loan, 6.55%, (3-month LIBOR plus 3.75%), 4/12/25 | $ | 49,625 |
| $ | 47,702 |
|
Capital Markets† | | |
Lions Gate Capital Holdings LLC, 2018 Term Loan B, 4.75%, (1-month LIBOR plus 2.25%), 3/24/25 | 66,450 |
| 65,744 |
|
| Chemicals — 0.1% | | |
| Consolidated Energy Finance, S.A., Term Loan B, 4.99%, (1-month LIBOR plus 2.50%), 5/7/25 | 148,875 |
| 144,409 |
|
| Venator Materials Corporation, Term Loan B, 5.50%, (1-month LIBOR plus 3.00%), 8/8/24 | 49,250 |
| 48,655 |
|
| | | 193,064 |
|
| Commercial Services and Supplies — 0.2% | | |
| Aramark Services, Inc., 2018 Term Loan B3, 4.25%, (1-month LIBOR plus 1.75%), 3/11/25 | 321,633 |
| 319,573 |
|
| Asurion LLC, 2017 Term Loan B4, 5.50%, (1-month LIBOR plus 3.00%), 8/4/22 | 60,846 |
| 60,640 |
|
| Asurion LLC, 2018 Term Loan B6, 5.50%, (1-month LIBOR plus 3.00%), 11/3/23 | 47,681 |
| 47,537 |
|
| USS Ultimate Holdings, Inc., 1st Lien Term Loan, 6.25%, (1-month LIBOR plus 3.75%), 8/25/24 | 98,686 |
| 98,151 |
|
| | | 525,901 |
|
Communications Equipment† | | |
| Radiate Holdco, LLC, 1st Lien Term Loan, 5.50%, (1-month LIBOR plus 3.00%), 2/1/24 | 98,000 |
| 95,959 |
|
Construction Materials† | | |
| ASP Unifrax Holdings Inc, Term Loan B, 6.35%, (3-month LIBOR plus 3.75%), 12/12/25 | 49,875 |
| 47,675 |
|
| Consumer Finance — 0.1% | | |
| Financial & Risk US Holdings, Inc., 2018 USD Term Loan, 6.25%, (1-month LIBOR plus 3.75%), 10/1/25 | 174,563 |
| 169,793 |
|
| Containers and Packaging — 0.1% | | |
| BWAY Holding Company, 2017 Term Loan B, 6.03%, (3-month LIBOR plus 3.25%), 4/3/24 | 97,322 |
| 95,193 |
|
| Consolidated Container Company LLC, 2017 1st Lien Term Loan, 5.25%, (1-month LIBOR plus 2.75%), 5/22/24 | 41,322 |
| 40,780 |
|
| Consolidated Container Company LLC, 2017 1st Lien Term Loan, 5.25%, (1-month LIBOR plus 2.75%), 5/22/24 | 7,929 |
| 7,825 |
|
Flex Acquisition Company, Inc., 1st Lien Term Loan, 5.63%, (3-month LIBOR plus 3.00%), 12/29/23 | 122,500 |
| 118,952 |
|
Flex Acquisition Company, Inc., 1st Lien Term Loan, 5.49%, (1-month LIBOR plus 3.00%), 12/29/23 | 312 |
| 304 |
|
| | | 263,054 |
|
| Distributors — 0.1% | | |
| American Builders & Contractors Supply Co., Inc., 2018 Term Loan B, 4.50%, (1-month LIBOR plus 2.00%), 10/31/23 | 124,682 |
| 121,867 |
|
| Diversified Financial Services — 0.2% | | |
Camelot UK Holdco Limited, 2017 Repriced Term Loan, 5.75%, (1-month LIBOR plus 3.25%), 10/3/23 | 1,068 |
| 1,064 |
|
Camelot UK Holdco Limited, 2017 Repriced Term Loan, 5.75%, (1-month LIBOR plus 3.25%), 10/3/23 | 2,107 |
| 2,099 |
|
Camelot UK Holdco Limited, 2017 Repriced Term Loan, 5.75%, (1-month LIBOR plus 3.25%), 10/3/23 | 15,195 |
| 15,136 |
|
|
| | | | | | |
| | Principal Amount/Shares | Value |
Camelot UK Holdco Limited, 2017 Repriced Term Loan, 5.75%, (1-month LIBOR plus 3.25%), 10/3/23 | $ | 26,681 |
| $ | 26,578 |
|
Camelot UK Holdco Limited, 2017 Repriced Term Loan, 10/3/23(10) | 75,000 |
| 74,711 |
|
Camelot UK Holdco Limited, 2017 Repriced Term Loan, 10/3/23(10) | 50,000 |
| 49,807 |
|
| Edelman Financial Center, LLC, 2018 1st Lien Term Loan, 6.04%, (3-month LIBOR plus 3.25%), 7/21/25 | 124,688 |
| 123,870 |
|
| Tempo Acquisition LLC, Term Loan, 5.50%, (1-month LIBOR plus 3.00%), 5/1/24 | 73,688 |
| 73,098 |
|
| UFC Holdings, LLC, 1st Lien Term Loan, 5.75%, (1-month LIBOR plus 3.25%), 8/18/23 | 48,750 |
| 48,507 |
|
| UFC Holdings, LLC, 2nd Lien Term Loan, 10.00%, (1-month LIBOR plus 7.50%), 8/18/24 | 25,000 |
| 25,177 |
|
| | | 440,047 |
|
| Diversified Telecommunication Services — 0.1% | | |
| Level 3 Financing, Inc., 2017 Term Loan B, 4.74%, (3-month LIBOR plus 2.25%), 2/22/24 | 150,000 |
| 148,453 |
|
| Electric Utilities — 0.1% | | |
| Vistra Operations Company LLC, 1st Lien Term Loan B3, 4.50%, (1-month LIBOR plus 2.00%), 12/31/25 | 32,763 |
| 32,329 |
|
| Vistra Operations Company LLC, 1st Lien Term Loan B3, 4.48%, (1-month LIBOR plus 2.00%), 12/31/25 | 91,923 |
| 90,705 |
|
| | | 123,034 |
|
Energy Equipment and Services† | | |
| McDermott Technology Americas, Inc., 2018 1st Lien Term Loan, 7.50%, (1-month LIBOR plus 5.00%), 5/10/25 | 48,752 |
| 46,841 |
|
| Parker Drilling Co, 2nd Lien PIK Term Loan, 11.00% Cash and 2.00% PIK, 2/25/24 | 36,881 |
| 36,927 |
|
| | | 83,768 |
|
Food Products† | | |
| National Intergovernmental Purchasing Alliance Company, 1st Lien Term Loan, 6.35%, (3-month LIBOR plus 3.75%), 5/23/25 | 56,535 |
| 56,288 |
|
| National Intergovernmental Purchasing Alliance Company, 1st Lien Term Loan, 6.35%, (3-month LIBOR plus 3.75%), 5/23/25 | 17,903 |
| 17,824 |
|
| | | 74,112 |
|
| Health Care Providers and Services — 0.2% | | |
21st Century Oncology Holdings, Inc., Exit Term Loan, 8.91%, (3-month LIBOR plus 6.13%), 1/16/23 | 24,255 |
| 20,435 |
|
| Air Methods Corporation, 2017 Term Loan B, 6.10%, (3-month LIBOR plus 3.50%), 4/21/24 | 73,688 |
| 55,795 |
|
| Envision Healthcare Corporation, 2018 1st Lien Term Loan, 6.25%, (1-month LIBOR plus 3.75%), 10/10/25 | 49,875 |
| 46,779 |
|
MPH Acquisition Holdings LLC, 2016 Term Loan B, 5.35%, (3-month LIBOR plus 2.75%), 6/7/23 | 297,985 |
| 289,117 |
|
| Surgery Center Holdings, Inc., 2017 Term Loan B, 5.75%, (1-month LIBOR plus 3.25%), 9/2/24 | 49,250 |
| 48,460 |
|
| Wink Holdco, Inc., 1st Lien Term Loan B, 5.50%, (1-month LIBOR plus 3.00%), 12/2/24 | 74,063 |
| 71,933 |
|
| Wink Holdco, Inc., 2nd Lien Term Loan B, 9.25%, (1-month LIBOR plus 6.75%), 11/3/25 | 50,000 |
| 49,000 |
|
| | | 581,519 |
|
| Hotels, Restaurants and Leisure — 1.2% | | |
| 1011778 B.C. Unlimited Liability Company, Term Loan B3, 4.75%, (1-month LIBOR plus 2.25%), 2/16/24 | 192,792 |
| 190,061 |
|
|
| | | | | | |
| | Principal Amount/Shares | Value |
| 1011778 B.C. Unlimited Liability Company, Term Loan B3, 4.75%, (1-month LIBOR plus 2.25%), 2/16/24 | $ | 155,419 |
| $ | 153,217 |
|
| Boyd Gaming Corporation, Term Loan B3, 4.66%, (1-week LIBOR plus 2.25%), 9/15/23 | 150,000 |
| 148,958 |
|
Boyd Gaming Corporation, Term Loan B3, 9/15/23(10) | 100,000 |
| 99,306 |
|
| Caesars Entertainment Operating Company, Exit Term Loan, 4.50%, (1-month LIBOR plus 2.00%), 10/6/24 | 98,750 |
| 96,701 |
|
| CityCenter Holdings, LLC, 2017 Term Loan B, 4.75%, (1-month LIBOR plus 2.25%), 4/18/24 | 471,973 |
| 464,414 |
|
| Equinox Holdings, Inc., 2017 1st Lien Term Loan, 5.50%, (1-month LIBOR plus 3.00%), 3/8/24 | 24,937 |
| 24,818 |
|
| Gateway Casinos & Entertainment Limited, 2018 Term Loan B, 5.60%, (3-month LIBOR plus 3.00%), 12/1/23 | 148,875 |
| 148,666 |
|
Golden Nugget, Inc., 2017 Incremental Term Loan B, 5.25%, (1-month LIBOR plus 2.75%), 10/4/23 | 136,952 |
| 135,786 |
|
Golden Nugget, Inc., 2017 Incremental Term Loan B, 5.23%, (1-month LIBOR plus 2.75%), 10/4/23 | 109,260 |
| 108,330 |
|
| Hilton Worldwide Finance, LLC, Term Loan B2, 4.24%, (1-month LIBOR plus 1.75%), 10/25/23 | 475,000 |
| 474,444 |
|
Hilton Worldwide Finance, LLC, Term Loan B2, 10/25/23(10) | 100,000 |
| 99,883 |
|
| Life Time Fitness, Inc., 2017 Term Loan B, 5.38%, (3-month LIBOR plus 2.75%), 6/10/22 | 566,657 |
| 561,089 |
|
Marriott Ownership Resorts, Inc., 2018 Term Loan B, 4.75%, (1-month LIBOR plus 2.25%), 8/29/25 | 124,688 |
| 124,220 |
|
| RHP Hotel Properties, LP, 2017 Term Loan B, 4.78%, (3-month LIBOR plus 2.00%), 5/11/24 | 347,867 |
| 345,041 |
|
Scientific Games International, Inc., 2018 Term Loan B5, 5.25%, (1-month LIBOR plus 2.75%), 8/14/24 | 9,546 |
| 9,313 |
|
Scientific Games International, Inc., 2018 Term Loan B5, 5.33%, (2-month LIBOR plus 2.75%), 8/14/24 | 39,768 |
| 38,799 |
|
| Tacala, LLC, 1st Lien Term Loan, 5.75%, (1-month LIBOR plus 3.25%), 1/31/25 | 24,750 |
| 24,479 |
|
| TopGolf International, Inc., Term Loan B, 8.00%, (1-month LIBOR plus 5.50%), 2/9/26 | 25,000 |
| 25,125 |
|
| | | 3,272,650 |
|
Industrial Conglomerates† | | |
| Core & Main LP, 2017 Term Loan B, 5.63%, (3-month LIBOR plus 3.00%), 8/1/24 | 39,113 |
| 38,901 |
|
| Core & Main LP, 2017 Term Loan B, 5.63%, (3-month LIBOR plus 3.00%), 8/1/24 | 34,825 |
| 34,637 |
|
| | | 73,538 |
|
| Insurance — 0.1% | | |
| Genworth Holdings, Inc., Term Loan, 6.98%, (3-month LIBOR plus 4.50%), 3/7/23 | 74,438 |
| 74,577 |
|
| Hub International Limited, 2018 Term Loan B, 5.51%, (3-month LIBOR plus 2.75%), 4/25/25 | 273,561 |
| 265,041 |
|
| | | 339,618 |
|
IT Services† | | |
| First Data Corporation, 2024 USD Term Loan, 4.49%, (1-month LIBOR plus 2.00%), 4/26/24 | 100,000 |
| 99,823 |
|
| Life Sciences Tools and Services — 0.3% | | |
| IQVIA Inc., 2018 USD Term Loan B3, 4.25%, (1-month LIBOR plus 1.75%), 6/11/25 | 672,804 |
| 666,705 |
|
IQVIA Inc., 2018 USD Term Loan B3, 6/11/25(10) | 75,000 |
| 74,320 |
|
|
| | | | | | |
| | Principal Amount/Shares | Value |
| Parexel International Corporation, Term Loan B, 5.25%, (1-month LIBOR plus 2.75%), 9/27/24 | $ | 73,875 |
| $ | 71,356 |
|
| | | 812,381 |
|
| Machinery — 0.1% | | |
| Altra Industrial Motion Corp., 2018 Term Loan B, 4.50%, (1-month LIBOR plus 2.00%), 10/1/25 | 97,388 |
| 95,806 |
|
| Engineered Machinery Holdings, Inc., USD 1st Lien Term Loan, 5.85%, (3-month LIBOR plus 3.25%), 7/19/24 | 24,688 |
| 23,916 |
|
| Engineered Machinery Holdings, Inc., USD 2nd Lien Term Loan, 9.85%, (3-month LIBOR plus 7.25%), 7/18/25 | 24,574 |
| 24,185 |
|
| Navistar International Corporation, 2017 1st Lien Term Loan B, 6.00%, (1-month LIBOR plus 3.50%), 11/6/24 | 98,503 |
| 98,380 |
|
| | | 242,287 |
|
Metals and Mining† | | |
| Big River Steel LLC, Term Loan B, 7.60%, (3-month LIBOR plus 5.00%), 8/23/23 | 49,188 |
| 49,496 |
|
| Neenah Foundry Company, 2017 Term Loan, 9.06%, (2-month LIBOR plus 6.50%), 12/13/22 | 30,086 |
| 29,785 |
|
| Neenah Foundry Company, 2017 Term Loan, 9.08%, (2-month LIBOR plus 6.50%), 12/13/22 | 35,686 |
| 35,329 |
|
| | | 114,610 |
|
| Multi-Utilities — 0.1% | | |
| TEX Operations Co. LLC, Exit Term Loan B, 4.50%, (1-month LIBOR plus 2.00%), 8/4/23 | 99,745 |
| 98,791 |
|
TEX Operations Co. LLC, Exit Term Loan B, 8/4/23(10) | 100,000 |
| 99,044 |
|
| | | 197,835 |
|
| Oil, Gas and Consumable Fuels — 0.3% | | |
BCP Renaissance Parent LLC, 2017 Term Loan B, 6.24%, (3-month LIBOR plus 3.50%), 10/31/24 | 49,376 |
| 49,266 |
|
| California Resources Corporation, 2017 1st Lien Term Loan, 7.25%, (1-month LIBOR plus 4.75%), 12/31/22 | 525,000 |
| 517,947 |
|
| California Resources Corporation, Second Out Term Loan, 12.87%, (1-month LIBOR plus 10.38%), 12/31/21 | 25,000 |
| 26,422 |
|
Keane Group Holdings, LLC, 2018 1st Lien Term Loan, 6.25%, (1-month LIBOR plus 3.75%), 5/25/25 | 49,625 |
| 47,929 |
|
| Prairie ECI Acquiror LP, Term Loan B, 7.37%, (3-month LIBOR plus 4.75%), 3/11/26 | 125,000 |
| 125,521 |
|
| | | 767,085 |
|
Pharmaceuticals† | | |
| HLF Financing S.a r.l., 2018 Term Loan B, 5.75%, (1-month LIBOR plus 3.25%), 8/18/25 | 74,625 |
| 74,829 |
|
| Professional Services — 0.1% | | |
| Dun & Bradstreet Corporation (The), Term Loan, 7.49%, (1-month LIBOR plus 5.00%), 2/1/26 | 125,000 |
| 123,828 |
|
Specialty Retail† | | |
| Priso Acquisition Corporation, 2017 Term Loan B, 5.50%, (1-month LIBOR plus 3.00%), 5/8/22 | 22,952 |
| 22,199 |
|
Serta Simmons Bedding, LLC, 2nd Lien Term Loan, 10.49%, (1-month LIBOR plus 8.00%), 11/8/24 | 94,933 |
| 48,534 |
|
| | | 70,733 |
|
| Technology Hardware, Storage and Peripherals — 0.1% | | |
| Everi Payments Inc., Term Loan B, 5.50%, (1-month LIBOR plus 3.00%), 5/9/24 | 98,250 |
| 97,783 |
|
|
| | | | | | |
| | Principal Amount/Shares | Value |
| Western Digital Corporation, 2018 Term Loan B4, 4.25%, (1-month LIBOR plus 1.75%), 4/29/23 | $ | 20,562 |
| $ | 20,057 |
|
| | | 117,840 |
|
| Trading Companies and Distributors — 0.1% | | |
| Foundation Building Materials Holding Company LLC, 2018 Term Loan B, 5.50%, (1-month LIBOR plus 3.00%), 8/13/25 | 124,688 |
| 122,583 |
|
| HD Supply, Inc., Term Loan B5, 4.25%, (1-month LIBOR plus 1.75%), 10/17/23 | 99,749 |
| 98,727 |
|
HD Supply, Inc., Term Loan B5, 10/17/23(10) | 50,000 |
| 49,488 |
|
| | | 270,798 |
|
Transportation Infrastructure† | | |
| Syncreon Global Finance (US) Inc., Term Loan B, 6.99%, (3-month LIBOR plus 4.25%), 10/28/20 | 70,704 |
| 46,382 |
|
TOTAL BANK LOAN OBLIGATIONS
(Cost $9,796,138) | | 9,605,929 |
|
| PREFERRED STOCKS — 1.5% | | |
| Banks — 1.3% | | |
| Bank of America Corp., 6.25% | 1,025,000 |
| 1,087,100 |
|
| Bank of America Corp., 6.50% | 100,000 |
| 108,563 |
|
| Bank of America Corp., 6.30% | 25,000 |
| 27,180 |
|
| Bank of America Corp., 5.875% | 75,000 |
| 76,209 |
|
| Bank of Nova Scotia (The), 4.65% | 50,000 |
| 46,346 |
|
| Citigroup, Inc., 6.875% | 1,749 |
| 47,345 |
|
| Citigroup, Inc., 5.95% | 250,000 |
| 254,521 |
|
| Citigroup, Inc., 5.90% | 425,000 |
| 433,217 |
|
| Citigroup, Inc., 5.95% | 25,000 |
| 25,255 |
|
| Citigroup, Inc., 6.25% | 150,000 |
| 158,015 |
|
| JPMorgan Chase & Co., 6.10% | 650,000 |
| 684,720 |
|
| JPMorgan Chase & Co., 6.75% | 156,000 |
| 171,119 |
|
| JPMorgan Chase & Co., 6.125% | 175,000 |
| 183,642 |
|
| Wells Fargo & Co., 5.90% | 50,000 |
| 51,177 |
|
| | | 3,354,409 |
|
| Capital Markets — 0.1% | | |
| Charles Schwab Corp. (The), 5.00% | 150,000 |
| 141,221 |
|
| Goldman Sachs Group, Inc. (The), 5.70% | 25,000 |
| 25,031 |
|
| Goldman Sachs Group, Inc. (The), 5.375% | 50,000 |
| 50,448 |
|
| | | 216,700 |
|
| Oil, Gas and Consumable Fuels — 0.1% | | |
| Energy Transfer Operating LP, 6.25% | 150,000 |
| 141,971 |
|
| Energy Transfer Operating LP, 6.625% | 50,000 |
| 47,606 |
|
Nine Point Energy Holdings (Acquired 3/28/17, Cost $18,000)(2)(6) | 18 |
| 6,300 |
|
| Plains All American Pipeline LP, 6.125% | 75,000 |
| 70,423 |
|
| Summit Midstream Partners LP, 9.50% | 175,000 |
| 161,978 |
|
| | | 428,278 |
|
Trading Companies and Distributors† | | |
| General Finance Corp., 8.125% | 1,116 |
| 29,032 |
|
TOTAL PREFERRED STOCKS
(Cost $4,035,754) | | 4,028,419 |
|
|
| | | | | | |
| | Principal Amount/Shares | Value |
| CONVERTIBLE BONDS — 0.5% | | |
Auto Components† | | |
Exide Technologies, 7.00% PIK, 4/30/25 (Acquired 4/30/15 - 12/3/18, Cost $3,922)(2) | $ | 18,243 |
| $ | 10,490 |
|
| Banks — 0.5% | | |
| Barclays Bank plc, 7.625%, 11/21/22 | 200,000 |
| 217,617 |
|
Barclays plc, VRN, 7.75%(4) | 200,000 |
| 200,457 |
|
Royal Bank of Scotland Group plc, VRN, 8.00%(4) | 400,000 |
| 430,000 |
|
Royal Bank of Scotland Group plc, VRN, 8.625%(4) | 400,000 |
| 427,000 |
|
| | | 1,275,074 |
|
Machinery† | | |
| Meritor, Inc., VRDN, 4.00%, 2/15/27 | 75,000 |
| 75,375 |
|
Oil, Gas and Consumable Fuels† | | |
| Chesapeake Energy Corp., 5.50%, 9/15/26 | 25,000 |
| 23,227 |
|
TOTAL CONVERTIBLE BONDS
(Cost $1,383,278) | | 1,384,166 |
|
| COMMON STOCKS — 0.2% | | |
Diversified Telecommunication Services† | | |
Colt, Class B (Acquired 5/18/16, Cost $338)(2)(6) | 676 |
| — |
|
Energy Equipment and Services† | | |
Parker Drilling Co.(6) | 2,027 |
| 38,003 |
|
Household Products† | | |
Exide Technologies (Acquired 5/14/15, Cost $—)(2)(6) | 162 |
| 221 |
|
Independent Power and Renewable Electricity Producers† | | |
Vistra Energy Corp.(6) | 3,055 |
| 79,522 |
|
| Metals and Mining — 0.1% | | |
UC Holdings, Inc. (Acquired 9/21/15 - 9/30/15, Cost $103,222)(2)(6) | 4,088 |
| 96,068 |
|
| Oil, Gas and Consumable Fuels — 0.1% | | |
Bonanza Creek Energy, Inc.(6) | 2,979 |
| 67,594 |
|
Denbury Resources, Inc.(6) | 14,404 |
| 29,528 |
|
Midstates Petroleum Co., Inc.(6) | 34 |
| 332 |
|
Nine Point Energy (Acquired 6/19/17 - 4/4/18, Cost $12,544)(2)(6) | 1,082 |
| 5,410 |
|
Riviera Resources Inc. / Linn(6) | 821 |
| 11,486 |
|
Roan Resources, Inc.(6) | 821 |
| 5,016 |
|
Sabine Oil & Gas Holdings, Inc. (Acquired 5/30/17, Cost $579)(2)(6) | 13 |
| 331 |
|
Southcross Holdings GP, LLC, Class A (Acquired 5/10/16, Cost $360)(2)(6) | 4 |
| 1,125 |
|
Southcross Holdings LP, Class A (Acquired 5/10/16, Cost $360)(2)(6) | 4 |
| 1,125 |
|
Warren Resources, Inc. (Acquired 10/19/16, Cost $4,800)(2)(6) | 960 |
| 960 |
|
| | | 122,907 |
|
Software† | | |
Avaya Holdings Corp.(6) | 3,260 |
| 54,866 |
|
TOTAL COMMON STOCKS
(Cost $413,054) | | 391,587 |
|
|
| | | | | | |
| | Principal Amount/Shares | Value |
ESCROW INTERESTS(11)† | | |
Banks† | | |
Washington Mutual Bank, Escrow(6) | $ | 250,000 |
| $ | 3,000 |
|
Energy Equipment and Services† | | |
Hercules Offshore, Inc., Escrow(6) | 3,570 |
| 9,817 |
|
Sanjel Corp.(6) | 200,000 |
| — |
|
| | | 9,817 |
|
Industrial Conglomerates† | | |
Claire's Stores, Inc., Escrow(6) | 25,000 |
| 3,813 |
|
Multi-Utilities† | | |
GenOn Energy(6) | 25,000 |
| — |
|
GenOn Energy, Inc.(6) | 75,000 |
| — |
|
Texas Competitive Electric Holdings Co., Escrow(6) | 200,000 |
| 1,000 |
|
| | | 1,000 |
|
Oil, Gas and Consumable Fuels† | | |
Denver Parent, Escrow(6) | 63,341 |
| — |
|
Paper and Forest Products† | | |
Appvion, Inc., Escrow(6) | 200,000 |
| 2,750 |
|
TOTAL ESCROW INTERESTS
(Cost $608,246) | | 20,380 |
|
WARRANTS† | | |
Independent Power and Renewable Electricity Producers† | | |
Vistra Energy Corp.(6) | 1,215 |
| 2,661 |
|
Metals and Mining† | | |
UC Holdings, Inc.(6) | 600 |
| 5,400 |
|
Oil, Gas and Consumable Fuels† | | |
Halcon Resources Corp.(6) | 291 |
| 3 |
|
Midstates Petroleum Co., Inc.(6) | 337 |
| — |
|
Sabine Oil & Gas Holdings, Inc.(6) | 7 |
| 25 |
|
| | | 28 |
|
Paper and Forest Products† | | |
Appvion Holdings Corp.(6) | 195 |
| 1 |
|
Appvion Holdings Corp.(6) | 195 |
| 1 |
|
| | | 2 |
|
TOTAL WARRANTS
(Cost $5,596) | | 8,091 |
|
RIGHTS† | | |
Independent Power and Renewable Electricity Producers† | | |
Vistra Energy Corp.(6)
(Cost $—) | 3,425 |
| 2,654 |
|
| TEMPORARY CASH INVESTMENTS — 5.5% | | |
State Street Institutional U.S. Government Money Market Fund, Premier Class
(Cost $14,540,710) | 14,540,710 |
| 14,540,710 |
|
TOTAL INVESTMENT SECURITIES — 98.6%
(Cost $266,121,607) | | 261,656,550 |
|
| OTHER ASSETS AND LIABILITIES — 1.4% | | 3,737,771 |
|
| TOTAL NET ASSETS — 100.0% | | $ | 265,394,321 |
|
|
| | |
| NOTES TO SCHEDULE OF INVESTMENTS |
| LIBOR | - | London Interbank Offered Rate |
| MTN | - | Medium Term Note |
| PIK | - | Payment in Kind. Security may pay a cash rate and/or an in kind rate. |
| USD | - | United States Dollar |
| VRDN | - | Variable Rate Demand Note. The instrument may be payable upon demand and adjusts periodically based upon the terms set forth in the security's offering documents. The rate shown is effective at the period end and the reference rate and spread, if any, is indicated. The date of the demand feature is disclosed. |
| VRN | - | Variable Rate Note. The rate adjusts periodically based upon the terms set forth in the security’s offering documents. The rate shown is effective at the period end and the reference rate and spread, if any, is indicated. |
† Category is less than 0.05% of total net assets.
| |
| (1) | Security was purchased pursuant to Rule 144A under the Securities Act of 1933 and may be sold in transactions exempt from registration, normally to qualified institutional investors. The aggregate value of these securities at the period end was $126,228,444, which represented 47.6% of total net assets. Of these securities, 0.2% of total net assets were deemed illiquid under policies approved by the Board of Trustees. |
| |
| (2) | Restricted security that may not be offered for public sale without being registered with the Securities and Exchange Commission and/or may be subject to resale, redemption or transferability restrictions. The aggregate value of these securities at the period end was $299,348, which represented 0.1% of total net assets. |
| |
| (3) | When-issued security. The issue price and yield are fixed on the date of the commitment, but payment and delivery are scheduled for a future date. |
| |
| (4) | Perpetual maturity with no stated maturity date. |
| |
| (5) | The security's rate was paid in cash at the last payment date. |
| |
| (7) | Security is in default. |
| |
| (8) | The security's rate was paid in kind or a combination of cash and in kind at the last payment date. |
| |
| (9) | The interest rate on a bank loan obligation adjusts periodically based on a predetermined schedule. Rate shown is effective at period end. The maturity date on a bank loan obligation may be less than indicated as a result of contractual or optional prepayments. These prepayments cannot be predicted with certainty. |
| |
| (10) | The interest rate will be determined upon settlement of the bank loan obligation after period end. |
| |
| (11) | Escrow interests represent beneficial interests in bankruptcy reorganizations or liquidation proceedings and may be subject to resale, redemption, or transferability restrictions. The amount and timing of future payments, if any, cannot be predicted with certainty. |
See Notes to Financial Statements.
|
|
| Statement of Assets and Liabilities |
|
| | | |
| MARCH 31, 2019 | |
| Assets | |
| Investment securities, at value (cost of $266,121,607) | $ | 261,656,550 |
|
| Cash | 1,832,776 |
|
| Receivable for investments sold | 896,445 |
|
| Receivable for capital shares sold | 119,281 |
|
| Interest and dividends receivable | 4,388,799 |
|
| | 268,893,851 |
|
| | |
| Liabilities | |
| Payable for investments purchased | 2,980,178 |
|
| Payable for capital shares redeemed | 138,295 |
|
| Accrued management fees | 130,292 |
|
| Distribution and service fees payable | 224 |
|
| Dividends payable | 250,541 |
|
| | 3,499,530 |
|
| | |
| Net Assets | $ | 265,394,321 |
|
| | |
| Net Assets Consist of: | |
| Capital paid in | $ | 272,257,020 |
|
| Distributable earnings | (6,862,699 | ) |
| | $ | 265,394,321 |
|
|
| | | | | | |
| | Net Assets | Shares Outstanding | Net Asset Value Per Share |
| Investor Class |
| $16,795,955 |
| 1,801,280 |
| $9.32 |
| I Class |
| $24,825,239 |
| 2,664,510 |
| $9.32 |
| Y Class |
| $125,104,019 |
| 13,422,985 |
| $9.32 |
| A Class |
| $924,263 |
| 99,167 |
| $9.32* |
| R5 Class |
| $145,824 |
| 15,646 |
| $9.32 |
| R6 Class |
| $97,599,021 |
| 10,476,725 |
| $9.32 |
* Maximum offering price $9.76 (net asset value divided by 0.955).
See Notes to Financial Statements.
|
| | | |
| YEAR ENDED MARCH 31, 2019 | |
| Investment Income (Loss) | |
| Income: | |
| Interest | $ | 13,868,083 |
|
| Dividends | 27,873 |
|
| | 13,895,956 |
|
| | |
| Expenses: | |
| Management fees | 1,243,102 |
|
| Distribution and service fees - A Class | 1,267 |
|
| Trustees' fees and expenses | 14,379 |
|
| | 1,258,748 |
|
| | |
| Net investment income (loss) | 12,637,208 |
|
| | |
| Realized and Unrealized Gain (Loss) | |
| Net realized gain (loss) on investment transactions | (734,555 | ) |
| Change in net unrealized appreciation (depreciation) on investments | (2,934,223 | ) |
| | |
| Net realized and unrealized gain (loss) | (3,668,778 | ) |
| | |
| Net Increase (Decrease) in Net Assets Resulting from Operations | $ | 8,968,430 |
|
See Notes to Financial Statements.
|
|
| Statement of Changes in Net Assets |
|
| | | | | | | | | |
| YEAR ENDED MARCH 31, 2019, SIX MONTHS ENDED MARCH 31, 2018 AND YEAR ENDED SEPTEMBER 30, 2017 |
| Increase (Decrease) in Net Assets | March 31,
2019 | March 31, 2018(1) | September 30,
2017 |
| Operations | | | |
| Net investment income (loss) | $ | 12,637,208 |
| $ | 4,082,785 |
| $ | 6,292,640 |
|
| Net realized gain (loss) | (734,555 | ) | 1,256 |
| 979,351 |
|
| Change in net unrealized appreciation (depreciation) | (2,934,223 | ) | (3,850,461 | ) | 1,948,590 |
|
| Net increase (decrease) in net assets resulting from operations | 8,968,430 |
| 233,580 |
| 9,220,581 |
|
| | | | |
| Distributions to Shareholders | | | |
| From earnings: | | | |
| Investor Class | (508,506 | ) | (17,318 | ) | — |
|
| I Class | (1,055,650 | ) | (75,164 | ) | — |
|
| Y Class | (8,469,757 | ) | (4,069,530 | ) | (6,179,656 | ) |
| A Class | (28,080 | ) | (140 | ) | — |
|
| R5 Class | (1,119 | ) | (151 | ) | — |
|
| R6 Class | (2,574,115 | ) | (33,104 | ) | — |
|
| Decrease in net assets from distributions | (12,637,227 | ) | (4,195,407 | ) | (6,179,656 | ) |
| | | | |
| Capital Share Transactions | | | |
| Net increase (decrease) in net assets from capital share transactions (Note 5) | 110,962,398 |
| 34,648,257 |
| 30,176,641 |
|
| | | | |
| Net increase (decrease) in net assets | 107,293,601 |
| 30,686,430 |
| 33,217,566 |
|
| | | | |
| Net Assets | | | |
| Beginning of period | 158,100,720 |
| 127,414,290 |
| 94,196,724 |
|
| End of period | $ | 265,394,321 |
| $ | 158,100,720 |
| $ | 127,414,290 |
|
| |
| (1) | The fund's fiscal year end was changed from September 30 to March 31, resulting in a six-month annual reporting period. |
See Notes to Financial Statements.
|
|
Notes to Financial Statements |
MARCH 31, 2019
1. Organization
American Century Investment Trust (the trust) is registered under the Investment Company Act of 1940, as amended (the 1940 Act), as an open-end management investment company and is organized as a Massachusetts business trust. High Income Fund (the fund) is one fund in a series issued by the trust. The fund’s investment objective is to seek current yield and capital growth.
The fund offers the Investor Class, I Class, Y Class, A Class, R5 Class and R6 Class. The A Class may incur an initial sales charge and may be subject to a contingent deferred sales charge. Sale of the Investor Class, I Class, A Class, R5 Class and R6 Class commenced on October 2, 2017.
2. Significant Accounting Policies
The following is a summary of significant accounting policies consistently followed by the fund in preparation of its financial statements. The fund is an investment company and follows accounting and reporting guidance in accordance with accounting principles generally accepted in the United States of America. This may require management to make certain estimates and assumptions at the date of the financial statements. Actual results could differ from these estimates. Management evaluated the impact of events or transactions occurring through the date the financial statements were issued that would merit recognition or disclosure.
Investment Valuations — The fund determines the fair value of its investments and computes its net asset value per share at the close of regular trading (usually 4 p.m. Eastern time) on the New York Stock Exchange (NYSE) on each day the NYSE is open. The Board of Trustees has adopted valuation policies and procedures to guide the investment advisor in the fund’s investment valuation process and to provide methodologies for the oversight of the fund’s pricing function.
Fixed income securities are valued at the evaluated mean as provided by independent pricing services or at the mean of the most recent bid and asked prices as provided by investment dealers. Corporate bonds, bank loan obligations and convertible bonds are valued using market models that consider trade data, quotations from dealers and active market makers, relevant yield curve and spread data, creditworthiness, trade data or market information on comparable securities, and other relevant security specific information. Mortgage-related and asset-backed securities are valued based on models that consider trade data, prepayment and default projections, benchmark yield and spread data and estimated cash flows of each tranche of the issuer.
Equity securities that are listed or traded on a domestic securities exchange are valued at the last reported sales price or at the official closing price as provided by the exchange. Equity securities traded on foreign securities exchanges are generally valued at the closing price of such securities on the exchange where primarily traded or at the close of the NYSE, if that is earlier. If no last sales price is reported, or if local convention or regulation so provides, the mean of the latest bid and asked prices may be used. Securities traded over-the-counter are valued at the mean of the latest bid and asked prices, the last sales price, or the official closing price.
Open-end management investment companies are valued at the reported net asset value per share.
If the fund determines that the market price for an investment is not readily available or the valuation methods mentioned above do not reflect an investment’s fair value, such investment is valued as determined in good faith by the Board of Trustees or its delegate, in accordance with policies and procedures adopted by the Board of Trustees. In its determination of fair value, the fund may review several factors including, but not limited to, market information regarding the specific investment or comparable investments and correlation with other investment types, futures indices or general market indicators. Circumstances that may cause the fund to use these procedures to value an investment include, but are not limited to: an investment has been declared in default or is distressed; trading in a security has been suspended during the trading day or a security is not actively trading on its principal exchange; prices received from a regular pricing source are deemed unreliable; or there is a foreign market holiday and no trading occurred.
The fund monitors for significant events occurring after the close of an investment’s primary exchange but before the fund’s net asset value per share is determined. Significant events may include, but are not limited to: corporate announcements and transactions; governmental action and political unrest that could impact a specific investment or an investment sector; or armed conflicts, natural disasters and similar events that could affect investments in a specific country or region. The fund also monitors for significant fluctuations between domestic and foreign markets, as evidenced by the U.S. market or such other indicators that the Board of Trustees, or its delegate, deems appropriate. If significant fluctuations in foreign markets are identified, the fund may apply a model-derived factor to the closing price of equity securities traded on foreign securities exchanges. The factor is based on observable market data as provided by an independent pricing service.
Security Transactions — Security transactions are accounted for as of the trade date. Net realized gains and losses are determined on the identified cost basis, which is also used for federal income tax purposes.
Investment Income — Interest income is recorded on the accrual basis and includes paydown gain (loss) and accretion of discounts and amortization of premiums. Dividend income less foreign taxes withheld, if any, is recorded as of the ex-dividend date. Distributions received on securities that represent a return of capital or long-term capital gain are recorded as a reduction of cost of investments and/or as a realized gain. The fund may estimate the components of distributions received that may be considered nontaxable distributions or long-term capital gain distributions for income tax purposes.
Segregated Assets — In accordance with the 1940 Act, the fund segregates assets on its books and records to cover certain types of investment securities and other financial instruments. American Century Investment Management, Inc. (ACIM) (the investment advisor) monitors, on a daily basis, the securities segregated to ensure the fund designates a sufficient amount of liquid assets, marked-to-market daily. The fund may also receive assets or be required to pledge assets at the custodian bank or with a broker for collateral requirements.
Income Tax Status — It is the fund’s policy to distribute substantially all net investment income and net realized gains to shareholders and to otherwise qualify as a regulated investment company under provisions of the Internal Revenue Code. Accordingly, no provision has been made for income taxes. The fund files U.S. federal, state, local and non-U.S. tax returns as applicable. The fund's tax returns are subject to examination by the relevant taxing authority until expiration of the applicable statute of limitations, which is generally three years from the date of filing but can be longer in certain jurisdictions. At this time, management believes there are no uncertain tax positions which, based on their technical merit, would not be sustained upon examination and for which it is reasonably possible that the total amounts of unrecognized tax benefits will significantly change in the next twelve months.
Multiple Class — All shares of the fund represent an equal pro rata interest in the net assets of the class to which such shares belong, and have identical voting, dividend, liquidation and other rights and the same terms and conditions, except for class specific expenses and exclusive rights to vote on matters affecting only individual classes. Income, non-class specific expenses, and realized and unrealized capital gains and losses of the fund are allocated to each class of shares based on their relative net assets.
Distributions to Shareholders — Distributions from net investment income, if any, are declared daily and paid monthly. Distributions from net realized gains, if any, are generally declared and paid annually.
Indemnifications — Under the trust’s organizational documents, its officers and trustees are indemnified against certain liabilities arising out of the performance of their duties to the fund. In addition, in the normal course of business, the fund enters into contracts that provide general indemnifications. The maximum exposure under these arrangements is unknown as this would involve future claims that may be made against a fund. The risk of material loss from such claims is considered by management to be remote.
3. Fees and Transactions with Related Parties
Certain officers and trustees of the trust are also officers and/or directors of American Century Companies, Inc. (ACC). The trust's investment advisor, ACIM, the trust's distributor, American Century Investment Services, Inc. (ACIS), and the trust's transfer agent, American Century Services, LLC, are wholly owned, directly or indirectly, by ACC. ACIM has engaged Nomura Corporate Research and Asset Management Inc. (NCRAM) to serve as a subadvisor for the fund and to manage the fund’s assets. NCRAM is responsible for the day-to-day management of the fund, subject to the general supervision of the Board of Trustees and the investment advisor and in accordance with the investment objective, policies and restrictions of the fund. ACIM pays all costs associated with retaining NCRAM as the subadvisor of the fund. A subsidiary of NCRAM’s parent company indirectly owns a non-controlling equity interest in ACC.
Management Fees — The trust has entered into a management agreement with ACIM, under which ACIM provides the fund with investment advisory and management services in exchange for a single, unified management fee (the fee) per class. The agreement provides that all expenses of managing and operating the fund, except distribution and service fees, brokerage expenses, taxes, interest, fees and expenses of the independent trustees (including legal counsel fees), and extraordinary expenses, will be paid by ACIM. The fee is computed and accrued daily based on each class's daily net assets and paid monthly in arrears. The difference in the fee among the classes is a result of their separate arrangements for non-Rule 12b-1 shareholder services. It is not the result of any difference in advisory or custodial fees or other expenses related to the management of the fund’s assets, which do not vary by class.
The annual management fee for each class is as follows:
|
| | | | | |
Investor Class | I Class | Y Class | A Class | R5 Class | R6 Class |
| 0.775% | 0.675% | 0.575% | 0.775% | 0.575% | 0.525% |
Distribution and Service Fees — The Board of Trustees has adopted a Master Distribution and Individual Shareholder Services Plan (the plan) for the A Class, pursuant to Rule 12b-1 of the 1940 Act. The plan provides that the A Class will pay ACIS an annual distribution and service fee of 0.25%. The fees are computed and accrued daily based on the A Class’s daily net assets and paid monthly in arrears. The fees are used to pay financial intermediaries for distribution and individual shareholder services. Fees incurred under the plan during the period ended March 31, 2019 are detailed in the Statement of Operations.
Trustees’ Fees and Expenses — The Board of Trustees is responsible for overseeing the investment advisor’s management and operations of the fund. The trustees receive detailed information about the fund and its investment advisor regularly throughout the year, and meet at least quarterly with management of the investment advisor to review reports about fund operations. The fund’s officers do not receive compensation from the fund.
Interfund Transactions — The fund may enter into security transactions with other American Century Investments funds and other client accounts of the investment advisor, in accordance with the 1940 Act rules and procedures adopted by the Board of Trustees. The rules and procedures require, among other things, that these transactions be effected at the independent current market price of the security. There were no interfund transactions during the period.
4. Investment Transactions
Purchases and sales of investment securities, excluding short-term investments, for the period ended March 31, 2019 were $192,534,504 and $84,032,928, respectively.
5. Capital Share Transactions
Transactions in shares of the fund were as follows (unlimited number of shares authorized):
|
| | | | | | | | | | | | | | | |
| | Year ended March 31, 2019 | Six months ended
March 31, 2018(1)(2) | Year ended
September 30, 2017 |
| | Shares | Amount | Shares | Amount | Shares | Amount |
| Investor Class | | | | | N/A |
| |
| Sold | 2,492,048 |
| $ | 23,300,470 |
| 188,709 |
| $ | 1,808,267 |
| | |
| Issued in reinvestment of distributions | 52,841 |
| 489,784 |
| 1,747 |
| 16,651 |
| | |
| Redeemed | (892,212 | ) | (8,164,840 | ) | (41,853 | ) | (398,770 | ) | | |
| | 1,652,677 |
| 15,625,414 |
| 148,603 |
| 1,426,148 |
| | |
| I Class | | | | | N/A |
| |
| Sold | 3,242,753 |
| 30,328,252 |
| 854,014 |
| 8,160,249 |
| | |
| Issued in reinvestment of distributions | 112,632 |
| 1,045,262 |
| 7,915 |
| 75,164 |
| | |
| Redeemed | (1,548,171 | ) | (14,267,881 | ) | (4,633 | ) | (43,805 | ) | | |
| | 1,807,214 |
| 17,105,633 |
| 857,296 |
| 8,191,608 |
| | |
| Y Class | | | | | | |
| Sold | 7,276,212 |
| 67,726,650 |
| 2,826,105 |
| 27,188,837 |
| 12,790,918 |
| $ | 123,058,806 |
|
| Issued in reinvestment of distributions | 617,896 |
| 5,767,299 |
| 290,458 |
| 2,780,975 |
| 133,112 |
| 1,282,705 |
|
| Redeemed | (9,503,262 | ) | (86,541,386 | ) | (1,252,780 | ) | (11,991,479 | ) | (9,753,965 | ) | (94,164,870 | ) |
| | (1,609,154 | ) | (13,047,437 | ) | 1,863,783 |
| 17,978,333 |
| 3,170,065 |
| 30,176,641 |
|
| A Class | | | | | N/A |
| |
| Sold | 146,952 |
| 1,360,626 |
| 517 |
| 5,008 |
| | |
| Issued in reinvestment of distributions | 2,782 |
| 25,721 |
| 14 |
| 132 |
| | |
| Redeemed | (51,098 | ) | (471,216 | ) | — |
| — |
| | |
| | 98,636 |
| 915,131 |
| 531 |
| 5,140 |
| | |
| R5 Class | | | | | N/A |
| |
| Sold | 15,018 |
| 139,588 |
| 516 |
| 5,000 |
| | |
| Issued in reinvestment of distributions | 120 |
| 1,119 |
| 16 |
| 151 |
| | |
| Redeemed | (24 | ) | (223 | ) | — |
| — |
| | |
| | 15,114 |
| 140,484 |
| 532 |
| 5,151 |
| | |
| R6 Class | | | | | N/A |
| |
| Sold | 11,750,108 |
| 108,674,614 |
| 735,928 |
| 7,008,773 |
| | |
| Issued in reinvestment of distributions | 276,052 |
| 2,551,007 |
| 3,514 |
| 33,104 |
| | |
| Redeemed | (2,288,877 | ) | (21,002,448 | ) | — |
| — |
| | |
| | 9,737,283 |
| 90,223,173 |
| 739,442 |
| 7,041,877 |
| | |
| Net increase (decrease) | 11,701,770 |
| $ | 110,962,398 |
| 3,610,187 |
| $ | 34,648,257 |
| 3,170,065 |
| $ | 30,176,641 |
|
| |
| (1) | The fund's fiscal year end was changed from September 30 to March 31, resulting in a six-month annual reporting period. |
| |
| (2) | October 2, 2017 (commencement of sale) through March 31, 2018 for Investor Class, I Class, A Class, R5 Class and R6 Class. |
6. Fair Value Measurements
The fund’s investments valuation process is based on several considerations and may use multiple inputs to determine the fair value of the investments held by the fund. In conformity with accounting principles generally accepted in the United States of America, the inputs used to determine a valuation are classified into three broad levels.
| |
| • | Level 1 valuation inputs consist of unadjusted quoted prices in an active market for identical investments. |
| |
| • | Level 2 valuation inputs consist of direct or indirect observable market data (including quoted prices for comparable investments, evaluations of subsequent market events, interest rates, prepayment speeds, credit risk, etc.). These inputs also consist of quoted prices for identical investments initially expressed in local currencies that are adjusted through translation into U.S. dollars. |
| |
| • | Level 3 valuation inputs consist of unobservable data (including a fund’s own assumptions). |
The level classification is based on the lowest level input that is significant to the fair valuation measurement. The valuation inputs are not necessarily an indication of the risks associated with investing in these securities or other financial instruments.
The following is a summary of the level classifications as of period end. The Schedule of Investments provides additional information on the fund’s portfolio holdings.
|
| | | | | | | | |
| | Level 1 | Level 2 | Level 3 |
| Assets | | | |
| Investment Securities | | | |
| Corporate Bonds | — |
| $ | 231,674,614 |
| — |
|
| Bank Loan Obligations | — |
| 9,605,929 |
| — |
|
| Preferred Stocks | $ | 47,345 |
| 3,981,074 |
| — |
|
| Convertible Bonds | — |
| 1,384,166 |
| — |
|
| Common Stocks | 391,587 |
| — |
| — |
|
| Escrow Interests | — |
| 20,380 |
| — |
|
| Warrants | — |
| 8,091 |
| — |
|
| Rights | — |
| 2,654 |
| — |
|
| Temporary Cash Investments | 14,540,710 |
| — |
| — |
|
| | $ | 14,979,642 |
| $ | 246,676,908 |
| — |
|
7. Risk Factors
The fund invests primarily in high-yield and lower-quality debt securities, which are subject to substantial risks including liquidity risk and credit risk.
8. Federal Tax Information
The tax character of distributions paid during the year ended March 31, 2019, the six months ended March 31, 2018 and the year ended September 30, 2017 were as follows:
|
| | | | | | | | | |
| | March 31, 2019 | March 31, 2018(1) | September 30, 2017 |
| Distributions Paid From | | | |
| Ordinary income | $ | 12,637,227 |
| $ | 4,195,407 |
| $ | 6,179,656 |
|
| Long-term capital gains | — |
| — |
| — |
|
| |
| (1) | The fund's fiscal year end was changed from September 30 to March 31, resulting in a six-month annual reporting period. |
The book-basis character of distributions made during the year from net investment income or net realized gains may differ from their ultimate characterization for federal income tax purposes. These differences reflect the differing character of certain income items and net realized gains and losses for financial statement and tax purposes, and may result in reclassification among certain capital accounts on the financial statements.
As of period end, the federal tax cost of investments and the components of distributable earnings on a tax-basis were as follows:
|
| | | |
| Federal tax cost of investments | $ | 266,682,474 |
|
| Gross tax appreciation of investments | $ | 4,227,792 |
|
| Gross tax depreciation of investments | (9,253,716 | ) |
| Net tax appreciation (depreciation) of investments | $ | (5,025,924 | ) |
| Other book-to-tax adjustments | $ | (77,396 | ) |
| Undistributed ordinary income | — |
|
| Accumulated short-term capital losses | $ | (471,117 | ) |
| Accumulated long-term capital losses | $ | (1,288,262 | ) |
The difference between book-basis and tax-basis unrealized appreciation (depreciation) is attributable primarily to the tax deferral of losses on wash sales.
Accumulated capital losses represent net capital loss carryovers that may be used to offset future realized capital gains for federal income tax purposes. The capital loss carryovers may be carried forward for an unlimited period. Future capital loss carryover utilization in any given year may be subject to Internal Revenue Code limitations.
9. Reorganization
On September 15, 2017, the Nomura High Yield Fund shareholders approved an agreement and plan of reorganization (the reorganization), whereby the net assets of Nomura High Yield Fund, a series issued by The Advisors’ Inner Circle Fund III, were transferred to High Income Fund, a newly organized series issued by the trust, with no investment operations prior to the reorganization, in exchange for shares of High Income Fund. The transaction will allow the Nomura High Yield Fund’s shareholders to access American Century Investment’s capabilities and operational infrastructure in terms of shareholder servicing, relationship management, and product support, and benefit from their expanded resources in the areas of multi-channel distribution and relationship management. The financial statements and performance history of Nomura High Yield Fund survived after the reorganization and the fiscal year end was changed from September 30 to March 31. The reorganization was effective on October 2, 2017.
Prior to the reorganization, the fund’s investment advisor was Nomura Asset Management U.S.A. Inc. and the fund paid an annual investment advisory fee of 0.50%. The fund was also charged a variety of other fees, including an administration and accounting fee, transfer agent fee, pricing fee, legal fee, registration fee and other expenses. Nomura Asset Management U.S.A. Inc. contractually agreed to reduce its fees and/or reimburse expenses to the extent necessary to keep total annual fund operating expenses from exceeding 0.575% of the fund’s average daily net assets. Nomura Asset Management U.S.A. Inc. had an agreement with NCRAM to subadvise the fund and paid the NCRAM out of their investment advisory fee.
The reorganization was accomplished by a tax-free exchange of shares between Nomura High Yield Fund - Class I and High Income Fund - Y Class. On October 2, 2017, Nomura High Yield Fund exchanged its shares for shares of High Income Fund as follows:
|
| | | | | | | | | |
| Original Fund/Class | Shares
Exchanged | Net Assets | New Fund/Class | Shares
Received | Net Assets |
| Nomura High Yield Fund – Class I | 13,168,356 |
| $127,414,290 |
| High Income Fund – Y Class | 13,168,356 |
| $127,414,290 |
|
Because High Income Fund was a newly organized series with no investment operations prior to the reorganization and the reorganization was effective at the commencement of High Income Fund’s fiscal year, it is not practicable to present proforma results of operations during the period or separate the amounts of revenue and earnings of Nomura High Yield Fund that have been included in High Income Fund’s Statement of Operations.
10. Recently Issued Accounting Standards
In March 2017, the Financial Accounting Standards Board (FASB) issued Accounting Standards Update No. 2017-08, “Receivables - Nonrefundable Fees and Other Costs (Subtopic 310-20), Premium Amortization on Purchased Callable Debt Securities” (ASU 2017-08). ASU 2017-08 amends the amortization period for certain purchased callable debt securities held at a premium, shortening such period to the earliest call date. The amendments are effective for fiscal years, and interim periods within those fiscal years, beginning after December 15, 2018. Management is currently evaluating the impact that adopting ASU 2017-08 will have on the financial statements.
|
| | | | | | | | | | | | | | | | |
| For a Share Outstanding Throughout the Years Ended March 31 (except as noted) |
| Per-Share Data | | | | | | | | Ratios and Supplemental Data | |
| | | Income From Investment Operations: | Distributions From: | | | Ratio to Average Net Assets of: | | |
| | Net Asset
Value,
Beginning
of Period | Net
Investment
Income
(Loss)(1) | Net
Realized
and
Unrealized
Gain (Loss) | Total From
Investment
Operations | Net
Investment
Income | Net
Realized
Gains | Total Distributions | Net Asset
Value,
End
of Period | Total
Return(2) | Operating
Expenses | Operating
Expenses
(before
expense
waiver) | Net
Investment
Income
(Loss) | Portfolio
Turnover
Rate | Net
Assets,
End of
Period
(in thousands) |
| Investor Class | | | | | | | | | | | | | |
| 2019 | $9.43 | 0.53 | (0.11) | 0.42 | (0.53) | — | (0.53) | $9.32 | 4.65% | 0.78% | 0.78% | 5.73% | 43% |
| $16,796 |
|
2018(3) | $9.68 | 0.27 | (0.24) | 0.03 | (0.28) | — | (0.28) | $9.43 | 0.29% | 0.78%(4) | 0.78%(4) | 5.70%(4) | 26% |
| $1,401 |
|
| I Class | | | | | | | | | | | | | |
| 2019 | $9.42 | 0.54 | (0.10) | 0.44 | (0.54) | — | (0.54) | $9.32 | 4.86% | 0.68% | 0.68% | 5.83% | 43% |
| $24,825 |
|
2018(3) | $9.68 | 0.27 | (0.25) | 0.02 | (0.28) | — | (0.28) | $9.42 | 0.23% | 0.68%(4) | 0.68%(4) | 5.80%(4) | 26% |
| $8,078 |
|
| Y Class | | | | | | | | | | | | | |
| 2019 | $9.42 | 0.55 | (0.10) | 0.45 | (0.55) | — | (0.55) | $9.32 | 4.97% | 0.58% | 0.58% | 5.93% | 43% |
| $125,104 |
|
2018(5) | $9.68 | 0.28 | (0.25) | 0.03 | (0.29) | — | (0.29) | $9.42 | 0.31% | 0.58%(4) | 0.58%(4) | 5.90%(4) | 26% |
| $141,643 |
|
| 2017 | $9.42 | 0.56 | 0.24 | 0.80 | (0.54) | — | (0.54) | $9.68 | 8.74% | 0.58% | 1.00% | 5.83%(6) | 81% |
| $127,414 |
|
| 2016 | $8.95 | 0.58 | 0.46 | 1.04 | (0.57)(7) | — | (0.57) | $9.42 | 12.15% | 0.61% | 1.49% | 6.37%(6) | 116% |
| $94,197 |
|
| 2015 | $10.24 | 0.65 | (1.11) | (0.46) | (0.65) | (0.18) | (0.83) | $8.95 | (4.79)% | 0.71% | 2.95% | 6.62%(6) | 106% |
| $34,075 |
|
| 2014 | $10.23 | 0.65 | 0.20 | 0.85 | (0.70) | (0.14) | (0.84) | $10.24 | 8.50% | 0.85% | 2.60% | 6.24%(6) | 114% |
| $50,820 |
|
| A Class | | | | | | | | | | | | | |
| 2019 | $9.42 | 0.51 | (0.10) | 0.41 | (0.51) | — | (0.51) | $9.32 | 4.50% | 1.03% | 1.03% | 5.48% | 43% |
| $924 |
|
2018(3) | $9.68 | 0.26 | (0.25) | 0.01 | (0.27) | — | (0.27) | $9.42 | 0.06% | 1.03%(4) | 1.03%(4) | 5.45%(4) | 26% |
| $5 |
|
| R5 Class | | | | | | | | | | | | | |
| 2019 | $9.42 | 0.55 | (0.10) | 0.45 | (0.55) | — | (0.55) | $9.32 | 4.96% | 0.58% | 0.58% | 5.93% | 43% |
| $146 |
|
2018(3) | $9.68 | 0.28 | (0.25) | 0.03 | (0.29) | — | (0.29) | $9.42 | 0.27% | 0.58%(4) | 0.58%(4) | 5.90%(4) | 26% |
| $5 |
|
|
| | | | | | | | | | | | | | | | |
| For a Share Outstanding Throughout the Years Ended March 31 (except as noted) |
| Per-Share Data | | | | | | | | Ratios and Supplemental Data | |
| | | Income From Investment Operations: | Distributions From: | | | Ratio to Average Net Assets of: | | |
| | Net Asset
Value,
Beginning
of Period | Net
Investment
Income
(Loss)(1) | Net
Realized
and
Unrealized
Gain (Loss) | Total From
Investment
Operations | Net
Investment
Income | Net
Realized
Gains | Total Distributions | Net Asset
Value,
End
of Period | Total
Return(2) | Operating
Expenses | Operating
Expenses
(before
expense
waiver) | Net
Investment
Income
(Loss) | Portfolio
Turnover
Rate | Net
Assets,
End of
Period
(in thousands) |
| R6 Class | | | | | | | | | | | | | |
| 2019 | $9.42 | 0.56 | (0.10) | 0.46 | (0.56) | — | (0.56) | $9.32 | 5.02% | 0.53% | 0.53% | 5.98% | 43% |
| $97,599 |
|
2018(3) | $9.68 | 0.26 | (0.23) | 0.03 | (0.29) | — | (0.29) | $9.42 | 0.31% | 0.53%(4) | 0.53%(4) | 5.95%(4) | 26% |
| $6,969 |
|
|
|
| Notes to Financial Highlights |
| |
| (1) | Computed using average shares outstanding throughout the period. |
| |
| (2) | Total returns are calculated based on the net asset value of the last business day and do not reflect applicable sales charges, if any. Total returns for periods less than one year are not annualized. |
| |
| (3) | October 2, 2017 (commencement of sale) through March 31, 2018. |
| |
| (5) | October 1, 2017 through March 31, 2018. The fund's fiscal year end was changed from September 30 to March 31, resulting in a six-month annual reporting period. For the years before March 31, 2018, the fund's fiscal year end was September 30. |
| |
| (6) | The ratio of net investment income (loss) to average net assets would have been lower if a portion of the fees had not been waived and/or reimbursed. |
| |
| (7) | Per-share amount includes a distribution from tax return of capital of less than $0.005. |
See Notes to Financial Statements.
|
|
| Report of Independent Registered Public Accounting Firm |
To the Board of Trustees of American Century Investment Trust and Shareholders of High Income Fund:
Opinion on the Financial Statements
We have audited the accompanying statement of assets and liabilities, including the schedule of investments, of High Income Fund (one of the funds constituting American Century Investment Trust, referred to hereafter as the “Fund”) as of March 31, 2019, the related statement of operations for the year ended March 31, 2019, the statement of changes in net assets for the year ended March 31, 2019 and for the six months ended March 31, 2018, including the related notes, and the financial highlights for the year ended March 31, 2019 and the periods ended March 31, 2018 (collectively referred to as the “financial statements”). In our opinion, the financial statements present fairly, in all material respects, the financial position of the Fund as of March 31, 2019, the results of its operations for the year then ended, the changes in its net assets for the year ended March 31, 2019 and for the six months ended March 31, 2018, and the financial highlights for the year ended March 31, 2019 and the periods ended March 31, 2018 in conformity with accounting principles generally accepted in the United States of America.
The financial statements as of and for the year ended on September 30, 2017 and the financial highlights for each of the periods ended on or prior to September 30, 2017 (not presented herein, other than the statement of changes in net assets and the financial highlights) were audited by other auditors whose report dated November 29, 2017 expressed an unqualified opinion on those financial statements and financial highlights.
Basis for Opinion
These financial statements are the responsibility of the Fund’s management. Our responsibility is to express an opinion on the Fund’s financial statements based on our audits. We are a public accounting firm registered with the Public Company Accounting Oversight Board (United States) (“PCAOB”) and are required to be independent with respect to the Fund in accordance with the U.S. federal securities laws and the applicable rules and regulations of the Securities and Exchange Commission and the PCAOB.
We conducted our audits of these financial statements in accordance with the standards of the PCAOB. Those standards require that we plan and perform the audit to obtain reasonable assurance about whether the financial statements are free of material misstatement, whether due to error or fraud.
Our audits included performing procedures to assess the risks of material misstatement of the financial statements, whether due to error or fraud, and performing procedures that respond to those risks. Such procedures included examining, on a test basis, evidence regarding the amounts and disclosures in the financial statements. Our audits also included evaluating the accounting principles used and significant estimates made by management, as well as evaluating the overall presentation of the financial statements. Our procedures included confirmation of securities owned as of March 31, 2019 by correspondence with the custodian and brokers; when replies were not received from brokers, we performed other auditing procedures. We believe that our audits provide a reasonable basis for our opinion.
/s/ PricewaterhouseCoopers LLP
Kansas City, Missouri
May 17, 2019
We have served as the auditor of one or more investment companies in American Century Investments since 1997.
Board of Trustees
The individuals listed below serve as trustees of the funds. Each trustee will continue to serve in this capacity until death, retirement, resignation or removal from office. The board has adopted a mandatory retirement age for trustees who are not “interested persons,” as that term is defined in the Investment Company Act (independent trustees). Independent trustees shall retire on December 31 of the year in which they reach their 75th birthday; provided, however, that on or after January 1, 2022, independent trustees shall retire on December 31 of the year in which they reach their 76th birthday.
Mr. Thomas is an “interested person” because he currently serves as President and Chief Executive Officer of American Century Companies, Inc. (ACC), the parent company of American Century Investment Management, Inc. (ACIM or the advisor). The other trustees (more than three-fourths of the total number) are independent. They are not employees, directors or officers of, and have no financial interest in, ACC or any of its wholly owned, direct or indirect, subsidiaries, including ACIM, American Century Investment Services, Inc. (ACIS) and American Century Services, LLC (ACS), and they do not have any other affiliations, positions or relationships that would cause them to be considered “interested persons” under the Investment Company Act. The trustees serve in this capacity for eight (in the case of Jonathan S. Thomas, 16; and Ronald J. Gilson, 9) registered investment companies in the American Century Investments family of funds.
The following table presents additional information about the trustees. The mailing address for each trustee other than Jonathan S. Thomas is 1665 Charleston Road, Mountain View, California 94043. The mailing address for Jonathan S. Thomas is 4500 Main Street, Kansas City, Missouri 64111.
|
| | | | | |
Name
(Year of Birth) | Position(s) Held with Funds | Length of Time Served | Principal Occupation(s) During Past 5 Years | Number of American Century Portfolios Overseen by Trustee | Other Directorships Held During Past 5 Years |
| Independent Trustees |
|
|
Tanya S. Beder
(1955) | Trustee | Since 2011 | Chairman and CEO, SBCC Group Inc. (independent advisory services) (2006 to present) | 45 | CYS Investments, Inc.; Nabors Industries Ltd. |
Jeremy I. Bulow
(1954) | Trustee | Since 2011 | Professor of Economics, Stanford University, Graduate School of Business (1979 to present) | 45 | None |
Anne Casscells
(1958) | Trustee | Since 2016 | Co-Chief Executive Officer and Chief Investment Officer, Aetos Alternatives Management (investment advisory firm) (2001 to present); Lecturer in Accounting, Stanford University, Graduate School of Business (2009 to 2017) | 45 | None |
Ronald J. Gilson
(1946) | Trustee and Chairman of the Board | Since 1995
(Chairman since 2005) | Charles J. Meyers Professor of Law and Business, Emeritus, Stanford Law School (1979 to 2016); Marc and Eva Stern Professor of Law and Business, Columbia University School of Law (1992 to present) | 50 | None |
|
| | | | | |
Name
(Year of Birth) | Position(s) Held with Funds | Length of Time Served | Principal Occupation(s) During Past 5 Years | Number of American Century Portfolios Overseen by Trustee | Other Directorships Held During Past 5 Years |
| Independent Trustees |
|
|
Frederick L. A. Grauer
(1946) | Trustee | Since 2008 | Senior Advisor, Credit Sesame, Inc. (credit monitoring firm) (2018 to present); Senior Advisor, Course Hero (an educational technology company) (2015 to present); Senior Advisor, iShares by BlackRock, Inc. (investment management firm) (2013 to 2015)
| 45 | None |
Jonathan D. Levin
(1972) | Trustee | Since 2016 | Philip H. Knight Professor and Dean, Graduate School of Business, Stanford University (2016 to present); Professor, Stanford University, (2000 to present); Chair, Department of Economics, Stanford University (2011 to 2014) | 45 | None |
Peter F. Pervere
(1947) | Trustee | Since 2007 | Retired | 45 | None |
John B. Shoven
(1947) | Trustee | Since 2002 | Charles R. Schwab Professor of Economics, Stanford University (1973 to present) | 45 | Cadence Design Systems; Exponent; Financial Engines |
| Interested Trustee |
|
|
Jonathan S. Thomas
(1963) | Trustee and President | Since 2007 | President and Chief Executive Officer, ACC (2007 to present). Also serves as Chief Executive Officer, ACS; Executive Vice President, ACIM; Director, ACC, ACIM and other ACC subsidiaries | 117 | BioMed Valley Discoveries, Inc. |
The Statement of Additional Information has additional information about the fund's trustees and is available without charge, upon request, by calling 1-800-345-2021.
Officers
The following table presents certain information about the executive officers of the funds. Each officer serves as an officer for 16 (in the case of Robert J. Leach, 15) investment companies in the American Century family of funds, unless otherwise noted. No officer is compensated for his or her service as an officer of the funds. The listed officers are interested persons of the funds and are appointed or re-appointed on an annual basis. The mailing address for each of the officers listed below is 4500 Main Street, Kansas City, Missouri 64111.
|
| | |
Name
(Year of Birth) | Offices with the Funds | Principal Occupation(s) During the Past Five Years |
Jonathan S. Thomas
(1963) | Trustee and President since 2007 | President and Chief Executive Officer, ACC (2007 to present). Also serves as Chief Executive Officer, ACS; Executive Vice President, ACIM; Director, ACC, ACIM and other ACC subsidiaries |
R. Wes Campbell
(1974)
| Chief Financial Officer and Treasurer since 2018
| Investment Operations and Investment Accounting, ACS (2000 to present) |
Amy D. Shelton
(1964) | Chief Compliance Officer and Vice President since 2014 | Chief Compliance Officer, American Century funds, (2014 to present); Chief Compliance Officer, ACIM (2014 to present); Chief Compliance Officer, ACIS (2009 to present); Vice President, Client Interactions and Marketing, ACIS (2013 to 2014). Also serves as Vice President, ACIS |
Charles A. Etherington
(1957) | General Counsel since 2007 and Senior Vice President since 2006 | Attorney, ACC (1994 to present); Vice President, ACC (2005 to present); General Counsel, ACC (2007 to present). Also serves as General Counsel, ACIM, ACS, ACIS and other ACC subsidiaries; and Senior Vice President, ACIM and ACS |
C. Jean Wade
(1964) | Vice President since 2012 | Senior Vice President, ACS (2017 to present); Vice President ACS (2000 to 2017) |
Robert J. Leach
(1966) | Vice President since 2006 | Vice President, ACS (2000 to present) |
David H. Reinmiller
(1963) | Vice President since 2000 | Attorney, ACC (1994 to present) Also serves as Vice President, ACIM and ACS |
Ward D. Stauffer
(1960) | Secretary since 2005 | Attorney, ACC (2003 to present) |
Retirement Account Information
As required by law, distributions you receive from certain retirement accounts are subject to federal income tax withholding, unless you elect not to have withholding apply*. Tax will be withheld on the total amount withdrawn even though you may be receiving amounts that are not subject to withholding, such as nondeductible contributions. In such case, excess amounts of withholding could occur. You may adjust your withholding election so that a greater or lesser amount will be withheld.
If you don’t want us to withhold on this amount, you must notify us to not withhold the federal income tax. You may notify us in writing or in certain situations by telephone or through other electronic means. For systematic withdrawals, your withholding election will remain in effect until revoked or changed by filing a new election. You have the right to revoke your election at any time and change your withholding percentage for future distributions.
Remember, even if you elect not to have income tax withheld, you are liable for paying income tax on the taxable portion of your withdrawal. If you elect not to have income tax withheld or you don’t have enough income tax withheld, you may be responsible for payment of estimated tax. You may incur penalties under the estimated tax rules if your withholding and estimated tax payments are not sufficient. You can reduce or defer the income tax on a distribution by directly or indirectly rolling such distribution over to another IRA or eligible plan. You should consult your tax advisor for additional information.
State tax will be withheld if, at the time of your distribution, your address is within one of the mandatory withholding states and you have federal income tax withheld (or as otherwise required by state law). State taxes will be withheld from your distribution in accordance with the respective state rules.
*Some 403(b), 457 and qualified retirement plan distributions may be subject to 20% mandatory withholding, as they are subject to special tax and withholding rules. Your plan administrator or plan sponsor is required to provide you with a special tax notice explaining those rules at the time you request a distribution. If applicable, federal and/or state taxes may be withheld from your distribution amount.
Proxy Voting Policies
Descriptions of the principles and policies that the fund's investment advisor uses in exercising the voting rights associated with the securities purchased and/or held by the fund are available without charge, upon request, by calling 1-800-345-2021 or visiting the "About Us" page of American Century Investments’ website at americancentury.com. A description of the policies is also available on the Securities and Exchange Commission’s website at sec.gov. Information regarding how the investment advisor voted proxies relating to portfolio securities during the most recent 12-month period ended June 30 is available on the "About Us" page at americancentury.com. It is also available at sec.gov.
Quarterly Portfolio Disclosure
The fund files its complete schedule of portfolio holdings with the Securities and Exchange Commission (SEC) for the first and third quarters of each fiscal year on Form N-Q or as an exhibit to its reports on Form N-PORT. The fund’s Forms N-Q and Form N-PORT reports are available on the SEC’s website at sec.gov. The fund also makes its complete schedule of portfolio holdings for the most recent quarter of its fiscal year available on its website at americancentury.com and, upon request, by calling 1-800-345-2021.
Other Tax Information
The following information is provided pursuant to provisions of the Internal Revenue Code.
The fund hereby designates up to the maximum amount allowable as qualified dividend income for the fiscal year ended March 31, 2019.
For corporate taxpayers, the fund hereby designates $26,380, or up to the maximum amount allowable, of ordinary income distributions paid during the fiscal year ended March 31, 2019 as qualified for the corporate dividends received deduction.
|
| | |
| |
| | | |
| Contact Us | americancentury.com | |
| Automated Information Line | 1-800-345-8765 | |
| Investor Services Representative | 1-800-345-2021 or 816-531-5575 | |
| Investors Using Advisors | 1-800-378-9878 | |
| Business, Not-For-Profit, Employer-Sponsored Retirement Plans | 1-800-345-3533 | |
| Banks and Trust Companies, Broker-Dealers, Financial Professionals, Insurance Companies | 1-800-345-6488 | |
| Telecommunications Relay Service for the Deaf | 711 | |
| | | |
| American Century Investment Trust | |
| | | |
Investment Advisor: American Century Investment Management, Inc. Kansas City, Missouri | |
| | | |
| This report and the statements it contains are submitted for the general information of our shareholders. The report is not authorized for distribution to prospective investors unless preceded or accompanied by an effective prospectus. | |
| | | |
©2019 American Century Proprietary Holdings, Inc. All rights reserved.
CL-ANN-93333 1905 | |
|
| |
| | |
| | Annual Report |
| | |
| | March 31, 2019 |
| | |
| | High-Yield Fund |
| | Investor Class (ABHIX) |
| | I Class (AHYHX) |
| | Y Class (AHYLX) |
| | A Class (AHYVX) |
| | C Class (AHDCX) |
| | R Class (AHYRX) |
| | R5 Class (ACYIX) |
| | R6 Class (AHYDX) |
Beginning on January 1, 2021, as permitted by regulations adopted by the Securities and Exchange Commission, paper copies of the fund’s shareholder reports like this one will no longer be sent by mail, unless you specifically request paper copies of the reports from the fund or from your financial intermediary, such as a broker-dealer or bank. Instead, the reports will be made available on a website, and you will be notified by mail each time a report is posted and provided with a website link to access the report.
If you already elected to receive shareholder reports electronically, you will not be affected by this change and you need not take any action. You may elect to receive shareholder reports and other communications from the fund or your financial intermediary electronically by calling or sending an email request to your appropriate contacts as listed on the back cover of this report.
You may elect to receive all future reports in paper free of charge. You can inform the fund or your financial intermediary that you wish to continue receiving paper copies of your shareholder reports by calling or sending an email request to your appropriate contacts as listed on the back cover of this report. Your election to receive reports in paper will apply to all funds held with the fund complex/your financial intermediary.
|
| |
| President’s Letter | 2 |
| Performance | 3 |
| Portfolio Commentary | |
| Fund Characteristics | |
| Shareholder Fee Example | |
| Schedule of Investments | |
| Statement of Assets and Liabilities | |
| Statement of Operations | |
| Statement of Changes in Net Assets | |
| Notes to Financial Statements | |
| Financial Highlights | |
| Report of Independent Registered Public Accounting Firm | |
| Management | |
| Additional Information | |
Any opinions expressed in this report reflect those of the author as of the date of the report, and do not necessarily represent the opinions of American Century Investments® or any other person in the American Century Investments organization. Any such opinions are subject to change at any time based upon market or other conditions and American Century Investments disclaims any responsibility to update such opinions. These opinions may not be relied upon as investment advice and, because investment decisions made by American Century Investments funds are based on numerous factors, may not be relied upon as an indication of trading intent on behalf of any American Century Investments fund. Security examples are used for representational purposes only and are not intended as recommendations to purchase or sell securities. Performance information for comparative indices and securities is provided to American Century Investments by third party vendors. To the best of American Century Investments’ knowledge, such information is accurate at the time of printing.
Jonathan Thomas
Dear Investor:
Thank you for reviewing this annual report for the period ended March 31, 2019. Annual reports help convey important information about fund returns, including market factors that affected performance during the reporting period. For additional, updated investment and market insights, we encourage you to visit our website, americancentury.com.
Markets Ended Roller-Coaster Period on Upswing
For the first half of the period, U.S. stocks climbed higher, while bond returns headed lower. Robust economic growth, bolstered by federal tax and regulatory reform, and record corporate earnings results fueled risk-on sentiment that drove stock prices higher. Meanwhile, the combination of strong economic data, the Federal Reserve’s (Fed’s) ongoing rate-hike campaign and an uptick in inflation pushed investment-grade bond returns lower.
Market trends began changing in late 2018. Mounting investor concerns about slowing global economic and earnings growth, U.S.-China trade tensions and rising interest rates triggered widespread volatility. Stock prices plunged as investors sought safe-haven investments, including U.S. Treasuries. Furthermore, the Fed issued another rate hike in December, its fourth of the year, and maintained its hawkish outlook. Investors feared the December rate increase and the Fed’s plans for two more rate hikes in 2019 were too aggressive, and risk-off investing remained in favor.
January brought a renewed sense of stability to the markets. Investors’ concerns about growth and trade eased, and the Fed changed course, pausing its rate-hike campaign amid moderating global growth and inflation. Valuations appeared attractive after the late-2018 sell-off, and risk-on investing resumed. In March, the Fed held rates steady again, hinting additional tightening was off the table for 2019. This news drove stock and bond returns higher and left both asset classes on an upward track to end the period. Overall, stocks (S&P 500 Index) overcame their late-2018 nosedive to gain 9.50% for the period. Bonds (Bloomberg Barclays U.S. Aggregate Bond Index) bounced back from losses early in the period to return 4.48%.
We expect volatility to remain a formidable factor as investors react to global growth trends, central bank policy and geopolitical developments. We believe this scenario underscores the importance of using professionally managed portfolios in pursuit of investment goals. We appreciate your continued trust and confidence in us.
Sincerely,
Jonathan Thomas
President and Chief Executive Officer
American Century Investments
|
| | | | | | |
| Total Returns as of March 31, 2019 |
| | | | Average Annual Returns | |
| | Ticker Symbol | 1 year | 5 years | 10 years | Since Inception | Inception Date |
| Investor Class | ABHIX | 4.91% | 3.16% | 8.42% | — | 9/30/97 |
| Bloomberg Barclays U.S. High-Yield 2% Issuer Capped Bond Index | — | 5.93% | 4.68% | 11.20% | — | — |
| I Class | AHYHX | 5.01% | — | — | 3.60% | 4/10/17 |
| Y Class | AHYLX | 5.12% | — | — | 3.70% | 4/10/17 |
| A Class | AHYVX | | | | | 3/8/02 |
| No sales charge | | 4.65% | 2.94% | 8.17% | — | |
| With sales charge | | -0.01% | 2.01% | 7.68% | — | |
| C Class | AHDCX | 3.87% | 2.14% | 7.35% | — | 12/10/01 |
| R Class | AHYRX | 4.39% | 2.65% | 7.88% | — | 7/29/05 |
| R5 Class | ACYIX | 5.12% | 3.40% | 8.66% | — | 8/2/04 |
| R6 Class | AHYDX | 5.17% | 3.42% | — | 4.03% | 7/26/13 |
Average annual returns since inception are presented when ten years of performance history is not available. Fund returns would have been lower if a portion of the fees had not been waived.
Sales charges include initial sales charges and contingent deferred sales charges (CDSCs), as applicable. A Class shares have a 4.50% maximum initial sales charge and may be subject to a maximum CDSC of 1.00%. C Class shares redeemed within 12 months of purchase are subject to a maximum CDSC of 1.00%. The SEC requires that mutual funds provide performance information net of maximum sales charges in all cases where charges could be applied.
Data presented reflect past performance. Past performance is no guarantee of future results. Current performance may be higher or lower than the performance shown. Total returns for periods less than one year are not annualized. Investment return and principal value will fluctuate, and redemption value may be more or less than original cost. Data assumes reinvestment of dividends and capital gains, and none of the charts reflect the deduction of taxes that a shareholder would pay on fund distributions or the redemption of fund shares. To obtain performance data current to the most recent month end, please call 1-800-345-2021 or visit americancentury.com. For additional information about the fund, please consult the prospectus.
|
|
| Growth of $10,000 Over 10 Years |
| $10,000 investment made March 31, 2009 |
| Performance for other share classes will vary due to differences in fee structure. |
|
| |
| Value on March 31, 2019 |
| | Investor Class — $22,454 |
| |
| | Bloomberg Barclays U.S. High-Yield 2% Issuer Capped Bond Index— $28,935 |
| |
Ending value of Investor Class would have been lower if a portion of the fees had not been waived.
|
| | | | | | | |
| Total Annual Fund Operating Expenses | | |
| Investor Class | I Class | Y Class | A Class | C Class | R Class | R5 Class | R6 Class |
| 0.86% | 0.76% | 0.66% | 1.11% | 1.86% | 1.36% | 0.66% | 0.61% |
The total annual fund operating expenses shown is as stated in the fund’s prospectus current as of the date of this report. The prospectus may vary from the expense ratio shown elsewhere in this report because it is based on a different time period, includes acquired fund fees and expenses, and, if applicable, does not include fee waivers or expense reimbursements.
Data presented reflect past performance. Past performance is no guarantee of future results. Current performance may be higher or lower than the performance shown. Total returns for periods less than one year are not annualized. Investment return and principal value will fluctuate, and redemption value may be more or less than original cost. Data assumes reinvestment of dividends and capital gains, and none of the charts reflect the deduction of taxes that a shareholder would pay on fund distributions or the redemption of fund shares. To obtain performance data current to the most recent month end, please call 1-800-345-2021 or visit americancentury.com. For additional information about the fund, please consult the prospectus.
Portfolio Managers: Kevin Akioka and Gavin Fleischman
Effective October 31, 2018, Dave MacEwen left the portfolio management team ahead of his
December 31, 2018, retirement.
Performance Summary
High-Yield returned 4.91%* for the 12 months ended March 31, 2019, compared with the Bloomberg Barclays U.S. High-Yield 2% Issuer Capped Bond Index, which gained 5.93%. Fund returns reflect operating expenses, while index returns do not.
The fund’s results reflect the positive performance of higher-yielding, lower-quality securities, as risk-on investing reigned during much of the period. The fiscal year witnessed a marked shift in Federal Reserve (Fed) policy and investor sentiment toward the U.S. and global economic growth outlook, which influenced performance in the fixed-income market. In the first several months of the period, robust economic growth, rising inflation and the Fed’s steady rate-tightening strategy drove Treasury yields higher. Investment-grade bond returns were generally flat to slightly negative. Meanwhile, risk-on investing remained in favor, and higher-yielding securities outperformed. The environment reversed sharply in late 2018, as worries about future economic and corporate earnings growth, U.S.-China trade negotiations and a surprisingly bullish Fed outlook triggered severe volatility in the equity markets. Investors fled risk assets in favor of U.S. Treasuries and other perceived safe-haven investments.
The new year brought a new sense of stability to the financial markets. Progress with U.S.-China trade negotiations and better-than-feared U.S. economic and earnings data helped restore some investor optimism. Additionally, the Fed paused its rate-hike campaign in January, seemingly acknowledging its December plan for two rate hikes in 2019 may have been too aggressive. Investors responded enthusiastically to this backdrop, and risk assets returned to favor. Meanwhile, Treasury yields moved modestly lower. Then, at its March monetary policy meeting, the Fed held rates steady and suggested additional tightening was likely off the table for 2019. While this news triggered a sharp rally among Treasuries, it also extended the rally among higher-risk assets. Overall, the broad U.S. fixed-income market advanced for the entire 12-month period, and high-yield securities generally outperformed higher-quality bonds. Relative to the index, our more-defensive positioning and security selection primarily accounted for the portfolio’s underperformance.
Defensive Positioning, Security Selection Detracted
Overall, the portfolio’s larger-than-average cash position was the primary detractor on a relative basis. Although our cash holdings provided some downside protection during the sell-off in risk assets in late 2018, they weighed on performance in early 2019 as high-yield bonds rallied. In another defensive strategy, we maintained an underweight position in securities with CCC credit ratings. This weighed on relative results, as lower-quality securities rebounded late in the period and were top performers overall.
Security selection also detracted from relative performance. In particular, our selections among independent energy producers dragged down results, as declining oil prices in 2018 provided
*All fund returns referenced in this commentary are for Investor Class shares. Fund returns would have been lower if a portion of the fees had not been waived. Performance for other share classes will vary due to differences in fee structure; when Investor Class performance exceeds that of the index, other share classes may not. See page 3 for returns for all share classes.
a headwind for energy-sector companies. Despite the oil price rebound in early 2019, some of our
exploration and production companies continued to struggle, due to their smaller scale and limited
financial flexibility. We repositioned the portfolio’s exposure in this industry. Additionally, our selections among pharmaceutical companies also hurt performance. On the positive side, our selections among oil field services companies contributed to relative performance.
Sector Allocation Aided Performance
Our sector allocations added value. In particular, an overweight position in the pharmaceuticals sector and underweight positions in the automotive, oil field services and consumer cyclical sectors lifted relative performance.
Portfolio Positioning
We expect the U.S. economy to continue to grow, but at a more moderate pace (2.0% to 2.5% annualized). However, we expect U.S. economic growth to remain more robust than growth in Europe and Japan. We expect headline inflation to eventually converge with core inflation near 2%. These factors should enable the Fed to remain on hold throughout the remainder of 2019. Against a backdrop of slowing global growth, geopolitical uncertainties (mainly Brexit) and a dovish Fed, we expect the 10-year Treasury yield to fluctuate within a near-term range of 2.35% to 2.80%. We expect the yield curve to remain relatively flat, and we do not believe the brief inversion of the curve earlier this year indicates an impending recession.
In the wake of the first-quarter rally among high-yield bonds, valuations appear high. We believe this factor combined with our outlook for modest U.S. growth and weaker global growth warrant a continued underweight to bonds with CCC credit ratings. We continue to find value among securities with B credit ratings, which we believe offer better risk/reward profiles. As the environment evolves, our bottom-up security selection process, which strives to identify bonds with attractive yields, solid balance sheets and good fundamentals trading at attractive valuations, will remain a key factor in seeking strong relative performance.
|
| |
| MARCH 31, 2019 | |
| Portfolio at a Glance | |
| Average Duration (effective) | 2.9 years |
| Weighted Average Life to Maturity | 5.1 years |
| | |
| Types of Investments in Portfolio | % of net assets |
| Corporate Bonds | 89.9% |
| Bank Loan Obligations | 2.2% |
| Exchange-Traded Funds | 1.1% |
| Asset-Backed Securities | 0.3% |
| Sovereign Governments and Agencies | 0.2% |
| Temporary Cash Investments | 10.4% |
| Temporary Cash Investments - Securities Lending Collateral | 9.7% |
| Other Assets and Liabilities | (13.8)%* |
*Amount relates primarily to payable for collateral received for securities on loan.
Fund shareholders may incur two types of costs: (1) transaction costs, including sales charges (loads) on purchase payments and redemption/exchange fees; and (2) ongoing costs, including management fees; distribution and service (12b-1) fees; and other fund expenses. This example is intended to help you understand your ongoing costs (in dollars) of investing in your fund and to compare these costs with the ongoing cost of investing in other mutual funds.
The example is based on an investment of $1,000 made at the beginning of the period and held for the entire period from October 1, 2018 to March 31, 2019.
Actual Expenses
The table provides information about actual account values and actual expenses for each class. You may use the information, together with the amount you invested, to estimate the expenses that you paid over the period. First, identify the share class you own. Then simply divide your account value by $1,000 (for example, an $8,600 account value divided by $1,000 = 8.6), then multiply the result by the number under the heading “Expenses Paid During Period” to estimate the expenses you paid on your account during this period.
If you hold Investor Class shares of any American Century Investments fund, or I Class shares of the American Century Diversified Bond Fund, in an American Century Investments account (i.e., not a financial intermediary or retirement plan account), American Century Investments may charge you a $12.50 semiannual account maintenance fee if the value of those shares is less than $10,000. We will redeem shares automatically in one of your accounts to pay the $12.50 fee. In determining your total eligible investment amount, we will include your investments in all personal accounts (including American Century Investments Brokerage accounts) registered under your Social Security number. Personal accounts include individual accounts, joint accounts, UGMA/UTMA accounts, personal trusts, Coverdell Education Savings Accounts and IRAs (including traditional, Roth, Rollover, SEP-, SARSEP- and SIMPLE-IRAs), and certain other retirement accounts. If you have only business, business retirement, employer-sponsored or American Century Investments Brokerage accounts, you are currently not subject to this fee. If you are subject to the Account Maintenance Fee, your account value could be reduced by the fee amount.
Hypothetical Example for Comparison Purposes
The table also provides information about hypothetical account values and hypothetical expenses based on the actual expense ratio of each class of your fund and an assumed rate of return of 5% per year before expenses, which is not the actual return of a fund’s share class. The hypothetical account values and expenses may not be used to estimate the actual ending account balance or expenses you paid for the period. You may use this information to compare the ongoing costs of investing in your fund and other funds. To do so, compare this 5% hypothetical example with the 5% hypothetical examples that appear in the shareholder reports of the other funds.
Please note that the expenses shown in the table are meant to highlight your ongoing costs only and do not reflect any transactional costs, such as sales charges (loads) or redemption/exchange fees. Therefore, the table is useful in comparing ongoing costs only, and will not help you determine the relative total costs of owning different funds. In addition, if these transactional costs were included, your costs would have been higher.
|
| | | | |
| | Beginning
Account Value
10/1/18 | Ending
Account Value
3/31/19 | Expenses Paid
During Period(1)
10/1/18 - 3/31/19 | Annualized
Expense Ratio(1) |
| Actual | | | | |
| Investor Class | $1,000 | $1,015.60 | $3.92 | 0.78% |
| I Class | $1,000 | $1,016.10 | $3.42 | 0.68% |
| Y Class | $1,000 | $1,016.60 | $2.92 | 0.58% |
| A Class | $1,000 | $1,014.30 | $5.17 | 1.03% |
| C Class | $1,000 | $1,010.50 | $8.92 | 1.78% |
| R Class | $1,000 | $1,011.20 | $6.42 | 1.28% |
| R5 Class | $1,000 | $1,016.60 | $2.92 | 0.58% |
| R6 Class | $1,000 | $1,016.90 | $2.67 | 0.53% |
| Hypothetical | | | | |
| Investor Class | $1,000 | $1,021.04 | $3.93 | 0.78% |
| I Class | $1,000 | $1,021.54 | $3.43 | 0.68% |
| Y Class | $1,000 | $1,022.04 | $2.92 | 0.58% |
| A Class | $1,000 | $1,019.80 | $5.19 | 1.03% |
| C Class | $1,000 | $1,016.06 | $8.95 | 1.78% |
| R Class | $1,000 | $1,018.55 | $6.44 | 1.28% |
| R5 Class | $1,000 | $1,022.04 | $2.92 | 0.58% |
| R6 Class | $1,000 | $1,022.29 | $2.67 | 0.53% |
| |
| (1) | Expenses are equal to the class's annualized expense ratio listed in the table above, multiplied by the average account value over the period, multiplied by 182, the number of days in the most recent fiscal half-year, divided by 365, to reflect the one-half year period. Annualized expense ratio reflects actual expenses, including any applicable fee waivers or expense reimbursements and excluding any acquired fund fees and expenses. |
MARCH 31, 2019
|
| | | | | | |
| | Principal Amount | Value |
| CORPORATE BONDS — 89.9% | | |
| Aerospace and Defense — 2.5% | | |
| Arconic, Inc., 6.15%, 8/15/20 | $ | 500,000 |
| $ | 517,002 |
|
| Arconic, Inc., 5.40%, 4/15/21 | 105,000 |
| 108,327 |
|
| Arconic, Inc., 5.125%, 10/1/24 | 175,000 |
| 179,649 |
|
Bombardier, Inc., 8.75%, 12/1/21(1) | 160,000 |
| 177,400 |
|
Bombardier, Inc., 5.75%, 3/15/22(1)(2) | 215,000 |
| 221,181 |
|
Bombardier, Inc., 6.00%, 10/15/22(1) | 185,000 |
| 187,544 |
|
Bombardier, Inc., 7.50%, 3/15/25(1)(2) | 305,000 |
| 315,294 |
|
| TransDigm, Inc., 6.00%, 7/15/22 | 160,000 |
| 162,973 |
|
TransDigm, Inc., 6.25%, 3/15/26(1) | 1,000,000 |
| 1,040,000 |
|
| TransDigm, Inc., 6.375%, 6/15/26 | 520,000 |
| 516,672 |
|
| | | 3,426,042 |
|
| Air Freight and Logistics — 0.1% | | |
XPO Logistics, Inc., 6.50%, 6/15/22(1) | 180,000 |
| 184,635 |
|
| Airlines — 0.6% | | |
American Airlines Group, Inc., 4.625%, 3/1/20(1)(2) | 275,000 |
| 277,585 |
|
| United Continental Holdings, Inc., 5.00%, 2/1/24 | 555,000 |
| 560,550 |
|
| | | 838,135 |
|
| Auto Components — 0.6% | | |
American Axle & Manufacturing, Inc., 6.625%, 10/15/22(2) | 139,000 |
| 142,649 |
|
Goodyear Tire & Rubber Co. (The), 5.125%, 11/15/23(2) | 540,000 |
| 541,350 |
|
ZF North America Capital, Inc., 4.75%, 4/29/25(1) | 160,000 |
| 155,643 |
|
| | | 839,642 |
|
| Automobiles — 0.2% | | |
| Ford Motor Credit Co. LLC, 2.98%, 8/3/22 | 300,000 |
| 286,959 |
|
| Banks — 0.3% | | |
| CIT Group, Inc., 5.00%, 8/1/23 | 250,000 |
| 262,812 |
|
| Royal Bank of Scotland Group plc, 6.125%, 12/15/22 | 130,000 |
| 138,711 |
|
| | | 401,523 |
|
| Building Products — 0.4% | | |
Builders FirstSource, Inc., 5.625%, 9/1/24(1) | 289,000 |
| 285,749 |
|
USG Corp., 5.50%, 3/1/25(1) | 280,000 |
| 285,390 |
|
| | | 571,139 |
|
| Capital Markets — 0.4% | | |
MSCI, Inc., 5.75%, 8/15/25(1) | 500,000 |
| 527,500 |
|
| Chemicals — 2.3% | | |
| CF Industries, Inc., 3.45%, 6/1/23 | 413,000 |
| 402,159 |
|
Element Solutions, Inc., 5.875%, 12/1/25(1)(2) | 370,000 |
| 372,719 |
|
| Hexion, Inc., 6.625%, 4/15/20 | 405,000 |
| 339,188 |
|
| Huntsman International LLC, 5.125%, 11/15/22 | 195,000 |
| 204,263 |
|
INEOS Group Holdings SA, 5.625%, 8/1/24(1)(2) | 425,000 |
| 426,062 |
|
NOVA Chemicals Corp., 4.875%, 6/1/24(1) | 500,000 |
| 493,125 |
|
|
| | | | | | |
| | Principal Amount | Value |
| Olin Corp., 5.125%, 9/15/27 | $ | 360,000 |
| $ | 365,850 |
|
Tronox Finance plc, 5.75%, 10/1/25(1) | 680,000 |
| 633,250 |
|
| | | 3,236,616 |
|
| Commercial Services and Supplies — 2.0% | | |
| ADT Security Corp. (The), 6.25%, 10/15/21 | 355,000 |
| 374,188 |
|
| Covanta Holding Corp., 5.875%, 3/1/24 | 606,000 |
| 622,665 |
|
Harland Clarke Holdings Corp., 9.25%, 3/1/21(1)(2) | 140,000 |
| 140,175 |
|
Nielsen Finance LLC / Nielsen Finance Co., 5.00%, 4/15/22(1) | 355,000 |
| 353,225 |
|
Prime Security Services Borrower LLC / Prime Finance, Inc., 9.25%, 5/15/23(1) | 379,000 |
| 398,898 |
|
Prime Security Services Borrower LLC / Prime Finance, Inc., 5.25%, 4/15/24(1)(3) | 500,000 |
| 501,250 |
|
| RR Donnelley & Sons Co., 6.00%, 4/1/24 | 415,000 |
| 422,262 |
|
| | | 2,812,663 |
|
| Communications Equipment — 0.6% | | |
CommScope Technologies LLC, 6.00%, 6/15/25(1) | 70,000 |
| 68,317 |
|
CommScope Technologies LLC, 5.00%, 3/15/27(1) | 285,000 |
| 253,416 |
|
CommScope, Inc., 5.50%, 6/15/24(1) | 238,000 |
| 233,918 |
|
IHS Netherlands Holdco BV, 9.50%, 10/27/21(1) | 305,000 |
| 316,193 |
|
| | | 871,844 |
|
| Construction Materials — 0.3% | | |
Standard Industries, Inc., 6.00%, 10/15/25(1) | 375,000 |
| 394,534 |
|
| Consumer Finance — 1.9% | | |
| Ally Financial, Inc., 8.00%, 3/15/20 | 700,000 |
| 733,250 |
|
| Ally Financial, Inc., 8.00%, 11/1/31 | 210,000 |
| 261,712 |
|
| Navient Corp., 5.00%, 10/26/20 | 60,000 |
| 60,975 |
|
| Navient Corp., 5.50%, 1/25/23 | 705,000 |
| 708,525 |
|
| Navient Corp., MTN, 6.125%, 3/25/24 | 140,000 |
| 140,525 |
|
| Springleaf Finance Corp., 6.125%, 3/15/24 | 750,000 |
| 768,735 |
|
| | | 2,673,722 |
|
| Containers and Packaging — 3.7% | | |
ARD Finance SA, 7.125% Cash or 7.875% PIK, 9/15/23(4) | 780,000 |
| 780,975 |
|
Ardagh Packaging Finance plc / Ardagh Holdings USA, Inc., 6.00%, 2/15/25(1) | 415,000 |
| 416,038 |
|
| Ball Corp., 5.00%, 3/15/22 | 205,000 |
| 213,200 |
|
| Ball Corp., 4.00%, 11/15/23 | 90,000 |
| 90,900 |
|
| Ball Corp., 5.25%, 7/1/25 | 250,000 |
| 262,500 |
|
| Berry Global, Inc., 5.50%, 5/15/22 | 100,000 |
| 101,875 |
|
| Berry Global, Inc., 5.125%, 7/15/23 | 330,000 |
| 336,188 |
|
BWAY Holding Co., 5.50%, 4/15/24(1) | 480,000 |
| 478,344 |
|
| Crown Americas LLC / Crown Americas Capital Corp. IV, 4.50%, 1/15/23 | 645,000 |
| 653,062 |
|
Owens-Brockway Glass Container, Inc., 5.875%, 8/15/23(1) | 240,000 |
| 252,276 |
|
| Reynolds Group Issuer, Inc. / Reynolds Group Issuer LLC / Reynolds Group Issuer Lu, 6.875%, 2/15/21 | 109,159 |
| 109,705 |
|
Reynolds Group Issuer, Inc. / Reynolds Group Issuer LLC / Reynolds Group Issuer Lu, 5.125%, 7/15/23(1) | 390,000 |
| 396,825 |
|
Reynolds Group Issuer, Inc. / Reynolds Group Issuer LLC / Reynolds Group Issuer Lu, 7.00%, 7/15/24(1) | 535,000 |
| 552,120 |
|
| | | |
|
| | | | | | |
| | Principal Amount | Value |
Sealed Air Corp., 5.125%, 12/1/24(1) | $ | 440,000 |
| $ | 458,022 |
|
| | | 5,102,030 |
|
| Diversified Financial Services — 1.2% | | |
| Icahn Enterprises LP / Icahn Enterprises Finance Corp., 6.00%, 8/1/20 | 100,000 |
| 101,075 |
|
| Icahn Enterprises LP / Icahn Enterprises Finance Corp., 5.875%, 2/1/22 | 405,000 |
| 411,533 |
|
Solera LLC / Solera Finance, Inc., 10.50%, 3/1/24(1) | 750,000 |
| 816,690 |
|
| Voya Financial, Inc., VRN, 5.65%, 5/15/53 | 350,000 |
| 345,266 |
|
| | | 1,674,564 |
|
| Diversified Telecommunication Services — 5.7% | | |
Altice France SA, 7.375%, 5/1/26(1) | 615,000 |
| 604,237 |
|
| CenturyLink, Inc., 5.625%, 4/1/20 | 655,000 |
| 670,026 |
|
| CenturyLink, Inc., 5.80%, 3/15/22 | 360,000 |
| 369,450 |
|
Cincinnati Bell, Inc., 7.00%, 7/15/24(1)(2) | 195,000 |
| 180,488 |
|
| Frontier Communications Corp., 10.50%, 9/15/22 | 235,000 |
| 180,363 |
|
| Frontier Communications Corp., 7.125%, 1/15/23 | 555,000 |
| 339,937 |
|
| Frontier Communications Corp., 6.875%, 1/15/25 | 450,000 |
| 244,688 |
|
Frontier Communications Corp., 11.00%, 9/15/25(2) | 55,000 |
| 36,516 |
|
| Hughes Satellite Systems Corp., 5.25%, 8/1/26 | 480,000 |
| 478,200 |
|
Inmarsat Finance plc, 4.875%, 5/15/22(1) | 175,000 |
| 178,535 |
|
Intelsat Jackson Holdings SA, 9.75%, 7/15/25(1) | 560,000 |
| 571,368 |
|
| Level 3 Financing, Inc., 5.375%, 8/15/22 | 345,000 |
| 347,587 |
|
| Level 3 Financing, Inc., 5.375%, 5/1/25 | 185,000 |
| 187,738 |
|
| Level 3 Financing, Inc., 5.25%, 3/15/26 | 850,000 |
| 850,000 |
|
| Sprint Capital Corp., 6.875%, 11/15/28 | 280,000 |
| 269,850 |
|
| Sprint Capital Corp., 8.75%, 3/15/32 | 280,000 |
| 296,128 |
|
| Telecom Italia Capital SA, 6.375%, 11/15/33 | 750,000 |
| 727,500 |
|
Virgin Media Finance plc, 5.75%, 1/15/25(1) | 640,000 |
| 653,600 |
|
| Zayo Group LLC / Zayo Capital, Inc., 6.00%, 4/1/23 | 315,000 |
| 320,512 |
|
Zayo Group LLC / Zayo Capital, Inc., 5.75%, 1/15/27(1) | 380,000 |
| 380,114 |
|
| | | 7,886,837 |
|
| Energy Equipment and Services — 2.2% | | |
Ensco plc, 8.00%, 1/31/24(2) | 488,000 |
| 447,740 |
|
Ensco plc, 5.20%, 3/15/25(2) | 145,000 |
| 113,144 |
|
| Nabors Industries, Inc., 4.625%, 9/15/21 | 360,000 |
| 357,300 |
|
| Noble Holding International Ltd., 7.75%, 1/15/24 | 115,000 |
| 104,115 |
|
| Precision Drilling Corp., 5.25%, 11/15/24 | 375,000 |
| 352,500 |
|
Transocean Poseidon Ltd., 6.875%, 2/1/27(1) | 250,000 |
| 260,625 |
|
Transocean, Inc., 9.00%, 7/15/23(1) | 870,000 |
| 930,900 |
|
Weatherford International Ltd., 7.75%, 6/15/21(2) | 290,000 |
| 261,000 |
|
| Weatherford International Ltd., 9.875%, 2/15/24 | 250,000 |
| 181,250 |
|
| | | 3,008,574 |
|
| Entertainment — 2.0% | | |
AMC Entertainment Holdings, Inc., 5.875%, 2/15/22(2) | 140,000 |
| 142,625 |
|
AMC Entertainment Holdings, Inc., 5.75%, 6/15/25(2) | 140,000 |
| 131,397 |
|
| Cinemark USA, Inc., 5.125%, 12/15/22 | 165,000 |
| 168,094 |
|
Netflix, Inc., 5.875%, 11/15/28(1) | 500,000 |
| 529,375 |
|
|
| | | | | | |
| | Principal Amount | Value |
UPCB Finance IV Ltd., 5.375%, 1/15/25(1) | $ | 315,000 |
| $ | 320,512 |
|
WMG Acquisition Corp., 5.625%, 4/15/22(1) | 461,000 |
| 467,339 |
|
Ziggo Bond Co. BV, 5.875%, 1/15/25(1) | 290,000 |
| 287,100 |
|
Ziggo BV, 5.50%, 1/15/27(1) | 675,000 |
| 669,937 |
|
| | | 2,716,379 |
|
| Equity Real Estate Investment Trusts (REITs) — 2.0% | | |
| Equinix, Inc., 5.375%, 5/15/27 | 520,000 |
| 546,000 |
|
| Iron Mountain, Inc., 5.75%, 8/15/24 | 395,000 |
| 399,937 |
|
Iron Mountain, Inc., 4.875%, 9/15/27(1) | 500,000 |
| 482,500 |
|
| MGM Growth Properties Operating Partnership LP / MGP Finance Co-Issuer, Inc., 5.625%, 5/1/24 | 475,000 |
| 498,156 |
|
| RHP Hotel Properties LP / RHP Finance Corp., 5.00%, 4/15/21 | 280,000 |
| 281,400 |
|
| SBA Communications Corp., 4.875%, 7/15/22 | 415,000 |
| 421,744 |
|
Uniti Group LP / Uniti Group Finance, Inc. / CSL Capital LLC, 6.00%, 4/15/23(1) | 140,000 |
| 133,042 |
|
| | | 2,762,779 |
|
| Food and Staples Retailing — 0.6% | | |
| Albertsons Cos. LLC / Safeway, Inc. / New Albertson's, LP / Albertson's LLC, 6.625%, 6/15/24 | 595,000 |
| 603,925 |
|
Rite Aid Corp., 6.125%, 4/1/23(1) | 335,000 |
| 278,888 |
|
| | | 882,813 |
|
| Food Products — 2.1% | | |
B&G Foods, Inc., 5.25%, 4/1/25(2) | 260,000 |
| 250,250 |
|
JBS USA LUX SA / JBS USA Finance, Inc., 7.25%, 6/1/21(1) | 210,000 |
| 212,520 |
|
JBS USA LUX SA / JBS USA Finance, Inc., 5.875%, 7/15/24(1) | 280,000 |
| 288,750 |
|
JBS USA LUX SA / JBS USA Finance, Inc., 5.75%, 6/15/25(1) | 45,000 |
| 46,294 |
|
Lamb Weston Holdings, Inc., 4.625%, 11/1/24(1) | 460,000 |
| 465,750 |
|
Pilgrim's Pride Corp., 5.75%, 3/15/25(1) | 755,000 |
| 766,325 |
|
Post Holdings, Inc., 5.00%, 8/15/26(1) | 935,000 |
| 912,793 |
|
| | | 2,942,682 |
|
| Gas Utilities — 2.5% | | |
| Cheniere Corpus Christi Holdings LLC, 7.00%, 6/30/24 | 245,000 |
| 277,169 |
|
| Cheniere Corpus Christi Holdings LLC, 5.875%, 3/31/25 | 85,000 |
| 92,650 |
|
| Cheniere Corpus Christi Holdings LLC, 5.125%, 6/30/27 | 450,000 |
| 473,062 |
|
| Crestwood Midstream Partners LP / Crestwood Midstream Finance Corp., 6.25%, 4/1/23 | 140,000 |
| 144,200 |
|
| Crestwood Midstream Partners LP / Crestwood Midstream Finance Corp., 5.75%, 4/1/25 | 460,000 |
| 473,800 |
|
| Genesis Energy LP / Genesis Energy Finance Corp., 6.75%, 8/1/22 | 135,000 |
| 138,713 |
|
| Genesis Energy LP / Genesis Energy Finance Corp., 5.625%, 6/15/24 | 810,000 |
| 781,650 |
|
| NuStar Logistics LP, 4.75%, 2/1/22 | 155,000 |
| 156,550 |
|
| Targa Resources Partners LP / Targa Resources Partners Finance Corp., 4.25%, 11/15/23 | 471,000 |
| 470,411 |
|
| Targa Resources Partners LP / Targa Resources Partners Finance Corp., 5.125%, 2/1/25 | 461,000 |
| 472,525 |
|
| | | 3,480,730 |
|
|
| | | | | | |
| | Principal Amount | Value |
| Health Care Equipment and Supplies — 0.7% | | |
Hologic, Inc., 4.375%, 10/15/25(1) | $ | 500,000 |
| $ | 499,900 |
|
Mallinckrodt International Finance SA / Mallinckrodt CB LLC, 5.625%, 10/15/23(1)(2) | 265,000 |
| 221,275 |
|
Mallinckrodt International Finance SA / Mallinckrodt CB LLC, 5.50%, 4/15/25(1)(2) | 145,000 |
| 113,825 |
|
Ortho-Clinical Diagnostics, Inc. / Ortho-Clinical Diagnostics SA, 6.625%, 5/15/22(1) | 175,000 |
| 166,687 |
|
| | | 1,001,687 |
|
| Health Care Providers and Services — 6.1% | | |
| Acadia Healthcare Co., Inc., 5.125%, 7/1/22 | 100,000 |
| 100,750 |
|
| Acadia Healthcare Co., Inc., 5.625%, 2/15/23 | 290,000 |
| 293,263 |
|
| Centene Corp., 4.75%, 1/15/25 | 700,000 |
| 715,750 |
|
CHS / Community Health Systems, Inc., 5.125%, 8/1/21(2) | 270,000 |
| 266,787 |
|
| CHS / Community Health Systems, Inc., 6.875%, 2/1/22 | 180,000 |
| 120,600 |
|
| CHS / Community Health Systems, Inc., 6.25%, 3/31/23 | 575,000 |
| 541,937 |
|
CHS / Community Health Systems, Inc., 8.125%, 6/30/24(1)(2) | 85,000 |
| 63,776 |
|
CHS / Community Health Systems, Inc., VRN, 11.00%, 6/30/23(1)(2) | 315,000 |
| 258,498 |
|
| DaVita, Inc., 5.125%, 7/15/24 | 532,000 |
| 526,680 |
|
| DaVita, Inc., 5.00%, 5/1/25 | 595,000 |
| 572,390 |
|
| Encompass Health Corp., 5.75%, 11/1/24 | 275,000 |
| 279,469 |
|
Envision Healthcare Corp., 8.75%, 10/15/26(1)(2) | 300,000 |
| 268,125 |
|
| HCA, Inc., 5.00%, 3/15/24 | 190,000 |
| 201,410 |
|
| HCA, Inc., 5.375%, 2/1/25 | 695,000 |
| 738,437 |
|
| HCA, Inc., 7.69%, 6/15/25 | 500,000 |
| 568,750 |
|
| HCA, Inc., 4.50%, 2/15/27 | 480,000 |
| 494,101 |
|
Jaguar Holding Co. II / Pharmaceutical Product Development LLC, 6.375%, 8/1/23(1) | 375,000 |
| 382,969 |
|
Team Health Holdings, Inc., 6.375%, 2/1/25(1)(2) | 230,000 |
| 187,738 |
|
| Tenet Healthcare Corp., 8.125%, 4/1/22 | 470,000 |
| 507,412 |
|
Tenet Healthcare Corp., 6.75%, 6/15/23(2) | 780,000 |
| 806,325 |
|
| Tenet Healthcare Corp., 5.125%, 5/1/25 | 500,000 |
| 503,775 |
|
| | | 8,398,942 |
|
| Hotels, Restaurants and Leisure — 6.0% | | |
1011778 BC ULC / New Red Finance, Inc., 5.00%, 10/15/25(1) | 500,000 |
| 495,150 |
|
| Boyd Gaming Corp., 6.875%, 5/15/23 | 288,000 |
| 300,240 |
|
| Boyd Gaming Corp., 6.375%, 4/1/26 | 350,000 |
| 363,562 |
|
Caesars Resort Collection LLC / CRC Finco, Inc., 5.25%, 10/15/25(1) | 600,000 |
| 580,500 |
|
| Eldorado Resorts, Inc., 7.00%, 8/1/23 | 600,000 |
| 629,346 |
|
Golden Nugget, Inc., 6.75%, 10/15/24(1) | 610,000 |
| 614,575 |
|
| Hilton Domestic Operating Co., Inc., 4.25%, 9/1/24 | 510,000 |
| 510,316 |
|
| Hilton Worldwide Finance LLC / Hilton Worldwide Finance Corp., 4.625%, 4/1/25 | 455,000 |
| 460,687 |
|
International Game Technology plc, 6.50%, 2/15/25(1) | 585,000 |
| 611,325 |
|
Jack Ohio Finance LLC / Jack Ohio Finance 1 Corp., 6.75%, 11/15/21(1) | 460,000 |
| 474,950 |
|
KFC Holding Co. / Pizza Hut Holdings LLC / Taco Bell of America LLC, 5.25%, 6/1/26(1) | 250,000 |
| 252,969 |
|
| MGM Resorts International, 6.00%, 3/15/23 | 350,000 |
| 370,125 |
|
|
| | | | | | |
| | Principal Amount | Value |
| MGM Resorts International, 4.625%, 9/1/26 | $ | 280,000 |
| $ | 273,700 |
|
Penn National Gaming, Inc., 5.625%, 1/15/27(1)(2) | 680,000 |
| 663,000 |
|
Rivers Pittsburgh Borrower LP / Rivers Pittsburgh Finance Corp., 6.125%, 8/15/21(1) | 260,000 |
| 261,300 |
|
| Scientific Games International, Inc., 6.25%, 9/1/20 | 445,000 |
| 447,225 |
|
| Scientific Games International, Inc., 10.00%, 12/1/22 | 158,000 |
| 166,888 |
|
Station Casinos LLC, 5.00%, 10/1/25(1) | 100,000 |
| 98,750 |
|
Wynn Las Vegas LLC / Wynn Las Vegas Capital Corp., 5.50%, 3/1/25(1) | 605,000 |
| 598,950 |
|
| Yum! Brands, Inc., 3.75%, 11/1/21 | 200,000 |
| 201,250 |
|
| | | 8,374,808 |
|
| Household Durables — 3.2% | | |
| Beazer Homes USA, Inc., 7.25%, 2/1/23 | 15,000 |
| 14,475 |
|
Beazer Homes USA, Inc., 5.875%, 10/15/27(2) | 330,000 |
| 289,575 |
|
Brookfield Residential Properties, Inc. / Brookfield Residential US Corp., 6.125%, 7/1/22(1) | 340,000 |
| 342,975 |
|
| Century Communities, Inc., 6.875%, 5/15/22 | 235,000 |
| 240,288 |
|
| Lennar Corp., 4.50%, 4/30/24 | 695,000 |
| 706,606 |
|
| Meritage Homes Corp., 7.00%, 4/1/22 | 110,000 |
| 118,113 |
|
| Meritage Homes Corp., 5.125%, 6/6/27 | 730,000 |
| 709,706 |
|
| PulteGroup, Inc., 5.50%, 3/1/26 | 465,000 |
| 481,856 |
|
Shea Homes LP / Shea Homes Funding Corp., 5.875%, 4/1/23(1) | 355,000 |
| 351,450 |
|
Taylor Morrison Communities, Inc. / Taylor Morrison Holdings II, Inc., 5.625%, 3/1/24(1) | 715,000 |
| 713,212 |
|
| William Lyon Homes, Inc., 5.875%, 1/31/25 | 570,000 |
| 538,650 |
|
| | | 4,506,906 |
|
| Household Products — 0.5% | | |
Energizer Holdings, Inc., 5.50%, 6/15/25(1) | 365,000 |
| 362,719 |
|
| Spectrum Brands, Inc., 5.75%, 7/15/25 | 325,000 |
| 329,062 |
|
| | | 691,781 |
|
| Independent Power and Renewable Electricity Producers — 1.5% | |
| Calpine Corp., 5.375%, 1/15/23 | 645,000 |
| 647,419 |
|
| NRG Energy, Inc., 6.25%, 5/1/24 | 230,000 |
| 237,763 |
|
| NRG Energy, Inc., 7.25%, 5/15/26 | 530,000 |
| 585,088 |
|
| Vistra Energy Corp., 7.375%, 11/1/22 | 405,000 |
| 421,200 |
|
| Vistra Energy Corp., 7.625%, 11/1/24 | 122,000 |
| 129,322 |
|
| | | 2,020,792 |
|
| Insurance — 0.9% | | |
| AerCap Ireland Capital DAC / AerCap Global Aviation Trust, 5.00%, 10/1/21 | 300,000 |
| 311,466 |
|
| Genworth Holdings, Inc., 7.625%, 9/24/21 | 315,000 |
| 305,550 |
|
Liberty Mutual Group, Inc., VRN, 5.52%, (3-month LIBOR plus 2.91%), 3/7/67(1) | 670,000 |
| 635,787 |
|
| | | 1,252,803 |
|
| Interactive Media and Services — 0.4% | | |
| IAC/InterActiveCorp, 4.75%, 12/15/22 | 130,000 |
| 128,375 |
|
Rackspace Hosting, Inc., 8.625%, 11/15/24(1)(2) | 520,000 |
| 464,558 |
|
| | | 592,933 |
|
| | | |
|
| | | | | | |
| | Principal Amount | Value |
| IT Services — 0.5% | | |
| CDW LLC / CDW Finance Corp., 5.50%, 12/1/24 | $ | 290,000 |
| $ | 306,313 |
|
First Data Corp., 5.75%, 1/15/24(1) | 410,000 |
| 423,120 |
|
| | | 729,433 |
|
| Life Sciences Tools and Services — 0.4% | | |
IQVIA, Inc., 4.875%, 5/15/23(1) | 75,000 |
| 76,695 |
|
IQVIA, Inc., 5.00%, 10/15/26(1) | 485,000 |
| 498,037 |
|
| | | 574,732 |
|
| Marine — 0.4% | | |
| Martin Midstream Partners LP / Martin Midstream Finance Corp., 7.25%, 2/15/21 | 525,000 |
| 511,875 |
|
| Media — 9.2% | | |
Altice Financing SA, 6.625%, 2/15/23(1) | 430,000 |
| 440,750 |
|
Altice Financing SA, 7.50%, 5/15/26(1) | 505,000 |
| 501,213 |
|
Altice Luxembourg SA, 7.625%, 2/15/25(1)(2) | 470,000 |
| 413,600 |
|
| AMC Networks, Inc., 4.75%, 8/1/25 | 730,000 |
| 726,350 |
|
| Cablevision Systems Corp., 5.875%, 9/15/22 | 705,000 |
| 738,487 |
|
CCO Holdings LLC / CCO Holdings Capital Corp., 5.375%, 5/1/25(1) | 625,000 |
| 646,875 |
|
CCO Holdings LLC / CCO Holdings Capital Corp., 5.75%, 2/15/26(1) | 880,000 |
| 924,000 |
|
CCO Holdings LLC / CCO Holdings Capital Corp., 5.125%, 5/1/27(1) | 515,000 |
| 519,506 |
|
| Clear Channel Worldwide Holdings, Inc., 6.50%, 11/15/22 | 205,000 |
| 210,381 |
|
| CSC Holdings LLC, 6.75%, 11/15/21 | 565,000 |
| 605,256 |
|
CSC Holdings LLC, 5.375%, 7/15/23(1) | 460,000 |
| 469,775 |
|
CSC Holdings LLC, 6.625%, 10/15/25(1) | 200,000 |
| 212,500 |
|
CSC Holdings LLC, 5.50%, 5/15/26(1) | 245,000 |
| 252,424 |
|
CSC Holdings LLC, 5.50%, 4/15/27(1) | 485,000 |
| 496,470 |
|
| DISH DBS Corp., 5.125%, 5/1/20 | 200,000 |
| 201,750 |
|
DISH DBS Corp., 5.00%, 3/15/23(2) | 435,000 |
| 393,131 |
|
| DISH DBS Corp., 5.875%, 11/15/24 | 630,000 |
| 531,563 |
|
Gray Television, Inc., 5.125%, 10/15/24(1) | 475,000 |
| 477,375 |
|
Gray Television, Inc., 5.875%, 7/15/26(1) | 455,000 |
| 464,191 |
|
| Lamar Media Corp., 5.00%, 5/1/23 | 290,000 |
| 295,438 |
|
Nexstar Broadcasting, Inc., 5.625%, 8/1/24(1) | 635,000 |
| 646,112 |
|
Sinclair Television Group, Inc., 5.625%, 8/1/24(1) | 485,000 |
| 490,456 |
|
Sirius XM Radio, Inc., 4.625%, 5/15/23(1) | 315,000 |
| 320,119 |
|
Sirius XM Radio, Inc., 5.375%, 4/15/25(1) | 350,000 |
| 360,500 |
|
| TEGNA, Inc., 5.125%, 7/15/20 | 80,000 |
| 80,300 |
|
TEGNA, Inc., 5.50%, 9/15/24(1) | 415,000 |
| 420,706 |
|
Unitymedia GmbH, 6.125%, 1/15/25(1) | 265,000 |
| 276,369 |
|
Univision Communications, Inc., 5.125%, 2/15/25(1) | 375,000 |
| 351,094 |
|
| Videotron Ltd., 5.00%, 7/15/22 | 280,000 |
| 289,800 |
|
| | | 12,756,491 |
|
| Metals and Mining — 4.2% | | |
Alcoa Nederland Holding BV, 6.75%, 9/30/24(1) | 410,000 |
| 435,625 |
|
| Allegheny Technologies, Inc., 5.95%, 1/15/21 | 715,000 |
| 736,450 |
|
| Cleveland-Cliffs, Inc., 5.75%, 3/1/25 | 830,000 |
| 796,800 |
|
|
| | | | | | |
| | Principal Amount | Value |
Constellium NV, 6.625%, 3/1/25(1)(2) | $ | 835,000 |
| $ | 853,787 |
|
First Quantum Minerals Ltd., 7.25%, 5/15/22(1)(2) | 305,000 |
| 308,050 |
|
| Freeport-McMoRan, Inc., 3.55%, 3/1/22 | 375,000 |
| 371,719 |
|
| Freeport-McMoRan, Inc., 5.40%, 11/14/34 | 655,000 |
| 599,325 |
|
Novelis Corp., 5.875%, 9/30/26(1) | 780,000 |
| 778,050 |
|
| Steel Dynamics, Inc., 5.00%, 12/15/26 | 360,000 |
| 368,550 |
|
Teck Resources Ltd., 6.25%, 7/15/41(2) | 465,000 |
| 498,228 |
|
| United States Steel Corp., 6.875%, 8/15/25 | 100,000 |
| 98,250 |
|
| | | 5,844,834 |
|
| Multi-Utilities — 0.3% | | |
Talen Energy Supply LLC, 6.50%, 6/1/25(2) | 390,000 |
| 345,150 |
|
| Oil, Gas and Consumable Fuels — 8.8% | | |
| Antero Resources Corp., 5.125%, 12/1/22 | 255,000 |
| 257,308 |
|
| Antero Resources Corp., 5.625%, 6/1/23 | 155,000 |
| 157,713 |
|
Calumet Specialty Products Partners LP / Calumet Finance Corp., 6.50%, 4/15/21(2) | 235,000 |
| 230,888 |
|
Carrizo Oil & Gas, Inc., 6.25%, 4/15/23(2) | 235,000 |
| 232,067 |
|
| Cheniere Energy Partners LP, 5.25%, 10/1/25 | 500,000 |
| 513,125 |
|
Chesapeake Energy Corp., 8.00%, 1/15/25(2) | 605,000 |
| 620,125 |
|
| CNX Resources Corp., 5.875%, 4/15/22 | 429,000 |
| 430,072 |
|
Denbury Resources, Inc., 9.00%, 5/15/21(1) | 255,000 |
| 249,263 |
|
| Denbury Resources, Inc., 4.625%, 7/15/23 | 220,000 |
| 140,162 |
|
| Diamondback Energy, Inc., 4.75%, 11/1/24 | 385,000 |
| 395,029 |
|
| EnLink Midstream Partners LP, 4.85%, 7/15/26 | 700,000 |
| 697,375 |
|
EP Energy LLC / Everest Acquisition Finance, Inc., 8.00%, 11/29/24(1) | 530,000 |
| 295,475 |
|
Ferrellgas LP / Ferrellgas Finance Corp., 6.50%, 5/1/21(2) | 80,000 |
| 70,500 |
|
Ferrellgas LP / Ferrellgas Finance Corp., 6.75%, 1/15/22(2) | 90,000 |
| 78,975 |
|
| Gulfport Energy Corp., 6.00%, 10/15/24 | 105,000 |
| 95,827 |
|
| Gulfport Energy Corp., 6.375%, 5/15/25 | 410,000 |
| 372,587 |
|
Hilcorp Energy I LP / Hilcorp Finance Co., 5.75%, 10/1/25(1) | 240,000 |
| 237,000 |
|
Laredo Petroleum, Inc., 6.25%, 3/15/23(2) | 285,000 |
| 255,788 |
|
MEG Energy Corp., 7.00%, 3/31/24(1) | 135,000 |
| 126,563 |
|
MEG Energy Corp., 6.50%, 1/15/25(1) | 355,000 |
| 351,006 |
|
| Murphy Oil Corp., 4.45%, 12/1/22 | 360,000 |
| 364,724 |
|
| Newfield Exploration Co., 5.75%, 1/30/22 | 180,000 |
| 192,326 |
|
| Oasis Petroleum, Inc., 6.875%, 3/15/22 | 500,000 |
| 506,250 |
|
Parsley Energy LLC / Parsley Finance Corp., 5.375%, 1/15/25(1) | 580,000 |
| 582,900 |
|
| QEP Resources, Inc., 5.375%, 10/1/22 | 565,000 |
| 554,406 |
|
| Range Resources Corp., 5.75%, 6/1/21 | 180,000 |
| 183,600 |
|
| Range Resources Corp., 5.00%, 8/15/22 | 415,000 |
| 412,925 |
|
SM Energy Co., 5.00%, 1/15/24(2) | 365,000 |
| 339,450 |
|
| Southwestern Energy Co., 6.20%, 1/23/25 | 555,000 |
| 548,062 |
|
| Suburban Propane Partners LP / Suburban Energy Finance Corp., 5.50%, 6/1/24 | 185,000 |
| 181,134 |
|
| Suburban Propane Partners LP / Suburban Energy Finance Corp., 5.75%, 3/1/25 | 550,000 |
| 534,875 |
|
| Sunoco LP / Sunoco Finance Corp., 5.50%, 2/15/26 | 850,000 |
| 843,625 |
|
| Whiting Petroleum Corp., 5.75%, 3/15/21 | 510,000 |
| 518,415 |
|
|
| | | | | | |
| | Principal Amount | Value |
| WPX Energy, Inc., 6.00%, 1/15/22 | $ | 415,000 |
| $ | 432,637 |
|
| WPX Energy, Inc., 8.25%, 8/1/23 | 235,000 |
| 265,550 |
|
| | | 12,267,727 |
|
| Personal Products — 0.2% | | |
Avon Products, Inc., 7.00%, 3/15/23(2) | 280,000 |
| 274,750 |
|
| Pharmaceuticals — 2.7% | | |
Bausch Health Cos., Inc., 5.50%, 3/1/23(1) | 570,000 |
| 574,891 |
|
Bausch Health Cos., Inc., 6.125%, 4/15/25(1) | 700,000 |
| 694,750 |
|
Bausch Health Cos., Inc., 5.50%, 11/1/25(1) | 800,000 |
| 820,000 |
|
Endo Dac / Endo Finance LLC / Endo Finco, Inc., 6.00%, 7/15/23(1) | 465,000 |
| 360,375 |
|
| Horizon Pharma USA, Inc., 6.625%, 5/1/23 | 415,000 |
| 428,658 |
|
| Teva Pharmaceutical Finance Netherlands III BV, 2.20%, 7/21/21 | 500,000 |
| 476,965 |
|
| Teva Pharmaceutical Finance Netherlands III BV, 3.15%, 10/1/26 | 420,000 |
| 343,795 |
|
| | | 3,699,434 |
|
| Road and Rail — 0.3% | | |
Park Aerospace Holdings Ltd., 5.25%, 8/15/22(1) | 460,000 |
| 472,604 |
|
| Semiconductors and Semiconductor Equipment — 0.6% | | |
Advanced Micro Devices, Inc., 7.00%, 7/1/24(2) | 181,000 |
| 189,938 |
|
NXP BV / NXP Funding LLC, 3.875%, 9/1/22(1) | 455,000 |
| 462,566 |
|
Sensata Technologies BV, 5.00%, 10/1/25(1) | 138,000 |
| 142,140 |
|
| | | 794,644 |
|
| Software — 0.7% | | |
| Infor US, Inc., 6.50%, 5/15/22 | 513,000 |
| 521,977 |
|
| Symantec Corp., 4.20%, 9/15/20 | 500,000 |
| 507,755 |
|
| | | 1,029,732 |
|
| Specialty Retail — 2.9% | | |
Herc Rentals, Inc., 7.50%, 6/1/22(1) | 245,000 |
| 256,025 |
|
| Hertz Corp. (The), 5.875%, 10/15/20 | 125,000 |
| 125,125 |
|
Hertz Corp. (The), 7.375%, 1/15/21(2) | 230,000 |
| 230,000 |
|
Hertz Corp. (The), 6.25%, 10/15/22(2) | 235,000 |
| 223,250 |
|
| L Brands, Inc., 5.625%, 2/15/22 | 525,000 |
| 547,313 |
|
Party City Holdings, Inc., 6.125%, 8/15/23(1)(2) | 180,000 |
| 182,700 |
|
PetSmart, Inc., 7.125%, 3/15/23(1) | 380,000 |
| 285,000 |
|
PetSmart, Inc., 5.875%, 6/1/25(1) | 180,000 |
| 151,650 |
|
| Sally Holdings LLC / Sally Capital, Inc., 5.50%, 11/1/23 | 280,000 |
| 282,275 |
|
Sonic Automotive, Inc., 5.00%, 5/15/23(2) | 235,000 |
| 226,775 |
|
| United Rentals North America, Inc., 5.75%, 11/15/24 | 800,000 |
| 825,000 |
|
| United Rentals North America, Inc., 5.50%, 7/15/25 | 170,000 |
| 174,250 |
|
| United Rentals North America, Inc., 5.50%, 5/15/27 | 555,000 |
| 561,937 |
|
| | | 4,071,300 |
|
| Technology Hardware, Storage and Peripherals — 2.0% | | |
Dell International LLC / EMC Corp., 5.875%, 6/15/21(1) | 265,000 |
| 270,076 |
|
Dell International LLC / EMC Corp., 7.125%, 6/15/24(1)(2) | 335,000 |
| 355,236 |
|
Dell International LLC / EMC Corp., 4.90%, 10/1/26(1) | 250,000 |
| 254,975 |
|
| EMC Corp., 2.65%, 6/1/20 | 500,000 |
| 496,369 |
|
| NCR Corp., 5.00%, 7/15/22 | 380,000 |
| 380,950 |
|
| Western Digital Corp., 4.75%, 2/15/26 | 340,000 |
| 325,125 |
|
|
| | | | | | |
| | Principal Amount | Value |
| Xerox Corp., 4.50%, 5/15/21 | $ | 700,000 |
| $ | 710,500 |
|
| | | 2,793,231 |
|
| Textiles, Apparel and Luxury Goods — 0.3% | | |
Hanesbrands, Inc., 4.625%, 5/15/24(1) | 475,000 |
| 478,658 |
|
| Trading Companies and Distributors — 0.3% | | |
Beacon Roofing Supply, Inc., 4.875%, 11/1/25(1) | 370,000 |
| 352,888 |
|
| Wireless Telecommunication Services — 2.6% | | |
| Sprint Corp., 7.25%, 9/15/21 | 585,000 |
| 615,712 |
|
| Sprint Corp., 7.875%, 9/15/23 | 380,000 |
| 399,950 |
|
| Sprint Corp., 7.125%, 6/15/24 | 550,000 |
| 559,625 |
|
| Sprint Corp., 7.625%, 2/15/25 | 280,000 |
| 286,300 |
|
| T-Mobile USA, Inc., 6.00%, 3/1/23 | 350,000 |
| 360,500 |
|
| T-Mobile USA, Inc., 6.375%, 3/1/25 | 355,000 |
| 370,549 |
|
| T-Mobile USA, Inc., 6.50%, 1/15/26 | 445,000 |
| 476,150 |
|
| T-Mobile USA, Inc., 4.75%, 2/1/28 | 500,000 |
| 497,500 |
|
| | | 3,566,286 |
|
TOTAL CORPORATE BONDS
(Cost $125,187,323) | | 124,926,763 |
|
BANK LOAN OBLIGATIONS(5) — 2.2% | | |
| Diversified Telecommunication Services — 0.6% | | |
| CenturyLink, Inc., 2017 Term Loan B, 5.25%, (1-month LIBOR plus 2.75%), 1/31/25 | 281,629 |
| 276,703 |
|
| Level 3 Financing Inc., 2017 Term Loan B, 4.74%, (3-month LIBOR plus 2.25%), 2/22/24 | 200,000 |
| 197,937 |
|
| Zayo Group, LLC, 2017 Incremental Term Loan, 4.75%, (1-month LIBOR plus 2.25%), 1/19/24 | 300,000 |
| 298,770 |
|
| | | 773,410 |
|
| Health Care Providers and Services — 0.7% | | |
Acadia Healthcare Company, Inc., 2018 Term Loan B4, 2/16/23(6) | 500,000 |
| 496,875 |
|
| HCA Inc., 2018 Term Loan B10, 4.50%, (1-month LIBOR plus 2.00%), 3/13/25 | 495,000 |
| 495,042 |
|
| | | 991,917 |
|
| Hotels, Restaurants and Leisure — 0.2% | | |
| 1011778 B.C. Unlimited Liability Company, Term Loan B3, 4.75%, (1-month LIBOR plus 2.25%), 2/16/24 | 155,358 |
| 153,157 |
|
| 1011778 B.C. Unlimited Liability Company, Term Loan B3, 4.75%, (1-month LIBOR plus 2.25%), 2/16/24 | 192,717 |
| 189,986 |
|
| | | 343,143 |
|
| Pharmaceuticals — 0.7% | | |
| Catalent Pharma Solutions Inc., USD Term Loan B, 4.75%, (1-month LIBOR plus 2.25%), 5/20/24 | 546,969 |
| 545,347 |
|
| Valeant Pharmaceuticals International, Inc., 2018 Term Loan B, 5.48%, (1-month LIBOR plus 3.00%), 6/2/25 | 462,500 |
| 460,065 |
|
| | | 1,005,412 |
|
TOTAL BANK LOAN OBLIGATIONS
(Cost $3,141,065) | | 3,113,882 |
|
|
| | | | | | |
| | Principal Amount/Shares | Value |
| EXCHANGE-TRADED FUNDS — 1.1% | | |
| iShares iBoxx High Yield Corporate Bond ETF | 8,500 |
| $ | 734,995 |
|
SPDR Bloomberg Barclays High Yield Bond ETF(2) | 20,200 |
| 726,594 |
|
TOTAL EXCHANGE-TRADED FUNDS
(Cost $1,425,314) | | 1,461,589 |
|
| ASSET-BACKED SECURITIES — 0.3% | | |
| UAL Pass-Through Trust, Series 2007-1, Class A, 6.64%, 1/2/24 | $ | 214,071 |
| 225,663 |
|
| US Airways Pass-Through Trust, Series 2013-1, Class B, 5.375%, 5/15/23 | 215,179 |
| 222,287 |
|
TOTAL ASSET-BACKED SECURITIES
(Cost $431,689) | | 447,950 |
|
| SOVEREIGN GOVERNMENTS AND AGENCIES — 0.2% | | |
| Argentina — 0.2% | | |
Argentine Republic Government International Bond, 6.875%, 4/22/21
(Cost $280,000) | 280,000 |
| 256,340 |
|
| TEMPORARY CASH INVESTMENTS — 10.4% | | |
Bennington Stark Capital Co. LLC, 2.55%, 4/1/19 (LOC: Societe Generale SA)(1)(7) | 3,773,000 |
| 3,772,214 |
|
| Repurchase Agreement, BMO Capital Markets Corp., (collateralized by various U.S. Treasury obligations, 0.125% - 2.875%, 9/30/19 - 2/15/44, valued at $4,928,736), in a joint trading account at 2.35%, dated 3/29/19, due 4/1/19 (Delivery value $4,831,223) | | 4,830,277 |
|
| Repurchase Agreement, Fixed Income Clearing Corp., (collateralized by various U.S. Treasury obligations, 2.75%, 6/30/25, valued at $827,578), at 1.25%, dated 3/29/19, due 4/1/19 (Delivery value $807,084) | | 807,000 |
|
Societe Generale SA, 2.50%, 4/1/19(1)(7) | 5,000,000 |
| 4,998,997 |
|
| State Street Institutional U.S. Government Money Market Fund, Premier Class | 12,931 |
| 12,931 |
|
TOTAL TEMPORARY CASH INVESTMENTS
(Cost $14,423,208) | | 14,421,419 |
|
TEMPORARY CASH INVESTMENTS - SECURITIES LENDING COLLATERAL(8) — 9.7% |
State Street Navigator Securities Lending Government Money Market Portfolio
(Cost $13,452,950) | 13,452,950 |
| 13,452,950 |
|
TOTAL INVESTMENT SECURITIES — 113.8%
(Cost $158,341,549) | | 158,080,893 |
|
OTHER ASSETS AND LIABILITIES(9) — (13.8)% | | (19,154,052 | ) |
| TOTAL NET ASSETS — 100.0% | | $ | 138,926,841 |
|
|
| | | | | | | | | | | | | | | |
| CENTRALLY CLEARED CREDIT DEFAULT SWAP AGREEMENTS | |
| Reference Entity | Type‡ | Fixed Rate
Received
(Paid) | Termination
Date | Notional Amount | Premiums Paid (Received) | Unrealized Appreciation
(Depreciation) | Value^ |
| Markit CDX North America High Yield Index Series 31 | Sell | 5.00% | 12/20/23 | $ | 1,960,000 |
| $ | 77,256 |
| $ | 56,525 |
| $ | 133,781 |
|
‡The maximum potential amount the fund could be required to deliver as a seller of credit protection if a credit event occurs as defined under the terms of the agreement is the notional amount. The maximum potential amount may be partially offset by any recovery values of the reference entities and upfront payments received upon entering into the agreement.
^The value for credit default swap agreements serve as an indicator of the current status of the payment/performance risk and represent the likelihood of an expected liability or profit at the period end. Increasing values in absolute terms when compared to the notional amount of the credit default swap agreement represent a deterioration of the referenced entity's credit soundness and an increased likelihood or risk of a credit event occurring as defined in the agreement.
|
| | |
| NOTES TO SCHEDULE OF INVESTMENTS |
| CDX | - | Credit Derivatives Indexes |
| LIBOR | - | London Interbank Offered Rate |
| LOC | - | Letter of Credit |
| MTN | - | Medium Term Note |
| PIK | - | Payment in Kind. Security may pay a cash rate and/or an in kind rate. |
| USD | - | United States Dollar |
| VRN | - | Variable Rate Note. The rate adjusts periodically based upon the terms set forth in the security’s offering documents. The rate shown is effective at the period end and the reference rate and spread, if any, is indicated. |
| |
| (1) | Security was purchased pursuant to Rule 144A or Section 4(2) under the Securities Act of 1933 and may be sold in transactions exempt from registration, normally to qualified institutional investors. The aggregate value of these securities at the period end was $59,704,624, which represented 43.0% of total net assets. |
| |
| (2) | Security, or a portion thereof, is on loan. At the period end, the aggregate value of securities on loan was $13,011,271. The amount of securities on loan indicated may not correspond with the securities on loan identified because securities with pending sales are in the process of recall from the brokers. |
| |
| (3) | When-issued security. The issue price and yield are fixed on the date of the commitment, but payment and delivery are scheduled for a future date. |
| |
| (4) | The security's rate was paid in cash at the last payment date. |
| |
| (5) | The interest rate on a bank loan obligation adjusts periodically based on a predetermined schedule. Rate shown is effective at period end. The maturity date on a bank loan obligation may be less than indicated as a result of contractual or optional prepayments. These prepayments cannot be predicted with certainty. |
| |
| (6) | The interest rate will be determined upon settlement of the bank loan obligation after period end. |
| |
| (7) | The rate indicated is the yield to maturity at purchase. |
| |
| (8) | Investment of cash collateral from securities on loan. At the period end, the aggregate market value of the collateral held by the fund was $13,452,950. |
| |
| (9) | Amount relates primarily to payable for collateral received for securities on loan. |
See Notes to Financial Statements.
|
|
| Statement of Assets and Liabilities |
|
| | | |
| MARCH 31, 2019 | |
| Assets | |
| Investment securities, at value (cost of $144,888,599) | $ | 144,627,943 |
|
Investment made with cash collateral received for securities on loan, at value
(cost of $13,452,950) | 13,452,950 |
|
| Total investment securities, at value (cost of $158,341,549) | 158,080,893 |
|
| Deposits with broker for swap agreements | 97,479 |
|
| Receivable for investments sold | 143,823 |
|
| Receivable for capital shares sold | 80,189 |
|
| Receivable for variation margin on swap agreements | 8,047 |
|
| Interest and dividends receivable | 1,946,047 |
|
| Securities lending receivable | 9,217 |
|
| | 160,365,695 |
|
| | |
| Liabilities | |
| Payable for collateral received for securities on loan | 13,452,950 |
|
| Payable for investments purchased | 997,530 |
|
| Payable for capital shares redeemed | 6,829,785 |
|
| Accrued management fees | 93,499 |
|
| Distribution and service fees payable | 7,690 |
|
| Dividends payable | 57,400 |
|
| | 21,438,854 |
|
| | |
| Net Assets | $ | 138,926,841 |
|
| | |
| Net Assets Consist of: | |
| Capital paid in | $ | 177,700,757 |
|
| Distributable earnings | (38,773,916 | ) |
| | $ | 138,926,841 |
|
|
| | | | | |
| | Net Assets | Shares Outstanding | Net Asset Value Per Share |
| Investor Class |
| $110,623,981 |
| 19,965,003 | $5.54 |
| I Class |
| $2,300,269 |
| 414,139 | $5.55 |
| Y Class |
| $5,727,026 |
| 1,032,373 | $5.55 |
| A Class |
| $11,867,932 |
| 2,139,854 | $5.55* |
| C Class |
| $5,574,113 |
| 1,005,294 | $5.54 |
| R Class |
| $988,396 |
| 178,274 | $5.54 |
| R5 Class |
| $1,655,570 |
| 298,408 | $5.55 |
| R6 Class |
| $189,554 |
| 34,213 | $5.54 |
*Maximum offering price $5.81 (net asset value divided by 0.955).
See Notes to Financial Statements.
|
| | | |
| YEAR ENDED MARCH 31, 2019 | |
| Investment Income (Loss) | |
| Income: | |
| Interest | $ | 8,610,113 |
|
| Securities lending, net | 16,939 |
|
| Dividends | 13,374 |
|
| | 8,640,426 |
|
| | |
| Expenses: | |
| Management fees | 1,190,243 |
|
| Distribution and service fees: | |
| A Class | 30,792 |
|
| C Class | 69,411 |
|
| R Class | 4,864 |
|
| Trustees' fees and expenses | 9,875 |
|
| Other expenses | 10,704 |
|
| | 1,315,889 |
|
Fees waived(1) | (100,675 | ) |
| | 1,215,214 |
|
| | |
| Net investment income (loss) | 7,425,212 |
|
| | |
| Realized and Unrealized Gain (Loss) | |
| Net realized gain (loss) on: | |
| Investment transactions | (2,267,269 | ) |
| Swap agreement transactions | (27,392 | ) |
| | (2,294,661 | ) |
| | |
| Change in net unrealized appreciation (depreciation) on: | |
| Investments | 1,534,574 |
|
| Swap agreements | 72,911 |
|
| | 1,607,485 |
|
| | |
| Net realized and unrealized gain (loss) | (687,176 | ) |
| | |
| Net Increase (Decrease) in Net Assets Resulting from Operations | $ | 6,738,036 |
|
| |
| (1) | Amount consists of $78,731, $1,983, $1,956, $8,622, $4,859, $681, $1,100 and $2,743 for Investor Class, I Class, Y Class, A Class, C Class, R Class, R5 Class and R6 Class, respectively. |
See Notes to Financial Statements.
|
|
| Statement of Changes in Net Assets |
|
| | | | | | |
| YEARS ENDED MARCH 31, 2019 AND MARCH 31, 2018 |
| Increase (Decrease) in Net Assets | March 31, 2019 | March 31, 2018 |
| Operations | | |
| Net investment income (loss) | $ | 7,425,212 |
| $ | 16,329,072 |
|
| Net realized gain (loss) | (2,294,661 | ) | 20,788,456 |
|
| Change in net unrealized appreciation (depreciation) | 1,607,485 |
| (20,683,594 | ) |
| Net increase (decrease) in net assets resulting from operations | 6,738,036 |
| 16,433,934 |
|
| | | |
| Distributions to Shareholders | | |
| From earnings: | | |
| Investor Class | (5,993,988 | ) | (8,450,221 | ) |
| I Class | (154,119 | ) | (192,633 | ) |
| Y Class | (153,733 | ) | (1,647 | ) |
| A Class | (626,853 | ) | (741,366 | ) |
| C Class | (301,522 | ) | (387,006 | ) |
| R Class | (47,087 | ) | (56,363 | ) |
| R5 Class | (87,006 | ) | (5,095,194 | ) |
| R6 Class | (217,873 | ) | (1,603,744 | ) |
| Decrease in net assets from distributions | (7,582,181 | ) | (16,528,174 | ) |
| | | |
| Capital Share Transactions | | |
| Net increase (decrease) in net assets from capital share transactions (Note 5) | (9,199,688 | ) | (797,843,273 | ) |
| | | |
| Net increase (decrease) in net assets | (10,043,833 | ) | (797,937,513 | ) |
| | | |
| Net Assets | | |
| Beginning of period | 148,970,674 |
| 946,908,187 |
|
| End of period | $ | 138,926,841 |
| $ | 148,970,674 |
|
See Notes to Financial Statements.
|
|
Notes to Financial Statements |
MARCH 31, 2019
1. Organization
American Century Investment Trust (the trust) is registered under the Investment Company Act of 1940, as amended (the 1940 Act), as an open-end management investment company and is organized as a Massachusetts business trust. High-Yield Fund (the fund) is one fund in a series issued by the trust. The fund’s investment objective is to seek high current income. As a secondary objective, the fund seeks capital appreciation, but only when consistent with its primary objective of maximizing current income.
The fund offers the Investor Class, I Class, Y Class, A Class, C Class, R Class, R5 Class and R6 Class. The A Class may incur an initial sales charge. The A Class and C Class may be subject to a contingent deferred sales charge. Sale of the I Class and Y Class commenced on April 10, 2017.
2. Significant Accounting Policies
The following is a summary of significant accounting policies consistently followed by the fund in preparation of its financial statements. The fund is an investment company and follows accounting and reporting guidance in accordance with accounting principles generally accepted in the United States of America. This may require management to make certain estimates and assumptions at the date of the financial statements. Actual results could differ from these estimates. Management evaluated the impact of events or transactions occurring through the date the financial statements were issued that would merit recognition or disclosure.
Investment Valuations — The fund determines the fair value of its investments and computes its net asset value per share at the close of regular trading (usually 4 p.m. Eastern time) on the New York Stock Exchange (NYSE) on each day the NYSE is open. The Board of Trustees has adopted valuation policies and procedures to guide the investment advisor in the fund’s investment valuation process and to provide methodologies for the oversight of the fund’s pricing function.
Fixed income securities are valued at the evaluated mean as provided by independent pricing services or at the mean of the most recent bid and asked prices as provided by investment dealers. Corporate bonds, U.S. Treasury and Government Agency securities, convertible bonds, bank loan obligations, municipal securities, and sovereign governments and agencies are valued using market models that consider trade data, quotations from dealers and active market makers, relevant yield curve and spread data, creditworthiness, trade data or market information on comparable securities, and other relevant security specific information. Mortgage-related and asset-backed securities are valued based on models that consider trade data, prepayment and default projections, benchmark yield and spread data and estimated cash flows of each tranche of the issuer. Commercial paper is valued using a curve-based approach that considers money market rates for specific instruments, programs, currencies and maturity points from a variety of active market makers.
Equity securities that are listed or traded on a domestic securities exchange are valued at the last reported sales price or at the official closing price as provided by the exchange. Equity securities traded on foreign securities exchanges are generally valued at the closing price of such securities on the exchange where primarily traded or at the close of the NYSE, if that is earlier. If no last sales price is reported, or if local convention or regulation so provides, the mean of the latest bid and asked prices may be used. Securities traded over-the-counter are valued at the mean of the latest bid and asked prices, the last sales price, or the official closing price.
Open-end management investment companies are valued at the reported net asset value per share. Repurchase agreements are valued at cost, which approximates fair value. Swap agreements are valued at an evaluated mean as provided by independent pricing services or independent brokers.
If the fund determines that the market price for an investment is not readily available or the valuation methods mentioned above do not reflect an investment’s fair value, such investment is valued as determined in good faith by the Board of Trustees or its delegate, in accordance with policies and procedures adopted by the Board of Trustees. In its determination of fair value, the fund may review several factors including, but not limited to, market information regarding the specific investment or comparable investments and correlation with other investment types, futures indices or general market indicators. Circumstances that may cause the fund to use these procedures to value an investment include, but are not limited to: an investment has been declared in default or is distressed; trading in a security has been suspended during the trading day or a security is not actively trading on its principal exchange; prices received from a regular pricing source are deemed unreliable; or there is a foreign market holiday and no trading occurred.
The fund monitors for significant events occurring after the close of an investment’s primary exchange but before the fund’s net asset value per share is determined. Significant events may include, but are not limited to: corporate announcements and transactions; governmental action and political unrest that could impact a specific investment or an investment sector; or armed conflicts, natural disasters and similar events that could affect investments in a specific country or region. The fund also monitors for significant fluctuations between domestic and foreign markets, as evidenced by the U.S. market or such other indicators that the Board of Trustees, or its delegate, deems appropriate. If significant fluctuations in foreign markets are identified, the fund may apply a model-derived factor to the closing price of equity securities traded on foreign securities exchanges. The factor is based on observable market data as provided by an independent pricing service.
Security Transactions — Security transactions are accounted for as of the trade date. Net realized gains and losses are determined on the identified cost basis, which is also used for federal income tax purposes.
Investment Income — Interest income is recorded on the accrual basis and includes paydown gain (loss) and accretion of discounts and amortization of premiums. Dividend income less foreign taxes withheld, if any, is recorded as of the ex-dividend date. Distributions received on securities that represent a return of capital or long-term capital gain are recorded as a reduction of cost of investments and/or as a realized gain. The fund may estimate the components of distributions received that may be considered nontaxable distributions or long-term capital gain distributions for income tax purposes. Securities lending income is net of fees and
rebates earned by the lending agent for its services.
Repurchase Agreements — The fund may enter into repurchase agreements with institutions that American Century Investment Management, Inc. (ACIM) (the investment advisor) has determined are creditworthy pursuant to criteria adopted by the Board of Trustees. The fund requires that the collateral, represented by securities, received in a repurchase transaction be transferred to the custodian in a manner sufficient to enable the fund to obtain those securities in the event of a default under the repurchase agreement. ACIM monitors, on a daily basis, the securities transferred to ensure the value, including accrued interest, of the securities under each repurchase agreement is equal to or greater than amounts owed to the fund under each repurchase agreement.
Joint Trading Account — Pursuant to an Exemptive Order issued by the Securities and Exchange Commission, the fund, along with certain other funds in the American Century Investments family of funds, may transfer uninvested cash balances into a joint trading account. These balances are invested in one or more repurchase agreements that are collateralized by U.S. Treasury or Agency obligations.
Segregated Assets — In accordance with the 1940 Act, the fund segregates assets on its books and records to cover certain types of investment securities and other financial instruments. ACIM monitors, on a daily basis, the securities segregated to ensure the fund designates a sufficient amount of liquid assets, marked-to-market daily. The fund may also receive assets or be required to pledge assets at the custodian bank or with a broker for collateral requirements.
Income Tax Status — It is the fund’s policy to distribute substantially all net investment income and net realized gains to shareholders and to otherwise qualify as a regulated investment company under provisions of the Internal Revenue Code. Accordingly, no provision has been made for income taxes. The fund files U.S. federal, state, local and non-U.S. tax returns as applicable. The fund's tax returns are subject to examination by the relevant taxing authority until expiration of the applicable statute of limitations, which is generally three years from the date of filing but can be longer in certain jurisdictions. At this time, management believes there are no uncertain tax positions which, based on their technical merit, would not be sustained upon examination and for which it is reasonably possible that the total amounts of unrecognized tax benefits will significantly change in the next twelve months.
Multiple Class — All shares of the fund represent an equal pro rata interest in the net assets of the class to which such shares belong, and have identical voting, dividend, liquidation and other rights and the same terms and conditions, except for class specific expenses and exclusive rights to vote on matters affecting only individual classes. Income, non-class specific expenses, and realized and unrealized capital gains and losses of the fund are allocated to each class of shares based on their relative net assets.
Distributions to Shareholders — Distributions from net investment income, if any, are declared daily and paid monthly. Distributions from net realized gains, if any, are generally declared and paid annually.
Indemnifications — Under the trust’s organizational documents, its officers and trustees are indemnified against certain liabilities arising out of the performance of their duties to the fund. In addition, in the normal course of business, the fund enters into contracts that provide general indemnifications. The maximum exposure under these arrangements is unknown as this would involve future claims that may be made against a fund. The risk of material loss from such claims is considered by management to be remote.
Securities Lending — Securities are lent to qualified financial institutions and brokers. State Street Bank &
Trust Co. serves as securities lending agent to the fund pursuant to a Securities Lending Agreement. The
lending of securities exposes the fund to risks such as: the borrowers may fail to return the loaned securities,
the borrowers may not be able to provide additional collateral, the fund may experience delays in recovery of
the loaned securities or delays in access to collateral, or the fund may experience losses related to the
investment collateral. To minimize certain risks, loan counterparties pledge collateral in the form of cash and/
or securities. The lending agent has agreed to indemnify the fund in the case of default of any securities
borrowed. Cash collateral received is invested in the State Street Navigator Securities Lending Government Money Market Portfolio, a money market mutual fund registered under the 1940 Act. The loans may also be secured by U.S. government securities in an amount at least equal to the market value of the securities loaned, plus accrued interest and dividends, determined on a daily basis and adjusted accordingly. By lending securities, the fund seeks to increase its net investment income through the receipt of interest and fees. Such income is reflected separately within the Statement of Operations. The value of loaned securities and related collateral outstanding at period end, if any, are shown on a gross basis within the Schedule of Investments and Statement of Assets and Liabilities.
The following table reflects a breakdown of transactions accounted for as secured borrowings, the gross obligation by the type of collateral pledged, and the remaining contractual maturity of those transactions as of March 31, 2019.
|
| | | | | | | | | | | | |
| Remaining Contractual Maturity of Agreements |
| | Overnight and
Continuous | <30 days | Between
30 & 90 days | >90 days | Total |
Securities Lending Transactions(1) | | | | |
| Corporate Bonds | $ | 12,701,698 |
| — |
| — |
| — |
| $ | 12,701,698 |
|
| Exchange-Traded Funds | 751,252 |
| — |
| — |
| — |
| 751,252 |
|
| Total Borrowings | $ | 13,452,950 |
| — |
| — |
| — |
| $ | 13,452,950 |
|
| Gross amount of recognized liabilities for securities lending transactions | $ | 13,452,950 |
|
(1) Amount represents the payable for cash collateral received for securities on loan. This will generally be in the Overnight and Continuous column as the securities are typically callable on demand.
3. Fees and Transactions with Related Parties
Certain officers and trustees of the trust are also officers and/or directors of American Century Companies, Inc. (ACC). The trust's investment advisor, ACIM, the trust's distributor, American Century Investment Services, Inc. (ACIS), and the trust's transfer agent, American Century Services, LLC, are wholly owned, directly or indirectly, by ACC.
Management Fees — The trust has entered into a management agreement with ACIM, under which ACIM provides the fund with investment advisory and management services in exchange for a single, unified management fee (the fee) per class. The agreement provides that all expenses of managing and operating the fund, except distribution and service fees, brokerage expenses, taxes, interest, fees and expenses of the independent trustees (including legal counsel fees), and extraordinary expenses, will be paid by ACIM. The fee is computed and accrued daily based on each class's daily net assets and paid monthly in arrears. The difference in the fee among the classes is a result of their separate arrangements for non-Rule 12b-1 shareholder services. It is not the result of any difference in advisory or custodial fees or other expenses related to the management of the fund’s assets, which do not vary by class. The fee consists of (1) an Investment Category Fee based on the daily net assets of the fund and certain other accounts managed by the investment advisor that are in the same broad investment category as the fund and (2) a Complex Fee based on the assets of all the funds in the American Century Investments family of funds. During the period ended March 31, 2019, the investment advisor agreed to waive 0.07% of the fund's management fee. The investment advisor expects this waiver to continue until July 31, 2019 and cannot terminate it prior to such date without the approval of the Board of Trustees.
The Investment Category Fee range, the Complex Fee range and the effective annual management fee before and after waiver for each class for the period ended March 31, 2019 are as follows:
|
| | | | |
| | | | Effective Annual Management Fee |
| | Investment Category Fee Range | Complex Fee Range | Before Waiver | After Waiver |
| Investor Class | 0.5425%
to 0.6600% | 0.2500% to 0.3100% | 0.84% | 0.77% |
| I Class | 0.1500% to 0.2100% | 0.74% | 0.67% |
| Y Class | 0.0500% to 0.1100% | 0.64% | 0.57% |
| A Class | 0.2500% to 0.3100% | 0.84% | 0.77% |
| C Class | 0.2500% to 0.3100% | 0.84% | 0.77% |
| R Class | 0.2500% to 0.3100% | 0.84% | 0.77% |
| R5 Class | 0.0500% to 0.1100% | 0.64% | 0.57% |
| R6 Class | 0.0000% to 0.0600% | 0.59% | 0.52% |
Distribution and Service Fees — The Board of Trustees has adopted a separate Master Distribution and Individual Shareholder Services Plan for each of the A Class, C Class and R Class (collectively the plans), pursuant to Rule 12b-1 of the 1940 Act. The plans provide that the A Class will pay ACIS an annual distribution and service fee of 0.25%. The plans provide that the C Class will pay ACIS an annual distribution and service fee of 1.00%, of which 0.25% is paid for individual shareholder services and 0.75% is paid for distribution services. The plans provide that the R Class will pay ACIS an annual distribution and service fee of 0.50%. The fees are computed and accrued daily based on each class’s daily net assets and paid monthly in arrears. The fees are used to pay financial intermediaries for distribution and individual shareholder services. Fees incurred under the plans during the period ended March 31, 2019 are detailed in the Statement of Operations.
Trustees’ Fees and Expenses — The Board of Trustees is responsible for overseeing the investment advisor’s management and operations of the fund. The trustees receive detailed information about the fund and its investment advisor regularly throughout the year, and meet at least quarterly with management of the investment advisor to review reports about fund operations. The fund’s officers do not receive compensation from the fund.
Interfund Transactions — The fund may enter into security transactions with other American Century Investments funds and other client accounts of the investment advisor, in accordance with the 1940 Act rules and procedures adopted by the Board of Trustees. The rules and procedures require, among other things, that these transactions be effected at the independent current market price of the security. There were no interfund transactions during the period.
4. Investment Transactions
Purchases and sales of investment securities, excluding short-term investments, for the period ended March 31, 2019 were $33,062,981 and $46,737,759, respectively.
5. Capital Share Transactions
Transactions in shares of the fund were as follows (unlimited number of shares authorized):
|
| | | | | | | | | | |
| | Year ended
March 31, 2019 | Year ended March 31, 2018(1) |
| | Shares | Amount | Shares | Amount |
| Investor Class | | | | |
| Sold | 12,448,873 |
| $ | 69,118,275 |
| 12,241,503 |
| $ | 70,444,111 |
|
| Issued in reinvestment of distributions | 955,164 |
| 5,263,536 |
| 1,272,121 |
| 7,304,486 |
|
| Redeemed | (13,350,485 | ) | (73,963,906 | ) | (43,707,086 | ) | (251,303,781 | ) |
| | 53,552 |
| 417,905 |
| (30,193,462 | ) | (173,555,184 | ) |
| I Class | | | | |
| Sold | 90,790 |
| 506,228 |
| 1,194,087 |
| 6,905,940 |
|
| Issued in reinvestment of distributions | 26,689 |
| 147,594 |
| 31,030 |
| 177,970 |
|
| Redeemed | (483,393 | ) | (2,695,266 | ) | (445,064 | ) | (2,548,174 | ) |
| | (365,914 | ) | (2,041,444 | ) | 780,053 |
| 4,535,736 |
|
| Y Class | | | | |
| Sold | 1,012,561 |
| 5,600,018 |
| 46,631 |
| 263,346 |
|
| Issued in reinvestment of distributions | 28,019 |
| 153,678 |
| 300 |
| 1,647 |
|
| Redeemed | (55,116 | ) | (298,822 | ) | (22 | ) | (128 | ) |
| | 985,464 |
| 5,454,874 |
| 46,909 |
| 264,865 |
|
| A Class | | | | |
| Sold | 426,615 |
| 2,368,335 |
| 346,026 |
| 1,987,296 |
|
| Issued in reinvestment of distributions | 107,600 |
| 593,585 |
| 121,423 |
| 697,024 |
|
| Redeemed | (723,224 | ) | (3,992,813 | ) | (2,004,864 | ) | (11,509,245 | ) |
| | (189,009 | ) | (1,030,893 | ) | (1,537,415 | ) | (8,824,925 | ) |
| C Class | | | | |
| Sold | 87,824 |
| 483,241 |
| 102,431 |
| 587,835 |
|
| Issued in reinvestment of distributions | 50,386 |
| 278,026 |
| 60,977 |
| 349,814 |
|
| Redeemed | (617,331 | ) | (3,404,093 | ) | (420,400 | ) | (2,409,265 | ) |
| | (479,121 | ) | (2,642,826 | ) | (256,992 | ) | (1,471,616 | ) |
| R Class | | | | |
| Sold | 93,275 |
| 513,476 |
| 63,980 |
| 366,514 |
|
| Issued in reinvestment of distributions | 8,356 |
| 46,121 |
| 9,543 |
| 54,794 |
|
| Redeemed | (109,721 | ) | (604,783 | ) | (151,574 | ) | (872,758 | ) |
| | (8,090 | ) | (45,186 | ) | (78,051 | ) | (451,450 | ) |
| R5 Class | | | | |
| Sold | 67,739 |
| 375,160 |
| 2,497,373 |
| 14,321,193 |
|
| Issued in reinvestment of distributions | 15,653 |
| 86,374 |
| 537,364 |
| 3,100,867 |
|
| Redeemed | (101,804 | ) | (566,900 | ) | (96,444,588 | ) | (556,103,237 | ) |
| | (18,412 | ) | (105,366 | ) | (93,409,851 | ) | (538,681,177 | ) |
| R6 Class | | | | |
| Sold | 54,007 |
| 301,428 |
| 1,402,155 |
| 8,108,527 |
|
| Issued in reinvestment of distributions | 38,855 |
| 216,459 |
| 238,783 |
| 1,372,947 |
|
| Redeemed | (1,737,462 | ) | (9,724,639 | ) | (15,447,135 | ) | (89,140,996 | ) |
| | (1,644,600 | ) | (9,206,752 | ) | (13,806,197 | ) | (79,659,522 | ) |
| Net increase (decrease) | (1,666,130 | ) | $ | (9,199,688 | ) | (138,455,006 | ) | $ | (797,843,273 | ) |
| |
| (1) | April 10, 2017 (commencement of sale) through March 31, 2018 for the I Class and Y Class. |
6. Fair Value Measurements
The fund’s investments valuation process is based on several considerations and may use multiple inputs to determine the fair value of the investments held by the fund. In conformity with accounting principles generally accepted in the United States of America, the inputs used to determine a valuation are classified into three broad levels.
| |
| • | Level 1 valuation inputs consist of unadjusted quoted prices in an active market for identical investments. |
| |
| • | Level 2 valuation inputs consist of direct or indirect observable market data (including quoted prices for comparable investments, evaluations of subsequent market events, interest rates, prepayment speeds, credit risk, etc.). These inputs also consist of quoted prices for identical investments initially expressed in local currencies that are adjusted through translation into U.S. dollars. |
| |
| • | Level 3 valuation inputs consist of unobservable data (including a fund’s own assumptions). |
The level classification is based on the lowest level input that is significant to the fair valuation measurement. The valuation inputs are not necessarily an indication of the risks associated with investing in these securities or other financial instruments.
The following is a summary of the level classifications as of period end. The Schedule of Investments provides additional information on the fund’s portfolio holdings.
|
| | | | | | | | |
| | Level 1 | Level 2 | Level 3 |
| Assets | | | |
| Investment Securities | | | |
| Corporate Bonds | — |
| $ | 124,926,763 |
| — |
|
| Bank Loan Obligations | — |
| 3,113,882 |
| — |
|
| Exchange-Traded Funds | $ | 1,461,589 |
| — |
| — |
|
| Asset-Backed Securities | — |
| 447,950 |
| — |
|
| Sovereign Governments and Agencies | — |
| 256,340 |
| — |
|
| Temporary Cash Investments | 12,931 |
| 14,408,488 |
| — |
|
| Temporary Cash Investments - Securities Lending Collateral | 13,452,950 |
| — |
| — |
|
| | $ | 14,927,470 |
| $ | 143,153,423 |
| — |
|
| Other Financial Instruments | | | |
| Swap Agreements | — |
| $ | 133,781 |
| — |
|
7. Derivative Instruments
Credit Risk — The fund is subject to credit risk in the normal course of pursuing its investment objectives. The value of a bond generally declines as the credit quality of its issuer declines. Credit default swap agreements enable a fund to buy/sell protection against a credit event of a specific issuer or index. A fund may attempt to enhance returns by selling protection or attempt to mitigate credit risk by buying protection. The buyer/seller of credit protection against a security or basket of securities may pay/receive an up-front or periodic payment to compensate for/against potential default events. Changes in value, including the periodic amounts of interest to be paid or received on swap agreements, are recorded as unrealized appreciation (depreciation) on swap agreements. Upon entering into a centrally cleared swap, a fund is required to deposit cash or securities (initial margin) with a financial intermediary in an amount equal to a certain percentage of the notional amount. Subsequent payments (variation margin) are made or received daily, in cash, by a fund. The variation margin is equal to the daily change in the value and is a component of unrealized gains and losses. Realized gain or loss is recorded upon receipt or payment of a periodic settlement or termination of swap agreements. Net realized and unrealized gains or losses occurring during the holding period of swap agreements are a component of net realized gain (loss) on swap agreement transactions and change in net unrealized appreciation (depreciation) on swap agreements, respectively. The risks of entering into swap agreements include the possible lack of liquidity, failure of the counterparty to meet its obligations, and that there may be unfavorable changes in the underlying investments or instruments. The fund's average notional amount held during the period was $5,725,556.
The value of credit risk derivative instruments as of March 31, 2019, is disclosed on the Statement of Assets and Liabilities as an asset of $8,047 in receivable for variation margin on swap agreements*. For the year ended March 31, 2019, the effect of credit risk derivative instruments on the Statement of Operations was $(27,392) in net realized gain (loss) on swap agreement transactions and $72,911 in change in net unrealized appreciation (depreciation) on swap agreements.
* Included in the unrealized appreciation (depreciation) on centrally cleared swap agreements, as reported in the Schedule of Investments.
8. Risk Factors
The fund invests primarily in lower-rated debt securities, which are subject to substantial risks including liquidity risk and credit risk.
There are certain risks involved in investing in foreign securities. These risks include those resulting from political events (such as civil unrest, national elections and imposition of exchange controls), social and economic events (such as labor strikes and rising inflation), and natural disasters. Securities of foreign issuers may be less liquid and more volatile. Investing in emerging markets or a significant portion of assets in one country or region may accentuate these risks.
9. Federal Tax Information
The tax character of distributions paid during the years ended March 31, 2019 and March 31, 2018 were as follows:
|
| | | | | | |
| | 2019 | 2018 |
| Distributions Paid From | | |
| Ordinary income | $ | 7,582,181 |
| $ | 16,528,174 |
|
| Long-term capital gains | — |
| — |
|
The book-basis character of distributions made during the year from net investment income or net realized gains may differ from their ultimate characterization for federal income tax purposes. These differences reflect the differing character of certain income items and net realized gains and losses for financial statement and tax purposes, and may result in reclassification among certain capital accounts on the financial statements.
As of period end, the federal tax cost of investments and the components of distributable earnings on a tax-basis were as follows:
|
| | | |
| Federal tax cost of investments | $ | 158,388,533 |
|
| Gross tax appreciation of investments | $ | 2,684,241 |
|
| Gross tax depreciation of investments | (2,991,881 | ) |
| Net tax appreciation (depreciation) of investments | (307,640 | ) |
| Net tax appreciation (depreciation) on derivatives | 53,258 |
|
| Net tax appreciation (depreciation) | $ | (254,382 | ) |
| Other book-to-tax adjustments | $ | (15,196 | ) |
| Undistributed ordinary income | — |
|
| Accumulated short-term capital losses | $ | (3,569,501 | ) |
Accumulated long-term capital losses
| $ | (34,934,837 | ) |
The difference between book-basis and tax-basis unrealized appreciation (depreciation) is attributable primarily to the tax deferral of losses on wash sales.
Accumulated capital losses represent net capital loss carryovers that may be used to offset future realized capital gains for federal income tax purposes. The capital loss carryovers may be carried forward for an unlimited period. Future capital loss carryover utilization in any given year may be subject to Internal Revenue Code limitations.
10. Recently Issued Accounting Standards
In March 2017, the Financial Accounting Standards Board (FASB) issued Accounting Standards Update No. 2017-08, “Receivables - Nonrefundable Fees and Other Costs (Subtopic 310-20), Premium Amortization on Purchased Callable Debt Securities” (ASU 2017-08). ASU 2017-08 amends the amortization period for certain purchased callable debt securities held at a premium, shortening such period to the earliest call date. The amendments are effective for fiscal years, and interim periods within those fiscal years, beginning after December 15, 2018. Management is currently evaluating the impact that adopting ASU 2017-08 will have on the financial statements.
|
| | | | | | | | | | | | | | | | | |
| For a Share Outstanding Throughout the Years Ended March 31 (except as noted) |
| Per-Share Data | | Ratios and Supplemental Data | | | |
| | | Income From Investment Operations: | Distributions From: | | | Ratio to Average Net Assets of: | | | |
| | Net Asset
Value,
Beginning
of Period | Net
Investment
Income
(Loss)(1) | Net
Realized
and
Unrealized
Gain (Loss) | Total From
Investment
Operations | Net
Investment
Income | Net
Realized
Gains | Total
Distributions | Net Asset
Value,
End
of Period | Total
Return(2) | Operating
Expenses | Operating
Expenses
(before
expense
waiver) | Net
Investment
Income
(Loss) | Net
Investment
Income
(Loss)
(before
expense
waiver) | Portfolio
Turnover
Rate | Net
Assets,
End of
Period
(in thousands) |
| Investor Class | | | | | | | | | | | | | | |
| 2019 | $5.57 | 0.29 | (0.03) | 0.26 | (0.29) | — | (0.29) | $5.54 | 4.91% | 0.79% | 0.86% | 5.22% | 5.15% | 24% |
| $110,624 |
|
| 2018 | $5.73 | 0.29 | (0.15)(3) | 0.14 | (0.30) | — | (0.30) | $5.57 | 2.33% | 0.83% | 0.86% | 5.03% | 5.00% | 20% |
| $110,940 |
|
| 2017 | $5.36 | 0.29 | 0.37 | 0.66 | (0.29) | — | (0.29) | $5.73 | 12.62% | 0.85% | 0.85% | 5.13% | 5.13% | 29% |
| $287,088 |
|
| 2016 | $5.92 | 0.30 | (0.55) | (0.25) | (0.31) | — | (0.31) | $5.36 | (4.30)% | 0.85% | 0.85% | 5.36% | 5.36% | 24% |
| $344,505 |
|
| 2015 | $6.24 | 0.32 | (0.26) | 0.06 | (0.33) | (0.05) | (0.38) | $5.92 | 0.97% | 0.85% | 0.85% | 5.29% | 5.29% | 34% |
| $305,901 |
|
| I Class | | | | | | | | | | | | | | |
| 2019 | $5.58 | 0.30 | (0.03) | 0.27 | (0.30) | — | (0.30) | $5.55 | 5.01% | 0.69% | 0.76% | 5.32% | 5.25% | 24% |
| $2,300 |
|
2018(4) | $5.75 | 0.29 | (0.17)(3) | 0.12 | (0.29) | — | (0.29) | $5.58 | 2.11% | 0.73%(5) | 0.76%(5) | 5.22%(5) | 5.19%(5) | 20%(6) |
| $4,356 |
|
| Y Class | | | | | | | | | | | | | | |
| 2019 | $5.58 | 0.30 | (0.02) | 0.28 | (0.31) | — | (0.31) | $5.55 | 5.12% | 0.59% | 0.66% | 5.42% | 5.35% | 24% |
| $5,727 |
|
2018(4) | $5.75 | 0.30 | (0.17)(3) | 0.13 | (0.30) | — | (0.30) | $5.58 | 2.20% | 0.63%(5) | 0.66%(5) | 5.51%(5) | 5.48%(5) | 20%(6) |
| $262 |
|
| A Class | | | | | | | | | | | | | | |
| 2019 | $5.58 | 0.28 | (0.03) | 0.25 | (0.28) | — | (0.28) | $5.55 | 4.65% | 1.04% | 1.11% | 4.97% | 4.90% | 24% |
| $11,868 |
|
| 2018 | $5.73 | 0.28 | (0.15)(3) | 0.13 | (0.28) | — | (0.28) | $5.58 | 2.25% | 1.08% | 1.11% | 4.78% | 4.75% | 20% |
| $12,985 |
|
| 2017 | $5.36 | 0.28 | 0.37 | 0.65 | (0.28) | — | (0.28) | $5.73 | 12.35% | 1.10% | 1.10% | 4.88% | 4.88% | 29% |
| $22,166 |
|
| 2016 | $5.92 | 0.28 | (0.55) | (0.27) | (0.29) | — | (0.29) | $5.36 | (4.54)% | 1.10% | 1.10% | 5.11% | 5.11% | 24% |
| $24,610 |
|
| 2015 | $6.24 | 0.31 | (0.27) | 0.04 | (0.31) | (0.05) | (0.36) | $5.92 | 0.72% | 1.10% | 1.10% | 5.04% | 5.04% | 34% |
| $34,928 |
|
|
| | | | | | | | | | | | | | | | | |
| For a Share Outstanding Throughout the Years Ended March 31 (except as noted) |
| Per-Share Data | | Ratios and Supplemental Data | | | |
| | | Income From Investment Operations: | Distributions From: | | | Ratio to Average Net Assets of: | | | |
| | Net Asset
Value,
Beginning
of Period | Net
Investment
Income
(Loss)(1) | Net
Realized
and
Unrealized
Gain (Loss) | Total From
Investment
Operations | Net
Investment
Income | Net
Realized
Gains | Total
Distributions | Net Asset
Value,
End
of Period | Total
Return(2) | Operating
Expenses | Operating
Expenses
(before
expense
waiver) | Net
Investment
Income
(Loss) | Net
Investment
Income
(Loss)
(before
expense
waiver) | Portfolio
Turnover
Rate | Net
Assets,
End of
Period
(in thousands) |
| C Class | | | | | | | | | | | | | | |
| 2019 | $5.57 | 0.23 | (0.02) | 0.21 | (0.24) | — | (0.24) | $5.54 | 3.87% | 1.79% | 1.86% | 4.22% | 4.15% | 24% |
| $5,574 |
|
| 2018 | $5.73 | 0.24 | (0.16)(3) | 0.08 | (0.24) | — | (0.24) | $5.57 | 1.31% | 1.83% | 1.86% | 4.03% | 4.00% | 20% |
| $8,275 |
|
| 2017 | $5.36 | 0.23 | 0.38 | 0.61 | (0.24) | — | (0.24) | $5.73 | 11.51% | 1.85% | 1.85% | 4.13% | 4.13% | 29% |
| $9,985 |
|
| 2016 | $5.92 | 0.24 | (0.55) | (0.31) | (0.25) | — | (0.25) | $5.36 | (5.25)% | 1.85% | 1.85% | 4.36% | 4.36% | 24% |
| $9,695 |
|
| 2015 | $6.24 | 0.26 | (0.26) | — | (0.27) | (0.05) | (0.32) | $5.92 | (0.03)% | 1.85% | 1.85% | 4.29% | 4.29% | 34% |
| $14,555 |
|
| R Class | | | | | | | | | | | | | | |
| 2019 | $5.57 | 0.26 | (0.02) | 0.24 | (0.27) | — | (0.27) | $5.54 | 4.39% | 1.29% | 1.36% | 4.72% | 4.65% | 24% |
| $988 |
|
| 2018 | $5.73 | 0.26 | (0.15)(3) | 0.11 | (0.27) | — | (0.27) | $5.57 | 1.82% | 1.33% | 1.36% | 4.53% | 4.50% | 20% |
| $1,039 |
|
| 2017 | $5.36 | 0.26 | 0.38 | 0.64 | (0.27) | — | (0.27) | $5.73 | 12.06% | 1.35% | 1.35% | 4.63% | 4.63% | 29% |
| $1,516 |
|
| 2016 | $5.92 | 0.27 | (0.55) | (0.28) | (0.28) | — | (0.28) | $5.36 | (4.78)% | 1.35% | 1.35% | 4.86% | 4.86% | 24% |
| $1,624 |
|
| 2015 | $6.24 | 0.29 | (0.26) | 0.03 | (0.30) | (0.05) | (0.35) | $5.92 | 0.47% | 1.35% | 1.35% | 4.79% | 4.79% | 34% |
| $1,832 |
|
| R5 Class | | | | | | | | | | | | | | |
| 2019 | $5.58 | 0.30 | (0.02) | 0.28 | (0.31) | — | (0.31) | $5.55 | 5.12% | 0.59% | 0.66% | 5.42% | 5.35% | 24% |
| $1,656 |
|
| 2018 | $5.73 | 0.29 | (0.13)(3) | 0.16 | (0.31) | — | (0.31) | $5.58 | 2.72% | 0.63% | 0.66% | 5.23% | 5.20% | 20% |
| $1,767 |
|
| 2017 | $5.36 | 0.30 | 0.38 | 0.68 | (0.31) | — | (0.31) | $5.73 | 12.85% | 0.65% | 0.65% | 5.33% | 5.33% | 29% |
| $537,457 |
|
| 2016 | $5.92 | 0.31 | (0.55) | (0.24) | (0.32) | — | (0.32) | $5.36 | (4.11)% | 0.65% | 0.65% | 5.56% | 5.56% | 24% |
| $473,014 |
|
| 2015 | $6.24 | 0.33 | (0.26) | 0.07 | (0.34) | (0.05) | (0.39) | $5.92 | 1.18% | 0.65% | 0.65% | 5.49% | 5.49% | 34% |
| $404,881 |
|
|
| | | | | | | | | | | | | | | | | |
| For a Share Outstanding Throughout the Years Ended March 31 (except as noted) |
| Per-Share Data | | Ratios and Supplemental Data | | | |
| | | Income From Investment Operations: | Distributions From: | | | Ratio to Average Net Assets of: | | | |
| | Net Asset
Value,
Beginning
of Period | Net
Investment
Income
(Loss)(1) | Net
Realized
and
Unrealized
Gain (Loss) | Total From
Investment
Operations | Net
Investment
Income | Net
Realized
Gains | Total
Distributions | Net Asset
Value,
End
of Period | Total
Return(2) | Operating
Expenses | Operating
Expenses
(before
expense
waiver) | Net
Investment
Income
(Loss) | Net
Investment
Income
(Loss)
(before
expense
waiver) | Portfolio
Turnover
Rate | Net
Assets,
End of
Period
(in thousands) |
| R6 Class | | | | | | | | | | | | | | |
| 2019 | $5.57 | 0.30 | (0.02) | 0.28 | (0.31) | — | (0.31) | $5.54 | 5.17% | 0.54% | 0.61% | 5.47% | 5.40% | 24% |
| $190 |
|
| 2018 | $5.73 | 0.30 | (0.15)(3) | 0.15 | (0.31) | — | (0.31) | $5.57 | 2.58% | 0.58% | 0.61% | 5.28% | 5.25% | 20% |
| $9,348 |
|
| 2017 | $5.36 | 0.30 | 0.38 | 0.68 | (0.31) | — | (0.31) | $5.73 | 12.90% | 0.60% | 0.60% | 5.38% | 5.38% | 29% |
| $88,697 |
|
| 2016 | $5.92 | 0.31 | (0.55) | (0.24) | (0.32) | — | (0.32) | $5.36 | (4.06)% | 0.60% | 0.60% | 5.61% | 5.61% | 24% |
| $55,552 |
|
| 2015 | $6.24 | 0.33 | (0.26) | 0.07 | (0.34) | (0.05) | (0.39) | $5.92 | 1.23% | 0.60% | 0.60% | 5.54% | 5.54% | 34% |
| $40,362 |
|
|
| | | | |
| Notes to Financial Highlights | | |
| |
| (1) | Computed using average shares outstanding throughout the period. |
| |
| (2) | Total returns are calculated based on the net asset value of the last business day and do not reflect applicable sales charges, if any. Total returns for periods less than one year are not annualized. |
| |
| (3) | Per-share amount was not in accord with the net realized and unrealized gain (loss) for the period because of the timing of transactions in shares of the fund and the amount and timing of per-share net realized and unrealized gain (loss) on such shares. |
| |
| (4) | April 10, 2017 (commencement of sale) through March 31, 2018. |
| |
| (6) | Portfolio turnover is calculated at the fund level. Percentage indicated was calculated for the year ended March 31, 2018. |
See Notes to Financial Statements.
|
|
| Report of Independent Registered Public Accounting Firm |
To the Board of Trustees of the American Century Investment Trust and Shareholders of the High-Yield Fund:
Opinion on the Financial Statements
We have audited the accompanying statement of assets and liabilities, including the schedule of investments, of High-Yield Fund (one of the funds constituting American Century Investment Trust, referred to hereafter as the “Fund”) as of March 31, 2019, the related statement of operations for the year ended March 31, 2019, the statement of changes in net assets for each of the two years in the period ended March 31, 2019, including the related notes, and the financial highlights for each of the periods indicated therein (collectively referred to as the “financial statements”). In our opinion, the financial statements present fairly, in all material respects, the financial position of the Fund as of March 31, 2019, the results of its operations for the year then ended, the changes in its net assets for each of the two years in the period ended March 31, 2019 and the financial highlights for each of the periods indicated therein in conformity with accounting principles generally accepted in the United States of America.
Basis for Opinion
These financial statements are the responsibility of the Fund’s management. Our responsibility is to express an opinion on the Fund’s financial statements based on our audits. We are a public accounting firm registered with the Public Company Accounting Oversight Board (United States) (“PCAOB”) and are required to be independent with respect to the Fund in accordance with the U.S. federal securities laws and the applicable rules and regulations of the Securities and Exchange Commission and the PCAOB.
We conducted our audits of these financial statements in accordance with the standards of the PCAOB. Those standards require that we plan and perform the audit to obtain reasonable assurance about whether the financial statements are free of material misstatement, whether due to error or fraud.
Our audits included performing procedures to assess the risks of material misstatement of the financial statements, whether due to error or fraud, and performing procedures that respond to those risks. Such procedures included examining, on a test basis, evidence regarding the amounts and disclosures in the financial statements. Our audits also included evaluating the accounting principles used and significant estimates made by management, as well as evaluating the overall presentation of the financial statements. Our procedures included confirmation of securities owned as of March 31, 2019 by correspondence with the custodian and brokers; when replies were not received from brokers, we performed other auditing procedures. We believe that our audits provide a reasonable basis for our opinion.
/s/ PricewaterhouseCoopers LLP
Kansas City, Missouri
May 17, 2019
We have served as the auditor of one or more investment companies in American Century Investments since 1997.
Board of Trustees
The individuals listed below serve as trustees of the funds. Each trustee will continue to serve in this capacity until death, retirement, resignation or removal from office. The board has adopted a mandatory retirement age for trustees who are not “interested persons,” as that term is defined in the Investment Company Act (independent trustees). Independent trustees shall retire on December 31 of the year in which they reach their 75th birthday; provided, however, that on or after January 1, 2022, independent trustees shall retire on December 31 of the year in which they reach their 76th birthday.
Mr. Thomas is an “interested person” because he currently serves as President and Chief Executive Officer of American Century Companies, Inc. (ACC), the parent company of American Century Investment Management, Inc. (ACIM or the advisor). The other trustees (more than three-fourths of the total number) are independent. They are not employees, directors or officers of, and have no financial interest in, ACC or any of its wholly owned, direct or indirect, subsidiaries, including ACIM, American Century Investment Services, Inc. (ACIS) and American Century Services, LLC (ACS), and they do not have any other affiliations, positions or relationships that would cause them to be considered “interested persons” under the Investment Company Act. The trustees serve in this capacity for eight (in the case of Jonathan S. Thomas, 16; and Ronald J. Gilson, 9) registered investment companies in the American Century Investments family of funds.
The following table presents additional information about the trustees. The mailing address for each trustee other than Jonathan S. Thomas is 1665 Charleston Road, Mountain View, California 94043. The mailing address for Jonathan S. Thomas is 4500 Main Street, Kansas City, Missouri 64111.
|
| | | | | |
Name
(Year of Birth) | Position(s) Held with Funds | Length of Time Served | Principal Occupation(s) During Past 5 Years | Number of American Century Portfolios Overseen by Trustee | Other Directorships Held During Past 5 Years |
| Independent Trustees |
|
|
Tanya S. Beder
(1955) | Trustee | Since 2011 | Chairman and CEO, SBCC Group Inc. (independent advisory services) (2006 to present) | 45 | CYS Investments, Inc.; Nabors Industries Ltd. |
Jeremy I. Bulow
(1954) | Trustee | Since 2011 | Professor of Economics, Stanford University, Graduate School of Business (1979 to present) | 45 | None |
Anne Casscells
(1958) | Trustee | Since 2016 | Co-Chief Executive Officer and Chief Investment Officer, Aetos Alternatives Management (investment advisory firm) (2001 to present); Lecturer in Accounting, Stanford University, Graduate School of Business (2009 to 2017) | 45 | None |
Ronald J. Gilson
(1946) | Trustee and Chairman of the Board | Since 1995
(Chairman since 2005) | Charles J. Meyers Professor of Law and Business, Emeritus, Stanford Law School (1979 to 2016); Marc and Eva Stern Professor of Law and Business, Columbia University School of Law (1992 to present) | 50 | None |
|
| | | | | |
Name
(Year of Birth) | Position(s) Held with Funds | Length of Time Served | Principal Occupation(s) During Past 5 Years | Number of American Century Portfolios Overseen by Trustee | Other Directorships Held During Past 5 Years |
| Independent Trustees |
|
|
Frederick L. A. Grauer
(1946) | Trustee | Since 2008 | Senior Advisor, Credit Sesame, Inc. (credit monitoring firm) (2018 to present); Senior Advisor, Course Hero (an educational technology company) (2015 to present); Senior Advisor, iShares by BlackRock, Inc. (investment management firm) (2013 to 2015)
| 45 | None |
Jonathan D. Levin
(1972) | Trustee | Since 2016 | Philip H. Knight Professor and Dean, Graduate School of Business, Stanford University (2016 to present); Professor, Stanford University, (2000 to present); Chair, Department of Economics, Stanford University (2011 to 2014) | 45 | None |
Peter F. Pervere
(1947) | Trustee | Since 2007 | Retired | 45 | None |
John B. Shoven
(1947) | Trustee | Since 2002 | Charles R. Schwab Professor of Economics, Stanford University (1973 to present) | 45 | Cadence Design Systems; Exponent; Financial Engines |
| Interested Trustee |
|
|
Jonathan S. Thomas
(1963) | Trustee and President | Since 2007 | President and Chief Executive Officer, ACC (2007 to present). Also serves as Chief Executive Officer, ACS; Executive Vice President, ACIM; Director, ACC, ACIM and other ACC subsidiaries | 117 | BioMed Valley Discoveries, Inc. |
The Statement of Additional Information has additional information about the fund's trustees and is available without charge, upon request, by calling 1-800-345-2021.
Officers
The following table presents certain information about the executive officers of the funds. Each officer serves as an officer for 16 (in the case of Robert J. Leach, 15) investment companies in the American Century family of funds, unless otherwise noted. No officer is compensated for his or her service as an officer of the funds. The listed officers are interested persons of the funds and are appointed or re-appointed on an annual basis. The mailing address for each of the officers listed below is 4500 Main Street, Kansas City, Missouri 64111.
|
| | |
Name
(Year of Birth) | Offices with the Funds | Principal Occupation(s) During the Past Five Years |
Jonathan S. Thomas
(1963) | Trustee and President since 2007 | President and Chief Executive Officer, ACC (2007 to present). Also serves as Chief Executive Officer, ACS; Executive Vice President, ACIM; Director, ACC, ACIM and other ACC subsidiaries |
R. Wes Campbell
(1974)
| Chief Financial Officer and Treasurer since 2018
| Investment Operations and Investment Accounting, ACS (2000 to present) |
Amy D. Shelton
(1964) | Chief Compliance Officer and Vice President since 2014 | Chief Compliance Officer, American Century funds, (2014 to present); Chief Compliance Officer, ACIM (2014 to present); Chief Compliance Officer, ACIS (2009 to present); Vice President, Client Interactions and Marketing, ACIS (2013 to 2014). Also serves as Vice President, ACIS |
Charles A. Etherington
(1957) | General Counsel since 2007 and Senior Vice President since 2006 | Attorney, ACC (1994 to present); Vice President, ACC (2005 to present); General Counsel, ACC (2007 to present). Also serves as General Counsel, ACIM, ACS, ACIS and other ACC subsidiaries; and Senior Vice President, ACIM and ACS |
C. Jean Wade
(1964) | Vice President since 2012 | Senior Vice President, ACS (2017 to present); Vice President ACS (2000 to 2017) |
Robert J. Leach
(1966) | Vice President since 2006 | Vice President, ACS (2000 to present) |
David H. Reinmiller
(1963) | Vice President since 2000 | Attorney, ACC (1994 to present) Also serves as Vice President, ACIM and ACS |
Ward D. Stauffer
(1960) | Secretary since 2005 | Attorney, ACC (2003 to present) |
Retirement Account Information
As required by law, distributions you receive from certain retirement accounts are subject to federal income tax withholding, unless you elect not to have withholding apply*. Tax will be withheld on the total amount withdrawn even though you may be receiving amounts that are not subject to withholding, such as nondeductible contributions. In such case, excess amounts of withholding could occur. You may adjust your withholding election so that a greater or lesser amount will be withheld.
If you don’t want us to withhold on this amount, you must notify us to not withhold the federal income tax. You may notify us in writing or in certain situations by telephone or through other electronic means. For systematic withdrawals, your withholding election will remain in effect until revoked or changed by filing a new election. You have the right to revoke your election at any time and change your withholding percentage for future distributions.
Remember, even if you elect not to have income tax withheld, you are liable for paying income tax on the taxable portion of your withdrawal. If you elect not to have income tax withheld or you don’t have enough income tax withheld, you may be responsible for payment of estimated tax. You may incur penalties under the estimated tax rules if your withholding and estimated tax payments are not sufficient. You can reduce or defer the income tax on a distribution by directly or indirectly rolling such distribution over to another IRA or eligible plan. You should consult your tax advisor for additional information.
State tax will be withheld if, at the time of your distribution, your address is within one of the mandatory withholding states and you have federal income tax withheld (or as otherwise required by state law). State taxes will be withheld from your distribution in accordance with the respective state rules.
*Some 403(b), 457 and qualified retirement plan distributions may be subject to 20% mandatory withholding, as they are subject to special tax and withholding rules. Your plan administrator or plan sponsor is required to provide you with a special tax notice explaining those rules at the time you request a distribution. If applicable, federal and/or state taxes may be withheld from your distribution amount.
Proxy Voting Policies
Descriptions of the principles and policies that the fund's investment advisor uses in exercising the voting rights associated with the securities purchased and/or held by the fund are available without charge, upon request, by calling 1-800-345-2021 or visiting the "About Us" page of American Century Investments’ website at americancentury.com. A description of the policies is also available on the Securities and Exchange Commission’s website at sec.gov. Information regarding how the investment advisor voted proxies relating to portfolio securities during the most recent 12-month period ended June 30 is available on the "About Us" page at americancentury.com. It is also available at sec.gov.
Quarterly Portfolio Disclosure
The fund files its complete schedule of portfolio holdings with the Securities and Exchange Commission (SEC) for the first and third quarters of each fiscal year on Form N-Q or as an exhibit to its reports on Form N-PORT. The fund’s Forms N-Q and Form N-PORT reports are available on the SEC’s website at sec.gov. The fund also makes its complete schedule of portfolio holdings for the most recent quarter of its fiscal year available on its website at americancentury.com and, upon request, by calling 1-800-345-2021.
|
| | |
| |
| | | |
| Contact Us | americancentury.com | |
| Automated Information Line | 1-800-345-8765 | |
| Investor Services Representative | 1-800-345-2021 or 816-531-5575 | |
| Investors Using Advisors | 1-800-378-9878 | |
| Business, Not-For-Profit, Employer-Sponsored Retirement Plans | 1-800-345-3533 | |
| Banks and Trust Companies, Broker-Dealers, Financial Professionals, Insurance Companies | 1-800-345-6488 | |
| Telecommunications Relay Service for the Deaf | 711 | |
| | | |
| American Century Investment Trust | |
| | | |
Investment Advisor: American Century Investment Management, Inc. Kansas City, Missouri | |
| | | |
| This report and the statements it contains are submitted for the general information of our shareholders. The report is not authorized for distribution to prospective investors unless preceded or accompanied by an effective prospectus. | |
| | | |
©2019 American Century Proprietary Holdings, Inc. All rights reserved.
CL-ANN-92281 1905 | |
|
| |
| | |
| | Annual Report |
| | |
| | March 31, 2019 |
| | |
| | NT Diversified Bond Fund |
| | G Class (ACLDX) |
Beginning on January 1, 2021, as permitted by regulations adopted by the Securities and Exchange Commission, paper copies of the fund’s shareholder reports like this one will no longer be sent by mail, unless you specifically request paper copies of the reports from the fund or from your financial intermediary, such as a broker-dealer or bank. Instead, the reports will be made available on a website, and you will be notified by mail each time a report is posted and provided with a website link to access the report.
If you already elected to receive shareholder reports electronically, you will not be affected by this change and you need not take any action. You may elect to receive shareholder reports and other communications from the fund or your financial intermediary electronically by calling or sending an email request to your appropriate contacts as listed on the back cover of this report.
You may elect to receive all future reports in paper free of charge. You can inform the fund or your financial intermediary that you wish to continue receiving paper copies of your shareholder reports by calling or sending an email request to your appropriate contacts as listed on the back cover of this report. Your election to receive reports in paper will apply to all funds held with the fund complex/your financial intermediary.
|
| |
| Performance | 2 |
| Portfolio Commentary | |
| Fund Characteristics | |
| Shareholder Fee Example | |
| Schedule of Investments | |
| Statement of Assets and Liabilities | |
| Statement of Operations | |
| Statement of Changes in Net Assets | |
| Notes to Financial Statements | |
| Financial Highlights | |
| Report of Independent Registered Public Accounting Firm | |
| Management | |
| Additional Information | |
Any opinions expressed in this report reflect those of the author as of the date of the report, and do not necessarily represent the opinions of American Century Investments® or any other person in the American Century Investments organization. Any such opinions are subject to change at any time based upon market or other conditions and American Century Investments disclaims any responsibility to update such opinions. These opinions may not be relied upon as investment advice and, because investment decisions made by American Century Investments funds are based on numerous factors, may not be relied upon as an indication of trading intent on behalf of any American Century Investments fund. Security examples are used for representational purposes only and are not intended as recommendations to purchase or sell securities. Performance information for comparative indices and securities is provided to American Century Investments by third party vendors. To the best of American Century Investments’ knowledge, such information is accurate at the time of printing.
|
| | | | | |
| Total Returns as of March 31, 2019 | |
| | | | Average Annual Returns | |
| | Ticker Symbol | 1 year | 5 years | 10 years | Inception Date |
| G Class | ACLDX | 3.93% | 2.65% | 3.80% | 5/12/06 |
| Bloomberg Barclays U.S. Aggregate Bond Index | — | 4.48% | 2.74% | 3.76% | — |
Fund returns would have been lower if a portion of the fees had not been waived.
|
|
| Growth of $10,000 Over 10 Years |
| $10,000 investment made March 31, 2009 |
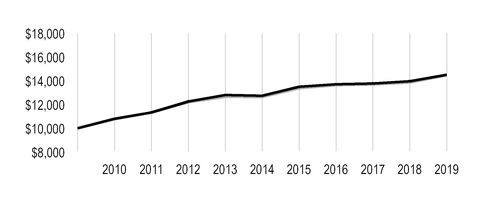
|
| |
| Value on March 31, 2019 |
| | G Class — $14,518 |
| |
| | Bloomberg Barclays U.S. Aggregate Bond Index — $14,472 |
| |
Ending value of G Class would have been lower if a portion of the fees had not been waived.
|
|
| Total Annual Fund Operating Expenses |
| G Class 0.35% |
The total annual fund operating expenses shown is as stated in the fund’s prospectus current as of the date of this report. The prospectus may vary from the expense ratio shown elsewhere in this report because it is based on a different time period, includes acquired fund fees and expenses, and, if applicable, does not include fee waivers or expense reimbursements.
Data presented reflect past performance. Past performance is no guarantee of future results. Current performance may be higher or lower than the performance shown. Total returns for periods less than one year are not annualized. Investment return and principal value will fluctuate, and redemption value may be more or less than original cost. Data assumes reinvestment of dividends and capital gains, and none of the charts reflect the deduction of taxes that a shareholder would pay on fund distributions or the redemption of fund shares. To obtain performance data current to the most recent month end, please call 1-800-345-2021 or visit americancentury.com. For additional information about the fund, please consult the prospectus.
Portfolio Managers: Bob Gahagan, Hando Aguilar, Jeff Houston, Brian Howell and Charles Tan
Effective October 31, 2018, Charles Tan joined the portfolio management team, replacing Dave MacEwen, who left the team ahead of his December 31, 2018, retirement.
Performance Summary
NT Diversified Bond returned 3.93%* for the 12 months ended March 31, 2019. By comparison, the Bloomberg Barclays U.S. Aggregate Bond Index returned 4.48%. Fund returns reflect operating expenses, while index returns do not.
Returns for the fund and the index reflect a generally positive, albeit challenging, environment for investment-grade bonds. The 12-month period witnessed a marked shift in Federal Reserve (Fed) policy and investor sentiment toward the U.S. and global economic growth outlook, which influenced performance in the fixed-income market. In the first several months of the period, robust economic growth, rising inflation and the Fed’s steady rate-tightening strategy drove Treasury yields higher. Investment-grade bond returns were generally flat to slightly negative. Meanwhile, risk-on investing remained in favor, and higher-yielding securities outperformed. The environment reversed sharply in late 2018, as worries about future economic and corporate earnings growth, U.S.-China trade negotiations and a surprisingly bullish Fed outlook triggered severe volatility in the equity markets. After climbing to a reporting period high of 3.24% in early November (according to Bloomberg), the 10-year U.S. Treasury yield plunged to 2.68% by the end of December 2018, as investors fled risk assets in favor of perceived safe-haven investments.
The new year brought a new sense of stability to the financial markets. Progress with U.S.-China trade negotiations and better-than-feared U.S. economic and earnings data helped restore some investor optimism. Additionally, the Fed paused its rate-hike campaign in January, seemingly acknowledging its December plan for two rate hikes in 2019 may have been too aggressive. Investors responded enthusiastically to this backdrop, and risk assets returned to favor. Meanwhile, Treasury yields moved modestly lower. Then, at its March monetary policy meeting, the Fed held rates steady and suggested additional tightening was likely off the table for 2019. This news triggered a sharp rally among Treasuries, and the 10-year Treasury note ended the 12-month period yielding 2.5%. The yield curve flattened dramatically and briefly inverted.
Overall, the Treasury market rally of late 2018 and early 2019 supported broad U.S. fixed-income gains for the entire 12-month period. Longer-maturity Treasuries and corporate bonds were top performers. NT Diversified Bond’s out-of-index exposure to global interest rate movements primarily accounted for the fund’s underperformance relative to the index.
Global Interest Rates Position Detracted
Throughout most of 2018, we held a non-index position designed to take advantage of differences in global interest rates. As part of this strategy, we held short positions in European government bond futures, a neutral position in U.S. Treasury futures and a long position in local-currency emerging markets bonds. Initially, we expected European rates to rise from their unusually low levels and converge with U.S. rates. We also expected select emerging markets rates to remain
*Fund returns would have been lower if a portion of the fees had not been waived.
stable or decline. However, yields in Europe steadily declined, weighing on our short positions in European governments. Additionally, mounting investor concerns about the sustainability of synchronized global growth combined with country-specific issues pressured emerging markets assets. With the global economy showing signs of slowing and leading central banks maintaining dovish policies, we exited our global rates trade in late 2018.
Sector Allocation, Security Selection Were Mixed
We continued to underweight Treasuries and government agencies relative to the index in favor of spread (non-Treasury) sectors, including corporate credit and securitized bonds. This strategy delivered mixed results. Our overweight position in the securitized sector contributed to relative results, while our overweight to investment-grade corporate bonds modestly detracted.
Security selection within these allocations also was mixed. Within the investment-grade corporate sector, our selections contributed to results. In particular, our corporate bond holdings with BBB credit ratings delivered robust performance late in the reporting period. However, our selections in the securitized sector detracted from results.
Meanwhile, our out-of-index allocation to high-yield corporate bonds was a modest contributor, as positive performance in the first half of the reporting period combined with the early 2019 risk rally offset the effects of the high-yield sell-off in late 2018.
Portfolio Positioning
We expect the U.S. economy to continue to grow, but at a more moderate pace (2.0% to 2.5% annualized). However, we expect U.S. economic growth to remain more robust than growth in Europe and Japan. We expect headline inflation to eventually converge with core inflation near 2%. These factors should enable the Fed to remain on hold throughout the remainder of 2019. Against a backdrop of slowing global growth, geopolitical uncertainties (mainly Brexit) and a dovish Fed, we expect the 10-year Treasury yield to fluctuate within a near-term range of 2.35% to 2.80%.
We do not believe the dramatic flattening (and brief) inversion of the yield curve late in the reporting period is an indication of a looming recession. Instead, we believe the curve flattened in response to the Fed’s unexpected pivot to dovish monetary policy. We believe the Fed’s change of course is more reflective of a lack of inflation than a lack of growth. Given the yield curve’s notable flattening, we initiated a position designed to take advantage of our outlook for the curve between two and five years to steepen.
Additionally, we expect to maintain our preference for spread sectors versus Treasuries, remaining mindful of market conditions. For example, in light of the strong rally in risk assets in the final months of the reporting period, we took profits in and reduced exposure to investment-grade and high-yield corporate bonds. We also took profits in credit-sensitive mortgage-backed securities that participated in the rally. We will continue to look for opportunities to tactically add exposure to riskier corporate and securitized securities, as valuations, fundamentals and market conditions dictate. However, from a longer-term, strategic perspective, we plan to reduce spread sector risk, given the potential for spread widening as the credit cycle matures. As always, we favor a bottom-up approach to portfolio management, emphasizing careful security selection.
|
| |
| MARCH 31, 2019 | |
| Portfolio at a Glance | |
| Average Duration (effective) | 5.6 years |
| Weighted Average Life to Maturity | 7.7 years |
| | |
| Types of Investments in Portfolio | % of net assets |
| Corporate Bonds | 28.6% |
| U.S. Treasury Securities | 27.6% |
| U.S. Government Agency Mortgage-Backed Securities | 22.4% |
| Asset-Backed Securities | 6.1% |
| Collateralized Mortgage Obligations | 5.0% |
| Commercial Mortgage-Backed Securities | 4.9% |
| Collateralized Loan Obligations | 4.1% |
| Bank Loan Obligations | 1.3% |
| Municipal Securities | 1.2% |
| Sovereign Governments and Agencies | 0.7% |
| U.S. Government Agency Securities | 0.3% |
| Temporary Cash Investments | 3.0% |
| Other Assets and Liabilities | (5.2)%* |
*Amount relates primarily to payable for investments purchased, but not settled, at period end.
Fund shareholders may incur two types of costs: (1) transaction costs, including sales charges (loads) on purchase payments and redemption/exchange fees; and (2) ongoing costs, including management fees; distribution and service (12b-1) fees; and other fund expenses. This example is intended to help you understand your ongoing costs (in dollars) of investing in your fund and to compare these costs with the ongoing cost of investing in other mutual funds.
The example is based on an investment of $1,000 made at the beginning of the period and held for the entire period from October 1, 2018 to March 31, 2019.
Actual Expenses
The table provides information about actual account values and actual expenses for each class. You may use the information, together with the amount you invested, to estimate the expenses that you paid over the period. First, identify the share class you own. Then simply divide your account value by $1,000 (for example, an $8,600 account value divided by $1,000 = 8.6), then multiply the result by the number under the heading “Expenses Paid During Period” to estimate the expenses you paid on your account during this period.
Hypothetical Example for Comparison Purposes
The table also provides information about hypothetical account values and hypothetical expenses based on the actual expense ratio of each class of your fund and an assumed rate of return of 5% per year before expenses, which is not the actual return of a fund’s share class. The hypothetical account values and expenses may not be used to estimate the actual ending account balance or expenses you paid for the period. You may use this information to compare the ongoing costs of investing in your fund and other funds. To do so, compare this 5% hypothetical example with the 5% hypothetical examples that appear in the shareholder reports of the other funds.
Please note that the expenses shown in the table are meant to highlight your ongoing costs only and do not reflect any transactional costs, such as sales charges (loads) or redemption/exchange fees. Therefore, the table is useful in comparing ongoing costs only, and will not help you determine the relative total costs of owning different funds. In addition, if these transactional costs were included, your costs would have been higher.
|
| | | | |
| | Beginning
Account Value
10/1/18 | Ending
Account Value
3/31/19 | Expenses Paid
During Period(1)
10/1/18 - 3/31/19 |
Annualized
Expense Ratio(1) |
| Actual | | | | |
| G Class | $1,000 | $1,040.70 | $0.05 | 0.01% |
| Hypothetical | | | | |
| G Class | $1,000 | $1,024.88 | $0.05 | 0.01% |
| |
| (1) | Expenses are equal to the class's annualized expense ratio listed in the table above, multiplied by the average account value over the period, multiplied by 182, the number of days in the most recent fiscal half-year, divided by 365, to reflect the one-half year period. Annualized expense ratio reflects actual expenses, including any applicable fee waivers or expense reimbursements and excluding any acquired fund fees and expenses. |
MARCH 31, 2019
|
| | | | | | |
| | Principal Amount | Value |
| CORPORATE BONDS — 28.6% | | |
| Aerospace and Defense — 0.1% | | |
| United Technologies Corp., 6.05%, 6/1/36 | $ | 730,000 |
| $ | 870,311 |
|
| United Technologies Corp., 5.70%, 4/15/40 | 1,420,000 |
| 1,662,619 |
|
| | | 2,532,930 |
|
| Air Freight and Logistics — 0.1% | | |
| FedEx Corp., 4.40%, 1/15/47 | 1,780,000 |
| 1,679,978 |
|
| Automobiles — 1.0% | | |
| Ford Motor Credit Co. LLC, 2.68%, 1/9/20 | 5,110,000 |
| 5,089,180 |
|
| Ford Motor Credit Co. LLC, 8.125%, 1/15/20 | 1,150,000 |
| 1,192,120 |
|
| Ford Motor Credit Co. LLC, 5.875%, 8/2/21 | 4,280,000 |
| 4,435,932 |
|
| Ford Motor Credit Co. LLC, 2.98%, 8/3/22 | 1,200,000 |
| 1,147,836 |
|
| General Motors Co., 4.20%, 10/1/27 | 1,500,000 |
| 1,441,155 |
|
| General Motors Co., 5.15%, 4/1/38 | 1,900,000 |
| 1,741,509 |
|
| General Motors Financial Co., Inc., 3.15%, 1/15/20 | 3,050,000 |
| 3,054,801 |
|
| General Motors Financial Co., Inc., 3.20%, 7/6/21 | 3,110,000 |
| 3,098,099 |
|
| General Motors Financial Co., Inc., 5.25%, 3/1/26 | 3,080,000 |
| 3,183,704 |
|
| | | 24,384,336 |
|
| Banks — 6.2% | | |
| Banco Santander SA, 3.50%, 4/11/22 | 2,600,000 |
| 2,626,706 |
|
| Bank of America Corp., 4.10%, 7/24/23 | 4,160,000 |
| 4,353,977 |
|
| Bank of America Corp., MTN, 4.20%, 8/26/24 | 4,320,000 |
| 4,476,201 |
|
| Bank of America Corp., MTN, 4.00%, 1/22/25 | 3,140,000 |
| 3,208,283 |
|
| Bank of America Corp., MTN, 5.00%, 1/21/44 | 830,000 |
| 939,423 |
|
| Bank of America Corp., MTN, VRN, 2.37%, 7/21/21 | 3,070,000 |
| 3,050,457 |
|
| Bank of America Corp., MTN, VRN, 2.33%, 10/1/21 | 4,310,000 |
| 4,271,618 |
|
| Bank of America Corp., MTN, VRN, 3.82%, 1/20/28 | 3,020,000 |
| 3,066,933 |
|
| Bank of America Corp., MTN, VRN, 3.97%, 3/5/29 | 1,840,000 |
| 1,880,730 |
|
| Bank of America Corp., MTN, VRN, 4.44%, 1/20/48 | 1,230,000 |
| 1,291,232 |
|
| Bank of America Corp., VRN, 3.00%, 12/20/23 | 3,664,000 |
| 3,656,119 |
|
| Bank of America N.A., 6.00%, 10/15/36 | 650,000 |
| 807,425 |
|
Banque Federative du Credit Mutuel SA, 2.00%, 4/12/19(1) | 1,550,000 |
| 1,549,649 |
|
| Barclays Bank plc, 5.14%, 10/14/20 | 2,290,000 |
| 2,352,329 |
|
| Barclays plc, 4.375%, 1/12/26 | 1,500,000 |
| 1,510,882 |
|
BNP Paribas SA, 4.375%, 9/28/25(1) | 1,550,000 |
| 1,589,508 |
|
BPCE SA, 3.00%, 5/22/22(1) | 2,060,000 |
| 2,039,981 |
|
BPCE SA, 5.15%, 7/21/24(1) | 1,870,000 |
| 1,953,582 |
|
BPCE SA, 3.50%, 10/23/27(1) | 1,000,000 |
| 969,675 |
|
| Citibank N.A., 3.65%, 1/23/24 | 2,600,000 |
| 2,685,403 |
|
| Citigroup, Inc., 2.55%, 4/8/19 | 1,250,000 |
| 1,249,953 |
|
| Citigroup, Inc., 2.90%, 12/8/21 | 4,000,000 |
| 3,999,249 |
|
| Citigroup, Inc., 2.75%, 4/25/22 | 4,320,000 |
| 4,305,134 |
|
| Citigroup, Inc., 4.05%, 7/30/22 | 1,400,000 |
| 1,442,912 |
|
|
| | | | | | |
| | Principal Amount | Value |
| Citigroup, Inc., 3.20%, 10/21/26 | $ | 1,200,000 |
| $ | 1,177,422 |
|
| Citigroup, Inc., 4.45%, 9/29/27 | 9,270,000 |
| 9,544,841 |
|
| Citigroup, Inc., VRN, 3.52%, 10/27/28 | 4,050,000 |
| 3,987,241 |
|
| Cooperatieve Rabobank UA, 3.95%, 11/9/22 | 3,180,000 |
| 3,241,313 |
|
| Discover Bank, 3.35%, 2/6/23 | 1,850,000 |
| 1,861,285 |
|
| Discover Bank, 3.45%, 7/27/26 | 3,730,000 |
| 3,618,744 |
|
| Fifth Third BanCorp., 4.30%, 1/16/24 | 750,000 |
| 786,358 |
|
| Fifth Third Bank, 2.875%, 10/1/21 | 1,830,000 |
| 1,832,597 |
|
| HSBC Bank USA N.A., 5.875%, 11/1/34 | 420,000 |
| 503,192 |
|
| HSBC Holdings plc, 2.95%, 5/25/21 | 4,917,000 |
| 4,918,065 |
|
| HSBC Holdings plc, 4.30%, 3/8/26 | 3,420,000 |
| 3,554,589 |
|
| HSBC Holdings plc, 4.375%, 11/23/26 | 3,100,000 |
| 3,180,953 |
|
| HSBC Holdings plc, VRN, 3.26%, 3/13/23 | 1,520,000 |
| 1,524,875 |
|
| Huntington Bancshares, Inc., 2.30%, 1/14/22 | 2,380,000 |
| 2,345,404 |
|
| JPMorgan Chase & Co., 2.25%, 1/23/20 | 4,860,000 |
| 4,842,868 |
|
| JPMorgan Chase & Co., 2.55%, 3/1/21 | 2,850,000 |
| 2,842,834 |
|
| JPMorgan Chase & Co., 4.625%, 5/10/21 | 4,680,000 |
| 4,857,553 |
|
| JPMorgan Chase & Co., 3.25%, 9/23/22 | 3,880,000 |
| 3,938,382 |
|
| JPMorgan Chase & Co., 3.875%, 9/10/24 | 1,370,000 |
| 1,406,161 |
|
| JPMorgan Chase & Co., 3.125%, 1/23/25 | 2,750,000 |
| 2,755,216 |
|
| JPMorgan Chase & Co., VRN, 3.54%, 5/1/28 | 1,600,000 |
| 1,603,877 |
|
| JPMorgan Chase & Co., VRN, 3.88%, 7/24/38 | 1,400,000 |
| 1,378,497 |
|
| JPMorgan Chase & Co., VRN, 3.96%, 11/15/48 | 2,050,000 |
| 2,005,709 |
|
| JPMorgan Chase & Co., VRN, 3.90%, 1/23/49 | 1,800,000 |
| 1,746,365 |
|
| PNC Financial Services Group, Inc. (The), 4.375%, 8/11/20 | 1,820,000 |
| 1,863,452 |
|
| Regions Financial Corp., 2.75%, 8/14/22 | 2,370,000 |
| 2,353,709 |
|
| Regions Financial Corp., 3.80%, 8/14/23 | 1,830,000 |
| 1,883,010 |
|
| Royal Bank of Canada, 2.15%, 10/26/20 | 2,590,000 |
| 2,573,790 |
|
| Synchrony Bank, 3.00%, 6/15/22 | 1,400,000 |
| 1,382,652 |
|
| U.S. Bancorp, MTN, 3.60%, 9/11/24 | 1,910,000 |
| 1,972,012 |
|
| Wells Fargo & Co., 3.07%, 1/24/23 | 1,860,000 |
| 1,863,997 |
|
| Wells Fargo & Co., 4.125%, 8/15/23 | 760,000 |
| 788,327 |
|
| Wells Fargo & Co., 3.00%, 4/22/26 | 1,000,000 |
| 978,914 |
|
| Wells Fargo & Co., 5.61%, 1/15/44 | 366,000 |
| 423,043 |
|
| Wells Fargo & Co., MTN, 2.60%, 7/22/20 | 6,920,000 |
| 6,911,542 |
|
| Wells Fargo & Co., MTN, 3.75%, 1/24/24 | 1,920,000 |
| 1,977,642 |
|
| Wells Fargo & Co., MTN, 4.10%, 6/3/26 | 2,700,000 |
| 2,765,004 |
|
| Wells Fargo & Co., MTN, 4.65%, 11/4/44 | 1,555,000 |
| 1,602,532 |
|
| Wells Fargo & Co., MTN, 4.75%, 12/7/46 | 640,000 |
| 671,362 |
|
| Wells Fargo & Co., MTN, VRN, 3.58%, 5/22/28 | 1,100,000 |
| 1,106,558 |
|
| | | 159,849,248 |
|
| Beverages — 0.4% | | |
Anheuser-Busch Cos. LLC / Anheuser-Busch InBev Worldwide, Inc., 4.90%, 2/1/46(1) | 3,860,000 |
| 3,884,965 |
|
| Anheuser-Busch InBev Worldwide, Inc., 4.75%, 1/23/29 | 2,690,000 |
| 2,866,919 |
|
| Constellation Brands, Inc., 2.00%, 11/7/19 | 1,640,000 |
| 1,631,265 |
|
| Constellation Brands, Inc., 4.75%, 12/1/25 | 1,100,000 |
| 1,174,494 |
|
| | | 9,557,643 |
|
|
| | | | | | |
| | Principal Amount | Value |
| Biotechnology — 1.6% | | |
| AbbVie, Inc., 2.50%, 5/14/20 | $ | 3,630,000 |
| $ | 3,619,775 |
|
| AbbVie, Inc., 2.90%, 11/6/22 | 3,240,000 |
| 3,234,772 |
|
| AbbVie, Inc., 3.60%, 5/14/25 | 3,110,000 |
| 3,121,794 |
|
| AbbVie, Inc., 4.40%, 11/6/42 | 1,790,000 |
| 1,667,213 |
|
| AbbVie, Inc., 4.70%, 5/14/45 | 800,000 |
| 772,716 |
|
| Amgen, Inc., 2.20%, 5/22/19 | 4,600,000 |
| 4,598,300 |
|
| Amgen, Inc., 2.65%, 5/11/22 | 4,880,000 |
| 4,867,676 |
|
| Amgen, Inc., 4.66%, 6/15/51 | 2,183,000 |
| 2,204,398 |
|
| Celgene Corp., 3.25%, 8/15/22 | 2,490,000 |
| 2,517,766 |
|
| Celgene Corp., 3.625%, 5/15/24 | 850,000 |
| 865,117 |
|
| Celgene Corp., 3.875%, 8/15/25 | 3,650,000 |
| 3,750,302 |
|
| Gilead Sciences, Inc., 1.85%, 9/20/19 | 2,020,000 |
| 2,010,003 |
|
| Gilead Sciences, Inc., 4.40%, 12/1/21 | 1,490,000 |
| 1,549,279 |
|
| Gilead Sciences, Inc., 3.65%, 3/1/26 | 5,530,000 |
| 5,649,131 |
|
| Gilead Sciences, Inc., 4.15%, 3/1/47 | 1,000,000 |
| 968,391 |
|
| | | 41,396,633 |
|
| Building Products — 0.1% | | |
| Masco Corp., 4.45%, 4/1/25 | 1,260,000 |
| 1,295,780 |
|
| Capital Markets — 1.8% | | |
| Goldman Sachs Group, Inc. (The), 2.30%, 12/13/19 | 5,480,000 |
| 5,462,809 |
|
| Goldman Sachs Group, Inc. (The), 3.50%, 1/23/25 | 2,540,000 |
| 2,534,508 |
|
| Goldman Sachs Group, Inc. (The), 3.50%, 11/16/26 | 6,500,000 |
| 6,424,651 |
|
| Goldman Sachs Group, Inc. (The), VRN, 2.88%, 10/31/22 | 1,450,000 |
| 1,438,690 |
|
| Goldman Sachs Group, Inc. (The), VRN, 3.27%, 9/29/25 | 2,000,000 |
| 1,976,134 |
|
| Goldman Sachs Group, Inc. (The), VRN, 3.81%, 4/23/29 | 1,860,000 |
| 1,845,498 |
|
| Jefferies Group LLC / Jefferies Group Capital Finance, Inc., 4.15%, 1/23/30 | 1,480,000 |
| 1,357,851 |
|
| Morgan Stanley, 2.75%, 5/19/22 | 800,000 |
| 795,791 |
|
| Morgan Stanley, 5.00%, 11/24/25 | 3,370,000 |
| 3,617,790 |
|
| Morgan Stanley, MTN, 5.625%, 9/23/19 | 8,010,000 |
| 8,114,566 |
|
| Morgan Stanley, MTN, 3.70%, 10/23/24 | 2,450,000 |
| 2,495,550 |
|
| Morgan Stanley, MTN, 4.00%, 7/23/25 | 6,830,000 |
| 7,040,614 |
|
| Morgan Stanley, MTN, VRN, 3.77%, 1/24/29 | 2,550,000 |
| 2,569,114 |
|
| Morgan Stanley, VRN, 3.97%, 7/22/38 | 920,000 |
| 907,020 |
|
| | | 46,580,586 |
|
| Chemicals — 0.1% | | |
| Westlake Chemical Corp., 4.375%, 11/15/47 | 1,885,000 |
| 1,675,733 |
|
| Commercial Services and Supplies — 0.1% | | |
| Republic Services, Inc., 3.55%, 6/1/22 | 1,910,000 |
| 1,953,827 |
|
| Consumer Finance — 0.7% | | |
| American Express Credit Corp., MTN, 2.20%, 3/3/20 | 4,500,000 |
| 4,480,256 |
|
| Capital One Bank USA N.A., 2.30%, 6/5/19 | 2,390,000 |
| 2,388,360 |
|
| Capital One Bank USA N.A., 3.375%, 2/15/23 | 1,580,000 |
| 1,580,802 |
|
| Capital One Financial Corp., 3.75%, 7/28/26 | 3,515,000 |
| 3,429,689 |
|
| PNC Bank N.A., 3.80%, 7/25/23 | 1,150,000 |
| 1,184,252 |
|
| PNC Bank N.A., MTN, 2.30%, 6/1/20 | 4,640,000 |
| 4,620,957 |
|
|
| | | | | | |
| | Principal Amount | Value |
| Synchrony Financial, 3.00%, 8/15/19 | $ | 500,000 |
| $ | 500,159 |
|
| | | 18,184,475 |
|
Containers and Packaging† | | |
| International Paper Co., 4.40%, 8/15/47 | 980,000 |
| 921,014 |
|
| Diversified Consumer Services — 0.1% | | |
| Board of Trustees of The Leland Stanford Junior University (The), 3.46%, 5/1/47 | 670,000 |
| 671,332 |
|
| CommonSpirit Health, 2.95%, 11/1/22 | 860,000 |
| 854,909 |
|
| George Washington University (The), 3.55%, 9/15/46 | 960,000 |
| 928,764 |
|
| | | 2,455,005 |
|
| Diversified Financial Services — 0.6% | | |
| Credit Suisse Group Funding Guernsey Ltd., 3.125%, 12/10/20 | 4,550,000 |
| 4,566,774 |
|
| Credit Suisse Group Funding Guernsey Ltd., 3.45%, 4/16/21 | 2,550,000 |
| 2,577,981 |
|
| GE Capital International Funding Co. Unlimited Co., 2.34%, 11/15/20 | 1,300,000 |
| 1,284,237 |
|
UBS Group Funding Switzerland AG, 3.49%, 5/23/23(1) | 4,800,000 |
| 4,826,730 |
|
UBS Group Funding Switzerland AG, 4.125%, 9/24/25(1) | 950,000 |
| 982,353 |
|
| Voya Financial, Inc., 5.70%, 7/15/43 | 1,900,000 |
| 2,213,273 |
|
| | | 16,451,348 |
|
| Diversified Telecommunication Services — 0.9% | | |
| AT&T, Inc., 3.875%, 8/15/21 | 2,780,000 |
| 2,852,617 |
|
| AT&T, Inc., 3.40%, 5/15/25 | 4,780,000 |
| 4,737,474 |
|
| AT&T, Inc., 4.10%, 2/15/28 | 1,300,000 |
| 1,315,070 |
|
| AT&T, Inc., 5.25%, 3/1/37 | 1,100,000 |
| 1,161,088 |
|
| AT&T, Inc., 4.85%, 3/1/39 | 1,200,000 |
| 1,208,481 |
|
| AT&T, Inc., 5.15%, 11/15/46 | 301,000 |
| 309,950 |
|
| Orange SA, 4.125%, 9/14/21 | 722,000 |
| 747,086 |
|
| Telefonica Emisiones SA, 5.46%, 2/16/21 | 1,590,000 |
| 1,663,251 |
|
| Verizon Communications, Inc., 3.38%, 2/15/25 | 1,920,000 |
| 1,948,457 |
|
| Verizon Communications, Inc., 2.625%, 8/15/26 | 2,250,000 |
| 2,149,592 |
|
| Verizon Communications, Inc., 4.75%, 11/1/41 | 1,490,000 |
| 1,578,724 |
|
| Verizon Communications, Inc., 5.01%, 8/21/54 | 3,070,000 |
| 3,295,162 |
|
| | | 22,966,952 |
|
| Electric Utilities — 0.7% | | |
| AEP Transmission Co. LLC, 3.75%, 12/1/47 | 970,000 |
| 957,108 |
|
| American Electric Power Co., Inc., 3.20%, 11/13/27 | 1,050,000 |
| 1,029,666 |
|
| Duke Energy Corp., 3.55%, 9/15/21 | 1,250,000 |
| 1,270,116 |
|
| Duke Energy Corp., 2.65%, 9/1/26 | 1,540,000 |
| 1,469,030 |
|
| Duke Energy Florida LLC, 6.35%, 9/15/37 | 463,000 |
| 615,133 |
|
| Duke Energy Florida LLC, 3.85%, 11/15/42 | 1,410,000 |
| 1,416,981 |
|
| Duke Energy Progress LLC, 3.25%, 8/15/25 | 1,000,000 |
| 1,023,777 |
|
| Duke Energy Progress LLC, 4.15%, 12/1/44 | 500,000 |
| 522,434 |
|
| Duke Energy Progress LLC, 3.70%, 10/15/46 | 515,000 |
| 504,515 |
|
| Exelon Corp., 5.15%, 12/1/20 | 1,276,000 |
| 1,315,988 |
|
| Exelon Corp., 4.45%, 4/15/46 | 1,400,000 |
| 1,447,569 |
|
| FirstEnergy Corp., 4.25%, 3/15/23 | 1,260,000 |
| 1,315,624 |
|
NextEra Energy Operating Partners LP, 4.50%, 9/15/27(1) | 1,520,000 |
| 1,487,700 |
|
| Southern Co. Gas Capital Corp., 3.95%, 10/1/46 | 970,000 |
| 913,107 |
|
|
| | | | | | |
| | Principal Amount | Value |
| Virginia Electric & Power Co., 3.45%, 2/15/24 | $ | 1,110,000 |
| $ | 1,141,292 |
|
| Xcel Energy, Inc., 3.35%, 12/1/26 | 1,000,000 |
| 1,002,804 |
|
| | | 17,432,844 |
|
| Energy Equipment and Services — 0.1% | | |
| Halliburton Co., 3.80%, 11/15/25 | 2,260,000 |
| 2,313,450 |
|
| Halliburton Co., 4.85%, 11/15/35 | 1,090,000 |
| 1,145,644 |
|
| | | 3,459,094 |
|
| Entertainment — 0.4% | | |
| Activision Blizzard, Inc., 2.30%, 9/15/21 | 1,780,000 |
| 1,756,244 |
|
| Viacom, Inc., 3.125%, 6/15/22 | 1,260,000 |
| 1,258,120 |
|
| Viacom, Inc., 4.25%, 9/1/23 | 1,840,000 |
| 1,914,719 |
|
| Viacom, Inc., 4.375%, 3/15/43 | 1,500,000 |
| 1,348,721 |
|
Walt Disney Co. (The), 6.90%, 8/15/39(1) | 1,370,000 |
| 1,937,907 |
|
Walt Disney Co. (The), 4.75%, 9/15/44(1) | 720,000 |
| 827,889 |
|
| | | 9,043,600 |
|
| Equity Real Estate Investment Trusts (REITs) — 0.7% | | |
| American Tower Corp., 3.375%, 10/15/26 | 833,000 |
| 813,297 |
|
| AvalonBay Communities, Inc., MTN, 3.20%, 1/15/28 | 625,000 |
| 620,670 |
|
| Boston Properties LP, 3.65%, 2/1/26 | 2,410,000 |
| 2,424,554 |
|
| Crown Castle International Corp., 5.25%, 1/15/23 | 2,474,000 |
| 2,659,045 |
|
| Essex Portfolio LP, 3.625%, 8/15/22 | 710,000 |
| 722,869 |
|
| Essex Portfolio LP, 3.25%, 5/1/23 | 1,220,000 |
| 1,220,136 |
|
| GLP Capital LP / GLP Financing II, Inc., 5.75%, 6/1/28 | 1,140,000 |
| 1,228,293 |
|
| Hospitality Properties Trust, 4.65%, 3/15/24 | 1,480,000 |
| 1,509,651 |
|
| Kilroy Realty LP, 3.80%, 1/15/23 | 1,670,000 |
| 1,698,454 |
|
| Kimco Realty Corp., 2.80%, 10/1/26 | 2,130,000 |
| 2,007,764 |
|
| Ventas Realty LP, 4.125%, 1/15/26 | 720,000 |
| 740,296 |
|
| VEREIT Operating Partnership LP, 4.125%, 6/1/21 | 2,310,000 |
| 2,349,628 |
|
| | | 17,994,657 |
|
| Food and Staples Retailing — 0.2% | | |
| Kroger Co. (The), 3.30%, 1/15/21 | 2,610,000 |
| 2,626,450 |
|
| Kroger Co. (The), 3.875%, 10/15/46 | 1,390,000 |
| 1,160,742 |
|
| Walmart, Inc., 4.05%, 6/29/48 | 1,220,000 |
| 1,302,819 |
|
| | | 5,090,011 |
|
| Gas Utilities — 1.0% | | |
| Andeavor Logistics LP / Tesoro Logistics Finance Corp., 5.25%, 1/15/25 | 1,900,000 |
| 1,974,822 |
|
| Enterprise Products Operating LLC, 5.20%, 9/1/20 | 4,180,000 |
| 4,321,363 |
|
| Enterprise Products Operating LLC, 4.85%, 3/15/44 | 3,550,000 |
| 3,780,560 |
|
| Plains All American Pipeline LP / PAA Finance Corp., 3.65%, 6/1/22 | 2,240,000 |
| 2,255,754 |
|
| Sabine Pass Liquefaction LLC, 5.625%, 3/1/25 | 5,920,000 |
| 6,515,212 |
|
| Sunoco Logistics Partners Operations LP, 3.45%, 1/15/23 | 2,970,000 |
| 2,984,907 |
|
| Sunoco Logistics Partners Operations LP, 4.00%, 10/1/27 | 2,650,000 |
| 2,632,873 |
|
| Targa Resources Partners LP / Targa Resources Partners Finance Corp., 5.00%, 1/15/28 | 570,000 |
| 562,163 |
|
| | | 25,027,654 |
|
| Health Care Equipment and Supplies — 0.3% | | |
| Becton Dickinson and Co., 3.73%, 12/15/24 | 3,360,000 |
| 3,415,348 |
|
|
| | | | | | |
| | Principal Amount | Value |
| Medtronic, Inc., 3.50%, 3/15/25 | $ | 3,615,000 |
| $ | 3,736,494 |
|
| Medtronic, Inc., 4.375%, 3/15/35 | 1,580,000 |
| 1,728,711 |
|
| | | 8,880,553 |
|
| Health Care Providers and Services — 1.3% | | |
| Anthem, Inc., 3.65%, 12/1/27 | 1,400,000 |
| 1,399,241 |
|
| Anthem, Inc., 4.65%, 1/15/43 | 1,810,000 |
| 1,877,992 |
|
| Cardinal Health, Inc., 1.95%, 6/14/19 | 4,640,000 |
| 4,631,913 |
|
| CVS Health Corp., 3.50%, 7/20/22 | 2,820,000 |
| 2,858,425 |
|
| CVS Health Corp., 2.75%, 12/1/22 | 1,345,000 |
| 1,327,671 |
|
| CVS Health Corp., 4.30%, 3/25/28 | 3,250,000 |
| 3,299,120 |
|
| CVS Health Corp., 4.78%, 3/25/38 | 1,510,000 |
| 1,499,746 |
|
| Duke University Health System, Inc., 3.92%, 6/1/47 | 2,150,000 |
| 2,228,137 |
|
| HCA, Inc., 4.25%, 10/15/19 | 1,000,000 |
| 1,005,262 |
|
| Johns Hopkins Health System Corp. (The), 3.84%, 5/15/46 | 895,000 |
| 909,348 |
|
| Kaiser Foundation Hospitals, 4.15%, 5/1/47 | 840,000 |
| 890,056 |
|
| Northwell Healthcare, Inc., 4.26%, 11/1/47 | 1,090,000 |
| 1,103,194 |
|
| Stanford Health Care, 3.80%, 11/15/48 | 885,000 |
| 892,394 |
|
| UnitedHealth Group, Inc., 2.875%, 12/15/21 | 1,480,000 |
| 1,488,469 |
|
| UnitedHealth Group, Inc., 2.875%, 3/15/22 | 1,950,000 |
| 1,962,982 |
|
| UnitedHealth Group, Inc., 3.75%, 7/15/25 | 2,640,000 |
| 2,760,066 |
|
| UnitedHealth Group, Inc., 4.75%, 7/15/45 | 1,450,000 |
| 1,643,660 |
|
Universal Health Services, Inc., 4.75%, 8/1/22(1) | 1,850,000 |
| 1,870,813 |
|
| | | 33,648,489 |
|
| Hotels, Restaurants and Leisure — 0.1% | | |
| McDonald's Corp., MTN, 3.375%, 5/26/25 | 2,070,000 |
| 2,110,242 |
|
| McDonald's Corp., MTN, 4.70%, 12/9/35 | 1,070,000 |
| 1,151,148 |
|
| | | 3,261,390 |
|
| Household Durables — 0.3% | | |
| D.R. Horton, Inc., 2.55%, 12/1/20 | 1,260,000 |
| 1,252,381 |
|
| D.R. Horton, Inc., 5.75%, 8/15/23 | 650,000 |
| 702,857 |
|
| Lennar Corp., 4.75%, 4/1/21 | 1,880,000 |
| 1,919,950 |
|
| Lennar Corp., 4.75%, 11/29/27 | 210,000 |
| 210,886 |
|
| Toll Brothers Finance Corp., 6.75%, 11/1/19 | 720,000 |
| 737,964 |
|
| Toll Brothers Finance Corp., 4.35%, 2/15/28 | 1,940,000 |
| 1,823,600 |
|
| TRI Pointe Group, Inc. / TRI Pointe Homes, Inc., 4.375%, 6/15/19 | 855,000 |
| 858,206 |
|
| | | 7,505,844 |
|
| Insurance — 1.1% | | |
| AerCap Ireland Capital DAC / AerCap Global Aviation Trust, 3.75%, 5/15/19 | 3,290,000 |
| 3,292,797 |
|
| AerCap Ireland Capital DAC / AerCap Global Aviation Trust, 5.00%, 10/1/21 | 3,700,000 |
| 3,841,419 |
|
| American International Group, Inc., 4.125%, 2/15/24 | 4,170,000 |
| 4,308,052 |
|
| American International Group, Inc., 4.50%, 7/16/44 | 1,400,000 |
| 1,345,138 |
|
| Berkshire Hathaway Finance Corp., 3.00%, 5/15/22 | 1,410,000 |
| 1,434,489 |
|
| Berkshire Hathaway Finance Corp., 4.20%, 8/15/48 | 2,000,000 |
| 2,079,328 |
|
| Chubb INA Holdings, Inc., 3.15%, 3/15/25 | 1,770,000 |
| 1,788,132 |
|
| Chubb INA Holdings, Inc., 3.35%, 5/3/26 | 155,000 |
| 157,995 |
|
| Hartford Financial Services Group, Inc. (The), 5.95%, 10/15/36 | 1,380,000 |
| 1,649,302 |
|
|
| | | | | | |
| | Principal Amount | Value |
| Markel Corp., 4.90%, 7/1/22 | $ | 1,400,000 |
| $ | 1,478,400 |
|
| Markel Corp., 3.50%, 11/1/27 | 1,200,000 |
| 1,144,589 |
|
| MetLife, Inc., 4.125%, 8/13/42 | 450,000 |
| 455,615 |
|
Metropolitan Life Global Funding I, 3.00%, 1/10/23(1) | 1,790,000 |
| 1,804,049 |
|
| Prudential Financial, Inc., 3.94%, 12/7/49 | 3,289,000 |
| 3,185,532 |
|
| Prudential Financial, Inc., MTN, 5.70%, 12/14/36 | 170,000 |
| 203,199 |
|
| WR Berkley Corp., 4.625%, 3/15/22 | 1,100,000 |
| 1,149,750 |
|
| | | 29,317,786 |
|
| Internet and Direct Marketing Retail — 0.3% | | |
| Alibaba Group Holding Ltd., 2.50%, 11/28/19 | 2,000,000 |
| 1,997,996 |
|
| Alibaba Group Holding Ltd., 3.60%, 11/28/24 | 3,500,000 |
| 3,591,555 |
|
| eBay, Inc., 2.15%, 6/5/20 | 1,390,000 |
| 1,381,077 |
|
| | | 6,970,628 |
|
| IT Services — 0.1% | | |
| Fidelity National Information Services, Inc., 3.00%, 8/15/26 | 3,780,000 |
| 3,627,909 |
|
| Life Sciences Tools and Services — 0.1% | | |
| Thermo Fisher Scientific, Inc., 3.30%, 2/15/22 | 988,000 |
| 1,001,468 |
|
| Thermo Fisher Scientific, Inc., 2.95%, 9/19/26 | 1,720,000 |
| 1,660,544 |
|
| Thermo Fisher Scientific, Inc., 5.30%, 2/1/44 | 590,000 |
| 681,048 |
|
| | | 3,343,060 |
|
| Media — 1.0% | | |
| CBS Corp., 4.85%, 7/1/42 | 360,000 |
| 359,368 |
|
| Charter Communications Operating LLC / Charter Communications Operating Capital, 4.91%, 7/23/25 | 5,940,000 |
| 6,269,164 |
|
| Charter Communications Operating LLC / Charter Communications Operating Capital, 6.48%, 10/23/45 | 2,180,000 |
| 2,449,385 |
|
| Comcast Corp., 6.40%, 5/15/38 | 790,000 |
| 1,014,883 |
|
| Comcast Corp., 4.60%, 10/15/38 | 4,430,000 |
| 4,757,485 |
|
| Comcast Corp., 4.75%, 3/1/44 | 3,650,000 |
| 3,969,308 |
|
| Interpublic Group of Cos., Inc. (The), 4.00%, 3/15/22 | 1,300,000 |
| 1,327,542 |
|
| TEGNA, Inc., 5.125%, 7/15/20 | 1,920,000 |
| 1,927,200 |
|
| Warner Media LLC, 2.95%, 7/15/26 | 2,650,000 |
| 2,512,636 |
|
| Warner Media LLC, 3.80%, 2/15/27 | 1,200,000 |
| 1,194,976 |
|
| | | 25,781,947 |
|
| Metals and Mining — 0.1% | | |
| Steel Dynamics, Inc., 4.125%, 9/15/25 | 2,590,000 |
| 2,544,675 |
|
| Multi-Utilities — 1.0% | | |
| Berkshire Hathaway Energy Co., 3.50%, 2/1/25 | 1,550,000 |
| 1,589,462 |
|
| Berkshire Hathaway Energy Co., 3.80%, 7/15/48 | 1,460,000 |
| 1,400,563 |
|
| CenterPoint Energy, Inc., 4.25%, 11/1/28 | 2,030,000 |
| 2,106,412 |
|
| Consolidated Edison Co. of New York, Inc., 3.95%, 3/1/43 | 880,000 |
| 876,419 |
|
| Dominion Energy, Inc., 2.75%, 9/15/22 | 540,000 |
| 535,843 |
|
| Dominion Energy, Inc., 4.90%, 8/1/41 | 2,210,000 |
| 2,362,650 |
|
| Exelon Generation Co. LLC, 4.25%, 6/15/22 | 1,250,000 |
| 1,297,583 |
|
| Exelon Generation Co. LLC, 5.60%, 6/15/42 | 410,000 |
| 432,398 |
|
FirstEnergy Transmission LLC, 4.55%, 4/1/49(1) | 1,250,000 |
| 1,282,299 |
|
| Florida Power & Light Co., 4.125%, 2/1/42 | 930,000 |
| 987,624 |
|
| MidAmerican Energy Co., 4.40%, 10/15/44 | 2,100,000 |
| 2,299,463 |
|
|
| | | | | | |
| | Principal Amount | Value |
| NextEra Energy Capital Holdings, Inc., 3.55%, 5/1/27 | $ | 2,210,000 |
| $ | 2,226,836 |
|
| NiSource, Inc., 5.65%, 2/1/45 | 1,310,000 |
| 1,526,842 |
|
| Potomac Electric Power Co., 3.60%, 3/15/24 | 1,010,000 |
| 1,045,039 |
|
| Sempra Energy, 2.875%, 10/1/22 | 1,220,000 |
| 1,203,322 |
|
| Sempra Energy, 3.25%, 6/15/27 | 1,700,000 |
| 1,629,481 |
|
| Sempra Energy, 3.80%, 2/1/38 | 800,000 |
| 735,483 |
|
| Sempra Energy, 4.00%, 2/1/48 | 1,000,000 |
| 914,042 |
|
| Southwestern Public Service Co., 3.70%, 8/15/47 | 930,000 |
| 901,200 |
|
| | | 25,352,961 |
|
| Oil, Gas and Consumable Fuels — 3.0% | | |
| Antero Resources Corp., 5.00%, 3/1/25 | 640,000 |
| 632,800 |
|
| Apache Corp., 4.75%, 4/15/43 | 490,000 |
| 463,571 |
|
| BP Capital Markets America, Inc., 4.50%, 10/1/20 | 360,000 |
| 369,609 |
|
| Cimarex Energy Co., 4.375%, 6/1/24 | 2,600,000 |
| 2,704,113 |
|
| CNOOC Finance Ltd., 4.25%, 1/26/21 | 5,000,000 |
| 5,107,540 |
|
| CNOOC Nexen Finance 2014 ULC, 4.25%, 4/30/24 | 1,030,000 |
| 1,078,038 |
|
| Concho Resources, Inc., 4.375%, 1/15/25 | 2,310,000 |
| 2,376,402 |
|
| Continental Resources, Inc., 4.375%, 1/15/28 | 3,920,000 |
| 4,038,302 |
|
| Ecopetrol SA, 5.875%, 5/28/45 | 690,000 |
| 717,600 |
|
| Enbridge, Inc., 4.00%, 10/1/23 | 1,600,000 |
| 1,661,004 |
|
| Encana Corp., 6.50%, 2/1/38 | 2,280,000 |
| 2,682,445 |
|
| Energy Transfer Operating LP, 4.15%, 10/1/20 | 1,220,000 |
| 1,240,182 |
|
| Energy Transfer Operating LP, 7.50%, 10/15/20 | 1,090,000 |
| 1,160,921 |
|
| Energy Transfer Operating LP, 4.25%, 3/15/23 | 2,400,000 |
| 2,467,110 |
|
| Energy Transfer Operating LP, 5.25%, 4/15/29 | 2,500,000 |
| 2,687,456 |
|
| Energy Transfer Operating LP, 4.90%, 3/15/35 | 1,600,000 |
| 1,525,101 |
|
| Energy Transfer Operating LP, 6.50%, 2/1/42 | 420,000 |
| 467,964 |
|
| Energy Transfer Operating LP, 6.00%, 6/15/48 | 1,560,000 |
| 1,689,364 |
|
| EOG Resources, Inc., 4.10%, 2/1/21 | 1,440,000 |
| 1,474,691 |
|
| Hess Corp., 6.00%, 1/15/40 | 970,000 |
| 1,013,219 |
|
| Kinder Morgan Energy Partners LP, 5.30%, 9/15/20 | 950,000 |
| 982,159 |
|
| Kinder Morgan Energy Partners LP, 6.50%, 9/1/39 | 2,729,000 |
| 3,207,396 |
|
| Kinder Morgan, Inc., 5.55%, 6/1/45 | 1,600,000 |
| 1,753,592 |
|
| Marathon Oil Corp., 3.85%, 6/1/25 | 1,790,000 |
| 1,814,962 |
|
| MPLX LP, 4.875%, 6/1/25 | 3,280,000 |
| 3,497,005 |
|
| MPLX LP, 4.50%, 4/15/38 | 1,080,000 |
| 1,029,933 |
|
| MPLX LP, 5.20%, 3/1/47 | 1,270,000 |
| 1,292,900 |
|
| Newfield Exploration Co., 5.75%, 1/30/22 | 2,130,000 |
| 2,275,855 |
|
| Noble Energy, Inc., 4.15%, 12/15/21 | 2,080,000 |
| 2,131,387 |
|
| Petroleos Mexicanos, 6.00%, 3/5/20 | 306,000 |
| 313,405 |
|
| Petroleos Mexicanos, 4.875%, 1/24/22 | 870,000 |
| 879,579 |
|
| Petroleos Mexicanos, 3.50%, 1/30/23 | 130,000 |
| 124,488 |
|
| Petroleos Mexicanos, 4.625%, 9/21/23 | 4,500,000 |
| 4,443,795 |
|
| Petroleos Mexicanos, 6.50%, 3/13/27 | 2,500,000 |
| 2,516,775 |
|
| Petroleos Mexicanos, 6.625%, 6/15/35 | 850,000 |
| 805,375 |
|
| Petroleos Mexicanos, 6.50%, 6/2/41 | 320,000 |
| 290,461 |
|
| Petroleos Mexicanos, 6.35%, 2/12/48 | 800,000 |
| 709,320 |
|
|
| | | | | | |
| | Principal Amount | Value |
| Petronas Capital Ltd., 5.25%, 8/12/19 | $ | 3,200,000 |
| $ | 3,232,038 |
|
| Phillips 66, 4.30%, 4/1/22 | 1,981,000 |
| 2,067,914 |
|
| Shell International Finance BV, 2.375%, 8/21/22 | 1,800,000 |
| 1,789,247 |
|
| Shell International Finance BV, 3.625%, 8/21/42 | 980,000 |
| 959,490 |
|
| Sinopec Group Overseas Development Ltd., 1.75%, 9/29/19 | 1,300,000 |
| 1,293,890 |
|
| Williams Cos., Inc. (The), 4.125%, 11/15/20 | 2,550,000 |
| 2,591,546 |
|
| Williams Cos., Inc. (The), 4.55%, 6/24/24 | 2,090,000 |
| 2,208,523 |
|
| | | 77,768,467 |
|
| Paper and Forest Products — 0.1% | | |
Georgia-Pacific LLC, 5.40%, 11/1/20(1) | 2,100,000 |
| 2,184,026 |
|
| Pharmaceuticals — 0.3% | | |
| Allergan Finance LLC, 3.25%, 10/1/22 | 2,210,000 |
| 2,212,544 |
|
| Allergan Funding SCS, 3.85%, 6/15/24 | 2,557,000 |
| 2,591,506 |
|
| Shire Acquisitions Investments Ireland DAC, 2.40%, 9/23/21 | 3,910,000 |
| 3,867,176 |
|
| | | 8,671,226 |
|
| Road and Rail — 0.5% | | |
| Burlington Northern Santa Fe LLC, 4.95%, 9/15/41 | 1,075,000 |
| 1,232,663 |
|
| Burlington Northern Santa Fe LLC, 4.45%, 3/15/43 | 750,000 |
| 812,610 |
|
| Burlington Northern Santa Fe LLC, 4.15%, 4/1/45 | 2,880,000 |
| 3,006,987 |
|
| CSX Corp., 3.40%, 8/1/24 | 1,400,000 |
| 1,427,797 |
|
| CSX Corp., 3.25%, 6/1/27 | 2,830,000 |
| 2,798,569 |
|
| Union Pacific Corp., 3.60%, 9/15/37 | 860,000 |
| 825,779 |
|
| Union Pacific Corp., 4.75%, 9/15/41 | 1,190,000 |
| 1,289,428 |
|
| Union Pacific Corp., 4.05%, 11/15/45 | 730,000 |
| 712,777 |
|
| | | 12,106,610 |
|
| Semiconductors and Semiconductor Equipment — 0.2% | | |
NXP BV / NXP Funding LLC, 4.125%, 6/15/20(1) | 1,800,000 |
| 1,827,198 |
|
NXP BV / NXP Funding LLC, 3.875%, 9/1/22(1) | 1,950,000 |
| 1,982,428 |
|
| | | 3,809,626 |
|
| Software — 0.6% | | |
| Microsoft Corp., 2.70%, 2/12/25 | 5,000,000 |
| 5,008,671 |
|
| Microsoft Corp., 3.45%, 8/8/36 | 2,200,000 |
| 2,214,270 |
|
| Microsoft Corp., 4.25%, 2/6/47 | 2,000,000 |
| 2,237,159 |
|
| Oracle Corp., 2.50%, 10/15/22 | 1,635,000 |
| 1,627,619 |
|
| Oracle Corp., 3.625%, 7/15/23 | 1,990,000 |
| 2,066,785 |
|
| Oracle Corp., 2.65%, 7/15/26 | 1,600,000 |
| 1,549,752 |
|
| | | 14,704,256 |
|
| Specialty Retail — 0.4% | | |
Ashtead Capital, Inc., 4.125%, 8/15/25(1) | 2,500,000 |
| 2,468,750 |
|
| Home Depot, Inc. (The), 3.75%, 2/15/24 | 1,500,000 |
| 1,576,748 |
|
| Home Depot, Inc. (The), 3.00%, 4/1/26 | 1,640,000 |
| 1,650,052 |
|
| Home Depot, Inc. (The), 5.95%, 4/1/41 | 1,860,000 |
| 2,392,819 |
|
| Home Depot, Inc. (The), 3.90%, 6/15/47 | 1,120,000 |
| 1,136,865 |
|
| United Rentals North America, Inc., 4.625%, 7/15/23 | 880,000 |
| 897,050 |
|
| | | 10,122,284 |
|
| Technology Hardware, Storage and Peripherals — 0.9% | | |
| Apple, Inc., 2.75%, 1/13/25 | 1,330,000 |
| 1,323,757 |
|
|
| | | | | | |
| | Principal Amount | Value |
| Apple, Inc., 2.50%, 2/9/25 | $ | 4,970,000 |
| $ | 4,887,578 |
|
| Apple, Inc., 2.45%, 8/4/26 | 1,900,000 |
| 1,837,357 |
|
| Apple, Inc., 2.90%, 9/12/27 | 4,010,000 |
| 3,960,584 |
|
Dell International LLC / EMC Corp., 6.02%, 6/15/26(1) | 6,560,000 |
| 7,061,928 |
|
Dell International LLC / EMC Corp., 4.90%, 10/1/26(1) | 2,010,000 |
| 2,050,001 |
|
| Hewlett Packard Enterprise Co., 3.60%, 10/15/20 | 1,910,000 |
| 1,928,483 |
|
| | | 23,049,688 |
|
Trading Companies and Distributors† | | |
| International Lease Finance Corp., 5.875%, 8/15/22 | 860,000 |
| 927,996 |
|
Wireless Telecommunication Services† | | |
| America Movil SAB de CV, 3.125%, 7/16/22 | 1,065,000 |
| 1,074,176 |
|
TOTAL CORPORATE BONDS
(Cost $728,253,098) | | 734,586,945 |
|
| U.S. TREASURY SECURITIES — 27.6% | | |
U.S. Treasury Bills, 2.54%, 1/30/20(5) | 10,000,000 |
| 9,803,498 |
|
U.S. Treasury Bills, 2.54%, 2/27/20(5) | 50,000,000 |
| 48,929,223 |
|
U.S. Treasury Bonds, 3.50%, 2/15/39(2) | 28,000,000 |
| 31,794,219 |
|
| U.S. Treasury Bonds, 4.375%, 11/15/39 | 700,000 |
| 891,406 |
|
| U.S. Treasury Bonds, 3.125%, 11/15/41 | 29,500,000 |
| 31,456,680 |
|
| U.S. Treasury Bonds, 3.00%, 5/15/42 | 24,000,000 |
| 25,027,969 |
|
| U.S. Treasury Bonds, 2.875%, 5/15/43 | 16,000,000 |
| 16,285,000 |
|
U.S. Treasury Bonds, 3.125%, 8/15/44(2) | 6,300,000 |
| 6,694,488 |
|
| U.S. Treasury Bonds, 3.00%, 11/15/44 | 10,500,000 |
| 10,914,873 |
|
| U.S. Treasury Bonds, 2.50%, 2/15/45 | 26,050,000 |
| 24,640,146 |
|
| U.S. Treasury Bonds, 3.00%, 5/15/45 | 5,000,000 |
| 5,199,707 |
|
| U.S. Treasury Bonds, 3.00%, 11/15/45 | 10,000,000 |
| 10,404,687 |
|
| U.S. Treasury Bonds, 3.375%, 11/15/48 | 39,500,000 |
| 44,071,045 |
|
| U.S. Treasury Notes, 2.625%, 5/15/21 | 40,000,000 |
| 40,293,750 |
|
| U.S. Treasury Notes, 2.75%, 9/15/21 | 77,000,000 |
| 77,933,926 |
|
| U.S. Treasury Notes, 2.625%, 12/15/21 | 60,000,000 |
| 60,629,297 |
|
| U.S. Treasury Notes, 1.875%, 1/31/22 | 45,000,000 |
| 44,565,820 |
|
| U.S. Treasury Notes, 2.375%, 3/15/22 | 43,000,000 |
| 43,205,762 |
|
| U.S. Treasury Notes, 2.00%, 11/30/22 | 7,000,000 |
| 6,946,406 |
|
| U.S. Treasury Notes, 2.375%, 2/29/24 | 21,500,000 |
| 21,654,531 |
|
| U.S. Treasury Notes, 2.125%, 11/30/24 | 9,000,000 |
| 8,930,566 |
|
| U.S. Treasury Notes, 2.625%, 12/31/25 | 28,000,000 |
| 28,557,813 |
|
| U.S. Treasury Notes, 2.50%, 2/28/26 | 8,000,000 |
| 8,096,250 |
|
| U.S. Treasury Notes, 3.125%, 11/15/28 | 96,000,000 |
| 101,953,125 |
|
TOTAL U.S. TREASURY SECURITIES
(Cost $694,380,037) | | 708,880,187 |
|
| U.S. GOVERNMENT AGENCY MORTGAGE-BACKED SECURITIES — 22.4% | |
| Adjustable-Rate U.S. Government Agency Mortgage-Backed Securities — 2.9% | |
| FHLMC, VRN, 4.62%, (1-year H15T1Y plus 2.25%), 9/1/35 | 677,756 |
| 713,810 |
|
| FHLMC, VRN, 4.51%, (12-month LIBOR plus 1.87%), 7/1/36 | 1,421,419 |
| 1,491,377 |
|
| FHLMC, VRN, 4.45%, (1-year H15T1Y plus 2.14%), 10/1/36 | 1,413,581 |
| 1,485,464 |
|
| FHLMC, VRN, 4.58%, (1-year H15T1Y plus 2.25%), 4/1/37 | 1,011,745 |
| 1,063,480 |
|
| FHLMC, VRN, 4.47%, (12-month LIBOR plus 1.78%), 2/1/38 | 404,300 |
| 423,406 |
|
| FHLMC, VRN, 4.51%, (12-month LIBOR plus 1.85%), 6/1/38 | 232,474 |
| 244,556 |
|
|
| | | | | | |
| | Principal Amount | Value |
| FHLMC, VRN, 4.63%, (12-month LIBOR plus 1.88%), 7/1/40 | $ | 145,233 |
| $ | 152,134 |
|
| FHLMC, VRN, 4.14%, (12-month LIBOR plus 1.78%), 9/1/40 | 269,297 |
| 279,007 |
|
| FHLMC, VRN, 3.81%, (12-month LIBOR plus 1.78%), 2/1/41 | 194,078 |
| 199,666 |
|
| FHLMC, VRN, 4.23%, (12-month LIBOR plus 1.88%), 5/1/41 | 58,262 |
| 60,858 |
|
| FHLMC, VRN, 3.69%, (12-month LIBOR plus 1.89%), 7/1/41 | 471,734 |
| 483,293 |
|
| FHLMC, VRN, 4.08%, (12-month LIBOR plus 1.87%), 7/1/41 | 898,909 |
| 932,913 |
|
| FHLMC, VRN, 2.07%, (12-month LIBOR plus 1.65%), 12/1/42 | 1,620,652 |
| 1,658,234 |
|
| FHLMC, VRN, 2.32%, (12-month LIBOR plus 1.65%), 2/1/43 | 2,411,167 |
| 2,405,642 |
|
| FHLMC, VRN, 4.70%, (12-month LIBOR plus 1.64%), 2/1/43 | 296,620 |
| 307,367 |
|
| FHLMC, VRN, 4.06%, (12-month LIBOR plus 1.63%), 5/1/43 | 187,444 |
| 192,958 |
|
| FHLMC, VRN, 4.25%, (12-month LIBOR plus 1.62%), 6/1/43 | 85,198 |
| 88,074 |
|
| FHLMC, VRN, 4.27%, (12-month LIBOR plus 1.65%), 6/1/43 | 208,041 |
| 215,214 |
|
| FHLMC, VRN, 2.85%, (12-month LIBOR plus 1.62%), 1/1/44 | 2,412,991 |
| 2,426,428 |
|
| FHLMC, VRN, 3.18%, (12-month LIBOR plus 1.62%), 6/1/44 | 1,241,016 |
| 1,258,444 |
|
| FHLMC, VRN, 2.45%, (12-month LIBOR plus 1.57%), 10/1/44 | 3,465,473 |
| 3,533,757 |
|
| FHLMC, VRN, 2.59%, (12-month LIBOR plus 1.60%), 6/1/45 | 1,819,546 |
| 1,830,336 |
|
| FHLMC, VRN, 2.37%, (12-month LIBOR plus 1.63%), 8/1/46 | 7,042,510 |
| 7,037,370 |
|
| FHLMC, VRN, 3.07%, (12-month LIBOR plus 1.64%), 9/1/47 | 6,452,246 |
| 6,539,225 |
|
| FNMA, VRN, 4.24%, (6-month LIBOR plus 1.57%), 6/1/35 | 1,322,835 |
| 1,369,245 |
|
| FNMA, VRN, 4.24%, (6-month LIBOR plus 1.57%), 6/1/35 | 2,104,327 |
| 2,178,828 |
|
| FNMA, VRN, 4.25%, (6-month LIBOR plus 1.57%), 6/1/35 | 772,482 |
| 799,846 |
|
| FNMA, VRN, 4.27%, (6-month LIBOR plus 1.57%), 6/1/35 | 198,614 |
| 205,214 |
|
| FNMA, VRN, 4.26%, (6-month LIBOR plus 1.54%), 9/1/35 | 1,994,390 |
| 2,064,213 |
|
| FNMA, VRN, 4.49%, (1-year H15T1Y plus 2.16%), 3/1/38 | 1,151,668 |
| 1,209,535 |
|
| FNMA, VRN, 4.82%, (12-month LIBOR plus 1.69%), 1/1/40 | 66,979 |
| 70,476 |
|
| FNMA, VRN, 3.62%, (12-month LIBOR plus 1.79%), 8/1/40 | 312,948 |
| 323,202 |
|
| FNMA, VRN, 3.92%, (12-month LIBOR plus 1.77%), 10/1/40 | 461,958 |
| 477,047 |
|
| FNMA, VRN, 4.50%, (12-month LIBOR plus 1.75%), 8/1/41 | 166,138 |
| 173,097 |
|
| FNMA, VRN, 3.32%, (12-month LIBOR plus 1.82%), 9/1/41 | 205,882 |
| 209,802 |
|
| FNMA, VRN, 2.71%, (12-month LIBOR plus 1.72%), 4/1/42 | 671,825 |
| 677,381 |
|
| FNMA, VRN, 4.56%, (12-month LIBOR plus 1.56%), 3/1/43 | 1,388,963 |
| 1,433,362 |
|
| FNMA, VRN, 2.31%, (12-month LIBOR plus 1.59%), 8/1/45 | 751,510 |
| 759,209 |
|
| FNMA, VRN, 2.60%, (12-month LIBOR plus 1.60%), 4/1/46 | 3,746,959 |
| 3,762,099 |
|
| FNMA, VRN, 3.19%, (12-month LIBOR plus 1.61%), 3/1/47 | 5,340,927 |
| 5,405,405 |
|
| FNMA, VRN, 3.20%, (12-month LIBOR plus 1.61%), 3/1/47 | 2,203,923 |
| 2,231,550 |
|
| FNMA, VRN, 3.17%, (12-month LIBOR plus 1.61%), 4/1/47 | 4,473,781 |
| 4,532,699 |
|
| FNMA, VRN, 2.96%, (12-month LIBOR plus 1.62%), 5/1/47 | 2,614,843 |
| 2,640,902 |
|
| FNMA, VRN, 3.26%, (12-month LIBOR plus 1.62%), 5/1/47 | 5,473,751 |
| 5,567,310 |
|
| FNMA, VRN, 2.89%, (12-month LIBOR plus 1.61%), 10/1/47 | 3,458,941 |
| 3,488,798 |
|
| | | 74,602,233 |
|
| Fixed-Rate U.S. Government Agency Mortgage-Backed Securities — 19.5% | |
| FHLMC, 5.00%, 4/1/19 | 1,754 |
| 1,762 |
|
| FHLMC, 7.00%, 9/1/27 | 179 |
| 200 |
|
| FHLMC, 6.50%, 1/1/28 | 285 |
| 316 |
|
| FHLMC, 7.00%, 2/1/28 | 49 |
| 53 |
|
| FHLMC, 6.50%, 3/1/29 | 1,812 |
| 2,015 |
|
| FHLMC, 6.50%, 6/1/29 | 1,905 |
| 2,110 |
|
|
| | | | | | |
| | Principal Amount | Value |
| FHLMC, 7.00%, 8/1/29 | $ | 192 |
| $ | 207 |
|
| FHLMC, 6.50%, 5/1/31 | 1,484 |
| 1,644 |
|
| FHLMC, 6.50%, 6/1/31 | 72 |
| 79 |
|
| FHLMC, 6.50%, 6/1/31 | 174 |
| 193 |
|
| FHLMC, 5.50%, 12/1/33 | 23,852 |
| 26,420 |
|
| FHLMC, 6.00%, 2/1/38 | 179,569 |
| 198,092 |
|
| FHLMC, 5.50%, 4/1/38 | 95,995 |
| 105,290 |
|
| FHLMC, 6.00%, 5/1/38 | 154,742 |
| 170,734 |
|
| FHLMC, 6.00%, 8/1/38 | 28,020 |
| 30,828 |
|
| FHLMC, 5.50%, 9/1/38 | 770,386 |
| 846,383 |
|
| FHLMC, 3.00%, 2/1/43 | 10,450,287 |
| 10,463,796 |
|
| FNMA, 3.50%, TBA | 23,920,000 |
| 24,253,572 |
|
| FNMA, 4.00%, TBA | 23,485,000 |
| 24,160,193 |
|
| FNMA, 4.50%, TBA | 53,750,000 |
| 56,012,067 |
|
| FNMA, 6.50%, 1/1/26 | 1,348 |
| 1,489 |
|
| FNMA, 7.00%, 12/1/27 | 320 |
| 344 |
|
| FNMA, 7.50%, 4/1/28 | 1,944 |
| 2,109 |
|
| FNMA, 7.00%, 5/1/28 | 1,829 |
| 1,870 |
|
| FNMA, 7.00%, 6/1/28 | 31 |
| 32 |
|
| FNMA, 6.50%, 1/1/29 | 295 |
| 330 |
|
| FNMA, 6.50%, 4/1/29 | 1,229 |
| 1,359 |
|
| FNMA, 7.00%, 7/1/29 | 180 |
| 181 |
|
| FNMA, 7.50%, 7/1/29 | 1,845 |
| 1,978 |
|
| FNMA, 7.50%, 9/1/30 | 629 |
| 740 |
|
| FNMA, 5.00%, 7/1/31 | 1,780,995 |
| 1,884,378 |
|
| FNMA, 7.00%, 9/1/31 | 3,517 |
| 3,804 |
|
| FNMA, 6.50%, 1/1/32 | 931 |
| 1,029 |
|
| FNMA, 6.50%, 8/1/32 | 4,324 |
| 4,889 |
|
| FNMA, 5.50%, 6/1/33 | 12,642 |
| 13,821 |
|
| FNMA, 5.50%, 7/1/33 | 74,656 |
| 81,471 |
|
| FNMA, 5.50%, 8/1/33 | 26,336 |
| 28,893 |
|
| FNMA, 5.50%, 9/1/33 | 39,852 |
| 44,169 |
|
| FNMA, 5.00%, 11/1/33 | 163,872 |
| 176,432 |
|
| FNMA, 6.00%, 12/1/33 | 552,651 |
| 609,965 |
|
| FNMA, 5.50%, 1/1/34 | 41,469 |
| 45,612 |
|
| FNMA, 5.50%, 12/1/34 | 43,704 |
| 47,860 |
|
| FNMA, 4.50%, 1/1/35 | 169,216 |
| 178,886 |
|
| FNMA, 5.00%, 8/1/35 | 65,698 |
| 70,677 |
|
| FNMA, 5.00%, 2/1/36 | 507,664 |
| 549,192 |
|
| FNMA, 5.50%, 7/1/36 | 25,842 |
| 28,306 |
|
| FNMA, 5.50%, 2/1/37 | 12,632 |
| 13,896 |
|
| FNMA, 6.00%, 4/1/37 | 120,450 |
| 132,853 |
|
| FNMA, 6.00%, 7/1/37 | 331,574 |
| 365,701 |
|
| FNMA, 6.00%, 8/1/37 | 221,131 |
| 243,971 |
|
| FNMA, 6.50%, 8/1/37 | 36,734 |
| 40,053 |
|
| FNMA, 6.00%, 9/1/37 | 228,879 |
| 252,423 |
|
| FNMA, 6.00%, 11/1/37 | 72,116 |
| 79,401 |
|
|
| | | | | | |
| | Principal Amount | Value |
| FNMA, 5.50%, 2/1/38 | $ | 525,154 |
| $ | 577,017 |
|
| FNMA, 5.50%, 2/1/38 | 93,039 |
| 102,130 |
|
| FNMA, 5.50%, 6/1/38 | 206,819 |
| 224,857 |
|
| FNMA, 5.00%, 1/1/39 | 135,379 |
| 146,005 |
|
| FNMA, 4.50%, 2/1/39 | 429,403 |
| 453,896 |
|
| FNMA, 5.50%, 3/1/39 | 458,075 |
| 496,351 |
|
| FNMA, 4.50%, 4/1/39 | 318,197 |
| 339,104 |
|
| FNMA, 4.50%, 5/1/39 | 807,503 |
| 860,232 |
|
| FNMA, 6.50%, 5/1/39 | 112,470 |
| 129,008 |
|
| FNMA, 4.50%, 6/1/39 | 432,809 |
| 459,421 |
|
| FNMA, 5.00%, 8/1/39 | 446,321 |
| 482,434 |
|
| FNMA, 4.50%, 9/1/39 | 1,504,067 |
| 1,603,273 |
|
| FNMA, 4.50%, 10/1/39 | 1,392,525 |
| 1,484,315 |
|
| FNMA, 5.00%, 4/1/40 | 2,297,323 |
| 2,479,445 |
|
| FNMA, 5.00%, 4/1/40 | 1,244,991 |
| 1,343,708 |
|
| FNMA, 5.00%, 6/1/40 | 1,915,583 |
| 2,067,112 |
|
| FNMA, 4.00%, 10/1/40 | 1,476,038 |
| 1,541,812 |
|
| FNMA, 4.50%, 11/1/40 | 1,242,549 |
| 1,319,902 |
|
| FNMA, 4.00%, 8/1/41 | 2,711,816 |
| 2,832,905 |
|
| FNMA, 4.50%, 9/1/41 | 1,192,242 |
| 1,259,646 |
|
| FNMA, 3.50%, 10/1/41 | 2,124,981 |
| 2,171,527 |
|
| FNMA, 3.50%, 12/1/41 | 7,745,651 |
| 7,915,300 |
|
| FNMA, 4.00%, 12/1/41 | 3,819,589 |
| 3,968,590 |
|
| FNMA, 5.00%, 1/1/42 | 4,304,873 |
| 4,643,969 |
|
| FNMA, 3.50%, 2/1/42 | 3,974,523 |
| 4,061,500 |
|
| FNMA, 3.50%, 5/1/42 | 1,643,954 |
| 1,679,963 |
|
| FNMA, 3.50%, 6/1/42 | 1,706,839 |
| 1,744,225 |
|
| FNMA, 3.50%, 8/1/42 | 8,314,333 |
| 8,496,472 |
|
| FNMA, 3.50%, 9/1/42 | 2,565,498 |
| 2,621,700 |
|
| FNMA, 3.50%, 8/1/43 | 3,484,293 |
| 3,554,872 |
|
| FNMA, 3.50%, 5/1/45 | 7,073,157 |
| 7,208,941 |
|
| FNMA, 3.50%, 11/1/45 | 7,767,105 |
| 7,900,005 |
|
| FNMA, 3.50%, 11/1/45 | 7,731,105 |
| 7,863,390 |
|
| FNMA, 4.00%, 11/1/45 | 9,432,500 |
| 9,759,275 |
|
| FNMA, 4.00%, 2/1/46 | 7,378,390 |
| 7,632,450 |
|
| FNMA, 3.50%, 3/1/46 | 8,630,365 |
| 8,767,327 |
|
| FNMA, 4.00%, 4/1/46 | 19,311,624 |
| 19,974,993 |
|
| FNMA, 3.50%, 5/1/46 | 9,175,173 |
| 9,333,578 |
|
| FNMA, 3.00%, 11/1/46 | 37,409,380 |
| 37,267,574 |
|
| FNMA, 3.50%, 2/1/47 | 17,343,936 |
| 17,673,511 |
|
| FNMA, 6.50%, 8/1/47 | 6,804 |
| 7,278 |
|
| FNMA, 6.50%, 9/1/47 | 8,653 |
| 9,215 |
|
| FNMA, 6.50%, 9/1/47 | 416 |
| 444 |
|
| FNMA, 6.50%, 9/1/47 | 4,549 |
| 4,845 |
|
| FNMA, 3.50%, 10/1/47 | 18,395,404 |
| 18,690,331 |
|
| FNMA, 3.00%, 4/1/48 | 20,452,555 |
| 20,415,997 |
|
| FNMA, 4.00%, 6/1/48 | 22,651,090 |
| 23,368,139 |
|
|
| | | | | | |
| | Principal Amount | Value |
| FNMA, 4.50%, 2/1/49 | $ | 12,970,587 |
| $ | 13,548,684 |
|
| GNMA, 3.00%, TBA | 22,800,000 |
| 22,911,328 |
|
| GNMA, 4.00%, TBA | 26,240,000 |
| 27,104,075 |
|
| GNMA, 7.00%, 11/15/22 | 528 |
| 546 |
|
| GNMA, 7.00%, 4/20/26 | 199 |
| 221 |
|
| GNMA, 7.50%, 8/15/26 | 410 |
| 453 |
|
| GNMA, 8.00%, 8/15/26 | 178 |
| 192 |
|
| GNMA, 7.50%, 5/15/27 | 391 |
| 405 |
|
| GNMA, 8.00%, 6/15/27 | 1,021 |
| 1,036 |
|
| GNMA, 7.50%, 11/15/27 | 164 |
| 166 |
|
| GNMA, 7.00%, 2/15/28 | 233 |
| 234 |
|
| GNMA, 7.50%, 2/15/28 | 181 |
| 181 |
|
| GNMA, 6.50%, 3/15/28 | 524 |
| 575 |
|
| GNMA, 7.00%, 4/15/28 | 149 |
| 149 |
|
| GNMA, 6.50%, 5/15/28 | 2,402 |
| 2,638 |
|
| GNMA, 7.00%, 12/15/28 | 269 |
| 269 |
|
| GNMA, 7.00%, 5/15/31 | 2,133 |
| 2,435 |
|
| GNMA, 6.00%, 7/15/33 | 594,115 |
| 668,101 |
|
| GNMA, 4.50%, 8/15/33 | 612,279 |
| 643,106 |
|
| GNMA, 5.00%, 3/20/36 | 69,416 |
| 74,309 |
|
| GNMA, 5.00%, 4/20/36 | 139,270 |
| 148,994 |
|
| GNMA, 5.00%, 5/20/36 | 238,190 |
| 254,870 |
|
| GNMA, 5.50%, 1/15/39 | 733,650 |
| 807,840 |
|
| GNMA, 6.00%, 1/20/39 | 29,497 |
| 32,556 |
|
| GNMA, 6.00%, 2/20/39 | 183,626 |
| 202,878 |
|
| GNMA, 4.50%, 6/15/39 | 1,747,164 |
| 1,845,844 |
|
| GNMA, 5.50%, 9/15/39 | 73,667 |
| 80,507 |
|
| GNMA, 5.00%, 10/15/39 | 846,167 |
| 909,171 |
|
| GNMA, 4.50%, 1/15/40 | 759,950 |
| 800,044 |
|
| GNMA, 4.00%, 11/20/40 | 2,352,793 |
| 2,451,933 |
|
| GNMA, 4.00%, 12/15/40 | 761,487 |
| 791,449 |
|
| GNMA, 4.50%, 6/15/41 | 640,854 |
| 677,614 |
|
| GNMA, 4.50%, 7/20/41 | 968,269 |
| 1,019,848 |
|
| GNMA, 3.50%, 4/20/42 | 5,016,414 |
| 5,146,594 |
|
| GNMA, 3.50%, 6/20/42 | 10,906,440 |
| 11,197,479 |
|
| GNMA, 3.50%, 7/20/42 | 2,000,752 |
| 2,052,288 |
|
| GNMA, 3.50%, 4/20/43 | 3,024,652 |
| 3,102,489 |
|
| GNMA, 3.50%, 4/20/46 | 10,632,452 |
| 10,889,576 |
|
| GNMA, 2.50%, 7/20/46 | 10,636,241 |
| 10,424,804 |
|
| GNMA, 2.50%, 2/20/47 | 4,949,582 |
| 4,851,115 |
|
| | | 500,769,048 |
|
TOTAL U.S. GOVERNMENT AGENCY MORTGAGE-BACKED SECURITIES
(Cost $577,386,997) | 575,371,281 |
|
| ASSET-BACKED SECURITIES — 6.1% | | |
| Argent Securities, Inc., Series 2004-W8, Class M1, VRN, 3.31%, (1-month LIBOR plus 0.83%), 5/25/34 | 4,745,756 |
| 4,741,063 |
|
Avis Budget Rental Car Funding AESOP LLC, Series 2014-1A, Class A SEQ, 2.46%, 7/20/20(1) | 7,666,667 |
| 7,660,703 |
|
|
| | | | | | |
| | Principal Amount | Value |
BRE Grand Islander Timeshare Issuer LLC, Series 2017-1A, Class A SEQ, 2.94%, 5/25/29(1) | $ | 2,975,804 |
| $ | 2,953,815 |
|
Colony Starwood Homes, Series 2016-2A, Class A, VRN, 3.73%, (1-month LIBOR plus 1.25%), 12/17/33(1) | 6,910,261 |
| 6,916,553 |
|
Goodgreen, Series 2018-1A, Class A, VRN, 3.93%, 10/15/53(1) | 6,371,905 |
| 6,519,269 |
|
Hilton Grand Vacations Trust, Series 2013-A, Class A SEQ, 2.28%, 1/25/26(1) | 325,510 |
| 324,694 |
|
Hilton Grand Vacations Trust, Series 2014-AA, Class A SEQ, 1.77%, 11/25/26(1) | 1,346,187 |
| 1,332,811 |
|
Hilton Grand Vacations Trust, Series 2017-AA, Class A SEQ, 2.66%, 12/26/28(1) | 2,535,813 |
| 2,517,743 |
|
Invitation Homes Trust, Series 2017-SFR2, Class A, VRN, 3.33%, (1-month LIBOR plus 0.85%), 12/17/36(1) | 11,651,249 |
| 11,618,172 |
|
Invitation Homes Trust, Series 2018-SFR1, Class A, VRN, 3.18%, (1-month LIBOR plus 0.70%), 3/17/37(1) | 16,952,233 |
| 16,750,713 |
|
Invitation Homes Trust, Series 2018-SFR2, Class B, VRN, 3.56%, (1-month LIBOR plus 1.08%), 6/17/37(1) | 10,525,000 |
| 10,460,151 |
|
Invitation Homes Trust, Series 2018-SFR3, Class A, VRN, 3.48%, (1-month LIBOR plus 1.00%), 7/17/37(1) | 16,261,365 |
| 16,258,139 |
|
MVW Owner Trust, Series 2014-1A, Class A SEQ, 2.25%, 9/22/31(1) | 1,309,980 |
| 1,295,476 |
|
MVW Owner Trust, Series 2015-1A, Class A SEQ, 2.52%, 12/20/32(1) | 1,262,721 |
| 1,250,089 |
|
MVW Owner Trust, Series 2016-1A, Class A SEQ, 2.25%, 12/20/33(1) | 2,371,897 |
| 2,331,794 |
|
MVW Owner Trust, Series 2017-1A, Class A SEQ, 2.42%, 12/20/34(1) | 6,130,715 |
| 6,018,493 |
|
MVW Owner Trust, Series 2018-1A, Class A SEQ, 3.45%, 1/21/36(1) | 8,866,801 |
| 8,999,890 |
|
Progress Residential Trust, Series 2016-SFR2, Class A SEQ, VRN, 3.88%, (1-month LIBOR plus 1.40%), 1/17/34(1) | 4,870,196 |
| 4,885,498 |
|
Progress Residential Trust, Series 2018-SFR1, Class A SEQ, 3.26%, 3/17/35(1) | 8,875,000 |
| 8,890,283 |
|
Progress Residential Trust, Series 2018-SFR3, Class A SEQ, 3.88%, 10/17/35(1) | 7,000,000 |
| 7,206,787 |
|
Sierra Timeshare Conduit Receivables Funding LLC, Series 2017-1A, Class A SEQ, 2.91%, 3/20/34(1) | 1,505,105 |
| 1,494,457 |
|
Sierra Timeshare Receivables Funding LLC, Series 2015-1A, Class A SEQ, 2.40%, 3/22/32(1) | 804,921 |
| 801,536 |
|
Sierra Timeshare Receivables Funding LLC, Series 2016-1A, Class A SEQ, 3.08%, 3/21/33(1) | 1,942,785 |
| 1,940,116 |
|
Sierra Timeshare Receivables Funding LLC, Series 2018-2A, Class A SEQ, 3.50%, 6/20/35(1) | 5,150,243 |
| 5,216,679 |
|
Towd Point Mortgage Trust, Series 2016-1, Class A1, VRN, 3.50%, 2/25/55(1) | 2,154,872 |
| 2,164,667 |
|
Towd Point Mortgage Trust, Series 2017-2, Class A1, VRN, 2.75%, 4/25/57(1) | 3,911,239 |
| 3,876,322 |
|
Towd Point Mortgage Trust, Series 2017-6, Class A1, VRN, 2.75%, 10/25/57(1) | 7,231,993 |
| 7,105,545 |
|
Towd Point Mortgage Trust, Series 2018-4, Class A1, VRN, 3.00%, 6/25/58(1) | 2,263,904 |
| 2,245,386 |
|
VSE VOI Mortgage LLC, Series 2016-A, Class A SEQ, 2.54%, 7/20/33(1) | 4,109,280 |
| 4,065,677 |
|
TOTAL ASSET-BACKED SECURITIES
(Cost $157,977,104) | | 157,842,521 |
|
| | | |
| | | |
| | | |
|
| | | | | | |
| | Principal Amount | Value |
| COLLATERALIZED MORTGAGE OBLIGATIONS — 5.0% | | |
| Private Sponsor Collateralized Mortgage Obligations — 3.8% | | |
| Adjustable Rate Mortgage Trust, Series 2004-4, Class 4A1, VRN, 4.33%, 3/25/35 | $ | 1,493,290 |
| $ | 1,513,285 |
|
Agate Bay Mortgage Loan Trust, Series 2014-3, Class A2, VRN, 3.50%, 11/25/44(1) | 1,778,807 |
| 1,768,522 |
|
Agate Bay Mortgage Loan Trust, Series 2016-1, Class A3, VRN, 3.50%, 12/25/45(1) | 2,723,840 |
| 2,719,551 |
|
Agate Bay Mortgage Loan Trust, Series 2016-2, Class A3, VRN, 3.50%, 3/25/46(1) | 2,354,323 |
| 2,352,858 |
|
Agate Bay Mortgage Trust, Series 2016-3, Class A3, VRN, 3.50%, 8/25/46(1) | 3,833,939 |
| 3,848,328 |
|
| Banc of America Mortgage Trust, Series 2004-E, Class 2A6 SEQ, VRN, 4.39%, 6/25/34 | 1,451,385 |
| 1,453,419 |
|
| Bear Stearns Adjustable Rate Mortgage Trust, Series 2004-12, Class 2A1, VRN, 4.34%, 2/25/35 | 269,733 |
| 273,161 |
|
| Bear Stearns Adjustable Rate Mortgage Trust, Series 2004-8, Class 2A1, VRN, 4.23%, 11/25/34 | 892,997 |
| 872,620 |
|
| Citicorp Mortgage Securities Trust, Series 2007-8, Class 1A3, 6.00%, 9/25/37 | 141,432 |
| 148,827 |
|
| Citigroup Mortgage Loan Trust, Inc., Series 2004-UST1, Class A4, VRN, 4.45%, 8/25/34 | 700,685 |
| 685,438 |
|
| Citigroup Mortgage Loan Trust, Inc., Series 2004-UST1, Class A5, VRN, 4.43%, 8/25/34 | 2,459,357 |
| 2,451,479 |
|
| Citigroup Mortgage Loan Trust, Inc., Series 2005-4, Class A, VRN, 4.48%, 8/25/35 | 161,539 |
| 163,976 |
|
| Citigroup Mortgage Loan Trust, Inc., Series 2005-6, Class A2, VRN, 4.24%, (1-year H15T1Y plus 2.15%), 9/25/35 | 1,525,279 |
| 1,551,197 |
|
| Countrywide Home Loan Mortgage Pass-Through Trust, Series 2004-5, Class 2A4, 5.50%, 5/25/34 | 104,107 |
| 105,466 |
|
| Countrywide Home Loan Mortgage Pass-Through Trust, Series 2005-17, Class 1A11, 5.50%, 9/25/35 | 8,335 |
| 8,122 |
|
| Credit Suisse First Boston Mortgage-Backed Trust, Series 2004-AR6, Class 2A1, VRN, 4.21%, 10/25/34 | 228,244 |
| 229,385 |
|
Credit Suisse Mortgage Trust, Series 2017-HL2, Class A3 SEQ, VRN, 3.50%, 10/25/47(1) | 2,759,080 |
| 2,771,258 |
|
| First Horizon Alternative Mortgage Securities Trust, Series 2004-AA4, Class A1, VRN, 4.37%, 10/25/34 | 1,324,517 |
| 1,316,337 |
|
| First Horizon Mortgage Pass-Through Trust, Series 2005-AR3, Class 4A1, VRN, 4.39%, 8/25/35 | 377,114 |
| 380,372 |
|
| GSR Mortgage Loan Trust, Series 2004-7, Class 3A1, VRN, 3.84%, 6/25/34 | 370,682 |
| 367,775 |
|
| GSR Mortgage Loan Trust, Series 2004-AR5, Class 3A3, VRN, 4.44%, 5/25/34 | 1,147,458 |
| 1,176,355 |
|
| GSR Mortgage Loan Trust, Series 2005-AR1, Class 3A1, VRN, 4.02%, 1/25/35 | 1,125,885 |
| 1,116,161 |
|
| GSR Mortgage Loan Trust, Series 2005-AR6, Class 2A1, VRN, 4.52%, 9/25/35 | 1,248,374 |
| 1,276,730 |
|
| GSR Mortgage Loan Trust, Series 2005-AR6, Class 3A1, VRN, 4.39%, 9/25/35 | 1,830,737 |
| 1,856,272 |
|
| GSR Mortgage Loan Trust, Series 2005-AR6, Class 4A5, VRN, 4.41%, 9/25/35 | 1,193,783 |
| 1,210,177 |
|
| JPMorgan Mortgage Trust, Series 2005-A4, Class 1A1, VRN, 4.33%, 7/25/35 | 122,631 |
| 123,611 |
|
| JPMorgan Mortgage Trust, Series 2005-A6, Class 7A1, VRN, 4.32%, 8/25/35 | 241,107 |
| 234,071 |
|
|
| | | | | | |
| | Principal Amount | Value |
| JPMorgan Mortgage Trust, Series 2006-A3, Class 7A1, VRN, 4.69%, 4/25/35 | $ | 265,173 |
| $ | 269,526 |
|
JPMorgan Mortgage Trust, Series 2013-1, Class 2A2 SEQ, VRN, 2.50%, 3/25/43(1) | 658,087 |
| 648,405 |
|
JPMorgan Mortgage Trust, Series 2018-6, Class 1A4 SEQ, VRN, 3.50%, 12/25/48(1) | 5,357,556 |
| 5,386,725 |
|
| MASTR Adjustable Rate Mortgages Trust, Series 2004-13, Class 3A7, VRN, 4.47%, 11/21/34 | 1,076,949 |
| 1,111,602 |
|
| Merrill Lynch Mortgage Investors Trust, Series 2005-3, Class 2A, VRN, 4.36%, 11/25/35 | 2,045,972 |
| 2,037,019 |
|
| Merrill Lynch Mortgage Investors Trust, Series 2005-A2, Class A2, VRN, 4.45%, 2/25/35 | 937,178 |
| 971,635 |
|
Mill City Mortgage Loan Trust, Series 2017-2, Class A1, VRN, 2.75%, 7/25/59(1) | 3,892,045 |
| 3,855,520 |
|
New Residential Mortgage Loan Trust, Series 2017-1A, Class A1, VRN, 4.00%, 2/25/57(1) | 2,156,776 |
| 2,203,100 |
|
New Residential Mortgage Loan Trust, Series 2017-2A, Class A3, VRN, 4.00%, 3/25/57(1) | 3,610,366 |
| 3,705,152 |
|
New Residential Mortgage Loan Trust, Series 2017-5A, Class A1, VRN, 3.99%, (1-month LIBOR plus 1.50%), 6/25/57(1) | 4,913,154 |
| 5,002,750 |
|
Sequoia Mortgage Trust, Series 2017-7, Class A4 SEQ, VRN, 3.50%, 10/25/47(1) | 3,963,073 |
| 3,975,612 |
|
Sequoia Mortgage Trust, Series 2017-CH1, Class A1, VRN, 4.00%, 8/25/47(1) | 4,450,824 |
| 4,536,015 |
|
Sequoia Mortgage Trust, Series 2017-CH2, Class A10 SEQ, VRN, 4.00%, 12/25/47(1) | 5,004,563 |
| 5,063,790 |
|
Sequoia Mortgage Trust, Series 2018-7, Class A4, VRN, 4.00%, 9/25/48(1) | 4,595,513 |
| 4,688,844 |
|
Sequoia Mortgage Trust, Series 2018-CH2, Class A12 SEQ, VRN, 4.00%, 6/25/48(1) | 3,695,837 |
| 3,753,483 |
|
Sofi Mortgage Trust, Series 2016-1A, Class 1A4 SEQ, VRN, 3.00%, 11/25/46(1) | 2,671,204 |
| 2,610,917 |
|
| Structured Adjustable Rate Mortgage Loan Trust, Series 2004-8, Class 2A1, VRN, 4.47%, 7/25/34 | 563,350 |
| 567,723 |
|
| Thornburg Mortgage Securities Trust, Series 2004-3, Class A, VRN, 3.23%, (1-month LIBOR plus 0.74%), 9/25/44 | 2,406,675 |
| 2,376,833 |
|
| WaMu Mortgage Pass-Through Certificates, Series 2003-S11, Class 3A5, 5.95%, 11/25/33 | 71,942 |
| 72,148 |
|
| WaMu Mortgage Pass-Through Certificates, Series 2005-AR3, Class A1, VRN, 4.47%, 3/25/35 | 2,416,197 |
| 2,385,606 |
|
| Wells Fargo Mortgage-Backed Securities Trust, Series 2004-A, Class A1, VRN, 5.01%, 2/25/34 | 70,735 |
| 73,702 |
|
| Wells Fargo Mortgage-Backed Securities Trust, Series 2004-H, Class A1, VRN, 4.44%, 6/25/34 | 383,548 |
| 393,646 |
|
| Wells Fargo Mortgage-Backed Securities Trust, Series 2004-S, Class A1, VRN, 4.62%, 9/25/34 | 1,052,481 |
| 1,084,019 |
|
| Wells Fargo Mortgage-Backed Securities Trust, Series 2004-Z, Class 2A2, VRN, 4.98%, 12/25/34 | 872,444 |
| 892,450 |
|
| Wells Fargo Mortgage-Backed Securities Trust, Series 2005-17, Class 1A1, 5.50%, 1/25/36 | 190,397 |
| 187,531 |
|
| Wells Fargo Mortgage-Backed Securities Trust, Series 2005-9, Class 1A11, 5.50%, 10/25/35 | 470,910 |
| 477,157 |
|
| Wells Fargo Mortgage-Backed Securities Trust, Series 2005-9, Class 2A6, 5.25%, 10/25/35 | 1,311,671 |
| 1,342,768 |
|
| Wells Fargo Mortgage-Backed Securities Trust, Series 2005-AR10, Class 1A1, VRN, 4.73%, 6/25/35 | 667,938 |
| 707,643 |
|
| Wells Fargo Mortgage-Backed Securities Trust, Series 2005-AR12, Class 2A6, VRN, 4.88%, 6/25/35 | 801,138 |
| 825,464 |
|
|
| | | | | | |
| | Principal Amount | Value |
| Wells Fargo Mortgage-Backed Securities Trust, Series 2005-AR13, Class A1, SEQ, VRN, 2.79%, (1-month LIBOR plus 0.30%), 5/25/35 | $ | 1,029,702 |
| $ | 985,974 |
|
| Wells Fargo Mortgage-Backed Securities Trust, Series 2005-AR16, Class 3A2, VRN, 4.97%, 3/25/35 | 982,045 |
| 1,003,254 |
|
| Wells Fargo Mortgage-Backed Securities Trust, Series 2005-AR7, Class 1A1, VRN, 4.44%, 5/25/35 | 660,066 |
| 679,513 |
|
| Wells Fargo Mortgage-Backed Securities Trust, Series 2006-10, Class A4 SEQ, 6.00%, 8/25/36 | 344,662 |
| 343,040 |
|
| Wells Fargo Mortgage-Backed Securities Trust, Series 2006-13, Class A5, 6.00%, 10/25/36 | 646,624 |
| 639,708 |
|
| Wells Fargo Mortgage-Backed Securities Trust, Series 2006-9, Class 1A9 SEQ, 6.00%, 8/25/36 | 207,696 |
| 205,471 |
|
| Wells Fargo Mortgage-Backed Securities Trust, Series 2007-13, Class A1, 6.00%, 9/25/37 | 157,833 |
| 157,357 |
|
| Wells Fargo Mortgage-Backed Securities Trust, Series 2007-14, Class 2A2, 5.50%, 10/25/22 | 115,745 |
| 117,685 |
|
| Wells Fargo Mortgage-Backed Securities Trust, Series 2007-16, Class 1A1, 6.00%, 12/28/37 | 124,657 |
| 123,998 |
|
| Wells Fargo Mortgage-Backed Securities Trust, Series 2007-AR10, Class 1A1, VRN, 4.91%, 1/25/38 | 152,518 |
| 147,146 |
|
| Wells Fargo Mortgage-Backed Securities Trust, Series 2008-1, Class 4A1, 5.75%, 2/25/38 | 502,878 |
| 529,813 |
|
| | | 98,114,497 |
|
| U.S. Government Agency Collateralized Mortgage Obligations — 1.2% | |
| FHLMC, Series 2016-DNA3, Class M2, VRN, 4.49%, (1-month LIBOR plus 2.00%), 12/25/28 | 2,775,286 |
| 2,798,550 |
|
| FHLMC, Series 2016-DNA4, Class M2, VRN, 3.79%, (1-month LIBOR plus 1.30%), 3/25/29 | 2,935,496 |
| 2,950,742 |
|
| FHLMC, Series 2016-HQA3, Class M2, VRN, 3.84%, (1-month LIBOR plus 1.35%), 3/25/29 | 3,535,217 |
| 3,567,594 |
|
| FHLMC, Series 2017-DNA2, Class M1, VRN, 3.69%, (1-month LIBOR plus 1.20%), 10/25/29 | 4,132,520 |
| 4,156,282 |
|
| FHLMC, Series 2017-HQA2, Class M1, VRN, 3.29%, (1-month LIBOR plus 0.80%), 12/25/29 | 275,897 |
| 276,069 |
|
| FHLMC, Series 3397, Class GF, VRN, 2.98%, (1-month LIBOR plus 0.50%), 12/15/37 | 1,589,531 |
| 1,592,870 |
|
| FHLMC, Series KF29, Class A, VRN, 2.85%, (1-month LIBOR plus 0.36%), 2/25/24 | 1,625,130 |
| 1,621,818 |
|
| FNMA, Series 1989-35, Class G SEQ, 9.50%, 7/25/19 | 4 |
| 4 |
|
| FNMA, Series 2014-C02, Class 1M2, VRN, 5.09%, (1-month LIBOR plus 2.60%), 5/25/24 | 2,936,000 |
| 3,080,527 |
|
| FNMA, Series 2014-C02, Class 2M2, VRN, 5.09%, (1-month LIBOR plus 2.60%), 5/25/24 | 2,785,895 |
| 2,893,833 |
|
| FNMA, Series 2016-C04, Class 1M1, VRN, 3.94%, (1-month LIBOR plus 1.45%), 1/25/29 | 1,463,915 |
| 1,469,700 |
|
| FNMA, Series 2016-C05, Class 2M1, VRN, 3.84%, (1-month LIBOR plus 1.35%), 1/25/29 | 383,909 |
| 384,274 |
|
| FNMA, Series 2017-C01, Class 1M1, VRN, 3.79%, (1-month LIBOR plus 1.30%), 7/25/29 | 2,507,466 |
| 2,517,972 |
|
| FNMA, Series 2017-C03, Class 1M1, VRN, 3.44%, (1-month LIBOR plus 0.95%), 10/25/29 | 807,241 |
| 808,944 |
|
| FNMA, Series 2018-C02, Class 2M1, VRN, 3.14%, (1-month LIBOR plus 0.65%), 8/25/30 | 3,329,863 |
| 3,329,126 |
|
| | | 31,448,305 |
|
TOTAL COLLATERALIZED MORTGAGE OBLIGATIONS
(Cost $129,269,025) | | 129,562,802 |
|
|
| | | | | | |
| | Principal Amount | Value |
| COMMERCIAL MORTGAGE-BACKED SECURITIES — 4.9% | | |
Bank of America Merrill Lynch Commercial Mortgage Securities Trust, Series 2015-200P, Class B, 3.49%, 4/14/33(1) | $ | 5,000,000 |
| $ | 5,052,792 |
|
BB-UBS Trust, Series 2012-SHOW, Class A SEQ, 3.43%, 11/5/36(1) | 5,000,000 |
| 5,090,684 |
|
| BENCHMARK Mortgage Trust, Series 2018-B1, Class AM, VRN, 3.88%, 1/15/51 | 5,789,000 |
| 5,983,156 |
|
BX Trust, Series 2018-MCSF, Class A, VRN, 3.06%, (1-month LIBOR plus 0.58%), 4/15/35(1) | 5,700,000 |
| 5,620,297 |
|
| Commercial Mortgage Pass-Through Certificates, Series 2014-CR15, Class AM, VRN, 4.43%, 2/10/47 | 5,000,000 |
| 5,285,795 |
|
| Commercial Mortgage Pass-Through Certificates, Series 2014-LC17, Class AM, VRN, 4.19%, 10/10/47 | 5,500,000 |
| 5,758,089 |
|
| Commercial Mortgage Pass-Through Certificates, Series 2014-UBS5, Class AM, VRN, 4.19%, 9/10/47 | 7,625,000 |
| 7,969,356 |
|
| Commercial Mortgage Pass-Through Certificates, Series 2015-CR22, Class AM, VRN, 3.60%, 3/10/48 | 9,000,000 |
| 9,066,407 |
|
| Commercial Mortgage Pass-Through Certificates, Series 2016-CR28, Class B, VRN, 4.65%, 2/10/49 | 3,000,000 |
| 3,207,249 |
|
| Commercial Mortgage Trust, Series 2015-LC21, Class AM, VRN, 4.04%, 7/10/48 | 5,000,000 |
| 5,203,987 |
|
Commercial Mortgage Trust, Series 2017-PANW, Class A SEQ, 3.24%, 10/10/29(1) | 5,000,000 |
| 5,047,964 |
|
Core Industrial Trust, Series 2015-CALW, Class C, 3.56%, 2/10/34(1) | 4,000,000 |
| 4,036,827 |
|
Core Industrial Trust, Series 2015-WEST, Class A SEQ, 3.29%, 2/10/37(1) | 4,907,126 |
| 4,986,893 |
|
DBCG Mortgage Trust, Series 2017-BBG, Class A, VRN, 3.18%, (1-month LIBOR plus 0.70%), 6/15/34(1) | 7,400,000 |
| 7,377,581 |
|
| GS Mortgage Securities Trust, Series 2016-GS2, Class B, VRN, 3.76%, 5/10/49 | 7,500,000 |
| 7,632,231 |
|
| JPMBB Commercial Mortgage Securities Trust, Series 2014-C21, Class B, VRN, 4.34%, 8/15/47 | 6,250,000 |
| 6,461,428 |
|
| JPMDB Commercial Mortgage Securities Trust, Series 2017-C5, Class A4 SEQ, 3.41%, 3/15/50 | 5,000,000 |
| 5,105,032 |
|
| JPMorgan Chase Commercial Mortgage Securities Trust, Series 2016-JP2, Class A4 SEQ, 2.82%, 8/15/49 | 5,300,000 |
| 5,208,865 |
|
| JPMorgan Chase Commercial Mortgage Securities Trust, Series 2016-JP3, Class AS, 3.14%, 8/15/49 | 6,300,000 |
| 6,206,427 |
|
| Morgan Stanley Bank of America Merrill Lynch Trust, Series 2017-C34, Class A3 SEQ, 3.28%, 11/15/52 | 6,400,000 |
| 6,443,197 |
|
Morgan Stanley Capital I Trust, Series 2014-CPT, Class C, VRN, 3.45%, 7/13/29(1) | 2,710,000 |
| 2,725,667 |
|
| UBS Commercial Mortgage Trust, Series 2017-C1, Class A3 SEQ, 3.20%, 6/15/50 | 6,200,000 |
| 6,212,894 |
|
TOTAL COMMERCIAL MORTGAGE-BACKED SECURITIES
(Cost $125,611,321) | | 125,682,818 |
|
| COLLATERALIZED LOAN OBLIGATIONS — 4.1% | | |
ARES LI CLO Ltd., Series 2019-51A, Class B, VRN, 4.35%, (3-month LIBOR plus 1.85%), 4/15/31(1) | 5,900,000 |
| 5,906,325 |
|
Bean Creek CLO Ltd., Series 2015-1A, Class AR, VRN, 3.78%, (3-month LIBOR plus 1.02%), 4/20/31(1) | 6,275,000 |
| 6,194,410 |
|
Carlyle Global Market Strategies CLO Ltd., Series 2014-5A, Class A1RR, VRN, 3.93%, (3-month LIBOR plus 1.14%), 7/15/31(1) | 4,600,000 |
| 4,559,964 |
|
CBAM 2019-9 Ltd., Series 2019-9A, Class A, VRN, 4.01%, (3-month LIBOR plus 1.28%), 2/12/30(1) | 7,675,000 |
| 7,669,174 |
|
CBAM 2019-9 Ltd., Series 2019-9A, Class B1, VRN, 4.63%, (3-month LIBOR plus 1.90%), 2/12/30(1) | 4,400,000 |
| 4,400,245 |
|
|
| | | | | | |
| | Principal Amount | Value |
CBAM Ltd., Series 2018-5A, Class A, VRN, 3.79%, (3-month LIBOR plus 1.02%), 4/17/31(1) | $ | 4,500,000 |
| $ | 4,426,011 |
|
CIFC Funding 2019-I Ltd., Series 2019-1A, Class B, VRN, 4.43%, (3-month LIBOR plus 1.80%), 4/20/32(1) | 7,600,000 |
| 7,594,498 |
|
| CIFC Funding Ltd., Series 2013-3RA, Class A1, VRN, 3.76%, (3-month LIBOR plus 0.98%), 4/24/31 | 3,200,000 |
| 3,148,272 |
|
CIFC Funding Ltd., Series 2015-1A, Class ARR, VRN, 3.87%, (3-month LIBOR plus 1.11%), 1/22/31(1) | 2,225,000 |
| 2,204,392 |
|
Dryden 41 Senior Loan Fund, Series 2015-41A, Class AR, VRN, 3.76%, (3-month LIBOR plus 0.97%), 4/15/31(1) | 3,300,000 |
| 3,243,886 |
|
| Dryden 64 CLO Ltd., Series 2018-64A, Class A, VRN, 3.75%, (3-month LIBOR plus 0.97%), 4/18/31 | 2,550,000 |
| 2,506,662 |
|
Dryden 71 CLO Ltd., Series 2018-71A, Class B, VRN, 4.59%, (3-month LIBOR plus 1.90%), 1/15/29(1) | 4,500,000 |
| 4,507,195 |
|
Goldentree Loan Opportunities X Ltd., Series 2015-10A, Class AR, VRN, 3.88%, (3-month LIBOR plus 1.12%), 7/20/31(1) | 4,000,000 |
| 3,967,626 |
|
KKR CLO Ltd., Series 11, Class AR, VRN, 3.97%, (3-month LIBOR plus 1.18%), 1/15/31(1) | 4,500,000 |
| 4,466,137 |
|
KKR CLO Ltd., Series 22A, Class A, VRN, 3.91%, (3-month LIBOR plus 1.15%), 7/20/31(1) | 4,500,000 |
| 4,466,533 |
|
LCM XIV LP, Series 14A, Class AR, VRN, 3.82%, (3-month LIBOR plus 1.04%), 7/20/31(1) | 2,275,000 |
| 2,247,530 |
|
LoanCore Issuer Ltd., Series 2018-CRE1, Class AS, VRN, 3.98%, (1-month LIBOR plus 1.50%), 5/15/28(1) | 6,000,000 |
| 6,007,483 |
|
Madison Park Funding XIII Ltd., Series 2014-13A, Class AR2, VRN, 3.71%, (3-month LIBOR plus 0.95%), 4/19/30(1) | 4,500,000 |
| 4,466,477 |
|
Magnetite VIII Ltd., Series 2014-8A, Class AR2, VRN, 3.77%, (3-month LIBOR plus 0.98%), 4/15/31(1) | 5,875,000 |
| 5,808,844 |
|
Sounds Point CLO IV-R Ltd., Series 2013-3RA, Class A, VRN, 3.93%, (3-month LIBOR plus 1.15%), 4/18/31(1) | 5,750,000 |
| 5,694,880 |
|
Treman Park CLO Ltd., Series 2015-1A, Class ARR, VRN, 3.83%, (3-month LIBOR plus 1.07%), 10/20/28(1) | 5,000,000 |
| 4,993,214 |
|
Voya CLO Ltd., Series 2013-2A, Class A1R, VRN, 3.74%, (3-month LIBOR plus 0.97%), 4/25/31(1) | 3,000,000 |
| 2,950,314 |
|
Voya CLO Ltd., Series 2013-3A, Class A1RR, VRN, 3.93%, (3-month LIBOR plus 1.15%), 10/18/31(1) | 2,575,000 |
| 2,552,630 |
|
TOTAL COLLATERALIZED LOAN OBLIGATIONS
(Cost $104,699,718) | | 103,982,702 |
|
BANK LOAN OBLIGATIONS(3) — 1.3% | | |
| Diversified Telecommunication Services — 0.3% | | |
| Level 3 Financing Inc., 2017 Term Loan B, 4.74%, (3-month LIBOR plus 2.25%), 2/22/24 | 3,700,000 |
| 3,661,835 |
|
| Zayo Group, LLC, 2017 Incremental Term Loan, 4.75%, (1-month LIBOR plus 2.25%), 1/19/24 | 3,950,000 |
| 3,933,805 |
|
| | | 7,595,640 |
|
| Food Products — 0.1% | | |
| Post Holdings Inc., 2017 Series A Incremental Term Loan, 4.49%, (1-month LIBOR plus 2.00%), 5/24/24 | 1,331,497 |
| 1,322,037 |
|
| Post Holdings Inc., 2017 Series A Incremental Term Loan, 4.49%, (1-month LIBOR plus 2.00%), 5/24/24 | 412,098 |
| 409,170 |
|
| | | 1,731,207 |
|
| Health Care Providers and Services — 0.2% | | |
| DaVita, Inc., Term Loan B, 5.25%, (1-month LIBOR plus 2.75%), 6/24/21 | 2,685,901 |
| 2,688,009 |
|
| | | |
|
| | | | | | |
| | Principal Amount | Value |
| HCA Inc., 2018 Term Loan B10, 4.50%, (1-month LIBOR plus 2.00%), 3/13/25 | $ | 3,242,599 |
| $ | 3,242,875 |
|
| | | 5,930,884 |
|
| Hotels, Restaurants and Leisure — 0.3% | | |
| Hilton Worldwide Finance, LLC, Term Loan B2, 4.24%, (1-month LIBOR plus 1.75%), 10/25/23 | 3,849,746 |
| 3,845,242 |
|
| MGM Growth Properties Operating Partnership LP, 2016 Term Loan B, 4.50%, (1-month LIBOR plus 2.00%), 3/21/25 | 4,331,184 |
| 4,278,993 |
|
| | | 8,124,235 |
|
| Independent Power and Renewable Electricity Producers — 0.2% | |
| NRG Energy, Inc., 2016 Term Loan B, 4.25%, (1-month LIBOR plus 1.75%), 6/30/23 | 4,763,265 |
| 4,714,823 |
|
| Media — 0.1% | | |
| Charter Communications Operating, LLC, 2017 Term Loan B, 4.50%, (1-month LIBOR plus 2.00%), 4/30/25 | 2,487,406 |
| 2,473,886 |
|
| Technology Hardware, Storage and Peripherals — 0.1% | | |
| Dell International LLC, 2017 Term Loan B, 4.50%, (1-month LIBOR plus 2.00%), 9/7/23 | 592,119 |
| 586,150 |
|
| Western Digital Corporation, 2018 Term Loan B4, 4.25%, (1-month LIBOR plus 1.75%), 4/29/23 | 2,374,828 |
| 2,316,443 |
|
| | | 2,902,593 |
|
TOTAL BANK LOAN OBLIGATIONS
(Cost $33,811,424) | | 33,473,268 |
|
| MUNICIPAL SECURITIES — 1.2% | | |
| Bay Area Toll Authority Rev., 6.92%, 4/1/40 | 980,000 |
| 1,364,199 |
|
| Dallas Area Rapid Transit Rev., 6.00%, 12/1/44 | 1,000,000 |
| 1,337,710 |
|
| Houston GO, 3.96%, 3/1/47 | 820,000 |
| 843,182 |
|
| Los Angeles Community College District GO, 6.75%, 8/1/49 | 1,330,000 |
| 2,013,434 |
|
| Los Angeles Department of Airports Rev., 6.58%, 5/15/39 | 1,075,000 |
| 1,390,781 |
|
| Metropolitan Transportation Authority Rev., 6.69%, 11/15/40 | 1,165,000 |
| 1,574,742 |
|
| Metropolitan Transportation Authority Rev., 6.81%, 11/15/40 | 470,000 |
| 641,691 |
|
| New Jersey Turnpike Authority Rev., 7.41%, 1/1/40 | 975,000 |
| 1,466,234 |
|
| New Jersey Turnpike Authority Rev., 7.10%, 1/1/41 | 480,000 |
| 700,723 |
|
| New York City GO, 6.27%, 12/1/37 | 335,000 |
| 445,741 |
|
| New York City Water & Sewer System Rev., 5.95%, 6/15/42 | 925,000 |
| 1,263,929 |
|
| Pennsylvania Turnpike Commission Rev., 5.56%, 12/1/49 | 420,000 |
| 544,593 |
|
| Port Authority of New York & New Jersey Rev., 4.93%, 10/1/51 | 400,000 |
| 483,500 |
|
| Port Authority of New York & New Jersey Rev., 4.46%, 10/1/62 | 500,000 |
| 561,260 |
|
| Rutgers The State University of New Jersey Rev., 5.67%, 5/1/40 | 675,000 |
| 838,141 |
|
| Sacramento Municipal Utility District Rev., 6.16%, 5/15/36 | 375,000 |
| 482,966 |
|
| San Antonio Electric & Gas Systems Rev., 5.99%, 2/1/39 | 280,000 |
| 374,069 |
|
| San Diego County Regional Airport Authority Rev., 5.59%, 7/1/43 | 750,000 |
| 827,708 |
|
| San Diego County Water Authority Rev., 6.14%, 5/1/49 | 460,000 |
| 635,669 |
|
| San Francisco Public Utilities Commission Water Rev., 6.00%, 11/1/40 | 1,100,000 |
| 1,390,840 |
|
| San Francisco Public Utilities Commission Water Rev., 6.95%, 11/1/50 | 765,000 |
| 1,119,601 |
|
| San Jose Redevelopment Agency Successor Agency Tax Allocation, 3.375%, 8/1/34 | 1,085,000 |
| 1,085,119 |
|
| Santa Clara Valley Transportation Authority Rev., 5.88%, 4/1/32 | 920,000 |
| 1,102,896 |
|
| State of California GO, 4.60%, 4/1/38 | 1,380,000 |
| 1,471,273 |
|
|
| | | | | | |
| | Principal Amount | Value |
| State of California GO, 7.55%, 4/1/39 | $ | 450,000 |
| $ | 684,257 |
|
| State of California GO, 7.30%, 10/1/39 | 1,210,000 |
| 1,752,891 |
|
| State of Illinois GO, 5.10%, 6/1/33 | 1,618,000 |
| 1,591,157 |
|
| State of Kansas Department of Transportation Rev., 4.60%, 9/1/35 | 925,000 |
| 1,040,967 |
|
| University of California Rev., 4.60%, 5/15/31 | 1,975,000 |
| 2,205,838 |
|
TOTAL MUNICIPAL SECURITIES
(Cost $27,735,186) | | 31,235,111 |
|
| SOVEREIGN GOVERNMENTS AND AGENCIES — 0.7% | | |
| Chile — 0.1% | | |
| Chile Government International Bond, 3.25%, 9/14/21 | 920,000 |
| 936,790 |
|
| Chile Government International Bond, 3.625%, 10/30/42 | 500,000 |
| 500,225 |
|
| | | 1,437,015 |
|
| Colombia — 0.1% | | |
| Colombia Government International Bond, 4.375%, 7/12/21 | 2,770,000 |
| 2,851,023 |
|
| Colombia Government International Bond, 6.125%, 1/18/41 | 820,000 |
| 970,888 |
|
| | | 3,821,911 |
|
Mexico† | | |
| Mexico Government International Bond, 4.15%, 3/28/27 | 18,000 |
| 18,328 |
|
| Panama — 0.1% | | |
| Panama Government International Bond, 7.125%, 1/29/26 | 1,400,000 |
| 1,713,250 |
|
| Peru — 0.1% | | |
| Peruvian Government International Bond, 6.55%, 3/14/37 | 730,000 |
| 986,412 |
|
| Peruvian Government International Bond, 5.625%, 11/18/50 | 1,240,000 |
| 1,594,020 |
|
| | | 2,580,432 |
|
| Philippines — 0.2% | | |
| Philippine Government International Bond, 4.00%, 1/15/21 | 1,590,000 |
| 1,623,748 |
|
| Philippine Government International Bond, 5.50%, 3/30/26 | 3,000,000 |
| 3,465,798 |
|
| Philippine Government International Bond, 6.375%, 10/23/34 | 730,000 |
| 974,923 |
|
| | | 6,064,469 |
|
| Poland — 0.1% | | |
| Republic of Poland Government International Bond, 3.00%, 3/17/23 | 1,050,000 |
| 1,057,959 |
|
| Republic of Poland Government International Bond, 5.125%, 4/21/21 | 450,000 |
| 472,158 |
|
| | | 1,530,117 |
|
Uruguay† | | |
| Uruguay Government International Bond, 4.375%, 10/27/27 | 820,000 |
| 866,432 |
|
| Uruguay Government International Bond, 4.125%, 11/20/45 | 340,000 |
| 333,200 |
|
| | | 1,199,632 |
|
TOTAL SOVEREIGN GOVERNMENTS AND AGENCIES
(Cost $17,828,238) | | 18,365,154 |
|
| U.S. GOVERNMENT AGENCY SECURITIES — 0.3% | | |
FNMA, 6.625%, 11/15/30 (Cost $6,223,363) | 5,000,000 |
| 6,899,549 |
|
TEMPORARY CASH INVESTMENTS(4) — 3.0% | | |
Bennington Stark Capital Co. LLC, 2.55%, 4/1/19 (LOC: Societe Generale SA)(1)(5) | 48,853,000 |
| 48,842,822 |
|
Societe Generale SA, 2.50%, 4/1/19(1)(5) | 28,000,000 |
| 27,994,384 |
|
|
| | | | | |
| | Shares | Value |
| Repurchase Agreement, BMO Capital Markets Corp., (collateralized by various U.S. Treasury obligations, 0.125% - 2.875%, 9/30/19 - 2/15/44, valued at $740,372), in a joint trading account at 2.35%, dated 3/29/19, due 4/1/19 (Delivery value $725,724) | | $ | 725,582 |
|
| Repurchase Agreement, Fixed Income Clearing Corp., (collateralized by various U.S. Treasury obligations, 2.75%, 6/30/25, valued at $124,137), at 1.25%, dated 3/29/19, due 4/1/19 (Delivery value $121,013) | | 121,000 |
|
| State Street Institutional U.S. Government Money Market Fund, Premier Class | 4,829 |
| 4,829 |
|
TOTAL TEMPORARY CASH INVESTMENTS
(Cost $77,704,411) | | 77,688,617 |
|
TOTAL INVESTMENT SECURITIES — 105.2%
(Cost $2,680,879,922) | | 2,703,570,955 |
|
OTHER ASSETS AND LIABILITIES(6) — (5.2)% | | (132,415,984 | ) |
| TOTAL NET ASSETS — 100.0% | | $ | 2,571,154,971 |
|
|
| | | | | | | | | | |
| FORWARD FOREIGN CURRENCY EXCHANGE CONTRACTS |
| Currency Purchased | Currency Sold | Counterparty | Settlement Date | Unrealized Appreciation
(Depreciation) |
| CLP | 193,401,407 |
| USD | 288,689 |
| Goldman Sachs & Co. | 6/19/19 | $ | (4,493 | ) |
| USD | 1,759,654 |
| HUF | 491,960,627 |
| UBS AG | 6/19/19 | 31,797 |
|
| USD | 2,261,244 |
| MXN | 44,635,816 |
| Morgan Stanley | 6/19/19 | (9,894 | ) |
| | | | | | | $ | 17,410 |
|
|
| | | | | | | | | | | | |
| FUTURES CONTRACTS PURCHASED |
| Reference Entity | Contracts | Expiration Date | Notional Amount | Underlying Contract Value | Unrealized Appreciation (Depreciation) |
| U.S. Treasury 10-Year Notes | 229 |
| June 2019 | $ | 22,900,000 |
| $ | 28,446,094 |
| $ | 364,453 |
|
| U.S. Treasury 10-Year Ultra Notes | 9 |
| June 2019 | $ | 900,000 |
| 1,195,031 |
| 22,620 |
|
| U.S. Treasury 2-Year Notes | 1,028 |
| June 2019 | $ | 205,600,000 |
| 219,060,375 |
| 739,562 |
|
| U.S. Treasury 5-Year Notes | 765 |
| June 2019 | $ | 76,500,000 |
| 88,608,516 |
| 874,607 |
|
| U.S. Treasury Long Bonds | 122 |
| June 2019 | $ | 12,200,000 |
| 18,258,062 |
| 369,351 |
|
| | | | | | $ | 355,568,078 |
| $ | 2,370,593 |
|
|
| | |
| NOTES TO SCHEDULE OF INVESTMENTS |
| CLP | - | Chilean Peso |
| FHLMC | - | Federal Home Loan Mortgage Corporation |
| FNMA | - | Federal National Mortgage Association |
| GNMA | - | Government National Mortgage Association |
| GO | - | General Obligation |
| H15T1Y | - | Constant Maturity U.S. Treasury Note Yield Curve Rate Index |
| HUF | - | Hungarian Forint |
| LIBOR | - | London Interbank Offered Rate |
| LOC | - | Letter of Credit |
| MTN | - | Medium Term Note |
| MXN | - | Mexican Peso |
| SEQ | - | Sequential Payer |
| TBA | - | To-Be-Announced. Security was purchased on a forward commitment basis with an approximate principal amount and maturity date. Actual principal amount and maturity date will be determined upon settlement. |
| USD | - | United States Dollar |
| VRN | - | Variable Rate Note. The rate adjusts periodically based upon the terms set forth in the security’s offering documents. The rate shown is effective at the period end and the reference rate and spread, if any, is indicated. |
† Category is less than 0.05% of total net assets.
| |
| (1) | Security was purchased pursuant to Rule 144A or Section 4(2) under the Securities Act of 1933 and may be sold in transactions exempt from registration, normally to qualified institutional investors. The aggregate value of these securities at the period end was $471,677,398, which represented 18.3% of total net assets. Of these securities, 1.0% of total net assets were deemed illiquid under policies approved by the Board of Trustees. |
| |
| (2) | Security, or a portion thereof, has been pledged at the custodian bank or with a broker for collateral requirements on forward commitments, forward foreign currency exchange contracts and futures contracts. At the period end, the aggregate value of securities pledged was $3,488,033. |
| |
| (3) | The interest rate on a bank loan obligation adjusts periodically based on a predetermined schedule. Rate shown is effective at period end. The maturity date on a bank loan obligation may be less than indicated as a result of contractual or optional prepayments. These prepayments cannot be predicted with certainty. |
| |
| (4) | Category includes collateral received at the custodian bank for collateral requirements on forward commitments. At the period end, the aggregate value of cash deposits received was $1,131,818. |
| |
| (5) | The rate indicated is the yield to maturity at purchase. |
| |
| (6) | Amount relates primarily to payable for investments purchased, but not settled, at period end. |
See Notes to Financial Statements.
|
|
| Statement of Assets and Liabilities |
|
| | | |
| MARCH 31, 2019 | |
| Assets | |
| Investment securities, at value (cost of $2,680,879,922) | $ | 2,703,570,955 |
|
| Cash | 11,163 |
|
| Receivable for investments sold | 27,084,993 |
|
| Unrealized appreciation on forward foreign currency exchange contracts | 31,797 |
|
| Interest receivable | 15,183,427 |
|
| | 2,745,882,335 |
|
| | |
| Liabilities | |
| Payable for collateral received for forward commitments | 1,131,818 |
|
| Payable for investments purchased | 156,768,602 |
|
| Payable for capital shares redeemed | 16,276,584 |
|
| Payable for variation margin on futures contracts | 535,973 |
|
| Unrealized depreciation on forward foreign currency exchange contracts | 14,387 |
|
| | 174,727,364 |
|
| | |
| Net Assets | $ | 2,571,154,971 |
|
| | |
| G Class Capital Shares | |
| Shares outstanding (unlimited number of shares authorized) | 242,039,404 |
|
| Net Asset Value Per Share | $ | 10.62 |
|
| | |
| Net Assets Consist of: | |
| Capital paid in | $ | 2,615,479,832 |
|
| Distributable earnings | (44,324,861 | ) |
| | $ | 2,571,154,971 |
|
See Notes to Financial Statements.
|
| | | |
| YEAR ENDED MARCH 31, 2019 |
|
| Investment Income (Loss) | |
| Income: | |
| Interest | $ | 93,579,231 |
|
| | |
| Expenses: | |
| Management fees | 9,545,563 |
|
| Trustees' fees and expenses | 196,074 |
|
| Other expenses | 45,797 |
|
| | 9,787,434 |
|
| Fees waived | (9,545,563 | ) |
| | 241,871 |
|
| | |
| Net investment income (loss) | 93,337,360 |
|
| | |
| Realized and Unrealized Gain (Loss) | |
| Net realized gain (loss) on: | |
| Investment transactions | (67,932,279 | ) |
| Forward foreign currency exchange contract transactions | 28,814,811 |
|
| Futures contract transactions | (12,469,770 | ) |
| Swap agreement transactions | 1,356,815 |
|
| Foreign currency translation transactions | (1,244,153 | ) |
| | (51,474,576 | ) |
| | |
| Change in net unrealized appreciation (depreciation) on: | |
| Investments | 44,873,453 |
|
| Forward foreign currency exchange contracts | 3,049,917 |
|
| Futures contracts | 5,626,488 |
|
| Swap agreements | (165,592 | ) |
| Translation of assets and liabilities in foreign currencies | (57,294 | ) |
| | 53,326,972 |
|
| | |
| Net realized and unrealized gain (loss) | 1,852,396 |
|
| | |
| Net Increase (Decrease) in Net Assets Resulting from Operations | $ | 95,189,756 |
|
See Notes to Financial Statements.
|
|
| Statement of Changes in Net Assets |
|
| | | | | | |
| YEARS ENDED MARCH 31, 2019 AND MARCH 31, 2018 |
| Increase (Decrease) in Net Assets | March 31, 2019 | March 31, 2018 |
| Operations | | |
| Net investment income (loss) | $ | 93,337,360 |
| $ | 83,805,951 |
|
| Net realized gain (loss) | (51,474,576 | ) | (15,558,575 | ) |
| Change in net unrealized appreciation (depreciation) | 53,326,972 |
| (28,803,118 | ) |
| Net increase (decrease) in net assets resulting from operations | 95,189,756 |
| 39,444,258 |
|
| | | |
| Distributions to Shareholders | | |
| From earnings: | | |
| G Class | (82,373,652 | ) | (81,681,648 | ) |
| R6 Class | — |
| (2,572,468 | ) |
| Decrease in net assets from distributions | (82,373,652 | ) | (84,254,116 | ) |
| | | |
| Capital Share Transactions | | |
| Net increase (decrease) in net assets from capital share transactions (Note 5) | (476,180,770 | ) | 22,307,893 |
|
| | | |
| Net increase (decrease) in net assets | (463,364,666 | ) | (22,501,965 | ) |
| | | |
| Net Assets | | |
| Beginning of period | 3,034,519,637 |
| 3,057,021,602 |
|
| End of period | $ | 2,571,154,971 |
| $ | 3,034,519,637 |
|
See Notes to Financial Statements.
|
|
Notes to Financial Statements |
MARCH 31, 2019
1. Organization
American Century Investment Trust (the trust) is registered under the Investment Company Act of 1940, as amended (the 1940 Act), as an open-end management investment company and is organized as a Massachusetts business trust. NT Diversified Bond Fund (the fund) is one fund in a series issued by the trust. The fund’s investment objective is to seek a high level of income by investing in non-money market debt securities. The fund is not permitted to invest in securities issued by companies assigned the Global Industry Classification Standard or the Bloomberg Industry Classification Standard for the tobacco industry. The fund offers the G Class. On July 31, 2017, all outstanding R6 Class shares were converted to G Class shares and the fund discontinued offering the R6 Class.
2. Significant Accounting Policies
The following is a summary of significant accounting policies consistently followed by the fund in preparation of its financial statements. The fund is an investment company and follows accounting and reporting guidance in accordance with accounting principles generally accepted in the United States of America. This may require management to make certain estimates and assumptions at the date of the financial statements. Actual results could differ from these estimates. Management evaluated the impact of events or transactions occurring through the date the financial statements were issued that would merit recognition or disclosure.
Investment Valuations — The fund determines the fair value of its investments and computes its net asset value per share at the close of regular trading (usually 4 p.m. Eastern time) on the New York Stock Exchange (NYSE) on each day the NYSE is open. The Board of Trustees has adopted valuation policies and procedures to guide the investment advisor in the fund’s investment valuation process and to provide methodologies for the oversight of the fund’s pricing function.
Fixed income securities are valued at the evaluated mean as provided by independent pricing services or at the mean of the most recent bid and asked prices as provided by investment dealers. Corporate bonds, U.S. Treasury and Government Agency securities, convertible bonds, bank loan obligations, municipal securities, and sovereign governments and agencies are valued using market models that consider trade data, quotations from dealers and active market makers, relevant yield curve and spread data, creditworthiness, trade data or market information on comparable securities, and other relevant security specific information. Mortgage-related and asset-backed securities are valued based on models that consider trade data, prepayment and default projections, benchmark yield and spread data and estimated cash flows of each tranche of the issuer. Collateralized loan obligations are valued based on discounted cash flow models that consider trade and economic data, prepayment assumptions and default projections. Commercial paper is valued using a curve-based approach that considers money market rates for specific instruments, programs, currencies and maturity points from a variety of active market makers. Fixed income securities initially expressed in local currencies are translated into U.S. dollars at the mean of the appropriate currency exchange rate at the close of the NYSE as provided by an independent pricing service.
Open-end management investment companies are valued at the reported net asset value per share. Repurchase agreements are valued at cost, which approximates fair value. Exchange-traded futures contracts are valued at the settlement price as provided by the appropriate exchange. Swap agreements are valued at an evaluated mean as provided by independent pricing services or independent brokers. Forward foreign currency exchange contracts are valued at the mean of the appropriate forward exchange rate at the close of the NYSE as provided by an independent pricing service. Investments initially expressed in local currencies are translated into U.S. dollars at the mean of the appropriate currency exchange rate at the close of the NYSE as provided by an independent pricing service.
If the fund determines that the market price for an investment is not readily available or the valuation methods mentioned above do not reflect an investment’s fair value, such investment is valued as determined in good faith by the Board of Trustees or its delegate, in accordance with policies and procedures adopted by the Board of Trustees. In its determination of fair value, the fund may review several factors including, but not limited to, market information regarding the specific investment or comparable investments and correlation with other investment types, futures indices or general market indicators. Circumstances that may cause the
fund to use these procedures to value an investment include, but are not limited to: an investment has been declared in default or is distressed; trading in a security has been suspended during the trading day or a security is not actively trading on its principal exchange; prices received from a regular pricing source are deemed unreliable; or there is a foreign market holiday and no trading occurred.
The fund monitors for significant events occurring after the close of an investment’s primary exchange but before the fund’s net asset value per share is determined. Significant events may include, but are not limited to: corporate announcements and transactions; governmental action and political unrest that could impact a specific investment or an investment sector; or armed conflicts, natural disasters and similar events that could affect investments in a specific country or region.
Security Transactions — Security transactions are accounted for as of the trade date. Net realized gains and losses are determined on the identified cost basis, which is also used for federal income tax purposes.
Investment Income — Interest income is recorded on the accrual basis and includes paydown gain (loss) and accretion of discounts and amortization of premiums. Inflation adjustments related to inflation-linked debt securities are reflected as interest income.
Foreign Currency Translations — All assets and liabilities initially expressed in foreign currencies are translated into U.S. dollars at prevailing exchange rates at period end. The fund may enter into spot foreign currency exchange contracts to facilitate transactions denominated in a foreign currency. Purchases and sales of investment securities, dividend and interest income, spot foreign currency exchange contracts, and expenses are translated at the rates of exchange prevailing on the respective dates of such transactions. Net realized and unrealized foreign currency exchange gains or losses related to investment securities are a component of net realized gain (loss) on investment transactions and change in net unrealized appreciation (depreciation) on investments, respectively.
Forward Commitments — The fund may engage in securities transactions on a forward commitment basis. In these transactions, the securities’ prices and yields are fixed on the date of the commitment. The fund may sell a to-be-announced (TBA) security and at the same time make a commitment to purchase the same security at a future date at a specified price. Conversely, the fund may purchase a TBA security and at the same time make a commitment to sell the same security at a future date at a specified price. These types of transactions are known as “TBA roll” transactions and are accounted for as purchases and sales. The fund will segregate cash, cash equivalents or other appropriate liquid securities on its records in amounts sufficient to meet the purchase price.
Repurchase Agreements — The fund may enter into repurchase agreements with institutions that American Century Investment Management, Inc. (ACIM) (the investment advisor) has determined are creditworthy pursuant to criteria adopted by the Board of Trustees. The fund requires that the collateral, represented by securities, received in a repurchase transaction be transferred to the custodian in a manner sufficient to enable the fund to obtain those securities in the event of a default under the repurchase agreement. ACIM monitors, on a daily basis, the securities transferred to ensure the value, including accrued interest, of the securities under each repurchase agreement is equal to or greater than amounts owed to the fund under each repurchase agreement.
Joint Trading Account — Pursuant to an Exemptive Order issued by the Securities and Exchange Commission, the fund, along with certain other funds in the American Century Investments family of funds, may transfer uninvested cash balances into a joint trading account. These balances are invested in one or more repurchase agreements that are collateralized by U.S. Treasury or Agency obligations.
Segregated Assets — In accordance with the 1940 Act, the fund segregates assets on its books and records to cover certain types of investment securities and other financial instruments. ACIM monitors, on a daily basis, the securities segregated to ensure the fund designates a sufficient amount of liquid assets, marked-to-market daily. The fund may also receive assets or be required to pledge assets at the custodian bank or with a broker for collateral requirements.
Income Tax Status — It is the fund’s policy to distribute substantially all net investment income and net realized gains to shareholders and to otherwise qualify as a regulated investment company under provisions of the Internal Revenue Code. Accordingly, no provision has been made for income taxes. The fund files U.S. federal, state, local and non-U.S. tax returns as applicable. The fund's tax returns are subject to examination
by the relevant taxing authority until expiration of the applicable statute of limitations, which is generally three years from the date of filing but can be longer in certain jurisdictions. At this time, management believes there are no uncertain tax positions which, based on their technical merit, would not be sustained upon examination and for which it is reasonably possible that the total amounts of unrecognized tax benefits will significantly change in the next twelve months.
Distributions to Shareholders — Distributions from net investment income, if any, are declared daily and paid monthly. Distributions from net realized gains, if any, are generally declared and paid annually.
Indemnifications — Under the trust’s organizational documents, its officers and trustees are indemnified against certain liabilities arising out of the performance of their duties to the fund. In addition, in the normal course of business, the fund enters into contracts that provide general indemnifications. The maximum exposure under these arrangements is unknown as this would involve future claims that may be made against a fund. The risk of material loss from such claims is considered by management to be remote.
3. Fees and Transactions with Related Parties
Certain officers and trustees of the trust are also officers and/or directors of American Century Companies, Inc. (ACC). The trust's investment advisor, ACIM, the trust's distributor, American Century Investment Services, Inc., and the trust's transfer agent, American Century Services, LLC, are wholly owned, directly or indirectly, by ACC. Various funds issued by American Century Asset Allocation Portfolios, Inc. own, in aggregate, 100% of the shares of the fund. Related parties do not invest in the fund for the purpose of exercising management or control.
Management Fees — The trust has entered into a management agreement with ACIM, under which ACIM provides the fund with investment advisory and management services in exchange for a single, unified management fee (the fee). The agreement provides that all expenses of managing and operating the fund, except brokerage expenses, taxes, interest, fees and expenses of the independent trustees (including legal counsel fees), and extraordinary expenses, will be paid by ACIM. The fee is computed and accrued daily based on the daily net assets of the fund and paid monthly in arrears. The fee consists of (1) an Investment Category Fee based on the daily net assets of the fund and certain other accounts managed by the investment advisor that are in the same broad investment category as the fund and (2) a Complex Fee based on the assets of all the funds in the American Century Investments family of funds. The rates for the Investment Category Fee range from 0.2925% to 0.4100%. The rates for the Complex Fee range from 0.0000% to 0.0600%. The investment advisor agreed to waive the fund’s management fee in its entirety. The investment advisor expects this waiver to remain in effect permanently and cannot terminate it without the approval of the Board of Trustees. The effective annual management fee for the period ended March 31, 2019 was 0.34% before waiver and 0.00% after waiver.
Trustees’ Fees and Expenses — The Board of Trustees is responsible for overseeing the investment advisor’s management and operations of the fund. The trustees receive detailed information about the fund and its investment advisor regularly throughout the year, and meet at least quarterly with management of the investment advisor to review reports about fund operations. The fund’s officers do not receive compensation from the fund.
Interfund Transactions — The fund may enter into security transactions with other American Century Investments funds and other client accounts of the investment advisor, in accordance with the 1940 Act rules and procedures adopted by the Board of Trustees. The rules and procedures require, among other things, that these transactions be effected at the independent current market price of the security. There were no interfund transactions during the period.
4. Investment Transactions
Purchases of investment securities, excluding short-term investments, for the period ended March 31, 2019 totaled $5,553,863,110, of which $4,982,596,086 represented U.S. Treasury and Government Agency obligations.
Sales of investment securities, excluding short-term investments, for the period ended March 31, 2019 totaled $6,372,116,981, of which $5,140,733,029 represented U.S. Treasury and Government Agency obligations.
5. Capital Share Transactions
Transactions in shares of the fund were as follows (unlimited number of shares authorized):
|
| | | | | | | | | | |
| | Year ended
March 31, 2019 | Year ended
March 31, 2018 |
| | Shares | Amount | Shares | Amount |
| G Class | | | | |
| Sold | 28,688,091 |
| $ | 297,773,497 |
| 72,458,777 |
| $ | 780,457,679 |
|
| Issued in reinvestment of distributions | 7,927,067 |
| 82,083,103 |
| 7,621,571 |
| 81,614,602 |
|
| Redeemed | (83,031,742 | ) | (856,037,370 | ) | (47,761,372 | ) | (509,674,355 | ) |
| | (46,416,584 | ) | (476,180,770 | ) | 32,318,976 |
| 352,397,926 |
|
| R6 Class | N/A
|
| | | |
| Sold | | | 3,500,678 |
| 37,677,906 |
|
| Issued in reinvestment of distributions | | | 180,700 |
| 1,945,064 |
|
| Redeemed | | | (34,224,315 | ) | (369,713,003 | ) |
| | | | (30,542,937 | ) | (330,090,033 | ) |
| Net increase (decrease) | (46,416,584 | ) | $ | (476,180,770 | ) | 1,776,039 |
| $ | 22,307,893 |
|
6. Fair Value Measurements
The fund’s investments valuation process is based on several considerations and may use multiple inputs to determine the fair value of the investments held by the fund. In conformity with accounting principles generally accepted in the United States of America, the inputs used to determine a valuation are classified into three broad levels.
| |
| • | Level 1 valuation inputs consist of unadjusted quoted prices in an active market for identical investments. |
| |
| • | Level 2 valuation inputs consist of direct or indirect observable market data (including quoted prices for comparable investments, evaluations of subsequent market events, interest rates, prepayment speeds, credit risk, etc.). These inputs also consist of quoted prices for identical investments initially expressed in local currencies that are adjusted through translation into U.S. dollars. |
| |
| • | Level 3 valuation inputs consist of unobservable data (including a fund’s own assumptions). |
The level classification is based on the lowest level input that is significant to the fair valuation measurement. The valuation inputs are not necessarily an indication of the risks associated with investing in these securities or other financial instruments.
The following is a summary of the level classifications as of period end. The Schedule of Investments provides additional information on the fund’s portfolio holdings.
|
| | | | | | | | |
| | Level 1 | Level 2 | Level 3 |
| Assets | | | |
| Investment Securities | | | |
| Corporate Bonds | — |
| $ | 734,586,945 |
| — |
|
| U.S. Treasury Securities | — |
| 708,880,187 |
| — |
|
| U.S. Government Agency Mortgage-Backed Securities | — |
| 575,371,281 |
| — |
|
| Asset-Backed Securities | — |
| 157,842,521 |
| — |
|
| Collateralized Mortgage Obligations | — |
| 129,562,802 |
| — |
|
| Commercial Mortgage-Backed Securities | — |
| 125,682,818 |
| — |
|
| Collateralized Loan Obligations | — |
| 103,982,702 |
| — |
|
| Bank Loan Obligations | — |
| 33,473,268 |
| — |
|
| Municipal Securities | — |
| 31,235,111 |
| — |
|
| Sovereign Governments and Agencies | — |
| 18,365,154 |
| — |
|
| U.S. Government Agency Securities | — |
| 6,899,549 |
| — |
|
| Temporary Cash Investments | $ | 4,829 |
| 77,683,788 |
| — |
|
| | $ | 4,829 |
| $ | 2,703,566,126 |
| — |
|
| Other Financial Instruments | | | |
| Futures Contracts | $ | 2,370,593 |
| — |
| — |
|
| Forward Foreign Currency Exchange Contracts | — |
| $ | 31,797 |
| — |
|
| | $ | 2,370,593 |
| $ | 31,797 |
| — |
|
| | | | |
| Liabilities | | | |
| Other Financial Instruments | | | |
| Forward Foreign Currency Exchange Contracts | — |
| $ | 14,387 |
| — |
|
7. Derivative Instruments
Credit Risk — The fund is subject to credit risk in the normal course of pursuing its investment objectives. The value of a bond generally declines as the credit quality of its issuer declines. Credit default swap agreements enable a fund to buy/sell protection against a credit event of a specific issuer or index. A fund may attempt to enhance returns by selling protection or attempt to mitigate credit risk by buying protection. The buyer/seller of credit protection against a security or basket of securities may pay/receive an up-front or periodic payment to compensate for/against potential default events. Changes in value, including the periodic amounts of interest to be paid or received on swap agreements, are recorded as unrealized appreciation (depreciation) on swap agreements. Upon entering into a centrally cleared swap, a fund is required to deposit cash or securities (initial margin) with a financial intermediary in an amount equal to a certain percentage of the notional amount. Subsequent payments (variation margin) are made or received daily, in cash, by a fund. The variation margin is equal to the daily change in the value and is a component of unrealized gains and losses. Realized gain or loss is recorded upon receipt or payment of a periodic settlement or termination of swap agreements. Net realized and unrealized gains or losses occurring during the holding period of swap agreements are a component of net realized gain (loss) on swap agreement transactions and change in net unrealized appreciation (depreciation) on swap agreements, respectively. The risks of entering into swap agreements include the possible lack of liquidity, failure of the counterparty to meet its obligations, and that there may be unfavorable changes in the underlying investments or instruments. The fund's average notional amount held during the period was $62,500,000.
Foreign Currency Risk — The fund is subject to foreign currency exchange rate risk in the normal course of pursuing its investment objectives. The value of foreign investments held by a fund may be significantly affected by changes in foreign currency exchange rates. The dollar value of a foreign security generally decreases when the value of the dollar rises against the foreign currency in which the security is denominated and tends to increase when the value of the dollar declines against such foreign currency. A fund may enter into forward foreign currency exchange contracts to reduce a fund's exposure to foreign currency exchange rate fluctuations or to gain exposure to the fluctuations in the value of foreign currencies. The net U.S. dollar value of foreign currency underlying all contractual commitments held by a fund and the resulting unrealized
appreciation or depreciation are determined daily. Realized gain or loss is recorded upon the termination of the contract. Net realized and unrealized gains or losses occurring during the holding period of forward foreign currency exchange contracts are a component of net realized gain (loss) on forward foreign currency exchange contract transactions and change in net unrealized appreciation (depreciation) on forward foreign currency exchange contracts, respectively. A fund bears the risk of an unfavorable change in the foreign currency exchange rate underlying the forward contract. Additionally, losses, up to the fair value, may arise if the counterparties do not perform under the contract terms. The fund's average U.S. dollar exposure to foreign currency risk derivative instruments held during the period was $238,035,051.
Interest Rate Risk — The fund is subject to interest rate risk in the normal course of pursuing its investment objectives. A fund may enter into futures contracts or interest rate swap agreements in order to manage its exposure to changes in market conditions. The value of bonds generally declines as interest rates rise. The risks of entering into interest rate risk derivative instruments include the possible lack of liquidity, failure of the counterparty to meet its obligations, and that there may be unfavorable changes in the underlying investments or instruments.
A fund may enter into futures contracts based on a bond index or a specific underlying security. A fund may purchase futures contracts to gain exposure to increases in market value or sell futures contracts to protect against a decline in market value. Upon entering into a futures contract, a fund will segregate cash, cash equivalents or other appropriate liquid securities on its records in amounts sufficient to meet requirements. Subsequent payments (variation margin) are made or received daily, in cash, by a fund. The variation margin is equal to the daily change in the contract value and is recorded as unrealized gains and losses. A fund recognizes a realized gain or loss when the futures contract is closed or expires. Net realized and unrealized gains or losses occurring during the holding period of futures contracts are a component of net realized gain (loss) on futures contract transactions and change in net unrealized appreciation (depreciation) on futures contracts, respectively. The fund's average notional exposure to these interest rate risk derivative instruments held during the period was $268,095,899 futures contracts purchased and $326,488,657 futures contracts sold.
A fund may enter into interest rate swap agreements to gain exposure to declines in interest rates, to protect against increases in interest rates, or to maintain its ability to generate income at prevailing interest rates. A fund will segregate cash, cash equivalents or other appropriate liquid securities on its records in amounts sufficient to meet requirements. Changes in value, including the periodic amounts of interest to be paid or received on swap agreements, are recorded as unrealized appreciation (depreciation) on swap agreements. Upon entering into a centrally cleared swap, a fund is required to deposit cash or securities (initial margin) with a financial intermediary in an amount equal to a certain percentage of the notional amount. Subsequent payments (variation margin) are made or received daily, in cash, by a fund. The variation margin is equal to the daily change in the value and is a component of unrealized gains and losses. Realized gain or loss is recorded upon receipt or payment of a periodic settlement or termination of swap agreements. Net realized and unrealized gains or losses occurring during the holding period of swap agreements are a component of net realized gain (loss) on swap agreement transactions and change in net unrealized appreciation (depreciation) on swap agreements, respectively. The fund's average notional amount on interest rate swap agreements held during the period was $51,532,166.
Other Contracts — A fund may enter into total return swap agreements in order to attempt to obtain or preserve a particular return or spread at a lower cost than obtaining a return or spread through purchases and/or sales of instruments in other markets or gain exposure to certain markets in the most economical way possible. A fund will segregate cash, cash equivalents or other appropriate liquid securities on its records in amounts sufficient to meet requirements. Changes in value, including the periodic amounts of interest to be paid or received on swap agreements, are recorded as unrealized appreciation (depreciation) on swap agreements. Upon entering into a centrally cleared swap, a fund is required to deposit cash or securities (initial margin) with a financial intermediary in an amount equal to a certain percentage of the notional amount. Subsequent payments (variation margin) are made or received daily, in cash, by a fund. The variation margin is equal to the daily change in the value and is a component of unrealized gains and losses. Realized gain or loss is recorded upon receipt or payment of a periodic settlement or termination of swap agreements. Net realized and unrealized gains or losses occurring during the holding period of swap agreements are a component of net realized gain (loss) on swap agreement transactions and change in net unrealized appreciation (depreciation) on swap agreements, respectively. The risks of entering into swap agreements include the possible lack of liquidity, failure of the counterparty to meet its obligations, and that there may be unfavorable changes in the underlying investments or instruments, including inflationary risk. The fund's average notional amount held during the period was $95,450,000.
Value of Derivative Instruments as of March 31, 2019
|
| | | | | | | | |
| | Asset Derivatives | Liability Derivatives |
| Type of Risk Exposure | Location on Statement of Assets and Liabilities | Value | Location on Statement of Assets and Liabilities | Value |
| Foreign Currency Risk | Unrealized appreciation on forward foreign currency exchange contracts | $ | 31,797 |
| Unrealized depreciation on forward foreign currency exchange contracts | $ | 14,387 |
|
| Interest Rate Risk | Receivable for variation margin on futures contracts* | – |
| Payable for variation margin on futures contracts* | 535,973 |
|
| | | $ | 31,797 |
| | $ | 550,360 |
|
* Included in the unrealized appreciation (depreciation) on futures contracts as reported in the Schedule of Investments.
Effect of Derivative Instruments on the Statement of Operations for the Year Ended March 31, 2019
|
| | | | | | | | |
| | Net Realized Gain (Loss) | Change in Net Unrealized Appreciation (Depreciation) |
| Type of Risk Exposure | Location on Statement of Operations | Value | Location on Statement of Operations | Value |
| Credit Risk | Net realized gain (loss) on swap agreement transactions | $ | 455,871 |
| Change in net unrealized appreciation (depreciation) on swap agreements | – |
|
| Foreign Currency Risk | Net realized gain (loss) on forward foreign currency exchange contract transactions | 28,814,811 |
| Change in net unrealized appreciation (depreciation) on forward foreign currency exchange contracts | $ | 3,049,917 |
|
| Interest Rate Risk | Net realized gain (loss) on futures contract transactions | (12,469,770 | ) | Change in net unrealized appreciation (depreciation) on futures contracts | 5,626,488 |
|
| Interest Rate Risk | Net realized gain (loss) on swap agreement transactions | 95,997 |
| Change in net unrealized appreciation (depreciation) on swap agreements | – |
|
| Other Contracts | Net realized gain (loss) on swap agreement transactions | 804,947 |
| Change in net unrealized appreciation (depreciation) on swap agreements | (165,592 | ) |
| | | $ | 17,701,856 |
| | $ | 8,510,813 |
|
8. Risk Factors
The fund’s investment process may result in high portfolio turnover, which could mean high transaction costs, affecting both performance and capital gains tax liabilities to investors.
9. Federal Tax Information
The tax character of distributions paid during the years ended March 31, 2019 and March 31, 2018 were as follows:
|
| | | | | | |
| | 2019 | 2018 |
| Distributions Paid From | | |
| Ordinary income | $ | 82,373,652 |
| $ | 84,254,116 |
|
| Long-term capital gains | — |
| — |
|
The book-basis character of distributions made during the year from net investment income or net realized gains may differ from their ultimate characterization for federal income tax purposes. These differences reflect the differing character of certain income items and net realized gains and losses for financial statement and tax purposes, and may result in reclassification among certain capital accounts on the financial statements.
As of period end, the federal tax cost of investments and the components of distributable earnings on a tax-basis were as follows:
|
| | | |
| Federal tax cost of investments | $ | 2,680,974,538 |
|
| Gross tax appreciation of investments | $ | 39,957,476 |
|
| Gross tax depreciation of investments | (17,361,059 | ) |
| Net tax appreciation (depreciation) of investments | $ | 22,596,417 |
|
| Other book-to-tax adjustments | $ | (247,632 | ) |
| Undistributed ordinary income | — |
|
| Accumulated short-term capital losses | $ | (32,799,028 | ) |
Accumulated long-term capital losses
| $ | (33,630,736 | ) |
| Late-year ordinary loss deferral | $ | (243,882 | ) |
The difference between book-basis and tax-basis unrealized appreciation (depreciation) is attributable primarily to the realization for tax purposes of unrealized gains (losses) on futures contracts. Other book-to-tax adjustments are attributable primarily to the tax deferral of losses on straddle positions.
Accumulated capital losses represent net capital loss carryovers that may be used to offset future realized capital gains for federal income tax purposes. The capital loss carryovers may be carried forward for an unlimited period. Future capital loss carryover utilization in any given year may be subject to Internal Revenue Code limitations.
Loss deferrals represent certain qualified losses that the fund has elected to treat as having been incurred in the following fiscal year for federal income tax purposes.
10. Recently Issued Accounting Standards
In March 2017, the Financial Accounting Standards Board (FASB) issued Accounting Standards Update No. 2017-08, “Receivables - Nonrefundable Fees and Other Costs (Subtopic 310-20), Premium Amortization on Purchased Callable Debt Securities” (ASU 2017-08). ASU 2017-08 amends the amortization period for certain purchased callable debt securities held at a premium, shortening such period to the earliest call date. The amendments are effective for fiscal years, and interim periods within those fiscal years, beginning after December 15, 2018. Management is currently evaluating the impact that adopting ASU 2017-08 will have on the financial statements.
|
| | | | | | | | | | | | | | | | | |
| For a Share Outstanding Throughout the Years Ended March 31 (except as noted) |
| Per-Share Data | | | | | | | | | Ratios and Supplemental Data | | | |
| | | Income From Investment Operations: | Distributions From: | | | Ratio to Average Net Assets of: | | |
| | Net Asset
Value,
Beginning
of Period | Net
Investment
Income
(Loss)(1) | Net
Realized
and
Unrealized
Gain (Loss) | Total From
Investment
Operations | Net
Investment
Income | Net
Realized
Gains | Total
Distributions | Net Asset
Value,
End
of Period | Total
Return(2) | Operating
Expenses | Operating
Expenses
(before
expense
waiver) | Net
Investment
Income
(Loss) | Net
Investment
Income
(Loss)
(before
expense
waiver) | Portfolio
Turnover
Rate | Net
Assets,
End of
Period
(in thousands) |
| G Class | | | | | | | | | | | | | | |
| 2019 | $10.52 | 0.35 | 0.05 | 0.40 | (0.30) | — | (0.30) | $10.62 | 3.93% | 0.01% | 0.35% | 3.35% | 3.01% | 185% |
| $2,571,155 |
|
| 2018 | $10.66 | 0.29 | (0.14) | 0.15 | (0.29) | — | (0.29) | $10.52 | 1.36% | 0.12% | 0.36% | 2.66% | 2.42% | 186% |
| $3,034,520 |
|
| 2017 | $10.85 | 0.22 | (0.16) | 0.06 | (0.24) | (0.01) | (0.25) | $10.66 | 0.59% | 0.40% | 0.40% | 2.07% | 2.07% | 139% |
| $2,731,236 |
|
| 2016 | $11.03 | 0.21 | (0.04) | 0.17 | (0.23) | (0.12) | (0.35) | $10.85 | 1.57% | 0.40% | 0.40% | 1.96% | 1.96% | 207% |
| $2,406,977 |
|
| 2015 | $10.70 | 0.20 | 0.42 | 0.62 | (0.29) | — | (0.29) | $11.03 | 5.90% | 0.40% | 0.40% | 1.85% | 1.85% | 248% |
| $2,198,329 |
|
|
|
| Notes to Financial Highlights |
| |
| (1) | Computed using average shares outstanding throughout the period. |
| |
| (2) | Total returns are calculated based on the net asset value of the last business day. Total returns for periods less than one year are not annualized. |
See Notes to Financial Statements.
|
|
| Report of Independent Registered Public Accounting Firm |
To the Board of Trustees of American Century Investment Trust and Shareholders of NT Diversified Bond Fund:
Opinion on the Financial Statements
We have audited the accompanying statement of assets and liabilities, including the schedule of investments, of NT Diversified Bond Fund (one of the funds constituting American Century Investment Trust, referred to hereafter as the “Fund”) as of March 31, 2019, the related statement of operations for the year ended March 31, 2019, the statement of changes in net assets for each of the two years in the period ended March 31, 2019, including the related notes, and the financial highlights for each of the five years in the period ended March 31, 2019 (collectively referred to as the “financial statements”). In our opinion, the financial statements present fairly, in all material respects, the financial position of the Fund as of March 31, 2019, the results of its operations for the year then ended, the changes in its net assets for each of the two years in the period ended March 31, 2019 and the financial highlights for each of the five years in the period ended March 31, 2019 in conformity with accounting principles generally accepted in the United States of America.
Basis for Opinion
These financial statements are the responsibility of the Fund’s management. Our responsibility is to express an opinion on the Fund’s financial statements based on our audits. We are a public accounting firm registered with the Public Company Accounting Oversight Board (United States) (“PCAOB”) and are required to be independent with respect to the Fund in accordance with the U.S. federal securities laws and the applicable rules and regulations of the Securities and Exchange Commission and the PCAOB.
We conducted our audits of these financial statements in accordance with the standards of the PCAOB. Those standards require that we plan and perform the audit to obtain reasonable assurance about whether the financial statements are free of material misstatement, whether due to error or fraud.
Our audits included performing procedures to assess the risks of material misstatement of the financial statements, whether due to error or fraud, and performing procedures that respond to those risks. Such procedures included examining, on a test basis, evidence regarding the amounts and disclosures in the financial statements. Our audits also included evaluating the accounting principles used and significant estimates made by management, as well as evaluating the overall presentation of the financial statements. Our procedures included confirmation of securities owned as of March 31, 2019 by correspondence with the custodian and brokers; when replies were not received from brokers, we performed other auditing procedures. We believe that our audits provide a reasonable basis for our opinion.
/s/ PricewaterhouseCoopers LLP
Kansas City, Missouri
May 17, 2019
We have served as the auditor of one or more investment companies in American Century Investments since 1997.
Board of Trustees
The individuals listed below serve as trustees of the funds. Each trustee will continue to serve in this capacity until death, retirement, resignation or removal from office. The board has adopted a mandatory retirement age for trustees who are not “interested persons,” as that term is defined in the Investment Company Act (independent trustees). Independent trustees shall retire on December 31 of the year in which they reach their 75th birthday; provided, however, that on or after January 1, 2022, independent trustees shall retire on December 31 of the year in which they reach their 76th birthday.
Mr. Thomas is an “interested person” because he currently serves as President and Chief Executive Officer of American Century Companies, Inc. (ACC), the parent company of American Century Investment Management, Inc. (ACIM or the advisor). The other trustees (more than three-fourths of the total number) are independent. They are not employees, directors or officers of, and have no financial interest in, ACC or any of its wholly owned, direct or indirect, subsidiaries, including ACIM, American Century Investment Services, Inc. (ACIS) and American Century Services, LLC (ACS), and they do not have any other affiliations, positions or relationships that would cause them to be considered “interested persons” under the Investment Company Act. The trustees serve in this capacity for eight (in the case of Jonathan S. Thomas, 16; and Ronald J. Gilson, 9) registered investment companies in the American Century Investments family of funds.
The following table presents additional information about the trustees. The mailing address for each trustee other than Jonathan S. Thomas is 1665 Charleston Road, Mountain View, California 94043. The mailing address for Jonathan S. Thomas is 4500 Main Street, Kansas City, Missouri 64111.
|
| | | | | |
Name
(Year of Birth) | Position(s) Held with Funds | Length of Time Served | Principal Occupation(s) During Past 5 Years | Number of American Century Portfolios Overseen by Trustee | Other Directorships Held During Past 5 Years |
| Independent Trustees |
|
|
Tanya S. Beder
(1955) | Trustee | Since 2011 | Chairman and CEO, SBCC Group Inc. (independent advisory services) (2006 to present) | 45 | CYS Investments, Inc.; Nabors Industries Ltd. |
Jeremy I. Bulow
(1954) | Trustee | Since 2011 | Professor of Economics, Stanford University, Graduate School of Business (1979 to present) | 45 | None |
Anne Casscells
(1958) | Trustee | Since 2016 | Co-Chief Executive Officer and Chief Investment Officer, Aetos Alternatives Management (investment advisory firm) (2001 to present); Lecturer in Accounting, Stanford University, Graduate School of Business (2009 to 2017) | 45 | None |
Ronald J. Gilson
(1946) | Trustee and Chairman of the Board | Since 1995
(Chairman since 2005) | Charles J. Meyers Professor of Law and Business, Emeritus, Stanford Law School (1979 to 2016); Marc and Eva Stern Professor of Law and Business, Columbia University School of Law (1992 to present) | 50 | None |
|
| | | | | |
Name
(Year of Birth) | Position(s) Held with Funds | Length of Time Served | Principal Occupation(s) During Past 5 Years | Number of American Century Portfolios Overseen by Trustee | Other Directorships Held During Past 5 Years |
| Independent Trustees |
|
|
Frederick L. A. Grauer
(1946) | Trustee | Since 2008 | Senior Advisor, Credit Sesame, Inc. (credit monitoring firm) (2018 to present); Senior Advisor, Course Hero (an educational technology company) (2015 to present); Senior Advisor, iShares by BlackRock, Inc. (investment management firm) (2013 to 2015)
| 45 | None |
Jonathan D. Levin
(1972) | Trustee | Since 2016 | Philip H. Knight Professor and Dean, Graduate School of Business, Stanford University (2016 to present); Professor, Stanford University, (2000 to present); Chair, Department of Economics, Stanford University (2011 to 2014) | 45 | None |
Peter F. Pervere
(1947) | Trustee | Since 2007 | Retired | 45 | None |
John B. Shoven
(1947) | Trustee | Since 2002 | Charles R. Schwab Professor of Economics, Stanford University (1973 to present) | 45 | Cadence Design Systems; Exponent; Financial Engines |
| Interested Trustee |
|
|
Jonathan S. Thomas
(1963) | Trustee and President | Since 2007 | President and Chief Executive Officer, ACC (2007 to present). Also serves as Chief Executive Officer, ACS; Executive Vice President, ACIM; Director, ACC, ACIM and other ACC subsidiaries | 117 | BioMed Valley Discoveries, Inc. |
The Statement of Additional Information has additional information about the fund's trustees and is available without charge, upon request, by calling 1-800-345-2021.
Officers
The following table presents certain information about the executive officers of the funds. Each officer serves as an officer for 16 (in the case of Robert J. Leach, 15) investment companies in the American Century family of funds, unless otherwise noted. No officer is compensated for his or her service as an officer of the funds. The listed officers are interested persons of the funds and are appointed or re-appointed on an annual basis. The mailing address for each of the officers listed below is 4500 Main Street, Kansas City, Missouri 64111.
|
| | |
Name
(Year of Birth) | Offices with the Funds | Principal Occupation(s) During the Past Five Years |
Jonathan S. Thomas
(1963) | Trustee and President since 2007 | President and Chief Executive Officer, ACC (2007 to present). Also serves as Chief Executive Officer, ACS; Executive Vice President, ACIM; Director, ACC, ACIM and other ACC subsidiaries |
R. Wes Campbell
(1974)
| Chief Financial Officer and Treasurer since 2018
| Investment Operations and Investment Accounting, ACS (2000 to present) |
Amy D. Shelton
(1964) | Chief Compliance Officer and Vice President since 2014 | Chief Compliance Officer, American Century funds, (2014 to present); Chief Compliance Officer, ACIM (2014 to present); Chief Compliance Officer, ACIS (2009 to present); Vice President, Client Interactions and Marketing, ACIS (2013 to 2014). Also serves as Vice President, ACIS |
Charles A. Etherington
(1957) | General Counsel since 2007 and Senior Vice President since 2006 | Attorney, ACC (1994 to present); Vice President, ACC (2005 to present); General Counsel, ACC (2007 to present). Also serves as General Counsel, ACIM, ACS, ACIS and other ACC subsidiaries; and Senior Vice President, ACIM and ACS |
C. Jean Wade
(1964) | Vice President since 2012 | Senior Vice President, ACS (2017 to present); Vice President ACS (2000 to 2017) |
Robert J. Leach
(1966) | Vice President since 2006 | Vice President, ACS (2000 to present) |
David H. Reinmiller
(1963) | Vice President since 2000 | Attorney, ACC (1994 to present) Also serves as Vice President, ACIM and ACS |
Ward D. Stauffer
(1960) | Secretary since 2005 | Attorney, ACC (2003 to present) |
Retirement Account Information
As required by law, distributions you receive from certain retirement accounts are subject to federal income tax withholding, unless you elect not to have withholding apply*. Tax will be withheld on the total amount withdrawn even though you may be receiving amounts that are not subject to withholding, such as nondeductible contributions. In such case, excess amounts of withholding could occur. You may adjust your withholding election so that a greater or lesser amount will be withheld.
If you don’t want us to withhold on this amount, you must notify us to not withhold the federal income tax. You may notify us in writing or in certain situations by telephone or through other electronic means. For systematic withdrawals, your withholding election will remain in effect until revoked or changed by filing a new election. You have the right to revoke your election at any time and change your withholding percentage for future distributions.
Remember, even if you elect not to have income tax withheld, you are liable for paying income tax on the taxable portion of your withdrawal. If you elect not to have income tax withheld or you don’t have enough income tax withheld, you may be responsible for payment of estimated tax. You may incur penalties under the estimated tax rules if your withholding and estimated tax payments are not sufficient. You can reduce or defer the income tax on a distribution by directly or indirectly rolling such distribution over to another IRA or eligible plan. You should consult your tax advisor for additional information.
State tax will be withheld if, at the time of your distribution, your address is within one of the mandatory withholding states and you have federal income tax withheld (or as otherwise required by state law). State taxes will be withheld from your distribution in accordance with the respective state rules.
*Some 403(b), 457 and qualified retirement plan distributions may be subject to 20% mandatory withholding, as they are subject to special tax and withholding rules. Your plan administrator or plan sponsor is required to provide you with a special tax notice explaining those rules at the time you request a distribution. If applicable, federal and/or state taxes may be withheld from your distribution amount.
Proxy Voting Policies
Descriptions of the principles and policies that the fund's investment advisor uses in exercising the voting rights associated with the securities purchased and/or held by the fund are available without charge, upon request, by calling 1-800-345-2021 or visiting the "About Us" page of American Century Investments’ website at americancentury.com. A description of the policies is also available on the Securities and Exchange Commission’s website at sec.gov. Information regarding how the investment advisor voted proxies relating to portfolio securities during the most recent 12-month period ended June 30 is available on the "About Us" page at americancentury.com. It is also available at sec.gov.
Quarterly Portfolio Disclosure
The fund files its complete schedule of portfolio holdings with the Securities and Exchange Commission (SEC) for the first and third quarters of each fiscal year on Form N-Q or as an exhibit to its reports on Form N-PORT. The fund’s Forms N-Q and Form N-PORT reports are available on the SEC’s website at sec.gov. The fund also makes its complete schedule of portfolio holdings for the most recent quarter of its fiscal year available on its website at americancentury.com and, upon request, by calling 1-800-345-2021.
|
| | |
| |
| | | |
| Contact Us | americancentury.com | |
| Automated Information Line | 1-800-345-8765 | |
| Investor Services Representative | 1-800-345-2021 or 816-531-5575 | |
| Investors Using Advisors | 1-800-378-9878 | |
| Business, Not-For-Profit, Employer-Sponsored Retirement Plans | 1-800-345-3533 | |
| Banks and Trust Companies, Broker-Dealers, Financial Professionals, Insurance Companies | 1-800-345-6488 | |
| Telecommunications Relay Service for the Deaf | 711 | |
| | | |
| American Century Investment Trust | |
| | | |
Investment Advisor: American Century Investment Management, Inc. Kansas City, Missouri | |
| | | |
| This report and the statements it contains are submitted for the general information of our shareholders. The report is not authorized for distribution to prospective investors unless preceded or accompanied by an effective prospectus. | |
| | | |
©2019 American Century Proprietary Holdings, Inc. All rights reserved.
CL-ANN-92292 1905 | |
|
| |
| | |
| | Annual Report |
| | |
| | March 31, 2019 |
| | |
| | NT High Income Fund |
| | Investor Class (AHGVX) |
| | G Class (AHGNX) |
Beginning on January 1, 2021, as permitted by regulations adopted by the Securities and Exchange Commission, paper copies of the fund’s shareholder reports like this one will no longer be sent by mail, unless you specifically request paper copies of the reports from the fund or from your financial intermediary, such as a broker-dealer or bank. Instead, the reports will be made available on a website, and you will be notified by mail each time a report is posted and provided with a website link to access the report.
If you already elected to receive shareholder reports electronically, you will not be affected by this change and you need not take any action. You may elect to receive shareholder reports and other communications from the fund or your financial intermediary electronically by calling or sending an email request to your appropriate contacts as listed on the back cover of this report.
You may elect to receive all future reports in paper free of charge. You can inform the fund or your financial intermediary that you wish to continue receiving paper copies of your shareholder reports by calling or sending an email request to your appropriate contacts as listed on the back cover of this report. Your election to receive reports in paper will apply to all funds held with the fund complex/your financial intermediary.
|
| |
| Performance | |
| Portfolio Commentary | |
| Fund Characteristics | |
| Shareholder Fee Example | |
| Schedule of Investments | |
| Statement of Assets and Liabilities | |
| Statement of Operations | |
| Statement of Changes in Net Assets | |
| Notes to Financial Statements | |
| Financial Highlights | |
| Report of Independent Registered Public Accounting Firm | |
| Management | |
| Additional Information | |
Any opinions expressed in this report reflect those of the author as of the date of the report, and do not necessarily represent the opinions of American Century Investments® or any other person in the American Century Investments organization. Any such opinions are subject to change at any time based upon market or other conditions and American Century Investments disclaims any responsibility to update such opinions. These opinions may not be relied upon as investment advice and, because investment decisions made by American Century Investments funds are based on numerous factors, may not be relied upon as an indication of trading intent on behalf of any American Century Investments fund. Security examples are used for representational purposes only and are not intended as recommendations to purchase or sell securities. Performance information for comparative indices and securities is provided to American Century Investments by third party vendors. To the best of American Century Investments’ knowledge, such information is accurate at the time of printing.
|
| | | | |
| Total Returns as of March 31, 2019 | | |
| | | | Average Annual Returns | |
| | Ticker Symbol | 1 year | Since Inception | Inception Date |
| Investor Class | AHGVX | 4.21% | 3.42% | 5/19/17 |
| ICE BofAML U.S. High Yield Constrained Index | — | 5.93% | 4.28% | — |
| G Class | AHGNX | 5.02% | 4.16% | 5/19/17 |
Fund returns would have been lower if a portion of the fees had not been waived.
|
|
| Growth of $10,000 Over Life of Class |
| $10,000 investment made May 19, 2017 |
Performance for other share classes will vary due to differences in fee structure.
|
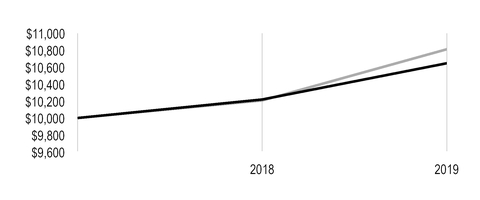
|
| |
| Value on March 31, 2019 |
| | Investor Class — $10,648 |
| |
| | ICE BofAML U.S. High Yield Constrained Index — $10,813 |
| |
Ending value of Investor Class would have been lower if a portion of the fees had not been waived.
|
| |
| Total Annual Fund Operating Expenses |
| Investor Class | G Class |
| 0.86% | 0.61% |
The total annual fund operating expenses shown is as stated in the fund’s prospectus current as of the date of this report. The prospectus may vary from the expense ratio shown elsewhere in this report because it is based on a different time period, includes acquired fund fees and expenses, and, if applicable, does not include fee waivers or expense reimbursements.
Data presented reflect past performance. Past performance is no guarantee of future results. Current performance may be higher or lower than the performance shown. Total returns for periods less than one year are not annualized. Investment return and principal value will fluctuate, and redemption value may be more or less than original cost. Data assumes reinvestment of dividends and capital gains, and none of the charts reflect the deduction of taxes that a shareholder would pay on fund distributions or the redemption of fund shares. To obtain performance data current to the most recent month end, please call 1-800-345-2021 or visit americancentury.com. For additional information about the fund, please consult the prospectus.
Investment Advisor: American Century Investment Management, Inc.
Subadvisor: Nomura Corporate Research and Asset Management Inc.
Portfolio Managers: Steve Kotsen and David Crall
Performance Summary
NT High Income returned 5.02%* for the 12-month period ended March 31, 2019. By comparison, the ICE BofAML U.S. High Yield Constrained Index returned 5.93%. Fund returns reflect operating expenses, while index returns do not.
The U.S. high-yield market began the fiscal year on an upbeat note. The U.S. economy was robust, corporate fundamentals were strong, commodity prices were improving and the default environment was benign. These factors provided an ideal setting for credit risk taking. U.S. real gross domestic product hovered near 4% during the second quarter of 2018. At the same time, the U.S. market showed signs of decoupling from global markets, as the U.S. economy continued to grow at a solid pace due to tax reform, deregulation and, to a lesser degree, government spending. For the first half of the fiscal year, lower-quality segments of the market outperformed their higher-quality, more duration-sensitive counterparts, but this trend would ultimately reverse by the end of 2018. Yields on the U.S. 10-year Treasury note began the fiscal year at 2.74% and rose to 3.24% in early November. The U.S. Federal Reserve (Fed) continued to normalize short-term interest rates with four increases of 25 basis points (bps) each in 2018. Rising interest rates were a modest headwind for fixed-income securities for much of the year.
Market sentiment started to sour in October 2018, beginning with an underwhelming start to the third-quarter earnings season, compounded by negative narratives surrounding U.S.-China trade relations, softening growth in emerging markets and the eurozone, and geopolitical concerns involving Brexit, Italy’s budget, Saudi Arabia and Iran. These concerns, coupled with the lack of clarity about waivers for Iran oil production, led to a precipitous decline in West Texas Intermediate crude oil prices from a peak of $73 to $45 per barrel to end 2018. This had an immediate impact on the high-yield energy sector. Mounting global growth concerns led to a sell-off in risky assets, and the 10-year Treasury yield ended 2018 at 2.69%. Alongside the sharpest decline for the S&P 500 Index since September 2011, the U.S. high-yield market also came under pressure. The average option-adjusted spread (OAS) on high-yield bonds widened more than 200 bps, from 316 bps to 544 bps, over this period. Despite grinding out positive returns for most of 2018, the U.S. high-yield market gave everything back and then some in the final quarter of 2018.
Many of the fears that drove the negative fourth-quarter sentiment quickly dissipated in January. The Fed shifted course at its January policy meeting, with key changes to the post-meeting statement and new balance sheet normalization guidance. The Fed also ruled out returning to a small balance sheet, confirming its intention to continue to control short-term interest rates by paying interest on reserves and maintaining an ample supply of reserves. At its March 2019 meeting, the Fed moved from the pause in rate hikes it signaled in January to essentially preclude the possibility of any rate increases in 2019. The European Central Bank also lowered its growth outlook and pushed back its first interest rate hike. In the first quarter of 2019, markets responded positively to more dovish central bank policies, strong corporate earnings and further progress on U.S.-China trade talks along with an outlook for steady growth.
*All fund returns referenced in this commentary are for G Class shares. Fund returns would have been lower if a portion of the fees had not been waived. Performance for other share classes will vary due to differences in fee structure; when G Class performance exceeds that of the index, other share classes may not. See page 2 for returns for all share classes.
Security Selection, Sector Allocation Detracted
Overall, security selection primarily accounted for the portfolio’s underperformance relative to the index. In particular, our selections in the pharmaceuticals, integrated electric, wholesale food, oil field equipment and services, and cable and satellite TV sectors detracted from relative results.
Sector allocation had a slightly negative effect on relative performance. Underweight positions relative to the index in the cable and satellite TV and health facilities sectors and an overweight position in the energy exploration and production sector weighed on results. Conversely, our allocation decisions in the automobile parts and equipment (underweight), gaming (overweight) and telecommunication wireline (underweight) sectors contributed to performance on a relative basis.
Portfolio Positioning and Market Outlook
We believe U.S. high-yield bonds can perform well in a slow-growth economy coupled with target-level inflation and other supportive influences. Recession fears are slowly fading, as U.S. economic strength holds up against a backdrop of slowing global growth. This factor is alleviating concerns about the credit cycle ending and a potential surge in default rates and/or significant downgrades from investment-grade bonds into the high-yield market. Interest rate risk, a modest headwind for the high-yield market for most of 2018, remains subdued because of the economic slowdown and dovish Fed policy. The default rate is very low on a trailing 12-month basis, and while we expect it to increase modestly in 2019, we still expect defaults to remain below historical averages.
|
| |
| MARCH 31, 2019 | |
| Types of Investments in Portfolio | % of net assets |
| Corporate Bonds | 90.1% |
| Bank Loan Obligations | 3.7% |
| Preferred Stocks | 1.8% |
| Convertible Bonds | 0.3% |
| Common Stocks | 0.1% |
| Asset-Backed Securities | 0.1% |
| Escrow Interests | —* |
| Temporary Cash Investments | 2.7% |
| Other Assets and Liabilities | 1.2% |
* Category is less than 0.05% of total net assets.
Fund shareholders may incur two types of costs: (1) transaction costs, including sales charges (loads) on purchase payments and redemption/exchange fees; and (2) ongoing costs, including management fees; distribution and service (12b-1) fees; and other fund expenses. This example is intended to help you understand your ongoing costs (in dollars) of investing in your fund and to compare these costs with the ongoing cost of investing in other mutual funds.
The example is based on an investment of $1,000 made at the beginning of the period and held for the entire period from October 1, 2018 to March 31, 2019.
Actual Expenses
The table provides information about actual account values and actual expenses for each class. You may use the information, together with the amount you invested, to estimate the expenses that you paid over the period. First, identify the share class you own. Then simply divide your account value by $1,000 (for example, an $8,600 account value divided by $1,000 = 8.6), then multiply the result by the number under the heading “Expenses Paid During Period” to estimate the expenses you paid on your account during this period.
Hypothetical Example for Comparison Purposes
The table also provides information about hypothetical account values and hypothetical expenses based on the actual expense ratio of each class of your fund and an assumed rate of return of 5% per year before expenses, which is not the actual return of a fund’s share class. The hypothetical account values and expenses may not be used to estimate the actual ending account balance or expenses you paid for the period. You may use this information to compare the ongoing costs of investing in your fund and other funds. To do so, compare this 5% hypothetical example with the 5% hypothetical examples that appear in the shareholder reports of the other funds.
Please note that the expenses shown in the table are meant to highlight your ongoing costs only and do not reflect any transactional costs, such as sales charges (loads) or redemption/exchange fees. Therefore, the table is useful in comparing ongoing costs only, and will not help you determine the relative total costs of owning different funds. In addition, if these transactional costs were included, your costs would have been higher.
|
| | | | |
| | Beginning
Account Value
10/1/18 | Ending
Account Value
3/31/19 | Expenses Paid
During Period(1)
10/1/18 - 3/31/19 |
Annualized
Expense Ratio(1) |
| Actual | | | | |
| Investor Class | $1,000 | $1,006.40 | $3.90 | 0.78% |
| G Class | $1,000 | $1,009.20 | $0.05 | 0.01% |
| Hypothetical | | | | |
| Investor Class | $1,000 | $1,021.04 | $3.93 | 0.78% |
| G Class | $1,000 | $1,024.88 | $0.05 | 0.01% |
| |
| (1) | Expenses are equal to the class's annualized expense ratio listed in the table above, multiplied by the average account value over the period, multiplied by 182, the number of days in the most recent fiscal half-year, divided by 365, to reflect the one-half year period. Annualized expense ratio reflects actual expenses, including any applicable fee waivers or expense reimbursements and excluding any acquired fund fees and expenses. |
MARCH 31, 2019
|
| | | | | | |
| | Principal Amount/Shares | Value |
| CORPORATE BONDS — 90.1% | | |
| Aerospace and Defense — 2.2% | | |
| Arconic, Inc., 5.125%, 10/1/24 | $ | 1,500,000 |
| $ | 1,539,847 |
|
| Arconic, Inc., 5.90%, 2/1/27 | 250,000 |
| 259,841 |
|
| Arconic, Inc., 5.95%, 2/1/37 | 1,225,000 |
| 1,211,984 |
|
Bombardier, Inc., 5.75%, 3/15/22(1) | 1,085,000 |
| 1,116,194 |
|
Bombardier, Inc., 6.00%, 10/15/22(1) | 1,005,000 |
| 1,018,819 |
|
Bombardier, Inc., 6.125%, 1/15/23(1) | 475,000 |
| 482,719 |
|
Bombardier, Inc., 7.50%, 12/1/24(1) | 775,000 |
| 806,969 |
|
Bombardier, Inc., 7.50%, 3/15/25(1) | 495,000 |
| 511,706 |
|
Bombardier, Inc., 7.875%, 4/15/27(1) | 1,800,000 |
| 1,858,500 |
|
BWX Technologies, Inc., 5.375%, 7/15/26(1) | 375,000 |
| 382,500 |
|
Pioneer Holdings LLC / Pioneer Finance Corp., 9.00%, 11/1/22(1) | 575,000 |
| 585,063 |
|
TransDigm UK Holdings plc, 6.875%, 5/15/26(1) | 200,000 |
| 199,500 |
|
| TransDigm, Inc., 6.00%, 7/15/22 | 1,740,000 |
| 1,772,329 |
|
| TransDigm, Inc., 6.50%, 5/15/25 | 100,000 |
| 101,885 |
|
TransDigm, Inc., 6.25%, 3/15/26(1) | 800,000 |
| 832,000 |
|
| TransDigm, Inc., 6.375%, 6/15/26 | 850,000 |
| 844,560 |
|
TransDigm, Inc., 7.50%, 3/15/27(1) | 850,000 |
| 872,312 |
|
| Triumph Group, Inc., 4.875%, 4/1/21 | 375,000 |
| 367,500 |
|
| Triumph Group, Inc., 7.75%, 8/15/25 | 525,000 |
| 502,688 |
|
| | | 15,266,916 |
|
| Air Freight and Logistics — 0.3% | | |
XPO Logistics, Inc., 6.50%, 6/15/22(1) | 1,421,000 |
| 1,457,591 |
|
XPO Logistics, Inc., 6.125%, 9/1/23(1) | 600,000 |
| 606,000 |
|
| | | 2,063,591 |
|
| Airlines — 0.4% | | |
Air Canada, 7.75%, 4/15/21(1) | 225,000 |
| 242,156 |
|
American Airlines Group, Inc., 4.625%, 3/1/20(1) | 975,000 |
| 984,165 |
|
| United Continental Holdings, Inc., 4.25%, 10/1/22 | 225,000 |
| 225,914 |
|
| United Continental Holdings, Inc., 5.00%, 2/1/24 | 1,445,000 |
| 1,459,450 |
|
| | | 2,911,685 |
|
| Auto Components — 0.9% | | |
| American Axle & Manufacturing, Inc., 6.625%, 10/15/22 | 785,000 |
| 805,606 |
|
| Dana, Inc., 6.00%, 9/15/23 | 1,484,000 |
| 1,526,665 |
|
Delphi Technologies plc, 5.00%, 10/1/25(1) | 800,000 |
| 706,400 |
|
Panther BF Aggregator 2 LP / Panther Finance Co., Inc., 6.25%, 5/15/26(1)(2) | 450,000 |
| 460,125 |
|
Panther BF Aggregator 2 LP / Panther Finance Co., Inc., 8.50%, 5/15/27(1)(2) | 1,400,000 |
| 1,407,000 |
|
| Tenneco, Inc., 5.00%, 7/15/26 | 825,000 |
| 664,125 |
|
| Titan International, Inc., 6.50%, 11/30/23 | 1,175,000 |
| 1,088,344 |
|
| | | 6,658,265 |
|
|
| | | | | | |
| | Principal Amount/Shares | Value |
| Automobiles — 0.4% | | |
Mclaren Finance plc, 5.75%, 8/1/22(1) | $ | 400,000 |
| $ | 381,000 |
|
Tesla, Inc., 5.30%, 8/15/25(1) | 2,575,000 |
| 2,240,250 |
|
| | | 2,621,250 |
|
| Banks — 0.4% | | |
Barclays plc, VRN, 8.00%(3) | 200,000 |
| 204,750 |
|
| CIT Group, Inc., 4.125%, 3/9/21 | 275,000 |
| 279,125 |
|
| CIT Group, Inc., 5.00%, 8/15/22 | 1,363,000 |
| 1,422,631 |
|
| CIT Group, Inc., 5.00%, 8/1/23 | 900,000 |
| 946,125 |
|
| | | 2,852,631 |
|
| Building Products — 0.7% | | |
American Woodmark Corp., 4.875%, 3/15/26(1) | 300,000 |
| 294,750 |
|
Builders FirstSource, Inc., 5.625%, 9/1/24(1) | 1,365,000 |
| 1,349,644 |
|
| Griffon Corp., 5.25%, 3/1/22 | 1,225,000 |
| 1,209,687 |
|
Masonite International Corp., 5.75%, 9/15/26(1) | 275,000 |
| 281,875 |
|
Northwest Hardwoods, Inc., 7.50%, 8/1/21(1) | 275,000 |
| 171,875 |
|
PGT Escrow Issuer, Inc., 6.75%, 8/1/26(1) | 525,000 |
| 547,312 |
|
USG Corp., 5.50%, 3/1/25(1) | 735,000 |
| 749,149 |
|
| | | 4,604,292 |
|
| Capital Markets — 0.3% | | |
| Donnelley Financial Solutions, Inc., 8.25%, 10/15/24 | 375,000 |
| 378,750 |
|
Lions Gate Capital Holdings LLC, 6.375%, 2/1/24(1) | 900,000 |
| 945,000 |
|
Lions Gate Capital Holdings LLC, 5.875%, 11/1/24(1) | 250,000 |
| 258,750 |
|
MSCI, Inc., 4.75%, 8/1/26(1) | 150,000 |
| 154,500 |
|
MSCI, Inc., 5.375%, 5/15/27(1) | 125,000 |
| 132,500 |
|
| | | 1,869,500 |
|
| Chemicals — 1.9% | | |
| CF Industries, Inc., 7.125%, 5/1/20 | 175,000 |
| 183,094 |
|
| CF Industries, Inc., 4.95%, 6/1/43 | 125,000 |
| 107,656 |
|
| CF Industries, Inc., 5.375%, 3/15/44 | 1,475,000 |
| 1,334,875 |
|
| Chemours Co. (The), 6.625%, 5/15/23 | 466,000 |
| 483,517 |
|
Consolidated Energy Finance SA, 6.50%, 5/15/26(1) | 750,000 |
| 750,000 |
|
CVR Partners LP / CVR Nitrogen Finance Corp., 9.25%, 6/15/23(1) | 150,000 |
| 157,688 |
|
Element Solutions, Inc., 5.875%, 12/1/25(1) | 525,000 |
| 528,859 |
|
GCP Applied Technologies, Inc., 5.50%, 4/15/26(1) | 250,000 |
| 255,625 |
|
Hexion, Inc., 10.375%, 2/1/22(1)(6) | 1,275,000 |
| 1,074,187 |
|
Hexion, Inc., 13.75%, 2/1/22(1)(6) | 1,425,000 |
| 498,750 |
|
Hexion, Inc. / Hexion Nova Scotia Finance ULC, 9.00%, 11/15/20(6) | 200,000 |
| 51,000 |
|
INEOS Group Holdings SA, 5.625%, 8/1/24(1) | 1,425,000 |
| 1,428,562 |
|
Kissner Holdings LP / Kissner Milling Co. Ltd. / BSC Holding, Inc. / Kissner USA, 8.375%, 12/1/22(1) | 275,000 |
| 288,062 |
|
NOVA Chemicals Corp., 5.25%, 6/1/27(1) | 900,000 |
| 886,500 |
|
Nufarm Australia Ltd. / Nufarm Americas, Inc., 5.75%, 4/30/26(1) | 450,000 |
| 418,500 |
|
OCI NV, 6.625%, 4/15/23(1) | 800,000 |
| 833,600 |
|
| Olin Corp., 5.00%, 2/1/30 | 100,000 |
| 98,375 |
|
PQ Corp., 5.75%, 12/15/25(1) | 250,000 |
| 244,688 |
|
| Scotts Miracle-Gro Co. (The), 5.25%, 12/15/26 | 325,000 |
| 320,937 |
|
|
| | | | | | |
| | Principal Amount/Shares | Value |
SPCM SA, 4.875%, 9/15/25(1) | $ | 300,000 |
| $ | 294,465 |
|
TPC Group, Inc., 8.75%, 12/15/20(1) | 1,275,000 |
| 1,262,250 |
|
Trinseo Materials Operating SCA / Trinseo Materials Finance, Inc., 5.375%, 9/1/25(1) | 1,000,000 |
| 951,250 |
|
Tronox Finance plc, 5.75%, 10/1/25(1) | 675,000 |
| 628,594 |
|
Venator Finance S.a.r.l. / Venator Materials LLC, 5.75%, 7/15/25(1) | 275,000 |
| 242,688 |
|
| | | 13,323,722 |
|
| Commercial Services and Supplies — 2.7% | | |
| ADT Security Corp. (The), 5.25%, 3/15/20 | 775,000 |
| 786,625 |
|
| ADT Security Corp. (The), 6.25%, 10/15/21 | 325,000 |
| 342,566 |
|
Aptim Corp., 7.75%, 6/15/25(1) | 1,325,000 |
| 1,030,187 |
|
| Aramark Services, Inc., 5.125%, 1/15/24 | 1,105,000 |
| 1,139,531 |
|
Aramark Services, Inc., 5.00%, 4/1/25(1) | 250,000 |
| 256,625 |
|
Aramark Services, Inc., 5.00%, 2/1/28(1) | 950,000 |
| 948,461 |
|
Brand Industrial Services, Inc., 8.50%, 7/15/25(1) | 1,050,000 |
| 947,625 |
|
| Covanta Holding Corp., 5.875%, 3/1/24 | 2,090,000 |
| 2,147,475 |
|
Garda World Security Corp., 8.75%, 5/15/25(1) | 775,000 |
| 742,062 |
|
Harland Clarke Holdings Corp., 9.25%, 3/1/21(1) | 1,435,000 |
| 1,436,794 |
|
Harland Clarke Holdings Corp., 8.375%, 8/15/22(1) | 1,450,000 |
| 1,314,715 |
|
KAR Auction Services, Inc., 5.125%, 6/1/25(1) | 300,000 |
| 298,125 |
|
Matthews International Corp., 5.25%, 12/1/25(1) | 500,000 |
| 481,250 |
|
Multi-Color Corp., 6.125%, 12/1/22(1) | 425,000 |
| 438,813 |
|
Nielsen Co. Luxembourg SARL (The), 5.50%, 10/1/21(1) | 550,000 |
| 552,750 |
|
| Nielsen Finance LLC / Nielsen Finance Co., 4.50%, 10/1/20 | 740,000 |
| 740,925 |
|
Nielsen Finance LLC / Nielsen Finance Co., 5.00%, 4/15/22(1) | 570,000 |
| 567,150 |
|
Prime Security Services Borrower LLC / Prime Finance, Inc., 9.25%, 5/15/23(1) | 1,056,000 |
| 1,111,440 |
|
Prime Security Services Borrower LLC / Prime Finance, Inc., 5.25%, 4/15/24(1)(2) | 425,000 |
| 426,063 |
|
Ritchie Bros Auctioneers, Inc., 5.375%, 1/15/25(1) | 450,000 |
| 460,687 |
|
Star Merger Sub, Inc., 6.875%, 8/15/26(1) | 525,000 |
| 537,797 |
|
Star Merger Sub, Inc., 10.25%, 2/15/27(1) | 2,075,000 |
| 2,137,250 |
|
TMS International Corp., 7.25%, 8/15/25(1) | 375,000 |
| 364,133 |
|
Waste Pro USA, Inc., 5.50%, 2/15/26(1) | 25,000 |
| 24,188 |
|
| | | 19,233,237 |
|
| Communications Equipment — 0.9% | | |
Anixter, Inc., 6.00%, 12/1/25(1) | 350,000 |
| 368,375 |
|
CommScope Finance LLC, 5.50%, 3/1/24(1) | 600,000 |
| 615,174 |
|
CommScope Finance LLC, 6.00%, 3/1/26(1) | 550,000 |
| 570,278 |
|
CommScope Finance LLC, 8.25%, 3/1/27(1) | 800,000 |
| 832,000 |
|
CommScope Technologies LLC, 6.00%, 6/15/25(1) | 2,150,000 |
| 2,098,292 |
|
CommScope Technologies LLC, 5.00%, 3/15/27(1) | 470,000 |
| 417,915 |
|
CommScope, Inc., 5.00%, 6/15/21(1) | 475,000 |
| 476,425 |
|
| Nokia of America Corp., 6.45%, 3/15/29 | 425,000 |
| 417,563 |
|
| Nokia Oyj, 3.375%, 6/12/22 | 225,000 |
| 223,031 |
|
ViaSat, Inc., 5.625%, 4/15/27(1) | 425,000 |
| 433,547 |
|
| | | 6,452,600 |
|
|
| | | | | | |
| | Principal Amount/Shares | Value |
| Construction and Engineering — 0.2% | | |
| Great Lakes Dredge & Dock Corp., 8.00%, 5/15/22 | $ | 375,000 |
| $ | 394,219 |
|
New Enterprise Stone & Lime Co., Inc., 10.125%, 4/1/22(1) | 475,000 |
| 483,313 |
|
New Enterprise Stone & Lime Co., Inc., 6.25%, 3/15/26(1) | 750,000 |
| 731,332 |
|
| | | 1,608,864 |
|
| Construction Materials — 1.0% | | |
BMC East LLC, 5.50%, 10/1/24(1) | 840,000 |
| 828,450 |
|
James Hardie International Finance DAC, 4.75%, 1/15/25(1) | 400,000 |
| 396,000 |
|
James Hardie International Finance DAC, 5.00%, 1/15/28(1) | 400,000 |
| 389,000 |
|
Standard Industries, Inc., 4.75%, 1/15/28(1) | 825,000 |
| 789,937 |
|
| Summit Materials LLC / Summit Materials Finance Corp., 6.125%, 7/15/23 | 325,000 |
| 333,401 |
|
Summit Materials LLC / Summit Materials Finance Corp., 5.125%, 6/1/25(1) | 400,000 |
| 387,000 |
|
Summit Materials LLC / Summit Materials Finance Corp., 6.50%, 3/15/27(1) | 275,000 |
| 277,750 |
|
TerraForm Power Operating LLC, 4.25%, 1/31/23(1) | 700,000 |
| 695,093 |
|
TerraForm Power Operating LLC, 5.00%, 1/31/28(1) | 825,000 |
| 799,219 |
|
| US Concrete, Inc., 6.375%, 6/1/24 | 1,950,000 |
| 1,989,000 |
|
| | | 6,884,850 |
|
| Consumer Finance — 3.1% | | |
| Ally Financial, Inc., 4.125%, 3/30/20 | 975,000 |
| 983,863 |
|
| Ally Financial, Inc., 8.00%, 11/1/31 | 1,225,000 |
| 1,526,656 |
|
ASP AMC Merger Sub, Inc., 8.00%, 5/15/25(1) | 1,575,000 |
| 716,625 |
|
Credit Acceptance Corp., 6.625%, 3/15/26(1) | 425,000 |
| 432,438 |
|
goeasy Ltd., 7.875%, 11/1/22(1) | 525,000 |
| 552,563 |
|
Ladder Capital Finance Holdings LLLP / Ladder Capital Finance Corp., 5.875%, 8/1/21(1) | 925,000 |
| 945,812 |
|
Ladder Capital Finance Holdings LLLP / Ladder Capital Finance Corp., 5.25%, 3/15/22(1) | 1,567,000 |
| 1,594,422 |
|
| Navient Corp., 5.00%, 10/26/20 | 990,000 |
| 1,006,087 |
|
| Navient Corp., 5.875%, 3/25/21 | 50,000 |
| 51,813 |
|
| Navient Corp., 5.50%, 1/25/23 | 2,345,000 |
| 2,356,725 |
|
| Navient Corp., 7.25%, 9/25/23 | 1,250,000 |
| 1,325,000 |
|
| Navient Corp., 5.875%, 10/25/24 | 375,000 |
| 364,688 |
|
| Navient Corp., 6.75%, 6/25/25 | 3,425,000 |
| 3,404,621 |
|
| Navient Corp., 6.75%, 6/15/26 | 675,000 |
| 648,000 |
|
| Navient Corp., MTN, 4.875%, 6/17/19 | 207,000 |
| 207,388 |
|
| Navient Corp., MTN, 6.125%, 3/25/24 | 360,000 |
| 361,350 |
|
Refinitiv US Holdings, Inc., 6.25%, 5/15/26(1) | 325,000 |
| 330,281 |
|
Refinitiv US Holdings, Inc., 8.25%, 11/15/26(1) | 400,000 |
| 393,500 |
|
| Springleaf Finance Corp., 8.25%, 12/15/20 | 125,000 |
| 134,531 |
|
| Springleaf Finance Corp., 6.125%, 3/15/24 | 125,000 |
| 128,123 |
|
| Springleaf Finance Corp., 6.875%, 3/15/25 | 1,125,000 |
| 1,164,375 |
|
| Springleaf Finance Corp., 7.125%, 3/15/26 | 2,200,000 |
| 2,243,989 |
|
Verscend Escrow Corp., 9.75%, 8/15/26(1) | 925,000 |
| 926,156 |
|
| | | 21,799,006 |
|
|
| | | | | | |
| | Principal Amount/Shares | Value |
| Containers and Packaging — 2.6% | | |
ARD Finance SA, 7.125% Cash or 7.875% PIK, 9/15/23(4) | $ | 720,000 |
| $ | 720,900 |
|
Ardagh Packaging Finance plc / Ardagh Holdings USA, Inc., 4.625%, 5/15/23(1) | 400,000 |
| 403,500 |
|
Ardagh Packaging Finance plc / Ardagh Holdings USA, Inc., 7.25%, 5/15/24(1) | 1,365,000 |
| 1,443,078 |
|
Ardagh Packaging Finance plc / Ardagh Holdings USA, Inc., 6.00%, 2/15/25(1) | 1,085,000 |
| 1,087,712 |
|
| Berry Global, Inc., 6.00%, 10/15/22 | 850,000 |
| 877,625 |
|
BWAY Holding Co., 5.50%, 4/15/24(1) | 850,000 |
| 847,067 |
|
BWAY Holding Co., 7.25%, 4/15/25(1) | 3,650,000 |
| 3,533,638 |
|
Flex Acquisition Co., Inc., 6.875%, 1/15/25(1) | 225,000 |
| 216,000 |
|
Flex Acquisition Co., Inc., 7.875%, 7/15/26(1) | 600,000 |
| 580,500 |
|
Greif, Inc., 6.50%, 3/1/27(1) | 575,000 |
| 589,375 |
|
OI European Group BV, 4.00%, 3/15/23(1) | 475,000 |
| 467,281 |
|
Owens-Brockway Glass Container, Inc., 5.00%, 1/15/22(1) | 375,000 |
| 385,781 |
|
Owens-Brockway Glass Container, Inc., 5.875%, 8/15/23(1) | 625,000 |
| 656,969 |
|
Owens-Brockway Glass Container, Inc., 6.375%, 8/15/25(1) | 150,000 |
| 157,875 |
|
Plastipak Holdings, Inc., 6.25%, 10/15/25(1) | 375,000 |
| 352,500 |
|
| Reynolds Group Issuer, Inc. / Reynolds Group Issuer LLC / Reynolds Group Issuer Lu, 5.75%, 10/15/20 | 1,051,482 |
| 1,054,111 |
|
| Reynolds Group Issuer, Inc. / Reynolds Group Issuer LLC / Reynolds Group Issuer Lu, 6.875%, 2/15/21 | 280,695 |
| 282,099 |
|
Reynolds Group Issuer, Inc. / Reynolds Group Issuer LLC / Reynolds Group Issuer Lu, 5.125%, 7/15/23(1) | 1,010,000 |
| 1,027,675 |
|
Reynolds Group Issuer, Inc. / Reynolds Group Issuer LLC / Reynolds Group Issuer Lu, 7.00%, 7/15/24(1) | 1,790,000 |
| 1,847,280 |
|
Sealed Air Corp., 5.125%, 12/1/24(1) | 1,410,000 |
| 1,467,754 |
|
| | | 17,998,720 |
|
| Distributors — 0.1% | | |
American Builders & Contractors Supply Co., Inc., 5.75%, 12/15/23(1) | 375,000 |
| 385,781 |
|
| Diversified Consumer Services — 0.4% | | |
Graham Holdings Co., 5.75%, 6/1/26(1) | 650,000 |
| 684,125 |
|
| Service Corp., International, 5.375%, 1/15/22 | 720,000 |
| 728,640 |
|
Sotheby's, 4.875%, 12/15/25(1) | 800,000 |
| 781,000 |
|
Weight Watchers International, Inc., 8.625%, 12/1/25(1) | 575,000 |
| 520,375 |
|
| | | 2,714,140 |
|
| Diversified Financial Services — 2.4% | | |
Arrow Bidco LLC, 9.50%, 3/15/24(1) | 200,000 |
| 199,250 |
|
Camelot Finance SA, 7.875%, 10/15/24(1) | 750,000 |
| 795,000 |
|
Cornerstone Chemical Co., 6.75%, 8/15/24(1) | 550,000 |
| 519,750 |
|
Exela Intermediate LLC / Exela Finance, Inc., 10.00%, 7/15/23(1) | 1,050,000 |
| 1,073,100 |
|
HUB International Ltd., 7.00%, 5/1/26(1) | 175,000 |
| 173,688 |
|
| Icahn Enterprises LP / Icahn Enterprises Finance Corp., 6.00%, 8/1/20 | 1,555,000 |
| 1,571,716 |
|
| Icahn Enterprises LP / Icahn Enterprises Finance Corp., 5.875%, 2/1/22 | 1,355,000 |
| 1,376,856 |
|
| Icahn Enterprises LP / Icahn Enterprises Finance Corp., 6.25%, 2/1/22 | 655,000 |
| 673,569 |
|
|
| | | | | | |
| | Principal Amount/Shares | Value |
| Icahn Enterprises LP / Icahn Enterprises Finance Corp., 6.375%, 12/15/25 | $ | 1,225,000 |
| $ | 1,257,156 |
|
Jefferies Finance LLC / JFIN Co-Issuer Corp., 7.375%, 4/1/20(1) | 1,710,000 |
| 1,714,275 |
|
| Nationstar Mortgage LLC / Nationstar Capital Corp., 6.50%, 7/1/21 | 1,000,000 |
| 1,002,500 |
|
Oxford Finance LLC / Oxford Finance Co-Issuer II, Inc., 6.375%, 12/15/22(1) | 650,000 |
| 669,500 |
|
Solera LLC / Solera Finance, Inc., 10.50%, 3/1/24(1) | 2,655,000 |
| 2,891,083 |
|
Tempo Acquisition LLC / Tempo Acquisition Finance Corp., 6.75%, 6/1/25(1) | 850,000 |
| 860,625 |
|
Trident Merger Sub, Inc., 6.625%, 11/1/25(1) | 275,000 |
| 258,500 |
|
Vantiv LLC / Vantiv Issuer Corp., 4.375%, 11/15/25(1) | 600,000 |
| 619,878 |
|
VFH Parent LLC / Orchestra Co-Issuer, Inc., 6.75%, 6/15/22(1) | 425,000 |
| 439,378 |
|
Werner FinCo LP / Werner FinCo, Inc., 8.75%, 7/15/25(1) | 1,050,000 |
| 909,930 |
|
| | | 17,005,754 |
|
| Diversified Telecommunication Services — 5.3% | | |
Altice France SA, 6.25%, 5/15/24(1) | 400,000 |
| 404,500 |
|
Altice France SA, 7.375%, 5/1/26(1) | 2,560,000 |
| 2,515,200 |
|
Altice France SA, 8.125%, 2/1/27(1) | 1,200,000 |
| 1,215,000 |
|
| CenturyLink, Inc., 5.625%, 4/1/20 | 1,470,000 |
| 1,503,722 |
|
| CenturyLink, Inc., 6.45%, 6/15/21 | 200,000 |
| 208,750 |
|
| CenturyLink, Inc., 5.80%, 3/15/22 | 550,000 |
| 564,437 |
|
| CenturyLink, Inc., 6.75%, 12/1/23 | 350,000 |
| 366,188 |
|
| CenturyLink, Inc., 7.50%, 4/1/24 | 550,000 |
| 583,000 |
|
| CenturyLink, Inc., 7.60%, 9/15/39 | 400,000 |
| 353,000 |
|
Cogent Communications Group, Inc., 5.375%, 3/1/22(1) | 50,000 |
| 51,375 |
|
| Frontier Communications Corp., 10.50%, 9/15/22 | 4,775,000 |
| 3,664,812 |
|
| Frontier Communications Corp., 11.00%, 9/15/25 | 125,000 |
| 82,990 |
|
Frontier Communications Corp., 8.50%, 4/1/26(1) | 375,000 |
| 349,219 |
|
Frontier Communications Corp., 8.00%, 4/1/27(1) | 875,000 |
| 905,625 |
|
| Hughes Satellite Systems Corp., 5.25%, 8/1/26 | 1,245,000 |
| 1,240,331 |
|
Inmarsat Finance plc, 4.875%, 5/15/22(1) | 455,000 |
| 464,191 |
|
Intelsat Connect Finance SA, 9.50%, 2/15/23(1) | 3,025,000 |
| 2,693,157 |
|
Intelsat Jackson Holdings SA, 8.00%, 2/15/24(1) | 75,000 |
| 78,375 |
|
Intelsat Jackson Holdings SA, 8.50%, 10/15/24(1) | 1,500,000 |
| 1,466,250 |
|
Intelsat Jackson Holdings SA, 9.75%, 7/15/25(1) | 2,150,000 |
| 2,193,645 |
|
| Intelsat Luxembourg SA, 8.125%, 6/1/23 | 900,000 |
| 630,000 |
|
| Level 3 Financing, Inc., 5.375%, 8/15/22 | 1,400,000 |
| 1,410,500 |
|
| Level 3 Financing, Inc., 5.625%, 2/1/23 | 425,000 |
| 430,844 |
|
| Level 3 Financing, Inc., 5.375%, 5/1/25 | 475,000 |
| 482,030 |
|
| Qwest Corp., 6.75%, 12/1/21 | 450,000 |
| 479,032 |
|
| Sprint Capital Corp., 6.90%, 5/1/19 | 790,000 |
| 793,950 |
|
| Sprint Capital Corp., 6.875%, 11/15/28 | 475,000 |
| 457,781 |
|
| Sprint Capital Corp., 8.75%, 3/15/32 | 3,570,000 |
| 3,775,632 |
|
Virgin Media Finance plc, 5.75%, 1/15/25(1) | 1,660,000 |
| 1,695,275 |
|
Windstream Services LLC / Windstream Finance Corp., 7.75%, 10/15/20(6) | 890,000 |
| 231,400 |
|
Windstream Services LLC / Windstream Finance Corp., 7.75%, 10/1/21(6) | 88,000 |
| 22,880 |
|
|
| | | | | | |
| | Principal Amount/Shares | Value |
Windstream Services LLC / Windstream Finance Corp., 10.50%, 6/30/24(1)(6) | $ | 475,000 |
| $ | 352,688 |
|
Windstream Services LLC / Windstream Finance Corp., 8.625%, 10/31/25(1)(6) | 563,000 |
| 536,961 |
|
| Zayo Group LLC / Zayo Capital, Inc., 6.00%, 4/1/23 | 1,970,000 |
| 2,004,475 |
|
Zayo Group LLC / Zayo Capital, Inc., 5.75%, 1/15/27(1) | 2,750,000 |
| 2,750,825 |
|
| | | 36,958,040 |
|
| Electric Utilities — 0.8% | | |
Drax Finco plc, 6.625%, 11/1/25(1) | 200,000 |
| 203,500 |
|
NextEra Energy Operating Partners LP, 4.25%, 9/15/24(1) | 450,000 |
| 448,312 |
|
NextEra Energy Operating Partners LP, 4.50%, 9/15/27(1) | 73,000 |
| 71,449 |
|
Pacific Gas & Electric Co., 3.50%, 10/1/20(5)(6) | 100,000 |
| 92,500 |
|
Pacific Gas & Electric Co., 6.05%, 3/1/34(5)(6) | 1,550,000 |
| 1,546,125 |
|
Pacific Gas & Electric Co., 5.80%, 3/1/37(5)(6) | 825,000 |
| 804,375 |
|
Pacific Gas & Electric Co., 5.40%, 1/15/40(5)(6) | 625,000 |
| 596,875 |
|
Pacific Gas & Electric Co., 5.125%, 11/15/43(5)(6) | 700,000 |
| 636,562 |
|
Vistra Operations Co. LLC, 5.50%, 9/1/26(1) | 225,000 |
| 234,563 |
|
Vistra Operations Co. LLC, 5.625%, 2/15/27(1) | 750,000 |
| 781,875 |
|
| | | 5,416,136 |
|
| Electronic Equipment, Instruments and Components — 0.1% | | |
Itron, Inc., 5.00%, 1/15/26(1) | 250,000 |
| 246,563 |
|
TTM Technologies, Inc., 5.625%, 10/1/25(1) | 475,000 |
| 457,781 |
|
| | | 704,344 |
|
| Energy Equipment and Services — 2.9% | | |
| Apergy Corp., 6.375%, 5/1/26 | 275,000 |
| 279,469 |
|
Archrock Partners LP / Archrock Partners Finance Corp., 6.875%, 4/1/27(1) | 550,000 |
| 562,210 |
|
Basic Energy Services, Inc., 10.75%, 10/15/23(1) | 175,000 |
| 140,875 |
|
Bristow Group, Inc., 8.75%, 3/1/23(1) | 275,000 |
| 199,375 |
|
Calfrac Holdings LP, 8.50%, 6/15/26(1) | 900,000 |
| 702,000 |
|
CGG Holding US, Inc., 9.00%, 5/1/23(1) | 200,000 |
| 212,500 |
|
| Diamond Offshore Drilling, Inc., 7.875%, 8/15/25 | 850,000 |
| 824,500 |
|
| Ensco plc, 7.75%, 2/1/26 | 350,000 |
| 297,063 |
|
| Exterran Energy Solutions LP / EES Finance Corp., 8.125%, 5/1/25 | 425,000 |
| 435,625 |
|
| FTS International, Inc., 6.25%, 5/1/22 | 1,360,000 |
| 1,322,600 |
|
Jonah Energy LLC / Jonah Energy Finance Corp., 7.25%, 10/15/25(1) | 575,000 |
| 307,625 |
|
KCA Deutag UK Finance plc, 9.625%, 4/1/23(1) | 800,000 |
| 673,000 |
|
McDermott Technology Americas, Inc. / McDermott Technology US, Inc., 10.625%, 5/1/24(1) | 500,000 |
| 417,500 |
|
Nine Energy Service, Inc., 8.75%, 11/1/23(1) | 300,000 |
| 311,250 |
|
| Noble Holding International Ltd., 7.75%, 1/15/24 | 323,000 |
| 292,428 |
|
Noble Holding International Ltd., 7.875%, 2/1/26(1) | 975,000 |
| 907,969 |
|
| Noble Holding International Ltd., 6.20%, 8/1/40 | 175,000 |
| 111,563 |
|
| Precision Drilling Corp., 5.25%, 11/15/24 | 975,000 |
| 916,500 |
|
Precision Drilling Corp., 7.125%, 1/15/26(1) | 550,000 |
| 548,109 |
|
| Rowan Cos., Inc., 7.375%, 6/15/25 | 300,000 |
| 264,000 |
|
| SESI LLC, 7.125%, 12/15/21 | 1,050,000 |
| 946,312 |
|
|
| | | | | | |
| | Principal Amount/Shares | Value |
| SESI LLC, 7.75%, 9/15/24 | $ | 775,000 |
| $ | 645,187 |
|
Shelf Drilling Holdings Ltd., 8.25%, 2/15/25(1) | 950,000 |
| 904,875 |
|
Transocean Guardian Ltd., 5.875%, 1/15/24(1) | 141,750 |
| 144,585 |
|
Transocean Pontus Ltd., 6.125%, 8/1/25(1) | 448,875 |
| 456,730 |
|
Transocean Poseidon Ltd., 6.875%, 2/1/27(1) | 450,000 |
| 469,125 |
|
Transocean, Inc., 9.00%, 7/15/23(1) | 2,305,000 |
| 2,466,350 |
|
Transocean, Inc., 7.50%, 1/15/26(1) | 1,125,000 |
| 1,116,562 |
|
| Transocean, Inc., 7.50%, 4/15/31 | 250,000 |
| 215,000 |
|
| USA Compression Partners LP / USA Compression Finance Corp., 6.875%, 4/1/26 | 825,000 |
| 847,687 |
|
USA Compression Partners LP / USA Compression Finance Corp., 6.875%, 9/1/27(1) | 675,000 |
| 689,344 |
|
| Weatherford International LLC, 9.875%, 3/1/25 | 400,000 |
| 285,000 |
|
| Weatherford International Ltd., 5.125%, 9/15/20 | 425,000 |
| 376,125 |
|
| Weatherford International Ltd., 8.25%, 6/15/23 | 125,000 |
| 89,063 |
|
| Weatherford International Ltd., 9.875%, 2/15/24 | 1,100,000 |
| 797,500 |
|
| | | 20,175,606 |
|
| Entertainment — 1.7% | | |
| AMC Entertainment Holdings, Inc., 5.75%, 6/15/25 | 355,000 |
| 333,185 |
|
| AMC Entertainment Holdings, Inc., 5.875%, 11/15/26 | 1,325,000 |
| 1,199,125 |
|
| AMC Entertainment Holdings, Inc., 6.125%, 5/15/27 | 425,000 |
| 386,219 |
|
| Cinemark USA, Inc., 5.125%, 12/15/22 | 785,000 |
| 799,719 |
|
| Cinemark USA, Inc., 4.875%, 6/1/23 | 300,000 |
| 305,790 |
|
Live Nation Entertainment, Inc., 5.625%, 3/15/26(1) | 650,000 |
| 672,750 |
|
| Netflix, Inc., 5.375%, 2/1/21 | 450,000 |
| 468,422 |
|
| Netflix, Inc., 5.50%, 2/15/22 | 175,000 |
| 184,187 |
|
| Netflix, Inc., 4.875%, 4/15/28 | 25,000 |
| 24,813 |
|
Netflix, Inc., 5.875%, 11/15/28(1) | 525,000 |
| 555,844 |
|
Netflix, Inc., 6.375%, 5/15/29(1) | 2,275,000 |
| 2,465,531 |
|
UPCB Finance IV Ltd., 5.375%, 1/15/25(1) | 810,000 |
| 824,175 |
|
WMG Acquisition Corp., 5.625%, 4/15/22(1) | 1,201,000 |
| 1,217,514 |
|
Ziggo Bond Co. BV, 5.875%, 1/15/25(1) | 745,000 |
| 737,550 |
|
Ziggo Bond Co. BV, 6.00%, 1/15/27(1) | 150,000 |
| 144,375 |
|
Ziggo BV, 5.50%, 1/15/27(1) | 1,525,000 |
| 1,513,562 |
|
| | | 11,832,761 |
|
| Equity Real Estate Investment Trusts (REITs) — 1.8% | | |
| CyrusOne LP / CyrusOne Finance Corp., 5.00%, 3/15/24 | 175,000 |
| 179,156 |
|
| CyrusOne LP / CyrusOne Finance Corp., 5.375%, 3/15/27 | 175,000 |
| 181,510 |
|
| Equinix, Inc., 5.375%, 4/1/23 | 2,085,000 |
| 2,129,306 |
|
| Equinix, Inc., 5.75%, 1/1/25 | 300,000 |
| 312,188 |
|
ESH Hospitality, Inc., 5.25%, 5/1/25(1) | 200,000 |
| 199,250 |
|
| FelCor Lodging LP, 6.00%, 6/1/25 | 1,280,000 |
| 1,323,200 |
|
| GLP Capital LP / GLP Financing II, Inc., 4.875%, 11/1/20 | 575,000 |
| 587,362 |
|
| GLP Capital LP / GLP Financing II, Inc., 5.375%, 11/1/23 | 500,000 |
| 528,220 |
|
| GLP Capital LP / GLP Financing II, Inc., 5.25%, 6/1/25 | 150,000 |
| 157,521 |
|
| GLP Capital LP / GLP Financing II, Inc., 5.375%, 4/15/26 | 660,000 |
| 691,284 |
|
| Iron Mountain, Inc., 5.75%, 8/15/24 | 1,780,000 |
| 1,802,250 |
|
|
| | | | | | |
| | Principal Amount/Shares | Value |
| iStar, Inc., 4.625%, 9/15/20 | $ | 475,000 |
| $ | 481,531 |
|
| iStar, Inc., 5.25%, 9/15/22 | 125,000 |
| 123,438 |
|
MGM Growth Properties Operating Partnership LP / MGP Finance Co-Issuer, Inc., 5.75%, 2/1/27(1) | 200,000 |
| 207,250 |
|
| Sabra Health Care LP / Sabra Capital Corp., 5.50%, 2/1/21 | 950,000 |
| 961,281 |
|
| SBA Communications Corp., 4.875%, 7/15/22 | 960,000 |
| 975,600 |
|
| SBA Communications Corp., 4.00%, 10/1/22 | 400,000 |
| 403,440 |
|
Uniti Group LP / Uniti Fiber Holdings, Inc. / CSL Capital LLC, 7.125%, 12/15/24(1) | 1,615,000 |
| 1,396,975 |
|
| | | 12,640,762 |
|
| Food and Staples Retailing — 0.2% | | |
| Albertsons Cos. LLC / Safeway, Inc. / New Albertson's, LP / Albertson's LLC, 6.625%, 6/15/24 | 600,000 |
| 609,000 |
|
| Albertsons Cos. LLC / Safeway, Inc. / New Albertson's, LP / Albertson's LLC, 5.75%, 3/15/25 | 200,000 |
| 190,750 |
|
| Ingles Markets, Inc., 5.75%, 6/15/23 | 200,000 |
| 204,750 |
|
| Rite Aid Corp., 7.70%, 2/15/27 | 200,000 |
| 126,000 |
|
US Foods, Inc., 5.875%, 6/15/24(1) | 250,000 |
| 256,875 |
|
| | | 1,387,375 |
|
| Food Products — 1.7% | | |
| B&G Foods, Inc., 5.25%, 4/1/25 | 815,000 |
| 784,437 |
|
Chobani LLC / Chobani Finance Corp., Inc., 7.50%, 4/15/25(1) | 250,000 |
| 225,313 |
|
Cooke Omega Investments, Inc. / Alpha VesselCo Holdings, Inc., 8.50%, 12/15/22(1) | 950,000 |
| 934,325 |
|
Darling Ingredients, Inc., 5.25%, 4/15/27(1)(2) | 300,000 |
| 305,063 |
|
HLF Financing Sarl LLC / Herbalife International, Inc., 7.25%, 8/15/26(1) | 100,000 |
| 103,125 |
|
JBS USA LUX SA / JBS USA Finance, Inc., 5.875%, 7/15/24(1) | 730,000 |
| 752,812 |
|
JBS USA LUX SA / JBS USA Finance, Inc., 5.75%, 6/15/25(1) | 1,065,000 |
| 1,095,619 |
|
Pilgrim's Pride Corp., 5.75%, 3/15/25(1) | 3,280,000 |
| 3,329,200 |
|
Pilgrim's Pride Corp., 5.875%, 9/30/27(1) | 525,000 |
| 530,250 |
|
Post Holdings, Inc., 5.75%, 3/1/27(1) | 3,150,000 |
| 3,177,562 |
|
Sigma Holdco BV, 7.875%, 5/15/26(1) | 500,000 |
| 463,750 |
|
| | | 11,701,456 |
|
| Gas Utilities — 3.0% | | |
American Midstream Partners LP / American Midstream Finance Corp., 9.50%, 12/15/21(1) | 475,000 |
| 439,375 |
|
| Andeavor Logistics LP / Tesoro Logistics Finance Corp., 5.50%, 10/15/19 | 1,145,000 |
| 1,156,588 |
|
| Antero Midstream Partners LP / Antero Midstream Finance Corp., 5.375%, 9/15/24 | 750,000 |
| 759,600 |
|
Antero Midstream Partners LP / Antero Midstream Finance Corp., 5.75%, 3/1/27(1) | 525,000 |
| 534,187 |
|
Blue Racer Midstream LLC / Blue Racer Finance Corp., 6.125%, 11/15/22(1) | 775,000 |
| 790,500 |
|
Blue Racer Midstream LLC / Blue Racer Finance Corp., 6.625%, 7/15/26(1) | 250,000 |
| 256,250 |
|
| Cheniere Corpus Christi Holdings LLC, 7.00%, 6/30/24 | 630,000 |
| 712,719 |
|
| Cheniere Corpus Christi Holdings LLC, 5.875%, 3/31/25 | 815,000 |
| 888,350 |
|
| Cheniere Corpus Christi Holdings LLC, 5.125%, 6/30/27 | 325,000 |
| 341,656 |
|
|
| | | | | | |
| | Principal Amount/Shares | Value |
CNX Midstream Partners LP / CNX Midstream Finance Corp., 6.50%, 3/15/26(1) | $ | 425,000 |
| $ | 413,312 |
|
| Crestwood Midstream Partners LP / Crestwood Midstream Finance Corp., 6.25%, 4/1/23 | 820,000 |
| 844,600 |
|
| Crestwood Midstream Partners LP / Crestwood Midstream Finance Corp., 5.75%, 4/1/25 | 1,090,000 |
| 1,122,700 |
|
DCP Midstream Operating LP, 5.35%, 3/15/20(1) | 300,000 |
| 305,625 |
|
| DCP Midstream Operating LP, 5.375%, 7/15/25 | 900,000 |
| 940,500 |
|
| Genesis Energy LP / Genesis Energy Finance Corp., 6.50%, 10/1/25 | 325,000 |
| 317,688 |
|
| Genesis Energy LP / Genesis Energy Finance Corp., 6.25%, 5/15/26 | 275,000 |
| 261,250 |
|
Holly Energy Partners LP / Holly Energy Finance Corp., 6.00%, 8/1/24(1) | 125,000 |
| 129,625 |
|
NGPL PipeCo LLC, 4.375%, 8/15/22(1) | 800,000 |
| 814,000 |
|
NGPL PipeCo LLC, 4.875%, 8/15/27(1) | 50,000 |
| 50,688 |
|
| PBF Logistics LP / PBF Logistics Finance Corp., 6.875%, 5/15/23 | 550,000 |
| 562,375 |
|
Rockies Express Pipeline LLC, 5.625%, 4/15/20(1) | 2,115,000 |
| 2,170,519 |
|
Rockies Express Pipeline LLC, 6.875%, 4/15/40(1) | 175,000 |
| 188,697 |
|
| SemGroup Corp. / Rose Rock Finance Corp., 5.625%, 7/15/22 | 475,000 |
| 472,031 |
|
| SemGroup Corp. / Rose Rock Finance Corp., 5.625%, 11/15/23 | 375,000 |
| 354,038 |
|
| Summit Midstream Holdings LLC / Summit Midstream Finance Corp., 5.50%, 8/15/22 | 1,350,000 |
| 1,343,250 |
|
| Summit Midstream Holdings LLC / Summit Midstream Finance Corp., 5.75%, 4/15/25 | 425,000 |
| 403,219 |
|
Superior Plus LP / Superior General Partner, Inc., 7.00%, 7/15/26(1) | 250,000 |
| 255,313 |
|
Tallgrass Energy Partners LP / Tallgrass Energy Finance Corp., 4.75%, 10/1/23(1) | 650,000 |
| 656,298 |
|
Tallgrass Energy Partners LP / Tallgrass Energy Finance Corp., 5.50%, 1/15/28(1) | 300,000 |
| 301,875 |
|
| Targa Resources Partners LP / Targa Resources Partners Finance Corp., 4.25%, 11/15/23 | 1,215,000 |
| 1,213,481 |
|
| Targa Resources Partners LP / Targa Resources Partners Finance Corp., 5.125%, 2/1/25 | 1,205,000 |
| 1,235,125 |
|
Targa Resources Partners LP / Targa Resources Partners Finance Corp., 5.875%, 4/15/26(1) | 225,000 |
| 238,950 |
|
Targa Resources Partners LP / Targa Resources Partners Finance Corp., 6.50%, 7/15/27(1) | 75,000 |
| 81,094 |
|
Targa Resources Partners LP / Targa Resources Partners Finance Corp., 6.875%, 1/15/29(1) | 325,000 |
| 354,656 |
|
| TransMontaigne Partners LP / TLP Finance Corp., 6.125%, 2/15/26 | 450,000 |
| 425,250 |
|
| | | 21,335,384 |
|
| Health Care Equipment and Supplies — 0.4% | | |
Avantor, Inc., 6.00%, 10/1/24(1) | 425,000 |
| 442,000 |
|
Avantor, Inc., 9.00%, 10/1/25(1) | 950,000 |
| 1,031,938 |
|
Mallinckrodt International Finance SA / Mallinckrodt CB LLC, 5.75%, 8/1/22(1) | 630,000 |
| 595,350 |
|
Mallinckrodt International Finance SA / Mallinckrodt CB LLC, 5.625%, 10/15/23(1) | 355,000 |
| 296,425 |
|
Ortho-Clinical Diagnostics, Inc. / Ortho-Clinical Diagnostics SA, 6.625%, 5/15/22(1) | 800,000 |
| 762,000 |
|
| | | 3,127,713 |
|
|
| | | | | | |
| | Principal Amount/Shares | Value |
| Health Care Providers and Services — 3.8% | | |
| Centene Corp., 5.625%, 2/15/21 | $ | 1,445,000 |
| $ | 1,468,481 |
|
| Centene Corp., 6.125%, 2/15/24 | 1,120,000 |
| 1,174,936 |
|
Centene Corp., 5.375%, 6/1/26(1) | 1,100,000 |
| 1,149,500 |
|
| CHS / Community Health Systems, Inc., 6.875%, 2/1/22 | 815,000 |
| 546,050 |
|
CHS / Community Health Systems, Inc., 8.625%, 1/15/24(1) | 50,000 |
| 50,188 |
|
CHS / Community Health Systems, Inc., 8.125%, 6/30/24(1) | 422,000 |
| 316,627 |
|
CHS / Community Health Systems, Inc., 8.00%, 3/15/26(1) | 750,000 |
| 719,475 |
|
CHS / Community Health Systems, Inc., VRN, 11.00%, 6/30/23(1) | 1,110,000 |
| 910,899 |
|
| DaVita, Inc., 5.75%, 8/15/22 | 1,625,000 |
| 1,659,531 |
|
| Encompass Health Corp., 5.75%, 11/1/24 | 540,000 |
| 548,775 |
|
Envision Healthcare Corp., 8.75%, 10/15/26(1) | 1,925,000 |
| 1,720,469 |
|
| HCA Healthcare, Inc., 6.25%, 2/15/21 | 125,000 |
| 131,669 |
|
| HCA, Inc., 7.50%, 2/15/22 | 1,925,000 |
| 2,127,702 |
|
| HCA, Inc., 7.69%, 6/15/25 | 1,730,000 |
| 1,967,875 |
|
| HCA, Inc., 5.875%, 2/15/26 | 625,000 |
| 676,562 |
|
| HCA, Inc., 5.375%, 9/1/26 | 1,825,000 |
| 1,925,375 |
|
| HCA, Inc., 5.625%, 9/1/28 | 1,845,000 |
| 1,955,700 |
|
MEDNAX, Inc., 6.25%, 1/15/27(1) | 375,000 |
| 380,156 |
|
MPH Acquisition Holdings LLC, 7.125%, 6/1/24(1) | 1,200,000 |
| 1,200,000 |
|
Polaris Intermediate Corp., 8.50% Cash or 9.25% PIK, 12/1/22(1)(4) | 1,175,000 |
| 1,163,544 |
|
| Select Medical Corp., 6.375%, 6/1/21 | 1,600,000 |
| 1,608,000 |
|
Surgery Center Holdings, Inc., 10.00%, 4/15/27(1)(2) | 250,000 |
| 254,375 |
|
| Tenet Healthcare Corp., 6.00%, 10/1/20 | 250,000 |
| 259,688 |
|
| Tenet Healthcare Corp., 8.125%, 4/1/22 | 275,000 |
| 296,890 |
|
| Tenet Healthcare Corp., 6.75%, 6/15/23 | 980,000 |
| 1,013,075 |
|
| Tenet Healthcare Corp., 4.625%, 7/15/24 | 881,000 |
| 886,506 |
|
Tenet Healthcare Corp., 6.25%, 2/1/27(1) | 150,000 |
| 155,813 |
|
WellCare Health Plans, Inc., 5.375%, 8/15/26(1) | 550,000 |
| 576,812 |
|
| | | 26,844,673 |
|
| Hotels, Restaurants and Leisure — 6.1% | | |
1011778 BC ULC / New Red Finance, Inc., 4.625%, 1/15/22(1) | 200,000 |
| 201,442 |
|
1011778 BC ULC / New Red Finance, Inc., 5.00%, 10/15/25(1) | 3,150,000 |
| 3,119,445 |
|
| Boyd Gaming Corp., 6.875%, 5/15/23 | 260,000 |
| 271,050 |
|
| Boyd Gaming Corp., 6.375%, 4/1/26 | 1,150,000 |
| 1,194,562 |
|
| Boyd Gaming Corp., 6.00%, 8/15/26 | 1,450,000 |
| 1,491,687 |
|
Boyne USA, Inc., 7.25%, 5/1/25(1) | 246,000 |
| 264,450 |
|
Caesars Resort Collection LLC / CRC Finco, Inc., 5.25%, 10/15/25(1) | 1,700,000 |
| 1,644,750 |
|
| Carrols Restaurant Group, Inc., 8.00%, 5/1/22 | 75,000 |
| 76,819 |
|
Churchill Downs, Inc., 5.50%, 4/1/27(1) | 475,000 |
| 482,125 |
|
Churchill Downs, Inc., 4.75%, 1/15/28(1) | 750,000 |
| 717,187 |
|
Downstream Development Authority of the Quapaw Tribe of Oklahoma, 10.50%, 2/15/23(1) | 725,000 |
| 753,094 |
|
| Eldorado Resorts, Inc., 7.00%, 8/1/23 | 2,315,000 |
| 2,428,227 |
|
| Eldorado Resorts, Inc., 6.00%, 4/1/25 | 625,000 |
| 635,938 |
|
| Eldorado Resorts, Inc., 6.00%, 9/15/26 | 125,000 |
| 127,500 |
|
|
| | | | | | |
| | Principal Amount/Shares | Value |
Enterprise Development Authority (The), 12.00%, 7/15/24(1) | $ | 675,000 |
| $ | 688,500 |
|
Gateway Casinos & Entertainment Ltd., 8.25%, 3/1/24(1) | 1,150,000 |
| 1,211,812 |
|
Golden Nugget, Inc., 6.75%, 10/15/24(1) | 2,375,000 |
| 2,392,812 |
|
Golden Nugget, Inc., 8.75%, 10/1/25(1) | 1,550,000 |
| 1,631,375 |
|
Hilton Domestic Operating Co., Inc., 5.125%, 5/1/26(1) | 1,525,000 |
| 1,551,687 |
|
Inn of the Mountain Gods Resort & Casino, 9.25% Cash or 9.25% PIK, 11/30/20(4) | 300,000 |
| 298,500 |
|
IRB Holding Corp., 6.75%, 2/15/26(1) | 975,000 |
| 918,937 |
|
Jack Ohio Finance LLC / Jack Ohio Finance 1 Corp., 6.75%, 11/15/21(1) | 1,190,000 |
| 1,228,675 |
|
Jacobs Entertainment, Inc., 7.875%, 2/1/24(1) | 550,000 |
| 577,500 |
|
KFC Holding Co. / Pizza Hut Holdings LLC / Taco Bell of America LLC, 5.00%, 6/1/24(1) | 250,000 |
| 255,625 |
|
LTF Merger Sub, Inc., 8.50%, 6/15/23(1) | 2,775,000 |
| 2,861,719 |
|
Marriott Ownership Resorts, Inc. / ILG LLC, 6.50%, 9/15/26(1) | 100,000 |
| 105,145 |
|
Merlin Entertainments plc, 5.75%, 6/15/26(1) | 400,000 |
| 413,500 |
|
| MGM Resorts International, 5.25%, 3/31/20 | 1,340,000 |
| 1,368,475 |
|
| MGM Resorts International, 6.75%, 10/1/20 | 250,000 |
| 262,813 |
|
| MGM Resorts International, 6.625%, 12/15/21 | 800,000 |
| 857,000 |
|
| MGM Resorts International, 7.75%, 3/15/22 | 980,000 |
| 1,085,350 |
|
| MGM Resorts International, 6.00%, 3/15/23 | 1,975,000 |
| 2,088,562 |
|
| MGM Resorts International, 5.75%, 6/15/25 | 25,000 |
| 26,031 |
|
MGM Resorts International, 5.50%, 4/15/27(2) | 450,000 |
| 457,875 |
|
Mohegan Gaming & Entertainment, 7.875%, 10/15/24(1) | 1,900,000 |
| 1,895,250 |
|
Nathan's Famous, Inc., 6.625%, 11/1/25(1) | 825,000 |
| 805,406 |
|
NCL Corp. Ltd., 4.75%, 12/15/21(1) | 442,000 |
| 448,078 |
|
| Scientific Games International, Inc., 6.25%, 9/1/20 | 1,410,000 |
| 1,417,050 |
|
| Scientific Games International, Inc., 6.625%, 5/15/21 | 275,000 |
| 279,125 |
|
Silversea Cruise Finance Ltd., 7.25%, 2/1/25(1) | 475,000 |
| 516,088 |
|
Station Casinos LLC, 5.00%, 10/1/25(1) | 325,000 |
| 320,938 |
|
Viking Cruises Ltd., 6.25%, 5/15/25(1) | 600,000 |
| 612,000 |
|
Viking Cruises Ltd., 5.875%, 9/15/27(1) | 425,000 |
| 414,375 |
|
VOC Escrow Ltd., 5.00%, 2/15/28(1) | 25,000 |
| 24,438 |
|
Wynn Las Vegas LLC / Wynn Las Vegas Capital Corp., 5.50%, 3/1/25(1) | 125,000 |
| 123,750 |
|
Wynn Las Vegas LLC / Wynn Las Vegas Capital Corp., 5.25%, 5/15/27(1) | 950,000 |
| 900,125 |
|
Wynn Macau Ltd., 4.875%, 10/1/24(1) | 800,000 |
| 782,472 |
|
Wynn Macau Ltd., 5.50%, 10/1/27(1) | 800,000 |
| 768,000 |
|
| | | 42,997,264 |
|
| Household Durables — 3.4% | | |
Ashton Woods USA LLC / Ashton Woods Finance Co., 6.75%, 8/1/25(1) | 475,000 |
| 434,625 |
|
| Beazer Homes USA, Inc., 8.75%, 3/15/22 | 795,000 |
| 833,557 |
|
| Beazer Homes USA, Inc., 7.25%, 2/1/23 | 38,000 |
| 36,670 |
|
| Beazer Homes USA, Inc., 6.75%, 3/15/25 | 300,000 |
| 285,000 |
|
Brookfield Residential Properties, Inc., 6.375%, 5/15/25(1) | 1,000,000 |
| 965,000 |
|
Brookfield Residential Properties, Inc. / Brookfield Residential US Corp., 6.125%, 7/1/22(1) | 1,235,000 |
| 1,245,806 |
|
|
| | | | | | |
| | Principal Amount/Shares | Value |
| Century Communities, Inc., 6.875%, 5/15/22 | $ | 835,000 |
| $ | 853,787 |
|
FXI Holdings, Inc., 7.875%, 11/1/24(1) | 150,000 |
| 139,875 |
|
Jeld-Wen, Inc., 4.625%, 12/15/25(1) | 375,000 |
| 357,188 |
|
| KB Home, 8.00%, 3/15/20 | 360,000 |
| 375,840 |
|
| KB Home, 7.00%, 12/15/21 | 565,000 |
| 606,669 |
|
| KB Home, 7.625%, 5/15/23 | 150,000 |
| 164,063 |
|
| KB Home, 6.875%, 6/15/27 | 425,000 |
| 438,813 |
|
| Lennar Corp., 4.50%, 4/30/24 | 1,805,000 |
| 1,835,143 |
|
| Lennar Corp., 5.00%, 6/15/27 | 625,000 |
| 628,906 |
|
Mattamy Group Corp., 6.50%, 10/1/25(1) | 300,000 |
| 297,465 |
|
| Meritage Homes Corp., 7.00%, 4/1/22 | 540,000 |
| 579,825 |
|
| Meritage Homes Corp., 6.00%, 6/1/25 | 750,000 |
| 791,250 |
|
Shea Homes LP / Shea Homes Funding Corp., 5.875%, 4/1/23(1) | 920,000 |
| 910,800 |
|
Shea Homes LP / Shea Homes Funding Corp., 6.125%, 4/1/25(1) | 50,000 |
| 47,875 |
|
| Taylor Morrison Communities, Inc., 6.625%, 5/15/22 | 450,000 |
| 466,875 |
|
Taylor Morrison Communities, Inc. / Taylor Morrison Holdings II, Inc., 5.625%, 3/1/24(1) | 2,625,000 |
| 2,618,437 |
|
| Toll Brothers Finance Corp., 6.75%, 11/1/19 | 490,000 |
| 502,226 |
|
| Toll Brothers Finance Corp., 5.875%, 2/15/22 | 225,000 |
| 237,544 |
|
TopBuild Corp., 5.625%, 5/1/26(1) | 675,000 |
| 668,250 |
|
| TRI Pointe Group, Inc., 5.25%, 6/1/27 | 625,000 |
| 575,781 |
|
| TRI Pointe Group, Inc. / TRI Pointe Homes, Inc., 5.875%, 6/15/24 | 2,490,000 |
| 2,508,675 |
|
| Weekley Homes LLC / Weekley Finance Corp., 6.00%, 2/1/23 | 900,000 |
| 870,750 |
|
| Weekley Homes LLC / Weekley Finance Corp., 6.625%, 8/15/25 | 750,000 |
| 720,000 |
|
| William Lyon Homes, Inc., 6.00%, 9/1/23 | 525,000 |
| 510,563 |
|
| William Lyon Homes, Inc., 5.875%, 1/31/25 | 1,480,000 |
| 1,398,600 |
|
Williams Scotsman International, Inc., 7.875%, 12/15/22(1) | 700,000 |
| 722,750 |
|
Williams Scotsman International, Inc., 6.875%, 8/15/23(1) | 525,000 |
| 526,312 |
|
| | | 24,154,920 |
|
| Household Products — 0.3% | | |
| Central Garden & Pet Co., 5.125%, 2/1/28 | 200,000 |
| 184,000 |
|
Energizer Holdings, Inc., 5.50%, 6/15/25(1) | 350,000 |
| 347,813 |
|
Energizer Holdings, Inc., 6.375%, 7/15/26(1) | 425,000 |
| 436,688 |
|
| Spectrum Brands, Inc., 5.75%, 7/15/25 | 845,000 |
| 855,562 |
|
| | | 1,824,063 |
|
| Independent Power and Renewable Electricity Producers — 1.3% |
| Calpine Corp., 5.375%, 1/15/23 | 3,540,000 |
| 3,553,275 |
|
Calpine Corp., 5.875%, 1/15/24(1) | 225,000 |
| 231,188 |
|
| Calpine Corp., 5.50%, 2/1/24 | 360,000 |
| 359,100 |
|
Calpine Corp., 5.25%, 6/1/26(1) | 800,000 |
| 799,000 |
|
| NRG Energy, Inc., 6.25%, 5/1/24 | 1,610,000 |
| 1,664,337 |
|
| NRG Energy, Inc., 7.25%, 5/15/26 | 320,000 |
| 353,261 |
|
| Vistra Energy Corp., 7.375%, 11/1/22 | 2,221,000 |
| 2,309,840 |
|
| Vistra Energy Corp., 5.875%, 6/1/23 | 75,000 |
| 76,969 |
|
| Vistra Energy Corp., 7.625%, 11/1/24 | 74,000 |
| 78,441 |
|
| | | 9,425,411 |
|
|
| | | | | | |
| | Principal Amount/Shares | Value |
| Industrial Conglomerates — 0.8% | | |
DAE Funding LLC, 4.00%, 8/1/20(1) | $ | 725,000 |
| $ | 728,625 |
|
DAE Funding LLC, 5.25%, 11/15/21(1) | 1,175,000 |
| 1,201,437 |
|
DAE Funding LLC, 4.50%, 8/1/22(1) | 1,275,000 |
| 1,289,344 |
|
DAE Funding LLC, 5.00%, 8/1/24(1) | 1,250,000 |
| 1,268,750 |
|
Grinding Media, Inc. / Moly-Cop AltaSteel Ltd., 7.375%, 12/15/23(1) | 125,000 |
| 120,625 |
|
JPW Industries Holding Corp., 9.00%, 10/1/24(1) | 400,000 |
| 392,000 |
|
RBS Global, Inc. / Rexnord LLC, 4.875%, 12/15/25(1) | 725,000 |
| 719,563 |
|
| | | 5,720,344 |
|
| Insurance — 1.0% | | |
Acrisure LLC / Acrisure Finance, Inc., 8.125%, 2/15/24(1) | 425,000 |
| 441,165 |
|
Acrisure LLC / Acrisure Finance, Inc., 7.00%, 11/15/25(1) | 1,150,000 |
| 1,040,750 |
|
| Aircastle Ltd., 5.125%, 3/15/21 | 150,000 |
| 154,848 |
|
Ardonagh Midco 3 plc, 8.625%, 7/15/23(1) | 1,600,000 |
| 1,376,000 |
|
AssuredPartners, Inc., 7.00%, 8/15/25(1) | 700,000 |
| 651,000 |
|
Fidelity & Guaranty Life Holdings, Inc., 5.50%, 5/1/25(1) | 925,000 |
| 933,094 |
|
| Genworth Holdings, Inc., 7.625%, 9/24/21 | 820,000 |
| 795,400 |
|
| Genworth Holdings, Inc., VRN, 4.69%, (3-month LIBOR plus 2.00%), 11/15/66 | 450,000 |
| 252,000 |
|
NFP Corp., 6.875%, 7/15/25(1) | 925,000 |
| 888,000 |
|
| Prudential Financial, Inc., VRN, 5.70%, 9/15/48 | 225,000 |
| 228,043 |
|
| | | 6,760,300 |
|
| Interactive Media and Services — 0.3% | | |
| Match Group, Inc., 6.375%, 6/1/24 | 700,000 |
| 738,500 |
|
Match Group, Inc., 5.625%, 2/15/29(1) | 225,000 |
| 228,656 |
|
Rackspace Hosting, Inc., 8.625%, 11/15/24(1) | 960,000 |
| 857,645 |
|
| | | 1,824,801 |
|
| IT Services — 0.4% | | |
Banff Merger Sub, Inc., 9.75%, 9/1/26(1) | 500,000 |
| 486,250 |
|
| CDW LLC / CDW Finance Corp., 5.00%, 9/1/23 | 615,000 |
| 631,144 |
|
| CDW LLC / CDW Finance Corp., 5.50%, 12/1/24 | 755,000 |
| 797,469 |
|
First Data Corp., 5.00%, 1/15/24(1) | 100,000 |
| 102,462 |
|
First Data Corp., 5.75%, 1/15/24(1) | 800,000 |
| 825,600 |
|
Gartner, Inc., 5.125%, 4/1/25(1) | 75,000 |
| 75,990 |
|
| | | 2,918,915 |
|
| Leisure Products — 0.1% | | |
Constellation Merger Sub, Inc., 8.50%, 9/15/25(1) | 725,000 |
| 659,750 |
|
| Life Sciences Tools and Services — 0.2% | | |
Charles River Laboratories International, Inc., 5.50%, 4/1/26(1) | 525,000 |
| 546,000 |
|
IQVIA, Inc., 4.875%, 5/15/23(1) | 475,000 |
| 485,735 |
|
IQVIA, Inc., 5.00%, 10/15/26(1) | 200,000 |
| 205,376 |
|
| | | 1,237,111 |
|
| Machinery — 1.1% | | |
Allison Transmission, Inc., 5.875%, 6/1/29(1) | 425,000 |
| 430,844 |
|
Cleaver-Brooks, Inc., 7.875%, 3/1/23(1) | 350,000 |
| 324,625 |
|
Cloud Crane LLC, 10.125%, 8/1/24(1) | 575,000 |
| 619,562 |
|
Colfax Corp., 6.00%, 2/15/24(1) | 325,000 |
| 339,625 |
|
|
| | | | | | |
| | Principal Amount/Shares | Value |
Colfax Corp., 6.375%, 2/15/26(1) | $ | 200,000 |
| $ | 213,124 |
|
EnPro Industries, Inc., 5.75%, 10/15/26(1) | 500,000 |
| 505,000 |
|
JB Poindexter & Co., Inc., 7.125%, 4/15/26(1) | 675,000 |
| 680,285 |
|
Manitowoc Co., Inc. (The), 9.00%, 4/1/26(1) | 275,000 |
| 279,125 |
|
Mueller Water Products, Inc., 5.50%, 6/15/26(1) | 275,000 |
| 279,812 |
|
Navistar International Corp., 6.625%, 11/1/25(1) | 75,000 |
| 76,594 |
|
SPX FLOW, Inc., 5.625%, 8/15/24(1) | 150,000 |
| 151,500 |
|
Stevens Holding Co., Inc., 6.125%, 10/1/26(1) | 300,000 |
| 310,500 |
|
Vertiv Group Corp., 9.25%, 10/15/24(1) | 375,000 |
| 375,000 |
|
Vertiv Intermediate Holding Corp., 12.00% Cash or 13.00% PIK, 2/15/22(1)(4) | 2,725,000 |
| 2,639,844 |
|
Wabash National Corp., 5.50%, 10/1/25(1) | 750,000 |
| 703,125 |
|
| | | 7,928,565 |
|
| Marine — 0.3% | | |
| Martin Midstream Partners LP / Martin Midstream Finance Corp., 7.25%, 2/15/21 | 2,485,000 |
| 2,422,875 |
|
| Media — 6.5% | | |
Altice Financing SA, 6.625%, 2/15/23(1) | 1,740,000 |
| 1,783,500 |
|
Altice Financing SA, 7.50%, 5/15/26(1) | 1,445,000 |
| 1,434,162 |
|
Altice Finco SA, 7.625%, 2/15/25(1) | 940,000 |
| 858,925 |
|
Altice Luxembourg SA, 7.75%, 5/15/22(1) | 3,525,000 |
| 3,533,812 |
|
| AMC Networks, Inc., 5.00%, 4/1/24 | 450,000 |
| 453,330 |
|
| Cablevision Systems Corp., 8.00%, 4/15/20 | 300,000 |
| 314,250 |
|
| Cablevision Systems Corp., 5.875%, 9/15/22 | 300,000 |
| 314,250 |
|
| CCO Holdings LLC / CCO Holdings Capital Corp., 5.25%, 9/30/22 | 700,000 |
| 714,438 |
|
CCO Holdings LLC / CCO Holdings Capital Corp., 4.00%, 3/1/23(1) | 725,000 |
| 726,124 |
|
CCO Holdings LLC / CCO Holdings Capital Corp., 5.125%, 5/1/23(1) | 500,000 |
| 512,995 |
|
| CCO Holdings LLC / CCO Holdings Capital Corp., 5.75%, 1/15/24 | 100,000 |
| 102,875 |
|
CCO Holdings LLC / CCO Holdings Capital Corp., 5.375%, 5/1/25(1) | 950,000 |
| 983,250 |
|
CCO Holdings LLC / CCO Holdings Capital Corp., 5.75%, 2/15/26(1) | 3,615,000 |
| 3,795,750 |
|
CCO Holdings LLC / CCO Holdings Capital Corp., 5.50%, 5/1/26(1) | 375,000 |
| 388,125 |
|
CCO Holdings LLC / CCO Holdings Capital Corp., 5.875%, 5/1/27(1) | 325,000 |
| 338,098 |
|
Clear Channel International BV, 8.75%, 12/15/20(1) | 125,000 |
| 128,906 |
|
| Clear Channel Worldwide Holdings, Inc., 6.50%, 11/15/22 | 195,000 |
| 200,606 |
|
| Clear Channel Worldwide Holdings, Inc., 6.50%, 11/15/22 | 1,925,000 |
| 1,975,531 |
|
Clear Channel Worldwide Holdings, Inc., 9.25%, 2/15/24(1) | 500,000 |
| 531,250 |
|
CSC Holdings LLC, 5.125%, 12/15/21(1) | 1,775,000 |
| 1,781,656 |
|
CSC Holdings LLC, 5.375%, 7/15/23(1) | 600,000 |
| 612,750 |
|
CSC Holdings LLC, 5.50%, 5/15/26(1) | 630,000 |
| 649,089 |
|
CSC Holdings LLC, 6.50%, 2/1/29(1) | 1,700,000 |
| 1,812,625 |
|
Digicel Ltd., 6.00%, 4/15/21(1) | 300,000 |
| 252,063 |
|
| DISH DBS Corp., 5.00%, 3/15/23 | 845,000 |
| 763,669 |
|
| DISH DBS Corp., 7.75%, 7/1/26 | 675,000 |
| 588,938 |
|
| Embarq Corp., 8.00%, 6/1/36 | 1,675,000 |
| 1,639,406 |
|
EW Scripps Co. (The), 5.125%, 5/15/25(1) | 350,000 |
| 334,250 |
|
Gray Television, Inc., 5.125%, 10/15/24(1) | 2,250,000 |
| 2,261,250 |
|
Gray Television, Inc., 5.875%, 7/15/26(1) | 450,000 |
| 459,090 |
|
|
| | | | | | |
| | Principal Amount/Shares | Value |
Gray Television, Inc., 7.00%, 5/15/27(1) | $ | 700,000 |
| $ | 745,500 |
|
| Lamar Media Corp., 5.00%, 5/1/23 | 1,010,000 |
| 1,028,937 |
|
Lamar Media Corp., 5.75%, 2/1/26(1) | 100,000 |
| 104,875 |
|
| Level 3 Parent LLC, 5.75%, 12/1/22 | 800,000 |
| 810,240 |
|
Midcontinent Communications / Midcontinent Finance Corp., 6.875%, 8/15/23(1) | 350,000 |
| 365,851 |
|
Nexstar Broadcasting, Inc., 5.625%, 8/1/24(1) | 1,440,000 |
| 1,465,200 |
|
Qualitytech LP / QTS Finance Corp., 4.75%, 11/15/25(1) | 500,000 |
| 486,250 |
|
| Quebecor Media, Inc., 5.75%, 1/15/23 | 250,000 |
| 261,875 |
|
Radiate Holdco LLC / Radiate Finance, Inc., 6.875%, 2/15/23(1) | 250,000 |
| 248,750 |
|
Radiate Holdco LLC / Radiate Finance, Inc., 6.625%, 2/15/25(1) | 125,000 |
| 121,250 |
|
| Sinclair Television Group, Inc., 5.375%, 4/1/21 | 720,000 |
| 721,800 |
|
Sinclair Television Group, Inc., 5.875%, 3/15/26(1) | 400,000 |
| 404,500 |
|
Sirius XM Radio, Inc., 3.875%, 8/1/22(1) | 1,025,000 |
| 1,022,438 |
|
Sirius XM Radio, Inc., 4.625%, 5/15/23(1) | 1,185,000 |
| 1,204,256 |
|
Telenet Finance Luxembourg Notes Sarl, 5.50%, 3/1/28(1) | 800,000 |
| 788,402 |
|
Townsquare Media, Inc., 6.50%, 4/1/23(1) | 1,075,000 |
| 1,033,344 |
|
Unitymedia GmbH, 6.125%, 1/15/25(1) | 1,320,000 |
| 1,376,628 |
|
Univision Communications, Inc., 6.75%, 9/15/22(1) | 315,000 |
| 321,300 |
|
UPC Holding BV, 5.50%, 1/15/28(1) | 600,000 |
| 600,000 |
|
| Videotron Ltd., 5.00%, 7/15/22 | 650,000 |
| 672,750 |
|
Virgin Media Secured Finance plc, 5.25%, 1/15/26(1) | 1,330,000 |
| 1,343,300 |
|
Virgin Media Secured Finance plc, 5.50%, 8/15/26(1) | 655,000 |
| 668,100 |
|
| | | 46,040,509 |
|
| Metals and Mining — 5.1% | | |
| AK Steel Corp., 7.625%, 10/1/21 | 975,000 |
| 982,312 |
|
Alcoa Nederland Holding BV, 6.75%, 9/30/24(1) | 1,060,000 |
| 1,126,250 |
|
Alcoa Nederland Holding BV, 6.125%, 5/15/28(1) | 600,000 |
| 619,500 |
|
Aleris International, Inc., 10.75%, 7/15/23(1) | 700,000 |
| 736,750 |
|
| Allegheny Technologies, Inc., 5.95%, 1/15/21 | 1,855,000 |
| 1,910,650 |
|
| ArcelorMittal, 6.125%, 6/1/25 | 1,390,000 |
| 1,542,925 |
|
Baffinland Iron Mines Corp. / Baffinland Iron Mines LP, 8.75%, 7/15/26(1) | 625,000 |
| 630,512 |
|
Big River Steel LLC / BRS Finance Corp., 7.25%, 9/1/25(1) | 625,000 |
| 654,875 |
|
| Cleveland-Cliffs, Inc., 5.75%, 3/1/25 | 1,315,000 |
| 1,262,400 |
|
| Coeur Mining, Inc., 5.875%, 6/1/24 | 450,000 |
| 434,813 |
|
Constellium NV, 6.625%, 3/1/25(1) | 2,165,000 |
| 2,213,712 |
|
Constellium NV, 5.875%, 2/15/26(1) | 250,000 |
| 246,094 |
|
First Quantum Minerals Ltd., 7.00%, 2/15/21(1) | 60,000 |
| 61,125 |
|
First Quantum Minerals Ltd., 7.25%, 4/1/23(1) | 895,000 |
| 877,100 |
|
First Quantum Minerals Ltd., 6.50%, 3/1/24(1) | 3,000,000 |
| 2,831,250 |
|
First Quantum Minerals Ltd., 6.875%, 3/1/26(1) | 800,000 |
| 745,000 |
|
| Freeport-McMoRan, Inc., 4.00%, 11/14/21 | 400,000 |
| 403,500 |
|
| Freeport-McMoRan, Inc., 3.55%, 3/1/22 | 225,000 |
| 223,031 |
|
| Freeport-McMoRan, Inc., 3.875%, 3/15/23 | 475,000 |
| 469,352 |
|
| Freeport-McMoRan, Inc., 5.40%, 11/14/34 | 2,570,000 |
| 2,351,550 |
|
| Freeport-McMoRan, Inc., 5.45%, 3/15/43 | 1,550,000 |
| 1,364,015 |
|
|
| | | | | | |
| | Principal Amount/Shares | Value |
| Hecla Mining Co., 6.875%, 5/1/21 | $ | 200,000 |
| $ | 200,375 |
|
Hudbay Minerals, Inc., 7.625%, 1/15/25(1) | 350,000 |
| 360,500 |
|
IAMGOLD Corp., 7.00%, 4/15/25(1) | 175,000 |
| 178,063 |
|
| Kinross Gold Corp., 5.125%, 9/1/21 | 360,000 |
| 371,700 |
|
| Kinross Gold Corp., 4.50%, 7/15/27 | 525,000 |
| 500,062 |
|
Mountain Province Diamonds, Inc., 8.00%, 12/15/22(1) | 350,000 |
| 350,438 |
|
Northwest Acquisitions ULC / Dominion Finco, Inc., 7.125%, 11/1/22(1) | 400,000 |
| 353,000 |
|
Novelis Corp., 6.25%, 8/15/24(1) | 685,000 |
| 702,125 |
|
Novelis Corp., 5.875%, 9/30/26(1) | 2,025,000 |
| 2,019,937 |
|
| Park-Ohio Industries, Inc., 6.625%, 4/15/27 | 275,000 |
| 275,000 |
|
| Steel Dynamics, Inc., 5.25%, 4/15/23 | 510,000 |
| 520,200 |
|
Taseko Mines Ltd., 8.75%, 6/15/22(1) | 1,200,000 |
| 1,110,000 |
|
| Teck Resources Ltd., 4.75%, 1/15/22 | 1,510,000 |
| 1,548,872 |
|
Teck Resources Ltd., 8.50%, 6/1/24(1) | 685,000 |
| 734,498 |
|
| Teck Resources Ltd., 6.125%, 10/1/35 | 1,075,000 |
| 1,148,176 |
|
| Teck Resources Ltd., 6.00%, 8/15/40 | 375,000 |
| 390,755 |
|
| Teck Resources Ltd., 6.25%, 7/15/41 | 469,000 |
| 502,514 |
|
| Teck Resources Ltd., 5.20%, 3/1/42 | 1,275,000 |
| 1,234,821 |
|
| Teck Resources Ltd., 5.40%, 2/1/43 | 200,000 |
| 198,899 |
|
| United States Steel Corp., 6.875%, 8/15/25 | 650,000 |
| 638,625 |
|
| United States Steel Corp., 6.25%, 3/15/26 | 525,000 |
| 492,891 |
|
| | | 35,518,167 |
|
Mortgage Real Estate Investment Trusts (REITs)† | | |
| Starwood Property Trust, Inc., 4.75%, 3/15/25 | 175,000 |
| 174,563 |
|
| Multi-Utilities — 0.5% | | |
| AmeriGas Partners LP / AmeriGas Finance Corp., 5.75%, 5/20/27 | 1,045,000 |
| 1,037,162 |
|
| Clearway Energy Operating LLC, 5.375%, 8/15/24 | 500,000 |
| 501,250 |
|
Clearway Energy Operating LLC, 5.75%, 10/15/25(1) | 650,000 |
| 654,875 |
|
| Clearway Energy Operating LLC, 5.00%, 9/15/26 | 175,000 |
| 167,563 |
|
| GenOn Energy, Inc. / NRG Americas, Inc., VRN, 9.39%, (6-month LIBOR plus 6.50%), 12/1/23 | 92,082 |
| 91,852 |
|
Talen Energy Supply LLC, 9.50%, 7/15/22(1) | 300,000 |
| 324,000 |
|
Talen Energy Supply LLC, 10.50%, 1/15/26(1) | 450,000 |
| 471,150 |
|
| | | 3,247,852 |
|
| Multiline Retail — 0.1% | | |
JC Penney Corp., Inc., 8.625%, 3/15/25(1) | 600,000 |
| 354,000 |
|
| JC Penney Corp., Inc., 6.375%, 10/15/36 | 625,000 |
| 221,875 |
|
Neiman Marcus Group Ltd. LLC, 8.00%, 10/15/21(1) | 100,000 |
| 53,500 |
|
Neiman Marcus Group Ltd. LLC, 8.75% Cash or 9.50% PIK, 10/15/21(1)(4) | 547,822 |
| 290,346 |
|
| | | 919,721 |
|
| Oil, Gas and Consumable Fuels — 9.8% | | |
| Alta Mesa Holdings LP / Alta Mesa Finance Services Corp., 7.875%, 12/15/24 | 737,000 |
| 280,060 |
|
| Antero Resources Corp., 5.125%, 12/1/22 | 1,120,000 |
| 1,130,136 |
|
Ascent Resources Utica Holdings LLC / ARU Finance Corp., 10.00%, 4/1/22(1) | 1,008,000 |
| 1,109,102 |
|
|
| | | | | | |
| | Principal Amount/Shares | Value |
Ascent Resources Utica Holdings LLC / ARU Finance Corp., 7.00%, 11/1/26(1) | $ | 675,000 |
| $ | 652,219 |
|
| Brazos Valley Longhorn LLC / Brazos Valley Longhorn Finance Corp., 6.875%, 2/1/25 | 1,075,000 |
| 1,089,781 |
|
Bruin E&P Partners LLC, 8.875%, 8/1/23(1) | 1,200,000 |
| 1,149,000 |
|
California Resources Corp., 8.00%, 12/15/22(1) | 2,730,000 |
| 2,150,694 |
|
| Callon Petroleum Co., 6.125%, 10/1/24 | 800,000 |
| 808,000 |
|
| Callon Petroleum Co., 6.375%, 7/1/26 | 600,000 |
| 604,500 |
|
| Carrizo Oil & Gas, Inc., 6.25%, 4/15/23 | 1,340,000 |
| 1,323,277 |
|
| Cenovus Energy, Inc., 6.75%, 11/15/39 | 1,300,000 |
| 1,453,296 |
|
Centennial Resource Production LLC, 5.375%, 1/15/26(1) | 525,000 |
| 505,969 |
|
Chaparral Energy, Inc., 8.75%, 7/15/23(1) | 900,000 |
| 621,000 |
|
| Chesapeake Energy Corp., 6.625%, 8/15/20 | 1,025,000 |
| 1,057,031 |
|
| Chesapeake Energy Corp., 6.875%, 11/15/20 | 1,050,000 |
| 1,084,125 |
|
| Chesapeake Energy Corp., 8.00%, 1/15/25 | 1,075,000 |
| 1,101,875 |
|
Citgo Holding, Inc., 10.75%, 2/15/20(1) | 2,040,000 |
| 2,096,508 |
|
Cloud Peak Energy Resources LLC / Cloud Peak Energy Finance Corp., 12.00%, 11/1/21(5)(6) | 1,600,000 |
| 292,000 |
|
Cloud Peak Energy Resources LLC / Cloud Peak Energy Finance Corp., 6.375%, 3/15/24(5)(6) | 450,000 |
| 27,000 |
|
| CNX Resources Corp., 5.875%, 4/15/22 | 857,000 |
| 859,142 |
|
CONSOL Energy, Inc., 11.00%, 11/15/25(1) | 725,000 |
| 824,687 |
|
| Continental Resources, Inc., 4.90%, 6/1/44 | 100,000 |
| 102,143 |
|
Conuma Coal Resources Ltd., 10.00%, 5/1/23(1) | 230,000 |
| 236,325 |
|
Covey Park Energy LLC / Covey Park Finance Corp., 7.50%, 5/15/25(1) | 700,000 |
| 652,540 |
|
CrownRock LP / CrownRock Finance, Inc., 5.625%, 10/15/25(1) | 1,200,000 |
| 1,156,500 |
|
Denbury Resources, Inc., 9.00%, 5/15/21(1) | 1,470,000 |
| 1,436,925 |
|
| Denbury Resources, Inc., 6.375%, 8/15/21 | 1,614,000 |
| 1,258,920 |
|
Denbury Resources, Inc., 9.25%, 3/31/22(1) | 650,000 |
| 630,500 |
|
Denbury Resources, Inc., 7.50%, 2/15/24(1) | 170,000 |
| 145,988 |
|
| Energy Transfer Operating LP, 7.50%, 10/15/20 | 725,000 |
| 772,172 |
|
| Energy Transfer Operating LP, 4.25%, 3/15/23 | 875,000 |
| 899,467 |
|
| EnLink Midstream Partners LP, 4.40%, 4/1/24 | 75,000 |
| 74,531 |
|
| EnLink Midstream Partners LP, 4.85%, 7/15/26 | 550,000 |
| 547,938 |
|
| EnLink Midstream Partners LP, 5.60%, 4/1/44 | 200,000 |
| 180,000 |
|
| EnLink Midstream Partners LP, 5.05%, 4/1/45 | 300,000 |
| 260,250 |
|
| EnLink Midstream Partners LP, 5.45%, 6/1/47 | 575,000 |
| 514,625 |
|
| EP Energy LLC / Everest Acquisition Finance, Inc., 9.375%, 5/1/20 | 2,150,000 |
| 989,000 |
|
| EP Energy LLC / Everest Acquisition Finance, Inc., 6.375%, 6/15/23 | 681,000 |
| 139,605 |
|
EP Energy LLC / Everest Acquisition Finance, Inc., 9.375%, 5/1/24(1) | 3,675,000 |
| 1,341,375 |
|
EP Energy LLC / Everest Acquisition Finance, Inc., 8.00%, 2/15/25(1) | 180,000 |
| 63,000 |
|
Extraction Oil & Gas, Inc., 7.375%, 5/15/24(1) | 275,000 |
| 231,000 |
|
Extraction Oil & Gas, Inc., 5.625%, 2/1/26(1) | 550,000 |
| 424,875 |
|
| Ferrellgas LP / Ferrellgas Finance Corp., 6.50%, 5/1/21 | 720,000 |
| 634,500 |
|
| Ferrellgas LP / Ferrellgas Finance Corp., 6.75%, 1/15/22 | 745,000 |
| 653,738 |
|
| Ferrellgas LP / Ferrellgas Finance Corp., 6.75%, 6/15/23 | 155,000 |
| 136,013 |
|
|
| | | | | | |
| | Principal Amount/Shares | Value |
| Gulfport Energy Corp., 6.00%, 10/15/24 | $ | 495,000 |
| $ | 451,757 |
|
| Gulfport Energy Corp., 6.375%, 5/15/25 | 465,000 |
| 422,569 |
|
| Gulfport Energy Corp., 6.375%, 1/15/26 | 400,000 |
| 356,000 |
|
| Halcon Resources Corp., 6.75%, 2/15/25 | 545,000 |
| 329,725 |
|
Hess Infrastructure Partners LP / Hess Infrastructure Partners Finance Corp., 5.625%, 2/15/26(1) | 1,577,000 |
| 1,612,482 |
|
Hilcorp Energy I LP / Hilcorp Finance Co., 6.25%, 11/1/28(1) | 1,225,000 |
| 1,234,187 |
|
Indigo Natural Resources LLC, 6.875%, 2/15/26(1) | 1,025,000 |
| 912,250 |
|
| Jagged Peak Energy LLC, 5.875%, 5/1/26 | 450,000 |
| 448,448 |
|
Jones Energy Holdings LLC / Jones Energy Finance Corp., 6.75%, 4/1/22(5)(6) | 975,000 |
| 34,125 |
|
Jones Energy Holdings LLC / Jones Energy Finance Corp., 9.25%, 3/15/23(1)(5)(6) | 475,000 |
| 262,438 |
|
| Laredo Petroleum, Inc., 5.625%, 1/15/22 | 500,000 |
| 459,375 |
|
Magnolia Oil & Gas Operating LLC / Magnolia Oil & Gas Finance Corp., 6.00%, 8/1/26(1) | 275,000 |
| 279,125 |
|
| Matador Resources Co., 5.875%, 9/15/26 | 125,000 |
| 125,313 |
|
MEG Energy Corp., 6.375%, 1/30/23(1) | 950,000 |
| 882,312 |
|
Moss Creek Resources Holdings, Inc., 7.50%, 1/15/26(1) | 1,575,000 |
| 1,460,812 |
|
| Murphy Oil Corp., 4.45%, 12/1/22 | 1,190,000 |
| 1,205,617 |
|
| Murphy Oil Corp., 6.875%, 8/15/24 | 325,000 |
| 344,290 |
|
| Murphy Oil Corp., 5.75%, 8/15/25 | 260,000 |
| 268,725 |
|
Murray Energy Corp., 11.25%, 4/15/21(1) | 200,000 |
| 107,000 |
|
Murray Energy Corp., 9.00% Cash plus 3.00% PIK, 4/15/24(1) | 3,538,987 |
| 1,504,069 |
|
Northern Oil and Gas, Inc., 8.50% Cash or 8.50% Cash plus 1.00% PIK, 5/15/23(7) | 601,500 |
| 625,560 |
|
| Oasis Petroleum, Inc., 6.50%, 11/1/21 | 675,000 |
| 669,938 |
|
| Oasis Petroleum, Inc., 6.875%, 3/15/22 | 396,000 |
| 400,950 |
|
Oasis Petroleum, Inc., 6.25%, 5/1/26(1) | 700,000 |
| 668,500 |
|
Parkland Fuel Corp., 6.00%, 4/1/26(1) | 275,000 |
| 278,864 |
|
Parsley Energy LLC / Parsley Finance Corp., 5.625%, 10/15/27(1) | 175,000 |
| 175,438 |
|
Peabody Energy Corp., 6.00%, 3/31/22(1) | 1,400,000 |
| 1,415,750 |
|
| QEP Resources, Inc., 5.625%, 3/1/26 | 225,000 |
| 204,750 |
|
| Range Resources Corp., 5.75%, 6/1/21 | 720,000 |
| 734,400 |
|
| Range Resources Corp., 5.00%, 8/15/22 | 810,000 |
| 805,950 |
|
| Range Resources Corp., 5.00%, 3/15/23 | 850,000 |
| 836,187 |
|
Rockpoint Gas Storage Canada Ltd., 7.00%, 3/31/23(1) | 450,000 |
| 448,313 |
|
| Sanchez Energy Corp., 7.75%, 6/15/21 | 2,855,000 |
| 410,406 |
|
| Sanchez Energy Corp., 6.125%, 1/15/23 | 1,275,000 |
| 178,500 |
|
| SemGroup Corp., 7.25%, 3/15/26 | 525,000 |
| 511,875 |
|
Seven Generations Energy Ltd., 5.375%, 9/30/25(1) | 1,375,000 |
| 1,349,219 |
|
| SM Energy Co., 6.125%, 11/15/22 | 580,000 |
| 582,900 |
|
| SM Energy Co., 5.625%, 6/1/25 | 1,050,000 |
| 976,122 |
|
| Southwestern Energy Co., 6.20%, 1/23/25 | 496,000 |
| 489,800 |
|
| SRC Energy, Inc., 6.25%, 12/1/25 | 675,000 |
| 606,015 |
|
| Suburban Propane Partners LP / Suburban Energy Finance Corp., 5.50%, 6/1/24 | 1,005,000 |
| 983,995 |
|
| Suburban Propane Partners LP / Suburban Energy Finance Corp., 5.75%, 3/1/25 | 1,425,000 |
| 1,385,812 |
|
|
| | | | | | |
| | Principal Amount/Shares | Value |
| Sunoco LP / Sunoco Finance Corp., 4.875%, 1/15/23 | $ | 1,700,000 |
| $ | 1,731,280 |
|
| Sunoco LP / Sunoco Finance Corp., 5.50%, 2/15/26 | 150,000 |
| 148,875 |
|
Sunoco LP / Sunoco Finance Corp., 6.00%, 4/15/27(1) | 850,000 |
| 854,250 |
|
Tullow Oil plc, 7.00%, 3/1/25(1) | 200,000 |
| 201,890 |
|
Vine Oil & Gas LP / Vine Oil & Gas Finance Corp., 8.75%, 4/15/23(1) | 850,000 |
| 680,000 |
|
Vine Oil & Gas LP / Vine Oil & Gas Finance Corp., 9.75%, 4/15/23(1) | 1,000,000 |
| 830,000 |
|
Warrior Met Coal, Inc., 8.00%, 11/1/24(1) | 787,000 |
| 822,415 |
|
| Whiting Petroleum Corp., 5.75%, 3/15/21 | 820,000 |
| 833,530 |
|
| Williams Cos., Inc. (The), 4.55%, 6/24/24 | 1,170,000 |
| 1,236,350 |
|
| WPX Energy, Inc., 6.00%, 1/15/22 | 633,000 |
| 659,903 |
|
| | | 69,139,688 |
|
| Paper and Forest Products — 0.2% | | |
| Mercer International, Inc., 6.50%, 2/1/24 | 550,000 |
| 565,125 |
|
Mercer International, Inc., 7.375%, 1/15/25(1) | 450,000 |
| 473,625 |
|
Schweitzer-Mauduit International, Inc., 6.875%, 10/1/26(1) | 550,000 |
| 556,875 |
|
| | | 1,595,625 |
|
| Personal Products — 0.1% | | |
First Quality Finance Co., Inc., 5.00%, 7/1/25(1) | 225,000 |
| 219,382 |
|
Prestige Brands, Inc., 6.375%, 3/1/24(1) | 200,000 |
| 204,500 |
|
| | | 423,882 |
|
| Pharmaceuticals — 1.8% | | |
Bausch Health Americas, Inc., 8.50%, 1/31/27(1) | 725,000 |
| 770,312 |
|
Bausch Health Cos., Inc., 5.50%, 3/1/23(1) | 193,000 |
| 194,656 |
|
Bausch Health Cos., Inc., 5.875%, 5/15/23(1) | 577,000 |
| 584,934 |
|
Bausch Health Cos., Inc., 6.125%, 4/15/25(1) | 4,160,000 |
| 4,128,800 |
|
Bausch Health Cos., Inc., 9.00%, 12/15/25(1) | 1,850,000 |
| 2,016,592 |
|
Bausch Health Cos., Inc., 5.75%, 8/15/27(1) | 225,000 |
| 231,188 |
|
Eagle Holding Co. II LLC, 7.625% Cash or 8.375% PIK, 5/15/22(1)(4) | 1,675,000 |
| 1,693,844 |
|
Elanco Animal Health, Inc., 3.91%, 8/27/21(1) | 75,000 |
| 76,296 |
|
Elanco Animal Health, Inc., 4.27%, 8/28/23(1) | 275,000 |
| 283,712 |
|
Endo Dac / Endo Finance LLC / Endo Finco, Inc., 6.00%, 7/15/23(1) | 905,000 |
| 701,375 |
|
Endo Dac / Endo Finance LLC / Endo Finco, Inc., 6.00%, 2/1/25(1) | 1,190,000 |
| 868,700 |
|
Par Pharmaceutical, Inc., 7.50%, 4/1/27(1) | 175,000 |
| 177,844 |
|
| Teva Pharmaceutical Finance Netherlands III BV, 6.00%, 4/15/24 | 200,000 |
| 200,881 |
|
| Teva Pharmaceutical Finance Netherlands III BV, 6.75%, 3/1/28 | 200,000 |
| 201,962 |
|
West Street Merger Sub, Inc., 6.375%, 9/1/25(1) | 825,000 |
| 806,437 |
|
| | | 12,937,533 |
|
Professional Services† | | |
Michael Baker International LLC, 8.75%, 3/1/23(1) | 250,000 |
| 252,500 |
|
| Real Estate Management and Development — 0.6% | | |
Five Point Operating Co. LP / Five Point Capital Corp., 7.875%, 11/15/25(1) | 375,000 |
| 360,000 |
|
Greystar Real Estate Partners LLC, 5.75%, 12/1/25(1) | 550,000 |
| 552,750 |
|
Howard Hughes Corp. (The), 5.375%, 3/15/25(1) | 250,000 |
| 250,000 |
|
Hunt Cos., Inc., 6.25%, 2/15/26(1) | 825,000 |
| 771,375 |
|
| Kennedy-Wilson, Inc., 5.875%, 4/1/24 | 250,000 |
| 249,687 |
|
| Newmark Group, Inc., 6.125%, 11/15/23 | 500,000 |
| 516,023 |
|
|
| | | | | | |
| | Principal Amount/Shares | Value |
Realogy Group LLC / Realogy Co-Issuer Corp., 4.875%, 6/1/23(1) | $ | 1,175,000 |
| $ | 1,098,625 |
|
Realogy Group LLC / Realogy Co-Issuer Corp., 9.375%, 4/1/27(1) | 275,000 |
| 282,219 |
|
| | | 4,080,679 |
|
| Road and Rail — 0.4% | | |
Avolon Holdings Funding Ltd., 5.25%, 5/15/24(1) | 275,000 |
| 283,938 |
|
Park Aerospace Holdings Ltd., 3.625%, 3/15/21(1) | 550,000 |
| 547,250 |
|
Park Aerospace Holdings Ltd., 5.25%, 8/15/22(1) | 1,515,000 |
| 1,556,511 |
|
Park Aerospace Holdings Ltd., 5.50%, 2/15/24(1) | 525,000 |
| 546,000 |
|
| | | 2,933,699 |
|
| Semiconductors and Semiconductor Equipment — 1.1% | | |
| Advanced Micro Devices, Inc., 7.50%, 8/15/22 | 1,215,000 |
| 1,359,281 |
|
| Advanced Micro Devices, Inc., 7.00%, 7/1/24 | 145,000 |
| 152,160 |
|
| Amkor Technology, Inc., 6.375%, 10/1/22 | 720,000 |
| 733,968 |
|
Amkor Technology, Inc., 6.625%, 9/15/27(1) | 275,000 |
| 279,641 |
|
Entegris, Inc., 4.625%, 2/10/26(1) | 650,000 |
| 646,750 |
|
| Micron Technology, Inc., 4.64%, 2/6/24 | 125,000 |
| 128,374 |
|
| Micron Technology, Inc., 5.50%, 2/1/25 | 675,000 |
| 699,374 |
|
| Micron Technology, Inc., 4.98%, 2/6/26 | 150,000 |
| 152,955 |
|
| Micron Technology, Inc., 5.33%, 2/6/29 | 25,000 |
| 25,728 |
|
NXP BV / NXP Funding LLC, 4.125%, 6/1/21(1) | 800,000 |
| 817,008 |
|
NXP BV / NXP Funding LLC, 3.875%, 9/1/22(1) | 1,645,000 |
| 1,672,356 |
|
NXP BV / NXP Funding LLC, 4.625%, 6/1/23(1) | 200,000 |
| 208,200 |
|
Qorvo, Inc., 5.50%, 7/15/26(1) | 275,000 |
| 284,653 |
|
Sensata Technologies UK Financing Co. plc, 6.25%, 2/15/26(1) | 425,000 |
| 452,625 |
|
| | | 7,613,073 |
|
| Software — 0.9% | | |
ACI Worldwide, Inc., 5.75%, 8/15/26(1) | 350,000 |
| 359,625 |
|
Ascend Learning LLC, 6.875%, 8/1/25(1) | 250,000 |
| 249,375 |
|
Ascend Learning LLC, 6.875%, 8/1/25(1) | 200,000 |
| 199,500 |
|
| CDK Global, Inc., 5.875%, 6/15/26 | 625,000 |
| 656,250 |
|
Change Healthcare Holdings LLC / Change Healthcare Finance, Inc., 5.75%, 3/1/25(1) | 647,000 |
| 642,600 |
|
Infor Software Parent LLC / Infor Software Parent, Inc., 7.125% Cash or 7.875% PIK, 5/1/21(1)(4) | 150,000 |
| 150,954 |
|
| Infor US, Inc., 6.50%, 5/15/22 | 1,195,000 |
| 1,215,913 |
|
SS&C Technologies, Inc., 5.50%, 9/30/27(1) | 1,625,000 |
| 1,644,297 |
|
Veritas US, Inc. / Veritas Bermuda Ltd., 10.50%, 2/1/24(1) | 1,200,000 |
| 1,080,000 |
|
| | | 6,198,514 |
|
| Specialty Retail — 1.6% | | |
Ahern Rentals, Inc., 7.375%, 5/15/23(1) | 1,423,000 |
| 1,318,054 |
|
| Asbury Automotive Group, Inc., 6.00%, 12/15/24 | 1,171,000 |
| 1,210,170 |
|
Ashtead Capital, Inc., 5.625%, 10/1/24(1) | 1,195,000 |
| 1,239,812 |
|
Carlson Travel, Inc., 9.50%, 12/15/24(1) | 800,000 |
| 774,000 |
|
Carvana Co., 8.875%, 10/1/23(1) | 400,000 |
| 411,000 |
|
Cumberland Farms, Inc., 6.75%, 5/1/25(1) | 375,000 |
| 390,937 |
|
Herc Rentals, Inc., 7.50%, 6/1/22(1) | 708,000 |
| 739,860 |
|
Herc Rentals, Inc., 7.75%, 6/1/24(1) | 422,000 |
| 448,902 |
|
|
| | | | | | |
| | Principal Amount/Shares | Value |
Lithia Motors, Inc., 5.25%, 8/1/25(1) | $ | 325,000 |
| $ | 327,844 |
|
| Penske Automotive Group, Inc., 3.75%, 8/15/20 | 425,000 |
| 425,000 |
|
PriSo Acquisition Corp., 9.00%, 5/15/23(1) | 1,525,000 |
| 1,523,094 |
|
| Sonic Automotive, Inc., 6.125%, 3/15/27 | 400,000 |
| 365,000 |
|
| United Rentals North America, Inc., 5.875%, 9/15/26 | 125,000 |
| 129,688 |
|
| United Rentals North America, Inc., 6.50%, 12/15/26 | 350,000 |
| 369,250 |
|
| United Rentals North America, Inc., 5.50%, 5/15/27 | 1,420,000 |
| 1,437,750 |
|
| | | 11,110,361 |
|
| Technology Hardware, Storage and Peripherals — 0.9% | | |
Dell International LLC / EMC Corp., 5.875%, 6/15/21(1) | 325,000 |
| 331,225 |
|
Dell International LLC / EMC Corp., 7.125%, 6/15/24(1) | 582,000 |
| 617,155 |
|
| EMC Corp., 2.65%, 6/1/20 | 420,000 |
| 416,950 |
|
Everi Payments, Inc., 7.50%, 12/15/25(1) | 900,000 |
| 936,000 |
|
j2 Cloud Services LLC / j2 Global Co-Obligor, Inc., 6.00%, 7/15/25(1) | 1,150,000 |
| 1,198,875 |
|
| NCR Corp., 5.00%, 7/15/22 | 895,000 |
| 897,238 |
|
| Western Digital Corp., 4.75%, 2/15/26 | 2,225,000 |
| 2,127,656 |
|
| | | 6,525,099 |
|
| Textiles, Apparel and Luxury Goods — 0.1% | | |
Eagle Intermediate Global Holding BV/Ruyi US Finance LLC, 7.50%, 5/1/25(1) | 600,000 |
| 594,000 |
|
William Carter Co. (The), 5.625%, 3/15/27(1) | 250,000 |
| 259,375 |
|
| | | 853,375 |
|
| Thrifts and Mortgage Finance — 0.4% | | |
| MGIC Investment Corp., 5.75%, 8/15/23 | 200,000 |
| 212,000 |
|
Nationstar Mortgage Holdings, Inc., 8.125%, 7/15/23(1) | 500,000 |
| 516,250 |
|
Nationstar Mortgage Holdings, Inc., 9.125%, 7/15/26(1) | 650,000 |
| 661,375 |
|
| Radian Group, Inc., 7.00%, 3/15/21 | 470,000 |
| 499,375 |
|
| Radian Group, Inc., 4.50%, 10/1/24 | 625,000 |
| 618,750 |
|
| | | 2,507,750 |
|
| Trading Companies and Distributors — 0.5% | | |
Beacon Roofing Supply, Inc., 4.875%, 11/1/25(1) | 800,000 |
| 763,000 |
|
| Fly Leasing Ltd., 6.375%, 10/15/21 | 200,000 |
| 203,000 |
|
| Fly Leasing Ltd., 5.25%, 10/15/24 | 400,000 |
| 386,000 |
|
Fortress Transportation & Infrastructure Investors LLC, 6.75%, 3/15/22(1) | 150,000 |
| 153,000 |
|
Fortress Transportation & Infrastructure Investors LLC, 6.50%, 10/1/25(1) | 650,000 |
| 643,500 |
|
| H&E Equipment Services, Inc., 5.625%, 9/1/25 | 1,350,000 |
| 1,351,688 |
|
| | | 3,500,188 |
|
| Transportation Infrastructure — 0.3% | | |
Aeropuertos Argentina 2000 SA, 6.875%, 2/1/27(1) | 1,120,000 |
| 1,059,800 |
|
Algeco Global Finance 2 plc, 10.00%, 8/15/23(1) | 800,000 |
| 804,000 |
|
Algeco Global Finance plc, 8.00%, 2/15/23(1) | 600,000 |
| 604,500 |
|
| | | 2,468,300 |
|
| Wireless Telecommunication Services — 1.3% | | |
| Digicel Group One, Ltd., 8.25%, 12/30/22 | 1,486,000 |
| 917,605 |
|
Digicel Group Two Ltd., 8.25%, 9/30/22(1) | 1,803,000 |
| 617,528 |
|
GTH Finance BV, 7.25%, 4/26/23(1) | 2,020,000 |
| 2,158,451 |
|
|
| | | | | | |
| | Principal Amount/Shares | Value |
| Sprint Communications, Inc., 9.25%, 4/15/22 | $ | 675,000 |
| $ | 791,437 |
|
| Sprint Communications, Inc., 6.00%, 11/15/22 | 100,000 |
| 101,030 |
|
| Sprint Corp., 7.875%, 9/15/23 | 2,235,000 |
| 2,352,337 |
|
| Sprint Corp., 7.125%, 6/15/24 | 150,000 |
| 152,625 |
|
| T-Mobile USA, Inc., 6.00%, 3/1/23 | 600,000 |
| 618,000 |
|
| T-Mobile USA, Inc., 6.00%, 4/15/24 | 325,000 |
| 339,625 |
|
| T-Mobile USA, Inc., 4.50%, 2/1/26 | 700,000 |
| 702,242 |
|
| T-Mobile USA, Inc., 4.75%, 2/1/28 | 400,000 |
| 398,000 |
|
| | | 9,148,880 |
|
TOTAL CORPORATE BONDS
(Cost $656,549,892) | | 633,443,331 |
|
BANK LOAN OBLIGATIONS(8) — 3.7% | | |
Building Products† | | |
| NCI Building Systems, Inc., 2018 Term Loan, 6.55%, (3-month LIBOR plus 3.75%), 4/12/25 | 223,313 |
| 214,659 |
|
| Capital Markets — 0.1% | | |
Lions Gate Capital Holdings LLC, 2018 Term Loan B, 4.75%, (1-month LIBOR plus 2.25%), 3/24/25 | 398,700 |
| 394,464 |
|
| Chemicals — 0.2% | | |
| Consolidated Energy Finance, S.A., Term Loan B, 4.99%, (1-month LIBOR plus 2.50%), 5/7/25 | 818,813 |
| 794,248 |
|
| Venator Materials Corporation, Term Loan B, 5.50%, (1-month LIBOR plus 3.00%), 8/8/24 | 295,500 |
| 291,929 |
|
| | | 1,086,177 |
|
| Commercial Services and Supplies — 0.2% | | |
| Aramark Services, Inc., 2018 Term Loan B3, 4.25%, (1-month LIBOR plus 1.75%), 3/11/25 | 256,482 |
| 254,840 |
|
| Asurion LLC, 2018 Term Loan B6, 5.50%, (1-month LIBOR plus 3.00%), 11/3/23 | 524,489 |
| 522,908 |
|
| USS Ultimate Holdings, Inc., 1st Lien Term Loan, 6.25%, (1-month LIBOR plus 3.75%), 8/25/24 | 468,433 |
| 465,894 |
|
USS Ultimate Holdings, Inc., 2nd Lien Term Loan, 10.25%, (1-month LIBOR plus 7.75%), 8/25/25 | 175,000 |
| 167,416 |
|
| | | 1,411,058 |
|
Construction Materials† | | |
| ASP Unifrax Holdings Inc, Term Loan B, 6.35%, (3-month LIBOR plus 3.75%), 12/12/25 | 199,500 |
| 190,701 |
|
| Consumer Finance — 0.1% | | |
| Financial & Risk US Holdings, Inc., 2018 USD Term Loan, 6.25%, (1-month LIBOR plus 3.75%), 10/1/25 | 598,500 |
| 582,149 |
|
| Distributors — 0.1% | | |
| American Builders & Contractors Supply Co., Inc., 2018 Term Loan B, 4.50%, (1-month LIBOR plus 2.00%), 10/31/23 | 398,982 |
| 389,973 |
|
| Diversified Financial Services — 0.2% | | |
Camelot UK Holdco Limited, 2017 Repriced Term Loan, 10/3/23(9) | 175,000 |
| 174,325 |
|
Camelot UK Holdco Limited, 2017 Repriced Term Loan, 5.75%, (1-month LIBOR plus 3.25%), 10/3/23 | 4,665 |
| 4,647 |
|
Camelot UK Holdco Limited, 2017 Repriced Term Loan, 5.75%, (1-month LIBOR plus 3.25%), 10/3/23 | 2,365 |
| 2,356 |
|
Camelot UK Holdco Limited, 2017 Repriced Term Loan, 5.75%, (1-month LIBOR plus 3.25%), 10/3/23 | 33,641 |
| 33,512 |
|
|
| | | | | | |
| | Principal Amount/Shares | Value |
Camelot UK Holdco Limited, 2017 Repriced Term Loan, 5.75%, (1-month LIBOR plus 3.25%), 10/3/23 | $ | 59,070 |
| $ | 58,842 |
|
Camelot UK Holdco Limited, 2017 Repriced Term Loan, 10/3/23(9) | 150,000 |
| 149,422 |
|
| Edelman Financial Center, LLC, 2018 1st Lien Term Loan, 6.04%, (3-month LIBOR plus 3.25%), 7/21/25 | 648,375 |
| 644,122 |
|
| UFC Holdings, LLC, 2nd Lien Term Loan, 10.00%, (1-month LIBOR plus 7.50%), 8/18/24 | 250,000 |
| 251,770 |
|
| | | 1,318,996 |
|
| Diversified Telecommunication Services — 0.1% | | |
| Level 3 Financing, Inc., 2017 Term Loan B, 4.74%, (3-month LIBOR plus 2.25%), 2/22/24 | 425,000 |
| 420,616 |
|
Electric Utilities† | | |
| Vistra Operations Company LLC, 1st Lien Term Loan B3, 4.48%, (1-month LIBOR plus 2.00%), 12/31/25 | 257,384 |
| 253,974 |
|
| Vistra Operations Company LLC, 1st Lien Term Loan B3, 4.50%, (1-month LIBOR plus 2.00%), 12/31/25 | 91,736 |
| 90,521 |
|
| | | 344,495 |
|
| Energy Equipment and Services — 0.1% | | |
| McDermott Technology Americas, Inc., 2018 1st Lien Term Loan, 7.50%, (1-month LIBOR plus 5.00%), 5/10/25 | 318,571 |
| 306,081 |
|
| Parker Drilling Co, 2nd Lien PIK Term Loan, 11.00% Cash and 2.00% PIK, 2/25/24 | 208,869 |
| 209,130 |
|
| | | 515,211 |
|
| Food Products — 0.1% | | |
| National Intergovernmental Purchasing Alliance Company, 1st Lien Term Loan, 6.35%, (3-month LIBOR plus 3.75%), 5/23/25 | 301,519 |
| 300,200 |
|
| National Intergovernmental Purchasing Alliance Company, 1st Lien Term Loan, 6.35%, (3-month LIBOR plus 3.75%), 5/23/25 | 95,481 |
| 95,063 |
|
| | | 395,263 |
|
| Health Care Providers and Services — 0.2% | | |
| Envision Healthcare Corporation, 2018 1st Lien Term Loan, 6.25%, (1-month LIBOR plus 3.75%), 10/10/25 | 199,500 |
| 187,115 |
|
MPH Acquisition Holdings LLC, 2016 Term Loan B, 5.35%, (3-month LIBOR plus 2.75%), 6/7/23 | 255,223 |
| 247,627 |
|
| Surgery Center Holdings, Inc., 2017 Term Loan B, 5.75%, (1-month LIBOR plus 3.25%), 9/2/24 | 394,497 |
| 388,170 |
|
| Wink Holdco, Inc., 1st Lien Term Loan B, 5.50%, (1-month LIBOR plus 3.00%), 12/2/24 | 395,000 |
| 383,644 |
|
| Wink Holdco, Inc., 2nd Lien Term Loan B, 9.25%, (1-month LIBOR plus 6.75%), 11/3/25 | 300,000 |
| 294,000 |
|
| | | 1,500,556 |
|
| Hotels, Restaurants and Leisure — 1.1% | | |
| Boyd Gaming Corporation, Term Loan B3, 4.66%, (1-week LIBOR plus 2.25%), 9/15/23 | 538,368 |
| 534,629 |
|
Boyd Gaming Corporation, Term Loan B3, 9/15/23(9) | 225,000 |
| 223,437 |
|
| Delta 2 (LUX) S.a.r.l., 2018 USD Term Loan, 5.00%, (1-month LIBOR plus 2.50%), 2/1/24 | 43,943 |
| 42,449 |
|
| Equinox Holdings, Inc., 2017 1st Lien Term Loan, 5.50%, (1-month LIBOR plus 3.00%), 3/8/24 | 74,810 |
| 74,455 |
|
| Gateway Casinos & Entertainment Limited, 2018 Term Loan B, 5.60%, (3-month LIBOR plus 3.00%), 12/1/23 | 719,563 |
| 718,552 |
|
Golden Nugget, Inc., 2017 Incremental Term Loan B, 5.25%, (1-month LIBOR plus 2.75%), 10/4/23 | 279,974 |
| 277,590 |
|
|
| | | | | | |
| | Principal Amount/Shares | Value |
Golden Nugget, Inc., 2017 Incremental Term Loan B, 5.23%, (1-month LIBOR plus 2.75%), 10/4/23 | $ | 223,363 |
| $ | 221,461 |
|
| Hilton Worldwide Finance, LLC, Term Loan B2, 4.24%, (1-month LIBOR plus 1.75%), 10/25/23 | 1,375,000 |
| 1,373,391 |
|
Hilton Worldwide Finance, LLC, Term Loan B2, 10/25/23(9) | 275,000 |
| 274,678 |
|
| Life Time Fitness, Inc., 2017 Term Loan B, 5.38%, (3-month LIBOR plus 2.75%), 6/10/22 | 3,138,368 |
| 3,107,534 |
|
Marriott Ownership Resorts, Inc., 2018 Term Loan B, 4.75%, (1-month LIBOR plus 2.25%), 8/29/25 | 573,563 |
| 571,412 |
|
Scientific Games International, Inc., 2018 Term Loan B5, 5.33%, (2-month LIBOR plus 2.75%), 8/14/24 | 198,743 |
| 193,898 |
|
Scientific Games International, Inc., 2018 Term Loan B5, 5.25%, (1-month LIBOR plus 2.75%), 8/14/24 | 47,706 |
| 46,543 |
|
| Tacala, LLC, 1st Lien Term Loan, 5.75%, (1-month LIBOR plus 3.25%), 1/31/25 | 123,128 |
| 121,781 |
|
| TopGolf International, Inc., Term Loan B, 8.00%, (1-month LIBOR plus 5.50%), 2/9/26 | 75,000 |
| 75,375 |
|
| | | 7,857,185 |
|
| Insurance — 0.1% | | |
| Genworth Holdings, Inc., Term Loan, 6.98%, (3-month LIBOR plus 4.50%), 3/7/23 | 397,000 |
| 397,746 |
|
| Hub International Limited, 2018 Term Loan B, 5.51%, (3-month LIBOR plus 2.75%), 4/25/25 | 272,938 |
| 264,437 |
|
| | | 662,183 |
|
| Life Sciences Tools and Services — 0.1% | | |
| IQVIA Inc., 2018 USD Term Loan B3, 4.25%, (1-month LIBOR plus 1.75%), 6/11/25 | 648,367 |
| 642,489 |
|
IQVIA Inc., 2018 USD Term Loan B3, 6/11/25(9) | 200,000 |
| 198,187 |
|
| | | 840,676 |
|
| Machinery — 0.2% | | |
| Altra Industrial Motion Corp., 2018 Term Loan B, 4.50%, (1-month LIBOR plus 2.00%), 10/1/25 | 340,858 |
| 335,319 |
|
| Engineered Machinery Holdings, Inc., USD 1st Lien Term Loan, 5.85%, (3-month LIBOR plus 3.25%), 7/19/24 | 172,813 |
| 167,412 |
|
| Engineered Machinery Holdings, Inc., USD 2nd Lien Term Loan, 9.85%, (3-month LIBOR plus 7.25%), 7/18/25 | 172,021 |
| 169,298 |
|
| Navistar International Corporation, 2017 1st Lien Term Loan B, 6.00%, (1-month LIBOR plus 3.50%), 11/6/24 | 765,572 |
| 764,616 |
|
| | | 1,436,645 |
|
| Metals and Mining — 0.1% | | |
| Big River Steel LLC, Term Loan B, 7.60%, (3-month LIBOR plus 5.00%), 8/23/23 | 245,880 |
| 247,416 |
|
| Neenah Foundry Company, 2017 Term Loan, 9.08%, (2-month LIBOR plus 6.50%), 12/13/22 | 237,904 |
| 235,525 |
|
| Neenah Foundry Company, 2017 Term Loan, 9.06%, (2-month LIBOR plus 6.50%), 12/13/22 | 200,574 |
| 198,569 |
|
| | | 681,510 |
|
| Multi-Utilities — 0.1% | | |
| TEX Operations Co. LLC, Exit Term Loan B, 4.50%, (1-month LIBOR plus 2.00%), 8/4/23 | 274,298 |
| 271,676 |
|
TEX Operations Co. LLC, Exit Term Loan B, 8/4/23(9) | 300,000 |
| 297,132 |
|
| | | 568,808 |
|
|
| | | | | | |
| | Principal Amount/Shares | Value |
| Oil, Gas and Consumable Fuels — 0.4% | | |
BCP Renaissance Parent LLC, 2017 Term Loan B, 6.24%, (3-month LIBOR plus 3.50%), 10/31/24 | $ | 495,442 |
| $ | 494,337 |
|
| California Resources Corporation, 2017 1st Lien Term Loan, 7.25%, (1-month LIBOR plus 4.75%), 12/31/22 | 2,025,000 |
| 1,997,794 |
|
Keane Group Holdings, LLC, 2018 1st Lien Term Loan, 6.25%, (1-month LIBOR plus 3.75%), 5/25/25 | 248,125 |
| 239,648 |
|
| Prairie ECI Acquiror LP, Term Loan B, 7.37%, (3-month LIBOR plus 4.75%), 3/11/26 | 325,000 |
| 326,353 |
|
| | | 3,058,132 |
|
Pharmaceuticals† | | |
| HLF Financing S.a r.l., 2018 Term Loan B, 5.75%, (1-month LIBOR plus 3.25%), 8/18/25 | 298,500 |
| 299,316 |
|
| Professional Services — 0.1% | | |
| Dun & Bradstreet Corporation (The), Term Loan, 7.49%, (1-month LIBOR plus 5.00%), 2/1/26 | 350,000 |
| 346,719 |
|
Technology Hardware, Storage and Peripherals† | | |
| Western Digital Corporation, 2018 Term Loan B4, 4.25%, (1-month LIBOR plus 1.75%), 4/29/23 | 185,062 |
| 180,513 |
|
| Trading Companies and Distributors — 0.1% | | |
| Foundation Building Materials Holding Company LLC, 2018 Term Loan B, 5.50%, (1-month LIBOR plus 3.00%), 8/13/25 | 598,500 |
| 588,400 |
|
| HD Supply, Inc., Term Loan B5, 4.25%, (1-month LIBOR plus 1.75%), 10/17/23 | 224,436 |
| 222,136 |
|
HD Supply, Inc., Term Loan B5, 10/17/23(9) | 150,000 |
| 148,462 |
|
| | | 958,998 |
|
TOTAL BANK LOAN OBLIGATIONS
(Cost $26,015,554) | | 25,655,003 |
|
| PREFERRED STOCKS — 1.8% | | |
Automobiles† | | |
| General Motors Financial Co., Inc., 5.75% | 225,000 |
| 197,488 |
|
| Banks — 1.2% | | |
| Bank of America Corp., 5.875% | 200,000 |
| 203,225 |
|
| Bank of America Corp., 6.25% | 1,775,000 |
| 1,882,538 |
|
| Bank of Nova Scotia (The), 4.65% | 325,000 |
| 301,247 |
|
| Citigroup, Inc., 6.25% | 675,000 |
| 711,069 |
|
| Citigroup, Inc., 5.90% | 700,000 |
| 713,535 |
|
| JPMorgan Chase & Co., 6.22% | 986,000 |
| 992,384 |
|
| JPMorgan Chase & Co., 6.10% | 1,100,000 |
| 1,158,757 |
|
| JPMorgan Chase & Co., 6.125% | 275,000 |
| 288,581 |
|
Lloyds Banking Group plc, 6.66%(1) | 1,985,000 |
| 2,034,625 |
|
| | | 8,285,961 |
|
| Capital Markets — 0.2% | | |
| Charles Schwab Corp. (The), 5.00% | 825,000 |
| 776,717 |
|
| Goldman Sachs Group, Inc. (The), 5.375% | 750,000 |
| 756,716 |
|
| | | 1,533,433 |
|
| Oil, Gas and Consumable Fuels — 0.4% | | |
| Energy Transfer Operating LP, 6.25% | 1,050,000 |
| 993,799 |
|
| Energy Transfer Operating LP, 6.625% | 350,000 |
| 333,244 |
|
| Plains All American Pipeline LP, 6.125% | 425,000 |
| 399,064 |
|
|
| | | | | | |
| | Principal Amount/Shares | Value |
| Summit Midstream Partners LP, 9.50% | 1,000,000 |
| $ | 925,585 |
|
| | | 2,651,692 |
|
TOTAL PREFERRED STOCKS
(Cost $13,259,857) | | 12,668,574 |
|
| CONVERTIBLE BONDS — 0.3% | | |
| Banks — 0.3% | | |
| Barclays Bank plc, 7.625%, 11/21/22 | $ | 830,000 |
| 903,111 |
|
Barclays plc, VRN, 7.75%(3) | 200,000 |
| 200,457 |
|
Lloyds Banking Group plc, VRN, 7.50%(3) | 200,000 |
| 203,129 |
|
Royal Bank of Scotland Group plc, VRN, 8.00%(3) | 200,000 |
| 215,000 |
|
Royal Bank of Scotland Group plc, VRN, 8.625%(3) | 600,000 |
| 640,500 |
|
| | | 2,162,197 |
|
Oil, Gas and Consumable Fuels† | | |
| Chesapeake Energy Corp., 5.50%, 9/15/26 | 175,000 |
| 162,591 |
|
TOTAL CONVERTIBLE BONDS
(Cost $2,348,794) | | 2,324,788 |
|
| COMMON STOCKS — 0.1% | | |
Energy Equipment and Services† | | |
Parker Drilling Co.(5) | 11,731 |
| 218,474 |
|
Media† | | |
Cumulus Media, Inc., Class A(5) | 2,563 |
| 46,160 |
|
Oil, Gas and Consumable Fuels† | | |
Denbury Resources, Inc.(5) | 70,284 |
| 144,082 |
|
| Software — 0.1% | | |
Avaya Holdings Corp.(5) | 28,269 |
| 475,767 |
|
TOTAL COMMON STOCKS
(Cost $963,704) | | 884,483 |
|
| ASSET-BACKED SECURITIES — 0.1% | | |
UAL Pass-Through Trust, Series 2007-1, Class A, 6.64%, 1/2/24
(Cost $589,595) | $ | 556,142 |
| 586,258 |
|
ESCROW INTERESTS(10)† | | |
Multi-Utilities† | | |
GenOn Energy(5)
(Cost $123,420) | 425,000 |
| — |
|
| TEMPORARY CASH INVESTMENTS — 2.7% | | |
State Street Institutional U.S. Government Money Market Fund, Premier Class
(Cost $18,963,644) | 18,963,644 |
| 18,963,644 |
|
TOTAL INVESTMENT SECURITIES — 98.8%
(Cost $718,814,460) | | 694,526,081 |
|
| OTHER ASSETS AND LIABILITIES — 1.2% | | 8,269,574 |
|
| TOTAL NET ASSETS — 100.0% | | $ | 702,795,655 |
|
|
| | |
| NOTES TO SCHEDULE OF INVESTMENTS |
| LIBOR | - | London Interbank Offered Rate |
| MTN | - | Medium Term Note |
| PIK | - | Payment in Kind. Security may pay a cash rate and/or an in kind rate. |
| USD | - | United States Dollar |
| VRN | - | Variable Rate Note. The rate adjusts periodically based upon the terms set forth in the security’s offering documents. The rate shown is effective at the period end and the reference rate and spread, if any, is indicated. |
† Category is less than 0.05% of total net assets.
| |
| (1) | Security was purchased pursuant to Rule 144A under the Securities Act of 1933 and may be sold in transactions exempt from registration, normally to qualified institutional investors. The aggregate value of these securities at the period end was $363,778,220, which represented 51.8% of total net assets. Of these securities, 0.2% of total net assets were deemed illiquid under policies approved by the Board of Trustees. |
| |
| (2) | When-issued security. The issue price and yield are fixed on the date of the commitment, but payment and delivery are scheduled for a future date. |
| |
| (3) | Perpetual maturity with no stated maturity date. |
| |
| (4) | The security's rate was paid in cash at the last payment date. |
| |
| (6) | Security is in default. |
| |
| (7) | The security's rate was paid in kind or a combination of cash and in kind at the last payment date. |
| |
| (8) | The interest rate on a bank loan obligation adjusts periodically based on a predetermined schedule. Rate shown is effective at period end. The maturity date on a bank loan obligation may be less than indicated as a result of contractual or optional prepayments. These prepayments cannot be predicted with certainty. |
| |
| (9) | The interest rate will be determined upon settlement of the bank loan obligation after period end. |
| |
| (10) | Escrow interests represent beneficial interests in bankruptcy reorganizations or liquidation proceedings and may be subject to resale, redemption, or transferability restrictions. The amount and timing of future payments, if any, cannot be predicted with certainty. |
See Notes to Financial Statements.
|
|
| Statement of Assets and Liabilities |
|
| | | |
| MARCH 31, 2019 | |
| Assets | |
| Investment securities, at value (cost of $718,814,460) | $ | 694,526,081 |
|
| Cash | 1,147,933 |
|
| Receivable for investments sold | 1,059,804 |
|
| Interest receivable | 12,032,098 |
|
| | 708,765,916 |
|
| | |
| Liabilities | |
| Payable for investments purchased | 5,623,352 |
|
| Payable for capital shares redeemed | 255,415 |
|
| Accrued management fees | 91,494 |
|
| | 5,970,261 |
|
| | |
| Net Assets | $ | 702,795,655 |
|
| | |
| Net Assets Consist of: | |
| Capital paid in | $ | 733,660,049 |
|
| Distributable earnings | (30,864,394 | ) |
| | $ | 702,795,655 |
|
|
| | | | | | |
| | Net Assets | Shares Outstanding | Net Asset Value Per Share |
| Investor Class |
| $140,095,547 |
| 14,559,016 |
| $9.62 |
| G Class |
| $562,700,108 |
| 58,469,324 |
| $9.62 |
See Notes to Financial Statements.
|
| | | | |
| YEAR ENDED MARCH 31, 2019 | | |
| Investment Income (Loss) | | |
| Income: | | |
| Interest | | $ | 48,424,174 |
|
| | | |
| Expenses: | | |
| Management fees | | 4,862,075 |
|
| Trustees' fees and expenses | | 52,695 |
|
| Other expenses | | 397 |
|
| | | 4,915,167 |
|
Fees waived(1) | | (3,765,845 | ) |
| | | 1,149,322 |
|
| | | |
| Net investment income (loss) | | 47,274,852 |
|
| | | |
| Realized and Unrealized Gain (Loss) | | |
| Net realized gain (loss) on investment transactions | | (4,366,803 | ) |
| Change in net unrealized appreciation (depreciation) on investments | | (7,326,650 | ) |
| | | |
| Net realized and unrealized gain (loss) | | (11,693,453 | ) |
| | | |
| Net Increase (Decrease) in Net Assets Resulting from Operations | | $ | 35,581,399 |
|
| |
| (1) | Amount consists of $106,087 and $3,659,758 for Investor Class and G Class, respectively. |
See Notes to Financial Statements.
|
|
| Statement of Changes in Net Assets |
|
| | | | | | |
| YEAR ENDED MARCH 31, 2019 AND PERIOD ENDED MARCH 31, 2018 |
| Increase (Decrease) in Net Assets | March 31, 2019 | March 31, 2018(1) |
| Operations | | |
| Net investment income (loss) | $ | 47,274,852 |
| $ | 36,507,186 |
|
| Net realized gain (loss) | (4,366,803 | ) | (908,065 | ) |
| Change in net unrealized appreciation (depreciation) | (7,326,650 | ) | (16,961,729 | ) |
| Net increase (decrease) in net assets resulting from operations | 35,581,399 |
| 18,637,392 |
|
| | | |
| Distributions to Shareholders | | |
From earnings:(2) | | |
| Investor Class | (8,018,143 | ) | (6,447,094 | ) |
| G Class | (39,257,606 | ) | (30,825,453 | ) |
| R6 Class | — |
| (555,902 | ) |
| Decrease in net assets from distributions | (47,275,749 | ) | (37,828,449 | ) |
| | | |
| Capital Share Transactions | | |
| Net increase (decrease) in net assets from capital share transactions (Note 5) | (98,062,493 | ) | 831,743,555 |
|
| | | |
| Net increase (decrease) in net assets | (109,756,843 | ) | 812,552,498 |
|
| | | |
| Net Assets | | |
| Beginning of period | 812,552,498 |
| — |
|
| End of period | $ | 702,795,655 |
| $ | 812,552,498 |
|
| |
| (1) | May 19, 2017 (fund inception) through March 31, 2018. |
| |
| (2) | Prior period presentation has been updated to reflect the current period combination of distributions to shareholders from net investment income and net realized gains. Distributions from net investment income were $(6,221,322), $(29,729,845) and $(555,902) for Investor Class, G Class and R6 Class, respectively. Distributions from net realized gains were $(225,772) and $(1,095,608) for Investor Class and G Class, respectively. |
See Notes to Financial Statements.
|
|
Notes to Financial Statements |
MARCH 31, 2019
1. Organization
American Century Investment Trust (the trust) is registered under the Investment Company Act of 1940, as amended (the 1940 Act), as an open-end management investment company and is organized as a Massachusetts business trust. NT High Income Fund (the fund) is one fund in a series issued by the trust. The fund’s investment objective is to seek current yield and capital growth. The fund is not permitted to invest in securities issued by companies assigned the Global Industry Classification Standard or the Bloomberg Industry Classification Standard for the tobacco industry.
The fund offers the Investor Class and G Class. All classes of the fund commenced sale on May 19, 2017, the fund’s inception date. On July 31, 2017, all outstanding R6 Class shares were converted to G Class shares and the fund discontinued offering the R6 Class.
2. Significant Accounting Policies
The following is a summary of significant accounting policies consistently followed by the fund in preparation of its financial statements. The fund is an investment company and follows accounting and reporting guidance in accordance with accounting principles generally accepted in the United States of America. This may require management to make certain estimates and assumptions at the date of the financial statements. Actual results could differ from these estimates. Management evaluated the impact of events or transactions occurring through the date the financial statements were issued that would merit recognition or disclosure.
Investment Valuations — The fund determines the fair value of its investments and computes its net asset value per share at the close of regular trading (usually 4 p.m. Eastern time) on the New York Stock Exchange (NYSE) on each day the NYSE is open. The Board of Trustees has adopted valuation policies and procedures to guide the investment advisor in the fund’s investment valuation process and to provide methodologies for the oversight of the fund’s pricing function.
Fixed income securities are valued at the evaluated mean as provided by independent pricing services or at the mean of the most recent bid and asked prices as provided by investment dealers. Corporate bonds, bank loan obligations and convertible bonds are valued using market models that consider trade data, quotations from dealers and active market makers, relevant yield curve and spread data, creditworthiness, trade data or market information on comparable securities, and other relevant security specific information. Mortgage-related and asset-backed securities are valued based on models that consider trade data, prepayment and default projections, benchmark yield and spread data and estimated cash flows of each tranche of the issuer.
Equity securities that are listed or traded on a domestic securities exchange are valued at the last reported sales price or at the official closing price as provided by the exchange. Equity securities traded on foreign securities exchanges are generally valued at the closing price of such securities on the exchange where primarily traded or at the close of the NYSE, if that is earlier. If no last sales price is reported, or if local convention or regulation so provides, the mean of the latest bid and asked prices may be used. Securities traded over-the-counter are valued at the mean of the latest bid and asked prices, the last sales price, or the official closing price.
Open-end management investment companies are valued at the reported net asset value per share.
If the fund determines that the market price for an investment is not readily available or the valuation methods mentioned above do not reflect an investment’s fair value, such investment is valued as determined in good faith by the Board of Trustees or its delegate, in accordance with policies and procedures adopted by the Board of Trustees. In its determination of fair value, the fund may review several factors including, but not limited to, market information regarding the specific investment or comparable investments and correlation with other investment types, futures indices or general market indicators. Circumstances that may cause the fund to use these procedures to value an investment include, but are not limited to: an investment has been declared in default or is distressed; trading in a security has been suspended during the trading day or a security is not actively trading on its principal exchange; prices received from a regular pricing source are deemed unreliable; or there is a foreign market holiday and no trading occurred.
The fund monitors for significant events occurring after the close of an investment’s primary exchange but before the fund’s net asset value per share is determined. Significant events may include, but are not limited
to: corporate announcements and transactions; governmental action and political unrest that could impact a specific investment or an investment sector; or armed conflicts, natural disasters and similar events that could affect investments in a specific country or region. The fund also monitors for significant fluctuations between domestic and foreign markets, as evidenced by the U.S. market or such other indicators that the Board of Trustees, or its delegate, deems appropriate. If significant fluctuations in foreign markets are identified, the fund may apply a model-derived factor to the closing price of equity securities traded on foreign securities exchanges. The factor is based on observable market data as provided by an independent pricing service.
Security Transactions — Security transactions are accounted for as of the trade date. Net realized gains and losses are determined on the identified cost basis, which is also used for federal income tax purposes.
Investment Income — Interest income is recorded on the accrual basis and includes paydown gain (loss) and accretion of discounts and amortization of premiums.
Segregated Assets — In accordance with the 1940 Act, the fund segregates assets on its books and records to cover certain types of investment securities and other financial instruments. American Century Investment Management, Inc. (ACIM) (the investment advisor) monitors, on a daily basis, the securities segregated to ensure the fund designates a sufficient amount of liquid assets, marked-to-market daily. The fund may also receive assets or be required to pledge assets at the custodian bank or with a broker for collateral requirements.
Income Tax Status — It is the fund’s policy to distribute substantially all net investment income and net realized gains to shareholders and to otherwise qualify as a regulated investment company under provisions of the Internal Revenue Code. Accordingly, no provision has been made for income taxes. The fund files U.S. federal, state, local and non-U.S. tax returns as applicable. The fund's tax returns are subject to examination by the relevant taxing authority until expiration of the applicable statute of limitations, which is generally three years from the date of filing but can be longer in certain jurisdictions. At this time, management believes there are no uncertain tax positions which, based on their technical merit, would not be sustained upon examination and for which it is reasonably possible that the total amounts of unrecognized tax benefits will significantly change in the next twelve months.
Multiple Class — All shares of the fund represent an equal pro rata interest in the net assets of the class to which such shares belong, and have identical voting, dividend, liquidation and other rights and the same terms and conditions, except for class specific expenses and exclusive rights to vote on matters affecting only individual classes. Income, non-class specific expenses, and realized and unrealized capital gains and losses of the fund are allocated to each class of shares based on their relative net assets.
Distributions to Shareholders — Distributions from net investment income, if any, are declared daily and paid monthly. Distributions from net realized gains, if any, are generally declared and paid annually.
Indemnifications — Under the trust’s organizational documents, its officers and trustees are indemnified against certain liabilities arising out of the performance of their duties to the fund. In addition, in the normal course of business, the fund enters into contracts that provide general indemnifications. The maximum exposure under these arrangements is unknown as this would involve future claims that may be made against a fund. The risk of material loss from such claims is considered by management to be remote.
3. Fees and Transactions with Related Parties
Certain officers and trustees of the trust are also officers and/or directors of American Century Companies, Inc. (ACC). The trust's investment advisor, ACIM, the trust's distributor, American Century Investment Services, Inc., and the trust's transfer agent, American Century Services, LLC, are wholly owned, directly or indirectly, by ACC. ACIM has engaged Nomura Corporate Research and Asset Management Inc. (NCRAM) to serve as a subadvisor for the fund and to manage the fund’s assets. NCRAM is responsible for the day-to-day management of the fund, subject to the general supervision of the Board of Trustees and the investment advisor and in accordance with the investment objective, policies and restrictions of the fund. ACIM pays all costs associated with retaining NCRAM as the subadvisor of the fund. A subsidiary of NCRAM’s parent company indirectly owns a non-controlling equity interest in ACC. Various funds issued by American Century Asset Allocation Portfolios, Inc. and American Century Strategic Asset Allocation, Inc. own, in aggregate, 100% of the shares of the fund. Related parties do not invest in the fund for the purpose of exercising management or control.
Management Fees — The trust has entered into a management agreement with ACIM, under which ACIM provides the fund with investment advisory and management services in exchange for a single, unified management fee (the fee) per class. The agreement provides that all expenses of managing and operating
the fund, except brokerage expenses, taxes, interest, fees and expenses of the independent trustees (including legal counsel fees), and extraordinary expenses, will be paid by ACIM. The fee is computed and accrued daily based on each class's daily net assets and paid monthly in arrears. The difference in the fee among the classes is a result of their separate arrangements for non-Rule 12b-1 shareholder services, which may be provided indirectly through another American Century Investments mutual fund. It is not the result of any difference in advisory or custodial fees or other expenses related to the management of the fund’s assets, which do not vary by class. During the period ended March 31, 2019, the investment advisor agreed to waive 0.075% of the fund's management fee. The investment advisor expects this waiver to continue until July 31, 2019 and cannot terminate it prior to such date without the approval of the Board of Trustees. The investment advisor agreed to waive the G Class’s management fee in its entirety. The investment advisor expects this waiver to remain in effect permanently and cannot terminate it without the approval of the Board of Trustees.
The annual management fee and the effective annual management fee after waiver for each class for the period ended March 31, 2019 are as follows:
|
| | |
| |
Annual Management Fee | Effective Annual Management Fee After Waiver |
| Investor Class | 0.85% | 0.77% |
| G Class | 0.60% | 0.00% |
Trustees’ Fees and Expenses — The Board of Trustees is responsible for overseeing the investment advisor’s management and operations of the fund. The trustees receive detailed information about the fund and its investment advisor regularly throughout the year, and meet at least quarterly with management of the investment advisor to review reports about fund operations. The fund’s officers do not receive compensation from the fund.
Interfund Transactions — The fund may enter into security transactions with other American Century Investments funds and other client accounts of the investment advisor, in accordance with the 1940 Act rules and procedures adopted by the Board of Trustees. The rules and procedures require, among other things, that these transactions be effected at the independent current market price of the security. There were no interfund transactions during the period.
4. Investment Transactions
Purchases and sales of investment securities, excluding short-term investments, for the period ended March 31, 2019 were $279,847,915 and $378,160,479, respectively.
5. Capital Share Transactions
Transactions in shares of the fund were as follows (unlimited number of shares authorized):
|
| | | | | | | | | | |
| | Year ended
March 31, 2019 | Period ended
March 31, 2018(1) |
| | Shares | Amount | Shares | Amount |
| Investor Class | | | | |
| Sold | 167,178 |
| $ | 1,527,094 |
| 15,252,145 |
| $ | 152,523,243 |
|
| Issued in reinvestment of distributions | 829,340 |
| 7,997,254 |
| 646,713 |
| 6,447,094 |
|
| Redeemed | (1,007,451 | ) | (9,475,324 | ) | (1,328,909 | ) | (13,330,663 | ) |
| | (10,933 | ) | 49,024 |
| 14,569,949 |
| 145,639,674 |
|
| G Class | | | | |
| Sold | 1,868,631 |
| 17,837,972 |
| 70,651,724 |
| 706,603,334 |
|
| Issued in reinvestment of distributions | 4,055,073 |
| 39,145,079 |
| 3,094,078 |
| 30,825,453 |
|
| Redeemed | (16,067,893 | ) | (155,094,568 | ) | (5,132,289 | ) | (50,991,510 | ) |
| | (10,144,189 | ) | (98,111,517 | ) | 68,613,513 |
| 686,437,277 |
|
| R6 Class | N/A |
| | | |
| Sold | | | 6,405,960 |
| 64,050,278 |
|
| Issued in reinvestment of distributions | | | 32,824 |
| 327,591 |
|
| Redeemed | | | (6,438,784 | ) | (64,711,265 | ) |
| | | | — |
| (333,396 | ) |
| Net increase (decrease) | (10,155,122 | ) | $ | (98,062,493 | ) | 83,183,462 |
| $ | 831,743,555 |
|
| |
| (1) | May 19, 2017 (fund inception) through March 31, 2018. |
6. Fair Value Measurements
The fund’s investments valuation process is based on several considerations and may use multiple inputs to determine the fair value of the investments held by the fund. In conformity with accounting principles generally accepted in the United States of America, the inputs used to determine a valuation are classified into three broad levels.
| |
| • | Level 1 valuation inputs consist of unadjusted quoted prices in an active market for identical investments. |
| |
| • | Level 2 valuation inputs consist of direct or indirect observable market data (including quoted prices for comparable investments, evaluations of subsequent market events, interest rates, prepayment speeds, credit risk, etc.). These inputs also consist of quoted prices for identical investments initially expressed in local currencies that are adjusted through translation into U.S. dollars. |
| |
| • | Level 3 valuation inputs consist of unobservable data (including a fund’s own assumptions). |
The level classification is based on the lowest level input that is significant to the fair valuation measurement. The valuation inputs are not necessarily an indication of the risks associated with investing in these securities or other financial instruments.
The following is a summary of the level classifications as of period end. The Schedule of Investments provides additional information on the fund’s portfolio holdings.
|
| | | | | | | | |
| | Level 1 | Level 2 | Level 3 |
| Assets | | | |
| Investment Securities | | | |
| Corporate Bonds | — |
| $ | 633,443,331 |
| — |
|
| Bank Loan Obligations | — |
| 25,655,003 |
| — |
|
| Preferred Stocks | — |
| 12,668,574 |
| — |
|
| Convertible Bonds | — |
| 2,324,788 |
| — |
|
| Common Stocks | $ | 884,483 |
| — |
| — |
|
| Asset-Backed Securities | — |
| 586,258 |
| — |
|
| Escrow Interests | — |
| — |
| — |
|
| Temporary Cash Investments | 18,963,644 |
| — |
| — |
|
| | $ | 19,848,127 |
| $ | 674,677,954 |
| — |
|
7. Risk Factors
The fund invests primarily in high-yield and lower-quality debt securities, which are subject to substantial risks including liquidity risk and credit risk.
8. Federal Tax Information
The tax character of distributions paid during the year ended March 31, 2019 and the period ended March 31, 2018 were as follows:
|
| | | | | | |
| | 2019 | 2018(1) |
| Distributions Paid From | | |
| Ordinary income | $ | 47,275,749 |
| $ | 37,828,449 |
|
| Long-term capital gains | — |
| — |
|
| |
| (1) | May 19, 2017 (fund inception) through March 31, 2018. |
The book-basis character of distributions made during the year from net investment income or net realized gains may differ from their ultimate characterization for federal income tax purposes. These differences reflect the differing character of certain income items and net realized gains and losses for financial statement and tax purposes, and may result in reclassification among certain capital accounts on the financial statements.
As of period end, the federal tax cost of investments and the components of distributable earnings on a tax-basis were as follows:
|
| | | |
| Federal tax cost of investments | $ | 719,956,796 |
|
| Gross tax appreciation of investments | $ | 7,127,887 |
|
| Gross tax depreciation of investments | (32,558,602 | ) |
| Net tax appreciation (depreciation) of investments | $ | (25,430,715 | ) |
| Undistributed ordinary income | — |
|
| Accumulated short-term capital losses | $ | (1,782,470 | ) |
| Accumulated long-term capital losses | $ | (3,651,209 | ) |
The difference between book-basis and tax-basis unrealized appreciation (depreciation) is attributable primarily to the tax deferral of losses on wash sales.
Accumulated capital losses represent net capital loss carryovers that may be used to offset future realized capital gains for federal income tax purposes. The capital loss carryovers may be carried forward for an unlimited period. Future capital loss carryover utilization in any given year may be subject to Internal Revenue Code limitations.
9. Recently Issued Accounting Standards
In March 2017, the Financial Accounting Standards Board (FASB) issued Accounting Standards Update No. 2017-08, “Receivables - Nonrefundable Fees and Other Costs (Subtopic 310-20), Premium Amortization on Purchased Callable Debt Securities” (ASU 2017-08). ASU 2017-08 amends the amortization period for certain purchased callable debt securities held at a premium, shortening such period to the earliest call date. The amendments are effective for fiscal years, and interim periods within those fiscal years, beginning after December 15, 2018. Management is currently evaluating the impact that adopting ASU 2017-08 will have on the financial statements.
|
| | | | | | | | | | | | | | | | | |
| For a Share Outstanding Throughout the Years Ended March 31 (except as noted) |
| Per-Share Data | | | | | | | | Ratios and Supplemental Data | |
| | | Income From Investment Operations: | Distributions From: | | | Ratio to Average Net Assets of: | | |
| | Net Asset
Value,
Beginning
of Period | Net
Investment
Income
(Loss)(1) | Net
Realized
and
Unrealized
Gain (Loss) | Total From
Investment
Operations | Net
Investment
Income | Net
Realized
Gains | Total
Distributions | Net Asset
Value,
End
of Period | Total
Return(2) | Operating
Expenses | Operating
Expenses
(before
expense
waiver) | Net
Investment
Income
(Loss) | Net
Investment
Income
(Loss)
(before
expense
waiver) | Portfolio
Turnover
Rate | Net
Assets,
End of
Period
(in thousands) |
| Investor Class | | | | | | | | | | | | | | |
| 2019 | $9.77 | 0.55 | (0.15) | 0.40 | (0.55) | — | (0.55) | $9.62 | 4.21% | 0.78% | 0.86% | 5.66% | 5.58% | 38% |
| $140,096 |
|
2018(3) | $10.00 | 0.43 | (0.21) | 0.22 | (0.43) | (0.02) | (0.45) | $9.77 | 2.18% | 0.81%(4) | 0.85%(4) | 5.04%(4) | 5.00%(4) | 64% |
| $142,308 |
|
| G Class | | | | | | | | | | | | | | |
| 2019 | $9.77 | 0.62 | (0.15) | 0.47 | (0.62) | — | (0.62) | $9.62 | 5.02% | 0.01% | 0.61% | 6.43% | 5.83% | 38% |
| $562,700 |
|
2018(3) | $10.00 | 0.50 | (0.22) | 0.28 | (0.49) | (0.02) | (0.51) | $9.77 | 2.76% | 0.12%(4) | 0.61%(4) | 5.73%(4) | 5.24%(4) | 64% |
| $670,244 |
|
|
|
| Notes to Financial Highlights |
| |
| (1) | Computed using average shares outstanding throughout the period. |
| |
| (2) | Total returns are calculated based on the net asset value of the last business day. Total returns for periods less than one year are not annualized. |
| |
| (3) | May 19, 2017 (fund inception) through March 31, 2018. |
See Notes to Financial Statements.
|
|
| Report of Independent Registered Public Accounting Firm |
To the Board of Trustees of American Century Investment Trust and Shareholders of NT High Income Fund:
Opinion on the Financial Statements
We have audited the accompanying statement of assets and liabilities, including the schedule of investments, of NT High Income Fund (one of the funds constituting American Century Investment Trust, referred to hereafter as the “Fund”) as of March 31, 2019, the related statement of operations for the year ended March 31, 2019, the statement of changes in net assets and the financial highlights for the year ended March 31, 2019 and for the period May 19, 2017 (fund inception) through March 31, 2018, including the related notes (collectively referred to as the “financial statements”). In our opinion, the financial statements present fairly, in all material respects, the financial position of the Fund as of March 31, 2019, the results of its operations for the year ended March 31 2019, and the changes in its net assets and the financial highlights for the year ended March 31, 2019 and for the period May 19, 2017 (fund inception) through March 31, 2018, in conformity with accounting principles generally accepted in the United States of America.
Basis for Opinion
These financial statements are the responsibility of the Fund’s management. Our responsibility is to express an opinion on the Fund’s financial statements based on our audits. We are a public accounting firm registered with the Public Company Accounting Oversight Board (United States) (“PCAOB”) and are required to be independent with respect to the Fund in accordance with the U.S. federal securities laws and the applicable rules and regulations of the Securities and Exchange Commission and the PCAOB.
We conducted our audits of these financial statements in accordance with the standards of the PCAOB. Those standards require that we plan and perform the audit to obtain reasonable assurance about whether the financial statements are free of material misstatement, whether due to error or fraud.
Our audits included performing procedures to assess the risks of material misstatement of the financial statements, whether due to error or fraud, and performing procedures that respond to those risks. Such procedures included examining, on a test basis, evidence regarding the amounts and disclosures in the financial statements. Our audits also included evaluating the accounting principles used and significant estimates made by management, as well as evaluating the overall presentation of the financial statements. Our procedures included confirmation of securities owned as of March 31, 2019 by correspondence with the custodian and brokers; when replies were not received from brokers, we performed other auditing procedures. We believe that our audits provide a reasonable basis for our opinion.
/s/ PricewaterhouseCoopers LLP
Kansas City, Missouri
May 17, 2019
We have served as the auditor of one or more investment companies in American Century Investments since 1997.
Board of Trustees
The individuals listed below serve as trustees of the funds. Each trustee will continue to serve in this capacity until death, retirement, resignation or removal from office. The board has adopted a mandatory retirement age for trustees who are not “interested persons,” as that term is defined in the Investment Company Act (independent trustees). Independent trustees shall retire on December 31 of the year in which they reach their 75th birthday; provided, however, that on or after January 1, 2022, independent trustees shall retire on December 31 of the year in which they reach their 76th birthday.
Mr. Thomas is an “interested person” because he currently serves as President and Chief Executive Officer of American Century Companies, Inc. (ACC), the parent company of American Century Investment Management, Inc. (ACIM or the advisor). The other trustees (more than three-fourths of the total number) are independent. They are not employees, directors or officers of, and have no financial interest in, ACC or any of its wholly owned, direct or indirect, subsidiaries, including ACIM, American Century Investment Services, Inc. (ACIS) and American Century Services, LLC (ACS), and they do not have any other affiliations, positions or relationships that would cause them to be considered “interested persons” under the Investment Company Act. The trustees serve in this capacity for eight (in the case of Jonathan S. Thomas, 16; and Ronald J. Gilson, 9) registered investment companies in the American Century Investments family of funds.
The following table presents additional information about the trustees. The mailing address for each trustee other than Jonathan S. Thomas is 1665 Charleston Road, Mountain View, California 94043. The mailing address for Jonathan S. Thomas is 4500 Main Street, Kansas City, Missouri 64111.
|
| | | | | |
Name
(Year of Birth) | Position(s) Held with Funds | Length of Time Served | Principal Occupation(s) During Past 5 Years | Number of American Century Portfolios Overseen by Trustee | Other Directorships Held During Past 5 Years |
| Independent Trustees |
|
|
Tanya S. Beder
(1955) | Trustee | Since 2011 | Chairman and CEO, SBCC Group Inc. (independent advisory services) (2006 to present) | 45 | CYS Investments, Inc.; Nabors Industries Ltd. |
Jeremy I. Bulow
(1954) | Trustee | Since 2011 | Professor of Economics, Stanford University, Graduate School of Business (1979 to present) | 45 | None |
Anne Casscells
(1958) | Trustee | Since 2016 | Co-Chief Executive Officer and Chief Investment Officer, Aetos Alternatives Management (investment advisory firm) (2001 to present); Lecturer in Accounting, Stanford University, Graduate School of Business (2009 to 2017) | 45 | None |
Ronald J. Gilson
(1946) | Trustee and Chairman of the Board | Since 1995
(Chairman since 2005) | Charles J. Meyers Professor of Law and Business, Emeritus, Stanford Law School (1979 to 2016); Marc and Eva Stern Professor of Law and Business, Columbia University School of Law (1992 to present) | 50 | None |
|
| | | | | |
Name
(Year of Birth) | Position(s) Held with Funds | Length of Time Served | Principal Occupation(s) During Past 5 Years | Number of American Century Portfolios Overseen by Trustee | Other Directorships Held During Past 5 Years |
| Independent Trustees |
|
|
Frederick L. A. Grauer
(1946) | Trustee | Since 2008 | Senior Advisor, Credit Sesame, Inc. (credit monitoring firm) (2018 to present); Senior Advisor, Course Hero (an educational technology company) (2015 to present); Senior Advisor, iShares by BlackRock, Inc. (investment management firm) (2013 to 2015)
| 45 | None |
Jonathan D. Levin
(1972) | Trustee | Since 2016 | Philip H. Knight Professor and Dean, Graduate School of Business, Stanford University (2016 to present); Professor, Stanford University, (2000 to present); Chair, Department of Economics, Stanford University (2011 to 2014) | 45 | None |
Peter F. Pervere
(1947) | Trustee | Since 2007 | Retired | 45 | None |
John B. Shoven
(1947) | Trustee | Since 2002 | Charles R. Schwab Professor of Economics, Stanford University (1973 to present) | 45 | Cadence Design Systems; Exponent; Financial Engines |
| Interested Trustee |
|
|
Jonathan S. Thomas
(1963) | Trustee and President | Since 2007 | President and Chief Executive Officer, ACC (2007 to present). Also serves as Chief Executive Officer, ACS; Executive Vice President, ACIM; Director, ACC, ACIM and other ACC subsidiaries | 117 | BioMed Valley Discoveries, Inc. |
The Statement of Additional Information has additional information about the fund's trustees and is available without charge, upon request, by calling 1-800-345-2021.
Officers
The following table presents certain information about the executive officers of the funds. Each officer serves as an officer for 16 (in the case of Robert J. Leach, 15) investment companies in the American Century family of funds, unless otherwise noted. No officer is compensated for his or her service as an officer of the funds. The listed officers are interested persons of the funds and are appointed or re-appointed on an annual basis. The mailing address for each of the officers listed below is 4500 Main Street, Kansas City, Missouri 64111.
|
| | |
Name
(Year of Birth) | Offices with the Funds | Principal Occupation(s) During the Past Five Years |
Jonathan S. Thomas
(1963) | Trustee and President since 2007 | President and Chief Executive Officer, ACC (2007 to present). Also serves as Chief Executive Officer, ACS; Executive Vice President, ACIM; Director, ACC, ACIM and other ACC subsidiaries |
R. Wes Campbell
(1974)
| Chief Financial Officer and Treasurer since 2018
| Investment Operations and Investment Accounting, ACS (2000 to present) |
Amy D. Shelton
(1964) | Chief Compliance Officer and Vice President since 2014 | Chief Compliance Officer, American Century funds, (2014 to present); Chief Compliance Officer, ACIM (2014 to present); Chief Compliance Officer, ACIS (2009 to present); Vice President, Client Interactions and Marketing, ACIS (2013 to 2014). Also serves as Vice President, ACIS |
Charles A. Etherington
(1957) | General Counsel since 2007 and Senior Vice President since 2006 | Attorney, ACC (1994 to present); Vice President, ACC (2005 to present); General Counsel, ACC (2007 to present). Also serves as General Counsel, ACIM, ACS, ACIS and other ACC subsidiaries; and Senior Vice President, ACIM and ACS |
C. Jean Wade
(1964) | Vice President since 2012 | Senior Vice President, ACS (2017 to present); Vice President ACS (2000 to 2017) |
Robert J. Leach
(1966) | Vice President since 2006 | Vice President, ACS (2000 to present) |
David H. Reinmiller
(1963) | Vice President since 2000 | Attorney, ACC (1994 to present) Also serves as Vice President, ACIM and ACS |
Ward D. Stauffer
(1960) | Secretary since 2005 | Attorney, ACC (2003 to present) |
Retirement Account Information
As required by law, distributions you receive from certain retirement accounts are subject to federal income tax withholding, unless you elect not to have withholding apply*. Tax will be withheld on the total amount withdrawn even though you may be receiving amounts that are not subject to withholding, such as nondeductible contributions. In such case, excess amounts of withholding could occur. You may adjust your withholding election so that a greater or lesser amount will be withheld.
If you don’t want us to withhold on this amount, you must notify us to not withhold the federal income tax. You may notify us in writing or in certain situations by telephone or through other electronic means. For systematic withdrawals, your withholding election will remain in effect until revoked or changed by filing a new election. You have the right to revoke your election at any time and change your withholding percentage for future distributions.
Remember, even if you elect not to have income tax withheld, you are liable for paying income tax on the taxable portion of your withdrawal. If you elect not to have income tax withheld or you don’t have enough income tax withheld, you may be responsible for payment of estimated tax. You may incur penalties under the estimated tax rules if your withholding and estimated tax payments are not sufficient. You can reduce or defer the income tax on a distribution by directly or indirectly rolling such distribution over to another IRA or eligible plan. You should consult your tax advisor for additional information.
State tax will be withheld if, at the time of your distribution, your address is within one of the mandatory withholding states and you have federal income tax withheld (or as otherwise required by state law). State taxes will be withheld from your distribution in accordance with the respective state rules.
*Some 403(b), 457 and qualified retirement plan distributions may be subject to 20% mandatory withholding, as they are subject to special tax and withholding rules. Your plan administrator or plan sponsor is required to provide you with a special tax notice explaining those rules at the time you request a distribution. If applicable, federal and/or state taxes may be withheld from your distribution amount.
Proxy Voting Policies
Descriptions of the principles and policies that the fund's investment advisor uses in exercising the voting rights associated with the securities purchased and/or held by the fund are available without charge, upon request, by calling 1-800-345-2021 or visiting the "About Us" page of American Century Investments’ website at americancentury.com. A description of the policies is also available on the Securities and Exchange Commission’s website at sec.gov. Information regarding how the investment advisor voted proxies relating to portfolio securities during the most recent 12-month period ended June 30 is available on the "About Us" page at americancentury.com. It is also available at sec.gov.
Quarterly Portfolio Disclosure
The fund files its complete schedule of portfolio holdings with the Securities and Exchange Commission (SEC) for the first and third quarters of each fiscal year on Form N-Q or as an exhibit to its reports on Form N-PORT. The fund’s Forms N-Q and Form N-PORT reports are available on the SEC’s website at sec.gov. The fund also makes its complete schedule of portfolio holdings for the most recent quarter of its fiscal year available on its website at americancentury.com and, upon request, by calling 1-800-345-2021.
|
| | |
| |
| | | |
| Contact Us | americancentury.com | |
| Automated Information Line | 1-800-345-8765 | |
| Investor Services Representative | 1-800-345-2021 or 816-531-5575 | |
| Investors Using Advisors | 1-800-378-9878 | |
| Business, Not-For-Profit, Employer-Sponsored Retirement Plans | 1-800-345-3533 | |
| Banks and Trust Companies, Broker-Dealers, Financial Professionals, Insurance Companies | 1-800-345-6488 | |
| Telecommunications Relay Service for the Deaf | 711 | |
| | | |
| American Century Investment Trust | |
| | | |
Investment Advisor: American Century Investment Management, Inc. Kansas City, Missouri | |
| | | |
| This report and the statements it contains are submitted for the general information of our shareholders. The report is not authorized for distribution to prospective investors unless preceded or accompanied by an effective prospectus. | |
| | | |
©2019 American Century Proprietary Holdings, Inc. All rights reserved.
CL-ANN-93335 1905 | |
|
| |
| | |
| | Annual Report |
| | |
| | March 31, 2019 |
| | |
| | Prime Money Market Fund |
| | Investor Class (BPRXX) |
| | A Class (ACAXX) |
| | C Class (ARCXX) |
Beginning on January 1, 2021, as permitted by regulations adopted by the Securities and Exchange Commission, paper copies of the fund’s shareholder reports like this one will no longer be sent by mail, unless you specifically request paper copies of the reports from the fund or from your financial intermediary, such as a broker-dealer or bank. Instead, the reports will be made available on a website, and you will be notified by mail each time a report is posted and provided with a website link to access the report.
If you already elected to receive shareholder reports electronically, you will not be affected by this change and you need not take any action. You may elect to receive shareholder reports and other communications from the fund or your financial intermediary electronically by calling or sending an email request to your appropriate contacts as listed on the back cover of this report.
You may elect to receive all future reports in paper free of charge. You can inform the fund or your financial intermediary that you wish to continue receiving paper copies of your shareholder reports by calling or sending an email request to your appropriate contacts as listed on the back cover of this report. Your election to receive reports in paper will apply to all funds held with the fund complex/your financial intermediary.
|
| | |
| President’s Letter | 2 |
|
| Performance | 3 |
|
| Fund Characteristics | |
|
| Shareholder Fee Example | |
|
| Schedule of Investments | |
|
| Statement of Assets and Liabilities | |
|
| Statement of Operations | |
|
| Statement of Changes in Net Assets | |
|
| Notes to Financial Statements | |
|
| Financial Highlights | |
|
| Report of Independent Registered Public Accounting Firm | |
|
| Management | |
|
| Additional Information | |
|
Any opinions expressed in this report reflect those of the author as of the date of the report, and do not necessarily represent the opinions of American Century Investments® or any other person in the American Century Investments organization. Any such opinions are subject to change at any time based upon market or other conditions and American Century Investments disclaims any responsibility to update such opinions. These opinions may not be relied upon as investment advice and, because investment decisions made by American Century Investments funds are based on numerous factors, may not be relied upon as an indication of trading intent on behalf of any American Century Investments fund. Security examples are used for representational purposes only and are not intended as recommendations to purchase or sell securities. Performance information for comparative indices and securities is provided to American Century Investments by third party vendors. To the best of American Century Investments’ knowledge, such information is accurate at the time of printing.
Jonathan Thomas
Dear Investor:
Thank you for reviewing this annual report for the period ended March 31, 2019. Annual reports help convey important information about fund returns, including market factors that affected performance during the reporting period. For additional, updated investment and market insights, we encourage you to visit our website, americancentury.com.
Markets Ended Roller-Coaster Period on Upswing
For the first half of the period, U.S. stocks climbed higher, while bond returns headed lower. Robust economic growth, bolstered by federal tax and regulatory reform, and record corporate earnings results fueled risk-on sentiment that drove stock prices higher. Meanwhile, the combination of strong economic data, the Federal Reserve’s (Fed’s) ongoing rate-hike campaign and an uptick in inflation pushed investment-grade bond returns lower.
Market trends began changing in late 2018. Mounting investor concerns about slowing global economic and earnings growth, U.S.-China trade tensions and rising interest rates triggered widespread volatility. Stock prices plunged as investors sought safe-haven investments, including U.S. Treasuries. Furthermore, the Fed issued another rate hike in December, its fourth of the year, and maintained its hawkish outlook. Investors feared the December rate increase and the Fed’s plans for two more rate hikes in 2019 were too aggressive, and risk-off investing remained in favor.
January brought a renewed sense of stability to the markets. Investors’ concerns about growth and trade eased, and the Fed changed course, pausing its rate-hike campaign amid moderating global growth and inflation. Valuations appeared attractive after the late-2018 sell-off, and risk-on investing resumed. In March, the Fed held rates steady again, hinting additional tightening was off the table for 2019. This news drove stock and bond returns higher and left both asset classes on an upward track to end the period. Overall, stocks (S&P 500 Index) overcame their late-2018 nosedive to gain 9.50% for the period. Bonds (Bloomberg Barclays U.S. Aggregate Bond Index) bounced back from losses early in the period to return 4.48%.
We expect volatility to remain a formidable factor as investors react to global growth trends, central bank policy and geopolitical developments. We believe this scenario underscores the importance of using professionally managed portfolios in pursuit of investment goals. We appreciate your continued trust and confidence in us.
Sincerely,
Jonathan Thomas
President and Chief Executive Officer
American Century Investments
|
| | | | | |
| Total Returns as of March 31, 2019 | |
| | | | Average Annual Returns | |
| | Ticker Symbol | 1 year | 5 years | 10 years | Inception Date |
| Investor Class | BPRXX | 1.79% | 0.55% | 0.30% | 11/17/93 |
| A Class | ACAXX | 1.54% | 0.48% | 0.25% | 8/28/98 |
| C Class | ARCXX | 1.03% | 0.33% | 0.17% | 5/7/02 |
Fund returns would have been lower if a portion of the fees had not been waived.
|
| | |
| Total Annual Fund Operating Expenses |
| Investor Class | A Class | C Class |
| 0.58% | 0.83% | 1.33% |
The total annual fund operating expenses shown is as stated in the fund’s prospectus current as of the date of this report. The prospectus may vary from the expense ratio shown elsewhere in this report because it is based on a different time period, includes acquired fund fees and expenses, and, if applicable, does not include fee waivers or expense reimbursements.
Data presented reflect past performance. Past performance is no guarantee of future results. Current performance may be higher or lower than the performance shown. Total returns for periods less than one year are not annualized. To obtain performance data current to the most recent month end, please call 1-800-345-2021 or visit americancentury.com. For additional information about the fund, please consult the prospectus.
You could lose money by investing in the fund. Although the fund seeks to preserve the value of your investment at $1.00 per share, it cannot guarantee it will do so. The fund may impose a fee upon sale of your shares or may temporarily suspend your ability to sell shares if the fund’s liquidity falls below required minimums because of market conditions or other factors. An investment in the fund is not insured or guaranteed by the Federal Deposit Insurance Corporation or any other government agency. The fund’s sponsor has no legal obligation to provide financial support to the fund, and you should not expect that the sponsor will provide financial support to the fund at any time.
The 7-day current yield more closely reflects the current earnings of the fund than the total return.
|
| | | |
| MARCH 31, 2019 | | | |
| Yield | Investor Class | A Class | C Class |
| 7-Day Current Yield | 2.04% | 1.80% | 1.30% |
| 7-Day Effective Yield | 2.06% | 1.81% | 1.30% |
|
| |
| Portfolio at a Glance |
| Weighted Average Maturity | 41 days |
| Weighted Average Life | 93 days |
| | |
| Portfolio Composition by Maturity | % of fund investments |
| 1-30 days | 60% |
| 31-90 days | 25% |
| 91-180 days | 14% |
| More than 180 days | 1% |
Fund shareholders may incur two types of costs: (1) transaction costs, including sales charges (loads) on purchase payments and redemption/exchange fees; and (2) ongoing costs, including management fees; distribution and service (12b-1) fees; and other fund expenses. This example is intended to help you understand your ongoing costs (in dollars) of investing in your fund and to compare these costs with the ongoing cost of investing in other mutual funds.
The example is based on an investment of $1,000 made at the beginning of the period and held for the entire period from October 1, 2018 to March 31, 2019.
Actual Expenses
The table provides information about actual account values and actual expenses for each class. You may use the information, together with the amount you invested, to estimate the expenses that you paid over the period. First, identify the share class you own. Then simply divide your account value by $1,000 (for example, an $8,600 account value divided by $1,000 = 8.6), then multiply the result by the number under the heading “Expenses Paid During Period” to estimate the expenses you paid on your account during this period.
If you hold Investor Class shares of any American Century Investments fund, or I Class shares of the American Century Diversified Bond Fund, in an American Century Investments account (i.e., not a financial intermediary or retirement plan account), American Century Investments may charge you a $12.50 semiannual account maintenance fee if the value of those shares is less than $10,000. We will redeem shares automatically in one of your accounts to pay the $12.50 fee. In determining your total eligible investment amount, we will include your investments in all personal accounts (including American Century Investments Brokerage accounts) registered under your Social Security number. Personal accounts include individual accounts, joint accounts, UGMA/UTMA accounts, personal trusts, Coverdell Education Savings Accounts and IRAs (including traditional, Roth, Rollover, SEP-, SARSEP- and SIMPLE-IRAs), and certain other retirement accounts. If you have only business, business retirement, employer-sponsored or American Century Investments Brokerage accounts, you are currently not subject to this fee. If you are subject to the Account Maintenance Fee, your account value could be reduced by the fee amount.
Hypothetical Example for Comparison Purposes
The table also provides information about hypothetical account values and hypothetical expenses based on the actual expense ratio of each class of your fund and an assumed rate of return of 5% per year before expenses, which is not the actual return of a fund’s share class. The hypothetical account values and expenses may not be used to estimate the actual ending account balance or expenses you paid for the period. You may use this information to compare the ongoing costs of investing in your fund and other funds. To do so, compare this 5% hypothetical example with the 5% hypothetical examples that appear in the shareholder reports of the other funds.
Please note that the expenses shown in the table are meant to highlight your ongoing costs only and do not reflect any transactional costs, such as sales charges (loads) or redemption/exchange fees. Therefore, the table is useful in comparing ongoing costs only, and will not help you determine the relative total costs of owning different funds. In addition, if these transactional costs were included, your costs would have been higher.
|
| | | | |
| Beginning
Account Value
10/1/18 | Ending
Account Value
3/31/19 | Expenses Paid
During Period(1)
10/1/18 - 3/31/19 |
Annualized
Expense Ratio(1) |
| Actual | | | | |
| Investor Class | $1,000 | $1,009.90 | $2.91 | 0.58% |
| A Class | $1,000 | $1,008.60 | $4.16 | 0.83% |
| C Class | $1,000 | $1,006.10 | $6.65 | 1.33% |
| Hypothetical | | | | |
| Investor Class | $1,000 | $1,022.04 | $2.92 | 0.58% |
| A Class | $1,000 | $1,020.79 | $4.18 | 0.83% |
| C Class | $1,000 | $1,018.30 | $6.69 | 1.33% |
| |
| (1) | Expenses are equal to the class's annualized expense ratio listed in the table above, multiplied by the average account value over the period, multiplied by 182, the number of days in the most recent fiscal half-year, divided by 365, to reflect the one-half year period. Annualized expense ratio reflects actual expenses, including any applicable fee waivers or expense reimbursements and excluding any acquired fund fees and expenses. |
MARCH 31, 2019
|
| | | | | | |
| | Principal Amount | Value |
COMMERCIAL PAPER(1) — 48.1% | | |
Apple, Inc., 2.66%, 6/26/19(2) | $ | 10,000,000 |
| $ | 9,937,411 |
|
Apple, Inc., 2.67%, 7/15/19(2) | 26,300,000 |
| 26,098,257 |
|
Bennington Stark Capital Co. LLC, 2.61%, 6/14/19 (LOC: Societe Generale SA)(2) | 64,000,000 |
| 63,661,902 |
|
CAFCO LLC, 2.76%, 4/23/19 (LOC: Citibank N.A.)(2) | 12,000,000 |
| 11,980,053 |
|
Canadian Imperial Bank of Commerce, VRN, 2.94%, (3-month LIBOR plus 0.16%), 4/18/19(2) | 25,000,000 |
| 25,000,000 |
|
Chariot Funding LLC, VRN, 2.65%, (1-month LIBOR plus 0.16%), 8/8/19 (LOC: JPMorgan Chase Bank N.A.)(2) | 27,000,000 |
| 27,000,000 |
|
Chariot Funding LLC, VRN, 2.60%, (1-month LIBOR plus 0.11%), 8/14/19 (LOC: JPMorgan Chase Bank N.A.)(2) | 25,000,000 |
| 25,000,000 |
|
Chariot Funding LLC, VRN, 2.59%, (1-month LIBOR plus 0.11%), 9/5/19 (LOC: JPMorgan Chase Bank N.A.)(2) | 8,000,000 |
| 8,000,000 |
|
Chesham Finance Ltd. / Chesham Finance LLC, 2.48%, 4/1/19 (LOC: HSBC Bank plc)(2) | 3,000,000 |
| 3,000,000 |
|
Coca-Cola Co. (The), 2.64%, 4/24/19(2) | 22,500,000 |
| 22,462,625 |
|
CRC Funding LLC, 2.88%, 4/3/19 (LOC: Citibank N.A.)(2) | 19,000,000 |
| 18,997,002 |
|
CRC Funding LLC, 2.58%, 5/28/19 (LOC: Citibank N.A.)(2) | 7,050,000 |
| 7,021,647 |
|
CRC Funding LLC, 2.57%, 6/7/19 (LOC: Citibank N.A.)(2) | 12,500,000 |
| 12,441,143 |
|
CRC Funding LLC, 2.58%, 6/14/19 (LOC: Citibank N.A.)(2) | 6,000,000 |
| 5,968,673 |
|
Crown Point Capital Co. LLC, 2.74%, 4/29/19 (LOC: Credit Suisse AG)(2) | 5,176,000 |
| 5,165,131 |
|
Crown Point Capital Co. LLC, Series A, VRN, 2.65%, (1-month LIBOR plus 0.17%), 7/18/19 (LOC: Credit Suisse AG)(2) | 35,000,000 |
| 35,000,000 |
|
Crown Point Capital Co. LLC, Series A, VRN, 2.69%, (1-month LIBOR plus 0.20%), 8/1/19 (LOC: Credit Suisse AG)(2) | 25,000,000 |
| 25,000,000 |
|
Fairway Finance Co. LLC, VRN, 2.64%, (1-month LIBOR plus 0.15%), 4/10/19 (LOC: Bank of Montreal)(2) | 15,000,000 |
| 15,000,000 |
|
Fairway Finance Co. LLC, VRN, 2.73%, (1-month LIBOR plus 0.24%), 5/1/19 (LOC: Bank of Montreal)(2) | 15,500,000 |
| 15,500,000 |
|
Fairway Finance Co. LLC, VRN, 2.60%, (1-month LIBOR plus 0.11%), 8/14/19 (LOC: Bank of Montreal)(2) | 15,000,000 |
| 15,000,000 |
|
Fairway Finance Co. LLC, VRN, 2.58%, (1-month LIBOR plus 0.10%), 8/19/19 (LOC: Bank of Montreal)(2) | 20,000,000 |
| 20,000,000 |
|
Liberty Street Funding LLC, 2.58%, 6/10/19 (LOC: Bank of Nova Scotia)(2) | 2,000,000 |
| 1,990,122 |
|
Liberty Street Funding LLC, 2.61%, 7/18/19 (LOC: Bank of Nova Scotia)(2) | 27,000,000 |
| 26,791,830 |
|
| LMA-Americas LLC, 2.54%, 4/8/19 (LOC: Credit Agricole Corporate and Investment Bank) | 9,000,000 |
| 8,995,625 |
|
| LMA-Americas LLC, 2.54%, 4/11/19 (LOC: Credit Agricole Corporate and Investment Bank) | 13,500,000 |
| 13,490,625 |
|
| LMA-Americas LLC, 2.59%, 6/12/19 (LOC: Credit Agricole Corporate and Investment Bank) | 12,500,000 |
| 12,436,250 |
|
| LMA-Americas LLC, 2.76%, 8/1/19 (LOC: Credit Agricole Corporate and Investment Bank) | 10,000,000 |
| 9,907,822 |
|
| LMA-Americas LLC, 2.76%, 8/5/19 (LOC: Credit Agricole Corporate and Investment Bank) | 15,000,000 |
| 14,857,200 |
|
| Old Line Funding LLC, 2.57%, 5/9/19 (LOC: Royal Bank of Canada) | 25,000,000 |
| 24,926,111 |
|
|
| | | | | | |
| | Principal Amount | Value |
Old Line Funding LLC, 2.84%, 6/18/19 (LOC: Royal Bank of Canada)(2) | $ | 16,800,000 |
| $ | 16,707,908 |
|
Ridgefield Funding Co. LLC, 3.02%, 6/5/19 (LOC: BNP Paribas)(2) | 20,000,000 |
| 19,892,389 |
|
Ridgefield Funding Co. LLC, 2.64%, 8/16/19 (LOC: BNP Paribas)(2) | 35,000,000 |
| 34,653,695 |
|
Societe Generale SA, 2.65%, 5/31/19 (LOC: Societe Generale SA)(2) | 22,000,000 |
| 21,904,300 |
|
Thunder Bay Funding LLC, VRN, 2.65%, (1-month LIBOR plus 0.17%), 4/18/19 (LOC: Royal Bank of Canada)(2) | 25,000,000 |
| 25,000,000 |
|
Toronto-Dominion Bank (The), VRN, 2.67%, (1-month LIBOR plus 0.18%), 5/9/19(2) | 20,000,000 |
| 20,000,000 |
|
| Toyota Financial Services de Puerto Rico, Inc., 2.59%, 7/25/19 (LOC: Toyota Financial Services Corp.) | 10,000,000 |
| 9,918,542 |
|
| TOTAL COMMERCIAL PAPER | | 658,706,263 |
|
| CERTIFICATES OF DEPOSIT — 13.5% | | |
| Bank of Montreal VRN, 2.77%, (3-month LIBOR plus 0.03%), 2/7/20 | 30,000,000 |
| 30,000,000 |
|
| Bank of Nova Scotia (The) VRN, 2.81%, (3-month LIBOR plus 0.13%), 5/17/19 | 25,000,000 |
| 25,000,000 |
|
| Bank of Nova Scotia (The), 2.61%, 8/28/19 | 35,000,000 |
| 35,000,000 |
|
| MUFG Union Bank N.A., 2.59%, 6/19/19 | 14,500,000 |
| 14,500,000 |
|
| Toronto-Dominion Bank VRN, 2.72%, (3-month LIBOR plus 0.11%), 9/6/19 | 20,000,000 |
| 20,000,000 |
|
| Toronto-Dominion Bank VRN, 2.68%, (Daily EFFR plus 0.27%), 3/13/20 | 20,000,000 |
| 20,000,000 |
|
| Wells Fargo Bank N.A. VRN, 2.87%, (3-month LIBOR plus 0.07%), 7/2/19 | 30,000,000 |
| 30,000,000 |
|
| Wells Fargo Bank N.A. VRN, 2.79%, (1-month LIBOR plus 0.30%), 7/23/19 | 10,000,000 |
| 10,000,000 |
|
| TOTAL CERTIFICATES OF DEPOSIT | | 184,500,000 |
|
CORPORATE BONDS — 12.8% | | |
| CHS Properties, Inc., VRDN, 2.42%, 4/5/19 (LOC: Wells Fargo Bank N.A.) | 730,000 |
| 730,000 |
|
| Cypress Bend Real Estate Development Co. LLC, VRDN, 2.49%, 4/5/19 (LOC: FHLB) | 20,605,000 |
| 20,605,000 |
|
| D & I Properties LLC, VRDN, 2.50%, 4/5/19 (LOC: Wells Fargo Bank N.A.) | 3,350,000 |
| 3,350,000 |
|
| East Grand Office Park LP, VRDN, 2.49%, 4/5/19 (LOC: FHLB) | 3,840,000 |
| 3,840,000 |
|
| Fiore Capital LLC, VRDN, 2.40%, 4/5/19 (LOC: Wells Fargo Bank N.A.) | 13,530,000 |
| 13,530,000 |
|
| First Baptist Church of Opelika, VRDN, 2.50%, 4/5/19 (LOC: FHLB) | 1,900,000 |
| 1,900,000 |
|
| General Secretariat of the Organization of American States, VRDN, 2.42%, 4/5/19 (LOC: Bank of America N.A.) | 15,725,000 |
| 15,725,000 |
|
| HHH Investment Co., VRDN, 2.50%, 4/5/19 (LOC: Bank of the West) | 13,395,000 |
| 13,395,000 |
|
| Labcon North America, VRDN, 2.50%, 4/5/19 (LOC: Bank of the West) | 2,190,000 |
| 2,190,000 |
|
| Lakeport Group LLC, VRDN, 2.50%, 4/5/19 (LOC: MUFG Union Bank N.A.) | 2,985,000 |
| 2,985,000 |
|
| Ness Family Partners LP, VRDN, 2.50%, 4/5/19 (LOC: Bank of the West) | 5,545,000 |
| 5,545,000 |
|
| Partisan Property, Inc., Series 2014, VRDN, 2.50%, 4/5/19 (LOC: Wells Fargo Bank N.A.) | 6,535,000 |
| 6,535,000 |
|
| Providence Health & Services, VRDN, 2.46%, 4/5/19 (LOC: U.S. Bank N.A.) | 40,115,000 |
| 40,115,000 |
|
| Relay Relay LLC, VRDN, 2.49%, 4/5/19 (LOC: FHLB) | 6,910,000 |
| 6,910,000 |
|
| Sidal Realty Co. LP, VRDN, 2.47%, 4/5/19 (LOC: Wells Fargo Bank N.A.) | 5,985,000 |
| 5,985,000 |
|
|
| | | | | | |
| | Principal Amount | Value |
| Westpac Banking Corp., 4.88%, 11/19/19 | $ | 7,425,000 |
| $ | 7,523,497 |
|
| World Wildlife Fund, VRDN, 2.41%, 4/5/19 (LOC: JPMorgan Chase Bank N.A.) | 25,025,000 |
| 25,025,000 |
|
| TOTAL CORPORATE BONDS | | 175,888,497 |
|
U.S. TREASURY SECURITIES(1) — 12.0% | | |
| U.S. Treasury Bills, 2.50%, 4/4/19 | 25,000,000 |
| 24,994,865 |
|
| U.S. Treasury Bills, 2.49%, 4/23/19 | 35,000,000 |
| 34,947,383 |
|
| U.S. Treasury Notes, VRN, 2.49%, (3-month USBMMY plus 0.07%), 4/30/19 | 5,000,000 |
| 5,000,020 |
|
| U.S. Treasury Notes, 0.88%, 7/31/19 | 35,000,000 |
| 34,815,911 |
|
| U.S. Treasury Notes, VRN, 2.42%, (3-month USBMMY), 1/31/20 | 5,000,000 |
| 4,999,328 |
|
| U.S. Treasury Notes, VRN, 2.46%, (3-month USBMMY plus 0.03%), 4/30/20 | 15,000,000 |
| 15,001,249 |
|
| U.S. Treasury Notes, VRN, 2.47%, (3-month USBMMY plus 0.04%), 7/31/20 | 30,000,000 |
| 29,999,683 |
|
| U.S. Treasury Notes, VRN, 2.47%, (3-month USBMMY plus 0.04%), 10/31/20 | 10,000,000 |
| 9,999,148 |
|
| U.S. Treasury Notes, VRN, 2.54%, (3-month USBMMY plus 0.12%), 1/31/21 | 5,000,000 |
| 4,994,513 |
|
| TOTAL U.S. TREASURY SECURITIES | | 164,752,100 |
|
| MUNICIPAL SECURITIES — 10.4% | | |
| Alameda Public Financing Authority Rev., (Alameda Point Improvement Project), VRDN, 2.30%, 4/5/19 (LOC: MUFG Union Bank N.A.) | 2,950,000 |
| 2,950,000 |
|
| California Infrastructure & Economic Development Bank Rev., VRDN, 2.81%, 4/5/19 (LOC: Bank of the West) | 3,365,000 |
| 3,365,000 |
|
| City of Philadelphia, 2.64%, 6/4/19 (LOC: Wells Fargo Bank N.A.) | 18,000,000 |
| 18,000,000 |
|
| Hesperia Public Financing Authority Rev., VRDN, 2.51%, 4/5/19 (LOC: Bank of the West) | 3,625,000 |
| 3,625,000 |
|
| Idaho Housing & Finance Association Rev., (Traditions at Boise LLC), VRDN, 2.65%, 4/5/19 (GA: FHLMC) | 85,000 |
| 85,000 |
|
| Illinois Housing Development Authority Rev., VRDN, 2.35%, 4/5/19 (SBBPA: FHLB) | 11,100,000 |
| 11,100,000 |
|
| Illinois Housing Development Authority Rev., VRDN, 2.42%, 4/5/19 (SBBPA: FHLB) | 5,000,000 |
| 5,000,000 |
|
Macon-Bibb County Industrial Authority Rev., (Bass Pro Outdoor World LLC), VRDN, 2.38%, 4/5/19 (LOC: Bank of America N.A.)(2) | 11,970,000 |
| 11,970,000 |
|
| Massachusetts Education Financing Authority, 2.45%, 4/1/19 (LOC: Royal Bank of Canada) | 6,000,000 |
| 6,000,000 |
|
| Massachusetts Education Financing Authority, 2.50%, 4/1/19 (LOC: Royal Bank of Canada) | 3,500,000 |
| 3,500,000 |
|
| Missouri Development Finance Board Rev., (St. Louis Center), VRDN, 2.45%, 4/5/19 (LOC: U.S. Bank N.A.) | 2,230,000 |
| 2,230,000 |
|
| Nassau Health Care Corp. Rev., VRDN, 2.40%, 4/5/19 (LOC: JPMorgan Chase Bank N.A.) | 2,905,000 |
| 2,905,000 |
|
| Pasadena Public Financing Authority Rev., VRDN, 2.53%, 4/5/19 (SBBPA: Bank of the West) | 7,705,000 |
| 7,705,000 |
|
| South Dakota Housing Development Authority Rev., VRDN, 2.40%, 4/5/19 (SBBPA: South Dakota Housing Development Authority) | 25,000,000 |
| 25,000,000 |
|
| State of New York Mortgage Agency Rev., VRDN, 2.40%, 4/5/19 (SBBPA: Barclays Bank plc) | 10,000,000 |
| 10,000,000 |
|
| State of Texas GO, VRDN, 2.50%, 4/5/19 (SBBPA: U.S. Bank N.A.) | 14,750,000 |
| 14,750,000 |
|
| Traer Creek Metropolitan District Rev., VRDN, 2.50%, 4/5/19 (LOC: BNP Paribas) | 7,413,000 |
| 7,413,000 |
|
|
| | | | | | |
| | Principal Amount | Value |
| Washington State Housing Finance Commission Rev., (Traditions at South Hill LLC), VRDN, 2.65%, 4/5/19 (LIQ FAC: FHLMC) | $ | 120,000 |
| $ | 120,000 |
|
| Westchester County Healthcare Corp. Rev., (Senior Lien), VRDN, 2.35%, 4/5/19 (LOC: TD Bank N.A.) | 3,205,000 |
| 3,205,000 |
|
| Westmoreland County Industrial Development Authority Rev., (Excela Health), VRDN, 2.41%, 4/5/19 (LOC: PNC Bank N.A.) | 1,685,000 |
| 1,685,000 |
|
| Wilkes-Barre GO, VRDN, 2.41%, 4/5/19 (LOC: PNC Bank N.A.) | 1,560,000 |
| 1,560,000 |
|
| TOTAL MUNICIPAL SECURITIES | | 142,168,000 |
|
U.S. GOVERNMENT AGENCY SECURITIES(1) — 2.8% | | |
| Federal Home Loan Bank, 2.48%, 4/29/19 | 38,000,000 |
| 37,927,589 |
|
| TOTAL INVESTMENT SECURITIES — 99.6% | | 1,363,942,449 |
|
| OTHER ASSETS AND LIABILITIES — 0.4% | | 5,532,645 |
|
| TOTAL NET ASSETS — 100.0% | | $ | 1,369,475,094 |
|
|
| | |
| NOTES TO SCHEDULE OF INVESTMENTS |
| EFFR | - | Effective Federal Funds Rate |
| FHLB | - | Federal Home Loan Bank |
| FHLMC | - | Federal Home Loan Mortgage Corporation |
| GA | - | Guaranty Agreement |
| GO | - | General Obligation |
| LIBOR | - | London Interbank Offered Rate |
| LIQ FAC | - | Liquidity Facilities |
| LOC | - | Letter of Credit |
| SBBPA | - | Standby Bond Purchase Agreement |
| USBMMY | - | U.S. Treasury Bill Money Market Yield |
| VRDN | - | Variable Rate Demand Note. The instrument may be payable upon demand and adjusts periodically based upon the terms set forth in the security's offering documents. The rate shown is effective at the period end and the reference rate and spread, if any, is indicated. The date of the demand feature is disclosed. |
| VRN | - | Variable Rate Note. The rate adjusts periodically based upon the terms set forth in the security’s offering documents. The rate shown is effective at the period end and the reference rate and spread, if any, is indicated. |
| |
| (1) | The rate indicated is the yield to maturity at purchase for non-interest bearing securities. For interest bearing securities, the stated coupon rate is shown. |
| |
| (2) | Security was purchased pursuant to Rule 144A or Section 4(2) under the Securities Act of 1933 and may be sold in transactions exempt from registration, normally to qualified institutional investors. The aggregate value of these securities at the period end was $576,144,088, which represented 42.1% of total net assets. |
See Notes to Financial Statements.
|
|
| Statement of Assets and Liabilities |
|
| | | |
| MARCH 31, 2019 | |
| Assets | |
| Investment securities, at value (amortized cost and cost for federal income tax purposes) | $ | 1,363,942,449 |
|
| Cash | 785,053 |
|
| Receivable for investments sold | 1,955,000 |
|
| Receivable for capital shares sold | 2,184,459 |
|
| Interest receivable | 2,502,610 |
|
| | 1,371,369,571 |
|
| | |
| Liabilities | |
| Payable for capital shares redeemed | 1,207,445 |
|
| Accrued management fees | 662,038 |
|
| Distribution and service fees payable | 12,396 |
|
| Dividends payable | 12,598 |
|
| | 1,894,477 |
|
| | |
| Net Assets | $ | 1,369,475,094 |
|
| | |
| Net Assets Consist of: | |
| Capital paid in | $ | 1,369,467,970 |
|
| Distributable earnings | 7,124 |
|
| | $ | 1,369,475,094 |
|
|
| | | | | | |
| | Net Assets | Shares Outstanding | Net Asset Value Per Share |
| Investor Class |
| $1,336,785,144 |
| 1,336,927,005 |
| $1.00 |
| A Class |
| $19,847,266 |
| 19,835,618 |
| $1.00 |
| C Class |
| $12,842,684 |
| 12,840,491 |
| $1.00 |
See Notes to Financial Statements.
|
| | | |
| YEAR ENDED MARCH 31, 2019 | |
| Investment Income (Loss) | |
| Income: | |
| Interest | $ | 30,962,555 |
|
| | |
| Expenses: | |
| Management fees | 7,488,308 |
|
| Distribution and service fees: | |
| A Class | 54,239 |
|
| C Class | 93,222 |
|
| Trustees' fees and expenses | 90,973 |
|
| Other expenses | 332 |
|
| | 7,727,074 |
|
| | |
| Net investment income (loss) | 23,235,481 |
|
| | |
| Net realized gain (loss) on investment transactions | 9,143 |
|
| | |
| Net Increase (Decrease) in Net Assets Resulting from Operations | $ | 23,244,624 |
|
See Notes to Financial Statements.
|
|
| Statement of Changes in Net Assets |
|
| | | | | | |
| YEARS ENDED MARCH 31, 2019 AND MARCH 31, 2018 |
| Increase (Decrease) in Net Assets | March 31, 2019 | March 31, 2018 |
| Operations | | |
| Net investment income (loss) | $ | 23,235,481 |
| $ | 9,800,046 |
|
| Net realized gain (loss) | 9,143 |
| (2,019 | ) |
| Net increase (decrease) in net assets resulting from operations | 23,244,624 |
| 9,798,027 |
|
| | | |
| Distributions to Shareholders | | |
| From earnings: | | |
| Investor Class | (22,779,012 | ) | (9,599,779 | ) |
| A Class | (328,127 | ) | (157,231 | ) |
| C Class | (128,342 | ) | (43,036 | ) |
| Decrease in net assets from distributions | (23,235,481 | ) | (9,800,046 | ) |
| | | |
| Capital Share Transactions | | |
| Net increase (decrease) in net assets from capital share transactions (Note 4) | 95,857,128 |
| (30,144,469 | ) |
| | | |
| Net increase (decrease) in net assets | 95,866,271 |
| (30,146,488 | ) |
| | | |
| Net Assets | | |
| Beginning of period | 1,273,608,823 |
| 1,303,755,311 |
|
| End of period | $ | 1,369,475,094 |
| $ | 1,273,608,823 |
|
See Notes to Financial Statements.
|
|
| Notes to Financial Statements |
MARCH 31, 2019
1. Organization
American Century Investment Trust (the trust) is registered under the Investment Company Act of 1940, as amended (the 1940 Act), as an open-end management investment company and is organized as a Massachusetts business trust. Prime Money Market Fund (the fund) is one fund in a series issued by the trust. The fund’s investment objective is to seek to earn the highest level of current income while preserving the value of your investment.
The fund offers the Investor Class, A Class and C Class. The A Class and C Class may be subject to a contingent deferred sales charge.
2. Significant Accounting Policies
The following is a summary of significant accounting policies consistently followed by the fund in preparation of its financial statements. The fund is an investment company and follows accounting and reporting guidance in accordance with accounting principles generally accepted in the United States of America. This may require management to make certain estimates and assumptions at the date of the financial statements. Actual results could differ from these estimates. Management evaluated the impact of events or transactions occurring through the date the financial statements were issued that would merit recognition or disclosure.
Investment Valuations — The fund determines the fair value of its investments and computes its net asset value per share at the close of regular trading (usually 4 p.m. Eastern time) on the New York Stock Exchange (NYSE) on each day the NYSE is open. Investments are generally valued at amortized cost, which approximates fair value. If the fund determines that the amortized cost does not reflect an investment’s fair value, such investment is valued as determined in good faith by the Board of Trustees or its delegate, in accordance with policies and procedures adopted by the Board of Trustees.
Security Transactions — Security transactions are accounted for as of the trade date. Net realized gains and losses are determined on the identified cost basis, which is also used for federal income tax purposes.
Investment Income — Interest income is recorded on the accrual basis and includes accretion of discounts and amortization of premiums.
Treasury Roll Transactions — The fund purchases a security and at the same time makes a commitment to sell the same security at a future settlement date at a specified price. These types of transactions are known as treasury roll transactions. The difference between the purchase price and the sale price represents interest income reflective of an agreed upon rate between the fund and the counterparty.
Income Tax Status — It is the fund’s policy to distribute substantially all net investment income and net realized gains to shareholders and to otherwise qualify as a regulated investment company under provisions of the Internal Revenue Code. Accordingly, no provision has been made for income taxes. The fund files U.S. federal, state, local and non-U.S. tax returns as applicable. The fund's tax returns are subject to examination by the relevant taxing authority until expiration of the applicable statute of limitations, which is generally three years from the date of filing but can be longer in certain jurisdictions. At this time, management believes there are no uncertain tax positions which, based on their technical merit, would not be sustained upon examination and for which it is reasonably possible that the total amounts of unrecognized tax benefits will significantly change in the next twelve months.
Multiple Class — All shares of the fund represent an equal pro rata interest in the net assets of the class to which such shares belong, and have identical voting, dividend, liquidation and other rights and the same terms and conditions, except for class specific expenses and exclusive rights to vote on matters affecting only individual classes. Income, non-class specific expenses, and realized and unrealized capital gains and losses of the fund are allocated to each class of shares based on their relative net assets.
Distributions to Shareholders — Distributions from net investment income, if any, are declared daily and paid monthly. The fund may make capital gains distributions to comply with the distribution requirements of the Internal Revenue Code.
Indemnifications — Under the trust’s organizational documents, its officers and trustees are indemnified against certain liabilities arising out of the performance of their duties to the fund. In addition, in the normal course of business, the fund enters into contracts that provide general indemnifications. The maximum exposure under these arrangements is unknown as this would involve future claims that may be made against a fund. The risk of material loss from such claims is considered by management to be remote.
3. Fees and Transactions with Related Parties
Certain officers and trustees of the trust are also officers and/or directors of American Century Companies, Inc. (ACC). The trust's investment advisor, American Century Investment Management, Inc. (ACIM), the trust's distributor, American Century Investment Services, Inc. (ACIS), and the trust's transfer agent, American Century Services, LLC, are wholly owned, directly or indirectly, by ACC.
Management Fees — The trust has entered into a management agreement with ACIM, under which ACIM provides the fund with investment advisory and management services in exchange for a single, unified management fee (the fee) per class. The agreement provides that all expenses of managing and operating the fund, except distribution and service fees, brokerage expenses, taxes, interest, fees and expenses of the independent trustees (including legal counsel fees), and extraordinary expenses, will be paid by ACIM. The fee is computed and accrued daily based on each class's daily net assets and paid monthly in arrears. The fee consists of (1) an Investment Category Fee based on the daily net assets of the fund and certain other accounts managed by the investment advisor that are in the same broad investment category as the fund and (2) a Complex Fee based on the assets of all the funds in the American Century Investments family of funds. The rates for the Investment Category Fee range from 0.2370% to 0.3500% and the rates for the Complex Fee range from 0.2500% to 0.3100%. The effective annual management fee for each class for the period ended March 31, 2019 was 0.57%.
Distribution and Service Fees — The Board of Trustees has adopted a separate Master Distribution and Individual Shareholder Services Plan for each of the A Class and C Class (collectively the plans), pursuant to Rule 12b-1 of the 1940 Act. The plans provide that the A Class will pay ACIS an annual distribution and service fee of 0.25%. The plans provide that the C Class will pay ACIS an annual distribution and service fee of 0.75%, of which 0.25% is paid for individual shareholder services and 0.50% is paid for distribution services. The fees are computed and accrued daily based on each class’s daily net assets and paid monthly in arrears. The fees are used to pay financial intermediaries for distribution and individual shareholder services. Fees incurred under the plans during the period ended March 31, 2019 are detailed in the Statement of Operations.
Trustees’ Fees and Expenses — The Board of Trustees is responsible for overseeing the investment advisor’s management and operations of the fund. The trustees receive detailed information about the fund and its investment advisor regularly throughout the year, and meet at least quarterly with management of the investment advisor to review reports about fund operations. The fund’s officers do not receive compensation from the fund.
Interfund Transactions — The fund may enter into security transactions with other American Century Investments funds and other client accounts of the investment advisor, in accordance with the 1940 Act rules and procedures adopted by the Board of Trustees. The rules and procedures require, among other things, that these transactions be effected at the independent current market price of the security. During the period, the
interfund sales were $2,000,000 and there were no interfund purchases. The interfund transactions had no
effect on the Statement of Operations in net realized gain (loss) on investment transactions.
4. Capital Share Transactions
Transactions in shares of the fund were as follows (unlimited number of shares authorized):
|
| | | | | | | | | | |
| | Year ended
March 31, 2019 | Year ended
March 31, 2018 |
| | Shares | Amount | Shares | Amount |
| Investor Class | | | | |
| Sold | 656,576,136 |
| $ | 656,576,136 |
| 506,111,422 |
| $ | 506,111,422 |
|
| Issued in reinvestment of distributions | 22,511,234 |
| 22,511,234 |
| 9,514,069 |
| 9,514,069 |
|
| Redeemed | (579,840,725 | ) | (579,840,725 | ) | (546,241,994 | ) | (546,241,994 | ) |
| | 99,246,645 |
| 99,246,645 |
| (30,616,503 | ) | (30,616,503 | ) |
| A Class | | | | |
| Sold | 8,916,930 |
| 8,916,930 |
| 12,089,207 |
| 12,089,207 |
|
| Issued in reinvestment of distributions | 324,537 |
| 324,537 |
| 156,193 |
| 156,193 |
|
| Redeemed | (13,406,255 | ) | (13,406,255 | ) | (13,882,729 | ) | (13,882,729 | ) |
| | (4,164,788 | ) | (4,164,788 | ) | (1,637,329 | ) | (1,637,329 | ) |
| C Class | | | | |
| Sold | 5,388,586 |
| 5,388,586 |
| 5,326,886 |
| 5,326,886 |
|
| Issued in reinvestment of distributions | 127,980 |
| 127,980 |
| 42,758 |
| 42,758 |
|
| Redeemed | (4,741,295 | ) | (4,741,295 | ) | (3,260,281 | ) | (3,260,281 | ) |
| | 775,271 |
| 775,271 |
| 2,109,363 |
| 2,109,363 |
|
| Net increase (decrease) | 95,857,128 |
| $ | 95,857,128 |
| (30,144,469 | ) | $ | (30,144,469 | ) |
5. Fair Value Measurements
The fund’s investments valuation process is based on several considerations and may use multiple inputs to determine the fair value of the investments held by the fund. In conformity with accounting principles generally accepted in the United States of America, the inputs used to determine a valuation are classified into three broad levels.
| |
| • | Level 1 valuation inputs consist of unadjusted quoted prices in an active market for identical investments. |
| |
| • | Level 2 valuation inputs consist of direct or indirect observable market data (including quoted prices for comparable investments, evaluations of subsequent market events, interest rates, prepayment speeds, credit risk, etc.). These inputs also consist of quoted prices for identical investments initially expressed in local currencies that are adjusted through translation into U.S. dollars. |
| |
| • | Level 3 valuation inputs consist of unobservable data (including a fund’s own assumptions). |
The level classification is based on the lowest level input that is significant to the fair valuation measurement. The valuation inputs are not necessarily an indication of the risks associated with investing in these securities or other financial instruments.
As of period end, the fund’s investment securities were classified as Level 2. The Schedule of Investments provides additional information on the fund’s portfolio holdings.
6. Federal Tax Information
The tax character of distributions paid during the years ended March 31, 2019 and March 31, 2018 were as follows:
|
| | | | | | |
| | 2019 | 2018 |
| Distributions Paid From | | |
| Ordinary income | $ | 23,235,481 |
| $ | 9,800,046 |
|
| Long-term capital gains | — |
| — |
|
The book-basis character of distributions made during the year from net investment income or net realized gains may differ from their ultimate characterization for federal income tax purposes. These differences reflect the differing character of certain income items and net realized gains and losses for financial statement and tax purposes, and may result in reclassification among certain capital accounts on the financial statements.
As of March 31, 2019, the fund had undistributed ordinary income for federal income tax purposes of $7,124.
7. Recently Issued Accounting Standards
In March 2017, the Financial Accounting Standards Board (FASB) issued Accounting Standards Update No. 2017-08, “Receivables - Nonrefundable Fees and Other Costs (Subtopic 310-20), Premium Amortization on Purchased Callable Debt Securities” (ASU 2017-08). ASU 2017-08 amends the amortization period for certain purchased callable debt securities held at a premium, shortening such period to the earliest call date. The amendments are effective for fiscal years, and interim periods within those fiscal years, beginning after December 15, 2018. Management is currently evaluating the impact that adopting ASU 2017-08 will have on the financial statements.
|
| | | | | | | | | | | | | | |
| For a Share Outstanding Throughout the Years Ended March 31 (except as noted) | | | | | |
| Per-Share Data | | | | | | Ratios and Supplemental Data | | |
| | | Income From Investment Operations: | | | | Ratio to Average Net Assets of: | |
| | Net Asset Value, Beginning of Period | Net
Investment
Income
(Loss) | Net
Realized
and
Unrealized
Gain (Loss) | Total From Investment Operations | Distributions From Net Investment Income | Net Asset Value, End of Period | Total Return(1) | Operating Expenses | Operating Expenses (before expense waiver) | Net Investment Income (Loss) | Net Investment Income (Loss) (before expense waiver) | Net Assets, End of Period (in thousands) |
| Investor Class | | | | | | | | | | | | |
| 2019 | $1.00 | 0.02 | —(2) | 0.02 | (0.02) | $1.00 | 1.79% | 0.58% | 0.58% | 1.78% | 1.78% |
| $1,336,785 |
|
| 2018 | $1.00 | 0.01 | —(2) | 0.01 | (0.01) | $1.00 | 0.78% | 0.58% | 0.58% | 0.77% | 0.77% |
| $1,237,530 |
|
| 2017 | $1.00 | —(2) | —(2) | —(2) | —(2) | $1.00 | 0.19% | 0.58% | 0.58% | 0.17% | 0.17% |
| $1,268,148 |
|
| 2016 | $1.00 | —(2) | —(2) | —(2) | —(2) | $1.00 | 0.01% | 0.30% | 0.58% | 0.02% | (0.26)% |
| $1,563,574 |
|
| 2015 | $1.00 | —(2) | —(2) | —(2) | —(2) | $1.00 | 0.01% | 0.15% | 0.58% | 0.01% | (0.42)% |
| $1,813,054 |
|
| A Class | | | | | | | | | | | | |
| 2019 | $1.00 | 0.02 | —(2) | 0.02 | (0.02) | $1.00 | 1.54% | 0.83% | 0.83% | 1.53% | 1.53% |
| $19,847 |
|
| 2018 | $1.00 | 0.01 | —(2) | 0.01 | (0.01) | $1.00 | 0.65% | 0.70% | 0.83% | 0.65% | 0.52% |
| $24,012 |
|
| 2017 | $1.00 | —(2) | —(2) | —(2) | —(2) | $1.00 | 0.19% | 0.58% | 0.83% | 0.17% | (0.08)% |
| $25,649 |
|
| 2016 | $1.00 | —(2) | —(2) | —(2) | —(2) | $1.00 | 0.01% | 0.32% | 0.83% | 0.00%(3) | (0.51)% |
| $209,165 |
|
| 2015 | $1.00 | —(2) | —(2) | —(2) | —(2) | $1.00 | 0.01% | 0.15% | 0.83% | 0.01% | (0.67)% |
| $186,961 |
|
| C Class | | | | | | | | | | | | |
| 2019 | $1.00 | 0.01 | —(2) | 0.01 | (0.01) | $1.00 | 1.03% | 1.33% | 1.33% | 1.03% | 1.03% |
| $12,843 |
|
| 2018 | $1.00 | —(2) | —(2) | —(2) | —(2) | $1.00 | 0.40% | 0.96% | 1.33% | 0.39% | 0.02% |
| $12,067 |
|
| 2017 | $1.00 | —(2) | —(2) | —(2) | —(2) | $1.00 | 0.19% | 0.58% | 1.33% | 0.17% | (0.58)% |
| $9,958 |
|
| 2016 | $1.00 | —(2) | —(2) | —(2) | —(2) | $1.00 | 0.01% | 0.32% | 1.33% | 0.00%(3) | (1.01)% |
| $9,526 |
|
| 2015 | $1.00 | —(2) | —(2) | —(2) | —(2) | $1.00 | 0.01% | 0.15% | 1.33% | 0.01% | (1.17)% |
| $7,146 |
|
|
| | | | |
| Notes to Financial Highlights | | |
| |
| (1) | Total returns are calculated based on the net asset value of the last business day and do not reflect applicable sales charges, if any. Total returns for periods less than one year are not annualized. |
| |
| (2) | Per-share amount was less than $0.005. |
| |
| (3) | Ratio was less than 0.005%. |
See Notes to Financial Statements.
|
|
| Report of Independent Registered Public Accounting Firm |
To the Board of Trustees of American Century Investment Trust and Shareholders of Prime Money Market Fund:
Opinion on the Financial Statements
We have audited the accompanying statement of assets and liabilities, including the schedule of investments, of Prime Money Market Fund (one of the funds constituting American Century Investment Trust, referred to hereafter as the “Fund”) as of March 31, 2019, the related statement of operations for the year ended March 31, 2019, the statement of changes in net assets for each of the two years in the period ended March 31, 2019, including the related notes, and the financial highlights for each of the five years in the period ended March 31, 2019 (collectively referred to as the “financial statements”). In our opinion, the financial statements present fairly, in all material respects, the financial position of the Fund as of March 31, 2019, the results of its operations for the year then ended, the changes in its net assets for each of the two years in the period ended March 31, 2019 and the financial highlights for each of the five years in the period ended March 31, 2019 in conformity with accounting principles generally accepted in the United States of America.
Basis for Opinion
These financial statements are the responsibility of the Fund’s management. Our responsibility is to express an opinion on the Fund’s financial statements based on our audits. We are a public accounting firm registered with the Public Company Accounting Oversight Board (United States) (“PCAOB”) and are required to be independent with respect to the Fund in accordance with the U.S. federal securities laws and the applicable rules and regulations of the Securities and Exchange Commission and the PCAOB.
We conducted our audits of these financial statements in accordance with the standards of the PCAOB. Those standards require that we plan and perform the audit to obtain reasonable assurance about whether the financial statements are free of material misstatement, whether due to error or fraud.
Our audits included performing procedures to assess the risks of material misstatement of the financial statements, whether due to error or fraud, and performing procedures that respond to those risks. Such procedures included examining, on a test basis, evidence regarding the amounts and disclosures in the financial statements. Our audits also included evaluating the accounting principles used and significant estimates made by management, as well as evaluating the overall presentation of the financial statements. Our procedures included confirmation of securities owned as of March 31, 2019 by correspondence with the custodian and brokers; when replies were not received from brokers, we performed other auditing procedures. We believe that our audits provide a reasonable basis for our opinion.
/s/ PricewaterhouseCoopers LLP
Kansas City, Missouri
May 17, 2019
We have served as the auditor of one or more investment companies in American Century Investments since 1997.
Board of Trustees
The individuals listed below serve as trustees of the funds. Each trustee will continue to serve in this capacity until death, retirement, resignation or removal from office. The board has adopted a mandatory retirement age for trustees who are not “interested persons,” as that term is defined in the Investment Company Act (independent trustees). Independent trustees shall retire on December 31 of the year in which they reach their 75th birthday; provided, however, that on or after January 1, 2022, independent trustees shall retire on December 31 of the year in which they reach their 76th birthday.
Mr. Thomas is an “interested person” because he currently serves as President and Chief Executive Officer of American Century Companies, Inc. (ACC), the parent company of American Century Investment Management, Inc. (ACIM or the advisor). The other trustees (more than three-fourths of the total number) are independent. They are not employees, directors or officers of, and have no financial interest in, ACC or any of its wholly owned, direct or indirect, subsidiaries, including ACIM, American Century Investment Services, Inc. (ACIS) and American Century Services, LLC (ACS), and they do not have any other affiliations, positions or relationships that would cause them to be considered “interested persons” under the Investment Company Act. The trustees serve in this capacity for eight (in the case of Jonathan S. Thomas, 16; and Ronald J. Gilson, 9) registered investment companies in the American Century Investments family of funds.
The following table presents additional information about the trustees. The mailing address for each trustee other than Jonathan S. Thomas is 1665 Charleston Road, Mountain View, California 94043. The mailing address for Jonathan S. Thomas is 4500 Main Street, Kansas City, Missouri 64111.
|
| | | | | |
Name
(Year of Birth) | Position(s) Held with Funds | Length of Time Served | Principal Occupation(s) During Past 5 Years | Number of American Century Portfolios Overseen by Trustee | Other Directorships Held During Past 5 Years |
| Independent Trustees |
|
|
Tanya S. Beder
(1955) | Trustee | Since 2011 | Chairman and CEO, SBCC Group Inc. (independent advisory services) (2006 to present) | 45 | CYS Investments, Inc.; Nabors Industries Ltd. |
Jeremy I. Bulow
(1954) | Trustee | Since 2011 | Professor of Economics, Stanford University, Graduate School of Business (1979 to present) | 45 | None |
Anne Casscells
(1958) | Trustee | Since 2016 | Co-Chief Executive Officer and Chief Investment Officer, Aetos Alternatives Management (investment advisory firm) (2001 to present); Lecturer in Accounting, Stanford University, Graduate School of Business (2009 to 2017) | 45 | None |
Ronald J. Gilson
(1946) | Trustee and Chairman of the Board | Since 1995
(Chairman since 2005) | Charles J. Meyers Professor of Law and Business, Emeritus, Stanford Law School (1979 to 2016); Marc and Eva Stern Professor of Law and Business, Columbia University School of Law (1992 to present) | 50 | None |
|
| | | | | |
Name
(Year of Birth) | Position(s) Held with Funds | Length of Time Served | Principal Occupation(s) During Past 5 Years | Number of American Century Portfolios Overseen by Trustee | Other Directorships Held During Past 5 Years |
| Independent Trustees |
|
|
Frederick L. A. Grauer
(1946) | Trustee | Since 2008 | Senior Advisor, Credit Sesame, Inc. (credit monitoring firm) (2018 to present); Senior Advisor, Course Hero (an educational technology company) (2015 to present); Senior Advisor, iShares by BlackRock, Inc. (investment management firm) (2013 to 2015)
| 45 | None |
Jonathan D. Levin
(1972) | Trustee | Since 2016 | Philip H. Knight Professor and Dean, Graduate School of Business, Stanford University (2016 to present); Professor, Stanford University, (2000 to present); Chair, Department of Economics, Stanford University (2011 to 2014) | 45 | None |
Peter F. Pervere
(1947) | Trustee | Since 2007 | Retired | 45 | None |
John B. Shoven
(1947) | Trustee | Since 2002 | Charles R. Schwab Professor of Economics, Stanford University (1973 to present) | 45 | Cadence Design Systems; Exponent; Financial Engines |
| Interested Trustee |
|
|
Jonathan S. Thomas
(1963) | Trustee and President | Since 2007 | President and Chief Executive Officer, ACC (2007 to present). Also serves as Chief Executive Officer, ACS; Executive Vice President, ACIM; Director, ACC, ACIM and other ACC subsidiaries | 117 | BioMed Valley Discoveries, Inc. |
The Statement of Additional Information has additional information about the fund's trustees and is available without charge, upon request, by calling 1-800-345-2021.
Officers
The following table presents certain information about the executive officers of the funds. Each officer serves as an officer for 16 (in the case of Robert J. Leach, 15) investment companies in the American Century family of funds, unless otherwise noted. No officer is compensated for his or her service as an officer of the funds. The listed officers are interested persons of the funds and are appointed or re-appointed on an annual basis. The mailing address for each of the officers listed below is 4500 Main Street, Kansas City, Missouri 64111.
|
| | |
Name
(Year of Birth) | Offices with the Funds | Principal Occupation(s) During the Past Five Years |
Jonathan S. Thomas
(1963) | Trustee and President since 2007 | President and Chief Executive Officer, ACC (2007 to present). Also serves as Chief Executive Officer, ACS; Executive Vice President, ACIM; Director, ACC, ACIM and other ACC subsidiaries |
R. Wes Campbell
(1974)
| Chief Financial Officer and Treasurer since 2018
| Investment Operations and Investment Accounting, ACS (2000 to present) |
Amy D. Shelton
(1964) | Chief Compliance Officer and Vice President since 2014 | Chief Compliance Officer, American Century funds, (2014 to present); Chief Compliance Officer, ACIM (2014 to present); Chief Compliance Officer, ACIS (2009 to present); Vice President, Client Interactions and Marketing, ACIS (2013 to 2014). Also serves as Vice President, ACIS |
Charles A. Etherington
(1957) | General Counsel since 2007 and Senior Vice President since 2006 | Attorney, ACC (1994 to present); Vice President, ACC (2005 to present); General Counsel, ACC (2007 to present). Also serves as General Counsel, ACIM, ACS, ACIS and other ACC subsidiaries; and Senior Vice President, ACIM and ACS |
C. Jean Wade
(1964) | Vice President since 2012 | Senior Vice President, ACS (2017 to present); Vice President ACS (2000 to 2017) |
Robert J. Leach
(1966) | Vice President since 2006 | Vice President, ACS (2000 to present) |
David H. Reinmiller
(1963) | Vice President since 2000 | Attorney, ACC (1994 to present) Also serves as Vice President, ACIM and ACS |
Ward D. Stauffer
(1960) | Secretary since 2005 | Attorney, ACC (2003 to present) |
Retirement Account Information
As required by law, distributions you receive from certain retirement accounts are subject to federal income tax withholding, unless you elect not to have withholding apply*. Tax will be withheld on the total amount withdrawn even though you may be receiving amounts that are not subject to withholding, such as nondeductible contributions. In such case, excess amounts of withholding could occur. You may adjust your withholding election so that a greater or lesser amount will be withheld.
If you don’t want us to withhold on this amount, you must notify us to not withhold the federal income tax. You may notify us in writing or in certain situations by telephone or through other electronic means. For systematic withdrawals, your withholding election will remain in effect until revoked or changed by filing a new election. You have the right to revoke your election at any time and change your withholding percentage for future distributions.
Remember, even if you elect not to have income tax withheld, you are liable for paying income tax on the taxable portion of your withdrawal. If you elect not to have income tax withheld or you don’t have enough income tax withheld, you may be responsible for payment of estimated tax. You may incur penalties under the estimated tax rules if your withholding and estimated tax payments are not sufficient. You can reduce or defer the income tax on a distribution by directly or indirectly rolling such distribution over to another IRA or eligible plan. You should consult your tax advisor for additional information.
State tax will be withheld if, at the time of your distribution, your address is within one of the mandatory withholding states and you have federal income tax withheld (or as otherwise required by state law). State taxes will be withheld from your distribution in accordance with the respective state rules.
*Some 403(b), 457 and qualified retirement plan distributions may be subject to 20% mandatory withholding, as they are subject to special tax and withholding rules. Your plan administrator or plan sponsor is required to provide you with a special tax notice explaining those rules at the time you request a distribution. If applicable, federal and/or state taxes may be withheld from your distribution amount.
Proxy Voting Policies
Descriptions of the principles and policies that the fund's investment advisor uses in exercising the voting rights associated with the securities purchased and/or held by the fund are available without charge, upon request, by calling 1-800-345-2021 or visiting the "About Us" page of American Century Investments’ website at americancentury.com. A description of the policies is also available on the Securities and Exchange Commission’s website at sec.gov. Information regarding how the investment advisor voted proxies relating to portfolio securities during the most recent 12-month period ended June 30 is available on the "About Us" page at americancentury.com. It is also available at sec.gov.
Quarterly Portfolio Disclosure
The fund files its complete schedule of portfolio holdings with the Securities and Exchange Commission (SEC) for the first and third quarters of each fiscal year on Form N-Q or as an exhibit to its reports on Form N-PORT. The fund’s Forms N-Q and Form N-PORT reports are available on the SEC’s website at sec.gov. The fund also makes its complete schedule of portfolio holdings for the most recent quarter of its fiscal year available on its website at americancentury.com and, upon request, by calling 1-800-345-2021.
|
| | |
| |
| | | |
| Contact Us | americancentury.com | |
| Automated Information Line | 1-800-345-8765 | |
| Investor Services Representative | 1-800-345-2021 or 816-531-5575 | |
| Investors Using Advisors | 1-800-378-9878 | |
| Business, Not-For-Profit, Employer-Sponsored Retirement Plans | 1-800-345-3533 | |
| Banks and Trust Companies, Broker-Dealers, Financial Professionals, Insurance Companies | 1-800-345-6488 | |
| Telecommunications Relay Service for the Deaf | 711 | |
| | | |
| American Century Investment Trust | |
| | | |
Investment Advisor: American Century Investment Management, Inc. Kansas City, Missouri | |
| | | |
| This report and the statements it contains are submitted for the general information of our shareholders. The report is not authorized for distribution to prospective investors unless preceded or accompanied by an effective prospectus. | |
| | | |
©2019 American Century Proprietary Holdings, Inc. All rights reserved.
CL-ANN-92284 1905 | |
|
| |
| | |
| | Annual Report |
| | |
| | March 31, 2019 |
| | |
| | Short Duration Fund |
| | Investor Class (ACSNX) |
| | I Class (ASHHX) |
| | A Class (ACSQX) |
| | C Class (ACSKX) |
| | R Class (ACSPX) |
| | R5 Class (ACSUX) |
| | R6 Class (ASDDX) |
Beginning on January 1, 2021, as permitted by regulations adopted by the Securities and Exchange Commission, paper copies of the fund’s shareholder reports like this one will no longer be sent by mail, unless you specifically request paper copies of the reports from the fund or from your financial intermediary, such as a broker-dealer or bank. Instead, the reports will be made available on a website, and you will be notified by mail each time a report is posted and provided with a website link to access the report.
If you already elected to receive shareholder reports electronically, you will not be affected by this change and you need not take any action. You may elect to receive shareholder reports and other communications from the fund or your financial intermediary electronically by calling or sending an email request to your appropriate contacts as listed on the back cover of this report.
You may elect to receive all future reports in paper free of charge. You can inform the fund or your financial intermediary that you wish to continue receiving paper copies of your shareholder reports by calling or sending an email request to your appropriate contacts as listed on the back cover of this report. Your election to receive reports in paper will apply to all funds held with the fund complex/your financial intermediary.
|
| | |
| President’s Letter | 2 |
|
| Performance | 3 |
|
| Portfolio Commentary | |
|
| Fund Characteristics | |
|
| Shareholder Fee Example | |
|
| Schedule of Investments | |
|
| Statement of Assets and Liabilities | |
|
| Statement of Operations | |
|
| Statement of Changes in Net Assets | |
|
| Notes to Financial Statements | |
|
| Financial Highlights | |
|
| Report of Independent Registered Public Accounting Firm | |
|
| Management | |
|
| Additional Information | |
|
Any opinions expressed in this report reflect those of the author as of the date of the report, and do not necessarily represent the opinions of American Century Investments® or any other person in the American Century Investments organization. Any such opinions are subject to change at any time based upon market or other conditions and American Century Investments disclaims any responsibility to update such opinions. These opinions may not be relied upon as investment advice and, because investment decisions made by American Century Investments funds are based on numerous factors, may not be relied upon as an indication of trading intent on behalf of any American Century Investments fund. Security examples are used for representational purposes only and are not intended as recommendations to purchase or sell securities. Performance information for comparative indices and securities is provided to American Century Investments by third party vendors. To the best of American Century Investments’ knowledge, such information is accurate at the time of printing.
Jonathan Thomas
Dear Investor:
Thank you for reviewing this annual report for the period ended March 31, 2019. Annual reports help convey important information about fund returns, including market factors that affected performance during the reporting period. For additional, updated investment and market insights, we encourage you to visit our website, americancentury.com.
Markets Ended Roller-Coaster Period on Upswing
For the first half of the period, U.S. stocks climbed higher, while bond returns headed lower. Robust economic growth, bolstered by federal tax and regulatory reform, and record corporate earnings results fueled risk-on sentiment that drove stock prices higher. Meanwhile, the combination of strong economic data, the Federal Reserve’s (Fed’s) ongoing rate-hike campaign and an uptick in inflation pushed investment-grade bond returns lower.
Market trends began changing in late 2018. Mounting investor concerns about slowing global economic and earnings growth, U.S.-China trade tensions and rising interest rates triggered widespread volatility. Stock prices plunged as investors sought safe-haven investments, including U.S. Treasuries. Furthermore, the Fed issued another rate hike in December, its fourth of the year, and maintained its hawkish outlook. Investors feared the December rate increase and the Fed’s plans for two more rate hikes in 2019 were too aggressive, and risk-off investing remained in favor.
January brought a renewed sense of stability to the markets. Investors’ concerns about growth and trade eased, and the Fed changed course, pausing its rate-hike campaign amid moderating global growth and inflation. Valuations appeared attractive after the late-2018 sell-off, and risk-on investing resumed. In March, the Fed held rates steady again, hinting additional tightening was off the table for 2019. This news drove stock and bond returns higher and left both asset classes on an upward track to end the period. Overall, stocks (S&P 500 Index) overcame their late-2018 nosedive to gain 9.50% for the period. Bonds (Bloomberg Barclays U.S. Aggregate Bond Index) bounced back from losses early in the period to return 4.48%.
We expect volatility to remain a formidable factor as investors react to global growth trends, central bank policy and geopolitical developments. We believe this scenario underscores the importance of using professionally managed portfolios in pursuit of investment goals. We appreciate your continued trust and confidence in us.
Sincerely,
Jonathan Thomas
President and Chief Executive Officer
American Century Investments
|
| | | | | | |
| Total Returns as of March 31, 2019 | | |
| | | | Average Annual Returns | |
| | Ticker Symbol | 1 year | 5 years | 10 years | Since Inception | Inception Date |
| Investor Class | ACSNX | 2.87% | 1.45% | 1.91% | — | 11/30/06 |
| Bloomberg Barclays U.S. 1-3 Year Government/Credit Bond Index | — | 3.03% | 1.22% | 1.59% | — | — |
| I Class | ASHHX | 2.97% | — | — | 1.97% | 4/10/17 |
| A Class | ACSQX | | | | | 11/30/06 |
| No sales charge | | 2.61% | 1.20% | 1.65% | — | |
| With sales charge | | 0.34% | 0.74% | 1.42% | — | |
| C Class | ACSKX | 1.75% | 0.43% | 0.89% | — | 11/30/06 |
| R Class | ACSPX | 2.26% | 0.93% | 1.40% | — | 11/30/06 |
| R5 Class | ACSUX | 3.08% | 1.66% | 2.11% | — | 11/30/06 |
| R6 Class | ASDDX | 3.03% | — | — | 1.93% | 7/28/17 |
Average annual returns since inception are presented when ten years of performance history is not available.
Sales charges include initial sales charges and contingent deferred sales charges (CDSCs), as applicable. A Class shares have a 2.25% maximum initial sales charge and may be subject to a maximum CDSC of 1.00%. C Class shares redeemed within 12 months of purchase are subject to a maximum CDSC of 1.00%. The SEC requires that mutual funds provide performance information net of maximum sales charges in all cases where charges could be applied.
Data presented reflect past performance. Past performance is no guarantee of future results. Current performance may be higher or lower than the performance shown. Total returns for periods less than one year are not annualized. Investment return and principal value will fluctuate, and redemption value may be more or less than original cost. Data assumes reinvestment of dividends and capital gains, and none of the charts reflect the deduction of taxes that a shareholder would pay on fund distributions or the redemption of fund shares. To obtain performance data current to the most recent month end, please call 1-800-345-2021 or visit americancentury.com. For additional information about the fund, please consult the prospectus.
|
|
| Growth of $10,000 Over 10 Years |
| $10,000 investment made March 31, 2009 |
Performance for other share classes will vary due to differences in fee structure.
|
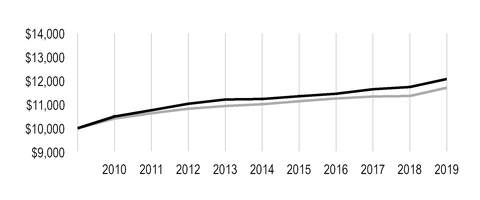
|
| |
| Value on March 31, 2019 |
| | Investor Class — $12,079 |
| |
| | Bloomberg Barclays U.S. 1-3 Year Government/Credit Bond Index — $11,705 |
| |
|
| | | | | | |
| Total Annual Fund Operating Expenses |
| Investor Class | I Class | A Class | C Class | R Class | R5 Class | R6 Class |
| 0.59% | 0.49% | 0.84% | 1.59% | 1.09% | 0.39% | 0.34% |
The total annual fund operating expenses shown is as stated in the fund’s prospectus current as of the date of this report. The prospectus may vary from the expense ratio shown elsewhere in this report because it is based on a different time period, includes acquired fund fees and expenses, and, if applicable, does not include fee waivers or expense reimbursements.
Data presented reflect past performance. Past performance is no guarantee of future results. Current performance may be higher or lower than the performance shown. Total returns for periods less than one year are not annualized. Investment return and principal value will fluctuate, and redemption value may be more or less than original cost. Data assumes reinvestment of dividends and capital gains, and none of the charts reflect the deduction of taxes that a shareholder would pay on fund distributions or the redemption of fund shares. To obtain performance data current to the most recent month end, please call 1-800-345-2021 or visit americancentury.com. For additional information about the fund, please consult the prospectus.
Portfolio Managers: Bob Gahagan, Hando Aguilar, Jeff Houston, Jim Platz and Charles Tan
Effective October 31, 2018, Charles Tan joined the portfolio management team, replacing Dave MacEwen, who left the team ahead of his December 31, 2018, retirement.
Performance Summary
Short Duration returned 2.87%* for the 12 months ended March 31, 2019. By comparison, the Bloomberg Barclays U.S. 1-3 Year Government/Credit Bond Index gained 3.03%. Fund returns reflect operating expenses, while index returns do not.
Returns for the fund and the index reflect a positive, yet challenging, environment for fixed-income securities. The 12-month period witnessed a marked shift in Federal Reserve (Fed) policy and investor sentiment toward the U.S. and global economic growth outlook, which influenced performance in the fixed-income market. In the first several months of the period, robust economic growth, rising inflation and the Fed’s steady rate-tightening strategy drove Treasury yields higher. Investment-grade bond returns were generally flat to slightly negative. Meanwhile, risk-on investing remained in favor, and higher-yielding securities outperformed. The environment reversed sharply in late 2018, as worries about future economic and corporate earnings growth, U.S.-China trade negotiations and a surprisingly bullish Fed outlook triggered severe volatility in the equity markets. After climbing to a reporting period high of 3.24% in early November (according to Bloomberg), the 10-year U.S. Treasury yield plunged to 2.68% by the end of December 2018, as investors fled risk assets in favor of perceived safe-haven investments.
The new year brought a new sense of stability to the financial markets. Progress with U.S.-China trade negotiations and better-than-feared U.S. economic and earnings data helped restore some investor optimism. Additionally, the Fed paused its rate-hike campaign in January, seemingly acknowledging its December plan for two rate hikes in 2019 may have been too aggressive. Investors responded enthusiastically to this backdrop, and risk assets returned to favor. Meanwhile, Treasury yields moved modestly lower. Then, at its March monetary policy meeting, the Fed held rates steady and suggested additional tightening was likely off the table for 2019. This news triggered a sharp rally among Treasuries, and the 10-year Treasury note ended March 2019 yielding 2.41%, compared with 2.74% a year earlier.
Overall, the Treasury market rally of late 2018 and early 2019 supported broad U.S. fixed-income gains for the entire 12-month period. In general, longer-duration securities (those with greater sensitivity to interest rate changes) outperformed shorter-duration securities, and lower-quality bonds outperformed higher-quality bonds.
Duration Was a Modest Detractor
The dramatic decline in short-maturity interest rates coupled with significant flattening of the yield curve in late 2018 and early 2019 created challenges for shorter-duration assets and strategies. In this environment, our slightly shorter-than-index duration modestly detracted from relative results.
* All fund returns referenced in this commentary are for Investor Class shares. Performance for other share classes will vary due to differences in fee structure; when Investor Class performance exceeds that of the index, other share classes may not. See page 3 for returns for all share classes.
Corporate, Securitized Bonds Aided Performance
We continued to underweight Treasuries and government agencies relative to the index in favor of spread (non-Treasury) sectors, including corporate credit and securitized bonds. This positioning boosted the portfolio’s relative returns, given the broad outperformance of corporate and securitized bonds relative to government securities.
Within the corporate sector, our out-of-index position in high-yield bonds was a significant contributor to relative results, particularly in early 2019. In addition, our selections among investment-grade corporates added value. We continued to favor securities with BBB credit ratings, which generally outperformed their higher-quality peers. Within the securitized sector, positions among non-agency collateralized mortgage obligations and commercial mortgage-backed securities, collateralized loan obligations and asset-back securities contributed to performance.
Portfolio Positioning
We expect the U.S. economy to continue to grow, but at a more moderate pace (2.0% to 2.5% annualized). However, we expect U.S. economic growth to remain more robust than growth in Europe and Japan. We expect headline inflation to eventually converge with core inflation near 2%. These factors should enable the Fed to remain on hold throughout the remainder of 2019. Against a backdrop of slowing global growth, geopolitical uncertainties (mainly Brexit) and a dovish Fed, we expect the 10-year Treasury yield to fluctuate within a near-term range of 2.35% to 2.80%.
We do not believe the dramatic flattening (and brief) inversion of the yield curve late in the reporting period is an indication of a looming recession. Instead, we believe the curve flattened in response to the Fed’s unexpected pivot to dovish monetary policy. We believe the Fed’s change of course is more reflective of a lack of inflation than a lack of growth. Given the yield curve’s notable flattening, we initiated a position designed to take advantage of our outlook for the curve between two and five years to steepen.
Additionally, we expect to maintain our preference for spread sectors versus Treasuries, remaining mindful of market conditions. For example, in light of the strong rally in risk assets in the final months of the reporting period, we took profits in and reduced exposure to investment-grade and high-yield corporate bonds. We also took profits in credit-sensitive mortgage-backed securities that participated in the rally. We will continue to look for opportunities to tactically add exposure to riskier corporate and securitized securities, as valuations, fundamentals and market conditions dictate. However, from a longer-term, strategic perspective, we plan to reduce spread sector risk, given the potential for spread widening as the credit cycle matures. As always, we favor a bottom-up approach to portfolio management, emphasizing careful security selection.
|
| |
| MARCH 31, 2019 | |
| Portfolio at a Glance | |
| Average Duration (effective) | 1.8 years |
| Weighted Average Life to Maturity | 2.5 years |
| | |
| Types of Investments in Portfolio | % of net assets |
| Corporate Bonds | 33.0% |
| U.S. Treasury Securities | 25.4% |
| Asset-Backed Securities | 14.8% |
| Collateralized Mortgage Obligations | 13.0% |
| Collateralized Loan Obligations | 3.8% |
| Commercial Mortgage-Backed Securities | 2.5% |
| Bank Loan Obligations | 1.6% |
| U.S. Government Agency Mortgage-Backed Securities | 1.0% |
| Sovereign Governments and Agencies | 0.2% |
| Temporary Cash Investments | 4.2% |
| Other Assets and Liabilities | 0.5% |
Fund shareholders may incur two types of costs: (1) transaction costs, including sales charges (loads) on purchase payments and redemption/exchange fees; and (2) ongoing costs, including management fees; distribution and service (12b-1) fees; and other fund expenses. This example is intended to help you understand your ongoing costs (in dollars) of investing in your fund and to compare these costs with the ongoing cost of investing in other mutual funds.
The example is based on an investment of $1,000 made at the beginning of the period and held for the entire period from October 1, 2018 to March 31, 2019.
Actual Expenses
The table provides information about actual account values and actual expenses for each class. You may use the information, together with the amount you invested, to estimate the expenses that you paid over the period. First, identify the share class you own. Then simply divide your account value by $1,000 (for example, an $8,600 account value divided by $1,000 = 8.6), then multiply the result by the number under the heading “Expenses Paid During Period” to estimate the expenses you paid on your account during this period.
If you hold Investor Class shares of any American Century Investments fund, or I Class shares of the American Century Diversified Bond Fund, in an American Century Investments account (i.e., not a financial intermediary or retirement plan account), American Century Investments may charge you a $12.50 semiannual account maintenance fee if the value of those shares is less than $10,000. We will redeem shares automatically in one of your accounts to pay the $12.50 fee. In determining your total eligible investment amount, we will include your investments in all personal accounts (including American Century Investments Brokerage accounts) registered under your Social Security number. Personal accounts include individual accounts, joint accounts, UGMA/UTMA accounts, personal trusts, Coverdell Education Savings Accounts and IRAs (including traditional, Roth, Rollover, SEP-, SARSEP- and SIMPLE-IRAs), and certain other retirement accounts. If you have only business, business retirement, employer-sponsored or American Century Investments Brokerage accounts, you are currently not subject to this fee. If you are subject to the Account Maintenance Fee, your account value could be reduced by the fee amount.
Hypothetical Example for Comparison Purposes
The table also provides information about hypothetical account values and hypothetical expenses based on the actual expense ratio of each class of your fund and an assumed rate of return of 5% per year before expenses, which is not the actual return of a fund’s share class. The hypothetical account values and expenses may not be used to estimate the actual ending account balance or expenses you paid for the period. You may use this information to compare the ongoing costs of investing in your fund and other funds. To do so, compare this 5% hypothetical example with the 5% hypothetical examples that appear in the shareholder reports of the other funds.
Please note that the expenses shown in the table are meant to highlight your ongoing costs only and do not reflect any transactional costs, such as sales charges (loads) or redemption/exchange fees. Therefore, the table is useful in comparing ongoing costs only, and will not help you determine the relative total costs of owning different funds. In addition, if these transactional costs were included, your costs would have been higher.
|
| | | | |
| Beginning
Account Value
10/1/18 | Ending
Account Value
3/31/19 | Expenses Paid
During Period(1)
10/1/18 - 3/31/19 | Annualized
Expense Ratio(1) |
| Actual | | | | |
| Investor Class | $1,000 | $1,019.40 | $2.97 | 0.59% |
| I Class | $1,000 | $1,020.00 | $2.47 | 0.49% |
| A Class | $1,000 | $1,018.20 | $4.23 | 0.84% |
| C Class | $1,000 | $1,013.40 | $7.98 | 1.59% |
| R Class | $1,000 | $1,015.90 | $5.48 | 1.09% |
| R5 Class | $1,000 | $1,020.50 | $1.96 | 0.39% |
| R6 Class | $1,000 | $1,019.70 | $1.71 | 0.34% |
| Hypothetical | | | | |
| Investor Class | $1,000 | $1,021.99 | $2.97 | 0.59% |
| I Class | $1,000 | $1,022.49 | $2.47 | 0.49% |
| A Class | $1,000 | $1,020.74 | $4.23 | 0.84% |
| C Class | $1,000 | $1,017.00 | $8.00 | 1.59% |
| R Class | $1,000 | $1,019.50 | $5.49 | 1.09% |
| R5 Class | $1,000 | $1,022.99 | $1.97 | 0.39% |
| R6 Class | $1,000 | $1,023.24 | $1.72 | 0.34% |
| |
| (1) | Expenses are equal to the class's annualized expense ratio listed in the table above, multiplied by the average account value over the period, multiplied by 182, the number of days in the most recent fiscal half-year, divided by 365, to reflect the one-half year period. Annualized expense ratio reflects actual expenses, including any applicable fee waivers or expense reimbursements and excluding any acquired fund fees and expenses. |
MARCH 31, 2019
|
| | | | | | |
| | Principal Amount | Value |
| CORPORATE BONDS — 33.0% | | |
| Aerospace and Defense — 0.5% | | |
| United Technologies Corp., 1.50%, 11/1/19 | $ | 2,000,000 |
| $ | 1,984,977 |
|
| Air Freight and Logistics — 0.2% | | |
| FedEx Corp., 3.40%, 1/14/22 | 1,000,000 |
| 1,014,104 |
|
| Auto Components — 0.3% | | |
Schaeffler Finance BV, 4.75%, 5/15/23(1) | 800,000 |
| 810,800 |
|
ZF North America Capital, Inc., 4.00%, 4/29/20(1) | 476,000 |
| 476,380 |
|
| | | 1,287,180 |
|
| Automobiles — 1.4% | | |
Daimler Finance North America LLC, 2.30%, 1/6/20(1) | 1,000,000 |
| 995,806 |
|
Daimler Finance North America LLC, 3.40%, 2/22/22(1) | 1,000,000 |
| 1,010,049 |
|
| Ford Motor Credit Co. LLC, 2.68%, 1/9/20 | 1,000,000 |
| 995,926 |
|
| General Motors Financial Co., Inc., 3.20%, 7/6/21 | 1,500,000 |
| 1,494,260 |
|
| General Motors Financial Co., Inc., 4.20%, 11/6/21 | 1,000,000 |
| 1,019,537 |
|
| | | 5,515,578 |
|
| Banks — 6.1% | | |
Banco de Credito del Peru, 2.25%, 10/25/19(1) | 400,000 |
| 399,120 |
|
| Bank of America Corp., MTN, VRN, 2.33%, 10/1/21 | 1,000,000 |
| 991,095 |
|
| Bank of America Corp., VRN, 3.00%, 12/20/23 | 2,713,000 |
| 2,707,165 |
|
Banque Federative du Credit Mutuel SA, 2.00%, 4/12/19(1) | 1,000,000 |
| 999,774 |
|
| Barclays Bank plc, 5.14%, 10/14/20 | 850,000 |
| 873,135 |
|
| Barclays plc, 2.75%, 11/8/19 | 1,000,000 |
| 999,390 |
|
| CIT Group, Inc., 5.00%, 8/15/22 | 500,000 |
| 521,875 |
|
| Citibank N.A., 2.125%, 10/20/20 | 1,000,000 |
| 991,995 |
|
| Citibank N.A., VRN, 3.17%, 2/19/22 | 3,000,000 |
| 3,012,012 |
|
| Discover Bank, 3.10%, 6/4/20 | 1,500,000 |
| 1,503,736 |
|
HSBC Bank plc, 4.125%, 8/12/20(1) | 2,015,000 |
| 2,052,212 |
|
| Huntington National Bank (The), 2.20%, 4/1/19 | 1,000,000 |
| 1,000,000 |
|
| Huntington National Bank (The), 3.125%, 4/1/22 | 1,000,000 |
| 1,008,037 |
|
| JPMorgan Chase & Co., 2.25%, 1/23/20 | 2,000,000 |
| 1,992,950 |
|
| QNB Finansbank AS, MTN, 6.25%, 4/30/19 | 650,000 |
| 650,098 |
|
| Royal Bank of Canada, 2.15%, 10/26/20 | 1,460,000 |
| 1,450,862 |
|
| Synchrony Bank, 3.65%, 5/24/21 | 1,000,000 |
| 1,009,744 |
|
| Wells Fargo & Co., MTN, 3.00%, 1/22/21 | 2,500,000 |
| 2,511,969 |
|
| | | 24,675,169 |
|
| Beverages — 0.6% | | |
| Constellation Brands, Inc., 2.00%, 11/7/19 | 1,800,000 |
| 1,790,412 |
|
| Constellation Brands, Inc., 3.875%, 11/15/19 | 830,000 |
| 834,490 |
|
| | | 2,624,902 |
|
| Biotechnology — 1.1% | | |
| AbbVie, Inc., 2.50%, 5/14/20 | 1,000,000 |
| 997,183 |
|
| Amgen, Inc., 1.90%, 5/10/19 | 2,000,000 |
| 1,998,881 |
|
|
| | | | | | |
| | Principal Amount | Value |
| Celgene Corp., 2.25%, 5/15/19 | $ | 1,000,000 |
| $ | 999,365 |
|
| Gilead Sciences, Inc., 1.85%, 9/20/19 | 440,000 |
| 437,823 |
|
| | | 4,433,252 |
|
| Capital Markets — 1.9% | | |
| Goldman Sachs Group, Inc. (The), 2.30%, 12/13/19 | 3,000,000 |
| 2,990,589 |
|
| Goldman Sachs Group, Inc. (The), MTN, 5.375%, 3/15/20 | 500,000 |
| 511,796 |
|
| Morgan Stanley, MTN, 5.625%, 9/23/19 | 3,000,000 |
| 3,039,163 |
|
| Morgan Stanley, MTN, 5.50%, 7/28/21 | 1,000,000 |
| 1,059,306 |
|
| | | 7,600,854 |
|
| Chemicals — 0.7% | | |
| Ashland LLC, 4.75%, 8/15/22 | 960,000 |
| 991,200 |
|
| Sherwin-Williams Co. (The), 2.25%, 5/15/20 | 2,000,000 |
| 1,988,684 |
|
| | | 2,979,884 |
|
| Commercial Services and Supplies — 0.1% | | |
Nielsen Finance LLC / Nielsen Finance Co., 5.00%, 4/15/22(1) | 500,000 |
| 497,500 |
|
| Consumer Finance — 1.2% | | |
| American Express Co., 3.00%, 2/22/21 | 1,000,000 |
| 1,005,507 |
|
| American Express Credit Corp., MTN, 2.25%, 5/5/21 | 1,500,000 |
| 1,491,050 |
|
| Capital One N.A., 2.35%, 1/31/20 | 1,230,000 |
| 1,224,069 |
|
| Capital One N.A., 2.25%, 9/13/21 | 1,000,000 |
| 984,702 |
|
| | | 4,705,328 |
|
| Containers and Packaging — 0.7% | | |
Ardagh Packaging Finance plc / Ardagh Holdings USA, Inc., 4.625%, 5/15/23(1) | 800,000 |
| 807,000 |
|
| Ball Corp., 4.375%, 12/15/20 | 1,000,000 |
| 1,017,500 |
|
| Reynolds Group Issuer, Inc. / Reynolds Group Issuer LLC / Reynolds Group Issuer Lu, 5.75%, 10/15/20 | 872,197 |
| 874,378 |
|
| | | 2,698,878 |
|
| Diversified Financial Services — 0.5% | | |
| Credit Suisse Group Funding Guernsey Ltd., 3.125%, 12/10/20 | 1,000,000 |
| 1,003,686 |
|
UBS Group Funding Switzerland AG, 2.95%, 9/24/20(1) | 1,000,000 |
| 1,000,156 |
|
| | | 2,003,842 |
|
| Diversified Telecommunication Services — 0.7% | | |
| AT&T, Inc., 2.45%, 6/30/20 | 1,750,000 |
| 1,742,887 |
|
| Deutsche Telekom International Finance BV, 6.00%, 7/8/19 | 1,000,000 |
| 1,008,276 |
|
| | | 2,751,163 |
|
| Electric Utilities — 0.2% | | |
| American Electric Power Co., Inc., 2.15%, 11/13/20 | 1,000,000 |
| 991,128 |
|
| Entertainment — 0.3% | | |
| Viacom, Inc., 4.50%, 3/1/21 | 1,000,000 |
| 1,026,297 |
|
| Equity Real Estate Investment Trusts (REITs) — 0.4% | | |
| GLP Capital LP / GLP Financing II, Inc., 4.375%, 4/15/21 | 1,000,000 |
| 1,016,810 |
|
| VEREIT Operating Partnership LP, 4.125%, 6/1/21 | 500,000 |
| 508,578 |
|
| | | 1,525,388 |
|
| Food and Staples Retailing — 0.3% | | |
Mondelez International Holdings Netherlands BV, 1.625%, 10/28/19(1) | 1,370,000 |
| 1,360,109 |
|
|
| | | | | | |
| | Principal Amount | Value |
| Food Products — 0.7% | | |
| Conagra Brands, Inc., 3.80%, 10/22/21 | $ | 1,000,000 |
| $ | 1,019,020 |
|
| Kraft Heinz Foods Co., 5.375%, 2/10/20 | 1,000,000 |
| 1,020,619 |
|
| Tyson Foods, Inc., 2.65%, 8/15/19 | 1,000,000 |
| 999,225 |
|
| | | 3,038,864 |
|
| Gas Utilities — 0.6% | | |
| Andeavor Logistics LP / Tesoro Logistics Finance Corp., 5.50%, 10/15/19 | 750,000 |
| 757,590 |
|
| Andeavor Logistics LP / Tesoro Logistics Finance Corp., 5.25%, 1/15/25 | 400,000 |
| 415,752 |
|
| Sabine Pass Liquefaction LLC, 5.625%, 2/1/21 | 1,310,000 |
| 1,361,555 |
|
| | | 2,534,897 |
|
| Health Care Equipment and Supplies — 0.7% | | |
| Becton Dickinson and Co., 2.13%, 6/6/19 | 2,000,000 |
| 1,997,511 |
|
| Becton Dickinson and Co., 2.68%, 12/15/19 | 1,000,000 |
| 996,940 |
|
| | | 2,994,451 |
|
| Health Care Providers and Services — 3.2% | | |
| Anthem, Inc., 2.50%, 11/21/20 | 1,000,000 |
| 995,404 |
|
| Cardinal Health, Inc., 1.95%, 6/14/19 | 1,130,000 |
| 1,128,031 |
|
Cigna Corp., 3.20%, 9/17/20(1) | 2,000,000 |
| 2,010,339 |
|
| CVS Health Corp., 3.35%, 3/9/21 | 3,000,000 |
| 3,025,570 |
|
| DaVita, Inc., 5.75%, 8/15/22 | 630,000 |
| 643,387 |
|
| Express Scripts Holding Co., 2.60%, 11/30/20 | 2,000,000 |
| 1,992,440 |
|
Fresenius Medical Care US Finance II, Inc., 4.125%, 10/15/20(1) | 850,000 |
| 857,598 |
|
| HCA, Inc., 4.25%, 10/15/19 | 500,000 |
| 502,631 |
|
| Tenet Healthcare Corp., 4.75%, 6/1/20 | 1,000,000 |
| 1,016,250 |
|
Universal Health Services, Inc., 4.75%, 8/1/22(1) | 1,000,000 |
| 1,011,250 |
|
| | | 13,182,900 |
|
| Hotels, Restaurants and Leisure — 0.4% | | |
1011778 BC ULC / New Red Finance, Inc., 4.625%, 1/15/22(1) | 760,000 |
| 765,479 |
|
| Royal Caribbean Cruises Ltd., 2.65%, 11/28/20 | 1,000,000 |
| 999,325 |
|
| | | 1,764,804 |
|
| Household Durables — 0.9% | | |
| D.R. Horton, Inc., 2.55%, 12/1/20 | 1,000,000 |
| 993,953 |
|
| Lennar Corp., 2.95%, 11/29/20 | 1,500,000 |
| 1,494,375 |
|
| TRI Pointe Group, Inc. / TRI Pointe Homes, Inc., 4.375%, 6/15/19 | 990,000 |
| 993,713 |
|
| | | 3,482,041 |
|
| Insurance — 0.4% | | |
| AerCap Ireland Capital DAC / AerCap Global Aviation Trust, 3.75%, 5/15/19 | 500,000 |
| 500,425 |
|
| AerCap Ireland Capital DAC / AerCap Global Aviation Trust, 4.625%, 10/30/20 | 1,000,000 |
| 1,024,113 |
|
| | | 1,524,538 |
|
| Internet and Direct Marketing Retail — 0.1% | | |
| eBay, Inc., 2.15%, 6/5/20 | 400,000 |
| 397,432 |
|
| IT Services — 0.5% | | |
| DXC Technology Co., 2.875%, 3/27/20 | 2,000,000 |
| 1,999,357 |
|
| Life Sciences Tools and Services — 0.3% | | |
IQVIA, Inc., 4.875%, 5/15/23(1) | 1,000,000 |
| 1,022,600 |
|
|
| | | | | | |
| | Principal Amount | Value |
| Machinery — 0.5% | | |
| Caterpillar Financial Services Corp., MTN, 1.85%, 9/4/20 | $ | 860,000 |
| $ | 850,756 |
|
| Fortive Corp., 1.80%, 6/15/19 | 231,000 |
| 230,047 |
|
| Oshkosh Corp., 5.375%, 3/1/25 | 1,000,000 |
| 1,028,750 |
|
| | | 2,109,553 |
|
| Media — 1.7% | | |
| CCO Holdings LLC / CCO Holdings Capital Corp., 5.125%, 2/15/23 | 1,000,000 |
| 1,020,000 |
|
| Comcast Corp., 3.30%, 10/1/20 | 2,000,000 |
| 2,019,817 |
|
| Discovery Communications LLC, 2.20%, 9/20/19 | 500,000 |
| 498,035 |
|
| Discovery Communications LLC, 2.95%, 3/20/23 | 500,000 |
| 495,779 |
|
| Interpublic Group of Cos., Inc. (The), 3.50%, 10/1/20 | 2,000,000 |
| 2,018,215 |
|
Sirius XM Radio, Inc., 6.00%, 7/15/24(1) | 930,000 |
| 967,200 |
|
| | | 7,019,046 |
|
| Metals and Mining — 0.4% | | |
Alcoa Nederland Holding BV, 6.75%, 9/30/24(1) | 700,000 |
| 743,750 |
|
| Steel Dynamics, Inc., 5.25%, 4/15/23 | 750,000 |
| 765,000 |
|
| | | 1,508,750 |
|
| Multi-Utilities — 0.9% | | |
| CenterPoint Energy, Inc., 3.60%, 11/1/21 | 2,000,000 |
| 2,030,895 |
|
| Sempra Energy, 2.85%, 11/15/20 | 1,500,000 |
| 1,497,727 |
|
| | | 3,528,622 |
|
| Oil, Gas and Consumable Fuels — 1.9% | | |
| Anadarko Petroleum Corp., 4.85%, 3/15/21 | 1,632,000 |
| 1,692,614 |
|
| Antero Resources Corp., 5.375%, 11/1/21 | 930,000 |
| 936,975 |
|
| Continental Resources, Inc., 5.00%, 9/15/22 | 400,000 |
| 403,433 |
|
| Encana Corp., 3.90%, 11/15/21 | 930,000 |
| 947,405 |
|
| Energy Transfer Operating LP, 4.15%, 10/1/20 | 1,179,000 |
| 1,198,504 |
|
| Energy Transfer Operating LP, 7.50%, 10/15/20 | 450,000 |
| 479,279 |
|
| Williams Cos., Inc. (The), 4.125%, 11/15/20 | 1,000,000 |
| 1,016,292 |
|
| Williams Cos., Inc. (The), 7.875%, 9/1/21 | 1,000,000 |
| 1,105,803 |
|
| | | 7,780,305 |
|
| Pharmaceuticals — 0.4% | | |
| Allergan Funding SCS, 3.00%, 3/12/20 | 1,000,000 |
| 999,693 |
|
| Mylan NV, 2.50%, 6/7/19 | 550,000 |
| 549,612 |
|
| | | 1,549,305 |
|
| Semiconductors and Semiconductor Equipment — 0.7% | | |
| Broadcom Corp. / Broadcom Cayman Finance Ltd., 2.20%, 1/15/21 | 2,000,000 |
| 1,969,678 |
|
NXP BV / NXP Funding LLC, 4.125%, 6/15/20(1) | 750,000 |
| 761,332 |
|
| | | 2,731,010 |
|
| Software — 0.7% | | |
| Microsoft Corp., 1.85%, 2/6/20 | 3,000,000 |
| 2,982,626 |
|
| Specialty Retail — 0.1% | | |
| United Rentals North America, Inc., 4.625%, 7/15/23 | 390,000 |
| 397,556 |
|
| Technology Hardware, Storage and Peripherals — 0.7% | | |
Dell International LLC / EMC Corp., 5.875%, 6/15/21(1) | 500,000 |
| 509,576 |
|
| EMC Corp., 2.65%, 6/1/20 | 1,000,000 |
| 992,739 |
|
Hewlett Packard Enterprise Co., 2.10%, 10/4/19(1) | 670,000 |
| 667,243 |
|
|
| | | | | | |
| | Principal Amount | Value |
| Seagate HDD Cayman, 4.25%, 3/1/22 | $ | 500,000 |
| $ | 501,728 |
|
| | | 2,671,286 |
|
TOTAL CORPORATE BONDS
(Cost $134,071,164) | | 133,895,476 |
|
| U.S. TREASURY SECURITIES — 25.4% | | |
U.S. Treasury Bills, 2.56%, 1/30/20(4) | 1,000,000 |
| 980,350 |
|
U.S. Treasury Bills, 2.54%, 2/27/20(4) | 10,000,000 |
| 9,785,845 |
|
U.S. Treasury Notes, 1.375%, 10/31/20(2) | 800,000 |
| 788,141 |
|
| U.S. Treasury Notes, 2.625%, 5/15/21 | 9,500,000 |
| 9,569,766 |
|
| U.S. Treasury Notes, 2.75%, 9/15/21 | 22,000,000 |
| 22,266,836 |
|
| U.S. Treasury Notes, 2.625%, 12/15/21 | 20,000,000 |
| 20,209,765 |
|
| U.S. Treasury Notes, 1.875%, 1/31/22 | 24,000,000 |
| 23,768,437 |
|
| U.S. Treasury Notes, 2.375%, 3/15/22 | 7,900,000 |
| 7,937,803 |
|
| U.S. Treasury Notes, 1.875%, 4/30/22 | 4,500,000 |
| 4,453,682 |
|
| U.S. Treasury Notes, 2.00%, 11/30/22 | 3,000,000 |
| 2,977,031 |
|
TOTAL U.S. TREASURY SECURITIES
(Cost $101,770,028) | | 102,737,656 |
|
| ASSET-BACKED SECURITIES — 14.8% | | |
Argent Securities, Inc., Series 2004-W8, Class M1, VRN, 3.31%, (1-month LIBOR plus 0.83%), 5/25/34 | 2,338,980 |
| 2,336,667 |
|
Avis Budget Rental Car Funding AESOP LLC, Series 2014-1A, Class A SEQ, 2.46%, 7/20/20(1) | 1,666,667 |
| 1,665,370 |
|
Avis Budget Rental Car Funding AESOP LLC, Series 2015-1A, Class A SEQ, 2.50%, 7/20/21(1) | 4,420,000 |
| 4,400,385 |
|
Avis Budget Rental Car Funding AESOP LLC, Series 2015-2A, Class B, 3.42%, 12/20/21(1) | 675,000 |
| 674,326 |
|
BRE Grand Islander Timeshare Issuer LLC, Series 2017-1A, Class B, 3.24%, 5/25/29(1) | 317,804 |
| 313,729 |
|
Colony Starwood Homes, Series 2016-2A, Class A, VRN, 3.73%, (1-month LIBOR plus 1.25%), 12/17/33(1) | 994,605 |
| 995,511 |
|
Enterprise Fleet Financing LLC, Series 2016-2, Class A2 SEQ, 1.74%, 2/22/22(1) | 336,035 |
| 335,270 |
|
Goodgreen, Series 2018-1A, Class A, VRN, 3.93%, 10/15/53(1) | 809,807 |
| 828,536 |
|
Hertz Vehicle Financing II LP, Series 2015-1A, Class A SEQ, 2.73%, 3/25/21(1) | 2,550,000 |
| 2,542,705 |
|
Hertz Vehicle Financing II LP, Series 2016-3A, Class A SEQ, 2.27%, 7/25/20(1) | 1,729,000 |
| 1,725,521 |
|
Hilton Grand Vacations Trust, Series 2013-A, Class A SEQ, 2.28%, 1/25/26(1) | 290,634 |
| 289,905 |
|
Hilton Grand Vacations Trust, Series 2014-AA, Class A SEQ, 1.77%, 11/25/26(1) | 240,897 |
| 238,503 |
|
Hilton Grand Vacations Trust, Series 2014-AA, Class B, 2.07%, 11/25/26(1) | 170,045 |
| 167,824 |
|
Hilton Grand Vacations Trust, Series 2017-AA, Class A SEQ, 2.66%, 12/26/28(1) | 353,708 |
| 351,187 |
|
Hilton Grand Vacations Trust, Series 2018-AA, Class B, 3.70%, 2/25/32(1) | 2,036,673 |
| 2,069,978 |
|
Invitation Homes Trust, Series 2017-SFR2, Class B, VRN, 3.63%, (1-month LIBOR plus 1.15%), 12/17/36(1) | 1,300,000 |
| 1,301,138 |
|
Invitation Homes Trust, Series 2018-SFR1, Class B, VRN, 3.43%, (1-month LIBOR plus 0.95%), 3/17/37(1) | 2,575,000 |
| 2,546,039 |
|
Invitation Homes Trust, Series 2018-SFR1, Class C, VRN, 3.73%, (1-month LIBOR plus 1.25%), 3/17/37(1) | 2,000,000 |
| 1,997,856 |
|
Invitation Homes Trust, Series 2018-SFR2, Class C, VRN, 3.76%, (1-month LIBOR plus 1.28%), 6/17/37(1) | 1,450,000 |
| 1,442,778 |
|
|
| | | | | | |
| | Principal Amount | Value |
Invitation Homes Trust, Series 2018-SFR3, Class B, VRN, 3.63%, (1-month LIBOR plus 1.15%), 7/17/37(1) | $ | 1,450,000 |
| $ | 1,453,451 |
|
Invitation Homes Trust, Series 2018-SFR4, Class B, VRN, 3.73%, (1-month LIBOR plus 1.25%), 1/17/38(1) | 2,475,000 |
| 2,482,999 |
|
Marriott Vacation Club Owner Trust, Series 2012-1A, Class A SEQ, 2.51%, 5/20/30(1) | 238,321 |
| 237,336 |
|
Mill City Mortgage Loan Trust, Series 2017-2, Class A1, VRN, 2.75%, 7/25/59(1) | 1,164,500 |
| 1,153,572 |
|
MVW Owner Trust, Series 2013-1A, Class A SEQ, 2.15%, 4/22/30(1) | 357,003 |
| 354,320 |
|
MVW Owner Trust, Series 2014-1A, Class B, 2.70%, 9/22/31(1) | 711,132 |
| 697,924 |
|
MVW Owner Trust, Series 2015-1A, Class A SEQ, 2.52%, 12/20/32(1) | 384,585 |
| 380,738 |
|
MVW Owner Trust, Series 2016-1A, Class A SEQ, 2.25%, 12/20/33(1) | 295,257 |
| 290,265 |
|
MVW Owner Trust, Series 2017-1A, Class B, 2.75%, 12/20/34(1) | 1,477,659 |
| 1,455,298 |
|
MVW Owner Trust, Series 2018-1A, Class B, 3.60%, 1/21/36(1) | 1,773,360 |
| 1,798,986 |
|
Progress Residential Trust, Series 2016-SFR2, Class A SEQ, VRN, 3.88%, (1-month LIBOR plus 1.40%), 1/17/34(1) | 599,409 |
| 601,292 |
|
Progress Residential Trust, Series 2017-SFR1, Class A SEQ, 2.77%, 8/17/34(1) | 1,071,558 |
| 1,063,362 |
|
Progress Residential Trust, Series 2017-SFR2, Class A SEQ, 2.90%, 12/17/34(1) | 2,375,000 |
| 2,357,717 |
|
Progress Residential Trust, Series 2018-SFR1, Class C, 3.68%, 3/17/35(1) | 1,250,000 |
| 1,259,016 |
|
Progress Residential Trust, Series 2018-SFR2, Class C, 4.04%, 8/17/35(1) | 1,775,000 |
| 1,798,260 |
|
Progress Residential Trust, Series 2018-SFR2, Class D, 4.34%, 8/17/35(1) | 1,075,000 |
| 1,086,897 |
|
Progress Residential Trust, Series 2018-SFR3, Class B, 4.08%, 10/17/35(1) | 2,700,000 |
| 2,751,163 |
|
Progress Residential Trust, Series 2018-SFR3, Class C, 4.18%, 10/17/35(1) | 1,775,000 |
| 1,806,340 |
|
Sierra Timeshare Conduit Receivables Funding LLC, Series 2017-1A, Class A SEQ, 2.91%, 3/20/34(1) | 319,361 |
| 317,101 |
|
Sierra Timeshare Receivables Funding LLC, Series 2015-1A, Class A SEQ, 2.40%, 3/22/32(1) | 344,506 |
| 343,057 |
|
Sierra Timeshare Receivables Funding LLC, Series 2015-3A, Class A SEQ, 2.58%, 9/20/32(1) | 337,829 |
| 336,428 |
|
Sierra Timeshare Receivables Funding LLC, Series 2016-1A, Class A SEQ, 3.08%, 3/21/33(1) | 281,063 |
| 280,677 |
|
Sierra Timeshare Receivables Funding LLC, Series 2016-2A, Class A SEQ, 2.33%, 7/20/33(1) | 257,478 |
| 254,012 |
|
Sierra Timeshare Receivables Funding LLC, Series 2018-2A, Class B, 3.65%, 6/20/35(1) | 2,131,723 |
| 2,152,774 |
|
Sierra Timeshare Receivables Funding LLC, Series 2018-3A, Class B, 3.87%, 9/20/35(1) | 627,978 |
| 638,215 |
|
Sierra Timeshare Receivables Funding LLC, Series 2018-3A, Class C, 4.17%, 9/20/35(1) | 1,746,563 |
| 1,783,117 |
|
Towd Point Mortgage Trust, Series 2017-6, Class A1, VRN, 2.75%, 10/25/57(1) | 1,406,221 |
| 1,381,634 |
|
Towd Point Mortgage Trust, Series 2018-4, Class A1, VRN, 3.00%, 6/25/58(1) | 471,647 |
| 467,789 |
|
VSE VOI Mortgage LLC, Series 2016-A, Class A SEQ, 2.54%, 7/20/33(1) | 1,232,784 |
| 1,219,703 |
|
VSE VOI Mortgage LLC, Series 2017-A, Class B, 2.63%, 3/20/35(1) | 807,763 |
| 794,940 |
|
VSE VOI Mortgage LLC, Series 2018-A, Class B, 3.72%, 2/20/36(1) | 835,269 |
| 847,444 |
|
TOTAL ASSET-BACKED SECURITIES
(Cost $59,906,847) | | 60,069,055 |
|
|
| | | | | | |
| | Principal Amount | Value |
| COLLATERALIZED MORTGAGE OBLIGATIONS — 13.0% | | |
| Private Sponsor Collateralized Mortgage Obligations — 7.4% | | |
| Bear Stearns Adjustable Rate Mortgage Trust, Series 2004-12, Class 2A1, VRN, 4.34%, 2/25/35 | $ | 269,733 |
| $ | 273,161 |
|
| Bear Stearns Adjustable Rate Mortgage Trust, Series 2006-1, Class A1, VRN, 4.91%, (1-year H15T1Y plus 2.25%), 2/25/36 | 546,830 |
| 552,948 |
|
| Citicorp Mortgage Securities Trust, Series 2007-8, Class 1A3, 6.00%, 9/25/37 | 441,975 |
| 465,083 |
|
| Citigroup Mortgage Loan Trust, Inc., Series 2004-UST1, Class A4, VRN, 4.45%, 8/25/34 | 252,247 |
| 246,758 |
|
| Citigroup Mortgage Loan Trust, Inc., Series 2004-UST1, Class A5, VRN, 4.43%, 8/25/34 | 819,786 |
| 817,160 |
|
| Citigroup Mortgage Loan Trust, Inc., Series 2005-4, Class A, VRN, 4.48%, 8/25/35 | 241,232 |
| 244,871 |
|
| Citigroup Mortgage Loan Trust, Inc., Series 2005-6, Class A2, VRN, 4.24%, (1-year H15T1Y plus 2.15%), 9/25/35 | 300,785 |
| 305,896 |
|
| Countrywide Home Loan Mortgage Pass-Through Trust, Series 2004-4, Class A19, 5.25%, 5/25/34 | 125,726 |
| 128,117 |
|
| Countrywide Home Loan Mortgage Pass-Through Trust, Series 2004-5, Class 2A4, 5.50%, 5/25/34 | 99,829 |
| 101,132 |
|
| Countrywide Home Loan Mortgage Pass-Through Trust, Series 2005-17, Class 1A11, 5.50%, 9/25/35 | 3,046 |
| 2,968 |
|
Credit Suisse Mortgage Trust, Series 2017-HL1, Class A3 SEQ, VRN, 3.50%, 6/25/47(1) | 396,203 |
| 397,702 |
|
| First Horizon Mortgage Pass-Through Trust, Series 2005-AR3, Class 4A1, VRN, 4.39%, 8/25/35 | 226,268 |
| 228,223 |
|
| First Horizon Mortgage Pass-Through Trust, Series 2006-AR4, Class 1A2, VRN, 4.68%, 1/25/37 | 987,551 |
| 884,421 |
|
| GSR Mortgage Loan Trust, Series 2004-AR5, Class 3A3, VRN, 4.44%, 5/25/34 | 106,217 |
| 108,891 |
|
| GSR Mortgage Loan Trust, Series 2005-AR1, Class 3A1, VRN, 4.02%, 1/25/35 | 97,432 |
| 96,591 |
|
| GSR Mortgage Loan Trust, Series 2005-AR6, Class 2A1, VRN, 4.52%, 9/25/35 | 566,413 |
| 579,279 |
|
| JPMorgan Mortgage Trust, Series 2005-A6, Class 7A1, VRN, 4.32%, 8/25/35 | 289,718 |
| 281,263 |
|
JPMorgan Mortgage Trust, Series 2014-5, Class A1, VRN, 2.98%, 10/25/29(1) | 419,861 |
| 419,796 |
|
JPMorgan Mortgage Trust, Series 2018-6, Class 1A4 SEQ, VRN, 3.50%, 12/25/48(1) | 758,987 |
| 763,119 |
|
| MASTR Adjustable Rate Mortgages Trust, Series 2004-13, Class 3A7, VRN, 4.47%, 11/21/34 | 353,098 |
| 364,460 |
|
| Merrill Lynch Mortgage Investors Trust, Series 2005-A2, Class A1, VRN, 4.45%, 2/25/35 | 312,393 |
| 317,381 |
|
New Residential Mortgage Loan Trust, Series 2017-2A, Class A3, VRN, 4.00%, 3/25/57(1) | 1,781,739 |
| 1,828,516 |
|
New Residential Mortgage Loan Trust, Series 2017-5A, Class A1, VRN, 3.99%, (1-month LIBOR plus 1.50%), 6/25/57(1) | 1,842,433 |
| 1,876,031 |
|
Sequoia Mortgage Trust, Series 2017-7, Class A4 SEQ, VRN, 3.50%, 10/25/47(1) | 646,153 |
| 648,198 |
|
Sequoia Mortgage Trust, Series 2017-CH1, Class A1, VRN, 4.00%, 8/25/47(1) | 1,112,706 |
| 1,134,004 |
|
Sequoia Mortgage Trust, Series 2017-CH2, Class A10 SEQ, VRN, 4.00%, 12/25/47(1) | 1,563,926 |
| 1,582,434 |
|
Sequoia Mortgage Trust, Series 2018-2, Class A4 SEQ, VRN, 3.50%, 2/25/48(1) | 905,165 |
| 909,255 |
|
|
| | | | | | |
| | Principal Amount | Value |
Sequoia Mortgage Trust, Series 2018-CH2, Class A12 SEQ, VRN, 4.00%, 6/25/48(1) | $ | 602,582 |
| $ | 611,981 |
|
| Structured Adjustable Rate Mortgage Loan Trust, Series 2004-8, Class 2A1, VRN, 4.47%, 7/25/34 | 112,670 |
| 113,545 |
|
| Thornburg Mortgage Securities Trust, Series 2006-4, Class A2B, VRN, 4.72%, 7/25/36 | 661,667 |
| 641,298 |
|
| WaMu Mortgage Pass-Through Certificates, Series 2005-AR3, Class A1, VRN, 4.47%, 3/25/35 | 290,998 |
| 287,314 |
|
| WaMu Mortgage Pass-Through Certificates, Series 2005-AR7, Class A3, VRN, 4.10%, 8/25/35 | 472,962 |
| 478,683 |
|
| Wells Fargo Mortgage-Backed Securities Trust, Series 2004-A, Class A1, VRN, 5.01%, 2/25/34 | 536,056 |
| 558,535 |
|
| Wells Fargo Mortgage-Backed Securities Trust, Series 2004-H, Class A1, VRN, 4.44%, 6/25/34 | 240,868 |
| 247,209 |
|
| Wells Fargo Mortgage-Backed Securities Trust, Series 2004-S, Class A1, VRN, 4.62%, 9/25/34 | 158,268 |
| 163,010 |
|
| Wells Fargo Mortgage-Backed Securities Trust, Series 2004-Z, Class 2A2, VRN, 4.98%, 12/25/34 | 203,042 |
| 207,697 |
|
| Wells Fargo Mortgage-Backed Securities Trust, Series 2005-17, Class 2A1, 5.50%, 1/25/36 | 530,949 |
| 536,660 |
|
| Wells Fargo Mortgage-Backed Securities Trust, Series 2005-18, Class 1A1, 5.50%, 1/25/36 | 511,127 |
| 509,270 |
|
| Wells Fargo Mortgage-Backed Securities Trust, Series 2005-AR10, Class 1A1, VRN, 4.73%, 6/25/35 | 200,381 |
| 212,293 |
|
| Wells Fargo Mortgage-Backed Securities Trust, Series 2005-AR10, Class 2A15, VRN, 4.80%, 6/25/35 | 229,400 |
| 238,223 |
|
| Wells Fargo Mortgage-Backed Securities Trust, Series 2005-AR13, Class A1, SEQ, VRN, 2.79%, (1-month LIBOR plus 0.30%), 5/25/35 | 343,234 |
| 328,658 |
|
| Wells Fargo Mortgage-Backed Securities Trust, Series 2005-AR16, Class 3A2, VRN, 4.97%, 3/25/35 | 275,279 |
| 281,225 |
|
| Wells Fargo Mortgage-Backed Securities Trust, Series 2005-AR16, Class 4A8, VRN, 4.54%, 10/25/35 | 1,260,000 |
| 1,283,542 |
|
| Wells Fargo Mortgage-Backed Securities Trust, Series 2005-AR4, Class 2A1, VRN, 5.09%, 4/25/35 | 221,464 |
| 224,800 |
|
| Wells Fargo Mortgage-Backed Securities Trust, Series 2006-10, Class A4 SEQ, 6.00%, 8/25/36 | 77,204 |
| 76,841 |
|
| Wells Fargo Mortgage-Backed Securities Trust, Series 2006-4, Class 2A1, 6.00%, 4/25/36 | 688,647 |
| 679,734 |
|
| Wells Fargo Mortgage-Backed Securities Trust, Series 2006-6, Class 1A16 SEQ, 5.75%, 5/25/36 | 483,223 |
| 471,145 |
|
| Wells Fargo Mortgage-Backed Securities Trust, Series 2006-8, Class A10 SEQ, 6.00%, 7/25/36 | 199,880 |
| 200,250 |
|
| Wells Fargo Mortgage-Backed Securities Trust, Series 2006-8, Class A9 SEQ, 6.00%, 7/25/36 | 186,554 |
| 186,900 |
|
| Wells Fargo Mortgage-Backed Securities Trust, Series 2006-AR1, Class 2A5 SEQ, VRN, 5.10%, 3/25/36 | 746,997 |
| 738,757 |
|
| Wells Fargo Mortgage-Backed Securities Trust, Series 2006-AR10, Class 1A1, VRN, 4.70%, 7/25/36 | 142,692 |
| 143,690 |
|
| Wells Fargo Mortgage-Backed Securities Trust, Series 2006-AR10, Class 2A1, VRN, 4.66%, 7/25/36 | 297,463 |
| 301,278 |
|
| Wells Fargo Mortgage-Backed Securities Trust, Series 2006-AR10, Class 5A6 SEQ, VRN, 4.54%, 7/25/36 | 375,429 |
| 377,306 |
|
| Wells Fargo Mortgage-Backed Securities Trust, Series 2006-AR12, Class 1A1, VRN, 4.71%, 9/25/36 | 130,060 |
| 131,318 |
|
| Wells Fargo Mortgage-Backed Securities Trust, Series 2006-AR14, Class 2A1, VRN, 4.75%, 10/25/36 | 73,674 |
| 73,043 |
|
| Wells Fargo Mortgage-Backed Securities Trust, Series 2006-AR15, Class A1, VRN, 4.73%, 10/25/36 | 61,305 |
| 60,705 |
|
|
| | | | | | |
| | Principal Amount | Value |
| Wells Fargo Mortgage-Backed Securities Trust, Series 2006-AR16, Class A1, VRN, 4.70%, 10/25/36 | $ | 396,201 |
| $ | 392,083 |
|
| Wells Fargo Mortgage-Backed Securities Trust, Series 2006-AR19, Class A1, VRN, 4.86%, 12/25/36 | 655,366 |
| 644,843 |
|
| Wells Fargo Mortgage-Backed Securities Trust, Series 2006-AR2, Class 2A3, VRN, 4.95%, 3/25/36 | 225,086 |
| 229,133 |
|
| Wells Fargo Mortgage-Backed Securities Trust, Series 2006-AR5, Class 2A1, VRN, 5.08%, 4/25/36 | 485,279 |
| 483,615 |
|
| Wells Fargo Mortgage-Backed Securities Trust, Series 2007-11, Class A3 SEQ, 6.00%, 8/25/37 | 143,311 |
| 143,098 |
|
| Wells Fargo Mortgage-Backed Securities Trust, Series 2007-11, Class A36, 6.00%, 8/25/37 | 594,451 |
| 593,566 |
|
| Wells Fargo Mortgage-Backed Securities Trust, Series 2007-12, Class A7, 5.50%, 9/25/37 | 86,290 |
| 86,963 |
|
| Wells Fargo Mortgage-Backed Securities Trust, Series 2007-13, Class A1, 6.00%, 9/25/37 | 242,820 |
| 242,088 |
|
| Wells Fargo Mortgage-Backed Securities Trust, Series 2007-14, Class 2A2, 5.50%, 10/25/22 | 18,372 |
| 18,680 |
|
| Wells Fargo Mortgage-Backed Securities Trust, Series 2007-15, Class A1, 6.00%, 11/25/37 | 107,453 |
| 107,457 |
|
| Wells Fargo Mortgage-Backed Securities Trust, Series 2007-16, Class 1A1, 6.00%, 12/28/37 | 80,946 |
| 80,518 |
|
| Wells Fargo Mortgage-Backed Securities Trust, Series 2007-8, Class 1A5 SEQ, 6.00%, 7/25/37 | 539,049 |
| 535,983 |
|
| Wells Fargo Mortgage-Backed Securities Trust, Series 2007-8, Class 2A2, 6.00%, 7/25/37 | 509,104 |
| 505,270 |
|
| Wells Fargo Mortgage-Backed Securities Trust, Series 2008-1, Class 4A1, 5.75%, 2/25/38 | 42,798 |
| 45,090 |
|
| | | 30,030,955 |
|
| U.S. Government Agency Collateralized Mortgage Obligations — 5.6% | |
| FHLMC, Series 2015-HQ2, Class M3, VRN, 5.74%, (1-month LIBOR plus 3.25%), 5/25/25 | 550,000 |
| 596,432 |
|
| FHLMC, Series 2017-DNA2, Class M1, VRN, 3.69%, (1-month LIBOR plus 1.20%), 10/25/29 | 2,892,764 |
| 2,909,397 |
|
| FNMA, Series 2006-60, Class KF, VRN, 2.79%, (1-month LIBOR plus 0.30%), 7/25/36 | 689,393 |
| 688,188 |
|
| FNMA, Series 2009-33, Class FB, VRN, 3.31%, (1-month LIBOR plus 0.82%), 3/25/37 | 789,731 |
| 808,081 |
|
| FNMA, Series 2014-C02, Class 1M2, VRN, 5.09%, (1-month LIBOR plus 2.60%), 5/25/24 | 507,000 |
| 531,958 |
|
| FNMA, Series 2014-C02, Class 2M2, VRN, 5.09%, (1-month LIBOR plus 2.60%), 5/25/24 | 1,583,980 |
| 1,645,351 |
|
| FNMA, Series 2016-55, Class PI, IO, 4.00%, 8/25/46 | 22,830,119 |
| 4,028,354 |
|
| FNMA, Series 2016-C03, Class 2M2, VRN, 8.39%, (1-month LIBOR plus 5.90%), 10/25/28 | 473,222 |
| 535,778 |
|
| FNMA, Series 2017-7, Class AI, IO, 6.00%, 2/25/47 | 15,633,547 |
| 3,657,909 |
|
| FNMA, Series 2017-C03, Class 1M2, VRN, 5.49%, (1-month LIBOR plus 3.00%), 10/25/29 | 1,200,000 |
| 1,267,667 |
|
| FNMA, Series 2017-C05, Class 1M2, VRN, 4.69%, (1-month LIBOR plus 2.20%), 1/25/30 | 750,000 |
| 759,871 |
|
| FNMA, Series 2018-C02, Class 2M1, VRN, 3.14%, (1-month LIBOR plus 0.65%), 8/25/30 | 1,664,931 |
| 1,664,563 |
|
| FNMA, Series 417, Class C5, IO, 3.50%, 2/25/43 | 19,402,089 |
| 3,540,267 |
|
| | | 22,633,816 |
|
TOTAL COLLATERALIZED MORTGAGE OBLIGATIONS
(Cost $52,485,660) | | 52,664,771 |
|
|
| | | | | | |
| | Principal Amount | Value |
| COLLATERALIZED LOAN OBLIGATIONS — 3.8% | | |
Ares XXXIIR CLO Ltd., Series 2014-32RA, Class A2A, VRN, 4.23%, (3-month LIBOR plus 1.55%), 5/15/30(1) | $ | 725,000 |
| $ | 715,951 |
|
Bean Creek CLO Ltd., Series 2015-1A, Class BR, VRN, 4.21%, (3-month LIBOR plus 1.45%), 4/20/31(1) | 600,000 |
| 587,386 |
|
Carlyle Global Market Strategies CLO Ltd., Series 2014-2RA, Class A3, VRN, 4.18%, (3-month LIBOR plus 1.50%), 5/15/31(1) | 725,000 |
| 712,709 |
|
CBAM Ltd., Series 2018-5A, Class A, VRN, 3.79%, (3-month LIBOR plus 1.02%), 4/17/31(1) | 575,000 |
| 565,546 |
|
CBAM Ltd., Series 2018-5A, Class B1, VRN, 4.17%, (3-month LIBOR plus 1.40%), 4/17/31(1) | 1,200,000 |
| 1,161,626 |
|
CIFC Funding Ltd., Series 2013-3RA, Class A2, VRN, 4.18%, (3-month LIBOR plus 1.40%), 4/24/31(1) | 575,000 |
| 563,446 |
|
Dryden 64 CLO Ltd., Series 2018-64A, Class B, VRN, 4.18%, (3-month LIBOR plus 1.40%), 4/18/31(1) | 1,500,000 |
| 1,466,284 |
|
Goldentree Loan Opportunities X Ltd., Series 2015-10A, Class AR, VRN, 3.88%, (3-month LIBOR plus 1.12%), 7/20/31(1) | 300,000 |
| 297,572 |
|
KKR CLO Ltd., Series 22A, Class A, VRN, 3.91%, (3-month LIBOR plus 1.15%), 7/20/31(1) | 400,000 |
| 397,025 |
|
KKR CLO Ltd., Series 22A, Class B, VRN, 4.36%, (3-month LIBOR plus 1.60%), 7/20/31(1) | 750,000 |
| 736,755 |
|
LCM XIV LP, Series 14A, Class AR, VRN, 3.82%, (3-month LIBOR plus 1.04%), 7/20/31(1) | 375,000 |
| 370,472 |
|
LCM XIV LP, Series 2014A, Class BR, VRN, 4.34%, (3-month LIBOR plus 1.58%), 7/20/31(1) | 1,250,000 |
| 1,237,499 |
|
LoanCore Issuer Ltd., Series 2018-CRE1, Class AS, VRN, 3.98%, (1-month LIBOR plus 1.50%), 5/15/28(1) | 500,000 |
| 500,624 |
|
Madison Park Funding XIII Ltd., Series 2014-13A, Class AR2, VRN, 3.71%, (3-month LIBOR plus 0.95%), 4/19/30(1) | 650,000 |
| 645,158 |
|
Madison Park Funding XIII Ltd., Series 2014-13A, Class BR2, VRN, 4.26%, (3-month LIBOR plus 1.50%), 4/19/30(1) | 750,000 |
| 742,809 |
|
Magnetite VIII Ltd., Series 2014-8A, Class AR2, VRN, 3.77%, (3-month LIBOR plus 0.98%), 4/15/31(1) | 1,000,000 |
| 988,739 |
|
Symphony CLO XIX Ltd., Series 2018-19A, Class A, VRN, 3.74%, (3-month LIBOR plus 0.96%), 4/16/31(1) | 1,500,000 |
| 1,475,883 |
|
Treman Park CLO Ltd., Series 2015-1A, Class ARR, VRN, 3.83%, (3-month LIBOR plus 1.07%), 10/20/28(1) | 500,000 |
| 499,321 |
|
Voya CLO Ltd., Series 2013-2A, Class A2AR, VRN, 4.17%, (3-month LIBOR plus 1.40%), 4/25/31(1) | 1,000,000 |
| 979,752 |
|
Voya CLO Ltd., Series 2013-3A, Class A2RR, VRN, 4.48%, (3-month LIBOR plus 1.70%), 10/18/31(1) | 750,000 |
| 747,725 |
|
TOTAL COLLATERALIZED LOAN OBLIGATIONS
(Cost $15,608,577) | | 15,392,282 |
|
| COMMERCIAL MORTGAGE-BACKED SECURITIES — 2.5% | | |
Commercial Mortgage Trust, Series 2017-PANW, Class A SEQ, 3.24%, 10/10/29(1) | 1,000,000 |
| 1,009,593 |
|
Core Industrial Trust, Series 2015-CALW, Class B, 3.25%, 2/10/34(1) | 1,925,000 |
| 1,936,308 |
|
Core Industrial Trust, Series 2015-TEXW, Class B, 3.33%, 2/10/34(1) | 1,000,000 |
| 1,007,965 |
|
DBCG Mortgage Trust, Series 2017-BBG, Class A, VRN, 3.18%, (1-month LIBOR plus 0.70%), 6/15/34(1) | 1,880,000 |
| 1,874,304 |
|
Irvine Core Office Trust, Series 2013-IRV, Class A2 SEQ, VRN, 3.17%, 5/15/48(1) | 2,000,000 |
| 2,036,082 |
|
Morgan Stanley Capital I Trust, Series 2014-CPT, Class AM, VRN, 3.40%, 7/13/29(1) | 1,400,000 |
| 1,412,577 |
|
|
| | | | | | |
| | Principal Amount | Value |
Morgan Stanley Capital I Trust, Series 2014-CPT, Class C, VRN, 3.45%, 7/13/29(1) | $ | 1,000,000 |
| $ | 1,005,781 |
|
TOTAL COMMERCIAL MORTGAGE-BACKED SECURITIES
(Cost $10,383,184) | | 10,282,610 |
|
BANK LOAN OBLIGATIONS(3) — 1.6% | | |
| Diversified Telecommunication Services — 0.3% | | |
| Level 3 Financing Inc., 2017 Term Loan B, 4.74%, (3-month LIBOR plus 2.25%), 2/22/24 | 400,000 |
| 395,874 |
|
| Zayo Group, LLC, 2017 Incremental Term Loan, 4.75%, (1-month LIBOR plus 2.25%), 1/19/24 | 750,000 |
| 746,925 |
|
| | | 1,142,799 |
|
| Health Care Providers and Services — 0.4% | | |
| DaVita, Inc., Term Loan B, 5.25%, (1-month LIBOR plus 2.75%), 6/24/21 | 994,778 |
| 995,559 |
|
| HCA Inc., 2018 Term Loan B10, 4.50%, (1-month LIBOR plus 2.00%), 3/13/25 | 740,500 |
| 740,563 |
|
| | | 1,736,122 |
|
| Hotels, Restaurants and Leisure — 0.6% | | |
| 1011778 B.C. Unlimited Liability Company, Term Loan B3, 4.75%, (1-month LIBOR plus 2.25%), 2/16/24 | 466,074 |
| 459,470 |
|
| 1011778 B.C. Unlimited Liability Company, Term Loan B3, 4.75%, (1-month LIBOR plus 2.25%), 2/16/24 | 578,151 |
| 569,959 |
|
| Caesars Resort Collection, LLC, 2017 1st Lien Term Loan B, 5.25%, (1-month LIBOR plus 2.75%), 12/22/24 | 7,870 |
| 7,778 |
|
| Hilton Worldwide Finance, LLC, Term Loan B2, 4.24%, (1-month LIBOR plus 1.75%), 10/25/23 | 682,262 |
| 681,464 |
|
| MGM Growth Properties Operating Partnership LP, 2016 Term Loan B, 4.50%, (1-month LIBOR plus 2.00%), 3/21/25 | 692,857 |
| 684,508 |
|
| | | 2,403,179 |
|
IT Services† | | |
| First Data Corporation, 2024 USD Term Loan, 4.49%, (1-month LIBOR plus 2.00%), 4/26/24 | 180,000 |
| 179,682 |
|
| Pharmaceuticals — 0.2% | | |
Catalent Pharma Solutions Inc., USD Term Loan B, 4.75%, (1-month LIBOR plus 2.25%), 5/20/24 | 533,447 |
| 531,866 |
|
| Valeant Pharmaceuticals International, Inc., 2018 Term Loan B, 5.48%, (1-month LIBOR plus 3.00%), 6/2/25 | 327,848 |
| 326,122 |
|
| | | 857,988 |
|
| Technology Hardware, Storage and Peripherals — 0.1% | | |
| Western Digital Corporation, 2018 Term Loan B4, 4.25%, (1-month LIBOR plus 1.75%), 4/29/23 | 317,374 |
| 309,571 |
|
TOTAL BANK LOAN OBLIGATIONS
(Cost $6,695,015) | | 6,629,341 |
|
| U.S. GOVERNMENT AGENCY MORTGAGE-BACKED SECURITIES — 1.0% | |
| Adjustable-Rate U.S. Government Agency Mortgage-Backed Securities — 1.0% | |
| FHLMC, VRN, 4.62%, (1-year H15T1Y plus 2.25%), 9/1/35 | 339,309 |
| 357,359 |
|
| FHLMC, VRN, 4.51%, (12-month LIBOR plus 1.87%), 7/1/36 | 40,612 |
| 42,611 |
|
| FHLMC, VRN, 4.63%, (12-month LIBOR plus 1.88%), 7/1/40 | 188,802 |
| 197,775 |
|
| FHLMC, VRN, 4.14%, (12-month LIBOR plus 1.78%), 9/1/40 | 100,986 |
| 104,628 |
|
| FHLMC, VRN, 3.81%, (12-month LIBOR plus 1.78%), 2/1/41 | 326,051 |
| 335,439 |
|
| FHLMC, VRN, 4.23%, (12-month LIBOR plus 1.88%), 5/1/41 | 91,035 |
| 95,090 |
|
| FHLMC, VRN, 4.08%, (12-month LIBOR plus 1.87%), 7/1/41 | 179,782 |
| 186,583 |
|
| FHLMC, VRN, 4.76%, (12-month LIBOR plus 1.88%), 10/1/41 | 167,809 |
| 174,483 |
|
|
| | | | | | |
| | Principal Amount/Shares | Value |
| FHLMC, VRN, 2.07%, (12-month LIBOR plus 1.65%), 12/1/42 | $ | 486,196 |
| $ | 497,470 |
|
| FHLMC, VRN, 2.32%, (12-month LIBOR plus 1.65%), 2/1/43 | 385,203 |
| 384,321 |
|
| FHLMC, VRN, 4.70%, (12-month LIBOR plus 1.64%), 2/1/43 | 83,054 |
| 86,063 |
|
| FHLMC, VRN, 4.06%, (12-month LIBOR plus 1.63%), 5/1/43 | 53,109 |
| 54,672 |
|
| FHLMC, VRN, 4.25%, (12-month LIBOR plus 1.62%), 6/1/43 | 27,571 |
| 28,501 |
|
| FHLMC, VRN, 4.27%, (12-month LIBOR plus 1.65%), 6/1/43 | 58,129 |
| 60,133 |
|
| FNMA, VRN, 4.25%, (6-month LIBOR plus 1.57%), 6/1/35 | 257,494 |
| 266,615 |
|
| FNMA, VRN, 4.27%, (6-month LIBOR plus 1.57%), 6/1/35 | 117,591 |
| 121,499 |
|
| FNMA, VRN, 4.70%, (12-month LIBOR plus 1.71%), 12/1/37 | 4,486 |
| 4,705 |
|
| FNMA, VRN, 4.44%, (12-month LIBOR plus 1.69%), 8/1/39 | 64,140 |
| 67,161 |
|
| FNMA, VRN, 4.82%, (12-month LIBOR plus 1.69%), 1/1/40 | 29,991 |
| 31,556 |
|
| FNMA, VRN, 3.32%, (12-month LIBOR plus 1.82%), 9/1/41 | 380,881 |
| 388,134 |
|
| FNMA, VRN, 3.00%, (12-month LIBOR plus 1.82%), 11/1/41 | 398,282 |
| 403,266 |
|
| | | 3,888,064 |
|
Fixed-Rate U.S. Government Agency Mortgage-Backed Securities† | |
| FHLMC, 5.50%, 12/1/36 | 1,828 |
| 2,000 |
|
| FNMA, 5.00%, 7/1/20 | 3,748 |
| 3,837 |
|
| FNMA, 5.50%, 7/1/36 | 1,988 |
| 2,177 |
|
| | | 8,014 |
|
TOTAL U.S. GOVERNMENT AGENCY MORTGAGE-BACKED SECURITIES
(Cost $3,901,782) | 3,896,078 |
|
| SOVEREIGN GOVERNMENTS AND AGENCIES — 0.2% | | |
| Argentina — 0.2% | | |
Argentine Republic Government International Bond, 6.25%, 4/22/19 (Cost $1,000,000) | 1,000,000 |
| 1,001,750 |
|
| TEMPORARY CASH INVESTMENTS — 4.2% | | |
Bennington Stark Capital Co. LLC, 2.55%, 4/1/19 (LOC: Societe Generale SA)(1)(4) | 10,703,000 |
| 10,700,770 |
|
Societe Generale SA, 2.50%, 4/1/19(1)(4) | 1,600,000 |
| 1,599,679 |
|
| Repurchase Agreement, BMO Capital Markets Corp., (collateralized by various U.S. Treasury obligations, 0.125% - 2.875%, 9/30/19 - 2/15/44, valued at $4,124,036), in a joint trading account at 2.35%, dated 3/29/19, due 4/1/19 (Delivery value $4,042,443) | | 4,041,652 |
|
| Repurchase Agreement, Fixed Income Clearing Corp., (collateralized by various U.S. Treasury obligations, 2.75%, 6/30/25, valued at $693,097), at 1.25%, dated 3/29/19, due 4/1/19 (Delivery value $675,070) | | 675,000 |
|
| State Street Institutional U.S. Government Money Market Fund, Premier Class | 26,388 |
| 26,388 |
|
TOTAL TEMPORARY CASH INVESTMENTS
(Cost $17,046,040) | | 17,043,489 |
|
TOTAL INVESTMENT SECURITIES — 99.5%
(Cost $402,868,297) | | 403,612,508 |
|
| OTHER ASSETS AND LIABILITIES — 0.5% | | 1,917,240 |
|
| TOTAL NET ASSETS — 100.0% | | $ | 405,529,748 |
|
|
| | | | | | | | | | | |
| FUTURES CONTRACTS PURCHASED |
| Reference Entity | Contracts | Expiration Date | Notional Amount | Underlying Contract Value | Unrealized Appreciation (Depreciation) |
| U.S. Treasury 2-Year Notes | 746 | June 2019 | $ | 149,200,000 |
| $ | 158,967,937 |
| $ | 511,197 |
|
|
| | | | | | | | | | | |
| FUTURES CONTRACTS SOLD |
| Reference Entity | Contracts | Expiration Date | Notional Amount | Underlying Contract Value | Unrealized Appreciation (Depreciation) |
| U.S. Treasury 10-Year Notes | 12 | June 2019 | $ | 1,200,000 |
| $ | 1,490,625 |
| $ | (10,402 | ) |
| U.S. Treasury 5-Year Notes | 202 | June 2019 | $ | 20,200,000 |
| 23,397,281 |
| (221,908 | ) |
| | | | | | $ | 24,887,906 |
| $ | (232,310 | ) |
|
| | | | | | | | | | | | | | | |
| CENTRALLY CLEARED CREDIT DEFAULT SWAP AGREEMENTS | | |
| Reference Entity | Type‡ | Fixed Rate Received (Paid) | Termination
Date | Notional Amount | Premiums Paid (Received) | Unrealized Appreciation
(Depreciation) | Value^ |
| Markit CDX North America Investment Grade Index Series 30 | Sell | 1.00% | 6/20/23 | $ | 6,000,000 |
| $ | 82,135 |
| $ | 38,191 |
| $ | 120,326 |
|
‡The maximum potential amount the fund could be required to deliver as a seller of credit protection if a credit event occurs as defined under the terms of the agreement is the notional amount. The maximum potential amount may be partially offset by any recovery values of the reference entities and upfront payments received upon entering into the agreement.
^The value for credit default swap agreements serve as an indicator of the current status of the payment/performance risk and represent the likelihood of an expected liability or profit at the period end. Increasing values in absolute terms when compared to the notional amount of the credit default swap agreement represent a deterioration of the referenced entity's credit soundness and an increased likelihood or risk of a credit event occurring as defined in the agreement.
|
| | |
| NOTES TO SCHEDULE OF INVESTMENTS |
| CDX | - | Credit Derivatives Indexes |
| FHLMC | - | Federal Home Loan Mortgage Corporation |
| FNMA | - | Federal National Mortgage Association |
| H15T1Y | - | Constant Maturity U.S. Treasury Note Yield Curve Rate Index |
| IO | - | Interest Only |
| LIBOR | - | London Interbank Offered Rate |
| LOC | - | Letter of Credit |
| MTN | - | Medium Term Note |
| SEQ | - | Sequential Payer |
| USD | - | United States Dollar |
| VRN | - | Variable Rate Note. The rate adjusts periodically based upon the terms set forth in the security’s offering documents. The rate shown is effective at the period end and the reference rate and spread, if any, is indicated. |
† Category is less than 0.05% of total net assets.
| |
| (1) | Security was purchased pursuant to Rule 144A or Section 4(2) under the Securities Act of 1933 and may be sold in transactions exempt from registration, normally to qualified institutional investors. The aggregate value of these securities at the period end was $125,604,038, which represented 31.0% of total net assets. |
| |
| (2) | Security, or a portion thereof, has been pledged at the custodian bank or with a broker for collateral requirements on futures contracts and/or swap agreements. At the period end, the aggregate value of securities pledged was $530,170. |
| |
| (3) | The interest rate on a bank loan obligation adjusts periodically based on a predetermined schedule. Rate shown is effective at period end. The maturity date on a bank loan obligation may be less than indicated as a result of contractual or optional prepayments. These prepayments cannot be predicted with certainty. |
| |
| (4) | The rate indicated is the yield to maturity at purchase. |
See Notes to Financial Statements.
|
|
| Statement of Assets and Liabilities |
|
| | | |
| MARCH 31, 2019 | |
| Assets | |
| Investment securities, at value (cost of $402,868,297) | $ | 403,612,508 |
|
| Receivable for investments sold | 1,220,782 |
|
| Receivable for capital shares sold | 214,615 |
|
| Receivable for variation margin on swap agreements | 6,281 |
|
| Interest receivable | 2,210,717 |
|
| | 407,264,903 |
|
| | |
| Liabilities | |
| Payable for capital shares redeemed | 1,372,209 |
|
| Payable for variation margin on futures contracts | 116,690 |
|
| Accrued management fees | 177,372 |
|
| Distribution and service fees payable | 12,666 |
|
| Dividends payable | 56,218 |
|
| | 1,735,155 |
|
| | |
| Net Assets | $ | 405,529,748 |
|
| | |
| Net Assets Consist of: | |
| Capital paid in | $ | 416,224,698 |
|
| Distributable earnings | (10,694,950 | ) |
| | $ | 405,529,748 |
|
|
| | | | | | |
| | Net Assets | Shares Outstanding | Net Asset Value Per Share |
| Investor Class |
| $226,340,739 |
| 22,305,898 |
| $10.15 |
| I Class |
| $56,264,410 |
| 5,544,613 |
| $10.15 |
| A Class |
| $21,709,241 |
| 2,139,652 |
| $10.15* |
| C Class |
| $9,045,964 |
| 891,100 |
| $10.15 |
| R Class |
| $755,775 |
| 74,431 |
| $10.15 |
| R5 Class |
| $20,661,727 |
| 2,036,324 |
| $10.15 |
| R6 Class |
| $70,751,892 |
| 6,978,162 |
| $10.14 |
*Maximum offering price $10.38 (net asset value divided by 0.9775).
See Notes to Financial Statements.
|
| | | |
| YEAR ENDED MARCH 31, 2019 | |
| Investment Income (Loss) | |
| Income: | |
| Interest | $ | 11,626,133 |
|
| | |
| Expenses: | |
| Management fees | 2,032,598 |
|
| Distribution and service fees: | |
| A Class | 52,432 |
|
| C Class | 95,360 |
|
| R Class | 2,468 |
|
| Trustees' fees and expenses | 26,949 |
|
| Other expenses | 12,058 |
|
| | 2,221,865 |
|
| | |
| Net investment income (loss) | 9,404,268 |
|
| | |
| Realized and Unrealized Gain (Loss) | |
| Net realized gain (loss) on: | |
| Investment transactions | (2,180,490 | ) |
| Forward foreign currency exchange contract transactions | 1,291,294 |
|
| Futures contract transactions | (697,556 | ) |
| Swap agreement transactions | 173,862 |
|
| Foreign currency translation transactions | (46,894 | ) |
| | (1,459,784 | ) |
| | |
| Change in net unrealized appreciation (depreciation) on: | |
| Investments | 2,471,689 |
|
| Forward foreign currency exchange contracts | (104,029 | ) |
| Futures contracts | 631,480 |
|
| Swap agreements | 79,242 |
|
| Translation of assets and liabilities in foreign currencies | (120 | ) |
| | 3,078,262 |
|
| | |
| Net realized and unrealized gain (loss) | 1,618,478 |
|
| | |
| Net Increase (Decrease) in Net Assets Resulting from Operations | $ | 11,022,746 |
|
See Notes to Financial Statements.
|
|
| Statement of Changes in Net Assets |
|
| | | | | | |
| YEARS ENDED MARCH 31, 2019 AND MARCH 31, 2018 |
| Increase (Decrease) in Net Assets | March 31, 2019 | March 31, 2018 |
| Operations | | |
| Net investment income (loss) | $ | 9,404,268 |
| $ | 7,630,817 |
|
| Net realized gain (loss) | (1,459,784 | ) | (1,372,774 | ) |
| Change in net unrealized appreciation (depreciation) | 3,078,262 |
| (3,052,454 | ) |
| Net increase (decrease) in net assets resulting from operations | 11,022,746 |
| 3,205,589 |
|
| | | |
| Distributions to Shareholders | | |
| From earnings: | | |
| Investor Class | (5,957,493 | ) | (5,193,289 | ) |
| I Class | (1,326,168 | ) | (585,101 | ) |
| A Class | (501,382 | ) | (588,698 | ) |
| C Class | (156,404 | ) | (125,994 | ) |
| R Class | (10,725 | ) | (7,153 | ) |
| R5 Class | (596,220 | ) | (907,349 | ) |
| R6 Class | (1,832,621 | ) | (683,301 | ) |
| Decrease in net assets from distributions | (10,381,013 | ) | (8,090,885 | ) |
| | | |
| Capital Share Transactions | | |
| Net increase (decrease) in net assets from capital share transactions (Note 5) | 19,284,513 |
| 5,375,109 |
|
| | | |
| Net increase (decrease) in net assets | 19,926,246 |
| 489,813 |
|
| | | |
| Net Assets | | |
| Beginning of period | 385,603,502 |
| 385,113,689 |
|
| End of period | $ | 405,529,748 |
| $ | 385,603,502 |
|
See Notes to Financial Statements.
|
|
| Notes to Financial Statements |
MARCH 31, 2019
1. Organization
American Century Investment Trust (the trust) is registered under the Investment Company Act of 1940, as amended (the 1940 Act), as an open-end management investment company and is organized as a Massachusetts business trust. Short Duration Fund (the fund) is one fund in a series issued by the trust. The fund’s investment objective is to seek to maximize total return. As a secondary objective, the fund seeks a high level of income.
The fund offers the Investor Class, I Class, A Class, C Class, R Class, R5 Class and R6 Class. The A Class may incur an initial sales charge. The A Class and C Class may be subject to a contingent deferred sales charge. Sale of the I Class and R6 Class commenced on April 10, 2017 and July 28, 2017, respectively.
2. Significant Accounting Policies
The following is a summary of significant accounting policies consistently followed by the fund in preparation of its financial statements. The fund is an investment company and follows accounting and reporting guidance in accordance with accounting principles generally accepted in the United States of America. This may require management to make certain estimates and assumptions at the date of the financial statements. Actual results could differ from these estimates. Management evaluated the impact of events or transactions occurring through the date the financial statements were issued that would merit recognition or disclosure.
Investment Valuations — The fund determines the fair value of its investments and computes its net asset value per share at the close of regular trading (usually 4 p.m. Eastern time) on the New York Stock Exchange (NYSE) on each day the NYSE is open. The Board of Trustees has adopted valuation policies and procedures to guide the investment advisor in the fund’s investment valuation process and to provide methodologies for the oversight of the fund’s pricing function.
Fixed income securities are valued at the evaluated mean as provided by independent pricing services or at the mean of the most recent bid and asked prices as provided by investment dealers. Corporate bonds, U.S. Treasury and Government Agency securities, convertible bonds, bank loan obligations, municipal securities, and sovereign governments and agencies are valued using market models that consider trade data, quotations from dealers and active market makers, relevant yield curve and spread data, creditworthiness, trade data or market information on comparable securities, and other relevant security specific information. Mortgage-related and asset-backed securities are valued based on models that consider trade data, prepayment and default projections, benchmark yield and spread data and estimated cash flows of each tranche of the issuer. Collateralized loan obligations are valued based on discounted cash flow models that consider trade and economic data, prepayment assumptions and default projections. Commercial paper is valued using a curve-based approach that considers money market rates for specific instruments, programs, currencies and maturity points from a variety of active market makers. Fixed income securities initially expressed in local currencies are translated into U.S. dollars at the mean of the appropriate currency exchange rate at the close of the NYSE as provided by an independent pricing service.
Open-end management investment companies are valued at the reported net asset value per share. Repurchase agreements are valued at cost, which approximates fair value. Exchange-traded futures contracts are valued at the settlement price as provided by the appropriate exchange. Swap agreements are valued at an evaluated mean as provided by independent pricing services or independent brokers. Forward foreign currency exchange contracts are valued at the mean of the appropriate forward exchange rate at the close of the NYSE as provided by an independent pricing service. Investments initially expressed in local currencies are translated into U.S. dollars at the mean of the appropriate currency exchange rate at the close of the NYSE as provided by an independent pricing service.
If the fund determines that the market price for an investment is not readily available or the valuation methods mentioned above do not reflect an investment’s fair value, such investment is valued as determined in good faith by the Board of Trustees or its delegate, in accordance with policies and procedures adopted by the Board of Trustees. In its determination of fair value, the fund may review several factors including, but not limited to, market information regarding the specific investment or comparable investments and correlation with other investment types, futures indices or general market indicators. Circumstances that may cause the fund to use these procedures to value an investment include, but are not limited to: an investment has been
declared in default or is distressed; trading in a security has been suspended during the trading day or a security is not actively trading on its principal exchange; prices received from a regular pricing source are deemed unreliable; or there is a foreign market holiday and no trading occurred.
The fund monitors for significant events occurring after the close of an investment’s primary exchange but before the fund’s net asset value per share is determined. Significant events may include, but are not limited to: corporate announcements and transactions; governmental action and political unrest that could impact a specific investment or an investment sector; or armed conflicts, natural disasters and similar events that could affect investments in a specific country or region.
Security Transactions — Security transactions are accounted for as of the trade date. Net realized gains and losses are determined on the identified cost basis, which is also used for federal income tax purposes.
Investment Income — Interest income is recorded on the accrual basis and includes paydown gain (loss) and accretion of discounts and amortization of premiums. Inflation adjustments related to inflation-linked debt securities are reflected as interest income.
Foreign Currency Translations — All assets and liabilities initially expressed in foreign currencies are translated into U.S. dollars at prevailing exchange rates at period end. The fund may enter into spot foreign currency exchange contracts to facilitate transactions denominated in a foreign currency. Purchases and sales of investment securities, dividend and interest income, spot foreign currency exchange contracts, and expenses are translated at the rates of exchange prevailing on the respective dates of such transactions. Net realized and unrealized foreign currency exchange gains or losses related to investment securities are a component of net realized gain (loss) on investment transactions and change in net unrealized appreciation (depreciation) on investments, respectively.
Repurchase Agreements — The fund may enter into repurchase agreements with institutions that American Century Investment Management, Inc. (ACIM) (the investment advisor) has determined are creditworthy pursuant to criteria adopted by the Board of Trustees. The fund requires that the collateral, represented by securities, received in a repurchase transaction be transferred to the custodian in a manner sufficient to enable the fund to obtain those securities in the event of a default under the repurchase agreement. ACIM monitors, on a daily basis, the securities transferred to ensure the value, including accrued interest, of the securities under each repurchase agreement is equal to or greater than amounts owed to the fund under each repurchase agreement.
Joint Trading Account — Pursuant to an Exemptive Order issued by the Securities and Exchange Commission, the fund, along with certain other funds in the American Century Investments family of funds, may transfer uninvested cash balances into a joint trading account. These balances are invested in one or more repurchase agreements that are collateralized by U.S. Treasury or Agency obligations.
Segregated Assets — In accordance with the 1940 Act, the fund segregates assets on its books and records to cover certain types of investment securities and other financial instruments. ACIM monitors, on a daily basis, the securities segregated to ensure the fund designates a sufficient amount of liquid assets, marked-to-market daily. The fund may also receive assets or be required to pledge assets at the custodian bank or with a broker for collateral requirements.
Income Tax Status — It is the fund’s policy to distribute substantially all net investment income and net realized gains to shareholders and to otherwise qualify as a regulated investment company under provisions of the Internal Revenue Code. Accordingly, no provision has been made for income taxes. The fund files U.S. federal, state, local and non-U.S. tax returns as applicable. The fund's tax returns are subject to examination by the relevant taxing authority until expiration of the applicable statute of limitations, which is generally three years from the date of filing but can be longer in certain jurisdictions. At this time, management believes there are no uncertain tax positions which, based on their technical merit, would not be sustained upon examination and for which it is reasonably possible that the total amounts of unrecognized tax benefits will significantly change in the next twelve months.
Multiple Class — All shares of the fund represent an equal pro rata interest in the net assets of the class to which such shares belong, and have identical voting, dividend, liquidation and other rights and the same terms and conditions, except for class specific expenses and exclusive rights to vote on matters affecting only individual classes. Income, non-class specific expenses, and realized and unrealized capital gains and losses of the fund are allocated to each class of shares based on their relative net assets.
Distributions to Shareholders — Distributions from net investment income, if any, are declared daily and paid monthly. Distributions from net realized gains, if any, are generally declared and paid annually.
Indemnifications — Under the trust’s organizational documents, its officers and trustees are indemnified against certain liabilities arising out of the performance of their duties to the fund. In addition, in the normal course of business, the fund enters into contracts that provide general indemnifications. The maximum exposure under these arrangements is unknown as this would involve future claims that may be made against a fund. The risk of material loss from such claims is considered by management to be remote.
3. Fees and Transactions with Related Parties
Certain officers and trustees of the trust are also officers and/or directors of American Century Companies, Inc. (ACC). The trust's investment advisor, ACIM, the trust's distributor, American Century Investment Services, Inc. (ACIS), and the trust's transfer agent, American Century Services, LLC, are wholly owned, directly or indirectly, by ACC. Various funds issued by American Century Asset Allocation Portfolios, Inc. own, in aggregate, 7% of the shares of the fund.
Management Fees — The trust has entered into a management agreement with ACIM, under which ACIM provides the fund with investment advisory and management services in exchange for a single, unified management fee (the fee) per class. The agreement provides that all expenses of managing and operating the fund, except distribution and service fees, brokerage expenses, taxes, interest, fees and expenses of the independent trustees (including legal counsel fees), and extraordinary expenses, will be paid by ACIM. The fee is computed and accrued daily based on each class's daily net assets and paid monthly in arrears. The difference in the fee among the classes is a result of their separate arrangements for non-Rule 12b-1 shareholder services. It is not the result of any difference in advisory or custodial fees or other expenses related to the management of the fund’s assets, which do not vary by class. The fee consists of (1) an Investment Category Fee based on the daily net assets of the fund and certain other accounts managed by the investment advisor that are in the same broad investment category as the fund and (2) a Complex Fee based on the assets of all the funds in the American Century Investments family of funds.
The Investment Category Fee range, the Complex Fee range and the effective annual management fee for each class for the period ended March 31, 2019 are as follows:
|
| | | |
| | Investment Category Fee Range | Complex Fee Range | Effective Annual Management Fee |
| Investor Class | 0.2825%
to 0.4000%* | 0.2500% to 0.3100% | 0.59% |
| I Class | 0.1500% to 0.2100% | 0.49% |
| A Class | 0.2500% to 0.3100% | 0.59% |
| C Class | 0.2500% to 0.3100% | 0.59% |
| R Class | 0.2500% to 0.3100% | 0.59% |
| R5 Class | 0.0500% to 0.1100% | 0.39% |
| R6 Class | 0.0000% to 0.0600% | 0.34% |
*Prior to August 1, 2018, the Investment Category Fee range was 0.2925% to 0.4100%.
Distribution and Service Fees — The Board of Trustees has adopted a separate Master Distribution and Individual Shareholder Services Plan for each of the A Class, C Class and R Class (collectively the plans), pursuant to Rule 12b-1 of the 1940 Act. The plans provide that the A Class will pay ACIS an annual distribution and service fee of 0.25%. The plans provide that the C Class will pay ACIS an annual distribution and service fee of 1.00%, of which 0.25% is paid for individual shareholder services and 0.75% is paid for distribution services. The plans provide that the R Class will pay ACIS an annual distribution and service fee of 0.50%. The fees are computed and accrued daily based on each class’s daily net assets and paid monthly in arrears. The fees are used to pay financial intermediaries for distribution and individual shareholder services. Fees incurred under the plans during the period ended March 31, 2019 are detailed in the Statement of Operations.
Trustees’ Fees and Expenses — The Board of Trustees is responsible for overseeing the investment advisor’s management and operations of the fund. The trustees receive detailed information about the fund and its investment advisor regularly throughout the year, and meet at least quarterly with management of the investment advisor to review reports about fund operations. The fund’s officers do not receive compensation from the fund.
Interfund Transactions — The fund may enter into security transactions with other American Century Investments funds and other client accounts of the investment advisor, in accordance with the 1940 Act rules and procedures adopted by the Board of Trustees. The rules and procedures require, among other things, that these transactions be effected at the independent current market price of the security. There were no interfund transactions during the period.
4. Investment Transactions
Purchases of investment securities, excluding short-term investments, for the period ended March 31, 2019 totaled $274,006,876, of which $183,427,244 represented U.S. Treasury and Government Agency obligations.
Sales of investment securities, excluding short-term investments, for the period ended March 31, 2019 totaled $281,147,670, of which $134,272,658 represented U.S. Treasury and Government Agency obligations.
5. Capital Share Transactions
Transactions in shares of the fund were as follows (unlimited number of shares authorized):
|
| | | | | | | | | | |
| | Year ended
March 31, 2019 | Year ended March 31, 2018(1) |
| | Shares | Amount | Shares | Amount |
| Investor Class | | | | |
| Sold | 8,078,384 |
| $ | 81,587,050 |
| 14,129,656 |
| $ | 144,704,883 |
|
| Issued in reinvestment of distributions | 560,546 |
| 5,663,161 |
| 482,115 |
| 4,926,670 |
|
| Redeemed | (9,331,853 | ) | (94,229,239 | ) | (16,442,496 | ) | (168,132,709 | ) |
| | (692,923 | ) | (6,979,028 | ) | (1,830,725 | ) | (18,501,156 | ) |
| I Class | | | | |
| Sold | 5,652,905 |
| 57,084,211 |
| 6,792,067 |
| 69,571,697 |
|
| Issued in reinvestment of distributions | 116,253 |
| 1,174,307 |
| 50,386 |
| 513,857 |
|
| Redeemed | (4,415,843 | ) | (44,605,117 | ) | (2,651,155 | ) | (27,088,710 | ) |
| | 1,353,315 |
| 13,653,401 |
| 4,191,298 |
| 42,996,844 |
|
| A Class | | | | |
| Sold | 659,617 |
| 6,654,085 |
| 445,592 |
| 4,564,821 |
|
| Issued in reinvestment of distributions | 35,909 |
| 362,717 |
| 46,451 |
| 474,806 |
|
| Redeemed | (619,036 | ) | (6,250,405 | ) | (3,497,498 | ) | (35,762,511 | ) |
| | 76,490 |
| 766,397 |
| (3,005,455 | ) | (30,722,884 | ) |
| C Class | | | | |
| Sold | 601,676 |
| 6,062,410 |
| 217,421 |
| 2,227,369 |
|
| Issued in reinvestment of distributions | 13,709 |
| 138,520 |
| 10,706 |
| 109,486 |
|
| Redeemed | (657,711 | ) | (6,639,749 | ) | (782,038 | ) | (8,010,992 | ) |
| | (42,326 | ) | (438,819 | ) | (553,911 | ) | (5,674,137 | ) |
| R Class | | | | |
| Sold | 42,731 |
| 432,212 |
| 8,772 |
| 89,667 |
|
| Issued in reinvestment of distributions | 1,051 |
| 10,623 |
| 688 |
| 7,035 |
|
| Redeemed | (8,703 | ) | (87,842 | ) | (20,990 | ) | (214,740 | ) |
| | 35,079 |
| 354,993 |
| (11,530 | ) | (118,038 | ) |
| R5 Class | | | | |
| Sold | 413,496 |
| 4,176,159 |
| 720,356 |
| 7,393,228 |
|
| Issued in reinvestment of distributions | 58,849 |
| 594,533 |
| 83,490 |
| 854,886 |
|
| Redeemed | (577,709 | ) | (5,832,918 | ) | (4,792,710 | ) | (49,148,126 | ) |
| | (105,364 | ) | (1,062,226 | ) | (3,988,864 | ) | (40,900,012 | ) |
| R6 Class | | | | |
| Sold | 2,623,219 |
| 26,458,826 |
| 5,983,832 |
| 61,266,395 |
|
| Issued in reinvestment of distributions | 181,110 |
| 1,828,198 |
| 67,597 |
| 683,301 |
|
| Redeemed | (1,518,965 | ) | (15,297,229 | ) | (358,631 | ) | (3,655,204 | ) |
| | 1,285,364 |
| 12,989,795 |
| 5,692,798 |
| 58,294,492 |
|
| Net increase (decrease) | 1,909,635 |
| $ | 19,284,513 |
| 493,611 |
| $ | 5,375,109 |
|
| |
| (1) | April 10, 2017 (commencement of sale) through March 31, 2018 for the I Class and July 28, 2017 (commencement of sale) through March 31, 2018 for the R6 Class. |
6. Fair Value Measurements
The fund’s investments valuation process is based on several considerations and may use multiple inputs to determine the fair value of the investments held by the fund. In conformity with accounting principles generally accepted in the United States of America, the inputs used to determine a valuation are classified into three broad levels.
| |
| • | Level 1 valuation inputs consist of unadjusted quoted prices in an active market for identical investments. |
| |
| • | Level 2 valuation inputs consist of direct or indirect observable market data (including quoted prices for comparable investments, evaluations of subsequent market events, interest rates, prepayment speeds, credit risk, etc.). These inputs also consist of quoted prices for identical investments initially expressed in local currencies that are adjusted through translation into U.S. dollars. |
| |
| • | Level 3 valuation inputs consist of unobservable data (including a fund’s own assumptions). |
The level classification is based on the lowest level input that is significant to the fair valuation measurement. The valuation inputs are not necessarily an indication of the risks associated with investing in these securities or other financial instruments.
The following is a summary of the level classifications as of period end. The Schedule of Investments provides additional information on the fund’s portfolio holdings.
|
| | | | | | | | |
| | Level 1 | Level 2 | Level 3 |
| Assets | | | |
| Investment Securities | | | |
| Corporate Bonds | — |
| $ | 133,895,476 |
| — |
|
| U.S. Treasury Securities | — |
| 102,737,656 |
| — |
|
| Asset-Backed Securities | — |
| 60,069,055 |
| — |
|
| Collateralized Mortgage Obligations | — |
| 52,664,771 |
| — |
|
| Collateralized Loan Obligations | — |
| 15,392,282 |
| — |
|
| Commercial Mortgage-Backed Securities | — |
| 10,282,610 |
| — |
|
| Bank Loan Obligations | — |
| 6,629,341 |
| — |
|
| U.S. Government Agency Mortgage-Backed Securities | — |
| 3,896,078 |
| — |
|
| Sovereign Governments and Agencies | — |
| 1,001,750 |
| — |
|
| Temporary Cash Investments | $ | 26,388 |
| 17,017,101 |
| — |
|
| | $ | 26,388 |
| $ | 403,586,120 |
| — |
|
| Other Financial Instruments | | | |
| Futures Contracts | $ | 511,197 |
| — |
| — |
|
| Swap Agreements | — |
| $ | 120,326 |
| — |
|
| | $ | 511,197 |
| $ | 120,326 |
| — |
|
| | | | |
| Liabilities | | | |
| Other Financial Instruments | | | |
| Futures Contracts | $ | 232,310 |
| — |
| — |
|
7. Derivative Instruments
Credit Risk — The fund is subject to credit risk in the normal course of pursuing its investment objectives. The value of a bond generally declines as the credit quality of its issuer declines. Credit default swap agreements enable a fund to buy/sell protection against a credit event of a specific issuer or index. A fund may attempt to enhance returns by selling protection or attempt to mitigate credit risk by buying protection. The buyer/seller of credit protection against a security or basket of securities may pay/receive an up-front or periodic payment to compensate for/against potential default events. Changes in value, including the periodic amounts of interest to be paid or received on swap agreements, are recorded as unrealized appreciation (depreciation) on swap agreements. Upon entering into a centrally cleared swap, a fund is required to deposit cash or securities (initial margin) with a financial intermediary in an amount equal to a certain percentage of the notional amount. Subsequent payments (variation margin) are made or received daily, in cash, by a fund. The variation margin is equal to the daily change in the value and is a component of unrealized gains and losses. Realized gain or loss is recorded upon receipt or payment of a periodic settlement or termination of swap agreements. Net realized and unrealized gains or losses occurring during the holding period of swap agreements are a component of net realized gain (loss) on swap agreement transactions and change in net unrealized appreciation (depreciation) on swap agreements, respectively. The risks of entering into swap agreements include the possible lack of liquidity, failure of the counterparty to meet its obligations, and that there may be unfavorable changes in the underlying investments or instruments. The fund's average notional amount held during the period was $9,962,500.
Foreign Currency Risk — The fund is subject to foreign currency exchange rate risk in the normal course of pursuing its investment objectives. The value of foreign investments held by a fund may be significantly affected by changes in foreign currency exchange rates. The dollar value of a foreign security generally decreases when the value of the dollar rises against the foreign currency in which the security is denominated and tends to increase when the value of the dollar declines against such foreign currency. A fund may enter into forward foreign currency exchange contracts to reduce a fund's exposure to foreign currency exchange rate fluctuations or to gain exposure to the fluctuations in the value of foreign currencies. The net U.S. dollar value of foreign currency underlying all contractual commitments held by a fund and the resulting unrealized appreciation or depreciation are determined daily. Realized gain or loss is recorded upon the termination of the contract. Net realized and unrealized gains or losses occurring during the holding period of forward foreign currency exchange contracts are a component of net realized gain (loss) on forward foreign currency exchange contract transactions and change in net unrealized appreciation (depreciation) on forward foreign currency exchange contracts, respectively. A fund bears the risk of an unfavorable change in the foreign currency exchange rate underlying the forward contract. Additionally, losses, up to the fair value, may arise if the counterparties do not perform under the contract terms. The fund's average U.S. dollar exposure to foreign currency risk derivative instruments held during the period was $45,698,801.
Interest Rate Risk — The fund is subject to interest rate risk in the normal course of pursuing its investment objectives. The value of bonds generally declines as interest rates rise. A fund may enter into futures contracts based on a bond index or a specific underlying security. A fund may purchase futures contracts to gain exposure to increases in market value or sell futures contracts to protect against a decline in market value. Upon entering into a futures contract, a fund will segregate cash, cash equivalents or other appropriate liquid securities on its records in amounts sufficient to meet requirements. Subsequent payments (variation margin) are made or received daily, in cash, by a fund. The variation margin is equal to the daily change in the contract value and is recorded as unrealized gains and losses. A fund recognizes a realized gain or loss when the futures contract is closed or expires. Net realized and unrealized gains or losses occurring during the holding period of futures contracts are a component of net realized gain (loss) on futures contract transactions and change in net unrealized appreciation (depreciation) on futures contracts, respectively. One of the risks of entering into futures contracts is the possibility that the change in value of the contract may not correlate with the changes in value of the underlying securities. The fund's average notional exposure to interest rate risk derivative instruments held during the period was $117,841,667 futures contracts purchased and $36,690,956 futures contracts sold.
Value of Derivative Instruments as of March 31, 2019
|
| | | | | | | | |
| | Asset Derivatives | Liability Derivatives |
| Type of Risk Exposure | Location on Statement of Assets and Liabilities | Value | Location on Statement of Assets and Liabilities | Value |
| Credit Risk | Receivable for variation margin on swap agreements* | $ | 6,281 |
| Payable for variation margin on swap agreements* | — |
|
| Interest Rate Risk | Receivable for variation margin on futures contracts* | — |
| Payable for variation margin on futures contracts* | $ | 116,690 |
|
| | | $ | 6,281 |
| | $ | 116,690 |
|
| |
| * | Included in the unrealized appreciation (depreciation) on futures contracts or centrally cleared swap agreements, as applicable, as reported in the Schedule of Investments. |
Effect of Derivative Instruments on the Statement of Operations for the Year Ended March 31, 2019
|
| | | | | | | | |
| | Net Realized Gain (Loss) | Change in Net Unrealized Appreciation (Depreciation) |
| Type of Risk Exposure | Location on Statement of Operations | Value | Location on Statement of Operations | Value |
| Credit Risk | Net realized gain (loss) on swap agreement transactions | $ | 173,862 |
| Change in net unrealized appreciation (depreciation) on swap agreements | $ | 79,242 |
|
| Foreign Currency Risk | Net realized gain (loss) on forward foreign currency exchange contract transactions | 1,291,294 |
| Change in net unrealized appreciation (depreciation) on forward foreign currency exchange contracts | (104,029 | ) |
| Interest Rate Risk | Net realized gain (loss) on futures contract transactions | (697,556 | ) | Change in net unrealized appreciation (depreciation) on futures contracts | 631,480 |
|
| | | $ | 767,600 |
| | $ | 606,693 |
|
8. Risk Factors
There are certain risks involved in investing in foreign securities. These risks include those resulting from political events (such as civil unrest, national elections and imposition of exchange controls), social and economic events (such as labor strikes and rising inflation), and natural disasters. Securities of foreign issuers may be less liquid and more volatile. Investing in emerging markets or a significant portion of assets in one country or region may accentuate these risks.
9. Federal Tax Information
The tax character of distributions paid during the years ended March 31, 2019 and March 31, 2018 were as follows:
|
| | | | | | |
| | 2019 | 2018 |
| Distributions Paid From | | |
| Ordinary income | $ | 10,381,013 |
| $ | 8,090,885 |
|
| Long-term capital gains | — |
| — |
|
The book-basis character of distributions made during the year from net investment income or net realized gains may differ from their ultimate characterization for federal income tax purposes. These differences reflect the differing character of certain income items and net realized gains and losses for financial statement and tax purposes, and may result in reclassification among certain capital accounts on the financial statements.
As of period end, the federal tax cost of investments and the components of distributable earnings on a tax-basis were as follows:
|
| | | |
| Federal tax cost of investments | $ | 402,897,866 |
|
| Gross tax appreciation of investments | $ | 2,446,450 |
|
| Gross tax depreciation of investments | (1,731,808 | ) |
| Net tax appreciation (depreciation) of investments | 714,642 |
|
| Net tax appreciation (depreciation) on derivatives and translation of assets and liabilities in foreign currencies | 36,191 |
|
| Net tax appreciation (depreciation) | $ | 750,833 |
|
| Other book-to-tax adjustments | $ | (544,068 | ) |
| Undistributed ordinary income | — |
|
| Accumulated short-term capital losses | $ | (5,354,971 | ) |
Accumulated long-term capital losses
| $ | (4,910,904 | ) |
| Late-year ordinary loss deferral | $ | (635,840 | ) |
The difference between book-basis and tax-basis unrealized appreciation (depreciation) is attributable primarily to the realization for tax purposes of unrealized gains (losses) on futures contracts. Other book-to-tax adjustments are attributable primarily to the tax deferral of losses on straddle positions.
Accumulated capital losses represent net capital loss carryovers that may be used to offset future realized capital gains for federal income tax purposes. The capital loss carryovers may be carried forward for an unlimited period. Future capital loss carryover utilization in any given year may be subject to Internal Revenue Code limitations.
Loss deferrals represent certain qualified losses that the fund has elected to treat as having been incurred in the following fiscal year for federal income tax purposes.
10. Recently Issued Accounting Standards
In March 2017, the Financial Accounting Standards Board (FASB) issued Accounting Standards Update No. 2017-08, “Receivables - Nonrefundable Fees and Other Costs (Subtopic 310-20), Premium Amortization on Purchased Callable Debt Securities” (ASU 2017-08). ASU 2017-08 amends the amortization period for certain purchased callable debt securities held at a premium, shortening such period to the earliest call date. The amendments are effective for fiscal years, and interim periods within those fiscal years, beginning after December 15, 2018. Management is currently evaluating the impact that adopting ASU 2017-08 will have on the financial statements.
|
| | | | | | | | | | | | | |
| For a Share Outstanding Throughout the Years Ended March 31 (except as noted) | |
| Per-Share Data | | | | | | | Ratios and Supplemental Data |
| | | Income From Investment Operations: | | | | Ratio to Average Net Assets of: | |
| | Net Asset Value, Beginning of Period | Net Investment Income (Loss)(1) | Net Realized and Unrealized Gain (Loss) | Total From Investment Operations | Distributions From Net Investment Income | Net Asset Value, End of Period | Total Return(2) | Operating Expenses | Net Investment Income (Loss) | Portfolio Turnover Rate | Net Assets, End of Period (in thousands) |
| Investor Class | | | | | | | | | | |
| 2019 | $10.13 | 0.24 | 0.05 | 0.29 | (0.27) | $10.15 | 2.87% | 0.60% | 2.39% | 72% |
| $226,341 |
|
| 2018 | $10.25 | 0.20 | (0.11) | 0.09 | (0.21) | $10.13 | 0.88% | 0.60% | 1.94% | 89% |
| $233,033 |
|
| 2017 | $10.25 | 0.16 | 0.01 | 0.17 | (0.17) | $10.25 | 1.65% | 0.60% | 1.56% | 85% |
| $254,540 |
|
| 2016 | $10.33 | 0.14 | (0.05) | 0.09 | (0.17) | $10.25 | 0.87% | 0.60% | 1.37% | 73% |
| $224,708 |
|
| 2015 | $10.42 | 0.17 | (0.06) | 0.11 | (0.20) | $10.33 | 1.02% | 0.60% | 1.61% | 56% |
| $217,035 |
|
| I Class | | | | | | | | | | |
| 2019 | $10.13 | 0.26 | 0.04 | 0.30 | (0.28) | $10.15 | 2.97% | 0.50% | 2.49% | 72% |
| $56,264 |
|
2018(3) | $10.25 | 0.21 | (0.12) | 0.09 | (0.21) | $10.13 | 0.92% | 0.50%(4) | 2.10%(4) | 89%(5) |
| $42,466 |
|
| A Class | | | | | | | | | | | |
| 2019 | $10.13 | 0.22 | 0.04 | 0.26 | (0.24) | $10.15 | 2.61% | 0.85% | 2.14% | 72% |
| $21,709 |
|
| 2018 | $10.25 | 0.17 | (0.11) | 0.06 | (0.18) | $10.13 | 0.62% | 0.85% | 1.69% | 89% |
| $20,903 |
|
| 2017 | $10.25 | 0.13 | 0.01 | 0.14 | (0.14) | $10.25 | 1.40% | 0.85% | 1.31% | 85% |
| $51,956 |
|
| 2016 | $10.33 | 0.11 | (0.05) | 0.06 | (0.14) | $10.25 | 0.62% | 0.85% | 1.12% | 73% |
| $61,261 |
|
| 2015 | $10.42 | 0.14 | (0.06) | 0.08 | (0.17) | $10.33 | 0.77% | 0.85% | 1.36% | 56% |
| $56,703 |
|
|
| | | | | | | | | | | | | |
| For a Share Outstanding Throughout the Years Ended March 31 (except as noted) | |
| Per-Share Data | | | | | | | Ratios and Supplemental Data |
| | | Income From Investment Operations: | | | | Ratio to Average Net Assets of: | |
| | Net Asset Value, Beginning of Period | Net Investment Income (Loss)(1) | Net Realized and Unrealized Gain (Loss) | Total From Investment Operations | Distributions From Net Investment Income | Net Asset Value, End of Period | Total Return(2) | Operating Expenses | Net Investment Income (Loss) | Portfolio Turnover Rate | Net Assets, End of Period (in thousands) |
| C Class | | | | | | | | | | | |
| 2019 | $10.14 | 0.14 | 0.04 | 0.18 | (0.17) | $10.15 | 1.75% | 1.60% | 1.39% | 72% |
| $9,046 |
|
| 2018 | $10.26 | 0.09 | (0.10) | (0.01) | (0.11) | $10.14 | (0.13)% | 1.60% | 0.94% | 89% |
| $9,462 |
|
| 2017 | $10.26 | 0.06 | 0.01 | 0.07 | (0.07) | $10.26 | 0.64% | 1.60% | 0.56% | 85% |
| $15,254 |
|
| 2016 | $10.34 | 0.04 | (0.05) | (0.01) | (0.07) | $10.26 | (0.13)% | 1.60% | 0.37% | 73% |
| $18,919 |
|
| 2015 | $10.43 | 0.06 | (0.06) | — | (0.09) | $10.34 | 0.02% | 1.60% | 0.61% | 56% |
| $23,414 |
|
| R Class | | | | | | | | | | | |
| 2019 | $10.14 | 0.19 | 0.04 | 0.23 | (0.22) | $10.15 | 2.26% | 1.10% | 1.89% | 72% |
| $756 |
|
| 2018 | $10.26 | 0.15 | (0.11) | 0.04 | (0.16) | $10.14 | 0.37% | 1.10% | 1.44% | 89% |
| $399 |
|
| 2017 | $10.26 | 0.11 | 0.01 | 0.12 | (0.12) | $10.26 | 1.15% | 1.10% | 1.06% | 85% |
| $522 |
|
| 2016 | $10.34 | 0.09 | (0.05) | 0.04 | (0.12) | $10.26 | 0.37% | 1.10% | 0.87% | 73% |
| $658 |
|
| 2015 | $10.43 | 0.11 | (0.06) | 0.05 | (0.14) | $10.34 | 0.52% | 1.10% | 1.11% | 56% |
| $1,199 |
|
| R5 Class | | | | | | | | | | |
| 2019 | $10.13 | 0.26 | 0.05 | 0.31 | (0.29) | $10.15 | 3.08% | 0.40% | 2.59% | 72% |
| $20,662 |
|
| 2018 | $10.25 | 0.21 | (0.10) | 0.11 | (0.23) | $10.13 | 1.08% | 0.40% | 2.14% | 89% |
| $21,699 |
|
| 2017 | $10.25 | 0.18 | 0.01 | 0.19 | (0.19) | $10.25 | 1.85% | 0.40% | 1.76% | 85% |
| $62,843 |
|
| 2016 | $10.33 | 0.16 | (0.05) | 0.11 | (0.19) | $10.25 | 1.07% | 0.40% | 1.57% | 73% |
| $64,283 |
|
| 2015 | $10.42 | 0.19 | (0.06) | 0.13 | (0.22) | $10.33 | 1.22% | 0.40% | 1.81% | 56% |
| $50,715 |
|
|
| | | | | | | | | | | | | |
| For a Share Outstanding Throughout the Years Ended March 31 (except as noted) | |
| Per-Share Data | | | | | | | Ratios and Supplemental Data |
| | | Income From Investment Operations: | | | | Ratio to Average Net Assets of: | |
| | Net Asset Value, Beginning of Period | Net Investment Income (Loss)(1) | Net Realized and Unrealized Gain (Loss) | Total From Investment Operations | Distributions From Net Investment Income | Net Asset Value, End of Period | Total Return(2) | Operating Expenses | Net Investment Income (Loss) | Portfolio Turnover Rate | Net Assets, End of Period (in thousands) |
| R6 Class | | | | | | | | | | |
| 2019 | $10.13 | 0.27 | 0.03 | 0.30 | (0.29) | $10.14 | 3.03% | 0.35% | 2.64% | 72% |
| $70,752 |
|
2018(6) | $10.27 | 0.16 | (0.14) | 0.02 | (0.16) | $10.13 | 0.22% | 0.35%(4) | 2.31%(4) | 89%(5) |
| $57,642 |
|
|
|
| Notes to Financial Highlights |
| |
| (1) | Computed using average shares outstanding throughout the period. |
| |
| (2) | Total returns are calculated based on the net asset value of the last business day and do not reflect applicable sales charges, if any. Total returns for periods less than one year are not annualized. |
| |
| (3) | April 10, 2017 (commencement of sale) through March 31, 2018. |
| |
| (5) | Portfolio turnover is calculated at the fund level. Percentage indicated was calculated for the year ended March 31, 2018. |
| |
| (6) | July 28, 2017 (commencement of sale) through March 31, 2018. |
See Notes to Financial Statements.
|
|
| Report of Independent Registered Public Accounting Firm |
To the Board of Trustees of American Century Investment Trust and Shareholders of Short Duration Fund:
Opinion on the Financial Statements
We have audited the accompanying statement of assets and liabilities, including the schedule of investments, of Short Duration Fund (one of the funds constituting American Century Investment Trust, referred to hereafter as the “Fund”) as of March 31, 2019, the related statement of operations for the year ended March 31, 2019, the statement of changes in net assets for each of the two years in the period ended March 31, 2019, including the related notes, and the financial highlights for each of the periods indicated therein (collectively referred to as the “financial statements”). In our opinion, the financial statements present fairly, in all material respects, the financial position of the Fund as of March 31, 2019, the results of its operations for the year then ended, the changes in its net assets for each of the two years in the period ended March 31, 2019 and the financial highlights for each of the periods indicated therein in conformity with accounting principles generally accepted in the United States of America.
Basis for Opinion
These financial statements are the responsibility of the Fund’s management. Our responsibility is to express an opinion on the Fund’s financial statements based on our audits. We are a public accounting firm registered with the Public Company Accounting Oversight Board (United States) (“PCAOB”) and are required to be independent with respect to the Fund in accordance with the U.S. federal securities laws and the applicable rules and regulations of the Securities and Exchange Commission and the PCAOB.
We conducted our audits of these financial statements in accordance with the standards of the PCAOB. Those standards require that we plan and perform the audit to obtain reasonable assurance about whether the financial statements are free of material misstatement, whether due to error or fraud.
Our audits included performing procedures to assess the risks of material misstatement of the financial statements, whether due to error or fraud, and performing procedures that respond to those risks. Such procedures included examining, on a test basis, evidence regarding the amounts and disclosures in the financial statements. Our audits also included evaluating the accounting principles used and significant estimates made by management, as well as evaluating the overall presentation of the financial statements. Our procedures included confirmation of securities owned as of March 31, 2019 by correspondence with the custodian and brokers; when replies were not received from brokers, we performed other auditing procedures. We believe that our audits provide a reasonable basis for our opinion.
/s/ PricewaterhouseCoopers LLP
Kansas City, Missouri
May 17, 2019
We have served as the auditor of one or more investment companies in American Century Investments since 1997.
Board of Trustees
The individuals listed below serve as trustees of the funds. Each trustee will continue to serve in this capacity until death, retirement, resignation or removal from office. The board has adopted a mandatory retirement age for trustees who are not “interested persons,” as that term is defined in the Investment Company Act (independent trustees). Independent trustees shall retire on December 31 of the year in which they reach their 75th birthday; provided, however, that on or after January 1, 2022, independent trustees shall retire on December 31 of the year in which they reach their 76th birthday.
Mr. Thomas is an “interested person” because he currently serves as President and Chief Executive Officer of American Century Companies, Inc. (ACC), the parent company of American Century Investment Management, Inc. (ACIM or the advisor). The other trustees (more than three-fourths of the total number) are independent. They are not employees, directors or officers of, and have no financial interest in, ACC or any of its wholly owned, direct or indirect, subsidiaries, including ACIM, American Century Investment Services, Inc. (ACIS) and American Century Services, LLC (ACS), and they do not have any other affiliations, positions or relationships that would cause them to be considered “interested persons” under the Investment Company Act. The trustees serve in this capacity for eight (in the case of Jonathan S. Thomas, 16; and Ronald J. Gilson, 9) registered investment companies in the American Century Investments family of funds.
The following table presents additional information about the trustees. The mailing address for each trustee other than Jonathan S. Thomas is 1665 Charleston Road, Mountain View, California 94043. The mailing address for Jonathan S. Thomas is 4500 Main Street, Kansas City, Missouri 64111.
|
| | | | | |
Name
(Year of Birth) | Position(s) Held with Funds | Length of Time Served | Principal Occupation(s) During Past 5 Years | Number of American Century Portfolios Overseen by Trustee | Other Directorships Held During Past 5 Years |
| Independent Trustees |
|
|
Tanya S. Beder
(1955) | Trustee | Since 2011 | Chairman and CEO, SBCC Group Inc. (independent advisory services) (2006 to present) | 45 | CYS Investments, Inc.; Nabors Industries Ltd. |
Jeremy I. Bulow
(1954) | Trustee | Since 2011 | Professor of Economics, Stanford University, Graduate School of Business (1979 to present) | 45 | None |
Anne Casscells
(1958) | Trustee | Since 2016 | Co-Chief Executive Officer and Chief Investment Officer, Aetos Alternatives Management (investment advisory firm) (2001 to present); Lecturer in Accounting, Stanford University, Graduate School of Business (2009 to 2017) | 45 | None |
Ronald J. Gilson
(1946) | Trustee and Chairman of the Board | Since 1995
(Chairman since 2005) | Charles J. Meyers Professor of Law and Business, Emeritus, Stanford Law School (1979 to 2016); Marc and Eva Stern Professor of Law and Business, Columbia University School of Law (1992 to present) | 50 | None |
|
| | | | | |
Name
(Year of Birth) | Position(s) Held with Funds | Length of Time Served | Principal Occupation(s) During Past 5 Years | Number of American Century Portfolios Overseen by Trustee | Other Directorships Held During Past 5 Years |
| Independent Trustees |
|
|
Frederick L. A. Grauer
(1946) | Trustee | Since 2008 | Senior Advisor, Credit Sesame, Inc. (credit monitoring firm) (2018 to present); Senior Advisor, Course Hero (an educational technology company) (2015 to present); Senior Advisor, iShares by BlackRock, Inc. (investment management firm) (2013 to 2015)
| 45 | None |
Jonathan D. Levin
(1972) | Trustee | Since 2016 | Philip H. Knight Professor and Dean, Graduate School of Business, Stanford University (2016 to present); Professor, Stanford University, (2000 to present); Chair, Department of Economics, Stanford University (2011 to 2014) | 45 | None |
Peter F. Pervere
(1947) | Trustee | Since 2007 | Retired | 45 | None |
John B. Shoven
(1947) | Trustee | Since 2002 | Charles R. Schwab Professor of Economics, Stanford University (1973 to present) | 45 | Cadence Design Systems; Exponent; Financial Engines |
| Interested Trustee |
|
|
Jonathan S. Thomas
(1963) | Trustee and President | Since 2007 | President and Chief Executive Officer, ACC (2007 to present). Also serves as Chief Executive Officer, ACS; Executive Vice President, ACIM; Director, ACC, ACIM and other ACC subsidiaries | 117 | BioMed Valley Discoveries, Inc. |
The Statement of Additional Information has additional information about the fund's trustees and is available without charge, upon request, by calling 1-800-345-2021.
Officers
The following table presents certain information about the executive officers of the funds. Each officer serves as an officer for 16 (in the case of Robert J. Leach, 15) investment companies in the American Century family of funds, unless otherwise noted. No officer is compensated for his or her service as an officer of the funds. The listed officers are interested persons of the funds and are appointed or re-appointed on an annual basis. The mailing address for each of the officers listed below is 4500 Main Street, Kansas City, Missouri 64111.
|
| | |
Name
(Year of Birth) | Offices with the Funds | Principal Occupation(s) During the Past Five Years |
Jonathan S. Thomas
(1963) | Trustee and President since 2007 | President and Chief Executive Officer, ACC (2007 to present). Also serves as Chief Executive Officer, ACS; Executive Vice President, ACIM; Director, ACC, ACIM and other ACC subsidiaries |
R. Wes Campbell
(1974)
| Chief Financial Officer and Treasurer since 2018
| Investment Operations and Investment Accounting, ACS (2000 to present) |
Amy D. Shelton
(1964) | Chief Compliance Officer and Vice President since 2014 | Chief Compliance Officer, American Century funds, (2014 to present); Chief Compliance Officer, ACIM (2014 to present); Chief Compliance Officer, ACIS (2009 to present); Vice President, Client Interactions and Marketing, ACIS (2013 to 2014). Also serves as Vice President, ACIS |
Charles A. Etherington
(1957) | General Counsel since 2007 and Senior Vice President since 2006 | Attorney, ACC (1994 to present); Vice President, ACC (2005 to present); General Counsel, ACC (2007 to present). Also serves as General Counsel, ACIM, ACS, ACIS and other ACC subsidiaries; and Senior Vice President, ACIM and ACS |
C. Jean Wade
(1964) | Vice President since 2012 | Senior Vice President, ACS (2017 to present); Vice President ACS (2000 to 2017) |
Robert J. Leach
(1966) | Vice President since 2006 | Vice President, ACS (2000 to present) |
David H. Reinmiller
(1963) | Vice President since 2000 | Attorney, ACC (1994 to present) Also serves as Vice President, ACIM and ACS |
Ward D. Stauffer
(1960) | Secretary since 2005 | Attorney, ACC (2003 to present) |
Retirement Account Information
As required by law, distributions you receive from certain retirement accounts are subject to federal income tax withholding, unless you elect not to have withholding apply*. Tax will be withheld on the total amount withdrawn even though you may be receiving amounts that are not subject to withholding, such as nondeductible contributions. In such case, excess amounts of withholding could occur. You may adjust your withholding election so that a greater or lesser amount will be withheld.
If you don’t want us to withhold on this amount, you must notify us to not withhold the federal income tax. You may notify us in writing or in certain situations by telephone or through other electronic means. For systematic withdrawals, your withholding election will remain in effect until revoked or changed by filing a new election. You have the right to revoke your election at any time and change your withholding percentage for future distributions.
Remember, even if you elect not to have income tax withheld, you are liable for paying income tax on the taxable portion of your withdrawal. If you elect not to have income tax withheld or you don’t have enough income tax withheld, you may be responsible for payment of estimated tax. You may incur penalties under the estimated tax rules if your withholding and estimated tax payments are not sufficient. You can reduce or defer the income tax on a distribution by directly or indirectly rolling such distribution over to another IRA or eligible plan. You should consult your tax advisor for additional information.
State tax will be withheld if, at the time of your distribution, your address is within one of the mandatory withholding states and you have federal income tax withheld (or as otherwise required by state law). State taxes will be withheld from your distribution in accordance with the respective state rules.
*Some 403(b), 457 and qualified retirement plan distributions may be subject to 20% mandatory withholding, as they are subject to special tax and withholding rules. Your plan administrator or plan sponsor is required to provide you with a special tax notice explaining those rules at the time you request a distribution. If applicable, federal and/or state taxes may be withheld from your distribution amount.
Proxy Voting Policies
Descriptions of the principles and policies that the fund's investment advisor uses in exercising the voting rights associated with the securities purchased and/or held by the fund are available without charge, upon request, by calling 1-800-345-2021 or visiting the "About Us" page of American Century Investments’ website at americancentury.com. A description of the policies is also available on the Securities and Exchange Commission’s website at sec.gov. Information regarding how the investment advisor voted proxies relating to portfolio securities during the most recent 12-month period ended June 30 is available on the "About Us" page at americancentury.com. It is also available at sec.gov.
Quarterly Portfolio Disclosure
The fund files its complete schedule of portfolio holdings with the Securities and Exchange Commission (SEC) for the first and third quarters of each fiscal year on Form N-Q or as an exhibit to its reports on Form N-PORT. The fund’s Forms N-Q and Form N-PORT reports are available on the SEC’s website at sec.gov. The fund also makes its complete schedule of portfolio holdings for the most recent quarter of its fiscal year available on its website at americancentury.com and, upon request, by calling 1-800-345-2021.
|
| | |
| |
| | | |
| Contact Us | americancentury.com | |
| Automated Information Line | 1-800-345-8765 | |
| Investor Services Representative | 1-800-345-2021 or 816-531-5575 | |
| Investors Using Advisors | 1-800-378-9878 | |
| Business, Not-For-Profit, Employer-Sponsored Retirement Plans | 1-800-345-3533 | |
| Banks and Trust Companies, Broker-Dealers, Financial Professionals, Insurance Companies | 1-800-345-6488 | |
| Telecommunications Relay Service for the Deaf | 711 | |
| | | |
| American Century Investment Trust | |
| | | |
Investment Advisor: American Century Investment Management, Inc. Kansas City, Missouri | |
| | | |
| This report and the statements it contains are submitted for the general information of our shareholders. The report is not authorized for distribution to prospective investors unless preceded or accompanied by an effective prospectus. | |
| | | |
©2019 American Century Proprietary Holdings, Inc. All rights reserved.
CL-ANN-92285 1905 | |
|
| |
| | |
| | Annual Report |
| | |
| | March 31, 2019 |
| | |
| | Short Duration Inflation Protection Bond Fund |
| | Investor Class (APOIX) |
| | I Class (APOHX) |
| | Y Class (APOYX) |
| | A Class (APOAX) |
| | C Class (APOCX) |
| | R Class (APORX) |
| | R5 Class (APISX) |
| | R6 Class (APODX) |
| | G Class (APOGX) |
Beginning on January 1, 2021, as permitted by regulations adopted by the Securities and Exchange Commission, paper copies of the fund’s shareholder reports like this one will no longer be sent by mail, unless you specifically request paper copies of the reports from the fund or from your financial intermediary, such as a broker-dealer or bank. Instead, the reports will be made available on a website, and you will be notified by mail each time a report is posted and provided with a website link to access the report.
If you already elected to receive shareholder reports electronically, you will not be affected by this change and you need not take any action. You may elect to receive shareholder reports and other communications from the fund or your financial intermediary electronically by calling or sending an email request to your appropriate contacts as listed on the back cover of this report.
You may elect to receive all future reports in paper free of charge. You can inform the fund or your financial intermediary that you wish to continue receiving paper copies of your shareholder reports by calling or sending an email request to your appropriate contacts as listed on the back cover of this report. Your election to receive reports in paper will apply to all funds held with the fund complex/your financial intermediary.
|
| | |
| President’s Letter | 2 |
|
| Performance | 3 |
|
| Portfolio Commentary | |
|
| Fund Characteristics | |
|
| Shareholder Fee Example | |
|
| Schedule of Investments | |
|
| Statement of Assets and Liabilities | |
|
| Statement of Operations | |
|
| Statement of Changes in Net Assets | |
|
| Notes to Financial Statements | |
|
| Financial Highlights | |
|
| Report of Independent Registered Public Accounting Firm | |
|
| Management | |
|
| Additional Information | |
|
Any opinions expressed in this report reflect those of the author as of the date of the report, and do not necessarily represent the opinions of American Century Investments® or any other person in the American Century Investments organization. Any such opinions are subject to change at any time based upon market or other conditions and American Century Investments disclaims any responsibility to update such opinions. These opinions may not be relied upon as investment advice and, because investment decisions made by American Century Investments funds are based on numerous factors, may not be relied upon as an indication of trading intent on behalf of any American Century Investments fund. Security examples are used for representational purposes only and are not intended as recommendations to purchase or sell securities. Performance information for comparative indices and securities is provided to American Century Investments by third party vendors. To the best of American Century Investments’ knowledge, such information is accurate at the time of printing.
Jonathan Thomas
Dear Investor:
Thank you for reviewing this annual report for the period ended March 31, 2019. Annual reports help convey important information about fund returns, including market factors that affected performance during the reporting period. For additional, updated investment and market insights, we encourage you to visit our website, americancentury.com.
Markets Ended Roller-Coaster Period on Upswing
For the first half of the period, U.S. stocks climbed higher, while bond returns headed lower. Robust economic growth, bolstered by federal tax and regulatory reform, and record corporate earnings results fueled risk-on sentiment that drove stock prices higher. Meanwhile, the combination of strong economic data, the Federal Reserve’s (Fed’s) ongoing rate-hike campaign and an uptick in inflation pushed investment-grade bond returns lower.
Market trends began changing in late 2018. Mounting investor concerns about slowing global economic and earnings growth, U.S.-China trade tensions and rising interest rates triggered widespread volatility. Stock prices plunged as investors sought safe-haven investments, including U.S. Treasuries. Furthermore, the Fed issued another rate hike in December, its fourth of the year, and maintained its hawkish outlook. Investors feared the December rate increase and the Fed’s plans for two more rate hikes in 2019 were too aggressive, and risk-off investing remained in favor.
January brought a renewed sense of stability to the markets. Investors’ concerns about growth and trade eased, and the Fed changed course, pausing its rate-hike campaign amid moderating global growth and inflation. Valuations appeared attractive after the late-2018 sell-off, and risk-on investing resumed. In March, the Fed held rates steady again, hinting additional tightening was off the table for 2019. This news drove stock and bond returns higher and left both asset classes on an upward track to end the period. Overall, stocks (S&P 500 Index) overcame their late-2018 nosedive to gain 9.50% for the period. Bonds (Bloomberg Barclays U.S. Aggregate Bond Index) bounced back from losses early in the period to return 4.48%.
We expect volatility to remain a formidable factor as investors react to global growth trends, central bank policy and geopolitical developments. We believe this scenario underscores the importance of using professionally managed portfolios in pursuit of investment goals. We appreciate your continued trust and confidence in us.
Sincerely,
Jonathan Thomas
President and Chief Executive Officer
American Century Investments
|
| | | | | | |
| Total Returns as of March 31, 2019 | | | | |
| | | | Average Annual Returns | |
| | Ticker Symbol | 1 year | 5 years | 10 years | Since Inception | Inception Date |
| Investor Class | APOIX | 1.79% | 0.71% | 2.48% | — | 5/31/05 |
| Bloomberg Barclays U.S. 1-5 Year Treasury Inflation Protected Securities (TIPS) Index | — | 2.04% | 0.91% | 1.99% | — | — |
| I Class | APOHX | 1.87% | — | — | 1.06% | 4/10/17 |
| Y Class | APOYX | 1.98% | — | — | 1.14% | 4/10/17 |
| A Class | APOAX | | | | | 5/31/05 |
| No sales charge | | 1.55% | 0.47% | 2.22% | — | |
| With sales charge | | -0.72% | 0.02% | 1.98% | — | |
| C Class | APOCX | 0.80% | -0.30% | 1.46% | — | 5/31/05 |
| R Class | APORX | 1.26% | 0.22% | 1.97% | — | 5/31/05 |
| R5 Class | APISX | 1.98% | 0.91% | 2.69% | — | 5/31/05 |
| R6 Class | APODX | 2.03% | 0.97% | — | 0.87% | 7/26/13 |
| G Class | APOGX | 2.34% | — | — | 1.79% | 7/28/17 |
Fund returns would have been lower if a portion of the fees had not been waived. Prior to August 31, 2011, the A Class had a maximum initial sales charge of 4.50%. The maximum initial sales charge is now 2.25%. Performance prior to that date has been adjusted to reflect this change in the initial sales charge.
Sales charges include initial sales charges and contingent deferred sales charges (CDSCs), as applicable. A Class shares have a 2.25% maximum initial sales charge and may be subject to a maximum CDSC of 1.00%. C Class shares redeemed within 12 months of purchase are subject to a maximum CDSC of 1.00%. The SEC requires that mutual funds provide performance information net of maximum sales charges in all cases where charges could be applied.
Data presented reflect past performance. Past performance is no guarantee of future results. Current performance may be higher or lower than the performance shown. Total returns for periods less than one year are not annualized. Investment return and principal value will fluctuate, and redemption value may be more or less than original cost. Data assumes reinvestment of dividends and capital gains, and none of the charts reflect the deduction of taxes that a shareholder would pay on fund distributions or the redemption of fund shares. To obtain performance data current to the most recent month end, please call 1-800-345-2021 or visit americancentury.com. For additional information about the fund, please consult the prospectus.
|
|
| Growth of $10,000 Over 10 Years |
| $10,000 investment made March 31, 2009 |
Performance for other share classes will vary due to differences in fee structure.
|
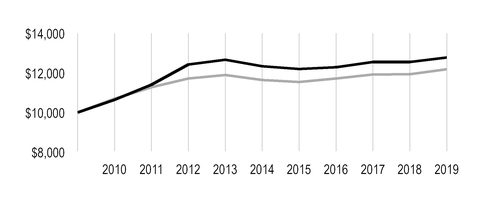
|
| |
| Value on March 31, 2019 |
| | Investor Class — $12,777 |
| |
| | Bloomberg Barclays U.S. 1-5 Year Treasury Inflation Protected Securities (TIPS) Index — $12,178 |
| |
Ending value of Investor Class would have been lower if a portion of the fees had not been waived.
|
| | | | | | | | |
| Total Annual Fund Operating Expenses | |
| Investor Class | I Class | Y Class | A Class | C Class | R Class | R5 Class | R6 Class | G Class |
| 0.57% | 0.47% | 0.37% | 0.82% | 1.57% | 1.07% | 0.37% | 0.32% | 0.32% |
The total annual fund operating expenses shown is as stated in the fund’s prospectus current as of the date of this report. The prospectus may vary from the expense ratio shown elsewhere in this report because it is based on a different time period, includes acquired fund fees and expenses, and, if applicable, does not include fee waivers or expense reimbursements.
Data presented reflect past performance. Past performance is no guarantee of future results. Current performance may be higher or lower than the performance shown. Total returns for periods less than one year are not annualized. Investment return and principal value will fluctuate, and redemption value may be more or less than original cost. Data assumes reinvestment of dividends and capital gains, and none of the charts reflect the deduction of taxes that a shareholder would pay on fund distributions or the redemption of fund shares. To obtain performance data current to the most recent month end, please call 1-800-345-2021 or visit americancentury.com. For additional information about the fund, please consult the prospectus.
Portfolio Managers: Bob Gahagan, Brian Howell, Jim Platz and Miguel Castillo
Performance Summary
Short Duration Inflation Protection Bond returned 1.79%* for the 12 months ended March 31, 2019. By comparison, the Bloomberg Barclays U.S. 1-5 Year Treasury Inflation Protected Securities (TIPS) Index gained 2.04%. Fund returns reflect operating expenses, while index returns do not.
Performance reflects the positive, yet challenging, backdrop for short-duration (less price sensitivity to interest rate changes) TIPS as interest rates and inflation expectations declined overall. The 12-month period witnessed a marked shift in growth and inflation trends, Federal Reserve (Fed) policy and investor sentiment, which influenced performance in the fixed-income market. In the first several months of the period, robust economic growth, rising inflation and the Fed’s steady rate-tightening strategy drove Treasury yields higher. Investment-grade bond returns were generally flat to slightly negative, while risk remained in favor. The environment reversed sharply in late 2018, as worries about future economic and corporate earnings growth, U.S.-China trade negotiations and a surprisingly bullish Fed outlook triggered severe volatility in the equity markets. Treasury yields plunged, as investors fled risk assets in favor of perceived safe-haven investments.
The new year brought a new sense of stability to the financial markets. Progress with U.S.-China trade negotiations and better-than-feared U.S. economic and earnings data helped restore some investor optimism. Additionally, the Fed paused its rate-hike campaign in January. Investors responded enthusiastically to this backdrop, and risk assets returned to favor. Meanwhile, Treasury yields moved modestly lower. Then, at its March monetary policy meeting, the Fed held rates steady again and suggested additional tightening was likely off the table for 2019. This news triggered another rally among Treasuries.
Overall, the Treasury market rally of late 2018 and early 2019 supported broad U.S. fixed-income gains for the entire 12-month period. TIPS advanced but underperformed the broad Treasury market as current inflation weakened and inflation expectations declined. The trailing 12-month headline inflation rate (as measured by the Consumer Price Index, or CPI) started the period at 2.4%, reached a reporting-period high of 2.9% in June and July, and ended the period at 1.9%. Annual core CPI (excluding food and energy prices) started the period at 2.0% and ended March 2019 at 1.8%. Longer-term inflation expectations, as measured by the 10-year breakeven rate (the yield difference between nominal 10-year Treasuries and 10-year TIPS), generally tracked headline inflation, rising early in the period before retreating to close the fiscal year at 187 basis points (one basis point equals 0.01%), 18 basis points lower than in March 2018. Theoretically, this rate indicates the market’s expectations for inflation for the next 10 years and also reflects the inflation rate required for TIPS to outperform nominal Treasuries during that period (1.87% or higher).
Duration Was a Modest Detractor
The dramatic decline in short-maturity interest rates coupled with significant flattening of the yield curve in late 2018 and early 2019 created challenges for shorter-duration assets and strategies. In this environment, our slightly shorter-than-index duration modestly detracted from relative results.
* All fund returns referenced in this commentary are for Investor Class shares. Performance for other share classes will vary due to differences in fee structure; when Investor Class performance exceeds that of the index, other share classes may not. See page 3 for returns for all share classes.
Exposure to Corporate, Securitized Bonds Aided Relative Results
Approximately 84% of the portfolio was invested in TIPS at the end of the reporting period. The remainder included out-of-index allocations to securitized bonds, investment-grade and high-yield corporate bonds, and select U.S. dollar-denominated emerging markets bonds. The portfolio’s position in high-yield corporate bonds was a prominent contributor to performance, particularly in early 2019. Securitized bonds also contributed to performance, largely due to our focus on credit-sensitive securities, including non-agency collateralized mortgage obligations and commercial mortgage-backed securities, asset-backed securities and collateralized loan obligations. Our investment-grade corporate bonds were modest contributors, while our position in U.S. dollar-denominated emerging markets bonds detracted slightly.
To diversify inflation protection, we used inflation swaps to create an inflation overlay for the non-inflation-linked corporate and securitized securities. Inflation swaps are fixed-maturity instruments, negotiated through a counterparty (investment bank), that return the rate of inflation (CPI). All swaps bear counterparty credit risk, but American Century Investments applies stringent controls and oversight with regard to this risk. Overall, this strategy, combined with the portfolio’s corporate and securitized bonds, contributed modestly to results for the 12-month period.
Portfolio Positioning
Our portfolio positioning reflects our expectations for year-over-year headline and core inflation to converge near the Fed’s 2% target over the next several months. We expect the U.S. economy to continue to grow, but at a more moderate pace (2.0% to 2.5% annualized). However, we expect U.S. economic growth to remain more robust than growth in Europe and Japan. These factors should enable the Fed to remain on hold throughout the remainder of 2019. Meanwhile, market-based inflation expectations, including breakeven rates, remain below historic averages, suggesting TIPS and other inflation-linked securities still offer value. Although we have reduced risk in our out-of-index allocations, we will continue to look for opportunities among corporate bonds, securitized securities, emerging markets bonds and inflation swaps wherever value is apparent.
|
| |
| MARCH 31, 2019 | |
| Portfolio at a Glance | |
| Average Duration (effective) | 2.9 years |
| Weighted Average Life to Maturity | 3.1 years |
| | |
| Types of Investments in Portfolio | % of net assets |
| U.S. Treasury Securities | 83.5% |
| Asset-Backed Securities | 4.2% |
| Collateralized Loan Obligations | 2.6% |
| Corporate Bonds | 2.5% |
| Collateralized Mortgage Obligations | 2.5% |
| Bank Loan Obligations | 0.9% |
| Commercial Mortgage-Backed Securities | 0.5% |
| Sovereign Governments and Agencies | 0.1% |
| Temporary Cash Investments | 3.0% |
| Other Assets and Liabilities | 0.2% |
Fund shareholders may incur two types of costs: (1) transaction costs, including sales charges (loads) on purchase payments and redemption/exchange fees; and (2) ongoing costs, including management fees; distribution and service (12b-1) fees; and other fund expenses. This example is intended to help you understand your ongoing costs (in dollars) of investing in your fund and to compare these costs with the ongoing cost of investing in other mutual funds.
The example is based on an investment of $1,000 made at the beginning of the period and held for the entire period from October 1, 2018 to March 31, 2019.
Actual Expenses
The table provides information about actual account values and actual expenses for each class. You may use the information, together with the amount you invested, to estimate the expenses that you paid over the period. First, identify the share class you own. Then simply divide your account value by $1,000 (for example, an $8,600 account value divided by $1,000 = 8.6), then multiply the result by the number under the heading “Expenses Paid During Period” to estimate the expenses you paid on your account during this period.
If you hold Investor Class shares of any American Century Investments fund, or I Class shares of the American Century Diversified Bond Fund, in an American Century Investments account (i.e., not a financial intermediary or retirement plan account), American Century Investments may charge you a $12.50 semiannual account maintenance fee if the value of those shares is less than $10,000. We will redeem shares automatically in one of your accounts to pay the $12.50 fee. In determining your total eligible investment amount, we will include your investments in all personal accounts (including American Century Investments Brokerage accounts) registered under your Social Security number. Personal accounts include individual accounts, joint accounts, UGMA/UTMA accounts, personal trusts, Coverdell Education Savings Accounts and IRAs (including traditional, Roth, Rollover, SEP-, SARSEP- and SIMPLE-IRAs), and certain other retirement accounts. If you have only business, business retirement, employer-sponsored or American Century Investments Brokerage accounts, you are currently not subject to this fee. If you are subject to the Account Maintenance Fee, your account value could be reduced by the fee amount.
Hypothetical Example for Comparison Purposes
The table also provides information about hypothetical account values and hypothetical expenses based on the actual expense ratio of each class of your fund and an assumed rate of return of 5% per year before expenses, which is not the actual return of a fund’s share class. The hypothetical account values and expenses may not be used to estimate the actual ending account balance or expenses you paid for the period. You may use this information to compare the ongoing costs of investing in your fund and other funds. To do so, compare this 5% hypothetical example with the 5% hypothetical examples that appear in the shareholder reports of the other funds.
Please note that the expenses shown in the table are meant to highlight your ongoing costs only and do not reflect any transactional costs, such as sales charges (loads) or redemption/exchange fees. Therefore, the table is useful in comparing ongoing costs only, and will not help you determine the relative total costs of owning different funds. In addition, if these transactional costs were included, your costs would have been higher.
|
| | | | |
| | Beginning
Account Value
10/1/18 | Ending
Account Value
3/31/19 | Expenses Paid
During Period(1)
10/1/18 - 3/31/19 |
Annualized
Expense Ratio(1) |
| Actual | | | | |
| Investor Class | $1,000 | $1,013.00 | $2.86 | 0.57% |
| I Class | $1,000 | $1,013.50 | $2.36 | 0.47% |
| Y Class | $1,000 | $1,013.00 | $1.86 | 0.37% |
| A Class | $1,000 | $1,011.80 | $4.11 | 0.82% |
| C Class | $1,000 | $1,007.90 | $7.86 | 1.57% |
| R Class | $1,000 | $1,010.20 | $5.36 | 1.07% |
| R5 Class | $1,000 | $1,014.00 | $1.86 | 0.37% |
| R6 Class | $1,000 | $1,014.30 | $1.61 | 0.32% |
| G Class | $1,000 | $1,014.90 | $0.05 | 0.01% |
| Hypothetical | | | | |
| Investor Class | $1,000 | $1,022.09 | $2.87 | 0.57% |
| I Class | $1,000 | $1,022.59 | $2.37 | 0.47% |
| Y Class | $1,000 | $1,023.09 | $1.87 | 0.37% |
| A Class | $1,000 | $1,020.84 | $4.13 | 0.82% |
| C Class | $1,000 | $1,017.10 | $7.90 | 1.57% |
| R Class | $1,000 | $1,019.60 | $5.39 | 1.07% |
| R5 Class | $1,000 | $1,023.09 | $1.87 | 0.37% |
| R6 Class | $1,000 | $1,023.34 | $1.61 | 0.32% |
| G Class | $1,000 | $1,024.88 | $0.05 | 0.01% |
| |
| (1) | Expenses are equal to the class's annualized expense ratio listed in the table above, multiplied by the average account value over the period, multiplied by 182, the number of days in the most recent fiscal half-year, divided by 365, to reflect the one-half year period. Annualized expense ratio reflects actual expenses, including any applicable fee waivers or expense reimbursements and excluding any acquired fund fees and expenses. |
MARCH 31, 2019
|
| | | | | | |
| | Principal Amount | Value |
| U.S. TREASURY SECURITIES — 83.5% | | |
U.S. Treasury Inflation Indexed Notes, 0.125%, 4/15/20(1) | $ | 62,556,852 |
| $ | 62,275,258 |
|
| U.S. Treasury Inflation Indexed Notes, 1.125%, 1/15/21 | 71,341,540 |
| 72,274,963 |
|
| U.S. Treasury Inflation Indexed Notes, 0.125%, 4/15/21 | 355,783,400 |
| 353,082,257 |
|
| U.S. Treasury Inflation Indexed Notes, 0.625%, 7/15/21 | 50,256,450 |
| 50,722,198 |
|
| U.S. Treasury Inflation Indexed Notes, 0.125%, 1/15/22 | 121,387,898 |
| 120,469,009 |
|
| U.S. Treasury Inflation Indexed Notes, 0.125%, 4/15/22 | 101,431,960 |
| 100,421,849 |
|
| U.S. Treasury Inflation Indexed Notes, 0.125%, 7/15/22 | 6,129,648 |
| 6,100,379 |
|
| U.S. Treasury Inflation Indexed Notes, 0.125%, 1/15/23 | 191,928,000 |
| 189,850,099 |
|
| U.S. Treasury Inflation Indexed Notes, 0.625%, 4/15/23 | 84,413,721 |
| 85,045,817 |
|
| U.S. Treasury Inflation Indexed Notes, 0.375%, 7/15/23 | 40,560,750 |
| 40,685,529 |
|
| U.S. Treasury Inflation Indexed Notes, 0.625%, 1/15/24 | 200,653,080 |
| 202,709,921 |
|
| U.S. Treasury Inflation Indexed Notes, 0.25%, 1/15/25 | 47,504,031 |
| 47,032,708 |
|
TOTAL U.S. TREASURY SECURITIES
(Cost $1,331,255,506) | | 1,330,669,987 |
|
| ASSET-BACKED SECURITIES — 4.2% | | |
Avis Budget Rental Car Funding AESOP LLC, Series 2014-1A, Class A SEQ, 2.46%, 7/20/20(2) | 3,466,667 |
| 3,463,970 |
|
Avis Budget Rental Car Funding AESOP LLC, Series 2015-2A, Class B, 3.42%, 12/20/21(2) | 2,625,000 |
| 2,622,378 |
|
BRE Grand Islander Timeshare Issuer LLC, Series 2017-1A, Class B, 3.24%, 5/25/29(2) | 1,285,663 |
| 1,269,176 |
|
Colony Starwood Homes, Series 2016-2A, Class A, VRN, 3.73%, (1-month LIBOR plus 1.25%), 12/17/33(2) | 3,543,724 |
| 3,546,951 |
|
Enterprise Fleet Financing LLC, Series 2016-2, Class A2 SEQ, 1.74%, 2/22/22(2) | 1,148,475 |
| 1,145,858 |
|
Hilton Grand Vacations Trust, Series 2013-A, Class A SEQ, 2.28%, 1/25/26(2) | 171,474 |
| 171,044 |
|
Hilton Grand Vacations Trust, Series 2014-AA, Class A SEQ, 1.77%, 11/25/26(2) | 703,796 |
| 696,803 |
|
Hilton Grand Vacations Trust, Series 2017-AA, Class A SEQ, 2.66%, 12/26/28(2) | 1,387,623 |
| 1,377,735 |
|
Invitation Homes Trust, Series 2018-SFR1, Class B, VRN, 3.43%, (1-month LIBOR plus 0.95%), 3/17/37(2) | 3,875,000 |
| 3,831,418 |
|
Invitation Homes Trust, Series 2018-SFR3, Class B, VRN, 3.63%, (1-month LIBOR plus 1.15%), 7/17/37(2) | 6,600,000 |
| 6,615,707 |
|
Invitation Homes Trust, Series 2018-SFR4, Class B, VRN, 3.73%, (1-month LIBOR plus 1.25%), 1/17/38(2) | 10,900,000 |
| 10,935,228 |
|
MVW Owner Trust, Series 2015-1A, Class A SEQ, 2.52%, 12/20/32(2) | 666,614 |
| 659,946 |
|
MVW Owner Trust, Series 2016-1A, Class A SEQ, 2.25%, 12/20/33(2) | 1,141,660 |
| 1,122,357 |
|
Progress Residential Trust, Series 2016-SFR2, Class A SEQ, VRN, 3.88%, (1-month LIBOR plus 1.40%), 1/17/34(2) | 2,447,586 |
| 2,455,276 |
|
Progress Residential Trust, Series 2018-SFR3, Class A SEQ, 3.88%, 10/17/35(2) | 7,063,000 |
| 7,271,648 |
|
Sierra Timeshare Conduit Receivables Funding LLC, Series 2017-1A, Class A SEQ, 2.91%, 3/20/34(2) | 1,286,928 |
| 1,277,823 |
|
Sierra Timeshare Receivables Funding LLC, Series 2015-1A, Class A SEQ, 2.40%, 3/22/32(2) | 325,188 |
| 323,821 |
|
|
| | | | | | |
| | Principal Amount | Value |
Sierra Timeshare Receivables Funding LLC, Series 2015-3A, Class A SEQ, 2.58%, 9/20/32(2) | $ | 1,369,098 |
| $ | 1,363,418 |
|
Sierra Timeshare Receivables Funding LLC, Series 2016-2A, Class A SEQ, 2.33%, 7/20/33(2) | 989,859 |
| 976,534 |
|
Sierra Timeshare Receivables Funding LLC, Series 2018-3A, Class B, 3.87%, 9/20/35(2) | 2,982,895 |
| 3,031,520 |
|
| Towd Point Mortgage Trust, Series 2017-3, Class M1, VRN, 3.50%, 7/25/57 | 5,000,000 |
| 4,933,478 |
|
Towd Point Mortgage Trust, Series 2018-1, Class A1 SEQ, VRN, 3.00%, 1/25/58(2) | 2,034,969 |
| 2,019,193 |
|
VSE VOI Mortgage LLC, Series 2016-A, Class A SEQ, 2.54%, 7/20/33(2) | 1,725,898 |
| 1,707,584 |
|
VSE VOI Mortgage LLC, Series 2017-A, Class A SEQ, 2.33%, 3/20/35(2) | 3,820,047 |
| 3,754,541 |
|
TOTAL ASSET-BACKED SECURITIES
(Cost $66,589,735) | | 66,573,407 |
|
| COLLATERALIZED LOAN OBLIGATIONS — 2.6% | | |
Ares XXXIIR CLO Ltd., Series 2014-32RA, Class A2A, VRN, 4.23%, (3-month LIBOR plus 1.55%), 5/15/30(2) | 3,250,000 |
| 3,209,434 |
|
Bean Creek CLO Ltd., Series 2015-1A, Class BR, VRN, 4.21%, (3-month LIBOR plus 1.45%), 4/20/31(2) | 3,300,000 |
| 3,230,624 |
|
Carlyle Global Market Strategies CLO Ltd., Series 2014-2RA, Class A3, VRN, 4.18%, (3-month LIBOR plus 1.50%), 5/15/31(2) | 4,525,000 |
| 4,448,289 |
|
CBAM Ltd., Series 2018-5A, Class A, VRN, 3.79%, (3-month LIBOR plus 1.02%), 4/17/31(2) | 2,175,000 |
| 2,139,239 |
|
CBAM Ltd., Series 2018-5A, Class B1, VRN, 4.17%, (3-month LIBOR plus 1.40%), 4/17/31(2) | 2,275,000 |
| 2,202,248 |
|
CIFC Funding Ltd., Series 2013-3RA, Class A2, VRN, 4.18%, (3-month LIBOR plus 1.40%), 4/24/31(2) | 2,500,000 |
| 2,449,765 |
|
Dryden 41 Senior Loan Fund, Series 2015-41A, Class AR, VRN, 3.76%, (3-month LIBOR plus 0.97%), 4/15/31(2) | 1,475,000 |
| 1,449,919 |
|
Goldentree Loan Management US CLO 3 Ltd., Series 2018-3A, Class B1, VRN, 4.31%, (3-month LIBOR plus 1.55%), 4/20/30(2) | 3,000,000 |
| 2,958,150 |
|
KKR CLO Ltd., Series 22A, Class B, VRN, 4.36%, (3-month LIBOR plus 1.60%), 7/20/31(2) | 3,325,000 |
| 3,266,280 |
|
Madison Park Funding XIII Ltd., Series 2014-13A, Class BR2, VRN, 4.26%, (3-month LIBOR plus 1.50%), 4/19/30(2) | 4,150,000 |
| 4,110,212 |
|
Magnetite VIII Ltd., Series 2014-8A, Class BR2, VRN, 4.29%, (3-month LIBOR plus 1.50%), 4/15/31(2) | 3,300,000 |
| 3,261,787 |
|
Sounds Point CLO IV-R Ltd., Series 2013-3RA, Class B, VRN, 4.53%, (3-month LIBOR plus 1.75%), 4/18/31(2) | 3,300,000 |
| 3,299,559 |
|
Symphony CLO XIX Ltd., Series 2018-19A, Class A, VRN, 3.74%, (3-month LIBOR plus 0.96%), 4/16/31(2) | 5,500,000 |
| 5,411,572 |
|
TOTAL COLLATERALIZED LOAN OBLIGATIONS
(Cost $42,053,062) | | 41,437,078 |
|
| CORPORATE BONDS — 2.5% | | |
Auto Components† | | |
ZF North America Capital, Inc., 4.00%, 4/29/20(2) | 644,000 |
| 644,514 |
|
| Banks — 0.2% | | |
Banco de Credito del Peru, 2.25%, 10/25/19(2) | 1,400,000 |
| 1,396,920 |
|
| QNB Finansbank AS, MTN, 6.25%, 4/30/19 | 2,200,000 |
| 2,200,330 |
|
| | | 3,597,250 |
|
Commercial Services and Supplies† | | |
Nielsen Finance LLC / Nielsen Finance Co., 5.00%, 4/15/22(2) | 650,000 |
| 646,750 |
|
|
| | | | | | |
| | Principal Amount | Value |
| Containers and Packaging — 0.3% | | |
Ardagh Packaging Finance plc / Ardagh Holdings USA, Inc., 4.625%, 5/15/23(2) | $ | 2,000,000 |
| $ | 2,017,500 |
|
| Ball Corp., 4.375%, 12/15/20 | 950,000 |
| 966,625 |
|
| Reynolds Group Issuer, Inc. / Reynolds Group Issuer LLC / Reynolds Group Issuer Lu, 5.75%, 10/15/20 | 998,181 |
| 1,000,676 |
|
| | | 3,984,801 |
|
| Health Care Providers and Services — 0.6% | | |
| DaVita, Inc., 5.75%, 8/15/22 | 1,515,000 |
| 1,547,194 |
|
Fresenius Medical Care US Finance II, Inc., 4.125%, 10/15/20(2) | 1,580,000 |
| 1,594,123 |
|
| HCA, Inc., 4.25%, 10/15/19 | 3,280,000 |
| 3,297,258 |
|
| Tenet Healthcare Corp., 4.75%, 6/1/20 | 2,370,000 |
| 2,408,513 |
|
| | | 8,847,088 |
|
Hotels, Restaurants and Leisure† | | |
1011778 BC ULC / New Red Finance, Inc., 4.625%, 1/15/22(2) | 580,000 |
| 584,182 |
|
| Household Durables — 0.2% | | |
| Lennar Corp., 2.95%, 11/29/20 | 2,350,000 |
| 2,341,187 |
|
| Life Sciences Tools and Services — 0.2% | | |
IQVIA, Inc., 4.875%, 5/15/23(2) | 2,530,000 |
| 2,587,178 |
|
| Media — 0.3% | | |
| CCO Holdings LLC / CCO Holdings Capital Corp., 5.125%, 2/15/23 | 2,380,000 |
| 2,427,600 |
|
Sirius XM Radio, Inc., 6.00%, 7/15/24(2) | 2,450,000 |
| 2,548,000 |
|
| | | 4,975,600 |
|
| Metals and Mining — 0.1% | | |
| Steel Dynamics, Inc., 5.25%, 4/15/23 | 1,500,000 |
| 1,530,000 |
|
Multi-Utilities† | | |
| IPALCO Enterprises, Inc., 3.45%, 7/15/20 | 700,000 |
| 700,657 |
|
| Oil, Gas and Consumable Fuels — 0.3% | | |
| Encana Corp., 3.90%, 11/15/21 | 1,100,000 |
| 1,120,586 |
|
| Energy Transfer Operating LP, 7.50%, 10/15/20 | 727,000 |
| 774,303 |
|
| Petroleos Mexicanos, 6.00%, 3/5/20 | 160,000 |
| 163,872 |
|
| Petroleos Mexicanos, 6.375%, 2/4/21 | 2,700,000 |
| 2,806,650 |
|
| | | 4,865,411 |
|
| Semiconductors and Semiconductor Equipment — 0.1% | | |
NXP BV / NXP Funding LLC, 4.125%, 6/15/20(2) | 1,050,000 |
| 1,065,866 |
|
| Technology Hardware, Storage and Peripherals — 0.2% | | |
Dell International LLC / EMC Corp., 5.875%, 6/15/21(2) | 900,000 |
| 917,238 |
|
| EMC Corp., 2.65%, 6/1/20 | 1,950,000 |
| 1,935,841 |
|
| Seagate HDD Cayman, 4.25%, 3/1/22 | 667,000 |
| 669,304 |
|
| | | 3,522,383 |
|
TOTAL CORPORATE BONDS
(Cost $40,179,096) | | 39,892,867 |
|
| COLLATERALIZED MORTGAGE OBLIGATIONS — 2.5% | | |
| Private Sponsor Collateralized Mortgage Obligations — 2.1% | | |
| ABN Amro Mortgage Corp., Series 2003-6, Class 1A4, 5.50%, 5/25/33 | 53,863 |
| 56,248 |
|
| Bear Stearns Adjustable Rate Mortgage Trust, Series 2004-12, Class 2A1, VRN, 4.34%, 2/25/35 | 404,599 |
| 409,742 |
|
|
| | | | | | |
| | Principal Amount | Value |
| Bear Stearns Adjustable Rate Mortgage Trust, Series 2004-8, Class 2A1, VRN, 4.23%, 11/25/34 | $ | 669,748 |
| $ | 654,465 |
|
| Bear Stearns Adjustable Rate Mortgage Trust, Series 2006-1, Class A1, VRN, 4.91%, (1-year H15T1Y plus 2.25%), 2/25/36 | 836,643 |
| 846,003 |
|
| Citigroup Mortgage Loan Trust, Inc., Series 2004-UST1, Class A4, VRN, 4.45%, 8/25/34 | 280,274 |
| 274,175 |
|
| Citigroup Mortgage Loan Trust, Inc., Series 2005-4, Class A, VRN, 4.48%, 8/25/35 | 327,386 |
| 332,325 |
|
| Countrywide Home Loan Mortgage Pass-Through Trust, Series 2004-4, Class A19, 5.25%, 5/25/34 | 440,040 |
| 448,409 |
|
| First Horizon Mortgage Pass-Through Trust, Series 2005-AR3, Class 4A1, VRN, 4.39%, 8/25/35 | 377,114 |
| 380,372 |
|
| First Horizon Mortgage Pass-Through Trust, Series 2006-AR4, Class 1A2, VRN, 4.68%, 1/25/37 | 469,087 |
| 420,100 |
|
| GSR Mortgage Loan Trust, Series 2005-6F, Class 1A5 SEQ, 5.25%, 7/25/35 | 507,434 |
| 530,873 |
|
| GSR Mortgage Loan Trust, Series 2005-AR6, Class 2A1, VRN, 4.52%, 9/25/35 | 339,848 |
| 347,567 |
|
| JPMorgan Mortgage Trust, Series 2005-A6, Class 7A1, VRN, 4.32%, 8/25/35 | 686,767 |
| 666,725 |
|
| JPMorgan Mortgage Trust, Series 2006-A3, Class 7A1, VRN, 4.69%, 4/25/35 | 387,153 |
| 393,509 |
|
| JPMorgan Mortgage Trust, Series 2006-A4, Class 3A1, VRN, 4.14%, 6/25/36 | 451,912 |
| 402,821 |
|
| JPMorgan Mortgage Trust, Series 2006-S1, Class 1A2 SEQ, 6.50%, 4/25/36 | 314,639 |
| 339,821 |
|
| Merrill Lynch Mortgage Investors Trust, Series 2005-A2, Class A1, VRN, 4.45%, 2/25/35 | 124,957 |
| 126,952 |
|
New Residential Mortgage Loan Trust, Series 2017-5A, Class A1, VRN, 3.99%, (1-month LIBOR plus 1.50%), 6/25/57(2) | 3,070,721 |
| 3,126,719 |
|
Sequoia Mortgage Trust, Series 2014-3, Class A14, SEQ, VRN, 3.00%, 10/25/44(2) | 880,242 |
| 866,998 |
|
Sequoia Mortgage Trust, Series 2017-CH1, Class A1, VRN, 4.00%, 8/25/47(2) | 3,709,020 |
| 3,780,012 |
|
Sequoia Mortgage Trust, Series 2018-2, Class A4 SEQ, VRN, 3.50%, 2/25/48(2) | 3,620,660 |
| 3,637,022 |
|
| Structured Adjustable Rate Mortgage Loan Trust, Series 2004-8, Class 2A1, VRN, 4.47%, 7/25/34 | 929,527 |
| 936,743 |
|
| Thornburg Mortgage Securities Trust, Series 2004-3, Class A, VRN, 3.23%, (1-month LIBOR plus 0.74%), 9/25/44 | 471,758 |
| 465,909 |
|
| Thornburg Mortgage Securities Trust, Series 2006-4, Class A2B, VRN, 4.72%, 7/25/36 | 1,323,334 |
| 1,282,596 |
|
| Wells Fargo Mortgage-Backed Securities Trust, Series 2004-Z, Class 2A2, VRN, 4.98%, 12/25/34 | 111,038 |
| 113,585 |
|
| Wells Fargo Mortgage-Backed Securities Trust, Series 2005-17, Class 1A1, 5.50%, 1/25/36 | 614,183 |
| 604,938 |
|
| Wells Fargo Mortgage-Backed Securities Trust, Series 2005-AR10, Class 1A1, VRN, 4.73%, 6/25/35 | 1,011,926 |
| 1,072,078 |
|
| Wells Fargo Mortgage-Backed Securities Trust, Series 2005-AR16, Class 3A2, VRN, 4.97%, 3/25/35 | 429,645 |
| 438,924 |
|
| Wells Fargo Mortgage-Backed Securities Trust, Series 2005-AR4, Class 2A1, VRN, 5.09%, 4/25/35 | 461,384 |
| 468,333 |
|
| Wells Fargo Mortgage-Backed Securities Trust, Series 2006-10, Class A4 SEQ, 6.00%, 8/25/36 | 428,760 |
| 426,741 |
|
| Wells Fargo Mortgage-Backed Securities Trust, Series 2006-13, Class A5, 6.00%, 10/25/36 | 401,691 |
| 397,395 |
|
| Wells Fargo Mortgage-Backed Securities Trust, Series 2006-7, Class 3A1 SEQ, 6.00%, 6/25/36 | 237,517 |
| 236,955 |
|
|
| | | | | | |
| | Principal Amount | Value |
| Wells Fargo Mortgage-Backed Securities Trust, Series 2006-8, Class A9 SEQ, 6.00%, 7/25/36 | $ | 666,266 |
| $ | 667,499 |
|
| Wells Fargo Mortgage-Backed Securities Trust, Series 2006-9, Class 1A9 SEQ, 6.00%, 8/25/36 | 296,440 |
| 293,264 |
|
| Wells Fargo Mortgage-Backed Securities Trust, Series 2006-AR1, Class 2A5 SEQ, VRN, 5.10%, 3/25/36 | 1,216,868 |
| 1,203,444 |
|
| Wells Fargo Mortgage-Backed Securities Trust, Series 2006-AR14, Class 2A1, VRN, 4.75%, 10/25/36 | 640,646 |
| 635,156 |
|
| Wells Fargo Mortgage-Backed Securities Trust, Series 2006-AR15, Class A1, VRN, 4.73%, 10/25/36 | 193,928 |
| 192,030 |
|
| Wells Fargo Mortgage-Backed Securities Trust, Series 2006-AR16, Class A1, VRN, 4.70%, 10/25/36 | 283,001 |
| 280,059 |
|
| Wells Fargo Mortgage-Backed Securities Trust, Series 2006-AR2, Class 2A3, VRN, 4.95%, 3/25/36 | 600,228 |
| 611,021 |
|
| Wells Fargo Mortgage-Backed Securities Trust, Series 2006-AR7, Class 2A1, VRN, 4.42%, 5/25/36 | 336,608 |
| 346,298 |
|
| Wells Fargo Mortgage-Backed Securities Trust, Series 2007-11, Class A3 SEQ, 6.00%, 8/25/37 | 225,203 |
| 224,868 |
|
| Wells Fargo Mortgage-Backed Securities Trust, Series 2007-11, Class A36, 6.00%, 8/25/37 | 610,163 |
| 609,254 |
|
| Wells Fargo Mortgage-Backed Securities Trust, Series 2007-12, Class A7, 5.50%, 9/25/37 | 580,357 |
| 584,884 |
|
| Wells Fargo Mortgage-Backed Securities Trust, Series 2007-13, Class A1, 6.00%, 9/25/37 | 145,692 |
| 145,253 |
|
| Wells Fargo Mortgage-Backed Securities Trust, Series 2007-14, Class 2A2, 5.50%, 10/25/22 | 33,070 |
| 33,624 |
|
| Wells Fargo Mortgage-Backed Securities Trust, Series 2007-15, Class A1, 6.00%, 11/25/37 | 762,304 |
| 762,333 |
|
| Wells Fargo Mortgage-Backed Securities Trust, Series 2007-16, Class 1A1, 6.00%, 12/28/37 | 129,514 |
| 128,829 |
|
| Wells Fargo Mortgage-Backed Securities Trust, Series 2007-2, Class 3A2, SEQ, 5.25%, 3/25/37 | 303,639 |
| 312,137 |
|
| Wells Fargo Mortgage-Backed Securities Trust, Series 2007-4, Class A15, 6.00%, 4/25/37 | 345,887 |
| 346,142 |
|
| Wells Fargo Mortgage-Backed Securities Trust, Series 2007-8, Class 2A2, 6.00%, 7/25/37 | 846,320 |
| 839,947 |
|
| Wells Fargo Mortgage-Backed Securities Trust, Series 2007-AR10, Class 1A1, VRN, 4.91%, 1/25/38 | 152,518 |
| 147,146 |
|
| Wells Fargo Mortgage-Backed Securities Trust, Series 2008-1, Class 4A1, 5.75%, 2/25/38 | 267,488 |
| 281,815 |
|
WinWater Mortgage Loan Trust, Series 2014-1, Class A4 SEQ, VRN, 3.50%, 6/20/44(2) | 308,494 |
| 312,051 |
|
| | | 33,442,109 |
|
| U.S. Government Agency Collateralized Mortgage Obligations — 0.4% |
| FNMA, Series 2014-C02, Class 1M2, VRN, 5.09%, (1-month LIBOR plus 2.60%), 5/25/24 | 1,550,000 |
| 1,626,301 |
|
| FNMA, Series 2014-C02, Class 2M2, VRN, 5.09%, (1-month LIBOR plus 2.60%), 5/25/24 | 2,387,910 |
| 2,480,428 |
|
| FNMA, Series 2016-C03, Class 2M2, VRN, 8.39%, (1-month LIBOR plus 5.90%), 10/25/28 | 1,892,886 |
| 2,143,111 |
|
| | | 6,249,840 |
|
TOTAL COLLATERALIZED MORTGAGE OBLIGATIONS
(Cost $39,167,872) | | 39,691,949 |
|
|
| | | | | | |
| | Principal Amount | Value |
BANK LOAN OBLIGATIONS(3) — 0.9% |
| Diversified Telecommunication Services — 0.2% | | |
| Level 3 Financing Inc., 2017 Term Loan B, 4.74%, (3-month LIBOR plus 2.25%), 2/22/24 | $ | 1,680,000 |
| $ | 1,662,671 |
|
| Zayo Group, LLC, 2017 Incremental Term Loan, 4.75%, (1-month LIBOR plus 2.25%), 1/19/24 | 2,350,000 |
| 2,340,365 |
|
| | | 4,003,036 |
|
| Food Products — 0.1% | | |
| Post Holdings Inc., 2017 Series A Incremental Term Loan, 4.49%, (1-month LIBOR plus 2.00%), 5/24/24 | 252,943 |
| 251,146 |
|
| Post Holdings Inc., 2017 Series A Incremental Term Loan, 4.49%, (1-month LIBOR plus 2.00%), 5/24/24 | 817,264 |
| 811,457 |
|
| | | 1,062,603 |
|
Health Care Providers and Services† | | |
| HCA Inc., 2018 Term Loan B10, 4.50%, (1-month LIBOR plus 2.00%), 3/13/25 | 329,844 |
| 329,872 |
|
| Hotels, Restaurants and Leisure — 0.2% | | |
| Hilton Worldwide Finance, LLC, Term Loan B2, 4.24%, (1-month LIBOR plus 1.75%), 10/25/23 | 1,979,609 |
| 1,977,293 |
|
| MGM Growth Properties Operating Partnership LP, 2016 Term Loan B, 4.50%, (1-month LIBOR plus 2.00%), 3/21/25 | 1,323,858 |
| 1,307,906 |
|
| | | 3,285,199 |
|
| Independent Power and Renewable Electricity Producers — 0.2% |
| NRG Energy, Inc., 2016 Term Loan B, 4.25%, (1-month LIBOR plus 1.75%), 6/30/23 | 2,778,571 |
| 2,750,313 |
|
| Media — 0.1% | | |
| Charter Communications Operating, LLC, 2017 Term Loan B, 4.50%, (1-month LIBOR plus 2.00%), 4/30/25 | 1,790,932 |
| 1,781,198 |
|
| Technology Hardware, Storage and Peripherals — 0.1% | | |
| Dell International LLC, 2017 Term Loan B, 4.50%, (1-month LIBOR plus 2.00%), 9/7/23 | 268,496 |
| 265,790 |
|
| Western Digital Corporation, 2018 Term Loan B4, 4.25%, (1-month LIBOR plus 1.75%), 4/29/23 | 1,320,042 |
| 1,287,588 |
|
| | | 1,553,378 |
|
TOTAL BANK LOAN OBLIGATIONS
(Cost $14,928,968) | | 14,765,599 |
|
| COMMERCIAL MORTGAGE-BACKED SECURITIES — 0.5% | | |
DBCG Mortgage Trust, Series 2017-BBG, Class A, VRN, 3.18%, (1-month LIBOR plus 0.70%), 6/15/34(2) | 5,800,000 |
| 5,782,428 |
|
Morgan Stanley Capital I Trust, Series 2014-CPT, Class C, VRN, 3.45%, 7/13/29(2) | 2,750,000 |
| 2,765,898 |
|
TOTAL COMMERCIAL MORTGAGE-BACKED SECURITIES
(Cost $8,576,746) | | 8,548,326 |
|
| SOVEREIGN GOVERNMENTS AND AGENCIES — 0.1% | | |
| Argentina — 0.1% | | |
Argentine Republic Government International Bond, 6.875%, 4/22/21
(Cost $2,461,642) | 2,350,000 |
| 2,151,425 |
|
| TEMPORARY CASH INVESTMENTS — 3.0% | | |
Bennington Stark Capital Co. LLC, 2.55%, 4/1/19 (LOC: Societe Generale SA)(2)(4) | 46,887,000 |
| 46,877,232 |
|
|
| | | | | |
| | Shares | Value |
| State Street Institutional U.S. Government Money Market Fund, Premier Class | 12,442 |
| $ | 12,442 |
|
TOTAL TEMPORARY CASH INVESTMENTS
(Cost $46,899,442) | | 46,889,674 |
|
TOTAL INVESTMENT SECURITIES — 99.8%
(Cost $1,592,112,069) | | 1,590,620,312 |
|
| OTHER ASSETS AND LIABILITIES — 0.2% | | 3,331,731 |
|
| TOTAL NET ASSETS — 100.0% | | $ | 1,593,952,043 |
|
|
| | | | | | | | | | | |
| FUTURES CONTRACTS PURCHASED |
| Reference Entity | Contracts | Expiration Date | Notional
Amount | Underlying
Contract
Value | Unrealized Appreciation
(Depreciation) |
| U.S. Treasury 2-Year Notes | 537 | June 2019 | $ | 107,400,000 |
| $ | 114,431,344 |
| $ | 359,597 |
|
|
| | | | | | | | | | | | | | | |
| CENTRALLY CLEARED TOTAL RETURN SWAP AGREEMENTS |
| Floating Rate Index | Pay/Receive Floating
Rate Index | Fixed
Rate | Termination
Date | Notional
Amount | Premiums Paid (Received) | Unrealized
Appreciation
(Depreciation) | Value |
| CPURNSA | Receive | 2.24% | 8/19/19 | $ | 24,500,000 |
| $ | 650 |
| $ | (1,033,878 | ) | $ | (1,033,228 | ) |
| CPURNSA | Receive | 2.06% | 5/2/22 | $ | 22,000,000 |
| 634 |
| (210,956 | ) | (210,322 | ) |
| CPURNSA | Receive | 2.07% | 5/3/22 | $ | 40,000,000 |
| 744 |
| (413,790 | ) | (413,046 | ) |
| CPURNSA | Receive | 2.02% | 5/4/22 | $ | 23,500,000 |
| 643 |
| (178,797 | ) | (178,154 | ) |
| CPURNSA | Receive | 1.93% | 9/5/22 | $ | 18,000,000 |
| (610 | ) | 57,024 |
| 56,414 |
|
| | | | | | $ | 2,061 |
| $ | (1,780,397 | ) | $ | (1,778,336 | ) |
|
| | | | | | | | | | |
| TOTAL RETURN SWAP AGREEMENTS |
| Counterparty | Floating Rate
Index | Pay/Receive
Floating Rate
Index | Fixed Rate | Termination
Date | Notional
Amount | Value* |
Bank of America N.A.(5) | CPURNSA | Receive | 1.41% | 8/27/20 | $ | 40,000,000 |
| $ | 712,337 |
|
Bank of America N.A.(5) | CPURNSA | Receive | 1.49% | 9/3/20 | $ | 9,700,000 |
| 132,719 |
|
| Barclays Bank plc | CPURNSA | Receive | 1.64% | 2/3/20 | $ | 49,000,000 |
| 16,049 |
|
| | | | | | | $ | 861,105 |
|
*Amount represents value and unrealized appreciation (depreciation).
|
| | |
| NOTES TO SCHEDULE OF INVESTMENTS |
| CPURNSA | - | U.S. Consumer Price Index Urban Consumers Not Seasonally Adjusted Index |
| FNMA | - | Federal National Mortgage Association |
| H15T1Y | - | Constant Maturity U.S. Treasury Note Yield Curve Rate Index |
| LIBOR | - | London Interbank Offered Rate |
| LOC | - | Letter of Credit |
| MTN | - | Medium Term Note |
| SEQ | - | Sequential Payer |
| VRN | - | Variable Rate Note. The rate adjusts periodically based upon the terms set forth in the security’s offering documents. The rate shown is effective at the period end and the reference rate and spread, if any, is indicated. |
| |
| † | Category is less than 0.05% of total net assets. |
| |
| (1) | Security, or a portion thereof, has been pledged at the custodian bank or with a broker for collateral requirements on futures contracts and/or swap agreements. At the period end, the aggregate value of securities pledged was $2,899,985. |
| |
| (2) | Security was purchased pursuant to Rule 144A or Section 4(2) under the Securities Act of 1933 and may be sold in transactions exempt from registration, normally to qualified institutional investors. The aggregate value of these securities at the period end was $184,227,638, which represented 11.6% of total net assets. Of these securities, 2.0% of total net assets were deemed illiquid under policies approved by the Board of Trustees. |
| |
| (3) | The interest rate on a bank loan obligation adjusts periodically based on a predetermined schedule. Rate shown is effective at period end. The maturity date on a bank loan obligation may be less than indicated as a result of contractual or optional prepayments. These prepayments cannot be predicted with certainty. |
| |
| (4) | The rate indicated is the yield to maturity at purchase. |
| |
| (5) | Collateral has been received at the custodian for collateral requirements on swap agreements. At the period end, the aggregate value of securities received was $850,566. |
See Notes to Financial Statements.
|
|
| Statement of Assets and Liabilities |
|
| | | |
| MARCH 31, 2019 | |
| Assets | |
| Investment securities, at value (cost of $1,592,112,069) | $ | 1,590,620,312 |
|
| Receivable for investments sold | 16,143 |
|
| Receivable for capital shares sold | 699,975 |
|
| Receivable for variation margin on swap agreements | 205,607 |
|
| Swap agreements, at value | 861,105 |
|
| Interest receivable | 2,515,017 |
|
| | 1,594,918,159 |
|
| | |
| Liabilities | |
| Payable for capital shares redeemed | 334,462 |
|
| Payable for variation margin on futures contracts | 117,469 |
|
| Accrued management fees | 486,916 |
|
| Distribution and service fees payable | 27,269 |
|
| | 966,116 |
|
| | |
| Net Assets | $ | 1,593,952,043 |
|
| | |
| Net Assets Consist of: | |
| Capital paid in | $ | 1,618,150,439 |
|
| Distributable earnings | (24,198,396 | ) |
| | $ | 1,593,952,043 |
|
|
| | | | | | |
| | Net Assets | Shares Outstanding | Net Asset Value Per Share |
| Investor Class |
| $559,790,072 |
| 55,391,722 |
| $10.11 |
| I Class |
| $186,378,257 |
| 18,294,632 |
| $10.19 |
| Y Class |
| $4,471,149 |
| 438,751 |
| $10.19 |
| A Class |
| $24,987,597 |
| 2,497,321 |
| $10.01* |
| C Class |
| $17,768,738 |
| 1,834,211 |
| $9.69 |
| R Class |
| $15,253,030 |
| 1,494,316 |
| $10.21 |
| R5 Class |
| $376,691,084 |
| 36,980,835 |
| $10.19 |
| R6 Class |
| $8,920,065 |
| 875,634 |
| $10.19 |
| G Class |
| $399,692,051 |
| 39,175,586 |
| $10.20 |
*Maximum offering price $10.24 (net asset value divided by 0.9775).
See Notes to Financial Statements.
|
| | | |
| YEAR ENDED MARCH 31, 2019 | |
| Investment Income (Loss) | |
| Income: | |
| Interest | $ | 34,044,234 |
|
| | |
| Expenses: | |
| Management fees | 7,285,986 |
|
| Distribution and service fees: | |
| A Class | 61,567 |
|
| C Class | 207,159 |
|
| R Class | 72,077 |
|
| Trustees' fees and expenses | 115,358 |
|
| Other expenses | 36,104 |
|
| | 7,778,251 |
|
| Fees waived - G Class | (1,339,921 | ) |
| | 6,438,330 |
|
| | |
| Net investment income (loss) | 27,605,904 |
|
| | |
| Realized and Unrealized Gain (Loss) | |
| Net realized gain (loss) on: | |
| Investment transactions | (7,204,930 | ) |
| Forward foreign currency exchange contract transactions | (52,110 | ) |
| Futures contract transactions | 988,746 |
|
| Swap agreement transactions | (363,401 | ) |
| | (6,631,695 | ) |
| | |
| Change in net unrealized appreciation (depreciation) on: | |
| Investments | 10,179,087 |
|
| Forward foreign currency exchange contracts | (391,811 | ) |
| Futures contracts | 359,597 |
|
| Swap agreements | (810,088 | ) |
| | 9,336,785 |
|
| | |
| Net realized and unrealized gain (loss) | 2,705,090 |
|
| | |
| Net Increase (Decrease) in Net Assets Resulting from Operations | $ | 30,310,994 |
|
See Notes to Financial Statements.
|
|
| Statement of Changes in Net Assets |
|
| | | | | | |
| YEARS ENDED MARCH 31, 2019 AND MARCH 31, 2018 |
| Increase (Decrease) in Net Assets | March 31, 2019 | March 31, 2018 |
| Operations | | |
| Net investment income (loss) | $ | 27,605,904 |
| $ | 27,754,402 |
|
| Net realized gain (loss) | (6,631,695 | ) | 2,575,798 |
|
| Change in net unrealized appreciation (depreciation) | 9,336,785 |
| (25,660,640 | ) |
| Net increase (decrease) in net assets resulting from operations | 30,310,994 |
| 4,669,560 |
|
| | | |
| Distributions to Shareholders | | |
| From earnings: | | |
| Investor Class | (13,529,034 | ) | (8,637,793 | ) |
| I Class | (4,638,038 | ) | (1,750,952 | ) |
| Y Class | (57,097 | ) | (82 | ) |
| A Class | (494,557 | ) | (344,340 | ) |
| C Class | (254,024 | ) | (119,975 | ) |
| R Class | (254,623 | ) | (123,639 | ) |
| R5 Class | (9,029,513 | ) | (7,749,744 | ) |
| R6 Class | (251,819 | ) | (3,156,417 | ) |
| G Class | (11,509,794 | ) | (5,883,305 | ) |
| Decrease in net assets from distributions | (40,018,499 | ) | (27,766,247 | ) |
| | | |
| Capital Share Transactions | | |
| Net increase (decrease) in net assets from capital share transactions (Note 5) | (54,072,974 | ) | 152,131,675 |
|
| | | |
| Net increase (decrease) in net assets | (63,780,479 | ) | 129,034,988 |
|
| | | |
| Net Assets | | |
| Beginning of period | 1,657,732,522 |
| 1,528,697,534 |
|
| End of period | $ | 1,593,952,043 |
| $ | 1,657,732,522 |
|
See Notes to Financial Statements.
|
|
| Notes to Financial Statements |
MARCH 31, 2019
1. Organization
American Century Investment Trust (the trust) is registered under the Investment Company Act of 1940, as amended (the 1940 Act), as an open-end management investment company and is organized as a Massachusetts business trust. Short Duration Inflation Protection Bond Fund (the fund) is one fund in a series issued by the trust. The fund’s investment objective is to pursue total return using a strategy that seeks to protect against U.S. inflation.
The fund offers the Investor Class, I Class, Y Class, A Class, C Class, R Class, R5 Class, R6 Class and G Class. The A Class may incur an initial sales charge. The A Class and C Class may be subject to a contingent deferred sales charge. Sale of the I Class and Y Class commenced on April 10, 2017 and sale of the G Class commenced on July 28, 2017.
2. Significant Accounting Policies
The following is a summary of significant accounting policies consistently followed by the fund in preparation of its financial statements. The fund is an investment company and follows accounting and reporting guidance in accordance with accounting principles generally accepted in the United States of America. This may require management to make certain estimates and assumptions at the date of the financial statements. Actual results could differ from these estimates. Management evaluated the impact of events or transactions occurring through the date the financial statements were issued that would merit recognition or disclosure.
Investment Valuations — The fund determines the fair value of its investments and computes its net asset value per share at the close of regular trading (usually 4 p.m. Eastern time) on the New York Stock Exchange (NYSE) on each day the NYSE is open. The Board of Trustees has adopted valuation policies and procedures to guide the investment advisor in the fund’s investment valuation process and to provide methodologies for the oversight of the fund’s pricing function.
Fixed income securities are valued at the evaluated mean as provided by independent pricing services or at the mean of the most recent bid and asked prices as provided by investment dealers. Corporate bonds, U.S. Treasury and Government Agency securities, convertible bonds, bank loan obligations, municipal securities, and sovereign governments and agencies are valued using market models that consider trade data, quotations from dealers and active market makers, relevant yield curve and spread data, creditworthiness, trade data or market information on comparable securities, and other relevant security specific information. Mortgage-related and asset-backed securities are valued based on models that consider trade data, prepayment and default projections, benchmark yield and spread data and estimated cash flows of each tranche of the issuer. Collateralized loan obligations are valued based on discounted cash flow models that consider trade and economic data, prepayment assumptions and default projections. Commercial paper is valued using a curve-based approach that considers money market rates for specific instruments, programs, currencies and maturity points from a variety of active market makers.
Open-end management investment companies are valued at the reported net asset value per share. Exchange-traded futures contracts are valued at the settlement price as provided by the appropriate exchange. Swap agreements are valued at an evaluated mean as provided by independent pricing services or independent brokers. Forward foreign currency exchange contracts are valued at the mean of the appropriate forward exchange rate at the close of the NYSE as provided by an independent pricing service.
If the fund determines that the market price for an investment is not readily available or the valuation methods mentioned above do not reflect an investment’s fair value, such investment is valued as determined in good faith by the Board of Trustees or its delegate, in accordance with policies and procedures adopted by the Board of Trustees. In its determination of fair value, the fund may review several factors including, but not limited to, market information regarding the specific investment or comparable investments and correlation with other investment types, futures indices or general market indicators. Circumstances that may cause the fund to use these procedures to value an investment include, but are not limited to: an investment has been declared in default or is distressed; trading in a security has been suspended during the trading day or a security is not actively trading on its principal exchange; prices received from a regular pricing source are deemed unreliable; or there is a foreign market holiday and no trading occurred.
The fund monitors for significant events occurring after the close of an investment’s primary exchange but before the fund’s net asset value per share is determined. Significant events may include, but are not limited to: corporate announcements and transactions; governmental action and political unrest that could impact a specific investment or an investment sector; or armed conflicts, natural disasters and similar events that could affect investments in a specific country or region.
Security Transactions — Security transactions are accounted for as of the trade date. Net realized gains and losses are determined on the identified cost basis, which is also used for federal income tax purposes.
Investment Income — Interest income is recorded on the accrual basis and includes paydown gain (loss) and accretion of discounts and amortization of premiums. Inflation adjustments related to inflation-linked debt securities are reflected as interest income.
Foreign Currency Translations — All assets and liabilities initially expressed in foreign currencies are translated into U.S. dollars at prevailing exchange rates at period end. The fund may enter into spot foreign currency exchange contracts to facilitate transactions denominated in a foreign currency. Purchases and sales of investment securities, dividend and interest income, spot foreign currency exchange contracts, and expenses are translated at the rates of exchange prevailing on the respective dates of such transactions. Net realized and unrealized foreign currency exchange gains or losses related to investment securities are a component of net realized gain (loss) on investment transactions and change in net unrealized appreciation (depreciation) on investments, respectively.
Segregated Assets — In accordance with the 1940 Act, the fund segregates assets on its books and records to cover certain types of investment securities and other financial instruments. American Century Investment Management, Inc. (ACIM) (the investment advisor) monitors, on a daily basis, the securities segregated to ensure the fund designates a sufficient amount of liquid assets, marked-to-market daily. The fund may also receive assets or be required to pledge assets at the custodian bank or with a broker for collateral requirements.
Income Tax Status — It is the fund’s policy to distribute substantially all net investment income and net realized gains to shareholders and to otherwise qualify as a regulated investment company under provisions of the Internal Revenue Code. Accordingly, no provision has been made for income taxes. The fund files U.S. federal, state, local and non-U.S. tax returns as applicable. The fund's tax returns are subject to examination by the relevant taxing authority until expiration of the applicable statute of limitations, which is generally three years from the date of filing but can be longer in certain jurisdictions. At this time, management believes there are no uncertain tax positions which, based on their technical merit, would not be sustained upon examination and for which it is reasonably possible that the total amounts of unrecognized tax benefits will significantly change in the next twelve months.
Multiple Class — All shares of the fund represent an equal pro rata interest in the net assets of the class to which such shares belong, and have identical voting, dividend, liquidation and other rights and the same terms and conditions, except for class specific expenses and exclusive rights to vote on matters affecting only individual classes. Income, non-class specific expenses, and realized and unrealized capital gains and losses of the fund are allocated to each class of shares based on their relative net assets.
Distributions to Shareholders — Distributions from net investment income, if any, are generally declared and paid quarterly, but may be paid less frequently. Distributions from net realized gains, if any, are generally declared and paid annually.
Indemnifications — Under the trust’s organizational documents, its officers and trustees are indemnified against certain liabilities arising out of the performance of their duties to the fund. In addition, in the normal course of business, the fund enters into contracts that provide general indemnifications. The maximum exposure under these arrangements is unknown as this would involve future claims that may be made against a fund. The risk of material loss from such claims is considered by management to be remote.
3. Fees and Transactions with Related Parties
Certain officers and trustees of the trust are also officers and/or directors of American Century Companies, Inc. (ACC). The trust's investment advisor, ACIM, the trust's distributor, American Century Investment Services, Inc. (ACIS), and the trust's transfer agent, American Century Services, LLC, are wholly owned, directly or indirectly, by ACC. Various funds issued by American Century Asset Allocation Portfolios, Inc. own, in aggregate, 34% of the shares of the fund. Related parties do not invest in the fund for the purpose of exercising management or control.
Management Fees — The trust has entered into a management agreement with ACIM, under which ACIM provides the fund with investment advisory and management services in exchange for a single, unified management fee (the fee) per class. The agreement provides that all expenses of managing and operating the fund, except distribution and service fees, brokerage expenses, taxes, interest, fees and expenses of the independent trustees (including legal counsel fees), and extraordinary expenses, will be paid by ACIM. The fee is computed and accrued daily based on each class's daily net assets and paid monthly in arrears. The difference in the fee among the classes is a result of their separate arrangements for non-Rule 12b-1 shareholder services. It is not the result of any difference in advisory or custodial fees or other expenses related to the management of the fund’s assets, which do not vary by class. The fee consists of (1) an Investment Category Fee based on the daily net assets of the fund and certain other accounts managed by the investment advisor that are in the same broad investment category as the fund and (2) a Complex Fee based on the assets of all the funds in the American Century Investments family of funds. The investment advisor agreed to waive the G Class’s management fee in its entirety. The investment advisor expects this waiver to remain in effect permanently and cannot terminate it without the approval of the Board of Trustees.
The Investment Category Fee range, the Complex Fee range and the effective annual management fee for each class for the period ended March 31, 2019 are as follows:
|
| | | |
| | Investment Category Fee Range | Complex Fee Range | Effective Annual Management Fee |
| Investor Class | 0.2625% to 0.3800% | 0.2500% to 0.3100% | 0.56% |
| I Class | 0.1500% to 0.2100% | 0.46% |
| Y Class | 0.0500% to 0.1100% | 0.36% |
| A Class | 0.2500% to 0.3100% | 0.56% |
| C Class | 0.2500% to 0.3100% | 0.56% |
| R Class | 0.2500% to 0.3100% | 0.56% |
| R5 Class | 0.0500% to 0.1100% | 0.36% |
| R6 Class | 0.0000% to 0.0600% | 0.31% |
| G Class | 0.0000% to 0.0600% | 0.00%(1) |
| |
| (1) | Effective annual management fee before waiver was 0.31%. |
Distribution and Service Fees — The Board of Trustees has adopted a separate Master Distribution and Individual Shareholder Services Plan for each of the A Class, C Class and R Class (collectively the plans), pursuant to Rule 12b-1 of the 1940 Act. The plans provide that the A Class will pay ACIS an annual distribution and service fee of 0.25%. The plans provide that the C Class will pay ACIS an annual distribution and service fee of 1.00%, of which 0.25% is paid for individual shareholder services and 0.75% is paid for distribution services. The plans provide that the R Class will pay ACIS an annual distribution and service fee of 0.50%. The fees are computed and accrued daily based on each class’s daily net assets and paid monthly in arrears. The fees are used to pay financial intermediaries for distribution and individual shareholder services. Fees incurred under the plans during the period ended March 31, 2019 are detailed in the Statement of Operations.
Trustees’ Fees and Expenses — The Board of Trustees is responsible for overseeing the investment advisor’s management and operations of the fund. The trustees receive detailed information about the fund and its investment advisor regularly throughout the year, and meet at least quarterly with management of the investment advisor to review reports about fund operations. The fund’s officers do not receive compensation from the fund.
Interfund Transactions — The fund may enter into security transactions with other American Century Investments funds and other client accounts of the investment advisor, in accordance with the 1940 Act rules and procedures adopted by the Board of Trustees. The rules and procedures require, among other things, that these transactions be effected at the independent current market price of the security. There were no interfund transactions during the period.
4. Investment Transactions
Purchases of investment securities, excluding short-term investments, for the period ended March 31, 2019 totaled $495,247,778, of which $405,297,052 represented U.S. Treasury and Government Agency obligations.
Sales of investment securities, excluding short-term investments, for the period ended March 31, 2019 totaled $563,243,561, of which $478,524,917 represented U.S. Treasury and Government Agency obligations.
5. Capital Share Transactions
Transactions in shares of the fund were as follows (unlimited number of shares authorized):
|
| | | | | | | | | | |
| | Year ended
March 31, 2019 | Year ended
March 31, 2018(1) |
| | Shares | Amount | Shares | Amount |
| Investor Class | | | | |
| Sold | 8,376,795 |
| $ | 84,668,535 |
| 22,049,594 |
| $ | 225,023,197 |
|
| Issued in reinvestment of distributions | 1,357,528 |
| 13,511,281 |
| 845,253 |
| 8,561,739 |
|
| Redeemed | (15,667,583 | ) | (157,715,291 | ) | (17,720,170 | ) | (181,321,846 | ) |
| | (5,933,260 | ) | (59,535,475 | ) | 5,174,677 |
| 52,263,090 |
|
| I Class | | | | |
| Sold | 9,647,354 |
| 98,304,633 |
| 18,475,550 |
| 190,555,472 |
|
| Issued in reinvestment of distributions | 413,802 |
| 4,148,760 |
| 161,705 |
| 1,648,786 |
|
| Redeemed | (7,196,182 | ) | (72,676,457 | ) | (3,207,597 | ) | (32,799,260 | ) |
| | 2,864,974 |
| 29,776,936 |
| 15,429,658 |
| 159,404,998 |
|
| Y Class | | | | |
| Sold | 453,529 |
| 4,616,406 |
| 15,085 |
| 153,944 |
|
| Issued in reinvestment of distributions | 5,723 |
| 57,097 |
| 8 |
| 82 |
|
| Redeemed | (35,594 | ) | (360,515 | ) | — |
| — |
|
| | 423,658 |
| 4,312,988 |
| 15,093 |
| 154,026 |
|
| A Class | | | | |
| Sold | 1,264,895 |
| 12,630,614 |
| 897,212 |
| 9,087,952 |
|
| Issued in reinvestment of distributions | 40,163 |
| 395,548 |
| 27,247 |
| 273,644 |
|
| Redeemed | (1,200,787 | ) | (11,999,092 | ) | (3,124,155 | ) | (31,692,511 | ) |
| | 104,271 |
| 1,027,070 |
| (2,199,696 | ) | (22,330,915 | ) |
| C Class | | | | |
| Sold | 402,028 |
| 3,900,149 |
| 349,236 |
| 3,414,166 |
|
| Issued in reinvestment of distributions | 23,837 |
| 227,216 |
| 10,769 |
| 104,710 |
|
| Redeemed | (911,500 | ) | (8,833,024 | ) | (822,597 | ) | (8,065,585 | ) |
| | (485,635 | ) | (4,705,659 | ) | (462,592 | ) | (4,546,709 | ) |
| R Class | | | | |
| Sold | 657,828 |
| 6,731,539 |
| 399,088 |
| 4,113,234 |
|
| Issued in reinvestment of distributions | 20,738 |
| 208,358 |
| 11,693 |
| 119,798 |
|
| Redeemed | (463,304 | ) | (4,725,025 | ) | (288,491 | ) | (2,978,221 | ) |
| | 215,262 |
| 2,214,872 |
| 122,290 |
| 1,254,811 |
|
| R5 Class | | | | |
| Sold | 8,934,549 |
| 91,219,008 |
| 29,643,482 |
| 305,489,110 |
|
| Issued in reinvestment of distributions | 880,366 |
| 8,820,400 |
| 742,898 |
| 7,592,935 |
|
| Redeemed | (6,032,967 | ) | (61,029,129 | ) | (61,126,668 | ) | (630,575,303 | ) |
| | 3,781,948 |
| 39,010,279 |
| (30,740,288 | ) | (317,493,258 | ) |
| R6 Class | | | | |
| Sold | 552,330 |
| 5,622,664 |
| 4,811,283 |
| 49,638,018 |
|
| Issued in reinvestment of distributions | 22,160 |
| 221,974 |
| 309,058 |
| 3,156,417 |
|
| Redeemed | (507,609 | ) | (5,154,511 | ) | (23,506,883 | ) | (240,839,763 | ) |
| | 66,881 |
| 690,127 |
| (18,386,542 | ) | (188,045,328 | ) |
|
| | | | | | | | | | |
| | Year ended
March 31, 2019 | Year ended
March 31, 2018(1) |
| | Shares | Amount | Shares | Amount |
| G Class | | | | |
| Sold | 2,770,629 |
| $ | 28,154,792 |
| 49,271,579 |
| $ | 508,047,160 |
|
| Issued in reinvestment of distributions | 1,145,461 |
| 11,509,794 |
| 577,361 |
| 5,883,305 |
|
| Redeemed | (10,462,037 | ) | (106,528,698 | ) | (4,127,407 | ) | (42,459,505 | ) |
| | (6,545,947 | ) | (66,864,112 | ) | 45,721,533 |
| 471,470,960 |
|
| Net increase (decrease) | (5,507,848 | ) | $ | (54,072,974 | ) | 14,674,133 |
| $ | 152,131,675 |
|
| |
| (1) | April 10, 2017 (commencement of sale) through March 31, 2018 for the I Class and Y Class and July 28, 2017 (commencement of sale) through March 31, 2018 for the G Class. |
6. Fair Value Measurements
The fund’s investments valuation process is based on several considerations and may use multiple inputs to determine the fair value of the investments held by the fund. In conformity with accounting principles generally accepted in the United States of America, the inputs used to determine a valuation are classified into three broad levels.
| |
| • | Level 1 valuation inputs consist of unadjusted quoted prices in an active market for identical investments. |
| |
| • | Level 2 valuation inputs consist of direct or indirect observable market data (including quoted prices for comparable investments, evaluations of subsequent market events, interest rates, prepayment speeds, credit risk, etc.). These inputs also consist of quoted prices for identical investments initially expressed in local currencies that are adjusted through translation into U.S. dollars. |
| |
| • | Level 3 valuation inputs consist of unobservable data (including a fund’s own assumptions). |
The level classification is based on the lowest level input that is significant to the fair valuation measurement. The valuation inputs are not necessarily an indication of the risks associated with investing in these securities or other financial instruments.
The following is a summary of the level classifications as of period end. The Schedule of Investments provides additional information on the fund’s portfolio holdings.
|
| | | | | | | | |
| | Level 1 | Level 2 | Level 3 |
| Assets | | | |
| Investment Securities | | | |
| U.S. Treasury Securities | — |
| $ | 1,330,669,987 |
| — |
|
| Asset-Backed Securities | — |
| 66,573,407 |
| — |
|
| Collateralized Loan Obligations | — |
| 41,437,078 |
| — |
|
| Corporate Bonds | — |
| 39,892,867 |
| — |
|
| Collateralized Mortgage Obligations | — |
| 39,691,949 |
| — |
|
| Bank Loan Obligations | — |
| 14,765,599 |
| — |
|
| Commercial Mortgage-Backed Securities | — |
| 8,548,326 |
| — |
|
| Sovereign Governments and Agencies | — |
| 2,151,425 |
| — |
|
| Temporary Cash Investments | $ | 12,442 |
| 46,877,232 |
| — |
|
| | $ | 12,442 |
| $ | 1,590,607,870 |
| — |
|
| Other Financial Instruments | | | |
| Futures Contracts | $ | 359,597 |
| — |
| — |
|
| Swap Agreements | — |
| $ | 917,519 |
| — |
|
| | $ | 359,597 |
| $ | 917,519 |
| — |
|
| | | | |
| Liabilities | | | |
| Other Financial Instruments | | | |
| Swap Agreements | — |
| $ | 1,834,750 |
| — |
|
7. Derivative Instruments
Credit Risk — The fund is subject to credit risk in the normal course of pursuing its investment objectives. The value of a bond generally declines as the credit quality of its issuer declines. Credit default swap agreements enable a fund to buy/sell protection against a credit event of a specific issuer or index. A fund may attempt to enhance returns by selling protection or attempt to mitigate credit risk by buying protection. The buyer/seller of credit protection against a security or basket of securities may pay/receive an up-front or periodic payment to compensate for/against potential default events. Changes in value, including the periodic amounts of interest to be paid or received on swap agreements, are recorded as unrealized appreciation (depreciation) on swap agreements. Upon entering into a centrally cleared swap, a fund is required to deposit cash or securities (initial margin) with a financial intermediary in an amount equal to a certain percentage of the notional amount. Subsequent payments (variation margin) are made or received daily, in cash, by a fund. The variation margin is equal to the daily change in the value and is a component of unrealized gains and losses. Realized gain or loss is recorded upon receipt or payment of a periodic settlement or termination of swap agreements. Net realized and unrealized gains or losses occurring during the holding period of swap agreements are a component of net realized gain (loss) on swap agreement transactions and change in net unrealized appreciation (depreciation) on swap agreements, respectively. The risks of entering into swap agreements include the possible lack of liquidity, failure of the counterparty to meet its obligations, and that there may be unfavorable changes in the underlying investments or instruments. The fund's average notional amount held during the period was $49,730,000.
Foreign Currency Risk — The fund is subject to foreign currency exchange rate risk in the normal course of pursuing its investment objectives. The value of foreign investments held by a fund may be significantly affected by changes in foreign currency exchange rates. The dollar value of a foreign security generally decreases when the value of the dollar rises against the foreign currency in which the security is denominated and tends to increase when the value of the dollar declines against such foreign currency. A fund may enter into forward foreign currency exchange contracts to reduce a fund's exposure to foreign currency exchange rate fluctuations or to gain exposure to the fluctuations in the value of foreign currencies. The net U.S. dollar value of foreign currency underlying all contractual commitments held by a fund and the resulting unrealized appreciation or depreciation are determined daily. Realized gain or loss is recorded upon the termination of the contract. Net realized and unrealized gains or losses occurring during the holding period of forward foreign currency exchange contracts are a component of net realized gain (loss) on forward foreign currency exchange contract transactions and change in net unrealized appreciation (depreciation) on forward foreign currency exchange contracts, respectively. A fund bears the risk of an unfavorable change in the foreign currency exchange rate underlying the forward contract. Additionally, losses, up to the fair value, may arise if the counterparties do not perform under the contract terms. The fund's average U.S. dollar exposure to foreign currency risk derivative instruments held during the period was $188,822,835.
Interest Rate Risk — The fund is subject to interest rate risk in the normal course of pursuing its investment objectives. The value of bonds generally declines as interest rates rise. A fund may enter into futures contracts based on a bond index or a specific underlying security. A fund may purchase futures contracts to gain exposure to increases in market value or sell futures contracts to protect against a decline in market value. Upon entering into a futures contract, a fund will segregate cash, cash equivalents or other appropriate liquid securities on its records in amounts sufficient to meet requirements. Subsequent payments (variation margin) are made or received daily, in cash, by a fund. The variation margin is equal to the daily change in the contract value and is recorded as unrealized gains and losses. A fund recognizes a realized gain or loss when the futures contract is closed or expires. Net realized and unrealized gains or losses occurring during the holding period of futures contracts are a component of net realized gain (loss) on futures contract transactions and change in net unrealized appreciation (depreciation) on futures contracts, respectively. One of the risks of entering into futures contracts is the possibility that the change in value of the contract may not correlate with the changes in value of the underlying securities. The fund's average notional exposure to interest rate risk derivative instruments held during the period was $51,916,667 futures contracts purchased.
Other Contracts — A fund may enter into total return swap agreements in order to attempt to obtain or preserve a particular return or spread at a lower cost than obtaining a return or spread through purchases and/or sales of instruments in other markets or gain exposure to certain markets in the most economical way possible. A fund will segregate cash, cash equivalents or other appropriate liquid securities on its records in amounts sufficient to meet requirements. Changes in value, including the periodic amounts of interest to be paid or received on swap agreements, are recorded as unrealized appreciation (depreciation) on swap agreements. Upon entering into a centrally cleared swap, a fund is required to deposit cash or securities (initial margin) with a financial intermediary in an amount equal to a certain percentage of the notional amount. Subsequent payments (variation margin) are made or received daily, in cash, by a fund. The variation margin is equal to the daily change in the value and is a component of unrealized gains and losses. Realized gain or loss is recorded upon receipt or payment of a periodic settlement or termination of swap agreements. Net realized and unrealized gains or losses occurring during the holding period of swap agreements are a component of net realized gain (loss) on swap agreement transactions and change in net unrealized appreciation (depreciation) on swap agreements, respectively. The risks of entering into swap agreements include the possible lack of liquidity, failure of the counterparty to meet its obligations, and that there may be unfavorable changes in the underlying investments or instruments, including inflationary risk. The fund's average notional amount held during the period was $228,700,000.
Value of Derivative Instruments as of March 31, 2019
|
| | | | | | | | |
| | Asset Derivatives | Liability Derivatives |
| Type of Risk Exposure | Location on Statement of Assets and Liabilities | Value | Location on Statement of Assets and Liabilities | Value |
| Other Contracts | Receivable for variation margin on swap agreements* | $ | 205,607 |
| Payable for variation margin on swap agreements* | — |
|
| Interest Rate Risk | Receivable for variation margin on futures contracts* | — |
| Payable for variation margin on futures contracts* | $ | 117,469 |
|
| Other Contracts | Swap agreements | 861,105 |
| Swap agreements | — |
|
| | | $ | 1,066,712 |
| | $ | 117,469 |
|
| |
| * | Included in the unrealized appreciation (depreciation) on futures contracts or centrally cleared swap agreements, as applicable, as reported in the Schedule of Investments. |
Effect of Derivative Instruments on the Statement of Operations for the Year Ended March 31, 2019
|
| | | | | | | | |
| | Net Realized Gain (Loss) | Change in Net Unrealized Appreciation (Depreciation) |
| Type of Risk Exposure | Location on Statement of Operations | Value | Location on Statement of Operations | Value |
| Credit Risk | Net realized gain (loss) on swap agreement transactions | $ | 697,222 |
| Change in net unrealized appreciation (depreciation) on swap agreements | $ | 611,988 |
|
| Foreign Currency Risk | Net realized gain (loss) on forward foreign currency exchange contract transactions | (52,110 | ) | Change in net unrealized appreciation (depreciation) on forward foreign currency exchange contracts | (391,811 | ) |
| Interest Rate Risk | Net realized gain (loss) on futures contract transactions | 988,746 |
| Change in net unrealized appreciation (depreciation) on futures contracts | 359,597 |
|
| Other Contracts | Net realized gain (loss) on swap agreement transactions | (1,060,623 | ) | Change in net unrealized appreciation (depreciation) on swap agreements | (1,422,076 | ) |
| | | $ | 573,235 |
| | $ | (842,302 | ) |
8. Risk Factors
There are certain risks involved in investing in foreign securities. These risks include those resulting from political events (such as civil unrest, national elections and imposition of exchange controls), social and economic events (such as labor strikes and rising inflation), and natural disasters. Securities of foreign issuers may be less liquid and more volatile. Investing in emerging markets or a significant portion of assets in one country or region may accentuate these risks.
9. Federal Tax Information
The tax character of distributions paid during the years ended March 31, 2019 and March 31, 2018 were as follows:
|
| | | | | | |
| | 2019 | 2018 |
| Distributions Paid From | | |
| Ordinary income | $ | 40,018,499 |
| $ | 27,766,247 |
|
| Long-term capital gains | — |
| — |
|
The book-basis character of distributions made during the year from net investment income or net realized gains may differ from their ultimate characterization for federal income tax purposes. These differences reflect the differing character of certain income items and net realized gains and losses for financial statement and tax purposes, and may result in reclassification among certain capital accounts on the financial statements.
As of period end, the federal tax cost of investments and the components of distributable earnings on a tax-basis were as follows:
|
| | | |
| Federal tax cost of investments | $ | 1,592,143,372 |
|
| Gross tax appreciation of investments | $ | 6,874,169 |
|
| Gross tax depreciation of investments | (8,397,229 | ) |
| Net tax appreciation (depreciation) of investments | (1,523,060 | ) |
| Net tax appreciation (depreciation) on derivatives | (919,292 | ) |
| Net tax appreciation (depreciation) | $ | (2,442,352 | ) |
| Undistributed ordinary income | — |
|
| Accumulated short-term capital losses | $ | (6,485,719 | ) |
Accumulated long-term capital losses
| $ | (14,670,377 | ) |
| Late-year ordinary loss deferral | $ | (599,948 | ) |
The difference between book-basis and tax-basis unrealized appreciation (depreciation) is attributable primarily to the realization for tax purposes of unrealized gains (losses) on futures contracts.
Accumulated capital losses represent net capital loss carryovers that may be used to offset future realized capital gains for federal income tax purposes. The capital loss carryovers may be carried forward for an unlimited period. Future capital loss carryover utilization in any given year may be subject to Internal Revenue Code limitations.
Loss deferrals represent certain qualified losses that the fund has elected to treat as having been incurred in the following fiscal year for federal income tax purposes.
10. Recently Issued Accounting Standards
In March 2017, the Financial Accounting Standards Board (FASB) issued Accounting Standards Update No. 2017-08, “Receivables - Nonrefundable Fees and Other Costs (Subtopic 310-20), Premium Amortization on Purchased Callable Debt Securities” (ASU 2017-08). ASU 2017-08 amends the amortization period for certain purchased callable debt securities held at a premium, shortening such period to the earliest call date. The amendments are effective for fiscal years, and interim periods within those fiscal years, beginning after December 15, 2018. Management is currently evaluating the impact that adopting ASU 2017-08 will have on the financial statements.
|
| | | | | | | | | | | | | | | |
| For a Share Outstanding Throughout the Years Ended March 31 (except as noted) | | | | | | | |
| Per-Share Data | | | | | | Ratios and Supplemental Data | | | |
| | | Income From Investment Operations: | | | Ratio to Average Net Assets of: | | | |
| | Net Asset
Value,
Beginning
of Period | Net
Investment
Income
(Loss)(1) | Net
Realized
and
Unrealized
Gain (Loss) | Total From
Investment
Operations | Distributions From Net
Investment
Income | Net Asset
Value,
End
of Period | Total
Return(2) | Operating
Expenses | Operating Expenses (before expense waiver) | Net
Investment
Income
(Loss) | Net
Investment
Income
(Loss) (before expense waiver) | Portfolio
Turnover
Rate | Net
Assets,
End of
Period
(in thousands) |
| Investor Class | | | | | | | | | | | | |
| 2019 | $10.16 | 0.15 | 0.03 | 0.18 | (0.23) | $10.11 | 1.79% | 0.57% | 0.57% | 1.49% | 1.49% | 31% |
| $559,790 |
|
| 2018 | $10.31 | 0.16 | (0.16) | — | (0.15) | $10.16 | 0.05% | 0.57% | 0.57% | 1.52% | 1.52% | 31% |
| $622,940 |
|
| 2017 | $10.14 | 0.17 | 0.04 | 0.21 | (0.04) | $10.31 | 2.11% | 0.57% | 0.57% | 1.69% | 1.69% | 48% |
| $578,775 |
|
| 2016 | $10.06 | 0.05 | 0.03 | 0.08 | — | $10.14 | 0.80% | 0.57% | 0.57% | 0.61% | 0.61% | 36% |
| $507,940 |
|
| 2015 | $10.29 | 0.05 | (0.17) | (0.12) | (0.11) | $10.06 | (1.13)% | 0.57% | 0.57% | 0.35% | 0.35% | 56% |
| $434,166 |
|
| I Class | | | | | | | | | | | | |
| 2019 | $10.24 | 0.15 | 0.04 | 0.19 | (0.24) | $10.19 | 1.87% | 0.47% | 0.47% | 1.59% | 1.59% | 31% |
| $186,378 |
|
2018(3) | $10.38 | 0.15 | (0.13) | 0.02 | (0.16) | $10.24 | 0.22% | 0.47%(4) | 0.47%(4) | 1.51%(4) | 1.51%(4) | 31%(5) |
| $157,963 |
|
| Y Class | | | | | | | | | | | | |
| 2019 | $10.24 | 0.15 | 0.05 | 0.20 | (0.25) | $10.19 | 1.98% | 0.37% | 0.37% | 1.69% | 1.69% | 31% |
| $4,471 |
|
2018(3) | $10.38 | 0.18 | (0.15) | 0.03 | (0.17) | $10.24 | 0.29% | 0.37%(4) | 0.37%(4) | 1.76%(4) | 1.76%(4) | 31%(5) |
| $155 |
|
| A Class | | | | | | | | | | | | |
| 2019 | $10.06 | 0.11 | 0.04 | 0.15 | (0.20) | $10.01 | 1.55% | 0.82% | 0.82% | 1.24% | 1.24% | 31% |
| $24,988 |
|
| 2018 | $10.21 | 0.13 | (0.15) | (0.02) | (0.13) | $10.06 | (0.21)% | 0.82% | 0.82% | 1.27% | 1.27% | 31% |
| $24,073 |
|
| 2017 | $10.04 | 0.15 | 0.04 | 0.19 | (0.02) | $10.21 | 1.87% | 0.82% | 0.82% | 1.44% | 1.44% | 48% |
| $46,885 |
|
| 2016 | $9.98 | 0.10 | (0.04) | 0.06 | — | $10.04 | 0.60% | 0.82% | 0.82% | 0.36% | 0.36% | 36% |
| $53,748 |
|
| 2015 | $10.20 | 0.05 | (0.20) | (0.15) | (0.07) | $9.98 | (1.43)% | 0.82% | 0.82% | 0.10% | 0.10% | 56% |
| $117,032 |
|
|
| | | | | | | | | | | | | | | |
| For a Share Outstanding Throughout the Years Ended March 31 (except as noted) | | | | | | | |
| Per-Share Data | | | | | | Ratios and Supplemental Data | | | |
| | | Income From Investment Operations: | | | Ratio to Average Net Assets of: | | | |
| | Net Asset
Value,
Beginning
of Period | Net
Investment
Income
(Loss)(1) | Net
Realized
and
Unrealized
Gain (Loss) | Total From
Investment
Operations | Distributions From Net
Investment
Income | Net Asset
Value,
End
of Period | Total
Return(2) | Operating
Expenses | Operating Expenses (before expense waiver) | Net
Investment
Income
(Loss) | Net
Investment
Income
(Loss) (before expense waiver) | Portfolio
Turnover
Rate | Net
Assets,
End of
Period
(in thousands) |
| C Class | | | | | | | | | | | | |
| 2019 | $9.74 | 0.05 | 0.03 | 0.08 | (0.13) | $9.69 | 0.80% | 1.57% | 1.57% | 0.49% | 0.49% | 31% |
| $17,769 |
|
| 2018 | $9.89 | 0.05 | (0.15) | (0.10) | (0.05) | $9.74 | (0.99)% | 1.57% | 1.57% | 0.52% | 0.52% | 31% |
| $22,600 |
|
| 2017 | $9.78 | 0.07 | 0.04 | 0.11 | — | $9.89 | 1.12% | 1.57% | 1.57% | 0.69% | 0.69% | 48% |
| $27,511 |
|
| 2016 | $9.80 | (0.02) | — | (0.02) | — | $9.78 | (0.20)% | 1.57% | 1.57% | (0.39)% | (0.39)% | 36% |
| $31,482 |
|
| 2015 | $10.05 | (0.03) | (0.19) | (0.22) | (0.03) | $9.80 | (2.18)% | 1.57% | 1.57% | (0.65)% | (0.65)% | 56% |
| $40,247 |
|
| R Class | | | | | | | | | | | | |
| 2019 | $10.26 | 0.08 | 0.05 | 0.13 | (0.18) | $10.21 | 1.26% | 1.07% | 1.07% | 0.99% | 0.99% | 31% |
| $15,253 |
|
| 2018 | $10.41 | 0.11 | (0.16) | (0.05) | (0.10) | $10.26 | (0.45)% | 1.07% | 1.07% | 1.02% | 1.02% | 31% |
| $13,120 |
|
| 2017 | $10.25 | 0.13 | 0.03 | 0.16 | — | $10.41 | 1.56% | 1.07% | 1.07% | 1.19% | 1.19% | 48% |
| $12,039 |
|
| 2016 | $10.21 | —(6) | 0.04 | 0.04 | — | $10.25 | 0.39% | 1.07% | 1.07% | 0.11% | 0.11% | 36% |
| $13,658 |
|
| 2015 | $10.44 | 0.01 | (0.18) | (0.17) | (0.06) | $10.21 | (1.63)% | 1.07% | 1.07% | (0.15)% | (0.15)% | 56% |
| $17,466 |
|
| R5 Class | | | | | | | | | | | | |
| 2019 | $10.24 | 0.16 | 0.04 | 0.20 | (0.25) | $10.19 | 1.98% | 0.37% | 0.37% | 1.69% | 1.69% | 31% |
| $376,691 |
|
| 2018 | $10.39 | 0.18 | (0.16) | 0.02 | (0.17) | $10.24 | 0.25% | 0.37% | 0.37% | 1.72% | 1.72% | 31% |
| $339,844 |
|
| 2017 | $10.22 | 0.19 | 0.04 | 0.23 | (0.06) | $10.39 | 2.30% | 0.37% | 0.37% | 1.89% | 1.89% | 48% |
| $664,148 |
|
| 2016 | $10.11 | 0.08 | 0.03 | 0.11 | —(6) | $10.22 | 1.10% | 0.37% | 0.37% | 0.81% | 0.81% | 36% |
| $575,649 |
|
| 2015 | $10.36 | 0.03 | (0.13) | (0.10) | (0.15) | $10.11 | (1.01)% | 0.37% | 0.37% | 0.55% | 0.55% | 56% |
| $543,717 |
|
|
| | | | | | | | | | | | | | | |
| For a Share Outstanding Throughout the Years Ended March 31 (except as noted) | | | | | | | |
| Per-Share Data | | | | | | Ratios and Supplemental Data | | | |
| | | Income From Investment Operations: | | | Ratio to Average Net Assets of: | | | |
| | Net Asset
Value,
Beginning
of Period | Net
Investment
Income
(Loss)(1) | Net
Realized
and
Unrealized
Gain (Loss) | Total From
Investment
Operations | Distributions From Net
Investment
Income | Net Asset
Value,
End
of Period | Total
Return(2) | Operating
Expenses | Operating Expenses (before expense waiver) | Net
Investment
Income
(Loss) | Net
Investment
Income
(Loss) (before expense waiver) | Portfolio
Turnover
Rate | Net
Assets,
End of
Period
(in thousands) |
| R6 Class | | | | | | | | | | | | |
| 2019 | $10.24 | 0.16 | 0.04 | 0.20 | (0.25) | $10.19 | 2.03% | 0.32% | 0.32% | 1.74% | 1.74% | 31% |
| $8,920 |
|
| 2018 | $10.38 | 0.18 | (0.14) | 0.04 | (0.18) | $10.24 | 0.29% | 0.32% | 0.32% | 1.77% | 3.54% | 31% |
| $8,280 |
|
| 2017 | $10.22 | 0.20 | 0.03 | 0.23 | (0.07) | $10.38 | 2.35% | 0.32% | 0.32% | 1.94% | 1.94% | 48% |
| $199,340 |
|
| 2016 | $10.11 | 0.06 | 0.06 | 0.12 | (0.01) | $10.22 | 1.15% | 0.32% | 0.32% | 0.86% | 0.86% | 36% |
| $166,472 |
|
| 2015 | $10.36 | (0.07)(7) | (0.03) | (0.10) | (0.15) | $10.11 | (0.94)% | 0.32% | 0.32% | 0.60% | 0.60% | 56% |
| $13,937 |
|
| G Class | | | | | | | | | | | | |
| 2019 | $10.25 | 0.22 | 0.01 | 0.23 | (0.28) | $10.20 | 2.34% | 0.01% | 0.32% | 2.05% | 1.74% | 31% |
| $399,692 |
|
2018(8) | $10.31 | 0.14 | (0.07) | 0.07 | (0.13) | $10.25 | 0.66% | 0.01%(4) | 0.32%(4) | 2.02%(4) | 1.71%(4) | 31%(5) |
| $468,758 |
|
|
| | | | |
| Notes to Financial Highlights | | |
| |
| (1) | Computed using average shares outstanding throughout the period. |
| |
| (2) | Total returns are calculated based on the net asset value of the last business day and do not reflect applicable sales charges, if any. Total returns for periods less than one year are not annualized. |
| |
| (3) | April 10, 2017 (commencement of sale) through March 31, 2018. |
| |
| (5) | Portfolio turnover is calculated at the fund level. Percentage indicated was calculated for the year ended March 31, 2018. |
| |
| (6) | Per-share amount was less than $0.005. |
| |
| (7) | Per-share amount was affected by certain income adjustments and timing of capital share transactions. |
| |
| (8) | July 28, 2017 (commencement of sale) through March 31, 2018. |
See Notes to Financial Statements.
|
|
| Report of Independent Registered Public Accounting Firm |
To the Board of Trustees of American Century Investment Trust and Shareholders of Short Duration Inflation Protection Bond Fund:
Opinion on the Financial Statements
We have audited the accompanying statement of assets and liabilities, including the schedule of investments, of Short Duration Inflation Protection Bond Fund (one of the funds constituting American Century Investment Trust, referred to hereafter as the “Fund”) as of March 31, 2019, the related statement of operations for the year ended March 31, 2019, the statement of changes in net assets for each of the two years in the period ended March 31, 2019, including the related notes, and the financial highlights for each of the periods indicated therein (collectively referred to as the “financial statements”). In our opinion, the financial statements present fairly, in all material respects, the financial position of the Fund as of March 31, 2019, the results of its operations for the year then ended, the changes in its net assets for each of the two years in the period ended March 31, 2019 and the financial highlights for each of the periods indicated therein in conformity with accounting principles generally accepted in the United States of America.
Basis for Opinion
These financial statements are the responsibility of the Fund’s management. Our responsibility is to express an opinion on the Fund’s financial statements based on our audits. We are a public accounting firm registered with the Public Company Accounting Oversight Board (United States) (“PCAOB”) and are required to be independent with respect to the Fund in accordance with the U.S. federal securities laws and the applicable rules and regulations of the Securities and Exchange Commission and the PCAOB.
We conducted our audits of these financial statements in accordance with the standards of the PCAOB. Those standards require that we plan and perform the audit to obtain reasonable assurance about whether the financial statements are free of material misstatement, whether due to error or fraud.
Our audits included performing procedures to assess the risks of material misstatement of the financial statements, whether due to error or fraud, and performing procedures that respond to those risks. Such procedures included examining, on a test basis, evidence regarding the amounts and disclosures in the financial statements. Our audits also included evaluating the accounting principles used and significant estimates made by management, as well as evaluating the overall presentation of the financial statements. Our procedures included confirmation of securities owned as of March 31, 2019 by correspondence with the custodian and brokers; when replies were not received from brokers, we performed other auditing procedures. We believe that our audits provide a reasonable basis for our opinion.
/s/ PricewaterhouseCoopers LLP
Kansas City, Missouri
May 17, 2019
We have served as the auditor of one or more investment companies in American Century Investments since 1997.
Board of Trustees
The individuals listed below serve as trustees of the funds. Each trustee will continue to serve in this capacity until death, retirement, resignation or removal from office. The board has adopted a mandatory retirement age for trustees who are not “interested persons,” as that term is defined in the Investment Company Act (independent trustees). Independent trustees shall retire on December 31 of the year in which they reach their 75th birthday; provided, however, that on or after January 1, 2022, independent trustees shall retire on December 31 of the year in which they reach their 76th birthday.
Mr. Thomas is an “interested person” because he currently serves as President and Chief Executive Officer of American Century Companies, Inc. (ACC), the parent company of American Century Investment Management, Inc. (ACIM or the advisor). The other trustees (more than three-fourths of the total number) are independent. They are not employees, directors or officers of, and have no financial interest in, ACC or any of its wholly owned, direct or indirect, subsidiaries, including ACIM, American Century Investment Services, Inc. (ACIS) and American Century Services, LLC (ACS), and they do not have any other affiliations, positions or relationships that would cause them to be considered “interested persons” under the Investment Company Act. The trustees serve in this capacity for eight (in the case of Jonathan S. Thomas, 16; and Ronald J. Gilson, 9) registered investment companies in the American Century Investments family of funds.
The following table presents additional information about the trustees. The mailing address for each trustee other than Jonathan S. Thomas is 1665 Charleston Road, Mountain View, California 94043. The mailing address for Jonathan S. Thomas is 4500 Main Street, Kansas City, Missouri 64111.
|
| | | | | |
Name
(Year of Birth) | Position(s) Held with Funds | Length of Time Served | Principal Occupation(s) During Past 5 Years | Number of American Century Portfolios Overseen by Trustee | Other Directorships Held During Past 5 Years |
| Independent Trustees |
|
|
Tanya S. Beder
(1955) | Trustee | Since 2011 | Chairman and CEO, SBCC Group Inc. (independent advisory services) (2006 to present) | 45 | CYS Investments, Inc.; Nabors Industries Ltd. |
Jeremy I. Bulow
(1954) | Trustee | Since 2011 | Professor of Economics, Stanford University, Graduate School of Business (1979 to present) | 45 | None |
Anne Casscells
(1958) | Trustee | Since 2016 | Co-Chief Executive Officer and Chief Investment Officer, Aetos Alternatives Management (investment advisory firm) (2001 to present); Lecturer in Accounting, Stanford University, Graduate School of Business (2009 to 2017) | 45 | None |
Ronald J. Gilson
(1946) | Trustee and Chairman of the Board | Since 1995
(Chairman since 2005) | Charles J. Meyers Professor of Law and Business, Emeritus, Stanford Law School (1979 to 2016); Marc and Eva Stern Professor of Law and Business, Columbia University School of Law (1992 to present) | 50 | None |
|
| | | | | |
Name
(Year of Birth) | Position(s) Held with Funds | Length of Time Served | Principal Occupation(s) During Past 5 Years | Number of American Century Portfolios Overseen by Trustee | Other Directorships Held During Past 5 Years |
| Independent Trustees |
|
|
Frederick L. A. Grauer
(1946) | Trustee | Since 2008 | Senior Advisor, Credit Sesame, Inc. (credit monitoring firm) (2018 to present); Senior Advisor, Course Hero (an educational technology company) (2015 to present); Senior Advisor, iShares by BlackRock, Inc. (investment management firm) (2013 to 2015)
| 45 | None |
Jonathan D. Levin
(1972) | Trustee | Since 2016 | Philip H. Knight Professor and Dean, Graduate School of Business, Stanford University (2016 to present); Professor, Stanford University, (2000 to present); Chair, Department of Economics, Stanford University (2011 to 2014) | 45 | None |
Peter F. Pervere
(1947) | Trustee | Since 2007 | Retired | 45 | None |
John B. Shoven
(1947) | Trustee | Since 2002 | Charles R. Schwab Professor of Economics, Stanford University (1973 to present) | 45 | Cadence Design Systems; Exponent; Financial Engines |
| Interested Trustee |
|
|
Jonathan S. Thomas
(1963) | Trustee and President | Since 2007 | President and Chief Executive Officer, ACC (2007 to present). Also serves as Chief Executive Officer, ACS; Executive Vice President, ACIM; Director, ACC, ACIM and other ACC subsidiaries | 117 | BioMed Valley Discoveries, Inc. |
The Statement of Additional Information has additional information about the fund's trustees and is available without charge, upon request, by calling 1-800-345-2021.
Officers
The following table presents certain information about the executive officers of the funds. Each officer serves as an officer for 16 (in the case of Robert J. Leach, 15) investment companies in the American Century family of funds, unless otherwise noted. No officer is compensated for his or her service as an officer of the funds. The listed officers are interested persons of the funds and are appointed or re-appointed on an annual basis. The mailing address for each of the officers listed below is 4500 Main Street, Kansas City, Missouri 64111.
|
| | |
Name
(Year of Birth) | Offices with the Funds | Principal Occupation(s) During the Past Five Years |
Jonathan S. Thomas
(1963) | Trustee and President since 2007 | President and Chief Executive Officer, ACC (2007 to present). Also serves as Chief Executive Officer, ACS; Executive Vice President, ACIM; Director, ACC, ACIM and other ACC subsidiaries |
R. Wes Campbell
(1974)
| Chief Financial Officer and Treasurer since 2018
| Investment Operations and Investment Accounting, ACS (2000 to present) |
Amy D. Shelton
(1964) | Chief Compliance Officer and Vice President since 2014 | Chief Compliance Officer, American Century funds, (2014 to present); Chief Compliance Officer, ACIM (2014 to present); Chief Compliance Officer, ACIS (2009 to present); Vice President, Client Interactions and Marketing, ACIS (2013 to 2014). Also serves as Vice President, ACIS |
Charles A. Etherington
(1957) | General Counsel since 2007 and Senior Vice President since 2006 | Attorney, ACC (1994 to present); Vice President, ACC (2005 to present); General Counsel, ACC (2007 to present). Also serves as General Counsel, ACIM, ACS, ACIS and other ACC subsidiaries; and Senior Vice President, ACIM and ACS |
C. Jean Wade
(1964) | Vice President since 2012 | Senior Vice President, ACS (2017 to present); Vice President ACS (2000 to 2017) |
Robert J. Leach
(1966) | Vice President since 2006 | Vice President, ACS (2000 to present) |
David H. Reinmiller
(1963) | Vice President since 2000 | Attorney, ACC (1994 to present) Also serves as Vice President, ACIM and ACS |
Ward D. Stauffer
(1960) | Secretary since 2005 | Attorney, ACC (2003 to present) |
Retirement Account Information
As required by law, distributions you receive from certain retirement accounts are subject to federal income tax withholding, unless you elect not to have withholding apply*. Tax will be withheld on the total amount withdrawn even though you may be receiving amounts that are not subject to withholding, such as nondeductible contributions. In such case, excess amounts of withholding could occur. You may adjust your withholding election so that a greater or lesser amount will be withheld.
If you don’t want us to withhold on this amount, you must notify us to not withhold the federal income tax. You may notify us in writing or in certain situations by telephone or through other electronic means. For systematic withdrawals, your withholding election will remain in effect until revoked or changed by filing a new election. You have the right to revoke your election at any time and change your withholding percentage for future distributions.
Remember, even if you elect not to have income tax withheld, you are liable for paying income tax on the taxable portion of your withdrawal. If you elect not to have income tax withheld or you don’t have enough income tax withheld, you may be responsible for payment of estimated tax. You may incur penalties under the estimated tax rules if your withholding and estimated tax payments are not sufficient. You can reduce or defer the income tax on a distribution by directly or indirectly rolling such distribution over to another IRA or eligible plan. You should consult your tax advisor for additional information.
State tax will be withheld if, at the time of your distribution, your address is within one of the mandatory withholding states and you have federal income tax withheld (or as otherwise required by state law). State taxes will be withheld from your distribution in accordance with the respective state rules.
*Some 403(b), 457 and qualified retirement plan distributions may be subject to 20% mandatory withholding, as they are subject to special tax and withholding rules. Your plan administrator or plan sponsor is required to provide you with a special tax notice explaining those rules at the time you request a distribution. If applicable, federal and/or state taxes may be withheld from your distribution amount.
Proxy Voting Policies
Descriptions of the principles and policies that the fund's investment advisor uses in exercising the voting rights associated with the securities purchased and/or held by the fund are available without charge, upon request, by calling 1-800-345-2021 or visiting the "About Us" page of American Century Investments’ website at americancentury.com. A description of the policies is also available on the Securities and Exchange Commission’s website at sec.gov. Information regarding how the investment advisor voted proxies relating to portfolio securities during the most recent 12-month period ended June 30 is available on the "About Us" page at americancentury.com. It is also available at sec.gov.
Quarterly Portfolio Disclosure
The fund files its complete schedule of portfolio holdings with the Securities and Exchange Commission (SEC) for the first and third quarters of each fiscal year on Form N-Q or as an exhibit to its reports on Form N-PORT. The fund’s Forms N-Q and Form N-PORT reports are available on the SEC’s website at sec.gov. The fund also makes its complete schedule of portfolio holdings for the most recent quarter of its fiscal year available on its website at americancentury.com and, upon request, by calling 1-800-345-2021.
|
| | |
| |
| | | |
| Contact Us | americancentury.com | |
| Automated Information Line | 1-800-345-8765 | |
| Investor Services Representative | 1-800-345-2021 or 816-531-5575 | |
| Investors Using Advisors | 1-800-378-9878 | |
| Business, Not-For-Profit, Employer-Sponsored Retirement Plans | 1-800-345-3533 | |
| Banks and Trust Companies, Broker-Dealers, Financial Professionals, Insurance Companies | 1-800-345-6488 | |
| Telecommunications Relay Service for the Deaf | 711 | |
| | | |
| American Century Investment Trust | |
| | | |
Investment Advisor: American Century Investment Management, Inc. Kansas City, Missouri | |
| | | |
| This report and the statements it contains are submitted for the general information of our shareholders. The report is not authorized for distribution to prospective investors unless preceded or accompanied by an effective prospectus. | |
| | | |
©2019 American Century Proprietary Holdings, Inc. All rights reserved.
CL-ANN-92282 1905 | |
|
| |
| | |
| | Annual Report |
| | |
| | March 31, 2019 |
| | |
| | Short Duration Strategic Income Fund |
| | Investor Class (ASDVX) |
| | I Class (ASDHX) |
| | Y Class (ASYDX) |
| | A Class (ASADX) |
| | C Class (ASCDX) |
| | R Class (ASDRX) |
| | R5 Class (ASDJX) |
| | R6 Class (ASXDX) |
Beginning on January 1, 2021, as permitted by regulations adopted by the Securities and Exchange Commission, paper copies of the fund’s shareholder reports like this one will no longer be sent by mail, unless you specifically request paper copies of the reports from the fund or from your financial intermediary, such as a broker-dealer or bank. Instead, the reports will be made available on a website, and you will be notified by mail each time a report is posted and provided with a website link to access the report.
If you already elected to receive shareholder reports electronically, you will not be affected by this change and you need not take any action. You may elect to receive shareholder reports and other communications from the fund or your financial intermediary electronically by calling or sending an email request to your appropriate contacts as listed on the back cover of this report.
You may elect to receive all future reports in paper free of charge. You can inform the fund or your financial intermediary that you wish to continue receiving paper copies of your shareholder reports by calling or sending an email request to your appropriate contacts as listed on the back cover of this report. Your election to receive reports in paper will apply to all funds held with the fund complex/your financial intermediary.
|
| | |
| President’s Letter | 2 |
|
| Performance | 3 |
|
| Portfolio Commentary | |
|
| Fund Characteristics | |
|
| Shareholder Fee Example | |
|
| Schedule of Investments | |
|
| Statement of Assets and Liabilities | |
|
| Statement of Operations | |
|
| Statement of Changes in Net Assets | |
|
| Notes to Financial Statements | |
|
| Financial Highlights | |
|
| Report of Independent Registered Public Accounting Firm | |
|
| Management | |
|
| Additional Information | |
|
Any opinions expressed in this report reflect those of the author as of the date of the report, and do not necessarily represent the opinions of American Century Investments® or any other person in the American Century Investments organization. Any such opinions are subject to change at any time based upon market or other conditions and American Century Investments disclaims any responsibility to update such opinions. These opinions may not be relied upon as investment advice and, because investment decisions made by American Century Investments funds are based on numerous factors, may not be relied upon as an indication of trading intent on behalf of any American Century Investments fund. Security examples are used for representational purposes only and are not intended as recommendations to purchase or sell securities. Performance information for comparative indices and securities is provided to American Century Investments by third party vendors. To the best of American Century Investments’ knowledge, such information is accurate at the time of printing.
Jonathan Thomas
Dear Investor:
Thank you for reviewing this annual report for the period ended March 31, 2019. Annual reports help convey important information about fund returns, including market factors that affected performance during the reporting period. For additional, updated investment and market insights, we encourage you to visit our website, americancentury.com.
Markets Ended Roller-Coaster Period on Upswing
For the first half of the period, U.S. stocks climbed higher, while bond returns headed lower. Robust economic growth, bolstered by federal tax and regulatory reform, and record corporate earnings results fueled risk-on sentiment that drove stock prices higher. Meanwhile, the combination of strong economic data, the Federal Reserve’s (Fed’s) ongoing rate-hike campaign and an uptick in inflation pushed investment-grade bond returns lower.
Market trends began changing in late 2018. Mounting investor concerns about slowing global economic and earnings growth, U.S.-China trade tensions and rising interest rates triggered widespread volatility. Stock prices plunged as investors sought safe-haven investments, including U.S. Treasuries. Furthermore, the Fed issued another rate hike in December, its fourth of the year, and maintained its hawkish outlook. Investors feared the December rate increase and the Fed’s plans for two more rate hikes in 2019 were too aggressive, and risk-off investing remained in favor.
January brought a renewed sense of stability to the markets. Investors’ concerns about growth and trade eased, and the Fed changed course, pausing its rate-hike campaign amid moderating global growth and inflation. Valuations appeared attractive after the late-2018 sell-off, and risk-on investing resumed. In March, the Fed held rates steady again, hinting additional tightening was off the table for 2019. This news drove stock and bond returns higher and left both asset classes on an upward track to end the period. Overall, stocks (S&P 500 Index) overcame their late-2018 nosedive to gain 9.50% for the period. Bonds (Bloomberg Barclays U.S. Aggregate Bond Index) bounced back from losses early in the period to return 4.48%.
We expect volatility to remain a formidable factor as investors react to global growth trends, central bank policy and geopolitical developments. We believe this scenario underscores the importance of using professionally managed portfolios in pursuit of investment goals. We appreciate your continued trust and confidence in us.
Sincerely,
Jonathan Thomas
President and Chief Executive Officer
American Century Investments
|
| | | | |
| Total Returns as of March 31, 2019 |
| | | | Average Annual Returns | |
| | Ticker Symbol | 1 year | Since Inception | Inception Date |
| Investor Class | ASDVX | 2.75% | 1.85% | 7/28/14 |
| Bloomberg Barclays U.S. 1-3 Year Government/Credit Bond Index | — | 3.03% | 1.25% | — |
| I Class | ASDHX | 2.75% | 2.10% | 4/10/17 |
| Y Class | ASYDX | 2.92% | 2.24% | 4/10/17 |
| A Class | ASADX | | | 7/28/14 |
| No sales charge | | 2.50% | 1.60% | |
| With sales charge | | 0.19% | 1.10% | |
| C Class | ASCDX | 1.73% | 0.84% | 7/28/14 |
| R Class | ASDRX | 2.24% | 1.34% | 7/28/14 |
| R5 Class | ASDJX | 2.96% | 2.05% | 7/28/14 |
| R6 Class | ASXDX | 3.01% | 2.10% | 7/28/14 |
Fund returns would have been lower if a portion of the fees had not been waived.
Sales charges include initial sales charges and contingent deferred sales charges (CDSCs), as applicable. A Class shares have a 2.25% maximum initial sales charge and may be subject to a maximum CDSC of 1.00%. C Class shares redeemed within 12 months of purchase are subject to a maximum CDSC of 1.00%. The SEC requires that mutual funds provide performance information net of maximum sales charges in all cases where charges could be applied.
Data presented reflect past performance. Past performance is no guarantee of future results. Current performance may be higher or lower than the performance shown. Total returns for periods less than one year are not annualized. Investment return and principal value will fluctuate, and redemption value may be more or less than original cost. Data assumes reinvestment of dividends and capital gains, and none of the charts reflect the deduction of taxes that a shareholder would pay on fund distributions or the redemption of fund shares. To obtain performance data current to the most recent month end, please call 1-800-345-2021 or visit americancentury.com. For additional information about the fund, please consult the prospectus.
|
|
| Growth of $10,000 Over Life of Class |
| $10,000 investment made July 28, 2014 |
Performance for other share classes will vary due to differences in fee structure.
|
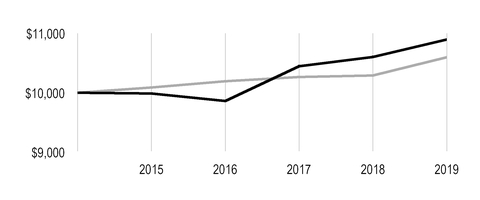
|
| |
| Value on March 31, 2019 |
| | Investor Class — $10,894 |
| |
| | Bloomberg Barclays U.S. 1-3 Year Government/Credit Bond Index — $10,599 |
| |
Ending value of Investor Class would have been lower if a portion of the fees had not been waived.
|
| | | | | | | |
| Total Annual Fund Operating Expenses |
| Investor Class | I Class | Y Class | A Class | C Class | R Class | R5 Class | R6 Class |
| 0.64% | 0.54% | 0.44% | 0.89% | 1.64% | 1.14% | 0.44% | 0.39% |
The total annual fund operating expenses shown is as stated in the fund’s prospectus current as of the date of this report. The prospectus may vary from the expense ratio shown elsewhere in this report because it is based on a different time period, includes acquired fund fees and expenses, and, if applicable, does not include fee waivers or expense reimbursements.
Data presented reflect past performance. Past performance is no guarantee of future results. Current performance may be higher or lower than the performance shown. Total returns for periods less than one year are not annualized. Investment return and principal value will fluctuate, and redemption value may be more or less than original cost. Data assumes reinvestment of dividends and capital gains, and none of the charts reflect the deduction of taxes that a shareholder would pay on fund distributions or the redemption of fund shares. To obtain performance data current to the most recent month end, please call 1-800-345-2021 or visit americancentury.com. For additional information about the fund, please consult the prospectus.
Portfolio Managers: Kevin Akioka, Jeff Houston, Bob Gahagan, Brian Howell and Margé Karner
Performance Summary
Short Duration Strategic Income returned 2.75%* for the 12 months ended March 31, 2019. The investment-grade Bloomberg Barclays U.S. 1-3 Year Government/Credit Bond Index gained 3.03% for the same period. Fund returns reflect operating expenses, while index returns do not.
The fund’s results reflect the positive performance of higher-yielding securities during the 12 months. The reporting period witnessed a marked shift in Federal Reserve (Fed) policy and investor sentiment toward the U.S. and global economic growth outlook, which influenced performance in the fixed-income market. In the first several months of the period, robust economic growth, rising inflation and the Fed’s steady rate-tightening strategy drove Treasury yields higher. Investment-grade bond returns were generally flat to slightly negative. Meanwhile, risk-on investing remained in favor, and higher-yielding securities outperformed. The environment reversed sharply in late 2018, as worries about future economic and corporate earnings growth, U.S.-China trade negotiations and a surprisingly bullish Fed outlook triggered severe volatility in the equity markets. Investors fled risk assets in favor of U.S. Treasuries and other perceived safe-haven investments.
The new year brought a new sense of stability to the financial markets. Progress with U.S.-China trade negotiations and better-than-feared U.S. economic and earnings data helped restore some investor optimism. Additionally, the Fed paused its rate-hike campaign in January, seemingly acknowledging its December plan for two rate hikes in 2019 may have been too aggressive. Investors responded enthusiastically to this backdrop, and risk assets returned to favor. Meanwhile, Treasury yields moved modestly lower. Then, at its March monetary policy meeting, the Fed held rates steady and suggested additional tightening was likely off the table for 2019. While this news triggered a sharp rally among Treasuries, it also extended the rally among higher-risk assets. Overall, the broad U.S. fixed-income market advanced for the entire 12-month period, and higher-yielding securities generally outperformed higher-quality bonds.
The portfolio provided diversified exposure to higher-yielding segments of the fixed-income market, including investment-grade corporate bonds, out-of-index high-yield corporate bonds, mortgage-backed and other securitized bonds, and out-of-index emerging markets debt. Higher-yielding bond sectors generally outperformed higher-quality sectors, which are more prevalent in the Bloomberg Barclays U.S. 1-3 Year Government/Credit Bond Index.
Corporate Bonds Were Top Contributors
We invested a large portion of the portfolio in corporate bonds (approximately 42% as of March 31, 2019), including investment-grade and high-yield securities. The portfolio’s investment-grade corporate bonds were top contributors to performance. We generally favored the higher-yielding, lower-quality end of the investment-grade corporate bond spectrum (credits with BBB ratings), which rallied on favorable corporate and economic fundamentals during the first several months of the reporting period and again in early 2019. Our out-of-index position in high-yield corporate bonds also added value. Favorable fundamentals and investor preferences for risk throughout most of the period helped high-yield bonds outperform their investment-grade counterparts.
* All fund returns referenced in this commentary are for Investor Class shares. Fund returns would have been lower if a portion of the fees had not been waived. Performance for other share classes will vary due to differences in fee structure; when Investor Class performance exceeds that of the index, other share classes may not. See page 3 for returns for all share classes.
Securitized Sector Aided Performance
Our position in securitized bonds (approximately 38% of the portfolio as of March 31, 2019) also contributed to performance. Our positions in non-agency collateralized mortgage obligations, non-agency commercial mortgage-backed securities and collateralized loan obligations added value compared with the conventional agency-backed mortgage-backed securities represented in the index. In addition, our asset-backed securities lifted results.
Emerging Markets Bonds Were Modest Contributors
Our out-of-index position in emerging markets corporate and sovereign securities was a modest contributor to performance. For much of the period, emerging markets bonds struggled due to slowing growth in China, trade policy concerns, country-specific events and Fed tightening. However, attractive valuations within the asset class, combined with falling U.S. Treasury yields, a dovish Fed and the return of risk-on investing, helped emerging markets bounce back in early 2019 and aid portfolio results.
Portfolio Positioning
We expect the U.S. economy to continue to grow, but at a more moderate pace (2.0% to 2.5% annualized). However, we expect U.S. economic growth to remain more robust than growth in Europe and Japan. We expect headline inflation to eventually converge with core inflation near 2%. These factors should enable the Fed to remain on hold throughout the remainder of 2019. Against a backdrop of slowing global growth, geopolitical uncertainties (mainly Brexit) and a dovish Fed, we expect the 10-year Treasury yield to fluctuate within a near-term range of 2.35% to 2.80%.
In light of the first-quarter 2019 rally among credit and other higher-yielding sectors, we took profits in and reduced exposure to high-yield corporate bonds, and we purchased higher-quality bonds within the securitized sector. We also purchased Treasury securities, which gives us the ability to take advantage of attractive investment opportunities as they arise. Given our outlook for continued economic growth, albeit slower, and healthy corporate fundamentals, we believe credit sectors still offer value. We continue to favor corporate and securitized bonds and select emerging markets securities, adding exposure as valuations, fundamentals and market conditions dictate. Overall, we favor a bottom-up approach, emphasizing careful security selection. We believe our focus on higher-yielding securities with low correlation to Treasuries positions the portfolio favorably if rates eventually move higher.
|
| |
| MARCH 31, 2019 | |
| Portfolio at a Glance | |
| Average Duration (effective) | 1.3 years |
| Weighted Average Life to Maturity | 2.5 years |
| | |
| Types of Investments in Portfolio | % of net assets |
| Corporate Bonds | 42.4% |
| Asset-Backed Securities | 16.4% |
| Collateralized Mortgage Obligations | 12.0% |
| U.S. Treasury Securities | 11.1% |
| Collateralized Loan Obligations | 6.6% |
| Commercial Mortgage-Backed Securities | 3.4% |
| Bank Loan Obligations | 3.1% |
| Sovereign Governments and Agencies | 2.3% |
| Temporary Cash Investments | 2.1% |
| Other Assets and Liabilities | 0.6% |
Fund shareholders may incur two types of costs: (1) transaction costs, including sales charges (loads) on purchase payments and redemption/exchange fees; and (2) ongoing costs, including management fees; distribution and service (12b-1) fees; and other fund expenses. This example is intended to help you understand your ongoing costs (in dollars) of investing in your fund and to compare these costs with the ongoing cost of investing in other mutual funds.
The example is based on an investment of $1,000 made at the beginning of the period and held for the entire period from October 1, 2018 to March 31, 2019.
Actual Expenses
The table provides information about actual account values and actual expenses for each class. You may use the information, together with the amount you invested, to estimate the expenses that you paid over the period. First, identify the share class you own. Then simply divide your account value by $1,000 (for example, an $8,600 account value divided by $1,000 = 8.6), then multiply the result by the number under the heading “Expenses Paid During Period” to estimate the expenses you paid on your account during this period.
If you hold Investor Class shares of any American Century Investments fund, or I Class shares of the American Century Diversified Bond Fund, in an American Century Investments account (i.e., not a financial intermediary or retirement plan account), American Century Investments may charge you a $12.50 semiannual account maintenance fee if the value of those shares is less than $10,000. We will redeem shares automatically in one of your accounts to pay the $12.50 fee. In determining your total eligible investment amount, we will include your investments in all personal accounts (including American Century Investments Brokerage accounts) registered under your Social Security number. Personal accounts include individual accounts, joint accounts, UGMA/UTMA accounts, personal trusts, Coverdell Education Savings Accounts and IRAs (including traditional, Roth, Rollover, SEP-, SARSEP- and SIMPLE-IRAs), and certain other retirement accounts. If you have only business, business retirement, employer-sponsored or American Century Investments Brokerage accounts, you are currently not subject to this fee. If you are subject to the Account Maintenance Fee, your account value could be reduced by the fee amount.
Hypothetical Example for Comparison Purposes
The table also provides information about hypothetical account values and hypothetical expenses based on the actual expense ratio of each class of your fund and an assumed rate of return of 5% per year before expenses, which is not the actual return of a fund’s share class. The hypothetical account values and expenses may not be used to estimate the actual ending account balance or expenses you paid for the period. You may use this information to compare the ongoing costs of investing in your fund and other funds. To do so, compare this 5% hypothetical example with the 5% hypothetical examples that appear in the shareholder reports of the other funds.
Please note that the expenses shown in the table are meant to highlight your ongoing costs only and do not reflect any transactional costs, such as sales charges (loads) or redemption/exchange fees. Therefore, the table is useful in comparing ongoing costs only, and will not help you determine the relative total costs of owning different funds. In addition, if these transactional costs were included, your costs would have been higher.
|
| | | | |
| Beginning
Account Value
10/1/18 | Ending
Account Value
3/31/19 | Expenses Paid
During Period(1)
10/1/18 - 3/31/19 | Annualized
Expense Ratio(1) |
| Actual | | | | |
| Investor Class | $1,000 | $1,017.60 | $2.67 | 0.53% |
| I Class | $1,000 | $1,017.00 | $2.16 | 0.43% |
| Y Class | $1,000 | $1,018.40 | $1.66 | 0.33% |
| A Class | $1,000 | $1,016.30 | $3.92 | 0.78% |
| C Class | $1,000 | $1,012.50 | $7.68 | 1.53% |
| R Class | $1,000 | $1,015.10 | $5.17 | 1.03% |
| R5 Class | $1,000 | $1,017.50 | $1.66 | 0.33% |
| R6 Class | $1,000 | $1,018.80 | $1.41 | 0.28% |
| Hypothetical | | | | |
| Investor Class | $1,000 | $1,022.29 | $2.67 | 0.53% |
| I Class | $1,000 | $1,022.79 | $2.17 | 0.43% |
| Y Class | $1,000 | $1,023.29 | $1.66 | 0.33% |
| A Class | $1,000 | $1,021.04 | $3.93 | 0.78% |
| C Class | $1,000 | $1,017.30 | $7.70 | 1.53% |
| R Class | $1,000 | $1,019.80 | $5.19 | 1.03% |
| R5 Class | $1,000 | $1,023.29 | $1.66 | 0.33% |
| R6 Class | $1,000 | $1,023.54 | $1.41 | 0.28% |
| |
| (1) | Expenses are equal to the class's annualized expense ratio listed in the table above, multiplied by the average account value over the period, multiplied by 182, the number of days in the most recent fiscal half-year, divided by 365, to reflect the one-half year period. Annualized expense ratio reflects actual expenses, including any applicable fee waivers or expense reimbursements and excluding any acquired fund fees and expenses. |
MARCH 31, 2019
|
| | | | | | |
| | Principal Amount | Value |
| CORPORATE BONDS — 42.4% | | |
| Aerospace and Defense — 0.6% | | |
| United Technologies Corp., 1.50%, 11/1/19 | $ | 800,000 |
| $ | 793,991 |
|
| Airlines — 0.4% | | |
| United Continental Holdings, Inc., 4.25%, 10/1/22 | 500,000 |
| 502,030 |
|
| Auto Components — 0.5% | | |
ZF North America Capital, Inc., 4.00%, 4/29/20(1) | 650,000 |
| 650,519 |
|
| Automobiles — 1.3% | | |
| Fiat Chrysler Automobiles NV, 4.50%, 4/15/20 | 250,000 |
| 253,125 |
|
| Ford Motor Credit Co. LLC, 2.68%, 1/9/20 | 800,000 |
| 796,740 |
|
| General Motors Financial Co., Inc., 3.15%, 1/15/20 | 700,000 |
| 701,102 |
|
| | | 1,750,967 |
|
| Banks — 7.0% | | |
| Banco Santander SA, 3.50%, 4/11/22 | 600,000 |
| 606,163 |
|
| Banistmo SA, 3.65%, 9/19/22 | 200,000 |
| 197,500 |
|
| Bank of America Corp., MTN, VRN, 2.33%, 10/1/21 | 1,000,000 |
| 991,095 |
|
| Bank of America Corp., VRN, 3.00%, 12/20/23 | 271,000 |
| 270,417 |
|
| Barclays Bank plc, 5.14%, 10/14/20 | 1,000,000 |
| 1,027,218 |
|
| Citigroup, Inc., 2.70%, 3/30/21 | 600,000 |
| 599,710 |
|
| Citigroup, Inc., 2.90%, 12/8/21 | 800,000 |
| 799,850 |
|
| Discover Bank, 3.10%, 6/4/20 | 1,000,000 |
| 1,002,491 |
|
| ICICI Bank Ltd., 5.75%, 11/16/20 | 200,000 |
| 207,504 |
|
| JPMorgan Chase & Co., 4.625%, 5/10/21 | 500,000 |
| 518,969 |
|
| PNC Financial Services Group, Inc. (The), 4.375%, 8/11/20 | 800,000 |
| 819,100 |
|
| Regions Financial Corp., 2.75%, 8/14/22 | 1,000,000 |
| 993,126 |
|
| Wells Fargo & Co., 3.07%, 1/24/23 | 1,000,000 |
| 1,002,149 |
|
| Zenith Bank plc, MTN, 6.25%, 4/22/19 | 200,000 |
| 200,575 |
|
| | | 9,235,867 |
|
| Beverages — 0.5% | | |
| Constellation Brands, Inc., 2.00%, 11/7/19 | 700,000 |
| 696,271 |
|
| Biotechnology — 2.3% | | |
| AbbVie, Inc., 2.50%, 5/14/20 | 600,000 |
| 598,310 |
|
| Biogen, Inc., 3.625%, 9/15/22 | 575,000 |
| 584,570 |
|
| Celgene Corp., 3.25%, 8/15/22 | 1,075,000 |
| 1,086,987 |
|
| Gilead Sciences, Inc., 4.40%, 12/1/21 | 750,000 |
| 779,838 |
|
| | | 3,049,705 |
|
| Chemicals — 0.8% | | |
| Ashland LLC, 4.75%, 8/15/22 | 500,000 |
| 516,250 |
|
| Sherwin-Williams Co. (The), 2.25%, 5/15/20 | 600,000 |
| 596,605 |
|
| | | 1,112,855 |
|
|
| | | | | | |
| | Principal Amount | Value |
| Commercial Services and Supplies — 1.1% | | |
Nielsen Finance LLC / Nielsen Finance Co., 5.00%, 4/15/22(1) | $ | 400,000 |
| $ | 398,000 |
|
| Republic Services, Inc., 3.55%, 6/1/22 | 1,000,000 |
| 1,022,946 |
|
| | | 1,420,946 |
|
| Communications Equipment — 0.4% | | |
| HTA Group Ltd., 9.125%, 3/8/22 | 400,000 |
| 418,325 |
|
IHS Netherlands Holdco BV, 9.50%, 10/27/21(1) | 100,000 |
| 103,670 |
|
| | | 521,995 |
|
| Consumer Finance — 1.5% | | |
| American Express Credit Corp., MTN, 2.20%, 3/3/20 | 950,000 |
| 945,832 |
|
| Capital One N.A., 2.35%, 1/31/20 | 1,000,000 |
| 995,178 |
|
| | | 1,941,010 |
|
| Containers and Packaging — 0.8% | | |
Ardagh Packaging Finance plc / Ardagh Holdings USA, Inc., 4.625%, 5/15/23(1) | 200,000 |
| 201,750 |
|
| Crown Americas LLC / Crown Americas Capital Corp. IV, 4.50%, 1/15/23 | 450,000 |
| 455,625 |
|
Reynolds Group Issuer, Inc. / Reynolds Group Issuer LLC / Reynolds Group Issuer Lu, 5.125%, 7/15/23(1) | 400,000 |
| 407,000 |
|
| | | 1,064,375 |
|
| Diversified Financial Services — 1.0% | | |
| Credit Suisse Group Funding Guernsey Ltd., 3.45%, 4/16/21 | 400,000 |
| 404,389 |
|
| GE Capital International Funding Co. Unlimited Co., 2.34%, 11/15/20 | 400,000 |
| 395,150 |
|
UBS Group Funding Switzerland AG, 2.95%, 9/24/20(1) | 500,000 |
| 500,078 |
|
| | | 1,299,617 |
|
| Diversified Telecommunication Services — 1.3% | | |
| AT&T, Inc., 2.45%, 6/30/20 | 200,000 |
| 199,187 |
|
| AT&T, Inc., 3.875%, 8/15/21 | 800,000 |
| 820,897 |
|
| Orange SA, 4.125%, 9/14/21 | 500,000 |
| 517,373 |
|
| Turk Telekomunikasyon AS, 3.75%, 6/19/19 | 200,000 |
| 199,228 |
|
| | | 1,736,685 |
|
| Electric Utilities — 1.2% | | |
| American Electric Power Co., Inc., 2.15%, 11/13/20 | 600,000 |
| 594,677 |
|
| Duke Energy Corp., 3.55%, 9/15/21 | 250,000 |
| 254,023 |
|
| Progress Energy, Inc., 3.15%, 4/1/22 | 700,000 |
| 705,417 |
|
| | | 1,554,117 |
|
| Energy Equipment and Services — 0.1% | | |
Transocean, Inc., 9.00%, 7/15/23(1) | 75,000 |
| 80,250 |
|
| Entertainment — 2.1% | | |
| Activision Blizzard, Inc., 2.30%, 9/15/21 | 1,075,000 |
| 1,060,653 |
|
| Netflix, Inc., 5.375%, 2/1/21 | 450,000 |
| 468,422 |
|
| Viacom, Inc., 3.125%, 6/15/22 | 900,000 |
| 898,657 |
|
| VTR Finance BV, 6.875%, 1/15/24 | 359,000 |
| 369,321 |
|
| | | 2,797,053 |
|
| Equity Real Estate Investment Trusts (REITs) — 0.9% | | |
| Equinix, Inc., 5.375%, 4/1/23 | 350,000 |
| 357,437 |
|
| Essex Portfolio LP, 3.625%, 8/15/22 | 600,000 |
| 610,876 |
|
|
| | | | | | |
| | Principal Amount | Value |
| VEREIT Operating Partnership LP, 4.125%, 6/1/21 | $ | 200,000 |
| $ | 203,431 |
|
| | | 1,171,744 |
|
| Food Products — 0.5% | | |
| Conagra Brands, Inc., 3.80%, 10/22/21 | 600,000 |
| 611,412 |
|
| Gas Utilities — 0.8% | | |
| Andeavor Logistics LP / Tesoro Logistics Finance Corp., 5.50%, 10/15/19 | 100,000 |
| 101,012 |
|
| Sabine Pass Liquefaction LLC, 5.625%, 2/1/21 | 950,000 |
| 987,387 |
|
| | | 1,088,399 |
|
| Health Care Providers and Services — 3.5% | | |
| Anthem, Inc., 2.50%, 11/21/20 | 900,000 |
| 895,864 |
|
| CHS / Community Health Systems, Inc., 5.125%, 8/1/21 | 300,000 |
| 296,430 |
|
Cigna Corp., 3.20%, 9/17/20(1) | 900,000 |
| 904,653 |
|
| CVS Health Corp., 3.35%, 3/9/21 | 500,000 |
| 504,262 |
|
| DaVita, Inc., 5.75%, 8/15/22 | 150,000 |
| 153,187 |
|
Fresenius Medical Care US Finance II, Inc., 4.125%, 10/15/20(1) | 600,000 |
| 605,363 |
|
| HCA, Inc., 5.00%, 3/15/24 | 200,000 |
| 212,011 |
|
| UnitedHealth Group, Inc., 2.875%, 12/15/21 | 1,000,000 |
| 1,005,722 |
|
| | | 4,577,492 |
|
| Hotels, Restaurants and Leisure — 0.8% | | |
| Hilton Domestic Operating Co., Inc., 4.25%, 9/1/24 | 300,000 |
| 300,186 |
|
International Game Technology plc, 6.25%, 2/15/22(1) | 175,000 |
| 182,656 |
|
| MGM Resorts International, 6.625%, 12/15/21 | 300,000 |
| 321,375 |
|
| Royal Caribbean Cruises Ltd., 2.65%, 11/28/20 | 300,000 |
| 299,798 |
|
| | | 1,104,015 |
|
| Household Durables — 0.4% | | |
| Lennar Corp., 2.95%, 11/29/20 | 500,000 |
| 498,125 |
|
| Insurance — 1.1% | | |
| AerCap Ireland Capital DAC / AerCap Global Aviation Trust, 4.625%, 10/30/20 | 500,000 |
| 512,056 |
|
| American International Group, Inc., 4.125%, 2/15/24 | 235,000 |
| 242,780 |
|
| Prudential Financial, Inc., MTN, 5.375%, 6/21/20 | 700,000 |
| 722,782 |
|
| | | 1,477,618 |
|
| Internet and Direct Marketing Retail — 0.2% | | |
| Alibaba Group Holding Ltd., 2.50%, 11/28/19 | 200,000 |
| 199,800 |
|
| Life Sciences Tools and Services — 0.6% | | |
| Thermo Fisher Scientific, Inc., 3.60%, 8/15/21 | 775,000 |
| 788,097 |
|
| Media — 2.9% | | |
| CCO Holdings LLC / CCO Holdings Capital Corp., 5.25%, 9/30/22 | 400,000 |
| 408,250 |
|
| Charter Communications Operating LLC / Charter Communications Operating Capital, 3.58%, 7/23/20 | 600,000 |
| 604,530 |
|
| Comcast Corp., 3.30%, 10/1/20 | 1,000,000 |
| 1,009,908 |
|
| CSC Holdings LLC, 6.75%, 11/15/21 | 410,000 |
| 439,213 |
|
| DISH DBS Corp., 5.125%, 5/1/20 | 300,000 |
| 302,625 |
|
Liquid Telecommunications Financing plc, 8.50%, 7/13/22(1) | 400,000 |
| 412,808 |
|
| TBG Global Pte Ltd., 5.25%, 2/10/22 | 200,000 |
| 200,359 |
|
| TEGNA, Inc., 5.125%, 7/15/20 | 400,000 |
| 401,500 |
|
| | | 3,779,193 |
|
|
| | | | | | |
| | Principal Amount | Value |
| Mortgage Real Estate Investment Trusts (REITs) — 0.4% | | |
| Starwood Property Trust, Inc., 5.00%, 12/15/21 | $ | 460,000 |
| $ | 473,800 |
|
| Multi-Utilities — 0.6% | | |
| Sempra Energy, 2.875%, 10/1/22 | 825,000 |
| 813,722 |
|
| Oil, Gas and Consumable Fuels — 3.3% | | |
| Anadarko Petroleum Corp., 4.85%, 3/15/21 | 558,000 |
| 578,725 |
|
| Antero Resources Corp., 5.375%, 11/1/21 | 500,000 |
| 503,750 |
|
| Energy Transfer Operating LP, 4.15%, 10/1/20 | 500,000 |
| 508,271 |
|
| Energy Transfer Operating LP, 7.50%, 10/15/20 | 500,000 |
| 532,532 |
|
| Gazprom OAO Via Gaz Capital SA, 9.25%, 4/23/19 | 200,000 |
| 200,807 |
|
| Kinder Morgan Energy Partners LP, 5.30%, 9/15/20 | 500,000 |
| 516,926 |
|
| Petroleos Mexicanos, 4.875%, 1/24/22 | 200,000 |
| 202,202 |
|
Ras Laffan Liquefied Natural Gas Co. Ltd. II, 5.30%, 9/30/20(1) | 55,150 |
| 55,847 |
|
| Southwestern Energy Co., 4.10%, 3/15/22 | 500,000 |
| 487,600 |
|
| Williams Cos., Inc. (The), 4.125%, 11/15/20 | 700,000 |
| 711,405 |
|
| | | 4,298,065 |
|
| Paper and Forest Products — 0.5% | | |
Georgia-Pacific LLC, 5.40%, 11/1/20(1) | 600,000 |
| 624,008 |
|
| Pharmaceuticals — 1.1% | | |
| Allergan Funding SCS, 3.00%, 3/12/20 | 900,000 |
| 899,724 |
|
| Shire Acquisitions Investments Ireland DAC, 2.40%, 9/23/21 | 575,000 |
| 568,702 |
|
| | | 1,468,426 |
|
| Semiconductors and Semiconductor Equipment — 0.8% | | |
| Broadcom Corp. / Broadcom Cayman Finance Ltd., 2.20%, 1/15/21 | 900,000 |
| 886,355 |
|
NXP BV / NXP Funding LLC, 3.875%, 9/1/22(1) | 200,000 |
| 203,326 |
|
| | | 1,089,681 |
|
| Software — 0.2% | | |
| Symantec Corp., 4.20%, 9/15/20 | 300,000 |
| 304,653 |
|
| Specialty Retail — 0.3% | | |
| United Rentals North America, Inc., 4.625%, 7/15/23 | 400,000 |
| 407,750 |
|
| Technology Hardware, Storage and Peripherals — 0.4% | | |
| Hewlett Packard Enterprise Co., 3.60%, 10/15/20 | 300,000 |
| 302,903 |
|
| Seagate HDD Cayman, 4.25%, 3/1/22 | 242,000 |
| 242,836 |
|
| | | 545,739 |
|
| Trading Companies and Distributors — 0.2% | | |
| International Lease Finance Corp., 4.625%, 4/15/21 | 235,000 |
| 240,574 |
|
TOTAL CORPORATE BONDS
(Cost $55,485,043) | | 55,770,566 |
|
| ASSET-BACKED SECURITIES — 16.4% | | |
Avis Budget Rental Car Funding AESOP LLC, Series 2014-1A, Class A SEQ, 2.46%, 7/20/20(1) | 233,333 |
| 233,152 |
|
Avis Budget Rental Car Funding AESOP LLC, Series 2014-2A, Class A SEQ, 2.50%, 2/20/21(1) | 300,000 |
| 299,178 |
|
Avis Budget Rental Car Funding AESOP LLC, Series 2015-1A, Class A SEQ, 2.50%, 7/20/21(1) | 1,015,000 |
| 1,010,496 |
|
Avis Budget Rental Car Funding AESOP LLC, Series 2019-1A, Class A SEQ, 3.45%, 3/20/23(1) | 770,000 |
| 779,118 |
|
BRE Grand Islander Timeshare Issuer LLC, Series 2017-1A, Class A SEQ, 2.94%, 5/25/29(1) | 260,022 |
| 258,100 |
|
|
| | | | | | |
| | Principal Amount | Value |
BRE Grand Islander Timeshare Issuer LLC, Series 2017-1A, Class B, 3.24%, 5/25/29(1) | $ | 28,891 |
| $ | 28,521 |
|
Colony Starwood Homes, Series 2016-2A, Class A, VRN, 3.73%, (1-month LIBOR plus 1.25%), 12/17/33(1) | 118,124 |
| 118,232 |
|
Enterprise Fleet Financing LLC, Series 2019-1, Class A2 SEQ, 2.98%, 10/22/24(1) | 1,100,000 |
| 1,101,364 |
|
Hertz Vehicle Financing II LP, Series 2015-1A, Class A SEQ, 2.73%, 3/25/21(1) | 1,525,000 |
| 1,520,637 |
|
Hertz Vehicle Financing II LP, Series 2016-3A, Class A SEQ, 2.27%, 7/25/20(1) | 200,000 |
| 199,598 |
|
Hilton Grand Vacations Trust, Series 2013-A, Class A SEQ, 2.28%, 1/25/26(1) | 828,306 |
| 826,229 |
|
Hilton Grand Vacations Trust, Series 2014-AA, Class A SEQ, 1.77%, 11/25/26(1) | 188,938 |
| 187,061 |
|
Hilton Grand Vacations Trust, Series 2014-AA, Class B, 2.07%, 11/25/26(1) | 37,788 |
| 37,294 |
|
Hilton Grand Vacations Trust, Series 2017-AA, Class A SEQ, 2.66%, 12/26/28(1) | 1,360,415 |
| 1,350,720 |
|
Hilton Grand Vacations Trust, Series 2018-AA, Class B, 3.70%, 2/25/32(1) | 709,403 |
| 721,004 |
|
| Honda Auto Receivables Owner Trust, Series 2019-1, Class A3 SEQ, 2.83%, 3/20/23 | 700,000 |
| 704,735 |
|
Invitation Homes Trust, Series 2017-SFR2, Class A, VRN, 3.33%, (1-month LIBOR plus 0.85%), 12/17/36(1) | 631,109 |
| 629,318 |
|
Invitation Homes Trust, Series 2017-SFR2, Class B, VRN, 3.63%, (1-month LIBOR plus 1.15%), 12/17/36(1) | 125,000 |
| 125,109 |
|
Invitation Homes Trust, Series 2018-SFR1, Class A, VRN, 3.18%, (1-month LIBOR plus 0.70%), 3/17/37(1) | 981,316 |
| 969,651 |
|
Invitation Homes Trust, Series 2018-SFR1, Class B, VRN, 3.43%, (1-month LIBOR plus 0.95%), 3/17/37(1) | 325,000 |
| 321,345 |
|
Invitation Homes Trust, Series 2018-SFR1, Class C, VRN, 3.73%, (1-month LIBOR plus 1.25%), 3/17/37(1) | 275,000 |
| 274,705 |
|
Invitation Homes Trust, Series 2018-SFR2, Class A, VRN, 3.38%, (1-month LIBOR plus 0.90%), 6/17/37(1) | 538,998 |
| 539,452 |
|
Invitation Homes Trust, Series 2018-SFR2, Class B, VRN, 3.56%, (1-month LIBOR plus 1.08%), 6/17/37(1) | 150,000 |
| 149,076 |
|
Invitation Homes Trust, Series 2018-SFR2, Class C, VRN, 3.76%, (1-month LIBOR plus 1.28%), 6/17/37(1) | 175,000 |
| 174,128 |
|
Invitation Homes Trust, Series 2018-SFR3, Class A, VRN, 3.48%, (1-month LIBOR plus 1.00%), 7/17/37(1) | 990,037 |
| 989,841 |
|
Invitation Homes Trust, Series 2018-SFR3, Class B, VRN, 3.63%, (1-month LIBOR plus 1.15%), 7/17/37(1) | 200,000 |
| 200,476 |
|
Invitation Homes Trust, Series 2018-SFR4, Class B, VRN, 3.73%, (1-month LIBOR plus 1.25%), 1/17/38(1) | 400,000 |
| 401,293 |
|
Marriott Vacation Club Owner Trust, Series 2012-1A, Class A SEQ, 2.51%, 5/20/30(1) | 102,661 |
| 102,237 |
|
MVW Owner Trust, Series 2013-1A, Class A SEQ, 2.15%, 4/22/30(1) | 93,194 |
| 92,493 |
|
MVW Owner Trust, Series 2014-1A, Class B, 2.70%, 9/22/31(1) | 49,904 |
| 48,977 |
|
MVW Owner Trust, Series 2016-1A, Class A SEQ, 2.25%, 12/20/33(1) | 19,684 |
| 19,351 |
|
MVW Owner Trust, Series 2017-1A, Class B, 2.75%, 12/20/34(1) | 337,661 |
| 332,551 |
|
MVW Owner Trust, Series 2018-1A, Class B, 3.60%, 1/21/36(1) | 266,004 |
| 269,848 |
|
Progress Residential Trust, Series 2019-SFR1, Class A, 3.42%, 8/17/35(1) | 700,000 |
| 707,608 |
|
Progress Residential Trust, Series 2016-SFR2, Class A SEQ, VRN, 3.88%, (1-month LIBOR plus 1.40%), 1/17/34(1) | 549,458 |
| 551,184 |
|
|
| | | | | | |
| | Principal Amount | Value |
Progress Residential Trust, Series 2017-SFR1, Class A SEQ, 2.77%, 8/17/34(1) | $ | 99,680 |
| $ | 98,917 |
|
Progress Residential Trust, Series 2018-SFR1, Class C, 3.68%, 3/17/35(1) | 125,000 |
| 125,902 |
|
Progress Residential Trust, Series 2018-SFR1, Class D, 3.88%, 3/17/35(1) | 150,000 |
| 149,563 |
|
Progress Residential Trust, Series 2018-SFR3, Class B, 4.08%, 10/17/35(1) | 400,000 |
| 407,580 |
|
Progress Residential Trust, Series 2018-SFR3, Class C, 4.18%, 10/17/35(1) | 275,000 |
| 279,856 |
|
Sierra Timeshare Receivables Funding LLC, Series 2019-1A, Class A SEQ, 3.20%, 1/20/36(1) | 500,000 |
| 503,518 |
|
Sierra Timeshare Receivables Funding LLC, Series 2019-1A, Class B, 3.42%, 1/20/36(1) | 800,000 |
| 805,247 |
|
Sierra Timeshare Conduit Receivables Funding LLC, Series 2017-1A, Class A SEQ, 2.91%, 3/20/34(1) | 25,296 |
| 25,117 |
|
Sierra Timeshare Receivables Funding LLC, Series 2015-1A, Class A SEQ, 2.40%, 3/22/32(1) | 32,197 |
| 32,061 |
|
Sierra Timeshare Receivables Funding LLC, Series 2015-2A, Class A SEQ, 2.43%, 6/20/32(1) | 36,559 |
| 36,207 |
|
Sierra Timeshare Receivables Funding LLC, Series 2015-3A, Class A SEQ, 2.58%, 9/20/32(1) | 88,902 |
| 88,534 |
|
Sierra Timeshare Receivables Funding LLC, Series 2016-2A, Class A SEQ, 2.33%, 7/20/33(1) | 17,165 |
| 16,934 |
|
Sierra Timeshare Receivables Funding LLC, Series 2018-2A, Class B, 3.65%, 6/20/35(1) | 187,592 |
| 189,444 |
|
Sierra Timeshare Receivables Funding LLC, Series 2018-3A, Class C, 4.17%, 9/20/35(1) | 274,740 |
| 280,490 |
|
| Verizon Owner Trust, Series 2019-A, Class A1A SEQ, 2.93%, 9/20/23 | 1,000,000 |
| 1,008,100 |
|
VSE VOI Mortgage LLC, Series 2016-A, Class A SEQ, 2.54%, 7/20/33(1) | 205,464 |
| 203,284 |
|
VSE VOI Mortgage LLC, Series 2017-A, Class A SEQ, 2.33%, 3/20/35(1) | 403,882 |
| 396,956 |
|
VSE VOI Mortgage LLC, Series 2017-A, Class B, 2.63%, 3/20/35(1) | 84,142 |
| 82,806 |
|
VSE VOI Mortgage LLC, Series 2018-A, Class A SEQ, 3.56%, 2/20/36(1) | 397,747 |
| 404,607 |
|
VSE VOI Mortgage LLC, Series 2018-A, Class B, 3.72%, 2/20/36(1) | 99,437 |
| 100,886 |
|
TOTAL ASSET-BACKED SECURITIES
(Cost $21,403,103) | | 21,510,091 |
|
| COLLATERALIZED MORTGAGE OBLIGATIONS — 12.0% | | |
| Private Sponsor Collateralized Mortgage Obligations — 3.9% | | |
| Banc of America Mortgage Trust, Series 2004-E, Class 2A6 SEQ, VRN, 4.39%, 6/25/34 | 31,552 |
| 31,596 |
|
| Bear Stearns Adjustable Rate Mortgage Trust, Series 2004-12, Class 2A1, VRN, 4.34%, 2/25/35 | 53,947 |
| 54,632 |
|
| Bear Stearns Adjustable Rate Mortgage Trust, Series 2004-8, Class 2A1, VRN, 4.23%, 11/25/34 | 78,137 |
| 76,354 |
|
| Bear Stearns Adjustable Rate Mortgage Trust, Series 2006-1, Class A1, VRN, 4.91%, (1-year H15T1Y plus 2.25%), 2/25/36 | 20,916 |
| 21,150 |
|
| Citigroup Mortgage Loan Trust, Inc., Series 2004-UST1, Class A5, VRN, 4.43%, 8/25/34 | 61,484 |
| 61,287 |
|
| Citigroup Mortgage Loan Trust, Inc., Series 2005-4, Class A, VRN, 4.48%, 8/25/35 | 64,616 |
| 65,591 |
|
| Citigroup Mortgage Loan Trust, Inc., Series 2005-6, Class A2, VRN, 4.24%, (1-year H15T1Y plus 2.15%), 9/25/35 | 80,424 |
| 81,790 |
|
|
| | | | | | |
| | Principal Amount | Value |
| First Horizon Mortgage Pass-Through Trust, Series 2006-AR4, Class 1A2, VRN, 4.68%, 1/25/37 | $ | 41,971 |
| $ | 37,588 |
|
Flagstar Mortgage Trust, Series 2017-1, Class 1A5 SEQ, VRN, 3.50%, 3/25/47(1) | 1,614,096 |
| 1,618,194 |
|
| GSR Mortgage Loan Trust, Series 2005-AR6, Class 2A1, VRN, 4.52%, 9/25/35 | 42,481 |
| 43,446 |
|
| GSR Mortgage Loan Trust, Series 2005-AR6, Class 4A5, VRN, 4.41%, 9/25/35 | 133,156 |
| 134,984 |
|
| Merrill Lynch Mortgage Investors Trust, Series 2005-A2, Class A2, VRN, 4.45%, 2/25/35 | 24,991 |
| 25,910 |
|
Sequoia Mortgage Trust, Series 2017-CH2, Class A10 SEQ, VRN, 4.00%, 12/25/47(1) | 469,178 |
| 474,730 |
|
| Thornburg Mortgage Securities Trust, Series 2004-3, Class A, VRN, 3.23%, (1-month LIBOR plus 0.74%), 9/25/44 | 92,667 |
| 91,518 |
|
| WaMu Mortgage Pass-Through Certificates, Series 2005-AR3, Class A1, VRN, 4.47%, 3/25/35 | 49,885 |
| 49,254 |
|
| Wells Fargo Mortgage-Backed Securities Trust, Series 2004-A, Class A1, VRN, 5.01%, 2/25/34 | 6,838 |
| 7,125 |
|
| Wells Fargo Mortgage-Backed Securities Trust, Series 2004-S, Class A1, VRN, 4.62%, 9/25/34 | 23,740 |
| 24,452 |
|
| Wells Fargo Mortgage-Backed Securities Trust, Series 2005-AR16, Class 3A2, VRN, 4.97%, 3/25/35 | 42,964 |
| 43,892 |
|
| Wells Fargo Mortgage-Backed Securities Trust, Series 2005-AR16, Class 4A8, VRN, 4.54%, 10/25/35 | 100,000 |
| 101,868 |
|
| Wells Fargo Mortgage-Backed Securities Trust, Series 2006-4, Class 2A1, 6.00%, 4/25/36 | 1,421,520 |
| 1,403,120 |
|
| Wells Fargo Mortgage-Backed Securities Trust, Series 2006-AR10, Class 2A1, VRN, 4.66%, 7/25/36 | 41,187 |
| 41,715 |
|
| Wells Fargo Mortgage-Backed Securities Trust, Series 2006-AR10, Class 4A1, VRN, 5.18%, 7/25/36 | 98,407 |
| 99,144 |
|
| Wells Fargo Mortgage-Backed Securities Trust, Series 2006-AR10, Class 5A6 SEQ, VRN, 4.54%, 7/25/36 | 38,456 |
| 38,649 |
|
| Wells Fargo Mortgage-Backed Securities Trust, Series 2006-AR15, Class A1, VRN, 4.73%, 10/25/36 | 23,841 |
| 23,607 |
|
| Wells Fargo Mortgage-Backed Securities Trust, Series 2006-AR16, Class A1, VRN, 4.70%, 10/25/36 | 91,409 |
| 90,459 |
|
| Wells Fargo Mortgage-Backed Securities Trust, Series 2006-AR19, Class A1, VRN, 4.86%, 12/25/36 | 147,877 |
| 145,503 |
|
| Wells Fargo Mortgage-Backed Securities Trust, Series 2006-AR5, Class 2A1, VRN, 5.08%, 4/25/36 | 64,704 |
| 64,482 |
|
| Wells Fargo Mortgage-Backed Securities Trust, Series 2007-11, Class A36, 6.00%, 8/25/37 | 38,135 |
| 38,078 |
|
| Wells Fargo Mortgage-Backed Securities Trust, Series 2007-14, Class 2A2, 5.50%, 10/25/22 | 12,861 |
| 13,076 |
|
| Wells Fargo Mortgage-Backed Securities Trust, Series 2007-7, Class A1, 6.00%, 6/25/37 | 82,508 |
| 83,281 |
|
| | | 5,086,475 |
|
| U.S. Government Agency Collateralized Mortgage Obligations — 8.1% | |
| FHLMC, Series 2015-HQ2, Class M3, VRN, 5.74%, (1-month LIBOR plus 3.25%), 5/25/25 | 100,000 |
| 108,442 |
|
| FHLMC, Series 2017-DNA2, Class M1, VRN, 3.69%, (1-month LIBOR plus 1.20%), 10/25/29 | 289,276 |
| 290,940 |
|
| FHLMC, Series 2018-DNA1, Class M2, VRN, 4.29%, (1-month LIBOR plus 1.80%), 7/25/30 | 1,300,000 |
| 1,271,058 |
|
FHLMC, Series 2019-DNA1, Class M1, VRN, 3.39%, (1-month LIBOR plus 0.90%), 1/25/49(1) | 1,250,000 |
| 1,252,179 |
|
|
| | | | | | |
| | Principal Amount | Value |
| FNMA, Series 2014-C02, Class 2M2, VRN, 5.09%, (1-month LIBOR plus 2.60%), 5/25/24 | $ | 278,590 |
| $ | 289,383 |
|
| FNMA, Series 2016-55, Class PI, IO, 4.00%, 8/25/46 | 3,526,320 |
| 622,216 |
|
| FNMA, Series 2016-C03, Class 2M2, VRN, 8.39%, (1-month LIBOR plus 5.90%), 10/25/28 | 47,322 |
| 53,578 |
|
| FNMA, Series 2017-7, Class AI, IO, 6.00%, 2/25/47 | 2,622,445 |
| 613,595 |
|
| FNMA, Series 2017-C03, Class 1M1, VRN, 3.44%, (1-month LIBOR plus 0.95%), 10/25/29 | 1,614,482 |
| 1,617,889 |
|
| FNMA, Series 2017-C05, Class 1M2, VRN, 4.69%, (1-month LIBOR plus 2.20%), 1/25/30 | 350,000 |
| 354,607 |
|
| FNMA, Series 2017-C07, Class 1M1, VRN, 3.14%, (1-month LIBOR plus 0.65%), 5/25/30 | 1,704,233 |
| 1,703,076 |
|
| FNMA, Series 2018-C01, Class 1M1, VRN, 3.09%, (1-month LIBOR plus 0.60%), 7/25/30 | 909,165 |
| 907,433 |
|
| FNMA, Series 2018-C02, Class 2M1, VRN, 3.14%, (1-month LIBOR plus 0.65%), 8/25/30 | 1,141,235 |
| 1,140,982 |
|
| FNMA, Series 417, Class C5, IO, 3.50%, 2/25/43 | 2,615,463 |
| 477,239 |
|
| | | 10,702,617 |
|
TOTAL COLLATERALIZED MORTGAGE OBLIGATIONS
(Cost $15,785,561) | | 15,789,092 |
|
| U.S. TREASURY SECURITIES — 11.1% | | |
U.S. Treasury Bills, 2.46%, 6/13/19(4) | 100,000 |
| 99,521 |
|
U.S. Treasury Bills, 2.55%, 1/30/20(4) | 4,000,000 |
| 3,921,399 |
|
| U.S. Treasury Notes, 2.50%, 1/31/21 | 8,500,000 |
| 8,532,207 |
|
| U.S. Treasury Notes, 2.625%, 12/15/21 | 2,000,000 |
| 2,020,977 |
|
TOTAL U.S. TREASURY SECURITIES
(Cost $14,521,730) | | 14,574,104 |
|
| COLLATERALIZED LOAN OBLIGATIONS — 6.6% | | |
Ares XXXIIR CLO Ltd., Series 2014-32RA, Class A2A, VRN, 4.23%, (3-month LIBOR plus 1.55%), 5/15/30(1) | 1,000,000 |
| 987,518 |
|
Carlyle Global Market Strategies CLO Ltd., Series 2014-1A, Class A1R2, VRN, 3.74%, (3-month LIBOR plus 0.97%), 4/17/31(1) | 1,370,000 |
| 1,351,092 |
|
CBAM Ltd., Series 2018-5A, Class B1, VRN, 4.17%, (3-month LIBOR plus 1.40%), 4/17/31(1) | 1,000,000 |
| 968,021 |
|
Dryden 41 Senior Loan Fund, Series 2015-41A, Class AR, VRN, 3.76%, (3-month LIBOR plus 0.97%), 4/15/31(1) | 1,200,000 |
| 1,179,595 |
|
| Dryden 64 CLO Ltd., Series 2018-64A, Class A, VRN, 3.75%, (3-month LIBOR plus 0.97%), 4/18/31 | 1,500,000 |
| 1,474,507 |
|
Magnetite VIII Ltd., Series 2014-8A, Class AR2, VRN, 3.77%, (3-month LIBOR plus 0.98%), 4/15/31(1) | 900,000 |
| 889,866 |
|
Sounds Point CLO IV-R Ltd., Series 2013-3RA, Class B, VRN, 4.53%, (3-month LIBOR plus 1.75%), 4/18/31(1) | 350,000 |
| 349,953 |
|
Symphony CLO XIX Ltd., Series 2018-19A, Class A, VRN, 3.74%, (3-month LIBOR plus 0.96%), 4/16/31(1) | 1,500,000 |
| 1,475,883 |
|
TOTAL COLLATERALIZED LOAN OBLIGATIONS
(Cost $8,710,300) | | 8,676,435 |
|
| COMMERCIAL MORTGAGE-BACKED SECURITIES — 3.4% | | |
BB-UBS Trust, Series 2012-SHOW, Class A SEQ, 3.43%, 11/5/36(1) | 150,000 |
| 152,721 |
|
BX Commercial Mortgage Trust, Series 2018-IND, Class A, VRN, 3.23%, (1-month LIBOR plus 0.75%), 11/15/35(1) | 817,768 |
| 816,617 |
|
BX Trust, Series 2018-MCSF, Class A, VRN, 3.06%, (1-month LIBOR plus 0.58%), 4/15/35(1) | 600,000 |
| 591,610 |
|
| Commercial Mortgage Pass-Through Certificates, Series 2014-CR15, Class B, VRN, 4.69%, 2/10/47 | 260,000 |
| 277,988 |
|
|
| | | | | | |
| | Principal Amount | Value |
| Commercial Mortgage Pass-Through Certificates, Series 2014-LC17, Class B, VRN, 4.49%, 10/10/47 | $ | 75,000 |
| $ | 78,214 |
|
Core Industrial Trust, Series 2015-CALW, Class C, 3.56%, 2/10/34(1) | 250,000 |
| 252,302 |
|
DBCG Mortgage Trust, Series 2017-BBG, Class A, VRN, 3.18%, (1-month LIBOR plus 0.70%), 6/15/34(1) | 1,000,000 |
| 996,970 |
|
Irvine Core Office Trust, Series 2013-IRV, Class A2 SEQ, VRN, 3.17%, 5/15/48(1) | 250,000 |
| 254,510 |
|
| JPMBB Commercial Mortgage Securities Trust, Series 2014-C21, Class B, VRN, 4.34%, 8/15/47 | 250,000 |
| 258,457 |
|
| JPMorgan Chase Commercial Mortgage Securities Trust, Series 2013-C16, Class C, VRN, 5.03%, 12/15/46 | 190,000 |
| 200,996 |
|
Morgan Stanley Capital I Trust, Series 2014-CPT, Class AM, VRN, 3.40%, 7/13/29(1) | 400,000 |
| 403,593 |
|
Morgan Stanley Capital I Trust, Series 2014-CPT, Class C, VRN, 3.45%, 7/13/29(1) | 200,000 |
| 201,156 |
|
TOTAL COMMERCIAL MORTGAGE-BACKED SECURITIES
(Cost $4,485,483) | | 4,485,134 |
|
BANK LOAN OBLIGATIONS(2) — 3.1% | | |
| Diversified Telecommunication Services — 0.7% | | |
| CenturyLink, Inc., 2017 Term Loan B, 5.25%, (1-month LIBOR plus 2.75%), 1/31/25 | 157,871 |
| 155,109 |
|
| Level 3 Financing Inc., 2017 Term Loan B, 4.74%, (3-month LIBOR plus 2.25%), 2/22/24 | 230,000 |
| 227,627 |
|
| Sprint Communications, Inc., 1st Lien Term Loan B, 5.00%, (1-month LIBOR plus 2.50%), 2/2/24 | 248,101 |
| 242,147 |
|
| Zayo Group, LLC, 2017 Incremental Term Loan, 4.75%, (1-month LIBOR plus 2.25%), 1/19/24 | 330,000 |
| 328,647 |
|
| | | 953,530 |
|
| Food Products — 0.1% | | |
| Post Holdings Inc., 2017 Series A Incremental Term Loan, 4.49%, (1-month LIBOR plus 2.00%), 5/24/24 | 137,741 |
| 136,762 |
|
| Post Holdings Inc., 2017 Series A Incremental Term Loan, 4.49%, (1-month LIBOR plus 2.00%), 5/24/24 | 42,631 |
| 42,328 |
|
| | | 179,090 |
|
| Health Care Providers and Services — 0.6% | | |
Acadia Healthcare Company, Inc., 2018 Term Loan B4, 2/16/23(3) | 300,000 |
| 298,125 |
|
| DaVita, Inc., Term Loan B, 5.25%, (1-month LIBOR plus 2.75%), 6/24/21 | 298,433 |
| 298,668 |
|
| HCA Inc., 2018 Term Loan B10, 4.50%, (1-month LIBOR plus 2.00%), 3/13/25 | 148,500 |
| 148,512 |
|
| | | 745,305 |
|
| Hotels, Restaurants and Leisure — 0.5% | | |
| 1011778 B.C. Unlimited Liability Company, Term Loan B3, 4.75%, (1-month LIBOR plus 2.25%), 2/16/24 | 55,062 |
| 54,282 |
|
| 1011778 B.C. Unlimited Liability Company, Term Loan B3, 4.75%, (1-month LIBOR plus 2.25%), 2/16/24 | 44,388 |
| 43,759 |
|
| Caesars Resort Collection, LLC, 2017 1st Lien Term Loan B, 5.25%, (1-month LIBOR plus 2.75%), 12/22/24 | 197,741 |
| 195,445 |
|
| Hilton Worldwide Finance, LLC, Term Loan B2, 4.24%, (1-month LIBOR plus 1.75%), 10/25/23 | 200,698 |
| 200,463 |
|
| MGM Growth Properties Operating Partnership LP, 2016 Term Loan B, 4.50%, (1-month LIBOR plus 2.00%), 3/21/25 | 217,755 |
| 215,131 |
|
| | | 709,080 |
|
|
| | | | | | |
| | Principal Amount/ Shares | Value |
| IT Services — 0.3% | | |
| First Data Corporation, 2024 USD Term Loan, 4.49%, (1-month LIBOR plus 2.00%), 4/26/24 | $ | 330,000 |
| $ | 329,418 |
|
| Pharmaceuticals — 0.5% | | |
| Catalent Pharma Solutions Inc., USD Term Loan B, 4.75%, (1-month LIBOR plus 2.25%), 5/20/24 | 309,251 |
| 308,334 |
|
| Valeant Pharmaceuticals International, Inc., 2018 Term Loan B, 5.48%, (1-month LIBOR plus 3.00%), 6/2/25 | 306,421 |
| 304,808 |
|
| | | 613,142 |
|
| Technology Hardware, Storage and Peripherals — 0.4% | | |
| Dell International LLC, 2017 Term Loan B, 4.50%, (1-month LIBOR plus 2.00%), 9/7/23 | 308,063 |
| 304,958 |
|
| Western Digital Corporation, 2018 Term Loan B4, 4.25%, (1-month LIBOR plus 1.75%), 4/29/23 | 187,801 |
| 183,184 |
|
| | | 488,142 |
|
TOTAL BANK LOAN OBLIGATIONS
(Cost $4,059,922) | | 4,017,707 |
|
| SOVEREIGN GOVERNMENTS AND AGENCIES — 2.3% | | |
| Argentina — 0.1% | | |
| Argentine Republic Government International Bond, 6.875%, 4/22/21 | 150,000 |
| 137,325 |
|
| Egypt — 0.8% | | |
| Egypt Government International Bond, 6.125%, 1/31/22 | 1,000,000 |
| 1,014,157 |
|
| Hungary — 0.6% | | |
| Hungary Government International Bond, 6.375%, 3/29/21 | 800,000 |
| 853,190 |
|
| Oman — 0.6% | | |
| Oman Government International Bond, 4.125%, 1/17/23 | 800,000 |
| 767,118 |
|
| South Africa — 0.2% | | |
| Republic of South Africa Government International Bond, 5.50%, 3/9/20 | 200,000 |
| 203,522 |
|
TOTAL SOVEREIGN GOVERNMENTS AND AGENCIES
(Cost $2,970,657) | | 2,975,312 |
|
| TEMPORARY CASH INVESTMENTS — 2.1% | | |
| Repurchase Agreement, BMO Capital Markets Corp., (collateralized by various U.S. Treasury obligations, 0.125% - 2.875%, 9/30/19 - 2/15/44, valued at $2,467,039), in a joint trading account at 2.35%, dated 3/29/19, due 4/1/19 (Delivery value $2,418,229) | | 2,417,756 |
|
| Repurchase Agreement, Fixed Income Clearing Corp., (collateralized by various U.S. Treasury obligations, 2.75%, 6/30/25, valued at $413,789), at 1.25%, dated 3/29/19, due 4/1/19 (Delivery value $404,042) | | 404,000 |
|
| State Street Institutional U.S. Government Money Market Fund, Premier Class | 6,190 |
| 6,190 |
|
TOTAL TEMPORARY CASH INVESTMENTS
(Cost $2,827,946) | | 2,827,946 |
|
TOTAL INVESTMENT SECURITIES — 99.4%
(Cost $130,249,745) | | 130,626,387 |
|
| OTHER ASSETS AND LIABILITIES — 0.6% | | 726,169 |
|
| TOTAL NET ASSETS — 100.0% | | $ | 131,352,556 |
|
|
| | |
| NOTES TO SCHEDULE OF INVESTMENTS |
| FHLMC | - | Federal Home Loan Mortgage Corporation |
| FNMA | - | Federal National Mortgage Association |
| H15T1Y | - | Constant Maturity U.S. Treasury Note Yield Curve Rate Index |
| IO | - | Interest Only |
| LIBOR | - | London Interbank Offered Rate |
| MTN | - | Medium Term Note |
| SEQ | - | Sequential Payer |
| USD | - | United States Dollar |
| VRN | - | Variable Rate Note. The rate adjusts periodically based upon the terms set forth in the security’s offering documents. The rate shown is effective at the period end and the reference rate and spread, if any, is indicated. |
| |
| (1) | Security was purchased pursuant to Rule 144A under the Securities Act of 1933 and may be sold in transactions exempt from registration, normally to qualified institutional investors. The aggregate value of these securities at the period end was $39,343,694, which represented 30.0% of total net assets. |
| |
| (2) | The interest rate on a bank loan obligation adjusts periodically based on a predetermined schedule. Rate shown is effective at period end. The maturity date on a bank loan obligation may be less than indicated as a result of contractual or optional prepayments. These prepayments cannot be predicted with certainty. |
| |
| (3) | The interest rate will be determined upon settlement of the bank loan obligation after period end. |
| |
| (4) | The rate indicated is the yield to maturity at purchase. |
See Notes to Financial Statements.
|
|
| Statement of Assets and Liabilities |
|
| | | |
| MARCH 31, 2019 | |
| Assets | |
| Investment securities, at value (cost of $130,249,745) | $ | 130,626,387 |
|
| Receivable for investments sold | 151,291 |
|
| Receivable for capital shares sold | 216,625 |
|
| Interest receivable | 815,167 |
|
| | 131,809,470 |
|
| | |
| Liabilities | |
| Payable for investments purchased | 298,125 |
|
| Payable for capital shares redeemed | 98,850 |
|
| Accrued management fees | 52,755 |
|
| Distribution and service fees payable | 2,355 |
|
| Dividends payable | 4,829 |
|
| | 456,914 |
|
| | |
| Net Assets | $ | 131,352,556 |
|
| | |
| Net Assets Consist of: | |
| Capital paid in | $ | 132,485,452 |
|
| Distributable earnings | (1,132,896 | ) |
| | $ | 131,352,556 |
|
|
| | | | | | |
| | Net Assets | Shares Outstanding | Net Asset Value Per Share |
| Investor Class |
| $109,863,495 |
| 11,568,531 |
| $9.50 |
| I Class |
| $13,462,815 |
| 1,418,415 |
| $9.49 |
| Y Class |
| $5,223 |
| 550 |
| $9.50 |
| A Class |
| $5,870,352 |
| 618,110 |
| $9.50* |
| C Class |
| $1,089,577 |
| 114,726 |
| $9.50 |
| R Class |
| $670,758 |
| 70,614 |
| $9.50 |
| R5 Class |
| $226,490 |
| 23,836 |
| $9.50 |
| R6 Class |
| $163,846 |
| 17,247 |
| $9.50 |
*Maximum offering price $9.72 (net asset value divided by 0.9775).
See Notes to Financial Statements.
|
| | | |
| YEAR ENDED MARCH 31, 2019 | |
| Investment Income (Loss) | |
| Income: | |
| Interest | $ | 2,425,259 |
|
| | |
| Expenses: | |
| Management fees | 414,283 |
|
| Distribution and service fees: | |
| A Class | 7,082 |
|
| C Class | 6,055 |
|
| R Class | 2,489 |
|
| Trustees' fees and expenses | 4,486 |
|
| Other expenses | 1,637 |
|
| | 436,032 |
|
Fees waived(1) | (51,621 | ) |
| | 384,411 |
|
| | |
| Net investment income (loss) | 2,040,848 |
|
| | |
| Realized and Unrealized Gain (Loss) | |
| Net realized gain (loss) on: | |
| Investment transactions | (576,252 | ) |
| Forward foreign currency exchange contract transactions | 5,377 |
|
| Futures contract transactions | (68,107 | ) |
| Swap agreement transactions | (267 | ) |
| Foreign currency translation transactions | 231 |
|
| | (639,018 | ) |
| | |
| Change in net unrealized appreciation (depreciation) on: | |
| Investments | 957,070 |
|
| Forward foreign currency exchange contracts | (10,585 | ) |
| Futures contracts | 21,289 |
|
| Swap agreements | 161 |
|
| Translation of assets and liabilities in foreign currencies | (6 | ) |
| | 967,929 |
|
| | |
| Net realized and unrealized gain (loss) | 328,911 |
|
| | |
| Net Increase (Decrease) in Net Assets Resulting from Operations | $ | 2,369,759 |
|
| |
| (1) | Amount consists of $39,862, $5,854, $4, $2,197, $465, $333, $2,457 and $449 for Investor Class, I Class, Y Class, A Class, C Class, R Class, R5 Class and R6 Class, respectively. |
See Notes to Financial Statements.
|
|
| Statement of Changes in Net Assets |
|
| | | | | | |
| YEARS ENDED MARCH 31, 2019 AND MARCH 31, 2018 |
| Increase (Decrease) in Net Assets | March 31, 2019 | March 31, 2018 |
| Operations | | |
| Net investment income (loss) | $ | 2,040,848 |
| $ | 903,867 |
|
| Net realized gain (loss) | (639,018 | ) | (8,642 | ) |
| Change in net unrealized appreciation (depreciation) | 967,929 |
| (428,923 | ) |
| Net increase (decrease) in net assets resulting from operations | 2,369,759 |
| 466,302 |
|
| | | |
| Distributions to Shareholders | | |
| From earnings: | | |
| Investor Class | (1,621,171 | ) | (435,683 | ) |
| I Class | (284,223 | ) | (156 | ) |
| Y Class | (163 | ) | (117 | ) |
| A Class | (82,054 | ) | (152,385 | ) |
| C Class | (13,047 | ) | (14,118 | ) |
| R Class | (13,077 | ) | (16,300 | ) |
| R5 Class | (94,981 | ) | (175,518 | ) |
| R6 Class | (19,210 | ) | (26,381 | ) |
| Decrease in net assets from distributions | (2,127,926 | ) | (820,658 | ) |
| | | |
| Capital Share Transactions | | |
| Net increase (decrease) in net assets from capital share transactions (Note 5) | 86,266,023 |
| 13,789,319 |
|
| | | |
| Net increase (decrease) in net assets | 86,507,856 |
| 13,434,963 |
|
| | | |
| Net Assets | | |
| Beginning of period | 44,844,700 |
| 31,409,737 |
|
| End of period | $ | 131,352,556 |
| $ | 44,844,700 |
|
See Notes to Financial Statements.
|
|
| Notes to Financial Statements |
MARCH 31, 2019
1. Organization
American Century Investment Trust (the trust) is registered under the Investment Company Act of 1940, as amended (the 1940 Act), as an open-end management investment company and is organized as a Massachusetts business trust. Short Duration Strategic Income Fund (the fund) is one fund in a series issued by the trust. The fund’s investment objective is to seek income. As a secondary objective, the fund seeks long-term capital appreciation.
The fund offers the Investor Class, I Class, Y Class, A Class, C Class, R Class, R5 Class and R6 Class. The A Class may incur an initial sales charge. The A Class and C Class may be subject to a contingent deferred sales charge. Sale of the I Class and Y Class commenced on April 10, 2017.
2. Significant Accounting Policies
The following is a summary of significant accounting policies consistently followed by the fund in preparation of its financial statements. The fund is an investment company and follows accounting and reporting guidance in accordance with accounting principles generally accepted in the United States of America. This may require management to make certain estimates and assumptions at the date of the financial statements. Actual results could differ from these estimates. Management evaluated the impact of events or transactions occurring through the date the financial statements were issued that would merit recognition or disclosure.
Investment Valuations — The fund determines the fair value of its investments and computes its net asset value per share at the close of regular trading (usually 4 p.m. Eastern time) on the New York Stock Exchange (NYSE) on each day the NYSE is open. The Board of Trustees has adopted valuation policies and procedures to guide the investment advisor in the fund’s investment valuation process and to provide methodologies for the oversight of the fund’s pricing function.
Fixed income securities are valued at the evaluated mean as provided by independent pricing services or at the mean of the most recent bid and asked prices as provided by investment dealers. Corporate bonds, U.S. Treasury and Government Agency securities, convertible bonds, bank loan obligations, municipal securities, and sovereign governments and agencies are valued using market models that consider trade data, quotations from dealers and active market makers, relevant yield curve and spread data, creditworthiness, trade data or market information on comparable securities, and other relevant security specific information. Mortgage-related and asset-backed securities are valued based on models that consider trade data, prepayment and default projections, benchmark yield and spread data and estimated cash flows of each tranche of the issuer. Collateralized loan obligations are valued based on discounted cash flow models that consider trade and economic data, prepayment assumptions and default projections. Fixed income securities initially expressed in local currencies are translated into U.S. dollars at the mean of the appropriate currency exchange rate at the close of the NYSE as provided by an independent pricing service.
Equity securities that are listed or traded on a domestic securities exchange are valued at the last reported sales price or at the official closing price as provided by the exchange. Equity securities traded on foreign securities exchanges are generally valued at the closing price of such securities on the exchange where primarily traded or at the close of the NYSE, if that is earlier. If no last sales price is reported, or if local convention or regulation so provides, the mean of the latest bid and asked prices may be used. Securities traded over-the-counter are valued at the mean of the latest bid and asked prices, the last sales price, or the official closing price. Equity securities initially expressed in local currencies are translated into U.S. dollars at the mean of the appropriate currency exchange rate at the close of the NYSE as provided by an independent pricing service.
Open-end management investment companies are valued at the reported net asset value per share. Repurchase agreements are valued at cost, which approximates fair value. Exchange-traded futures contracts are valued at the settlement price as provided by the appropriate exchange. Swap agreements are valued at an evaluated mean as provided by independent pricing services or independent brokers. Forward foreign currency exchange contracts are valued at the mean of the appropriate forward exchange rate at the close of the NYSE as provided by an independent pricing service. Investments initially expressed in local currencies are translated into U.S. dollars at the mean of the appropriate currency exchange rate at the close of the NYSE as provided by an independent pricing service.
If the fund determines that the market price for an investment is not readily available or the valuation methods mentioned above do not reflect an investment’s fair value, such investment is valued as determined in good faith by the Board of Trustees or its delegate, in accordance with policies and procedures adopted by the Board of Trustees. In its determination of fair value, the fund may review several factors including, but not limited to, market information regarding the specific investment or comparable investments and correlation with other investment types, futures indices or general market indicators. Circumstances that may cause the fund to use these procedures to value an investment include, but are not limited to: an investment has been declared in default or is distressed; trading in a security has been suspended during the trading day or a security is not actively trading on its principal exchange; prices received from a regular pricing source are deemed unreliable; or there is a foreign market holiday and no trading occurred.
The fund monitors for significant events occurring after the close of an investment’s primary exchange but before the fund’s net asset value per share is determined. Significant events may include, but are not limited to: corporate announcements and transactions; governmental action and political unrest that could impact a specific investment or an investment sector; or armed conflicts, natural disasters and similar events that could affect investments in a specific country or region. The fund also monitors for significant fluctuations between domestic and foreign markets, as evidenced by the U.S. market or such other indicators that the Board of Trustees, or its delegate, deems appropriate. If significant fluctuations in foreign markets are identified, the fund may apply a model-derived factor to the closing price of equity securities traded on foreign securities exchanges. The factor is based on observable market data as provided by an independent pricing service.
Security Transactions — Security transactions are accounted for as of the trade date. Net realized gains and losses are determined on the identified cost basis, which is also used for federal income tax purposes.
Investment Income — Interest income is recorded on the accrual basis and includes paydown gain (loss) and accretion of discounts and amortization of premiums. Inflation adjustments related to inflation-linked debt securities are reflected as interest income.
Foreign Currency Translations — All assets and liabilities initially expressed in foreign currencies are translated into U.S. dollars at prevailing exchange rates at period end. The fund may enter into spot foreign currency exchange contracts to facilitate transactions denominated in a foreign currency. Purchases and sales of investment securities, dividend and interest income, spot foreign currency exchange contracts, and expenses are translated at the rates of exchange prevailing on the respective dates of such transactions. Net realized and unrealized foreign currency exchange gains or losses related to investment securities are a component of net realized gain (loss) on investment transactions and change in net unrealized appreciation (depreciation) on investments, respectively.
Repurchase Agreements — The fund may enter into repurchase agreements with institutions that American Century Investment Management, Inc. (ACIM) (the investment advisor) has determined are creditworthy pursuant to criteria adopted by the Board of Trustees. The fund requires that the collateral, represented by securities, received in a repurchase transaction be transferred to the custodian in a manner sufficient to enable the fund to obtain those securities in the event of a default under the repurchase agreement. ACIM monitors, on a daily basis, the securities transferred to ensure the value, including accrued interest, of the securities under each repurchase agreement is equal to or greater than amounts owed to the fund under each repurchase agreement.
Joint Trading Account — Pursuant to an Exemptive Order issued by the Securities and Exchange Commission, the fund, along with certain other funds in the American Century Investments family of funds, may transfer uninvested cash balances into a joint trading account. These balances are invested in one or more repurchase agreements that are collateralized by U.S. Treasury or Agency obligations.
Segregated Assets — In accordance with the 1940 Act, the fund segregates assets on its books and records to cover certain types of investment securities and other financial instruments. ACIM monitors, on a daily basis, the securities segregated to ensure the fund designates a sufficient amount of liquid assets, marked-to-market daily. The fund may also receive assets or be required to pledge assets at the custodian bank or with a broker for collateral requirements.
Income Tax Status — It is the fund’s policy to distribute substantially all net investment income and net realized gains to shareholders and to otherwise qualify as a regulated investment company under provisions of the Internal Revenue Code. Accordingly, no provision has been made for income taxes. The fund files U.S. federal, state, local and non-U.S. tax returns as applicable. The fund's tax returns are subject to examination by the relevant taxing authority until expiration of the applicable statute of limitations, which is generally three years from the date of filing but can be longer in certain jurisdictions. At this time, management believes there are no uncertain tax positions which, based on their technical merit, would not be sustained upon examination and for which it is reasonably possible that the total amounts of unrecognized tax benefits will significantly change in the next twelve months.
Multiple Class — All shares of the fund represent an equal pro rata interest in the net assets of the class to which such shares belong, and have identical voting, dividend, liquidation and other rights and the same terms and conditions, except for class specific expenses and exclusive rights to vote on matters affecting only individual classes. Income, non-class specific expenses, and realized and unrealized capital gains and losses of the fund are allocated to each class of shares based on their relative net assets.
Distributions to Shareholders — Distributions from net investment income, if any, are declared daily and paid monthly. Distributions from net realized gains, if any, are generally declared and paid annually.
Indemnifications — Under the trust’s organizational documents, its officers and trustees are indemnified against certain liabilities arising out of the performance of their duties to the fund. In addition, in the normal course of business, the fund enters into contracts that provide general indemnifications. The maximum exposure under these arrangements is unknown as this would involve future claims that may be made against a fund. The risk of material loss from such claims is considered by management to be remote.
3. Fees and Transactions with Related Parties
Certain officers and trustees of the trust are also officers and/or directors of American Century Companies, Inc. (ACC). The trust's investment advisor, ACIM, the trust's distributor, American Century Investment Services, Inc. (ACIS), and the trust's transfer agent, American Century Services, LLC, are wholly owned, directly or indirectly, by ACC.
Management Fees — The trust has entered into a management agreement with ACIM, under which ACIM provides the fund with investment advisory and management services in exchange for a single, unified management fee (the fee) per class. The agreement provides that all expenses of managing and operating the fund, except distribution and service fees, brokerage expenses, taxes, interest, fees and expenses of the independent trustees (including legal counsel fees), and extraordinary expenses, will be paid by ACIM. The fee is computed and accrued daily based on each class's daily net assets and paid monthly in arrears. The difference in the fee among the classes is a result of their separate arrangements for non-Rule 12b-1 shareholder services. It is not the result of any difference in advisory or custodial fees or other expenses related to the management of the fund’s assets, which do not vary by class. From April 1, 2018 through July 31, 2018, the investment advisor agreed to waive 0.09% of the fund's management fee. Effective August 1, 2018, the investment advisor decreased this waiver to 0.04% and decreased the annual management fee by 0.14%. Effective December 1, 2018, the investment advisor agreed to waive 0.09% of the fund's management fee. The investment advisor expects this waiver to continue until November 30, 2019 and cannot terminate it prior to such date without the approval of the Board of Trustees.
The annual management fee and the effective annual management fee before and after waiver for each class for the period ended March 31, 2019 are as follows:
|
| | | |
| | | Effective Annual Management Fee |
| | Annual Management Fee* | Before Waiver | After Waiver |
| Investor Class | 0.60% | 0.65% | 0.57% |
| I Class | 0.50% | 0.55% | 0.47% |
| Y Class | 0.40% | 0.45% | 0.37% |
| A Class | 0.60% | 0.65% | 0.57% |
| C Class | 0.60% | 0.65% | 0.57% |
| R Class | 0.60% | 0.65% | 0.57% |
| R5 Class | 0.40% | 0.45% | 0.37% |
| R6 Class | 0.35% | 0.40% | 0.32% |
*Prior to August 1, 2018, the annual management fee was 0.74% for the Investor Class, A Class, C Class and R Class, 0.64% for the I Class, 0.54% for the Y Class and R5 Class and 0.49% for the R6 Class.
Distribution and Service Fees — The Board of Trustees has adopted a separate Master Distribution and Individual Shareholder Services Plan for each of the A Class, C Class and R Class (collectively the plans), pursuant to Rule 12b-1 of the 1940 Act. The plans provide that the A Class will pay ACIS an annual distribution and service fee of 0.25%. The plans provide that the C Class will pay ACIS an annual distribution and service fee of 1.00%, of which 0.25% is paid for individual shareholder services and 0.75% is paid for distribution services. The plans provide that the R Class will pay ACIS an annual distribution and service fee of 0.50%. The fees are computed and accrued daily based on each class’s daily net assets and paid monthly in arrears. The fees are used to pay financial intermediaries for distribution and individual shareholder services. Fees incurred under the plans during the period ended March 31, 2019 are detailed in the Statement of Operations.
Trustees’ Fees and Expenses — The Board of Trustees is responsible for overseeing the investment advisor’s management and operations of the fund. The trustees receive detailed information about the fund and its investment advisor regularly throughout the year, and meet at least quarterly with management of the investment advisor to review reports about fund operations. The fund’s officers do not receive compensation from the fund.
Interfund Transactions — The fund may enter into security transactions with other American Century Investments funds and other client accounts of the investment advisor, in accordance with the 1940 Act rules and procedures adopted by the Board of Trustees. The rules and procedures require, among other things, that these transactions be effected at the independent current market price of the security. There were no interfund transactions during the period.
4. Investment Transactions
Purchases of investment securities, excluding short-term investments, for the period ended March 31, 2019 totaled $117,666,038, of which $24,100,555 represented U.S. Treasury and Government Agency obligations.
Sales of investment securities, excluding short-term investments, for the period ended March 31, 2019 totaled $39,216,528, of which $6,358,951 represented U.S. Treasury and Government Agency obligations.
5. Capital Share Transactions
Transactions in shares of the fund were as follows (unlimited number of shares authorized):
|
| | | | | | | | | | |
| | Year ended
March 31, 2019 | Year ended March 31, 2018(1) |
| | Shares | Amount | Shares | Amount |
| Investor Class | | | | |
| Sold | 11,675,445 |
| $ | 110,364,198 |
| 3,129,598 |
| $ | 30,049,274 |
|
| Issued in reinvestment of distributions | 164,600 |
| 1,556,473 |
| 44,557 |
| 427,918 |
|
| Redeemed | (3,626,603 | ) | (34,354,138 | ) | (996,329 | ) | (9,569,215 | ) |
| | 8,213,442 |
| 77,566,533 |
| 2,177,826 |
| 20,907,977 |
|
| I Class | | | | |
| Sold | 3,136,773 |
| 29,693,845 |
| 1,963 |
| 18,771 |
|
| Issued in reinvestment of distributions | 30,064 |
| 284,218 |
| 16 |
| 156 |
|
| Redeemed | (1,750,401 | ) | (16,472,725 | ) | — |
| — |
|
| | 1,416,436 |
| 13,505,338 |
| 1,979 |
| 18,927 |
|
| Y Class | | | | |
| Sold | — |
| — |
| 521 |
| 5,001 |
|
| Issued in reinvestment of distributions | 17 |
| 163 |
| 12 |
| 117 |
|
| | 17 |
| 163 |
| 533 |
| 5,118 |
|
| A Class | | | | |
| Sold | 667,365 |
| 6,311,533 |
| 85,309 |
| 819,847 |
|
| Issued in reinvestment of distributions | 8,501 |
| 80,380 |
| 15,687 |
| 150,904 |
|
| Redeemed | (482,972 | ) | (4,587,944 | ) | (682,652 | ) | (6,545,960 | ) |
| | 192,894 |
| 1,803,969 |
| (581,656 | ) | (5,575,209 | ) |
| C Class | | | | |
| Sold | 121,672 |
| 1,145,675 |
| 17,165 |
| 164,984 |
|
| Issued in reinvestment of distributions | 1,376 |
| 13,006 |
| 1,459 |
| 14,034 |
|
| Redeemed | (50,064 | ) | (474,458 | ) | (102,493 | ) | (979,768 | ) |
| | 72,984 |
| 684,223 |
| (83,869 | ) | (800,750 | ) |
| R Class | | | | |
| Sold | 75,683 |
| 717,329 |
| 1,805 |
| 17,454 |
|
| Issued in reinvestment of distributions | 1,378 |
| 13,028 |
| 1,682 |
| 16,187 |
|
| Redeemed | (12,566 | ) | (118,977 | ) | (104,833 | ) | (1,001,686 | ) |
| | 64,495 |
| 611,380 |
| (101,346 | ) | (968,045 | ) |
| R5 Class | | | | |
| Sold | 3,193 |
| 30,373 |
| — |
| — |
|
| Issued in reinvestment of distributions | 9,946 |
| 94,437 |
| 18,200 |
| 175,001 |
|
| Redeemed | (751,573 | ) | (7,129,387 | ) | — |
| — |
|
| | (738,434 | ) | (7,004,577 | ) | 18,200 |
| 175,001 |
|
| R6 Class | | | | |
| Sold | 5,263 |
| 49,865 |
| — |
| — |
|
| Issued in reinvestment of distributions | 2,016 |
| 19,129 |
| 2,736 |
| 26,300 |
|
| Redeemed | (102,321 | ) | (970,000 | ) | — |
| — |
|
| | (95,042 | ) | (901,006 | ) | 2,736 |
| 26,300 |
|
| Net increase (decrease) | 9,126,792 |
| $ | 86,266,023 |
| 1,434,403 |
| $ | 13,789,319 |
|
| |
| (1) | April 10, 2017 (commencement of sale) through March 31, 2018 for the I Class and Y Class. |
6. Fair Value Measurements
The fund’s investments valuation process is based on several considerations and may use multiple inputs to determine the fair value of the investments held by the fund. In conformity with accounting principles generally accepted in the United States of America, the inputs used to determine a valuation are classified into three broad levels.
| |
| • | Level 1 valuation inputs consist of unadjusted quoted prices in an active market for identical investments. |
| |
| • | Level 2 valuation inputs consist of direct or indirect observable market data (including quoted prices for comparable investments, evaluations of subsequent market events, interest rates, prepayment speeds, credit risk, etc.). These inputs also consist of quoted prices for identical investments initially expressed in local currencies that are adjusted through translation into U.S. dollars. |
| |
| • | Level 3 valuation inputs consist of unobservable data (including a fund’s own assumptions). |
The level classification is based on the lowest level input that is significant to the fair valuation measurement. The valuation inputs are not necessarily an indication of the risks associated with investing in these securities or other financial instruments.
The following is a summary of the level classifications as of period end. The Schedule of Investments provides additional information on the fund’s portfolio holdings.
|
| | | | | | | | |
| | Level 1 | Level 2 | Level 3 |
| Assets | | | |
| Investment Securities | | | |
| Corporate Bonds | — |
| $ | 55,770,566 |
| — |
|
| Asset-Backed Securities | — |
| 21,510,091 |
| — |
|
| Collateralized Mortgage Obligations | — |
| 15,789,092 |
| — |
|
| U.S. Treasury Securities | — |
| 14,574,104 |
| — |
|
| Collateralized Loan Obligations | — |
| 8,676,435 |
| — |
|
| Commercial Mortgage-Backed Securities | — |
| 4,485,134 |
| — |
|
| Bank Loan Obligations | — |
| 4,017,707 |
| — |
|
| Sovereign Governments and Agencies | — |
| 2,975,312 |
| — |
|
| Temporary Cash Investments | $ | 6,190 |
| 2,821,756 |
| — |
|
| | $ | 6,190 |
| $ | 130,620,197 |
| — |
|
7. Derivative Instruments
Credit Risk — The fund is subject to credit risk in the normal course of pursuing its investment objectives. The value of a bond generally declines as the credit quality of its issuer declines. Credit default swap agreements enable a fund to buy/sell protection against a credit event of a specific issuer or index. A fund may attempt to enhance returns by selling protection or attempt to mitigate credit risk by buying protection. The buyer/seller of credit protection against a security or basket of securities may pay/receive an up-front or periodic payment to compensate for/against potential default events. Changes in value, including the periodic amounts of interest to be paid or received on swap agreements, are recorded as unrealized appreciation (depreciation) on swap agreements. Upon entering into a centrally cleared swap, a fund is required to deposit cash or securities (initial margin) with a financial intermediary in an amount equal to a certain percentage of the notional amount. Subsequent payments (variation margin) are made or received daily, in cash, by a fund. The variation margin is equal to the daily change in the value and is a component of unrealized gains and losses. Realized gain or loss is recorded upon receipt or payment of a periodic settlement or termination of swap agreements. Net realized and unrealized gains or losses occurring during the holding period of swap agreements are a component of net realized gain (loss) on swap agreement transactions and change in net unrealized appreciation (depreciation) on swap agreements, respectively. The risks of entering into swap agreements include the possible lack of liquidity, failure of the counterparty to meet its obligations, and that there may be unfavorable changes in the underlying investments or instruments. The fund's average notional amount held during the period was $1,320,000.
Foreign Currency Risk — The fund is subject to foreign currency exchange rate risk in the normal course of pursuing its investment objectives. The value of foreign investments held by a fund may be significantly affected by changes in foreign currency exchange rates. The dollar value of a foreign security generally decreases when the value of the dollar rises against the foreign currency in which the security is denominated and tends to increase when the value of the dollar declines against such foreign currency. A fund may enter into forward foreign currency exchange contracts to reduce a fund's exposure to foreign currency exchange rate fluctuations or to gain exposure to the fluctuations in the value of foreign currencies. The net U.S. dollar value of foreign currency underlying all contractual commitments held by a fund and the resulting unrealized appreciation or depreciation are determined daily. Realized gain or loss is recorded upon the termination of the contract. Net realized and unrealized gains or losses occurring during the holding period of forward foreign currency exchange contracts are a component of net realized gain (loss) on forward foreign currency exchange contract transactions and change in net unrealized appreciation (depreciation) on forward foreign currency exchange contracts, respectively. A fund bears the risk of an unfavorable change in the foreign currency exchange rate underlying the forward contract. Additionally, losses, up to the fair value, may arise if the counterparties do not perform under the contract terms. The fund's average U.S. dollar exposure to foreign currency risk derivative instruments held during the period was $4,677,598.
Interest Rate Risk — The fund is subject to interest rate risk in the normal course of pursuing its investment objectives. The value of bonds generally declines as interest rates rise. A fund may enter into futures contracts based on a bond index or a specific underlying security. A fund may purchase futures contracts to gain exposure to increases in market value or sell futures contracts to protect against a decline in market value. Upon entering into a futures contract, a fund will segregate cash, cash equivalents or other appropriate liquid securities on its records in amounts sufficient to meet requirements. Subsequent payments (variation margin) are made or received daily, in cash, by a fund. The variation margin is equal to the daily change in the contract value and is recorded as unrealized gains and losses. A fund recognizes a realized gain or loss when the futures contract is closed or expires. Net realized and unrealized gains or losses occurring during the holding period of futures contracts are a component of net realized gain (loss) on futures contract transactions and change in net unrealized appreciation (depreciation) on futures contracts, respectively. One of the risks of entering into futures contracts is the possibility that the change in value of the contract may not correlate with the changes in value of the underlying securities. The fund's average notional exposure to interest rate risk derivative instruments held during the period was $1,500,000 futures contracts purchased and $2,253,802 futures contracts sold.
At period end, the fund did not have any derivative instruments disclosed on the Statement of Assets and Liabilities.
Effect of Derivative Instruments on the Statement of Operations for the Year Ended March 31, 2019
|
| | | | | | | | |
| | Net Realized Gain (Loss) | Change in Net Unrealized Appreciation (Depreciation) |
| Type of Risk Exposure | Location on Statement of Operations | Value | Location on Statement of Operations | Value |
| Credit Risk | Net realized gain (loss) on swap agreement transactions | $ | (267 | ) | Change in net unrealized appreciation (depreciation) on swap agreements | $ | 161 |
|
| Foreign Currency Risk | Net realized gain (loss) on forward foreign currency exchange contract transactions | 5,377 |
| Change in net unrealized appreciation (depreciation) on forward foreign currency exchange contracts | (10,585 | ) |
| Interest Rate Risk | Net realized gain (loss) on futures contract transactions | (68,107 | ) | Change in net unrealized appreciation (depreciation) on futures contracts | 21,289 |
|
| | | $ | (62,997 | ) | | $ | 10,865 |
|
8. Risk Factors
There are certain risks involved in investing in foreign securities. These risks include those resulting from political events (such as civil unrest, national elections and imposition of exchange controls), social and economic events (such as labor strikes and rising inflation), and natural disasters. Securities of foreign issuers may be less liquid and more volatile. Investing in emerging markets or a significant portion of assets in one country or region may accentuate these risks.
The fund invests in lower-rated debt securities, which are subject to substantial risks including liquidity risk and credit risk.
9. Federal Tax Information
The tax character of distributions paid during the years ended March 31, 2019 and March 31, 2018 were as follows:
|
| | | | | | |
| | 2019 | 2018 |
| Distributions Paid From | | |
| Ordinary income | $ | 2,127,926 |
| $ | 820,658 |
|
| Long-term capital gains | — |
| — |
|
The book-basis character of distributions made during the year from net investment income or net realized gains may differ from their ultimate characterization for federal income tax purposes. These differences reflect the differing character of certain income items and net realized gains and losses for financial statement and tax purposes, and may result in reclassification among certain capital accounts on the financial statements.
As of period end, the federal tax cost of investments and the components of distributable earnings on a tax-basis were as follows:
|
| | | |
| Federal tax cost of investments | $ | 130,261,495 |
|
| Gross tax appreciation of investments | $ | 659,334 |
|
| Gross tax depreciation of investments | (294,442 | ) |
| Net tax appreciation (depreciation) of investments | $ | 364,892 |
|
| Other book-to-tax adjustments | $ | (2,307 | ) |
| Undistributed ordinary income | — |
|
| Accumulated short-term capital losses | $ | (471,131 | ) |
Accumulated long-term capital losses
| $ | (1,024,350 | ) |
The difference between book-basis and tax-basis unrealized appreciation (depreciation) is attributable primarily to the tax deferral of losses on wash sales.
Accumulated capital losses represent net capital loss carryovers that may be used to offset future realized capital gains for federal income tax purposes. The capital loss carryovers may be carried forward for an unlimited period. Future capital loss carryover utilization in any given year may be subject to Internal Revenue Code limitations.
10. Recently Issued Accounting Standards
In March 2017, the Financial Accounting Standards Board (FASB) issued Accounting Standards Update No. 2017-08, “Receivables - Nonrefundable Fees and Other Costs (Subtopic 310-20), Premium Amortization on Purchased Callable Debt Securities” (ASU 2017-08). ASU 2017-08 amends the amortization period for certain purchased callable debt securities held at a premium, shortening such period to the earliest call date. The amendments are effective for fiscal years, and interim periods within those fiscal years, beginning after December 15, 2018. Management is currently evaluating the impact that adopting ASU 2017-08 will have on the financial statements.
|
| | | | | | | | | | | | | | | | | |
| For a Share Outstanding Throughout the Years Ended March 31 (except as noted) |
| Per-Share Data | | | | | | | | | Ratios and Supplemental Data |
| | | Income From Investment Operations: | Distributions From: | | | Ratio to Average Net Assets of: | | |
| | Net Asset
Value,
Beginning
of Period | Net
Investment
Income
(Loss)(1) | Net
Realized
and
Unrealized
Gain (Loss) | Total From
Investment
Operations | Net Investment Income | Tax Return of Capital | Total Distributions | Net Asset
Value,
End of Period | Total
Return(2) | Operating
Expenses | Operating
Expenses
(before
expense
waiver) | Net
Investment
Income
(Loss) | Net
Investment
Income (Loss) (before expense waiver) | Portfolio
Turnover
Rate | Net
Assets,
End of
Period (in thousands) |
| Investor Class | | | | | | | | | | | | | | |
| 2019 | $9.53 | 0.28 | (0.02) | 0.26 | (0.29) | — | (0.29) | $9.50 | 2.75% | 0.58% | 0.66% | 2.97% | 2.89% | 61% |
| $109,863 |
|
| 2018 | $9.60 | 0.23 | (0.09) | 0.14 | (0.21) | — | (0.21) | $9.53 | 1.50% | 0.63% | 0.75% | 2.43% | 2.31% | 57% |
| $31,975 |
|
| 2017 | $9.31 | 0.24 | 0.31 | 0.55 | (0.25) | (0.01) | (0.26) | $9.60 | 5.96% | 0.60% | 0.75% | 2.54% | 2.39% | 29% |
| $11,304 |
|
| 2016 | $9.75 | 0.26 | (0.38) | (0.12) | (0.32) | — | (0.32) | $9.31 | (1.26)% | 0.60% | 0.75% | 2.69% | 2.54% | 19% |
| $4,927 |
|
2015(3) | $10.00 | 0.18 | (0.20) | (0.02) | (0.23) | — | (0.23) | $9.75 | (0.16)% | 0.61%(4) | 0.75%(4) | 2.78%(4) | 2.64%(4) | 18% |
| $9,879 |
|
| I Class | | | | | | | | | | | | | | |
| 2019 | $9.53 | 0.29 | (0.03) | 0.26 | (0.30) | — | (0.30) | $9.49 | 2.75% | 0.48% | 0.56% | 3.07% | 2.99% | 61% |
| $13,463 |
|
2018(5) | $9.61 | 0.24 | (0.11) | 0.13 | (0.21) | — | (0.21) | $9.53 | 1.39% | 0.53%(4) | 0.65%(4) | 2.56%(4) | 2.44%(4) | 57%(6) |
| $19 |
|
| Y Class | | | | | | | | | | | | | | |
| 2019 | $9.53 | 0.29 | (0.02) | 0.27 | (0.30) | — | (0.30) | $9.50 | 2.92% | 0.38% | 0.46% | 3.17% | 3.09% | 61% |
| $5 |
|
2018(5) | $9.61 | 0.25 | (0.11) | 0.14 | (0.22) | — | (0.22) | $9.53 | 1.49% | 0.43%(4) | 0.55%(4) | 2.62%(4) | 2.50%(4) | 57%(6) |
| $5 |
|
| A Class | | | | | | | | | | | | | | | |
| 2019 | $9.53 | 0.26 | (0.03) | 0.23 | (0.26) | — | (0.26) | $9.50 | 2.50% | 0.83% | 0.91% | 2.72% | 2.64% | 61% |
| $5,870 |
|
| 2018 | $9.60 | 0.21 | (0.09) | 0.12 | (0.19) | — | (0.19) | $9.53 | 1.25% | 0.88% | 1.00% | 2.18% | 2.06% | 57% |
| $4,052 |
|
| 2017 | $9.31 | 0.22 | 0.31 | 0.53 | (0.23) | (0.01) | (0.24) | $9.60 | 5.69% | 0.85% | 1.00% | 2.29% | 2.14% | 29% |
| $9,669 |
|
| 2016 | $9.75 | 0.23 | (0.38) | (0.15) | (0.29) | — | (0.29) | $9.31 | (1.50)% | 0.85% | 1.00% | 2.44% | 2.29% | 19% |
| $9,901 |
|
2015(3) | $10.00 | 0.17 | (0.20) | (0.03) | (0.22) | — | (0.22) | $9.75 | (0.33)% | 0.86%(4) | 1.00%(4) | 2.53%(4) | 2.39%(4) | 18% |
| $7,288 |
|
|
| | | | | | | | | | | | | | | | | |
| For a Share Outstanding Throughout the Years Ended March 31 (except as noted) |
| Per-Share Data | | | | | | | | | Ratios and Supplemental Data |
| | | Income From Investment Operations: | Distributions From: | | | Ratio to Average Net Assets of: | | |
| | Net Asset
Value,
Beginning
of Period | Net
Investment
Income
(Loss)(1) | Net
Realized
and
Unrealized
Gain (Loss) | Total From
Investment
Operations | Net Investment Income | Tax Return of Capital | Total Distributions | Net Asset
Value,
End of Period | Total
Return(2) | Operating
Expenses | Operating
Expenses
(before
expense
waiver) | Net
Investment
Income
(Loss) | Net
Investment
Income (Loss) (before expense waiver) | Portfolio
Turnover
Rate | Net
Assets,
End of
Period (in thousands) |
| C Class | | | | | | | | | | | | | | |
| 2019 | $9.53 | 0.19 | (0.03) | 0.16 | (0.19) | — | (0.19) | $9.50 | 1.73% | 1.58% | 1.66% | 1.97% | 1.89% | 61% |
| $1,090 |
|
| 2018 | $9.60 | 0.14 | (0.09) | 0.05 | (0.12) | — | (0.12) | $9.53 | 0.49% | 1.63% | 1.75% | 1.43% | 1.31% | 57% |
| $398 |
|
| 2017 | $9.31 | 0.15 | 0.30 | 0.45 | (0.15) | (0.01) | (0.16) | $9.60 | 4.91% | 1.60% | 1.75% | 1.54% | 1.39% | 29% |
| $1,206 |
|
| 2016 | $9.75 | 0.16 | (0.38) | (0.22) | (0.22) | — | (0.22) | $9.31 | (2.24)% | 1.60% | 1.75% | 1.69% | 1.54% | 19% |
| $1,104 |
|
2015(3) | $10.00 | 0.12 | (0.20) | (0.08) | (0.17) | — | (0.17) | $9.75 | (0.83)% | 1.61%(4) | 1.75%(4) | 1.78%(4) | 1.64%(4) | 18% |
| $1,009 |
|
| R Class | | | | | | | | | | | | | | |
| 2019 | $9.53 | 0.24 | (0.03) | 0.21 | (0.24) | — | (0.24) | $9.50 | 2.24% | 1.08% | 1.16% | 2.47% | 2.39% | 61% |
| $671 |
|
| 2018 | $9.60 | 0.19 | (0.09) | 0.10 | (0.17) | — | (0.17) | $9.53 | 1.00% | 1.13% | 1.25% | 1.93% | 1.81% | 57% |
| $58 |
|
| 2017 | $9.31 | 0.19 | 0.31 | 0.50 | (0.20) | (0.01) | (0.21) | $9.60 | 5.43% | 1.10% | 1.25% | 2.04% | 1.89% | 29% |
| $1,032 |
|
| 2016 | $9.75 | 0.21 | (0.38) | (0.17) | (0.27) | — | (0.27) | $9.31 | (1.75)% | 1.10% | 1.25% | 2.19% | 2.04% | 19% |
| $979 |
|
2015(3) | $10.00 | 0.15 | (0.20) | (0.05) | (0.20) | — | (0.20) | $9.75 | (0.49)% | 1.11%(4) | 1.25%(4) | 2.28%(4) | 2.14%(4) | 18% |
| $995 |
|
| R5 Class | | | | | | | | | | | | | | |
| 2019 | $9.53 | 0.28 | —(7) | 0.28 | (0.31) | — | (0.31) | $9.50 | 2.96% | 0.38% | 0.46% | 3.17% | 3.09% | 61% |
| $226 |
|
| 2018 | $9.60 | 0.25 | (0.09) | 0.16 | (0.23) | — | (0.23) | $9.53 | 1.71% | 0.43% | 0.55% | 2.63% | 2.51% | 57% |
| $7,267 |
|
| 2017 | $9.31 | 0.26 | 0.31 | 0.57 | (0.27) | (0.01) | (0.28) | $9.60 | 6.17% | 0.40% | 0.55% | 2.74% | 2.59% | 29% |
| $7,146 |
|
| 2016 | $9.75 | 0.28 | (0.38) | (0.10) | (0.34) | — | (0.34) | $9.31 | (1.06)% | 0.40% | 0.55% | 2.89% | 2.74% | 19% |
| $6,729 |
|
2015(3) | $10.00 | 0.20 | (0.20) | — | (0.25) | — | (0.25) | $9.75 | (0.02)% | 0.41%(4) | 0.55%(4) | 2.98%(4) | 2.84%(4) | 18% |
| $7,301 |
|
|
| | | | | | | | | | | | | | | | | |
| For a Share Outstanding Throughout the Years Ended March 31 (except as noted) |
| Per-Share Data | | | | | | | | | Ratios and Supplemental Data |
| | | Income From Investment Operations: | Distributions From: | | | Ratio to Average Net Assets of: | | |
| | Net Asset
Value,
Beginning
of Period | Net
Investment
Income
(Loss)(1) | Net
Realized
and
Unrealized
Gain (Loss) | Total From
Investment
Operations | Net Investment Income | Tax Return of Capital | Total Distributions | Net Asset
Value,
End of Period | Total
Return(2) | Operating
Expenses | Operating
Expenses
(before
expense
waiver) | Net
Investment
Income
(Loss) | Net
Investment
Income (Loss) (before expense waiver) | Portfolio
Turnover
Rate | Net
Assets,
End of
Period (in thousands) |
| R6 Class | | | | | | | | | | | | | | |
| 2019 | $9.53 | 0.29 | (0.01) | 0.28 | (0.31) | — | (0.31) | $9.50 | 3.01% | 0.33% | 0.41% | 3.22% | 3.14% | 61% |
| $164 |
|
| 2018 | $9.60 | 0.26 | (0.09) | 0.17 | (0.24) | — | (0.24) | $9.53 | 1.76% | 0.38% | 0.50% | 2.68% | 2.56% | 57% |
| $1,070 |
|
| 2017 | $9.31 | 0.27 | 0.30 | 0.57 | (0.27) | (0.01) | (0.28) | $9.60 | 6.22% | 0.35% | 0.50% | 2.79% | 2.64% | 29% |
| $1,052 |
|
| 2016 | $9.75 | 0.28 | (0.38) | (0.10) | (0.34) | — | (0.34) | $9.31 | (1.01)% | 0.35% | 0.50% | 2.94% | 2.79% | 19% |
| $990 |
|
2015(3) | $10.00 | 0.20 | (0.20) | — | (0.25) | — | (0.25) | $9.75 | 0.01% | 0.36%(4) | 0.50%(4) | 3.03%(4) | 2.89%(4) | 18% |
| $1,000 |
|
|
|
| Notes to Financial Highlights |
| |
| (1) | Computed using average shares outstanding throughout the period. |
| |
| (2) | Total returns are calculated based on the net asset value of the last business day and do not reflect applicable sales charges, if any. Total returns for periods less than one year are not annualized. |
| |
| (3) | July 28, 2014 (fund inception) through March 31, 2015. |
| |
| (5) | April 10, 2017 (commencement of sale) through March 31, 2018. |
| |
| (6) | Portfolio turnover is calculated at the fund level. Percentage indicated was calculated for the year ended March 31, 2018. |
| |
| (7) | Per-share amount was less than $0.005. |
See Notes to Financial Statements.
|
|
| Report of Independent Registered Public Accounting Firm |
To the Board of Trustees of American Century Investment Trust and Shareholders of Short Duration Strategic Income Fund:
Opinion on the Financial Statements
We have audited the accompanying statement of assets and liabilities, including the schedule of investments, of Short Duration Strategic Income Fund (one of the funds constituting American Century Investment Trust, referred to hereafter as the “Fund”) as of March 31, 2019, the related statement of operations for the year ended March 31, 2019, the statement of changes in net assets for each of the two years in the period ended March 31, 2019, including the related notes, and the financial highlights for each of the periods indicated therein (collectively referred to as the “financial statements”). In our opinion, the financial statements present fairly, in all material respects, the financial position of the Fund as of March 31, 2019, the results of its operations for the year then ended, the changes in its net assets for each of the two years in the period ended March 31, 2019 and the financial highlights for each of the periods indicated therein in conformity with accounting principles generally accepted in the United States of America.
Basis for Opinion
These financial statements are the responsibility of the Fund’s management. Our responsibility is to express an opinion on the Fund’s financial statements based on our audits. We are a public accounting firm registered with the Public Company Accounting Oversight Board (United States) (“PCAOB”) and are required to be independent with respect to the Fund in accordance with the U.S. federal securities laws and the applicable rules and regulations of the Securities and Exchange Commission and the PCAOB.
We conducted our audits of these financial statements in accordance with the standards of the PCAOB. Those standards require that we plan and perform the audit to obtain reasonable assurance about whether the financial statements are free of material misstatement, whether due to error or fraud.
Our audits included performing procedures to assess the risks of material misstatement of the financial statements, whether due to error or fraud, and performing procedures that respond to those risks. Such procedures included examining, on a test basis, evidence regarding the amounts and disclosures in the financial statements. Our audits also included evaluating the accounting principles used and significant estimates made by management, as well as evaluating the overall presentation of the financial statements. Our procedures included confirmation of securities owned as of March 31, 2019 by correspondence with the custodian and brokers; when replies were not received from brokers, we performed other auditing procedures. We believe that our audits provide a reasonable basis for our opinion.
/s/ PricewaterhouseCoopers LLP
Kansas City, Missouri
May 17, 2019
We have served as the auditor of one or more investment companies in American Century Investments since 1997.
Board of Trustees
The individuals listed below serve as trustees of the funds. Each trustee will continue to serve in this capacity until death, retirement, resignation or removal from office. The board has adopted a mandatory retirement age for trustees who are not “interested persons,” as that term is defined in the Investment Company Act (independent trustees). Independent trustees shall retire on December 31 of the year in which they reach their 75th birthday; provided, however, that on or after January 1, 2022, independent trustees shall retire on December 31 of the year in which they reach their 76th birthday.
Mr. Thomas is an “interested person” because he currently serves as President and Chief Executive Officer of American Century Companies, Inc. (ACC), the parent company of American Century Investment Management, Inc. (ACIM or the advisor). The other trustees (more than three-fourths of the total number) are independent. They are not employees, directors or officers of, and have no financial interest in, ACC or any of its wholly owned, direct or indirect, subsidiaries, including ACIM, American Century Investment Services, Inc. (ACIS) and American Century Services, LLC (ACS), and they do not have any other affiliations, positions or relationships that would cause them to be considered “interested persons” under the Investment Company Act. The trustees serve in this capacity for eight (in the case of Jonathan S. Thomas, 16; and Ronald J. Gilson, 9) registered investment companies in the American Century Investments family of funds.
The following table presents additional information about the trustees. The mailing address for each trustee other than Jonathan S. Thomas is 1665 Charleston Road, Mountain View, California 94043. The mailing address for Jonathan S. Thomas is 4500 Main Street, Kansas City, Missouri 64111.
|
| | | | | |
Name
(Year of Birth) | Position(s) Held with Funds | Length of Time Served | Principal Occupation(s) During Past 5 Years | Number of American Century Portfolios Overseen by Trustee | Other Directorships Held During Past 5 Years |
| Independent Trustees |
|
|
Tanya S. Beder
(1955) | Trustee | Since 2011 | Chairman and CEO, SBCC Group Inc. (independent advisory services) (2006 to present) | 45 | CYS Investments, Inc.; Nabors Industries Ltd. |
Jeremy I. Bulow
(1954) | Trustee | Since 2011 | Professor of Economics, Stanford University, Graduate School of Business (1979 to present) | 45 | None |
Anne Casscells
(1958) | Trustee | Since 2016 | Co-Chief Executive Officer and Chief Investment Officer, Aetos Alternatives Management (investment advisory firm) (2001 to present); Lecturer in Accounting, Stanford University, Graduate School of Business (2009 to 2017) | 45 | None |
Ronald J. Gilson
(1946) | Trustee and Chairman of the Board | Since 1995
(Chairman since 2005) | Charles J. Meyers Professor of Law and Business, Emeritus, Stanford Law School (1979 to 2016); Marc and Eva Stern Professor of Law and Business, Columbia University School of Law (1992 to present) | 50 | None |
|
| | | | | |
Name
(Year of Birth) | Position(s) Held with Funds | Length of Time Served | Principal Occupation(s) During Past 5 Years | Number of American Century Portfolios Overseen by Trustee | Other Directorships Held During Past 5 Years |
| Independent Trustees |
|
|
Frederick L. A. Grauer
(1946) | Trustee | Since 2008 | Senior Advisor, Credit Sesame, Inc. (credit monitoring firm) (2018 to present); Senior Advisor, Course Hero (an educational technology company) (2015 to present); Senior Advisor, iShares by BlackRock, Inc. (investment management firm) (2013 to 2015)
| 45 | None |
Jonathan D. Levin
(1972) | Trustee | Since 2016 | Philip H. Knight Professor and Dean, Graduate School of Business, Stanford University (2016 to present); Professor, Stanford University, (2000 to present); Chair, Department of Economics, Stanford University (2011 to 2014) | 45 | None |
Peter F. Pervere
(1947) | Trustee | Since 2007 | Retired | 45 | None |
John B. Shoven
(1947) | Trustee | Since 2002 | Charles R. Schwab Professor of Economics, Stanford University (1973 to present) | 45 | Cadence Design Systems; Exponent; Financial Engines |
| Interested Trustee |
|
|
Jonathan S. Thomas
(1963) | Trustee and President | Since 2007 | President and Chief Executive Officer, ACC (2007 to present). Also serves as Chief Executive Officer, ACS; Executive Vice President, ACIM; Director, ACC, ACIM and other ACC subsidiaries | 117 | BioMed Valley Discoveries, Inc. |
The Statement of Additional Information has additional information about the fund's trustees and is available without charge, upon request, by calling 1-800-345-2021.
Officers
The following table presents certain information about the executive officers of the funds. Each officer serves as an officer for 16 (in the case of Robert J. Leach, 15) investment companies in the American Century family of funds, unless otherwise noted. No officer is compensated for his or her service as an officer of the funds. The listed officers are interested persons of the funds and are appointed or re-appointed on an annual basis. The mailing address for each of the officers listed below is 4500 Main Street, Kansas City, Missouri 64111.
|
| | |
Name
(Year of Birth) | Offices with the Funds | Principal Occupation(s) During the Past Five Years |
Jonathan S. Thomas
(1963) | Trustee and President since 2007 | President and Chief Executive Officer, ACC (2007 to present). Also serves as Chief Executive Officer, ACS; Executive Vice President, ACIM; Director, ACC, ACIM and other ACC subsidiaries |
R. Wes Campbell
(1974)
| Chief Financial Officer and Treasurer since 2018
| Investment Operations and Investment Accounting, ACS (2000 to present) |
Amy D. Shelton
(1964) | Chief Compliance Officer and Vice President since 2014 | Chief Compliance Officer, American Century funds, (2014 to present); Chief Compliance Officer, ACIM (2014 to present); Chief Compliance Officer, ACIS (2009 to present); Vice President, Client Interactions and Marketing, ACIS (2013 to 2014). Also serves as Vice President, ACIS |
Charles A. Etherington
(1957) | General Counsel since 2007 and Senior Vice President since 2006 | Attorney, ACC (1994 to present); Vice President, ACC (2005 to present); General Counsel, ACC (2007 to present). Also serves as General Counsel, ACIM, ACS, ACIS and other ACC subsidiaries; and Senior Vice President, ACIM and ACS |
C. Jean Wade
(1964) | Vice President since 2012 | Senior Vice President, ACS (2017 to present); Vice President ACS (2000 to 2017) |
Robert J. Leach
(1966) | Vice President since 2006 | Vice President, ACS (2000 to present) |
David H. Reinmiller
(1963) | Vice President since 2000 | Attorney, ACC (1994 to present) Also serves as Vice President, ACIM and ACS |
Ward D. Stauffer
(1960) | Secretary since 2005 | Attorney, ACC (2003 to present) |
Retirement Account Information
As required by law, distributions you receive from certain retirement accounts are subject to federal income tax withholding, unless you elect not to have withholding apply*. Tax will be withheld on the total amount withdrawn even though you may be receiving amounts that are not subject to withholding, such as nondeductible contributions. In such case, excess amounts of withholding could occur. You may adjust your withholding election so that a greater or lesser amount will be withheld.
If you don’t want us to withhold on this amount, you must notify us to not withhold the federal income tax. You may notify us in writing or in certain situations by telephone or through other electronic means. For systematic withdrawals, your withholding election will remain in effect until revoked or changed by filing a new election. You have the right to revoke your election at any time and change your withholding percentage for future distributions.
Remember, even if you elect not to have income tax withheld, you are liable for paying income tax on the taxable portion of your withdrawal. If you elect not to have income tax withheld or you don’t have enough income tax withheld, you may be responsible for payment of estimated tax. You may incur penalties under the estimated tax rules if your withholding and estimated tax payments are not sufficient. You can reduce or defer the income tax on a distribution by directly or indirectly rolling such distribution over to another IRA or eligible plan. You should consult your tax advisor for additional information.
State tax will be withheld if, at the time of your distribution, your address is within one of the mandatory withholding states and you have federal income tax withheld (or as otherwise required by state law). State taxes will be withheld from your distribution in accordance with the respective state rules.
*Some 403(b), 457 and qualified retirement plan distributions may be subject to 20% mandatory withholding, as they are subject to special tax and withholding rules. Your plan administrator or plan sponsor is required to provide you with a special tax notice explaining those rules at the time you request a distribution. If applicable, federal and/or state taxes may be withheld from your distribution amount.
Proxy Voting Policies
Descriptions of the principles and policies that the fund's investment advisor uses in exercising the voting rights associated with the securities purchased and/or held by the fund are available without charge, upon request, by calling 1-800-345-2021 or visiting the "About Us" page of American Century Investments’ website at americancentury.com. A description of the policies is also available on the Securities and Exchange Commission’s website at sec.gov. Information regarding how the investment advisor voted proxies relating to portfolio securities during the most recent 12-month period ended June 30 is available on the "About Us" page at americancentury.com. It is also available at sec.gov.
Quarterly Portfolio Disclosure
The fund files its complete schedule of portfolio holdings with the Securities and Exchange Commission (SEC) for the first and third quarters of each fiscal year on Form N-Q or as an exhibit to its reports on Form N-PORT. The fund’s Forms N-Q and Form N-PORT reports are available on the SEC’s website at sec.gov. The fund also makes its complete schedule of portfolio holdings for the most recent quarter of its fiscal year available on its website at americancentury.com and, upon request, by calling 1-800-345-2021.
|
| | |
| |
| | | |
| Contact Us | americancentury.com | |
| Automated Information Line | 1-800-345-8765 | |
| Investor Services Representative | 1-800-345-2021 or 816-531-5575 | |
| Investors Using Advisors | 1-800-378-9878 | |
| Business, Not-For-Profit, Employer-Sponsored Retirement Plans | 1-800-345-3533 | |
| Banks and Trust Companies, Broker-Dealers, Financial Professionals, Insurance Companies | 1-800-345-6488 | |
| Telecommunications Relay Service for the Deaf | 711 | |
| | | |
| American Century Investment Trust | |
| | | |
Investment Advisor: American Century Investment Management, Inc. Kansas City, Missouri | |
| | | |
| This report and the statements it contains are submitted for the general information of our shareholders. The report is not authorized for distribution to prospective investors unless preceded or accompanied by an effective prospectus. | |
| | | |
©2019 American Century Proprietary Holdings, Inc. All rights reserved.
CL-ANN-92286 1905 | |
|
| |
| | |
| | Annual Report |
| | |
| | March 31, 2019 |
| | |
| | Strategic Income Fund |
| | Investor Class (ASIEX) |
| | I Class (ASIGX) |
| | Y Class (ASYIX) |
| | A Class (ASIQX) |
| | C Class (ASIHX) |
| | R Class (ASIWX) |
| | R5 Class (ASIJX) |
| | R6 Class (ASIPX) |
Beginning on January 1, 2021, as permitted by regulations adopted by the Securities and Exchange Commission, paper copies of the fund’s shareholder reports like this one will no longer be sent by mail, unless you specifically request paper copies of the reports from the fund or from your financial intermediary, such as a broker-dealer or bank. Instead, the reports will be made available on a website, and you will be notified by mail each time a report is posted and provided with a website link to access the report.
If you already elected to receive shareholder reports electronically, you will not be affected by this change and you need not take any action. You may elect to receive shareholder reports and other communications from the fund or your financial intermediary electronically by calling or sending an email request to your appropriate contacts as listed on the back cover of this report.
You may elect to receive all future reports in paper free of charge. You can inform the fund or your financial intermediary that you wish to continue receiving paper copies of your shareholder reports by calling or sending an email request to your appropriate contacts as listed on the back cover of this report. Your election to receive reports in paper will apply to all funds held with the fund complex/your financial intermediary.
|
| | |
| President’s Letter | 2 |
|
| Performance | 3 |
|
| Portfolio Commentary | |
|
| Fund Characteristics | |
|
| Shareholder Fee Example | |
|
| Schedule of Investments | |
|
| Statement of Assets and Liabilities | |
|
| Statement of Operations | |
|
| Statement of Changes in Net Assets | |
|
| Notes to Financial Statements | |
|
| Financial Highlights | |
|
| Report of Independent Registered Public Accounting Firm | |
|
| Management | |
|
| Additional Information | |
|
Any opinions expressed in this report reflect those of the author as of the date of the report, and do not necessarily represent the opinions of American Century Investments® or any other person in the American Century Investments organization. Any such opinions are subject to change at any time based upon market or other conditions and American Century Investments disclaims any responsibility to update such opinions. These opinions may not be relied upon as investment advice and, because investment decisions made by American Century Investments funds are based on numerous factors, may not be relied upon as an indication of trading intent on behalf of any American Century Investments fund. Security examples are used for representational purposes only and are not intended as recommendations to purchase or sell securities. Performance information for comparative indices and securities is provided to American Century Investments by third party vendors. To the best of American Century Investments’ knowledge, such information is accurate at the time of printing.
Jonathan Thomas
Dear Investor:
Thank you for reviewing this annual report for the period ended March 31, 2019. Annual reports help convey important information about fund returns, including market factors that affected performance during the reporting period. For additional, updated investment and market insights, we encourage you to visit our website, americancentury.com.
Markets Ended Roller-Coaster Period on Upswing
For the first half of the period, U.S. stocks climbed higher, while bond returns headed lower. Robust economic growth, bolstered by federal tax and regulatory reform, and record corporate earnings results fueled risk-on sentiment that drove stock prices higher. Meanwhile, the combination of strong economic data, the Federal Reserve’s (Fed’s) ongoing rate-hike campaign and an uptick in inflation pushed investment-grade bond returns lower.
Market trends began changing in late 2018. Mounting investor concerns about slowing global economic and earnings growth, U.S.-China trade tensions and rising interest rates triggered widespread volatility. Stock prices plunged as investors sought safe-haven investments, including U.S. Treasuries. Furthermore, the Fed issued another rate hike in December, its fourth of the year, and maintained its hawkish outlook. Investors feared the December rate increase and the Fed’s plans for two more rate hikes in 2019 were too aggressive, and risk-off investing remained in favor.
January brought a renewed sense of stability to the markets. Investors’ concerns about growth and trade eased, and the Fed changed course, pausing its rate-hike campaign amid moderating global growth and inflation. Valuations appeared attractive after the late-2018 sell-off, and risk-on investing resumed. In March, the Fed held rates steady again, hinting additional tightening was off the table for 2019. This news drove stock and bond returns higher and left both asset classes on an upward track to end the period. Overall, stocks (S&P 500 Index) overcame their late-2018 nosedive to gain 9.50% for the period. Bonds (Bloomberg Barclays U.S. Aggregate Bond Index) bounced back from losses early in the period to return 4.48%.
We expect volatility to remain a formidable factor as investors react to global growth trends, central bank policy and geopolitical developments. We believe this scenario underscores the importance of using professionally managed portfolios in pursuit of investment goals. We appreciate your continued trust and confidence in us.
Sincerely,
Jonathan Thomas
President and Chief Executive Officer
American Century Investments
|
| | | | |
| Total Returns as of March 31, 2019 |
| | | | Average Annual Returns | |
| | Ticker Symbol | 1 year | Since Inception | Inception Date |
| Investor Class | ASIEX | 3.88% | 3.21% | 7/28/14 |
| Bloomberg Barclays U.S. Aggregate Bond Index | — | 4.48% | 2.48% | — |
| I Class | ASIGX | 4.09% | 3.41% | 4/10/17 |
| Y Class | ASYIX | 4.18% | 3.50% | 4/10/17 |
| A Class | ASIQX | | | 7/28/14 |
| No sales charge | | 3.62% | 2.96% | |
| With sales charge | | -1.05% | 1.95% | |
| C Class | ASIHX | 2.85% | 2.19% | 7/28/14 |
| R Class | ASIWX | 3.36% | 2.70% | 7/28/14 |
| R5 Class | ASIJX | 4.09% | 3.42% | 7/28/14 |
| R6 Class | ASIPX | 4.14% | 3.47% | 7/28/14 |
Fund returns would have been lower if a portion of the fees had not been waived.
Sales charges include initial sales charges and contingent deferred sales charges (CDSCs), as applicable. A Class shares have a 4.50% maximum initial sales charge and may be subject to a maximum CDSC of 1.00%. C Class shares redeemed within 12 months of purchase are subject to a maximum CDSC of 1.00%. The SEC requires that mutual funds provide performance information net of maximum sales charges in all cases where charges could be applied.
Data presented reflect past performance. Past performance is no guarantee of future results. Current performance may be higher or lower than the performance shown. Total returns for periods less than one year are not annualized. Investment return and principal value will fluctuate, and redemption value may be more or less than original cost. Data assumes reinvestment of dividends and capital gains, and none of the charts reflect the deduction of taxes that a shareholder would pay on fund distributions or the redemption of fund shares. To obtain performance data current to the most recent month end, please call 1-800-345-2021 or visit americancentury.com. For additional information about the fund, please consult the prospectus.
|
|
| Growth of $10,000 Over Life of Class |
| $10,000 investment made July 28, 2014 |
Performance for other share classes will vary due to differences in fee structure.
|
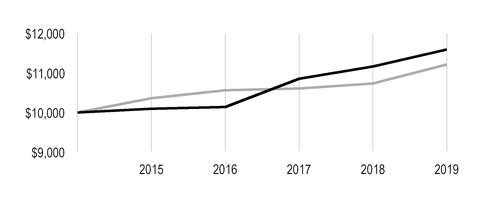
|
| |
| Value on March 31, 2019 |
| | Investor Class — $11,593 |
| |
| | Bloomberg Barclays U.S. Aggregate Bond Index — $11,215 |
| |
Ending value of Investor Class would have been lower if a portion of the fees had not been waived.
|
| | | | | | | |
| Total Annual Fund Operating Expenses |
| Investor Class | I Class | Y Class | A Class | C Class | R Class | R5 Class | R6 Class |
| 0.83% | 0.73% | 0.63% | 1.08% | 1.83% | 1.33% | 0.63% | 0.58% |
The total annual fund operating expenses shown is as stated in the fund’s prospectus current as of the date of this report. The prospectus may vary from the expense ratio shown elsewhere in this report because it is based on a different time period, includes acquired fund fees and expenses, and, if applicable, does not include fee waivers or expense reimbursements.
Data presented reflect past performance. Past performance is no guarantee of future results. Current performance may be higher or lower than the performance shown. Total returns for periods less than one year are not annualized. Investment return and principal value will fluctuate, and redemption value may be more or less than original cost. Data assumes reinvestment of dividends and capital gains, and none of the charts reflect the deduction of taxes that a shareholder would pay on fund distributions or the redemption of fund shares. To obtain performance data current to the most recent month end, please call 1-800-345-2021 or visit americancentury.com. For additional information about the fund, please consult the prospectus.
Portfolio Managers: Kevin Akioka, Jeff Houston, Bob Gahagan, Brian Howell and Margé Karner
Performance Summary
Strategic Income returned 3.88%* for the 12 months ended March 31, 2019. By comparison, the investment-grade Bloomberg Barclays U.S. Aggregate Bond Index gained 4.48% for the same period. Fund returns reflect operating expenses, while index returns do not.
The fund’s results reflect the positive performance of higher-yielding securities for the 12 months ended March 31, 2019. The reporting period witnessed a marked shift in Federal Reserve (Fed) policy and investor sentiment toward the U.S. and global economic growth outlook, which influenced performance in the fixed-income market. In the first several months of the period, robust economic growth, rising inflation and the Fed’s steady rate-tightening strategy drove Treasury yields higher. Investment-grade bond returns were generally flat to slightly negative. Meanwhile, risk-on investing remained in favor, and higher-yielding securities outperformed. The environment reversed sharply in late 2018, as worries about future economic and corporate earnings growth, U.S.-China trade negotiations and a surprisingly bullish Fed outlook triggered severe volatility in the equity markets. Investors fled risk assets in favor of U.S. Treasuries and other perceived safe-haven investments.
The new year brought a new sense of stability to the financial markets. Progress with U.S.-China trade negotiations and better-than-feared U.S. economic and earnings data helped restore some investor optimism. Additionally, the Fed paused its rate-hike campaign in January, seemingly acknowledging its December plan for two rate hikes in 2019 may have been too aggressive. Investors responded enthusiastically to this backdrop, and risk assets returned to favor. Meanwhile, Treasury yields moved modestly lower. Then, at its March monetary policy meeting, the Fed held rates steady and suggested additional tightening was likely off the table for 2019. While this news triggered strong gains for Treasuries, it also extended the rally among higher-risk assets. Overall, the broad U.S. fixed-income market advanced for the entire 12-month period, and higher-yielding securities generally outperformed higher-quality bonds.
The portfolio provided diversified exposure to higher-yielding segments of the fixed-income market, including investment-grade corporate bonds, out-of-index high-yield corporate bonds, mortgage-backed and other securitized bonds, and out-of-index emerging markets debt. Higher-yielding bond sectors generally outperformed higher-quality sectors, which are more prevalent in the Bloomberg Barclays U.S. Aggregate Bond Index.
Corporate Bonds Were Top Contributors
Our position in corporate bonds, which comprised approximately 37% of the portfolio on March 31, 2019, was the main contributor to performance. In particular, our out-of-index allocation to high-yield corporate bonds was a key driver of results. Favorable fundamentals and investor preferences for risk throughout most of the period helped high-yield bonds outperform their investment-grade counterparts. Within the portfolio’s investment-grade corporate allocation, we focused on the higher-yielding, lower-quality end of the investment-grade corporate bond spectrum (credits with BBB ratings), which rallied on favorable corporate and economic fundamentals during the first several months of the reporting period and again in early 2019.
* All fund returns referenced in this commentary are for Investor Class shares. Fund returns would have been lower if a portion of the fees had not been waived. Performance for other share classes will vary due to differences in fee structure; when Investor Class performance exceeds that of the index, other share classes may not. See page 3 for returns for all share classes.
Securitized Sector Aided Performance
Our allocation to securitized bonds (approximately 32% of the portfolio as of March 31, 2019) also contributed to performance. Our positions in non-agency collateralized mortgage obligations, non-agency commercial mortgage-backed securities and collateralized loan obligations added value compared with the conventional agency-backed mortgage-backed securities represented in the index. In addition, our asset-backed securities lifted results.
Emerging Markets Bonds Contributed
Our out-of-index position in U.S. dollar-denominated emerging markets corporate and sovereign securities also added value. For much of the period, emerging markets bonds struggled due to slowing growth in China, trade policy concerns, country-specific events and Fed tightening. However, attractive valuations within the asset class, combined with falling U.S. Treasury yields, a dovish Fed and the return of risk-on investing, helped emerging markets bounce back in early 2019 and aid portfolio results.
Equity Holdings Detracted
The portfolio held a small out-of-index position in preferred stock, which we owned for its dividend-paying feature. This position detracted from results in the late-2018 equity market sell-off. We exited this position during the early 2019 equity market rally.
Portfolio Positioning
We expect the U.S. economy to continue to grow, but at a more moderate pace (2.0% to 2.5% annualized). However, we expect U.S. economic growth to remain more robust than growth in Europe and Japan. We expect headline inflation to eventually converge with core inflation near 2%. These factors should enable the Fed to remain on hold throughout the remainder of 2019. Against a backdrop of slowing global growth, geopolitical uncertainties (mainly Brexit) and a dovish Fed, we expect the 10-year Treasury yield to fluctuate within a near-term range of 2.35% to 2.80%. We expect the yield curve to remain relatively flat, and we do not believe the brief inversion of the curve earlier this year indicates an impending recession.
In light of the first-quarter 2019 rally among credit and other higher-yielding sectors, we took profits in and reduced exposure to high-yield corporate bonds, and we purchased higher-quality bonds within the securitized sector. We also purchased Treasury securities, which gives us the ability to take advantage of attractive investment opportunities as they arise. Given our outlook for continued economic growth, albeit slower, and healthy corporate fundamentals, we believe credit sectors still offer value. We continue to favor corporate and securitized bonds and select emerging markets securities, adding exposure as valuations, fundamentals and market conditions dictate. Overall, we favor a bottom-up approach, emphasizing careful security selection. We believe our focus on higher-yielding securities with low correlation to Treasuries positions the portfolio favorably if rates eventually move higher.
|
| |
| MARCH 31, 2019 | |
| Portfolio at a Glance | |
| Average Duration (effective) | 3.5 years |
| Weighted Average Life to Maturity | 7.2 years |
| | |
| Types of Investments in Portfolio | % of net assets |
| Corporate Bonds | 36.9% |
| Collateralized Mortgage Obligations | 14.8% |
| U.S. Treasury Securities | 10.8% |
| Affiliated Funds | 8.0% |
| Collateralized Loan Obligations | 6.0% |
| Asset-Backed Securities | 5.7% |
| Commercial Mortgage-Backed Securities | 5.0% |
| Bank Loan Obligations | 4.7% |
| Sovereign Governments and Agencies | 4.3% |
| Preferred Stocks | 2.0% |
| Temporary Cash Investments | 0.7% |
| Other Assets and Liabilities | 1.1% |
Fund shareholders may incur two types of costs: (1) transaction costs, including sales charges (loads) on purchase payments and redemption/exchange fees; and (2) ongoing costs, including management fees; distribution and service (12b-1) fees; and other fund expenses. This example is intended to help you understand your ongoing costs (in dollars) of investing in your fund and to compare these costs with the ongoing cost of investing in other mutual funds.
The example is based on an investment of $1,000 made at the beginning of the period and held for the entire period from October 1, 2018 to March 31, 2019.
Actual Expenses
The table provides information about actual account values and actual expenses for each class. You may use the information, together with the amount you invested, to estimate the expenses that you paid over the period. First, identify the share class you own. Then simply divide your account value by $1,000 (for example, an $8,600 account value divided by $1,000 = 8.6), then multiply the result by the number under the heading “Expenses Paid During Period” to estimate the expenses you paid on your account during this period.
If you hold Investor Class shares of any American Century Investments fund, or I Class shares of the American Century Diversified Bond Fund, in an American Century Investments account (i.e., not a financial intermediary or retirement plan account), American Century Investments may charge you a $12.50 semiannual account maintenance fee if the value of those shares is less than $10,000. We will redeem shares automatically in one of your accounts to pay the $12.50 fee. In determining your total eligible investment amount, we will include your investments in all personal accounts (including American Century Investments Brokerage accounts) registered under your Social Security number. Personal accounts include individual accounts, joint accounts, UGMA/UTMA accounts, personal trusts, Coverdell Education Savings Accounts and IRAs (including traditional, Roth, Rollover, SEP-, SARSEP- and SIMPLE-IRAs), and certain other retirement accounts. If you have only business, business retirement, employer-sponsored or American Century Investments Brokerage accounts, you are currently not subject to this fee. If you are subject to the Account Maintenance Fee, your account value could be reduced by the fee amount.
Hypothetical Example for Comparison Purposes
The table also provides information about hypothetical account values and hypothetical expenses based on the actual expense ratio of each class of your fund and an assumed rate of return of 5% per year before expenses, which is not the actual return of a fund’s share class. The hypothetical account values and expenses may not be used to estimate the actual ending account balance or expenses you paid for the period. You may use this information to compare the ongoing costs of investing in your fund and other funds. To do so, compare this 5% hypothetical example with the 5% hypothetical examples that appear in the shareholder reports of the other funds.
Please note that the expenses shown in the table are meant to highlight your ongoing costs only and do not reflect any transactional costs, such as sales charges (loads) or redemption/exchange fees. Therefore, the table is useful in comparing ongoing costs only, and will not help you determine the relative total costs of owning different funds. In addition, if these transactional costs were included, your costs would have been higher.
|
| | | | |
| | Beginning
Account Value
10/1/18 | Ending
Account Value
3/31/19 | Expenses Paid
During Period(1)
10/1/18 - 3/31/19 |
Annualized
Expense Ratio(1) |
| Actual | | | | |
| Investor Class | $1,000 | $1,030.00 | $3.54 | 0.70% |
| I Class | $1,000 | $1,030.50 | $3.04 | 0.60% |
| Y Class | $1,000 | $1,030.90 | $2.53 | 0.50% |
| A Class | $1,000 | $1,028.70 | $4.80 | 0.95% |
| C Class | $1,000 | $1,024.90 | $8.58 | 1.70% |
| R Class | $1,000 | $1,026.30 | $6.06 | 1.20% |
| R5 Class | $1,000 | $1,031.00 | $2.53 | 0.50% |
| R6 Class | $1,000 | $1,031.30 | $2.28 | 0.45% |
| Hypothetical | | | | |
| Investor Class | $1,000 | $1,021.44 | $3.53 | 0.70% |
| I Class | $1,000 | $1,021.94 | $3.02 | 0.60% |
| Y Class | $1,000 | $1,022.44 | $2.52 | 0.50% |
| A Class | $1,000 | $1,020.20 | $4.78 | 0.95% |
| C Class | $1,000 | $1,016.46 | $8.55 | 1.70% |
| R Class | $1,000 | $1,018.95 | $6.04 | 1.20% |
| R5 Class | $1,000 | $1,022.44 | $2.52 | 0.50% |
| R6 Class | $1,000 | $1,022.69 | $2.27 | 0.45% |
| |
| (1) | Expenses are equal to the class's annualized expense ratio listed in the table above, multiplied by the average account value over the period, multiplied by 182, the number of days in the most recent fiscal half-year, divided by 365, to reflect the one-half year period. Annualized expense ratio reflects actual expenses, including any applicable fee waivers or expense reimbursements and excluding any acquired fund fees and expenses. |
MARCH 31, 2019
|
| | | | | | | |
| | | Principal Amount/Shares | Value |
| CORPORATE BONDS — 36.9% | | | |
| Aerospace and Defense — 0.4% | | | |
| Lockheed Martin Corp., 3.80%, 3/1/45 | | $ | 75,000 |
| $ | 74,186 |
|
| Air Freight and Logistics — 0.9% | | | |
| FedEx Corp., 4.40%, 1/15/47 | | 175,000 |
| 165,166 |
|
| Auto Components — 0.3% | | | |
| American Axle & Manufacturing, Inc., 6.625%, 10/15/22 | | 61,000 |
| 62,601 |
|
| Automobiles — 1.0% | | | |
| Ford Motor Co., 4.35%, 12/8/26 | | 200,000 |
| 185,971 |
|
| Banks — 1.3% | | | |
| Bank of America Corp., MTN, VRN, 3.82%, 1/20/28 | | 150,000 |
| 152,331 |
|
| BBVA Bancomer SA, 7.25%, 4/22/20 | | 100,000 |
| 103,626 |
|
| | | | 255,957 |
|
| Biotechnology — 0.8% | | | |
| Amgen, Inc., 4.66%, 6/15/51 | | 150,000 |
| 151,470 |
|
| Building Products — 0.5% | | | |
| Masco Corp., 4.45%, 4/1/25 | | 100,000 |
| 102,840 |
|
| Capital Markets — 0.4% | | | |
| Jefferies Group LLC / Jefferies Group Capital Finance, Inc., 4.15%, 1/23/30 | | 80,000 |
| 73,397 |
|
| Chemicals — 0.5% | | | |
NOVA Chemicals Corp., 4.875%, 6/1/24(1) | | 100,000 |
| 98,625 |
|
| Commercial Services and Supplies — 0.4% | | | |
| Covanta Holding Corp., 5.875%, 3/1/24 | | 75,000 |
| 77,063 |
|
| Consumer Finance — 0.4% | | | |
| Discover Financial Services, 3.75%, 3/4/25 | | 75,000 |
| 74,850 |
|
| Containers and Packaging — 1.2% | | | |
| Berry Global, Inc., 5.125%, 7/15/23 | | 75,000 |
| 76,406 |
|
| Crown Americas LLC / Crown Americas Capital Corp. IV, 4.50%, 1/15/23 | | 75,000 |
| 75,938 |
|
Reynolds Group Issuer, Inc. / Reynolds Group Issuer LLC / Reynolds Group Issuer Lu, 5.125%, 7/15/23(1) | | 75,000 |
| 76,312 |
|
| | | | 228,656 |
|
| Diversified Financial Services — 0.3% | | | |
| Voya Financial, Inc., VRN, 5.65%, 5/15/53 | | 50,000 |
| 49,324 |
|
| Diversified Telecommunication Services — 0.6% | | | |
| AT&T, Inc., 4.45%, 4/1/24 | | 100,000 |
| 104,748 |
|
| Energy Equipment and Services — 0.5% | | | |
| Ensco plc, 8.00%, 1/31/24 | | 46,000 |
| 42,205 |
|
Transocean, Inc., 9.00%, 7/15/23(1) | | 45,000 |
| 48,150 |
|
| | | | 90,355 |
|
| Entertainment — 1.7% | | | |
| Netflix, Inc., 4.875%, 4/15/28 | | 75,000 |
| 74,438 |
|
| Viacom, Inc., 3.125%, 6/15/22 | | 150,000 |
| 149,776 |
|
|
| | | | | | | |
| | | Principal Amount/Shares | Value |
Walt Disney Co. (The), 6.90%, 8/15/39(1) | | $ | 75,000 |
| $ | 106,090 |
|
| | | | 330,304 |
|
| Equity Real Estate Investment Trusts (REITs) — 1.7% | | | |
| American Tower Corp., 3.375%, 10/15/26 | | 125,000 |
| 122,043 |
|
| Crown Castle International Corp., 5.25%, 1/15/23 | | 95,000 |
| 102,106 |
|
| MGM Growth Properties Operating Partnership LP / MGP Finance Co-Issuer, Inc., 4.50%, 9/1/26 | | 100,000 |
| 97,750 |
|
| | | | 321,899 |
|
| Food Products — 0.5% | | | |
Lamb Weston Holdings, Inc., 4.625%, 11/1/24(1) | | 100,000 |
| 101,250 |
|
| Gas Utilities — 0.7% | | | |
| Sunoco Logistics Partners Operations LP, 3.90%, 7/15/26 | | 125,000 |
| 124,554 |
|
| Health Care Providers and Services — 2.7% | | | |
| Acadia Healthcare Co., Inc., 5.125%, 7/1/22 | | 25,000 |
| 25,187 |
|
| Cardinal Health, Inc., 1.95%, 6/14/19 | | 150,000 |
| 149,739 |
|
| CHS / Community Health Systems, Inc., 5.125%, 8/1/21 | | 75,000 |
| 74,107 |
|
| DaVita, Inc., 5.125%, 7/15/24 | | 80,000 |
| 79,200 |
|
| Express Scripts Holding Co., 4.50%, 2/25/26 | | 100,000 |
| 104,852 |
|
| Tenet Healthcare Corp., 4.75%, 6/1/20 | | 75,000 |
| 76,219 |
|
| | | | 509,304 |
|
| Hotels, Restaurants and Leisure — 1.6% | | | |
Caesars Resort Collection LLC / CRC Finco, Inc., 5.25%, 10/15/25(1) | | 75,000 |
| 72,563 |
|
| Hilton Domestic Operating Co., Inc., 4.25%, 9/1/24 | | 75,000 |
| 75,046 |
|
International Game Technology plc, 6.25%, 2/15/22(1) | | 80,000 |
| 83,500 |
|
| MGM Resorts International, 6.625%, 12/15/21 | | 75,000 |
| 80,344 |
|
| | | | 311,453 |
|
| Household Durables — 0.8% | | | |
| Lennar Corp., 4.75%, 5/30/25 | | 75,000 |
| 76,969 |
|
| PulteGroup, Inc., 5.50%, 3/1/26 | | 75,000 |
| 77,718 |
|
| | | | 154,687 |
|
| Insurance — 2.7% | | | |
| American International Group, Inc., 4.50%, 7/16/44 | | 150,000 |
| 144,122 |
|
| AXA SA, MTN, VRN, 3.375%, 7/6/47 | EUR | 100,000 |
| 119,805 |
|
| CNP Assurances, VRN, 4.50%, 6/10/47 | EUR | 100,000 |
| 125,557 |
|
Liberty Mutual Group, Inc., VRN, 5.52%, (3-month LIBOR plus 2.91%), 3/7/67(1) | | $ | 125,000 |
| 118,617 |
|
| | | | 508,101 |
|
| IT Services — 0.6% | | | |
| Fidelity National Information Services, Inc., 3.00%, 8/15/26 | | 125,000 |
| 119,971 |
|
| Media — 4.7% | | | |
| AMC Networks, Inc., 4.75%, 8/1/25 | | 150,000 |
| 149,250 |
|
CCO Holdings LLC / CCO Holdings Capital Corp., 5.125%, 5/1/27(1) | | 75,000 |
| 75,656 |
|
| Comcast Corp., 4.40%, 8/15/35 | | 150,000 |
| 157,053 |
|
| CSC Holdings LLC, 6.75%, 11/15/21 | | 75,000 |
| 80,344 |
|
| DISH DBS Corp., 5.125%, 5/1/20 | | 75,000 |
| 75,656 |
|
Gray Television, Inc., 5.125%, 10/15/24(1) | | 75,000 |
| 75,375 |
|
|
| | | | | | | |
| | | Principal Amount/Shares | Value |
Nexstar Broadcasting, Inc., 5.625%, 8/1/24(1) | | $ | 75,000 |
| $ | 76,312 |
|
| TEGNA, Inc., 5.125%, 7/15/20 | | 75,000 |
| 75,281 |
|
| Warner Media LLC, 3.80%, 2/15/27 | | 120,000 |
| 119,498 |
|
| | | | 884,425 |
|
| Metals and Mining — 0.4% | | | |
| Freeport-McMoRan, Inc., 3.875%, 3/15/23 | | 75,000 |
| 74,108 |
|
| Mortgage Real Estate Investment Trusts (REITs) — 0.4% | | | |
| Starwood Property Trust, Inc., 5.00%, 12/15/21 | | 75,000 |
| 77,250 |
|
| Multi-Utilities — 1.0% | | | |
| AmeriGas Partners LP / AmeriGas Finance Corp., 5.875%, 8/20/26 | | 75,000 |
| 75,187 |
|
| Exelon Generation Co. LLC, 5.60%, 6/15/42 | | 100,000 |
| 105,463 |
|
| | | | 180,650 |
|
| Oil, Gas and Consumable Fuels — 3.6% | | | |
| Antero Resources Corp., 5.375%, 11/1/21 | | 75,000 |
| 75,562 |
|
| Continental Resources, Inc., 5.00%, 9/15/22 | | 48,000 |
| 48,412 |
|
| Kinder Morgan Energy Partners LP, 6.50%, 9/1/39 | | 115,000 |
| 135,160 |
|
| Lukoil International Finance BV, 7.25%, 11/5/19 | | 100,000 |
| 102,465 |
|
| Newfield Exploration Co., 5.375%, 1/1/26 | | 100,000 |
| 108,224 |
|
| Petroleos Mexicanos, 6.00%, 3/5/20 | | 64,000 |
| 65,549 |
|
| Southwestern Energy Co., 4.10%, 3/15/22 | | 75,000 |
| 73,140 |
|
| Williams Cos., Inc. (The), 4.55%, 6/24/24 | | 75,000 |
| 79,253 |
|
| | | | 687,765 |
|
| Pharmaceuticals — 0.2% | | | |
| Teva Pharmaceutical Finance Netherlands III BV, 3.15%, 10/1/26 | | 40,000 |
| 32,742 |
|
| Road and Rail — 1.0% | | | |
| Burlington Northern Santa Fe LLC, 4.15%, 4/1/45 | | 180,000 |
| 187,937 |
|
| Software — 0.8% | | | |
Symantec Corp., 5.00%, 4/15/25(1) | | 150,000 |
| 150,415 |
|
| Specialty Retail — 0.9% | | | |
| Avis Budget Car Rental LLC / Avis Budget Finance, Inc., 5.50%, 4/1/23 | | 75,000 |
| 75,844 |
|
| Home Depot, Inc. (The), 5.95%, 4/1/41 | | 75,000 |
| 96,484 |
|
| | | | 172,328 |
|
| Textiles, Apparel and Luxury Goods — 0.4% | | | |
Hanesbrands, Inc., 4.625%, 5/15/24(1) | | 70,000 |
| 70,539 |
|
| Trading Companies and Distributors — 1.0% | | | |
| International Lease Finance Corp., 5.875%, 8/15/22 | | 180,000 |
| 194,232 |
|
TOTAL CORPORATE BONDS
(Cost $6,882,506) | | | 6,989,123 |
|
| COLLATERALIZED MORTGAGE OBLIGATIONS — 14.8% | | | |
| Private Sponsor Collateralized Mortgage Obligations — 5.8% |
| Bear Stearns Adjustable Rate Mortgage Trust, Series 2004-12, Class 2A1, VRN, 4.34%, 2/25/35 | | 40,460 |
| 40,974 |
|
| Bear Stearns Adjustable Rate Mortgage Trust, Series 2004-8, Class 2A1, VRN, 4.23%, 11/25/34 | | 20,092 |
| 19,634 |
|
|
| | | | | | | |
| | | Principal Amount/Shares | Value |
| Bear Stearns Adjustable Rate Mortgage Trust, Series 2006-1, Class A1, VRN, 4.91%, (1-year H15T1Y plus 2.25%), 2/25/36 | | $ | 39,322 |
| $ | 39,762 |
|
| Chase Mortgage Finance Trust, Series 2007-A2, Class 6A2 SEQ, VRN, 4.38%, 7/25/37 | | 7,585 |
| 7,322 |
|
| Citicorp Mortgage Securities Trust, Series 2007-8, Class 1A3, 6.00%, 9/25/37 | | 27,874 |
| 29,331 |
|
| Citigroup Mortgage Loan Trust, Inc., Series 2004-UST1, Class A5, VRN, 4.43%, 8/25/34 | | 61,484 |
| 61,287 |
|
| Citigroup Mortgage Loan Trust, Inc., Series 2005-4, Class A, VRN, 4.48%, 8/25/35 | | 30,154 |
| 30,609 |
|
| Citigroup Mortgage Loan Trust, Inc., Series 2005-6, Class A2, VRN, 4.24%, (1-year H15T1Y plus 2.15%), 9/25/35 | | 22,186 |
| 22,563 |
|
| Credit Suisse First Boston Mortgage-Backed Pass-Through Certificates, Series 2005-3, Class 1A1, VRN, 5.39%, 7/25/35 | | 36,214 |
| 37,537 |
|
| First Horizon Mortgage Pass-Through Trust, Series 2006-AR4, Class 1A2, VRN, 4.68%, 1/25/37 | | 16,295 |
| 14,593 |
|
| GSR Mortgage Loan Trust, Series 2005-AR6, Class 2A1, VRN, 4.52%, 9/25/35 | | 25,489 |
| 26,068 |
|
| JPMorgan Mortgage Trust, Series 2005-A4, Class 1A1, VRN, 4.33%, 7/25/35 | | 8,759 |
| 8,829 |
|
| Merrill Lynch Mortgage Investors Trust, Series 2005-3, Class 2A, VRN, 4.36%, 11/25/35 | | 50,200 |
| 49,981 |
|
Sequoia Mortgage Trust, Series 2017-CH2, Class A10 SEQ, VRN, 4.00%, 12/25/47(1) | | 109,475 |
| 110,770 |
|
| WaMu Mortgage Pass-Through Certificates, Series 2005-AR3, Class A1, VRN, 4.47%, 3/25/35 | | 24,162 |
| 23,856 |
|
| WaMu Mortgage Pass-Through Certificates, Series 2005-AR7, Class A3, VRN, 4.10%, 8/25/35 | | 22,267 |
| 22,536 |
|
| Wells Fargo Mortgage-Backed Securities Trust, Series 2004-A, Class A1, VRN, 5.01%, 2/25/34 | | 13,558 |
| 14,126 |
|
| Wells Fargo Mortgage-Backed Securities Trust, Series 2005-18, Class 1A1, 5.50%, 1/25/36 | | 12,267 |
| 12,223 |
|
| Wells Fargo Mortgage-Backed Securities Trust, Series 2005-AR12, Class 2A6, VRN, 4.88%, 6/25/35 | | 23,621 |
| 24,338 |
|
| Wells Fargo Mortgage-Backed Securities Trust, Series 2005-AR16, Class 4A8, VRN, 4.54%, 10/25/35 | | 35,000 |
| 35,654 |
|
| Wells Fargo Mortgage-Backed Securities Trust, Series 2006-6, Class 1A16 SEQ, 5.75%, 5/25/36 | | 40,269 |
| 39,262 |
|
| Wells Fargo Mortgage-Backed Securities Trust, Series 2006-7, Class 3A1 SEQ, 6.00%, 6/25/36 | | 8,907 |
| 8,886 |
|
| Wells Fargo Mortgage-Backed Securities Trust, Series 2006-8, Class A10 SEQ, 6.00%, 7/25/36 | | 15,058 |
| 15,086 |
|
| Wells Fargo Mortgage-Backed Securities Trust, Series 2006-AR1, Class 2A5 SEQ, VRN, 5.10%, 3/25/36 | | 46,467 |
| 45,954 |
|
| Wells Fargo Mortgage-Backed Securities Trust, Series 2006-AR10, Class 1A1, VRN, 4.70%, 7/25/36 | | 14,269 |
| 14,369 |
|
| Wells Fargo Mortgage-Backed Securities Trust, Series 2006-AR10, Class 2A1, VRN, 4.66%, 7/25/36 | | 16,475 |
| 16,686 |
|
| Wells Fargo Mortgage-Backed Securities Trust, Series 2006-AR10, Class 5A6 SEQ, VRN, 4.54%, 7/25/36 | | 31,246 |
| 31,402 |
|
| Wells Fargo Mortgage-Backed Securities Trust, Series 2006-AR15, Class A1, VRN, 4.73%, 10/25/36 | | 5,109 |
| 5,059 |
|
| Wells Fargo Mortgage-Backed Securities Trust, Series 2006-AR16, Class A1, VRN, 4.70%, 10/25/36 | | 11,320 |
| 11,202 |
|
| Wells Fargo Mortgage-Backed Securities Trust, Series 2006-AR19, Class A1, VRN, 4.86%, 12/25/36 | | 43,691 |
| 42,990 |
|
|
| | | | | | | |
| | | Principal Amount/Shares | Value |
| Wells Fargo Mortgage-Backed Securities Trust, Series 2006-AR5, Class 2A1, VRN, 5.08%, 4/25/36 | | $ | 16,176 |
| $ | 16,121 |
|
| Wells Fargo Mortgage-Backed Securities Trust, Series 2007-11, Class A36, 6.00%, 8/25/37 | | 30,508 |
| 30,463 |
|
| Wells Fargo Mortgage-Backed Securities Trust, Series 2007-15, Class A1, 6.00%, 11/25/37 | | 4,912 |
| 4,912 |
|
| Wells Fargo Mortgage-Backed Securities Trust, Series 2007-4, Class A15, 6.00%, 4/25/37 | | 17,294 |
| 17,307 |
|
| Wells Fargo Mortgage-Backed Securities Trust, Series 2007-7, Class A1, 6.00%, 6/25/37 | | 35,753 |
| 36,088 |
|
| Wells Fargo Mortgage-Backed Securities Trust, Series 2007-8, Class 2A2, 6.00%, 7/25/37 | | 131,212 |
| 130,224 |
|
| | | | 1,098,004 |
|
| U.S. Government Agency Collateralized Mortgage Obligations — 9.0% |
FHLMC, Series 2017-HQA2, Class M1, VRN, 3.29%, (1-month LIBOR plus 0.80%), 12/25/29 | | 162,292 |
| 162,394 |
|
FHLMC, Series 2018-DNA1, Class M2, VRN, 4.29%, (1-month LIBOR plus 1.80%), 7/25/30 | | 100,000 |
| 97,774 |
|
FHLMC, Series 2019-DNA1, Class M1, VRN, 3.39%, (1-month LIBOR plus 0.90%), 1/25/49(1) | | 200,000 |
| 200,349 |
|
| FNMA, Series 2016-55, Class PI, IO, 4.00%, 8/25/46 | | 776,192 |
| 136,958 |
|
| FNMA, Series 2017-7, Class AI, IO, 6.00%, 2/25/47 | | 620,218 |
| 145,118 |
|
| FNMA, Series 2017-C03, Class 1M1, VRN, 3.44%, (1-month LIBOR plus 0.95%), 10/25/29 | | 228,718 |
| 229,201 |
|
| FNMA, Series 2017-C05, Class 1M2, VRN, 4.69%, (1-month LIBOR plus 2.20%), 1/25/30 | | 100,000 |
| 101,316 |
|
| FNMA, Series 2017-C06, Class 2M2, VRN, 5.29%, (1-month LIBOR plus 2.80%), 2/25/30 | | 150,000 |
| 155,168 |
|
| FNMA, Series 2018-C01, Class 1M1, VRN, 3.09%, (1-month LIBOR plus 0.60%), 7/25/30 | | 204,562 |
| 204,172 |
|
| FNMA, Series 2018-C02, Class 2M1, VRN, 3.14%, (1-month LIBOR plus 0.65%), 8/25/30 | | 151,357 |
| 151,324 |
|
| FNMA, Series 417, Class C5, IO, 3.50%, 2/25/43 | | 659,591 |
| 120,354 |
|
| | | | 1,704,128 |
|
TOTAL COLLATERALIZED MORTGAGE OBLIGATIONS
(Cost $2,798,439) | | | 2,802,132 |
|
| U.S. TREASURY SECURITIES — 10.8% | | | |
U.S. Treasury Bills, 2.46%, 6/13/19(4) | | 200,000 |
| 199,042 |
|
U.S. Treasury Bills, 2.55%, 1/30/20(4) | | 1,000,000 |
| 980,349 |
|
| U.S. Treasury Notes, 2.625%, 2/15/29 | | 850,000 |
| 866,651 |
|
TOTAL U.S. TREASURY SECURITIES
(Cost $2,023,817) | | | 2,046,042 |
|
AFFILIATED FUNDS(2) — 8.0% | | | |
Emerging Markets Debt Fund R6 Class
(Cost $1,473,456) | | 148,752 |
| 1,508,341 |
|
| COLLATERALIZED LOAN OBLIGATIONS — 6.0% | | | |
Ares XXXIIR CLO Ltd., Series 2014-32RA, Class A2A, VRN, 4.23%, (3-month LIBOR plus 1.55%), 5/15/30(1) | | $ | 75,000 |
| 74,064 |
|
Carlyle Global Market Strategies CLO Ltd., Series 2014-1A, Class A1R2, VRN, 3.74%, (3-month LIBOR plus 0.97%), 4/17/31(1) | | 100,000 |
| 98,620 |
|
CBAM Ltd., Series 2018-5A, Class B1, VRN, 4.17%, (3-month LIBOR plus 1.40%), 4/17/31(1) | | 150,000 |
| 145,203 |
|
|
| | | | | | | |
| | | Principal Amount/Shares | Value |
Dryden 41 Senior Loan Fund, Series 2015-41A, Class AR, VRN, 3.76%, (3-month LIBOR plus 0.97%), 4/15/31(1) | | $ | 200,000 |
| $ | 196,599 |
|
Dryden 64 CLO Ltd., Series 2018-64A, Class A, VRN, 3.75%, (3-month LIBOR plus 0.97%), 4/18/31(1) | | 250,000 |
| 245,751 |
|
Sounds Point CLO IV-R Ltd., Series 2013-3RA, Class B, VRN, 4.53%, (3-month LIBOR plus 1.75%), 4/18/31(1) | | 125,000 |
| 124,983 |
|
Symphony CLO XIX Ltd., Series 2018-19A, Class A, VRN, 3.74%, (3-month LIBOR plus 0.96%), 4/16/31(1) | | 250,000 |
| 245,981 |
|
TOTAL COLLATERALIZED LOAN OBLIGATIONS
(Cost $1,140,614) | | | 1,131,201 |
|
| ASSET-BACKED SECURITIES — 5.7% | | | |
Avis Budget Rental Car Funding AESOP LLC, Series 2015-2A, Class B, 3.42%, 12/20/21(1) | | 25,000 |
| 24,975 |
|
BRE Grand Islander Timeshare Issuer LLC, Series 2017-1A, Class A SEQ, 2.94%, 5/25/29(1) | | 57,783 |
| 57,356 |
|
BRE Grand Islander Timeshare Issuer LLC, Series 2017-1A, Class B, 3.24%, 5/25/29(1) | | 14,446 |
| 14,260 |
|
Colony Starwood Homes, Series 2016-2A, Class A, VRN, 3.73%, (1-month LIBOR plus 1.25%), 12/17/33(1) | | 44,297 |
| 44,337 |
|
Hilton Grand Vacations Trust, Series 2014-AA, Class B, 2.07%, 11/25/26(1) | | 7,558 |
| 7,459 |
|
| Honda Auto Receivables Owner Trust, Series 2019-1, Class A3 SEQ, 2.83%, 3/20/23 | | 100,000 |
| 100,676 |
|
Invitation Homes Trust, Series 2017-SFR2, Class A, VRN, 3.33%, (1-month LIBOR plus 0.85%), 12/17/36(1) | | 48,547 |
| 48,409 |
|
Invitation Homes Trust, Series 2017-SFR2, Class B, VRN, 3.63%, (1-month LIBOR plus 1.15%), 12/17/36(1) | | 50,000 |
| 50,044 |
|
Invitation Homes Trust, Series 2018-SFR1, Class C, VRN, 3.73%, (1-month LIBOR plus 1.25%), 3/17/37(1) | | 100,000 |
| 99,893 |
|
Invitation Homes Trust, Series 2018-SFR2, Class C, VRN, 3.76%, (1-month LIBOR plus 1.28%), 6/17/37(1) | | 100,000 |
| 99,502 |
|
Marriott Vacation Club Owner Trust, Series 2012-1A, Class B, VRN, 3.50%, 5/20/30(1) | | 5,238 |
| 5,212 |
|
MVW Owner Trust, Series 2013-1A, Class A SEQ, 2.15%, 4/22/30(1) | | 35,844 |
| 35,574 |
|
MVW Owner Trust, Series 2014-1A, Class B, 2.70%, 9/22/31(1) | | 12,476 |
| 12,244 |
|
MVW Owner Trust, Series 2017-1A, Class B, 2.75%, 12/20/34(1) | | 62,879 |
| 61,927 |
|
Progress Residential Trust, Series 2019-SFR1, Class A, 3.42%, 8/17/35(1) | | 100,000 |
| 101,087 |
|
Progress Residential Trust, Series 2017-SFR1, Class A SEQ, 2.77%, 8/17/34(1) | | 49,840 |
| 49,459 |
|
Progress Residential Trust, Series 2017-SFR2, Class A SEQ, 2.90%, 12/17/34(1) | | 75,000 |
| 74,454 |
|
Sierra Timeshare Conduit Receivables Funding LLC, Series 2017-1A, Class A SEQ, 2.91%, 3/20/34(1) | | 9,486 |
| 9,419 |
|
Sierra Timeshare Receivables Funding LLC, Series 2015-1A, Class A SEQ, 2.40%, 3/22/32(1) | | 12,879 |
| 12,825 |
|
Sierra Timeshare Receivables Funding LLC, Series 2015-2A, Class A SEQ, 2.43%, 6/20/32(1) | | 14,623 |
| 14,483 |
|
Sierra Timeshare Receivables Funding LLC, Series 2015-3A, Class A SEQ, 2.58%, 9/20/32(1) | | 17,780 |
| 17,707 |
|
Sierra Timeshare Receivables Funding LLC, Series 2016-2A, Class A SEQ, 2.33%, 7/20/33(1) | | 5,722 |
| 5,645 |
|
Towd Point Mortgage Trust, Series 2017-3, Class M1, VRN, 3.50%, 7/25/57(1) | | 100,000 |
| 98,669 |
|
|
| | | | | | | |
| | | Principal Amount/Shares | Value |
VSE VOI Mortgage LLC, Series 2016-A, Class A SEQ, 2.54%, 7/20/33(1) | | $ | 41,093 |
| $ | 40,657 |
|
TOTAL ASSET-BACKED SECURITIES
(Cost $1,091,078) | | | 1,086,273 |
|
| COMMERCIAL MORTGAGE-BACKED SECURITIES — 5.0% |
| Commercial Mortgage Pass-Through Certificates, Series 2014-CR15, Class B, VRN, 4.69%, 2/10/47 | | 65,000 |
| 69,497 |
|
| Commercial Mortgage Pass-Through Certificates, Series 2014-LC17, Class B, VRN, 4.49%, 10/10/47 | | 50,000 |
| 52,142 |
|
| Commercial Mortgage Pass-Through Certificates, Series 2016-CR28, Class B, VRN, 4.65%, 2/10/49 | | 75,000 |
| 80,181 |
|
| Commercial Mortgage Trust, Series 2015-CR22, Class B, VRN, 3.93%, 3/10/48 | | 25,000 |
| 25,312 |
|
| Commercial Mortgage Trust, Series 2016-CD1, Class AM, 2.93%, 8/10/49 | | 25,000 |
| 24,165 |
|
Commercial Mortgage Trust, Series 2017-PANW, Class A SEQ, 3.24%, 10/10/29(1) | | 50,000 |
| 50,480 |
|
Core Industrial Trust, Series 2015-CALW, Class C, 3.56%, 2/10/34(1) | | 100,000 |
| 100,921 |
|
Core Industrial Trust, Series 2015-TEXW, Class B, 3.33%, 2/10/34(1) | | 25,000 |
| 25,199 |
|
| CSAIL Commercial Mortgage Trust, Series 2017-CX10, Class AS, VRN, 3.67%, 11/15/50 | | 25,000 |
| 25,356 |
|
| GS Mortgage Securities Trust, Series 2015-GC28, Class AS, 3.76%, 2/10/48 | | 50,000 |
| 51,294 |
|
| GS Mortgage Securities Trust, Series 2016-GS2, Class B, VRN, 3.76%, 5/10/49 | | 25,000 |
| 25,441 |
|
Hudson Yards Mortgage Trust, Series 2016-10HY, Class A SEQ, 2.84%, 8/10/38(1) | | 50,000 |
| 49,019 |
|
Hudson Yards Mortgage Trust, Series 2016-10HY, Class B, VRN, 2.98%, 8/10/38(1) | | 25,000 |
| 24,461 |
|
| JPMBB Commercial Mortgage Securities Trust, Series 2014-C21, Class B, VRN, 4.34%, 8/15/47 | | 60,000 |
| 62,030 |
|
| JPMDB Commercial Mortgage Securities Trust, Series 2017-C5, Class A4 SEQ, 3.41%, 3/15/50 | | 60,000 |
| 61,260 |
|
| JPMorgan Chase Commercial Mortgage Securities Trust, Series 2013-C16, Class C, VRN, 5.03%, 12/15/46 | | 37,000 |
| 39,141 |
|
| JPMorgan Chase Commercial Mortgage Securities Trust, Series 2016-JP2, Class B, 3.46%, 8/15/49 | | 40,000 |
| 39,650 |
|
Morgan Stanley Capital I Trust, Series 2014-CPT, Class C, VRN, 3.45%, 7/13/29(1) | | 40,000 |
| 40,231 |
|
| UBS Commercial Mortgage Trust, Series 2017-C1, Class A3 SEQ, 3.20%, 6/15/50 | | 100,000 |
| 100,208 |
|
TOTAL COMMERCIAL MORTGAGE-BACKED SECURITIES
(Cost $951,164) | 945,988 |
|
BANK LOAN OBLIGATIONS(3) — 4.7% | | | |
| Diversified Telecommunication Services — 1.3% | | | |
| CenturyLink, Inc., 2017 Term Loan B, 5.25%, (1-month LIBOR plus 2.75%), 1/31/25 | | 54,336 |
| 53,386 |
|
| Level 3 Financing, Inc., 2017 Term Loan B, 4.74%, (3-month LIBOR plus 2.25%), 2/22/24 | | 70,000 |
| 69,278 |
|
| Sprint Communications, Inc., 1st Lien Term Loan B, 5.00%, (1-month LIBOR plus 2.50%), 2/2/24 | | 49,620 |
| 48,429 |
|
Zayo Group, LLC, 2017 Incremental Term Loan, 4.75%, (1-month LIBOR plus 2.25%), 1/19/24 | | 70,000 |
| 69,713 |
|
| | | | 240,806 |
|
|
| | | | | | | |
| | | Principal Amount/Shares | Value |
| Food Products — 0.2% | | | |
| Post Holdings Inc., 2017 Series A Incremental Term Loan, 4.49%, (1-month LIBOR plus 2.00%), 5/24/24 | | $ | 11,368 |
| $ | 11,288 |
|
| Post Holdings Inc., 2017 Series A Incremental Term Loan, 4.49%, (1-month LIBOR plus 2.00%), 5/24/24 | | 36,731 |
| 36,470 |
|
| | | | 47,758 |
|
| Health Care Providers and Services — 0.3% | | | |
| HCA Inc., 2018 Term Loan B10, 4.50%, (1-month LIBOR plus 2.00%), 3/13/25 | | 49,500 |
| 49,504 |
|
| Hotels, Restaurants and Leisure — 1.3% | | | |
| 1011778 B.C. Unlimited Liability Company, Term Loan B3, 4.75%, (1-month LIBOR plus 2.25%), 2/16/24 | | 31,072 |
| 30,631 |
|
| 1011778 B.C. Unlimited Liability Company, Term Loan B3, 4.75%, (1-month LIBOR plus 2.25%), 2/16/24 | | 38,543 |
| 37,997 |
|
| Caesars Resort Collection, LLC, 2017 1st Lien Term Loan B, 5.25%, (1-month LIBOR plus 2.75%), 12/22/24 | | 19,749 |
| 19,520 |
|
Hilton Worldwide Finance, LLC, Term Loan B2, 4.24%, (1-month LIBOR plus 1.75%), 10/25/23 | | 72,981 |
| 72,896 |
|
| MGM Growth Properties Operating Partnership LP, 2016 Term Loan B, 4.50%, (1-month LIBOR plus 2.00%), 3/21/25 | | 79,184 |
| 78,229 |
|
| | | | 239,273 |
|
| IT Services — 0.1% | | | |
First Data Corporation, 2024 USD Term Loan, 4.49%, (1-month LIBOR plus 2.00%), 4/26/24 | | 20,000 |
| 19,965 |
|
| Pharmaceuticals — 0.8% | | | |
| Catalent Pharma Solutions Inc., USD Term Loan B, 4.75%, (1-month LIBOR plus 2.25%), 5/20/24 | | 80,693 |
| 80,454 |
|
| Valeant Pharmaceuticals International, Inc., 2018 Term Loan B, 5.48%, (1-month LIBOR plus 3.00%), 6/2/25 | | 64,750 |
| 64,409 |
|
| | | | 144,863 |
|
| Technology Hardware, Storage and Peripherals — 0.7% | | | |
| Dell International LLC, 2017 Term Loan B, 4.50%, (1-month LIBOR plus 2.00%), 9/7/23 | | 79,472 |
| 78,671 |
|
Western Digital Corporation, 2018 Term Loan B4, 4.25%, (1-month LIBOR plus 1.75%), 4/29/23 | | 59,363 |
| 57,903 |
|
| | | | 136,574 |
|
TOTAL BANK LOAN OBLIGATIONS
(Cost $890,187) | | | 878,743 |
|
| SOVEREIGN GOVERNMENTS AND AGENCIES — 4.3% | | | |
| Dominican Republic — 0.6% | | | |
| Dominican Republic International Bond, 6.875%, 1/29/26 | | 100,000 |
| 110,125 |
|
| Egypt — 1.6% | | | |
| Egypt Government International Bond, 5.75%, 4/29/20 | | 100,000 |
| 101,325 |
|
| Egypt Government International Bond, 6.125%, 1/31/22 | | 200,000 |
| 202,831 |
|
| | | | 304,156 |
|
| Hungary — 1.1% | | | |
| Hungary Government International Bond, 6.375%, 3/29/21 | | 200,000 |
| 213,297 |
|
| Oman — 1.0% | | | |
| Oman Government International Bond, 4.125%, 1/17/23 | | 200,000 |
| 191,780 |
|
TOTAL SOVEREIGN GOVERNMENTS AND AGENCIES
(Cost $814,319) | | | 819,358 |
|
|
| | | | | | | |
| | | Principal Amount/Shares | Value |
| PREFERRED STOCKS — 2.0% | | | |
| Banks — 1.5% | | | |
| Bank of America Corp., 5.20% | | 135,000 |
| $ | 135,765 |
|
| JPMorgan Chase & Co., 5.15% | | 150,000 |
| 151,264 |
|
| | | | 287,029 |
|
| Equity Real Estate Investment Trusts (REITs) — 0.5% | | | |
| Kimco Realty Corp., 5.625% | | 1,800 |
| 44,640 |
|
| SITE Centers Corp., 6.25% | | 1,400 |
| 36,036 |
|
| | | | 80,676 |
|
TOTAL PREFERRED STOCKS
(Cost $357,348) | | | 367,705 |
|
| TEMPORARY CASH INVESTMENTS — 0.7% | | | |
| Repurchase Agreement, BMO Capital Markets Corp., (collateralized by various U.S. Treasury obligations, 0.125% - 2.875%, 9/30/19 - 2/15/44, valued at $114,901), in a joint trading account at 2.35%, dated 3/29/19, due 4/1/19 (Delivery value $112,627) | | | 112,605 |
|
| State Street Institutional U.S. Government Money Market Fund, Premier Class | | 20,533 |
| 20,533 |
|
TOTAL TEMPORARY CASH INVESTMENTS
(Cost $133,138) | | | 133,138 |
|
TOTAL INVESTMENT SECURITIES — 98.9%
(Cost $18,556,066) | | | 18,708,044 |
|
| OTHER ASSETS AND LIABILITIES — 1.1% | | | 215,459 |
|
| TOTAL NET ASSETS — 100.0% | | | $ | 18,923,503 |
|
|
| | | | | | | | | | |
| FORWARD FOREIGN CURRENCY EXCHANGE CONTRACTS |
| Currency Purchased | Currency Sold | Counterparty | Settlement Date | Unrealized Appreciation (Depreciation) |
| USD | 242,226 |
| EUR | 214,029 |
| JPMorgan Chase Bank N.A. | 6/19/19 | $ | 557 |
|
| GBP | 5 |
| USD | 7 |
| Bank of America N.A. | 6/19/19 | — |
|
| MXN | 170,424 |
| USD | 8,634 |
| Morgan Stanley | 6/19/19 | 38 |
|
| | | | | | | $ | 595 |
|
|
| | |
| NOTES TO SCHEDULE OF INVESTMENTS |
| EUR | - | Euro |
| FHLMC | - | Federal Home Loan Mortgage Corporation |
| FNMA | - | Federal National Mortgage Association |
| GBP | - | British Pound |
| H15T1Y | - | Constant Maturity U.S. Treasury Note Yield Curve Rate Index |
| IO | - | Interest Only |
| LIBOR | - | London Interbank Offered Rate |
| MTN | - | Medium Term Note |
| MXN | - | Mexican Peso |
| SEQ | - | Sequential Payer |
| USD | - | United States Dollar |
| VRN | - | Variable Rate Note. The rate adjusts periodically based upon the terms set forth in the security’s offering documents. The rate shown is effective at the period end and the reference rate and spread, if any, is indicated. |
| |
| (1) | Security was purchased pursuant to Rule 144A under the Securities Act of 1933 and may be sold in transactions exempt from registration, normally to qualified institutional investors. The aggregate value of these securities at the period end was $3,871,632, which represented 20.5% of total net assets. |
| |
| (2) | Investments are funds within the American Century Investments family of funds and are considered affiliated funds. |
| |
| (3) | The interest rate on a bank loan obligation adjusts periodically based on a predetermined schedule. Rate shown is effective at period end. The maturity date on a bank loan obligation may be less than indicated as a result of contractual or optional prepayments. These prepayments cannot be predicted with certainty. |
| |
| (4) | The rate indicated is the yield to maturity at purchase. |
See Notes to Financial Statements.
|
|
| Statement of Assets and Liabilities |
|
| | | |
| MARCH 31, 2019 | |
| Assets | |
| Investment securities - unaffiliated, at value (cost of $17,082,610) | $ | 17,199,703 |
|
| Investment securities - affiliated, at value (cost of $1,473,456) | 1,508,341 |
|
| Total investment securities, at value (cost of $18,556,066) | 18,708,044 |
|
| Receivable for investments sold | 464 |
|
| Receivable for capital shares sold | 100,932 |
|
| Unrealized appreciation on forward foreign currency exchange contracts | 595 |
|
| Interest and dividends receivable | 140,679 |
|
| | 18,950,714 |
|
| | |
| Liabilities | |
| Payable for investments purchased | 5,477 |
|
| Payable for capital shares redeemed | 8,343 |
|
| Accrued management fees | 10,961 |
|
| Distribution and service fees payable | 479 |
|
| Dividends payable | 1,951 |
|
| | 27,211 |
|
| | |
| Net Assets | $ | 18,923,503 |
|
| | |
| Net Assets Consist of: | |
| Capital paid in | $ | 19,134,940 |
|
| Distributable earnings | (211,437 | ) |
| | $ | 18,923,503 |
|
|
| | | | | | |
| | Net Assets | Shares Outstanding | Net Asset Value Per Share |
| Investor Class |
| $15,718,163 |
| 1,614,969 |
| $9.73 |
| I Class |
| $1,344,511 |
| 138,214 |
| $9.73 |
| Y Class |
| $5,350 |
| 550 |
| $9.73 |
| A Class |
| $1,324,654 |
| 136,108 |
| $9.73* |
| C Class |
| $182,369 |
| 18,745 |
| $9.73 |
| R Class |
| $112,152 |
| 11,522 |
| $9.73 |
| R5 Class |
| $99,011 |
| 10,174 |
| $9.73 |
| R6 Class |
| $137,293 |
| 14,107 |
| $9.73 |
*Maximum offering price $10.19 (net asset value divided by 0.955).
See Notes to Financial Statements.
|
| | | |
| YEAR ENDED MARCH 31, 2019 | |
| Investment Income (Loss) | |
| Income: | |
| Interest | $ | 663,481 |
|
| Income distributions from affiliated funds | 58,207 |
|
| Dividends | 3,818 |
|
| | 725,506 |
|
| | |
| Expenses: | |
| Management fees | 122,877 |
|
| Distribution and service fees: | |
| A Class | 2,989 |
|
| C Class | 6,307 |
|
| R Class | 2,000 |
|
| Trustees' fees and expenses | 1,178 |
|
| Other expenses | 1,669 |
|
| | 137,020 |
|
Fees waived(1) | (10,230 | ) |
| | 126,790 |
|
| | |
| Net investment income (loss) | 598,716 |
|
| | |
| Realized and Unrealized Gain (Loss) | |
| Net realized gain (loss) on: | |
| Investment transactions | (328,239 | ) |
| Forward foreign currency exchange contract transactions | 144,108 |
|
| Futures contract transactions | (27,247 | ) |
| Swap agreement transactions | 43,517 |
|
| Foreign currency translation transactions | (7,639 | ) |
| | (175,500 | ) |
| | |
| Change in net unrealized appreciation (depreciation) on: | |
| Investments (including $1,312 from affiliated funds) | 273,588 |
|
| Forward foreign currency exchange contracts | 12,251 |
|
| Futures contracts | 9,848 |
|
| Swap agreements | (4,623 | ) |
| Translation of assets and liabilities in foreign currencies | (659 | ) |
| | 290,405 |
|
| | |
| Net realized and unrealized gain (loss) | 114,905 |
|
| | |
| Net Increase (Decrease) in Net Assets Resulting from Operations | $ | 713,621 |
|
| |
| (1) | Amount consists of $7,603, $628, $4, $719, $391, $248, $309 and $328 for Investor Class, I Class, Y Class, A Class, C Class, R Class, R5 Class and R6 Class, respectively. |
See Notes to Financial Statements.
|
|
| Statement of Changes in Net Assets |
|
| | | | | | |
| YEARS ENDED MARCH 31, 2019 AND MARCH 31, 2018 |
| Increase (Decrease) in Net Assets | March 31, 2019 | March 31, 2018 |
| Operations | | |
| Net investment income (loss) | $ | 598,716 |
| $ | 479,701 |
|
| Net realized gain (loss) | (175,500 | ) | 46,353 |
|
| Change in net unrealized appreciation (depreciation) | 290,405 |
| (175,397 | ) |
| Net increase (decrease) in net assets resulting from operations | 713,621 |
| 350,657 |
|
| | | |
| Distributions to Shareholders | | |
| From earnings: | | |
| Investor Class | (499,842 | ) | (339,323 | ) |
| I Class | (42,574 | ) | (6,675 | ) |
| Y Class | (212 | ) | (169 | ) |
| A Class | (44,458 | ) | (29,684 | ) |
| C Class | (17,840 | ) | (25,579 | ) |
| R Class | (13,277 | ) | (21,820 | ) |
| R5 Class | (20,067 | ) | (25,042 | ) |
| R6 Class | (21,566 | ) | (27,317 | ) |
| Decrease in net assets from distributions | (659,836 | ) | (475,609 | ) |
| | | |
| Capital Share Transactions | | |
| Net increase (decrease) in net assets from capital share transactions (Note 5) | 1,746,930 |
| 5,119,463 |
|
| | | |
| Net increase (decrease) in net assets | 1,800,715 |
| 4,994,511 |
|
| | | |
| Net Assets | | |
| Beginning of period | 17,122,788 |
| 12,128,277 |
|
| End of period | $ | 18,923,503 |
| $ | 17,122,788 |
|
See Notes to Financial Statements.
|
|
| Notes to Financial Statements |
MARCH 31, 2019
1. Organization
American Century Investment Trust (the trust) is registered under the Investment Company Act of 1940, as amended (the 1940 Act), as an open-end management investment company and is organized as a Massachusetts business trust. Strategic Income Fund (the fund) is one fund in a series issued by the trust. The fund’s investment objective is to seek income. As a secondary objective, the fund seeks long-term capital appreciation.
The fund offers the Investor Class, I Class, Y Class, A Class, C Class, R Class, R5 Class and R6 Class. The A Class may incur an initial sales charge. The A Class and C Class may be subject to a contingent deferred sales charge. Sale of the I Class and Y Class commenced on April 10, 2017.
2. Significant Accounting Policies
The following is a summary of significant accounting policies consistently followed by the fund in preparation of its financial statements. The fund is an investment company and follows accounting and reporting guidance in accordance with accounting principles generally accepted in the United States of America. This may require management to make certain estimates and assumptions at the date of the financial statements. Actual results could differ from these estimates. Management evaluated the impact of events or transactions occurring through the date the financial statements were issued that would merit recognition or disclosure.
Investment Valuations — The fund determines the fair value of its investments and computes its net asset value per share at the close of regular trading (usually 4 p.m. Eastern time) on the New York Stock Exchange (NYSE) on each day the NYSE is open. The Board of Trustees has adopted valuation policies and procedures to guide the investment advisor in the fund’s investment valuation process and to provide methodologies for the oversight of the fund’s pricing function.
Fixed income securities are valued at the evaluated mean as provided by independent pricing services or at the mean of the most recent bid and asked prices as provided by investment dealers. Corporate bonds, U.S. Treasury and Government Agency securities, convertible bonds, bank loan obligations, municipal securities, and sovereign governments and agencies are valued using market models that consider trade data, quotations from dealers and active market makers, relevant yield curve and spread data, creditworthiness, trade data or market information on comparable securities, and other relevant security specific information. Mortgage-related and asset-backed securities are valued based on models that consider trade data, prepayment and default projections, benchmark yield and spread data and estimated cash flows of each tranche of the issuer. Collateralized loan obligations are valued based on discounted cash flow models that consider trade and economic data, prepayment assumptions and default projections. Fixed income securities initially expressed in local currencies are translated into U.S. dollars at the mean of the appropriate currency exchange rate at the close of the NYSE as provided by an independent pricing service.
Equity securities that are listed or traded on a domestic securities exchange are valued at the last reported sales price or at the official closing price as provided by the exchange. Equity securities traded on foreign securities exchanges are generally valued at the closing price of such securities on the exchange where primarily traded or at the close of the NYSE, if that is earlier. If no last sales price is reported, or if local convention or regulation so provides, the mean of the latest bid and asked prices may be used. Securities traded over-the-counter are valued at the mean of the latest bid and asked prices, the last sales price, or the official closing price. Equity securities initially expressed in local currencies are translated into U.S. dollars at the mean of the appropriate currency exchange rate at the close of the NYSE as provided by an independent pricing service.
Open-end management investment companies are valued at the reported net asset value per share. Repurchase agreements are valued at cost, which approximates fair value. Exchange-traded futures contracts are valued at the settlement price as provided by the appropriate exchange. Swap agreements are valued at an evaluated mean as provided by independent pricing services or independent brokers. Forward foreign currency exchange contracts are valued at the mean of the appropriate forward exchange rate at the close of the NYSE as provided by an independent pricing service. Investments initially expressed in local currencies are translated into U.S. dollars at the mean of the appropriate currency exchange rate at the close of the NYSE as provided by an independent pricing service.
If the fund determines that the market price for an investment is not readily available or the valuation methods mentioned above do not reflect an investment’s fair value, such investment is valued as determined in good faith by the Board of Trustees or its delegate, in accordance with policies and procedures adopted by the Board of Trustees. In its determination of fair value, the fund may review several factors including, but not limited to, market information regarding the specific investment or comparable investments and correlation with other investment types, futures indices or general market indicators. Circumstances that may cause the fund to use these procedures to value an investment include, but are not limited to: an investment has been declared in default or is distressed; trading in a security has been suspended during the trading day or a security is not actively trading on its principal exchange; prices received from a regular pricing source are deemed unreliable; or there is a foreign market holiday and no trading occurred.
The fund monitors for significant events occurring after the close of an investment’s primary exchange but before the fund’s net asset value per share is determined. Significant events may include, but are not limited to: corporate announcements and transactions; governmental action and political unrest that could impact a specific investment or an investment sector; or armed conflicts, natural disasters and similar events that could affect investments in a specific country or region. The fund also monitors for significant fluctuations between domestic and foreign markets, as evidenced by the U.S. market or such other indicators that the Board of Trustees, or its delegate, deems appropriate. If significant fluctuations in foreign markets are identified, the fund may apply a model-derived factor to the closing price of equity securities traded on foreign securities exchanges. The factor is based on observable market data as provided by an independent pricing service.
Security Transactions — Security transactions are accounted for as of the trade date. Net realized gains and losses are determined on the identified cost basis, which is also used for federal income tax purposes.
Investment Income — Interest income is recorded on the accrual basis and includes paydown gain (loss) and accretion of discounts and amortization of premiums. Inflation adjustments related to inflation-linked debt securities are reflected as interest income. Dividend income less foreign taxes withheld, if any, is recorded as of the ex-dividend date. Income and capital gain distributions, if any, from the affiliated funds are recorded as of the ex-dividend date. Distributions received on securities that represent a return of capital or long-term capital gain are recorded as a reduction of cost of investments and/or as a realized gain. The fund may estimate the components of distributions received that may be considered nontaxable distributions or long-term capital gain distributions for income tax purposes.
Foreign Currency Translations — All assets and liabilities initially expressed in foreign currencies are translated into U.S. dollars at prevailing exchange rates at period end. The fund may enter into spot foreign currency exchange contracts to facilitate transactions denominated in a foreign currency. Purchases and sales of investment securities, dividend and interest income, spot foreign currency exchange contracts, and expenses are translated at the rates of exchange prevailing on the respective dates of such transactions. Net realized and unrealized foreign currency exchange gains or losses related to investment securities are a component of net realized gain (loss) on investment transactions and change in net unrealized appreciation (depreciation) on investments, respectively.
Repurchase Agreements — The fund may enter into repurchase agreements with institutions that American Century Investment Management, Inc. (ACIM) (the investment advisor) has determined are creditworthy pursuant to criteria adopted by the Board of Trustees. The fund requires that the collateral, represented by securities, received in a repurchase transaction be transferred to the custodian in a manner sufficient to enable the fund to obtain those securities in the event of a default under the repurchase agreement. ACIM monitors, on a daily basis, the securities transferred to ensure the value, including accrued interest, of the securities under each repurchase agreement is equal to or greater than amounts owed to the fund under each repurchase agreement.
Joint Trading Account — Pursuant to an Exemptive Order issued by the Securities and Exchange Commission, the fund, along with certain other funds in the American Century Investments family of funds, may transfer uninvested cash balances into a joint trading account. These balances are invested in one or more repurchase agreements that are collateralized by U.S. Treasury or Agency obligations.
Segregated Assets — In accordance with the 1940 Act, the fund segregates assets on its books and records to cover certain types of investment securities and other financial instruments. ACIM monitors, on a daily basis, the securities segregated to ensure the fund designates a sufficient amount of liquid assets, marked-to-market daily. The fund may also receive assets or be required to pledge assets at the custodian bank or with a broker for collateral requirements.
Income Tax Status — It is the fund’s policy to distribute substantially all net investment income and net realized gains to shareholders and to otherwise qualify as a regulated investment company under provisions of the Internal Revenue Code. Accordingly, no provision has been made for income taxes. The fund files U.S. federal, state, local and non-U.S. tax returns as applicable. The fund's tax returns are subject to examination by the relevant taxing authority until expiration of the applicable statute of limitations, which is generally three years from the date of filing but can be longer in certain jurisdictions. At this time, management believes there are no uncertain tax positions which, based on their technical merit, would not be sustained upon examination and for which it is reasonably possible that the total amounts of unrecognized tax benefits will significantly change in the next twelve months.
Multiple Class — All shares of the fund represent an equal pro rata interest in the net assets of the class to which such shares belong, and have identical voting, dividend, liquidation and other rights and the same terms and conditions, except for class specific expenses and exclusive rights to vote on matters affecting only individual classes. Income, non-class specific expenses, and realized and unrealized capital gains and losses of the fund are allocated to each class of shares based on their relative net assets.
Distributions to Shareholders — Distributions from net investment income, if any, are declared daily and paid monthly. Distributions from net realized gains, if any, are generally declared and paid annually.
Indemnifications — Under the trust’s organizational documents, its officers and trustees are indemnified against certain liabilities arising out of the performance of their duties to the fund. In addition, in the normal course of business, the fund enters into contracts that provide general indemnifications. The maximum exposure under these arrangements is unknown as this would involve future claims that may be made against a fund. The risk of material loss from such claims is considered by management to be remote.
3. Fees and Transactions with Related Parties
Certain officers and trustees of the trust are also officers and/or directors of American Century Companies, Inc. (ACC). The trust's investment advisor, ACIM, the trust's distributor, American Century Investment Services, Inc. (ACIS), and the trust's transfer agent, American Century Services, LLC, are wholly owned, directly or indirectly, by ACC.
Management Fees — The trust has entered into a management agreement with ACIM, under which ACIM provides the fund with investment advisory and management services in exchange for a single, unified management fee (the fee) per class. The agreement provides that all expenses of managing and operating the fund, except distribution and service fees, brokerage expenses, taxes, interest, fees and expenses of the independent trustees (including legal counsel fees), and extraordinary expenses, will be paid by ACIM. The fee is computed and accrued daily based on each class's daily net assets and paid monthly in arrears. The difference in the fee among the classes is a result of their separate arrangements for non-Rule 12b-1 shareholder services. It is not the result of any difference in advisory or custodial fees or other expenses related to the management of the fund’s assets, which do not vary by class. The investment advisor will waive the portion of the fund’s management fee equal to the expenses attributable to the management fees of the American Century Investments funds in which the fund invests. The amount of this waiver will fluctuate depending on the fund’s daily allocation to other American Century Investments funds. This waiver is expected to remain in effect permanently and it cannot be terminated without the approval of the Board of Trustees.
The annual management fee and the effective annual management fee after waiver for each class for the period ended March 31, 2019 are as follows:
|
| | |
| | Annual Management Fee | Effective Annual Management Fee After Waiver |
| Investor Class | 0.74% | 0.68% |
| I Class | 0.64% | 0.58% |
| Y Class | 0.54% | 0.48% |
| A Class | 0.74% | 0.68% |
| C Class | 0.74% | 0.68% |
| R Class | 0.74% | 0.68% |
| R5 Class | 0.54% | 0.48% |
| R6 Class | 0.49% | 0.43% |
Distribution and Service Fees — The Board of Trustees has adopted a separate Master Distribution and Individual Shareholder Services Plan for each of the A Class, C Class and R Class (collectively the plans), pursuant to Rule 12b-1 of the 1940 Act. The plans provide that the A Class will pay ACIS an annual distribution and service fee of 0.25%. The plans provide that the C Class will pay ACIS an annual distribution and service fee of 1.00%, of which 0.25% is paid for individual shareholder services and 0.75% is paid for distribution services. The plans provide that the R Class will pay ACIS an annual distribution and service fee of 0.50%. The fees are computed and accrued daily based on each class’s daily net assets and paid monthly in arrears. The fees are used to pay financial intermediaries for distribution and individual shareholder services. Fees incurred under the plans during the period ended March 31, 2019 are detailed in the Statement of Operations.
Trustees’ Fees and Expenses — The Board of Trustees is responsible for overseeing the investment advisor’s management and operations of the fund. The trustees receive detailed information about the fund and its investment advisor regularly throughout the year, and meet at least quarterly with management of the investment advisor to review reports about fund operations. The fund’s officers do not receive compensation from the fund.
Interfund Transactions — The fund may enter into security transactions with other American Century Investments funds and other client accounts of the investment advisor, in accordance with the 1940 Act rules and procedures adopted by the Board of Trustees. The rules and procedures require, among other things, that these transactions be effected at the independent current market price of the security. There were no interfund transactions during the period.
4. Investment Transactions
Purchases of investment securities, excluding short-term investments, for the period ended March 31, 2019 totaled $10,783,174, of which $2,359,094 represented U.S. Treasury and Government Agency obligations.
Sales of investment securities, excluding short-term investments, for the period ended March 31, 2019 totaled $9,840,306, of which $20,451 represented U.S. Treasury and Government Agency obligations.
5. Capital Share Transactions
Transactions in shares of the fund were as follows (unlimited number of shares authorized):
|
| | | | | | | | | | |
| | Year ended
March 31, 2019 | Year ended
March 31, 2018(1) |
| | Shares | Amount | Shares | Amount |
| Investor Class | | | | |
| Sold | 1,104,462 |
| $ | 10,560,239 |
| 1,294,139 |
| $ | 12,796,254 |
|
| Issued in reinvestment of distributions | 49,179 |
| 471,880 |
| 32,389 |
| 319,727 |
|
| Redeemed | (794,260) |
| (7,633,594 | ) | (867,846) |
| (8,577,550 | ) |
| | 359,381 |
| 3,398,525 |
| 458,682 |
| 4,538,431 |
|
| I Class | | | | |
| Sold | 77,683 |
| 744,902 |
| 70,226 |
| 692,508 |
|
| Issued in reinvestment of distributions | 4,434 |
| 42,501 |
| 679 |
| 6,675 |
|
| Redeemed | (14,448 | ) | (139,428 | ) | (360 | ) | (3,543 | ) |
| | 67,669 |
| 647,975 |
| 70,545 |
| 695,640 |
|
| Y Class | | | | |
| Sold | — |
| — |
| 511 |
| 5,000 |
|
| Issued in reinvestment of distributions | 22 |
| 212 |
| 17 |
| 168 |
|
| | 22 |
| 212 |
| 528 |
| 5,168 |
|
| A Class | | | | |
| Sold | 148,484 |
| 1,418,224 |
| 18,268 |
| 180,323 |
|
| Issued in reinvestment of distributions | 4,583 |
| 43,932 |
| 2,984 |
| 29,499 |
|
| Redeemed | (84,968 | ) | (805,318 | ) | (54,738 | ) | (540,111 | ) |
| | 68,099 |
| 656,838 |
| (33,486 | ) | (330,289 | ) |
| C Class | | | | |
| Sold | 805 |
| 7,587 |
| 9,916 |
| 98,153 |
|
| Issued in reinvestment of distributions | 1,805 |
| 17,350 |
| 2,578 |
| 25,450 |
|
| Redeemed | (106,482 | ) | (1,021,900 | ) | (2,219 | ) | (21,935 | ) |
| | (103,872 | ) | (996,963 | ) | 10,275 |
| 101,668 |
|
| R Class | | | | |
| Sold | 3,801 |
| 36,646 |
| 4,126 |
| 40,482 |
|
| Issued in reinvestment of distributions | 1,372 |
| 13,193 |
| 2,199 |
| 21,720 |
|
| Redeemed | (78,363 | ) | (753,666 | ) | (555 | ) | (5,511 | ) |
| | (73,190 | ) | (703,827 | ) | 5,770 |
| 56,691 |
|
| R5 Class | | | | |
| Issued in reinvestment of distributions | 2,080 |
| 19,986 |
| 2,525 |
| 24,944 |
|
| Redeemed | (67,198 | ) | (637,943 | ) | — |
| — |
|
| | (65,118 | ) | (617,957 | ) | 2,525 |
| 24,944 |
|
| R6 Class | | | | |
| Sold | 3,298 |
| 31,073 |
| — |
| — |
|
| Issued in reinvestment of distributions | 2,233 |
| 21,478 |
| 2,755 |
| 27,210 |
|
| Redeemed | (72,382 | ) | (690,424 | ) | — |
| — |
|
| | (66,851 | ) | (637,873 | ) | 2,755 |
| 27,210 |
|
| Net increase (decrease) | 186,140 |
| $ | 1,746,930 |
| 517,594 |
| $ | 5,119,463 |
|
| |
| (1) | April 10, 2017 (commencement of sale) through March 31, 2018 for the I Class and Y Class. |
6. Affiliated Fund Transactions
A summary of transactions for each affiliated fund for the period ended March 31, 2019 follows (amounts in thousands):
|
| | | | | | | | | | | | | | | | | | | | | |
Affiliated Fund(1) | Beginning Value | Purchase Cost | Sales Cost | Change in Net Unrealized Appreciation (Depreciation) | Ending Value | Ending Shares | Net Realized Gain (Loss) | Distributions Received(2) |
| Emerging Markets Debt Fund R6 Class | $ | 1,449 |
| $ | 58 |
| — |
| $ | 1 |
| $ | 1,508 |
| 149 |
| — |
| $ | 58 |
|
| |
| (1) | Investments are funds within the American Century Investments family of funds and are considered affiliated funds. The fund does not invest in an affiliated fund for the purpose of exercising management or control; however, investments by the fund within its investment strategy may represent a significant portion of an affiliated fund's net assets. Additional information and attributes of each affiliated fund are available at americancentury.com. |
| |
| (2) | Distributions received includes distributions from net investment income and from capital gains, if any. |
7. Fair Value Measurements
The fund’s investments valuation process is based on several considerations and may use multiple inputs to determine the fair value of the investments held by the fund. In conformity with accounting principles generally accepted in the United States of America, the inputs used to determine a valuation are classified into three broad levels.
| |
| • | Level 1 valuation inputs consist of unadjusted quoted prices in an active market for identical investments. |
| |
| • | Level 2 valuation inputs consist of direct or indirect observable market data (including quoted prices for comparable investments, evaluations of subsequent market events, interest rates, prepayment speeds, credit risk, etc.). These inputs also consist of quoted prices for identical investments initially expressed in local currencies that are adjusted through translation into U.S. dollars. |
| |
| • | Level 3 valuation inputs consist of unobservable data (including a fund’s own assumptions). |
The level classification is based on the lowest level input that is significant to the fair valuation measurement. The valuation inputs are not necessarily an indication of the risks associated with investing in these securities or other financial instruments.
The following is a summary of the level classifications as of period end. The Schedule of Investments provides additional information on the fund’s portfolio holdings.
|
| | | | | | | | |
| | Level 1 | Level 2 | Level 3 |
| Assets | | | |
| Investment Securities | | | |
| Corporate Bonds | — |
| $ | 6,989,123 |
| — |
|
| Collateralized Mortgage Obligations | — |
| 2,802,132 |
| — |
|
| U.S. Treasury Securities | — |
| 2,046,042 |
| — |
|
| Affiliated Funds | $ | 1,508,341 |
| — |
| — |
|
| Collateralized Loan Obligations | — |
| 1,131,201 |
| — |
|
| Asset-Backed Securities | — |
| 1,086,273 |
| — |
|
| Commercial Mortgage-Backed Securities | — |
| 945,988 |
| — |
|
| Bank Loan Obligations | — |
| 878,743 |
| — |
|
| Sovereign Governments and Agencies | — |
| 819,358 |
| — |
|
| Preferred Stocks | 80,676 |
| 287,029 |
| — |
|
| Temporary Cash Investments | 20,533 |
| 112,605 |
| — |
|
| | $ | 1,609,550 |
| $ | 17,098,494 |
| — |
|
| Other Financial Instruments | | | |
| Forward Foreign Currency Exchange Contracts | — |
| $ | 595 |
| — |
|
8. Derivative Instruments
Credit Risk — The fund is subject to credit risk in the normal course of pursuing its investment objectives. The value of a bond generally declines as the credit quality of its issuer declines. Credit default swap agreements enable a fund to buy/sell protection against a credit event of a specific issuer or index. A fund may attempt to enhance returns by selling protection or attempt to mitigate credit risk by buying protection. The buyer/seller of credit protection against a security or basket of securities may pay/receive an up-front or periodic payment to compensate for/against potential default events. Changes in value, including the periodic amounts of interest to be paid or received on swap agreements, are recorded as unrealized appreciation (depreciation) on swap agreements. Upon entering into a centrally cleared swap, a fund is required to deposit cash or securities (initial margin) with a financial intermediary in an amount equal to a certain percentage of the notional amount. Subsequent payments (variation margin) are made or received daily, in cash, by a fund. The variation margin is equal to the daily change in the value and is a component of unrealized gains and losses. Realized gain or loss is recorded upon receipt or payment of a periodic settlement or termination of swap agreements. Net realized and unrealized gains or losses occurring during the holding period of swap agreements are a component of net realized gain (loss) on swap agreement transactions and change in net unrealized appreciation (depreciation) on swap agreements, respectively. The risks of entering into swap agreements include the possible lack of liquidity, failure of the counterparty to meet its obligations, and that there may be unfavorable changes in the underlying investments or instruments. The fund's average notional amount held during the period was $942,450.
Foreign Currency Risk — The fund is subject to foreign currency exchange rate risk in the normal course of pursuing its investment objectives. The value of foreign investments held by a fund may be significantly affected by changes in foreign currency exchange rates. The dollar value of a foreign security generally decreases when the value of the dollar rises against the foreign currency in which the security is denominated and tends to increase when the value of the dollar declines against such foreign currency. A fund may enter into forward foreign currency exchange contracts to reduce a fund's exposure to foreign currency exchange rate fluctuations or to gain exposure to the fluctuations in the value of foreign currencies. The net U.S. dollar value of foreign currency underlying all contractual commitments held by a fund and the resulting unrealized appreciation or depreciation are determined daily. Realized gain or loss is recorded upon the termination of the contract. Net realized and unrealized gains or losses occurring during the holding period of forward foreign currency exchange contracts are a component of net realized gain (loss) on forward foreign currency exchange contract transactions and change in net unrealized appreciation (depreciation) on forward foreign currency exchange contracts, respectively. A fund bears the risk of an unfavorable change in the foreign currency exchange rate underlying the forward contract. Additionally, losses, up to the fair value, may arise if the counterparties do not perform under the contract terms. The fund's average U.S. dollar exposure to foreign currency risk derivative instruments held during the period was $3,192,376.
Interest Rate Risk — The fund is subject to interest rate risk in the normal course of pursuing its investment objectives. A fund may enter into futures contracts or interest rate swap agreements in order to manage its exposure to changes in market conditions. The value of bonds generally declines as interest rates rise. The risks of entering into interest rate risk derivative instruments include the possible lack of liquidity, failure of the counterparty to meet its obligations, and that there may be unfavorable changes in the underlying investments or instruments.
A fund may enter into futures contracts based on a bond index or a specific underlying security. A fund may purchase futures contracts to gain exposure to increases in market value or sell futures contracts to protect against a decline in market value. Upon entering into a futures contract, a fund will segregate cash, cash equivalents or other appropriate liquid securities on its records in amounts sufficient to meet requirements. Subsequent payments (variation margin) are made or received daily, in cash, by a fund. The variation margin is equal to the daily change in the contract value and is recorded as unrealized gains and losses. A fund recognizes a realized gain or loss when the futures contract is closed or expires. Net realized and unrealized gains or losses occurring during the holding period of futures contracts are a component of net realized gain (loss) on futures contract transactions and change in net unrealized appreciation (depreciation) on futures contracts, respectively. The fund's average notional exposure to these interest rate risk derivative instruments held during the period was $451,937 futures contracts purchased and $1,214,662 futures contracts sold.
A fund may enter into interest rate swap agreements to gain exposure to declines in interest rates, to protect against increases in interest rates, or to maintain its ability to generate income at prevailing interest rates. A fund will segregate cash, cash equivalents or other appropriate liquid securities on its records in amounts sufficient to meet requirements. Changes in value, including the periodic amounts of interest to be paid or received on swap agreements, are recorded as unrealized appreciation (depreciation) on swap agreements. Upon entering into a centrally cleared swap, a fund is required to deposit cash or securities (initial margin) with a financial intermediary in an amount equal to a certain percentage of the notional amount. Subsequent payments (variation margin) are made or received daily, in cash, by a fund. The variation margin is equal to the daily change in the value and is a component of unrealized gains and losses. Realized gain or loss is recorded upon receipt or payment of a periodic settlement or termination of swap agreements. Net realized and unrealized gains or losses occurring during the holding period of swap agreements are a component of net realized gain (loss) on swap agreement transactions and change in net unrealized appreciation (depreciation) on swap agreements, respectively. The fund's average notional amount on interest rate swap agreements held during the period was $114,720.
Other Contracts — A fund may enter into total return swap agreements in order to attempt to obtain or preserve a particular return or spread at a lower cost than obtaining a return or spread through purchases and/or sales of instruments in other markets or gain exposure to certain markets in the most economical way possible. A fund will segregate cash, cash equivalents or other appropriate liquid securities on its records in amounts sufficient to meet requirements. Changes in value, including the periodic amounts of interest to be paid or received on swap agreements, are recorded as unrealized appreciation (depreciation) on swap agreements. Upon entering into a centrally cleared swap, a fund is required to deposit cash or securities (initial margin) with a financial intermediary in an amount equal to a certain percentage of the notional amount. Subsequent payments (variation margin) are made or received daily, in cash, by a fund. The variation margin is equal to the daily change in the value and is a component of unrealized gains and losses. Realized gain or loss is recorded upon receipt or payment of a periodic settlement or termination of swap agreements. Net realized and unrealized gains or losses occurring during the holding period of swap agreements are a component of net realized gain (loss) on swap agreement transactions and change in net unrealized appreciation (depreciation) on swap agreements, respectively. The risks of entering into swap agreements include the possible lack of liquidity, failure of the counterparty to meet its obligations, and that there may be unfavorable changes in the underlying investments or instruments, including inflationary risk. The fund's average notional amount held during the period was $550,000.
Value of Derivative Instruments as of March 31, 2019
|
| | | | | | | |
| | Asset Derivatives | Liability Derivatives |
| Type of Risk Exposure | Location on Statement of Assets and Liabilities | Value | Location on Statement of Assets and Liabilities | Value |
| Foreign Currency Risk | Unrealized appreciation on forward foreign currency exchange contracts | $ | 595 |
| Unrealized depreciation on forward foreign currency exchange contracts | — |
|
Effect of Derivative Instruments on the Statement of Operations for the Year Ended March 31, 2019
|
| | | | | | | | |
| | Net Realized Gain (Loss) | Change in Net Unrealized Appreciation (Depreciation) |
| Type of Risk Exposure | Location on Statement of Operations | Value | Location on Statement of Operations | Value |
| Credit Risk | Net realized gain (loss) on swap agreement transactions | $ | 37,401 |
| Change in net unrealized appreciation (depreciation) on swap agreements | $ | (2,031 | ) |
| Foreign Currency Risk | Net realized gain (loss) on forward foreign currency exchange contract transactions | 144,108 |
| Change in net unrealized appreciation (depreciation) on forward foreign currency exchange contracts | 12,251 |
|
| Interest Rate Risk | Net realized gain (loss) on futures contract transactions | (27,247 | ) | Change in net unrealized appreciation (depreciation) on futures contracts | 9,848 |
|
| Interest Rate Risk | Net realized gain (loss) on swap agreement transactions | 690 |
| Change in net unrealized appreciation (depreciation) on swap agreements | — |
|
| Other Contracts | Net realized gain (loss) on swap agreement transactions | 5,426 |
| Change in net unrealized appreciation (depreciation) on swap agreements | (2,592 | ) |
| | | $ | 160,378 |
| | $ | 17,476 |
|
9. Risk Factors
There are certain risks involved in investing in foreign securities. These risks include those resulting from political events (such as civil unrest, national elections and imposition of exchange controls), social and economic events (such as labor strikes and rising inflation), and natural disasters. Securities of foreign issuers may be less liquid and more volatile. Investing in emerging markets or a significant portion of assets in one country or region may accentuate these risks.
The fund invests in lower-rated debt securities, which are subject to substantial risks including liquidity risk and credit risk.
The fund’s investments in secured and unsecured participations in bank loan obligations and assignments of such loans may create substantial risk. The market for bank loans may not be highly liquid and the fund may have difficulty selling them. The fund’s bank loan investments typically will result in the fund having a contractual relationship only with the lender, not with the borrower. In connection with purchasing loan participations, the fund generally will have no right to enforce compliance by borrowers with loan terms nor any set off rights, and the fund may not benefit directly from any posted collateral. As a result, the fund may be subject to the credit risk of both the borrower and the lender selling the participation.
10. Federal Tax Information
The tax character of distributions paid during the years ended March 31, 2019 and March 31, 2018 were as follows:
|
| | | | | | |
| | 2019 | 2018 |
| Distributions Paid From | | |
| Ordinary income | $ | 659,836 |
| $ | 475,609 |
|
| Long-term capital gains | — |
| — |
|
The book-basis character of distributions made during the year from net investment income or net realized gains may differ from their ultimate characterization for federal income tax purposes. These differences reflect the differing character of certain income items and net realized gains and losses for financial statement and tax purposes, and may result in reclassification among certain capital accounts on the financial statements.
As of period end, the federal tax cost of investments and the components of distributable earnings on a tax-basis were as follows:
|
| | | |
| Federal tax cost of investments | $ | 18,556,067 |
|
| Gross tax appreciation of investments | $ | 274,451 |
|
| Gross tax depreciation of investments | (122,474 | ) |
| Net tax appreciation (depreciation) of investments | 151,977 |
|
| Net tax appreciation (depreciation) on derivatives and translation of assets and liabilities in foreign currencies | (156 | ) |
| Net tax appreciation (depreciation) | $ | 151,821 |
|
| Other book-to-tax adjustments | $ | (1,364 | ) |
| Undistributed ordinary income | — |
|
| Accumulated short-term capital losses | $ | (103,904 | ) |
Accumulated long-term capital losses
| $ | (172,239 | ) |
| Late-year ordinary loss deferral | $ | (85,751 | ) |
The difference between book-basis and tax-basis unrealized appreciation (depreciation) is attributable primarily to the realization for tax purposes of unrealized gains (losses) on certain foreign currency exchange contracts.
Accumulated capital losses represent net capital loss carryovers that may be used to offset future realized capital gains for federal income tax purposes. The capital loss carryovers may be carried forward for an unlimited period. Future capital loss carryover utilization in any given year may be subject to Internal Revenue Code limitations.
Loss deferrals represent certain qualified losses that the fund has elected to treat as having been incurred in the following fiscal year for federal income tax purposes.
11. Recently Issued Accounting Standards
In March 2017, the Financial Accounting Standards Board (FASB) issued Accounting Standards Update No. 2017-08, “Receivables - Nonrefundable Fees and Other Costs (Subtopic 310-20), Premium Amortization on Purchased Callable Debt Securities” (ASU 2017-08). ASU 2017-08 amends the amortization period for certain purchased callable debt securities held at a premium, shortening such period to the earliest call date. The amendments are effective for fiscal years, and interim periods within those fiscal years, beginning after December 15, 2018. Management is currently evaluating the impact that adopting ASU 2017-08 will have on the financial statements.
|
| | | | | | | | | | | | | | | |
| For a Share Outstanding Throughout the Years Ended March 31 (except as noted) | | | | | | | |
| Per-Share Data | | | | | | Ratios and Supplemental Data | | |
| | | Income From Investment Operations: | | | | Ratio to Average Net Assets of: | | |
| | Net Asset
Value,
Beginning
of Period | Net
Investment
Income
(Loss)(1) | Net
Realized
and
Unrealized
Gain (Loss) | Total From
Investment
Operations | Distributions From Net
Investment
Income | Net Asset
Value,
End
of Period | Total
Return(2) | Operating
Expenses | Operating
Expenses
(before
expense
waiver) | Net
Investment
Income
(Loss) | Net
Investment
Income
(Loss)
(before
expense
waiver) | Portfolio
Turnover
Rate | Net
Assets,
End of
Period
(in thousands) |
| Investor Class | | | | | | | | | | | | |
| 2019 | $9.74 | 0.34 | 0.03 | 0.37 | (0.38) | $9.73 | 3.88% | 0.70% | 0.76% | 3.55% | 3.49% | 60% |
| $15,718 |
|
| 2018 | $9.78 | 0.32 | (0.04) | 0.28 | (0.32) | $9.74 | 2.86% | 0.69% | 0.76% | 3.27% | 3.20% | 64% |
| $12,228 |
|
| 2017 | $9.45 | 0.33 | 0.33 | 0.66 | (0.33) | $9.78 | 7.06% | 0.65% | 0.76% | 3.39% | 3.28% | 40% |
| $7,791 |
|
| 2016 | $9.81 | 0.33 | (0.29) | 0.04 | (0.40) | $9.45 | 0.44% | 0.64% | 0.75% | 3.52% | 3.41% | 25% |
| $2,290 |
|
2015(3) | $10.00 | 0.23 | (0.14) | 0.09 | (0.28) | $9.81 | 0.91% | 0.65%(4) | 0.74%(4) | 3.43%(4) | 3.34%(4) | 9% |
| $2,965 |
|
| I Class | | | | | | | | | | | | |
| 2019 | $9.73 | 0.35 | 0.03 | 0.38 | (0.38) | $9.73 | 4.09% | 0.60% | 0.66% | 3.65% | 3.59% | 60% |
| $1,345 |
|
2018(5) | $9.79 | 0.33 | (0.07) | 0.26 | (0.32) | $9.73 | 2.64% | 0.59%(4) | 0.66%(4) | 3.37%(4) | 3.30%(4) | 64%(6) |
| $687 |
|
| Y Class | | | | | | | | | | | | |
| 2019 | $9.73 | 0.36 | 0.03 | 0.39 | (0.39) | $9.73 | 4.18% | 0.50% | 0.56% | 3.75% | 3.69% | 60% |
| $5 |
|
2018(5) | $9.79 | 0.33 | (0.06) | 0.27 | (0.33) | $9.73 | 2.73% | 0.49%(4) | 0.56%(4) | 3.46%(4) | 3.39%(4) | 64%(6) |
| $5 |
|
| A Class | | | | | | | | | | | | |
| 2019 | $9.74 | 0.32 | 0.02 | 0.34 | (0.35) | $9.73 | 3.62% | 0.95% | 1.01% | 3.30% | 3.24% | 60% |
| $1,325 |
|
| 2018 | $9.77 | 0.29 | (0.03) | 0.26 | (0.29) | $9.74 | 2.71% | 0.94% | 1.01% | 3.02% | 2.95% | 64% |
| $662 |
|
| 2017 | $9.45 | 0.30 | 0.32 | 0.62 | (0.30) | $9.77 | 6.68% | 0.90% | 1.01% | 3.14% | 3.03% | 40% |
| $992 |
|
| 2016 | $9.81 | 0.31 | (0.30) | 0.01 | (0.37) | $9.45 | 0.19% | 0.89% | 1.00% | 3.27% | 3.16% | 25% |
| $1,180 |
|
2015(3) | $10.00 | 0.21 | (0.14) | 0.07 | (0.26) | $9.81 | 0.74% | 0.90%(4) | 0.99%(4) | 3.18%(4) | 3.09%(4) | 9% |
| $935 |
|
|
| | | | | | | | | | | | | | | |
| For a Share Outstanding Throughout the Years Ended March 31 (except as noted) | | | | | | | |
| Per-Share Data | | | | | | Ratios and Supplemental Data | | |
| | | Income From Investment Operations: | | | | Ratio to Average Net Assets of: | | |
| | Net Asset
Value,
Beginning
of Period | Net
Investment
Income
(Loss)(1) | Net
Realized
and
Unrealized
Gain (Loss) | Total From
Investment
Operations | Distributions From Net
Investment
Income | Net Asset
Value,
End
of Period | Total
Return(2) | Operating
Expenses | Operating
Expenses
(before
expense
waiver) | Net
Investment
Income
(Loss) | Net
Investment
Income
(Loss)
(before
expense
waiver) | Portfolio
Turnover
Rate | Net
Assets,
End of
Period
(in thousands) |
| C Class | | | | | | | | | | | | |
| 2019 | $9.74 | 0.24 | 0.03 | 0.27 | (0.28) | $9.73 | 2.85% | 1.70% | 1.76% | 2.55% | 2.49% | 60% |
| $182 |
|
| 2018 | $9.77 | 0.22 | (0.03) | 0.19 | (0.22) | $9.74 | 1.94% | 1.69% | 1.76% | 2.27% | 2.20% | 64% |
| $1,194 |
|
| 2017 | $9.45 | 0.23 | 0.32 | 0.55 | (0.23) | $9.77 | 5.89% | 1.65% | 1.76% | 2.39% | 2.28% | 40% |
| $1,098 |
|
| 2016 | $9.81 | 0.24 | (0.30) | (0.06) | (0.30) | $9.45 | (0.56)% | 1.64% | 1.75% | 2.52% | 2.41% | 25% |
| $993 |
|
2015(3) | $10.00 | 0.16 | (0.14) | 0.02 | (0.21) | $9.81 | 0.24% | 1.65%(4) | 1.74%(4) | 2.43%(4) | 2.34%(4) | 9% |
| $917 |
|
| R Class | | | | | | | | | | | | |
| 2019 | $9.74 | 0.29 | 0.03 | 0.32 | (0.33) | $9.73 | 3.36% | 1.20% | 1.26% | 3.05% | 2.99% | 60% |
| $112 |
|
| 2018 | $9.78 | 0.27 | (0.04) | 0.23 | (0.27) | $9.74 | 2.45% | 1.19% | 1.26% | 2.77% | 2.70% | 64% |
| $825 |
|
| 2017 | $9.45 | 0.28 | 0.33 | 0.61 | (0.28) | $9.78 | 6.42% | 1.15% | 1.26% | 2.89% | 2.78% | 40% |
| $772 |
|
| 2016 | $9.81 | 0.29 | (0.30) | (0.01) | (0.35) | $9.45 | (0.06)% | 1.14% | 1.25% | 3.02% | 2.91% | 25% |
| $714 |
|
2015(3) | $10.00 | 0.19 | (0.13) | 0.06 | (0.25) | $9.81 | 0.58% | 1.15%(4) | 1.24%(4) | 2.93%(4) | 2.84%(4) | 9% |
| $704 |
|
| R5 Class | | | | | | | | | | | | |
| 2019 | $9.74 | 0.35 | 0.03 | 0.38 | (0.39) | $9.73 | 4.09% | 0.50% | 0.56% | 3.75% | 3.69% | 60% |
| $99 |
|
| 2018 | $9.77 | 0.34 | (0.03) | 0.31 | (0.34) | $9.74 | 3.17% | 0.49% | 0.56% | 3.47% | 3.40% | 64% |
| $733 |
|
| 2017 | $9.45 | 0.35 | 0.32 | 0.67 | (0.35) | $9.77 | 7.16% | 0.45% | 0.56% | 3.59% | 3.48% | 40% |
| $711 |
|
| 2016 | $9.81 | 0.36 | (0.30) | 0.06 | (0.42) | $9.45 | 0.64% | 0.44% | 0.55% | 3.72% | 3.61% | 25% |
| $663 |
|
2015(3) | $10.00 | 0.24 | (0.14) | 0.10 | (0.29) | $9.81 | 1.05% | 0.45%(4) | 0.54%(4) | 3.63%(4) | 3.54%(4) | 9% |
| $909 |
|
|
| | | | | | | | | | | | | | | |
| For a Share Outstanding Throughout the Years Ended March 31 (except as noted) | | | | | | | |
| Per-Share Data | | | | | | Ratios and Supplemental Data | | |
| | | Income From Investment Operations: | | | | Ratio to Average Net Assets of: | | |
| | Net Asset
Value,
Beginning
of Period | Net
Investment
Income
(Loss)(1) | Net
Realized
and
Unrealized
Gain (Loss) | Total From
Investment
Operations | Distributions From Net
Investment
Income | Net Asset
Value,
End
of Period | Total
Return(2) | Operating
Expenses | Operating
Expenses
(before
expense
waiver) | Net
Investment
Income
(Loss) | Net
Investment
Income
(Loss)
(before
expense
waiver) | Portfolio
Turnover
Rate | Net
Assets,
End of
Period
(in thousands) |
| R6 Class | | | | | | | | | | | | |
| 2019 | $9.74 | 0.36 | 0.03 | 0.39 | (0.40) | $9.73 | 4.14% | 0.45% | 0.51% | 3.80% | 3.74% | 60% |
| $137 |
|
| 2018 | $9.78 | 0.35 | (0.05) | 0.30 | (0.34) | $9.74 | 3.22% | 0.44% | 0.51% | 3.52% | 3.45% | 64% |
| $789 |
|
| 2017 | $9.45 | 0.35 | 0.33 | 0.68 | (0.35) | $9.78 | 7.21% | 0.40% | 0.51% | 3.64% | 3.53% | 40% |
| $764 |
|
| 2016 | $9.81 | 0.36 | (0.30) | 0.06 | (0.42) | $9.45 | 0.69% | 0.39% | 0.50% | 3.77% | 3.66% | 25% |
| $712 |
|
2015(3) | $10.00 | 0.24 | (0.13) | 0.11 | (0.30) | $9.81 | 1.08% | 0.40%(4) | 0.49%(4) | 3.68%(4) | 3.59%(4) | 9% |
| $708 |
|
|
| | | | |
| Notes to Financial Highlights | | |
| |
| (1) | Computed using average shares outstanding throughout the period. |
| |
| (2) | Total returns are calculated based on the net asset value of the last business day and do not reflect applicable sales charges, if any. Total returns for periods less than one year are not annualized. |
| |
| (3) | July 28, 2014 (fund inception) through March 31, 2015. |
| |
| (5) | April 10, 2017 (commencement of sale) through March 31, 2018. |
| |
| (6) | Portfolio turnover is calculated at the fund level. Percentage indicated was calculated for the year ended March 31, 2018. |
See Notes to Financial Statements.
|
|
| Report of Independent Registered Public Accounting Firm |
To the Board of Trustees of American Century Investment Trust and Shareholders of Strategic Income Fund:
Opinion on the Financial Statements
We have audited the accompanying statement of assets and liabilities, including the schedule of investments, of Strategic Income Fund (one of the funds constituting American Century Investment Trust, referred to hereafter as the “Fund”) as of March 31, 2019, the related statement of operations for the year ended March 31, 2019, the statement of changes in net assets for each of the two years in the period ended March 31, 2019, including the related notes, and the financial highlights for each of the periods indicated therein (collectively referred to as the “financial statements”). In our opinion, the financial statements present fairly, in all material respects, the financial position of the Fund as of March 31, 2019, the results of its operations for the year then ended, the changes in its net assets for each of the two years in the period ended March 31, 2019 and the financial highlights for each of the periods indicated therein in conformity with accounting principles generally accepted in the United States of America.
Basis for Opinion
These financial statements are the responsibility of the Fund’s management. Our responsibility is to express an opinion on the Fund’s financial statements based on our audits. We are a public accounting firm registered with the Public Company Accounting Oversight Board (United States) (“PCAOB”) and are required to be independent with respect to the Fund in accordance with the U.S. federal securities laws and the applicable rules and regulations of the Securities and Exchange Commission and the PCAOB.
We conducted our audits of these financial statements in accordance with the standards of the PCAOB. Those standards require that we plan and perform the audit to obtain reasonable assurance about whether the financial statements are free of material misstatement, whether due to error or fraud.
Our audits included performing procedures to assess the risks of material misstatement of the financial statements, whether due to error or fraud, and performing procedures that respond to those risks. Such procedures included examining, on a test basis, evidence regarding the amounts and disclosures in the financial statements. Our audits also included evaluating the accounting principles used and significant estimates made by management, as well as evaluating the overall presentation of the financial statements. Our procedures included confirmation of securities owned as of March 31, 2019 by correspondence with the custodian, transfer agent and brokers; when replies were not received from brokers, we performed other auditing procedures. We believe that our audits provide a reasonable basis for our opinion.
/s/ PricewaterhouseCoopers LLP
Kansas City, Missouri
May 17, 2019
We have served as the auditor of one or more investment companies in American Century Investments since 1997.
Board of Trustees
The individuals listed below serve as trustees of the funds. Each trustee will continue to serve in this capacity until death, retirement, resignation or removal from office. The board has adopted a mandatory retirement age for trustees who are not “interested persons,” as that term is defined in the Investment Company Act (independent trustees). Independent trustees shall retire on December 31 of the year in which they reach their 75th birthday; provided, however, that on or after January 1, 2022, independent trustees shall retire on December 31 of the year in which they reach their 76th birthday.
Mr. Thomas is an “interested person” because he currently serves as President and Chief Executive Officer of American Century Companies, Inc. (ACC), the parent company of American Century Investment Management, Inc. (ACIM or the advisor). The other trustees (more than three-fourths of the total number) are independent. They are not employees, directors or officers of, and have no financial interest in, ACC or any of its wholly owned, direct or indirect, subsidiaries, including ACIM, American Century Investment Services, Inc. (ACIS) and American Century Services, LLC (ACS), and they do not have any other affiliations, positions or relationships that would cause them to be considered “interested persons” under the Investment Company Act. The trustees serve in this capacity for eight (in the case of Jonathan S. Thomas, 16; and Ronald J. Gilson, 9) registered investment companies in the American Century Investments family of funds.
The following table presents additional information about the trustees. The mailing address for each trustee other than Jonathan S. Thomas is 1665 Charleston Road, Mountain View, California 94043. The mailing address for Jonathan S. Thomas is 4500 Main Street, Kansas City, Missouri 64111.
|
| | | | | |
Name
(Year of Birth) | Position(s) Held with Funds | Length of Time Served | Principal Occupation(s) During Past 5 Years | Number of American Century Portfolios Overseen by Trustee | Other Directorships Held During Past 5 Years |
| Independent Trustees |
|
|
Tanya S. Beder
(1955) | Trustee | Since 2011 | Chairman and CEO, SBCC Group Inc. (independent advisory services) (2006 to present) | 45 | CYS Investments, Inc.; Nabors Industries Ltd. |
Jeremy I. Bulow
(1954) | Trustee | Since 2011 | Professor of Economics, Stanford University, Graduate School of Business (1979 to present) | 45 | None |
Anne Casscells
(1958) | Trustee | Since 2016 | Co-Chief Executive Officer and Chief Investment Officer, Aetos Alternatives Management (investment advisory firm) (2001 to present); Lecturer in Accounting, Stanford University, Graduate School of Business (2009 to 2017) | 45 | None |
Ronald J. Gilson
(1946) | Trustee and Chairman of the Board | Since 1995
(Chairman since 2005) | Charles J. Meyers Professor of Law and Business, Emeritus, Stanford Law School (1979 to 2016); Marc and Eva Stern Professor of Law and Business, Columbia University School of Law (1992 to present) | 50 | None |
|
| | | | | |
Name
(Year of Birth) | Position(s) Held with Funds | Length of Time Served | Principal Occupation(s) During Past 5 Years | Number of American Century Portfolios Overseen by Trustee | Other Directorships Held During Past 5 Years |
| Independent Trustees |
|
|
Frederick L. A. Grauer
(1946) | Trustee | Since 2008 | Senior Advisor, Credit Sesame, Inc. (credit monitoring firm) (2018 to present); Senior Advisor, Course Hero (an educational technology company) (2015 to present); Senior Advisor, iShares by BlackRock, Inc. (investment management firm) (2013 to 2015)
| 45 | None |
Jonathan D. Levin
(1972) | Trustee | Since 2016 | Philip H. Knight Professor and Dean, Graduate School of Business, Stanford University (2016 to present); Professor, Stanford University, (2000 to present); Chair, Department of Economics, Stanford University (2011 to 2014) | 45 | None |
Peter F. Pervere
(1947) | Trustee | Since 2007 | Retired | 45 | None |
John B. Shoven
(1947) | Trustee | Since 2002 | Charles R. Schwab Professor of Economics, Stanford University (1973 to present) | 45 | Cadence Design Systems; Exponent; Financial Engines |
| Interested Trustee |
|
|
Jonathan S. Thomas
(1963) | Trustee and President | Since 2007 | President and Chief Executive Officer, ACC (2007 to present). Also serves as Chief Executive Officer, ACS; Executive Vice President, ACIM; Director, ACC, ACIM and other ACC subsidiaries | 117 | BioMed Valley Discoveries, Inc. |
The Statement of Additional Information has additional information about the fund's trustees and is available without charge, upon request, by calling 1-800-345-2021.
Officers
The following table presents certain information about the executive officers of the funds. Each officer serves as an officer for 16 (in the case of Robert J. Leach, 15) investment companies in the American Century family of funds, unless otherwise noted. No officer is compensated for his or her service as an officer of the funds. The listed officers are interested persons of the funds and are appointed or re-appointed on an annual basis. The mailing address for each of the officers listed below is 4500 Main Street, Kansas City, Missouri 64111.
|
| | |
Name
(Year of Birth) | Offices with the Funds | Principal Occupation(s) During the Past Five Years |
Jonathan S. Thomas
(1963) | Trustee and President since 2007 | President and Chief Executive Officer, ACC (2007 to present). Also serves as Chief Executive Officer, ACS; Executive Vice President, ACIM; Director, ACC, ACIM and other ACC subsidiaries |
R. Wes Campbell
(1974)
| Chief Financial Officer and Treasurer since 2018
| Investment Operations and Investment Accounting, ACS (2000 to present) |
Amy D. Shelton
(1964) | Chief Compliance Officer and Vice President since 2014 | Chief Compliance Officer, American Century funds, (2014 to present); Chief Compliance Officer, ACIM (2014 to present); Chief Compliance Officer, ACIS (2009 to present); Vice President, Client Interactions and Marketing, ACIS (2013 to 2014). Also serves as Vice President, ACIS |
Charles A. Etherington
(1957) | General Counsel since 2007 and Senior Vice President since 2006 | Attorney, ACC (1994 to present); Vice President, ACC (2005 to present); General Counsel, ACC (2007 to present). Also serves as General Counsel, ACIM, ACS, ACIS and other ACC subsidiaries; and Senior Vice President, ACIM and ACS |
C. Jean Wade
(1964) | Vice President since 2012 | Senior Vice President, ACS (2017 to present); Vice President ACS (2000 to 2017) |
Robert J. Leach
(1966) | Vice President since 2006 | Vice President, ACS (2000 to present) |
David H. Reinmiller
(1963) | Vice President since 2000 | Attorney, ACC (1994 to present) Also serves as Vice President, ACIM and ACS |
Ward D. Stauffer
(1960) | Secretary since 2005 | Attorney, ACC (2003 to present) |
Retirement Account Information
As required by law, distributions you receive from certain retirement accounts are subject to federal income tax withholding, unless you elect not to have withholding apply*. Tax will be withheld on the total amount withdrawn even though you may be receiving amounts that are not subject to withholding, such as nondeductible contributions. In such case, excess amounts of withholding could occur. You may adjust your withholding election so that a greater or lesser amount will be withheld.
If you don’t want us to withhold on this amount, you must notify us to not withhold the federal income tax. You may notify us in writing or in certain situations by telephone or through other electronic means. For systematic withdrawals, your withholding election will remain in effect until revoked or changed by filing a new election. You have the right to revoke your election at any time and change your withholding percentage for future distributions.
Remember, even if you elect not to have income tax withheld, you are liable for paying income tax on the taxable portion of your withdrawal. If you elect not to have income tax withheld or you don’t have enough income tax withheld, you may be responsible for payment of estimated tax. You may incur penalties under the estimated tax rules if your withholding and estimated tax payments are not sufficient. You can reduce or defer the income tax on a distribution by directly or indirectly rolling such distribution over to another IRA or eligible plan. You should consult your tax advisor for additional information.
State tax will be withheld if, at the time of your distribution, your address is within one of the mandatory withholding states and you have federal income tax withheld (or as otherwise required by state law). State taxes will be withheld from your distribution in accordance with the respective state rules.
*Some 403(b), 457 and qualified retirement plan distributions may be subject to 20% mandatory withholding, as they are subject to special tax and withholding rules. Your plan administrator or plan sponsor is required to provide you with a special tax notice explaining those rules at the time you request a distribution. If applicable, federal and/or state taxes may be withheld from your distribution amount.
Proxy Voting Policies
Descriptions of the principles and policies that the fund's investment advisor uses in exercising the voting rights associated with the securities purchased and/or held by the fund are available without charge, upon request, by calling 1-800-345-2021 or visiting the "About Us" page of American Century Investments’ website at americancentury.com. A description of the policies is also available on the Securities and Exchange Commission’s website at sec.gov. Information regarding how the investment advisor voted proxies relating to portfolio securities during the most recent 12-month period ended June 30 is available on the "About Us" page at americancentury.com. It is also available at sec.gov.
Quarterly Portfolio Disclosure
The fund files its complete schedule of portfolio holdings with the Securities and Exchange Commission (SEC) for the first and third quarters of each fiscal year on Form N-Q or as an exhibit to its reports on Form N-PORT. The fund’s Forms N-Q and Form N-PORT reports are available on the SEC’s website at sec.gov. The fund also makes its complete schedule of portfolio holdings for the most recent quarter of its fiscal year available on its website at americancentury.com and, upon request, by calling 1-800-345-2021.
|
| | |
| |
| | | |
| Contact Us | americancentury.com | |
| Automated Information Line | 1-800-345-8765 | |
| Investor Services Representative | 1-800-345-2021 or 816-531-5575 | |
| Investors Using Advisors | 1-800-378-9878 | |
| Business, Not-For-Profit, Employer-Sponsored Retirement Plans | 1-800-345-3533 | |
| Banks and Trust Companies, Broker-Dealers, Financial Professionals, Insurance Companies | 1-800-345-6488 | |
| Telecommunications Relay Service for the Deaf | 711 | |
| | | |
| American Century Investment Trust | |
| | | |
Investment Advisor: American Century Investment Management, Inc. Kansas City, Missouri | |
| | | |
| This report and the statements it contains are submitted for the general information of our shareholders. The report is not authorized for distribution to prospective investors unless preceded or accompanied by an effective prospectus. | |
| | | |
©2019 American Century Proprietary Holdings, Inc. All rights reserved.
CL-ANN-92287 1905 | |
|
| |
| | |
| | Annual Report |
| | |
| | March 31, 2019 |
| | |
| | U.S. Government Money Market Fund |
| | Investor Class (TCRXX) |
| | A Class (AGQXX) |
| | C Class (AGHXX) |
| | G Class (AGGXX) |
Beginning on January 1, 2021, as permitted by regulations adopted by the Securities and Exchange Commission, paper copies of the fund’s shareholder reports like this one will no longer be sent by mail, unless you specifically request paper copies of the reports from the fund or from your financial intermediary, such as a broker-dealer or bank. Instead, the reports will be made available on a website, and you will be notified by mail each time a report is posted and provided with a website link to access the report.
If you already elected to receive shareholder reports electronically, you will not be affected by this change and you need not take any action. You may elect to receive shareholder reports and other communications from the fund or your financial intermediary electronically by calling or sending an email request to your appropriate contacts as listed on the back cover of this report.
You may elect to receive all future reports in paper free of charge. You can inform the fund or your financial intermediary that you wish to continue receiving paper copies of your shareholder reports by calling or sending an email request to your appropriate contacts as listed on the back cover of this report. Your election to receive reports in paper will apply to all funds held with the fund complex/your financial intermediary.
|
| |
| President's Letter | 2 |
| Performance | 3 |
| Fund Characteristics | |
| Shareholder Fee Example | |
| Schedule of Investments | |
| Statement of Assets and Liabilities | |
| Statement of Operations | |
| Statement of Changes in Net Assets. | |
| Notes to Financial Statements | |
| Financial Highlights | |
| Report of Independent Registered Public Accounting Firm | |
| Management | |
| Additional Information | |
Any opinions expressed in this report reflect those of the author as of the date of the report, and do not necessarily represent the opinions of American Century Investments® or any other person in the American Century Investments organization. Any such opinions are subject to change at any time based upon market or other conditions and American Century Investments disclaims any responsibility to update such opinions. These opinions may not be relied upon as investment advice and, because investment decisions made by American Century Investments funds are based on numerous factors, may not be relied upon as an indication of trading intent on behalf of any American Century Investments fund. Security examples are used for representational purposes only and are not intended as recommendations to purchase or sell securities. Performance information for comparative indices and securities is provided to American Century Investments by third party vendors. To the best of American Century Investments’ knowledge, such information is accurate at the time of printing.
Jonathan Thomas
Dear Investor:
Thank you for reviewing this annual report for the period ended March 31, 2019. Annual reports help convey important information about fund returns, including market factors that affected performance during the reporting period. For additional, updated investment and market insights, we encourage you to visit our website, americancentury.com.
Markets Ended Roller-Coaster Period on Upswing
For the first half of the period, U.S. stocks climbed higher, while bond returns headed lower. Robust economic growth, bolstered by federal tax and regulatory reform, and record corporate earnings results fueled risk-on sentiment that drove stock prices higher. Meanwhile, the combination of strong economic data, the Federal Reserve’s (Fed’s) ongoing rate-hike campaign and an uptick in inflation pushed investment-grade bond returns lower.
Market trends began changing in late 2018. Mounting investor concerns about slowing global economic and earnings growth, U.S.-China trade tensions and rising interest rates triggered widespread volatility. Stock prices plunged as investors sought safe-haven investments, including U.S. Treasuries. Furthermore, the Fed issued another rate hike in December, its fourth of the year, and maintained its hawkish outlook. Investors feared the December rate increase and the Fed’s plans for two more rate hikes in 2019 were too aggressive, and risk-off investing remained in favor.
January brought a renewed sense of stability to the markets. Investors’ concerns about growth and trade eased, and the Fed changed course, pausing its rate-hike campaign amid moderating global growth and inflation. Valuations appeared attractive after the late-2018 sell-off, and risk-on investing resumed. In March, the Fed held rates steady again, hinting additional tightening was off the table for 2019. This news drove stock and bond returns higher and left both asset classes on an upward track to end the period. Overall, stocks (S&P 500 Index) overcame their late-2018 nosedive to gain 9.50% for the period. Bonds (Bloomberg Barclays U.S. Aggregate Bond Index) bounced back from losses early in the period to return 4.48%.
We expect volatility to remain a formidable factor as investors react to global growth trends, central bank policy and geopolitical developments. We believe this scenario underscores the importance of using professionally managed portfolios in pursuit of investment goals. We appreciate your continued trust and confidence in us.
Sincerely,
Jonathan Thomas
President and Chief Executive Officer
American Century Investments
|
| | | | | | |
| Total Returns as of March 31, 2019 |
| | | | Average Annual Returns | |
| | Ticker Symbol | 1 year | 5 years | 10 years | Since Inception | Inception Date |
| Investor Class | TCRXX | 1.67% | 0.48% | 0.27% | — | 4/1/93 |
| A Class | AGQXX | 1.41% | — | — | 0.60% | 12/1/15 |
| C Class | AGHXX | 0.91% | — | — | 0.38% | 12/1/15 |
| G Class | AGGXX | 2.13% | — | — | 1.75% | 7/28/17 |
Average annual returns since inception are presented when ten years of performance history is not available.
Fund returns would have been lower if a portion of the fees had not been waived.
|
| | | |
| Total Annual Fund Operating Expenses | |
| Investor Class | A Class | C Class | G Class |
| 0.46% | 0.71% | 1.21% | 0.46% |
The total annual fund operating expenses shown is as stated in the fund’s prospectus current as of the date of this report. The prospectus may vary from the expense ratio shown elsewhere in this report because it is based on a different time period, includes acquired fund fees and expenses, and, if applicable, does not include fee waivers or expense reimbursements.
Data presented reflect past performance. Past performance is no guarantee of future results. Current performance may be higher or lower than the performance shown. Total returns for periods less than one year are not annualized. To obtain performance data current to the most recent month end, please call 1-800-345-2021 or visit americancentury.com. For additional information about the fund, please consult the prospectus.
You could lose money by investing in the fund. Although the fund seeks to preserve the value of your investment at $1.00 per share, it cannot guarantee it will do so. An investment in the fund is not insured or guaranteed by the Federal Deposit Insurance Corporation or any other government agency. The fund’s sponsor has no legal obligation to provide financial support to the fund, and you should not expect that the sponsor will provide financial support to the fund at any time.
The 7-day current yield more closely reflects the current earnings of the fund than the total return.
|
| | | | |
| MARCH 31, 2019 | | | | |
| 7-Day Current Yields | Investor Class | A Class | C Class | G Class |
After waiver(1) | 2.01% | 1.76% | 1.26% | 2.46% |
| Before waiver | 2.01% | 1.76% | 1.26% | 2.01% |
| 7-Day Effective Yields | Investor Class | A Class | C Class | G Class |
After waiver(1) | 2.03% | 1.78% | 1.27% | 2.49% |
| (1) Yields would have been lower if a portion of the fees had not been waived. |
|
| |
| Portfolio at a Glance | |
| Weighted Average Maturity | 28 days |
| Weighted Average Life | 84 days |
| | |
| Portfolio Composition by Maturity | % of fund investments |
| 1-30 days | 78% |
| 31-90 days | 20% |
| 91-180 days | 1% |
| More than 180 days | 1% |
Fund shareholders may incur two types of costs: (1) transaction costs, including sales charges (loads) on purchase payments and redemption/exchange fees; and (2) ongoing costs, including management fees; distribution and service (12b-1) fees; and other fund expenses. This example is intended to help you understand your ongoing costs (in dollars) of investing in your fund and to compare these costs with the ongoing cost of investing in other mutual funds.
The example is based on an investment of $1,000 made at the beginning of the period and held for the entire period from October 1, 2018 to March 31, 2019.
Actual Expenses
The table provides information about actual account values and actual expenses for each class. You may use the information, together with the amount you invested, to estimate the expenses that you paid over the period. First, identify the share class you own. Then simply divide your account value by $1,000 (for example, an $8,600 account value divided by $1,000 = 8.6), then multiply the result by the number under the heading “Expenses Paid During Period” to estimate the expenses you paid on your account during this period.
If you hold Investor Class shares of any American Century Investments fund, or I Class shares of the American Century Diversified Bond Fund, in an American Century Investments account (i.e., not a financial intermediary or retirement plan account), American Century Investments may charge you a $12.50 semiannual account maintenance fee if the value of those shares is less than $10,000. We will redeem shares automatically in one of your accounts to pay the $12.50 fee. In determining your total eligible investment amount, we will include your investments in all personal accounts (including American Century Investments Brokerage accounts) registered under your Social Security number. Personal accounts include individual accounts, joint accounts, UGMA/UTMA accounts, personal trusts, Coverdell Education Savings Accounts and IRAs (including traditional, Roth, Rollover, SEP-, SARSEP- and SIMPLE-IRAs), and certain other retirement accounts. If you have only business, business retirement, employer-sponsored or American Century Investments Brokerage accounts, you are currently not subject to this fee. If you are subject to the Account Maintenance Fee, your account value could be reduced by the fee amount.
Hypothetical Example for Comparison Purposes
The table also provides information about hypothetical account values and hypothetical expenses based on the actual expense ratio of each class of your fund and an assumed rate of return of 5% per year before expenses, which is not the actual return of a fund’s share class. The hypothetical account values and expenses may not be used to estimate the actual ending account balance or expenses you paid for the period. You may use this information to compare the ongoing costs of investing in your fund and other funds. To do so, compare this 5% hypothetical example with the 5% hypothetical examples that appear in the shareholder reports of the other funds.
Please note that the expenses shown in the table are meant to highlight your ongoing costs only and do not reflect any transactional costs, such as sales charges (loads) or redemption/exchange fees. Therefore, the table is useful in comparing ongoing costs only, and will not help you determine the relative total costs of owning different funds. In addition, if these transactional costs were included, your costs would have been higher.
|
| | | | |
| | Beginning
Account Value
10/1/18 | Ending
Account Value
3/31/19 | Expenses Paid
During Period(1)
10/1/18 - 3/31/19 | Annualized
Expense Ratio(1) |
| Actual | | | | |
| Investor Class | $1,000 | $1,009.40 | $2.30 | 0.46% |
| A Class | $1,000 | $1,008.20 | $3.55 | 0.71% |
| C Class | $1,000 | $1,005.70 | $6.05 | 1.21% |
| G Class | $1,000 | $1,011.70 | $0.05 | 0.01% |
| Hypothetical | | | | |
| Investor Class | $1,000 | $1,022.64 | $2.32 | 0.46% |
| A Class | $1,000 | $1,021.39 | $3.58 | 0.71% |
| C Class | $1,000 | $1,018.90 | $6.09 | 1.21% |
| G Class | $1,000 | $1,024.88 | $0.05 | 0.01% |
| |
| (1) | Expenses are equal to the class's annualized expense ratio listed in the table above, multiplied by the average account value over the period, multiplied by 182, the number of days in the most recent fiscal half-year, divided by 365, to reflect the one-half year period. Annualized expense ratio reflects actual expenses, including any applicable fee waivers or expense reimbursements and excluding any acquired fund fees and expenses. |
MARCH 31, 2019
|
| | | | | | |
| | Principal Amount | Value |
U.S. GOVERNMENT AGENCY SECURITIES(1) — 76.3% | | |
| Adjustable-Rate U.S. Government Agency Securities — 47.9% | | |
| Federal Farm Credit Banks, VRN, 2.41%, (1-month LIBOR less 0.08%), 6/20/19 | $ | 25,000,000 |
| $ | 24,996,044 |
|
| Federal Home Loan Bank, VRN, 2.40%, (1-month LIBOR less 0.09%), 4/12/19 | 19,500,000 |
| 19,499,871 |
|
| Federal Home Loan Bank, VRN, 2.44%, (1-month LIBOR less 0.05%), 5/24/19 | 75,000,000 |
| 75,000,000 |
|
| Federal Home Loan Bank, VRN, 2.44%, (3-month LIBOR less 0.16%), 6/12/19 | 7,210,000 |
| 7,211,787 |
|
| Federal Home Loan Bank, VRN, 2.47%, (3-month LIBOR less 0.16%), 6/20/19 | 45,040,000 |
| 45,047,000 |
|
| Federal Home Loan Bank, VRN, 2.42%, (1-month LIBOR less 0.07%), 7/23/19 | 175,000,000 |
| 175,000,000 |
|
| Federal Home Loan Bank, VRN, 2.51%, (3-month LIBOR less 0.26%), 7/25/19 | 100,000,000 |
| 100,000,000 |
|
| Federal Home Loan Bank, VRN, 2.45%, (1-month LIBOR less 0.03%), 9/16/19 | 35,000,000 |
| 35,000,000 |
|
| Federal Home Loan Bank, VRN, 2.52%, (3-month LIBOR less 0.28%), 10/9/19 | 60,000,000 |
| 60,000,000 |
|
| Federal Home Loan Bank, VRN, 2.58%, (3-month LIBOR less 0.22%), 10/15/19 | 75,000,000 |
| 75,000,000 |
|
| Federal Home Loan Bank, VRN, 2.46%, (3-month USBMMY plus 0.03%), 12/6/19 | 35,000,000 |
| 35,000,000 |
|
| Federal Home Loan Bank, VRN, 2.49%, (3-month LIBOR less 0.14%), 12/19/19 | 31,895,000 |
| 31,917,189 |
|
| Federal Home Loan Bank, VRN, 2.45%, (1-month LIBOR less 0.03%), 4/16/20 | 50,000,000 |
| 50,000,000 |
|
| Federal Home Loan Mortgage Corp., MTN, VRN, 2.41%, 5/8/19 | 120,000,000 |
| 120,000,000 |
|
| | | 853,671,891 |
|
| Fixed-Rate U.S. Government Agency Securities — 28.4% | | |
| Federal Farm Credit Banks, 1.03%, 4/5/19 | 4,650,000 |
| 4,649,252 |
|
| Federal Home Loan Bank, 2.44%, 4/15/19 | 1,500,000 |
| 1,498,594 |
|
| Federal Home Loan Bank, 2.45%, 4/17/19 | 43,000,000 |
| 42,953,809 |
|
| Federal Home Loan Bank, 2.45%, 4/22/19 | 98,000,000 |
| 97,862,057 |
|
| Federal Home Loan Bank, 2.45%, 4/26/19 | 115,000,000 |
| 114,807,135 |
|
| Federal Home Loan Bank, 2.44%, 5/1/19 | 125,000,000 |
| 124,749,688 |
|
| Federal Home Loan Bank, 2.46%, 5/9/19 | 79,300,000 |
| 79,097,014 |
|
| Federal Home Loan Bank, 2.50%, 8/23/19 | 21,000,000 |
| 20,793,108 |
|
| Federal Home Loan Bank, 2.55%, 12/19/19 | 20,000,000 |
| 20,000,000 |
|
| | | 506,410,657 |
|
| TOTAL U.S. GOVERNMENT AGENCY SECURITIES | | 1,360,082,548 |
|
U.S. TREASURY SECURITIES(1) — 10.5% | | |
| U.S. Treasury Bills, 2.43%, 4/11/19 | 27,000,000 |
| 26,982,000 |
|
| U.S. Treasury Bills, 2.43%, 4/23/19 | 100,000,000 |
| 99,853,333 |
|
|
| | | | | | |
| | Principal Amount | Value |
| U.S. Treasury Notes, 3.125%, 5/15/19 | $ | 53,000,000 |
| $ | 53,042,511 |
|
| U.S. Treasury Notes, VRN, 2.54%, (3-month USBMMY plus 0.12%), 1/31/21 | 8,000,000 |
| 7,995,016 |
|
| TOTAL U.S. TREASURY SECURITIES | | 187,872,860 |
|
| CORPORATE BONDS — 7.1% | | |
| Anton Mountain View LLC, VRDN, 2.49%, 4/28/19 (LOC: FHLB) | 14,855,000 |
| 14,855,000 |
|
| Doghouse Properties LLC, VRDN, 2.66%, 4/5/19 (LOC: FHLB) | 1,310,000 |
| 1,310,000 |
|
| EPR GO Zone Holdings LLC, VRDN, 2.44%, 4/5/19 (LOC: FHLB) | 24,995,000 |
| 24,995,000 |
|
| Fairfield North Texas Associates LP, VRDN, 2.49%, 4/5/19 (LOC: FHLB) | 4,800,000 |
| 4,800,000 |
|
| Manse on Marsh LP, VRDN, 2.49%, 4/5/19 (LOC: FHLB) | 9,330,000 |
| 9,330,000 |
|
| Northcreek Church, VRDN, 2.50%, 4/5/19 (LOC: FHLB) | 4,950,000 |
| 4,950,000 |
|
| Saddleback Valley Community Church, VRDN, 2.55%, 4/5/19 (LOC: FHLB) | 7,105,000 |
| 7,105,000 |
|
| Santa Monica Ocean Park Partners LP, VRDN, 2.49%, 4/5/19 (LOC: FHLB) | 9,370,000 |
| 9,370,000 |
|
| Sendero LLC, VRDN, 2.49%, 4/5/19 (LOC: FHLB) | 25,980,000 |
| 25,980,000 |
|
| Sendero LLC, VRDN, 2.49%, 4/5/19 (LOC: FHLB) | 15,920,000 |
| 15,920,000 |
|
| Varenna Care Center LP, VRDN, 2.49%, 4/5/19 (LOC: FHLB) | 8,765,000 |
| 8,765,000 |
|
| TOTAL CORPORATE BONDS | | 127,380,000 |
|
| MUNICIPAL SECURITIES — 0.8% | | |
| ABAG Finance Authority for Nonprofit Corps. Rev., (2471 Shattuck LLC), VRDN, 2.42%, 4/5/19 (LOC: FNMA)(LIQ FAC: FNMA) | 1,715,000 |
| 1,715,000 |
|
| ABAG Finance Authority for Nonprofit Corps. Rev., (Berkeleyan LLC), VRDN, 2.42%, 4/5/19 (LOC: FNMA)(LIQ FAC: FNMA) | 500,000 |
| 500,000 |
|
| California Health Facilities Financing Authority Rev., (Ampla Health), VRDN, 2.38%, 4/5/19 (LOC: FHLB and Preferred Bank ) | 510,000 |
| 510,000 |
|
| California Statewide Communities Development Authority Rev., (Uptown Newport Building Owner LP), VRDN, 2.74%, 4/5/19 (LOC: East West Bank, Zions Bank and FHLB) | 5,100,000 |
| 5,100,000 |
|
| JJB Properties LLC Rev., VRDN, 2.49%, 4/5/19 (LOC: Arvest Bank and FHLB) | 3,275,000 |
| 3,275,000 |
|
| New York City Housing Development Corp. Rev., (2 Gold LLC), VRDN, 2.45%, 4/5/19 (LOC: FNMA)(LIQ FAC: FNMA) | 900,000 |
| 900,000 |
|
| St Tammany Parish Economic & Industrial Development District Rev., (Diversified Foods and Seasonings LLC), VRDN, 2.47%, 4/5/19 (LOC: Fidelity Homestead Assistance and FHLB) | 1,360,000 |
| 1,360,000 |
|
| TOTAL MUNICIPAL SECURITIES | | 13,360,000 |
|
| TOTAL INVESTMENT SECURITIES — 94.7% | | 1,688,695,408 |
|
OTHER ASSETS AND LIABILITIES(2) — 5.3% | | 94,594,796 |
|
| TOTAL NET ASSETS — 100.0% | | $ | 1,783,290,204 |
|
|
| | |
| NOTES TO SCHEDULE OF INVESTMENTS |
| FHLB | - | Federal Home Loan Bank |
| FNMA | - | Federal National Mortgage Association |
| LIBOR | - | London Interbank Offered Rate |
| LIQ FAC | - | Liquidity Facilities |
| LOC | - | Letter of Credit |
| MTN | - | Medium Term Note |
| USBMMY | - | U.S. Treasury Bill Money Market Yield |
| VRDN | - | Variable Rate Demand Note. The instrument may be payable upon demand and adjusts periodically based upon the terms set forth in the security's offering documents. The rate shown is effective at the period end and the reference rate and spread, if any, is indicated. The date of the demand feature is disclosed. |
| VRN | - | Variable Rate Note. The rate adjusts periodically based upon the terms set forth in the security’s offering documents. The rate shown is effective at the period end and the reference rate and spread, if any, is indicated. |
| |
| (1) | The rate indicated is the yield to maturity at purchase for non-interest bearing securities. For interest bearing securities, the stated coupon rate is shown. |
| |
| (2) | Amount relates primarily to receivable for investments sold, but not settled, at period end. |
See Notes to Financial Statements.
|
|
| Statement of Assets and Liabilities |
|
| | | |
| MARCH 31, 2019 | |
| Assets | |
| Investment securities, at value (amortized cost and cost for federal income tax purposes) | $ | 1,688,695,408 |
|
| Cash | 453,021 |
|
| Receivable for investments sold | 109,093,357 |
|
| Receivable for capital shares sold | 1,816,786 |
|
| Interest receivable | 3,000,033 |
|
| | 1,803,058,605 |
|
| | |
| Liabilities | |
| Payable for investments purchased | 18,500,000 |
|
| Payable for capital shares redeemed | 897,464 |
|
| Accrued management fees | 350,235 |
|
| Distribution and service fees payable | 14,651 |
|
| Dividends payable | 6,051 |
|
| | 19,768,401 |
|
| | |
| Net Assets | $ | 1,783,290,204 |
|
| | |
| Net Assets Consist of: | |
| Capital paid in | $ | 1,783,351,312 |
|
| Distributable earnings | (61,108 | ) |
| | $ | 1,783,290,204 |
|
|
| | | | | | | | |
| | Net Assets | Shares Outstanding | Net Asset Value Per Share |
| Investor Class |
| $851,334,075 |
| 851,504,099 |
|
| $1.00 |
|
| A Class |
| $67,515,877 |
| 67,515,200 |
|
| $1.00 |
|
| C Class |
| $76,609 |
| 76,607 |
|
| $1.00 |
|
| G Class |
| $864,363,643 |
| 864,385,566 |
|
| $1.00 |
|
See Notes to Financial Statements.
|
| | | |
| YEAR ENDED MARCH 31, 2019 |
| Investment Income (Loss) | |
| Income: | |
| Interest | $ | 40,153,650 |
|
| | |
| Expenses: | |
| Management fees | 8,591,794 |
|
| Distribution and service fees: | |
| A Class | 180,612 |
|
| C Class | 464 |
|
| Trustees' fees and expenses | 131,863 |
|
| Other expenses | 8,217 |
|
| | 8,912,950 |
|
| Fees waived - G Class | (4,100,925 | ) |
| | 4,812,025 |
|
| | |
| Net investment income (loss) | 35,341,625 |
|
| | |
| Net realized gain (loss) on investment transactions | 6,713 |
|
| | |
| Net Increase (Decrease) in Net Assets Resulting from Operations | $ | 35,348,338 |
|
See Notes to Financial Statements.
|
|
| Statement of Changes in Net Assets |
|
| | | | | | |
| YEARS ENDED MARCH 31, 2019 AND MARCH 31, 2018 |
| Increase (Decrease) in Net Assets | March 31, 2019 | March 31, 2018 |
| Operations | | |
| Net investment income (loss) | $ | 35,341,625 |
| $ | 15,865,070 |
|
| Net realized gain (loss) | 6,713 |
| (67,821 | ) |
| Net increase (decrease) in net assets resulting from operations | 35,348,338 |
| 15,797,249 |
|
| | | |
| Distributions to Shareholders | | |
| From earnings: | | |
| Investor Class | (15,302,067 | ) | (7,553,922 | ) |
| A Class | (1,007,024 | ) | (431,740 | ) |
| C Class | (698 | ) | (115 | ) |
| G Class | (19,031,836 | ) | (7,879,293 | ) |
| Decrease in net assets from distributions | (35,341,625 | ) | (15,865,070 | ) |
| | | |
| Capital Share Transactions | | |
| Net increase (decrease) in net assets from capital share transactions (Note 4) | (95,609,086 | ) | (286,164,479 | ) |
| | | |
| Net increase (decrease) in net assets | (95,602,373 | ) | (286,232,300 | ) |
| | | |
| Net Assets | | |
| Beginning of period | 1,878,892,577 |
| 2,165,124,877 |
|
| End of period | $ | 1,783,290,204 |
| $ | 1,878,892,577 |
|
See Notes to Financial Statements.
|
|
Notes to Financial Statements |
MARCH 31, 2019
1. Organization
American Century Investment Trust (the trust) is registered under the Investment Company Act of 1940, as amended (the 1940 Act), as an open-end management investment company and is organized as a Massachusetts business trust. U.S. Government Money Market Fund (the fund) is one fund in a series issued by the trust. The fund’s investment objective is to seek current income while maintaining liquidity and preserving capital.
The fund offers the Investor Class, A Class, C Class and G Class. The A Class and C Class may be subject to a contingent deferred sales charge. Sale of the G Class commenced on July 28, 2017.
2. Significant Accounting Policies
The following is a summary of significant accounting policies consistently followed by the fund in preparation of its financial statements. The fund is an investment company and follows accounting and reporting guidance in accordance with accounting principles generally accepted in the United States of America. This may require management to make certain estimates and assumptions at the date of the financial statements. Actual results could differ from these estimates. Management evaluated the impact of events or transactions occurring through the date the financial statements were issued that would merit recognition or disclosure.
Investment Valuations — The fund determines the fair value of its investments and computes its net asset value per share at the close of regular trading (usually 4 p.m. Eastern time) on the New York Stock Exchange (NYSE) on each day the NYSE is open. Investments are generally valued at amortized cost, which approximates fair value. If the fund determines that the amortized cost does not reflect an investment’s fair value, such investment is valued as determined in good faith by the Board of Trustees or its delegate, in accordance with policies and procedures adopted by the Board of Trustees.
Security Transactions — Security transactions are accounted for as of the trade date. Net realized gains and losses are determined on the identified cost basis, which is also used for federal income tax purposes.
Investment Income — Interest income is recorded on the accrual basis and includes accretion of discounts and amortization of premiums.
Treasury Roll Transactions — The fund purchases a security and at the same time makes a commitment to sell the same security at a future settlement date at a specified price. These types of transactions are known as treasury roll transactions. The difference between the purchase price and the sale price represents interest income reflective of an agreed upon rate between the fund and the counterparty.
Income Tax Status — It is the fund’s policy to distribute substantially all net investment income and net realized gains to shareholders and to otherwise qualify as a regulated investment company under provisions of the Internal Revenue Code. Accordingly, no provision has been made for income taxes. The fund files U.S. federal, state, local and non-U.S. tax returns as applicable. The fund's tax returns are subject to examination by the relevant taxing authority until expiration of the applicable statute of limitations, which is generally three years from the date of filing but can be longer in certain jurisdictions. At this time, management believes there are no uncertain tax positions which, based on their technical merit, would not be sustained upon examination and for which it is reasonably possible that the total amounts of unrecognized tax benefits will significantly change in the next twelve months.
Multiple Class — All shares of the fund represent an equal pro rata interest in the net assets of the class to which such shares belong, and have identical voting, dividend, liquidation and other rights and the same terms and conditions, except for class specific expenses and exclusive rights to vote on matters affecting only individual classes. Income, non-class specific expenses, and realized and unrealized capital gains and losses of the fund are allocated to each class of shares based on their relative net assets.
Distributions to Shareholders — Distributions from net investment income, if any, are declared daily and paid monthly. The fund may make capital gains distributions to comply with the distribution requirements of the Internal Revenue Code.
Indemnifications — Under the trust’s organizational documents, its officers and trustees are indemnified against certain liabilities arising out of the performance of their duties to the fund. In addition, in the normal course of business, the fund enters into contracts that provide general indemnifications. The maximum exposure under these arrangements is unknown as this would involve future claims that may be made against a fund. The risk of material loss from such claims is considered by management to be remote.
3. Fees and Transactions with Related Parties
Certain officers and trustees of the trust are also officers and/or directors of American Century Companies, Inc. (ACC). The trust's investment advisor, American Century Investment Management, Inc. (ACIM), the trust's distributor, American Century Investment Services, Inc. (ACIS), and the trust's transfer agent, American Century Services, LLC, are wholly owned, directly or indirectly, by ACC. Various funds issued by American Century Asset Allocation Portfolios, Inc. own, in aggregate, 59% of the shares of the fund. ACIM owns 14% of the shares of the fund. Related parties do not invest in the fund for the purpose of exercising management or control.
Management Fees — The trust has entered into a management agreement with ACIM, under which ACIM provides the fund with investment advisory and management services in exchange for a single, unified management fee (the fee) per class. The agreement provides that all expenses of managing and operating the fund, except distribution and service fees, brokerage expenses, taxes, interest, fees and expenses of the independent trustees (including legal counsel fees), and extraordinary expenses, will be paid by ACIM. The fee is computed and accrued daily based on each class's daily net assets and paid monthly in arrears. The fee consists of (1) an Investment Category Fee based on the daily net assets of the fund and certain other accounts managed by the investment advisor that are in the same broad investment category as the fund and (2) a Complex Fee based on the assets of all the funds in the American Century Investments family of funds. The investment advisor agreed to waive the G Class’s management fee in its entirety. The investment advisor expects this waiver to remain in effect permanently and cannot terminate it without the approval of the Board of Trustees.
The Investment Category Fee range, the Complex Fee range and the effective annual management fee for each class for the period ended March 31, 2019 are as follows:
|
| | | |
| | Investment Category Fee Range | Complex Fee Range | Effective Annual Management Fee |
| Investor Class | 0.1170% to 0.2300% | 0.2500% to 0.3100% | 0.45% |
| A Class | 0.45% |
| C Class | 0.45% |
| G Class | 0.00%(1) |
(1) Effective annual management fee before waiver was 0.45%.
Distribution and Service Fees — The Board of Trustees has adopted a separate Master Distribution and Individual Shareholder Services Plan for each of the A Class and C Class (collectively the plans), pursuant to Rule 12b-1 of the 1940 Act. The plans provide that the A Class will pay ACIS an annual distribution and service fee of 0.25%. The plans provide that the C Class will pay ACIS an annual distribution and service fee of 0.75%, of which 0.25% is paid for individual shareholder services and 0.50% is paid for distribution services. The fees are computed and accrued daily based on each class’s daily net assets and paid monthly in arrears. The fees are used to pay financial intermediaries for distribution and individual shareholder services. Fees incurred under the plans during the period ended March 31, 2019 are detailed in the Statement of Operations.
Trustees’ Fees and Expenses — The Board of Trustees is responsible for overseeing the investment advisor’s management and operations of the fund. The trustees receive detailed information about the fund and its investment advisor regularly throughout the year, and meet at least quarterly with management of the investment advisor to review reports about fund operations. The fund’s officers do not receive compensation from the fund.
4. Capital Share Transactions
Transactions in shares of the fund were as follows (unlimited number of shares authorized):
|
| | | | | | | | | | |
| | Year ended
March 31, 2019 | Year ended
March 31, 2018(1) |
| | Shares | Amount | Shares | Amount |
| Investor Class | | | | |
| Sold | 610,098,718 |
| $ | 610,098,718 |
| 1,302,373,057 |
| $ | 1,302,373,057 |
|
| Issued in reinvestment of distributions | 15,209,824 |
| 15,209,824 |
| 7,039,033 |
| 7,039,033 |
|
| Redeemed | (600,775,338 | ) | (600,775,338 | ) | (2,553,672,005 | ) | (2,553,672,005 | ) |
| | 24,533,204 |
| 24,533,204 |
| (1,244,259,915 | ) | (1,244,259,915 | ) |
| A Class | | | | |
| Sold | 38,826,325 |
| 38,826,325 |
| 44,219,235 |
| 44,219,235 |
|
| Issued in reinvestment of distributions | 1,005,244 |
| 1,005,244 |
| 431,740 |
| 431,740 |
|
| Redeemed | (52,835,390 | ) | (52,835,390 | ) | (58,095,432 | ) | (58,095,432 | ) |
| | (13,003,821 | ) | (13,003,821 | ) | (13,444,457 | ) | (13,444,457 | ) |
| C Class | | | | |
| Sold | 199,366 |
| 199,366 |
| 624 |
| 624 |
|
| Issued in reinvestment of distributions | 280 |
| 280 |
| 113 |
| 113 |
|
| Redeemed | (151,767 | ) | (151,767 | ) | (32,758 | ) | (32,758 | ) |
| | 47,879 |
| 47,879 |
| (32,021 | ) | (32,021 | ) |
| G Class | | | | |
| Sold | 60,813,798 |
| 60,813,798 |
| 1,022,867,471 |
| 1,022,867,471 |
|
| Issued in reinvestment of distributions | 18,991,237 |
| 18,991,237 |
| 7,879,293 |
| 7,879,293 |
|
| Redeemed | (186,991,383 | ) | (186,991,383 | ) | (59,174,850 | ) | (59,174,850 | ) |
| | (107,186,348 | ) | (107,186,348 | ) | 971,571,914 |
| 971,571,914 |
|
| Net increase (decrease) | (95,609,086 | ) | $ | (95,609,086 | ) | (286,164,479 | ) | $ | (286,164,479 | ) |
| |
| (1) | July 28, 2017 (commencement of sale) through March 31, 2018 for the G Class. |
5. Fair Value Measurements
The fund’s investments valuation process is based on several considerations and may use multiple inputs to determine the fair value of the investments held by the fund. In conformity with accounting principles generally accepted in the United States of America, the inputs used to determine a valuation are classified into three broad levels.
| |
| • | Level 1 valuation inputs consist of unadjusted quoted prices in an active market for identical investments. |
| |
| • | Level 2 valuation inputs consist of direct or indirect observable market data (including quoted prices for comparable investments, evaluations of subsequent market events, interest rates, prepayment speeds, credit risk, etc.). These inputs also consist of quoted prices for identical investments initially expressed in local currencies that are adjusted through translation into U.S. dollars. |
| |
| • | Level 3 valuation inputs consist of unobservable data (including a fund’s own assumptions). |
The level classification is based on the lowest level input that is significant to the fair valuation measurement. The valuation inputs are not necessarily an indication of the risks associated with investing in these securities or other financial instruments.
As of period end, the fund’s investment securities were classified as Level 2. The Schedule of Investments provides additional information on the fund’s portfolio holdings.
6. Federal Tax Information
The tax character of distributions paid during the years ended March 31, 2019 and March 31, 2018 were as follows:
|
| | | | | | |
| | 2019 | 2018 |
| Distributions Paid From | | |
| Ordinary income | $ | 35,341,625 |
| $ | 15,865,070 |
|
| Long-term capital gains | — |
| — |
|
The book-basis character of distributions made during the year from net investment income or net realized gains may differ from their ultimate characterization for federal income tax purposes. These differences reflect the differing character of certain income items and net realized gains and losses for financial statement and tax purposes, and may result in reclassification among certain capital accounts on the financial statements.
As of March 31, 2019, the fund had accumulated short-term capital losses of $(61,108), which represent net capital loss carryovers that may be used to offset future realized capital gains for federal income tax purposes. The capital loss carryovers may be carried forward for an unlimited period. Future capital loss carryover utilization in any given year may be subject to Internal Revenue Code limitations.
7. Recently Issued Accounting Standards
In March 2017, the Financial Accounting Standards Board (FASB) issued Accounting Standards Update No. 2017-08, “Receivables - Nonrefundable Fees and Other Costs (Subtopic 310-20), Premium Amortization on Purchased Callable Debt Securities” (ASU 2017-08). ASU 2017-08 amends the amortization period for certain purchased callable debt securities held at a premium, shortening such period to the earliest call date. The amendments are effective for fiscal years, and interim periods within those fiscal years, beginning after December 15, 2018. Management is currently evaluating the impact that adopting ASU 2017-08 will have on the financial statements.
|
| | | | | | | | | | | | | | |
| For a Share Outstanding Throughout the Years Ended March 31 (except as noted) |
| Per-Share Data | | Ratios and Supplemental Data |
| | | Income From Investment Operations: | | | | Ratio to Average Net Assets of: | |
| | Net Asset
Value,
Beginning
of Period | Net
Investment
Income
(Loss) | Net
Realized
and
Unrealized
Gain (Loss) | Total From Investment Operations | Distributions From Net
Investment
Income | Net Asset
Value,
End
of Period | Total
Return(1) | Operating
Expenses | Operating
Expenses
(before
expense
waiver) | Net
Investment
Income
(Loss) | Net Investment Income (Loss) (before expense waiver) | Net
Assets,
End of
Period (in thousands) |
| Investor Class | | | | | | | | | | | | |
| 2019 | $1.00 | 0.02 | —(2) | 0.02 | (0.02) | $1.00 | 1.67% | 0.46% | 0.46% | 1.65% | 1.65% |
| $851,334 |
|
| 2018 | $1.00 | 0.01 | —(2) | 0.01 | (0.01) | $1.00 | 0.64% | 0.46% | 0.46% | 0.62% | 0.62% |
| $826,798 |
|
| 2017 | $1.00 | —(2) | —(2) | —(2) | —(2) | $1.00 | 0.07% | 0.44% | 0.46% | 0.07% | 0.05% |
| $2,071,097 |
|
| 2016 | $1.00 | —(2) | —(2) | —(2) | —(2) | $1.00 | 0.01% | 0.23% | 0.46% | 0.01% | (0.22)% |
| $1,574,173 |
|
| 2015 | $1.00 | —(2) | —(2) | —(2) | —(2) | $1.00 | 0.01% | 0.15% | 0.46% | 0.01% | (0.30)% |
| $1,373,230 |
|
| A Class | | | | | | | | | | | | |
| 2019 | $1.00 | 0.01 | —(2) | 0.01 | (0.01) | $1.00 | 1.41% | 0.71% | 0.71% | 1.40% | 1.40% |
| $67,516 |
|
| 2018 | $1.00 | 0.01 | —(2) | 0.01 | (0.01) | $1.00 | 0.51% | 0.57% | 0.71% | 0.51% | 0.37% |
| $80,519 |
|
| 2017 | $1.00 | —(2) | —(2) | —(2) | —(2) | $1.00 | 0.07% | 0.46% | 0.71% | 0.05% | (0.20)% |
| $93,967 |
|
2016(3) | $1.00 | —(2) | —(2) | —(2) | —(2) | $1.00 | 0.01% | 0.34%(4) | 0.71%(4) | 0.01%(4) | (0.35)%(4) |
| $52 |
|
| C Class | | | | | | | | | | | | |
| 2019 | $1.00 | 0.01 | —(2) | 0.01 | (0.01) | $1.00 | 0.91% | 1.21% | 1.21% | 0.90% | 0.90% |
| $77 |
|
| 2018 | $1.00 | —(2) | —(2) | —(2) | —(2) | $1.00 | 0.29% | 0.74% | 1.21% | 0.34% | (0.13)% |
| $29 |
|
| 2017 | $1.00 | —(2) | —(2) | —(2) | —(2) | $1.00 | 0.07% | 0.44% | 1.21% | 0.07% | (0.70)% |
| $61 |
|
2016(3) | $1.00 | —(2) | —(2) | —(2) | —(2) | $1.00 | 0.01% | 0.32%(4) | 1.21%(4) | 0.01%(4) | (0.88)%(4) |
| $25 |
|
| G Class | | | | | | | | | | | | |
| 2019 | $1.00 | 0.02 | —(2) | 0.02 | (0.02) | $1.00 | 2.13% | 0.01% | 0.46% | 2.10% | 1.65% |
| $864,364 |
|
2018(5) | $1.00 | 0.01 | —(2) | 0.01 | (0.01) | $1.00 | 0.81% | 0.01%(4) | 0.46%(4) | 1.20%(4) | 0.75%(4) |
| $971,546 |
|
|
| | | | |
| Notes to Financial Highlights | | |
| |
| (1) | Total returns are calculated based on the net asset value of the last business day and do not reflect applicable sales charges, if any. Total returns for periods less than one year are not annualized. |
| |
| (2) | Per-share amount was less than $0.005. |
| |
| (3) | December 1, 2015 (commencement of sale) through March 31, 2016. |
| |
| (5) | July 28, 2017 (commencement of sale) through March 31, 2018. |
See Notes to Financial Statements.
|
|
| Report of Independent Registered Public Accounting Firm |
To the Board of Trustees of American Century Investment Trust and Shareholders of U.S. Government Money Market Fund:
Opinion on the Financial Statements
We have audited the accompanying statement of assets and liabilities, including the schedule of investments, of U.S. Government Money Market Fund (one of the funds constituting American Century Investment Trust, referred to hereafter as the “Fund”) as of March 31, 2019, the related statement of operations for the year ended March 31, 2019, the statement of changes in net assets for each of the two years in the period ended March 31, 2019, including the related notes, and the financial highlights for each of the periods indicated therein (collectively referred to as the “financial statements”). In our opinion, the financial statements present fairly, in all material respects, the financial position of the Fund as of March 31, 2019, the results of its operations for the year then ended, the changes in its net assets for each of the two years in the period ended March 31, 2019 and the financial highlights for each of the periods indicated therein in conformity with accounting principles generally accepted in the United States of America.
Basis for Opinion
These financial statements are the responsibility of the Fund’s management. Our responsibility is to express an opinion on the Fund’s financial statements based on our audits. We are a public accounting firm registered with the Public Company Accounting Oversight Board (United States) (“PCAOB”) and are required to be independent with respect to the Fund in accordance with the U.S. federal securities laws and the applicable rules and regulations of the Securities and Exchange Commission and the PCAOB.
We conducted our audits of these financial statements in accordance with the standards of the PCAOB. Those standards require that we plan and perform the audit to obtain reasonable assurance about whether the financial statements are free of material misstatement, whether due to error or fraud.
Our audits included performing procedures to assess the risks of material misstatement of the financial statements, whether due to error or fraud, and performing procedures that respond to those risks. Such procedures included examining, on a test basis, evidence regarding the amounts and disclosures in the financial statements. Our audits also included evaluating the accounting principles used and significant estimates made by management, as well as evaluating the overall presentation of the financial statements. Our procedures included confirmation of securities owned as of March 31, 2019 by correspondence with the custodian and brokers; when replies were not received from brokers, we performed other auditing procedures. We believe that our audits provide a reasonable basis for our opinion.
/s/ PricewaterhouseCoopers LLP
Kansas City, Missouri
May 17, 2019
We have served as the auditor of one or more investment companies in American Century Investments since 1997.
Board of Trustees
The individuals listed below serve as trustees of the funds. Each trustee will continue to serve in this capacity until death, retirement, resignation or removal from office. The board has adopted a mandatory retirement age for trustees who are not “interested persons,” as that term is defined in the Investment Company Act (independent trustees). Independent trustees shall retire on December 31 of the year in which they reach their 75th birthday; provided, however, that on or after January 1, 2022, independent trustees shall retire on December 31 of the year in which they reach their 76th birthday.
Mr. Thomas is an “interested person” because he currently serves as President and Chief Executive Officer of American Century Companies, Inc. (ACC), the parent company of American Century Investment Management, Inc. (ACIM or the advisor). The other trustees (more than three-fourths of the total number) are independent. They are not employees, directors or officers of, and have no financial interest in, ACC or any of its wholly owned, direct or indirect, subsidiaries, including ACIM, American Century Investment Services, Inc. (ACIS) and American Century Services, LLC (ACS), and they do not have any other affiliations, positions or relationships that would cause them to be considered “interested persons” under the Investment Company Act. The trustees serve in this capacity for eight (in the case of Jonathan S. Thomas, 16; and Ronald J. Gilson, 9) registered investment companies in the American Century Investments family of funds.
The following table presents additional information about the trustees. The mailing address for each trustee other than Jonathan S. Thomas is 1665 Charleston Road, Mountain View, California 94043. The mailing address for Jonathan S. Thomas is 4500 Main Street, Kansas City, Missouri 64111.
|
| | | | | |
Name
(Year of Birth) | Position(s) Held with Funds | Length of Time Served | Principal Occupation(s) During Past 5 Years | Number of American Century Portfolios Overseen by Trustee | Other Directorships Held During Past 5 Years |
| Independent Trustees |
|
|
Tanya S. Beder
(1955) | Trustee | Since 2011 | Chairman and CEO, SBCC Group Inc. (independent advisory services) (2006 to present) | 45 | CYS Investments, Inc.; Nabors Industries Ltd. |
Jeremy I. Bulow
(1954) | Trustee | Since 2011 | Professor of Economics, Stanford University, Graduate School of Business (1979 to present) | 45 | None |
Anne Casscells
(1958) | Trustee | Since 2016 | Co-Chief Executive Officer and Chief Investment Officer, Aetos Alternatives Management (investment advisory firm) (2001 to present); Lecturer in Accounting, Stanford University, Graduate School of Business (2009 to 2017) | 45 | None |
Ronald J. Gilson
(1946) | Trustee and Chairman of the Board | Since 1995
(Chairman since 2005) | Charles J. Meyers Professor of Law and Business, Emeritus, Stanford Law School (1979 to 2016); Marc and Eva Stern Professor of Law and Business, Columbia University School of Law (1992 to present) | 50 | None |
|
| | | | | |
Name
(Year of Birth) | Position(s) Held with Funds | Length of Time Served | Principal Occupation(s) During Past 5 Years | Number of American Century Portfolios Overseen by Trustee | Other Directorships Held During Past 5 Years |
| Independent Trustees |
|
|
Frederick L. A. Grauer
(1946) | Trustee | Since 2008 | Senior Advisor, Credit Sesame, Inc. (credit monitoring firm) (2018 to present); Senior Advisor, Course Hero (an educational technology company) (2015 to present); Senior Advisor, iShares by BlackRock, Inc. (investment management firm) (2013 to 2015)
| 45 | None |
Jonathan D. Levin
(1972) | Trustee | Since 2016 | Philip H. Knight Professor and Dean, Graduate School of Business, Stanford University (2016 to present); Professor, Stanford University, (2000 to present); Chair, Department of Economics, Stanford University (2011 to 2014) | 45 | None |
Peter F. Pervere
(1947) | Trustee | Since 2007 | Retired | 45 | None |
John B. Shoven
(1947) | Trustee | Since 2002 | Charles R. Schwab Professor of Economics, Stanford University (1973 to present) | 45 | Cadence Design Systems; Exponent; Financial Engines |
| Interested Trustee |
|
|
Jonathan S. Thomas
(1963) | Trustee and President | Since 2007 | President and Chief Executive Officer, ACC (2007 to present). Also serves as Chief Executive Officer, ACS; Executive Vice President, ACIM; Director, ACC, ACIM and other ACC subsidiaries | 117 | BioMed Valley Discoveries, Inc. |
The Statement of Additional Information has additional information about the fund's trustees and is available without charge, upon request, by calling 1-800-345-2021.
Officers
The following table presents certain information about the executive officers of the funds. Each officer serves as an officer for 16 (in the case of Robert J. Leach, 15) investment companies in the American Century family of funds, unless otherwise noted. No officer is compensated for his or her service as an officer of the funds. The listed officers are interested persons of the funds and are appointed or re-appointed on an annual basis. The mailing address for each of the officers listed below is 4500 Main Street, Kansas City, Missouri 64111.
|
| | |
Name
(Year of Birth) | Offices with the Funds | Principal Occupation(s) During the Past Five Years |
Jonathan S. Thomas
(1963) | Trustee and President since 2007 | President and Chief Executive Officer, ACC (2007 to present). Also serves as Chief Executive Officer, ACS; Executive Vice President, ACIM; Director, ACC, ACIM and other ACC subsidiaries |
R. Wes Campbell
(1974)
| Chief Financial Officer and Treasurer since 2018
| Investment Operations and Investment Accounting, ACS (2000 to present) |
Amy D. Shelton
(1964) | Chief Compliance Officer and Vice President since 2014 | Chief Compliance Officer, American Century funds, (2014 to present); Chief Compliance Officer, ACIM (2014 to present); Chief Compliance Officer, ACIS (2009 to present); Vice President, Client Interactions and Marketing, ACIS (2013 to 2014). Also serves as Vice President, ACIS |
Charles A. Etherington
(1957) | General Counsel since 2007 and Senior Vice President since 2006 | Attorney, ACC (1994 to present); Vice President, ACC (2005 to present); General Counsel, ACC (2007 to present). Also serves as General Counsel, ACIM, ACS, ACIS and other ACC subsidiaries; and Senior Vice President, ACIM and ACS |
C. Jean Wade
(1964) | Vice President since 2012 | Senior Vice President, ACS (2017 to present); Vice President ACS (2000 to 2017) |
Robert J. Leach
(1966) | Vice President since 2006 | Vice President, ACS (2000 to present) |
David H. Reinmiller
(1963) | Vice President since 2000 | Attorney, ACC (1994 to present) Also serves as Vice President, ACIM and ACS |
Ward D. Stauffer
(1960) | Secretary since 2005 | Attorney, ACC (2003 to present) |
Retirement Account Information
As required by law, distributions you receive from certain retirement accounts are subject to federal income tax withholding, unless you elect not to have withholding apply*. Tax will be withheld on the total amount withdrawn even though you may be receiving amounts that are not subject to withholding, such as nondeductible contributions. In such case, excess amounts of withholding could occur. You may adjust your withholding election so that a greater or lesser amount will be withheld.
If you don’t want us to withhold on this amount, you must notify us to not withhold the federal income tax. You may notify us in writing or in certain situations by telephone or through other electronic means. For systematic withdrawals, your withholding election will remain in effect until revoked or changed by filing a new election. You have the right to revoke your election at any time and change your withholding percentage for future distributions.
Remember, even if you elect not to have income tax withheld, you are liable for paying income tax on the taxable portion of your withdrawal. If you elect not to have income tax withheld or you don’t have enough income tax withheld, you may be responsible for payment of estimated tax. You may incur penalties under the estimated tax rules if your withholding and estimated tax payments are not sufficient. You can reduce or defer the income tax on a distribution by directly or indirectly rolling such distribution over to another IRA or eligible plan. You should consult your tax advisor for additional information.
State tax will be withheld if, at the time of your distribution, your address is within one of the mandatory withholding states and you have federal income tax withheld (or as otherwise required by state law). State taxes will be withheld from your distribution in accordance with the respective state rules.
*Some 403(b), 457 and qualified retirement plan distributions may be subject to 20% mandatory withholding, as they are subject to special tax and withholding rules. Your plan administrator or plan sponsor is required to provide you with a special tax notice explaining those rules at the time you request a distribution. If applicable, federal and/or state taxes may be withheld from your distribution amount.
Proxy Voting Policies
Descriptions of the principles and policies that the fund's investment advisor uses in exercising the voting rights associated with the securities purchased and/or held by the fund are available without charge, upon request, by calling 1-800-345-2021 or visiting the "About Us" page of American Century Investments’ website at americancentury.com. A description of the policies is also available on the Securities and Exchange Commission’s website at sec.gov. Information regarding how the investment advisor voted proxies relating to portfolio securities during the most recent 12-month period ended June 30 is available on the "About Us" page at americancentury.com. It is also available at sec.gov.
Quarterly Portfolio Disclosure
The fund files its complete schedule of portfolio holdings with the Securities and Exchange Commission (SEC) for the first and third quarters of each fiscal year on Form N-Q or as an exhibit to its reports on Form N-PORT. The fund’s Forms N-Q and Form N-PORT reports are available on the SEC’s website at sec.gov. The fund also makes its complete schedule of portfolio holdings for the most recent quarter of its fiscal year available on its website at americancentury.com and, upon request, by calling 1-800-345-2021.
|
| | |
| |
| | | |
| Contact Us | americancentury.com | |
| Automated Information Line | 1-800-345-8765 | |
| Investor Services Representative | 1-800-345-2021 or 816-531-5575 | |
| Investors Using Advisors | 1-800-378-9878 | |
| Business, Not-For-Profit, Employer-Sponsored Retirement Plans | 1-800-345-3533 | |
| Banks and Trust Companies, Broker-Dealers, Financial Professionals, Insurance Companies | 1-800-345-6488 | |
| Telecommunications Relay Service for the Deaf | 711 | |
| | | |
| American Century Investment Trust | |
| | | |
Investment Advisor: American Century Investment Management, Inc. Kansas City, Missouri | |
| | | |
| This report and the statements it contains are submitted for the general information of our shareholders. The report is not authorized for distribution to prospective investors unless preceded or accompanied by an effective prospectus. | |
| | | |
©2019 American Century Proprietary Holdings, Inc. All rights reserved.
CL-ANN-92283 1905 | |
ITEM 2. CODE OF ETHICS.
| |
| (a) | The registrant has adopted a Code of Ethics for Senior Financial Officers that applies to the registrant’s principal executive officer, principal financial officer, principal accounting officer, and persons performing similar functions. |
| |
| (f) | The registrant’s Code of Ethics for Senior Financial Officers was filed as Exhibit 12 (a)(1) to American Century Asset Allocation Portfolios, Inc.’s Annual Certified Shareholder Report on Form N-CSR, File No. 811-21591, on September 29, 2005, and is incorporated herein by reference. |
ITEM 3. AUDIT COMMITTEE FINANCIAL EXPERT.
| |
| (a)(1) | The registrant's board has determined that the registrant has at least one audit committee financial expert serving on its audit committee. |
| |
| (a)(2) | Tanya S. Beder, Anne Casscells, Peter F. Pervere and Ronald J. Gilson are the registrant's designated audit committee financial experts. They are "independent" as defined in Item 3 of Form N-CSR. |
ITEM 4. PRINCIPAL ACCOUNTANT FEES AND SERVICES.
The aggregate fees billed for each of the last two fiscal years for professional services rendered by the principal accountant for the audit of the registrant’s annual financial statements or services that are normally provided by the accountant in connection with statutory and regulatory filings or engagements for those fiscal years were as follows:
FY 2018: $344,809
FY 2019: $358,679
The aggregate fees billed in each of the last two fiscal years for assurance and related services by the principal accountant that are reasonably related to the performance of the audit of the registrant’s financial statements and are not reported under paragraph (a) of this Item were as follows:
For services rendered to the registrant:
FY 2018:$0
FY 2019:$0
Fees required to be approved pursuant to paragraph (c)(7)(ii) of Rule 2-01 of Regulation S-X (relating to certain engagements for non-audit services with the registrant’s investment adviser and its affiliates):
FY 2018:$0
FY 2019:$0
The aggregate fees billed in each of the last two fiscal years for professional services rendered by the principal accountant for tax compliance, tax advice, and tax planning were as follows:
For services rendered to the registrant:
FY 2018: $0
FY 2019: $0
Fees required to be approved pursuant to paragraph (c)(7)(ii) of Rule 2-01 of Regulation S-X (relating to certain engagements for non-audit services with the registrant’s investment adviser and its affiliates):
FY 2018: $0
FY 2019: $0
The aggregate fees billed in each of the last two fiscal years for products and services provided by the principal accountant, other than the services reported in paragraphs (a) through (c) of this Item were as follows:
For services rendered to the registrant:
FY 2018:$0
FY 2019:$0
Fees required to be approved pursuant to paragraph (c)(7)(ii) of Rule 2-01 of Regulation S-X (relating to certain engagements for non-audit services with the registrant’s investment adviser and its affiliates):
FY 2018:$0
FY 2019:$0
| |
| (e)(1) | In accordance with paragraph (c)(7)(i)(A) of Rule 2-01 of Regulation S-X, before the accountant is engaged by the registrant to render audit or non-audit services, the engagement is approved by the registrant’s audit committee. Pursuant to paragraph (c)(7)(ii) of Rule 2-01 of Regulation S-X, the registrant’s audit committee also pre-approves its accountant’s engagements for non-audit services with the registrant’s investment adviser, its parent company, and any entity controlled by, or under common control with the investment adviser that provides ongoing services to the registrant, if the engagement relates directly to the operations and financial reporting of the registrant. |
| |
| (e)(2) | All services described in each of paragraphs (b) through (d) of this Item were pre-approved before the engagement by the registrant’s audit committee pursuant to paragraph (c)(7)(i)(A) of Rule 2-01 of Regulation S-X. Consequently, none of such services were required to be approved by the audit committee pursuant to paragraph (c)(7)(i)(C). |
| |
| (f) | The percentage of hours expended on the principal accountant’s engagement to audit the registrant’s financial statements for the most recent fiscal year that were attributed to work performed by persons other than the principal accountant’s full-time, permanent employees was less than 50%. |
| |
| (g) | The aggregate non-audit fees billed by the registrant’s accountant for services rendered to the registrant, and rendered to the registrant’s investment adviser (not including any sub-adviser whose role is primarily portfolio management and is subcontracted with or overseen by another investment adviser), and any entity controlling, controlled by, or under common control with the adviser that provides ongoing services to the registrant for each of the last two fiscal years of the registrant were as follows: |
FY 2018: $132,303
FY 2019: $131,797
| |
| (h) | The registrant’s investment adviser and accountant have notified the registrant’s audit committee of all non-audit services that were rendered by the registrant’s accountant to the registrant’s investment adviser, its parent company, and any entity controlled by, or under common control with the investment adviser that provides services to the registrant, which services were not required to be pre-approved pursuant to paragraph (c)(7)(ii) of Rule 2-01 of Regulation S-X. The notification provided to the registrant’s audit committee included sufficient details regarding such services to allow the registrant’s audit committee to consider the continuing independence of its principal accountant. |
ITEM 5. AUDIT COMMITTEE OF LISTED REGISTRANTS.
Not applicable.
ITEM 6. INVESTMENTS.
| |
| (a) | The schedule of investments is included as part of the report to stockholders filed under Item 1 of this Form. |
ITEM 7. DISCLOSURE OF PROXY VOTING POLICIES AND PROCEDURES FOR CLOSED-END MANAGEMENT INVESTMENT COMPANIES.
Not applicable.
ITEM 8. PORTFOLIO MANAGERS OF CLOSED-END MANAGEMENT INVESTMENT COMPANIES.
Not applicable.
ITEM 9. PURCHASES OF EQUITY SECURITIES BY CLOSED-END MANAGEMENT INVESTMENT COMPANY AND AFFILIATED PURCHASERS.
Not applicable.
ITEM 10. SUBMISSION OF MATTERS TO A VOTE OF SECURITY HOLDERS.
During the reporting period, there were no material changes to the procedures by which shareholders may recommend nominees to the registrant’s board.
ITEM 11. CONTROLS AND PROCEDURES.
| |
| (a) | The registrant's principal executive officer and principal financial officer have concluded that the registrant's disclosure controls and procedures (as defined in Rule 30a-3(c) under the Investment Company Act of 1940) are effective based on their evaluation of these controls and procedures as of a date within 90 days of the filing date of this report. |
| |
| (b) | There were no changes in the registrant's internal control over financial reporting (as defined in Rule 30a-3(d) under the Investment Company Act of 1940) that occurred during the period covered by this report that have materially affected, or are reasonably likely to materially affect, the registrant's internal control over financial reporting. |
ITEM 12. DISCLOSURE OF SECURITIES LENDING ACTIVITIES FOR CLOSED-END MANAGEMENT INVESTMENT COMPANIES.
Not applicable.
ITEM 13. EXHIBITS.
| |
| (a)(1) | Registrant’s Code of Ethics for Senior Financial Officers, which is the subject of the disclosure required by Item 2 of Form N-CSR, was filed as Exhibit 12(a)(1) to American Century Asset Allocation Portfolios, Inc.’s Certified Shareholder Report on Form N-CSR, File No. 811-21591, on September 29, 2005. |
| |
| (a)(2) | Separate certifications by the registrant’s principal executive officer and principal financial officer, pursuant to Section 302 of the Sarbanes-Oxley Act of 2002 and Rule 30a-2(a) under the Investment Company Act of 1940, are filed and attached hereto as EX-99.CERT. |
| |
| (b) | A certification by the registrant’s chief executive officer and chief financial officer, pursuant to Section 906 of the Sarbanes-Oxley Act of 2002, is furnished and attached hereto as EX-99.906CERT. |
SIGNATURES
Pursuant to the requirements of the Securities Exchange Act of 1934 and the Investment Company Act of 1940, the registrant has duly caused this report to be signed on its behalf by the undersigned, thereunto duly authorized.
|
| | | |
| Registrant: | American Century Investment Trust |
| | | |
| By: | /s/ Jonathan S. Thomas |
| | Name: | Jonathan S. Thomas |
| | Title: | President |
| | | |
| Date: | May 24, 2019 |
Pursuant to the requirements of the Securities Exchange Act of 1934 and the Investment Company Act of 1940, this report has been signed below by the following persons on behalf of the registrant and in the capacities and on the dates indicated.
|
| | |
| By: | /s/ Jonathan S. Thomas |
| | Name: | Jonathan S. Thomas |
| | Title: | President |
| | | (principal executive officer) |
| | | |
| Date: | May 24, 2019 |
|
| | |
| By: | /s/ R. Wes Campbell |
| | Name: | R. Wes Campbell |
| | Title: | Treasurer and |
| | | Chief Financial Officer |
| | | (principal financial officer) |
| | | |
| Date: | May 24, 2019 |