UNITED STATES
SECURITIES AND EXCHANGE COMMISSION
Washington, D.C. 20549
FORM N-CSR
CERTIFIED SHAREHOLDER REPORT OF REGISTERED
MANAGEMENT INVESTMENT COMPANIES
|
| | | | | | |
| Investment Company Act file number | 811-07822 |
| | |
| AMERICAN CENTURY INVESTMENT TRUST |
| (Exact name of registrant as specified in charter) |
| | |
| 4500 MAIN STREET, KANSAS CITY, MISSOURI | 64111 |
| (Address of principal executive offices) | (Zip Code) |
| | |
CHARLES A. ETHERINGTON 4500 MAIN STREET, KANSAS CITY, MISSOURI 64111 |
| (Name and address of agent for service) |
| | |
| Registrant’s telephone number, including area code: | 816-531-5575 |
| | |
| Date of fiscal year end: | 03-31 |
| | |
| Date of reporting period: | 03-31-2020 |
ITEM 1. REPORTS TO STOCKHOLDERS.
|
| |
| | |
| | Annual Report |
| | |
| | March 31, 2020 |
| | |
| | Core Plus Fund |
| | Investor Class (ACCNX) |
| | I Class (ACCTX) |
| | A Class (ACCQX) |
| | C Class (ACCKX) |
| | R Class (ACCPX) |
| | R5 Class (ACCUX) |
Beginning on January 1, 2021, as permitted by regulations adopted by the Securities and Exchange Commission, paper copies of the fund’s shareholder reports like this one will no longer be sent by mail, unless you specifically request paper copies of the reports from the fund or from your financial intermediary, such as a broker-dealer or bank. Instead, the reports will be made available on a website, and you will be notified by mail each time a report is posted and provided with a website link to access the report.
If you already elected to receive shareholder reports electronically, you will not be affected by this change and you need not take any action. You may elect to receive shareholder reports and other communications from the fund or your financial intermediary electronically by calling or sending an email request to your appropriate contacts as listed on the back cover of this report.
You may elect to receive all future reports in paper free of charge. You can inform the fund or your financial intermediary that you wish to continue receiving paper copies of your shareholder reports by calling or sending an email request to your appropriate contacts as listed on the back cover of this report. Your election to receive reports in paper will apply to all funds held with the fund complex/your financial intermediary.
|
| |
| President’s Letter | |
| Performance | |
| Portfolio Commentary | |
| Fund Characteristics | |
| Shareholder Fee Example | |
| Schedule of Investments | |
| Statement of Assets and Liabilities | |
| Statement of Operations | |
| Statement of Changes in Net Assets | |
| Notes to Financial Statements | |
| Financial Highlights | |
| Report of Independent Registered Public Accounting Firm | |
| Management | |
| Liquidity Risk Management Program | |
| Additional Information | |
Any opinions expressed in this report reflect those of the author as of the date of the report, and do not necessarily represent the opinions of American Century Investments® or any other person in the American Century Investments organization. Any such opinions are subject to change at any time based upon market or other conditions and American Century Investments disclaims any responsibility to update such opinions. These opinions may not be relied upon as investment advice and, because investment decisions made by American Century Investments funds are based on numerous factors, may not be relied upon as an indication of trading intent on behalf of any American Century Investments fund. Security examples are used for representational purposes only and are not intended as recommendations to purchase or sell securities. Performance information for comparative indices and securities is provided to American Century Investments by third party vendors. To the best of American Century Investments’ knowledge, such information is accurate at the time of printing.
 Jonathan Thomas
Dear Investor:
Thank you for reviewing this annual report for the period ended March 31, 2020. Annual reports help convey important information about fund returns, including market factors that affected performance during the reporting period. For additional insights, please visit americancentury.com.
Virus Outbreak Abruptly Altered Economic, Market Backdrops
Through most of the period, market sentiment was upbeat, partly due to accommodative Federal Reserve (Fed) policy and modest inflation. Improving economic and corporate earnings data and a phase 1 U.S.-China trade deal also helped boost growth outlooks. Against this backdrop, key U.S. stock benchmarks rose to record highs by mid-February, and U.S. bonds continued to advance.
However, beginning in late February, unprecedented social and economic turmoil emerged and reversed the positive trajectory. The COVID-19 epidemic originating in China rapidly spread throughout the world, forcing stay-at-home orders and industry-wide shutdowns. U.S. stocks, corporate bonds and other riskier assets sold off sharply, while U.S. Treasuries rallied in the global flight to quality. The Fed stepped in quickly and aggressively, slashing interest rates to near 0% and enacting massive lending and asset-purchase programs to stabilize the financial system.
The swift and severe sell-off erased the strong stock market gains realized earlier in the period and left key benchmarks with losses for the 12 months. Reflecting their defensive characteristics, high-quality U.S. bonds withstood the turmoil and delivered solid returns for the 12-month period.
Promoting Health and Safety Remains Our Focus
While the market impact of COVID-19 has been severe, reducing the human toll is most important. We are monitoring the situation closely and following guidelines and protocols from all relevant authorities. Our firm has activated a comprehensive Pandemic Response Plan, which includes social distancing and work-from-home mandates, travel restrictions and escalated cleaning regimens at all our facilities. We’ve also launched a Business Continuity Plan to maintain regular business operations and ensure delivery of outstanding service.
We appreciate your confidence in us during these extraordinary times. We have a long history of helping clients weather volatile markets, and we are confident we will meet today’s challenges. In the meantime, the health and safety of you, your family and our employees remain a top priority.
Sincerely,
Jonathan Thomas
President and Chief Executive Officer
American Century Investments
|
| | | | | | |
| Total Returns as of March 31, 2020 | | |
| | | | Average Annual Returns | |
| | Ticker Symbol | 1 year | 5 years | 10 years | Since Inception | Inception Date |
| Investor Class | ACCNX | 4.57% | 2.56% | 3.56% | — | 11/30/06 |
| Bloomberg Barclays U.S. Aggregate Bond Index | — | 8.93% | 3.35% | 3.88% | — | — |
| I Class | ACCTX | 4.67% | — | — | 3.38% | 4/10/17 |
| A Class | ACCQX | | | | | 11/30/06 |
| No sales charge | | 4.31% | 2.30% | 3.30% | — | |
| With sales charge | | -0.41% | 1.36% | 2.83% | — | |
| C Class | ACCKX | 3.45% | 1.54% | 2.53% | — | 11/30/06 |
| R Class | ACCPX | 4.05% | 2.06% | 3.05% | — | 11/30/06 |
| R5 Class | ACCUX | 4.68% | 2.74% | 3.76% | — | 11/30/06 |
Average annual returns since inception are presented when ten years of performance history is not available.
Fund returns would have been lower if a portion of the fees had not been waived.
Sales charges include initial sales charges and contingent deferred sales charges (CDSCs), as applicable. A Class shares have a 4.50% maximum initial sales charge and may be subject to a maximum CDSC of 1.00%. C Class shares redeemed within 12 months of purchase are subject to a maximum CDSC of 1.00%. The SEC requires that mutual funds provide performance information net of maximum sales charges in all cases where charges could be applied.
Data presented reflect past performance. Past performance is no guarantee of future results. Current performance may be higher or lower than the performance shown. Total returns for periods less than one year are not annualized. Investment return and principal value will fluctuate, and redemption value may be more or less than original cost. Data assumes reinvestment of dividends and capital gains, and none of the charts reflect the deduction of taxes that a shareholder would pay on fund distributions or the redemption of fund shares. To obtain performance data current to the most recent month end, please call 1-800-345-2021 or visit americancentury.com. For additional information about the fund, please consult the prospectus.
|
|
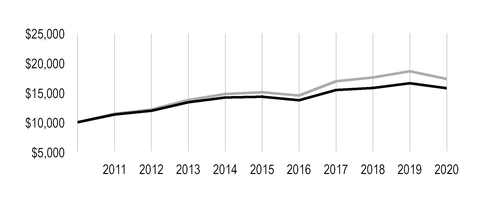
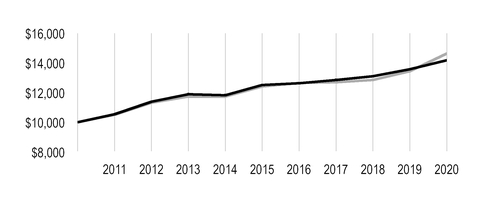
| Growth of $10,000 Over 10 Years |
| $10,000 investment made March 31, 2010 |
Performance for other share classes will vary due to differences in fee structure.
|
|
| |
| Value on March 31, 2020 |
| | Investor Class — $14,193 |
| |
| | Bloomberg Barclays U.S. Aggregate Bond Index — $14,639 |
| |
Ending value of Investor Class would have been lower if a portion of the fees had not been waived.
|
| | | | | |
| Total Annual Fund Operating Expenses |
| Investor Class | I Class | A Class | C Class | R Class | R5 Class |
| 0.65% | 0.55% | 0.90% | 1.65% | 1.15% | 0.45% |
The total annual fund operating expenses shown is as stated in the fund’s prospectus current as of the date of this report. The prospectus may vary from the expense ratio shown elsewhere in this report because it is based on a different time period, includes acquired fund fees and expenses, and, if applicable, does not include fee waivers or expense reimbursements.
Data presented reflect past performance. Past performance is no guarantee of future results. Current performance may be higher or lower than the performance shown. Total returns for periods less than one year are not annualized. Investment return and principal value will fluctuate, and redemption value may be more or less than original cost. Data assumes reinvestment of dividends and capital gains, and none of the charts reflect the deduction of taxes that a shareholder would pay on fund distributions or the redemption of fund shares. To obtain performance data current to the most recent month end, please call 1-800-345-2021 or visit americancentury.com. For additional information about the fund, please consult the prospectus.
Portfolio Managers: Bob Gahagan, Hando Aguilar, Jeff Houston, Brian Howell and Charles Tan
Performance Summary
Core Plus returned 4.57%* for the 12 months ended March 31, 2020. By comparison, the Bloomberg Barclays U.S. Aggregate Bond Index gained 8.93%. Fund returns reflect operating expenses, while index returns do not. Returns for the fund and the index during the period largely reflected the defensive characteristics of the broad U.S. investment-grade bond market in the face of unprecedented market unrest in early 2020.
The reporting period began on an upbeat note for bond investors. The Federal Reserve’s (Fed’s) early 2019 pivot toward dovish policy set the stage for rate cuts in July, September and October. This action, along with modest economic and earnings growth and low inflation, generally supported solid gains for U.S. bonds. By year-end 2019, global economic data improved, the U.S. and China signed a phase 1 trade deal, and the Fed suggested it would hold rates steady through 2020.
Conditions deteriorated rapidly within the first quarter of 2020. As the COVID-19 epidemic originating in China expanded into a pandemic, nervous fixed-income investors scrambled to shed credit risk and seek shelter in cash. Market volatility soared and liquidity sank. In response, the Fed slashed short-term rates to near 0% and launched a series of initiatives to stabilize the financial markets. Separately, Congress passed a $2 trillion fiscal relief package. Reflecting market sentiment, the 10-year Treasury yield started the period at 2.41% and closed at 0.68% after touching a record-low 0.54% in early March. The two-year Treasury yield followed a similar path during the 12-month period, dropping from 2.27% to 0.22%, including a 135-basis-point decline in the first quarter of 2020.
Amid a global flight to quality, riskier investments, including corporate and securitized bonds, suffered significant losses. The Fed’s rescue programs helped stabilize credit-sensitive sectors of the fixed-income universe, including mortgage-backed securities, municipal bonds (munis) and investment-grade corporate bonds. Against this backdrop, an underweight position in Treasuries, relative to the benchmark, accounted for much of Core Plus’ underperformance.
Securitized Exposure Hindered Performance
We continued to underweight Treasuries and government agencies relative to the index in favor of spread (non-Treasury) sectors, including securitized bonds and corporate issues. This strategy diminished returns amid the late-period rush for stability and liquidity.
Throughout the period, we maintained an overweight position in securitized bonds, believing the sector offered better relative value and less volatility than corporate credit issues. The strategy generally aided performance during risk-on periods, but it proved detrimental amid the coronavirus sell-off. Forced selling created havoc for the sector, as the credit-sensitive holdings we favored, including non-agency commercial mortgage-backed securities, collateralized mortgage obligations and collateralized loan obligations, were hardest hit. Agency-backed mortgages recovered slightly after the Fed announced its asset-purchase plan, which included agency mortgages.
*All fund returns referenced in this commentary are for Investor Class shares. Fund returns would have been lower if a portion of the fees had not been waived. Performance for other share classes will vary due to differences in fee structure; when Investor Class performance exceeds that of the index, other share classes may not. See page 3 for returns for all share classes.
Corporate, Non-Index Securities Weighed on Results
As sentiment on the economy started to soften during 2019, we reduced our allocation to the corporate bond sector. Combined with our view that the credit cycle had entered its final stage, we believed that valuations among corporate bonds had advanced to levels in line with fundamentals. In addition to trimming exposure, we maintained a higher-quality bias, given the then uncertainties surrounding the effects of tariffs on corporate earnings. We also reduced our out-of-index stake in high-yield bonds. Although our corporate exposure suffered with all risk assets in the early 2020 decline, investment-grade securities recovered slightly late in the period on news the Fed would purchase corporate bonds.
Meanwhile, our out-of-index foreign currency exposure dragged down relative performance as the U.S. dollar soared.
Portfolio Positioning
The economic downturn during the first quarter was swift and severe, but we do not expect an equally swift, or V-shaped, recovery. The consumer is the main driver of the U.S. economy, and we believe the effects of the COVID-19 pandemic will weigh on consumer sentiment—and job and economic growth—for several months. Ultimately, this crisis requires a medical solution.
With its massive financial rescue package, the Fed has demonstrated it will take extraordinary steps to maintain broad market liquidity and assure credit market stability. However, we don’t expect the Fed to ease further, as policymakers previously noted an unwillingness to push rates below zero. Additionally, the effects of significant fiscal stimulus should allow the Fed to keep rates steady.
Heightened volatility often creates market disruptions that lead to attractive buying opportunities. In the first quarter’s flight to quality, we identified such opportunities in the securitized, corporate credit and muni sectors. We’re remaining cautious and defensive in our positioning, focusing on high-quality securities and positioning our portfolio to weather a U-shaped recovery. We’re emphasizing securities the Fed is buying—high-quality corporate, mortgage and muni securities and Treasury inflation-protected securities.
At the same time, we’re reviewing each portfolio holding, eliminating securities we’re uncomfortable holding in the current environment. In particular, we’ve reduced exposure to securitized securities. We believe rising unemployment and the broad economic shutdown created by the pandemic will create challenges for certain segments of the mortgage market. We’ve also hedged overall risk in the portfolio via credit default swaps. As always, we favor a bottom-up approach to portfolio management, emphasizing careful security selection.
|
| |
| MARCH 31, 2020 | |
| Portfolio at a Glance | |
| Average Duration (effective) | 5.9 years |
| Weighted Average Life to Maturity | 7.9 years |
| | |
| Types of Investments in Portfolio | % of net assets |
| Corporate Bonds | 31.6% |
| U.S. Treasury Securities | 28.2% |
| U.S. Government Agency Mortgage-Backed Securities | 12.8% |
| Asset-Backed Securities | 6.8% |
| Collateralized Mortgage Obligations | 4.5% |
| Collateralized Loan Obligations | 3.9% |
| Municipal Securities | 2.1% |
| Commercial Mortgage-Backed Securities | 1.9% |
| Sovereign Governments and Agencies | 1.8% |
| Preferred Stocks | 0.2% |
| Bank Loan Obligations | 0.2% |
| Temporary Cash Investments | 6.0% |
| Other Assets and Liabilities | —* |
*Category is less than 0.05% of total net assets.
Fund shareholders may incur two types of costs: (1) transaction costs, including sales charges (loads) on purchase payments and redemption/exchange fees; and (2) ongoing costs, including management fees; distribution and service (12b-1) fees; and other fund expenses. This example is intended to help you understand your ongoing costs (in dollars) of investing in your fund and to compare these costs with the ongoing cost of investing in other mutual funds.
The example is based on an investment of $1,000 made at the beginning of the period and held for the entire period from October 1, 2019 to March 31, 2020.
Actual Expenses
The table provides information about actual account values and actual expenses for each class. You may use the information, together with the amount you invested, to estimate the expenses that you paid over the period. First, identify the share class you own. Then simply divide your account value by $1,000 (for example, an $8,600 account value divided by $1,000 = 8.6), then multiply the result by the number under the heading “Expenses Paid During Period” to estimate the expenses you paid on your account during this period.
If you hold Investor Class shares of any American Century Investments fund, or I Class shares of the American Century Diversified Bond Fund, in an American Century Investments account (i.e., not through a financial intermediary or employer-sponsored retirement plan account), American Century Investments may charge you a $25.00 annual account maintenance fee if the value of those shares is less than $10,000. We will redeem shares automatically in one of your accounts to pay the $25.00 fee. In determining your total eligible investment amount, we will include your investments in all personal accounts (including American Century Investments brokerage accounts) registered under your Social Security number. Personal accounts include individual accounts, joint accounts, UGMA/UTMA accounts, personal trusts, Coverdell Education Savings Accounts and IRAs (including traditional, Roth, Rollover, SEP-, SARSEP- and SIMPLE-IRAs), and certain other retirement accounts. If you have only business, business retirement, employer-sponsored or American Century Investments brokerage accounts, you are currently not subject to this fee. If you are subject to the account maintenance fee, your account value could be reduced by the fee amount.
Hypothetical Example for Comparison Purposes
The table also provides information about hypothetical account values and hypothetical expenses based on the actual expense ratio of each class of your fund and an assumed rate of return of 5% per year before expenses, which is not the actual return of a fund’s share class. The hypothetical account values and expenses may not be used to estimate the actual ending account balance or expenses you paid for the period. You may use this information to compare the ongoing costs of investing in your fund and other funds. To do so, compare this 5% hypothetical example with the 5% hypothetical examples that appear in the shareholder reports of the other funds.
Please note that the expenses shown in the table are meant to highlight your ongoing costs only and do not reflect any transactional costs, such as sales charges (loads) or redemption/exchange fees. Therefore, the table is useful in comparing ongoing costs only, and will not help you determine the relative total costs of owning different funds. In addition, if these transactional costs were included, your costs would have been higher.
|
| | | | |
| | Beginning
Account Value
10/1/19 | Ending
Account Value
3/31/20 | Expenses Paid
During Period(1)
10/1/19 - 3/31/20 | Annualized
Expense Ratio(1) |
| Actual | | | | |
| Investor Class | $1,000 | $994.80 | $2.74 | 0.55% |
| I Class | $1,000 | $995.30 | $2.24 | 0.45% |
| A Class | $1,000 | $993.60 | $3.99 | 0.80% |
| C Class | $1,000 | $989.10 | $7.71 | 1.55% |
| R Class | $1,000 | $992.40 | $5.23 | 1.05% |
| R5 Class | $1,000 | $994.90 | $1.75 | 0.35% |
| Hypothetical | | | | |
| Investor Class | $1,000 | $1,022.25 | $2.78 | 0.55% |
| I Class | $1,000 | $1,022.75 | $2.28 | 0.45% |
| A Class | $1,000 | $1,021.00 | $4.04 | 0.80% |
| C Class | $1,000 | $1,017.25 | $7.82 | 1.55% |
| R Class | $1,000 | $1,019.75 | $5.30 | 1.05% |
| R5 Class | $1,000 | $1,023.25 | $1.77 | 0.35% |
| |
| (1) | Expenses are equal to the class's annualized expense ratio listed in the table above, multiplied by the average account value over the period, multiplied by 183, the number of days in the most recent fiscal half-year, divided by 366, to reflect the one-half year period. Annualized expense ratio reflects actual expenses, including any applicable fee waivers or expense reimbursements and excluding any acquired fund fees and expenses. |
MARCH 31, 2020
|
| | | | | | |
| | Principal Amount/ Shares | Value |
| CORPORATE BONDS — 31.6% | | |
| Aerospace and Defense — 0.2% | | |
| Lockheed Martin Corp., 3.80%, 3/1/45 | $ | 90,000 |
| $ | 98,308 |
|
| United Technologies Corp., 6.05%, 6/1/36 | 95,000 |
| 127,174 |
|
| | | 225,482 |
|
| Auto Components — 0.1% | | |
ZF North America Capital, Inc., 4.00%, 4/29/20(1) | 150,000 |
| 149,252 |
|
| Automobiles — 0.7% | | |
| Ford Motor Credit Co. LLC, 5.875%, 8/2/21 | 270,000 |
| 265,950 |
|
| Ford Motor Credit Co. LLC, 2.98%, 8/3/22 | 200,000 |
| 187,000 |
|
| Ford Motor Credit Co. LLC, 3.35%, 11/1/22 | 200,000 |
| 185,000 |
|
| General Motors Co., 5.15%, 4/1/38 | 100,000 |
| 72,646 |
|
| General Motors Financial Co., Inc., 3.20%, 7/6/21 | 210,000 |
| 200,688 |
|
| General Motors Financial Co., Inc., 5.25%, 3/1/26 | 75,000 |
| 66,329 |
|
| | | 977,613 |
|
| Banks — 4.8% | | |
| Banco Santander SA, 3.50%, 4/11/22 | 200,000 |
| 197,978 |
|
| Bank of America Corp., MTN, 4.00%, 1/22/25 | 250,000 |
| 264,460 |
|
| Bank of America Corp., MTN, VRN, 3.82%, 1/20/28 | 150,000 |
| 155,906 |
|
| Bank of America Corp., VRN, 3.00%, 12/20/23 | 325,000 |
| 331,548 |
|
| Bank of America Corp., VRN, 3.42%, 12/20/28 | 60,000 |
| 62,077 |
|
| Bank of Montreal, MTN, 3.30%, 2/5/24 | 30,000 |
| 31,389 |
|
BNP Paribas SA, VRN, 2.82%, 11/19/25(1) | 150,000 |
| 148,446 |
|
BPCE SA, 5.15%, 7/21/24(1) | 200,000 |
| 211,235 |
|
| Canadian Imperial Bank of Commerce, 2.25%, 1/28/25 | 260,000 |
| 257,842 |
|
| Citigroup, Inc., 2.90%, 12/8/21 | 592,000 |
| 597,844 |
|
| Citigroup, Inc., 2.75%, 4/25/22 | 12,000 |
| 12,072 |
|
| Citigroup, Inc., 4.05%, 7/30/22 | 80,000 |
| 81,537 |
|
| Citigroup, Inc., VRN, 3.52%, 10/27/28 | 180,000 |
| 180,592 |
|
| Cooperatieve Rabobank UA, 3.95%, 11/9/22 | 250,000 |
| 251,797 |
|
| Fifth Third BanCorp., 4.30%, 1/16/24 | 80,000 |
| 86,029 |
|
| Fifth Third BanCorp., 2.375%, 1/28/25 | 270,000 |
| 263,499 |
|
| FNB Corp., 2.20%, 2/24/23 | 180,000 |
| 176,922 |
|
| HSBC Holdings plc, 2.95%, 5/25/21 | 200,000 |
| 201,330 |
|
| HSBC Holdings plc, 4.30%, 3/8/26 | 200,000 |
| 213,950 |
|
| HSBC Holdings plc, 4.375%, 11/23/26 | 200,000 |
| 212,851 |
|
| HSBC Holdings plc, VRN, 3.26%, 3/13/23 | 200,000 |
| 200,479 |
|
| HSBC Holdings plc, VRN, 2.63%, 11/7/25 | 200,000 |
| 194,384 |
|
| Huntington Bancshares, Inc., 2.55%, 2/4/30 | 330,000 |
| 300,696 |
|
| JPMorgan Chase & Co., VRN, 3.70%, 5/6/30 | 135,000 |
| 145,277 |
|
| Lloyds Banking Group plc, VRN, 2.44%, 2/5/26 | 200,000 |
| 189,272 |
|
| PNC Bank N.A., 2.70%, 10/22/29 | 250,000 |
| 243,079 |
|
| Regions Financial Corp., 3.80%, 8/14/23 | 100,000 |
| 101,427 |
|
|
| | | | | | |
| | Principal Amount/ Shares | Value |
| Royal Bank of Canada, 2.15%, 10/26/20 | $ | 210,000 |
| $ | 209,915 |
|
| Sumitomo Mitsui Financial Group, Inc., 2.35%, 1/15/25 | 300,000 |
| 298,540 |
|
| Truist Bank, 3.30%, 5/15/26 | 200,000 |
| 205,627 |
|
| U.S. Bancorp, MTN, 3.60%, 9/11/24 | 70,000 |
| 71,994 |
|
| U.S. Bank N.A., 2.80%, 1/27/25 | 250,000 |
| 258,416 |
|
UniCredit SpA, VRN, 5.86%, 6/19/32(1) | 200,000 |
| 184,417 |
|
| Wells Fargo & Co., 4.125%, 8/15/23 | 10,000 |
| 10,329 |
|
| Wells Fargo & Co., 3.00%, 10/23/26 | 250,000 |
| 256,712 |
|
| Wells Fargo & Co., MTN, 4.65%, 11/4/44 | 150,000 |
| 173,558 |
|
| | | 6,983,426 |
|
| Beverages — 0.4% | | |
| Anheuser-Busch Cos. LLC / Anheuser-Busch InBev Worldwide, Inc., 4.90%, 2/1/46 | 240,000 |
| 263,138 |
|
| Anheuser-Busch InBev Worldwide, Inc., 4.75%, 1/23/29 | 190,000 |
| 209,331 |
|
| Constellation Brands, Inc., 4.75%, 12/1/25 | 140,000 |
| 146,757 |
|
| | | 619,226 |
|
| Biotechnology — 0.9% | | |
| AbbVie, Inc., 3.60%, 5/14/25 | 280,000 |
| 295,527 |
|
AbbVie, Inc., 3.20%, 11/21/29(1) | 180,000 |
| 184,748 |
|
AbbVie, Inc., 4.25%, 11/21/49(1) | 140,000 |
| 152,970 |
|
| Amgen, Inc., 4.66%, 6/15/51 | 108,000 |
| 136,615 |
|
| Biogen, Inc., 3.625%, 9/15/22 | 210,000 |
| 215,905 |
|
| Gilead Sciences, Inc., 3.65%, 3/1/26 | 230,000 |
| 251,193 |
|
| Gilead Sciences, Inc., 4.15%, 3/1/47 | 50,000 |
| 61,431 |
|
| | | 1,298,389 |
|
| Building Products — 0.5% | | |
Builders FirstSource, Inc., 5.00%, 3/1/30(1) | 260,000 |
| 235,462 |
|
Carrier Global Corp., 2.72%, 2/15/30(1) | 131,000 |
| 121,304 |
|
| Masco Corp., 4.45%, 4/1/25 | 100,000 |
| 102,318 |
|
Standard Industries, Inc., 4.75%, 1/15/28(1) | 224,000 |
| 207,854 |
|
| | | 666,938 |
|
| Capital Markets — 2.3% | | |
| Ares Capital Corp., 3.25%, 7/15/25 | 325,000 |
| 258,888 |
|
| Goldman Sachs BDC, Inc., 3.75%, 2/10/25 | 103,000 |
| 95,677 |
|
| Goldman Sachs Group, Inc. (The), 3.50%, 4/1/25 | 204,000 |
| 207,236 |
|
| Goldman Sachs Group, Inc. (The), 3.50%, 11/16/26 | 380,000 |
| 389,203 |
|
| Goldman Sachs Group, Inc. (The), VRN, 2.88%, 10/31/22 | 70,000 |
| 70,416 |
|
| Icahn Enterprises LP / Icahn Enterprises Finance Corp., 5.25%, 5/15/27 | 391,000 |
| 364,119 |
|
KKR Group Finance Co. VII LLC, 3.625%, 2/25/50(1) | 310,000 |
| 257,233 |
|
LPL Holdings, Inc., 4.625%, 11/15/27(1) | 250,000 |
| 230,530 |
|
| Morgan Stanley, MTN, 3.70%, 10/23/24 | 60,000 |
| 63,511 |
|
| Morgan Stanley, MTN, 4.00%, 7/23/25 | 440,000 |
| 471,810 |
|
| Morgan Stanley, MTN, VRN, 2.70%, 1/22/31 | 240,000 |
| 235,760 |
|
MSCI, Inc., 4.00%, 11/15/29(1) | 330,000 |
| 329,647 |
|
| Oaktree Specialty Lending Corp., 3.50%, 2/25/25 | 155,000 |
| 139,508 |
|
State Street Corp., VRN, 2.83%, 3/30/23(1) | 40,000 |
| 40,392 |
|
|
| | | | | | |
| | Principal Amount/ Shares | Value |
UBS Group AG, 3.49%, 5/23/23(1) | $ | 200,000 |
| $ | 202,334 |
|
| | | 3,356,264 |
|
| Chemicals — 0.2% | | |
CF Industries, Inc., 4.50%, 12/1/26(1) | 130,000 |
| 137,286 |
|
| CF Industries, Inc., 5.15%, 3/15/34 | 110,000 |
| 112,288 |
|
| | | 249,574 |
|
| Commercial Services and Supplies — 0.7% | | |
Nielsen Finance LLC / Nielsen Finance Co., 5.00%, 4/15/22(1) | 80,000 |
| 74,173 |
|
| Republic Services, Inc., 3.55%, 6/1/22 | 190,000 |
| 195,064 |
|
| Republic Services, Inc., 2.30%, 3/1/30 | 341,000 |
| 327,752 |
|
| Waste Connections, Inc., 3.50%, 5/1/29 | 130,000 |
| 131,966 |
|
| Waste Connections, Inc., 2.60%, 2/1/30 | 230,000 |
| 215,789 |
|
| Waste Management, Inc., 4.75%, 6/30/20 | 70,000 |
| 70,453 |
|
| | | 1,015,197 |
|
| Communications Equipment — 0.2% | | |
CommScope, Inc., 5.50%, 3/1/24(1) | 140,000 |
| 142,556 |
|
| Motorola Solutions, Inc., 4.60%, 5/23/29 | 190,000 |
| 199,981 |
|
| | | 342,537 |
|
| Construction Materials — 0.2% | | |
| Martin Marietta Materials, Inc., 2.50%, 3/15/30 | 227,000 |
| 208,011 |
|
| Consumer Finance — 1.2% | | |
| AerCap Ireland Capital DAC / AerCap Global Aviation Trust, 5.00%, 10/1/21 | 150,000 |
| 134,658 |
|
| Ally Financial, Inc., 4.625%, 3/30/25 | 278,000 |
| 267,432 |
|
| Ally Financial, Inc., 5.75%, 11/20/25 | 36,000 |
| 35,485 |
|
| Capital One Bank USA N.A., 3.375%, 2/15/23 | 250,000 |
| 244,918 |
|
| Capital One Bank USA N.A., VRN, 2.28%, 1/28/26 | 300,000 |
| 272,222 |
|
| Capital One Financial Corp., 3.80%, 1/31/28 | 130,000 |
| 128,785 |
|
| Discover Financial Services, 3.75%, 3/4/25 | 200,000 |
| 197,926 |
|
| Navient Corp., 5.00%, 3/15/27 | 100,000 |
| 86,720 |
|
Park Aerospace Holdings Ltd., 5.50%, 2/15/24(1) | 225,000 |
| 194,124 |
|
| Synchrony Financial, 2.85%, 7/25/22 | 140,000 |
| 133,544 |
|
| Synchrony Financial, 3.95%, 12/1/27 | 100,000 |
| 89,138 |
|
| | | 1,784,952 |
|
| Containers and Packaging — 0.4% | | |
Ardagh Packaging Finance plc / Ardagh Holdings USA, Inc., 5.25%, 8/15/27(1) | 200,000 |
| 206,110 |
|
Berry Global, Inc., 4.875%, 7/15/26(1) | 150,000 |
| 152,343 |
|
| Crown Americas LLC / Crown Americas Capital Corp. V, 4.25%, 9/30/26 | 65,000 |
| 64,580 |
|
Reynolds Group Issuer, Inc. / Reynolds Group Issuer LLC / Reynolds Group Issuer Lu, 5.125%, 7/15/23(1) | 130,000 |
| 129,837 |
|
| | | 552,870 |
|
| Diversified Financial Services — 0.2% | | |
| Berkshire Hathaway, Inc., 2.75%, 3/15/23 | 10,000 |
| 10,421 |
|
| Credit Suisse Group Funding Guernsey Ltd., 3.45%, 4/16/21 | 250,000 |
| 251,658 |
|
| | | 262,079 |
|
|
| | | | | | |
| | Principal Amount/ Shares | Value |
| Diversified Telecommunication Services — 1.4% | | |
| AT&T, Inc., 3.875%, 8/15/21 | $ | 180,000 |
| $ | 184,427 |
|
| AT&T, Inc., 3.80%, 2/15/27 | 100,000 |
| 104,143 |
|
| AT&T, Inc., 4.10%, 2/15/28 | 160,000 |
| 168,420 |
|
| AT&T, Inc., 4.30%, 2/15/30 | 200,000 |
| 215,691 |
|
| AT&T, Inc., 5.15%, 11/15/46 | 55,000 |
| 64,976 |
|
Deutsche Telekom AG, 3.625%, 1/21/50(1) | 200,000 |
| 199,952 |
|
| Telefonica Emisiones SA, 5.46%, 2/16/21 | 110,000 |
| 112,376 |
|
| Verizon Communications, Inc., 2.95%, 3/15/22 | 182,000 |
| 185,794 |
|
| Verizon Communications, Inc., 2.45%, 11/1/22 | 111,000 |
| 112,928 |
|
| Verizon Communications, Inc., 4.40%, 11/1/34 | 300,000 |
| 352,363 |
|
| Verizon Communications, Inc., 4.75%, 11/1/41 | 100,000 |
| 116,927 |
|
| Verizon Communications, Inc., 5.01%, 8/21/54 | 130,000 |
| 178,518 |
|
| | | 1,996,515 |
|
| Electric Utilities — 1.3% | | |
| AEP Transmission Co. LLC, 3.75%, 12/1/47 | 60,000 |
| 62,215 |
|
| Berkshire Hathaway Energy Co., 3.80%, 7/15/48 | 90,000 |
| 94,774 |
|
| Commonwealth Edison Co., 3.20%, 11/15/49 | 40,000 |
| 40,442 |
|
| DTE Electric Co., 2.25%, 3/1/30 | 130,000 |
| 126,261 |
|
| Duke Energy Corp., 3.55%, 9/15/21 | 80,000 |
| 81,130 |
|
| Duke Energy Corp., 2.65%, 9/1/26 | 50,000 |
| 49,736 |
|
| Duke Energy Florida LLC, 6.35%, 9/15/37 | 70,000 |
| 96,842 |
|
| Duke Energy Florida LLC, 3.85%, 11/15/42 | 10,000 |
| 11,055 |
|
| Duke Energy Progress LLC, 4.15%, 12/1/44 | 20,000 |
| 22,665 |
|
| Duke Energy Progress LLC, 3.70%, 10/15/46 | 50,000 |
| 54,177 |
|
| Exelon Corp., 5.15%, 12/1/20 | 130,000 |
| 131,278 |
|
| Exelon Corp., 4.45%, 4/15/46 | 60,000 |
| 61,006 |
|
FirstEnergy Transmission LLC, 4.55%, 4/1/49(1) | 80,000 |
| 80,278 |
|
| Florida Power & Light Co., 4.125%, 2/1/42 | 70,000 |
| 76,161 |
|
| Florida Power & Light Co., 3.15%, 10/1/49 | 70,000 |
| 72,967 |
|
| Georgia Power Co., 4.30%, 3/15/42 | 70,000 |
| 76,425 |
|
| MidAmerican Energy Co., 4.40%, 10/15/44 | 140,000 |
| 160,243 |
|
| Nevada Power Co., 2.40%, 5/1/30 | 91,000 |
| 87,231 |
|
NextEra Energy Operating Partners LP, 4.50%, 9/15/27(1) | 100,000 |
| 98,197 |
|
| Oncor Electric Delivery Co. LLC, 3.10%, 9/15/49 | 80,000 |
| 78,084 |
|
| Progress Energy, Inc., 3.15%, 4/1/22 | 80,000 |
| 80,967 |
|
| Southern Co. Gas Capital Corp., 3.95%, 10/1/46 | 10,000 |
| 8,989 |
|
| Xcel Energy, Inc., 3.35%, 12/1/26 | 30,000 |
| 29,701 |
|
Xcel Energy, Inc., 3.40%, 6/1/30(2) | 140,000 |
| 142,198 |
|
| | | 1,823,022 |
|
| Electronic Equipment, Instruments and Components — 0.1% | | |
| Amphenol Corp., 2.05%, 3/1/25 | 200,000 |
| 189,792 |
|
| Energy Equipment and Services — 0.1% | | |
| Baker Hughes a GE Co. LLC / Baker Hughes Co-Obligor, Inc., 3.14%, 11/7/29 | 115,000 |
| 99,974 |
|
| Equity Real Estate Investment Trusts (REITs) — 1.6% | | |
| Alexandria Real Estate Equities, Inc., 4.90%, 12/15/30 | 40,000 |
| 43,635 |
|
|
| | | | | | |
| | Principal Amount/ Shares | Value |
| American Tower Corp., 3.375%, 10/15/26 | $ | 70,000 |
| $ | 70,175 |
|
| American Tower Corp., 2.90%, 1/15/30 | 178,000 |
| 174,315 |
|
| AvalonBay Communities, Inc., MTN, 3.20%, 1/15/28 | 110,000 |
| 109,649 |
|
| Boston Properties LP, 3.65%, 2/1/26 | 200,000 |
| 213,262 |
|
| Crown Castle International Corp., 5.25%, 1/15/23 | 240,000 |
| 254,866 |
|
Crown Castle International Corp., 3.30%, 7/1/30(2) | 14,000 |
| 14,026 |
|
| Duke Realty LP, 2.875%, 11/15/29 | 194,000 |
| 187,032 |
|
| Duke Realty LP, 3.05%, 3/1/50 | 50,000 |
| 40,616 |
|
| Essex Portfolio LP, 3.625%, 8/15/22 | 170,000 |
| 168,657 |
|
| Essex Portfolio LP, 3.25%, 5/1/23 | 50,000 |
| 49,103 |
|
| Healthcare Realty Trust, Inc., 2.40%, 3/15/30 | 100,000 |
| 89,132 |
|
| Kilroy Realty LP, 3.80%, 1/15/23 | 44,000 |
| 44,838 |
|
| Kimco Realty Corp., 2.80%, 10/1/26 | 150,000 |
| 146,682 |
|
| MPT Operating Partnership LP / MPT Finance Corp., 5.00%, 10/15/27 | 160,000 |
| 156,412 |
|
| MPT Operating Partnership LP / MPT Finance Corp., 4.625%, 8/1/29 | 120,000 |
| 111,075 |
|
| National Retail Properties, Inc., 2.50%, 4/15/30 | 100,000 |
| 89,423 |
|
| Prologis LP, 2.125%, 4/15/27 | 50,000 |
| 47,721 |
|
| Prologis LP, 3.00%, 4/15/50 | 146,000 |
| 127,228 |
|
| Public Storage, 3.39%, 5/1/29 | 100,000 |
| 100,576 |
|
SBA Communications Corp., 3.875%, 2/15/27(1) | 20,000 |
| 20,200 |
|
| Service Properties Trust, 4.65%, 3/15/24 | 80,000 |
| 58,694 |
|
| Ventas Realty LP, 4.125%, 1/15/26 | 10,000 |
| 10,006 |
|
Ventas Realty LP, 4.75%, 11/15/30(2) | 33,000 |
| 32,479 |
|
| | | 2,359,802 |
|
| Food and Staples Retailing — 0.4% | | |
Albertsons Cos., Inc. / Safeway, Inc. / New Albertsons LP / Albertsons LLC, 4.875%, 2/15/30(1) | 260,000 |
| 259,350 |
|
| Kroger Co. (The), 3.875%, 10/15/46 | 130,000 |
| 128,185 |
|
Sysco Corp., 5.95%, 4/1/30(2) | 42,000 |
| 44,307 |
|
| Walmart, Inc., 4.05%, 6/29/48 | 100,000 |
| 129,175 |
|
| | | 561,017 |
|
| Food Products — 0.4% | | |
| Conagra Brands, Inc., 4.60%, 11/1/25 | 130,000 |
| 137,872 |
|
Kraft Heinz Foods Co., 3.75%, 4/1/30(1) | 120,000 |
| 114,733 |
|
Lamb Weston Holdings, Inc., 4.625%, 11/1/24(1) | 170,000 |
| 168,513 |
|
Post Holdings, Inc., 4.625%, 4/15/30(1) | 180,000 |
| 173,700 |
|
| | | 594,818 |
|
| Health Care Equipment and Supplies — 0.3% | | |
Baxter International, Inc., 3.95%, 4/1/30(1) | 30,000 |
| 32,505 |
|
| Becton Dickinson and Co., 3.73%, 12/15/24 | 200,000 |
| 205,428 |
|
| DH Europe Finance II Sarl, 3.40%, 11/15/49 | 50,000 |
| 49,393 |
|
| Medtronic, Inc., 3.50%, 3/15/25 | 67,000 |
| 72,298 |
|
| Medtronic, Inc., 4.375%, 3/15/35 | 72,000 |
| 89,969 |
|
| | | 449,593 |
|
| Health Care Providers and Services — 1.4% | | |
| Acadia Healthcare Co., Inc., 5.125%, 7/1/22 | 100,000 |
| 96,156 |
|
|
| | | | | | |
| | Principal Amount/ Shares | Value |
| Aetna, Inc., 2.75%, 11/15/22 | $ | 60,000 |
| $ | 60,436 |
|
| Anthem, Inc., 3.65%, 12/1/27 | 80,000 |
| 82,801 |
|
Catalent Pharma Solutions, Inc., 5.00%, 7/15/27(1) | 200,000 |
| 195,110 |
|
| Centene Corp., 4.75%, 1/15/25 | 70,000 |
| 71,313 |
|
Centene Corp., 4.625%, 12/15/29(1) | 150,000 |
| 151,583 |
|
| Cigna Corp., 2.40%, 3/15/30 | 130,000 |
| 123,780 |
|
| CommonSpirit Health, 2.95%, 11/1/22 | 100,000 |
| 97,758 |
|
| CVS Health Corp., 3.50%, 7/20/22 | 70,000 |
| 71,883 |
|
| CVS Health Corp., 2.75%, 12/1/22 | 20,000 |
| 20,160 |
|
| CVS Health Corp., 4.30%, 3/25/28 | 110,000 |
| 117,052 |
|
| CVS Health Corp., 4.78%, 3/25/38 | 80,000 |
| 88,180 |
|
| HCA, Inc., 5.00%, 3/15/24 | 30,000 |
| 31,116 |
|
| HCA, Inc., 3.50%, 9/1/30 | 195,000 |
| 177,717 |
|
IQVIA, Inc., 5.00%, 5/15/27(1) | 200,000 |
| 205,894 |
|
| Partners Healthcare System, Inc., 3.19%, 7/1/49 | 85,000 |
| 85,476 |
|
Tenet Healthcare Corp., 4.875%, 1/1/26(1) | 75,000 |
| 71,719 |
|
| UnitedHealth Group, Inc., 2.875%, 3/15/22 | 10,000 |
| 10,282 |
|
| UnitedHealth Group, Inc., 3.75%, 7/15/25 | 170,000 |
| 184,765 |
|
| UnitedHealth Group, Inc., 4.75%, 7/15/45 | 70,000 |
| 89,610 |
|
| | | 2,032,791 |
|
| Hotels, Restaurants and Leisure — 0.1% | | |
| McDonald's Corp., MTN, 3.375%, 5/26/25 | 160,000 |
| 167,048 |
|
| Household Durables — 0.8% | | |
| D.R. Horton, Inc., 2.50%, 10/15/24 | 160,000 |
| 149,768 |
|
| Lennar Corp., 4.75%, 11/29/27 | 100,000 |
| 100,305 |
|
Mattamy Group Corp., 4.625%, 3/1/30(1) | 225,000 |
| 194,766 |
|
| MDC Holdings, Inc., 3.85%, 1/15/30 | 410,000 |
| 371,306 |
|
| Toll Brothers Finance Corp., 4.35%, 2/15/28 | 100,000 |
| 91,854 |
|
| Toll Brothers Finance Corp., 3.80%, 11/1/29 | 220,000 |
| 194,167 |
|
| | | 1,102,166 |
|
Household Products† | | |
| Kimberly-Clark Corp., 3.10%, 3/26/30 | 28,000 |
| 30,105 |
|
| Independent Power and Renewable Electricity Producers — 0.2% | |
Cometa Energia SA de CV, 6.375%, 4/24/35(1) | 290,700 |
| 266,079 |
|
| Industrial Conglomerates — 0.2% | | |
| Carlisle Cos., Inc., 2.75%, 3/1/30 | 335,000 |
| 294,618 |
|
| Insurance — 1.4% | | |
Aflac, Inc., 3.60%, 4/1/30(2) | 58,000 |
| 58,834 |
|
| American International Group, Inc., 4.125%, 2/15/24 | 420,000 |
| 441,544 |
|
| American International Group, Inc., 4.50%, 7/16/44 | 157,000 |
| 161,184 |
|
Athene Holding Ltd., 6.15%, 4/3/30(2) | 100,000 |
| 100,022 |
|
| Berkshire Hathaway Finance Corp., 4.20%, 8/15/48 | 60,000 |
| 70,850 |
|
| Chubb INA Holdings, Inc., 3.15%, 3/15/25 | 80,000 |
| 83,570 |
|
| Hartford Financial Services Group, Inc. (The), 3.60%, 8/19/49 | 184,000 |
| 174,942 |
|
Liberty Mutual Group, Inc., 4.50%, 6/15/49(1) | 60,000 |
| 59,115 |
|
| Markel Corp., 4.90%, 7/1/22 | 212,000 |
| 213,202 |
|
| MetLife, Inc., 4.125%, 8/13/42 | 120,000 |
| 126,880 |
|
|
| | | | | | |
| | Principal Amount/ Shares | Value |
| Prudential Financial, Inc., MTN, 1.50%, 3/10/26 | $ | 300,000 |
| $ | 282,760 |
|
| Prudential Financial, Inc., VRN, 5.875%, 9/15/42 | 100,000 |
| 97,170 |
|
| WR Berkley Corp., 4.625%, 3/15/22 | 110,000 |
| 94,556 |
|
| | | 1,964,629 |
|
| IT Services — 0.3% | | |
| Fiserv, Inc., 3.50%, 7/1/29 | 90,000 |
| 95,789 |
|
| Global Payments, Inc., 3.20%, 8/15/29 | 160,000 |
| 157,252 |
|
| Mastercard, Inc., 3.65%, 6/1/49 | 80,000 |
| 93,684 |
|
Visa, Inc., 1.90%, 4/15/27(2) | 70,000 |
| 70,004 |
|
| Western Union Co. (The), 2.85%, 1/10/25 | 54,000 |
| 53,855 |
|
| | | 470,584 |
|
| Machinery — 0.1% | | |
Otis Worldwide Corp., VRN, 2.09%, 4/5/23(1) | 60,000 |
| 57,131 |
|
| Media — 1.0% | | |
Cable Onda SA, 4.50%, 1/30/30(1) | 200,000 |
| 177,110 |
|
| Charter Communications Operating LLC / Charter Communications Operating Capital, 4.91%, 7/23/25 | 160,000 |
| 172,675 |
|
| Charter Communications Operating LLC / Charter Communications Operating Capital, 4.20%, 3/15/28 | 10,000 |
| 10,288 |
|
| Charter Communications Operating LLC / Charter Communications Operating Capital, 4.80%, 3/1/50 | 60,000 |
| 62,816 |
|
| Comcast Corp., 4.40%, 8/15/35 | 30,000 |
| 36,461 |
|
| Comcast Corp., 6.40%, 5/15/38 | 80,000 |
| 117,041 |
|
| Comcast Corp., 4.75%, 3/1/44 | 154,000 |
| 195,539 |
|
| Comcast Corp., 3.97%, 11/1/47 | 102,000 |
| 118,400 |
|
Fox Corp., 3.05%, 4/7/25(2) | 40,000 |
| 40,430 |
|
TEGNA, Inc., 4.625%, 3/15/28(1) | 125,000 |
| 110,547 |
|
TEGNA, Inc., 5.00%, 9/15/29(1) | 140,000 |
| 126,525 |
|
| ViacomCBS, Inc., 3.125%, 6/15/22 | 50,000 |
| 49,389 |
|
| ViacomCBS, Inc., 4.25%, 9/1/23 | 140,000 |
| 142,988 |
|
| ViacomCBS, Inc., 3.70%, 8/15/24 | 100,000 |
| 102,162 |
|
| | | 1,462,371 |
|
| Metals and Mining — 0.4% | | |
Minera Mexico SA de CV, 4.50%, 1/26/50(1) | 300,000 |
| 255,091 |
|
Novelis Corp., 4.75%, 1/30/30(1) | 235,000 |
| 210,472 |
|
| Steel Dynamics, Inc., 3.45%, 4/15/30 | 90,000 |
| 82,048 |
|
| | | 547,611 |
|
| Multi-Utilities — 0.5% | | |
Ameren Corp., 3.50%, 1/15/31(2) | 42,000 |
| 42,291 |
|
| CenterPoint Energy, Inc., 4.25%, 11/1/28 | 120,000 |
| 123,340 |
|
| Consolidated Edison Co. of New York, Inc., 3.95%, 3/1/43 | 110,000 |
| 103,259 |
|
| Dominion Energy, Inc., 4.90%, 8/1/41 | 100,000 |
| 104,739 |
|
| NiSource, Inc., 5.65%, 2/1/45 | 110,000 |
| 126,885 |
|
| Sempra Energy, 2.875%, 10/1/22 | 130,000 |
| 130,590 |
|
| Sempra Energy, 3.25%, 6/15/27 | 100,000 |
| 97,412 |
|
| Sempra Energy, 4.00%, 2/1/48 | 50,000 |
| 48,165 |
|
| | | 776,681 |
|
|
| | | | | | |
| | Principal Amount/ Shares | Value |
| Oil, Gas and Consumable Fuels — 3.3% | | |
Aker BP ASA, 3.75%, 1/15/30(1) | $ | 150,000 |
| $ | 112,923 |
|
| CNOOC Nexen Finance 2014 ULC, 4.25%, 4/30/24 | 70,000 |
| 74,901 |
|
| Concho Resources, Inc., 4.375%, 1/15/25 | 110,000 |
| 94,018 |
|
| Continental Resources, Inc., 4.375%, 1/15/28 | 140,000 |
| 65,314 |
|
| Diamondback Energy, Inc., 5.375%, 5/31/25 | 100,000 |
| 73,975 |
|
| Diamondback Energy, Inc., 3.50%, 12/1/29 | 260,000 |
| 184,411 |
|
| Enbridge, Inc., 4.00%, 10/1/23 | 10,000 |
| 9,533 |
|
| Energy Transfer Operating LP, 4.25%, 3/15/23 | 70,000 |
| 62,820 |
|
| Energy Transfer Operating LP, 3.75%, 5/15/30 | 140,000 |
| 110,313 |
|
| Energy Transfer Operating LP, 6.50%, 2/1/42 | 140,000 |
| 126,701 |
|
| EnLink Midstream Partners LP, 4.85%, 7/15/26 | 110,000 |
| 54,853 |
|
| Enterprise Products Operating LLC, 4.85%, 3/15/44 | 200,000 |
| 209,299 |
|
| Equinor ASA, 3.25%, 11/18/49 | 100,000 |
| 98,939 |
|
Gazprom PJSC via Gaz Finance plc, 3.25%, 2/25/30(1) | 400,000 |
| 371,329 |
|
| Hess Corp., 6.00%, 1/15/40 | 70,000 |
| 50,626 |
|
Holly Energy Partners LP / Holly Energy Finance Corp., 5.00%, 2/1/28(1) | 120,000 |
| 101,175 |
|
| Kinder Morgan Energy Partners LP, 5.30%, 9/15/20 | 60,000 |
| 59,823 |
|
| Kinder Morgan Energy Partners LP, 6.50%, 9/1/39 | 161,000 |
| 158,308 |
|
| MPLX LP, 4.875%, 6/1/25 | 190,000 |
| 156,740 |
|
MPLX LP, 4.25%, 12/1/27(1) | 60,000 |
| 52,022 |
|
| MPLX LP, 4.50%, 4/15/38 | 50,000 |
| 39,234 |
|
| MPLX LP, 5.20%, 3/1/47 | 70,000 |
| 56,107 |
|
| Newfield Exploration Co., 5.375%, 1/1/26 | 110,000 |
| 57,651 |
|
| Ovintiv, Inc., 6.50%, 2/1/38 | 30,000 |
| 13,065 |
|
| Petroleos Mexicanos, 6.375%, 2/4/21 | 600,000 |
| 570,720 |
|
| Petroleos Mexicanos, 4.875%, 1/24/22 | 350,000 |
| 302,955 |
|
| Petroleos Mexicanos, 6.50%, 3/13/27 | 600,000 |
| 449,185 |
|
| Petroleos Mexicanos, 6.625%, 6/15/35 | 50,000 |
| 34,138 |
|
| Petroleos Mexicanos, 5.50%, 6/27/44 | 80,000 |
| 50,136 |
|
| Phillips 66, 4.30%, 4/1/22 | 60,000 |
| 60,263 |
|
| Sabine Pass Liquefaction LLC, 5.625%, 3/1/25 | 315,000 |
| 289,667 |
|
| Sunoco Logistics Partners Operations LP, 4.00%, 10/1/27 | 50,000 |
| 39,660 |
|
| Williams Cos., Inc. (The), 4.125%, 11/15/20 | 280,000 |
| 276,836 |
|
| Williams Cos., Inc. (The), 4.55%, 6/24/24 | 135,000 |
| 123,249 |
|
| Williams Cos., Inc. (The), 5.10%, 9/15/45 | 80,000 |
| 76,311 |
|
| WPX Energy, Inc., 4.50%, 1/15/30 | 120,000 |
| 65,610 |
|
| | | 4,732,810 |
|
| Pharmaceuticals — 0.8% | | |
| Allergan Finance LLC, 3.25%, 10/1/22 | 60,000 |
| 60,224 |
|
| Allergan Funding SCS, 3.85%, 6/15/24 | 100,000 |
| 104,926 |
|
| Allergan Funding SCS, 4.55%, 3/15/35 | 100,000 |
| 110,539 |
|
Bausch Health Cos., Inc., 7.00%, 3/15/24(1) | 150,000 |
| 154,688 |
|
Bausch Health Cos., Inc., 5.00%, 1/30/28(1) | 220,000 |
| 209,924 |
|
Bristol-Myers Squibb Co., 3.25%, 8/15/22(1) | 200,000 |
| 207,874 |
|
| Elanco Animal Health, Inc., 5.65%, 8/28/28 | 270,000 |
| 285,491 |
|
|
| | | | | | |
| | Principal Amount/ Shares | Value |
| Zoetis, Inc., 3.00%, 9/12/27 | $ | 70,000 |
| $ | 70,732 |
|
| | | 1,204,398 |
|
| Road and Rail — 0.7% | | |
Ashtead Capital, Inc., 4.125%, 8/15/25(1) | 200,000 |
| 184,000 |
|
| Burlington Northern Santa Fe LLC, 4.95%, 9/15/41 | 100,000 |
| 125,993 |
|
| Burlington Northern Santa Fe LLC, 4.45%, 3/15/43 | 120,000 |
| 142,592 |
|
| Burlington Northern Santa Fe LLC, 4.15%, 4/1/45 | 90,000 |
| 105,810 |
|
| CSX Corp., 3.25%, 6/1/27 | 170,000 |
| 174,992 |
|
| CSX Corp., 3.80%, 4/15/50 | 70,000 |
| 73,860 |
|
| Union Pacific Corp., 2.40%, 2/5/30 | 90,000 |
| 88,160 |
|
| Union Pacific Corp., 3.60%, 9/15/37 | 50,000 |
| 51,956 |
|
Union Pacific Corp., 3.84%, 3/20/60(1) | 10,000 |
| 10,872 |
|
| Union Pacific Corp., MTN, 3.55%, 8/15/39 | 80,000 |
| 80,932 |
|
| | | 1,039,167 |
|
| Semiconductors and Semiconductor Equipment — 0.1% | | |
NXP BV / NXP Funding LLC, 3.875%, 9/1/22(1) | 200,000 |
| 200,967 |
|
| Software — 0.4% | | |
| Adobe, Inc., 2.30%, 2/1/30 | 200,000 |
| 200,719 |
|
| Oracle Corp., 2.50%, 10/15/22 | 105,000 |
| 107,527 |
|
Oracle Corp., 2.50%, 4/1/25(2) | 150,000 |
| 153,307 |
|
| Oracle Corp., 2.65%, 7/15/26 | 20,000 |
| 20,557 |
|
Oracle Corp., 2.95%, 4/1/30(2) | 100,000 |
| 100,813 |
|
| | | 582,923 |
|
| Specialty Retail — 0.4% | | |
| Home Depot, Inc. (The), 3.75%, 2/15/24 | 20,000 |
| 21,155 |
|
| Home Depot, Inc. (The), 3.00%, 4/1/26 | 150,000 |
| 158,619 |
|
| Home Depot, Inc. (The), 5.95%, 4/1/41 | 170,000 |
| 238,952 |
|
| Home Depot, Inc. (The), 3.90%, 6/15/47 | 20,000 |
| 22,589 |
|
| Home Depot, Inc. (The), 3.35%, 4/15/50 | 98,000 |
| 106,868 |
|
| | | 548,183 |
|
| Technology Hardware, Storage and Peripherals — 0.4% | | |
Dell International LLC / EMC Corp., 5.45%, 6/15/23(1) | 230,000 |
| 236,313 |
|
Dell International LLC / EMC Corp., 6.02%, 6/15/26(1) | 320,000 |
| 341,175 |
|
| | | 577,488 |
|
| Textiles, Apparel and Luxury Goods — 0.1% | | |
| NIKE, Inc., 3.375%, 3/27/50 | 70,000 |
| 76,935 |
|
| Trading Companies and Distributors — 0.2% | | |
| Air Lease Corp., MTN, 3.00%, 2/1/30 | 332,000 |
| 241,490 |
|
| International Lease Finance Corp., 5.875%, 8/15/22 | 110,000 |
| 98,452 |
|
| | | 339,942 |
|
| Wireless Telecommunication Services — 0.2% | | |
| Vodafone Group plc, 2.95%, 2/19/23 | 321,000 |
| 328,144 |
|
TOTAL CORPORATE BONDS
(Cost $47,174,430) | | 45,569,114 |
|
| U.S. TREASURY SECURITIES — 28.2% | | |
| U.S. Treasury Bonds, 3.50%, 2/15/39 | 300,000 |
| 427,195 |
|
U.S. Treasury Bonds, 4.375%, 11/15/39(3) | 600,000 |
| 949,547 |
|
|
| | | | | | |
| | Principal Amount/ Shares | Value |
| U.S. Treasury Bonds, 3.125%, 11/15/41 | $ | 200,000 |
| $ | 273,187 |
|
| U.S. Treasury Bonds, 3.125%, 2/15/42 | 300,000 |
| 410,156 |
|
| U.S. Treasury Bonds, 3.00%, 5/15/42 | 1,600,000 |
| 2,148,500 |
|
| U.S. Treasury Bonds, 2.875%, 5/15/43 | 400,000 |
| 527,219 |
|
U.S. Treasury Bonds, 3.125%, 8/15/44(3) | 200,000 |
| 275,773 |
|
| U.S. Treasury Bonds, 3.00%, 11/15/44 | 200,000 |
| 270,828 |
|
| U.S. Treasury Bonds, 2.50%, 2/15/45 | 700,000 |
| 874,426 |
|
| U.S. Treasury Bonds, 3.00%, 5/15/45 | 1,100,000 |
| 1,496,602 |
|
| U.S. Treasury Bonds, 3.00%, 11/15/45 | 200,000 |
| 273,703 |
|
| U.S. Treasury Bonds, 3.375%, 11/15/48 | 800,000 |
| 1,188,000 |
|
| U.S. Treasury Bonds, 2.25%, 8/15/49 | 2,700,000 |
| 3,285,773 |
|
| U.S. Treasury Bonds, 2.00%, 2/15/50 | 400,000 |
| 464,805 |
|
| U.S. Treasury Inflation Indexed Notes, 0.25%, 7/15/29 | 2,521,275 |
| 2,621,076 |
|
| U.S. Treasury Notes, 1.625%, 12/31/21 | 1,700,000 |
| 1,741,736 |
|
| U.S. Treasury Notes, 0.375%, 3/31/22 | 700,000 |
| 701,928 |
|
| U.S. Treasury Notes, 1.75%, 6/15/22 | 2,500,000 |
| 2,584,229 |
|
| U.S. Treasury Notes, 1.50%, 9/15/22 | 4,000,000 |
| 4,122,109 |
|
| U.S. Treasury Notes, 1.875%, 9/30/22 | 2,500,000 |
| 2,601,660 |
|
| U.S. Treasury Notes, 1.625%, 12/15/22 | 3,500,000 |
| 3,629,131 |
|
| U.S. Treasury Notes, 0.50%, 3/15/23 | 3,100,000 |
| 3,119,738 |
|
| U.S. Treasury Notes, 1.50%, 11/30/24 | 3,000,000 |
| 3,159,961 |
|
| U.S. Treasury Notes, 1.125%, 2/28/25 | 1,500,000 |
| 1,556,250 |
|
| U.S. Treasury Notes, 0.50%, 3/31/25 | 300,000 |
| 301,928 |
|
| U.S. Treasury Notes, 1.375%, 8/31/26 | 500,000 |
| 526,934 |
|
| U.S. Treasury Notes, 1.625%, 9/30/26 | 100,000 |
| 107,055 |
|
| U.S. Treasury Notes, 0.625%, 3/31/27 | 1,000,000 |
| 1,005,684 |
|
TOTAL U.S. TREASURY SECURITIES
(Cost $37,197,826) | | 40,645,133 |
|
| U.S. GOVERNMENT AGENCY MORTGAGE-BACKED SECURITIES — 12.8% |
| Adjustable-Rate U.S. Government Agency Mortgage-Backed Securities — 0.4% | |
| FHLMC, VRN, 4.28%, (12-month LIBOR plus 1.80%), 2/1/38 | 50,645 |
| 51,286 |
|
| FHLMC, VRN, 4.29%, (12-month LIBOR plus 1.84%), 6/1/38 | 40,868 |
| 41,510 |
|
| FHLMC, VRN, 3.90%, (12-month LIBOR plus 1.78%), 9/1/40 | 43,730 |
| 44,642 |
|
| FHLMC, VRN, 4.77%, (12-month LIBOR plus 1.88%), 5/1/41 | 21,247 |
| 21,734 |
|
| FHLMC, VRN, 3.64%, (12-month LIBOR plus 1.64%), 2/1/43 | 21,219 |
| 21,607 |
|
| FHLMC, VRN, 4.43%, (12-month LIBOR plus 1.65%), 6/1/43 | 11,150 |
| 11,221 |
|
| FHLMC, VRN, 4.50%, (12-month LIBOR plus 1.62%), 6/1/43 | 325 |
| 328 |
|
| FHLMC, VRN, 3.06%, (12-month LIBOR plus 1.64%), 9/1/47 | 204,272 |
| 211,145 |
|
| FNMA, VRN, 3.49%, (6-month LIBOR plus 1.57%), 6/1/35 | 20,703 |
| 21,087 |
|
| FNMA, VRN, 3.69%, (12-month LIBOR plus 1.69%), 1/1/40 | 11,107 |
| 11,331 |
|
| FNMA, VRN, 3.81%, (12-month LIBOR plus 1.77%), 10/1/40 | 68,706 |
| 70,135 |
|
| FNMA, VRN, 3.17%, (12-month LIBOR plus 1.61%), 3/1/47 | 88,042 |
| 91,087 |
|
| | | 597,113 |
|
| Fixed-Rate U.S. Government Agency Mortgage-Backed Securities — 12.4% | |
| FHLMC, 4.50%, 6/1/21 | 660 |
| 690 |
|
| FHLMC, 5.50%, 1/1/38 | 4,993 |
| 5,647 |
|
| FHLMC, 5.50%, 4/1/38 | 31,913 |
| 36,249 |
|
|
| | | | | | |
| | Principal Amount/ Shares | Value |
| FNMA, 5.00%, 7/1/20 | $ | 1,127 |
| $ | 1,187 |
|
| FNMA, 5.00%, 7/1/31 | 262,511 |
| 286,328 |
|
| FNMA, 4.50%, 10/1/33 | 136,214 |
| 149,516 |
|
| FNMA, 5.00%, 11/1/33 | 298,823 |
| 331,938 |
|
| FNMA, 6.00%, 12/1/33 | 173,083 |
| 196,290 |
|
| FNMA, 3.50%, 3/1/34 | 687,215 |
| 724,379 |
|
| FNMA, 5.50%, 4/1/34 | 231,068 |
| 261,675 |
|
| FNMA, 5.50%, 4/1/34 | 77,475 |
| 87,530 |
|
| FNMA, 5.00%, 8/1/34 | 37,679 |
| 41,857 |
|
| FNMA, 5.50%, 8/1/34 | 73,575 |
| 83,324 |
|
| FNMA, 5.00%, 4/1/35 | 181,024 |
| 201,421 |
|
| FNMA, 5.00%, 8/1/35 | 12,433 |
| 13,850 |
|
| FNMA, 4.50%, 9/1/35 | 14,543 |
| 15,932 |
|
| FNMA, 5.50%, 7/1/36 | 11,785 |
| 13,197 |
|
| FNMA, 5.50%, 12/1/36 | 19,351 |
| 21,976 |
|
| FNMA, 6.00%, 7/1/37 | 43,984 |
| 49,886 |
|
| FNMA, 6.00%, 8/1/37 | 30,098 |
| 34,209 |
|
| FNMA, 6.50%, 8/1/37 | 2,122 |
| 2,453 |
|
| FNMA, 6.00%, 9/1/37 | 37,479 |
| 42,900 |
|
| FNMA, 6.00%, 11/1/37 | 41,438 |
| 47,743 |
|
| FNMA, 5.00%, 3/1/38 | 65,012 |
| 72,359 |
|
| FNMA, 6.50%, 9/1/38 | 117,601 |
| 135,892 |
|
| FNMA, 5.50%, 1/1/39 | 79,422 |
| 90,224 |
|
| FNMA, 5.00%, 2/1/39 | 179,222 |
| 199,703 |
|
| FNMA, 4.50%, 4/1/39 | 64,520 |
| 71,137 |
|
| FNMA, 4.50%, 5/1/39 | 161,638 |
| 178,043 |
|
| FNMA, 6.50%, 5/1/39 | 2,502 |
| 2,977 |
|
| FNMA, 4.50%, 10/1/39 | 280,936 |
| 310,640 |
|
| FNMA, 4.00%, 10/1/40 | 291,071 |
| 319,054 |
|
| FNMA, 4.50%, 11/1/40 | 267,390 |
| 293,561 |
|
| FNMA, 4.00%, 8/1/41 | 422,032 |
| 460,736 |
|
| FNMA, 4.50%, 9/1/41 | 244,158 |
| 267,975 |
|
| FNMA, 3.50%, 5/1/42 | 362,723 |
| 390,219 |
|
| FNMA, 3.50%, 6/1/42 | 420,123 |
| 451,982 |
|
| FNMA, 3.50%, 9/1/42 | 319,498 |
| 343,744 |
|
| FNMA, 3.50%, 5/1/45 | 827,485 |
| 885,821 |
|
| FNMA, 3.50%, 2/1/47 | 2,083,556 |
| 2,222,833 |
|
| FNMA, 3.50%, 7/1/47 | 1,729,925 |
| 1,837,500 |
|
| FNMA, 6.50%, 8/1/47 | 761 |
| 817 |
|
| FNMA, 6.50%, 9/1/47 | 1,541 |
| 1,650 |
|
| FNMA, 6.50%, 9/1/47 | 74 |
| 79 |
|
| FNMA, 6.50%, 9/1/47 | 810 |
| 867 |
|
| FNMA, 4.00%, 6/1/48 | 2,030,697 |
| 2,170,271 |
|
| FNMA, 4.00%, 10/1/48 | 994,300 |
| 1,060,798 |
|
| FNMA, 3.50%, 5/1/49 | 445,883 |
| 471,742 |
|
| GNMA, 5.50%, 12/15/32 | 79,345 |
| 90,035 |
|
| GNMA, 6.00%, 9/20/38 | 23,660 |
| 27,035 |
|
|
| | | | | | |
| | Principal Amount/ Shares | Value |
| GNMA, 5.50%, 12/20/38 | $ | 55,897 |
| $ | 62,709 |
|
| GNMA, 4.50%, 6/15/39 | 360,269 |
| 403,958 |
|
| GNMA, 4.50%, 1/15/40 | 147,178 |
| 163,259 |
|
| GNMA, 4.50%, 4/15/40 | 229,796 |
| 257,638 |
|
| GNMA, 4.00%, 11/20/40 | 467,968 |
| 511,057 |
|
| GNMA, 3.50%, 6/20/42 | 504,433 |
| 540,251 |
|
| GNMA, 2.50%, 7/20/46 | 440,206 |
| 463,014 |
|
| GNMA, 2.50%, 2/20/47 | 523,155 |
| 550,179 |
|
| | | 17,959,936 |
|
TOTAL U.S. GOVERNMENT AGENCY MORTGAGE-BACKED SECURITIES
(Cost $17,739,142) | 18,557,049 |
|
| ASSET-BACKED SECURITIES — 6.8% | | |
Avis Budget Rental Car Funding AESOP LLC, Series 2015-2A, Class B, 3.42%, 12/20/21(1) | 250,000 |
| 246,543 |
|
BRE Grand Islander Timeshare Issuer LLC, Series 2017-1A, Class A SEQ, 2.94%, 5/25/29(1) | 94,431 |
| 92,643 |
|
Goodgreen, Series 2018-1A, Class A, VRN, 3.93%, 10/15/53(1) | 264,878 |
| 272,039 |
|
Hilton Grand Vacations Trust, Series 2014-AA, Class A SEQ, 1.77%, 11/25/26(1) | 54,360 |
| 53,952 |
|
Hilton Grand Vacations Trust, Series 2017-AA, Class A SEQ, 2.66%, 12/26/28(1) | 85,700 |
| 84,470 |
|
Hilton Grand Vacations Trust, Series 2017-AA, Class B, 2.96%, 12/26/28(1) | 140,236 |
| 138,195 |
|
Invitation Homes Trust, Series 2018-SFR1, Class B, VRN, 1.75%, (1-month LIBOR plus 0.95%), 3/17/37(1) | 725,000 |
| 654,831 |
|
Invitation Homes Trust, Series 2018-SFR2, Class C, VRN, 1.98%, (1-month LIBOR plus 1.28%), 6/17/37(1) | 575,000 |
| 519,901 |
|
Invitation Homes Trust, Series 2018-SFR3, Class B, VRN, 1.95%, (1-month LIBOR plus 1.15%), 7/17/37(1) | 550,000 |
| 498,673 |
|
MVW Owner Trust, Series 2013-1A, Class A SEQ, 2.15%, 4/22/30(1) | 41,758 |
| 41,733 |
|
MVW Owner Trust, Series 2015-1A, Class A SEQ, 2.52%, 12/20/32(1) | 43,454 |
| 42,891 |
|
MVW Owner Trust, Series 2017-1A, Class B, 2.75%, 12/20/34(1) | 602,748 |
| 588,277 |
|
MVW Owner Trust, Series 2018-1A, Class B, 3.60%, 1/21/36(1) | 270,592 |
| 257,257 |
|
Progress Residential Trust, Series 2017-SFR1, Class A SEQ, 2.77%, 8/17/34(1) | 373,427 |
| 372,580 |
|
Progress Residential Trust, Series 2017-SFR2, Class A SEQ, 2.90%, 12/17/34(1) | 848,421 |
| 853,405 |
|
Progress Residential Trust, Series 2018-SFR1, Class B, 3.48%, 3/17/35(1) | 325,000 |
| 321,619 |
|
Progress Residential Trust, Series 2018-SFR2, Class C, 4.04%, 8/17/35(1) | 675,000 |
| 673,632 |
|
Progress Residential Trust, Series 2018-SFR3, Class B, 4.08%, 10/17/35(1) | 1,000,000 |
| 1,009,913 |
|
Progress Residential Trust, Series 2018-SFR3, Class C, 4.18%, 10/17/35(1) | 675,000 |
| 676,614 |
|
Sierra Timeshare Conduit Receivables Funding LLC, Series 2017-1A, Class A SEQ, 2.91%, 3/20/34(1) | 68,347 |
| 67,516 |
|
Sierra Timeshare Receivables Funding LLC, Series 2016-1A, Class A SEQ, 3.08%, 3/21/33(1) | 62,274 |
| 61,994 |
|
Sierra Timeshare Receivables Funding LLC, Series 2016-2A, Class A SEQ, 2.33%, 7/20/33(1) | 62,213 |
| 61,489 |
|
|
| | | | | | |
| | Principal Amount/ Shares | Value |
Sierra Timeshare Receivables Funding LLC, Series 2018-2A, Class B, 3.65%, 6/20/35(1) | $ | 267,760 |
| $ | 255,995 |
|
Sierra Timeshare Receivables Funding LLC, Series 2019-2A, Class C, 3.12%, 5/20/36(1) | 364,359 |
| 359,863 |
|
Towd Point Mortgage Trust, Series 2017-3, Class M1, VRN, 3.50%, 7/25/57(1) | 300,000 |
| 270,509 |
|
Towd Point Mortgage Trust, Series 2017-6, Class A1, VRN, 2.75%, 10/25/57(1) | 501,505 |
| 502,180 |
|
Towd Point Mortgage Trust, Series 2018-4, Class A1, VRN, 3.00%, 6/25/58(1) | 207,663 |
| 205,408 |
|
| US Airways Pass-Through Trust, Series 2013-1, Class A, 3.95%, 5/15/27 | 65,236 |
| 65,283 |
|
VSE VOI Mortgage LLC, Series 2016-A, Class A SEQ, 2.54%, 7/20/33(1) | 139,774 |
| 137,453 |
|
VSE VOI Mortgage LLC, Series 2017-A, Class B, 2.63%, 3/20/35(1) | 196,721 |
| 192,084 |
|
VSE VOI Mortgage LLC, Series 2018-A, Class B, 3.72%, 2/20/36(1) | 228,312 |
| 225,880 |
|
TOTAL ASSET-BACKED SECURITIES
(Cost $10,055,436) | | 9,804,822 |
|
| COLLATERALIZED MORTGAGE OBLIGATIONS — 4.5% | | |
| Private Sponsor Collateralized Mortgage Obligations — 2.5% | | |
| Bear Stearns Adjustable Rate Mortgage Trust, Series 2004-12, Class 2A1, VRN, 3.74%, 2/25/35 | 52,511 |
| 47,774 |
|
| Bear Stearns Adjustable Rate Mortgage Trust, Series 2006-1, Class A1, VRN, 3.84%, (1-year H15T1Y plus 2.25%), 2/25/36 | 89,198 |
| 84,083 |
|
| Citigroup Mortgage Loan Trust, Inc., Series 2004-UST1, Class A4, VRN, 3.74%, 8/25/34 | 23,517 |
| 20,850 |
|
| Citigroup Mortgage Loan Trust, Inc., Series 2005-4, Class A, VRN, 4.59%, 8/25/35 | 90,631 |
| 84,446 |
|
| Countrywide Home Loan Mortgage Pass-Through Trust, Series 2004-4, Class A19, 5.25%, 5/25/34 | 73,472 |
| 75,324 |
|
| Countrywide Home Loan Mortgage Pass-Through Trust, Series 2005-17, Class 1A11, 5.50%, 9/25/35 | 964 |
| 888 |
|
| Credit Suisse First Boston Mortgage-Backed Pass-Through Certificates, Series 2005-3, Class 1A1, VRN, 5.50%, 7/25/35 | 124,880 |
| 123,722 |
|
Credit Suisse Mortgage Trust, Series 2017-HL2, Class A3 SEQ, VRN, 3.50%, 10/25/47(1) | 122,915 |
| 122,465 |
|
| First Horizon Alternative Mortgage Securities Trust, Series 2004-AA4, Class A1, VRN, 3.80%, 10/25/34 | 42,382 |
| 38,955 |
|
| First Horizon Mortgage Pass-Through Trust, Series 2005-AR3, Class 4A1, VRN, 5.01%, 8/25/35 | 54,675 |
| 52,828 |
|
| First Horizon Mortgage Pass-Through Trust, Series 2006-AR4, Class 1A2, VRN, 3.99%, 1/25/37 | 70,324 |
| 54,862 |
|
Flagstar Mortgage Trust, Series 2017-1, Class 1A5 SEQ, VRN, 3.50%, 3/25/47(1) | 155,077 |
| 157,135 |
|
| GSR Mortgage Loan Trust, Series 2005-AR6, Class 2A1, VRN, 4.10%, 9/25/35 | 74,420 |
| 70,453 |
|
| JPMorgan Mortgage Trust, Series 2005-A4, Class 2A1, VRN, 4.12%, 7/25/35 | 35,529 |
| 32,716 |
|
| JPMorgan Mortgage Trust, Series 2005-A6, Class 7A1, VRN, 4.19%, 8/25/35 | 166,688 |
| 153,258 |
|
| JPMorgan Mortgage Trust, Series 2005-S2, Class 3A1, VRN, 7.16%, 2/25/32 | 13,631 |
| 13,784 |
|
| MASTR Adjustable Rate Mortgages Trust, Series 2004-13, Class 3A7, VRN, 4.68%, 11/21/34 | 44,522 |
| 42,477 |
|
| Merrill Lynch Mortgage Investors Trust, Series 2005-3, Class 2A, VRN, 3.80%, 11/25/35 | 86,563 |
| 75,864 |
|
|
| | | | | | |
| | Principal Amount/ Shares | Value |
New Residential Mortgage Loan Trust, Series 2017-2A, Class A3, VRN, 4.00%, 3/25/57(1) | $ | 127,051 |
| $ | 132,828 |
|
New Residential Mortgage Loan Trust, Series 2017-5A, Class A1, VRN, 2.45%, (1-month LIBOR plus 1.50%), 6/25/57(1) | 225,427 |
| 215,982 |
|
Sequoia Mortgage Trust, Series 2017-CH1, Class A1, VRN, 4.00%, 8/25/47(1) | 240,913 |
| 245,000 |
|
Sequoia Mortgage Trust, Series 2017-CH2, Class A10 SEQ, VRN, 4.00%, 12/25/47(1) | 270,256 |
| 271,705 |
|
Sequoia Mortgage Trust, Series 2018-CH2, Class A12 SEQ, VRN, 4.00%, 6/25/48(1) | 68,012 |
| 68,509 |
|
| Structured Adjustable Rate Mortgage Loan Trust, Series 2004-8, Class 2A1, VRN, 3.78%, 7/25/34 | 54,067 |
| 50,273 |
|
| Thornburg Mortgage Securities Trust, Series 2006-4, Class A2B, VRN, 4.43%, 7/25/36 | 105,211 |
| 90,330 |
|
Verus Securitization Trust, Series 2019-3, Class A1, 2.78%, 7/25/59(1) | 7,623 |
| 7,483 |
|
| WaMu Mortgage Pass-Through Certificates, Series 2005-AR7, Class A3, VRN, 4.26%, 8/25/35 | 68,093 |
| 61,083 |
|
| Wells Fargo Mortgage-Backed Securities Trust, Series 2006-7, Class 3A1 SEQ, 6.00%, 6/25/36 | 251,956 |
| 240,155 |
|
| Wells Fargo Mortgage-Backed Securities Trust, Series 2006-AR12, Class 1A1, VRN, 4.71%, 9/25/36 | 95,668 |
| 85,476 |
|
| Wells Fargo Mortgage-Backed Securities Trust, Series 2006-AR15, Class A1, VRN, 4.61%, 10/25/36 | 33,629 |
| 29,515 |
|
| Wells Fargo Mortgage-Backed Securities Trust, Series 2006-AR16, Class A1, VRN, 4.49%, 10/25/36 | 73,512 |
| 65,094 |
|
| Wells Fargo Mortgage-Backed Securities Trust, Series 2006-AR19, Class A1, VRN, 4.35%, 12/25/36 | 53,704 |
| 47,641 |
|
| Wells Fargo Mortgage-Backed Securities Trust, Series 2006-AR5, Class 2A1, VRN, 4.14%, 4/25/36 | 84,973 |
| 80,255 |
|
| Wells Fargo Mortgage-Backed Securities Trust, Series 2007-AR10, Class 1A1, VRN, 4.26%, 1/25/38 | 51,834 |
| 44,002 |
|
| Wells Fargo Mortgage-Backed Securities Trust, Series 2007-AR7, Class A1, VRN, 4.35%, 12/28/37 | 345,274 |
| 302,733 |
|
Wells Fargo Mortgage-Backed Securities Trust, Series 2018-1, Class A3, VRN, 3.50%, 7/25/47(1) | 356,710 |
| 357,242 |
|
| | | 3,647,190 |
|
| U.S. Government Agency Collateralized Mortgage Obligations — 2.0% | |
| FHLMC, Series 2013-DN2, Class M2, VRN, 5.20%, (1-month LIBOR plus 4.25%), 11/25/23 | 151,428 |
| 146,990 |
|
| FHLMC, Series 2015-DNA1, Class M3, VRN, 4.25%, (1-month LIBOR plus 3.30%), 10/25/27 | 175,000 |
| 169,956 |
|
| FHLMC, Series 2015-HQ2, Class M3, VRN, 4.20%, (1-month LIBOR plus 3.25%), 5/25/25 | 175,000 |
| 156,001 |
|
| FHLMC, Series 2018-DNA1, Class M2, VRN, 2.75%, (1-month LIBOR plus 1.80%), 7/25/30 | 100,000 |
| 83,227 |
|
FHLMC, Series 2020-DNA2, Class M2, VRN, 2.80%, (1-month LIBOR plus 1.85%), 2/25/50(1) | 250,000 |
| 162,639 |
|
| FHLMC, Series 3397, Class GF, VRN, 1.20%, (1-month LIBOR plus 0.50%), 12/15/37 | 77,724 |
| 77,761 |
|
| FNMA, Series 2014-C02, Class 1M2, VRN, 3.55%, (1-month LIBOR plus 2.60%), 5/25/24 | 309,465 |
| 280,937 |
|
| FNMA, Series 2014-C02, Class 2M2, VRN, 3.55%, (1-month LIBOR plus 2.60%), 5/25/24 | 323,335 |
| 297,166 |
|
| FNMA, Series 2016-C01, Class 2M2, VRN, 7.90%, (1-month LIBOR plus 6.95%), 8/25/28 | 156,665 |
| 158,093 |
|
|
| | | | | | |
| | Principal Amount/ Shares | Value |
| FNMA, Series 2016-C03, Class 2M2, VRN, 6.85%, (1-month LIBOR plus 5.90%), 10/25/28 | $ | 139,878 |
| $ | 137,888 |
|
| FNMA, Series 2017-C03, Class 1M2, VRN, 3.95%, (1-month LIBOR plus 3.00%), 10/25/29 | 225,000 |
| 202,218 |
|
| FNMA, Series 2017-C05, Class 1M2, VRN, 3.15%, (1-month LIBOR plus 2.20%), 1/25/30 | 283,377 |
| 253,502 |
|
| FNMA, Series 2017-C06, Class 2M2, VRN, 3.75%, (1-month LIBOR plus 2.80%), 2/25/30 | 641,635 |
| 542,341 |
|
| FNMA, Series 2017-C07, Class 1M2, VRN, 3.35%, (1-month LIBOR plus 2.40%), 5/25/30 | 150,000 |
| 135,287 |
|
| | | 2,804,006 |
|
TOTAL COLLATERALIZED MORTGAGE OBLIGATIONS
(Cost $6,988,365) | | 6,451,196 |
|
| COLLATERALIZED LOAN OBLIGATIONS — 3.9% | | |
Allegany Park CLO Ltd., Series 2019-1A, Class C, VRN, 4.38%, (3-month LIBOR plus 2.55%), 1/20/33(1) | 475,000 |
| 411,183 |
|
Ares XLI CLO Ltd., Series 2016-41A, Class AR, VRN, 3.03%, (3-month LIBOR plus 1.20%), 1/15/29(1) | 375,000 |
| 360,679 |
|
Bean Creek CLO Ltd., Series 2015-1A, Class BR, VRN, 3.27%, (3-month LIBOR plus 1.45%), 4/20/31(1) | 250,000 |
| 222,400 |
|
CBAM Ltd., Series 2018-5A, Class B1, VRN, 3.24%, (3-month LIBOR plus 1.40%), 4/17/31(1) | 200,000 |
| 177,309 |
|
CIFC Funding Ltd., Series 2013-2A, Class A2LR, VRN, 3.43%, (3-month LIBOR plus 1.60%), 10/18/30(1) | 400,000 |
| 370,816 |
|
CIFC Funding Ltd., Series 2016-1A, Class BR, VRN, 3.77%, (3-month LIBOR plus 1.95%), 10/21/31(1) | 125,000 |
| 115,043 |
|
Elmwood CLO IV Ltd., Series 2020-1A, Class B, VRN, 3.07%, (3-month LIBOR plus 1.70%), 4/15/33(1) | 500,000 |
| 460,000 |
|
Goldentree Loan Management US CLO 3 Ltd., Series 2018-3A, Class B1, VRN, 3.37%, (3-month LIBOR plus 1.55%), 4/20/30(1) | 300,000 |
| 276,496 |
|
Goldentree Loan Management US CLO 5 Ltd., Series 2019-5A, Class A, VRN, 3.12%, (3-month LIBOR plus 1.30%), 10/20/32(1) | 300,000 |
| 283,412 |
|
KKR CLO Ltd., Series 2022A, Class B, VRN, 3.42%, (3-month LIBOR plus 1.60%), 7/20/31(1) | 150,000 |
| 137,894 |
|
LCM XIV LP, Series 2014A, Class BR, VRN, 3.40%, (3-month LIBOR plus 1.58%), 7/20/31(1) | 500,000 |
| 453,717 |
|
Madison Park Funding XXII Ltd., Series 2016-22A, Class BR, VRN, 3.26%, (3-month LIBOR plus 1.60%), 1/15/33(1) | 100,000 |
| 87,243 |
|
Magnetite VIII Ltd., Series 2014-8A, Class BR2, VRN, 3.33%, (3-month LIBOR plus 1.50%), 4/15/31(1) | 100,000 |
| 92,335 |
|
Magnetite XXIV Ltd., Series 2019-24A, Class B, VRN, 3.76%, (3-month LIBOR plus 1.85%), 1/15/33(1) | 500,000 |
| 446,743 |
|
Magnetite XXIV Ltd., Series 2019-24A, Class C, VRN, 4.46%, (3-month LIBOR plus 2.55%), 1/15/33(1) | 700,000 |
| 604,738 |
|
Octagon Investment Partners 45 Ltd., Series 2019-1A, Class B1, VRN, 3.68%, (3-month LIBOR plus 1.85%), 10/15/32(1) | 450,000 |
| 417,405 |
|
Sounds Point CLO IV-R Ltd., Series 2013-3RA, Class A, VRN, 2.97%, (3-month LIBOR plus 1.15%), 4/18/31(1) | 150,000 |
| 139,780 |
|
Sounds Point CLO IV-R Ltd., Series 2013-3RA, Class B, VRN, 3.57%, (3-month LIBOR plus 1.75%), 4/18/31(1) | 200,000 |
| 178,063 |
|
Voya CLO Ltd., Series 2013-2A, Class A2AR, VRN, 3.19%, (3-month LIBOR plus 1.40%), 4/25/31(1) | 350,000 |
| 316,169 |
|
Voya CLO Ltd., Series 2013-3A, Class A2RR, VRN, 3.52%, (3-month LIBOR plus 1.70%), 10/18/31(1) | 150,000 |
| 137,656 |
|
TOTAL COLLATERALIZED LOAN OBLIGATIONS
(Cost $6,263,833) | | 5,689,081 |
|
|
| | | | | | |
| | Principal Amount/ Shares | Value |
| MUNICIPAL SECURITIES — 2.1% | | |
| Bay Area Toll Authority Rev., 6.92%, 4/1/40 | $ | 180,000 |
| $ | 265,918 |
|
| California State University Rev., 2.98%, 11/1/51 | 225,000 |
| 224,975 |
|
| Chicago GO, 7.05%, 1/1/29 | 50,000 |
| 57,499 |
|
| Escambia County Health Facilities Authority Rev., (Baptist Health Care Corp. Obligated Group), 3.61%, 8/15/40 (AGM) | 105,000 |
| 101,692 |
|
| Foothill-Eastern Transportation Corridor Agency Rev., 4.09%, 1/15/49 | 95,000 |
| 96,358 |
|
| Grand Parkway Transportation Corp. Rev., 3.24%, 10/1/52 | 135,000 |
| 131,613 |
|
| Houston GO, 3.96%, 3/1/47 | 50,000 |
| 56,287 |
|
| Metropolitan Transportation Authority Rev., 6.69%, 11/15/40 | 80,000 |
| 104,109 |
|
| Metropolitan Transportation Authority Rev., 6.81%, 11/15/40 | 50,000 |
| 65,500 |
|
| Missouri Highway & Transportation Commission Rev., 5.45%, 5/1/33 | 50,000 |
| 64,059 |
|
| New Jersey Turnpike Authority Rev., 7.10%, 1/1/41 | 40,000 |
| 57,112 |
|
| New York State Dormitory Authority Rev., (State of New York Personal Income Tax Rev.), 3.19%, 2/15/43 | 85,000 |
| 84,373 |
|
| Ohio Turnpike & Infrastructure Commission Rev., 3.22%, 2/15/48 | 130,000 |
| 130,900 |
|
| Ohio Water Development Authority Water Pollution Control Loan Fund Rev., 4.88%, 12/1/34 | 80,000 |
| 89,539 |
|
| Pennsylvania Turnpike Commission Rev., 5.56%, 12/1/49 | 65,000 |
| 88,668 |
|
| Port Authority of New York & New Jersey Rev., 4.93%, 10/1/51 | 75,000 |
| 93,370 |
|
| Regents of the University of California Medical Center Pooled Rev., 3.26%, 5/15/60 | 155,000 |
| 145,748 |
|
| Rutgers The State University of New Jersey Rev., 5.67%, 5/1/40 | 175,000 |
| 231,794 |
|
| Sacramento Municipal Utility District Rev., 6.16%, 5/15/36 | 150,000 |
| 204,709 |
|
| San Antonio Electric & Gas Systems Rev., 5.99%, 2/1/39 | 50,000 |
| 70,167 |
|
| San Francisco Public Utilities Commission Water Rev., 6.00%, 11/1/40 | 50,000 |
| 61,622 |
|
| Santa Clara Valley Transportation Authority Rev., 5.88%, 4/1/32 | 100,000 |
| 124,477 |
|
| State of California GO, 4.60%, 4/1/38 | 10,000 |
| 11,026 |
|
| State of California GO, 7.55%, 4/1/39 | 130,000 |
| 211,461 |
|
| State of California GO, 7.30%, 10/1/39 | 5,000 |
| 7,700 |
|
| State of California GO, 7.60%, 11/1/40 | 25,000 |
| 41,709 |
|
| State of Kansas Department of Transportation Rev., 4.60%, 9/1/35 | 45,000 |
| 54,851 |
|
| State of Washington GO, 5.14%, 8/1/40 | 90,000 |
| 123,825 |
|
TOTAL MUNICIPAL SECURITIES
(Cost $2,513,845) | | 3,001,061 |
|
| COMMERCIAL MORTGAGE-BACKED SECURITIES — 1.9% | | |
| Commercial Mortgage Pass-Through Certificates, Series 2014-LC17, Class B, VRN, 4.49%, 10/10/47 | 400,000 |
| 405,340 |
|
| Commercial Mortgage Pass-Through Certificates, Series 2016-CR28, Class B, VRN, 4.65%, 2/10/49 | 300,000 |
| 308,657 |
|
| Commercial Mortgage Trust, Series 2015-CR22, Class B, VRN, 3.93%, 3/10/48 | 400,000 |
| 397,189 |
|
| GS Mortgage Securities Trust, Series 2016-GS2, Class B, VRN, 3.76%, 5/10/49 | 400,000 |
| 383,742 |
|
| GS Mortgage Securities Trust, Series 2020-GC45, Class AS, 3.17%, 2/13/53 | 200,000 |
| 193,206 |
|
| JPMBB Commercial Mortgage Securities Trust, Series 2014-C21, Class B, VRN, 4.34%, 8/15/47 | 320,000 |
| 321,637 |
|
|
| | | | | | |
| | Principal Amount/ Shares | Value |
| JPMorgan Chase Commercial Mortgage Securities Trust, Series 2016-JP2, Class B, 3.46%, 8/15/49 | $ | 779,000 |
| $ | 731,615 |
|
TOTAL COMMERCIAL MORTGAGE-BACKED SECURITIES
(Cost $2,847,992) | | 2,741,386 |
|
| SOVEREIGN GOVERNMENTS AND AGENCIES — 1.8% | | |
| Brazil — 0.2% | | |
| Brazilian Government International Bond, 4.875%, 1/22/21 | 190,000 |
| 194,324 |
|
| Colombia — 0.2% | | |
| Colombia Government International Bond, 4.375%, 7/12/21 | 330,000 |
| 333,798 |
|
| Dominican Republic — 0.1% | | |
| Dominican Republic International Bond, 5.95%, 1/25/27 | 200,000 |
| 190,791 |
|
| Egypt — 0.1% | | |
| Egypt Government International Bond, 8.50%, 1/31/47 | 200,000 |
| 164,750 |
|
| Jordan — 0.2% | | |
| Jordan Government International Bond, 7.375%, 10/10/47 | 200,000 |
| 168,706 |
|
| Jordan Government International Bond, 7.375%, 10/10/47 | 200,000 |
| 168,705 |
|
| | | 337,411 |
|
| Namibia — 0.1% | | |
| Namibia International Bonds, 5.25%, 10/29/25 | 200,000 |
| 172,031 |
|
| Nigeria — 0.1% | | |
| Nigeria Government International Bond, 7.625%, 11/21/25 | 200,000 |
| 156,235 |
|
| Peru — 0.1% | | |
| Peruvian Government International Bond, 5.625%, 11/18/50 | 90,000 |
| 135,027 |
|
| Philippines — 0.1% | | |
| Philippine Government International Bond, 4.00%, 1/15/21 | 100,000 |
| 101,392 |
|
| Poland — 0.1% | | |
| Republic of Poland Government International Bond, 5.125%, 4/21/21 | 60,000 |
| 62,328 |
|
| Republic of Poland Government International Bond, 3.00%, 3/17/23 | 100,000 |
| 104,286 |
|
| | | 166,614 |
|
| Russia — 0.2% | | |
| Russian Foreign Bond - Eurobond, 5.25%, 6/23/47 | 200,000 |
| 242,920 |
|
| Tunisia — 0.1% | | |
| Banque Centrale de Tunisie International Bond, 5.75%, 1/30/25 | 200,000 |
| 161,112 |
|
| Turkey — 0.1% | | |
| Turkey Government International Bond, 6.875%, 3/17/36 | 200,000 |
| 177,220 |
|
| Uruguay — 0.1% | | |
| Uruguay Government International Bond, 4.125%, 11/20/45 | 80,000 |
| 82,425 |
|
TOTAL SOVEREIGN GOVERNMENTS AND AGENCIES
(Cost $2,815,394) | | 2,616,050 |
|
| PREFERRED STOCKS — 0.2% | | |
| Banks — 0.2% | | |
| JPMorgan Chase & Co., 4.00% | 335,000 |
| 286,299 |
|
Machinery† | | |
| Stanley Black & Decker, Inc., 4.00% | 65,000 |
| 62,597 |
|
TOTAL PREFERRED STOCKS
(Cost $400,000) | | 348,896 |
|
|
| | | | | | |
| | Principal Amount/ Shares | Value |
BANK LOAN OBLIGATIONS(4) — 0.2% | | |
| Health Care Providers and Services — 0.1% | | |
| Acadia Healthcare Company, Inc., 2018 Term Loan B4, 3.50%, (1-month LIBOR plus 2.50%), 2/16/23 | $ | 194,578 |
| $ | 180,423 |
|
| Pharmaceuticals — 0.1% | | |
| Bausch Health Companies Inc., 2018 Term Loan B, 3.61%, (1-month LIBOR plus 3.00%), 6/2/25 | 128,432 |
| 122,921 |
|
TOTAL BANK LOAN OBLIGATIONS
(Cost $322,255) | | 303,344 |
|
| TEMPORARY CASH INVESTMENTS — 6.0% | | |
| Repurchase Agreement, BMO Capital Markets Corp., (collateralized by various U.S. Treasury obligations, 1.875% - 3.00%, 11/30/21 - 5/15/45, valued at $2,879,105), in a joint trading account at 0.01%, dated 3/31/20, due 4/1/20 (Delivery value $2,823,127) | | 2,823,126 |
|
| State Street Institutional U.S. Government Money Market Fund, Premier Class | 5,792,185 |
| 5,792,185 |
|
TOTAL TEMPORARY CASH INVESTMENTS
(Cost $8,615,311) | | 8,615,311 |
|
TOTAL INVESTMENT SECURITIES — 100.0%
(Cost $142,933,829) | | 144,342,443 |
|
OTHER ASSETS AND LIABILITIES† | | (27,608 | ) |
| TOTAL NET ASSETS — 100.0% | | $ | 144,314,835 |
|
|
| | | | | | | | | | |
| FORWARD FOREIGN CURRENCY EXCHANGE CONTRACTS |
| Currency Purchased | Currency Sold | Counterparty | Settlement Date | Unrealized Appreciation
(Depreciation) |
| AUD | 301,688 |
| USD | 191,771 |
| UBS AG | 6/17/20 | $ | (6,164 | ) |
| AUD | 303,048 |
| USD | 187,229 |
| UBS AG | 6/17/20 | (786 | ) |
| CAD | 264,910 |
| USD | 191,646 |
| Morgan Stanley | 6/17/20 | (3,269 | ) |
| CAD | 259,677 |
| USD | 179,222 |
| Morgan Stanley | 6/17/20 | 5,433 |
|
| USD | 190,087 |
| CAD | 264,910 |
| Morgan Stanley | 6/17/20 | 1,710 |
|
| USD | 183,626 |
| CAD | 259,677 |
| Morgan Stanley | 6/17/20 | (1,029 | ) |
| CLP | 332,923,212 |
| USD | 391,674 |
| Goldman Sachs & Co. | 6/17/20 | (1,925 | ) |
| USD | 387,661 |
| CLP | 332,923,212 |
| Goldman Sachs & Co. | 6/17/20 | (2,089 | ) |
| COP | 763,780,762 |
| USD | 187,201 |
| Goldman Sachs & Co. | 6/17/20 | (207 | ) |
| COP | 690,567,977 |
| USD | 170,490 |
| Goldman Sachs & Co. | 6/17/20 | (1,419 | ) |
| USD | 329,246 |
| COP | 1,331,472,705 |
| Goldman Sachs & Co. | 6/17/20 | 3,265 |
|
| USD | 213,196 |
| COP | 886,894,446 |
| Goldman Sachs & Co. | 6/17/20 | (3,941 | ) |
| CZK | 4,532,787 |
| USD | 193,885 |
| UBS AG | 6/17/20 | (11,320 | ) |
| CZK | 8,867,301 |
| USD | 362,849 |
| UBS AG | 6/17/20 | (5,705 | ) |
| CZK | 4,514,568 |
| USD | 174,943 |
| UBS AG | 6/17/20 | 6,889 |
|
| CZK | 4,647,537 |
| USD | 181,978 |
| UBS AG | 6/17/20 | 5,209 |
|
| USD | 194,936 |
| CZK | 4,532,787 |
| UBS AG | 6/17/20 | 12,371 |
|
| USD | 341,273 |
| CZK | 8,867,301 |
| UBS AG | 6/17/20 | (15,871 | ) |
| EUR | 208,108 |
| USD | 233,293 |
| JPMorgan Chase Bank N.A. | 6/17/20 | (3,104 | ) |
| USD | 232,101 |
| EUR | 208,099 |
| JPMorgan Chase Bank N.A. | 6/17/20 | 1,922 |
|
| USD | 399,492 |
| HUF | 119,935,611 |
| UBS AG | 6/17/20 | 32,136 |
|
| USD | 163,998 |
| HUF | 53,551,769 |
| UBS AG | 6/17/20 | (29 | ) |
| USD | 183,050 |
| HUF | 60,003,724 |
| UBS AG | 6/17/20 | (738 | ) |
| IDR | 10,807,403,099 |
| USD | 658,988 |
| Goldman Sachs & Co. | 6/17/20 | (4,529 | ) |
| USD | 726,792 |
| IDR | 10,807,403,099 |
| Goldman Sachs & Co. | 6/17/20 | 72,334 |
|
| ILS | 697,667 |
| USD | 191,967 |
| UBS AG | 6/17/20 | 5,761 |
|
| USD | 193,046 |
| ILS | 697,667 |
| UBS AG | 6/17/20 | (4,683 | ) |
| INR | 24,454,721 |
| USD | 323,475 |
| Goldman Sachs & Co. | 6/17/20 | (5,453 | ) |
| USD | 309,828 |
| INR | 24,454,721 |
| Goldman Sachs & Co. | 6/17/20 | (8,194 | ) |
| KZT | 301,145,594 |
| USD | 726,352 |
| Goldman Sachs & Co. | 6/17/20 | (80,003 | ) |
| USD | 300,250 |
| KZT | 148,623,830 |
| Goldman Sachs & Co. | 6/17/20 | (18,742 | ) |
| MXN | 8,783,697 |
| USD | 379,770 |
| JPMorgan Chase Bank N.A. | 6/17/20 | (13,640 | ) |
| MXN | 3,129,852 |
| USD | 138,389 |
| Morgan Stanley | 6/17/20 | (7,927 | ) |
| USD | 244,538 |
| MXN | 5,960,848 |
| JPMorgan Chase Bank N.A. | 6/17/20 | (3,928 | ) |
| NOK | 3,704,416 |
| USD | 366,259 |
| Goldman Sachs & Co. | 6/17/20 | (9,840 | ) |
| NOK | 2,041,202 |
| USD | 181,525 |
| Goldman Sachs & Co. | 6/17/20 | 14,869 |
|
| NZD | 316,952 |
| USD | 196,418 |
| UBS AG | 6/17/20 | (7,407 | ) |
| USD | 187,490 |
| NZD | 316,952 |
| UBS AG | 6/17/20 | (1,521 | ) |
| USD | 496,017 |
| PEN | 1,773,013 |
| Goldman Sachs & Co. | 6/17/20 | (18,956 | ) |
| USD | 188,500 |
| PHP | 9,704,559 |
| Goldman Sachs & Co. | 6/17/20 | 575 |
|
| PLN | 769,412 |
| USD | 199,015 |
| UBS AG | 6/17/20 | (13,082 | ) |
| USD | 186,909 |
| PLN | 769,412 |
| UBS AG | 6/17/20 | 976 |
|
| SEK | 5,992,155 |
| USD | 619,780 |
| Goldman Sachs & Co. | 6/17/20 | (13,043 | ) |
| USD | 194,107 |
| SEK | 1,976,303 |
| Goldman Sachs & Co. | 6/17/20 | (6,004 | ) |
| USD | 174,818 |
| SEK | 1,817,724 |
| Goldman Sachs & Co. | 6/17/20 | (9,236 | ) |
| | | | | | | $ | (120,334 | ) |
|
| | | | | | | | | | | | |
| FUTURES CONTRACTS PURCHASED |
| Reference Entity | Contracts | Expiration Date | Notional Amount | Underlying Contract Value | Unrealized Appreciation (Depreciation) |
| U.S. Treasury 10-Year Notes | 22 |
| June 2020 | $ | 2,200,000 |
| $ | 3,051,125 |
| $ | 18,891 |
|
| U.S. Treasury 2-Year Notes | 26 |
| June 2020 | $ | 5,200,000 |
| 5,729,953 |
| 12,799 |
|
| U.S. Treasury 5-Year Notes | 21 |
| June 2020 | $ | 2,100,000 |
| 2,632,547 |
| 14,189 |
|
| U.S. Treasury Long Bonds | 3 |
| June 2020 | $ | 300,000 |
| 537,187 |
| (3,414 | ) |
| | | | | $ | 11,950,812 |
| $ | 42,465 |
|
|
| | | | | | | | | | | | |
| FUTURES CONTRACTS SOLD |
| Reference Entity | Contracts | Expiration Date | Notional Amount | Underlying Contract Value | Unrealized Appreciation (Depreciation) |
| U.S. Treasury 10-Year Ultra Notes | 18 |
| June 2020 | $ | 1,800,000 |
| $ | 2,808,563 |
| $ | (34,243 | ) |
|
| | | | | | | | | | | | | | | |
| CENTRALLY CLEARED CREDIT DEFAULT SWAP AGREEMENTS |
| Reference Entity | Type | Fixed Rate
Received
(Paid) Quarterly | Termination
Date | Notional
Amount | Premiums Paid (Received) | Unrealized
Appreciation
(Depreciation) | Value^ |
| Markit CDX North America High Yield Index Series 33 | Buy | (5.00)% | 12/20/24 | $ | 12,838,000 |
| $ | 656,177 |
| $ | 105,340 |
| $ | 761,517 |
|
^The value for credit default swap agreements serves as an indicator of the current status of the payment/performance risk and represent the likelihood of an expected liability or profit at the period end. Increasing values in absolute terms when compared to the notional amount of the credit default swap agreement represent a deterioration of the referenced entity's credit soundness and an increased likelihood or risk of a credit event occurring as defined in the agreement.
|
| | | | | | | | | | | | | | | |
| CENTRALLY CLEARED TOTAL RETURN SWAP AGREEMENTS |
| Floating Rate Index | Pay/Receive Floating Rate Index at Termination | Fixed Rate | Termination
Date | Notional
Amount | Premiums Paid (Received) | Unrealized
Appreciation
(Depreciation) | Value |
| CPURNSA | Receive | 1.78% | 8/5/24 | $ | 1,500,000 |
| $ | (445 | ) | $ | (85,056 | ) | $ | (85,501 | ) |
|
| | |
| NOTES TO SCHEDULE OF INVESTMENTS |
| AGM | - | Assured Guaranty Municipal Corporation |
| AUD | - | Australian Dollar |
| CAD | - | Canadian Dollar |
| CDX | - | Credit Derivatives Indexes |
| CLP | - | Chilean Peso |
| COP | - | Colombian Peso |
| CPURNSA | - | U.S. Consumer Price Index Urban Consumers Not Seasonally Adjusted Index |
| CZK | - | Czech Koruna |
| EUR | - | Euro |
| FHLMC | - | Federal Home Loan Mortgage Corporation |
| FNMA | - | Federal National Mortgage Association |
| GNMA | - | Government National Mortgage Association |
| GO | - | General Obligation |
| H15T1Y | - | Constant Maturity U.S. Treasury Note Yield Curve Rate Index |
| HUF | - | Hungarian Forint |
| IDR | - | Indonesian Rupiah |
| ILS | - | Israeli Shekel |
| INR | - | Indian Rupee |
| KZT | - | Kazakhstani Tenge |
| LIBOR | - | London Interbank Offered Rate |
| MTN | - | Medium Term Note |
| MXN | - | Mexican Peso |
| NOK | - | Norwegian Krone |
| NZD | - | New Zealand Dollar |
| PEN | - | Peruvian Sol |
| PHP | - | Philippine Peso |
| PLN | - | Polish Zloty |
| SEK | - | Swedish Krona |
| SEQ | - | Sequential Payer |
| USD | - | United States Dollar |
| VRN | - | Variable Rate Note. The rate adjusts periodically based upon the terms set forth in the security’s offering documents. The rate shown is effective at the period end and the reference rate and spread, if any, is indicated. The security's effective maturity date may be shorter than the final maturity date shown. |
† Category is less than 0.05% of total net assets.
| |
| (1) | Security was purchased pursuant to Rule 144A under the Securities Act of 1933 and may be sold in transactions exempt from registration, normally to qualified institutional investors. The aggregate value of these securities at the period end was $26,273,693, which represented 18.2% of total net assets. |
| |
| (2) | When-issued security. The issue price and yield are fixed on the date of the commitment, but payment and delivery are scheduled for a future date. |
| |
| (3) | Security, or a portion thereof, has been pledged at the custodian bank or with a broker for collateral requirements on forward foreign currency exchange contracts, futures contracts and/or swap agreements. At the period end, the aggregate value of securities pledged was $885,224. |
| |
| (4) | The interest rate on a bank loan obligation adjusts periodically based on a predetermined schedule. Rate shown is effective at period end. The maturity date on a bank loan obligation may be less than indicated as a result of contractual or optional prepayments. These prepayments cannot be predicted with certainty. |
See Notes to Financial Statements.
|
|
| Statement of Assets and Liabilities |
|
| | | |
| MARCH 31, 2020 | |
| Assets | |
| Investment securities, at value (cost of $142,933,829) | $ | 144,342,443 |
|
| Cash | 183,574 |
|
| Receivable for investments sold | 10,982,274 |
|
| Receivable for capital shares sold | 17,393 |
|
| Receivable for variation margin on swap agreements | 201,377 |
|
| Unrealized appreciation on forward foreign currency exchange contracts | 163,450 |
|
| Interest and dividends receivable | 767,190 |
|
| | 156,657,701 |
|
| | |
| Liabilities | |
| Payable for investments purchased | 11,467,294 |
|
| Payable for capital shares redeemed | 510,164 |
|
| Payable for variation margin on futures contracts | 4,057 |
|
| Payable for variation margin on swap agreements | 2,690 |
|
| Unrealized depreciation on forward foreign currency exchange contracts | 283,784 |
|
| Accrued management fees | 64,802 |
|
| Distribution and service fees payable | 6,951 |
|
| Dividends payable | 3,124 |
|
| | 12,342,866 |
|
| | |
| Net Assets | $ | 144,314,835 |
|
| | |
| Net Assets Consist of: | |
| Capital paid in | $ | 145,302,289 |
|
| Distributable earnings | (987,454 | ) |
| | $ | 144,314,835 |
|
|
| | | | | |
| | Net Assets | Shares Outstanding | Net Asset Value Per Share |
| Investor Class |
| $85,343,019 |
| 7,920,334 | $10.78 |
| I Class |
| $27,998,968 |
| 2,598,738 | $10.77 |
| A Class |
| $16,670,365 |
| 1,546,892 | $10.78* |
| C Class |
| $3,623,105 |
| 336,293 | $10.77 |
| R Class |
| $486,854 |
| 45,186 | $10.77 |
| R5 Class |
| $10,192,524 |
| 946,350 | $10.77 |
*Maximum offering price $11.29 (net asset value divided by 0.955).
See Notes to Financial Statements.
|
| | | |
| YEAR ENDED MARCH 31, 2020 | |
| Investment Income (Loss) | |
| Income: | |
| Interest | $ | 4,714,210 |
|
| Dividends | 36,595 |
|
| | 4,750,805 |
|
| | |
| Expenses: | |
| Management fees | 909,692 |
|
| Distribution and service fees: | |
| A Class | 41,530 |
|
| C Class | 37,363 |
|
| R Class | 3,161 |
|
| Trustees' fees and expenses | 11,090 |
|
| Other expenses | 2,072 |
|
| | 1,004,908 |
|
Fees waived(1) | (149,179 | ) |
| | 855,729 |
|
| | |
| Net investment income (loss) | 3,895,076 |
|
| | |
| Realized and Unrealized Gain (Loss) | |
| Net realized gain (loss) on: | |
| Investment transactions | 2,151,775 |
|
| Forward foreign currency exchange contract transactions | (144,639 | ) |
| Futures contract transactions | 899,947 |
|
| Swap agreement transactions | 14,098 |
|
| Foreign currency translation transactions | (38 | ) |
| | 2,921,143 |
|
| | |
| Change in net unrealized appreciation (depreciation) on: | |
| Investments | (193,157 | ) |
| Forward foreign currency exchange contracts | (228,908 | ) |
| Futures contracts | (148,197 | ) |
| Swap agreements | 34,682 |
|
| Translation of assets and liabilities in foreign currencies | 20 |
|
| | (535,560 | ) |
| | |
| Net realized and unrealized gain (loss) | 2,385,583 |
|
| | |
| Net Increase (Decrease) in Net Assets Resulting from Operations | $ | 6,280,659 |
|
| |
| (1) | Amount consists of $89,423, $28,076, $16,612, $3,736, $632 and $10,700 for Investor Class, I Class, A Class, C Class, R Class and R5 Class, respectively. |
See Notes to Financial Statements.
|
|
| Statement of Changes in Net Assets |
|
| | | | | | |
| YEARS ENDED MARCH 31, 2020 AND MARCH 31, 2019 |
| Increase (Decrease) in Net Assets | March 31, 2020 | March 31, 2019 |
| Operations | | |
| Net investment income (loss) | $ | 3,895,076 |
| $ | 4,456,494 |
|
| Net realized gain (loss) | 2,921,143 |
| (2,014,905 | ) |
| Change in net unrealized appreciation (depreciation) | (535,560 | ) | 2,451,259 |
|
| Net increase (decrease) in net assets resulting from operations | 6,280,659 |
| 4,892,848 |
|
| | | |
| Distributions to Shareholders | | |
| From earnings: | | |
| Investor Class | (2,163,108 | ) | (4,155,744 | ) |
| I Class | (689,767 | ) | (154,831 | ) |
| A Class | (356,726 | ) | (515,469 | ) |
| C Class | (52,918 | ) | (113,890 | ) |
| R Class | (12,206 | ) | (18,805 | ) |
| R5 Class | (277,529 | ) | (383,124 | ) |
| Decrease in net assets from distributions | (3,552,254 | ) | (5,341,863 | ) |
| | | |
| Capital Share Transactions | | |
| Net increase (decrease) in net assets from capital share transactions (Note 5) | (4,054,437 | ) | (5,088,125 | ) |
| | | |
| Net increase (decrease) in net assets | (1,326,032 | ) | (5,537,140 | ) |
| | | |
| Net Assets | | |
| Beginning of period | 145,640,867 |
| 151,178,007 |
|
| End of period | $ | 144,314,835 |
| $ | 145,640,867 |
|
See Notes to Financial Statements.
|
|
| Notes to Financial Statements |
MARCH 31, 2020
1. Organization
American Century Investment Trust (the trust) is registered under the Investment Company Act of 1940, as amended (the 1940 Act), as an open-end management investment company and is organized as a Massachusetts business trust. Core Plus Fund (the fund) is one fund in a series issued by the trust. The fund’s investment objective is to seek to maximize total return. As a secondary objective, the fund seeks a high level of income.
The fund offers the Investor Class, I Class, A Class, C Class, R Class and R5 Class. The A Class may incur an initial sales charge. The A Class and C Class may be subject to a contingent deferred sales charge.
2. Significant Accounting Policies
The following is a summary of significant accounting policies consistently followed by the fund in preparation of its financial statements. The fund is an investment company and follows accounting and reporting guidance in accordance with accounting principles generally accepted in the United States of America. This may require management to make certain estimates and assumptions at the date of the financial statements. Actual results could differ from these estimates. Management evaluated the impact of events or transactions occurring through the date the financial statements were issued that would merit recognition or disclosure.
Investment Valuations — The fund determines the fair value of its investments and computes its net asset value per share at the close of regular trading (usually 4 p.m. Eastern time) on the New York Stock Exchange (NYSE) on each day the NYSE is open. The Board of Trustees has adopted valuation policies and procedures to guide the investment advisor in the fund’s investment valuation process and to provide methodologies for the oversight of the fund’s pricing function.
Fixed income securities are valued at the evaluated mean as provided by independent pricing services or at the mean of the most recent bid and asked prices as provided by investment dealers. Corporate bonds, U.S. Treasury and Government Agency securities, convertible bonds, bank loan obligations, municipal securities, and sovereign governments and agencies are valued using market models that consider trade data, quotations from dealers and active market makers, relevant yield curve and spread data, creditworthiness, trade data or market information on comparable securities, and other relevant security specific information. Mortgage-related and asset-backed securities are valued based on models that consider trade data, prepayment and default projections, benchmark yield and spread data and estimated cash flows of each tranche of the issuer. Collateralized loan obligations are valued based on discounted cash flow models that consider trade and economic data, prepayment assumptions and default projections. Commercial paper is valued using a curve-based approach that considers money market rates for specific instruments, programs, currencies and maturity points from a variety of active market makers.
Hybrid securities are valued at the evaluated mean as provided by independent pricing services or at the mean of the most recent bid and asked prices as provided by investment dealers. Preferred stocks and convertible preferred stocks with perpetual maturities are valued using market models that consider trade data, quotations from dealers and active market makers, relevant yield curve and spread data, creditworthiness, trade data or market information on comparable securities, and other relevant security specific information.
Open-end management investment companies are valued at the reported net asset value per share. Repurchase agreements are valued at cost, which approximates fair value. Exchange-traded futures contracts are valued at the settlement price as provided by the appropriate exchange. Swap agreements are valued at an evaluated mean as provided by independent pricing services or independent brokers. Forward foreign currency exchange contracts are valued at the mean of the appropriate forward exchange rate at the close of the NYSE as provided by an independent pricing service.
If the fund determines that the market price for an investment is not readily available or the valuation methods mentioned above do not reflect an investment’s fair value, such investment is valued as determined in good faith by the Board of Trustees or its delegate, in accordance with policies and procedures adopted by the Board of Trustees. In its determination of fair value, the fund may review several factors including, but not limited to, market information regarding the specific investment or comparable investments and correlation with other investment types, futures indices or general market indicators. Circumstances that may cause the fund to use these procedures to value an investment include, but are not limited to: an investment has been declared in default or is distressed; trading in a security has been suspended during the trading day or a security is not actively trading on its principal exchange; prices received from a regular pricing source are deemed unreliable; or there is a foreign market holiday and no trading occurred.
The fund monitors for significant events occurring after the close of an investment’s primary exchange but before the fund’s net asset value per share is determined. Significant events may include, but are not limited to: corporate announcements and transactions; governmental action and political unrest that could impact a specific investment or an investment sector; or armed conflicts, natural disasters and similar events that could affect investments in a specific country or region.
Security Transactions — Security transactions are accounted for as of the trade date. Net realized gains and losses are determined on the identified cost basis, which is also used for federal income tax purposes.
Investment Income — Interest income is recorded on the accrual basis and includes paydown gain (loss) and accretion of discounts and amortization of premiums. Inflation adjustments related to inflation-linked debt securities are reflected as interest income. Dividend income less foreign taxes withheld, if any, is recorded as of the ex-dividend date. Distributions received on securities that represent a return of capital or long-term capital gain are recorded as a reduction of cost of investments and/or as a realized gain. The fund may estimate the components of distributions received that may be considered nontaxable distributions or long-term capital gain distributions for income tax purposes.
Foreign Currency Translations — All assets and liabilities initially expressed in foreign currencies are translated into U.S. dollars at prevailing exchange rates at period end. The fund may enter into spot foreign currency exchange contracts to facilitate transactions denominated in a foreign currency. Purchases and sales of investment securities, dividend and interest income, spot foreign currency exchange contracts, and expenses are translated at the rates of exchange prevailing on the respective dates of such transactions. Net realized and unrealized foreign currency exchange gains or losses related to investment securities are a component of net realized gain (loss) on investment transactions and change in net unrealized appreciation (depreciation) on investments, respectively.
Repurchase Agreements — The fund may enter into repurchase agreements with institutions that American Century Investment Management, Inc. (ACIM) (the investment advisor) has determined are creditworthy pursuant to criteria adopted by the Board of Trustees. The fund requires that the collateral, represented by securities, received in a repurchase transaction be transferred to the custodian in a manner sufficient to enable the fund to obtain those securities in the event of a default under the repurchase agreement. ACIM monitors, on a daily basis, the securities transferred to ensure the value, including accrued interest, of the securities under each repurchase agreement is equal to or greater than amounts owed to the fund under each repurchase agreement.
Joint Trading Account — Pursuant to an Exemptive Order issued by the Securities and Exchange Commission, the fund, along with certain other funds in the American Century Investments family of funds, may transfer uninvested cash balances into a joint trading account. These balances are invested in one or more repurchase agreements that are collateralized by U.S. Treasury or Agency obligations.
Segregated Assets — In accordance with the 1940 Act, the fund segregates assets on its books and records to cover certain types of investment securities and other financial instruments. ACIM monitors, on a daily basis, the securities segregated to ensure the fund designates a sufficient amount of liquid assets, marked-to-market daily. The fund may also receive assets or be required to pledge assets at the custodian bank or with a broker for collateral requirements.
Income Tax Status — It is the fund’s policy to distribute substantially all net investment income and net realized gains to shareholders and to otherwise qualify as a regulated investment company under provisions of the Internal Revenue Code. Accordingly, no provision has been made for income taxes. The fund files U.S. federal, state, local and non-U.S. tax returns as applicable. The fund's tax returns are subject to examination by the relevant taxing authority until expiration of the applicable statute of limitations, which is generally three years from the date of filing but can be longer in certain jurisdictions. At this time, management believes there are no uncertain tax positions which, based on their technical merit, would not be sustained upon examination and for which it is reasonably possible that the total amounts of unrecognized tax benefits will significantly change in the next twelve months.
Multiple Class — All shares of the fund represent an equal pro rata interest in the net assets of the class to which such shares belong, and have identical voting, dividend, liquidation and other rights and the same terms and conditions, except for class specific expenses and exclusive rights to vote on matters affecting only individual classes. Income, non-class specific expenses, and realized and unrealized capital gains and losses of the fund are allocated to each class of shares based on their relative net assets.
Distributions to Shareholders — Distributions from net investment income, if any, are declared daily and paid monthly. Distributions from net realized gains, if any, are generally declared and paid annually.
Indemnifications — Under the trust’s organizational documents, its officers and trustees are indemnified against certain liabilities arising out of the performance of their duties to the fund. In addition, in the normal course of business, the fund enters into contracts that provide general indemnifications. The maximum exposure under these arrangements is unknown as this would involve future claims that may be made against a fund. The risk of material loss from such claims is considered by management to be remote.
3. Fees and Transactions with Related Parties
Certain officers and trustees of the trust are also officers and/or directors of American Century Companies, Inc. (ACC). The trust's investment advisor, ACIM, the trust's distributor, American Century Investment Services, Inc. (ACIS), and the trust's transfer agent, American Century Services, LLC, are wholly owned, directly or indirectly, by ACC.
Management Fees — The trust has entered into a management agreement with ACIM, under which ACIM provides the fund with investment advisory and management services in exchange for a single, unified management fee (the fee) per class. The agreement provides that all expenses of managing and operating the fund, except distribution and service fees, brokerage expenses, taxes, interest, fees and expenses of the independent trustees (including legal counsel fees), and extraordinary expenses, will be paid by ACIM. The fee is computed and accrued daily based on each class's daily net assets and paid monthly in arrears. The difference in the fee among the classes is a result of their separate arrangements for non-Rule 12b-1 shareholder services. It is not the result of any difference in advisory or custodial fees or other expenses related to the management of the fund’s assets, which do not vary by class. The fee consists of (1) an Investment Category Fee based on the daily net assets of the fund and certain other accounts managed by the investment advisor that are in the same broad investment category as the fund and (2) a Complex Fee based on the assets of all the funds in the American Century Investments family of funds. During the period ended March 31, 2020, the investment advisor agreed to waive 0.10% of the fund's management fee. The investment advisor expects this waiver to continue until July 31, 2020 and cannot terminate it prior to such date without the approval of the Board of Trustees.
The Investment Category Fee range, the Complex Fee range and the effective annual management fee before and after waiver for each class for the period ended March 31, 2020 are as follows:
|
| | | | |
| | | | Effective Annual Management Fee |
| | Investment Category Fee Range | Complex Fee Range | Before Waiver | After Waiver |
| Investor Class | 0.3425%
to 0.4600% | 0.2500% to 0.3100% | 0.64% | 0.54% |
| I Class | 0.1500% to 0.2100% | 0.54% | 0.44% |
| A Class | 0.2500% to 0.3100% | 0.64% | 0.54% |
| C Class | 0.2500% to 0.3100% | 0.64% | 0.54% |
| R Class | 0.2500% to 0.3100% | 0.64% | 0.54% |
| R5 Class | 0.0500% to 0.1100% | 0.44% | 0.34% |
Distribution and Service Fees — The Board of Trustees has adopted a separate Master Distribution and Individual Shareholder Services Plan for each of the A Class, C Class and R Class (collectively the plans), pursuant to Rule 12b-1 of the 1940 Act. The plans provide that the A Class will pay ACIS an annual distribution and service fee of 0.25%. The plans provide that the C Class will pay ACIS an annual distribution and service fee of 1.00%, of which 0.25% is paid for individual shareholder services and 0.75% is paid for distribution services. The plans provide that the R Class will pay ACIS an annual distribution and service fee of 0.50%. The fees are computed and accrued daily based on each class’s daily net assets and paid monthly in arrears. The fees are used to pay financial intermediaries for distribution and individual shareholder services. Fees incurred under the plans during the period ended March 31, 2020 are detailed in the Statement of Operations.
Trustees’ Fees and Expenses — The Board of Trustees is responsible for overseeing the investment advisor’s management and operations of the fund. The trustees receive detailed information about the fund and its investment advisor regularly throughout the year, and meet at least quarterly with management of the investment advisor to review reports about fund operations. The fund’s officers do not receive compensation from the fund.
Interfund Transactions — The fund may enter into security transactions with other American Century Investments funds and other client accounts of the investment advisor, in accordance with the 1940 Act rules and procedures adopted by the Board of Trustees. The rules and procedures require, among other things, that these transactions be effected at the independent current market price of the security. There were no interfund transactions during the period.
4. Investment Transactions
Purchases of investment securities, excluding short-term investments, for the period ended March 31, 2020 totaled $193,009,587, of which $133,855,179 represented U.S. Treasury and Government Agency obligations.
Sales of investment securities, excluding short-term investments, for the period ended March 31, 2020 totaled $201,934,819, of which $137,323,274 represented U.S. Treasury and Government Agency obligations.
5. Capital Share Transactions
Transactions in shares of the fund were as follows (unlimited number of shares authorized):
|
| | | | | | | | |
| | Year ended March 31, 2020 | Year ended March 31, 2019 |
| | Shares | Amount | Shares | Amount |
| Investor Class | | | | |
| Sold | 2,506,142 | $ | 27,310,053 |
| 3,567,664 | $ | 36,936,228 |
|
| Issued in reinvestment of distributions | 190,348 | 2,066,899 |
| 384,507 | 3,987,347 |
|
| Redeemed | (5,168,305) | (55,406,182) |
| (4,737,909) | (49,084,300) |
|
| | (2,471,815) | (26,029,230) |
| (785,738) | (8,160,725) |
|
| I Class | | | | |
| Sold | 3,133,903 | 33,458,643 |
| 441,715 | 4,590,990 |
|
| Issued in reinvestment of distributions | 63,351 | 689,594 |
| 14,325 | 148,384 |
|
| Redeemed | (1,192,245) | (12,963,639) |
| (187,407) | (1,948,190) |
|
| | 2,005,009 | 21,184,598 |
| 268,633 | 2,791,184 |
|
| A Class | | | | |
| Sold | 457,399 | 4,956,897 |
| 428,625 | 4,450,885 |
|
| Issued in reinvestment of distributions | 32,150 | 349,426 |
| 48,810 | 505,965 |
|
| Redeemed | (422,311) | (4,573,516) |
| (333,272) | (3,462,658) |
|
| | 67,238 | 732,807 |
| 144,163 | 1,494,192 |
|
| C Class | | | | |
| Sold | 106,541 | 1,152,608 |
| 16,872 | 175,567 |
|
| Issued in reinvestment of distributions | 4,631 | 50,273 |
| 9,998 | 103,642 |
|
| Redeemed | (102,204) | (1,106,668) |
| (188,805) | (1,960,272) |
|
| | 8,968 | 96,213 |
| (161,935) | (1,681,063) |
|
| R Class | | | | |
| Sold | 20,423 | 222,603 |
| 31,923 | 331,978 |
|
| Issued in reinvestment of distributions | 1,105 | 12,000 |
| 1,760 | 18,262 |
|
| Redeemed | (34,601) | (378,490) |
| (48,598) | (505,905) |
|
| | (13,073) | (143,887) |
| (14,915) | (155,665) |
|
| R5 Class | | | | |
| Sold | 184,585 | 1,999,196 |
| 256,751 | 2,670,346 |
|
| Issued in reinvestment of distributions | 25,541 | 277,519 |
| 36,883 | 382,195 |
|
| Redeemed | (202,549) | (2,171,653) |
| (235,302) | (2,428,589) |
|
| | 7,577 | 105,062 |
| 58,332 | 623,952 |
|
| Net increase (decrease) | (396,096) | $ | (4,054,437 | ) | (491,460) | $ | (5,088,125 | ) |
6. Fair Value Measurements
The fund’s investments valuation process is based on several considerations and may use multiple inputs to determine the fair value of the investments held by the fund. In conformity with accounting principles generally accepted in the United States of America, the inputs used to determine a valuation are classified into three broad levels.
| |
| • | Level 1 valuation inputs consist of unadjusted quoted prices in an active market for identical investments. |
| |
| • | Level 2 valuation inputs consist of direct or indirect observable market data (including quoted prices for comparable investments, evaluations of subsequent market events, interest rates, prepayment speeds, credit risk, etc.). These inputs also consist of quoted prices for identical investments initially expressed in local currencies that are adjusted through translation into U.S. dollars. |
| |
| • | Level 3 valuation inputs consist of unobservable data (including a fund’s own assumptions). |
The level classification is based on the lowest level input that is significant to the fair valuation measurement. The valuation inputs are not necessarily an indication of the risks associated with investing in these securities or other financial instruments.
The following is a summary of the level classifications as of period end. The Schedule of Investments provides additional information on the fund’s portfolio holdings.
|
| | | | | | | | |
| | Level 1 | Level 2 | Level 3 |
| Assets | | | |
| Investment Securities | | | |
| Corporate Bonds | — |
| $ | 45,569,114 |
| — |
|
| U.S. Treasury Securities | — |
| 40,645,133 |
| — |
|
| U.S. Government Agency Mortgage-Backed Securities | — |
| 18,557,049 |
| — |
|
| Asset-Backed Securities | — |
| 9,804,822 |
| — |
|
| Collateralized Mortgage Obligations | — |
| 6,451,196 |
| — |
|
| Collateralized Loan Obligations | — |
| 5,689,081 |
| — |
|
| Municipal Securities | — |
| 3,001,061 |
| — |
|
| Commercial Mortgage-Backed Securities | — |
| 2,741,386 |
| — |
|
| Sovereign Governments and Agencies | — |
| 2,616,050 |
| — |
|
| Preferred Stocks | — |
| 348,896 |
| — |
|
| Bank Loan Obligations | — |
| 303,344 |
| — |
|
| Temporary Cash Investments | $ | 5,792,185 |
| 2,823,126 |
| — |
|
| | $ | 5,792,185 |
| $ | 138,550,258 |
| — |
|
| Other Financial Instruments | | | |
| Futures Contracts | $ | 45,879 |
| — |
| — |
|
| Swap Agreements | — |
| $ | 761,517 |
| — |
|
| Forward Foreign Currency Exchange Contracts | — |
| 163,450 |
| — |
|
| | $ | 45,879 |
| $ | 924,967 |
| — |
|
| | | | |
| Liabilities | | | |
| Other Financial Instruments | | | |
| Futures Contracts | $ | 37,657 |
| — |
| — |
|
| Swap Agreements | — |
| $ | 85,501 |
| — |
|
| Forward Foreign Currency Exchange Contracts | — |
| 283,784 |
| — |
|
| | $ | 37,657 |
| $ | 369,285 |
| — |
|
7. Derivative Instruments
Credit Risk — The fund is subject to credit risk in the normal course of pursuing its investment objectives. The value of a bond generally declines as the credit quality of its issuer declines. Credit default swap agreements enable a fund to buy/sell protection against a credit event of a specific issuer or index. A fund may attempt to enhance returns by selling protection or attempt to mitigate credit risk by buying protection. The buyer/seller of credit protection against a security or basket of securities may pay/receive an up-front or periodic payment to compensate for/against potential default events. Changes in value, including the periodic amounts of interest to be paid or received on swap agreements, are recorded as unrealized appreciation (depreciation) on swap agreements. Upon entering into a centrally cleared swap, a fund is required to deposit cash or securities (initial margin) with a financial intermediary in an amount equal to a certain percentage of the notional amount. Subsequent payments (variation margin) are made or received daily, in cash, by a fund. The variation margin is equal to the daily change in the value and is a component of unrealized gains and losses. Realized gain or loss is recorded upon receipt or payment of a periodic settlement or termination of swap agreements. Net realized and unrealized gains or losses occurring during the holding period of swap agreements are a component of net realized gain (loss) on swap agreement transactions and change in net unrealized appreciation (depreciation) on swap agreements, respectively. The risks of entering into swap agreements include the possible lack of liquidity, failure of the counterparty to meet its obligations, and that there may be unfavorable changes in the underlying investments or instruments. The fund's average notional amount held during the period was $2,912,545.
Foreign Currency Risk — The fund is subject to foreign currency exchange rate risk in the normal course of pursuing its investment objectives. The value of foreign investments held by a fund may be significantly affected by changes in foreign currency exchange rates. The dollar value of a foreign security generally decreases when the value of the dollar rises against the foreign currency in which the security is denominated and tends to increase when the value of the dollar declines against such foreign currency. A fund may enter into forward foreign currency exchange contracts to reduce a fund's exposure to foreign currency exchange rate fluctuations or to gain exposure to the fluctuations in the value of foreign currencies. The net U.S. dollar value of foreign currency underlying all contractual commitments held by a fund and the resulting unrealized appreciation or depreciation are determined daily. Realized gain or loss is recorded upon the termination of the contract. Net realized and unrealized gains or losses occurring during the holding period of forward foreign currency exchange contracts are a component of net realized gain (loss) on forward foreign currency exchange contract transactions and change in net unrealized appreciation (depreciation) on forward foreign currency exchange contracts, respectively. A fund bears the risk of an unfavorable change in the foreign currency exchange rate underlying the forward contract. Additionally, losses, up to the fair value, may arise if the counterparties do not perform under the contract terms. The fund's average U.S. dollar exposure to foreign currency risk derivative instruments held during the period was $44,333,704.
Interest Rate Risk — The fund is subject to interest rate risk in the normal course of pursuing its investment objectives. The value of bonds generally declines as interest rates rise. A fund may enter into futures contracts based on a bond index or a specific underlying security. A fund may purchase futures contracts to gain exposure to increases in market value or sell futures contracts to protect against a decline in market value. Upon entering into a futures contract, a fund will segregate cash, cash equivalents or other appropriate liquid securities on its records in amounts sufficient to meet requirements. Subsequent payments (variation margin) are made or received daily, in cash, by a fund. The variation margin is equal to the daily change in the contract value and is recorded as unrealized gains and losses. A fund recognizes a realized gain or loss when the futures contract is closed or expires. Net realized and unrealized gains or losses occurring during the holding period of futures contracts are a component of net realized gain (loss) on futures contract transactions and change in net unrealized appreciation (depreciation) on futures contracts, respectively. One of the risks of entering into futures contracts is the possibility that the change in value of the contract may not correlate with the changes in value of the underlying securities. The fund's average notional exposure to interest rate risk derivative instruments held during the period was $13,933,333 futures contracts purchased and $1,160,000 futures contracts sold.
Other Contracts — A fund may enter into total return swap agreements in order to attempt to obtain or preserve a particular return or spread at a lower cost than obtaining a return or spread through purchases and/or sales of instruments in other markets or gain exposure to certain markets in the most economical way possible. A fund will segregate cash, cash equivalents or other appropriate liquid securities on its records in amounts sufficient to meet requirements. Changes in value, including the periodic amounts of interest to be paid or received on swap agreements, are recorded as unrealized appreciation (depreciation) on swap agreements. Upon entering into a centrally cleared swap, a fund is required to deposit cash or securities (initial margin) with a financial intermediary in an amount equal to a certain percentage of the notional amount. Subsequent payments (variation margin) are made or received daily, in cash, by a fund. The variation margin is equal to the daily change in the value and is a component of unrealized gains and losses. Realized gain or loss is recorded upon receipt or payment of a periodic settlement or termination of swap agreements. Net realized and unrealized gains or losses occurring during the holding period of swap agreements are a component of net realized gain (loss) on swap agreement transactions and change in net unrealized appreciation (depreciation) on swap agreements, respectively. The risks of entering into swap agreements include the possible lack of liquidity, failure of the counterparty to meet its obligations, and that there may be unfavorable changes in the underlying investments or instruments, including inflationary risk. The fund's average notional amount held during the period was $1,500,000.
|
| | | | | | | | |
| Value of Derivative Instruments as of March 31, 2020 |
| | Asset Derivatives | Liability Derivatives |
| Type of Risk Exposure | Location on Statement of Assets and Liabilities | Value | Location on Statement of Assets and Liabilities | Value |
| Credit Risk | Receivable for variation margin on swap agreements* | $ | 201,377 |
| Payable for variation margin on swap agreements* | — |
|
| Foreign Currency Risk | Unrealized appreciation on forward foreign currency exchange contracts | 163,450 |
| Unrealized depreciation on forward foreign currency exchange contracts | $ | 283,784 |
|
| Interest Rate Risk | Receivable for variation margin on futures contracts* | — |
| Payable for variation margin on futures contracts* | 4,057 |
|
| Other Contracts | Receivable for variation margin on swap agreements* | — |
| Payable for variation margin on swap agreements* | 2,690 |
|
| | | $ | 364,827 |
| | $ | 290,531 |
|
| |
| * | Included in the unrealized appreciation (depreciation) on futures contracts or centrally cleared swap agreements, as applicable, as reported in the Schedule of Investments. |
|
| | | | | | | | |
| Effect of Derivative Instruments on the Statement of Operations for the Year Ended March 31, 2020 |
| | Net Realized Gain (Loss) | Change in Net Unrealized Appreciation (Depreciation) |
| Type of Risk Exposure | Location on Statement of Operations | Value | Location on Statement of Operations | Value |
| Credit Risk | Net realized gain (loss) on swap agreement transactions | $ | 14,098 |
| Change in net unrealized appreciation (depreciation) on swap agreements | $ | 119,738 |
|
| Foreign Currency Risk | Net realized gain (loss) on forward foreign currency exchange contract transactions | (144,639 | ) | Change in net unrealized appreciation (depreciation) on forward foreign currency exchange contracts | (228,908 | ) |
| Interest Rate Risk | Net realized gain (loss) on futures contract transactions | 899,947 |
| Change in net unrealized appreciation (depreciation) on futures contracts | (148,197 | ) |
| Other Contracts | Net realized gain (loss) on swap agreement transactions | — |
| Change in net unrealized appreciation (depreciation) on swap agreements | (85,056 | ) |
| | | $ | 769,406 |
| | $ | (342,423 | ) |
8. Risk Factors
The value of the fund’s shares will go up and down, sometimes rapidly or unpredictably, based on the performance of the securities owned by the fund and other factors generally affecting the securities market. Market risks, including political, regulatory, economic and social developments, can affect the value of the fund’s investments. Natural disasters, public health emergencies, terrorism and other unforeseeable events may lead to increased market volatility and may have adverse long-term effects on world economies and markets generally.
The fund may invest in instruments that have variable or floating coupon rates based on the London Interbank Offered Rate (LIBOR). LIBOR is a benchmark interest rate intended to be representative of the rate at which certain major international banks lend to one another over short-terms. LIBOR will be phased out by the end of 2021. Uncertainty remains regarding a replacement rate or rates for LIBOR. The transition process may lead to increased volatility or illiquidity in markets for instruments that rely on LIBOR. This could result in a change to the value of such instruments.
There are certain risks involved in investing in foreign securities. These risks include those resulting from political events (such as civil unrest, national elections and imposition of exchange controls), social and economic events (such as labor strikes and rising inflation), and natural disasters. Securities of foreign issuers may be less liquid and more volatile. Investing in emerging markets or a significant portion of assets in one country or region may accentuate these risks.
The fund’s investment process may result in high portfolio turnover, which could mean high transaction costs, affecting both performance and capital gains tax liabilities to investors.
9. Federal Tax Information
The tax character of distributions paid during the years ended March 31, 2020 and March 31, 2019 were as follows:
|
| | | | | | |
| | 2020 | 2019 |
| Distributions Paid From | | |
| Ordinary income | $ | 3,552,254 |
| $ | 5,341,863 |
|
| Long-term capital gains | — |
| — |
|
The book-basis character of distributions made during the year from net investment income or net realized gains may differ from their ultimate characterization for federal income tax purposes. These differences reflect the differing character of certain income items and net realized gains and losses for financial statement and tax purposes, and may result in reclassification among certain capital accounts on the financial statements.
As of period end, the federal tax cost of investments and the components of distributable earnings on a tax-basis were as follows:
|
| | | |
| Federal tax cost of investments | $ | 142,978,677 |
|
| Gross tax appreciation of investments | $ | 5,835,634 |
|
| Gross tax depreciation of investments | (4,471,868 | ) |
| Net tax appreciation (depreciation) of investments | 1,363,766 |
|
| Net tax appreciation (depreciation) on derivatives and translation of assets and liabilities in foreign currencies | (7,831 | ) |
| Net tax appreciation (depreciation) | $ | 1,355,935 |
|
| Other book-to-tax adjustments | $ | (87,844 | ) |
| Undistributed ordinary income | $ | 611 |
|
Accumulated short-term capital losses
| $ | (2,050,453 | ) |
Accumulated long-term capital losses
| $ | (205,703 | ) |
The difference between book-basis and tax-basis unrealized appreciation (depreciation) is attributable primarily to the tax deferral of losses on wash sales and the realization for tax purposes of unrealized gains (losses) on certain foreign currency exchange contracts and unsettled interest on swap agreements. Other book-to-tax adjustments are attributable primarily to the tax deferral of losses on straddle positions.
Accumulated capital losses represent net capital loss carryovers that may be used to offset future realized capital gains for federal income tax purposes. The capital loss carryovers may be carried forward for an unlimited period. Future capital loss carryover utilization in any given year may be subject to Internal Revenue Code limitations.
10. Recently Issued Accounting Standards
In March 2017, the Financial Accounting Standards Board (FASB) issued Accounting Standards Update No. 2017-08, “Receivables - Nonrefundable Fees and Other Costs (Subtopic 310-20), Premium Amortization on Purchased Callable Debt Securities” (ASU 2017-08). ASU 2017-08 amends the amortization period for certain purchased callable debt securities held at a premium, shortening such period to the earliest call date. The amendments are effective for fiscal years, and interim periods within those fiscal years, beginning after December 15, 2018. The adoption of ASU 2017-08 did not materially impact the financial statements.
|
| | | | | | | | | | | | | | | |
| For a Share Outstanding Throughout the Years Ended March 31 (except as noted) |
| Per-Share Data | | | | | | Ratios and Supplemental Data | |
| | | Income From Investment Operations: | | Ratio to Average Net Assets of: | | |
| | Net Asset
Value,
Beginning
of Period | Net
Investment
Income
(Loss)(1) | Net
Realized
and
Unrealized
Gain (Loss) | Total From
Investment
Operations | Distributions From Net
Investment
Income | Net Asset
Value,
End
of Period | Total
Return(2) | Operating
Expenses | Operating
Expenses
(before
expense
waiver) | Net
Investment
Income
(Loss) | Net
Investment
Income
(Loss)
(before
expense
waiver) | Portfolio
Turnover
Rate | Net
Assets,
End of
Period
(in thousands) |
| Investor Class | | | | | | | | | | | | |
| 2020 | $10.56 | 0.29 | 0.19 | 0.48 | (0.26) | $10.78 | 4.57% | 0.55% | 0.65% | 2.64% | 2.54% | 129% |
| $85,343 |
|
| 2019 | $10.59 | 0.33 | 0.03 | 0.36 | (0.39) | $10.56 | 3.55% | 0.58% | 0.65% | 3.17% | 3.10% | 139% |
| $109,760 |
|
| 2018 | $10.71 | 0.30 | (0.09) | 0.21 | (0.33) | $10.59 | 1.92% | 0.63% | 0.65% | 2.80% | 2.78% | 144% |
| $118,329 |
|
| 2017 | $10.82 | 0.27 | (0.08) | 0.19 | (0.30) | $10.71 | 1.76% | 0.62% | 0.65% | 2.52% | 2.49% | 150% |
| $84,193 |
|
| 2016 | $11.02 | 0.27 | (0.16) | 0.11 | (0.31) | $10.82 | 1.02% | 0.63% | 0.65% | 2.53% | 2.51% | 145% |
| $90,012 |
|
| I Class | | | | | | | | | | | | |
| 2020 | $10.56 | 0.30 | 0.18 | 0.48 | (0.27) | $10.77 | 4.67% | 0.45% | 0.55% | 2.74% | 2.64% | 129% |
| $27,999 |
|
| 2019 | $10.58 | 0.34 | 0.04 | 0.38 | (0.40) | $10.56 | 3.76% | 0.48% | 0.55% | 3.27% | 3.20% | 139% |
| $6,269 |
|
2018(3) | $10.73 | 0.31 | (0.13) | 0.18 | (0.33) | $10.58 | 1.65% | 0.53%(4) | 0.55%(4) | 2.97%(4) | 2.95%(4) | 144%(5) |
| $3,441 |
|
|
| | | | | | | | | | | | | | | |
| For a Share Outstanding Throughout the Years Ended March 31 (except as noted) |
| Per-Share Data | | | | | | Ratios and Supplemental Data | |
| | | Income From Investment Operations: | | Ratio to Average Net Assets of: | | |
| | Net Asset
Value,
Beginning
of Period | Net
Investment
Income
(Loss)(1) | Net
Realized
and
Unrealized
Gain (Loss) | Total From
Investment
Operations | Distributions From Net
Investment
Income | Net Asset
Value,
End
of Period | Total
Return(2) | Operating
Expenses | Operating
Expenses
(before
expense
waiver) | Net
Investment
Income
(Loss) | Net
Investment
Income
(Loss)
(before
expense
waiver) | Portfolio
Turnover
Rate | Net
Assets,
End of
Period
(in thousands) |
| A Class | | | | | | | | | | | | |
| 2020 | $10.56 | 0.26 | 0.19 | 0.45 | (0.23) | $10.78 | 4.31% | 0.80% | 0.90% | 2.39% | 2.29% | 129% |
| $16,670 |
|
| 2019 | $10.59 | 0.30 | 0.04 | 0.34 | (0.37) | $10.56 | 3.30% | 0.83% | 0.90% | 2.92% | 2.85% | 139% |
| $15,630 |
|
| 2018 | $10.71 | 0.27 | (0.09) | 0.18 | (0.30) | $10.59 | 1.67% | 0.88% | 0.90% | 2.55% | 2.53% | 144% |
| $14,139 |
|
| 2017 | $10.82 | 0.25 | (0.09) | 0.16 | (0.27) | $10.71 | 1.51% | 0.87% | 0.90% | 2.27% | 2.24% | 150% |
| $27,498 |
|
| 2016 | $11.02 | 0.24 | (0.16) | 0.08 | (0.28) | $10.82 | 0.77% | 0.88% | 0.90% | 2.28% | 2.26% | 145% |
| $28,220 |
|
| C Class | | | | | | | | | | | | |
| 2020 | $10.56 | 0.18 | 0.18 | 0.36 | (0.15) | $10.77 | 3.45% | 1.55% | 1.65% | 1.64% | 1.54% | 129% |
| $3,623 |
|
| 2019 | $10.58 | 0.23 | 0.04 | 0.27 | (0.29) | $10.56 | 2.62% | 1.58% | 1.65% | 2.17% | 2.10% | 139% |
| $3,457 |
|
| 2018 | $10.71 | 0.19 | (0.10) | 0.09 | (0.22) | $10.58 | 0.81% | 1.63% | 1.65% | 1.80% | 1.78% | 144% |
| $5,179 |
|
| 2017 | $10.82 | 0.17 | (0.09) | 0.08 | (0.19) | $10.71 | 0.76% | 1.62% | 1.65% | 1.52% | 1.49% | 150% |
| $6,955 |
|
| 2016 | $11.01 | 0.16 | (0.15) | 0.01 | (0.20) | $10.82 | 0.11% | 1.63% | 1.65% | 1.53% | 1.51% | 145% |
| $8,618 |
|
|
| | | | | | | | | | | | | | | |
| For a Share Outstanding Throughout the Years Ended March 31 (except as noted) |
| Per-Share Data | | | | | | Ratios and Supplemental Data | |
| | | Income From Investment Operations: | | Ratio to Average Net Assets of: | | |
| | Net Asset
Value,
Beginning
of Period | Net
Investment
Income
(Loss)(1) | Net
Realized
and
Unrealized
Gain (Loss) | Total From
Investment
Operations | Distributions From Net
Investment
Income | Net Asset
Value,
End
of Period | Total
Return(2) | Operating
Expenses | Operating
Expenses
(before
expense
waiver) | Net
Investment
Income
(Loss) | Net
Investment
Income
(Loss)
(before
expense
waiver) | Portfolio
Turnover
Rate | Net
Assets,
End of
Period
(in thousands) |
| R Class | | | | | | | | | | | | |
| 2020 | $10.56 | 0.23 | 0.19 | 0.42 | (0.21) | $10.77 | 4.05% | 1.05% | 1.15% | 2.14% | 2.04% | 129% |
| $487 |
|
| 2019 | $10.59 | 0.28 | 0.03 | 0.31 | (0.34) | $10.56 | 3.04% | 1.08% | 1.15% | 2.67% | 2.60% | 139% |
| $615 |
|
| 2018 | $10.71 | 0.24 | (0.09) | 0.15 | (0.27) | $10.59 | 1.41% | 1.13% | 1.15% | 2.30% | 2.28% | 144% |
| $775 |
|
| 2017 | $10.82 | 0.22 | (0.08) | 0.14 | (0.25) | $10.71 | 1.26% | 1.12% | 1.15% | 2.02% | 1.99% | 150% |
| $1,472 |
|
| 2016 | $11.01 | 0.22 | (0.16) | 0.06 | (0.25) | $10.82 | 0.61% | 1.13% | 1.15% | 2.03% | 2.01% | 145% |
| $2,649 |
|
| R5 Class | | | | | | | | | | | | |
| 2020 | $10.56 | 0.31 | 0.18 | 0.49 | (0.28) | $10.77 | 4.68% | 0.35% | 0.45% | 2.84% | 2.74% | 129% |
| $10,193 |
|
| 2019 | $10.58 | 0.35 | 0.04 | 0.39 | (0.41) | $10.56 | 3.86% | 0.38% | 0.45% | 3.37% | 3.30% | 139% |
| $9,910 |
|
| 2018 | $10.71 | 0.33 | (0.11) | 0.22 | (0.35) | $10.58 | 2.03% | 0.43% | 0.45% | 3.00% | 2.98% | 144% |
| $9,315 |
|
| 2017 | $10.82 | 0.30 | (0.09) | 0.21 | (0.32) | $10.71 | 1.97% | 0.42% | 0.45% | 2.72% | 2.69% | 150% |
| $3,535 |
|
| 2016 | $11.02 | 0.29 | (0.16) | 0.13 | (0.33) | $10.82 | 1.23% | 0.43% | 0.45% | 2.73% | 2.71% | 145% |
| $1,224 |
|
|
| | | | |
| Notes to Financial Highlights | | |
| |
| (1) | Computed using average shares outstanding throughout the period. |
| |
| (2) | Total returns are calculated based on the net asset value of the last business day and do not reflect applicable sales charges, if any. Total returns for periods less than one year are not annualized. |
| |
| (3) | April 10, 2017 (commencement of sale) through March 31, 2018. |
| |
| (5) | Portfolio turnover is calculated at the fund level. Percentage indicated was calculated for the year ended March 31, 2018. |
See Notes to Financial Statements.
|
|
| Report of Independent Registered Public Accounting Firm |
To the Board of Trustees of American Century Investment Trust and Shareholders of Core Plus Fund
Opinion on the Financial Statements
We have audited the accompanying statement of assets and liabilities, including the schedule of investments, of Core Plus Fund (one of the funds constituting American Century Investment Trust, referred to hereafter as the “Fund”) as of March 31, 2020, the related statement of operations for the year ended March 31, 2020, the statement of changes in net assets for each of the two years in the period ended March 31, 2020, including the related notes, and the financial highlights for each of the periods indicated therein (collectively referred to as the “financial statements”). In our opinion, the financial statements present fairly, in all material respects, the financial position of the Fund as of March 31, 2020, the results of its operations for the year then ended, the changes in its net assets for each of the two years in the period ended March 31, 2020 and the financial highlights for each of the periods indicated therein in conformity with accounting principles generally accepted in the United States of America.
Basis for Opinion
These financial statements are the responsibility of the Fund’s management. Our responsibility is to express an opinion on the Fund’s financial statements based on our audits. We are a public accounting firm registered with the Public Company Accounting Oversight Board (United States) (PCAOB) and are required to be independent with respect to the Fund in accordance with the U.S. federal securities laws and the applicable rules and regulations of the Securities and Exchange Commission and the PCAOB.
We conducted our audits of these financial statements in accordance with the standards of the PCAOB. Those standards require that we plan and perform the audit to obtain reasonable assurance about whether the financial statements are free of material misstatement, whether due to error or fraud.
Our audits included performing procedures to assess the risks of material misstatement of the financial statements, whether due to error or fraud, and performing procedures that respond to those risks. Such procedures included examining, on a test basis, evidence regarding the amounts and disclosures in the financial statements. Our audits also included evaluating the accounting principles used and significant estimates made by management, as well as evaluating the overall presentation of the financial statements. Our procedures included confirmation of securities owned as of March 31, 2020 by correspondence with the custodian and brokers; when replies were not received from brokers, we performed other auditing procedures. We believe that our audits provide a reasonable basis for our opinion.
/s/ PricewaterhouseCoopers LLP
Kansas City, Missouri
May 18, 2020
We have served as the auditor of one or more investment companies in American Century Investments since 1997.
Board of Trustees
The individuals listed below serve as trustees of the funds. Each trustee will continue to serve in this capacity until death, retirement, resignation or removal from office. The board has adopted a mandatory retirement age for trustees who are not “interested persons,” as that term is defined in the Investment Company Act (independent trustees). Independent trustees shall retire on December 31 of the year in which they reach their 75th birthday; provided, however, that on or after January 1, 2022, independent trustees shall retire on December 31 of the year in which they reach their 76th birthday.
Mr. Thomas is an “interested person” because he currently serves as President and Chief Executive Officer of American Century Companies, Inc. (ACC), the parent company of American Century Investment Management, Inc. (ACIM or the advisor). The other trustees (more than three-fourths of the total number) are independent. They are not employees, directors or officers of, and have no financial interest in, ACC or any of its wholly owned, direct or indirect, subsidiaries, including ACIM, American Century Investment Services, Inc. (ACIS) and American Century Services, LLC (ACS), and they do not have any other affiliations, positions or relationships that would cause them to be considered “interested persons” under the Investment Company Act. The trustees serve in this capacity for eight (in the case of Jonathan S. Thomas, 16; and Ronald J. Gilson, 9) registered investment companies in the American Century Investments family of funds.
The following table presents additional information about the trustees. The mailing address for each trustee other than Mr. Thomas is 1665 Charleston Road, Mountain View, California 94043. The mailing address for Mr. Thomas is 4500 Main Street, Kansas City, Missouri 64111.
|
| | | | | |
Name
(Year of Birth) | Position(s) Held with Funds | Length of Time Served | Principal Occupation(s) During Past 5 Years | Number of American Century Portfolios Overseen by Trustee | Other Directorships Held During Past 5 Years |
| Independent Trustees |
|
|
Tanya S. Beder
(1955) | Trustee | Since 2011 | Chairman and CEO, SBCC Group Inc. (independent advisory services) (2006 to present) | 40 | CYS Investments, Inc.; Kirby Corporation; Nabors Industries Ltd. |
Jeremy I. Bulow
(1954) | Trustee | Since 2011 | Professor of Economics, Stanford University, Graduate School of Business (1979 to present) | 40 | None |
Anne Casscells
(1958) | Trustee | Since 2016 | Co-Chief Executive Officer and Chief Investment Officer, Aetos Alternatives Management (investment advisory firm) (2001 to present); Lecturer in Accounting, Stanford University, Graduate School of Business (2009 to 2017) | 40 | None |
Ronald J. Gilson
(1946) | Trustee and Chairman of the Board | Since 1995
(Chairman since 2005) | Charles J. Meyers Professor of Law and Business, Emeritus, Stanford Law School (1979 to 2016); Marc and Eva Stern Professor of Law and Business, Columbia University School of Law (1992 to present) | 57 | None |
|
| | | | | |
Name
(Year of Birth) | Position(s) Held with Funds | Length of Time Served | Principal Occupation(s) During Past 5 Years | Number of American Century Portfolios Overseen by Trustee | Other Directorships Held During Past 5 Years |
| Independent Trustees |
|
|
Frederick L. A. Grauer
(1946) | Trustee | Since 2008 | Senior Advisor, Credit Sesame, Inc. (credit monitoring firm) (2018 to present); Senior Advisor, Course Hero (an educational technology company) (2015 to present) | 40 | None |
Jonathan D. Levin
(1972) | Trustee | Since 2016 | Philip H. Knight Professor and Dean, Graduate School of Business, Stanford University (2016 to present); Professor, Stanford University, (2000 to present) | 40 | None |
Peter F. Pervere
(1947) | Trustee | Since 2007 | Retired | 40 | None |
John B. Shoven
(1947) | Trustee | Since 2002 | Charles R. Schwab Professor of Economics, Stanford University (1973 to present, emeritus since 2019) | 40 | Cadence Design Systems; Exponent; Financial Engines |
| Interested Trustee |
|
|
Jonathan S. Thomas
(1963) | Trustee | Since 2007 | President and Chief Executive Officer, ACC (2007 to present). Also serves as Chief Executive Officer, ACS; Executive Vice President, ACIM; Director, ACC, ACIM and other ACC subsidiaries | 120 | None |
The Statement of Additional Information has additional information about the fund's trustees and is available without charge, upon request, by calling 1-800-345-2021.
Officers
The following table presents certain information about the executive officers of the funds. Each officer serves as an officer for 16 (in the case of Robert J. Leach, 15) investment companies in the American Century family of funds, unless otherwise noted. No officer is compensated for his or her service as an officer of the funds. The listed officers are interested persons of the funds and are appointed or re-appointed on an annual basis. The mailing address for each of the officers listed below is 4500 Main Street, Kansas City, Missouri 64111.
|
| | |
Name
(Year of Birth) | Offices with the Funds | Principal Occupation(s) During the Past Five Years |
Patrick Bannigan
(1965)
| President since 2019 | Executive Vice President and Director, ACC (2012 to present); Chief Financial Officer, Chief Accounting Officer and Treasurer, ACC (2015 to present); Chief Operating Officer, ACC (2012-2015). Also serves as President, ACS; Vice President, ACIM; Chief Financial Officer, Chief Accounting Officer and/or Director, ACIM, ACS and other ACC subsidiaries |
R. Wes Campbell
(1974)
| Chief Financial Officer and Treasurer since 2018 | Vice President, ACS (2020 to present); Investment Operations and Investment Accounting, ACS (2000 to present) |
Amy D. Shelton
(1964) | Chief Compliance Officer and Vice President since 2014 | Chief Compliance Officer, American Century funds, (2014 to present); Chief Compliance Officer, ACIM (2014 to present); Chief Compliance Officer, ACIS (2009 to present). Also serves as Vice President, ACIS |
Charles A. Etherington
(1957) | General Counsel since 2007 and Senior Vice President since 2006 | Attorney, ACC (1994 to present); Vice President, ACC (2005 to present); General Counsel, ACC (2007 to present). Also serves as General Counsel, ACIM, ACS, ACIS and other ACC subsidiaries; and Senior Vice President, ACIM and ACS |
C. Jean Wade
(1964) | Vice President since 2012 | Senior Vice President, ACS (2017 to present); Vice President ACS (2000 to 2017)
|
Robert J. Leach
(1966) | Vice President since 2006 | Vice President, ACS (2000 to present) |
David H. Reinmiller
(1963) | Vice President since 2000 | Attorney, ACC (1994 to present). Also serves as Vice President, ACIM and ACS |
Ward D. Stauffer
(1960) | Secretary since 2005 | Attorney, ACC (2003 to present) |
|
|
| Liquidity Risk Management Program |
The Fund has adopted a liquidity risk management program (the “program”). The Fund’s Board of Trustees (the "Board") has designated American Century Investment Management, Inc. (“ACIM”) as the administrator of the program. Personnel of ACIM or its affiliates conduct the day-to-day operation of the program pursuant to policies and procedures administered by those members of the ACIM’s Investment Oversight Committee who are members of the ACIM’s Investment Management and Global Analytics departments.
Under the program, ACIM manages the Fund’s liquidity risk, which is the risk that the Fund could not meet shareholder redemption requests without significant dilution of remaining shareholders’ interests in the Fund. This risk is managed by monitoring the degree of liquidity of the Fund’s investments, limiting the amount of the Fund’s illiquid investments, and utilizing various risk management tools and facilities available to the Fund for meeting shareholder redemptions, among other means. ACIM’s process of determining the degree of liquidity of the Fund’s investments is supported by one or more third-party liquidity assessment vendors.
The Board reviewed a report prepared by ACIM regarding the operation and effectiveness of the program for the period December 1, 2018 through December 31, 2019. No significant liquidity events impacting the Fund were noted in the report. In addition, ACIM provided its assessment that the program had been effective in managing the Fund’s liquidity risk.
Retirement Account Information
As required by law, distributions you receive from certain retirement accounts are subject to federal income tax withholding, unless you elect not to have withholding apply*. Tax will be withheld on the total amount withdrawn even though you may be receiving amounts that are not subject to withholding, such as nondeductible contributions. In such case, excess amounts of withholding could occur. You may adjust your withholding election so that a greater or lesser amount will be withheld.
If you don’t want us to withhold on this amount, you must notify us to not withhold the federal income tax. You may notify us in writing or in certain situations by telephone or through other electronic means. For systematic withdrawals, your withholding election will remain in effect until revoked or changed by filing a new election. You have the right to revoke your election at any time and change your withholding percentage for future distributions.
Remember, even if you elect not to have income tax withheld, you are liable for paying income tax on the taxable portion of your withdrawal. If you elect not to have income tax withheld or you don’t have enough income tax withheld, you may be responsible for payment of estimated tax. You may incur penalties under the estimated tax rules if your withholding and estimated tax payments are not sufficient. You can reduce or defer the income tax on a distribution by directly or indirectly rolling such distribution over to another IRA or eligible plan. You should consult your tax advisor for additional information.
State tax will be withheld if, at the time of your distribution, your address is within one of the mandatory withholding states and you have federal income tax withheld (or as otherwise required by state law). State taxes will be withheld from your distribution in accordance with the respective state rules.
*Some 403(b), 457 and qualified retirement plan distributions may be subject to 20% mandatory withholding, as they are subject to special tax and withholding rules. Your plan administrator or plan sponsor is required to provide you with a special tax notice explaining those rules at the time you request a distribution. If applicable, federal and/or state taxes may be withheld from your distribution amount.
Proxy Voting Policies
Descriptions of the principles and policies that the fund's investment advisor uses in exercising the voting rights associated with the securities purchased and/or held by the fund are available without charge, upon request, by calling 1-800-345-2021 or visiting American Century Investments’ website at americancentury.com/proxy. A description of the policies is also available on the Securities and Exchange Commission’s website at sec.gov. Information regarding how the investment advisor voted proxies relating to portfolio securities during the most recent 12-month period ended June 30 is available on americancentury.com/proxy. It is also available at sec.gov.
Quarterly Portfolio Disclosure
The fund files its complete schedule of portfolio holdings with the Securities and Exchange Commission (SEC) for the first and third quarters of each fiscal year as an exhibit to its reports on Form N-PORT. The fund’s Form N-PORT reports are available on the SEC’s website at sec.gov. The fund also makes its complete schedule of portfolio holdings for the most recent quarter of its fiscal year available on its website at americancentury.com and, upon request, by calling 1-800-345-2021.
|
| | |
| |
| | | |
| Contact Us | americancentury.com | |
| Automated Information Line | 1-800-345-8765 | |
| Investor Services Representative | 1-800-345-2021 or 816-531-5575 | |
| Investors Using Advisors | 1-800-378-9878 | |
| Business, Not-For-Profit, Employer-Sponsored Retirement Plans | 1-800-345-3533 | |
| Banks and Trust Companies, Broker-Dealers, Financial Professionals, Insurance Companies | 1-800-345-6488 | |
| Telecommunications Relay Service for the Deaf | 711 | |
| | | |
| American Century Investment Trust | |
| | | |
Investment Advisor: American Century Investment Management, Inc. Kansas City, Missouri | |
| | | |
| This report and the statements it contains are submitted for the general information of our shareholders. The report is not authorized for distribution to prospective investors unless preceded or accompanied by an effective prospectus. | |
| | | |
©2020 American Century Proprietary Holdings, Inc. All rights reserved.
CL-ANN-92279 2005 | |

|
| |
| | |
| | Annual Report |
| | |
| | March 31, 2020 |
| | |
| | Diversified Bond Fund |
| | Investor Class (ADFIX) |
| | I Class (ACBPX) |
| | Y Class (ADVYX) |
| | A Class (ADFAX) |
| | C Class (CDBCX) |
| | R Class (ADVRX) |
| | R5 Class (ADRVX) |
| | R6 Class (ADDVX) |
Beginning on January 1, 2021, as permitted by regulations adopted by the Securities and Exchange Commission, paper copies of the fund’s shareholder reports like this one will no longer be sent by mail, unless you specifically request paper copies of the reports from the fund or from your financial intermediary, such as a broker-dealer or bank. Instead, the reports will be made available on a website, and you will be notified by mail each time a report is posted and provided with a website link to access the report.
If you already elected to receive shareholder reports electronically, you will not be affected by this change and you need not take any action. You may elect to receive shareholder reports and other communications from the fund or your financial intermediary electronically by calling or sending an email request to your appropriate contacts as listed on the back cover of this report.
You may elect to receive all future reports in paper free of charge. You can inform the fund or your financial intermediary that you wish to continue receiving paper copies of your shareholder reports by calling or sending an email request to your appropriate contacts as listed on the back cover of this report. Your election to receive reports in paper will apply to all funds held with the fund complex/your financial intermediary.
|
| |
| President’s Letter | |
| Performance | |
| Portfolio Commentary | |
| Fund Characteristics | |
| Shareholder Fee Example | |
| Schedule of Investments | |
| Statement of Assets and Liabilities | |
| Statement of Operations | |
| Statement of Changes in Net Assets | |
| Notes to Financial Statements | |
| Financial Highlights | |
| Report of Independent Registered Public Accounting Firm | |
| Management | |
| Liquidity Risk Management Program | |
| Additional Information | |
Any opinions expressed in this report reflect those of the author as of the date of the report, and do not necessarily represent the opinions of American Century Investments® or any other person in the American Century Investments organization. Any such opinions are subject to change at any time based upon market or other conditions and American Century Investments disclaims any responsibility to update such opinions. These opinions may not be relied upon as investment advice and, because investment decisions made by American Century Investments funds are based on numerous factors, may not be relied upon as an indication of trading intent on behalf of any American Century Investments fund. Security examples are used for representational purposes only and are not intended as recommendations to purchase or sell securities. Performance information for comparative indices and securities is provided to American Century Investments by third party vendors. To the best of American Century Investments’ knowledge, such information is accurate at the time of printing.
Jonathan Thomas
Dear Investor:
Thank you for reviewing this annual report for the period ended March 31, 2020. Annual reports help convey important information about fund returns, including market factors that affected performance during the reporting period. For additional insights, please visit americancentury.com.
Virus Outbreak Abruptly Altered Economic, Market Backdrops
Through most of the period, market sentiment was upbeat, partly due to accommodative Federal Reserve (Fed) policy and modest inflation. Improving economic and corporate earnings data and a phase 1 U.S.-China trade deal also helped boost growth outlooks. Against this backdrop, key U.S. stock benchmarks rose to record highs by mid-February, and U.S. bonds continued to advance.
However, beginning in late February, unprecedented social and economic turmoil emerged and reversed the positive trajectory. The COVID-19 epidemic originating in China rapidly spread throughout the world, forcing stay-at-home orders and industry-wide shutdowns. U.S. stocks, corporate bonds and other riskier assets sold off sharply, while U.S. Treasuries rallied in the global flight to quality. The Fed stepped in quickly and aggressively, slashing interest rates to near 0% and enacting massive lending and asset-purchase programs to stabilize the financial system.
The swift and severe sell-off erased the strong stock market gains realized earlier in the period and left key benchmarks with losses for the 12 months. Reflecting their defensive characteristics, high-quality U.S. bonds withstood the turmoil and delivered solid returns for the 12-month period.
Promoting Health and Safety Remains Our Focus
While the market impact of COVID-19 has been severe, reducing the human toll is most important. We are monitoring the situation closely and following guidelines and protocols from all relevant authorities. Our firm has activated a comprehensive Pandemic Response Plan, which includes social distancing and work-from-home mandates, travel restrictions and escalated cleaning regimens at all our facilities. We’ve also launched a Business Continuity Plan to maintain regular business operations and ensure delivery of outstanding service.
We appreciate your confidence in us during these extraordinary times. We have a long history of helping clients weather volatile markets, and we are confident we will meet today’s challenges. In the meantime, the health and safety of you, your family and our employees remain a top priority.
Sincerely,
Jonathan Thomas
President and Chief Executive Officer
American Century Investments
|
| | | | | | |
| Total Returns as of March 31, 2020 | |
| | | | Average Annual Returns | |
| | Ticker Symbol | 1 year | 5 years | 10 years | Since Inception | Inception Date |
| Investor Class | ADFIX | 7.18% | 2.61% | 3.48% | — | 12/3/01 |
| Bloomberg Barclays U.S. Aggregate Bond Index | — | 8.93% | 3.35% | 3.88% | — | — |
| I Class | ACBPX | 7.39% | 2.83% | 3.70% | — | 4/1/93 |
| Y Class | ADVYX | 7.42% | — | — | 3.90% | 4/10/17 |
| A Class | ADFAX | | | | | 12/3/01 |
| No sales charge | | 6.81% | 2.34% | 3.23% | — | |
| With sales charge | | 2.01% | 1.40% | 2.76% | — | |
| C Class | CDBCX | 6.02% | 1.59% | 2.46% | — | 1/31/03 |
| R Class | ADVRX | 6.65% | 2.09% | 2.98% | — | 7/29/05 |
| R5 Class | ADRVX | 7.29% | — | — | 3.85% | 4/10/17 |
| R6 Class | ADDVX | 7.34% | 2.88% | — | 3.37% | 7/26/13 |
Average annual returns since inception are presented when ten years of performance history is not available.
Fund returns would have been lower if a portion of the fees had not been waived.
Sales charges include initial sales charges and contingent deferred sales charges (CDSCs), as applicable. A Class shares have a 4.50% maximum initial sales charge and may be subject to a maximum CDSC of 1.00%. C Class shares redeemed within 12 months of purchase are subject to a maximum CDSC of 1.00%. The SEC requires that mutual funds provide performance information net of maximum sales charges in all cases where charges could be applied.
Data presented reflect past performance. Past performance is no guarantee of future results. Current performance may be higher or lower than the performance shown. Total returns for periods less than one year are not annualized. Investment return and principal value will fluctuate, and redemption value may be more or less than original cost. Data assumes reinvestment of dividends and capital gains, and none of the charts reflect the deduction of taxes that a shareholder would pay on fund distributions or the redemption of fund shares. To obtain performance data current to the most recent month end, please call 1-800-345-2021 or visit americancentury.com. For additional information about the fund, please consult the prospectus.
|
|
| Growth of $10,000 Over 10 Years |
| $10,000 investment made March 31, 2010 |
Performance for other share classes will vary due to differences in fee structure.
|
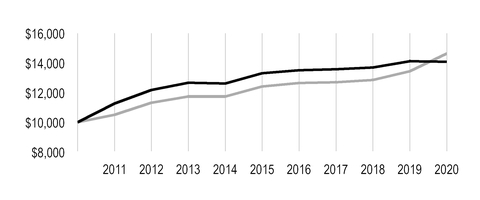
|
| |
| Value on March 31, 2020 |
| | Investor Class — $14,088 |
| |
| | Bloomberg Barclays U.S. Aggregate Bond Index — $14,639 |
| |
Ending value of Investor Class would have been lower if a portion of the fees had not been waived.
|
| | | | | | | |
| Total Annual Fund Operating Expenses |
| Investor Class | I Class | Y Class | A Class | C Class | R Class | R5 Class | R6 Class |
| 0.60% | 0.40% | 0.37% | 0.85% | 1.60% | 1.10% | 0.40% | 0.35% |
The total annual fund operating expenses shown is as stated in the fund’s prospectus current as of the date of this report. The prospectus may vary from the expense ratio shown elsewhere in this report because it is based on a different time period, includes acquired fund fees and expenses, and, if applicable, does not include fee waivers or expense reimbursements.
Data presented reflect past performance. Past performance is no guarantee of future results. Current performance may be higher or lower than the performance shown. Total returns for periods less than one year are not annualized. Investment return and principal value will fluctuate, and redemption value may be more or less than original cost. Data assumes reinvestment of dividends and capital gains, and none of the charts reflect the deduction of taxes that a shareholder would pay on fund distributions or the redemption of fund shares. To obtain performance data current to the most recent month end, please call 1-800-345-2021 or visit americancentury.com. For additional information about the fund, please consult the prospectus.
Portfolio Managers: Bob Gahagan, Hando Aguilar, Jeff Houston, Brian Howell and Charles Tan
Performance Summary
Diversified Bond returned 7.18%* for the 12 months ended March 31, 2020. By comparison, the Bloomberg Barclays U.S. Aggregate Bond Index returned 8.93%. Fund returns reflect operating expenses, while index returns do not. Returns for the fund and the index largely reflected the defensive characteristics of the broad U.S. investment-grade bond market in the face of unprecedented market unrest in early 2020.
The reporting period began on an upbeat note for bond investors. The Federal Reserve’s (Fed’s) early 2019 pivot toward dovish policy set the stage for rate cuts in July, September and October. This action, along with modest economic and earnings growth and low inflation, generally supported solid gains for U.S. bonds. By year-end 2019, global economic data improved, the U.S. and China signed a phase 1 trade deal and the Fed suggested it would hold rates steady through 2020.
Conditions deteriorated rapidly within the first quarter of 2020. As the COVID-19 epidemic originating in China expanded into a pandemic, nervous fixed-income investors scrambled to shed credit risk and seek shelter in cash. Market volatility soared and liquidity sank. In response, the Fed slashed short-term rates to near 0% and launched a series of initiatives to stabilize the financial markets. Separately, Congress passed a $2 trillion fiscal relief package. Reflecting market sentiment, the 10-year Treasury yield started the period at 2.41% and closed at 0.68% after touching a record-low 0.54% in early March. The two-year Treasury yield followed a similar path during the 12-month period, dropping from 2.27% to 0.22%, including a 135-basis-point decline in the first quarter of 2020.
Amid a global flight to quality, riskier investments, including corporate and securitized bonds, suffered significant losses. The Fed’s rescue programs helped stabilize credit-sensitive sectors of the fixed-income universe, including mortgage-backed securities, municipal bonds (munis) and investment-grade corporate bonds. Against this backdrop, an underweight position in Treasuries, relative to the benchmark, accounted for much of Diversified Bond’s underperformance.
Securitized Exposure Hindered Performance
We continued to underweight Treasuries and government agencies relative to the index in favor of spread (non-Treasury) sectors, including securitized bonds and corporate issues. This strategy diminished returns amid the late-period rush for stability and liquidity.
Throughout the period, we maintained an overweight position in securitized bonds, believing the sector offered better relative value and less volatility than corporate credit issues. The strategy generally aided performance during risk-on periods, but it proved detrimental amid the coronavirus sell-off. Forced selling created havoc for the sector, as the credit-sensitive holdings we favored, including non-agency commercial mortgage-backed securities, collateralized mortgage obligations and collateralized loan obligations, were hardest hit. Agency-backed mortgages recovered slightly after the Fed announced its asset-purchase plan, which included agency mortgages.
*All fund returns referenced in this commentary are for Investor Class shares. Performance for other share classes will vary due to differences in fee structure; when Investor Class performance exceeds that of the index, other share classes may not. See page 3 for returns for all share classes.
Corporate, Non-Index Securities Weighed on Results
As sentiment on the economy started to soften during 2019, we reduced our allocation to the corporate bond sector. Combined with our view that the credit cycle had entered its final stage, we believed that valuations among corporate bonds had advanced to levels in line with fundamentals. In addition to trimming exposure, we maintained a higher-quality bias, given the then uncertainties surrounding the effects of tariffs on corporate earnings. We also reduced our out-of-index stake in high-yield bonds. Although our corporate exposure suffered with all risk assets in the early 2020 decline, investment-grade securities recovered slightly late in the period on news the Fed would purchase corporate bonds.
Meanwhile, our out-of-index allocation to inflation-linked securities modestly detracted from relative performance. Late in the period, longer-term inflation expectations (10-year breakeven rate) sagged to their lowest level since 2009.
Portfolio Positioning
The economic downturn during the first quarter was swift and severe, but we do not expect an equally swift, or V-shaped, recovery. The consumer is the main driver of the U.S. economy, and we believe the effects of the COVID-19 pandemic will weigh on consumer sentiment—and job and economic growth—for several months. Ultimately, this crisis requires a medical solution.
With its massive financial rescue package, the Fed has demonstrated it will take extraordinary steps to maintain broad market liquidity and assure credit market stability. However, we don’t expect the Fed to ease further, as policymakers previously noted an unwillingness to push rates below zero. Additionally, the effects of significant fiscal stimulus should allow the Fed to keep rates steady.
Heightened volatility often creates market disruptions that lead to attractive buying opportunities. In the first quarter’s flight to quality, we identified such opportunities in the securitized, corporate credit and muni sectors. We’re remaining cautious and defensive in our positioning, focusing on high-quality securities and positioning our portfolio to weather a U-shaped recovery. We’re emphasizing securities the Fed is buying—high-quality corporate, mortgage and muni securities and Treasury inflation-protected securities.
At the same time, we’re reviewing each portfolio holding, eliminating securities we’re uncomfortable holding in the current environment. In particular, we’ve reduced exposure to securitized securities. We believe rising unemployment and the broad economic shutdown created by the pandemic will create challenges for certain segments of the mortgage market. We’ve also hedged overall risk in the portfolio via credit default swaps. As always, we favor a bottom-up approach to portfolio management, emphasizing careful security selection.
|
| |
| MARCH 31, 2020 | |
| Portfolio at a Glance | |
| Average Duration (effective) | 5.9 years |
| Weighted Average Life to Maturity | 7.6 years |
| | |
| Types of Investments in Portfolio | % of net assets |
| Corporate Bonds | 32.5% |
| U.S. Treasury Securities | 21.4% |
| U.S. Government Agency Mortgage-Backed Securities | 14.7% |
| Asset-Backed Securities | 6.4% |
| Collateralized Mortgage Obligations | 4.1% |
| Collateralized Loan Obligations | 3.8% |
| Commercial Mortgage-Backed Securities | 3.7% |
| Municipal Securities | 2.2% |
| Sovereign Governments and Agencies | 0.9% |
| U.S. Government Agency Securities | 0.3% |
| Preferred Stocks | 0.2% |
| Temporary Cash Investments | 9.9% |
| Other Assets and Liabilities | (0.1)% |
Fund shareholders may incur two types of costs: (1) transaction costs, including sales charges (loads) on purchase payments and redemption/exchange fees; and (2) ongoing costs, including management fees; distribution and service (12b-1) fees; and other fund expenses. This example is intended to help you understand your ongoing costs (in dollars) of investing in your fund and to compare these costs with the ongoing cost of investing in other mutual funds.
The example is based on an investment of $1,000 made at the beginning of the period and held for the entire period from October 1, 2019 to March 31, 2020.
Actual Expenses
The table provides information about actual account values and actual expenses for each class. You may use the information, together with the amount you invested, to estimate the expenses that you paid over the period. First, identify the share class you own. Then simply divide your account value by $1,000 (for example, an $8,600 account value divided by $1,000 = 8.6), then multiply the result by the number under the heading “Expenses Paid During Period” to estimate the expenses you paid on your account during this period.
If you hold Investor Class shares of any American Century Investments fund, or I Class shares of the American Century Diversified Bond Fund, in an American Century Investments account (i.e., not through a financial intermediary or employer-sponsored retirement plan account), American Century Investments may charge you a $25.00 annual account maintenance fee if the value of those shares is less than $10,000. We will redeem shares automatically in one of your accounts to pay the $25.00 fee. In determining your total eligible investment amount, we will include your investments in all personal accounts (including American Century Investments brokerage accounts) registered under your Social Security number. Personal accounts include individual accounts, joint accounts, UGMA/UTMA accounts, personal trusts, Coverdell Education Savings Accounts and IRAs (including traditional, Roth, Rollover, SEP-, SARSEP- and SIMPLE-IRAs), and certain other retirement accounts. If you have only business, business retirement, employer sponsored or American Century Investments brokerage accounts, you are currently not subject to this fee. If you are subject to the account maintenance fee, your account value could be reduced by the fee amount.
Hypothetical Example for Comparison Purposes
The table also provides information about hypothetical account values and hypothetical expenses based on the actual expense ratio of each class of your fund and an assumed rate of return of 5% per year before expenses, which is not the actual return of a fund’s share class. The hypothetical account values and expenses may not be used to estimate the actual ending account balance or expenses you paid for the period. You may use this information to compare the ongoing costs of investing in your fund and other funds. To do so, compare this 5% hypothetical example with the 5% hypothetical examples that appear in the shareholder reports of the other funds.
Please note that the expenses shown in the table are meant to highlight your ongoing costs only and do not reflect any transactional costs, such as sales charges (loads) or redemption/exchange fees. Therefore, the table is useful in comparing ongoing costs only, and will not help you determine the relative total costs of owning different funds. In addition, if these transactional costs were included, your costs would have been higher.
|
| | | | |
| Beginning
Account Value
10/1/19 | Ending
Account Value
3/31/20 | Expenses Paid
During Period(1)
10/1/19 - 3/31/20 |
Annualized
Expense Ratio(1) |
| Actual | | | | |
| Investor Class | $1,000 | $1,017.30 | $3.03 | 0.60% |
| I Class | $1,000 | $1,019.20 | $2.02 | 0.40% |
| Y Class | $1,000 | $1,019.40 | $1.87 | 0.37% |
| A Class | $1,000 | $1,016.00 | $4.28 | 0.85% |
| C Class | $1,000 | $1,012.20 | $8.05 | 1.60% |
| R Class | $1,000 | $1,014.70 | $5.54 | 1.10% |
| R5 Class | $1,000 | $1,018.30 | $2.02 | 0.40% |
| R6 Class | $1,000 | $1,018.50 | $1.77 | 0.35% |
| Hypothetical | | | | |
| Investor Class | $1,000 | $1,022.00 | $3.03 | 0.60% |
| I Class | $1,000 | $1,023.00 | $2.02 | 0.40% |
| Y Class | $1,000 | $1,023.15 | $1.87 | 0.37% |
| A Class | $1,000 | $1,020.75 | $4.29 | 0.85% |
| C Class | $1,000 | $1,017.00 | $8.07 | 1.60% |
| R Class | $1,000 | $1,019.50 | $5.55 | 1.10% |
| R5 Class | $1,000 | $1,023.00 | $2.02 | 0.40% |
| R6 Class | $1,000 | $1,023.25 | $1.77 | 0.35% |
| |
| (1) | Expenses are equal to the class's annualized expense ratio listed in the table above, multiplied by the average account value over the period, multiplied by 183, the number of days in the most recent fiscal half-year, divided by 366, to reflect the one-half year period. Annualized expense ratio reflects actual expenses, including any applicable fee waivers or expense reimbursements and excluding any acquired fund fees and expenses. |
MARCH 31, 2020
|
| | | | | | |
| | Principal Amount | Value |
| CORPORATE BONDS — 32.5% | | |
| Aerospace and Defense — 0.1% | | |
| United Technologies Corp., 6.05%, 6/1/36 | $ | 1,868,000 |
| $ | 2,500,639 |
|
| Automobiles — 0.8% | | |
| Ford Motor Credit Co. LLC, 5.875%, 8/2/21 | 5,810,000 |
| 5,722,850 |
|
| Ford Motor Credit Co. LLC, 2.98%, 8/3/22 | 3,820,000 |
| 3,571,700 |
|
| Ford Motor Credit Co. LLC, 3.35%, 11/1/22 | 2,730,000 |
| 2,525,250 |
|
| General Motors Co., 5.15%, 4/1/38 | 1,350,000 |
| 980,723 |
|
| General Motors Financial Co., Inc., 3.20%, 7/6/21 | 4,620,000 |
| 4,415,140 |
|
| General Motors Financial Co., Inc., 5.25%, 3/1/26 | 2,760,000 |
| 2,440,904 |
|
| | | 19,656,567 |
|
| Banks — 6.4% | | |
| Banco Santander SA, 3.50%, 4/11/22 | 4,200,000 |
| 4,157,541 |
|
| Bank of America Corp., MTN, 4.00%, 1/22/25 | 5,000,000 |
| 5,289,209 |
|
| Bank of America Corp., VRN, 3.00%, 12/20/23 | 3,772,000 |
| 3,847,996 |
|
| Bank of America Corp., VRN, 3.42%, 12/20/28 | 4,800,000 |
| 4,966,180 |
|
| Bank of Montreal, MTN, 3.30%, 2/5/24 | 9,649,000 |
| 10,095,672 |
|
| Barclays Bank plc, 5.14%, 10/14/20 | 3,230,000 |
| 3,261,520 |
|
BNP Paribas SA, VRN, 2.82%, 11/19/25(1) | 3,202,000 |
| 3,168,821 |
|
BPCE SA, 3.00%, 5/22/22(1) | 4,760,000 |
| 4,717,218 |
|
BPCE SA, 5.15%, 7/21/24(1) | 2,380,000 |
| 2,513,693 |
|
| Canadian Imperial Bank of Commerce, 2.25%, 1/28/25 | 5,100,000 |
| 5,057,679 |
|
| Citigroup, Inc., 2.90%, 12/8/21 | 11,003,000 |
| 11,111,625 |
|
| Citigroup, Inc., 2.75%, 4/25/22 | 5,758,000 |
| 5,792,346 |
|
| Citigroup, Inc., VRN, 3.52%, 10/27/28 | 2,240,000 |
| 2,247,370 |
|
| Cooperatieve Rabobank UA, 3.95%, 11/9/22 | 4,970,000 |
| 5,005,721 |
|
| Discover Bank, 3.35%, 2/6/23 | 2,200,000 |
| 2,212,027 |
|
| Discover Bank, 3.45%, 7/27/26 | 5,790,000 |
| 5,674,239 |
|
| Fifth Third BanCorp., 2.375%, 1/28/25 | 4,930,000 |
| 4,811,300 |
|
| FNB Corp., 2.20%, 2/24/23 | 3,330,000 |
| 3,273,058 |
|
| HSBC Holdings plc, 4.30%, 3/8/26 | 2,680,000 |
| 2,866,926 |
|
| HSBC Holdings plc, 3.90%, 5/25/26 | 349,000 |
| 355,842 |
|
| HSBC Holdings plc, 4.375%, 11/23/26 | 4,800,000 |
| 5,108,435 |
|
| HSBC Holdings plc, 4.95%, 3/31/30 | 774,000 |
| 854,619 |
|
| HSBC Holdings plc, VRN, 3.26%, 3/13/23 | 4,900,000 |
| 4,911,734 |
|
| HSBC Holdings plc, VRN, 2.63%, 11/7/25 | 3,310,000 |
| 3,217,056 |
|
| Huntington Bancshares, Inc., 2.55%, 2/4/30 | 6,000,000 |
| 5,467,198 |
|
| JPMorgan Chase & Co., VRN, 4.02%, 12/5/24 | 5,020,000 |
| 5,326,788 |
|
| JPMorgan Chase & Co., VRN, 3.70%, 5/6/30 | 1,075,000 |
| 1,156,838 |
|
| Lloyds Banking Group plc, VRN, 2.91%, 11/7/23 | 1,126,000 |
| 1,126,103 |
|
| Lloyds Banking Group plc, VRN, 2.44%, 2/5/26 | 2,898,000 |
| 2,742,546 |
|
| PNC Bank N.A., 2.70%, 10/22/29 | 4,100,000 |
| 3,986,488 |
|
| Regions Financial Corp., 3.80%, 8/14/23 | 3,100,000 |
| 3,144,235 |
|
|
| | | | | | |
| | Principal Amount | Value |
| Sumitomo Mitsui Financial Group, Inc., 2.35%, 1/15/25 | $ | 5,900,000 |
| $ | 5,871,282 |
|
| Truist Bank, 2.25%, 3/11/30 | 3,345,000 |
| 3,071,061 |
|
| U.S. Bancorp, MTN, 3.60%, 9/11/24 | 2,820,000 |
| 2,900,346 |
|
| Wells Fargo & Co., 4.125%, 8/15/23 | 2,170,000 |
| 2,241,371 |
|
| Wells Fargo & Co., 3.00%, 10/23/26 | 4,550,000 |
| 4,672,161 |
|
| Wells Fargo & Co., MTN, 4.65%, 11/4/44 | 2,330,000 |
| 2,695,931 |
|
| | | 148,920,175 |
|
| Beverages — 0.5% | | |
| Anheuser-Busch Cos. LLC / Anheuser-Busch InBev Worldwide, Inc., 4.90%, 2/1/46 | 5,320,000 |
| 5,832,904 |
|
| Anheuser-Busch InBev Worldwide, Inc., 4.75%, 1/23/29 | 4,610,000 |
| 5,079,030 |
|
| | | 10,911,934 |
|
| Biotechnology — 1.5% | | |
| AbbVie, Inc., 2.90%, 11/6/22 | 5,270,000 |
| 5,338,137 |
|
AbbVie, Inc., 3.20%, 11/21/29(1) | 3,680,000 |
| 3,777,061 |
|
| AbbVie, Inc., 4.40%, 11/6/42 | 810,000 |
| 904,097 |
|
AbbVie, Inc., 4.25%, 11/21/49(1) | 2,810,000 |
| 3,070,333 |
|
| Amgen, Inc., 2.65%, 5/11/22 | 6,080,000 |
| 6,155,326 |
|
| Amgen, Inc., 4.66%, 6/15/51 | 2,070,000 |
| 2,618,448 |
|
| Gilead Sciences, Inc., 4.40%, 12/1/21 | 6,230,000 |
| 6,437,558 |
|
| Gilead Sciences, Inc., 3.65%, 3/1/26 | 5,710,000 |
| 6,236,131 |
|
| | | 34,537,091 |
|
| Building Products — 0.1% | | |
Carrier Global Corp., 2.72%, 2/15/30(1) | 2,352,000 |
| 2,177,909 |
|
| Capital Markets — 2.5% | | |
| Ares Capital Corp., 3.25%, 7/15/25 | 6,491,000 |
| 5,170,598 |
|
Credit Suisse Group AG, VRN, 2.59%, 9/11/25(1) | 2,020,000 |
| 1,922,576 |
|
Credit Suisse Group AG, VRN, 4.19%, 4/1/31(1)(2) | 2,600,000 |
| 2,668,825 |
|
| Goldman Sachs BDC, Inc., 3.75%, 2/10/25 | 2,143,000 |
| 1,990,629 |
|
| Goldman Sachs Group, Inc. (The), 3.50%, 4/1/25 | 1,455,000 |
| 1,478,082 |
|
| Goldman Sachs Group, Inc. (The), 3.50%, 11/16/26 | 8,120,000 |
| 8,316,660 |
|
KKR Group Finance Co. VII LLC, 3.625%, 2/25/50(1) | 6,020,000 |
| 4,995,293 |
|
| Morgan Stanley, 2.75%, 5/19/22 | 5,110,000 |
| 5,168,406 |
|
| Morgan Stanley, MTN, 3.70%, 10/23/24 | 3,830,000 |
| 4,054,102 |
|
| Morgan Stanley, MTN, 4.00%, 7/23/25 | 6,130,000 |
| 6,573,176 |
|
| Morgan Stanley, MTN, VRN, 2.70%, 1/22/31 | 1,700,000 |
| 1,669,967 |
|
| Morgan Stanley, VRN, 3.97%, 7/22/38 | 1,880,000 |
| 2,073,919 |
|
| Oaktree Specialty Lending Corp., 3.50%, 2/25/25 | 2,630,000 |
| 2,367,132 |
|
State Street Corp., VRN, 2.83%, 3/30/23(1) | 645,000 |
| 651,327 |
|
UBS Group AG, 3.49%, 5/23/23(1) | 8,150,000 |
| 8,245,110 |
|
| | | 57,345,802 |
|
| Chemicals — 0.2% | | |
CF Industries, Inc., 4.50%, 12/1/26(1) | 2,580,000 |
| 2,724,607 |
|
| CF Industries, Inc., 5.15%, 3/15/34 | 1,640,000 |
| 1,674,112 |
|
| | | 4,398,719 |
|
| Commercial Services and Supplies — 0.6% | | |
| Republic Services, Inc., 3.55%, 6/1/22 | 2,170,000 |
| 2,227,837 |
|
| Republic Services, Inc., 2.30%, 3/1/30 | 6,180,000 |
| 5,939,905 |
|
|
| | | | | | |
| | Principal Amount | Value |
| Waste Connections, Inc., 3.50%, 5/1/29 | $ | 2,670,000 |
| $ | 2,710,374 |
|
| Waste Connections, Inc., 2.60%, 2/1/30 | 3,810,000 |
| 3,574,587 |
|
| | | 14,452,703 |
|
| Construction Materials — 0.2% | | |
| Martin Marietta Materials, Inc., 2.50%, 3/15/30 | 4,060,000 |
| 3,720,370 |
|
| Consumer Finance — 1.1% | | |
| AerCap Ireland Capital DAC / AerCap Global Aviation Trust, 5.00%, 10/1/21 | 6,320,000 |
| 5,673,584 |
|
| Ally Financial, Inc., 4.625%, 3/30/25 | 4,700,000 |
| 4,521,329 |
|
| Ally Financial, Inc., 5.75%, 11/20/25 | 654,000 |
| 644,648 |
|
| Capital One Bank USA N.A., 3.375%, 2/15/23 | 4,900,000 |
| 4,800,397 |
|
| Capital One Bank USA N.A., VRN, 2.28%, 1/28/26 | 2,778,000 |
| 2,520,778 |
|
| Capital One Financial Corp., 3.80%, 1/31/28 | 4,210,000 |
| 4,170,655 |
|
Park Aerospace Holdings Ltd., 5.50%, 2/15/24(1) | 3,460,000 |
| 2,985,198 |
|
| | | 25,316,589 |
|
| Diversified Consumer Services — 0.1% | | |
| Pepperdine University, 3.30%, 12/1/59 | 2,800,000 |
| 3,244,919 |
|
| Diversified Financial Services — 0.2% | | |
| Credit Suisse Group Funding Guernsey Ltd., 3.45%, 4/16/21 | 5,500,000 |
| 5,536,477 |
|
| Diversified Telecommunication Services — 1.4% | | |
| AT&T, Inc., 3.875%, 8/15/21 | 3,160,000 |
| 3,237,722 |
|
| AT&T, Inc., 4.30%, 2/15/30 | 3,600,000 |
| 3,882,434 |
|
| AT&T, Inc., 5.15%, 11/15/46 | 2,676,000 |
| 3,161,384 |
|
Deutsche Telekom AG, 3.625%, 1/21/50(1) | 3,930,000 |
| 3,929,058 |
|
| Ooredoo International Finance Ltd., 3.25%, 2/21/23 | 1,150,000 |
| 1,120,476 |
|
| Verizon Communications, Inc., 2.95%, 3/15/22 | 3,581,000 |
| 3,655,649 |
|
| Verizon Communications, Inc., 2.45%, 11/1/22 | 2,179,000 |
| 2,216,842 |
|
| Verizon Communications, Inc., 4.40%, 11/1/34 | 6,025,000 |
| 7,076,617 |
|
| Verizon Communications, Inc., 4.75%, 11/1/41 | 800,000 |
| 935,420 |
|
| Verizon Communications, Inc., 5.01%, 8/21/54 | 2,250,000 |
| 3,089,737 |
|
| | | 32,305,339 |
|
| Electric Utilities — 2.0% | | |
| AEP Transmission Co. LLC, 3.75%, 12/1/47 | 1,020,000 |
| 1,057,649 |
|
| American Electric Power Co., Inc., 3.20%, 11/13/27 | 2,050,000 |
| 2,036,757 |
|
| Berkshire Hathaway Energy Co., 3.50%, 2/1/25 | 1,900,000 |
| 1,996,428 |
|
| Berkshire Hathaway Energy Co., 3.80%, 7/15/48 | 2,700,000 |
| 2,843,232 |
|
| Commonwealth Edison Co., 3.20%, 11/15/49 | 850,000 |
| 859,397 |
|
| DTE Electric Co., 2.25%, 3/1/30 | 2,370,000 |
| 2,301,835 |
|
| Duke Energy Corp., 3.55%, 9/15/21 | 2,686,000 |
| 2,723,953 |
|
| Duke Energy Florida LLC, 6.35%, 9/15/37 | 307,000 |
| 424,720 |
|
| Duke Energy Florida LLC, 3.85%, 11/15/42 | 2,070,000 |
| 2,288,342 |
|
| Duke Energy Progress LLC, 4.15%, 12/1/44 | 1,100,000 |
| 1,246,554 |
|
| Duke Energy Progress LLC, 3.70%, 10/15/46 | 2,280,000 |
| 2,470,488 |
|
| Exelon Corp., 5.15%, 12/1/20 | 1,700,000 |
| 1,716,714 |
|
| Exelon Corp., 4.45%, 4/15/46 | 1,842,000 |
| 1,872,897 |
|
FirstEnergy Transmission LLC, 4.55%, 4/1/49(1) | 1,570,000 |
| 1,575,459 |
|
| Florida Power & Light Co., 3.15%, 10/1/49 | 1,450,000 |
| 1,511,455 |
|
| MidAmerican Energy Co., 4.40%, 10/15/44 | 2,100,000 |
| 2,403,645 |
|
|
| | | | | | |
| | Principal Amount | Value |
| Nevada Power Co., 2.40%, 5/1/30 | $ | 1,690,000 |
| $ | 1,620,000 |
|
| NextEra Energy Capital Holdings, Inc., 3.55%, 5/1/27 | 1,860,000 |
| 1,923,916 |
|
NextEra Energy Operating Partners LP, 4.50%, 9/15/27(1) | 3,340,000 |
| 3,279,771 |
|
| Oncor Electric Delivery Co. LLC, 3.10%, 9/15/49 | 1,450,000 |
| 1,415,270 |
|
| Potomac Electric Power Co., 3.60%, 3/15/24 | 1,700,000 |
| 1,746,218 |
|
| Southern Co. Gas Capital Corp., 3.95%, 10/1/46 | 1,570,000 |
| 1,411,272 |
|
| Southwestern Public Service Co., 3.70%, 8/15/47 | 1,880,000 |
| 2,010,565 |
|
| Xcel Energy, Inc., 3.35%, 12/1/26 | 780,000 |
| 772,217 |
|
Xcel Energy, Inc., 3.40%, 6/1/30(2) | 2,320,000 |
| 2,356,424 |
|
| | | 45,865,178 |
|
| Electronic Equipment, Instruments and Components — 0.2% | | |
| Amphenol Corp., 2.05%, 3/1/25 | 3,800,000 |
| 3,606,040 |
|
| Energy Equipment and Services — 0.1% | | |
| Baker Hughes a GE Co. LLC / Baker Hughes Co-Obligor, Inc., 3.14%, 11/7/29 | 2,115,000 |
| 1,838,648 |
|
| Equity Real Estate Investment Trusts (REITs) — 1.8% | | |
| Alexandria Real Estate Equities, Inc., 4.90%, 12/15/30 | 670,000 |
| 730,880 |
|
| American Tower Corp., 3.375%, 10/15/26 | 1,330,000 |
| 1,333,326 |
|
| American Tower Corp., 2.90%, 1/15/30 | 3,547,000 |
| 3,473,566 |
|
| Boston Properties LP, 3.65%, 2/1/26 | 4,900,000 |
| 5,224,934 |
|
| Crown Castle International Corp., 5.25%, 1/15/23 | 3,240,000 |
| 3,440,686 |
|
Crown Castle International Corp., 3.30%, 7/1/30(2) | 220,000 |
| 220,406 |
|
| Duke Realty LP, 2.875%, 11/15/29 | 3,857,000 |
| 3,718,467 |
|
| Duke Realty LP, 3.05%, 3/1/50 | 1,250,000 |
| 1,015,404 |
|
| Essex Portfolio LP, 3.25%, 5/1/23 | 1,712,000 |
| 1,681,302 |
|
| Healthcare Realty Trust, Inc., 2.40%, 3/15/30 | 1,900,000 |
| 1,693,502 |
|
| Kilroy Realty LP, 3.80%, 1/15/23 | 3,380,000 |
| 3,444,358 |
|
| Kimco Realty Corp., 2.80%, 10/1/26 | 3,910,000 |
| 3,823,510 |
|
| National Retail Properties, Inc., 2.50%, 4/15/30 | 1,760,000 |
| 1,573,854 |
|
| Prologis LP, 2.125%, 4/15/27 | 1,060,000 |
| 1,011,680 |
|
| Prologis LP, 3.00%, 4/15/50 | 2,512,000 |
| 2,189,018 |
|
| Public Storage, 3.39%, 5/1/29 | 2,160,000 |
| 2,172,449 |
|
| Service Properties Trust, 4.65%, 3/15/24 | 1,870,000 |
| 1,371,974 |
|
| Ventas Realty LP, 4.125%, 1/15/26 | 2,600,000 |
| 2,601,454 |
|
Ventas Realty LP, 4.75%, 11/15/30(2) | 690,000 |
| 679,118 |
|
| | | 41,399,888 |
|
| Food and Staples Retailing — 0.1% | | |
| Kroger Co. (The), 3.875%, 10/15/46 | 2,080,000 |
| 2,050,960 |
|
Sysco Corp., 5.95%, 4/1/30(2) | 680,000 |
| 717,359 |
|
| | | 2,768,319 |
|
| Health Care Equipment and Supplies — 0.5% | | |
Baxter International, Inc., 3.95%, 4/1/30(1) | 460,000 |
| 498,404 |
|
| Becton Dickinson and Co., 3.73%, 12/15/24 | 4,671,000 |
| 4,797,764 |
|
| DH Europe Finance II Sarl, 3.40%, 11/15/49 | 1,820,000 |
| 1,797,921 |
|
| Medtronic, Inc., 3.50%, 3/15/25 | 2,043,000 |
| 2,204,560 |
|
| Medtronic, Inc., 4.375%, 3/15/35 | 2,154,000 |
| 2,691,580 |
|
| | | 11,990,229 |
|
|
| | | | | | |
| | Principal Amount | Value |
| Health Care Providers and Services — 1.4% | | |
| Aetna, Inc., 2.75%, 11/15/22 | $ | 1,540,000 |
| $ | 1,551,194 |
|
| Anthem, Inc., 3.65%, 12/1/27 | 2,800,000 |
| 2,898,035 |
|
| Cigna Corp., 2.40%, 3/15/30 | 2,430,000 |
| 2,313,739 |
|
| CommonSpirit Health, 2.95%, 11/1/22 | 2,420,000 |
| 2,365,747 |
|
| CVS Health Corp., 3.50%, 7/20/22 | 5,400,000 |
| 5,545,236 |
|
| CVS Health Corp., 4.30%, 3/25/28 | 3,810,000 |
| 4,054,236 |
|
| CVS Health Corp., 4.78%, 3/25/38 | 1,480,000 |
| 1,631,330 |
|
| Duke University Health System, Inc., 3.92%, 6/1/47 | 2,000,000 |
| 2,284,751 |
|
| Partners Healthcare System, Inc., 3.19%, 7/1/49 | 1,695,000 |
| 1,704,495 |
|
| UnitedHealth Group, Inc., 2.875%, 3/15/22 | 4,060,000 |
| 4,174,547 |
|
| UnitedHealth Group, Inc., 3.75%, 7/15/25 | 2,000,000 |
| 2,173,711 |
|
Universal Health Services, Inc., 4.75%, 8/1/22(1) | 2,700,000 |
| 2,705,019 |
|
| | | 33,402,040 |
|
| Hotels, Restaurants and Leisure — 0.1% | | |
| McDonald's Corp., MTN, 4.70%, 12/9/35 | 1,270,000 |
| 1,439,868 |
|
| Household Durables — 0.5% | | |
| D.R. Horton, Inc., 2.55%, 12/1/20 | 2,420,000 |
| 2,386,708 |
|
| D.R. Horton, Inc., 2.50%, 10/15/24 | 2,640,000 |
| 2,471,177 |
|
| Lennar Corp., 4.75%, 4/1/21 | 3,290,000 |
| 3,275,063 |
|
| Toll Brothers Finance Corp., 4.35%, 2/15/28 | 3,620,000 |
| 3,325,124 |
|
| | | 11,458,072 |
|
Household Products† | | |
| Kimberly-Clark Corp., 3.10%, 3/26/30 | 461,000 |
| 495,662 |
|
| Industrial Conglomerates — 0.2% | | |
| Carlisle Cos., Inc., 2.75%, 3/1/30 | 5,925,000 |
| 5,210,787 |
|
| Insurance — 1.4% | | |
Aflac, Inc., 3.60%, 4/1/30(2) | 1,137,000 |
| 1,153,349 |
|
| American International Group, Inc., 4.125%, 2/15/24 | 7,680,000 |
| 8,073,948 |
|
| American International Group, Inc., 4.50%, 7/16/44 | 3,147,000 |
| 3,230,870 |
|
Athene Holding Ltd., 6.15%, 4/3/30(2) | 1,100,000 |
| 1,100,242 |
|
| Berkshire Hathaway Finance Corp., 4.20%, 8/15/48 | 1,620,000 |
| 1,912,957 |
|
| Chubb INA Holdings, Inc., 3.15%, 3/15/25 | 1,700,000 |
| 1,775,857 |
|
| Hartford Financial Services Group, Inc. (The), 3.60%, 8/19/49 | 3,320,000 |
| 3,156,565 |
|
Liberty Mutual Group, Inc., 4.50%, 6/15/49(1) | 1,100,000 |
| 1,083,782 |
|
| Markel Corp., 4.90%, 7/1/22 | 3,120,000 |
| 3,137,686 |
|
Metropolitan Life Global Funding I, 3.00%, 1/10/23(1) | 2,220,000 |
| 2,253,252 |
|
| Prudential Financial, Inc., MTN, 1.50%, 3/10/26 | 4,760,000 |
| 4,486,459 |
|
| WR Berkley Corp., 4.625%, 3/15/22 | 1,875,000 |
| 1,611,742 |
|
| | | 32,976,709 |
|
| IT Services — 0.4% | | |
| Fiserv, Inc., 3.50%, 7/1/29 | 1,500,000 |
| 1,596,488 |
|
| Global Payments, Inc., 3.20%, 8/15/29 | 3,040,000 |
| 2,987,780 |
|
| Mastercard, Inc., 3.65%, 6/1/49 | 1,530,000 |
| 1,791,707 |
|
Visa, Inc., 1.90%, 4/15/27(2) | 1,140,000 |
| 1,140,070 |
|
| Western Union Co. (The), 2.85%, 1/10/25 | 1,059,000 |
| 1,056,144 |
|
| | | 8,572,189 |
|
|
| | | | | | |
| | Principal Amount | Value |
Machinery† | | |
Otis Worldwide Corp., VRN, 2.09%, 4/5/23(1) | $ | 1,110,000 |
| $ | 1,056,915 |
|
| Media — 0.9% | | |
| Charter Communications Operating LLC / Charter Communications Operating Capital, 4.91%, 7/23/25 | 4,190,000 |
| 4,521,922 |
|
| Charter Communications Operating LLC / Charter Communications Operating Capital, 4.80%, 3/1/50 | 1,415,000 |
| 1,481,413 |
|
| Comcast Corp., 6.40%, 5/15/38 | 2,270,000 |
| 3,321,051 |
|
| Comcast Corp., 4.75%, 3/1/44 | 3,486,000 |
| 4,426,282 |
|
| Comcast Corp., 3.97%, 11/1/47 | 1,507,000 |
| 1,749,301 |
|
Fox Corp., 3.05%, 4/7/25(2) | 610,000 |
| 616,549 |
|
| ViacomCBS, Inc., 3.125%, 6/15/22 | 1,690,000 |
| 1,669,354 |
|
| ViacomCBS, Inc., 4.25%, 9/1/23 | 2,100,000 |
| 2,144,822 |
|
| | | 19,930,694 |
|
| Metals and Mining — 0.3% | | |
Minera Mexico SA de CV, 4.50%, 1/26/50(1) | 5,900,000 |
| 5,016,800 |
|
| Steel Dynamics, Inc., 3.45%, 4/15/30 | 1,870,000 |
| 1,704,771 |
|
| | | 6,721,571 |
|
| Multi-Utilities — 0.7% | | |
Ameren Corp., 3.50%, 1/15/31(2) | 695,000 |
| 699,810 |
|
| CenterPoint Energy, Inc., 4.25%, 11/1/28 | 2,500,000 |
| 2,569,592 |
|
| Consolidated Edison Co. of New York, Inc., 3.95%, 3/1/43 | 1,530,000 |
| 1,436,234 |
|
| Dominion Energy, Inc., 4.90%, 8/1/41 | 2,920,000 |
| 3,058,394 |
|
| NiSource, Inc., 5.65%, 2/1/45 | 2,080,000 |
| 2,399,272 |
|
| Sempra Energy, 2.875%, 10/1/22 | 1,820,000 |
| 1,828,260 |
|
| Sempra Energy, 3.25%, 6/15/27 | 1,700,000 |
| 1,656,004 |
|
| Sempra Energy, 4.00%, 2/1/48 | 1,500,000 |
| 1,444,962 |
|
| | | 15,092,528 |
|
| Oil, Gas and Consumable Fuels — 2.4% | | |
Aker BP ASA, 3.75%, 1/15/30(1) | 3,600,000 |
| 2,710,157 |
|
| CNOOC Finance Ltd., 4.25%, 1/26/21 | 4,975,000 |
| 5,061,615 |
|
| CNOOC Nexen Finance 2014 ULC, 4.25%, 4/30/24 | 2,000,000 |
| 2,140,028 |
|
| Concho Resources, Inc., 4.375%, 1/15/25 | 1,210,000 |
| 1,034,197 |
|
| Continental Resources, Inc., 4.375%, 1/15/28 | 2,660,000 |
| 1,240,969 |
|
| Diamondback Energy, Inc., 3.50%, 12/1/29 | 4,690,000 |
| 3,326,486 |
|
| Ecopetrol SA, 5.875%, 5/28/45 | 1,220,000 |
| 1,093,504 |
|
| Energy Transfer Operating LP, 4.25%, 3/15/23 | 4,740,000 |
| 4,253,797 |
|
| Energy Transfer Operating LP, 3.75%, 5/15/30 | 2,050,000 |
| 1,615,305 |
|
| Energy Transfer Operating LP, 4.90%, 3/15/35 | 3,470,000 |
| 2,739,514 |
|
| Energy Transfer Operating LP, 6.50%, 2/1/42 | 880,000 |
| 796,404 |
|
| Enterprise Products Operating LLC, 4.85%, 3/15/44 | 5,480,000 |
| 5,734,794 |
|
| Equinor ASA, 3.25%, 11/18/49 | 1,170,000 |
| 1,157,588 |
|
| Hess Corp., 6.00%, 1/15/40 | 1,590,000 |
| 1,149,927 |
|
| Kinder Morgan Energy Partners LP, 6.50%, 9/1/39 | 4,250,000 |
| 4,178,934 |
|
MPLX LP, 5.25%, 1/15/25(1) | 2,950,000 |
| 2,601,386 |
|
| MPLX LP, 4.875%, 6/1/25 | 3,800,000 |
| 3,134,808 |
|
| MPLX LP, 4.50%, 4/15/38 | 1,130,000 |
| 886,688 |
|
| MPLX LP, 5.20%, 3/1/47 | 1,480,000 |
| 1,186,259 |
|
|
| | | | | | |
| | Principal Amount | Value |
| Ovintiv, Inc., 6.50%, 2/1/38 | $ | 690,000 |
| $ | 300,504 |
|
| Petroleos Mexicanos, 4.875%, 1/24/22 | 2,160,000 |
| 1,869,666 |
|
| Petroleos Mexicanos, 6.50%, 3/13/27 | 800,000 |
| 598,914 |
|
| Petroleos Mexicanos, 5.50%, 6/27/44 | 700,000 |
| 438,694 |
|
| Sabine Pass Liquefaction LLC, 5.625%, 3/1/25 | 6,700,000 |
| 6,161,165 |
|
| | | 55,411,303 |
|
| Pharmaceuticals — 0.6% | | |
| Allergan Finance LLC, 3.25%, 10/1/22 | 6,880,000 |
| 6,905,702 |
|
Bristol-Myers Squibb Co., 3.25%, 8/15/22(1) | 5,180,000 |
| 5,383,941 |
|
| Elanco Animal Health, Inc., 5.65%, 8/28/28 | 2,528,000 |
| 2,673,039 |
|
| | | 14,962,682 |
|
| Road and Rail — 0.9% | | |
Ashtead Capital, Inc., 4.125%, 8/15/25(1) | 3,750,000 |
| 3,450,000 |
|
| Burlington Northern Santa Fe LLC, 4.95%, 9/15/41 | 3,850,000 |
| 4,850,732 |
|
| Burlington Northern Santa Fe LLC, 4.15%, 4/1/45 | 1,070,000 |
| 1,257,959 |
|
| CSX Corp., 3.25%, 6/1/27 | 3,490,000 |
| 3,592,491 |
|
| CSX Corp., 3.80%, 4/15/50 | 1,163,000 |
| 1,227,124 |
|
| Union Pacific Corp., 2.40%, 2/5/30 | 1,690,000 |
| 1,655,443 |
|
| Union Pacific Corp., 3.60%, 9/15/37 | 1,730,000 |
| 1,797,687 |
|
Union Pacific Corp., 3.84%, 3/20/60(1) | 2,480,000 |
| 2,696,283 |
|
| Union Pacific Corp., MTN, 3.55%, 8/15/39 | 1,210,000 |
| 1,224,089 |
|
| | | 21,751,808 |
|
| Semiconductors and Semiconductor Equipment — 0.2% | | |
NXP BV / NXP Funding LLC, 3.875%, 9/1/22(1) | 3,950,000 |
| 3,969,095 |
|
| Software — 0.6% | | |
| Adobe, Inc., 2.30%, 2/1/30 | 3,800,000 |
| 3,813,667 |
|
| Oracle Corp., 2.50%, 10/15/22 | 2,500,000 |
| 2,560,165 |
|
| Oracle Corp., 3.625%, 7/15/23 | 3,070,000 |
| 3,261,357 |
|
Oracle Corp., 2.50%, 4/1/25(2) | 2,400,000 |
| 2,452,916 |
|
Oracle Corp., 2.95%, 4/1/30(2) | 1,600,000 |
| 1,612,997 |
|
| | | 13,701,102 |
|
| Specialty Retail — 0.3% | | |
| Home Depot, Inc. (The), 3.00%, 4/1/26 | 2,560,000 |
| 2,707,100 |
|
| Home Depot, Inc. (The), 3.90%, 6/15/47 | 2,750,000 |
| 3,106,028 |
|
| Home Depot, Inc. (The), 3.35%, 4/15/50 | 1,629,000 |
| 1,776,410 |
|
| | | 7,589,538 |
|
| Technology Hardware, Storage and Peripherals — 0.5% | | |
Dell International LLC / EMC Corp., 5.45%, 6/15/23(1) | 4,200,000 |
| 4,315,272 |
|
Dell International LLC / EMC Corp., 6.02%, 6/15/26(1) | 6,950,000 |
| 7,409,906 |
|
| | | 11,725,178 |
|
| Textiles, Apparel and Luxury Goods — 0.1% | | |
| NIKE, Inc., 3.375%, 3/27/50 | 1,168,000 |
| 1,283,709 |
|
| Trading Companies and Distributors — 0.3% | | |
| Air Lease Corp., MTN, 3.00%, 2/1/30 | 6,621,000 |
| 4,815,977 |
|
| International Lease Finance Corp., 5.875%, 8/15/22 | 1,670,000 |
| 1,494,679 |
|
| | | 6,310,656 |
|
|
| | | | | | |
| | Principal Amount | Value |
| Wireless Telecommunication Services — 0.3% | | |
| Vodafone Group plc, 2.95%, 2/19/23 | $ | 5,689,000 |
| $ | 5,815,608 |
|
TOTAL CORPORATE BONDS
(Cost $760,689,605) | | 751,371,249 |
|
| U.S. TREASURY SECURITIES — 21.4% | | |
| U.S. Treasury Bonds, 5.00%, 5/15/37 | 2,000,000 |
| 3,286,016 |
|
| U.S. Treasury Bonds, 4.50%, 5/15/38 | 9,000,000 |
| 14,259,375 |
|
| U.S. Treasury Bonds, 3.50%, 2/15/39 | 1,780,000 |
| 2,534,692 |
|
| U.S. Treasury Bonds, 3.125%, 11/15/41 | 10,000,000 |
| 13,659,375 |
|
| U.S. Treasury Bonds, 3.125%, 2/15/42 | 20,000,000 |
| 27,343,750 |
|
| U.S. Treasury Bonds, 3.00%, 5/15/42 | 12,800,000 |
| 17,188,000 |
|
| U.S. Treasury Bonds, 2.75%, 11/15/42 | 8,500,000 |
| 10,983,262 |
|
| U.S. Treasury Bonds, 2.50%, 2/15/45 | 17,000,000 |
| 21,236,055 |
|
U.S. Treasury Bonds, 3.375%, 11/15/48(3) | 38,000,000 |
| 56,430,000 |
|
| U.S. Treasury Bonds, 2.25%, 8/15/49 | 13,400,000 |
| 16,307,172 |
|
| U.S. Treasury Bonds, 2.375%, 11/15/49 | 7,000,000 |
| 8,742,617 |
|
| U.S. Treasury Inflation Indexed Notes, 0.25%, 7/15/29 | 15,631,905 |
| 16,250,670 |
|
U.S. Treasury Notes, 1.50%, 5/31/20(3) | 10,000,000 |
| 10,023,269 |
|
U.S. Treasury Notes, 1.125%, 8/31/21(3) | 1,000,000 |
| 1,013,184 |
|
| U.S. Treasury Notes, 1.50%, 9/15/22 | 20,000,000 |
| 20,610,547 |
|
| U.S. Treasury Notes, 1.875%, 9/30/22 | 40,000,000 |
| 41,626,562 |
|
| U.S. Treasury Notes, 1.625%, 11/15/22 | 15,000,000 |
| 15,532,910 |
|
| U.S. Treasury Notes, 1.625%, 12/15/22 | 15,000,000 |
| 15,553,418 |
|
| U.S. Treasury Notes, 0.50%, 3/15/23 | 48,000,000 |
| 48,305,625 |
|
| U.S. Treasury Notes, 1.50%, 3/31/23 | 10,000,000 |
| 10,364,453 |
|
| U.S. Treasury Notes, 1.50%, 11/30/24 | 21,000,000 |
| 22,119,726 |
|
| U.S. Treasury Notes, 1.125%, 2/28/25 | 9,000,000 |
| 9,337,500 |
|
| U.S. Treasury Notes, 0.50%, 3/31/25 | 5,000,000 |
| 5,032,129 |
|
| U.S. Treasury Notes, 1.125%, 2/28/27 | 26,000,000 |
| 27,032,891 |
|
| U.S. Treasury Notes, 0.625%, 3/31/27 | 60,500,000 |
| 60,843,857 |
|
TOTAL U.S. TREASURY SECURITIES
(Cost $440,808,797) | | 495,617,055 |
|
| U.S. GOVERNMENT AGENCY MORTGAGE-BACKED SECURITIES — 14.7% | |
| Adjustable-Rate U.S. Government Agency Mortgage-Backed Securities — 1.2% | |
| FHLMC, VRN, 4.32%, (1-year H15T1Y plus 2.25%), 4/1/37 | 326,874 |
| 330,785 |
|
| FHLMC, VRN, 4.29%, (12-month LIBOR plus 1.84%), 6/1/38 | 852,806 |
| 866,214 |
|
| FHLMC, VRN, 4.51%, (12-month LIBOR plus 1.88%), 7/1/40 | 338,362 |
| 346,999 |
|
| FHLMC, VRN, 3.90%, (12-month LIBOR plus 1.78%), 9/1/40 | 787,145 |
| 803,564 |
|
| FHLMC, VRN, 4.77%, (12-month LIBOR plus 1.88%), 5/1/41 | 283,295 |
| 289,794 |
|
| FHLMC, VRN, 4.00%, (12-month LIBOR plus 1.87%), 7/1/41 | 1,042,666 |
| 1,070,932 |
|
| FHLMC, VRN, 4.51%, (12-month LIBOR plus 1.63%), 5/1/43 | 288,475 |
| 292,006 |
|
| FHLMC, VRN, 4.43%, (12-month LIBOR plus 1.65%), 6/1/43 | 234,918 |
| 236,415 |
|
| FHLMC, VRN, 4.50%, (12-month LIBOR plus 1.62%), 6/1/43 | 8,946 |
| 9,026 |
|
| FHLMC, VRN, 3.20%, (12-month LIBOR plus 1.62%), 6/1/44 | 1,484,911 |
| 1,535,889 |
|
| FHLMC, VRN, 2.35%, (12-month LIBOR plus 1.63%), 8/1/46 | 2,503,173 |
| 2,516,682 |
|
| FNMA, VRN, 3.77%, (12-month LIBOR plus 1.71%), 12/1/37 | 249,916 |
| 255,107 |
|
| FNMA, VRN, 3.69%, (12-month LIBOR plus 1.69%), 1/1/40 | 242,972 |
| 247,861 |
|
| FNMA, VRN, 3.64%, (12-month LIBOR plus 1.79%), 8/1/40 | 1,092,406 |
| 1,114,501 |
|
|
| | | | | | |
| | Principal Amount | Value |
| FNMA, VRN, 3.81%, (12-month LIBOR plus 1.77%), 10/1/40 | $ | 1,526,323 |
| $ | 1,558,058 |
|
| FNMA, VRN, 4.27%, (12-month LIBOR plus 1.75%), 8/1/41 | 692,171 |
| 706,769 |
|
| FNMA, VRN, 3.70%, (12-month LIBOR plus 1.56%), 3/1/43 | 282,042 |
| 286,456 |
|
| FNMA, VRN, 3.78%, (12-month LIBOR plus 1.57%), 1/1/45 | 1,547,369 |
| 1,570,704 |
|
| FNMA, VRN, 2.625%, (12-month LIBOR plus 1.60%), 4/1/46 | 6,765,470 |
| 6,909,148 |
|
| FNMA, VRN, 3.24%, (12-month LIBOR plus 1.62%), 5/1/47 | 6,068,608 |
| 6,283,869 |
|
| | | 27,230,779 |
|
| Fixed-Rate U.S. Government Agency Mortgage-Backed Securities — 13.5% | |
| FHLMC, 5.00%, 1/1/21 | 62,350 |
| 65,696 |
|
| FHLMC, 5.00%, 4/1/21 | 12,216 |
| 12,872 |
|
| FHLMC, 7.00%, 9/1/27 | 1,161 |
| 1,318 |
|
| FHLMC, 6.50%, 1/1/28 | 1,961 |
| 2,188 |
|
| FHLMC, 7.00%, 2/1/28 | 309 |
| 350 |
|
| FHLMC, 6.50%, 3/1/29 | 11,836 |
| 13,437 |
|
| FHLMC, 6.50%, 6/1/29 | 13,799 |
| 15,458 |
|
| FHLMC, 7.00%, 8/1/29 | 1,208 |
| 1,345 |
|
| FHLMC, 5.00%, 4/1/31 | 1,823,053 |
| 1,988,254 |
|
| FHLMC, 5.00%, 5/1/31 | 2,448,871 |
| 2,671,095 |
|
| FHLMC, 6.50%, 5/1/31 | 11,991 |
| 13,311 |
|
| FHLMC, 6.50%, 6/1/31 | 1,344 |
| 1,491 |
|
| FHLMC, 5.50%, 12/1/33 | 149,872 |
| 168,614 |
|
| FHLMC, 6.00%, 9/1/35 | 2,372,997 |
| 2,738,911 |
|
| FHLMC, 5.50%, 12/1/37 | 171,409 |
| 194,286 |
|
| FHLMC, 5.50%, 1/1/38 | 278,167 |
| 314,608 |
|
| FHLMC, 6.00%, 2/1/38 | 1,277,838 |
| 1,472,239 |
|
| FHLMC, 5.50%, 4/1/38 | 398,913 |
| 453,106 |
|
| FHLMC, 6.00%, 8/1/38 | 90,351 |
| 103,502 |
|
| FNMA, 6.50%, 1/1/26 | 8,907 |
| 9,883 |
|
| FNMA, 7.00%, 12/1/27 | 2,480 |
| 2,762 |
|
| FNMA, 7.50%, 4/1/28 | 15,176 |
| 17,046 |
|
| FNMA, 7.00%, 5/1/28 | 14,133 |
| 14,689 |
|
| FNMA, 7.00%, 6/1/28 | 246 |
| 253 |
|
| FNMA, 6.50%, 1/1/29 | 2,021 |
| 2,327 |
|
| FNMA, 6.50%, 4/1/29 | 6,328 |
| 7,158 |
|
| FNMA, 7.00%, 7/1/29 | 1,234 |
| 1,238 |
|
| FNMA, 7.50%, 7/1/29 | 10,294 |
| 10,707 |
|
| FNMA, 7.50%, 9/1/30 | 4,542 |
| 5,386 |
|
| FNMA, 5.00%, 6/1/31 | 1,895,403 |
| 2,067,358 |
|
| FNMA, 5.00%, 7/1/31 | 2,998,097 |
| 3,270,105 |
|
| FNMA, 7.00%, 9/1/31 | 21,582 |
| 23,104 |
|
| FNMA, 6.50%, 1/1/32 | 7,536 |
| 8,646 |
|
| FNMA, 6.50%, 8/1/32 | 30,966 |
| 35,574 |
|
| FNMA, 5.50%, 2/1/33 | 1,497,163 |
| 1,682,694 |
|
| FNMA, 5.00%, 6/1/33 | 1,605,271 |
| 1,783,001 |
|
| FNMA, 5.50%, 6/1/33 | 96,176 |
| 108,249 |
|
| FNMA, 5.50%, 7/1/33 | 525,574 |
| 592,391 |
|
| FNMA, 5.00%, 8/1/33 | 239,217 |
| 265,676 |
|
|
| | | | | | |
| | Principal Amount | Value |
| FNMA, 5.50%, 8/1/33 | $ | 213,111 |
| $ | 241,131 |
|
| FNMA, 5.50%, 9/1/33 | 320,280 |
| 362,574 |
|
| FNMA, 5.00%, 11/1/33 | 1,025,938 |
| 1,139,631 |
|
| FNMA, 6.00%, 12/1/33 | 678,097 |
| 769,015 |
|
| FNMA, 5.50%, 1/1/34 | 257,962 |
| 291,843 |
|
| FNMA, 5.50%, 2/1/34 | 916,341 |
| 1,036,032 |
|
| FNMA, 3.50%, 3/1/34 | 5,232,506 |
| 5,515,475 |
|
| FNMA, 5.00%, 3/1/34 | 604,045 |
| 670,912 |
|
| FNMA, 4.50%, 1/1/35 | 5,097,750 |
| 5,592,785 |
|
| FNMA, 5.00%, 4/1/35 | 1,418,021 |
| 1,577,796 |
|
| FNMA, 5.00%, 6/1/35 | 1,068,480 |
| 1,186,674 |
|
| FNMA, 5.00%, 7/1/35 | 2,062,087 |
| 2,290,216 |
|
| FNMA, 5.00%, 8/1/35 | 64,215 |
| 71,535 |
|
| FNMA, 4.50%, 9/1/35 | 246,162 |
| 269,669 |
|
| FNMA, 5.00%, 10/1/35 | 456,451 |
| 508,523 |
|
| FNMA, 5.50%, 12/1/35 | 3,018,900 |
| 3,420,824 |
|
| FNMA, 5.00%, 2/1/36 | 360,840 |
| 402,688 |
|
| FNMA, 5.50%, 4/1/36 | 376,706 |
| 427,985 |
|
| FNMA, 5.50%, 5/1/36 | 759,211 |
| 862,668 |
|
| FNMA, 5.50%, 7/1/36 | 183,592 |
| 205,582 |
|
| FNMA, 5.50%, 2/1/37 | 99,498 |
| 113,008 |
|
| FNMA, 5.50%, 5/1/37 | 152,986 |
| 173,279 |
|
| FNMA, 6.00%, 8/1/37 | 274,042 |
| 311,478 |
|
| FNMA, 6.50%, 8/1/37 | 50,596 |
| 58,467 |
|
| FNMA, 6.00%, 9/1/37 | 1,123,612 |
| 1,286,134 |
|
| FNMA, 6.00%, 11/1/37 | 1,478,764 |
| 1,703,761 |
|
| FNMA, 5.50%, 12/1/37 | 800,737 |
| 907,256 |
|
| FNMA, 5.50%, 2/1/38 | 173,985 |
| 194,193 |
|
| FNMA, 5.50%, 6/1/38 | 384,237 |
| 435,998 |
|
| FNMA, 5.50%, 12/1/38 | 742,727 |
| 831,296 |
|
| FNMA, 5.00%, 1/1/39 | 545,901 |
| 602,981 |
|
| FNMA, 5.50%, 1/1/39 | 3,744,172 |
| 4,253,423 |
|
| FNMA, 4.50%, 2/1/39 | 1,018,309 |
| 1,115,251 |
|
| FNMA, 5.00%, 2/1/39 | 2,145,235 |
| 2,390,388 |
|
| FNMA, 4.50%, 4/1/39 | 1,877,848 |
| 2,070,431 |
|
| FNMA, 4.50%, 5/1/39 | 4,773,224 |
| 5,257,663 |
|
| FNMA, 6.50%, 5/1/39 | 976,640 |
| 1,162,014 |
|
| FNMA, 5.00%, 8/1/39 | 2,193,524 |
| 2,437,453 |
|
| FNMA, 4.50%, 10/1/39 | 8,295,604 |
| 9,172,729 |
|
| FNMA, 4.00%, 10/1/40 | 8,534,594 |
| 9,355,111 |
|
| FNMA, 4.50%, 11/1/40 | 7,905,336 |
| 8,679,061 |
|
| FNMA, 4.00%, 8/1/41 | 8,225,670 |
| 8,980,027 |
|
| FNMA, 4.50%, 9/1/41 | 4,708,759 |
| 5,168,087 |
|
| FNMA, 3.50%, 10/1/41 | 9,896,886 |
| 10,644,344 |
|
| FNMA, 5.00%, 1/1/42 | 3,535,973 |
| 3,927,663 |
|
| FNMA, 3.50%, 2/1/42 | 6,475,977 |
| 6,963,242 |
|
| FNMA, 3.50%, 6/1/42 | 19,908,159 |
| 21,417,857 |
|
|
| | | | | | |
| | Principal Amount | Value |
| FNMA, 3.50%, 8/1/42 | $ | 1,882,614 |
| $ | 2,025,340 |
|
| FNMA, 3.50%, 8/1/42 | 7,970,558 |
| 8,574,338 |
|
| FNMA, 4.00%, 11/1/45 | 12,570,376 |
| 13,550,197 |
|
| FNMA, 4.00%, 11/1/45 | 3,801,570 |
| 4,117,933 |
|
| FNMA, 4.00%, 2/1/46 | 11,171,688 |
| 12,084,075 |
|
| FNMA, 4.00%, 4/1/46 | 14,110,601 |
| 15,196,560 |
|
| FNMA, 6.50%, 8/1/47 | 18,140 |
| 19,478 |
|
| FNMA, 6.50%, 9/1/47 | 36,732 |
| 39,344 |
|
| FNMA, 6.50%, 9/1/47 | 1,765 |
| 1,892 |
|
| FNMA, 6.50%, 9/1/47 | 19,312 |
| 20,672 |
|
| FNMA, 4.00%, 6/1/48 | 24,152,195 |
| 25,812,218 |
|
| FNMA, 4.50%, 2/1/49 | 9,911,197 |
| 10,678,595 |
|
| FNMA, 4.00%, 6/1/49 | 6,409,208 |
| 6,844,272 |
|
| GNMA, 7.00%, 11/15/22 | 3,232 |
| 3,349 |
|
| GNMA, 7.00%, 4/20/26 | 1,325 |
| 1,505 |
|
| GNMA, 7.50%, 8/15/26 | 2,922 |
| 3,330 |
|
| GNMA, 8.00%, 8/15/26 | 1,283 |
| 1,420 |
|
| GNMA, 7.50%, 5/15/27 | 1,614 |
| 1,645 |
|
| GNMA, 8.00%, 6/15/27 | 3,113 |
| 3,116 |
|
| GNMA, 7.00%, 2/15/28 | 1,427 |
| 1,432 |
|
| GNMA, 7.50%, 2/15/28 | 963 |
| 966 |
|
| GNMA, 6.50%, 3/15/28 | 4,081 |
| 4,479 |
|
| GNMA, 7.00%, 4/15/28 | 1,056 |
| 1,060 |
|
| GNMA, 6.50%, 5/15/28 | 109 |
| 120 |
|
| GNMA, 6.50%, 5/15/28 | 18,424 |
| 20,251 |
|
| GNMA, 7.00%, 12/15/28 | 1,920 |
| 1,927 |
|
| GNMA, 7.00%, 5/15/31 | 15,654 |
| 18,734 |
|
| GNMA, 4.50%, 8/15/33 | 858,792 |
| 945,301 |
|
| GNMA, 6.00%, 9/20/38 | 520,521 |
| 594,776 |
|
| GNMA, 5.50%, 11/15/38 | 1,312,401 |
| 1,502,280 |
|
| GNMA, 5.50%, 11/15/38 | 307,880 |
| 337,131 |
|
| GNMA, 6.00%, 1/20/39 | 157,483 |
| 179,867 |
|
| GNMA, 5.00%, 3/20/39 | 1,106,205 |
| 1,226,849 |
|
| GNMA, 4.50%, 4/15/39 | 1,283,457 |
| 1,423,050 |
|
| GNMA, 4.50%, 1/15/40 | 735,892 |
| 816,292 |
|
| GNMA, 4.00%, 7/15/40 | 1,620,548 |
| 1,757,181 |
|
| GNMA, 4.00%, 11/20/40 | 13,702,959 |
| 14,964,684 |
|
| GNMA, 4.50%, 12/15/40 | 3,202,449 |
| 3,587,608 |
|
| GNMA, 4.50%, 7/20/41 | 5,179,821 |
| 5,717,294 |
|
| GNMA, 3.50%, 6/20/42 | 5,019,104 |
| 5,375,501 |
|
| GNMA, 2.50%, 7/20/46 | 16,931,016 |
| 17,808,215 |
|
| | | 311,860,758 |
|
TOTAL U.S. GOVERNMENT AGENCY MORTGAGE-BACKED SECURITIES
(Cost $325,859,904) | 339,091,537 |
|
| ASSET-BACKED SECURITIES — 6.4% | | |
| Argent Securities, Inc., Series 2004-W8, Class M1, VRN, 1.77%, (1-month LIBOR plus 0.83%), 5/25/34 | 9,491,513 |
| 8,715,731 |
|
BRE Grand Islander Timeshare Issuer LLC, Series 2017-1A, Class A SEQ, 2.94%, 5/25/29(1) | 4,616,616 |
| 4,529,192 |
|
|
| | | | | | |
| | Principal Amount | Value |
Goodgreen, Series 2018-1A, Class A, VRN, 3.93%, 10/15/53(1) | $ | 10,595,100 |
| $ | 10,881,570 |
|
Hertz Fleet Lease Funding LP, Series 2017-1, Class A1, VRN, 1.51%, (1-month LIBOR plus 0.65%), 4/10/31(1) | 3,503,574 |
| 3,494,279 |
|
Hilton Grand Vacations Trust, Series 2014-AA, Class A SEQ, 1.77%, 11/25/26(1) | 1,522,092 |
| 1,510,651 |
|
Invitation Homes Trust, Series 2017-SFR2, Class A, VRN, 1.65%, (1-month LIBOR plus 0.85%), 12/17/36(1) | 12,056,437 |
| 11,212,332 |
|
Invitation Homes Trust, Series 2018-SFR1, Class A, VRN, 1.50%, (1-month LIBOR plus 0.70%), 3/17/37(1) | 9,200,168 |
| 8,576,481 |
|
Invitation Homes Trust, Series 2018-SFR2, Class B, VRN, 1.78%, (1-month LIBOR plus 1.08%), 6/17/37(1) | 20,000,000 |
| 18,703,130 |
|
Invitation Homes Trust, Series 2018-SFR3, Class A, VRN, 1.80%, (1-month LIBOR plus 1.00%), 7/17/37(1) | 14,028,528 |
| 13,290,769 |
|
MVW Owner Trust, Series 2013-1A, Class A SEQ, 2.15%, 4/22/30(1) | 1,230,773 |
| 1,230,039 |
|
MVW Owner Trust, Series 2014-1A, Class A SEQ, 2.25%, 9/22/31(1) | 2,357,500 |
| 2,332,958 |
|
MVW Owner Trust, Series 2015-1A, Class A SEQ, 2.52%, 12/20/32(1) | 1,677,318 |
| 1,655,610 |
|
MVW Owner Trust, Series 2016-1A, Class A SEQ, 2.25%, 12/20/33(1) | 2,944,653 |
| 2,880,265 |
|
MVW Owner Trust, Series 2017-1A, Class A SEQ, 2.42%, 12/20/34(1) | 7,916,093 |
| 7,743,310 |
|
MVW Owner Trust, Series 2018-1A, Class A SEQ, 3.45%, 1/21/36(1) | 6,313,811 |
| 6,097,368 |
|
Progress Residential Trust, Series 2018-SFR3, Class A SEQ, 3.88%, 10/17/35(1) | 9,993,717 |
| 10,079,055 |
|
Progress Residential Trust, Series 2019-SFR3, Class A SEQ, 2.27%, 9/17/36(1) | 4,900,000 |
| 4,760,096 |
|
Sierra Timeshare Conduit Receivables Funding LLC, Series 2017-1A, Class A SEQ, 2.91%, 3/20/34(1) | 3,583,051 |
| 3,539,452 |
|
Sierra Timeshare Receivables Funding LLC, Series 2016-1A, Class A SEQ, 3.08%, 3/21/33(1) | 2,397,558 |
| 2,386,770 |
|
Sierra Timeshare Receivables Funding LLC, Series 2019-2A, Class A SEQ, 2.59%, 5/20/36(1) | 6,107,343 |
| 6,032,285 |
|
Towd Point Mortgage Trust, Series 2018-4, Class A1, VRN, 3.00%, 6/25/58(1) | 3,239,543 |
| 3,204,358 |
|
| US Airways Pass-Through Trust, Series 2013-1, Class A, 3.95%, 5/15/27 | 2,139,088 |
| 2,140,619 |
|
VSE VOI Mortgage LLC, Series 2016-A, Class A SEQ, 2.54%, 7/20/33(1) | 5,590,975 |
| 5,498,128 |
|
VSE VOI Mortgage LLC, Series 2018-A, Class B, 3.72%, 2/20/36(1) | 7,719,782 |
| 7,637,578 |
|
TOTAL ASSET-BACKED SECURITIES
(Cost $152,204,870) | | 148,132,026 |
|
| COLLATERALIZED MORTGAGE OBLIGATIONS — 4.1% | | |
| Private Sponsor Collateralized Mortgage Obligations — 3.3% | | |
| Adjustable Rate Mortgage Trust, Series 2004-4, Class 4A1, VRN, 4.04%, 3/25/35 | 1,695,602 |
| 1,558,774 |
|
Agate Bay Mortgage Loan Trust, Series 2016-3, Class A3, VRN, 3.50%, 8/25/46(1) | 2,809,677 |
| 2,788,588 |
|
| Banc of America Mortgage Trust, Series 2004-E, Class 2A6 SEQ, VRN, 4.77%, 6/25/34 | 911,629 |
| 819,499 |
|
| Bear Stearns Adjustable Rate Mortgage Trust, Series 2004-12, Class 2A1, VRN, 3.74%, 2/25/35 | 1,344,282 |
| 1,223,024 |
|
| Bear Stearns Adjustable Rate Mortgage Trust, Series 2004-8, Class 2A1, VRN, 3.95%, 11/25/34 | 1,466,121 |
| 1,307,979 |
|
|
| | | | | | |
| | Principal Amount | Value |
| Citicorp Mortgage Securities Trust, Series 2007-8, Class 1A3, 6.00%, 9/25/37 | $ | 597,799 |
| $ | 621,999 |
|
| Citigroup Mortgage Loan Trust, Inc., Series 2004-UST1, Class A4, VRN, 3.74%, 8/25/34 | 1,254,234 |
| 1,112,001 |
|
| Citigroup Mortgage Loan Trust, Inc., Series 2004-UST1, Class A5, VRN, 3.79%, 8/25/34 | 3,709,649 |
| 3,338,003 |
|
| Citigroup Mortgage Loan Trust, Inc., Series 2005-4, Class A, VRN, 4.59%, 8/25/35 | 442,643 |
| 412,436 |
|
Countrywide Home Loan Mortgage Pass-Through Trust, Series 2004-4, Class A19, 5.25%, 5/25/34 | 979,620 |
| 1,004,314 |
|
Countrywide Home Loan Mortgage Pass-Through Trust, Series 2004-5, Class 2A4, 5.50%, 5/25/34 | 428,204 |
| 420,543 |
|
Countrywide Home Loan Mortgage Pass-Through Trust, Series 2005-17, Class 1A11, 5.50%, 9/25/35 | 41,446 |
| 38,195 |
|
Credit Suisse First Boston Mortgage-Backed Trust, Series 2004-AR6, Class 2A1, VRN, 4.03%, 10/25/34 | 182,051 |
| 175,831 |
|
Credit Suisse Mortgage Trust, Series 2019-AFC1, Class A1, VRN, 2.57%, 7/25/49(1) | 3,612,165 |
| 3,489,095 |
|
Credit Suisse Mortgage Trust, Series 2020-AFC1, Class A1, VRN, 2.24%, 2/25/50(1) | 1,355,410 |
| 1,211,995 |
|
First Horizon Alternative Mortgage Securities Trust, Series 2004-AA4, Class A1, VRN, 3.80%, 10/25/34 | 2,719,513 |
| 2,499,585 |
|
| First Horizon Mortgage Pass-Through Trust, Series 2005-AR3, Class 4A1, VRN, 5.01%, 8/25/35 | 911,249 |
| 880,465 |
|
Galton Funding Mortgage Trust, Series 2020-H1, Class A1, VRN, 2.31%, 1/25/60(1) | 4,371,773 |
| 4,260,340 |
|
| GSR Mortgage Loan Trust, Series 2004-7, Class 3A1, VRN, 4.04%, 6/25/34 | 798,089 |
| 727,418 |
|
| GSR Mortgage Loan Trust, Series 2004-AR5, Class 3A3, VRN, 4.31%, 5/25/34 | 1,367,922 |
| 1,218,128 |
|
| GSR Mortgage Loan Trust, Series 2005-AR1, Class 3A1, VRN, 4.00%, 1/25/35 | 1,526,678 |
| 1,372,083 |
|
| GSR Mortgage Loan Trust, Series 2005-AR6, Class 2A1, VRN, 4.10%, 9/25/35 | 3,272,433 |
| 3,097,995 |
|
| GSR Mortgage Loan Trust, Series 2005-AR6, Class 3A1, VRN, 4.05%, 9/25/35 | 2,655,199 |
| 2,440,848 |
|
| GSR Mortgage Loan Trust, Series 2005-AR6, Class 4A5, VRN, 4.51%, 9/25/35 | 1,096,431 |
| 1,033,640 |
|
| JPMorgan Mortgage Trust, Series 2005-A4, Class 1A1, VRN, 4.07%, 7/25/35 | 523,346 |
| 509,647 |
|
| JPMorgan Mortgage Trust, Series 2005-A4, Class 2A1, VRN, 4.12%, 7/25/35 | 984,342 |
| 906,398 |
|
| JPMorgan Mortgage Trust, Series 2005-A6, Class 7A1, VRN, 4.19%, 8/25/35 | 1,221,420 |
| 1,123,010 |
|
| JPMorgan Mortgage Trust, Series 2006-A3, Class 7A1, VRN, 4.02%, 4/25/35 | 775,197 |
| 739,061 |
|
JPMorgan Mortgage Trust, Series 2013-1, Class 2A2 SEQ, VRN, 2.50%, 3/25/43(1) | 984,269 |
| 988,672 |
|
JPMorgan Mortgage Trust, Series 2018-6, Class 1A4 SEQ, VRN, 3.50%, 12/25/48(1) | 2,326,302 |
| 2,313,060 |
|
MASTR Adjustable Rate Mortgages Trust, Series 2004-13, Class 3A7, VRN, 4.68%, 11/21/34 | 636,030 |
| 606,808 |
|
| Merrill Lynch Mortgage Investors Trust, Series 2005-3, Class 2A, VRN, 3.80%, 11/25/35 | 1,425,032 |
| 1,248,897 |
|
| Merrill Lynch Mortgage Investors Trust, Series 2005-A2, Class A1, VRN, 3.73%, 2/25/35 | 1,496,795 |
| 1,322,894 |
|
| Merrill Lynch Mortgage Investors Trust, Series 2005-A2, Class A2, VRN, 3.73%, 2/25/35 | 748,397 |
| 660,229 |
|
|
| | | | | | |
| | Principal Amount | Value |
New Residential Mortgage Loan Trust, Series 2017-1A, Class A1, VRN, 4.00%, 2/25/57(1) | $ | 1,460,041 |
| $ | 1,521,587 |
|
New Residential Mortgage Loan Trust, Series 2017-2A, Class A3, VRN, 4.00%, 3/25/57(1) | 3,379,550 |
| 3,533,217 |
|
New Residential Mortgage Loan Trust, Series 2017-5A, Class A1, VRN, 2.45%, (1-month LIBOR plus 1.50%), 6/25/57(1) | 3,043,269 |
| 2,915,760 |
|
Sequoia Mortgage Trust, Series 2017-CH1, Class A1, VRN, 4.00%, 8/25/47(1) | 2,828,800 |
| 2,876,795 |
|
Sequoia Mortgage Trust, Series 2017-CH2, Class A10 SEQ, VRN, 4.00%, 12/25/47(1) | 2,702,563 |
| 2,717,050 |
|
Sequoia Mortgage Trust, Series 2018-CH2, Class A12 SEQ, VRN, 4.00%, 6/25/48(1) | 2,040,357 |
| 2,055,282 |
|
Sofi Mortgage Trust, Series 2016-1A, Class 1A4 SEQ, VRN, 3.00%, 11/25/46(1) | 3,876,660 |
| 3,808,690 |
|
| Structured Adjustable Rate Mortgage Loan Trust, Series 2004-8, Class 2A1, VRN, 3.78%, 7/25/34 | 1,876,548 |
| 1,744,868 |
|
| Thornburg Mortgage Securities Trust, Series 2004-3, Class A, VRN, 1.69%, (1-month LIBOR plus 0.74%), 9/25/34 | 3,590,447 |
| 3,074,137 |
|
| WaMu Mortgage Pass-Through Certificates, Series 2003-S11, Class 3A5, 5.95%, 11/25/33 | 311,050 |
| 301,192 |
|
| WaMu Mortgage Pass-Through Certificates, Series 2005-AR3, Class A1, VRN, 3.62%, 3/25/35 | 1,828,367 |
| 1,680,401 |
|
| Wells Fargo Mortgage-Backed Securities Trust, Series 2005-AR7, Class 1A1, VRN, 4.97%, 5/25/35 | 787,676 |
| 788,182 |
|
| Wells Fargo Mortgage-Backed Securities Trust, Series 2006-AR15, Class A1, VRN, 4.61%, 10/25/36 | 302,231 |
| 265,261 |
|
| Wells Fargo Mortgage-Backed Securities Trust, Series 2007-AR10, Class 1A1, VRN, 4.26%, 1/25/38 | 1,073,714 |
| 911,459 |
|
| | | 75,665,335 |
|
| U.S. Government Agency Collateralized Mortgage Obligations — 0.8% | |
| FHLMC, Series 2013-DN2, Class M2, VRN, 5.20%, (1-month LIBOR plus 4.25%), 11/25/23 | 2,918,781 |
| 2,833,236 |
|
FHLMC, Series 2019-DNA3, Class M2, VRN, 3.00%, (1-month LIBOR plus 2.05%), 7/25/49(1) | 4,604,757 |
| 3,800,898 |
|
| FHLMC, Series 3397, Class GF, VRN, 1.20%, (1-month LIBOR plus 0.50%), 12/15/37 | 725,423 |
| 725,765 |
|
| FNMA, Series 2014-C02, Class 1M2, VRN, 3.55%, (1-month LIBOR plus 2.60%), 5/25/24 | 6,087,615 |
| 5,526,441 |
|
| FNMA, Series 2014-C02, Class 2M2, VRN, 3.55%, (1-month LIBOR plus 2.60%), 5/25/24 | 2,258,484 |
| 2,075,698 |
|
| FNMA, Series 2016-C06, Class 1M2, VRN, 5.20%, (1-month LIBOR plus 4.25%), 4/25/29 | 1,352,000 |
| 1,315,922 |
|
| GNMA, Series 2007-5, Class FA, VRN, 0.91%, (1-month LIBOR plus 0.14%), 2/20/37 | 1,621,424 |
| 1,603,196 |
|
| | | 17,881,156 |
|
TOTAL COLLATERALIZED MORTGAGE OBLIGATIONS
(Cost $98,355,457) | | 93,546,491 |
|
| COLLATERALIZED LOAN OBLIGATIONS — 3.8% | | |
Anchorage Credit Opportunities CLO 1 Ltd., Series 2019-1A, Class A1, VRN, 3.69%, (3-month LIBOR plus 1.95%), 1/20/32(1) | 5,500,000 |
| 5,363,907 |
|
Ares XLI CLO Ltd., Series 2016-41A, Class AR, VRN, 3.03%, (3-month LIBOR plus 1.20%), 1/15/29(1) | 2,400,000 |
| 2,308,347 |
|
Bean Creek CLO Ltd., Series 2015-1A, Class AR, VRN, 2.84%, (3-month LIBOR plus 1.02%), 4/20/31(1) | 6,000,000 |
| 5,651,923 |
|
CBAM Ltd., Series 2019-9A, Class A, VRN, 3.11%, (3-month LIBOR plus 1.28%), 2/12/30(1) | 6,000,000 |
| 5,783,688 |
|
CIFC Funding Ltd., Series 2013-3RA, Class A1, VRN, 2.78%, (3-month LIBOR plus 0.98%), 4/24/31(1) | 3,465,000 |
| 3,265,585 |
|
|
| | | | | | |
| | Principal Amount | Value |
CIFC Funding Ltd., Series 2015-1A, Class ARR, VRN, 2.91%, (3-month LIBOR plus 1.11%), 1/22/31(1) | $ | 3,350,000 |
| $ | 3,164,191 |
|
Dryden 64 CLO Ltd., Series 2018-64A, Class A, VRN, 2.79%, (3-month LIBOR plus 0.97%), 4/18/31(1) | 4,400,000 |
| 4,138,248 |
|
Elmwood CLO IV Ltd., Series 2020-1A, Class A, VRN, 2.61%, (3-month LIBOR plus 1.24%), 4/15/33(1) | 7,900,000 |
| 7,505,000 |
|
Goldentree Loan Opportunities X Ltd., Series 2015-10A, Class AR, VRN, 2.94%, (3-month LIBOR plus 1.12%), 7/20/31(1) | 3,500,000 |
| 3,320,865 |
|
KKR CLO Ltd., Series 2022A, Class A, VRN, 2.97%, (3-month LIBOR plus 1.15%), 7/20/31(1) | 4,175,000 |
| 3,946,800 |
|
Madison Park Funding XXII Ltd., Series 2016-22A, Class A1R, VRN, 2.92%, (3-month LIBOR plus 1.26%), 1/15/33(1) | 7,500,000 |
| 7,115,112 |
|
Magnetite VIII Ltd., Series 2014-8A, Class AR2, VRN, 2.81%, (3-month LIBOR plus 0.98%), 4/15/31(1) | 6,000,000 |
| 5,711,642 |
|
Octagon Investment Partners 45 Ltd., Series 2019-1A, Class A, VRN, 3.16%, (3-month LIBOR plus 1.33%), 10/15/32(1) | 13,000,000 |
| 12,085,489 |
|
Sounds Point CLO IV-R Ltd., Series 2013-3RA, Class A, VRN, 2.97%, (3-month LIBOR plus 1.15%), 4/18/31(1) | 7,500,000 |
| 6,989,018 |
|
Treman Park CLO Ltd., Series 2015-1A, Class ARR, VRN, 2.89%, (3-month LIBOR plus 1.07%), 10/20/28(1) | 4,250,000 |
| 4,125,598 |
|
Voya CLO Ltd., Series 2013-2A, Class A1R, VRN, 2.76%, (3-month LIBOR plus 0.97%), 4/25/31(1) | 3,350,000 |
| 3,146,664 |
|
Voya CLO Ltd., Series 2013-3A, Class A1RR, VRN, 2.97%, (3-month LIBOR plus 1.15%), 10/18/31(1) | 4,400,000 |
| 4,162,510 |
|
TOTAL COLLATERALIZED LOAN OBLIGATIONS
(Cost $92,348,594) | | 87,784,587 |
|
| COMMERCIAL MORTGAGE-BACKED SECURITIES — 3.7% | | |
Commercial Mortgage Pass-Through Certificates, Series 2014-CR15, Class AM, VRN, 4.43%, 2/10/47 | 10,691,000 |
| 11,223,673 |
|
Commercial Mortgage Pass-Through Certificates, Series 2014-LC17, Class AM, VRN, 4.19%, 10/10/47 | 10,000,000 |
| 10,477,762 |
|
Commercial Mortgage Pass-Through Certificates, Series 2014-UBS5, Class AM, VRN, 4.19%, 9/10/47 | 14,000,000 |
| 14,671,755 |
|
Commercial Mortgage Pass-Through Certificates, Series 2015-CR22, Class AM, VRN, 3.60%, 3/10/48 | 15,000,000 |
| 15,381,100 |
|
Commercial Mortgage Pass-Through Certificates, Series 2016-CR28, Class B, VRN, 4.65%, 2/10/49 | 5,000,000 |
| 5,144,293 |
|
| GS Mortgage Securities Trust, Series 2015-GC28, Class AS, 3.76%, 2/10/48 | 9,000,000 |
| 9,287,137 |
|
| JPMBB Commercial Mortgage Securities Trust, Series 2014-C21, Class B, VRN, 4.34%, 8/15/47 | 10,000,000 |
| 10,051,152 |
|
JPMorgan Chase Commercial Mortgage Securities Trust, Series 2016-JP3, Class AS, 3.14%, 8/15/49 | 10,000,000 |
| 10,081,992 |
|
TOTAL COMMERCIAL MORTGAGE-BACKED SECURITIES
(Cost $85,747,606) | | 86,318,864 |
|
| MUNICIPAL SECURITIES — 2.2% | | |
| Bay Area Toll Authority Rev., 6.92%, 4/1/40 | 2,189,000 |
| 3,233,853 |
|
| California State University Rev., 2.98%, 11/1/51 | 2,000,000 |
| 1,999,780 |
|
| Foothill-Eastern Transportation Corridor Agency Rev., 4.09%, 1/15/49 | 2,285,000 |
| 2,317,676 |
|
| Grand Parkway Transportation Corp. Rev., 3.24%, 10/1/52 | 955,000 |
| 931,039 |
|
| Houston GO, 3.96%, 3/1/47 | 1,615,000 |
| 1,818,070 |
|
| Los Angeles Community College District GO, 6.75%, 8/1/49 | 1,000,000 |
| 1,631,220 |
|
| Metropolitan Transportation Authority Rev., 6.69%, 11/15/40 | 1,235,000 |
| 1,607,180 |
|
| Metropolitan Transportation Authority Rev., 6.81%, 11/15/40 | 1,070,000 |
| 1,401,700 |
|
| New Jersey Turnpike Authority Rev., 7.41%, 1/1/40 | 1,180,000 |
| 1,731,508 |
|
|
| | | | | | |
| | Principal Amount | Value |
| Ohio Turnpike & Infrastructure Commission Rev., 3.22%, 2/15/48 | $ | 2,540,000 |
| $ | 2,557,577 |
|
| Ohio Water Development Authority Water Pollution Control Loan Fund Rev., 4.88%, 12/1/34 | 2,330,000 |
| 2,607,829 |
|
| Pennsylvania Turnpike Commission Rev., 5.56%, 12/1/49 | 1,385,000 |
| 1,889,306 |
|
| Port Authority of New York & New Jersey Rev., 4.93%, 10/1/51 | 1,750,000 |
| 2,178,645 |
|
| Regents of the University of California Medical Center Pooled Rev., 3.26%, 5/15/60 | 2,345,000 |
| 2,205,027 |
|
| Rutgers The State University of New Jersey Rev., 5.67%, 5/1/40 | 2,715,000 |
| 3,596,126 |
|
| Sacramento Municipal Utility District Rev., 6.16%, 5/15/36 | 1,000,000 |
| 1,364,730 |
|
| San Antonio Electric & Gas Systems Rev., 5.99%, 2/1/39 | 1,000,000 |
| 1,403,340 |
|
| San Diego County Regional Airport Authority Rev., 5.59%, 7/1/43 | 1,000,000 |
| 1,105,160 |
|
| San Francisco Public Utilities Commission Water Rev., 6.00%, 11/1/40 | 1,000,000 |
| 1,232,440 |
|
| San Jose Redevelopment Agency Successor Agency Tax Allocation, 3.375%, 8/1/34 | 1,145,000 |
| 1,156,668 |
|
| Santa Clara Valley Transportation Authority Rev., 5.88%, 4/1/32 | 2,990,000 |
| 3,721,862 |
|
| State of California GO, 4.60%, 4/1/38 | 1,000,000 |
| 1,102,560 |
|
| State of California GO, 7.55%, 4/1/39 | 2,000,000 |
| 3,253,240 |
|
| State of California GO, 7.30%, 10/1/39 | 1,000,000 |
| 1,539,980 |
|
| State of Kansas Department of Transportation Rev., 4.60%, 9/1/35 | 1,665,000 |
| 2,029,469 |
|
| University of California Rev., 5.95%, 5/15/45 | 1,630,000 |
| 2,197,403 |
|
TOTAL MUNICIPAL SECURITIES
(Cost $43,497,871) | | 51,813,388 |
|
| SOVEREIGN GOVERNMENTS AND AGENCIES — 0.9% | | |
| Chile — 0.1% | | |
| Chile Government International Bond, 3.25%, 9/14/21 | 1,180,000 |
| 1,200,662 |
|
| Chile Government International Bond, 3.625%, 10/30/42 | 1,200,000 |
| 1,281,300 |
|
| | | 2,481,962 |
|
| Colombia — 0.1% | | |
| Colombia Government International Bond, 4.375%, 7/12/21 | 1,810,000 |
| 1,830,833 |
|
| Panama — 0.1% | | |
| Panama Government International Bond, 6.70%, 1/26/36 | 1,700,000 |
| 2,199,910 |
|
| Peru — 0.1% | | |
| Peruvian Government International Bond, 5.625%, 11/18/50 | 1,640,000 |
| 2,460,500 |
|
| Philippines — 0.3% | | |
| Philippine Government International Bond, 4.00%, 1/15/21 | 3,170,000 |
| 3,214,127 |
|
| Philippine Government International Bond, 6.375%, 10/23/34 | 1,840,000 |
| 2,457,215 |
|
| | | 5,671,342 |
|
| Poland — 0.1% | | |
| Republic of Poland Government International Bond, 5.125%, 4/21/21 | 1,400,000 |
| 1,454,313 |
|
| Republic of Poland Government International Bond, 3.00%, 3/17/23 | 1,290,000 |
| 1,345,292 |
|
| | | 2,799,605 |
|
| Uruguay — 0.1% | | |
| Uruguay Government International Bond, 4.375%, 10/27/27 | 980,000 |
| 1,066,782 |
|
| Uruguay Government International Bond, 4.125%, 11/20/45 | 1,030,000 |
| 1,061,224 |
|
| | | 2,128,006 |
|
TOTAL SOVEREIGN GOVERNMENTS AND AGENCIES
(Cost $18,025,238) | | 19,572,158 |
|
|
| | | | | | |
| | Principal Amount/Shares | Value |
| U.S. GOVERNMENT AGENCY SECURITIES — 0.3% | | |
FNMA, 6.625%, 11/15/30
(Cost $6,382,607) | $ | 5,200,000 |
| $ | 7,914,857 |
|
| PREFERRED STOCKS — 0.2% | | |
| Banks — 0.1% | | |
| JPMorgan Chase & Co., 4.00% | 3,640,000 |
| 3,110,835 |
|
| Machinery — 0.1% | | |
| Stanley Black & Decker, Inc., 4.00% | 1,150,000 |
| 1,107,487 |
|
TOTAL PREFERRED STOCKS
(Cost $4,790,000) | | 4,218,322 |
|
| TEMPORARY CASH INVESTMENTS — 9.9% | | |
BNP Paribas SA, 0.03%, 4/1/20(1)(4) | $ | 80,000,000 |
| 80,000,149 |
|
Credit Agricole Corporate and Investment Bank, 0.06%, 4/1/20(1)(4) | 105,000,000 |
| 105,000,195 |
|
Repurchase Agreement, BMO Capital Markets Corp., (collateralized by various U.S. Treasury obligations, 1.875% - 3.00%, 11/30/21 - 5/15/45, valued at $18,415,500), in a joint trading account at 0.01%, dated 3/31/20, due 4/1/20 (Delivery value $18,057,448) | | 18,057,443 |
|
| State Street Institutional U.S. Government Money Market Fund, Premier Class | 26,268,206 |
| 26,268,206 |
|
TOTAL TEMPORARY CASH INVESTMENTS
(Cost $229,325,649) | | 229,325,993 |
|
TOTAL INVESTMENT SECURITIES — 100.1%
(Cost $2,258,036,198) | | 2,314,706,527 |
|
| OTHER ASSETS AND LIABILITIES — (0.1)% | | (1,918,097 | ) |
| TOTAL NET ASSETS — 100.0% | | $ | 2,312,788,430 |
|
|
| | | | | | | | | | | | |
| FUTURES CONTRACTS PURCHASED |
| Reference Entity | Contracts | Expiration Date | Notional Amount | Underlying Contract Value | Unrealized Appreciation (Depreciation) |
| U.S. Treasury 10-Year Notes | 298 |
| June 2020 | $ | 29,800,000 |
| $ | 41,328,875 |
| $ | 99,199 |
|
| U.S. Treasury 2-Year Notes | 541 |
| June 2020 | $ | 108,200,000 |
| 119,227,101 |
| 690,948 |
|
| U.S. Treasury 5-Year Notes | 835 |
| June 2020 | $ | 83,500,000 |
| 104,675,078 |
| 316,159 |
|
| U.S. Treasury Long Bonds | 57 |
| June 2020 | $ | 5,700,000 |
| 10,206,563 |
| (52,629 | ) |
| U.S. Treasury Ultra Bonds | 10 |
| June 2020 | $ | 1,000,000 |
| 2,218,750 |
| (22,523 | ) |
| | | | | $ | 277,656,367 |
| $ | 1,031,154 |
|
|
| | | | | | | | | | | | |
| FUTURES CONTRACTS SOLD |
| Reference Entity | Contracts | Expiration
Date | Notional
Amount | Underlying
Contract
Value | Unrealized
Appreciation
(Depreciation) |
| U.S. Treasury 10-Year Ultra Notes | 50 |
| June 2020 | $ | 5,000,000 |
| $ | 7,801,563 |
| $ | (41,656 | ) |
|
| | | | | | | | | | | | | | | |
| CENTRALLY CLEARED CREDIT DEFAULT SWAP AGREEMENTS |
| Reference Entity | Type | Fixed Rate
Received
(Paid) Quarterly | Termination
Date | Notional
Amount | Premiums Paid (Received) | Unrealized
Appreciation
(Depreciation) | Value^ |
| Markit CDX North America High Yield Index Series 33 | Buy | (5.00)% | 12/20/24 | $ | 222,803,500 |
| $ | 4,289,026 |
| $ | 8,931,718 |
| $ | 13,220,744 |
|
| Markit CDX North America Investment Grade Index Series 33 | Buy | (1.00)% | 12/20/24 | $ | 90,000,000 |
| (136,642 | ) | 430,128 |
| 293,486 |
|
| | | | | | $ | 4,152,384 |
| $ | 9,361,846 |
| $ | 13,514,230 |
|
^The value for credit default swap agreements serves as an indicator of the current status of the payment/performance risk and represent the likelihood of an expected liability or profit at the period end. Increasing values in absolute terms when compared to the notional amount of the credit default swap agreement represent a deterioration of the referenced entity's credit soundness and an increased likelihood or risk of a credit event occurring as defined in the agreement.
|
| | | | | | | | | | | | | | | |
| CENTRALLY CLEARED TOTAL RETURN SWAP AGREEMENTS |
| Floating Rate Index | Pay/Receive Floating Rate Index at Termination | Fixed Rate | Termination
Date | Notional
Amount | Premiums Paid (Received) | Unrealized
Appreciation
(Depreciation) | Value |
| CPURNSA | Receive | 1.78% | 8/5/24 | $ | 6,500,000 |
| $ | (481 | ) | $ | (370,024 | ) | $ | (370,505 | ) |
| CPURNSA | Receive | 1.77% | 8/5/24 | $ | 24,500,000 |
| (606 | ) | (1,389,393 | ) | (1,389,999 | ) |
| | | | | | $ | (1,087 | ) | $ | (1,759,417 | ) | $ | (1,760,504 | ) |
|
| | |
| NOTES TO SCHEDULE OF INVESTMENTS |
| CDX | - | Credit Derivatives Indexes |
| CPURNSA | - | U.S. Consumer Price Index Urban Consumers Not Seasonally Adjusted Index |
| FHLMC | - | Federal Home Loan Mortgage Corporation |
| FNMA | - | Federal National Mortgage Association |
| GNMA | - | Government National Mortgage Association |
| GO | - | General Obligation |
| H15T1Y | - | Constant Maturity U.S. Treasury Note Yield Curve Rate Index |
| LIBOR | - | London Interbank Offered Rate |
| MTN | - | Medium Term Note |
| SEQ | - | Sequential Payer |
| VRN | - | Variable Rate Note. The rate adjusts periodically based upon the terms set forth in the security’s offering documents. The rate shown is effective at the period end and the reference rate and spread, if any, is indicated. The security's effective maturity date may be shorter than the final maturity date shown. |
† Category is less than 0.05% of total net assets.
| |
| (1) | Security was purchased pursuant to Rule 144A or Section 4(2) under the Securities Act of 1933 and may be sold in transactions exempt from registration, normally to qualified institutional investors. The aggregate value of these securities at the period end was $545,894,107, which represented 23.6% of total net assets. Of these securities, 0.3% of total net assets were deemed illiquid under policies approved by the Board of Trustees. |
| |
| (2) | When-issued security. The issue price and yield are fixed on the date of the commitment, but payment and delivery are scheduled for a future date. |
| |
| (3) | Security, or a portion thereof, has been pledged at the custodian bank or with a broker for collateral requirements on futures contracts and/or swap agreements. At the period end, the aggregate value of securities pledged was $13,116,090. |
| |
| (4) | The rate indicated is the yield to maturity at purchase. |
See Notes to Financial Statements.
|
|
| Statement of Assets and Liabilities |
|
| | | |
| MARCH 31, 2020 | |
| Assets | |
| Investment securities, at value (cost of $2,258,036,198) | $ | 2,314,706,527 |
|
| Cash | 1,403,880 |
|
| Deposits with broker for futures contracts | 2,105,700 |
|
| Receivable for investments sold | 32,474,011 |
|
| Receivable for capital shares sold | 2,898,560 |
|
| Receivable for variation margin on futures contracts | 5,813,658 |
|
| Receivable for variation margin on swap agreements | 3,752,647 |
|
| Interest receivable | 11,549,535 |
|
| | 2,374,704,518 |
|
| | |
| Liabilities | |
| Payable for investments purchased | 56,208,655 |
|
| Payable for capital shares redeemed | 4,372,386 |
|
| Payable for variation margin on swap agreements | 55,593 |
|
| Accrued management fees | 1,096,346 |
|
| Distribution and service fees payable | 43,772 |
|
| Dividends payable | 139,336 |
|
| | 61,916,088 |
|
| | |
| Net Assets | $ | 2,312,788,430 |
|
| | |
| Net Assets Consist of: | |
| Capital paid in | $ | 2,241,526,717 |
|
| Distributable earnings | 71,261,713 |
|
| | $ | 2,312,788,430 |
|
|
| | | | |
| | Net Assets | Shares Outstanding | Net Asset Value Per Share |
| Investor Class | $1,302,957,640 | 117,387,691 |
| $11.10 |
| I Class | $648,831,634 | 58,427,035 |
| $11.10 |
| Y Class | $72,593,900 | 6,536,815 |
| $11.11 |
| A Class | $118,924,365 | 10,710,508 |
| $11.10* |
| C Class | $18,182,012 | 1,639,130 |
| $11.09 |
| R Class | $7,211,394 | 649,696 |
| $11.10 |
| R5 Class | $614,521 | 55,341 |
| $11.10 |
| R6 Class | $143,472,964 | 12,913,373 |
| $11.11 |
*Maximum offering price $11.62 (net asset value divided by 0.955).
See Notes to Financial Statements.
|
| | | |
| YEAR ENDED MARCH 31, 2020 | |
| Investment Income (Loss) | |
| Income: | |
| Interest | $ | 90,454,459 |
|
| | |
| Expenses: | |
| Management fees | 14,952,360 |
|
| Distribution and service fees: | |
| A Class | 276,243 |
|
| C Class | 227,678 |
|
| R Class | 40,109 |
|
| Trustees' fees and expenses | 227,577 |
|
| Other expenses | 21,382 |
|
| | 15,745,349 |
|
| | |
| Net investment income (loss) | 74,709,110 |
|
| | |
| Realized and Unrealized Gain (Loss) | |
| Net realized gain (loss) on: | |
| Investment transactions | 87,396,928 |
|
| Futures contract transactions | 27,772,813 |
|
| Swap agreement transactions | 8,866,812 |
|
| Foreign currency translation transactions | 5,031 |
|
| | 124,041,584 |
|
| | |
| Change in net unrealized appreciation (depreciation) on: | |
| Investments | 14,159,124 |
|
| Futures contracts | (2,591,922 | ) |
| Swap agreements | 7,602,429 |
|
| Translation of assets and liabilities in foreign currencies | (2,957 | ) |
| | 19,166,674 |
|
| | |
| Net realized and unrealized gain (loss) | 143,208,258 |
|
| | |
| Net Increase (Decrease) in Net Assets Resulting from Operations | $ | 217,917,368 |
|
See Notes to Financial Statements.
|
|
| Statement of Changes in Net Assets |
|
| | | | | | |
| YEARS ENDED MARCH 31, 2020 AND MARCH 31, 2019 |
| Increase (Decrease) in Net Assets | March 31, 2020 | March 31, 2019 |
| Operations | | |
| Net investment income (loss) | $ | 74,709,110 |
| $ | 140,067,829 |
|
| Net realized gain (loss) | 124,041,584 |
| (100,018,497 | ) |
| Change in net unrealized appreciation (depreciation) | 19,166,674 |
| 78,171,664 |
|
| Net increase (decrease) in net assets resulting from operations | 217,917,368 |
| 118,220,996 |
|
| | | |
| Distributions to Shareholders | | |
| From earnings: | | |
| Investor Class | (36,468,092 | ) | (45,125,218 | ) |
| I Class | (24,686,714 | ) | (50,762,670 | ) |
| Y Class | (4,065,955 | ) | (8,254,043 | ) |
| A Class | (2,389,165 | ) | (3,199,293 | ) |
| C Class | (335,431 | ) | (572,506 | ) |
| R Class | (155,586 | ) | (171,380 | ) |
| R5 Class | (12,644 | ) | (6,073 | ) |
| R6 Class | (8,130,214 | ) | (7,061,411 | ) |
| From tax return of capital: | | |
| Investor Class | — |
| (3,901,075 | ) |
| I Class | — |
| (4,940,428 | ) |
| Y Class | — |
| (394,094 | ) |
| A Class | — |
| (234,667 | ) |
| C Class | — |
| (54,444 | ) |
| R Class | — |
| (17,350 | ) |
| R5 Class | — |
| (1,029 | ) |
| R6 Class | — |
| (774,024 | ) |
| Decrease in net assets from distributions | (76,243,801 | ) | (125,469,705 | ) |
| | | |
| Capital Share Transactions | | |
| Net increase (decrease) in net assets from capital share transactions (Note 5) | (1,063,174,224 | ) | (2,947,658,348 | ) |
| | | |
| Net increase (decrease) in net assets | (921,500,657 | ) | (2,954,907,057 | ) |
| | | |
| Net Assets | | |
| Beginning of period | 3,234,289,087 |
| 6,189,196,144 |
|
| End of period | $ | 2,312,788,430 |
| $ | 3,234,289,087 |
|
See Notes to Financial Statements.
|
|
| Notes to Financial Statements |
MARCH 31, 2020
1. Organization
American Century Investment Trust (the trust) is registered under the Investment Company Act of 1940, as amended (the 1940 Act), as an open-end management investment company and is organized as a Massachusetts business trust. Diversified Bond Fund (the fund) is one fund in a series issued by the trust. The fund’s investment objective is to seek a high level of income by investing in non-money market debt securities.
The fund offers the Investor Class, I Class, Y Class, A Class, C Class, R Class, R5 Class and R6 Class. The A Class may incur an initial sales charge. The A Class and C Class may be subject to a contingent deferred sales charge.
2. Significant Accounting Policies
The following is a summary of significant accounting policies consistently followed by the fund in preparation of its financial statements. The fund is an investment company and follows accounting and reporting guidance in accordance with accounting principles generally accepted in the United States of America. This may require management to make certain estimates and assumptions at the date of the financial statements. Actual results could differ from these estimates. Management evaluated the impact of events or transactions occurring through the date the financial statements were issued that would merit recognition or disclosure.
Investment Valuations — The fund determines the fair value of its investments and computes its net asset value per share at the close of regular trading (usually 4 p.m. Eastern time) on the New York Stock Exchange (NYSE) on each day the NYSE is open. The Board of Trustees has adopted valuation policies and procedures to guide the investment advisor in the fund’s investment valuation process and to provide methodologies for the oversight of the fund’s pricing function.
Fixed income securities are valued at the evaluated mean as provided by independent pricing services or at the mean of the most recent bid and asked prices as provided by investment dealers. Corporate bonds, U.S. Treasury and Government Agency securities, convertible bonds, bank loan obligations, municipal securities, and sovereign governments and agencies are valued using market models that consider trade data, quotations from dealers and active market makers, relevant yield curve and spread data, creditworthiness, trade data or market information on comparable securities, and other relevant security specific information. Mortgage-related and asset-backed securities are valued based on models that consider trade data, prepayment and default projections, benchmark yield and spread data and estimated cash flows of each tranche of the issuer. Collateralized loan obligations are valued based on discounted cash flow models that consider trade and economic data, prepayment assumptions and default projections. Commercial paper is valued using a curve-based approach that considers money market rates for specific instruments, programs, currencies and maturity points from a variety of active market makers.
Hybrid securities are valued at the evaluated mean as provided by independent pricing services or at the mean of the most recent bid and asked prices as provided by investment dealers. Preferred stocks and convertible preferred stocks with perpetual maturities are valued using market models that consider trade data, quotations from dealers and active market makers, relevant yield curve and spread data, creditworthiness, trade data or market information on comparable securities, and other relevant security specific information.
Open-end management investment companies are valued at the reported net asset value per share. Repurchase agreements are valued at cost, which approximates fair value. Exchange-traded futures contracts are valued at the settlement price as provided by the appropriate exchange. Swap agreements are valued at an evaluated mean as provided by independent pricing services or independent brokers.
If the fund determines that the market price for an investment is not readily available or the valuation methods mentioned above do not reflect an investment’s fair value, such investment is valued as determined in good faith by the Board of Trustees or its delegate, in accordance with policies and procedures adopted by the Board of Trustees. In its determination of fair value, the fund may review several factors including, but not limited to, market information regarding the specific investment or comparable investments and correlation with other investment types, futures indices or general market indicators. Circumstances that may cause the fund to use these procedures to value an investment include, but are not limited to: an investment has been declared in default or is distressed; trading in a security has been suspended during the trading day or a security is not actively trading on its principal exchange; prices received from a regular pricing source are deemed unreliable; or there is a foreign market holiday and no trading occurred.
The fund monitors for significant events occurring after the close of an investment’s primary exchange but before the fund’s net asset value per share is determined. Significant events may include, but are not limited to: corporate announcements and transactions; governmental action and political unrest that could impact a specific investment or an investment sector; or armed conflicts, natural disasters and similar events that could affect investments in a specific country or region.
Security Transactions — Security transactions are accounted for as of the trade date. Net realized gains and losses are determined on the identified cost basis, which is also used for federal income tax purposes.
Investment Income — Interest income is recorded on the accrual basis and includes paydown gain (loss) and accretion of discounts and amortization of premiums. Inflation adjustments related to inflation-linked debt securities are reflected as interest income.
Foreign Currency Translations — All assets and liabilities initially expressed in foreign currencies are translated into U.S. dollars at prevailing exchange rates at period end. The fund may enter into spot foreign currency exchange contracts to facilitate transactions denominated in a foreign currency. Purchases and sales of investment securities, dividend and interest income, spot foreign currency exchange contracts, and expenses are translated at the rates of exchange prevailing on the respective dates of such transactions. Net realized and unrealized foreign currency exchange gains or losses related to investment securities are a component of net realized gain (loss) on investment transactions and change in net unrealized appreciation (depreciation) on investments, respectively.
Repurchase Agreements — The fund may enter into repurchase agreements with institutions that American Century Investment Management, Inc. (ACIM) (the investment advisor) has determined are creditworthy pursuant to criteria adopted by the Board of Trustees. The fund requires that the collateral, represented by securities, received in a repurchase transaction be transferred to the custodian in a manner sufficient to enable the fund to obtain those securities in the event of a default under the repurchase agreement. ACIM monitors, on a daily basis, the securities transferred to ensure the value, including accrued interest, of the securities under each repurchase agreement is equal to or greater than amounts owed to the fund under each repurchase agreement.
Joint Trading Account — Pursuant to an Exemptive Order issued by the Securities and Exchange Commission, the fund, along with certain other funds in the American Century Investments family of funds, may transfer uninvested cash balances into a joint trading account. These balances are invested in one or more repurchase agreements that are collateralized by U.S. Treasury or Agency obligations.
Segregated Assets — In accordance with the 1940 Act, the fund segregates assets on its books and records to cover certain types of investment securities and other financial instruments. ACIM monitors, on a daily basis, the securities segregated to ensure the fund designates a sufficient amount of liquid assets, marked-to-market daily. The fund may also receive assets or be required to pledge assets at the custodian bank or with a broker for collateral requirements.
Income Tax Status — It is the fund’s policy to distribute substantially all net investment income and net realized gains to shareholders and to otherwise qualify as a regulated investment company under provisions of the Internal Revenue Code. Accordingly, no provision has been made for income taxes. The fund files U.S. federal, state, local and non-U.S. tax returns as applicable. The fund's tax returns are subject to examination by the relevant taxing authority until expiration of the applicable statute of limitations, which is generally three years from the date of filing but can be longer in certain jurisdictions. At this time, management believes there are no uncertain tax positions which, based on their technical merit, would not be sustained upon examination and for which it is reasonably possible that the total amounts of unrecognized tax benefits will significantly change in the next twelve months.
Multiple Class — All shares of the fund represent an equal pro rata interest in the net assets of the class to which such shares belong, and have identical voting, dividend, liquidation and other rights and the same terms and conditions, except for class specific expenses and exclusive rights to vote on matters affecting only individual classes. Income, non-class specific expenses, and realized and unrealized capital gains and losses of the fund are allocated to each class of shares based on their relative net assets.
Distributions to Shareholders — Distributions from net investment income, if any, are declared daily and paid monthly. Distributions from net realized gains, if any, are generally declared and paid annually.
Indemnifications — Under the trust’s organizational documents, its officers and trustees are indemnified against certain liabilities arising out of the performance of their duties to the fund. In addition, in the normal course of business, the fund enters into contracts that provide general indemnifications. The maximum exposure under these arrangements is unknown as this would involve future claims that may be made against a fund. The risk of material loss from such claims is considered by management to be remote.
3. Fees and Transactions with Related Parties
Certain officers and trustees of the trust are also officers and/or directors of American Century Companies, Inc. (ACC). The trust's investment advisor, ACIM, the trust's distributor, American Century Investment Services, Inc. (ACIS), and the trust's transfer agent, American Century Services, LLC, are wholly owned, directly or indirectly, by ACC. Various funds issued by American Century Asset Allocation Portfolios, Inc. own, in aggregate, 25% of the shares of the fund. Related parties do not invest in the fund for the purpose of exercising management or control.
Management Fees — The trust has entered into a management agreement with ACIM, under which ACIM provides the fund with investment advisory and management services in exchange for a single, unified management fee (the fee) per class. The agreement provides that all expenses of managing and operating the fund, except distribution and service fees, brokerage expenses, taxes, interest, fees and expenses of the independent trustees (including legal counsel fees), and extraordinary expenses, will be paid by ACIM. The fee is computed and accrued daily based on each class's daily net assets and paid monthly in arrears. The difference in the fee among the classes is a result of their separate arrangements for non-Rule 12b-1 shareholder services. It is not the result of any difference in advisory or custodial fees or other expenses related to the management of the fund’s assets, which do not vary by class. The fee consists of (1) an Investment Category Fee based on the daily net assets of the fund and certain other accounts managed by the investment advisor that are in the same broad investment category as the fund and (2) a Complex Fee based on the assets of all the funds in the American Century Investments family of funds.
The Investment Category Fee range, the Complex Fee range and the effective annual management fee for each class for the period ended March 31, 2020 are as follows:
|
| | | |
| | Investment Category Fee Range | Complex Fee Range | Effective Annual Management Fee |
| Investor Class | 0.2925%
to 0.4100%
| 0.2500% to 0.3100% | 0.59% |
| I Class | 0.0500% to 0.1100% | 0.39% |
| Y Class | 0.0200% to 0.0800% | 0.36% |
| A Class | 0.2500% to 0.3100% | 0.59% |
| C Class | 0.2500% to 0.3100% | 0.59% |
| R Class | 0.2500% to 0.3100% | 0.59% |
| R5 Class | 0.0500% to 0.1100% | 0.39% |
| R6 Class | 0.0000% to 0.0600% | 0.34% |
Distribution and Service Fees — The Board of Trustees has adopted a separate Master Distribution and Individual Shareholder Services Plan for each of the A Class, C Class and R Class (collectively the plans), pursuant to Rule 12b-1 of the 1940 Act. The plans provide that the A Class will pay ACIS an annual distribution and service fee of 0.25%. The plans provide that the C Class will pay ACIS an annual distribution and service fee of 1.00%, of which 0.25% is paid for individual shareholder services and 0.75% is paid for distribution services. The plans provide that the R Class will pay ACIS an annual distribution and service fee of 0.50%. The fees are computed and accrued daily based on each class’s daily net assets and paid monthly in arrears. The fees are used to pay financial intermediaries for distribution and individual shareholder services. Fees incurred under the plans during the period ended March 31, 2020 are detailed in the Statement of Operations.
Trustees’ Fees and Expenses — The Board of Trustees is responsible for overseeing the investment advisor’s management and operations of the fund. The trustees receive detailed information about the fund and its investment advisor regularly throughout the year, and meet at least quarterly with management of the investment advisor to review reports about fund operations. The fund’s officers do not receive compensation from the fund.
Interfund Transactions — The fund may enter into security transactions with other American Century Investments funds and other client accounts of the investment advisor, in accordance with the 1940 Act rules and procedures adopted by the Board of Trustees. The rules and procedures require, among other things, that these transactions be effected at the independent current market price of the security. There were no interfund transactions during the period.
4. Investment Transactions
Purchases of investment securities, excluding short-term investments, for the period ended March 31, 2020 totaled $2,364,839,280, of which $1,713,509,633 represented U.S. Treasury and Government Agency obligations.
Sales of investment securities, excluding short-term investments, for the period ended March 31, 2020 totaled $3,493,928,260, of which $2,363,862,011 represented U.S. Treasury and Government Agency obligations.
5. Capital Share Transactions
Transactions in shares of the fund were as follows (unlimited number of shares authorized):
|
| | | | | | | | | | |
| | Year ended
March 31, 2020 | Year ended
March 31, 2019 |
| | Shares | Amount | Shares | Amount |
| Investor Class | | | | |
| Sold | 18,765,053 |
| $ | 206,095,200 |
| 31,325,261 |
| $ | 324,292,830 |
|
| Issued in reinvestment of distributions | 3,295,335 |
| 36,095,976 |
| 4,675,136 |
| 48,466,228 |
|
| Redeemed | (59,827,353 | ) | (653,071,063 | ) | (141,109,875 | ) | (1,467,307,574 | ) |
| | (37,766,965 | ) | (410,879,887 | ) | (105,109,478 | ) | (1,094,548,516 | ) |
| I Class | | | | |
| Sold | 31,535,685 |
| 341,454,688 |
| 49,180,608 |
| 509,555,656 |
|
| Issued in reinvestment of distributions | 1,996,279 |
| 21,878,131 |
| 4,857,472 |
| 50,339,677 |
|
| Redeemed | (68,653,115 | ) | (751,331,723 | ) | (178,388,008 | ) | (1,859,706,777 | ) |
| | (35,121,151 | ) | (387,998,904 | ) | (124,349,928 | ) | (1,299,811,444 | ) |
| Y Class | | | | |
| Sold | 4,884,209 |
| 53,253,149 |
| 5,869,446 |
| 60,949,056 |
|
| Issued in reinvestment of distributions | 370,767 |
| 4,063,679 |
| 827,203 |
| 8,594,073 |
|
| Redeemed | (13,068,615 | ) | (144,792,119 | ) | (49,627,198 | ) | (516,289,263 | ) |
| | (7,813,639 | ) | (87,475,291 | ) | (42,930,549 | ) | (446,746,134 | ) |
| A Class | | | | |
| Sold | 3,934,953 |
| 42,929,142 |
| 2,683,206 |
| 27,891,724 |
|
| Issued in reinvestment of distributions | 202,773 |
| 2,224,086 |
| 316,082 |
| 3,276,539 |
|
| Redeemed | (2,741,479 | ) | (29,881,482 | ) | (12,333,087 | ) | (127,677,174 | ) |
| | 1,396,247 |
| 15,271,746 |
| (9,333,799 | ) | (96,508,911 | ) |
| C Class | | | | |
| Sold | 206,008 |
| 2,253,431 |
| 189,966 |
| 1,972,112 |
|
| Issued in reinvestment of distributions | 26,362 |
| 287,616 |
| 51,732 |
| 536,171 |
|
| Redeemed | (1,560,858 | ) | (16,944,094 | ) | (1,865,057 | ) | (19,337,878 | ) |
| | (1,328,488 | ) | (14,403,047 | ) | (1,623,359 | ) | (16,829,595 | ) |
| R Class | | | | |
| Sold | 199,266 |
| 2,190,231 |
| 262,652 |
| 2,711,815 |
|
| Issued in reinvestment of distributions | 14,155 |
| 154,920 |
| 18,060 |
| 187,177 |
|
| Redeemed | (387,829 | ) | (4,236,210 | ) | (517,869 | ) | (5,367,549 | ) |
| | (174,408 | ) | (1,891,059 | ) | (237,157 | ) | (2,468,557 | ) |
| R5 Class | | | | |
| Sold | 21,730 |
| 238,322 |
| 56,075 |
| 581,596 |
|
| Issued in reinvestment of distributions | 1,152 |
| 12,644 |
| 680 |
| 7,022 |
|
| Redeemed | (7,015 | ) | (77,024 | ) | (37,363 | ) | (387,005 | ) |
| | 15,867 |
| 173,942 |
| 19,392 |
| 201,613 |
|
| R6 Class | | | | |
| Sold | 7,834,903 |
| 86,001,628 |
| 8,078,618 |
| 83,884,165 |
|
| Issued in reinvestment of distributions | 735,316 |
| 8,066,444 |
| 743,782 |
| 7,709,361 |
|
| Redeemed | (24,066,364 | ) | (270,039,796 | ) | (7,958,961 | ) | (82,540,330 | ) |
| | (15,496,145 | ) | (175,971,724 | ) | 863,439 |
| 9,053,196 |
|
| Net increase (decrease) | (96,288,682 | ) | $ | (1,063,174,224 | ) | (282,701,439 | ) | $ | (2,947,658,348 | ) |
6. Fair Value Measurements
The fund’s investments valuation process is based on several considerations and may use multiple inputs to determine the fair value of the investments held by the fund. In conformity with accounting principles generally accepted in the United States of America, the inputs used to determine a valuation are classified into three broad levels.
| |
| • | Level 1 valuation inputs consist of unadjusted quoted prices in an active market for identical investments. |
| |
| • | Level 2 valuation inputs consist of direct or indirect observable market data (including quoted prices for comparable investments, evaluations of subsequent market events, interest rates, prepayment speeds, credit risk, etc.). These inputs also consist of quoted prices for identical investments initially expressed in local currencies that are adjusted through translation into U.S. dollars. |
| |
| • | Level 3 valuation inputs consist of unobservable data (including a fund’s own assumptions). |
The level classification is based on the lowest level input that is significant to the fair valuation measurement. The valuation inputs are not necessarily an indication of the risks associated with investing in these securities or other financial instruments.
The following is a summary of the level classifications as of period end. The Schedule of Investments provides additional information on the fund’s portfolio holdings.
|
| | | | | | | | |
| | Level 1 | Level 2 | Level 3 |
| Assets | | | |
| Investment Securities | | | |
| Corporate Bonds | — |
| $ | 751,371,249 |
| — |
|
| U.S. Treasury Securities | — |
| 495,617,055 |
| — |
|
| U.S. Government Agency Mortgage-Backed Securities | — |
| 339,091,537 |
| — |
|
| Asset-Backed Securities | — |
| 148,132,026 |
| — |
|
| Collateralized Mortgage Obligations | — |
| 93,546,491 |
| — |
|
| Collateralized Loan Obligations | — |
| 87,784,587 |
| — |
|
| Commercial Mortgage-Backed Securities | — |
| 86,318,864 |
| — |
|
| Municipal Securities | — |
| 51,813,388 |
| — |
|
| Sovereign Governments and Agencies | — |
| 19,572,158 |
| — |
|
| U.S. Government Agency Securities | — |
| 7,914,857 |
| — |
|
| Preferred Stocks | — |
| 4,218,322 |
| — |
|
| Temporary Cash Investments | $ | 26,268,206 |
| 203,057,787 |
| — |
|
| | $ | 26,268,206 |
| $ | 2,288,438,321 |
| — |
|
| Other Financial Instruments | | | |
| Futures Contracts | $ | 1,106,306 |
| — |
| — |
|
| Swap Agreements | — |
| $ | 13,514,230 |
| — |
|
| | $ | 1,106,306 |
| $ | 13,514,230 |
| — |
|
| | | | |
| Liabilities | | | |
| Other Financial Instruments | | | |
| Futures Contracts | $ | 116,808 |
| — |
| — |
|
| Swap Agreements | — |
| $ | 1,760,504 |
| — |
|
| | $ | 116,808 |
| $ | 1,760,504 |
| — |
|
7. Derivative Instruments
Credit Risk — The fund is subject to credit risk in the normal course of pursuing its investment objectives. The value of a bond generally declines as the credit quality of its issuer declines. Credit default swap agreements enable a fund to buy/sell protection against a credit event of a specific issuer or index. A fund may attempt to enhance returns by selling protection or attempt to mitigate credit risk by buying protection. The buyer/seller of credit protection against a security or basket of securities may pay/receive an up-front or periodic payment to compensate for/against potential default events. Changes in value, including the periodic amounts of interest to be paid or received on swap agreements, are recorded as unrealized appreciation (depreciation) on swap agreements. Upon entering into a centrally cleared swap, a fund is required to deposit cash or securities (initial margin) with a financial intermediary in an amount equal to a certain percentage of the notional amount. Subsequent payments (variation margin) are made or received daily, in cash, by a fund. The variation margin is equal to the daily change in the value and is a component of unrealized gains and losses. Realized gain or loss is recorded upon receipt or payment of a periodic settlement or termination of swap agreements. Net realized and unrealized gains or losses occurring during the holding period of swap agreements are a component of net realized gain (loss) on swap agreement transactions and change in net unrealized appreciation (depreciation) on swap agreements, respectively. The risks of entering into swap agreements include the possible lack of liquidity, failure of the counterparty to meet its obligations, and that there may be unfavorable changes in the underlying investments or instruments. The fund's average notional amount held during the period was $205,490,500.
Interest Rate Risk — The fund is subject to interest rate risk in the normal course of pursuing its investment objectives. The value of bonds generally declines as interest rates rise. A fund may enter into futures contracts based on a bond index or a specific underlying security. A fund may purchase futures contracts to gain exposure to increases in market value or sell futures contracts to protect against a decline in market value. Upon entering into a futures contract, a fund will segregate cash, cash equivalents or other appropriate liquid securities on its records in amounts sufficient to meet requirements. Subsequent payments (variation margin) are made or received daily, in cash, by a fund. The variation margin is equal to the daily change in the contract value and is recorded as unrealized gains and losses. A fund recognizes a realized gain or loss when the futures contract is closed or expires. Net realized and unrealized gains or losses occurring during the holding period of futures contracts are a component of net realized gain (loss) on futures contract transactions and change in net unrealized appreciation (depreciation) on futures contracts, respectively. One of the risks of entering into futures contracts is the possibility that the change in value of the contract may not correlate with the changes in value of the underlying securities. The fund's average notional exposure to interest rate risk derivative instruments held during the period was $325,808,333 futures contracts purchased and $5,000,000 futures contracts sold.
Other Contracts — A fund may enter into total return swap agreements in order to attempt to obtain or preserve a particular return or spread at a lower cost than obtaining a return or spread through purchases and/or sales of instruments in other markets or gain exposure to certain markets in the most economical way possible. A fund will segregate cash, cash equivalents or other appropriate liquid securities on its records in amounts sufficient to meet requirements. Changes in value, including the periodic amounts of interest to be paid or received on swap agreements, are recorded as unrealized appreciation (depreciation) on swap agreements. Upon entering into a centrally cleared swap, a fund is required to deposit cash or securities (initial margin) with a financial intermediary in an amount equal to a certain percentage of the notional amount. Subsequent payments (variation margin) are made or received daily, in cash, by a fund. The variation margin is equal to the daily change in the value and is a component of unrealized gains and losses. Realized gain or loss is recorded upon receipt or payment of a periodic settlement or termination of swap agreements. Net realized and unrealized gains or losses occurring during the holding period of swap agreements are a component of net realized gain (loss) on swap agreement transactions and change in net unrealized appreciation (depreciation) on swap agreements, respectively. The risks of entering into swap agreements include the possible lack of liquidity, failure of the counterparty to meet its obligations, and that there may be unfavorable changes in the underlying investments or instruments, including inflationary risk. The fund's average notional amount held during the period was $31,000,000.
Value of Derivative Instruments as of March 31, 2020
|
| | | | | | | | |
| | Asset Derivatives | Liability Derivatives |
| Type of Risk Exposure | Location on Statement of Assets and Liabilities | Value | Location on Statement of Assets and Liabilities | Value |
| Credit Risk | Receivable for variation margin on swap agreements* | $ | 3,752,647 |
| Payable for variation margin on swap agreements* | — |
|
| Interest Rate Risk | Receivable for variation margin on futures contracts* | 5,813,658 |
| Payable for variation margin on futures contracts* | — |
|
| Other Contracts | Receivable for variation margin on swap agreements* | — |
| Payable for variation margin on swap agreements* | $ | 55,593 |
|
| | | $ | 9,566,305 |
| | $ | 55,593 |
|
*Included in the unrealized appreciation (depreciation) on futures contracts or centrally cleared swap agreements, as applicable, as reported in the Schedule of Investments.
Effect of Derivative Instruments on the Statement of Operations for the Year Ended March 31, 2020
|
| | | | | | | | |
| | Net Realized Gain (Loss) | Change in Net Unrealized Appreciation (Depreciation) |
| Type of Risk Exposure | Location on Statement of Operations | Value | Location on Statement of Operations | Value |
| Credit Risk | Net realized gain (loss) on swap agreement transactions | $ | 8,866,812 |
| Change in net unrealized appreciation (depreciation) on swap agreements | $ | 9,361,846 |
|
| Interest Rate Risk | Net realized gain (loss) on futures contract transactions | 27,772,813 |
| Change in net unrealized appreciation (depreciation) on futures contracts | (2,591,922 | ) |
| Other Contracts | Net realized gain (loss) on swap agreement transactions | — |
| Change in net unrealized appreciation (depreciation) on swap agreements | (1,759,417 | ) |
| | | $ | 36,639,625 |
| | $ | 5,010,507 |
|
8. Risk Factors
The value of the fund’s shares will go up and down, sometimes rapidly or unpredictably, based on the performance of the securities owned by the fund and other factors generally affecting the securities market. Market risks, including political, regulatory, economic and social developments, can affect the value of the fund’s investments. Natural disasters, public health emergencies, terrorism and other unforeseeable events may lead to increased market volatility and may have adverse long-term effects on world economies and markets generally.
The fund may invest in instruments that have variable or floating coupon rates based on the London Interbank Offered Rate (LIBOR). LIBOR is a benchmark interest rate intended to be representative of the rate at which certain major international banks lend to one another over short-terms. LIBOR will be phased out by the end of 2021. Uncertainty remains regarding a replacement rate or rates for LIBOR. The transition process may lead to increased volatility or illiquidity in markets for instruments that rely on LIBOR. This could result in a change to the value of such instruments.
9. Federal Tax Information
The tax character of distributions paid during the years ended March 31, 2020 and March 31, 2019 were as follows:
|
| | | | | | |
| | 2020 | 2019 |
| Distributions Paid From | | |
| Ordinary income | $ | 76,243,801 |
| $ | 115,152,594 |
|
| Long-term capital gains | — |
| — |
|
| Tax return of capital | — |
| $ | 10,317,111 |
|
The book-basis character of distributions made during the year from net investment income or net realized gains may differ from their ultimate characterization for federal income tax purposes. These differences reflect the differing character of certain income items and net realized gains and losses for financial statement and tax purposes, and may result in reclassification among certain capital accounts on the financial statements.
As of period end, the federal tax cost of investments and the components of distributable earnings on a tax-basis were as follows:
|
| | | |
| Federal tax cost of investments | $ | 2,259,249,318 |
|
| Gross tax appreciation of investments | $ | 101,487,976 |
|
| Gross tax depreciation of investments | (46,030,767 | ) |
| Net tax appreciation (depreciation) of investments | 55,457,209 |
|
| Net tax appreciation (depreciation) on derivatives | 7,995,369 |
|
| Net tax appreciation (depreciation) | $ | 63,452,578 |
|
| Other book-to-tax adjustments | $ | (170,727 | ) |
| Undistributed ordinary income | $ | 2,679,357 |
|
| Accumulated long-term gains | $ | 5,300,505 |
|
The difference between book-basis and tax-basis unrealized appreciation (depreciation) is attributable primarily to the tax deferral of losses on wash sales and the realization for tax purposes of unrealized gains (losses) on futures contracts. Other book-to-tax adjustments are attributable primarily to the tax deferral of losses on straddle positions.
10. Recently Issued Accounting Standards
In March 2017, the Financial Accounting Standards Board (FASB) issued Accounting Standards Update No. 2017-08, “Receivables - Nonrefundable Fees and Other Costs (Subtopic 310-20), Premium Amortization on Purchased Callable Debt Securities” (ASU 2017-08). ASU 2017-08 amends the amortization period for certain purchased callable debt securities held at a premium, shortening such period to the earliest call date. The amendments are effective for fiscal years, and interim periods within those fiscal years, beginning after December 15, 2018. The adoption of ASU 2017-08 did not materially impact the financial statements.
|
| | | | | | | | | | | | | | | | |
| For a Share Outstanding Throughout the Years Ended March 31 (except as noted) | | | | | | | | |
| Per-Share Data | | | | | | | | | | Ratios and Supplemental Data |
| | | Income From Investment Operations: | Distributions From: | | | Ratio to Average Net Assets of: | | |
| | Net Asset
Value,
Beginning
of Period | Net
Investment
Income
(Loss)(1) | Net Realized and
Unrealized
Gain (Loss) | Total From
Investment
Operations | Net
Investment
Income | Net
Realized
Gains | Tax Return of Capital | Total
Distributions | Net Asset
Value,
End
of Period | Total
Return(2) | Operating
Expenses | Net
Investment
Income
(Loss) | Portfolio
Turnover
Rate | Net Assets,
End of
Period (in thousands) |
| Investor Class | | | | | | | | | | | | | |
| 2020 | $10.61 | 0.26 | 0.50 | 0.76 | (0.27) | — | — | (0.27) | $11.10 | 7.18% | 0.60% | 2.40% | 82% |
| $1,302,958 |
|
| 2019 | $10.54 | 0.29 | 0.03 | 0.32 | (0.23) | — | (0.02) | (0.25) | $10.61 | 3.15% | 0.60% | 2.80% | 184% |
| $1,646,934 |
|
| 2018 | $10.68 | 0.23 | (0.14) | 0.09 | (0.23) | — | — | (0.23) | $10.54 | 0.86% | 0.60% | 2.19% | 179% |
| $2,742,374 |
|
| 2017 | $10.88 | 0.22 | (0.17) | 0.05 | (0.24) | (0.01) | — | (0.25) | $10.68 | 0.51% | 0.60% | 2.02% | 133% |
| $2,895,840 |
|
| 2016 | $11.01 | 0.22 | (0.06) | 0.16 | (0.29) | — | — | (0.29) | $10.88 | 1.49% | 0.60% | 2.04% | 174% |
| $2,122,636 |
|
| I Class | | | | | | | | | | | | | |
| 2020 | $10.62 | 0.28 | 0.49 | 0.77 | (0.29) | — | — | (0.29) | $11.10 | 7.39% | 0.40% | 2.60% | 82% |
| $648,832 |
|
| 2019 | $10.54 | 0.31 | 0.04 | 0.35 | (0.24) | — | (0.03) | (0.27) | $10.62 | 3.43% | 0.40% | 3.00% | 184% |
| $993,543 |
|
| 2018 | $10.68 | 0.25 | (0.13) | 0.12 | (0.26) | — | — | (0.26) | $10.54 | 1.06% | 0.40% | 2.39% | 179% |
| $2,296,395 |
|
| 2017 | $10.88 | 0.24 | (0.16) | 0.08 | (0.27) | (0.01) | — | (0.28) | $10.68 | 0.71% | 0.40% | 2.22% | 133% |
| $2,801,686 |
|
| 2016 | $11.01 | 0.24 | (0.06) | 0.18 | (0.31) | — | — | (0.31) | $10.88 | 1.69% | 0.40% | 2.24% | 174% |
| $2,240,569 |
|
|
| | | | | | | | | | | | | | | | |
| For a Share Outstanding Throughout the Years Ended March 31 (except as noted) | | | | | | | | |
| Per-Share Data | | | | | | | | | | Ratios and Supplemental Data |
| | | Income From Investment Operations: | Distributions From: | | | Ratio to Average Net Assets of: | | |
| | Net Asset
Value,
Beginning
of Period | Net
Investment
Income
(Loss)(1) | Net Realized and
Unrealized
Gain (Loss) | Total From
Investment
Operations | Net
Investment
Income | Net
Realized
Gains | Tax Return of Capital | Total
Distributions | Net Asset
Value,
End
of Period | Total
Return(2) | Operating
Expenses | Net
Investment
Income
(Loss) | Portfolio
Turnover
Rate | Net Assets,
End of
Period (in thousands) |
| Y Class | | | | | | | | | | | | | |
| 2020 | $10.62 | 0.29 | 0.49 | 0.78 | (0.29) | — | — | (0.29) | $11.11 | 7.42% | 0.37% | 2.63% | 82% |
| $72,594 |
|
| 2019 | $10.54 | 0.31 | 0.04 | 0.35 | (0.24) | — | (0.03) | (0.27) | $10.62 | 3.46% | 0.37% | 3.03% | 184% |
| $152,412 |
|
2018(3) | $10.70 | 0.26 | (0.17) | 0.09 | (0.25) | — | — | (0.25) | $10.54 | 0.84% | 0.37%(4) | 2.52%(4) | 179%(5) |
| $603,691 |
|
| A Class | | | | | | | | | | | | | |
| 2020 | $10.62 | 0.23 | 0.49 | 0.72 | (0.24) | — | — | (0.24) | $11.10 | 6.81% | 0.85% | 2.15% | 82% |
| $118,924 |
|
| 2019 | $10.54 | 0.27 | 0.04 | 0.31 | (0.21) | — | (0.02) | (0.23) | $10.62 | 3.02% | 0.85% | 2.55% | 184% |
| $98,899 |
|
| 2018 | $10.68 | 0.20 | (0.13) | 0.07 | (0.21) | — | — | (0.21) | $10.54 | 0.61% | 0.85% | 1.94% | 179% |
| $196,563 |
|
| 2017 | $10.89 | 0.19 | (0.17) | 0.02 | (0.22) | (0.01) | — | (0.23) | $10.68 | 0.17% | 0.85% | 1.77% | 133% |
| $414,571 |
|
| 2016 | $11.02 | 0.19 | (0.06) | 0.13 | (0.26) | — | — | (0.26) | $10.89 | 1.24% | 0.85% | 1.79% | 174% |
| $454,565 |
|
| C Class | | | | | | | | | | | | | |
| 2020 | $10.61 | 0.15 | 0.49 | 0.64 | (0.16) | — | — | (0.16) | $11.09 | 6.02% | 1.60% | 1.40% | 82% |
| $18,182 |
|
| 2019 | $10.54 | 0.19 | 0.04 | 0.23 | (0.14) | — | (0.02) | (0.16) | $10.61 | 2.24% | 1.60% | 1.80% | 184% |
| $31,481 |
|
| 2018 | $10.68 | 0.13 | (0.14) | (0.01) | (0.13) | — | — | (0.13) | $10.54 | (0.14)% | 1.60% | 1.19% | 179% |
| $48,386 |
|
| 2017 | $10.89 | 0.11 | (0.17) | (0.06) | (0.14) | (0.01) | — | (0.15) | $10.68 | (0.57)% | 1.60% | 1.02% | 133% |
| $66,394 |
|
| 2016 | $11.01 | 0.11 | (0.05) | 0.06 | (0.18) | — | — | (0.18) | $10.89 | 0.57% | 1.60% | 1.04% | 174% |
| $81,039 |
|
|
| | | | | | | | | | | | | | | | |
| For a Share Outstanding Throughout the Years Ended March 31 (except as noted) | | | | | | | | |
| Per-Share Data | | | | | | | | | | Ratios and Supplemental Data |
| | | Income From Investment Operations: | Distributions From: | | | Ratio to Average Net Assets of: | | |
| | Net Asset
Value,
Beginning
of Period | Net
Investment
Income
(Loss)(1) | Net Realized and
Unrealized
Gain (Loss) | Total From
Investment
Operations | Net
Investment
Income | Net
Realized
Gains | Tax Return of Capital | Total
Distributions | Net Asset
Value,
End
of Period | Total
Return(2) | Operating
Expenses | Net
Investment
Income
(Loss) | Portfolio
Turnover
Rate | Net Assets,
End of
Period (in thousands) |
| R Class | | | | | | | | | | | | | |
| 2020 | $10.61 | 0.21 | 0.49 | 0.70 | (0.21) | — | — | (0.21) | $11.10 | 6.65% | 1.10% | 1.90% | 82% |
| $7,211 |
|
| 2019 | $10.54 | 0.24 | 0.04 | 0.28 | (0.19) | — | (0.02) | (0.21) | $10.61 | 2.69% | 1.10% | 2.30% | 184% |
| $8,748 |
|
| 2018 | $10.68 | 0.18 | (0.14) | 0.04 | (0.18) | — | — | (0.18) | $10.54 | 0.36% | 1.10% | 1.69% | 179% |
| $11,186 |
|
| 2017 | $10.89 | 0.16 | (0.17) | (0.01) | (0.19) | (0.01) | — | (0.20) | $10.68 | (0.08)% | 1.10% | 1.52% | 133% |
| $14,318 |
|
| 2016 | $11.02 | 0.17 | (0.07) | 0.10 | (0.23) | — | — | (0.23) | $10.89 | 0.98% | 1.10% | 1.54% | 174% |
| $20,362 |
|
| R5 Class | | | | | | | | | | | | | |
| 2020 | $10.62 | 0.28 | 0.49 | 0.77 | (0.29) | — | — | (0.29) | $11.10 | 7.29% | 0.40% | 2.60% | 82% |
| $615 |
|
| 2019 | $10.54 | 0.32 | 0.03 | 0.35 | (0.24) | — | (0.03) | (0.27) | $10.62 | 3.45% | 0.40% | 3.00% | 184% |
| $419 |
|
2018(3) | $10.70 | 0.26 | (0.17) | 0.09 | (0.25) | — | — | (0.25) | $10.54 | 0.81% | 0.40%(4) | 2.46%(4) | 179%(5) |
| $212 |
|
| R6 Class | | | | | | | | | | | | | |
| 2020 | $10.63 | 0.29 | 0.48 | 0.77 | (0.29) | — | — | (0.29) | $11.11 | 7.34% | 0.35% | 2.65% | 82% |
| $143,473 |
|
| 2019 | $10.54 | 0.32 | 0.05 | 0.37 | (0.25) | — | (0.03) | (0.28) | $10.63 | 3.58% | 0.35% | 3.05% | 184% |
| $301,853 |
|
| 2018 | $10.68 | 0.26 | (0.14) | 0.12 | (0.26) | — | — | (0.26) | $10.54 | 1.11% | 0.35% | 2.44% | 179% |
| $290,390 |
|
| 2017 | $10.89 | 0.24 | (0.17) | 0.07 | (0.27) | (0.01) | — | (0.28) | $10.68 | 0.67% | 0.35% | 2.27% | 133% |
| $304,836 |
|
| 2016 | $11.01 | 0.25 | (0.06) | 0.19 | (0.31) | — | — | (0.31) | $10.89 | 1.83% | 0.35% | 2.29% | 174% |
| $93,751 |
|
|
| | | | |
| Notes to Financial Highlights | | |
| |
| (1) | Computed using average shares outstanding throughout the period. |
| |
| (2) | Total returns are calculated based on the net asset value of the last business day and do not reflect applicable sales charges, if any. Total returns for periods less than one year are not annualized. |
| |
| (3) | April 10, 2017 (commencement of sale) through March 31, 2018. |
| |
| (5) | Portfolio turnover is calculated at the fund level. Percentage indicated was calculated for the year ended March 31, 2018. |
See Notes to Financial Statements.
|
|
| Report of Independent Registered Public Accounting Firm |
To the Board of Trustees of American Century Investment Trust and Shareholders of Diversified Bond Fund
Opinion on the Financial Statements
We have audited the accompanying statement of assets and liabilities, including the schedule of investments, of Diversified Bond Fund (one of the funds constituting American Century Investment Trust, referred to hereafter as the “Fund”) as of March 31, 2020, the related statement of operations for the year ended March 31, 2020, the statement of changes in net assets for each of the two years in the period ended March 31, 2020, including the related notes, and the financial highlights for each of the periods indicated therein (collectively referred to as the “financial statements”). In our opinion, the financial statements present fairly, in all material respects, the financial position of the Fund as of March 31, 2020, the results of its operations for the year then ended, the changes in its net assets for each of the two years in the period ended March 31, 2020 and the financial highlights for each of the periods indicated therein in conformity with accounting principles generally accepted in the United States of America.
Basis for Opinion
These financial statements are the responsibility of the Fund’s management. Our responsibility is to express an opinion on the Fund’s financial statements based on our audits. We are a public accounting firm registered with the Public Company Accounting Oversight Board (United States) (PCAOB) and are required to be independent with respect to the Fund in accordance with the U.S. federal securities laws and the applicable rules and regulations of the Securities and Exchange Commission and the PCAOB.
We conducted our audits of these financial statements in accordance with the standards of the PCAOB. Those standards require that we plan and perform the audit to obtain reasonable assurance about whether the financial statements are free of material misstatement, whether due to error or fraud.
Our audits included performing procedures to assess the risks of material misstatement of the financial statements, whether due to error or fraud, and performing procedures that respond to those risks. Such procedures included examining, on a test basis, evidence regarding the amounts and disclosures in the financial statements. Our audits also included evaluating the accounting principles used and significant estimates made by management, as well as evaluating the overall presentation of the financial statements. Our procedures included confirmation of securities owned as of March 31, 2020 by correspondence with the custodian and brokers; when replies were not received from brokers, we performed other auditing procedures. We believe that our audits provide a reasonable basis for our opinion.
/s/ PricewaterhouseCoopers LLP
Kansas City, Missouri
May 18, 2020
We have served as the auditor of one or more investment companies in American Century Investments since 1997.
Board of Trustees
The individuals listed below serve as trustees of the funds. Each trustee will continue to serve in this capacity until death, retirement, resignation or removal from office. The board has adopted a mandatory retirement age for trustees who are not “interested persons,” as that term is defined in the Investment Company Act (independent trustees). Independent trustees shall retire on December 31 of the year in which they reach their 75th birthday; provided, however, that on or after January 1, 2022, independent trustees shall retire on December 31 of the year in which they reach their 76th birthday.
Mr. Thomas is an “interested person” because he currently serves as President and Chief Executive Officer of American Century Companies, Inc. (ACC), the parent company of American Century Investment Management, Inc. (ACIM or the advisor). The other trustees (more than three-fourths of the total number) are independent. They are not employees, directors or officers of, and have no financial interest in, ACC or any of its wholly owned, direct or indirect, subsidiaries, including ACIM, American Century Investment Services, Inc. (ACIS) and American Century Services, LLC (ACS), and they do not have any other affiliations, positions or relationships that would cause them to be considered “interested persons” under the Investment Company Act. The trustees serve in this capacity for eight (in the case of Jonathan S. Thomas, 16; and Ronald J. Gilson, 9) registered investment companies in the American Century Investments family of funds.
The following table presents additional information about the trustees. The mailing address for each trustee other than Mr. Thomas is 1665 Charleston Road, Mountain View, California 94043. The mailing address for Mr. Thomas is 4500 Main Street, Kansas City, Missouri 64111.
|
| | | | | |
Name
(Year of Birth) | Position(s) Held with Funds | Length of Time Served | Principal Occupation(s) During Past 5 Years | Number of American Century Portfolios Overseen by Trustee | Other Directorships Held During Past 5 Years |
| Independent Trustees |
|
|
Tanya S. Beder
(1955) | Trustee | Since 2011 | Chairman and CEO, SBCC Group Inc. (independent advisory services) (2006 to present) | 40 | CYS Investments, Inc.; Kirby Corporation; Nabors Industries Ltd. |
Jeremy I. Bulow
(1954) | Trustee | Since 2011 | Professor of Economics, Stanford University, Graduate School of Business (1979 to present) | 40 | None |
Anne Casscells
(1958) | Trustee | Since 2016 | Co-Chief Executive Officer and Chief Investment Officer, Aetos Alternatives Management (investment advisory firm) (2001 to present); Lecturer in Accounting, Stanford University, Graduate School of Business (2009 to 2017) | 40 | None |
Ronald J. Gilson
(1946) | Trustee and Chairman of the Board | Since 1995
(Chairman since 2005) | Charles J. Meyers Professor of Law and Business, Emeritus, Stanford Law School (1979 to 2016); Marc and Eva Stern Professor of Law and Business, Columbia University School of Law (1992 to present) | 57 | None |
|
| | | | | |
Name
(Year of Birth) | Position(s) Held with Funds | Length of Time Served | Principal Occupation(s) During Past 5 Years | Number of American Century Portfolios Overseen by Trustee | Other Directorships Held During Past 5 Years |
| Independent Trustees |
|
|
Frederick L. A. Grauer
(1946) | Trustee | Since 2008 | Senior Advisor, Credit Sesame, Inc. (credit monitoring firm) (2018 to present); Senior Advisor, Course Hero (an educational technology company) (2015 to present) | 40 | None |
Jonathan D. Levin
(1972) | Trustee | Since 2016 | Philip H. Knight Professor and Dean, Graduate School of Business, Stanford University (2016 to present); Professor, Stanford University, (2000 to present) | 40 | None |
Peter F. Pervere
(1947) | Trustee | Since 2007 | Retired | 40 | None |
John B. Shoven
(1947) | Trustee | Since 2002 | Charles R. Schwab Professor of Economics, Stanford University (1973 to present, emeritus since 2019) | 40 | Cadence Design Systems; Exponent; Financial Engines |
| Interested Trustee |
|
|
Jonathan S. Thomas
(1963) | Trustee | Since 2007 | President and Chief Executive Officer, ACC (2007 to present). Also serves as Chief Executive Officer, ACS; Executive Vice President, ACIM; Director, ACC, ACIM and other ACC subsidiaries | 120 | None |
The Statement of Additional Information has additional information about the fund's trustees and is available without charge, upon request, by calling 1-800-345-2021.
Officers
The following table presents certain information about the executive officers of the funds. Each officer serves as an officer for 16 (in the case of Robert J. Leach, 15) investment companies in the American Century family of funds, unless otherwise noted. No officer is compensated for his or her service as an officer of the funds. The listed officers are interested persons of the funds and are appointed or re-appointed on an annual basis. The mailing address for each of the officers listed below is 4500 Main Street, Kansas City, Missouri 64111.
|
| | |
Name
(Year of Birth) | Offices with the Funds | Principal Occupation(s) During the Past Five Years |
Patrick Bannigan
(1965)
| President since 2019 | Executive Vice President and Director, ACC (2012 to present); Chief Financial Officer, Chief Accounting Officer and Treasurer, ACC (2015 to present); Chief Operating Officer, ACC (2012-2015). Also serves as President, ACS; Vice President, ACIM; Chief Financial Officer, Chief Accounting Officer and/or Director, ACIM, ACS and other ACC subsidiaries |
R. Wes Campbell
(1974)
| Chief Financial Officer and Treasurer since 2018 | Vice President, ACS (2020 to present); Investment Operations and Investment Accounting, ACS (2000 to present) |
Amy D. Shelton
(1964) | Chief Compliance Officer and Vice President since 2014 | Chief Compliance Officer, American Century funds, (2014 to present); Chief Compliance Officer, ACIM (2014 to present); Chief Compliance Officer, ACIS (2009 to present). Also serves as Vice President, ACIS |
Charles A. Etherington
(1957) | General Counsel since 2007 and Senior Vice President since 2006 | Attorney, ACC (1994 to present); Vice President, ACC (2005 to present); General Counsel, ACC (2007 to present). Also serves as General Counsel, ACIM, ACS, ACIS and other ACC subsidiaries; and Senior Vice President, ACIM and ACS |
C. Jean Wade
(1964) | Vice President since 2012 | Senior Vice President, ACS (2017 to present); Vice President ACS (2000 to 2017)
|
Robert J. Leach
(1966) | Vice President since 2006 | Vice President, ACS (2000 to present) |
David H. Reinmiller
(1963) | Vice President since 2000 | Attorney, ACC (1994 to present). Also serves as Vice President, ACIM and ACS |
Ward D. Stauffer
(1960) | Secretary since 2005 | Attorney, ACC (2003 to present) |
|
|
| Liquidity Risk Management Program |
The Fund has adopted a liquidity risk management program (the “program”). The Fund’s Board of Trustees (the "Board") has designated American Century Investment Management, Inc. (“ACIM”) as the administrator of the program. Personnel of ACIM or its affiliates conduct the day-to-day operation of the program pursuant to policies and procedures administered by those members of the ACIM’s Investment Oversight Committee who are members of the ACIM’s Investment Management and Global Analytics departments.
Under the program, ACIM manages the Fund’s liquidity risk, which is the risk that the Fund could not meet shareholder redemption requests without significant dilution of remaining shareholders’ interests in the Fund. This risk is managed by monitoring the degree of liquidity of the Fund’s investments, limiting the amount of the Fund’s illiquid investments, and utilizing various risk management tools and facilities available to the Fund for meeting shareholder redemptions, among other means. ACIM’s process of determining the degree of liquidity of the Fund’s investments is supported by one or more third-party liquidity assessment vendors.
The Board reviewed a report prepared by ACIM regarding the operation and effectiveness of the program for the period December 1, 2018 through December 31, 2019. No significant liquidity events impacting the Fund were noted in the report. In addition, ACIM provided its assessment that the program had been effective in managing the Fund’s liquidity risk.
Retirement Account Information
As required by law, distributions you receive from certain retirement accounts are subject to federal income tax withholding, unless you elect not to have withholding apply*. Tax will be withheld on the total amount withdrawn even though you may be receiving amounts that are not subject to withholding, such as nondeductible contributions. In such case, excess amounts of withholding could occur. You may adjust your withholding election so that a greater or lesser amount will be withheld.
If you don’t want us to withhold on this amount, you must notify us to not withhold the federal income tax. You may notify us in writing or in certain situations by telephone or through other electronic means. For systematic withdrawals, your withholding election will remain in effect until revoked or changed by filing a new election. You have the right to revoke your election at any time and change your withholding percentage for future distributions.
Remember, even if you elect not to have income tax withheld, you are liable for paying income tax on the taxable portion of your withdrawal. If you elect not to have income tax withheld or you don’t have enough income tax withheld, you may be responsible for payment of estimated tax. You may incur penalties under the estimated tax rules if your withholding and estimated tax payments are not sufficient. You can reduce or defer the income tax on a distribution by directly or indirectly rolling such distribution over to another IRA or eligible plan. You should consult your tax advisor for additional information.
State tax will be withheld if, at the time of your distribution, your address is within one of the mandatory withholding states and you have federal income tax withheld (or as otherwise required by state law). State taxes will be withheld from your distribution in accordance with the respective state rules.
*Some 403(b), 457 and qualified retirement plan distributions may be subject to 20% mandatory withholding, as they are subject to special tax and withholding rules. Your plan administrator or plan sponsor is required to provide you with a special tax notice explaining those rules at the time you request a distribution. If applicable, federal and/or state taxes may be withheld from your distribution amount.
Proxy Voting Policies
Descriptions of the principles and policies that the fund's investment advisor uses in exercising the voting rights associated with the securities purchased and/or held by the fund are available without charge, upon request, by calling 1-800-345-2021 or visiting American Century Investments’ website at americancentury.com/proxy. A description of the policies is also available on the Securities and Exchange Commission’s website at sec.gov. Information regarding how the investment advisor voted proxies relating to portfolio securities during the most recent 12-month period ended June 30 is available on americancentury.com/proxy. It is also available at sec.gov.
Quarterly Portfolio Disclosure
The fund files its complete schedule of portfolio holdings with the Securities and Exchange Commission (SEC) for the first and third quarters of each fiscal year as an exhibit to its reports on Form N-PORT. The fund’s Form N-PORT reports are available on the SEC’s website at sec.gov. The fund also makes its complete schedule of portfolio holdings for the most recent quarter of its fiscal year available on its website at americancentury.com and, upon request, by calling 1-800-345-2021.
|
| | |
| |
| | | |
| Contact Us | americancentury.com | |
| Automated Information Line | 1-800-345-8765 | |
| Investor Services Representative | 1-800-345-2021 or 816-531-5575 | |
| Investors Using Advisors | 1-800-378-9878 | |
| Business, Not-For-Profit, Employer-Sponsored Retirement Plans | 1-800-345-3533 | |
| Banks and Trust Companies, Broker-Dealers, Financial Professionals, Insurance Companies | 1-800-345-6488 | |
| Telecommunications Relay Service for the Deaf | 711 | |
| | | |
| American Century Investment Trust | |
| | | |
Investment Advisor: American Century Investment Management, Inc. Kansas City, Missouri | |
| | | |
| This report and the statements it contains are submitted for the general information of our shareholders. The report is not authorized for distribution to prospective investors unless preceded or accompanied by an effective prospectus. | |
| | | |
©2020 American Century Proprietary Holdings, Inc. All rights reserved.
CL-ANN-92280 2005 | |
|
| |
| | |
| | Annual Report |
| | |
| | March 31, 2020 |
| | |
| | High Income Fund |
| | Investor Class (AHIVX) |
| | I Class (AHIIX) |
| | Y Class (NPHIX) |
| | A Class (AHIAX) |
| | R5 Class (AHIEX) |
| | R6 Class (AHIDX) |
Beginning on January 1, 2021, as permitted by regulations adopted by the Securities and Exchange Commission, paper copies of the fund’s shareholder reports like this one will no longer be sent by mail, unless you specifically request paper copies of the reports from the fund or from your financial intermediary, such as a broker-dealer or bank. Instead, the reports will be made available on a website, and you will be notified by mail each time a report is posted and provided with a website link to access the report.
If you already elected to receive shareholder reports electronically, you will not be affected by this change and you need not take any action. You may elect to receive shareholder reports and other communications from the fund or your financial intermediary electronically by calling or sending an email request to your appropriate contacts as listed on the back cover of this report.
You may elect to receive all future reports in paper free of charge. You can inform the fund or your financial intermediary that you wish to continue receiving paper copies of your shareholder reports by calling or sending an email request to your appropriate contacts as listed on the back cover of this report. Your election to receive reports in paper will apply to all funds held with the fund complex/your financial intermediary.
|
| |
| President's Letter | |
| Performance | |
| Portfolio Commentary | |
| Fund Characteristics | |
| Shareholder Fee Example | |
| Schedule of Investments | |
| Statement of Assets and Liabilities | |
| Statement of Operations | |
| Statement of Changes in Net Assets | |
| Notes to Financial Statements | |
| Financial Highlights | |
| Report of Independent Registered Public Accounting Firm | |
| Management | |
| Liquidity Risk Management Program | |
| Additional Information | |
Any opinions expressed in this report reflect those of the author as of the date of the report, and do not necessarily represent the opinions of American Century Investments® or any other person in the American Century Investments organization. Any such opinions are subject to change at any time based upon market or other conditions and American Century Investments disclaims any responsibility to update such opinions. These opinions may not be relied upon as investment advice and, because investment decisions made by American Century Investments funds are based on numerous factors, may not be relied upon as an indication of trading intent on behalf of any American Century Investments fund. Security examples are used for representational purposes only and are not intended as recommendations to purchase or sell securities. Performance information for comparative indices and securities is provided to American Century Investments by third party vendors. To the best of American Century Investments’ knowledge, such information is accurate at the time of printing.
Jonathan Thomas
Dear Investor:
Thank you for reviewing this annual report for the period ended March 31, 2020. Annual reports help convey important information about fund returns, including market factors that affected performance during the reporting period. For additional insights, please visit americancentury.com.
Virus Outbreak Abruptly Altered Economic, Market Backdrops
Through most of the period, market sentiment was upbeat, partly due to accommodative Federal Reserve (Fed) policy and modest inflation. Improving economic and corporate earnings data and a phase 1 U.S.-China trade deal also helped boost growth outlooks. Against this backdrop, key U.S. stock benchmarks rose to record highs by mid-February, and U.S. bonds continued to advance.
However, beginning in late February, unprecedented social and economic turmoil emerged and reversed the positive trajectory. The COVID-19 epidemic originating in China rapidly spread throughout the world, forcing stay-at-home orders and industry-wide shutdowns. U.S. stocks, corporate bonds and other riskier assets sold off sharply, while U.S. Treasuries rallied in the global flight to quality. The Fed stepped in quickly and aggressively, slashing interest rates to near 0% and enacting massive lending and asset-purchase programs to stabilize the financial system.
The swift and severe sell-off erased the strong stock market gains realized earlier in the period and left key benchmarks with losses for the 12 months. Reflecting their defensive characteristics, high-quality U.S. bonds withstood the turmoil and delivered solid returns for the 12-month period.
Promoting Health and Safety Remains Our Focus
While the market impact of COVID-19 has been severe, reducing the human toll is most important. We are monitoring the situation closely and following guidelines and protocols from all relevant authorities. Our firm has activated a comprehensive Pandemic Response Plan, which includes social distancing and work-from-home mandates, travel restrictions and escalated cleaning regimens at all our facilities. We’ve also launched a Business Continuity Plan to maintain regular business operations and ensure delivery of outstanding service.
We appreciate your confidence in us during these extraordinary times. We have a long history of helping clients weather volatile markets, and we are confident we will meet today’s challenges. In the meantime, the health and safety of you, your family and our employees remain a top priority.
Sincerely,
Jonathan Thomas
President and Chief Executive Officer
American Century Investments
|
| | | | | |
| Total Returns as of March 31, 2020 | |
| | | | Average Annual Returns | |
| | Ticker Symbol | 1 year | 5 years | Since Inception | Inception Date |
| Y Class | NPHIX | -7.57% | 2.34% | 3.86% | 12/27/12 |
| ICE BofA U.S. High Yield Constrained Index | — | -7.46% | 2.67% | 3.55% | — |
| Investor Class | AHIVX | -7.76% | — | -1.29% | 10/2/17 |
| I Class | AHIIX | -7.66% | — | -1.19% | 10/2/17 |
| A Class | AHIAX | | | | 10/2/17 |
| No sales charge | | -7.99% | — | -1.54% | |
| With sales charge | | -12.14% | — | -3.35% | |
| R5 Class | AHIEX | -7.56% | — | -1.09% | 10/2/17 |
| R6 Class | AHIDX | -7.53% | — | -1.04% | 10/2/17 |
Y Class returns would have been lower if a portion of the fees had not been waived.
Sales charges include initial sales charges and contingent deferred sales charges (CDSCs), as applicable. A Class shares have a 4.50% maximum initial sales charge and may be subject to a maximum CDSC of 1.00%. The SEC requires that mutual funds provide performance information net of maximum sales charges in all cases where charges could be applied.
The fund acquired the net assets and assumed the historical performance of the Nomura High Yield Fund, a series of The Advisors’ Inner Circle Fund III on October 2, 2017. Accordingly, the performance shown for periods prior to October 2, 2017 represents the performance of Class I shares of the Nomura High Yield Fund. In addition, the Nomura High Yield Fund acquired the net assets and assumed the historical performance of the High Yield Fund, a series of Nomura Partners Funds, Inc. on December 8, 2014. Accordingly, the performance shown for periods before December 8, 2014 represents the performance of Class I shares of the High Yield Fund. The Nomura High Yield Fund and the High Yield Fund returns in the performance tables and graphs have not been adjusted to reflect the fund’s expenses. If the Nomura High Yield Fund and the High Yield Fund performance information had been adjusted to reflect the fund’s expenses, the performance may have been higher or lower for a given period depending on the expenses incurred by the Nomura High Yield Fund and the High Yield Fund for that period.
Data presented reflect past performance. Past performance is no guarantee of future results. Current performance may be higher or lower than the performance shown. Total returns for periods less than one year are not annualized. Investment return and principal value will fluctuate, and redemption value may be more or less than original cost. Data assumes reinvestment of dividends and capital gains, and none of the charts reflect the deduction of taxes that a shareholder would pay on fund distributions or the redemption of fund shares. To obtain performance data current to the most recent month end, please call 1-800-345-2021 or visit americancentury.com. For additional information about the fund, please consult the prospectus.
|
|
| Growth of $10,000 Over Life of Class |
| $10,000 investment made December 27, 2012 |
Performance for other share classes will vary due to differences in fee structure.
|
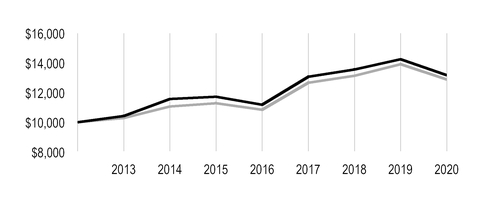
|
| |
| Value on March 31, 2020 |
| | Y Class — $13,166 |
| |
| | ICE BofA U.S. High Yield Constrained Index — $12,883 |
| |
Ending value of Y Class would have been lower if a portion of the fees had not been waived.
|
| | | | | |
| Total Annual Fund Operating Expenses |
| Investor Class | I Class | Y Class | A Class | R5 Class | R6 Class |
| 0.79% | 0.69% | 0.59% | 1.04% | 0.59% | 0.54% |
The total annual fund operating expenses shown is as stated in the fund’s prospectus current as of the date of this report. The prospectus may vary from the expense ratio shown elsewhere in this report because it is based on a different time period, includes acquired fund fees and expenses, and, if applicable, does not include fee waivers or expense reimbursements.
Data presented reflect past performance. Past performance is no guarantee of future results. Current performance may be higher or lower than the performance shown. Total returns for periods less than one year are not annualized. Investment return and principal value will fluctuate, and redemption value may be more or less than original cost. Data assumes reinvestment of dividends and capital gains, and none of the charts reflect the deduction of taxes that a shareholder would pay on fund distributions or the redemption of fund shares. To obtain performance data current to the most recent month end, please call 1-800-345-2021 or visit americancentury.com. For additional information about the fund, please consult the prospectus.
Investment Advisor: American Century Investment Management, Inc.
Subadvisor: Nomura Corporate Research and Asset Management Inc.
Portfolio Managers: Steve Kotsen, David Crall, Amy Yu Chang and Derek Leung
As of August 2019, Amy Yu Chang and Derek Leung joined the portfolio management team.
Performance Summary
High Income returned -7.57%* for the 12-month period ended March 31, 2020. By comparison, the ICE BofA U.S. High Yield Constrained Index returned -7.46%. Fund returns reflect operating expenses, while index returns do not.
Although high-yield bonds performed relatively well through most of the reporting period, their negative results in early 2020 dragged down returns for the entire 12-month period. As the COVID-19 epidemic originating in China expanded into a pandemic in early 2020, investors scrambled to shed credit risk and seek shelter in cash. Market volatility soared and liquidity markedly worsened. Amid the global flight to quality, riskier investments, including investment-grade and high-yield corporate bonds, suffered significant losses. Separately, an unexpected price war between Saudi Arabia and Russia amid waning demand for oil triggered a sizable drop in the oil markets. This development accelerated the havoc in the high-yield sector, home to many energy companies.
The swiftness and the depth of the Federal Reserve’s (Fed’s) response to the broad market unrest helped calm the credit markets in late March. In addition to cutting short-term rates to nearly 0%, the Fed announced programs to directly support the functioning of investment-grade primary and secondary markets. This action followed earlier announcements to address the functioning of Treasury, commercial paper and asset-backed securities markets. The Fed stepping in to purchase investment-grade corporate debt, which inspired many other market participants to also purchase the securities, was particularly helpful for stabilizing the corporate debt markets, including the high-yield market.
Gaming Companies Were Main Detractors
We began the fiscal year with a positive view toward the U.S. consumer and tilted the portfolio toward more U.S.-centric, noncyclical sectors, including gaming. We focused on Las Vegas and regional gaming operators and also held a small position in Macau gaming. Our gaming sector overweight relative to the index served us well until the first quarter of 2020, when the COVID-19 outbreak halted economic activity. Amid increasing infection and mortality rates, government officials issued stay-at-home orders, and international and domestic travel shut down. In particular, several of our gaming issues suffered significant downturns after Nevada’s governor ordered a 30-day statewide shutdown of casinos (and other nonessential businesses) on March 18.
The pandemic and resulting U.S. economic shutdown also dragged down results in the support-services sector. In particular, our holdings among rental car, office equipment and construction rental equipment companies suffered due to declining demand. Additionally, our underweight and security selection in the wireline telecommunication sector also detracted from performance.
*All fund returns referenced in this commentary are for Y Class shares. Performance for other share classes will vary due to differences in fee structure; when Y Class performance exceeds that of the index, other share classes may not. See page 3 for returns for all share classes.
Meanwhile, our exposure to cash and an overweight and strong security selection in the electric-generation sector helped offset the negative effects from gaming, support-services and wireline telecommunication holdings. The main driver in this sector was a distressed play in a California-based power provider. Security selection in the pharmaceuticals sector also helped offset some of the losses. Additionally, underweight positions in the oil field equipment and services and real estate investment trusts sectors also added to relative performance.
Higher-Rated Securities Aided Performance; Duration Detracted
Overall, higher-rated bonds significantly outperformed their lower-rated counterparts during the fiscal year. Our overweight and security selection within the B-rated segment of the market contributed to relative performance. In addition, our out-of-index exposure to investment-grade (BBB-rated) issuers aided results. However, our overweight and security selection among issuers with CCC credit ratings and an underweight to credits with BB ratings detracted from relative performance.
Our short-duration posture to begin the fiscal year also had a negative impact on portfolio performance. We lengthened duration over the course of the reporting period, as we opportunistically increased exposure to securities within the BB ratings category during the last three quarters of 2019. We also added BB-rated securities as they sold off in February and March. In addition, we participated in the new-issues market and lengthened duration with some fallen angels (securities that dropped out of the investment-grade universe and into the high-yield category due to credit ratings downgrades).
Portfolio Positioning
Regarding our holdings and potential investments, we are calling companies and aggressively examining their business prospects, liquidity and ability to obtain government help during the COVID-19 disruptions. We have concentrated our purchases in higher-quality, more-defensive sectors, including cable, TMT (technology, media and telecommunication), packaging and food. We have also started building positions in recent and potential fallen angels. In addition, as the investment-grade market improved in late March, we participated in some new issues there. Beyond these steps, we are focusing on companies we believe can manage through this environment, including banks, health care companies, homebuilders, building products suppliers, metals companies and equipment rental firms. We also have engaged in some value buying in oversold sectors, such as gaming, aerospace and restaurants. We have sold issuers facing liquidity problems as well as some deep cyclicals and energy positions.
Looking ahead, the path of the virus, the depth of the economic contraction and the form of fiscal and monetary stimulus will remain key considerations. We will monitor these factors closely. The economic contraction will be deep, but we remain hopeful the economy can start growing again in the third quarter.
|
| |
| MARCH 31, 2020 | |
| Types of Investments in Portfolio | % of net assets |
| Corporate Bonds | 92.1% |
| Bank Loan Obligations | 3.3% |
| Preferred Stocks | 2.8% |
| Convertible Bonds | 0.1% |
| Common Stocks | 0.1% |
| Escrow Interests | —* |
| Warrants | —* |
| Rights | —* |
| Other Assets and Liabilities | 1.6% |
*Category is less than 0.05% of total net assets.
Fund shareholders may incur two types of costs: (1) transaction costs, including sales charges (loads) on purchase payments and redemption/exchange fees; and (2) ongoing costs, including management fees; distribution and service (12b-1) fees; and other fund expenses. This example is intended to help you understand your ongoing costs (in dollars) of investing in your fund and to compare these costs with the ongoing cost of investing in other mutual funds.
The example is based on an investment of $1,000 made at the beginning of the period and held for the entire period from October 1, 2019 to March 31, 2020.
Actual Expenses
The table provides information about actual account values and actual expenses for each class. You may use the information, together with the amount you invested, to estimate the expenses that you paid over the period. First, identify the share class you own. Then simply divide your account value by $1,000 (for example, an $8,600 account value divided by $1,000 = 8.6), then multiply the result by the number under the heading “Expenses Paid During Period” to estimate the expenses you paid on your account during this period.
If you hold Investor Class shares of any American Century Investments fund, or I Class shares of the American Century Diversified Bond Fund, in an American Century Investments account (i.e., not through a financial intermediary or employer-sponsored retirement plan account), American Century Investments may charge you a $25.00 annual account maintenance fee if the value of those shares is less than $10,000. We will redeem shares automatically in one of your accounts to pay the $25.00 fee. In determining your total eligible investment amount, we will include your investments in all personal accounts (including American Century Investments brokerage accounts) registered under your Social Security number. Personal accounts include individual accounts, joint accounts, UGMA/UTMA accounts, personal trusts, Coverdell Education Savings Accounts and IRAs (including traditional, Roth, Rollover, SEP-, SARSEP- and SIMPLE-IRAs), and certain other retirement accounts. If you have only business, business retirement, employer-sponsored or American Century Investments brokerage accounts, you are currently not subject to this fee. If you are subject to the account maintenance fee, your account value could be reduced by the fee amount.
Hypothetical Example for Comparison Purposes
The table also provides information about hypothetical account values and hypothetical expenses based on the actual expense ratio of each class of your fund and an assumed rate of return of 5% per year before expenses, which is not the actual return of a fund’s share class. The hypothetical account values and expenses may not be used to estimate the actual ending account balance or expenses you paid for the period. You may use this information to compare the ongoing costs of investing in your fund and other funds. To do so, compare this 5% hypothetical example with the 5% hypothetical examples that appear in the shareholder reports of the other funds.
Please note that the expenses shown in the table are meant to highlight your ongoing costs only and do not reflect any transactional costs, such as sales charges (loads) or redemption/exchange fees. Therefore, the table is useful in comparing ongoing costs only, and will not help you determine the relative total costs of owning different funds. In addition, if these transactional costs were included, your costs would have been higher.
|
| | | | |
| | Beginning
Account Value
10/1/19 | Ending
Account Value
3/31/20 | Expenses Paid
During Period(1)
10/1/19 - 3/31/20 |
Annualized
Expense Ratio(1) |
| Actual | | | | |
| Investor Class | $1,000 | $894.30 | $3.69 | 0.78% |
| I Class | $1,000 | $895.70 | $3.22 | 0.68% |
| Y Class | $1,000 | $896.20 | $2.75 | 0.58% |
| A Class | $1,000 | $894.10 | $4.88 | 1.03% |
| R5 Class | $1,000 | $896.30 | $2.75 | 0.58% |
| R6 Class | $1,000 | $896.40 | $2.51 | 0.53% |
| Hypothetical | | | | |
| Investor Class | $1,000 | $1,021.10 | $3.94 | 0.78% |
| I Class | $1,000 | $1,021.60 | $3.44 | 0.68% |
| Y Class | $1,000 | $1,022.10 | $2.93 | 0.58% |
| A Class | $1,000 | $1,019.85 | $5.20 | 1.03% |
| R5 Class | $1,000 | $1,022.10 | $2.93 | 0.58% |
| R6 Class | $1,000 | $1,022.35 | $2.68 | 0.53% |
| |
| (1) | Expenses are equal to the class's annualized expense ratio listed in the table above, multiplied by the average account value over the period, multiplied by 183, the number of days in the most recent fiscal half-year, divided by 366, to reflect the one-half year period. Annualized expense ratio reflects actual expenses, including any applicable fee waivers or expense reimbursements and excluding any acquired fund fees and expenses. |
MARCH 31, 2020
|
| | | | | | |
| | Principal Amount/Shares | Value |
| CORPORATE BONDS — 92.1% | | |
| Aerospace and Defense — 2.7% | | |
| Arconic, Inc., 5.125%, 10/1/24 | $ | 650,000 |
| $ | 643,148 |
|
| Arconic, Inc., 5.90%, 2/1/27 | 695,000 |
| 650,346 |
|
| Arconic, Inc., 5.95%, 2/1/37 | 1,000,000 |
| 873,060 |
|
Bombardier, Inc., 8.75%, 12/1/21(1) | 175,000 |
| 146,431 |
|
Bombardier, Inc., 6.00%, 10/15/22(1) | 1,650,000 |
| 1,249,875 |
|
Bombardier, Inc., 6.125%, 1/15/23(1) | 325,000 |
| 231,158 |
|
Bombardier, Inc., 7.50%, 12/1/24(1) | 575,000 |
| 384,534 |
|
Bombardier, Inc., 7.50%, 3/15/25(1) | 427,000 |
| 298,900 |
|
Bombardier, Inc., 7.875%, 4/15/27(1) | 1,025,000 |
| 715,014 |
|
F-Brasile SpA / F-Brasile US LLC, 7.375%, 8/15/26(1) | 400,000 |
| 400,000 |
|
| TransDigm UK Holdings plc, 6.875%, 5/15/26 | 400,000 |
| 375,417 |
|
| TransDigm, Inc., 6.50%, 7/15/24 | 800,000 |
| 766,724 |
|
| TransDigm, Inc., 6.50%, 5/15/25 | 1,150,000 |
| 1,099,693 |
|
TransDigm, Inc., 6.25%, 3/15/26(1) | 1,375,000 |
| 1,375,855 |
|
| TransDigm, Inc., 6.375%, 6/15/26 | 175,000 |
| 168,534 |
|
| TransDigm, Inc., 7.50%, 3/15/27 | 375,000 |
| 363,469 |
|
TransDigm, Inc., 5.50%, 11/15/27(1) | 2,775,000 |
| 2,505,964 |
|
| Triumph Group, Inc., 5.25%, 6/1/22 | 125,000 |
| 104,179 |
|
Triumph Group, Inc., 6.25%, 9/15/24(1) | 125,000 |
| 112,196 |
|
| Triumph Group, Inc., 7.75%, 8/15/25 | 425,000 |
| 305,467 |
|
| | | 12,769,964 |
|
| Air Freight and Logistics — 0.5% | | |
Cargo Aircraft Management, Inc., 4.75%, 2/1/28(1) | 325,000 |
| 303,875 |
|
XPO Logistics, Inc., 6.50%, 6/15/22(1) | 763,000 |
| 768,982 |
|
XPO Logistics, Inc., 6.125%, 9/1/23(1) | 625,000 |
| 615,628 |
|
XPO Logistics, Inc., 6.75%, 8/15/24(1) | 775,000 |
| 762,643 |
|
| | | 2,451,128 |
|
| Airlines — 0.3% | | |
Air Canada, 7.75%, 4/15/21(1) | 725,000 |
| 711,370 |
|
American Airlines Group, Inc., 5.00%, 6/1/22(1) | 350,000 |
| 283,062 |
|
| United Airlines Holdings, Inc., 6.00%, 12/1/20 | 25,000 |
| 24,218 |
|
| United Airlines Holdings, Inc., 4.25%, 10/1/22 | 325,000 |
| 297,716 |
|
Virgin Australia Holdings Ltd., 8.125%, 11/15/24(1)(5) | 200,000 |
| 93,100 |
|
| | | 1,409,466 |
|
| Auto Components — 0.4% | | |
Adient Global Holdings Ltd., 4.875%, 8/15/26(1) | 250,000 |
| 173,106 |
|
Cooper-Standard Automotive, Inc., 5.625%, 11/15/26(1) | 100,000 |
| 73,854 |
|
Dealer Tire LLC / DT Issuer LLC, 8.00%, 2/1/28(1) | 300,000 |
| 242,250 |
|
Exide Technologies, 11.00% Cash or 7.00% PIK, 4/30/20 (Acquired 4/30/15 - 12/1/19, Cost $241,100)(2)(3) | 241,970 |
| 198,416 |
|
Panther BF Aggregator 2 LP / Panther Finance Co., Inc., 8.50%, 5/15/27(1) | 1,050,000 |
| 921,848 |
|
|
| | | | | | |
| | Principal Amount/Shares | Value |
| Tenneco, Inc., 5.375%, 12/15/24 | $ | 250,000 |
| $ | 142,186 |
|
| Tenneco, Inc., 5.00%, 7/15/26 | 525,000 |
| 333,414 |
|
| | | 2,085,074 |
|
| Automobiles — 1.2% | | |
| Ford Motor Credit Co. LLC, 5.875%, 8/2/21 | 1,000,000 |
| 985,000 |
|
| Ford Motor Credit Co. LLC, 4.06%, 11/1/24 | 200,000 |
| 182,500 |
|
| Ford Motor Credit Co. LLC, 4.69%, 6/9/25 | 400,000 |
| 358,000 |
|
| Ford Motor Credit Co. LLC, 4.13%, 8/4/25 | 400,000 |
| 356,800 |
|
| Ford Motor Credit Co. LLC, 4.54%, 8/1/26 | 200,000 |
| 176,000 |
|
| Ford Motor Credit Co. LLC, 3.82%, 11/2/27 | 200,000 |
| 150,333 |
|
| Ford Motor Credit Co. LLC, 5.11%, 5/3/29 | 2,200,000 |
| 1,886,500 |
|
Tesla, Inc., 5.30%, 8/15/25(1) | 1,550,000 |
| 1,466,688 |
|
| | | 5,561,821 |
|
| Banks — 0.2% | | |
| CIT Group, Inc., 4.125%, 3/9/21 | 150,000 |
| 148,569 |
|
| CIT Group, Inc., 5.00%, 8/15/22 | 200,000 |
| 196,504 |
|
| CIT Group, Inc., 5.00%, 8/1/23 | 675,000 |
| 653,647 |
|
| | | 998,720 |
|
| Building Products — 1.0% | | |
Advanced Drainage Systems, Inc., 5.00%, 9/30/27(1) | 175,000 |
| 157,245 |
|
BMC East LLC, 5.50%, 10/1/24(1) | 725,000 |
| 705,965 |
|
Builders FirstSource, Inc., 6.75%, 6/1/27(1) | 472,000 |
| 466,592 |
|
Builders FirstSource, Inc., 5.00%, 3/1/30(1) | 275,000 |
| 249,047 |
|
CPG Merger Sub LLC, 8.00%, 10/1/21(1) | 100,000 |
| 97,910 |
|
Griffon Corp., 5.75%, 3/1/28(1) | 675,000 |
| 638,297 |
|
Jeld-Wen, Inc., 4.625%, 12/15/25(1) | 50,000 |
| 44,437 |
|
Masonite International Corp., 5.75%, 9/15/26(1) | 75,000 |
| 74,141 |
|
Masonite International Corp., 5.375%, 2/1/28(1) | 125,000 |
| 123,544 |
|
Northwest Hardwoods, Inc., 7.50%, 8/1/21(1) | 50,000 |
| 18,000 |
|
NWH Escrow Corp., 7.50%, 8/1/21(1) | 50,000 |
| 18,000 |
|
Patrick Industries, Inc., 7.50%, 10/15/27(1) | 575,000 |
| 568,412 |
|
PGT Innovations, Inc., 6.75%, 8/1/26(1) | 325,000 |
| 309,223 |
|
Standard Industries, Inc., 5.50%, 2/15/23(1) | 223,000 |
| 216,861 |
|
Standard Industries, Inc., 5.375%, 11/15/24(1) | 925,000 |
| 894,965 |
|
Standard Industries, Inc., 5.00%, 2/15/27(1) | 300,000 |
| 275,090 |
|
Standard Industries, Inc., 4.75%, 1/15/28(1) | 50,000 |
| 46,396 |
|
| | | 4,904,125 |
|
| Capital Markets — 1.6% | | |
AG Issuer LLC, 6.25%, 3/1/28(1) | 500,000 |
| 423,750 |
|
| Donnelley Financial Solutions, Inc., 8.25%, 10/15/24 | 175,000 |
| 166,030 |
|
| Icahn Enterprises LP / Icahn Enterprises Finance Corp., 6.25%, 2/1/22 | 755,000 |
| 760,919 |
|
| Icahn Enterprises LP / Icahn Enterprises Finance Corp., 6.75%, 2/1/24 | 175,000 |
| 170,406 |
|
| Icahn Enterprises LP / Icahn Enterprises Finance Corp., 4.75%, 9/15/24 | 1,725,000 |
| 1,589,156 |
|
| Icahn Enterprises LP / Icahn Enterprises Finance Corp., 6.375%, 12/15/25 | 150,000 |
| 142,688 |
|
|
| | | | | | |
| | Principal Amount/Shares | Value |
| Icahn Enterprises LP / Icahn Enterprises Finance Corp., 6.25%, 5/15/26 | $ | 1,225,000 |
| $ | 1,164,512 |
|
| Icahn Enterprises LP / Icahn Enterprises Finance Corp., 5.25%, 5/15/27 | 1,500,000 |
| 1,396,875 |
|
LPL Holdings, Inc., 4.625%, 11/15/27(1) | 200,000 |
| 184,424 |
|
MSCI, Inc., 4.75%, 8/1/26(1) | 100,000 |
| 99,197 |
|
MSCI, Inc., 4.00%, 11/15/29(1) | 25,000 |
| 24,973 |
|
NFP Corp., 6.875%, 7/15/25(1) | 625,000 |
| 620,294 |
|
NFP Corp., 8.00%, 7/15/25(1) | 835,000 |
| 771,327 |
|
| | | 7,514,551 |
|
| Chemicals — 1.7% | | |
Atotech Alpha 2 BV, 8.75% Cash or 9.50% PIK, 6/1/23(1)(4) | 400,000 |
| 363,498 |
|
Atotech Alpha 3 BV / Alpha US Bidco, Inc., 6.25%, 2/1/25(1) | 200,000 |
| 185,250 |
|
| Blue Cube Spinco LLC, 10.00%, 10/15/25 | 338,000 |
| 358,738 |
|
| CF Industries, Inc., 5.375%, 3/15/44 | 200,000 |
| 192,066 |
|
| Chemours Co. (The), 7.00%, 5/15/25 | 350,000 |
| 293,564 |
|
| Chemours Co. (The), 5.375%, 5/15/27 | 75,000 |
| 57,932 |
|
Consolidated Energy Finance SA, 6.50%, 5/15/26(1) | 250,000 |
| 212,136 |
|
Cornerstone Chemical Co., 6.75%, 8/15/24(1) | 175,000 |
| 146,343 |
|
Element Solutions, Inc., 5.875%, 12/1/25(1) | 175,000 |
| 172,807 |
|
Foxtrot Escrow Issuer LLC / Foxtrot Escrow Corp., 12.25%, 11/15/26(1) | 1,025,000 |
| 805,263 |
|
Innophos Holdings, Inc., 9.375%, 2/15/28(1) | 575,000 |
| 562,062 |
|
Kraton Polymers LLC / Kraton Polymers Capital Corp., 7.00%, 4/15/25(1) | 300,000 |
| 268,029 |
|
NOVA Chemicals Corp., 5.00%, 5/1/25(1) | 100,000 |
| 84,625 |
|
NOVA Chemicals Corp., 5.25%, 6/1/27(1) | 525,000 |
| 445,226 |
|
Nufarm Australia Ltd. / Nufarm Americas, Inc., 5.75%, 4/30/26(1) | 125,000 |
| 110,254 |
|
OCI NV, 6.625%, 4/15/23(1) | 400,000 |
| 368,000 |
|
OCI NV, 5.25%, 11/1/24(1) | 400,000 |
| 350,000 |
|
| Olin Corp., 5.50%, 8/15/22 | 150,000 |
| 139,265 |
|
| Olin Corp., 5.625%, 8/1/29 | 250,000 |
| 231,450 |
|
PQ Corp., 5.75%, 12/15/25(1) | 25,000 |
| 22,719 |
|
| Scotts Miracle-Gro Co. (The), 5.25%, 12/15/26 | 575,000 |
| 551,162 |
|
SPCM SA, 4.875%, 9/15/25(1) | 300,000 |
| 285,741 |
|
TPC Group, Inc., 10.50%, 8/1/24(1) | 575,000 |
| 474,522 |
|
Trinseo Materials Operating SCA / Trinseo Materials Finance, Inc., 5.375%, 9/1/25(1) | 700,000 |
| 595,000 |
|
Tronox Finance plc, 5.75%, 10/1/25(1) | 350,000 |
| 315,436 |
|
Tronox, Inc., 6.50%, 4/15/26(1) | 450,000 |
| 408,409 |
|
Valvoline, Inc., 4.25%, 2/15/30(1) | 225,000 |
| 210,516 |
|
| | | 8,210,013 |
|
| Commercial Services and Supplies — 1.4% | | |
| ADT Security Corp. (The), 6.25%, 10/15/21 | 125,000 |
| 122,870 |
|
Algeco Global Finance 2 plc, 10.00%, 8/15/23(1) | 300,000 |
| 220,500 |
|
Allied Universal HoldCo LLC / Allied Universal Finance Corp., 6.625%, 7/15/26(1) | 1,425,000 |
| 1,402,739 |
|
Allied Universal HoldCo LLC / Allied Universal Finance Corp., 9.75%, 7/15/27(1) | 1,325,000 |
| 1,257,912 |
|
|
| | | | | | |
| | Principal Amount/Shares | Value |
Cimpress plc, 7.00%, 6/15/26(1) | $ | 150,000 |
| $ | 133,281 |
|
Clean Harbors, Inc., 4.875%, 7/15/27(1) | 125,000 |
| 123,056 |
|
Clean Harbors, Inc., 5.125%, 7/15/29(1) | 50,000 |
| 46,927 |
|
Garda World Security Corp., 4.625%, 2/15/27(1) | 325,000 |
| 293,312 |
|
GFL Environmental, Inc., 5.125%, 12/15/26(1) | 100,000 |
| 98,250 |
|
IAA, Inc., 5.50%, 6/15/27(1) | 300,000 |
| 291,915 |
|
KAR Auction Services, Inc., 5.125%, 6/1/25(1) | 300,000 |
| 288,377 |
|
Matthews International Corp., 5.25%, 12/1/25(1) | 150,000 |
| 134,065 |
|
Midas Intermediate Holdco II LLC / Midas Intermediate Holdco II Finance, Inc., 7.875%, 10/1/22(1) | 1,000,000 |
| 648,436 |
|
Nielsen Co. Luxembourg SARL (The), 5.50%, 10/1/21(1) | 400,000 |
| 394,700 |
|
| Nielsen Finance LLC / Nielsen Finance Co., 4.50%, 10/1/20 | 25,000 |
| 24,344 |
|
Nielsen Finance LLC / Nielsen Finance Co., 5.00%, 4/15/22(1) | 625,000 |
| 579,475 |
|
Prime Security Services Borrower LLC / Prime Finance, Inc., 5.25%, 4/15/24(1) | 75,000 |
| 74,553 |
|
Prime Security Services Borrower LLC / Prime Finance, Inc., 6.25%, 1/15/28(1) | 225,000 |
| 195,750 |
|
Ritchie Bros Auctioneers, Inc., 5.375%, 1/15/25(1) | 175,000 |
| 177,845 |
|
TMS International Holding Corp., 7.25%, 8/15/25(1) | 75,000 |
| 68,156 |
|
| | | 6,576,463 |
|
| Communications Equipment — 0.6% | | |
CommScope Technologies LLC, 6.00%, 6/15/25(1) | 1,100,000 |
| 1,014,970 |
|
CommScope Technologies LLC, 5.00%, 3/15/27(1) | 425,000 |
| 371,907 |
|
CommScope, Inc., 5.00%, 6/15/21(1) | 10,000 |
| 9,987 |
|
CommScope, Inc., 5.50%, 3/1/24(1) | 200,000 |
| 203,651 |
|
CommScope, Inc., 6.00%, 3/1/26(1) | 650,000 |
| 652,679 |
|
CommScope, Inc., 8.25%, 3/1/27(1) | 325,000 |
| 315,071 |
|
| Nokia of America Corp., 6.45%, 3/15/29 | 150,000 |
| 161,250 |
|
| Nokia Oyj, 3.375%, 6/12/22 | 25,000 |
| 25,079 |
|
ViaSat, Inc., 5.625%, 4/15/27(1) | 150,000 |
| 148,958 |
|
| | | 2,903,552 |
|
| Construction and Engineering — 0.6% | | |
Brand Industrial Services, Inc., 8.50%, 7/15/25(1) | 875,000 |
| 693,586 |
|
| Great Lakes Dredge & Dock Corp., 8.00%, 5/15/22 | 300,000 |
| 296,155 |
|
New Enterprise Stone & Lime Co., Inc., 10.125%, 4/1/22(1) | 446,000 |
| 448,648 |
|
New Enterprise Stone & Lime Co., Inc., 6.25%, 3/15/26(1) | 325,000 |
| 301,776 |
|
| Weekley Homes LLC / Weekley Finance Corp., 6.00%, 2/1/23 | 475,000 |
| 450,654 |
|
| Weekley Homes LLC / Weekley Finance Corp., 6.625%, 8/15/25 | 525,000 |
| 477,091 |
|
| | | 2,667,910 |
|
| Construction Materials — 0.5% | | |
Cemex SAB de CV, 7.75%, 4/16/26(1) | 400,000 |
| 360,224 |
|
Cemex SAB de CV, 5.45%, 11/19/29(1) | 800,000 |
| 652,200 |
|
| Summit Materials LLC / Summit Materials Finance Corp., 6.125%, 7/15/23 | 125,000 |
| 124,219 |
|
Summit Materials LLC / Summit Materials Finance Corp., 5.125%, 6/1/25(1) | 225,000 |
| 211,218 |
|
Summit Materials LLC / Summit Materials Finance Corp., 6.50%, 3/15/27(1) | 425,000 |
| 405,255 |
|
|
| | | | | | |
| | Principal Amount/Shares | Value |
| US Concrete, Inc., 6.375%, 6/1/24 | $ | 875,000 |
| $ | 795,537 |
|
| | | 2,548,653 |
|
| Consumer Finance — 2.5% | | |
4finance SA, 10.75%, 5/1/22(1) | 200,000 |
| 162,584 |
|
| Ally Financial, Inc., 4.125%, 2/13/22 | 100,000 |
| 98,732 |
|
| Ally Financial, Inc., 3.875%, 5/21/24 | 175,000 |
| 158,595 |
|
| Ally Financial, Inc., 5.125%, 9/30/24 | 300,000 |
| 294,224 |
|
| Ally Financial, Inc., 8.00%, 11/1/31 | 575,000 |
| 664,154 |
|
Avolon Holdings Funding Ltd., 3.625%, 5/1/22(1) | 75,000 |
| 66,566 |
|
Credit Acceptance Corp., 5.125%, 12/31/24(1) | 300,000 |
| 275,250 |
|
| Credit Acceptance Corp., 6.625%, 3/15/26 | 150,000 |
| 142,500 |
|
FirstCash, Inc., 5.375%, 6/1/24(1) | 50,000 |
| 48,312 |
|
Global Aircraft Leasing Co. Ltd., 6.50% Cash or 7.25% PIK, 9/15/24(1)(4) | 1,975,000 |
| 1,286,713 |
|
| Navient Corp., 5.00%, 10/26/20 | 25,000 |
| 24,711 |
|
| Navient Corp., 5.875%, 3/25/21 | 425,000 |
| 417,796 |
|
| Navient Corp., 6.625%, 7/26/21 | 275,000 |
| 283,731 |
|
| Navient Corp., 6.50%, 6/15/22 | 350,000 |
| 342,202 |
|
| Navient Corp., 5.50%, 1/25/23 | 400,000 |
| 379,000 |
|
| Navient Corp., 7.25%, 9/25/23 | 275,000 |
| 271,554 |
|
| Navient Corp., 5.875%, 10/25/24 | 450,000 |
| 416,412 |
|
| Navient Corp., 6.75%, 6/25/25 | 1,425,000 |
| 1,321,687 |
|
| Navient Corp., 6.75%, 6/15/26 | 675,000 |
| 624,746 |
|
| Navient Corp., 5.00%, 3/15/27 | 100,000 |
| 86,720 |
|
| Navient Corp., MTN, 6.125%, 3/25/24 | 625,000 |
| 589,081 |
|
Park Aerospace Holdings Ltd., 3.625%, 3/15/21(1) | 100,000 |
| 94,828 |
|
Park Aerospace Holdings Ltd., 5.25%, 8/15/22(1) | 550,000 |
| 497,664 |
|
| Springleaf Finance Corp., 8.25%, 12/15/20 | 25,000 |
| 25,169 |
|
| Springleaf Finance Corp., 7.75%, 10/1/21 | 150,000 |
| 150,819 |
|
| Springleaf Finance Corp., 6.125%, 5/15/22 | 225,000 |
| 229,995 |
|
| Springleaf Finance Corp., 8.25%, 10/1/23 | 175,000 |
| 176,075 |
|
| Springleaf Finance Corp., 6.875%, 3/15/25 | 873,000 |
| 885,737 |
|
| Springleaf Finance Corp., 7.125%, 3/15/26 | 1,300,000 |
| 1,279,688 |
|
| Springleaf Finance Corp., 6.625%, 1/15/28 | 525,000 |
| 494,524 |
|
| Springleaf Finance Corp., 5.375%, 11/15/29 | 200,000 |
| 184,214 |
|
| | | 11,973,983 |
|
| Containers and Packaging — 1.9% | | |
ARD Finance SA, 6.50% Cash or 7.25% PIK, 6/30/27(1)(4) | 1,600,000 |
| 1,383,120 |
|
Ardagh Packaging Finance plc / Ardagh Holdings USA, Inc., 4.25%, 9/15/22(1) | 200,000 |
| 201,246 |
|
Ardagh Packaging Finance plc / Ardagh Holdings USA, Inc., 6.00%, 2/15/25(1) | 400,000 |
| 404,120 |
|
| Berry Global, Inc., 6.00%, 10/15/22 | 250,000 |
| 249,141 |
|
Berry Global, Inc., 4.875%, 7/15/26(1) | 400,000 |
| 406,249 |
|
Cascades, Inc. / Cascades USA, Inc., 5.125%, 1/15/26(1) | 100,000 |
| 97,500 |
|
Cascades, Inc. / Cascades USA, Inc., 5.375%, 1/15/28(1) | 150,000 |
| 144,375 |
|
Flex Acquisition Co., Inc., 6.875%, 1/15/25(1) | 650,000 |
| 612,605 |
|
Flex Acquisition Co., Inc., 7.875%, 7/15/26(1) | 150,000 |
| 139,205 |
|
|
| | | | | | |
| | Principal Amount/Shares | Value |
Graphic Packaging International LLC, 4.75%, 7/15/27(1) | $ | 125,000 |
| $ | 123,318 |
|
Greif, Inc., 6.50%, 3/1/27(1) | 475,000 |
| 458,209 |
|
Mauser Packaging Solutions Holding Co., 5.50%, 4/15/24(1) | 75,000 |
| 69,560 |
|
Mauser Packaging Solutions Holding Co., 7.25%, 4/15/25(1) | 1,550,000 |
| 1,185,796 |
|
OI European Group BV, 4.00%, 3/15/23(1) | 200,000 |
| 191,749 |
|
Owens-Brockway Glass Container, Inc., 5.00%, 1/15/22(1) | 50,000 |
| 50,775 |
|
Owens-Brockway Glass Container, Inc., 6.375%, 8/15/25(1) | 350,000 |
| 335,125 |
|
Plastipak Holdings, Inc., 6.25%, 10/15/25(1) | 75,000 |
| 67,688 |
|
Reynolds Group Issuer, Inc. / Reynolds Group Issuer LLC / Reynolds Group Issuer Lu, 5.125%, 7/15/23(1) | 450,000 |
| 449,435 |
|
Reynolds Group Issuer, Inc. / Reynolds Group Issuer LLC / Reynolds Group Issuer Lu, 7.00%, 7/15/24(1) | 425,000 |
| 434,297 |
|
Sealed Air Corp., 5.125%, 12/1/24(1) | 250,000 |
| 253,125 |
|
Sealed Air Corp., 4.00%, 12/1/27(1) | 575,000 |
| 539,120 |
|
Silgan Holdings, Inc., 4.125%, 2/1/28(1) | 225,000 |
| 209,250 |
|
Trident TPI Holdings, Inc., 9.25%, 8/1/24(1) | 300,000 |
| 251,623 |
|
Trident TPI Holdings, Inc., 6.625%, 11/1/25(1) | 50,000 |
| 40,563 |
|
Trivium Packaging Finance BV, 5.50%, 8/15/26(1) | 400,000 |
| 400,249 |
|
Trivium Packaging Finance BV, 8.50%, 8/15/27(1) | 200,000 |
| 202,110 |
|
| | | 8,899,553 |
|
| Distributors — 0.7% | | |
| Anixter, Inc., 6.00%, 12/1/25 | 400,000 |
| 394,998 |
|
Performance Food Group, Inc., 5.50%, 6/1/24(1) | 2,000,000 |
| 1,877,490 |
|
Performance Food Group, Inc., 5.50%, 10/15/27(1) | 225,000 |
| 210,392 |
|
Resideo Funding, Inc., 6.125%, 11/1/26(1) | 100,000 |
| 88,007 |
|
Univar Solutions USA, Inc., 5.125%, 12/1/27(1) | 700,000 |
| 640,885 |
|
| | | 3,211,772 |
|
| Diversified Consumer Services — 0.4% | | |
GEMS MENASA Cayman Ltd. / GEMS Education Delaware LLC, 7.125%, 7/31/26(1) | 200,000 |
| 167,601 |
|
Graham Holdings Co., 5.75%, 6/1/26(1) | 600,000 |
| 593,126 |
|
| Service Corp. International/US, 5.375%, 5/15/24 | 150,000 |
| 153,000 |
|
| Service Corp. International/US, 5.125%, 6/1/29 | 375,000 |
| 384,581 |
|
Sotheby's, 7.375%, 10/15/27(1) | 400,000 |
| 321,220 |
|
WW International, Inc., 8.625%, 12/1/25(1) | 200,000 |
| 173,249 |
|
| | | 1,792,777 |
|
| Diversified Financial Services — 0.8% | | |
Cardtronics, Inc. / Cardtronics USA, Inc., 5.50%, 5/1/25(1) | 125,000 |
| 119,843 |
|
Fairstone Financial, Inc., 7.875%, 7/15/24(1) | 350,000 |
| 332,061 |
|
Jefferies Finance LLC / JFIN Co-Issuer Corp., 7.25%, 8/15/24(1) | 200,000 |
| 173,749 |
|
Jefferies Finance LLC / JFIN Co-Issuer Corp., 6.25%, 6/3/26(1) | 400,000 |
| 372,847 |
|
MPH Acquisition Holdings LLC, 7.125%, 6/1/24(1) | 800,000 |
| 702,024 |
|
Oxford Finance LLC / Oxford Finance Co-Issuer II, Inc., 6.375%, 12/15/22(1) | 175,000 |
| 170,351 |
|
Refinitiv US Holdings, Inc., 6.25%, 5/15/26(1) | 675,000 |
| 700,683 |
|
Refinitiv US Holdings, Inc., 8.25%, 11/15/26(1) | 300,000 |
| 317,250 |
|
Verscend Escrow Corp., 9.75%, 8/15/26(1) | 650,000 |
| 653,702 |
|
|
| | | | | | |
| | Principal Amount/Shares | Value |
VistaJet Malta Finance plc / XO Management Holding, Inc., 10.50%, 6/1/24(1) | $ | 350,000 |
| $ | 285,252 |
|
| | | 3,827,762 |
|
| Diversified Telecommunication Services — 6.5% | | |
Altice France Holding SA, 10.50%, 5/15/27(1) | 1,600,000 |
| 1,696,000 |
|
Altice France Holding SA, 6.00%, 2/15/28(1) | 1,200,000 |
| 1,064,616 |
|
Altice France SA, 7.375%, 5/1/26(1) | 1,000,000 |
| 1,015,550 |
|
Altice France SA, 8.125%, 2/1/27(1) | 2,050,000 |
| 2,148,502 |
|
Altice France SA, 5.50%, 1/15/28(1) | 1,700,000 |
| 1,601,145 |
|
| CenturyLink, Inc., 5.625%, 4/1/20 | 1,175,000 |
| 1,175,000 |
|
| CenturyLink, Inc., 6.45%, 6/15/21 | 300,000 |
| 306,150 |
|
| CenturyLink, Inc., 5.80%, 3/15/22 | 325,000 |
| 329,765 |
|
| CenturyLink, Inc., 6.75%, 12/1/23 | 1,225,000 |
| 1,309,592 |
|
| CenturyLink, Inc., 7.50%, 4/1/24 | 175,000 |
| 192,720 |
|
CenturyLink, Inc., 5.125%, 12/15/26(1) | 775,000 |
| 776,937 |
|
Cogent Communications Group, Inc., 5.625%, 4/15/21(1) | 75,000 |
| 74,438 |
|
Cogent Communications Group, Inc., 5.375%, 3/1/22(1) | 550,000 |
| 557,390 |
|
Connect Finco SARL / Connect US Finco LLC, 6.75%, 10/1/26(1) | 1,400,000 |
| 1,162,000 |
|
Digicel Group Two Ltd., 8.25%, 9/30/22(1) | 486,000 |
| 85,050 |
|
Digicel Group Two Ltd., 7.125% Cash plus 2.00% PIK, 4/1/24(1) | 202,863 |
| 30,429 |
|
| Embarq Corp., 8.00%, 6/1/36 | 1,475,000 |
| 1,468,104 |
|
Front Range BidCo, Inc., 6.125%, 3/1/28(1) | 550,000 |
| 525,594 |
|
Frontier Communications Corp., 10.50%, 9/15/22(5)(6) | 3,550,000 |
| 957,385 |
|
Frontier Communications Corp., 8.50%, 4/1/26(1)(5) | 300,000 |
| 275,835 |
|
Frontier Communications Corp., 8.00%, 4/1/27(1)(5) | 525,000 |
| 520,711 |
|
| Hughes Satellite Systems Corp., 6.625%, 8/1/26 | 650,000 |
| 663,947 |
|
Intelsat Connect Finance SA, 9.50%, 2/15/23(1)(5) | 1,600,000 |
| 600,000 |
|
Intelsat Jackson Holdings SA, 8.00%, 2/15/24(1)(5) | 75,000 |
| 72,937 |
|
Intelsat Jackson Holdings SA, 8.50%, 10/15/24(1)(5) | 1,200,000 |
| 763,146 |
|
Intelsat Jackson Holdings SA, 9.75%, 7/15/25(1)(5) | 1,950,000 |
| 1,230,947 |
|
Intelsat Luxembourg SA, 7.75%, 6/1/21(5) | 75,000 |
| 38,063 |
|
Intelsat Luxembourg SA, 8.125%, 6/1/23(5) | 550,000 |
| 116,875 |
|
| Level 3 Financing, Inc., 5.375%, 8/15/22 | 289,000 |
| 290,662 |
|
| Level 3 Financing, Inc., 5.625%, 2/1/23 | 1,050,000 |
| 1,043,469 |
|
| Level 3 Financing, Inc., 5.125%, 5/1/23 | 250,000 |
| 247,186 |
|
| Level 3 Financing, Inc., 5.375%, 1/15/24 | 525,000 |
| 529,591 |
|
| Level 3 Financing, Inc., 5.375%, 5/1/25 | 200,000 |
| 200,251 |
|
Qualitytech LP / QTS Finance Corp., 4.75%, 11/15/25(1) | 125,000 |
| 121,718 |
|
| Qwest Corp., 6.75%, 12/1/21 | 75,000 |
| 76,566 |
|
| Sprint Capital Corp., 6.875%, 11/15/28 | 650,000 |
| 746,038 |
|
| Sprint Capital Corp., 8.75%, 3/15/32 | 3,350,000 |
| 4,448,967 |
|
| Telecom Italia Capital SA, 6.00%, 9/30/34 | 1,025,000 |
| 1,021,892 |
|
| Telecom Italia Capital SA, 7.20%, 7/18/36 | 100,000 |
| 104,280 |
|
Telecom Italia SpA, 5.30%, 5/30/24(1) | 200,000 |
| 202,506 |
|
Telesat Canada / Telesat LLC, 4.875%, 6/1/27(1) | 500,000 |
| 481,150 |
|
Telesat Canada / Telesat LLC, 6.50%, 10/15/27(1) | 450,000 |
| 434,498 |
|
Windstream Holding of the Midwest, Inc., 6.75%, 4/1/28(5) | 50,000 |
| 40,483 |
|
|
| | | | | | |
| | Principal Amount/Shares | Value |
Windstream Services LLC / Windstream Finance Corp., 10.50%, 6/30/24(1)(5)(6) | $ | 325,000 |
| $ | 16,250 |
|
| | | 30,764,335 |
|
| Electric Utilities — 2.0% | | |
Drax Finco plc, 6.625%, 11/1/25(1) | 600,000 |
| 605,253 |
|
NextEra Energy Operating Partners LP, 4.25%, 7/15/24(1) | 350,000 |
| 343,439 |
|
NextEra Energy Operating Partners LP, 4.25%, 9/15/24(1) | 75,000 |
| 73,594 |
|
NextEra Energy Operating Partners LP, 3.875%, 10/15/26(1) | 1,050,000 |
| 1,003,403 |
|
NextEra Energy Operating Partners LP, 4.50%, 9/15/27(1) | 150,000 |
| 147,295 |
|
| NRG Energy, Inc., 7.25%, 5/15/26 | 1,350,000 |
| 1,421,617 |
|
| NRG Energy, Inc., 6.625%, 1/15/27 | 700,000 |
| 731,885 |
|
Pacific Gas & Electric Co., 3.25%, 6/15/23(5)(6) | 75,000 |
| 72,656 |
|
Pacific Gas & Electric Co., 6.05%, 3/1/34(5)(6) | 1,050,000 |
| 1,066,327 |
|
Pacific Gas & Electric Co., 5.80%, 3/1/37(5)(6) | 300,000 |
| 306,840 |
|
Pacific Gas & Electric Co., 5.40%, 1/15/40(5)(6) | 375,000 |
| 383,550 |
|
Pacific Gas & Electric Co., 5.125%, 11/15/43(5)(6) | 700,000 |
| 707,214 |
|
Pacific Gas & Electric Co., 4.00%, 12/1/46(5)(6) | 100,000 |
| 91,780 |
|
| Talen Energy Supply LLC, 6.50%, 6/1/25 | 100,000 |
| 65,605 |
|
Talen Energy Supply LLC, 10.50%, 1/15/26(1) | 675,000 |
| 490,703 |
|
Talen Energy Supply LLC, 7.25%, 5/15/27(1) | 75,000 |
| 68,194 |
|
Talen Energy Supply LLC, 6.625%, 1/15/28(1) | 175,000 |
| 148,130 |
|
Vistra Operations Co. LLC, 3.55%, 7/15/24(1) | 325,000 |
| 306,491 |
|
Vistra Operations Co. LLC, 5.625%, 2/15/27(1) | 350,000 |
| 362,880 |
|
Vistra Operations Co. LLC, 5.00%, 7/31/27(1) | 850,000 |
| 867,468 |
|
| | | 9,264,324 |
|
| Electronic Equipment, Instruments and Components — 0.1% | | |
MTS Systems Corp., 5.75%, 8/15/27(1) | 250,000 |
| 234,011 |
|
TTM Technologies, Inc., 5.625%, 10/1/25(1) | 75,000 |
| 63,656 |
|
| | | 297,667 |
|
| Energy Equipment and Services — 1.4% | | |
| Apergy Corp., 6.375%, 5/1/26 | 50,000 |
| 38,927 |
|
Archrock Partners LP / Archrock Partners Finance Corp., 6.875%, 4/1/27(1) | 425,000 |
| 304,754 |
|
Archrock Partners LP / Archrock Partners Finance Corp., 6.25%, 4/1/28(1) | 525,000 |
| 366,187 |
|
Basic Energy Services, Inc., 10.75%, 10/15/23(1) | 75,000 |
| 37,500 |
|
Calfrac Holdings LP, 8.50%, 6/15/26(1) | 175,000 |
| 14,875 |
|
Diamond Offshore Drilling, Inc., 3.45%, 11/1/23(5) | 175,000 |
| 53,155 |
|
Diamond Offshore Drilling, Inc., 7.875%, 8/15/25(5) | 750,000 |
| 198,281 |
|
Diamond Offshore Drilling, Inc., 5.70%, 10/15/39(5) | 200,000 |
| 33,061 |
|
Diamond Offshore Drilling, Inc., 4.875%, 11/1/43(5) | 125,000 |
| 18,163 |
|
Ensign Drilling, Inc., 9.25%, 4/15/24(1) | 825,000 |
| 309,350 |
|
| Exterran Energy Solutions LP / EES Finance Corp., 8.125%, 5/1/25 | 650,000 |
| 432,250 |
|
| FTS International, Inc., 6.25%, 5/1/22 | 800,000 |
| 284,749 |
|
| Global Marine, Inc., 7.00%, 6/1/28 | 25,000 |
| 8,437 |
|
KCA Deutag UK Finance plc, 9.625%, 4/1/23(1) | 300,000 |
| 109,031 |
|
Nabors Industries Ltd., 7.25%, 1/15/26(1) | 450,000 |
| 156,375 |
|
Nabors Industries Ltd., 7.50%, 1/15/28(1) | 250,000 |
| 81,875 |
|
|
| | | | | | |
| | Principal Amount/Shares | Value |
| Nabors Industries, Inc., 5.75%, 2/1/25 | $ | 1,000,000 |
| $ | 228,745 |
|
Nine Energy Service, Inc., 8.75%, 11/1/23(1) | 125,000 |
| 32,481 |
|
| Noble Holding International Ltd., 7.75%, 1/15/24 | 113,000 |
| 11,158 |
|
Noble Holding International Ltd., 7.875%, 2/1/26(1) | 800,000 |
| 198,834 |
|
| Noble Holding International Ltd., 6.20%, 8/1/40 | 25,000 |
| 1,633 |
|
| Noble Holding International Ltd., 8.95%, 4/1/45 | 100,000 |
| 6,031 |
|
| Precision Drilling Corp., 5.25%, 11/15/24 | 25,000 |
| 8,969 |
|
Precision Drilling Corp., 7.125%, 1/15/26(1) | 525,000 |
| 177,735 |
|
SESI LLC, 7.125%, 12/15/21(1) | 400,000 |
| 173,000 |
|
| SESI LLC, 7.75%, 9/15/24 | 150,000 |
| 40,312 |
|
Shelf Drilling Holdings Ltd., 8.25%, 2/15/25(1) | 800,000 |
| 402,400 |
|
Transocean Guardian Ltd., 5.875%, 1/15/24(1) | 709,750 |
| 573,102 |
|
Transocean Pontus Ltd., 6.125%, 8/1/25(1) | 125,250 |
| 102,388 |
|
Transocean Poseidon Ltd., 6.875%, 2/1/27(1) | 225,000 |
| 183,818 |
|
Transocean Sentry Ltd., 5.375%, 5/15/23(1) | 275,000 |
| 233,054 |
|
| Transocean, Inc., 5.80%, 10/15/22 | 225,000 |
| 140,836 |
|
Transocean, Inc., 7.25%, 11/1/25(1) | 200,000 |
| 102,054 |
|
Transocean, Inc., 8.00%, 2/1/27(1) | 875,000 |
| 418,906 |
|
| Transocean, Inc., 7.50%, 4/15/31 | 800,000 |
| 209,940 |
|
| Transocean, Inc., 6.80%, 3/15/38 | 200,000 |
| 47,560 |
|
| Transocean, Inc., 9.35%, 12/15/41 | 150,000 |
| 37,501 |
|
| USA Compression Partners LP / USA Compression Finance Corp., 6.875%, 4/1/26 | 700,000 |
| 441,435 |
|
| USA Compression Partners LP / USA Compression Finance Corp., 6.875%, 9/1/27 | 275,000 |
| 172,026 |
|
| | | 6,390,888 |
|
| Entertainment — 1.2% | | |
Allen Media LLC / Allen Media Co-Issuer, Inc., 10.50%, 2/15/28(1) | 600,000 |
| 494,565 |
|
| AMC Entertainment Holdings, Inc., 5.875%, 11/15/26 | 925,000 |
| 390,320 |
|
| AMC Entertainment Holdings, Inc., 6.125%, 5/15/27 | 475,000 |
| 200,723 |
|
Banijay Entertainment SASU, 5.375%, 3/1/25(1) | 200,000 |
| 184,500 |
|
| Cinemark USA, Inc., 5.125%, 12/15/22 | 225,000 |
| 179,648 |
|
| Cinemark USA, Inc., 4.875%, 6/1/23 | 150,000 |
| 113,246 |
|
Lions Gate Capital Holdings LLC, 6.375%, 2/1/24(1) | 650,000 |
| 576,855 |
|
Lions Gate Capital Holdings LLC, 5.875%, 11/1/24(1) | 500,000 |
| 430,278 |
|
Live Nation Entertainment, Inc., 5.625%, 3/15/26(1) | 500,000 |
| 449,271 |
|
| Netflix, Inc., 5.375%, 2/1/21 | 583,000 |
| 591,308 |
|
| Netflix, Inc., 5.875%, 11/15/28 | 425,000 |
| 457,109 |
|
| Netflix, Inc., 6.375%, 5/15/29 | 1,050,000 |
| 1,150,327 |
|
Netflix, Inc., 5.375%, 11/15/29(1) | 100,000 |
| 105,055 |
|
WMG Acquisition Corp., 5.00%, 8/1/23(1) | 50,000 |
| 50,062 |
|
WMG Acquisition Corp., 5.50%, 4/15/26(1) | 300,000 |
| 295,813 |
|
| | | 5,669,080 |
|
| Equity Real Estate Investment Trusts (REITs) — 1.4% | | |
ESH Hospitality, Inc., 5.25%, 5/1/25(1) | 350,000 |
| 296,189 |
|
ESH Hospitality, Inc., 4.625%, 10/1/27(1) | 925,000 |
| 726,634 |
|
| FelCor Lodging LP, 6.00%, 6/1/25 | 1,150,000 |
| 1,108,307 |
|
|
| | | | | | |
| | Principal Amount/Shares | Value |
| GEO Group, Inc. (The), 5.875%, 10/15/24 | $ | 25,000 |
| $ | 17,719 |
|
| GEO Group, Inc. (The), 6.00%, 4/15/26 | 50,000 |
| 32,848 |
|
| GLP Capital LP / GLP Financing II, Inc., 5.25%, 6/1/25 | 75,000 |
| 69,935 |
|
HAT Holdings I LLC / HAT Holdings II LLC, 5.25%, 7/15/24(1) | 375,000 |
| 362,346 |
|
| Iron Mountain, Inc., 5.75%, 8/15/24 | 125,000 |
| 125,309 |
|
Iron Mountain, Inc., 4.875%, 9/15/29(1) | 850,000 |
| 804,395 |
|
| MGM Growth Properties Operating Partnership LP / MGP Finance Co-Issuer, Inc., 5.75%, 2/1/27 | 75,000 |
| 65,531 |
|
| MPT Operating Partnership LP / MPT Finance Corp., 5.50%, 5/1/24 | 150,000 |
| 146,437 |
|
| RHP Hotel Properties LP / RHP Finance Corp., 5.00%, 4/15/23 | 25,000 |
| 19,719 |
|
| SBA Communications Corp., 4.00%, 10/1/22 | 200,000 |
| 201,436 |
|
SBA Communications Corp., 3.875%, 2/15/27(1) | 800,000 |
| 808,000 |
|
Uniti Group LP / Uniti Fiber Holdings, Inc. / CSL Capital LLC, 7.125%, 12/15/24(1) | 50,000 |
| 37,517 |
|
Uniti Group LP / Uniti Fiber Holdings, Inc. / CSL Capital LLC, 7.875%, 2/15/25(1) | 925,000 |
| 867,187 |
|
Uniti Group LP / Uniti Group Finance, Inc. / CSL Capital LLC, 6.00%, 4/15/23(1) | 75,000 |
| 68,812 |
|
VICI Properties LP / VICI Note Co., Inc., 4.25%, 12/1/26(1) | 175,000 |
| 161,526 |
|
VICI Properties LP / VICI Note Co., Inc., 3.75%, 2/15/27(1) | 225,000 |
| 213,328 |
|
VICI Properties LP / VICI Note Co., Inc., 4.125%, 8/15/30(1) | 225,000 |
| 214,453 |
|
| | | 6,347,628 |
|
| Food and Staples Retailing — 1.0% | | |
Albertsons Cos., Inc. / Safeway, Inc. / New Albertsons LP / Albertsons LLC, 3.50%, 2/15/23(1) | 425,000 |
| 421,600 |
|
| Albertsons Cos., Inc. / Safeway, Inc. / New Albertsons LP / Albertsons LLC, 6.625%, 6/15/24 | 1,550,000 |
| 1,584,828 |
|
| Albertsons Cos., Inc. / Safeway, Inc. / New Albertsons LP / Albertsons LLC, 5.75%, 3/15/25 | 425,000 |
| 428,190 |
|
Albertsons Cos., Inc. / Safeway, Inc. / New Albertsons LP / Albertsons LLC, 4.625%, 1/15/27(1) | 650,000 |
| 650,357 |
|
Albertsons Cos., Inc. / Safeway, Inc. / New Albertsons LP / Albertsons LLC, 5.875%, 2/15/28(1) | 125,000 |
| 127,919 |
|
Albertsons Cos., Inc. / Safeway, Inc. / New Albertsons LP / Albertsons LLC, 4.875%, 2/15/30(1) | 275,000 |
| 274,313 |
|
| Ingles Markets, Inc., 5.75%, 6/15/23 | 97,000 |
| 97,240 |
|
Rite Aid Corp., 6.125%, 4/1/23(1) | 534,000 |
| 463,245 |
|
Rite Aid Corp., 7.50%, 7/1/25(1) | 91,000 |
| 87,133 |
|
Sysco Corp., 5.65%, 4/1/25(7) | 75,000 |
| 78,176 |
|
Sysco Corp., 6.60%, 4/1/40(7) | 50,000 |
| 53,791 |
|
Sysco Corp., 6.60%, 4/1/50(7) | 250,000 |
| 272,572 |
|
| | | 4,539,364 |
|
| Food Products — 3.2% | | |
Chobani LLC / Chobani Finance Corp., Inc., 7.50%, 4/15/25(1) | 450,000 |
| 412,861 |
|
Clearwater Seafoods, Inc., 6.875%, 5/1/25(1) | 75,000 |
| 64,594 |
|
Cooke Omega Investments, Inc. / Alpha VesselCo Holdings, Inc., 8.50%, 12/15/22(1) | 650,000 |
| 645,733 |
|
Darling Ingredients, Inc., 5.25%, 4/15/27(1) | 125,000 |
| 122,083 |
|
HLF Financing Sarl LLC / Herbalife International, Inc., 7.25%, 8/15/26(1) | 150,000 |
| 128,063 |
|
|
| | | | | | |
| | Principal Amount/Shares | Value |
JBS Investments II GmbH, 7.00%, 1/15/26(1) | $ | 200,000 |
| $ | 200,408 |
|
JBS Investments II GmbH, 5.75%, 1/15/28(1) | 200,000 |
| 195,210 |
|
JBS USA LUX SA / JBS USA Finance, Inc., 5.875%, 7/15/24(1) | 75,000 |
| 76,219 |
|
JBS USA LUX SA / JBS USA Finance, Inc., 5.75%, 6/15/25(1) | 300,000 |
| 305,624 |
|
JBS USA LUX SA / JBS USA Food Co. / JBS USA Finance, Inc., 6.50%, 4/15/29(1) | 800,000 |
| 862,600 |
|
JBS USA LUX SA / JBS USA Food Co. / JBS USA Finance, Inc., 5.50%, 1/15/30(1) | 375,000 |
| 389,269 |
|
KeHE Distributors LLC / KeHE Finance Corp., 8.625%, 10/15/26(1) | 125,000 |
| 126,328 |
|
| Kraft Heinz Foods Co., 4.625%, 1/30/29 | 100,000 |
| 101,019 |
|
Kraft Heinz Foods Co., 3.75%, 4/1/30(1) | 175,000 |
| 167,318 |
|
| Kraft Heinz Foods Co., 5.00%, 7/15/35 | 875,000 |
| 875,789 |
|
| Kraft Heinz Foods Co., 6.875%, 1/26/39 | 300,000 |
| 345,260 |
|
| Kraft Heinz Foods Co., 6.50%, 2/9/40 | 1,050,000 |
| 1,152,985 |
|
| Kraft Heinz Foods Co., 5.00%, 6/4/42 | 450,000 |
| 428,494 |
|
| Kraft Heinz Foods Co., 5.20%, 7/15/45 | 1,025,000 |
| 991,299 |
|
| Kraft Heinz Foods Co., 4.375%, 6/1/46 | 2,675,000 |
| 2,425,219 |
|
Kraft Heinz Foods Co., 4.875%, 10/1/49(1) | 1,400,000 |
| 1,280,224 |
|
Pilgrim's Pride Corp., 5.75%, 3/15/25(1) | 525,000 |
| 530,909 |
|
Pilgrim's Pride Corp., 5.875%, 9/30/27(1) | 477,000 |
| 477,930 |
|
Post Holdings, Inc., 5.00%, 8/15/26(1) | 241,000 |
| 249,363 |
|
Post Holdings, Inc., 5.75%, 3/1/27(1) | 1,000,000 |
| 1,031,677 |
|
Post Holdings, Inc., 5.625%, 1/15/28(1) | 650,000 |
| 664,982 |
|
Post Holdings, Inc., 4.625%, 4/15/30(1) | 425,000 |
| 410,125 |
|
US Foods, Inc., 5.875%, 6/15/24(1) | 300,000 |
| 272,624 |
|
| | | 14,934,209 |
|
| Gas Utilities — 0.1% | | |
| AmeriGas Partners LP / AmeriGas Finance Corp., 5.50%, 5/20/25 | 625,000 |
| 579,669 |
|
| AmeriGas Partners LP / AmeriGas Finance Corp., 5.75%, 5/20/27 | 100,000 |
| 93,709 |
|
| | | 673,378 |
|
| Health Care Equipment and Supplies — 0.2% | | |
Hill-Rom Holdings, Inc., 4.375%, 9/15/27(1) | 175,000 |
| 173,870 |
|
Ortho-Clinical Diagnostics, Inc. / Ortho-Clinical Diagnostics SA, 6.625%, 5/15/22(1) | 317,000 |
| 301,936 |
|
Ortho-Clinical Diagnostics, Inc. / Ortho-Clinical Diagnostics SA, 7.25%, 2/1/28(1) | 275,000 |
| 238,535 |
|
| | | 714,341 |
|
| Health Care Providers and Services — 4.4% | | |
ASP AMC Merger Sub, Inc., 8.00%, 5/15/25(1) | 550,000 |
| 321,060 |
|
Catalent Pharma Solutions, Inc., 5.00%, 7/15/27(1) | 100,000 |
| 97,555 |
|
| Centene Corp., 4.75%, 5/15/22 | 1,375,000 |
| 1,389,217 |
|
Centene Corp., 4.75%, 1/15/25(1) | 850,000 |
| 865,942 |
|
Centene Corp., 5.375%, 6/1/26(1) | 700,000 |
| 724,962 |
|
Centene Corp., 5.375%, 8/15/26(1) | 25,000 |
| 25,781 |
|
Centene Corp., 4.25%, 12/15/27(1) | 1,500,000 |
| 1,511,175 |
|
Centene Corp., 4.625%, 12/15/29(1) | 850,000 |
| 858,967 |
|
| CHS / Community Health Systems, Inc., 6.875%, 2/1/22 | 391,000 |
| 296,183 |
|
CHS / Community Health Systems, Inc., 8.625%, 1/15/24(1) | 550,000 |
| 547,063 |
|
|
| | | | | | |
| | Principal Amount/Shares | Value |
CHS / Community Health Systems, Inc., 8.125%, 6/30/24(1) | $ | 71,000 |
| $ | 49,725 |
|
CHS / Community Health Systems, Inc., 8.00%, 3/15/26(1) | 1,525,000 |
| 1,457,324 |
|
CHS / Community Health Systems, Inc., 8.00%, 12/15/27(1) | 125,000 |
| 115,938 |
|
CHS / Community Health Systems, Inc., 6.875%, 4/1/28(1) | 479,000 |
| 193,995 |
|
CHS / Community Health Systems, Inc., VRN, 9.875%, 6/30/23(1) | 125,000 |
| 98,593 |
|
CHS/Community Health Systems, Inc., 6.625%, 2/15/25(1) | 875,000 |
| 815,937 |
|
| DaVita, Inc., 5.125%, 7/15/24 | 1,225,000 |
| 1,228,987 |
|
| Encompass Health Corp., 5.75%, 11/1/24 | 248,000 |
| 250,717 |
|
| Encompass Health Corp., 4.75%, 2/1/30 | 300,000 |
| 297,165 |
|
Envision Healthcare Corp., 8.75%, 10/15/26(1) | 850,000 |
| 213,386 |
|
| HCA, Inc., 5.875%, 5/1/23 | 450,000 |
| 472,556 |
|
| HCA, Inc., 5.375%, 2/1/25 | 550,000 |
| 563,060 |
|
| HCA, Inc., 7.69%, 6/15/25 | 250,000 |
| 264,686 |
|
| HCA, Inc., 5.875%, 2/15/26 | 450,000 |
| 471,128 |
|
| HCA, Inc., 5.375%, 9/1/26 | 400,000 |
| 415,030 |
|
| HCA, Inc., 5.625%, 9/1/28 | 650,000 |
| 683,963 |
|
| HCA, Inc., 3.50%, 9/1/30 | 350,000 |
| 318,980 |
|
| HCA, Inc., MTN, 7.58%, 9/15/25 | 1,250,000 |
| 1,293,750 |
|
IQVIA, Inc., 5.00%, 5/15/27(1) | 475,000 |
| 488,997 |
|
LifePoint Health, Inc., 4.375%, 2/15/27(1) | 200,000 |
| 189,900 |
|
MEDNAX, Inc., 6.25%, 1/15/27(1) | 125,000 |
| 101,259 |
|
Polaris Intermediate Corp., 8.50% Cash or 9.25% PIK, 12/1/22(1)(4) | 575,000 |
| 449,926 |
|
Radiology Partners, Inc., 9.25%, 2/1/28(1) | 125,000 |
| 109,156 |
|
Select Medical Corp., 6.25%, 8/15/26(1) | 575,000 |
| 578,165 |
|
| Tenet Healthcare Corp., 8.125%, 4/1/22 | 275,000 |
| 261,344 |
|
| Tenet Healthcare Corp., 6.75%, 6/15/23 | 350,000 |
| 325,064 |
|
| Tenet Healthcare Corp., 4.625%, 7/15/24 | 425,000 |
| 406,938 |
|
Tenet Healthcare Corp., 4.625%, 9/1/24(1) | 400,000 |
| 385,120 |
|
Tenet Healthcare Corp., 4.875%, 1/1/26(1) | 750,000 |
| 717,187 |
|
Tenet Healthcare Corp., 6.25%, 2/1/27(1) | 225,000 |
| 220,219 |
|
Tenet Healthcare Corp., 5.125%, 11/1/27(1) | 225,000 |
| 215,719 |
|
West Street Merger Sub, Inc., 6.375%, 9/1/25(1) | 500,000 |
| 439,585 |
|
| | | 20,731,404 |
|
| Hotels, Restaurants and Leisure — 7.1% | | |
1011778 BC ULC / New Red Finance, Inc., 4.25%, 5/15/24(1) | 125,000 |
| 125,468 |
|
1011778 BC ULC / New Red Finance, Inc., 5.00%, 10/15/25(1) | 2,450,000 |
| 2,355,050 |
|
1011778 BC ULC / New Red Finance, Inc., 4.375%, 1/15/28(1) | 300,000 |
| 278,835 |
|
Aramark Services, Inc., 5.00%, 4/1/25(1) | 100,000 |
| 95,407 |
|
Aramark Services, Inc., 5.00%, 2/1/28(1) | 465,000 |
| 435,319 |
|
Arrow Bidco LLC, 9.50%, 3/15/24(1) | 75,000 |
| 34,406 |
|
| Boyd Gaming Corp., 6.375%, 4/1/26 | 1,725,000 |
| 1,501,699 |
|
| Boyd Gaming Corp., 6.00%, 8/15/26 | 850,000 |
| 738,261 |
|
Boyne USA, Inc., 7.25%, 5/1/25(1) | 675,000 |
| 650,528 |
|
Caesars Resort Collection LLC / CRC Finco, Inc., 5.25%, 10/15/25(1) | 1,010,000 |
| 736,997 |
|
Carlson Travel, Inc., 9.50%, 12/15/24(1) | 502,000 |
| 335,710 |
|
| Cedar Fair LP / Canada's Wonderland Co. / Magnum Management Corp., 5.375%, 6/1/24 | 400,000 |
| 363,498 |
|
|
| | | | | | |
| | Principal Amount/Shares | Value |
Churchill Downs, Inc., 5.50%, 4/1/27(1) | $ | 500,000 |
| $ | 474,025 |
|
Churchill Downs, Inc., 4.75%, 1/15/28(1) | 100,000 |
| 87,555 |
|
Downstream Development Authority of the Quapaw Tribe of Oklahoma, 10.50%, 2/15/23(1) | 300,000 |
| 242,624 |
|
| Eldorado Resorts, Inc., 7.00%, 8/1/23 | 1,075,000 |
| 974,224 |
|
| Eldorado Resorts, Inc., 6.00%, 4/1/25 | 1,250,000 |
| 1,132,819 |
|
Enterprise Development Authority (The), 12.00%, 7/15/24(1) | 900,000 |
| 790,871 |
|
Gateway Casinos & Entertainment Ltd., 8.25%, 3/1/24(1) | 830,000 |
| 729,358 |
|
Golden Entertainment, Inc., 7.625%, 4/15/26(1) | 700,000 |
| 466,982 |
|
Golden Nugget, Inc., 6.75%, 10/15/24(1) | 1,675,000 |
| 1,067,578 |
|
Golden Nugget, Inc., 8.75%, 10/1/25(1) | 1,550,000 |
| 811,766 |
|
| Hilton Domestic Operating Co., Inc., 5.125%, 5/1/26 | 1,125,000 |
| 1,086,798 |
|
| Hilton Worldwide Finance LLC / Hilton Worldwide Finance Corp., 4.625%, 4/1/25 | 200,000 |
| 187,749 |
|
Inn of the Mountain Gods Resort & Casino, 9.25% Cash or 9.25% PIK, 11/30/20(4) | 147,722 |
| 146,983 |
|
IRB Holding Corp., 6.75%, 2/15/26(1) | 275,000 |
| 219,026 |
|
Jacobs Entertainment, Inc., 7.875%, 2/1/24(1) | 780,000 |
| 663,971 |
|
KFC Holding Co. / Pizza Hut Holdings LLC / Taco Bell of America LLC, 5.00%, 6/1/24(1) | 1,275,000 |
| 1,257,475 |
|
KFC Holding Co. / Pizza Hut Holdings LLC / Taco Bell of America LLC, 5.25%, 6/1/26(1) | 105,000 |
| 105,648 |
|
KFC Holding Co. / Pizza Hut Holdings LLC / Taco Bell of America LLC, 4.75%, 6/1/27(1) | 725,000 |
| 686,551 |
|
LTF Merger Sub, Inc., 8.50%, 6/15/23(1) | 3,661,000 |
| 3,034,035 |
|
Marriott Ownership Resorts, Inc., 4.75%, 1/15/28(1) | 125,000 |
| 94,818 |
|
| Marriott Ownership Resorts, Inc. / ILG LLC, 6.50%, 9/15/26 | 475,000 |
| 415,920 |
|
Melco Resorts Finance Ltd., 5.25%, 4/26/26(1) | 525,000 |
| 476,478 |
|
Melco Resorts Finance Ltd., 5.625%, 7/17/27(1) | 200,000 |
| 175,840 |
|
Melco Resorts Finance Ltd., 5.375%, 12/4/29(1) | 400,000 |
| 348,011 |
|
Merlin Entertainments Ltd., 5.75%, 6/15/26(1) | 800,000 |
| 682,834 |
|
MGM China Holdings Ltd., 5.375%, 5/15/24(1) | 600,000 |
| 569,433 |
|
| MGM Resorts International, 7.75%, 3/15/22 | 750,000 |
| 746,895 |
|
| MGM Resorts International, 6.00%, 3/15/23 | 1,800,000 |
| 1,748,259 |
|
| MGM Resorts International, 5.50%, 4/15/27 | 131,000 |
| 119,937 |
|
Mohegan Gaming & Entertainment, 7.875%, 10/15/24(1) | 1,650,000 |
| 1,235,429 |
|
Motion Bondco DAC, 6.625%, 11/15/27(1) | 200,000 |
| 145,000 |
|
Nathan's Famous, Inc., 6.625%, 11/1/25(1) | 200,000 |
| 187,000 |
|
NCL Corp. Ltd., 3.625%, 12/15/24(1) | 75,000 |
| 48,398 |
|
Scientific Games International, Inc., 8.25%, 3/15/26(1) | 250,000 |
| 161,433 |
|
Scientific Games International, Inc., 7.00%, 5/15/28(1) | 975,000 |
| 605,036 |
|
Scientific Games International, Inc., 7.25%, 11/15/29(1) | 925,000 |
| 577,616 |
|
Speedway Motorsports LLC / Speedway Funding II, Inc., 4.875%, 11/1/27(1) | 175,000 |
| 158,813 |
|
Twin River Worldwide Holdings, Inc., 6.75%, 6/1/27(1) | 100,000 |
| 75,854 |
|
Viking Cruises Ltd., 6.25%, 5/15/25(1) | 25,000 |
| 16,219 |
|
Viking Cruises Ltd., 5.875%, 9/15/27(1) | 650,000 |
| 383,929 |
|
Wyndham Destinations, Inc., 4.625%, 3/1/30(1) | 225,000 |
| 174,516 |
|
Wynn Las Vegas LLC / Wynn Las Vegas Capital Corp., 5.50%, 3/1/25(1) | 300,000 |
| 281,241 |
|
|
| | | | | | |
| | Principal Amount/Shares | Value |
Wynn Las Vegas LLC / Wynn Las Vegas Capital Corp., 5.25%, 5/15/27(1) | $ | 725,000 |
| $ | 658,844 |
|
Wynn Macau Ltd., 4.875%, 10/1/24(1) | 200,000 |
| 188,749 |
|
Wynn Macau Ltd., 5.50%, 10/1/27(1) | 425,000 |
| 379,943 |
|
Wynn Resorts Finance LLC / Wynn Resorts Capital Corp., 5.125%, 10/1/29(1) | 125,000 |
| 114,453 |
|
| Yum! Brands, Inc., 3.875%, 11/1/23 | 525,000 |
| 492,841 |
|
Yum! Brands, Inc., 7.75%, 4/1/25(1)(7) | 125,000 |
| 131,563 |
|
| | | 33,212,518 |
|
| Household Durables — 2.6% | | |
Adams Homes, Inc., 7.50%, 2/15/25(1) | 450,000 |
| 433,125 |
|
Ashton Woods USA LLC / Ashton Woods Finance Co., 6.75%, 8/1/25(1) | 325,000 |
| 262,842 |
|
Ashton Woods USA LLC / Ashton Woods Finance Co., 6.625%, 1/15/28(1) | 300,000 |
| 239,250 |
|
| Beazer Homes USA, Inc., 6.75%, 3/15/25 | 477,000 |
| 388,156 |
|
| Beazer Homes USA, Inc., 7.25%, 10/15/29 | 350,000 |
| 268,651 |
|
Brookfield Residential Properties, Inc. / Brookfield Residential US Corp., 6.375%, 5/15/25(1) | 100,000 |
| 90,875 |
|
Brookfield Residential Properties, Inc. / Brookfield Residential US Corp., 4.875%, 2/15/30(1) | 450,000 |
| 343,552 |
|
| Century Communities, Inc., 5.875%, 7/15/25 | 325,000 |
| 281,292 |
|
| Century Communities, Inc., 6.75%, 6/1/27 | 750,000 |
| 612,253 |
|
Installed Building Products, Inc., 5.75%, 2/1/28(1) | 300,000 |
| 288,313 |
|
K Hovnanian Enterprises, Inc., 13.50%, 2/1/26(1) | 26,000 |
| 20,280 |
|
K Hovnanian Enterprises, Inc., 5.00%, 2/1/40(1) | 26,000 |
| 10,465 |
|
| KB Home, 7.00%, 12/15/21 | 125,000 |
| 124,838 |
|
| KB Home, 7.625%, 5/15/23 | 50,000 |
| 50,687 |
|
| KB Home, 6.875%, 6/15/27 | 650,000 |
| 655,553 |
|
| Lennar Corp., 4.75%, 4/1/21 | 525,000 |
| 522,616 |
|
| Lennar Corp., 6.25%, 12/15/21 | 50,000 |
| 50,310 |
|
| Lennar Corp., 5.00%, 6/15/27 | 200,000 |
| 184,708 |
|
Mattamy Group Corp., 4.625%, 3/1/30(1) | 525,000 |
| 454,453 |
|
| Meritage Homes Corp., 7.00%, 4/1/22 | 275,000 |
| 277,320 |
|
| Meritage Homes Corp., 6.00%, 6/1/25 | 925,000 |
| 861,402 |
|
| Newell Brands, Inc., 4.20%, 4/1/26 | 1,400,000 |
| 1,372,489 |
|
| Newell Brands, Inc., 5.625%, 4/1/36 | 1,100,000 |
| 1,095,488 |
|
| Newell Brands, Inc., 5.75%, 4/1/46 | 225,000 |
| 229,083 |
|
Shea Homes LP / Shea Homes Funding Corp., 4.75%, 2/15/28(1) | 325,000 |
| 279,297 |
|
Taylor Morrison Communities, Inc., 6.00%, 9/1/23(1) | 150,000 |
| 145,688 |
|
Taylor Morrison Communities, Inc., 5.875%, 1/31/25(1) | 125,000 |
| 117,656 |
|
Taylor Morrison Communities, Inc., 6.625%, 7/15/27(1) | 150,000 |
| 136,688 |
|
Taylor Morrison Communities, Inc., 5.75%, 1/15/28(1) | 225,000 |
| 202,828 |
|
| Toll Brothers Finance Corp., 5.875%, 2/15/22 | 525,000 |
| 527,625 |
|
TopBuild Corp., 5.625%, 5/1/26(1) | 350,000 |
| 324,990 |
|
| TRI Pointe Group, Inc., 5.25%, 6/1/27 | 175,000 |
| 157,192 |
|
| TRI Pointe Group, Inc. / TRI Pointe Homes, Inc., 5.875%, 6/15/24 | 390,000 |
| 365,713 |
|
Williams Scotsman International, Inc., 7.875%, 12/15/22(1) | 158,000 |
| 155,462 |
|
|
| | | | | | |
| | Principal Amount/Shares | Value |
Williams Scotsman International, Inc., 6.875%, 8/15/23(1) | $ | 1,000,000 |
| $ | 918,745 |
|
| | | 12,449,885 |
|
| Household Products — 0.6% | | |
| Central Garden & Pet Co., 6.125%, 11/15/23 | 75,000 |
| 72,086 |
|
| Central Garden & Pet Co., 5.125%, 2/1/28 | 75,000 |
| 70,016 |
|
Energizer Holdings, Inc., 5.50%, 6/15/25(1) | 900,000 |
| 878,629 |
|
Energizer Holdings, Inc., 6.375%, 7/15/26(1) | 325,000 |
| 330,054 |
|
Energizer Holdings, Inc., 7.75%, 1/15/27(1) | 175,000 |
| 181,869 |
|
Kronos Acquisition Holdings, Inc., 9.00%, 8/15/23(1) | 350,000 |
| 290,061 |
|
Prestige Brands, Inc., 6.375%, 3/1/24(1) | 100,000 |
| 103,125 |
|
Prestige Brands, Inc., 5.125%, 1/15/28(1) | 275,000 |
| 274,395 |
|
| Spectrum Brands, Inc., 6.125%, 12/15/24 | 225,000 |
| 216,843 |
|
| Spectrum Brands, Inc., 5.75%, 7/15/25 | 275,000 |
| 259,179 |
|
| | | 2,676,257 |
|
| Independent Power and Renewable Electricity Producers — 2.2% | |
| Calpine Corp., 5.50%, 2/1/24 | 575,000 |
| 550,545 |
|
| Calpine Corp., 5.75%, 1/15/25 | 325,000 |
| 303,063 |
|
Calpine Corp., 5.25%, 6/1/26(1) | 150,000 |
| 143,545 |
|
Calpine Corp., 4.50%, 2/15/28(1) | 625,000 |
| 608,125 |
|
Calpine Corp., 5.125%, 3/15/28(1) | 1,600,000 |
| 1,484,000 |
|
| Clearway Energy Operating LLC, 5.75%, 10/15/25 | 1,300,000 |
| 1,295,131 |
|
| Clearway Energy Operating LLC, 5.00%, 9/15/26 | 1,350,000 |
| 1,317,657 |
|
Clearway Energy Operating LLC, 4.75%, 3/15/28(1) | 575,000 |
| 535,469 |
|
Pattern Energy Group, Inc., 5.875%, 2/1/24(1) | 100,000 |
| 100,143 |
|
TerraForm Power Operating LLC, 4.25%, 1/31/23(1) | 350,000 |
| 349,990 |
|
TerraForm Power Operating LLC, 5.00%, 1/31/28(1) | 175,000 |
| 184,336 |
|
TerraForm Power Operating LLC, 4.75%, 1/15/30(1) | 650,000 |
| 634,107 |
|
| Vistra Energy Corp., 5.875%, 6/1/23 | 2,800,000 |
| 2,813,916 |
|
| | | 10,320,027 |
|
| Industrial Conglomerates — 0.1% | | |
Amsted Industries, Inc., 5.625%, 7/1/27(1) | 125,000 |
| 122,682 |
|
Stena International SA, 6.125%, 2/1/25(1) | 200,000 |
| 169,500 |
|
| | | 292,182 |
|
| Insurance — 1.4% | | |
Acrisure LLC / Acrisure Finance, Inc., 8.125%, 2/15/24(1) | 575,000 |
| 563,313 |
|
Acrisure LLC / Acrisure Finance, Inc., 7.00%, 11/15/25(1) | 1,050,000 |
| 910,843 |
|
Acrisure LLC / Acrisure Finance, Inc., 10.125%, 8/1/26(1) | 175,000 |
| 163,996 |
|
Ardonagh Midco 3 plc, 8.625%, 7/15/23(1) | 450,000 |
| 403,315 |
|
Ardonagh Midco 3 plc, 8.625%, 7/15/23(1) | 200,000 |
| 179,749 |
|
AssuredPartners, Inc., 7.00%, 8/15/25(1) | 475,000 |
| 431,048 |
|
Fidelity & Guaranty Life Holdings, Inc., 5.50%, 5/1/25(1) | 700,000 |
| 696,689 |
|
| Genworth Holdings, Inc., 7.625%, 9/24/21 | 350,000 |
| 334,936 |
|
| Genworth Holdings, Inc., 4.90%, 8/15/23 | 625,000 |
| 542,187 |
|
| Genworth Holdings, Inc., 4.80%, 2/15/24 | 250,000 |
| 218,125 |
|
GTCR AP Finance, Inc., 8.00%, 5/15/27(1) | 75,000 |
| 69,641 |
|
HUB International Ltd., 7.00%, 5/1/26(1) | 1,225,000 |
| 1,222,029 |
|
|
| | | | | | |
| | Principal Amount/Shares | Value |
MBIA Insurance Corp., VRN, 13.09%, (3-month LIBOR plus 11.26%), 1/15/33(1)(5)(6) | $ | 125,000 |
| $ | 67,318 |
|
| MBIA, Inc., 7.15%, 7/15/27 | 25,000 |
| 20,319 |
|
USI, Inc., 6.875%, 5/1/25(1) | 575,000 |
| 539,045 |
|
| | | 6,362,553 |
|
| Interactive Media and Services — 0.3% | | |
| Match Group, Inc., 6.375%, 6/1/24 | 1,185,000 |
| 1,204,262 |
|
Match Group, Inc., 5.00%, 12/15/27(1) | 75,000 |
| 72,266 |
|
Match Group, Inc., 5.625%, 2/15/29(1) | 100,000 |
| 96,354 |
|
Twitter, Inc., 3.875%, 12/15/27(1) | 150,000 |
| 145,406 |
|
| | | 1,518,288 |
|
| Internet and Direct Marketing Retail — 0.2% | | |
Go Daddy Operating Co. LLC / GD Finance Co., Inc., 5.25%, 12/1/27(1) | 625,000 |
| 634,219 |
|
| QVC, Inc., 4.75%, 2/15/27 | 400,000 |
| 355,597 |
|
| | | 989,816 |
|
| IT Services — 0.9% | | |
Banff Merger Sub, Inc., 9.75%, 9/1/26(1) | 375,000 |
| 332,841 |
|
| CDW LLC / CDW Finance Corp., 5.00%, 9/1/25 | 275,000 |
| 285,053 |
|
Exela Intermediate LLC / Exela Finance, Inc., 10.00%, 7/15/23(1) | 1,000,000 |
| 270,000 |
|
Gartner, Inc., 5.125%, 4/1/25(1) | 225,000 |
| 221,345 |
|
Presidio Holdings, Inc., 4.875%, 2/1/27(1) | 325,000 |
| 294,328 |
|
Presidio Holdings, Inc., 8.25%, 2/1/28(1) | 775,000 |
| 688,781 |
|
Science Applications International Corp., 4.875%, 4/1/28(1) | 725,000 |
| 700,078 |
|
Tempo Acquisition LLC / Tempo Acquisition Finance Corp., 6.75%, 6/1/25(1) | 725,000 |
| 668,834 |
|
Vericast Corp., 8.375%, 8/15/22(1) | 1,025,000 |
| 799,178 |
|
| | | 4,260,438 |
|
| Leisure Products — 0.2% | | |
Mattel, Inc., 6.75%, 12/31/25(1) | 450,000 |
| 461,815 |
|
Mattel, Inc., 5.875%, 12/15/27(1) | 200,000 |
| 205,110 |
|
| Mattel, Inc., 5.45%, 11/1/41 | 75,000 |
| 60,023 |
|
| | | 726,948 |
|
| Life Sciences Tools and Services — 0.3% | | |
Avantor, Inc., 6.00%, 10/1/24(1) | 100,000 |
| 105,396 |
|
Avantor, Inc., 9.00%, 10/1/25(1) | 1,000,000 |
| 1,058,955 |
|
Charles River Laboratories International, Inc., 5.50%, 4/1/26(1) | 450,000 |
| 462,135 |
|
| | | 1,626,486 |
|
| Machinery — 1.0% | | |
BCD Acquisition, Inc., 9.625%, 9/15/23(1) | 50,000 |
| 41,749 |
|
Cleaver-Brooks, Inc., 7.875%, 3/1/23(1) | 50,000 |
| 41,937 |
|
Cloud Crane LLC, 10.125%, 8/1/24(1) | 550,000 |
| 436,565 |
|
Colfax Corp., 6.00%, 2/15/24(1) | 225,000 |
| 225,282 |
|
Colfax Corp., 6.375%, 2/15/26(1) | 75,000 |
| 74,156 |
|
| EnPro Industries, Inc., 5.75%, 10/15/26 | 425,000 |
| 417,247 |
|
Granite US Holdings Corp., 11.00%, 10/1/27(1) | 150,000 |
| 129,969 |
|
Husky III Holding Ltd., 13.00% Cash or 13.75% PIK, 2/15/25(1)(4) | 400,000 |
| 296,792 |
|
JPW Industries Holding Corp., 9.00%, 10/1/24(1) | 75,000 |
| 59,062 |
|
|
| | | | | | |
| | Principal Amount/Shares | Value |
Manitowoc Co., Inc. (The), 9.00%, 4/1/26(1) | $ | 100,000 |
| $ | 89,212 |
|
Navistar International Corp., 6.625%, 11/1/25(1) | 500,000 |
| 419,377 |
|
RBS Global, Inc. / Rexnord LLC, 4.875%, 12/15/25(1) | 125,000 |
| 117,809 |
|
SPX FLOW, Inc., 5.625%, 8/15/24(1) | 50,000 |
| 48,937 |
|
SPX FLOW, Inc., 5.875%, 8/15/26(1) | 375,000 |
| 363,203 |
|
Stevens Holding Co., Inc., 6.125%, 10/1/26(1) | 150,000 |
| 149,469 |
|
| Tennant Co., 5.625%, 5/1/25 | 150,000 |
| 145,687 |
|
Titan Acquisition Ltd. / Titan Co-Borrower LLC, 7.75%, 4/15/26(1) | 500,000 |
| 420,984 |
|
| Titan International, Inc., 6.50%, 11/30/23 | 425,000 |
| 194,967 |
|
Wabash National Corp., 5.50%, 10/1/25(1) | 200,000 |
| 160,749 |
|
Werner FinCo LP / Werner FinCo, Inc., 8.75%, 7/15/25(1) | 700,000 |
| 622,121 |
|
| | | 4,455,274 |
|
| Media — 10.7% | | |
Altice Financing SA, 7.50%, 5/15/26(1) | 1,100,000 |
| 1,075,855 |
|
Altice Financing SA, 5.00%, 1/15/28(1) | 1,000,000 |
| 892,500 |
|
| AMC Networks, Inc., 4.75%, 12/15/22 | 350,000 |
| 341,264 |
|
| AMC Networks, Inc., 5.00%, 4/1/24 | 300,000 |
| 289,500 |
|
Block Communications, Inc., 4.875%, 3/1/28(1) | 225,000 |
| 210,516 |
|
| CCO Holdings LLC / CCO Holdings Capital Corp., 5.25%, 9/30/22 | 225,000 |
| 222,264 |
|
CCO Holdings LLC / CCO Holdings Capital Corp., 4.00%, 3/1/23(1) | 600,000 |
| 602,232 |
|
CCO Holdings LLC / CCO Holdings Capital Corp., 5.125%, 5/1/23(1) | 1,100,000 |
| 1,117,880 |
|
CCO Holdings LLC / CCO Holdings Capital Corp., 5.875%, 4/1/24(1) | 550,000 |
| 565,815 |
|
CCO Holdings LLC / CCO Holdings Capital Corp., 5.375%, 5/1/25(1) | 425,000 |
| 438,368 |
|
CCO Holdings LLC / CCO Holdings Capital Corp., 5.75%, 2/15/26(1) | 3,075,000 |
| 3,124,046 |
|
CCO Holdings LLC / CCO Holdings Capital Corp., 5.50%, 5/1/26(1) | 675,000 |
| 688,208 |
|
CCO Holdings LLC / CCO Holdings Capital Corp., 5.875%, 5/1/27(1) | 350,000 |
| 362,897 |
|
CCO Holdings LLC / CCO Holdings Capital Corp., 5.00%, 2/1/28(1) | 375,000 |
| 378,585 |
|
CCO Holdings LLC / CCO Holdings Capital Corp., 4.75%, 3/1/30(1) | 225,000 |
| 225,686 |
|
CCO Holdings LLC / CCO Holdings Capital Corp., 4.50%, 8/15/30(1) | 2,875,000 |
| 2,833,672 |
|
CCO Holdings LLC / CCO Holdings Capital Corp., 4.50%, 5/1/32(1) | 1,825,000 |
| 1,790,006 |
|
Clear Channel Worldwide Holdings, Inc., 9.25%, 2/15/24(1) | 638,000 |
| 552,671 |
|
Clear Channel Worldwide Holdings, Inc., 5.125%, 8/15/27(1) | 1,525,000 |
| 1,436,474 |
|
| CSC Holdings LLC, 6.75%, 11/15/21 | 50,000 |
| 51,838 |
|
CSC Holdings LLC, 5.375%, 7/15/23(1) | 200,000 |
| 203,251 |
|
CSC Holdings LLC, 10.875%, 10/15/25(1) | 3,700,000 |
| 4,007,562 |
|
CSC Holdings LLC, 5.50%, 5/15/26(1) | 400,000 |
| 416,527 |
|
CSC Holdings LLC, 6.50%, 2/1/29(1) | 1,600,000 |
| 1,734,584 |
|
CSC Holdings LLC, 5.75%, 1/15/30(1) | 2,850,000 |
| 2,884,798 |
|
Diamond Sports Group LLC / Diamond Sports Finance Co., 5.375%, 8/15/26(1) | 1,075,000 |
| 879,503 |
|
Diamond Sports Group LLC / Diamond Sports Finance Co., 6.625%, 8/15/27(1) | 675,000 |
| 455,152 |
|
| DISH DBS Corp., 5.125%, 5/1/20 | 225,000 |
| 224,056 |
|
| DISH DBS Corp., 6.75%, 6/1/21 | 75,000 |
| 76,460 |
|
|
| | | | | | |
| | Principal Amount/Shares | Value |
| DISH DBS Corp., 5.875%, 7/15/22 | $ | 50,000 |
| $ | 48,958 |
|
| DISH DBS Corp., 5.00%, 3/15/23 | 75,000 |
| 72,564 |
|
| DISH DBS Corp., 5.875%, 11/15/24 | 900,000 |
| 882,076 |
|
EW Scripps Co. (The), 5.125%, 5/15/25(1) | 275,000 |
| 244,405 |
|
GCI LLC, 6.625%, 6/15/24(1) | 350,000 |
| 349,561 |
|
Gray Television, Inc., 5.125%, 10/15/24(1) | 830,000 |
| 807,179 |
|
Gray Television, Inc., 5.875%, 7/15/26(1) | 775,000 |
| 750,471 |
|
Gray Television, Inc., 7.00%, 5/15/27(1) | 825,000 |
| 825,454 |
|
| iHeartCommunications, Inc., 6.375%, 5/1/26 | 601,300 |
| 572,364 |
|
| iHeartCommunications, Inc., 8.375%, 5/1/27 | 152,438 |
| 130,632 |
|
iHeartCommunications, Inc., 5.25%, 8/15/27(1) | 825,000 |
| 723,484 |
|
iHeartCommunications, Inc., 4.75%, 1/15/28(1) | 525,000 |
| 475,414 |
|
| Lamar Media Corp., 5.00%, 5/1/23 | 250,000 |
| 249,368 |
|
| Lamar Media Corp., 5.75%, 2/1/26 | 50,000 |
| 51,438 |
|
Lamar Media Corp., 3.75%, 2/15/28(1) | 275,000 |
| 259,842 |
|
Lamar Media Corp., 4.00%, 2/15/30(1) | 325,000 |
| 304,687 |
|
LCPR Senior Secured Financing DAC, 6.75%, 10/15/27(1) | 400,000 |
| 396,220 |
|
Midcontinent Communications / Midcontinent Finance Corp., 5.375%, 8/15/27(1) | 350,000 |
| 341,865 |
|
Nexstar Broadcasting, Inc., 5.625%, 8/1/24(1) | 550,000 |
| 521,122 |
|
Nexstar Broadcasting, Inc., 5.625%, 7/15/27(1) | 1,425,000 |
| 1,400,846 |
|
Outfront Media Capital LLC / Outfront Media Capital Corp., 5.00%, 8/15/27(1) | 950,000 |
| 879,272 |
|
Outfront Media Capital LLC / Outfront Media Capital Corp., 4.625%, 3/15/30(1) | 50,000 |
| 44,778 |
|
| Quebecor Media, Inc., 5.75%, 1/15/23 | 425,000 |
| 433,987 |
|
Salem Media Group, Inc., 6.75%, 6/1/24(1) | 175,000 |
| 146,125 |
|
Scripps Escrow, Inc., 5.875%, 7/15/27(1) | 225,000 |
| 199,249 |
|
Sinclair Television Group, Inc., 5.875%, 3/15/26(1) | 225,000 |
| 201,047 |
|
Sinclair Television Group, Inc., 5.125%, 2/15/27(1) | 75,000 |
| 64,016 |
|
Sinclair Television Group, Inc., 5.50%, 3/1/30(1) | 675,000 |
| 562,309 |
|
Sirius XM Radio, Inc., 3.875%, 8/1/22(1) | 439,000 |
| 440,637 |
|
Sirius XM Radio, Inc., 4.625%, 5/15/23(1) | 250,000 |
| 249,061 |
|
Sirius XM Radio, Inc., 4.625%, 7/15/24(1) | 725,000 |
| 740,359 |
|
Sirius XM Radio, Inc., 5.00%, 8/1/27(1) | 200,000 |
| 204,090 |
|
Sirius XM Radio, Inc., 5.50%, 7/1/29(1) | 750,000 |
| 769,162 |
|
TEGNA, Inc., 4.875%, 9/15/21(1) | 25,000 |
| 24,594 |
|
TEGNA, Inc., 4.625%, 3/15/28(1) | 1,550,000 |
| 1,370,781 |
|
TEGNA, Inc., 5.00%, 9/15/29(1) | 425,000 |
| 384,094 |
|
Townsquare Media, Inc., 6.50%, 4/1/23(1) | 775,000 |
| 750,777 |
|
Univision Communications, Inc., 6.75%, 9/15/22(1) | 436,000 |
| 422,238 |
|
Univision Communications, Inc., 5.125%, 2/15/25(1) | 350,000 |
| 301,000 |
|
UPC Holding BV, 5.50%, 1/15/28(1) | 200,000 |
| 189,110 |
|
| Videotron Ltd., 5.00%, 7/15/22 | 1,500,000 |
| 1,500,031 |
|
Videotron Ltd., 5.375%, 6/15/24(1) | 500,000 |
| 506,085 |
|
Virgin Media Finance plc, 6.00%, 10/15/24(1) | 400,000 |
| 397,498 |
|
Virgin Media Finance plc, 5.75%, 1/15/25(1) | 400,000 |
| 391,498 |
|
Virgin Media Secured Finance plc, 5.50%, 5/15/29(1) | 600,000 |
| 603,330 |
|
|
| | | | | | |
| | Principal Amount/Shares | Value |
Ziggo Bond Co. BV, 6.00%, 1/15/27(1) | $ | 500,000 |
| $ | 488,484 |
|
Ziggo Bond Co. BV, 5.125%, 2/28/30(1) | 200,000 |
| 197,125 |
|
Ziggo BV, 5.50%, 1/15/27(1) | 270,000 |
| 271,498 |
|
Ziggo BV, 4.875%, 1/15/30(1) | 200,000 |
| 196,181 |
|
| | | 50,418,536 |
|
| Metals and Mining — 4.1% | | |
Alcoa Nederland Holding BV, 6.75%, 9/30/24(1) | 400,000 |
| 390,868 |
|
Alcoa Nederland Holding BV, 7.00%, 9/30/26(1) | 200,000 |
| 187,110 |
|
Alcoa Nederland Holding BV, 6.125%, 5/15/28(1) | 600,000 |
| 549,330 |
|
Aleris International, Inc., 10.75%, 7/15/23(1) | 250,000 |
| 245,000 |
|
| Allegheny Technologies, Inc., 5.875%, 12/1/27 | 375,000 |
| 312,750 |
|
Anglo American Capital plc, 4.125%, 9/27/22(1) | 250,000 |
| 246,752 |
|
Arconic Corp., 6.125%, 2/15/28(1) | 200,000 |
| 206,000 |
|
Baffinland Iron Mines Corp. / Baffinland Iron Mines LP, 8.75%, 7/15/26(1) | 150,000 |
| 134,168 |
|
Big River Steel LLC / BRS Finance Corp., 7.25%, 9/1/25(1) | 425,000 |
| 389,925 |
|
| Cleveland-Cliffs, Inc., 5.75%, 3/1/25 | 163,000 |
| 127,140 |
|
Cleveland-Cliffs, Inc., 6.75%, 3/15/26(1) | 225,000 |
| 200,109 |
|
Cleveland-Cliffs, Inc., 5.875%, 6/1/27(1) | 1,250,000 |
| 755,562 |
|
| Coeur Mining, Inc., 5.875%, 6/1/24 | 200,000 |
| 181,749 |
|
| Commercial Metals Co., 5.75%, 4/15/26 | 375,000 |
| 352,692 |
|
| Commercial Metals Co., 5.375%, 7/15/27 | 50,000 |
| 46,427 |
|
Compass Minerals International, Inc., 4.875%, 7/15/24(1) | 75,000 |
| 71,156 |
|
Compass Minerals International, Inc., 6.75%, 12/1/27(1) | 375,000 |
| 340,613 |
|
Constellium SE, 5.75%, 5/15/24(1) | 250,000 |
| 225,336 |
|
Constellium SE, 6.625%, 3/1/25(1) | 750,000 |
| 680,602 |
|
First Quantum Minerals Ltd., 7.25%, 4/1/23(1) | 850,000 |
| 733,129 |
|
First Quantum Minerals Ltd., 6.50%, 3/1/24(1) | 2,400,000 |
| 2,007,012 |
|
First Quantum Minerals Ltd., 7.50%, 4/1/25(1) | 600,000 |
| 503,067 |
|
First Quantum Minerals Ltd., 6.875%, 3/1/26(1) | 225,000 |
| 181,811 |
|
FMG Resources August 2006 Pty Ltd., 4.75%, 5/15/22(1) | 50,000 |
| 50,080 |
|
| Freeport-McMoRan, Inc., 3.55%, 3/1/22 | 89,000 |
| 85,855 |
|
| Freeport-McMoRan, Inc., 3.875%, 3/15/23 | 2,475,000 |
| 2,372,919 |
|
| Freeport-McMoRan, Inc., 5.00%, 9/1/27 | 450,000 |
| 420,300 |
|
| Freeport-McMoRan, Inc., 4.125%, 3/1/28 | 700,000 |
| 615,398 |
|
| Freeport-McMoRan, Inc., 4.25%, 3/1/30 | 975,000 |
| 850,736 |
|
| Freeport-McMoRan, Inc., 5.45%, 3/15/43 | 1,075,000 |
| 970,510 |
|
Grinding Media, Inc. / Moly-Cop AltaSteel Ltd., 7.375%, 12/15/23(1) | 550,000 |
| 517,148 |
|
Hillman Group, Inc. (The), 6.375%, 7/15/22(1) | 25,000 |
| 19,617 |
|
Hudbay Minerals, Inc., 7.25%, 1/15/23(1) | 50,000 |
| 43,937 |
|
Hudbay Minerals, Inc., 7.625%, 1/15/25(1) | 600,000 |
| 525,753 |
|
IAMGOLD Corp., 7.00%, 4/15/25(1) | 75,000 |
| 70,406 |
|
Kaiser Aluminum Corp., 4.625%, 3/1/28(1) | 300,000 |
| 267,915 |
|
| Kinross Gold Corp., 5.125%, 9/1/21 | 50,000 |
| 50,463 |
|
| Kinross Gold Corp., 4.50%, 7/15/27 | 50,000 |
| 47,488 |
|
Mineral Resources Ltd., 8.125%, 5/1/27(1) | 650,000 |
| 613,494 |
|
Mountain Province Diamonds, Inc., 8.00%, 12/15/22(1) | 75,000 |
| 54,844 |
|
|
| | | | | | |
| | Principal Amount/Shares | Value |
Northwest Acquisitions ULC / Dominion Finco, Inc., 7.125%, 11/1/22(1) | $ | 75,000 |
| $ | 37,151 |
|
Novelis Corp., 5.875%, 9/30/26(1) | 900,000 |
| 889,499 |
|
Novelis Corp., 4.75%, 1/30/30(1) | 1,450,000 |
| 1,298,656 |
|
| Park-Ohio Industries, Inc., 6.625%, 4/15/27 | 275,000 |
| 219,713 |
|
Petra Diamonds US Treasury plc, 7.25%, 5/1/22(1) | 200,000 |
| 47,000 |
|
Taseko Mines Ltd., 8.75%, 6/15/22(1) | 575,000 |
| 263,601 |
|
| United States Steel Corp., 6.25%, 3/15/26 | 25,000 |
| 16,389 |
|
| | | 19,417,180 |
|
| Mortgage Real Estate Investment Trusts (REITs) — 0.3% | | |
Ladder Capital Finance Holdings LLLP / Ladder Capital Finance Corp., 5.875%, 8/1/21(1) | 650,000 |
| 551,655 |
|
Ladder Capital Finance Holdings LLLP / Ladder Capital Finance Corp., 5.25%, 3/15/22(1) | 475,000 |
| 428,678 |
|
Ladder Capital Finance Holdings LLLP / Ladder Capital Finance Corp., 4.25%, 2/1/27(1) | 325,000 |
| 259,187 |
|
| | | 1,239,520 |
|
Multiline Retail† | | |
JC Penney Corp., Inc., 8.625%, 3/15/25(1) | 250,000 |
| 45,000 |
|
| JC Penney Corp., Inc., 6.375%, 10/15/36 | 125,000 |
| 11,250 |
|
Neiman Marcus Group Ltd. LLC / Neiman Marcus Group LLC / Mariposa Borrower / NMG, 8.75%, 10/25/24(1)(5) | 103,452 |
| 10,345 |
|
| | | 66,595 |
|
| Oil, Gas and Consumable Fuels — 5.1% | | |
| Antero Midstream Partners LP / Antero Midstream Finance Corp., 5.375%, 9/15/24 | 375,000 |
| 263,325 |
|
Antero Midstream Partners LP / Antero Midstream Finance Corp., 5.75%, 3/1/27(1) | 575,000 |
| 372,356 |
|
| Antero Resources Corp., 5.375%, 11/1/21 | 250,000 |
| 183,240 |
|
| Antero Resources Corp., 5.125%, 12/1/22 | 275,000 |
| 144,469 |
|
| Antero Resources Corp., 5.625%, 6/1/23 | 75,000 |
| 30,563 |
|
| Antero Resources Corp., 5.00%, 3/1/25 | 25,000 |
| 9,438 |
|
Ascent Resources Utica Holdings LLC / ARU Finance Corp., 10.00%, 4/1/22(1) | 575,000 |
| 311,926 |
|
Ascent Resources Utica Holdings LLC / ARU Finance Corp., 7.00%, 11/1/26(1) | 75,000 |
| 22,203 |
|
Bruin E&P Partners LLC, 8.875%, 8/1/23(1) | 875,000 |
| 74,375 |
|
| Callon Petroleum Co., 6.25%, 4/15/23 | 225,000 |
| 55,118 |
|
| Callon Petroleum Co., 6.125%, 10/1/24 | 975,000 |
| 180,375 |
|
| Callon Petroleum Co., 8.25%, 7/15/25 | 68,000 |
| 11,475 |
|
| Callon Petroleum Co., 6.375%, 7/1/26 | 125,000 |
| 21,068 |
|
Centennial Resource Production LLC, 5.375%, 1/15/26(1) | 450,000 |
| 111,844 |
|
Centennial Resource Production LLC, 6.875%, 4/1/27(1) | 200,000 |
| 50,394 |
|
Chaparral Energy, Inc., 8.75%, 7/15/23(1) | 350,000 |
| 24,675 |
|
| Chesapeake Energy Corp., 6.875%, 11/15/20 | 675,000 |
| 189,000 |
|
| Chesapeake Energy Corp., 5.75%, 3/15/23 | 175,000 |
| 18,813 |
|
| Chesapeake Energy Corp., 8.00%, 1/15/25 | 487,000 |
| 34,090 |
|
Citgo Holding, Inc., 9.25%, 8/1/24(1) | 1,475,000 |
| 1,213,187 |
|
| CNX Resources Corp., 5.875%, 4/15/22 | 425,000 |
| 392,062 |
|
CNX Resources Corp., 7.25%, 3/14/27(1) | 600,000 |
| 428,091 |
|
|
| | | | | | |
| | Principal Amount/Shares | Value |
Comstock Resources, Inc., 7.50%, 5/15/25(1) | $ | 350,000 |
| $ | 250,250 |
|
| Crestwood Midstream Partners LP / Crestwood Midstream Finance Corp., 6.25%, 4/1/23 | 1,360,000 |
| 770,379 |
|
Crestwood Midstream Partners LP / Crestwood Midstream Finance Corp., 5.625%, 5/1/27(1) | 275,000 |
| 153,253 |
|
CrownRock LP / CrownRock Finance, Inc., 5.625%, 10/15/25(1) | 775,000 |
| 408,789 |
|
DCP Midstream Operating LP, 4.75%, 9/30/21(1) | 295,000 |
| 260,146 |
|
| DCP Midstream Operating LP, 3.875%, 3/15/23 | 600,000 |
| 484,302 |
|
| DCP Midstream Operating LP, 5.125%, 5/15/29 | 525,000 |
| 333,638 |
|
| Delek Logistics Partners LP / Delek Logistics Finance Corp., 6.75%, 5/15/25 | 384,000 |
| 376,802 |
|
Denbury Resources, Inc., 9.00%, 5/15/21(1) | 1,405,000 |
| 420,446 |
|
Endeavor Energy Resources LP / EER Finance, Inc., 5.50%, 1/30/26(1) | 125,000 |
| 87,147 |
|
Endeavor Energy Resources LP / EER Finance, Inc., 5.75%, 1/30/28(1) | 550,000 |
| 377,052 |
|
| EnLink Midstream LLC, 5.375%, 6/1/29 | 1,000,000 |
| 526,967 |
|
| EnLink Midstream Partners LP, 4.40%, 4/1/24 | 325,000 |
| 166,455 |
|
| EnLink Midstream Partners LP, 4.85%, 7/15/26 | 1,175,000 |
| 585,934 |
|
| EnLink Midstream Partners LP, 5.60%, 4/1/44 | 450,000 |
| 156,512 |
|
| EnLink Midstream Partners LP, 5.05%, 4/1/45 | 50,000 |
| 18,750 |
|
| EnLink Midstream Partners LP, 5.45%, 6/1/47 | 150,000 |
| 50,640 |
|
EP Energy LLC / Everest Acquisition Finance, Inc., 9.375%, 5/1/20(5)(6) | 537,000 |
| 2,067 |
|
EP Energy LLC / Everest Acquisition Finance, Inc., 9.375%, 5/1/24(1)(5)(6) | 592,000 |
| 5,328 |
|
| EQT Corp., 7.00%, 2/1/30 | 75,000 |
| 56,439 |
|
Extraction Oil & Gas, Inc., 7.375%, 5/15/24(1) | 150,000 |
| 27,937 |
|
| Genesis Energy LP / Genesis Energy Finance Corp., 6.00%, 5/15/23 | 200,000 |
| 146,819 |
|
| Genesis Energy LP / Genesis Energy Finance Corp., 7.75%, 2/1/28 | 600,000 |
| 419,970 |
|
| Gulfport Energy Corp., 6.00%, 10/15/24 | 125,000 |
| 31,563 |
|
| Gulfport Energy Corp., 6.375%, 5/15/25 | 442,000 |
| 111,050 |
|
| Gulfport Energy Corp., 6.375%, 1/15/26 | 275,000 |
| 56,088 |
|
Hess Midstream Operations LP, 5.625%, 2/15/26(1) | 475,000 |
| 338,690 |
|
Hess Midstream Operations LP, 5.125%, 6/15/28(1) | 1,075,000 |
| 759,541 |
|
| HighPoint Operating Corp., 7.00%, 10/15/22 | 50,000 |
| 26,172 |
|
Hilcorp Energy I LP / Hilcorp Finance Co., 6.25%, 11/1/28(1) | 400,000 |
| 179,417 |
|
Holly Energy Partners LP / Holly Energy Finance Corp., 5.00%, 2/1/28(1) | 700,000 |
| 590,187 |
|
Indigo Natural Resources LLC, 6.875%, 2/15/26(1) | 700,000 |
| 467,302 |
|
| Jagged Peak Energy LLC, 5.875%, 5/1/26 | 325,000 |
| 245,348 |
|
| Laredo Petroleum, Inc., 9.50%, 1/15/25 | 525,000 |
| 211,969 |
|
Lonestar Resources America, Inc., 11.25%, 1/1/23(1) | 100,000 |
| 23,250 |
|
Magnolia Oil & Gas Operating LLC / Magnolia Oil & Gas Finance Corp., 6.00%, 8/1/26(1) | 250,000 |
| 156,250 |
|
| Matador Resources Co., 5.875%, 9/15/26 | 300,000 |
| 86,168 |
|
MEG Energy Corp., 7.00%, 3/31/24(1) | 360,000 |
| 168,302 |
|
MEG Energy Corp., 7.125%, 2/1/27(1) | 550,000 |
| 277,750 |
|
Moss Creek Resources Holdings, Inc., 7.50%, 1/15/26(1) | 675,000 |
| 201,516 |
|
|
| | | | | | |
| | Principal Amount/Shares | Value |
Moss Creek Resources Holdings, Inc., 10.50%, 5/15/27(1) | $ | 150,000 |
| $ | 50,031 |
|
| Murphy Oil Corp., 6.875%, 8/15/24 | 650,000 |
| 389,191 |
|
| Murphy Oil Corp., 5.75%, 8/15/25 | 250,000 |
| 135,339 |
|
| Murphy Oil Corp., 5.875%, 12/1/27 | 125,000 |
| 65,819 |
|
Murray Energy Corp., 9.00% Cash plus 3.00% PIK, 4/15/24(1)(5)(6) | 879,713 |
| 1,108 |
|
| NuStar Logistics LP, 6.00%, 6/1/26 | 200,000 |
| 149,124 |
|
| Oasis Petroleum, Inc., 6.875%, 3/15/22 | 325,000 |
| 66,625 |
|
Oasis Petroleum, Inc., 6.25%, 5/1/26(1) | 175,000 |
| 29,326 |
|
| Occidental Petroleum Corp., 7.50%, 5/1/31 | 325,000 |
| 168,484 |
|
Parkland Fuel Corp., 6.00%, 4/1/26(1) | 50,000 |
| 46,778 |
|
Parkland Fuel Corp., 5.875%, 7/15/27(1) | 775,000 |
| 730,786 |
|
Parsley Energy LLC / Parsley Finance Corp., 5.625%, 10/15/27(1) | 275,000 |
| 195,401 |
|
Parsley Energy LLC / Parsley Finance Corp., 4.125%, 2/15/28(1) | 475,000 |
| 326,563 |
|
PBF Holding Co. LLC / PBF Finance Corp., 6.00%, 2/15/28(1) | 400,000 |
| 272,000 |
|
| PBF Logistics LP / PBF Logistics Finance Corp., 6.875%, 5/15/23 | 675,000 |
| 420,889 |
|
| PDC Energy, Inc., 6.125%, 9/15/24 | 175,000 |
| 94,937 |
|
| PDC Energy, Inc., 5.75%, 5/15/26 | 25,000 |
| 14,168 |
|
| Range Resources Corp., 5.875%, 7/1/22 | 141,000 |
| 102,709 |
|
| Range Resources Corp., 5.00%, 8/15/22 | 25,000 |
| 18,930 |
|
Sanchez Energy Corp., 7.75%, 6/15/21(5)(6) | 475,000 |
| 3,349 |
|
Sanchez Energy Corp., 6.125%, 1/15/23(5)(6) | 775,000 |
| 11,625 |
|
Seven Generations Energy Ltd., 6.75%, 5/1/23(1) | 200,000 |
| 141,749 |
|
Seven Generations Energy Ltd., 6.875%, 6/30/23(1) | 425,000 |
| 295,224 |
|
Seven Generations Energy Ltd., 5.375%, 9/30/25(1) | 175,000 |
| 97,557 |
|
| SM Energy Co., 6.125%, 11/15/22 | 425,000 |
| 183,415 |
|
| SM Energy Co., 5.00%, 1/15/24 | 50,000 |
| 15,187 |
|
| SM Energy Co., 5.625%, 6/1/25 | 500,000 |
| 140,628 |
|
| SM Energy Co., 6.75%, 9/15/26 | 150,000 |
| 46,281 |
|
| SM Energy Co., 6.625%, 1/15/27 | 225,000 |
| 67,057 |
|
| Southwestern Energy Co., 6.20%, 1/23/25 | 471,000 |
| 324,246 |
|
| Southwestern Energy Co., 7.75%, 10/1/27 | 150,000 |
| 99,761 |
|
| Summit Midstream Holdings LLC / Summit Midstream Finance Corp., 5.50%, 8/15/22 | 800,000 |
| 182,749 |
|
| Summit Midstream Holdings LLC / Summit Midstream Finance Corp., 5.75%, 4/15/25 | 100,000 |
| 11,875 |
|
| Sunoco LP / Sunoco Finance Corp., 4.875%, 1/15/23 | 531,000 |
| 517,414 |
|
| Sunoco LP / Sunoco Finance Corp., 5.50%, 2/15/26 | 50,000 |
| 43,691 |
|
| Sunoco LP / Sunoco Finance Corp., 6.00%, 4/15/27 | 950,000 |
| 823,619 |
|
Tallgrass Energy Partners LP / Tallgrass Energy Finance Corp., 4.75%, 10/1/23(1) | 200,000 |
| 125,006 |
|
Tallgrass Energy Partners LP / Tallgrass Energy Finance Corp., 5.50%, 9/15/24(1) | 75,000 |
| 41,810 |
|
| Targa Resources Partners LP / Targa Resources Partners Finance Corp., 4.25%, 11/15/23 | 1,477,000 |
| 1,280,493 |
|
| Targa Resources Partners LP / Targa Resources Partners Finance Corp., 6.75%, 3/15/24 | 25,000 |
| 22,187 |
|
| Targa Resources Partners LP / Targa Resources Partners Finance Corp., 6.50%, 7/15/27 | 100,000 |
| 86,000 |
|
| Targa Resources Partners LP / Targa Resources Partners Finance Corp., 5.00%, 1/15/28 | 825,000 |
| 670,752 |
|
|
| | | | | | |
| | Principal Amount/Shares | Value |
| Targa Resources Partners LP / Targa Resources Partners Finance Corp., 6.875%, 1/15/29 | $ | 500,000 |
| $ | 406,250 |
|
Targa Resources Partners LP / Targa Resources Partners Finance Corp., 5.50%, 3/1/30(1) | 250,000 |
| 195,313 |
|
| TransMontaigne Partners LP / TLP Finance Corp., 6.125%, 2/15/26 | 75,000 |
| 60,641 |
|
Vine Oil & Gas LP / Vine Oil & Gas Finance Corp., 8.75%, 4/15/23(1) | 800,000 |
| 196,000 |
|
Vine Oil & Gas LP / Vine Oil & Gas Finance Corp., 9.75%, 4/15/23(1) | 500,000 |
| 130,625 |
|
Whiting Petroleum Corp., 5.75%, 3/15/21(5) | 150,000 |
| 11,093 |
|
Whiting Petroleum Corp., 6.25%, 4/1/23(5) | 450,000 |
| 37,125 |
|
Whiting Petroleum Corp., 6.625%, 1/15/26(5) | 575,000 |
| 43,168 |
|
| WPX Energy, Inc., 8.25%, 8/1/23 | 143,000 |
| 106,356 |
|
| WPX Energy, Inc., 5.75%, 6/1/26 | 50,000 |
| 28,848 |
|
| WPX Energy, Inc., 4.50%, 1/15/30 | 575,000 |
| 314,381 |
|
| | | 24,198,355 |
|
| Paper and Forest Products — 0.2% | | |
| Mercer International, Inc., 6.50%, 2/1/24 | 475,000 |
| 407,904 |
|
| Mercer International, Inc., 7.375%, 1/15/25 | 375,000 |
| 315,471 |
|
Schweitzer-Mauduit International, Inc., 6.875%, 10/1/26(1) | 150,000 |
| 150,531 |
|
| | | 873,906 |
|
Personal Products† | | |
Avon International Capital plc, 6.50%, 8/15/22(1) | 125,000 |
| 111,680 |
|
| Revlon Consumer Products Corp., 6.25%, 8/1/24 | 50,000 |
| 11,937 |
|
| | | 123,617 |
|
| Pharmaceuticals — 3.3% | | |
Bausch Health Americas, Inc., 8.50%, 1/31/27(1) | 625,000 |
| 656,594 |
|
Bausch Health Cos., Inc., 5.50%, 3/1/23(1) | 31,000 |
| 30,651 |
|
Bausch Health Cos., Inc., 5.875%, 5/15/23(1) | 82,000 |
| 81,334 |
|
Bausch Health Cos., Inc., 6.125%, 4/15/25(1) | 3,575,000 |
| 3,543,737 |
|
Bausch Health Cos., Inc., 9.00%, 12/15/25(1) | 3,475,000 |
| 3,689,407 |
|
Bausch Health Cos., Inc., 5.75%, 8/15/27(1) | 75,000 |
| 77,636 |
|
Bausch Health Cos., Inc., 7.00%, 1/15/28(1) | 375,000 |
| 390,956 |
|
Bausch Health Cos., Inc., 5.00%, 1/30/28(1) | 1,025,000 |
| 978,055 |
|
Bausch Health Cos., Inc., 7.25%, 5/30/29(1) | 225,000 |
| 234,754 |
|
Bausch Health Cos., Inc., 5.25%, 1/30/30(1) | 425,000 |
| 400,562 |
|
| Elanco Animal Health, Inc., 5.65%, 8/28/28 | 225,000 |
| 237,909 |
|
Endo Dac / Endo Finance LLC / Endo Finco, Inc., 6.00%, 7/15/23(1) | 2,048,000 |
| 1,498,829 |
|
Endo Dac / Endo Finance LLC / Endo Finco, Inc., 6.00%, 2/1/25(1) | 800,000 |
| 550,744 |
|
Horizon Therapeutics USA, Inc., 5.50%, 8/1/27(1) | 600,000 |
| 605,670 |
|
Mallinckrodt International Finance SA / Mallinckrodt CB LLC, 5.75%, 8/1/22(1) | 300,000 |
| 152,250 |
|
Mallinckrodt International Finance SA / Mallinckrodt CB LLC, 5.625%, 10/15/23(1) | 50,000 |
| 12,812 |
|
Par Pharmaceutical, Inc., 7.50%, 4/1/27(1) | 750,000 |
| 751,931 |
|
| Teva Pharmaceutical Finance Netherlands III BV, 6.00%, 4/15/24 | 200,000 |
| 197,749 |
|
Teva Pharmaceutical Finance Netherlands III BV, 7.125%, 1/31/25(1) | 800,000 |
| 796,508 |
|
| Teva Pharmaceutical Finance Netherlands III BV, 4.10%, 10/1/46 | 900,000 |
| 664,020 |
|
|
| | | | | | |
| | Principal Amount/Shares | Value |
Vizient, Inc., 6.25%, 5/15/27(1) | $ | 100,000 |
| $ | 100,646 |
|
| | | 15,652,754 |
|
| Professional Services — 0.4% | | |
ASGN, Inc., 4.625%, 5/15/28(1) | 525,000 |
| 495,101 |
|
Dun & Bradstreet Corp. (The), 6.875%, 8/15/26(1) | 175,000 |
| 182,985 |
|
Dun & Bradstreet Corp. (The), 10.25%, 2/15/27(1) | 1,275,000 |
| 1,358,576 |
|
| | | 2,036,662 |
|
| Real Estate Management and Development — 0.6% | | |
Five Point Operating Co. LP / Five Point Capital Corp., 7.875%, 11/15/25(1) | 50,000 |
| 43,374 |
|
Forestar Group, Inc., 8.00%, 4/15/24(1) | 675,000 |
| 687,653 |
|
Forestar Group, Inc., 5.00%, 3/1/28(1) | 275,000 |
| 229,899 |
|
Greystar Real Estate Partners LLC, 5.75%, 12/1/25(1) | 150,000 |
| 136,879 |
|
Howard Hughes Corp. (The), 5.375%, 3/15/25(1) | 275,000 |
| 268,117 |
|
Hunt Cos., Inc., 6.25%, 2/15/26(1) | 525,000 |
| 396,095 |
|
| Kennedy-Wilson, Inc., 5.875%, 4/1/24 | 425,000 |
| 383,422 |
|
| Newmark Group, Inc., 6.125%, 11/15/23 | 475,000 |
| 483,981 |
|
Realogy Group LLC / Realogy Co-Issuer Corp., 4.875%, 6/1/23(1) | 100,000 |
| 84,750 |
|
Realogy Group LLC / Realogy Co-Issuer Corp., 9.375%, 4/1/27(1) | 75,000 |
| 63,777 |
|
| | | 2,777,947 |
|
| Road and Rail — 1.3% | | |
Ahern Rentals, Inc., 7.375%, 5/15/23(1) | 325,000 |
| 188,092 |
|
Avis Budget Car Rental LLC / Avis Budget Finance, Inc., 5.75%, 7/15/27(1) | 350,000 |
| 280,936 |
|
Capitol Investment Merger Sub 2 LLC, 10.00%, 8/1/24(1) | 75,000 |
| 68,156 |
|
DAE Funding LLC, 5.25%, 11/15/21(1) | 575,000 |
| 525,766 |
|
DAE Funding LLC, 4.50%, 8/1/22(1) | 800,000 |
| 747,983 |
|
DAE Funding LLC, 5.00%, 8/1/24(1) | 300,000 |
| 273,741 |
|
Hertz Corp. (The), 5.50%, 10/15/24(1) | 50,000 |
| 28,427 |
|
Hertz Corp. (The), 7.125%, 8/1/26(1) | 975,000 |
| 515,946 |
|
Hertz Corp. (The), 6.00%, 1/15/28(1) | 1,400,000 |
| 742,770 |
|
Uber Technologies, Inc., 7.50%, 11/1/23(1) | 1,225,000 |
| 1,199,006 |
|
Uber Technologies, Inc., 8.00%, 11/1/26(1) | 775,000 |
| 769,600 |
|
Uber Technologies, Inc., 7.50%, 9/15/27(1) | 275,000 |
| 273,563 |
|
| United Rentals North America, Inc., 6.50%, 12/15/26 | 400,000 |
| 408,220 |
|
| | | 6,022,206 |
|
| Semiconductors and Semiconductor Equipment — 0.8% | | |
| Advanced Micro Devices, Inc., 7.50%, 8/15/22 | 723,000 |
| 772,479 |
|
Amkor Technology, Inc., 6.625%, 9/15/27(1) | 200,000 |
| 189,110 |
|
Entegris, Inc., 4.625%, 2/10/26(1) | 450,000 |
| 429,997 |
|
NXP BV / NXP Funding LLC, 4.125%, 6/1/21(1) | 400,000 |
| 403,884 |
|
NXP BV / NXP Funding LLC, 4.625%, 6/15/22(1) | 400,000 |
| 414,091 |
|
NXP BV / NXP Funding LLC, 4.625%, 6/1/23(1) | 400,000 |
| 412,206 |
|
| Qorvo, Inc., 5.50%, 7/15/26 | 375,000 |
| 394,077 |
|
Qorvo, Inc., 4.375%, 10/15/29(1) | 350,000 |
| 327,469 |
|
Sensata Technologies UK Financing Co. plc, 6.25%, 2/15/26(1) | 600,000 |
| 591,330 |
|
| | | 3,934,643 |
|
|
| | | | | | |
| | Principal Amount/Shares | Value |
| Software — 1.8% | | |
ACI Worldwide, Inc., 5.75%, 8/15/26(1) | $ | 125,000 |
| $ | 124,818 |
|
Ascend Learning LLC, 6.875%, 8/1/25(1) | 150,000 |
| 146,812 |
|
Ascend Learning LLC, 6.875%, 8/1/25(1) | 50,000 |
| 48,937 |
|
Camelot Finance SA, 4.50%, 11/1/26(1) | 500,000 |
| 487,811 |
|
Castle US Holding Corp., 9.50%, 2/15/28(1) | 1,075,000 |
| 1,027,297 |
|
| CDK Global, Inc., 5.875%, 6/15/26 | 275,000 |
| 292,064 |
|
CDK Global, Inc., 5.25%, 5/15/29(1) | 400,000 |
| 409,500 |
|
| Infor US, Inc., 6.50%, 5/15/22 | 1,010,000 |
| 989,457 |
|
j2 Cloud Services LLC / j2 Cloud Co-Obligor, Inc., 6.00%, 7/15/25(1) | 750,000 |
| 749,059 |
|
Open Text Corp., 5.875%, 6/1/26(1) | 350,000 |
| 369,057 |
|
Open Text Corp., 3.875%, 2/15/28(1) | 550,000 |
| 519,578 |
|
Open Text Holdings, Inc., 4.125%, 2/15/30(1) | 550,000 |
| 520,231 |
|
PTC, Inc., 3.625%, 2/15/25(1) | 325,000 |
| 306,312 |
|
PTC, Inc., 4.00%, 2/15/28(1) | 225,000 |
| 217,755 |
|
RP Crown Parent LLC, 7.375%, 10/15/24(1) | 150,000 |
| 144,232 |
|
Solera LLC / Solera Finance, Inc., 10.50%, 3/1/24(1) | 425,000 |
| 419,158 |
|
SS&C Technologies, Inc., 5.50%, 9/30/27(1) | 1,000,000 |
| 1,036,875 |
|
Veritas US, Inc. / Veritas Bermuda Ltd., 10.50%, 2/1/24(1) | 825,000 |
| 702,277 |
|
| | | 8,511,230 |
|
| Specialty Retail — 1.7% | | |
Asbury Automotive Group, Inc., 4.50%, 3/1/28(1) | 120,000 |
| 102,900 |
|
Asbury Automotive Group, Inc., 4.75%, 3/1/30(1) | 120,000 |
| 102,900 |
|
Carvana Co., 8.875%, 10/1/23(1) | 200,000 |
| 190,494 |
|
eG Global Finance plc, 6.75%, 2/7/25(1) | 200,000 |
| 165,251 |
|
eG Global Finance plc, 8.50%, 10/30/25(1) | 600,000 |
| 537,753 |
|
| Ferrellgas LP / Ferrellgas Finance Corp., 6.50%, 5/1/21 | 75,000 |
| 66,090 |
|
| Ferrellgas Partners LP / Ferrellgas Partners Finance Corp., 8.625%, 6/15/20 | 50,000 |
| 12,933 |
|
| Ferrellgas Partners LP / Ferrellgas Partners Finance Corp., 8.625%, 6/15/20 | 50,000 |
| 12,933 |
|
| Group 1 Automotive, Inc., 5.00%, 6/1/22 | 275,000 |
| 255,057 |
|
Group 1 Automotive, Inc., 5.25%, 12/15/23(1) | 25,000 |
| 25,656 |
|
| L Brands, Inc., 5.25%, 2/1/28 | 75,000 |
| 57,709 |
|
| L Brands, Inc., 7.50%, 6/15/29 | 425,000 |
| 337,641 |
|
| L Brands, Inc., 6.875%, 11/1/35 | 365,000 |
| 272,044 |
|
| L Brands, Inc., 6.75%, 7/1/36 | 1,300,000 |
| 946,140 |
|
Lithia Motors, Inc., 5.25%, 8/1/25(1) | 50,000 |
| 43,937 |
|
Lithia Motors, Inc., 4.625%, 12/15/27(1) | 200,000 |
| 181,520 |
|
| Murphy Oil USA, Inc., 4.75%, 9/15/29 | 200,000 |
| 188,610 |
|
| Penske Automotive Group, Inc., 3.75%, 8/15/20 | 225,000 |
| 220,762 |
|
| Penske Automotive Group, Inc., 5.75%, 10/1/22 | 100,000 |
| 93,248 |
|
PetSmart, Inc., 7.125%, 3/15/23(1) | 1,475,000 |
| 1,400,513 |
|
PriSo Acquisition Corp., 9.00%, 5/15/23(1) | 75,000 |
| 52,125 |
|
| Sonic Automotive, Inc., 6.125%, 3/15/27 | 450,000 |
| 399,844 |
|
Staples, Inc., 7.50%, 4/15/26(1) | 1,050,000 |
| 924,659 |
|
Staples, Inc., 10.75%, 4/15/27(1) | 1,425,000 |
| 1,101,311 |
|
|
| | | | | | |
| | Principal Amount/Shares | Value |
| Suburban Propane Partners LP / Suburban Energy Finance Corp., 5.50%, 6/1/24 | $ | 325,000 |
| $ | 307,928 |
|
Superior Plus LP / Superior General Partner, Inc., 7.00%, 7/15/26(1) | 50,000 |
| 49,177 |
|
| | | 8,049,135 |
|
| Technology Hardware, Storage and Peripherals — 1.2% | | |
Dell International LLC / EMC Corp., 5.875%, 6/15/21(1) | 1,002,000 |
| 1,002,000 |
|
Dell International LLC / EMC Corp., 7.125%, 6/15/24(1) | 1,375,000 |
| 1,424,844 |
|
| Diebold Nixdorf, Inc., 8.50%, 4/15/24 | 350,000 |
| 230,564 |
|
| EMC Corp., 2.65%, 6/1/20 | 555,000 |
| 553,918 |
|
Everi Payments, Inc., 7.50%, 12/15/25(1) | 344,000 |
| 264,448 |
|
| NCR Corp., 6.375%, 12/15/23 | 300,000 |
| 298,123 |
|
NCR Corp., 5.75%, 9/1/27(1) | 1,150,000 |
| 1,054,513 |
|
NCR Corp., 6.125%, 9/1/29(1) | 1,100,000 |
| 1,033,395 |
|
| | | 5,861,805 |
|
Textiles, Apparel and Luxury Goods† | | |
Eagle Intermediate Global Holding BV/Ruyi US Finance LLC, 7.50%, 5/1/25(1) | 150,000 |
| 87,562 |
|
| Thrifts and Mortgage Finance — 0.8% | | |
| MGIC Investment Corp., 5.75%, 8/15/23 | 475,000 |
| 443,918 |
|
Nationstar Mortgage Holdings, Inc., 8.125%, 7/15/23(1) | 875,000 |
| 861,048 |
|
Nationstar Mortgage Holdings, Inc., 9.125%, 7/15/26(1) | 225,000 |
| 204,469 |
|
Nationstar Mortgage Holdings, Inc., 6.00%, 1/15/27(1) | 500,000 |
| 427,813 |
|
Provident Funding Associates LP / PFG Finance Corp., 6.375%, 6/15/25(1) | 200,000 |
| 169,249 |
|
| Radian Group, Inc., 4.50%, 10/1/24 | 325,000 |
| 322,967 |
|
| Radian Group, Inc., 4.875%, 3/15/27 | 1,200,000 |
| 1,192,251 |
|
| | | 3,621,715 |
|
Tobacco† | | |
Vector Group Ltd., 6.125%, 2/1/25(1) | 75,000 |
| 68,811 |
|
Vector Group Ltd., 10.50%, 11/1/26(1) | 75,000 |
| 63,041 |
|
| | | 131,852 |
|
| Trading Companies and Distributors — 0.4% | | |
| Aircastle Ltd., 5.125%, 3/15/21 | 275,000 |
| 273,057 |
|
Beacon Roofing Supply, Inc., 4.875%, 11/1/25(1) | 325,000 |
| 295,345 |
|
Beacon Roofing Supply, Inc., 4.50%, 11/15/26(1) | 175,000 |
| 162,146 |
|
| Fly Leasing Ltd., 6.375%, 10/15/21 | 200,000 |
| 192,125 |
|
| Fly Leasing Ltd., 5.25%, 10/15/24 | 200,000 |
| 169,749 |
|
Fortress Transportation & Infrastructure Investors LLC, 6.75%, 3/15/22(1) | 325,000 |
| 302,546 |
|
Fortress Transportation & Infrastructure Investors LLC, 6.50%, 10/1/25(1) | 175,000 |
| 129,718 |
|
| H&E Equipment Services, Inc., 5.625%, 9/1/25 | 575,000 |
| 536,909 |
|
| | | 2,061,595 |
|
| Wireless Telecommunication Services — 2.0% | | |
Digicel Group One, Ltd., 8.25%, 12/30/22(1) | 1,314,000 |
| 650,430 |
|
| Sprint Communications, Inc., 9.25%, 4/15/22 | 350,000 |
| 377,453 |
|
| Sprint Communications, Inc., 6.00%, 11/15/22 | 250,000 |
| 261,485 |
|
| Sprint Corp., 7.25%, 9/15/21 | 275,000 |
| 284,944 |
|
|
| | | | | | |
| | Principal Amount/Shares | Value |
| Sprint Corp., 7.875%, 9/15/23 | $ | 1,500,000 |
| $ | 1,662,952 |
|
| Sprint Corp., 7.125%, 6/15/24 | 575,000 |
| 635,366 |
|
| Sprint Corp., 7.625%, 2/15/25 | 125,000 |
| 139,269 |
|
| Sprint Corp., 7.625%, 3/1/26 | 425,000 |
| 483,374 |
|
Sprint Corp., 7.25%, 2/1/28(1) | 100,000 |
| 100,875 |
|
| T-Mobile USA, Inc., 6.00%, 3/1/23 | 1,600,000 |
| 1,618,824 |
|
| T-Mobile USA, Inc., 6.50%, 1/15/24 | 150,000 |
| 153,370 |
|
| T-Mobile USA, Inc., 6.00%, 4/15/24 | 275,000 |
| 281,179 |
|
| T-Mobile USA, Inc., 6.375%, 3/1/25 | 1,750,000 |
| 1,800,321 |
|
| T-Mobile USA, Inc., 5.125%, 4/15/25 | 25,000 |
| 25,749 |
|
| T-Mobile USA, Inc., 4.75%, 2/1/28 | 375,000 |
| 389,269 |
|
| Vodafone Group plc, VRN, 7.00%, 4/4/79 | 575,000 |
| 615,802 |
|
Xplornet Communications, Inc., 9.625% Cash or 10.625% PIK, 6/1/22(1)(3) | 57,086 |
| 53,572 |
|
| | | 9,534,234 |
|
TOTAL CORPORATE BONDS
(Cost $501,918,262) | | 434,145,626 |
|
BANK LOAN OBLIGATIONS(8) — 3.3% | | |
| Auto Components — 0.2% | | |
| Panther BF Aggregator 2 LP, USD Term Loan B, 4.44%, (1-month LIBOR plus 3.50%), 4/30/26 | 771,125 |
| 709,435 |
|
Chemicals† | | |
| ASP Unifrax Holdings Inc, Term Loan B, 4.82%, (6-month LIBOR plus 3.75%), 12/12/25 | 49,375 |
| 39,562 |
|
| Consolidated Energy Finance, S.A., Term Loan B, 3.20%, (3-month LIBOR plus 2.50%), 5/7/25 | 147,375 |
| 106,847 |
|
| | | 146,409 |
|
| Commercial Services and Supplies — 0.1% | | |
| KAR Auction Services, Inc., 2019 Term Loan B6, 3.19%, (1-month LIBOR plus 2.25%), 9/19/26 | 149,250 |
| 138,802 |
|
| MRO Holdings, Inc., 2019 Term Loan B, 6.45%, (3-month LIBOR plus 5.00%), 6/4/26 | 45,807 |
| 37,295 |
|
| MRO Holdings, Inc., 2019 Term Loan B, 6.45%, (3-month LIBOR plus 5.00%), 6/4/26 | 22,503 |
| 18,321 |
|
| MRO Holdings, Inc., 2019 Term Loan B, 6.45%, (3-month LIBOR plus 5.00%), 6/4/26 | 155,003 |
| 126,199 |
|
| National Intergovernmental Purchasing Alliance Company, 1st Lien Term Loan, 5.20%, (3-month LIBOR plus 3.75%), 5/23/25 | 73,689 |
| 64,478 |
|
| | | 385,095 |
|
| Containers and Packaging — 0.2% | | |
| Berry Global, Inc., Term Loan Y, 2.86%, (1-month LIBOR plus 2.00%), 7/1/26 | 521,063 |
| 498,050 |
|
| BWAY Holding Company, 2017 Term Loan B, 5.08%, (3-month LIBOR plus 3.25%), 4/3/24 | 494,285 |
| 408,715 |
|
| Flex Acquisition Company, Inc., 1st Lien Term Loan, 4.58%, (1-month LIBOR plus 3.00%), 12/29/23 | 3,991 |
| 3,672 |
|
| Flex Acquisition Company, Inc., 1st Lien Term Loan, 4.91%, (3-month LIBOR plus 3.00%), 12/29/23 | 106,333 |
| 97,826 |
|
| | | 1,008,263 |
|
Distributors† | | |
| HD Supply, Inc., Term Loan B5, 2.74%, (1-month LIBOR plus 1.75%), 10/17/23 | 197,555 |
| 186,361 |
|
|
| | | | | | |
| | Principal Amount/Shares | Value |
| Diversified Financial Services — 0.4% | | |
| MPH Acquisition Holdings LLC, 2016 Term Loan B, 4.20%, (3-month LIBOR plus 2.75%), 6/7/23 | $ | 447,985 |
| $ | 403,186 |
|
| Refinitiv US Holdings Inc., 2018 USD Term Loan, 4.24%, (1-month LIBOR plus 3.25%), 10/1/25 | 1,465,013 |
| 1,414,346 |
|
| | | 1,817,532 |
|
| Electric Utilities — 0.2% | | |
| Vistra Operations Company LLC, 1st Lien Term Loan B3, 2.55%, (1-month LIBOR plus 1.75%), 12/31/25 | 176,200 |
| 168,381 |
|
| Vistra Operations Company LLC, 1st Lien Term Loan B3, 2.74%, (1-month LIBOR plus 1.75%), 12/31/25 | 736,177 |
| 703,509 |
|
| | | 871,890 |
|
Energy Equipment and Services† | | |
| Keane Group Holdings, LLC, 2018 1st Lien Term Loan, 4.50%, (1-month LIBOR plus 3.50%), 5/25/25 | 24,125 |
| 16,164 |
|
| Parker Drilling Co, 2nd Lien PIK Term Loan, 11.00% Cash plus 2.00% PIK, 3/26/24 | 31,250 |
| 30,468 |
|
| | | 46,632 |
|
| Entertainment — 0.1% | | |
| Allen Media, LLC, 2020 Term Loan B, 7.23%, (3-month LIBOR plus 5.50%), 2/10/27 | 825,000 |
| 693,000 |
|
| Lions Gate Capital Holdings LLC, 2018 Term Loan B, 3.24%, (1-month LIBOR plus 2.25%), 3/24/25 | 14,495 |
| 13,227 |
|
| | | 706,227 |
|
| Equity Real Estate Investment Trusts (REITs) — 0.1% | | |
| RHP Hotel Properties, LP, 2017 Term Loan B, 2.99%, (1-month LIBOR plus 2.00%), 5/11/24 | 272,629 |
| 246,048 |
|
| Health Care Providers and Services — 0.2% | | |
| Air Methods Corporation, 2017 Term Loan B, 4.95%, (3-month LIBOR plus 3.50%), 4/22/24 | 196,665 |
| 140,506 |
|
| IQVIA Inc., 2018 USD Term Loan B3, 3.20%, (3-month LIBOR plus 1.75%), 6/11/25 | 491,349 |
| 474,152 |
|
| RegionalCare Hospital Partners Holdings, Inc., 2018 Term Loan B, 4.74%, (1-month LIBOR plus 3.75%), 11/17/25 | 550,000 |
| 513,565 |
|
| | | 1,128,223 |
|
| Hotels, Restaurants and Leisure — 0.6% | | |
| 1011778 B.C. Unlimited Liability Company, Term Loan B4, 2.74%, (1-month LIBOR plus 1.75%), 11/19/26 | 316,865 |
| 293,892 |
|
| Boyd Gaming Corporation, Term Loan B3, 2.93%, (1-week LIBOR plus 2.25%), 9/15/23 | 235,016 |
| 206,006 |
|
| Caesars Entertainment Operating Company, Exit Term Loan, 2.99%, (1-month LIBOR plus 2.00%), 10/7/24 | 81,083 |
| 66,894 |
|
| Gateway Casinos & Entertainment Limited, 2018 Term Loan B, 4.45%, (3-month LIBOR plus 3.00%), 3/13/25 | 147,375 |
| 106,847 |
|
| Golden Nugget, Inc., 2017 Incremental Term Loan B, 3.49%, (1-month LIBOR plus 2.50%), 10/4/23 | 154,900 |
| 121,596 |
|
| Golden Nugget, Inc., 2017 Incremental Term Loan B, 3.70%, (3-month LIBOR plus 2.50%), 10/4/23 | 132,221 |
| 103,794 |
|
| Hilton Worldwide Finance, LLC, 2019 Term Loan B2, 2.70%, (1-month LIBOR plus 1.75%), 6/22/26 | 600,000 |
| 571,500 |
|
| Life Time Fitness Inc, 2017 Term Loan B, 4.36%, (3-month LIBOR plus 2.75%), 6/10/22 | 560,904 |
| 422,080 |
|
| NASCAR Holdings, Inc, Term Loan B, 3.67%, (1-month LIBOR plus 2.75%), 10/19/26 | 283,085 |
| 251,946 |
|
|
| | | | | | |
| | Principal Amount/Shares | Value |
| UFC Holdings, LLC, 2019 Term Loan, 4.25%, (1-month LIBOR plus 3.25%), 4/29/26 | $ | 792,916 |
| $ | 706,687 |
|
| | | 2,851,242 |
|
| Insurance — 0.1% | | |
| Asurion LLC, 2017 Term Loan B4, 3.99%, (1-month LIBOR plus 3.00%), 8/4/22 | 54,776 |
| 52,493 |
|
| Asurion LLC, 2018 Term Loan B6, 3.99%, (1-month LIBOR plus 3.00%), 11/3/23 | 47,183 |
| 45,532 |
|
| Hub International Limited, 2018 Term Loan B, 4.39%, (2-month LIBOR plus 2.75%), 4/25/25 | 28,077 |
| 26,449 |
|
| Hub International Limited, 2018 Term Loan B, 4.55%, (2-month LIBOR plus 2.75%), 4/25/25 | 591,839 |
| 557,512 |
|
| | | 681,986 |
|
| Machinery — 0.3% | | |
| Altra Industrial Motion Corp., 2018 Term Loan B, 2.99%, (1-month LIBOR plus 2.00%), 10/1/25 | 88,358 |
| 78,390 |
|
| Navistar International Corporation, 2017 1st Lien Term Loan B, 4.28%, (1-month LIBOR plus 3.50%), 11/6/24 | 47,762 |
| 41,951 |
|
| Vertiv Group Corporation, Term Loan B, 4.58%, (1-month LIBOR plus 3.00%), 3/2/27 | 1,375,000 |
| 1,196,250 |
|
| | | 1,316,591 |
|
| Media — 0.3% | | |
Banijay Entertainment S.A.S, USD Term Loan, 3/4/25(9) | 225,000 |
| 202,500 |
|
| Cengage Learning, Inc., 2016 Term Loan B, 5.25%, (1-month LIBOR plus 4.25%), 6/7/23 | 496,134 |
| 406,830 |
|
| Diamond Sports Group, LLC, Term Loan, 4.18%, (1-month LIBOR plus 3.25%), 8/24/26 | 174,125 |
| 136,688 |
|
| Nexstar Broadcasting, Inc., 2019 Term Loan B4, 4.33%, (1-month LIBOR plus 2.75%), 9/18/26 | 288,188 |
| 271,761 |
|
| Radiate Holdco, LLC, 1st Lien Term Loan, 3.99%, (1-month LIBOR plus 3.00%), 2/1/24 | 97,001 |
| 90,696 |
|
| Sinclair Television Group Inc., Term Loan B2B, 3.21%, (1-month LIBOR plus 2.50%), 9/30/26 | 99,500 |
| 95,022 |
|
| | | 1,203,497 |
|
| Metals and Mining — 0.1% | | |
Arconic Rolled Products Corporation, Term Loan B, 2/4/27(9) | 150,000 |
| 137,250 |
|
| Big River Steel LLC, Term Loan B, 6.45%, (3-month LIBOR plus 5.00%), 8/23/23 | 48,689 |
| 46,741 |
|
| Neenah Foundry Company, 2017 Term Loan, 7.76%, (2-month LIBOR plus 6.50%), 12/13/22 | 28,332 |
| 24,791 |
|
| Neenah Foundry Company, 2017 Term Loan, 8.12%, (2-month LIBOR plus 6.50%), 12/13/22 | 33,932 |
| 29,690 |
|
| | | 238,472 |
|
| Oil, Gas and Consumable Fuels — 0.1% | | |
| California Resources Corporation, 2017 1st Lien Term Loan, 6.36%, (3-month LIBOR plus 4.75%), 12/31/22 | 525,000 |
| 139,999 |
|
| California Resources Corporation, Second Out Term Loan, 11.99%, (3-month LIBOR plus 10.38%), 12/31/21 | 25,000 |
| 1,821 |
|
| CITGO Holding Inc., 2019 Term Loan B, 8.00%, (1-month LIBOR plus 7.00%), 8/1/23 | 348,250 |
| 287,888 |
|
| Prairie ECI Acquiror LP, Term Loan B, 6.20%, (3-month LIBOR plus 4.75%), 3/11/26 | 118,552 |
| 63,100 |
|
| | | 492,808 |
|
|
| | | | | | |
| | Principal Amount/Shares | Value |
Professional Services† | | |
| Dun & Bradstreet Corporation (The), Term Loan, 4.96%, (1-month LIBOR plus 4.00%), 2/6/26 | $ | 75,000 |
| $ | 68,156 |
|
Road and Rail† | | |
| USS Ultimate Holdings, Inc., 1st Lien Term Loan, 5.67%, (6-month LIBOR plus 3.75%), 8/25/24 | 97,684 |
| 84,985 |
|
| Software — 0.2% | | |
Camelot U.S. Acquisition 1 Co., Term Loan B, 10/31/26(9) | 400,000 |
| 382,000 |
|
Camelot U.S. Acquisition 1 Co., Term Loan B, 10/31/26(9) | 325,000 |
| 310,375 |
|
SS&C Technologies Holdings Europe S.A.R.L., 2018 Term Loan B4, 4/16/25(9) | 141,797 |
| 133,999 |
|
| SS&C Technologies Holdings Europe S.A.R.L., 2018 Term Loan B4, 2.74%, (1-month LIBOR plus 1.75%), 4/16/25 | 35,866 |
| 33,893 |
|
SS&C Technologies Inc., 2018 Term Loan B3, 4/16/25(9) | 198,716 |
| 187,786 |
|
| SS&C Technologies Inc., 2018 Term Loan B3, 2.74%, (1-month LIBOR plus 1.75%), 4/16/25 | 50,263 |
| 47,499 |
|
| | | 1,095,552 |
|
| Specialty Retail — 0.1% | | |
| Priso Acquisition Corporation, 2017 Term Loan B, 4.91%, (3-month LIBOR plus 3.00%), 5/8/22 | 22,952 |
| 19,337 |
|
| Serta Simmons Bedding, LLC, 2nd Lien Term Loan, 9.00%, (1-month LIBOR plus 8.00%), 11/8/24 | 94,933 |
| 22,547 |
|
| Staples, Inc., 7 Year Term Loan, 6.52%, (1-month LIBOR plus 5.00%), 4/16/26 | 272,938 |
| 218,077 |
|
| | | 259,961 |
|
Transportation Infrastructure† | | |
| Syncreon Group B.V., 2019 Second Out Term Loan, 7.45%, (3-month LIBOR plus 6.00%), 4/1/25 | 23,305 |
| 15,731 |
|
TOTAL BANK LOAN OBLIGATIONS
(Cost $17,872,390) | | 15,561,096 |
|
| PREFERRED STOCKS — 2.8% | | |
| Banks — 2.2% | | |
| Bank of America Corp., 5.125% | 475,000 |
| 451,580 |
|
| Bank of America Corp., 5.875% | 225,000 |
| 228,185 |
|
| Bank of America Corp., 6.25% | 1,275,000 |
| 1,295,011 |
|
| Bank of America Corp., 6.30% | 25,000 |
| 26,271 |
|
| Bank of America Corp., 6.50% | 325,000 |
| 343,101 |
|
| Barclays plc, 7.75% | 550,000 |
| 482,732 |
|
| Barclays plc, 8.00% | 400,000 |
| 371,722 |
|
| Citigroup, Inc., 4.70% | 1,100,000 |
| 953,563 |
|
| Citigroup, Inc., 5.90% | 425,000 |
| 410,333 |
|
| Citigroup, Inc., 5.95% | 825,000 |
| 798,344 |
|
| Citigroup, Inc., 5.95% | 25,000 |
| 22,006 |
|
| Citigroup, Inc., 6.25% | 150,000 |
| 154,625 |
|
| Citigroup, Inc., 6.875% | 1,749 |
| 45,089 |
|
| JPMorgan Chase & Co., 4.60% | 350,000 |
| 306,758 |
|
| JPMorgan Chase & Co., 4.75% | 200,000 |
| 173,949 |
|
| JPMorgan Chase & Co., 6.00% | 845,000 |
| 845,587 |
|
| JPMorgan Chase & Co., 6.10% | 1,350,000 |
| 1,376,588 |
|
| JPMorgan Chase & Co., 6.125% | 400,000 |
| 380,278 |
|
|
| | | | | | |
| | Principal Amount/Shares | Value |
| JPMorgan Chase & Co., 6.75% | 331,000 |
| $ | 346,125 |
|
| Royal Bank of Scotland Group plc, 3.77% | 300,000 |
| 250,179 |
|
| Royal Bank of Scotland Group plc, 8.00% | 600,000 |
| 563,823 |
|
| Royal Bank of Scotland Group plc, 8.625% | 400,000 |
| 392,130 |
|
| | | 10,217,979 |
|
| Capital Markets — 0.4% | | |
Credit Suisse Group AG, 5.10%(1) | 200,000 |
| 154,750 |
|
Credit Suisse Group AG, 6.25%(1) | 450,000 |
| 417,874 |
|
| Deutsche Bank AG, 6.00% | 200,000 |
| 134,400 |
|
| Goldman Sachs Group, Inc. (The), 4.95% | 875,000 |
| 779,358 |
|
| Goldman Sachs Group, Inc. (The), 5.375% | 350,000 |
| 312,888 |
|
| | | 1,799,270 |
|
Internet and Direct Marketing Retail† | | |
MYT Holding Co., 10.00%(1) | 21,052 |
| 15,473 |
|
| Oil, Gas and Consumable Fuels — 0.2% | | |
| Energy Transfer Operating LP, 6.25% | 150,000 |
| 74,512 |
|
| Energy Transfer Operating LP, 6.625% | 625,000 |
| 310,466 |
|
Nine Point Energy Holdings, Inc. (Acquired 3/28/17, Cost $18,000)(2)(6) | 18 |
| 3,600 |
|
| Plains All American Pipeline LP, 6.125% | 1,350,000 |
| 677,356 |
|
| Summit Midstream Partners LP, 9.50% | 175,000 |
| 2,600 |
|
| | | 1,068,534 |
|
Trading Companies and Distributors† | | |
| General Finance Corp., 8.125% | 1,116 |
| 24,853 |
|
TOTAL PREFERRED STOCKS
(Cost $15,434,769) | | 13,126,109 |
|
| CONVERTIBLE BONDS — 0.1% | | |
| Banks — 0.1% | | |
| Barclays Bank plc, 7.625%, 11/21/22 | $ | 200,000 |
| 204,698 |
|
Oil, Gas and Consumable Fuels† | | |
| Chesapeake Energy Corp., 5.50%, 9/15/26 | 25,000 |
| 1,375 |
|
Denbury Resources, Inc., 6.375%, 12/31/24(1) | 218,000 |
| 88,759 |
|
| | | 90,134 |
|
TOTAL CONVERTIBLE BONDS
(Cost $405,526) | | 294,832 |
|
| COMMON STOCKS — 0.1% | | |
Auto Components† | | |
Exide Technologies(6) | 3,465 |
| 433 |
|
| Chemicals — 0.1% | | |
Hexion Holdings Corp., Class B(6) | 12,508 |
| 118,826 |
|
Diversified Telecommunication Services† | | |
Colt, Class B (Acquired 5/18/16, Cost $338)(2)(6) | 676 |
| — |
|
Electrical Equipment† | | |
Exide Technologies (Acquired 5/14/15, Cost $—)(2)(6) | 162 |
| 221 |
|
Energy Equipment and Services† | | |
Parker Drilling Co.(6) | 2,027 |
| 17,189 |
|
Weatherford International plc(6) | 3,858 |
| 22,955 |
|
| | | 40,144 |
|
|
| | | | | | |
| | Principal Amount/Shares | Value |
Gas Utilities† | | |
Southcross Holdings GP, LLC, Class A (Acquired 5/10/16, Cost $360)(2) | 4 |
| — |
|
Southcross Holdings LP, Class A (Acquired 5/10/16, Cost $360)(2) | 4 |
| — |
|
| | | — |
|
Machinery† | | |
UC Holdings, Inc. (Acquired 9/21/15 - 9/30/15, Cost $103,222)(2)(6) | 4,088 |
| $ | 44,968 |
|
Oil, Gas and Consumable Fuels† | | |
Jones Energy II, Inc.(6) | 4,722 |
| 66,226 |
|
Nine Point Energy (Acquired 6/19/17 - 4/4/18, Cost $12,544)(2)(6) | 1,082 |
| 2,164 |
|
Sabine Oil & Gas Holdings, Inc. (Acquired 5/30/17, Cost $579)(2) | 13 |
| 913 |
|
Warren Resources, Inc. (Acquired 10/19/16, Cost $4,800)(2)(6) | 960 |
| 960 |
|
| | | 70,263 |
|
Software† | | |
Avaya Holdings Corp.(6) | 140 |
| 1,133 |
|
Transportation Infrastructure† | | |
syncreon(6) | 829 |
| 3,730 |
|
TOTAL COMMON STOCKS
(Cost $938,178) | | 279,718 |
|
ESCROW INTERESTS(10)† | | |
Diversified Financial Services† | | |
Denver Parent, Escrow(6) | $ | 63,341 |
| — |
|
Electric Utilities† | | |
GenOn Energy(6) | 25,000 |
| — |
|
GenOn Energy, Inc.(6) | 75,000 |
| — |
|
Texas Competitive Electric Holdings Co., Escrow(6) | 200,000 |
| 900 |
|
| | | 900 |
|
Energy Equipment and Services† | | |
Hercules Offshore, Inc., Escrow(6) | 3,570 |
| 9,817 |
|
Sanjel Corp.(6) | 200,000 |
| — |
|
| | | 9,817 |
|
Oil, Gas and Consumable Fuels† | | |
Cloud Peak Energy Resources LLC / Cloud Peak Energy Finance Corp.(6) | 500,000 |
| 5,500 |
|
Paper and Forest Products† | | |
Appvion, Inc., Escrow(6) | 200,000 |
| 2,250 |
|
Specialty Retail† | | |
Claire's Stores, Inc., Escrow(6) | 25,000 |
| 3,812 |
|
Thrifts and Mortgage Finance† | | |
Washington Mutual Bank, Escrow(6) | 250,000 |
| 3,438 |
|
TOTAL ESCROW INTERESTS
(Cost $802,484) | | 25,717 |
|
WARRANTS† | | |
Independent Power and Renewable Electricity Producers† | | |
Vistra Energy Corp.(6) | 1,215 |
| 963 |
|
Machinery† | | |
UC Holdings, Inc.(6) | 600 |
| 300 |
|
|
| | | | | | |
| | Principal Amount/Shares | Value |
Media† | | |
iHeartMedia, Inc.(6) | 342 |
| $ | 2,232 |
|
Oil, Gas and Consumable Fuels† | | |
Amplify Energy Corp.(6) | 344 |
| — |
|
Jones Energy II, Inc.(6) | 678 |
| 637 |
|
| | | 637 |
|
Paper and Forest Products† | | |
Appvion Holdings Corp.(6) | 195 |
| 1 |
|
Appvion Holdings Corp.(6) | 195 |
| 1 |
|
| | | 2 |
|
TOTAL WARRANTS
(Cost $13,129) | | 4,134 |
|
RIGHTS† | | |
Independent Power and Renewable Electricity Producers† | | |
Vistra Energy Corp.
(Cost $—) | 3,425 |
| 3,844 |
|
TOTAL INVESTMENT SECURITIES — 98.4%
(Cost $537,384,738) | | 463,441,076 |
|
| OTHER ASSETS AND LIABILITIES — 1.6% | | 7,580,590 |
|
| TOTAL NET ASSETS — 100.0% | | $ | 471,021,666 |
|
|
| | |
| NOTES TO SCHEDULE OF INVESTMENTS |
| LIBOR | - | London Interbank Offered Rate |
| MTN | - | Medium Term Note |
| PIK | - | Payment in Kind. Security may pay a cash rate and/or an in kind rate. |
| USD | - | United States Dollar |
| VRN | - | Variable Rate Note. The rate adjusts periodically based upon the terms set forth in the security’s offering documents. The rate shown is effective at the period end and the reference rate and spread, if any, is indicated. The security's effective maturity date may be shorter than the final maturity date shown. |
† Category is less than 0.05% of total net assets.
| |
| (1) | Security was purchased pursuant to Rule 144A under the Securities Act of 1933 and may be sold in transactions exempt from registration, normally to qualified institutional investors. The aggregate value of these securities at the period end was $281,661,617, which represented 59.8% of total net assets. Of these securities, 0.2% of total net assets were deemed illiquid under policies approved by the Board of Trustees. |
| |
| (2) | Restricted security that may not be offered for public sale without being registered with the Securities and Exchange Commission and/or may be subject to resale, redemption or transferability restrictions. The aggregate value of these securities at the period end was $251,242, which represented 0.1% of total net assets. |
| |
| (3) | The security's rate was paid in kind or a combination of cash and in kind at the last payment date. |
| |
| (4) | The security's rate was paid in cash at the last payment date. |
| |
| (5) | Security is in default. |
| |
| (7) | When-issued security. The issue price and yield are fixed on the date of the commitment, but payment and delivery are scheduled for a future date. |
| |
| (8) | The interest rate on a bank loan obligation adjusts periodically based on a predetermined schedule. Rate shown is effective at period end. The maturity date on a bank loan obligation may be less than indicated as a result of contractual or optional prepayments. These prepayments cannot be predicted with certainty. |
| |
| (9) | The interest rate will be determined upon settlement of the bank loan obligation after period end. |
| |
| (10) | Escrow interests represent beneficial interests in bankruptcy reorganizations or liquidation proceedings and may be subject to resale, redemption, or transferability restrictions. The amount and timing of future payments, if any, cannot be predicted with certainty. |
See Notes to Financial Statements.
|
|
| Statement of Assets and Liabilities |
|
| | | |
| MARCH 31, 2020 | |
| Assets | |
| Investment securities, at value (cost of $537,384,738) | $ | 463,441,076 |
|
| Cash | 161,490 |
|
| Receivable for investments sold | 5,663,909 |
|
| Receivable for capital shares sold | 544,758 |
|
| Interest and dividends receivable | 8,842,813 |
|
| | 478,654,046 |
|
| | |
| Liabilities | |
| Payable for investments purchased | 5,105,462 |
|
| Payable for capital shares redeemed | 1,177,130 |
|
| Accrued management fees | 250,679 |
|
| Distribution and service fees payable | 622 |
|
| Dividends payable | 1,098,487 |
|
| | 7,632,380 |
|
| | |
| Net Assets | $ | 471,021,666 |
|
| | |
| Net Assets Consist of: | |
| Capital paid in | $ | 551,978,470 |
|
| Distributable earnings | (80,956,804 | ) |
| | $ | 471,021,666 |
|
|
| | | | | | |
| | Net Assets | Shares Outstanding | Net Asset Value Per Share |
| Investor Class |
| $16,377,043 |
| 2,008,809 |
| $8.15 |
| I Class |
| $54,346,320 |
| 6,671,824 |
| $8.15 |
| Y Class |
| $291,873,493 |
| 35,816,004 |
| $8.15 |
| A Class |
| $2,793,413 |
| 342,775 |
| $8.15* |
| R5 Class |
| $105,825 |
| 12,986 |
| $8.15 |
| R6 Class |
| $105,525,572 |
| 12,956,483 |
| $8.14 |
*Maximum offering price $8.53 (net asset value divided by 0.955).
See Notes to Financial Statements.
|
| | | |
| YEAR ENDED MARCH 31, 2020 |
| Investment Income (Loss) | |
| Income: | |
| Interest | $ | 25,512,247 |
|
| Dividends | 8,232 |
|
| | 25,520,479 |
|
| | |
| Expenses: | |
| Management fees | 2,532,053 |
|
| Distribution and service fees - A Class | 5,451 |
|
| Trustees' fees and expenses | 31,636 |
|
| | 2,569,140 |
|
| | |
| Net investment income (loss) | 22,951,339 |
|
| | |
| Realized and Unrealized Gain (Loss) | |
| Net realized gain (loss) on investment transactions | (3,843,211 | ) |
| Change in net unrealized appreciation (depreciation) on investments | (69,478,605 | ) |
| | |
| Net realized and unrealized gain (loss) | (73,321,816 | ) |
| | |
| Net Increase (Decrease) in Net Assets Resulting from Operations | $ | (50,370,477 | ) |
See Notes to Financial Statements.
|
|
| Statement of Changes in Net Assets |
|
| | | | | | |
| YEARS ENDED MARCH 31, 2020 AND MARCH 31, 2019 |
| Increase (Decrease) in Net Assets | March 31, 2020 | March 31, 2019 |
| Operations | | |
| Net investment income (loss) | $ | 22,951,339 |
| $ | 12,637,208 |
|
| Net realized gain (loss) | (3,843,211 | ) | (734,555 | ) |
| Change in net unrealized appreciation (depreciation) | (69,478,605 | ) | (2,934,223 | ) |
| Net increase (decrease) in net assets resulting from operations | (50,370,477 | ) | 8,968,430 |
|
| | | |
| Distributions to Shareholders | | |
| From earnings: | | |
| Investor Class | (1,120,993 | ) | (508,506 | ) |
| I Class | (2,883,230 | ) | (1,055,650 | ) |
| Y Class | (13,638,015 | ) | (8,469,757 | ) |
| A Class | (110,089 | ) | (28,080 | ) |
| R5 Class | (7,056 | ) | (1,119 | ) |
| R6 Class | (5,964,245 | ) | (2,574,115 | ) |
| Decrease in net assets from distributions | (23,723,628 | ) | (12,637,227 | ) |
| | | |
| Capital Share Transactions | | |
| Net increase (decrease) in net assets from capital share transactions (Note 5) | 279,721,450 |
| 110,962,398 |
|
| | | |
| Net increase (decrease) in net assets | 205,627,345 |
| 107,293,601 |
|
| | | |
| Net Assets | | |
| Beginning of period | 265,394,321 |
| 158,100,720 |
|
| End of period | $ | 471,021,666 |
| $ | 265,394,321 |
|
See Notes to Financial Statements.
|
|
Notes to Financial Statements |
MARCH 31, 2020
1. Organization
American Century Investment Trust (the trust) is registered under the Investment Company Act of 1940, as amended (the 1940 Act), as an open-end management investment company and is organized as a Massachusetts business trust. High Income Fund (the fund) is one fund in a series issued by the trust. The fund’s investment objective is to seek current yield and capital growth.
The fund offers the Investor Class, I Class, Y Class, A Class, R5 Class and R6 Class. The A Class may incur an initial sales charge and may be subject to a contingent deferred sales charge.
2. Significant Accounting Policies
The following is a summary of significant accounting policies consistently followed by the fund in preparation of its financial statements. The fund is an investment company and follows accounting and reporting guidance in accordance with accounting principles generally accepted in the United States of America. This may require management to make certain estimates and assumptions at the date of the financial statements. Actual results could differ from these estimates. Management evaluated the impact of events or transactions occurring through the date the financial statements were issued that would merit recognition or disclosure.
Investment Valuations — The fund determines the fair value of its investments and computes its net asset value per share at the close of regular trading (usually 4 p.m. Eastern time) on the New York Stock Exchange (NYSE) on each day the NYSE is open. The Board of Trustees has adopted valuation policies and procedures to guide the investment advisor in the fund’s investment valuation process and to provide methodologies for the oversight of the fund’s pricing function.
Fixed income securities are valued at the evaluated mean as provided by independent pricing services or at the mean of the most recent bid and asked prices as provided by investment dealers. Corporate bonds, bank loan obligations and convertible bonds are valued using market models that consider trade data, quotations from dealers and active market makers, relevant yield curve and spread data, creditworthiness, trade data or market information on comparable securities, and other relevant security specific information.
Equity securities that are listed or traded on a domestic securities exchange are valued at the last reported sales price or at the official closing price as provided by the exchange. Equity securities traded on foreign securities exchanges are generally valued at the closing price of such securities on the exchange where primarily traded or at the close of the NYSE, if that is earlier. If no last sales price is reported, or if local convention or regulation so provides, the mean of the latest bid and asked prices may be used. Securities traded over-the-counter are valued at the mean of the latest bid and asked prices, the last sales price, or the official closing price.
Hybrid securities are valued at the evaluated mean as provided by independent pricing services or at the mean of the most recent bid and asked prices as provided by investment dealers. Preferred stocks and convertible preferred stocks with perpetual maturities are valued using market models that consider trade data, quotations from dealers and active market makers, relevant yield curve and spread data, creditworthiness, trade data or market information on comparable securities, and other relevant security specific information.
Open-end management investment companies are valued at the reported net asset value per share.
If the fund determines that the market price for an investment is not readily available or the valuation methods mentioned above do not reflect an investment’s fair value, such investment is valued as determined in good faith by the Board of Trustees or its delegate, in accordance with policies and procedures adopted by the Board of Trustees. In its determination of fair value, the fund may review several factors including, but not limited to, market information regarding the specific investment or comparable investments and correlation with other investment types, futures indices or general market indicators. Circumstances that may cause the fund to use these procedures to value an investment include, but are not limited to: an investment has been
declared in default or is distressed; trading in a security has been suspended during the trading day or a security is not actively trading on its principal exchange; prices received from a regular pricing source are deemed unreliable; or there is a foreign market holiday and no trading occurred.
The fund monitors for significant events occurring after the close of an investment’s primary exchange but before the fund’s net asset value per share is determined. Significant events may include, but are not limited to: corporate announcements and transactions; governmental action and political unrest that could impact a specific investment or an investment sector; or armed conflicts, natural disasters and similar events that could affect investments in a specific country or region. The fund also monitors for significant fluctuations between domestic and foreign markets, as evidenced by the U.S. market or such other indicators that the Board of Trustees, or its delegate, deems appropriate. The fund may apply a model-derived factor to the closing price of equity securities traded on foreign securities exchanges. The factor is based on observable market data as provided by an independent pricing service.
Security Transactions — Security transactions are accounted for as of the trade date. Net realized gains and losses are determined on the identified cost basis, which is also used for federal income tax purposes.
Investment Income — Interest income is recorded on the accrual basis and includes paydown gain (loss) and accretion of discounts and amortization of premiums. Dividend income less foreign taxes withheld, if any, is recorded as of the ex-dividend date. Distributions received on securities that represent a return of capital or long-term capital gain are recorded as a reduction of cost of investments and/or as a realized gain. The fund may estimate the components of distributions received that may be considered nontaxable distributions or long-term capital gain distributions for income tax purposes.
Segregated Assets — In accordance with the 1940 Act, the fund segregates assets on its books and records to cover certain types of investment securities and other financial instruments. American Century Investment Management, Inc. (ACIM) (the investment advisor) monitors, on a daily basis, the securities segregated to ensure the fund designates a sufficient amount of liquid assets, marked-to-market daily. The fund may also receive assets or be required to pledge assets at the custodian bank or with a broker for collateral requirements.
Income Tax Status — It is the fund’s policy to distribute substantially all net investment income and net realized gains to shareholders and to otherwise qualify as a regulated investment company under provisions of the Internal Revenue Code. Accordingly, no provision has been made for income taxes. The fund files U.S. federal, state, local and non-U.S. tax returns as applicable. The fund's tax returns are subject to examination by the relevant taxing authority until expiration of the applicable statute of limitations, which is generally three years from the date of filing but can be longer in certain jurisdictions. At this time, management believes there are no uncertain tax positions which, based on their technical merit, would not be sustained upon examination and for which it is reasonably possible that the total amounts of unrecognized tax benefits will significantly change in the next twelve months.
Multiple Class — All shares of the fund represent an equal pro rata interest in the net assets of the class to which such shares belong, and have identical voting, dividend, liquidation and other rights and the same terms and conditions, except for class specific expenses and exclusive rights to vote on matters affecting only individual classes. Income, non-class specific expenses, and realized and unrealized capital gains and losses of the fund are allocated to each class of shares based on their relative net assets.
Distributions to Shareholders — Distributions from net investment income, if any, are declared daily and paid monthly. Distributions from net realized gains, if any, are generally declared and paid annually.
Indemnifications — Under the trust’s organizational documents, its officers and trustees are indemnified against certain liabilities arising out of the performance of their duties to the fund. In addition, in the normal course of business, the fund enters into contracts that provide general indemnifications. The maximum exposure under these arrangements is unknown as this would involve future claims that may be made against a fund. The risk of material loss from such claims is considered by management to be remote.
3. Fees and Transactions with Related Parties
Certain officers and trustees of the trust are also officers and/or directors of American Century Companies, Inc. (ACC). The trust's investment advisor, ACIM, the trust's distributor, American Century Investment Services, Inc. (ACIS), and the trust's transfer agent, American Century Services, LLC, are wholly owned, directly or indirectly, by ACC. ACIM has engaged Nomura Corporate Research and Asset Management Inc. (NCRAM) to serve as a subadvisor for the fund and to manage the fund’s assets. NCRAM is responsible for the day-to-day management of the fund, subject to the general supervision of the Board of Trustees and the investment advisor and in accordance with the investment objective, policies and restrictions of the fund. ACIM pays all costs associated with retaining NCRAM as the subadvisor of the fund. A subsidiary of NCRAM’s parent company indirectly owns a non-controlling equity interest in ACC.
Management Fees — The trust has entered into a management agreement with ACIM, under which ACIM provides the fund with investment advisory and management services in exchange for a single, unified management fee (the fee) per class. The agreement provides that all expenses of managing and operating the fund, except distribution and service fees, brokerage expenses, taxes, interest, fees and expenses of the independent trustees (including legal counsel fees), and extraordinary expenses, will be paid by ACIM. The fee is computed and accrued daily based on each class's daily net assets and paid monthly in arrears. The difference in the fee among the classes is a result of their separate arrangements for non-Rule 12b-1 shareholder services. It is not the result of any difference in advisory or custodial fees or other expenses related to the management of the fund’s assets, which do not vary by class.
The annual management fee for each class is as follows:
|
| | | | | |
Investor Class | I Class | Y Class | A Class | R5 Class | R6 Class |
| 0.775% | 0.675% | 0.575% | 0.775% | 0.575% | 0.525% |
Distribution and Service Fees — The Board of Trustees has adopted a Master Distribution and Individual Shareholder Services Plan (the plan) for the A Class, pursuant to Rule 12b-1 of the 1940 Act. The plan provides that the A Class will pay ACIS an annual distribution and service fee of 0.25%. The fees are computed and accrued daily based on the A Class’s daily net assets and paid monthly in arrears. The fees are used to pay financial intermediaries for distribution and individual shareholder services. Fees incurred under the plan during the period ended March 31, 2020 are detailed in the Statement of Operations.
Trustees’ Fees and Expenses — The Board of Trustees is responsible for overseeing the investment advisor’s management and operations of the fund. The trustees receive detailed information about the fund and its investment advisor regularly throughout the year, and meet at least quarterly with management of the investment advisor to review reports about fund operations. The fund’s officers do not receive compensation from the fund.
Interfund Transactions — The fund may enter into security transactions with other American Century Investments funds and other client accounts of the investment advisor, in accordance with the 1940 Act rules and procedures adopted by the Board of Trustees. The rules and procedures require, among other things, that these transactions be effected at the independent current market price of the security. There were no interfund transactions during the period.
4. Investment Transactions
Purchases and sales of investment securities, excluding short-term investments, for the period ended March 31, 2020 were $505,334,255 and $216,676,577, respectively.
5. Capital Share Transactions
Transactions in shares of the fund were as follows (unlimited number of shares authorized):
|
| | | | | | | | | | |
| | Year ended
March 31, 2020 | Year ended March 31, 2019 |
| | Shares | Amount | Shares | Amount |
| Investor Class | | | | |
| Sold | 2,582,968 |
| $ | 24,120,040 |
| 2,492,048 |
| $ | 23,300,470 |
|
| Issued in reinvestment of distributions | 110,350 |
| 1,019,509 |
| 52,841 |
| 489,784 |
|
| Redeemed | (2,485,789 | ) | (21,937,345 | ) | (892,212 | ) | (8,164,840 | ) |
| | 207,529 |
| 3,202,204 |
| 1,652,677 |
| 15,625,414 |
|
| I Class | | | | |
| Sold | 8,352,870 |
| 78,150,692 |
| 3,242,753 |
| 30,328,252 |
|
| Issued in reinvestment of distributions | 313,010 |
| 2,880,273 |
| 112,632 |
| 1,045,262 |
|
| Redeemed | (4,658,566 | ) | (42,376,491 | ) | (1,548,171 | ) | (14,267,881 | ) |
| | 4,007,314 |
| 38,654,474 |
| 1,807,214 |
| 17,105,633 |
|
| Y Class | | | | |
| Sold | 28,658,736 |
| 267,758,192 |
| 7,276,212 |
| 67,726,650 |
|
| Issued in reinvestment of distributions | 527,541 |
| 4,858,908 |
| 617,896 |
| 5,767,299 |
|
| Redeemed | (6,793,258 | ) | (60,475,175 | ) | (9,503,262 | ) | (86,541,386 | ) |
| | 22,393,019 |
| 212,141,925 |
| (1,609,154 | ) | (13,047,437 | ) |
| A Class | | | | |
| Sold | 382,324 |
| 3,587,904 |
| 146,952 |
| 1,360,626 |
|
| Issued in reinvestment of distributions | 11,759 |
| 107,889 |
| 2,782 |
| 25,721 |
|
| Redeemed | (150,475 | ) | (1,402,229 | ) | (51,098 | ) | (471,216 | ) |
| | 243,608 |
| 2,293,564 |
| 98,636 |
| 915,131 |
|
| R5 Class | | | | |
| Sold | 3,507 |
| 32,230 |
| 15,018 |
| 139,588 |
|
| Issued in reinvestment of distributions | 763 |
| 7,056 |
| 120 |
| 1,119 |
|
| Redeemed | (6,930 | ) | (64,798 | ) | (24 | ) | (223 | ) |
| | (2,660 | ) | (25,512 | ) | 15,114 |
| 140,484 |
|
| R6 Class | | | | |
| Sold | 3,272,990 |
| 30,517,557 |
| 11,750,108 |
| 108,674,614 |
|
| Issued in reinvestment of distributions | 647,328 |
| 5,964,033 |
| 276,052 |
| 2,551,007 |
|
| Redeemed | (1,440,560 | ) | (13,026,795 | ) | (2,288,877 | ) | (21,002,448 | ) |
| | 2,479,758 |
| 23,454,795 |
| 9,737,283 |
| 90,223,173 |
|
| Net increase (decrease) | 29,328,568 |
| $ | 279,721,450 |
| 11,701,770 |
| $ | 110,962,398 |
|
6. Fair Value Measurements
The fund’s investments valuation process is based on several considerations and may use multiple inputs to determine the fair value of the investments held by the fund. In conformity with accounting principles generally accepted in the United States of America, the inputs used to determine a valuation are classified into three broad levels.
| |
| • | Level 1 valuation inputs consist of unadjusted quoted prices in an active market for identical investments. |
| |
| • | Level 2 valuation inputs consist of direct or indirect observable market data (including quoted prices for comparable investments, evaluations of subsequent market events, interest rates, prepayment speeds, credit risk, etc.). These inputs also consist of quoted prices for identical investments initially expressed in local currencies that are adjusted through translation into U.S. dollars. |
| |
| • | Level 3 valuation inputs consist of unobservable data (including a fund’s own assumptions). |
The level classification is based on the lowest level input that is significant to the fair valuation measurement. The valuation inputs are not necessarily an indication of the risks associated with investing in these securities or other financial instruments.
The following is a summary of the level classifications as of period end. The Schedule of Investments provides additional information on the fund’s portfolio holdings.
|
| | | | | | | | |
| | Level 1 | Level 2 | Level 3 |
| Assets | | | |
| Investment Securities | | | |
| Corporate Bonds | — |
| $ | 434,145,626 |
| — |
|
| Bank Loan Obligations | — |
| 15,561,096 |
| — |
|
| Preferred Stocks | $ | 69,942 |
| 13,056,167 |
| — |
|
| Convertible Bonds | — |
| 294,832 |
| — |
|
| Common Stocks | 160,103 |
| 119,615 |
| — |
|
| Escrow Interests | — |
| 25,717 |
| — |
|
| Warrants | 963 |
| 3,171 |
| — |
|
| Rights | — |
| 3,844 |
| — |
|
| | $ | 231,008 |
| $ | 463,210,068 |
| — |
|
7. Risk Factors
The value of the fund’s shares will go up and down, sometimes rapidly or unpredictably, based on the performance of the securities owned by the fund and other factors generally affecting the securities market. Market risks, including political, regulatory, economic and social developments, can affect the value of the fund’s investments. Natural disasters, public health emergencies, terrorism and other unforeseeable events may lead to increased market volatility and may have adverse long-term effects on world economies and markets generally.
The fund invests primarily in high-yield and lower-quality debt securities, which are subject to substantial risks including liquidity risk and credit risk.
The fund may invest in instruments that have variable or floating coupon rates based on the London Interbank Offered Rate (LIBOR). LIBOR is a benchmark interest rate intended to be representative of the rate at which certain major international banks lend to one another over short-terms. LIBOR will be phased out by the end of 2021. Uncertainty remains regarding a replacement rate or rates for LIBOR. The transition process may lead to increased volatility or illiquidity in markets for instruments that rely on LIBOR. This could result in a change to the value of such instruments.
8. Federal Tax Information
The tax character of distributions paid during the years ended March 31, 2020 and March 31, 2019 were as follows:
|
| | | | | | |
| | 2020 | 2019 |
| Distributions Paid From | | |
| Ordinary income | $ | 23,723,628 |
| $ | 12,637,227 |
|
| Long-term capital gains | — |
| — |
|
The book-basis character of distributions made during the year from net investment income or net realized gains may differ from their ultimate characterization for federal income tax purposes. These differences reflect the differing character of certain income items and net realized gains and losses for financial statement and tax purposes, and may result in reclassification among certain capital accounts on the financial statements.
As of period end, the federal tax cost of investments and the components of distributable earnings on a tax-basis were as follows:
|
| | | |
| Federal tax cost of investments | $ | 538,304,442 |
|
| Gross tax appreciation of investments | $ | 2,204,836 |
|
| Gross tax depreciation of investments | (77,068,202 | ) |
| Net tax appreciation (depreciation) of investments | $ | (74,863,366 | ) |
| Other book-to-tax adjustments | $ | (57,366 | ) |
| Undistributed ordinary income | $ | 5,974 |
|
| Accumulated short-term capital losses | $ | (1,786,399 | ) |
| Accumulated long-term capital losses | $ | (4,255,647 | ) |
The difference between book-basis and tax-basis unrealized appreciation (depreciation) is attributable primarily to the tax deferral of losses on wash sales.
Accumulated capital losses represent net capital loss carryovers that may be used to offset future realized capital gains for federal income tax purposes. The capital loss carryovers may be carried forward for an unlimited period. Future capital loss carryover utilization in any given year may be subject to Internal Revenue Code limitations.
9. Recently Issued Accounting Standards
In March 2017, the Financial Accounting Standards Board (FASB) issued Accounting Standards Update No. 2017-08, “Receivables - Nonrefundable Fees and Other Costs (Subtopic 310-20), Premium Amortization on Purchased Callable Debt Securities” (ASU 2017-08). ASU 2017-08 amends the amortization period for certain purchased callable debt securities held at a premium, shortening such period to the earliest call date. The amendments are effective for fiscal years, and interim periods within those fiscal years, beginning after December 15, 2018. The adoption of ASU 2017-08 did not materially impact the financial statements.
|
| | | | | | | | | | | | | | | | |
| For a Share Outstanding Throughout the Years Ended March 31 (except as noted) |
| Per-Share Data | | | | | | | | Ratios and Supplemental Data | |
| | | Income From Investment Operations: | Distributions From: | | | Ratio to Average Net Assets of: | | |
| | Net Asset
Value,
Beginning
of Period | Net
Investment
Income
(Loss)(1) | Net
Realized
and
Unrealized
Gain (Loss) | Total From
Investment
Operations | Net
Investment
Income | Net
Realized
Gains | Total Distributions | Net Asset
Value,
End
of Period | Total
Return(2) | Operating
Expenses | Operating
Expenses
(before
expense
waiver) | Net
Investment
Income
(Loss) | Portfolio
Turnover
Rate | Net
Assets,
End of
Period
(in thousands) |
| Investor Class | | | | | | | | | | | | | |
| 2020 | $9.32 | 0.48 | (1.16) | (0.68) | (0.49) | — | (0.49) | $8.15 | (7.76)% | 0.78% | 0.78% | 5.14% | 55% |
| $16,377 |
|
| 2019 | $9.43 | 0.53 | (0.11) | 0.42 | (0.53) | — | (0.53) | $9.32 | 4.65% | 0.78% | 0.78% | 5.73% | 43% |
| $16,796 |
|
2018(3) | $9.68 | 0.27 | (0.24) | 0.03 | (0.28) | — | (0.28) | $9.43 | 0.29% | 0.78%(4) | 0.78%(4) | 5.70%(4) | 26% |
| $1,401 |
|
| I Class | | | | | | | | | | | | | |
| 2020 | $9.32 | 0.48 | (1.15) | (0.67) | (0.50) | — | (0.50) | $8.15 | (7.66)% | 0.68% | 0.68% | 5.24% | 55% |
| $54,346 |
|
| 2019 | $9.42 | 0.54 | (0.10) | 0.44 | (0.54) | — | (0.54) | $9.32 | 4.86% | 0.68% | 0.68% | 5.83% | 43% |
| $24,825 |
|
2018(3) | $9.68 | 0.27 | (0.25) | 0.02 | (0.28) | — | (0.28) | $9.42 | 0.23% | 0.68%(4) | 0.68%(4) | 5.80%(4) | 26% |
| $8,078 |
|
| Y Class | | | | | | | | | | | | | |
| 2020 | $9.32 | 0.49 | (1.15) | (0.66) | (0.51) | — | (0.51) | $8.15 | (7.57)% | 0.58% | 0.58% | 5.34% | 55% |
| $291,873 |
|
| 2019 | $9.42 | 0.55 | (0.10) | 0.45 | (0.55) | — | (0.55) | $9.32 | 4.97% | 0.58% | 0.58% | 5.93% | 43% |
| $125,104 |
|
2018(5) | $9.68 | 0.28 | (0.25) | 0.03 | (0.29) | — | (0.29) | $9.42 | 0.31% | 0.58%(4) | 0.58%(4) | 5.90%(4) | 26% |
| $141,643 |
|
| 2017 | $9.42 | 0.56 | 0.24 | 0.80 | (0.54) | — | (0.54) | $9.68 | 8.74% | 0.58% | 1.00% | 5.83%(6) | 81% |
| $127,414 |
|
| 2016 | $8.95 | 0.58 | 0.46 | 1.04 | (0.57)(7) | — | (0.57) | $9.42 | 12.15% | 0.61% | 1.49% | 6.37%(6) | 116% |
| $94,197 |
|
| 2015 | $10.24 | 0.65 | (1.11) | (0.46) | (0.65) | (0.18) | (0.83) | $8.95 | (4.79)% | 0.71% | 2.95% | 6.62%(6) | 106% |
| $34,075 |
|
| A Class | | | | | | | | | | | | | |
| 2020 | $9.32 | 0.45 | (1.15) | (0.70) | (0.47) | — | (0.47) | $8.15 | (7.99)% | 1.03% | 1.03% | 4.89% | 55% |
| $2,793 |
|
| 2019 | $9.42 | 0.51 | (0.10) | 0.41 | (0.51) | — | (0.51) | $9.32 | 4.50% | 1.03% | 1.03% | 5.48% | 43% |
| $924 |
|
2018(3) | $9.68 | 0.26 | (0.25) | 0.01 | (0.27) | — | (0.27) | $9.42 | 0.06% | 1.03%(4) | 1.03%(4) | 5.45%(4) | 26% |
| $5 |
|
|
| | | | | | | | | | | | | | | | |
| For a Share Outstanding Throughout the Years Ended March 31 (except as noted) |
| Per-Share Data | | | | | | | | Ratios and Supplemental Data | |
| | | Income From Investment Operations: | Distributions From: | | | Ratio to Average Net Assets of: | | |
| | Net Asset
Value,
Beginning
of Period | Net
Investment
Income
(Loss)(1) | Net
Realized
and
Unrealized
Gain (Loss) | Total From
Investment
Operations | Net
Investment
Income | Net
Realized
Gains | Total Distributions | Net Asset
Value,
End
of Period | Total
Return(2) | Operating
Expenses | Operating
Expenses
(before
expense
waiver) | Net
Investment
Income
(Loss) | Portfolio
Turnover
Rate | Net
Assets,
End of
Period
(in thousands) |
| R5 Class | | | | | | | | | | | | | |
| 2020 | $9.32 | 0.50 | (1.16) | (0.66) | (0.51) | — | (0.51) | $8.15 | (7.56)% | 0.58% | 0.58% | 5.34% | 55% |
| $106 |
|
| 2019 | $9.42 | 0.55 | (0.10) | 0.45 | (0.55) | — | (0.55) | $9.32 | 4.96% | 0.58% | 0.58% | 5.93% | 43% |
| $146 |
|
2018(3) | $9.68 | 0.28 | (0.25) | 0.03 | (0.29) | — | (0.29) | $9.42 | 0.27% | 0.58%(4) | 0.58%(4) | 5.90%(4) | 26% |
| $5 |
|
| R6 Class | | | | | | | | | | | | | |
| 2020 | $9.32 | 0.50 | (1.16) | (0.66) | (0.52) | — | (0.52) | $8.14 | (7.53)% | 0.53% | 0.53% | 5.39% | 55% |
| $105,526 |
|
| 2019 | $9.42 | 0.56 | (0.10) | 0.46 | (0.56) | — | (0.56) | $9.32 | 5.02% | 0.53% | 0.53% | 5.98% | 43% |
| $97,599 |
|
2018(3) | $9.68 | 0.26 | (0.23) | 0.03 | (0.29) | — | (0.29) | $9.42 | 0.31% | 0.53%(4) | 0.53%(4) | 5.95%(4) | 26% |
| $6,969 |
|
|
|
| Notes to Financial Highlights |
| |
| (1) | Computed using average shares outstanding throughout the period. |
| |
| (2) | Total returns are calculated based on the net asset value of the last business day and do not reflect applicable sales charges, if any. Total returns for periods less than one year are not annualized. |
| |
| (3) | October 2, 2017 (commencement of sale) through March 31, 2018. |
| |
| (5) | October 1, 2017 through March 31, 2018. The fund's fiscal year end was changed from September 30 to March 31, resulting in a six-month annual reporting period. For the years before March 31, 2018, the fund's fiscal year end was September 30. |
| |
| (6) | The ratio of net investment income (loss) to average net assets would have been lower if a portion of the fees had not been waived and/or reimbursed. |
| |
| (7) | Per-share amount includes a distribution from tax return of capital of less than $0.005. |
See Notes to Financial Statements.
|
|
| Report of Independent Registered Public Accounting Firm |
To the Board of Trustees of American Century Investment Trust and Shareholders of High Income Fund
Opinion on the Financial Statements
We have audited the accompanying statement of assets and liabilities, including the schedule of investments, of High Income Fund (one of the funds constituting American Century Investment Trust, referred to hereafter as the “Fund”) as of March 31, 2020, the related statement of operations for the year ended March 31, 2020, the statement of changes in net assets for each of the two years in the period ended March 31, 2020, including the related notes, and the financial highlights for the years ended March 31, 2020 and March 31, 2019, and the periods ended March 31, 2018 (collectively referred to as the “financial statements”). In our opinion, the financial statements present fairly, in all material respects, the financial position of the Fund as of March 31, 2020, the results of its operations for the year then ended, the changes in its net assets for each of the two years in the period ended March 31, 2020 and the financial highlights for the years ended March 31, 2020 and March 31, 2019, and the periods ended March 31, 2018 in conformity with accounting principles generally accepted in the United States of America.
The financial statements as of and for the year ended on September 30, 2017 and the financial highlights for each of the periods ended on or prior to September 30, 2017 (not presented herein, other than the financial highlights) were audited by other auditors whose report dated November 29, 2017 expressed an unqualified opinion on those financial statements and financial highlights.
Basis for Opinion
These financial statements are the responsibility of the Fund’s management. Our responsibility is to express an opinion on the Fund’s financial statements based on our audits. We are a public accounting firm registered with the Public Company Accounting Oversight Board (United States) (PCAOB) and are required to be independent with respect to the Fund in accordance with the U.S. federal securities laws and the applicable rules and regulations of the Securities and Exchange Commission and the PCAOB.
We conducted our audits of these financial statements in accordance with the standards of the PCAOB. Those standards require that we plan and perform the audit to obtain reasonable assurance about whether the financial statements are free of material misstatement, whether due to error or fraud.
Our audits included performing procedures to assess the risks of material misstatement of the financial statements, whether due to error or fraud, and performing procedures that respond to those risks. Such procedures included examining, on a test basis, evidence regarding the amounts and disclosures in the financial statements. Our audits also included evaluating the accounting principles used and significant estimates made by management, as well as evaluating the overall presentation of the financial statements. Our procedures included confirmation of securities owned as of March 31, 2020 by correspondence with the custodian and brokers; when replies were not received from brokers, we performed other auditing procedures. We believe that our audits provide a reasonable basis for our opinion.
/s/ PricewaterhouseCoopers LLP
Kansas City, Missouri
May 18, 2020
We have served as the auditor of one or more investment companies in American Century Investments since 1997.
Board of Trustees
The individuals listed below serve as trustees of the funds. Each trustee will continue to serve in this capacity until death, retirement, resignation or removal from office. The board has adopted a mandatory retirement age for trustees who are not “interested persons,” as that term is defined in the Investment Company Act (independent trustees). Independent trustees shall retire on December 31 of the year in which they reach their 75th birthday; provided, however, that on or after January 1, 2022, independent trustees shall retire on December 31 of the year in which they reach their 76th birthday.
Mr. Thomas is an “interested person” because he currently serves as President and Chief Executive Officer of American Century Companies, Inc. (ACC), the parent company of American Century Investment Management, Inc. (ACIM or the advisor). The other trustees (more than three-fourths of the total number) are independent. They are not employees, directors or officers of, and have no financial interest in, ACC or any of its wholly owned, direct or indirect, subsidiaries, including ACIM, American Century Investment Services, Inc. (ACIS) and American Century Services, LLC (ACS), and they do not have any other affiliations, positions or relationships that would cause them to be considered “interested persons” under the Investment Company Act. The trustees serve in this capacity for eight (in the case of Jonathan S. Thomas, 16; and Ronald J. Gilson, 9) registered investment companies in the American Century Investments family of funds.
The following table presents additional information about the trustees. The mailing address for each trustee other than Mr. Thomas is 1665 Charleston Road, Mountain View, California 94043. The mailing address for Mr. Thomas is 4500 Main Street, Kansas City, Missouri 64111.
|
| | | | | |
Name
(Year of Birth) | Position(s) Held with Funds | Length of Time Served | Principal Occupation(s) During Past 5 Years | Number of American Century Portfolios Overseen by Trustee | Other Directorships Held During Past 5 Years |
| Independent Trustees |
|
|
Tanya S. Beder
(1955) | Trustee | Since 2011 | Chairman and CEO, SBCC Group Inc. (independent advisory services) (2006 to present) | 40 | CYS Investments, Inc.; Kirby Corporation; Nabors Industries Ltd. |
Jeremy I. Bulow
(1954) | Trustee | Since 2011 | Professor of Economics, Stanford University, Graduate School of Business (1979 to present) | 40 | None |
Anne Casscells
(1958) | Trustee | Since 2016 | Co-Chief Executive Officer and Chief Investment Officer, Aetos Alternatives Management (investment advisory firm) (2001 to present); Lecturer in Accounting, Stanford University, Graduate School of Business (2009 to 2017) | 40 | None |
Ronald J. Gilson
(1946) | Trustee and Chairman of the Board | Since 1995
(Chairman since 2005) | Charles J. Meyers Professor of Law and Business, Emeritus, Stanford Law School (1979 to 2016); Marc and Eva Stern Professor of Law and Business, Columbia University School of Law (1992 to present) | 57 | None |
|
| | | | | |
Name
(Year of Birth) | Position(s) Held with Funds | Length of Time Served | Principal Occupation(s) During Past 5 Years | Number of American Century Portfolios Overseen by Trustee | Other Directorships Held During Past 5 Years |
| Independent Trustees |
|
|
Frederick L. A. Grauer
(1946) | Trustee | Since 2008 | Senior Advisor, Credit Sesame, Inc. (credit monitoring firm) (2018 to present); Senior Advisor, Course Hero (an educational technology company) (2015 to present) | 40 | None |
Jonathan D. Levin
(1972) | Trustee | Since 2016 | Philip H. Knight Professor and Dean, Graduate School of Business, Stanford University (2016 to present); Professor, Stanford University, (2000 to present) | 40 | None |
Peter F. Pervere
(1947) | Trustee | Since 2007 | Retired | 40 | None |
John B. Shoven
(1947) | Trustee | Since 2002 | Charles R. Schwab Professor of Economics, Stanford University (1973 to present, emeritus since 2019) | 40 | Cadence Design Systems; Exponent; Financial Engines |
| Interested Trustee |
|
|
Jonathan S. Thomas
(1963) | Trustee | Since 2007 | President and Chief Executive Officer, ACC (2007 to present). Also serves as Chief Executive Officer, ACS; Executive Vice President, ACIM; Director, ACC, ACIM and other ACC subsidiaries | 120 | None |
The Statement of Additional Information has additional information about the fund's trustees and is available without charge, upon request, by calling 1-800-345-2021.
Officers
The following table presents certain information about the executive officers of the funds. Each officer serves as an officer for 16 (in the case of Robert J. Leach, 15) investment companies in the American Century family of funds, unless otherwise noted. No officer is compensated for his or her service as an officer of the funds. The listed officers are interested persons of the funds and are appointed or re-appointed on an annual basis. The mailing address for each of the officers listed below is 4500 Main Street, Kansas City, Missouri 64111.
|
| | |
Name
(Year of Birth) | Offices with the Funds | Principal Occupation(s) During the Past Five Years |
Patrick Bannigan
(1965)
| President since 2019 | Executive Vice President and Director, ACC (2012 to present); Chief Financial Officer, Chief Accounting Officer and Treasurer, ACC (2015 to present); Chief Operating Officer, ACC (2012-2015). Also serves as President, ACS; Vice President, ACIM; Chief Financial Officer, Chief Accounting Officer and/or Director, ACIM, ACS and other ACC subsidiaries |
R. Wes Campbell
(1974)
| Chief Financial Officer and Treasurer since 2018 | Vice President, ACS (2020 to present); Investment Operations and Investment Accounting, ACS (2000 to present) |
Amy D. Shelton
(1964) | Chief Compliance Officer and Vice President since 2014 | Chief Compliance Officer, American Century funds, (2014 to present); Chief Compliance Officer, ACIM (2014 to present); Chief Compliance Officer, ACIS (2009 to present). Also serves as Vice President, ACIS |
Charles A. Etherington
(1957) | General Counsel since 2007 and Senior Vice President since 2006 | Attorney, ACC (1994 to present); Vice President, ACC (2005 to present); General Counsel, ACC (2007 to present). Also serves as General Counsel, ACIM, ACS, ACIS and other ACC subsidiaries; and Senior Vice President, ACIM and ACS |
C. Jean Wade
(1964) | Vice President since 2012 | Senior Vice President, ACS (2017 to present); Vice President ACS (2000 to 2017)
|
Robert J. Leach
(1966) | Vice President since 2006 | Vice President, ACS (2000 to present) |
David H. Reinmiller
(1963) | Vice President since 2000 | Attorney, ACC (1994 to present). Also serves as Vice President, ACIM and ACS |
Ward D. Stauffer
(1960) | Secretary since 2005 | Attorney, ACC (2003 to present) |
|
|
| Liquidity Risk Management Program |
The Fund has adopted a liquidity risk management program (the “program”). The Fund’s Board of Trustees (the "Board") has designated American Century Investment Management, Inc. (“ACIM”) as the administrator of the program. Personnel of ACIM or its affiliates conduct the day-to-day operation of the program pursuant to policies and procedures administered by those members of the ACIM’s Investment Oversight Committee who are members of the ACIM’s Investment Management and Global Analytics departments.
Under the program, ACIM manages the Fund’s liquidity risk, which is the risk that the Fund could not meet shareholder redemption requests without significant dilution of remaining shareholders’ interests in the Fund. This risk is managed by monitoring the degree of liquidity of the Fund’s investments, limiting the amount of the Fund’s illiquid investments, and utilizing various risk management tools and facilities available to the Fund for meeting shareholder redemptions, among other means. ACIM’s process of determining the degree of liquidity of the Fund’s investments is supported by one or more third-party liquidity assessment vendors.
The Board reviewed a report prepared by ACIM regarding the operation and effectiveness of the program for the period December 1, 2018 through December 31, 2019. No significant liquidity events impacting the Fund were noted in the report. In addition, ACIM provided its assessment that the program had been effective in managing the Fund’s liquidity risk.
Retirement Account Information
As required by law, distributions you receive from certain retirement accounts are subject to federal income tax withholding, unless you elect not to have withholding apply*. Tax will be withheld on the total amount withdrawn even though you may be receiving amounts that are not subject to withholding, such as nondeductible contributions. In such case, excess amounts of withholding could occur. You may adjust your withholding election so that a greater or lesser amount will be withheld.
If you don’t want us to withhold on this amount, you must notify us to not withhold the federal income tax. You may notify us in writing or in certain situations by telephone or through other electronic means. For systematic withdrawals, your withholding election will remain in effect until revoked or changed by filing a new election. You have the right to revoke your election at any time and change your withholding percentage for future distributions.
Remember, even if you elect not to have income tax withheld, you are liable for paying income tax on the taxable portion of your withdrawal. If you elect not to have income tax withheld or you don’t have enough income tax withheld, you may be responsible for payment of estimated tax. You may incur penalties under the estimated tax rules if your withholding and estimated tax payments are not sufficient. You can reduce or defer the income tax on a distribution by directly or indirectly rolling such distribution over to another IRA or eligible plan. You should consult your tax advisor for additional information.
State tax will be withheld if, at the time of your distribution, your address is within one of the mandatory withholding states and you have federal income tax withheld (or as otherwise required by state law). State taxes will be withheld from your distribution in accordance with the respective state rules.
*Some 403(b), 457 and qualified retirement plan distributions may be subject to 20% mandatory withholding, as they are subject to special tax and withholding rules. Your plan administrator or plan sponsor is required to provide you with a special tax notice explaining those rules at the time you request a distribution. If applicable, federal and/or state taxes may be withheld from your distribution amount.
Proxy Voting Policies
Descriptions of the principles and policies that the fund's investment advisor uses in exercising the voting rights associated with the securities purchased and/or held by the fund are available without charge, upon request, by calling 1-800-345-2021 or visiting American Century Investments’ website at americancentury.com/proxy. A description of the policies is also available on the Securities and Exchange Commission’s website at sec.gov. Information regarding how the investment advisor voted proxies relating to portfolio securities during the most recent 12-month period ended June 30 is available on americancentury.com/proxy. It is also available at sec.gov.
Quarterly Portfolio Disclosure
The fund files its complete schedule of portfolio holdings with the Securities and Exchange Commission (SEC) for the first and third quarters of each fiscal year as an exhibit to its reports on Form N-PORT. The fund’s Form N-PORT reports are available on the SEC’s website at sec.gov. The fund also makes its complete schedule of portfolio holdings for the most recent quarter of its fiscal year available on its website at americancentury.com and, upon request, by calling 1-800-345-2021.
|
| | |
| |
| | | |
| Contact Us | americancentury.com | |
| Automated Information Line | 1-800-345-8765 | |
| Investor Services Representative | 1-800-345-2021 or 816-531-5575 | |
| Investors Using Advisors | 1-800-378-9878 | |
| Business, Not-For-Profit, Employer-Sponsored Retirement Plans | 1-800-345-3533 | |
| Banks and Trust Companies, Broker-Dealers, Financial Professionals, Insurance Companies | 1-800-345-6488 | |
| Telecommunications Relay Service for the Deaf | 711 | |
| | | |
| American Century Investment Trust | |
| | | |
Investment Advisor: American Century Investment Management, Inc. Kansas City, Missouri | |
| | | |
| This report and the statements it contains are submitted for the general information of our shareholders. The report is not authorized for distribution to prospective investors unless preceded or accompanied by an effective prospectus. | |
| | | |
©2020 American Century Proprietary Holdings, Inc. All rights reserved.
CL-ANN-93333 2005 | |
|
| |
| | |
| | Annual Report |
| | |
| | March 31, 2020 |
| | |
| | High-Yield Fund |
| | Investor Class (ABHIX) |
| | I Class (AHYHX) |
| | Y Class (AHYLX) |
| | A Class (AHYVX) |
| | C Class (AHDCX) |
| | R Class (AHYRX) |
| | R5 Class (ACYIX) |
| | R6 Class (AHYDX) |
Beginning on January 1, 2021, as permitted by regulations adopted by the Securities and Exchange Commission, paper copies of the fund’s shareholder reports like this one will no longer be sent by mail, unless you specifically request paper copies of the reports from the fund or from your financial intermediary, such as a broker-dealer or bank. Instead, the reports will be made available on a website, and you will be notified by mail each time a report is posted and provided with a website link to access the report.
If you already elected to receive shareholder reports electronically, you will not be affected by this change and you need not take any action. You may elect to receive shareholder reports and other communications from the fund or your financial intermediary electronically by calling or sending an email request to your appropriate contacts as listed on the back cover of this report.
You may elect to receive all future reports in paper free of charge. You can inform the fund or your financial intermediary that you wish to continue receiving paper copies of your shareholder reports by calling or sending an email request to your appropriate contacts as listed on the back cover of this report. Your election to receive reports in paper will apply to all funds held with the fund complex/your financial intermediary.
|
| |
| President’s Letter | |
| Performance | |
| Portfolio Commentary | |
| Fund Characteristics | |
| Shareholder Fee Example | |
| Schedule of Investments | |
| Statement of Assets and Liabilities | |
| Statement of Operations | |
| Statement of Changes in Net Assets | |
| Notes to Financial Statements | |
| Financial Highlights | |
| Report of Independent Registered Public Accounting Firm | |
| Management | |
| Liquidity Risk Management Program | |
| Additional Information | |
Any opinions expressed in this report reflect those of the author as of the date of the report, and do not necessarily represent the opinions of American Century Investments® or any other person in the American Century Investments organization. Any such opinions are subject to change at any time based upon market or other conditions and American Century Investments disclaims any responsibility to update such opinions. These opinions may not be relied upon as investment advice and, because investment decisions made by American Century Investments funds are based on numerous factors, may not be relied upon as an indication of trading intent on behalf of any American Century Investments fund. Security examples are used for representational purposes only and are not intended as recommendations to purchase or sell securities. Performance information for comparative indices and securities is provided to American Century Investments by third party vendors. To the best of American Century Investments’ knowledge, such information is accurate at the time of printing.
Jonathan Thomas
Dear Investor:
Thank you for reviewing this annual report for the period ended March 31, 2020. Annual reports help convey important information about fund returns, including market factors that affected performance during the reporting period. For additional insights, please visit americancentury.com.
Virus Outbreak Abruptly Altered Economic, Market Backdrops
Through most of the period, market sentiment was upbeat, partly due to accommodative Federal Reserve (Fed) policy and modest inflation. Improving economic and corporate earnings data and a phase 1 U.S.-China trade deal also helped boost growth outlooks. Against this backdrop, key U.S. stock benchmarks rose to record highs by mid-February, and U.S. bonds continued to advance.
However, beginning in late February, unprecedented social and economic turmoil emerged and reversed the positive trajectory. The COVID-19 epidemic originating in China rapidly spread throughout the world, forcing stay-at-home orders and industry-wide shutdowns. U.S. stocks, corporate bonds and other riskier assets sold off sharply, while U.S. Treasuries rallied in the global flight to quality. The Fed stepped in quickly and aggressively, slashing interest rates to near 0% and enacting massive lending and asset-purchase programs to stabilize the financial system.
The swift and severe sell-off erased the strong stock market gains realized earlier in the period and left key benchmarks with losses for the 12 months. Reflecting their defensive characteristics, high-quality U.S. bonds withstood the turmoil and delivered solid returns for the 12-month period.
Promoting Health and Safety Remains Our Focus
While the market impact of COVID-19 has been severe, reducing the human toll is most important. We are monitoring the situation closely and following guidelines and protocols from all relevant authorities. Our firm has activated a comprehensive Pandemic Response Plan, which includes social distancing and work-from-home mandates, travel restrictions and escalated cleaning regimens at all our facilities. We’ve also launched a Business Continuity Plan to maintain regular business operations and ensure delivery of outstanding service.
We appreciate your confidence in us during these extraordinary times. We have a long history of helping clients weather volatile markets, and we are confident we will meet today’s challenges. In the meantime, the health and safety of you, your family and our employees remain a top priority.
Sincerely,
Jonathan Thomas
President and Chief Executive Officer
American Century Investments
|
| | | | | | |
| Total Returns as of March 31, 2020 |
| | | | Average Annual Returns | |
| | Ticker Symbol | 1 year | 5 years | 10 years | Since Inception | Inception Date |
| Investor Class | ABHIX | -5.09% | 1.89% | 4.63% | — | 9/30/97 |
| Bloomberg Barclays U.S. High-Yield 2% Issuer Capped Bond Index | — | -6.94% | 2.78% | 5.63% | — | — |
| I Class | AHYHX | -4.98% | — | — | 0.63% | 4/10/17 |
| Y Class | AHYLX | -5.08% | — | — | 0.66% | 4/10/17 |
| A Class | AHYVX | | | | | 3/8/02 |
| No sales charge | | -5.50% | 1.63% | 4.37% | — | |
| With sales charge | | -9.73% | 0.70% | 3.89% | — | |
| C Class | AHDCX | -6.04% | 0.88% | 3.60% | — | 12/10/01 |
| R Class | AHYRX | -5.57% | 1.38% | 4.11% | — | 7/29/05 |
| R5 Class | ACYIX | -5.08% | 2.09% | 4.84% | — | 8/2/04 |
| R6 Class | AHYDX | -4.85% | 2.14% | — | 2.65% | 7/26/13 |
Average annual returns since inception are presented when ten years of performance history is not available.
Fund returns would have been lower if a portion of the fees had not been waived.
Sales charges include initial sales charges and contingent deferred sales charges (CDSCs), as applicable. A Class shares have a 4.50% maximum initial sales charge and may be subject to a maximum CDSC of 1.00%. C Class shares redeemed within 12 months of purchase are subject to a maximum CDSC of 1.00%. The SEC requires that mutual funds provide performance information net of maximum sales charges in all cases where charges could be applied.
Data presented reflect past performance. Past performance is no guarantee of future results. Current performance may be higher or lower than the performance shown. Total returns for periods less than one year are not annualized. Investment return and principal value will fluctuate, and redemption value may be more or less than original cost. Data assumes reinvestment of dividends and capital gains, and none of the charts reflect the deduction of taxes that a shareholder would pay on fund distributions or the redemption of fund shares. To obtain performance data current to the most recent month end, please call 1-800-345-2021 or visit americancentury.com. For additional information about the fund, please consult the prospectus.
|
|
| Growth of $10,000 Over 10 Years |
| $10,000 investment made March 31, 2010 |
| Performance for other share classes will vary due to differences in fee structure. |
|
| |
| Value on March 31, 2020 |
| | Investor Class — $15,735 |
| |
| | Bloomberg Barclays U.S. High-Yield 2% Issuer Capped Bond Index— $17,302 |
| |
Ending value of Investor Class would have been lower if a portion of the fees had not been waived.
|
| | | | | | | |
| Total Annual Fund Operating Expenses | | |
| Investor Class | I Class | Y Class | A Class | C Class | R Class | R5 Class | R6 Class |
| 0.79% | 0.69% | 0.59% | 1.04% | 1.79% | 1.29% | 0.59% | 0.54% |
The total annual fund operating expenses shown is as stated in the fund’s prospectus current as of the date of this report. The prospectus may vary from the expense ratio shown elsewhere in this report because it is based on a different time period, includes acquired fund fees and expenses, and, if applicable, does not include fee waivers or expense reimbursements.
Data presented reflect past performance. Past performance is no guarantee of future results. Current performance may be higher or lower than the performance shown. Total returns for periods less than one year are not annualized. Investment return and principal value will fluctuate, and redemption value may be more or less than original cost. Data assumes reinvestment of dividends and capital gains, and none of the charts reflect the deduction of taxes that a shareholder would pay on fund distributions or the redemption of fund shares. To obtain performance data current to the most recent month end, please call 1-800-345-2021 or visit americancentury.com. For additional information about the fund, please consult the prospectus.
Portfolio Managers: Jeffrey Houston, Gavin Fleischman and Charles Tan
Effective May 2019, Kevin Akioka left the portfolio management team, and Charles Tan joined the team.
Performance Summary
High-Yield returned -5.09%* for the 12 months ended March 31, 2020, compared with the Bloomberg Barclays U.S. High-Yield 2% Issuer Capped Bond Index, which returned -6.94%. Fund returns reflect operating expenses, while index returns do not. Results for the fund and the index reflect the negative performance of high-yield bonds during the unprecedented sell-off of risk assets late in the reporting period.
The 12-month period began on an upbeat note for bond investors. The Federal Reserve’s (Fed’s) early 2019 pivot toward dovish policy set the stage for rate cuts in July, September and October. This action, along with modest economic and corporate earnings growth and low inflation, generally supported solid gains for most U.S. bond sectors. By year-end 2019, global economic data improved, the U.S. and China signed a phase 1 trade deal and the Fed suggested it would hold rates steady through 2020. These factors combined to create a favorable outlook for high-yield bonds.
Nevertheless, conditions deteriorated rapidly within the first quarter of 2020. As the COVID-19 epidemic originating in China expanded into a pandemic, nervous fixed-income investors scrambled to shed credit risk and seek shelter in cash. Market volatility soared and liquidity markedly worsened. In response, the Fed slashed short-term rates to near 0% and launched a series of initiatives to stabilize the financial markets. Separately, Congress passed a $2 trillion fiscal relief package.
Amid the global flight to quality, riskier investments, including investment-grade and high-yield corporate bonds, suffered significant losses. Separately, an unexpected price war between Saudi Arabia and Russia amid waning demand for oil triggered a sizable drop in the oil markets. This development accelerated the havoc in the high-yield sector, home to many energy companies.
By the end of March, the Fed’s rescue programs helped stabilize the credit-sensitive sectors of the fixed-income universe, but not before those sectors experienced sharp losses. Against this backdrop, our bias toward the higher-quality segments of the high-yield universe versus the index, along with an out-of-index allocation to investment-grade corporates, largely accounted for the portfolio’s better relative results.
Defensive Positioning Aided Relative Results
Through most of the reporting period, we positioned the portfolio with a more-defensive posture than the index. This was largely due to our belief that many segments of the high-yield market had become overvalued after an extended period of strong performance. This positioning was a modest detractor from relative results in 2019, when risk-on investing generally remained in favor. However, our defensive bias helped relative results as market sentiment shifted quickly and
*All fund returns referenced in this commentary are for Investor Class shares. Fund returns would have been lower if a portion of the fees had not been waived. Performance for other share classes will vary due to differences in fee structure; when Investor Class performance exceeds that of the index, other share classes may not. See page 3 for returns for all share classes.
dramatically in early 2020. In the market sell-off, the highest-risk issuers fared the worst, and our underweight position relative to the index in securities with CCC credit ratings added value. Our
focus on high-yield securities with B and BB credit ratings and an out-of-index allocation to investment-grade corporates with BBB credit ratings also helped relative performance.
Additionally, the portfolio’s larger-than-average cash position contributed to relative results. Although our cash holdings weighed on performance in the risk-on environment of 2019, they provided important downside protection in the first quarter of 2020, which proved to be the defining period of the fiscal year.
Sector Allocation, Security Selection Helped Versus Index
Our sector allocations contributed to the portfolio’s relative results, largely due to results late in the reporting period. In particular, an overweight position in the pharmaceuticals sector and an underweight position in the oil field services sector lifted relative performance. These decisions helped offset negative results versus the index from our underweight in the defensive electric utilities sector, which outperformed, and overweight positions in the gaming and airlines sectors. Gaming and airlines issues were among the hardest hit due to virus-related shutdown orders across the country.
Security selection also contributed to relative performance. Specifically, our selections among media, midstream oil production and aerospace companies helped relative results and offset our selections among energy exploration and production and gaming companies.
Portfolio Positioning
The economic downturn during the first quarter was swift and severe, but we do not expect an equally swift, or V-shaped, recovery. The consumer is the main driver of the U.S. economy, and we believe the effects of the COVID-19 pandemic will weigh on consumer sentiment—and job and economic growth—for several months. Ultimately, this crisis requires a medical solution.
Heightened volatility often creates market disruptions that lead to attractive buying opportunities. Although we identified such opportunities late in the reporting period, we’re remaining cautious and selective in our positioning and mindful of the economic headwinds. We expect continued near-term pressure on credit spreads from growing defaults and rapid downgrades. Accordingly, we’re maintaining our higher-quality bias versus the index, and we’re holding a larger-than-average cash position to take advantage of select opportunities as they emerge. In particular, we’re finding value within the new-issues market and among select investment-grade corporates.
We’re also continuing our regular process of reviewing all portfolio holdings, selling those that do not align with our outlook in the current environment. As always, we favor a bottom-up approach to portfolio management, emphasizing careful security selection as we seek to enhance portfolio yield and returns.
|
| |
| MARCH 31, 2020 | |
| Portfolio at a Glance | |
| Average Duration (effective) | 3.9 years |
| Weighted Average Life to Maturity | 5.7 years |
| | |
| Types of Investments in Portfolio | % of net assets |
| Corporate Bonds | 91.9% |
| Preferred Stocks | 0.9% |
| Bank Loan Obligations | 0.5% |
| Asset-Backed Securities | 0.3% |
| Temporary Cash Investments | 5.2% |
| Temporary Cash Investments - Securities Lending Collateral | —* |
| Other Assets and Liabilities | 1.2% |
*Category is less than 0.05% of total net assets.
Fund shareholders may incur two types of costs: (1) transaction costs, including sales charges (loads) on purchase payments and redemption/exchange fees; and (2) ongoing costs, including management fees; distribution and service (12b-1) fees; and other fund expenses. This example is intended to help you understand your ongoing costs (in dollars) of investing in your fund and to compare these costs with the ongoing cost of investing in other mutual funds.
The example is based on an investment of $1,000 made at the beginning of the period and held for the entire period from October 1, 2019 to March 31, 2020.
Actual Expenses
The table provides information about actual account values and actual expenses for each class. You may use the information, together with the amount you invested, to estimate the expenses that you paid over the period. First, identify the share class you own. Then simply divide your account value by $1,000 (for example, an $8,600 account value divided by $1,000 = 8.6), then multiply the result by the number under the heading “Expenses Paid During Period” to estimate the expenses you paid on your account during this period.
If you hold Investor Class shares of any American Century Investments fund, or I Class shares of the American Century Diversified Bond Fund, in an American Century Investments account (i.e., not through a financial intermediary or employer-sponsored retirement plan account), American Century Investments may charge you a $25.00 annual account maintenance fee if the value of those shares is less than $10,000. We will redeem shares automatically in one of your accounts to pay the $25.00 fee. In determining your total eligible investment amount, we will include your investments in all personal accounts (including American Century Investments brokerage accounts) registered under your Social Security number. Personal accounts include individual accounts, joint accounts, UGMA/UTMA accounts, personal trusts, Coverdell Education Savings Accounts and IRAs (including traditional, Roth, Rollover, SEP-, SARSEP- and SIMPLE-IRAs), and certain other retirement accounts. If you have only business, business retirement, employer-sponsored or American Century Investments brokerage accounts, you are currently not subject to this fee. If you are subject to the account maintenance fee, your account value could be reduced by the fee amount.
Hypothetical Example for Comparison Purposes
The table also provides information about hypothetical account values and hypothetical expenses based on the actual expense ratio of each class of your fund and an assumed rate of return of 5% per year before expenses, which is not the actual return of a fund’s share class. The hypothetical account values and expenses may not be used to estimate the actual ending account balance or expenses you paid for the period. You may use this information to compare the ongoing costs of investing in your fund and other funds. To do so, compare this 5% hypothetical example with the 5% hypothetical examples that appear in the shareholder reports of the other funds.
Please note that the expenses shown in the table are meant to highlight your ongoing costs only and do not reflect any transactional costs, such as sales charges (loads) or redemption/exchange fees. Therefore, the table is useful in comparing ongoing costs only, and will not help you determine the relative total costs of owning different funds. In addition, if these transactional costs were included, your costs would have been higher.
|
| | | | |
| | Beginning
Account Value
10/1/19 | Ending
Account Value
3/31/20 | Expenses Paid
During Period(1)
10/1/19 - 3/31/20 | Annualized
Expense Ratio(1) |
| Actual | | | | |
| Investor Class | $1,000 | $913.90 | $3.73 | 0.78% |
| I Class | $1,000 | $914.60 | $3.25 | 0.68% |
| Y Class | $1,000 | $914.80 | $2.78 | 0.58% |
| A Class | $1,000 | $912.80 | $4.93 | 1.03% |
| C Class | $1,000 | $909.30 | $8.50 | 1.78% |
| R Class | $1,000 | $911.60 | $6.12 | 1.28% |
| R5 Class | $1,000 | $914.80 | $2.78 | 0.58% |
| R6 Class | $1,000 | $915.20 | $2.54 | 0.53% |
| Hypothetical | | | | |
| Investor Class | $1,000 | $1,021.10 | $3.94 | 0.78% |
| I Class | $1,000 | $1,021.60 | $3.44 | 0.68% |
| Y Class | $1,000 | $1,022.10 | $2.93 | 0.58% |
| A Class | $1,000 | $1,019.85 | $5.20 | 1.03% |
| C Class | $1,000 | $1,016.10 | $8.97 | 1.78% |
| R Class | $1,000 | $1,018.60 | $6.46 | 1.28% |
| R5 Class | $1,000 | $1,022.10 | $2.93 | 0.58% |
| R6 Class | $1,000 | $1,022.35 | $2.68 | 0.53% |
| |
| (1) | Expenses are equal to the class's annualized expense ratio listed in the table above, multiplied by the average account value over the period, multiplied by 183, the number of days in the most recent fiscal half-year, divided by 366, to reflect the one-half year period. Annualized expense ratio reflects actual expenses, including any applicable fee waivers or expense reimbursements and excluding any acquired fund fees and expenses. |
MARCH 31, 2020
|
| | | | | | |
| | Principal Amount | Value |
| CORPORATE BONDS — 91.9% | | |
| Aerospace and Defense — 2.0% | | |
| Arconic, Inc., 5.40%, 4/15/21 | $ | 105,000 |
| $ | 104,152 |
|
| Arconic, Inc., 5.125%, 10/1/24 | 175,000 |
| 173,155 |
|
Bombardier, Inc., 8.75%, 12/1/21(1) | 160,000 |
| 133,880 |
|
Bombardier, Inc., 5.75%, 3/15/22(1) | 215,000 |
| 164,011 |
|
Bombardier, Inc., 6.00%, 10/15/22(1) | 185,000 |
| 140,138 |
|
Bombardier, Inc., 7.50%, 3/15/25(1) | 305,000 |
| 213,500 |
|
TransDigm, Inc., 6.25%, 3/15/26(1) | 1,000,000 |
| 1,000,622 |
|
| TransDigm, Inc., 6.375%, 6/15/26 | 520,000 |
| 500,786 |
|
| | | 2,430,244 |
|
| Air Freight and Logistics — 0.2% | | |
XPO Logistics, Inc., 6.50%, 6/15/22(1) | 180,000 |
| 181,411 |
|
XPO Logistics, Inc., 6.75%, 8/15/24(1) | 100,000 |
| 98,406 |
|
| | | 279,817 |
|
| Airlines — 0.4% | | |
| United Airlines Holdings, Inc., 5.00%, 2/1/24 | 555,000 |
| 487,012 |
|
| Auto Components — 0.6% | | |
| American Axle & Manufacturing, Inc., 6.625%, 10/15/22 | 139,000 |
| 116,543 |
|
| Goodyear Tire & Rubber Co. (The), 5.125%, 11/15/23 | 540,000 |
| 514,501 |
|
ZF North America Capital, Inc., 4.75%, 4/29/25(1) | 160,000 |
| 134,453 |
|
| | | 765,497 |
|
| Automobiles — 0.2% | | |
| Ford Motor Credit Co. LLC, 2.98%, 8/3/22 | 300,000 |
| 280,500 |
|
| Banks — 1.0% | | |
| CIT Bank N.A., VRN, 2.97%, 9/27/25 | 1,000,000 |
| 848,855 |
|
| CIT Group, Inc., 5.00%, 8/1/23 | 250,000 |
| 242,091 |
|
| Royal Bank of Scotland Group plc, 6.125%, 12/15/22 | 130,000 |
| 134,261 |
|
| | | 1,225,207 |
|
| Building Products — 1.1% | | |
Builders FirstSource, Inc., 5.00%, 3/1/30(1) | 120,000 |
| 108,675 |
|
Griffon Corp., 5.75%, 3/1/28(1) | 800,000 |
| 756,500 |
|
Standard Industries, Inc., 6.00%, 10/15/25(1) | 375,000 |
| 371,351 |
|
Standard Industries, Inc., 4.75%, 1/15/28(1) | 135,000 |
| 125,269 |
|
| | | 1,361,795 |
|
| Capital Markets — 1.7% | | |
| Icahn Enterprises LP / Icahn Enterprises Finance Corp., 5.25%, 5/15/27 | 787,000 |
| 732,894 |
|
LPL Holdings, Inc., 4.625%, 11/15/27(1) | 250,000 |
| 230,530 |
|
MSCI, Inc., 5.75%, 8/15/25(1) | 500,000 |
| 519,915 |
|
MSCI, Inc., 4.00%, 11/15/29(1) | 420,000 |
| 419,550 |
|
| Oaktree Specialty Lending Corp., 3.50%, 2/25/25 | 180,000 |
| 162,009 |
|
| | | 2,064,898 |
|
|
| | | | | | |
| | Principal Amount | Value |
| Chemicals — 2.4% | | |
| CF Industries, Inc., 3.45%, 6/1/23 | $ | 413,000 |
| $ | 408,886 |
|
| CF Industries, Inc., 4.95%, 6/1/43 | 500,000 |
| 478,750 |
|
Element Solutions, Inc., 5.875%, 12/1/25(1) | 370,000 |
| 365,364 |
|
| Huntsman International LLC, 5.125%, 11/15/22 | 195,000 |
| 200,234 |
|
| Olin Corp., 5.125%, 9/15/27 | 360,000 |
| 324,192 |
|
| Olin Corp., 5.625%, 8/1/29 | 500,000 |
| 462,900 |
|
Tronox Finance plc, 5.75%, 10/1/25(1) | 680,000 |
| 612,847 |
|
| | | 2,853,173 |
|
| Commercial Services and Supplies — 2.4% | | |
| ADT Security Corp. (The), 6.25%, 10/15/21 | 355,000 |
| 348,951 |
|
Clean Harbors, Inc., 4.875%, 7/15/27(1) | 500,000 |
| 492,225 |
|
| Covanta Holding Corp., 5.875%, 3/1/24 | 606,000 |
| 576,454 |
|
Nielsen Finance LLC / Nielsen Finance Co., 5.00%, 4/15/22(1) | 555,000 |
| 514,574 |
|
Prime Security Services Borrower LLC / Prime Finance, Inc., 5.25%, 4/15/24(1) | 500,000 |
| 497,023 |
|
| RR Donnelley & Sons Co., 6.00%, 4/1/24 | 415,000 |
| 410,329 |
|
| | | 2,839,556 |
|
| Communications Equipment — 0.7% | | |
CommScope Technologies LLC, 6.00%, 6/15/25(1) | 70,000 |
| 64,589 |
|
CommScope Technologies LLC, 5.00%, 3/15/27(1) | 285,000 |
| 249,396 |
|
CommScope, Inc., 5.50%, 3/1/24(1) | 150,000 |
| 152,738 |
|
CommScope, Inc., 5.50%, 6/15/24(1) | 238,000 |
| 221,571 |
|
CommScope, Inc., 8.25%, 3/1/27(1) | 200,000 |
| 193,890 |
|
| | | 882,184 |
|
| Consumer Finance — 1.7% | | |
| AerCap Ireland Capital DAC / AerCap Global Aviation Trust, 5.00%, 10/1/21 | 300,000 |
| 269,316 |
|
| Ally Financial, Inc., 4.625%, 3/30/25 | 75,000 |
| 72,149 |
|
| Ally Financial, Inc., 5.75%, 11/20/25 | 168,000 |
| 165,598 |
|
| Ally Financial, Inc., 8.00%, 11/1/31 | 210,000 |
| 242,561 |
|
| Navient Corp., 5.00%, 10/26/20 | 60,000 |
| 59,307 |
|
| Navient Corp., 5.50%, 1/25/23 | 705,000 |
| 667,987 |
|
| Navient Corp., MTN, 6.125%, 3/25/24 | 140,000 |
| 131,954 |
|
Park Aerospace Holdings Ltd., 5.25%, 8/15/22(1) | 460,000 |
| 416,228 |
|
| | | 2,025,100 |
|
| Containers and Packaging — 4.5% | | |
ARD Finance SA, 6.50% Cash or 7.25% PIK, 6/30/27(1)(2) | 800,000 |
| 691,560 |
|
Ardagh Packaging Finance plc / Ardagh Holdings USA, Inc., 6.00%, 2/15/25(1) | 415,000 |
| 419,274 |
|
| Ball Corp., 5.00%, 3/15/22 | 205,000 |
| 212,105 |
|
| Ball Corp., 4.00%, 11/15/23 | 90,000 |
| 91,347 |
|
| Ball Corp., 5.25%, 7/1/25 | 250,000 |
| 273,389 |
|
| Berry Global, Inc., 5.50%, 5/15/22 | 100,000 |
| 99,252 |
|
| Berry Global, Inc., 5.125%, 7/15/23 | 330,000 |
| 333,191 |
|
| Crown Americas LLC / Crown Americas Capital Corp. IV, 4.50%, 1/15/23 | 845,000 |
| 871,601 |
|
Mauser Packaging Solutions Holding Co., 5.50%, 4/15/24(1) | 480,000 |
| 445,186 |
|
|
| | | | | | |
| | Principal Amount | Value |
Mauser Packaging Solutions Holding Co., 7.25%, 4/15/25(1) | $ | 100,000 |
| $ | 76,503 |
|
Owens-Brockway Glass Container, Inc., 5.875%, 8/15/23(1) | 240,000 |
| 236,701 |
|
Reynolds Group Issuer, Inc. / Reynolds Group Issuer LLC / Reynolds Group Issuer Lu, 5.125%, 7/15/23(1) | 390,000 |
| 389,511 |
|
Reynolds Group Issuer, Inc. / Reynolds Group Issuer LLC / Reynolds Group Issuer Lu, 7.00%, 7/15/24(1) | 785,000 |
| 802,172 |
|
Sealed Air Corp., 5.125%, 12/1/24(1) | 440,000 |
| 445,500 |
|
| | | 5,387,292 |
|
| Diversified Financial Services — 0.7% | | |
Refinitiv US Holdings, Inc., 8.25%, 11/15/26(1) | 500,000 |
| 528,750 |
|
| Voya Financial, Inc., VRN, 5.65%, 5/15/53 | 350,000 |
| 321,389 |
|
| | | 850,139 |
|
| Diversified Telecommunication Services — 5.4% | | |
Altice France SA, 7.375%, 5/1/26(1) | 815,000 |
| 827,673 |
|
| CenturyLink, Inc., 5.625%, 4/1/20 | 655,000 |
| 655,000 |
|
| CenturyLink, Inc., 5.80%, 3/15/22 | 860,000 |
| 872,608 |
|
Cincinnati Bell, Inc., 7.00%, 7/15/24(1) | 195,000 |
| 197,675 |
|
| Hughes Satellite Systems Corp., 5.25%, 8/1/26 | 480,000 |
| 479,300 |
|
Intelsat Jackson Holdings SA, 5.50%, 8/1/23(7) | 1,100,000 |
| 683,381 |
|
Intelsat Jackson Holdings SA, 9.75%, 7/15/25(1)(7) | 560,000 |
| 353,503 |
|
| Level 3 Financing, Inc., 5.375%, 8/15/22 | 290,000 |
| 291,668 |
|
| Level 3 Financing, Inc., 5.375%, 5/1/25 | 185,000 |
| 185,232 |
|
| Level 3 Financing, Inc., 5.25%, 3/15/26 | 450,000 |
| 452,216 |
|
| Sprint Capital Corp., 6.875%, 11/15/28 | 280,000 |
| 321,370 |
|
| Sprint Capital Corp., 8.75%, 3/15/32 | 265,000 |
| 351,933 |
|
| Telecom Italia Capital SA, 6.375%, 11/15/33 | 750,000 |
| 765,413 |
|
| | | 6,436,972 |
|
| Electric Utilities — 0.7% | | |
| NRG Energy, Inc., 7.25%, 5/15/26 | 530,000 |
| 558,116 |
|
| Talen Energy Supply LLC, 6.50%, 6/1/25 | 390,000 |
| 255,858 |
|
| | | 813,974 |
|
| Electronic Equipment, Instruments and Components — 0.3% | | |
Sensata Technologies BV, 5.00%, 10/1/25(1) | 338,000 |
| 322,369 |
|
| Energy Equipment and Services — 0.3% | | |
| Nabors Industries, Inc., 4.625%, 9/15/21 | 38,000 |
| 24,331 |
|
| Precision Drilling Corp., 5.25%, 11/15/24 | 375,000 |
| 134,529 |
|
Transocean Poseidon Ltd., 6.875%, 2/1/27(1) | 250,000 |
| 204,242 |
|
| | | 363,102 |
|
| Entertainment — 1.3% | | |
| AMC Entertainment Holdings, Inc., 5.75%, 6/15/25 | 140,000 |
| 59,676 |
|
| Cinemark USA, Inc., 5.125%, 12/15/22 | 165,000 |
| 131,742 |
|
| Netflix, Inc., 5.875%, 11/15/28 | 500,000 |
| 537,775 |
|
Netflix, Inc., 5.375%, 11/15/29(1) | 750,000 |
| 787,912 |
|
| | | 1,517,105 |
|
| Equity Real Estate Investment Trusts (REITs) — 2.7% | | |
| Equinix, Inc., 5.375%, 5/15/27 | 520,000 |
| 521,731 |
|
| Iron Mountain, Inc., 5.75%, 8/15/24 | 395,000 |
| 395,976 |
|
|
| | | | | | |
| | Principal Amount | Value |
Iron Mountain, Inc., 4.875%, 9/15/27(1) | $ | 500,000 |
| $ | 488,484 |
|
Iron Mountain, Inc., 4.875%, 9/15/29(1) | 500,000 |
| 473,174 |
|
| MGM Growth Properties Operating Partnership LP / MGP Finance Co-Issuer, Inc., 5.625%, 5/1/24 | 475,000 |
| 458,971 |
|
| MPT Operating Partnership LP / MPT Finance Corp., 4.625%, 8/1/29 | 1,000,000 |
| 925,625 |
|
SBA Communications Corp., 3.875%, 2/15/27(1) | 20,000 |
| 20,200 |
|
| | | 3,284,161 |
|
| Food and Staples Retailing — 1.6% | | |
Albertsons Cos., Inc. / Safeway, Inc. / New Albertsons LP / Albertsons LLC, 3.50%, 2/15/23(1) | 890,000 |
| 882,880 |
|
| Albertsons Cos., Inc. / Safeway, Inc. / New Albertsons LP / Albertsons LLC, 6.625%, 6/15/24 | 595,000 |
| 608,370 |
|
Rite Aid Corp., 6.125%, 4/1/23(1) | 212,000 |
| 183,910 |
|
Rite Aid Corp., 7.50%, 7/1/25(1) | 123,000 |
| 117,772 |
|
Sysco Corp., 5.65%, 4/1/25(3) | 170,000 |
| 177,199 |
|
| | | 1,970,131 |
|
| Food Products — 4.3% | | |
| B&G Foods, Inc., 5.25%, 4/1/25 | 260,000 |
| 255,298 |
|
JBS USA LUX SA / JBS USA Finance, Inc., 5.875%, 7/15/24(1) | 280,000 |
| 284,550 |
|
JBS USA LUX SA / JBS USA Finance, Inc., 5.75%, 6/15/25(1) | 45,000 |
| 45,844 |
|
| Kraft Heinz Foods Co., 3.00%, 6/1/26 | 500,000 |
| 487,095 |
|
Kraft Heinz Foods Co., 3.75%, 4/1/30(1) | 950,000 |
| 908,298 |
|
| Kraft Heinz Foods Co., 4.375%, 6/1/46 | 500,000 |
| 453,312 |
|
Lamb Weston Holdings, Inc., 4.625%, 11/1/24(1) | 460,000 |
| 455,977 |
|
Pilgrim's Pride Corp., 5.75%, 3/15/25(1) | 755,000 |
| 763,498 |
|
Post Holdings, Inc., 5.00%, 8/15/26(1) | 935,000 |
| 967,444 |
|
Post Holdings, Inc., 5.50%, 12/15/29(1) | 250,000 |
| 260,713 |
|
Post Holdings, Inc., 4.625%, 4/15/30(1) | 250,000 |
| 241,250 |
|
| | | 5,123,279 |
|
| Health Care Equipment and Supplies — 0.4% | | |
Hologic, Inc., 4.375%, 10/15/25(1) | 500,000 |
| 498,273 |
|
Ortho-Clinical Diagnostics, Inc. / Ortho-Clinical Diagnostics SA, 6.625%, 5/15/22(1) | 40,000 |
| 38,099 |
|
| | | 536,372 |
|
| Health Care Providers and Services — 7.5% | | |
| Acadia Healthcare Co., Inc., 5.125%, 7/1/22 | 100,000 |
| 96,156 |
|
| Acadia Healthcare Co., Inc., 5.625%, 2/15/23 | 290,000 |
| 275,107 |
|
Catalent Pharma Solutions, Inc., 5.00%, 7/15/27(1) | 550,000 |
| 536,552 |
|
| Centene Corp., 4.75%, 1/15/25 | 700,000 |
| 713,128 |
|
Centene Corp., 4.625%, 12/15/29(1) | 380,000 |
| 384,009 |
|
| CHS / Community Health Systems, Inc., 6.25%, 3/31/23 | 575,000 |
| 550,203 |
|
CHS / Community Health Systems, Inc., 8.125%, 6/30/24(1) | 85,000 |
| 59,530 |
|
CHS / Community Health Systems, Inc., 8.00%, 12/15/27(1)(4) | 52,000 |
| 48,230 |
|
CHS / Community Health Systems, Inc., 6.875%, 4/1/28(1) | 127,000 |
| 51,435 |
|
CHS / Community Health Systems, Inc., VRN, 9.875%, 6/30/23(1) | 315,000 |
| 248,455 |
|
| DaVita, Inc., 5.125%, 7/15/24 | 532,000 |
| 533,732 |
|
| DaVita, Inc., 5.00%, 5/1/25 | 722,000 |
| 725,570 |
|
|
| | | | | | |
| | Principal Amount | Value |
| Encompass Health Corp., 5.75%, 11/1/24 | $ | 160,000 |
| $ | 161,753 |
|
Envision Healthcare Corp., 8.75%, 10/15/26(1) | 300,000 |
| 75,313 |
|
| HCA, Inc., 5.00%, 3/15/24 | 190,000 |
| 197,068 |
|
| HCA, Inc., 7.69%, 6/15/25 | 500,000 |
| 529,373 |
|
| HCA, Inc., 4.50%, 2/15/27 | 480,000 |
| 495,314 |
|
| HCA, Inc., 3.50%, 9/1/30 | 430,000 |
| 391,890 |
|
IQVIA, Inc., 5.00%, 10/15/26(1) | 485,000 |
| 498,079 |
|
IQVIA, Inc., 5.00%, 5/15/27(1) | 300,000 |
| 308,840 |
|
LifePoint Health, Inc., 4.375%, 2/15/27(1) | 400,000 |
| 379,800 |
|
Team Health Holdings, Inc., 6.375%, 2/1/25(1) | 230,000 |
| 82,511 |
|
| Tenet Healthcare Corp., 8.125%, 4/1/22 | 470,000 |
| 446,660 |
|
| Tenet Healthcare Corp., 6.75%, 6/15/23 | 780,000 |
| 724,429 |
|
| Tenet Healthcare Corp., 5.125%, 5/1/25 | 500,000 |
| 476,250 |
|
| | | 8,989,387 |
|
| Hotels, Restaurants and Leisure — 5.4% | | |
1011778 BC ULC / New Red Finance, Inc., 5.00%, 10/15/25(1) | 500,000 |
| 480,622 |
|
1011778 BC ULC / New Red Finance, Inc., 4.375%, 1/15/28(1) | 450,000 |
| 418,252 |
|
Aramark Services, Inc., 5.00%, 2/1/28(1) | 400,000 |
| 374,468 |
|
| Boyd Gaming Corp., 6.375%, 4/1/26 | 350,000 |
| 304,693 |
|
Caesars Resort Collection LLC / CRC Finco, Inc., 5.25%, 10/15/25(1) | 600,000 |
| 437,820 |
|
| Eldorado Resorts, Inc., 7.00%, 8/1/23 | 600,000 |
| 543,753 |
|
Golden Nugget, Inc., 6.75%, 10/15/24(1) | 610,000 |
| 388,790 |
|
| Hilton Worldwide Finance LLC / Hilton Worldwide Finance Corp., 4.625%, 4/1/25 | 455,000 |
| 427,129 |
|
International Game Technology plc, 6.50%, 2/15/25(1) | 585,000 |
| 522,031 |
|
KFC Holding Co. / Pizza Hut Holdings LLC / Taco Bell of America LLC, 5.25%, 6/1/26(1) | 250,000 |
| 251,544 |
|
| MGM Resorts International, 6.00%, 3/15/23 | 350,000 |
| 339,939 |
|
| MGM Resorts International, 4.625%, 9/1/26 | 215,000 |
| 184,313 |
|
Penn National Gaming, Inc., 5.625%, 1/15/27(1) | 680,000 |
| 510,280 |
|
Scientific Games International, Inc., 8.25%, 3/15/26(1) | 200,000 |
| 129,146 |
|
Scientific Games International, Inc., 7.25%, 11/15/29(1) | 500,000 |
| 312,225 |
|
Station Casinos LLC, 5.00%, 10/1/25(1) | 100,000 |
| 84,031 |
|
Wynn Las Vegas LLC / Wynn Las Vegas Capital Corp., 5.50%, 3/1/25(1) | 605,000 |
| 567,169 |
|
| Yum! Brands, Inc., 3.75%, 11/1/21 | 200,000 |
| 191,760 |
|
| | | 6,467,965 |
|
| Household Durables — 3.8% | | |
| Beazer Homes USA, Inc., 5.875%, 10/15/27 | 330,000 |
| 251,650 |
|
| Lennar Corp., 4.50%, 4/30/24 | 695,000 |
| 684,085 |
|
Mattamy Group Corp., 4.625%, 3/1/30(1) | 330,000 |
| 285,656 |
|
| MDC Holdings, Inc., 3.85%, 1/15/30 | 990,000 |
| 896,569 |
|
| Meritage Homes Corp., 7.00%, 4/1/22 | 110,000 |
| 110,928 |
|
| Meritage Homes Corp., 5.125%, 6/6/27 | 230,000 |
| 218,165 |
|
| Newell Brands, Inc., 4.20%, 4/1/26 | 500,000 |
| 490,174 |
|
| PulteGroup, Inc., 5.50%, 3/1/26 | 465,000 |
| 461,760 |
|
Taylor Morrison Communities, Inc., 5.875%, 1/31/25(1) | 570,000 |
| 536,512 |
|
|
| | | | | | |
| | Principal Amount | Value |
| Toll Brothers Finance Corp., 4.35%, 2/15/28 | $ | 200,000 |
| $ | 183,709 |
|
| Toll Brothers Finance Corp., 3.80%, 11/1/29 | 500,000 |
| 441,288 |
|
| | | 4,560,496 |
|
| Household Products — 0.6% | | |
Energizer Holdings, Inc., 5.50%, 6/15/25(1) | 365,000 |
| 356,333 |
|
| Spectrum Brands, Inc., 5.75%, 7/15/25 | 325,000 |
| 306,303 |
|
| | | 662,636 |
|
| Insurance — 0.3% | | |
| Genworth Holdings, Inc., 7.625%, 9/24/21 | 315,000 |
| 301,442 |
|
| Interactive Media and Services — 0.4% | | |
Rackspace Hosting, Inc., 8.625%, 11/15/24(1) | 520,000 |
| 466,544 |
|
| IT Services — 0.3% | | |
| CDW LLC / CDW Finance Corp., 5.50%, 12/1/24 | 290,000 |
| 304,078 |
|
| Life Sciences Tools and Services — 0.4% | | |
Charles River Laboratories International, Inc., 4.25%, 5/1/28(1) | 500,000 |
| 484,725 |
|
| Media — 13.2% | | |
Altice Financing SA, 7.50%, 5/15/26(1) | 1,205,000 |
| 1,178,550 |
|
| AMC Networks, Inc., 4.75%, 8/1/25 | 730,000 |
| 714,491 |
|
| Cablevision Systems Corp., 5.875%, 9/15/22 | 705,000 |
| 715,815 |
|
CCO Holdings LLC / CCO Holdings Capital Corp., 5.375%, 5/1/25(1) | 625,000 |
| 644,659 |
|
CCO Holdings LLC / CCO Holdings Capital Corp., 5.75%, 2/15/26(1) | 880,000 |
| 894,036 |
|
CCO Holdings LLC / CCO Holdings Capital Corp., 5.125%, 5/1/27(1) | 515,000 |
| 521,190 |
|
CCO Holdings LLC / CCO Holdings Capital Corp., 5.00%, 2/1/28(1) | 500,000 |
| 504,780 |
|
CCO Holdings LLC / CCO Holdings Capital Corp., 4.50%, 8/15/30(1) | 1,000,000 |
| 985,625 |
|
| CSC Holdings LLC, 6.75%, 11/15/21 | 565,000 |
| 585,764 |
|
CSC Holdings LLC, 5.375%, 7/15/23(1) | 460,000 |
| 467,477 |
|
CSC Holdings LLC, 6.625%, 10/15/25(1) | 200,000 |
| 211,756 |
|
CSC Holdings LLC, 5.50%, 5/15/26(1) | 245,000 |
| 255,123 |
|
CSC Holdings LLC, 5.50%, 4/15/27(1) | 735,000 |
| 764,731 |
|
| DISH DBS Corp., 5.125%, 5/1/20 | 200,000 |
| 199,161 |
|
| DISH DBS Corp., 5.00%, 3/15/23 | 435,000 |
| 420,871 |
|
| DISH DBS Corp., 5.875%, 11/15/24 | 630,000 |
| 617,454 |
|
Gray Television, Inc., 5.125%, 10/15/24(1) | 475,000 |
| 461,940 |
|
Gray Television, Inc., 5.875%, 7/15/26(1) | 455,000 |
| 440,599 |
|
| Lamar Media Corp., 5.00%, 5/1/23 | 290,000 |
| 289,266 |
|
Nexstar Broadcasting, Inc., 5.625%, 8/1/24(1) | 635,000 |
| 601,659 |
|
Nexstar Broadcasting, Inc., 5.625%, 7/15/27(1) | 400,000 |
| 393,220 |
|
Sinclair Television Group, Inc., 5.625%, 8/1/24(1) | 485,000 |
| 449,840 |
|
Sirius XM Radio, Inc., 4.625%, 5/15/23(1) | 315,000 |
| 313,817 |
|
Sirius XM Radio, Inc., 5.375%, 4/15/25(1) | 350,000 |
| 355,686 |
|
Sirius XM Radio, Inc., 5.50%, 7/1/29(1) | 250,000 |
| 256,388 |
|
TEGNA, Inc., 5.50%, 9/15/24(1) | 415,000 |
| 395,806 |
|
TEGNA, Inc., 5.00%, 9/15/29(1) | 260,000 |
| 234,975 |
|
Univision Communications, Inc., 5.125%, 2/15/25(1) | 375,000 |
| 322,500 |
|
| ViacomCBS, Inc., VRN, 6.25%, 2/28/57 | 200,000 |
| 173,065 |
|
| Videotron Ltd., 5.00%, 7/15/22 | 280,000 |
| 280,006 |
|
Virgin Media Finance plc, 5.75%, 1/15/25(1) | 640,000 |
| 626,397 |
|
|
| | | | | | |
| | Principal Amount | Value |
Ziggo BV, 5.50%, 1/15/27(1) | $ | 607,000 |
| $ | 610,369 |
|
| | | 15,887,016 |
|
| Metals and Mining — 4.1% | | |
Alcoa Nederland Holding BV, 6.75%, 9/30/24(1) | 410,000 |
| 400,640 |
|
| Cleveland-Cliffs, Inc., 5.75%, 3/1/25 | 830,000 |
| 647,400 |
|
Cleveland-Cliffs, Inc., 7.00%, 3/15/27(1) | 400,000 |
| 246,000 |
|
Constellium SE, 6.625%, 3/1/25(1) | 835,000 |
| 757,738 |
|
First Quantum Minerals Ltd., 7.25%, 5/15/22(1) | 305,000 |
| 273,079 |
|
| Freeport-McMoRan, Inc., 3.55%, 3/1/22 | 49,000 |
| 47,268 |
|
| Freeport-McMoRan, Inc., 4.125%, 3/1/28 | 310,000 |
| 272,533 |
|
| Freeport-McMoRan, Inc., 5.40%, 11/14/34 | 655,000 |
| 610,439 |
|
Novelis Corp., 5.875%, 9/30/26(1) | 780,000 |
| 770,899 |
|
| Steel Dynamics, Inc., 5.00%, 12/15/26 | 360,000 |
| 376,304 |
|
| Teck Resources Ltd., 6.25%, 7/15/41 | 465,000 |
| 403,855 |
|
| United States Steel Corp., 6.875%, 8/15/25 | 100,000 |
| 70,356 |
|
| | | 4,876,511 |
|
| Oil, Gas and Consumable Fuels — 6.4% | | |
Aker BP ASA, 3.75%, 1/15/30(1) | 500,000 |
| 376,411 |
|
| Antero Resources Corp., 5.125%, 12/1/22 | 255,000 |
| 133,962 |
|
| Antero Resources Corp., 5.625%, 6/1/23 | 155,000 |
| 63,162 |
|
| Callon Petroleum Co., 6.25%, 4/15/23 | 235,000 |
| 57,568 |
|
| Cheniere Corpus Christi Holdings LLC, 7.00%, 6/30/24 | 245,000 |
| 215,602 |
|
| Cheniere Corpus Christi Holdings LLC, 5.875%, 3/31/25 | 85,000 |
| 77,566 |
|
| Cheniere Corpus Christi Holdings LLC, 5.125%, 6/30/27 | 450,000 |
| 404,582 |
|
| Cheniere Energy Partners LP, 5.25%, 10/1/25 | 500,000 |
| 468,735 |
|
| Cheniere Energy Partners LP, 5.625%, 10/1/26 | 350,000 |
| 327,468 |
|
Chesapeake Energy Corp., 11.50%, 1/1/25(1) | 178,000 |
| 30,260 |
|
| CNX Resources Corp., 5.875%, 4/15/22 | 429,000 |
| 395,752 |
|
| Crestwood Midstream Partners LP / Crestwood Midstream Finance Corp., 6.25%, 4/1/23 | 140,000 |
| 79,304 |
|
| Crestwood Midstream Partners LP / Crestwood Midstream Finance Corp., 5.75%, 4/1/25 | 460,000 |
| 266,814 |
|
Denbury Resources, Inc., 9.00%, 5/15/21(1) | 255,000 |
| 76,309 |
|
| EnLink Midstream Partners LP, 4.85%, 7/15/26 | 700,000 |
| 349,067 |
|
| Genesis Energy LP / Genesis Energy Finance Corp., 5.625%, 6/15/24 | 130,000 |
| 92,137 |
|
| Gulfport Energy Corp., 6.00%, 10/15/24 | 105,000 |
| 26,512 |
|
| Gulfport Energy Corp., 6.375%, 5/15/25 | 410,000 |
| 103,010 |
|
Hilcorp Energy I LP / Hilcorp Finance Co., 5.75%, 10/1/25(1) | 240,000 |
| 112,499 |
|
MEG Energy Corp., 7.00%, 3/31/24(1) | 81,000 |
| 37,868 |
|
MEG Energy Corp., 6.50%, 1/15/25(1) | 295,000 |
| 187,141 |
|
| NuStar Logistics LP, 4.75%, 2/1/22 | 155,000 |
| 122,739 |
|
| Oasis Petroleum, Inc., 6.875%, 3/15/22 | 500,000 |
| 102,500 |
|
Oasis Petroleum, Inc., 6.25%, 5/1/26(1) | 500,000 |
| 83,787 |
|
Parsley Energy LLC / Parsley Finance Corp., 5.375%, 1/15/25(1) | 580,000 |
| 452,371 |
|
| QEP Resources, Inc., 5.375%, 10/1/22 | 565,000 |
| 270,316 |
|
| SM Energy Co., 5.00%, 1/15/24 | 365,000 |
| 110,867 |
|
|
| | | | | | |
| | Principal Amount | Value |
| Southwestern Energy Co., 6.20%, 1/23/25 | $ | 555,000 |
| $ | 382,073 |
|
| Sunoco LP / Sunoco Finance Corp., 5.50%, 2/15/26 | 850,000 |
| 742,749 |
|
Tallgrass Energy Partners LP / Tallgrass Energy Finance Corp., 6.00%, 3/1/27(1) | 500,000 |
| 268,750 |
|
| Targa Resources Partners LP / Targa Resources Partners Finance Corp., 4.25%, 11/15/23 | 471,000 |
| 408,336 |
|
| Targa Resources Partners LP / Targa Resources Partners Finance Corp., 5.125%, 2/1/25 | 461,000 |
| 396,400 |
|
Whiting Petroleum Corp., 5.75%, 3/15/21(7) | 760,000 |
| 56,202 |
|
| WPX Energy, Inc., 8.25%, 8/1/23 | 235,000 |
| 174,780 |
|
| WPX Energy, Inc., 5.25%, 10/15/27 | 500,000 |
| 277,775 |
|
| | | 7,731,374 |
|
| Personal Products — 0.2% | | |
| Avon Products, Inc., 7.00%, 3/15/23 | 280,000 |
| 232,334 |
|
| Pharmaceuticals — 3.3% | | |
Bausch Health Cos., Inc., 5.50%, 3/1/23(1) | 177,000 |
| 175,008 |
|
Bausch Health Cos., Inc., 6.125%, 4/15/25(1) | 700,000 |
| 693,879 |
|
Bausch Health Cos., Inc., 5.50%, 11/1/25(1) | 800,000 |
| 813,244 |
|
Bausch Health Cos., Inc., 5.00%, 1/30/28(1) | 1,000,000 |
| 954,200 |
|
| Elanco Animal Health, Inc., 5.02%, 8/28/23 | 350,000 |
| 354,669 |
|
Horizon Therapeutics USA, Inc., 5.50%, 8/1/27(1) | 750,000 |
| 757,087 |
|
| Teva Pharmaceutical Finance Netherlands III BV, 3.15%, 10/1/26 | 300,000 |
| 254,978 |
|
| | | 4,003,065 |
|
| Professional Services — 0.3% | | |
Jaguar Holding Co. II / Pharmaceutical Product Development LLC, 6.375%, 8/1/23(1) | 375,000 |
| 384,364 |
|
| Road and Rail — 1.8% | | |
Ashtead Capital, Inc., 4.125%, 8/15/25(1) | 800,000 |
| 736,000 |
|
| Hertz Corp. (The), 6.25%, 10/15/22 | 235,000 |
| 166,375 |
|
| United Rentals North America, Inc., 5.50%, 7/15/25 | 170,000 |
| 167,663 |
|
| United Rentals North America, Inc., 5.50%, 5/15/27 | 555,000 |
| 545,246 |
|
| United Rentals North America, Inc., 4.875%, 1/15/28 | 500,000 |
| 487,775 |
|
| | | 2,103,059 |
|
| Semiconductors and Semiconductor Equipment — 0.4% | | |
NXP BV / NXP Funding LLC, 3.875%, 9/1/22(1) | 455,000 |
| 457,200 |
|
| Software — 0.8% | | |
| Infor US, Inc., 6.50%, 5/15/22 | 513,000 |
| 502,566 |
|
| NortonLifeLock, Inc., 4.20%, 9/15/20 | 500,000 |
| 496,877 |
|
| | | 999,443 |
|
| Specialty Retail — 1.1% | | |
| L Brands, Inc., 5.625%, 2/15/22 | 525,000 |
| 490,744 |
|
PetSmart, Inc., 5.875%, 6/1/25(1) | 180,000 |
| 178,650 |
|
| Suburban Propane Partners LP / Suburban Energy Finance Corp., 5.50%, 6/1/24 | 185,000 |
| 175,282 |
|
| Suburban Propane Partners LP / Suburban Energy Finance Corp., 5.75%, 3/1/25 | 550,000 |
| 513,559 |
|
| | | 1,358,235 |
|
|
| | | | | | |
| | Principal Amount | Value |
| Technology Hardware, Storage and Peripherals — 1.1% | | |
Dell International LLC / EMC Corp., 5.875%, 6/15/21(1) | $ | 175,000 |
| $ | 175,000 |
|
Dell International LLC / EMC Corp., 7.125%, 6/15/24(1) | 335,000 |
| 347,144 |
|
| EMC Corp., 2.65%, 6/1/20 | 150,000 |
| 149,707 |
|
| NCR Corp., 5.00%, 7/15/22 | 380,000 |
| 358,625 |
|
| Western Digital Corp., 4.75%, 2/15/26 | 340,000 |
| 346,885 |
|
| | | 1,377,361 |
|
| Textiles, Apparel and Luxury Goods — 0.4% | | |
Hanesbrands, Inc., 4.625%, 5/15/24(1) | 475,000 |
| 473,221 |
|
| Trading Companies and Distributors — 0.3% | | |
Beacon Roofing Supply, Inc., 4.875%, 11/1/25(1) | 370,000 |
| 336,239 |
|
| Wireless Telecommunication Services — 3.2% | | |
| Sprint Corp., 7.25%, 9/15/21 | 785,000 |
| 813,385 |
|
| Sprint Corp., 7.875%, 9/15/23 | 380,000 |
| 421,281 |
|
| Sprint Corp., 7.125%, 6/15/24 | 550,000 |
| 607,742 |
|
| Sprint Corp., 7.625%, 2/15/25 | 280,000 |
| 311,962 |
|
| T-Mobile USA, Inc., 6.00%, 3/1/23 | 350,000 |
| 354,118 |
|
| T-Mobile USA, Inc., 6.375%, 3/1/25 | 355,000 |
| 365,208 |
|
| T-Mobile USA, Inc., 6.50%, 1/15/26 | 445,000 |
| 469,720 |
|
| T-Mobile USA, Inc., 4.75%, 2/1/28 | 500,000 |
| 519,025 |
|
| | | 3,862,441 |
|
TOTAL CORPORATE BONDS (Cost $121,411,280) | | 110,419,015 |
|
| PREFERRED STOCKS — 0.9% | | |
| Banks — 0.9% | | |
BNP Paribas SA, 4.50%(1) | 378,000 |
| 291,296 |
|
| JPMorgan Chase & Co., 4.00% | 890,000 |
| 760,617 |
|
TOTAL PREFERRED STOCKS
(Cost $1,268,000) | | 1,051,913 |
|
BANK LOAN OBLIGATIONS(5) — 0.5% | | |
| Health Care Providers and Services — 0.3% | | |
| Acadia Healthcare Company, Inc., 2018 Term Loan B4, 3.50%, (1-month LIBOR plus 2.50%), 2/16/23 | $ | 486,446 |
| 451,057 |
|
| Pharmaceuticals — 0.2% | | |
| Bausch Health Companies Inc., 2018 Term Loan B, 3.61%, (1-month LIBOR plus 3.00%), 6/2/25 | 225,203 |
| 215,538 |
|
TOTAL BANK LOAN OBLIGATIONS
(Cost $710,224) | | 666,595 |
|
| ASSET-BACKED SECURITIES — 0.3% | | |
| UAL Pass-Through Trust, Series 2007-1, Class A, 6.64%, 1/2/24 | 188,646 |
| 174,532 |
|
| US Airways Pass-Through Trust, Series 2013-1, Class B, 5.375%, 5/15/23 | 201,069 |
| 192,230 |
|
TOTAL ASSET-BACKED SECURITIES
(Cost $391,478) | | 366,762 |
|
|
| | | | | |
| | Shares | Value |
| TEMPORARY CASH INVESTMENTS — 5.2% | | |
| Repurchase Agreement, BMO Capital Markets Corp., (collateralized by various U.S. Treasury obligations, 1.875% - 3.00%, 11/30/21 - 5/15/45, valued at $2,121,136), in a joint trading account at 0.01%, dated 3/31/20, due 4/1/20 (Delivery value $2,079,895) | | $ | 2,079,894 |
|
| State Street Institutional U.S. Government Money Market Fund, Premier Class | 4,130,835 |
| 4,130,835 |
|
TOTAL TEMPORARY CASH INVESTMENTS
(Cost $6,210,729) | | 6,210,729 |
|
TEMPORARY CASH INVESTMENTS - SECURITIES LENDING COLLATERAL(6)† |
State Street Navigator Securities Lending Government Money Market Portfolio
(Cost $50,440) | 50,440 |
| 50,440 |
|
TOTAL INVESTMENT SECURITIES — 98.8%
(Cost $130,042,151) | | 118,765,454 |
|
| OTHER ASSETS AND LIABILITIES — 1.2% | | 1,410,485 |
|
| TOTAL NET ASSETS — 100.0% | | $ | 120,175,939 |
|
|
| | |
| NOTES TO SCHEDULE OF INVESTMENTS |
| LIBOR | - | London Interbank Offered Rate |
| MTN | - | Medium Term Note |
| PIK | - | Payment in Kind. Security may pay a cash rate and/or an in kind rate. |
| VRN | - | Variable Rate Note. The rate adjusts periodically based upon the terms set forth in the security’s offering documents. The rate shown is effective at the period end and the reference rate and spread, if any, is indicated. The security's effective maturity date may be shorter than the final maturity date shown. |
| |
| † | Category is less than 0.05% of total net assets. |
| |
| (1) | Security was purchased pursuant to Rule 144A under the Securities Act of 1933 and may be sold in transactions exempt from registration, normally to qualified institutional investors. The aggregate value of these securities at the period end was $53,753,862, which represented 44.7% of total net assets. |
| |
| (2) | The security's rate was paid in cash at the last payment date. |
| |
| (3) | When-issued security. The issue price and yield are fixed on the date of the commitment, but payment and delivery are scheduled for a future date. |
| |
| (4) | Security, or a portion thereof, is on loan. At the period end, the aggregate value of securities on loan was $48,230. The amount of securities on loan indicated may not correspond with the securities on loan identified because securities with pending sales are in the process of recall from the brokers. |
| |
| (5) | The interest rate on a bank loan obligation adjusts periodically based on a predetermined schedule. Rate shown is effective at period end. The maturity date on a bank loan obligation may be less than indicated as a result of contractual or optional prepayments. These prepayments cannot be predicted with certainty. |
| |
| (6) | Investment of cash collateral from securities on loan. At the period end, the aggregate market value of the collateral held by the fund was $50,440. |
| |
| (7) | Security is in default. |
See Notes to Financial Statements.
|
|
| Statement of Assets and Liabilities |
|
| | | |
| MARCH 31, 2020 | |
| Assets | |
| Investment securities, at value (cost of $129,991,711) — including $48,230 of securities on loan | $ | 118,715,014 |
|
Investment made with cash collateral received for securities on loan, at value (cost of $50,440) | 50,440 |
|
| Total investment securities, at value (cost of $130,042,151) | 118,765,454 |
|
| Receivable for investments sold | 154,481 |
|
| Receivable for capital shares sold | 62,739 |
|
| Interest and dividends receivable | 1,736,511 |
|
| Securities lending receivable | 3,714 |
|
| | 120,722,899 |
|
| | |
| Liabilities | |
| Payable for collateral received for securities on loan | 50,440 |
|
| Payable for investments purchased | 241,769 |
|
| Payable for capital shares redeemed | 116,964 |
|
| Accrued management fees | 80,369 |
|
| Distribution and service fees payable | 5,438 |
|
| Dividends payable | 51,980 |
|
| | 546,960 |
|
| | |
| Net Assets | $ | 120,175,939 |
|
| | |
| Net Assets Consist of: | |
| Capital paid in | $ | 172,254,836 |
|
| Distributable earnings | (52,078,897) |
|
| | $ | 120,175,939 |
|
|
| | | | | |
| | Net Assets | Shares Outstanding | Net Asset Value Per Share |
| Investor Class |
| $89,168,276 |
| 17,768,738 | $5.02 |
| I Class |
| $4,063,423 |
| 807,923 | $5.03 |
| Y Class |
| $10,819,314 |
| 2,153,420 | $5.02 |
| A Class |
| $11,313,523 |
| 2,252,122 | $5.02* |
| C Class |
| $2,775,202 |
| 552,636 | $5.02 |
| R Class |
| $863,654 |
| 171,996 | $5.02 |
| R5 Class |
| $1,012,870 |
| 201,603 | $5.02 |
| R6 Class |
| $159,677 |
| 31,828 | $5.02 |
| |
| * | Maximum offering price $5.26 (net asset value divided by 0.955). |
See Notes to Financial Statements.
|
| | | |
| YEAR ENDED MARCH 31, 2020 | |
| Investment Income (Loss) | |
| Income: | |
| Interest | $ | 7,489,104 |
|
| Securities lending, net | 57,194 |
|
| Dividends | 37,890 |
|
| | 7,584,188 |
|
| | |
| Expenses: | |
| Management fees | 1,107,474 |
|
| Distribution and service fees: | |
| A Class | 32,147 |
|
| C Class | 43,932 |
|
| R Class | 4,814 |
|
| Trustees' fees and expenses | 10,689 |
|
| Other expenses | 2,454 |
|
| | 1,201,510 |
|
Fees waived(1) | (33,079 | ) |
| | 1,168,431 |
|
| | |
| Net investment income (loss) | 6,415,757 |
|
| | |
| Realized and Unrealized Gain (Loss) | |
| Net realized gain (loss) on: | |
| Investment transactions | (2,195,898 | ) |
| Swap agreement transactions | 56,943 |
|
| | (2,138,955 | ) |
| | |
| Change in net unrealized appreciation (depreciation) on: | |
| Investments | (11,016,041 | ) |
| Swap agreements | (56,525 | ) |
| | (11,072,566 | ) |
| | |
| Net realized and unrealized gain (loss) | (13,211,521 | ) |
| | |
| Net Increase (Decrease) in Net Assets Resulting from Operations | $ | (6,795,764 | ) |
| |
| (1) | Amount consists of $25,632, $1,096, $1,646, $2,849, $1,204, $209, $398 and $45 for Investor Class, I Class, Y Class, A Class, C Class, R Class, R5 Class and R6 Class, respectively. |
See Notes to Financial Statements.
|
|
| Statement of Changes in Net Assets |
|
| | | | | | |
| YEARS ENDED MARCH 31, 2020 AND MARCH 31, 2019 |
| Increase (Decrease) in Net Assets | March 31, 2020 | March 31, 2019 |
| Operations | | |
| Net investment income (loss) | $ | 6,415,757 |
| $ | 7,425,212 |
|
| Net realized gain (loss) | (2,138,955 | ) | (2,294,661 | ) |
| Change in net unrealized appreciation (depreciation) | (11,072,566 | ) | 1,607,485 |
|
| Net increase (decrease) in net assets resulting from operations | (6,795,764 | ) | 6,738,036 |
|
| | | |
| Distributions to Shareholders | | |
| From earnings: | | |
| Investor Class | (4,983,213 | ) | (5,993,988 | ) |
| I Class | (228,569 | ) | (154,119 | ) |
| Y Class | (442,665 | ) | (153,733 | ) |
| A Class | (559,791 | ) | (626,853 | ) |
| C Class | (158,889 | ) | (301,522 | ) |
| R Class | (39,488 | ) | (47,087 | ) |
| R5 Class | (87,289 | ) | (87,006 | ) |
| R6 Class | (9,313 | ) | (217,873 | ) |
| Decrease in net assets from distributions | (6,509,217 | ) | (7,582,181 | ) |
| | | |
| Capital Share Transactions | | |
| Net increase (decrease) in net assets from capital share transactions (Note 5) | (5,445,921 | ) | (9,199,688 | ) |
| | | |
| Net increase (decrease) in net assets | (18,750,902 | ) | (10,043,833 | ) |
| | | |
| Net Assets | | |
| Beginning of period | 138,926,841 |
| 148,970,674 |
|
| End of period | $ | 120,175,939 |
| $ | 138,926,841 |
|
See Notes to Financial Statements.
|
|
Notes to Financial Statements |
MARCH 31, 2020
1. Organization
American Century Investment Trust (the trust) is registered under the Investment Company Act of 1940, as amended (the 1940 Act), as an open-end management investment company and is organized as a Massachusetts business trust. High-Yield Fund (the fund) is one fund in a series issued by the trust. The fund’s investment objective is to seek high current income. As a secondary objective, the fund seeks capital appreciation, but only when consistent with its primary objective of maximizing current income.
The fund offers the Investor Class, I Class, Y Class, A Class, C Class, R Class, R5 Class and R6 Class. The A Class may incur an initial sales charge. The A Class and C Class may be subject to a contingent deferred sales charge.
2. Significant Accounting Policies
The following is a summary of significant accounting policies consistently followed by the fund in preparation of its financial statements. The fund is an investment company and follows accounting and reporting guidance in accordance with accounting principles generally accepted in the United States of America. This may require management to make certain estimates and assumptions at the date of the financial statements. Actual results could differ from these estimates. Management evaluated the impact of events or transactions occurring through the date the financial statements were issued that would merit recognition or disclosure.
Investment Valuations — The fund determines the fair value of its investments and computes its net asset value per share at the close of regular trading (usually 4 p.m. Eastern time) on the New York Stock Exchange (NYSE) on each day the NYSE is open. The Board of Trustees has adopted valuation policies and procedures to guide the investment advisor in the fund’s investment valuation process and to provide methodologies for the oversight of the fund’s pricing function.
Fixed income securities are valued at the evaluated mean as provided by independent pricing services or at the mean of the most recent bid and asked prices as provided by investment dealers. Corporate bonds, U.S. Treasury and Government Agency securities, convertible bonds, bank loan obligations, municipal securities, and sovereign governments and agencies are valued using market models that consider trade data, quotations from dealers and active market makers, relevant yield curve and spread data, creditworthiness, trade data or market information on comparable securities, and other relevant security specific information. Mortgage-related and asset-backed securities are valued based on models that consider trade data, prepayment and default projections, benchmark yield and spread data and estimated cash flows of each tranche of the issuer. Commercial paper is valued using a curve-based approach that considers money market rates for specific instruments, programs, currencies and maturity points from a variety of active market makers.
Hybrid securities are valued at the evaluated mean as provided by independent pricing services or at the mean of the most recent bid and asked prices as provided by investment dealers. Preferred stocks and convertible preferred stocks with perpetual maturities are valued using market models that consider trade data, quotations from dealers and active market makers, relevant yield curve and spread data, creditworthiness, trade data or market information on comparable securities, and other relevant security specific information.
Open-end management investment companies are valued at the reported net asset value per share. Repurchase agreements are valued at cost, which approximates fair value. Swap agreements are valued at an evaluated mean as provided by independent pricing services or independent brokers.
If the fund determines that the market price for an investment is not readily available or the valuation methods mentioned above do not reflect an investment’s fair value, such investment is valued as determined in good faith by the Board of Trustees or its delegate, in accordance with policies and procedures adopted by the Board of Trustees. In its determination of fair value, the fund may review several factors including, but not limited to, market information regarding the specific investment or comparable investments and correlation with other investment types, futures indices or general market indicators. Circumstances that may cause the fund to use these procedures to value an investment include, but are not limited to: an investment has been declared in default or is distressed; trading in a security has been suspended during the trading day or a security is not actively trading on its principal exchange; prices received from a regular pricing source are deemed unreliable; or there is a foreign market holiday and no trading occurred.
The fund monitors for significant events occurring after the close of an investment’s primary exchange but before the fund’s net asset value per share is determined. Significant events may include, but are not limited to: corporate announcements and transactions; governmental action and political unrest that could impact a specific investment or an investment sector; or armed conflicts, natural disasters and similar events that could affect investments in a specific country or region.
Security Transactions — Security transactions are accounted for as of the trade date. Net realized gains and losses are determined on the identified cost basis, which is also used for federal income tax purposes.
Investment Income — Interest income is recorded on the accrual basis and includes paydown gain (loss) and accretion of discounts and amortization of premiums. Dividend income less foreign taxes withheld, if any, is recorded as of the ex-dividend date. Distributions received on securities that represent a return of capital or long-term capital gain are recorded as a reduction of cost of investments and/or as a realized gain. The fund may estimate the components of distributions received that may be considered nontaxable distributions or long-term capital gain distributions for income tax purposes. Securities lending income is net of fees and rebates earned by the lending agent for its services.
Repurchase Agreements — The fund may enter into repurchase agreements with institutions that American Century Investment Management, Inc. (ACIM) (the investment advisor) has determined are creditworthy pursuant to criteria adopted by the Board of Trustees. The fund requires that the collateral, represented by securities, received in a repurchase transaction be transferred to the custodian in a manner sufficient to enable the fund to obtain those securities in the event of a default under the repurchase agreement. ACIM monitors, on a daily basis, the securities transferred to ensure the value, including accrued interest, of the securities under each repurchase agreement is equal to or greater than amounts owed to the fund under each repurchase agreement.
Joint Trading Account — Pursuant to an Exemptive Order issued by the Securities and Exchange Commission, the fund, along with certain other funds in the American Century Investments family of funds, may transfer uninvested cash balances into a joint trading account. These balances are invested in one or more repurchase agreements that are collateralized by U.S. Treasury or Agency obligations.
Segregated Assets — In accordance with the 1940 Act, the fund segregates assets on its books and records to cover certain types of investment securities and other financial instruments. ACIM monitors, on a daily basis, the securities segregated to ensure the fund designates a sufficient amount of liquid assets, marked-to-market daily. The fund may also receive assets or be required to pledge assets at the custodian bank or with a broker for collateral requirements.
Income Tax Status — It is the fund’s policy to distribute substantially all net investment income and net realized gains to shareholders and to otherwise qualify as a regulated investment company under provisions of the Internal Revenue Code. Accordingly, no provision has been made for income taxes. The fund files U.S. federal, state, local and non-U.S. tax returns as applicable. The fund's tax returns are subject to examination by the relevant taxing authority until expiration of the applicable statute of limitations, which is generally three years from the date of filing but can be longer in certain jurisdictions. At this time, management believes there are no uncertain tax positions which, based on their technical merit, would not be sustained upon examination and for which it is reasonably possible that the total amounts of unrecognized tax benefits will significantly change in the next twelve months.
Multiple Class — All shares of the fund represent an equal pro rata interest in the net assets of the class to which such shares belong, and have identical voting, dividend, liquidation and other rights and the same terms and conditions, except for class specific expenses and exclusive rights to vote on matters affecting only individual classes. Income, non-class specific expenses, and realized and unrealized capital gains and losses of the fund are allocated to each class of shares based on their relative net assets.
Distributions to Shareholders — Distributions from net investment income, if any, are declared daily and paid monthly. Distributions from net realized gains, if any, are generally declared and paid annually.
Indemnifications — Under the trust’s organizational documents, its officers and trustees are indemnified against certain liabilities arising out of the performance of their duties to the fund. In addition, in the normal course of business, the fund enters into contracts that provide general indemnifications. The maximum exposure under these arrangements is unknown as this would involve future claims that may be made against a fund. The risk of material loss from such claims is considered by management to be remote.
Securities Lending — Securities are lent to qualified financial institutions and brokers. State Street Bank & Trust Co. serves as securities lending agent to the fund pursuant to a Securities Lending Agreement. The lending of securities exposes the fund to risks such as: the borrowers may fail to return the loaned securities, the borrowers may not be able to provide additional collateral, the fund may experience delays in recovery of the loaned securities or delays in access to collateral, or the fund may experience losses related to the investment collateral. To minimize certain risks, loan counterparties pledge collateral in the form of cash and/or securities. The lending agent has agreed to indemnify the fund in the case of default of any securities borrowed. Cash collateral received is invested in the State Street Navigator Securities Lending Government Money Market Portfolio, a money market mutual fund registered under the 1940 Act. The loans may also be secured by U.S. government securities in an amount at least equal to the market value of the securities loaned, plus accrued interest and dividends, determined on a daily basis and adjusted accordingly. By lending securities, the fund seeks to increase its net investment income through the receipt of interest and fees. Such income is reflected separately within the Statement of Operations. The value of loaned securities and related collateral outstanding at period end, if any, are shown on a gross basis within the Schedule of Investments and Statement of Assets and Liabilities.
The following table reflects a breakdown of transactions accounted for as secured borrowings, the gross obligation by the type of collateral pledged, and the remaining contractual maturity of those transactions as of March 31, 2020.
|
| | | | | | | | | | | | |
| Remaining Contractual Maturity of Agreements |
| | Overnight and
Continuous | <30 days | Between
30 & 90 days | >90 days | Total |
Securities Lending Transactions(1) | | | | |
| Corporate Bonds | $ | 50,440 |
| — |
| — |
| — |
| $ | 50,440 |
|
| Gross amount of recognized liabilities for securities lending transactions | $ | 50,440 |
|
| |
| (1) | Amount represents the payable for cash collateral received for securities on loan. This will generally be in the Overnight and Continuous column as the securities are typically callable on demand. |
3. Fees and Transactions with Related Parties
Certain officers and trustees of the trust are also officers and/or directors of American Century Companies, Inc. (ACC). The trust's investment advisor, ACIM, the trust's distributor, American Century Investment Services, Inc. (ACIS), and the trust's transfer agent, American Century Services, LLC, are wholly owned, directly or indirectly, by ACC.
Management Fees — The trust has entered into a management agreement with ACIM, under which ACIM provides the fund with investment advisory and management services in exchange for a single, unified management fee (the fee) per class. The agreement provides that all expenses of managing and operating the fund, except distribution and service fees, brokerage expenses, taxes, interest, fees and expenses of the independent trustees (including legal counsel fees), and extraordinary expenses, will be paid by ACIM. The fee is computed and accrued daily based on each class's daily net assets and paid monthly in arrears. The difference in the fee among the classes is a result of their separate arrangements for non-Rule 12b-1 shareholder services. It is not the result of any difference in advisory or custodial fees or other expenses related to the management of the fund’s assets, which do not vary by class. The fee consists of (1) an Investment Category Fee based on the daily net assets of the fund and certain other accounts managed by the investment advisor that are in the same broad investment category as the fund and (2) a Complex Fee based on the assets of all the funds in the American Century Investments family of funds. From April 1, 2019 through July 31, 2019, the investment advisor agreed to waive 0.07% of the fund's management fee. Effective August 1, 2019, the investment advisor terminated the waiver and decreased the annual management fee by 0.07%.
The Investment Category Fee range, the Complex Fee range and the effective annual management fee before and after waiver for each class for the period ended March 31, 2020 are as follows:
|
| | | | |
| | | | Effective Annual Management Fee |
| | Investment Category Fee Range* | Complex Fee Range | Before Waiver | After Waiver |
| Investor Class | 0.4725%
to 0.5900% | 0.2500% to 0.3100% | 0.80% | 0.77% |
| I Class | 0.1500% to 0.2100% | 0.70% | 0.67% |
| Y Class | 0.0500% to 0.1100% | 0.60% | 0.57% |
| A Class | 0.2500% to 0.3100% | 0.80% | 0.77% |
| C Class | 0.2500% to 0.3100% | 0.80% | 0.77% |
| R Class | 0.2500% to 0.3100% | 0.80% | 0.77% |
| R5 Class | 0.0500% to 0.1100% | 0.60% | 0.57% |
| R6 Class | 0.0000% to 0.0600% | 0.55% | 0.52% |
*Prior to August 1, 2019, the investment category fee range was 0.5425% to 0.6600%.
Distribution and Service Fees — The Board of Trustees has adopted a separate Master Distribution and Individual Shareholder Services Plan for each of the A Class, C Class and R Class (collectively the plans), pursuant to Rule 12b-1 of the 1940 Act. The plans provide that the A Class will pay ACIS an annual distribution and service fee of 0.25%. The plans provide that the C Class will pay ACIS an annual distribution and service fee of 1.00%, of which 0.25% is paid for individual shareholder services and 0.75% is paid for distribution services. The plans provide that the R Class will pay ACIS an annual distribution and service fee of 0.50%. The fees are computed and accrued daily based on each class’s daily net assets and paid monthly in arrears. The fees are used to pay financial intermediaries for distribution and individual shareholder services. Fees incurred under the plans during the period ended March 31, 2020 are detailed in the Statement of Operations.
Trustees’ Fees and Expenses — The Board of Trustees is responsible for overseeing the investment advisor’s management and operations of the fund. The trustees receive detailed information about the fund and its investment advisor regularly throughout the year, and meet at least quarterly with management of the investment advisor to review reports about fund operations. The fund’s officers do not receive compensation from the fund.
Interfund Transactions — The fund may enter into security transactions with other American Century Investments funds and other client accounts of the investment advisor, in accordance with the 1940 Act rules and procedures adopted by the Board of Trustees. The rules and procedures require, among other things, that these transactions be effected at the independent current market price of the security. There were no interfund transactions during the period.
4. Investment Transactions
Purchases and sales of investment securities, excluding short-term investments, for the period ended March 31, 2020 were $49,063,499 and $53,463,104, respectively.
5. Capital Share Transactions
Transactions in shares of the fund were as follows (unlimited number of shares authorized):
|
| | | | | | | | | | |
| | Year ended March 31, 2020 | Year ended March 31, 2019 |
| | Shares | Amount | Shares | Amount |
| Investor Class | | | | |
| Sold | 4,942,542 |
| $ | 27,375,119 |
| 12,448,873 |
| $ | 69,118,275 |
|
| Issued in reinvestment of distributions | 778,790 |
| 4,321,248 |
| 955,164 |
| 5,263,536 |
|
| Redeemed | (7,917,597 | ) | (43,284,857 | ) | (13,350,485 | ) | (73,963,906 | ) |
| | (2,196,265 | ) | (11,588,490 | ) | 53,552 |
| 417,905 |
|
| I Class | | | | |
| Sold | 795,961 |
| 4,436,745 |
| 90,790 |
| 506,228 |
|
| Issued in reinvestment of distributions | 41,109 |
| 228,569 |
| 26,689 |
| 147,594 |
|
| Redeemed | (443,286 | ) | (2,440,782 | ) | (483,393 | ) | (2,695,266 | ) |
| | 393,784 |
| 2,224,532 |
| (365,914 | ) | (2,041,444 | ) |
| Y Class | | | | |
| Sold | 1,239,405 |
| 6,896,371 |
| 1,012,561 |
| 5,600,018 |
|
| Issued in reinvestment of distributions | 79,896 |
| 442,665 |
| 28,019 |
| 153,678 |
|
| Redeemed | (198,254 | ) | (1,080,041 | ) | (55,116 | ) | (298,822 | ) |
| | 1,121,047 |
| 6,258,995 |
| 985,464 |
| 5,454,874 |
|
| A Class | | | | |
| Sold | 613,504 |
| 3,434,886 |
| 426,615 |
| 2,368,335 |
|
| Issued in reinvestment of distributions | 95,214 |
| 528,748 |
| 107,600 |
| 593,585 |
|
| Redeemed | (596,450 | ) | (3,292,248 | ) | (723,224 | ) | (3,992,813 | ) |
| | 112,268 |
| 671,386 |
| (189,009 | ) | (1,030,893 | ) |
| C Class | | | | |
| Sold | 36,604 |
| 205,299 |
| 87,824 |
| 483,241 |
|
| Issued in reinvestment of distributions | 25,735 |
| 143,114 |
| 50,386 |
| 278,026 |
|
| Redeemed | (514,997 | ) | (2,837,953 | ) | (617,331 | ) | (3,404,093 | ) |
| | (452,658 | ) | (2,489,540 | ) | (479,121 | ) | (2,642,826 | ) |
| R Class | | | | |
| Sold | 82,658 |
| 458,549 |
| 93,275 |
| 513,476 |
|
| Issued in reinvestment of distributions | 6,991 |
| 38,799 |
| 8,356 |
| 46,121 |
|
| Redeemed | (95,927 | ) | (525,608 | ) | (109,721 | ) | (604,783 | ) |
| | (6,278 | ) | (28,260 | ) | (8,090 | ) | (45,186 | ) |
| R5 Class | | | | |
| Sold | 95,173 |
| 531,721 |
| 67,739 |
| 375,160 |
|
| Issued in reinvestment of distributions | 15,688 |
| 87,274 |
| 15,653 |
| 86,374 |
|
| Redeemed | (207,666 | ) | (1,101,339 | ) | (101,804 | ) | (566,900 | ) |
| | (96,805 | ) | (482,344 | ) | (18,412 | ) | (105,366 | ) |
| R6 Class | | | | |
| Sold | 1,297 |
| 7,215 |
| 54,007 |
| 301,428 |
|
| Issued in reinvestment of distributions | 1,679 |
| 9,313 |
| 38,855 |
| 216,459 |
|
| Redeemed | (5,361 | ) | (28,728 | ) | (1,737,462 | ) | (9,724,639 | ) |
| | (2,385 | ) | (12,200 | ) | (1,644,600 | ) | (9,206,752 | ) |
| Net increase (decrease) | (1,127,292 | ) | $ | (5,445,921 | ) | (1,666,130 | ) | $ | (9,199,688 | ) |
6. Fair Value Measurements
The fund’s investments valuation process is based on several considerations and may use multiple inputs to determine the fair value of the investments held by the fund. In conformity with accounting principles generally accepted in the United States of America, the inputs used to determine a valuation are classified into three broad levels.
| |
| • | Level 1 valuation inputs consist of unadjusted quoted prices in an active market for identical investments. |
| |
| • | Level 2 valuation inputs consist of direct or indirect observable market data (including quoted prices for comparable investments, evaluations of subsequent market events, interest rates, prepayment speeds, credit risk, etc.). These inputs also consist of quoted prices for identical investments initially expressed in local currencies that are adjusted through translation into U.S. dollars. |
| |
| • | Level 3 valuation inputs consist of unobservable data (including a fund’s own assumptions). |
The level classification is based on the lowest level input that is significant to the fair valuation measurement. The valuation inputs are not necessarily an indication of the risks associated with investing in these securities or other financial instruments.
The following is a summary of the level classifications as of period end. The Schedule of Investments provides additional information on the fund’s portfolio holdings.
|
| | | | | | | | |
| | Level 1 | Level 2 | Level 3 |
| Assets | | | |
| Investment Securities | | | |
| Corporate Bonds | — |
| $ | 110,419,015 |
| — |
|
| Preferred Stocks | — |
| 1,051,913 |
| — |
|
| Bank Loan Obligations | — |
| 666,595 |
| — |
|
| Asset-Backed Securities | — |
| 366,762 |
| — |
|
| Temporary Cash Investments | $ | 4,130,835 |
| 2,079,894 |
| — |
|
| Temporary Cash Investments - Securities Lending Collateral | 50,440 |
| — |
| — |
|
| | $ | 4,181,275 |
| $ | 114,584,179 |
| — |
|
7. Derivative Instruments
Credit Risk — The fund is subject to credit risk in the normal course of pursuing its investment objectives. The value of a bond generally declines as the credit quality of its issuer declines. Credit default swap agreements enable a fund to buy/sell protection against a credit event of a specific issuer or index. A fund may attempt to enhance returns by selling protection or attempt to mitigate credit risk by buying protection. The buyer/seller of credit protection against a security or basket of securities may pay/receive an up-front or periodic payment to compensate for/against potential default events. Changes in value, including the periodic amounts of interest to be paid or received on swap agreements, are recorded as unrealized appreciation (depreciation) on swap agreements. Upon entering into a centrally cleared swap, a fund is required to deposit cash or securities (initial margin) with a financial intermediary in an amount equal to a certain percentage of the notional amount. Subsequent payments (variation margin) are made or received daily, in cash, by a fund. The variation margin is equal to the daily change in the value and is a component of unrealized gains and losses. Realized gain or loss is recorded upon receipt or payment of a periodic settlement or termination of swap agreements. Net realized and unrealized gains or losses occurring during the holding period of swap agreements are a component of net realized gain (loss) on swap agreement transactions and change in net unrealized appreciation (depreciation) on swap agreements, respectively. The risks of entering into swap agreements include the possible lack of liquidity, failure of the counterparty to meet its obligations, and that there may be unfavorable changes in the underlying investments or instruments. The fund's average notional amount held during the period was $1,089,000.
At period end, the fund did not have any derivative instruments disclosed on the Statement of Assets and Liabilities. For the year ended March 31, 2020, the effect of credit risk derivative instruments on the Statement of Operations was $56,943 in net realized gain (loss) on swap agreement transactions and $(56,525) in change in net unrealized appreciation (depreciation) on swap agreements.
8. Risk Factors
The value of the fund’s shares will go up and down, sometimes rapidly or unpredictably, based on the performance of the securities owned by the fund and other factors generally affecting the securities market. Market risks, including political, regulatory, economic and social developments, can affect the value of the fund’s investments. Natural disasters, public health emergencies, terrorism and other unforeseeable events may lead to increased market volatility and may have adverse long-term effects on world economies and markets generally.
The fund invests primarily in lower-rated debt securities, which are subject to substantial risks including liquidity risk and credit risk.
There are certain risks involved in investing in foreign securities. These risks include those resulting from political events (such as civil unrest, national elections and imposition of exchange controls), social and economic events (such as labor strikes and rising inflation), and natural disasters. Securities of foreign issuers may be less liquid and more volatile. Investing in emerging markets or a significant portion of assets in one country or region may accentuate these risks.
The fund may invest in instruments that have variable or floating coupon rates based on the London Interbank Offered Rate (LIBOR). LIBOR is a benchmark interest rate intended to be representative of the rate at which certain major international banks lend to one another over short-terms. LIBOR will be phased out by the end of 2021. Uncertainty remains regarding a replacement rate or rates for LIBOR. The transition process may lead to increased volatility or illiquidity in markets for instruments that rely on LIBOR. This could result in a change to the value of such instruments.
9. Federal Tax Information
The tax character of distributions paid during the years ended March 31, 2020 and March 31, 2019 were as follows:
|
| | | | | | |
| | 2020 | 2019 |
| Distributions Paid From | | |
| Ordinary income | $ | 6,509,217 |
| $ | 7,582,181 |
|
| Long-term capital gains | — |
| — |
|
The book-basis character of distributions made during the year from net investment income or net realized gains may differ from their ultimate characterization for federal income tax purposes. These differences reflect the differing character of certain income items and net realized gains and losses for financial statement and tax purposes, and may result in reclassification among certain capital accounts on the financial statements.
As of period end, the federal tax cost of investments and the components of distributable earnings on a tax-basis were as follows:
|
| | | |
| Federal tax cost of investments | $ | 130,084,822 |
|
| Gross tax appreciation of investments | $ | 1,251,313 |
|
| Gross tax depreciation of investments | (12,570,681 | ) |
| Net tax appreciation (depreciation) of investments | $ | (11,319,368 | ) |
Other book-to-tax adjustments
| $ | (26,301 | ) |
| Undistributed ordinary income | — |
|
| Accumulated short-term capital losses | $ | (3,762,656 | ) |
| Accumulated long-term capital losses | $ | (36,970,572 | ) |
The difference between book-basis and tax-basis unrealized appreciation (depreciation) is attributable primarily to the tax deferral of losses on wash sales.
Accumulated capital losses represent net capital loss carryovers that may be used to offset future realized capital gains for federal income tax purposes. The capital loss carryovers may be carried forward for an unlimited period. Future capital loss carryover utilization in any given year may be subject to Internal Revenue Code limitations.
10. Recently Issued Accounting Standards
In March 2017, the Financial Accounting Standards Board (FASB) issued Accounting Standards Update No. 2017-08, “Receivables - Nonrefundable Fees and Other Costs (Subtopic 310-20), Premium Amortization on Purchased Callable Debt Securities” (ASU 2017-08). ASU 2017-08 amends the amortization period for certain purchased callable debt securities held at a premium, shortening such period to the earliest call date. The amendments are effective for fiscal years, and interim periods within those fiscal years, beginning after December 15, 2018. The adoption of ASU 2017-08 did not materially impact the financial statements.
|
| | | | | | | | | | | | | | | |
| For a Share Outstanding Throughout the Years Ended March 31 (except as noted) |
| Per-Share Data | | Ratios and Supplemental Data | | | |
| | | Income From Investment Operations: | | | | Ratio to Average Net Assets of: | | | |
| | Net Asset
Value,
Beginning
of Period | Net
Investment
Income
(Loss)(1) | Net
Realized
and
Unrealized
Gain (Loss) | Total From
Investment
Operations | Distributions From Net
Investment
Income | Net Asset
Value,
End
of Period | Total
Return(2) | Operating
Expenses | Operating
Expenses
(before
expense
waiver) | Net
Investment
Income
(Loss) | Net
Investment
Income
(Loss)
(before
expense
waiver) | Portfolio
Turnover
Rate | Net
Assets,
End of
Period
(in thousands) |
| Investor Class | | | | | | | | | | | | |
| 2020 | $5.54 | 0.25 | (0.51) | (0.26) | (0.26) | $5.02 | (5.09)% | 0.78% | 0.81% | 4.55% | 4.52% | 38% |
| $89,168 |
|
| 2019 | $5.57 | 0.29 | (0.03) | 0.26 | (0.29) | $5.54 | 4.91% | 0.79% | 0.86% | 5.22% | 5.15% | 24% |
| $110,624 |
|
| 2018 | $5.73 | 0.29 | (0.15)(3) | 0.14 | (0.30) | $5.57 | 2.33% | 0.83% | 0.86% | 5.03% | 5.00% | 20% |
| $110,940 |
|
| 2017 | $5.36 | 0.29 | 0.37 | 0.66 | (0.29) | $5.73 | 12.62% | 0.85% | 0.85% | 5.13% | 5.13% | 29% |
| $287,088 |
|
| 2016 | $5.92 | 0.30 | (0.55) | (0.25) | (0.31) | $5.36 | (4.30)% | 0.85% | 0.85% | 5.36% | 5.36% | 24% |
| $344,505 |
|
| I Class | | | | | | | | | | | | |
| 2020 | $5.55 | 0.26 | (0.52) | (0.26) | (0.26) | $5.03 | (4.98)% | 0.68% | 0.71% | 4.65% | 4.62% | 38% |
| $4,063 |
|
| 2019 | $5.58 | 0.30 | (0.03) | 0.27 | (0.30) | $5.55 | 5.01% | 0.69% | 0.76% | 5.32% | 5.25% | 24% |
| $2,300 |
|
2018(4) | $5.75 | 0.29 | (0.17)(3) | 0.12 | (0.29) | $5.58 | 2.11% | 0.73%(5) | 0.76%(5) | 5.22%(5) | 5.19%(5) | 20%(6) |
| $4,356 |
|
| Y Class | | | | | | | | | | | | |
| 2020 | $5.55 | 0.26 | (0.52) | (0.26) | (0.27) | $5.02 | (5.08)% | 0.58% | 0.61% | 4.75% | 4.72% | 38% |
| $10,819 |
|
| 2019 | $5.58 | 0.30 | (0.02) | 0.28 | (0.31) | $5.55 | 5.12% | 0.59% | 0.66% | 5.42% | 5.35% | 24% |
| $5,727 |
|
2018(4) | $5.75 | 0.30 | (0.17)(3) | 0.13 | (0.30) | $5.58 | 2.20% | 0.63%(5) | 0.66%(5) | 5.51%(5) | 5.48%(5) | 20%(6) |
| $262 |
|
|
| | | | | | | | | | | | | | | |
| For a Share Outstanding Throughout the Years Ended March 31 (except as noted) |
| Per-Share Data | | Ratios and Supplemental Data | | | |
| | | Income From Investment Operations: | | | | Ratio to Average Net Assets of: | | | |
| | Net Asset
Value,
Beginning
of Period | Net
Investment
Income
(Loss)(1) | Net
Realized
and
Unrealized
Gain (Loss) | Total From
Investment
Operations | Distributions From Net
Investment
Income | Net Asset
Value,
End
of Period | Total
Return(2) | Operating
Expenses | Operating
Expenses
(before
expense
waiver) | Net
Investment
Income
(Loss) | Net
Investment
Income
(Loss)
(before
expense
waiver) | Portfolio
Turnover
Rate | Net
Assets,
End of
Period
(in thousands) |
| A Class | | | | | | | | | | | | |
| 2020 | $5.55 | 0.24 | (0.53) | (0.29) | (0.24) | $5.02 | (5.50)% | 1.03% | 1.06% | 4.30% | 4.27% | 38% |
| $11,314 |
|
| 2019 | $5.58 | 0.28 | (0.03) | 0.25 | (0.28) | $5.55 | 4.65% | 1.04% | 1.11% | 4.97% | 4.90% | 24% |
| $11,868 |
|
| 2018 | $5.73 | 0.28 | (0.15)(3) | 0.13 | (0.28) | $5.58 | 2.25% | 1.08% | 1.11% | 4.78% | 4.75% | 20% |
| $12,985 |
|
| 2017 | $5.36 | 0.28 | 0.37 | 0.65 | (0.28) | $5.73 | 12.35% | 1.10% | 1.10% | 4.88% | 4.88% | 29% |
| $22,166 |
|
| 2016 | $5.92 | 0.28 | (0.55) | (0.27) | (0.29) | $5.36 | (4.54)% | 1.10% | 1.10% | 5.11% | 5.11% | 24% |
| $24,610 |
|
| C Class | | | | | | | | | | | | |
| 2020 | $5.54 | 0.20 | (0.52) | (0.32) | (0.20) | $5.02 | (6.04)% | 1.78% | 1.81% | 3.55% | 3.52% | 38% |
| $2,775 |
|
| 2019 | $5.57 | 0.23 | (0.02) | 0.21 | (0.24) | $5.54 | 3.87% | 1.79% | 1.86% | 4.22% | 4.15% | 24% |
| $5,574 |
|
| 2018 | $5.73 | 0.24 | (0.16)(3) | 0.08 | (0.24) | $5.57 | 1.31% | 1.83% | 1.86% | 4.03% | 4.00% | 20% |
| $8,275 |
|
| 2017 | $5.36 | 0.23 | 0.38 | 0.61 | (0.24) | $5.73 | 11.51% | 1.85% | 1.85% | 4.13% | 4.13% | 29% |
| $9,985 |
|
| 2016 | $5.92 | 0.24 | (0.55) | (0.31) | (0.25) | $5.36 | (5.25)% | 1.85% | 1.85% | 4.36% | 4.36% | 24% |
| $9,695 |
|
| R Class | | | | | | | | | | | | |
| 2020 | $5.54 | 0.22 | (0.51) | (0.29) | (0.23) | $5.02 | (5.57)% | 1.28% | 1.31% | 4.05% | 4.02% | 38% |
| $864 |
|
| 2019 | $5.57 | 0.26 | (0.02) | 0.24 | (0.27) | $5.54 | 4.39% | 1.29% | 1.36% | 4.72% | 4.65% | 24% |
| $988 |
|
| 2018 | $5.73 | 0.26 | (0.15)(3) | 0.11 | (0.27) | $5.57 | 1.82% | 1.33% | 1.36% | 4.53% | 4.50% | 20% |
| $1,039 |
|
| 2017 | $5.36 | 0.26 | 0.38 | 0.64 | (0.27) | $5.73 | 12.06% | 1.35% | 1.35% | 4.63% | 4.63% | 29% |
| $1,516 |
|
| 2016 | $5.92 | 0.27 | (0.55) | (0.28) | (0.28) | $5.36 | (4.78)% | 1.35% | 1.35% | 4.86% | 4.86% | 24% |
| $1,624 |
|
|
| | | | | | | | | | | | | | | |
| For a Share Outstanding Throughout the Years Ended March 31 (except as noted) |
| Per-Share Data | | Ratios and Supplemental Data | | | |
| | | Income From Investment Operations: | | | | Ratio to Average Net Assets of: | | | |
| | Net Asset
Value,
Beginning
of Period | Net
Investment
Income
(Loss)(1) | Net
Realized
and
Unrealized
Gain (Loss) | Total From
Investment
Operations | Distributions From Net
Investment
Income | Net Asset
Value,
End
of Period | Total
Return(2) | Operating
Expenses | Operating
Expenses
(before
expense
waiver) | Net
Investment
Income
(Loss) | Net
Investment
Income
(Loss)
(before
expense
waiver) | Portfolio
Turnover
Rate | Net
Assets,
End of
Period
(in thousands) |
| R5 Class | | | | | | | | | | | | |
| 2020 | $5.55 | 0.26 | (0.52) | (0.26) | (0.27) | $5.02 | (5.08)% | 0.58% | 0.61% | 4.75% | 4.72% | 38% |
| $1,013 |
|
| 2019 | $5.58 | 0.30 | (0.02) | 0.28 | (0.31) | $5.55 | 5.12% | 0.59% | 0.66% | 5.42% | 5.35% | 24% |
| $1,656 |
|
| 2018 | $5.73 | 0.29 | (0.13)(3) | 0.16 | (0.31) | $5.58 | 2.72% | 0.63% | 0.66% | 5.23% | 5.20% | 20% |
| $1,767 |
|
| 2017 | $5.36 | 0.30 | 0.38 | 0.68 | (0.31) | $5.73 | 12.85% | 0.65% | 0.65% | 5.33% | 5.33% | 29% |
| $537,457 |
|
| 2016 | $5.92 | 0.31 | (0.55) | (0.24) | (0.32) | $5.36 | (4.11)% | 0.65% | 0.65% | 5.56% | 5.56% | 24% |
| $473,014 |
|
| R6 Class | | | | | | | | | | | | |
| 2020 | $5.54 | 0.27 | (0.52) | (0.25) | (0.27) | $5.02 | (4.85)% | 0.53% | 0.56% | 4.80% | 4.77% | 38% |
| $160 |
|
| 2019 | $5.57 | 0.30 | (0.02) | 0.28 | (0.31) | $5.54 | 5.17% | 0.54% | 0.61% | 5.47% | 5.40% | 24% |
| $190 |
|
| 2018 | $5.73 | 0.30 | (0.15)(3) | 0.15 | (0.31) | $5.57 | 2.58% | 0.58% | 0.61% | 5.28% | 5.25% | 20% |
| $9,348 |
|
| 2017 | $5.36 | 0.30 | 0.38 | 0.68 | (0.31) | $5.73 | 12.90% | 0.60% | 0.60% | 5.38% | 5.38% | 29% |
| $88,697 |
|
| 2016 | $5.92 | 0.31 | (0.55) | (0.24) | (0.32) | $5.36 | (4.06)% | 0.60% | 0.60% | 5.61% | 5.61% | 24% |
| $55,552 |
|
|
| | | | |
| Notes to Financial Highlights | | |
| |
| (1) | Computed using average shares outstanding throughout the period. |
| |
| (2) | Total returns are calculated based on the net asset value of the last business day and do not reflect applicable sales charges, if any. Total returns for periods less than one year are not annualized. |
| |
| (3) | Per-share amount was not in accord with the net realized and unrealized gain (loss) for the period because of the timing of transactions in shares of the fund and the amount and timing of per-share net realized and unrealized gain (loss) on such shares. |
| |
| (4) | April 10, 2017 (commencement of sale) through March 31, 2018. |
| |
| (6) | Portfolio turnover is calculated at the fund level. Percentage indicated was calculated for the year ended March 31, 2018. |
See Notes to Financial Statements.
|
|
| Report of Independent Registered Public Accounting Firm |
To the Board of Trustees of American Century Investment Trust and Shareholders of High-Yield Fund
Opinion on the Financial Statements
We have audited the accompanying statement of assets and liabilities, including the schedule of investments, of High-Yield Fund (one of the funds constituting American Century Investment Trust, referred to hereafter as the “Fund”) as of March 31, 2020, the related statement of operations for the year ended March 31, 2020, the statement of changes in net assets for each of the two years in the period ended March 31, 2020, including the related notes, and the financial highlights for each of the periods indicated therein (collectively referred to as the “financial statements”). In our opinion, the financial statements present fairly, in all material respects, the financial position of the Fund as of March 31, 2020, the results of its operations for the year then ended, the changes in its net assets for each of the two years in the period ended March 31, 2020 and the financial highlights for each of the periods indicated therein in conformity with accounting principles generally accepted in the United States of America.
Basis for Opinion
These financial statements are the responsibility of the Fund’s management. Our responsibility is to express an opinion on the Fund’s financial statements based on our audits. We are a public accounting firm registered with the Public Company Accounting Oversight Board (United States) (PCAOB) and are required to be independent with respect to the Fund in accordance with the U.S. federal securities laws and the applicable rules and regulations of the Securities and Exchange Commission and the PCAOB.
We conducted our audits of these financial statements in accordance with the standards of the PCAOB. Those standards require that we plan and perform the audit to obtain reasonable assurance about whether the financial statements are free of material misstatement, whether due to error or fraud.
Our audits included performing procedures to assess the risks of material misstatement of the financial statements, whether due to error or fraud, and performing procedures that respond to those risks. Such procedures included examining, on a test basis, evidence regarding the amounts and disclosures in the financial statements. Our audits also included evaluating the accounting principles used and significant estimates made by management, as well as evaluating the overall presentation of the financial statements. Our procedures included confirmation of securities owned as of March 31, 2020 by correspondence with the custodian and brokers; when replies were not received from brokers, we performed other auditing procedures. We believe that our audits provide a reasonable basis for our opinion.
/s/ PricewaterhouseCoopers LLP
Kansas City, Missouri
May 18, 2020
We have served as the auditor of one or more investment companies in American Century Investments since 1997.
Board of Trustees
The individuals listed below serve as trustees of the funds. Each trustee will continue to serve in this capacity until death, retirement, resignation or removal from office. The board has adopted a mandatory retirement age for trustees who are not “interested persons,” as that term is defined in the Investment Company Act (independent trustees). Independent trustees shall retire on December 31 of the year in which they reach their 75th birthday; provided, however, that on or after January 1, 2022, independent trustees shall retire on December 31 of the year in which they reach their 76th birthday.
Mr. Thomas is an “interested person” because he currently serves as President and Chief Executive Officer of American Century Companies, Inc. (ACC), the parent company of American Century Investment Management, Inc. (ACIM or the advisor). The other trustees (more than three-fourths of the total number) are independent. They are not employees, directors or officers of, and have no financial interest in, ACC or any of its wholly owned, direct or indirect, subsidiaries, including ACIM, American Century Investment Services, Inc. (ACIS) and American Century Services, LLC (ACS), and they do not have any other affiliations, positions or relationships that would cause them to be considered “interested persons” under the Investment Company Act. The trustees serve in this capacity for eight (in the case of Jonathan S. Thomas, 16; and Ronald J. Gilson, 9) registered investment companies in the American Century Investments family of funds.
The following table presents additional information about the trustees. The mailing address for each trustee other than Mr. Thomas is 1665 Charleston Road, Mountain View, California 94043. The mailing address for Mr. Thomas is 4500 Main Street, Kansas City, Missouri 64111.
|
| | | | | |
Name
(Year of Birth) | Position(s) Held with Funds | Length of Time Served | Principal Occupation(s) During Past 5 Years | Number of American Century Portfolios Overseen by Trustee | Other Directorships Held During Past 5 Years |
| Independent Trustees |
|
|
Tanya S. Beder
(1955) | Trustee | Since 2011 | Chairman and CEO, SBCC Group Inc. (independent advisory services) (2006 to present) | 40 | CYS Investments, Inc.; Kirby Corporation; Nabors Industries Ltd. |
Jeremy I. Bulow
(1954) | Trustee | Since 2011 | Professor of Economics, Stanford University, Graduate School of Business (1979 to present) | 40 | None |
Anne Casscells
(1958) | Trustee | Since 2016 | Co-Chief Executive Officer and Chief Investment Officer, Aetos Alternatives Management (investment advisory firm) (2001 to present); Lecturer in Accounting, Stanford University, Graduate School of Business (2009 to 2017) | 40 | None |
Ronald J. Gilson
(1946) | Trustee and Chairman of the Board | Since 1995
(Chairman since 2005) | Charles J. Meyers Professor of Law and Business, Emeritus, Stanford Law School (1979 to 2016); Marc and Eva Stern Professor of Law and Business, Columbia University School of Law (1992 to present) | 57 | None |
|
| | | | | |
Name
(Year of Birth) | Position(s) Held with Funds | Length of Time Served | Principal Occupation(s) During Past 5 Years | Number of American Century Portfolios Overseen by Trustee | Other Directorships Held During Past 5 Years |
| Independent Trustees |
|
|
Frederick L. A. Grauer
(1946) | Trustee | Since 2008 | Senior Advisor, Credit Sesame, Inc. (credit monitoring firm) (2018 to present); Senior Advisor, Course Hero (an educational technology company) (2015 to present) | 40 | None |
Jonathan D. Levin
(1972) | Trustee | Since 2016 | Philip H. Knight Professor and Dean, Graduate School of Business, Stanford University (2016 to present); Professor, Stanford University, (2000 to present) | 40 | None |
Peter F. Pervere
(1947) | Trustee | Since 2007 | Retired | 40 | None |
John B. Shoven
(1947) | Trustee | Since 2002 | Charles R. Schwab Professor of Economics, Stanford University (1973 to present, emeritus since 2019) | 40 | Cadence Design Systems; Exponent; Financial Engines |
| Interested Trustee |
|
|
Jonathan S. Thomas
(1963) | Trustee | Since 2007 | President and Chief Executive Officer, ACC (2007 to present). Also serves as Chief Executive Officer, ACS; Executive Vice President, ACIM; Director, ACC, ACIM and other ACC subsidiaries | 120 | None |
The Statement of Additional Information has additional information about the fund's trustees and is available without charge, upon request, by calling 1-800-345-2021.
Officers
The following table presents certain information about the executive officers of the funds. Each officer serves as an officer for 16 (in the case of Robert J. Leach, 15) investment companies in the American Century family of funds, unless otherwise noted. No officer is compensated for his or her service as an officer of the funds. The listed officers are interested persons of the funds and are appointed or re-appointed on an annual basis. The mailing address for each of the officers listed below is 4500 Main Street, Kansas City, Missouri 64111.
|
| | |
Name
(Year of Birth) | Offices with the Funds | Principal Occupation(s) During the Past Five Years |
Patrick Bannigan
(1965)
| President since 2019 | Executive Vice President and Director, ACC (2012 to present); Chief Financial Officer, Chief Accounting Officer and Treasurer, ACC (2015 to present); Chief Operating Officer, ACC (2012-2015). Also serves as President, ACS; Vice President, ACIM; Chief Financial Officer, Chief Accounting Officer and/or Director, ACIM, ACS and other ACC subsidiaries |
R. Wes Campbell
(1974)
| Chief Financial Officer and Treasurer since 2018 | Vice President, ACS (2020 to present); Investment Operations and Investment Accounting, ACS (2000 to present) |
Amy D. Shelton
(1964) | Chief Compliance Officer and Vice President since 2014 | Chief Compliance Officer, American Century funds, (2014 to present); Chief Compliance Officer, ACIM (2014 to present); Chief Compliance Officer, ACIS (2009 to present). Also serves as Vice President, ACIS |
Charles A. Etherington
(1957) | General Counsel since 2007 and Senior Vice President since 2006 | Attorney, ACC (1994 to present); Vice President, ACC (2005 to present); General Counsel, ACC (2007 to present). Also serves as General Counsel, ACIM, ACS, ACIS and other ACC subsidiaries; and Senior Vice President, ACIM and ACS |
C. Jean Wade
(1964) | Vice President since 2012 | Senior Vice President, ACS (2017 to present); Vice President ACS (2000 to 2017)
|
Robert J. Leach
(1966) | Vice President since 2006 | Vice President, ACS (2000 to present) |
David H. Reinmiller
(1963) | Vice President since 2000 | Attorney, ACC (1994 to present). Also serves as Vice President, ACIM and ACS |
Ward D. Stauffer
(1960) | Secretary since 2005 | Attorney, ACC (2003 to present) |
|
|
| Liquidity Risk Management Program |
The Fund has adopted a liquidity risk management program (the “program”). The Fund’s Board of Trustees (the "Board") has designated American Century Investment Management, Inc. (“ACIM”) as the administrator of the program. Personnel of ACIM or its affiliates conduct the day-to-day operation of the program pursuant to policies and procedures administered by those members of the ACIM’s Investment Oversight Committee who are members of the ACIM’s Investment Management and Global Analytics departments.
Under the program, ACIM manages the Fund’s liquidity risk, which is the risk that the Fund could not meet shareholder redemption requests without significant dilution of remaining shareholders’ interests in the Fund. This risk is managed by monitoring the degree of liquidity of the Fund’s investments, limiting the amount of the Fund’s illiquid investments, and utilizing various risk management tools and facilities available to the Fund for meeting shareholder redemptions, among other means. ACIM’s process of determining the degree of liquidity of the Fund’s investments is supported by one or more third-party liquidity assessment vendors.
The Board reviewed a report prepared by ACIM regarding the operation and effectiveness of the program for the period December 1, 2018 through December 31, 2019. No significant liquidity events impacting the Fund were noted in the report. In addition, ACIM provided its assessment that the program had been effective in managing the Fund’s liquidity risk.
Retirement Account Information
As required by law, distributions you receive from certain retirement accounts are subject to federal income tax withholding, unless you elect not to have withholding apply*. Tax will be withheld on the total amount withdrawn even though you may be receiving amounts that are not subject to withholding, such as nondeductible contributions. In such case, excess amounts of withholding could occur. You may adjust your withholding election so that a greater or lesser amount will be withheld.
If you don’t want us to withhold on this amount, you must notify us to not withhold the federal income tax. You may notify us in writing or in certain situations by telephone or through other electronic means. For systematic withdrawals, your withholding election will remain in effect until revoked or changed by filing a new election. You have the right to revoke your election at any time and change your withholding percentage for future distributions.
Remember, even if you elect not to have income tax withheld, you are liable for paying income tax on the taxable portion of your withdrawal. If you elect not to have income tax withheld or you don’t have enough income tax withheld, you may be responsible for payment of estimated tax. You may incur penalties under the estimated tax rules if your withholding and estimated tax payments are not sufficient. You can reduce or defer the income tax on a distribution by directly or indirectly rolling such distribution over to another IRA or eligible plan. You should consult your tax advisor for additional information.
State tax will be withheld if, at the time of your distribution, your address is within one of the mandatory withholding states and you have federal income tax withheld (or as otherwise required by state law). State taxes will be withheld from your distribution in accordance with the respective state rules.
*Some 403(b), 457 and qualified retirement plan distributions may be subject to 20% mandatory withholding, as they are subject to special tax and withholding rules. Your plan administrator or plan sponsor is required to provide you with a special tax notice explaining those rules at the time you request a distribution. If applicable, federal and/or state taxes may be withheld from your distribution amount.
Proxy Voting Policies
Descriptions of the principles and policies that the fund's investment advisor uses in exercising the voting rights associated with the securities purchased and/or held by the fund are available without charge, upon request, by calling 1-800-345-2021 or visiting American Century Investments’ website at americancentury.com/proxy. A description of the policies is also available on the Securities and Exchange Commission’s website at sec.gov. Information regarding how the investment advisor voted proxies relating to portfolio securities during the most recent 12-month period ended June 30 is available on americancentury.com/proxy. It is also available at sec.gov.
Quarterly Portfolio Disclosure
The fund files its complete schedule of portfolio holdings with the Securities and Exchange Commission (SEC) for the first and third quarters of each fiscal year as an exhibit to its reports on Form N-PORT. The fund’s Form N-PORT reports are available on the SEC’s website at sec.gov. The fund also makes its complete schedule of portfolio holdings for the most recent quarter of its fiscal year available on its website at americancentury.com and, upon request, by calling 1-800-345-2021.
|
| | |
| |
| | | |
| Contact Us | americancentury.com | |
| Automated Information Line | 1-800-345-8765 | |
| Investor Services Representative | 1-800-345-2021 or 816-531-5575 | |
| Investors Using Advisors | 1-800-378-9878 | |
| Business, Not-For-Profit, Employer-Sponsored Retirement Plans | 1-800-345-3533 | |
| Banks and Trust Companies, Broker-Dealers, Financial Professionals, Insurance Companies | 1-800-345-6488 | |
| Telecommunications Relay Service for the Deaf | 711 | |
| | | |
| American Century Investment Trust | |
| | | |
Investment Advisor: American Century Investment Management, Inc. Kansas City, Missouri | |
| | | |
| This report and the statements it contains are submitted for the general information of our shareholders. The report is not authorized for distribution to prospective investors unless preceded or accompanied by an effective prospectus. | |
| | | |
©2020 American Century Proprietary Holdings, Inc. All rights reserved.
CL-ANN-92281 2005 | |
|
| |
| | |
| | Annual Report |
| | |
| | March 31, 2020 |
| | |
| | NT Diversified Bond Fund |
| | G Class (ACLDX) |
Beginning on January 1, 2021, as permitted by regulations adopted by the Securities and Exchange Commission, paper copies of the fund’s shareholder reports like this one will no longer be sent by mail, unless you specifically request paper copies of the reports from the fund or from your financial intermediary, such as a broker-dealer or bank. Instead, the reports will be made available on a website, and you will be notified by mail each time a report is posted and provided with a website link to access the report.
If you already elected to receive shareholder reports electronically, you will not be affected by this change and you need not take any action. You may elect to receive shareholder reports and other communications from the fund or your financial intermediary electronically by calling or sending an email request to your appropriate contacts as listed on the back cover of this report.
You may elect to receive all future reports in paper free of charge. You can inform the fund or your financial intermediary that you wish to continue receiving paper copies of your shareholder reports by calling or sending an email request to your appropriate contacts as listed on the back cover of this report. Your election to receive reports in paper will apply to all funds held with the fund complex/your financial intermediary.
|
| |
| Performance | |
| Portfolio Commentary | |
| Fund Characteristics | |
| Shareholder Fee Example | |
| Schedule of Investments | |
| Statement of Assets and Liabilities | |
| Statement of Operations | |
| Statement of Changes in Net Assets | |
| Notes to Financial Statements | |
| Financial Highlights | |
| Report of Independent Registered Public Accounting Firm | |
| Management | |
| Liquidity Risk Management Program | |
| Additional Information | |
Any opinions expressed in this report reflect those of the author as of the date of the report, and do not necessarily represent the opinions of American Century Investments® or any other person in the American Century Investments organization. Any such opinions are subject to change at any time based upon market or other conditions and American Century Investments disclaims any responsibility to update such opinions. These opinions may not be relied upon as investment advice and, because investment decisions made by American Century Investments funds are based on numerous factors, may not be relied upon as an indication of trading intent on behalf of any American Century Investments fund. Security examples are used for representational purposes only and are not intended as recommendations to purchase or sell securities. Performance information for comparative indices and securities is provided to American Century Investments by third party vendors. To the best of American Century Investments’ knowledge, such information is accurate at the time of printing.
|
| | | | | |
| Total Returns as of March 31, 2020 | |
| | | | Average Annual Returns | |
| | Ticker Symbol | 1 year | 5 years | 10 years | Inception Date |
| G Class | ACLDX | 8.18% | 3.09% | 3.81% | 5/12/06 |
| Bloomberg Barclays U.S. Aggregate Bond Index | — | 8.93% | 3.35% | 3.88% | — |
Fund returns would have been lower if a portion of the fees had not been waived.
|
|
| Growth of $10,000 Over 10 Years |
| $10,000 investment made March 31, 2010 |
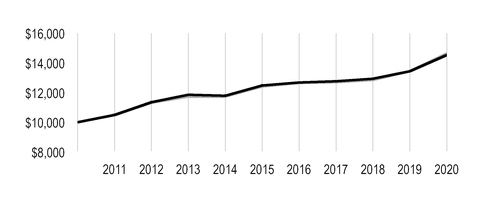
|
| |
| Value on March 31, 2020 |
| | G Class — $14,545 |
| |
| | Bloomberg Barclays U.S. Aggregate Bond Index — $14,639 |
| |
Ending value of G Class would have been lower if a portion of the fees had not been waived.
|
|
| Total Annual Fund Operating Expenses |
| G Class 0.35% |
The total annual fund operating expenses shown is as stated in the fund’s prospectus current as of the date of this report. The prospectus may vary from the expense ratio shown elsewhere in this report because it is based on a different time period, includes acquired fund fees and expenses, and, if applicable, does not include fee waivers or expense reimbursements.
Data presented reflect past performance. Past performance is no guarantee of future results. Current performance may be higher or lower than the performance shown. Total returns for periods less than one year are not annualized. Investment return and principal value will fluctuate, and redemption value may be more or less than original cost. Data assumes reinvestment of dividends and capital gains, and none of the charts reflect the deduction of taxes that a shareholder would pay on fund distributions or the redemption of fund shares. To obtain performance data current to the most recent month end, please call 1-800-345-2021 or visit americancentury.com. For additional information about the fund, please consult the prospectus.
Portfolio Managers: Bob Gahagan, Hando Aguilar, Jeff Houston, Brian Howell and Charles Tan
Performance Summary
NT Diversified Bond returned 8.18%* for the 12 months ended March 31, 2020. By comparison, the Bloomberg Barclays U.S. Aggregate Bond Index returned 8.93%. Returns for the fund and the index largely reflected the defensive characteristics of the broad U.S. investment-grade bond market in the face of unprecedented market unrest in early 2020.
The reporting period began on an upbeat note for bond investors. The Federal Reserve’s (Fed’s) early 2019 pivot toward dovish policy set the stage for rate cuts in July, September and October. This action, along with modest economic and earnings growth and low inflation, generally supported solid gains for U.S. bonds. By year-end 2019, global economic data improved, the U.S. and China signed a phase 1 trade deal and the Fed suggested it would hold rates steady through 2020.
Conditions deteriorated rapidly within the first quarter of 2020. As the COVID-19 epidemic originating in China expanded into a pandemic, nervous fixed-income investors scrambled to shed credit risk and seek shelter in cash. Market volatility soared and liquidity sank. In response, the Fed slashed short-term rates to near 0% and launched a series of initiatives to stabilize the financial markets. Separately, Congress passed a $2 trillion fiscal relief package. Reflecting market sentiment, the 10-year Treasury yield started the period at 2.41% and closed at 0.68% after touching a record-low 0.54% in early March. The two-year Treasury yield followed a similar path during the 12-month period, dropping from 2.27% to 0.22%, including a 135-basis-point decline in the first quarter of 2020.
Amid a global flight to quality, riskier investments, including corporate and securitized bonds, suffered significant losses. The Fed’s rescue programs helped stabilize credit-sensitive sectors of the fixed-income universe, including mortgage-backed securities, municipal bonds (munis) and investment-grade corporate bonds. Against this backdrop, an underweight position in Treasuries, relative to the benchmark, accounted for much of NT Diversified Bond’s underperformance.
Securitized Exposure Hindered Performance
We continued to underweight Treasuries and government agencies relative to the index in favor of spread (non-Treasury) sectors, including securitized bonds and corporate issues. This strategy diminished returns amid the late-period rush for stability and liquidity.
Throughout the period, we maintained an overweight position in securitized bonds, believing the sector offered better relative value and less volatility than corporate credit issues. The strategy generally aided performance during risk-on periods, but it proved detrimental amid the coronavirus sell-off. Forced selling created havoc for the sector, as the credit-sensitive holdings we favored, including non-agency commercial mortgage-backed securities, collateralized mortgage obligations and collateralized loan obligations, were hardest hit. Agency-backed mortgages recovered slightly after the Fed announced its asset-purchase plan, which included agency mortgages.
*Fund returns would have been lower if a portion of the fees had not been waived.
Corporate, Non-Index Securities Weighed on Results
As sentiment on the economy started to soften during 2019, we reduced our allocation to the corporate bond sector. Combined with our view that the credit cycle had entered its final stage, we believed that valuations among corporate bonds had advanced to levels in line with fundamentals. In addition to trimming exposure, we maintained a higher-quality bias, given the then uncertainties surrounding the effects of tariffs on corporate earnings. We also reduced our out-of-index stake in high-yield bonds. Although our corporate exposure suffered with all risk assets in the early 2020 decline, investment-grade securities recovered slightly late in the period on news the Fed would purchase corporate bonds.
Meanwhile, our out-of-index allocation to inflation-linked securities modestly detracted from relative performance. Late in the period, longer-term inflation expectations (10-year breakeven rate) sagged to their lowest level since 2009.
Portfolio Positioning
The economic downturn during the first quarter was swift and severe, but we do not expect an equally swift, or V-shaped, recovery. The consumer is the main driver of the U.S. economy, and we believe the effects of the COVID-19 pandemic will weigh on consumer sentiment—and job and economic growth—for several months. Ultimately, this crisis requires a medical solution.
With its massive financial rescue package, the Fed has demonstrated it will take extraordinary steps to maintain broad market liquidity and assure credit market stability. However, we don’t expect the Fed to ease further, as policymakers previously noted an unwillingness to push rates below zero. Additionally, the effects of significant fiscal stimulus should allow the Fed to keep rates steady.
Heightened volatility often creates market disruptions that lead to attractive buying opportunities. In the first quarter’s flight to quality, we identified such opportunities in the securitized, corporate credit and muni sectors. We’re remaining cautious and defensive in our positioning, focusing on high-quality securities and positioning our portfolio to weather a U-shaped recovery. We’re emphasizing securities the Fed is buying—high-quality corporate, mortgage and muni securities and Treasury inflation-protected securities.
At the same time, we’re reviewing each portfolio holding, eliminating securities we’re uncomfortable holding in the current environment. In particular, we’ve reduced exposure to securitized securities. We believe rising unemployment and the broad economic shutdown created by the pandemic will create challenges for certain segments of the mortgage market. We’ve also hedged overall risk in the portfolio via credit default swaps. As always, we favor a bottom-up approach to portfolio management, emphasizing careful security selection.
|
| |
| MARCH 31, 2020 | |
| Portfolio at a Glance | |
| Average Duration (effective) | 5.9 years |
| Weighted Average Life to Maturity | 7.3 years |
| | |
| Types of Investments in Portfolio | % of net assets |
| Corporate Bonds | 29.0% |
| U.S. Treasury Securities | 24.9% |
| U.S. Government Agency Mortgage-Backed Securities | 17.8% |
| Asset-Backed Securities | 4.0% |
| Collateralized Mortgage Obligations | 3.8% |
| Collateralized Loan Obligations | 3.7% |
| Commercial Mortgage-Backed Securities | 3.3% |
| Municipal Securities | 1.7% |
| Sovereign Governments and Agencies | 0.8% |
| U.S. Government Agency Securities | 0.3% |
| Preferred Stocks | 0.2% |
| Temporary Cash Investments | 11.1% |
| Other Assets and Liabilities | (0.6)% |
Fund shareholders may incur two types of costs: (1) transaction costs, including sales charges (loads) on purchase payments and redemption/exchange fees; and (2) ongoing costs, including management fees; distribution and service (12b-1) fees; and other fund expenses. This example is intended to help you understand your ongoing costs (in dollars) of investing in your fund and to compare these costs with the ongoing cost of investing in other mutual funds.
The example is based on an investment of $1,000 made at the beginning of the period and held for the entire period from October 1, 2019 to March 31, 2020.
Actual Expenses
The table provides information about actual account values and actual expenses for each class. You may use the information, together with the amount you invested, to estimate the expenses that you paid over the period. First, identify the share class you own. Then simply divide your account value by $1,000 (for example, an $8,600 account value divided by $1,000 = 8.6), then multiply the result by the number under the heading “Expenses Paid During Period” to estimate the expenses you paid on your account during this period.
Hypothetical Example for Comparison Purposes
The table also provides information about hypothetical account values and hypothetical expenses based on the actual expense ratio of each class of your fund and an assumed rate of return of 5% per year before expenses, which is not the actual return of a fund’s share class. The hypothetical account values and expenses may not be used to estimate the actual ending account balance or expenses you paid for the period. You may use this information to compare the ongoing costs of investing in your fund and other funds. To do so, compare this 5% hypothetical example with the 5% hypothetical examples that appear in the shareholder reports of the other funds.
Please note that the expenses shown in the table are meant to highlight your ongoing costs only and do not reflect any transactional costs, such as sales charges (loads) or redemption/exchange fees. Therefore, the table is useful in comparing ongoing costs only, and will not help you determine the relative total costs of owning different funds. In addition, if these transactional costs were included, your costs would have been higher.
|
| | | | |
| | Beginning
Account Value
10/1/19 | Ending
Account Value
3/31/20 | Expenses Paid
During Period(1)
10/1/19 - 3/31/20 |
Annualized
Expense Ratio(1) |
| Actual | | | | |
| G Class | $1,000 | $1,024.40 | $0.05 | 0.01% |
| Hypothetical | | | | |
| G Class | $1,000 | $1,024.95 | $0.05 | 0.01% |
| |
| (1) | Expenses are equal to the class's annualized expense ratio listed in the table above, multiplied by the average account value over the period, multiplied by 183, the number of days in the most recent fiscal half-year, divided by 366, to reflect the one-half year period. Annualized expense ratio reflects actual expenses, including any applicable fee waivers or expense reimbursements and excluding any acquired fund fees and expenses. |
MARCH 31, 2020
|
| | | | | | |
| | Principal Amount | Value |
| CORPORATE BONDS — 29.0% | | |
| Aerospace and Defense — 0.1% | | |
| United Technologies Corp., 6.05%, 6/1/36 | $ | 730,000 |
| $ | 977,230 |
|
| United Technologies Corp., 5.70%, 4/15/40 | 1,420,000 |
| 1,834,576 |
|
| | | 2,811,806 |
|
| Automobiles — 0.6% | | |
| Ford Motor Credit Co. LLC, 5.875%, 8/2/21 | 4,280,000 |
| 4,215,800 |
|
| Ford Motor Credit Co. LLC, 2.98%, 8/3/22 | 1,200,000 |
| 1,122,000 |
|
| Ford Motor Credit Co. LLC, 3.35%, 11/1/22 | 2,220,000 |
| 2,053,500 |
|
| General Motors Co., 5.15%, 4/1/38 | 1,500,000 |
| 1,089,692 |
|
| General Motors Financial Co., Inc., 3.20%, 7/6/21 | 3,110,000 |
| 2,972,096 |
|
| General Motors Financial Co., Inc., 5.25%, 3/1/26 | 1,480,000 |
| 1,308,891 |
|
| | | 12,761,979 |
|
| Banks — 6.0% | | |
| Banco Santander SA, 3.50%, 4/11/22 | 2,600,000 |
| 2,573,716 |
|
| Bank of America Corp., MTN, 4.00%, 1/22/25 | 5,140,000 |
| 5,437,307 |
|
| Bank of America Corp., MTN, VRN, 3.82%, 1/20/28 | 3,020,000 |
| 3,138,914 |
|
| Bank of America Corp., VRN, 3.00%, 12/20/23 | 3,664,000 |
| 3,737,820 |
|
| Bank of America Corp., VRN, 3.42%, 12/20/28 | 80,000 |
| 82,770 |
|
| Bank of Montreal, MTN, 3.30%, 2/5/24 | 4,433,000 |
| 4,638,213 |
|
| Barclays Bank plc, 5.14%, 10/14/20 | 2,290,000 |
| 2,312,347 |
|
BNP Paribas SA, VRN, 2.82%, 11/19/25(1) | 2,630,000 |
| 2,602,748 |
|
BPCE SA, 3.00%, 5/22/22(1) | 2,060,000 |
| 2,041,485 |
|
BPCE SA, 5.15%, 7/21/24(1) | 1,870,000 |
| 1,975,044 |
|
| Canadian Imperial Bank of Commerce, 2.25%, 1/28/25 | 4,200,000 |
| 4,165,148 |
|
| Citigroup, Inc., 2.90%, 12/8/21 | 7,951,000 |
| 8,029,495 |
|
| Citigroup, Inc., 2.75%, 4/25/22 | 4,508,000 |
| 4,534,889 |
|
| Citigroup, Inc., 4.05%, 7/30/22 | 1,400,000 |
| 1,426,900 |
|
| Citigroup, Inc., VRN, 3.52%, 10/27/28 | 4,050,000 |
| 4,063,325 |
|
| Cooperatieve Rabobank UA, 3.95%, 11/9/22 | 3,180,000 |
| 3,202,856 |
|
| Discover Bank, 3.35%, 2/6/23 | 1,850,000 |
| 1,860,113 |
|
| Discover Bank, 3.45%, 7/27/26 | 3,730,000 |
| 3,655,425 |
|
| Fifth Third BanCorp., 4.30%, 1/16/24 | 750,000 |
| 806,522 |
|
| Fifth Third BanCorp., 2.375%, 1/28/25 | 4,070,000 |
| 3,972,006 |
|
| FNB Corp., 2.20%, 2/24/23 | 2,900,000 |
| 2,850,411 |
|
| HSBC Holdings plc, 2.95%, 5/25/21 | 4,917,000 |
| 4,949,691 |
|
| HSBC Holdings plc, 4.30%, 3/8/26 | 3,420,000 |
| 3,658,540 |
|
| HSBC Holdings plc, 3.90%, 5/25/26 | 288,000 |
| 293,646 |
|
| HSBC Holdings plc, 4.375%, 11/23/26 | 3,100,000 |
| 3,299,198 |
|
| HSBC Holdings plc, 4.95%, 3/31/30 | 631,000 |
| 696,724 |
|
| HSBC Holdings plc, VRN, 3.26%, 3/13/23 | 1,520,000 |
| 1,523,640 |
|
| HSBC Holdings plc, VRN, 2.63%, 11/7/25 | 2,700,000 |
| 2,624,185 |
|
| Huntington Bancshares, Inc., 2.55%, 2/4/30 | 5,230,000 |
| 4,765,575 |
|
|
| | | | | | |
| | Principal Amount | Value |
| JPMorgan Chase & Co., VRN, 4.02%, 12/5/24 | $ | 3,880,000 |
| $ | 4,117,119 |
|
| JPMorgan Chase & Co., VRN, 3.70%, 5/6/30 | 2,380,000 |
| 2,561,185 |
|
| Lloyds Banking Group plc, VRN, 2.91%, 11/7/23 | 996,000 |
| 996,091 |
|
| Lloyds Banking Group plc, VRN, 2.44%, 2/5/26 | 2,313,000 |
| 2,188,926 |
|
| PNC Bank N.A., 2.70%, 10/22/29 | 3,300,000 |
| 3,208,636 |
|
| Regions Financial Corp., 3.80%, 8/14/23 | 1,830,000 |
| 1,856,113 |
|
| Royal Bank of Canada, 2.15%, 10/26/20 | 2,590,000 |
| 2,588,950 |
|
| Sumitomo Mitsui Financial Group, Inc., 2.35%, 1/15/25 | 4,900,000 |
| 4,876,150 |
|
| Truist Bank, 2.25%, 3/11/30 | 2,810,000 |
| 2,579,875 |
|
| U.S. Bancorp, MTN, 3.60%, 9/11/24 | 1,910,000 |
| 1,964,419 |
|
| Wells Fargo & Co., 4.125%, 8/15/23 | 760,000 |
| 784,996 |
|
| Wells Fargo & Co., 3.00%, 10/23/26 | 3,950,000 |
| 4,056,052 |
|
| Wells Fargo & Co., MTN, 4.65%, 11/4/44 | 1,555,000 |
| 1,799,215 |
|
| | | 122,496,380 |
|
| Beverages — 0.4% | | |
| Anheuser-Busch Cos. LLC / Anheuser-Busch InBev Worldwide, Inc., 4.90%, 2/1/46 | 3,860,000 |
| 4,232,144 |
|
| Anheuser-Busch InBev Worldwide, Inc., 4.75%, 1/23/29 | 3,790,000 |
| 4,175,602 |
|
| | | 8,407,746 |
|
| Biotechnology — 1.2% | | |
| AbbVie, Inc., 2.90%, 11/6/22 | 3,240,000 |
| 3,281,891 |
|
AbbVie, Inc., 3.20%, 11/21/29(1) | 3,065,000 |
| 3,145,840 |
|
| AbbVie, Inc., 4.40%, 11/6/42 | 1,790,000 |
| 1,997,943 |
|
AbbVie, Inc., 4.25%, 11/21/49(1) | 2,300,000 |
| 2,513,084 |
|
| Amgen, Inc., 2.65%, 5/11/22 | 4,880,000 |
| 4,940,459 |
|
| Amgen, Inc., 4.66%, 6/15/51 | 1,533,000 |
| 1,939,169 |
|
| Gilead Sciences, Inc., 4.40%, 12/1/21 | 1,490,000 |
| 1,539,641 |
|
| Gilead Sciences, Inc., 3.65%, 3/1/26 | 4,230,000 |
| 4,619,761 |
|
| | | 23,977,788 |
|
| Building Products — 0.1% | | |
Carrier Global Corp., 2.72%, 2/15/30(1) | 2,056,000 |
| 1,903,819 |
|
| Capital Markets — 2.3% | | |
| Ares Capital Corp., 3.25%, 7/15/25 | 5,143,000 |
| 4,096,809 |
|
Credit Suisse Group AG, VRN, 2.59%, 9/11/25(1) | 1,610,000 |
| 1,532,350 |
|
Credit Suisse Group AG, VRN, 4.19%, 4/1/31(1)(2) | 2,200,000 |
| 2,258,236 |
|
| Goldman Sachs BDC, Inc., 3.75%, 2/10/25 | 1,717,000 |
| 1,594,918 |
|
| Goldman Sachs Group, Inc. (The), 3.50%, 4/1/25 | 2,090,000 |
| 2,123,156 |
|
| Goldman Sachs Group, Inc. (The), 3.50%, 11/16/26 | 6,500,000 |
| 6,657,425 |
|
| Goldman Sachs Group, Inc. (The), VRN, 2.88%, 10/31/22 | 1,450,000 |
| 1,458,626 |
|
KKR Group Finance Co. VII LLC, 3.625%, 2/25/50(1) | 4,800,000 |
| 3,982,958 |
|
| Morgan Stanley, 2.75%, 5/19/22 | 800,000 |
| 809,144 |
|
| Morgan Stanley, MTN, 3.70%, 10/23/24 | 2,450,000 |
| 2,593,355 |
|
| Morgan Stanley, MTN, 4.00%, 7/23/25 | 7,990,000 |
| 8,567,648 |
|
| Morgan Stanley, MTN, VRN, 2.70%, 1/22/31 | 1,540,000 |
| 1,512,793 |
|
| Morgan Stanley, VRN, 3.97%, 7/22/38 | 920,000 |
| 1,014,896 |
|
| Oaktree Specialty Lending Corp., 3.50%, 2/25/25 | 2,050,000 |
| 1,845,103 |
|
State Street Corp., VRN, 2.83%, 3/30/23(1) | 550,000 |
| 555,395 |
|
UBS Group AG, 3.49%, 5/23/23(1) | 4,800,000 |
| 4,856,016 |
|
|
| | | | | | |
| | Principal Amount | Value |
UBS Group AG, 4.125%, 9/24/25(1) | $ | 950,000 |
| $ | 988,912 |
|
| | | 46,447,740 |
|
| Chemicals — 0.2% | | |
CF Industries, Inc., 4.50%, 12/1/26(1) | 2,230,000 |
| 2,354,990 |
|
| CF Industries, Inc., 5.15%, 3/15/34 | 1,610,000 |
| 1,643,488 |
|
| | | 3,998,478 |
|
| Commercial Services and Supplies — 0.6% | | |
| Republic Services, Inc., 3.55%, 6/1/22 | 1,910,000 |
| 1,960,907 |
|
| Republic Services, Inc., 2.30%, 3/1/30 | 5,110,000 |
| 4,911,475 |
|
| Waste Connections, Inc., 3.50%, 5/1/29 | 2,130,000 |
| 2,162,209 |
|
| Waste Connections, Inc., 2.60%, 2/1/30 | 3,900,000 |
| 3,659,026 |
|
| | | 12,693,617 |
|
| Construction Materials — 0.2% | | |
| Martin Marietta Materials, Inc., 2.50%, 3/15/30 | 3,442,000 |
| 3,154,067 |
|
| Consumer Finance — 0.8% | | |
| AerCap Ireland Capital DAC / AerCap Global Aviation Trust, 5.00%, 10/1/21 | 3,700,000 |
| 3,321,560 |
|
| Ally Financial, Inc., 4.625%, 3/30/25 | 3,917,000 |
| 3,768,095 |
|
| Ally Financial, Inc., 5.75%, 11/20/25 | 520,000 |
| 512,564 |
|
| Capital One Bank USA N.A., 3.375%, 2/15/23 | 1,580,000 |
| 1,547,883 |
|
| Capital One Bank USA N.A., VRN, 2.28%, 1/28/26 | 2,293,000 |
| 2,080,685 |
|
| Capital One Financial Corp., 3.80%, 1/31/28 | 3,550,000 |
| 3,516,824 |
|
Park Aerospace Holdings Ltd., 5.50%, 2/15/24(1) | 2,870,000 |
| 2,476,161 |
|
| | | 17,223,772 |
|
| Diversified Consumer Services — 0.1% | | |
| Pepperdine University, 3.30%, 12/1/59 | 2,290,000 |
| 2,653,880 |
|
| Diversified Financial Services — 0.1% | | |
| Credit Suisse Group Funding Guernsey Ltd., 3.45%, 4/16/21 | 2,550,000 |
| 2,566,912 |
|
| Diversified Telecommunication Services — 1.5% | | |
| AT&T, Inc., 3.875%, 8/15/21 | 2,780,000 |
| 2,848,376 |
|
| AT&T, Inc., 3.80%, 2/15/27 | 1,200,000 |
| 1,249,716 |
|
| AT&T, Inc., 4.10%, 2/15/28 | 1,300,000 |
| 1,368,411 |
|
| AT&T, Inc., 4.30%, 2/15/30 | 3,000,000 |
| 3,235,361 |
|
| AT&T, Inc., 5.15%, 11/15/46 | 1,236,000 |
| 1,460,191 |
|
Deutsche Telekom AG, 3.625%, 1/21/50(1) | 3,210,000 |
| 3,209,231 |
|
| Ooredoo International Finance Ltd., 3.25%, 2/21/23 | 930,000 |
| 906,124 |
|
| Telefonica Emisiones SA, 5.46%, 2/16/21 | 1,590,000 |
| 1,624,340 |
|
| Verizon Communications, Inc., 2.95%, 3/15/22 | 2,855,000 |
| 2,914,515 |
|
| Verizon Communications, Inc., 2.45%, 11/1/22 | 1,737,000 |
| 1,767,166 |
|
| Verizon Communications, Inc., 4.40%, 11/1/34 | 4,150,000 |
| 4,874,351 |
|
| Verizon Communications, Inc., 4.75%, 11/1/41 | 1,490,000 |
| 1,742,219 |
|
| Verizon Communications, Inc., 5.01%, 8/21/54 | 2,170,000 |
| 2,979,879 |
|
| | | 30,179,880 |
|
| Electric Utilities — 1.8% | | |
| AEP Transmission Co. LLC, 3.75%, 12/1/47 | 970,000 |
| 1,005,803 |
|
| American Electric Power Co., Inc., 3.20%, 11/13/27 | 1,050,000 |
| 1,043,217 |
|
| Berkshire Hathaway Energy Co., 1.77%, 2/1/25 | 1,550,000 |
| 1,628,665 |
|
|
| | | | | | |
| | Principal Amount | Value |
| Berkshire Hathaway Energy Co., 1.125%, 7/15/48 | $ | 1,460,000 |
| $ | 1,537,451 |
|
| Commonwealth Edison Co., 3.20%, 11/15/49 | 690,000 |
| 697,628 |
|
| DTE Electric Co., 2.25%, 3/1/30 | 2,050,000 |
| 1,991,039 |
|
| Duke Energy Corp., 3.55%, 9/15/21 | 1,250,000 |
| 1,267,663 |
|
| Duke Energy Corp., 2.65%, 9/1/26 | 1,540,000 |
| 1,531,879 |
|
| Duke Energy Florida LLC, 6.35%, 9/15/37 | 463,000 |
| 640,538 |
|
| Duke Energy Florida LLC, 3.85%, 11/15/42 | 1,410,000 |
| 1,558,726 |
|
| Duke Energy Progress LLC, 3.25%, 8/15/25 | 1,000,000 |
| 1,067,826 |
|
| Duke Energy Progress LLC, 4.15%, 12/1/44 | 500,000 |
| 566,615 |
|
| Duke Energy Progress LLC, 3.70%, 10/15/46 | 515,000 |
| 558,027 |
|
| Exelon Corp., 5.15%, 12/1/20 | 1,276,000 |
| 1,288,545 |
|
| Exelon Corp., 4.45%, 4/15/46 | 1,400,000 |
| 1,423,483 |
|
| Exelon Generation Co. LLC, 4.25%, 6/15/22 | 1,250,000 |
| 1,251,194 |
|
FirstEnergy Transmission LLC, 4.55%, 4/1/49(1) | 1,250,000 |
| 1,254,346 |
|
| Florida Power & Light Co., 4.125%, 2/1/42 | 930,000 |
| 1,011,856 |
|
| Florida Power & Light Co., 3.15%, 10/1/49 | 1,160,000 |
| 1,209,164 |
|
| MidAmerican Energy Co., 4.40%, 10/15/44 | 2,100,000 |
| 2,403,646 |
|
| Nevada Power Co., 2.40%, 5/1/30 | 1,470,000 |
| 1,409,112 |
|
| NextEra Energy Capital Holdings, Inc., 3.55%, 5/1/27 | 2,210,000 |
| 2,285,943 |
|
NextEra Energy Operating Partners LP, 4.50%, 9/15/27(1) | 1,520,000 |
| 1,492,591 |
|
| Oncor Electric Delivery Co. LLC, 3.10%, 9/15/49 | 1,160,000 |
| 1,132,216 |
|
| Potomac Electric Power Co., 3.60%, 3/15/24 | 1,010,000 |
| 1,037,459 |
|
| Southern Co. Gas Capital Corp., 3.95%, 10/1/46 | 970,000 |
| 871,933 |
|
| Southwestern Public Service Co., 3.70%, 8/15/47 | 930,000 |
| 994,588 |
|
| Xcel Energy, Inc., 3.35%, 12/1/26 | 1,000,000 |
| 990,022 |
|
Xcel Energy, Inc., 3.40%, 6/1/30(2) | 2,000,000 |
| 2,031,400 |
|
| | | 37,182,575 |
|
| Electronic Equipment, Instruments and Components — 0.1% | | |
| Amphenol Corp., 2.05%, 3/1/25 | 3,000,000 |
| 2,846,874 |
|
| Energy Equipment and Services — 0.1% | | |
| Baker Hughes a GE Co. LLC / Baker Hughes Co-Obligor, Inc., 3.14%, 11/7/29 | 1,733,000 |
| 1,506,561 |
|
| Equity Real Estate Investment Trusts (REITs) — 1.4% | | |
| Alexandria Real Estate Equities, Inc., 4.90%, 12/15/30 | 560,000 |
| 610,884 |
|
| American Tower Corp., 3.375%, 10/15/26 | 833,000 |
| 835,083 |
|
| American Tower Corp., 2.90%, 1/15/30 | 2,810,000 |
| 2,751,824 |
|
| AvalonBay Communities, Inc., MTN, 3.20%, 1/15/28 | 625,000 |
| 623,004 |
|
| Boston Properties LP, 3.65%, 2/1/26 | 2,410,000 |
| 2,569,814 |
|
| Crown Castle International Corp., 5.25%, 1/15/23 | 2,474,000 |
| 2,627,240 |
|
Crown Castle International Corp., 3.30%, 7/1/30(2) | 200,000 |
| 200,369 |
|
| Duke Realty LP, 2.875%, 11/15/29 | 3,095,000 |
| 2,983,836 |
|
| Duke Realty LP, 3.05%, 3/1/50 | 1,000,000 |
| 812,323 |
|
| Essex Portfolio LP, 3.25%, 5/1/23 | 1,220,000 |
| 1,198,124 |
|
| Healthcare Realty Trust, Inc., 2.40%, 3/15/30 | 1,600,000 |
| 1,426,107 |
|
| Kilroy Realty LP, 3.80%, 1/15/23 | 1,670,000 |
| 1,701,798 |
|
| Kimco Realty Corp., 2.80%, 10/1/26 | 2,130,000 |
| 2,082,884 |
|
| National Retail Properties, Inc., 2.50%, 4/15/30 | 1,400,000 |
| 1,251,929 |
|
|
| | | | | | |
| | Principal Amount | Value |
| Prologis LP, 2.125%, 4/15/27 | $ | 900,000 |
| $ | 858,974 |
|
| Prologis LP, 3.00%, 4/15/50 | 2,035,000 |
| 1,773,349 |
|
| Public Storage, 3.39%, 5/1/29 | 1,710,000 |
| 1,719,855 |
|
| Service Properties Trust, 4.65%, 3/15/24 | 1,480,000 |
| 1,085,841 |
|
| Ventas Realty LP, 4.125%, 1/15/26 | 720,000 |
| 720,403 |
|
Ventas Realty LP, 4.75%, 11/15/30(2) | 600,000 |
| 590,538 |
|
| | | 28,424,179 |
|
| Food and Staples Retailing — 0.2% | | |
| Kroger Co. (The), 3.875%, 10/15/46 | 2,140,000 |
| 2,110,122 |
|
Sysco Corp., 5.95%, 4/1/30(2) | 592,000 |
| 624,524 |
|
| Walmart, Inc., 4.05%, 6/29/48 | 1,220,000 |
| 1,575,936 |
|
| | | 4,310,582 |
|
| Health Care Equipment and Supplies — 0.4% | | |
Baxter International, Inc., 3.95%, 4/1/30(1) | 400,000 |
| 433,394 |
|
| Becton Dickinson and Co., 3.73%, 12/15/24 | 3,360,000 |
| 3,451,186 |
|
| DH Europe Finance II Sarl, 3.40%, 11/15/49 | 1,480,000 |
| 1,462,046 |
|
| Medtronic, Inc., 3.50%, 3/15/25 | 1,609,000 |
| 1,736,239 |
|
| Medtronic, Inc., 4.375%, 3/15/35 | 1,131,000 |
| 1,413,267 |
|
| | | 8,496,132 |
|
| Health Care Providers and Services — 1.3% | | |
| Anthem, Inc., 3.65%, 12/1/27 | 1,400,000 |
| 1,449,018 |
|
| Cigna Corp., 2.40%, 3/15/30 | 2,050,000 |
| 1,951,920 |
|
| CommonSpirit Health, 2.95%, 11/1/22 | 860,000 |
| 840,720 |
|
| CVS Health Corp., 3.50%, 7/20/22 | 2,820,000 |
| 2,895,845 |
|
| CVS Health Corp., 2.75%, 12/1/22 | 1,345,000 |
| 1,355,740 |
|
| CVS Health Corp., 4.30%, 3/25/28 | 3,250,000 |
| 3,458,338 |
|
| CVS Health Corp., 4.78%, 3/25/38 | 1,510,000 |
| 1,664,397 |
|
| Duke University Health System, Inc., 3.92%, 6/1/47 | 2,150,000 |
| 2,456,107 |
|
| Partners Healthcare System, Inc., 3.19%, 7/1/49 | 1,395,000 |
| 1,402,815 |
|
| UnitedHealth Group, Inc., 2.875%, 3/15/22 | 1,950,000 |
| 2,005,017 |
|
| UnitedHealth Group, Inc., 3.75%, 7/15/25 | 2,640,000 |
| 2,869,298 |
|
| UnitedHealth Group, Inc., 4.75%, 7/15/45 | 1,450,000 |
| 1,856,207 |
|
Universal Health Services, Inc., 4.75%, 8/1/22(1) | 1,850,000 |
| 1,853,439 |
|
| | | 26,058,861 |
|
| Hotels, Restaurants and Leisure — 0.1% | | |
| McDonald's Corp., MTN, 4.70%, 12/9/35 | 1,070,000 |
| 1,213,117 |
|
| Household Durables — 0.4% | | |
| D.R. Horton, Inc., 2.55%, 12/1/20 | 1,260,000 |
| 1,242,666 |
|
| D.R. Horton, Inc., 5.75%, 8/15/23 | 650,000 |
| 671,948 |
|
| D.R. Horton, Inc., 2.50%, 10/15/24 | 2,140,000 |
| 2,003,151 |
|
| Lennar Corp., 4.75%, 4/1/21 | 1,880,000 |
| 1,871,465 |
|
| Toll Brothers Finance Corp., 4.35%, 2/15/28 | 1,940,000 |
| 1,781,973 |
|
| | | 7,571,203 |
|
Household Products† | | |
| Kimberly-Clark Corp., 3.10%, 3/26/30 | 400,000 |
| 430,075 |
|
| Industrial Conglomerates — 0.2% | | |
| Carlisle Cos., Inc., 2.75%, 3/1/30 | 5,140,000 |
| 4,520,413 |
|
|
| | | | | | |
| | Principal Amount | Value |
| Insurance — 1.2% | | |
Aflac, Inc., 3.60%, 4/1/30(2) | $ | 1,000,000 |
| $ | 1,014,379 |
|
| American International Group, Inc., 4.125%, 2/15/24 | 4,170,000 |
| 4,383,902 |
|
| American International Group, Inc., 4.50%, 7/16/44 | 3,040,000 |
| 3,121,018 |
|
Athene Holding Ltd., 6.15%, 4/3/30(2) | 1,000,000 |
| 1,000,220 |
|
| Berkshire Hathaway Finance Corp., 1.06%, 8/15/48 | 2,000,000 |
| 2,361,676 |
|
| Chubb INA Holdings, Inc., 3.15%, 3/15/25 | 1,770,000 |
| 1,848,980 |
|
| Hartford Financial Services Group, Inc. (The), 3.60%, 8/19/49 | 2,603,000 |
| 2,474,861 |
|
| Markel Corp., 4.90%, 7/1/22 | 1,400,000 |
| 1,407,936 |
|
| MetLife, Inc., 4.125%, 8/13/42 | 450,000 |
| 475,799 |
|
Metropolitan Life Global Funding I, 3.00%, 1/10/23(1) | 1,790,000 |
| 1,816,811 |
|
| Prudential Financial, Inc., MTN, 1.50%, 3/10/26 | 4,050,000 |
| 3,817,260 |
|
| WR Berkley Corp., 4.625%, 3/15/22 | 1,100,000 |
| 945,556 |
|
| | | 24,668,398 |
|
| Internet and Direct Marketing Retail — 0.1% | | |
| eBay, Inc., 2.15%, 6/5/20 | 1,390,000 |
| 1,389,259 |
|
| IT Services — 0.3% | | |
| Fiserv, Inc., 3.50%, 7/1/29 | 1,235,000 |
| 1,314,442 |
|
| Global Payments, Inc., 3.20%, 8/15/29 | 2,460,000 |
| 2,417,743 |
|
| Mastercard, Inc., 3.65%, 6/1/49 | 1,265,000 |
| 1,481,379 |
|
Visa, Inc., 1.90%, 4/15/27(2) | 990,000 |
| 990,061 |
|
| Western Union Co. (The), 2.85%, 1/10/25 | 876,000 |
| 873,637 |
|
| | | 7,077,262 |
|
Machinery† | | |
Otis Worldwide Corp., VRN, 2.09%, 4/5/23(1) | 970,000 |
| 923,610 |
|
| Media — 0.7% | | |
| Charter Communications Operating LLC / Charter Communications Operating Capital, 4.91%, 7/23/25 | 2,560,000 |
| 2,762,797 |
|
| Charter Communications Operating LLC / Charter Communications Operating Capital, 4.80%, 3/1/50 | 865,000 |
| 905,599 |
|
| Comcast Corp., 6.40%, 5/15/38 | 790,000 |
| 1,155,784 |
|
| Comcast Corp., 4.75%, 3/1/44 | 2,800,000 |
| 3,555,246 |
|
| Comcast Corp., 3.97%, 11/1/47 | 1,207,000 |
| 1,401,066 |
|
Fox Corp., 3.05%, 4/7/25(2) | 525,000 |
| 530,637 |
|
| ViacomCBS, Inc., 3.125%, 6/15/22 | 1,260,000 |
| 1,244,607 |
|
| ViacomCBS, Inc., 4.25%, 9/1/23 | 1,840,000 |
| 1,879,273 |
|
| | | 13,435,009 |
|
| Metals and Mining — 0.3% | | |
Minera Mexico SA de CV, 4.50%, 1/26/50(1) | 4,900,000 |
| 4,166,495 |
|
| Steel Dynamics, Inc., 3.45%, 4/15/30 | 1,440,000 |
| 1,312,765 |
|
| | | 5,479,260 |
|
| Multi-Utilities — 0.6% | | |
Ameren Corp., 3.50%, 1/15/31(2) | 607,000 |
| 611,201 |
|
| CenterPoint Energy, Inc., 4.25%, 11/1/28 | 2,030,000 |
| 2,086,509 |
|
| Consolidated Edison Co. of New York, Inc., 3.95%, 3/1/43 | 880,000 |
| 826,069 |
|
| Dominion Energy, Inc., 4.90%, 8/1/41 | 2,210,000 |
| 2,314,743 |
|
| NiSource, Inc., 5.65%, 2/1/45 | 1,310,000 |
| 1,511,080 |
|
| Sempra Energy, 2.875%, 10/1/22 | 1,220,000 |
| 1,225,537 |
|
|
| | | | | | |
| | Principal Amount | Value |
| Sempra Energy, 3.25%, 6/15/27 | $ | 1,700,000 |
| $ | 1,656,004 |
|
| Sempra Energy, 4.00%, 2/1/48 | 1,000,000 |
| 963,308 |
|
| | | 11,194,451 |
|
| Oil, Gas and Consumable Fuels — 2.3% | | |
Aker BP ASA, 3.75%, 1/15/30(1) | 3,080,000 |
| 2,318,690 |
|
| CNOOC Finance Ltd., 4.25%, 1/26/21 | 5,000,000 |
| 5,087,050 |
|
| CNOOC Nexen Finance 2014 ULC, 4.25%, 4/30/24 | 1,030,000 |
| 1,102,114 |
|
| Concho Resources, Inc., 4.375%, 1/15/25 | 2,310,000 |
| 1,974,377 |
|
| Continental Resources, Inc., 4.375%, 1/15/28 | 2,160,000 |
| 1,007,704 |
|
| Diamondback Energy, Inc., 3.50%, 12/1/29 | 3,910,000 |
| 2,773,254 |
|
| Ecopetrol SA, 5.875%, 5/28/45 | 690,000 |
| 618,457 |
|
| Energy Transfer Operating LP, 4.25%, 3/15/23 | 2,400,000 |
| 2,153,821 |
|
| Energy Transfer Operating LP, 3.75%, 5/15/30 | 1,960,000 |
| 1,544,389 |
|
| Energy Transfer Operating LP, 4.90%, 3/15/35 | 1,600,000 |
| 1,263,176 |
|
| Energy Transfer Operating LP, 6.50%, 2/1/42 | 420,000 |
| 380,102 |
|
| Enterprise Products Operating LLC, 4.85%, 3/15/44 | 3,550,000 |
| 3,715,058 |
|
| EOG Resources, Inc., 4.10%, 2/1/21 | 1,440,000 |
| 1,448,649 |
|
| Equinor ASA, 3.25%, 11/18/49 | 960,000 |
| 949,816 |
|
| Hess Corp., 6.00%, 1/15/40 | 970,000 |
| 701,528 |
|
| Kinder Morgan Energy Partners LP, 5.30%, 9/15/20 | 950,000 |
| 947,194 |
|
| Kinder Morgan Energy Partners LP, 6.50%, 9/1/39 | 2,729,000 |
| 2,683,367 |
|
MPLX LP, 5.25%, 1/15/25(1) | 1,900,000 |
| 1,675,469 |
|
| MPLX LP, 4.875%, 6/1/25 | 3,280,000 |
| 2,705,834 |
|
| MPLX LP, 4.50%, 4/15/38 | 1,080,000 |
| 847,454 |
|
| MPLX LP, 5.20%, 3/1/47 | 1,270,000 |
| 1,017,939 |
|
| Ovintiv, Inc., 6.50%, 2/1/38 | 560,000 |
| 243,888 |
|
| Petroleos Mexicanos, 4.875%, 1/24/22 | 870,000 |
| 753,060 |
|
| Petroleos Mexicanos, 3.50%, 1/30/23 | 130,000 |
| 107,087 |
|
| Petroleos Mexicanos, 4.625%, 9/21/23 | 1,800,000 |
| 1,469,601 |
|
| Petroleos Mexicanos, 6.50%, 3/13/27 | 1,500,000 |
| 1,122,964 |
|
| Petroleos Mexicanos, 6.625%, 6/15/35 | 50,000 |
| 34,138 |
|
| Sabine Pass Liquefaction LLC, 5.625%, 3/1/25 | 5,170,000 |
| 4,754,212 |
|
| Sunoco Logistics Partners Operations LP, 4.00%, 10/1/27 | 2,650,000 |
| 2,101,956 |
|
| | | 47,502,348 |
|
| Pharmaceuticals — 0.5% | | |
| Allergan Finance LLC, 3.25%, 10/1/22 | 2,210,000 |
| 2,218,256 |
|
| Allergan Funding SCS, 3.85%, 6/15/24 | 2,557,000 |
| 2,682,974 |
|
Bristol-Myers Squibb Co., 3.25%, 8/15/22(1) | 2,490,000 |
| 2,588,033 |
|
Bristol-Myers Squibb Co., 3.625%, 5/15/24(1) | 850,000 |
| 899,775 |
|
| Elanco Animal Health, Inc., 5.65%, 8/28/28 | 2,007,000 |
| 2,122,147 |
|
| | | 10,511,185 |
|
| Road and Rail — 0.8% | | |
Ashtead Capital, Inc., 4.125%, 8/15/25(1) | 2,500,000 |
| 2,300,000 |
|
| Burlington Northern Santa Fe LLC, 4.95%, 9/15/41 | 1,075,000 |
| 1,354,425 |
|
| Burlington Northern Santa Fe LLC, 4.45%, 3/15/43 | 750,000 |
| 891,202 |
|
| Burlington Northern Santa Fe LLC, 4.15%, 4/1/45 | 2,880,000 |
| 3,385,909 |
|
| CSX Corp., 3.25%, 6/1/27 | 2,830,000 |
| 2,913,108 |
|
|
| | | | | | |
| | Principal Amount | Value |
| CSX Corp., 3.80%, 4/15/50 | $ | 1,002,000 |
| $ | 1,057,247 |
|
| Union Pacific Corp., 2.40%, 2/5/30 | 1,470,000 |
| 1,439,942 |
|
| Union Pacific Corp., 3.60%, 9/15/37 | 860,000 |
| 893,648 |
|
Union Pacific Corp., 3.84%, 3/20/60(1) | 1,190,000 |
| 1,293,781 |
|
| Union Pacific Corp., MTN, 3.55%, 8/15/39 | 980,000 |
| 991,411 |
|
| | | 16,520,673 |
|
| Semiconductors and Semiconductor Equipment — 0.1% | | |
NXP BV / NXP Funding LLC, 3.875%, 9/1/22(1) | 1,950,000 |
| 1,959,427 |
|
| Software — 0.5% | | |
| Adobe, Inc., 2.30%, 2/1/30 | 3,200,000 |
| 3,211,509 |
|
| Oracle Corp., 2.50%, 10/15/22 | 1,635,000 |
| 1,674,348 |
|
| Oracle Corp., 3.625%, 7/15/23 | 1,990,000 |
| 2,114,039 |
|
Oracle Corp., 2.50%, 4/1/25(2) | 2,120,000 |
| 2,166,742 |
|
Oracle Corp., 2.95%, 4/1/30(2) | 1,400,000 |
| 1,411,373 |
|
| | | 10,578,011 |
|
| Specialty Retail — 0.4% | | |
| Home Depot, Inc. (The), 3.00%, 4/1/26 | 1,640,000 |
| 1,734,236 |
|
| Home Depot, Inc. (The), 5.95%, 4/1/41 | 1,860,000 |
| 2,614,408 |
|
| Home Depot, Inc. (The), 3.90%, 6/15/47 | 1,120,000 |
| 1,265,001 |
|
| Home Depot, Inc. (The), 3.35%, 4/15/50 | 1,403,000 |
| 1,529,959 |
|
| | | 7,143,604 |
|
| Technology Hardware, Storage and Peripherals — 0.5% | | |
Dell International LLC / EMC Corp., 5.45%, 6/15/23(1) | 3,470,000 |
| 3,565,237 |
|
Dell International LLC / EMC Corp., 6.02%, 6/15/26(1) | 6,560,000 |
| 6,994,098 |
|
| | | 10,559,335 |
|
| Textiles, Apparel and Luxury Goods — 0.1% | | |
| NIKE, Inc., 3.375%, 3/27/50 | 1,002,000 |
| 1,101,264 |
|
| Trading Companies and Distributors — 0.2% | | |
| Air Lease Corp., MTN, 3.00%, 2/1/30 | 5,245,000 |
| 3,815,104 |
|
| International Lease Finance Corp., 5.875%, 8/15/22 | 860,000 |
| 769,714 |
|
| | | 4,584,818 |
|
| Wireless Telecommunication Services — 0.2% | | |
| Vodafone Group plc, 2.95%, 2/19/23 | 4,693,000 |
| 4,797,442 |
|
TOTAL CORPORATE BONDS
(Cost $601,243,959) | | 593,263,792 |
|
| U.S. TREASURY SECURITIES — 24.9% | | |
| U.S. Treasury Bonds, 5.00%, 5/15/37 | 1,500,000 |
| 2,464,512 |
|
U.S. Treasury Bonds, 3.50%, 2/15/39(3) | 12,000,000 |
| 17,087,813 |
|
| U.S. Treasury Bonds, 3.125%, 11/15/41 | 19,000,000 |
| 25,952,812 |
|
| U.S. Treasury Bonds, 3.00%, 5/15/42 | 24,000,000 |
| 32,227,500 |
|
| U.S. Treasury Bonds, 2.875%, 5/15/43 | 6,500,000 |
| 8,567,305 |
|
U.S. Treasury Bonds, 3.125%, 8/15/44(3) | 1,000,000 |
| 1,378,867 |
|
| U.S. Treasury Bonds, 2.50%, 2/15/45 | 27,500,000 |
| 34,352,441 |
|
| U.S. Treasury Bonds, 3.375%, 11/15/48 | 36,500,000 |
| 54,202,500 |
|
| U.S. Treasury Bonds, 2.375%, 11/15/49 | 1,200,000 |
| 1,498,734 |
|
| U.S. Treasury Inflation Indexed Notes, 0.25%, 7/15/29 | 14,119,140 |
| 14,678,025 |
|
| U.S. Treasury Notes, 1.50%, 5/31/20 | 10,000,000 |
| 10,023,269 |
|
| U.S. Treasury Notes, 1.50%, 8/31/21 | 5,000,000 |
| 5,091,699 |
|
|
| | | | | | |
| | Principal Amount | Value |
| U.S. Treasury Notes, 1.50%, 9/15/22 | $ | 20,000,000 |
| $ | 20,610,547 |
|
| U.S. Treasury Notes, 1.875%, 9/30/22 | 15,000,000 |
| 15,609,961 |
|
| U.S. Treasury Notes, 1.625%, 11/15/22 | 20,000,000 |
| 20,710,547 |
|
| U.S. Treasury Notes, 1.625%, 12/15/22 | 35,000,000 |
| 36,291,309 |
|
| U.S. Treasury Notes, 0.50%, 3/15/23 | 79,000,000 |
| 79,503,008 |
|
| U.S. Treasury Notes, 1.50%, 11/30/24 | 25,000,000 |
| 26,333,008 |
|
| U.S. Treasury Notes, 1.125%, 2/28/25 | 23,000,000 |
| 23,862,500 |
|
| U.S. Treasury Notes, 0.50%, 3/31/25 | 4,000,000 |
| 4,025,703 |
|
| U.S. Treasury Notes, 2.625%, 12/31/25 | 16,000,000 |
| 17,958,750 |
|
| U.S. Treasury Notes, 1.375%, 8/31/26 | 5,000,000 |
| 5,269,336 |
|
| U.S. Treasury Notes, 1.125%, 2/28/27 | 27,500,000 |
| 28,592,480 |
|
| U.S. Treasury Notes, 0.625%, 3/31/27 | 19,000,000 |
| 19,107,988 |
|
| U.S. Treasury Notes, 1.50%, 2/15/30 | 4,000,000 |
| 4,312,734 |
|
TOTAL U.S. TREASURY SECURITIES
(Cost $455,706,388) | | 509,713,348 |
|
| U.S. GOVERNMENT AGENCY MORTGAGE-BACKED SECURITIES — 17.8% | |
| Adjustable-Rate U.S. Government Agency Mortgage-Backed Securities — 1.5% | |
| FHLMC, VRN, 4.21%, (1-year H15T1Y plus 2.25%), 9/1/35 | 334,209 |
| 339,380 |
|
| FHLMC, VRN, 4.39%, (12-month LIBOR plus 1.86%), 7/1/36 | 1,073,327 |
| 1,091,654 |
|
| FHLMC, VRN, 4.19%, (1-year H15T1Y plus 2.14%), 10/1/36 | 1,018,369 |
| 1,028,056 |
|
| FHLMC, VRN, 4.32%, (1-year H15T1Y plus 2.25%), 4/1/37 | 817,186 |
| 826,963 |
|
| FHLMC, VRN, 4.28%, (12-month LIBOR plus 1.80%), 2/1/38 | 303,872 |
| 307,717 |
|
| FHLMC, VRN, 4.29%, (12-month LIBOR plus 1.84%), 6/1/38 | 204,339 |
| 207,552 |
|
| FHLMC, VRN, 4.51%, (12-month LIBOR plus 1.88%), 7/1/40 | 67,672 |
| 69,400 |
|
| FHLMC, VRN, 3.90%, (12-month LIBOR plus 1.78%), 9/1/40 | 174,921 |
| 178,570 |
|
| FHLMC, VRN, 4.77%, (12-month LIBOR plus 1.88%), 5/1/41 | 56,659 |
| 57,959 |
|
| FHLMC, VRN, 4.00%, (12-month LIBOR plus 1.87%), 7/1/41 | 726,544 |
| 746,240 |
|
| FHLMC, VRN, 3.67%, (12-month LIBOR plus 1.65%), 12/1/42 | 583,730 |
| 593,505 |
|
| FHLMC, VRN, 3.64%, (12-month LIBOR plus 1.64%), 2/1/43 | 151,566 |
| 154,333 |
|
| FHLMC, VRN, 4.51%, (12-month LIBOR plus 1.63%), 5/1/43 | 86,542 |
| 87,602 |
|
| FHLMC, VRN, 4.43%, (12-month LIBOR plus 1.65%), 6/1/43 | 68,926 |
| 69,365 |
|
| FHLMC, VRN, 4.50%, (12-month LIBOR plus 1.62%), 6/1/43 | 2,513 |
| 2,536 |
|
| FHLMC, VRN, 2.84%, (12-month LIBOR plus 1.63%), 1/1/44 | 1,965,705 |
| 2,014,005 |
|
| FHLMC, VRN, 3.20%, (12-month LIBOR plus 1.62%), 6/1/44 | 920,453 |
| 952,053 |
|
| FHLMC, VRN, 4.11%, (12-month LIBOR plus 1.60%), 10/1/44 | 828,767 |
| 839,951 |
|
| FHLMC, VRN, 2.57%, (12-month LIBOR plus 1.60%), 6/1/45 | 1,502,189 |
| 1,529,219 |
|
| FNMA, VRN, 3.49%, (6-month LIBOR plus 1.57%), 6/1/35 | 149,864 |
| 152,643 |
|
| FNMA, VRN, 3.50%, (6-month LIBOR plus 1.57%), 6/1/35 | 434,980 |
| 442,651 |
|
| FNMA, VRN, 3.51%, (6-month LIBOR plus 1.57%), 6/1/35 | 1,186,136 |
| 1,207,313 |
|
| FNMA, VRN, 3.51%, (6-month LIBOR plus 1.57%), 6/1/35 | 955,486 |
| 972,589 |
|
| FNMA, VRN, 3.56%, (6-month LIBOR plus 1.54%), 9/1/35 | 877,283 |
| 893,121 |
|
| FNMA, VRN, 4.18%, (1-year H15T1Y plus 2.16%), 3/1/38 | 972,038 |
| 982,303 |
|
| FNMA, VRN, 3.69%, (12-month LIBOR plus 1.69%), 1/1/40 | 46,512 |
| 47,448 |
|
| FNMA, VRN, 3.64%, (12-month LIBOR plus 1.79%), 8/1/40 | 109,241 |
| 111,450 |
|
| FNMA, VRN, 3.81%, (12-month LIBOR plus 1.77%), 10/1/40 | 322,061 |
| 328,757 |
|
| FNMA, VRN, 4.27%, (12-month LIBOR plus 1.75%), 8/1/41 | 146,234 |
| 149,318 |
|
| FNMA, VRN, 3.70%, (12-month LIBOR plus 1.56%), 3/1/43 | 280,219 |
| 284,605 |
|
|
| | | | | | |
| | Principal Amount | Value |
| FNMA, VRN, 2.29%, (12-month LIBOR plus 1.59%), 8/1/45 | $ | 384,483 |
| $ | 387,434 |
|
| FNMA, VRN, 2.63%, (12-month LIBOR plus 1.60%), 4/1/46 | 2,618,660 |
| 2,674,273 |
|
| FNMA, VRN, 3.17%, (12-month LIBOR plus 1.61%), 3/1/47 | 3,903,176 |
| 4,038,199 |
|
| FNMA, VRN, 3.19%, (12-month LIBOR plus 1.61%), 3/1/47 | 1,460,883 |
| 1,513,076 |
|
| FNMA, VRN, 3.16%, (12-month LIBOR plus 1.61%), 4/1/47 | 3,000,858 |
| 3,103,946 |
|
| FNMA, VRN, 2.95%, (12-month LIBOR plus 1.62%), 5/1/47 | 1,572,469 |
| 1,608,288 |
|
| | | 29,993,474 |
|
| Fixed-Rate U.S. Government Agency Mortgage-Backed Securities — 16.3% | |
| FHLMC, 7.00%, 9/1/27 | 135 |
| 154 |
|
| FHLMC, 6.50%, 1/1/28 | 230 |
| 256 |
|
| FHLMC, 7.00%, 2/1/28 | 37 |
| 42 |
|
| FHLMC, 6.50%, 3/1/29 | 1,385 |
| 1,572 |
|
| FHLMC, 6.50%, 6/1/29 | 1,614 |
| 1,808 |
|
| FHLMC, 7.00%, 8/1/29 | 142 |
| 158 |
|
| FHLMC, 6.50%, 5/1/31 | 1,403 |
| 1,557 |
|
| FHLMC, 6.50%, 6/1/31 | 165 |
| 183 |
|
| FHLMC, 5.50%, 12/1/33 | 17,536 |
| 19,729 |
|
| FHLMC, 6.00%, 2/1/38 | 147,727 |
| 170,201 |
|
| FHLMC, 5.50%, 4/1/38 | 79,783 |
| 90,621 |
|
| FHLMC, 6.00%, 5/1/38 | 124,336 |
| 143,234 |
|
| FHLMC, 6.00%, 8/1/38 | 20,781 |
| 23,805 |
|
| FHLMC, 5.50%, 9/1/38 | 625,889 |
| 709,455 |
|
| FHLMC, 4.50%, 5/1/47 | 10,885,864 |
| 11,809,589 |
|
| FHLMC, 3.50%, 12/1/47 | 3,492,077 |
| 3,712,344 |
|
| FHLMC, 4.00%, 9/1/48 | 17,860,614 |
| 19,080,876 |
|
| FHLMC, 4.00%, 10/1/48 | 2,774,795 |
| 2,964,513 |
|
| FHLMC, 4.00%, 10/1/48 | 22,201,603 |
| 23,712,879 |
|
| FHLMC, 3.50%, 4/1/49 | 21,066,247 |
| 22,336,682 |
|
| FHLMC, 3.50%, 10/1/49 | 38,285,581 |
| 40,562,163 |
|
| FNMA, 6.50%, 1/1/26 | 1,043 |
| 1,157 |
|
| FNMA, 7.00%, 12/1/27 | 291 |
| 324 |
|
| FNMA, 7.50%, 4/1/28 | 1,777 |
| 1,997 |
|
| FNMA, 7.00%, 5/1/28 | 1,657 |
| 1,722 |
|
| FNMA, 7.00%, 6/1/28 | 29 |
| 30 |
|
| FNMA, 6.50%, 1/1/29 | 236 |
| 272 |
|
| FNMA, 6.50%, 4/1/29 | 743 |
| 840 |
|
| FNMA, 7.00%, 7/1/29 | 145 |
| 145 |
|
| FNMA, 7.50%, 7/1/29 | 1,207 |
| 1,255 |
|
| FNMA, 7.50%, 9/1/30 | 531 |
| 630 |
|
| FNMA, 5.00%, 7/1/31 | 1,384,587 |
| 1,510,206 |
|
| FNMA, 7.00%, 9/1/31 | 2,525 |
| 2,703 |
|
| FNMA, 6.50%, 1/1/32 | 882 |
| 1,012 |
|
| FNMA, 6.50%, 8/1/32 | 3,625 |
| 4,165 |
|
| FNMA, 5.50%, 6/1/33 | 11,249 |
| 12,661 |
|
| FNMA, 5.50%, 7/1/33 | 61,521 |
| 69,342 |
|
| FNMA, 5.50%, 8/1/33 | 24,928 |
| 28,206 |
|
| FNMA, 5.50%, 9/1/33 | 37,506 |
| 42,459 |
|
|
| | | | | | |
| | Principal Amount | Value |
| FNMA, 5.00%, 11/1/33 | $ | 134,521 |
| $ | 149,429 |
|
| FNMA, 6.00%, 12/1/33 | 415,399 |
| 471,095 |
|
| FNMA, 5.50%, 1/1/34 | 30,183 |
| 34,148 |
|
| FNMA, 3.50%, 3/1/34 | 1,860,446 |
| 1,961,058 |
|
| FNMA, 5.50%, 12/1/34 | 32,684 |
| 36,144 |
|
| FNMA, 4.50%, 1/1/35 | 141,604 |
| 155,355 |
|
| FNMA, 5.00%, 8/1/35 | 55,325 |
| 61,632 |
|
| FNMA, 5.00%, 2/1/36 | 421,699 |
| 470,605 |
|
| FNMA, 5.50%, 7/1/36 | 24,592 |
| 27,538 |
|
| FNMA, 5.50%, 2/1/37 | 10,779 |
| 12,242 |
|
| FNMA, 6.00%, 4/1/37 | 108,988 |
| 125,505 |
|
| FNMA, 6.00%, 7/1/37 | 236,836 |
| 268,615 |
|
| FNMA, 6.00%, 8/1/37 | 177,046 |
| 201,232 |
|
| FNMA, 6.50%, 8/1/37 | 11,785 |
| 13,618 |
|
| FNMA, 6.00%, 9/1/37 | 169,256 |
| 193,737 |
|
| FNMA, 6.00%, 11/1/37 | 63,591 |
| 73,267 |
|
| FNMA, 5.50%, 2/1/38 | 441,500 |
| 500,638 |
|
| FNMA, 5.50%, 2/1/38 | 71,641 |
| 79,962 |
|
| FNMA, 5.50%, 6/1/38 | 166,730 |
| 189,190 |
|
| FNMA, 5.00%, 1/1/39 | 115,243 |
| 127,293 |
|
| FNMA, 4.50%, 2/1/39 | 351,657 |
| 385,112 |
|
| FNMA, 5.50%, 3/1/39 | 366,878 |
| 416,891 |
|
| FNMA, 4.50%, 4/1/39 | 264,226 |
| 291,324 |
|
| FNMA, 4.50%, 5/1/39 | 674,662 |
| 743,134 |
|
| FNMA, 6.50%, 5/1/39 | 93,511 |
| 111,260 |
|
| FNMA, 4.50%, 6/1/39 | 368,379 |
| 404,093 |
|
| FNMA, 5.00%, 8/1/39 | 361,677 |
| 401,897 |
|
| FNMA, 4.50%, 9/1/39 | 1,315,109 |
| 1,454,178 |
|
| FNMA, 4.50%, 10/1/39 | 1,171,450 |
| 1,295,311 |
|
| FNMA, 5.00%, 4/1/40 | 1,018,598 |
| 1,132,649 |
|
| FNMA, 5.00%, 4/1/40 | 1,712,525 |
| 1,901,753 |
|
| FNMA, 5.00%, 6/1/40 | 1,561,049 |
| 1,733,096 |
|
| FNMA, 4.00%, 10/1/40 | 1,250,281 |
| 1,370,483 |
|
| FNMA, 4.50%, 11/1/40 | 1,123,039 |
| 1,232,955 |
|
| FNMA, 4.00%, 8/1/41 | 2,250,839 |
| 2,457,258 |
|
| FNMA, 4.50%, 9/1/41 | 1,046,391 |
| 1,148,464 |
|
| FNMA, 3.50%, 10/1/41 | 1,747,731 |
| 1,879,728 |
|
| FNMA, 3.50%, 12/1/41 | 6,604,646 |
| 7,101,825 |
|
| FNMA, 4.00%, 12/1/41 | 3,319,424 |
| 3,599,725 |
|
| FNMA, 5.00%, 1/1/42 | 3,591,577 |
| 3,989,426 |
|
| FNMA, 3.50%, 2/1/42 | 3,453,854 |
| 3,713,729 |
|
| FNMA, 3.50%, 5/1/42 | 1,450,893 |
| 1,560,874 |
|
| FNMA, 3.50%, 6/1/42 | 1,470,429 |
| 1,581,936 |
|
| FNMA, 3.50%, 8/1/42 | 7,335,743 |
| 7,891,435 |
|
| FNMA, 3.50%, 9/1/42 | 2,413,470 |
| 2,596,622 |
|
| FNMA, 4.00%, 11/1/45 | 6,494,694 |
| 7,000,935 |
|
| FNMA, 4.00%, 2/1/46 | 5,809,278 |
| 6,283,719 |
|
| FNMA, 4.00%, 4/1/46 | 14,110,601 |
| 15,196,560 |
|
|
| | | | | | |
| | Principal Amount | Value |
| FNMA, 6.50%, 8/1/47 | $ | 4,225 |
| $ | 4,537 |
|
| FNMA, 6.50%, 9/1/47 | 8,555 |
| 9,164 |
|
| FNMA, 6.50%, 9/1/47 | 411 |
| 441 |
|
| FNMA, 6.50%, 9/1/47 | 4,498 |
| 4,815 |
|
| FNMA, 4.00%, 6/1/48 | 15,721,527 |
| 16,802,094 |
|
| FNMA, 4.50%, 7/1/48 | 19,991,078 |
| 21,604,648 |
|
| FNMA, 4.50%, 2/1/49 | 8,589,704 |
| 9,254,782 |
|
| FNMA, 3.50%, 4/1/49 | 19,960,178 |
| 21,136,459 |
|
| FNMA, 4.00%, 6/1/49 | 5,506,920 |
| 5,880,736 |
|
| FNMA, 3.50%, 9/1/49 | 2,198,209 |
| 2,326,152 |
|
| GNMA, 7.00%, 11/15/22 | 377 |
| 391 |
|
| GNMA, 7.00%, 4/20/26 | 154 |
| 175 |
|
| GNMA, 7.50%, 8/15/26 | 341 |
| 388 |
|
| GNMA, 8.00%, 8/15/26 | 150 |
| 166 |
|
| GNMA, 7.50%, 5/15/27 | 190 |
| 193 |
|
| GNMA, 8.00%, 6/15/27 | 365 |
| 366 |
|
| GNMA, 7.00%, 2/15/28 | 167 |
| 168 |
|
| GNMA, 7.50%, 2/15/28 | 113 |
| 114 |
|
| GNMA, 6.50%, 3/15/28 | 477 |
| 523 |
|
| GNMA, 7.00%, 4/15/28 | 123 |
| 124 |
|
| GNMA, 6.50%, 5/15/28 | 2,160 |
| 2,375 |
|
| GNMA, 7.00%, 12/15/28 | 224 |
| 225 |
|
| GNMA, 7.00%, 5/15/31 | 1,833 |
| 2,194 |
|
| GNMA, 6.00%, 7/15/33 | 529,814 |
| 612,825 |
|
| GNMA, 4.50%, 8/15/33 | 511,052 |
| 562,532 |
|
| GNMA, 5.00%, 3/20/36 | 58,978 |
| 65,550 |
|
| GNMA, 5.00%, 4/20/36 | 117,477 |
| 130,580 |
|
| GNMA, 5.00%, 5/20/36 | 198,743 |
| 220,985 |
|
| GNMA, 5.50%, 1/15/39 | 596,434 |
| 687,894 |
|
| GNMA, 6.00%, 1/20/39 | 24,866 |
| 28,400 |
|
| GNMA, 6.00%, 2/20/39 | 159,285 |
| 182,007 |
|
| GNMA, 4.50%, 6/15/39 | 1,492,381 |
| 1,673,356 |
|
| GNMA, 5.50%, 9/15/39 | 57,175 |
| 64,095 |
|
| GNMA, 5.00%, 10/15/39 | 714,867 |
| 798,163 |
|
| GNMA, 4.50%, 1/15/40 | 625,509 |
| 693,848 |
|
| GNMA, 4.00%, 11/20/40 | 1,935,687 |
| 2,113,918 |
|
| GNMA, 4.00%, 12/15/40 | 651,755 |
| 706,849 |
|
| GNMA, 4.50%, 6/15/41 | 535,314 |
| 603,747 |
|
| GNMA, 4.50%, 7/20/41 | 807,447 |
| 891,230 |
|
| GNMA, 3.50%, 4/20/42 | 4,201,637 |
| 4,499,978 |
|
| GNMA, 3.50%, 6/20/42 | 9,079,787 |
| 9,724,524 |
|
| GNMA, 3.50%, 4/20/43 | 2,539,887 |
| 2,720,263 |
|
| GNMA, 3.50%, 4/20/46 | 8,313,671 |
| 8,868,933 |
|
| GNMA, 2.50%, 7/20/46 | 9,142,749 |
| 9,616,436 |
|
| | | 333,546,965 |
|
TOTAL U.S. GOVERNMENT AGENCY MORTGAGE-BACKED SECURITIES
(Cost $353,157,390) | 363,540,439 |
|
|
| | | | | | |
| | Principal Amount | Value |
| ASSET-BACKED SECURITIES — 4.0% | | |
| Argent Securities, Inc., Series 2004-W8, Class M1, VRN, 1.77%, (1-month LIBOR plus 0.83%), 5/25/34 | $ | 4,745,756 |
| $ | 4,357,866 |
|
BRE Grand Islander Timeshare Issuer LLC, Series 2017-1A, Class A SEQ, 2.94%, 5/25/29(1) | 2,161,416 |
| 2,120,485 |
|
Goodgreen, Series 2018-1A, Class A, VRN, 3.93%, 10/15/53(1) | 5,279,892 |
| 5,422,649 |
|
Hilton Grand Vacations Trust, Series 2014-AA, Class A SEQ, 1.77%, 11/25/26(1) | 815,406 |
| 809,277 |
|
Hilton Grand Vacations Trust, Series 2017-AA, Class A SEQ, 2.66%, 12/26/28(1) | 1,815,276 |
| 1,789,232 |
|
Invitation Homes Trust, Series 2017-SFR2, Class A, VRN, 1.65%, (1-month LIBOR plus 0.85%), 12/17/36(1) | 23,876 |
| 22,205 |
|
Invitation Homes Trust, Series 2018-SFR1, Class A, VRN, 1.50%, (1-month LIBOR plus 0.70%), 3/17/37(1) | 4,951,551 |
| 4,615,881 |
|
Invitation Homes Trust, Series 2018-SFR2, Class B, VRN, 1.78%, (1-month LIBOR plus 1.08%), 6/17/37(1) | 9,500,000 |
| 8,883,987 |
|
Invitation Homes Trust, Series 2018-SFR3, Class A, VRN, 1.80%, (1-month LIBOR plus 1.00%), 7/17/37(1) | 9,352,352 |
| 8,860,513 |
|
MVW Owner Trust, Series 2014-1A, Class A SEQ, 2.25%, 9/22/31(1) | 884,062 |
| 874,859 |
|
MVW Owner Trust, Series 2015-1A, Class A SEQ, 2.52%, 12/20/32(1) | 856,040 |
| 844,962 |
|
MVW Owner Trust, Series 2016-1A, Class A SEQ, 2.25%, 12/20/33(1) | 1,601,944 |
| 1,566,916 |
|
MVW Owner Trust, Series 2017-1A, Class A SEQ, 2.42%, 12/20/34(1) | 3,917,863 |
| 3,832,348 |
|
MVW Owner Trust, Series 2018-1A, Class A SEQ, 3.45%, 1/21/36(1) | 6,013,154 |
| 5,807,017 |
|
Progress Residential Trust, Series 2018-SFR1, Class A SEQ, 3.26%, 3/17/35(1) | 3,820,351 |
| 3,784,150 |
|
Progress Residential Trust, Series 2018-SFR3, Class A SEQ, 3.88%, 10/17/35(1) | 6,995,602 |
| 7,055,338 |
|
Sierra Timeshare Conduit Receivables Funding LLC, Series 2017-1A, Class A SEQ, 2.91%, 3/20/34(1) | 985,857 |
| 973,861 |
|
Sierra Timeshare Receivables Funding LLC, Series 2016-1A, Class A SEQ, 3.08%, 3/21/33(1) | 1,226,803 |
| 1,221,282 |
|
Sierra Timeshare Receivables Funding LLC, Series 2018-2A, Class A SEQ, 3.50%, 6/20/35(1) | 3,234,543 |
| 3,131,274 |
|
Sierra Timeshare Receivables Funding LLC, Series 2019-2A, Class A SEQ, 2.59%, 5/20/36(1) | 4,962,216 |
| 4,901,231 |
|
Towd Point Mortgage Trust, Series 2017-6, Class A1, VRN, 2.75%, 10/25/57(1) | 6,018,058 |
| 6,026,164 |
|
Towd Point Mortgage Trust, Series 2018-4, Class A1, VRN, 3.00%, 6/25/58(1) | 1,993,565 |
| 1,971,913 |
|
VSE VOI Mortgage LLC, Series 2016-A, Class A SEQ, 2.54%, 7/20/33(1) | 2,795,487 |
| 2,749,064 |
|
TOTAL ASSET-BACKED SECURITIES
(Cost $83,848,867) | | 81,622,474 |
|
| COLLATERALIZED MORTGAGE OBLIGATIONS — 3.8% | | |
| Private Sponsor Collateralized Mortgage Obligations — 2.9% | | |
| Adjustable Rate Mortgage Trust, Series 2004-4, Class 4A1, VRN, 4.04%, 3/25/35 | 1,269,733 |
| 1,167,272 |
|
Agate Bay Mortgage Loan Trust, Series 2014-3, Class A2, VRN, 3.50%, 11/25/44(1) | 1,358,320 |
| 1,352,893 |
|
Agate Bay Mortgage Loan Trust, Series 2016-1, Class A3, VRN, 3.50%, 12/25/45(1) | 2,061,950 |
| 2,119,569 |
|
Agate Bay Mortgage Loan Trust, Series 2016-3, Class A3, VRN, 3.50%, 8/25/46(1) | 3,104,131 |
| 3,080,832 |
|
|
| | | | | | |
| | Principal Amount | Value |
| Banc of America Mortgage Trust, Series 2004-E, Class 2A6 SEQ, VRN, 4.77%, 6/25/34 | $ | 1,048,374 |
| $ | 942,424 |
|
| Bear Stearns Adjustable Rate Mortgage Trust, Series 2004-12, Class 2A1, VRN, 3.74%, 2/25/35 | 210,044 |
| 191,097 |
|
Bear Stearns Adjustable Rate Mortgage Trust, Series 2004-8, Class 2A1, VRN, 3.95%, 11/25/34 | 775,938 |
| 692,242 |
|
| Citicorp Mortgage Securities Trust, Series 2007-8, Class 1A3, 6.00%, 9/25/37 | 110,363 |
| 114,831 |
|
| Citigroup Mortgage Loan Trust, Inc., Series 2004-UST1, Class A4, VRN, 3.74%, 8/25/34 | 470,338 |
| 417,000 |
|
| Citigroup Mortgage Loan Trust, Inc., Series 2004-UST1, Class A5, VRN, 3.79%, 8/25/34 | 1,710,816 |
| 1,539,421 |
|
| Citigroup Mortgage Loan Trust, Inc., Series 2005-4, Class A, VRN, 4.59%, 8/25/35 | 103,745 |
| 96,665 |
|
| Citigroup Mortgage Loan Trust, Inc., Series 2005-6, Class A2, VRN, 4.55%, (1-year H15T1Y plus 2.15%), 9/25/35 | 1,008,839 |
| 939,405 |
|
Countrywide Home Loan Mortgage Pass-Through Trust, Series 2004-5, Class 2A4, 5.50%, 5/25/34 | 84,484 |
| 82,972 |
|
Countrywide Home Loan Mortgage Pass-Through Trust, Series 2005-17, Class 1A11, 5.50%, 9/25/35 | 5,569 |
| 5,132 |
|
Credit Suisse First Boston Mortgage-Backed Trust, Series 2004-AR6, Class 2A1, VRN, 4.03%, 10/25/34 | 109,231 |
| 105,499 |
|
Credit Suisse Mortgage Trust, Series 2017-HL2, Class A3 SEQ, VRN, 3.50%, 10/25/47(1) | 1,997,365 |
| 1,990,049 |
|
Credit Suisse Mortgage Trust, Series 2019-AFC1, Class A1, VRN, 2.57%, 7/25/49(1) | 3,435,962 |
| 3,318,895 |
|
Credit Suisse Mortgage Trust, Series 2020-AFC1, Class A1, VRN, 2.24%, 2/25/50(1) | 1,182,904 |
| 1,057,741 |
|
First Horizon Alternative Mortgage Securities Trust, Series 2004-AA4, Class A1, VRN, 3.80%, 10/25/34 | 980,084 |
| 900,824 |
|
| First Horizon Mortgage Pass-Through Trust, Series 2005-AR3, Class 4A1, VRN, 5.01%, 8/25/35 | 273,375 |
| 264,139 |
|
Galton Funding Mortgage Trust, Series 2020-H1, Class A1, VRN, 2.31%, 1/25/60(1) | 3,886,020 |
| 3,786,969 |
|
| GSR Mortgage Loan Trust, Series 2004-7, Class 3A1, VRN, 4.04%, 6/25/34 | 277,651 |
| 253,065 |
|
| GSR Mortgage Loan Trust, Series 2004-AR5, Class 3A3, VRN, 4.31%, 5/25/34 | 844,438 |
| 751,968 |
|
| GSR Mortgage Loan Trust, Series 2005-AR1, Class 3A1, VRN, 4.00%, 1/25/35 | 746,823 |
| 671,198 |
|
| GSR Mortgage Loan Trust, Series 2005-AR6, Class 2A1, VRN, 4.10%, 9/25/35 | 911,237 |
| 862,663 |
|
| GSR Mortgage Loan Trust, Series 2005-AR6, Class 3A1, VRN, 4.05%, 9/25/35 | 1,327,599 |
| 1,220,424 |
|
| GSR Mortgage Loan Trust, Series 2005-AR6, Class 4A5, VRN, 4.51%, 9/25/35 | 870,644 |
| 820,784 |
|
| JPMorgan Mortgage Trust, Series 2005-A4, Class 1A1, VRN, 4.07%, 7/25/35 | 84,540 |
| 82,328 |
|
| JPMorgan Mortgage Trust, Series 2005-A6, Class 7A1, VRN, 4.19%, 8/25/35 | 178,184 |
| 163,827 |
|
| JPMorgan Mortgage Trust, Series 2006-A3, Class 7A1, VRN, 4.02%, 4/25/35 | 180,278 |
| 171,874 |
|
JPMorgan Mortgage Trust, Series 2013-1, Class 2A2 SEQ, VRN, 2.50%, 3/25/43(1) | 456,669 |
| 458,712 |
|
JPMorgan Mortgage Trust, Series 2018-6, Class 1A4 SEQ, VRN, 3.50%, 12/25/48(1) | 1,993,973 |
| 1,982,623 |
|
MASTR Adjustable Rate Mortgages Trust, Series 2004-13, Class 3A7, VRN, 4.68%, 11/21/34 | 775,957 |
| 740,306 |
|
|
| | | | | | |
| | Principal Amount | Value |
| Merrill Lynch Mortgage Investors Trust, Series 2005-3, Class 2A, VRN, 3.80%, 11/25/35 | $ | 1,411,189 |
| $ | 1,236,765 |
|
| Merrill Lynch Mortgage Investors Trust, Series 2005-A2, Class A2, VRN, 3.73%, 2/25/35 | 748,397 |
| 660,229 |
|
New Residential Mortgage Loan Trust, Series 2017-1A, Class A1, VRN, 4.00%, 2/25/57(1) | 1,277,536 |
| 1,331,388 |
|
New Residential Mortgage Loan Trust, Series 2017-2A, Class A3, VRN, 4.00%, 3/25/57(1) | 2,934,873 |
| 3,068,320 |
|
New Residential Mortgage Loan Trust, Series 2017-5A, Class A1, VRN, 2.45%, (1-month LIBOR plus 1.50%), 6/25/57(1) | 3,606,838 |
| 3,455,716 |
|
Sequoia Mortgage Trust, Series 2017-7, Class A4 SEQ, VRN, 3.50%, 10/25/47(1) | 3,020,384 |
| 3,059,554 |
|
Sequoia Mortgage Trust, Series 2017-CH1, Class A1, VRN, 4.00%, 8/25/47(1) | 2,890,955 |
| 2,940,005 |
|
Sequoia Mortgage Trust, Series 2017-CH2, Class A10 SEQ, VRN, 4.00%, 12/25/47(1) | 2,882,733 |
| 2,898,187 |
|
Sequoia Mortgage Trust, Series 2018-CH2, Class A12 SEQ, VRN, 4.00%, 6/25/48(1) | 2,085,698 |
| 2,100,955 |
|
Sofi Mortgage Trust, Series 2016-1A, Class 1A4 SEQ, VRN, 3.00%, 11/25/46(1) | 2,351,718 |
| 2,310,485 |
|
| Structured Adjustable Rate Mortgage Loan Trust, Series 2004-8, Class 2A1, VRN, 3.78%, 7/25/34 | 432,534 |
| 402,182 |
|
| Thornburg Mortgage Securities Trust, Series 2004-3, Class A, VRN, 1.69%, (1-month LIBOR plus 0.74%), 9/25/34 | 2,051,467 |
| 1,756,463 |
|
| WaMu Mortgage Pass-Through Certificates, Series 2003-S11, Class 3A5, 5.95%, 11/25/33 | 49,768 |
| 48,191 |
|
| WaMu Mortgage Pass-Through Certificates, Series 2005-AR3, Class A1, VRN, 3.62%, 3/25/35 | 1,828,367 |
| 1,680,401 |
|
| Wells Fargo Mortgage-Backed Securities Trust, Series 2005-AR7, Class 1A1, VRN, 4.97%, 5/25/35 | 463,339 |
| 463,636 |
|
| Wells Fargo Mortgage-Backed Securities Trust, Series 2007-AR10, Class 1A1, VRN, 4.26%, 1/25/38 | 133,289 |
| 113,147 |
|
| | | 59,871,267 |
|
| U.S. Government Agency Collateralized Mortgage Obligations — 0.9% | |
| FHLMC, Series 2016-DNA4, Class M2, VRN, 2.25%, (1-month LIBOR plus 1.30%), 3/25/29 | 851,047 |
| 840,173 |
|
| FHLMC, Series 2016-HQA3, Class M2, VRN, 2.30%, (1-month LIBOR plus 1.35%), 3/25/29 | 1,618,121 |
| 1,555,137 |
|
| FHLMC, Series 2017-DNA2, Class M1, VRN, 2.15%, (1-month LIBOR plus 1.20%), 10/25/29 | 2,145,980 |
| 2,095,504 |
|
FHLMC, Series 2019-DNA3, Class M2, VRN, 3.00%, (1-month LIBOR plus 2.05%), 7/25/49(1) | 4,604,757 |
| 3,800,898 |
|
FHLMC, Series 3397, Class GF, VRN, 1.20%, (1-month LIBOR plus 0.50%), 12/15/37 | 1,217,674 |
| 1,218,249 |
|
| FNMA, Series 2014-C02, Class 1M2, VRN, 3.55%, (1-month LIBOR plus 2.60%), 5/25/24 | 5,248,523 |
| 4,764,699 |
|
| FNMA, Series 2014-C02, Class 2M2, VRN, 3.55%, (1-month LIBOR plus 2.60%), 5/25/24 | 2,263,342 |
| 2,080,163 |
|
| FNMA, Series 2016-C06, Class 1M2, VRN, 5.20%, (1-month LIBOR plus 4.25%), 4/25/29 | 2,150,000 |
| 2,092,628 |
|
| | | 18,447,451 |
|
TOTAL COLLATERALIZED MORTGAGE OBLIGATIONS
(Cost $82,008,215) | | 78,318,718 |
|
| COLLATERALIZED LOAN OBLIGATIONS — 3.7% | | |
Anchorage Credit Opportunities CLO 1 Ltd., Series 2019-1A, Class A1, VRN, 3.69%, (3-month LIBOR plus 1.95%), 1/20/32(1) | 5,250,000 |
| 5,120,093 |
|
|
| | | | | | |
| | Principal Amount | Value |
Ares XLI CLO Ltd., Series 2016-41A, Class AR, VRN, 3.03%, (3-month LIBOR plus 1.20%), 1/15/29(1) | $ | 2,100,000 |
| $ | 2,019,804 |
|
Bean Creek CLO Ltd., Series 2015-1A, Class AR, VRN, 2.84%, (3-month LIBOR plus 1.02%), 4/20/31(1) | 5,000,000 |
| 4,709,936 |
|
CBAM Ltd., Series 2019-9A, Class A, VRN, 3.11%, (3-month LIBOR plus 1.28%), 2/12/30(1) | 5,150,000 |
| 4,964,332 |
|
CIFC Funding Ltd., Series 2013-3RA, Class A1, VRN, 2.78%, (3-month LIBOR plus 0.98%), 4/24/31(1) | 3,200,000 |
| 3,015,836 |
|
CIFC Funding Ltd., Series 2015-1A, Class ARR, VRN, 2.91%, (3-month LIBOR plus 1.11%), 1/22/31(1) | 2,225,000 |
| 2,101,589 |
|
Dryden 64 CLO Ltd., Series 2018-64A, Class A, VRN, 2.79%, (3-month LIBOR plus 0.97%), 4/18/31(1) | 2,550,000 |
| 2,398,303 |
|
Elmwood CLO IV Ltd., Series 2020-1A, Class A, VRN, 2.88%, (3-month LIBOR plus 1.24%), 4/15/33(1) | 7,100,000 |
| 6,745,000 |
|
Goldentree Loan Opportunities X Ltd., Series 2015-10A, Class AR, VRN, 2.94%, (3-month LIBOR plus 1.12%), 7/20/31(1) | 3,500,000 |
| 3,320,865 |
|
KKR CLO Ltd., Series 2022A, Class A, VRN, 2.97%, (3-month LIBOR plus 1.15%), 7/20/31(1) | 3,700,000 |
| 3,497,763 |
|
Madison Park Funding XXII Ltd., Series 2016-22A, Class A1R, VRN, 2.92%, (3-month LIBOR plus 1.26%), 1/15/33(1) | 6,500,000 |
| 6,166,430 |
|
Magnetite VIII Ltd., Series 2014-8A, Class AR2, VRN, 2.81%, (3-month LIBOR plus 0.98%), 4/15/31(1) | 5,000,000 |
| 4,759,702 |
|
Octagon Investment Partners 45 Ltd., Series 2019-1A, Class A, VRN, 3.16%, (3-month LIBOR plus 1.33%), 10/15/32(1) | 12,950,000 |
| 12,039,006 |
|
Sounds Point CLO IV-R Ltd., Series 2013-3RA, Class A, VRN, 2.97%, (3-month LIBOR plus 1.15%), 4/18/31(1) | 5,885,000 |
| 5,484,050 |
|
Treman Park CLO Ltd., Series 2015-1A, Class ARR, VRN, 2.89%, (3-month LIBOR plus 1.07%), 10/20/28(1) | 4,000,000 |
| 3,882,916 |
|
Voya CLO Ltd., Series 2013-2A, Class A1R, VRN, 2.76%, (3-month LIBOR plus 0.97%), 4/25/31(1) | 3,000,000 |
| 2,817,908 |
|
Voya CLO Ltd., Series 2013-3A, Class A1RR, VRN, 2.97%, (3-month LIBOR plus 1.15%), 10/18/31(1) | 2,575,000 |
| 2,436,015 |
|
TOTAL COLLATERALIZED LOAN OBLIGATIONS
(Cost $79,495,740) | | 75,479,548 |
|
| COMMERCIAL MORTGAGE-BACKED SECURITIES — 3.3% | | |
| Benchmark Mortgage Trust, Series 2018-B1, Class AM, VRN, 3.88%, 1/15/51 | 5,789,000 |
| 6,181,087 |
|
Commercial Mortgage Pass-Through Certificates, Series 2014-CR15, Class AM, VRN, 4.43%, 2/10/47 | 5,000,000 |
| 5,249,122 |
|
Commercial Mortgage Pass-Through Certificates, Series 2014-LC17, Class AM, VRN, 4.19%, 10/10/47 | 5,500,000 |
| 5,762,769 |
|
Commercial Mortgage Pass-Through Certificates, Series 2014-UBS5, Class AM, VRN, 4.19%, 9/10/47 | 7,625,000 |
| 7,990,867 |
|
Commercial Mortgage Pass-Through Certificates, Series 2015-CR22, Class AM, VRN, 3.60%, 3/10/48 | 9,000,000 |
| 9,228,660 |
|
Commercial Mortgage Pass-Through Certificates, Series 2016-CR28, Class B, VRN, 4.65%, 2/10/49 | 3,000,000 |
| 3,086,576 |
|
| Commercial Mortgage Trust, Series 2015-LC21, Class AM, VRN, 4.04%, 7/10/48 | 5,000,000 |
| 5,236,812 |
|
| GS Mortgage Securities Trust, Series 2016-GS2, Class B, VRN, 3.76%, 5/10/49 | 7,500,000 |
| 7,195,159 |
|
| JPMBB Commercial Mortgage Securities Trust, Series 2014-C21, Class B, VRN, 4.34%, 8/15/47 | 6,250,000 |
| 6,281,970 |
|
JPMorgan Chase Commercial Mortgage Securities Trust, Series 2016-JP2, Class A4 SEQ, 2.82%, 8/15/49 | 5,300,000 |
| 5,504,489 |
|
|
| | | | | | |
| | Principal Amount | Value |
JPMorgan Chase Commercial Mortgage Securities Trust, Series 2016-JP3, Class AS, 3.14%, 8/15/49 | $ | 6,300,000 |
| $ | 6,351,655 |
|
TOTAL COMMERCIAL MORTGAGE-BACKED SECURITIES
(Cost $67,995,266) | | 68,069,166 |
|
| MUNICIPAL SECURITIES — 1.7% | | |
| Bay Area Toll Authority Rev., 6.92%, 4/1/40 | 980,000 |
| 1,447,774 |
|
| California State University Rev., 2.98%, 11/1/51 | 2,000,000 |
| 1,999,780 |
|
| Dallas Area Rapid Transit Rev., 6.00%, 12/1/44 | 1,000,000 |
| 1,448,620 |
|
| Foothill-Eastern Transportation Corridor Agency Rev., 4.09%, 1/15/49 | 1,905,000 |
| 1,932,241 |
|
| Grand Parkway Transportation Corp. Rev., 3.24%, 10/1/52 | 1,415,000 |
| 1,379,498 |
|
| Houston GO, 3.96%, 3/1/47 | 820,000 |
| 923,107 |
|
| Los Angeles Community College District GO, 6.75%, 8/1/49 | 1,330,000 |
| 2,169,523 |
|
| Los Angeles Department of Airports Rev., 6.58%, 5/15/39 | 1,075,000 |
| 1,408,691 |
|
| Metropolitan Transportation Authority Rev., 6.69%, 11/15/40 | 1,165,000 |
| 1,516,084 |
|
| Metropolitan Transportation Authority Rev., 6.81%, 11/15/40 | 470,000 |
| 615,700 |
|
| New Jersey Turnpike Authority Rev., 7.41%, 1/1/40 | 975,000 |
| 1,430,695 |
|
| New Jersey Turnpike Authority Rev., 7.10%, 1/1/41 | 480,000 |
| 685,349 |
|
| New York City GO, 6.27%, 12/1/37 | 335,000 |
| 438,337 |
|
| New York City Water & Sewer System Rev., 5.95%, 6/15/42 | 925,000 |
| 1,369,268 |
|
| Ohio Turnpike & Infrastructure Commission Rev., 3.22%, 2/15/48 | 2,100,000 |
| 2,114,532 |
|
| Pennsylvania Turnpike Commission Rev., 5.56%, 12/1/49 | 420,000 |
| 572,930 |
|
| Port Authority of New York & New Jersey Rev., 4.93%, 10/1/51 | 400,000 |
| 497,976 |
|
| Regents of the University of California Medical Center Pooled Rev., 3.26%, 5/15/60 | 2,340,000 |
| 2,200,325 |
|
| Rutgers The State University of New Jersey Rev., 5.67%, 5/1/40 | 675,000 |
| 894,065 |
|
| Sacramento Municipal Utility District Rev., 6.16%, 5/15/36 | 375,000 |
| 511,774 |
|
| San Antonio Electric & Gas Systems Rev., 5.99%, 2/1/39 | 280,000 |
| 392,935 |
|
| San Diego County Regional Airport Authority Rev., 5.59%, 7/1/43 | 750,000 |
| 828,870 |
|
| San Francisco Public Utilities Commission Water Rev., 6.00%, 11/1/40 | 1,100,000 |
| 1,355,684 |
|
| San Jose Redevelopment Agency Successor Agency Tax Allocation, 3.375%, 8/1/34 | 1,085,000 |
| 1,096,056 |
|
| Santa Clara Valley Transportation Authority Rev., 5.88%, 4/1/32 | 920,000 |
| 1,145,188 |
|
| State of California GO, 4.60%, 4/1/38 | 1,380,000 |
| 1,521,533 |
|
| State of California GO, 7.55%, 4/1/39 | 450,000 |
| 731,979 |
|
| State of California GO, 7.30%, 10/1/39 | 1,210,000 |
| 1,863,376 |
|
| State of Kansas Department of Transportation Rev., 4.60%, 9/1/35 | 925,000 |
| 1,127,483 |
|
TOTAL MUNICIPAL SECURITIES
(Cost $31,915,795) | | 35,619,373 |
|
| SOVEREIGN GOVERNMENTS AND AGENCIES — 0.8% | | |
| Chile — 0.1% | | |
| Chile Government International Bond, 3.25%, 9/14/21 | 920,000 |
| 936,109 |
|
| Chile Government International Bond, 3.625%, 10/30/42 | 500,000 |
| 533,875 |
|
| | | 1,469,984 |
|
| Colombia — 0.1% | | |
| Colombia Government International Bond, 4.375%, 7/12/21 | 2,770,000 |
| 2,801,883 |
|
Mexico† | | |
| Mexico Government International Bond, 4.15%, 3/28/27 | 18,000 |
| 18,477 |
|
| | | |
|
| | | | | | |
| | Principal Amount/Shares | Value |
| Panama — 0.1% | | |
| Panama Government International Bond, 7.125%, 1/29/26 | $ | 1,400,000 |
| $ | 1,702,474 |
|
| Peru — 0.1% | | |
| Peruvian Government International Bond, 5.625%, 11/18/50 | 1,240,000 |
| 1,860,378 |
|
| Philippines — 0.2% | | |
| Philippine Government International Bond, 4.00%, 1/15/21 | 1,590,000 |
| 1,612,133 |
|
| Philippine Government International Bond, 5.50%, 3/30/26 | 3,000,000 |
| 3,437,261 |
|
| Philippine Government International Bond, 6.375%, 10/23/34 | 730,000 |
| 974,873 |
|
| | | 6,024,267 |
|
| Poland — 0.1% | | |
| Republic of Poland Government International Bond, 5.125%, 4/21/21 | 450,000 |
| 467,458 |
|
| Republic of Poland Government International Bond, 3.00%, 3/17/23 | 1,050,000 |
| 1,095,005 |
|
| | | 1,562,463 |
|
| Uruguay — 0.1% | | |
| Uruguay Government International Bond, 4.375%, 10/27/27 | 820,000 |
| 892,613 |
|
| Uruguay Government International Bond, 4.125%, 11/20/45 | 340,000 |
| 350,307 |
|
| | | 1,242,920 |
|
TOTAL SOVEREIGN GOVERNMENTS AND AGENCIES
(Cost $15,819,739) | | 16,682,846 |
|
| U.S. GOVERNMENT AGENCY SECURITIES — 0.3% | | |
FNMA, 6.625%, 11/15/30
(Cost $5,524,389) | 4,500,000 |
| 6,849,395 |
|
| PREFERRED STOCKS — 0.2% | | |
| Banks — 0.1% | | |
| JPMorgan Chase & Co., 4.00% | 3,170,000 |
| 2,709,161 |
|
| Machinery — 0.1% | | |
| Stanley Black & Decker, Inc., 4.00% | 1,000,000 |
| 963,032 |
|
TOTAL PREFERRED STOCKS
(Cost $4,170,000) | | 3,672,193 |
|
TEMPORARY CASH INVESTMENTS(4) — 11.1% | | |
BNP Paribas SA, 0.03%, 4/1/20(1)(5) | $ | 95,000,000 |
| 95,000,177 |
|
Credit Agricole Corporate and Investment Bank, 0.06%, 4/1/20(1)(5) | 95,000,000 |
| 95,000,177 |
|
| Repurchase Agreement, BMO Capital Markets Corp., (collateralized by various U.S. Treasury obligations, 1.875% - 3.00%, 11/30/21 - 5/15/45, valued at $11,746,247), in a joint trading account at 0.01%, dated 3/31/20, due 4/1/20 (Delivery value $11,517,865) | | 11,517,862 |
|
| State Street Institutional U.S. Government Money Market Fund, Premier Class | 24,532,705 |
| 24,532,705 |
|
TOTAL TEMPORARY CASH INVESTMENTS
(Cost $226,050,567) | | 226,050,921 |
|
TOTAL INVESTMENT SECURITIES — 100.6%
(Cost $2,006,936,315) | | 2,058,882,213 |
|
| OTHER ASSETS AND LIABILITIES — (0.6)% | | (11,270,473 | ) |
| TOTAL NET ASSETS — 100.0% | | $ | 2,047,611,740 |
|
|
| | | | | | | | | | |
| FORWARD FOREIGN CURRENCY EXCHANGE CONTRACTS |
| Currency Purchased | Currency Sold | Counterparty | Settlement Date | Unrealized Appreciation
(Depreciation) |
| USD | 1,638,667 |
| HUF | 491,960,627 |
| UBS AG | 6/17/20 | $ | 131,819 |
|
| USD | 1,973,604 |
| MXN | 44,635,816 |
| Morgan Stanley | 6/17/20 | 113,053 |
|
| | | | | | | $ | 244,872 |
|
|
| | | | | | | | | | | | |
| FUTURES CONTRACTS PURCHASED |
| Reference Entity | Contracts | Expiration Date | Notional Amount | Underlying Contract Value | Unrealized Appreciation (Depreciation) |
| U.S. Treasury 10-Year Notes | 446 |
| June 2020 | $ | 44,600,000 |
| $ | 61,854,625 |
| $ | 336,905 |
|
| U.S. Treasury 10-Year Ultra Notes | 40 |
| June 2020 | $ | 4,000,000 |
| 6,241,250 |
| 13,379 |
|
| U.S. Treasury 2-Year Notes | 608 |
| June 2020 | $ | 121,600,000 |
| 133,992,750 |
| 894,506 |
|
| U.S. Treasury 5-Year Notes | 495 |
| June 2020 | $ | 49,500,000 |
| 62,052,890 |
| 30,994 |
|
| U.S. Treasury Long Bonds | 68 |
| June 2020 | $ | 6,800,000 |
| 12,176,250 |
| (8,508 | ) |
| U.S. Treasury Ultra Bonds | 29 |
| June 2020 | $ | 2,900,000 |
| 6,434,375 |
| (70,593 | ) |
| | | | | $ | 282,752,140 |
| $ | 1,196,683 |
|
|
| | | | | | | | | | | | | | | |
| CENTRALLY CLEARED CREDIT DEFAULT SWAP AGREEMENTS |
| Reference Entity | Type | Fixed Rate
Received
(Paid) Quarterly | Termination
Date | Notional
Amount | Premiums Paid (Received) | Unrealized
Appreciation
(Depreciation) | Value^ |
| Markit CDX North America High Yield Index Series 33 | Buy | (5.00)% | 12/20/24 | $ | 149,069,500 |
| $ | 1,137,950 |
| $ | 7,707,556 |
| $ | 8,845,506 |
|
| Markit CDX North America Investment Grade Index Series 33 | Buy | (1.00)% | 12/20/24 | $ | 53,800,000 |
| 570,119 |
| (394,874 | ) | 175,245 |
|
| | | | | | $ | 1,708,069 |
| $ | 7,312,682 |
| $ | 9,020,751 |
|
^The value for credit default swap agreements serves as an indicator of the current status of the payment/performance risk and represent the likelihood of an expected liability or profit at the period end. Increasing values in absolute terms when compared to the notional amount of the credit default swap agreement represent a deterioration of the referenced entity's credit soundness and an increased likelihood or risk of a credit event occurring as defined in the agreement.
|
| | | | | | | | | | | | | | | |
| CENTRALLY CLEARED TOTAL RETURN SWAP AGREEMENTS |
| Floating Rate Index | Pay/Receive Floating Rate Index At Termination | Fixed Rate | Termination
Date | Notional
Amount | Premiums Paid (Received) | Unrealized
Appreciation
(Depreciation) | Value |
| CPURNSA | Receive | 1.77% | 8/5/24 | $ | 25,500,000 |
| $ | (614 | ) | $ | (1,446,120 | ) | $ | (1,446,734 | ) |
|
| | |
| NOTES TO SCHEDULE OF INVESTMENTS |
| CDX | - | Credit Derivatives Indexes |
| CPURNSA | - | U.S. Consumer Price Index Urban Consumers Not Seasonally Adjusted Index |
| FHLMC | - | Federal Home Loan Mortgage Corporation |
| FNMA | - | Federal National Mortgage Association |
| GNMA | - | Government National Mortgage Association |
| GO | - | General Obligation |
| H15T1Y | - | Constant Maturity U.S. Treasury Note Yield Curve Rate Index |
| HUF | - | Hungarian Forint |
| LIBOR | - | London Interbank Offered Rate |
| MTN | - | Medium Term Note |
| MXN | - | Mexican Peso |
| SEQ | - | Sequential Payer |
| USD | - | United States Dollar |
| VRN | - | Variable Rate Note. The rate adjusts periodically based upon the terms set forth in the security’s offering documents. The rate shown is effective at the period end and the reference rate and spread, if any, is indicated. The security's effective maturity date may be shorter than the final maturity date shown. |
† Category is less than 0.05% of total net assets.
| |
| (1) | Security was purchased pursuant to Rule 144A or Section 4(2) under the Securities Act of 1933 and may be sold in transactions exempt from registration, normally to qualified institutional investors. The aggregate value of these securities at the period end was $458,789,766, which represented 22.4% of total net assets. |
| |
| (2) | When-issued security. The issue price and yield are fixed on the date of the commitment, but payment and delivery are scheduled for a future date. |
| |
| (3) | Security, or a portion thereof, has been pledged at the custodian bank or with a broker for collateral requirements on forward foreign currency exchange contracts, futures contracts and/or swap agreements. At the period end, the aggregate value of securities pledged was $14,968,840. |
| |
| (4) | Category includes collateral received at the custodian bank for collateral requirements on forward commitments. At the period end, the aggregate value of cash deposits received was $67,141. |
| |
| (5) | The rate indicated is the yield to maturity at purchase. |
See Notes to Financial Statements.
|
|
| Statement of Assets and Liabilities |
|
| | | |
| MARCH 31, 2020 | |
| Assets | |
| Investment securities, at value (cost of $2,006,936,315) | $ | 2,058,882,213 |
|
| Cash | 581,620 |
|
| Receivable for investments sold | 65,639,566 |
|
| Receivable for capital shares sold | 4,523,734 |
|
| Receivable for variation margin on swap agreements | 2,493,602 |
|
| Unrealized appreciation on forward foreign currency exchange contracts | 244,872 |
|
| Interest receivable | 9,818,031 |
|
| | 2,142,183,638 |
|
| | |
| Liabilities | |
| Payable for collateral received for forward commitments | 67,141 |
|
| Payable for investments purchased | 94,172,455 |
|
| Payable for variation margin on futures contracts | 286,572 |
|
| Payable for variation margin on swap agreements | 45,730 |
|
| | 94,571,898 |
|
| | |
| Net Assets | $ | 2,047,611,740 |
|
| | |
| G Class Capital Shares | |
| Shares outstanding (unlimited number of shares authorized) | 183,685,559 |
|
| | |
| Net Asset Value Per Share | $ | 11.15 |
|
| | |
| Net Assets Consist of: | |
| Capital paid in | $ | 1,966,293,222 |
|
| Distributable earnings | 81,318,518 |
|
| | $ | 2,047,611,740 |
|
See Notes to Financial Statements.
|
| | | |
| YEAR ENDED MARCH 31, 2020 | |
| Investment Income (Loss) | |
| Income: | |
| Interest | $ | 71,767,686 |
|
| | |
| Expenses: | |
| Management fees | 8,530,204 |
|
| Trustees' fees and expenses | 187,223 |
|
| Other expenses | 12,148 |
|
| | 8,729,575 |
|
| Fees waived | (8,530,204 | ) |
| | 199,371 |
|
| | |
| Net investment income (loss) | 71,568,315 |
|
| | |
| Realized and Unrealized Gain (Loss) | |
| Net realized gain (loss) on: | |
| Investment transactions | 75,520,036 |
|
| Forward foreign currency exchange contract transactions | 293,862 |
|
| Futures contract transactions | 12,344,067 |
|
| Swap agreement transactions | 7,097,366 |
|
| | 95,255,331 |
|
| | |
| Change in net unrealized appreciation (depreciation) on: | |
| Investments | 29,254,865 |
|
| Forward foreign currency exchange contracts | 227,462 |
|
| Futures contracts | (1,173,910 | ) |
| Swap agreements | 5,866,562 |
|
| | 34,174,979 |
|
| | |
| Net realized and unrealized gain (loss) | 129,430,310 |
|
| | |
| Net Increase (Decrease) in Net Assets Resulting from Operations | $ | 200,998,625 |
|
See Notes to Financial Statements.
|
|
| Statement of Changes in Net Assets |
|
| | | | | | |
| YEARS ENDED MARCH 31, 2020 AND MARCH 31, 2019 |
| Increase (Decrease) in Net Assets | March 31, 2020 | March 31, 2019 |
| Operations | | |
| Net investment income (loss) | $ | 71,568,315 |
| $ | 93,337,360 |
|
| Net realized gain (loss) | 95,255,331 |
| (51,474,576 | ) |
| Change in net unrealized appreciation (depreciation) | 34,174,979 |
| 53,326,972 |
|
| Net increase (decrease) in net assets resulting from operations | 200,998,625 |
| 95,189,756 |
|
| | | |
| Distributions to Shareholders | | |
| From earnings | (75,070,089 | ) | (82,373,652 | ) |
| | | |
| Capital Share Transactions | | |
| Proceeds from shares sold | 346,486,144 |
| 297,773,497 |
|
| Proceeds from reinvestment of distributions | 75,070,089 |
| 82,083,103 |
|
| Payments for shares redeemed | (1,071,028,000 | ) | (856,037,370 | ) |
| Net increase (decrease) in net assets from capital share transactions | (649,471,767 | ) | (476,180,770 | ) |
| | | |
| Net increase (decrease) in net assets | (523,543,231 | ) | (463,364,666 | ) |
| | | |
| Net Assets | | |
| Beginning of period | 2,571,154,971 |
| 3,034,519,637 |
|
| End of period | $ | 2,047,611,740 |
| $ | 2,571,154,971 |
|
| | | |
| Transactions in Shares of the Fund | | |
| Sold | 31,707,990 |
| 28,688,091 |
|
| Issued in reinvestment of distributions | 6,841,662 |
| 7,927,067 |
|
| Redeemed | (96,903,497 | ) | (83,031,742 | ) |
| Net increase (decrease) in shares of the fund | (58,353,845 | ) | (46,416,584 | ) |
See Notes to Financial Statements.
|
|
Notes to Financial Statements |
MARCH 31, 2020
1. Organization
American Century Investment Trust (the trust) is registered under the Investment Company Act of 1940, as amended (the 1940 Act), as an open-end management investment company and is organized as a Massachusetts business trust. NT Diversified Bond Fund (the fund) is one fund in a series issued by the trust. The fund’s investment objective is to seek a high level of income by investing in non-money market debt securities. The fund is not permitted to invest in securities issued by companies assigned the Global Industry Classification Standard or the Bloomberg Industry Classification Standard for the tobacco industry. The fund offers the G Class.
2. Significant Accounting Policies
The following is a summary of significant accounting policies consistently followed by the fund in preparation of its financial statements. The fund is an investment company and follows accounting and reporting guidance in accordance with accounting principles generally accepted in the United States of America. This may require management to make certain estimates and assumptions at the date of the financial statements. Actual results could differ from these estimates. Management evaluated the impact of events or transactions occurring through the date the financial statements were issued that would merit recognition or disclosure.
Investment Valuations — The fund determines the fair value of its investments and computes its net asset value per share at the close of regular trading (usually 4 p.m. Eastern time) on the New York Stock Exchange (NYSE) on each day the NYSE is open. The Board of Trustees has adopted valuation policies and procedures to guide the investment advisor in the fund’s investment valuation process and to provide methodologies for the oversight of the fund’s pricing function.
Fixed income securities are valued at the evaluated mean as provided by independent pricing services or at the mean of the most recent bid and asked prices as provided by investment dealers. Corporate bonds, U.S. Treasury and Government Agency securities, convertible bonds, bank loan obligations, municipal securities, and sovereign governments and agencies are valued using market models that consider trade data, quotations from dealers and active market makers, relevant yield curve and spread data, creditworthiness, trade data or market information on comparable securities, and other relevant security specific information. Mortgage-related and asset-backed securities are valued based on models that consider trade data, prepayment and default projections, benchmark yield and spread data and estimated cash flows of each tranche of the issuer. Collateralized loan obligations are valued based on discounted cash flow models that consider trade and economic data, prepayment assumptions and default projections. Commercial paper is valued using a curve-based approach that considers money market rates for specific instruments, programs, currencies and maturity points from a variety of active market makers.
Hybrid securities are valued at the evaluated mean as provided by independent pricing services or at the mean of the most recent bid and asked prices as provided by investment dealers. Preferred stocks and convertible preferred stocks with perpetual maturities are valued using market models that consider trade data, quotations from dealers and active market makers, relevant yield curve and spread data, creditworthiness, trade data or market information on comparable securities, and other relevant security specific information.
Open-end management investment companies are valued at the reported net asset value per share. Repurchase agreements are valued at cost, which approximates fair value. Exchange-traded futures contracts are valued at the settlement price as provided by the appropriate exchange. Swap agreements are valued at an evaluated mean as provided by independent pricing services or independent brokers. Forward foreign currency exchange contracts are valued at the mean of the appropriate forward exchange rate at the close of the NYSE as provided by an independent pricing service.
If the fund determines that the market price for an investment is not readily available or the valuation methods mentioned above do not reflect an investment’s fair value, such investment is valued as determined in good faith by the Board of Trustees or its delegate, in accordance with policies and procedures adopted by the Board of Trustees. In its determination of fair value, the fund may review several factors including, but not limited to, market information regarding the specific investment or comparable investments and correlation with other investment types, futures indices or general market indicators. Circumstances that may cause the fund to use these procedures to value an investment include, but are not limited to: an investment has been declared in default or is distressed; trading in a security has been suspended during the trading day or a security is not actively trading on its principal exchange; prices received from a regular pricing source are deemed unreliable; or there is a foreign market holiday and no trading occurred.
The fund monitors for significant events occurring after the close of an investment’s primary exchange but before the fund’s net asset value per share is determined. Significant events may include, but are not limited to: corporate announcements and transactions; governmental action and political unrest that could impact a specific investment or an investment sector; or armed conflicts, natural disasters and similar events that could affect investments in a specific country or region.
Security Transactions — Security transactions are accounted for as of the trade date. Net realized gains and losses are determined on the identified cost basis, which is also used for federal income tax purposes.
Investment Income — Interest income is recorded on the accrual basis and includes paydown gain (loss) and accretion of discounts and amortization of premiums. Inflation adjustments related to inflation-linked debt securities are reflected as interest income.
Foreign Currency Translations — All assets and liabilities initially expressed in foreign currencies are translated into U.S. dollars at prevailing exchange rates at period end. The fund may enter into spot foreign currency exchange contracts to facilitate transactions denominated in a foreign currency. Purchases and sales of investment securities, dividend and interest income, spot foreign currency exchange contracts, and expenses are translated at the rates of exchange prevailing on the respective dates of such transactions. Net realized and unrealized foreign currency exchange gains or losses related to investment securities are a component of net realized gain (loss) on investment transactions and change in net unrealized appreciation (depreciation) on investments, respectively.
Forward Commitments — The fund may engage in securities transactions on a forward commitment basis. In these transactions, the securities’ prices and yields are fixed on the date of the commitment. The fund may sell a to-be-announced (TBA) security and at the same time make a commitment to purchase the same security at a future date at a specified price. Conversely, the fund may purchase a TBA security and at the same time make a commitment to sell the same security at a future date at a specified price. These types of transactions are known as “TBA roll” transactions and are accounted for as purchases and sales. The fund will segregate cash, cash equivalents or other appropriate liquid securities on its records in amounts sufficient to meet the purchase price.
Repurchase Agreements — The fund may enter into repurchase agreements with institutions that American Century Investment Management, Inc. (ACIM) (the investment advisor) has determined are creditworthy pursuant to criteria adopted by the Board of Trustees. The fund requires that the collateral, represented by securities, received in a repurchase transaction be transferred to the custodian in a manner sufficient to enable the fund to obtain those securities in the event of a default under the repurchase agreement. ACIM monitors, on a daily basis, the securities transferred to ensure the value, including accrued interest, of the securities under each repurchase agreement is equal to or greater than amounts owed to the fund under each repurchase agreement.
Joint Trading Account — Pursuant to an Exemptive Order issued by the Securities and Exchange Commission, the fund, along with certain other funds in the American Century Investments family of funds, may transfer uninvested cash balances into a joint trading account. These balances are invested in one or more repurchase agreements that are collateralized by U.S. Treasury or Agency obligations.
Segregated Assets — In accordance with the 1940 Act, the fund segregates assets on its books and records to cover certain types of investment securities and other financial instruments. ACIM monitors, on a daily basis, the securities segregated to ensure the fund designates a sufficient amount of liquid assets, marked-to-market daily. The fund may also receive assets or be required to pledge assets at the custodian bank or with a broker for collateral requirements.
Income Tax Status — It is the fund’s policy to distribute substantially all net investment income and net realized gains to shareholders and to otherwise qualify as a regulated investment company under provisions of the Internal Revenue Code. Accordingly, no provision has been made for income taxes. The fund files U.S. federal, state, local and non-U.S. tax returns as applicable. The fund's tax returns are subject to examination by the relevant taxing authority until expiration of the applicable statute of limitations, which is generally three years from the date of filing but can be longer in certain jurisdictions. At this time, management believes there are no uncertain tax positions which, based on their technical merit, would not be sustained upon examination and for which it is reasonably possible that the total amounts of unrecognized tax benefits will significantly change in the next twelve months.
Distributions to Shareholders — Distributions from net investment income, if any, are declared daily and paid monthly. Distributions from net realized gains, if any, are generally declared and paid annually. The fund may elect to treat a portion of its payment to a redeeming shareholder, which represents the pro rata share of undistributed net investment income and net realized gains, as a distribution for federal income tax purposes (tax equalization).
Indemnifications — Under the trust’s organizational documents, its officers and trustees are indemnified against certain liabilities arising out of the performance of their duties to the fund. In addition, in the normal course of business, the fund enters into contracts that provide general indemnifications. The maximum exposure under these arrangements is unknown as this would involve future claims that may be made against a fund. The risk of material loss from such claims is considered by management to be remote.
3. Fees and Transactions with Related Parties
Certain officers and trustees of the trust are also officers and/or directors of American Century Companies, Inc. (ACC). The trust's investment advisor, ACIM, the trust's distributor, American Century Investment Services, Inc., and the trust's transfer agent, American Century Services, LLC, are wholly owned, directly or indirectly, by ACC. Various funds issued by American Century Asset Allocation Portfolios, Inc. own, in aggregate, 99% of the shares of the fund. Related parties do not invest in the fund for the purpose of exercising management or control.
Management Fees — The trust has entered into a management agreement with ACIM, under which ACIM provides the fund with investment advisory and management services in exchange for a single, unified management fee (the fee). The agreement provides that all expenses of managing and operating the fund, except brokerage expenses, taxes, interest, fees and expenses of the independent trustees (including legal counsel fees), and extraordinary expenses, will be paid by ACIM. The fee is computed and accrued daily based on the daily net assets of the fund and paid monthly in arrears. The fee consists of (1) an Investment Category Fee based on the daily net assets of the fund and certain other accounts managed by the investment advisor that are in the same broad investment category as the fund and (2) a Complex Fee based on the assets of all the funds in the American Century Investments family of funds. The rates for the Investment Category Fee range from 0.2925% to 0.4100%. The rates for the Complex Fee range from 0.0000% to 0.0600%. The investment advisor agreed to waive the fund’s management fee in its entirety. The investment advisor expects this waiver to remain in effect permanently and cannot terminate it without the approval of the Board of Trustees. The effective annual management fee for the period ended March 31, 2020 was 0.34% before waiver and 0.00% after waiver.
Trustees’ Fees and Expenses — The Board of Trustees is responsible for overseeing the investment advisor’s management and operations of the fund. The trustees receive detailed information about the fund and its investment advisor regularly throughout the year, and meet at least quarterly with management of the investment advisor to review reports about fund operations. The fund’s officers do not receive compensation from the fund.
Interfund Transactions — The fund may enter into security transactions with other American Century Investments funds and other client accounts of the investment advisor, in accordance with the 1940 Act rules and procedures adopted by the Board of Trustees. The rules and procedures require, among other things, that these transactions be effected at the independent current market price of the security. There were no interfund transactions during the period.
4. Investment Transactions
Purchases of investment securities, excluding short-term investments, for the period ended March 31, 2020 totaled $3,178,387,749, of which $2,659,871,597 represented U.S. Treasury and Government Agency obligations.
Sales of investment securities, excluding short-term investments, for the period ended March 31, 2020 totaled $4,020,818,688, of which $3,136,380,180 represented U.S. Treasury and Government Agency obligations.
5. Fair Value Measurements
The fund’s investments valuation process is based on several considerations and may use multiple inputs to determine the fair value of the investments held by the fund. In conformity with accounting principles generally accepted in the United States of America, the inputs used to determine a valuation are classified into three broad levels.
| |
| • | Level 1 valuation inputs consist of unadjusted quoted prices in an active market for identical investments. |
| |
| • | Level 2 valuation inputs consist of direct or indirect observable market data (including quoted prices for comparable investments, evaluations of subsequent market events, interest rates, prepayment speeds, credit risk, etc.). These inputs also consist of quoted prices for identical investments initially expressed in local currencies that are adjusted through translation into U.S. dollars. |
| |
| • | Level 3 valuation inputs consist of unobservable data (including a fund’s own assumptions). |
The level classification is based on the lowest level input that is significant to the fair valuation measurement. The valuation inputs are not necessarily an indication of the risks associated with investing in these securities or other financial instruments.
The following is a summary of the level classifications as of period end. The Schedule of Investments provides additional information on the fund’s portfolio holdings.
|
| | | | | | | | |
| | Level 1 | Level 2 | Level 3 |
| Assets | | | |
| Investment Securities | | | |
| Corporate Bonds | — |
| $ | 593,263,792 |
| — |
|
| U.S. Treasury Securities | — |
| 509,713,348 |
| — |
|
| U.S. Government Agency Mortgage-Backed Securities | — |
| 363,540,439 |
| — |
|
| Asset-Backed Securities | — |
| 81,622,474 |
| — |
|
| Collateralized Mortgage Obligations | — |
| 78,318,718 |
| — |
|
| Collateralized Loan Obligations | — |
| 75,479,548 |
| — |
|
| Commercial Mortgage-Backed Securities | — |
| 68,069,166 |
| — |
|
| Municipal Securities | — |
| 35,619,373 |
| — |
|
| Sovereign Governments and Agencies | — |
| 16,682,846 |
| — |
|
| U.S. Government Agency Securities | — |
| 6,849,395 |
| — |
|
| Preferred Stocks | — |
| 3,672,193 |
| — |
|
| Temporary Cash Investments | $ | 24,532,705 |
| 201,518,216 |
| — |
|
| | $ | 24,532,705 |
| $ | 2,034,349,508 |
| — |
|
| Other Financial Instruments | | | |
| Futures Contracts | $ | 1,275,784 |
| — |
| — |
|
| Swap Agreements | — |
| $ | 9,020,751 |
| — |
|
| Forward Foreign Currency Exchange Contracts | — |
| 244,872 |
| — |
|
| | $ | 1,275,784 |
| $ | 9,265,623 |
| — |
|
| | | | |
| Liabilities | | | |
| Other Financial Instruments | | | |
| Futures Contracts | $ | 79,101 |
| — |
| — |
|
| Swap Agreements | — |
| $ | 1,446,734 |
| — |
|
| | $ | 79,101 |
| $ | 1,446,734 |
| — |
|
6. Derivative Instruments
Credit Risk — The fund is subject to credit risk in the normal course of pursuing its investment objectives. The value of a bond generally declines as the credit quality of its issuer declines. Credit default swap agreements enable a fund to buy/sell protection against a credit event of a specific issuer or index. A fund may attempt to enhance returns by selling protection or attempt to mitigate credit risk by buying protection. The buyer/seller of credit protection against a security or basket of securities may pay/receive an up-front or periodic payment to compensate for/against potential default events. Changes in value, including the periodic amounts of interest to be paid or received on swap agreements, are recorded as unrealized appreciation (depreciation) on swap agreements. Upon entering into a centrally cleared swap, a fund is required to deposit cash or securities (initial margin) with a financial intermediary in an amount equal to a certain percentage of the notional amount. Subsequent payments (variation margin) are made or received daily, in cash, by a fund. The variation margin is equal to the daily change in the value and is a component of unrealized gains and losses. Realized gain or loss is recorded upon receipt or payment of a periodic settlement or termination of swap agreements. Net realized and unrealized gains or losses occurring during the holding period of swap agreements are a component of net realized gain (loss) on swap agreement transactions and change in net unrealized appreciation (depreciation) on swap agreements, respectively. The risks of entering into swap agreements include the possible lack of liquidity, failure of the counterparty to meet its obligations, and that there may be unfavorable changes in the underlying investments or instruments. The fund's average notional amount held during the period was $82,105,643.
Foreign Currency Risk — The fund is subject to foreign currency exchange rate risk in the normal course of pursuing its investment objectives. The value of foreign investments held by a fund may be significantly affected by changes in foreign currency exchange rates. The dollar value of a foreign security generally decreases when the value of the dollar rises against the foreign currency in which the security is denominated and tends to increase when the value of the dollar declines against such foreign currency. A fund may enter into forward foreign currency exchange contracts to reduce a fund's exposure to foreign currency exchange rate fluctuations or to gain exposure to the fluctuations in the value of foreign currencies. The net U.S. dollar value of foreign currency underlying all contractual commitments held by a fund and the resulting unrealized appreciation or depreciation are determined daily. Realized gain or loss is recorded upon the termination of the contract. Net realized and unrealized gains or losses occurring during the holding period of forward foreign currency exchange contracts are a component of net realized gain (loss) on forward foreign currency exchange contract transactions and change in net unrealized appreciation (depreciation) on forward foreign currency exchange contracts, respectively. A fund bears the risk of an unfavorable change in the foreign currency exchange rate underlying the forward contract. Additionally, losses, up to the fair value, may arise if the counterparties do not perform under the contract terms. The fund's average U.S. dollar exposure to foreign currency risk derivative instruments held during the period was $4,673,511.
Interest Rate Risk — The fund is subject to interest rate risk in the normal course of pursuing its investment objectives. The value of bonds generally declines as interest rates rise. A fund may enter into futures contracts based on a bond index or a specific underlying security. A fund may purchase futures contracts to gain exposure to increases in market value or sell futures contracts to protect against a decline in market value. Upon entering into a futures contract, a fund will segregate cash, cash equivalents or other appropriate liquid securities on its records in amounts sufficient to meet requirements. Subsequent payments (variation margin) are made or received daily, in cash, by a fund. The variation margin is equal to the daily change in the contract value and is recorded as unrealized gains and losses. A fund recognizes a realized gain or loss when the futures contract is closed or expires. Net realized and unrealized gains or losses occurring during the holding period of futures contracts are a component of net realized gain (loss) on futures contract transactions and change in net unrealized appreciation (depreciation) on futures contracts, respectively. One of the risks of entering into futures contracts is the possibility that the change in value of the contract may not correlate with the changes in value of the underlying securities. The fund's average notional exposure to interest rate risk derivative instruments held during the period was $209,633,333 futures contracts purchased.
Other Contracts — A fund may enter into total return swap agreements in order to attempt to obtain or preserve a particular return or spread at a lower cost than obtaining a return or spread through purchases and/or sales of instruments in other markets or gain exposure to certain markets in the most economical way possible. A fund will segregate cash, cash equivalents or other appropriate liquid securities on its records in amounts sufficient to meet requirements. Changes in value, including the periodic amounts of interest to be paid or received on swap agreements, are recorded as unrealized appreciation (depreciation) on swap agreements. Upon entering into a centrally cleared swap, a fund is required to deposit cash or securities (initial margin) with a financial intermediary in an amount equal to a certain percentage of the notional amount. Subsequent payments (variation margin) are made or received daily, in cash, by a fund. The variation margin is equal to the daily change in the value and is a component of unrealized gains and losses. Realized gain or
loss is recorded upon receipt or payment of a periodic settlement or termination of swap agreements. Net realized and unrealized gains or losses occurring during the holding period of swap agreements are a component of net realized gain (loss) on swap agreement transactions and change in net unrealized appreciation (depreciation) on swap agreements, respectively. The risks of entering into swap agreements include the possible lack of liquidity, failure of the counterparty to meet its obligations, and that there may be unfavorable changes in the underlying investments or instruments, including inflationary risk. The fund's average notional amount held during the period was $25,500,000.
Value of Derivative Instruments as of March 31, 2020
|
| | | | | | | | |
| | Asset Derivatives | Liability Derivatives |
| Type of Risk Exposure | Location on Statement of Assets and Liabilities | Value | Location on Statement of Assets and Liabilities | Value |
| Credit Risk | Receivable for variation margin on swap agreements* | $ | 2,493,602 |
| Payable for variation margin on swap agreements* | — |
|
| Foreign Currency Risk | Unrealized appreciation on forward foreign currency exchange contracts | 244,872 |
| Unrealized depreciation on forward foreign currency exchange contracts | — |
|
| Interest Rate Risk | Receivable for variation margin on futures contracts* | — |
| Payable for variation margin on futures contracts* | $ | 286,572 |
|
| Other Contracts | Receivable for variation margin on swap agreements* | — |
| Payable for variation margin on swap agreements* | 45,730 |
|
| | | $ | 2,738,474 |
| | $ | 332,302 |
|
*Included in the unrealized appreciation (depreciation) on futures contracts or centrally cleared swap agreements, as applicable, as reported in the Schedule of Investments.
Effect of Derivative Instruments on the Statement of Operations for the Year Ended March 31, 2020
|
| | | | | | | | |
| | Net Realized Gain (Loss) | Change in Net Unrealized Appreciation (Depreciation) |
| Type of Risk Exposure | Location on Statement of Operations | Value | Location on Statement of Operations | Value |
| Credit Risk | Net realized gain (loss) on swap agreement transactions | $ | 7,097,366 |
| Change in net unrealized appreciation (depreciation) on swap agreements | $ | 7,312,682 |
|
| Foreign Currency Risk | Net realized gain (loss) on forward foreign currency exchange contract transactions | 293,862 |
| Change in net unrealized appreciation (depreciation) on forward foreign currency exchange contracts | 227,462 |
|
| Interest Rate Risk | Net realized gain (loss) on futures contract transactions | 12,344,067 |
| Change in net unrealized appreciation (depreciation) on futures contracts | (1,173,910 | ) |
| Other Contracts | Net realized gain (loss) on swap agreement transactions | — |
| Change in net unrealized appreciation (depreciation) on swap agreements | (1,446,120 | ) |
| | | $ | 19,735,295 |
| | $ | 4,920,114 |
|
7. Risk Factors
The value of the fund’s shares will go up and down, sometimes rapidly or unpredictably, based on the performance of the securities owned by the fund and other factors generally affecting the securities market. Market risks, including political, regulatory, economic and social developments, can affect the value of the fund’s investments. Natural disasters, public health emergencies, terrorism and other unforeseeable events may lead to increased market volatility and may have adverse long-term effects on world economies and markets generally.
The fund is owned by a relatively small number of shareholders, and in the event such shareholders redeem, the ongoing operations of the fund may be at risk.
The fund’s investment process may result in high portfolio turnover, which could mean high transaction costs, affecting both performance and capital gains tax liabilities to investors.
The fund may invest in instruments that have variable or floating coupon rates based on the London Interbank Offered Rate (LIBOR). LIBOR is a benchmark interest rate intended to be representative of the rate at which certain major international banks lend to one another over short-terms. LIBOR will be phased out by the end of 2021. Uncertainty remains regarding a replacement rate or rates for LIBOR. The transition process may lead to increased volatility or illiquidity in markets for instruments that rely on LIBOR. This could result in a change to the value of such instruments.
8. Federal Tax Information
The tax character of distributions paid during the years ended March 31, 2020 and March 31, 2019 were as follows:
|
| | | | | | |
| | 2020 | 2019 |
| Distributions Paid From | | |
| Ordinary income | $ | 75,070,089 |
| $ | 82,373,652 |
|
| Long-term capital gains | — |
| — |
|
The book-basis character of distributions made during the year from net investment income or net realized gains may differ from their ultimate characterization for federal income tax purposes. These differences reflect the differing character of certain income items and net realized gains and losses for financial statement and tax purposes, and may result in reclassification among certain capital accounts on the financial statements.
As of period end, the federal tax cost of investments and the components of distributable earnings on a tax-basis were as follows:
|
| | | |
| Federal tax cost of investments | $ | 2,007,039,975 |
|
| Gross tax appreciation of investments | $ | 88,120,341 |
|
| Gross tax depreciation of investments | (36,278,103 | ) |
| Net tax appreciation (depreciation) of investments | 51,842,238 |
|
| Net tax appreciation (depreciation) on derivatives | 6,127,543 |
|
| Net tax appreciation (depreciation) | $ | 57,969,781 |
|
| Other book-to-tax adjustments | $ | (233,296 | ) |
| Undistributed ordinary income | $ | 11,493,948 |
|
| Accumulated long-term gains | $ | 12,088,085 |
|
The difference between book-basis and tax-basis unrealized appreciation (depreciation) is attributable primarily to the realization for tax purposes of unrealized gains (losses) on futures contracts. Other book-to-tax adjustments are attributable primarily to the tax deferral of losses on straddle positions.
9. Recently Issued Accounting Standards
In March 2017, the Financial Accounting Standards Board (FASB) issued Accounting Standards Update No. 2017-08, “Receivables - Nonrefundable Fees and Other Costs (Subtopic 310-20), Premium Amortization on Purchased Callable Debt Securities” (ASU 2017-08). ASU 2017-08 amends the amortization period for certain purchased callable debt securities held at a premium, shortening such period to the earliest call date. The amendments are effective for fiscal years, and interim periods within those fiscal years, beginning after December 15, 2018. The adoption of ASU 2017-08 did not materially impact the financial statements.
|
| | | | | | | | | | | | | | | | | |
| For a Share Outstanding Throughout the Years Ended March 31 (except as noted) |
| Per-Share Data | | | | | | | | | Ratios and Supplemental Data | | | |
| | | Income From Investment Operations: | Distributions From: | | | Ratio to Average Net Assets of: | | |
| | Net Asset
Value,
Beginning
of Period | Net
Investment
Income
(Loss)(1) | Net
Realized
and
Unrealized
Gain (Loss) | Total From
Investment
Operations | Net
Investment
Income | Net
Realized
Gains | Total
Distributions | Net Asset
Value,
End
of Period | Total
Return(2) | Operating
Expenses | Operating
Expenses
(before
expense
waiver) | Net
Investment
Income
(Loss) | Net
Investment
Income
(Loss)
(before
expense
waiver) | Portfolio
Turnover
Rate | Net
Assets,
End of
Period
(in thousands) |
| G Class | | | | | | | | | | | | | | |
| 2020 | $10.62 | 0.32 | 0.54 | 0.86 | (0.33) | — | (0.33) | $11.15 | 8.18% | 0.01% | 0.35% | 2.88% | 2.54% | 128% |
| $2,047,612 |
|
| 2019 | $10.52 | 0.35 | 0.05 | 0.40 | (0.30) | — | (0.30) | $10.62 | 3.93% | 0.01% | 0.35% | 3.35% | 3.01% | 185% |
| $2,571,155 |
|
| 2018 | $10.66 | 0.29 | (0.14) | 0.15 | (0.29) | — | (0.29) | $10.52 | 1.36% | 0.12% | 0.36% | 2.66% | 2.42% | 186% |
| $3,034,520 |
|
| 2017 | $10.85 | 0.22 | (0.16) | 0.06 | (0.24) | (0.01) | (0.25) | $10.66 | 0.59% | 0.40% | 0.40% | 2.07% | 2.07% | 139% |
| $2,731,236 |
|
| 2016 | $11.03 | 0.21 | (0.04) | 0.17 | (0.23) | (0.12) | (0.35) | $10.85 | 1.57% | 0.40% | 0.40% | 1.96% | 1.96% | 207% |
| $2,406,977 |
|
|
|
| Notes to Financial Highlights |
| |
| (1) | Computed using average shares outstanding throughout the period. |
| |
| (2) | Total returns are calculated based on the net asset value of the last business day. Total returns for periods less than one year are not annualized. |
See Notes to Financial Statements.
|
|
| Report of Independent Registered Public Accounting Firm |
To the Board of Trustees of American Century Investment Trust and Shareholders of NT Diversified Bond Fund
Opinion on the Financial Statements
We have audited the accompanying statement of assets and liabilities, including the schedule of investments, of NT Diversified Bond Fund (one of the funds constituting American Century Investment Trust, referred to hereafter as the “Fund”) as of March 31, 2020, the related statement of operations for the year ended March 31, 2020, the statement of changes in net assets for each of the two years in the period ended March 31, 2020, including the related notes, and the financial highlights for each of the five years in the period ended March 31, 2020 (collectively referred to as the “financial statements”). In our opinion, the financial statements present fairly, in all material respects, the financial position of the Fund as of March 31, 2020, the results of its operations for the year then ended, the changes in its net assets for each of the two years in the period ended March 31, 2020 and the financial highlights for each of the five years in the period ended March 31, 2020 in conformity with accounting principles generally accepted in the United States of America.
Basis for Opinion
These financial statements are the responsibility of the Fund’s management. Our responsibility is to express an opinion on the Fund’s financial statements based on our audits. We are a public accounting firm registered with the Public Company Accounting Oversight Board (United States) (PCAOB) and are required to be independent with respect to the Fund in accordance with the U.S. federal securities laws and the applicable rules and regulations of the Securities and Exchange Commission and the PCAOB.
We conducted our audits of these financial statements in accordance with the standards of the PCAOB. Those standards require that we plan and perform the audit to obtain reasonable assurance about whether the financial statements are free of material misstatement, whether due to error or fraud.
Our audits included performing procedures to assess the risks of material misstatement of the financial statements, whether due to error or fraud, and performing procedures that respond to those risks. Such procedures included examining, on a test basis, evidence regarding the amounts and disclosures in the financial statements. Our audits also included evaluating the accounting principles used and significant estimates made by management, as well as evaluating the overall presentation of the financial statements. Our procedures included confirmation of securities owned as of March 31, 2020 by correspondence with the custodian and brokers; when replies were not received from brokers, we performed other auditing procedures. We believe that our audits provide a reasonable basis for our opinion.
/s/ PricewaterhouseCoopers LLP
Kansas City, Missouri
May 18, 2020
We have served as the auditor of one or more investment companies in American Century Investments since 1997.
Board of Trustees
The individuals listed below serve as trustees of the funds. Each trustee will continue to serve in this capacity until death, retirement, resignation or removal from office. The board has adopted a mandatory retirement age for trustees who are not “interested persons,” as that term is defined in the Investment Company Act (independent trustees). Independent trustees shall retire on December 31 of the year in which they reach their 75th birthday; provided, however, that on or after January 1, 2022, independent trustees shall retire on December 31 of the year in which they reach their 76th birthday.
Mr. Thomas is an “interested person” because he currently serves as President and Chief Executive Officer of American Century Companies, Inc. (ACC), the parent company of American Century Investment Management, Inc. (ACIM or the advisor). The other trustees (more than three-fourths of the total number) are independent. They are not employees, directors or officers of, and have no financial interest in, ACC or any of its wholly owned, direct or indirect, subsidiaries, including ACIM, American Century Investment Services, Inc. (ACIS) and American Century Services, LLC (ACS), and they do not have any other affiliations, positions or relationships that would cause them to be considered “interested persons” under the Investment Company Act. The trustees serve in this capacity for eight (in the case of Jonathan S. Thomas, 16; and Ronald J. Gilson, 9) registered investment companies in the American Century Investments family of funds.
The following table presents additional information about the trustees. The mailing address for each trustee other than Mr. Thomas is 1665 Charleston Road, Mountain View, California 94043. The mailing address for Mr. Thomas is 4500 Main Street, Kansas City, Missouri 64111.
|
| | | | | |
Name
(Year of Birth) | Position(s) Held with Funds | Length of Time Served | Principal Occupation(s) During Past 5 Years | Number of American Century Portfolios Overseen by Trustee | Other Directorships Held During Past 5 Years |
| Independent Trustees |
|
|
Tanya S. Beder
(1955) | Trustee | Since 2011 | Chairman and CEO, SBCC Group Inc. (independent advisory services) (2006 to present) | 40 | CYS Investments, Inc.; Kirby Corporation; Nabors Industries Ltd. |
Jeremy I. Bulow
(1954) | Trustee | Since 2011 | Professor of Economics, Stanford University, Graduate School of Business (1979 to present) | 40 | None |
Anne Casscells
(1958) | Trustee | Since 2016 | Co-Chief Executive Officer and Chief Investment Officer, Aetos Alternatives Management (investment advisory firm) (2001 to present); Lecturer in Accounting, Stanford University, Graduate School of Business (2009 to 2017) | 40 | None |
Ronald J. Gilson
(1946) | Trustee and Chairman of the Board | Since 1995
(Chairman since 2005) | Charles J. Meyers Professor of Law and Business, Emeritus, Stanford Law School (1979 to 2016); Marc and Eva Stern Professor of Law and Business, Columbia University School of Law (1992 to present) | 57 | None |
|
| | | | | |
Name
(Year of Birth) | Position(s) Held with Funds | Length of Time Served | Principal Occupation(s) During Past 5 Years | Number of American Century Portfolios Overseen by Trustee | Other Directorships Held During Past 5 Years |
| Independent Trustees |
|
|
Frederick L. A. Grauer
(1946) | Trustee | Since 2008 | Senior Advisor, Credit Sesame, Inc. (credit monitoring firm) (2018 to present); Senior Advisor, Course Hero (an educational technology company) (2015 to present) | 40 | None |
Jonathan D. Levin
(1972) | Trustee | Since 2016 | Philip H. Knight Professor and Dean, Graduate School of Business, Stanford University (2016 to present); Professor, Stanford University, (2000 to present) | 40 | None |
Peter F. Pervere
(1947) | Trustee | Since 2007 | Retired | 40 | None |
John B. Shoven
(1947) | Trustee | Since 2002 | Charles R. Schwab Professor of Economics, Stanford University (1973 to present, emeritus since 2019) | 40 | Cadence Design Systems; Exponent; Financial Engines |
| Interested Trustee |
|
|
Jonathan S. Thomas
(1963) | Trustee | Since 2007 | President and Chief Executive Officer, ACC (2007 to present). Also serves as Chief Executive Officer, ACS; Executive Vice President, ACIM; Director, ACC, ACIM and other ACC subsidiaries | 120 | None |
The Statement of Additional Information has additional information about the fund's trustees and is available without charge, upon request, by calling 1-800-345-2021.
Officers
The following table presents certain information about the executive officers of the funds. Each officer serves as an officer for 16 (in the case of Robert J. Leach, 15) investment companies in the American Century family of funds, unless otherwise noted. No officer is compensated for his or her service as an officer of the funds. The listed officers are interested persons of the funds and are appointed or re-appointed on an annual basis. The mailing address for each of the officers listed below is 4500 Main Street, Kansas City, Missouri 64111.
|
| | |
Name
(Year of Birth) | Offices with the Funds | Principal Occupation(s) During the Past Five Years |
Patrick Bannigan
(1965)
| President since 2019 | Executive Vice President and Director, ACC (2012 to present); Chief Financial Officer, Chief Accounting Officer and Treasurer, ACC (2015 to present); Chief Operating Officer, ACC (2012-2015). Also serves as President, ACS; Vice President, ACIM; Chief Financial Officer, Chief Accounting Officer and/or Director, ACIM, ACS and other ACC subsidiaries |
R. Wes Campbell
(1974)
| Chief Financial Officer and Treasurer since 2018 | Vice President, ACS (2020 to present); Investment Operations and Investment Accounting, ACS (2000 to present) |
Amy D. Shelton
(1964) | Chief Compliance Officer and Vice President since 2014 | Chief Compliance Officer, American Century funds, (2014 to present); Chief Compliance Officer, ACIM (2014 to present); Chief Compliance Officer, ACIS (2009 to present). Also serves as Vice President, ACIS |
Charles A. Etherington
(1957) | General Counsel since 2007 and Senior Vice President since 2006 | Attorney, ACC (1994 to present); Vice President, ACC (2005 to present); General Counsel, ACC (2007 to present). Also serves as General Counsel, ACIM, ACS, ACIS and other ACC subsidiaries; and Senior Vice President, ACIM and ACS |
C. Jean Wade
(1964) | Vice President since 2012 | Senior Vice President, ACS (2017 to present); Vice President ACS (2000 to 2017)
|
Robert J. Leach
(1966) | Vice President since 2006 | Vice President, ACS (2000 to present) |
David H. Reinmiller
(1963) | Vice President since 2000 | Attorney, ACC (1994 to present). Also serves as Vice President, ACIM and ACS |
Ward D. Stauffer
(1960) | Secretary since 2005 | Attorney, ACC (2003 to present) |
|
|
| Liquidity Risk Management Program |
The Fund has adopted a liquidity risk management program (the “program”). The Fund’s Board of Trustees (the "Board") has designated American Century Investment Management, Inc. (“ACIM”) as the administrator of the program. Personnel of ACIM or its affiliates conduct the day-to-day operation of the program pursuant to policies and procedures administered by those members of the ACIM’s Investment Oversight Committee who are members of the ACIM’s Investment Management and Global Analytics departments.
Under the program, ACIM manages the Fund’s liquidity risk, which is the risk that the Fund could not meet shareholder redemption requests without significant dilution of remaining shareholders’ interests in the Fund. This risk is managed by monitoring the degree of liquidity of the Fund’s investments, limiting the amount of the Fund’s illiquid investments, and utilizing various risk management tools and facilities available to the Fund for meeting shareholder redemptions, among other means. ACIM’s process of determining the degree of liquidity of the Fund’s investments is supported by one or more third-party liquidity assessment vendors.
The Board reviewed a report prepared by ACIM regarding the operation and effectiveness of the program for the period December 1, 2018 through December 31, 2019. No significant liquidity events impacting the Fund were noted in the report. In addition, ACIM provided its assessment that the program had been effective in managing the Fund’s liquidity risk.
Retirement Account Information
As required by law, distributions you receive from certain retirement accounts are subject to federal income tax withholding, unless you elect not to have withholding apply*. Tax will be withheld on the total amount withdrawn even though you may be receiving amounts that are not subject to withholding, such as nondeductible contributions. In such case, excess amounts of withholding could occur. You may adjust your withholding election so that a greater or lesser amount will be withheld.
If you don’t want us to withhold on this amount, you must notify us to not withhold the federal income tax. You may notify us in writing or in certain situations by telephone or through other electronic means. For systematic withdrawals, your withholding election will remain in effect until revoked or changed by filing a new election. You have the right to revoke your election at any time and change your withholding percentage for future distributions.
Remember, even if you elect not to have income tax withheld, you are liable for paying income tax on the taxable portion of your withdrawal. If you elect not to have income tax withheld or you don’t have enough income tax withheld, you may be responsible for payment of estimated tax. You may incur penalties under the estimated tax rules if your withholding and estimated tax payments are not sufficient. You can reduce or defer the income tax on a distribution by directly or indirectly rolling such distribution over to another IRA or eligible plan. You should consult your tax advisor for additional information.
State tax will be withheld if, at the time of your distribution, your address is within one of the mandatory withholding states and you have federal income tax withheld (or as otherwise required by state law). State taxes will be withheld from your distribution in accordance with the respective state rules.
*Some 403(b), 457 and qualified retirement plan distributions may be subject to 20% mandatory withholding, as they are subject to special tax and withholding rules. Your plan administrator or plan sponsor is required to provide you with a special tax notice explaining those rules at the time you request a distribution. If applicable, federal and/or state taxes may be withheld from your distribution amount.
Proxy Voting Policies
Descriptions of the principles and policies that the fund's investment advisor uses in exercising the voting rights associated with the securities purchased and/or held by the fund are available without charge, upon request, by calling 1-800-345-2021 or visiting American Century Investments’ website at americancentury.com/proxy. A description of the policies is also available on the Securities and Exchange Commission’s website at sec.gov. Information regarding how the investment advisor voted proxies relating to portfolio securities during the most recent 12-month period ended June 30 is available on americancentury.com/proxy. It is also available at sec.gov.
Quarterly Portfolio Disclosure
The fund files its complete schedule of portfolio holdings with the Securities and Exchange Commission (SEC) for the first and third quarters of each fiscal year as an exhibit to its reports on Form N-PORT. The fund’s Form N-PORT reports are available on the SEC’s website at sec.gov. The fund also makes its complete schedule of portfolio holdings for the most recent quarter of its fiscal year available on its website at americancentury.com and, upon request, by calling 1-800-345-2021.
Other Tax Information
The following information is provided pursuant to provisions of the Internal Revenue Code.
The fund hereby designates $34,941, or up to the maximum amount allowable, as long-term capital gain distributions (20% rate gain distributions) for the fiscal year ended March 31, 2020.
The fund hereby designates $30,401 as qualified short-term capital gain distributions for purposes of Internal Revenue Code Section 871 for the fiscal year ended March 31, 2020.
The fund utilized earnings and profits of $285,157 distributed to shareholders on redemption of shares as part of the dividends paid deduction (tax equalization).
|
| | |
| |
| | | |
| Contact Us | americancentury.com | |
| Automated Information Line | 1-800-345-8765 | |
| Investor Services Representative | 1-800-345-2021 or 816-531-5575 | |
| Investors Using Advisors | 1-800-378-9878 | |
| Business, Not-For-Profit, Employer-Sponsored Retirement Plans | 1-800-345-3533 | |
| Banks and Trust Companies, Broker-Dealers, Financial Professionals, Insurance Companies | 1-800-345-6488 | |
| Telecommunications Relay Service for the Deaf | 711 | |
| | | |
| American Century Investment Trust | |
| | | |
Investment Advisor: American Century Investment Management, Inc. Kansas City, Missouri | |
| | | |
| This report and the statements it contains are submitted for the general information of our shareholders. The report is not authorized for distribution to prospective investors unless preceded or accompanied by an effective prospectus. | |
| | | |
©2020 American Century Proprietary Holdings, Inc. All rights reserved.
CL-ANN-92292 2005 | |
|
| |
| | |
| | Annual Report |
| | |
| | March 31, 2020 |
| | |
| | NT High Income Fund |
| | Investor Class (AHGVX) |
| | G Class (AHGNX) |
Beginning on January 1, 2021, as permitted by regulations adopted by the Securities and Exchange Commission, paper copies of the fund’s shareholder reports like this one will no longer be sent by mail, unless you specifically request paper copies of the reports from the fund or from your financial intermediary, such as a broker-dealer or bank. Instead, the reports will be made available on a website, and you will be notified by mail each time a report is posted and provided with a website link to access the report.
If you already elected to receive shareholder reports electronically, you will not be affected by this change and you need not take any action. You may elect to receive shareholder reports and other communications from the fund or your financial intermediary electronically by calling or sending an email request to your appropriate contacts as listed on the back cover of this report.
You may elect to receive all future reports in paper free of charge. You can inform the fund or your financial intermediary that you wish to continue receiving paper copies of your shareholder reports by calling or sending an email request to your appropriate contacts as listed on the back cover of this report. Your election to receive reports in paper will apply to all funds held with the fund complex/your financial intermediary.
|
| |
| Performance | |
| Portfolio Commentary | |
| Fund Characteristics | |
| Shareholder Fee Example | |
| Schedule of Investments | |
| Statement of Assets and Liabilities | |
| Statement of Operations | |
| Statement of Changes in Net Assets | |
| Notes to Financial Statements | |
| Financial Highlights | |
| Report of Independent Registered Public Accounting Firm | |
| Management | |
| Liquidity Risk Management Program | |
| Additional Information | |
Any opinions expressed in this report reflect those of the author as of the date of the report, and do not necessarily represent the opinions of American Century Investments® or any other person in the American Century Investments organization. Any such opinions are subject to change at any time based upon market or other conditions and American Century Investments disclaims any responsibility to update such opinions. These opinions may not be relied upon as investment advice and, because investment decisions made by American Century Investments funds are based on numerous factors, may not be relied upon as an indication of trading intent on behalf of any American Century Investments fund. Security examples are used for representational purposes only and are not intended as recommendations to purchase or sell securities. Performance information for comparative indices and securities is provided to American Century Investments by third party vendors. To the best of American Century Investments’ knowledge, such information is accurate at the time of printing.
|
| | | | |
| Total Returns as of March 31, 2020 | | |
| | | | Average Annual Returns | |
| | Ticker Symbol | 1 year | Since Inception | Inception Date |
| Investor Class | AHGVX | -9.51% | -1.29% | 5/19/17 |
| ICE BofA U.S. High Yield Constrained Index | — | -7.46% | 0.02% | — |
| G Class | AHGNX | -8.80% | -0.56% | 5/19/17 |
Fund returns would have been lower if a portion of the fees had not been waived.
|
|
| Growth of $10,000 Over Life of Class |
| $10,000 investment made May 19, 2017 |
Performance for other share classes will vary due to differences in fee structure.
|
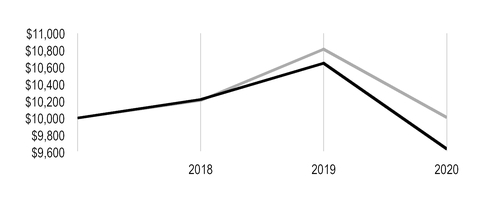
|
| |
| Value on March 31, 2020 |
| | Investor Class — $9,635 |
| |
| | ICE BofA U.S. High Yield Constrained Index — $10,006 |
| |
Ending value of Investor Class would have been lower if a portion of the fees had not been waived.
|
| |
| Total Annual Fund Operating Expenses |
| Investor Class | G Class |
| 0.79% | 0.54% |
The total annual fund operating expenses shown is as stated in the fund’s prospectus current as of the date of this report. The prospectus may vary from the expense ratio shown elsewhere in this report because it is based on a different time period, includes acquired fund fees and expenses, and, if applicable, does not include fee waivers or expense reimbursements.
Data presented reflect past performance. Past performance is no guarantee of future results. Current performance may be higher or lower than the performance shown. Total returns for periods less than one year are not annualized. Investment return and principal value will fluctuate, and redemption value may be more or less than original cost. Data assumes reinvestment of dividends and capital gains, and none of the charts reflect the deduction of taxes that a shareholder would pay on fund distributions or the redemption of fund shares. To obtain performance data current to the most recent month end, please call 1-800-345-2021 or visit americancentury.com. For additional information about the fund, please consult the prospectus.
Investment Advisor: American Century Investment Management, Inc.
Subadvisor: Nomura Corporate Research and Asset Management Inc.
Portfolio Managers: Steve Kotsen, David Crall, Amy Yu Chang and Derek Leung
As of August 2019, Amy Yu Chang and Derek Leung joined the portfolio management team.
Performance Summary
NT High Income returned -8.80%* for the 12-month period ended March 31, 2020. By comparison, the ICE BofA U.S. High Yield Constrained Index returned -7.46%.
Although high-yield bonds performed relatively well through most of the reporting period, their negative results in early 2020 dragged down returns for the entire 12-month period. As the COVID-19 epidemic originating in China expanded into a pandemic in early 2020, investors scrambled to shed credit risk and seek shelter in cash. Market volatility soared and liquidity markedly worsened. Amid the global flight to quality, riskier investments, including investment-grade and high-yield corporate bonds, suffered significant losses. Separately, an unexpected price war between Saudi Arabia and Russia amid waning demand for oil triggered a sizable drop in the oil markets. This development accelerated the havoc in the high-yield sector, home to many energy companies.
The swiftness and the depth of the Federal Reserve’s (Fed’s) response to the broad market unrest helped calm the credit markets in late March. In addition to cutting short-term rates to nearly 0%, the Fed announced programs to directly support the functioning of investment-grade primary and secondary markets. This action followed earlier announcements to address the functioning of Treasury, commercial paper and asset-backed securities markets. The Fed stepping in to purchase investment-grade corporate debt, which inspired many other market participants to also purchase the securities, was particularly helpful for stabilizing the corporate debt markets, including the high-yield market.
Gaming Companies Were Main Detractors
We began the fiscal year with a positive view toward the U.S. consumer and tilted the portfolio toward more U.S.-centric, noncyclical sectors, including gaming. We focused on Las Vegas and regional gaming operators and also held a small position in Macau gaming. Our gaming sector overweight relative to the index served us well until the first quarter of 2020, when the COVID-19 outbreak halted economic activity. Amid increasing infection and mortality rates, government officials issued stay-at-home orders, and international and domestic travel shut down. In particular, several of our gaming issues suffered significant downturns after Nevada’s governor ordered a 30-day statewide shutdown of casinos (and other nonessential businesses) on March 18.
The pandemic and resulting U.S. economic shutdown also dragged down results in the support-services sector. In particular, our holdings among rental car, office equipment and construction rental equipment companies suffered due to declining demand. Additionally, our underweight and security selection in the wireline telecommunication sector also detracted from performance.
*All fund returns referenced in this commentary are for G Class shares. Fund returns would have been lower if a portion of the fees had not been waived. Performance for other share classes will vary due to differences in fee structure; when G Class performance exceeds that of the index, other share classes may not. See page 2 for returns for all share classes.
Meanwhile, our exposure to cash and an overweight and strong security selection in the electric-generation sector helped offset the effects of the gaming, support-services and wireline telecommunication sectors. The main driver in this sector was a distressed play in a California-based power provider. Security selection in the pharmaceuticals sector also helped offset some of the losses. Additionally, underweight positions in the oil field equipment and services and real estate investment trusts sectors also added to relative performance.
Higher-Rated Securities Aided Performance; Duration Detracted
Overall, higher-rated bonds significantly outperformed their lower-rated counterparts during the fiscal year. Our overweight and security selection within the B-rated segment of the market contributed to relative performance. In addition, our out-of-index exposure to investment-grade (BBB-rated) issuers aided results. However, our overweight and security selection among issuers with CCC credit ratings and an underweight to credits with BB ratings detracted from relative performance.
Our short-duration posture to begin the fiscal year also had a negative impact on portfolio performance. We lengthened duration over the course of the reporting period, as we opportunistically increased exposure to securities within the BB ratings category during the last three quarters of 2019. We also added BB-rated securities as they sold off in February and March. In addition, we participated in the new-issues market and lengthened duration with some fallen angels (securities that dropped out of the investment-grade universe and into the high-yield category due to credit ratings downgrades).
Portfolio Positioning
Regarding our holdings and potential investments, we are calling companies and aggressively examining their business prospects, liquidity and ability to obtain government help during the COVID-19 disruptions. We have concentrated our purchases in higher-quality, more-defensive sectors, including cable, TMT (technology, media and telecommunication), packaging and food. We have also started building positions in recent and potential fallen angels. In addition, as the investment-grade market improved in late March, we participated in some new issues there. Beyond these steps, we are focusing on companies we believe can manage through this environment, including banks, health care companies, homebuilders, building products suppliers, metals companies and equipment rental firms. We also have engaged in some value buying in oversold sectors, such as gaming, aerospace and restaurants. We have sold issuers facing liquidity problems as well as some deep cyclicals and energy positions.
Looking ahead, the path of the virus, the depth of the economic contraction and the form of fiscal and monetary stimulus will remain key considerations. We will monitor these factors closely. The economic contraction will be deep, but we remain hopeful the economy can start growing again in the third quarter.
|
| |
| MARCH 31, 2020 | |
| Types of Investments in Portfolio | % of net assets |
| Corporate Bonds | 90.8% |
| Bank Loan Obligations | 4.1% |
| Preferred Stocks | 2.1% |
| Common Stocks | 0.2% |
| Convertible Bonds | 0.2% |
| Escrow Interests | —* |
| Warrants | —* |
| Temporary Cash Investments | 0.9% |
| Other Assets and Liabilities | 1.7% |
*Category is less than 0.05% of total net assets.
Fund shareholders may incur two types of costs: (1) transaction costs, including sales charges (loads) on purchase payments and redemption/exchange fees; and (2) ongoing costs, including management fees; distribution and service (12b-1) fees; and other fund expenses. This example is intended to help you understand your ongoing costs (in dollars) of investing in your fund and to compare these costs with the ongoing cost of investing in other mutual funds.
The example is based on an investment of $1,000 made at the beginning of the period and held for the entire period from October 1, 2019 to March 31, 2020.
Actual Expenses
The table provides information about actual account values and actual expenses for each class. You may use the information, together with the amount you invested, to estimate the expenses that you paid over the period. First, identify the share class you own. Then simply divide your account value by $1,000 (for example, an $8,600 account value divided by $1,000 = 8.6), then multiply the result by the number under the heading “Expenses Paid During Period” to estimate the expenses you paid on your account during this period.
Hypothetical Example for Comparison Purposes
The table also provides information about hypothetical account values and hypothetical expenses based on the actual expense ratio of each class of your fund and an assumed rate of return of 5% per year before expenses, which is not the actual return of a fund’s share class. The hypothetical account values and expenses may not be used to estimate the actual ending account balance or expenses you paid for the period. You may use this information to compare the ongoing costs of investing in your fund and other funds. To do so, compare this 5% hypothetical example with the 5% hypothetical examples that appear in the shareholder reports of the other funds.
Please note that the expenses shown in the table are meant to highlight your ongoing costs only and do not reflect any transactional costs, such as sales charges (loads) or redemption/exchange fees. Therefore, the table is useful in comparing ongoing costs only, and will not help you determine the relative total costs of owning different funds. In addition, if these transactional costs were included, your costs would have been higher.
|
| | | | |
| | Beginning
Account Value
10/1/19 | Ending
Account Value
3/31/20 | Expenses Paid
During Period(1)
10/1/19 - 3/31/20 |
Annualized
Expense Ratio(1) |
| Actual | | | | |
| Investor Class | $1,000 | $878.40 | $3.66 | 0.78% |
| G Class | $1,000 | $881.80 | $0.05 | 0.01% |
| Hypothetical | | | | |
| Investor Class | $1,000 | $1,021.10 | $3.94 | 0.78% |
| G Class | $1,000 | $1,024.95 | $0.05 | 0.01% |
| |
| (1) | Expenses are equal to the class's annualized expense ratio listed in the table above, multiplied by the average account value over the period, multiplied by 183, the number of days in the most recent fiscal half-year, divided by 366, to reflect the one-half year period. Annualized expense ratio reflects actual expenses, including any applicable fee waivers or expense reimbursements and excluding any acquired fund fees and expenses. |
MARCH 31, 2020
|
| | | | | | |
| | Principal Amount/Shares | Value |
| CORPORATE BONDS — 90.8% | | |
| Aerospace and Defense — 2.8% | | |
| Arconic, Inc., 5.125%, 10/1/24 | $ | 1,500,000 |
| $ | 1,484,188 |
|
| Arconic, Inc., 5.95%, 2/1/37 | 1,525,000 |
| 1,331,416 |
|
Bombardier, Inc., 8.75%, 12/1/21(1) | 50,000 |
| 41,838 |
|
Bombardier, Inc., 6.00%, 10/15/22(1) | 705,000 |
| 534,038 |
|
Bombardier, Inc., 6.125%, 1/15/23(1) | 400,000 |
| 284,502 |
|
Bombardier, Inc., 7.50%, 12/1/24(1) | 1,075,000 |
| 718,912 |
|
Bombardier, Inc., 7.50%, 3/15/25(1) | 495,000 |
| 346,500 |
|
Bombardier, Inc., 7.875%, 4/15/27(1) | 1,025,000 |
| 715,014 |
|
F-Brasile SpA / F-Brasile US LLC, 7.375%, 8/15/26(1) | 1,000,000 |
| 1,000,000 |
|
| TransDigm UK Holdings plc, 6.875%, 5/15/26 | 400,000 |
| 375,417 |
|
| TransDigm, Inc., 6.50%, 7/15/24 | 700,000 |
| 670,883 |
|
| TransDigm, Inc., 6.50%, 5/15/25 | 525,000 |
| 502,034 |
|
TransDigm, Inc., 6.25%, 3/15/26(1) | 1,750,000 |
| 1,751,088 |
|
| TransDigm, Inc., 6.375%, 6/15/26 | 850,000 |
| 818,592 |
|
| TransDigm, Inc., 7.50%, 3/15/27 | 675,000 |
| 654,244 |
|
TransDigm, Inc., 5.50%, 11/15/27(1) | 3,625,000 |
| 3,273,556 |
|
Triumph Group, Inc., 6.25%, 9/15/24(1) | 200,000 |
| 179,513 |
|
| Triumph Group, Inc., 7.75%, 8/15/25 | 225,000 |
| 161,718 |
|
| | | 14,843,453 |
|
| Air Freight and Logistics — 0.4% | | |
Cargo Aircraft Management, Inc., 4.75%, 2/1/28(1) | 175,000 |
| 163,625 |
|
XPO Logistics, Inc., 6.50%, 6/15/22(1) | 1,271,000 |
| 1,280,965 |
|
XPO Logistics, Inc., 6.125%, 9/1/23(1) | 600,000 |
| 591,003 |
|
| | | 2,035,593 |
|
| Airlines — 0.5% | | |
Air Canada, 7.75%, 4/15/21(1) | 975,000 |
| 956,670 |
|
American Airlines Group, Inc., 5.00%, 6/1/22(1) | 550,000 |
| 444,813 |
|
| United Airlines Holdings, Inc., 4.25%, 10/1/22 | 225,000 |
| 206,111 |
|
| United Airlines Holdings, Inc., 5.00%, 2/1/24 | 945,000 |
| 829,237 |
|
Virgin Australia Holdings Ltd., 8.125%, 11/15/24(1)(3) | 175,000 |
| 81,463 |
|
| | | 2,518,294 |
|
| Auto Components — 0.4% | | |
Dealer Tire LLC / DT Issuer LLC, 8.00%, 2/1/28(1) | 375,000 |
| 302,813 |
|
Panther BF Aggregator 2 LP / Panther Finance Co., Inc., 8.50%, 5/15/27(1) | 1,150,000 |
| 1,009,642 |
|
| Tenneco, Inc., 5.00%, 7/15/26 | 975,000 |
| 619,198 |
|
| | | 1,931,653 |
|
| Automobiles — 1.3% | | |
| Ford Motor Credit Co. LLC, 5.875%, 8/2/21 | 800,000 |
| 788,000 |
|
| Ford Motor Credit Co. LLC, 3.22%, 1/9/22 | 200,000 |
| 187,500 |
|
| Ford Motor Credit Co. LLC, 4.14%, 2/15/23 | 200,000 |
| 187,120 |
|
|
| | | | | | |
| | Principal Amount/Shares | Value |
| Ford Motor Credit Co. LLC, 4.69%, 6/9/25 | $ | 600,000 |
| $ | 537,000 |
|
| Ford Motor Credit Co. LLC, 4.13%, 8/4/25 | 600,000 |
| 535,200 |
|
| Ford Motor Credit Co. LLC, 4.54%, 8/1/26 | 200,000 |
| 176,000 |
|
| Ford Motor Credit Co. LLC, 3.82%, 11/2/27 | 400,000 |
| 300,667 |
|
| Ford Motor Credit Co. LLC, 5.11%, 5/3/29 | 2,400,000 |
| 2,058,000 |
|
Mclaren Finance plc, 5.75%, 8/1/22(1) | 400,000 |
| 254,840 |
|
Tesla, Inc., 5.30%, 8/15/25(1) | 1,750,000 |
| 1,655,937 |
|
| | | 6,680,264 |
|
| Banks — 0.2% | | |
| CIT Group, Inc., 4.125%, 3/9/21 | 275,000 |
| 272,377 |
|
| CIT Group, Inc., 5.00%, 8/1/23 | 900,000 |
| 871,528 |
|
| | | 1,143,905 |
|
| Building Products — 0.9% | | |
Advanced Drainage Systems, Inc., 5.00%, 9/30/27(1) | 275,000 |
| 247,099 |
|
BMC East LLC, 5.50%, 10/1/24(1) | 840,000 |
| 817,946 |
|
Builders FirstSource, Inc., 6.75%, 6/1/27(1) | 787,000 |
| 777,983 |
|
Builders FirstSource, Inc., 5.00%, 3/1/30(1) | 325,000 |
| 294,328 |
|
Griffon Corp., 5.75%, 3/1/28(1) | 775,000 |
| 732,860 |
|
Jeld-Wen, Inc., 4.625%, 12/15/25(1) | 375,000 |
| 333,279 |
|
Masonite International Corp., 5.75%, 9/15/26(1) | 275,000 |
| 271,849 |
|
Masonite International Corp., 5.375%, 2/1/28(1) | 75,000 |
| 74,126 |
|
Northwest Hardwoods, Inc., 7.50%, 8/1/21(1) | 275,000 |
| 99,000 |
|
Patrick Industries, Inc., 7.50%, 10/15/27(1) | 800,000 |
| 790,834 |
|
PGT Innovations, Inc., 6.75%, 8/1/26(1) | 500,000 |
| 475,729 |
|
| | | 4,915,033 |
|
| Capital Markets — 1.6% | | |
AG Issuer LLC, 6.25%, 3/1/28(1) | 575,000 |
| 487,313 |
|
| Donnelley Financial Solutions, Inc., 8.25%, 10/15/24 | 375,000 |
| 355,779 |
|
| Icahn Enterprises LP / Icahn Enterprises Finance Corp., 6.25%, 2/1/22 | 655,000 |
| 660,135 |
|
| Icahn Enterprises LP / Icahn Enterprises Finance Corp., 4.75%, 9/15/24 | 1,575,000 |
| 1,450,969 |
|
| Icahn Enterprises LP / Icahn Enterprises Finance Corp., 6.375%, 12/15/25 | 1,225,000 |
| 1,165,287 |
|
| Icahn Enterprises LP / Icahn Enterprises Finance Corp., 6.25%, 5/15/26 | 1,550,000 |
| 1,473,464 |
|
| Icahn Enterprises LP / Icahn Enterprises Finance Corp., 5.25%, 5/15/27 | 1,375,000 |
| 1,280,469 |
|
LPL Holdings, Inc., 4.625%, 11/15/27(1) | 250,000 |
| 230,530 |
|
MSCI, Inc., 4.75%, 8/1/26(1) | 150,000 |
| 148,795 |
|
NFP Corp., 6.875%, 7/15/25(1) | 925,000 |
| 918,035 |
|
NFP Corp., 8.00%, 7/15/25(1) | 475,000 |
| 438,779 |
|
| | | 8,609,555 |
|
| Chemicals — 2.0% | | |
Atotech Alpha 2 BV, 8.75% Cash or 9.50% PIK, 6/1/23(1)(2) | 400,000 |
| 363,498 |
|
| CF Industries, Inc., 5.375%, 3/15/44 | 225,000 |
| 216,074 |
|
| Chemours Co. (The), 6.625%, 5/15/23 | 466,000 |
| 399,015 |
|
Consolidated Energy Finance SA, 6.50%, 5/15/26(1) | 450,000 |
| 381,844 |
|
Cornerstone Chemical Co., 6.75%, 8/15/24(1) | 550,000 |
| 459,935 |
|
|
| | | | | | |
| | Principal Amount/Shares | Value |
Element Solutions, Inc., 5.875%, 12/1/25(1) | $ | 400,000 |
| $ | 394,988 |
|
Foxtrot Escrow Issuer LLC / Foxtrot Escrow Corp., 12.25%, 11/15/26(1) | 1,375,000 |
| 1,080,230 |
|
Innophos Holdings, Inc., 9.375%, 2/15/28(1) | 675,000 |
| 659,813 |
|
Kraton Polymers LLC / Kraton Polymers Capital Corp., 7.00%, 4/15/25(1) | 325,000 |
| 290,365 |
|
NOVA Chemicals Corp., 5.25%, 6/1/27(1) | 900,000 |
| 763,245 |
|
Nufarm Australia Ltd. / Nufarm Americas, Inc., 5.75%, 4/30/26(1) | 375,000 |
| 330,763 |
|
OCI NV, 6.625%, 4/15/23(1) | 800,000 |
| 736,000 |
|
OCI NV, 5.25%, 11/1/24(1) | 600,000 |
| 525,000 |
|
| Olin Corp., 5.625%, 8/1/29 | 400,000 |
| 370,320 |
|
PQ Corp., 5.75%, 12/15/25(1) | 250,000 |
| 227,186 |
|
| Scotts Miracle-Gro Co. (The), 5.25%, 12/15/26 | 325,000 |
| 311,526 |
|
SPCM SA, 4.875%, 9/15/25(1) | 300,000 |
| 285,741 |
|
TPC Group, Inc., 10.50%, 8/1/24(1) | 800,000 |
| 660,204 |
|
Trinseo Materials Operating SCA / Trinseo Materials Finance, Inc., 5.375%, 9/1/25(1) | 900,000 |
| 765,000 |
|
Tronox Finance plc, 5.75%, 10/1/25(1) | 675,000 |
| 608,341 |
|
Tronox, Inc., 6.50%, 4/15/26(1) | 425,000 |
| 385,719 |
|
Valvoline, Inc., 4.25%, 2/15/30(1) | 250,000 |
| 233,906 |
|
| | | 10,448,713 |
|
| Commercial Services and Supplies — 1.8% | | |
| ADT Security Corp. (The), 6.25%, 10/15/21 | 325,000 |
| 319,462 |
|
Algeco Global Finance 2 plc, 10.00%, 8/15/23(1) | 800,000 |
| 588,000 |
|
Allied Universal HoldCo LLC / Allied Universal Finance Corp., 6.625%, 7/15/26(1) | 1,475,000 |
| 1,451,958 |
|
Allied Universal HoldCo LLC / Allied Universal Finance Corp., 9.75%, 7/15/27(1) | 1,650,000 |
| 1,566,456 |
|
Cimpress plc, 7.00%, 6/15/26(1) | 150,000 |
| 133,281 |
|
Clean Harbors, Inc., 4.875%, 7/15/27(1) | 275,000 |
| 270,724 |
|
Clean Harbors, Inc., 5.125%, 7/15/29(1) | 75,000 |
| 70,391 |
|
Garda World Security Corp., 4.625%, 2/15/27(1) | 400,000 |
| 361,000 |
|
GFL Environmental, Inc., 5.125%, 12/15/26(1) | 125,000 |
| 122,813 |
|
IAA, Inc., 5.50%, 6/15/27(1) | 400,000 |
| 389,220 |
|
KAR Auction Services, Inc., 5.125%, 6/1/25(1) | 475,000 |
| 456,596 |
|
Matthews International Corp., 5.25%, 12/1/25(1) | 400,000 |
| 357,506 |
|
Midas Intermediate Holdco II LLC / Midas Intermediate Holdco II Finance, Inc., 7.875%, 10/1/22(1) | 1,125,000 |
| 729,490 |
|
Nielsen Co. Luxembourg SARL (The), 5.50%, 10/1/21(1) | 550,000 |
| 542,713 |
|
| Nielsen Finance LLC / Nielsen Finance Co., 4.50%, 10/1/20 | 740,000 |
| 720,575 |
|
Nielsen Finance LLC / Nielsen Finance Co., 5.00%, 4/15/22(1) | 570,000 |
| 528,481 |
|
Prime Security Services Borrower LLC / Prime Finance, Inc., 5.25%, 4/15/24(1) | 250,000 |
| 248,511 |
|
Prime Security Services Borrower LLC / Prime Finance, Inc., 6.25%, 1/15/28(1) | 200,000 |
| 174,000 |
|
Ritchie Bros Auctioneers, Inc., 5.375%, 1/15/25(1) | 450,000 |
| 457,315 |
|
TMS International Holding Corp., 7.25%, 8/15/25(1) | 325,000 |
| 295,342 |
|
| | | 9,783,834 |
|
| Communications Equipment — 0.8% | | |
CommScope Technologies LLC, 6.00%, 6/15/25(1) | 1,875,000 |
| 1,730,063 |
|
|
| | | | | | |
| | Principal Amount/Shares | Value |
CommScope Technologies LLC, 5.00%, 3/15/27(1) | $ | 470,000 |
| $ | 411,285 |
|
CommScope, Inc., 5.00%, 6/15/21(1) | 37,000 |
| 36,952 |
|
CommScope, Inc., 5.50%, 3/1/24(1) | 600,000 |
| 610,953 |
|
CommScope, Inc., 6.00%, 3/1/26(1) | 25,000 |
| 25,103 |
|
CommScope, Inc., 8.25%, 3/1/27(1) | 300,000 |
| 290,835 |
|
| Nokia of America Corp., 6.45%, 3/15/29 | 425,000 |
| 456,875 |
|
| Nokia Oyj, 3.375%, 6/12/22 | 225,000 |
| 225,707 |
|
ViaSat, Inc., 5.625%, 4/15/27(1) | 425,000 |
| 422,046 |
|
| | | 4,209,819 |
|
| Construction and Engineering — 0.8% | | |
Aeropuertos Argentina 2000 SA, 6.875%, 2/1/27(1) | 980,000 |
| 571,179 |
|
Brand Industrial Services, Inc., 8.50%, 7/15/25(1) | 1,000,000 |
| 792,670 |
|
| Great Lakes Dredge & Dock Corp., 8.00%, 5/15/22 | 375,000 |
| 370,194 |
|
New Enterprise Stone & Lime Co., Inc., 10.125%, 4/1/22(1) | 475,000 |
| 477,820 |
|
New Enterprise Stone & Lime Co., Inc., 6.25%, 3/15/26(1) | 750,000 |
| 696,407 |
|
| Weekley Homes LLC / Weekley Finance Corp., 6.00%, 2/1/23 | 900,000 |
| 853,870 |
|
| Weekley Homes LLC / Weekley Finance Corp., 6.625%, 8/15/25 | 550,000 |
| 499,810 |
|
| | | 4,261,950 |
|
| Construction Materials — 0.6% | | |
Cemex SAB de CV, 5.45%, 11/19/29(1) | 1,200,000 |
| 978,300 |
|
| Summit Materials LLC / Summit Materials Finance Corp., 6.125%, 7/15/23 | 325,000 |
| 322,969 |
|
Summit Materials LLC / Summit Materials Finance Corp., 5.125%, 6/1/25(1) | 50,000 |
| 46,937 |
|
Summit Materials LLC / Summit Materials Finance Corp., 6.50%, 3/15/27(1) | 275,000 |
| 262,224 |
|
| US Concrete, Inc., 6.375%, 6/1/24 | 1,525,000 |
| 1,386,507 |
|
| | | 2,996,937 |
|
| Consumer Finance — 2.6% | | |
| Ally Financial, Inc., 3.875%, 5/21/24 | 425,000 |
| 385,158 |
|
| Ally Financial, Inc., 8.00%, 11/1/31 | 650,000 |
| 750,783 |
|
Credit Acceptance Corp., 5.125%, 12/31/24(1) | 400,000 |
| 367,000 |
|
| Credit Acceptance Corp., 6.625%, 3/15/26 | 425,000 |
| 403,750 |
|
Global Aircraft Leasing Co. Ltd., 6.50% Cash or 7.25% PIK, 9/15/24(1)(2) | 1,375,000 |
| 895,813 |
|
| Navient Corp., 5.00%, 10/26/20 | 990,000 |
| 978,565 |
|
| Navient Corp., 5.875%, 3/25/21 | 50,000 |
| 49,153 |
|
| Navient Corp., 7.25%, 9/25/23 | 950,000 |
| 938,096 |
|
| Navient Corp., 5.875%, 10/25/24 | 225,000 |
| 208,206 |
|
| Navient Corp., 6.75%, 6/25/25 | 2,625,000 |
| 2,434,687 |
|
| Navient Corp., 6.75%, 6/15/26 | 675,000 |
| 624,746 |
|
| Navient Corp., 5.00%, 3/15/27 | 125,000 |
| 108,400 |
|
| Navient Corp., MTN, 6.125%, 3/25/24 | 460,000 |
| 433,564 |
|
Park Aerospace Holdings Ltd., 3.625%, 3/15/21(1) | 550,000 |
| 521,555 |
|
Park Aerospace Holdings Ltd., 5.25%, 8/15/22(1) | 965,000 |
| 873,175 |
|
| Springleaf Finance Corp., 8.25%, 12/15/20 | 125,000 |
| 125,844 |
|
| Springleaf Finance Corp., 6.875%, 3/15/25 | 1,125,000 |
| 1,141,414 |
|
| Springleaf Finance Corp., 7.125%, 3/15/26 | 1,875,000 |
| 1,845,703 |
|
|
| | | | | | |
| | Principal Amount/Shares | Value |
| Springleaf Finance Corp., 6.625%, 1/15/28 | $ | 775,000 |
| $ | 730,011 |
|
| Springleaf Finance Corp., 5.375%, 11/15/29 | 225,000 |
| 207,241 |
|
| | | 14,022,864 |
|
| Containers and Packaging — 2.3% | | |
ARD Finance SA, 6.50% Cash or 7.25% PIK, 6/30/27(1)(2) | 1,600,000 |
| 1,383,120 |
|
Ardagh Packaging Finance plc / Ardagh Holdings USA, Inc., 6.00%, 2/15/25(1) | 285,000 |
| 287,935 |
|
| Berry Global, Inc., 6.00%, 10/15/22 | 425,000 |
| 423,540 |
|
Berry Global, Inc., 4.875%, 7/15/26(1) | 525,000 |
| 533,202 |
|
Cascades, Inc. / Cascades USA, Inc., 5.125%, 1/15/26(1) | 125,000 |
| 121,875 |
|
Cascades, Inc. / Cascades USA, Inc., 5.375%, 1/15/28(1) | 125,000 |
| 120,313 |
|
Flex Acquisition Co., Inc., 6.875%, 1/15/25(1) | 225,000 |
| 212,056 |
|
Flex Acquisition Co., Inc., 7.875%, 7/15/26(1) | 600,000 |
| 556,819 |
|
Graphic Packaging International LLC, 4.75%, 7/15/27(1) | 275,000 |
| 271,299 |
|
Greif, Inc., 6.50%, 3/1/27(1) | 575,000 |
| 554,674 |
|
Mauser Packaging Solutions Holding Co., 5.50%, 4/15/24(1) | 250,000 |
| 231,868 |
|
Mauser Packaging Solutions Holding Co., 7.25%, 4/15/25(1) | 2,425,000 |
| 1,855,198 |
|
OI European Group BV, 4.00%, 3/15/23(1) | 225,000 |
| 215,718 |
|
Owens-Brockway Glass Container, Inc., 5.00%, 1/15/22(1) | 375,000 |
| 380,809 |
|
Owens-Brockway Glass Container, Inc., 5.875%, 8/15/23(1) | 625,000 |
| 616,409 |
|
Plastipak Holdings, Inc., 6.25%, 10/15/25(1) | 275,000 |
| 248,187 |
|
Reynolds Group Issuer, Inc. / Reynolds Group Issuer LLC / Reynolds Group Issuer Lu, 7.00%, 7/15/24(1) | 1,590,000 |
| 1,624,781 |
|
Sealed Air Corp., 5.125%, 12/1/24(1) | 610,000 |
| 617,625 |
|
Sealed Air Corp., 4.00%, 12/1/27(1) | 725,000 |
| 679,760 |
|
Silgan Holdings, Inc., 4.125%, 2/1/28(1) | 250,000 |
| 232,500 |
|
Trident TPI Holdings, Inc., 9.25%, 8/1/24(1) | 500,000 |
| 419,372 |
|
Trident TPI Holdings, Inc., 6.625%, 11/1/25(1) | 275,000 |
| 223,095 |
|
Trivium Packaging Finance BV, 5.50%, 8/15/26(1) | 600,000 |
| 600,373 |
|
| | | 12,410,528 |
|
| Distributors — 0.4% | | |
| Anixter, Inc., 6.00%, 12/1/25 | 350,000 |
| 345,623 |
|
Performance Food Group, Inc., 5.50%, 6/1/24(1) | 975,000 |
| 915,277 |
|
Performance Food Group, Inc., 5.50%, 10/15/27(1) | 350,000 |
| 327,276 |
|
Univar Solutions USA, Inc., 5.125%, 12/1/27(1) | 800,000 |
| 732,440 |
|
| | | 2,320,616 |
|
| Diversified Consumer Services — 0.3% | | |
GEMS MENASA Cayman Ltd. / GEMS Education Delaware LLC, 7.125%, 7/31/26(1) | 350,000 |
| 293,302 |
|
Graham Holdings Co., 5.75%, 6/1/26(1) | 650,000 |
| 642,552 |
|
| Service Corp. International/US, 5.125%, 6/1/29 | 300,000 |
| 307,665 |
|
Sotheby's, 7.375%, 10/15/27(1) | 400,000 |
| 321,220 |
|
| | | 1,564,739 |
|
| Diversified Financial Services — 0.9% | | |
Cardtronics, Inc. / Cardtronics USA, Inc., 5.50%, 5/1/25(1) | 200,000 |
| 191,749 |
|
Fairstone Financial, Inc., 7.875%, 7/15/24(1) | 750,000 |
| 711,559 |
|
Jefferies Finance LLC / JFIN Co-Issuer Corp., 6.25%, 6/3/26(1) | 600,000 |
| 559,270 |
|
MPH Acquisition Holdings LLC, 7.125%, 6/1/24(1) | 925,000 |
| 811,715 |
|
|
| | | | | | |
| | Principal Amount/Shares | Value |
Oxford Finance LLC / Oxford Finance Co-Issuer II, Inc., 6.375%, 12/15/22(1) | $ | 650,000 |
| $ | 632,733 |
|
Refinitiv US Holdings, Inc., 6.25%, 5/15/26(1) | 325,000 |
| 337,366 |
|
Refinitiv US Holdings, Inc., 8.25%, 11/15/26(1) | 525,000 |
| 555,188 |
|
Verscend Escrow Corp., 9.75%, 8/15/26(1) | 800,000 |
| 804,556 |
|
VistaJet Malta Finance plc / XO Management Holding, Inc., 10.50%, 6/1/24(1) | 550,000 |
| 448,253 |
|
| | | 5,052,389 |
|
| Diversified Telecommunication Services — 5.7% | | |
Altice France Holding SA, 10.50%, 5/15/27(1) | 1,200,000 |
| 1,272,000 |
|
Altice France Holding SA, 6.00%, 2/15/28(1) | 1,200,000 |
| 1,064,616 |
|
Altice France SA, 7.375%, 5/1/26(1) | 2,560,000 |
| 2,599,808 |
|
Altice France SA, 8.125%, 2/1/27(1) | 400,000 |
| 419,220 |
|
Altice France SA, 5.50%, 1/15/28(1) | 1,000,000 |
| 941,850 |
|
| CenturyLink, Inc., 5.625%, 4/1/20 | 1,995,000 |
| 1,995,000 |
|
| CenturyLink, Inc., 6.45%, 6/15/21 | 200,000 |
| 204,100 |
|
| CenturyLink, Inc., 5.80%, 3/15/22 | 550,000 |
| 558,063 |
|
| CenturyLink, Inc., 6.75%, 12/1/23 | 350,000 |
| 374,169 |
|
| CenturyLink, Inc., 7.50%, 4/1/24 | 550,000 |
| 605,690 |
|
CenturyLink, Inc., 5.125%, 12/15/26(1) | 650,000 |
| 651,625 |
|
Cogent Communications Group, Inc., 5.375%, 3/1/22(1) | 50,000 |
| 50,672 |
|
Connect Finco SARL / Connect US Finco LLC, 6.75%, 10/1/26(1) | 1,000,000 |
| 830,000 |
|
Digicel Group Two Ltd., 8.25%, 9/30/22(1) | 1,803,000 |
| 315,525 |
|
| Embarq Corp., 8.00%, 6/1/36 | 1,725,000 |
| 1,716,936 |
|
Frontier Communications Corp., 10.50%, 9/15/22(3)(4) | 4,450,000 |
| 1,200,103 |
|
Frontier Communications Corp., 8.50%, 4/1/26(1)(3) | 375,000 |
| 344,794 |
|
Frontier Communications Corp., 8.00%, 4/1/27(1)(3) | 725,000 |
| 719,077 |
|
Intelsat Connect Finance SA, 9.50%, 2/15/23(1)(3) | 1,825,000 |
| 684,375 |
|
Intelsat Jackson Holdings SA, 8.00%, 2/15/24(1)(3) | 75,000 |
| 72,937 |
|
Intelsat Jackson Holdings SA, 8.50%, 10/15/24(1)(3) | 1,550,000 |
| 985,730 |
|
Intelsat Jackson Holdings SA, 9.75%, 7/15/25(1)(3) | 2,425,000 |
| 1,530,793 |
|
Intelsat Luxembourg SA, 7.75%, 6/1/21(3) | 75,000 |
| 38,063 |
|
Intelsat Luxembourg SA, 8.125%, 6/1/23(3) | 600,000 |
| 127,500 |
|
| Level 3 Financing, Inc., 5.375%, 8/15/22 | 1,177,000 |
| 1,183,768 |
|
| Level 3 Financing, Inc., 5.625%, 2/1/23 | 425,000 |
| 422,357 |
|
| Level 3 Financing, Inc., 5.375%, 5/1/25 | 475,000 |
| 475,596 |
|
Qualitytech LP / QTS Finance Corp., 4.75%, 11/15/25(1) | 500,000 |
| 486,872 |
|
| Qwest Corp., 6.75%, 12/1/21 | 450,000 |
| 459,394 |
|
| Sprint Capital Corp., 6.875%, 11/15/28 | 375,000 |
| 430,406 |
|
| Sprint Capital Corp., 8.75%, 3/15/32 | 3,695,000 |
| 4,907,145 |
|
| Telecom Italia Capital SA, 6.00%, 9/30/34 | 1,285,000 |
| 1,281,103 |
|
| Telecom Italia Capital SA, 7.20%, 7/18/36 | 175,000 |
| 182,490 |
|
Telecom Italia SpA, 5.30%, 5/30/24(1) | 125,000 |
| 126,566 |
|
Telesat Canada / Telesat LLC, 4.875%, 6/1/27(1) | 400,000 |
| 384,920 |
|
Telesat Canada / Telesat LLC, 6.50%, 10/15/27(1) | 625,000 |
| 603,469 |
|
Windstream Services LLC / Windstream Finance Corp., 10.50%, 6/30/24(1)(3)(4) | 475,000 |
| 23,750 |
|
| | | 30,270,482 |
|
|
| | | | | | |
| | Principal Amount/Shares | Value |
| Electric Utilities — 1.9% | | |
Drax Finco plc, 6.625%, 11/1/25(1) | $ | 600,000 |
| $ | 605,253 |
|
NextEra Energy Operating Partners LP, 4.25%, 7/15/24(1) | 725,000 |
| 711,410 |
|
NextEra Energy Operating Partners LP, 4.25%, 9/15/24(1) | 450,000 |
| 441,565 |
|
NextEra Energy Operating Partners LP, 3.875%, 10/15/26(1) | 1,025,000 |
| 979,512 |
|
| NRG Energy, Inc., 7.25%, 5/15/26 | 320,000 |
| 336,976 |
|
Pacific Gas & Electric Co., 3.25%, 6/15/23(3)(4) | 200,000 |
| 193,749 |
|
Pacific Gas & Electric Co., 6.05%, 3/1/34(3)(4) | 1,150,000 |
| 1,167,882 |
|
Pacific Gas & Electric Co., 5.80%, 3/1/37(3)(4) | 825,000 |
| 843,810 |
|
Pacific Gas & Electric Co., 5.40%, 1/15/40(3)(4) | 600,000 |
| 613,680 |
|
Pacific Gas & Electric Co., 5.125%, 11/15/43(3)(4) | 850,000 |
| 858,759 |
|
Pacific Gas & Electric Co., 4.00%, 12/1/46(3)(4) | 150,000 |
| 137,670 |
|
Talen Energy Supply LLC, 10.50%, 1/15/26(1) | 900,000 |
| 654,271 |
|
Talen Energy Supply LLC, 7.25%, 5/15/27(1) | 175,000 |
| 159,119 |
|
Talen Energy Supply LLC, 6.625%, 1/15/28(1) | 350,000 |
| 296,260 |
|
Vistra Operations Co. LLC, 3.55%, 7/15/24(1) | 600,000 |
| 565,830 |
|
Vistra Operations Co. LLC, 5.625%, 2/15/27(1) | 225,000 |
| 233,280 |
|
Vistra Operations Co. LLC, 5.00%, 7/31/27(1) | 1,200,000 |
| 1,224,660 |
|
| | | 10,023,686 |
|
| Electronic Equipment, Instruments and Components — 0.1% | | |
MTS Systems Corp., 5.75%, 8/15/27(1) | 325,000 |
| 304,214 |
|
TTM Technologies, Inc., 5.625%, 10/1/25(1) | 475,000 |
| 403,154 |
|
| | | 707,368 |
|
| Energy Equipment and Services — 1.5% | | |
| Apergy Corp., 6.375%, 5/1/26 | 275,000 |
| 214,099 |
|
Archrock Partners LP / Archrock Partners Finance Corp., 6.875%, 4/1/27(1) | 400,000 |
| 286,827 |
|
Archrock Partners LP / Archrock Partners Finance Corp., 6.25%, 4/1/28(1) | 700,000 |
| 488,250 |
|
Basic Energy Services, Inc., 10.75%, 10/15/23(1) | 175,000 |
| 87,500 |
|
Calfrac Holdings LP, 8.50%, 6/15/26(1) | 275,000 |
| 23,375 |
|
Diamond Offshore Drilling, Inc., 3.45%, 11/1/23(3) | 250,000 |
| 75,936 |
|
Diamond Offshore Drilling, Inc., 7.875%, 8/15/25(3) | 850,000 |
| 224,719 |
|
Diamond Offshore Drilling, Inc., 5.70%, 10/15/39(3) | 275,000 |
| 45,459 |
|
Ensign Drilling, Inc., 9.25%, 4/15/24(1) | 975,000 |
| 365,596 |
|
| Exterran Energy Solutions LP / EES Finance Corp., 8.125%, 5/1/25 | 425,000 |
| 282,625 |
|
| FTS International, Inc., 6.25%, 5/1/22 | 1,185,000 |
| 421,784 |
|
KCA Deutag UK Finance plc, 9.625%, 4/1/23(1) | 400,000 |
| 145,374 |
|
Nabors Industries Ltd., 7.25%, 1/15/26(1) | 400,000 |
| 139,000 |
|
Nabors Industries Ltd., 7.50%, 1/15/28(1) | 300,000 |
| 98,250 |
|
| Nabors Industries, Inc., 5.75%, 2/1/25 | 1,700,000 |
| 388,867 |
|
Nine Energy Service, Inc., 8.75%, 11/1/23(1) | 300,000 |
| 77,955 |
|
| Noble Holding International Ltd., 7.75%, 1/15/24 | 323,000 |
| 31,895 |
|
Noble Holding International Ltd., 7.875%, 2/1/26(1) | 1,075,000 |
| 267,183 |
|
| Noble Holding International Ltd., 6.20%, 8/1/40 | 175,000 |
| 11,428 |
|
| Noble Holding International Ltd., 8.95%, 4/1/45 | 200,000 |
| 12,061 |
|
| Precision Drilling Corp., 5.25%, 11/15/24 | 500,000 |
| 179,373 |
|
|
| | | | | | |
| | Principal Amount/Shares | Value |
Precision Drilling Corp., 7.125%, 1/15/26(1) | $ | 550,000 |
| $ | 186,198 |
|
SESI LLC, 7.125%, 12/15/21(1) | 875,000 |
| 378,438 |
|
| SESI LLC, 7.75%, 9/15/24 | 300,000 |
| 80,624 |
|
Shelf Drilling Holdings Ltd., 8.25%, 2/15/25(1) | 1,075,000 |
| 540,725 |
|
Transocean Guardian Ltd., 5.875%, 1/15/24(1) | 688,875 |
| 556,246 |
|
Transocean Pontus Ltd., 6.125%, 8/1/25(1) | 438,375 |
| 358,358 |
|
Transocean Poseidon Ltd., 6.875%, 2/1/27(1) | 150,000 |
| 122,545 |
|
Transocean Sentry Ltd., 5.375%, 5/15/23(1) | 375,000 |
| 317,801 |
|
Transocean, Inc., 7.25%, 11/1/25(1) | 300,000 |
| 153,081 |
|
Transocean, Inc., 8.00%, 2/1/27(1) | 1,175,000 |
| 562,531 |
|
| Transocean, Inc., 7.50%, 4/15/31 | 1,000,000 |
| 262,425 |
|
| Transocean, Inc., 6.80%, 3/15/38 | 200,000 |
| 47,560 |
|
| Transocean, Inc., 9.35%, 12/15/41 | 175,000 |
| 43,751 |
|
| USA Compression Partners LP / USA Compression Finance Corp., 6.875%, 4/1/26 | 625,000 |
| 394,139 |
|
| USA Compression Partners LP / USA Compression Finance Corp., 6.875%, 9/1/27 | 575,000 |
| 359,691 |
|
| | | 8,231,669 |
|
| Entertainment — 1.2% | | |
Allen Media LLC / Allen Media Co-Issuer, Inc., 10.50%, 2/15/28(1) | 400,000 |
| 329,710 |
|
| AMC Entertainment Holdings, Inc., 5.875%, 11/15/26 | 1,025,000 |
| 432,517 |
|
| AMC Entertainment Holdings, Inc., 6.125%, 5/15/27 | 175,000 |
| 73,951 |
|
Banijay Entertainment SASU, 5.375%, 3/1/25(1) | 200,000 |
| 184,500 |
|
| Cinemark USA, Inc., 5.125%, 12/15/22 | 610,000 |
| 487,046 |
|
| Cinemark USA, Inc., 4.875%, 6/1/23 | 300,000 |
| 226,491 |
|
Lions Gate Capital Holdings LLC, 6.375%, 2/1/24(1) | 900,000 |
| 798,723 |
|
Lions Gate Capital Holdings LLC, 5.875%, 11/1/24(1) | 250,000 |
| 215,139 |
|
Live Nation Entertainment, Inc., 5.625%, 3/15/26(1) | 650,000 |
| 584,052 |
|
| Netflix, Inc., 5.375%, 2/1/21 | 450,000 |
| 456,412 |
|
| Netflix, Inc., 6.375%, 5/15/29 | 1,950,000 |
| 2,136,322 |
|
Netflix, Inc., 5.375%, 11/15/29(1) | 525,000 |
| 551,539 |
|
| | | 6,476,402 |
|
| Equity Real Estate Investment Trusts (REITs) — 1.7% | | |
ESH Hospitality, Inc., 5.25%, 5/1/25(1) | 200,000 |
| 169,251 |
|
ESH Hospitality, Inc., 4.625%, 10/1/27(1) | 550,000 |
| 432,052 |
|
| FelCor Lodging LP, 6.00%, 6/1/25 | 1,280,000 |
| 1,233,594 |
|
| GEO Group, Inc. (The), 5.875%, 10/15/24 | 50,000 |
| 35,437 |
|
| GEO Group, Inc. (The), 6.00%, 4/15/26 | 50,000 |
| 32,848 |
|
| GLP Capital LP / GLP Financing II, Inc., 5.375%, 11/1/23 | 500,000 |
| 460,070 |
|
| GLP Capital LP / GLP Financing II, Inc., 5.25%, 6/1/25 | 150,000 |
| 139,871 |
|
| GLP Capital LP / GLP Financing II, Inc., 5.375%, 4/15/26 | 310,000 |
| 276,505 |
|
HAT Holdings I LLC / HAT Holdings II LLC, 5.25%, 7/15/24(1) | 525,000 |
| 507,284 |
|
| Iron Mountain, Inc., 5.75%, 8/15/24 | 620,000 |
| 621,531 |
|
Iron Mountain, Inc., 4.875%, 9/15/29(1) | 775,000 |
| 733,419 |
|
| MGM Growth Properties Operating Partnership LP / MGP Finance Co-Issuer, Inc., 5.75%, 2/1/27 | 200,000 |
| 174,750 |
|
| MPT Operating Partnership LP / MPT Finance Corp., 5.50%, 5/1/24 | 400,000 |
| 390,500 |
|
|
| | | | | | |
| | Principal Amount/Shares | Value |
| SBA Communications Corp., 4.00%, 10/1/22 | $ | 125,000 |
| $ | 125,897 |
|
SBA Communications Corp., 3.875%, 2/15/27(1) | 925,000 |
| 934,250 |
|
Uniti Group LP / Uniti Fiber Holdings, Inc. / CSL Capital LLC, 7.125%, 12/15/24(1) | 1,615,000 |
| 1,211,783 |
|
Uniti Group LP / Uniti Fiber Holdings, Inc. / CSL Capital LLC, 7.875%, 2/15/25(1) | 950,000 |
| 890,625 |
|
VICI Properties LP / VICI Note Co., Inc., 4.25%, 12/1/26(1) | 200,000 |
| 184,601 |
|
VICI Properties LP / VICI Note Co., Inc., 3.75%, 2/15/27(1) | 250,000 |
| 237,031 |
|
VICI Properties LP / VICI Note Co., Inc., 4.125%, 8/15/30(1) | 250,000 |
| 238,281 |
|
| | | 9,029,580 |
|
| Food and Staples Retailing — 0.8% | | |
Albertsons Cos., Inc. / Safeway, Inc. / New Albertsons LP / Albertsons LLC, 3.50%, 2/15/23(1) | 450,000 |
| 446,400 |
|
| Albertsons Cos., Inc. / Safeway, Inc. / New Albertsons LP / Albertsons LLC, 6.625%, 6/15/24 | 1,050,000 |
| 1,073,594 |
|
| Albertsons Cos., Inc. / Safeway, Inc. / New Albertsons LP / Albertsons LLC, 5.75%, 3/15/25 | 200,000 |
| 201,501 |
|
Albertsons Cos., Inc. / Safeway, Inc. / New Albertsons LP / Albertsons LLC, 4.625%, 1/15/27(1) | 775,000 |
| 775,426 |
|
Albertsons Cos., Inc. / Safeway, Inc. / New Albertsons LP / Albertsons LLC, 4.875%, 2/15/30(1) | 575,000 |
| 573,563 |
|
| Ingles Markets, Inc., 5.75%, 6/15/23 | 156,000 |
| 156,385 |
|
Rite Aid Corp., 6.125%, 4/1/23(1) | 290,000 |
| 251,575 |
|
Rite Aid Corp., 7.50%, 7/1/25(1) | 110,000 |
| 105,325 |
|
Sysco Corp., 5.65%, 4/1/25(5) | 75,000 |
| 78,176 |
|
Sysco Corp., 6.60%, 4/1/40(5) | 50,000 |
| 53,791 |
|
Sysco Corp., 6.60%, 4/1/50(5) | 275,000 |
| 299,829 |
|
| | | 4,015,565 |
|
| Food Products — 3.6% | | |
Chobani LLC / Chobani Finance Corp., Inc., 7.50%, 4/15/25(1) | 550,000 |
| 504,608 |
|
Cooke Omega Investments, Inc. / Alpha VesselCo Holdings, Inc., 8.50%, 12/15/22(1) | 950,000 |
| 943,764 |
|
Darling Ingredients, Inc., 5.25%, 4/15/27(1) | 300,000 |
| 293,000 |
|
HLF Financing Sarl LLC / Herbalife International, Inc., 7.25%, 8/15/26(1) | 100,000 |
| 85,375 |
|
JBS Investments II GmbH, 7.00%, 1/15/26(1) | 400,000 |
| 400,816 |
|
JBS Investments II GmbH, 5.75%, 1/15/28(1) | 400,000 |
| 390,420 |
|
JBS USA LUX SA / JBS USA Finance, Inc., 5.75%, 6/15/25(1) | 1,365,000 |
| 1,390,587 |
|
JBS USA LUX SA / JBS USA Food Co. / JBS USA Finance, Inc., 6.50%, 4/15/29(1) | 25,000 |
| 26,956 |
|
JBS USA LUX SA / JBS USA Food Co. / JBS USA Finance, Inc., 5.50%, 1/15/30(1) | 775,000 |
| 804,489 |
|
KeHE Distributors LLC / KeHE Finance Corp., 8.625%, 10/15/26(1) | 200,000 |
| 202,125 |
|
| Kraft Heinz Foods Co., 4.625%, 1/30/29 | 125,000 |
| 126,274 |
|
Kraft Heinz Foods Co., 3.75%, 4/1/30(1) | 200,000 |
| 191,221 |
|
| Kraft Heinz Foods Co., 5.00%, 7/15/35 | 975,000 |
| 975,880 |
|
| Kraft Heinz Foods Co., 6.875%, 1/26/39 | 325,000 |
| 374,031 |
|
| Kraft Heinz Foods Co., 6.50%, 2/9/40 | 1,175,000 |
| 1,290,245 |
|
| Kraft Heinz Foods Co., 5.00%, 6/4/42 | 500,000 |
| 476,104 |
|
| Kraft Heinz Foods Co., 5.20%, 7/15/45 | 1,175,000 |
| 1,136,367 |
|
| Kraft Heinz Foods Co., 4.375%, 6/1/46 | 3,050,000 |
| 2,765,203 |
|
|
| | | | | | |
| | Principal Amount/Shares | Value |
Kraft Heinz Foods Co., 4.875%, 10/1/49(1) | $ | 1,600,000 |
| $ | 1,463,113 |
|
Pilgrim's Pride Corp., 5.75%, 3/15/25(1) | 1,030,000 |
| 1,041,593 |
|
Pilgrim's Pride Corp., 5.875%, 9/30/27(1) | 525,000 |
| 526,024 |
|
Post Holdings, Inc., 5.75%, 3/1/27(1) | 2,925,000 |
| 3,017,657 |
|
Post Holdings, Inc., 4.625%, 4/15/30(1) | 400,000 |
| 386,000 |
|
US Foods, Inc., 5.875%, 6/15/24(1) | 350,000 |
| 318,061 |
|
| | | 19,129,913 |
|
| Gas Utilities — 0.2% | | |
| AmeriGas Partners LP / AmeriGas Finance Corp., 5.75%, 5/20/27 | 1,045,000 |
| 979,262 |
|
| Health Care Equipment and Supplies — 0.1% | | |
Hill-Rom Holdings, Inc., 4.375%, 9/15/27(1) | 250,000 |
| 248,386 |
|
Ortho-Clinical Diagnostics, Inc. / Ortho-Clinical Diagnostics SA, 6.625%, 5/15/22(1) | 185,000 |
| 176,209 |
|
| | | 424,595 |
|
| Health Care Providers and Services — 4.0% | | |
ASP AMC Merger Sub, Inc., 8.00%, 5/15/25(1) | 1,200,000 |
| 700,494 |
|
Catalent Pharma Solutions, Inc., 5.00%, 7/15/27(1) | 225,000 |
| 219,499 |
|
| Centene Corp., 4.75%, 5/15/22 | 1,325,000 |
| 1,338,700 |
|
Centene Corp., 4.75%, 1/15/25(1) | 1,300,000 |
| 1,324,381 |
|
Centene Corp., 4.25%, 12/15/27(1) | 1,325,000 |
| 1,334,871 |
|
Centene Corp., 4.625%, 12/15/29(1) | 100,000 |
| 101,055 |
|
| CHS / Community Health Systems, Inc., 6.875%, 2/1/22 | 422,000 |
| 319,665 |
|
CHS / Community Health Systems, Inc., 8.625%, 1/15/24(1) | 575,000 |
| 571,929 |
|
CHS / Community Health Systems, Inc., 8.125%, 6/30/24(1) | 422,000 |
| 295,548 |
|
CHS / Community Health Systems, Inc., 8.00%, 3/15/26(1) | 875,000 |
| 836,169 |
|
CHS / Community Health Systems, Inc., 8.00%, 12/15/27(1) | 172,000 |
| 159,530 |
|
CHS / Community Health Systems, Inc., 6.875%, 4/1/28(1) | 545,000 |
| 220,725 |
|
CHS / Community Health Systems, Inc., VRN, 9.875%, 6/30/23(1) | 1,110,000 |
| 875,507 |
|
CHS/Community Health Systems, Inc., 6.625%, 2/15/25(1) | 1,000,000 |
| 932,500 |
|
| Encompass Health Corp., 5.75%, 11/1/24 | 315,000 |
| 318,451 |
|
| Encompass Health Corp., 4.75%, 2/1/30 | 200,000 |
| 198,110 |
|
Envision Healthcare Corp., 8.75%, 10/15/26(1) | 1,225,000 |
| 307,527 |
|
| HCA, Inc., 5.875%, 5/1/23 | 325,000 |
| 341,291 |
|
| HCA, Inc., 7.69%, 6/15/25 | 1,730,000 |
| 1,831,629 |
|
| HCA, Inc., 5.875%, 2/15/26 | 625,000 |
| 654,344 |
|
| HCA, Inc., 5.375%, 9/1/26 | 775,000 |
| 804,121 |
|
| HCA, Inc., 5.625%, 9/1/28 | 1,795,000 |
| 1,888,789 |
|
| HCA, Inc., 3.50%, 9/1/30 | 50,000 |
| 45,569 |
|
IQVIA, Inc., 5.00%, 5/15/27(1) | 425,000 |
| 437,524 |
|
LifePoint Health, Inc., 4.375%, 2/15/27(1) | 225,000 |
| 213,637 |
|
MEDNAX, Inc., 6.25%, 1/15/27(1) | 375,000 |
| 303,778 |
|
Polaris Intermediate Corp., 8.50% Cash or 9.25% PIK, 12/1/22(1)(2) | 875,000 |
| 684,670 |
|
Radiology Partners, Inc., 9.25%, 2/1/28(1) | 125,000 |
| 109,156 |
|
Select Medical Corp., 6.25%, 8/15/26(1) | 550,000 |
| 553,028 |
|
| Tenet Healthcare Corp., 8.125%, 4/1/22 | 75,000 |
| 71,276 |
|
| Tenet Healthcare Corp., 6.75%, 6/15/23 | 580,000 |
| 538,678 |
|
| Tenet Healthcare Corp., 4.625%, 7/15/24 | 706,000 |
| 675,995 |
|
|
| | | | | | |
| | Principal Amount/Shares | Value |
Tenet Healthcare Corp., 4.625%, 9/1/24(1) | $ | 425,000 |
| $ | 409,190 |
|
Tenet Healthcare Corp., 4.875%, 1/1/26(1) | 825,000 |
| 788,906 |
|
Tenet Healthcare Corp., 6.25%, 2/1/27(1) | 150,000 |
| 146,812 |
|
Tenet Healthcare Corp., 5.125%, 11/1/27(1) | 125,000 |
| 119,844 |
|
West Street Merger Sub, Inc., 6.375%, 9/1/25(1) | 600,000 |
| 527,502 |
|
| | | 21,200,400 |
|
| Hotels, Restaurants and Leisure — 6.7% | | |
1011778 BC ULC / New Red Finance, Inc., 4.25%, 5/15/24(1) | 325,000 |
| 326,217 |
|
1011778 BC ULC / New Red Finance, Inc., 5.00%, 10/15/25(1) | 2,850,000 |
| 2,739,548 |
|
1011778 BC ULC / New Red Finance, Inc., 4.375%, 1/15/28(1) | 400,000 |
| 371,780 |
|
Aramark Services, Inc., 5.00%, 4/1/25(1) | 250,000 |
| 238,518 |
|
Arrow Bidco LLC, 9.50%, 3/15/24(1) | 200,000 |
| 91,749 |
|
| Boyd Gaming Corp., 6.375%, 4/1/26 | 350,000 |
| 304,693 |
|
| Boyd Gaming Corp., 6.00%, 8/15/26 | 1,450,000 |
| 1,259,387 |
|
Boyne USA, Inc., 7.25%, 5/1/25(1) | 771,000 |
| 743,047 |
|
Caesars Resort Collection LLC / CRC Finco, Inc., 5.25%, 10/15/25(1) | 1,125,000 |
| 820,912 |
|
Carlson Travel, Inc., 9.50%, 12/15/24(1) | 800,000 |
| 534,996 |
|
Churchill Downs, Inc., 5.50%, 4/1/27(1) | 475,000 |
| 450,324 |
|
Churchill Downs, Inc., 4.75%, 1/15/28(1) | 500,000 |
| 437,775 |
|
Downstream Development Authority of the Quapaw Tribe of Oklahoma, 10.50%, 2/15/23(1) | 575,000 |
| 465,028 |
|
| Eldorado Resorts, Inc., 7.00%, 8/1/23 | 2,315,000 |
| 2,097,980 |
|
| Eldorado Resorts, Inc., 6.00%, 4/1/25 | 625,000 |
| 566,409 |
|
Enterprise Development Authority (The), 12.00%, 7/15/24(1) | 1,025,000 |
| 900,714 |
|
Gateway Casinos & Entertainment Ltd., 8.25%, 3/1/24(1) | 1,150,000 |
| 1,010,557 |
|
Golden Entertainment, Inc., 7.625%, 4/15/26(1) | 850,000 |
| 567,050 |
|
Golden Nugget, Inc., 6.75%, 10/15/24(1) | 2,450,000 |
| 1,561,532 |
|
Golden Nugget, Inc., 8.75%, 10/1/25(1) | 1,500,000 |
| 785,580 |
|
| Hilton Domestic Operating Co., Inc., 5.125%, 5/1/26 | 1,425,000 |
| 1,376,611 |
|
Inn of the Mountain Gods Resort & Casino, 9.25% Cash or 9.25% PIK, 11/30/20(2) | 319,365 |
| 317,768 |
|
IRB Holding Corp., 6.75%, 2/15/26(1) | 425,000 |
| 338,494 |
|
Jacobs Entertainment, Inc., 7.875%, 2/1/24(1) | 550,000 |
| 468,185 |
|
KFC Holding Co. / Pizza Hut Holdings LLC / Taco Bell of America LLC, 4.75%, 6/1/27(1) | 850,000 |
| 804,922 |
|
LTF Merger Sub, Inc., 8.50%, 6/15/23(1) | 2,775,000 |
| 2,299,767 |
|
Marriott Ownership Resorts, Inc., 4.75%, 1/15/28(1) | 200,000 |
| 151,709 |
|
| Marriott Ownership Resorts, Inc. / ILG LLC, 6.50%, 9/15/26 | 100,000 |
| 87,562 |
|
Melco Resorts Finance Ltd., 5.25%, 4/26/26(1) | 800,000 |
| 726,062 |
|
Melco Resorts Finance Ltd., 5.625%, 7/17/27(1) | 400,000 |
| 351,680 |
|
Melco Resorts Finance Ltd., 5.375%, 12/4/29(1) | 600,000 |
| 522,016 |
|
Merlin Entertainments Ltd., 5.75%, 6/15/26(1) | 800,000 |
| 682,834 |
|
MGM China Holdings Ltd., 5.375%, 5/15/24(1) | 400,000 |
| 379,622 |
|
MGM China Holdings Ltd., 5.875%, 5/15/26(1) | 200,000 |
| 177,124 |
|
| MGM Resorts International, 7.75%, 3/15/22 | 980,000 |
| 975,943 |
|
| MGM Resorts International, 6.00%, 3/15/23 | 2,100,000 |
| 2,039,635 |
|
Mohegan Gaming & Entertainment, 7.875%, 10/15/24(1) | 2,125,000 |
| 1,591,083 |
|
|
| | | | | | |
| | Principal Amount/Shares | Value |
Motion Bondco DAC, 6.625%, 11/15/27(1) | $ | 200,000 |
| $ | 145,000 |
|
Nathan's Famous, Inc., 6.625%, 11/1/25(1) | 825,000 |
| 771,375 |
|
NCL Corp. Ltd., 3.625%, 12/15/24(1) | 75,000 |
| 48,398 |
|
Scientific Games International, Inc., 8.25%, 3/15/26(1) | 350,000 |
| 226,006 |
|
Scientific Games International, Inc., 7.00%, 5/15/28(1) | 1,150,000 |
| 713,633 |
|
Scientific Games International, Inc., 7.25%, 11/15/29(1) | 475,000 |
| 296,614 |
|
Speedway Motorsports LLC / Speedway Funding II, Inc., 4.875%, 11/1/27(1) | 250,000 |
| 226,875 |
|
Twin River Worldwide Holdings, Inc., 6.75%, 6/1/27(1) | 225,000 |
| 170,672 |
|
Viking Cruises Ltd., 6.25%, 5/15/25(1) | 600,000 |
| 389,247 |
|
Viking Cruises Ltd., 5.875%, 9/15/27(1) | 100,000 |
| 59,066 |
|
Wyndham Destinations, Inc., 4.625%, 3/1/30(1) | 250,000 |
| 193,906 |
|
Wynn Las Vegas LLC / Wynn Las Vegas Capital Corp., 5.50%, 3/1/25(1) | 250,000 |
| 234,368 |
|
Wynn Las Vegas LLC / Wynn Las Vegas Capital Corp., 5.25%, 5/15/27(1) | 725,000 |
| 658,844 |
|
Wynn Macau Ltd., 4.875%, 10/1/24(1) | 800,000 |
| 754,996 |
|
Wynn Macau Ltd., 5.50%, 10/1/27(1) | 400,000 |
| 357,593 |
|
Wynn Resorts Finance LLC / Wynn Resorts Capital Corp., 5.125%, 10/1/29(1) | 175,000 |
| 160,234 |
|
| Yum! Brands, Inc., 3.875%, 11/1/23 | 625,000 |
| 586,716 |
|
Yum! Brands, Inc., 7.75%, 4/1/25(1)(5) | 150,000 |
| 157,875 |
|
| | | 35,716,231 |
|
| Household Durables — 3.0% | | |
Adams Homes, Inc., 7.50%, 2/15/25(1) | 525,000 |
| 505,313 |
|
Ashton Woods USA LLC / Ashton Woods Finance Co., 6.75%, 8/1/25(1) | 475,000 |
| 384,154 |
|
Ashton Woods USA LLC / Ashton Woods Finance Co., 6.625%, 1/15/28(1) | 350,000 |
| 279,125 |
|
| Beazer Homes USA, Inc., 6.75%, 3/15/25 | 300,000 |
| 244,124 |
|
| Beazer Homes USA, Inc., 7.25%, 10/15/29 | 350,000 |
| 268,651 |
|
Brookfield Residential Properties, Inc. / Brookfield Residential US Corp., 6.375%, 5/15/25(1) | 1,000,000 |
| 908,745 |
|
Brookfield Residential Properties, Inc. / Brookfield Residential US Corp., 4.875%, 2/15/30(1) | 500,000 |
| 381,725 |
|
| Century Communities, Inc., 6.75%, 6/1/27 | 450,000 |
| 367,352 |
|
Installed Building Products, Inc., 5.75%, 2/1/28(1) | 475,000 |
| 456,495 |
|
| KB Home, 7.00%, 12/15/21 | 565,000 |
| 564,265 |
|
| KB Home, 7.625%, 5/15/23 | 150,000 |
| 152,062 |
|
| KB Home, 6.875%, 6/15/27 | 425,000 |
| 428,631 |
|
| Lennar Corp., 5.00%, 6/15/27 | 625,000 |
| 577,214 |
|
Mattamy Group Corp., 4.625%, 3/1/30(1) | 575,000 |
| 497,734 |
|
| Meritage Homes Corp., 7.00%, 4/1/22 | 540,000 |
| 544,555 |
|
| Meritage Homes Corp., 6.00%, 6/1/25 | 750,000 |
| 698,434 |
|
| Newell Brands, Inc., 4.20%, 4/1/26 | 1,250,000 |
| 1,225,436 |
|
| Newell Brands, Inc., 5.625%, 4/1/36 | 1,350,000 |
| 1,344,463 |
|
| Newell Brands, Inc., 5.75%, 4/1/46 | 325,000 |
| 330,897 |
|
Shea Homes LP / Shea Homes Funding Corp., 4.75%, 2/15/28(1) | 375,000 |
| 322,266 |
|
Taylor Morrison Communities, Inc., 6.00%, 9/1/23(1) | 525,000 |
| 509,906 |
|
Taylor Morrison Communities, Inc., 5.875%, 1/31/25(1) | 1,480,000 |
| 1,393,050 |
|
|
| | | | | | |
| | Principal Amount/Shares | Value |
Taylor Morrison Communities, Inc., 6.625%, 7/15/27(1) | $ | 325,000 |
| $ | 296,156 |
|
Taylor Morrison Communities, Inc., 5.75%, 1/15/28(1) | 450,000 |
| 405,656 |
|
| Toll Brothers Finance Corp., 5.875%, 2/15/22 | 225,000 |
| 226,125 |
|
TopBuild Corp., 5.625%, 5/1/26(1) | 675,000 |
| 626,766 |
|
| TRI Pointe Group, Inc. / TRI Pointe Homes, Inc., 5.875%, 6/15/24 | 815,000 |
| 764,246 |
|
Williams Scotsman International, Inc., 7.875%, 12/15/22(1) | 630,000 |
| 619,880 |
|
Williams Scotsman International, Inc., 6.875%, 8/15/23(1) | 850,000 |
| 780,933 |
|
| | | 16,104,359 |
|
| Household Products — 0.4% | | |
| Central Garden & Pet Co., 5.125%, 2/1/28 | 200,000 |
| 186,709 |
|
Energizer Holdings, Inc., 6.375%, 7/15/26(1) | 475,000 |
| 482,386 |
|
Kronos Acquisition Holdings, Inc., 9.00%, 8/15/23(1) | 375,000 |
| 310,779 |
|
Prestige Brands, Inc., 6.375%, 3/1/24(1) | 200,000 |
| 206,251 |
|
Prestige Brands, Inc., 5.125%, 1/15/28(1) | 375,000 |
| 374,175 |
|
| Spectrum Brands, Inc., 5.75%, 7/15/25 | 845,000 |
| 796,387 |
|
| | | 2,356,687 |
|
| Independent Power and Renewable Electricity Producers — 1.4% | |
| Calpine Corp., 5.50%, 2/1/24 | 360,000 |
| 344,689 |
|
Calpine Corp., 5.25%, 6/1/26(1) | 800,000 |
| 765,574 |
|
Calpine Corp., 4.50%, 2/15/28(1) | 900,000 |
| 875,700 |
|
Calpine Corp., 5.125%, 3/15/28(1) | 1,600,000 |
| 1,484,000 |
|
| Clearway Energy Operating LLC, 5.75%, 10/15/25 | 775,000 |
| 772,098 |
|
| Clearway Energy Operating LLC, 5.00%, 9/15/26 | 175,000 |
| 170,807 |
|
Clearway Energy Operating LLC, 4.75%, 3/15/28(1) | 800,000 |
| 745,000 |
|
TerraForm Power Operating LLC, 4.25%, 1/31/23(1) | 700,000 |
| 699,979 |
|
TerraForm Power Operating LLC, 5.00%, 1/31/28(1) | 825,000 |
| 869,014 |
|
TerraForm Power Operating LLC, 4.75%, 1/15/30(1) | 425,000 |
| 414,609 |
|
| Vistra Energy Corp., 5.875%, 6/1/23 | 175,000 |
| 175,870 |
|
| | | 7,317,340 |
|
| Industrial Conglomerates — 0.1% | | |
Amsted Industries, Inc., 5.625%, 7/1/27(1) | 250,000 |
| 245,364 |
|
Stena International SA, 6.125%, 2/1/25(1) | 200,000 |
| 169,500 |
|
| | | 414,864 |
|
| Insurance — 1.4% | | |
Acrisure LLC / Acrisure Finance, Inc., 8.125%, 2/15/24(1) | 700,000 |
| 685,773 |
|
Acrisure LLC / Acrisure Finance, Inc., 7.00%, 11/15/25(1) | 1,600,000 |
| 1,387,952 |
|
Acrisure LLC / Acrisure Finance, Inc., 10.125%, 8/1/26(1) | 325,000 |
| 304,563 |
|
Ardonagh Midco 3 plc, 8.625%, 7/15/23(1) | 1,400,000 |
| 1,254,757 |
|
AssuredPartners, Inc., 7.00%, 8/15/25(1) | 700,000 |
| 635,229 |
|
Fidelity & Guaranty Life Holdings, Inc., 5.50%, 5/1/25(1) | 925,000 |
| 920,625 |
|
| Genworth Holdings, Inc., 7.625%, 9/24/21 | 820,000 |
| 784,707 |
|
| Genworth Holdings, Inc., 4.90%, 8/15/23 | 450,000 |
| 390,375 |
|
| Genworth Holdings, Inc., VRN, 3.69%, (3-month LIBOR plus 2.00%), 11/15/66 | 450,000 |
| 184,637 |
|
GTCR AP Finance, Inc., 8.00%, 5/15/27(1) | 225,000 |
| 208,922 |
|
HUB International Ltd., 7.00%, 5/1/26(1) | 925,000 |
| 922,757 |
|
| | | 7,680,297 |
|
|
| | | | | | |
| | Principal Amount/Shares | Value |
| Interactive Media and Services — 0.3% | | |
| Match Group, Inc., 6.375%, 6/1/24 | $ | 700,000 |
| $ | 711,379 |
|
Match Group, Inc., 5.00%, 12/15/27(1) | 400,000 |
| 385,417 |
|
Match Group, Inc., 5.625%, 2/15/29(1) | 300,000 |
| 289,063 |
|
Twitter, Inc., 3.875%, 12/15/27(1) | 225,000 |
| 218,109 |
|
| | | 1,603,968 |
|
| Internet and Direct Marketing Retail — 0.2% | | |
Go Daddy Operating Co. LLC / GD Finance Co., Inc., 5.25%, 12/1/27(1) | 775,000 |
| 786,431 |
|
| QVC, Inc., 4.75%, 2/15/27 | 400,000 |
| 355,598 |
|
| | | 1,142,029 |
|
| IT Services — 1.0% | | |
Banff Merger Sub, Inc., 9.75%, 9/1/26(1) | 525,000 |
| 465,977 |
|
| CDW LLC / CDW Finance Corp., 5.50%, 12/1/24 | 230,000 |
| 241,165 |
|
Exela Intermediate LLC / Exela Finance, Inc., 10.00%, 7/15/23(1) | 1,150,000 |
| 310,500 |
|
Gartner, Inc., 5.125%, 4/1/25(1) | 225,000 |
| 221,345 |
|
Presidio Holdings, Inc., 4.875%, 2/1/27(1) | 375,000 |
| 339,609 |
|
Presidio Holdings, Inc., 8.25%, 2/1/28(1) | 925,000 |
| 822,094 |
|
Science Applications International Corp., 4.875%, 4/1/28(1) | 825,000 |
| 796,641 |
|
Tempo Acquisition LLC / Tempo Acquisition Finance Corp., 6.75%, 6/1/25(1) | 850,000 |
| 784,150 |
|
Vericast Corp., 9.25%, 3/1/21(1) | 485,000 |
| 497,125 |
|
Vericast Corp., 8.375%, 8/15/22(1) | 1,450,000 |
| 1,130,545 |
|
| | | 5,609,151 |
|
| Leisure Products — 0.1% | | |
Mattel, Inc., 6.75%, 12/31/25(1) | 375,000 |
| 384,846 |
|
Mattel, Inc., 5.875%, 12/15/27(1) | 275,000 |
| 282,026 |
|
| Mattel, Inc., 5.45%, 11/1/41 | 75,000 |
| 60,023 |
|
| | | 726,895 |
|
| Life Sciences Tools and Services — 0.4% | | |
Avantor, Inc., 6.00%, 10/1/24(1) | 425,000 |
| 447,931 |
|
Avantor, Inc., 9.00%, 10/1/25(1) | 1,050,000 |
| 1,111,903 |
|
Charles River Laboratories International, Inc., 5.50%, 4/1/26(1) | 525,000 |
| 539,158 |
|
| | | 2,098,992 |
|
| Machinery — 1.1% | | |
Cleaver-Brooks, Inc., 7.875%, 3/1/23(1) | 150,000 |
| 125,812 |
|
Cloud Crane LLC, 10.125%, 8/1/24(1) | 575,000 |
| 456,409 |
|
Colfax Corp., 6.00%, 2/15/24(1) | 325,000 |
| 325,408 |
|
Colfax Corp., 6.375%, 2/15/26(1) | 125,000 |
| 123,594 |
|
| EnPro Industries, Inc., 5.75%, 10/15/26 | 500,000 |
| 490,879 |
|
Granite US Holdings Corp., 11.00%, 10/1/27(1) | 225,000 |
| 194,953 |
|
Husky III Holding Ltd., 13.00% Cash or 13.75% PIK, 2/15/25(1)(2) | 450,000 |
| 333,891 |
|
JPW Industries Holding Corp., 9.00%, 10/1/24(1) | 400,000 |
| 314,998 |
|
Manitowoc Co., Inc. (The), 9.00%, 4/1/26(1) | 275,000 |
| 245,332 |
|
Navistar International Corp., 6.625%, 11/1/25(1) | 575,000 |
| 482,284 |
|
RBS Global, Inc. / Rexnord LLC, 4.875%, 12/15/25(1) | 175,000 |
| 164,932 |
|
SPX FLOW, Inc., 5.625%, 8/15/24(1) | 150,000 |
| 146,812 |
|
|
| | | | | | |
| | Principal Amount/Shares | Value |
Stevens Holding Co., Inc., 6.125%, 10/1/26(1) | $ | 300,000 |
| $ | 298,937 |
|
| Tennant Co., 5.625%, 5/1/25 | 300,000 |
| 291,374 |
|
Titan Acquisition Ltd. / Titan Co-Borrower LLC, 7.75%, 4/15/26(1) | 550,000 |
| 463,082 |
|
| Titan International, Inc., 6.50%, 11/30/23 | 550,000 |
| 252,310 |
|
Wabash National Corp., 5.50%, 10/1/25(1) | 575,000 |
| 462,153 |
|
Werner FinCo LP / Werner FinCo, Inc., 8.75%, 7/15/25(1) | 1,050,000 |
| 933,182 |
|
| | | 6,106,342 |
|
| Media — 9.4% | | |
Altice Financing SA, 7.50%, 5/15/26(1) | 1,445,000 |
| 1,413,282 |
|
Altice Financing SA, 5.00%, 1/15/28(1) | 1,200,000 |
| 1,071,000 |
|
| AMC Networks, Inc., 5.00%, 4/1/24 | 125,000 |
| 120,625 |
|
Block Communications, Inc., 4.875%, 3/1/28(1) | 250,000 |
| 233,906 |
|
| Cablevision Systems Corp., 5.875%, 9/15/22 | 300,000 |
| 304,602 |
|
| CCO Holdings LLC / CCO Holdings Capital Corp., 5.25%, 9/30/22 | 700,000 |
| 691,488 |
|
CCO Holdings LLC / CCO Holdings Capital Corp., 4.00%, 3/1/23(1) | 725,000 |
| 727,697 |
|
CCO Holdings LLC / CCO Holdings Capital Corp., 5.125%, 5/1/23(1) | 500,000 |
| 508,128 |
|
CCO Holdings LLC / CCO Holdings Capital Corp., 5.875%, 4/1/24(1) | 375,000 |
| 385,783 |
|
CCO Holdings LLC / CCO Holdings Capital Corp., 5.375%, 5/1/25(1) | 950,000 |
| 979,882 |
|
CCO Holdings LLC / CCO Holdings Capital Corp., 5.75%, 2/15/26(1) | 3,815,000 |
| 3,875,849 |
|
CCO Holdings LLC / CCO Holdings Capital Corp., 5.50%, 5/1/26(1) | 375,000 |
| 382,338 |
|
CCO Holdings LLC / CCO Holdings Capital Corp., 5.875%, 5/1/27(1) | 325,000 |
| 336,975 |
|
CCO Holdings LLC / CCO Holdings Capital Corp., 4.75%, 3/1/30(1) | 300,000 |
| 300,915 |
|
CCO Holdings LLC / CCO Holdings Capital Corp., 4.50%, 8/15/30(1) | 2,525,000 |
| 2,488,703 |
|
CCO Holdings LLC / CCO Holdings Capital Corp., 4.50%, 5/1/32(1) | 2,050,000 |
| 2,010,691 |
|
Clear Channel Worldwide Holdings, Inc., 9.25%, 2/15/24(1) | 525,000 |
| 454,784 |
|
Clear Channel Worldwide Holdings, Inc., 5.125%, 8/15/27(1) | 1,575,000 |
| 1,483,571 |
|
CSC Holdings LLC, 5.375%, 7/15/23(1) | 600,000 |
| 609,753 |
|
CSC Holdings LLC, 5.50%, 5/15/26(1) | 630,000 |
| 656,030 |
|
CSC Holdings LLC, 6.50%, 2/1/29(1) | 2,200,000 |
| 2,385,053 |
|
CSC Holdings LLC, 5.75%, 1/15/30(1) | 1,725,000 |
| 1,746,062 |
|
Diamond Sports Group LLC / Diamond Sports Finance Co., 5.375%, 8/15/26(1) | 1,375,000 |
| 1,124,945 |
|
Diamond Sports Group LLC / Diamond Sports Finance Co., 6.625%, 8/15/27(1) | 725,000 |
| 488,868 |
|
| DISH DBS Corp., 5.125%, 5/1/20 | 125,000 |
| 124,476 |
|
| DISH DBS Corp., 6.75%, 6/1/21 | 100,000 |
| 101,946 |
|
| DISH DBS Corp., 5.875%, 7/15/22 | 100,000 |
| 97,916 |
|
| DISH DBS Corp., 5.00%, 3/15/23 | 1,170,000 |
| 1,131,998 |
|
| DISH DBS Corp., 5.875%, 11/15/24 | 350,000 |
| 343,030 |
|
EW Scripps Co. (The), 5.125%, 5/15/25(1) | 350,000 |
| 311,061 |
|
GCI LLC, 6.625%, 6/15/24(1) | 350,000 |
| 349,561 |
|
Gray Television, Inc., 5.125%, 10/15/24(1) | 2,250,000 |
| 2,188,136 |
|
Gray Television, Inc., 5.875%, 7/15/26(1) | 625,000 |
| 605,219 |
|
Gray Television, Inc., 7.00%, 5/15/27(1) | 375,000 |
| 375,206 |
|
|
| | | | | | |
| | Principal Amount/Shares | Value |
| iHeartCommunications, Inc., 6.375%, 5/1/26 | $ | 525,000 |
| $ | 499,736 |
|
| iHeartCommunications, Inc., 8.375%, 5/1/27 | 200,000 |
| 171,390 |
|
iHeartCommunications, Inc., 5.25%, 8/15/27(1) | 925,000 |
| 811,179 |
|
iHeartCommunications, Inc., 4.75%, 1/15/28(1) | 525,000 |
| 475,414 |
|
| Lamar Media Corp., 5.75%, 2/1/26 | 100,000 |
| 102,875 |
|
Lamar Media Corp., 3.75%, 2/15/28(1) | 200,000 |
| 188,976 |
|
Lamar Media Corp., 4.00%, 2/15/30(1) | 375,000 |
| 351,563 |
|
LCPR Senior Secured Financing DAC, 6.75%, 10/15/27(1) | 600,000 |
| 594,330 |
|
Midcontinent Communications / Midcontinent Finance Corp., 5.375%, 8/15/27(1) | 350,000 |
| 341,865 |
|
Nexstar Broadcasting, Inc., 5.625%, 8/1/24(1) | 1,440,000 |
| 1,364,393 |
|
Nexstar Broadcasting, Inc., 5.625%, 7/15/27(1) | 1,375,000 |
| 1,351,694 |
|
Outfront Media Capital LLC / Outfront Media Capital Corp., 5.00%, 8/15/27(1) | 875,000 |
| 809,856 |
|
Outfront Media Capital LLC / Outfront Media Capital Corp., 4.625%, 3/15/30(1) | 75,000 |
| 67,166 |
|
| Quebecor Media, Inc., 5.75%, 1/15/23 | 250,000 |
| 255,286 |
|
Salem Media Group, Inc., 6.75%, 6/1/24(1) | 325,000 |
| 271,375 |
|
Scripps Escrow, Inc., 5.875%, 7/15/27(1) | 325,000 |
| 287,804 |
|
Sinclair Television Group, Inc., 5.875%, 3/15/26(1) | 300,000 |
| 268,063 |
|
Sinclair Television Group, Inc., 5.50%, 3/1/30(1) | 575,000 |
| 479,004 |
|
Sirius XM Radio, Inc., 3.875%, 8/1/22(1) | 925,000 |
| 928,449 |
|
Sirius XM Radio, Inc., 4.625%, 5/15/23(1) | 1,185,000 |
| 1,180,550 |
|
Sirius XM Radio, Inc., 4.625%, 7/15/24(1) | 600,000 |
| 612,711 |
|
Sirius XM Radio, Inc., 5.50%, 7/1/29(1) | 550,000 |
| 564,052 |
|
TEGNA, Inc., 4.625%, 3/15/28(1) | 1,625,000 |
| 1,437,109 |
|
TEGNA, Inc., 5.00%, 9/15/29(1) | 525,000 |
| 474,469 |
|
Townsquare Media, Inc., 6.50%, 4/1/23(1) | 1,075,000 |
| 1,041,401 |
|
Univision Communications, Inc., 6.75%, 9/15/22(1) | 315,000 |
| 305,057 |
|
Univision Communications, Inc., 5.125%, 2/15/25(1) | 600,000 |
| 516,000 |
|
UPC Holding BV, 5.50%, 1/15/28(1) | 600,000 |
| 567,330 |
|
Videotron Ltd., 5.375%, 6/15/24(1) | 225,000 |
| 227,738 |
|
Virgin Media Finance plc, 5.75%, 1/15/25(1) | 1,660,000 |
| 1,624,717 |
|
Virgin Media Secured Finance plc, 5.50%, 8/15/26(1) | 655,000 |
| 669,389 |
|
Ziggo BV, 5.50%, 1/15/27(1) | 607,000 |
| 610,369 |
|
Ziggo BV, 4.875%, 1/15/30(1) | 200,000 |
| 196,181 |
|
| | | 50,056,970 |
|
| Metals and Mining — 4.1% | | |
Alcoa Nederland Holding BV, 6.75%, 9/30/24(1) | 1,060,000 |
| 1,035,800 |
|
Alcoa Nederland Holding BV, 6.125%, 5/15/28(1) | 600,000 |
| 549,330 |
|
Aleris International, Inc., 10.75%, 7/15/23(1) | 700,000 |
| 686,000 |
|
| Allegheny Technologies, Inc., 5.875%, 12/1/27 | 425,000 |
| 354,450 |
|
Arconic Corp., 6.125%, 2/15/28(1) | 250,000 |
| 257,500 |
|
Baffinland Iron Mines Corp. / Baffinland Iron Mines LP, 8.75%, 7/15/26(1) | 625,000 |
| 559,031 |
|
Big River Steel LLC / BRS Finance Corp., 7.25%, 9/1/25(1) | 450,000 |
| 412,861 |
|
| Cleveland-Cliffs, Inc., 5.75%, 3/1/25 | 497,000 |
| 387,660 |
|
Cleveland-Cliffs, Inc., 6.75%, 3/15/26(1) | 250,000 |
| 222,344 |
|
|
| | | | | | |
| | Principal Amount/Shares | Value |
Cleveland-Cliffs, Inc., 5.875%, 6/1/27(1) | $ | 975,000 |
| $ | 589,339 |
|
| Coeur Mining, Inc., 5.875%, 6/1/24 | 450,000 |
| 408,935 |
|
Compass Minerals International, Inc., 6.75%, 12/1/27(1) | 525,000 |
| 476,857 |
|
Constellium SE, 6.625%, 3/1/25(1) | 2,165,000 |
| 1,964,673 |
|
First Quantum Minerals Ltd., 7.25%, 4/1/23(1) | 695,000 |
| 599,441 |
|
First Quantum Minerals Ltd., 6.50%, 3/1/24(1) | 3,200,000 |
| 2,676,016 |
|
First Quantum Minerals Ltd., 7.50%, 4/1/25(1) | 600,000 |
| 503,067 |
|
| Freeport-McMoRan, Inc., 3.55%, 3/1/22 | 122,000 |
| 117,689 |
|
| Freeport-McMoRan, Inc., 3.875%, 3/15/23 | 500,000 |
| 479,377 |
|
| Freeport-McMoRan, Inc., 5.00%, 9/1/27 | 625,000 |
| 583,750 |
|
| Freeport-McMoRan, Inc., 4.125%, 3/1/28 | 775,000 |
| 681,333 |
|
| Freeport-McMoRan, Inc., 4.25%, 3/1/30 | 1,075,000 |
| 937,991 |
|
| Freeport-McMoRan, Inc., 5.45%, 3/15/43 | 1,775,000 |
| 1,602,470 |
|
Grinding Media, Inc. / Moly-Cop AltaSteel Ltd., 7.375%, 12/15/23(1) | 125,000 |
| 117,534 |
|
Hudbay Minerals, Inc., 7.625%, 1/15/25(1) | 350,000 |
| 306,689 |
|
IAMGOLD Corp., 7.00%, 4/15/25(1) | 175,000 |
| 164,280 |
|
Kaiser Aluminum Corp., 4.625%, 3/1/28(1) | 425,000 |
| 379,546 |
|
| Kinross Gold Corp., 5.125%, 9/1/21 | 360,000 |
| 363,330 |
|
| Kinross Gold Corp., 4.50%, 7/15/27 | 525,000 |
| 498,620 |
|
Mineral Resources Ltd., 8.125%, 5/1/27(1) | 850,000 |
| 802,262 |
|
Mountain Province Diamonds, Inc., 8.00%, 12/15/22(1) | 350,000 |
| 255,938 |
|
Northwest Acquisitions ULC / Dominion Finco, Inc., 7.125%, 11/1/22(1) | 300,000 |
| 148,602 |
|
Novelis Corp., 5.875%, 9/30/26(1) | 775,000 |
| 765,958 |
|
Novelis Corp., 4.75%, 1/30/30(1) | 1,275,000 |
| 1,141,922 |
|
| Park-Ohio Industries, Inc., 6.625%, 4/15/27 | 275,000 |
| 219,713 |
|
Petra Diamonds US Treasury plc, 7.25%, 5/1/22(1) | 200,000 |
| 47,000 |
|
Taseko Mines Ltd., 8.75%, 6/15/22(1) | 1,025,000 |
| 469,897 |
|
| United States Steel Corp., 6.25%, 3/15/26 | 150,000 |
| 98,333 |
|
Warrior Met Coal, Inc., 8.00%, 11/1/24(1) | 100,000 |
| 83,188 |
|
| | | 21,948,726 |
|
| Mortgage Real Estate Investment Trusts (REITs) — 0.3% | | |
Ladder Capital Finance Holdings LLLP / Ladder Capital Finance Corp., 5.25%, 3/15/22(1) | 1,376,000 |
| 1,241,811 |
|
Ladder Capital Finance Holdings LLLP / Ladder Capital Finance Corp., 4.25%, 2/1/27(1) | 375,000 |
| 299,063 |
|
| | | 1,540,874 |
|
Multiline Retail† | | |
JC Penney Corp., Inc., 8.625%, 3/15/25(1) | 600,000 |
| 108,000 |
|
| JC Penney Corp., Inc., 6.375%, 10/15/36 | 625,000 |
| 56,250 |
|
Neiman Marcus Group Ltd. LLC / Neiman Marcus Group LLC / Mariposa Borrower / NMG, 8.75%, 10/25/24(1)(3) | 455,189 |
| 45,519 |
|
| | | 209,769 |
|
| Oil, Gas and Consumable Fuels — 5.0% | | |
| Antero Midstream Partners LP / Antero Midstream Finance Corp., 5.375%, 9/15/24 | 725,000 |
| 509,095 |
|
Antero Midstream Partners LP / Antero Midstream Finance Corp., 5.75%, 3/1/27(1) | 550,000 |
| 356,166 |
|
| Antero Resources Corp., 5.375%, 11/1/21 | 375,000 |
| 274,860 |
|
|
| | | | | | |
| | Principal Amount/Shares | Value |
| Antero Resources Corp., 5.125%, 12/1/22 | $ | 350,000 |
| $ | 183,869 |
|
| Antero Resources Corp., 5.625%, 6/1/23 | 100,000 |
| 40,750 |
|
| Antero Resources Corp., 5.00%, 3/1/25 | 75,000 |
| 28,313 |
|
Ascent Resources Utica Holdings LLC / ARU Finance Corp., 10.00%, 4/1/22(1) | 650,000 |
| 352,612 |
|
Ascent Resources Utica Holdings LLC / ARU Finance Corp., 7.00%, 11/1/26(1) | 75,000 |
| 22,203 |
|
Bruin E&P Partners LLC, 8.875%, 8/1/23(1) | 1,425,000 |
| 121,125 |
|
| Callon Petroleum Co., 6.25%, 4/15/23 | 265,000 |
| 64,917 |
|
| Callon Petroleum Co., 6.125%, 10/1/24 | 575,000 |
| 106,375 |
|
| Callon Petroleum Co., 6.375%, 7/1/26 | 575,000 |
| 96,912 |
|
Centennial Resource Production LLC, 5.375%, 1/15/26(1) | 750,000 |
| 186,407 |
|
Chaparral Energy, Inc., 8.75%, 7/15/23(1) | 1,000,000 |
| 70,500 |
|
| Chesapeake Energy Corp., 6.625%, 8/15/20 | 11,000 |
| 3,300 |
|
| Chesapeake Energy Corp., 6.875%, 11/15/20 | 1,200,000 |
| 336,000 |
|
| Chesapeake Energy Corp., 5.75%, 3/15/23 | 250,000 |
| 26,875 |
|
| Chesapeake Energy Corp., 8.00%, 1/15/25 | 725,000 |
| 50,750 |
|
Citgo Holding, Inc., 9.25%, 8/1/24(1) | 1,625,000 |
| 1,336,562 |
|
| CNX Resources Corp., 5.875%, 4/15/22 | 350,000 |
| 322,875 |
|
CNX Resources Corp., 7.25%, 3/14/27(1) | 675,000 |
| 481,602 |
|
Comstock Resources, Inc., 7.50%, 5/15/25(1) | 250,000 |
| 178,750 |
|
| Crestwood Midstream Partners LP / Crestwood Midstream Finance Corp., 6.25%, 4/1/23 | 1,045,000 |
| 591,945 |
|
| Crestwood Midstream Partners LP / Crestwood Midstream Finance Corp., 5.75%, 4/1/25 | 590,000 |
| 342,218 |
|
Crestwood Midstream Partners LP / Crestwood Midstream Finance Corp., 5.625%, 5/1/27(1) | 475,000 |
| 264,710 |
|
CrownRock LP / CrownRock Finance, Inc., 5.625%, 10/15/25(1) | 900,000 |
| 474,723 |
|
| DCP Midstream Operating LP, 5.125%, 5/15/29 | 575,000 |
| 365,413 |
|
| Delek Logistics Partners LP / Delek Logistics Finance Corp., 6.75%, 5/15/25 | 300,000 |
| 294,377 |
|
Denbury Resources, Inc., 9.00%, 5/15/21(1) | 1,695,000 |
| 507,229 |
|
Endeavor Energy Resources LP / EER Finance, Inc., 5.50%, 1/30/26(1) | 125,000 |
| 87,147 |
|
Endeavor Energy Resources LP / EER Finance, Inc., 5.75%, 1/30/28(1) | 625,000 |
| 428,469 |
|
| EnLink Midstream LLC, 5.375%, 6/1/29 | 950,000 |
| 500,619 |
|
| EnLink Midstream Partners LP, 4.40%, 4/1/24 | 175,000 |
| 89,630 |
|
| EnLink Midstream Partners LP, 4.85%, 7/15/26 | 1,300,000 |
| 648,268 |
|
| EnLink Midstream Partners LP, 5.60%, 4/1/44 | 200,000 |
| 69,561 |
|
| EnLink Midstream Partners LP, 5.05%, 4/1/45 | 225,000 |
| 84,376 |
|
| EnLink Midstream Partners LP, 5.45%, 6/1/47 | 375,000 |
| 126,600 |
|
EP Energy LLC / Everest Acquisition Finance, Inc., 9.375%, 5/1/20(3)(4) | 1,725,000 |
| 6,641 |
|
EP Energy LLC / Everest Acquisition Finance, Inc., 9.375%, 5/1/24(1)(3)(4) | 1,075,000 |
| 9,675 |
|
| EQT Corp., 7.00%, 2/1/30 | 75,000 |
| 56,439 |
|
Extraction Oil & Gas, Inc., 7.375%, 5/15/24(1) | 175,000 |
| 32,593 |
|
| Genesis Energy LP / Genesis Energy Finance Corp., 7.75%, 2/1/28 | 575,000 |
| 402,471 |
|
| Gulfport Energy Corp., 6.00%, 10/15/24 | 395,000 |
| 99,738 |
|
|
| | | | | | |
| | Principal Amount/Shares | Value |
| Gulfport Energy Corp., 6.375%, 5/15/25 | $ | 465,000 |
| $ | 116,829 |
|
| Gulfport Energy Corp., 6.375%, 1/15/26 | 350,000 |
| 71,385 |
|
Hess Midstream Operations LP, 5.625%, 2/15/26(1) | 1,577,000 |
| 1,124,452 |
|
Hess Midstream Operations LP, 5.125%, 6/15/28(1) | 1,050,000 |
| 741,877 |
|
Hilcorp Energy I LP / Hilcorp Finance Co., 6.25%, 11/1/28(1) | 1,150,000 |
| 515,824 |
|
Holly Energy Partners LP / Holly Energy Finance Corp., 5.00%, 2/1/28(1) | 475,000 |
| 400,484 |
|
Indigo Natural Resources LLC, 6.875%, 2/15/26(1) | 800,000 |
| 534,060 |
|
| Jagged Peak Energy LLC, 5.875%, 5/1/26 | 450,000 |
| 339,713 |
|
| Laredo Petroleum, Inc., 9.50%, 1/15/25 | 575,000 |
| 232,156 |
|
Magnolia Oil & Gas Operating LLC / Magnolia Oil & Gas Finance Corp., 6.00%, 8/1/26(1) | 350,000 |
| 218,750 |
|
| Matador Resources Co., 5.875%, 9/15/26 | 450,000 |
| 129,251 |
|
MEG Energy Corp., 7.00%, 3/31/24(1) | 375,000 |
| 175,314 |
|
MEG Energy Corp., 7.125%, 2/1/27(1) | 650,000 |
| 328,250 |
|
Moss Creek Resources Holdings, Inc., 7.50%, 1/15/26(1) | 775,000 |
| 231,370 |
|
Moss Creek Resources Holdings, Inc., 10.50%, 5/15/27(1) | 150,000 |
| 50,031 |
|
| Murphy Oil Corp., 6.875%, 8/15/24 | 375,000 |
| 224,533 |
|
| Murphy Oil Corp., 5.75%, 8/15/25 | 485,000 |
| 262,557 |
|
| Murphy Oil Corp., 5.875%, 12/1/27 | 125,000 |
| 65,819 |
|
Murray Energy Corp., 9.00% Cash plus 3.00% PIK, 4/15/24(1)(3)(4) | 3,592,071 |
| 4,526 |
|
| NuStar Logistics LP, 6.00%, 6/1/26 | 250,000 |
| 186,406 |
|
| Oasis Petroleum, Inc., 6.875%, 3/15/22 | 275,000 |
| 56,375 |
|
Oasis Petroleum, Inc., 6.25%, 5/1/26(1) | 175,000 |
| 29,326 |
|
| Occidental Petroleum Corp., 7.50%, 5/1/31 | 350,000 |
| 181,444 |
|
Parkland Fuel Corp., 6.00%, 4/1/26(1) | 275,000 |
| 257,276 |
|
Parkland Fuel Corp., 5.875%, 7/15/27(1) | 550,000 |
| 518,622 |
|
Parsley Energy LLC / Parsley Finance Corp., 4.125%, 2/15/28(1) | 225,000 |
| 154,688 |
|
PBF Holding Co. LLC / PBF Finance Corp., 6.00%, 2/15/28(1) | 250,000 |
| 170,000 |
|
| PBF Logistics LP / PBF Logistics Finance Corp., 6.875%, 5/15/23 | 550,000 |
| 342,947 |
|
| PDC Energy, Inc., 6.125%, 9/15/24 | 225,000 |
| 122,061 |
|
| PDC Energy, Inc., 5.75%, 5/15/26 | 50,000 |
| 28,336 |
|
| Range Resources Corp., 5.00%, 8/15/22 | 1,010,000 |
| 764,772 |
|
Sanchez Energy Corp., 7.75%, 6/15/21(3)(4) | 2,855,000 |
| 20,128 |
|
Sanchez Energy Corp., 6.125%, 1/15/23(3)(4) | 1,250,000 |
| 18,750 |
|
Seven Generations Energy Ltd., 5.375%, 9/30/25(1) | 850,000 |
| 473,849 |
|
| SM Energy Co., 5.625%, 6/1/25 | 725,000 |
| 203,910 |
|
| SM Energy Co., 6.75%, 9/15/26 | 225,000 |
| 69,422 |
|
| SM Energy Co., 6.625%, 1/15/27 | 275,000 |
| 81,959 |
|
| Southwestern Energy Co., 7.75%, 10/1/27 | 200,000 |
| 133,015 |
|
| Summit Midstream Holdings LLC / Summit Midstream Finance Corp., 5.50%, 8/15/22 | 1,000,000 |
| 228,436 |
|
| Summit Midstream Holdings LLC / Summit Midstream Finance Corp., 5.75%, 4/15/25 | 425,000 |
| 50,467 |
|
| Sunoco LP / Sunoco Finance Corp., 4.875%, 1/15/23 | 1,525,000 |
| 1,485,983 |
|
| Sunoco LP / Sunoco Finance Corp., 5.50%, 2/15/26 | 150,000 |
| 131,073 |
|
| Sunoco LP / Sunoco Finance Corp., 6.00%, 4/15/27 | 400,000 |
| 346,787 |
|
Tallgrass Energy Partners LP / Tallgrass Energy Finance Corp., 4.75%, 10/1/23(1) | 650,000 |
| 406,270 |
|
|
| | | | | | |
| | Principal Amount/Shares | Value |
| Targa Resources Partners LP / Targa Resources Partners Finance Corp., 4.25%, 11/15/23 | $ | 1,240,000 |
| $ | 1,075,024 |
|
| Targa Resources Partners LP / Targa Resources Partners Finance Corp., 6.75%, 3/15/24 | 225,000 |
| 199,681 |
|
| Targa Resources Partners LP / Targa Resources Partners Finance Corp., 6.50%, 7/15/27 | 75,000 |
| 64,500 |
|
| Targa Resources Partners LP / Targa Resources Partners Finance Corp., 5.00%, 1/15/28 | 575,000 |
| 467,494 |
|
| Targa Resources Partners LP / Targa Resources Partners Finance Corp., 6.875%, 1/15/29 | 325,000 |
| 264,063 |
|
Targa Resources Partners LP / Targa Resources Partners Finance Corp., 5.50%, 3/1/30(1) | 375,000 |
| 292,969 |
|
| TransMontaigne Partners LP / TLP Finance Corp., 6.125%, 2/15/26 | 450,000 |
| 363,844 |
|
Tullow Oil plc, 7.00%, 3/1/25(1) | 200,000 |
| 51,494 |
|
Vine Oil & Gas LP / Vine Oil & Gas Finance Corp., 8.75%, 4/15/23(1) | 800,000 |
| 196,000 |
|
Vine Oil & Gas LP / Vine Oil & Gas Finance Corp., 9.75%, 4/15/23(1) | 925,000 |
| 241,656 |
|
Whiting Petroleum Corp., 5.75%, 3/15/21(3) | 200,000 |
| 14,790 |
|
Whiting Petroleum Corp., 6.25%, 4/1/23(3) | 400,000 |
| 33,000 |
|
Whiting Petroleum Corp., 6.625%, 1/15/26(3) | 625,000 |
| 46,922 |
|
| WPX Energy, Inc., 5.75%, 6/1/26 | 75,000 |
| 43,273 |
|
| WPX Energy, Inc., 4.50%, 1/15/30 | 425,000 |
| 232,369 |
|
| | | 26,450,222 |
|
| Paper and Forest Products — 0.3% | | |
| Mercer International, Inc., 6.50%, 2/1/24 | 550,000 |
| 472,310 |
|
| Mercer International, Inc., 7.375%, 1/15/25 | 450,000 |
| 378,565 |
|
Schweitzer-Mauduit International, Inc., 6.875%, 10/1/26(1) | 550,000 |
| 551,948 |
|
| | | 1,402,823 |
|
Personal Products† | | |
Avon International Capital plc, 6.50%, 8/15/22(1) | 275,000 |
| 245,695 |
|
| Pharmaceuticals — 2.7% | | |
Bausch Health Americas, Inc., 8.50%, 1/31/27(1) | 750,000 |
| 787,912 |
|
Bausch Health Cos., Inc., 5.50%, 3/1/23(1) | 60,000 |
| 59,325 |
|
Bausch Health Cos., Inc., 5.875%, 5/15/23(1) | 192,000 |
| 190,440 |
|
Bausch Health Cos., Inc., 6.125%, 4/15/25(1) | 4,285,000 |
| 4,247,528 |
|
Bausch Health Cos., Inc., 9.00%, 12/15/25(1) | 950,000 |
| 1,008,615 |
|
Bausch Health Cos., Inc., 5.75%, 8/15/27(1) | 225,000 |
| 232,909 |
|
Bausch Health Cos., Inc., 7.00%, 1/15/28(1) | 775,000 |
| 807,976 |
|
Bausch Health Cos., Inc., 5.00%, 1/30/28(1) | 725,000 |
| 691,795 |
|
Bausch Health Cos., Inc., 7.25%, 5/30/29(1) | 450,000 |
| 469,507 |
|
Bausch Health Cos., Inc., 5.25%, 1/30/30(1) | 550,000 |
| 518,375 |
|
| Elanco Animal Health, Inc., 5.65%, 8/28/28 | 275,000 |
| 290,778 |
|
Endo Dac / Endo Finance LLC / Endo Finco, Inc., 6.00%, 7/15/23(1) | 1,855,000 |
| 1,357,582 |
|
Endo Dac / Endo Finance LLC / Endo Finco, Inc., 6.00%, 2/1/25(1) | 1,365,000 |
| 939,707 |
|
Mallinckrodt International Finance SA / Mallinckrodt CB LLC, 5.75%, 8/1/22(1) | 530,000 |
| 268,975 |
|
Mallinckrodt International Finance SA / Mallinckrodt CB LLC, 5.625%, 10/15/23(1) | 230,000 |
| 58,936 |
|
Par Pharmaceutical, Inc., 7.50%, 4/1/27(1) | 900,000 |
| 902,317 |
|
|
| | | | | | |
| | Principal Amount/Shares | Value |
Teva Pharmaceutical Finance Netherlands III BV, 7.125%, 1/31/25(1) | $ | 600,000 |
| $ | 597,381 |
|
| Teva Pharmaceutical Finance Netherlands III BV, 6.75%, 3/1/28 | 200,000 |
| 195,110 |
|
| Teva Pharmaceutical Finance Netherlands III BV, 4.10%, 10/1/46 | 1,000,000 |
| 737,800 |
|
Vizient, Inc., 6.25%, 5/15/27(1) | 200,000 |
| 201,292 |
|
| | | 14,564,260 |
|
| Professional Services — 0.5% | | |
ASGN, Inc., 4.625%, 5/15/28(1) | 725,000 |
| 683,711 |
|
Dun & Bradstreet Corp. (The), 6.875%, 8/15/26(1) | 525,000 |
| 548,953 |
|
Dun & Bradstreet Corp. (The), 10.25%, 2/15/27(1) | 1,600,000 |
| 1,704,880 |
|
| | | 2,937,544 |
|
| Real Estate Management and Development — 0.7% | | |
Five Point Operating Co. LP / Five Point Capital Corp., 7.875%, 11/15/25(1) | 375,000 |
| 325,301 |
|
Forestar Group, Inc., 8.00%, 4/15/24(1) | 975,000 |
| 993,276 |
|
Forestar Group, Inc., 5.00%, 3/1/28(1) | 300,000 |
| 250,798 |
|
Greystar Real Estate Partners LLC, 5.75%, 12/1/25(1) | 725,000 |
| 661,584 |
|
Howard Hughes Corp. (The), 5.375%, 3/15/25(1) | 250,000 |
| 243,743 |
|
Hunt Cos., Inc., 6.25%, 2/15/26(1) | 650,000 |
| 490,404 |
|
| Kennedy-Wilson, Inc., 5.875%, 4/1/24 | 250,000 |
| 225,543 |
|
| Newmark Group, Inc., 6.125%, 11/15/23 | 500,000 |
| 509,453 |
|
Realogy Group LLC / Realogy Co-Issuer Corp., 4.875%, 6/1/23(1) | 50,000 |
| 42,375 |
|
Realogy Group LLC / Realogy Co-Issuer Corp., 9.375%, 4/1/27(1) | 150,000 |
| 127,555 |
|
| | | 3,870,032 |
|
| Road and Rail — 1.4% | | |
Ahern Rentals, Inc., 7.375%, 5/15/23(1) | 1,148,000 |
| 664,399 |
|
Algeco Global Finance plc, 8.00%, 2/15/23(1) | 600,000 |
| 463,482 |
|
Avis Budget Car Rental LLC / Avis Budget Finance, Inc., 5.75%, 7/15/27(1) | 275,000 |
| 220,736 |
|
DAE Funding LLC, 4.00%, 8/1/20(1) | 725,000 |
| 716,780 |
|
DAE Funding LLC, 5.00%, 8/1/24(1) | 800,000 |
| 729,976 |
|
Hertz Corp. (The), 5.50%, 10/15/24(1) | 75,000 |
| 42,641 |
|
Hertz Corp. (The), 7.125%, 8/1/26(1) | 1,325,000 |
| 701,157 |
|
Hertz Corp. (The), 6.00%, 1/15/28(1) | 1,325,000 |
| 702,979 |
|
Uber Technologies, Inc., 7.50%, 11/1/23(1) | 1,550,000 |
| 1,517,109 |
|
Uber Technologies, Inc., 8.00%, 11/1/26(1) | 950,000 |
| 943,381 |
|
Uber Technologies, Inc., 7.50%, 9/15/27(1) | 350,000 |
| 348,171 |
|
| United Rentals North America, Inc., 6.50%, 12/15/26 | 225,000 |
| 229,624 |
|
| | | 7,280,435 |
|
| Semiconductors and Semiconductor Equipment — 0.7% | | |
| Advanced Micro Devices, Inc., 7.50%, 8/15/22 | 1,215,000 |
| 1,298,150 |
|
Amkor Technology, Inc., 6.625%, 9/15/27(1) | 300,000 |
| 283,665 |
|
Entegris, Inc., 4.625%, 2/10/26(1) | 650,000 |
| 621,107 |
|
NXP BV / NXP Funding LLC, 4.125%, 6/1/21(1) | 400,000 |
| 403,884 |
|
NXP BV / NXP Funding LLC, 4.625%, 6/1/23(1) | 200,000 |
| 206,103 |
|
| Qorvo, Inc., 5.50%, 7/15/26 | 200,000 |
| 210,174 |
|
Qorvo, Inc., 4.375%, 10/15/29(1) | 450,000 |
| 421,031 |
|
|
| | | | | | |
| | Principal Amount/Shares | Value |
Sensata Technologies UK Financing Co. plc, 6.25%, 2/15/26(1) | $ | 425,000 |
| $ | 418,859 |
|
| | | 3,862,973 |
|
| Software — 2.0% | | |
ACI Worldwide, Inc., 5.75%, 8/15/26(1) | 200,000 |
| 199,709 |
|
Ascend Learning LLC, 6.875%, 8/1/25(1) | 250,000 |
| 244,686 |
|
Ascend Learning LLC, 6.875%, 8/1/25(1) | 200,000 |
| 195,749 |
|
Camelot Finance SA, 4.50%, 11/1/26(1) | 650,000 |
| 634,154 |
|
Castle US Holding Corp., 9.50%, 2/15/28(1) | 1,225,000 |
| 1,170,641 |
|
CDK Global, Inc., 5.25%, 5/15/29(1) | 375,000 |
| 383,906 |
|
| Infor US, Inc., 6.50%, 5/15/22 | 1,195,000 |
| 1,170,694 |
|
j2 Cloud Services LLC / j2 Cloud Co-Obligor, Inc., 6.00%, 7/15/25(1) | 1,150,000 |
| 1,148,557 |
|
Open Text Corp., 3.875%, 2/15/28(1) | 450,000 |
| 425,109 |
|
Open Text Holdings, Inc., 4.125%, 2/15/30(1) | 450,000 |
| 425,644 |
|
PTC, Inc., 3.625%, 2/15/25(1) | 375,000 |
| 353,437 |
|
PTC, Inc., 4.00%, 2/15/28(1) | 250,000 |
| 241,950 |
|
Solera LLC / Solera Finance, Inc., 10.50%, 3/1/24(1) | 1,655,000 |
| 1,632,252 |
|
SS&C Technologies, Inc., 5.50%, 9/30/27(1) | 1,550,000 |
| 1,607,156 |
|
Veritas US, Inc. / Veritas Bermuda Ltd., 10.50%, 2/1/24(1) | 1,200,000 |
| 1,021,494 |
|
| | | 10,855,138 |
|
| Specialty Retail — 2.1% | | |
Asbury Automotive Group, Inc., 4.50%, 3/1/28(1) | 133,000 |
| 114,048 |
|
Carvana Co., 8.875%, 10/1/23(1) | 400,000 |
| 380,988 |
|
eG Global Finance plc, 6.75%, 2/7/25(1) | 800,000 |
| 661,004 |
|
eG Global Finance plc, 8.50%, 10/30/25(1) | 400,000 |
| 358,502 |
|
| Ferrellgas LP / Ferrellgas Finance Corp., 6.50%, 5/1/21 | 720,000 |
| 634,464 |
|
| Ferrellgas LP / Ferrellgas Finance Corp., 6.75%, 6/15/23 | 155,000 |
| 135,043 |
|
| L Brands, Inc., 7.50%, 6/15/29 | 475,000 |
| 377,364 |
|
| L Brands, Inc., 6.875%, 11/1/35 | 425,000 |
| 316,763 |
|
| L Brands, Inc., 6.75%, 7/1/36 | 1,350,000 |
| 982,530 |
|
Lithia Motors, Inc., 4.625%, 12/15/27(1) | 275,000 |
| 249,590 |
|
| Murphy Oil USA, Inc., 4.75%, 9/15/29 | 250,000 |
| 235,762 |
|
| Penske Automotive Group, Inc., 3.75%, 8/15/20 | 425,000 |
| 416,994 |
|
PetSmart, Inc., 7.125%, 3/15/23(1) | 1,775,000 |
| 1,685,362 |
|
PriSo Acquisition Corp., 9.00%, 5/15/23(1) | 1,525,000 |
| 1,059,875 |
|
| Sonic Automotive, Inc., 6.125%, 3/15/27 | 400,000 |
| 355,417 |
|
Staples, Inc., 7.50%, 4/15/26(1) | 1,300,000 |
| 1,144,816 |
|
Staples, Inc., 10.75%, 4/15/27(1) | 1,675,000 |
| 1,294,524 |
|
| Suburban Propane Partners LP / Suburban Energy Finance Corp., 5.75%, 3/1/25 | 809,000 |
| 755,400 |
|
Superior Plus LP / Superior General Partner, Inc., 7.00%, 7/15/26(1) | 250,000 |
| 245,886 |
|
| | | 11,404,332 |
|
| Technology Hardware, Storage and Peripherals — 0.8% | | |
Dell International LLC / EMC Corp., 7.125%, 6/15/24(1) | 832,000 |
| 862,160 |
|
| Diebold Nixdorf, Inc., 8.50%, 4/15/24 | 375,000 |
| 247,033 |
|
Everi Payments, Inc., 7.50%, 12/15/25(1) | 697,000 |
| 535,816 |
|
| NCR Corp., 5.00%, 7/15/22 | 895,000 |
| 844,656 |
|
NCR Corp., 5.75%, 9/1/27(1) | 800,000 |
| 733,574 |
|
|
| | | | | | |
| | Principal Amount/Shares | Value |
NCR Corp., 6.125%, 9/1/29(1) | $ | 1,025,000 |
| $ | 962,936 |
|
| | | 4,186,175 |
|
| Textiles, Apparel and Luxury Goods — 0.1% | | |
Eagle Intermediate Global Holding BV/Ruyi US Finance LLC, 7.50%, 5/1/25(1) | 600,000 |
| 350,247 |
|
| Thrifts and Mortgage Finance — 0.6% | | |
| MGIC Investment Corp., 5.75%, 8/15/23 | 200,000 |
| 186,913 |
|
Nationstar Mortgage Holdings, Inc., 8.125%, 7/15/23(1) | 500,000 |
| 492,027 |
|
Nationstar Mortgage Holdings, Inc., 9.125%, 7/15/26(1) | 550,000 |
| 499,812 |
|
Nationstar Mortgage Holdings, Inc., 6.00%, 1/15/27(1) | 250,000 |
| 213,906 |
|
Provident Funding Associates LP / PFG Finance Corp., 6.375%, 6/15/25(1) | 300,000 |
| 253,874 |
|
| Radian Group, Inc., 4.50%, 10/1/24 | 525,000 |
| 521,716 |
|
| Radian Group, Inc., 4.875%, 3/15/27 | 825,000 |
| 819,673 |
|
| | | 2,987,921 |
|
| Trading Companies and Distributors — 0.6% | | |
Beacon Roofing Supply, Inc., 4.875%, 11/1/25(1) | 450,000 |
| 408,940 |
|
Beacon Roofing Supply, Inc., 4.50%, 11/15/26(1) | 275,000 |
| 254,801 |
|
| Fly Leasing Ltd., 6.375%, 10/15/21 | 200,000 |
| 192,125 |
|
| Fly Leasing Ltd., 5.25%, 10/15/24 | 600,000 |
| 509,247 |
|
Fortress Transportation & Infrastructure Investors LLC, 6.75%, 3/15/22(1) | 150,000 |
| 139,636 |
|
Fortress Transportation & Infrastructure Investors LLC, 6.50%, 10/1/25(1) | 650,000 |
| 481,809 |
|
| H&E Equipment Services, Inc., 5.625%, 9/1/25 | 1,250,000 |
| 1,167,194 |
|
| | | 3,153,752 |
|
| Wireless Telecommunication Services — 2.0% | | |
Digicel Group One, Ltd., 8.25%, 12/30/22(1) | 1,486,000 |
| 735,570 |
|
Digicel Ltd., 6.00%, 4/15/21(1) | 300,000 |
| 173,610 |
|
| Sprint Communications, Inc., 9.25%, 4/15/22 | 675,000 |
| 727,944 |
|
| Sprint Communications, Inc., 6.00%, 11/15/22 | 100,000 |
| 104,594 |
|
| Sprint Corp., 7.875%, 9/15/23 | 3,335,000 |
| 3,697,298 |
|
| Sprint Corp., 7.125%, 6/15/24 | 150,000 |
| 165,748 |
|
| Sprint Corp., 7.625%, 3/1/26 | 250,000 |
| 284,338 |
|
| T-Mobile USA, Inc., 6.00%, 3/1/23 | 1,000,000 |
| 1,011,765 |
|
| T-Mobile USA, Inc., 6.50%, 1/15/24 | 65,000 |
| 66,461 |
|
| T-Mobile USA, Inc., 6.00%, 4/15/24 | 550,000 |
| 562,358 |
|
| T-Mobile USA, Inc., 6.375%, 3/1/25 | 1,150,000 |
| 1,183,068 |
|
| T-Mobile USA, Inc., 4.75%, 2/1/28 | 900,000 |
| 934,245 |
|
| Vodafone Group plc, VRN, 7.00%, 4/4/79 | 850,000 |
| 910,316 |
|
Xplornet Communications, Inc., 9.625% Cash or 10.625% PIK, 6/1/22(1)(6) | 78,984 |
| 74,121 |
|
| | | 10,631,436 |
|
TOTAL CORPORATE BONDS
(Cost $577,135,466) | | 485,055,540 |
|
BANK LOAN OBLIGATIONS(7) — 4.1% | | |
| Chemicals — 0.1% | | |
| ASP Unifrax Holdings Inc, Term Loan B, 4.82%, (6-month LIBOR plus 3.75%), 12/12/25 | 197,500 |
| 158,247 |
|
|
| | | | | | |
| | Principal Amount/Shares | Value |
| Consolidated Energy Finance, S.A., Term Loan B, 3.20%, (3-month LIBOR plus 2.50%), 5/7/25 | $ | 810,563 |
| $ | 587,658 |
|
| | | 745,905 |
|
| Commercial Services and Supplies — 0.2% | | |
| KAR Auction Services, Inc., 2019 Term Loan B6, 3.19%, (1-month LIBOR plus 2.25%), 9/19/26 | 248,750 |
| 231,337 |
|
| MRO Holdings, Inc., 2019 Term Loan B, 6.45%, (3-month LIBOR plus 5.00%), 6/4/26 | 111,972 |
| 91,165 |
|
| MRO Holdings, Inc., 2019 Term Loan B, 6.45%, (3-month LIBOR plus 5.00%), 6/4/26 | 55,006 |
| 44,785 |
|
| MRO Holdings, Inc., 2019 Term Loan B, 6.45%, (3-month LIBOR plus 5.00%), 6/4/26 | 378,896 |
| 308,486 |
|
| National Intergovernmental Purchasing Alliance Company, 1st Lien Term Loan, 5.20%, (3-month LIBOR plus 3.75%), 5/23/25 | 393,007 |
| 343,881 |
|
| | | 1,019,654 |
|
| Containers and Packaging — 0.2% | | |
| Berry Global, Inc., Term Loan Y, 2.86%, (1-month LIBOR plus 2.00%), 7/1/26 | 1,091,750 |
| 1,043,533 |
|
| Distributors — 0.1% | | |
| HD Supply, Inc., Term Loan B5, 2.74%, (1-month LIBOR plus 1.75%), 10/17/23 | 493,920 |
| 465,932 |
|
| Diversified Financial Services — 0.3% | | |
| MPH Acquisition Holdings LLC, 2016 Term Loan B, 4.20%, (3-month LIBOR plus 2.75%), 6/7/23 | 255,223 |
| 229,700 |
|
| Refinitiv US Holdings Inc., 2018 USD Term Loan, 4.24%, (1-month LIBOR plus 3.25%), 10/1/25 | 1,211,536 |
| 1,169,635 |
|
| | | 1,399,335 |
|
| Electric Utilities — 0.1% | | |
| Vistra Operations Company LLC, 1st Lien Term Loan B3, 2.55%, (1-month LIBOR plus 1.75%), 12/31/25 | 76,333 |
| 72,946 |
|
| Vistra Operations Company LLC, 1st Lien Term Loan B3, 2.74%, (1-month LIBOR plus 1.75%), 12/31/25 | 318,926 |
| 304,773 |
|
| | | 377,719 |
|
| Energy Equipment and Services — 0.1% | | |
| Keane Group Holdings, LLC, 2018 1st Lien Term Loan, 4.50%, (1-month LIBOR plus 3.50%), 5/25/25 | 120,625 |
| 80,819 |
|
| Parker Drilling Co, 2nd Lien PIK Term Loan, 11.00% Cash plus 2.00% PIK, 3/26/24 | 176,978 |
| 172,554 |
|
| | | 253,373 |
|
| Entertainment — 0.2% | | |
| Allen Media, LLC, 2020 Term Loan B, 7.23%, (3-month LIBOR plus 5.50%), 2/10/27 | 925,000 |
| 777,000 |
|
| Lions Gate Capital Holdings LLC, 2018 Term Loan B, 3.24%, (1-month LIBOR plus 2.25%), 3/24/25 | 244,776 |
| 223,358 |
|
| | | 1,000,358 |
|
| Health Care Providers and Services — 0.2% | | |
| Air Methods Corporation, 2017 Term Loan B, 4.95%, (3-month LIBOR plus 3.50%), 4/22/24 | 197,964 |
| 141,434 |
|
| IQVIA Inc., 2018 USD Term Loan B3, 3.20%, (3-month LIBOR plus 1.75%), 6/11/25 | 615,461 |
| 593,920 |
|
| RegionalCare Hospital Partners Holdings, Inc., 2018 Term Loan B, 4.74%, (1-month LIBOR plus 3.75%), 11/17/25 | 600,000 |
| 560,253 |
|
| | | 1,295,607 |
|
|
| | | | | | |
| | Principal Amount/Shares | Value |
| Hotels, Restaurants and Leisure — 1.1% | | |
| Boyd Gaming Corporation, Term Loan B3, 2.93%, (1 Week LIBOR plus 2.25%), 9/15/23 | $ | 680,452 |
| $ | 596,457 |
|
| Gateway Casinos & Entertainment Limited, 2018 Term Loan B, 4.45%, (3-month LIBOR plus 3.00%), 3/13/25 | 712,313 |
| 516,427 |
|
| Golden Nugget, Inc., 2017 Incremental Term Loan B, 3.49%, (1-month LIBOR plus 2.50%), 10/4/23 | 302,023 |
| 237,088 |
|
| Golden Nugget, Inc., 2017 Incremental Term Loan B, 3.70%, (3-month LIBOR plus 2.50%), 10/4/23 | 257,805 |
| 202,377 |
|
| Hilton Worldwide Finance, LLC, 2019 Term Loan B2, 2.70%, (1-month LIBOR plus 1.75%), 6/22/26 | 1,050,000 |
| 1,000,125 |
|
| Life Time Fitness Inc, 2017 Term Loan B, 4.36%, (3-month LIBOR plus 2.75%), 6/10/22 | 3,106,506 |
| 2,337,646 |
|
| NASCAR Holdings, Inc, Term Loan B, 3.67%, (1-month LIBOR plus 2.75%), 10/19/26 | 518,989 |
| 461,900 |
|
| UFC Holdings, LLC, 2019 Term Loan, 4.25%, (1-month LIBOR plus 3.25%), 4/29/26 | 445,893 |
| 397,403 |
|
| | | 5,749,423 |
|
| Insurance — 0.1% | | |
| Asurion LLC, 2018 Term Loan B6, 3.99%, (1-month LIBOR plus 3.00%), 11/3/23 | 519,016 |
| 500,851 |
|
| Hub International Limited, 2018 Term Loan B, 4.39%, (2-month LIBOR plus 2.75%), 4/25/25 | 12,268 |
| 11,557 |
|
| Hub International Limited, 2018 Term Loan B, 4.55%, (2-month LIBOR plus 2.75%), 4/25/25 | 257,919 |
| 242,959 |
|
| | | 755,367 |
|
| Machinery — 0.4% | | |
| Altra Industrial Motion Corp., 2018 Term Loan B, 2.99%, (1-month LIBOR plus 2.00%), 10/1/25 | 309,254 |
| 274,365 |
|
| Navistar International Corporation, 2017 1st Lien Term Loan B, 4.28%, (1-month LIBOR plus 3.50%), 11/6/24 | 558,855 |
| 490,862 |
|
| Vertiv Group Corporation, Term Loan B, 4.58%, (1-month LIBOR plus 3.00%), 3/2/27 | 1,350,000 |
| 1,174,500 |
|
| | | 1,939,727 |
|
| Media — 0.4% | | |
Banijay Entertainment S.A.S, USD Term Loan, 3/4/25(8) | 250,000 |
| 225,000 |
|
| Cengage Learning, Inc., 2016 Term Loan B, 5.25%, (1-month LIBOR plus 4.25%), 6/7/23 | 843,428 |
| 691,611 |
|
| Diamond Sports Group, LLC, Term Loan, 4.18%, (1-month LIBOR plus 3.25%), 8/24/26 | 323,375 |
| 253,849 |
|
| Nexstar Broadcasting, Inc., 2019 Term Loan B4, 4.33%, (1-month LIBOR plus 2.75%), 9/18/26 | 552,359 |
| 520,875 |
|
| Sinclair Television Group Inc., Term Loan B2B, 3.21%, (1-month LIBOR plus 2.50%), 9/30/26 | 273,625 |
| 261,312 |
|
| | | 1,952,647 |
|
| Metals and Mining — 0.1% | | |
Arconic Rolled Products Corporation, Term Loan B, 2/4/27(8) | 175,000 |
| 160,125 |
|
| Big River Steel LLC, Term Loan B, 6.45%, (3-month LIBOR plus 5.00%), 8/23/23 | 243,383 |
| 233,648 |
|
| Neenah Foundry Company, 2017 Term Loan, 7.76%, (2-month LIBOR plus 6.50%), 12/13/22 | 188,882 |
| 165,271 |
|
| Neenah Foundry Company, 2017 Term Loan, 8.12%, (2-month LIBOR plus 6.50%), 12/13/22 | 226,211 |
| 197,935 |
|
| | | 756,979 |
|
|
| | | | | | |
| | Principal Amount/Shares | Value |
| Oil, Gas and Consumable Fuels — 0.2% | | |
| California Resources Corporation, 2017 1st Lien Term Loan, 6.36%, (3-month LIBOR plus 4.75%), 12/31/22 | $ | 1,675,000 |
| $ | 446,664 |
|
| CITGO Holding Inc., 2019 Term Loan B, 8.00%, (1-month LIBOR plus 7.00%), 8/1/23 | 671,625 |
| 555,212 |
|
| Prairie ECI Acquiror LP, Term Loan B, 6.20%, (3-month LIBOR plus 4.75%), 3/11/26 | 308,236 |
| 164,059 |
|
| | | 1,165,935 |
|
Professional Services† | | |
| Dun & Bradstreet Corporation (The), Term Loan, 4.96%, (1-month LIBOR plus 4.00%), 2/6/26 | 275,000 |
| 249,906 |
|
| Road and Rail — 0.1% | | |
| USS Ultimate Holdings, Inc., 1st Lien Term Loan, 5.67%, (6-month LIBOR plus 3.75%), 8/25/24 | 463,678 |
| 403,400 |
|
| Software — 0.1% | | |
Camelot U.S. Acquisition 1 Co., Term Loan B, 10/31/26(8) | 450,000 |
| 429,750 |
|
| SS&C Technologies Holdings Europe S.A.R.L., 2018 Term Loan B4, 2.74%, (1-month LIBOR plus 1.75%), 4/16/25 | 98,632 |
| 93,207 |
|
| SS&C Technologies Inc., 2018 Term Loan B3, 2.74%, (1-month LIBOR plus 1.75%), 4/16/25 | 138,223 |
| 130,621 |
|
| | | 653,578 |
|
| Specialty Retail — 0.1% | | |
| Staples, Inc., 7 Year Term Loan, 6.52%, (1-month LIBOR plus 5.00%), 4/16/26 | 694,750 |
| 555,105 |
|
TOTAL BANK LOAN OBLIGATIONS
(Cost $26,430,418) | | 21,783,483 |
|
| PREFERRED STOCKS — 2.1% | | |
| Banks — 1.4% | | |
| Bank of America Corp., 5.125% | 325,000 |
| 308,976 |
|
| Bank of America Corp., 5.875% | 50,000 |
| 50,708 |
|
| Bank of America Corp., 6.25% | 1,775,000 |
| 1,802,859 |
|
| Barclays plc, 7.75% | 200,000 |
| 175,539 |
|
| Barclays plc, 8.00% | 200,000 |
| 185,861 |
|
| Citigroup, Inc., 4.70% | 775,000 |
| 671,828 |
|
| Citigroup, Inc., 5.90% | 525,000 |
| 506,882 |
|
| Citigroup, Inc., 6.25% | 675,000 |
| 695,814 |
|
| JPMorgan Chase & Co., 4.60% | 425,000 |
| 372,491 |
|
| JPMorgan Chase & Co., 5.24% | 672,000 |
| 607,653 |
|
| JPMorgan Chase & Co., 6.10% | 1,100,000 |
| 1,121,664 |
|
| JPMorgan Chase & Co., 6.125% | 275,000 |
| 261,441 |
|
| Royal Bank of Scotland Group plc, 8.00% | 200,000 |
| 187,941 |
|
| Royal Bank of Scotland Group plc, 8.625% | 600,000 |
| 588,195 |
|
| | | 7,537,852 |
|
| Capital Markets — 0.4% | | |
Credit Suisse Group AG, 5.10%(1) | 200,000 |
| 154,750 |
|
Credit Suisse Group AG, 6.25%(1) | 400,000 |
| 371,443 |
|
| Deutsche Bank AG, 6.00% | 200,000 |
| 134,400 |
|
| Goldman Sachs Group, Inc. (The), 4.95% | 700,000 |
| 623,486 |
|
| Goldman Sachs Group, Inc. (The), 5.375% | 750,000 |
| 670,474 |
|
| | | 1,954,553 |
|
|
| | | | | | |
| | Principal Amount/Shares | Value |
Internet and Direct Marketing Retail† | | |
MYT Holding Co., 10.00%(1) | 92,632 |
| $ | 68,085 |
|
| Oil, Gas and Consumable Fuels — 0.3% | | |
| Energy Transfer Operating LP, 6.25% | 1,050,000 |
| 521,582 |
|
| Energy Transfer Operating LP, 6.625% | 350,000 |
| 173,861 |
|
| Plains All American Pipeline LP, 6.125% | 1,775,000 |
| 890,597 |
|
| Summit Midstream Partners LP, 9.50% | 1,000,000 |
| 14,860 |
|
| | | 1,600,900 |
|
TOTAL PREFERRED STOCKS
(Cost $14,724,219) | | 11,161,390 |
|
| COMMON STOCKS — 0.2% | | |
| Chemicals — 0.1% | | |
Hexion Holdings Corp., Class B(4) | 54,930 |
| 521,835 |
|
Energy Equipment and Services† | | |
Parker Drilling Co.(4) | 11,731 |
| 99,479 |
|
Weatherford International plc(4) | 7,388 |
| 43,958 |
|
| | | 143,437 |
|
Media† | | |
Cumulus Media, Inc., Class A(4) | 2,563 |
| 13,891 |
|
| Oil, Gas and Consumable Fuels — 0.1% | | |
Jones Energy II, Inc.(4) | 15,461 |
| 216,841 |
|
Software† | | |
Avaya Holdings Corp.(4) | 21,139 |
| 171,015 |
|
TOTAL COMMON STOCKS
(Cost $3,419,553) | | 1,067,019 |
|
| CONVERTIBLE BONDS — 0.2% | | |
| Banks — 0.2% | | |
| Barclays Bank plc, 7.625%, 11/21/22 | $ | 830,000 |
| 849,497 |
|
Oil, Gas and Consumable Fuels† | | |
| Chesapeake Energy Corp., 5.50%, 9/15/26 | 175,000 |
| 9,625 |
|
Denbury Resources, Inc., 6.375%, 12/31/24(1) | 359,000 |
| 146,167 |
|
| | | 155,792 |
|
TOTAL CONVERTIBLE BONDS
(Cost $1,322,138) | | 1,005,289 |
|
ESCROW INTERESTS(9)† | | |
Electric Utilities† | | |
GenOn Energy(4) | 425,000 |
| — |
|
Oil, Gas and Consumable Fuels† | | |
Cloud Peak Energy Resources LLC / Cloud Peak Energy Finance Corp.(4) | 450,000 |
| 4,950 |
|
TOTAL ESCROW INTERESTS
(Cost $168,750) | | 4,950 |
|
WARRANTS† | | |
Oil, Gas and Consumable Fuels† | | |
Jones Energy II, Inc.(4)
(Cost $11,372) | 4,374 |
| 4,111 |
|
| | | |
|
| | | | | | |
| | Principal Amount/Shares | Value |
| TEMPORARY CASH INVESTMENTS — 0.9% | | |
State Street Institutional U.S. Government Money Market Fund, Premier Class
(Cost $5,050,938) | 5,050,938 |
| $ | 5,050,938 |
|
TOTAL INVESTMENT SECURITIES — 98.3%
(Cost $628,262,854) | | 525,132,720 |
|
| OTHER ASSETS AND LIABILITIES — 1.7% | | 9,064,462 |
|
| TOTAL NET ASSETS — 100.0% | | $ | 534,197,182 |
|
|
| | |
| NOTES TO SCHEDULE OF INVESTMENTS |
| LIBOR | - | London Interbank Offered Rate |
| MTN | - | Medium Term Note |
| PIK | - | Payment in Kind. Security may pay a cash rate and/or an in kind rate. |
| USD | - | United States Dollar |
| VRN | - | Variable Rate Note. The rate adjusts periodically based upon the terms set forth in the security’s offering documents. The rate shown is effective at the period end and the reference rate and spread, if any, is indicated. The security's effective maturity date may be shorter than the final maturity date shown. |
† Category is less than 0.05% of total net assets.
| |
| (1) | Security was purchased pursuant to Rule 144A under the Securities Act of 1933 and may be sold in transactions exempt from registration, normally to qualified institutional investors. The aggregate value of these securities at the period end was $324,459,826, which represented 60.7% of total net assets. Of these securities, 0.2% of total net assets were deemed illiquid under policies approved by the Board of Trustees. |
| |
| (2) | The security's rate was paid in cash at the last payment date. |
| |
| (3) | Security is in default. |
| |
| (5) | When-issued security. The issue price and yield are fixed on the date of the commitment, but payment and delivery are scheduled for a future date. |
| |
| (6) | The security's rate was paid in kind or a combination of cash and in kind at the last payment date. |
| |
| (7) | The interest rate on a bank loan obligation adjusts periodically based on a predetermined schedule. Rate shown is effective at period end. The maturity date on a bank loan obligation may be less than indicated as a result of contractual or optional prepayments. These prepayments cannot be predicted with certainty. |
| |
| (8) | The interest rate will be determined upon settlement of the bank loan obligation after period end. |
| |
| (9) | Escrow interests represent beneficial interests in bankruptcy reorganizations or liquidation proceedings and may be subject to resale, redemption, or transferability restrictions. The amount and timing of future payments, if any, cannot be predicted with certainty. |
See Notes to Financial Statements.
|
|
| Statement of Assets and Liabilities |
|
| | | |
| MARCH 31, 2020 | |
| Assets | |
| Investment securities, at value (cost of $628,262,854) | $ | 525,132,720 |
|
| Cash | 131,105 |
|
| Receivable for investments sold | 3,131,275 |
|
| Receivable for capital shares sold | 1,002,490 |
|
| Interest receivable | 10,184,758 |
|
| | 539,582,348 |
|
| | |
| Liabilities | |
| Payable for investments purchased | 5,303,443 |
|
| Payable for capital shares redeemed | 10,838 |
|
| Accrued management fees | 70,885 |
|
| | 5,385,166 |
|
| | |
| Net Assets | $ | 534,197,182 |
|
| | |
| Net Assets Consist of: | |
| Capital paid in | $ | 656,660,499 |
|
| Distributable earnings | (122,463,317 | ) |
| | $ | 534,197,182 |
|
|
| | | | | | |
| | Net Assets | Shares Outstanding | Net Asset Value Per Share |
| Investor Class |
| $101,336,524 |
| 12,310,708 |
| $8.23 |
| G Class |
| $432,860,658 |
| 52,578,982 |
| $8.23 |
See Notes to Financial Statements.
|
| | | |
| YEAR ENDED MARCH 31, 2020 |
| Investment Income (Loss) | |
| Income: | |
| Interest | $ | 42,171,242 |
|
| | |
| Expenses: | |
| Management fees | 4,027,282 |
|
| Trustees' fees and expenses | 50,521 |
|
| Other expenses | 218 |
|
| | 4,078,021 |
|
Fees waived(1) | (3,023,121 | ) |
| | 1,054,900 |
|
| | |
| Net investment income (loss) | 41,116,342 |
|
| | |
| Realized and Unrealized Gain (Loss) | |
| Net realized gain (loss) on investment transactions | (12,236,986 | ) |
| Change in net unrealized appreciation (depreciation) on investments | (78,841,755 | ) |
| | |
| Net realized and unrealized gain (loss) | (91,078,741 | ) |
| | |
| Net Increase (Decrease) in Net Assets Resulting from Operations | $ | (49,962,399 | ) |
| |
| (1) | Amount consists of $35,382 and $2,987,739 for Investor Class and G Class, respectively. |
See Notes to Financial Statements.
|
|
| Statement of Changes in Net Assets |
|
| | | | | | |
| YEARS ENDED MARCH 31, 2020 AND MARCH 31, 2019 |
| Increase (Decrease) in Net Assets | March 31, 2020 | March 31, 2019 |
| Operations | | |
| Net investment income (loss) | $ | 41,116,342 |
| $ | 47,274,852 |
|
| Net realized gain (loss) | (12,236,986 | ) | (4,366,803 | ) |
| Change in net unrealized appreciation (depreciation) | (78,841,755 | ) | (7,326,650 | ) |
| Net increase (decrease) in net assets resulting from operations | (49,962,399 | ) | 35,581,399 |
|
| | | |
| Distributions to Shareholders | | |
| From earnings: | | |
| Investor Class | (7,216,652 | ) | (8,018,143 | ) |
| G Class | (34,400,787 | ) | (39,257,606 | ) |
| Decrease in net assets from distributions | (41,617,439 | ) | (47,275,749 | ) |
| | | |
| Capital Share Transactions | | |
| Net increase (decrease) in net assets from capital share transactions (Note 5) | (77,018,635 | ) | (98,062,493 | ) |
| | | |
| Net increase (decrease) in net assets | (168,598,473 | ) | (109,756,843 | ) |
| | | |
| Net Assets | | |
| Beginning of period | 702,795,655 |
| 812,552,498 |
|
| End of period | $ | 534,197,182 |
| $ | 702,795,655 |
|
See Notes to Financial Statements.
|
|
Notes to Financial Statements |
MARCH 31, 2020
1. Organization
American Century Investment Trust (the trust) is registered under the Investment Company Act of 1940, as amended (the 1940 Act), as an open-end management investment company and is organized as a Massachusetts business trust. NT High Income Fund (the fund) is one fund in a series issued by the trust. The fund’s investment objective is to seek current yield and capital growth. The fund is not permitted to invest in securities issued by companies assigned the Global Industry Classification Standard or the Bloomberg Industry Classification Standard for the tobacco industry. The fund offers the Investor Class and G Class.
2. Significant Accounting Policies
The following is a summary of significant accounting policies consistently followed by the fund in preparation of its financial statements. The fund is an investment company and follows accounting and reporting guidance in accordance with accounting principles generally accepted in the United States of America. This may require management to make certain estimates and assumptions at the date of the financial statements. Actual results could differ from these estimates. Management evaluated the impact of events or transactions occurring through the date the financial statements were issued that would merit recognition or disclosure.
Investment Valuations — The fund determines the fair value of its investments and computes its net asset value per share at the close of regular trading (usually 4 p.m. Eastern time) on the New York Stock Exchange (NYSE) on each day the NYSE is open. The Board of Trustees has adopted valuation policies and procedures to guide the investment advisor in the fund’s investment valuation process and to provide methodologies for the oversight of the fund’s pricing function.
Fixed income securities are valued at the evaluated mean as provided by independent pricing services or at the mean of the most recent bid and asked prices as provided by investment dealers. Corporate bonds, bank loan obligations and convertible bonds are valued using market models that consider trade data, quotations from dealers and active market makers, relevant yield curve and spread data, creditworthiness, trade data or market information on comparable securities, and other relevant security specific information. Mortgage-related and asset-backed securities are valued based on models that consider trade data, prepayment and default projections, benchmark yield and spread data and estimated cash flows of each tranche of the issuer.
Equity securities that are listed or traded on a domestic securities exchange are valued at the last reported sales price or at the official closing price as provided by the exchange. Equity securities traded on foreign securities exchanges are generally valued at the closing price of such securities on the exchange where primarily traded or at the close of the NYSE, if that is earlier. If no last sales price is reported, or if local convention or regulation so provides, the mean of the latest bid and asked prices may be used. Securities traded over-the-counter are valued at the mean of the latest bid and asked prices, the last sales price, or the official closing price.
Hybrid securities are valued at the evaluated mean as provided by independent pricing services or at the mean of the most recent bid and asked prices as provided by investment dealers. Preferred stocks and convertible preferred stocks with perpetual maturities are valued using market models that consider trade data, quotations from dealers and active market makers, relevant yield curve and spread data, creditworthiness, trade data or market information on comparable securities, and other relevant security specific information.
Open-end management investment companies are valued at the reported net asset value per share.
If the fund determines that the market price for an investment is not readily available or the valuation methods mentioned above do not reflect an investment’s fair value, such investment is valued as determined in good faith by the Board of Trustees or its delegate, in accordance with policies and procedures adopted by the Board of Trustees. In its determination of fair value, the fund may review several factors including, but not limited to, market information regarding the specific investment or comparable investments and correlation with other investment types, futures indices or general market indicators. Circumstances that may cause the fund to use these procedures to value an investment include, but are not limited to: an investment has been
declared in default or is distressed; trading in a security has been suspended during the trading day or a security is not actively trading on its principal exchange; prices received from a regular pricing source are deemed unreliable; or there is a foreign market holiday and no trading occurred.
The fund monitors for significant events occurring after the close of an investment’s primary exchange but before the fund’s net asset value per share is determined. Significant events may include, but are not limited to: corporate announcements and transactions; governmental action and political unrest that could impact a specific investment or an investment sector; or armed conflicts, natural disasters and similar events that could affect investments in a specific country or region. The fund also monitors for significant fluctuations between domestic and foreign markets, as evidenced by the U.S. market or such other indicators that the Board of Trustees, or its delegate, deems appropriate. The fund may apply a model-derived factor to the closing price of equity securities traded on foreign securities exchanges. The factor is based on observable market data as provided by an independent pricing service.
Security Transactions — Security transactions are accounted for as of the trade date. Net realized gains and losses are determined on the identified cost basis, which is also used for federal income tax purposes.
Investment Income — Interest income is recorded on the accrual basis and includes paydown gain (loss) and accretion of discounts and amortization of premiums.
Segregated Assets — In accordance with the 1940 Act, the fund segregates assets on its books and records to cover certain types of investment securities and other financial instruments. American Century Investment Management, Inc. (ACIM) (the investment advisor) monitors, on a daily basis, the securities segregated to ensure the fund designates a sufficient amount of liquid assets, marked-to-market daily. The fund may also receive assets or be required to pledge assets at the custodian bank or with a broker for collateral requirements.
Income Tax Status — It is the fund’s policy to distribute substantially all net investment income and net realized gains to shareholders and to otherwise qualify as a regulated investment company under provisions of the Internal Revenue Code. Accordingly, no provision has been made for income taxes. The fund files U.S. federal, state, local and non-U.S. tax returns as applicable. The fund's tax returns are subject to examination by the relevant taxing authority until expiration of the applicable statute of limitations, which is generally three years from the date of filing but can be longer in certain jurisdictions. At this time, management believes there are no uncertain tax positions which, based on their technical merit, would not be sustained upon examination and for which it is reasonably possible that the total amounts of unrecognized tax benefits will significantly change in the next twelve months.
Multiple Class — All shares of the fund represent an equal pro rata interest in the net assets of the class to which such shares belong, and have identical voting, dividend, liquidation and other rights and the same terms and conditions, except for class specific expenses and exclusive rights to vote on matters affecting only individual classes. Income, non-class specific expenses, and realized and unrealized capital gains and losses of the fund are allocated to each class of shares based on their relative net assets.
Distributions to Shareholders — Distributions from net investment income, if any, are declared daily and paid monthly. Distributions from net realized gains, if any, are generally declared and paid annually.
Indemnifications — Under the trust’s organizational documents, its officers and trustees are indemnified against certain liabilities arising out of the performance of their duties to the fund. In addition, in the normal course of business, the fund enters into contracts that provide general indemnifications. The maximum exposure under these arrangements is unknown as this would involve future claims that may be made against a fund. The risk of material loss from such claims is considered by management to be remote.
3. Fees and Transactions with Related Parties
Certain officers and trustees of the trust are also officers and/or directors of American Century Companies, Inc. (ACC). The trust's investment advisor, ACIM, the trust's distributor, American Century Investment Services, Inc., and the trust's transfer agent, American Century Services, LLC, are wholly owned, directly or indirectly, by ACC. ACIM has engaged Nomura Corporate Research and Asset Management Inc. (NCRAM) to serve as a subadvisor for the fund and to manage the fund’s assets. NCRAM is responsible for the day-to-day management of the fund, subject to the general supervision of the Board of Trustees and the investment advisor and in accordance with the investment objective, policies and restrictions of the fund. ACIM pays all costs associated with retaining NCRAM as the subadvisor of the fund. A subsidiary of NCRAM’s parent company indirectly owns a non-controlling equity interest in ACC. Various funds issued by American Century
Asset Allocation Portfolios, Inc. and American Century Strategic Asset Allocation, Inc. own, in aggregate, 99% of the shares of the fund. Related parties do not invest in the fund for the purpose of exercising management or control.
Management Fees — The trust has entered into a management agreement with ACIM, under which ACIM provides the fund with investment advisory and management services in exchange for a single, unified management fee (the fee) per class. The agreement provides that all expenses of managing and operating the fund, except brokerage expenses, taxes, interest, fees and expenses of the independent trustees (including legal counsel fees), and extraordinary expenses, will be paid by ACIM. The fee is computed and accrued daily based on each class's daily net assets and paid monthly in arrears. The difference in the fee among the classes is a result of their separate arrangements for non-Rule 12b-1 shareholder services, which may be provided indirectly through another American Century Investments mutual fund. It is not the result of any difference in advisory or custodial fees or other expenses related to the management of the fund’s assets, which do not vary by class. From April 1, 2019 through July 31, 2019, the investment advisor agreed to waive 0.075% of the fund's management fee. Effective August 1, 2019, the investment advisor terminated this waiver and decreased the annual management fee by 0.075%. The investment advisor agreed to waive the G Class’s management fee in its entirety. The investment advisor expects this waiver to remain in effect permanently and cannot terminate it without the approval of the Board of Trustees.
The annual management fee and the effective annual management fee before and after waiver for each class for the period ended March 31, 2020 are as follows:
|
| | | |
| | Annual Management Fee* | Effective Annual Management Fee |
| Before Waiver | After Waiver |
| Investor Class | 0.775% | 0.80% | 0.77% |
| G Class | 0.525% | 0.55% | 0.00% |
*Prior to August 1, 2019, the annual management fee was 0.85% for the Investor Class and 0.60% for the G Class.
Trustees’ Fees and Expenses — The Board of Trustees is responsible for overseeing the investment advisor’s management and operations of the fund. The trustees receive detailed information about the fund and its investment advisor regularly throughout the year, and meet at least quarterly with management of the investment advisor to review reports about fund operations. The fund’s officers do not receive compensation from the fund.
Interfund Transactions — The fund may enter into security transactions with other American Century Investments funds and other client accounts of the investment advisor, in accordance with the 1940 Act rules and procedures adopted by the Board of Trustees. The rules and procedures require, among other things, that these transactions be effected at the independent current market price of the security. There were no interfund transactions during the period.
4. Investment Transactions
Purchases and sales of investment securities, excluding short-term investments, for the period ended March 31, 2020 were $376,963,186 and $439,237,059, respectively.
5. Capital Share Transactions
Transactions in shares of the fund were as follows (unlimited number of shares authorized):
|
| | | | | | | | | | |
| | Year ended
March 31, 2020 | Year ended March 31, 2019 |
| | Shares | Amount | Shares | Amount |
| Investor Class | | | | |
| Sold | 160,642 |
| $ | 1,527,819 |
| 167,178 |
| $ | 1,527,094 |
|
| Issued in reinvestment of distributions | 758,569 |
| 7,216,652 |
| 829,340 |
| 7,997,254 |
|
| Redeemed | (3,167,519 | ) | (29,788,480 | ) | (1,007,451 | ) | (9,475,324 | ) |
| | (2,248,308 | ) | (21,044,009 | ) | (10,933 | ) | 49,024 |
|
| G Class | | | | |
| Sold | 2,570,023 |
| 24,417,668 |
| 1,868,631 |
| 17,837,972 |
|
| Issued in reinvestment of distributions | 3,615,672 |
| 34,400,787 |
| 4,055,073 |
| 39,145,079 |
|
| Redeemed | (12,076,037 | ) | (114,793,081 | ) | (16,067,893 | ) | (155,094,568 | ) |
| | (5,890,342 | ) | (55,974,626 | ) | (10,144,189 | ) | (98,111,517 | ) |
| Net increase (decrease) | (8,138,650 | ) | $ | (77,018,635 | ) | (10,155,122 | ) | $ | (98,062,493 | ) |
6. Fair Value Measurements
The fund’s investments valuation process is based on several considerations and may use multiple inputs to determine the fair value of the investments held by the fund. In conformity with accounting principles generally accepted in the United States of America, the inputs used to determine a valuation are classified into three broad levels.
| |
| • | Level 1 valuation inputs consist of unadjusted quoted prices in an active market for identical investments. |
| |
| • | Level 2 valuation inputs consist of direct or indirect observable market data (including quoted prices for comparable investments, evaluations of subsequent market events, interest rates, prepayment speeds, credit risk, etc.). These inputs also consist of quoted prices for identical investments initially expressed in local currencies that are adjusted through translation into U.S. dollars. |
| |
| • | Level 3 valuation inputs consist of unobservable data (including a fund’s own assumptions). |
The level classification is based on the lowest level input that is significant to the fair valuation measurement. The valuation inputs are not necessarily an indication of the risks associated with investing in these securities or other financial instruments.
The following is a summary of the level classifications as of period end. The Schedule of Investments provides additional information on the fund’s portfolio holdings.
|
| | | | | | | | |
| | Level 1 | Level 2 | Level 3 |
| Assets | | | |
| Investment Securities | | | |
| Corporate Bonds | — |
| $ | 485,055,540 |
| — |
|
| Bank Loan Obligations | — |
| 21,783,483 |
| — |
|
| Preferred Stocks | — |
| 11,161,390 |
| — |
|
| Common Stocks | $ | 850,178 |
| 216,841 |
| — |
|
| Convertible Bonds | — |
| 1,005,289 |
| — |
|
| Escrow Interests | — |
| 4,950 |
| — |
|
| Warrants | — |
| 4,111 |
| — |
|
| Temporary Cash Investments | 5,050,938 |
| — |
| — |
|
| | $ | 5,901,116 |
| $ | 519,231,604 |
| — |
|
7. Risk Factors
The value of the fund’s shares will go up and down, sometimes rapidly or unpredictably, based on the performance of the securities owned by the fund and other factors generally affecting the securities market. Market risks, including political, regulatory, economic and social developments, can affect the value of the fund’s investments. Natural disasters, public health emergencies, terrorism and other unforeseeable events may lead to increased market volatility and may have adverse long-term effects on world economies and markets generally.
The fund is owned by a relatively small number of shareholders, and in the event such shareholders redeem, the ongoing operations of the fund may be at risk.
The fund invests primarily in high-yield and lower-quality debt securities, which are subject to substantial risks including liquidity risk and credit risk.
The fund may invest in instruments that have variable or floating coupon rates based on the London Interbank Offered Rate (LIBOR). LIBOR is a benchmark interest rate intended to be representative of the rate at which certain major international banks lend to one another over short-terms. LIBOR will be phased out by the end of 2021. Uncertainty remains regarding a replacement rate or rates for LIBOR. The transition process may lead to increased volatility or illiquidity in markets for instruments that rely on LIBOR. This could result in a change to the value of such instruments.
8. Federal Tax Information
The tax character of distributions paid during the years ended March 31, 2020 and March 31, 2019 were as follows:
|
| | | | | | |
| | 2020 | 2019 |
| Distributions Paid From | | |
| Ordinary income | $ | 41,617,439 |
| $ | 47,275,749 |
|
| Long-term capital gains | — |
| — |
|
The book-basis character of distributions made during the year from net investment income or net realized gains may differ from their ultimate characterization for federal income tax purposes. These differences reflect the differing character of certain income items and net realized gains and losses for financial statement and tax purposes, and may result in reclassification among certain capital accounts on the financial statements.
As of period end, the federal tax cost of investments and the components of distributable earnings on a tax-basis were as follows:
|
| | | |
| Federal tax cost of investments | $ | 629,669,596 |
|
| Gross tax appreciation of investments | $ | 3,894,050 |
|
| Gross tax depreciation of investments | (108,430,926 | ) |
| Net tax appreciation (depreciation) of investments | $ | (104,536,876 | ) |
| Undistributed ordinary income | $ | 209,858 |
|
| Accumulated short-term capital losses | $ | (2,503,022 | ) |
| Accumulated long-term capital losses | $ | (15,633,277 | ) |
The difference between book-basis and tax-basis unrealized appreciation (depreciation) is attributable primarily to the tax deferral of losses on wash sales.
Accumulated capital losses represent net capital loss carryovers that may be used to offset future realized capital gains for federal income tax purposes. The capital loss carryovers may be carried forward for an unlimited period. Future capital loss carryover utilization in any given year may be subject to Internal Revenue Code limitations.
9. Recently Issued Accounting Standards
In March 2017, the Financial Accounting Standards Board (FASB) issued Accounting Standards Update No. 2017-08, “Receivables - Nonrefundable Fees and Other Costs (Subtopic 310-20), Premium Amortization on Purchased Callable Debt Securities” (ASU 2017-08). ASU 2017-08 amends the amortization period for certain purchased callable debt securities held at a premium, shortening such period to the earliest call date. The amendments are effective for fiscal years, and interim periods within those fiscal years, beginning after December 15, 2018. The adoption of ASU 2017-08 did not materially impact the financial statements.
|
| | | | | | | | | | | | | | | | | |
| For a Share Outstanding Throughout the Years Ended March 31 (except as noted) |
| Per-Share Data | | | | | | | | Ratios and Supplemental Data | |
| | | Income From Investment Operations: | Distributions From: | | | Ratio to Average Net Assets of: | | |
| | Net Asset
Value,
Beginning
of Period | Net
Investment
Income
(Loss)(1) | Net
Realized
and
Unrealized
Gain (Loss) | Total From
Investment
Operations | Net
Investment
Income | Net
Realized
Gains | Total
Distributions | Net Asset
Value,
End
of Period | Total
Return(2) | Operating
Expenses | Operating
Expenses
(before
expense
waiver) | Net
Investment
Income
(Loss) | Net
Investment
Income
(Loss)
(before
expense
waiver) | Portfolio
Turnover
Rate | Net
Assets,
End of
Period
(in thousands) |
| Investor Class | | | | | | | | | | | | | | |
| 2020 | $9.62 | 0.53 | (1.39) | (0.86) | (0.53) | — | (0.53) | $8.23 | (9.51)% | 0.78% | 0.81% | 5.51% | 5.48% | 58% |
| $101,337 |
|
| 2019 | $9.77 | 0.55 | (0.15) | 0.40 | (0.55) | — | (0.55) | $9.62 | 4.21% | 0.78% | 0.86% | 5.66% | 5.58% | 38% |
| $140,096 |
|
2018(3) | $10.00 | 0.43 | (0.21) | 0.22 | (0.43) | (0.02) | (0.45) | $9.77 | 2.18% | 0.81%(4) | 0.85%(4) | 5.04%(4) | 5.00%(4) | 64% |
| $142,308 |
|
| G Class | | | | | | | | | | | | | | |
| 2020 | $9.62 | 0.60 | (1.38) | (0.78) | (0.61) | — | (0.61) | $8.23 | (8.80)% | 0.01% | 0.56% | 6.28% | 5.73% | 58% |
| $432,861 |
|
| 2019 | $9.77 | 0.62 | (0.15) | 0.47 | (0.62) | — | (0.62) | $9.62 | 5.02% | 0.01% | 0.61% | 6.43% | 5.83% | 38% |
| $562,700 |
|
2018(3) | $10.00 | 0.50 | (0.22) | 0.28 | (0.49) | (0.02) | (0.51) | $9.77 | 2.76% | 0.12%(4) | 0.61%(4) | 5.73%(4) | 5.24%(4) | 64% |
| $670,244 |
|
|
|
| Notes to Financial Highlights |
| |
| (1) | Computed using average shares outstanding throughout the period. |
| |
| (2) | Total returns are calculated based on the net asset value of the last business day. Total returns for periods less than one year are not annualized. |
| |
| (3) | May 19, 2017 (fund inception) through March 31, 2018. |
See Notes to Financial Statements.
|
|
| Report of Independent Registered Public Accounting Firm |
To the Board of Trustees of American Century Investment Trust and Shareholders of NT High Income Fund
Opinion on the Financial Statements
We have audited the accompanying statement of assets and liabilities, including the schedule of investments, of NT High Income Fund (one of the funds constituting American Century Investment Trust, referred to hereafter as the “Fund”) as of March 31, 2020, the related statement of operations for the year ended March 31, 2020, the statement of changes in net assets for each of the two years in the period ended March 31, 2020, including the related notes, and the financial highlights for each of the periods indicated therein (collectively referred to as the “financial statements”). In our opinion, the financial statements present fairly, in all material respects, the financial position of the Fund as of March 31, 2020, the results of its operations for the year then ended, the changes in its net assets for each of the two years in the period ended March 31, 2020 and the financial highlights for each of the periods indicated therein in conformity with accounting principles generally accepted in the United States of America.
Basis for Opinion
These financial statements are the responsibility of the Fund’s management. Our responsibility is to express an opinion on the Fund’s financial statements based on our audits. We are a public accounting firm registered with the Public Company Accounting Oversight Board (United States) (PCAOB) and are required to be independent with respect to the Fund in accordance with the U.S. federal securities laws and the applicable rules and regulations of the Securities and Exchange Commission and the PCAOB.
We conducted our audits of these financial statements in accordance with the standards of the PCAOB. Those standards require that we plan and perform the audit to obtain reasonable assurance about whether the financial statements are free of material misstatement, whether due to error or fraud.
Our audits included performing procedures to assess the risks of material misstatement of the financial statements, whether due to error or fraud, and performing procedures that respond to those risks. Such procedures included examining, on a test basis, evidence regarding the amounts and disclosures in the financial statements. Our audits also included evaluating the accounting principles used and significant estimates made by management, as well as evaluating the overall presentation of the financial statements. Our procedures included confirmation of securities owned as of March 31, 2020 by correspondence with the custodian and brokers; when replies were not received from brokers, we performed other auditing procedures. We believe that our audits provide a reasonable basis for our opinion.
/s/ PricewaterhouseCoopers LLP
Kansas City, Missouri
May 18, 2020
We have served as the auditor of one or more investment companies in American Century Investments since 1997.
Board of Trustees
The individuals listed below serve as trustees of the funds. Each trustee will continue to serve in this capacity until death, retirement, resignation or removal from office. The board has adopted a mandatory retirement age for trustees who are not “interested persons,” as that term is defined in the Investment Company Act (independent trustees). Independent trustees shall retire on December 31 of the year in which they reach their 75th birthday; provided, however, that on or after January 1, 2022, independent trustees shall retire on December 31 of the year in which they reach their 76th birthday.
Mr. Thomas is an “interested person” because he currently serves as President and Chief Executive Officer of American Century Companies, Inc. (ACC), the parent company of American Century Investment Management, Inc. (ACIM or the advisor). The other trustees (more than three-fourths of the total number) are independent. They are not employees, directors or officers of, and have no financial interest in, ACC or any of its wholly owned, direct or indirect, subsidiaries, including ACIM, American Century Investment Services, Inc. (ACIS) and American Century Services, LLC (ACS), and they do not have any other affiliations, positions or relationships that would cause them to be considered “interested persons” under the Investment Company Act. The trustees serve in this capacity for eight (in the case of Jonathan S. Thomas, 16; and Ronald J. Gilson, 9) registered investment companies in the American Century Investments family of funds.
The following table presents additional information about the trustees. The mailing address for each trustee other than Mr. Thomas is 1665 Charleston Road, Mountain View, California 94043. The mailing address for Mr. Thomas is 4500 Main Street, Kansas City, Missouri 64111.
|
| | | | | |
Name
(Year of Birth) | Position(s) Held with Funds | Length of Time Served | Principal Occupation(s) During Past 5 Years | Number of American Century Portfolios Overseen by Trustee | Other Directorships Held During Past 5 Years |
| Independent Trustees |
|
|
Tanya S. Beder
(1955) | Trustee | Since 2011 | Chairman and CEO, SBCC Group Inc. (independent advisory services) (2006 to present) | 40 | CYS Investments, Inc.; Kirby Corporation; Nabors Industries Ltd. |
Jeremy I. Bulow
(1954) | Trustee | Since 2011 | Professor of Economics, Stanford University, Graduate School of Business (1979 to present) | 40 | None |
Anne Casscells
(1958) | Trustee | Since 2016 | Co-Chief Executive Officer and Chief Investment Officer, Aetos Alternatives Management (investment advisory firm) (2001 to present); Lecturer in Accounting, Stanford University, Graduate School of Business (2009 to 2017) | 40 | None |
Ronald J. Gilson
(1946) | Trustee and Chairman of the Board | Since 1995
(Chairman since 2005) | Charles J. Meyers Professor of Law and Business, Emeritus, Stanford Law School (1979 to 2016); Marc and Eva Stern Professor of Law and Business, Columbia University School of Law (1992 to present) | 57 | None |
|
| | | | | |
Name
(Year of Birth) | Position(s) Held with Funds | Length of Time Served | Principal Occupation(s) During Past 5 Years | Number of American Century Portfolios Overseen by Trustee | Other Directorships Held During Past 5 Years |
| Independent Trustees |
|
|
Frederick L. A. Grauer
(1946) | Trustee | Since 2008 | Senior Advisor, Credit Sesame, Inc. (credit monitoring firm) (2018 to present); Senior Advisor, Course Hero (an educational technology company) (2015 to present) | 40 | None |
Jonathan D. Levin
(1972) | Trustee | Since 2016 | Philip H. Knight Professor and Dean, Graduate School of Business, Stanford University (2016 to present); Professor, Stanford University, (2000 to present) | 40 | None |
Peter F. Pervere
(1947) | Trustee | Since 2007 | Retired | 40 | None |
John B. Shoven
(1947) | Trustee | Since 2002 | Charles R. Schwab Professor of Economics, Stanford University (1973 to present, emeritus since 2019) | 40 | Cadence Design Systems; Exponent; Financial Engines |
| Interested Trustee |
|
|
Jonathan S. Thomas
(1963) | Trustee | Since 2007 | President and Chief Executive Officer, ACC (2007 to present). Also serves as Chief Executive Officer, ACS; Executive Vice President, ACIM; Director, ACC, ACIM and other ACC subsidiaries | 120 | None |
The Statement of Additional Information has additional information about the fund's trustees and is available without charge, upon request, by calling 1-800-345-2021.
Officers
The following table presents certain information about the executive officers of the funds. Each officer serves as an officer for 16 (in the case of Robert J. Leach, 15) investment companies in the American Century family of funds, unless otherwise noted. No officer is compensated for his or her service as an officer of the funds. The listed officers are interested persons of the funds and are appointed or re-appointed on an annual basis. The mailing address for each of the officers listed below is 4500 Main Street, Kansas City, Missouri 64111.
|
| | |
Name
(Year of Birth) | Offices with the Funds | Principal Occupation(s) During the Past Five Years |
Patrick Bannigan
(1965)
| President since 2019 | Executive Vice President and Director, ACC (2012 to present); Chief Financial Officer, Chief Accounting Officer and Treasurer, ACC (2015 to present); Chief Operating Officer, ACC (2012-2015). Also serves as President, ACS; Vice President, ACIM; Chief Financial Officer, Chief Accounting Officer and/or Director, ACIM, ACS and other ACC subsidiaries |
R. Wes Campbell
(1974)
| Chief Financial Officer and Treasurer since 2018 | Vice President, ACS (2020 to present); Investment Operations and Investment Accounting, ACS (2000 to present) |
Amy D. Shelton
(1964) | Chief Compliance Officer and Vice President since 2014 | Chief Compliance Officer, American Century funds, (2014 to present); Chief Compliance Officer, ACIM (2014 to present); Chief Compliance Officer, ACIS (2009 to present). Also serves as Vice President, ACIS |
Charles A. Etherington
(1957) | General Counsel since 2007 and Senior Vice President since 2006 | Attorney, ACC (1994 to present); Vice President, ACC (2005 to present); General Counsel, ACC (2007 to present). Also serves as General Counsel, ACIM, ACS, ACIS and other ACC subsidiaries; and Senior Vice President, ACIM and ACS |
C. Jean Wade
(1964) | Vice President since 2012 | Senior Vice President, ACS (2017 to present); Vice President ACS (2000 to 2017)
|
Robert J. Leach
(1966) | Vice President since 2006 | Vice President, ACS (2000 to present) |
David H. Reinmiller
(1963) | Vice President since 2000 | Attorney, ACC (1994 to present). Also serves as Vice President, ACIM and ACS |
Ward D. Stauffer
(1960) | Secretary since 2005 | Attorney, ACC (2003 to present) |
|
|
| Liquidity Risk Management Program |
The Fund has adopted a liquidity risk management program (the “program”). The Fund’s Board of Trustees (the "Board") has designated American Century Investment Management, Inc. (“ACIM”) as the administrator of the program. Personnel of ACIM or its affiliates conduct the day-to-day operation of the program pursuant to policies and procedures administered by those members of the ACIM’s Investment Oversight Committee who are members of the ACIM’s Investment Management and Global Analytics departments.
Under the program, ACIM manages the Fund’s liquidity risk, which is the risk that the Fund could not meet shareholder redemption requests without significant dilution of remaining shareholders’ interests in the Fund. This risk is managed by monitoring the degree of liquidity of the Fund’s investments, limiting the amount of the Fund’s illiquid investments, and utilizing various risk management tools and facilities available to the Fund for meeting shareholder redemptions, among other means. ACIM’s process of determining the degree of liquidity of the Fund’s investments is supported by one or more third-party liquidity assessment vendors.
The Board reviewed a report prepared by ACIM regarding the operation and effectiveness of the program for the period December 1, 2018 through December 31, 2019. No significant liquidity events impacting the Fund were noted in the report. In addition, ACIM provided its assessment that the program had been effective in managing the Fund’s liquidity risk.
Retirement Account Information
As required by law, distributions you receive from certain retirement accounts are subject to federal income tax withholding, unless you elect not to have withholding apply*. Tax will be withheld on the total amount withdrawn even though you may be receiving amounts that are not subject to withholding, such as nondeductible contributions. In such case, excess amounts of withholding could occur. You may adjust your withholding election so that a greater or lesser amount will be withheld.
If you don’t want us to withhold on this amount, you must notify us to not withhold the federal income tax. You may notify us in writing or in certain situations by telephone or through other electronic means. For systematic withdrawals, your withholding election will remain in effect until revoked or changed by filing a new election. You have the right to revoke your election at any time and change your withholding percentage for future distributions.
Remember, even if you elect not to have income tax withheld, you are liable for paying income tax on the taxable portion of your withdrawal. If you elect not to have income tax withheld or you don’t have enough income tax withheld, you may be responsible for payment of estimated tax. You may incur penalties under the estimated tax rules if your withholding and estimated tax payments are not sufficient. You can reduce or defer the income tax on a distribution by directly or indirectly rolling such distribution over to another IRA or eligible plan. You should consult your tax advisor for additional information.
State tax will be withheld if, at the time of your distribution, your address is within one of the mandatory withholding states and you have federal income tax withheld (or as otherwise required by state law). State taxes will be withheld from your distribution in accordance with the respective state rules.
*Some 403(b), 457 and qualified retirement plan distributions may be subject to 20% mandatory withholding, as they are subject to special tax and withholding rules. Your plan administrator or plan sponsor is required to provide you with a special tax notice explaining those rules at the time you request a distribution. If applicable, federal and/or state taxes may be withheld from your distribution amount.
Proxy Voting Policies
Descriptions of the principles and policies that the fund's investment advisor uses in exercising the voting rights associated with the securities purchased and/or held by the fund are available without charge, upon request, by calling 1-800-345-2021 or visiting American Century Investments’ website at americancentury.com/proxy. A description of the policies is also available on the Securities and Exchange Commission’s website at sec.gov. Information regarding how the investment advisor voted proxies relating to portfolio securities during the most recent 12-month period ended June 30 is available on americancentury.com/proxy. It is also available at sec.gov.
Quarterly Portfolio Disclosure
The fund files its complete schedule of portfolio holdings with the Securities and Exchange Commission (SEC) for the first and third quarters of each fiscal year as an exhibit to its reports on Form N-PORT. The fund’s Form N-PORT reports are available on the SEC’s website at sec.gov. The fund also makes its complete schedule of portfolio holdings for the most recent quarter of its fiscal year available on its website at americancentury.com and, upon request, by calling 1-800-345-2021.
|
| | |
| |
| | | |
| Contact Us | americancentury.com | |
| Automated Information Line | 1-800-345-8765 | |
| Investor Services Representative | 1-800-345-2021 or 816-531-5575 | |
| Investors Using Advisors | 1-800-378-9878 | |
| Business, Not-For-Profit, Employer-Sponsored Retirement Plans | 1-800-345-3533 | |
| Banks and Trust Companies, Broker-Dealers, Financial Professionals, Insurance Companies | 1-800-345-6488 | |
| Telecommunications Relay Service for the Deaf | 711 | |
| | | |
| American Century Investment Trust | |
| | | |
Investment Advisor: American Century Investment Management, Inc. Kansas City, Missouri | |
| | | |
| This report and the statements it contains are submitted for the general information of our shareholders. The report is not authorized for distribution to prospective investors unless preceded or accompanied by an effective prospectus. | |
| | | |
©2020 American Century Proprietary Holdings, Inc. All rights reserved.
CL-ANN-93335 2005 | |
|
| |
| | |
| | Annual Report |
| | |
| | March 31, 2020 |
| | |
| | Prime Money Market Fund |
| | Investor Class (BPRXX) |
| | A Class (ACAXX) |
| | C Class (ARCXX) |
Beginning on January 1, 2021, as permitted by regulations adopted by the Securities and Exchange Commission, paper copies of the fund’s shareholder reports like this one will no longer be sent by mail, unless you specifically request paper copies of the reports from the fund or from your financial intermediary, such as a broker-dealer or bank. Instead, the reports will be made available on a website, and you will be notified by mail each time a report is posted and provided with a website link to access the report.
If you already elected to receive shareholder reports electronically, you will not be affected by this change and you need not take any action. You may elect to receive shareholder reports and other communications from the fund or your financial intermediary electronically by calling or sending an email request to your appropriate contacts as listed on the back cover of this report.
You may elect to receive all future reports in paper free of charge. You can inform the fund or your financial intermediary that you wish to continue receiving paper copies of your shareholder reports by calling or sending an email request to your appropriate contacts as listed on the back cover of this report. Your election to receive reports in paper will apply to all funds held with the fund complex/your financial intermediary.
|
| |
| President’s Letter | |
| Performance | |
| Fund Characteristics | |
| Shareholder Fee Example | |
| Schedule of Investments | |
| Statement of Assets and Liabilities | |
| Statement of Operations | |
| Statement of Changes in Net Assets | |
| Notes to Financial Statements | |
| Financial Highlights | |
| Report of Independent Registered Public Accounting Firm | |
| Management | |
| Liquidity Risk Management Program | |
| Additional Information | |
Any opinions expressed in this report reflect those of the author as of the date of the report, and do not necessarily represent the opinions of American Century Investments® or any other person in the American Century Investments organization. Any such opinions are subject to change at any time based upon market or other conditions and American Century Investments disclaims any responsibility to update such opinions. These opinions may not be relied upon as investment advice and, because investment decisions made by American Century Investments funds are based on numerous factors, may not be relied upon as an indication of trading intent on behalf of any American Century Investments fund. Security examples are used for representational purposes only and are not intended as recommendations to purchase or sell securities. Performance information for comparative indices and securities is provided to American Century Investments by third party vendors. To the best of American Century Investments’ knowledge, such information is accurate at the time of printing.
Jonathan Thomas
Dear Investor:
Thank you for reviewing this annual report for the period ended March 31, 2020. Annual reports help convey important information about fund returns, including market factors that affected performance during the reporting period. For additional insights, please visit americancentury.com.
Virus Outbreak Abruptly Altered Economic, Market Backdrops
Through most of the period, market sentiment was upbeat, partly due to accommodative Federal Reserve (Fed) policy and modest inflation. Improving economic and corporate earnings data and a phase 1 U.S.-China trade deal also helped boost growth outlooks. Against this backdrop, key U.S. stock benchmarks rose to record highs by mid-February, and U.S. bonds continued to advance.
However, beginning in late February, unprecedented social and economic turmoil emerged and reversed the positive trajectory. The COVID-19 epidemic originating in China rapidly spread throughout the world, forcing stay-at-home orders and industry-wide shutdowns. U.S. stocks, corporate bonds and other riskier assets sold off sharply, while U.S. Treasuries rallied in the global flight to quality. The Fed stepped in quickly and aggressively, slashing interest rates to near 0% and enacting massive lending and asset-purchase programs to stabilize the financial system.
The swift and severe sell-off erased the strong stock market gains realized earlier in the period and left key benchmarks with losses for the 12 months. Reflecting their defensive characteristics, high-quality U.S. bonds withstood the turmoil and delivered solid returns for the 12-month period.
Promoting Health and Safety Remains Our Focus
While the market impact of COVID-19 has been severe, reducing the human toll is most important. We are monitoring the situation closely and following guidelines and protocols from all relevant authorities. Our firm has activated a comprehensive Pandemic Response Plan, which includes social distancing and work-from-home mandates, travel restrictions and escalated cleaning regimens at all our facilities. We’ve also launched a Business Continuity Plan to maintain regular business operations and ensure delivery of outstanding service.
We appreciate your confidence in us during these extraordinary times. We have a long history of helping clients weather volatile markets, and we are confident we will meet today’s challenges. In the meantime, the health and safety of you, your family and our employees remain a top priority.
Sincerely,
Jonathan Thomas
President and Chief Executive Officer
American Century Investments
|
| | | | | |
| Total Returns as of March 31, 2020 | |
| | | | Average Annual Returns | |
| | Ticker Symbol | 1 year | 5 years | 10 years | Inception Date |
| Investor Class | BPRXX | 1.61% | 0.87% | 0.44% | 11/17/93 |
| A Class | ACAXX | 1.36% | 0.75% | 0.38% | 8/28/98 |
| C Class | ARCXX | 0.85% | 0.50% | 0.25% | 5/7/02 |
Fund returns would have been lower if a portion of the fees had not been waived.
|
| | |
| Total Annual Fund Operating Expenses |
| Investor Class | A Class | C Class |
| 0.58% | 0.83% | 1.33% |
The total annual fund operating expenses shown is as stated in the fund’s prospectus current as of the date of this report. The prospectus may vary from the expense ratio shown elsewhere in this report because it is based on a different time period, includes acquired fund fees and expenses, and, if applicable, does not include fee waivers or expense reimbursements.
Data presented reflect past performance. Past performance is no guarantee of future results. Current performance may be higher or lower than the performance shown. Total returns for periods less than one year are not annualized. To obtain performance data current to the most recent month end, please call 1-800-345-2021 or visit americancentury.com. For additional information about the fund, please consult the prospectus.
You could lose money by investing in the fund. Although the fund seeks to preserve the value of your investment at $1.00 per share, it cannot guarantee it will do so. The fund may impose a fee upon sale of your shares or may temporarily suspend your ability to sell shares if the fund’s liquidity falls below required minimums because of market conditions or other factors. An investment in the fund is not insured or guaranteed by the Federal Deposit Insurance Corporation or any other government agency. The fund’s sponsor has no legal obligation to provide financial support to the fund, and you should not expect that the sponsor will provide financial support to the fund at any time.
The 7-day current yield more closely reflects the current earnings of the fund than the total return.
|
| | | |
| MARCH 31, 2020 | | | |
| Yields | Investor Class | A Class | C Class |
| 7-Day Current Yield | 1.42% | 1.17% | 0.67% |
| 7-Day Effective Yield | 1.43% | 1.18% | 0.68% |
|
| |
| Portfolio at a Glance |
| Weighted Average Maturity | 43 days |
| Weighted Average Life | 79 days |
| | |
| Portfolio Composition by Maturity | % of fund investments |
| 1-30 days | 64% |
| 31-90 days | 16% |
| 91-180 days | 20% |
| More than 180 days | — |
Fund shareholders may incur two types of costs: (1) transaction costs, including sales charges (loads) on purchase payments and redemption/exchange fees; and (2) ongoing costs, including management fees; distribution and service (12b-1) fees; and other fund expenses. This example is intended to help you understand your ongoing costs (in dollars) of investing in your fund and to compare these costs with the ongoing cost of investing in other mutual funds.
The example is based on an investment of $1,000 made at the beginning of the period and held for the entire period from October 1, 2019 to March 31, 2020.
Actual Expenses
The table provides information about actual account values and actual expenses for each class. You may use the information, together with the amount you invested, to estimate the expenses that you paid over the period. First, identify the share class you own. Then simply divide your account value by $1,000 (for example, an $8,600 account value divided by $1,000 = 8.6), then multiply the result by the number under the heading “Expenses Paid During Period” to estimate the expenses you paid on your account during this period.
If you hold Investor Class shares of any American Century Investments fund, or I Class shares of the American Century Diversified Bond Fund, in an American Century Investments account (i.e., not through a financial intermediary or employer-sponsored retirement plan account), American Century Investments may charge you a $25.00 annual account maintenance fee if the value of those shares is less than $10,000. We will redeem shares automatically in one of your accounts to pay the $25.00 fee. In determining your total eligible investment amount, we will include your investments in all personal accounts (including American Century Investments brokerage accounts) registered under your Social Security number. Personal accounts include individual accounts, joint accounts, UGMA/UTMA accounts, personal trusts, Coverdell Education Savings Accounts and IRAs (including traditional, Roth, Rollover, SEP-, SARSEP- and SIMPLE-IRAs), and certain other retirement accounts. If you have only business, business retirement, employer-sponsored or American Century Investments brokerage accounts, you are currently not subject to this fee. If you are subject to the account maintenance fee, your account value could be reduced by the fee amount
Hypothetical Example for Comparison Purposes
The table also provides information about hypothetical account values and hypothetical expenses based on the actual expense ratio of each class of your fund and an assumed rate of return of 5% per year before expenses, which is not the actual return of a fund’s share class. The hypothetical account values and expenses may not be used to estimate the actual ending account balance or expenses you paid for the period. You may use this information to compare the ongoing costs of investing in your fund and other funds. To do so, compare this 5% hypothetical example with the 5% hypothetical examples that appear in the shareholder reports of the other funds.
Please note that the expenses shown in the table are meant to highlight your ongoing costs only and do not reflect any transactional costs, such as sales charges (loads) or redemption/exchange fees. Therefore, the table is useful in comparing ongoing costs only, and will not help you determine the relative total costs of owning different funds. In addition, if these transactional costs were included, your costs would have been higher.
|
| | | | |
| Beginning
Account Value
10/1/19 | Ending
Account Value
3/31/20 | Expenses Paid
During Period(1)
10/1/19 - 3/31/20 |
Annualized
Expense Ratio(1) |
| Actual | | | | |
| Investor Class | $1,000 | $1,006.60 | $2.91 | 0.58% |
| A Class | $1,000 | $1,005.30 | $4.16 | 0.83% |
| C Class | $1,000 | $1,002.80 | $6.66 | 1.33% |
| Hypothetical | | | | |
| Investor Class | $1,000 | $1,022.10 | $2.93 | 0.58% |
| A Class | $1,000 | $1,020.85 | $4.19 | 0.83% |
| C Class | $1,000 | $1,018.35 | $6.71 | 1.33% |
| |
| (1) | Expenses are equal to the class's annualized expense ratio listed in the table above, multiplied by the average account value over the period, multiplied by 183, the number of days in the most recent fiscal half-year, divided by 366, to reflect the one-half year period. Annualized expense ratio reflects actual expenses, including any applicable fee waivers or expense reimbursements and excluding any acquired fund fees and expenses. |
MARCH 31, 2020
|
| | | | | | |
| | Principal Amount | Value |
COMMERCIAL PAPER(1) — 55.1% | | |
| American Honda Finance Corp., 2.65%, 5/18/20 | $ | 2,000,000 |
| $ | 1,993,211 |
|
Bank of Nova Scotia (The), VRN, 1.10%, (1-month LIBOR plus 0.16%), 5/29/20(2) | 20,000,000 |
| 20,000,000 |
|
BASF SE, 1.42%, 5/27/20(2) | 40,000,000 |
| 39,913,200 |
|
Bennington Stark Capital Co. LLC, 2.14%, 4/1/20 (LOC: Societe Generale SA)(2) | 40,000,000 |
| 40,000,000 |
|
Bennington Stark Capital Co. LLC, 1.69%, 5/21/20 (LOC: Societe Generale SA)(2) | 11,000,000 |
| 10,974,792 |
|
Canadian Imperial Bank of Commerce, VRN, 1.01%, (1-month LIBOR plus 0.26%), 6/19/20(2) | 25,000,000 |
| 25,000,000 |
|
Canadian Imperial Bank of Commerce, VRN, 1.04%, (1-month LIBOR plus 0.12%), 10/21/20(2) | 10,000,000 |
| 10,000,000 |
|
Chariot Funding LLC, 2.14%, 4/2/20 (LOC: JPMorgan Chase Bank N.A.)(2) | 10,000,000 |
| 9,999,417 |
|
Chariot Funding LLC, VRN, 1.74%, (3-month LIBOR), 8/5/20 (LOC: JPMorgan Chase Bank N.A.)(2) | 25,000,000 |
| 25,000,000 |
|
Charta LLC, 1.77%, 4/15/20 (LOC: Citibank N.A.)(2) | 20,000,000 |
| 19,986,545 |
|
Chesham Finance Ltd. / Chesham Finance LLC, Series 3, 0.20%, 4/1/20 (LOC: Societe Generale SA)(2) | 49,000,000 |
| 49,000,000 |
|
Chevron Corp., 1.88%, 4/1/20(2) | 13,000,000 |
| 13,000,000 |
|
Chevron Corp., 0.87%, 8/27/20(2) | 20,000,000 |
| 19,930,111 |
|
Coca-Cola Co. (The), 1.74%, 4/15/20(2) | 1,700,000 |
| 1,698,876 |
|
Coca-Cola Co. (The), 1.74%, 4/15/20(2) | 10,000,000 |
| 9,993,389 |
|
Coca-Cola Co. (The), 1.125%, 9/18/20(2) | 20,000,000 |
| 19,896,111 |
|
CRC Funding LLC, 1.76%, 4/17/20 (LOC: Citibank N.A.)(2) | 11,000,000 |
| 10,991,591 |
|
CRC Funding LLC, 1.74%, 4/21/20 (LOC: Citibank N.A.)(2) | 11,000,000 |
| 10,989,611 |
|
CRC Funding LLC, 1.33%, 6/11/20 (LOC: Citibank N.A.)(2) | 20,000,000 |
| 19,948,722 |
|
Crown Point Capital Co. LLC, Series A, 1.70%, 8/7/20 (LOC: Credit Suisse AG)(2) | 40,000,000 |
| 40,000,000 |
|
Crown Point Capital Co. LLC, Series A, 1.71%, 8/18/20 (LOC: Credit Suisse AG)(2) | 25,000,000 |
| 25,000,000 |
|
| Exxon Mobil Corp., 1.06%, 7/14/20 | 11,000,000 |
| 10,966,951 |
|
Fairway Finance Co. LLC, 1.79%, 7/21/20 (LOC: Bank of Montreal)(2) | 20,000,000 |
| 19,892,700 |
|
Fairway Finance Co. LLC, VRN, 1.58%, (1-month LIBOR plus 0.22%), 5/4/20 (LOC: Bank of Montreal)(2) | 10,000,000 |
| 10,000,000 |
|
International Business Machines Corp., 1.01%, 6/30/20(2) | 15,000,000 |
| 14,962,875 |
|
Liberty Street Funding LLC, 1.84%, 4/9/20 (LOC: Bank of Nova Scotia)(2) | 30,000,000 |
| 29,988,000 |
|
LMA-Americas LLC, 1.70%, 4/6/20 (LOC: Credit Agricole Corporate and Investment Bank)(2) | 1,500,000 |
| 1,499,652 |
|
LMA-Americas LLC, 1.07%, 4/8/20 (LOC: Credit Agricole Corporate and Investment Bank)(2) | 5,000,000 |
| 4,998,979 |
|
LMA-Americas LLC, 1.61%, 5/4/20 (LOC: Credit Agricole Corporate and Investment Bank)(2) | 3,700,000 |
| 3,694,641 |
|
LMA-Americas LLC, 1.70%, 6/1/20 (LOC: Credit Agricole Corporate and Investment Bank)(2) | 22,900,000 |
| 22,835,587 |
|
LMA-Americas LLC, 1.00%, 8/10/20 (LOC: Credit Agricole Corporate and Investment Bank)(2) | 25,000,000 |
| 24,910,847 |
|
|
| | | | | | |
| | Principal Amount | Value |
National Australia Bank Ltd., 1.875%, 4/15/20(2) | $ | 30,000,000 |
| $ | 29,978,650 |
|
Old Line Funding LLC, 1.96%, 4/21/20 (LOC: Royal Bank of Canada)(2) | 20,000,000 |
| 19,978,778 |
|
Pfizer, Inc., 1.36%, 9/8/20(2) | 40,000,000 |
| 39,763,556 |
|
Ridgefield Funding Co. LLC, Series A1, VRN, 0.80%, (1-month LIBOR plus 0.08%), 8/11/20 (LOC: BNP Paribas)(2) | 41,000,000 |
| 41,000,000 |
|
Royal Bank of Canada, VRN, 0.37%, (Daily EFFR plus 0.28%), 6/12/20(2) | 25,000,000 |
| 25,000,000 |
|
Sheffield Receivables Co. LLC, 1.79%, 5/20/20 (LOC: Barclays Bank plc)(2) | 30,000,000 |
| 29,928,542 |
|
Sheffield Receivables Co. LLC, 1.02%, 6/1/20 (LOC: Barclays Bank plc)(2) | 9,000,000 |
| 8,984,750 |
|
Thunder Bay Funding LLC, 1.77%, 4/3/20 (LOC: Royal Bank of Canada)(2) | 10,000,000 |
| 9,999,039 |
|
Thunder Bay Funding LLC, 1.66%, 5/7/20 (LOC: Royal Bank of Canada)(2) | 3,270,000 |
| 3,264,670 |
|
Thunder Bay Funding LLC, 1.48%, 6/15/20 (LOC: Royal Bank of Canada)(2) | 15,000,000 |
| 14,954,688 |
|
Toronto-Dominion Bank (The), VRN, 1.83%, (3-month LIBOR plus 0.14%), 11/16/20(2) | 3,000,000 |
| 3,000,000 |
|
| Toyota Motor Credit Corp., 1.93%, 5/5/20 | 10,000,000 |
| 9,982,244 |
|
| Toyota Motor Credit Corp., 1.19%, 7/27/20 | 20,000,000 |
| 19,924,600 |
|
| Toyota Motor Credit Corp., 1.00%, 9/9/20 | 10,000,000 |
| 9,956,172 |
|
| Toyota Motor Credit Corp., VRN, 1.04%, (1-month LIBOR plus 0.11%), 11/18/20 | 25,000,000 |
| 25,000,000 |
|
Westpac Banking Corp., VRN, 1.37%, (3-month LIBOR plus 0.06%), 6/5/20(2) | 30,000,000 |
| 30,000,000 |
|
| Yale University, 1.17%, 4/1/20 | 16,000,000 |
| 16,000,000 |
|
| TOTAL COMMERCIAL PAPER | | 903,781,497 |
|
| CORPORATE BONDS — 11.6% | | |
| CHS Properties, Inc., VRDN, 6.05%, 4/6/20 (LOC: Wells Fargo Bank N.A.) | 372,000 |
| 372,000 |
|
| Cypress Bend Real Estate Development Co. LLC, VRDN, 4.60%, 4/6/20 (LOC: FHLB) | 19,135,000 |
| 19,135,000 |
|
| D & I Properties LLC, VRDN, 6.00%, 4/6/20 (LOC: Wells Fargo Bank N.A.) | 3,250,000 |
| 3,250,000 |
|
| East Grand Office Park LP, VRDN, 4.92%, 4/6/20 (LOC: FHLB) | 3,600,000 |
| 3,600,000 |
|
| Fiore Capital LLC, VRDN, 4.00%, 4/6/20 (LOC: Wells Fargo Bank N.A.) | 13,530,000 |
| 13,530,000 |
|
| First Baptist Church of Opelika, VRDN, 5.60%, 4/6/20 (LOC: FHLB) | 540,000 |
| 540,000 |
|
| General Secretariat of the Organization of American States, VRDN, 4.25%, 4/7/20 (LOC: Bank of America N.A.) | 14,935,000 |
| 14,935,000 |
|
| HHH Investment Co. LLC, VRDN, 6.00%, 4/6/20 (LOC: Bank of the West) | 12,925,000 |
| 12,925,000 |
|
| Labcon North America, VRDN, 5.10%, 4/6/20 (LOC: Bank of the West) | 2,130,000 |
| 2,130,000 |
|
| Ness Family Partners LP, VRDN, 5.10%, 4/6/20 (LOC: Bank of the West) | 5,545,000 |
| 5,545,000 |
|
| Partisan Property, Inc., Series 2014, VRDN, 1.25%, 4/6/20 (LOC: Wells Fargo Bank N.A.) | 6,380,000 |
| 6,380,000 |
|
| Providence Health & Services Obligated Group, VRDN, 4.16%, 4/6/20 (LOC: U.S. Bank N.A.) | 39,630,000 |
| 39,630,000 |
|
| Relay Relay LLC, VRDN, 4.60%, 4/6/20 (LOC: FHLB) | 6,355,000 |
| 6,355,000 |
|
| Sidal Realty Co. LP, VRDN, 6.00%, 4/6/20 (LOC: Wells Fargo Bank N.A.) | 5,630,000 |
| 5,630,000 |
|
|
| | | | | | |
| | Principal Amount | Value |
| Toyota Motor Credit Corp., MTN, VRN, 0.41%, (SOFR plus 0.40%), 10/23/20 | $ | 10,000,000 |
| $ | 9,971,838 |
|
| World Wildlife Fund, Inc., VRDN, 6.00%, 4/6/20 (LOC: JPMorgan Chase Bank N.A.) | 46,640,000 |
| 46,640,000 |
|
| TOTAL CORPORATE BONDS | | 190,568,838 |
|
| MUNICIPAL SECURITIES — 10.7% | | |
| Alameda Public Financing Authority Rev., (Alameda Point Improvement Project), VRDN, 3.50%, 4/7/20 (LOC: MUFG Union Bank N.A.) | 2,850,000 |
| 2,850,000 |
|
| Alaska Housing Finance Corp. Rev., VRDN, 3.50%, 4/7/20 | 13,000,000 |
| 13,000,000 |
|
| Alaska Housing Finance Corp. Rev., VRDN, 6.25%, 4/7/20 | 15,000,000 |
| 15,000,000 |
|
| City of Wilkes-Barre GO, VRDN, 3.75%, 4/7/20 (LOC: PNC Bank N.A.) | 1,560,000 |
| 1,560,000 |
|
| Colorado Housing & Finance Authority Rev., VRDN, 3.00%, 4/7/20 (SBBPA: Royal Bank of Canada) | 7,000,000 |
| 7,000,000 |
|
| Columbia County Industrial Development Agency Rev., (Columbia Memorial Hospital), VRDN, 4.75%, 4/7/20 (LOC: HSBC Bank USA N.A.) | 1,380,000 |
| 1,380,000 |
|
| Hesperia Public Financing Authority Rev., VRDN, 3.10%, 4/7/20 (LOC: Bank of the West) | 3,205,000 |
| 3,205,000 |
|
| Illinois Housing Development Authority Rev., VRDN, 2.75%, 4/7/20 (LIQ FAC: FHLB) | 7,230,000 |
| 7,230,000 |
|
| Illinois Housing Development Authority Rev., VRDN, 4.22%, 4/7/20 (SBBPA: FHLB) | 5,000,000 |
| 5,000,000 |
|
| Illinois Housing Development Authority Rev., VRDN, 4.50%, 4/7/20 (SBBPA: FHLB) | 2,700,000 |
| 2,700,000 |
|
Macon-Bibb County Industrial Authority Rev., (Bass Pro Outdoor World LLC), VRDN, 3.61%, 4/7/20 (LOC: Bank of America N.A.)(2) | 10,260,000 |
| 10,260,000 |
|
| Massachusetts Educational Financing Authority, 3.60%, 4/22/20 (LOC: Royal Bank of Canada) | 5,000,000 |
| 5,000,000 |
|
| Memphis Health Educational & Housing Facility Board Rev., (Pedcor Investments 2007-CIII LP), VRDN, 3.50%, 4/7/20 (LOC: U.S. Bank N.A.) | 1,305,000 |
| 1,305,000 |
|
| Missouri Development Finance Board Rev., (St. Louis Center), VRDN, 3.50%, 4/7/20 (LOC: U.S. Bank N.A.) | 2,230,000 |
| 2,230,000 |
|
| New Jersey Health Care Facilities Financing Authority Rev., (AHS Hospital Corp.), VRDN, 4.50%, 4/7/20 (LOC: JPMorgan Chase Bank N.A.) | 7,050,000 |
| 7,050,000 |
|
| New Mexico Hospital Equipment Loan Council, (Presbyterian Healthcare Services), VRDN, 4.12%, 4/7/20 (LOC: JPMorgan Chase Bank N.A.) | 10,000,000 |
| 10,000,000 |
|
| Pasadena Public Financing Authority Rev., VRDN, 4.41%, 4/7/20 (SBBPA: Bank of the West) | 7,450,000 |
| 7,450,000 |
|
| Port of Tacoma Rev., VRDN, 4.80%, 4/7/20 (LOC: PNC Bank N.A.) | 5,000,000 |
| 5,000,000 |
|
| San Francisco City & County Public Utilities Commission Power, 2.05%, 6/3/20 (LOC: Bank of America N.A.) | 10,000,000 |
| 10,000,000 |
|
| South Dakota Housing Development Authority Rev., VRDN, 4.11%, 4/7/20 (SBBPA: South Dakota Housing Development Authority) | 25,000,000 |
| 25,000,000 |
|
| State of California, 1.75%, 4/1/20 (LOC: Royal Bank of Canada) | 10,000,000 |
| 10,000,000 |
|
| State of Texas GO, VRDN, 4.00%, 4/7/20 (SBBPA: U.S. Bank N.A.) | 14,750,000 |
| 14,750,000 |
|
| Traer Creek Metropolitan District Rev., VRDN, 5.00%, 4/7/20 (LOC: BNP Paribas) | 6,807,000 |
| 6,807,000 |
|
| Westmoreland County Industrial Development Authority Rev., (Excela Health), VRDN, 3.75%, 4/7/20 (LOC: PNC Bank N.A.) | 1,425,000 |
| 1,425,000 |
|
| TOTAL MUNICIPAL SECURITIES | | 175,202,000 |
|
|
| | | | | | |
| | Principal Amount | Value |
| CERTIFICATES OF DEPOSIT — 10.6% | | |
| Bank of Montreal, VRN, 1.91%, (3-month LIBOR plus 0.07%), 4/14/20 | $ | 19,000,000 |
| $ | 19,000,000 |
|
| Bank of Montreal, VRN, 1.76%, (1-month LIBOR plus 0.18%), 5/1/20 | 10,000,000 |
| 10,000,000 |
|
| Bank of Montreal, VRN, 0.47%, (Daily EFFR plus 0.38%), 9/9/20 | 10,000,000 |
| 10,000,000 |
|
| Bank of Montreal, VRN, 0.30%, (Daily EFFR plus 0.21%), 2/8/21 | 30,000,000 |
| 30,000,000 |
|
| Bank of Nova Scotia (The), VRN, 1.16%, (1-month LIBOR plus 0.23%), 4/24/20 | 20,000,000 |
| 20,000,000 |
|
| Bank of Nova Scotia (The), VRN, 1.91%, (1-month LIBOR plus 0.33%), 10/2/20 | 10,000,000 |
| 10,000,000 |
|
| MUFG Union Bank N.A., 1.69%, 5/8/20 | 25,000,000 |
| 25,000,000 |
|
| Toronto-Dominion Bank, VRN, 0.43%, (SOFR plus 0.42%), 9/30/20 | 20,000,000 |
| 20,000,000 |
|
| Wells Fargo Bank N.A., VRN, 1.93%, (3-month LIBOR plus 0.09%), 1/15/21 | 30,000,000 |
| 30,000,000 |
|
| TOTAL CERTIFICATES OF DEPOSIT | | 174,000,000 |
|
U.S. TREASURY SECURITIES(1) — 9.2% | | |
| U.S. Treasury Notes, VRN, 0.12%, (3-month USBMMY plus 0.03%), 4/30/20 | 15,000,000 |
| 15,000,092 |
|
| U.S. Treasury Notes, VRN, 0.13%, (3-month USBMMY plus 0.04%), 7/31/20 | 30,000,000 |
| 29,999,921 |
|
| U.S. Treasury Notes, 2.63%, 8/15/20 | 10,000,000 |
| 10,036,510 |
|
| U.S. Treasury Notes, 2.63%, 8/31/20 | 50,000,000 |
| 50,204,975 |
|
| U.S. Treasury Notes, 1.38%, 9/15/20 | 15,000,000 |
| 14,983,076 |
|
| U.S. Treasury Notes, VRN, 0.13%, (3-month USBMMY plus 0.05%), 10/31/20 | 10,000,000 |
| 9,999,687 |
|
| U.S. Treasury Notes, VRN, 0.20%, (3-month USBMMY plus 0.12%), 1/31/21 | 20,000,000 |
| 19,993,058 |
|
| TOTAL U.S. TREASURY SECURITIES | | 150,217,319 |
|
| TOTAL INVESTMENT SECURITIES — 97.2% | | 1,593,769,654 |
|
| OTHER ASSETS AND LIABILITIES — 2.8% | | 45,422,820 |
|
| TOTAL NET ASSETS — 100.0% | | $ | 1,639,192,474 |
|
|
| | |
| NOTES TO SCHEDULE OF INVESTMENTS |
| EFFR | - | Effective Federal Funds Rate |
| FHLB | - | Federal Home Loan Bank |
| GO | - | General Obligation |
| LIBOR | - | London Interbank Offered Rate |
| LIQ FAC | - | Liquidity Facilities |
| LOC | - | Letter of Credit |
| MTN | - | Medium Term Note |
| SBBPA | - | Standby Bond Purchase Agreement |
| SOFR | - | Secured Overnight Financing Rate |
| USBMMY | - | U.S. Treasury Bill Money Market Yield |
| VRDN | - | Variable Rate Demand Note. The instrument may be payable upon demand and adjusts periodically based upon the terms set forth in the security's offering documents. The rate shown is effective at the period end and the reference rate and spread, if any, is indicated. The date of the demand feature is disclosed. |
| VRN | - | Variable Rate Note. The rate adjusts periodically based upon the terms set forth in the security’s offering documents. The rate shown is effective at the period end and the reference rate and spread, if any, is indicated. The security's effective maturity date may be shorter than the final maturity date shown. |
| |
| (1) | The rate indicated is the yield to maturity at purchase for non-interest bearing securities. For interest bearing securities, the stated coupon rate is shown. |
| |
| (2) | Security was purchased pursuant to Rule 144A or Section 4(2) under the Securities Act of 1933 and may be sold in transactions exempt from registration, normally to qualified institutional investors. The aggregate value of these securities at the period end was $820,218,319, which represented 50.0% of total net assets. |
See Notes to Financial Statements.
|
|
| Statement of Assets and Liabilities |
|
| | | |
| MARCH 31, 2020 | |
| Assets | |
| Investment securities, at value (amortized cost and cost for federal income tax purposes) | $ | 1,593,769,654 |
|
| Cash | 42,139,452 |
|
| Receivable for investments sold | 496,000 |
|
| Receivable for capital shares sold | 4,876,777 |
|
| Interest receivable | 2,098,632 |
|
| | 1,643,380,515 |
|
| | |
| Liabilities | |
| Payable for capital shares redeemed | 3,393,315 |
|
| Accrued management fees | 767,849 |
|
| Distribution and service fees payable | 18,175 |
|
| Dividends payable | 8,702 |
|
| | 4,188,041 |
|
| | |
| Net Assets | $ | 1,639,192,474 |
|
| | |
| Net Assets Consist of: | |
| Capital paid in | $ | 1,639,227,346 |
|
| Distributable earnings | (34,872 | ) |
| | $ | 1,639,192,474 |
|
|
| | | | | | |
| | Net Assets | Shares Outstanding | Net Asset Value Per Share |
| Investor Class |
| $1,594,491,369 |
| 1,594,674,106 |
| $1.00 |
| A Class |
| $21,448,196 |
| 21,437,122 |
| $1.00 |
| C Class |
| $23,252,909 |
| 23,251,262 |
| $1.00 |
See Notes to Financial Statements.
|
| | | |
| YEAR ENDED MARCH 31, 2020 | |
| Investment Income (Loss) | |
| Income: | |
| Interest | $ | 30,954,152 |
|
| | |
| Expenses: | |
| Management fees | 8,170,936 |
|
| Distribution and service fees: | |
| A Class | 51,094 |
|
| C Class | 125,308 |
|
| Trustees' fees and expenses | 105,468 |
|
| Other expenses | 4,724 |
|
| | 8,457,530 |
|
| | |
| Net investment income (loss) | 22,496,622 |
|
| | |
| Net realized gain (loss) on investment transactions | (34,851 | ) |
| | |
| Net Increase (Decrease) in Net Assets Resulting from Operations | $ | 22,461,771 |
|
See Notes to Financial Statements.
|
|
| Statement of Changes in Net Assets |
|
| | | | | | |
| YEARS ENDED MARCH 31, 2020 AND MARCH 31, 2019 |
| Increase (Decrease) in Net Assets | March 31, 2020 | March 31, 2019 |
| Operations | | |
| Net investment income (loss) | $ | 22,496,622 |
| $ | 23,235,481 |
|
| Net realized gain (loss) | (34,851 | ) | 9,143 |
|
| Net increase (decrease) in net assets resulting from operations | 22,461,771 |
| 23,244,624 |
|
| | | |
| Distributions to Shareholders | | |
| From earnings: | | |
| Investor Class | (22,095,996 | ) | (22,779,012 | ) |
| A Class | (273,245 | ) | (328,127 | ) |
| C Class | (134,526 | ) | (128,342 | ) |
| Decrease in net assets from distributions | (22,503,767 | ) | (23,235,481 | ) |
| | | |
| Capital Share Transactions | | |
| Net increase (decrease) in net assets from capital share transactions (Note 4) | 269,759,376 |
| 95,857,128 |
|
| | | |
| Net increase (decrease) in net assets | 269,717,380 |
| 95,866,271 |
|
| | | |
| Net Assets | | |
| Beginning of period | 1,369,475,094 |
| 1,273,608,823 |
|
| End of period | $ | 1,639,192,474 |
| $ | 1,369,475,094 |
|
See Notes to Financial Statements.
|
|
| Notes to Financial Statements |
MARCH 31, 2020
1. Organization
American Century Investment Trust (the trust) is registered under the Investment Company Act of 1940, as amended (the 1940 Act), as an open-end management investment company and is organized as a Massachusetts business trust. Prime Money Market Fund (the fund) is one fund in a series issued by the trust. The fund’s investment objective is to seek to earn the highest level of current income while preserving the value of your investment.
The fund offers the Investor Class, A Class and C Class. The A Class and C Class may be subject to a contingent deferred sales charge.
2. Significant Accounting Policies
The following is a summary of significant accounting policies consistently followed by the fund in preparation of its financial statements. The fund is an investment company and follows accounting and reporting guidance in accordance with accounting principles generally accepted in the United States of America. This may require management to make certain estimates and assumptions at the date of the financial statements. Actual results could differ from these estimates. Management evaluated the impact of events or transactions occurring through the date the financial statements were issued that would merit recognition or disclosure.
Investment Valuations — The fund determines the fair value of its investments and computes its net asset value per share at the close of regular trading (usually 4 p.m. Eastern time) on the New York Stock Exchange (NYSE) on each day the NYSE is open. Investments are generally valued at amortized cost, which approximates fair value. If the fund determines that the amortized cost does not reflect an investment’s fair value, such investment is valued as determined in good faith by the Board of Trustees or its delegate, in accordance with policies and procedures adopted by the Board of Trustees.
Security Transactions — Security transactions are accounted for as of the trade date. Net realized gains and losses are determined on the identified cost basis, which is also used for federal income tax purposes.
Investment Income — Interest income is recorded on the accrual basis and includes accretion of discounts and amortization of premiums.
Treasury Roll Transactions — The fund purchases a security and at the same time makes a commitment to sell the same security at a future settlement date at a specified price. These types of transactions are known as treasury roll transactions. The difference between the purchase price and the sale price represents interest income reflective of an agreed upon rate between the fund and the counterparty.
Income Tax Status — It is the fund’s policy to distribute substantially all net investment income and net realized gains to shareholders and to otherwise qualify as a regulated investment company under provisions of the Internal Revenue Code. Accordingly, no provision has been made for income taxes. The fund files U.S. federal, state, local and non-U.S. tax returns as applicable. The fund's tax returns are subject to examination by the relevant taxing authority until expiration of the applicable statute of limitations, which is generally three years from the date of filing but can be longer in certain jurisdictions. At this time, management believes there are no uncertain tax positions which, based on their technical merit, would not be sustained upon examination and for which it is reasonably possible that the total amounts of unrecognized tax benefits will significantly change in the next twelve months.
Multiple Class — All shares of the fund represent an equal pro rata interest in the net assets of the class to which such shares belong, and have identical voting, dividend, liquidation and other rights and the same terms and conditions, except for class specific expenses and exclusive rights to vote on matters affecting only individual classes. Income, non-class specific expenses, and realized and unrealized capital gains and losses of the fund are allocated to each class of shares based on their relative net assets.
Distributions to Shareholders — Distributions from net investment income, if any, are declared daily and paid monthly. The fund may make capital gains distributions to comply with the distribution requirements of the Internal Revenue Code.
Indemnifications — Under the trust’s organizational documents, its officers and trustees are indemnified against certain liabilities arising out of the performance of their duties to the fund. In addition, in the normal course of business, the fund enters into contracts that provide general indemnifications. The maximum exposure under these arrangements is unknown as this would involve future claims that may be made against a fund. The risk of material loss from such claims is considered by management to be remote.
3. Fees and Transactions with Related Parties
Certain officers and trustees of the trust are also officers and/or directors of American Century Companies, Inc. (ACC). The trust's investment advisor, American Century Investment Management, Inc. (ACIM), the trust's distributor, American Century Investment Services, Inc. (ACIS), and the trust's transfer agent, American Century Services, LLC, are wholly owned, directly or indirectly, by ACC.
Management Fees — The trust has entered into a management agreement with ACIM, under which ACIM provides the fund with investment advisory and management services in exchange for a single, unified management fee (the fee) per class. The agreement provides that all expenses of managing and operating the fund, except distribution and service fees, brokerage expenses, taxes, interest, fees and expenses of the independent trustees (including legal counsel fees), and extraordinary expenses, will be paid by ACIM. The fee is computed and accrued daily based on each class's daily net assets and paid monthly in arrears. The fee consists of (1) an Investment Category Fee based on the daily net assets of the fund and certain other accounts managed by the investment advisor that are in the same broad investment category as the fund and (2) a Complex Fee based on the assets of all the funds in the American Century Investments family of funds. The rates for the Investment Category Fee range from 0.2370% to 0.3500% and the rates for the Complex Fee range from 0.2500% to 0.3100%. The effective annual management fee for each class for the period ended March 31, 2020 was 0.57%.
Distribution and Service Fees — The Board of Trustees has adopted a separate Master Distribution and Individual Shareholder Services Plan for each of the A Class and C Class (collectively the plans), pursuant to Rule 12b-1 of the 1940 Act. The plans provide that the A Class will pay ACIS an annual distribution and service fee of 0.25%. The plans provide that the C Class will pay ACIS an annual distribution and service fee of 0.75%, of which 0.25% is paid for individual shareholder services and 0.50% is paid for distribution services. The fees are computed and accrued daily based on each class’s daily net assets and paid monthly in arrears. The fees are used to pay financial intermediaries for distribution and individual shareholder services. Fees incurred under the plans during the period ended March 31, 2020 are detailed in the Statement of Operations.
Trustees’ Fees and Expenses — The Board of Trustees is responsible for overseeing the investment advisor’s management and operations of the fund. The trustees receive detailed information about the fund and its investment advisor regularly throughout the year, and meet at least quarterly with management of the investment advisor to review reports about fund operations. The fund’s officers do not receive compensation from the fund.
Interfund Transactions — The fund may enter into security transactions with other American Century Investments funds and other client accounts of the investment advisor, in accordance with the 1940 Act rules and procedures adopted by the Board of Trustees. The rules and procedures require, among other things, that these transactions be effected at the independent current market price of the security. There were no interfund transactions during the period.
4. Capital Share Transactions
Transactions in shares of the fund were as follows (unlimited number of shares authorized):
|
| | | | | | | | | | |
| | Year ended March 31, 2020 | Year ended March 31, 2019 |
| | Shares | Amount | Shares | Amount |
| Investor Class | | | | |
| Sold | 964,711,949 |
| $ | 964,711,949 |
| 656,576,136 |
| $ | 656,576,136 |
|
| Issued in reinvestment of distributions | 21,831,093 |
| 21,831,093 |
| 22,511,234 |
| 22,511,234 |
|
| Redeemed | (728,795,941 | ) | (728,795,941 | ) | (579,840,725 | ) | (579,840,725 | ) |
| | 257,747,101 |
| 257,747,101 |
| 99,246,645 |
| 99,246,645 |
|
| A Class | | | | |
| Sold | 13,145,308 |
| 13,145,308 |
| 8,916,930 |
| 8,916,930 |
|
| Issued in reinvestment of distributions | 271,097 |
| 271,097 |
| 324,537 |
| 324,537 |
|
| Redeemed | (11,814,901 | ) | (11,814,901 | ) | (13,406,255 | ) | (13,406,255 | ) |
| | 1,601,504 |
| 1,601,504 |
| (4,164,788 | ) | (4,164,788 | ) |
| C Class | | | | |
| Sold | 14,897,813 |
| 14,897,813 |
| 5,388,586 |
| 5,388,586 |
|
| Issued in reinvestment of distributions | 134,407 |
| 134,407 |
| 127,980 |
| 127,980 |
|
| Redeemed | (4,621,449 | ) | (4,621,449 | ) | (4,741,295 | ) | (4,741,295 | ) |
| | 10,410,771 |
| 10,410,771 |
| 775,271 |
| 775,271 |
|
| Net increase (decrease) | 269,759,376 |
| $ | 269,759,376 |
| 95,857,128 |
| $ | 95,857,128 |
|
5. Fair Value Measurements
The fund’s investments valuation process is based on several considerations and may use multiple inputs to determine the fair value of the investments held by the fund. In conformity with accounting principles generally accepted in the United States of America, the inputs used to determine a valuation are classified into three broad levels.
| |
| • | Level 1 valuation inputs consist of unadjusted quoted prices in an active market for identical investments. |
| |
| • | Level 2 valuation inputs consist of direct or indirect observable market data (including quoted prices for comparable investments, evaluations of subsequent market events, interest rates, prepayment speeds, credit risk, etc.). These inputs also consist of quoted prices for identical investments initially expressed in local currencies that are adjusted through translation into U.S. dollars. |
| |
| • | Level 3 valuation inputs consist of unobservable data (including a fund’s own assumptions). |
The level classification is based on the lowest level input that is significant to the fair valuation measurement. The valuation inputs are not necessarily an indication of the risks associated with investing in these securities or other financial instruments.
As of period end, the fund’s investment securities were classified as Level 2. The Schedule of Investments provides additional information on the fund’s portfolio holdings.
6. Risk Factors
The fund may invest in instruments that have variable or floating coupon rates based on the London Interbank Offered Rate (LIBOR). LIBOR is a benchmark interest rate intended to be representative of the rate at which certain major international banks lend to one another over short-terms. LIBOR will be phased out by the end of 2021. Uncertainty remains regarding a replacement rate or rates for LIBOR. The transition process may lead to increased volatility or illiquidity in markets for instruments that rely on LIBOR. This could result in a change to the value of such instruments.
7. Federal Tax Information
The tax character of distributions paid during the years ended March 31, 2020 and March 31, 2019 were as follows:
|
| | | | | | |
| | 2020 | 2019 |
| Distributions Paid From | | |
| Ordinary income | $ | 22,503,767 |
| $ | 23,235,481 |
|
| Long-term capital gains | — |
| — |
|
The book-basis character of distributions made during the year from net investment income or net realized gains may differ from their ultimate characterization for federal income tax purposes. These differences reflect the differing character of certain income items and net realized gains and losses for financial statement and tax purposes, and may result in reclassification among certain capital accounts on the financial statements.
As of March 31, 2020, the fund had accumulated short-term capital losses of $(34,872), which represent net
capital loss carryovers that may be used to offset future realized capital gains for federal income tax purposes.
The capital loss carryovers may be carried forward for an unlimited period. Future capital loss carryover
utilization in any given year may be subject to Internal Revenue Code limitations.
8. Recently Issued Accounting Standards
In March 2017, the Financial Accounting Standards Board (FASB) issued Accounting Standards Update No. 2017-08, “Receivables - Nonrefundable Fees and Other Costs (Subtopic 310-20), Premium Amortization on Purchased Callable Debt Securities” (ASU 2017-08). ASU 2017-08 amends the amortization period for certain purchased callable debt securities held at a premium, shortening such period to the earliest call date. The amendments are effective for fiscal years, and interim periods within those fiscal years, beginning after December 15, 2018. The adoption of ASU 2017-08 did not materially impact the financial statements.
|
| | | | | | | | | | | | | | | | |
| For a Share Outstanding Throughout the Years Ended March 31 (except as noted) |
| Per-Share Data | | | | | | | | | Ratios and Supplemental Data | | |
| | | Income From Investment Operations: | Distributions From: | | | Ratio to Average Net Assets of: | |
| | Net Asset
Value,
Beginning
of Period | Net
Investment
Income
(Loss) | Net
Realized
and
Unrealized
Gain (Loss) | Total From
Investment
Operations | Net
Investment
Income | Net
Realized
Gains | Total
Distributions | Net Asset
Value,
End
of Period | Total
Return(1) | Operating
Expenses | Operating
Expenses
(before
expense
waiver) | Net
Investment
Income
(Loss) | Net
Investment
Income (Loss)
(before
expense
waiver) | Net
Assets,
End of
Period
(in thousands) |
| Investor Class |
| 2020 | $1.00 | 0.02 | —(2) | 0.02 | (0.02) | —(2) | (0.02) | $1.00 | 1.61% | 0.58% | 0.58% | 1.58% | 1.58% |
| $1,594,491 |
|
| 2019 | $1.00 | 0.02 | —(2) | 0.02 | (0.02) | — | (0.02) | $1.00 | 1.79% | 0.58% | 0.58% | 1.78% | 1.78% |
| $1,336,785 |
|
| 2018 | $1.00 | 0.01 | —(2) | 0.01 | (0.01) | — | (0.01) | $1.00 | 0.78% | 0.58% | 0.58% | 0.77% | 0.77% |
| $1,237,530 |
|
| 2017 | $1.00 | —(2) | —(2) | —(2) | —(2) | — | —(2) | $1.00 | 0.19% | 0.58% | 0.58% | 0.17% | 0.17% |
| $1,268,148 |
|
| 2016 | $1.00 | —(2) | —(2) | —(2) | —(2) | — | —(2) | $1.00 | 0.01% | 0.30% | 0.58% | 0.02% | (0.26)% |
| $1,563,574 |
|
| A Class |
| 2020 | $1.00 | 0.01 | —(2) | 0.01 | (0.01) | —(2) | (0.01) | $1.00 | 1.36% | 0.83% | 0.83% | 1.33% | 1.33% |
| $21,448 |
|
| 2019 | $1.00 | 0.02 | —(2) | 0.02 | (0.02) | — | (0.02) | $1.00 | 1.54% | 0.83% | 0.83% | 1.53% | 1.53% |
| $19,847 |
|
| 2018 | $1.00 | 0.01 | —(2) | 0.01 | (0.01) | — | (0.01) | $1.00 | 0.65% | 0.70% | 0.83% | 0.65% | 0.52% |
| $24,012 |
|
| 2017 | $1.00 | —(2) | —(2) | —(2) | —(2) | — | —(2) | $1.00 | 0.19% | 0.58% | 0.83% | 0.17% | (0.08)% |
| $25,649 |
|
| 2016 | $1.00 | —(2) | —(2) | —(2) | —(2) | — | —(2) | $1.00 | 0.01% | 0.32% | 0.83% | 0.00%(3) | (0.51)% |
| $209,165 |
|
| C Class |
| 2020 | $1.00 | 0.01 | —(2) | 0.01 | (0.01) | —(2) | (0.01) | $1.00 | 0.85% | 1.33% | 1.33% | 0.83% | 0.83% |
| $23,253 |
|
| 2019 | $1.00 | 0.01 | —(2) | 0.01 | (0.01) | — | (0.01) | $1.00 | 1.03% | 1.33% | 1.33% | 1.03% | 1.03% |
| $12,843 |
|
| 2018 | $1.00 | —(2) | —(2) | —(2) | —(2) | — | —(2) | $1.00 | 0.40% | 0.96% | 1.33% | 0.39% | 0.02% |
| $12,067 |
|
| 2017 | $1.00 | —(2) | —(2) | —(2) | —(2) | — | —(2) | $1.00 | 0.19% | 0.58% | 1.33% | 0.17% | (0.58)% |
| $9,958 |
|
| 2016 | $1.00 | —(2) | —(2) | —(2) | —(2) | — | —(2) | $1.00 | 0.01% | 0.32% | 1.33% | 0.00%(3) | (1.01)% |
| $9,526 |
|
|
| | | | |
| Notes to Financial Highlights | | |
| |
| (1) | Total returns are calculated based on the net asset value of the last business day and do not reflect applicable sales charges, if any. Total returns for periods less than one year are not annualized. |
| |
| (2) | Per-share amount was less than $0.005. |
| |
| (3) | Ratio was less than 0.005%. |
See Notes to Financial Statements.
|
|
| Report of Independent Registered Public Accounting Firm |
To the Board of Trustees of American Century Investment Trust and Shareholders of Prime Money Market Fund
Opinion on the Financial Statements
We have audited the accompanying statement of assets and liabilities, including the schedule of investments, of Prime Money Market Fund (one of the funds constituting American Century Investment Trust, referred to hereafter as the “Fund”) as of March 31, 2020, the related statement of operations for the year ended March 31, 2020, the statement of changes in net assets for each of the two years in the period ended March 31, 2020, including the related notes, and the financial highlights for each of the five years in the period ended March 31, 2020 (collectively referred to as the “financial statements”). In our opinion, the financial statements present fairly, in all material respects, the financial position of the Fund as of March 31, 2020, the results of its operations for the year then ended, the changes in its net assets for each of the two years in the period ended March 31, 2020 and the financial highlights for each of the five years in the period ended March 31, 2020 in conformity with accounting principles generally accepted in the United States of America.
Basis for Opinion
These financial statements are the responsibility of the Fund’s management. Our responsibility is to express an opinion on the Fund’s financial statements based on our audits. We are a public accounting firm registered with the Public Company Accounting Oversight Board (United States) (PCAOB) and are required to be independent with respect to the Fund in accordance with the U.S. federal securities laws and the applicable rules and regulations of the Securities and Exchange Commission and the PCAOB.
We conducted our audits of these financial statements in accordance with the standards of the PCAOB. Those standards require that we plan and perform the audit to obtain reasonable assurance about whether the financial statements are free of material misstatement, whether due to error or fraud.
Our audits included performing procedures to assess the risks of material misstatement of the financial statements, whether due to error or fraud, and performing procedures that respond to those risks. Such procedures included examining, on a test basis, evidence regarding the amounts and disclosures in the financial statements. Our audits also included evaluating the accounting principles used and significant estimates made by management, as well as evaluating the overall presentation of the financial statements. Our procedures included confirmation of securities owned as of March 31, 2020 by correspondence with the custodian and brokers; when replies were not received from brokers, we performed other auditing procedures. We believe that our audits provide a reasonable basis for our opinion.
/s/ PricewaterhouseCoopers LLP
Kansas City, Missouri
May 18, 2020
We have served as the auditor of one or more investment companies in American Century Investments since 1997.
Board of Trustees
The individuals listed below serve as trustees of the funds. Each trustee will continue to serve in this capacity until death, retirement, resignation or removal from office. The board has adopted a mandatory retirement age for trustees who are not “interested persons,” as that term is defined in the Investment Company Act (independent trustees). Independent trustees shall retire on December 31 of the year in which they reach their 75th birthday; provided, however, that on or after January 1, 2022, independent trustees shall retire on December 31 of the year in which they reach their 76th birthday.
Mr. Thomas is an “interested person” because he currently serves as President and Chief Executive Officer of American Century Companies, Inc. (ACC), the parent company of American Century Investment Management, Inc. (ACIM or the advisor). The other trustees (more than three-fourths of the total number) are independent. They are not employees, directors or officers of, and have no financial interest in, ACC or any of its wholly owned, direct or indirect, subsidiaries, including ACIM, American Century Investment Services, Inc. (ACIS) and American Century Services, LLC (ACS), and they do not have any other affiliations, positions or relationships that would cause them to be considered “interested persons” under the Investment Company Act. The trustees serve in this capacity for eight (in the case of Jonathan S. Thomas, 16; and Ronald J. Gilson, 9) registered investment companies in the American Century Investments family of funds.
The following table presents additional information about the trustees. The mailing address for each trustee other than Mr. Thomas is 1665 Charleston Road, Mountain View, California 94043. The mailing address for Mr. Thomas is 4500 Main Street, Kansas City, Missouri 64111.
|
| | | | | |
Name
(Year of Birth) | Position(s) Held with Funds | Length of Time Served | Principal Occupation(s) During Past 5 Years | Number of American Century Portfolios Overseen by Trustee | Other Directorships Held During Past 5 Years |
| Independent Trustees |
|
|
Tanya S. Beder
(1955) | Trustee | Since 2011 | Chairman and CEO, SBCC Group Inc. (independent advisory services) (2006 to present) | 40 | CYS Investments, Inc.; Kirby Corporation; Nabors Industries Ltd. |
Jeremy I. Bulow
(1954) | Trustee | Since 2011 | Professor of Economics, Stanford University, Graduate School of Business (1979 to present) | 40 | None |
Anne Casscells
(1958) | Trustee | Since 2016 | Co-Chief Executive Officer and Chief Investment Officer, Aetos Alternatives Management (investment advisory firm) (2001 to present); Lecturer in Accounting, Stanford University, Graduate School of Business (2009 to 2017) | 40 | None |
Ronald J. Gilson
(1946) | Trustee and Chairman of the Board | Since 1995
(Chairman since 2005) | Charles J. Meyers Professor of Law and Business, Emeritus, Stanford Law School (1979 to 2016); Marc and Eva Stern Professor of Law and Business, Columbia University School of Law (1992 to present) | 57 | None |
|
| | | | | |
Name
(Year of Birth) | Position(s) Held with Funds | Length of Time Served | Principal Occupation(s) During Past 5 Years | Number of American Century Portfolios Overseen by Trustee | Other Directorships Held During Past 5 Years |
| Independent Trustees |
|
|
Frederick L. A. Grauer
(1946) | Trustee | Since 2008 | Senior Advisor, Credit Sesame, Inc. (credit monitoring firm) (2018 to present); Senior Advisor, Course Hero (an educational technology company) (2015 to present) | 40 | None |
Jonathan D. Levin
(1972) | Trustee | Since 2016 | Philip H. Knight Professor and Dean, Graduate School of Business, Stanford University (2016 to present); Professor, Stanford University, (2000 to present) | 40 | None |
Peter F. Pervere
(1947) | Trustee | Since 2007 | Retired | 40 | None |
John B. Shoven
(1947) | Trustee | Since 2002 | Charles R. Schwab Professor of Economics, Stanford University (1973 to present, emeritus since 2019) | 40 | Cadence Design Systems; Exponent; Financial Engines |
| Interested Trustee |
|
|
Jonathan S. Thomas
(1963) | Trustee | Since 2007 | President and Chief Executive Officer, ACC (2007 to present). Also serves as Chief Executive Officer, ACS; Executive Vice President, ACIM; Director, ACC, ACIM and other ACC subsidiaries | 120 | None |
The Statement of Additional Information has additional information about the fund's trustees and is available without charge, upon request, by calling 1-800-345-2021.
Officers
The following table presents certain information about the executive officers of the funds. Each officer serves as an officer for 16 (in the case of Robert J. Leach, 15) investment companies in the American Century family of funds, unless otherwise noted. No officer is compensated for his or her service as an officer of the funds. The listed officers are interested persons of the funds and are appointed or re-appointed on an annual basis. The mailing address for each of the officers listed below is 4500 Main Street, Kansas City, Missouri 64111.
|
| | |
Name
(Year of Birth) | Offices with the Funds | Principal Occupation(s) During the Past Five Years |
Patrick Bannigan
(1965)
| President since 2019 | Executive Vice President and Director, ACC (2012 to present); Chief Financial Officer, Chief Accounting Officer and Treasurer, ACC (2015 to present); Chief Operating Officer, ACC (2012-2015). Also serves as President, ACS; Vice President, ACIM; Chief Financial Officer, Chief Accounting Officer and/or Director, ACIM, ACS and other ACC subsidiaries |
R. Wes Campbell
(1974)
| Chief Financial Officer and Treasurer since 2018 | Vice President, ACS (2020 to present); Investment Operations and Investment Accounting, ACS (2000 to present) |
Amy D. Shelton
(1964) | Chief Compliance Officer and Vice President since 2014 | Chief Compliance Officer, American Century funds, (2014 to present); Chief Compliance Officer, ACIM (2014 to present); Chief Compliance Officer, ACIS (2009 to present). Also serves as Vice President, ACIS |
Charles A. Etherington
(1957) | General Counsel since 2007 and Senior Vice President since 2006 | Attorney, ACC (1994 to present); Vice President, ACC (2005 to present); General Counsel, ACC (2007 to present). Also serves as General Counsel, ACIM, ACS, ACIS and other ACC subsidiaries; and Senior Vice President, ACIM and ACS |
C. Jean Wade
(1964) | Vice President since 2012 | Senior Vice President, ACS (2017 to present); Vice President ACS (2000 to 2017)
|
Robert J. Leach
(1966) | Vice President since 2006 | Vice President, ACS (2000 to present) |
David H. Reinmiller
(1963) | Vice President since 2000 | Attorney, ACC (1994 to present). Also serves as Vice President, ACIM and ACS |
Ward D. Stauffer
(1960) | Secretary since 2005 | Attorney, ACC (2003 to present) |
|
|
| Liquidity Risk Management Program |
The Fund has adopted a liquidity risk management program (the “program”). The Fund’s Board of Trustees (the "Board") has designated American Century Investment Management, Inc. (“ACIM”) as the administrator of the program. Personnel of ACIM or its affiliates conduct the day-to-day operation of the program pursuant to policies and procedures administered by those members of the ACIM’s Investment Oversight Committee who are members of the ACIM’s Investment Management and Global Analytics departments.
Under the program, ACIM manages the Fund’s liquidity risk, which is the risk that the Fund could not meet shareholder redemption requests without significant dilution of remaining shareholders’ interests in the Fund. This risk is managed by monitoring the degree of liquidity of the Fund’s investments, limiting the amount of the Fund’s illiquid investments, and utilizing various risk management tools and facilities available to the Fund for meeting shareholder redemptions, among other means. ACIM’s process of determining the degree of liquidity of the Fund’s investments is supported by one or more third-party liquidity assessment vendors.
The Board reviewed a report prepared by ACIM regarding the operation and effectiveness of the program for the period December 1, 2018 through December 31, 2019. No significant liquidity events impacting the Fund were noted in the report. In addition, ACIM provided its assessment that the program had been effective in managing the Fund’s liquidity risk.
Retirement Account Information
As required by law, distributions you receive from certain retirement accounts are subject to federal income tax withholding, unless you elect not to have withholding apply*. Tax will be withheld on the total amount withdrawn even though you may be receiving amounts that are not subject to withholding, such as nondeductible contributions. In such case, excess amounts of withholding could occur. You may adjust your withholding election so that a greater or lesser amount will be withheld.
If you don’t want us to withhold on this amount, you must notify us to not withhold the federal income tax. You may notify us in writing or in certain situations by telephone or through other electronic means. For systematic withdrawals, your withholding election will remain in effect until revoked or changed by filing a new election. You have the right to revoke your election at any time and change your withholding percentage for future distributions.
Remember, even if you elect not to have income tax withheld, you are liable for paying income tax on the taxable portion of your withdrawal. If you elect not to have income tax withheld or you don’t have enough income tax withheld, you may be responsible for payment of estimated tax. You may incur penalties under the estimated tax rules if your withholding and estimated tax payments are not sufficient. You can reduce or defer the income tax on a distribution by directly or indirectly rolling such distribution over to another IRA or eligible plan. You should consult your tax advisor for additional information.
State tax will be withheld if, at the time of your distribution, your address is within one of the mandatory withholding states and you have federal income tax withheld (or as otherwise required by state law). State taxes will be withheld from your distribution in accordance with the respective state rules.
*Some 403(b), 457 and qualified retirement plan distributions may be subject to 20% mandatory withholding, as they are subject to special tax and withholding rules. Your plan administrator or plan sponsor is required to provide you with a special tax notice explaining those rules at the time you request a distribution. If applicable, federal and/or state taxes may be withheld from your distribution amount.
Proxy Voting Policies
Descriptions of the principles and policies that the fund's investment advisor uses in exercising the voting rights associated with the securities purchased and/or held by the fund are available without charge, upon request, by calling 1-800-345-2021 or visiting American Century Investments’ website at americancentury.com/proxy. A description of the policies is also available on the Securities and Exchange Commission’s website at sec.gov. Information regarding how the investment advisor voted proxies relating to portfolio securities during the most recent 12-month period ended June 30 is available on americancentury.com/proxy. It is also available at sec.gov.
Portfolio Holdings Disclosure
The fund files its complete schedule of portfolio holdings with the Securities and Exchange Commission (SEC) each month on Form N-MFP. The fund’s Form N-MFP reports are available on its website at americancentury.com and on the SEC’s website at sec.gov. The fund also makes its complete schedule of portfolio holdings for the most recent quarter of its fiscal year available on its website at americancentury.com and, upon request, by calling 1-800-345-2021.
Other Tax Information
The following information is provided pursuant to provisions of the Internal Revenue Code.
The fund hereby designates $7,124 as qualified short-term capital gain distributions for purposes of Internal Revenue Code Section 871 for the fiscal year ended March 31, 2020.
|
| | |
| |
| | | |
| Contact Us | americancentury.com | |
| Automated Information Line | 1-800-345-8765 | |
| Investor Services Representative | 1-800-345-2021 or 816-531-5575 | |
| Investors Using Advisors | 1-800-378-9878 | |
| Business, Not-For-Profit, Employer-Sponsored Retirement Plans | 1-800-345-3533 | |
| Banks and Trust Companies, Broker-Dealers, Financial Professionals, Insurance Companies | 1-800-345-6488 | |
| Telecommunications Relay Service for the Deaf | 711 | |
| | | |
| American Century Investment Trust | |
| | | |
Investment Advisor: American Century Investment Management, Inc. Kansas City, Missouri | |
| | | |
| This report and the statements it contains are submitted for the general information of our shareholders. The report is not authorized for distribution to prospective investors unless preceded or accompanied by an effective prospectus. | |
| | | |
©2020 American Century Proprietary Holdings, Inc. All rights reserved.
CL-ANN-92284 2005 | |
|
| |
| | |
| | Annual Report |
| | |
| | March 31, 2020 |
| | |
| | Short Duration Fund |
| | Investor Class (ACSNX) |
| | I Class (ASHHX) |
| | A Class (ACSQX) |
| | C Class (ACSKX) |
| | R Class (ACSPX) |
| | R5 Class (ACSUX) |
| | R6 Class (ASDDX) |
Beginning on January 1, 2021, as permitted by regulations adopted by the Securities and Exchange Commission, paper copies of the fund’s shareholder reports like this one will no longer be sent by mail, unless you specifically request paper copies of the reports from the fund or from your financial intermediary, such as a broker-dealer or bank. Instead, the reports will be made available on a website, and you will be notified by mail each time a report is posted and provided with a website link to access the report.
If you already elected to receive shareholder reports electronically, you will not be affected by this change and you need not take any action. You may elect to receive shareholder reports and other communications from the fund or your financial intermediary electronically by calling or sending an email request to your appropriate contacts as listed on the back cover of this report.
You may elect to receive all future reports in paper free of charge. You can inform the fund or your financial intermediary that you wish to continue receiving paper copies of your shareholder reports by calling or sending an email request to your appropriate contacts as listed on the back cover of this report. Your election to receive reports in paper will apply to all funds held with the fund complex/your financial intermediary.
|
| |
| President’s Letter | |
| Performance | |
| Portfolio Commentary | |
| Fund Characteristics | |
| Shareholder Fee Example | |
| Schedule of Investments | |
| Statement of Assets and Liabilities | |
| Statement of Operations | |
| Statement of Changes in Net Assets | |
| Notes to Financial Statements | |
| Financial Highlights | |
| Report of Independent Registered Public Accounting Firm | |
| Management | |
| Liquidity Risk Management Program | |
| Additional Information | |
Any opinions expressed in this report reflect those of the author as of the date of the report, and do not necessarily represent the opinions of American Century Investments® or any other person in the American Century Investments organization. Any such opinions are subject to change at any time based upon market or other conditions and American Century Investments disclaims any responsibility to update such opinions. These opinions may not be relied upon as investment advice and, because investment decisions made by American Century Investments funds are based on numerous factors, may not be relied upon as an indication of trading intent on behalf of any American Century Investments fund. Security examples are used for representational purposes only and are not intended as recommendations to purchase or sell securities. Performance information for comparative indices and securities is provided to American Century Investments by third party vendors. To the best of American Century Investments’ knowledge, such information is accurate at the time of printing.
Jonathan Thomas
Dear Investor:
Thank you for reviewing this annual report for the period ended March 31, 2020. Annual reports help convey important information about fund returns, including market factors that affected performance during the reporting period. For additional insights, please visit americancentury.com.
Virus Outbreak Abruptly Altered Economic, Market Backdrops
Through most of the period, market sentiment was upbeat, partly due to accommodative Federal Reserve (Fed) policy and modest inflation. Improving economic and corporate earnings data and a phase 1 U.S.-China trade deal also helped boost growth outlooks. Against this backdrop, key U.S. stock benchmarks rose to record highs by mid-February, and U.S. bonds continued to advance.
However, beginning in late February, unprecedented social and economic turmoil emerged and reversed the positive trajectory. The COVID-19 epidemic originating in China rapidly spread throughout the world, forcing stay-at-home orders and industry-wide shutdowns. U.S. stocks, corporate bonds and other riskier assets sold off sharply, while U.S. Treasuries rallied in the global flight to quality. The Fed stepped in quickly and aggressively, slashing interest rates to near 0% and enacting massive lending and asset-purchase programs to stabilize the financial system.
The swift and severe sell-off erased the strong stock market gains realized earlier in the period and left key benchmarks with losses for the 12 months. Reflecting their defensive characteristics, high-quality U.S. bonds withstood the turmoil and delivered solid returns for the 12-month period.
Promoting Health and Safety Remains Our Focus
While the market impact of COVID-19 has been severe, reducing the human toll is most important. We are monitoring the situation closely and following guidelines and protocols from all relevant authorities. Our firm has activated a comprehensive Pandemic Response Plan, which includes social distancing and work-from-home mandates, travel restrictions and escalated cleaning regimens at all our facilities. We’ve also launched a Business Continuity Plan to maintain regular business operations and ensure delivery of outstanding service.
We appreciate your confidence in us during these extraordinary times. We have a long history of helping clients weather volatile markets, and we are confident we will meet today’s challenges. In the meantime, the health and safety of you, your family and our employees remain a top priority.
Sincerely,
Jonathan Thomas
President and Chief Executive Officer
American Century Investments
|
| | | | | | |
| Total Returns as of March 31, 2020 | | |
| | | | Average Annual Returns | |
| | Ticker Symbol | 1 year | 5 years | 10 years | Since Inception | Inception Date |
| Investor Class | ACSNX | 1.31% | 1.51% | 1.54% | — | 11/30/06 |
| Bloomberg Barclays U.S. 1-3 Year Government/Credit Bond Index | — | 4.53% | 1.89% | 1.62% | — | — |
| I Class | ASHHX | 1.41% | — | — | 1.78% | 4/10/17 |
| A Class | ACSQX | | | | | 11/30/06 |
| No sales charge | | 1.05% | 1.26% | 1.29% | — | |
| With sales charge | | -1.19% | 0.79% | 1.06% | — | |
| C Class | ACSKX | 0.30% | 0.48% | 0.53% | — | 11/30/06 |
| R Class | ACSPX | 0.90% | 1.01% | 1.05% | — | 11/30/06 |
| R5 Class | ACSUX | 1.51% | 1.71% | 1.75% | — | 11/30/06 |
| R6 Class | ASDDX | 1.56% | — | — | 1.79% | 7/28/17 |
Average annual returns since inception are presented when ten years of performance history is not available.
Sales charges include initial sales charges and contingent deferred sales charges (CDSCs), as applicable. A Class shares have a 2.25% maximum initial sales charge and may be subject to a maximum CDSC of 1.00%. C Class shares redeemed within 12 months of purchase are subject to a maximum CDSC of 1.00%. The SEC requires that mutual funds provide performance information net of maximum sales charges in all cases where charges could be applied.
Data presented reflect past performance. Past performance is no guarantee of future results. Current performance may be higher or lower than the performance shown. Total returns for periods less than one year are not annualized. Investment return and principal value will fluctuate, and redemption value may be more or less than original cost. Data assumes reinvestment of dividends and capital gains, and none of the charts reflect the deduction of taxes that a shareholder would pay on fund distributions or the redemption of fund shares. To obtain performance data current to the most recent month end, please call 1-800-345-2021 or visit americancentury.com. For additional information about the fund, please consult the prospectus.
|
|
| Growth of $10,000 Over 10 Years |
| $10,000 investment made March 31, 2010 |
Performance for other share classes will vary due to differences in fee structure.
|

|
| |
| Value on March 31, 2020 |
| | Investor Class — $11,657 |
| |
| | Bloomberg Barclays U.S. 1-3 Year Government/Credit Bond Index — $11,747 |
| |
|
| | | | | | |
| Total Annual Fund Operating Expenses |
| Investor Class | I Class | A Class | C Class | R Class | R5 Class | R6 Class |
| 0.59% | 0.49% | 0.84% | 1.59% | 1.09% | 0.39% | 0.34% |
The total annual fund operating expenses shown is as stated in the fund’s prospectus current as of the date of this report. The prospectus may vary from the expense ratio shown elsewhere in this report because it is based on a different time period, includes acquired fund fees and expenses, and, if applicable, does not include fee waivers or expense reimbursements.
Data presented reflect past performance. Past performance is no guarantee of future results. Current performance may be higher or lower than the performance shown. Total returns for periods less than one year are not annualized. Investment return and principal value will fluctuate, and redemption value may be more or less than original cost. Data assumes reinvestment of dividends and capital gains, and none of the charts reflect the deduction of taxes that a shareholder would pay on fund distributions or the redemption of fund shares. To obtain performance data current to the most recent month end, please call 1-800-345-2021 or visit americancentury.com. For additional information about the fund, please consult the prospectus.
Portfolio Managers: Bob Gahagan, Hando Aguilar, Jeff Houston, James Platz and Charles Tan
Performance Summary
Short Duration returned 1.31%* for the 12 months ended March 31, 2020. By comparison, the Bloomberg Barclays U.S. 1-3 Year Government/Credit Bond Index gained 4.53%. Returns for the fund and the index largely reflected the defensive characteristics of the broad U.S. investment-grade bond market in the face of unprecedented market unrest in early 2020.
The reporting period began on an upbeat note for bond investors. The Federal Reserve’s (Fed’s) early 2019 pivot toward dovish policy set the stage for rate cuts in July, September and October. This action, along with modest economic and earnings growth and low inflation, generally supported solid gains for U.S. bonds. By year-end 2019, global economic data improved, the U.S. and China signed a phase 1 trade deal and the Fed suggested it would hold rates steady through 2020.
Conditions deteriorated rapidly within the first quarter of 2020. As the COVID-19 epidemic originating in China expanded into a pandemic, nervous fixed-income investors scrambled to shed credit risk and seek shelter in cash. Market volatility soared and liquidity sank. In response, the Fed slashed short-term rates to near 0% and launched a series of initiatives to stabilize the financial markets. Separately, Congress passed a $2 trillion fiscal relief package. Reflecting market sentiment, the 10-year Treasury yield started the period at 2.41% and closed at 0.68% after touching a record-low 0.54% in early March. The two-year Treasury yield followed a similar path during the 12-month period, dropping from 2.27% to 0.22%, including a 135-basis-point decline in the first quarter of 2020.
Amid a global flight to quality, riskier investments, including corporate and securitized bonds, suffered significant losses. The Fed’s rescue programs helped stabilize credit-sensitive sectors of the fixed-income universe, including mortgage-backed securities, municipal bonds (munis) and investment-grade corporate bonds. Against this backdrop, an underweight position in Treasuries, relative to the benchmark, accounted for much of Short Duration’s underperformance.
Securitized Exposure Hindered Performance
We continued to underweight Treasuries and government agencies relative to the index in favor of spread (non-Treasury) sectors, including securitized bonds and corporate issues. This strategy diminished returns amid the late-period rush for stability and liquidity.
Throughout the period, we maintained an overweight position in securitized bonds, believing the sector offered better relative value and less volatility than corporate credit issues. The strategy generally aided performance during risk-on periods, but it proved detrimental amid the coronavirus sell-off. Forced selling created havoc for the sector, as the credit-sensitive holdings we favored, including non-agency commercial mortgage-backed securities, collateralized mortgage obligations and asset-backed securities, were hardest hit. Agency-backed mortgages recovered slightly after the Fed announced its asset-purchase plan, which included agency mortgages.
*All fund returns referenced in this commentary are for Investor Class shares. Performance for other share classes will vary due to differences in fee structure; when Investor Class performance exceeds that of the index, other share classes may not. See page 3 for returns for all share classes.
Corporate, Non-Index Securities Weighed on Results
As sentiment on the economy started to soften during 2019, we reduced our allocation to the corporate bond sector. Combined with our view that the credit cycle had entered its final stage, we believed that valuations among corporate bonds had advanced to levels in line with fundamentals. In addition to trimming exposure, we maintained a higher-quality bias, given the then uncertainties surrounding the effects of tariffs on corporate earnings. We also reduced our out-of-index stake in high-yield bonds. Although our corporate exposure suffered with all risk assets in the early 2020 decline, investment-grade securities recovered slightly late in the period on news the Fed would purchase corporate bonds.
Portfolio Positioning
The economic downturn during the first quarter was swift and severe, but we do not expect an equally swift, or V-shaped, recovery. The consumer is the main driver of the U.S. economy, and we believe the effects of the COVID-19 pandemic will weigh on consumer sentiment—and job and economic growth—for several months. Ultimately, this crisis requires a medical solution.
With its massive financial rescue package, the Fed has demonstrated it will take extraordinary steps to maintain broad market liquidity and assure credit market stability. However, we don’t expect the Fed to ease further, as policymakers previously noted an unwillingness to push rates below zero. Additionally, the effects of significant fiscal stimulus should allow the Fed to keep rates steady.
Heightened volatility often creates market disruptions that lead to attractive buying opportunities. In the first quarter’s flight to quality, we identified such opportunities in the securitized, corporate credit and muni sectors. We’re remaining cautious and defensive in our positioning, focusing on high-quality securities and positioning our portfolio to weather a U-shaped recovery. We’re emphasizing securities the Fed is buying—high-quality corporate, mortgage and muni securities and Treasury inflation-protected securities.
At the same time, we’re reviewing each portfolio holding, eliminating securities we’re uncomfortable holding in the current environment. In particular, we’ve reduced exposure to securitized securities. We believe rising unemployment and the broad economic shutdown created by the pandemic will create challenges for certain segments of the mortgage market. We’ve also hedged overall risk in the portfolio via credit default swaps. As always, we favor a bottom-up approach to portfolio management, emphasizing careful security selection.
|
| |
| MARCH 31, 2020 | |
| Portfolio at a Glance | |
| Average Duration (effective) | 2.5 years |
| Weighted Average Life to Maturity | 2.5 years |
| | |
| Types of Investments in Portfolio | % of net assets |
| Corporate Bonds | 45.9% |
| U.S. Treasury Securities | 24.8% |
| Asset-Backed Securities | 14.5% |
| Collateralized Mortgage Obligations | 7.9% |
| Collateralized Loan Obligations | 2.2% |
| U.S. Government Agency Mortgage-Backed Securities | 0.4% |
| Commercial Mortgage-Backed Securities | 0.4% |
| Bank Loan Obligations | —* |
| Temporary Cash Investments | 3.9% |
| Other Assets and Liabilities | —* |
*Category is less than 0.05% of total net assets.
Fund shareholders may incur two types of costs: (1) transaction costs, including sales charges (loads) on purchase payments and redemption/exchange fees; and (2) ongoing costs, including management fees; distribution and service (12b-1) fees; and other fund expenses. This example is intended to help you understand your ongoing costs (in dollars) of investing in your fund and to compare these costs with the ongoing cost of investing in other mutual funds.
The example is based on an investment of $1,000 made at the beginning of the period and held for the entire period from October 1, 2019 to March 31, 2020.
Actual Expenses
The table provides information about actual account values and actual expenses for each class. You may use the information, together with the amount you invested, to estimate the expenses that you paid over the period. First, identify the share class you own. Then simply divide your account value by $1,000 (for example, an $8,600 account value divided by $1,000 = 8.6), then multiply the result by the number under the heading “Expenses Paid During Period” to estimate the expenses you paid on your account during this period.
If you hold Investor Class shares of any American Century Investments fund, or I Class shares of the American Century Diversified Bond Fund, in an American Century Investments account (i.e., not through a financial intermediary or employer-sponsored retirement plan account), American Century Investments may charge you a $25.00 annual account maintenance fee if the value of those shares is less than $10,000. We will redeem shares automatically in one of your accounts to pay the $25.00 fee. In determining your total eligible investment amount, we will include your investments in all personal accounts (including American Century Investments brokerage accounts) registered under your Social Security number. Personal accounts include individual accounts, joint accounts, UGMA/UTMA accounts, personal trusts, Coverdell Education Savings Accounts and IRAs (including traditional, Roth, Rollover, SEP-, SARSEP- and SIMPLE-IRAs), and certain other retirement accounts. If you have only business, business retirement, employer-sponsored or American Century Investments brokerage accounts, you are currently not subject to this fee. If you are subject to the account maintenance fee, your account value could be reduced by the fee amount.
Hypothetical Example for Comparison Purposes
The table also provides information about hypothetical account values and hypothetical expenses based on the actual expense ratio of each class of your fund and an assumed rate of return of 5% per year before expenses, which is not the actual return of a fund’s share class. The hypothetical account values and expenses may not be used to estimate the actual ending account balance or expenses you paid for the period. You may use this information to compare the ongoing costs of investing in your fund and other funds. To do so, compare this 5% hypothetical example with the 5% hypothetical examples that appear in the shareholder reports of the other funds.
Please note that the expenses shown in the table are meant to highlight your ongoing costs only and do not reflect any transactional costs, such as sales charges (loads) or redemption/exchange fees. Therefore, the table is useful in comparing ongoing costs only, and will not help you determine the relative total costs of owning different funds. In addition, if these transactional costs were included, your costs would have been higher.
|
| | | | |
| Beginning
Account Value
10/1/19 | Ending
Account Value
3/31/20 | Expenses Paid
During Period(1)
10/1/19 - 3/31/20 |
Annualized
Expense Ratio(1) |
| Actual | | | | |
| Investor Class | $1,000 | $993.90 | $2.94 | 0.59% |
| I Class | $1,000 | $994.40 | $2.44 | 0.49% |
| A Class | $1,000 | $992.60 | $4.18 | 0.84% |
| C Class | $1,000 | $987.90 | $7.90 | 1.59% |
| R Class | $1,000 | $991.40 | $5.43 | 1.09% |
| R5 Class | $1,000 | $994.90 | $1.95 | 0.39% |
| R6 Class | $1,000 | $995.10 | $1.70 | 0.34% |
| Hypothetical | | | | |
| Investor Class | $1,000 | $1,022.05 | $2.98 | 0.59% |
| I Class | $1,000 | $1,022.55 | $2.48 | 0.49% |
| A Class | $1,000 | $1,020.80 | $4.24 | 0.84% |
| C Class | $1,000 | $1,017.05 | $8.02 | 1.59% |
| R Class | $1,000 | $1,019.55 | $5.50 | 1.09% |
| R5 Class | $1,000 | $1,023.05 | $1.97 | 0.39% |
| R6 Class | $1,000 | $1,023.30 | $1.72 | 0.34% |
| |
| (1) | Expenses are equal to the class's annualized expense ratio listed in the table above, multiplied by the average account value over the period, multiplied by 183, the number of days in the most recent fiscal half-year, divided by 366, to reflect the one-half year period. Annualized expense ratio reflects actual expenses, including any applicable fee waivers or expense reimbursements and excluding any acquired fund fees and expenses. |
MARCH 31, 2020
|
| | | | | | |
| | Principal Amount | Value |
| CORPORATE BONDS — 45.9% | | |
| Aerospace and Defense — 0.2% | | |
| Boeing Co. (The), 2.70%, 5/1/22 | $ | 1,000,000 |
| $ | 955,706 |
|
| Air Freight and Logistics — 0.3% | | |
| FedEx Corp., 3.40%, 1/14/22 | 1,000,000 |
| 1,006,338 |
|
| Auto Components — 0.1% | | |
ZF North America Capital, Inc., 4.00%, 4/29/20(1) | 476,000 |
| 473,627 |
|
| Automobiles — 1.8% | | |
Daimler Finance North America LLC, 3.40%, 2/22/22(1) | 1,000,000 |
| 972,617 |
|
| Ford Motor Credit Co. LLC, 5.09%, 1/7/21 | 1,200,000 |
| 1,158,744 |
|
| Ford Motor Credit Co. LLC, 3.35%, 11/1/22 | 2,000,000 |
| 1,850,000 |
|
| General Motors Financial Co., Inc., 3.20%, 7/6/21 | 1,500,000 |
| 1,433,487 |
|
| General Motors Financial Co., Inc., 4.20%, 11/6/21 | 1,000,000 |
| 951,475 |
|
Hyundai Capital America, 2.375%, 2/10/23(1) | 670,000 |
| 632,912 |
|
| | | 6,999,235 |
|
| Banks — 12.3% | | |
| Bank of America Corp., MTN, VRN, 2.33%, 10/1/21 | 1,520,000 |
| 1,518,075 |
|
| Bank of America Corp., VRN, 3.00%, 12/20/23 | 2,713,000 |
| 2,767,660 |
|
| Barclays Bank plc, 5.14%, 10/14/20 | 1,520,000 |
| 1,534,833 |
|
| BBVA Bancomer SA, 6.75%, 9/30/22 | 1,100,000 |
| 1,097,624 |
|
| Capital One N.A., 2.25%, 9/13/21 | 1,000,000 |
| 981,149 |
|
| CIT Group, Inc., 5.00%, 8/15/22 | 500,000 |
| 491,260 |
|
| Citibank N.A., VRN, 3.17%, 2/19/22 | 3,000,000 |
| 3,018,710 |
|
| Citigroup, Inc., 2.90%, 12/8/21 | 715,000 |
| 722,059 |
|
| Citigroup, Inc., 2.75%, 4/25/22 | 34,000 |
| 34,203 |
|
| Credit Suisse AG, 2.10%, 11/12/21 | 1,700,000 |
| 1,693,626 |
|
| Fifth Third BanCorp., 2.375%, 1/28/25 | 1,430,000 |
| 1,395,570 |
|
| FNB Corp., 2.20%, 2/24/23 | 530,000 |
| 520,937 |
|
| HSBC Holdings plc, VRN, 2.63%, 11/7/25 | 2,000,000 |
| 1,943,840 |
|
| Huntington National Bank (The), 3.125%, 4/1/22 | 1,000,000 |
| 1,013,989 |
|
| JPMorgan Chase & Co., VRN, 2.78%, 4/25/23 | 1,800,000 |
| 1,824,418 |
|
| Lloyds Bank plc, 2.25%, 8/14/22 | 1,000,000 |
| 997,497 |
|
| MUFG Union Bank N.A., 2.10%, 12/9/22 | 3,220,000 |
| 3,182,940 |
|
| National Australia Bank Ltd., 1.875%, 12/13/22 | 2,625,000 |
| 2,612,349 |
|
| National Bank of Canada, MTN, 2.10%, 2/1/23 | 2,293,000 |
| 2,286,552 |
|
| Santander UK plc, 2.10%, 1/13/23 | 2,200,000 |
| 2,136,375 |
|
| Synchrony Bank, 3.65%, 5/24/21 | 1,000,000 |
| 987,901 |
|
| Toronto-Dominion Bank (The), MTN, 2.65%, 6/12/24 | 2,260,000 |
| 2,311,605 |
|
| Truist Bank, 2.80%, 5/17/22 | 1,000,000 |
| 1,013,310 |
|
| Truist Bank, VRN, 0.88%, (SOFR plus 0.73%), 3/9/23 | 1,340,000 |
| 1,221,116 |
|
| Truist Financial Corp., MTN, 2.20%, 3/16/23 | 2,000,000 |
| 2,006,512 |
|
| US Bank N.A., 1.80%, 1/21/22 | 4,700,000 |
| 4,696,502 |
|
| Wells Fargo Bank N.A., VRN, 2.08%, 9/9/22 | 2,000,000 |
| 1,992,082 |
|
|
| | | | | | |
| | Principal Amount | Value |
| Westpac Banking Corp., 2.75%, 1/11/23 | $ | 2,290,000 |
| $ | 2,333,217 |
|
| | | 48,335,911 |
|
| Biotechnology — 2.1% | | |
AbbVie, Inc., 2.30%, 11/21/22(1) | 4,670,000 |
| 4,672,236 |
|
| Amgen, Inc., 3.625%, 5/15/22 | 1,500,000 |
| 1,555,891 |
|
| Biogen, Inc., 3.625%, 9/15/22 | 500,000 |
| 514,060 |
|
| Gilead Sciences, Inc., 3.25%, 9/1/22 | 1,500,000 |
| 1,535,873 |
|
| | | 8,278,060 |
|
| Capital Markets — 3.4% | | |
Banco BTG Pactual SA, 4.50%, 1/10/25(1) | 2,200,000 |
| 1,936,000 |
|
| Bank of New York Mellon Corp. (The), MTN, 1.85%, 1/27/23 | 3,350,000 |
| 3,368,404 |
|
Credit Suisse Group AG, VRN, 2.59%, 9/11/25(1) | 250,000 |
| 237,943 |
|
| Goldman Sachs BDC, Inc., 3.75%, 2/10/25 | 326,000 |
| 302,821 |
|
| Goldman Sachs Group, Inc. (The), 3.00%, 4/26/22 | 850,000 |
| 856,488 |
|
| Goldman Sachs Group, Inc. (The), 3.20%, 2/23/23 | 1,700,000 |
| 1,737,040 |
|
| Morgan Stanley, MTN, 5.50%, 7/28/21 | 1,000,000 |
| 1,038,937 |
|
| Oaktree Specialty Lending Corp., 3.50%, 2/25/25 | 360,000 |
| 324,018 |
|
State Street Corp., VRN, 2.83%, 3/30/23(1) | 110,000 |
| 111,079 |
|
UBS Group AG, 2.65%, 2/1/22(1) | 3,540,000 |
| 3,537,527 |
|
| | | 13,450,257 |
|
| Chemicals — 0.1% | | |
| Ashland LLC, 4.75%, 8/15/22 | 108,000 |
| 107,190 |
|
| Olin Corp., 5.50%, 8/15/22 | 500,000 |
| 464,218 |
|
| | | 571,408 |
|
| Commercial Services and Supplies — 0.1% | | |
Nielsen Finance LLC / Nielsen Finance Co., 5.00%, 4/15/22(1) | 500,000 |
| 463,580 |
|
| Consumer Finance — 1.2% | | |
| Ally Financial, Inc., 4.625%, 3/30/25 | 722,000 |
| 694,553 |
|
| American Express Co., 3.00%, 2/22/21 | 1,000,000 |
| 1,006,921 |
|
| Capital One Bank USA N.A., 3.375%, 2/15/23 | 1,400,000 |
| 1,371,542 |
|
| Discover Financial Services, 3.85%, 11/21/22 | 1,500,000 |
| 1,532,676 |
|
| | | 4,605,692 |
|
| Diversified Telecommunication Services — 2.9% | | |
| AT&T, Inc., 4.45%, 5/15/21 | 1,500,000 |
| 1,534,967 |
|
| AT&T, Inc., 3.00%, 6/30/22 | 2,000,000 |
| 2,019,354 |
|
Deutsche Telekom International Finance BV, 2.82%, 1/19/22(1) | 4,000,000 |
| 3,974,839 |
|
| Ooredoo International Finance Ltd., MTN, 4.75%, 2/16/21 | 2,200,000 |
| 2,198,186 |
|
| Verizon Communications, Inc., 2.95%, 3/15/22 | 1,061,000 |
| 1,083,117 |
|
| Verizon Communications, Inc., 2.45%, 11/1/22 | 646,000 |
| 657,219 |
|
| | | 11,467,682 |
|
| Electric Utilities — 0.1% | | |
| Florida Power & Light Co., 2.85%, 4/1/25 | 500,000 |
| 526,173 |
|
| Entertainment — 0.9% | | |
| Netflix, Inc., 5.50%, 2/15/22 | 1,000,000 |
| 1,025,000 |
|
| Walt Disney Co. (The), 3.35%, 3/24/25 | 2,220,000 |
| 2,426,362 |
|
| | | 3,451,362 |
|
|
| | | | | | |
| | Principal Amount | Value |
| Equity Real Estate Investment Trusts (REITs) — 0.9% | | |
| Crown Castle International Corp., 2.25%, 9/1/21 | $ | 2,000,000 |
| $ | 1,973,484 |
|
| Equinix, Inc., 5.875%, 1/15/26 | 700,000 |
| 718,144 |
|
| Simon Property Group LP, 2.75%, 6/1/23 | 895,000 |
| 883,260 |
|
| | | 3,574,888 |
|
| Food and Staples Retailing — 0.1% | | |
Sysco Corp., 5.65%, 4/1/25(2) | 550,000 |
| 573,291 |
|
| | | |
| Food Products — 0.8% | | |
| Conagra Brands, Inc., 3.80%, 10/22/21 | 1,000,000 |
| 1,008,624 |
|
Mondelez International Holdings Netherlands BV, 2.00%, 10/28/21(1) | 2,000,000 |
| 1,992,886 |
|
| | | 3,001,510 |
|
| Health Care Equipment and Supplies — 0.6% | | |
| Becton Dickinson and Co., 2.89%, 6/6/22 | 1,000,000 |
| 1,001,632 |
|
| DH Europe Finance II Sarl, 2.05%, 11/15/22 | 1,500,000 |
| 1,473,074 |
|
| | | 2,474,706 |
|
| Health Care Providers and Services — 1.5% | | |
| CVS Health Corp., 3.70%, 3/9/23 | 2,000,000 |
| 2,084,514 |
|
| Express Scripts Holding Co., 2.60%, 11/30/20 | 2,000,000 |
| 1,997,442 |
|
Fresenius Medical Care US Finance II, Inc., 4.125%, 10/15/20(1) | 850,000 |
| 844,578 |
|
Universal Health Services, Inc., 4.75%, 8/1/22(1) | 1,000,000 |
| 1,001,859 |
|
| | | 5,928,393 |
|
| Household Durables — 1.1% | | |
| D.R. Horton, Inc., 2.55%, 12/1/20 | 1,000,000 |
| 986,243 |
|
| Lennar Corp., 2.95%, 11/29/20 | 1,500,000 |
| 1,475,550 |
|
| Toll Brothers Finance Corp., 4.375%, 4/15/23 | 2,000,000 |
| 1,917,490 |
|
| | | 4,379,283 |
|
| Insurance — 0.7% | | |
Metropolitan Life Global Funding I, 1.95%, 1/13/23(1) | 2,625,000 |
| 2,572,580 |
|
| IT Services — 0.6% | | |
| International Business Machines Corp., 2.85%, 5/13/22 | 2,000,000 |
| 2,056,040 |
|
| Western Union Co. (The), 2.85%, 1/10/25 | 130,000 |
| 129,649 |
|
| | | 2,185,689 |
|
| Machinery — 0.5% | | |
| John Deere Capital Corp., MTN, 1.20%, 4/6/23 | 2,000,000 |
| 1,962,323 |
|
Otis Worldwide Corp., VRN, 2.09%, 4/5/23(1) | 180,000 |
| 171,392 |
|
| | | 2,133,715 |
|
| Media — 2.4% | | |
| Discovery Communications LLC, 3.80%, 3/13/24 | 800,000 |
| 796,632 |
|
Fox Corp., 3.05%, 4/7/25(2) | 205,000 |
| 207,201 |
|
| Omnicom Group, Inc. / Omnicom Capital, Inc., 3.625%, 5/1/22 | 2,000,000 |
| 2,034,886 |
|
| Time Warner Cable LLC, 4.125%, 2/15/21 | 1,050,000 |
| 1,053,329 |
|
| ViacomCBS, Inc., 4.50%, 3/1/21 | 1,000,000 |
| 1,002,259 |
|
| ViacomCBS, Inc., 3.875%, 4/1/24 | 2,250,000 |
| 2,246,422 |
|
| VTR Finance BV, 6.875%, 1/15/24 | 2,100,000 |
| 1,918,865 |
|
| | | 9,259,594 |
|
|
| | | | | | |
| | Principal Amount | Value |
| Metals and Mining — 0.6% | | |
Alcoa Nederland Holding BV, 6.75%, 9/30/24(1) | $ | 700,000 |
| $ | 684,019 |
|
| HTA Group Ltd., 9.125%, 3/8/22 | 1,000,000 |
| 923,446 |
|
| Steel Dynamics, Inc., 5.25%, 4/15/23 | 750,000 |
| 732,988 |
|
| | | 2,340,453 |
|
| Multi-Utilities — 1.3% | | |
| CenterPoint Energy, Inc., 3.60%, 11/1/21 | 2,000,000 |
| 1,997,046 |
|
| DTE Energy Co., 2.25%, 11/1/22 | 1,500,000 |
| 1,486,611 |
|
| Sempra Energy, 2.85%, 11/15/20 | 1,500,000 |
| 1,495,890 |
|
| | | 4,979,547 |
|
| Oil, Gas and Consumable Fuels — 3.8% | | |
| Continental Resources, Inc., 5.00%, 9/15/22 | 275,000 |
| 170,739 |
|
| Energy Transfer Partners LP / Regency Energy Finance Corp., 5.875%, 3/1/22 | 1,500,000 |
| 1,410,105 |
|
| Gazprom PJSC Via Gaz Capital SA, 6.00%, 1/23/21 | 2,200,000 |
| 2,240,963 |
|
| Lukoil International Finance BV, 6.125%, 11/9/20 | 2,200,000 |
| 2,227,481 |
|
MPLX LP, 5.25%, 1/15/25(1) | 400,000 |
| 352,730 |
|
| Ovintiv, Inc., 3.90%, 11/15/21 | 930,000 |
| 638,174 |
|
| Petroleos Mexicanos, 4.875%, 1/24/22 | 2,050,000 |
| 1,774,451 |
|
| Phillips 66, 4.30%, 4/1/22 | 2,000,000 |
| 2,008,755 |
|
| Sabine Pass Liquefaction LLC, 5.625%, 2/1/21 | 1,310,000 |
| 1,289,204 |
|
| Saudi Arabian Oil Co., MTN, 2.75%, 4/16/22 | 1,100,000 |
| 1,078,462 |
|
| Williams Cos., Inc. (The), 4.125%, 11/15/20 | 1,000,000 |
| 988,699 |
|
| Williams Cos., Inc. (The), 7.875%, 9/1/21 | 1,000,000 |
| 944,797 |
|
| | | 15,124,560 |
|
| Pharmaceuticals — 1.6% | | |
Bristol-Myers Squibb Co., 2.60%, 5/16/22(1) | 2,000,000 |
| 2,042,430 |
|
Bristol-Myers Squibb Co., 3.25%, 8/15/22(1) | 1,000,000 |
| 1,039,371 |
|
| Elanco Animal Health, Inc., 5.02%, 8/28/23 | 2,000,000 |
| 2,026,681 |
|
| Mylan NV, 3.15%, 6/15/21 | 1,000,000 |
| 991,134 |
|
| | | 6,099,616 |
|
| Road and Rail — 0.3% | | |
| United Rentals North America, Inc., 6.50%, 12/15/26 | 1,250,000 |
| 1,275,688 |
|
| Semiconductors and Semiconductor Equipment — 0.5% | | |
| Broadcom Corp. / Broadcom Cayman Finance Ltd., 2.20%, 1/15/21 | 2,000,000 |
| 1,974,582 |
|
| Software — 0.5% | | |
| Oracle Corp., 2.50%, 10/15/22 | 1,075,000 |
| 1,100,871 |
|
Oracle Corp., 2.50%, 4/1/25(2) | 820,000 |
| 838,079 |
|
| | | 1,938,950 |
|
| Technology Hardware, Storage and Peripherals — 0.5% | | |
Dell International LLC / EMC Corp., 5.875%, 6/15/21(1) | 331,000 |
| 331,000 |
|
Dell International LLC / EMC Corp., 5.45%, 6/15/23(1) | 1,505,000 |
| 1,546,306 |
|
| | | 1,877,306 |
|
| Textiles, Apparel and Luxury Goods — 0.4% | | |
| NIKE, Inc., 2.40%, 3/27/25 | 1,500,000 |
| 1,556,006 |
|
| Thrifts and Mortgage Finance — 0.5% | | |
Nationwide Building Society, 2.00%, 1/27/23(1) | 2,200,000 |
| 2,156,297 |
|
|
| | | | | | |
| | Principal Amount | Value |
| Transportation Infrastructure — 0.5% | | |
| DP World plc, MTN, 3.25%, 5/18/20 | $ | 1,900,000 |
| $ | 1,872,569 |
|
| Wireless Telecommunication Services — 0.7% | | |
| VEON Holdings BV, 3.95%, 6/16/21 | 1,100,000 |
| 1,095,820 |
|
| Vodafone Group plc, 2.95%, 2/19/23 | 1,500,000 |
| 1,533,382 |
|
| | | 2,629,202 |
|
TOTAL CORPORATE BONDS
(Cost $184,395,989) | | 180,493,456 |
|
| U.S. TREASURY SECURITIES — 24.8% | | |
U.S. Treasury Notes, 1.375%, 10/31/20(3) | 800,000 |
| 805,797 |
|
| U.S. Treasury Notes, 1.625%, 12/31/21 | 3,000,000 |
| 3,073,652 |
|
U.S. Treasury Notes, 1.875%, 3/31/22(3) | 1,000,000 |
| 1,032,969 |
|
| U.S. Treasury Notes, 1.75%, 7/15/22 | 12,500,000 |
| 12,933,350 |
|
| U.S. Treasury Notes, 1.50%, 9/15/22 | 20,000,000 |
| 20,610,547 |
|
| U.S. Treasury Notes, 1.875%, 9/30/22 | 10,000,000 |
| 10,406,640 |
|
| U.S. Treasury Notes, 1.625%, 12/15/22 | 20,000,000 |
| 20,737,890 |
|
| U.S. Treasury Notes, 0.50%, 3/15/23 | 27,800,000 |
| 27,977,008 |
|
TOTAL U.S. TREASURY SECURITIES
(Cost $95,239,584) | | 97,577,853 |
|
| ASSET-BACKED SECURITIES — 14.5% | | |
| Argent Securities, Inc., Series 2004-W8, Class M1, VRN, 1.77%, (1-month LIBOR plus 0.83%), 5/25/34 | 2,338,980 |
| 2,147,805 |
|
Avis Budget Rental Car Funding AESOP LLC, Series 2015-2A, Class B, 3.42%, 12/20/21(1) | 675,000 |
| 665,667 |
|
BRE Grand Islander Timeshare Issuer LLC, Series 2017-1A, Class B, 3.24%, 5/25/29(1) | 230,831 |
| 225,601 |
|
BRE Grand Islander Timeshare Issuer LLC, Series 2019-A, Class A SEQ, 3.28%, 9/26/33(1) | 1,490,490 |
| 1,480,461 |
|
Goodgreen, Series 2018-1A, Class A, VRN, 3.93%, 10/15/53(1) | 671,023 |
| 689,166 |
|
Hertz Fleet Lease Funding LP, Series 2017-1, Class A1, VRN, 1.51%, (1-month LIBOR plus 0.65%), 4/10/31(1) | 427,917 |
| 426,782 |
|
Hilton Grand Vacations Trust, Series 2014-AA, Class A SEQ, 1.77%, 11/25/26(1) | 145,915 |
| 144,818 |
|
Hilton Grand Vacations Trust, Series 2014-AA, Class B, 2.07%, 11/25/26(1) | 102,999 |
| 102,093 |
|
Hilton Grand Vacations Trust, Series 2017-AA, Class A SEQ, 2.66%, 12/26/28(1) | 253,204 |
| 249,571 |
|
Hilton Grand Vacations Trust, Series 2018-AA, Class B, 3.70%, 2/25/32(1) | 1,592,371 |
| 1,589,840 |
|
Hilton Grand Vacations Trust, Series 2019-AA, Class B, 2.54%, 7/25/33(1) | 1,894,923 |
| 1,563,430 |
|
Invitation Homes Trust, Series 2017-SFR2, Class B, VRN, 1.95%, (1-month LIBOR plus 1.15%), 12/17/36(1) | 2,400,000 |
| 2,155,791 |
|
Invitation Homes Trust, Series 2018-SFR1, Class B, VRN, 1.75%, (1-month LIBOR plus 0.95%), 3/17/37(1) | 2,575,000 |
| 2,325,779 |
|
Invitation Homes Trust, Series 2018-SFR1, Class C, VRN, 2.05%, (1-month LIBOR plus 1.25%), 3/17/37(1) | 2,000,000 |
| 1,770,349 |
|
Invitation Homes Trust, Series 2018-SFR2, Class C, VRN, 1.98%, (1-month LIBOR plus 1.28%), 6/17/37(1) | 1,450,000 |
| 1,311,053 |
|
Invitation Homes Trust, Series 2018-SFR3, Class B, VRN, 1.95%, (1-month LIBOR plus 1.15%), 7/17/37(1) | 1,450,000 |
| 1,314,683 |
|
MVW LLC, Series 2019-2A, Class B, 2.44%, 10/20/38(1) | 2,543,466 |
| 2,360,256 |
|
MVW Owner Trust, Series 2013-1A, Class A SEQ, 2.15%, 4/22/30(1) | 218,902 |
| 218,771 |
|
|
| | | | | | |
| | Principal Amount | Value |
MVW Owner Trust, Series 2014-1A, Class B, 2.70%, 9/22/31(1) | $ | 479,920 |
| $ | 476,015 |
|
MVW Owner Trust, Series 2015-1A, Class A SEQ, 2.52%, 12/20/32(1) | 260,723 |
| 257,349 |
|
MVW Owner Trust, Series 2016-1A, Class A SEQ, 2.25%, 12/20/33(1) | 199,412 |
| 195,052 |
|
MVW Owner Trust, Series 2017-1A, Class B, 2.75%, 12/20/34(1) | 944,306 |
| 921,634 |
|
MVW Owner Trust, Series 2018-1A, Class B, 3.60%, 1/21/36(1) | 1,202,631 |
| 1,143,364 |
|
Progress Residential Trust, Series 2017-SFR1, Class A SEQ, 2.77%, 8/17/34(1) | 1,070,490 |
| 1,068,062 |
|
Progress Residential Trust, Series 2017-SFR2, Class A SEQ, 2.90%, 12/17/34(1) | 2,121,052 |
| 2,133,512 |
|
Progress Residential Trust, Series 2018-SFR1, Class A SEQ, 3.26%, 3/17/35(1) | 1,997,569 |
| 1,978,640 |
|
Progress Residential Trust, Series 2018-SFR1, Class C, 3.68%, 3/17/35(1) | 1,250,000 |
| 1,235,426 |
|
Progress Residential Trust, Series 2018-SFR2, Class C, 4.04%, 8/17/35(1) | 1,775,000 |
| 1,771,402 |
|
Progress Residential Trust, Series 2018-SFR2, Class D, 4.34%, 8/17/35(1) | 1,075,000 |
| 1,057,670 |
|
Progress Residential Trust, Series 2018-SFR3, Class B, 4.08%, 10/17/35(1) | 2,700,000 |
| 2,726,766 |
|
Progress Residential Trust, Series 2018-SFR3, Class C, 4.18%, 10/17/35(1) | 1,775,000 |
| 1,779,244 |
|
Progress Residential Trust, Series 2019-SFR2, Class B, 3.45%, 5/17/36(1) | 2,600,000 |
| 2,595,596 |
|
Progress Residential Trust, Series 2019-SFR3, Class B, 2.57%, 9/17/36(1) | 2,100,000 |
| 2,020,693 |
|
Progress Residential Trust, Series 2019-SFR4, Class A SEQ, 2.69%, 10/17/36(1) | 3,650,000 |
| 3,607,564 |
|
Progress Residential Trust, Series 2020-SFR1, Class C, 2.18%, 4/17/37(1) | 1,250,000 |
| 1,132,682 |
|
Sierra Timeshare Conduit Receivables Funding LLC, Series 2017-1A, Class A SEQ, 2.91%, 3/20/34(1) | 209,184 |
| 206,639 |
|
Sierra Timeshare Receivables Funding LLC, Series 2015-3A, Class A SEQ, 2.58%, 9/20/32(1) | 229,147 |
| 227,480 |
|
Sierra Timeshare Receivables Funding LLC, Series 2016-1A, Class A SEQ, 3.08%, 3/21/33(1) | 177,482 |
| 176,683 |
|
Sierra Timeshare Receivables Funding LLC, Series 2016-2A, Class A SEQ, 2.33%, 7/20/33(1) | 164,680 |
| 162,764 |
|
Sierra Timeshare Receivables Funding LLC, Series 2018-2A, Class B, 3.65%, 6/20/35(1) | 1,338,801 |
| 1,279,975 |
|
Sierra Timeshare Receivables Funding LLC, Series 2018-3A, Class B, 3.87%, 9/20/35(1) | 369,432 |
| 370,757 |
|
Sierra Timeshare Receivables Funding LLC, Series 2018-3A, Class C, 4.17%, 9/20/35(1) | 1,027,481 |
| 1,031,323 |
|
Sierra Timeshare Receivables Funding LLC, Series 2019-2A, Class D, 4.54%, 5/20/36(1) | 694,016 |
| 688,220 |
|
Sierra Timeshare Receivables Funding LLC, Series 2019-3A, Class D, 4.18%, 8/20/36(1) | 877,392 |
| 791,749 |
|
Starwood Waypoint Homes Trust, Series 2017-1, Class A SEQ, VRN, 1.65%, (1-month LIBOR plus 0.95%), 1/17/35(1) | 1,853,764 |
| 1,733,680 |
|
Towd Point Mortgage Trust, Series 2017-6, Class A1, VRN, 2.75%, 10/25/57(1) | 1,170,178 |
| 1,171,754 |
|
Towd Point Mortgage Trust, Series 2018-4, Class A1, VRN, 3.00%, 6/25/58(1) | 415,326 |
| 410,815 |
|
VSE VOI Mortgage LLC, Series 2016-A, Class A SEQ, 2.54%, 7/20/33(1) | 838,646 |
| 824,719 |
|
|
| | | | | | |
| | Principal Amount | Value |
VSE VOI Mortgage LLC, Series 2017-A, Class B, 2.63%, 3/20/35(1) | $ | 555,447 |
| $ | 542,355 |
|
VSE VOI Mortgage LLC, Series 2018-A, Class B, 3.72%, 2/20/36(1) | 599,318 |
| 592,936 |
|
TOTAL ASSET-BACKED SECURITIES
(Cost $59,410,583) | | 57,054,436 |
|
| COLLATERALIZED MORTGAGE OBLIGATIONS — 7.9% | | |
| Private Sponsor Collateralized Mortgage Obligations — 4.5% | | |
| Bear Stearns Adjustable Rate Mortgage Trust, Series 2004-12, Class 2A1, VRN, 3.74%, 2/25/35 | 210,044 |
| 191,098 |
|
| Bear Stearns Adjustable Rate Mortgage Trust, Series 2006-1, Class A1, VRN, 3.84%, (1-year H15T1Y plus 2.25%), 2/25/36 | 386,091 |
| 363,952 |
|
Bunker Hill Loan Depositary Trust, Series 2019-3, Class A1 SEQ, 2.72%, 11/25/59(1) | 1,039,601 |
| 1,012,313 |
|
| Citicorp Mortgage Securities Trust, Series 2007-8, Class 1A3, 6.00%, 9/25/37 | 344,884 |
| 358,846 |
|
| Citigroup Mortgage Loan Trust, Inc., Series 2004-UST1, Class A4, VRN, 3.74%, 8/25/34 | 169,322 |
| 150,120 |
|
| Citigroup Mortgage Loan Trust, Inc., Series 2004-UST1, Class A5, VRN, 3.79%, 8/25/34 | 570,272 |
| 513,140 |
|
| Citigroup Mortgage Loan Trust, Inc., Series 2005-4, Class A, VRN, 4.59%, 8/25/35 | 154,925 |
| 144,353 |
|
| Citigroup Mortgage Loan Trust, Inc., Series 2005-6, Class A2, VRN, 4.55%, (1-year H15T1Y plus 2.15%), 9/25/35 | 198,943 |
| 185,251 |
|
| Countrywide Home Loan Mortgage Pass-Through Trust, Series 2004-4, Class A19, 5.25%, 5/25/34 | 97,962 |
| 100,431 |
|
| Countrywide Home Loan Mortgage Pass-Through Trust, Series 2004-5, Class 2A4, 5.50%, 5/25/34 | 81,012 |
| 79,562 |
|
| Countrywide Home Loan Mortgage Pass-Through Trust, Series 2005-17, Class 1A11, 5.50%, 9/25/35 | 2,035 |
| 1,875 |
|
Credit Suisse Mortgage Trust, Series 2019-NQM1, Class A1, 2.66%, 10/25/59(1) | 997,937 |
| 969,012 |
|
Credit Suisse Mortgage Trust, Series 2020-AFC1, Class A1, VRN, 2.24%, 2/25/50(1) | 1,478,630 |
| 1,322,177 |
|
| First Horizon Mortgage Pass-Through Trust, Series 2005-AR3, Class 4A1, VRN, 5.01%, 8/25/35 | 164,025 |
| 158,484 |
|
| First Horizon Mortgage Pass-Through Trust, Series 2006-AR4, Class 1A2, VRN, 3.99%, 1/25/37 | 703,238 |
| 548,623 |
|
| GSR Mortgage Loan Trust, Series 2004-AR5, Class 3A3, VRN, 4.31%, 5/25/34 | 78,167 |
| 69,607 |
|
| GSR Mortgage Loan Trust, Series 2005-AR1, Class 3A1, VRN, 4.00%, 1/25/35 | 64,629 |
| 58,084 |
|
| GSR Mortgage Loan Trust, Series 2005-AR6, Class 2A1, VRN, 4.10%, 9/25/35 | 413,447 |
| 391,408 |
|
| JPMorgan Mortgage Trust, Series 2005-A6, Class 7A1, VRN, 4.19%, 8/25/35 | 214,108 |
| 196,857 |
|
JPMorgan Mortgage Trust, Series 2014-5, Class A1, VRN, 2.96%, 10/25/29(1) | 324,556 |
| 328,152 |
|
JPMorgan Mortgage Trust, Series 2018-6, Class 1A4 SEQ, VRN, 3.50%, 12/25/48(1) | 282,480 |
| 280,872 |
|
| MASTR Adjustable Rate Mortgages Trust, Series 2004-13, Class 3A7, VRN, 4.68%, 11/21/34 | 254,412 |
| 242,723 |
|
| Merrill Lynch Mortgage Investors Trust, Series 2005-A2, Class A1, VRN, 3.73%, 2/25/35 | 249,466 |
| 220,482 |
|
New Residential Mortgage Loan Trust, Series 2017-2A, Class A3, VRN, 4.00%, 3/25/57(1) | 1,448,379 |
| 1,514,236 |
|
New Residential Mortgage Loan Trust, Series 2017-5A, Class A1, VRN, 2.45%, (1-month LIBOR plus 1.50%), 6/25/57(1) | 1,352,564 |
| 1,295,893 |
|
|
| | | | | | |
| | Principal Amount | Value |
Residential Mortgage Loan Trust, Series 2019-2, Class A1 SEQ, VRN, 2.91%, 5/25/59(1) | $ | 988,588 |
| $ | 972,992 |
|
Sequoia Mortgage Trust, Series 2017-7, Class A4 SEQ, VRN, 3.50%, 10/25/47(1) | 492,454 |
| 498,840 |
|
Sequoia Mortgage Trust, Series 2017-CH1, Class A1, VRN, 4.00%, 8/25/47(1) | 1,204,565 |
| 1,225,002 |
|
Sequoia Mortgage Trust, Series 2017-CH2, Class A10 SEQ, VRN, 4.00%, 12/25/47(1) | 450,427 |
| 452,842 |
|
Sequoia Mortgage Trust, Series 2018-2, Class A4 SEQ, VRN, 3.50%, 2/25/48(1) | 649,028 |
| 653,632 |
|
Sequoia Mortgage Trust, Series 2018-CH2, Class A12 SEQ, VRN, 4.00%, 6/25/48(1) | 340,060 |
| 342,547 |
|
| Structured Adjustable Rate Mortgage Loan Trust, Series 2004-8, Class 2A1, VRN, 3.78%, 7/25/34 | 86,507 |
| 80,436 |
|
| Thornburg Mortgage Securities Trust, Series 2006-4, Class A2B, VRN, 4.43%, 7/25/36 | 526,057 |
| 451,652 |
|
Verus Securitization Trust, Series 2019-3, Class A1, 2.78%, 7/25/59(1) | 70,133 |
| 68,846 |
|
| WaMu Mortgage Pass-Through Certificates, Series 2005-AR3, Class A1, VRN, 3.62%, 3/25/35 | 213,309 |
| 196,047 |
|
| WaMu Mortgage Pass-Through Certificates, Series 2005-AR7, Class A3, VRN, 4.26%, 8/25/35 | 340,463 |
| 305,415 |
|
| Wells Fargo Mortgage-Backed Securities Trust, Series 2006-AR1, Class 2A5 SEQ, VRN, 4.07%, 3/25/36 | 616,924 |
| 536,361 |
|
| Wells Fargo Mortgage-Backed Securities Trust, Series 2006-AR12, Class 1A1, VRN, 4.71%, 9/25/36 | 96,566 |
| 86,279 |
|
| Wells Fargo Mortgage-Backed Securities Trust, Series 2006-AR14, Class 2A1, VRN, 4.55%, 10/25/36 | 55,638 |
| 48,907 |
|
| Wells Fargo Mortgage-Backed Securities Trust, Series 2006-AR15, Class A1, VRN, 4.61%, 10/25/36 | 38,311 |
| 33,625 |
|
| Wells Fargo Mortgage-Backed Securities Trust, Series 2006-AR16, Class A1, VRN, 4.49%, 10/25/36 | 257,293 |
| 227,827 |
|
| Wells Fargo Mortgage-Backed Securities Trust, Series 2006-AR19, Class A1, VRN, 4.35%, 12/25/36 | 523,616 |
| 464,496 |
|
| Wells Fargo Mortgage-Backed Securities Trust, Series 2006-AR5, Class 2A1, VRN, 4.14%, 4/25/36 | 339,890 |
| 321,021 |
|
| Wells Fargo Mortgage-Backed Securities Trust, Series 2007-15, Class A1, 6.00%, 11/25/37 | 83,449 |
| 75,667 |
|
| | | 17,739,985 |
|
| U.S. Government Agency Collateralized Mortgage Obligations — 3.4% | |
| FHLMC, Series 2015-HQ2, Class M3, VRN, 4.20%, (1-month LIBOR plus 3.25%), 5/25/25 | 550,000 |
| 490,287 |
|
| FNMA, Series 2006-60, Class KF, VRN, 1.25%, (1-month LIBOR plus 0.30%), 7/25/36 | 581,928 |
| 573,580 |
|
| FNMA, Series 2009-33, Class FB, VRN, 1.77%, (1-month LIBOR plus 0.82%), 3/25/37 | 651,464 |
| 656,263 |
|
| FNMA, Series 2014-C02, Class 1M2, VRN, 3.55%, (1-month LIBOR plus 2.60%), 5/25/24 | 448,282 |
| 406,958 |
|
| FNMA, Series 2014-C02, Class 2M2, VRN, 3.55%, (1-month LIBOR plus 2.60%), 5/25/24 | 640,202 |
| 588,389 |
|
| FNMA, Series 2016-55, Class PI, IO, 4.00%, 8/25/46 | 19,074,601 |
| 3,361,761 |
|
| FNMA, Series 2016-C03, Class 2M2, VRN, 6.85%, (1-month LIBOR plus 5.90%), 10/25/28 | 349,696 |
| 344,720 |
|
| FNMA, Series 2016-C04, Class 1M2, VRN, 5.20%, (1-month LIBOR plus 4.25%), 1/25/29 | 927,790 |
| 882,230 |
|
| FNMA, Series 2017-7, Class AI, IO, 6.00%, 2/25/47 | 13,129,869 |
| 3,140,333 |
|
|
| | | | | | |
| | Principal Amount | Value |
| FNMA, Series 2017-C03, Class 1M2, VRN, 3.95%, (1-month LIBOR plus 3.00%), 10/25/29 | $ | 1,200,000 |
| $ | 1,078,495 |
|
| FNMA, Series 2017-C05, Class 1M2, VRN, 3.15%, (1-month LIBOR plus 2.20%), 1/25/30 | 708,443 |
| 633,756 |
|
| FNMA, Series 413, Class C27, IO, 4.00%, 7/25/42 | 6,288,216 |
| 985,334 |
|
| | | 13,142,106 |
|
TOTAL COLLATERALIZED MORTGAGE OBLIGATIONS
(Cost $31,698,602) | | 30,882,091 |
|
| COLLATERALIZED LOAN OBLIGATIONS — 2.2% | | |
Bean Creek CLO Ltd., Series 2015-1A, Class BR, VRN, 3.27%, (3-month LIBOR plus 1.45%), 4/20/31(1) | 600,000 |
| 533,760 |
|
CBAM Ltd., Series 2018-5A, Class B1, VRN, 3.24%, (3-month LIBOR plus 1.40%), 4/17/31(1) | 1,200,000 |
| 1,063,852 |
|
CIFC Funding Ltd., Series 2013-2A, Class A2LR, VRN, 3.43%, (3-month LIBOR plus 1.60%), 10/18/30(1) | 1,000,000 |
| 927,041 |
|
KKR CLO Ltd., Series 2022A, Class B, VRN, 3.42%, (3-month LIBOR plus 1.60%), 7/20/31(1) | 500,000 |
| 459,646 |
|
LCM XIV LP, Series 2014A, Class BR, VRN, 3.40%, (3-month LIBOR plus 1.58%), 7/20/31(1) | 1,250,000 |
| 1,134,292 |
|
Magnetite XXIV Ltd., Series 2019-24A, Class B, VRN, 3.76%, (3-month LIBOR plus 1.85%), 1/15/33(1) | 1,000,000 |
| 893,485 |
|
Octagon Investment Partners 45 Ltd., Series 2019-1A, Class B1, VRN, 3.68%, (3-month LIBOR plus 1.85%), 10/15/32(1) | 2,400,000 |
| 2,226,158 |
|
Voya CLO Ltd., Series 2013-2A, Class A2AR, VRN, 3.19%, (3-month LIBOR plus 1.40%), 4/25/31(1) | 1,000,000 |
| 903,339 |
|
Voya CLO Ltd., Series 2013-3A, Class A2RR, VRN, 3.52%, (3-month LIBOR plus 1.70%), 10/18/31(1) | 750,000 |
| 688,280 |
|
TOTAL COLLATERALIZED LOAN OBLIGATIONS
(Cost $9,678,640) | | 8,829,853 |
|
| U.S. GOVERNMENT AGENCY MORTGAGE-BACKED SECURITIES — 0.4% | |
| Adjustable-Rate U.S. Government Agency Mortgage-Backed Securities — 0.3% | |
| FHLMC, VRN, 4.21%, (1-year H15T1Y plus 2.25%), 9/1/35 | 250,656 |
| 254,535 |
|
| FHLMC, VRN, 4.39%, (12-month LIBOR plus 1.86%), 7/1/36 | 30,666 |
| 31,190 |
|
| FHLMC, VRN, 4.51%, (12-month LIBOR plus 1.88%), 7/1/40 | 87,974 |
| 90,220 |
|
| FHLMC, VRN, 3.90%, (12-month LIBOR plus 1.78%), 9/1/40 | 65,595 |
| 66,964 |
|
| FHLMC, VRN, 4.77%, (12-month LIBOR plus 1.88%), 5/1/41 | 88,530 |
| 90,560 |
|
| FHLMC, VRN, 4.00%, (12-month LIBOR plus 1.87%), 7/1/41 | 145,309 |
| 149,248 |
|
| FHLMC, VRN, 3.76%, (12-month LIBOR plus 1.88%), 10/1/41 | 85,794 |
| 87,046 |
|
| FHLMC, VRN, 3.67%, (12-month LIBOR plus 1.65%), 12/1/42 | 175,119 |
| 178,051 |
|
| FHLMC, VRN, 3.64%, (12-month LIBOR plus 1.64%), 2/1/43 | 42,438 |
| 43,213 |
|
| FHLMC, VRN, 4.51%, (12-month LIBOR plus 1.63%), 5/1/43 | 24,520 |
| 24,821 |
|
| FHLMC, VRN, 4.43%, (12-month LIBOR plus 1.65%), 6/1/43 | 19,259 |
| 19,381 |
|
| FHLMC, VRN, 4.50%, (12-month LIBOR plus 1.62%), 6/1/43 | 813 |
| 821 |
|
| FNMA, VRN, 3.49%, (6-month LIBOR plus 1.57%), 6/1/35 | 88,728 |
| 90,374 |
|
| FNMA, VRN, 3.50%, (6-month LIBOR plus 1.57%), 6/1/35 | 181,242 |
| 184,438 |
|
| FNMA, VRN, 3.77%, (12-month LIBOR plus 1.71%), 12/1/37 | 3,761 |
| 3,840 |
|
| FNMA, VRN, 4.02%, (12-month LIBOR plus 1.69%), 8/1/39 | 36,619 |
| 37,419 |
|
| FNMA, VRN, 3.69%, (12-month LIBOR plus 1.69%), 1/1/40 | 20,826 |
| 21,245 |
|
| | | 1,373,366 |
|
| Fixed-Rate U.S. Government Agency Mortgage-Backed Securities — 0.1% | |
| FHLMC, 5.50%, 12/1/36 | 794 |
| 871 |
|
|
| | | | | | |
| | Principal Amount/Shares | Value |
| FNMA, 5.00%, 7/1/20 | $ | 520 |
| $ | 548 |
|
| FNMA, 3.50%, 3/1/34 | 296,896 |
| 312,952 |
|
| FNMA, 5.50%, 7/1/36 | 1,892 |
| 2,118 |
|
| | | 316,489 |
|
TOTAL U.S. GOVERNMENT AGENCY MORTGAGE-BACKED SECURITIES
(Cost $1,699,470) | 1,689,855 |
|
| COMMERCIAL MORTGAGE-BACKED SECURITIES — 0.4% | | |
JPMBB Commercial Mortgage Securities Trust, Series 2014-C21, Class B, VRN, 4.34%, 8/15/47
(Cost $1,558,703) | 1,475,000 |
| 1,482,545 |
|
BANK LOAN OBLIGATIONS(4)† | | |
Pharmaceuticals† | | |
Bausch Health Companies Inc., 2018 Term Loan B, 3.61%, (1-month LIBOR plus 3.00%), 6/2/25
(Cost $132,516) | 131,865 |
| 126,205 |
|
| TEMPORARY CASH INVESTMENTS — 3.9% | | |
BNP Paribas SA, 0.03%, 4/1/20(1)(5) | 10,000,000 |
| 10,000,019 |
|
| Repurchase Agreement, BMO Capital Markets Corp., (collateralized by various U.S. Treasury obligations, 1.875% - 3.00%, 11/30/21 - 5/15/45, valued at $1,839,522), in a joint trading account at 0.01%, dated 3/31/20, due 4/1/20 (Delivery value $1,803,757) | | 1,803,756 |
|
| State Street Institutional U.S. Government Money Market Fund, Premier Class | 3,698,522 |
| 3,698,522 |
|
TOTAL TEMPORARY CASH INVESTMENTS
(Cost $15,502,278) | | 15,502,297 |
|
TOTAL INVESTMENT SECURITIES — 100.0%
(Cost $399,316,365) | | 393,638,591 |
|
OTHER ASSETS AND LIABILITIES† | | 69,711 |
|
| TOTAL NET ASSETS — 100.0% | | $ | 393,708,302 |
|
|
| | | | | | | | | | | |
| FUTURES CONTRACTS PURCHASED |
| Reference Entity | Contracts | Expiration Date | Notional Amount | Underlying Contract Value | Unrealized Appreciation (Depreciation) |
| U.S. Treasury 2-Year Notes | 162 | June 2020 | $ | 32,400,000 |
| $ | 35,702,016 |
| $ | 271,206 |
|
| U.S. Treasury 5-Year Notes | 158 | June 2020 | $ | 15,800,000 |
| 19,806,781 |
| 185,129 |
|
| | | | | $ | 55,508,797 |
| $ | 456,335 |
|
|
| | |
| NOTES TO SCHEDULE OF INVESTMENTS |
| FHLMC | - | Federal Home Loan Mortgage Corporation |
| FNMA | - | Federal National Mortgage Association |
| H15T1Y | - | Constant Maturity U.S. Treasury Note Yield Curve Rate Index |
| IO | - | Interest Only |
| LIBOR | - | London Interbank Offered Rate |
| MTN | - | Medium Term Note |
| SEQ | - | Sequential Payer |
| SOFR | - | Secured Overnight Financing Rate |
| VRN | - | Variable Rate Note. The rate adjusts periodically based upon the terms set forth in the security’s offering documents. The rate shown is effective at the period end and the reference rate and spread, if any, is indicated. The security's effective maturity date may be shorter than the final maturity date shown. |
† Category is less than 0.05% of total net assets.
| |
| (1) | Security was purchased pursuant to Rule 144A or Section 4(2) under the Securities Act of 1933 and may be sold in transactions exempt from registration, normally to qualified institutional investors. The aggregate value of these securities at the period end was $116,421,667, which represented 29.6% of total net assets. |
| |
| (2) | When-issued security. The issue price and yield are fixed on the date of the commitment, but payment and delivery are scheduled for a future date. |
| |
| (3) | Security, or a portion thereof, has been pledged at the custodian bank or with a broker for collateral requirements on futures contracts. At the period end, the aggregate value of securities pledged was $297,309. |
| |
| (4) | The interest rate on a bank loan obligation adjusts periodically based on a predetermined schedule. Rate shown is effective at period end. The maturity date on a bank loan obligation may be less than indicated as a result of contractual or optional prepayments. These prepayments cannot be predicted with certainty. |
| |
| (5) | The rate indicated is the yield to maturity at purchase. |
See Notes to Financial Statements.
|
|
| Statement of Assets and Liabilities |
|
| | | |
| MARCH 31, 2020 | |
| Assets | |
| Investment securities, at value (cost of $399,316,365) | $ | 393,638,591 |
|
| Receivable for investments sold | 1,060,743 |
|
| Receivable for capital shares sold | 268,896 |
|
| Interest receivable | 2,122,388 |
|
| | 397,090,618 |
|
| | |
| Liabilities | |
| Payable for investments purchased | 2,500,360 |
|
| Payable for capital shares redeemed | 651,926 |
|
| Payable for variation margin on futures contracts | 12,469 |
|
| Accrued management fees | 176,042 |
|
| Distribution and service fees payable | 9,522 |
|
| Dividends payable | 31,997 |
|
| | 3,382,316 |
|
| | |
| Net Assets | $ | 393,708,302 |
|
| | |
| Net Assets Consist of: | |
| Capital paid in | $ | 409,203,150 |
|
| Distributable earnings | (15,494,848 | ) |
| | $ | 393,708,302 |
|
|
| | | | | | |
| | Net Assets | Shares Outstanding | Net Asset Value Per Share |
| Investor Class |
| $155,169,377 |
| 15,441,400 |
| $10.05 |
| I Class |
| $127,684,254 |
| 12,705,797 |
| $10.05 |
| A Class |
| $16,411,405 |
| 1,633,229 |
| $10.05* |
| C Class |
| $6,162,666 |
| 613,013 |
| $10.05 |
| R Class |
| $763,789 |
| 75,949 |
| $10.06 |
| R5 Class |
| $23,611,755 |
| 2,349,631 |
| $10.05 |
| R6 Class |
| $63,905,056 |
| 6,364,675 |
| $10.04 |
*Maximum offering price $10.28 (net asset value divided by 0.9775).
See Notes to Financial Statements.
|
| | | |
| YEAR ENDED MARCH 31, 2020 | |
| Investment Income (Loss) | |
| Income: | |
| Interest (net of foreign taxes withheld of $1,066) | $ | 10,863,281 |
|
| | |
| Expenses: | |
| Management fees | 2,129,722 |
|
| Distribution and service fees: | |
| A Class | 53,325 |
|
| C Class | 75,779 |
|
| R Class | 4,134 |
|
| Trustees' fees and expenses | 31,469 |
|
| Other expenses | 5,269 |
|
| | 2,299,698 |
|
| | |
| Net investment income (loss) | 8,563,583 |
|
| | |
| Realized and Unrealized Gain (Loss) | |
| Net realized gain (loss) on: | |
| Investment transactions | 2,659,294 |
|
| Futures contract transactions | 211,282 |
|
| Swap agreement transactions | (92,293 | ) |
| | 2,778,283 |
|
| | |
| Change in net unrealized appreciation (depreciation) on: | |
| Investments | (6,421,985 | ) |
| Futures contracts | 177,448 |
|
| Swap agreements | (38,191 | ) |
| | (6,282,728 | ) |
| | |
| Net realized and unrealized gain (loss) | (3,504,445 | ) |
| | |
| Net Increase (Decrease) in Net Assets Resulting from Operations | $ | 5,059,138 |
|
See Notes to Financial Statements.
|
|
| Statement of Changes in Net Assets |
|
| | | | | | |
| YEARS ENDED MARCH 31, 2020 AND MARCH 31, 2019 |
| Increase (Decrease) in Net Assets | March 31, 2020 | March 31, 2019 |
| Operations | | |
| Net investment income (loss) | $ | 8,563,583 |
| $ | 9,404,268 |
|
| Net realized gain (loss) | 2,778,283 |
| (1,459,784 | ) |
| Change in net unrealized appreciation (depreciation) | (6,282,728 | ) | 3,078,262 |
|
| Net increase (decrease) in net assets resulting from operations | 5,059,138 |
| 11,022,746 |
|
| | | |
| Distributions to Shareholders | | |
| From earnings: | | |
| Investor Class | (4,367,095 | ) | (5,957,493 | ) |
| I Class | (2,521,756 | ) | (1,326,168 | ) |
| A Class | (436,163 | ) | (501,382 | ) |
| C Class | (101,636 | ) | (156,404 | ) |
| R Class | (14,630 | ) | (10,725 | ) |
| R5 Class | (541,255 | ) | (596,220 | ) |
| R6 Class | (1,876,501 | ) | (1,832,621 | ) |
| Decrease in net assets from distributions | (9,859,036 | ) | (10,381,013 | ) |
| | | |
| Capital Share Transactions | | |
| Net increase (decrease) in net assets from capital share transactions (Note 5) | (7,021,548 | ) | 19,284,513 |
|
| | | |
| Net increase (decrease) in net assets | (11,821,446 | ) | 19,926,246 |
|
| | | |
| Net Assets | | |
| Beginning of period | 405,529,748 |
| 385,603,502 |
|
| End of period | $ | 393,708,302 |
| $ | 405,529,748 |
|
See Notes to Financial Statements.
|
|
| Notes to Financial Statements |
MARCH 31, 2020
1. Organization
American Century Investment Trust (the trust) is registered under the Investment Company Act of 1940, as amended (the 1940 Act), as an open-end management investment company and is organized as a Massachusetts business trust. Short Duration Fund (the fund) is one fund in a series issued by the trust. The fund’s investment objective is to seek to maximize total return. As a secondary objective, the fund seeks a high level of income.
The fund offers the Investor Class, I Class, A Class, C Class, R Class, R5 Class and R6 Class. The A Class may incur an initial sales charge. The A Class and C Class may be subject to a contingent deferred sales charge.
2. Significant Accounting Policies
The following is a summary of significant accounting policies consistently followed by the fund in preparation of its financial statements. The fund is an investment company and follows accounting and reporting guidance in accordance with accounting principles generally accepted in the United States of America. This may require management to make certain estimates and assumptions at the date of the financial statements. Actual results could differ from these estimates. Management evaluated the impact of events or transactions occurring through the date the financial statements were issued that would merit recognition or disclosure.
Investment Valuations — The fund determines the fair value of its investments and computes its net asset value per share at the close of regular trading (usually 4 p.m. Eastern time) on the New York Stock Exchange (NYSE) on each day the NYSE is open. The Board of Trustees has adopted valuation policies and procedures to guide the investment advisor in the fund’s investment valuation process and to provide methodologies for the oversight of the fund’s pricing function.
Fixed income securities are valued at the evaluated mean as provided by independent pricing services or at the mean of the most recent bid and asked prices as provided by investment dealers. Corporate bonds, U.S. Treasury and Government Agency securities, bank loan obligations, and sovereign governments and agencies are valued using market models that consider trade data, quotations from dealers and active market makers, relevant yield curve and spread data, creditworthiness, trade data or market information on comparable securities, and other relevant security specific information. Mortgage-related and asset-backed securities are valued based on models that consider trade data, prepayment and default projections, benchmark yield and spread data and estimated cash flows of each tranche of the issuer. Collateralized loan obligations are valued based on discounted cash flow models that consider trade and economic data, prepayment assumptions and default projections. Commercial paper is valued using a curve-based approach that considers money market rates for specific instruments, programs, currencies and maturity points from a variety of active market makers.
Open-end management investment companies are valued at the reported net asset value per share. Repurchase agreements are valued at cost, which approximates fair value. Exchange-traded futures contracts are valued at the settlement price as provided by the appropriate exchange. Swap agreements are valued at an evaluated mean as provided by independent pricing services or independent brokers.
If the fund determines that the market price for an investment is not readily available or the valuation methods mentioned above do not reflect an investment’s fair value, such investment is valued as determined in good faith by the Board of Trustees or its delegate, in accordance with policies and procedures adopted by the Board of Trustees. In its determination of fair value, the fund may review several factors including, but not limited to, market information regarding the specific investment or comparable investments and correlation with other investment types, futures indices or general market indicators. Circumstances that may cause the fund to use these procedures to value an investment include, but are not limited to: an investment has been declared in default or is distressed; trading in a security has been suspended during the trading day or a security is not actively trading on its principal exchange; prices received from a regular pricing source are deemed unreliable; or there is a foreign market holiday and no trading occurred.
The fund monitors for significant events occurring after the close of an investment’s primary exchange but before the fund’s net asset value per share is determined. Significant events may include, but are not limited to: corporate announcements and transactions; governmental action and political unrest that could impact a specific investment or an investment sector; or armed conflicts, natural disasters and similar events that could affect investments in a specific country or region.
Security Transactions — Security transactions are accounted for as of the trade date. Net realized gains and losses are determined on the identified cost basis, which is also used for federal income tax purposes.
Investment Income — Interest income less foreign taxes withheld, if any, is recorded on the accrual basis and includes paydown gain (loss) and accretion of discounts and amortization of premiums. Inflation adjustments related to inflation-linked debt securities are reflected as interest income.
Repurchase Agreements — The fund may enter into repurchase agreements with institutions that American Century Investment Management, Inc. (ACIM) (the investment advisor) has determined are creditworthy pursuant to criteria adopted by the Board of Trustees. The fund requires that the collateral, represented by securities, received in a repurchase transaction be transferred to the custodian in a manner sufficient to enable the fund to obtain those securities in the event of a default under the repurchase agreement. ACIM monitors, on a daily basis, the securities transferred to ensure the value, including accrued interest, of the securities under each repurchase agreement is equal to or greater than amounts owed to the fund under each repurchase agreement.
Joint Trading Account — Pursuant to an Exemptive Order issued by the Securities and Exchange Commission, the fund, along with certain other funds in the American Century Investments family of funds, may transfer uninvested cash balances into a joint trading account. These balances are invested in one or more repurchase agreements that are collateralized by U.S. Treasury or Agency obligations.
Segregated Assets — In accordance with the 1940 Act, the fund segregates assets on its books and records to cover certain types of investment securities and other financial instruments. ACIM monitors, on a daily basis, the securities segregated to ensure the fund designates a sufficient amount of liquid assets, marked-to-market daily. The fund may also receive assets or be required to pledge assets at the custodian bank or with a broker for collateral requirements.
Income Tax Status — It is the fund’s policy to distribute substantially all net investment income and net realized gains to shareholders and to otherwise qualify as a regulated investment company under provisions of the Internal Revenue Code. Accordingly, no provision has been made for income taxes. The fund files U.S. federal, state, local and non-U.S. tax returns as applicable. The fund's tax returns are subject to examination by the relevant taxing authority until expiration of the applicable statute of limitations, which is generally three years from the date of filing but can be longer in certain jurisdictions. At this time, management believes there are no uncertain tax positions which, based on their technical merit, would not be sustained upon examination and for which it is reasonably possible that the total amounts of unrecognized tax benefits will significantly change in the next twelve months.
Multiple Class — All shares of the fund represent an equal pro rata interest in the net assets of the class to which such shares belong, and have identical voting, dividend, liquidation and other rights and the same terms and conditions, except for class specific expenses and exclusive rights to vote on matters affecting only individual classes. Income, non-class specific expenses, and realized and unrealized capital gains and losses of the fund are allocated to each class of shares based on their relative net assets.
Distributions to Shareholders — Distributions from net investment income, if any, are declared daily and paid monthly. Distributions from net realized gains, if any, are generally declared and paid annually.
Indemnifications — Under the trust’s organizational documents, its officers and trustees are indemnified against certain liabilities arising out of the performance of their duties to the fund. In addition, in the normal course of business, the fund enters into contracts that provide general indemnifications. The maximum exposure under these arrangements is unknown as this would involve future claims that may be made against a fund. The risk of material loss from such claims is considered by management to be remote.
3. Fees and Transactions with Related Parties
Certain officers and trustees of the trust are also officers and/or directors of American Century Companies, Inc. (ACC). The trust's investment advisor, ACIM, the trust's distributor, American Century Investment Services, Inc. (ACIS), and the trust's transfer agent, American Century Services, LLC, are wholly owned, directly or indirectly, by ACC. Various funds issued by American Century Asset Allocation Portfolios, Inc. own, in aggregate, 7% of the shares of the fund.
Management Fees — The trust has entered into a management agreement with ACIM, under which ACIM provides the fund with investment advisory and management services in exchange for a single, unified management fee (the fee) per class. The agreement provides that all expenses of managing and operating the fund, except distribution and service fees, brokerage expenses, taxes, interest, fees and expenses of the independent trustees (including legal counsel fees), and extraordinary expenses, will be paid by ACIM. The fee is computed and accrued daily based on each class's daily net assets and paid monthly in arrears. The difference in the fee among the classes is a result of their separate arrangements for non-Rule 12b-1 shareholder services. It is not the result of any difference in advisory or custodial fees or other expenses related to the management of the fund’s assets, which do not vary by class. The fee consists of (1) an Investment Category Fee based on the daily net assets of the fund and certain other accounts managed by the investment advisor that are in the same broad investment category as the fund and (2) a Complex Fee based on the assets of all the funds in the American Century Investments family of funds.
The Investment Category Fee range, the Complex Fee range and the effective annual management fee for each class for the period ended March 31, 2020 are as follows:
|
| | | |
| | Investment Category Fee Range | Complex Fee Range | Effective Annual Management Fee |
| Investor Class | 0.2825%
to 0.4000% | 0.2500% to 0.3100% | 0.58% |
| I Class | 0.1500% to 0.2100% | 0.48% |
| A Class | 0.2500% to 0.3100% | 0.58% |
| C Class | 0.2500% to 0.3100% | 0.58% |
| R Class | 0.2500% to 0.3100% | 0.58% |
| R5 Class | 0.0500% to 0.1100% | 0.38% |
| R6 Class | 0.0000% to 0.0600% | 0.33% |
Distribution and Service Fees — The Board of Trustees has adopted a separate Master Distribution and Individual Shareholder Services Plan for each of the A Class, C Class and R Class (collectively the plans), pursuant to Rule 12b-1 of the 1940 Act. The plans provide that the A Class will pay ACIS an annual distribution and service fee of 0.25%. The plans provide that the C Class will pay ACIS an annual distribution and service fee of 1.00%, of which 0.25% is paid for individual shareholder services and 0.75% is paid for distribution services. The plans provide that the R Class will pay ACIS an annual distribution and service fee of 0.50%. The fees are computed and accrued daily based on each class’s daily net assets and paid monthly in arrears. The fees are used to pay financial intermediaries for distribution and individual shareholder services. Fees incurred under the plans during the period ended March 31, 2020 are detailed in the Statement of Operations.
Trustees’ Fees and Expenses — The Board of Trustees is responsible for overseeing the investment advisor’s management and operations of the fund. The trustees receive detailed information about the fund and its investment advisor regularly throughout the year, and meet at least quarterly with management of the investment advisor to review reports about fund operations. The fund’s officers do not receive compensation from the fund.
Interfund Transactions — The fund may enter into security transactions with other American Century Investments funds and other client accounts of the investment advisor, in accordance with the 1940 Act rules and procedures adopted by the Board of Trustees. The rules and procedures require, among other things, that these transactions be effected at the independent current market price of the security. There were no interfund transactions during the period.
4. Investment Transactions
Purchases of investment securities, excluding short-term investments, for the period ended March 31, 2020 totaled $627,332,403, of which $397,911,922 represented U.S. Treasury and Government Agency obligations.
Sales of investment securities, excluding short-term investments, for the period ended March 31, 2020 totaled $620,700,175, of which $406,270,667 represented U.S. Treasury and Government Agency obligations.
5. Capital Share Transactions
Transactions in shares of the fund were as follows (unlimited number of shares authorized):
|
| | | | | | | | | | |
| | Year ended March 31, 2020 | Year ended March 31, 2019 |
| | Shares | Amount | Shares | Amount |
| Investor Class | | | | |
| Sold | 4,227,797 |
| $ | 43,134,067 |
| 8,078,384 |
| $ | 81,587,050 |
|
| Issued in reinvestment of distributions | 407,010 |
| 4,152,544 |
| 560,546 |
| 5,663,161 |
|
| Redeemed | (11,499,305 | ) | (116,834,393 | ) | (9,331,853 | ) | (94,229,239 | ) |
| | (6,864,498 | ) | (69,547,782 | ) | (692,923 | ) | (6,979,028 | ) |
| I Class | | | | |
| Sold | 14,378,731 |
| 146,463,623 |
| 5,652,905 |
| 57,084,211 |
|
| Issued in reinvestment of distributions | 217,240 |
| 2,216,706 |
| 116,253 |
| 1,174,307 |
|
| Redeemed | (7,434,787 | ) | (75,563,445 | ) | (4,415,843 | ) | (44,605,117 | ) |
| | 7,161,184 |
| 73,116,884 |
| 1,353,315 |
| 13,653,401 |
|
| A Class | | | | |
| Sold | 771,855 |
| 7,883,708 |
| 659,617 |
| 6,654,085 |
|
| Issued in reinvestment of distributions | 29,914 |
| 305,135 |
| 35,909 |
| 362,717 |
|
| Redeemed | (1,308,192 | ) | (13,266,421 | ) | (619,036 | ) | (6,250,405 | ) |
| | (506,423 | ) | (5,077,578 | ) | 76,490 |
| 766,397 |
|
| C Class | | | | |
| Sold | 228,075 |
| 2,323,342 |
| 601,676 |
| 6,062,410 |
|
| Issued in reinvestment of distributions | 8,469 |
| 86,443 |
| 13,709 |
| 138,520 |
|
| Redeemed | (514,631 | ) | (5,245,654 | ) | (657,711 | ) | (6,639,749 | ) |
| | (278,087 | ) | (2,835,869 | ) | (42,326 | ) | (438,819 | ) |
| R Class | | | | |
| Sold | 41,308 |
| 420,918 |
| 42,731 |
| 432,212 |
|
| Issued in reinvestment of distributions | 1,409 |
| 14,387 |
| 1,051 |
| 10,623 |
|
| Redeemed | (41,199 | ) | (419,897 | ) | (8,703 | ) | (87,842 | ) |
| | 1,518 |
| 15,408 |
| 35,079 |
| 354,993 |
|
| R5 Class | | | | |
| Sold | 1,015,245 |
| 10,324,731 |
| 413,496 |
| 4,176,159 |
|
| Issued in reinvestment of distributions | 53,053 |
| 541,230 |
| 58,849 |
| 594,533 |
|
| Redeemed | (754,991 | ) | (7,714,313 | ) | (577,709 | ) | (5,832,918 | ) |
| | 313,307 |
| 3,151,648 |
| (105,364 | ) | (1,062,226 | ) |
| R6 Class | | | | |
| Sold | 1,492,435 |
| 15,200,613 |
| 2,623,219 |
| 26,458,826 |
|
| Issued in reinvestment of distributions | 184,038 |
| 1,876,501 |
| 181,110 |
| 1,828,198 |
|
| Redeemed | (2,289,960 | ) | (22,921,373 | ) | (1,518,965 | ) | (15,297,229 | ) |
| | (613,487 | ) | (5,844,259 | ) | 1,285,364 |
| 12,989,795 |
|
| Net increase (decrease) | (786,486 | ) | $ | (7,021,548 | ) | 1,909,635 |
| $ | 19,284,513 |
|
6. Fair Value Measurements
The fund’s investments valuation process is based on several considerations and may use multiple inputs to determine the fair value of the investments held by the fund. In conformity with accounting principles generally accepted in the United States of America, the inputs used to determine a valuation are classified into three broad levels.
| |
| • | Level 1 valuation inputs consist of unadjusted quoted prices in an active market for identical investments. |
| |
| • | Level 2 valuation inputs consist of direct or indirect observable market data (including quoted prices for comparable investments, evaluations of subsequent market events, interest rates, prepayment speeds, credit risk, etc.). These inputs also consist of quoted prices for identical investments initially expressed in local currencies that are adjusted through translation into U.S. dollars. |
| |
| • | Level 3 valuation inputs consist of unobservable data (including a fund’s own assumptions). |
The level classification is based on the lowest level input that is significant to the fair valuation measurement. The valuation inputs are not necessarily an indication of the risks associated with investing in these securities or other financial instruments.
The following is a summary of the level classifications as of period end. The Schedule of Investments provides additional information on the fund’s portfolio holdings.
|
| | | | | | | | |
| | Level 1 | Level 2 | Level 3 |
| Assets | | | |
| Investment Securities | | | |
| Corporate Bonds | — |
| $ | 180,493,456 |
| — |
|
| U.S. Treasury Securities | — |
| 97,577,853 |
| — |
|
| Asset-Backed Securities | — |
| 57,054,436 |
| — |
|
| Collateralized Mortgage Obligations | — |
| 30,882,091 |
| — |
|
| Collateralized Loan Obligations | — |
| 8,829,853 |
| — |
|
| U.S. Government Agency Mortgage-Backed Securities | — |
| 1,689,855 |
| — |
|
| Commercial Mortgage-Backed Securities | — |
| 1,482,545 |
| — |
|
| Bank Loan Obligations | — |
| 126,205 |
| — |
|
| Temporary Cash Investments | $ | 3,698,522 |
| 11,803,775 |
| — |
|
| | $ | 3,698,522 |
| $ | 389,940,069 |
| — |
|
| Other Financial Instruments | | | |
| Futures Contracts | $ | 456,335 |
| — |
| — |
|
7. Derivative Instruments
Credit Risk — The fund is subject to credit risk in the normal course of pursuing its investment objectives. The value of a bond generally declines as the credit quality of its issuer declines. Credit default swap agreements enable a fund to buy/sell protection against a credit event of a specific issuer or index. A fund may attempt to enhance returns by selling protection or attempt to mitigate credit risk by buying protection. The buyer/seller of credit protection against a security or basket of securities may pay/receive an up-front or periodic payment to compensate for/against potential default events. Changes in value, including the periodic amounts of interest to be paid or received on swap agreements, are recorded as unrealized appreciation (depreciation) on swap agreements. Upon entering into a centrally cleared swap, a fund is required to deposit cash or securities (initial margin) with a financial intermediary in an amount equal to a certain percentage of the notional amount. Subsequent payments (variation margin) are made or received daily, in cash, by a fund. The variation margin is equal to the daily change in the value and is a component of unrealized gains and losses. Realized gain or loss is recorded upon receipt or payment of a periodic settlement or termination of swap agreements. Net realized and unrealized gains or losses occurring during the holding period of swap agreements are a component of net realized gain (loss) on swap agreement transactions and change in net unrealized appreciation (depreciation) on swap agreements, respectively. The risks of entering into swap agreements include the possible lack of liquidity, failure of the counterparty to meet its obligations, and that there may be unfavorable changes in the underlying investments or instruments. The fund's average notional amount held during the period was $10,003,611.
Interest Rate Risk — The fund is subject to interest rate risk in the normal course of pursuing its investment objectives. The value of bonds generally declines as interest rates rise. A fund may enter into futures contracts based on a bond index or a specific underlying security. A fund may purchase futures contracts to gain exposure to increases in market value or sell futures contracts to protect against a decline in market value. Upon entering into a futures contract, a fund will segregate cash, cash equivalents or other appropriate liquid securities on its records in amounts sufficient to meet requirements. Subsequent payments (variation margin) are made or received daily, in cash, by a fund. The variation margin is equal to the daily change in the contract value and is recorded as unrealized gains and losses. A fund recognizes a realized gain or loss when the futures contract is closed or expires. Net realized and unrealized gains or losses occurring during the holding period of futures contracts are a component of net realized gain (loss) on futures contract transactions and change in net unrealized appreciation (depreciation) on futures contracts, respectively. One of the risks of entering into futures contracts is the possibility that the change in value of the contract may not correlate with the changes in value of the underlying securities. The fund's average notional exposure to interest rate risk derivative instruments held during the period was $79,758,333 futures contracts purchased and $20,740,000 futures contracts sold.
Value of Derivative Instruments as of March 31, 2020
|
| | | | | | | |
| | Asset Derivatives | Liability Derivatives |
| Type of Risk Exposure | Location on Statement of Assets and Liabilities | Value | Location on Statement of Assets and Liabilities | Value |
| Interest Rate Risk | Receivable for variation margin on futures contracts* | — |
| Payable for variation margin on futures contracts* | $ | 12,469 |
|
| |
| * | Included in the unrealized appreciation (depreciation) on futures contracts as reported in the Schedule of Investments. |
Effect of Derivative Instruments on the Statement of Operations for the Year Ended March 31, 2020
|
| | | | | | | | |
| | Net Realized Gain (Loss) | Change in Net Unrealized Appreciation (Depreciation) |
| Type of Risk Exposure | Location on Statement of Operations | Value | Location on Statement of Operations | Value |
| Credit Risk | Net realized gain (loss) on swap agreement transactions | $ | (92,293 | ) | Change in net unrealized appreciation (depreciation) on swap agreements | $ | (38,191 | ) |
| Interest Rate Risk | Net realized gain (loss) on futures contract transactions | 211,282 |
| Change in net unrealized appreciation (depreciation) on futures contracts | 177,448 |
|
| | | $ | 118,989 |
| | $ | 139,257 |
|
8. Risk Factors
The value of the fund’s shares will go up and down, sometimes rapidly or unpredictably, based on the performance of the securities owned by the fund and other factors generally affecting the securities market. Market risks, including political, regulatory, economic and social developments, can affect the value of the fund’s investments. Natural disasters, public health emergencies, terrorism and other unforeseeable events may lead to increased market volatility and may have adverse long-term effects on world economies and markets generally.
The fund may invest in instruments that have variable or floating coupon rates based on the London Interbank Offered Rate (LIBOR). LIBOR is a benchmark interest rate intended to be representative of the rate at which certain major international banks lend to one another over short-terms. LIBOR will be phased out by the end of 2021. Uncertainty remains regarding a replacement rate or rates for LIBOR. The transition process may lead to increased volatility or illiquidity in markets for instruments that rely on LIBOR. This could result in a change to the value of such instruments.
The fund’s investment process may result in high portfolio turnover, which could mean high transaction costs, affecting both performance and capital gains tax liabilities to investors.
9. Federal Tax Information
The tax character of distributions paid during the years ended March 31, 2020 and March 31, 2019 were as follows:
|
| | | | | | |
| | 2020 | 2019 |
| Distributions Paid From | | |
| Ordinary income | $ | 9,859,036 |
| $ | 10,381,013 |
|
| Long-term capital gains | — |
| — |
|
The book-basis character of distributions made during the year from net investment income or net realized gains may differ from their ultimate characterization for federal income tax purposes. These differences reflect the differing character of certain income items and net realized gains and losses for financial statement and tax purposes, and may result in reclassification among certain capital accounts on the financial statements.
As of period end, the federal tax cost of investments and the components of distributable earnings on a tax-basis were as follows:
|
| | | |
| Federal tax cost of investments | $ | 399,342,014 |
|
| Gross tax appreciation of investments | $ | 3,799,544 |
|
| Gross tax depreciation of investments | (9,502,967 | ) |
| Net tax appreciation (depreciation) of investments | $ | (5,703,423 | ) |
Other book-to-tax adjustments
| $ | (658,695 | ) |
| Undistributed ordinary income | $ | 34,911 |
|
| Accumulated short-term capital losses | $ | (3,869,936 | ) |
| Accumulated long-term capital losses | $ | (5,297,705 | ) |
The difference between book-basis and tax-basis unrealized appreciation (depreciation) is attributable primarily to the realization for tax purposes of unrealized gains (losses) on futures contracts. Other book-to-tax adjustments are attributable primarily to the tax deferral of losses on straddle positions.
Accumulated capital losses represent net capital loss carryovers that may be used to offset future realized capital gains for federal income tax purposes. The capital loss carryovers may be carried forward for an unlimited period. Future capital loss carryover utilization in any given year may be subject to Internal Revenue Code limitations.
10. Recently Issued Accounting Standards
In March 2017, the Financial Accounting Standards Board (FASB) issued Accounting Standards Update No. 2017-08, “Receivables - Nonrefundable Fees and Other Costs (Subtopic 310-20), Premium Amortization on Purchased Callable Debt Securities” (ASU 2017-08). ASU 2017-08 amends the amortization period for certain purchased callable debt securities held at a premium, shortening such period to the earliest call date. The amendments are effective for fiscal years, and interim periods within those fiscal years, beginning after December 15, 2018. The adoption of ASU 2017-08 did not materially impact the financial statements.
|
| | | | | | | | | | | | | |
| For a Share Outstanding Throughout the Years Ended March 31 (except as noted) |
| Per-Share Data | | | | | | | Ratios and Supplemental Data |
| | | Income From Investment Operations: | | Ratio to Average Net Assets of: | |
| | Net Asset Value, Beginning of Period | Net Investment Income (Loss)(1) | Net Realized and Unrealized Gain (Loss) | Total From Investment Operations | Distributions From Net Investment Income | Net Asset Value, End of Period | Total Return(2) | Operating Expenses | Net Investment Income (Loss) | Portfolio Turnover Rate | Net Assets, End of Period (in thousands) |
| Investor Class | | | | | | | | | | |
| 2020 | $10.15 | 0.20 | (0.07) | 0.13 | (0.23) | $10.05 | 1.31% | 0.59% | 1.98% | 156% |
| $155,169 |
|
| 2019 | $10.13 | 0.24 | 0.05 | 0.29 | (0.27) | $10.15 | 2.87% | 0.60% | 2.39% | 72% |
| $226,341 |
|
| 2018 | $10.25 | 0.20 | (0.11) | 0.09 | (0.21) | $10.13 | 0.88% | 0.60% | 1.94% | 89% |
| $233,033 |
|
| 2017 | $10.25 | 0.16 | 0.01 | 0.17 | (0.17) | $10.25 | 1.65% | 0.60% | 1.56% | 85% |
| $254,540 |
|
| 2016 | $10.33 | 0.14 | (0.05) | 0.09 | (0.17) | $10.25 | 0.87% | 0.60% | 1.37% | 73% |
| $224,708 |
|
| I Class | | | | | | | | | | |
| 2020 | $10.15 | 0.21 | (0.07) | 0.14 | (0.24) | $10.05 | 1.41% | 0.49% | 2.08% | 156% |
| $127,684 |
|
| 2019 | $10.13 | 0.26 | 0.04 | 0.30 | (0.28) | $10.15 | 2.97% | 0.50% | 2.49% | 72% |
| $56,264 |
|
2018(3) | $10.25 | 0.21 | (0.12) | 0.09 | (0.21) | $10.13 | 0.92% | 0.50%(4) | 2.10%(4) | 89%(5) |
| $42,466 |
|
| A Class | | | | | | | | | | |
| 2020 | $10.15 | 0.18 | (0.07) | 0.11 | (0.21) | $10.05 | 1.05% | 0.84% | 1.73% | 156% |
| $16,411 |
|
| 2019 | $10.13 | 0.22 | 0.04 | 0.26 | (0.24) | $10.15 | 2.61% | 0.85% | 2.14% | 72% |
| $21,709 |
|
| 2018 | $10.25 | 0.17 | (0.11) | 0.06 | (0.18) | $10.13 | 0.62% | 0.85% | 1.69% | 89% |
| $20,903 |
|
| 2017 | $10.25 | 0.13 | 0.01 | 0.14 | (0.14) | $10.25 | 1.40% | 0.85% | 1.31% | 85% |
| $51,956 |
|
| 2016 | $10.33 | 0.11 | (0.05) | 0.06 | (0.14) | $10.25 | 0.62% | 0.85% | 1.12% | 73% |
| $61,261 |
|
|
| | | | | | | | | | | | | |
| For a Share Outstanding Throughout the Years Ended March 31 (except as noted) |
| Per-Share Data | | | | | | | Ratios and Supplemental Data |
| | | Income From Investment Operations: | | Ratio to Average Net Assets of: | |
| | Net Asset Value, Beginning of Period | Net Investment Income (Loss)(1) | Net Realized and Unrealized Gain (Loss) | Total From Investment Operations | Distributions From Net Investment Income | Net Asset Value, End of Period | Total Return(2) | Operating Expenses | Net Investment Income (Loss) | Portfolio Turnover Rate | Net Assets, End of Period (in thousands) |
| C Class | | | | | | | | | | |
| 2020 | $10.15 | 0.10 | (0.07) | 0.03 | (0.13) | $10.05 | 0.30% | 1.59% | 0.98% | 156% |
| $6,163 |
|
| 2019 | $10.14 | 0.14 | 0.04 | 0.18 | (0.17) | $10.15 | 1.75% | 1.60% | 1.39% | 72% |
| $9,046 |
|
| 2018 | $10.26 | 0.09 | (0.10) | (0.01) | (0.11) | $10.14 | (0.13)% | 1.60% | 0.94% | 89% |
| $9,462 |
|
| 2017 | $10.26 | 0.06 | 0.01 | 0.07 | (0.07) | $10.26 | 0.64% | 1.60% | 0.56% | 85% |
| $15,254 |
|
| 2016 | $10.34 | 0.04 | (0.05) | (0.01) | (0.07) | $10.26 | (0.13)% | 1.60% | 0.37% | 73% |
| $18,919 |
|
| R Class | | | | | | | | | | |
| 2020 | $10.15 | 0.15 | (0.06) | 0.09 | (0.18) | $10.06 | 0.90% | 1.09% | 1.48% | 156% |
| $764 |
|
| 2019 | $10.14 | 0.19 | 0.04 | 0.23 | (0.22) | $10.15 | 2.26% | 1.10% | 1.89% | 72% |
| $756 |
|
| 2018 | $10.26 | 0.15 | (0.11) | 0.04 | (0.16) | $10.14 | 0.37% | 1.10% | 1.44% | 89% |
| $399 |
|
| 2017 | $10.26 | 0.11 | 0.01 | 0.12 | (0.12) | $10.26 | 1.15% | 1.10% | 1.06% | 85% |
| $522 |
|
| 2016 | $10.34 | 0.09 | (0.05) | 0.04 | (0.12) | $10.26 | 0.37% | 1.10% | 0.87% | 73% |
| $658 |
|
| R5 Class | | | | | | | | | | |
| 2020 | $10.15 | 0.22 | (0.07) | 0.15 | (0.25) | $10.05 | 1.51% | 0.39% | 2.18% | 156% |
| $23,612 |
|
| 2019 | $10.13 | 0.26 | 0.05 | 0.31 | (0.29) | $10.15 | 3.08% | 0.40% | 2.59% | 72% |
| $20,662 |
|
| 2018 | $10.25 | 0.21 | (0.10) | 0.11 | (0.23) | $10.13 | 1.08% | 0.40% | 2.14% | 89% |
| $21,699 |
|
| 2017 | $10.25 | 0.18 | 0.01 | 0.19 | (0.19) | $10.25 | 1.85% | 0.40% | 1.76% | 85% |
| $62,843 |
|
| 2016 | $10.33 | 0.16 | (0.05) | 0.11 | (0.19) | $10.25 | 1.07% | 0.40% | 1.57% | 73% |
| $64,283 |
|
| R6 Class | | | | | | | | | | |
| 2020 | $10.14 | 0.23 | (0.07) | 0.16 | (0.26) | $10.04 | 1.56% | 0.34% | 2.23% | 156% |
| $63,905 |
|
| 2019 | $10.13 | 0.27 | 0.03 | 0.30 | (0.29) | $10.14 | 3.03% | 0.35% | 2.64% | 72% |
| $70,752 |
|
2018(6) | $10.27 | 0.16 | (0.14) | 0.02 | (0.16) | $10.13 | 0.22% | 0.35%(4) | 2.31%(4) | 89%(5) |
| $57,642 |
|
|
|
| Notes to Financial Highlights |
| |
| (1) | Computed using average shares outstanding throughout the period. |
| |
| (2) | Total returns are calculated based on the net asset value of the last business day and do not reflect applicable sales charges, if any. Total returns for periods less than one year are not annualized. |
| |
| (3) | April 10, 2017 (commencement of sale) through March 31, 2018. |
| |
| (5) | Portfolio turnover is calculated at the fund level. Percentage indicated was calculated for the year ended March 31, 2018. |
| |
| (6) | July 28, 2017 (commencement of sale) through March 31, 2018. |
See Notes to Financial Statements.
|
|
| Report of Independent Registered Public Accounting Firm |
To the Board of Trustees of American Century Investment Trust and Shareholders of Short Duration Fund
Opinion on the Financial Statements
We have audited the accompanying statement of assets and liabilities, including the schedule of investments, of Short Duration Fund (one of the funds constituting American Century Investment Trust, referred to hereafter as the “Fund”) as of March 31, 2020, the related statement of operations for the year ended March 31, 2020, the statement of changes in net assets for each of the two years in the period ended March 31, 2020, including the related notes, and the financial highlights for each of the periods indicated therein (collectively referred to as the “financial statements”). In our opinion, the financial statements present fairly, in all material respects, the financial position of the Fund as of March 31, 2020, the results of its operations for the year then ended, the changes in its net assets for each of the two years in the period ended March 31, 2020 and the financial highlights for each of the periods indicated therein in conformity with accounting principles generally accepted in the United States of America.
Basis for Opinion
These financial statements are the responsibility of the Fund’s management. Our responsibility is to express an opinion on the Fund’s financial statements based on our audits. We are a public accounting firm registered with the Public Company Accounting Oversight Board (United States) (PCAOB) and are required to be independent with respect to the Fund in accordance with the U.S. federal securities laws and the applicable rules and regulations of the Securities and Exchange Commission and the PCAOB.
We conducted our audits of these financial statements in accordance with the standards of the PCAOB. Those standards require that we plan and perform the audit to obtain reasonable assurance about whether the financial statements are free of material misstatement, whether due to error or fraud.
Our audits included performing procedures to assess the risks of material misstatement of the financial statements, whether due to error or fraud, and performing procedures that respond to those risks. Such procedures included examining, on a test basis, evidence regarding the amounts and disclosures in the financial statements. Our audits also included evaluating the accounting principles used and significant estimates made by management, as well as evaluating the overall presentation of the financial statements. Our procedures included confirmation of securities owned as of March 31, 2020 by correspondence with the custodian and brokers; when replies were not received from brokers, we performed other auditing procedures. We believe that our audits provide a reasonable basis for our opinion.
/s/ PricewaterhouseCoopers LLP
Kansas City, Missouri
May 18, 2020
We have served as the auditor of one or more investment companies in American Century Investments since 1997.
Board of Trustees
The individuals listed below serve as trustees of the funds. Each trustee will continue to serve in this capacity until death, retirement, resignation or removal from office. The board has adopted a mandatory retirement age for trustees who are not “interested persons,” as that term is defined in the Investment Company Act (independent trustees). Independent trustees shall retire on December 31 of the year in which they reach their 75th birthday; provided, however, that on or after January 1, 2022, independent trustees shall retire on December 31 of the year in which they reach their 76th birthday.
Mr. Thomas is an “interested person” because he currently serves as President and Chief Executive Officer of American Century Companies, Inc. (ACC), the parent company of American Century Investment Management, Inc. (ACIM or the advisor). The other trustees (more than three-fourths of the total number) are independent. They are not employees, directors or officers of, and have no financial interest in, ACC or any of its wholly owned, direct or indirect, subsidiaries, including ACIM, American Century Investment Services, Inc. (ACIS) and American Century Services, LLC (ACS), and they do not have any other affiliations, positions or relationships that would cause them to be considered “interested persons” under the Investment Company Act. The trustees serve in this capacity for eight (in the case of Jonathan S. Thomas, 16; and Ronald J. Gilson, 9) registered investment companies in the American Century Investments family of funds.
The following table presents additional information about the trustees. The mailing address for each trustee other than Mr. Thomas is 1665 Charleston Road, Mountain View, California 94043. The mailing address for Mr. Thomas is 4500 Main Street, Kansas City, Missouri 64111.
|
| | | | | |
Name
(Year of Birth) | Position(s) Held with Funds | Length of Time Served | Principal Occupation(s) During Past 5 Years | Number of American Century Portfolios Overseen by Trustee | Other Directorships Held During Past 5 Years |
| Independent Trustees |
|
|
Tanya S. Beder
(1955) | Trustee | Since 2011 | Chairman and CEO, SBCC Group Inc. (independent advisory services) (2006 to present) | 40 | CYS Investments, Inc.; Kirby Corporation; Nabors Industries Ltd. |
Jeremy I. Bulow
(1954) | Trustee | Since 2011 | Professor of Economics, Stanford University, Graduate School of Business (1979 to present) | 40 | None |
Anne Casscells
(1958) | Trustee | Since 2016 | Co-Chief Executive Officer and Chief Investment Officer, Aetos Alternatives Management (investment advisory firm) (2001 to present); Lecturer in Accounting, Stanford University, Graduate School of Business (2009 to 2017) | 40 | None |
Ronald J. Gilson
(1946) | Trustee and Chairman of the Board | Since 1995
(Chairman since 2005) | Charles J. Meyers Professor of Law and Business, Emeritus, Stanford Law School (1979 to 2016); Marc and Eva Stern Professor of Law and Business, Columbia University School of Law (1992 to present) | 57 | None |
|
| | | | | |
Name
(Year of Birth) | Position(s) Held with Funds | Length of Time Served | Principal Occupation(s) During Past 5 Years | Number of American Century Portfolios Overseen by Trustee | Other Directorships Held During Past 5 Years |
| Independent Trustees |
|
|
Frederick L. A. Grauer
(1946) | Trustee | Since 2008 | Senior Advisor, Credit Sesame, Inc. (credit monitoring firm) (2018 to present); Senior Advisor, Course Hero (an educational technology company) (2015 to present) | 40 | None |
Jonathan D. Levin
(1972) | Trustee | Since 2016 | Philip H. Knight Professor and Dean, Graduate School of Business, Stanford University (2016 to present); Professor, Stanford University, (2000 to present) | 40 | None |
Peter F. Pervere
(1947) | Trustee | Since 2007 | Retired | 40 | None |
John B. Shoven
(1947) | Trustee | Since 2002 | Charles R. Schwab Professor of Economics, Stanford University (1973 to present, emeritus since 2019) | 40 | Cadence Design Systems; Exponent; Financial Engines |
| Interested Trustee |
|
|
Jonathan S. Thomas
(1963) | Trustee | Since 2007 | President and Chief Executive Officer, ACC (2007 to present). Also serves as Chief Executive Officer, ACS; Executive Vice President, ACIM; Director, ACC, ACIM and other ACC subsidiaries | 120 | None |
The Statement of Additional Information has additional information about the fund's trustees and is available without charge, upon request, by calling 1-800-345-2021.
Officers
The following table presents certain information about the executive officers of the funds. Each officer serves as an officer for 16 (in the case of Robert J. Leach, 15) investment companies in the American Century family of funds, unless otherwise noted. No officer is compensated for his or her service as an officer of the funds. The listed officers are interested persons of the funds and are appointed or re-appointed on an annual basis. The mailing address for each of the officers listed below is 4500 Main Street, Kansas City, Missouri 64111.
|
| | |
Name
(Year of Birth) | Offices with the Funds | Principal Occupation(s) During the Past Five Years |
Patrick Bannigan
(1965)
| President since 2019 | Executive Vice President and Director, ACC (2012 to present); Chief Financial Officer, Chief Accounting Officer and Treasurer, ACC (2015 to present); Chief Operating Officer, ACC (2012-2015). Also serves as President, ACS; Vice President, ACIM; Chief Financial Officer, Chief Accounting Officer and/or Director, ACIM, ACS and other ACC subsidiaries |
R. Wes Campbell
(1974)
| Chief Financial Officer and Treasurer since 2018 | Vice President, ACS (2020 to present); Investment Operations and Investment Accounting, ACS (2000 to present) |
Amy D. Shelton
(1964) | Chief Compliance Officer and Vice President since 2014 | Chief Compliance Officer, American Century funds, (2014 to present); Chief Compliance Officer, ACIM (2014 to present); Chief Compliance Officer, ACIS (2009 to present). Also serves as Vice President, ACIS |
Charles A. Etherington
(1957) | General Counsel since 2007 and Senior Vice President since 2006 | Attorney, ACC (1994 to present); Vice President, ACC (2005 to present); General Counsel, ACC (2007 to present). Also serves as General Counsel, ACIM, ACS, ACIS and other ACC subsidiaries; and Senior Vice President, ACIM and ACS |
C. Jean Wade
(1964) | Vice President since 2012 | Senior Vice President, ACS (2017 to present); Vice President ACS (2000 to 2017)
|
Robert J. Leach
(1966) | Vice President since 2006 | Vice President, ACS (2000 to present) |
David H. Reinmiller
(1963) | Vice President since 2000 | Attorney, ACC (1994 to present). Also serves as Vice President, ACIM and ACS |
Ward D. Stauffer
(1960) | Secretary since 2005 | Attorney, ACC (2003 to present) |
|
|
| Liquidity Risk Management Program |
The Fund has adopted a liquidity risk management program (the “program”). The Fund’s Board of Trustees (the "Board") has designated American Century Investment Management, Inc. (“ACIM”) as the administrator of the program. Personnel of ACIM or its affiliates conduct the day-to-day operation of the program pursuant to policies and procedures administered by those members of the ACIM’s Investment Oversight Committee who are members of the ACIM’s Investment Management and Global Analytics departments.
Under the program, ACIM manages the Fund’s liquidity risk, which is the risk that the Fund could not meet shareholder redemption requests without significant dilution of remaining shareholders’ interests in the Fund. This risk is managed by monitoring the degree of liquidity of the Fund’s investments, limiting the amount of the Fund’s illiquid investments, and utilizing various risk management tools and facilities available to the Fund for meeting shareholder redemptions, among other means. ACIM’s process of determining the degree of liquidity of the Fund’s investments is supported by one or more third-party liquidity assessment vendors.
The Board reviewed a report prepared by ACIM regarding the operation and effectiveness of the program for the period December 1, 2018 through December 31, 2019. No significant liquidity events impacting the Fund were noted in the report. In addition, ACIM provided its assessment that the program had been effective in managing the Fund’s liquidity risk.
Retirement Account Information
As required by law, distributions you receive from certain retirement accounts are subject to federal income tax withholding, unless you elect not to have withholding apply*. Tax will be withheld on the total amount withdrawn even though you may be receiving amounts that are not subject to withholding, such as nondeductible contributions. In such case, excess amounts of withholding could occur. You may adjust your withholding election so that a greater or lesser amount will be withheld.
If you don’t want us to withhold on this amount, you must notify us to not withhold the federal income tax. You may notify us in writing or in certain situations by telephone or through other electronic means. For systematic withdrawals, your withholding election will remain in effect until revoked or changed by filing a new election. You have the right to revoke your election at any time and change your withholding percentage for future distributions.
Remember, even if you elect not to have income tax withheld, you are liable for paying income tax on the taxable portion of your withdrawal. If you elect not to have income tax withheld or you don’t have enough income tax withheld, you may be responsible for payment of estimated tax. You may incur penalties under the estimated tax rules if your withholding and estimated tax payments are not sufficient. You can reduce or defer the income tax on a distribution by directly or indirectly rolling such distribution over to another IRA or eligible plan. You should consult your tax advisor for additional information.
State tax will be withheld if, at the time of your distribution, your address is within one of the mandatory withholding states and you have federal income tax withheld (or as otherwise required by state law). State taxes will be withheld from your distribution in accordance with the respective state rules.
*Some 403(b), 457 and qualified retirement plan distributions may be subject to 20% mandatory withholding, as they are subject to special tax and withholding rules. Your plan administrator or plan sponsor is required to provide you with a special tax notice explaining those rules at the time you request a distribution. If applicable, federal and/or state taxes may be withheld from your distribution amount.
Proxy Voting Policies
Descriptions of the principles and policies that the fund's investment advisor uses in exercising the voting rights associated with the securities purchased and/or held by the fund are available without charge, upon request, by calling 1-800-345-2021 or visiting American Century Investments’ website at americancentury.com/proxy. A description of the policies is also available on the Securities and Exchange Commission’s website at sec.gov. Information regarding how the investment advisor voted proxies relating to portfolio securities during the most recent 12-month period ended June 30 is available on americancentury.com/proxy. It is also available at sec.gov.
Quarterly Portfolio Disclosure
The fund files its complete schedule of portfolio holdings with the Securities and Exchange Commission (SEC) for the first and third quarters of each fiscal year as an exhibit to its reports on Form N-PORT. The fund’s Form N-PORT reports are available on the SEC’s website at sec.gov. The fund also makes its complete schedule of portfolio holdings for the most recent quarter of its fiscal year available on its website at americancentury.com and, upon request, by calling 1-800-345-2021.
|
| | |
| |
| | | |
| Contact Us | americancentury.com | |
| Automated Information Line | 1-800-345-8765 | |
| Investor Services Representative | 1-800-345-2021 or 816-531-5575 | |
| Investors Using Advisors | 1-800-378-9878 | |
| Business, Not-For-Profit, Employer-Sponsored Retirement Plans | 1-800-345-3533 | |
| Banks and Trust Companies, Broker-Dealers, Financial Professionals, Insurance Companies | 1-800-345-6488 | |
| Telecommunications Relay Service for the Deaf | 711 | |
| | | |
| American Century Investment Trust | |
| | | |
Investment Advisor: American Century Investment Management, Inc. Kansas City, Missouri | |
| | | |
| This report and the statements it contains are submitted for the general information of our shareholders. The report is not authorized for distribution to prospective investors unless preceded or accompanied by an effective prospectus. | |
| | | |
©2020 American Century Proprietary Holdings, Inc. All rights reserved.
CL-ANN-92285 2005 | |
|
| |
| | |
| | Annual Report |
| | |
| | March 31, 2020 |
| | |
| | Short Duration Inflation Protection Bond Fund |
| | Investor Class (APOIX) |
| | I Class (APOHX) |
| | Y Class (APOYX) |
| | A Class (APOAX) |
| | C Class (APOCX) |
| | R Class (APORX) |
| | R5 Class (APISX) |
| | R6 Class (APODX) |
| | G Class (APOGX) |
Beginning on January 1, 2021, as permitted by regulations adopted by the Securities and Exchange Commission, paper copies of the fund’s shareholder reports like this one will no longer be sent by mail, unless you specifically request paper copies of the reports from the fund or from your financial intermediary, such as a broker-dealer or bank. Instead, the reports will be made available on a website, and you will be notified by mail each time a report is posted and provided with a website link to access the report.
If you already elected to receive shareholder reports electronically, you will not be affected by this change and you need not take any action. You may elect to receive shareholder reports and other communications from the fund or your financial intermediary electronically by calling or sending an email request to your appropriate contacts as listed on the back cover of this report.
You may elect to receive all future reports in paper free of charge. You can inform the fund or your financial intermediary that you wish to continue receiving paper copies of your shareholder reports by calling or sending an email request to your appropriate contacts as listed on the back cover of this report. Your election to receive reports in paper will apply to all funds held with the fund complex/your financial intermediary.
|
| |
| President’s Letter | |
| Performance | |
| Portfolio Commentary | |
| Fund Characteristics | |
| Shareholder Fee Example | |
| Schedule of Investments | |
| Statement of Assets and Liabilities | |
| Statement of Operations | |
| Statement of Changes in Net Assets | |
| Notes to Financial Statements | |
| Financial Highlights | |
| Report of Independent Registered Public Accounting Firm | |
| Management | |
| Liquidity Risk Management Program | |
| Additional Information | |
Any opinions expressed in this report reflect those of the author as of the date of the report, and do not necessarily represent the opinions of American Century Investments® or any other person in the American Century Investments organization. Any such opinions are subject to change at any time based upon market or other conditions and American Century Investments disclaims any responsibility to update such opinions. These opinions may not be relied upon as investment advice and, because investment decisions made by American Century Investments funds are based on numerous factors, may not be relied upon as an indication of trading intent on behalf of any American Century Investments fund. Security examples are used for representational purposes only and are not intended as recommendations to purchase or sell securities. Performance information for comparative indices and securities is provided to American Century Investments by third party vendors. To the best of American Century Investments’ knowledge, such information is accurate at the time of printing.
Jonathan Thomas
Dear Investor:
Thank you for reviewing this annual report for the period ended March 31, 2020. Annual reports help convey important information about fund returns, including market factors that affected performance during the reporting period. For additional insights, please visit americancentury.com.
Virus Outbreak Abruptly Altered Economic, Market Backdrops
Through most of the period, market sentiment was upbeat, partly due to accommodative Federal Reserve (Fed) policy and modest inflation. Improving economic and corporate earnings data and a phase 1 U.S.-China trade deal also helped boost growth outlooks. Against this backdrop, key U.S. stock benchmarks rose to record highs by mid-February, and U.S. bonds continued to advance.
However, beginning in late February, unprecedented social and economic turmoil emerged and reversed the positive trajectory. The COVID-19 epidemic originating in China rapidly spread throughout the world, forcing stay-at-home orders and industry-wide shutdowns. U.S. stocks, corporate bonds and other riskier assets sold off sharply, while U.S. Treasuries rallied in the global flight to quality. The Fed stepped in quickly and aggressively, slashing interest rates to near 0% and enacting massive lending and asset-purchase programs to stabilize the financial system.
The swift and severe sell-off erased the strong stock market gains realized earlier in the period and left key benchmarks with losses for the 12 months. Reflecting their defensive characteristics, high-quality U.S. bonds withstood the turmoil and delivered solid returns for the 12-month period.
Promoting Health and Safety Remains Our Focus
While the market impact of COVID-19 has been severe, reducing the human toll is most important. We are monitoring the situation closely and following guidelines and protocols from all relevant authorities. Our firm has activated a comprehensive Pandemic Response Plan, which includes social distancing and work-from-home mandates, travel restrictions and escalated cleaning regimens at all our facilities. We’ve also launched a Business Continuity Plan to maintain regular business operations and ensure delivery of outstanding service.
We appreciate your confidence in us during these extraordinary times. We have a long history of helping clients weather volatile markets, and we are confident we will meet today’s challenges. In the meantime, the health and safety of you, your family and our employees remain a top priority.
Sincerely,
Jonathan Thomas
President and Chief Executive Officer
American Century Investments
|
| | | | | | |
| Total Returns as of March 31, 2020 | | | | |
| | | | Average Annual Returns | |
| | Ticker Symbol | 1 year | 5 years | 10 years | Since Inception | Inception Date |
| Investor Class | APOIX | 0.69% | 1.08% | 1.91% | — | 5/31/05 |
| Bloomberg Barclays U.S. 1-5 Year Treasury Inflation Protected Securities (TIPS) Index | — | 2.51% | 1.59% | 1.56% | — | — |
| I Class | APOHX | 0.79% | — | — | 0.96% | 4/10/17 |
| Y Class | APOYX | 0.89% | — | — | 1.06% | 4/10/17 |
| A Class | APOAX | | | | | 5/31/05 |
| No sales charge | | 0.44% | 0.85% | 1.66% | — | |
| With sales charge | | -1.81% | 0.39% | 1.43% | — | |
| C Class | APOCX | -0.33% | 0.08% | 0.90% | — | 5/31/05 |
| R Class | APORX | 0.18% | 0.59% | 1.40% | — | 5/31/05 |
| R5 Class | APISX | 0.89% | 1.30% | 2.12% | — | 5/31/05 |
| R6 Class | APODX | 0.94% | 1.35% | — | 0.88% | 7/26/13 |
| G Class | APOGX | 1.25% | — | — | 1.59% | 7/28/17 |
Fund returns would have been lower if a portion of the fees had not been waived. Prior to August 31, 2011, the A Class had a maximum initial sales charge of 4.50%. The maximum initial sales charge is now 2.25%. Performance prior to that date has been adjusted to reflect this change in the initial sales charge.
Sales charges include initial sales charges and contingent deferred sales charges (CDSCs), as applicable. A Class shares have a 2.25% maximum initial sales charge and may be subject to a maximum CDSC of 1.00%. C Class shares redeemed within 12 months of purchase are subject to a maximum CDSC of 1.00%. The SEC requires that mutual funds provide performance information net of maximum sales charges in all cases where charges could be applied.
Data presented reflect past performance. Past performance is no guarantee of future results. Current performance may be higher or lower than the performance shown. Total returns for periods less than one year are not annualized. Investment return and principal value will fluctuate, and redemption value may be more or less than original cost. Data assumes reinvestment of dividends and capital gains, and none of the charts reflect the deduction of taxes that a shareholder would pay on fund distributions or the redemption of fund shares. To obtain performance data current to the most recent month end, please call 1-800-345-2021 or visit americancentury.com. For additional information about the fund, please consult the prospectus.
|
|
| Growth of $10,000 Over 10 Years |
| $10,000 investment made March 31, 2010 |
Performance for other share classes will vary due to differences in fee structure.
|
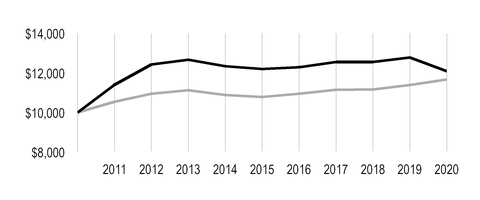
|
| |
| Value on March 31, 2020 |
| | Investor Class — $12,089 |
| |
| | Bloomberg Barclays U.S. 1-5 Year Treasury Inflation Protected Securities (TIPS) Index — $11,672 |
| |
Ending value of Investor Class would have been lower if a portion of the fees had not been waived.
|
| | | | | | | | |
| Total Annual Fund Operating Expenses | |
| Investor Class | I Class | Y Class | A Class | C Class | R Class | R5 Class | R6 Class | G Class |
| 0.57% | 0.47% | 0.37% | 0.82% | 1.57% | 1.07% | 0.37% | 0.32% | 0.32% |
The total annual fund operating expenses shown is as stated in the fund’s prospectus current as of the date of this report. The prospectus may vary from the expense ratio shown elsewhere in this report because it is based on a different time period, includes acquired fund fees and expenses, and, if applicable, does not include fee waivers or expense reimbursements.
Data presented reflect past performance. Past performance is no guarantee of future results. Current performance may be higher or lower than the performance shown. Total returns for periods less than one year are not annualized. Investment return and principal value will fluctuate, and redemption value may be more or less than original cost. Data assumes reinvestment of dividends and capital gains, and none of the charts reflect the deduction of taxes that a shareholder would pay on fund distributions or the redemption of fund shares. To obtain performance data current to the most recent month end, please call 1-800-345-2021 or visit americancentury.com. For additional information about the fund, please consult the prospectus.
Portfolio Managers: Bob Gahagan, Brian Howell, Jim Platz and Miguel Castillo
Performance Summary
Short Duration Inflation Protection Bond returned 0.69%* for the 12 months ended March 31, 2020. By comparison, the Bloomberg Barclays U.S. 1-5 Year Treasury Inflation Protected Securities (TIPS) Index gained 2.51%. Fund returns reflect operating expenses, while index returns do not.
Index performance reflects the positive, yet challenging, backdrop for TIPS as market-based inflation expectations sank to multiyear lows late in the reporting period. The portfolio’s underperformance versus the index was largely due to out-of-index positions in corporate and securitized bonds, which sold off sharply in early 2020.
The reporting period began on an upbeat note for bond investors. The Federal Reserve’s (Fed’s) early 2019 pivot toward dovish policy set the stage for rate cuts in July, September and October. This action, along with modest economic and earnings growth and inflation, generally supported solid gains for U.S. bonds. By year-end 2019, global economic data improved, the U.S. and China signed a phase 1 trade deal and the central bank suggested it would hold rates steady through 2020. Core inflation edged closer to the Fed’s 2.0% target, and longer-term inflation expectations were steadily climbing.
Conditions deteriorated rapidly within the first quarter of 2020, which proved to be the defining period of the portfolio’s fiscal year. As the COVID-19 epidemic originating in China expanded into a pandemic, nervous fixed-income investors scrambled to shed credit risk and seek shelter in cash. Beginning in late February, market volatility soared and liquidity sank. In response, the Fed slashed short-term rates to near 0% by mid-March and launched a series of initiatives to stabilize the financial markets. Separately, Congress passed a $2 trillion fiscal relief package. Reflecting market sentiment, the 10-year Treasury yield started the period at 2.41% and closed at 0.68% after touching a record-low 0.54% in early March. The two-year Treasury yield followed a similar path during the 12-month period, dropping from 2.27% to 0.22%, including a 135-basis-point decline in the first quarter of 2020.
Inflation Expectations Dropped Sharply
In addition to the coronavirus-related market disruptions, an oil price war broke out between Saudi Arabia and Russia. This development, combined with already-waning demand for oil due to global economic shutdowns, sent oil prices plunging. Annualized headline inflation, as measured by the Consumer Price Index (CPI), fell from 2.3% in February to 1.5% in March, largely due to declining oil prices. Inflation expectations, as measured by the 10-year breakeven rate (the yield difference between nominal 10-year Treasuries and 10-year TIPS), fell to an 11-year low of 50 basis points (one basis point equals 0.01%) in mid-March before recovering to 87 basis points by period-end. The 10-year breakeven rate started 2020 at 177 basis points. Theoretically, the breakeven rate indicates the market’s expectations for inflation for the next 10 years and also reflects the inflation rate required for TIPS to outperform nominal Treasuries during that period (0.87% or higher as of March 31).
*All fund returns referenced in this commentary are for Investor Class shares. Performance for other share classes will vary due to differences in fee structure; when Investor Class performance exceeds that of the index, other share classes may not. See page 3 for returns for all share classes.
Amid the global flight to quality, U.S. Treasuries rallied considerably, and nearly every other asset sold off. In late March, the Fed’s rescue programs helped stabilize credit-sensitive sectors of the fixed-income universe, including corporate and mortgage-backed securities, but not before they suffered significant declines. Against this backdrop, positions in out-of-index corporate and securitized securities accounted for much of the portfolio’s underperformance.
Out-of-Index Securities Weighed on Relative Results
Approximately 84% of the portfolio was invested in TIPS at the end of the reporting period. The remainder primarily included out-of-index allocations to securitized bonds and investment-grade and high-yield corporate bonds. Exposure to these credit-sensitive securities contributed to performance for most of the period, as risk-on sentiment generally remained in favor. However, positions in corporate and securitized bonds detracted from returns amid the flight to quality in the first quarter of 2020.
To diversify inflation protection, we used inflation swaps to create an inflation overlay for the non-inflation-linked corporate and securitized securities. Inflation swaps are fixed-maturity instruments, negotiated through a counterparty (investment bank), that return the rate of inflation (CPI). All swaps bear counterparty credit risk, but American Century Investments applies stringent controls and oversight with regard to this risk. Overall, this strategy, combined with the portfolio’s TIPS, positioned the portfolio with greater sensitivity to inflation than the index. This strategy generally aided performance during the second half of 2019, when inflation expectations modestly increased. However, it detracted late in the period, as virus-related economic shutdowns and plunging oil prices drove inflation expectations to their lowest levels since 2009.
Portfolio Positioning
The recent economic downturn has been swift and severe, but we do not expect an equally swift, or V-shaped, recovery. The consumer is the main driver of the U.S. economy, and we believe the effects of the COVID-19 pandemic will weigh on consumer sentiment—and job and economic growth—for several months. We expect near-term annual inflation rates to decline significantly due to coronavirus-related economic shocks and lower oil prices. Additionally, breakeven rates remain unusually low and well below historical averages, suggesting TIPS and other inflation-linked securities offer long-term value.
Heightened volatility often creates market disruptions that lead to attractive buying opportunities. In the early 2020 flight to quality, credit spreads widened considerably, creating dislocations and improving valuations in select sectors. We remain cautious and defensive in our out-of-index portfolio positioning, focusing on high-quality securities and positioning our portfolio to weather a U-shaped recovery. Along with TIPS, we’re emphasizing securities the Fed is buying, including high-quality corporate and mortgage securities.
At the same time, we’re engaged in a broad review of each portfolio holding, eliminating securities we’re uncomfortable holding in the current environment. In particular, we’ve reduced exposure to securitized securities. We believe rising unemployment and the broad economic shutdown created by the pandemic will create challenges for certain segments of the mortgage market. We’ve also hedged overall risk in the portfolio via credit default swaps.
|
| |
| MARCH 31, 2020 | |
| Portfolio at a Glance | |
| Average Duration (effective) | 3.2 years |
| Weighted Average Life to Maturity | 3.3 years |
| | |
| Types of Investments in Portfolio | % of net assets |
| U.S. Treasury Securities | 84.3% |
| Asset-Backed Securities | 4.8% |
| Collateralized Mortgage Obligations | 2.2% |
| Collateralized Loan Obligations | 0.8% |
| Corporate Bonds | 0.8% |
| Temporary Cash Investments | 6.9% |
| Other Assets and Liabilities | 0.2% |
Fund shareholders may incur two types of costs: (1) transaction costs, including sales charges (loads) on purchase payments and redemption/exchange fees; and (2) ongoing costs, including management fees; distribution and service (12b-1) fees; and other fund expenses. This example is intended to help you understand your ongoing costs (in dollars) of investing in your fund and to compare these costs with the ongoing cost of investing in other mutual funds.
The example is based on an investment of $1,000 made at the beginning of the period and held for the entire period from October 1, 2019 to March 31, 2020.
Actual Expenses
The table provides information about actual account values and actual expenses for each class. You may use the information, together with the amount you invested, to estimate the expenses that you paid over the period. First, identify the share class you own. Then simply divide your account value by $1,000 (for example, an $8,600 account value divided by $1,000 = 8.6), then multiply the result by the number under the heading “Expenses Paid During Period” to estimate the expenses you paid on your account during this period.
If you hold Investor Class shares of any American Century Investments fund, or I Class shares of the American Century Diversified Bond Fund, in an American Century Investments account (i.e., not through a financial intermediary or employer-sponsored retirement plan account), American Century Investments may charge you a $25.00 annual account maintenance fee if the value of those shares is less than $10,000. We will redeem shares automatically in one of your accounts to pay the $25.00 fee. In determining your total eligible investment amount, we will include your investments in all personal accounts (including American Century Investments brokerage accounts) registered under your Social Security number. Personal accounts include individual accounts, joint accounts, UGMA/UTMA accounts, personal trusts, Coverdell Education Savings Accounts and IRAs (including traditional, Roth, Rollover, SEP-, SARSEP- and SIMPLE-IRAs), and certain other retirement accounts. If you have only business, business retirement, employer-sponsored or American Century Investments brokerage accounts, you are currently not subject to this fee. If you are subject to the account maintenance fee, your account value could be reduced by the fee amount.
Hypothetical Example for Comparison Purposes
The table also provides information about hypothetical account values and hypothetical expenses based on the actual expense ratio of each class of your fund and an assumed rate of return of 5% per year before expenses, which is not the actual return of a fund’s share class. The hypothetical account values and expenses may not be used to estimate the actual ending account balance or expenses you paid for the period. You may use this information to compare the ongoing costs of investing in your fund and other funds. To do so, compare this 5% hypothetical example with the 5% hypothetical examples that appear in the shareholder reports of the other funds.
Please note that the expenses shown in the table are meant to highlight your ongoing costs only and do not reflect any transactional costs, such as sales charges (loads) or redemption/exchange fees. Therefore, the table is useful in comparing ongoing costs only, and will not help you determine the relative total costs of owning different funds. In addition, if these transactional costs were included, your costs would have been higher.
|
| | | | |
| | Beginning
Account Value
10/1/19 | Ending
Account Value
3/31/20 | Expenses Paid
During Period(1)
10/1/19 - 3/31/20 |
Annualized
Expense Ratio(1) |
| Actual | | | | |
| Investor Class | $1,000 | $989.30 | $2.83 | 0.57% |
| I Class | $1,000 | $989.40 | $2.34 | 0.47% |
| Y Class | $1,000 | $989.50 | $1.84 | 0.37% |
| A Class | $1,000 | $988.60 | $4.08 | 0.82% |
| C Class | $1,000 | $984.50 | $7.79 | 1.57% |
| R Class | $1,000 | $987.30 | $5.32 | 1.07% |
| R5 Class | $1,000 | $990.40 | $1.84 | 0.37% |
| R6 Class | $1,000 | $990.90 | $1.59 | 0.32% |
| G Class | $1,000 | $991.10 | $0.05 | 0.01% |
| Hypothetical | | | | |
| Investor Class | $1,000 | $1,022.15 | $2.88 | 0.57% |
| I Class | $1,000 | $1,022.65 | $2.38 | 0.47% |
| Y Class | $1,000 | $1,023.15 | $1.87 | 0.37% |
| A Class | $1,000 | $1,020.90 | $4.14 | 0.82% |
| C Class | $1,000 | $1,017.15 | $7.92 | 1.57% |
| R Class | $1,000 | $1,019.65 | $5.40 | 1.07% |
| R5 Class | $1,000 | $1,023.15 | $1.87 | 0.37% |
| R6 Class | $1,000 | $1,023.40 | $1.62 | 0.32% |
| G Class | $1,000 | $1,024.95 | $0.05 | 0.01% |
| |
| (1) | Expenses are equal to the class's annualized expense ratio listed in the table above, multiplied by the average account value over the period, multiplied by 183, the number of days in the most recent fiscal half-year, divided by 366, to reflect the one-half year period. Annualized expense ratio reflects actual expenses, including any applicable fee waivers or expense reimbursements and excluding any acquired fund fees and expenses. |
MARCH 31, 2020
|
| | | | | | |
| | Principal Amount | Value |
| U.S. TREASURY SECURITIES — 84.3% | | |
| U.S. Treasury Inflation Indexed Notes, 0.125%, 1/15/22 | $ | 76,536,227 |
| $ | 75,436,898 |
|
U.S. Treasury Inflation Indexed Notes, 0.125%, 4/15/22(1) | 103,954,480 |
| 102,484,666 |
|
| U.S. Treasury Inflation Indexed Notes, 0.125%, 1/15/23 | 222,965,190 |
| 220,253,039 |
|
| U.S. Treasury Inflation Indexed Notes, 0.625%, 4/15/23 | 112,477,131 |
| 113,344,502 |
|
| U.S. Treasury Inflation Indexed Notes, 0.375%, 7/15/23 | 62,076,560 |
| 62,456,442 |
|
| U.S. Treasury Inflation Indexed Notes, 0.625%, 1/15/24 | 205,641,600 |
| 209,068,019 |
|
| U.S. Treasury Inflation Indexed Notes, 0.50%, 4/15/24 | 75,179,475 |
| 76,286,925 |
|
| U.S. Treasury Inflation Indexed Notes, 0.125%, 7/15/24 | 21,728,800 |
| 21,780,394 |
|
| U.S. Treasury Inflation Indexed Notes, 0.125%, 10/15/24 | 24,131,520 |
| 24,430,297 |
|
| U.S. Treasury Inflation Indexed Notes, 0.25%, 1/15/25 | 353,977,000 |
| 357,234,176 |
|
| U.S. Treasury Inflation Indexed Notes, 0.625%, 1/15/26 | 51,026,960 |
| 52,733,682 |
|
TOTAL U.S. TREASURY SECURITIES
(Cost $1,315,744,859) | | 1,315,509,040 |
|
| ASSET-BACKED SECURITIES — 4.8% | | |
Avis Budget Rental Car Funding AESOP LLC, Series 2015-2A, Class B, 3.42%, 12/20/21(2) | 2,625,000 |
| 2,588,703 |
|
BRE Grand Islander Timeshare Issuer LLC, Series 2017-1A, Class A SEQ, 2.94%, 5/25/29(2) | 3,231,631 |
| 3,170,434 |
|
BRE Grand Islander Timeshare Issuer LLC, Series 2017-1A, Class B, 3.24%, 5/25/29(2) | 933,816 |
| 912,657 |
|
Hilton Grand Vacations Trust, Series 2014-AA, Class A SEQ, 1.77%, 11/25/26(2) | 426,300 |
| 423,096 |
|
Hilton Grand Vacations Trust, Series 2017-AA, Class A SEQ, 2.66%, 12/26/28(2) | 993,338 |
| 979,086 |
|
Invitation Homes Trust, Series 2017-SFR2, Class A, VRN, 1.65%, (1-month LIBOR plus 0.85%), 12/17/36(2) | 37,758 |
| 35,115 |
|
Invitation Homes Trust, Series 2018-SFR1, Class A, VRN, 1.50%, (1-month LIBOR plus 0.70%), 3/17/37(2) | 46,440 |
| 43,292 |
|
Invitation Homes Trust, Series 2018-SFR1, Class B, VRN, 1.75%, (1-month LIBOR plus 0.95%), 3/17/37(2) | 3,875,000 |
| 3,499,959 |
|
Invitation Homes Trust, Series 2018-SFR3, Class B, VRN, 1.95%, (1-month LIBOR plus 1.15%), 7/17/37(2) | 6,600,000 |
| 5,984,073 |
|
Invitation Homes Trust, Series 2018-SFR4, Class B, VRN, 2.05%, (1-month LIBOR plus 1.25%), 1/17/38(2) | 10,900,000 |
| 9,840,121 |
|
MVW LLC, Series 2019-2A, Class A SEQ, 2.22%, 10/20/38(2) | 6,549,988 |
| 6,053,444 |
|
MVW Owner Trust, Series 2015-1A, Class A SEQ, 2.52%, 12/20/32(2) | 451,920 |
| 446,071 |
|
MVW Owner Trust, Series 2016-1A, Class A SEQ, 2.25%, 12/20/33(2) | 771,060 |
| 754,200 |
|
Progress Residential Trust, Series 2018-SFR3, Class A SEQ, 3.88%, 10/17/35(2) | 7,058,562 |
| 7,118,836 |
|
Progress Residential Trust, Series 2019-SFR2, Class A SEQ, 3.15%, 5/17/36(2) | 7,200,000 |
| 7,252,777 |
|
Progress Residential Trust, Series 2019-SFR4, Class A SEQ, 2.69%, 10/17/36(2) | 8,250,000 |
| 8,154,083 |
|
Progress Residential Trust, Series 2020-SFR1, Class B, 2.03%, 4/17/37(2) | 4,400,000 |
| 4,095,349 |
|
|
| | | | | | |
| | Principal Amount | Value |
Sierra Timeshare Conduit Receivables Funding LLC, Series 2017-1A, Class A SEQ, 2.91%, 3/20/34(2) | $ | 842,949 |
| $ | 832,692 |
|
Sierra Timeshare Receivables Funding LLC, Series 2015-3A, Class A SEQ, 2.58%, 9/20/32(2) | 928,649 |
| 921,892 |
|
Sierra Timeshare Receivables Funding LLC, Series 2016-2A, Class A SEQ, 2.33%, 7/20/33(2) | 633,104 |
| 625,738 |
|
Sierra Timeshare Receivables Funding LLC, Series 2018-3A, Class B, 3.87%, 9/20/35(2) | 1,754,800 |
| 1,761,095 |
|
Towd Point Mortgage Trust, Series 2017-3, Class M1, VRN, 3.50%, 7/25/57(2) | 3,800,000 |
| 3,426,442 |
|
Towd Point Mortgage Trust, Series 2018-1, Class A1 SEQ, VRN, 3.00%, 1/25/58(2) | 1,673,172 |
| 1,691,193 |
|
VSE VOI Mortgage LLC, Series 2016-A, Class A SEQ, 2.54%, 7/20/33(2) | 1,174,105 |
| 1,154,607 |
|
VSE VOI Mortgage LLC, Series 2017-A, Class A SEQ, 2.33%, 3/20/35(2) | 2,626,800 |
| 2,560,616 |
|
TOTAL ASSET-BACKED SECURITIES
(Cost $77,944,660) | | 74,325,571 |
|
| COLLATERALIZED MORTGAGE OBLIGATIONS — 2.2% | | |
| Private Sponsor Collateralized Mortgage Obligations — 1.6% | | |
| ABN Amro Mortgage Corp., Series 2003-6, Class 1A4, 5.50%, 5/25/33 | 36,087 |
| 36,865 |
|
| Bear Stearns Adjustable Rate Mortgage Trust, Series 2004-12, Class 2A1, VRN, 3.74%, 2/25/35 | 315,066 |
| 286,646 |
|
| Bear Stearns Adjustable Rate Mortgage Trust, Series 2004-8, Class 2A1, VRN, 3.95%, 11/25/34 | 581,953 |
| 519,181 |
|
| Bear Stearns Adjustable Rate Mortgage Trust, Series 2006-1, Class A1, VRN, 3.84%, (1-year H15T1Y plus 2.25%), 2/25/36 | 590,714 |
| 556,842 |
|
Bunker Hill Loan Depositary Trust, Series 2019-3, Class A1 SEQ, 2.72%, 11/25/59(2) | 4,879,567 |
| 4,751,488 |
|
| Citigroup Mortgage Loan Trust, Inc., Series 2004-UST1, Class A4, VRN, 3.74%, 8/25/34 | 188,135 |
| 166,800 |
|
| Citigroup Mortgage Loan Trust, Inc., Series 2005-4, Class A, VRN, 4.59%, 8/25/35 | 210,256 |
| 195,907 |
|
| Countrywide Home Loan Mortgage Pass-Through Trust, Series 2004-4, Class A19, 5.25%, 5/25/34 | 342,867 |
| 351,510 |
|
Credit Suisse Mortgage Trust, Series 2019-NQM1, Class A1, 2.66%, 10/25/59(2) | 4,054,681 |
| 3,937,155 |
|
| First Horizon Mortgage Pass-Through Trust, Series 2005-AR3, Class 4A1, VRN, 5.01%, 8/25/35 | 273,375 |
| 264,139 |
|
| First Horizon Mortgage Pass-Through Trust, Series 2006-AR4, Class 1A2, VRN, 3.99%, 1/25/37 | 334,038 |
| 260,596 |
|
| GSR Mortgage Loan Trust, Series 2005-6F, Class 1A5 SEQ, 5.25%, 7/25/35 | 395,291 |
| 397,830 |
|
| GSR Mortgage Loan Trust, Series 2005-AR6, Class 2A1, VRN, 4.10%, 9/25/35 | 248,068 |
| 234,845 |
|
| JPMorgan Mortgage Trust, Series 2005-A6, Class 7A1, VRN, 4.19%, 8/25/35 | 507,536 |
| 466,644 |
|
| JPMorgan Mortgage Trust, Series 2006-A3, Class 7A1, VRN, 4.02%, 4/25/35 | 263,206 |
| 250,937 |
|
| JPMorgan Mortgage Trust, Series 2006-A4, Class 3A1, VRN, 4.30%, 6/25/36 | 349,180 |
| 278,457 |
|
| JPMorgan Mortgage Trust, Series 2006-S1, Class 1A2 SEQ, 6.50%, 4/25/36 | 264,592 |
| 270,958 |
|
| Merrill Lynch Mortgage Investors Trust, Series 2005-A2, Class A1, VRN, 3.73%, 2/25/35 | 99,786 |
| 88,193 |
|
|
| | | | | | |
| | Principal Amount | Value |
New Residential Mortgage Loan Trust, Series 2017-5A, Class A1, VRN, 2.45%, (1-month LIBOR plus 1.50%), 6/25/57(2) | $ | 2,254,274 |
| $ | 2,159,822 |
|
Sequoia Mortgage Trust, Series 2014-3, Class A14, SEQ, VRN, 3.00%, 10/25/44(2) | 468,978 |
| 465,758 |
|
Sequoia Mortgage Trust, Series 2017-CH1, Class A1, VRN, 4.00%, 8/25/47(2) | 2,409,130 |
| 2,450,004 |
|
Sequoia Mortgage Trust, Series 2018-2, Class A4 SEQ, VRN, 3.50%, 2/25/48(2) | 2,596,111 |
| 2,614,527 |
|
| Structured Adjustable Rate Mortgage Loan Trust, Series 2004-8, Class 2A1, VRN, 3.78%, 7/25/34 | 713,681 |
| 663,601 |
|
| Thornburg Mortgage Securities Trust, Series 2004-3, Class A, VRN, 1.69%, (1-month LIBOR plus 0.74%), 9/25/34 | 402,130 |
| 344,303 |
|
| Thornburg Mortgage Securities Trust, Series 2006-4, Class A2B, VRN, 4.43%, 7/25/36 | 1,052,114 |
| 903,304 |
|
| Wells Fargo Mortgage-Backed Securities Trust, Series 2006-7, Class 3A1 SEQ, 6.00%, 6/25/36 | 167,971 |
| 160,103 |
|
| Wells Fargo Mortgage-Backed Securities Trust, Series 2006-AR1, Class 2A5 SEQ, VRN, 4.07%, 3/25/36 | 1,004,976 |
| 873,739 |
|
| Wells Fargo Mortgage-Backed Securities Trust, Series 2006-AR14, Class 2A1, VRN, 4.55%, 10/25/36 | 483,812 |
| 425,278 |
|
| Wells Fargo Mortgage-Backed Securities Trust, Series 2006-AR15, Class A1, VRN, 4.61%, 10/25/36 | 121,190 |
| 106,366 |
|
| Wells Fargo Mortgage-Backed Securities Trust, Series 2006-AR16, Class A1, VRN, 4.49%, 10/25/36 | 183,780 |
| 162,734 |
|
| Wells Fargo Mortgage-Backed Securities Trust, Series 2007-15, Class A1, 6.00%, 11/25/37 | 592,013 |
| 536,805 |
|
| Wells Fargo Mortgage-Backed Securities Trust, Series 2007-AR10, Class 1A1, VRN, 4.26%, 1/25/38 | 133,289 |
| 113,147 |
|
WinWater Mortgage Loan Trust, Series 2014-1, Class A4 SEQ, VRN, 3.50%, 6/20/44(2) | 11,099 |
| 11,145 |
|
| | | 25,305,629 |
|
| U.S. Government Agency Collateralized Mortgage Obligations — 0.6% | |
| FHLMC, Series 2014-DN1, Class M2, VRN, 3.15%, (1-month LIBOR plus 2.20%), 2/25/24 | 5,198,453 |
| 5,178,894 |
|
| FNMA, Series 2014-C02, Class 1M2, VRN, 3.55%, (1-month LIBOR plus 2.60%), 5/25/24 | 1,370,487 |
| 1,244,152 |
|
| FNMA, Series 2014-C02, Class 2M2, VRN, 3.55%, (1-month LIBOR plus 2.60%), 5/25/24 | 1,940,007 |
| 1,782,996 |
|
| FNMA, Series 2016-C03, Class 2M2, VRN, 6.85%, (1-month LIBOR plus 5.90%), 10/25/28 | 1,398,782 |
| 1,378,879 |
|
| | | 9,584,921 |
|
TOTAL COLLATERALIZED MORTGAGE OBLIGATIONS
(Cost $36,391,137) | | 34,890,550 |
|
| COLLATERALIZED LOAN OBLIGATIONS — 0.8% | | |
Bean Creek CLO Ltd., Series 2015-1A, Class BR, VRN, 3.27%, (3-month LIBOR plus 1.45%), 4/20/31(2) | 3,300,000 |
| 2,935,681 |
|
Goldentree Loan Management US CLO 3 Ltd., Series 2018-3A, Class B1, VRN, 3.37%, (3-month LIBOR plus 1.55%), 4/20/30(2) | 3,000,000 |
| 2,764,963 |
|
KKR CLO Ltd., Series 2022A, Class B, VRN, 3.42%, (3-month LIBOR plus 1.60%), 7/20/31(2) | 1,775,000 |
| 1,631,745 |
|
Magnetite VIII Ltd., Series 2014-8A, Class BR2, VRN, 3.33%, (3-month LIBOR plus 1.50%), 4/15/31(2) | 1,900,000 |
| 1,754,372 |
|
Sounds Point CLO IV-R Ltd., Series 2013-3RA, Class B, VRN, 3.57%, (3-month LIBOR plus 1.75%), 4/18/31(2) | 3,300,000 |
| 2,938,037 |
|
TOTAL COLLATERALIZED LOAN OBLIGATIONS
(Cost $13,262,881) | | 12,024,798 |
|
|
| | | | | | |
| | Principal Amount | Value |
| CORPORATE BONDS — 0.8% | | |
Auto Components† | | |
ZF North America Capital, Inc., 4.00%, 4/29/20(2) | $ | 644,000 |
| $ | 640,790 |
|
Commercial Services and Supplies† | | |
Nielsen Finance LLC / Nielsen Finance Co., 5.00%, 4/15/22(2) | 650,000 |
| 602,654 |
|
| Electric Utilities — 0.1% | | |
| IPALCO Enterprises, Inc., 3.45%, 7/15/20 | 700,000 |
| 699,946 |
|
| Health Care Providers and Services — 0.1% | | |
Fresenius Medical Care US Finance II, Inc., 4.125%, 10/15/20(2) | 1,580,000 |
| 1,569,922 |
|
| Household Durables — 0.2% | | |
| Lennar Corp., 2.95%, 11/29/20 | 2,350,000 |
| 2,311,695 |
|
| Metals and Mining — 0.1% | | |
| Steel Dynamics, Inc., 5.25%, 4/15/23 | 1,500,000 |
| 1,465,976 |
|
| Oil, Gas and Consumable Fuels — 0.2% | | |
| Ovintiv, Inc., 3.90%, 11/15/21 | 1,100,000 |
| 754,830 |
|
| Petroleos Mexicanos, 6.375%, 2/4/21 | 2,700,000 |
| 2,568,240 |
|
| | | 3,323,070 |
|
| Technology Hardware, Storage and Peripherals — 0.1% | | |
Dell International LLC / EMC Corp., 5.875%, 6/15/21(2) | 595,000 |
| 595,000 |
|
| EMC Corp., 2.65%, 6/1/20 | 585,000 |
| 583,859 |
|
| | | 1,178,859 |
|
TOTAL CORPORATE BONDS
(Cost $12,528,687) | | 11,792,912 |
|
| TEMPORARY CASH INVESTMENTS — 6.9% | | |
BNP Paribas SA, 0.03%, 4/1/20(2)(3) | 55,000,000 |
| 55,000,102 |
|
| State Street Institutional U.S. Government Money Market Fund, Premier Class | 53,425,575 |
| 53,425,575 |
|
TOTAL TEMPORARY CASH INVESTMENTS
(Cost $108,425,575) | | 108,425,677 |
|
TOTAL INVESTMENT SECURITIES — 99.8%
(Cost $1,564,297,799) | | 1,556,968,548 |
|
| OTHER ASSETS AND LIABILITIES — 0.2% | | 2,503,059 |
|
| TOTAL NET ASSETS — 100.0% | | $ | 1,559,471,607 |
|
|
| | | | | | | | | | | | | | | |
| CENTRALLY CLEARED CREDIT DEFAULT SWAP AGREEMENTS |
| Reference Entity | Type | Fixed Rate
Received
(Paid) Quarterly | Termination
Date | Notional
Amount | Premiums Paid (Received) | Unrealized
Appreciation
(Depreciation) | Value^ |
| Markit CDX North America High Yield Index Series 33 | Buy | (5.00)% | 12/20/24 | $ | 47,628,000 |
| $ | 4,301,680 |
| $ | (1,476,102 | ) | $ | 2,825,578 |
|
^The value for credit default swap agreements serves as an indicator of the current status of the payment/performance risk and represent the likelihood of an expected liability or profit at the period end. Increasing values in absolute terms when compared to the notional amount of the credit default swap agreement represent a deterioration of the referenced entity's credit soundness and an increased likelihood or risk of a credit event occurring as defined in the agreement.
|
| | | | | | | | | | | | | | | |
| CENTRALLY CLEARED TOTAL RETURN SWAP AGREEMENTS |
| Floating Rate Index | Pay/Receive Floating Rate Index at Termination | Fixed Rate | Termination
Date | Notional
Amount | Premiums Paid (Received) | Unrealized
Appreciation
(Depreciation) | Value |
| CPURNSA | Receive | 2.06% | 5/2/22 | $ | 22,000,000 |
| $ | 634 |
| $ | (1,100,567 | ) | $ | (1,099,933 | ) |
| CPURNSA | Receive | 2.07% | 5/3/22 | $ | 40,000,000 |
| 744 |
| (2,034,196 | ) | (2,033,452 | ) |
| CPURNSA | Receive | 2.02% | 5/4/22 | $ | 23,500,000 |
| 643 |
| (1,126,905 | ) | (1,126,262 | ) |
| CPURNSA | Receive | 1.93% | 9/5/22 | $ | 18,000,000 |
| (610 | ) | (717,494 | ) | (718,104 | ) |
| CPURNSA | Receive | 1.71% | 6/20/24 | $ | 30,000,000 |
| (624 | ) | (1,570,756 | ) | (1,571,380 | ) |
| CPURNSA | Receive | 1.86% | 7/30/24 | $ | 26,500,000 |
| (618 | ) | (1,633,260 | ) | (1,633,878 | ) |
| CPURNSA | Receive | 1.85% | 8/1/24 | $ | 43,000,000 |
| (735 | ) | (2,633,973 | ) | (2,634,708 | ) |
| CPURNSA | Receive | 1.86% | 8/1/24 | $ | 23,700,000 |
| (600 | ) | (1,458,512 | ) | (1,459,112 | ) |
| CPURNSA | Receive | 1.67% | 10/21/24 | $ | 45,000,000 |
| (787 | ) | (2,446,176 | ) | (2,446,963 | ) |
| CPURNSA | Receive | 1.70% | 11/26/24 | $ | 25,000,000 |
| (654 | ) | (1,335,816 | ) | (1,336,470 | ) |
| CPURNSA | Receive | 1.79% | 12/13/24 | $ | 16,000,000 |
| (591 | ) | (949,109 | ) | (949,700 | ) |
| | | | | | $ | (3,198 | ) | $ | (17,006,764 | ) | $ | (17,009,962 | ) |
|
| | | | | | | | | | |
| TOTAL RETURN SWAP AGREEMENTS |
| Counterparty | Floating Rate
Index | Pay/Receive
Floating Rate
Index at Termination | Fixed Rate | Termination
Date | Notional
Amount | Value* |
Bank of America N.A.(4) | CPURNSA | Receive | 1.41% | 8/27/20 | $ | 40,000,000 |
| $ | 378,011 |
|
Bank of America N.A.(4) | CPURNSA | Receive | 1.49% | 9/3/20 | $ | 9,700,000 |
| 45,090 |
|
| | | | | | | $ | 423,101 |
|
*Amount represents value and unrealized appreciation (depreciation).
|
| | |
| NOTES TO SCHEDULE OF INVESTMENTS |
| CDX | - | Credit Derivatives Indexes |
| CPURNSA | - | U.S. Consumer Price Index Urban Consumers Not Seasonally Adjusted Index |
| FHLMC | - | Federal Home Loan Mortgage Corporation |
| FNMA | - | Federal National Mortgage Association |
| H15T1Y | - | Constant Maturity U.S. Treasury Note Yield Curve Rate Index |
| LIBOR | - | London Interbank Offered Rate |
| SEQ | - | Sequential Payer |
| VRN | - | Variable Rate Note. The rate adjusts periodically based upon the terms set forth in the security’s offering documents. The rate shown is effective at the period end and the reference rate and spread, if any, is indicated. The security's effective maturity date may be shorter than the final maturity date shown. |
| |
| † | Category is less than 0.05% of total net assets. |
| |
| (1) | Security, or a portion thereof, has been pledged at the custodian bank or with a broker for collateral requirements on swap agreements. At the period end, the aggregate value of securities pledged was $14,955,301. |
| |
| (2) | Security was purchased pursuant to Rule 144A or Section 4(2) under the Securities Act of 1933 and may be sold in transactions exempt from registration, normally to qualified institutional investors. The aggregate value of these securities at the period end was $161,148,736, which represented 10.3% of total net assets. |
| |
| (3) | The rate indicated is the yield to maturity at purchase. |
| |
| (4) | Collateral has been received at the custodian for collateral requirements on swap agreements. At the period end, the aggregate value of securities received was $539,366. |
See Notes to Financial Statements.
|
|
| Statement of Assets and Liabilities |
|
| | | |
| MARCH 31, 2020 | |
| Assets | |
| Investment securities, at value (cost of $1,564,297,799) | $ | 1,556,968,548 |
|
| Cash | 683,841 |
|
| Receivable for investments sold | 7,087 |
|
| Receivable for capital shares sold | 1,337,747 |
|
| Receivable for variation margin on swap agreements | 747,093 |
|
| Swap agreements, at value | 423,101 |
|
| Interest receivable | 1,363,746 |
|
| | 1,561,531,163 |
|
| | |
| Liabilities | |
| Payable for capital shares redeemed | 1,077,501 |
|
| Payable for variation margin on swap agreements | 438,131 |
|
| Accrued management fees | 523,773 |
|
| Distribution and service fees payable | 20,151 |
|
| | 2,059,556 |
|
| | |
| Net Assets | $ | 1,559,471,607 |
|
| | |
| Net Assets Consist of: | |
| Capital paid in | $ | 1,604,003,938 |
|
| Distributable earnings | (44,532,331 | ) |
| | $ | 1,559,471,607 |
|
|
| | | | | | |
| | Net Assets | Shares Outstanding | Net Asset Value Per Share |
| Investor Class |
| $572,935,302 |
| 57,254,363 |
| $10.01 |
| I Class |
| $150,405,118 |
| 14,910,720 |
| $10.09 |
| Y Class |
| $10,493,558 |
| 1,039,827 |
| $10.09 |
| A Class |
| $29,950,694 |
| 3,023,457 |
| $9.91* |
| C Class |
| $6,571,372 |
| 685,248 |
| $9.59 |
| R Class |
| $18,098,508 |
| 1,790,644 |
| $10.11 |
| R5 Class |
| $417,563,756 |
| 41,395,979 |
| $10.09 |
| R6 Class |
| $10,261,122 |
| 1,017,266 |
| $10.09 |
| G Class |
| $343,192,177 |
| 33,965,920 |
| $10.10 |
*Maximum offering price $10.14 (net asset value divided by 0.9775).
See Notes to Financial Statements.
|
| | | |
| YEAR ENDED MARCH 31, 2020 | |
| Investment Income (Loss) | |
| Income: | |
| Interest | $ | 45,684,083 |
|
| | |
| Expenses: | |
| Management fees | 7,448,165 |
|
| Distribution and service fees: | |
| A Class | 77,305 |
|
| C Class | 110,703 |
|
| R Class | 89,405 |
|
| Trustees' fees and expenses | 126,357 |
|
| Other expenses | 33,221 |
|
| | 7,885,156 |
|
| Fees waived - G Class | (1,238,392 | ) |
| | 6,646,764 |
|
| | |
| Net investment income (loss) | 39,037,319 |
|
| | |
| Realized and Unrealized Gain (Loss) | |
| Net realized gain (loss) on: | |
| Investment transactions | (6,971,800 | ) |
| Futures contract transactions | 4,594,153 |
|
| Swap agreement transactions | (1,650,053 | ) |
| | (4,027,700 | ) |
| | |
| Change in net unrealized appreciation (depreciation) on: | |
| Investments | (5,837,494 | ) |
| Futures contracts | (359,597 | ) |
| Swap agreements | (17,140,473 | ) |
| | (23,337,564 | ) |
| | |
| Net realized and unrealized gain (loss) | (27,365,264 | ) |
| | |
| Net Increase (Decrease) in Net Assets Resulting from Operations | $ | 11,672,055 |
|
See Notes to Financial Statements.
|
|
| Statement of Changes in Net Assets |
|
| | | | | | |
| YEARS ENDED MARCH 31, 2020 AND MARCH 31, 2019 |
| Increase (Decrease) in Net Assets | March 31, 2020 | March 31, 2019 |
| Operations | | |
| Net investment income (loss) | $ | 39,037,319 |
| $ | 27,605,904 |
|
| Net realized gain (loss) | (4,027,700 | ) | (6,631,695 | ) |
| Change in net unrealized appreciation (depreciation) | (23,337,564 | ) | 9,336,785 |
|
| Net increase (decrease) in net assets resulting from operations | 11,672,055 |
| 30,310,994 |
|
| | | |
| Distributions to Shareholders | | |
| From earnings: | | |
| Investor Class | (10,573,869 | ) | (13,529,034 | ) |
| I Class | (2,992,390 | ) | (4,638,038 | ) |
| Y Class | (186,806 | ) | (57,097 | ) |
| A Class | (470,488 | ) | (494,557 | ) |
| C Class | (57,446 | ) | (254,024 | ) |
| R Class | (219,768 | ) | (254,623 | ) |
| R5 Class | (8,289,266 | ) | (9,029,513 | ) |
| R6 Class | (199,320 | ) | (251,819 | ) |
| G Class | (9,016,637 | ) | (11,509,794 | ) |
| Decrease in net assets from distributions | (32,005,990 | ) | (40,018,499 | ) |
| | | |
| Capital Share Transactions | | |
| Net increase (decrease) in net assets from capital share transactions (Note 5) | (14,146,501 | ) | (54,072,974 | ) |
| | | |
| Net increase (decrease) in net assets | (34,480,436 | ) | (63,780,479 | ) |
| | | |
| Net Assets | | |
| Beginning of period | 1,593,952,043 |
| 1,657,732,522 |
|
| End of period | $ | 1,559,471,607 |
| $ | 1,593,952,043 |
|
See Notes to Financial Statements.
|
|
| Notes to Financial Statements |
MARCH 31, 2020
1. Organization
American Century Investment Trust (the trust) is registered under the Investment Company Act of 1940, as amended (the 1940 Act), as an open-end management investment company and is organized as a Massachusetts business trust. Short Duration Inflation Protection Bond Fund (the fund) is one fund in a series issued by the trust. The fund’s investment objective is to pursue total return using a strategy that seeks to protect against U.S. inflation.
The fund offers the Investor Class, I Class, Y Class, A Class, C Class, R Class, R5 Class, R6 Class and G Class. The A Class may incur an initial sales charge. The A Class and C Class may be subject to a contingent deferred sales charge.
2. Significant Accounting Policies
The following is a summary of significant accounting policies consistently followed by the fund in preparation of its financial statements. The fund is an investment company and follows accounting and reporting guidance in accordance with accounting principles generally accepted in the United States of America. This may require management to make certain estimates and assumptions at the date of the financial statements. Actual results could differ from these estimates. Management evaluated the impact of events or transactions occurring through the date the financial statements were issued that would merit recognition or disclosure.
Investment Valuations — The fund determines the fair value of its investments and computes its net asset value per share at the close of regular trading (usually 4 p.m. Eastern time) on the New York Stock Exchange (NYSE) on each day the NYSE is open. The Board of Trustees has adopted valuation policies and procedures to guide the investment advisor in the fund’s investment valuation process and to provide methodologies for the oversight of the fund’s pricing function.
Fixed income securities are valued at the evaluated mean as provided by independent pricing services or at the mean of the most recent bid and asked prices as provided by investment dealers. Corporate bonds, U.S. Treasury and Government Agency securities, convertible bonds, bank loan obligations, municipal securities, and sovereign governments and agencies are valued using market models that consider trade data, quotations from dealers and active market makers, relevant yield curve and spread data, creditworthiness, trade data or market information on comparable securities, and other relevant security specific information. Mortgage-related and asset-backed securities are valued based on models that consider trade data, prepayment and default projections, benchmark yield and spread data and estimated cash flows of each tranche of the issuer. Collateralized loan obligations are valued based on discounted cash flow models that consider trade and economic data, prepayment assumptions and default projections. Commercial paper is valued using a curve-based approach that considers money market rates for specific instruments, programs, currencies and maturity points from a variety of active market makers.
Open-end management investment companies are valued at the reported net asset value per share. Exchange-traded futures contracts are valued at the settlement price as provided by the appropriate exchange. Swap agreements are valued at an evaluated mean as provided by independent pricing services or independent brokers.
If the fund determines that the market price for an investment is not readily available or the valuation methods mentioned above do not reflect an investment’s fair value, such investment is valued as determined in good faith by the Board of Trustees or its delegate, in accordance with policies and procedures adopted by the Board of Trustees. In its determination of fair value, the fund may review several factors including, but not limited to, market information regarding the specific investment or comparable investments and correlation with other investment types, futures indices or general market indicators. Circumstances that may cause the fund to use these procedures to value an investment include, but are not limited to: an investment has been declared in default or is distressed; trading in a security has been suspended during the trading day or a security is not actively trading on its principal exchange; prices received from a regular pricing source are deemed unreliable; or there is a foreign market holiday and no trading occurred.
The fund monitors for significant events occurring after the close of an investment’s primary exchange but before the fund’s net asset value per share is determined. Significant events may include, but are not limited to: corporate announcements and transactions; governmental action and political unrest that could impact a specific investment or an investment sector; or armed conflicts, natural disasters and similar events that could affect investments in a specific country or region.
Security Transactions — Security transactions are accounted for as of the trade date. Net realized gains and losses are determined on the identified cost basis, which is also used for federal income tax purposes.
Investment Income — Interest income is recorded on the accrual basis and includes paydown gain (loss) and accretion of discounts and amortization of premiums. Inflation adjustments related to inflation-linked debt securities are reflected as interest income.
Segregated Assets — In accordance with the 1940 Act, the fund segregates assets on its books and records to cover certain types of investment securities and other financial instruments. American Century Investment Management, Inc. (ACIM) (the investment advisor) monitors, on a daily basis, the securities segregated to ensure the fund designates a sufficient amount of liquid assets, marked-to-market daily. The fund may also receive assets or be required to pledge assets at the custodian bank or with a broker for collateral requirements.
Income Tax Status — It is the fund’s policy to distribute substantially all net investment income and net realized gains to shareholders and to otherwise qualify as a regulated investment company under provisions of the Internal Revenue Code. Accordingly, no provision has been made for income taxes. The fund files U.S. federal, state, local and non-U.S. tax returns as applicable. The fund's tax returns are subject to examination by the relevant taxing authority until expiration of the applicable statute of limitations, which is generally three years from the date of filing but can be longer in certain jurisdictions. At this time, management believes there are no uncertain tax positions which, based on their technical merit, would not be sustained upon examination and for which it is reasonably possible that the total amounts of unrecognized tax benefits will significantly change in the next twelve months.
Multiple Class — All shares of the fund represent an equal pro rata interest in the net assets of the class to which such shares belong, and have identical voting, dividend, liquidation and other rights and the same terms and conditions, except for class specific expenses and exclusive rights to vote on matters affecting only individual classes. Income, non-class specific expenses, and realized and unrealized capital gains and losses of the fund are allocated to each class of shares based on their relative net assets.
Distributions to Shareholders — Distributions from net investment income, if any, are generally declared and paid quarterly, but may be paid less frequently. Distributions from net realized gains, if any, are generally declared and paid annually.
Indemnifications — Under the trust’s organizational documents, its officers and trustees are indemnified against certain liabilities arising out of the performance of their duties to the fund. In addition, in the normal course of business, the fund enters into contracts that provide general indemnifications. The maximum exposure under these arrangements is unknown as this would involve future claims that may be made against a fund. The risk of material loss from such claims is considered by management to be remote.
3. Fees and Transactions with Related Parties
Certain officers and trustees of the trust are also officers and/or directors of American Century Companies, Inc. (ACC). The trust's investment advisor, ACIM, the trust's distributor, American Century Investment Services, Inc. (ACIS), and the trust's transfer agent, American Century Services, LLC, are wholly owned, directly or indirectly, by ACC. Various funds issued by American Century Asset Allocation Portfolios, Inc. own, in aggregate, 30% of the shares of the fund. Related parties do not invest in the fund for the purpose of exercising management or control.
Management Fees — The trust has entered into a management agreement with ACIM, under which ACIM provides the fund with investment advisory and management services in exchange for a single, unified management fee (the fee) per class. The agreement provides that all expenses of managing and operating the fund, except distribution and service fees, brokerage expenses, taxes, interest, fees and expenses of the independent trustees (including legal counsel fees), and extraordinary expenses, will be paid by ACIM. The fee is computed and accrued daily based on each class's daily net assets and paid monthly in arrears. The difference in the fee among the classes is a result of their separate arrangements for non-Rule 12b-1 shareholder services. It is not the result of any difference in advisory or custodial fees or other expenses related to the management of the fund’s assets, which do not vary by class. The fee consists of (1) an Investment Category Fee based on the daily net assets of the fund and certain other accounts managed by the investment advisor that are in the same broad investment category as the fund and (2) a Complex Fee based on the assets of all the funds in the American Century Investments family of funds. The investment advisor agreed to waive the G Class’s management fee in its entirety. The investment advisor expects this waiver to remain in effect permanently and cannot terminate it without the approval of the Board of Trustees.
The Investment Category Fee range, the Complex Fee range and the effective annual management fee for each class for the period ended March 31, 2020 are as follows:
|
| | | |
| | Investment Category Fee Range | Complex Fee Range | Effective Annual Management Fee |
| Investor Class | 0.2625%
to 0.3800% | 0.2500% to 0.3100% | 0.56% |
| I Class | 0.1500% to 0.2100% | 0.46% |
| Y Class | 0.0500% to 0.1100% | 0.36% |
| A Class | 0.2500% to 0.3100% | 0.56% |
| C Class | 0.2500% to 0.3100% | 0.56% |
| R Class | 0.2500% to 0.3100% | 0.56% |
| R5 Class | 0.0500% to 0.1100% | 0.36% |
| R6 Class | 0.0000% to 0.0600% | 0.31% |
| G Class | 0.0000% to 0.0600% | 0.00%(1) |
| |
| (1) | Effective annual management fee before waiver was 0.31%. |
Distribution and Service Fees — The Board of Trustees has adopted a separate Master Distribution and Individual Shareholder Services Plan for each of the A Class, C Class and R Class (collectively the plans), pursuant to Rule 12b-1 of the 1940 Act. The plans provide that the A Class will pay ACIS an annual distribution and service fee of 0.25%. The plans provide that the C Class will pay ACIS an annual distribution and service fee of 1.00%, of which 0.25% is paid for individual shareholder services and 0.75% is paid for distribution services. The plans provide that the R Class will pay ACIS an annual distribution and service fee of 0.50%. The fees are computed and accrued daily based on each class’s daily net assets and paid monthly in arrears. The fees are used to pay financial intermediaries for distribution and individual shareholder services. Fees incurred under the plans during the period ended March 31, 2020 are detailed in the Statement of Operations.
Trustees’ Fees and Expenses — The Board of Trustees is responsible for overseeing the investment advisor’s management and operations of the fund. The trustees receive detailed information about the fund and its investment advisor regularly throughout the year, and meet at least quarterly with management of the investment advisor to review reports about fund operations. The fund’s officers do not receive compensation from the fund.
Interfund Transactions — The fund may enter into security transactions with other American Century Investments funds and other client accounts of the investment advisor, in accordance with the 1940 Act rules and procedures adopted by the Board of Trustees. The rules and procedures require, among other things, that these transactions be effected at the independent current market price of the security. There were no interfund transactions during the period.
4. Investment Transactions
Purchases of investment securities, excluding short-term investments, for the period ended March 31, 2020 totaled $820,926,286, of which $760,821,480 represented U.S. Treasury and Government Agency obligations.
Sales of investment securities, excluding short-term investments, for the period ended March 31, 2020 totaled $937,195,839, of which $801,935,676 represented U.S. Treasury and Government Agency obligations.
5. Capital Share Transactions
Transactions in shares of the fund were as follows (unlimited number of shares authorized):
|
| | | | | | | | | | |
| | Year ended
March 31, 2020 | Year ended
March 31, 2019 |
| | Shares | Amount | Shares | Amount |
| Investor Class | | | | |
| Sold | 27,732,599 |
| $ | 285,287,737 |
| 8,376,795 |
| $ | 84,668,535 |
|
| Issued in reinvestment of distributions | 1,035,523 |
| 10,562,334 |
| 1,357,528 |
| 13,511,281 |
|
| Redeemed | (26,905,481 | ) | (273,841,011 | ) | (15,667,583 | ) | (157,715,291 | ) |
| | 1,862,641 |
| 22,009,060 |
| (5,933,260 | ) | (59,535,475 | ) |
| I Class | | | | |
| Sold | 15,433,169 |
| 159,501,955 |
| 9,647,354 |
| 98,304,633 |
|
| Issued in reinvestment of distributions | 265,593 |
| 2,730,300 |
| 413,802 |
| 4,148,760 |
|
| Redeemed | (19,082,674 | ) | (197,349,981 | ) | (7,196,182 | ) | (72,676,457 | ) |
| | (3,383,912 | ) | (35,117,726 | ) | 2,864,974 |
| 29,776,936 |
|
| Y Class | | | | |
| Sold | 861,559 |
| 8,877,032 |
| 453,529 |
| 4,616,406 |
|
| Issued in reinvestment of distributions | 18,172 |
| 186,806 |
| 5,723 |
| 57,097 |
|
| Redeemed | (278,655 | ) | (2,888,711 | ) | (35,594 | ) | (360,515 | ) |
| | 601,076 |
| 6,175,127 |
| 423,658 |
| 4,312,988 |
|
| A Class | | | | |
| Sold | 1,908,713 |
| 19,349,546 |
| 1,264,895 |
| 12,630,614 |
|
| Issued in reinvestment of distributions | 26,375 |
| 266,383 |
| 40,163 |
| 395,548 |
|
| Redeemed | (1,408,952 | ) | (14,232,206 | ) | (1,200,787 | ) | (11,999,092 | ) |
| | 526,136 |
| 5,383,723 |
| 104,271 |
| 1,027,070 |
|
| C Class | | | | |
| Sold | 45,858 |
| 447,289 |
| 402,028 |
| 3,900,149 |
|
| Issued in reinvestment of distributions | 4,966 |
| 48,663 |
| 23,837 |
| 227,216 |
|
| Redeemed | (1,199,787 | ) | (11,769,350 | ) | (911,500 | ) | (8,833,024 | ) |
| | (1,148,963 | ) | (11,273,398 | ) | (485,635 | ) | (4,705,659 | ) |
| R Class | | | | |
| Sold | 1,082,156 |
| 11,188,462 |
| 657,828 |
| 6,731,539 |
|
| Issued in reinvestment of distributions | 20,699 |
| 213,616 |
| 20,738 |
| 208,358 |
|
| Redeemed | (806,527 | ) | (8,313,777 | ) | (463,304 | ) | (4,725,025 | ) |
| | 296,328 |
| 3,088,301 |
| 215,262 |
| 2,214,872 |
|
| R5 Class | | | | |
| Sold | 9,930,616 |
| 102,935,457 |
| 8,934,549 |
| 91,219,008 |
|
| Issued in reinvestment of distributions | 792,451 |
| 8,146,392 |
| 880,366 |
| 8,820,400 |
|
| Redeemed | (6,307,923 | ) | (63,999,450 | ) | (6,032,967 | ) | (61,029,129 | ) |
| | 4,415,144 |
| 47,082,399 |
| 3,781,948 |
| 39,010,279 |
|
| R6 Class | | | | |
| Sold | 585,004 |
| 6,030,686 |
| 552,330 |
| 5,622,664 |
|
| Issued in reinvestment of distributions | 16,191 |
| 166,280 |
| 22,160 |
| 221,974 |
|
| Redeemed | (459,563 | ) | (4,739,293 | ) | (507,609 | ) | (5,154,511 | ) |
| | 141,632 |
| 1,457,673 |
| 66,881 |
| 690,127 |
|
| G Class | | | | |
| Sold | 2,361,950 |
| 24,597,172 |
| 2,770,629 |
| 28,154,792 |
|
| Issued in reinvestment of distributions | 877,105 |
| 9,016,637 |
| 1,145,461 |
| 11,509,794 |
|
| Redeemed | (8,448,721 | ) | (86,565,469 | ) | (10,462,037 | ) | (106,528,698 | ) |
| | (5,209,666 | ) | (52,951,660 | ) | (6,545,947 | ) | (66,864,112 | ) |
| Net increase (decrease) | (1,899,584 | ) | $ | (14,146,501 | ) | (5,507,848 | ) | $ | (54,072,974 | ) |
6. Fair Value Measurements
The fund’s investments valuation process is based on several considerations and may use multiple inputs to determine the fair value of the investments held by the fund. In conformity with accounting principles generally accepted in the United States of America, the inputs used to determine a valuation are classified into three broad levels.
| |
| • | Level 1 valuation inputs consist of unadjusted quoted prices in an active market for identical investments. |
| |
| • | Level 2 valuation inputs consist of direct or indirect observable market data (including quoted prices for comparable investments, evaluations of subsequent market events, interest rates, prepayment speeds, credit risk, etc.). These inputs also consist of quoted prices for identical investments initially expressed in local currencies that are adjusted through translation into U.S. dollars. |
| |
| • | Level 3 valuation inputs consist of unobservable data (including a fund’s own assumptions). |
The level classification is based on the lowest level input that is significant to the fair valuation measurement. The valuation inputs are not necessarily an indication of the risks associated with investing in these securities or other financial instruments.
The following is a summary of the level classifications as of period end. The Schedule of Investments provides additional information on the fund’s portfolio holdings.
|
| | | | | | | | |
| | Level 1 | Level 2 | Level 3 |
| Assets | | | |
| Investment Securities | | | |
| U.S. Treasury Securities | — |
| $ | 1,315,509,040 |
| — |
|
| Asset-Backed Securities | — |
| 74,325,571 |
| — |
|
| Collateralized Mortgage Obligations | — |
| 34,890,550 |
| — |
|
| Collateralized Loan Obligations | — |
| 12,024,798 |
| — |
|
| Corporate Bonds | — |
| 11,792,912 |
| — |
|
| Temporary Cash Investments | $ | 53,425,575 |
| 55,000,102 |
| — |
|
| | $ | 53,425,575 |
| $ | 1,503,542,973 |
| — |
|
| Other Financial Instruments | | | |
| Swap Agreements | — |
| $ | 3,248,679 |
| — |
|
| | | | |
| Liabilities | | | |
| Other Financial Instruments | | | |
| Swap Agreements | — |
| $ | 17,009,962 |
| — |
|
7. Derivative Instruments
Credit Risk — The fund is subject to credit risk in the normal course of pursuing its investment objectives. The value of a bond generally declines as the credit quality of its issuer declines. Credit default swap agreements enable a fund to buy/sell protection against a credit event of a specific issuer or index. A fund may attempt to enhance returns by selling protection or attempt to mitigate credit risk by buying protection. The buyer/seller of credit protection against a security or basket of securities may pay/receive an up-front or periodic payment to compensate for/against potential default events. Changes in value, including the periodic amounts of interest to be paid or received on swap agreements, are recorded as unrealized appreciation (depreciation) on swap agreements. Upon entering into a centrally cleared swap, a fund is required to deposit cash or securities (initial margin) with a financial intermediary in an amount equal to a certain percentage of the notional amount. Subsequent payments (variation margin) are made or received daily, in cash, by a fund. The variation margin is equal to the daily change in the value and is a component of unrealized gains and losses. Realized gain or loss is recorded upon receipt or payment of a periodic settlement or termination of swap agreements. Net realized and unrealized gains or losses occurring during the holding period of swap agreements are a component of net realized gain (loss) on swap agreement transactions and change in net unrealized appreciation (depreciation) on swap agreements, respectively. The risks of entering into swap agreements include the possible lack of liquidity, failure of the counterparty to meet its obligations, and that there may be unfavorable changes in the underlying investments or instruments. The fund's average notional amount held during the period was $73,771,333.
Interest Rate Risk — The fund is subject to interest rate risk in the normal course of pursuing its investment objectives. The value of bonds generally declines as interest rates rise. A fund may enter into futures contracts based on a bond index or a specific underlying security. A fund may purchase futures contracts to gain exposure to increases in market value or sell futures contracts to protect against a decline in market value. Upon entering into a futures contract, a fund will segregate cash, cash equivalents or other appropriate liquid securities on its records in amounts sufficient to meet requirements. Subsequent payments (variation margin) are made or received daily, in cash, by a fund. The variation margin is equal to the daily change in the contract value and is recorded as unrealized gains and losses. A fund recognizes a realized gain or loss when the futures contract is closed or expires. Net realized and unrealized gains or losses occurring during the holding period of futures contracts are a component of net realized gain (loss) on futures contract transactions and change in net unrealized appreciation (depreciation) on futures contracts, respectively. One of the risks of entering into futures contracts is the possibility that the change in value of the contract may not correlate with the changes in value of the underlying securities. The fund's average notional exposure to interest rate risk derivative instruments held during the period was $283,036,364 futures contracts purchased.
Other Contracts — A fund may enter into total return swap agreements in order to attempt to obtain or preserve a particular return or spread at a lower cost than obtaining a return or spread through purchases and/or sales of instruments in other markets or gain exposure to certain markets in the most economical way possible. A fund will segregate cash, cash equivalents or other appropriate liquid securities on its records in amounts sufficient to meet requirements. Changes in value, including the periodic amounts of interest to be paid or received on swap agreements, are recorded as unrealized appreciation (depreciation) on swap agreements. Upon entering into a centrally cleared swap, a fund is required to deposit cash or securities (initial margin) with a financial intermediary in an amount equal to a certain percentage of the notional amount. Subsequent payments (variation margin) are made or received daily, in cash, by a fund. The variation margin is equal to the daily change in the value and is a component of unrealized gains and losses. Realized gain or loss is recorded upon receipt or payment of a periodic settlement or termination of swap agreements. Net realized and unrealized gains or losses occurring during the holding period of swap agreements are a component of net realized gain (loss) on swap agreement transactions and change in net unrealized appreciation (depreciation) on swap agreements, respectively. The risks of entering into swap agreements include the possible lack of liquidity, failure of the counterparty to meet its obligations, and that there may be unfavorable changes in the underlying investments or instruments, including inflationary risk. The fund's average notional amount held during the period was $335,350,000.
Value of Derivative Instruments as of March 31, 2020
|
| | | | | | | | |
| | Asset Derivatives | Liability Derivatives |
| Type of Risk Exposure | Location on Statement of Assets and Liabilities | Value | Location on Statement of Assets and Liabilities | Value |
| Credit Risk | Receivable for variation margin on swap agreements* | $ | 747,093 |
| Payable for variation margin on swap agreements* | — |
|
| Other Contracts | Receivable for variation margin on swap agreements* | — |
| Payable for variation margin on swap agreements* | $ | 438,131 |
|
| Other Contracts | Swap agreements | 423,101 |
| Swap agreements | — |
|
| | | $ | 1,170,194 |
| | $ | 438,131 |
|
*Included in the unrealized appreciation (depreciation) on centrally cleared swap agreements, as reported in the Schedule of Investments.
Effect of Derivative Instruments on the Statement of Operations for the Year Ended March 31, 2020
|
| | | | | | | | |
| | Net Realized Gain (Loss) | Change in Net Unrealized Appreciation (Depreciation) |
| Type of Risk Exposure | Location on Statement of Operations | Value | Location on Statement of Operations | Value |
| Credit Risk | Net realized gain (loss) on swap agreement transactions | $ | (876,907 | ) | Change in net unrealized appreciation (depreciation) on swap agreements | $ | (1,476,102 | ) |
| Interest Rate Risk | Net realized gain (loss) on futures contract transactions | 4,594,153 |
| Change in net unrealized appreciation (depreciation) on futures contracts | (359,597 | ) |
| Other Contracts | Net realized gain (loss) on swap agreement transactions | (773,146 | ) | Change in net unrealized appreciation (depreciation) on swap agreements | (15,664,371 | ) |
| | | $ | 2,944,100 |
| | $ | (17,500,070 | ) |
8. Risk Factors
The value of the fund’s shares will go up and down, sometimes rapidly or unpredictably, based on the performance of the securities owned by the fund and other factors generally affecting the securities market. Market risks, including political, regulatory, economic and social developments, can affect the value of the fund’s investments. Natural disasters, public health emergencies, terrorism and other unforeseeable events may lead to increased market volatility and may have adverse long-term effects on world economies and markets generally.
The fund may invest in instruments that have variable or floating coupon rates based on the London Interbank Offered Rate (LIBOR). LIBOR is a benchmark interest rate intended to be representative of the rate at which certain major international banks lend to one another over short-terms. LIBOR will be phased out by the end of 2021. Uncertainty remains regarding a replacement rate or rates for LIBOR. The transition process may lead to increased volatility or illiquidity in markets for instruments that rely on LIBOR. This could result in a change to the value of such instruments.
9. Federal Tax Information
The tax character of distributions paid during the years ended March 31, 2020 and March 31, 2019 were as follows:
|
| | | | | | |
| | 2020 | 2019 |
| Distributions Paid From | | |
| Ordinary income | $ | 32,005,990 |
| $ | 40,018,499 |
|
| Long-term capital gains | — |
| — |
|
The book-basis character of distributions made during the year from net investment income or net realized gains may differ from their ultimate characterization for federal income tax purposes. These differences reflect the differing character of certain income items and net realized gains and losses for financial statement and tax purposes, and may result in reclassification among certain capital accounts on the financial statements.
As of period end, the federal tax cost of investments and the components of distributable earnings on a tax-basis were as follows:
|
| | | |
| Federal tax cost of investments | $ | 1,564,297,799 |
|
| Gross tax appreciation of investments | $ | 6,541,995 |
|
| Gross tax depreciation of investments | (13,871,246 | ) |
| Net tax appreciation (depreciation) of investments | (7,329,251 | ) |
| Net tax appreciation (depreciation) on derivatives | (17,981,532 | ) |
| Net tax appreciation (depreciation) | $ | (25,310,783 | ) |
| Undistributed ordinary income | $ | 6,214,905 |
|
Accumulated short-term capital losses
| $ | (3,989,820 | ) |
| Accumulated long-term capital losses | $ | (21,446,633 | ) |
The difference between book-basis and tax-basis unrealized appreciation (depreciation) is attributable primarily to the realization for tax purposes of unsettled interest on swap agreements.
Accumulated capital losses represent net capital loss carryovers that may be used to offset future realized capital gains for federal income tax purposes. The capital loss carryovers may be carried forward for an unlimited period. Future capital loss carryover utilization in any given year may be subject to Internal Revenue Code limitations.
10. Recently Issued Accounting Standards
In March 2017, the Financial Accounting Standards Board (FASB) issued Accounting Standards Update No. 2017-08, “Receivables - Nonrefundable Fees and Other Costs (Subtopic 310-20), Premium Amortization on Purchased Callable Debt Securities” (ASU 2017-08). ASU 2017-08 amends the amortization period for certain purchased callable debt securities held at a premium, shortening such period to the earliest call date. The amendments are effective for fiscal years, and interim periods within those fiscal years, beginning after December 15, 2018. The adoption of ASU 2017-08 did not materially impact the financial statements.
|
| | | | | | | | | | | | | |
| For a Share Outstanding Throughout the Years Ended March 31 (except as noted) | | | | |
| Per-Share Data | | | | | | Ratios and Supplemental Data | | |
| | | Income From Investment Operations: | | Ratio to Average Net Assets of: | | |
| | Net Asset
Value,
Beginning
of Period | Net
Investment
Income
(Loss)(1) | Net Realized
and Unrealized
Gain (Loss) | Total From
Investment
Operations | Distributions From Net
Investment
Income | Net Asset
Value,
End
of Period | Total
Return(2) | Operating
Expenses | Net
Investment
Income
(Loss) | Portfolio
Turnover
Rate | Net Assets, End of Period
(in thousands) |
| Investor Class | | | | | | | | | | |
| 2020 | $10.11 | 0.21 | (0.14) | 0.07 | (0.17) | $10.01 | 0.69% | 0.57% | 2.13% | 50% |
| $572,935 |
|
| 2019 | $10.16 | 0.15 | 0.03 | 0.18 | (0.23) | $10.11 | 1.79% | 0.57% | 1.49% | 31% |
| $559,790 |
|
| 2018 | $10.31 | 0.16 | (0.16) | — | (0.15) | $10.16 | 0.05% | 0.57% | 1.52% | 31% |
| $622,940 |
|
| 2017 | $10.14 | 0.17 | 0.04 | 0.21 | (0.04) | $10.31 | 2.11% | 0.57% | 1.69% | 48% |
| $578,775 |
|
| 2016 | $10.06 | 0.05 | 0.03 | 0.08 | — | $10.14 | 0.80% | 0.57% | 0.61% | 36% |
| $507,940 |
|
| I Class | | | | | | | | | | |
| 2020 | $10.19 | 0.23 | (0.15) | 0.08 | (0.18) | $10.09 | 0.79% | 0.47% | 2.23% | 50% |
| $150,405 |
|
| 2019 | $10.24 | 0.15 | 0.04 | 0.19 | (0.24) | $10.19 | 1.87% | 0.47% | 1.59% | 31% |
| $186,378 |
|
2018(3) | $10.38 | 0.15 | (0.13) | 0.02 | (0.16) | $10.24 | 0.22% | 0.47%(4) | 1.51%(4) | 31%(5) |
| $157,963 |
|
| Y Class | | | | | | | | | | |
| 2020 | $10.19 | 0.22 | (0.13) | 0.09 | (0.19) | $10.09 | 0.89% | 0.37% | 2.33% | 50% |
| $10,494 |
|
| 2019 | $10.24 | 0.15 | 0.05 | 0.20 | (0.25) | $10.19 | 1.98% | 0.37% | 1.69% | 31% |
| $4,471 |
|
2018(3) | $10.38 | 0.18 | (0.15) | 0.03 | (0.17) | $10.24 | 0.29% | 0.37%(4) | 1.76%(4) | 31%(5) |
| $155 |
|
|
| | | | | | | | | | | | | |
| For a Share Outstanding Throughout the Years Ended March 31 (except as noted) | | | | |
| Per-Share Data | | | | | | Ratios and Supplemental Data | | |
| | | Income From Investment Operations: | | Ratio to Average Net Assets of: | | |
| | Net Asset
Value,
Beginning
of Period | Net
Investment
Income
(Loss)(1) | Net Realized
and Unrealized
Gain (Loss) | Total From
Investment
Operations | Distributions From Net
Investment
Income | Net Asset
Value,
End
of Period | Total
Return(2) | Operating
Expenses | Net
Investment
Income
(Loss) | Portfolio
Turnover
Rate | Net Assets, End of Period
(in thousands) |
| A Class | | | | | | | | | | |
| 2020 | $10.01 | 0.18 | (0.13) | 0.05 | (0.15) | $9.91 | 0.44% | 0.82% | 1.88% | 50% |
| $29,951 |
|
| 2019 | $10.06 | 0.11 | 0.04 | 0.15 | (0.20) | $10.01 | 1.55% | 0.82% | 1.24% | 31% |
| $24,988 |
|
| 2018 | $10.21 | 0.13 | (0.15) | (0.02) | (0.13) | $10.06 | (0.21)% | 0.82% | 1.27% | 31% |
| $24,073 |
|
| 2017 | $10.04 | 0.15 | 0.04 | 0.19 | (0.02) | $10.21 | 1.87% | 0.82% | 1.44% | 48% |
| $46,885 |
|
| 2016 | $9.98 | 0.10 | (0.04) | 0.06 | — | $10.04 | 0.60% | 0.82% | 0.36% | 36% |
| $53,748 |
|
| C Class | | | | | | | | | | |
| 2020 | $9.69 | 0.17 | (0.20) | (0.03) | (0.07) | $9.59 | (0.33)% | 1.57% | 1.13% | 50% |
| $6,571 |
|
| 2019 | $9.74 | 0.05 | 0.03 | 0.08 | (0.13) | $9.69 | 0.80% | 1.57% | 0.49% | 31% |
| $17,769 |
|
| 2018 | $9.89 | 0.05 | (0.15) | (0.10) | (0.05) | $9.74 | (0.99)% | 1.57% | 0.52% | 31% |
| $22,600 |
|
| 2017 | $9.78 | 0.07 | 0.04 | 0.11 | — | $9.89 | 1.12% | 1.57% | 0.69% | 48% |
| $27,511 |
|
| 2016 | $9.80 | (0.02) | — | (0.02) | — | $9.78 | (0.20)% | 1.57% | (0.39)% | 36% |
| $31,482 |
|
| R Class | | | | | | | | | | |
| 2020 | $10.21 | 0.16 | (0.14) | 0.02 | (0.12) | $10.11 | 0.18% | 1.07% | 1.63% | 50% |
| $18,099 |
|
| 2019 | $10.26 | 0.08 | 0.05 | 0.13 | (0.18) | $10.21 | 1.26% | 1.07% | 0.99% | 31% |
| $15,253 |
|
| 2018 | $10.41 | 0.11 | (0.16) | (0.05) | (0.10) | $10.26 | (0.45)% | 1.07% | 1.02% | 31% |
| $13,120 |
|
| 2017 | $10.25 | 0.13 | 0.03 | 0.16 | — | $10.41 | 1.56% | 1.07% | 1.19% | 48% |
| $12,039 |
|
| 2016 | $10.21 | —(6) | 0.04 | 0.04 | — | $10.25 | 0.39% | 1.07% | 0.11% | 36% |
| $13,658 |
|
|
| | | | | | | | | | | | | |
| For a Share Outstanding Throughout the Years Ended March 31 (except as noted) | | | | |
| Per-Share Data | | | | | | Ratios and Supplemental Data | | |
| | | Income From Investment Operations: | | Ratio to Average Net Assets of: | | |
| | Net Asset
Value,
Beginning
of Period | Net
Investment
Income
(Loss)(1) | Net Realized
and Unrealized
Gain (Loss) | Total From
Investment
Operations | Distributions From Net
Investment
Income | Net Asset
Value,
End
of Period | Total
Return(2) | Operating
Expenses | Net
Investment
Income
(Loss) | Portfolio
Turnover
Rate | Net Assets, End of Period
(in thousands) |
| R5 Class | | | | | | | | | | |
| 2020 | $10.19 | 0.24 | (0.15) | 0.09 | (0.19) | $10.09 | 0.89% | 0.37% | 2.33% | 50% |
| $417,564 |
|
| 2019 | $10.24 | 0.16 | 0.04 | 0.20 | (0.25) | $10.19 | 1.98% | 0.37% | 1.69% | 31% |
| $376,691 |
|
| 2018 | $10.39 | 0.18 | (0.16) | 0.02 | (0.17) | $10.24 | 0.25% | 0.37% | 1.72% | 31% |
| $339,844 |
|
| 2017 | $10.22 | 0.19 | 0.04 | 0.23 | (0.06) | $10.39 | 2.30% | 0.37% | 1.89% | 48% |
| $664,148 |
|
| 2016 | $10.11 | 0.08 | 0.03 | 0.11 | —(6) | $10.22 | 1.10% | 0.37% | 0.81% | 36% |
| $575,649 |
|
| R6 Class | | | | | | | | | | |
| 2020 | $10.19 | 0.25 | (0.15) | 0.10 | (0.20) | $10.09 | 0.94% | 0.32% | 2.38% | 50% |
| $10,261 |
|
| 2019 | $10.24 | 0.16 | 0.04 | 0.20 | (0.25) | $10.19 | 2.03% | 0.32% | 1.74% | 31% |
| $8,920 |
|
| 2018 | $10.38 | 0.18 | (0.14) | 0.04 | (0.18) | $10.24 | 0.29% | 0.32% | 1.77% | 31% |
| $8,280 |
|
| 2017 | $10.22 | 0.20 | 0.03 | 0.23 | (0.07) | $10.38 | 2.35% | 0.32% | 1.94% | 48% |
| $199,340 |
|
| 2016 | $10.11 | 0.06 | 0.06 | 0.12 | (0.01) | $10.22 | 1.15% | 0.32% | 0.86% | 36% |
| $166,472 |
|
| G Class | | | | | | | | | | |
| 2020 | $10.20 | 0.29 | (0.16) | 0.13 | (0.23) | $10.10 | 1.25% | 0.01%(7) | 2.69%(7) | 50% |
| $343,192 |
|
| 2019 | $10.25 | 0.22 | 0.01 | 0.23 | (0.28) | $10.20 | 2.34% | 0.01%(8) | 2.05%(8) | 31% |
| $399,692 |
|
2018(9) | $10.31 | 0.14 | (0.07) | 0.07 | (0.13) | $10.25 | 0.66% | 0.01%(4)(10) | 2.02%(4)(10) | 31%(5) |
| $468,758 |
|
|
| | | | |
| Notes to Financial Highlights | | |
| |
| (1) | Computed using average shares outstanding throughout the period. |
| |
| (2) | Total returns are calculated based on the net asset value of the last business day and do not reflect applicable sales charges, if any. Total returns for periods less than one year are not annualized. |
| |
| (3) | April 10, 2017 (commencement of sale) through March 31, 2018. |
| |
| (5) | Portfolio turnover is calculated at the fund level. Percentage indicated was calculated for the year ended March 31, 2018. |
| |
| (6) | Per-share amount was less than $0.005. |
| |
| (7) | The ratio of operating expenses to average net assets before expense waiver and the ratio of net investment income (loss) to average net assets before expense waiver was 0.32% and 2.38%, respectively. |
| |
| (8) | The ratio of operating expenses to average net assets before expense waiver and the ratio of net investment income (loss) to average net assets before expense waiver was 0.32% and 1.74%, respectively. |
| |
| (9) | July 28, 2017 (commencement of sale) through March 31, 2018. |
| |
| (10) | The annualized ratio of operating expenses to average net assets before expense waiver and the annualized ratio of net investment income (loss) to average net assets before expense waiver was 0.32% and 1.71%, respectively. |
See Notes to Financial Statements.
|
|
| Report of Independent Registered Public Accounting Firm |
To the Board of Trustees of American Century Investment Trust and Shareholders of Short Duration Inflation Protection Bond Fund
Opinion on the Financial Statements
We have audited the accompanying statement of assets and liabilities, including the schedule of investments, of Short Duration Inflation Protection Bond Fund (one of the funds constituting American Century Investment Trust, referred to hereafter as the “Fund”) as of March 31, 2020, the related statement of operations for the year ended March 31, 2020, the statement of changes in net assets for each of the two years in the period ended March 31, 2020, including the related notes, and the financial highlights for each of the periods indicated therein (collectively referred to as the “financial statements”). In our opinion, the financial statements present fairly, in all material respects, the financial position of the Fund as of March 31, 2020, the results of its operations for the year then ended, the changes in its net assets for each of the two years in the period ended March 31, 2020 and the financial highlights for each of the periods indicated therein in conformity with accounting principles generally accepted in the United States of America.
Basis for Opinion
These financial statements are the responsibility of the Fund’s management. Our responsibility is to express an opinion on the Fund’s financial statements based on our audits. We are a public accounting firm registered with the Public Company Accounting Oversight Board (United States) (PCAOB) and are required to be independent with respect to the Fund in accordance with the U.S. federal securities laws and the applicable rules and regulations of the Securities and Exchange Commission and the PCAOB.
We conducted our audits of these financial statements in accordance with the standards of the PCAOB. Those standards require that we plan and perform the audit to obtain reasonable assurance about whether the financial statements are free of material misstatement, whether due to error or fraud.
Our audits included performing procedures to assess the risks of material misstatement of the financial statements, whether due to error or fraud, and performing procedures that respond to those risks. Such procedures included examining, on a test basis, evidence regarding the amounts and disclosures in the financial statements. Our audits also included evaluating the accounting principles used and significant estimates made by management, as well as evaluating the overall presentation of the financial statements. Our procedures included confirmation of securities owned as of March 31, 2020 by correspondence with the custodian and brokers. We believe that our audits provide a reasonable basis for our opinion.
/s/ PricewaterhouseCoopers LLP
Kansas City, Missouri
May 18, 2020
We have served as the auditor of one or more investment companies in American Century Investments since 1997.
Board of Trustees
The individuals listed below serve as trustees of the funds. Each trustee will continue to serve in this capacity until death, retirement, resignation or removal from office. The board has adopted a mandatory retirement age for trustees who are not “interested persons,” as that term is defined in the Investment Company Act (independent trustees). Independent trustees shall retire on December 31 of the year in which they reach their 75th birthday; provided, however, that on or after January 1, 2022, independent trustees shall retire on December 31 of the year in which they reach their 76th birthday.
Mr. Thomas is an “interested person” because he currently serves as President and Chief Executive Officer of American Century Companies, Inc. (ACC), the parent company of American Century Investment Management, Inc. (ACIM or the advisor). The other trustees (more than three-fourths of the total number) are independent. They are not employees, directors or officers of, and have no financial interest in, ACC or any of its wholly owned, direct or indirect, subsidiaries, including ACIM, American Century Investment Services, Inc. (ACIS) and American Century Services, LLC (ACS), and they do not have any other affiliations, positions or relationships that would cause them to be considered “interested persons” under the Investment Company Act. The trustees serve in this capacity for eight (in the case of Jonathan S. Thomas, 16; and Ronald J. Gilson, 9) registered investment companies in the American Century Investments family of funds.
The following table presents additional information about the trustees. The mailing address for each trustee other than Mr. Thomas is 1665 Charleston Road, Mountain View, California 94043. The mailing address for Mr. Thomas is 4500 Main Street, Kansas City, Missouri 64111.
|
| | | | | |
Name
(Year of Birth) | Position(s) Held with Funds | Length of Time Served | Principal Occupation(s) During Past 5 Years | Number of American Century Portfolios Overseen by Trustee | Other Directorships Held During Past 5 Years |
| Independent Trustees |
|
|
Tanya S. Beder
(1955) | Trustee | Since 2011 | Chairman and CEO, SBCC Group Inc. (independent advisory services) (2006 to present) | 40 | CYS Investments, Inc.; Kirby Corporation; Nabors Industries Ltd. |
Jeremy I. Bulow
(1954) | Trustee | Since 2011 | Professor of Economics, Stanford University, Graduate School of Business (1979 to present) | 40 | None |
Anne Casscells
(1958) | Trustee | Since 2016 | Co-Chief Executive Officer and Chief Investment Officer, Aetos Alternatives Management (investment advisory firm) (2001 to present); Lecturer in Accounting, Stanford University, Graduate School of Business (2009 to 2017) | 40 | None |
Ronald J. Gilson
(1946) | Trustee and Chairman of the Board | Since 1995
(Chairman since 2005) | Charles J. Meyers Professor of Law and Business, Emeritus, Stanford Law School (1979 to 2016); Marc and Eva Stern Professor of Law and Business, Columbia University School of Law (1992 to present) | 57 | None |
|
| | | | | |
Name
(Year of Birth) | Position(s) Held with Funds | Length of Time Served | Principal Occupation(s) During Past 5 Years | Number of American Century Portfolios Overseen by Trustee | Other Directorships Held During Past 5 Years |
| Independent Trustees |
|
|
Frederick L. A. Grauer
(1946) | Trustee | Since 2008 | Senior Advisor, Credit Sesame, Inc. (credit monitoring firm) (2018 to present); Senior Advisor, Course Hero (an educational technology company) (2015 to present) | 40 | None |
Jonathan D. Levin
(1972) | Trustee | Since 2016 | Philip H. Knight Professor and Dean, Graduate School of Business, Stanford University (2016 to present); Professor, Stanford University, (2000 to present) | 40 | None |
Peter F. Pervere
(1947) | Trustee | Since 2007 | Retired | 40 | None |
John B. Shoven
(1947) | Trustee | Since 2002 | Charles R. Schwab Professor of Economics, Stanford University (1973 to present, emeritus since 2019) | 40 | Cadence Design Systems; Exponent; Financial Engines |
| Interested Trustee |
|
|
Jonathan S. Thomas
(1963) | Trustee | Since 2007 | President and Chief Executive Officer, ACC (2007 to present). Also serves as Chief Executive Officer, ACS; Executive Vice President, ACIM; Director, ACC, ACIM and other ACC subsidiaries | 120 | None |
The Statement of Additional Information has additional information about the fund's trustees and is available without charge, upon request, by calling 1-800-345-2021.
Officers
The following table presents certain information about the executive officers of the funds. Each officer serves as an officer for 16 (in the case of Robert J. Leach, 15) investment companies in the American Century family of funds, unless otherwise noted. No officer is compensated for his or her service as an officer of the funds. The listed officers are interested persons of the funds and are appointed or re-appointed on an annual basis. The mailing address for each of the officers listed below is 4500 Main Street, Kansas City, Missouri 64111.
|
| | |
Name
(Year of Birth) | Offices with the Funds | Principal Occupation(s) During the Past Five Years |
Patrick Bannigan
(1965)
| President since 2019 | Executive Vice President and Director, ACC (2012 to present); Chief Financial Officer, Chief Accounting Officer and Treasurer, ACC (2015 to present); Chief Operating Officer, ACC (2012-2015). Also serves as President, ACS; Vice President, ACIM; Chief Financial Officer, Chief Accounting Officer and/or Director, ACIM, ACS and other ACC subsidiaries |
R. Wes Campbell
(1974)
| Chief Financial Officer and Treasurer since 2018 | Vice President, ACS (2020 to present); Investment Operations and Investment Accounting, ACS (2000 to present) |
Amy D. Shelton
(1964) | Chief Compliance Officer and Vice President since 2014 | Chief Compliance Officer, American Century funds, (2014 to present); Chief Compliance Officer, ACIM (2014 to present); Chief Compliance Officer, ACIS (2009 to present). Also serves as Vice President, ACIS |
Charles A. Etherington
(1957) | General Counsel since 2007 and Senior Vice President since 2006 | Attorney, ACC (1994 to present); Vice President, ACC (2005 to present); General Counsel, ACC (2007 to present). Also serves as General Counsel, ACIM, ACS, ACIS and other ACC subsidiaries; and Senior Vice President, ACIM and ACS |
C. Jean Wade
(1964) | Vice President since 2012 | Senior Vice President, ACS (2017 to present); Vice President ACS (2000 to 2017)
|
Robert J. Leach
(1966) | Vice President since 2006 | Vice President, ACS (2000 to present) |
David H. Reinmiller
(1963) | Vice President since 2000 | Attorney, ACC (1994 to present). Also serves as Vice President, ACIM and ACS |
Ward D. Stauffer
(1960) | Secretary since 2005 | Attorney, ACC (2003 to present) |
|
|
| Liquidity Risk Management Program |
The Fund has adopted a liquidity risk management program (the “program”). The Fund’s Board of Trustees (the "Board") has designated American Century Investment Management, Inc. (“ACIM”) as the administrator of the program. Personnel of ACIM or its affiliates conduct the day-to-day operation of the program pursuant to policies and procedures administered by those members of the ACIM’s Investment Oversight Committee who are members of the ACIM’s Investment Management and Global Analytics departments.
Under the program, ACIM manages the Fund’s liquidity risk, which is the risk that the Fund could not meet shareholder redemption requests without significant dilution of remaining shareholders’ interests in the Fund. This risk is managed by monitoring the degree of liquidity of the Fund’s investments, limiting the amount of the Fund’s illiquid investments, and utilizing various risk management tools and facilities available to the Fund for meeting shareholder redemptions, among other means. ACIM’s process of determining the degree of liquidity of the Fund’s investments is supported by one or more third-party liquidity assessment vendors.
The Board reviewed a report prepared by ACIM regarding the operation and effectiveness of the program for the period December 1, 2018 through December 31, 2019. No significant liquidity events impacting the Fund were noted in the report. In addition, ACIM provided its assessment that the program had been effective in managing the Fund’s liquidity risk.
Retirement Account Information
As required by law, distributions you receive from certain retirement accounts are subject to federal income tax withholding, unless you elect not to have withholding apply*. Tax will be withheld on the total amount withdrawn even though you may be receiving amounts that are not subject to withholding, such as nondeductible contributions. In such case, excess amounts of withholding could occur. You may adjust your withholding election so that a greater or lesser amount will be withheld.
If you don’t want us to withhold on this amount, you must notify us to not withhold the federal income tax. You may notify us in writing or in certain situations by telephone or through other electronic means. For systematic withdrawals, your withholding election will remain in effect until revoked or changed by filing a new election. You have the right to revoke your election at any time and change your withholding percentage for future distributions.
Remember, even if you elect not to have income tax withheld, you are liable for paying income tax on the taxable portion of your withdrawal. If you elect not to have income tax withheld or you don’t have enough income tax withheld, you may be responsible for payment of estimated tax. You may incur penalties under the estimated tax rules if your withholding and estimated tax payments are not sufficient. You can reduce or defer the income tax on a distribution by directly or indirectly rolling such distribution over to another IRA or eligible plan. You should consult your tax advisor for additional information.
State tax will be withheld if, at the time of your distribution, your address is within one of the mandatory withholding states and you have federal income tax withheld (or as otherwise required by state law). State taxes will be withheld from your distribution in accordance with the respective state rules.
*Some 403(b), 457 and qualified retirement plan distributions may be subject to 20% mandatory withholding, as they are subject to special tax and withholding rules. Your plan administrator or plan sponsor is required to provide you with a special tax notice explaining those rules at the time you request a distribution. If applicable, federal and/or state taxes may be withheld from your distribution amount.
Proxy Voting Policies
Descriptions of the principles and policies that the fund's investment advisor uses in exercising the voting rights associated with the securities purchased and/or held by the fund are available without charge, upon request, by calling 1-800-345-2021 or visiting American Century Investments’ website at americancentury.com/proxy. A description of the policies is also available on the Securities and Exchange Commission’s website at sec.gov. Information regarding how the investment advisor voted proxies relating to portfolio securities during the most recent 12-month period ended June 30 is available on americancentury.com/proxy. It is also available at sec.gov.
Quarterly Portfolio Disclosure
The fund files its complete schedule of portfolio holdings with the Securities and Exchange Commission (SEC) for the first and third quarters of each fiscal year as an exhibit to its reports on Form N-PORT. The fund’s Form N-PORT reports are available on the SEC’s website at sec.gov. The fund also makes its complete schedule of portfolio holdings for the most recent quarter of its fiscal year available on its website at americancentury.com and, upon request, by calling 1-800-345-2021.
|
| | |
| |
| | | |
| Contact Us | americancentury.com | |
| Automated Information Line | 1-800-345-8765 | |
| Investor Services Representative | 1-800-345-2021 or 816-531-5575 | |
| Investors Using Advisors | 1-800-378-9878 | |
| Business, Not-For-Profit, Employer-Sponsored Retirement Plans | 1-800-345-3533 | |
| Banks and Trust Companies, Broker-Dealers, Financial Professionals, Insurance Companies | 1-800-345-6488 | |
| Telecommunications Relay Service for the Deaf | 711 | |
| | | |
| American Century Investment Trust | |
| | | |
Investment Advisor: American Century Investment Management, Inc. Kansas City, Missouri | |
| | | |
| This report and the statements it contains are submitted for the general information of our shareholders. The report is not authorized for distribution to prospective investors unless preceded or accompanied by an effective prospectus. | |
| | | |
©2020 American Century Proprietary Holdings, Inc. All rights reserved.
CL-ANN-92282 2005 | |
|
| |
| | |
| | Annual Report |
| | |
| | March 31, 2020 |
| | |
| | Short Duration Strategic Income Fund |
| | Investor Class (ASDVX) |
| | I Class (ASDHX) |
| | Y Class (ASYDX) |
| | A Class (ASADX) |
| | C Class (ASCDX) |
| | R Class (ASDRX) |
| | R5 Class (ASDJX) |
| | R6 Class (ASXDX) |
Beginning on January 1, 2021, as permitted by regulations adopted by the Securities and Exchange Commission, paper copies of the fund’s shareholder reports like this one will no longer be sent by mail, unless you specifically request paper copies of the reports from the fund or from your financial intermediary, such as a broker-dealer or bank. Instead, the reports will be made available on a website, and you will be notified by mail each time a report is posted and provided with a website link to access the report.
If you already elected to receive shareholder reports electronically, you will not be affected by this change and you need not take any action. You may elect to receive shareholder reports and other communications from the fund or your financial intermediary electronically by calling or sending an email request to your appropriate contacts as listed on the back cover of this report.
You may elect to receive all future reports in paper free of charge. You can inform the fund or your financial intermediary that you wish to continue receiving paper copies of your shareholder reports by calling or sending an email request to your appropriate contacts as listed on the back cover of this report. Your election to receive reports in paper will apply to all funds held with the fund complex/your financial intermediary.
|
| |
| President’s Letter | |
| Performance | |
| Portfolio Commentary | |
| Fund Characteristics | |
| Shareholder Fee Example | |
| Schedule of Investments | |
| Statement of Assets and Liabilities | |
| Statement of Operations | |
| Statement of Changes in Net Assets | |
| Notes to Financial Statements | |
| Financial Highlights | |
| Report of Independent Registered Public Accounting Firm | |
| Management | |
| Liquidity Risk Management Program | |
| Additional Information | |
Any opinions expressed in this report reflect those of the author as of the date of the report, and do not necessarily represent the opinions of American Century Investments® or any other person in the American Century Investments organization. Any such opinions are subject to change at any time based upon market or other conditions and American Century Investments disclaims any responsibility to update such opinions. These opinions may not be relied upon as investment advice and, because investment decisions made by American Century Investments funds are based on numerous factors, may not be relied upon as an indication of trading intent on behalf of any American Century Investments fund. Security examples are used for representational purposes only and are not intended as recommendations to purchase or sell securities. Performance information for comparative indices and securities is provided to American Century Investments by third party vendors. To the best of American Century Investments’ knowledge, such information is accurate at the time of printing.
Jonathan Thomas
Dear Investor:
Thank you for reviewing this annual report for the period ended March 31, 2020. Annual reports help convey important information about fund returns, including market factors that affected performance during the reporting period. For additional insights, please visit americancentury.com.
Virus Outbreak Abruptly Altered Economic, Market Backdrops
Through most of the period, market sentiment was upbeat, partly due to accommodative Federal Reserve (Fed) policy and modest inflation. Improving economic and corporate earnings data and a phase 1 U.S.-China trade deal also helped boost growth outlooks. Against this backdrop, key U.S. stock benchmarks rose to record highs by mid-February, and U.S. bonds continued to advance.
However, beginning in late February, unprecedented social and economic turmoil emerged and reversed the positive trajectory. The COVID-19 epidemic originating in China rapidly spread throughout the world, forcing stay-at-home orders and industry-wide shutdowns. U.S. stocks, corporate bonds and other riskier assets sold off sharply, while U.S. Treasuries rallied in the global flight to quality. The Fed stepped in quickly and aggressively, slashing interest rates to near 0% and enacting massive lending and asset-purchase programs to stabilize the financial system.
The swift and severe sell-off erased the strong stock market gains realized earlier in the period and left key benchmarks with losses for the 12 months. Reflecting their defensive characteristics, high-quality U.S. bonds withstood the turmoil and delivered solid returns for the 12-month period.
Promoting Health and Safety Remains Our Focus
While the market impact of COVID-19 has been severe, reducing the human toll is most important. We are monitoring the situation closely and following guidelines and protocols from all relevant authorities. Our firm has activated a comprehensive Pandemic Response Plan, which includes social distancing and work-from-home mandates, travel restrictions and escalated cleaning regimens at all our facilities. We’ve also launched a Business Continuity Plan to maintain regular business operations and ensure delivery of outstanding service.
We appreciate your confidence in us during these extraordinary times. We have a long history of helping clients weather volatile markets, and we are confident we will meet today’s challenges. In the meantime, the health and safety of you, your family and our employees remain a top priority.
Sincerely,
Jonathan Thomas
President and Chief Executive Officer
American Century Investments
|
| | | | | |
| Total Returns as of March 31, 2020 |
| | | | Average Annual Returns | |
| | Ticker Symbol | 1 year | 5 years | Since Inception | Inception Date |
| Investor Class | ASDVX | -0.65% | 1.63% | 1.40% | 7/28/14 |
| Bloomberg Barclays U.S. 1-3 Year Government/Credit Bond Index | — | 4.53% | 1.89% | 1.82% | — |
| I Class | ASDHX | -0.44% | — | 1.23% | 4/10/17 |
| Y Class | ASYDX | -0.45% | — | 1.32% | 4/10/17 |
| A Class | ASADX | | | | 7/28/14 |
| No sales charge | | -0.90% | 1.37% | 1.15% | |
| With sales charge | | -3.14% | 0.92% | 0.75% | |
| C Class | ASCDX | -1.63% | 0.62% | 0.40% | 7/28/14 |
| R Class | ASDRX | -1.14% | 1.12% | 0.90% | 7/28/14 |
| R5 Class | ASDJX | -0.33% | 1.85% | 1.63% | 7/28/14 |
| R6 Class | ASXDX | -0.39% | 1.88% | 1.66% | 7/28/14 |
Fund returns would have been lower if a portion of the fees had not been waived.
Sales charges include initial sales charges and contingent deferred sales charges (CDSCs), as applicable. A Class shares have a 2.25% maximum initial sales charge and may be subject to a maximum CDSC of 1.00%. C Class shares redeemed within 12 months of purchase are subject to a maximum CDSC of 1.00%. The SEC requires that mutual funds provide performance information net of maximum sales charges in all cases where charges could be applied.
Data presented reflect past performance. Past performance is no guarantee of future results. Current performance may be higher or lower than the performance shown. Total returns for periods less than one year are not annualized. Investment return and principal value will fluctuate, and redemption value may be more or less than original cost. Data assumes reinvestment of dividends and capital gains, and none of the charts reflect the deduction of taxes that a shareholder would pay on fund distributions or the redemption of fund shares. To obtain performance data current to the most recent month end, please call 1-800-345-2021 or visit americancentury.com. For additional information about the fund, please consult the prospectus.
|
|
| Growth of $10,000 Over Life of Class |
| $10,000 investment made July 28, 2014 |
Performance for other share classes will vary due to differences in fee structure.
|
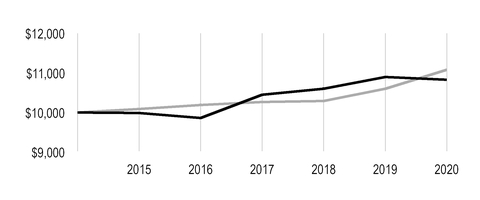
|
| |
| Value on March 31, 2020 |
| | Investor Class — $10,824 |
| |
| | Bloomberg Barclays U.S. 1-3 Year Government/Credit Bond Index — $11,079 |
| |
Ending value of Investor Class would have been lower if a portion of the fees had not been waived.
|
| | | | | | | |
| Total Annual Fund Operating Expenses |
| Investor Class | I Class | Y Class | A Class | C Class | R Class | R5 Class | R6 Class |
| 0.61% | 0.51% | 0.41% | 0.86% | 1.61% | 1.11% | 0.41% | 0.36% |
The total annual fund operating expenses shown is as stated in the fund’s prospectus current as of the date of this report. The prospectus may vary from the expense ratio shown elsewhere in this report because it is based on a different time period, includes acquired fund fees and expenses, and, if applicable, does not include fee waivers or expense reimbursements.
Data presented reflect past performance. Past performance is no guarantee of future results. Current performance may be higher or lower than the performance shown. Total returns for periods less than one year are not annualized. Investment return and principal value will fluctuate, and redemption value may be more or less than original cost. Data assumes reinvestment of dividends and capital gains, and none of the charts reflect the deduction of taxes that a shareholder would pay on fund distributions or the redemption of fund shares. To obtain performance data current to the most recent month end, please call 1-800-345-2021 or visit americancentury.com. For additional information about the fund, please consult the prospectus.
Portfolio Managers: Jason Greenblath, Jeff Houston, Bob Gahagan, Brian Howell and Charles Tan
Effective May 2019, Kevin Akioka left the portfolio management team, and Charles Tan joined the team. In June 2019, Margé Karner left the portfolio management team, and Jason Greenblath joined the team.
Performance Summary
Short Duration Strategic Income returned -0.65%* for the 12 months ended March 31, 2020. By comparison, the investment-grade Bloomberg Barclays U.S. 1-3 Year Government/Credit Bond Index gained 4.53% for the same period. Fund returns reflect operating expenses, while index returns do not. The fund’s results largely reflect the negative performance of out-of-index high-yield corporate and emerging markets bonds during the unprecedented sell-off of risk assets late in the reporting period.
The reporting period began on an upbeat note for bond investors. The Federal Reserve’s (Fed’s) early 2019 pivot toward dovish policy set the stage for rate cuts in July, September and October. This action, along with modest economic and corporate earnings growth and low inflation, generally supported solid gains for most U.S. and non-U.S. bond sectors. By year-end 2019, global economic data improved, the U.S. and China signed a phase 1 trade deal and the Fed suggested it would hold rates steady through 2020.
Conditions deteriorated rapidly within the first quarter of 2020. As the COVID-19 epidemic originating in China expanded into a pandemic, nervous fixed-income investors scrambled to shed credit risk and seek shelter in cash. Market volatility soared and liquidity markedly worsened. In response, the Fed slashed short-term rates to near 0% and launched a series of initiatives to stabilize the financial markets. Separately, Congress passed a $2 trillion fiscal relief package. Reflecting market sentiment, U.S. Treasury yields declined sharply, hitting record lows in March before recovering slightly by month-end.
Amid a global flight to quality, riskier investments, including investment-grade and high-yield corporate bonds, securitized bonds and emerging markets securities, suffered significant losses. The Fed’s rescue programs helped stabilize the credit-sensitive sectors of the fixed-income universe, but not before they experienced sharp losses. Against this backdrop, overweight positions in spread assets and an underweight in Treasury securities relative to the index and out-of-index positions in high-yield and emerging markets debt accounted for much of the portfolio’s underperformance.
High-Yield Bonds Were Main Detractors
Our out-of-index position in high-yield corporate bonds, which comprised approximately 13% of the portfolio on March 31, 2020, was the main detractor from performance. These securities generally delivered strong results through the first 10 months of the reporting period, as favorable corporate fundamentals and risk-on sentiment supported gains. But that positive performance unwound quickly and severely beginning in mid-February 2020, as the mounting coronavirus outbreak shut down normal business activity across the economic spectrum and pressured earnings outlooks. The resulting sell-off of risk assets hurt returns in the corporate credit markets. Additionally, an
unexpected price war between Saudi Arabia and Russia amid waning demand for oil triggered a
*All fund returns referenced in this commentary are for Investor Class shares. Fund returns would have been lower if a portion of the fees had not been waived. Performance for other share classes will vary due to differences in fee structure; when Investor Class performance exceeds that of the index, other share classes may not. See page 3 for returns for all share classes.
sizable drop in the oil markets. This development accelerated the havoc in the high-yield sector, home to many energy companies.
Our investment-grade corporate bonds also suffered in the late-period sell-off, but for the 12 months overall, they were modest contributors to performance. Through most of the reporting period, positive economic and corporate fundamentals generally supported solid gains among investment-grade corporates.
Given the extraordinary events of early 2020, we tilted toward a more defensive stance, eliminating investment-grade and high-yield corporate bonds that didn’t align with that posture. We sold securities that were either richly valued or unlikely to withstand an extended economic downturn, including gaming and lodging credits. We also extended duration beginning in summer 2019. We continued extending duration in early 2020. These moves contributed to results as rates declined.
Emerging Markets Bonds Weighed on Results
Our out-of-index position in U.S. dollar-denominated emerging markets corporate and sovereign securities also detracted from performance. For much of the period, emerging markets bonds rallied amid falling U.S. Treasury yields, a dovish Fed and the U.S.-China trade deal. However, with investors shunning risk late in the period, emerging markets bonds declined and were modest detractors overall. Falling oil and commodity prices and a weakened growth outlook for China weighed on emerging markets debt prices.
Securitized Sector Detracted Slightly
We maintained a sizable position in securitized bonds, which also struggled in the early 2020 sell-off. However, for the 12-month period overall, securitized bonds detracted only slightly, as strong performance from our holdings in 2019 largely offset negative results in early 2020. We favored out-of-index credit-sensitive securities, including non-agency collateralized mortgage obligations, non-agency commercial mortgage-backed securities, asset-backed securities and collateralized loan obligations, which generally rallied in the risk-on climate of 2019. The severe dislocations among credit-sensitive mortgage sectors late in the reporting period prompted us to reduce exposure to these securities. We believe rising unemployment and the broad economic shutdown created by the pandemic will create challenges for certain segments of the mortgage market.
Portfolio Positioning
The economic downturn during the first quarter of 2020 was swift and severe, but we do not expect an equally swift, or V-shaped, recovery. The consumer is the main driver of the U.S. economy, and we believe the effects of the COVID-19 pandemic will weigh on consumer sentiment—and job and economic growth—for several months. Ultimately, this crisis requires a medical solution.
Heightened volatility often creates market disruptions that lead to attractive buying opportunities. Although we identified such opportunities late in the reporting period, we’re remaining cautious. We expect continued near-term pressure on credit spreads from growing defaults and rapid downgrades. Accordingly, we’re focusing on higher-quality corporate and securitized securities and positioning our portfolio to weather a U-shaped recovery. Within the high-yield sector, we’re finding value among more recession-proof, BB-rated issuers in the media (cable providers) and containers and packaging industries. We continue to look for opportunities to enhance portfolio yield and returns, while being mindful of the economic headwinds.
Likewise, as a matter of course, we continue to review our portfolio holdings, selling those that do not align with our outlook in the current environment. We’ve also hedged overall risk in the portfolio via credit default swaps. As always, we favor a bottom-up approach to portfolio management, emphasizing careful security selection.
|
| |
| MARCH 31, 2020 | |
| Portfolio at a Glance | |
| Average Duration (effective) | 2.5 years |
| Weighted Average Life to Maturity | 2.9 years |
| | |
| Types of Investments in Portfolio | % of net assets |
| Corporate Bonds | 65.9% |
| U.S. Treasury Securities | 12.9% |
| Asset-Backed Securities | 9.1% |
| Collateralized Loan Obligations | 6.5% |
| Collateralized Mortgage Obligations | 4.1% |
| Commercial Mortgage-Backed Securities | 1.1% |
| Sovereign Governments and Agencies | 0.8% |
| Bank Loan Obligations | 0.2% |
| Temporary Cash Investments | 0.2% |
| Other Assets and Liabilities | (0.8)% |
Fund shareholders may incur two types of costs: (1) transaction costs, including sales charges (loads) on purchase payments and redemption/exchange fees; and (2) ongoing costs, including management fees; distribution and service (12b-1) fees; and other fund expenses. This example is intended to help you understand your ongoing costs (in dollars) of investing in your fund and to compare these costs with the ongoing cost of investing in other mutual funds.
The example is based on an investment of $1,000 made at the beginning of the period and held for the entire period from October 1, 2019 to March 31, 2020.
Actual Expenses
The table provides information about actual account values and actual expenses for each class. You may use the information, together with the amount you invested, to estimate the expenses that you paid over the period. First, identify the share class you own. Then simply divide your account value by $1,000 (for example, an $8,600 account value divided by $1,000 = 8.6), then multiply the result by the number under the heading “Expenses Paid During Period” to estimate the expenses you paid on your account during this period.
If you hold Investor Class shares of any American Century Investments fund, or I Class shares of the American Century Diversified Bond Fund, in an American Century Investments account (i.e., not through a financial intermediary or employer-sponsored retirement plan account), American Century Investments may charge you a $25.00 annual account maintenance fee if the value of those shares is less than $10,000. We will redeem shares automatically in one of your accounts to pay the $25.00 fee. In determining your total eligible investment amount, we will include your investments in all personal accounts (including American Century Investments brokerage accounts) registered under your Social Security number. Personal accounts include individual accounts, joint accounts, UGMA/UTMA accounts, personal trusts, Coverdell Education Savings Accounts and IRAs (including traditional, Roth, Rollover, SEP-, SARSEP- and SIMPLE-IRAs), and certain other retirement accounts. If you have only business, business retirement, employer-sponsored or American Century Investments brokerage accounts, you are currently not subject to this fee. If you are subject to the account maintenance fee, your account value could be reduced by the fee amount.
Hypothetical Example for Comparison Purposes
The table also provides information about hypothetical account values and hypothetical expenses based on the actual expense ratio of each class of your fund and an assumed rate of return of 5% per year before expenses, which is not the actual return of a fund’s share class. The hypothetical account values and expenses may not be used to estimate the actual ending account balance or expenses you paid for the period. You may use this information to compare the ongoing costs of investing in your fund and other funds. To do so, compare this 5% hypothetical example with the 5% hypothetical examples that appear in the shareholder reports of the other funds.
Please note that the expenses shown in the table are meant to highlight your ongoing costs only and do not reflect any transactional costs, such as sales charges (loads) or redemption/exchange fees. Therefore, the table is useful in comparing ongoing costs only, and will not help you determine the relative total costs of owning different funds. In addition, if these transactional costs were included, your costs would have been higher.
|
| | | | |
| Beginning
Account Value
10/1/19 | Ending
Account Value
3/31/20 | Expenses Paid
During Period(1)
10/1/19 - 3/31/20 |
Annualized
Expense Ratio(1) |
| Actual | | | | |
| Investor Class | $1,000 | $972.70 | $2.56 | 0.52% |
| I Class | $1,000 | $973.10 | $2.07 | 0.42% |
| Y Class | $1,000 | $973.70 | $1.58 | 0.32% |
| A Class | $1,000 | $971.40 | $3.79 | 0.77% |
| C Class | $1,000 | $967.80 | $7.48 | 1.52% |
| R Class | $1,000 | $970.20 | $5.02 | 1.02% |
| R5 Class | $1,000 | $973.70 | $1.58 | 0.32% |
| R6 Class | $1,000 | $973.90 | $1.33 | 0.27% |
| Hypothetical | | | | |
| Investor Class | $1,000 | $1,022.40 | $2.63 | 0.52% |
| I Class | $1,000 | $1,022.90 | $2.12 | 0.42% |
| Y Class | $1,000 | $1,023.40 | $1.62 | 0.32% |
| A Class | $1,000 | $1,021.15 | $3.89 | 0.77% |
| C Class | $1,000 | $1,017.40 | $7.67 | 1.52% |
| R Class | $1,000 | $1,019.90 | $5.15 | 1.02% |
| R5 Class | $1,000 | $1,023.40 | $1.62 | 0.32% |
| R6 Class | $1,000 | $1,023.65 | $1.37 | 0.27% |
| |
| (1) | Expenses are equal to the class's annualized expense ratio listed in the table above, multiplied by the average account value over the period, multiplied by 183, the number of days in the most recent fiscal half-year, divided by 366, to reflect the one-half year period. Annualized expense ratio reflects actual expenses, including any applicable fee waivers or expense reimbursements and excluding any acquired fund fees and expenses. |
MARCH 31, 2020
|
| | | | | | |
| | Principal Amount | Value |
| CORPORATE BONDS — 65.9% | | |
| Automobiles — 1.6% | | |
| Fiat Chrysler Automobiles NV, 4.50%, 4/15/20 | $ | 250,000 |
| $ | 250,716 |
|
| Ford Motor Credit Co. LLC, 5.09%, 1/7/21 | 800,000 |
| 772,496 |
|
| Ford Motor Credit Co. LLC, 3.20%, 1/15/21 | 400,000 |
| 388,500 |
|
| Ford Motor Credit Co. LLC, 3.35%, 11/1/22 | 1,000,000 |
| 925,000 |
|
| General Motors Financial Co., Inc., 3.45%, 4/10/22 | 500,000 |
| 462,153 |
|
Hyundai Capital America, 2.375%, 2/10/23(1) | 330,000 |
| 311,733 |
|
| | | 3,110,598 |
|
| Banks — 14.7% | | |
Banco Bradesco SA, 2.85%, 1/27/23(1) | 800,000 |
| 757,408 |
|
| Banco Santander SA, 3.50%, 4/11/22 | 600,000 |
| 593,934 |
|
| Banistmo SA, 3.65%, 9/19/22 | 200,000 |
| 185,313 |
|
| Bank of America Corp., MTN, VRN, 2.33%, 10/1/21 | 1,000,000 |
| 998,734 |
|
| Bank of America Corp., VRN, 3.00%, 12/20/23 | 271,000 |
| 276,460 |
|
| Barclays Bank plc, 5.14%, 10/14/20 | 1,300,000 |
| 1,312,686 |
|
| BBVA Bancomer SA, 6.75%, 9/30/22 | 1,100,000 |
| 1,097,624 |
|
| CIT Group, Inc., 5.00%, 8/15/22 | 1,000,000 |
| 982,521 |
|
| Citigroup, Inc., 2.70%, 3/30/21 | 600,000 |
| 602,702 |
|
| Citigroup, Inc., 2.90%, 12/8/21 | 1,378,000 |
| 1,391,604 |
|
| Citigroup, Inc., 2.75%, 4/25/22 | 28,000 |
| 28,167 |
|
| Credit Suisse AG, 2.10%, 11/12/21 | 800,000 |
| 797,000 |
|
| Fifth Third BanCorp., 2.375%, 1/28/25 | 630,000 |
| 614,831 |
|
| FNB Corp., 2.20%, 2/24/23 | 510,000 |
| 501,279 |
|
| HSBC Holdings plc, VRN, 2.63%, 11/7/25 | 1,000,000 |
| 971,920 |
|
| ICICI Bank Ltd., 5.75%, 11/16/20 | 200,000 |
| 203,097 |
|
| JPMorgan Chase & Co., 4.625%, 5/10/21 | 1,300,000 |
| 1,336,251 |
|
| JPMorgan Chase & Co., VRN, 2.78%, 4/25/23 | 800,000 |
| 810,852 |
|
| Lloyds Bank plc, 2.25%, 8/14/22 | 1,000,000 |
| 997,497 |
|
| MUFG Union Bank N.A., 2.10%, 12/9/22 | 1,530,000 |
| 1,512,391 |
|
| National Australia Bank Ltd., 1.875%, 12/13/22 | 1,375,000 |
| 1,368,374 |
|
| National Bank of Canada, MTN, 2.10%, 2/1/23 | 1,207,000 |
| 1,203,606 |
|
| Regions Financial Corp., 2.75%, 8/14/22 | 1,000,000 |
| 990,058 |
|
| Santander UK plc, 2.10%, 1/13/23 | 1,100,000 |
| 1,068,188 |
|
| Toronto-Dominion Bank (The), MTN, 2.65%, 6/12/24 | 1,080,000 |
| 1,104,661 |
|
| Truist Bank, VRN, 0.88%, (SOFR plus 0.73%), 3/9/23 | 660,000 |
| 601,445 |
|
| Truist Financial Corp., MTN, 2.20%, 3/16/23 | 1,000,000 |
| 1,003,256 |
|
| U.S. Bancorp, MTN, 3.60%, 9/11/24 | 1,000,000 |
| 1,028,492 |
|
| US Bank N.A., 1.80%, 1/21/22 | 2,300,000 |
| 2,298,288 |
|
| Wells Fargo Bank N.A., VRN, 2.08%, 9/9/22 | 1,000,000 |
| 996,041 |
|
| Westpac Banking Corp., 2.75%, 1/11/23 | 1,210,000 |
| 1,232,835 |
|
| | | 28,867,515 |
|
|
| | | | | | |
| | Principal Amount | Value |
| Biotechnology — 3.5% | | |
AbbVie, Inc., 2.30%, 11/21/22(1) | $ | 2,330,000 |
| $ | 2,331,116 |
|
| Amgen, Inc., 3.625%, 5/15/22 | 1,000,000 |
| 1,037,260 |
|
| Biogen, Inc., 3.625%, 9/15/22 | 2,075,000 |
| 2,133,348 |
|
| Gilead Sciences, Inc., 4.40%, 12/1/21 | 750,000 |
| 774,987 |
|
| Gilead Sciences, Inc., 3.25%, 9/1/22 | 500,000 |
| 511,958 |
|
| | | 6,788,669 |
|
| Capital Markets — 4.8% | | |
Banco BTG Pactual SA, 4.50%, 1/10/25(1) | 1,000,000 |
| 880,000 |
|
| Bank of New York Mellon Corp. (The), MTN, 1.85%, 1/27/23 | 1,650,000 |
| 1,659,065 |
|
Credit Suisse Group AG, VRN, 3.00%, 12/14/23(1) | 1,000,000 |
| 974,845 |
|
Credit Suisse Group AG, VRN, 2.59%, 9/11/25(1) | 500,000 |
| 475,885 |
|
| Goldman Sachs BDC, Inc., 3.75%, 2/10/25 | 299,000 |
| 277,741 |
|
| Goldman Sachs Group, Inc. (The), 3.00%, 4/26/22 | 525,000 |
| 529,007 |
|
| Goldman Sachs Group, Inc. (The), 3.20%, 2/23/23 | 1,000,000 |
| 1,021,788 |
|
| Morgan Stanley, MTN, 5.50%, 7/28/21 | 1,300,000 |
| 1,350,618 |
|
| Oaktree Specialty Lending Corp., 3.50%, 2/25/25 | 535,000 |
| 481,527 |
|
State Street Corp., VRN, 2.83%, 3/30/23(1) | 100,000 |
| 100,981 |
|
UBS Group AG, 2.65%, 2/1/22(1) | 1,770,000 |
| 1,768,764 |
|
| | | 9,520,221 |
|
| Chemicals — 1.0% | | |
| Ashland LLC, 4.75%, 8/15/22 | 90,000 |
| 89,325 |
|
| CF Industries, Inc., 3.45%, 6/1/23 | 1,000,000 |
| 990,040 |
|
| Olin Corp., 5.50%, 8/15/22 | 980,000 |
| 909,867 |
|
| | | 1,989,232 |
|
| Commercial Services and Supplies — 0.9% | | |
Nielsen Finance LLC / Nielsen Finance Co., 5.00%, 4/15/22(1) | 750,000 |
| 695,370 |
|
| Republic Services, Inc., 3.55%, 6/1/22 | 1,000,000 |
| 1,026,653 |
|
| | | 1,722,023 |
|
| Communications Equipment — 0.3% | | |
CommScope, Inc., 5.50%, 3/1/24(1) | 550,000 |
| 560,040 |
|
| Consumer Finance — 1.8% | | |
| Ally Financial, Inc., 4.625%, 3/30/25 | 450,000 |
| 432,894 |
|
| Ally Financial, Inc., 5.75%, 11/20/25 | 46,000 |
| 45,342 |
|
| Capital One Bank USA N.A., 3.375%, 2/15/23 | 1,100,000 |
| 1,077,640 |
|
| Discover Financial Services, 3.85%, 11/21/22 | 1,000,000 |
| 1,021,784 |
|
| Synchrony Financial, 2.85%, 7/25/22 | 1,000,000 |
| 953,885 |
|
| | | 3,531,545 |
|
| Containers and Packaging — 1.6% | | |
| Ball Corp., 5.00%, 3/15/22 | 990,000 |
| 1,024,314 |
|
| Berry Global, Inc., 5.125%, 7/15/23 | 1,030,000 |
| 1,039,960 |
|
Reynolds Group Issuer, Inc. / Reynolds Group Issuer LLC / Reynolds Group Issuer Lu, 5.125%, 7/15/23(1) | 1,030,000 |
| 1,028,707 |
|
| | | 3,092,981 |
|
| Diversified Financial Services — 0.4% | | |
| Credit Suisse Group Funding Guernsey Ltd., 3.45%, 4/16/21 | 700,000 |
| 704,642 |
|
|
| | | | | | |
| | Principal Amount | Value |
| Diversified Telecommunication Services — 4.3% | | |
| AT&T, Inc., 4.45%, 5/15/21 | $ | 500,000 |
| $ | 511,656 |
|
| AT&T, Inc., 3.875%, 8/15/21 | 800,000 |
| 819,676 |
|
| AT&T, Inc., 3.00%, 6/30/22 | 1,310,000 |
| 1,322,677 |
|
Deutsche Telekom International Finance BV, 2.82%, 1/19/22(1) | 2,000,000 |
| 1,987,420 |
|
| Ooredoo International Finance Ltd., MTN, 4.75%, 2/16/21 | 900,000 |
| 899,258 |
|
| Orange SA, 4.125%, 9/14/21 | 500,000 |
| 511,799 |
|
| TBG Global Pte Ltd., 5.25%, 2/10/22 | 700,000 |
| 671,895 |
|
| Verizon Communications, Inc., 2.95%, 3/15/22 | 1,004,000 |
| 1,024,929 |
|
| Verizon Communications, Inc., 2.45%, 11/1/22 | 611,000 |
| 621,611 |
|
| | | 8,370,921 |
|
| Electric Utilities — 0.8% | | |
| Duke Energy Corp., 3.55%, 9/15/21 | 250,000 |
| 253,532 |
|
| Florida Power & Light Co., 2.85%, 4/1/25 | 500,000 |
| 526,173 |
|
| Progress Energy, Inc., 3.15%, 4/1/22 | 700,000 |
| 708,462 |
|
| | | 1,488,167 |
|
| Entertainment — 1.2% | | |
| Netflix, Inc., 5.375%, 2/1/21 | 450,000 |
| 456,412 |
|
| Netflix, Inc., 5.50%, 2/15/22 | 590,000 |
| 604,750 |
|
| Walt Disney Co. (The), 3.35%, 3/24/25 | 1,120,000 |
| 1,224,111 |
|
| | | 2,285,273 |
|
| Equity Real Estate Investment Trusts (REITs) — 1.7% | | |
| Crown Castle International Corp., 2.25%, 9/1/21 | 1,000,000 |
| 986,742 |
|
| Crown Castle International Corp., 5.25%, 1/15/23 | 500,000 |
| 530,970 |
|
| Equinix, Inc., 5.875%, 1/15/26 | 700,000 |
| 718,144 |
|
| Essex Portfolio LP, 3.625%, 8/15/22 | 600,000 |
| 595,261 |
|
| Simon Property Group LP, 2.75%, 6/1/23 | 555,000 |
| 547,720 |
|
| | | 3,378,837 |
|
| Food and Staples Retailing — 0.7% | | |
Albertsons Cos., Inc. / Safeway, Inc. / New Albertsons LP / Albertsons LLC, 3.50%, 2/15/23(1) | 1,100,000 |
| 1,091,200 |
|
Sysco Corp., 5.65%, 4/1/25(2) | 280,000 |
| 291,857 |
|
| | | 1,383,057 |
|
| Food Products — 1.3% | | |
| Conagra Brands, Inc., 3.80%, 10/22/21 | 600,000 |
| 605,174 |
|
Lamb Weston Holdings, Inc., 4.625%, 11/1/24(1) | 1,000,000 |
| 991,255 |
|
Mondelez International Holdings Netherlands BV, 2.00%, 10/28/21(1) | 1,000,000 |
| 996,443 |
|
| | | 2,592,872 |
|
| Health Care Equipment and Supplies — 1.3% | | |
| Becton Dickinson and Co., 2.89%, 6/6/22 | 1,500,000 |
| 1,502,448 |
|
| DH Europe Finance II Sarl, 2.05%, 11/15/22 | 1,000,000 |
| 982,049 |
|
| | | 2,484,497 |
|
| Health Care Providers and Services — 2.7% | | |
| Acadia Healthcare Co., Inc., 5.125%, 7/1/22 | 1,000,000 |
| 961,564 |
|
| CVS Health Corp., 3.70%, 3/9/23 | 500,000 |
| 521,129 |
|
| DaVita, Inc., 5.125%, 7/15/24 | 1,000,000 |
| 1,003,255 |
|
Fresenius Medical Care US Finance II, Inc., 4.125%, 10/15/20(1) | 600,000 |
| 596,173 |
|
|
| | | | | | |
| | Principal Amount | Value |
| HCA, Inc., 5.00%, 3/15/24 | $ | 500,000 |
| $ | 518,600 |
|
| Tenet Healthcare Corp., 8.125%, 4/1/22 | 700,000 |
| 665,238 |
|
| UnitedHealth Group, Inc., 2.875%, 12/15/21 | 1,000,000 |
| 1,021,672 |
|
| | | 5,287,631 |
|
| Household Durables — 1.5% | | |
| D.R. Horton, Inc., 2.50%, 10/15/24 | 500,000 |
| 468,026 |
|
| Lennar Corp., 2.95%, 11/29/20 | 1,040,000 |
| 1,023,048 |
|
| Toll Brothers Finance Corp., 4.375%, 4/15/23 | 1,620,000 |
| 1,553,167 |
|
| | | 3,044,241 |
|
| Insurance — 1.5% | | |
| American International Group, Inc., 4.125%, 2/15/24 | 485,000 |
| 509,878 |
|
Metropolitan Life Global Funding I, 1.95%, 1/13/23(1) | 1,375,000 |
| 1,347,542 |
|
| WR Berkley Corp., 4.625%, 3/15/22 | 1,250,000 |
| 1,074,495 |
|
| | | 2,931,915 |
|
| IT Services — 0.1% | | |
| Western Union Co. (The), 2.85%, 1/10/25 | 124,000 |
| 123,665 |
|
| Machinery — 0.1% | | |
Otis Worldwide Corp., VRN, 2.09%, 4/5/23(1) | 170,000 |
| 161,870 |
|
| Media — 3.3% | | |
| CSC Holdings LLC, 6.75%, 11/15/21 | 970,000 |
| 1,005,647 |
|
| Discovery Communications LLC, 3.80%, 3/13/24 | 570,000 |
| 567,600 |
|
| DISH DBS Corp., 5.125%, 5/1/20 | 300,000 |
| 298,742 |
|
Fox Corp., 3.05%, 4/7/25(2) | 100,000 |
| 101,074 |
|
| Omnicom Group, Inc. / Omnicom Capital, Inc., 3.625%, 5/1/22 | 1,000,000 |
| 1,017,443 |
|
| Time Warner Cable LLC, 4.125%, 2/15/21 | 450,000 |
| 451,427 |
|
| ViacomCBS, Inc., 3.125%, 6/15/22 | 900,000 |
| 889,005 |
|
| ViacomCBS, Inc., 3.875%, 4/1/24 | 1,025,000 |
| 1,023,370 |
|
| VTR Finance BV, 6.875%, 1/15/24 | 1,259,000 |
| 1,150,405 |
|
| | | 6,504,713 |
|
| Metals and Mining — 0.5% | | |
| Freeport-McMoRan, Inc., 3.55%, 3/1/22 | 136,000 |
| 131,194 |
|
| HTA Group Ltd., 9.125%, 3/8/22 | 900,000 |
| 831,101 |
|
| | | 962,295 |
|
| Multi-Utilities — 1.2% | | |
| DTE Energy Co., 2.25%, 11/1/22 | 1,500,000 |
| 1,486,611 |
|
| Sempra Energy, 2.875%, 10/1/22 | 825,000 |
| 828,744 |
|
| | | 2,315,355 |
|
| Oil, Gas and Consumable Fuels — 4.8% | | |
| Energy Transfer Partners LP / Regency Energy Finance Corp., 5.875%, 3/1/22 | 1,000,000 |
| 940,070 |
|
| Gazprom PJSC Via Gaz Capital SA, 6.00%, 1/23/21 | 900,000 |
| 916,758 |
|
| Lukoil International Finance BV, 6.125%, 11/9/20 | 800,000 |
| 809,993 |
|
MPLX LP, 3.50%, 12/1/22(1) | 400,000 |
| 383,385 |
|
| Ovintiv, Inc., 3.90%, 11/15/21 | 600,000 |
| 411,725 |
|
| Petroleos Mexicanos, 4.875%, 1/24/22 | 2,410,000 |
| 2,086,062 |
|
| Phillips 66, 4.30%, 4/1/22 | 1,000,000 |
| 1,004,377 |
|
Ras Laffan Liquefied Natural Gas Co. Ltd. II, 5.30%, 9/30/20(1) | 28,025 |
| 28,559 |
|
|
| | | | | | |
| | Principal Amount | Value |
| Sabine Pass Liquefaction LLC, 5.625%, 2/1/21 | $ | 950,000 |
| $ | 934,919 |
|
| Saudi Arabian Oil Co., MTN, 2.75%, 4/16/22 | 900,000 |
| 882,378 |
|
| Southwestern Energy Co., 4.10%, 3/15/22 | 700,000 |
| 530,905 |
|
| WPX Energy, Inc., 5.25%, 10/15/27 | 1,000,000 |
| 555,550 |
|
| | | 9,484,681 |
|
| Pharmaceuticals — 2.1% | | |
Bausch Health Cos., Inc., 7.00%, 3/15/24(1) | 500,000 |
| 515,628 |
|
Bristol-Myers Squibb Co., 3.25%, 8/15/22(1) | 2,075,000 |
| 2,156,694 |
|
| Elanco Animal Health, Inc., 5.02%, 8/28/23 | 1,000,000 |
| 1,013,341 |
|
| Mylan NV, 3.15%, 6/15/21 | 500,000 |
| 495,567 |
|
| | | 4,181,230 |
|
| Road and Rail — 0.9% | | |
Ashtead Capital, Inc., 4.125%, 8/15/25(1) | 600,000 |
| 552,000 |
|
| United Rentals North America, Inc., 5.50%, 7/15/25 | 510,000 |
| 502,990 |
|
| United Rentals North America, Inc., 6.50%, 12/15/26 | 750,000 |
| 765,412 |
|
| | | 1,820,402 |
|
| Semiconductors and Semiconductor Equipment — 0.7% | | |
| Broadcom Corp. / Broadcom Cayman Finance Ltd., 2.20%, 1/15/21 | 900,000 |
| 888,562 |
|
NXP BV / NXP Funding LLC, 3.875%, 9/1/22(1) | 500,000 |
| 502,417 |
|
| | | 1,390,979 |
|
| Software — 0.9% | | |
| NortonLifeLock, Inc., 4.20%, 9/15/20 | 300,000 |
| 298,126 |
|
| Oracle Corp., 2.50%, 10/15/22 | 1,050,000 |
| 1,075,269 |
|
Oracle Corp., 2.50%, 4/1/25(2) | 400,000 |
| 408,820 |
|
| | | 1,782,215 |
|
| Technology Hardware, Storage and Peripherals — 0.5% | | |
Dell International LLC / EMC Corp., 5.875%, 6/15/21(1) | 198,000 |
| 198,000 |
|
Dell International LLC / EMC Corp., 5.45%, 6/15/23(1) | 740,000 |
| 760,310 |
|
| | | 958,310 |
|
| Textiles, Apparel and Luxury Goods — 0.8% | | |
| NIKE, Inc., 2.40%, 3/27/25 | 1,500,000 |
| 1,556,006 |
|
| Thrifts and Mortgage Finance — 0.5% | | |
Nationwide Building Society, 2.00%, 1/27/23(1) | 1,050,000 |
| 1,029,142 |
|
| Trading Companies and Distributors — 0.2% | | |
| International Lease Finance Corp., 4.625%, 4/15/21 | 535,000 |
| 494,062 |
|
| Transportation Infrastructure — 0.4% | | |
| DP World plc, MTN, 3.25%, 5/18/20 | 900,000 |
| 887,006 |
|
| Wireless Telecommunication Services — 1.3% | | |
| MTN Mauritius Investments Ltd., 5.37%, 2/13/22 | 500,000 |
| 469,497 |
|
| VEON Holdings BV, 3.95%, 6/16/21 | 1,000,000 |
| 996,200 |
|
| Vodafone Group plc, 2.95%, 2/19/23 | 1,000,000 |
| 1,022,255 |
|
| | | 2,487,952 |
|
TOTAL CORPORATE BONDS
(Cost $133,234,768) | | 129,274,760 |
|
| U.S. TREASURY SECURITIES — 12.9% | | |
U.S. Treasury Notes, 2.50%, 1/31/21(3) | 600,000 |
| 612,047 |
|
| U.S. Treasury Notes, 1.75%, 6/15/22 | 9,000,000 |
| 9,303,223 |
|
|
| | | | | | |
| | Principal Amount | Value |
| U.S. Treasury Notes, 1.625%, 11/15/22 | $ | 3,700,000 |
| $ | 3,831,451 |
|
| U.S. Treasury Notes, 0.50%, 3/15/23 | 9,500,000 |
| 9,560,488 |
|
| U.S. Treasury Notes, 1.125%, 2/28/25 | 2,000,000 |
| 2,075,000 |
|
TOTAL U.S. TREASURY SECURITIES
(Cost $24,855,331) | | 25,382,209 |
|
| ASSET-BACKED SECURITIES — 9.1% | | |
BRE Grand Islander Timeshare Issuer LLC, Series 2017-1A, Class A SEQ, 2.94%, 5/25/29(1) | 188,862 |
| 185,285 |
|
BRE Grand Islander Timeshare Issuer LLC, Series 2017-1A, Class B, 3.24%, 5/25/29(1) | 20,985 |
| 20,509 |
|
BRE Grand Islander Timeshare Issuer LLC, Series 2019-A, Class A SEQ, 3.28%, 9/26/33(1) | 496,830 |
| 493,487 |
|
Hertz Fleet Lease Funding LP, Series 2017-1, Class A1, VRN, 1.51%, (1-month LIBOR plus 0.65%), 4/10/31(1) | 133,724 |
| 133,369 |
|
Hilton Grand Vacations Trust, Series 2014-AA, Class A SEQ, 1.77%, 11/25/26(1) | 114,443 |
| 113,583 |
|
Hilton Grand Vacations Trust, Series 2014-AA, Class B, 2.07%, 11/25/26(1) | 22,889 |
| 22,687 |
|
Hilton Grand Vacations Trust, Series 2017-AA, Class A SEQ, 2.66%, 12/26/28(1) | 973,861 |
| 959,888 |
|
Hilton Grand Vacations Trust, Series 2017-AA, Class B, 2.96%, 12/26/28(1) | 350,590 |
| 345,488 |
|
Hilton Grand Vacations Trust, Series 2018-AA, Class B, 3.70%, 2/25/32(1) | 554,646 |
| 553,765 |
|
Hilton Grand Vacations Trust, Series 2019-AA, Class B, 2.54%, 7/25/33(1) | 812,110 |
| 670,041 |
|
Invitation Homes Trust, Series 2017-SFR2, Class B, VRN, 1.95%, (1-month LIBOR plus 1.15%), 12/17/36(1) | 625,000 |
| 561,404 |
|
Invitation Homes Trust, Series 2018-SFR1, Class B, VRN, 1.75%, (1-month LIBOR plus 0.95%), 3/17/37(1) | 325,000 |
| 293,545 |
|
Invitation Homes Trust, Series 2018-SFR1, Class C, VRN, 2.05%, (1-month LIBOR plus 1.25%), 3/17/37(1) | 860,000 |
| 761,250 |
|
Invitation Homes Trust, Series 2018-SFR2, Class C, VRN, 1.98%, (1-month LIBOR plus 1.28%), 6/17/37(1) | 175,000 |
| 158,231 |
|
Invitation Homes Trust, Series 2018-SFR3, Class A, VRN, 1.80%, (1-month LIBOR plus 1.00%), 7/17/37(1) | 935,235 |
| 886,051 |
|
Invitation Homes Trust, Series 2018-SFR3, Class B, VRN, 1.95%, (1-month LIBOR plus 1.15%), 7/17/37(1) | 200,000 |
| 181,336 |
|
MVW LLC, Series 2019-2A, Class B, 2.44%, 10/20/38(1) | 1,125,427 |
| 1,044,361 |
|
MVW Owner Trust, Series 2013-1A, Class A SEQ, 2.15%, 4/22/30(1) | 57,143 |
| 57,109 |
|
MVW Owner Trust, Series 2014-1A, Class B, 2.70%, 9/22/31(1) | 33,679 |
| 33,405 |
|
MVW Owner Trust, Series 2016-1A, Class A SEQ, 2.25%, 12/20/33(1) | 13,294 |
| 13,003 |
|
MVW Owner Trust, Series 2017-1A, Class B, 2.75%, 12/20/34(1) | 215,784 |
| 210,603 |
|
MVW Owner Trust, Series 2018-1A, Class B, 3.60%, 1/21/36(1) | 180,395 |
| 171,505 |
|
Progress Residential Trust, Series 2018-SFR1, Class B, 3.48%, 3/17/35(1) | 477,000 |
| 472,038 |
|
Progress Residential Trust, Series 2018-SFR1, Class C, 3.68%, 3/17/35(1) | 125,000 |
| 123,543 |
|
Progress Residential Trust, Series 2018-SFR1, Class D, 3.88%, 3/17/35(1) | 150,000 |
| 145,787 |
|
Progress Residential Trust, Series 2018-SFR3, Class B, 4.08%, 10/17/35(1) | 400,000 |
| 403,965 |
|
Progress Residential Trust, Series 2018-SFR3, Class C, 4.18%, 10/17/35(1) | 275,000 |
| 275,658 |
|
|
| | | | | | |
| | Principal Amount | Value |
Progress Residential Trust, Series 2019-SFR1, Class A SEQ, 3.42%, 8/17/35(1) | $ | 700,000 |
| $ | 707,827 |
|
Progress Residential Trust, Series 2019-SFR2, Class A SEQ, 3.15%, 5/17/36(1) | 800,000 |
| 805,864 |
|
Progress Residential Trust, Series 2019-SFR2, Class B, 3.45%, 5/17/36(1) | 900,000 |
| 898,476 |
|
Progress Residential Trust, Series 2019-SFR3, Class B, 2.57%, 9/17/36(1) | 1,750,000 |
| 1,683,911 |
|
Sierra Timeshare Conduit Receivables Funding LLC, Series 2017-1A, Class A SEQ, 2.91%, 3/20/34(1) | 16,569 |
| 16,367 |
|
Sierra Timeshare Receivables Funding LLC, Series 2015-3A, Class A SEQ, 2.58%, 9/20/32(1) | 60,302 |
| 59,863 |
|
Sierra Timeshare Receivables Funding LLC, Series 2016-2A, Class A SEQ, 2.33%, 7/20/33(1) | 10,979 |
| 10,851 |
|
Sierra Timeshare Receivables Funding LLC, Series 2018-2A, Class B, 3.65%, 6/20/35(1) | 117,815 |
| 112,638 |
|
Sierra Timeshare Receivables Funding LLC, Series 2018-3A, Class C, 4.17%, 9/20/35(1) | 161,626 |
| 162,231 |
|
Sierra Timeshare Receivables Funding LLC, Series 2019-1A, Class A SEQ, 3.20%, 1/20/36(1) | 287,383 |
| 286,055 |
|
Sierra Timeshare Receivables Funding LLC, Series 2019-1A, Class B, 3.42%, 1/20/36(1) | 459,812 |
| 456,870 |
|
Sierra Timeshare Receivables Funding LLC, Series 2019-2A, Class D, 4.54%, 5/20/36(1) | 694,016 |
| 688,220 |
|
Sierra Timeshare Receivables Funding LLC, Series 2019-3A, Class D, 4.18%, 8/20/36(1) | 478,577 |
| 431,863 |
|
VSE VOI Mortgage LLC, Series 2016-A, Class A SEQ, 2.54%, 7/20/33(1) | 139,774 |
| 137,453 |
|
VSE VOI Mortgage LLC, Series 2017-A, Class A SEQ, 2.33%, 3/20/35(1) | 277,723 |
| 270,726 |
|
VSE VOI Mortgage LLC, Series 2017-A, Class B, 2.63%, 3/20/35(1) | 57,859 |
| 56,495 |
|
VSE VOI Mortgage LLC, Series 2018-A, Class A SEQ, 3.56%, 2/20/36(1) | 1,712,336 |
| 1,714,290 |
|
VSE VOI Mortgage LLC, Series 2018-A, Class B, 3.72%, 2/20/36(1) | 71,347 |
| 70,588 |
|
TOTAL ASSET-BACKED SECURITIES
(Cost $18,534,402) | | 17,861,484 |
|
| COLLATERALIZED LOAN OBLIGATIONS — 6.5% | | |
Allegany Park CLO Ltd., Series 2019-1A, Class C, VRN, 4.38%, (3-month LIBOR plus 2.55%), 1/20/33(1) | 1,000,000 |
| 865,648 |
|
Anchorage Credit Opportunities CLO 1 Ltd., Series 2019-1A, Class B1, VRN, 4.64%, (3-month LIBOR plus 2.90%), 1/20/32(1) | 1,000,000 |
| 882,430 |
|
CBAM Ltd., Series 2018-5A, Class B1, VRN, 3.24%, (3-month LIBOR plus 1.40%), 4/17/31(1) | 1,000,000 |
| 886,543 |
|
CIFC Funding Ltd., Series 2013-2A, Class A2LR, VRN, 3.43%, (3-month LIBOR plus 1.60%), 10/18/30(1) | 500,000 |
| 463,521 |
|
CIFC Funding Ltd., Series 2015-1A, Class ARR, VRN, 2.91%, (3-month LIBOR plus 1.11%), 1/22/31(1) | 1,500,000 |
| 1,416,802 |
|
CIFC Funding Ltd., Series 2016-1A, Class BR, VRN, 3.77%, (3-month LIBOR plus 1.95%), 10/21/31(1) | 1,750,000 |
| 1,610,604 |
|
Dryden 64 CLO Ltd., Series 2018-64A, Class A, VRN, 2.79%, (3-month LIBOR plus 0.97%), 4/18/31(1) | 1,500,000 |
| 1,410,766 |
|
Elmwood CLO IV Ltd., Series 2020-1A, Class C, VRN, 3.42%, (3-month LIBOR plus 2.05%), 4/15/33(1) | 1,000,000 |
| 880,000 |
|
Goldentree Loan Management US CLO 6 Ltd., Series 2019-6A, Class B1, VRN, 3.66%, (3-month LIBOR plus 1.90%), 1/20/33(1) | 1,250,000 |
| 1,116,796 |
|
|
| | | | | | |
| | Principal Amount | Value |
Madison Park Funding XXII Ltd., Series 2016-22A, Class BR, VRN, 3.26%, (3-month LIBOR plus 1.60%), 1/15/33(1) | $ | 1,000,000 |
| $ | 872,429 |
|
Magnetite XXIV Ltd., Series 2019-24A, Class B, VRN, 3.76%, (3-month LIBOR plus 1.85%), 1/15/33(1) | 650,000 |
| 580,765 |
|
Magnetite XXIV Ltd., Series 2019-24A, Class C, VRN, 4.46%, (3-month LIBOR plus 2.55%), 1/15/33(1) | 1,600,000 |
| 1,382,258 |
|
Sounds Point CLO IV-R Ltd., Series 2013-3RA, Class B, VRN, 3.57%, (3-month LIBOR plus 1.75%), 4/18/31(1) | 350,000 |
| 311,610 |
|
TOTAL COLLATERALIZED LOAN OBLIGATIONS
(Cost $14,062,040) | | 12,680,172 |
|
| COLLATERALIZED MORTGAGE OBLIGATIONS — 4.1% | | |
| Private Sponsor Collateralized Mortgage Obligations — 1.8% | | |
| Banc of America Mortgage Trust, Series 2004-E, Class 2A6 SEQ, VRN, 4.77%, 6/25/34 | 22,791 |
| 20,487 |
|
| Bear Stearns Adjustable Rate Mortgage Trust, Series 2004-12, Class 2A1, VRN, 3.74%, 2/25/35 | 42,009 |
| 38,220 |
|
| Bear Stearns Adjustable Rate Mortgage Trust, Series 2004-8, Class 2A1, VRN, 3.95%, 11/25/34 | 67,895 |
| 60,571 |
|
| Bear Stearns Adjustable Rate Mortgage Trust, Series 2006-1, Class A1, VRN, 3.84%, (1-year H15T1Y plus 2.25%), 2/25/36 | 14,768 |
| 13,921 |
|
Bunker Hill Loan Depositary Trust, Series 2019-3, Class A1 SEQ, 2.72%, 11/25/59(1) | 487,020 |
| 474,237 |
|
| Citigroup Mortgage Loan Trust, Inc., Series 2004-UST1, Class A5, VRN, 3.79%, 8/25/34 | 42,770 |
| 38,486 |
|
| Citigroup Mortgage Loan Trust, Inc., Series 2005-4, Class A, VRN, 4.59%, 8/25/35 | 41,498 |
| 38,666 |
|
| Citigroup Mortgage Loan Trust, Inc., Series 2005-6, Class A2, VRN, 4.55%, (1-year H15T1Y plus 2.15%), 9/25/35 | 53,193 |
| 49,532 |
|
Credit Suisse Mortgage Trust, Series 2019-NQM1, Class A1, 2.66%, 10/25/59(1) | 467,502 |
| 453,951 |
|
| First Horizon Mortgage Pass-Through Trust, Series 2006-AR4, Class 1A2, VRN, 3.99%, 1/25/37 | 29,888 |
| 23,317 |
|
Flagstar Mortgage Trust, Series 2017-1, Class 1A5 SEQ, VRN, 3.50%, 3/25/47(1) | 1,240,615 |
| 1,257,081 |
|
| GSR Mortgage Loan Trust, Series 2005-AR6, Class 2A1, VRN, 4.10%, 9/25/35 | 31,009 |
| 29,356 |
|
| GSR Mortgage Loan Trust, Series 2005-AR6, Class 4A5, VRN, 4.51%, 9/25/35 | 97,112 |
| 91,551 |
|
| Merrill Lynch Mortgage Investors Trust, Series 2005-A2, Class A2, VRN, 3.73%, 2/25/35 | 19,957 |
| 17,606 |
|
Sequoia Mortgage Trust, Series 2017-CH2, Class A10 SEQ, VRN, 4.00%, 12/25/47(1) | 540,513 |
| 543,410 |
|
| Thornburg Mortgage Securities Trust, Series 2004-3, Class A, VRN, 1.69%, (1-month LIBOR plus 0.74%), 9/25/34 | 78,990 |
| 67,631 |
|
| WaMu Mortgage Pass-Through Certificates, Series 2005-AR3, Class A1, VRN, 3.62%, 3/25/35 | 36,567 |
| 33,608 |
|
| Wells Fargo Mortgage-Backed Securities Trust, Series 2006-AR15, Class A1, VRN, 4.61%, 10/25/36 | 14,899 |
| 13,076 |
|
| Wells Fargo Mortgage-Backed Securities Trust, Series 2006-AR16, Class A1, VRN, 4.49%, 10/25/36 | 59,361 |
| 52,563 |
|
| Wells Fargo Mortgage-Backed Securities Trust, Series 2006-AR19, Class A1, VRN, 4.35%, 12/25/36 | 118,149 |
| 104,809 |
|
| Wells Fargo Mortgage-Backed Securities Trust, Series 2006-AR5, Class 2A1, VRN, 4.14%, 4/25/36 | 45,319 |
| 42,803 |
|
| Wells Fargo Mortgage-Backed Securities Trust, Series 2007-7, Class A1, 6.00%, 6/25/37 | 61,902 |
| 56,944 |
|
| | | 3,521,826 |
|
|
| | | | | | |
| | Principal Amount | Value |
| U.S. Government Agency Collateralized Mortgage Obligations — 2.3% | |
| FHLMC, Series 2015-HQ2, Class M3, VRN, 4.20%, (1-month LIBOR plus 3.25%), 5/25/25 | $ | 100,000 |
| $ | 89,143 |
|
| FHLMC, Series 2018-DNA1, Class M2, VRN, 2.75%, (1-month LIBOR plus 1.80%), 7/25/30 | 1,300,000 |
| 1,081,954 |
|
| FNMA, Series 2014-C02, Class 2M2, VRN, 3.55%, (1-month LIBOR plus 2.60%), 5/25/24 | 226,334 |
| 208,016 |
|
| FNMA, Series 2016-55, Class PI, IO, 4.00%, 8/25/46 | 2,946,246 |
| 519,255 |
|
| FNMA, Series 2016-C03, Class 2M2, VRN, 6.85%, (1-month LIBOR plus 5.90%), 10/25/28 | 34,970 |
| 34,472 |
|
| FNMA, Series 2016-C04, Class 1M2, VRN, 5.20%, (1-month LIBOR plus 4.25%), 1/25/29 | 1,295,585 |
| 1,231,964 |
|
| FNMA, Series 2017-7, Class AI, IO, 6.00%, 2/25/47 | 2,202,466 |
| 526,774 |
|
| FNMA, Series 2017-C05, Class 1M2, VRN, 3.15%, (1-month LIBOR plus 2.20%), 1/25/30 | 330,607 |
| 295,753 |
|
| FNMA, Series 413, Class C27, IO, 4.00%, 7/25/42 | 2,848,192 |
| 446,298 |
|
| | | 4,433,629 |
|
TOTAL COLLATERALIZED MORTGAGE OBLIGATIONS
(Cost $8,311,109) | | 7,955,455 |
|
| COMMERCIAL MORTGAGE-BACKED SECURITIES — 1.1% | | |
| Commercial Mortgage Pass-Through Certificates, Series 2014-LC17, Class B, VRN, 4.49%, 10/10/47 | 75,000 |
| 76,001 |
|
| JPMBB Commercial Mortgage Securities Trust, Series 2014-C21, Class AS SEQ, 4.00%, 8/15/47 | 1,750,000 |
| 1,827,199 |
|
| JPMBB Commercial Mortgage Securities Trust, Series 2014-C21, Class B, VRN, 4.34%, 8/15/47 | 250,000 |
| 251,279 |
|
TOTAL COMMERCIAL MORTGAGE-BACKED SECURITIES
(Cost $2,178,235) | | 2,154,479 |
|
| SOVEREIGN GOVERNMENTS AND AGENCIES — 0.8% | | |
| Egypt — 0.5% | | |
| Egypt Government International Bond, 6.125%, 1/31/22 | 1,000,000 |
| 966,873 |
|
| Oman — 0.3% | | |
| Oman Government International Bond, 4.125%, 1/17/23 | 800,000 |
| 668,497 |
|
TOTAL SOVEREIGN GOVERNMENTS AND AGENCIES
(Cost $1,772,809) | | 1,635,370 |
|
BANK LOAN OBLIGATIONS(4) — 0.2% | | |
| Health Care Providers and Services — 0.1% | | |
| Acadia Healthcare Company, Inc., 2018 Term Loan B4, 3.50%, (1-month LIBOR plus 2.50%), 2/16/23 | 291,868 |
| 270,634 |
|
| Pharmaceuticals — 0.1% | | |
| Bausch Health Companies Inc., 2018 Term Loan B, 3.61%, (1-month LIBOR plus 3.00%), 6/2/25 | 139,511 |
| 133,524 |
|
TOTAL BANK LOAN OBLIGATIONS
(Cost $430,827) | | 404,158 |
|
| TEMPORARY CASH INVESTMENTS — 0.2% | | |
Repurchase Agreement, BMO Capital Markets Corp., (collateralized by various U.S. Treasury obligations, 1.875% - 3.00%, 11/30/21 - 5/15/45, valued at $316,135), in a joint trading account at 0.01%, dated 3/31/20, due 4/1/20 (Delivery value $309,989)
(Cost $309,989) | | 309,989 |
|
TOTAL INVESTMENT SECURITIES — 100.8%
(Cost $203,689,510) | | 197,658,076 |
|
| OTHER ASSETS AND LIABILITIES — (0.8)% | | (1,558,749 | ) |
| TOTAL NET ASSETS — 100.0% | | $ | 196,099,327 |
|
|
| | | | | | | | | | | |
| FUTURES CONTRACTS PURCHASED |
| Reference Entity | Contracts | Expiration Date | Notional Amount | Underlying Contract Value | Unrealized Appreciation (Depreciation) |
| U.S. Treasury 2-Year Notes | 106 | June 2020 | $ | 21,200,000 |
| $ | 23,360,578 |
| $ | 162,426 |
|
| U.S. Treasury 5-Year Notes | 31 | June 2020 | $ | 3,100,000 |
| 3,886,141 |
| 35,063 |
|
| | | | | $ | 27,246,719 |
| $ | 197,489 |
|
|
| | | | | | | | | | | | | | | |
| CENTRALLY CLEARED CREDIT DEFAULT SWAP AGREEMENTS |
| Reference Entity | Type | Fixed Rate
Received
(Paid) Quarterly | Termination
Date | Notional
Amount | Premiums Paid (Received) | Unrealized
Appreciation
(Depreciation) | Value^ |
| Markit CDX North America High Yield Index Series 33 | Buy | (5.00)% | 12/20/24 | $ | 21,560,000 |
| $ | 2,631,049 |
| $ | (1,352,500 | ) | $ | 1,278,549 |
|
^The value for credit default swap agreements serves as an indicator of the current status of the payment/performance risk and represent the likelihood of an expected liability or profit at the period end. Increasing values in absolute terms when compared to the notional amount of the credit default swap agreement represent a deterioration of the referenced entity's credit soundness and an increased likelihood or risk of a credit event occurring as defined in the agreement.
|
| | |
| NOTES TO SCHEDULE OF INVESTMENTS |
| CDX | - | Credit Derivatives Indexes |
| FHLMC | - | Federal Home Loan Mortgage Corporation |
| FNMA | - | Federal National Mortgage Association |
| H15T1Y | - | Constant Maturity U.S. Treasury Note Yield Curve Rate Index |
| IO | - | Interest Only |
| LIBOR | - | London Interbank Offered Rate |
| MTN | - | Medium Term Note |
| SEQ | - | Sequential Payer |
| SOFR | - | Secured Overnight Financing Rate |
| VRN | - | Variable Rate Note. The rate adjusts periodically based upon the terms set forth in the security’s offering documents. The rate shown is effective at the period end and the reference rate and spread, if any, is indicated. The security's effective maturity date may be shorter than the final maturity date shown. |
| |
| (1) | Security was purchased pursuant to Rule 144A under the Securities Act of 1933 and may be sold in transactions exempt from registration, normally to qualified institutional investors. The aggregate value of these securities at the period end was $56,453,222, which represented 28.8% of total net assets. |
| |
| (2) | When-issued security. The issue price and yield are fixed on the date of the commitment, but payment and delivery are scheduled for a future date. |
| |
| (3) | Security, or a portion thereof, has been pledged at the custodian bank or with a broker for collateral requirements on futures contracts and/or swap agreements. At the period end, the aggregate value of securities pledged was $184,136. |
| |
| (4) | The interest rate on a bank loan obligation adjusts periodically based on a predetermined schedule. Rate shown is effective at period end. The maturity date on a bank loan obligation may be less than indicated as a result of contractual or optional prepayments. These prepayments cannot be predicted with certainty. |
See Notes to Financial Statements.
|
|
| Statement of Assets and Liabilities |
|
| | | |
| MARCH 31, 2020 | |
| Assets | |
| Investment securities, at value (cost of $203,689,510) | $ | 197,658,076 |
|
| Receivable for investments sold | 740,233 |
|
| Receivable for capital shares sold | 141,187 |
|
| Receivable for variation margin on futures contracts | 1,598,432 |
|
| Receivable for variation margin on swap agreements | 338,191 |
|
| Interest receivable | 1,412,440 |
|
| | 201,888,559 |
|
| | |
| Liabilities | |
| Disbursements in excess of demand deposit cash | 947,479 |
|
| Payable for investments purchased | 2,059,778 |
|
| Payable for capital shares redeemed | 2,692,323 |
|
| Accrued management fees | 84,316 |
|
| Distribution and service fees payable | 4,578 |
|
| Dividends payable | 758 |
|
| | 5,789,232 |
|
| | |
| Net Assets | $ | 196,099,327 |
|
| | |
| Net Assets Consist of: | |
| Capital paid in | $ | 205,340,327 |
|
| Distributable earnings | (9,241,000 | ) |
| | $ | 196,099,327 |
|
|
| | | | | | |
| | Net Assets | Shares Outstanding | Net Asset Value Per Share |
| Investor Class |
| $96,773,308 |
| 10,529,981 |
| $9.19 |
| I Class |
| $83,286,944 |
| 9,067,254 |
| $9.19 |
| Y Class |
| $5,201 |
| 566 |
| $9.19 |
| A Class |
| $13,825,741 |
| 1,504,607 |
| $9.19* |
| C Class |
| $1,604,500 |
| 174,574 |
| $9.19 |
| R Class |
| $195,349 |
| 21,254 |
| $9.19 |
| R5 Class |
| $224,701 |
| 24,438 |
| $9.19 |
| R6 Class |
| $183,583 |
| 19,970 |
| $9.19 |
*Maximum offering price $9.40 (net asset value divided by 0.9775).
See Notes to Financial Statements.
|
| | | |
| YEAR ENDED MARCH 31, 2020 | |
| Investment Income (Loss) | |
| Income: | |
| Interest (net of foreign taxes withheld of $559) | $ | 5,610,903 |
|
| | |
| Expenses: | |
| Management fees | 1,033,273 |
|
| Distribution and service fees: | |
| A Class | 24,742 |
|
| C Class | 15,501 |
|
| R Class | 2,932 |
|
| Trustees' fees and expenses | 13,656 |
|
| Other expenses | 2,174 |
|
| | 1,092,278 |
|
Fees waived(1) | (168,836 | ) |
| | 923,442 |
|
| | |
| Net investment income (loss) | 4,687,461 |
|
| | |
| Realized and Unrealized Gain (Loss) | |
| Net realized gain (loss) on: | |
| Investment transactions | 164,124 |
|
| Futures contract transactions | (96,815 | ) |
| Swap agreement transactions | (286,420 | ) |
| | (219,111 | ) |
| | |
| Change in net unrealized appreciation (depreciation) on: | |
| Investments | (6,408,076 | ) |
| Futures contracts | 197,489 |
|
| Swap agreements | (1,352,500 | ) |
| | (7,563,087 | ) |
| | |
| Net realized and unrealized gain (loss) | (7,782,198 | ) |
| | |
| Net Increase (Decrease) in Net Assets Resulting from Operations | $ | (3,094,737 | ) |
| |
| (1) | Amount consists of $75,377, $82,262, $4, $8,907, $1,395, $528, $207 and $156 for Investor Class, I Class, Y Class, A Class, C Class, R Class, R5 Class and R6 Class, respectively. |
See Notes to Financial Statements.
|
|
| Statement of Changes in Net Assets |
|
| | | | | | |
| YEARS ENDED MARCH 31, 2020 AND MARCH 31, 2019 |
| Increase (Decrease) in Net Assets | March 31, 2020 | March 31, 2019 |
| Operations | | |
| Net investment income (loss) | $ | 4,687,461 |
| $ | 2,040,848 |
|
| Net realized gain (loss) | (219,111 | ) | (639,018 | ) |
| Change in net unrealized appreciation (depreciation) | (7,563,087 | ) | 967,929 |
|
| Net increase (decrease) in net assets resulting from operations | (3,094,737 | ) | 2,369,759 |
|
| | | |
| Distributions to Shareholders | | |
| From earnings: | | |
| Investor Class | (2,217,635 | ) | (1,621,171 | ) |
| I Class | (2,510,365 | ) | (284,223 | ) |
| Y Class | (152 | ) | (163 | ) |
| A Class | (235,015 | ) | (82,054 | ) |
| C Class | (25,657 | ) | (13,047 | ) |
| R Class | (12,874 | ) | (13,077 | ) |
| R5 Class | (6,621 | ) | (94,981 | ) |
| R6 Class | (5,048 | ) | (19,210 | ) |
| Decrease in net assets from distributions | (5,013,367 | ) | (2,127,926 | ) |
| | | |
| Capital Share Transactions | | |
| Net increase (decrease) in net assets from capital share transactions (Note 5) | 72,854,875 |
| 86,266,023 |
|
| | | |
| Net increase (decrease) in net assets | 64,746,771 |
| 86,507,856 |
|
| | | |
| Net Assets | | |
| Beginning of period | 131,352,556 |
| 44,844,700 |
|
| End of period | $ | 196,099,327 |
| $ | 131,352,556 |
|
See Notes to Financial Statements.
|
|
| Notes to Financial Statements |
MARCH 31, 2020
1. Organization
American Century Investment Trust (the trust) is registered under the Investment Company Act of 1940, as amended (the 1940 Act), as an open-end management investment company and is organized as a Massachusetts business trust. Short Duration Strategic Income Fund (the fund) is one fund in a series issued by the trust. The fund’s investment objective is to seek income. As a secondary objective, the fund seeks long-term capital appreciation.
The fund offers the Investor Class, I Class, Y Class, A Class, C Class, R Class, R5 Class and R6 Class. The A Class may incur an initial sales charge. The A Class and C Class may be subject to a contingent deferred sales charge.
2. Significant Accounting Policies
The following is a summary of significant accounting policies consistently followed by the fund in preparation of its financial statements. The fund is an investment company and follows accounting and reporting guidance in accordance with accounting principles generally accepted in the United States of America. This may require management to make certain estimates and assumptions at the date of the financial statements. Actual results could differ from these estimates. Management evaluated the impact of events or transactions occurring through the date the financial statements were issued that would merit recognition or disclosure.
Investment Valuations — The fund determines the fair value of its investments and computes its net asset value per share at the close of regular trading (usually 4 p.m. Eastern time) on the New York Stock Exchange (NYSE) on each day the NYSE is open. The Board of Trustees has adopted valuation policies and procedures to guide the investment advisor in the fund’s investment valuation process and to provide methodologies for the oversight of the fund’s pricing function.
Fixed income securities are valued at the evaluated mean as provided by independent pricing services or at the mean of the most recent bid and asked prices as provided by investment dealers. Corporate bonds, U.S. Treasury and Government Agency securities, convertible bonds, bank loan obligations, municipal securities, and sovereign governments and agencies are valued using market models that consider trade data, quotations from dealers and active market makers, relevant yield curve and spread data, creditworthiness, trade data or market information on comparable securities, and other relevant security specific information. Mortgage-related and asset-backed securities are valued based on models that consider trade data, prepayment and default projections, benchmark yield and spread data and estimated cash flows of each tranche of the issuer. Collateralized loan obligations are valued based on discounted cash flow models that consider trade and economic data, prepayment assumptions and default projections.
Open-end management investment companies are valued at the reported net asset value per share. Repurchase agreements are valued at cost, which approximates fair value. Exchange-traded futures contracts are valued at the settlement price as provided by the appropriate exchange. Swap agreements are valued at an evaluated mean as provided by independent pricing services or independent brokers.
If the fund determines that the market price for an investment is not readily available or the valuation methods mentioned above do not reflect an investment’s fair value, such investment is valued as determined in good faith by the Board of Trustees or its delegate, in accordance with policies and procedures adopted by the Board of Trustees. In its determination of fair value, the fund may review several factors including, but not limited to, market information regarding the specific investment or comparable investments and correlation with other investment types, futures indices or general market indicators. Circumstances that may cause the fund to use these procedures to value an investment include, but are not limited to: an investment has been declared in default or is distressed; trading in a security has been suspended during the trading day or a security is not actively trading on its principal exchange; prices received from a regular pricing source are deemed unreliable; or there is a foreign market holiday and no trading occurred.
The fund monitors for significant events occurring after the close of an investment’s primary exchange but before the fund’s net asset value per share is determined. Significant events may include, but are not limited to: corporate announcements and transactions; governmental action and political unrest that could impact a specific investment or an investment sector; or armed conflicts, natural disasters and similar events that could affect investments in a specific country or region.
Security Transactions — Security transactions are accounted for as of the trade date. Net realized gains and losses are determined on the identified cost basis, which is also used for federal income tax purposes.
Investment Income — Interest income less foreign taxes, withheld, if any, is recorded on the accrual basis and includes paydown gain (loss) and accretion of discounts and amortization of premiums. Inflation adjustments related to inflation-linked debt securities are reflected as interest income.
Repurchase Agreements — The fund may enter into repurchase agreements with institutions that American Century Investment Management, Inc. (ACIM) (the investment advisor) has determined are creditworthy pursuant to criteria adopted by the Board of Trustees. The fund requires that the collateral, represented by securities, received in a repurchase transaction be transferred to the custodian in a manner sufficient to enable the fund to obtain those securities in the event of a default under the repurchase agreement. ACIM monitors, on a daily basis, the securities transferred to ensure the value, including accrued interest, of the securities under each repurchase agreement is equal to or greater than amounts owed to the fund under each repurchase agreement.
Joint Trading Account — Pursuant to an Exemptive Order issued by the Securities and Exchange Commission, the fund, along with certain other funds in the American Century Investments family of funds, may transfer uninvested cash balances into a joint trading account. These balances are invested in one or more repurchase agreements that are collateralized by U.S. Treasury or Agency obligations.
Segregated Assets — In accordance with the 1940 Act, the fund segregates assets on its books and records to cover certain types of investment securities and other financial instruments. ACIM monitors, on a daily basis, the securities segregated to ensure the fund designates a sufficient amount of liquid assets, marked-to-market daily. The fund may also receive assets or be required to pledge assets at the custodian bank or with a broker for collateral requirements.
Income Tax Status — It is the fund’s policy to distribute substantially all net investment income and net realized gains to shareholders and to otherwise qualify as a regulated investment company under provisions of the Internal Revenue Code. Accordingly, no provision has been made for income taxes. The fund files U.S. federal, state, local and non-U.S. tax returns as applicable. The fund's tax returns are subject to examination by the relevant taxing authority until expiration of the applicable statute of limitations, which is generally three years from the date of filing but can be longer in certain jurisdictions. At this time, management believes there are no uncertain tax positions which, based on their technical merit, would not be sustained upon examination and for which it is reasonably possible that the total amounts of unrecognized tax benefits will significantly change in the next twelve months.
Multiple Class — All shares of the fund represent an equal pro rata interest in the net assets of the class to which such shares belong, and have identical voting, dividend, liquidation and other rights and the same terms and conditions, except for class specific expenses and exclusive rights to vote on matters affecting only individual classes. Income, non-class specific expenses, and realized and unrealized capital gains and losses of the fund are allocated to each class of shares based on their relative net assets.
Distributions to Shareholders — Distributions from net investment income, if any, are declared daily and paid monthly. Distributions from net realized gains, if any, are generally declared and paid annually.
Indemnifications — Under the trust’s organizational documents, its officers and trustees are indemnified against certain liabilities arising out of the performance of their duties to the fund. In addition, in the normal course of business, the fund enters into contracts that provide general indemnifications. The maximum exposure under these arrangements is unknown as this would involve future claims that may be made against a fund. The risk of material loss from such claims is considered by management to be remote.
3. Fees and Transactions with Related Parties
Certain officers and trustees of the trust are also officers and/or directors of American Century Companies, Inc. (ACC). The trust's investment advisor, ACIM, the trust's distributor, American Century Investment Services, Inc. (ACIS), and the trust's transfer agent, American Century Services, LLC, are wholly owned, directly or indirectly, by ACC.
Management Fees — The trust has entered into a management agreement with ACIM, under which ACIM provides the fund with investment advisory and management services in exchange for a single, unified management fee (the fee) per class. The agreement provides that all expenses of managing and operating the fund, except distribution and service fees, brokerage expenses, taxes, interest, fees and expenses of the independent trustees (including legal counsel fees), and extraordinary expenses, will be paid by ACIM. The fee is computed and accrued daily based on each class's daily net assets and paid monthly in arrears. The difference in the fee among the classes is a result of their separate arrangements for non-Rule 12b-1 shareholder services. It is not the result of any difference in advisory or custodial fees or other expenses related to the management of the fund’s assets, which do not vary by class. During the period ended March 31, 2020, the investment advisor agreed to waive 0.09% of the fund's management fee. The investment advisor expects this waiver to continue until July 31, 2020 and cannot terminate it prior to such date without the approval of the Board of Trustees.
The annual management fee and the effective annual management fee after waiver for each class for the period ended March 31, 2020 are as follows:
|
| | |
| | Annual Management Fee | Effective Annual Management Fee After Waiver |
| Investor Class | 0.60% | 0.51% |
| I Class | 0.50% | 0.41% |
| Y Class | 0.40% | 0.31% |
| A Class | 0.60% | 0.51% |
| C Class | 0.60% | 0.51% |
| R Class | 0.60% | 0.51% |
| R5 Class | 0.40% | 0.31% |
| R6 Class | 0.35% | 0.26% |
Distribution and Service Fees — The Board of Trustees has adopted a separate Master Distribution and Individual Shareholder Services Plan for each of the A Class, C Class and R Class (collectively the plans), pursuant to Rule 12b-1 of the 1940 Act. The plans provide that the A Class will pay ACIS an annual distribution and service fee of 0.25%. The plans provide that the C Class will pay ACIS an annual distribution and service fee of 1.00%, of which 0.25% is paid for individual shareholder services and 0.75% is paid for distribution services. The plans provide that the R Class will pay ACIS an annual distribution and service fee of 0.50%. The fees are computed and accrued daily based on each class’s daily net assets and paid monthly in arrears. The fees are used to pay financial intermediaries for distribution and individual shareholder services. Fees incurred under the plans during the period ended March 31, 2020 are detailed in the Statement of Operations.
Trustees’ Fees and Expenses — The Board of Trustees is responsible for overseeing the investment advisor’s management and operations of the fund. The trustees receive detailed information about the fund and its investment advisor regularly throughout the year, and meet at least quarterly with management of the investment advisor to review reports about fund operations. The fund’s officers do not receive compensation from the fund.
Interfund Transactions — The fund may enter into security transactions with other American Century Investments funds and other client accounts of the investment advisor, in accordance with the 1940 Act rules and procedures adopted by the Board of Trustees. The rules and procedures require, among other things, that these transactions be effected at the independent current market price of the security. There were no interfund transactions during the period.
4. Investment Transactions
Purchases of investment securities, excluding short-term investments, for the period ended March 31, 2020 totaled $251,630,882, of which $74,446,070 represented U.S. Treasury and Government Agency obligations.
Sales of investment securities, excluding short-term investments, for the period ended March 31, 2020 totaled $169,948,915, of which $66,190,031 represented U.S. Treasury and Government Agency obligations.
5. Capital Share Transactions
Transactions in shares of the fund were as follows (unlimited number of shares authorized):
|
| | | | | | | | | | |
| | Year ended March 31, 2020 | Year ended March 31, 2019 |
| | Shares | Amount | Shares | Amount |
| Investor Class | | | | |
| Sold | 11,160,721 |
| $ | 106,139,309 |
| 11,675,445 |
| $ | 110,364,198 |
|
| Issued in reinvestment of distributions | 227,716 |
| 2,170,986 |
| 164,600 |
| 1,556,473 |
|
| Redeemed | (12,426,987 | ) | (117,529,153 | ) | (3,626,603 | ) | (34,354,138 | ) |
| | (1,038,550 | ) | (9,218,858 | ) | 8,213,442 |
| 77,566,533 |
|
| I Class | | | | |
| Sold | 15,276,503 |
| 145,480,700 |
| 3,136,773 |
| 29,693,845 |
|
| Issued in reinvestment of distributions | 263,209 |
| 2,510,354 |
| 30,064 |
| 284,218 |
|
| Redeemed | (7,890,873 | ) | (74,561,139 | ) | (1,750,401 | ) | (16,472,725 | ) |
| | 7,648,839 |
| 73,429,915 |
| 1,416,436 |
| 13,505,338 |
|
| Y Class | | | | |
| Issued in reinvestment of distributions | 16 |
| 152 |
| 17 |
| 163 |
|
| A Class | | | | |
| Sold | 1,269,930 |
| 12,146,904 |
| 667,365 |
| 6,311,533 |
|
| Issued in reinvestment of distributions | 24,117 |
| 229,921 |
| 8,501 |
| 80,380 |
|
| Redeemed | (407,550 | ) | (3,884,586 | ) | (482,972 | ) | (4,587,944 | ) |
| | 886,497 |
| 8,492,239 |
| 192,894 |
| 1,803,969 |
|
| C Class | | | | |
| Sold | 177,859 |
| 1,700,862 |
| 121,672 |
| 1,145,675 |
|
| Issued in reinvestment of distributions | 2,685 |
| 25,625 |
| 1,376 |
| 13,006 |
|
| Redeemed | (120,696 | ) | (1,151,240 | ) | (50,064 | ) | (474,458 | ) |
| | 59,848 |
| 575,247 |
| 72,984 |
| 684,223 |
|
| R Class | | | | |
| Sold | 9,770 |
| 92,418 |
| 75,683 |
| 717,329 |
|
| Issued in reinvestment of distributions | 1,345 |
| 12,845 |
| 1,378 |
| 13,028 |
|
| Redeemed | (60,475 | ) | (560,392 | ) | (12,566 | ) | (118,977 | ) |
| | (49,360 | ) | (455,129 | ) | 64,495 |
| 611,380 |
|
| R5 Class | | | | |
| Sold | — |
| — |
| 3,193 |
| 30,373 |
|
| Issued in reinvestment of distributions | 694 |
| 6,621 |
| 9,946 |
| 94,437 |
|
| Redeemed | (92 | ) | (838 | ) | (751,573 | ) | (7,129,387 | ) |
| | 602 |
| 5,783 |
| (738,434 | ) | (7,004,577 | ) |
| R6 Class | | | | |
| Sold | 2,194 |
| 20,478 |
| 5,263 |
| 49,865 |
|
| Issued in reinvestment of distributions | 529 |
| 5,048 |
| 2,016 |
| 19,129 |
|
| Redeemed | — |
| — |
| (102,321 | ) | (970,000 | ) |
| | 2,723 |
| 25,526 |
| (95,042 | ) | (901,006 | ) |
| Net increase (decrease) | 7,510,615 |
| $ | 72,854,875 |
| 9,126,792 |
| $ | 86,266,023 |
|
6. Fair Value Measurements
The fund’s investments valuation process is based on several considerations and may use multiple inputs to determine the fair value of the investments held by the fund. In conformity with accounting principles generally accepted in the United States of America, the inputs used to determine a valuation are classified into three broad levels.
| |
| • | Level 1 valuation inputs consist of unadjusted quoted prices in an active market for identical investments. |
| |
| • | Level 2 valuation inputs consist of direct or indirect observable market data (including quoted prices for comparable investments, evaluations of subsequent market events, interest rates, prepayment speeds, credit risk, etc.). These inputs also consist of quoted prices for identical investments initially expressed in local currencies that are adjusted through translation into U.S. dollars. |
| |
| • | Level 3 valuation inputs consist of unobservable data (including a fund’s own assumptions). |
The level classification is based on the lowest level input that is significant to the fair valuation measurement. The valuation inputs are not necessarily an indication of the risks associated with investing in these securities or other financial instruments.
The following is a summary of the level classifications as of period end. The Schedule of Investments provides additional information on the fund’s portfolio holdings.
|
| | | | | | | | |
| | Level 1 | Level 2 | Level 3 |
| Assets | | | |
| Investment Securities | | | |
| Corporate Bonds | — |
| $ | 129,274,760 |
| — |
|
| U.S. Treasury Securities | — |
| 25,382,209 |
| — |
|
| Asset-Backed Securities | — |
| 17,861,484 |
| — |
|
| Collateralized Loan Obligations | — |
| 12,680,172 |
| — |
|
| Collateralized Mortgage Obligations | — |
| 7,955,455 |
| — |
|
| Commercial Mortgage-Backed Securities | — |
| 2,154,479 |
| — |
|
| Sovereign Governments and Agencies | — |
| 1,635,370 |
| — |
|
| Bank Loan Obligations | — |
| 404,158 |
| — |
|
| Temporary Cash Investments | — |
| 309,989 |
| — |
|
| | — |
| $ | 197,658,076 |
| — |
|
| Other Financial Instruments | | | |
| Futures Contracts | $ | 197,489 |
| — |
| — |
|
| Swap Agreements | — |
| $ | 1,278,549 |
| — |
|
| | $ | 197,489 |
| $ | 1,278,549 |
| — |
|
7. Derivative Instruments
Credit Risk — The fund is subject to credit risk in the normal course of pursuing its investment objectives. The value of a bond generally declines as the credit quality of its issuer declines. Credit default swap agreements enable a fund to buy/sell protection against a credit event of a specific issuer or index. A fund may attempt to enhance returns by selling protection or attempt to mitigate credit risk by buying protection. The buyer/seller of credit protection against a security or basket of securities may pay/receive an up-front or periodic payment to compensate for/against potential default events. Changes in value, including the periodic amounts of interest to be paid or received on swap agreements, are recorded as unrealized appreciation (depreciation) on swap agreements. Upon entering into a centrally cleared swap, a fund is required to deposit cash or securities (initial margin) with a financial intermediary in an amount equal to a certain percentage of the notional amount. Subsequent payments (variation margin) are made or received daily, in cash, by a fund. The variation margin is equal to the daily change in the value and is a component of unrealized gains and losses. Realized gain or loss is recorded upon receipt or payment of a periodic settlement or termination of swap agreements. Net realized and unrealized gains or losses occurring during the holding period of swap agreements are a component of net realized gain (loss) on swap agreement transactions and change in net unrealized appreciation (depreciation) on swap agreements, respectively. The risks of entering into swap agreements include the possible lack of liquidity, failure of the counterparty to meet its obligations, and that there may be unfavorable changes in the underlying investments or instruments. The fund's average notional amount held during the period was $9,544,383.
Interest Rate Risk — The fund is subject to interest rate risk in the normal course of pursuing its investment objectives. The value of bonds generally declines as interest rates rise. A fund may enter into futures contracts based on a bond index or a specific underlying security. A fund may purchase futures contracts to gain exposure to increases in market value or sell futures contracts to protect against a decline in market value. Upon entering into a futures contract, a fund will segregate cash, cash equivalents or other appropriate liquid securities on its records in amounts sufficient to meet requirements. Subsequent payments (variation margin) are made or received daily, in cash, by a fund. The variation margin is equal to the daily change in the contract value and is recorded as unrealized gains and losses. A fund recognizes a realized gain or loss when the futures contract is closed or expires. Net realized and unrealized gains or losses occurring during the holding period of futures contracts are a component of net realized gain (loss) on futures contract transactions and change in net unrealized appreciation (depreciation) on futures contracts, respectively. One of the risks of entering into futures contracts is the possibility that the change in value of the contract may not correlate with the changes in value of the underlying securities. The fund's average notional exposure to interest rate risk derivative instruments held during the period was $16,066,667 futures contracts purchased and $5,400,000 futures contracts sold.
Value of Derivative Instruments as of March 31, 2020
|
| | | | | | | |
| | Asset Derivatives | Liability Derivatives |
| Type of Risk Exposure | Location on Statement of Assets and Liabilities | Value | Location on Statement of Assets and Liabilities | Value |
| Credit Risk | Receivable for variation margin on swap agreements* | $ | 338,191 |
| Payable for variation margin on swap agreements* | — |
|
| Interest Rate Risk | Receivable for variation margin on futures contracts* | 1,598,432 |
| Payable for variation margin on futures contracts* | — |
|
| | | $ | 1,936,623 |
| | — |
|
*Included in the unrealized appreciation (depreciation) on futures contracts or centrally cleared swap agreements, as applicable, as reported in the Schedule of Investments.
Effect of Derivative Instruments on the Statement of Operations for the Year Ended March 31, 2020
|
| | | | | | | | |
| | Net Realized Gain (Loss) | Change in Net Unrealized Appreciation (Depreciation) |
| Type of Risk Exposure | Location on Statement of Operations | Value | Location on Statement of Operations | Value |
| Credit Risk | Net realized gain (loss) on swap agreement transactions | $ | (286,420 | ) | Change in net unrealized appreciation (depreciation) on swap agreements | $ | (1,352,500 | ) |
| Interest Rate Risk | Net realized gain (loss) on futures contract transactions | (96,815 | ) | Change in net unrealized appreciation (depreciation) on futures contracts | 197,489 |
|
| | | $ | (383,235 | ) | | $ | (1,155,011 | ) |
8. Risk Factors
The value of the fund’s shares will go up and down, sometimes rapidly or unpredictably, based on the performance of the securities owned by the fund and other factors generally affecting the securities market. Market risks, including political, regulatory, economic and social developments, can affect the value of the fund’s investments. Natural disasters, public health emergencies, terrorism and other unforeseeable events may lead to increased market volatility and may have adverse long-term effects on world economies and markets generally.
The fund invests in lower-rated debt securities, which are subject to substantial risks including liquidity risk and credit risk.
There are certain risks involved in investing in foreign securities. These risks include those resulting from political events (such as civil unrest, national elections and imposition of exchange controls), social and economic events (such as labor strikes and rising inflation), and natural disasters. Securities of foreign issuers may be less liquid and more volatile. Investing in emerging markets or a significant portion of assets in one country or region may accentuate these risks.
The fund may invest in instruments that have variable or floating coupon rates based on the London Interbank Offered Rate (LIBOR). LIBOR is a benchmark interest rate intended to be representative of the rate at which certain major international banks lend to one another over short-terms. LIBOR will be phased out by the end of 2021. Uncertainty remains regarding a replacement rate or rates for LIBOR. The transition process may lead to increased volatility or illiquidity in markets for instruments that rely on LIBOR. This could result in a change to the value of such instruments.
9. Federal Tax Information
The tax character of distributions paid during the years ended March 31, 2020 and March 31, 2019 were as follows:
|
| | | | | | |
| | 2020 | 2019 |
| Distributions Paid From | | |
| Ordinary income | $ | 5,013,367 |
| $ | 2,127,926 |
|
| Long-term capital gains | — |
| — |
|
The book-basis character of distributions made during the year from net investment income or net realized gains may differ from their ultimate characterization for federal income tax purposes. These differences reflect the differing character of certain income items and net realized gains and losses for financial statement and tax purposes, and may result in reclassification among certain capital accounts on the financial statements.
As of period end, the federal tax cost of investments and the components of distributable earnings on a tax-basis were as follows:
|
| | | |
| Federal tax cost of investments | $ | 203,711,939 |
|
| Gross tax appreciation of investments | $ | 1,074,051 |
|
| Gross tax depreciation of investments | (7,127,914 | ) |
| Net tax appreciation (depreciation) of investments | (6,053,863 | ) |
| Net tax appreciation (depreciation) on derivatives | (1,316,567 | ) |
| Net tax appreciation (depreciation) | $ | (7,370,430 | ) |
| Other book-to-tax adjustments | $ | (78,414 | ) |
| Undistributed ordinary income | $ | 2,421 |
|
| Accumulated short-term capital losses | $ | (682,908 | ) |
| Accumulated long-term capital losses | $ | (1,111,669 | ) |
The difference between book-basis and tax-basis unrealized appreciation (depreciation) is attributable primarily to the realization for tax purposes of unrealized gains (losses) on certain futures contracts. Other book-to-tax adjustments are attributable primarily to the tax deferral of losses on straddle positions.
Accumulated capital losses represent net capital loss carryovers that may be used to offset future realized capital gains for federal income tax purposes. The capital loss carryovers may be carried forward for an unlimited period. Future capital loss carryover utilization in any given year may be subject to Internal Revenue
Code limitations.
10. Recently Issued Accounting Standards
In March 2017, the Financial Accounting Standards Board (FASB) issued Accounting Standards Update No. 2017-08, “Receivables - Nonrefundable Fees and Other Costs (Subtopic 310-20), Premium Amortization on Purchased Callable Debt Securities” (ASU 2017-08). ASU 2017-08 amends the amortization period for certain purchased callable debt securities held at a premium, shortening such period to the earliest call date. The amendments are effective for fiscal years, and interim periods within those fiscal years, beginning after December 15, 2018. The adoption of ASU 2017-08 did not materially impact the financial statements.
|
| | | | | | | | | | | | | | | | | |
| For a Share Outstanding Throughout the Years Ended March 31 (except as noted) |
| Per-Share Data | | | | | | | | | Ratios and Supplemental Data |
| | | Income From Investment Operations: | Distributions From: | | | Ratio to Average Net Assets of: | | |
| | Net Asset
Value,
Beginning
of Period | Net
Investment
Income
(Loss)(1) | Net
Realized
and
Unrealized
Gain (Loss) | Total From
Investment
Operations | Net Investment Income | Tax Return of Capital | Total Distributions | Net Asset
Value,
End of Period | Total
Return(2) | Operating
Expenses | Operating
Expenses
(before
expense
waiver) | Net
Investment
Income
(Loss) | Net
Investment
Income (Loss) (before expense waiver) | Portfolio
Turnover
Rate | Net
Assets,
End of
Period (in thousands) |
| Investor Class | | | | | | | | | | | | | | |
| 2020 | $9.50 | 0.24 | (0.30) | (0.06) | (0.25) | — | (0.25) | $9.19 | (0.65)% | 0.52% | 0.61% | 2.48% | 2.39% | 98% |
| $96,773 |
|
| 2019 | $9.53 | 0.28 | (0.02) | 0.26 | (0.29) | — | (0.29) | $9.50 | 2.75% | 0.58% | 0.66% | 2.97% | 2.89% | 61% |
| $109,863 |
|
| 2018 | $9.60 | 0.23 | (0.09) | 0.14 | (0.21) | — | (0.21) | $9.53 | 1.50% | 0.63% | 0.75% | 2.43% | 2.31% | 57% |
| $31,975 |
|
| 2017 | $9.31 | 0.24 | 0.31 | 0.55 | (0.25) | (0.01) | (0.26) | $9.60 | 5.96% | 0.60% | 0.75% | 2.54% | 2.39% | 29% |
| $11,304 |
|
| 2016 | $9.75 | 0.26 | (0.38) | (0.12) | (0.32) | — | (0.32) | $9.31 | (1.26)% | 0.60% | 0.75% | 2.69% | 2.54% | 19% |
| $4,927 |
|
| I Class | | | | | | | | | | | | | | |
| 2020 | $9.49 | 0.25 | (0.29) | (0.04) | (0.26) | — | (0.26) | $9.19 | (0.44)% | 0.42% | 0.51% | 2.58% | 2.49% | 98% |
| $83,287 |
|
| 2019 | $9.53 | 0.29 | (0.03) | 0.26 | (0.30) | — | (0.30) | $9.49 | 2.75% | 0.48% | 0.56% | 3.07% | 2.99% | 61% |
| $13,463 |
|
2018(3) | $9.61 | 0.24 | (0.11) | 0.13 | (0.21) | — | (0.21) | $9.53 | 1.39% | 0.53%(4) | 0.65%(4) | 2.56%(4) | 2.44%(4) | 57%(5) |
| $19 |
|
| Y Class | | | | | | | | | | | | | | |
| 2020 | $9.50 | 0.26 | (0.30) | (0.04) | (0.27) | — | (0.27) | $9.19 | (0.45)% | 0.32% | 0.41% | 2.68% | 2.59% | 98% |
| $5 |
|
| 2019 | $9.53 | 0.29 | (0.02) | 0.27 | (0.30) | — | (0.30) | $9.50 | 2.92% | 0.38% | 0.46% | 3.17% | 3.09% | 61% |
| $5 |
|
2018(3) | $9.61 | 0.25 | (0.11) | 0.14 | (0.22) | — | (0.22) | $9.53 | 1.49% | 0.43%(4) | 0.55%(4) | 2.62%(4) | 2.50%(4) | 57%(5) |
| $5 |
|
|
| | | | | | | | | | | | | | | | | |
| For a Share Outstanding Throughout the Years Ended March 31 (except as noted) |
| Per-Share Data | | | | | | | | | Ratios and Supplemental Data |
| | | Income From Investment Operations: | Distributions From: | | | Ratio to Average Net Assets of: | | |
| | Net Asset
Value,
Beginning
of Period | Net
Investment
Income
(Loss)(1) | Net
Realized
and
Unrealized
Gain (Loss) | Total From
Investment
Operations | Net Investment Income | Tax Return of Capital | Total Distributions | Net Asset
Value,
End of Period | Total
Return(2) | Operating
Expenses | Operating
Expenses
(before
expense
waiver) | Net
Investment
Income
(Loss) | Net
Investment
Income (Loss) (before expense waiver) | Portfolio
Turnover
Rate | Net
Assets,
End of
Period (in thousands) |
| A Class | | | | | | | | | | | | | | | |
| 2020 | $9.50 | 0.21 | (0.29) | (0.08) | (0.23) | — | (0.23) | $9.19 | (0.90)% | 0.77% | 0.86% | 2.23% | 2.14% | 98% |
| $13,826 |
|
| 2019 | $9.53 | 0.26 | (0.03) | 0.23 | (0.26) | — | (0.26) | $9.50 | 2.50% | 0.83% | 0.91% | 2.72% | 2.64% | 61% |
| $5,870 |
|
| 2018 | $9.60 | 0.21 | (0.09) | 0.12 | (0.19) | — | (0.19) | $9.53 | 1.25% | 0.88% | 1.00% | 2.18% | 2.06% | 57% |
| $4,052 |
|
| 2017 | $9.31 | 0.22 | 0.31 | 0.53 | (0.23) | (0.01) | (0.24) | $9.60 | 5.69% | 0.85% | 1.00% | 2.29% | 2.14% | 29% |
| $9,669 |
|
| 2016 | $9.75 | 0.23 | (0.38) | (0.15) | (0.29) | — | (0.29) | $9.31 | (1.50)% | 0.85% | 1.00% | 2.44% | 2.29% | 19% |
| $9,901 |
|
| C Class | | | | | | | | | | | | | | |
| 2020 | $9.50 | 0.14 | (0.29) | (0.15) | (0.16) | — | (0.16) | $9.19 | (1.63)% | 1.52% | 1.61% | 1.48% | 1.39% | 98% |
| $1,605 |
|
| 2019 | $9.53 | 0.19 | (0.03) | 0.16 | (0.19) | — | (0.19) | $9.50 | 1.73% | 1.58% | 1.66% | 1.97% | 1.89% | 61% |
| $1,090 |
|
| 2018 | $9.60 | 0.14 | (0.09) | 0.05 | (0.12) | — | (0.12) | $9.53 | 0.49% | 1.63% | 1.75% | 1.43% | 1.31% | 57% |
| $398 |
|
| 2017 | $9.31 | 0.15 | 0.30 | 0.45 | (0.15) | (0.01) | (0.16) | $9.60 | 4.91% | 1.60% | 1.75% | 1.54% | 1.39% | 29% |
| $1,206 |
|
| 2016 | $9.75 | 0.16 | (0.38) | (0.22) | (0.22) | — | (0.22) | $9.31 | (2.24)% | 1.60% | 1.75% | 1.69% | 1.54% | 19% |
| $1,104 |
|
| R Class | | | | | | | | | | | | | | |
| 2020 | $9.50 | 0.19 | (0.29) | (0.10) | (0.21) | — | (0.21) | $9.19 | (1.14)% | 1.02% | 1.11% | 1.98% | 1.89% | 98% |
| $195 |
|
| 2019 | $9.53 | 0.24 | (0.03) | 0.21 | (0.24) | — | (0.24) | $9.50 | 2.24% | 1.08% | 1.16% | 2.47% | 2.39% | 61% |
| $671 |
|
| 2018 | $9.60 | 0.19 | (0.09) | 0.10 | (0.17) | — | (0.17) | $9.53 | 1.00% | 1.13% | 1.25% | 1.93% | 1.81% | 57% |
| $58 |
|
| 2017 | $9.31 | 0.19 | 0.31 | 0.50 | (0.20) | (0.01) | (0.21) | $9.60 | 5.43% | 1.10% | 1.25% | 2.04% | 1.89% | 29% |
| $1,032 |
|
| 2016 | $9.75 | 0.21 | (0.38) | (0.17) | (0.27) | — | (0.27) | $9.31 | (1.75)% | 1.10% | 1.25% | 2.19% | 2.04% | 19% |
| $979 |
|
|
| | | | | | | | | | | | | | | | | |
| For a Share Outstanding Throughout the Years Ended March 31 (except as noted) |
| Per-Share Data | | | | | | | | | Ratios and Supplemental Data |
| | | Income From Investment Operations: | Distributions From: | | | Ratio to Average Net Assets of: | | |
| | Net Asset
Value,
Beginning
of Period | Net
Investment
Income
(Loss)(1) | Net
Realized
and
Unrealized
Gain (Loss) | Total From
Investment
Operations | Net Investment Income | Tax Return of Capital | Total Distributions | Net Asset
Value,
End of Period | Total
Return(2) | Operating
Expenses | Operating
Expenses
(before
expense
waiver) | Net
Investment
Income
(Loss) | Net
Investment
Income (Loss) (before expense waiver) | Portfolio
Turnover
Rate | Net
Assets,
End of
Period (in thousands) |
| R5 Class | | | | | | | | | | | | | | |
| 2020 | $9.50 | 0.26 | (0.30) | (0.04) | (0.27) | — | (0.27) | $9.19 | (0.33)% | 0.32% | 0.41% | 2.68% | 2.59% | 98% |
| $225 |
|
| 2019 | $9.53 | 0.28 | —(6) | 0.28 | (0.31) | — | (0.31) | $9.50 | 2.96% | 0.38% | 0.46% | 3.17% | 3.09% | 61% |
| $226 |
|
| 2018 | $9.60 | 0.25 | (0.09) | 0.16 | (0.23) | — | (0.23) | $9.53 | 1.71% | 0.43% | 0.55% | 2.63% | 2.51% | 57% |
| $7,267 |
|
| 2017 | $9.31 | 0.26 | 0.31 | 0.57 | (0.27) | (0.01) | (0.28) | $9.60 | 6.17% | 0.40% | 0.55% | 2.74% | 2.59% | 29% |
| $7,146 |
|
| 2016 | $9.75 | 0.28 | (0.38) | (0.10) | (0.34) | — | (0.34) | $9.31 | (1.06)% | 0.40% | 0.55% | 2.89% | 2.74% | 19% |
| $6,729 |
|
| R6 Class | | | | | | | | | | | | | | |
| 2020 | $9.50 | 0.26 | (0.29) | (0.03) | (0.28) | — | (0.28) | $9.19 | (0.39)% | 0.27% | 0.36% | 2.73% | 2.64% | 98% |
| $184 |
|
| 2019 | $9.53 | 0.29 | (0.01) | 0.28 | (0.31) | — | (0.31) | $9.50 | 3.01% | 0.33% | 0.41% | 3.22% | 3.14% | 61% |
| $164 |
|
| 2018 | $9.60 | 0.26 | (0.09) | 0.17 | (0.24) | — | (0.24) | $9.53 | 1.76% | 0.38% | 0.50% | 2.68% | 2.56% | 57% |
| $1,070 |
|
| 2017 | $9.31 | 0.27 | 0.30 | 0.57 | (0.27) | (0.01) | (0.28) | $9.60 | 6.22% | 0.35% | 0.50% | 2.79% | 2.64% | 29% |
| $1,052 |
|
| 2016 | $9.75 | 0.28 | (0.38) | (0.10) | (0.34) | — | (0.34) | $9.31 | (1.01)% | 0.35% | 0.50% | 2.94% | 2.79% | 19% |
| $990 |
|
|
|
| Notes to Financial Highlights |
| |
| (1) | Computed using average shares outstanding throughout the period. |
| |
| (2) | Total returns are calculated based on the net asset value of the last business day and do not reflect applicable sales charges, if any. Total returns for periods less than one year are not annualized. |
| |
| (3) | April 10, 2017 (commencement of sale) through March 31, 2018. |
| |
| (5) | Portfolio turnover is calculated at the fund level. Percentage indicated was calculated for the year ended March 31, 2018. |
| |
| (6) | Per-share amount was less than $0.005. |
See Notes to Financial Statements.
|
|
| Report of Independent Registered Public Accounting Firm |
To the Board of Trustees of American Century Investment Trust and Shareholders of Short Duration Strategic Income Fund
Opinion on the Financial Statements
We have audited the accompanying statement of assets and liabilities, including the schedule of investments, of Short Duration Strategic Income Fund (one of the funds constituting American Century Investment Trust, referred to hereafter as the “Fund”) as of March 31, 2020, the related statement of operations for the year ended March 31, 2020, the statement of changes in net assets for each of the two years in the period ended March 31, 2020, including the related notes, and the financial highlights for each of the periods indicated therein (collectively referred to as the “financial statements”). In our opinion, the financial statements present fairly, in all material respects, the financial position of the Fund as of March 31, 2020, the results of its operations for the year then ended, the changes in its net assets for each of the two years in the period ended March 31, 2020 and the financial highlights for each of the periods indicated therein in conformity with accounting principles generally accepted in the United States of America.
Basis for Opinion
These financial statements are the responsibility of the Fund’s management. Our responsibility is to express an opinion on the Fund’s financial statements based on our audits. We are a public accounting firm registered with the Public Company Accounting Oversight Board (United States) (PCAOB) and are required to be independent with respect to the Fund in accordance with the U.S. federal securities laws and the applicable rules and regulations of the Securities and Exchange Commission and the PCAOB.
We conducted our audits of these financial statements in accordance with the standards of the PCAOB. Those standards require that we plan and perform the audit to obtain reasonable assurance about whether the financial statements are free of material misstatement, whether due to error or fraud.
Our audits included performing procedures to assess the risks of material misstatement of the financial statements, whether due to error or fraud, and performing procedures that respond to those risks. Such procedures included examining, on a test basis, evidence regarding the amounts and disclosures in the financial statements. Our audits also included evaluating the accounting principles used and significant estimates made by management, as well as evaluating the overall presentation of the financial statements. Our procedures included confirmation of securities owned as of March 31, 2020 by correspondence with the custodian and brokers; when replies were not received from brokers, we performed other auditing procedures. We believe that our audits provide a reasonable basis for our opinion.
/s/ PricewaterhouseCoopers LLP
Kansas City, Missouri
May 18, 2020
We have served as the auditor of one or more investment companies in American Century Investments since 1997.
Board of Trustees
The individuals listed below serve as trustees of the funds. Each trustee will continue to serve in this capacity until death, retirement, resignation or removal from office. The board has adopted a mandatory retirement age for trustees who are not “interested persons,” as that term is defined in the Investment Company Act (independent trustees). Independent trustees shall retire on December 31 of the year in which they reach their 75th birthday; provided, however, that on or after January 1, 2022, independent trustees shall retire on December 31 of the year in which they reach their 76th birthday.
Mr. Thomas is an “interested person” because he currently serves as President and Chief Executive Officer of American Century Companies, Inc. (ACC), the parent company of American Century Investment Management, Inc. (ACIM or the advisor). The other trustees (more than three-fourths of the total number) are independent. They are not employees, directors or officers of, and have no financial interest in, ACC or any of its wholly owned, direct or indirect, subsidiaries, including ACIM, American Century Investment Services, Inc. (ACIS) and American Century Services, LLC (ACS), and they do not have any other affiliations, positions or relationships that would cause them to be considered “interested persons” under the Investment Company Act. The trustees serve in this capacity for eight (in the case of Jonathan S. Thomas, 16; and Ronald J. Gilson, 9) registered investment companies in the American Century Investments family of funds.
The following table presents additional information about the trustees. The mailing address for each trustee other than Mr. Thomas is 1665 Charleston Road, Mountain View, California 94043. The mailing address for Mr. Thomas is 4500 Main Street, Kansas City, Missouri 64111.
|
| | | | | |
Name
(Year of Birth) | Position(s) Held with Funds | Length of Time Served | Principal Occupation(s) During Past 5 Years | Number of American Century Portfolios Overseen by Trustee | Other Directorships Held During Past 5 Years |
| Independent Trustees |
|
|
Tanya S. Beder
(1955) | Trustee | Since 2011 | Chairman and CEO, SBCC Group Inc. (independent advisory services) (2006 to present) | 40 | CYS Investments, Inc.; Kirby Corporation; Nabors Industries Ltd. |
Jeremy I. Bulow
(1954) | Trustee | Since 2011 | Professor of Economics, Stanford University, Graduate School of Business (1979 to present) | 40 | None |
Anne Casscells
(1958) | Trustee | Since 2016 | Co-Chief Executive Officer and Chief Investment Officer, Aetos Alternatives Management (investment advisory firm) (2001 to present); Lecturer in Accounting, Stanford University, Graduate School of Business (2009 to 2017) | 40 | None |
Ronald J. Gilson
(1946) | Trustee and Chairman of the Board | Since 1995
(Chairman since 2005) | Charles J. Meyers Professor of Law and Business, Emeritus, Stanford Law School (1979 to 2016); Marc and Eva Stern Professor of Law and Business, Columbia University School of Law (1992 to present) | 57 | None |
|
| | | | | |
Name
(Year of Birth) | Position(s) Held with Funds | Length of Time Served | Principal Occupation(s) During Past 5 Years | Number of American Century Portfolios Overseen by Trustee | Other Directorships Held During Past 5 Years |
| Independent Trustees |
|
|
Frederick L. A. Grauer
(1946) | Trustee | Since 2008 | Senior Advisor, Credit Sesame, Inc. (credit monitoring firm) (2018 to present); Senior Advisor, Course Hero (an educational technology company) (2015 to present) | 40 | None |
Jonathan D. Levin
(1972) | Trustee | Since 2016 | Philip H. Knight Professor and Dean, Graduate School of Business, Stanford University (2016 to present); Professor, Stanford University, (2000 to present) | 40 | None |
Peter F. Pervere
(1947) | Trustee | Since 2007 | Retired | 40 | None |
John B. Shoven
(1947) | Trustee | Since 2002 | Charles R. Schwab Professor of Economics, Stanford University (1973 to present, emeritus since 2019) | 40 | Cadence Design Systems; Exponent; Financial Engines |
| Interested Trustee |
|
|
Jonathan S. Thomas
(1963) | Trustee | Since 2007 | President and Chief Executive Officer, ACC (2007 to present). Also serves as Chief Executive Officer, ACS; Executive Vice President, ACIM; Director, ACC, ACIM and other ACC subsidiaries | 120 | None |
The Statement of Additional Information has additional information about the fund's trustees and is available without charge, upon request, by calling 1-800-345-2021.
Officers
The following table presents certain information about the executive officers of the funds. Each officer serves as an officer for 16 (in the case of Robert J. Leach, 15) investment companies in the American Century family of funds, unless otherwise noted. No officer is compensated for his or her service as an officer of the funds. The listed officers are interested persons of the funds and are appointed or re-appointed on an annual basis. The mailing address for each of the officers listed below is 4500 Main Street, Kansas City, Missouri 64111.
|
| | |
Name
(Year of Birth) | Offices with the Funds | Principal Occupation(s) During the Past Five Years |
Patrick Bannigan
(1965)
| President since 2019 | Executive Vice President and Director, ACC (2012 to present); Chief Financial Officer, Chief Accounting Officer and Treasurer, ACC (2015 to present); Chief Operating Officer, ACC (2012-2015). Also serves as President, ACS; Vice President, ACIM; Chief Financial Officer, Chief Accounting Officer and/or Director, ACIM, ACS and other ACC subsidiaries |
R. Wes Campbell
(1974)
| Chief Financial Officer and Treasurer since 2018 | Vice President, ACS (2020 to present); Investment Operations and Investment Accounting, ACS (2000 to present) |
Amy D. Shelton
(1964) | Chief Compliance Officer and Vice President since 2014 | Chief Compliance Officer, American Century funds, (2014 to present); Chief Compliance Officer, ACIM (2014 to present); Chief Compliance Officer, ACIS (2009 to present). Also serves as Vice President, ACIS |
Charles A. Etherington
(1957) | General Counsel since 2007 and Senior Vice President since 2006 | Attorney, ACC (1994 to present); Vice President, ACC (2005 to present); General Counsel, ACC (2007 to present). Also serves as General Counsel, ACIM, ACS, ACIS and other ACC subsidiaries; and Senior Vice President, ACIM and ACS |
C. Jean Wade
(1964) | Vice President since 2012 | Senior Vice President, ACS (2017 to present); Vice President ACS (2000 to 2017)
|
Robert J. Leach
(1966) | Vice President since 2006 | Vice President, ACS (2000 to present) |
David H. Reinmiller
(1963) | Vice President since 2000 | Attorney, ACC (1994 to present). Also serves as Vice President, ACIM and ACS |
Ward D. Stauffer
(1960) | Secretary since 2005 | Attorney, ACC (2003 to present) |
|
|
| Liquidity Risk Management Program |
The Fund has adopted a liquidity risk management program (the “program”). The Fund’s Board of Trustees (the "Board") has designated American Century Investment Management, Inc. (“ACIM”) as the administrator of the program. Personnel of ACIM or its affiliates conduct the day-to-day operation of the program pursuant to policies and procedures administered by those members of the ACIM’s Investment Oversight Committee who are members of the ACIM’s Investment Management and Global Analytics departments.
Under the program, ACIM manages the Fund’s liquidity risk, which is the risk that the Fund could not meet shareholder redemption requests without significant dilution of remaining shareholders’ interests in the Fund. This risk is managed by monitoring the degree of liquidity of the Fund’s investments, limiting the amount of the Fund’s illiquid investments, and utilizing various risk management tools and facilities available to the Fund for meeting shareholder redemptions, among other means. ACIM’s process of determining the degree of liquidity of the Fund’s investments is supported by one or more third-party liquidity assessment vendors.
The Board reviewed a report prepared by ACIM regarding the operation and effectiveness of the program for the period December 1, 2018 through December 31, 2019. No significant liquidity events impacting the Fund were noted in the report. In addition, ACIM provided its assessment that the program had been effective in managing the Fund’s liquidity risk.
Retirement Account Information
As required by law, distributions you receive from certain retirement accounts are subject to federal income tax withholding, unless you elect not to have withholding apply*. Tax will be withheld on the total amount withdrawn even though you may be receiving amounts that are not subject to withholding, such as nondeductible contributions. In such case, excess amounts of withholding could occur. You may adjust your withholding election so that a greater or lesser amount will be withheld.
If you don’t want us to withhold on this amount, you must notify us to not withhold the federal income tax. You may notify us in writing or in certain situations by telephone or through other electronic means. For systematic withdrawals, your withholding election will remain in effect until revoked or changed by filing a new election. You have the right to revoke your election at any time and change your withholding percentage for future distributions.
Remember, even if you elect not to have income tax withheld, you are liable for paying income tax on the taxable portion of your withdrawal. If you elect not to have income tax withheld or you don’t have enough income tax withheld, you may be responsible for payment of estimated tax. You may incur penalties under the estimated tax rules if your withholding and estimated tax payments are not sufficient. You can reduce or defer the income tax on a distribution by directly or indirectly rolling such distribution over to another IRA or eligible plan. You should consult your tax advisor for additional information.
State tax will be withheld if, at the time of your distribution, your address is within one of the mandatory withholding states and you have federal income tax withheld (or as otherwise required by state law). State taxes will be withheld from your distribution in accordance with the respective state rules.
*Some 403(b), 457 and qualified retirement plan distributions may be subject to 20% mandatory withholding, as they are subject to special tax and withholding rules. Your plan administrator or plan sponsor is required to provide you with a special tax notice explaining those rules at the time you request a distribution. If applicable, federal and/or state taxes may be withheld from your distribution amount.
Proxy Voting Policies
Descriptions of the principles and policies that the fund's investment advisor uses in exercising the voting rights associated with the securities purchased and/or held by the fund are available without charge, upon request, by calling 1-800-345-2021 or visiting American Century Investments’ website at americancentury.com/proxy. A description of the policies is also available on the Securities and Exchange Commission’s website at sec.gov. Information regarding how the investment advisor voted proxies relating to portfolio securities during the most recent 12-month period ended June 30 is available on americancentury.com/proxy. It is also available at sec.gov.
Quarterly Portfolio Disclosure
The fund files its complete schedule of portfolio holdings with the Securities and Exchange Commission (SEC) for the first and third quarters of each fiscal year as an exhibit to its reports on Form N-PORT. The fund’s Form N-PORT reports are available on the SEC’s website at sec.gov. The fund also makes its complete schedule of portfolio holdings for the most recent quarter of its fiscal year available on its website at americancentury.com and, upon request, by calling 1-800-345-2021.
|
| | |
| |
| | | |
| Contact Us | americancentury.com | |
| Automated Information Line | 1-800-345-8765 | |
| Investor Services Representative | 1-800-345-2021 or 816-531-5575 | |
| Investors Using Advisors | 1-800-378-9878 | |
| Business, Not-For-Profit, Employer-Sponsored Retirement Plans | 1-800-345-3533 | |
| Banks and Trust Companies, Broker-Dealers, Financial Professionals, Insurance Companies | 1-800-345-6488 | |
| Telecommunications Relay Service for the Deaf | 711 | |
| | | |
| American Century Investment Trust | |
| | | |
Investment Advisor: American Century Investment Management, Inc. Kansas City, Missouri | |
| | | |
| This report and the statements it contains are submitted for the general information of our shareholders. The report is not authorized for distribution to prospective investors unless preceded or accompanied by an effective prospectus. | |
| | | |
©2020 American Century Proprietary Holdings, Inc. All rights reserved.
CL-ANN-92286 2005 | |
|
| |
| | |
| | Annual Report |
| | |
| | March 31, 2020 |
| | |
| | Strategic Income Fund |
| | Investor Class (ASIEX) |
| | I Class (ASIGX) |
| | Y Class (ASYIX) |
| | A Class (ASIQX) |
| | C Class (ASIHX) |
| | R Class (ASIWX) |
| | R5 Class (ASIJX) |
| | R6 Class (ASIPX) |
Beginning on January 1, 2021, as permitted by regulations adopted by the Securities and Exchange Commission, paper copies of the fund’s shareholder reports like this one will no longer be sent by mail, unless you specifically request paper copies of the reports from the fund or from your financial intermediary, such as a broker-dealer or bank. Instead, the reports will be made available on a website, and you will be notified by mail each time a report is posted and provided with a website link to access the report.
If you already elected to receive shareholder reports electronically, you will not be affected by this change and you need not take any action. You may elect to receive shareholder reports and other communications from the fund or your financial intermediary electronically by calling or sending an email request to your appropriate contacts as listed on the back cover of this report.
You may elect to receive all future reports in paper free of charge. You can inform the fund or your financial intermediary that you wish to continue receiving paper copies of your shareholder reports by calling or sending an email request to your appropriate contacts as listed on the back cover of this report. Your election to receive reports in paper will apply to all funds held with the fund complex/your financial intermediary.
|
| |
| President’s Letter | |
| Performance | |
| Portfolio Commentary | |
| Fund Characteristics | |
| Shareholder Fee Example | |
| Schedule of Investments | |
| Statement of Assets and Liabilities | |
| Statement of Operations | |
| Statement of Changes in Net Assets | |
| Notes to Financial Statements | |
| Financial Highlights | |
| Report of Independent Registered Public Accounting Firm | |
| Management | |
| Liquidity Risk Management Program | |
| Additional Information | |
Any opinions expressed in this report reflect those of the author as of the date of the report, and do not necessarily represent the opinions of American Century Investments® or any other person in the American Century Investments organization. Any such opinions are subject to change at any time based upon market or other conditions and American Century Investments disclaims any responsibility to update such opinions. These opinions may not be relied upon as investment advice and, because investment decisions made by American Century Investments funds are based on numerous factors, may not be relied upon as an indication of trading intent on behalf of any American Century Investments fund. Security examples are used for representational purposes only and are not intended as recommendations to purchase or sell securities. Performance information for comparative indices and securities is provided to American Century Investments by third party vendors. To the best of American Century Investments’ knowledge, such information is accurate at the time of printing.
Jonathan Thomas
Dear Investor:
Thank you for reviewing this annual report for the period ended March 31, 2020. Annual reports help convey important information about fund returns, including market factors that affected performance during the reporting period. For additional insights, please visit americancentury.com.
Virus Outbreak Abruptly Altered Economic, Market Backdrops
Through most of the period, market sentiment was upbeat, partly due to accommodative Federal Reserve (Fed) policy and modest inflation. Improving economic and corporate earnings data and a phase 1 U.S.-China trade deal also helped boost growth outlooks. Against this backdrop, key U.S. stock benchmarks rose to record highs by mid-February, and U.S. bonds continued to advance.
However, beginning in late February, unprecedented social and economic turmoil emerged and reversed the positive trajectory. The COVID-19 epidemic originating in China rapidly spread throughout the world, forcing stay-at-home orders and industry-wide shutdowns. U.S. stocks, corporate bonds and other riskier assets sold off sharply, while U.S. Treasuries rallied in the global flight to quality. The Fed stepped in quickly and aggressively, slashing interest rates to near 0% and enacting massive lending and asset-purchase programs to stabilize the financial system.
The swift and severe sell-off erased the strong stock market gains realized earlier in the period and left key benchmarks with losses for the 12 months. Reflecting their defensive characteristics, high-quality U.S. bonds withstood the turmoil and delivered solid returns for the 12-month period.
Promoting Health and Safety Remains Our Focus
While the market impact of COVID-19 has been severe, reducing the human toll is most important. We are monitoring the situation closely and following guidelines and protocols from all relevant authorities. Our firm has activated a comprehensive Pandemic Response Plan, which includes social distancing and work-from-home mandates, travel restrictions and escalated cleaning regimens at all our facilities. We’ve also launched a Business Continuity Plan to maintain regular business operations and ensure delivery of outstanding service.
We appreciate your confidence in us during these extraordinary times. We have a long history of helping clients weather volatile markets, and we are confident we will meet today’s challenges. In the meantime, the health and safety of you, your family and our employees remain a top priority.
Sincerely,
Jonathan Thomas
President and Chief Executive Officer
American Century Investments
|
| | | | | |
| Total Returns as of March 31, 2020 |
| | | | Average Annual Returns | |
| | Ticker Symbol | 1 year | 5 year | Since Inception | Inception Date |
| Investor Class | ASIEX | -2.01% | 2.39% | 2.27% | 7/28/14 |
| Bloomberg Barclays U.S. Aggregate Bond Index | — | 8.93% | 3.35% | 3.59% | — |
| I Class | ASIGX | -1.91% | — | 1.58% | 4/10/17 |
| Y Class | ASYIX | -1.78% | — | 1.69% | 4/10/17 |
| A Class | ASIQX | | | | 7/28/14 |
| No sales charge | | -2.26% | 2.14% | 2.02% | |
| With sales charge | | -6.67% | 1.21% | 1.20% | |
| C Class | ASIHX | -2.99% | 1.38% | 1.26% | 7/28/14 |
| R Class | ASIWX | -2.39% | 1.91% | 1.78% | 7/28/14 |
| R5 Class | ASIJX | -1.82% | 2.60% | 2.48% | 7/28/14 |
| R6 Class | ASIPX | -1.77% | 2.65% | 2.53% | 7/28/14 |
Fund returns would have been lower if a portion of the fees had not been waived.
Sales charges include initial sales charges and contingent deferred sales charges (CDSCs), as applicable. A Class shares have a 4.50% maximum initial sales charge and may be subject to a maximum CDSC of 1.00%. C Class shares redeemed within 12 months of purchase are subject to a maximum CDSC of 1.00%. The SEC requires that mutual funds provide performance information net of maximum sales charges in all cases where charges could be applied.
Data presented reflect past performance. Past performance is no guarantee of future results. Current performance may be higher or lower than the performance shown. Total returns for periods less than one year are not annualized. Investment return and principal value will fluctuate, and redemption value may be more or less than original cost. Data assumes reinvestment of dividends and capital gains, and none of the charts reflect the deduction of taxes that a shareholder would pay on fund distributions or the redemption of fund shares. To obtain performance data current to the most recent month end, please call 1-800-345-2021 or visit americancentury.com. For additional information about the fund, please consult the prospectus.
|
|
| Growth of $10,000 Over Life of Class |
| $10,000 investment made July 28, 2014 |
Performance for other share classes will vary due to differences in fee structure.
|
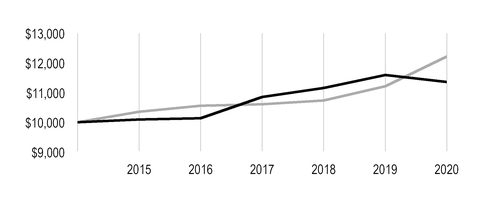
|
| |
| Value on March 31, 2020 |
| | Investor Class — $11,360 |
| |
| | Bloomberg Barclays U.S. Aggregate Bond Index — $12,217 |
| |
Ending value of Investor Class would have been lower if a portion of the fees had not been waived.
|
| | | | | | | |
| Total Annual Fund Operating Expenses |
| Investor Class | I Class | Y Class | A Class | C Class | R Class | R5 Class | R6 Class |
| 0.82% | 0.72% | 0.62% | 1.07% | 1.82% | 1.32% | 0.62% | 0.57% |
The total annual fund operating expenses shown is as stated in the fund’s prospectus current as of the date of this report. The prospectus may vary from the expense ratio shown elsewhere in this report because it is based on a different time period, includes acquired fund fees and expenses, and, if applicable, does not include fee waivers or expense reimbursements.
Data presented reflect past performance. Past performance is no guarantee of future results. Current performance may be higher or lower than the performance shown. Total returns for periods less than one year are not annualized. Investment return and principal value will fluctuate, and redemption value may be more or less than original cost. Data assumes reinvestment of dividends and capital gains, and none of the charts reflect the deduction of taxes that a shareholder would pay on fund distributions or the redemption of fund shares. To obtain performance data current to the most recent month end, please call 1-800-345-2021 or visit americancentury.com. For additional information about the fund, please consult the prospectus.
Portfolio Managers: Jason Greenblath, Jeff Houston, Bob Gahagan, Brian Howell and Charles Tan
Effective May 2019, Kevin Akioka left the portfolio management team, and Charles Tan joined the team. In June 2019, Margé Karner left the portfolio management team, and Jason Greenblath joined the team.
Performance Summary
Strategic Income returned -2.01%* for the 12 months ended March 31, 2020. By comparison, the investment-grade Bloomberg Barclays U.S. Aggregate Bond Index gained 8.93% for the same period. Fund returns reflect operating expenses, while index returns do not. The fund’s results reflect the negative performance of high-yield bonds and other non-index, credit-sensitive securities during the unprecedented sell-off of risk assets late in the reporting period.
The reporting period began on an upbeat note for bond investors. The Federal Reserve’s (Fed’s) early 2019 pivot toward dovish policy set the stage for rate cuts in July, September and October. This action, along with modest economic and corporate earnings growth and low inflation, generally supported solid gains for most U.S. and non-U.S. bond sectors. By year-end 2019, global economic data improved, the U.S. and China signed a phase 1 trade deal and the Fed suggested it would hold rates steady through 2020.
Conditions deteriorated rapidly within the first quarter of 2020. As the COVID-19 epidemic originating in China expanded into a pandemic, nervous fixed-income investors scrambled to shed credit risk and seek shelter in cash. Market volatility soared and liquidity markedly worsened. In response, the Fed slashed short-term rates to near 0% and launched a series of initiatives to stabilize the financial markets. Separately, Congress passed a $2 trillion fiscal relief package. Reflecting market sentiment, U.S. Treasury yields declined sharply, hitting record lows in March before recovering slightly by month-end.
Amid a global flight to quality, riskier investments, including investment-grade and high-yield corporate bonds, securitized bonds and emerging markets securities, suffered significant losses. The Fed’s rescue programs helped stabilize the credit-sensitive sectors of the fixed-income universe, but not before they experienced sharp losses. Against this backdrop, overweight positions in spread assets and an underweight in Treasury securities relative to the index and out-of-index positions in high-yield and emerging markets debt accounted for much of the portfolio’s underperformance.
Corporate Bonds Were Main Detractors
Our position in investment-grade and high-yield corporate bonds, which comprised more than half the portfolio on March 31, 2020, was the main detractor from performance. These securities generally delivered strong results through the first 10 months of the reporting period, as favorable corporate fundamentals and risk-on sentiment supported gains. But that positive performance unwound quickly and severely beginning in mid-February 2020, as the mounting coronavirus outbreak shut down normal business activity across the economic spectrum and pressured
*All fund returns referenced in this commentary are for Investor Class shares. Fund returns would have been lower if a portion of the fees had not been waived. Performance for other share classes will vary due to differences in fee structure; when Investor Class performance exceeds that of the index, other share classes may not. See page 3 for returns for all share classes.
earnings outlooks. The resulting sell-off of risk assets hurt returns in the credit markets. Additionally, an unexpected price war between Saudi Arabia and Russia amid waning demand for oil triggered a sizable drop in the oil markets. This development accelerated the havoc in the high-yield sector, home to many energy companies.
Given these extraordinary events, we tilted toward a more defensive stance, eliminating corporate bonds that didn’t align with that posture. We also continued to extend portfolio duration. We sold securities that were either richly valued or unlikely to withstand an extended economic downturn, including gaming and lodging credits.
Securitized Sector Struggled
We also maintained a sizable position in securitized bonds, which weighed on performance due to results in early 2020. Similar to our corporate holdings, positions in non-agency collateralized mortgage obligations, non-agency commercial mortgage-backed securities (CMBS) and collateralized loan obligations added value through most of the period, compared with the conventional agency-backed mortgage-backed securities represented in the index. However, the March risk-asset sell-off triggered severe dislocations among credit-sensitive mortgage sectors, and we reduced exposure to these securities. We believe rising unemployment and the broad economic shutdown created by the pandemic will create challenges for certain segments of the mortgage market, including CMBS.
Emerging Markets Bonds Weighed on Results
Our out-of-index position in U.S. dollar-denominated emerging markets corporate and sovereign securities also detracted from performance. For much of the period, emerging markets bonds rallied amid falling U.S. Treasury yields, a dovish Fed and a phase 1 trade deal between the U.S. and China. However, with investors shunning risk late in the period, emerging markets bonds declined and were modest detractors overall. Falling oil and commodity prices and a weakened growth outlook for China weighed on emerging markets debt prices.
Portfolio Positioning
The economic downturn during the first quarter of 2020 was swift and severe, but we do not expect an equally swift, or V-shaped, recovery. The consumer is the main driver of the U.S. economy, and we believe the effects of the COVID-19 pandemic will weigh on consumer sentiment—and job and economic growth—for several months. Ultimately, this crisis requires a medical solution.
Heightened volatility often creates market disruptions that lead to attractive buying opportunities. Although we identified such opportunities late in the reporting period, we’re remaining cautious and defensive in our positioning. We expect continued near-term pressure on credit spreads from growing defaults and rapid downgrades. Accordingly, we’re focusing on higher-quality corporate and securitized securities and positioning our portfolio to weather a U-shaped recovery. Within the high-yield sector, we’re finding value among BB-rated, more recession-proof issuers in the cable and packaging industries. We continue to look for opportunities to enhance portfolio yield and returns, while being mindful of the economic headwinds.
Likewise, we review as a matter of course our portfolio holdings, selling those that do not align with our outlook in the current environment. As always, we favor a bottom-up approach to portfolio management, emphasizing careful security selection.
|
| |
| MARCH 31, 2020 | |
| Portfolio at a Glance | |
| Average Duration (effective) | 4.6 years |
| Weighted Average Life to Maturity | 6.0 years |
| | |
| Types of Investments in Portfolio | % of net assets |
| Corporate Bonds | 63.1% |
| Asset-Backed Securities | 7.2% |
| Collateralized Loan Obligations | 7.0% |
| Affiliated Funds | 5.1% |
| Collateralized Mortgage Obligations | 4.9% |
| Commercial Mortgage-Backed Securities | 2.3% |
| Sovereign Governments and Agencies | 1.7% |
| U.S. Treasury Securities | 1.0% |
| Preferred Stocks | 0.4% |
| Bank Loan Obligations | 0.1% |
| Temporary Cash Investments | 6.0% |
| Other Assets and Liabilities | 1.2% |
Fund shareholders may incur two types of costs: (1) transaction costs, including sales charges (loads) on purchase payments and redemption/exchange fees; and (2) ongoing costs, including management fees; distribution and service (12b-1) fees; and other fund expenses. This example is intended to help you understand your ongoing costs (in dollars) of investing in your fund and to compare these costs with the ongoing cost of investing in other mutual funds.
The example is based on an investment of $1,000 made at the beginning of the period and held for the entire period from October 1, 2019 to March 31, 2020.
Actual Expenses
The table provides information about actual account values and actual expenses for each class. You may use the information, together with the amount you invested, to estimate the expenses that you paid over the period. First, identify the share class you own. Then simply divide your account value by $1,000 (for example, an $8,600 account value divided by $1,000 = 8.6), then multiply the result by the number under the heading “Expenses Paid During Period” to estimate the expenses you paid on your account during this period.
If you hold Investor Class shares of any American Century Investments fund, or I Class shares of the American Century Diversified Bond Fund, in an American Century Investments account (i.e., not through a financial intermediary or employer-sponsored retirement plan account), American Century Investments may charge you a $25.00 annual account maintenance fee if the value of those shares is less than $10,000. We will redeem shares automatically in one of your accounts to pay the $25.00 fee. In determining your total eligible investment amount, we will include your investments in all personal accounts (including American Century Investments brokerage accounts) registered under your Social Security number. Personal accounts include individual accounts, joint accounts, UGMA/UTMA accounts, personal trusts, Coverdell Education Savings Accounts and IRAs (including traditional, Roth, Rollover, SEP-, SARSEP- and SIMPLE-IRAs), and certain other retirement accounts. If you have only business, business retirement, employer-sponsored or American Century Investments brokerage accounts, you are currently not subject to this fee. If you are subject to the account maintenance fee, your account value could be reduced by the fee amount.
Hypothetical Example for Comparison Purposes
The table also provides information about hypothetical account values and hypothetical expenses based on the actual expense ratio of each class of your fund and an assumed rate of return of 5% per year before expenses, which is not the actual return of a fund’s share class. The hypothetical account values and expenses may not be used to estimate the actual ending account balance or expenses you paid for the period. You may use this information to compare the ongoing costs of investing in your fund and other funds. To do so, compare this 5% hypothetical example with the 5% hypothetical examples that appear in the shareholder reports of the other funds.
Please note that the expenses shown in the table are meant to highlight your ongoing costs only and do not reflect any transactional costs, such as sales charges (loads) or redemption/exchange fees. Therefore, the table is useful in comparing ongoing costs only, and will not help you determine the relative total costs of owning different funds. In addition, if these transactional costs were included, your costs would have been higher.
|
| | | | |
| | Beginning
Account Value
10/1/19 | Ending
Account Value
3/31/20 | Expenses Paid
During Period(1)
10/1/19 - 3/31/20 |
Annualized
Expense Ratio(1) |
| Actual | | | | |
| Investor Class | $1,000 | $941.20 | $3.45 | 0.71% |
| I Class | $1,000 | $942.60 | $2.96 | 0.61% |
| Y Class | $1,000 | $942.40 | $2.48 | 0.51% |
| A Class | $1,000 | $940.00 | $4.66 | 0.96% |
| C Class | $1,000 | $936.50 | $8.28 | 1.71% |
| R Class | $1,000 | $939.90 | $5.87 | 1.21% |
| R5 Class | $1,000 | $942.20 | $2.48 | 0.51% |
| R6 Class | $1,000 | $942.40 | $2.23 | 0.46% |
| Hypothetical | | | | |
| Investor Class | $1,000 | $1,021.45 | $3.59 | 0.71% |
| I Class | $1,000 | $1,021.95 | $3.08 | 0.61% |
| Y Class | $1,000 | $1,022.45 | $2.58 | 0.51% |
| A Class | $1,000 | $1,020.20 | $4.85 | 0.96% |
| C Class | $1,000 | $1,016.45 | $8.62 | 1.71% |
| R Class | $1,000 | $1,018.95 | $6.11 | 1.21% |
| R5 Class | $1,000 | $1,022.45 | $2.58 | 0.51% |
| R6 Class | $1,000 | $1,022.70 | $2.33 | 0.46% |
| |
| (1) | Expenses are equal to the class's annualized expense ratio listed in the table above, multiplied by the average account value over the period, multiplied by 183, the number of days in the most recent fiscal half-year, divided by 366, to reflect the one-half year period. Annualized expense ratio reflects actual expenses, including any applicable fee waivers or expense reimbursements and excluding any acquired fund fees and expenses. |
MARCH 31, 2020
|
| | | | | | |
| | Principal Amount/Shares | Value |
| CORPORATE BONDS — 63.1% | | |
| Aerospace and Defense — 0.3% | | |
| Lockheed Martin Corp., 3.80%, 3/1/45 | $ | 75,000 |
| $ | 81,923 |
|
| Auto Components — 0.1% | | |
| American Axle & Manufacturing, Inc., 6.625%, 10/15/22 | 47,000 |
| 39,406 |
|
| Automobiles — 1.4% | | |
| Ford Motor Co., 4.35%, 12/8/26 | 200,000 |
| 155,000 |
|
| General Motors Financial Co., Inc., 3.70%, 5/9/23 | 250,000 |
| 225,143 |
|
| | | 380,143 |
|
| Banks — 8.8% | | |
| Bancolombia SA, 3.00%, 1/29/25 | 200,000 |
| 179,952 |
|
| Bank of America Corp., MTN, VRN, 3.82%, 1/20/28 | 150,000 |
| 155,906 |
|
| Barclays Bank plc, 5.14%, 10/14/20 | 100,000 |
| 100,976 |
|
| BBVA Bancomer SA, 7.25%, 4/22/20 | 100,000 |
| 99,608 |
|
| Canadian Imperial Bank of Commerce, 2.25%, 1/28/25 | 200,000 |
| 198,340 |
|
| CIT Group, Inc., 5.00%, 8/15/22 | 125,000 |
| 122,815 |
|
| Citigroup, Inc., VRN, 3.52%, 10/27/28 | 140,000 |
| 140,461 |
|
| Fifth Third BanCorp., 2.375%, 1/28/25 | 130,000 |
| 126,870 |
|
| HSBC Holdings plc, VRN, 2.63%, 11/7/25 | 200,000 |
| 194,384 |
|
| Huntington Bancshares, Inc., 2.55%, 2/4/30 | 150,000 |
| 136,680 |
|
| JPMorgan Chase & Co., VRN, 2.30%, 10/15/25 | 100,000 |
| 100,182 |
|
| MUFG Union Bank N.A., 2.10%, 12/9/22 | 250,000 |
| 247,123 |
|
| PNC Bank N.A., 2.70%, 10/22/29 | 250,000 |
| 243,079 |
|
| Santander UK plc, 2.10%, 1/13/23 | 200,000 |
| 194,216 |
|
| Toronto-Dominion Bank (The), MTN, 2.65%, 6/12/24 | 160,000 |
| 163,653 |
|
| Wells Fargo & Co., 3.00%, 10/23/26 | 50,000 |
| 51,342 |
|
| | | 2,455,587 |
|
| Biotechnology — 1.8% | | |
| AbbVie, Inc., 3.60%, 5/14/25 | 200,000 |
| 211,091 |
|
AbbVie, Inc., 3.20%, 11/21/29(1) | 70,000 |
| 71,846 |
|
AbbVie, Inc., 4.25%, 11/21/49(1) | 30,000 |
| 32,779 |
|
| Amgen, Inc., 4.66%, 6/15/51 | 150,000 |
| 189,743 |
|
| | | 505,459 |
|
| Building Products — 2.0% | | |
Builders FirstSource, Inc., 5.00%, 3/1/30(1) | 130,000 |
| 117,731 |
|
Carrier Global Corp., 2.72%, 2/15/30(1) | 50,000 |
| 46,299 |
|
Griffon Corp., 5.75%, 3/1/28(1) | 200,000 |
| 189,125 |
|
| Masco Corp., 4.45%, 4/1/25 | 100,000 |
| 102,318 |
|
Standard Industries, Inc., 4.75%, 1/15/28(1) | 100,000 |
| 92,792 |
|
| | | 548,265 |
|
| Capital Markets — 2.9% | | |
| Ares Capital Corp., 3.25%, 7/15/25 | 71,000 |
| 56,557 |
|
Banco BTG Pactual SA, 4.50%, 1/10/25(1) | 200,000 |
| 176,000 |
|
|
| | | | | | |
| | Principal Amount/Shares | Value |
| Goldman Sachs BDC, Inc., 3.75%, 2/10/25 | $ | 65,000 |
| $ | 60,378 |
|
| Goldman Sachs Group, Inc. (The), 3.00%, 4/26/22 | 175,000 |
| 176,336 |
|
| Icahn Enterprises LP / Icahn Enterprises Finance Corp., 5.25%, 5/15/27 | 175,000 |
| 162,969 |
|
| Oaktree Specialty Lending Corp., 3.50%, 2/25/25 | 185,000 |
| 166,509 |
|
| | | 798,749 |
|
| Chemicals — 0.6% | | |
| Ashland LLC, 4.75%, 8/15/22 | 14,000 |
| 13,895 |
|
CF Industries, Inc., 4.50%, 12/1/26(1) | 86,000 |
| 90,820 |
|
| CF Industries, Inc., 5.15%, 3/15/34 | 50,000 |
| 51,040 |
|
| | | 155,755 |
|
| Commercial Services and Supplies — 0.4% | | |
| Covanta Holding Corp., 5.875%, 3/1/24 | 125,000 |
| 118,906 |
|
| Communications Equipment — 0.3% | | |
CommScope, Inc., 8.25%, 3/1/27(1) | 100,000 |
| 96,945 |
|
| Construction Materials — 0.4% | | |
| Martin Marietta Materials, Inc., 2.50%, 3/15/30 | 132,000 |
| 120,958 |
|
| Consumer Finance — 1.8% | | |
| Ally Financial, Inc., 4.625%, 3/30/25 | 74,000 |
| 71,187 |
|
| Ally Financial, Inc., 5.75%, 11/20/25 | 9,000 |
| 8,871 |
|
| Discover Financial Services, 3.75%, 3/4/25 | 75,000 |
| 74,223 |
|
| Navient Corp., 5.00%, 3/15/27 | 100,000 |
| 86,720 |
|
Park Aerospace Holdings Ltd., 5.50%, 2/15/24(1) | 80,000 |
| 69,022 |
|
| Synchrony Financial, 2.85%, 7/25/22 | 200,000 |
| 190,777 |
|
| | | 500,800 |
|
| Containers and Packaging — 1.4% | | |
Ardagh Packaging Finance plc / Ardagh Holdings USA, Inc., 5.25%, 8/15/27(1) | 200,000 |
| 206,110 |
|
| Berry Global, Inc., 5.125%, 7/15/23 | 100,000 |
| 100,967 |
|
Reynolds Group Issuer, Inc. / Reynolds Group Issuer LLC / Reynolds Group Issuer Lu, 5.125%, 7/15/23(1) | 75,000 |
| 74,906 |
|
| | | 381,983 |
|
| Diversified Financial Services — 0.2% | | |
| Voya Financial, Inc., VRN, 5.65%, 5/15/53 | 50,000 |
| 45,913 |
|
| Diversified Telecommunication Services — 3.9% | | |
| AT&T, Inc., 3.00%, 6/30/22 | 202,000 |
| 203,955 |
|
| AT&T, Inc., 4.45%, 4/1/24 | 100,000 |
| 106,108 |
|
| AT&T, Inc., 3.80%, 2/15/27 | 120,000 |
| 124,972 |
|
| AT&T, Inc., 4.30%, 2/15/30 | 100,000 |
| 107,845 |
|
Intelsat Jackson Holdings SA, 5.50%, 8/1/23(6) | 100,000 |
| 62,126 |
|
| Ooredoo International Finance Ltd., MTN, 4.75%, 2/16/21 | 200,000 |
| 199,835 |
|
| Verizon Communications, Inc., 2.95%, 3/15/22 | 82,000 |
| 83,709 |
|
| Verizon Communications, Inc., 2.45%, 11/1/22 | 50,000 |
| 50,868 |
|
| Verizon Communications, Inc., 4.40%, 11/1/34 | 130,000 |
| 152,691 |
|
| | | 1,092,109 |
|
| Electric Utilities — 0.5% | | |
| Commonwealth Edison Co., 3.20%, 11/15/49 | 10,000 |
| 10,110 |
|
|
| | | | | | |
| | Principal Amount/Shares | Value |
NextEra Energy Operating Partners LP, 4.50%, 9/15/27(1) | $ | 125,000 |
| $ | 122,746 |
|
| | | 132,856 |
|
| Electronic Equipment, Instruments and Components — 0.3% | | |
| Amphenol Corp., 2.05%, 3/1/25 | 100,000 |
| 94,896 |
|
| Energy Equipment and Services — 0.1% | | |
| Baker Hughes a GE Co. LLC / Baker Hughes Co-Obligor, Inc., 3.14%, 11/7/29 | 27,000 |
| 23,472 |
|
| Entertainment — 1.2% | | |
| Netflix, Inc., 4.875%, 4/15/28 | 150,000 |
| 154,136 |
|
| Walt Disney Co. (The), 3.35%, 3/24/25 | 160,000 |
| 174,873 |
|
| | | 329,009 |
|
| Equity Real Estate Investment Trusts (REITs) — 3.2% | | |
| American Tower Corp., 3.375%, 10/15/26 | 125,000 |
| 125,313 |
|
| American Tower Corp., 2.90%, 1/15/30 | 39,000 |
| 38,193 |
|
| Crown Castle International Corp., 5.25%, 1/15/23 | 195,000 |
| 207,078 |
|
Crown Castle International Corp., 3.30%, 7/1/30(2) | 6,000 |
| 6,011 |
|
| Duke Realty LP, 2.875%, 11/15/29 | 42,000 |
| 40,492 |
|
| Equinix, Inc., 5.875%, 1/15/26 | 100,000 |
| 102,592 |
|
| Healthcare Realty Trust, Inc., 2.40%, 3/15/30 | 40,000 |
| 35,653 |
|
| MGM Growth Properties Operating Partnership LP / MGP Finance Co-Issuer, Inc., 4.50%, 9/1/26 | 100,000 |
| 83,697 |
|
| MPT Operating Partnership LP / MPT Finance Corp., 4.625%, 8/1/29 | 130,000 |
| 120,331 |
|
| National Retail Properties, Inc., 2.50%, 4/15/30 | 40,000 |
| 35,769 |
|
SBA Communications Corp., 3.875%, 2/15/27(1) | 10,000 |
| 10,100 |
|
| Simon Property Group LP, 2.75%, 6/1/23 | 85,000 |
| 83,885 |
|
Ventas Realty LP, 4.75%, 11/15/30(2) | 15,000 |
| 14,763 |
|
| | | 903,877 |
|
| Food and Staples Retailing — 0.8% | | |
Albertsons Cos., Inc. / Safeway, Inc. / New Albertsons LP / Albertsons LLC, 4.875%, 2/15/30(1) | 184,000 |
| 183,540 |
|
Sysco Corp., 5.95%, 4/1/30(2) | 28,000 |
| 29,538 |
|
| | | 213,078 |
|
| Food Products — 1.6% | | |
| Kraft Heinz Foods Co., 3.00%, 6/1/26 | 200,000 |
| 194,838 |
|
Lamb Weston Holdings, Inc., 4.625%, 11/1/24(1) | 100,000 |
| 99,126 |
|
Post Holdings, Inc., 4.625%, 4/15/30(1) | 170,000 |
| 164,050 |
|
| | | 458,014 |
|
| Health Care Providers and Services — 3.9% | | |
| Acadia Healthcare Co., Inc., 5.125%, 7/1/22 | 200,000 |
| 192,313 |
|
Catalent Pharma Solutions, Inc., 5.00%, 7/15/27(1) | 100,000 |
| 97,555 |
|
Centene Corp., 4.625%, 12/15/29(1) | 90,000 |
| 90,950 |
|
Cigna Corp., 4.50%, 2/25/26(1) | 100,000 |
| 108,194 |
|
| CVS Health Corp., 4.30%, 3/25/28 | 100,000 |
| 106,410 |
|
| DaVita, Inc., 5.125%, 7/15/24 | 80,000 |
| 80,260 |
|
| DaVita, Inc., 5.00%, 5/1/25 | 30,000 |
| 30,148 |
|
| HCA, Inc., 3.50%, 9/1/30 | 150,000 |
| 136,706 |
|
LifePoint Health, Inc., 4.375%, 2/15/27(1) | 100,000 |
| 94,950 |
|
|
| | | | | | |
| | Principal Amount/Shares | Value |
| Tenet Healthcare Corp., 8.125%, 4/1/22 | $ | 150,000 |
| $ | 142,551 |
|
| | | 1,080,037 |
|
| Hotels, Restaurants and Leisure — 0.4% | | |
1011778 BC ULC / New Red Finance, Inc., 4.375%, 1/15/28(1) | 50,000 |
| 46,473 |
|
Caesars Resort Collection LLC / CRC Finco, Inc., 5.25%, 10/15/25(1) | 75,000 |
| 54,727 |
|
| | | 101,200 |
|
| Household Durables — 2.4% | | |
| D.R. Horton, Inc., 2.50%, 10/15/24 | 150,000 |
| 140,408 |
|
| Lennar Corp., 4.75%, 5/30/25 | 75,000 |
| 72,657 |
|
Mattamy Group Corp., 4.625%, 3/1/30(1) | 100,000 |
| 86,563 |
|
| MDC Holdings, Inc., 3.85%, 1/15/30 | 170,000 |
| 153,956 |
|
| PulteGroup, Inc., 5.50%, 3/1/26 | 75,000 |
| 74,477 |
|
| Toll Brothers Finance Corp., 3.80%, 11/1/29 | 150,000 |
| 132,386 |
|
| | | 660,447 |
|
| Industrial Conglomerates — 0.5% | | |
| Carlisle Cos., Inc., 2.75%, 3/1/30 | 165,000 |
| 145,111 |
|
| Insurance — 1.0% | | |
Aflac, Inc., 3.60%, 4/1/30(2) | 30,000 |
| 30,432 |
|
| American International Group, Inc., 4.50%, 7/16/44 | 150,000 |
| 153,998 |
|
Athene Holding Ltd., 6.15%, 4/3/30(2) | 10,000 |
| 10,002 |
|
| Prudential Financial, Inc., MTN, 1.50%, 3/10/26 | 100,000 |
| 94,253 |
|
| | | 288,685 |
|
| IT Services — 0.1% | | |
Visa, Inc., 1.90%, 4/15/27(2) | 15,000 |
| 15,001 |
|
| Western Union Co. (The), 2.85%, 1/10/25 | 19,000 |
| 18,949 |
|
| | | 33,950 |
|
| Machinery — 0.2% | | |
Otis Worldwide Corp., 2.06%, 4/5/25(1) | 60,000 |
| 58,859 |
|
| Media — 4.9% | | |
CCO Holdings LLC / CCO Holdings Capital Corp., 5.125%, 5/1/27(1) | 75,000 |
| 75,902 |
|
| Charter Communications Operating LLC / Charter Communications Operating Capital, 4.80%, 3/1/50 | 45,000 |
| 47,112 |
|
| Comcast Corp., 4.40%, 8/15/35 | 150,000 |
| 182,306 |
|
| CSC Holdings LLC, 6.75%, 11/15/21 | 75,000 |
| 77,756 |
|
| Discovery Communications LLC, 3.80%, 3/13/24 | 80,000 |
| 79,663 |
|
| DISH DBS Corp., 5.125%, 5/1/20 | 75,000 |
| 74,685 |
|
Fox Corp., 3.05%, 4/7/25(2) | 20,000 |
| 20,215 |
|
Gray Television, Inc., 5.125%, 10/15/24(1) | 125,000 |
| 121,563 |
|
Nexstar Broadcasting, Inc., 5.625%, 8/1/24(1) | 75,000 |
| 71,062 |
|
TEGNA, Inc., 5.00%, 9/15/29(1) | 100,000 |
| 90,375 |
|
| ViacomCBS, Inc., 3.125%, 6/15/22 | 150,000 |
| 148,168 |
|
| ViacomCBS, Inc., 3.70%, 8/15/24 | 200,000 |
| 204,324 |
|
| VTR Finance BV, 6.875%, 1/15/24 | 200,000 |
| 182,749 |
|
| | | 1,375,880 |
|
| Metals and Mining — 1.5% | | |
| Freeport-McMoRan, Inc., 3.875%, 3/15/23 | 75,000 |
| 71,907 |
|
| HTA Group Ltd., 9.125%, 3/8/22 | 200,000 |
| 184,689 |
|
|
| | | | | | |
| | Principal Amount/Shares | Value |
Novelis Corp., 4.75%, 1/30/30(1) | $ | 95,000 |
| $ | 85,084 |
|
| Steel Dynamics, Inc., 3.45%, 4/15/30 | 100,000 |
| 91,164 |
|
| | | 432,844 |
|
| Oil, Gas and Consumable Fuels — 6.7% | | |
Aker BP ASA, 3.75%, 1/15/30(1) | 150,000 |
| 112,923 |
|
| Continental Resources, Inc., 5.00%, 9/15/22 | 33,000 |
| 20,489 |
|
| Diamondback Energy, Inc., 5.375%, 5/31/25 | 125,000 |
| 92,468 |
|
| Diamondback Energy, Inc., 3.50%, 12/1/29 | 50,000 |
| 35,464 |
|
| Energy Transfer Operating LP, 3.75%, 5/15/30 | 100,000 |
| 78,795 |
|
| Equinor ASA, 3.25%, 11/18/49 | 60,000 |
| 59,363 |
|
| Gazprom PJSC Via Gaz Capital SA, 6.00%, 1/23/21 | 200,000 |
| 203,724 |
|
Gazprom PJSC via Gaz Finance plc, 3.25%, 2/25/30(1) | 200,000 |
| 185,664 |
|
Holly Energy Partners LP / Holly Energy Finance Corp., 5.00%, 2/1/28(1) | 120,000 |
| 101,175 |
|
| Kinder Morgan Energy Partners LP, 6.50%, 9/1/39 | 115,000 |
| 113,077 |
|
| Newfield Exploration Co., 5.375%, 1/1/26 | 100,000 |
| 52,410 |
|
| Petroleos Mexicanos, 4.875%, 1/24/22 | 240,000 |
| 207,741 |
|
| Saudi Arabian Oil Co., MTN, 2.75%, 4/16/22 | 200,000 |
| 196,084 |
|
| Southwestern Energy Co., 4.10%, 3/15/22 | 75,000 |
| 56,883 |
|
| Sunoco Logistics Partners Operations LP, 3.90%, 7/15/26 | 125,000 |
| 105,535 |
|
| Williams Cos., Inc. (The), 4.55%, 6/24/24 | 75,000 |
| 68,472 |
|
| WPX Energy, Inc., 5.25%, 10/15/27 | 200,000 |
| 111,110 |
|
| WPX Energy, Inc., 4.50%, 1/15/30 | 100,000 |
| 54,675 |
|
| | | 1,856,052 |
|
| Pharmaceuticals — 1.8% | | |
Bausch Health Cos., Inc., 6.125%, 4/15/25(1) | 120,000 |
| 118,951 |
|
Bausch Health Cos., Inc., 5.00%, 1/30/28(1) | 130,000 |
| 124,046 |
|
| Elanco Animal Health, Inc., 5.65%, 8/28/28 | 250,000 |
| 264,343 |
|
| | | 507,340 |
|
| Road and Rail — 1.5% | | |
Ashtead Capital, Inc., 4.125%, 8/15/25(1) | 200,000 |
| 184,000 |
|
| Avis Budget Car Rental LLC / Avis Budget Finance, Inc., 5.50%, 4/1/23 | 11,000 |
| 9,446 |
|
| Burlington Northern Santa Fe LLC, 4.15%, 4/1/45 | 180,000 |
| 211,620 |
|
| | | 405,066 |
|
| Software — 0.8% | | |
NortonLifeLock, Inc., 5.00%, 4/15/25(1) | 150,000 |
| 151,583 |
|
Oracle Corp., 2.50%, 4/1/25(2) | 60,000 |
| 61,323 |
|
Oracle Corp., 2.95%, 4/1/30(2) | 20,000 |
| 20,162 |
|
| | | 233,068 |
|
| Specialty Retail — 0.4% | | |
| Home Depot, Inc. (The), 5.95%, 4/1/41 | 75,000 |
| 105,420 |
|
| Technology Hardware, Storage and Peripherals — 0.2% | | |
Dell International LLC / EMC Corp., 5.875%, 6/15/21(1) | 17,000 |
| 17,000 |
|
Dell International LLC / EMC Corp., 5.45%, 6/15/23(1) | 40,000 |
| 41,098 |
|
| | | 58,098 |
|
| Textiles, Apparel and Luxury Goods — 0.2% | | |
Hanesbrands, Inc., 4.625%, 5/15/24(1) | 70,000 |
| 69,738 |
|
|
| | | | | | |
| | Principal Amount/Shares | Value |
| Trading Companies and Distributors — 0.8% | | |
| Air Lease Corp., MTN, 3.00%, 2/1/30 | $ | 72,000 |
| $ | 52,371 |
|
| International Lease Finance Corp., 5.875%, 8/15/22 | 180,000 |
| 161,103 |
|
| | | 213,474 |
|
| Transportation Infrastructure — 0.7% | | |
| DP World plc, MTN, 3.25%, 5/18/20 | 200,000 |
| 197,112 |
|
| Wireless Telecommunication Services — 1.1% | | |
| Sprint Corp., 7.625%, 2/15/25 | 100,000 |
| 111,415 |
|
| VEON Holdings BV, 3.95%, 6/16/21 | 200,000 |
| 199,240 |
|
| | | 310,655 |
|
TOTAL CORPORATE BONDS
(Cost $18,672,384) | | 17,611,139 |
|
| ASSET-BACKED SECURITIES — 7.2% | | |
Avis Budget Rental Car Funding AESOP LLC, Series 2015-2A, Class B, 3.42%, 12/20/21(1) | 25,000 |
| 24,654 |
|
BRE Grand Islander Timeshare Issuer LLC, Series 2017-1A, Class A SEQ, 2.94%, 5/25/29(1) | 41,969 |
| 41,175 |
|
BRE Grand Islander Timeshare Issuer LLC, Series 2017-1A, Class B, 3.24%, 5/25/29(1) | 10,492 |
| 10,255 |
|
Hilton Grand Vacations Trust, Series 2014-AA, Class B, 2.07%, 11/25/26(1) | 4,578 |
| 4,537 |
|
Hilton Grand Vacations Trust, Series 2019-AA, Class B, 2.54%, 7/25/33(1) | 90,234 |
| 74,449 |
|
Invitation Homes Trust, Series 2018-SFR1, Class C, VRN, 2.05%, (1-month LIBOR plus 1.25%), 3/17/37(1) | 100,000 |
| 88,517 |
|
Invitation Homes Trust, Series 2018-SFR2, Class C, VRN, 1.98%, (1-month LIBOR plus 1.28%), 6/17/37(1) | 100,000 |
| 90,418 |
|
MVW LLC, Series 2019-2A, Class B, 2.44%, 10/20/38(1) | 180,068 |
| 167,098 |
|
MVW Owner Trust, Series 2013-1A, Class A SEQ, 2.15%, 4/22/30(1) | 21,978 |
| 21,965 |
|
MVW Owner Trust, Series 2014-1A, Class B, 2.70%, 9/22/31(1) | 8,420 |
| 8,351 |
|
MVW Owner Trust, Series 2017-1A, Class B, 2.75%, 12/20/34(1) | 40,183 |
| 39,218 |
|
Progress Residential Trust, Series 2017-SFR1, Class A SEQ, 2.77%, 8/17/34(1) | 49,790 |
| 49,677 |
|
Progress Residential Trust, Series 2017-SFR2, Class A SEQ, 2.90%, 12/17/34(1) | 74,861 |
| 75,300 |
|
Progress Residential Trust, Series 2018-SFR1, Class A SEQ, 3.26%, 3/17/35(1) | 199,757 |
| 197,864 |
|
Progress Residential Trust, Series 2019-SFR1, Class A SEQ, 3.42%, 8/17/35(1) | 100,000 |
| 101,118 |
|
Progress Residential Trust, Series 2019-SFR2, Class A SEQ, 3.15%, 5/17/36(1) | 300,000 |
| 302,199 |
|
Progress Residential Trust, Series 2019-SFR3, Class B, 2.57%, 9/17/36(1) | 250,000 |
| 240,559 |
|
Progress Residential Trust, Series 2019-SFR4, Class B, 2.94%, 10/17/36(1) | 200,000 |
| 195,346 |
|
Sierra Timeshare Conduit Receivables Funding LLC, Series 2017-1A, Class A SEQ, 2.91%, 3/20/34(1) | 6,213 |
| 6,138 |
|
Sierra Timeshare Receivables Funding LLC, Series 2015-3A, Class A SEQ, 2.58%, 9/20/32(1) | 12,060 |
| 11,973 |
|
Sierra Timeshare Receivables Funding LLC, Series 2016-2A, Class A SEQ, 2.33%, 7/20/33(1) | 3,660 |
| 3,617 |
|
Sierra Timeshare Receivables Funding LLC, Series 2019-3A, Class B, 2.75%, 8/20/36(1) | 159,526 |
| 144,845 |
|
|
| | | | | | |
| | Principal Amount/Shares | Value |
Towd Point Mortgage Trust, Series 2017-3, Class M1, VRN, 3.50%, 7/25/57(1) | $ | 100,000 |
| $ | 90,170 |
|
VSE VOI Mortgage LLC, Series 2016-A, Class A SEQ, 2.54%, 7/20/33(1) | 27,955 |
| 27,491 |
|
TOTAL ASSET-BACKED SECURITIES
(Cost $2,115,488) | | 2,016,934 |
|
| COLLATERALIZED LOAN OBLIGATIONS — 7.0% | | |
Allegany Park CLO Ltd., Series 2019-1A, Class C, VRN, 4.38%, (3-month LIBOR plus 2.55%), 1/20/33(1) | 150,000 |
| 129,847 |
|
Anchorage Credit Opportunities CLO 1 Ltd., Series 2019-1A, Class B1, VRN, 4.64%, (3-month LIBOR plus 2.90%), 1/20/32(1) | 150,000 |
| 132,364 |
|
CBAM Ltd., Series 2018-5A, Class B1, VRN, 3.24%, (3-month LIBOR plus 1.40%), 4/17/31(1) | 150,000 |
| 132,982 |
|
CIFC Funding Ltd., Series 2013-2A, Class A2LR, VRN, 3.43%, (3-month LIBOR plus 1.60%), 10/18/30(1) | 100,000 |
| 92,704 |
|
CIFC Funding Ltd., Series 2015-1A, Class ARR, VRN, 2.91%, (3-month LIBOR plus 1.11%), 1/22/31(1) | 250,000 |
| 236,134 |
|
CIFC Funding Ltd., Series 2016-1A, Class BR, VRN, 3.77%, (3-month LIBOR plus 1.95%), 10/21/31(1) | 275,000 |
| 253,095 |
|
Dryden 64 CLO Ltd., Series 2018-64A, Class A, VRN, 2.79%, (3-month LIBOR plus 0.97%), 4/18/31(1) | 250,000 |
| 235,128 |
|
Elmwood CLO IV Ltd., Series 2020-1A, Class C, VRN, 3.23%, (3-month LIBOR plus 2.05%), 4/15/33(1) | 250,000 |
| 220,000 |
|
Madison Park Funding XXII Ltd., Series 2016-22A, Class BR, VRN, 3.26%, (3-month LIBOR plus 1.60%), 1/15/33(1) | 150,000 |
| 130,864 |
|
Magnetite XXIV Ltd., Series 2019-24A, Class B, VRN, 3.76%, (3-month LIBOR plus 1.85%), 1/15/33(1) | 100,000 |
| 89,349 |
|
Magnetite XXIV Ltd., Series 2019-24A, Class C, VRN, 4.46%, (3-month LIBOR plus 2.55%), 1/15/33(1) | 200,000 |
| 172,782 |
|
Sounds Point CLO IV-R Ltd., Series 2013-3RA, Class B, VRN, 3.57%, (3-month LIBOR plus 1.75%), 4/18/31(1) | 125,000 |
| 111,289 |
|
TOTAL COLLATERALIZED LOAN OBLIGATIONS
(Cost $2,143,234) | | 1,936,538 |
|
AFFILIATED FUNDS(3) — 5.1% | | |
Emerging Markets Debt Fund R6 Class
(Cost $1,540,631) | 155,287 |
| 1,406,896 |
|
| COLLATERALIZED MORTGAGE OBLIGATIONS — 4.9% | | |
| Private Sponsor Collateralized Mortgage Obligations — 2.4% | | |
| Bear Stearns Adjustable Rate Mortgage Trust, Series 2004-12, Class 2A1, VRN, 3.74%, 2/25/35 | $ | 31,507 |
| 28,665 |
|
Bear Stearns Adjustable Rate Mortgage Trust, Series 2004-8, Class 2A1, VRN, 3.95%, 11/25/34 | 17,459 |
| 15,575 |
|
Bear Stearns Adjustable Rate Mortgage Trust, Series 2006-1, Class A1, VRN, 3.84%, (1-year H15T1Y plus 2.25%), 2/25/36 | 27,764 |
| 26,172 |
|
Bunker Hill Loan Depositary Trust, Series 2019-3, Class A1 SEQ, 2.72%, 11/25/59(1) | 93,658 |
| 91,199 |
|
| Chase Mortgage Finance Trust, Series 2007-A2, Class 6A2 SEQ, VRN, 4.11%, 7/25/37 | 6,545 |
| 5,668 |
|
| Citicorp Mortgage Securities Trust, Series 2007-8, Class 1A3, 6.00%, 9/25/37 | 21,751 |
| 22,631 |
|
| Citigroup Mortgage Loan Trust, Inc., Series 2004-UST1, Class A5, VRN, 3.79%, 8/25/34 | 42,770 |
| 38,486 |
|
| Citigroup Mortgage Loan Trust, Inc., Series 2005-4, Class A, VRN, 4.59%, 8/25/35 | 19,366 |
| 18,044 |
|
| Citigroup Mortgage Loan Trust, Inc., Series 2005-6, Class A2, VRN, 4.55%, (1-year H15T1Y plus 2.15%), 9/25/35 | 14,674 |
| 13,664 |
|
|
| | | | | | |
| | Principal Amount/Shares | Value |
| Credit Suisse First Boston Mortgage-Backed Pass-Through Certificates, Series 2005-3, Class 1A1, VRN, 5.50%, 7/25/35 | $ | 31,220 |
| $ | 30,931 |
|
Credit Suisse Mortgage Trust, Series 2019-NQM1, Class A1, 2.66%, 10/25/59(1) | 89,904 |
| 87,298 |
|
| First Horizon Mortgage Pass-Through Trust, Series 2006-AR4, Class 1A2, VRN, 3.99%, 1/25/37 | 11,603 |
| 9,052 |
|
| GSR Mortgage Loan Trust, Series 2005-AR6, Class 2A1, VRN, 4.10%, 9/25/35 | 18,605 |
| 17,613 |
|
| JPMorgan Mortgage Trust, Series 2005-A4, Class 1A1, VRN, 4.07%, 7/25/35 | 6,039 |
| 5,881 |
|
| Merrill Lynch Mortgage Investors Trust, Series 2005-3, Class 2A, VRN, 3.80%, 11/25/35 | 34,625 |
| 30,346 |
|
Sequoia Mortgage Trust, Series 2017-CH2, Class A10 SEQ, VRN, 4.00%, 12/25/47(1) | 90,085 |
| 90,568 |
|
| WaMu Mortgage Pass-Through Certificates, Series 2005-AR3, Class A1, VRN, 3.62%, 3/25/35 | 18,284 |
| 16,804 |
|
| WaMu Mortgage Pass-Through Certificates, Series 2005-AR7, Class A3, VRN, 4.26%, 8/25/35 | 16,342 |
| 14,660 |
|
| Wells Fargo Mortgage-Backed Securities Trust, Series 2006-7, Class 3A1 SEQ, 6.00%, 6/25/36 | 6,299 |
| 6,004 |
|
| Wells Fargo Mortgage-Backed Securities Trust, Series 2006-AR1, Class 2A5 SEQ, VRN, 4.07%, 3/25/36 | 38,375 |
| 33,364 |
|
| Wells Fargo Mortgage-Backed Securities Trust, Series 2006-AR15, Class A1, VRN, 4.61%, 10/25/36 | 3,193 |
| 2,802 |
|
| Wells Fargo Mortgage-Backed Securities Trust, Series 2006-AR16, Class A1, VRN, 4.49%, 10/25/36 | 7,351 |
| 6,509 |
|
| Wells Fargo Mortgage-Backed Securities Trust, Series 2006-AR19, Class A1, VRN, 4.35%, 12/25/36 | 34,908 |
| 30,966 |
|
| Wells Fargo Mortgage-Backed Securities Trust, Series 2006-AR5, Class 2A1, VRN, 4.14%, 4/25/36 | 11,330 |
| 10,701 |
|
| Wells Fargo Mortgage-Backed Securities Trust, Series 2007-15, Class A1, 6.00%, 11/25/37 | 3,815 |
| 3,459 |
|
| Wells Fargo Mortgage-Backed Securities Trust, Series 2007-7, Class A1, 6.00%, 6/25/37 | 26,824 |
| 24,676 |
|
| | | 681,738 |
|
| U.S. Government Agency Collateralized Mortgage Obligations — 2.5% | |
FHLMC, Series 2018-DNA1, Class M2, VRN, 2.75%, (1-month LIBOR plus 1.80%), 7/25/30 | 100,000 |
| 83,227 |
|
FHLMC, Series 2019-DNA1, Class M1, VRN, 1.85%, (1-month LIBOR plus 0.90%), 1/25/49(1) | 41,779 |
| 41,070 |
|
| FNMA, Series 2016-55, Class PI, IO, 4.00%, 8/25/46 | 648,510 |
| 114,295 |
|
| FNMA, Series 2017-7, Class AI, IO, 6.00%, 2/25/47 | 520,892 |
| 124,584 |
|
| FNMA, Series 2017-C05, Class 1M2, VRN, 3.15%, (1-month LIBOR plus 2.20%), 1/25/30 | 94,459 |
| 84,501 |
|
| FNMA, Series 2017-C06, Class 2M2, VRN, 3.75%, (1-month LIBOR plus 2.80%), 2/25/30 | 128,327 |
| 108,468 |
|
| FNMA, Series 2017-C07, Class 1M1, VRN, 1.60%, (1-month LIBOR plus 0.65%), 5/25/30 | 8,071 |
| 7,986 |
|
| FNMA, Series 2018-C01, Class 1M1, VRN, 1.55%, (1-month LIBOR plus 0.60%), 7/25/30 | 53,925 |
| 53,610 |
|
| FNMA, Series 413, Class C27, IO, 4.00%, 7/25/42 | 452,685 |
| 70,934 |
|
| | | 688,675 |
|
TOTAL COLLATERALIZED MORTGAGE OBLIGATIONS
(Cost $1,450,680) | | 1,370,413 |
|
|
| | | | | | |
| | Principal Amount/Shares | Value |
| COMMERCIAL MORTGAGE-BACKED SECURITIES — 2.3% | | |
Commercial Mortgage Pass-Through Certificates, Series 2014-LC17, Class B, VRN, 4.49%, 10/10/47 | $ | 50,000 |
| $ | 50,667 |
|
Commercial Mortgage Pass-Through Certificates, Series 2016-CR28, Class B, VRN, 4.65%, 2/10/49 | 75,000 |
| 77,164 |
|
| Commercial Mortgage Trust, Series 2015-CR22, Class B, VRN, 3.93%, 3/10/48 | 25,000 |
| 24,824 |
|
| Commercial Mortgage Trust, Series 2016-CD1, Class AM, 2.93%, 8/10/49 | 25,000 |
| 24,639 |
|
| CSAIL Commercial Mortgage Trust, Series 2017-CX10, Class AS, VRN, 3.67%, 11/15/50 | 25,000 |
| 25,591 |
|
| GS Mortgage Securities Trust, Series 2015-GC28, Class AS, 3.76%, 2/10/48 | 50,000 |
| 51,595 |
|
| GS Mortgage Securities Trust, Series 2016-GS2, Class B, VRN, 3.76%, 5/10/49 | 25,000 |
| 23,984 |
|
| JPMBB Commercial Mortgage Securities Trust, Series 2014-C21, Class AS SEQ, 4.00%, 8/15/47 | 250,000 |
| 261,029 |
|
| JPMBB Commercial Mortgage Securities Trust, Series 2014-C21, Class B, VRN, 4.34%, 8/15/47 | 60,000 |
| 60,307 |
|
JPMorgan Chase Commercial Mortgage Securities Trust, Series 2016-JP2, Class B, 3.46%, 8/15/49 | 40,000 |
| 37,567 |
|
TOTAL COMMERCIAL MORTGAGE-BACKED SECURITIES
(Cost $650,810) | | 637,367 |
|
| SOVEREIGN GOVERNMENTS AND AGENCIES — 1.7% | | |
| Egypt — 1.1% | | |
| Egypt Government International Bond, 5.75%, 4/29/20 | 100,000 |
| 99,941 |
|
| Egypt Government International Bond, 6.125%, 1/31/22 | 200,000 |
| 193,375 |
|
| | | 293,316 |
|
| Oman — 0.6% | | |
| Oman Government International Bond, 4.125%, 1/17/23 | 200,000 |
| 167,124 |
|
TOTAL SOVEREIGN GOVERNMENTS AND AGENCIES
(Cost $492,199) | | 460,440 |
|
| U.S. TREASURY SECURITIES — 1.0% | | |
| U.S. Treasury Notes, 2.625%, 2/15/29 | 150,000 |
| 175,430 |
|
U.S. Treasury Notes, 1.625%, 8/15/29(4) | 100,000 |
| 108,605 |
|
TOTAL U.S. TREASURY SECURITIES
(Cost $248,045) | | 284,035 |
|
| PREFERRED STOCKS — 0.4% | | |
| Equity Real Estate Investment Trusts (REITs) — 0.1% | | |
| SITE Centers Corp., 6.25% | 1,400 |
| 25,970 |
|
| Machinery — 0.3% | | |
| Stanley Black & Decker, Inc., 4.00% | 100,000 |
| 96,303 |
|
TOTAL PREFERRED STOCKS
(Cost $134,748) | | 122,273 |
|
BANK LOAN OBLIGATIONS(5) — 0.1% | | |
| Pharmaceuticals — 0.1% | | |
Bausch Health Companies Inc., 2018 Term Loan B, 3.61%, (1-month LIBOR plus 3.00%), 6/2/25
(Cost $35,600) | $ | 35,453 |
| 33,931 |
|
| TEMPORARY CASH INVESTMENTS — 6.0% | | |
| Repurchase Agreement, BMO Capital Markets Corp., (collateralized by various U.S. Treasury obligations, 1.875% - 3.00%, 11/30/21 - 5/15/45, valued at $570,955), in a joint trading account at 0.01%, dated 3/31/20, due 4/1/20 (Delivery value $559,854) | | 559,854 |
|
|
| | | | | | |
| | Principal Amount/Shares | Value |
| State Street Institutional U.S. Government Money Market Fund, Premier Class | 1,128,400 |
| $ | 1,128,400 |
|
TOTAL TEMPORARY CASH INVESTMENTS
(Cost $1,688,254) | | 1,688,254 |
|
TOTAL INVESTMENT SECURITIES — 98.8%
(Cost $29,172,073) | | 27,568,220 |
|
| OTHER ASSETS AND LIABILITIES — 1.2% | | 331,013 |
|
| TOTAL NET ASSETS — 100.0% | | $ | 27,899,233 |
|
|
| | | | | | | | | | |
| FORWARD FOREIGN CURRENCY EXCHANGE CONTRACTS |
| Currency Purchased | Currency Sold | Counterparty | Settlement Date | Unrealized Appreciation (Depreciation) |
| EUR | 12,542 |
| USD | 14,060 |
| JPMorgan Chase Bank N.A. | 6/17/20 | $ | (187 | ) |
| MXN | 170,424 |
| USD | 7,535 |
| Morgan Stanley | 6/17/20 | (432 | ) |
| | | | | | | $ | (619 | ) |
|
| | | | | | | | | | | |
| FUTURES CONTRACTS PURCHASED |
| Reference Entity | Contracts | Expiration Date | Notional Amount | Underlying
Contract
Value | Unrealized
Appreciation
(Depreciation) |
| U.S. Treasury 2-Year Notes | 5 | June 2020 | $ | 1,000,000 |
| $ | 1,101,914 |
| $ | 5,223 |
|
| U.S. Treasury 5-Year Notes | 17 | June 2020 | $ | 1,700,000 |
| 2,131,109 |
| 45,971 |
|
| | | | | $ | 3,233,023 |
| $ | 51,194 |
|
|
| | |
| NOTES TO SCHEDULE OF INVESTMENTS |
| EUR | - | Euro |
| FHLMC | - | Federal Home Loan Mortgage Corporation |
| FNMA | - | Federal National Mortgage Association |
| H15T1Y | - | Constant Maturity U.S. Treasury Note Yield Curve Rate Index |
| IO | - | Interest Only |
| LIBOR | - | London Interbank Offered Rate |
| MTN | - | Medium Term Note |
| MXN | - | Mexican Peso |
| SEQ | - | Sequential Payer |
| USD | - | United States Dollar |
| VRN | - | Variable Rate Note. The rate adjusts periodically based upon the terms set forth in the security’s offering documents. The rate shown is effective at the period end and the reference rate and spread, if any, is indicated. The security's effective maturity date may be shorter than the final maturity date shown. |
| |
| (1) | Security was purchased pursuant to Rule 144A under the Securities Act of 1933 and may be sold in transactions exempt from registration, normally to qualified institutional investors. The aggregate value of these securities at the period end was $8,295,979, which represented 29.7% of total net assets. |
| |
| (2) | When-issued security. The issue price and yield are fixed on the date of the commitment, but payment and delivery are scheduled for a future date. |
| |
| (3) | Investments are funds within the American Century Investments family of funds and are considered affiliated funds. |
| |
| (4) | Security, or a portion thereof, has been pledged at the custodian bank or with a broker for collateral requirements on forward foreign currency exchange contracts and/or futures contracts. At the period end, the aggregate value of securities pledged was $28,237. |
| |
| (5) | The interest rate on a bank loan obligation adjusts periodically based on a predetermined schedule. Rate shown is effective at period end. The maturity date on a bank loan obligation may be less than indicated as a result of contractual or optional prepayments. These prepayments cannot be predicted with certainty. |
| |
| (6) | Security is in default. |
See Notes to Financial Statements.
|
|
| Statement of Assets and Liabilities |
|
| | | |
| MARCH 31, 2020 | |
| Assets | |
| Investment securities - unaffiliated, at value (cost of $27,631,442) | $ | 26,161,324 |
|
| Investment securities - affiliated, at value (cost of $1,540,631) | 1,406,896 |
|
| Total investment securities, at value (cost of $29,172,073) | 27,568,220 |
|
| Cash | 42,122 |
|
| Receivable for investments sold | 441,919 |
|
| Receivable for capital shares sold | 852 |
|
| Interest and dividends receivable | 235,320 |
|
| Securities lending receivable | 2,038 |
|
| | 28,290,471 |
|
| | |
| Liabilities | |
| Payable for investments purchased | 348,556 |
|
| Payable for capital shares redeemed | 21,778 |
|
| Payable for variation margin on futures contracts | 953 |
|
| Unrealized depreciation on forward foreign currency exchange contracts | 619 |
|
| Accrued management fees | 17,306 |
|
| Distribution and service fees payable | 662 |
|
| Dividends payable | 1,364 |
|
| | 391,238 |
|
| | |
| Net Assets | $ | 27,899,233 |
|
| | |
| Net Assets Consist of: | |
| Capital paid in | $ | 29,790,146 |
|
| Distributable earnings | (1,890,913 | ) |
| | $ | 27,899,233 |
|
|
| | | | | | |
| | Net Assets | Shares Outstanding | Net Asset Value Per Share |
| Investor Class |
| $20,836,098 |
| 2,244,732 |
| $9.28 |
| I Class |
| $2,955,106 |
| 318,539 |
| $9.28 |
| Y Class |
| $5,255 |
| 566 |
| $9.28 |
| A Class |
| $1,762,094 |
| 189,848 |
| $9.28* |
| C Class |
| $202,139 |
| 21,785 |
| $9.28 |
| R Class |
| $180,611 |
| 19,452 |
| $9.28 |
| R5 Class |
| $97,210 |
| 10,474 |
| $9.28 |
| R6 Class |
| $1,860,720 |
| 200,502 |
| $9.28 |
*Maximum offering price $9.72 (net asset value divided by 0.955).
See Notes to Financial Statements.
|
| | | |
| YEAR ENDED MARCH 31, 2020 | |
| Investment Income (Loss) | |
| Income: | |
| Interest | $ | 863,484 |
|
| Income distributions from affiliated funds | 67,176 |
|
| Dividends | 19,612 |
|
| Securities lending, net | 2,946 |
|
| | 953,218 |
|
| | |
| Expenses: | |
| Management fees | 200,171 |
|
| Distribution and service fees: | |
| A Class | 4,088 |
|
| C Class | 2,010 |
|
| R Class | 780 |
|
| Trustees' fees and expenses | 2,058 |
|
| Other expenses | 700 |
|
| | 209,807 |
|
Fees waived(1) | (11,175 | ) |
| | 198,632 |
|
| | |
| Net investment income (loss) | 754,586 |
|
| | |
| Realized and Unrealized Gain (Loss) | |
| Net realized gain (loss) on: | |
| Investment transactions | 99,134 |
|
| Forward foreign currency exchange contract transactions | (331 | ) |
| Futures contract transactions | 11,028 |
|
| Swap agreement transactions | (102,502 | ) |
| Foreign currency translation transactions | (187 | ) |
| | 7,142 |
|
| | |
| Change in net unrealized appreciation (depreciation) on: | |
| Investments (including $(168,620) from affiliated funds) | (1,755,831 | ) |
| Forward foreign currency exchange contracts | (1,214 | ) |
| Futures contracts | 51,194 |
|
| Translation of assets and liabilities in foreign currencies | 156 |
|
| | (1,705,695 | ) |
| | |
| Net realized and unrealized gain (loss) | (1,698,553 | ) |
| | |
| Net Increase (Decrease) in Net Assets Resulting from Operations | $ | (943,967 | ) |
| |
| (1) | Amount consists of $8,673, $1,031, $4, $658, $82, $63, $42 and $622 for Investor Class, I Class, Y Class, A Class, C Class, R Class, R5 Class and R6 Class, respectively. |
See Notes to Financial Statements.
|
|
| Statement of Changes in Net Assets |
|
| | | | | | |
| YEARS ENDED MARCH 31, 2020 AND MARCH 31, 2019 |
| Increase (Decrease) in Net Assets | March 31, 2020 | March 31, 2019 |
| Operations | | |
| Net investment income (loss) | $ | 754,586 |
| $ | 598,716 |
|
| Net realized gain (loss) | 7,142 |
| (175,500 | ) |
| Change in net unrealized appreciation (depreciation) | (1,705,695 | ) | 290,405 |
|
| Net increase (decrease) in net assets resulting from operations | (943,967 | ) | 713,621 |
|
| | | |
| Distributions to Shareholders | | |
| From earnings: | | |
| Investor Class | (573,315 | ) | (499,842 | ) |
| I Class | (70,627 | ) | (42,574 | ) |
| Y Class | (162 | ) | (212 | ) |
| A Class | (39,341 | ) | (44,458 | ) |
| C Class | (3,376 | ) | (17,840 | ) |
| R Class | (3,350 | ) | (13,277 | ) |
| R5 Class | (2,964 | ) | (20,067 | ) |
| R6 Class | (47,455 | ) | (21,566 | ) |
| Decrease in net assets from distributions | (740,590 | ) | (659,836 | ) |
| | | |
| Capital Share Transactions | | |
| Net increase (decrease) in net assets from capital share transactions (Note 5) | 10,660,287 |
| 1,746,930 |
|
| | | |
| Net increase (decrease) in net assets | 8,975,730 |
| 1,800,715 |
|
| | | |
| Net Assets | | |
| Beginning of period | 18,923,503 |
| 17,122,788 |
|
| End of period | $ | 27,899,233 |
| $ | 18,923,503 |
|
See Notes to Financial Statements.
|
|
| Notes to Financial Statements |
MARCH 31, 2020
1. Organization
American Century Investment Trust (the trust) is registered under the Investment Company Act of 1940, as amended (the 1940 Act), as an open-end management investment company and is organized as a Massachusetts business trust. Strategic Income Fund (the fund) is one fund in a series issued by the trust. The fund’s investment objective is to seek income. As a secondary objective, the fund seeks long-term capital appreciation.
The fund offers the Investor Class, I Class, Y Class, A Class, C Class, R Class, R5 Class and R6 Class. The A Class may incur an initial sales charge. The A Class and C Class may be subject to a contingent deferred sales charge.
2. Significant Accounting Policies
The following is a summary of significant accounting policies consistently followed by the fund in preparation of its financial statements. The fund is an investment company and follows accounting and reporting guidance in accordance with accounting principles generally accepted in the United States of America. This may require management to make certain estimates and assumptions at the date of the financial statements. Actual results could differ from these estimates. Management evaluated the impact of events or transactions occurring through the date the financial statements were issued that would merit recognition or disclosure.
Investment Valuations — The fund determines the fair value of its investments and computes its net asset value per share at the close of regular trading (usually 4 p.m. Eastern time) on the New York Stock Exchange (NYSE) on each day the NYSE is open. The Board of Trustees has adopted valuation policies and procedures to guide the investment advisor in the fund’s investment valuation process and to provide methodologies for the oversight of the fund’s pricing function.
Fixed income securities are valued at the evaluated mean as provided by independent pricing services or at the mean of the most recent bid and asked prices as provided by investment dealers. Corporate bonds, U.S. Treasury and Government Agency securities, convertible bonds, bank loan obligations, municipal securities, and sovereign governments and agencies are valued using market models that consider trade data, quotations from dealers and active market makers, relevant yield curve and spread data, creditworthiness, trade data or market information on comparable securities, and other relevant security specific information. Mortgage-related and asset-backed securities are valued based on models that consider trade data, prepayment and default projections, benchmark yield and spread data and estimated cash flows of each tranche of the issuer. Collateralized loan obligations are valued based on discounted cash flow models that consider trade and economic data, prepayment assumptions and default projections. Fixed income securities initially expressed in local currencies are translated into U.S. dollars at the mean of the appropriate currency exchange rate at the close of the NYSE as provided by an independent pricing service.
Equity securities that are listed or traded on a domestic securities exchange are valued at the last reported sales price or at the official closing price as provided by the exchange. Equity securities traded on foreign securities exchanges are generally valued at the closing price of such securities on the exchange where primarily traded or at the close of the NYSE, if that is earlier. If no last sales price is reported, or if local convention or regulation so provides, the mean of the latest bid and asked prices may be used. Securities traded over-the-counter are valued at the mean of the latest bid and asked prices, the last sales price, or the official closing price. Equity securities initially expressed in local currencies are translated into U.S. dollars at the mean of the appropriate currency exchange rate at the close of the NYSE as provided by an independent pricing service.
Hybrid securities are valued at the evaluated mean as provided by independent pricing services or at the mean of the most recent bid and asked prices as provided by investment dealers. Preferred stocks and convertible preferred stocks with perpetual maturities are valued using market models that consider trade data, quotations from dealers and active market makers, relevant yield curve and spread data, creditworthiness, trade data or market information on comparable securities, and other relevant security specific information.
Open-end management investment companies are valued at the reported net asset value per share. Repurchase agreements are valued at cost, which approximates fair value. Exchange-traded futures contracts are valued at the settlement price as provided by the appropriate exchange. Swap agreements are valued at an evaluated mean as provided by independent pricing services or independent brokers. Forward foreign currency exchange contracts are valued at the mean of the appropriate forward exchange rate at the close of the NYSE as provided by an independent pricing service.
If the fund determines that the market price for an investment is not readily available or the valuation methods mentioned above do not reflect an investment’s fair value, such investment is valued as determined in good faith by the Board of Trustees or its delegate, in accordance with policies and procedures adopted by the Board of Trustees. In its determination of fair value, the fund may review several factors including, but not limited to, market information regarding the specific investment or comparable investments and correlation with other investment types, futures indices or general market indicators. Circumstances that may cause the fund to use these procedures to value an investment include, but are not limited to: an investment has been declared in default or is distressed; trading in a security has been suspended during the trading day or a security is not actively trading on its principal exchange; prices received from a regular pricing source are deemed unreliable; or there is a foreign market holiday and no trading occurred.
The fund monitors for significant events occurring after the close of an investment’s primary exchange but before the fund’s net asset value per share is determined. Significant events may include, but are not limited to: corporate announcements and transactions; governmental action and political unrest that could impact a specific investment or an investment sector; or armed conflicts, natural disasters and similar events that could affect investments in a specific country or region. The fund also monitors for significant fluctuations between domestic and foreign markets, as evidenced by the U.S. market or such other indicators that the Board of Trustees, or its delegate, deems appropriate. The fund may apply a model-derived factor to the closing price of equity securities traded on foreign securities exchanges. The factor is based on observable market data as provided by an independent pricing service.
Security Transactions — Security transactions are accounted for as of the trade date. Net realized gains and losses are determined on the identified cost basis, which is also used for federal income tax purposes.
Investment Income — Interest income is recorded on the accrual basis and includes paydown gain (loss) and accretion of discounts and amortization of premiums. Inflation adjustments related to inflation-linked debt securities are reflected as interest income. Dividend income less foreign taxes withheld, if any, is recorded as of the ex-dividend date. Income and capital gain distributions, if any, from the affiliated funds are recorded as of the ex-dividend date. Distributions received on securities that represent a return of capital or long-term capital gain are recorded as a reduction of cost of investments and/or as a realized gain. The fund may estimate the components of distributions received that may be considered nontaxable distributions or long-term capital gain distributions for income tax purposes. Securities lending income is net of fees and rebates earned by the lending agent for its services.
Foreign Currency Translations — All assets and liabilities initially expressed in foreign currencies are translated into U.S. dollars at prevailing exchange rates at period end. The fund may enter into spot foreign currency exchange contracts to facilitate transactions denominated in a foreign currency. Purchases and sales of investment securities, dividend and interest income, spot foreign currency exchange contracts, and expenses are translated at the rates of exchange prevailing on the respective dates of such transactions. Net realized and unrealized foreign currency exchange gains or losses related to investment securities are a component of net realized gain (loss) on investment transactions and change in net unrealized appreciation (depreciation) on investments, respectively.
Repurchase Agreements — The fund may enter into repurchase agreements with institutions that American Century Investment Management, Inc. (ACIM) (the investment advisor) has determined are creditworthy pursuant to criteria adopted by the Board of Trustees. The fund requires that the collateral, represented by securities, received in a repurchase transaction be transferred to the custodian in a manner sufficient to enable the fund to obtain those securities in the event of a default under the repurchase agreement. ACIM monitors, on a daily basis, the securities transferred to ensure the value, including accrued interest, of the securities under each repurchase agreement is equal to or greater than amounts owed to the fund under each repurchase agreement.
Joint Trading Account — Pursuant to an Exemptive Order issued by the Securities and Exchange Commission, the fund, along with certain other funds in the American Century Investments family of funds, may transfer uninvested cash balances into a joint trading account. These balances are invested in one or more repurchase agreements that are collateralized by U.S. Treasury or Agency obligations.
Segregated Assets — In accordance with the 1940 Act, the fund segregates assets on its books and records to cover certain types of investment securities and other financial instruments. ACIM monitors, on a daily basis, the securities segregated to ensure the fund designates a sufficient amount of liquid assets, marked-to-market daily. The fund may also receive assets or be required to pledge assets at the custodian bank or with a broker for collateral requirements.
Income Tax Status — It is the fund’s policy to distribute substantially all net investment income and net realized gains to shareholders and to otherwise qualify as a regulated investment company under provisions of the Internal Revenue Code. Accordingly, no provision has been made for income taxes. The fund files U.S. federal, state, local and non-U.S. tax returns as applicable. The fund's tax returns are subject to examination by the relevant taxing authority until expiration of the applicable statute of limitations, which is generally three years from the date of filing but can be longer in certain jurisdictions. At this time, management believes there are no uncertain tax positions which, based on their technical merit, would not be sustained upon examination and for which it is reasonably possible that the total amounts of unrecognized tax benefits will significantly change in the next twelve months.
Multiple Class — All shares of the fund represent an equal pro rata interest in the net assets of the class to which such shares belong, and have identical voting, dividend, liquidation and other rights and the same terms and conditions, except for class specific expenses and exclusive rights to vote on matters affecting only individual classes. Income, non-class specific expenses, and realized and unrealized capital gains and losses of the fund are allocated to each class of shares based on their relative net assets.
Distributions to Shareholders — Distributions from net investment income, if any, are declared daily and paid monthly. Distributions from net realized gains, if any, are generally declared and paid annually.
Indemnifications — Under the trust’s organizational documents, its officers and trustees are indemnified against certain liabilities arising out of the performance of their duties to the fund. In addition, in the normal course of business, the fund enters into contracts that provide general indemnifications. The maximum exposure under these arrangements is unknown as this would involve future claims that may be made against a fund. The risk of material loss from such claims is considered by management to be remote.
Securities Lending — Securities are lent to qualified financial institutions and brokers. State Street Bank & Trust Co. serves as securities lending agent to the fund pursuant to a Securities Lending Agreement. The lending of securities exposes the fund to risks such as: the borrowers may fail to return the loaned securities, the borrowers may not be able to provide additional collateral, the fund may experience delays in recovery of the loaned securities or delays in access to collateral, or the fund may experience losses related to the investment collateral. To minimize certain risks, loan counterparties pledge collateral in the form of cash and/or securities. The lending agent has agreed to indemnify the fund in the case of default of any securities borrowed. Cash collateral received is invested in the State Street Navigator Securities Lending Government Money Market Portfolio, a money market mutual fund registered under the 1940 Act. The loans may also be secured by U.S. government securities in an amount at least equal to the market value of the securities loaned, plus accrued interest and dividends, determined on a daily basis and adjusted accordingly. By lending securities, the fund seeks to increase its net investment income through the receipt of interest and fees. Such income is reflected separately within the Statement of Operations. The value of loaned securities and related collateral outstanding at period end, if any, are shown on a gross basis within the Schedule of Investments and Statement of Assets and Liabilities.
3. Fees and Transactions with Related Parties
Certain officers and trustees of the trust are also officers and/or directors of American Century Companies, Inc. (ACC). The trust's investment advisor, ACIM, the trust's distributor, American Century Investment Services, Inc. (ACIS), and the trust's transfer agent, American Century Services, LLC, are wholly owned, directly or indirectly, by ACC. ACIM serves as the investment advisor for the affiliated funds.
Management Fees — The trust has entered into a management agreement with ACIM, under which ACIM provides the fund with investment advisory and management services in exchange for a single, unified management fee (the fee) per class. The agreement provides that all expenses of managing and operating the fund, except distribution and service fees, brokerage expenses, taxes, interest, fees and expenses of the independent trustees (including legal counsel fees), and extraordinary expenses, will be paid by ACIM. The fee is computed and accrued daily based on each class's daily net assets and paid monthly in arrears. The difference in the fee among the classes is a result of their separate arrangements for non-Rule 12b-1 shareholder services. It is not the result of any difference in advisory or custodial fees or other expenses related to the management of the fund’s assets, which do not vary by class. The investment advisor will waive the portion of the fund’s management fee equal to the expenses attributable to the management fees of the American Century Investments funds in which the fund invests. The amount of this waiver will fluctuate depending on the fund’s daily allocation to other American Century Investments funds. This waiver is expected to remain in effect permanently and it cannot be terminated without the approval of the Board of Trustees.
The annual management fee and the effective annual management fee after waiver for each class for the period ended March 31, 2020 are as follows:
|
| | |
| | Annual Management Fee | Effective Annual Management Fee After Waiver |
| Investor Class | 0.74% | 0.70% |
| I Class | 0.64% | 0.60% |
| Y Class | 0.54% | 0.50% |
| A Class | 0.74% | 0.70% |
| C Class | 0.74% | 0.70% |
| R Class | 0.74% | 0.70% |
| R5 Class | 0.54% | 0.50% |
| R6 Class | 0.49% | 0.45% |
Distribution and Service Fees — The Board of Trustees has adopted a separate Master Distribution and Individual Shareholder Services Plan for each of the A Class, C Class and R Class (collectively the plans), pursuant to Rule 12b-1 of the 1940 Act. The plans provide that the A Class will pay ACIS an annual distribution and service fee of 0.25%. The plans provide that the C Class will pay ACIS an annual distribution and service fee of 1.00%, of which 0.25% is paid for individual shareholder services and 0.75% is paid for distribution services. The plans provide that the R Class will pay ACIS an annual distribution and service fee of 0.50%. The fees are computed and accrued daily based on each class’s daily net assets and paid monthly in arrears. The fees are used to pay financial intermediaries for distribution and individual shareholder services. Fees incurred under the plans during the period ended March 31, 2020 are detailed in the Statement of Operations.
Trustees’ Fees and Expenses — The Board of Trustees is responsible for overseeing the investment advisor’s management and operations of the fund. The trustees receive detailed information about the fund and its investment advisor regularly throughout the year, and meet at least quarterly with management of the investment advisor to review reports about fund operations. The fund’s officers do not receive compensation from the fund.
Interfund Transactions — The fund may enter into security transactions with other American Century Investments funds and other client accounts of the investment advisor, in accordance with the 1940 Act rules and procedures adopted by the Board of Trustees. The rules and procedures require, among other things, that these transactions be effected at the independent current market price of the security. There were no interfund transactions during the period.
4. Investment Transactions
Purchases of investment securities, excluding short-term investments, for the period ended March 31, 2020 totaled $32,604,589, of which $4,851,371 represented U.S. Treasury and Government Agency obligations.
Sales of investment securities, excluding short-term investments, for the period ended March 31, 2020 totaled $22,337,490, of which $6,599,951 represented U.S. Treasury and Government Agency obligations.
5. Capital Share Transactions
Transactions in shares of the fund were as follows (unlimited number of shares authorized):
|
| | | | | | | | | | |
| | Year ended
March 31, 2020 | Year ended
March 31, 2019 |
| | Shares | Amount | Shares | Amount |
| Investor Class | | | | |
| Sold | 1,528,091 |
| $ | 15,140,922 |
| 1,104,462 |
| $ | 10,560,239 |
|
| Issued in reinvestment of distributions | 55,589 |
| 550,338 |
| 49,179 |
| 471,880 |
|
| Redeemed | (953,917) |
| (9,335,916 | ) | (794,260) |
| (7,633,594 | ) |
| | 629,763 |
| 6,355,344 |
| 359,381 |
| 3,398,525 |
|
| I Class | | | | |
| Sold | 182,748 |
| 1,801,940 |
| 77,683 |
| 744,902 |
|
| Issued in reinvestment of distributions | 7,143 |
| 70,627 |
| 4,434 |
| 42,501 |
|
| Redeemed | (9,566 | ) | (92,222 | ) | (14,448 | ) | (139,428 | ) |
| | 180,325 |
| 1,780,345 |
| 67,669 |
| 647,975 |
|
| Y Class | | | | |
| Issued in reinvestment of distributions | 16 |
| 162 |
| 22 |
| 212 |
|
| A Class | | | | |
| Sold | 82,536 |
| 823,420 |
| 148,484 |
| 1,418,224 |
|
| Issued in reinvestment of distributions | 3,979 |
| 39,341 |
| 4,583 |
| 43,932 |
|
| Redeemed | (32,775 | ) | (311,255 | ) | (84,968 | ) | (805,318 | ) |
| | 53,740 |
| 551,506 |
| 68,099 |
| 656,838 |
|
| C Class | | | | |
| Sold | 4,786 |
| 47,835 |
| 805 |
| 7,587 |
|
| Issued in reinvestment of distributions | 341 |
| 3,366 |
| 1,805 |
| 17,350 |
|
| Redeemed | (2,087 | ) | (20,235 | ) | (106,482 | ) | (1,021,900 | ) |
| | 3,040 |
| 30,966 |
| (103,872 | ) | (996,963 | ) |
| R Class | | | | |
| Sold | 14,049 |
| 139,297 |
| 3,801 |
| 36,646 |
|
| Issued in reinvestment of distributions | 334 |
| 3,302 |
| 1,372 |
| 13,193 |
|
| Redeemed | (6,453 | ) | (63,702 | ) | (78,363 | ) | (753,666 | ) |
| | 7,930 |
| 78,897 |
| (73,190 | ) | (703,827 | ) |
| R5 Class | | | | |
| Issued in reinvestment of distributions | 300 |
| 2,964 |
| 2,080 |
| 19,986 |
|
| Redeemed | — |
| — |
| (67,198 | ) | (637,943 | ) |
| | 300 |
| 2,964 |
| (65,118 | ) | (617,957 | ) |
| R6 Class | | | | |
| Sold | 306,274 |
| 3,049,089 |
| 3,298 |
| 31,073 |
|
| Issued in reinvestment of distributions | 4,782 |
| 47,455 |
| 2,233 |
| 21,478 |
|
| Redeemed | (124,661 | ) | (1,236,441 | ) | (72,382 | ) | (690,424 | ) |
| | 186,395 |
| 1,860,103 |
| (66,851 | ) | (637,873 | ) |
| Net increase (decrease) | 1,061,509 |
| $ | 10,660,287 |
| 186,140 |
| $ | 1,746,930 |
|
6. Affiliated Fund Transactions
A summary of transactions for each affiliated fund for the period ended March 31, 2020 follows (amounts in thousands):
|
| | | | | | | | | | | | | | | | | | | | | |
Affiliated Fund(1) | Beginning Value | Purchase Cost | Sales Cost | Change in Net Unrealized Appreciation (Depreciation) | Ending Value | Ending Shares | Net Realized Gain (Loss) | Distributions Received(2) |
| Emerging Markets Debt Fund R6 Class | $ | 1,508 |
| $ | 68 |
| — |
| $ | (169 | ) | $ | 1,407 |
| 155 |
| — |
| $ | 67 |
|
| |
| (1) | Investments are funds within the American Century Investments family of funds and are considered affiliated funds. Additional information and attributes of each affiliated fund are available at americancentury.com. |
| |
| (2) | Distributions received includes distributions from net investment income and from capital gains, if any. |
7. Investments in Affiliated Funds
The fund does not invest in an affiliated fund for the purpose of exercising management or control; however, investments by the fund within its investment strategy may represent a significant portion of an affiliated fund's net assets.
8. Fair Value Measurements
The fund’s investments valuation process is based on several considerations and may use multiple inputs to determine the fair value of the investments held by the fund. In conformity with accounting principles generally accepted in the United States of America, the inputs used to determine a valuation are classified into three broad levels.
| |
| • | Level 1 valuation inputs consist of unadjusted quoted prices in an active market for identical investments. |
| |
| • | Level 2 valuation inputs consist of direct or indirect observable market data (including quoted prices for comparable investments, evaluations of subsequent market events, interest rates, prepayment speeds, credit risk, etc.). These inputs also consist of quoted prices for identical investments initially expressed in local currencies that are adjusted through translation into U.S. dollars. |
| |
| • | Level 3 valuation inputs consist of unobservable data (including a fund’s own assumptions). |
The level classification is based on the lowest level input that is significant to the fair valuation measurement. The valuation inputs are not necessarily an indication of the risks associated with investing in these securities or other financial instruments.
The following is a summary of the level classifications as of period end. The Schedule of Investments provides additional information on the fund’s portfolio holdings.
|
| | | | | | | | |
| | Level 1 | Level 2 | Level 3 |
| Assets | | | |
| Investment Securities | | | |
| Corporate Bonds | — |
| $ | 17,611,139 |
| — |
|
| Asset-Backed Securities | — |
| 2,016,934 |
| — |
|
| Collateralized Loan Obligations | — |
| 1,936,538 |
| — |
|
| Affiliated Funds | $ | 1,406,896 |
| — |
| — |
|
| Collateralized Mortgage Obligations | — |
| 1,370,413 |
| — |
|
| Commercial Mortgage-Backed Securities | — |
| 637,367 |
| — |
|
| Sovereign Governments and Agencies | — |
| 460,440 |
| — |
|
| U.S. Treasury Securities | — |
| 284,035 |
| — |
|
| Preferred Stocks | 25,970 |
| 96,303 |
| — |
|
| Bank Loan Obligations | — |
| 33,931 |
| — |
|
| Temporary Cash Investments | 1,128,400 |
| 559,854 |
| — |
|
| | $ | 2,561,266 |
| $ | 25,006,954 |
| — |
|
| Other Financial Instruments | | | |
| Futures Contracts | $ | 51,194 |
| — |
| — |
|
| | | | |
| Liabilities | | | |
| Other Financial Instruments | | | |
| Forward Foreign Currency Exchange Contracts | — |
| $ | 619 |
| — |
|
9. Derivative Instruments
Credit Risk — The fund is subject to credit risk in the normal course of pursuing its investment objectives. The value of a bond generally declines as the credit quality of its issuer declines. Credit default swap agreements enable a fund to buy/sell protection against a credit event of a specific issuer or index. A fund may attempt to enhance returns by selling protection or attempt to mitigate credit risk by buying protection. The buyer/seller of credit protection against a security or basket of securities may pay/receive an up-front or periodic payment to compensate for/against potential default events. Changes in value, including the periodic amounts of interest to be paid or received on swap agreements, are recorded as unrealized appreciation (depreciation) on swap agreements. Upon entering into a centrally cleared swap, a fund is required to deposit cash or securities (initial margin) with a financial intermediary in an amount equal to a certain percentage of the notional amount. Subsequent payments (variation margin) are made or received daily, in cash, by a fund. The variation margin is equal to the daily change in the value and is a component of unrealized gains and losses. Realized gain or loss is recorded upon receipt or payment of a periodic settlement or termination of swap agreements. Net realized and unrealized gains or losses occurring during the holding period of swap agreements are a component of net realized gain (loss) on swap agreement transactions and change in net unrealized appreciation (depreciation) on swap agreements, respectively. The risks of entering into swap agreements include the possible lack of liquidity, failure of the counterparty to meet its obligations, and that there may be unfavorable changes in the underlying investments or instruments. The fund's average notional amount held during the period was $1,881,200.
Foreign Currency Risk — The fund is subject to foreign currency exchange rate risk in the normal course of pursuing its investment objectives. The value of foreign investments held by a fund may be significantly affected by changes in foreign currency exchange rates. The dollar value of a foreign security generally decreases when the value of the dollar rises against the foreign currency in which the security is denominated and tends to increase when the value of the dollar declines against such foreign currency. A fund may enter into forward foreign currency exchange contracts to reduce a fund's exposure to foreign currency exchange rate fluctuations or to gain exposure to the fluctuations in the value of foreign currencies. The net U.S. dollar value of foreign currency underlying all contractual commitments held by a fund and the resulting unrealized appreciation or depreciation are determined daily. Realized gain or loss is recorded upon the termination of the contract. Net realized and unrealized gains or losses occurring during the holding period of forward foreign currency exchange contracts are a component of net realized gain (loss) on forward foreign currency
exchange contract transactions and change in net unrealized appreciation (depreciation) on forward foreign currency exchange contracts, respectively. A fund bears the risk of an unfavorable change in the foreign currency exchange rate underlying the forward contract. Additionally, losses, up to the fair value, may arise if the counterparties do not perform under the contract terms. The fund's average U.S. dollar exposure to foreign currency risk derivative instruments held during the period was $107,076.
Interest Rate Risk — The fund is subject to interest rate risk in the normal course of pursuing its investment objectives. The value of bonds generally declines as interest rates rise. A fund may enter into futures contracts based on a bond index or a specific underlying security. A fund may purchase futures contracts to gain exposure to increases in market value or sell futures contracts to protect against a decline in market value. Upon entering into a futures contract, a fund will segregate cash, cash equivalents or other appropriate liquid securities on its records in amounts sufficient to meet requirements. Subsequent payments (variation margin) are made or received daily, in cash, by a fund. The variation margin is equal to the daily change in the contract value and is recorded as unrealized gains and losses. A fund recognizes a realized gain or loss when the futures contract is closed or expires. Net realized and unrealized gains or losses occurring during the holding period of futures contracts are a component of net realized gain (loss) on futures contract transactions and change in net unrealized appreciation (depreciation) on futures contracts, respectively. One of the risks of entering into futures contracts is the possibility that the change in value of the contract may not correlate with the changes in value of the underlying securities. The fund's average notional exposure to interest rate risk derivative instruments held during the period was $1,185,714 futures contracts purchased.
Value of Derivative Instruments as of March 31, 2020
|
| | | | | | | |
| | Asset Derivatives | Liability Derivatives |
| Type of Risk Exposure | Location on Statement of Assets and Liabilities | Value | Location on Statement of Assets and Liabilities | Value |
| Foreign Currency Risk | Unrealized appreciation on forward foreign currency exchange contracts | — |
| Unrealized depreciation on forward foreign currency exchange contracts | $ | 619 |
|
| Interest Rate Risk | Receivable for variation margin on futures contracts* | — |
| Payable for variation margin on futures contracts* | 953 |
|
| | | — |
| | $ | 1,572 |
|
*Included in the unrealized appreciation (depreciation) on futures contracts, as reported in the Schedule of Investments.
Effect of Derivative Instruments on the Statement of Operations for the Year Ended March 31, 2020
|
| | | | | | | | |
| | Net Realized Gain (Loss) | Change in Net Unrealized Appreciation (Depreciation) |
| Type of Risk Exposure | Location on Statement of Operations | Value | Location on Statement of Operations | Value |
| Credit Risk | Net realized gain (loss) on swap agreement transactions | $ | (102,502 | ) | Change in net unrealized appreciation (depreciation) on swap agreements | — |
|
| Foreign Currency Risk | Net realized gain (loss) on forward foreign currency exchange contract transactions | (331 | ) | Change in net unrealized appreciation (depreciation) on forward foreign currency exchange contracts | $ | (1,214 | ) |
| Interest Rate Risk | Net realized gain (loss) on futures contract transactions | 11,028 |
| Change in net unrealized appreciation (depreciation) on futures contracts | 51,194 |
|
| | | $ | (91,805 | ) | | $ | 49,980 |
|
10. Risk Factors
The value of the fund’s shares will go up and down, sometimes rapidly or unpredictably, based on the performance of the securities owned by the fund and other factors generally affecting the securities market. Market risks, including political, regulatory, economic and social developments, can affect the value of the fund’s investments. Natural disasters, public health emergencies, terrorism and other unforeseeable events may lead to increased market volatility and may have adverse long-term effects on world economies and markets generally.
The fund may invest in instruments that have variable or floating coupon rates based on the London Interbank Offered Rate (LIBOR). LIBOR is a benchmark interest rate intended to be representative of the rate at which certain major international banks lend to one another over short-terms. LIBOR will be phased out by the end of 2021. Uncertainty remains regarding a replacement rate or rates for LIBOR. The transition process may lead to increased volatility or illiquidity in markets for instruments that rely on LIBOR. This could result in a change to the value of such instruments.
There are certain risks involved in investing in foreign securities. These risks include those resulting from political events (such as civil unrest, national elections and imposition of exchange controls), social and economic events (such as labor strikes and rising inflation), and natural disasters. Securities of foreign issuers may be less liquid and more volatile. Investing in emerging markets or a significant portion of assets in one country or region may accentuate these risks.
The fund invests in lower-rated debt securities, which are subject to substantial risks including liquidity risk and credit risk.
11. Federal Tax Information
The tax character of distributions paid during the years ended March 31, 2020 and March 31, 2019 were as follows:
|
| | | | | | |
| | 2020 | 2019 |
| Distributions Paid From | | |
| Ordinary income | $ | 740,590 |
| $ | 659,836 |
|
| Long-term capital gains | — |
| — |
|
The book-basis character of distributions made during the year from net investment income or net realized gains may differ from their ultimate characterization for federal income tax purposes. These differences reflect the differing character of certain income items and net realized gains and losses for financial statement and tax purposes, and may result in reclassification among certain capital accounts on the financial statements.
As of period end, the federal tax cost of investments and the components of distributable earnings on a tax-basis were as follows:
|
| | | |
| Federal tax cost of investments | $ | 29,176,894 |
|
| Gross tax appreciation of investments | $ | 299,417 |
|
| Gross tax depreciation of investments | (1,908,091 | ) |
| Net tax appreciation (depreciation) of investments | $ | (1,608,674 | ) |
| Other book-to-tax adjustments | $ | (1,364 | ) |
| Undistributed ordinary income | — |
|
| Accumulated short-term capital losses | $ | (160,029 | ) |
| Accumulated long-term capital losses | $ | (120,846 | ) |
The difference between book-basis and tax-basis unrealized appreciation (depreciation) is attributable primarily to the realization for tax purposes of unrealized gains (losses) on futures contracts.
Accumulated capital losses represent net capital loss carryovers that may be used to offset future realized capital gains for federal income tax purposes. The capital loss carryovers may be carried forward for an unlimited period. Future capital loss carryover utilization in any given year may be subject to Internal Revenue Code limitations.
12. Recently Issued Accounting Standards
In March 2017, the Financial Accounting Standards Board (FASB) issued Accounting Standards Update No. 2017-08, “Receivables - Nonrefundable Fees and Other Costs (Subtopic 310-20), Premium Amortization on Purchased Callable Debt Securities” (ASU 2017-08). ASU 2017-08 amends the amortization period for certain purchased callable debt securities held at a premium, shortening such period to the earliest call date. The amendments are effective for fiscal years, and interim periods within those fiscal years, beginning after December 15, 2018. The adoption of ASU 2017-08 did not materially impact the financial statements.
|
| | | | | | | | | | | | | | | |
| For a Share Outstanding Throughout the Years Ended March 31 (except as noted) | | | | | | | |
| Per-Share Data | | | | | | Ratios and Supplemental Data | | |
| | | Income From Investment Operations: | | | | Ratio to Average Net Assets of: | | |
| | Net Asset
Value,
Beginning
of Period | Net
Investment
Income
(Loss)(1) | Net
Realized
and
Unrealized
Gain (Loss) | Total From
Investment
Operations | Distributions From Net
Investment
Income | Net Asset
Value,
End
of Period | Total
Return(2) | Operating
Expenses | Operating
Expenses
(before
expense
waiver) | Net
Investment
Income
(Loss) | Net
Investment
Income
(Loss)
(before
expense
waiver) | Portfolio
Turnover
Rate | Net
Assets,
End of
Period
(in thousands) |
| Investor Class | | | | | | | | | | | | |
| 2020 | $9.73 | 0.27 | (0.45) | (0.18) | (0.27) | $9.28 | (2.01)% | 0.71% | 0.75% | 2.70% | 2.66% | 88% |
| $20,836 |
|
| 2019 | $9.74 | 0.34 | 0.03 | 0.37 | (0.38) | $9.73 | 3.88% | 0.70% | 0.76% | 3.55% | 3.49% | 60% |
| $15,718 |
|
| 2018 | $9.78 | 0.32 | (0.04) | 0.28 | (0.32) | $9.74 | 2.86% | 0.69% | 0.76% | 3.27% | 3.20% | 64% |
| $12,228 |
|
| 2017 | $9.45 | 0.33 | 0.33 | 0.66 | (0.33) | $9.78 | 7.06% | 0.65% | 0.76% | 3.39% | 3.28% | 40% |
| $7,791 |
|
| 2016 | $9.81 | 0.33 | (0.29) | 0.04 | (0.40) | $9.45 | 0.44% | 0.64% | 0.75% | 3.52% | 3.41% | 25% |
| $2,290 |
|
| I Class | | | | | | | | | | | | |
| 2020 | $9.73 | 0.28 | (0.45) | (0.17) | (0.28) | $9.28 | (1.91)% | 0.61% | 0.65% | 2.80% | 2.76% | 88% |
| $2,955 |
|
| 2019 | $9.73 | 0.35 | 0.03 | 0.38 | (0.38) | $9.73 | 4.09% | 0.60% | 0.66% | 3.65% | 3.59% | 60% |
| $1,345 |
|
2018(3) | $9.79 | 0.33 | (0.07) | 0.26 | (0.32) | $9.73 | 2.64% | 0.59%(4) | 0.66%(4) | 3.37%(4) | 3.30%(4) | 64%(5) |
| $687 |
|
| Y Class | | | | | | | | | | | | |
| 2020 | $9.73 | 0.30 | (0.46) | (0.16) | (0.29) | $9.28 | (1.78)% | 0.51% | 0.55% | 2.90% | 2.86% | 88% |
| $5 |
|
| 2019 | $9.73 | 0.36 | 0.03 | 0.39 | (0.39) | $9.73 | 4.18% | 0.50% | 0.56% | 3.75% | 3.69% | 60% |
| $5 |
|
2018(3) | $9.79 | 0.33 | (0.06) | 0.27 | (0.33) | $9.73 | 2.73% | 0.49%(4) | 0.56%(4) | 3.46%(4) | 3.39%(4) | 64%(5) |
| $5 |
|
|
| | | | | | | | | | | | | | | |
| For a Share Outstanding Throughout the Years Ended March 31 (except as noted) | | | | | | | |
| Per-Share Data | | | | | | Ratios and Supplemental Data | | |
| | | Income From Investment Operations: | | | | Ratio to Average Net Assets of: | | |
| | Net Asset
Value,
Beginning
of Period | Net
Investment
Income
(Loss)(1) | Net
Realized
and
Unrealized
Gain (Loss) | Total From
Investment
Operations | Distributions From Net
Investment
Income | Net Asset
Value,
End
of Period | Total
Return(2) | Operating
Expenses | Operating
Expenses
(before
expense
waiver) | Net
Investment
Income
(Loss) | Net
Investment
Income
(Loss)
(before
expense
waiver) | Portfolio
Turnover
Rate | Net
Assets,
End of
Period
(in thousands) |
| A Class | | | | | | | | | | | | |
| 2020 | $9.73 | 0.24 | (0.45) | (0.21) | (0.24) | $9.28 | (2.26)% | 0.96% | 1.00% | 2.45% | 2.41% | 88% |
| $1,762 |
|
| 2019 | $9.74 | 0.32 | 0.02 | 0.34 | (0.35) | $9.73 | 3.62% | 0.95% | 1.01% | 3.30% | 3.24% | 60% |
| $1,325 |
|
| 2018 | $9.77 | 0.29 | (0.03) | 0.26 | (0.29) | $9.74 | 2.71% | 0.94% | 1.01% | 3.02% | 2.95% | 64% |
| $662 |
|
| 2017 | $9.45 | 0.30 | 0.32 | 0.62 | (0.30) | $9.77 | 6.68% | 0.90% | 1.01% | 3.14% | 3.03% | 40% |
| $992 |
|
| 2016 | $9.81 | 0.31 | (0.30) | 0.01 | (0.37) | $9.45 | 0.19% | 0.89% | 1.00% | 3.27% | 3.16% | 25% |
| $1,180 |
|
| C Class | | | | | | | | | | | | |
| 2020 | $9.73 | 0.17 | (0.45) | (0.28) | (0.17) | $9.28 | (2.99)% | 1.71% | 1.75% | 1.70% | 1.66% | 88% |
| $202 |
|
| 2019 | $9.74 | 0.24 | 0.03 | 0.27 | (0.28) | $9.73 | 2.85% | 1.70% | 1.76% | 2.55% | 2.49% | 60% |
| $182 |
|
| 2018 | $9.77 | 0.22 | (0.03) | 0.19 | (0.22) | $9.74 | 1.94% | 1.69% | 1.76% | 2.27% | 2.20% | 64% |
| $1,194 |
|
| 2017 | $9.45 | 0.23 | 0.32 | 0.55 | (0.23) | $9.77 | 5.89% | 1.65% | 1.76% | 2.39% | 2.28% | 40% |
| $1,098 |
|
| 2016 | $9.81 | 0.24 | (0.30) | (0.06) | (0.30) | $9.45 | (0.56)% | 1.64% | 1.75% | 2.52% | 2.41% | 25% |
| $993 |
|
| R Class | | | | | | | | | | | | |
| 2020 | $9.73 | 0.22 | (0.45) | (0.23) | (0.22) | $9.28 | (2.39)% | 1.21% | 1.25% | 2.20% | 2.16% | 88% |
| $181 |
|
| 2019 | $9.74 | 0.29 | 0.03 | 0.32 | (0.33) | $9.73 | 3.36% | 1.20% | 1.26% | 3.05% | 2.99% | 60% |
| $112 |
|
| 2018 | $9.78 | 0.27 | (0.04) | 0.23 | (0.27) | $9.74 | 2.45% | 1.19% | 1.26% | 2.77% | 2.70% | 64% |
| $825 |
|
| 2017 | $9.45 | 0.28 | 0.33 | 0.61 | (0.28) | $9.78 | 6.42% | 1.15% | 1.26% | 2.89% | 2.78% | 40% |
| $772 |
|
| 2016 | $9.81 | 0.29 | (0.30) | (0.01) | (0.35) | $9.45 | (0.06)% | 1.14% | 1.25% | 3.02% | 2.91% | 25% |
| $714 |
|
|
| | | | | | | | | | | | | | | |
| For a Share Outstanding Throughout the Years Ended March 31 (except as noted) | | | | | | | |
| Per-Share Data | | | | | | Ratios and Supplemental Data | | |
| | | Income From Investment Operations: | | | | Ratio to Average Net Assets of: | | |
| | Net Asset
Value,
Beginning
of Period | Net
Investment
Income
(Loss)(1) | Net
Realized
and
Unrealized
Gain (Loss) | Total From
Investment
Operations | Distributions From Net
Investment
Income | Net Asset
Value,
End
of Period | Total
Return(2) | Operating
Expenses | Operating
Expenses
(before
expense
waiver) | Net
Investment
Income
(Loss) | Net
Investment
Income
(Loss)
(before
expense
waiver) | Portfolio
Turnover
Rate | Net
Assets,
End of
Period
(in thousands) |
| R5 Class | | | | | | | | | | | | |
| 2020 | $9.73 | 0.29 | (0.45) | (0.16) | (0.29) | $9.28 | (1.82)% | 0.51% | 0.55% | 2.90% | 2.86% | 88% |
| $97 |
|
| 2019 | $9.74 | 0.35 | 0.03 | 0.38 | (0.39) | $9.73 | 4.09% | 0.50% | 0.56% | 3.75% | 3.69% | 60% |
| $99 |
|
| 2018 | $9.77 | 0.34 | (0.03) | 0.31 | (0.34) | $9.74 | 3.17% | 0.49% | 0.56% | 3.47% | 3.40% | 64% |
| $733 |
|
| 2017 | $9.45 | 0.35 | 0.32 | 0.67 | (0.35) | $9.77 | 7.16% | 0.45% | 0.56% | 3.59% | 3.48% | 40% |
| $711 |
|
| 2016 | $9.81 | 0.36 | (0.30) | 0.06 | (0.42) | $9.45 | 0.64% | 0.44% | 0.55% | 3.72% | 3.61% | 25% |
| $663 |
|
| R6 Class | | | | | | | | | | | | |
| 2020 | $9.73 | 0.28 | (0.44) | (0.16) | (0.29) | $9.28 | (1.77)% | 0.46% | 0.50% | 2.95% | 2.91% | 88% |
| $1,861 |
|
| 2019 | $9.74 | 0.36 | 0.03 | 0.39 | (0.40) | $9.73 | 4.14% | 0.45% | 0.51% | 3.80% | 3.74% | 60% |
| $137 |
|
| 2018 | $9.78 | 0.35 | (0.05) | 0.30 | (0.34) | $9.74 | 3.22% | 0.44% | 0.51% | 3.52% | 3.45% | 64% |
| $789 |
|
| 2017 | $9.45 | 0.35 | 0.33 | 0.68 | (0.35) | $9.78 | 7.21% | 0.40% | 0.51% | 3.64% | 3.53% | 40% |
| $764 |
|
| 2016 | $9.81 | 0.36 | (0.30) | 0.06 | (0.42) | $9.45 | 0.69% | 0.39% | 0.50% | 3.77% | 3.66% | 25% |
| $712 |
|
|
| | | | |
| Notes to Financial Highlights | | |
| |
| (1) | Computed using average shares outstanding throughout the period. |
| |
| (2) | Total returns are calculated based on the net asset value of the last business day and do not reflect applicable sales charges, if any. Total returns for periods less than one year are not annualized. |
| |
| (3) | April 10, 2017 (commencement of sale) through March 31, 2018. |
| |
| (5) | Portfolio turnover is calculated at the fund level. Percentage indicated was calculated for the year ended March 31, 2018. |
See Notes to Financial Statements.
|
|
| Report of Independent Registered Public Accounting Firm |
To the Board of Trustees of American Century Investment Trust and Shareholders of Strategic Income Fund
Opinion on the Financial Statements
We have audited the accompanying statement of assets and liabilities, including the schedule of investments, of Strategic Income Fund (one of the funds constituting American Century Investment Trust, referred to hereafter as the “Fund”) as of March 31, 2020, the related statement of operations for the year ended March 31, 2020, the statement of changes in net assets for each of the two years in the period ended March 31, 2020, including the related notes, and the financial highlights for each of the periods indicated therein (collectively referred to as the “financial statements”). In our opinion, the financial statements present fairly, in all material respects, the financial position of the Fund as of March 31, 2020, the results of its operations for the year then ended, the changes in its net assets for each of the two years in the period ended March 31, 2020 and the financial highlights for each of the periods indicated therein in conformity with accounting principles generally accepted in the United States of America.
Basis for Opinion
These financial statements are the responsibility of the Fund’s management. Our responsibility is to express an opinion on the Fund’s financial statements based on our audits. We are a public accounting firm registered with the Public Company Accounting Oversight Board (United States) (PCAOB) and are required to be independent with respect to the Fund in accordance with the U.S. federal securities laws and the applicable rules and regulations of the Securities and Exchange Commission and the PCAOB.
We conducted our audits of these financial statements in accordance with the standards of the PCAOB. Those standards require that we plan and perform the audit to obtain reasonable assurance about whether the financial statements are free of material misstatement, whether due to error or fraud.
Our audits included performing procedures to assess the risks of material misstatement of the financial statements, whether due to error or fraud, and performing procedures that respond to those risks. Such procedures included examining, on a test basis, evidence regarding the amounts and disclosures in the financial statements. Our audits also included evaluating the accounting principles used and significant estimates made by management, as well as evaluating the overall presentation of the financial statements. Our procedures included confirmation of securities owned as of March 31, 2020 by correspondence with the custodian, transfer agent and brokers; when replies were not received from brokers, we performed other auditing procedures. We believe that our audits provide a reasonable basis for our opinion.
/s/ PricewaterhouseCoopers LLP
Kansas City, Missouri
May 18, 2020
We have served as the auditor of one or more investment companies in American Century Investments since 1997.
Board of Trustees
The individuals listed below serve as trustees of the funds. Each trustee will continue to serve in this capacity until death, retirement, resignation or removal from office. The board has adopted a mandatory retirement age for trustees who are not “interested persons,” as that term is defined in the Investment Company Act (independent trustees). Independent trustees shall retire on December 31 of the year in which they reach their 75th birthday; provided, however, that on or after January 1, 2022, independent trustees shall retire on December 31 of the year in which they reach their 76th birthday.
Mr. Thomas is an “interested person” because he currently serves as President and Chief Executive Officer of American Century Companies, Inc. (ACC), the parent company of American Century Investment Management, Inc. (ACIM or the advisor). The other trustees (more than three-fourths of the total number) are independent. They are not employees, directors or officers of, and have no financial interest in, ACC or any of its wholly owned, direct or indirect, subsidiaries, including ACIM, American Century Investment Services, Inc. (ACIS) and American Century Services, LLC (ACS), and they do not have any other affiliations, positions or relationships that would cause them to be considered “interested persons” under the Investment Company Act. The trustees serve in this capacity for eight (in the case of Jonathan S. Thomas, 16; and Ronald J. Gilson, 9) registered investment companies in the American Century Investments family of funds.
The following table presents additional information about the trustees. The mailing address for each trustee other than Mr. Thomas is 1665 Charleston Road, Mountain View, California 94043. The mailing address for Mr. Thomas is 4500 Main Street, Kansas City, Missouri 64111.
|
| | | | | |
Name
(Year of Birth) | Position(s) Held with Funds | Length of Time Served | Principal Occupation(s) During Past 5 Years | Number of American Century Portfolios Overseen by Trustee | Other Directorships Held During Past 5 Years |
| Independent Trustees |
|
|
Tanya S. Beder
(1955) | Trustee | Since 2011 | Chairman and CEO, SBCC Group Inc. (independent advisory services) (2006 to present) | 40 | CYS Investments, Inc.; Kirby Corporation; Nabors Industries Ltd. |
Jeremy I. Bulow
(1954) | Trustee | Since 2011 | Professor of Economics, Stanford University, Graduate School of Business (1979 to present) | 40 | None |
Anne Casscells
(1958) | Trustee | Since 2016 | Co-Chief Executive Officer and Chief Investment Officer, Aetos Alternatives Management (investment advisory firm) (2001 to present); Lecturer in Accounting, Stanford University, Graduate School of Business (2009 to 2017) | 40 | None |
Ronald J. Gilson
(1946) | Trustee and Chairman of the Board | Since 1995
(Chairman since 2005) | Charles J. Meyers Professor of Law and Business, Emeritus, Stanford Law School (1979 to 2016); Marc and Eva Stern Professor of Law and Business, Columbia University School of Law (1992 to present) | 57 | None |
|
| | | | | |
Name
(Year of Birth) | Position(s) Held with Funds | Length of Time Served | Principal Occupation(s) During Past 5 Years | Number of American Century Portfolios Overseen by Trustee | Other Directorships Held During Past 5 Years |
| Independent Trustees |
|
|
Frederick L. A. Grauer
(1946) | Trustee | Since 2008 | Senior Advisor, Credit Sesame, Inc. (credit monitoring firm) (2018 to present); Senior Advisor, Course Hero (an educational technology company) (2015 to present) | 40 | None |
Jonathan D. Levin
(1972) | Trustee | Since 2016 | Philip H. Knight Professor and Dean, Graduate School of Business, Stanford University (2016 to present); Professor, Stanford University, (2000 to present) | 40 | None |
Peter F. Pervere
(1947) | Trustee | Since 2007 | Retired | 40 | None |
John B. Shoven
(1947) | Trustee | Since 2002 | Charles R. Schwab Professor of Economics, Stanford University (1973 to present, emeritus since 2019) | 40 | Cadence Design Systems; Exponent; Financial Engines |
| Interested Trustee |
|
|
Jonathan S. Thomas
(1963) | Trustee | Since 2007 | President and Chief Executive Officer, ACC (2007 to present). Also serves as Chief Executive Officer, ACS; Executive Vice President, ACIM; Director, ACC, ACIM and other ACC subsidiaries | 120 | None |
The Statement of Additional Information has additional information about the fund's trustees and is available without charge, upon request, by calling 1-800-345-2021.
Officers
The following table presents certain information about the executive officers of the funds. Each officer serves as an officer for 16 (in the case of Robert J. Leach, 15) investment companies in the American Century family of funds, unless otherwise noted. No officer is compensated for his or her service as an officer of the funds. The listed officers are interested persons of the funds and are appointed or re-appointed on an annual basis. The mailing address for each of the officers listed below is 4500 Main Street, Kansas City, Missouri 64111.
|
| | |
Name
(Year of Birth) | Offices with the Funds | Principal Occupation(s) During the Past Five Years |
Patrick Bannigan
(1965)
| President since 2019 | Executive Vice President and Director, ACC (2012 to present); Chief Financial Officer, Chief Accounting Officer and Treasurer, ACC (2015 to present); Chief Operating Officer, ACC (2012-2015). Also serves as President, ACS; Vice President, ACIM; Chief Financial Officer, Chief Accounting Officer and/or Director, ACIM, ACS and other ACC subsidiaries |
R. Wes Campbell
(1974)
| Chief Financial Officer and Treasurer since 2018 | Vice President, ACS (2020 to present); Investment Operations and Investment Accounting, ACS (2000 to present) |
Amy D. Shelton
(1964) | Chief Compliance Officer and Vice President since 2014 | Chief Compliance Officer, American Century funds, (2014 to present); Chief Compliance Officer, ACIM (2014 to present); Chief Compliance Officer, ACIS (2009 to present). Also serves as Vice President, ACIS |
Charles A. Etherington
(1957) | General Counsel since 2007 and Senior Vice President since 2006 | Attorney, ACC (1994 to present); Vice President, ACC (2005 to present); General Counsel, ACC (2007 to present). Also serves as General Counsel, ACIM, ACS, ACIS and other ACC subsidiaries; and Senior Vice President, ACIM and ACS |
C. Jean Wade
(1964) | Vice President since 2012 | Senior Vice President, ACS (2017 to present); Vice President ACS (2000 to 2017)
|
Robert J. Leach
(1966) | Vice President since 2006 | Vice President, ACS (2000 to present) |
David H. Reinmiller
(1963) | Vice President since 2000 | Attorney, ACC (1994 to present). Also serves as Vice President, ACIM and ACS |
Ward D. Stauffer
(1960) | Secretary since 2005 | Attorney, ACC (2003 to present) |
|
|
| Liquidity Risk Management Program |
The Fund has adopted a liquidity risk management program (the “program”). The Fund’s Board of Trustees (the "Board") has designated American Century Investment Management, Inc. (“ACIM”) as the administrator of the program. Personnel of ACIM or its affiliates conduct the day-to-day operation of the program pursuant to policies and procedures administered by those members of the ACIM’s Investment Oversight Committee who are members of the ACIM’s Investment Management and Global Analytics departments.
Under the program, ACIM manages the Fund’s liquidity risk, which is the risk that the Fund could not meet shareholder redemption requests without significant dilution of remaining shareholders’ interests in the Fund. This risk is managed by monitoring the degree of liquidity of the Fund’s investments, limiting the amount of the Fund’s illiquid investments, and utilizing various risk management tools and facilities available to the Fund for meeting shareholder redemptions, among other means. ACIM’s process of determining the degree of liquidity of the Fund’s investments is supported by one or more third-party liquidity assessment vendors.
The Board reviewed a report prepared by ACIM regarding the operation and effectiveness of the program for the period December 1, 2018 through December 31, 2019. No significant liquidity events impacting the Fund were noted in the report. In addition, ACIM provided its assessment that the program had been effective in managing the Fund’s liquidity risk.
Retirement Account Information
As required by law, distributions you receive from certain retirement accounts are subject to federal income tax withholding, unless you elect not to have withholding apply*. Tax will be withheld on the total amount withdrawn even though you may be receiving amounts that are not subject to withholding, such as nondeductible contributions. In such case, excess amounts of withholding could occur. You may adjust your withholding election so that a greater or lesser amount will be withheld.
If you don’t want us to withhold on this amount, you must notify us to not withhold the federal income tax. You may notify us in writing or in certain situations by telephone or through other electronic means. For systematic withdrawals, your withholding election will remain in effect until revoked or changed by filing a new election. You have the right to revoke your election at any time and change your withholding percentage for future distributions.
Remember, even if you elect not to have income tax withheld, you are liable for paying income tax on the taxable portion of your withdrawal. If you elect not to have income tax withheld or you don’t have enough income tax withheld, you may be responsible for payment of estimated tax. You may incur penalties under the estimated tax rules if your withholding and estimated tax payments are not sufficient. You can reduce or defer the income tax on a distribution by directly or indirectly rolling such distribution over to another IRA or eligible plan. You should consult your tax advisor for additional information.
State tax will be withheld if, at the time of your distribution, your address is within one of the mandatory withholding states and you have federal income tax withheld (or as otherwise required by state law). State taxes will be withheld from your distribution in accordance with the respective state rules.
*Some 403(b), 457 and qualified retirement plan distributions may be subject to 20% mandatory withholding, as they are subject to special tax and withholding rules. Your plan administrator or plan sponsor is required to provide you with a special tax notice explaining those rules at the time you request a distribution. If applicable, federal and/or state taxes may be withheld from your distribution amount.
Proxy Voting Policies
Descriptions of the principles and policies that the fund's investment advisor uses in exercising the voting rights associated with the securities purchased and/or held by the fund are available without charge, upon request, by calling 1-800-345-2021 or visiting American Century Investments’ website at americancentury.com/proxy. A description of the policies is also available on the Securities and Exchange Commission’s website at sec.gov. Information regarding how the investment advisor voted proxies relating to portfolio securities during the most recent 12-month period ended June 30 is available on americancentury.com/proxy. It is also available at sec.gov.
Quarterly Portfolio Disclosure
The fund files its complete schedule of portfolio holdings with the Securities and Exchange Commission (SEC) for the first and third quarters of each fiscal year as an exhibit to its reports on Form N-PORT. The fund’s Form N-PORT reports are available on the SEC’s website at sec.gov. The fund also makes its complete schedule of portfolio holdings for the most recent quarter of its fiscal year available on its website at americancentury.com and, upon request, by calling 1-800-345-2021.
|
| | |
| |
| | | |
| Contact Us | americancentury.com | |
| Automated Information Line | 1-800-345-8765 | |
| Investor Services Representative | 1-800-345-2021 or 816-531-5575 | |
| Investors Using Advisors | 1-800-378-9878 | |
| Business, Not-For-Profit, Employer-Sponsored Retirement Plans | 1-800-345-3533 | |
| Banks and Trust Companies, Broker-Dealers, Financial Professionals, Insurance Companies | 1-800-345-6488 | |
| Telecommunications Relay Service for the Deaf | 711 | |
| | | |
| American Century Investment Trust | |
| | | |
Investment Advisor: American Century Investment Management, Inc. Kansas City, Missouri | |
| | | |
| This report and the statements it contains are submitted for the general information of our shareholders. The report is not authorized for distribution to prospective investors unless preceded or accompanied by an effective prospectus. | |
| | | |
©2020 American Century Proprietary Holdings, Inc. All rights reserved.
CL-ANN-92287 2005 | |
|
| |
| | |
| | Annual Report |
| | |
| | March 31, 2020 |
| | |
| | U.S. Government Money Market Fund |
| | Investor Class (TCRXX) |
| | A Class (AGQXX) |
| | C Class (AGHXX) |
| | G Class (AGGXX) |
Beginning on January 1, 2021, as permitted by regulations adopted by the Securities and Exchange Commission, paper copies of the fund’s shareholder reports like this one will no longer be sent by mail, unless you specifically request paper copies of the reports from the fund or from your financial intermediary, such as a broker-dealer or bank. Instead, the reports will be made available on a website, and you will be notified by mail each time a report is posted and provided with a website link to access the report.
If you already elected to receive shareholder reports electronically, you will not be affected by this change and you need not take any action. You may elect to receive shareholder reports and other communications from the fund or your financial intermediary electronically by calling or sending an email request to your appropriate contacts as listed on the back cover of this report.
You may elect to receive all future reports in paper free of charge. You can inform the fund or your financial intermediary that you wish to continue receiving paper copies of your shareholder reports by calling or sending an email request to your appropriate contacts as listed on the back cover of this report. Your election to receive reports in paper will apply to all funds held with the fund complex/your financial intermediary.
|
| |
| President's Letter | |
| Performance | |
| Fund Characteristics | |
| Shareholder Fee Example | |
| Schedule of Investments | |
| Statement of Assets and Liabilities | |
| Statement of Operations | |
| Statement of Changes in Net Assets. | |
| Notes to Financial Statements | |
| Financial Highlights | |
| Report of Independent Registered Public Accounting Firm | |
| Management | |
| Liquidity Risk Management Program | |
| Additional Information | |
Any opinions expressed in this report reflect those of the author as of the date of the report, and do not necessarily represent the opinions of American Century Investments® or any other person in the American Century Investments organization. Any such opinions are subject to change at any time based upon market or other conditions and American Century Investments disclaims any responsibility to update such opinions. These opinions may not be relied upon as investment advice and, because investment decisions made by American Century Investments funds are based on numerous factors, may not be relied upon as an indication of trading intent on behalf of any American Century Investments fund. Security examples are used for representational purposes only and are not intended as recommendations to purchase or sell securities. Performance information for comparative indices and securities is provided to American Century Investments by third party vendors. To the best of American Century Investments’ knowledge, such information is accurate at the time of printing.
Jonathan Thomas
Dear Investor:
Thank you for reviewing this annual report for the period ended March 31, 2020. Annual reports help convey important information about fund returns, including market factors that affected performance during the reporting period. For additional insights, please visit americancentury.com.
Virus Outbreak Abruptly Altered Economic, Market Backdrops
Through most of the period, market sentiment was upbeat, partly due to accommodative Federal Reserve (Fed) policy and modest inflation. Improving economic and corporate earnings data and a phase 1 U.S.-China trade deal also helped boost growth outlooks. Against this backdrop, key U.S. stock benchmarks rose to record highs by mid-February, and U.S. bonds continued to advance.
However, beginning in late February, unprecedented social and economic turmoil emerged and reversed the positive trajectory. The COVID-19 epidemic originating in China rapidly spread throughout the world, forcing stay-at-home orders and industry-wide shutdowns. U.S. stocks, corporate bonds and other riskier assets sold off sharply, while U.S. Treasuries rallied in the global flight to quality. The Fed stepped in quickly and aggressively, slashing interest rates to near 0% and enacting massive lending and asset-purchase programs to stabilize the financial system.
The swift and severe sell-off erased the strong stock market gains realized earlier in the period and left key benchmarks with losses for the 12 months. Reflecting their defensive characteristics, high-quality U.S. bonds withstood the turmoil and delivered solid returns for the 12-month period.
Promoting Health and Safety Remains Our Focus
While the market impact of COVID-19 has been severe, reducing the human toll is most important. We are monitoring the situation closely and following guidelines and protocols from all relevant authorities. Our firm has activated a comprehensive Pandemic Response Plan, which includes social distancing and work-from-home mandates, travel restrictions and escalated cleaning regimens at all our facilities. We’ve also launched a Business Continuity Plan to maintain regular business operations and ensure delivery of outstanding service.
We appreciate your confidence in us during these extraordinary times. We have a long history of helping clients weather volatile markets, and we are confident we will meet today’s challenges. In the meantime, the health and safety of you, your family and our employees remain a top priority.
Sincerely,
Jonathan Thomas
President and Chief Executive Officer
American Century Investments
|
| | | | | | |
| Total Returns as of March 31, 2020 |
| | | | Average Annual Returns | |
| | Ticker Symbol | 1 year | 5 years | 10 years | Since Inception | Inception Date |
| Investor Class | TCRXX | 1.56% | 0.79% | 0.40% | — | 4/1/93 |
| A Class | AGQXX | 1.31% | — | — | 0.76% | 12/1/15 |
| C Class | AGHXX | 0.81% | — | — | 0.48% | 12/1/15 |
| G Class | AGGXX | 2.02% | — | — | 1.85% | 7/28/17 |
Average annual returns since inception are presented when ten years of performance history is not available.
Fund returns would have been lower if a portion of the fees had not been waived.
|
| | | |
| Total Annual Fund Operating Expenses | |
| Investor Class | A Class | C Class | G Class |
| 0.46% | 0.71% | 1.21% | 0.46% |
The total annual fund operating expenses shown is as stated in the fund’s prospectus current as of the date of this report. The prospectus may vary from the expense ratio shown elsewhere in this report because it is based on a different time period, includes acquired fund fees and expenses, and, if applicable, does not include fee waivers or expense reimbursements.
Data presented reflect past performance. Past performance is no guarantee of future results. Current performance may be higher or lower than the performance shown. Total returns for periods less than one year are not annualized. To obtain performance data current to the most recent month end, please call 1-800-345-2021 or visit americancentury.com. For additional information about the fund, please consult the prospectus.
You could lose money by investing in the fund. Although the fund seeks to preserve the value of your investment at $1.00 per share, it cannot guarantee it will do so. An investment in the fund is not insured or guaranteed by the Federal Deposit Insurance Corporation or any other government agency. The fund’s sponsor has no legal obligation to provide financial support to the fund, and you should not expect that the sponsor will provide financial support to the fund at any time.
The 7-day current yield more closely reflects the current earnings of the fund than the total return.
|
| | | | |
| MARCH 31, 2020 | | | | |
| 7-Day Current Yields | Investor Class | A Class | C Class | G Class |
| After waiver | 0.70% | 0.46% | 0.02%(1) | 1.16%(1) |
| Before waiver | 0.70% | 0.46% | -0.04% | 0.71% |
| 7-Day Effective Yields | Investor Class | A Class | C Class | G Class |
| After waiver | 0.71% | 0.46% | 0.02%(1) | 1.16%(1) |
| (1) Yields would have been lower if a portion of the fees had not been waived. |
|
| |
| Portfolio at a Glance | |
| Weighted Average Maturity | 18 days |
| Weighted Average Life | 93 days |
| | |
| Portfolio Composition by Maturity | % of fund investments |
| 1-30 days | 85% |
| 31-90 days | 11% |
| 91-180 days | 4% |
| More than 180 days | — |
Fund shareholders may incur two types of costs: (1) transaction costs, including sales charges (loads) on purchase payments and redemption/exchange fees; and (2) ongoing costs, including management fees; distribution and service (12b-1) fees; and other fund expenses. This example is intended to help you understand your ongoing costs (in dollars) of investing in your fund and to compare these costs with the ongoing cost of investing in other mutual funds.
The example is based on an investment of $1,000 made at the beginning of the period and held for the entire period from October 1, 2019 to March 31, 2020.
Actual Expenses
The table provides information about actual account values and actual expenses for each class. You may use the information, together with the amount you invested, to estimate the expenses that you paid over the period. First, identify the share class you own. Then simply divide your account value by $1,000 (for example, an $8,600 account value divided by $1,000 = 8.6), then multiply the result by the number under the heading “Expenses Paid During Period” to estimate the expenses you paid on your account during this period.
If you hold Investor Class shares of any American Century Investments fund, or I Class shares of the American Century Diversified Bond Fund, in an American Century Investments account (i.e., not through a financial intermediary or employer-sponsored retirement plan account), American Century Investments may charge you a $25.00 annual account maintenance fee if the value of those shares is less than $10,000. We will redeem shares automatically in one of your accounts to pay the $25.00 fee. In determining your total eligible investment amount, we will include your investments in all personal accounts (including American Century Investments brokerage accounts) registered under your Social Security number. Personal accounts include individual accounts, joint accounts, UGMA/UTMA accounts, personal trusts, Coverdell Education Savings Accounts and IRAs (including traditional, Roth, Rollover, SEP-, SARSEP- and SIMPLE-IRAs), and certain other retirement accounts. If you have only business, business retirement, employer sponsored or American Century Investments brokerage accounts, you are currently not subject to this fee. If you are subject to the account maintenance fee, your account value could be reduced by the fee amount.
Hypothetical Example for Comparison Purposes
The table also provides information about hypothetical account values and hypothetical expenses based on the actual expense ratio of each class of your fund and an assumed rate of return of 5% per year before expenses, which is not the actual return of a fund’s share class. The hypothetical account values and expenses may not be used to estimate the actual ending account balance or expenses you paid for the period. You may use this information to compare the ongoing costs of investing in your fund and other funds. To do so, compare this 5% hypothetical example with the 5% hypothetical examples that appear in the shareholder reports of the other funds.
Please note that the expenses shown in the table are meant to highlight your ongoing costs only and do not reflect any transactional costs, such as sales charges (loads) or redemption/exchange fees. Therefore, the table is useful in comparing ongoing costs only, and will not help you determine the relative total costs of owning different funds. In addition, if these transactional costs were included, your costs would have been higher.
|
| | | | |
| | Beginning
Account Value
10/1/19 | Ending
Account Value
3/31/20 | Expenses Paid
During Period(1)
10/1/19 - 3/31/20 |
Annualized
Expense Ratio(1) |
| Actual | | | | |
| Investor Class | $1,000 | $1,006.00 | $2.31 | 0.46% |
| A Class | $1,000 | $1,004.80 | $3.56 | 0.71% |
| C Class | $1,000 | $1,002.30 | $6.01 | 1.20% |
| G Class | $1,000 | $1,008.30 | $0.05 | 0.01% |
| Hypothetical | | | | |
| Investor Class | $1,000 | $1,022.70 | $2.33 | 0.46% |
| A Class | $1,000 | $1,021.45 | $3.59 | 0.71% |
| C Class | $1,000 | $1,019.00 | $6.06 | 1.20% |
| G Class | $1,000 | $1,024.95 | $0.05 | 0.01% |
| |
| (1) | Expenses are equal to the class's annualized expense ratio listed in the table above, multiplied by the average account value over the period, multiplied by 183, the number of days in the most recent fiscal half-year, divided by 366, to reflect the one-half year period. Annualized expense ratio reflects actual expenses, including any applicable fee waivers or expense reimbursements and excluding any acquired fund fees and expenses. |
MARCH 31, 2020
|
| | | | | | |
| | Principal Amount | Value |
U.S. GOVERNMENT AGENCY SECURITIES(1) — 72.1% | | |
| Adjustable-Rate U.S. Government Agency Securities — 61.3% | | |
| Federal Farm Credit Banks Funding Corp., VRN, 1.04%, (1-month LIBOR plus 0.10%), 12/30/20 | $ | 35,000,000 |
| $ | 34,997,389 |
|
| Federal Home Loan Bank, VRN, 0.07%, (SOFR plus 0.06%), 5/6/20 | 20,000,000 |
| 20,000,000 |
|
| Federal Home Loan Bank, VRN, 0.05%, (SOFR plus 0.04%), 5/8/20 | 70,000,000 |
| 70,000,000 |
|
| Federal Home Loan Bank, VRN, 1.06%, (1-month LIBOR plus 0.05%), 5/8/20 | 35,000,000 |
| 35,000,000 |
|
| Federal Home Loan Bank, VRN, 0.09%, (SOFR plus 0.08%), 5/11/20 | 65,000,000 |
| 65,000,000 |
|
| Federal Home Loan Bank, VRN, 0.03%, (SOFR plus 0.02%), 5/14/20 | 11,000,000 |
| 11,000,000 |
|
| Federal Home Loan Bank, VRN, 0.03%, (SOFR plus 0.02%), 6/5/20 | 42,000,000 |
| 42,000,000 |
|
| Federal Home Loan Bank, VRN, 0.91%, (1-month LIBOR less 0.08%), 6/12/20 | 60,000,000 |
| 60,000,000 |
|
| Federal Home Loan Bank, VRN, 0.66%, (1-month LIBOR less 0.09%), 6/19/20 | 30,000,000 |
| 30,000,000 |
|
| Federal Home Loan Bank, VRN, 0.92%, (1-month LIBOR less 0.09%), 7/8/20 | 45,000,000 |
| 45,000,000 |
|
| Federal Home Loan Bank, VRN, 0.11%, (SOFR plus 0.10%), 7/17/20 | 10,000,000 |
| 10,000,000 |
|
| Federal Home Loan Bank, VRN, 0.11%, (SOFR plus 0.10%), 7/29/20 | 20,000,000 |
| 19,999,995 |
|
| Federal Home Loan Bank, VRN, 0.04%, (SOFR plus 0.03%), 8/5/20 | 37,000,000 |
| 37,000,000 |
|
| Federal Home Loan Bank, VRN, 0.71%, (1-month LIBOR less 0.07%), 8/20/20 | 80,000,000 |
| 80,000,000 |
|
| Federal Home Loan Bank, VRN, 0.03%, (SOFR plus 0.02%), 8/28/20 | 13,000,000 |
| 13,000,000 |
|
| Federal Home Loan Bank, VRN, 0.64%, (1-month LIBOR less 0.07%), 9/16/20 | 65,000,000 |
| 65,000,000 |
|
| Federal Home Loan Bank, VRN, 1.60%, (3-month LIBOR less 0.18%), 10/29/20 | 65,000,000 |
| 65,000,000 |
|
| Federal Home Loan Bank, VRN, 0.67%, (1-month LIBOR less 0.04%), 11/16/20 | 30,000,000 |
| 30,000,000 |
|
| Federal Home Loan Bank, VRN, 0.10%, (SOFR plus 0.09%), 12/4/20 | 50,000,000 |
| 50,000,000 |
|
| Federal Home Loan Bank, VRN, 0.05%, (SOFR plus 0.04%), 2/25/21 | 4,500,000 |
| 4,500,000 |
|
| Federal Home Loan Bank, VRN, 0.09%, (SOFR plus 0.08%), 3/4/21 | 17,000,000 |
| 17,000,000 |
|
| Federal Home Loan Bank, VRN, 0.09%, (SOFR plus 0.08%), 7/8/21 | 15,000,000 |
| 15,000,000 |
|
| Federal Home Loan Mortgage Corp., MTN, VRN, 0.02%, (SOFR plus 0.01%), 5/13/20 | 5,000,000 |
| 5,000,000 |
|
| Federal Home Loan Mortgage Corp., MTN, VRN, 0.04%, (SOFR plus 0.03%), 6/2/20 | 20,000,000 |
| 20,000,000 |
|
| Federal Home Loan Mortgage Corp., MTN, VRN, 0.03%, (SOFR plus 0.02%), 7/10/20 | 65,000,000 |
| 65,000,000 |
|
| Federal Home Loan Mortgage Corp., MTN, VRN, 0.02%, (SOFR plus 0.01%), 7/22/20 | 60,000,000 |
| 60,000,000 |
|
| Federal National Mortgage Association, VRN, 0.05%, (SOFR plus 0.04%), 6/5/20 | 25,000,000 |
| 25,000,000 |
|
| | | 994,497,384 |
|
|
| | | | | | |
| | Principal Amount | Value |
| Fixed-Rate U.S. Government Agency Securities — 10.8% | | |
| Federal Home Loan Bank, 1.58%, 4/3/20 | $ | 12,200,000 |
| $ | 12,198,946 |
|
| Federal Home Loan Bank, 1.59%, 4/3/20 | 1,800,000 |
| 1,799,844 |
|
| Federal Home Loan Bank, 1.60%, 4/3/20 | 13,100,000 |
| 13,098,857 |
|
| Federal Home Loan Bank, 1.57%, 4/8/20 | 13,600,000 |
| 13,595,928 |
|
| Federal Home Loan Bank, 1.59%, 4/8/20 | 31,727,000 |
| 31,717,405 |
|
| Federal Home Loan Bank, 1.58%, 4/13/20 | 1,100,000 |
| 1,099,432 |
|
| Federal Home Loan Bank, 1.59%, 4/13/20 | 500,000 |
| 499,741 |
|
| Federal Home Loan Bank, 1.60%, 4/13/20 | 41,000,000 |
| 40,978,543 |
|
| Federal Home Loan Bank, 1.60%, 4/17/20 | 40,000,000 |
| 39,972,053 |
|
| Federal Home Loan Bank, 1.58%, 4/22/20 | 3,200,000 |
| 3,197,106 |
|
| Federal Home Loan Bank, 1.60%, 5/6/20 | 10,000,000 |
| 9,984,736 |
|
| Federal Home Loan Bank, 0.60%, 5/28/20 | 5,000,000 |
| 4,995,329 |
|
| Federal Home Loan Mortgage Corp., 1.58%, 4/9/20 | 2,425,000 |
| 2,424,162 |
|
| | | 175,562,082 |
|
| TOTAL U.S. GOVERNMENT AGENCY SECURITIES | | 1,170,059,466 |
|
U.S. TREASURY SECURITIES(1) — 15.3% | | |
| U.S. Treasury Bills, 1.59%, 4/14/20 | 6,650,000 |
| 6,646,261 |
|
| U.S. Treasury Bills, 0.01%, 6/11/20 | 145,000,000 |
| 144,997,140 |
|
| U.S. Treasury Bills, 0.01%, 6/18/20 | 18,000,000 |
| 17,999,805 |
|
| U.S. Treasury Bills, 0.00%, 7/2/20 | 70,000,000 |
| 69,984,960 |
|
| U.S. Treasury Notes, VRN, 0.20%, (3-month USBMMY plus 0.12%), 1/31/21 | 8,000,000 |
| 7,997,735 |
|
| TOTAL U.S. TREASURY SECURITIES | | 247,625,901 |
|
| CORPORATE BONDS — 9.4% | | |
| Anton Mountain View LLC, VRDN, 4.92%, 4/29/20 (LOC: FHLB) | 26,855,000 |
| 26,855,000 |
|
| Doghouse Properties LLC, VRDN, 4.60%, 4/6/20 (LOC: FHLB) | 1,170,000 |
| 1,170,000 |
|
| EPR GO Zone Holdings LLC, VRDN, 6.04%, 4/6/20 (LOC: FHLB) | 24,995,000 |
| 24,995,000 |
|
| Fairfield North Texas Associates LP, VRDN, 4.92%, 4/6/20 (LOC: FHLB) | 9,550,000 |
| 9,550,000 |
|
| Northcreek Church, VRDN, 6.00%, 4/6/20 (LOC: FHLB) | 3,000,000 |
| 3,000,000 |
|
| Saddleback Valley Community Church, VRDN, 4.71%, 4/6/20 (LOC: FHLB) | 6,775,000 |
| 6,775,000 |
|
| Santa Monica Ocean Park Partners LP, VRDN, 4.92%, 4/6/20 (LOC: FHLB) | 9,370,000 |
| 9,370,000 |
|
| Sendero LLC, VRDN, 4.92%, 4/6/20 (LOC: FHLB) | 39,000,000 |
| 39,000,000 |
|
| Sendero LLC, VRDN, 4.92%, 4/6/20 (LOC: FHLB) | 23,900,000 |
| 23,900,000 |
|
| Varenna Care Center LP, VRDN, 4.92%, 4/6/20 (LOC: FHLB) | 8,765,000 |
| 8,765,000 |
|
| TOTAL CORPORATE BONDS | | 153,380,000 |
|
| MUNICIPAL SECURITIES — 4.8% | | |
| California Municipal Finance Authority Rev., VRDN, 2.75%, 4/7/20 (LOC: FHLB) | 3,250,000 |
| 3,250,000 |
|
| California Statewide Communities Development Authority Rev., (Uptown Newport Building Owner LP), VRDN, 5.17%, 4/7/20 (LOC: East West Bank, Zions Bank and FHLB) | 8,415,000 |
| 8,415,000 |
|
| California Statewide Communities Development Authority Rev., (Vista del Monte Housing LP), VRDN, 2.75%, 4/7/20 (LOC: FNMA)(LIQ FAC: FNMA) | 4,700,000 |
| 4,700,000 |
|
| Daly City Housing Development Finance Agency Rev., (Serramonte Ridge LLC), VRDN, 4.90%, 4/7/20 (LOC: FNMA) | 15,675,000 |
| 15,675,000 |
|
|
| | | | | | |
| | Principal Amount | Value |
| Harris County Housing Finance Corp. Rev., (Louetta Village Apartments LP), VRDN, 2.75%, 4/7/20 (LOC: FNMA)(LIQ FAC: FNMA) | $ | 5,580,000 |
| $ | 5,580,000 |
|
| Hillsborough County Housing Finance Authority Rev., (RPK Associates Ltd.), VRDN, 4.55%, 4/7/20 (LOC: FNMA)(LIQ FAC: FNMA) | 7,850,000 |
| 7,850,000 |
|
| Louisiana Public Facilities Authority Rev., (Kingston Village Ltd.), VRDN, 5.20%, 4/7/20 (LOC: FNMA)(LIQ FAC: FNMA) | 8,900,000 |
| 8,900,000 |
|
| Mississippi Business Finance Corp. Rev., (Brown Bottling Group, Inc.), VRDN, 5.50%, 4/7/20 (LOC: Trustmark National Bank and FHLB) | 670,000 |
| 670,000 |
|
| New York City Housing Development Corp. Rev., (2 Gold LLC), VRDN, 4.25%, 4/7/20 (LOC: FNMA)(LIQ FAC: FNMA) | 810,000 |
| 810,000 |
|
| New York City Housing Development Corp. Rev., (55th Clinton Associates LLC), VRDN, 3.00%, 4/7/20 (LOC: FNMA) | 6,000,000 |
| 6,000,000 |
|
| New York City Housing Development Corp. Rev., (89 Murray Street Associates LLC), VRDN, 3.00%, 4/7/20 (LOC: FNMA) | 5,025,000 |
| 5,025,000 |
|
Platte County Industrial Development Authority Rev., VRDN, 6.00%, 4/7/20 (LOC: FHLMC)(LIQ FAC: FHLMC) (Acquired 3/24/20, Cost $4,675,000)(2) | 4,675,000 |
| 4,675,000 |
|
| St. Tammany Parish Economic & Industrial Development District Rev., (Diversified Foods and Seasonings LLC), VRDN, 6.79%, 4/7/20 (LOC: Fidelity Homestead Assistance and FHLB) | 960,000 |
| 960,000 |
|
| Texas Department of Housing & Community Affairs Rev., (Idlewilde Apartments LP), VRDN, 2.75%, 4/7/20 (LOC: FNMA)(LIQ FAC: FNMA) | 1,000,000 |
| 1,000,000 |
|
| Washington State Housing Finance Commission Rev., (Redmond Ridge Apartments LLC), VRDN, 3.25%, 4/7/20 (LOC: FHLB and East West Bank) | 3,700,000 |
| 3,700,000 |
|
| TOTAL MUNICIPAL SECURITIES | | 77,210,000 |
|
| TOTAL INVESTMENT SECURITIES — 101.6% | | 1,648,275,367 |
|
| OTHER ASSETS AND LIABILITIES — (1.6)% | | (26,114,074 | ) |
| TOTAL NET ASSETS — 100.0% | | $ | 1,622,161,293 |
|
|
| | |
| NOTES TO SCHEDULE OF INVESTMENTS |
| FHLB | - | Federal Home Loan Bank |
| FHLMC | - | Federal Home Loan Mortgage Corporation |
| FNMA | - | Federal National Mortgage Association |
| LIBOR | - | London Interbank Offered Rate |
| LIQ FAC | - | Liquidity Facilities |
| LOC | - | Letter of Credit |
| MTN | - | Medium Term Note |
| SOFR | - | Secured Overnight Financing Rate |
| USBMMY | - | U.S. Treasury Bill Money Market Yield |
| VRDN | - | Variable Rate Demand Note. The instrument may be payable upon demand and adjusts periodically based upon the terms set forth in the security's offering documents. The rate shown is effective at the period end and the reference rate and spread, if any, is indicated. The date of the demand feature is disclosed. |
| VRN | - | Variable Rate Note. The rate adjusts periodically based upon the terms set forth in the security’s offering documents. The rate shown is effective at the period end and the reference rate and spread, if any, is indicated. The security's effective maturity date may be shorter than the final maturity date shown. |
| |
| (1) | The rate indicated is the yield to maturity at purchase for non-interest bearing securities. For interest bearing securities, the stated coupon rate is shown. |
| |
| (2) | Restricted security that may not be offered for public sale without being registered with the Securities and Exchange Commission and/or may be subject to resale, redemption or transferability restrictions. The aggregate value of these securities at the period end was $4,675,000, which represented 0.3% of total net assets. |
See Notes to Financial Statements.
|
|
| Statement of Assets and Liabilities |
|
| | | |
| MARCH 31, 2020 | |
| Assets | |
| Investment securities, at value (amortized cost and cost for federal income tax purposes) | $ | 1,648,275,367 |
|
| Cash | 43,705,410 |
|
| Receivable for investments sold | 310,000 |
|
| Receivable for capital shares sold | 2,766,903 |
|
| Interest receivable | 1,828,625 |
|
| | 1,696,886,305 |
|
| | |
| Liabilities | |
| Payable for investments purchased | 71,984,960 |
|
| Payable for capital shares redeemed | 2,377,235 |
|
| Accrued management fees | 344,403 |
|
| Distribution and service fees payable | 16,003 |
|
| Dividends payable | 2,411 |
|
| | 74,725,012 |
|
| | |
| Net Assets | $ | 1,622,161,293 |
|
| | |
| Net Assets Consist of: | |
| Capital paid in | $ | 1,622,202,088 |
|
| Distributable earnings | (40,795 | ) |
| | $ | 1,622,161,293 |
|
|
| | | | | | | | |
| | Net Assets | Shares Outstanding | Net Asset Value Per Share |
| Investor Class |
| $845,564,363 |
| 845,723,997 |
|
| $1.00 |
|
| A Class |
| $82,410,130 |
| 82,408,701 |
|
| $1.00 |
|
| C Class |
| $395,544 |
| 395,541 |
|
| $1.00 |
|
| G Class |
| $693,791,256 |
| 693,804,009 |
|
| $1.00 |
|
See Notes to Financial Statements.
|
| | | |
| YEAR ENDED MARCH 31, 2020 |
| Investment Income (Loss) | |
| Income: | |
| Interest | $ | 36,833,329 |
|
| | |
| Expenses: | |
| Management fees | 8,235,502 |
|
| Distribution and service fees: | |
| A Class | 164,678 |
|
| C Class | 756 |
|
| Trustees' fees and expenses | 135,860 |
|
| Other expenses | 1,906 |
|
| | 8,538,702 |
|
| Fees waived | (3,792,233 | ) |
| | 4,746,469 |
|
| | |
| Net investment income (loss) | 32,086,860 |
|
| | |
| Net realized gain (loss) on investment transactions | 20,313 |
|
| | |
| Net Increase (Decrease) in Net Assets Resulting from Operations | $ | 32,107,173 |
|
See Notes to Financial Statements.
|
|
| Statement of Changes in Net Assets |
|
| | | | | | |
| YEARS ENDED MARCH 31, 2020 AND MARCH 31, 2019 |
| Increase (Decrease) in Net Assets | March 31, 2020 | March 31, 2019 |
| Operations | | |
| Net investment income (loss) | $ | 32,086,860 |
| $ | 35,341,625 |
|
| Net realized gain (loss) | 20,313 |
| 6,713 |
|
| Net increase (decrease) in net assets resulting from operations | 32,107,173 |
| 35,348,338 |
|
| | | |
| Distributions to Shareholders | | |
| From earnings: | | |
| Investor Class | (14,309,368 | ) | (15,302,067 | ) |
| A Class | (848,873 | ) | (1,007,024 | ) |
| C Class | (687 | ) | (698 | ) |
| G Class | (16,927,932 | ) | (19,031,836 | ) |
| Decrease in net assets from distributions | (32,086,860 | ) | (35,341,625 | ) |
| | | |
| Capital Share Transactions | | |
| Net increase (decrease) in net assets from capital share transactions (Note 4) | (161,149,224 | ) | (95,609,086 | ) |
| | | |
| Net increase (decrease) in net assets | (161,128,911 | ) | (95,602,373 | ) |
| | | |
| Net Assets | | |
| Beginning of period | 1,783,290,204 |
| 1,878,892,577 |
|
| End of period | $ | 1,622,161,293 |
| $ | 1,783,290,204 |
|
See Notes to Financial Statements.
|
|
Notes to Financial Statements |
MARCH 31, 2020
1. Organization
American Century Investment Trust (the trust) is registered under the Investment Company Act of 1940, as amended (the 1940 Act), as an open-end management investment company and is organized as a Massachusetts business trust. U.S. Government Money Market Fund (the fund) is one fund in a series issued by the trust. The fund’s investment objective is to seek current income while maintaining liquidity and preserving capital.
The fund offers the Investor Class, A Class, C Class and G Class. The A Class and C Class may be subject to a contingent deferred sales charge.
2. Significant Accounting Policies
The following is a summary of significant accounting policies consistently followed by the fund in preparation of its financial statements. The fund is an investment company and follows accounting and reporting guidance in accordance with accounting principles generally accepted in the United States of America. This may require management to make certain estimates and assumptions at the date of the financial statements. Actual results could differ from these estimates. Management evaluated the impact of events or transactions occurring through the date the financial statements were issued that would merit recognition or disclosure.
Investment Valuations — The fund determines the fair value of its investments and computes its net asset value per share at the close of regular trading (usually 4 p.m. Eastern time) on the New York Stock Exchange (NYSE) on each day the NYSE is open. Investments are generally valued at amortized cost, which approximates fair value. If the fund determines that the amortized cost does not reflect an investment’s fair value, such investment is valued as determined in good faith by the Board of Trustees or its delegate, in accordance with policies and procedures adopted by the Board of Trustees.
Security Transactions — Security transactions are accounted for as of the trade date. Net realized gains and losses are determined on the identified cost basis, which is also used for federal income tax purposes.
Investment Income — Interest income is recorded on the accrual basis and includes accretion of discounts and amortization of premiums.
Treasury Roll Transactions — The fund purchases a security and at the same time makes a commitment to sell the same security at a future settlement date at a specified price. These types of transactions are known as treasury roll transactions. The difference between the purchase price and the sale price represents interest income reflective of an agreed upon rate between the fund and the counterparty.
Income Tax Status — It is the fund’s policy to distribute substantially all net investment income and net realized gains to shareholders and to otherwise qualify as a regulated investment company under provisions of the Internal Revenue Code. Accordingly, no provision has been made for income taxes. The fund files U.S. federal, state, local and non-U.S. tax returns as applicable. The fund's tax returns are subject to examination by the relevant taxing authority until expiration of the applicable statute of limitations, which is generally three years from the date of filing but can be longer in certain jurisdictions. At this time, management believes there are no uncertain tax positions which, based on their technical merit, would not be sustained upon examination and for which it is reasonably possible that the total amounts of unrecognized tax benefits will significantly change in the next twelve months.
Multiple Class — All shares of the fund represent an equal pro rata interest in the net assets of the class to which such shares belong, and have identical voting, dividend, liquidation and other rights and the same terms and conditions, except for class specific expenses and exclusive rights to vote on matters affecting only individual classes. Income, non-class specific expenses, and realized and unrealized capital gains and losses of the fund are allocated to each class of shares based on their relative net assets.
Distributions to Shareholders — Distributions from net investment income, if any, are declared daily and paid monthly. The fund may make capital gains distributions to comply with the distribution requirements of the Internal Revenue Code.
Indemnifications — Under the trust’s organizational documents, its officers and trustees are indemnified against certain liabilities arising out of the performance of their duties to the fund. In addition, in the normal course of business, the fund enters into contracts that provide general indemnifications. The maximum exposure under these arrangements is unknown as this would involve future claims that may be made against a fund. The risk of material loss from such claims is considered by management to be remote.
3. Fees and Transactions with Related Parties
Certain officers and trustees of the trust are also officers and/or directors of American Century Companies, Inc. (ACC). The trust's investment advisor, American Century Investment Management, Inc. (ACIM), the trust's distributor, American Century Investment Services, Inc. (ACIS), and the trust's transfer agent, American Century Services, LLC, are wholly owned, directly or indirectly, by ACC. Various funds issued by American Century Asset Allocation Portfolios, Inc. own, in aggregate, 52% of the shares of the fund. ACIM owns 14% of the shares of the fund. Related parties do not invest in the fund for the purpose of exercising management or control.
Management Fees — The trust has entered into a management agreement with ACIM, under which ACIM provides the fund with investment advisory and management services in exchange for a single, unified management fee (the fee) per class. The agreement provides that all expenses of managing and operating the fund, except distribution and service fees, brokerage expenses, taxes, interest, fees and expenses of the independent trustees (including legal counsel fees), and extraordinary expenses, will be paid by ACIM. The fee is computed and accrued daily based on each class's daily net assets and paid monthly in arrears. The fee consists of (1) an Investment Category Fee based on the daily net assets of the fund and certain other accounts managed by the investment advisor that are in the same broad investment category as the fund and (2) a Complex Fee based on the assets of all the funds in the American Century Investments family of funds. The investment advisor agreed to waive the G Class’s management fee in its entirety. The investment advisor expects this waiver to remain in effect permanently and cannot terminate it without the approval of the Board of Trustees. The total amount of the waiver for the period ended March 31, 2020 was $3,792,225 for the G Class.
The Investment Category Fee range, the Complex Fee range and the effective annual management fee for each class for the period ended March 31, 2020 are as follows:
|
| | | |
| | Investment Category Fee Range | Complex Fee Range | Effective Annual Management Fee |
| Investor Class | 0.1170%
to 0.2300% | 0.2500%
to 0.3100% | 0.45% |
| A Class | 0.45% |
| C Class | 0.45% |
| G Class | 0.00%(1) |
| |
| (1) | Effective annual management fee before waiver was 0.45%. |
Distribution and Service Fees — The Board of Trustees has adopted a separate Master Distribution and Individual Shareholder Services Plan for each of the A Class and C Class (collectively the plans), pursuant to Rule 12b-1 of the 1940 Act. The plans provide that the A Class will pay ACIS an annual distribution and service fee of 0.25%. The plans provide that the C Class will pay ACIS an annual distribution and service fee of 0.75%, of which 0.25% is paid for individual shareholder services and 0.50% is paid for distribution services. The fees are computed and accrued daily based on each class’s daily net assets and paid monthly in arrears. The fees are used to pay financial intermediaries for distribution and individual shareholder services. Fees incurred under the plans during the period ended March 31, 2020 are detailed in the Statement of Operations.
In order to maintain a positive yield, all or a portion of the distribution and/or service fee may voluntarily be waived on a daily basis. The fee waiver may be revised or terminated at any time without notice. The total amount of the waiver for the period ended March 31, 2020 was $8 and the effective annual distribution and service fee after waiver was 0.74% for the C Class.
Trustees’ Fees and Expenses — The Board of Trustees is responsible for overseeing the investment advisor’s management and operations of the fund. The trustees receive detailed information about the fund and its investment advisor regularly throughout the year, and meet at least quarterly with management of the investment advisor to review reports about fund operations. The fund’s officers do not receive compensation from the fund.
4. Capital Share Transactions
Transactions in shares of the fund were as follows (unlimited number of shares authorized):
|
| | | | | | | | | | |
| | Year ended March 31, 2020 | Year ended March 31, 2019 |
| | Shares | Amount | Shares | Amount |
| Investor Class | | | | |
| Sold | 815,541,146 |
| $ | 815,541,146 |
| 610,098,718 |
| $ | 610,098,718 |
|
| Issued in reinvestment of distributions | 14,224,509 |
| 14,224,509 |
| 15,209,824 |
| 15,209,824 |
|
| Redeemed | (835,545,757 | ) | (835,545,757 | ) | (600,775,338 | ) | (600,775,338 | ) |
| | (5,780,102 | ) | (5,780,102 | ) | 24,533,204 |
| 24,533,204 |
|
| A Class | | | | |
| Sold | 50,869,593 |
| 50,869,593 |
| 38,826,325 |
| 38,826,325 |
|
| Issued in reinvestment of distributions | 848,873 |
| 848,873 |
| 1,005,244 |
| 1,005,244 |
|
| Redeemed | (36,824,965 | ) | (36,824,965 | ) | (52,835,390 | ) | (52,835,390 | ) |
| | 14,893,501 |
| 14,893,501 |
| (13,003,821 | ) | (13,003,821 | ) |
| C Class | | | | |
| Sold | 394,476 |
| 394,476 |
| 199,366 |
| 199,366 |
|
| Issued in reinvestment of distributions | 542 |
| 542 |
| 280 |
| 280 |
|
| Redeemed | (76,084 | ) | (76,084 | ) | (151,767 | ) | (151,767 | ) |
| | 318,934 |
| 318,934 |
| 47,879 |
| 47,879 |
|
| G Class | | | | |
| Sold | 54,270,654 |
| 54,270,654 |
| 60,813,798 |
| 60,813,798 |
|
| Issued in reinvestment of distributions | 16,927,622 |
| 16,927,622 |
| 18,991,237 |
| 18,991,237 |
|
| Redeemed | (241,779,833 | ) | (241,779,833 | ) | (186,991,383 | ) | (186,991,383 | ) |
| | (170,581,557 | ) | (170,581,557 | ) | (107,186,348 | ) | (107,186,348 | ) |
| Net increase (decrease) | (161,149,224 | ) | $ | (161,149,224 | ) | (95,609,086 | ) | $ | (95,609,086 | ) |
5. Fair Value Measurements
The fund’s investments valuation process is based on several considerations and may use multiple inputs to determine the fair value of the investments held by the fund. In conformity with accounting principles generally accepted in the United States of America, the inputs used to determine a valuation are classified into three broad levels.
| |
| • | Level 1 valuation inputs consist of unadjusted quoted prices in an active market for identical investments. |
| |
| • | Level 2 valuation inputs consist of direct or indirect observable market data (including quoted prices for comparable investments, evaluations of subsequent market events, interest rates, prepayment speeds, credit risk, etc.). These inputs also consist of quoted prices for identical investments initially expressed in local currencies that are adjusted through translation into U.S. dollars. |
| |
| • | Level 3 valuation inputs consist of unobservable data (including a fund’s own assumptions). |
The level classification is based on the lowest level input that is significant to the fair valuation measurement. The valuation inputs are not necessarily an indication of the risks associated with investing in these securities or other financial instruments.
As of period end, the fund’s investment securities were classified as Level 2. The Schedule of Investments provides additional information on the fund’s portfolio holdings.
6. Risk Factors
The fund may invest in instruments that have variable or floating coupon rates based on the London Interbank Offered Rate (LIBOR). LIBOR is a benchmark interest rate intended to be representative of the rate at which certain major international banks lend to one another over short-terms. LIBOR will be phased out by the end of 2021. Uncertainty remains regarding a replacement rate or rates for LIBOR. The transition process may lead to increased volatility or illiquidity in markets for instruments that rely on LIBOR. This could result in a change to the value of such instruments.
7. Federal Tax Information
The tax character of distributions paid during the years ended March 31, 2020 and March 31, 2019 were as follows:
|
| | | | | | |
| | 2020 | 2019 |
| Distributions Paid From | | |
| Ordinary income | $ | 32,086,860 |
| $ | 35,341,625 |
|
| Long-term capital gains | — |
| — |
|
The book-basis character of distributions made during the year from net investment income or net realized gains may differ from their ultimate characterization for federal income tax purposes. These differences reflect the differing character of certain income items and net realized gains and losses for financial statement and tax purposes, and may result in reclassification among certain capital accounts on the financial statements.
As of March 31, 2020, the fund had accumulated short-term capital losses of $(38,756) and accumulated long-term capital losses of $(2,039), which represent net capital loss carryovers that may be used to offset future realized capital gains for federal income tax purposes. The capital loss carryovers may be carried forward for an unlimited period. Future capital loss carryover utilization in any given year may be subject to Internal Revenue Code limitations.
8. Recently Issued Accounting Standards
In March 2017, the Financial Accounting Standards Board (FASB) issued Accounting Standards Update No. 2017-08, “Receivables - Nonrefundable Fees and Other Costs (Subtopic 310-20), Premium Amortization on Purchased Callable Debt Securities” (ASU 2017-08). ASU 2017-08 amends the amortization period for certain purchased callable debt securities held at a premium, shortening such period to the earliest call date. The amendments are effective for fiscal years, and interim periods within those fiscal years, beginning after December 15, 2018. The adoption of ASU 2017-08 did not materially impact the financial statements.
|
| | | | | | | | | | | | | | |
| For a Share Outstanding Throughout the Years Ended March 31 (except as noted) |
| Per-Share Data | | Ratios and Supplemental Data |
| | | Income From Investment Operations: | | | | Ratio to Average Net Assets of: | |
| | Net Asset
Value,
Beginning
of Period | Net
Investment
Income
(Loss) | Net
Realized
and
Unrealized
Gain (Loss) | Total From Investment Operations | Distributions From Net
Investment
Income | Net Asset
Value,
End
of Period | Total
Return(1) | Operating
Expenses | Operating
Expenses
(before
expense
waiver) | Net
Investment
Income
(Loss) | Net Investment Income (Loss) (before expense waiver) | Net
Assets,
End of
Period (in thousands) |
| Investor Class | | | | | | | | | | | | |
| 2020 | $1.00 | 0.02 | —(2) | 0.02 | (0.02) | $1.00 | 1.56% | 0.46% | 0.46% | 1.56% | 1.56% |
| $845,564 |
|
| 2019 | $1.00 | 0.02 | —(2) | 0.02 | (0.02) | $1.00 | 1.67% | 0.46% | 0.46% | 1.65% | 1.65% |
| $851,334 |
|
| 2018 | $1.00 | 0.01 | —(2) | 0.01 | (0.01) | $1.00 | 0.64% | 0.46% | 0.46% | 0.62% | 0.62% |
| $826,798 |
|
| 2017 | $1.00 | —(2) | —(2) | —(2) | —(2) | $1.00 | 0.07% | 0.44% | 0.46% | 0.07% | 0.05% |
| $2,071,097 |
|
| 2016 | $1.00 | —(2) | —(2) | —(2) | —(2) | $1.00 | 0.01% | 0.23% | 0.46% | 0.01% | (0.22)% |
| $1,574,173 |
|
| A Class | | | | | | | | | | | | |
| 2020 | $1.00 | 0.01 | —(2) | 0.01 | (0.01) | $1.00 | 1.31% | 0.71% | 0.71% | 1.31% | 1.31% |
| $82,410 |
|
| 2019 | $1.00 | 0.01 | —(2) | 0.01 | (0.01) | $1.00 | 1.41% | 0.71% | 0.71% | 1.40% | 1.40% |
| $67,516 |
|
| 2018 | $1.00 | 0.01 | —(2) | 0.01 | (0.01) | $1.00 | 0.51% | 0.57% | 0.71% | 0.51% | 0.37% |
| $80,519 |
|
| 2017 | $1.00 | —(2) | —(2) | —(2) | —(2) | $1.00 | 0.07% | 0.46% | 0.71% | 0.05% | (0.20)% |
| $93,967 |
|
2016(3) | $1.00 | —(2) | —(2) | —(2) | —(2) | $1.00 | 0.01% | 0.34%(4) | 0.71%(4) | 0.01%(4) | (0.35)%(4) |
| $52 |
|
|
| | | | | | | | | | | | | | |
| For a Share Outstanding Throughout the Years Ended March 31 (except as noted) |
| Per-Share Data | | Ratios and Supplemental Data |
| | | Income From Investment Operations: | | | | Ratio to Average Net Assets of: | |
| | Net Asset
Value,
Beginning
of Period | Net
Investment
Income
(Loss) | Net
Realized
and
Unrealized
Gain (Loss) | Total From Investment Operations | Distributions From Net
Investment
Income | Net Asset
Value,
End
of Period | Total
Return(1) | Operating
Expenses | Operating
Expenses
(before
expense
waiver) | Net
Investment
Income
(Loss) | Net Investment Income (Loss) (before expense waiver) | Net
Assets,
End of
Period (in thousands) |
| C Class | | | | | | | | | | | | |
| 2020 | $1.00 | 0.01 | —(2) | 0.01 | (0.01) | $1.00 | 0.81% | 1.20% | 1.21% | 0.82% | 0.81% |
| $396 |
|
| 2019 | $1.00 | 0.01 | —(2) | 0.01 | (0.01) | $1.00 | 0.91% | 1.21% | 1.21% | 0.90% | 0.90% |
| $77 |
|
| 2018 | $1.00 | —(2) | —(2) | —(2) | —(2) | $1.00 | 0.29% | 0.74% | 1.21% | 0.34% | (0.13)% |
| $29 |
|
| 2017 | $1.00 | —(2) | —(2) | —(2) | —(2) | $1.00 | 0.07% | 0.44% | 1.21% | 0.07% | (0.70)% |
| $61 |
|
2016(3) | $1.00 | —(2) | —(2) | —(2) | —(2) | $1.00 | 0.01% | 0.32%(4) | 1.21%(4) | 0.01%(4) | (0.88)%(4) |
| $25 |
|
| G Class | | | | | | | | | | | | |
| 2020 | $1.00 | 0.02 | —(2) | 0.02 | (0.02) | $1.00 | 2.02% | 0.01% | 0.46% | 2.01% | 1.56% |
| $693,791 |
|
| 2019 | $1.00 | 0.02 | —(2) | 0.02 | (0.02) | $1.00 | 2.13% | 0.01% | 0.46% | 2.10% | 1.65% |
| $864,364 |
|
2018(5) | $1.00 | 0.01 | —(2) | 0.01 | (0.01) | $1.00 | 0.81% | 0.01%(4) | 0.46%(4) | 1.20%(4) | 0.75%(4) |
| $971,546 |
|
|
| | | | |
| Notes to Financial Highlights | | |
| |
| (1) | Total returns are calculated based on the net asset value of the last business day and do not reflect applicable sales charges, if any. Total returns for periods less than one year are not annualized. |
| |
| (2) | Per-share amount was less than $0.005. |
| |
| (3) | December 1, 2015 (commencement of sale) through March 31, 2016. |
| |
| (5) | July 28, 2017 (commencement of sale) through March 31, 2018. |
See Notes to Financial Statements.
|
|
| Report of Independent Registered Public Accounting Firm |
To the Board of Trustees of American Century Investment Trust and Shareholders of U.S. Government Money Market Fund
Opinion on the Financial Statements
We have audited the accompanying statement of assets and liabilities, including the schedule of investments, of U.S. Government Money Market Fund (one of the funds constituting American Century Investment Trust, referred to hereafter as the “Fund”) as of March 31, 2020, the related statement of operations for the year ended March 31, 2020, the statement of changes in net assets for each of the two years in the period ended March 31, 2020, including the related notes, and the financial highlights for each of the periods indicated therein (collectively referred to as the “financial statements”). In our opinion, the financial statements present fairly, in all material respects, the financial position of the Fund as of March 31, 2020, the results of its operations for the year then ended, the changes in its net assets for each of the two years in the period ended March 31, 2020 and the financial highlights for each of the periods indicated therein in conformity with accounting principles generally accepted in the United States of America.
Basis for Opinion
These financial statements are the responsibility of the Fund’s management. Our responsibility is to express an opinion on the Fund’s financial statements based on our audits. We are a public accounting firm registered with the Public Company Accounting Oversight Board (United States) (PCAOB) and are required to be independent with respect to the Fund in accordance with the U.S. federal securities laws and the applicable rules and regulations of the Securities and Exchange Commission and the PCAOB.
We conducted our audits of these financial statements in accordance with the standards of the PCAOB. Those standards require that we plan and perform the audit to obtain reasonable assurance about whether the financial statements are free of material misstatement, whether due to error or fraud.
Our audits included performing procedures to assess the risks of material misstatement of the financial statements, whether due to error or fraud, and performing procedures that respond to those risks. Such procedures included examining, on a test basis, evidence regarding the amounts and disclosures in the financial statements. Our audits also included evaluating the accounting principles used and significant estimates made by management, as well as evaluating the overall presentation of the financial statements. Our procedures included confirmation of securities owned as of March 31, 2020 by correspondence with the custodian and brokers; when replies were not received from brokers, we performed other auditing procedures. We believe that our audits provide a reasonable basis for our opinion.
/s/ PricewaterhouseCoopers LLP
Kansas City, Missouri
May 18, 2020
We have served as the auditor of one or more investment companies in American Century Investments since 1997.
Board of Trustees
The individuals listed below serve as trustees of the funds. Each trustee will continue to serve in this capacity until death, retirement, resignation or removal from office. The board has adopted a mandatory retirement age for trustees who are not “interested persons,” as that term is defined in the Investment Company Act (independent trustees). Independent trustees shall retire on December 31 of the year in which they reach their 75th birthday; provided, however, that on or after January 1, 2022, independent trustees shall retire on December 31 of the year in which they reach their 76th birthday.
Mr. Thomas is an “interested person” because he currently serves as President and Chief Executive Officer of American Century Companies, Inc. (ACC), the parent company of American Century Investment Management, Inc. (ACIM or the advisor). The other trustees (more than three-fourths of the total number) are independent. They are not employees, directors or officers of, and have no financial interest in, ACC or any of its wholly owned, direct or indirect, subsidiaries, including ACIM, American Century Investment Services, Inc. (ACIS) and American Century Services, LLC (ACS), and they do not have any other affiliations, positions or relationships that would cause them to be considered “interested persons” under the Investment Company Act. The trustees serve in this capacity for eight (in the case of Jonathan S. Thomas, 16; and Ronald J. Gilson, 9) registered investment companies in the American Century Investments family of funds.
The following table presents additional information about the trustees. The mailing address for each trustee other than Mr. Thomas is 1665 Charleston Road, Mountain View, California 94043. The mailing address for Mr. Thomas is 4500 Main Street, Kansas City, Missouri 64111.
|
| | | | | |
Name
(Year of Birth) | Position(s) Held with Funds | Length of Time Served | Principal Occupation(s) During Past 5 Years | Number of American Century Portfolios Overseen by Trustee | Other Directorships Held During Past 5 Years |
| Independent Trustees |
|
|
Tanya S. Beder
(1955) | Trustee | Since 2011 | Chairman and CEO, SBCC Group Inc. (independent advisory services) (2006 to present) | 40 | CYS Investments, Inc.; Kirby Corporation; Nabors Industries Ltd. |
Jeremy I. Bulow
(1954) | Trustee | Since 2011 | Professor of Economics, Stanford University, Graduate School of Business (1979 to present) | 40 | None |
Anne Casscells
(1958) | Trustee | Since 2016 | Co-Chief Executive Officer and Chief Investment Officer, Aetos Alternatives Management (investment advisory firm) (2001 to present); Lecturer in Accounting, Stanford University, Graduate School of Business (2009 to 2017) | 40 | None |
Ronald J. Gilson
(1946) | Trustee and Chairman of the Board | Since 1995
(Chairman since 2005) | Charles J. Meyers Professor of Law and Business, Emeritus, Stanford Law School (1979 to 2016); Marc and Eva Stern Professor of Law and Business, Columbia University School of Law (1992 to present) | 57 | None |
|
| | | | | |
Name
(Year of Birth) | Position(s) Held with Funds | Length of Time Served | Principal Occupation(s) During Past 5 Years | Number of American Century Portfolios Overseen by Trustee | Other Directorships Held During Past 5 Years |
| Independent Trustees |
|
|
Frederick L. A. Grauer
(1946) | Trustee | Since 2008 | Senior Advisor, Credit Sesame, Inc. (credit monitoring firm) (2018 to present); Senior Advisor, Course Hero (an educational technology company) (2015 to present) | 40 | None |
Jonathan D. Levin
(1972) | Trustee | Since 2016 | Philip H. Knight Professor and Dean, Graduate School of Business, Stanford University (2016 to present); Professor, Stanford University, (2000 to present) | 40 | None |
Peter F. Pervere
(1947) | Trustee | Since 2007 | Retired | 40 | None |
John B. Shoven
(1947) | Trustee | Since 2002 | Charles R. Schwab Professor of Economics, Stanford University (1973 to present, emeritus since 2019) | 40 | Cadence Design Systems; Exponent; Financial Engines |
| Interested Trustee |
|
|
Jonathan S. Thomas
(1963) | Trustee | Since 2007 | President and Chief Executive Officer, ACC (2007 to present). Also serves as Chief Executive Officer, ACS; Executive Vice President, ACIM; Director, ACC, ACIM and other ACC subsidiaries | 120 | None |
The Statement of Additional Information has additional information about the fund's trustees and is available without charge, upon request, by calling 1-800-345-2021.
Officers
The following table presents certain information about the executive officers of the funds. Each officer serves as an officer for 16 (in the case of Robert J. Leach, 15) investment companies in the American Century family of funds, unless otherwise noted. No officer is compensated for his or her service as an officer of the funds. The listed officers are interested persons of the funds and are appointed or re-appointed on an annual basis. The mailing address for each of the officers listed below is 4500 Main Street, Kansas City, Missouri 64111.
|
| | |
Name
(Year of Birth) | Offices with the Funds | Principal Occupation(s) During the Past Five Years |
Patrick Bannigan
(1965)
| President since 2019 | Executive Vice President and Director, ACC (2012 to present); Chief Financial Officer, Chief Accounting Officer and Treasurer, ACC (2015 to present); Chief Operating Officer, ACC (2012-2015). Also serves as President, ACS; Vice President, ACIM; Chief Financial Officer, Chief Accounting Officer and/or Director, ACIM, ACS and other ACC subsidiaries |
R. Wes Campbell
(1974)
| Chief Financial Officer and Treasurer since 2018 | Vice President, ACS (2020 to present); Investment Operations and Investment Accounting, ACS (2000 to present) |
Amy D. Shelton
(1964) | Chief Compliance Officer and Vice President since 2014 | Chief Compliance Officer, American Century funds, (2014 to present); Chief Compliance Officer, ACIM (2014 to present); Chief Compliance Officer, ACIS (2009 to present). Also serves as Vice President, ACIS |
Charles A. Etherington
(1957) | General Counsel since 2007 and Senior Vice President since 2006 | Attorney, ACC (1994 to present); Vice President, ACC (2005 to present); General Counsel, ACC (2007 to present). Also serves as General Counsel, ACIM, ACS, ACIS and other ACC subsidiaries; and Senior Vice President, ACIM and ACS |
C. Jean Wade
(1964) | Vice President since 2012 | Senior Vice President, ACS (2017 to present); Vice President ACS (2000 to 2017)
|
Robert J. Leach
(1966) | Vice President since 2006 | Vice President, ACS (2000 to present) |
David H. Reinmiller
(1963) | Vice President since 2000 | Attorney, ACC (1994 to present). Also serves as Vice President, ACIM and ACS |
Ward D. Stauffer
(1960) | Secretary since 2005 | Attorney, ACC (2003 to present) |
|
|
| Liquidity Risk Management Program |
The Fund has adopted a liquidity risk management program (the “program”). The Fund’s Board of Trustees (the "Board") has designated American Century Investment Management, Inc. (“ACIM”) as the administrator of the program. Personnel of ACIM or its affiliates conduct the day-to-day operation of the program pursuant to policies and procedures administered by those members of the ACIM’s Investment Oversight Committee who are members of the ACIM’s Investment Management and Global Analytics departments.
Under the program, ACIM manages the Fund’s liquidity risk, which is the risk that the Fund could not meet shareholder redemption requests without significant dilution of remaining shareholders’ interests in the Fund. This risk is managed by monitoring the degree of liquidity of the Fund’s investments, limiting the amount of the Fund’s illiquid investments, and utilizing various risk management tools and facilities available to the Fund for meeting shareholder redemptions, among other means. ACIM’s process of determining the degree of liquidity of the Fund’s investments is supported by one or more third-party liquidity assessment vendors.
The Board reviewed a report prepared by ACIM regarding the operation and effectiveness of the program for the period December 1, 2018 through December 31, 2019. No significant liquidity events impacting the Fund were noted in the report. In addition, ACIM provided its assessment that the program had been effective in managing the Fund’s liquidity risk.
Retirement Account Information
As required by law, distributions you receive from certain retirement accounts are subject to federal income tax withholding, unless you elect not to have withholding apply*. Tax will be withheld on the total amount withdrawn even though you may be receiving amounts that are not subject to withholding, such as nondeductible contributions. In such case, excess amounts of withholding could occur. You may adjust your withholding election so that a greater or lesser amount will be withheld.
If you don’t want us to withhold on this amount, you must notify us to not withhold the federal income tax. You may notify us in writing or in certain situations by telephone or through other electronic means. For systematic withdrawals, your withholding election will remain in effect until revoked or changed by filing a new election. You have the right to revoke your election at any time and change your withholding percentage for future distributions.
Remember, even if you elect not to have income tax withheld, you are liable for paying income tax on the taxable portion of your withdrawal. If you elect not to have income tax withheld or you don’t have enough income tax withheld, you may be responsible for payment of estimated tax. You may incur penalties under the estimated tax rules if your withholding and estimated tax payments are not sufficient. You can reduce or defer the income tax on a distribution by directly or indirectly rolling such distribution over to another IRA or eligible plan. You should consult your tax advisor for additional information.
State tax will be withheld if, at the time of your distribution, your address is within one of the mandatory withholding states and you have federal income tax withheld (or as otherwise required by state law). State taxes will be withheld from your distribution in accordance with the respective state rules.
*Some 403(b), 457 and qualified retirement plan distributions may be subject to 20% mandatory withholding, as they are subject to special tax and withholding rules. Your plan administrator or plan sponsor is required to provide you with a special tax notice explaining those rules at the time you request a distribution. If applicable, federal and/or state taxes may be withheld from your distribution amount.
Proxy Voting Policies
Descriptions of the principles and policies that the fund's investment advisor uses in exercising the voting rights associated with the securities purchased and/or held by the fund are available without charge, upon request, by calling 1-800-345-2021 or visiting American Century Investments’ website at americancentury.com/proxy. A description of the policies is also available on the Securities and Exchange Commission’s website at sec.gov. Information regarding how the investment advisor voted proxies relating to portfolio securities during the most recent 12-month period ended June 30 is available on americancentury.com/proxy. It is also available at sec.gov.
Portfolio Holdings Disclosure
The fund files its complete schedule of portfolio holdings with the Securities and Exchange Commission (SEC) each month on Form N-MFP. The fund’s Form N-MFP reports are available on its website at americancentury.com and on the SEC’s website at sec.gov. The fund also makes its complete schedule of portfolio holdings for the most recent quarter of its fiscal year available on its website at americancentury.com and, upon request, by calling 1-800-345-2021.
|
| | |
| |
| | | |
| Contact Us | americancentury.com | |
| Automated Information Line | 1-800-345-8765 | |
| Investor Services Representative | 1-800-345-2021 or 816-531-5575 | |
| Investors Using Advisors | 1-800-378-9878 | |
| Business, Not-For-Profit, Employer-Sponsored Retirement Plans | 1-800-345-3533 | |
| Banks and Trust Companies, Broker-Dealers, Financial Professionals, Insurance Companies | 1-800-345-6488 | |
| Telecommunications Relay Service for the Deaf | 711 | |
| | | |
| American Century Investment Trust | |
| | | |
Investment Advisor: American Century Investment Management, Inc. Kansas City, Missouri | |
| | | |
| This report and the statements it contains are submitted for the general information of our shareholders. The report is not authorized for distribution to prospective investors unless preceded or accompanied by an effective prospectus. | |
| | | |
©2020 American Century Proprietary Holdings, Inc. All rights reserved.
CL-ANN-92283 2005 | |
ITEM 2. CODE OF ETHICS.
| |
| (a) | The registrant has adopted a Code of Ethics for Senior Financial Officers that applies to the registrant’s principal executive officer, principal financial officer, principal accounting officer, and persons performing similar functions. |
| |
| (f) | The registrant’s Code of Ethics for Senior Financial Officers was filed as Exhibit 12 (a)(1) to American Century Asset Allocation Portfolios, Inc.’s Annual Certified Shareholder Report on Form N-CSR, File No. 811-21591, on September 29, 2005, and is incorporated herein by reference. |
ITEM 3. AUDIT COMMITTEE FINANCIAL EXPERT.
| |
| (a)(1) | The registrant's board has determined that the registrant has at least one audit committee financial expert serving on its audit committee. |
| |
| (a)(2) | Tanya S. Beder, Anne Casscells, Peter F. Pervere and Ronald J. Gilson are the registrant's designated audit committee financial experts. They are "independent" as defined in Item 3 of Form N-CSR. |
ITEM 4. PRINCIPAL ACCOUNTANT FEES AND SERVICES.
The aggregate fees billed for each of the last two fiscal years for professional services rendered by the principal accountant for the audit of the registrant’s annual financial statements or services that are normally provided by the accountant in connection with statutory and regulatory filings or engagements for those fiscal years were as follows:
FY 2019: $358,679
FY 2020: $365,442
The aggregate fees billed in each of the last two fiscal years for assurance and related services by the principal accountant that are reasonably related to the performance of the audit of the registrant’s financial statements and are not reported under paragraph (a) of this Item were as follows:
For services rendered to the registrant:
Fees required to be approved pursuant to paragraph (c)(7)(ii) of Rule 2-01 of Regulation S-X (relating to certain engagements for non-audit services with the registrant’s investment adviser and its affiliates):
The aggregate fees billed in each of the last two fiscal years for professional services rendered by the principal accountant for tax compliance, tax advice, and tax planning were as follows:
For services rendered to the registrant:
FY 2019: $0
FY 2020: $0
Fees required to be approved pursuant to paragraph (c)(7)(ii) of Rule 2-01 of Regulation S-X (relating to certain engagements for non-audit services with the registrant’s investment adviser and its affiliates):
FY 2019: $0
FY 2020: $0
(d)All Other Fees.
The aggregate fees billed in each of the last two fiscal years for products and services provided by the principal accountant, other than the services reported in paragraphs (a) through (c) of this Item were as follows:
For services rendered to the registrant:
Fees required to be approved pursuant to paragraph (c)(7)(ii) of Rule 2-01 of Regulation S-X (relating to certain engagements for non-audit services with the registrant’s investment adviser and its affiliates):
| |
| (e)(1) | In accordance with paragraph (c)(7)(i)(A) of Rule 2-01 of Regulation S-X, before the accountant is engaged by the registrant to render audit or non-audit services, the engagement is approved by the registrant’s audit committee. Pursuant to paragraph (c)(7)(ii) of Rule 2-01 of Regulation S-X, the registrant’s audit committee also pre-approves its accountant’s engagements for non-audit services with the registrant’s investment adviser, its parent company, and any entity controlled by, or under common control with the investment adviser that provides ongoing services to the registrant, if the engagement relates directly to the operations and financial reporting of the registrant. |
| |
| (e)(2) | All services described in each of paragraphs (b) through (d) of this Item were pre-approved before the engagement by the registrant’s audit committee pursuant to paragraph (c)(7)(i)(A) of Rule 2-01 of Regulation S-X. Consequently, none of such services were required to be approved by the audit committee pursuant to paragraph (c)(7)(i)(C). |
| |
| (f) | The percentage of hours expended on the principal accountant’s engagement to audit the registrant’s financial statements for the most recent fiscal year that were attributed to work performed by persons other than the principal accountant’s full-time, permanent employees was less than 50%. |
| |
| (g) | The aggregate non-audit fees billed by the registrant’s accountant for services rendered to the registrant, and rendered to the registrant’s investment adviser (not including any sub-adviser whose role is primarily portfolio management and is subcontracted with or overseen by another investment adviser), and any entity controlling, controlled by, or under common control with the adviser that provides ongoing services to the registrant for each of the last two fiscal years of the registrant were as follows: |
FY 2019: $131,797
FY 2020: $186,900
| |
| (h) | The registrant’s investment adviser and accountant have notified the registrant’s audit committee of all non-audit services that were rendered by the registrant’s accountant to the registrant’s investment adviser, its parent company, and any entity controlled by, or under common control with the investment adviser that provides services to the registrant, which services were not required to be pre-approved pursuant to paragraph (c)(7)(ii) of Rule 2-01 of Regulation S-X. The notification provided to the registrant’s audit committee included sufficient details regarding such services to allow the registrant’s audit committee to consider the continuing independence of its principal accountant. |
ITEM 5. AUDIT COMMITTEE OF LISTED REGISTRANTS.
Not applicable.
ITEM 6. INVESTMENTS.
| |
| (a) | The schedule of investments is included as part of the report to stockholders filed under Item 1 of this Form. |
ITEM 7. DISCLOSURE OF PROXY VOTING POLICIES AND PROCEDURES FOR CLOSED-END MANAGEMENT INVESTMENT COMPANIES.
Not applicable.
ITEM 8. PORTFOLIO MANAGERS OF CLOSED-END MANAGEMENT INVESTMENT COMPANIES.
Not applicable.
ITEM 9. PURCHASES OF EQUITY SECURITIES BY CLOSED-END MANAGEMENT INVESTMENT COMPANY AND AFFILIATED PURCHASERS.
Not applicable.
ITEM 10. SUBMISSION OF MATTERS TO A VOTE OF SECURITY HOLDERS.
During the reporting period, there were no material changes to the procedures by which shareholders may recommend nominees to the registrant’s board.
ITEM 11. CONTROLS AND PROCEDURES.
| |
| (a) | The registrant's principal executive officer and principal financial officer have concluded that the registrant's disclosure controls and procedures (as defined in Rule 30a-3(c) under the Investment Company Act of 1940) are effective based on their evaluation of these controls and procedures as of a date within 90 days of the filing date of this report. |
| |
| (b) | There were no changes in the registrant's internal control over financial reporting (as defined in Rule 30a-3(d) under the Investment Company Act of 1940) that occurred during the period covered by this report that have materially affected, or are reasonably likely to materially affect, the registrant's internal control over financial reporting. |
ITEM 12. DISCLOSURE OF SECURITIES LENDING ACTIVITIES FOR CLOSED-END MANAGEMENT INVESTMENT COMPANIES.
Not applicable.
ITEM 13. EXHIBITS.
| |
| (a)(1) | Registrant’s Code of Ethics for Senior Financial Officers, which is the subject of the disclosure required by Item 2 of Form N-CSR, was filed as Exhibit 12(a)(1) to American Century Asset Allocation Portfolios, Inc.’s Certified Shareholder Report on Form N-CSR, File No. 811-21591, on September 29, 2005. |
SIGNATURES
Pursuant to the requirements of the Securities Exchange Act of 1934 and the Investment Company Act of 1940, the registrant has duly caused this report to be signed on its behalf by the undersigned, thereunto duly authorized.
|
| | | |
| Registrant: | American Century Investment Trust |
| | | |
| By: | /s/ Patrick Bannigan |
| | Name: | Patrick Bannigan |
| | Title: | President |
| | | |
| Date: | May 28, 2020 |
Pursuant to the requirements of the Securities Exchange Act of 1934 and the Investment Company Act of 1940, this report has been signed below by the following persons on behalf of the registrant and in the capacities and on the dates indicated.
|
| | |
| By: | /s/ Patrick Bannigan |
| | Name: | Patrick Bannigan |
| | Title: | President |
| | | (principal executive officer) |
| | | |
| Date: | May 28, 2020 |
|
| | |
| By: | /s/ R. Wes Campbell |
| | Name: | R. Wes Campbell |
| | Title: | Treasurer and |
| | | Chief Financial Officer |
| | | (principal financial officer) |
| | | |
| Date: | May 28, 2020 |