UNITED STATES
SECURITIES AND EXCHANGE COMMISSION
Washington, D.C. 20549
FORM N-CSR
CERTIFIED SHAREHOLDER REPORT OF REGISTERED
MANAGEMENT INVESTMENT COMPANIES
| | | | | | | | | | | | | | | | | | | | |
| Investment Company Act file number | 811-07822 |
| |
| AMERICAN CENTURY INVESTMENT TRUST |
| (Exact name of registrant as specified in charter) |
| |
| 4500 MAIN STREET, KANSAS CITY, MISSOURI | 64111 |
| (Address of principal executive offices) | (Zip Code) |
| |
JOHN PAK
4500 MAIN STREET, KANSAS CITY, MISSOURI 64111 |
| (Name and address of agent for service) |
| |
| Registrant’s telephone number, including area code: | 816-531-5575 |
| |
| Date of fiscal year end: | 03-31 |
| |
| Date of reporting period: | 03-31-2023 |
ITEM 1. REPORTS TO STOCKHOLDERS.
(a) Provided under separate cover.
| | | | | |
| |
| Annual Report |
| |
| March 31, 2023 |
| |
| Core Plus Fund |
| Investor Class (ACCNX) |
| I Class (ACCTX) |
| A Class (ACCQX) |
| C Class (ACCKX) |
| R Class (ACCPX) |
| R5 Class (ACCUX) |
| G Class (ACCYX) |
| | | | | |
| President’s Letter | |
| Performance | |
| Portfolio Commentary | |
| Fund Characteristics | |
| Shareholder Fee Example | |
| Schedule of Investments | |
| Statement of Assets and Liabilities | |
| Statement of Operations | |
| Statement of Changes in Net Assets | |
| Notes to Financial Statements | |
| Financial Highlights | |
| Report of Independent Registered Public Accounting Firm | |
| Management | |
| Liquidity Risk Management Program | |
| |
| Additional Information | |
Any opinions expressed in this report reflect those of the author as of the date of the report, and do not necessarily represent the opinions of American Century Investments® or any other person in the American Century Investments organization. Any such opinions are subject to change at any time based upon market or other conditions and American Century Investments disclaims any responsibility to update such opinions. These opinions may not be relied upon as investment advice and, because investment decisions made by American Century Investments funds are based on numerous factors, may not be relied upon as an indication of trading intent on behalf of any American Century Investments fund. Security examples are used for representational purposes only and are not intended as recommendations to purchase or sell securities. Performance information for comparative indices and securities is provided to American Century Investments by third party vendors. To the best of American Century Investments’ knowledge, such information is accurate at the time of printing.
 Jonathan Thomas
Dear Investor:
Thank you for reviewing this annual report for the period ended March 31, 2023. Annual reports help convey important information about fund returns, including market factors that affected performance. For additional investment insights, please visit americancentury.com.
Challenging Conditions Weighed on Asset Class Returns
Prevailing headwinds early in the reporting period continued to challenge U.S. financial markets throughout the 12 months. Asset class performance seesawed but declined overall amid mixed economic data, elevated inflation and anticipated monetary policy responses. By period-end, a new headwind emerged: banking industry uncertainty.
After launching its inflation-fighting rate-hike campaign in March 2022, the Federal Reserve (Fed) lifted rates eight more times by period-end. The federal funds target rate ended the reporting period at 4.75% to 5%, its highest level since 2007, while Treasury yields climbed to multiyear highs. Amid the Fed’s efforts, the annual inflation rate peaked at 9.1% in June, a 40-year high, before easing to 5% by March.
In addition to helping tame inflation, rapidly rising rates also fueled recession worries and led to expectations for the Fed to change course. This sentiment helped spark a rebound among stock and bond indices in the second half of the reporting period. The collapse of two U.S. regional banks late in the period and fears of a looming credit crunch and likely recession also contributed to market expectations for a Fed policy change. Nevertheless, the Fed indicated a near-term course change was unlikely.
Despite delivering strong gains in the second half of the reporting period, stock returns succumbed to first-half losses and declined for the 12 months. Similarly, weakness in the first half of the period overwhelmed second-half gains, and bond returns were negative for the 12-month period.
Remaining Diligent in Uncertain Times
We expect market volatility to linger as investors navigate a complex environment of still-high inflation, tighter financial conditions, banking industry turbulence and economic uncertainty. In addition, increasingly tense geopolitical considerations complicate the market backdrop.
We appreciate your confidence in us during these extraordinary times. Our firm has a long history of helping clients weather unpredictable and volatile markets, and we’re confident we will continue to meet today’s challenges.
Sincerely,
Jonathan Thomas
President and Chief Executive Officer
American Century Investments
| | | | | | | | | | | | | | | | | | | | |
| Total Returns as of March 31, 2023 | | |
| | | Average Annual Returns | |
| Ticker
Symbol | 1 year | 5 years | 10 years | Since Inception | Inception
Date |
| Investor Class | ACCNX | -6.42% | 0.74% | 1.35% | — | 11/30/06 |
| Bloomberg U.S. Aggregate Bond Index | — | -4.78% | 0.90% | 1.36% | — | — |
| I Class | ACCTX | -6.33% | 0.86% | — | 0.99% | 4/10/17 |
| A Class | ACCQX | | | | | 11/30/06 |
| No sales charge | | -6.66% | 0.49% | 1.09% | — | |
| With sales charge | | -10.86% | -0.43% | 0.63% | — | |
| C Class | ACCKX | -7.36% | -0.24% | 0.34% | — | 11/30/06 |
| R Class | ACCPX | -6.89% | 0.24% | 0.84% | — | 11/30/06 |
| R5 Class | ACCUX | -6.15% | 0.96% | 1.55% | — | 11/30/06 |
| G Class | ACCYX | -5.92% | — | — | -3.93% | 11/4/20 |
Average annual returns since inception are presented when ten years of performance history is not available. Fund returns would have been lower if a portion of the fees had not been waived.
C Class shares will automatically convert to A Class shares after being held for approximately eight years. C Class average annual returns do not reflect this conversion.
Sales charges include initial sales charges and contingent deferred sales charges (CDSCs), as applicable. A Class shares have a 4.50% maximum initial sales charge and may be subject to a maximum CDSC of 1.00%. C Class shares redeemed within 12 months of purchase are subject to a maximum CDSC of 1.00%. The SEC requires that mutual funds provide performance information net of maximum sales charges in all cases where charges could be applied.
Data presented reflect past performance. Past performance is no guarantee of future results. Current performance may be higher or lower than the performance shown. Total returns for periods less than one year are not annualized. Investment return and principal value will fluctuate, and redemption value may be more or less than original cost. Data assumes reinvestment of dividends and capital gains, and none of the charts reflect the deduction of taxes that a shareholder would pay on fund distributions or the redemption of fund shares. To obtain performance data current to the most recent month end, please call 1-800-345-2021 or visit americancentury.com. For additional information about the fund, please consult the prospectus.
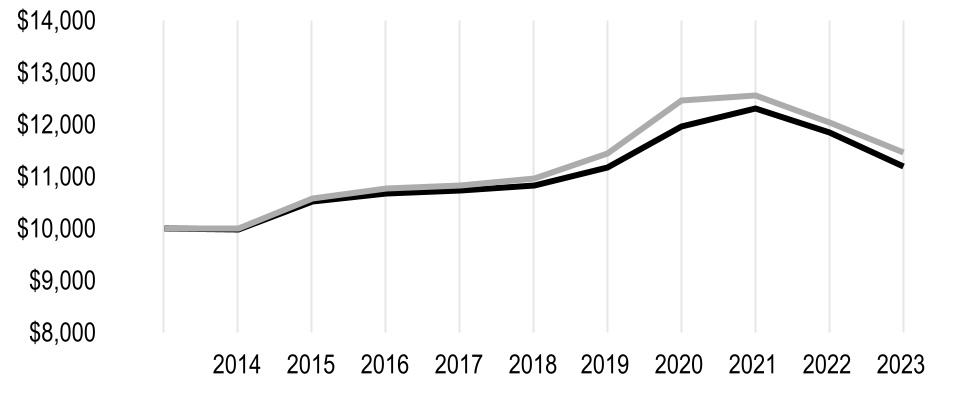
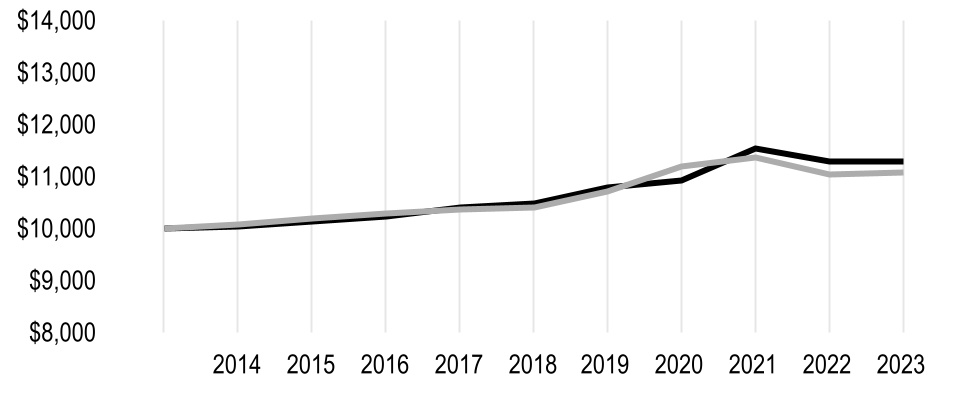
| | |
| Growth of $10,000 Over 10 Years |
| $10,000 investment made March 31, 2013 |
| Performance for other share classes will vary due to differences in fee structure. |
| | | | | |
| Value on March 31, 2023 |
| Investor Class — $11,430 |
|
| Bloomberg U.S. Aggregate Bond Index — $11,451 |
|
| |
|
Ending value of Investor Class would have been lower if a portion of the fees had not been waived.
| | | | | | | | | | | | | | | | | | | | |
| Total Annual Fund Operating Expenses | |
| Investor Class | I Class | A Class | C Class | R Class | R5 Class | G Class |
| 0.54% | 0.44% | 0.79% | 1.54% | 1.04% | 0.34% | 0.34% |
The total annual fund operating expenses shown is as stated in the fund’s prospectus current as of the date of this report. The prospectus may vary from the expense ratio shown elsewhere in this report because it is based on a different time period, includes acquired fund fees and expenses, and, if applicable, does not include fee waivers or expense reimbursements.
Data presented reflect past performance. Past performance is no guarantee of future results. Current performance may be higher or lower than the performance shown. Total returns for periods less than one year are not annualized. Investment return and principal value will fluctuate, and redemption value may be more or less than original cost. Data assumes reinvestment of dividends and capital gains, and none of the charts reflect the deduction of taxes that a shareholder would pay on fund distributions or the redemption of fund shares. To obtain performance data current to the most recent month end, please call 1-800-345-2021 or visit americancentury.com. For additional information about the fund, please consult the prospectus.
Portfolio Managers: Bob Gahagan, Peter Van Gelderen, Jeff Houston, Jason Greenblath and Charles Tan
Performance Summary
Core Plus returned -6.42%* for the 12 months ended March 31, 2023. By comparison, the Bloomberg U.S. Aggregate Bond Index returned -4.78%. Fund returns reflect operating expenses, while index returns do not.
Inflation, Federal Reserve Policy Challenged Bond Market
Elevated inflation, aggressive Federal Reserve (Fed) policy, rising interest rates and mounting recession risk dominated the reporting period and contributed to heightened market volatility. After peaking in June, inflation moderated but remained well above the Fed’s target, which led to consistent interest rate hikes. In March, the collapse of two U.S. regional banks introduced a new market headwind, as banks moved to tighten lending standards amid industry uncertainty.
Against this backdrop, Treasury yields were volatile, particularly during the banking industry turmoil. For the period overall, yields rose sharply across the yield curve. This dynamic contributed to negative 12-month returns for most investment-grade bond market sectors, including Treasuries, mortgage-backed securities (MBS) and corporate bonds. Credit-sensitive and longer maturity securities generally posted the largest losses.
High-Yield Exposure Weighed on Relative Results
An out-of-index hedged position in high-yield securities detracted from relative performance. The hedge, which included high-yield credit default swaps and reflected our more-defensive strategy, detracted as high-yield securities advanced in the second half of the reporting period. We reduced the portfolio’s high-yield exposure by the end of March, as we adopted an up-in-quality bias.
Security Selection Detracted
Security selection weighed on relative results, largely due to the securitized sector and positions in non-agency collateralized mortgage obligations (CMOs) and collateralized loan obligations (CLOs). However, positive relative results from agency MBS and asset-backed securities helped offset some of the negative effects from CMOs and CLOs. Selections among investment-grade corporates and emerging markets debt also detracted.
Duration Hindered Relative Performance
We began gradually extending the portfolio’s duration in the second half of 2022, as short-maturity Treasury yields were climbing to multiyear highs. In our view, the combination of high inflation, rising Treasury yields and aggressive Fed tightening would eventually trigger a recession and push yields lower. However, yields rose overall, and our longer-than-index duration positioning suffered. The strategy did aid relative results late in the period when the bank failures sparked a flight to quality.
*All fund returns referenced in this commentary are for Investor Class shares. Performance for other share classes will vary due to differences in fee structure; when Investor Class performance exceeds that of the index, other share classes may not. See page 3 for returns for all share classes.
| | | | | |
| MARCH 31, 2023 | |
| Types of Investments in Portfolio | % of net assets |
| U.S. Government Agency Mortgage-Backed Securities | 29.8% |
| Corporate Bonds | 29.5% |
| U.S. Treasury Securities | 17.2% |
| Asset-Backed Securities | 6.4% |
| Collateralized Loan Obligations | 5.8% |
| Collateralized Mortgage Obligations | 3.9% |
| Commercial Mortgage-Backed Securities | 2.0% |
| Municipal Securities | 1.9% |
| Sovereign Governments and Agencies | 1.0% |
| Bank Loan Obligations | 0.2% |
| Preferred Stocks | 0.1% |
| U.S. Government Agency Securities | 0.1% |
| Short-Term Investments | 4.1% |
| Other Assets and Liabilities | (2.0)% |
Fund shareholders may incur two types of costs: (1) transaction costs, including sales charges (loads) on purchase payments and redemption/exchange fees; and (2) ongoing costs, including management fees; distribution and service (12b-1) fees; and other fund expenses. This example is intended to help you understand your ongoing costs (in dollars) of investing in your fund and to compare these costs with the ongoing cost of investing in other mutual funds.
The example is based on an investment of $1,000 made at the beginning of the period and held for the entire period from October 1, 2022 to March 31, 2023.
Actual Expenses
The table provides information about actual account values and actual expenses for each class. You may use the information, together with the amount you invested, to estimate the expenses that you paid over the period. First, identify the share class you own. Then simply divide your account value by $1,000 (for example, an $8,600 account value divided by $1,000 = 8.6), then multiply the result by the number under the heading “Expenses Paid During Period” to estimate the expenses you paid on your account during this period.
If you hold Investor Class shares of any American Century Investments mutual fund, or I Class shares of the American Century Diversified Bond Fund, in an American Century Investments account (i.e., not through a financial intermediary or employer-sponsored retirement plan account), American Century Investments may charge you a $25 annual account maintenance fee if the value of those shares is less than $10,000. We will redeem shares automatically in one of your accounts to pay the $25 fee. In determining your total eligible investment amount, we will include your investments in all personal accounts (including American Century Investments brokerage accounts) registered under your Social Security number. Personal accounts include individual accounts, joint accounts, UGMA/UTMA accounts, personal trusts, Coverdell Education Savings Accounts and IRAs (including traditional, Roth, Rollover, SEP-, SARSEP- and SIMPLE-IRAs), and certain other retirement accounts. If you have only business, business retirement, employer-sponsored or American Century Investments brokerage accounts, you are currently not subject to this fee. If you are subject to the account maintenance fee, your account value could be reduced by the fee amount.
Hypothetical Example for Comparison Purposes
The table also provides information about hypothetical account values and hypothetical expenses based on the actual expense ratio of each class of your fund and an assumed rate of return of 5% per year before expenses, which is not the actual return of a fund’s share class. The hypothetical account values and expenses may not be used to estimate the actual ending account balance or expenses you paid for the period. You may use this information to compare the ongoing costs of investing in your fund and other funds. To do so, compare this 5% hypothetical example with the 5% hypothetical examples that appear in the shareholder reports of the other funds.
Please note that the expenses shown in the table are meant to highlight your ongoing costs only and do not reflect any transactional costs, such as sales charges (loads) or redemption/exchange fees. Therefore, the table is useful in comparing ongoing costs only, and will not help you determine the relative total costs of owning different funds. In addition, if these transactional costs were included, your costs would have been higher.
| | | | | | | | | | | | | | |
| Beginning
Account Value
10/1/22 | Ending
Account Value
3/31/23 | Expenses Paid During Period(1) 10/1/22 - 3/31/23 | Annualized Expense Ratio(1) |
| Actual | | | | |
| Investor Class | $1,000 | $1,043.90 | $2.80 | 0.55% |
| I Class | $1,000 | $1,044.40 | $2.29 | 0.45% |
| A Class | $1,000 | $1,042.60 | $4.07 | 0.80% |
| C Class | $1,000 | $1,038.70 | $7.88 | 1.55% |
| R Class | $1,000 | $1,041.30 | $5.34 | 1.05% |
| R5 Class | $1,000 | $1,044.90 | $1.78 | 0.35% |
| G Class | $1,000 | $1,046.70 | $0.05 | 0.01% |
| Hypothetical | | | | |
| Investor Class | $1,000 | $1,022.19 | $2.77 | 0.55% |
| I Class | $1,000 | $1,022.69 | $2.27 | 0.45% |
| A Class | $1,000 | $1,020.94 | $4.03 | 0.80% |
| C Class | $1,000 | $1,017.20 | $7.80 | 1.55% |
| R Class | $1,000 | $1,019.70 | $5.29 | 1.05% |
| R5 Class | $1,000 | $1,023.19 | $1.77 | 0.35% |
| G Class | $1,000 | $1,024.88 | $0.05 | 0.01% |
(1)Expenses are equal to the class's annualized expense ratio listed in the table above, multiplied by the average account value over the period, multiplied by 182, the number of days in the most recent fiscal half-year, divided by 365, to reflect the one-half year period. Annualized expense ratio reflects actual expenses, including any applicable fee waivers or expense reimbursements and excluding any acquired fund fees and expenses.
MARCH 31, 2023
| | | | | | | | | | | |
| | Principal Amount/Shares | Value |
| U.S. GOVERNMENT AGENCY MORTGAGE-BACKED SECURITIES — 29.8% |
| Adjustable-Rate U.S. Government Agency Mortgage-Backed Securities — 0.1% |
| FHLMC, VRN, 3.95%, (1-year H15T1Y plus 2.26%), 4/1/37 | | $ | 20,852 | | $ | 21,326 | |
| FHLMC, VRN, 4.09%, (12-month LIBOR plus 1.89%), 7/1/41 | | 30,831 | | 30,505 | |
| FHLMC, VRN, 3.77%, (12-month LIBOR plus 1.63%), 8/1/46 | | 66,593 | | 66,980 | |
| FHLMC, VRN, 3.07%, (12-month LIBOR plus 1.64%), 9/1/47 | | 38,399 | | 37,376 | |
| FNMA, VRN, 5.31%, (6-month LIBOR plus 1.57%), 6/1/35 | | 7,357 | | 7,397 | |
| FNMA, VRN, 6.09%, (12-month LIBOR plus 1.60%), 4/1/46 | | 173,555 | | 177,854 | |
| FNMA, VRN, 3.18%, (12-month LIBOR plus 1.61%), 3/1/47 | | 18,351 | | 17,734 | |
| FNMA, VRN, 3.20%, (12-month LIBOR plus 1.62%), 5/1/47 | | 177,019 | | 174,837 | |
| | | 534,009 | |
| Fixed-Rate U.S. Government Agency Mortgage-Backed Securities — 29.7% |
| FHLMC, 6.00%, 9/1/35 | | 163,044 | | 169,860 | |
| FHLMC, 6.00%, 2/1/38 | | 82,026 | | 85,862 | |
| FHLMC, 2.50%, 3/1/42 | | 1,618,113 | | 1,435,309 | |
| FHLMC, 3.50%, 5/1/50 | | 366,485 | | 343,648 | |
| FHLMC, 2.50%, 10/1/50 | | 1,775,037 | | 1,534,847 | |
| FHLMC, 2.50%, 5/1/51 | | 2,521,812 | | 2,187,937 | |
| FHLMC, 3.50%, 5/1/51 | | 2,423,798 | | 2,276,399 | |
| FHLMC, 3.00%, 7/1/51 | | 1,653,625 | | 1,489,157 | |
| FHLMC, 2.00%, 8/1/51 | | 2,436,055 | | 2,020,819 | |
| FHLMC, 2.00%, 8/1/51 | | 2,094,947 | | 1,738,191 | |
| FHLMC, 4.00%, 8/1/51 | | 957,495 | | 924,383 | |
| FHLMC, 2.50%, 10/1/51 | | 1,152,347 | | 1,005,781 | |
| FHLMC, 2.50%, 12/1/51 | | 331,156 | | 286,211 | |
| FHLMC, 3.00%, 12/1/51 | | 496,461 | | 446,787 | |
| FHLMC, 3.00%, 2/1/52 | | 3,512,968 | | 3,169,028 | |
| FHLMC, 3.50%, 5/1/52 | | 1,329,265 | | 1,246,846 | |
| FHLMC, 4.00%, 5/1/52 | | 1,323,089 | | 1,276,467 | |
| FHLMC, 4.00%, 5/1/52 | | 668,949 | | 640,643 | |
| FHLMC, 5.00%, 7/1/52 | | 921,266 | | 931,815 | |
| FHLMC, 5.00%, 8/1/52 | | 1,720,466 | | 1,722,647 | |
| FHLMC, 4.50%, 10/1/52 | | 3,036,968 | | 2,985,973 | |
| FHLMC, 4.50%, 10/1/52 | | 2,478,649 | | 2,430,722 | |
| FHLMC, 6.00%, 11/1/52 | | 3,307,245 | | 3,399,266 | |
| FHLMC, 5.50%, 12/1/52 | | 732,437 | | 742,126 | |
| FNMA, 6.00%, 12/1/33 | | 115,073 | | 119,750 | |
| FNMA, 3.50%, 3/1/34 | | 386,242 | | 375,119 | |
| FNMA, 2.00%, 5/1/36 | | 1,094,127 | | 988,861 | |
| FNMA, 2.00%, 1/1/37 | | 1,415,668 | | 1,278,908 | |
| FNMA, 6.00%, 9/1/37 | | 127,508 | | 133,121 | |
| FNMA, 6.00%, 11/1/37 | | 125,277 | | 131,047 | |
| FNMA, 4.50%, 4/1/39 | | 136,547 | | 137,452 | |
| FNMA, 4.50%, 5/1/39 | | 387,401 | | 389,968 | |
| FNMA, 6.50%, 5/1/39 | | 57,344 | | 60,431 | |
| FNMA, 4.50%, 10/1/39 | | 663,961 | | 668,363 | |
| FNMA, 4.00%, 8/1/41 | | 571,713 | | 561,864 | |
| FNMA, 3.50%, 10/1/41 | | 407,446 | | 389,115 | |
| | | | | | | | | | | |
| | Principal Amount/Shares | Value |
| FNMA, 3.50%, 2/1/42 | | $ | 298,405 | | $ | 284,973 | |
| FNMA, 2.50%, 3/1/42 | | 1,526,511 | | 1,350,283 | |
| FNMA, 3.50%, 5/1/42 | | 193,745 | | 185,027 | |
| FNMA, 2.50%, 6/1/42 | | 1,286,817 | | 1,141,446 | |
| FNMA, 3.50%, 6/1/42 | | 1,599,765 | | 1,527,754 | |
| FNMA, 3.50%, 8/1/42 | | 465,254 | | 444,307 | |
| FNMA, 3.50%, 9/1/42 | | 149,489 | | 142,736 | |
| FNMA, 3.50%, 5/1/45 | | 278,286 | | 263,774 | |
| FNMA, 4.00%, 11/1/45 | | 300,320 | | 292,429 | |
| FNMA, 4.00%, 11/1/45 | | 128,433 | | 125,337 | |
| FNMA, 4.00%, 2/1/46 | | 498,468 | | 486,350 | |
| FNMA, 4.00%, 4/1/46 | | 392,274 | | 382,859 | |
| FNMA, 3.50%, 2/1/47 | | 713,182 | | 673,996 | |
| FNMA, 2.50%, 4/1/50 | | 1,724,865 | | 1,493,199 | |
| FNMA, 2.50%, 6/1/50 | | 684,638 | | 594,598 | |
| FNMA, 4.00%, 5/1/51 | | 2,265,075 | | 2,193,696 | |
| FNMA, 2.50%, 9/1/51 | | 1,523,691 | | 1,315,800 | |
| FNMA, 2.50%, 12/1/51 | | 1,790,425 | | 1,546,911 | |
| FNMA, 2.50%, 12/1/51 | | 447,104 | | 386,155 | |
| FNMA, 2.50%, 2/1/52 | | 918,325 | | 796,244 | |
| FNMA, 3.00%, 2/1/52 | | 1,679,263 | | 1,514,839 | |
| FNMA, 2.00%, 3/1/52 | | 3,749,565 | | 3,113,032 | |
| FNMA, 2.50%, 3/1/52 | | 1,694,503 | | 1,471,320 | |
| FNMA, 3.00%, 3/1/52 | | 1,479,621 | | 1,341,658 | |
| FNMA, 3.00%, 4/1/52 | | 2,116,590 | | 1,909,362 | |
| FNMA, 3.50%, 4/1/52 | | 741,399 | | 689,745 | |
| FNMA, 4.00%, 4/1/52 | | 2,071,252 | | 1,996,346 | |
| FNMA, 4.00%, 4/1/52 | | 754,346 | | 727,998 | |
| FNMA, 4.00%, 4/1/52 | | 696,878 | | 668,298 | |
| FNMA, 2.50%, 5/1/52 | | 5,212,379 | | 4,504,953 | |
| FNMA, 3.00%, 5/1/52 | | 1,509,484 | | 1,370,839 | |
| FNMA, 3.50%, 5/1/52 | | 3,014,836 | | 2,810,290 | |
| FNMA, 3.50%, 5/1/52 | | 1,923,567 | | 1,790,554 | |
| FNMA, 4.00%, 5/1/52 | | 2,256,090 | | 2,160,800 | |
| FNMA, 3.00%, 6/1/52 | | 592,195 | | 537,800 | |
| FNMA, 4.50%, 7/1/52 | | 570,516 | | 559,751 | |
| FNMA, 5.00%, 8/1/52 | | 3,001,388 | | 3,001,835 | |
| FNMA, 4.50%, 9/1/52 | | 1,050,749 | | 1,044,746 | |
| FNMA, 5.00%, 9/1/52 | | 1,286,239 | | 1,300,357 | |
| FNMA, 5.50%, 10/1/52 | | 1,929,739 | | 1,950,952 | |
| FNMA, 5.50%, 1/1/53 | | 3,543,799 | | 3,584,497 | |
| FNMA, 6.50%, 1/1/53 | | 3,711,288 | | 3,833,258 | |
| FNMA, 4.00%, 6/1/57 | | 424,632 | | 415,063 | |
| FNMA, 4.00%, 11/1/59 | | 414,695 | | 402,248 | |
| GNMA, 7.00%, 4/20/26 | | 55 | | 56 | |
| GNMA, 7.50%, 8/15/26 | | 139 | | 141 | |
| GNMA, 8.00%, 8/15/26 | | 41 | | 42 | |
| GNMA, 8.00%, 6/15/27 | | 242 | | 241 | |
| GNMA, 6.50%, 3/15/28 | | 336 | | 346 | |
| GNMA, 6.50%, 5/15/28 | | 839 | | 864 | |
| GNMA, 7.00%, 5/15/31 | | 1,020 | | 1,071 | |
| | | | | | | | | | | |
| | Principal Amount/Shares | Value |
| GNMA, 5.50%, 12/15/32 | | $ | 37,237 | | $ | 38,414 | |
| GNMA, 4.50%, 8/15/33 | | 49,081 | | 49,221 | |
| GNMA, 6.00%, 9/20/38 | | 42,645 | | 45,158 | |
| GNMA, 5.50%, 11/15/38 | | 43,014 | | 44,285 | |
| GNMA, 5.50%, 11/15/38 | | 17,638 | | 18,011 | |
| GNMA, 6.00%, 1/20/39 | | 9,775 | | 10,355 | |
| GNMA, 4.50%, 4/15/39 | | 65,714 | | 65,817 | |
| GNMA, 4.50%, 6/15/39 | | 155,901 | | 157,581 | |
| GNMA, 4.50%, 1/15/40 | | 108,782 | | 109,859 | |
| GNMA, 4.50%, 4/15/40 | | 96,731 | | 97,689 | |
| GNMA, 4.50%, 12/15/40 | | 183,001 | | 184,958 | |
| GNMA, 3.50%, 6/20/42 | | 473,088 | | 452,552 | |
| GNMA, 3.00%, 4/20/50 | | 611,299 | | 562,248 | |
| GNMA, 3.00%, 5/20/50 | | 623,995 | | 573,590 | |
| GNMA, 3.00%, 6/20/50 | | 1,770,646 | | 1,629,900 | |
| GNMA, 3.00%, 7/20/50 | | 1,195,647 | | 1,098,441 | |
| GNMA, 2.00%, 10/20/50 | | 5,905,469 | | 5,058,897 | |
| GNMA, 2.50%, 11/20/50 | | 2,354,894 | | 2,034,646 | |
| GNMA, 2.50%, 2/20/51 | | 2,499,139 | | 2,211,831 | |
| GNMA, 3.50%, 6/20/51 | | 1,670,956 | | 1,579,225 | |
| GNMA, 2.50%, 9/20/51 | | 1,611,046 | | 1,419,613 | |
| GNMA, 2.50%, 12/20/51 | | 1,839,523 | | 1,620,840 | |
| GNMA, 5.50%, TBA | | 3,792,000 | | 3,832,068 | |
| UMBS, 6.00%, TBA | | 2,081,000 | | 2,122,864 | |
| | | 123,073,962 | |
TOTAL U.S. GOVERNMENT AGENCY MORTGAGE-BACKED SECURITIES (Cost $126,641,846) | 123,607,971 | |
| CORPORATE BONDS — 29.5% | | | |
| Aerospace and Defense — 0.6% | | | |
| Boeing Co., 5.81%, 5/1/50 | | 388,000 | | 391,125 | |
| Lockheed Martin Corp., 5.25%, 1/15/33 | | 261,000 | | 278,963 | |
| Northrop Grumman Corp., 5.15%, 5/1/40 | | 57,000 | | 57,746 | |
| Northrop Grumman Corp., 4.95%, 3/15/53 | | 126,000 | | 125,800 | |
| Raytheon Technologies Corp., 4.125%, 11/16/28 | | 664,000 | | 655,113 | |
| Raytheon Technologies Corp., 3.125%, 7/1/50 | | 250,000 | | 186,776 | |
| Raytheon Technologies Corp., 5.375%, 2/27/53 | | 310,000 | | 326,735 | |
TransDigm, Inc., 6.75%, 8/15/28(1) | | 511,000 | | 516,749 | |
| | | 2,539,007 | |
| Air Freight and Logistics — 0.1% | | | |
| GXO Logistics, Inc., 2.65%, 7/15/31 | | 438,000 | | 341,051 | |
| Automobiles — 0.7% | | | |
| Ford Motor Credit Co. LLC, 3.375%, 11/13/25 | | 850,000 | | 797,823 | |
| Ford Motor Credit Co. LLC, 7.35%, 11/4/27 | | 215,000 | | 221,990 | |
| General Motors Co., 5.15%, 4/1/38 | | 134,000 | | 120,994 | |
| General Motors Financial Co., Inc., 2.75%, 6/20/25 | | 929,000 | | 880,064 | |
| General Motors Financial Co., Inc., 2.40%, 10/15/28 | | 398,000 | | 340,750 | |
| Toyota Motor Credit Corp., 4.625%, 1/12/28 | | 461,000 | | 467,666 | |
| | | 2,829,287 | |
| Banks — 4.2% | | | |
| Banco Santander SA, VRN, 1.72%, 9/14/27 | | 400,000 | | 349,571 | |
| Banco Santander SA, VRN, 4.18%, 3/24/28 | | 200,000 | | 187,941 | |
| Bank of America Corp., VRN, 1.73%, 7/22/27 | | 800,000 | | 718,024 | |
| | | | | | | | | | | |
| | Principal Amount/Shares | Value |
| Bank of America Corp., VRN, 2.88%, 10/22/30 | | $ | 1,732,000 | | $ | 1,507,960 | |
| Bank of America Corp., VRN, 2.57%, 10/20/32 | | 350,000 | | 286,303 | |
| Bank of America Corp., VRN, 4.57%, 4/27/33 | | 350,000 | | 333,426 | |
| Bank of America Corp., VRN, 2.48%, 9/21/36 | | 440,000 | | 334,461 | |
| Barclays PLC, VRN, 2.28%, 11/24/27 | | 352,000 | | 309,573 | |
| Barclays PLC, VRN, 7.39%, 11/2/28 | | 210,000 | | 222,777 | |
BNP Paribas SA, VRN, 5.125%, 1/13/29(1) | | 450,000 | | 451,279 | |
BPCE SA, VRN, 5.98%, 1/18/27(1) | | 211,000 | | 210,659 | |
| Citigroup, Inc., VRN, 3.07%, 2/24/28 | | 505,000 | | 470,004 | |
| Citigroup, Inc., VRN, 3.67%, 7/24/28 | | 921,000 | | 873,221 | |
| Citigroup, Inc., VRN, 3.52%, 10/27/28 | | 816,000 | | 763,389 | |
| Citigroup, Inc., VRN, 4.41%, 3/31/31 | | 230,000 | | 218,518 | |
| Citigroup, Inc., VRN, 3.06%, 1/25/33 | | 870,000 | | 736,887 | |
| Commonwealth Bank of Australia, 5.32%, 3/13/26 | | 586,000 | | 596,305 | |
Cooperatieve Rabobank UA, VRN, 5.56%, 2/28/29(1) | | 430,000 | | 433,306 | |
Credit Agricole SA, 5.30%, 7/12/28(1) | | 200,000 | | 202,910 | |
| HSBC Holdings PLC, VRN, 2.80%, 5/24/32 | | 814,000 | | 665,218 | |
| HSBC Holdings PLC, VRN, 6.33%, 3/9/44 | | 340,000 | | 359,936 | |
| JPMorgan Chase & Co., VRN, 1.58%, 4/22/27 | | 527,000 | | 473,894 | |
| JPMorgan Chase & Co., VRN, 2.95%, 2/24/28 | | 841,000 | | 780,286 | |
| JPMorgan Chase & Co., VRN, 2.07%, 6/1/29 | | 1,316,000 | | 1,142,823 | |
| JPMorgan Chase & Co., VRN, 2.52%, 4/22/31 | | 710,000 | | 607,386 | |
| JPMorgan Chase & Co., VRN, 2.58%, 4/22/32 | | 545,000 | | 458,974 | |
| Lloyds Banking Group PLC, VRN, 5.87%, 3/6/29 | | 349,000 | | 352,146 | |
| Mitsubishi UFJ Financial Group, Inc., VRN, 5.44%, 2/22/34 | | 350,000 | | 353,906 | |
| PNC Financial Services Group, Inc., VRN, 5.07%, 1/24/34 | | 610,000 | | 602,257 | |
| Royal Bank of Canada, 6.00%, 11/1/27 | | 560,000 | | 584,446 | |
Societe Generale SA, VRN, 6.69%, 1/10/34(1) | | 294,000 | | 301,020 | |
| Toronto-Dominion Bank, 2.45%, 1/12/32 | | 355,000 | | 294,589 | |
| Toronto-Dominion Bank, 4.46%, 6/8/32 | | 220,000 | | 214,370 | |
| Truist Bank, 3.30%, 5/15/26 | | 321,000 | | 295,920 | |
| Truist Bank, VRN, 2.64%, 9/17/29 | | 334,000 | | 313,774 | |
| Truist Financial Corp., VRN, 5.12%, 1/26/34 | | 305,000 | | 297,700 | |
| Wells Fargo & Co., VRN, 4.54%, 8/15/26 | | 300,000 | | 294,748 | |
| | | 17,599,907 | |
| Beverages — 0.5% | | | |
| Anheuser-Busch Cos. LLC / Anheuser-Busch InBev Worldwide, Inc., 4.90%, 2/1/46 | | 853,000 | | 834,698 | |
| Anheuser-Busch InBev Worldwide, Inc., 4.75%, 1/23/29 | | 759,000 | | 775,533 | |
| Keurig Dr Pepper, Inc., 4.05%, 4/15/32 | | 220,000 | | 208,678 | |
| PepsiCo, Inc., 3.90%, 7/18/32 | | 177,000 | | 173,098 | |
| | | 1,992,007 | |
| Biotechnology — 0.8% | | | |
| AbbVie, Inc., 3.20%, 11/21/29 | | 569,000 | | 528,263 | |
| AbbVie, Inc., 4.40%, 11/6/42 | | 875,000 | | 800,387 | |
| Amgen, Inc., 4.05%, 8/18/29 | | 865,000 | | 835,238 | |
| Amgen, Inc., 5.25%, 3/2/33 | | 400,000 | | 411,178 | |
| Amgen, Inc., 5.60%, 3/2/43 | | 480,000 | | 494,902 | |
| Amgen, Inc., 5.65%, 3/2/53 | | 425,000 | | 442,730 | |
| | | 3,512,698 | |
| Broadline Retail — 0.1% | | | |
| Amazon.com, Inc., 4.60%, 12/1/25 | | 120,000 | | 121,040 | |
| | | | | | | | | | | |
| | Principal Amount/Shares | Value |
| Amazon.com, Inc., 4.55%, 12/1/27 | | $ | 225,000 | | $ | 228,519 | |
| | | 349,559 | |
| Building Products — 0.4% | | | |
Builders FirstSource, Inc., 5.00%, 3/1/30(1) | | 1,213,000 | | 1,124,503 | |
Standard Industries, Inc., 4.375%, 7/15/30(1) | | 514,000 | | 447,761 | |
| Trane Technologies Financing Ltd., 5.25%, 3/3/33 | | 193,000 | | 199,642 | |
| | | 1,771,906 | |
| Capital Markets — 1.9% | | | |
| Ameriprise Financial, Inc., 5.15%, 5/15/33 | | 520,000 | | 518,971 | |
| CME Group, Inc., 2.65%, 3/15/32 | | 41,000 | | 35,615 | |
| Deutsche Bank AG, VRN, 4.30%, 5/24/28 | | 279,000 | | 275,214 | |
| Goldman Sachs Group, Inc., VRN, 1.76%, 1/24/25 | | 370,000 | | 358,235 | |
| Goldman Sachs Group, Inc., VRN, 1.43%, 3/9/27 | | 750,000 | | 671,815 | |
| Goldman Sachs Group, Inc., VRN, 1.95%, 10/21/27 | | 760,000 | | 679,712 | |
| Goldman Sachs Group, Inc., VRN, 3.81%, 4/23/29 | | 131,000 | | 123,166 | |
| Goldman Sachs Group, Inc., VRN, 1.99%, 1/27/32 | | 800,000 | | 639,622 | |
| Golub Capital BDC, Inc., 2.50%, 8/24/26 | | 213,000 | | 182,873 | |
| Morgan Stanley, VRN, 2.63%, 2/18/26 | | 2,030,000 | | 1,928,184 | |
| Morgan Stanley, VRN, 5.12%, 2/1/29 | | 165,000 | | 166,439 | |
| Morgan Stanley, VRN, 2.70%, 1/22/31 | | 625,000 | | 538,714 | |
| Morgan Stanley, VRN, 2.51%, 10/20/32 | | 410,000 | | 336,164 | |
| Owl Rock Capital Corp., 3.40%, 7/15/26 | | 87,000 | | 76,942 | |
| Owl Rock Core Income Corp., 3.125%, 9/23/26 | | 240,000 | | 208,573 | |
| State Street Corp., VRN, 5.82%, 11/4/28 | | 310,000 | | 323,621 | |
UBS Group AG, VRN, 1.49%, 8/10/27(1) | | 797,000 | | 687,146 | |
| | | 7,751,006 | |
| Chemicals — 0.2% | | | |
| Albemarle Corp., 4.65%, 6/1/27 | | 594,000 | | 584,909 | |
| CF Industries, Inc., 5.15%, 3/15/34 | | 202,000 | | 193,864 | |
| CF Industries, Inc., 4.95%, 6/1/43 | | 300,000 | | 259,247 | |
| | | 1,038,020 | |
| Commercial Services and Supplies — 0.1% | | | |
| Republic Services, Inc., 5.00%, 4/1/34 | | 114,000 | | 116,220 | |
| Waste Connections, Inc., 3.20%, 6/1/32 | | 505,000 | | 450,444 | |
| | | 566,664 | |
| Construction and Engineering — 0.1% | | | |
| Quanta Services, Inc., 2.35%, 1/15/32 | | 590,000 | | 468,773 | |
| Construction Materials — 0.1% | | | |
| Eagle Materials, Inc., 2.50%, 7/1/31 | | 413,000 | | 338,623 | |
| Consumer Finance — 0.4% | | | |
| AerCap Ireland Capital DAC / AerCap Global Aviation Trust, 1.65%, 10/29/24 | | 188,000 | | 175,988 | |
Avolon Holdings Funding Ltd., 2.125%, 2/21/26(1) | | 1,585,000 | | 1,410,330 | |
| | | 1,586,318 | |
| Consumer Staples Distribution & Retail — 0.4% | | | |
| Sysco Corp., 5.95%, 4/1/30 | | 960,000 | | 1,018,537 | |
United Natural Foods, Inc., 6.75%, 10/15/28(1) | | 710,000 | | 660,520 | |
| | | 1,679,057 | |
| Containers and Packaging — 0.1% | | | |
| Sonoco Products Co., 2.25%, 2/1/27 | | 564,000 | | 511,754 | |
| Diversified Consumer Services — 0.1% | | | |
| Novant Health, Inc., 3.17%, 11/1/51 | | 325,000 | | 235,355 | |
| | | | | | | | | | | |
| | Principal Amount/Shares | Value |
| Pepperdine University, 3.30%, 12/1/59 | | $ | 357,000 | | $ | 260,076 | |
| | | 495,431 | |
| Diversified REITs — 0.3% | | | |
| GLP Capital LP / GLP Financing II, Inc., 5.375%, 4/15/26 | | 530,000 | | 514,845 | |
| Healthpeak OP LLC, 5.25%, 12/15/32 | | 225,000 | | 225,918 | |
VICI Properties LP / VICI Note Co., Inc., 4.125%, 8/15/30(1) | | 552,000 | | 488,071 | |
| | | 1,228,834 | |
| Diversified Telecommunication Services — 0.7% | | | |
| AT&T, Inc., 4.50%, 5/15/35 | | 475,000 | | 445,187 | |
| AT&T, Inc., 4.90%, 8/15/37 | | 402,000 | | 384,921 | |
| AT&T, Inc., 4.55%, 3/9/49 | | 299,000 | | 261,244 | |
Ooredoo International Finance Ltd., 2.625%, 4/8/31(1) | | 300,000 | | 260,621 | |
| Telecom Italia Capital SA, 6.375%, 11/15/33 | | 695,000 | | 629,990 | |
| Telefonica Emisiones SA, 4.90%, 3/6/48 | | 375,000 | | 312,509 | |
| Verizon Communications, Inc., 4.27%, 1/15/36 | | 460,000 | | 426,975 | |
| Verizon Communications, Inc., 4.81%, 3/15/39 | | 190,000 | | 181,557 | |
| | | 2,903,004 | |
| Electric Utilities — 2.5% | | | |
| AEP Texas, Inc., 2.10%, 7/1/30 | | 432,000 | | 359,299 | |
| Baltimore Gas & Electric Co., 2.25%, 6/15/31 | | 334,000 | | 282,047 | |
| CenterPoint Energy Houston Electric LLC, 4.95%, 4/1/33 | | 193,000 | | 197,205 | |
| CenterPoint Energy Houston Electric LLC, 4.45%, 10/1/32 | | 460,000 | | 456,171 | |
| Commonwealth Edison Co., 5.30%, 2/1/53 | | 300,000 | | 313,828 | |
| Duke Energy Carolinas LLC, 2.55%, 4/15/31 | | 188,000 | | 161,436 | |
| Duke Energy Corp., 2.55%, 6/15/31 | | 230,000 | | 192,679 | |
| Duke Energy Corp., 5.00%, 8/15/52 | | 290,000 | | 270,235 | |
| Duke Energy Florida LLC, 1.75%, 6/15/30 | | 339,000 | | 280,256 | |
| Duke Energy Florida LLC, 3.85%, 11/15/42 | | 77,000 | | 65,033 | |
| Duke Energy Florida LLC, 5.95%, 11/15/52 | | 175,000 | | 195,052 | |
| Duke Energy Indiana LLC, 5.40%, 4/1/53 | | 78,000 | | 79,555 | |
| Duke Energy Progress LLC, 4.15%, 12/1/44 | | 606,000 | | 524,742 | |
| Entergy Arkansas LLC, 2.65%, 6/15/51 | | 232,000 | | 150,569 | |
| Evergy Kansas Central, Inc., 5.70%, 3/15/53 | | 80,000 | | 84,096 | |
| Exelon Corp., 5.15%, 3/15/28 | | 266,000 | | 270,866 | |
FEL Energy VI Sarl, 5.75%, 12/1/40(1) | | 739,160 | | 610,457 | |
| Florida Power & Light Co., 2.45%, 2/3/32 | | 294,000 | | 251,262 | |
| Florida Power & Light Co., 4.125%, 2/1/42 | | 310,000 | | 273,767 | |
| MidAmerican Energy Co., 4.40%, 10/15/44 | | 408,000 | | 373,929 | |
| NextEra Energy Capital Holdings, Inc., 4.90%, 2/28/28 | | 360,000 | | 362,665 | |
| NextEra Energy Capital Holdings, Inc., 5.05%, 2/28/33 | | 400,000 | | 401,394 | |
| NextEra Energy Capital Holdings, Inc., 5.25%, 2/28/53 | | 200,000 | | 197,497 | |
| Northern States Power Co., 3.20%, 4/1/52 | | 300,000 | | 220,711 | |
NRG Energy, Inc., 2.00%, 12/2/25(1) | | 1,020,000 | | 919,500 | |
| Pacific Gas & Electric Co., 6.15%, 1/15/33 | | 120,000 | | 123,306 | |
| Pacific Gas & Electric Co., 4.20%, 6/1/41 | | 195,000 | | 154,114 | |
| Pacific Gas & Electric Co., 6.70%, 4/1/53 | | 38,000 | | 39,136 | |
| PacifiCorp, 3.30%, 3/15/51 | | 422,000 | | 312,037 | |
| PECO Energy Co., 4.375%, 8/15/52 | | 415,000 | | 376,507 | |
Public Service Co. of Colorado, 5.25%, 4/1/53(2) | | 230,000 | | 234,634 | |
| Public Service Electric & Gas Co., 3.10%, 3/15/32 | | 351,000 | | 313,930 | |
| Public Service Electric & Gas Co., 4.65%, 3/15/33 | | 268,000 | | 269,300 | |
| | | | | | | | | | | |
| | Principal Amount/Shares | Value |
| Southern Co. Gas Capital Corp., 1.75%, 1/15/31 | | $ | 485,000 | | $ | 386,818 | |
| Union Electric Co., 3.90%, 4/1/52 | | 294,000 | | 247,432 | |
| Xcel Energy, Inc., 3.40%, 6/1/30 | | 436,000 | | 398,453 | |
| Xcel Energy, Inc., 4.60%, 6/1/32 | | 176,000 | | 171,011 | |
| | | 10,520,929 | |
| Electrical Equipment — 0.1% | | | |
Regal Rexnord Corp., 6.40%, 4/15/33(1) | | 545,000 | | 545,986 | |
| Energy Equipment and Services — 0.2% | | | |
| Helmerich & Payne, Inc., 2.90%, 9/29/31 | | 608,000 | | 505,120 | |
| Schlumberger Investment SA, 2.65%, 6/26/30 | | 430,000 | | 380,359 | |
| | | 885,479 | |
| Entertainment — 0.1% | | | |
Warnermedia Holdings, Inc., 3.76%, 3/15/27(1) | | 224,000 | | 211,137 | |
Warnermedia Holdings, Inc., 5.05%, 3/15/42(1) | | 169,000 | | 141,510 | |
| | | 352,647 | |
| Financial Services — 0.3% | | | |
Antares Holdings LP, 2.75%, 1/15/27(1) | | 366,000 | | 298,511 | |
| Block Financial LLC, 3.875%, 8/15/30 | | 796,000 | | 685,102 | |
| GE Capital Funding LLC, 4.55%, 5/15/32 | | 223,000 | | 218,745 | |
| | | 1,202,358 | |
| Food Products — 0.6% | | | |
JDE Peet's NV, 2.25%, 9/24/31(1) | | 667,000 | | 528,242 | |
| Kraft Heinz Foods Co., 3.875%, 5/15/27 | | 450,000 | | 439,732 | |
| Kraft Heinz Foods Co., 5.00%, 6/4/42 | | 450,000 | | 431,979 | |
| Kraft Heinz Foods Co., 5.20%, 7/15/45 | | 213,000 | | 206,718 | |
| Mondelez International, Inc., 2.625%, 3/17/27 | | 400,000 | | 374,201 | |
Nestle Holdings, Inc., 4.85%, 3/14/33(1) | | 390,000 | | 408,233 | |
| | | 2,389,105 | |
| Gas Utilities — 0.1% | | | |
Infraestructura Energetica Nova SAPI de CV, 4.75%, 1/15/51(1) | | 519,000 | | 385,838 | |
| Ground Transportation — 0.7% | | | |
Ashtead Capital, Inc., 5.50%, 8/11/32(1) | | 490,000 | | 482,311 | |
Ashtead Capital, Inc., 5.55%, 5/30/33(1) | | 200,000 | | 197,816 | |
| Burlington Northern Santa Fe LLC, 4.15%, 4/1/45 | | 347,000 | | 310,418 | |
| Burlington Northern Santa Fe LLC, 3.30%, 9/15/51 | | 240,000 | | 183,768 | |
| CSX Corp., 4.25%, 3/15/29 | | 380,000 | | 375,673 | |
DAE Funding LLC, 1.55%, 8/1/24(1) | | 251,000 | | 236,200 | |
| Norfolk Southern Corp., 4.55%, 6/1/53 | | 270,000 | | 243,280 | |
| Union Pacific Corp., 3.55%, 8/15/39 | | 594,000 | | 505,229 | |
United Rentals North America, Inc., 6.00%, 12/15/29(1) | | 415,000 | | 421,113 | |
| | | 2,955,808 | |
| Health Care Equipment and Supplies — 0.3% | | | |
| Baxter International, Inc., 1.92%, 2/1/27 | | 237,000 | | 212,235 | |
GE HealthCare Technologies, Inc., 5.65%, 11/15/27(1) | | 1,000,000 | | 1,034,193 | |
| | | 1,246,428 | |
| Health Care Providers and Services — 1.8% | | | |
| Centene Corp., 4.625%, 12/15/29 | | 690,000 | | 649,387 | |
| Centene Corp., 3.375%, 2/15/30 | | 576,000 | | 503,046 | |
| CVS Health Corp., 5.25%, 2/21/33 | | 462,000 | | 471,703 | |
| CVS Health Corp., 4.78%, 3/25/38 | | 362,000 | | 345,346 | |
| CVS Health Corp., 5.05%, 3/25/48 | | 495,000 | | 463,552 | |
| | | | | | | | | | | |
| | Principal Amount/Shares | Value |
| CVS Health Corp., 5.625%, 2/21/53 | | $ | 630,000 | | $ | 638,996 | |
| Duke University Health System, Inc., 3.92%, 6/1/47 | | 128,000 | | 111,077 | |
| Elevance Health, Inc., 5.125%, 2/15/53 | | 210,000 | | 209,389 | |
| HCA, Inc., 2.375%, 7/15/31 | | 325,000 | | 262,539 | |
| Humana, Inc., 2.15%, 2/3/32 | | 513,000 | | 416,234 | |
| Kaiser Foundation Hospitals, 3.00%, 6/1/51 | | 240,000 | | 169,172 | |
Roche Holdings, Inc., 2.61%, 12/13/51(1) | | 360,000 | | 251,817 | |
| UnitedHealth Group, Inc., 5.35%, 2/15/33 | | 410,000 | | 436,131 | |
| UnitedHealth Group, Inc., 4.50%, 4/15/33 | | 400,000 | | 397,877 | |
| UnitedHealth Group, Inc., 5.875%, 2/15/53 | | 310,000 | | 348,989 | |
| UnitedHealth Group, Inc., 5.05%, 4/15/53 | | 390,000 | | 394,733 | |
| Universal Health Services, Inc., 1.65%, 9/1/26 | | 737,000 | | 649,111 | |
| Universal Health Services, Inc., 2.65%, 10/15/30 | | 872,000 | | 699,823 | |
| | | 7,418,922 | |
| Hotels, Restaurants and Leisure — 0.7% | | | |
Caesars Entertainment, Inc., 4.625%, 10/15/29(1) | | 323,000 | | 282,798 | |
International Game Technology PLC, 5.25%, 1/15/29(1) | | 1,175,000 | | 1,126,237 | |
| Marriott International, Inc., 3.50%, 10/15/32 | | 295,000 | | 258,833 | |
Scientific Games International, Inc., 7.25%, 11/15/29(1) | | 620,000 | | 621,761 | |
| Starbucks Corp., 4.75%, 2/15/26 | | 535,000 | | 538,370 | |
| | | 2,827,999 | |
| Household Durables — 0.3% | | | |
| D.R. Horton, Inc., 2.50%, 10/15/24 | | 452,000 | | 432,599 | |
| KB Home, 4.80%, 11/15/29 | | 520,000 | | 476,533 | |
Tempur Sealy International, Inc., 3.875%, 10/15/31(1) | | 493,000 | | 412,163 | |
| | | 1,321,295 | |
| Household Products — 0.2% | | | |
| Clorox Co., 1.80%, 5/15/30 | | 460,000 | | 381,453 | |
| Clorox Co., 4.60%, 5/1/32 | | 477,000 | | 474,757 | |
| | | 856,210 | |
| Insurance — 0.3% | | | |
| Allstate Corp., 5.25%, 3/30/33 | | 231,000 | | 233,742 | |
Five Corners Funding Trust III, 5.79%, 2/15/33(1) | | 250,000 | | 256,818 | |
| MetLife, Inc., 5.25%, 1/15/54 | | 270,000 | | 263,428 | |
SBL Holdings, Inc., VRN, 6.50%(1)(3) | | 535,000 | | 378,512 | |
| | | 1,132,500 | |
| IT Services — 0.2% | | | |
| International Business Machines Corp., 3.30%, 5/15/26 | | 415,000 | | 400,461 | |
| International Business Machines Corp., 4.75%, 2/6/33 | | 593,000 | | 589,741 | |
| | | 990,202 | |
| Life Sciences Tools and Services — 0.1% | | | |
| Danaher Corp., 2.80%, 12/10/51 | | 405,000 | | 283,104 | |
| Machinery — 0.5% | | | |
Chart Industries, Inc., 7.50%, 1/1/30(1) | | 580,000 | | 599,992 | |
| John Deere Capital Corp., 4.75%, 1/20/28 | | 766,000 | | 782,543 | |
| John Deere Capital Corp., 4.85%, 10/11/29 | | 208,000 | | 214,997 | |
| Westinghouse Air Brake Technologies Corp., 4.95%, 9/15/28 | | 601,000 | | 589,946 | |
| | | 2,187,478 | |
| Media — 1.2% | | | |
CCO Holdings LLC / CCO Holdings Capital Corp., 4.25%, 1/15/34(1) | | 910,000 | | 712,698 | |
| | | | | | | | | | | |
| | Principal Amount/Shares | Value |
| Charter Communications Operating LLC / Charter Communications Operating Capital, 5.125%, 7/1/49 | | $ | 270,000 | | $ | 213,998 | |
| Comcast Corp., 6.50%, 11/15/35 | | 250,000 | | 287,848 | |
| Comcast Corp., 3.20%, 7/15/36 | | 410,000 | | 345,762 | |
| Comcast Corp., 3.75%, 4/1/40 | | 588,000 | | 505,544 | |
| Comcast Corp., 2.94%, 11/1/56 | | 390,000 | | 260,058 | |
DISH DBS Corp., 5.25%, 12/1/26(1) | | 245,000 | | 195,944 | |
| Fox Corp., 5.48%, 1/25/39 | | 442,000 | | 423,740 | |
Gray Escrow II, Inc., 5.375%, 11/15/31(1) | | 703,000 | | 467,590 | |
| Paramount Global, 4.95%, 1/15/31 | | 240,000 | | 221,591 | |
| Paramount Global, 4.375%, 3/15/43 | | 190,000 | | 135,189 | |
| Paramount Global, VRN, 6.25%, 2/28/57 | | 560,000 | | 419,625 | |
| Time Warner Cable LLC, 4.50%, 9/15/42 | | 575,000 | | 442,121 | |
VTR Finance NV, 6.375%, 7/15/28(1) | | 822,000 | | 332,910 | |
| | | 4,964,618 | |
| Metals and Mining — 0.2% | | | |
Glencore Funding LLC, 2.625%, 9/23/31(1) | | 580,000 | | 476,441 | |
Minera Mexico SA de CV, 4.50%, 1/26/50(1) | | 24,000 | | 18,316 | |
South32 Treasury Ltd., 4.35%, 4/14/32(1) | | 430,000 | | 383,809 | |
| | | 878,566 | |
| Mortgage Real Estate Investment Trusts (REITs) — 0.2% | | | |
Ladder Capital Finance Holdings LLLP / Ladder Capital Finance Corp., 5.25%, 10/1/25(1) | | 235,000 | | 207,000 | |
Ladder Capital Finance Holdings LLLP / Ladder Capital Finance Corp., 4.25%, 2/1/27(1) | | 597,000 | | 472,203 | |
| | | 679,203 | |
| Multi-Utilities — 0.6% | | | |
Abu Dhabi National Energy Co. PJSC, 2.00%, 4/29/28(1) | | 405,000 | | 359,895 | |
| Ameren Corp., 3.50%, 1/15/31 | | 577,000 | | 525,418 | |
| Ameren Illinois Co., 3.85%, 9/1/32 | | 243,000 | | 230,032 | |
| Ameren Illinois Co., 5.90%, 12/1/52 | | 131,000 | | 146,628 | |
| CenterPoint Energy, Inc., 2.65%, 6/1/31 | | 358,000 | | 303,415 | |
| Dominion Energy, Inc., 4.90%, 8/1/41 | | 378,000 | | 346,956 | |
| Sempra Energy, 3.25%, 6/15/27 | | 317,000 | | 296,773 | |
| WEC Energy Group, Inc., 1.375%, 10/15/27 | | 390,000 | | 338,446 | |
| | | 2,547,563 | |
| Office REITs — 0.2% | | | |
| Alexandria Real Estate Equities, Inc., 4.50%, 7/30/29 | | 51,000 | | 49,445 | |
| Alexandria Real Estate Equities, Inc., 2.95%, 3/15/34 | | 45,000 | | 36,057 | |
| Alexandria Real Estate Equities, Inc., 4.75%, 4/15/35 | | 173,000 | | 162,305 | |
| Alexandria Real Estate Equities, Inc., 4.00%, 2/1/50 | | 400,000 | | 304,673 | |
| Alexandria Real Estate Equities, Inc., 5.15%, 4/15/53 | | 129,000 | | 118,407 | |
| | | 670,887 | |
| Oil, Gas and Consumable Fuels — 3.1% | | | |
Aker BP ASA, 3.75%, 1/15/30(1) | | 369,000 | | 333,498 | |
Antero Resources Corp., 7.625%, 2/1/29(1) | | 338,000 | | 345,936 | |
| BP Capital Markets America, Inc., 3.06%, 6/17/41 | | 330,000 | | 255,538 | |
| Cenovus Energy, Inc., 2.65%, 1/15/32 | | 340,000 | | 280,858 | |
Continental Resources, Inc., 2.27%, 11/15/26(1) | | 430,000 | | 382,279 | |
| Diamondback Energy, Inc., 6.25%, 3/15/33 | | 430,000 | | 454,689 | |
| Ecopetrol SA, 8.875%, 1/13/33 | | 849,000 | | 860,037 | |
| Enbridge, Inc., 5.70%, 3/8/33 | | 259,000 | | 269,552 | |
| | | | | | | | | | | |
| | Principal Amount/Shares | Value |
| Energy Transfer LP, 5.75%, 2/15/33 | | $ | 438,000 | | $ | 449,059 | |
| Energy Transfer LP, 4.90%, 3/15/35 | | 343,000 | | 320,776 | |
| Enterprise Products Operating LLC, 4.85%, 3/15/44 | | 328,000 | | 304,818 | |
| EQT Corp., 5.70%, 4/1/28 | | 432,000 | | 431,961 | |
| Equinor ASA, 3.25%, 11/18/49 | | 249,000 | | 192,322 | |
Galaxy Pipeline Assets Bidco Ltd., 2.94%, 9/30/40(1) | | 997,343 | | 810,327 | |
Geopark Ltd., 5.50%, 1/17/27(1) | | 200,000 | | 168,000 | |
| Kinder Morgan Energy Partners LP, 6.50%, 9/1/39 | | 244,000 | | 256,342 | |
MEG Energy Corp., 5.875%, 2/1/29(1) | | 980,000 | | 945,122 | |
| MPLX LP, 2.65%, 8/15/30 | | 410,000 | | 347,934 | |
| MPLX LP, 5.65%, 3/1/53 | | 120,000 | | 115,656 | |
| Occidental Petroleum Corp., 6.625%, 9/1/30 | | 190,000 | | 200,276 | |
| Petroleos Mexicanos, 6.70%, 2/16/32 | | 500,000 | | 398,381 | |
Petroleos Mexicanos, 10.00%, 2/7/33(1) | | 960,000 | | 920,922 | |
| Petroleos Mexicanos, 6.625%, 6/15/35 | | 50,000 | | 36,499 | |
SA Global Sukuk Ltd., 2.69%, 6/17/31(1) | | 1,135,000 | | 997,313 | |
| Sabine Pass Liquefaction LLC, 5.625%, 3/1/25 | | 685,000 | | 689,624 | |
| Shell International Finance BV, 2.375%, 11/7/29 | | 440,000 | | 390,543 | |
| Shell International Finance BV, 4.375%, 5/11/45 | | 260,000 | | 240,248 | |
| Southwestern Energy Co., 5.375%, 3/15/30 | | 972,000 | | 914,963 | |
Venture Global Calcasieu Pass LLC, 3.875%, 11/1/33(1) | | 407,000 | | 342,346 | |
Western Midstream Operating LP, 6.15%, 4/1/33(2) | | 152,000 | | 154,251 | |
| | | 12,810,070 | |
| Passenger Airlines — 0.2% | | | |
American Airlines, Inc. / AAdvantage Loyalty IP Ltd., 5.50%, 4/20/26(1) | | 953,231 | | 939,258 | |
Mileage Plus Holdings LLC / Mileage Plus Intellectual Property Assets Ltd., 6.50%, 6/20/27(1) | | 26 | | 26 | |
| | | 939,284 | |
| Personal Care Products — 0.2% | | | |
| Haleon US Capital LLC, 4.00%, 3/24/52 | | 275,000 | | 228,622 | |
Kenvue, Inc., 5.10%, 3/22/43(1) | | 620,000 | | 640,129 | |
Kenvue, Inc., 5.05%, 3/22/53(1) | | 106,000 | | 109,334 | |
| | | 978,085 | |
| Pharmaceuticals — 0.4% | | | |
| Bristol-Myers Squibb Co., 2.95%, 3/15/32 | | 513,000 | | 462,746 | |
| Bristol-Myers Squibb Co., 2.55%, 11/13/50 | | 324,000 | | 217,106 | |
| Eli Lilly & Co., 4.875%, 2/27/53 | | 335,000 | | 346,781 | |
| Viatris, Inc., 4.00%, 6/22/50 | | 175,000 | | 115,298 | |
| Zoetis, Inc., 5.60%, 11/16/32 | | 421,000 | | 449,285 | |
| | | 1,591,216 | |
| Real Estate Management and Development — 0.1% | | | |
| Essential Properties LP, 2.95%, 7/15/31 | | 421,000 | | 309,626 | |
| Retail REITs — 0.1% | | | |
| Kimco Realty OP LLC, 4.60%, 2/1/33 | | 145,000 | | 136,119 | |
| National Retail Properties, Inc., 4.80%, 10/15/48 | | 340,000 | | 289,068 | |
| | | 425,187 | |
| Semiconductors and Semiconductor Equipment — 0.2% | | | |
| Intel Corp., 5.70%, 2/10/53 | | 296,000 | | 302,434 | |
| Intel Corp., 3.20%, 8/12/61 | | 498,000 | | 330,046 | |
| | | 632,480 | |
| | | | | | | | | | | |
| | Principal Amount/Shares | Value |
| Software — 0.2% | | | |
| Oracle Corp., 3.90%, 5/15/35 | | $ | 355,000 | | $ | 310,439 | |
| Oracle Corp., 3.85%, 7/15/36 | | 223,000 | | 190,843 | |
| Oracle Corp., 3.60%, 4/1/40 | | 468,000 | | 363,656 | |
| | | 864,938 | |
| Specialized REITs — 0.2% | | | |
| Crown Castle, Inc., 4.15%, 7/1/50 | | 291,000 | | 232,842 | |
| Equinix, Inc., 2.90%, 11/18/26 | | 480,000 | | 446,679 | |
| | | 679,521 | |
| Specialty Retail — 0.4% | | | |
| Lowe's Cos., Inc., 2.625%, 4/1/31 | | 880,000 | | 752,555 | |
| Lowe's Cos., Inc., 5.75%, 7/1/53 | | 525,000 | | 535,435 | |
| O'Reilly Automotive, Inc., 4.70%, 6/15/32 | | 340,000 | | 335,802 | |
| | | 1,623,792 | |
| Technology Hardware, Storage and Peripherals — 0.2% | | | |
| Apple, Inc., 3.95%, 8/8/52 | | 690,000 | | 619,367 | |
| Dell International LLC / EMC Corp., 8.10%, 7/15/36 | | 140,000 | | 163,480 | |
| | | 782,847 | |
| Trading Companies and Distributors — 0.1% | | | |
Aircastle Ltd., 5.25%, 8/11/25(1) | | 464,000 | | 453,912 | |
| Water Utilities — 0.3% | | | |
| American Water Capital Corp., 4.45%, 6/1/32 | | 630,000 | | 620,833 | |
| Essential Utilities, Inc., 2.70%, 4/15/30 | | 513,000 | | 443,970 | |
| | | 1,064,803 | |
| Wireless Telecommunication Services — 0.6% | | | |
| Sprint LLC, 7.625%, 2/15/25 | | 1,030,000 | | 1,069,002 | |
| T-Mobile USA, Inc., 3.375%, 4/15/29 | | 996,000 | | 908,937 | |
| T-Mobile USA, Inc., 4.375%, 4/15/40 | | 195,000 | | 174,896 | |
| Vodafone Group PLC, 4.875%, 6/19/49 | | 455,000 | | 411,440 | |
| | | 2,564,275 | |
TOTAL CORPORATE BONDS (Cost $132,761,024) | | | 122,466,067 | |
| U.S. TREASURY SECURITIES — 17.2% | | | |
| U.S. Treasury Bonds, 4.375%, 11/15/39 | | 600,000 | | 655,992 | |
| U.S. Treasury Bonds, 1.125%, 8/15/40 | | 600,000 | | 397,102 | |
| U.S. Treasury Bonds, 1.875%, 2/15/41 | | 500,000 | | 374,385 | |
| U.S. Treasury Bonds, 3.75%, 8/15/41 | | 1,500,000 | | 1,498,975 | |
| U.S. Treasury Bonds, 2.00%, 11/15/41 | | 1,500,000 | | 1,133,291 | |
| U.S. Treasury Bonds, 3.125%, 11/15/41 | | 638,000 | | 582,100 | |
| U.S. Treasury Bonds, 2.375%, 2/15/42 | | 2,000,000 | | 1,609,414 | |
| U.S. Treasury Bonds, 3.00%, 5/15/42 | | 200,000 | | 177,762 | |
| U.S. Treasury Bonds, 3.25%, 5/15/42 | | 500,000 | | 461,602 | |
| U.S. Treasury Bonds, 3.375%, 8/15/42 | | 2,300,000 | | 2,160,562 | |
| U.S. Treasury Bonds, 2.75%, 11/15/42 | | 330,000 | | 280,120 | |
| U.S. Treasury Bonds, 4.00%, 11/15/42 | | 5,100,000 | | 5,240,250 | |
| U.S. Treasury Bonds, 2.875%, 5/15/43 | | 400,000 | | 345,930 | |
| U.S. Treasury Bonds, 3.75%, 11/15/43 | | 600,000 | | 593,145 | |
| U.S. Treasury Bonds, 3.00%, 11/15/44 | | 200,000 | | 174,609 | |
| U.S. Treasury Bonds, 3.00%, 11/15/45 | | 200,000 | | 174,207 | |
| U.S. Treasury Bonds, 2.75%, 11/15/47 | | 600,000 | | 499,605 | |
| U.S. Treasury Bonds, 2.875%, 5/15/49 | | 2,500,000 | | 2,140,820 | |
| U.S. Treasury Bonds, 2.25%, 8/15/49 | | 1,000,000 | | 752,578 | |
| | | | | | | | | | | |
| | Principal Amount/Shares | Value |
| U.S. Treasury Bonds, 2.375%, 11/15/49 | | $ | 2,590,000 | | $ | 2,002,596 | |
| U.S. Treasury Bonds, 1.25%, 5/15/50 | | 300,000 | | 174,586 | |
| U.S. Treasury Bonds, 1.625%, 11/15/50 | | 600,000 | | 385,125 | |
| U.S. Treasury Bonds, 2.375%, 5/15/51 | | 1,600,000 | | 1,229,281 | |
| U.S. Treasury Bonds, 3.00%, 8/15/52 | | 2,500,000 | | 2,196,875 | |
| U.S. Treasury Bonds, 4.00%, 11/15/52 | | 6,000,000 | | 6,369,375 | |
U.S. Treasury Notes, 1.125%, 1/15/25(4) | | 2,700,000 | | 2,559,516 | |
| U.S. Treasury Notes, 3.50%, 9/15/25 | | 2,500,000 | | 2,476,611 | |
| U.S. Treasury Notes, 3.00%, 9/30/25 | | 2,000,000 | | 1,956,602 | |
| U.S. Treasury Notes, 4.50%, 11/15/25 | | 5,000,000 | | 5,074,707 | |
| U.S. Treasury Notes, 4.00%, 12/15/25 | | 2,000,000 | | 2,007,908 | |
U.S. Treasury Notes, 3.875%, 11/30/27(4) | | 9,000,000 | | 9,095,098 | |
| U.S. Treasury Notes, 4.00%, 2/29/28 | | 4,500,000 | | 4,581,738 | |
| U.S. Treasury Notes, 3.875%, 11/30/29 | | 900,000 | | 915,820 | |
| U.S. Treasury Notes, 3.875%, 12/31/29 | | 700,000 | | 712,797 | |
| U.S. Treasury Notes, 4.00%, 2/28/30 | | 2,000,000 | | 2,053,125 | |
| U.S. Treasury Notes, 3.625%, 3/31/30 | | 5,700,000 | | 5,728,475 | |
| U.S. Treasury Notes, 4.125%, 11/15/32 | | 2,000,000 | | 2,101,875 | |
| U.S. Treasury Notes, 3.875%, 2/15/43 | | 600,000 | | 605,484 | |
TOTAL U.S. TREASURY SECURITIES (Cost $73,592,821) | | | 71,480,043 | |
| ASSET-BACKED SECURITIES — 6.4% | | | |
Aligned Data Centers Issuer LLC, Series 2021-1A, Class B, 2.48%, 8/15/46(1) | | 975,000 | | 845,193 | |
Applebee's Funding LLC / IHOP Funding LLC, Series 2019-1A, Class A2I, SEQ, 4.19%, 6/5/49(1) | | 1,073,160 | | 1,052,164 | |
Applebee's Funding LLC / IHOP Funding LLC, Series 2019-1A, Class A2II, SEQ, 4.72%, 6/5/49(1) | | 990,000 | | 928,772 | |
Blackbird Capital Aircraft, Series 2021-1A, Class B, 3.45%, 7/15/46(1) | | 2,346,455 | | 1,840,004 | |
Castlelake Aircraft Securitization Trust, Series 2018-1, Class A, SEQ, 4.125%, 6/15/43(1) | | 456,502 | | 412,830 | |
Castlelake Aircraft Structured Trust, Series 2017-1R, Class A, SEQ, 2.74%, 8/15/41(1) | | 662,969 | | 593,357 | |
Clsec Holdings 22t LLC, Series 2021-1, Class C, 6.17%, 5/11/37(1) | | 2,400,992 | | 1,999,164 | |
Cologix Canadian Issuer LP, Series 2022-1CAN, Class A2, SEQ, 4.94%, 1/25/52(1) | CAD | 2,100,000 | | 1,439,017 | |
DI Issuer LLC, Series 2021-1A, Class A2, SEQ, 3.72%, 9/15/51(1) | | $ | 2,619,085 | | 2,362,089 | |
Diamond Issuer, Series 2021-1A, Class C, 3.79%, 11/20/51(1) | | 1,900,000 | | 1,538,251 | |
Diamond Resorts Owner Trust, Series 2021-1A, Class C, 2.70%, 11/21/33(1) | | 577,087 | | 530,074 | |
Edgeconnex Data Centers Issuer LLC, Series 2022-1, Class A2, SEQ, 4.25%, 3/25/52(1) | | 1,182,064 | | 1,109,044 | |
Flexential Issuer, Series 2021-1A, Class A2, SEQ, 3.25%, 11/27/51(1) | | 1,639,000 | | 1,464,239 | |
Goodgreen Trust, Series 2018-1A, Class A, VRN, 3.93%, 10/15/53(1) | | 863,203 | | 787,381 | |
Goodgreen Trust, Series 2021-1A, Class A, SEQ, 2.66%, 10/15/56(1) | | 574,809 | | 486,589 | |
Lunar Aircarft Ltd., Series 2020-1A, Class A, SEQ, 3.38%, 2/15/45(1) | | 1,156,444 | | 1,002,354 | |
Lunar Structured Aircraft Portfolio Notes, Series 2021-1, Class A, SEQ, 2.64%, 10/15/46(1) | | 1,523,656 | | 1,328,984 | |
Lunar Structured Aircraft Portfolio Notes, Series 2021-1, Class B, 3.43%, 10/15/46(1) | | 561,550 | | 477,816 | |
| | | | | | | | | | | |
| | Principal Amount/Shares | Value |
MAPS Trust, Series 2021-1A, Class A, SEQ, 2.52%, 6/15/46(1) | | $ | 1,051,200 | | $ | 923,105 | |
Navigator Aircraft ABS Ltd., Series 2021-1, Class A, SEQ, 2.77%, 11/15/46(1) | | 1,543,155 | | 1,337,435 | |
Pioneer Aircraft Finance Ltd., Series 2019-1, Class A, SEQ, 3.97%, 6/15/44(1) | | 1,256,388 | | 1,089,816 | |
Sierra Timeshare Receivables Funding LLC, Series 2019-2A, Class C, 3.12%, 5/20/36(1) | | 90,468 | | 86,204 | |
Stack Infrastructure Issuer LLC, Series 2021-1A, Class A2, SEQ, 1.88%, 3/26/46(1) | | 834,000 | | 741,811 | |
Start II Ltd., Series 2019-1, Class A, SEQ, 4.09%, 3/15/44(1) | | 1,068,432 | | 946,575 | |
Stonepeak ABS, Series 2021-1A, Class AA, 2.30%, 2/28/33(1) | | 547,780 | | 506,315 | |
Tricon American Homes, Series 2020-SFR1, Class C, 2.25%, 7/17/38(1) | | 500,000 | | 452,482 | |
VSE VOI Mortgage LLC, Series 2018-A, Class B, 3.72%, 2/20/36(1) | | 362,802 | | 351,274 | |
TOTAL ASSET-BACKED SECURITIES (Cost $30,231,645) | | | 26,632,339 | |
| COLLATERALIZED LOAN OBLIGATIONS — 5.8% | | | |
AIMCO CLO 10 Ltd., Series 2019-10A, Class CR, VRN, 6.72%, (3-month LIBOR plus 1.90%), 7/22/32(1) | | 950,000 | | 917,258 | |
AMMC CLO XI Ltd., Series 2012-11A, Class BR2, VRN, 6.40%, (3-month LIBOR plus 1.60%), 4/30/31(1) | | 650,000 | | 629,091 | |
AMMC CLO XII Ltd., Series 2013-12A, Class BR, VRN, 6.36%, (3-month LIBOR plus 1.50%), 11/10/30(1) | | 700,000 | | 686,260 | |
Arbor Realty Collateralized Loan Obligation Ltd., Series 2020-FL1, Class AS, VRN, 6.34%, (1-month SOFR plus 1.51%), 2/15/35(1) | | 772,500 | | 772,109 | |
ARES L CLO Ltd., Series 2018-50A, Class CR, VRN, 6.69%, (3-month LIBOR plus 1.90%), 1/15/32(1) | | 850,000 | | 825,639 | |
ARES LII CLO Ltd., Series 2019-52A, Class CR, VRN, 6.92%, (3-month LIBOR plus 2.10%), 4/22/31(1) | | 700,000 | | 674,449 | |
Atrium IX, Series 9A, Class BR2, VRN, 6.45%, (3-month LIBOR plus 1.50%), 5/28/30(1) | | 625,000 | | 611,198 | |
BDS Ltd., Series 2021-FL7, Class C, VRN, 6.46%, (1-month LIBOR plus 1.70%), 6/16/36(1) | | 1,600,000 | | 1,503,692 | |
BXMT Ltd., Series 2020-FL2, Class D, VRN, 6.81%, (1-month SOFR plus 2.06%), 2/15/38(1) | | 706,000 | | 587,917 | |
Carlyle US CLO Ltd., Series 2019-2A, Class A2R, VRN, 6.44%, (3-month LIBOR plus 1.65%), 7/15/32(1) | | 550,000 | | 536,321 | |
Cerberus Loan Funding XXVIII LP, Series 2020-1A, Class A, VRN, 6.64%, (3-month LIBOR plus 1.85%), 10/15/31(1) | | 876,754 | | 871,141 | |
Dewolf Park CLO Ltd., Series 2017-1A, Class CR, VRN, 6.64%, (3-month LIBOR plus 1.85%), 10/15/30(1) | | 1,000,000 | | 963,887 | |
GoldenTree Loan Management US CLO 4 Ltd., Series 2019-4A, Class CR, VRN, 6.82%, (3-month LIBOR plus 2.00%), 4/24/31(1) | | 1,125,000 | | 1,092,747 | |
Greystone CRE Notes Ltd., Series 2019-FL2, Class C, VRN, 6.68%, (1-month LIBOR plus 2.00%), 9/15/37(1) | | 920,500 | | 901,220 | |
Greystone CRE Notes Ltd., Series 2019-FL2, Class D, VRN, 7.08%, (1-month LIBOR plus 2.40%), 9/15/37(1) | | 801,500 | | 774,814 | |
KKR CLO 18 Ltd., Series 2018, Class CR, VRN, 6.89%, (3-month LIBOR plus 2.10%), 7/18/30(1) | | 700,000 | | 672,471 | |
KKR Static CLO I Ltd., Series 2022-1A, Class B, VRN, 7.24%, (3-month SOFR plus 2.60%), 7/20/31(1) | | 725,000 | | 708,186 | |
Nassau Ltd., Series 2019-IA, Class BR, VRN, 7.43%, (3-month LIBOR plus 2.60%), 4/15/31(1) | | 1,500,000 | | 1,433,275 | |
Neuberger Berman Loan Advisers CLO Ltd., Series 2018-28A, Class B, VRN, 6.41%, (3-month LIBOR plus 1.60%), 4/20/30(1) | | 350,000 | | 342,586 | |
| | | | | | | | | | | |
| | Principal Amount/Shares | Value |
Octagon Investment Partners 31 Ltd., Series 2017-1A, Class CR, VRN, 6.86%, (3-month LIBOR plus 2.05%), 7/20/30(1) | | $ | 750,000 | | $ | 725,583 | |
Palmer Square Loan Funding Ltd., Series 2022-1A, Class D, VRN, 9.63%, (3-month SOFR plus 5.00%), 4/15/30(1) | | 900,000 | | 802,486 | |
Palmer Square Loan Funding Ltd., Series 2022-2A, Class A2, VRN, 6.56%, (3-month SOFR plus 1.90%), 10/15/30(1) | | 725,000 | | 707,472 | |
Palmer Square Loan Funding Ltd., Series 2022-4A, Class A2, VRN, 7.08%, (3-month SOFR plus 2.30%), 7/24/31(1) | | 900,000 | | 901,230 | |
Palmer Square Loan Funding Ltd., Series 2022-5A, Class A2, VRN, 7.31%, (3-month SOFR plus 2.65%), 1/15/31(1) | | 450,000 | | 445,768 | |
PFP Ltd., Series 2021-8, Class D, VRN, 6.88%, (1-month LIBOR plus 2.15%), 8/9/37(1) | | 600,000 | | 537,909 | |
Ready Capital Mortgage Financing LLC, Series 2021-FL5, Class C, VRN, 7.10%, (1-month LIBOR plus 2.25%), 4/25/38(1) | | 759,000 | | 724,422 | |
Rockford Tower CLO Ltd., Series 2020-1A, Class C, VRN, 7.16%, (3-month LIBOR plus 2.35%), 1/20/32(1) | | 1,100,000 | | 1,061,493 | |
Stewart Park CLO Ltd., Series 2015-1A, Class CR, VRN, 6.59%, (3-month LIBOR plus 1.80%), 1/15/30(1) | | 675,000 | | 638,862 | |
TCI-Symphony CLO Ltd., Series 2017-1A, Class CR, VRN, 6.59%, (3-month LIBOR plus 1.80%), 7/15/30(1) | | 1,300,000 | | 1,249,581 | |
Wellfleet CLO Ltd., Series 2022-1A, Class B1, VRN, 7.01%, (3-month SOFR plus 2.35%), 4/15/34(1) | | 675,000 | | 658,252 | |
TOTAL COLLATERALIZED LOAN OBLIGATIONS (Cost $24,772,301) | | | 23,957,319 | |
| COLLATERALIZED MORTGAGE OBLIGATIONS — 3.9% |
| Private Sponsor Collateralized Mortgage Obligations — 3.7% |
| Bear Stearns Adjustable Rate Mortgage Trust, Series 2006-1, Class A1, VRN, 6.80%, (1-year H15T1Y plus 2.25%), 2/25/36 | | 31,830 | | 29,961 | |
Bellemeade Re Ltd., Series 2018-1A, Class M2, VRN, 7.75%, (1-month LIBOR plus 2.90%), 4/25/28(1) | | 1,009,438 | | 1,014,933 | |
Bellemeade Re Ltd., Series 2018-3A, Class M1B, VRN, 6.70%, (1-month LIBOR plus 1.85%), 10/25/28(1) | | 46,226 | | 46,218 | |
Bellemeade Re Ltd., Series 2019-3A, Class M1C, VRN, 6.80%, (1-month LIBOR plus 1.95%), 7/25/29(1) | | 301,986 | | 301,005 | |
CHNGE Mortgage Trust, Series 2022-NQM1, Class A2, VRN, 5.82%, 6/25/67(1) | | 972,692 | | 955,178 | |
CHNGE Mortgage Trust, Series 2023-1, Class A1, SEQ, 7.07%, 3/25/58(1) | | 964,474 | | 962,178 | |
Citigroup Mortgage Loan Trust, Inc., Series 2015-PS1, Class B3, VRN, 5.25%, 9/25/42(1) | | 438,228 | | 413,675 | |
| Countrywide Home Loan Mortgage Pass-Through Trust, Series 2005-17, Class 1A11, 5.50%, 9/25/35 | | 2,347 | | 2,149 | |
Eagle RE Ltd., Series 2018-1, Class M2, VRN, 7.85%, (1-month LIBOR plus 3.00%), 11/25/28(1) | | 1,600,000 | | 1,606,239 | |
Ellington Financial Mortgage Trust, Series 2023-1, Class A2, 6.24%, 2/25/68(1) | | 910,858 | | 899,754 | |
GCAT Trust, Series 2023-NQM1, Class A2, 6.24%, 11/25/67(1) | | 641,010 | | 635,660 | |
Home RE Ltd., Series 2018-1, Class M2, VRN, 7.85%, (1-month LIBOR plus 3.00%), 10/25/28(1) | | 1,085,405 | | 1,093,867 | |
Home RE Ltd., Series 2020-1, Class M1C, VRN, 9.00%, (1-month LIBOR plus 4.15%), 10/25/30(1) | | 77,951 | | 78,104 | |
Home RE Ltd., Series 2020-1, Class M2, VRN, 10.10%, (1-month LIBOR plus 5.25%), 10/25/30(1) | | 600,000 | | 611,378 | |
Home RE Ltd., Series 2022-1, Class M1A, VRN, 7.41%, (30-day average SOFR plus 2.85%), 10/25/34(1) | | 550,000 | | 553,571 | |
Homeward Opportunities Fund I Trust, Series 2020-2, Class B3, VRN, 5.49%, 5/25/65(1) | | 1,350,000 | | 1,127,351 | |
| | | | | | | | | | | |
| | Principal Amount/Shares | Value |
| JP Morgan Mortgage Trust, Series 2005-S2, Class 3A1, VRN, 7.17%, 2/25/32 | | $ | 10,998 | | $ | 10,487 | |
Radnor RE Ltd., Series 2021-2, Class M1A, VRN, 6.41%, (30-day average SOFR plus 1.85%), 11/25/31(1) | | 608,640 | | 606,437 | |
Sofi Mortgage Trust, Series 2016-1A, Class 1A4, SEQ, VRN, 3.00%, 11/25/46(1) | | 79,718 | | 71,636 | |
Starwood Mortgage Residential Trust, Series 2020-2, Class B1E, VRN, 3.00%, 4/25/60(1) | | 584,000 | | 516,567 | |
Triangle Re Ltd., Series 2021-1, Class M2, VRN, 8.75%, (1-month LIBOR plus 3.90%), 8/25/33(1) | | 551,323 | | 554,480 | |
Verus Securitization Trust, Series 2022-INV1, Class A2, SEQ, 5.80%, 8/25/67(1) | | 884,647 | | 872,912 | |
Vista Point Securitization Trust, Series 2020-1, Class B1, VRN, 5.375%, 3/25/65(1) | | 2,600,000 | | 2,406,905 | |
| Wells Fargo Mortgage-Backed Securities Trust, Series 2006-7, Class 3A1, SEQ, 6.00%, 6/25/36 | | 60,920 | | 52,541 | |
| | | 15,423,186 | |
| U.S. Government Agency Collateralized Mortgage Obligations — 0.2% |
FHLMC, Series 2020-HQA2, Class M2, VRN, 7.95%, (1-month LIBOR plus 3.10%), 3/25/50(1) | | 99,697 | | 102,229 | |
| FHLMC, Series 3397, Class GF, VRN, 5.18%, (1-month LIBOR plus 0.50%), 12/15/37 | | 82,615 | | 81,911 | |
| FNMA, Series 2014-C02, Class 2M2, VRN, 7.45%, (1-month LIBOR plus 2.60%), 5/25/24 | | 154,980 | | 156,195 | |
| FNMA, Series 2014-C04, Class 1M2, VRN, 9.75%, (1-month LIBOR plus 4.90%), 11/25/24 | | 289,958 | | 302,230 | |
| FNMA, Series 2015-C01, Class 1M2, VRN, 9.15%, (1-month LIBOR plus 4.30%), 2/25/25 | | 37,700 | | 38,893 | |
| FNMA, Series 2015-C02, Class 1M2, VRN, 8.85%, (1-month LIBOR plus 4.00%), 5/25/25 | | 37,911 | | 39,193 | |
| FNMA, Series 2016-C01, Class 1M2, VRN, 11.60%, (1-month LIBOR plus 6.75%), 8/25/28 | | 41,243 | | 44,031 | |
| GNMA, Series 2007-5, Class FA, VRN, 4.90%, (1-month LIBOR plus 0.14%), 2/20/37 | | 112,303 | | 111,878 | |
| | | 876,560 | |
TOTAL COLLATERALIZED MORTGAGE OBLIGATIONS (Cost $16,979,417) | | | 16,299,746 | |
| COMMERCIAL MORTGAGE-BACKED SECURITIES — 2.0% |
BX Commercial Mortgage Trust, Series 2020-VIV2, Class C, VRN, 3.54%, 3/9/44(1) | | 758,491 | | 618,263 | |
BX Commercial Mortgage Trust, Series 2020-VIVA, Class D, VRN, 3.55%, 3/11/44(1) | | 825,000 | | 647,615 | |
BX Commercial Mortgage Trust, Series 2021-VOLT, Class F, VRN, 7.08%, (1-month LIBOR plus 2.40%), 9/15/36(1) | | 1,800,000 | | 1,661,650 | |
Credit Suisse Mortgage Capital Certificates, Series 2019-ICE4, Class E, VRN, 6.83%, (1-month LIBOR plus 2.15%), 5/15/36(1) | | 1,650,893 | | 1,599,641 | |
Med Trust, Series 2021-MDLN, Class F, VRN, 8.69%, (1-month LIBOR plus 4.00%), 11/15/38(1) | | 1,660,218 | | 1,544,000 | |
One Market Plaza Trust, Series 2017-1MKT, Class B, 3.85%, 2/10/32(1) | | 1,097,000 | | 1,005,894 | |
WMRK Commercial Mortgage Trust, Series 2022-WMRK, Class A, VRN, 7.62%, (1-month SOFR plus 2.79%), 11/15/27(1) | | 1,085,000 | | 1,077,211 | |
TOTAL COMMERCIAL MORTGAGE-BACKED SECURITIES (Cost $8,910,832) | 8,154,274 | |
| MUNICIPAL SECURITIES — 1.9% | | | |
| Bay Area Toll Authority Rev., 6.92%, 4/1/40 | | 330,000 | | 393,611 | |
| California State University Rev., 2.98%, 11/1/51 | | 400,000 | | 285,692 | |
| | | | | | | | | | | |
| | Principal Amount/Shares | Value |
| Dallas Area Rapid Transit Rev., 6.00%, 12/1/44 | | $ | 190,000 | | $ | 216,295 | |
| Escambia County Health Facilities Authority Rev., (Baptist Health Care Corp. Obligated Group), 3.61%, 8/15/40 (AGM) | | 105,000 | | 84,257 | |
| Foothill-Eastern Transportation Corridor Agency Rev., 4.09%, 1/15/49 | | 387,000 | | 341,209 | |
| Golden State Tobacco Securitization Corp. Rev., 2.75%, 6/1/34 | | 910,000 | | 760,970 | |
| Houston GO, 3.96%, 3/1/47 | | 255,000 | | 226,997 | |
| Los Angeles Community College District GO, 6.75%, 8/1/49 | | 130,000 | | 167,756 | |
| Los Angeles Unified School District GO, 5.75%, 7/1/34 | | 300,000 | | 325,588 | |
| Michigan Strategic Fund Rev., (Flint Water Advocacy Fund), 3.23%, 9/1/47 | | 580,000 | | 455,840 | |
| Missouri Highway & Transportation Commission Rev., 5.45%, 5/1/33 | | 50,000 | | 52,383 | |
| New Jersey Turnpike Authority Rev., 7.41%, 1/1/40 | | 300,000 | | 381,244 | |
| New Jersey Turnpike Authority Rev., 7.10%, 1/1/41 | | 40,000 | | 49,418 | |
| Ohio Turnpike & Infrastructure Commission Rev., 3.22%, 2/15/48 | | 455,000 | | 341,832 | |
| Ohio Water Development Authority Water Pollution Control Loan Fund Rev., 4.88%, 12/1/34 | | 160,000 | | 163,017 | |
| Pennsylvania Turnpike Commission Rev., 5.56%, 12/1/49 | | 240,000 | | 265,861 | |
| Port Authority of New York & New Jersey Rev., 4.93%, 10/1/51 | | 150,000 | | 152,724 | |
| Regents of the University of California Medical Center Pooled Rev., 3.26%, 5/15/60 | | 225,000 | | 154,472 | |
| Rutgers The State University of New Jersey Rev., 5.67%, 5/1/40 | | 395,000 | | 422,963 | |
| Sacramento Municipal Utility District Rev., 6.16%, 5/15/36 | | 355,000 | | 392,942 | |
| San Antonio Electric & Gas Systems Rev., 5.99%, 2/1/39 | | 178,000 | | 197,469 | |
| San Diego County Regional Airport Authority Rev., 5.59%, 7/1/43 | | 125,000 | | 122,751 | |
| San Francisco Public Utilities Commission Water Rev., 6.00%, 11/1/40 | | 180,000 | | 198,917 | |
| Santa Clara Valley Transportation Authority Rev., 5.88%, 4/1/32 | | 215,000 | | 225,589 | |
| State of California GO, 4.60%, 4/1/38 | | 140,000 | | 136,752 | |
| State of California GO, 7.55%, 4/1/39 | | 260,000 | | 337,277 | |
| State of California GO, 7.30%, 10/1/39 | | 135,000 | | 167,823 | |
| State of California GO, 7.60%, 11/1/40 | | 25,000 | | 32,982 | |
| State of Washington GO, 5.14%, 8/1/40 | | 190,000 | | 195,643 | |
| Texas Natural Gas Securitization Finance Corp. Rev., 5.17%, 4/1/41 | | 460,000 | | 487,574 | |
| University of California Rev., 3.07%, 5/15/51 | | 440,000 | | 318,130 | |
TOTAL MUNICIPAL SECURITIES (Cost $9,409,133) | | | 8,055,978 | |
| SOVEREIGN GOVERNMENTS AND AGENCIES — 1.0% | | | |
| Chile — 0.1% | | | |
| Chile Government International Bond, 3.625%, 10/30/42 | | 153,000 | | 121,517 | |
| Chile Government International Bond, 4.00%, 1/31/52 | | 350,000 | | 284,955 | |
| | | 406,472 | |
| Colombia — 0.2% | | | |
| Colombia Government International Bond, 7.50%, 2/2/34 | | 632,000 | | 622,424 | |
Mexico† | | | |
| Mexico Government International Bond, 6.35%, 2/9/35 | | 191,000 | | 203,300 | |
| Peru — 0.1% | | | |
| Peruvian Government International Bond, 5.625%, 11/18/50 | | 299,000 | | 302,096 | |
| | | | | | | | | | | |
| | Principal Amount/Shares | Value |
| Philippines — 0.1% | | | |
| Philippine Government International Bond, 6.375%, 10/23/34 | | $ | 235,000 | | $ | 264,375 | |
| Romania — 0.3% | | | |
Romanian Government International Bond, 6.625%, 2/17/28(1) | | 1,186,000 | | 1,233,280 | |
| Saudi Arabia — 0.2% | | | |
Saudi Government International Bond, 4.75%, 1/18/28(1) | | 405,000 | | 410,279 | |
Saudi Government International Bond, 5.50%, 10/25/32(1) | | 520,000 | | 555,568 | |
| | | 965,847 | |
South Africa† | | | |
| Republic of South Africa Government International Bond, 5.875%, 6/22/30 | | 100,000 | | 94,012 | |
TOTAL SOVEREIGN GOVERNMENTS AND AGENCIES (Cost $4,203,093) | | | 4,091,806 | |
BANK LOAN OBLIGATIONS(5) — 0.2% | | | |
Consumer Staples Distribution & Retail† | | | |
| United Natural Foods, Inc., Term Loan B, 8.17%, (1-month SOFR plus 3.25%), 10/22/25 | | 77,987 | | 78,134 | |
| Pharmaceuticals — 0.2% | | | |
| Horizon Therapeutics USA Inc., 2021 Term Loan B2, 6.56%, (1-month LIBOR plus 1.75%), 3/15/28 | | 768,320 | | 767,778 | |
TOTAL BANK LOAN OBLIGATIONS (Cost $846,358) | | | 845,912 | |
| PREFERRED STOCKS — 0.1% | | | |
| Trading Companies and Distributors — 0.1% | | | |
Aircastle Ltd., 5.25%(1) (Cost $688,252) | | 688,000 | | 505,405 | |
| U.S. GOVERNMENT AGENCY SECURITIES — 0.1% | | | |
Tennessee Valley Authority, 1.50%, 9/15/31
(Cost $399,938) | | $ | 400,000 | | 326,414 | |
| SHORT-TERM INVESTMENTS — 4.1% | | | |
| Repurchase Agreements — 4.1% | | | |
| BMO Capital Markets Corp., (collateralized by various U.S. Treasury obligations, 1.125% - 4.375%, 8/15/40 - 5/15/49, valued at $4,482,605), in a joint trading account at 4.67%, dated 3/31/23, due 4/3/23 (Delivery value $4,325,299) | | | 4,323,616 | |
| Fixed Income Clearing Corp., (collateralized by various U.S. Treasury obligations, 3.625%, 3/31/28, valued at $12,756,139), at 4.81%, dated 3/31/23, due 4/3/23 (Delivery value $12,511,013) | | | 12,506,000 | |
TOTAL SHORT-TERM INVESTMENTS (Cost $16,829,616) | | | 16,829,616 | |
TOTAL INVESTMENT SECURITIES — 102.0% (Cost $446,266,276) | | | 423,252,890 | |
| OTHER ASSETS AND LIABILITIES — (2.0)% | | | (8,172,751) | |
| TOTAL NET ASSETS — 100.0% | | | $ | 415,080,139 | |
| | | | | | | | | | | | | | | | | | | | |
| FORWARD FOREIGN CURRENCY EXCHANGE CONTRACTS |
| Currency Purchased | Currency Sold | Counterparty | Settlement Date | Unrealized Appreciation
(Depreciation) |
| USD | 1,428,659 | | CAD | 1,955,291 | | UBS AG | 6/15/23 | $ | (19,784) | |
| | | | | | | | | | | | | | |
| FUTURES CONTRACTS PURCHASED |
| Reference Entity | Contracts | Expiration Date | Notional
Amount | Unrealized Appreciation (Depreciation)^ |
| Euro-Bobl 10-Year Bonds | 35 | June 2023 | $ | 5,156,146 | | $ | 166,208 | |
| U.S. Treasury 2-Year Notes | 129 | June 2023 | 26,632,453 | | 7,630 | |
| U.S. Treasury 5-Year Notes | 157 | June 2023 | 17,192,727 | | 205,885 | |
| U.S. Treasury 10-Year Notes | 369 | June 2023 | 42,406,172 | | (212,840) | |
| U.S. Treasury 10-Year Ultra Notes | 84 | June 2023 | 10,175,813 | | 160,696 | |
| U.S. Treasury Long Bonds | 20 | June 2023 | 2,623,125 | | 18,836 | |
| U.S. Treasury Ultra Bonds | 26 | June 2023 | 3,669,250 | | 122,268 | |
| | | | $ | 107,855,686 | | $ | 468,683 | |
^Amount represents value and unrealized appreciation (depreciation).
| | | | | | | | | | | | | | | | | | | | | | | |
| CENTRALLY CLEARED CREDIT DEFAULT SWAP AGREEMENTS |
| Reference Entity | Type | Fixed Rate Received (Paid) Quarterly | Termination
Date | Notional
Amount | Premiums Paid (Received) | Unrealized
Appreciation
(Depreciation) | Value^ |
| Markit CDX North America High Yield Index Series 39 | Buy | (5.00)% | 12/20/27 | $ | 9,220,000 | | $ | (97,349) | | $ | (21,763) | | $ | (119,112) | |
^The value for credit default swap agreements serves as an indicator of the current status of the payment/performance risk and represent the likelihood of an expected liability or profit at the period end. Increasing values in absolute terms when compared to the notional amount of the credit default swap agreement represent a deterioration of the referenced entity's credit soundness and an increased likelihood or risk of a credit event occurring as defined in the agreement.
| | | | | | | | | | | | | | | | | | | | | | | |
| CENTRALLY CLEARED TOTAL RETURN SWAP AGREEMENTS |
Floating
Rate Index | Pay/Receive
Floating Rate
Index at
Termination | Fixed
Rate | Termination
Date | Notional
Amount | Premiums
Paid
(Received) | Unrealized
Appreciation
(Depreciation) | Value |
| CPURNSA | Receive | 2.90% | 10/11/23 | $ | 2,000,000 | | $ | 265 | | $ | 11,267 | | $ | 11,532 | |
| CPURNSA | Receive | 2.97% | 10/14/23 | $ | 2,950,000 | | 271 | | 15,005 | | 15,276 | |
| CPURNSA | Receive | 2.97% | 10/14/23 | $ | 2,950,000 | | 271 | | 15,005 | | 15,276 | |
| | | | | | $ | 807 | | $ | 41,277 | | $ | 42,084 | |
| | | | | | | | |
| NOTES TO SCHEDULE OF INVESTMENTS |
| AGM | – | Assured Guaranty Municipal Corporation |
| CAD | – | Canadian Dollar |
| CDX | – | Credit Derivatives Indexes |
| CPURNSA | – | U.S. Consumer Price Index Urban Consumers Not Seasonally Adjusted Index |
| FHLMC | – | Federal Home Loan Mortgage Corporation |
| FNMA | – | Federal National Mortgage Association |
| GNMA | – | Government National Mortgage Association |
| GO | – | General Obligation |
| H15T1Y | – | Constant Maturity U.S. Treasury Note Yield Curve Rate Index |
| LIBOR | – | London Interbank Offered Rate |
| SEQ | – | Sequential Payer |
| SOFR | – | Secured Overnight Financing Rate |
| TBA | – | To-Be-Announced. Security was purchased on a forward commitment basis with an approximate principal amount and maturity date. Actual principal amount and maturity date will be determined upon settlement. |
| UMBS | – | Uniform Mortgage-Backed Securities |
| USD | – | United States Dollar |
| VRN | – | Variable Rate Note. The rate adjusts periodically based upon the terms set forth in the security’s offering documents. The rate shown is effective at the period end and the reference rate and spread, if any, is indicated. The security's effective maturity date may be shorter than the final maturity date shown. |
†Category is less than 0.05% of total net assets.
(1)Security was purchased pursuant to Rule 144A or Section 4(2) under the Securities Act of 1933 and may be sold in transactions exempt from registration, normally to qualified institutional investors. The aggregate value of these securities at the period end was $105,439,969, which represented 25.4% of total net assets.
(2)When-issued security. The issue price and yield are fixed on the date of the commitment, but payment and delivery are scheduled for a future date.
(3)Perpetual maturity with no stated maturity date.
(4)Security, or a portion thereof, has been pledged at the custodian bank or with a broker for collateral requirements on forward commitments, forward foreign currency exchange contracts, futures contracts and/or swap agreements. At the period end, the aggregate value of securities pledged was $2,648,597.
(5)The interest rate on a bank loan obligation adjusts periodically based on a predetermined schedule. Rate or range of rates shown is effective at period end. The maturity date on a bank loan obligation may be less than indicated as a result of contractual or optional prepayments. These prepayments cannot be predicted with certainty.
See Notes to Financial Statements.
| | |
| Statement of Assets and Liabilities |
| | | | | |
| MARCH 31, 2023 | |
| Assets | |
| Investment securities, at value (cost of $446,266,276) | $ | 423,252,890 | |
| Cash | 21,779 | |
| Foreign currency holdings, at value (cost of $11) | 11 | |
| Receivable for investments sold | 9,692,116 | |
| Receivable for capital shares sold | 33,354 | |
| Receivable for variation margin on futures contracts | 280,268 | |
| Receivable for variation margin on swap agreements | 4,413 | |
| Interest receivable | 2,873,669 | |
| 436,158,500 | |
| |
| Liabilities | |
| Payable for investments purchased | 16,516,314 | |
| Payable for capital shares redeemed | 4,334,792 | |
| Payable for variation margin on swap agreements | 1,252 | |
| Unrealized depreciation on forward foreign currency exchange contracts | 19,784 | |
| Accrued management fees | 189,642 | |
| Distribution and service fees payable | 3,561 | |
| Dividends payable | 13,016 | |
| 21,078,361 | |
| |
| Net Assets | $ | 415,080,139 | |
| |
| Net Assets Consist of: | |
| Capital paid in | $ | 498,980,495 | |
| Distributable earnings (loss) | (83,900,356) | |
| $ | 415,080,139 | |
| | | | | | | | | | | |
| Net Assets | Shares Outstanding | Net Asset Value Per Share* |
| Investor Class | $369,557,504 | 39,107,432 | $9.45 |
| I Class | $22,491,578 | 2,380,140 | $9.45 |
| A Class | $12,590,963 | 1,332,144 | $9.45 |
| C Class | $638,223 | 67,528 | $9.45 |
| R Class | $881,161 | 93,236 | $9.45 |
| R5 Class | $8,916,168 | 943,887 | $9.45 |
| G Class | $4,542 | 481 | $9.44 |
*Maximum offering price per share was equal to the net asset value per share for all share classes, except Class A, for which the maximum offering price per share was $9.90 (net asset value divided by 0.955). A contingent deferred sales charge may be imposed on redemptions of Class A and Class C.
See Notes to Financial Statements.
| | | | | |
| YEAR ENDED MARCH 31, 2023 |
| Investment Income (Loss) | |
| Income: | |
| Interest (net of foreign taxes withheld of $1,412) | $ | 18,172,176 | |
| |
| Expenses: | |
| Management fees | 2,453,278 | |
| Distribution and service fees: | |
| A Class | 33,300 | |
| C Class | 7,306 | |
| R Class | 4,037 | |
| Trustees' fees and expenses | 30,180 | |
| Other expenses | 23,589 | |
| 2,551,690 | |
| Fees waived - G Class | (416) | |
| 2,551,274 | |
| |
| Net investment income (loss) | 15,620,902 | |
| |
| Realized and Unrealized Gain (Loss) | |
| Net realized gain (loss) on: | |
| Investment transactions | (50,716,920) | |
| Forward foreign currency exchange contract transactions | 92,206 | |
| Futures contract transactions | (4,663,144) | |
| Swap agreement transactions | 1,860,427 | |
| Foreign currency translation transactions | (2,910) | |
| (53,430,341) | |
| |
| Change in net unrealized appreciation (depreciation) on: | |
| Investments | 5,269,561 | |
| Forward foreign currency exchange contracts | 28,337 | |
| Futures contracts | 928,383 | |
| Swap agreements | (1,292,324) | |
| Translation of assets and liabilities in foreign currencies | (1,604) | |
| 4,932,353 | |
| |
| Net realized and unrealized gain (loss) | (48,497,988) | |
| |
| Net Increase (Decrease) in Net Assets Resulting from Operations | $ | (32,877,086) | |
See Notes to Financial Statements.
| | |
| Statement of Changes in Net Assets |
| | | | | | | | |
| YEARS ENDED MARCH 31, 2023 AND MARCH 31, 2022 |
| Increase (Decrease) in Net Assets | March 31, 2023 | March 31, 2022 |
| Operations | | |
| Net investment income (loss) | $ | 15,620,902 | | $ | 12,743,699 | |
| Net realized gain (loss) | (53,430,341) | | (4,752,632) | |
| Change in net unrealized appreciation (depreciation) | 4,932,353 | | (25,951,442) | |
| Net increase (decrease) in net assets resulting from operations | (32,877,086) | | (17,960,375) | |
| | |
| Distributions to Shareholders | | |
| From earnings: | | |
| Investor Class | (13,691,159) | | (15,222,461) | |
| I Class | (879,066) | | (1,265,395) | |
| A Class | (406,845) | | (575,824) | |
| C Class | (16,173) | | (31,511) | |
| R Class | (23,016) | | (20,848) | |
| R5 Class | (325,997) | | (378,418) | |
| G Class | (3,950) | | (1,008,956) | |
| Decrease in net assets from distributions | (15,346,206) | | (18,503,413) | |
| | |
| Capital Share Transactions | | |
| Net increase (decrease) in net assets from capital share transactions (Note 5) | (48,272,952) | | 47,858,837 | |
| | |
| Net increase (decrease) in net assets | (96,496,244) | | 11,395,049 | |
| | |
| Net Assets | | |
| Beginning of period | 511,576,383 | | 500,181,334 | |
| End of period | $ | 415,080,139 | | $ | 511,576,383 | |
See Notes to Financial Statements.
| | |
| Notes to Financial Statements |
MARCH 31, 2023
1. Organization
American Century Investment Trust (the trust) is registered under the Investment Company Act of 1940, as amended (the 1940 Act), as an open-end management investment company and is organized as a Massachusetts business trust. Core Plus Fund (the fund) is one fund in a series issued by the trust. The fund’s investment objective is to seek to maximize total return. As a secondary objective, the fund seeks a high level of income.
The fund offers the Investor Class, I Class, A Class, C Class, R Class, R5 Class and G Class. The A Class may incur an initial sales charge. The A Class and C Class may be subject to a contingent deferred sales charge.
2. Significant Accounting Policies
The following is a summary of significant accounting policies consistently followed by the fund in preparation of its financial statements. The fund is an investment company and follows accounting and reporting guidance in accordance with accounting principles generally accepted in the United States of America. This may require management to make certain estimates and assumptions at the date of the financial statements. Actual results could differ from these estimates. Management evaluated the impact of events or transactions occurring through the date the financial statements were issued that would merit recognition or disclosure.
Investment Valuations — The fund determines the fair value of its investments and computes its net asset value (NAV) per share at the close of regular trading (usually 4 p.m. Eastern time) on the New York Stock Exchange (NYSE) on each day the NYSE is open. The value of investments of the fund is determined by American Century Investment Management, Inc. (ACIM) (the investment advisor), as the valuation designee, pursuant to its valuation policies and procedures. The Board of Trustees oversees the valuation designee and reviews its valuation policies and procedures at least annually.
Fixed income securities are valued at the evaluated mean as provided by independent pricing services or at the mean of the most recent bid and asked prices as provided by investment dealers. Corporate bonds, U.S. Treasury and Government Agency securities, bank loan obligations, municipal securities and sovereign governments and agencies are valued using market models that consider trade data, quotations from dealers and active market makers, relevant yield curve and spread data, creditworthiness, trade data or market information on comparable securities, and other relevant security specific information. Mortgage-related and asset-backed securities are valued based on models that consider trade data, prepayment and default projections, benchmark yield and spread data and estimated cash flows of each tranche of the issuer. Collateralized loan obligations are valued based on discounted cash flow models that consider trade and economic data, prepayment assumptions and default projections. Fixed income securities initially expressed in local currencies are translated into U.S. dollars at the mean of the appropriate currency exchange rate at the close of the NYSE as provided by an independent pricing service.
Equity securities that are listed or traded on a domestic securities exchange are valued at the last reported sales price or at the official closing price as provided by the exchange. Equity securities traded on foreign securities exchanges are generally valued at the closing price of such securities on the exchange where primarily traded or at the close of the NYSE, if that is earlier. If no last sales price is reported, or if local convention or regulation so provides, the mean of the latest bid and asked prices may be used. Securities traded over-the-counter are valued at the mean of the latest bid and asked prices, the last sales price, or the official closing price. Equity securities initially expressed in local currencies are translated into U.S. dollars at the mean of the appropriate currency exchange rate at the close of the NYSE as provided by an independent pricing service.
Hybrid securities are valued at the evaluated mean as provided by independent pricing services or at the mean of the most recent bid and asked prices as provided by investment dealers. Preferred stocks and convertible preferred stocks with perpetual maturities are valued using market models that consider trade data, quotations from dealers and active market makers, relevant yield curve and spread data, creditworthiness, trade data or market information on comparable securities, and other relevant security specific information.
Open-end management investment companies are valued at the reported NAV per share. Repurchase agreements are valued at cost, which approximates fair value. Exchange-traded futures contracts are valued at the settlement price as provided by the appropriate exchange. Swap agreements are valued at an evaluated mean as provided by independent pricing services or independent brokers. Forward foreign currency exchange contracts are valued at the mean of the appropriate forward exchange rate at the close of the NYSE as provided by an independent pricing service. Investments initially expressed in local currencies are translated into U.S. dollars at the mean of the appropriate currency exchange rate at the close of the NYSE as provided by an independent pricing service.
If the valuation designee determines that the market price for a portfolio security is not readily available or is believed by the valuation designee to be unreliable, such security is valued at fair value as determined in good faith by the valuation designee, in accordance with its policies and procedures. Circumstances that may cause the fund to determine that market quotations are not available or reliable include, but are not limited to: when there is a significant event subsequent to the market quotation; trading in a security has been halted during the trading day; or trading in a security is insufficient or did not take place due to a closure or holiday.
The valuation designee monitors for significant events occurring after the close of an investment’s primary exchange but before the fund’s NAV per share is determined. Significant events may include, but are not limited to: corporate announcements and transactions; regulatory news, governmental action and political unrest that could impact a specific investment or an investment sector; or armed conflicts, natural disasters and similar events that could affect investments in a specific country or region. The valuation designee also monitors for significant fluctuations between domestic and foreign markets, as evidenced by the U.S. market or such other indicators that it deems appropriate. The valuation designee may apply a model-derived factor to the closing price of equity securities traded on foreign securities exchanges. The factor is based on observable market data as provided by an independent pricing service.
Security Transactions — Security transactions are accounted for as of the trade date. Net realized gains and losses are determined on the identified cost basis, which is also used for federal income tax purposes.
Investment Income — Interest income less foreign taxes withheld, if any, is recorded on the accrual basis and includes paydown gain (loss) and accretion of discounts and amortization of premiums. Inflation adjustments related to inflation-linked debt securities are reflected as interest income.
Foreign Currency Translations — All assets and liabilities initially expressed in foreign currencies are translated into U.S. dollars at prevailing exchange rates at period end. The fund may enter into spot foreign currency exchange contracts to facilitate transactions denominated in a foreign currency. Purchases and sales of investment securities, dividend and interest income, spot foreign currency exchange contracts, and expenses are translated at the rates of exchange prevailing on the respective dates of such transactions. Net realized and unrealized foreign currency exchange gains or losses related to investment securities are a component of net realized gain (loss) on investment transactions and change in net unrealized appreciation (depreciation) on investments, respectively.
Forward Commitments — The fund may engage in securities transactions on a forward commitment basis. In these transactions, the securities’ prices and yields are fixed on the date of the commitment. The fund may sell a to-be-announced (TBA) security and at the same time make a commitment to purchase the same security at a future date at a specified price. Conversely, the fund may purchase a TBA security and at the same time make a commitment to sell the same security at a future date at a specified price. These types of transactions are known as “TBA roll” transactions and are accounted for as purchases and sales. The fund will segregate cash, cash equivalents or other appropriate liquid securities on its records in amounts sufficient to meet the purchase price.
Repurchase Agreements — The fund may enter into repurchase agreements with institutions that ACIM has determined are creditworthy pursuant to criteria adopted by the Board of Trustees. The fund requires that the collateral, represented by securities, received in a repurchase transaction be transferred to the custodian in a manner sufficient to enable the fund to obtain those securities in the event of a default under the repurchase agreement. ACIM monitors, on a daily basis, the securities transferred to ensure the value, including accrued interest, of the securities under each repurchase agreement is equal to or greater than amounts owed to the fund under each repurchase agreement.
Joint Trading Account — Pursuant to an Exemptive Order issued by the Securities and Exchange Commission, the fund, along with certain other funds in the American Century Investments family of funds, may transfer uninvested cash balances into a joint trading account. These balances are invested in one or more repurchase agreements that are collateralized by U.S. Treasury or Agency obligations.
Income Tax Status — It is the fund's policy to distribute substantially all net investment income and net realized gains to shareholders and to otherwise qualify as a regulated investment company under provisions of the Internal Revenue Code. Accordingly, no provision has been made for income taxes. The fund files U.S. federal, state, local and non-U.S. tax returns as applicable. The fund's tax returns are subject to examination by the relevant taxing authority until expiration of the applicable statute of limitations, which is generally three years from the date of filing but can be longer in certain jurisdictions. At this time, management believes there are no uncertain tax positions which, based on their technical merit, would not be sustained upon examination and for which it is reasonably possible that the total amounts of unrecognized tax benefits will significantly change in the next twelve months.
Multiple Class — All shares of the fund represent an equal pro rata interest in the net assets of the class to which such shares belong, and have identical voting, dividend, liquidation and other rights and the same terms and conditions, except for class specific expenses and exclusive rights to vote on matters affecting only individual classes. Income, non-class specific expenses, and realized and unrealized capital gains and losses of the fund are allocated to each class of shares based on their relative net assets.
Distributions to Shareholders — Distributions from net investment income, if any, are declared daily and paid monthly. Distributions from net realized gains, if any, are generally declared and paid annually.
Indemnifications — Under the trust’s organizational documents, its officers and trustees are indemnified against certain liabilities arising out of the performance of their duties to the fund. In addition, in the normal course of business, the fund enters into contracts that provide general indemnifications. The maximum exposure under these arrangements is unknown as this would involve future claims that may be made against a fund. The risk of material loss from such claims is considered by management to be remote.
3. Fees and Transactions with Related Parties
Certain officers and trustees of the trust are also officers and/or directors of American Century Companies, Inc. (ACC). The trust's investment advisor, ACIM, the trust's distributor, American Century Investment Services, Inc. (ACIS), and the trust's transfer agent, American Century Services, LLC, are wholly owned, directly or indirectly, by ACC. Various funds issued by American Century Asset Allocation Portfolios, Inc. own, in aggregate, 76% of the shares of the fund. Related parties do not invest in the fund for the purpose of exercising management or control.
Management Fees — The trust has entered into a management agreement with ACIM, under which ACIM provides the fund with investment advisory and management services in exchange for a single, unified management fee (the fee) per class. The agreement provides that ACIM will pay all expenses of managing and operating the fund, except brokerage expenses, taxes, interest, fees and expenses of the independent trustees (including legal counsel fees), extraordinary expenses, and expenses incurred in connection with the provision of shareholder services and distribution services under a plan adopted pursuant to Rule 12b-1 under the 1940 Act. The fee is computed and accrued daily based on each class’s daily net assets and paid monthly in arrears. The difference in the fee among the classes is a result of their separate arrangements for non-Rule 12b-1 shareholder services. It is not the result of any difference in advisory or custodial fees or other expenses related to the management of the fund's assets, which do not vary by class. The fee consists of (1) an Investment Category Fee based on the daily net assets of the fund and certain other accounts managed by the investment advisor that are in the same broad investment category as the fund and (2) a Complex Fee based on the assets of all funds in the American Century Investments family of funds that have the same investment advisor and distributor as the fund. For purposes of determining the Investment Category Fee and Complex Fee, the assets of funds managed by the investment advisor that invest exclusively in the shares of other funds (funds of funds) are not included. The investment advisor agreed to waive the G Class's management fee in its entirety. The investment advisor expects this waiver to remain in effect permanently and cannot terminate it without the approval of the Board of Trustees.
The Investment Category Fee range, the Complex Fee range and the effective annual management fee for each class for the period ended March 31, 2023 are as follows:
| | | | | | | | | | | |
| Investment Category Fee Range | Complex Fee Range | Effective Annual
Management Fee |
| Investor Class | 0.2425%
to 0.3600% | 0.2500% to 0.3100% | 0.54% |
| I Class | 0.1500% to 0.2100% | 0.44% |
| A Class | 0.2500% to 0.3100% | 0.54% |
| C Class | 0.2500% to 0.3100% | 0.54% |
| R Class | 0.2500% to 0.3100% | 0.54% |
| R5 Class | 0.0500% to 0.1100% | 0.34% |
| G Class | 0.0500% to 0.1100% | 0.00%(1) |
(1)Effective annual management fee before waiver was 0.34%.
Distribution and Service Fees — The Board of Trustees has adopted a separate Master Distribution and Individual Shareholder Services Plan for each of the A Class, C Class and R Class (collectively the plans), pursuant to Rule 12b-1 of the 1940 Act. The plans provide that the A Class will pay ACIS an annual distribution and service fee of 0.25%. The plans provide that the C Class will pay ACIS an annual distribution and service fee of 1.00%, of which 0.25% is paid for individual shareholder services and 0.75% is paid for distribution services. The plans provide that the R Class will pay ACIS an annual distribution and service fee of 0.50%. The fees are computed and accrued daily based on each class’s daily net assets and paid monthly in arrears. The fees are used to pay financial intermediaries for distribution and individual shareholder services. Fees incurred under the plans during the period ended March 31, 2023 are detailed in the Statement of Operations.
Trustees' Fees and Expenses — The Board of Trustees is responsible for overseeing the investment advisor’s management and operations of the fund. The trustees receive detailed information about the fund and its investment advisor regularly throughout the year, and meet at least quarterly with management of the investment advisor to review reports about fund operations. The fund's officers do not receive compensation from the fund.
Interfund Transactions — The fund may enter into security transactions with other American Century Investments funds and other client accounts of the investment advisor, in accordance with the 1940 Act rules and procedures adopted by the Board of Trustees. The rules and procedures require, among other things, that these transactions be effected at the independent current market price of the security. During the period, the interfund purchases were $1,596,000 and there were no interfund sales.
4. Investment Transactions
Purchases of investment securities, excluding short-term investments, for the period ended March 31, 2023 totaled $802,826,904, of which $622,379,182 represented U.S. Treasury and Government Agency obligations.
Sales of investment securities, excluding short-term investments, for the period ended March 31, 2023 totaled $866,405,841, of which $591,759,550 represented U.S. Treasury and Government Agency obligations.
5. Capital Share Transactions
Transactions in shares of the fund were as follows (unlimited number of shares authorized):
| | | | | | | | | | | | | | |
| Year ended
March 31, 2023 | Year ended
March 31, 2022 |
| Shares | Amount | Shares | Amount |
| Investor Class | | | | |
| Sold | 5,081,059 | | $ | 47,667,019 | | 9,438,838 | | $ | 105,893,361 | |
| Issued in reinvestment of distributions | 1,429,507 | | 13,583,118 | | 1,349,001 | | 15,094,635 | |
| Redeemed | (10,325,717) | | (97,270,793) | | (2,147,725) | | (23,883,751) | |
| (3,815,151) | | (36,020,656) | | 8,640,114 | | 97,104,245 | |
| I Class | | | | |
| Sold | 757,903 | | 7,274,238 | | 1,671,772 | | 18,884,353 | |
| Issued in reinvestment of distributions | 92,122 | | 879,066 | | 113,026 | | 1,265,380 | |
| Redeemed | (1,828,990) | | (17,536,841) | | (1,980,061) | | (22,284,785) | |
| (978,965) | | (9,383,537) | | (195,263) | | (2,135,052) | |
| A Class | | | | |
| Sold | 180,012 | | 1,716,953 | | 390,452 | | 4,377,108 | |
| Issued in reinvestment of distributions | 41,394 | | 393,605 | | 50,365 | | 563,833 | |
| Redeemed | (354,251) | | (3,400,979) | | (699,973) | | (7,616,193) | |
| (132,845) | | (1,290,421) | | (259,156) | | (2,675,252) | |
| C Class | | | | |
| Sold | 15,493 | | 146,424 | | 33,535 | | 378,542 | |
| Issued in reinvestment of distributions | 1,696 | | 16,173 | | 2,811 | | 31,508 | |
| Redeemed | (60,271) | | (577,439) | | (56,167) | | (632,450) | |
| (43,082) | | (414,842) | | (19,821) | | (222,400) | |
| R Class | | | | |
| Sold | 24,675 | | 234,683 | | 48,205 | | 542,623 | |
| Issued in reinvestment of distributions | 2,413 | | 22,899 | | 1,843 | | 20,595 | |
| Redeemed | (12,897) | | (123,415) | | (23,832) | | (265,640) | |
| 14,191 | | 134,167 | | 26,216 | | 297,578 | |
| R5 Class | | | | |
| Sold | 185,671 | | 1,762,029 | | 174,971 | | 1,944,515 | |
| Issued in reinvestment of distributions | 34,049 | | 323,762 | | 33,838 | | 378,407 | |
| Redeemed | (305,024) | | (2,919,960) | | (147,768) | | (1,652,073) | |
| (85,304) | | (834,169) | | 61,041 | | 670,849 | |
| G Class | | | | |
| Sold | 1,035 | | 10,491 | | 993,529 | | 11,185,206 | |
| Issued in reinvestment of distributions | 270 | | 2,699 | | 89,031 | | 1,008,956 | |
| Redeemed | (49,187) | | (476,684) | | (5,071,908) | | (57,375,293) | |
| (47,882) | | (463,494) | | (3,989,348) | | (45,181,131) | |
| Net increase (decrease) | (5,089,038) | | $ | (48,272,952) | | 4,263,783 | | $ | 47,858,837 | |
6. Fair Value Measurements
The fund's investments valuation process is based on several considerations and may use multiple inputs to determine the fair value of the investments held by the fund. In conformity with accounting principles generally accepted in the United States of America, the inputs used to determine a valuation are classified into three broad levels.
•Level 1 valuation inputs consist of unadjusted quoted prices in an active market for identical investments.
•Level 2 valuation inputs consist of direct or indirect observable market data (including quoted prices for comparable investments, evaluations of subsequent market events, interest rates, prepayment speeds, credit risk, etc.). These inputs also consist of quoted prices for identical investments initially expressed in local currencies that are adjusted through translation into U.S. dollars.
•Level 3 valuation inputs consist of unobservable data (including a fund’s own assumptions).
The level classification is based on the lowest level input that is significant to the fair valuation measurement. The valuation inputs are not necessarily an indication of the risks associated with investing in these securities or other financial instruments.
The following is a summary of the level classifications as of period end. The Schedule of Investments provides additional information on the fund's portfolio holdings.
| | | | | | | | | | | |
| Level 1 | Level 2 | Level 3 |
| Assets | | | |
| Investment Securities | | | |
| U.S. Government Agency Mortgage-Backed Securities | — | | $ | 123,607,971 | | — | |
| Corporate Bonds | — | | 122,466,067 | | — | |
| U.S. Treasury Securities | — | | 71,480,043 | | — | |
| Asset-Backed Securities | — | | 26,632,339 | | — | |
| Collateralized Loan Obligations | — | | 23,957,319 | | — | |
| Collateralized Mortgage Obligations | — | | 16,299,746 | | — | |
| Commercial Mortgage-Backed Securities | — | | 8,154,274 | | — | |
| Municipal Securities | — | | 8,055,978 | | — | |
| Sovereign Governments and Agencies | — | | 4,091,806 | | — | |
| Bank Loan Obligations | — | | 845,912 | | — | |
| Preferred Stocks | — | | 505,405 | | — | |
| U.S. Government Agency Security | — | | 326,414 | | — | |
| Short-Term Investments | — | | 16,829,616 | | — | |
| — | | $ | 423,252,890 | | — | |
| Other Financial Instruments | | | |
| Futures Contracts | $ | 515,315 | | $ | 166,208 | | — | |
| Swap Agreements | — | | 42,084 | | — | |
| $ | 515,315 | | $ | 208,292 | | — | |
| | | |
| Liabilities | | | |
| Other Financial Instruments | | | |
| Futures Contracts | $ | 212,840 | | — | | — | |
| Swap Agreements | — | | $ | 119,112 | | — | |
| Forward Foreign Currency Exchange Contracts | — | | 19,784 | | — | |
| $ | 212,840 | | $ | 138,896 | | — | |
7. Derivative Instruments
Credit Risk — The fund is subject to credit risk in the normal course of pursuing its investment objectives. The value of a bond generally declines as the credit quality of its issuer declines. Credit default swap agreements enable a fund to buy/sell protection against a credit event of a specific issuer or index. A fund may attempt to enhance returns by selling protection or attempt to mitigate credit risk by buying protection. The buyer/seller of credit protection against a security or basket of securities may pay/receive an up-front or periodic payment to compensate for/against potential default events. Changes in value, including the periodic amounts of interest to be paid or received on swap agreements, are recorded as unrealized appreciation (depreciation) on swap agreements. Upon entering into a centrally cleared swap, a fund is required to deposit cash or securities (initial margin) with a financial intermediary in an amount equal to a certain percentage of the notional amount. A fund may incur charges or earn income on cash deposit balances, which are reflected in interest expenses or interest income, respectively. Subsequent payments (variation margin) are made or received daily, in cash, by a fund. The variation margin is equal to the daily change in the value and is a component of unrealized gains and losses. Realized gain or loss is recorded upon receipt or payment of a periodic settlement or termination of swap agreements. Net realized and unrealized gains or losses occurring during the holding period of swap agreements are a component of net realized gain (loss) on swap agreement transactions and change in net unrealized appreciation (depreciation) on swap agreements, respectively. The risks of entering into swap agreements include the possible lack of liquidity, failure of the counterparty to meet its obligations, and that there may be unfavorable changes in the underlying investments or instruments. The fund's average notional amount held during the period was $25,234,750.
Foreign Currency Risk — The fund is subject to foreign currency exchange rate risk in the normal course of pursuing its investment objectives. The value of foreign investments held by a fund may be significantly affected by changes in foreign currency exchange rates. The dollar value of a foreign security generally decreases when the value of the dollar rises against the foreign currency in which the security is denominated and tends to increase when the value of the dollar declines against such foreign currency. A fund may enter into forward foreign currency exchange contracts to reduce a fund's exposure to foreign currency exchange rate fluctuations or to gain exposure to the fluctuations in the value of foreign currencies. A fund will segregate cash, cash equivalents or other appropriate liquid securities on its records in amounts sufficient to meet requirements. The net U.S. dollar value of foreign currency underlying all contractual commitments held by a fund and the resulting unrealized appreciation or depreciation are determined daily. Realized gain or loss is recorded upon settlement of the contract. Net realized and unrealized gains or losses occurring during the holding period of forward foreign currency exchange contracts are a component of net realized gain (loss) on forward foreign currency exchange contract transactions and change in net unrealized appreciation (depreciation) on forward foreign currency exchange contracts, respectively. A fund bears the risk of an unfavorable change in the foreign currency exchange rate underlying the forward contract. Additionally, losses, up to the fair value, may arise if the counterparties do not perform under the contract terms. The fund's average U.S. dollar exposure to foreign currency risk derivative instruments held during the period was $3,962,518.
Interest Rate Risk — The fund is subject to interest rate risk in the normal course of pursuing its investment objectives. The value of bonds generally declines as interest rates rise. A fund may enter into futures contracts based on a bond index or a specific underlying security. A fund may purchase futures contracts to gain exposure to increases in market value or sell futures contracts to protect against a decline in market value. Upon entering into a futures contract, a fund will segregate cash, cash equivalents or other appropriate liquid securities on its records in amounts sufficient to meet requirements. A fund may incur charges or earn income on cash deposit balances, which are reflected in interest expenses or interest income, respectively. Subsequent payments (variation margin) are made or received daily, in cash, by a fund. The variation margin is equal to the daily change in the contract value and is recorded as unrealized gains and losses. A fund recognizes a realized gain or loss when the futures contract is closed or expires. Net realized and unrealized gains or losses occurring during the holding period of futures contracts are a component of net realized gain (loss) on futures contract transactions and change in net unrealized appreciation (depreciation) on futures contracts, respectively. One of the risks of entering into futures contracts is the possibility that the change in value of the contract may not correlate with the changes in value of the underlying securities. The fund's average notional exposure to interest rate risk derivative instruments held during the period was $57,554,014 futures contracts purchased and $18,438,672 futures contracts sold.
Other Contracts — A fund may enter into total return swap agreements in order to attempt to obtain or preserve a particular return or spread at a lower cost than obtaining a return or spread through purchases and/or sales of instruments in other markets or gain exposure to certain markets in the most economical way possible. A fund will segregate cash, cash equivalents or other appropriate liquid securities on its records in amounts sufficient to meet requirements. Changes in value, including the periodic amounts of interest to be paid or received on swap agreements, are recorded as unrealized appreciation (depreciation) on swap agreements. Upon entering into a centrally cleared swap, a fund is required to deposit cash or securities (initial margin) with a financial intermediary in an amount equal to a certain percentage of the notional amount. A fund may incur charges or earn income on cash deposit balances, which are reflected in interest expenses or interest income, respectively. Subsequent payments (variation margin) are made or received daily, in cash, by a fund. The variation margin is equal to the daily change in the value and is a component of unrealized gains and losses. Realized gain or loss is recorded upon receipt or payment of a periodic settlement or termination of swap agreements. Net realized and unrealized gains or losses occurring during the holding period of swap agreements are a component of net realized gain (loss) on swap agreement transactions and change in net unrealized appreciation (depreciation) on swap agreements, respectively. The risks of entering into swap agreements include the possible lack of liquidity, failure of the counterparty to meet its obligations, and that there may be unfavorable changes in the underlying investments or instruments, including inflationary risk. The fund's average notional amount held during the period was $10,766,667.
Value of Derivative Instruments as of March 31, 2023
| | | | | | | | | | | | | | |
| Asset Derivatives | Liability Derivatives |
| Type of Risk Exposure | Location on Statement of Assets and Liabilities | Value | Location on Statement of Assets and Liabilities | Value |
| Credit Risk | Receivable for variation margin on swap agreements* | — | | Payable for variation margin on swap agreements* | $ | 1,252 | |
| Foreign Currency Risk | Unrealized appreciation on forward foreign currency exchange contracts | — | | Unrealized depreciation on forward foreign currency exchange contracts | 19,784 | |
| Interest Rate Risk | Receivable for variation margin on futures contracts* | $ | 280,268 | | Payable for variation margin on futures contracts* | — | |
| Other Contracts | Receivable for variation margin on swap agreements* | 4,413 | | Payable for variation margin on swap agreements* | — | |
| | $ | 284,681 | | | $ | 21,036 | |
*Included in the unrealized appreciation (depreciation) on futures contracts or centrally cleared swap agreements, as applicable, as reported in the Schedule of Investments.
Effect of Derivative Instruments on the Statement of Operations for the Year Ended March 31, 2023
| | | | | | | | | | | | | | |
| Net Realized Gain (Loss) | Change in Net Unrealized
Appreciation (Depreciation) |
| Type of Risk Exposure | Location on Statement of Operations | Value | Location on Statement of Operations | Value |
| Credit Risk | Net realized gain (loss) on swap agreement transactions | $ | 350,988 | | Change in net unrealized appreciation (depreciation) on swap agreements | $ | 474,434 | |
| Foreign Currency Risk | Net realized gain (loss) on forward foreign currency exchange contract transactions | 92,206 | | Change in net unrealized appreciation (depreciation) on forward foreign currency exchange contracts | 28,337 | |
| Interest Rate Risk | Net realized gain (loss) on futures contract transactions | (4,663,144) | | Change in net unrealized appreciation (depreciation) on futures contracts | 928,383 | |
| Other Contracts | Net realized gain (loss) on swap agreement transactions | 1,509,439 | | Change in net unrealized appreciation (depreciation) on swap agreements | (1,766,758) | |
| | $ | (2,710,511) | | | $ | (335,604) | |
8. Risk Factors
The value of the fund’s shares will go up and down, sometimes rapidly or unpredictably, based on the performance of the securities owned by the fund and other factors generally affecting the securities market. Market risks, including political, regulatory, economic and social developments, can affect the value of the fund’s investments. Natural disasters, public health emergencies, war, terrorism and other unforeseeable events may lead to increased market volatility and may have adverse long-term effects on world economies and markets generally.
The fund may invest in instruments that have variable or floating coupon rates based on the London Interbank Offered Rate (LIBOR). LIBOR is a benchmark interest rate intended to be representative of the rate at which certain major international banks lend to one another over short-terms. Financial institutions have started the process of phasing out LIBOR and the transition process to a replacement rate may lead to increased volatility or illiquidity in markets for instruments that rely on LIBOR. This could result in a change to the value of such instruments or a change in the cost of temporary borrowing for the fund.
There are certain risks involved in investing in foreign securities. These risks include those resulting from political events (such as civil unrest, national elections and imposition of exchange controls), social and economic events (such as labor strikes and rising inflation), and natural disasters. Securities of foreign issuers may be less liquid and more volatile. Investing in emerging markets or a significant portion of assets in one country or region may accentuate these risks.
The fund's investment process may result in high portfolio turnover, which could mean high transaction costs, affecting both performance and capital gains tax liabilities to investors.
9. Federal Tax Information
The tax character of distributions paid during the years ended March 31, 2023 and March 31, 2022 were as follows:
| | | | | | | | |
| 2023 | 2022 |
| Distributions Paid From | | |
| Ordinary income | $ | 15,346,206 | | $ | 15,711,604 | |
| Long-term capital gains | — | | $ | 2,791,809 | |
The book-basis character of distributions made during the year from net investment income or net realized gains may differ from their ultimate characterization for federal income tax purposes. These differences reflect the differing character of certain income items and net realized gains and losses for financial statement and tax purposes, and may result in reclassification among certain capital accounts on the financial statements.
As of period end, the federal tax cost of investments and the components of distributable earnings on a tax-basis were as follows:
| | | | | |
| Federal tax cost of investments | $ | 446,698,076 | |
| Gross tax appreciation of investments | $ | 3,092,522 | |
| Gross tax depreciation of investments | (26,537,708) | |
| Net tax appreciation (depreciation) of investments | (23,445,186) | |
Net tax appreciation (depreciation) on derivatives and translation of assets
and liabilities in foreign currencies | 33,121 | |
| Net tax appreciation (depreciation) | $ | (23,412,065) | |
| Other book-to-tax adjustments | $ | (13,016) | |
| Undistributed ordinary income | — | |
| Accumulated short-term capital losses | $ | (32,012,982) | |
| Accumulated long-term capital losses | $ | (28,462,293) | |
The difference between book-basis and tax-basis unrealized appreciation (depreciation) is attributable primarily to the realization for tax purposes of unrealized gains (losses) on futures contracts.
Accumulated capital losses represent net capital loss carryovers that may be used to offset future realized capital gains for federal income tax purposes. The capital loss carryovers may be carried forward for an unlimited period. Future capital loss carryover utilization in any given year may be subject to Internal Revenue Code limitations.
| | | | | | | | | | | | | | | | | | | | | | | | | | | | | | | | | | | | | | | | | | | | | | | |
| For a Share Outstanding Throughout the Years Ended March 31 (except as noted) | |
| Per-Share Data | | | | | | Ratios and Supplemental Data | | | |
| | Income From Investment Operations: | Distributions From: | | | Ratio to Average Net Assets of: | | |
| Net Asset
Value,
Beginning
of Period | Net Investment Income (Loss)(1) | Net
Realized
and
Unrealized
Gain (Loss) | Total From
Investment
Operations | Net
Investment
Income | Net
Realized
Gains | Total
Distributions | Net Asset
Value,
End
of Period | Total Return(2) | Operating
Expenses | Operating
Expenses
(before
expense
waiver) | Net
Investment
Income
(Loss) | Net
Investment
Income
(Loss)
(before
expense
waiver) | Portfolio
Turnover
Rate | Net
Assets,
End of
Period
(in thousands) |
| Investor Class | | | | | | | | | | | | | | |
| 2023 | $10.44 | 0.32 | (0.99) | (0.67) | (0.32) | — | (0.32) | $9.45 | (6.42)% | 0.55% | 0.55% | 3.37% | 3.37% | 174% | $369,558 | |
| 2022 | $11.18 | 0.25 | (0.62) | (0.37) | (0.27) | (0.10) | (0.37) | $10.44 | (3.55)% | 0.54% | 0.54% | 2.20% | 2.20% | 238% | $448,004 | |
| 2021 | $10.78 | 0.23 | 0.44 | 0.67 | (0.27) | — | (0.27) | $11.18 | 6.17% | 0.55% | 0.58% | 2.01% | 1.98% | 285% | $383,214 | |
| 2020 | $10.56 | 0.29 | 0.19 | 0.48 | (0.26) | — | (0.26) | $10.78 | 4.57% | 0.55% | 0.65% | 2.64% | 2.54% | 129% | $85,343 | |
| 2019 | $10.59 | 0.33 | 0.03 | 0.36 | (0.39) | — | (0.39) | $10.56 | 3.55% | 0.58% | 0.65% | 3.17% | 3.10% | 139% | $109,760 | |
| I Class | | | | | | | | | | | | | | | |
| 2023 | $10.44 | 0.33 | (0.99) | (0.66) | (0.33) | — | (0.33) | $9.45 | (6.33)% | 0.45% | 0.45% | 3.47% | 3.47% | 174% | $22,492 | |
| 2022 | $11.18 | 0.26 | (0.62) | (0.36) | (0.28) | (0.10) | (0.38) | $10.44 | (3.45)% | 0.44% | 0.44% | 2.30% | 2.30% | 238% | $35,057 | |
| 2021 | $10.77 | 0.24 | 0.45 | 0.69 | (0.28) | — | (0.28) | $11.18 | 6.26% | 0.45% | 0.48% | 2.11% | 2.08% | 285% | $39,729 | |
| 2020 | $10.56 | 0.30 | 0.18 | 0.48 | (0.27) | — | (0.27) | $10.77 | 4.67% | 0.45% | 0.55% | 2.74% | 2.64% | 129% | $27,999 | |
| 2019 | $10.58 | 0.34 | 0.04 | 0.38 | (0.40) | — | (0.40) | $10.56 | 3.76% | 0.48% | 0.55% | 3.27% | 3.20% | 139% | $6,269 | |
| | | | | | | | | | | | | | | | | | | | | | | | | | | | | | | | | | | | | | | | | | | | | | | |
| For a Share Outstanding Throughout the Years Ended March 31 (except as noted) | |
| Per-Share Data | | | | | | Ratios and Supplemental Data | | | |
| | Income From Investment Operations: | Distributions From: | | | Ratio to Average Net Assets of: | | |
| Net Asset
Value,
Beginning
of Period | Net Investment Income (Loss)(1) | Net
Realized
and
Unrealized
Gain (Loss) | Total From
Investment
Operations | Net
Investment
Income | Net
Realized
Gains | Total
Distributions | Net Asset
Value,
End
of Period | Total Return(2) | Operating
Expenses | Operating
Expenses
(before
expense
waiver) | Net
Investment
Income
(Loss) | Net
Investment
Income
(Loss)
(before
expense
waiver) | Portfolio
Turnover
Rate | Net
Assets,
End of
Period
(in thousands) |
| A Class | | | | | | | | | | | | | | | |
| 2023 | $10.44 | 0.30 | (1.00) | (0.70) | (0.29) | — | (0.29) | $9.45 | (6.66)% | 0.80% | 0.80% | 3.12% | 3.12% | 174% | $12,591 | |
| 2022 | $11.18 | 0.22 | (0.62) | (0.40) | (0.24) | (0.10) | (0.34) | $10.44 | (3.79)% | 0.79% | 0.79% | 1.95% | 1.95% | 238% | $15,294 | |
| 2021 | $10.78 | 0.21 | 0.43 | 0.64 | (0.24) | — | (0.24) | $11.18 | 5.91% | 0.80% | 0.83% | 1.76% | 1.73% | 285% | $19,275 | |
| 2020 | $10.56 | 0.26 | 0.19 | 0.45 | (0.23) | — | (0.23) | $10.78 | 4.31% | 0.80% | 0.90% | 2.39% | 2.29% | 129% | $16,670 | |
| 2019 | $10.59 | 0.30 | 0.04 | 0.34 | (0.37) | — | (0.37) | $10.56 | 3.30% | 0.83% | 0.90% | 2.92% | 2.85% | 139% | $15,630 | |
| C Class | | | | | | | | | | | | | | | |
| 2023 | $10.44 | 0.22 | (0.99) | (0.77) | (0.22) | — | (0.22) | $9.45 | (7.36)% | 1.55% | 1.55% | 2.37% | 2.37% | 174% | $638 | |
| 2022 | $11.18 | 0.13 | (0.62) | (0.49) | (0.15) | (0.10) | (0.25) | $10.44 | (4.51)% | 1.54% | 1.54% | 1.20% | 1.20% | 238% | $1,154 | |
| 2021 | $10.77 | 0.12 | 0.44 | 0.56 | (0.15) | — | (0.15) | $11.18 | 5.20% | 1.55% | 1.58% | 1.01% | 0.98% | 285% | $1,458 | |
| 2020 | $10.56 | 0.18 | 0.18 | 0.36 | (0.15) | — | (0.15) | $10.77 | 3.45% | 1.55% | 1.65% | 1.64% | 1.54% | 129% | $3,623 | |
| 2019 | $10.58 | 0.23 | 0.04 | 0.27 | (0.29) | — | (0.29) | $10.56 | 2.62% | 1.58% | 1.65% | 2.17% | 2.10% | 139% | $3,457 | |
| R Class | | | | | | | | | | | | | | | |
| 2023 | $10.44 | 0.28 | (1.00) | (0.72) | (0.27) | — | (0.27) | $9.45 | (6.89)% | 1.05% | 1.05% | 2.87% | 2.87% | 174% | $881 | |
| 2022 | $11.18 | 0.19 | (0.62) | (0.43) | (0.21) | (0.10) | (0.31) | $10.44 | (4.03)% | 1.04% | 1.04% | 1.70% | 1.70% | 238% | $825 | |
| 2021 | $10.77 | 0.18 | 0.44 | 0.62 | (0.21) | — | (0.21) | $11.18 | 5.64% | 1.05% | 1.08% | 1.51% | 1.48% | 285% | $591 | |
| 2020 | $10.56 | 0.23 | 0.19 | 0.42 | (0.21) | — | (0.21) | $10.77 | 4.05% | 1.05% | 1.15% | 2.14% | 2.04% | 129% | $487 | |
| 2019 | $10.59 | 0.28 | 0.03 | 0.31 | (0.34) | — | (0.34) | $10.56 | 3.04% | 1.08% | 1.15% | 2.67% | 2.60% | 139% | $615 | |
| | | | | | | | | | | | | | | | | | | | | | | | | | | | | | | | | | | | | | | | | | | | | | | |
| For a Share Outstanding Throughout the Years Ended March 31 (except as noted) | |
| Per-Share Data | | | | | | Ratios and Supplemental Data | | | |
| | Income From Investment Operations: | Distributions From: | | | Ratio to Average Net Assets of: | | |
| Net Asset
Value,
Beginning
of Period | Net Investment Income (Loss)(1) | Net
Realized
and
Unrealized
Gain (Loss) | Total From
Investment
Operations | Net
Investment
Income | Net
Realized
Gains | Total
Distributions | Net Asset
Value,
End
of Period | Total Return(2) | Operating
Expenses | Operating
Expenses
(before
expense
waiver) | Net
Investment
Income
(Loss) | Net
Investment
Income
(Loss)
(before
expense
waiver) | Portfolio
Turnover
Rate | Net
Assets,
End of
Period
(in thousands) |
| R5 Class | | | | | | | | | | | | | | | |
| 2023 | $10.43 | 0.34 | (0.98) | (0.64) | (0.34) | — | (0.34) | $9.45 | (6.15)% | 0.35% | 0.35% | 3.57% | 3.57% | 174% | $8,916 | |
| 2022 | $11.17 | 0.27 | (0.62) | (0.35) | (0.29) | (0.10) | (0.39) | $10.43 | (3.36)% | 0.34% | 0.34% | 2.40% | 2.40% | 238% | $10,737 | |
| 2021 | $10.77 | 0.26 | 0.43 | 0.69 | (0.29) | — | (0.29) | $11.17 | 6.38% | 0.35% | 0.38% | 2.21% | 2.18% | 285% | $10,817 | |
| 2020 | $10.56 | 0.31 | 0.18 | 0.49 | (0.28) | — | (0.28) | $10.77 | 4.68% | 0.35% | 0.45% | 2.84% | 2.74% | 129% | $10,193 | |
| 2019 | $10.58 | 0.35 | 0.04 | 0.39 | (0.41) | — | (0.41) | $10.56 | 3.86% | 0.38% | 0.45% | 3.37% | 3.30% | 139% | $9,910 | |
| G Class | | | | | | | | | | | | | | | |
| 2023 | $10.43 | 0.34 | (0.96) | (0.62) | (0.37) | — | (0.37) | $9.44 | (5.92)% | 0.01% | 0.35% | 3.91% | 3.57% | 174% | $5 | |
| 2022 | $11.17 | 0.30 | (0.62) | (0.32) | (0.32) | (0.10) | (0.42) | $10.43 | (3.04)% | 0.01% | 0.34% | 2.73% | 2.40% | 238% | $504 | |
2021(3) | $11.37 | 0.11 | (0.16) | (0.05) | (0.15) | — | (0.15) | $11.17 | (0.45)% | 0.01%(4) | 0.35%(4) | 2.47%(4) | 2.13%(4) | 285%(5) | $45,097 | |
| | |
| Notes to Financial Highlights |
(1)Computed using average shares outstanding throughout the period.
(2)Total returns are calculated based on the net asset value of the last business day and do not reflect applicable sales charges, if any. Total returns for periods less than one year are not annualized.
(3)November 4, 2020 (commencement of sale) through March 31, 2021.
(4)Annualized.
(5)Portfolio turnover is calculated at the fund level. Percentage indicated was calculated for the year ended March 31, 2021.
See Notes to Financial Statements.
| | |
| Report of Independent Registered Public Accounting Firm |
To the Shareholders and the Board of Trustees of American Century Investment Trust:
Opinion on the Financial Statements and Financial Highlights
We have audited the accompanying statement of assets and liabilities, including the schedule of investments, of Core Plus Fund (the “Fund”), one of the funds constituting the American Century Investment Trust, as of March 31, 2023, the related statement of operations for the year then ended, the statements of changes in net assets and financial highlights for the two years in the period then ended, and the related notes. In our opinion, the financial statements and financial highlights present fairly, in all material respects, the financial position of Core Plus Fund of the American Century Investment Trust, as of March 31, 2023, and the results of its operations for the year then ended, the changes in its net assets, and the financial highlights for the two years then ended in conformity with accounting principles generally accepted in the United States of America. The financial highlights for each of the three years in the period ended March 31, 2021, were audited by other auditors, whose report, dated May 18, 2021, expressed an unqualified opinion on such financial highlights.
Basis for Opinion
These financial statements and financial highlights are the responsibility of the Fund's management. Our responsibility is to express an opinion on the Fund’s financial statements and financial highlights based on our audit. We are a public accounting firm registered with the Public Company Accounting Oversight Board (United States) (PCAOB) and are required to be independent with respect to the Fund in accordance with the U.S. federal securities laws and the applicable rules and regulations of the Securities and Exchange Commission and the PCAOB.
We conducted our audits in accordance with the standards of the PCAOB. Those standards require that we plan and perform the audit to obtain reasonable assurance about whether the financial statements and financial highlights are free of material misstatement, whether due to error or fraud. The Fund is not required to have, nor were we engaged to perform, an audit of its internal control over financial reporting. As part of our audit, we are required to obtain an understanding of internal control over financial reporting but not for the purpose of expressing an opinion on the effectiveness of the Fund’s internal control over financial reporting. Accordingly, we express no such opinion.
Our audits included performing procedures to assess the risks of material misstatement of the financial statements and financial highlights, whether due to error or fraud, and performing procedures that respond to those risks. Such procedures included examining, on a test basis, evidence regarding the amounts and disclosures in the financial statements and financial highlights. Our audits also included evaluating the accounting principles used and significant estimates made by management, as well as evaluating the overall presentation of the financial statements and financial highlights. Our procedures included confirmation of securities owned as of March 31, 2023, by correspondence with the custodian and brokers; when replies were not received from brokers, we performed other auditing procedures. We believe that our audits provide a reasonable basis for our opinion.
/s/ Deloitte & Touche LLP
Kansas City, Missouri
May 16, 2023
We have served as the auditor of one or more American Century investment companies since 1997.
Board of Trustees
The individuals listed below serve as trustees of the funds. Each trustee will continue to serve in this capacity until death, retirement, resignation or removal from office. The board has adopted a mandatory retirement age for trustees who are not “interested persons,” as that term is defined in the Investment Company Act (independent trustees). Independent trustees shall retire on December 31 of the year in which they reach their 76th birthday.
Jonathan S. Thomas is an “interested person” because he currently serves as President and Chief Executive Officer of American Century Companies, Inc. (ACC), the parent company of American Century Investment Management, Inc. (ACIM or the advisor). The other trustees (more than three-fourths of the total number) are independent. They are not employees, directors or officers of, and have no financial interest in, ACC or any of its wholly owned, direct or indirect, subsidiaries, including ACIM, American Century Investment Services, Inc. (ACIS) and American Century Services, LLC (ACS), and they do not have any other affiliations, positions or relationships that would cause them to be considered “interested persons” under the Investment Company Act. The trustees serve in this capacity for eight (in the case of Jonathan S. Thomas, 16; and Jeremy I. Bulow, 9) registered investment companies in the American Century Investments family of funds.
The following table presents additional information about the trustees. The mailing address for each trustee other than Jonathan S. Thomas is 3945 Freedom Circle, Suite #800, Santa Clara, California 95054. The mailing address for Jonathan S. Thomas is 4500 Main Street, Kansas City, Missouri 64111.
| | | | | | | | | | | | | | | | | |
Name
(Year of Birth) | Position(s) Held with Funds | Length of Time Served | Principal Occupation(s) During Past 5 Years | Number of American Century Portfolios Overseen by Trustee | Other Directorships Held During Past 5 Years |
| Independent Trustees | | |
Tanya S. Beder
(1955) | Trustee and Board Chair | Since 2011 (Board Chair since 2022) | Chairman and CEO, SBCC Group Inc. (independent advisory services) (2006 to present) | 32 | Kirby Corporation; Nabors Industries, Ltd. |
Jeremy I. Bulow
(1954) | Trustee | Since 2011 | Professor of Economics, Stanford University, Graduate School of Business (1979 to present) | 77 | None |
Jennifer Cabalquinto
(1968) | Trustee | Since 2021 | Chief Financial Officer, 2K (interactive entertainment) (2021 to present); Special Advisor, GSW Sports, LLC (2020 to 2021); Chief Financial Officer, GSW Sports, LLC (2013 to 2020) | 32 | Sabio Holdings, Inc. |
Anne Casscells
(1958) | Trustee | Since 2016 | Co-Chief Executive Officer and Chief Investment Officer, Aetos Alternatives Management (investment advisory firm) (2001 to present) | 32 | None |
| | | | | | | | | | | | | | | | | |
Name
(Year of Birth) | Position(s) Held with Funds | Length of Time Served | Principal Occupation(s) During Past 5 Years | Number of American Century Portfolios Overseen by Trustee | Other Directorships Held During Past 5 Years |
| Independent Trustees | | |
Jonathan D. Levin
(1972) | Trustee | Since 2016 | Philip H. Knight Professor and Dean, Graduate School of Business, Stanford University (2016 to present); Professor, Stanford University, (2000 to present) | 32 | None |
Peter F. Pervere
(1947) | Trustee | Since 2007 | Retired | 32 | None |
John B. Shoven
(1947) | Trustee | Since 2002 | Charles R. Schwab Professor of Economics, Stanford University (1973 to present, emeritus since 2019) | 32 | Cadence Design Systems; Exponent; Financial Engines |
| Interested Trustee | | |
Jonathan S. Thomas
(1963) | Trustee | Since 2007 | President and Chief Executive Officer, ACC (2007 to present). Also serves as Chief Executive Officer, ACS; Director, ACC and other ACC subsidiaries | 141 | None |
The Statement of Additional Information has additional information about the fund's trustees and is available without charge, upon request, by calling 1-800-345-2021.
Officers
The following table presents certain information about the executive officers of the funds. Each officer serves as an officer for 16 investment companies in the American Century family of funds. No officer is compensated for his or her service as an officer of the funds. The listed officers are interested persons of the funds and are appointed or re-appointed on an annual basis. The mailing address for each of the officers listed below is 4500 Main Street, Kansas City, Missouri 64111.
| | | | | | | | |
Name
(Year of Birth) | Offices with the Funds | Principal Occupation(s) During the Past Five Years |
Patrick Bannigan
(1965)
| President since 2019 | Executive Vice President and Director, ACC (2012 to present); Chief Financial Officer, Chief Accounting Officer and Treasurer, ACC (2015 to present). Also serves as President, ACS; Vice President, ACIM; Chief Financial Officer, Chief Accounting Officer and/or Director, ACIM, ACS and other ACC subsidiaries |
R. Wes Campbell
(1974)
| Chief Financial Officer and Treasurer since 2018 | Vice President, ACS (2020 to present); Investment Operations and Investment Accounting, ACS (2000 to present) |
Amy D. Shelton
(1964) | Chief Compliance Officer and Vice President since 2014 | Chief Compliance Officer, American Century funds, (2014 to present); Chief Compliance Officer, ACIM (2014 to present); Chief Compliance Officer, ACIS (2009 to present). Also serves as Vice President, ACIS |
John Pak
(1968) | General Counsel and Senior Vice President since 2021 | General Counsel and Senior Vice President, ACC (2021 to present); Also serves as General Counsel and Senior Vice President, ACIM, ACS and ACIS. Chief Legal Officer of Investment and Wealth Management, The Bank of New York Mellon (2014 to 2021) |
David H. Reinmiller
(1963) | Vice President since 2000 | Attorney, ACC (1994 to present). Also serves as Vice President, ACIM and ACS |
Ward D. Stauffer
(1960) | Secretary since 2005 | Attorney, ACC (2003 to present) |
| | |
| Liquidity Risk Management Program |
The Fund has adopted a liquidity risk management program (the “program”). The Fund’s Board of Trustees (the "Board") has designated American Century Investment Management, Inc. (“ACIM”) as the administrator of the program. Personnel of ACIM or its affiliates, including members of ACIM’s Investment Oversight Committee who are members of ACIM’s Investment Management and Global Analytics departments, conduct the day-to-day operation of the program pursuant to the program.
Under the program, ACIM manages the Fund’s liquidity risk, which is the risk that the Fund could not meet shareholder redemption requests without significant dilution of remaining shareholders’ interests in the Fund. This risk is managed by monitoring the degree of liquidity of the Fund’s investments, limiting the amount of the Fund’s illiquid investments, and utilizing various risk management tools and facilities available to the Fund for meeting shareholder redemptions, among other means. ACIM’s process of determining the degree of liquidity of certain investments held by the Fund is supported by a third-party liquidity assessment vendor.
The Board reviewed a report prepared by ACIM regarding the operation and effectiveness of the program for the period January 1, 2022 through December 31, 2022. No significant liquidity events impacting the Fund were noted in the report. In addition, ACIM provided its assessment that the program had been effective in managing the Fund’s liquidity risk.
Retirement Account Information
As required by law, distributions you receive from certain retirement accounts are subject to federal income tax withholding at the IRS default rate of 10%.* Tax will be withheld on the total amount withdrawn even though you may be receiving amounts that are not subject to withholding, such as nondeductible contributions. In such case, excess amounts of withholding could occur. You may adjust your withholding election so that a greater or lesser amount will be withheld.
You may elect a different withholding rate, or request zero withholding, by submitting an acceptable IRS Form W-4R election with your distribution request. You may notify us of your W-4R election by telephone, on our distribution forms, on IRS Form W-4R, or through other acceptable electronic means. If your withholding election is for an automatic withdrawal plan, you have the right to revoke your election at any time and any election you make will remain in effect until revoked by filing a new election.
Remember, even if you elect not to have income tax withheld, you are liable for paying income tax on the taxable portion of your withdrawal. If you elect not to have income tax withheld or you don’t have enough income tax withheld, you may be responsible for payment of estimated tax. You may incur penalties under the estimated tax rules if your withholding and estimated tax payments are not sufficient. You can reduce or defer the income tax on a distribution by directly or indirectly rolling such distribution over to another IRA or eligible plan. You should consult your tax advisor for additional information.
State tax will be withheld according to state regulations if, at the time of your distribution, your tax residency is within one of the mandatory withholding states.
*Some 403(b), 457 and qualified retirement plan distributions may be subject to 20% mandatory withholding, as they are subject to special tax and withholding rules. Your plan administrator or plan sponsor is required to provide you with a special tax notice explaining those rules at the time you request a distribution. If applicable, federal and/or state taxes may be withheld from your distribution amount.
Proxy Voting Policies
Descriptions of the principles and policies that the fund's investment advisor uses in exercising the voting rights associated with the securities purchased and/or held by the fund are available without charge, upon request, by calling 1-800-345-2021 or visiting American Century Investments’ website at americancentury.com/proxy. A description of the policies is also available on the Securities and Exchange Commission’s website at sec.gov. Information regarding how the investment advisor voted proxies relating to portfolio securities during the most recent 12-month period ended June 30 is available on americancentury.com/proxy. It is also available at sec.gov.
Quarterly Portfolio Disclosure
The fund files its complete schedule of portfolio holdings with the Securities and Exchange Commission (SEC) for the first and third quarters of each fiscal year as an exhibit to its reports on Form N-PORT. These portfolio holdings are available on the fund's website at americancentury.com and, upon request, by calling 1-800-345-2021. The fund’s Form N-PORT reports are available on the SEC’s website at sec.gov.
| | | | | | | | |
| |
| | |
| Contact Us | americancentury.com | |
| Automated Information Line | 1-800-345-8765 | |
| Investor Services Representative | 1-800-345-2021
or 816-531-5575 | |
| Investors Using Advisors | 1-800-378-9878 | |
| Business, Not-For-Profit, Employer-Sponsored Retirement Plans | 1-800-345-3533 | |
| Banks and Trust Companies, Broker-Dealers, Financial Professionals, Insurance Companies | 1-800-345-6488 | |
| Telecommunications Relay Service for the Deaf | 711 | |
| | |
| American Century Investment Trust | |
| | |
Investment Advisor: American Century Investment Management, Inc. Kansas City, Missouri | |
| | |
| This report and the statements it contains are submitted for the general information of our shareholders. The report is not authorized for distribution to prospective investors unless preceded or accompanied by an effective prospectus. | |
| | |
©2023 American Century Proprietary Holdings, Inc. All rights reserved.
CL-ANN-92279 2305 | |

| | | | | |
| |
| Annual Report |
| |
| March 31, 2023 |
| |
| Diversified Bond Fund |
| Investor Class (ADFIX) |
| I Class (ACBPX) |
| Y Class (ADVYX) |
| A Class (ADFAX) |
| C Class (CDBCX) |
| R Class (ADVRX) |
| R5 Class (ADRVX) |
| R6 Class (ADDVX) |
| G Class (ACDOX) |
| | | | | |
| President’s Letter | |
| Performance | |
| Portfolio Commentary | |
| Fund Characteristics | |
| Shareholder Fee Example | |
| Schedule of Investments | |
| Statement of Assets and Liabilities | |
| Statement of Operations | |
| Statement of Changes in Net Assets | |
| Notes to Financial Statements | |
| Financial Highlights | |
| Report of Independent Registered Public Accounting Firm | |
| Management | |
| |
| Liquidity Risk Management Program | |
| |
| Additional Information | |
Any opinions expressed in this report reflect those of the author as of the date of the report, and do not necessarily represent the opinions of American Century Investments® or any other person in the American Century Investments organization. Any such opinions are subject to change at any time based upon market or other conditions and American Century Investments disclaims any responsibility to update such opinions. These opinions may not be relied upon as investment advice and, because investment decisions made by American Century Investments funds are based on numerous factors, may not be relied upon as an indication of trading intent on behalf of any American Century Investments fund. Security examples are used for representational purposes only and are not intended as recommendations to purchase or sell securities. Performance information for comparative indices and securities is provided to American Century Investments by third party vendors. To the best of American Century Investments’ knowledge, such information is accurate at the time of printing.
Jonathan Thomas
Dear Investor:
Thank you for reviewing this annual report for the period ended March 31, 2023. Annual reports help convey important information about fund returns, including market factors that affected performance. For additional investment insights, please visit americancentury.com.
Challenging Conditions Weighed on Asset Class Returns
Prevailing headwinds early in the reporting period continued to challenge U.S. financial markets throughout the 12 months. Asset class performance seesawed but declined overall amid mixed economic data, elevated inflation and anticipated monetary policy responses. By period-end, a new headwind emerged: banking industry uncertainty.
After launching its inflation-fighting rate-hike campaign in March 2022, the Federal Reserve (Fed) lifted rates eight more times by period-end. The federal funds target rate ended the reporting period at 4.75% to 5%, its highest level since 2007, while Treasury yields climbed to multiyear highs. Amid the Fed’s efforts, the annual inflation rate peaked at 9.1% in June, a 40-year high, before easing to 5% by March.
In addition to helping tame inflation, rapidly rising rates also fueled recession worries and led to expectations for the Fed to change course. This sentiment helped spark a rebound among stock and bond indices in the second half of the reporting period. The collapse of two U.S. regional banks late in the period and fears of a looming credit crunch and likely recession also contributed to market expectations for a Fed policy change. Nevertheless, the Fed indicated a near-term course change was unlikely.
Despite delivering strong gains in the second half of the reporting period, stock returns succumbed to first-half losses and declined for the 12 months. Similarly, weakness in the first half of the period overwhelmed second-half gains, and bond returns were negative for the 12-month period.
Remaining Diligent in Uncertain Times
We expect market volatility to linger as investors navigate a complex environment of still-high inflation, tighter financial conditions, banking industry turbulence and economic uncertainty. In addition, increasingly tense geopolitical considerations complicate the market backdrop.
We appreciate your confidence in us during these extraordinary times. Our firm has a long history of helping clients weather unpredictable and volatile markets, and we’re confident we will continue to meet today’s challenges.
Sincerely,
Jonathan Thomas
President and Chief Executive Officer
American Century Investments
| | | | | | | | | | | | | | | | | | | | |
| Total Returns as of March 31, 2023 | |
| | | Average Annual Returns | |
| Ticker
Symbol | 1 year | 5 years | 10 years | Since
Inception | Inception
Date |
| Investor Class | ADFIX | -5.56% | 0.67% | 1.12% | — | 12/3/01 |
| Bloomberg U.S. Aggregate Bond Index | — | -4.78% | 0.90% | 1.36% | — | — |
| I Class | ACBPX | -5.37% | 0.87% | 1.32% | — | 4/1/93 |
| Y Class | ADVYX | -5.33% | 0.92% | — | 0.91% | 4/10/17 |
| A Class | ADFAX | | | | | 12/3/01 |
| No sales charge | | -5.79% | 0.42% | 0.86% | — | |
| With sales charge | | -10.03% | -0.50% | 0.40% | — | |
| C Class | CDBCX | -6.51% | -0.33% | 0.11% | — | 1/31/03 |
| R Class | ADVRX | -6.03% | 0.18% | 0.61% | — | 7/29/05 |
| R5 Class | ADRVX | -5.40% | 0.87% | — | 0.86% | 4/10/17 |
| R6 Class | ADDVX | -5.31% | 0.94% | — | 1.69% | 7/26/13 |
| G Class | ACDOX | — | — | — | -1.10% | 5/19/22 |
Average annual returns since inception are presented when ten years of performance history is not available.
G Class returns would have been lower if a portion of the fees had not been waived.
C Class shares will automatically convert to A Class shares after being held for approximately eight years. C Class average annual returns do not reflect this conversion.
Sales charges include initial sales charges and contingent deferred sales charges (CDSCs), as applicable. A Class shares have a 4.50% maximum initial sales charge and may be subject to a maximum CDSC of 1.00%. C Class shares redeemed within 12 months of purchase are subject to a maximum CDSC of 1.00%. The SEC requires that mutual funds provide performance information net of maximum sales charges in all cases where charges could be applied.
Data presented reflect past performance. Past performance is no guarantee of future results. Current performance may be higher or lower than the performance shown. Total returns for periods less than one year are not annualized. Investment return and principal value will fluctuate, and redemption value may be more or less than original cost. Data assumes reinvestment of dividends and capital gains, and none of the charts reflect the deduction of taxes that a shareholder would pay on fund distributions or the redemption of fund shares. To obtain performance data current to the most recent month end, please call 1-800-345-2021 or visit americancentury.com. For additional information about the fund, please consult the prospectus.
| | |
| Growth of $10,000 Over 10 Years |
| $10,000 investment made March 31, 2013 |
| Performance for other share classes will vary due to differences in fee structure. |
| | | | | |
| Value on March 31, 2023 |
| Investor Class — $11,180 |
|
| Bloomberg U.S. Aggregate Bond Index — $11,451 |
|
| |
|
| | | | | | | | | | | | | | | | | | | | | | | | | | |
| Total Annual Fund Operating Expenses | |
| Investor Class | I Class | Y Class | A Class | C Class | R Class | R5 Class | R6 Class | G Class |
| 0.59% | 0.39% | 0.36% | 0.84% | 1.59% | 1.09% | 0.39% | 0.34% | 0.34% |
The total annual fund operating expenses shown is as stated in the fund’s prospectus current as of the date of this report. The prospectus may vary from the expense ratio shown elsewhere in this report because it is based on a different time period, includes acquired fund fees and expenses, and, if applicable, does not include fee waivers or expense reimbursements.
Data presented reflect past performance. Past performance is no guarantee of future results. Current performance may be higher or lower than the performance shown. Total returns for periods less than one year are not annualized. Investment return and principal value will fluctuate, and redemption value may be more or less than original cost. Data assumes reinvestment of dividends and capital gains, and none of the charts reflect the deduction of taxes that a shareholder would pay on fund distributions or the redemption of fund shares. To obtain performance data current to the most recent month end, please call 1-800-345-2021 or visit americancentury.com. For additional information about the fund, please consult the prospectus.
Portfolio Managers: Bob Gahagan, Jason Greenblath, Jeff Houston, Peter Van Gelderen and Charles Tan
Performance Summary
Diversified Bond returned -5.56%* for the 12 months ended March 31, 2023. By comparison, the Bloomberg U.S. Aggregate Bond Index returned -4.78%. Fund returns reflect operating expenses, while index returns do not.
Inflation, Federal Reserve Policy Challenged Bond Market
Elevated inflation, aggressive Federal Reserve (Fed) policy, rising interest rates and mounting recession risk dominated the reporting period and contributed to heightened market volatility. After peaking in June, inflation moderated through March but remained well above the Fed’s target, which led to consistent interest rate hikes. In March, the collapse of two U.S. regional banks introduced a new market headwind, as banks moved to tighten lending standards amid industry uncertainty.
Against this backdrop, Treasury yields were volatile, particularly during the banking industry turmoil. For the period overall, yields rose sharply across the yield curve. This dynamic contributed to negative 12-month returns for most investment-grade bond market sectors, including Treasuries, mortgage-backed securities (MBS) and corporate bonds. Credit-sensitive and longer maturity securities generally posted the largest losses.
Duration Detracted from Relative Performance
We began modestly extending the portfolio’s duration in the second half of 2022, as short-maturity Treasury yields were climbing to multiyear highs. In our view, the combination of high inflation, rising Treasury yields and aggressive Fed tightening would eventually trigger a recession and push yields lower. However, yields rose overall, and our longer-than-index duration positioning suffered. The strategy did aid relative results late in the period when the bank failures sparked a flight to quality.
Security Selection Among Securitized Issues Enhanced Relative Performance
Security selection aided relative results, primarily in the securitized sector. Our investments in agency MBS and asset-backed securities contributed, largely due to solid performance late in the period. These results more than offset negative selection effects from non-agency collateralized mortgage obligations. In the investment-grade corporate sector, our security selections slightly detracted.
Elsewhere, an out-of-index stake in inflation-linked securities boosted results early in the reporting period, as inflation was climbing. We exited the position by the end of 2022 amid expectations for growth to slow and inflation to moderate. Conversely, out-of-index exposure to high-yield corporates, which we exited in early 2023, modestly detracted.
*All fund returns referenced in this commentary are for Investor Class shares. Performance for other share classes will vary due to differences in fee structure; when Investor Class performance exceeds that of the index, other share classes may not. See page 3 for returns for all share classes.
| | | | | |
| MARCH 31, 2023 | |
| Types of Investments in Portfolio | % of net assets |
| U.S. Government Agency Mortgage-Backed Securities | 28.9% |
| U.S. Treasury Securities | 27.0% |
| Corporate Bonds | 22.4% |
| Collateralized Loan Obligations | 6.7% |
| Asset-Backed Securities | 5.4% |
| Collateralized Mortgage Obligations | 2.7% |
| Municipal Securities | 1.4% |
| Commercial Mortgage-Backed Securities | 1.1% |
| U.S. Government Agency Securities | 0.7% |
| Sovereign Governments and Agencies | 0.4% |
| Bank Loan Obligations | 0.1% |
| Short-Term Investments | 5.6% |
| Other Assets and Liabilities | (2.4)% |
Fund shareholders may incur two types of costs: (1) transaction costs, including sales charges (loads) on purchase payments and redemption/exchange fees; and (2) ongoing costs, including management fees; distribution and service (12b-1) fees; and other fund expenses. This example is intended to help you understand your ongoing costs (in dollars) of investing in your fund and to compare these costs with the ongoing cost of investing in other mutual funds.
The example is based on an investment of $1,000 made at the beginning of the period and held for the entire period from October 1, 2022 to March 31, 2023.
Actual Expenses
The table provides information about actual account values and actual expenses for each class. You may use the information, together with the amount you invested, to estimate the expenses that you paid over the period. First, identify the share class you own. Then simply divide your account value by $1,000 (for example, an $8,600 account value divided by $1,000 = 8.6), then multiply the result by the number under the heading “Expenses Paid During Period” to estimate the expenses you paid on your account during this period.
If you hold Investor Class shares of any American Century Investments mutual fund, or I Class shares of the American Century Diversified Bond Fund, in an American Century Investments account (i.e., not through a financial intermediary or employer-sponsored retirement plan account), American Century Investments may charge you a $25 annual account maintenance fee if the value of those shares is less than $10,000. We will redeem shares automatically in one of your accounts to pay the $25 fee. In determining your total eligible investment amount, we will include your investments in all personal accounts (including American Century Investments brokerage accounts) registered under your Social Security number. Personal accounts include individual accounts, joint accounts, UGMA/UTMA accounts, personal trusts, Coverdell Education Savings Accounts and IRAs (including traditional, Roth, Rollover, SEP-, SARSEP- and SIMPLE-IRAs), and certain other retirement accounts. If you have only business, business retirement, employer-sponsored or American Century Investments brokerage accounts, you are currently not subject to this fee. If you are subject to the account maintenance fee, your account value could be reduced by the fee amount.
Hypothetical Example for Comparison Purposes
The table also provides information about hypothetical account values and hypothetical expenses based on the actual expense ratio of each class of your fund and an assumed rate of return of 5% per year before expenses, which is not the actual return of a fund’s share class. The hypothetical account values and expenses may not be used to estimate the actual ending account balance or expenses you paid for the period. You may use this information to compare the ongoing costs of investing in your fund and other funds. To do so, compare this 5% hypothetical example with the 5% hypothetical examples that appear in the shareholder reports of the other funds.
Please note that the expenses shown in the table are meant to highlight your ongoing costs only and do not reflect any transactional costs, such as sales charges (loads) or redemption/exchange fees. Therefore, the table is useful in comparing ongoing costs only, and will not help you determine the relative total costs of owning different funds. In addition, if these transactional costs were included, your costs would have been higher.
| | | | | | | | | | | | | | |
| Beginning
Account Value
10/1/22 | Ending
Account Value
3/31/23 | Expenses Paid During Period(1) 10/1/22 - 3/31/23 | Annualized Expense Ratio(1) |
| Actual | | | | |
| Investor Class | $1,000 | $1,047.40 | $3.06 | 0.60% |
| I Class | $1,000 | $1,047.20 | $2.04 | 0.40% |
| Y Class | $1,000 | $1,048.50 | $1.89 | 0.37% |
| A Class | $1,000 | $1,044.90 | $4.33 | 0.85% |
| C Class | $1,000 | $1,041.00 | $8.14 | 1.60% |
| R Class | $1,000 | $1,044.80 | $5.61 | 1.10% |
| R5 Class | $1,000 | $1,047.20 | $2.04 | 0.40% |
| R6 Class | $1,000 | $1,048.60 | $1.79 | 0.35% |
| G Class | $1,000 | $1,050.40 | $0.05 | 0.01% |
| Hypothetical | | | | |
| Investor Class | $1,000 | $1,021.94 | $3.02 | 0.60% |
| I Class | $1,000 | $1,022.94 | $2.02 | 0.40% |
| Y Class | $1,000 | $1,023.09 | $1.87 | 0.37% |
| A Class | $1,000 | $1,020.69 | $4.28 | 0.85% |
| C Class | $1,000 | $1,016.95 | $8.05 | 1.60% |
| R Class | $1,000 | $1,019.45 | $5.54 | 1.10% |
| R5 Class | $1,000 | $1,022.94 | $2.02 | 0.40% |
| R6 Class | $1,000 | $1,023.19 | $1.77 | 0.35% |
| G Class | $1,000 | $1,024.88 | $0.05 | 0.01% |
(1)Expenses are equal to the class's annualized expense ratio listed in the table above, multiplied by the average account value over the period, multiplied by 182, the number of days in the most recent fiscal half-year, divided by 365, to reflect the one-half year period. Annualized expense ratio reflects actual expenses, including any applicable fee waivers or expense reimbursements and excluding any acquired fund fees and expenses.
MARCH 31, 2023
| | | | | | | | |
| Principal Amount | Value |
| U.S. GOVERNMENT AGENCY MORTGAGE-BACKED SECURITIES — 28.9% |
| Adjustable-Rate U.S. Government Agency Mortgage-Backed Securities — 0.2% | |
| FHLMC, VRN, 4.17%, (1-year H15T1Y plus 2.25%), 9/1/35 | $ | 184,033 | | $ | 188,638 | |
| FHLMC, VRN, 3.69%, (12-month LIBOR plus 1.87%), 7/1/36 | 509,180 | | 514,090 | |
| FHLMC, VRN, 4.20%, (1-year H15T1Y plus 2.14%), 10/1/36 | 504,993 | | 516,475 | |
| FHLMC, VRN, 3.95%, (1-year H15T1Y plus 2.26%), 4/1/37 | 408,863 | | 418,155 | |
| FHLMC, VRN, 4.09%, (12-month LIBOR plus 1.89%), 7/1/41 | 168,320 | | 166,543 | |
| FHLMC, VRN, 3.90%, (12-month LIBOR plus 1.65%), 12/1/42 | 195,272 | | 196,034 | |
| FHLMC, VRN, 3.02%, (12-month LIBOR plus 1.63%), 1/1/44 | 742,617 | | 743,389 | |
| FHLMC, VRN, 3.54%, (12-month LIBOR plus 1.60%), 6/1/45 | 460,085 | | 464,061 | |
| FHLMC, VRN, 3.77%, (12-month LIBOR plus 1.63%), 8/1/46 | 569,173 | | 572,476 | |
| FHLMC, VRN, 3.07%, (12-month LIBOR plus 1.64%), 9/1/47 | 383,989 | | 373,761 | |
| FNMA, VRN, 5.18%, (6-month LIBOR plus 1.57%), 6/1/35 | 290,671 | | 292,828 | |
| FNMA, VRN, 5.21%, (6-month LIBOR plus 1.57%), 6/1/35 | 654,920 | | 659,590 | |
| FNMA, VRN, 5.25%, (6-month LIBOR plus 1.57%), 6/1/35 | 209,751 | | 211,053 | |
| FNMA, VRN, 5.31%, (6-month LIBOR plus 1.57%), 6/1/35 | 56,932 | | 57,240 | |
| FNMA, VRN, 4.97%, (6-month LIBOR plus 1.54%), 9/1/35 | 284,025 | | 286,590 | |
| FNMA, VRN, 4.01%, (1-year H15T1Y plus 2.15%), 3/1/38 | 525,423 | | 537,732 | |
| FNMA, VRN, 6.09%, (12-month LIBOR plus 1.60%), 4/1/46 | 684,530 | | 701,489 | |
| FNMA, VRN, 3.18%, (12-month LIBOR plus 1.61%), 3/1/47 | 1,119,434 | | 1,081,805 | |
| FNMA, VRN, 3.12%, (12-month LIBOR plus 1.61%), 4/1/47 | 662,878 | | 640,568 | |
| FNMA, VRN, 3.09%, (12-month LIBOR plus 1.62%), 5/1/47 | 776,081 | | 773,112 | |
| FNMA, VRN, 3.20%, (12-month LIBOR plus 1.62%), 5/1/47 | 213,644 | | 211,010 | |
| | 9,606,639 | |
| Fixed-Rate U.S. Government Agency Mortgage-Backed Securities — 28.7% | |
| FHLMC, 6.00%, 9/1/35 | 1,114,732 | | 1,161,333 | |
| FHLMC, 6.00%, 2/1/38 | 635,123 | | 664,820 | |
| FHLMC, 2.50%, 3/1/42 | 24,536,484 | | 21,764,516 | |
| FHLMC, 3.00%, 1/1/50 | 39,207,024 | | 35,314,007 | |
| FHLMC, 3.50%, 5/1/50 | 5,186,281 | | 4,863,116 | |
| FHLMC, 2.50%, 10/1/50 | 25,171,058 | | 21,765,021 | |
| FHLMC, 2.50%, 5/1/51 | 9,198,884 | | 7,980,999 | |
| FHLMC, 3.50%, 5/1/51 | 34,277,934 | | 32,193,379 | |
| FHLMC, 3.00%, 7/1/51 | 13,229,003 | | 11,913,256 | |
| FHLMC, 2.00%, 8/1/51 | 40,362,769 | | 33,482,769 | |
| FHLMC, 2.00%, 8/1/51 | 28,349,720 | | 23,521,945 | |
| FHLMC, 2.50%, 8/1/51 | 26,810,953 | | 23,164,493 | |
| FHLMC, 4.00%, 8/1/51 | 11,845,354 | | 11,435,716 | |
| FHLMC, 2.50%, 10/1/51 | 15,882,582 | | 13,862,483 | |
| FHLMC, 2.50%, 12/1/51 | 12,927,160 | | 11,172,652 | |
| FHLMC, 3.00%, 12/1/51 | 19,537,551 | | 17,582,688 | |
| FHLMC, 3.00%, 2/1/52 | 19,727,879 | | 17,796,404 | |
| FHLMC, 3.50%, 5/1/52 | 16,317,629 | | 15,305,874 | |
| FHLMC, 4.00%, 5/1/52 | 24,105,466 | | 23,085,459 | |
| FHLMC, 4.00%, 5/1/52 | 20,465,978 | | 19,744,808 | |
| FHLMC, 5.00%, 7/1/52 | 12,541,964 | | 12,685,578 | |
| FHLMC, 4.50%, 10/1/52 | 43,870,355 | | 43,133,711 | |
| FHLMC, 4.50%, 10/1/52 | 35,376,098 | | 34,692,063 | |
| | | | | | | | |
| Principal Amount | Value |
| FHLMC, 6.00%, 11/1/52 | $ | 56,379,195 | | $ | 57,947,887 | |
| FHLMC, 5.50%, 12/1/52 | 9,215,845 | | 9,337,745 | |
| FNMA, 6.00%, 12/1/33 | 446,341 | | 464,481 | |
| FNMA, 3.50%, 3/1/34 | 1,832,064 | | 1,779,305 | |
| FNMA, 2.00%, 5/1/36 | 15,464,047 | | 13,976,252 | |
| FNMA, 2.00%, 1/1/37 | 25,468,679 | | 23,008,301 | |
| FNMA, 6.00%, 9/1/37 | 810,424 | | 846,105 | |
| FNMA, 6.00%, 11/1/37 | 736,845 | | 770,786 | |
| FNMA, 4.50%, 4/1/39 | 854,041 | | 859,700 | |
| FNMA, 4.50%, 5/1/39 | 2,432,431 | | 2,448,551 | |
| FNMA, 6.50%, 5/1/39 | 426,517 | | 449,476 | |
| FNMA, 4.50%, 9/1/39 | 760,043 | | 763,105 | |
| FNMA, 4.50%, 10/1/39 | 4,167,593 | | 4,195,224 | |
| FNMA, 4.50%, 11/1/40 | 557,125 | | 560,814 | |
| FNMA, 3.50%, 12/1/40 | 85,133 | | 81,347 | |
| FNMA, 4.00%, 8/1/41 | 3,661,860 | | 3,598,781 | |
| FNMA, 4.50%, 9/1/41 | 478,365 | | 480,294 | |
| FNMA, 3.50%, 10/1/41 | 3,349,671 | | 3,198,968 | |
| FNMA, 3.50%, 12/1/41 | 2,674,648 | | 2,554,238 | |
| FNMA, 4.00%, 12/1/41 | 1,529,926 | | 1,498,739 | |
| FNMA, 3.50%, 2/1/42 | 3,911,068 | | 3,735,020 | |
| FNMA, 2.50%, 3/1/42 | 23,149,747 | | 20,477,226 | |
| FNMA, 3.50%, 5/1/42 | 774,979 | | 740,107 | |
| FNMA, 2.50%, 6/1/42 | 19,507,617 | | 17,303,854 | |
| FNMA, 3.50%, 6/1/42 | 10,179,186 | | 9,720,988 | |
| FNMA, 3.50%, 8/1/42 | 6,736,802 | | 6,433,495 | |
| FNMA, 3.50%, 9/1/42 | 1,129,231 | | 1,078,217 | |
| FNMA, 4.00%, 11/1/45 | 1,294,482 | | 1,260,470 | |
| FNMA, 4.00%, 11/1/45 | 1,180,056 | | 1,151,611 | |
| FNMA, 4.00%, 2/1/46 | 2,031,374 | | 1,981,990 | |
| FNMA, 4.00%, 4/1/46 | 3,282,843 | | 3,204,051 | |
| FNMA, 2.50%, 4/1/50 | 20,549,055 | | 17,789,125 | |
| FNMA, 3.00%, 5/1/50 | 3,621,319 | | 3,321,208 | |
| FNMA, 2.50%, 6/1/50 | 26,704,737 | | 23,192,662 | |
| FNMA, 4.00%, 5/1/51 | 35,097,633 | | 33,991,602 | |
| FNMA, 3.00%, 6/1/51 | 1,801,903 | | 1,642,579 | |
| FNMA, 2.50%, 9/1/51 | 29,996,649 | | 25,903,925 | |
| FNMA, 2.50%, 12/1/51 | 25,390,068 | | 21,936,785 | |
| FNMA, 2.50%, 12/1/51 | 4,023,940 | | 3,475,396 | |
| FNMA, 2.50%, 1/1/52 | 7,075,286 | | 6,110,792 | |
| FNMA, 2.50%, 2/1/52 | 10,939,329 | | 9,485,062 | |
| FNMA, 3.00%, 2/1/52 | 34,187,834 | | 30,750,833 | |
| FNMA, 3.00%, 2/1/52 | 19,311,526 | | 17,420,647 | |
| FNMA, 2.00%, 3/1/52 | 50,754,552 | | 42,138,360 | |
| FNMA, 2.50%, 3/1/52 | 31,644,838 | | 27,476,892 | |
| FNMA, 3.00%, 4/1/52 | 11,884,007 | | 10,720,483 | |
| FNMA, 3.50%, 4/1/52 | 9,099,756 | | 8,465,762 | |
| FNMA, 4.00%, 4/1/52 | 25,308,247 | | 24,392,985 | |
| FNMA, 4.00%, 4/1/52 | 11,696,560 | | 11,288,022 | |
| FNMA, 4.00%, 4/1/52 | 8,515,998 | | 8,166,754 | |
| FNMA, 2.50%, 5/1/52 | 50,780,586 | | 43,888,624 | |
| FNMA, 3.00%, 5/1/52 | 18,396,306 | | 16,706,615 | |
| | | | | | | | |
| Principal Amount | Value |
| FNMA, 3.50%, 5/1/52 | $ | 43,246,666 | | $ | 40,256,195 | |
| FNMA, 3.50%, 5/1/52 | 36,829,765 | | 34,330,991 | |
| FNMA, 3.50%, 5/1/52 | 28,644,261 | | 26,924,230 | |
| FNMA, 4.00%, 5/1/52 | 36,032,662 | | 34,510,759 | |
| FNMA, 3.00%, 6/1/52 | 7,472,358 | | 6,786,003 | |
| FNMA, 4.50%, 7/1/52 | 20,531,751 | | 20,144,351 | |
| FNMA, 5.00%, 8/1/52 | 58,935,400 | | 58,944,180 | |
| FNMA, 4.50%, 9/1/52 | 15,183,093 | | 15,096,346 | |
| FNMA, 5.00%, 9/1/52 | 17,509,751 | | 17,701,941 | |
| FNMA, 5.50%, 10/1/52 | 29,171,719 | | 29,492,386 | |
| FNMA, 5.50%, 1/1/53 | 50,798,396 | | 51,381,772 | |
| FNMA, 6.50%, 1/1/53 | 52,519,812 | | 54,245,846 | |
| FNMA, 5.00%, 2/1/53 | 12,379,083 | | 12,379,600 | |
| FNMA, 4.00%, 6/1/57 | 2,677,294 | | 2,616,959 | |
| FNMA, 4.00%, 11/1/59 | 2,608,746 | | 2,530,446 | |
| GNMA, 7.00%, 4/20/26 | 431 | | 436 | |
| GNMA, 7.50%, 8/15/26 | 1,082 | | 1,098 | |
| GNMA, 8.00%, 8/15/26 | 320 | | 326 | |
| GNMA, 8.00%, 6/15/27 | 1,877 | | 1,872 | |
| GNMA, 6.50%, 3/15/28 | 2,596 | | 2,674 | |
| GNMA, 6.50%, 5/15/28 | 6,498 | | 6,694 | |
| GNMA, 7.00%, 5/15/31 | 7,914 | | 8,309 | |
| GNMA, 6.00%, 7/15/33 | 274,460 | | 287,843 | |
| GNMA, 4.50%, 8/15/33 | 564,380 | | 565,990 | |
| GNMA, 6.00%, 9/20/38 | 214,995 | | 227,666 | |
| GNMA, 5.50%, 11/15/38 | 294,136 | | 302,828 | |
| GNMA, 5.50%, 11/15/38 | 120,572 | | 123,121 | |
| GNMA, 5.50%, 1/15/39 | 337,884 | | 353,642 | |
| GNMA, 6.00%, 1/20/39 | 78,940 | | 83,625 | |
| GNMA, 6.00%, 2/20/39 | 75,854 | | 80,336 | |
| GNMA, 4.50%, 4/15/39 | 449,288 | | 449,993 | |
| GNMA, 4.50%, 6/15/39 | 645,803 | | 652,765 | |
| GNMA, 5.00%, 9/15/39 | 19,395 | | 20,018 | |
| GNMA, 5.50%, 9/15/39 | 28,153 | | 29,637 | |
| GNMA, 5.00%, 10/15/39 | 307,010 | | 316,879 | |
| GNMA, 4.50%, 1/15/40 | 571,936 | | 577,599 | |
| GNMA, 4.00%, 11/20/40 | 769,592 | | 760,601 | |
| GNMA, 4.00%, 12/15/40 | 304,370 | | 291,862 | |
| GNMA, 4.50%, 12/15/40 | 1,251,038 | | 1,264,415 | |
| GNMA, 4.50%, 6/15/41 | 240,919 | | 243,524 | |
| GNMA, 3.50%, 4/20/42 | 1,749,616 | | 1,673,148 | |
| GNMA, 3.50%, 6/20/42 | 5,665,906 | | 5,419,957 | |
| GNMA, 3.50%, 3/20/43 | 248,916 | | 238,673 | |
| GNMA, 3.50%, 4/20/43 | 1,529,416 | | 1,464,455 | |
| GNMA, 3.50%, 3/15/46 | 984,318 | | 957,812 | |
| GNMA, 3.00%, 4/20/50 | 9,457,807 | | 8,698,908 | |
| GNMA, 3.00%, 5/20/50 | 9,657,153 | | 8,877,062 | |
| GNMA, 3.00%, 6/20/50 | 14,472,181 | | 13,321,810 | |
| GNMA, 3.00%, 7/20/50 | 25,570,982 | | 23,492,075 | |
| GNMA, 2.00%, 10/20/50 | 86,660,444 | | 74,237,330 | |
| GNMA, 2.50%, 11/20/50 | 33,430,847 | | 28,884,500 | |
| GNMA, 2.50%, 2/20/51 | 24,327,452 | | 21,530,696 | |
| | | | | | | | |
| Principal Amount | Value |
| GNMA, 3.50%, 2/20/51 | $ | 2,427,331 | | $ | 2,298,834 | |
| GNMA, 3.50%, 6/20/51 | 17,232,437 | | 16,286,425 | |
| GNMA, 2.50%, 9/20/51 | 21,097,737 | | 18,590,792 | |
| GNMA, 2.50%, 12/20/51 | 38,894,985 | | 34,271,127 | |
| GNMA, 5.50%, TBA | 54,583,000 | | 55,159,746 | |
| UMBS, 6.00%, TBA | 30,842,000 | | 31,462,454 | |
| | 1,783,320,893 | |
TOTAL U.S. GOVERNMENT AGENCY MORTGAGE-BACKED SECURITIES (Cost $1,838,898,679) | 1,792,927,532 | |
| U.S. TREASURY SECURITIES — 27.0% | | |
| U.S. Treasury Bonds, 5.00%, 5/15/37 | 5,000,000 | | 5,836,621 | |
| U.S. Treasury Bonds, 4.50%, 5/15/38 | 10,000,000 | | 11,098,437 | |
| U.S. Treasury Bonds, 3.50%, 2/15/39 | 25,000,000 | | 24,726,074 | |
| U.S. Treasury Bonds, 1.125%, 8/15/40 | 3,000,000 | | 1,985,508 | |
| U.S. Treasury Bonds, 1.375%, 11/15/40 | 3,000,000 | | 2,068,945 | |
| U.S. Treasury Bonds, 3.75%, 8/15/41 | 4,000,000 | | 3,997,266 | |
| U.S. Treasury Bonds, 2.00%, 11/15/41 | 4,000,000 | | 3,022,109 | |
| U.S. Treasury Bonds, 3.125%, 11/15/41 | 20,762,000 | | 18,942,892 | |
| U.S. Treasury Bonds, 3.00%, 5/15/42 | 35,000,000 | | 31,108,301 | |
| U.S. Treasury Bonds, 3.25%, 5/15/42 | 20,000,000 | | 18,464,062 | |
| U.S. Treasury Bonds, 3.375%, 8/15/42 | 85,000,000 | | 79,846,875 | |
| U.S. Treasury Bonds, 4.00%, 11/15/42 | 71,000,000 | | 72,952,500 | |
| U.S. Treasury Bonds, 2.875%, 5/15/43 | 6,500,000 | | 5,621,357 | |
| U.S. Treasury Bonds, 3.75%, 11/15/43 | 8,000,000 | | 7,908,594 | |
| U.S. Treasury Bonds, 3.125%, 8/15/44 | 1,000,000 | | 893,008 | |
| U.S. Treasury Bonds, 2.50%, 2/15/45 | 7,600,000 | | 6,070,352 | |
| U.S. Treasury Bonds, 2.50%, 2/15/46 | 8,000,000 | | 6,360,625 | |
| U.S. Treasury Bonds, 2.75%, 8/15/47 | 5,000,000 | | 4,159,766 | |
| U.S. Treasury Bonds, 2.75%, 11/15/47 | 5,000,000 | | 4,163,379 | |
| U.S. Treasury Bonds, 3.00%, 8/15/48 | 2,100,000 | | 1,835,203 | |
| U.S. Treasury Bonds, 3.375%, 11/15/48 | 23,000,000 | | 21,527,461 | |
| U.S. Treasury Bonds, 2.875%, 5/15/49 | 6,000,000 | | 5,137,969 | |
| U.S. Treasury Bonds, 2.25%, 8/15/49 | 17,000,000 | | 12,793,828 | |
| U.S. Treasury Bonds, 2.375%, 11/15/49 | 8,000,000 | | 6,185,625 | |
| U.S. Treasury Bonds, 2.00%, 2/15/50 | 15,000,000 | | 10,640,625 | |
| U.S. Treasury Bonds, 1.25%, 5/15/50 | 9,500,000 | | 5,528,555 | |
| U.S. Treasury Bonds, 1.625%, 11/15/50 | 1,000,000 | | 641,875 | |
| U.S. Treasury Bonds, 3.00%, 8/15/52 | 22,000,000 | | 19,332,500 | |
| U.S. Treasury Bonds, 4.00%, 11/15/52 | 120,000,000 | | 127,387,500 | |
U.S. Treasury Notes, 3.00%, 6/30/24(1) | 30,000,000 | | 29,472,070 | |
U.S. Treasury Notes, 4.50%, 11/30/24(1) | 6,000,000 | | 6,024,609 | |
| U.S. Treasury Notes, 1.125%, 1/15/25 | 2,000,000 | | 1,895,938 | |
| U.S. Treasury Notes, 4.625%, 2/28/25 | 15,000,000 | | 15,147,070 | |
| U.S. Treasury Notes, 2.75%, 6/30/25 | 24,000,000 | | 23,364,844 | |
| U.S. Treasury Notes, 3.50%, 9/15/25 | 65,000,000 | | 64,391,894 | |
| U.S. Treasury Notes, 3.00%, 9/30/25 | 20,000,000 | | 19,566,016 | |
| U.S. Treasury Notes, 4.50%, 11/15/25 | 70,000,000 | | 71,045,899 | |
| U.S. Treasury Notes, 4.00%, 12/15/25 | 95,000,000 | | 95,375,626 | |
| U.S. Treasury Notes, 2.625%, 12/31/25 | 8,000,000 | | 7,745,469 | |
| U.S. Treasury Notes, 4.625%, 3/15/26 | 152,000,000 | | 155,473,437 | |
| U.S. Treasury Notes, 1.75%, 12/31/26 | 3,500,000 | | 3,259,922 | |
| U.S. Treasury Notes, 0.50%, 8/31/27 | 3,000,000 | | 2,615,742 | |
| | | | | | | | |
| Principal Amount | Value |
| U.S. Treasury Notes, 3.875%, 11/30/27 | $ | 173,500,000 | | $ | 175,333,272 | |
| U.S. Treasury Notes, 3.875%, 12/31/27 | 25,000,000 | | 25,268,066 | |
| U.S. Treasury Notes, 4.00%, 2/29/28 | 157,100,000 | | 159,953,574 | |
| U.S. Treasury Notes, 1.25%, 4/30/28 | 33,600,000 | | 29,926,969 | |
| U.S. Treasury Notes, 1.25%, 6/30/28 | 7,000,000 | | 6,215,098 | |
| U.S. Treasury Notes, 1.25%, 9/30/28 | 2,000,000 | | 1,765,352 | |
| U.S. Treasury Notes, 1.875%, 2/28/29 | 15,000,000 | | 13,631,543 | |
| U.S. Treasury Notes, 3.875%, 11/30/29 | 45,000,000 | | 45,791,015 | |
| U.S. Treasury Notes, 3.875%, 12/31/29 | 30,000,000 | | 30,548,437 | |
| U.S. Treasury Notes, 3.50%, 1/31/30 | 70,000,000 | | 69,726,562 | |
| U.S. Treasury Notes, 3.625%, 3/31/30 | 43,000,000 | | 43,214,813 | |
| U.S. Treasury Notes, 4.125%, 11/15/32 | 55,000,000 | | 57,801,562 | |
TOTAL U.S. TREASURY SECURITIES (Cost $1,700,808,503) | | 1,674,792,611 | |
| CORPORATE BONDS — 22.4% | | |
| Aerospace and Defense — 0.4% | | |
| Boeing Co., 5.81%, 5/1/50 | 5,752,000 | | 5,798,334 | |
| Lockheed Martin Corp., 5.25%, 1/15/33 | 3,271,000 | | 3,496,122 | |
| Northrop Grumman Corp., 5.15%, 5/1/40 | 828,000 | | 838,834 | |
| Northrop Grumman Corp., 4.95%, 3/15/53 | 1,716,000 | | 1,713,280 | |
| Raytheon Technologies Corp., 4.125%, 11/16/28 | 8,766,000 | | 8,648,679 | |
| Raytheon Technologies Corp., 3.125%, 7/1/50 | 3,150,000 | | 2,353,380 | |
| Raytheon Technologies Corp., 5.375%, 2/27/53 | 4,600,000 | | 4,848,322 | |
| | 27,696,951 | |
| Air Freight and Logistics — 0.1% | | |
| GXO Logistics, Inc., 2.65%, 7/15/31 | 5,697,000 | | 4,436,000 | |
| Automobiles — 0.5% | | |
| General Motors Co., 5.15%, 4/1/38 | 1,646,000 | | 1,486,235 | |
| General Motors Financial Co., Inc., 2.75%, 6/20/25 | 13,221,000 | | 12,524,576 | |
| General Motors Financial Co., Inc., 2.40%, 10/15/28 | 4,676,000 | | 4,003,391 | |
| Toyota Motor Credit Corp., 4.625%, 1/12/28 | 13,072,000 | | 13,261,029 | |
| | 31,275,231 | |
| Banks — 4.1% | | |
| Banco Santander SA, VRN, 1.72%, 9/14/27 | 6,600,000 | | 5,767,925 | |
| Banco Santander SA, VRN, 4.18%, 3/24/28 | 3,400,000 | | 3,194,992 | |
| Bank of America Corp., VRN, 1.73%, 7/22/27 | 15,285,000 | | 13,718,753 | |
| Bank of America Corp., VRN, 2.88%, 10/22/30 | 22,995,000 | | 20,020,524 | |
| Bank of America Corp., VRN, 2.57%, 10/20/32 | 4,280,000 | | 3,501,073 | |
| Bank of America Corp., VRN, 4.57%, 4/27/33 | 7,380,000 | | 7,030,526 | |
| Bank of America Corp., VRN, 2.48%, 9/21/36 | 5,400,000 | | 4,104,746 | |
| Barclays PLC, VRN, 2.28%, 11/24/27 | 4,700,000 | | 4,133,507 | |
| Barclays PLC, VRN, 7.39%, 11/2/28 | 1,785,000 | | 1,893,605 | |
BNP Paribas SA, VRN, 5.125%, 1/13/29(2) | 5,955,000 | | 5,971,931 | |
BPCE SA, VRN, 5.98%, 1/18/27(2) | 5,642,000 | | 5,632,879 | |
| Citigroup, Inc., VRN, 3.07%, 2/24/28 | 7,444,000 | | 6,928,133 | |
| Citigroup, Inc., VRN, 3.67%, 7/24/28 | 10,892,000 | | 10,326,951 | |
| Citigroup, Inc., VRN, 3.52%, 10/27/28 | 9,506,000 | | 8,893,112 | |
| Citigroup, Inc., VRN, 4.41%, 3/31/31 | 3,100,000 | | 2,945,242 | |
| Citigroup, Inc., VRN, 3.06%, 1/25/33 | 11,310,000 | | 9,579,533 | |
| Commonwealth Bank of Australia, 5.32%, 3/13/26 | 7,497,000 | | 7,628,839 | |
Cooperatieve Rabobank UA, VRN, 5.56%, 2/28/29(2) | 6,055,000 | | 6,101,549 | |
Credit Agricole SA, 5.30%, 7/12/28(2) | 2,800,000 | | 2,840,735 | |
| | | | | | | | |
| Principal Amount | Value |
| HSBC Holdings PLC, VRN, 0.73%, 8/17/24 | $ | 5,160,000 | | $ | 5,054,008 | |
| HSBC Holdings PLC, VRN, 1.16%, 11/22/24 | 2,124,000 | | 2,061,738 | |
| HSBC Holdings PLC, VRN, 2.80%, 5/24/32 | 8,497,000 | | 6,943,932 | |
| HSBC Holdings PLC, VRN, 6.33%, 3/9/44 | 4,780,000 | | 5,060,283 | |
| JPMorgan Chase & Co., VRN, 1.58%, 4/22/27 | 6,578,000 | | 5,915,129 | |
| JPMorgan Chase & Co., VRN, 2.95%, 2/24/28 | 10,696,000 | | 9,923,825 | |
| JPMorgan Chase & Co., VRN, 2.07%, 6/1/29 | 16,742,000 | | 14,538,863 | |
| JPMorgan Chase & Co., VRN, 2.52%, 4/22/31 | 15,313,000 | | 13,099,854 | |
| JPMorgan Chase & Co., VRN, 2.58%, 4/22/32 | 7,070,000 | | 5,954,031 | |
| Lloyds Banking Group PLC, VRN, 5.87%, 3/6/29 | 5,019,000 | | 5,064,245 | |
| Mitsubishi UFJ Financial Group, Inc., VRN, 5.44%, 2/22/34 | 4,391,000 | | 4,440,000 | |
| PNC Financial Services Group, Inc., VRN, 5.07%, 1/24/34 | 8,840,000 | | 8,727,791 | |
| Royal Bank of Canada, 6.00%, 11/1/27 | 7,930,000 | | 8,276,172 | |
Societe Generale SA, VRN, 6.69%, 1/10/34(2) | 5,350,000 | | 5,477,735 | |
| Toronto-Dominion Bank, 2.45%, 1/12/32 | 5,135,000 | | 4,261,166 | |
| Toronto-Dominion Bank, 4.46%, 6/8/32 | 2,797,000 | | 2,725,416 | |
| Truist Bank, 3.30%, 5/15/26 | 4,350,000 | | 4,010,127 | |
| Truist Bank, VRN, 2.64%, 9/17/29 | 4,384,000 | | 4,118,525 | |
| Truist Financial Corp., VRN, 5.12%, 1/26/34 | 4,155,000 | | 4,055,552 | |
| Wells Fargo & Co., VRN, 4.54%, 8/15/26 | 3,810,000 | | 3,743,303 | |
| | 253,666,250 | |
| Beverages — 0.4% | | |
| Anheuser-Busch Cos. LLC / Anheuser-Busch InBev Worldwide, Inc., 4.90%, 2/1/46 | 7,777,000 | | 7,610,133 | |
| Anheuser-Busch InBev Worldwide, Inc., 4.75%, 1/23/29 | 11,491,000 | | 11,741,305 | |
| Keurig Dr Pepper, Inc., 4.05%, 4/15/32 | 2,740,000 | | 2,598,986 | |
| PepsiCo, Inc., 3.90%, 7/18/32 | 2,222,000 | | 2,173,020 | |
| | 24,123,444 | |
| Biotechnology — 0.9% | | |
| AbbVie, Inc., 3.20%, 11/21/29 | 13,706,000 | | 12,724,737 | |
| AbbVie, Inc., 4.40%, 11/6/42 | 9,415,000 | | 8,612,163 | |
| Amgen, Inc., 4.05%, 8/18/29 | 13,980,000 | | 13,498,982 | |
| Amgen, Inc., 5.25%, 3/2/33 | 5,500,000 | | 5,653,702 | |
| Amgen, Inc., 5.60%, 3/2/43 | 6,800,000 | | 7,011,115 | |
| Amgen, Inc., 5.65%, 3/2/53 | 6,400,000 | | 6,666,987 | |
| | 54,167,686 | |
| Broadline Retail — 0.1% | | |
| Amazon.com, Inc., 4.60%, 12/1/25 | 1,530,000 | | 1,543,259 | |
| Amazon.com, Inc., 4.55%, 12/1/27 | 2,920,000 | | 2,965,672 | |
| | 4,508,931 | |
Building Products† | | |
| Trane Technologies Financing Ltd., 5.25%, 3/3/33 | 2,700,000 | | 2,792,919 | |
| Capital Markets — 1.7% | | |
| Ameriprise Financial, Inc., 5.15%, 5/15/33 | 7,265,000 | | 7,250,621 | |
| CME Group, Inc., 2.65%, 3/15/32 | 556,000 | | 482,972 | |
| Deutsche Bank AG, VRN, 4.30%, 5/24/28 | 2,373,000 | | 2,340,800 | |
| Goldman Sachs Group, Inc., VRN, 1.76%, 1/24/25 | 9,706,000 | | 9,397,372 | |
| Goldman Sachs Group, Inc., VRN, 1.43%, 3/9/27 | 11,830,000 | | 10,596,759 | |
| Goldman Sachs Group, Inc., VRN, 1.95%, 10/21/27 | 11,969,000 | | 10,704,569 | |
| Goldman Sachs Group, Inc., VRN, 3.81%, 4/23/29 | 1,641,000 | | 1,542,870 | |
| Goldman Sachs Group, Inc., VRN, 1.99%, 1/27/32 | 6,765,000 | | 5,408,803 | |
| Golub Capital BDC, Inc., 2.50%, 8/24/26 | 2,794,000 | | 2,398,809 | |
| | | | | | | | |
| Principal Amount | Value |
| Morgan Stanley, VRN, 1.16%, 10/21/25 | $ | 10,317,000 | | $ | 9,641,141 | |
| Morgan Stanley, VRN, 2.63%, 2/18/26 | 14,569,000 | | 13,838,280 | |
| Morgan Stanley, VRN, 5.12%, 2/1/29 | 2,086,000 | | 2,104,198 | |
| Morgan Stanley, VRN, 2.70%, 1/22/31 | 13,045,000 | | 11,244,040 | |
| Morgan Stanley, VRN, 2.51%, 10/20/32 | 4,830,000 | | 3,960,180 | |
| Owl Rock Capital Corp., 3.40%, 7/15/26 | 1,084,000 | | 958,682 | |
| Owl Rock Core Income Corp., 3.125%, 9/23/26 | 3,070,000 | | 2,667,993 | |
| State Street Corp., VRN, 5.82%, 11/4/28 | 4,245,000 | | 4,431,524 | |
UBS Group AG, VRN, 1.49%, 8/10/27(2) | 11,579,000 | | 9,983,014 | |
| | 108,952,627 | |
| Chemicals — 0.1% | | |
| CF Industries, Inc., 5.15%, 3/15/34 | 2,590,000 | | 2,485,684 | |
| CF Industries, Inc., 4.95%, 6/1/43 | 3,700,000 | | 3,197,385 | |
| | 5,683,069 | |
| Commercial Services and Supplies — 0.2% | | |
| Republic Services, Inc., 2.30%, 3/1/30 | 4,257,000 | | 3,689,896 | |
| Republic Services, Inc., 5.00%, 4/1/34 | 1,680,000 | | 1,712,715 | |
| Waste Connections, Inc., 3.20%, 6/1/32 | 6,376,000 | | 5,687,193 | |
| Waste Management, Inc., 4.625%, 2/15/30 | 1,990,000 | | 1,991,928 | |
| | 13,081,732 | |
| Construction and Engineering — 0.1% | | |
| Quanta Services, Inc., 2.35%, 1/15/32 | 7,748,000 | | 6,156,016 | |
| Construction Materials — 0.1% | | |
| Eagle Materials, Inc., 2.50%, 7/1/31 | 5,253,000 | | 4,306,985 | |
Consumer Finance† | | |
| AerCap Ireland Capital DAC / AerCap Global Aviation Trust, 1.65%, 10/29/24 | 2,133,000 | | 1,996,714 | |
| AerCap Ireland Capital DAC / AerCap Global Aviation Trust, 2.45%, 10/29/26 | 776,000 | | 697,432 | |
| | 2,694,146 | |
| Consumer Staples Distribution & Retail — 0.1% | | |
| Sysco Corp., 5.95%, 4/1/30 | 8,469,000 | | 8,985,405 | |
| Containers and Packaging — 0.2% | | |
| Sonoco Products Co., 2.25%, 2/1/27 | 7,177,000 | | 6,512,154 | |
| WRKCo, Inc., 3.00%, 9/15/24 | 3,525,000 | | 3,413,440 | |
| | 9,925,594 | |
| Diversified Consumer Services — 0.2% | | |
| Duke University, 3.30%, 10/1/46 | 3,000,000 | | 2,441,343 | |
| Novant Health, Inc., 3.17%, 11/1/51 | 5,345,000 | | 3,870,689 | |
| Pepperdine University, 3.30%, 12/1/59 | 6,183,000 | | 4,504,338 | |
| | 10,816,370 | |
| Diversified REITs — 0.1% | | |
| GLP Capital LP / GLP Financing II, Inc., 5.375%, 4/15/26 | 6,550,000 | | 6,362,699 | |
| Healthpeak OP LLC, 5.25%, 12/15/32 | 2,983,000 | | 2,995,176 | |
| | 9,357,875 | |
| Diversified Telecommunication Services — 0.5% | | |
| AT&T, Inc., 4.50%, 5/15/35 | 6,007,000 | | 5,629,973 | |
| AT&T, Inc., 4.90%, 8/15/37 | 5,435,000 | | 5,204,096 | |
| AT&T, Inc., 4.55%, 3/9/49 | 3,509,000 | | 3,065,908 | |
Ooredoo International Finance Ltd., 2.625%, 4/8/31(2) | 3,700,000 | | 3,214,323 | |
| Telefonica Emisiones SA, 4.90%, 3/6/48 | 4,295,000 | | 3,579,270 | |
| Verizon Communications, Inc., 4.27%, 1/15/36 | 6,690,000 | | 6,209,706 | |
| | | | | | | | |
| Principal Amount | Value |
| Verizon Communications, Inc., 4.81%, 3/15/39 | $ | 2,580,000 | | $ | 2,465,346 | |
| | 29,368,622 | |
| Electric Utilities — 2.1% | | |
| AEP Texas, Inc., 2.10%, 7/1/30 | 7,288,000 | | 6,061,500 | |
| Baltimore Gas & Electric Co., 2.25%, 6/15/31 | 3,947,000 | | 3,333,055 | |
| CenterPoint Energy Houston Electric LLC, 4.95%, 4/1/33 | 2,837,000 | | 2,898,814 | |
| CenterPoint Energy Houston Electric LLC, 4.45%, 10/1/32 | 6,380,000 | | 6,326,900 | |
| Commonwealth Edison Co., 5.30%, 2/1/53 | 4,256,000 | | 4,452,167 | |
| Duke Energy Carolinas LLC, 2.55%, 4/15/31 | 2,596,000 | | 2,229,186 | |
| Duke Energy Corp., 2.55%, 6/15/31 | 2,920,000 | | 2,446,185 | |
| Duke Energy Corp., 5.00%, 8/15/52 | 3,750,000 | | 3,494,414 | |
| Duke Energy Florida LLC, 1.75%, 6/15/30 | 4,706,000 | | 3,890,519 | |
| Duke Energy Florida LLC, 3.85%, 11/15/42 | 2,673,000 | | 2,257,561 | |
| Duke Energy Florida LLC, 5.95%, 11/15/52 | 2,275,000 | | 2,535,674 | |
| Duke Energy Indiana LLC, 5.40%, 4/1/53 | 1,132,000 | | 1,154,566 | |
| Duke Energy Progress LLC, 2.00%, 8/15/31 | 7,400,000 | | 6,068,498 | |
| Duke Energy Progress LLC, 4.15%, 12/1/44 | 5,693,000 | | 4,929,633 | |
| Entergy Arkansas LLC, 2.65%, 6/15/51 | 3,298,000 | | 2,140,422 | |
| Evergy Kansas Central, Inc., 5.70%, 3/15/53 | 1,148,000 | | 1,206,778 | |
| Exelon Corp., 5.15%, 3/15/28 | 3,693,000 | | 3,760,557 | |
| Florida Power & Light Co., 2.45%, 2/3/32 | 3,703,000 | | 3,164,709 | |
| Florida Power & Light Co., 4.125%, 2/1/42 | 3,131,000 | | 2,765,049 | |
| MidAmerican Energy Co., 4.40%, 10/15/44 | 5,027,000 | | 4,607,203 | |
| NextEra Energy Capital Holdings, Inc., 4.90%, 2/28/28 | 5,010,000 | | 5,047,090 | |
| NextEra Energy Capital Holdings, Inc., 5.05%, 2/28/33 | 5,910,000 | | 5,930,599 | |
| NextEra Energy Capital Holdings, Inc., 5.25%, 2/28/53 | 2,736,000 | | 2,701,754 | |
| Northern States Power Co., 3.20%, 4/1/52 | 4,200,000 | | 3,089,947 | |
| Pacific Gas & Electric Co., 6.15%, 1/15/33 | 1,553,000 | | 1,595,789 | |
| Pacific Gas & Electric Co., 4.20%, 6/1/41 | 2,695,000 | | 2,129,933 | |
| Pacific Gas & Electric Co., 6.70%, 4/1/53 | 576,000 | | 593,214 | |
| PacifiCorp, 3.30%, 3/15/51 | 4,128,000 | | 3,052,342 | |
| PECO Energy Co., 4.375%, 8/15/52 | 5,740,000 | | 5,207,594 | |
| Public Service Co. of Colorado, 1.875%, 6/15/31 | 5,499,000 | | 4,496,497 | |
Public Service Co. of Colorado, 5.25%, 4/1/53(3) | 3,460,000 | | 3,529,714 | |
| Public Service Electric & Gas Co., 3.10%, 3/15/32 | 4,354,000 | | 3,894,161 | |
| Public Service Electric & Gas Co., 4.65%, 3/15/33 | 3,955,000 | | 3,974,185 | |
| Southern Co. Gas Capital Corp., 1.75%, 1/15/31 | 6,205,000 | | 4,948,883 | |
| Union Electric Co., 3.90%, 4/1/52 | 3,640,000 | | 3,063,439 | |
| Xcel Energy, Inc., 3.40%, 6/1/30 | 4,854,000 | | 4,435,984 | |
| Xcel Energy, Inc., 4.60%, 6/1/32 | 2,240,000 | | 2,176,507 | |
| | 129,591,022 | |
| Energy Equipment and Services — 0.1% | | |
| Schlumberger Investment SA, 2.65%, 6/26/30 | 5,360,000 | | 4,741,222 | |
| Entertainment — 0.1% | | |
Warnermedia Holdings, Inc., 3.76%, 3/15/27(2) | 3,249,000 | | 3,062,425 | |
Warnermedia Holdings, Inc., 5.05%, 3/15/42(2) | 2,112,000 | | 1,768,458 | |
| | 4,830,883 | |
| Financial Services — 0.3% | | |
Antares Holdings LP, 2.75%, 1/15/27(2) | 4,144,000 | | 3,379,859 | |
| Block Financial LLC, 3.875%, 8/15/30 | 11,201,000 | | 9,640,481 | |
| GE Capital Funding LLC, 4.55%, 5/15/32 | 2,969,000 | | 2,912,355 | |
| | 15,932,695 | |
| | | | | | | | |
| Principal Amount | Value |
| Food Products — 0.5% | | |
JDE Peet's NV, 2.25%, 9/24/31(2) | $ | 7,952,000 | | $ | 6,297,721 | |
| Kraft Heinz Foods Co., 3.875%, 5/15/27 | 5,500,000 | | 5,374,502 | |
| Kraft Heinz Foods Co., 5.00%, 6/4/42 | 6,805,000 | | 6,532,483 | |
| Kraft Heinz Foods Co., 5.20%, 7/15/45 | 2,906,000 | | 2,820,298 | |
| Mondelez International, Inc., 2.625%, 3/17/27 | 5,600,000 | | 5,238,821 | |
Nestle Holdings, Inc., 4.85%, 3/14/33(2) | 5,560,000 | | 5,819,933 | |
| | 32,083,758 | |
| Gas Utilities — 0.1% | | |
Infraestructura Energetica Nova SAPI de CV, 4.75%, 1/15/51(2) | 8,381,000 | | 6,230,645 | |
| Ground Transportation — 0.6% | | |
Ashtead Capital, Inc., 5.50%, 8/11/32(2) | 7,118,000 | | 7,006,310 | |
Ashtead Capital, Inc., 5.55%, 5/30/33(2) | 2,713,000 | | 2,683,370 | |
| Burlington Northern Santa Fe LLC, 4.15%, 4/1/45 | 3,073,000 | | 2,749,036 | |
| Burlington Northern Santa Fe LLC, 3.30%, 9/15/51 | 3,270,000 | | 2,503,837 | |
| CSX Corp., 4.25%, 3/15/29 | 4,910,000 | | 4,854,089 | |
DAE Funding LLC, 1.55%, 8/1/24(2) | 2,914,000 | | 2,742,173 | |
| Norfolk Southern Corp., 4.55%, 6/1/53 | 3,263,000 | | 2,940,087 | |
| Union Pacific Corp., 3.55%, 8/15/39 | 7,826,000 | | 6,656,435 | |
United Rentals North America, Inc., 6.00%, 12/15/29(2) | 3,000,000 | | 3,044,190 | |
| | 35,179,527 | |
| Health Care Equipment and Supplies — 0.5% | | |
| Baxter International, Inc., 1.92%, 2/1/27 | 4,187,000 | | 3,749,483 | |
GE HealthCare Technologies, Inc., 5.65%, 11/15/27(2) | 12,640,000 | | 13,072,202 | |
| Zimmer Biomet Holdings, Inc., 1.45%, 11/22/24 | 14,190,000 | | 13,417,851 | |
| | 30,239,536 | |
| Health Care Providers and Services — 1.6% | | |
| Centene Corp., 2.45%, 7/15/28 | 9,250,000 | | 8,055,825 | |
| Centene Corp., 4.625%, 12/15/29 | 4,011,000 | | 3,774,913 | |
| Centene Corp., 3.375%, 2/15/30 | 6,630,000 | | 5,790,271 | |
| CVS Health Corp., 5.25%, 2/21/33 | 6,750,000 | | 6,891,762 | |
| CVS Health Corp., 4.78%, 3/25/38 | 2,878,000 | | 2,745,596 | |
| CVS Health Corp., 5.05%, 3/25/48 | 7,160,000 | | 6,705,118 | |
| CVS Health Corp., 5.625%, 2/21/53 | 9,345,000 | | 9,478,432 | |
| Duke University Health System, Inc., 3.92%, 6/1/47 | 2,697,000 | | 2,340,428 | |
| Elevance Health, Inc., 5.125%, 2/15/53 | 2,890,000 | | 2,881,597 | |
| HCA, Inc., 2.375%, 7/15/31 | 4,660,000 | | 3,764,409 | |
| Humana, Inc., 2.15%, 2/3/32 | 8,621,000 | | 6,994,841 | |
| Kaiser Foundation Hospitals, 3.00%, 6/1/51 | 4,160,000 | | 2,932,309 | |
Roche Holdings, Inc., 2.61%, 12/13/51(2) | 8,090,000 | | 5,658,891 | |
| UnitedHealth Group, Inc., 5.35%, 2/15/33 | 5,880,000 | | 6,254,755 | |
| UnitedHealth Group, Inc., 4.50%, 4/15/33 | 5,900,000 | | 5,868,680 | |
| UnitedHealth Group, Inc., 5.875%, 2/15/53 | 4,270,000 | | 4,807,045 | |
| UnitedHealth Group, Inc., 5.05%, 4/15/53 | 5,900,000 | | 5,971,603 | |
| Universal Health Services, Inc., 1.65%, 9/1/26 | 7,147,000 | | 6,294,702 | |
| Universal Health Services, Inc., 2.65%, 10/15/30 | 6,358,000 | | 5,102,610 | |
| | 102,313,787 | |
| Hotels, Restaurants and Leisure — 0.2% | | |
| Marriott International, Inc., 3.50%, 10/15/32 | 3,656,000 | | 3,207,774 | |
| Starbucks Corp., 4.75%, 2/15/26 | 7,460,000 | | 7,506,990 | |
| | 10,714,764 | |
| Household Durables — 0.1% | | |
| D.R. Horton, Inc., 2.50%, 10/15/24 | 5,488,000 | | 5,252,446 | |
| | | | | | | | |
| Principal Amount | Value |
| Household Products — 0.2% | | |
| Clorox Co., 1.80%, 5/15/30 | $ | 7,005,000 | | $ | 5,808,857 | |
| Clorox Co., 4.60%, 5/1/32 | 6,744,000 | | 6,712,293 | |
| | 12,521,150 | |
| Insurance — 0.2% | | |
| Allstate Corp., 5.25%, 3/30/33 | 3,447,000 | | 3,487,917 | |
Five Corners Funding Trust III, 5.79%, 2/15/33(2) | 3,109,000 | | 3,193,791 | |
| MetLife, Inc., 5.25%, 1/15/54 | 3,379,000 | | 3,296,748 | |
| | 9,978,456 | |
| IT Services — 0.2% | | |
| International Business Machines Corp., 3.30%, 5/15/26 | 5,840,000 | | 5,635,398 | |
| International Business Machines Corp., 4.75%, 2/6/33 | 7,910,000 | | 7,866,530 | |
| | 13,501,928 | |
| Life Sciences Tools and Services — 0.1% | | |
| Danaher Corp., 2.80%, 12/10/51 | 5,175,000 | | 3,617,440 | |
| Machinery — 0.2% | | |
| John Deere Capital Corp., 4.75%, 1/20/28 | 10,792,000 | | 11,025,066 | |
| John Deere Capital Corp., 4.85%, 10/11/29 | 2,608,000 | | 2,695,731 | |
| | 13,720,797 | |
| Media — 0.6% | | |
| Charter Communications Operating LLC / Charter Communications Operating Capital, 5.125%, 7/1/49 | 3,285,000 | | 2,603,643 | |
| Comcast Corp., 6.50%, 11/15/35 | 3,475,000 | | 4,001,087 | |
| Comcast Corp., 3.20%, 7/15/36 | 6,000,000 | | 5,059,931 | |
| Comcast Corp., 3.75%, 4/1/40 | 8,342,000 | | 7,172,198 | |
| Comcast Corp., 2.94%, 11/1/56 | 5,885,000 | | 3,924,203 | |
| Fox Corp., 5.48%, 1/25/39 | 6,164,000 | | 5,909,345 | |
| Paramount Global, 4.95%, 1/15/31 | 3,030,000 | | 2,797,588 | |
| Paramount Global, 4.375%, 3/15/43 | 2,120,000 | | 1,508,425 | |
| Time Warner Cable LLC, 4.50%, 9/15/42 | 7,625,000 | | 5,862,915 | |
| | 38,839,335 | |
| Metals and Mining — 0.2% | | |
Glencore Funding LLC, 2.625%, 9/23/31(2) | 7,530,000 | | 6,185,518 | |
Minera Mexico SA de CV, 4.50%, 1/26/50(2) | 3,817,000 | | 2,912,968 | |
South32 Treasury Ltd., 4.35%, 4/14/32(2) | 5,400,000 | | 4,819,927 | |
| | 13,918,413 | |
| Multi-Utilities — 0.5% | | |
Abu Dhabi National Energy Co. PJSC, 2.00%, 4/29/28(2) | 4,670,000 | | 4,149,902 | |
| Ameren Corp., 3.50%, 1/15/31 | 7,733,000 | | 7,041,693 | |
| Ameren Illinois Co., 3.85%, 9/1/32 | 3,015,000 | | 2,854,098 | |
| Ameren Illinois Co., 5.90%, 12/1/52 | 1,706,000 | | 1,909,516 | |
| CenterPoint Energy, Inc., 2.65%, 6/1/31 | 4,853,000 | | 4,113,054 | |
| Dominion Energy, Inc., 4.90%, 8/1/41 | 4,957,000 | | 4,549,901 | |
| Sempra Energy, 3.25%, 6/15/27 | 4,523,000 | | 4,234,401 | |
| WEC Energy Group, Inc., 1.375%, 10/15/27 | 4,490,000 | | 3,896,472 | |
| | 32,749,037 | |
| Office REITs — 0.1% | | |
| Alexandria Real Estate Equities, Inc., 4.50%, 7/30/29 | 639,000 | | 619,516 | |
| Alexandria Real Estate Equities, Inc., 2.95%, 3/15/34 | 765,000 | | 612,981 | |
| Alexandria Real Estate Equities, Inc., 4.75%, 4/15/35 | 2,257,000 | | 2,117,470 | |
| Alexandria Real Estate Equities, Inc., 4.00%, 2/1/50 | 5,285,000 | | 4,025,493 | |
| Alexandria Real Estate Equities, Inc., 5.15%, 4/15/53 | 1,689,000 | | 1,550,302 | |
| | 8,925,762 | |
| | | | | | | | |
| Principal Amount | Value |
| Oil, Gas and Consumable Fuels — 1.6% | | |
Aker BP ASA, 3.75%, 1/15/30(2) | $ | 5,171,000 | | $ | 4,673,491 | |
| BP Capital Markets America, Inc., 3.06%, 6/17/41 | 4,820,000 | | 3,732,400 | |
| Cenovus Energy, Inc., 2.65%, 1/15/32 | 4,780,000 | | 3,948,532 | |
Continental Resources, Inc., 2.27%, 11/15/26(2) | 4,850,000 | | 4,311,751 | |
| Diamondback Energy, Inc., 6.25%, 3/15/33 | 5,400,000 | | 5,710,054 | |
| Enbridge, Inc., 5.70%, 3/8/33 | 3,703,000 | | 3,853,870 | |
| Energy Transfer LP, 5.75%, 2/15/33 | 5,588,000 | | 5,729,097 | |
| Energy Transfer LP, 4.90%, 3/15/35 | 4,927,000 | | 4,607,761 | |
| Enterprise Products Operating LLC, 4.85%, 3/15/44 | 4,503,000 | | 4,184,737 | |
| Equinor ASA, 3.25%, 11/18/49 | 2,481,000 | | 1,916,266 | |
Galaxy Pipeline Assets Bidco Ltd., 2.94%, 9/30/40(2) | 11,398,200 | | 9,260,880 | |
| Kinder Morgan Energy Partners LP, 6.50%, 9/1/39 | 3,003,000 | | 3,154,896 | |
| MPLX LP, 2.65%, 8/15/30 | 5,080,000 | | 4,310,987 | |
| MPLX LP, 5.65%, 3/1/53 | 1,632,000 | | 1,572,918 | |
| Petroleos Mexicanos, 4.625%, 9/21/23 | 1,800,000 | | 1,786,725 | |
| Petroleos Mexicanos, 6.70%, 2/16/32 | 1,000,000 | | 796,762 | |
| Petroleos Mexicanos, 6.625%, 6/15/35 | 1,050,000 | | 766,475 | |
SA Global Sukuk Ltd., 2.69%, 6/17/31(2) | 13,125,000 | | 11,532,806 | |
| Sabine Pass Liquefaction LLC, 5.625%, 3/1/25 | 8,590,000 | | 8,647,989 | |
Saudi Arabian Oil Co., 1.625%, 11/24/25(2) | 3,000,000 | | 2,782,083 | |
| Shell International Finance BV, 2.375%, 11/7/29 | 5,500,000 | | 4,881,789 | |
| Shell International Finance BV, 4.375%, 5/11/45 | 3,230,000 | | 2,984,614 | |
Western Midstream Operating LP, 6.15%, 4/1/33(3) | 2,270,000 | | 2,303,621 | |
| | 97,450,504 | |
| Personal Care Products — 0.2% | | |
| Haleon US Capital LLC, 4.00%, 3/24/52 | 2,795,000 | | 2,323,630 | |
Kenvue, Inc., 5.10%, 3/22/43(2) | 9,095,000 | | 9,390,278 | |
Kenvue, Inc., 5.05%, 3/22/53(2) | 1,559,000 | | 1,608,040 | |
| | 13,321,948 | |
| Pharmaceuticals — 0.6% | | |
| Bristol-Myers Squibb Co., 2.95%, 3/15/32 | 6,671,000 | | 6,017,502 | |
| Bristol-Myers Squibb Co., 2.55%, 11/13/50 | 5,441,000 | | 3,645,909 | |
| Eli Lilly & Co., 4.875%, 2/27/53 | 4,600,000 | | 4,761,760 | |
| Utah Acquisition Sub, Inc., 3.95%, 6/15/26 | 12,790,000 | | 12,191,334 | |
| Viatris, Inc., 4.00%, 6/22/50 | 2,059,000 | | 1,356,565 | |
| Zoetis, Inc., 5.60%, 11/16/32 | 6,266,000 | | 6,686,988 | |
| | 34,660,058 | |
| Real Estate Management and Development — 0.1% | | |
| Essential Properties LP, 2.95%, 7/15/31 | 5,160,000 | | 3,794,943 | |
| Retail REITs — 0.1% | | |
| Kimco Realty OP LLC, 4.60%, 2/1/33 | 1,875,000 | | 1,760,159 | |
| National Retail Properties, Inc., 4.80%, 10/15/48 | 4,265,000 | | 3,626,099 | |
| | 5,386,258 | |
| Semiconductors and Semiconductor Equipment — 0.1% | | |
| Intel Corp., 5.70%, 2/10/53 | 3,920,000 | | 4,005,205 | |
| Intel Corp., 3.20%, 8/12/61 | 6,948,000 | | 4,604,742 | |
| | 8,609,947 | |
| Software — 0.2% | | |
| Oracle Corp., 3.90%, 5/15/35 | 4,490,000 | | 3,926,399 | |
| Oracle Corp., 3.85%, 7/15/36 | 2,760,000 | | 2,361,996 | |
| Oracle Corp., 3.60%, 4/1/40 | 7,670,000 | | 5,959,922 | |
| | 12,248,317 | |
| | | | | | | | |
| Principal Amount | Value |
| Specialized REITs — 0.1% | | |
| Crown Castle, Inc., 4.15%, 7/1/50 | $ | 4,039,000 | | $ | 3,231,785 | |
| Equinix, Inc., 2.90%, 11/18/26 | 6,065,000 | | 5,643,971 | |
| | 8,875,756 | |
| Specialty Retail — 0.3% | | |
| Lowe's Cos., Inc., 2.625%, 4/1/31 | 11,420,000 | | 9,766,118 | |
| Lowe's Cos., Inc., 5.75%, 7/1/53 | 7,760,000 | | 7,914,235 | |
| O'Reilly Automotive, Inc., 4.70%, 6/15/32 | 4,287,000 | | 4,234,067 | |
| | 21,914,420 | |
| Technology Hardware, Storage and Peripherals — 0.2% | | |
| Apple, Inc., 3.95%, 8/8/52 | 9,600,000 | | 8,617,278 | |
| Dell International LLC / EMC Corp., 8.10%, 7/15/36 | 1,840,000 | | 2,148,603 | |
| | 10,765,881 | |
| Trading Companies and Distributors — 0.1% | | |
Aircastle Ltd., 5.25%, 8/11/25(2) | 3,703,000 | | 3,622,491 | |
| Water Utilities — 0.2% | | |
| American Water Capital Corp., 4.45%, 6/1/32 | 7,940,000 | | 7,824,466 | |
| Essential Utilities, Inc., 2.70%, 4/15/30 | 6,137,000 | | 5,311,202 | |
| | 13,135,668 | |
| Wireless Telecommunication Services — 0.3% | | |
| T-Mobile USA, Inc., 3.375%, 4/15/29 | 14,214,000 | | 12,971,517 | |
| T-Mobile USA, Inc., 4.375%, 4/15/40 | 2,410,000 | | 2,161,539 | |
| Vodafone Group PLC, 4.875%, 6/19/49 | 6,355,000 | | 5,746,595 | |
| | 20,879,651 | |
TOTAL CORPORATE BONDS (Cost $1,489,736,133) | | 1,391,544,298 | |
| COLLATERALIZED LOAN OBLIGATIONS — 6.7% | | |
ABPCI Direct Lending Fund CLO IV Ltd., Series 2017-2A, Class BR, VRN, 6.71%, (3-month LIBOR plus 1.90%), 10/27/33(2) | 9,900,000 | | 9,303,572 | |
ACREC LLC, Series 2023-FL2, Class A, VRN, 6.92%, (1-month SOFR plus 2.23%), 2/19/38(2) | 8,620,000 | | 8,527,280 | |
AIMCO CLO 10 Ltd., Series 2019-10A, Class BR, VRN, 6.42%, (3-month LIBOR plus 1.60%), 7/22/32(2) | 12,275,000 | | 11,943,751 | |
Arbor Realty Collateralized Loan Obligation Ltd., Series 2020-FL1, Class AS, VRN, 6.34%, (1-month SOFR plus 1.51%), 2/15/35(2) | 9,764,000 | | 9,759,062 | |
Arbor Realty Commercial Real Estate Notes Ltd., Series 2021-FL2, Class A, VRN, 5.78%, (1-month LIBOR plus 1.10%), 5/15/36(2) | 9,844,500 | | 9,716,934 | |
ARES LII CLO Ltd., Series 2019-52A, Class BR, VRN, 6.47%, (3-month LIBOR plus 1.65%), 4/22/31(2) | 9,250,000 | | 9,003,891 | |
Ares XL CLO Ltd., Series 2016-40A, Class BRR, VRN, 6.59%, (3-month LIBOR plus 1.80%), 1/15/29(2) | 8,900,000 | | 8,565,250 | |
BDS Ltd., Series 2021-FL7, Class C, VRN, 6.46%, (1-month LIBOR plus 1.70%), 6/16/36(2) | 19,000,000 | | 17,856,342 | |
BDS Ltd., Series 2021-FL8, Class A, VRN, 5.68%, (1-month LIBOR plus 0.92%), 1/18/36(2) | 14,099,725 | | 13,772,160 | |
BDS Ltd., Series 2021-FL8, Class C, VRN, 6.31%, (1-month LIBOR plus 1.55%), 1/18/36(2) | 5,768,000 | | 5,420,975 | |
BDS Ltd., Series 2021-FL8, Class D, VRN, 6.66%, (1-month LIBOR plus 1.90%), 1/18/36(2) | 7,200,000 | | 6,779,881 | |
Bean Creek CLO Ltd., Series 2015-1A, Class AR, VRN, 5.83%, (3-month LIBOR plus 1.02%), 4/20/31(2) | 9,375,000 | | 9,271,167 | |
BXMT Ltd., Series 2020-FL2, Class C, VRN, 6.51%, (1-month SOFR plus 1.76%), 2/15/38(2) | 11,971,000 | | 10,748,161 | |
Canyon Capital CLO Ltd., Series 2017-1A, Class BR, VRN, 6.39%, (3-month LIBOR plus 1.60%), 7/15/30(2) | 5,725,000 | | 5,527,550 | |
| | | | | | | | |
| Principal Amount | Value |
Carlyle Global Market Strategies CLO Ltd., Series 2013-1A, Class BRR, VRN, 7.07%, (3-month LIBOR plus 2.20%), 8/14/30(2) | $ | 8,150,000 | | $ | 7,960,340 | |
Carlyle US CLO Ltd., Series 2019-2A, Class A2R, VRN, 6.44%, (3-month LIBOR plus 1.65%), 7/15/32(2) | 14,600,000 | | 14,236,895 | |
CarVal CLO III Ltd., Series 2019-2A, Class BR, VRN, 6.41%, (3-month LIBOR plus 1.60%), 7/20/32(2) | 8,750,000 | | 8,442,911 | |
Cedar Funding X CLO Ltd., Series 2019-10A, Class BR, VRN, 6.41%, (3-month LIBOR plus 1.60%), 10/20/32(2) | 7,650,000 | | 7,397,156 | |
Cerberus Loan Funding XXXIII LP, Series 2021-3A, Class A, VRN, 6.35%, (3-month LIBOR plus 1.56%), 7/23/33(2) | 13,925,000 | | 13,568,180 | |
Cerberus Loan Funding XXXIX LP, Series 2022-3A, Class A, VRN, 7.03%, (3-month SOFR plus 2.40%), 1/20/33(2) | 12,350,000 | | 12,293,562 | |
Cerberus Loan Funding XXXVI LP, Series 2021-6A, Class A, VRN, 6.19%, (3-month LIBOR plus 1.40%), 11/22/33(2) | 2,932,758 | | 2,916,978 | |
CFIP CLO Ltd., Series 2014-1A, Class AR, VRN, 6.14%, (3-month LIBOR plus 1.32%), 7/13/29(2) | 6,517,196 | | 6,519,089 | |
FS Rialto Issuer LLC, Series 2022-FL6, Class A, SEQ, VRN, 7.27%, (1-month SOFR plus 2.58%), 8/17/37(2) | 9,545,000 | | 9,470,777 | |
Goldentree Loan Opportunities XI Ltd., Series 2015-11A, Class BR2, VRN, 6.14%, (3-month LIBOR plus 1.35%), 1/18/31(2) | 9,415,000 | | 9,246,776 | |
KKR CLO 18 Ltd., Series 2018, Class BR, VRN, 6.39%, (3-month LIBOR plus 1.60%), 7/18/30(2) | 9,725,000 | | 9,396,603 | |
KKR CLO 22 Ltd., Series 2022A, Class A, VRN, 5.96%, (3-month LIBOR plus 1.15%), 7/20/31(2) | 8,425,000 | | 8,325,657 | |
KKR CLO 30 Ltd., Series 2030A, Class BR, VRN, 6.39%, (3-month LIBOR plus 1.60%), 10/17/31(2) | 12,225,000 | | 11,821,190 | |
KREF Ltd., Series 2021-FL2, Class B, VRN, 6.36%, (1-month LIBOR plus 1.65%), 2/15/39(2) | 12,900,000 | | 12,306,410 | |
Madison Park Funding XXXVII Ltd., Series 2019-37A, Class BR, VRN, 6.44%, (3-month LIBOR plus 1.65%), 7/15/33(2) | 16,550,000 | | 16,055,001 | |
MF1 Ltd., Series 2021-FL7, Class AS, VRN, 6.21%, (1-month LIBOR plus 1.45%), 10/16/36(2) | 17,817,000 | | 17,034,786 | |
Octagon Investment Partners XV Ltd., Series 2013-1A, Class BRR, VRN, 6.30%, (3-month LIBOR plus 1.50%), 7/19/30(2) | 13,825,000 | | 13,359,977 | |
Palmer Square Loan Funding Ltd., Series 2021-3A, Class A2, VRN, 6.21%, (3-month LIBOR plus 1.40%), 7/20/29(2) | 7,000,000 | | 6,845,270 | |
Palmer Square Loan Funding Ltd., Series 2022-2A, Class A2, VRN, 6.56%, (3-month SOFR plus 1.90%), 10/15/30(2) | 9,325,000 | | 9,099,557 | |
Parallel Ltd., Series 2019-1A, Class BR, VRN, 6.61%, (3-month LIBOR plus 1.80%), 7/20/32(2) | 13,875,000 | | 13,291,817 | |
PFP Ltd., Series 2021-8, Class C, VRN, 6.53%, (1-month LIBOR plus 1.80%), 8/9/37(2) | 13,851,000 | | 12,975,361 | |
Sound Point CLO XXII Ltd., Series 2019-1A, Class BR, VRN, 6.51%, (3-month LIBOR plus 1.70%), 1/20/32(2) | 12,250,000 | | 11,834,917 | |
TCW CLO Ltd., Series 2018-1A, Class BR, VRN, 6.47%, (3-month LIBOR plus 1.65%), 4/25/31(2) | 12,125,000 | | 11,661,408 | |
THL Credit Wind River CLO Ltd., Series 2013-2A, Class BR2, VRN, 6.36%, (3-month LIBOR plus 1.57%), 10/18/30(2) | 9,275,000 | | 8,987,739 | |
TSTAT Ltd., Series 2022-1A, Class B, VRN, 7.91%, (3-month SOFR plus 3.27%), 7/20/31(2) | 8,300,000 | | 8,201,992 | |
Wellfleet CLO Ltd., Series 2022-1A, Class B1, VRN, 7.01%, (3-month SOFR plus 2.35%), 4/15/34(2) | 8,400,000 | | 8,191,575 | |
Wind River CLO Ltd., Series 2013-1A, Class A1RR, VRN, 5.79%, (3-month LIBOR plus 0.98%), 7/20/30(2) | 9,793,219 | | 9,708,839 | |
TOTAL COLLATERALIZED LOAN OBLIGATIONS (Cost $428,913,552) | | 417,346,739 | |
| ASSET-BACKED SECURITIES — 5.4% | | |
Aaset Trust, Series 2021-2A, Class A, SEQ, 2.80%, 1/15/47(2) | 22,071,104 | | 18,987,737 | |
Aligned Data Centers Issuer LLC, Series 2021-1A, Class A2, SEQ, 1.94%, 8/15/46(2) | 8,218,000 | | 7,261,856 | |
| | | | | | | | |
| Principal Amount | Value |
Aligned Data Centers Issuer LLC, Series 2021-1A, Class B, 2.48%, 8/15/46(2) | $ | 10,582,000 | | $ | 9,173,167 | |
Applebee's Funding LLC / IHOP Funding LLC, Series 2019-1A, Class A2I, SEQ, 4.19%, 6/5/49(2) | 17,456,670 | | 17,115,144 | |
Applebee's Funding LLC / IHOP Funding LLC, Series 2019-1A, Class A2II, SEQ, 4.72%, 6/5/49(2) | 13,712,490 | | 12,864,415 | |
Blackbird Capital Aircraft, Series 2021-1A, Class A, SEQ, 2.44%, 7/15/46(2) | 11,903,965 | | 10,341,571 | |
Castlelake Aircraft Structured Trust, Series 2017-1R, Class A, SEQ, 2.74%, 8/15/41(2) | 7,893,079 | | 7,064,305 | |
Castlelake Aircraft Structured Trust, Series 2021-1A, Class A, SEQ, 3.47%, 1/15/46(2) | 2,933,168 | | 2,704,518 | |
Clsec Holdings 22t LLC, Series 2021-1, Class B, 3.46%, 5/11/37(2) | 24,222,865 | | 20,937,745 | |
DI Issuer LLC, Series 2021-1A, Class A2, SEQ, 3.72%, 9/15/51(2) | 30,817,087 | | 27,793,179 | |
Edgeconnex Data Centers Issuer LLC, Series 2022-1, Class A2, SEQ, 4.25%, 3/25/52(2) | 14,915,014 | | 13,993,659 | |
FirstKey Homes Trust, Series 2021-SFR1, Class D, 2.19%, 8/17/38(2) | 15,900,000 | | 13,702,851 | |
FirstKey Homes Trust, Series 2021-SFR1, Class E1, 2.39%, 8/17/38(2) | 18,100,000 | | 15,439,662 | |
Flexential Issuer, Series 2021-1A, Class A2, SEQ, 3.25%, 11/27/51(2) | 19,850,000 | | 17,733,466 | |
Goodgreen Trust, Series 2018-1A, Class A, VRN, 3.93%, 10/15/53(2) | 7,753,745 | | 7,072,674 | |
Goodgreen Trust, Series 2020-1A, Class A, SEQ, 2.63%, 4/15/55(2) | 8,989,696 | | 7,686,848 | |
Goodgreen Trust, Series 2021-1A, Class A, SEQ, 2.66%, 10/15/56(2) | 6,754,010 | | 5,717,420 | |
Lunar Structured Aircraft Portfolio Notes, Series 2021-1, Class A, SEQ, 2.64%, 10/15/46(2) | 17,983,429 | | 15,685,751 | |
MAPS Trust, Series 2021-1A, Class A, SEQ, 2.52%, 6/15/46(2) | 18,469,568 | | 16,218,957 | |
Navigator Aircraft ABS Ltd., Series 2021-1, Class A, SEQ, 2.77%, 11/15/46(2) | 18,177,455 | | 15,754,203 | |
New Economy Assets Phase 1 Sponsor LLC, Series 2021-1, Class B1, 2.41%, 10/20/61(2) | 27,725,000 | | 23,687,031 | |
Progress Residential Trust, Series 2021-SFR3, Class C, 2.09%, 5/17/26(2) | 9,500,000 | | 8,473,181 | |
Progress Residential Trust, Series 2021-SFR8, Class E1, 2.38%, 10/17/38(2) | 7,800,000 | | 6,628,956 | |
Sabey Data Center Issuer LLC, Series 2021-1, Class A2, SEQ, 1.88%, 6/20/46(2) | 7,394,000 | | 6,504,883 | |
Sierra Timeshare Receivables Funding LLC, Series 2021-1A, Class C, 1.79%, 11/20/37(2) | 3,411,899 | | 3,147,851 | |
Stack Infrastructure Issuer LLC, Series 2019-1A, Class A2, SEQ, 4.54%, 2/25/44(2) | 11,986,395 | | 11,776,958 | |
Stack Infrastructure Issuer LLC, Series 2021-1A, Class A2, SEQ, 1.88%, 3/26/46(2) | 10,329,000 | | 9,187,250 | |
VSE VOI Mortgage LLC, Series 2018-A, Class B, 3.72%, 2/20/36(2) | 2,474,254 | | 2,395,635 | |
TOTAL ASSET-BACKED SECURITIES (Cost $371,782,922) | | 335,050,873 | |
| COLLATERALIZED MORTGAGE OBLIGATIONS — 2.7% | | |
| Private Sponsor Collateralized Mortgage Obligations — 2.4% | |
Agate Bay Mortgage Trust, Series 2016-1, Class A3, VRN, 3.50%, 12/25/45(2) | 299,801 | | 279,898 | |
Bellemeade Re Ltd., Series 2019-3A, Class B1, VRN, 7.35%, (1-month LIBOR plus 2.50%), 7/25/29(2) | 11,080,000 | | 11,017,211 | |
Bellemeade Re Ltd., Series 2019-3A, Class M1C, VRN, 6.80%, (1-month LIBOR plus 1.95%), 7/25/29(2) | 5,883,350 | | 5,864,251 | |
| | | | | | | | |
| Principal Amount | Value |
CHNGE Mortgage Trust, Series 2022-1, Class A1, SEQ, VRN, 3.01%, 1/25/67(2) | $ | 10,984,257 | | $ | 9,868,854 | |
| Countrywide Home Loan Mortgage Pass-Through Trust, Series 2005-17, Class 1A11, 5.50%, 9/25/35 | 15,662 | | 14,340 | |
Credit Suisse Mortgage Trust, Series 2020-AFC1, Class A3, VRN, 2.51%, 2/25/50(2) | 1,512,049 | | 1,399,142 | |
Credit Suisse Mortgage Trust, Series 2021-NQM2, Class A2, SEQ, VRN, 1.38%, 2/25/66(2) | 3,340,307 | | 2,812,494 | |
Credit Suisse Mortgage Trust, Series 2021-RPL3, Class A1, SEQ, VRN, 2.00%, 1/25/60(2) | 6,473,894 | | 5,558,489 | |
Deephaven Residential Mortgage Trust, Series 2020-2, Class M1, VRN, 4.11%, 5/25/65(2) | 9,000,000 | | 8,296,494 | |
Eagle RE Ltd., Series 2021-1, Class M1C, VRN, 7.26%, (30-day average SOFR plus 2.70%), 10/25/33(2) | 8,600,000 | | 8,589,590 | |
GCAT Trust, Series 2021-CM2, Class A1, SEQ, VRN, 2.35%, 8/25/66(2) | 17,166,626 | | 15,618,425 | |
GCAT Trust, Series 2021-NQM1, Class A3, SEQ, VRN, 1.15%, 1/25/66(2) | 2,817,582 | | 2,350,305 | |
Home RE Ltd., Series 2021-1, Class M1B, VRN, 6.40%, (1-month LIBOR plus 1.55%), 7/25/33(2) | 2,748,582 | | 2,745,126 | |
Home RE Ltd., Series 2022-1, Class M1A, VRN, 7.41%, (30-day average SOFR plus 2.85%), 10/25/34(2) | 6,625,000 | | 6,668,015 | |
JP Morgan Mortgage Trust, Series 2017-1, Class A2, VRN, 3.45%, 1/25/47(2) | 145,361 | | 133,228 | |
JP Morgan Mortgage Trust, Series 2020-3, Class A15, VRN, 3.50%, 8/25/50(2) | 2,243,445 | | 2,009,424 | |
MFA Trust, Series 2021-INV1, Class A3, SEQ, VRN, 1.26%, 1/25/56(2) | 1,104,498 | | 980,396 | |
MFA Trust, Series 2021-INV2, Class A3, SEQ, VRN, 2.26%, 11/25/56(2) | 11,707,909 | | 9,984,369 | |
MFA Trust, Series 2021-NQM1, Class A1, VRN, 1.15%, 4/25/65(2) | 2,228,696 | | 1,965,726 | |
MFA Trust, Series 2021-NQM1, Class A3, VRN, 1.64%, 4/25/65(2) | 1,591,933 | | 1,409,801 | |
NewRez Warehouse Securitization Trust, Series 2021-1, Class A, VRN, 5.60%, (1-month LIBOR plus 0.75%), 5/25/55(2) | 7,800,000 | | 7,722,829 | |
PRMI Securitization Trust, Series 2021-1, Class A5, VRN, 2.50%, 4/25/51(2) | 14,421,757 | | 11,380,967 | |
Radnor RE Ltd., Series 2021-1, Class M1B, VRN, 6.26%, (30-day average SOFR plus 1.70%), 12/27/33(2) | 9,665,828 | | 9,645,530 | |
Sofi Mortgage Trust, Series 2016-1A, Class 1A4, SEQ, VRN, 3.00%, 11/25/46(2) | 1,012,993 | | 910,303 | |
Starwood Mortgage Residential Trust, Series 2020-2, Class B1E, VRN, 3.00%, 4/25/60(2) | 7,888,000 | | 6,977,191 | |
Verus Securitization Trust, Series 2021-R2, Class A2, VRN, 1.12%, 2/25/64(2) | 2,678,485 | | 2,309,574 | |
Verus Securitization Trust, Series 2021-R2, Class A3, VRN, 1.23%, 2/25/64(2) | 3,160,438 | | 2,726,447 | |
Verus Securitization Trust, Series 2023-INV1, Class A2, VRN, 6.56%, 2/25/68(2) | 10,460,874 | | 10,454,479 | |
| | 149,692,898 | |
| U.S. Government Agency Collateralized Mortgage Obligations — 0.3% | |
FHLMC, Series 2020-DNA5, Class M2, VRN, 7.36%, (30-day average SOFR plus 2.80%), 10/25/50(2) | 2,720,020 | | 2,752,128 | |
| FHLMC, Series 3397, Class GF, VRN, 5.18%, (1-month LIBOR plus 0.50%), 12/15/37 | 897,907 | | 890,251 | |
| FNMA, Series 2013-C01, Class M2, VRN, 10.10%, (1-month LIBOR plus 5.25%), 10/25/23 | 5,401,019 | | 5,496,225 | |
| FNMA, Series 2014-C02, Class 2M2, VRN, 7.45%, (1-month LIBOR plus 2.60%), 5/25/24 | 1,504,522 | | 1,516,309 | |
| | | | | | | | |
| Principal Amount | Value |
| FNMA, Series 2014-C04, Class 1M2, VRN, 9.75%, (1-month LIBOR plus 4.90%), 11/25/24 | $ | 2,798,618 | | $ | 2,917,061 | |
| FNMA, Series 2016-C01, Class 1M2, VRN, 11.60%, (1-month LIBOR plus 6.75%), 8/25/28 | 81,440 | | 86,945 | |
| FNMA, Series 2017-C03, Class 1M2C, VRN, 7.85%, (1-month LIBOR plus 3.00%), 10/25/29 | 1,790,000 | | 1,835,700 | |
| GNMA, Series 2007-5, Class FA, VRN, 4.90%, (1-month LIBOR plus 0.14%), 2/20/37 | 751,389 | | 748,550 | |
| | 16,243,169 | |
TOTAL COLLATERALIZED MORTGAGE OBLIGATIONS (Cost $178,984,339) | | 165,936,067 | |
| MUNICIPAL SECURITIES — 1.4% | | |
| Bay Area Toll Authority Rev., 6.92%, 4/1/40 | 3,244,000 | | 3,869,316 | |
| Bay Area Toll Authority Rev., 6.26%, 4/1/49 | 2,000,000 | | 2,431,396 | |
| California State University Rev., 2.98%, 11/1/51 | 4,000,000 | | 2,856,917 | |
| Dallas Area Rapid Transit Rev., 6.00%, 12/1/44 | 1,250,000 | | 1,422,997 | |
| Foothill-Eastern Transportation Corridor Agency Rev., 4.09%, 1/15/49 | 6,048,000 | | 5,332,390 | |
| Golden State Tobacco Securitization Corp. Rev., 2.75%, 6/1/34 | 10,765,000 | | 9,002,019 | |
| Houston GO, 3.96%, 3/1/47 | 2,500,000 | | 2,225,458 | |
| Los Angeles Community College District GO, 6.75%, 8/1/49 | 2,400,000 | | 3,097,042 | |
| Los Angeles Department of Airports Rev., 6.58%, 5/15/39 | 1,510,000 | | 1,694,381 | |
| Los Angeles Unified School District GO, 5.75%, 7/1/34 | 2,250,000 | | 2,441,912 | |
| Michigan Strategic Fund Rev., (Flint Water Advocacy Fund), 3.23%, 9/1/47 | 5,000,000 | | 3,929,657 | |
| Missouri Highway & Transportation Commission Rev., 5.45%, 5/1/33 | 100,000 | | 104,767 | |
| New Jersey Turnpike Authority Rev., 7.41%, 1/1/40 | 3,236,000 | | 4,112,347 | |
| New Jersey Turnpike Authority Rev., 7.10%, 1/1/41 | 970,000 | | 1,198,376 | |
| New York City GO, 5.97%, 3/1/36 | 500,000 | | 552,304 | |
| New York City GO, 6.27%, 12/1/37 | 335,000 | | 381,931 | |
| New York City Municipal Water Finance Authority Rev. (New York City Water & Sewer System), 5.95%, 6/15/42 | 1,425,000 | | 1,635,849 | |
| New York State Dormitory Authority Rev. (State of New York Personal Income Tax Revenue), 3.19%, 2/15/43 | 500,000 | | 399,057 | |
| Ohio Turnpike & Infrastructure Commission Rev., 3.22%, 2/15/48 | 5,645,000 | | 4,240,972 | |
| Ohio Water Development Authority Water Pollution Control Loan Fund Rev., 4.88%, 12/1/34 | 550,000 | | 560,373 | |
| Pennsylvania Turnpike Commission Rev., 5.56%, 12/1/49 | 1,630,000 | | 1,805,639 | |
| Port Authority of New York & New Jersey Rev., 4.93%, 10/1/51 | 2,300,000 | | 2,341,761 | |
| Regents of the University of California Medical Center Pooled Rev., 3.26%, 5/15/60 | 4,120,000 | | 2,828,558 | |
| Rutgers The State University of New Jersey Rev., 5.67%, 5/1/40 | 3,070,000 | | 3,287,330 | |
| Sacramento Municipal Utility District Rev., 6.16%, 5/15/36 | 1,360,000 | | 1,505,355 | |
| San Antonio Electric & Gas Systems Rev., 5.99%, 2/1/39 | 1,352,000 | | 1,499,876 | |
| San Diego County Regional Airport Authority Rev., 5.59%, 7/1/43 | 1,675,000 | | 1,644,863 | |
| San Francisco Public Utilities Commission Water Rev., 6.00%, 11/1/40 | 1,970,000 | | 2,177,041 | |
| Santa Clara Valley Transportation Authority Rev., 5.88%, 4/1/32 | 2,060,000 | | 2,161,457 | |
| State of California GO, 4.60%, 4/1/38 | 3,035,000 | | 2,964,583 | |
| State of California GO, 7.55%, 4/1/39 | 3,220,000 | | 4,177,047 | |
| State of California GO, 7.30%, 10/1/39 | 2,605,000 | | 3,238,365 | |
| State of California GO, 7.60%, 11/1/40 | 455,000 | | 600,272 | |
| Texas Natural Gas Securitization Finance Corp. Rev., 5.17%, 4/1/41 | 3,865,000 | | 4,096,681 | |
| | | | | | | | |
| Principal Amount | Value |
| University of California Rev., 3.07%, 5/15/51 | $ | 5,565,000 | | $ | 4,023,618 | |
TOTAL MUNICIPAL SECURITIES (Cost $101,662,017) | | 89,841,907 | |
| COMMERCIAL MORTGAGE-BACKED SECURITIES — 1.1% | | |
BX Commercial Mortgage Trust, Series 2020-VIV2, Class C, VRN, 3.54%, 3/9/44(2) | 8,839,868 | | 7,205,576 | |
BX Commercial Mortgage Trust, Series 2020-VIVA, Class D, VRN, 3.55%, 3/11/44(2) | 12,817,000 | | 10,061,189 | |
BX Commercial Mortgage Trust, Series 2021-VOLT, Class F, VRN, 7.08%, (1-month LIBOR plus 2.40%), 9/15/36(2) | 21,200,000 | | 19,570,547 | |
ELP Commercial Mortgage Trust, Series 2021-ELP, Class E, VRN, 6.80%, (1-month LIBOR plus 2.12%), 11/15/38(2) | 18,460,000 | | 17,234,631 | |
WMRK Commercial Mortgage Trust, Series 2022-WMRK, Class A, VRN, 7.62%, (1-month SOFR plus 2.79%), 11/15/27(2) | 13,585,000 | | 13,487,481 | |
TOTAL COMMERCIAL MORTGAGE-BACKED SECURITIES (Cost $75,622,930) | | 67,559,424 | |
| U.S. GOVERNMENT AGENCY SECURITIES — 0.7% | | |
| FNMA, 0.75%, 10/8/27 | 29,724,000 | | 26,087,579 | |
| FNMA, 6.625%, 11/15/30 | 10,000,000 | | 11,854,961 | |
| Tennessee Valley Authority, 1.50%, 9/15/31 | 5,000,000 | | 4,080,173 | |
TOTAL U.S. GOVERNMENT AGENCY SECURITIES (Cost $46,653,085) | | 42,022,713 | |
| SOVEREIGN GOVERNMENTS AND AGENCIES — 0.4% | | |
| Chile — 0.1% | | |
| Chile Government International Bond, 3.10%, 5/7/41 | 3,400,000 | | 2,560,464 | |
| Chile Government International Bond, 3.625%, 10/30/42 | 1,697,000 | | 1,347,802 | |
| | 3,908,266 | |
Mexico† | | |
| Mexico Government International Bond, 4.15%, 3/28/27 | 18,000 | | 17,698 | |
| Peru — 0.1% | | |
| Peruvian Government International Bond, 5.625%, 11/18/50 | 4,946,000 | | 4,997,218 | |
| Philippines — 0.1% | | |
| Philippine Government International Bond, 5.50%, 3/30/26 | 3,000,000 | | 3,081,326 | |
| Philippine Government International Bond, 6.375%, 10/23/34 | 5,735,000 | | 6,451,875 | |
| | 9,533,201 | |
Poland† | | |
| Republic of Poland Government International Bond, 4.00%, 1/22/24 | 230,000 | | 228,571 | |
| Uruguay — 0.1% | | |
| Uruguay Government International Bond, 4.125%, 11/20/45 | 1,239,000 | | 1,145,174 | |
| Uruguay Government International Bond, 5.10%, 6/18/50 | 2,400,000 | | 2,410,995 | |
| | 3,556,169 | |
TOTAL SOVEREIGN GOVERNMENTS AND AGENCIES (Cost $26,382,144) | | 22,241,123 | |
BANK LOAN OBLIGATIONS(4) — 0.1% | | |
| Pharmaceuticals — 0.1% | | |
Horizon Therapeutics USA Inc., 2021 Term Loan B2, 6.56%, (1-month LIBOR plus 1.75%), 3/15/28
(Cost $8,354,877) | 8,347,735 | | 8,341,850 | |
SHORT-TERM INVESTMENTS(5) — 5.6% | | |
Discount Notes(6) — 0.4% | | |
| Federal Home Loan Bank Discount Notes, 4.67%, 4/12/23 | 26,000,000 | | 25,970,778 | |
| Repurchase Agreements — 4.7% | | |
| BMO Capital Markets Corp., (collateralized by various U.S. Treasury obligations, 1.125% - 4.375%, 8/15/40 - 5/15/49, valued at $77,379,870), in a joint trading account at 4.67%, dated 3/31/23, due 4/3/23 (Delivery value $74,664,404) | | 74,635,358 | |
| | | | | | | | |
| Principal Amount | Value |
| Fixed Income Clearing Corp., (collateralized by various U.S. Treasury obligations, 3.625%, 3/31/28, valued at $220,205,797), at 4.81%, dated 3/31/23, due 4/3/23 (Delivery value $215,974,535) | | $ | 215,888,000 | |
| | 290,523,358 | |
Treasury Bills(6) — 0.5% | | |
| U.S. Treasury Bills, 4.77%, 4/6/23 | $ | 28,000,000 | | 27,989,237 | |
TOTAL SHORT-TERM INVESTMENTS (Cost $344,469,128) | | 344,483,373 | |
TOTAL INVESTMENT SECURITIES — 102.4% (Cost $6,612,268,309) | | 6,352,088,510 | |
| OTHER ASSETS AND LIABILITIES — (2.4)% | | (146,537,481) | |
| TOTAL NET ASSETS — 100.0% | | $ | 6,205,551,029 | |
| | | | | | | | | | | | | | |
| FUTURES CONTRACTS PURCHASED |
| Reference Entity | Contracts | Expiration Date | Notional
Amount | Unrealized Appreciation (Depreciation)^ |
| Euro-Bobl 10-Year Bonds | 242 | June 2023 | $ | 35,651,069 | | $ | 1,149,208 | |
| U.S. Treasury 2-Year Notes | 1,577 | June 2023 | 325,576,580 | | 400,336 | |
| U.S. Treasury 5-Year Notes | 583 | June 2023 | 63,843,055 | | 64,499 | |
| U.S. Treasury 10-Year Notes | 2,725 | June 2023 | 313,162,109 | | (1,650,754) | |
| U.S. Treasury 10-Year Ultra Notes | 1,307 | June 2023 | 158,330,797 | | 4,336,116 | |
| U.S. Treasury Long Bonds | 326 | June 2023 | 42,756,937 | | 410,614 | |
| U.S. Treasury Ultra Bonds | 441 | June 2023 | 62,236,125 | | 1,467,046 | |
| | | $ | 1,001,556,672 | | $ | 6,177,065 | |
^Amount represents value and unrealized appreciation (depreciation).
| | | | | | | | | | | | | | | | | | | | | | | |
| CENTRALLY CLEARED TOTAL RETURN SWAP AGREEMENTS |
| Floating Rate Index | Pay/Receive Floating Rate Index at Termination | Fixed Rate | Termination
Date | Notional
Amount | Premiums Paid (Received) | Unrealized
Appreciation
(Depreciation) | Value |
| CPURNSA | Receive | 2.90% | 10/11/23 | $ | 24,000,000 | | $ | 282 | | $ | 138,108 | | $ | 138,390 | |
| CPURNSA | Receive | 2.97% | 10/14/23 | $ | 36,400,000 | | 296 | | 188,190 | | 188,486 | |
| CPURNSA | Receive | 2.97% | 10/14/23 | $ | 36,400,000 | | 296 | | 188,190 | | 188,486 | |
| | | | | $ | 874 | | $ | 514,488 | | $ | 515,362 | |
| | | | | | | | |
| NOTES TO SCHEDULE OF INVESTMENTS |
| CPURNSA | – | U.S. Consumer Price Index Urban Consumers Not Seasonally Adjusted Index |
| FHLMC | – | Federal Home Loan Mortgage Corporation |
| FNMA | – | Federal National Mortgage Association |
| GNMA | – | Government National Mortgage Association |
| GO | – | General Obligation |
| H15T1Y | – | Constant Maturity U.S. Treasury Note Yield Curve Rate Index |
| LIBOR | – | London Interbank Offered Rate |
| SEQ | – | Sequential Payer |
| SOFR | – | Secured Overnight Financing Rate |
| TBA | – | To-Be-Announced. Security was purchased on a forward commitment basis with an approximate principal amount and maturity date. Actual principal amount and maturity date will be determined upon settlement. |
| UMBS | – | Uniform Mortgage-Backed Securities |
| VRN | – | Variable Rate Note. The rate adjusts periodically based upon the terms set forth in the security’s offering documents. The rate shown is effective at the period end and the reference rate and spread, if any, is indicated. The security's effective maturity date may be shorter than the final maturity date shown. |
†Category is less than 0.05% of total net assets.
(1)Security, or a portion thereof, has been pledged at the custodian bank or with a broker for collateral requirements on forward commitments, futures contracts and/or swap agreements. At the period end, the aggregate value of securities pledged was $18,752,605.
(2)Security was purchased pursuant to Rule 144A or Section 4(2) under the Securities Act of 1933 and may be sold in transactions exempt from registration, normally to qualified institutional investors. The aggregate value of these securities at the period end was $1,140,819,991, which represented 18.4% of total net assets.
(3)When-issued security. The issue price and yield are fixed on the date of the commitment, but payment and delivery are scheduled for a future date.
(4)The interest rate on a bank loan obligation adjusts periodically based on a predetermined schedule. Rate or range of rates shown is effective at period end. The maturity date on a bank loan obligation may be less than indicated as a result of contractual or optional prepayments. These prepayments cannot be predicted with certainty.
(5)Category includes securities purchased with cash collateral received at the custodian bank for collateral requirements on forward commitments. At the period end, the aggregate value of cash deposits received was $970,276.
(6)The rate indicated is the yield to maturity at purchase for non-interest bearing securities. For interest bearing securities, the stated coupon rate is shown.
See Notes to Financial Statements.
| | |
| Statement of Assets and Liabilities |
| | | | | |
| MARCH 31, 2023 | |
| Assets | |
| Investment securities, at value (cost of $6,612,268,309) | $ | 6,352,088,510 | |
| Cash | 364,496 | |
| Receivable for investments sold | 42,222,886 | |
| Receivable for capital shares sold | 19,216,590 | |
| Receivable for variation margin on futures contracts | 2,805,248 | |
| Receivable for variation margin on swap agreements | 54,069 | |
| Interest receivable | 40,633,749 | |
| 6,457,385,548 | |
| |
| Liabilities | |
| Payable for collateral received for forward commitments | 970,276 | |
| Payable for investments purchased | 246,966,175 | |
| Payable for capital shares redeemed | 3,076,114 | |
| Accrued management fees | 638,272 | |
| Distribution and service fees payable | 23,810 | |
| Dividends payable | 159,872 | |
| 251,834,519 | |
| |
| Net Assets | $ | 6,205,551,029 | |
| |
| Net Assets Consist of: | |
| Capital paid in | $ | 7,107,539,484 | |
| Distributable earnings (loss) | (901,988,455) | |
| $ | 6,205,551,029 | |
| | | | | | | | | | | |
| Net Assets | Shares Outstanding | Net Asset Value Per Share* |
| Investor Class | $590,248,135 | 62,599,429 | $9.43 |
| I Class | $689,974,030 | 73,148,027 | $9.43 |
| Y Class | $119,167,403 | 12,630,208 | $9.44 |
| A Class | $74,012,848 | 7,847,870 | $9.43 |
| C Class | $7,638,327 | 810,727 | $9.42 |
| R Class | $4,796,482 | 508,777 | $9.43 |
| R5 Class | $5,264 | 558 | $9.43 |
| R6 Class | $138,248,393 | 14,650,158 | $9.44 |
| G Class | $4,581,460,147 | 485,574,758 | $9.44 |
*Maximum offering price per share was equal to the net asset value per share for all share classes, except Class A, for which the maximum offering price per share was $9.87 (net asset value divided by 0.955). A contingent deferred sales charge may be imposed on redemptions of Class A and Class C.
See Notes to Financial Statements.
| | | | | |
| YEAR ENDED MARCH 31, 2023 | |
| Investment Income (Loss) | |
| Income: | |
| Interest (net of foreign taxes withheld of $10,760) | $ | 188,161,283 | |
| |
| Expenses: | |
| Management fees | 19,877,840 | |
| Distribution and service fees: | |
| A Class | 194,655 | |
| C Class | 65,398 | |
| R Class | 23,739 | |
| Trustees' fees and expenses | 337,658 | |
| Other expenses | 132,019 | |
| 20,631,309 | |
| Fees waived - G Class | (11,850,092) | |
| 8,781,217 | |
| |
| Net investment income (loss) | 179,380,066 | |
| |
| Realized and Unrealized Gain (Loss) | |
| Net realized gain (loss) on: | |
| Investment transactions | (450,311,113) | |
| Forward foreign currency exchange contract transactions | (362,065) | |
| Futures contract transactions | (36,502,359) | |
| Swap agreement transactions | 1,059,373 | |
| Foreign currency translation transactions | (15,253) | |
| (486,131,417) | |
| |
| Change in net unrealized appreciation (depreciation) on: | |
| Investments | 119,276,273 | |
| Futures contracts | 7,602,184 | |
| Swap agreements | (7,695,539) | |
| Translation of assets and liabilities in foreign currencies | (11,189) | |
| 119,171,729 | |
| |
| Net realized and unrealized gain (loss) | (366,959,688) | |
| |
| Net Increase (Decrease) in Net Assets Resulting from Operations | $ | (187,579,622) | |
See Notes to Financial Statements.
| | |
| Statement of Changes in Net Assets |
| | | | | | | | |
| YEARS ENDED MARCH 31, 2023 AND MARCH 31, 2022 |
| Increase (Decrease) in Net Assets | March 31, 2023 | March 31, 2022 |
| Operations | | |
| Net investment income (loss) | $ | 179,380,066 | | $ | 30,005,772 | |
| Net realized gain (loss) | (486,131,417) | | (1,559,007) | |
| Change in net unrealized appreciation (depreciation) | 119,171,729 | | (97,708,759) | |
| Net increase (decrease) in net assets resulting from operations | (187,579,622) | | (69,261,994) | |
| | |
| Distributions to Shareholders | | |
| From earnings: | | |
| Investor Class | (19,569,703) | | (19,994,409) | |
| I Class | (20,599,587) | | (22,140,729) | |
| Y Class | (4,542,278) | | (3,770,269) | |
| A Class | (2,056,597) | | (2,209,990) | |
| C Class | (124,606) | | (143,761) | |
| R Class | (114,620) | | (121,811) | |
| R5 Class | (161) | | (4,048) | |
| R6 Class | (4,069,188) | | (3,599,101) | |
| G Class | (128,590,062) | | — | |
| Decrease in net assets from distributions | (179,666,802) | | (51,984,118) | |
| | |
| Capital Share Transactions | | |
| Net increase (decrease) in net assets from capital share transactions (Note 5) | 4,699,525,995 | | (3,286,059) | |
| | |
| Net increase (decrease) in net assets | 4,332,279,571 | | (124,532,171) | |
| | |
| Net Assets | | |
| Beginning of period | 1,873,271,458 | | 1,997,803,629 | |
| End of period | $ | 6,205,551,029 | | $ | 1,873,271,458 | |
See Notes to Financial Statements.
| | |
| Notes to Financial Statements |
MARCH 31, 2023
1. Organization
American Century Investment Trust (the trust) is registered under the Investment Company Act of 1940, as amended (the 1940 Act), as an open-end management investment company and is organized as a Massachusetts business trust. Diversified Bond Fund (the fund) is one fund in a series issued by the trust. The fund’s investment objective is to seek a high level of income by investing in non-money market debt securities.
The fund offers the Investor Class, I Class, Y Class, A Class, C Class, R Class, R5 Class, R6 Class and G Class. The A Class may incur an initial sales charge. The A Class and C Class may be subject to a contingent deferred sales charge. Sale of the G Class commenced on May 19, 2022.
2. Significant Accounting Policies
The following is a summary of significant accounting policies consistently followed by the fund in preparation of its financial statements. The fund is an investment company and follows accounting and reporting guidance in accordance with accounting principles generally accepted in the United States of America. This may require management to make certain estimates and assumptions at the date of the financial statements. Actual results could differ from these estimates. Management evaluated the impact of events or transactions occurring through the date the financial statements were issued that would merit recognition or disclosure.
Investment Valuations — The fund determines the fair value of its investments and computes its net asset value (NAV) per share at the close of regular trading (usually 4 p.m. Eastern time) on the New York Stock Exchange (NYSE) on each day the NYSE is open. The value of investments of the fund is determined by American Century Investment Management, Inc. (ACIM) (the investment advisor), as the valuation designee, pursuant to its valuation policies and procedures. The Board of Trustees oversees the valuation designee and reviews its valuation policies and procedures at least annually.
Fixed income securities are valued at the evaluated mean as provided by independent pricing services or at the mean of the most recent bid and asked prices as provided by investment dealers. Corporate bonds, U.S. Treasury and Government Agency securities, bank loan obligations, municipal securities and sovereign governments and agencies are valued using market models that consider trade data, quotations from dealers and active market makers, relevant yield curve and spread data, creditworthiness, trade data or market information on comparable securities, and other relevant security specific information. Mortgage-related and asset-backed securities are valued based on models that consider trade data, prepayment and default projections, benchmark yield and spread data and estimated cash flows of each tranche of the issuer. Collateralized loan obligations are valued based on discounted cash flow models that consider trade and economic data, prepayment assumptions and default projections. Commercial paper is valued using a curve-based approach that considers money market rates for specific instruments, programs, currencies and maturity points from a variety of active market makers.
Equity securities that are listed or traded on a domestic securities exchange are valued at the last reported sales price or at the official closing price as provided by the exchange. Equity securities traded on foreign securities exchanges are generally valued at the closing price of such securities on the exchange where primarily traded or at the close of the NYSE, if that is earlier. If no last sales price is reported, or if local convention or regulation so provides, the mean of the latest bid and asked prices may be used. Securities traded over-the-counter are valued at the mean of the latest bid and asked prices, the last sales price, or the official closing price.
Hybrid securities are valued at the evaluated mean as provided by independent pricing services or at the mean of the most recent bid and asked prices as provided by investment dealers. Preferred stocks and convertible preferred stocks with perpetual maturities are valued using market models that consider trade data, quotations from dealers and active market makers, relevant yield curve and spread data, creditworthiness, trade data or market information on comparable securities, and other relevant security specific information.
Open-end management investment companies are valued at the reported NAV per share. Repurchase agreements are valued at cost, which approximates fair value. Exchange-traded futures contracts are valued at the settlement price as provided by the appropriate exchange. Swap agreements are valued at an evaluated mean as provided by independent pricing services or independent brokers. Forward foreign currency exchange contracts are valued at the mean of the appropriate forward exchange rate at the close of the NYSE as provided by an independent pricing service. Investments initially expressed in local currencies are translated into U.S. dollars at the mean of the appropriate currency exchange rate at the close of the NYSE as provided by an independent pricing service.
If the valuation designee determines that the market price for a portfolio security is not readily available or is believed by the valuation designee to be unreliable, such security is valued at fair value as determined in good faith by the valuation designee, in accordance with its policies and procedures. Circumstances that may cause the fund to determine that market quotations are not available or reliable include, but are not limited to: when there is a significant event subsequent to the market quotation; trading in a security has been halted during the trading day; or trading in a security is insufficient or did not take place due to a closure or holiday.
The valuation designee monitors for significant events occurring after the close of an investment’s primary exchange but before the fund’s NAV per share is determined. Significant events may include, but are not limited to: corporate announcements and transactions; regulatory news, governmental action and political unrest that could impact a specific investment or an investment sector; or armed conflicts, natural disasters and similar events that could affect investments in a specific country or region. The valuation designee also monitors for significant fluctuations between domestic and foreign markets, as evidenced by the U.S. market or such other indicators that it deems appropriate. The valuation designee may apply a model-derived factor to the closing price of equity securities traded on foreign securities exchanges. The factor is based on observable market data as provided by an independent pricing service.
Security Transactions — Security transactions are accounted for as of the trade date. Net realized gains and losses are determined on the identified cost basis, which is also used for federal income tax purposes.
Investment Income — Interest income less foreign taxes withheld, if any, is recorded on the accrual basis and includes paydown gain (loss) and accretion of discounts and amortization of premiums. Inflation adjustments related to inflation-linked debt securities are reflected as interest income.
Foreign Currency Translations — All assets and liabilities initially expressed in foreign currencies are translated into U.S. dollars at prevailing exchange rates at period end. The fund may enter into spot foreign currency exchange contracts to facilitate transactions denominated in a foreign currency. Purchases and sales of investment securities, dividend and interest income, spot foreign currency exchange contracts, and expenses are translated at the rates of exchange prevailing on the respective dates of such transactions. Net realized and unrealized foreign currency exchange gains or losses related to investment securities are a component of net realized gain (loss) on investment transactions and change in net unrealized appreciation (depreciation) on investments, respectively.
Forward Commitments — The fund may engage in securities transactions on a forward commitment basis. In these transactions, the securities’ prices and yields are fixed on the date of the commitment. The fund may sell a to-be-announced (TBA) security and at the same time make a commitment to purchase the same security at a future date at a specified price. Conversely, the fund may purchase a TBA security and at the same time make a commitment to sell the same security at a future date at a specified price. These types of transactions are known as “TBA roll” transactions and are accounted for as purchases and sales. The fund will segregate cash, cash equivalents or other appropriate liquid securities on its records in amounts sufficient to meet the purchase price.
Repurchase Agreements — The fund may enter into repurchase agreements with institutions that ACIM has determined are creditworthy pursuant to criteria adopted by the Board of Trustees. The fund requires that the collateral, represented by securities, received in a repurchase transaction be transferred to the custodian in a manner sufficient to enable the fund to obtain those securities in the event of a default under the repurchase agreement. ACIM monitors, on a daily basis, the securities transferred to ensure the value, including accrued interest, of the securities under each repurchase agreement is equal to or greater than amounts owed to the fund under each repurchase agreement.
Joint Trading Account — Pursuant to an Exemptive Order issued by the Securities and Exchange Commission, the fund, along with certain other funds in the American Century Investments family of funds, may transfer uninvested cash balances into a joint trading account. These balances are invested in one or more repurchase agreements that are collateralized by U.S. Treasury or Agency obligations.
Income Tax Status — It is the fund's policy to distribute substantially all net investment income and net realized gains to shareholders and to otherwise qualify as a regulated investment company under provisions of the Internal Revenue Code. Accordingly, no provision has been made for income taxes. The fund files U.S. federal, state, local and non-U.S. tax returns as applicable. The fund's tax returns are subject to examination by the relevant taxing authority until expiration of the applicable statute of limitations, which is generally three years from the date of filing but can be longer in certain jurisdictions. At this time, management believes there are no uncertain tax positions which, based on their technical merit, would not be sustained upon examination and for which it is reasonably possible that the total amounts of unrecognized tax benefits will significantly change in the next twelve months.
Multiple Class — All shares of the fund represent an equal pro rata interest in the net assets of the class to which such shares belong, and have identical voting, dividend, liquidation and other rights and the same terms and conditions, except for class specific expenses and exclusive rights to vote on matters affecting only individual classes. Income, non-class specific expenses, and realized and unrealized capital gains and losses of the fund are allocated to each class of shares based on their relative net assets.
Distributions to Shareholders — Distributions from net investment income, if any, are declared daily and paid monthly. Distributions from net realized gains, if any, are generally declared and paid annually.
Indemnifications — Under the trust’s organizational documents, its officers and trustees are indemnified against certain liabilities arising out of the performance of their duties to the fund. In addition, in the normal course of business, the fund enters into contracts that provide general indemnifications. The maximum exposure under these arrangements is unknown as this would involve future claims that may be made against a fund. The risk of material loss from such claims is considered by management to be remote.
3. Fees and Transactions with Related Parties
Certain officers and trustees of the trust are also officers and/or directors of American Century Companies, Inc. (ACC). The trust's investment advisor, ACIM, the trust's distributor, American Century Investment Services, Inc. (ACIS), and the trust's transfer agent, American Century Services, LLC, are wholly owned, directly or indirectly, by ACC. Various funds issued by American Century Asset Allocation Portfolios, Inc. own, in aggregate, 41% of the shares of the fund. Related parties do not invest in the fund for the purpose of exercising management or control.
Management Fees — The trust has entered into a management agreement with ACIM, under which ACIM provides the fund with investment advisory and management services in exchange for a single, unified management fee (the fee) per class. The agreement provides that ACIM will pay all expenses of managing and operating the fund, except brokerage expenses, taxes, interest, fees and expenses of the independent trustees (including legal counsel fees), extraordinary expenses, and expenses incurred in connection with the provision of shareholder services and distribution services under a plan adopted pursuant to Rule 12b-1 under the 1940 Act. The fee is computed and accrued daily based on each class’s daily net assets and paid monthly in arrears. The difference in the fee among the classes is a result of their separate arrangements for non-Rule 12b-1 shareholder services. It is not the result of any difference in advisory or custodial fees or other expenses related to the management of the fund's assets, which do not vary by class. The fee consists of (1) an Investment Category Fee based on the daily net assets of the fund and certain other accounts managed by the investment advisor that are in the same broad investment category as the fund and (2) a Complex Fee based on the assets of all funds in the American Century Investments family of funds that have the same investment advisor and distributor as the fund. For purposes of determining the Investment Category Fee and Complex Fee, the assets of funds managed by the investment advisor that invest exclusively in the shares of other funds (funds of funds) are not included. The investment advisor agreed to waive the G Class's management fee in its entirety. The investment advisor expects this waiver to remain in effect permanently and cannot terminate it without the approval of the Board of Trustees.
The Investment Category Fee range, the Complex Fee range and the effective annual management fee for each class for the period ended March 31, 2023 are as follows:
| | | | | | | | | | | |
| Investment Category Fee Range | Complex Fee Range | Effective Annual
Management Fee |
| Investor Class | 0.2925% to 0.4100% | 0.2500% to 0.3100% | 0.59% |
| I Class | 0.0500% to 0.1100% | 0.39% |
| Y Class | 0.0200% to 0.0800% | 0.36% |
| A Class | 0.2500% to 0.3100% | 0.59% |
| C Class | 0.2500% to 0.3100% | 0.59% |
| R Class | 0.2500% to 0.3100% | 0.59% |
| R5 Class | 0.0500% to 0.1100% | 0.39% |
| R6 Class | 0.0000% to 0.0600% | 0.34% |
| G Class | 0.0000% to 0.0600% | 0.00%(1) |
(1)Effective annual management fee before waiver was 0.34%.
Distribution and Service Fees — The Board of Trustees has adopted a separate Master Distribution and Individual Shareholder Services Plan for each of the A Class, C Class and R Class (collectively the plans), pursuant to Rule 12b-1 of the 1940 Act. The plans provide that the A Class will pay ACIS an annual distribution and service fee of 0.25%. The plans provide that the C Class will pay ACIS an annual distribution and service fee of 1.00%, of which 0.25% is paid for individual shareholder services and 0.75% is paid for distribution services. The plans provide that the R Class will pay ACIS an annual distribution and service fee of 0.50%. The fees are computed and accrued daily based on each class’s daily net assets and paid monthly in arrears. The fees are used to pay financial intermediaries for distribution and individual shareholder services. Fees incurred under the plans during the period ended March 31, 2023 are detailed in the Statement of Operations.
Trustees' Fees and Expenses — The Board of Trustees is responsible for overseeing the investment advisor’s management and operations of the fund. The trustees receive detailed information about the fund and its investment advisor regularly throughout the year, and meet at least quarterly with management of the investment advisor to review reports about fund operations. The fund's officers do not receive compensation from the fund.
Interfund Transactions — The fund may enter into security transactions with other American Century Investments funds and other client accounts of the investment advisor, in accordance with the 1940 Act rules and procedures adopted by the Board of Trustees. The rules and procedures require, among other things, that these transactions be effected at the independent current market price of the security. There were no interfund transactions during the period.
4. Investment Transactions
Purchases of investment securities, excluding short-term investments, for the period ended March 31, 2023 totaled $8,996,536,752, of which $7,118,297,526 represented U.S. Treasury and Government Agency obligations.
Sales of investment securities, excluding short-term investments, for the period ended March 31, 2023 totaled $8,801,834,925, of which $6,426,010,296 represented U.S. Treasury and Government Agency obligations.
5. Capital Share Transactions
Transactions in shares of the fund were as follows (unlimited number of shares authorized):
| | | | | | | | | | | | | | |
| Year ended March 31, 2023(1) | Year ended March 31, 2022 |
| Shares | Amount | Shares | Amount |
| Investor Class | | | | |
| Sold | 18,623,991 | | $ | 174,732,084 | | 11,426,991 | | $ | 125,195,206 | |
| Issued in reinvestment of distributions | 2,020,376 | | 19,076,378 | | 1,800,254 | | 19,754,459 | |
| Redeemed | (31,479,699) | | (295,709,814) | | (8,326,838) | | (91,510,093) | |
| (10,835,332) | | (101,901,352) | | 4,900,407 | | 53,439,572 | |
| I Class | | | | |
| Sold | 35,508,524 | | 334,793,636 | | 14,570,423 | | 159,063,483 | |
| Issued in reinvestment of distributions | 2,040,603 | | 19,275,092 | | 1,899,356 | | 20,848,634 | |
| Redeemed | (37,464,788) | | (356,109,498) | | (22,875,783) | | (250,953,580) | |
| 84,339 | | (2,040,770) | | (6,406,004) | | (71,041,463) | |
| Y Class | | | | |
| Sold | 6,835,974 | | 66,237,269 | | 7,179,584 | | 78,487,935 | |
| Issued in reinvestment of distributions | 480,560 | | 4,540,429 | | 343,659 | | 3,770,212 | |
| Redeemed | (8,475,057) | | (80,193,190) | | (4,258,146) | | (47,086,529) | |
| (1,158,523) | | (9,415,492) | | 3,265,097 | | 35,171,618 | |
| A Class | | | | |
| Sold | 956,176 | | 9,053,633 | | 1,238,479 | | 13,584,288 | |
| Issued in reinvestment of distributions | 202,730 | | 1,914,145 | | 188,492 | | 2,069,402 | |
| Redeemed | (1,975,254) | | (18,766,114) | | (3,151,516) | | (34,741,938) | |
| (816,348) | | (7,798,336) | | (1,724,545) | | (19,088,248) | |
| C Class | | | | |
| Sold | 330,192 | | 3,107,903 | | 82,957 | | 908,698 | |
| Issued in reinvestment of distributions | 13,034 | | 122,715 | | 12,677 | | 139,113 | |
| Redeemed | (291,397) | | (2,772,836) | | (300,522) | | (3,277,754) | |
| 51,829 | | 457,782 | | (204,888) | | (2,229,943) | |
| R Class | | | | |
| Sold | 127,162 | | 1,206,392 | | 112,147 | | 1,228,216 | |
| Issued in reinvestment of distributions | 12,090 | | 113,971 | | 10,988 | | 120,635 | |
| Redeemed | (149,447) | | (1,426,909) | | (268,152) | | (2,952,369) | |
| (10,195) | | (106,546) | | (145,017) | | (1,603,518) | |
| R5 Class | | | | |
| Sold | — | | — | | 2,083 | | 23,050 | |
| Issued in reinvestment of distributions | 17 | | 161 | | 359 | | 3,986 | |
| Redeemed | — | | — | | (59,266) | | (666,793) | |
| 17 | | 161 | | (56,824) | | (639,757) | |
| R6 Class | | | | |
| Sold | 6,276,644 | | 60,051,602 | | 3,343,389 | | 36,649,917 | |
| Issued in reinvestment of distributions | 425,051 | | 4,011,953 | | 321,582 | | 3,531,647 | |
| Redeemed | (3,981,256) | | (37,787,995) | | (3,418,648) | | (37,475,884) | |
| 2,720,439 | | 26,275,560 | | 246,323 | | 2,705,680 | |
| G Class | | | N/A | |
| Sold | 91,486,497 | | 860,555,731 | | | |
| Issued in connection with reorganization (Note 10) | 435,638,705 | | 4,331,988,616 | | | |
| Issued in reinvestment of distributions | 13,700,263 | | 128,589,227 | | | |
| Redeemed | (55,250,707) | | (527,078,586) | | | |
| 485,574,758 | | 4,794,054,988 | | | |
| Net increase (decrease) | 475,610,984 | | $ | 4,699,525,995 | | (125,451) | | $ | (3,286,059) | |
(1)May 19, 2022 (commencement of sale) through March 31, 2023 for the G Class.
6. Fair Value Measurements
The fund's investments valuation process is based on several considerations and may use multiple inputs to determine the fair value of the investments held by the fund. In conformity with accounting principles generally accepted in the United States of America, the inputs used to determine a valuation are classified into three broad levels.
•Level 1 valuation inputs consist of unadjusted quoted prices in an active market for identical investments.
•Level 2 valuation inputs consist of direct or indirect observable market data (including quoted prices for comparable investments, evaluations of subsequent market events, interest rates, prepayment speeds, credit risk, etc.). These inputs also consist of quoted prices for identical investments initially expressed in local currencies that are adjusted through translation into U.S. dollars.
•Level 3 valuation inputs consist of unobservable data (including a fund’s own assumptions).
The level classification is based on the lowest level input that is significant to the fair valuation measurement. The valuation inputs are not necessarily an indication of the risks associated with investing in these securities or other financial instruments.
The following is a summary of the level classifications as of period end. The Schedule of Investments provides additional information on the fund's portfolio holdings.
| | | | | | | | | | | |
| Level 1 | Level 2 | Level 3 |
| Assets | | | |
| Investment Securities | | | |
| U.S. Government Agency Mortgage-Backed Securities | — | | $ | 1,792,927,532 | | — | |
| U.S. Treasury Securities | — | | 1,674,792,611 | | — | |
| Corporate Bonds | — | | 1,391,544,298 | | — | |
| Collateralized Loan Obligations | — | | 417,346,739 | | — | |
| Asset-Backed Securities | — | | 335,050,873 | | — | |
| Collateralized Mortgage Obligations | — | | 165,936,067 | | — | |
| Municipal Securities | — | | 89,841,907 | | — | |
| Commercial Mortgage-Backed Securities | — | | 67,559,424 | | — | |
| U.S. Government Agency Securities | — | | 42,022,713 | | — | |
| Sovereign Governments and Agencies | — | | 22,241,123 | | — | |
| Bank Loan Obligations | — | | 8,341,850 | | — | |
| Short-Term Investments | — | | 344,483,373 | | — | |
| — | | $ | 6,352,088,510 | | — | |
| Other Financial Instruments | | | |
| Futures Contracts | $ | 6,678,611 | | $ | 1,149,208 | | — | |
| Swap Agreements | — | | 515,362 | | — | |
| $ | 6,678,611 | | $ | 1,664,570 | | — | |
| | | |
| Liabilities | | | |
| Other Financial Instruments | | | |
| Futures Contracts | $ | 1,650,754 | | — | | — | |
7. Derivative Instruments
Credit Risk — The fund is subject to credit risk in the normal course of pursuing its investment objectives. The value of a bond generally declines as the credit quality of its issuer declines. Credit default swap agreements enable a fund to buy/sell protection against a credit event of a specific issuer or index. A fund may attempt to enhance returns by selling protection or attempt to mitigate credit risk by buying protection. The buyer/seller of credit protection against a security or basket of securities may pay/receive an up-front or periodic payment to compensate for/against potential default events. Changes in value, including the periodic amounts of interest to be paid or received on swap agreements, are recorded as unrealized appreciation (depreciation) on swap agreements. Upon entering into a centrally cleared swap, a fund is required to deposit cash or securities (initial margin) with a financial intermediary in an amount equal to a certain percentage of the notional amount. A fund may incur charges or earn income on cash deposit balances, which are reflected in interest expenses or interest income, respectively. Subsequent payments (variation margin) are made or received daily, in cash, by a fund. The variation margin is equal to the daily change in the value and is a component of unrealized gains and losses. Realized gain or loss is recorded upon receipt or payment of a periodic settlement or termination of swap agreements. Net realized and unrealized gains or losses occurring during the holding period of swap agreements are a component of net realized gain (loss) on swap agreement transactions and change in net unrealized appreciation (depreciation) on swap agreements, respectively. The risks of entering into swap agreements include the possible lack of liquidity, failure of the counterparty to meet its obligations, and that there may be unfavorable changes in the underlying investments or instruments. The fund's average notional amount held during the period was $248,731,545.
Foreign Currency Risk — The fund is subject to foreign currency exchange rate risk in the normal course of pursuing its investment objectives. The value of foreign investments held by a fund may be significantly affected by changes in foreign currency exchange rates. The dollar value of a foreign security generally decreases when the value of the dollar rises against the foreign currency in which the security is denominated and tends to increase when the value of the dollar declines against such foreign currency. A fund may enter into forward foreign currency exchange contracts to reduce a fund's exposure to foreign currency exchange rate fluctuations or to gain exposure to the fluctuations in the value of foreign currencies. A fund will segregate cash, cash equivalents or other appropriate liquid securities on its records in amounts sufficient to meet requirements. The net U.S. dollar value of foreign currency underlying all contractual commitments held by a fund and the resulting unrealized appreciation or depreciation are determined daily. Realized gain or loss is recorded upon settlement of the contract. Net realized and unrealized gains or losses occurring during the holding period of forward foreign currency exchange contracts are a component of net realized gain (loss) on forward foreign currency exchange contract transactions and change in net unrealized appreciation (depreciation) on forward foreign currency exchange contracts, respectively. A fund bears the risk of an unfavorable change in the foreign currency exchange rate underlying the forward contract. Additionally, losses, up to the fair value, may arise if the counterparties do not perform under the contract terms. The fund's average U.S. dollar exposure to foreign currency risk derivative instruments held during the period was $218,725,426.
Interest Rate Risk — The fund is subject to interest rate risk in the normal course of pursuing its investment objectives. The value of bonds generally declines as interest rates rise. A fund may enter into futures contracts based on a bond index or a specific underlying security. A fund may purchase futures contracts to gain exposure to increases in market value or sell futures contracts to protect against a decline in market value. Upon entering into a futures contract, a fund will segregate cash, cash equivalents or other appropriate liquid securities on its records in amounts sufficient to meet requirements. A fund may incur charges or earn income on cash deposit balances, which are reflected in interest expenses or interest income, respectively. Subsequent payments (variation margin) are made or received daily, in cash, by a fund. The variation margin is equal to the daily change in the contract value and is recorded as unrealized gains and losses. A fund recognizes a realized gain or loss when the futures contract is closed or expires. Net realized and unrealized gains or losses occurring during the holding period of futures contracts are a component of net realized gain (loss) on futures contract transactions and change in net unrealized appreciation (depreciation) on futures contracts, respectively. One of the risks of entering into futures contracts is the possibility that the change in value of the contract may not correlate with the changes in value of the underlying securities. The fund's average notional exposure to interest rate risk derivative instruments held during the period was $533,943,709 futures contracts purchased and $103,311,676 futures contracts sold.
Other Contracts — A fund may enter into total return swap agreements in order to attempt to obtain or preserve a particular return or spread at a lower cost than obtaining a return or spread through purchases and/or sales of instruments in other markets or gain exposure to certain markets in the most economical way possible. A fund will segregate cash, cash equivalents or other appropriate liquid securities on its records in amounts sufficient to meet requirements. Changes in value, including the periodic amounts of interest to be paid or received on swap agreements, are recorded as unrealized appreciation (depreciation) on swap agreements. Upon entering into a centrally cleared swap, a fund is required to deposit cash or securities (initial margin) with a financial intermediary in an amount equal to a certain percentage of the notional amount. A fund may incur charges or earn income on cash deposit balances, which are reflected in interest expenses or interest income, respectively. Subsequent payments (variation margin) are made or received daily, in cash, by a fund. The variation margin is equal to the daily change in the value and is a component of unrealized gains and losses. Realized gain or loss is recorded upon receipt or payment of a periodic settlement or termination of swap agreements. Net realized and unrealized gains or losses occurring during the holding period of swap agreements are a component of net realized gain (loss) on swap agreement transactions and change in net unrealized appreciation (depreciation) on swap agreements, respectively. The risks of entering into swap agreements include the possible lack of liquidity, failure of the counterparty to meet its obligations, and that there may be unfavorable changes in the underlying investments or instruments, including inflationary risk. The fund's average notional amount held during the period was $123,255,556.
Value of Derivative Instruments as of March 31, 2023
| | | | | | | | | | | | | | |
| Asset Derivatives | Liability Derivatives |
| Type of Risk Exposure | Location on Statement of Assets and Liabilities | Value | Location on Statement of Assets and Liabilities | Value |
| Interest Rate Risk | Receivable for variation margin on futures contracts* | $ | 2,805,248 | | Payable for variation margin on futures contracts* | — | |
| Other Contracts | Receivable for variation margin on swap agreements* | 54,069 | | Payable for variation margin on swap agreements* | — | |
| | $ | 2,859,317 | | | — | |
*Included in the unrealized appreciation (depreciation) on futures contracts or centrally cleared swap agreements, as applicable, as reported in the Schedule of Investments.
Effect of Derivative Instruments on the Statement of Operations for the Year Ended March 31, 2023
| | | | | | | | | | | | | | |
| Net Realized Gain (Loss) | Change in Net Unrealized Appreciation (Depreciation) |
| Type of Risk Exposure | Location on Statement of Operations | Value | Location on Statement of Operations | Value |
| Credit Risk | Net realized gain (loss) on swap agreement transactions | $ | (5,883,901) | | Change in net unrealized appreciation (depreciation) on swap agreements | $ | 415,890 | |
| Foreign Currency Risk | Net realized gain (loss) on forward foreign currency exchange contract transactions | (362,065) | | Change in net unrealized appreciation (depreciation) on forward foreign currency exchange contracts | — | |
| Interest Rate Risk | Net realized gain (loss) on futures contract transactions | (36,502,359) | | Change in net unrealized appreciation (depreciation) on futures contracts | 7,602,184 | |
| Other Contracts | Net realized gain (loss) on swap agreement transactions | 6,943,274 | | Change in net unrealized appreciation (depreciation) on swap agreements | (8,111,429) | |
| | $ | (35,805,051) | | | $ | (93,355) | |
8. Risk Factors
The value of the fund’s shares will go up and down, sometimes rapidly or unpredictably, based on the performance of the securities owned by the fund and other factors generally affecting the securities market. Market risks, including political, regulatory, economic and social developments, can affect the value of the fund’s investments. Natural disasters, public health emergencies, war, terrorism and other unforeseeable events may lead to increased market volatility and may have adverse long-term effects on world economies and markets generally.
The fund may invest in instruments that have variable or floating coupon rates based on the London Interbank Offered Rate (LIBOR). LIBOR is a benchmark interest rate intended to be representative of the rate at which certain major international banks lend to one another over short-terms. Financial institutions have started the process of phasing out LIBOR and the transition process to a replacement rate may lead to increased volatility or illiquidity in markets for instruments that rely on LIBOR. This could result in a change to the value of such instruments or a change in the cost of temporary borrowing for the fund.
The fund's investment process may result in high portfolio turnover, which could mean high transaction costs, affecting both performance and capital gains tax liabilities to investors.
9. Federal Tax Information
The tax character of distributions paid during the years ended March 31, 2023 and March 31, 2022 were as follows:
| | | | | | | | |
| 2023 | 2022 |
| Distributions Paid From | | |
| Ordinary income | $ | 179,666,802 | | $ | 36,117,546 | |
| Long-term capital gains | — | | $ | 15,866,572 | |
The book-basis character of distributions made during the year from net investment income or net realized gains may differ from their ultimate characterization for federal income tax purposes. These differences reflect the differing character of certain income items and net realized gains and losses for financial statement and tax purposes, and may result in reclassification among certain capital accounts on the financial statements.
The reclassifications, which are primarily due to merger adjustments, were made to capital paid in $137,252,975 and distributable earnings (loss) $(137,252,975).
As of period end, the federal tax cost of investments and the components of distributable earnings on a tax-basis were as follows:
| | | | | |
| Federal tax cost of investments | $ | 6,618,545,413 | |
| Gross tax appreciation of investments | $ | 47,258,160 | |
| Gross tax depreciation of investments | (313,715,063) | |
| Net tax appreciation (depreciation) of investments | (266,456,903) | |
Net tax appreciation (depreciation) on derivatives and translation of assets
and liabilities in foreign currencies | 503,299 | |
| Net tax appreciation (depreciation) | $ | (265,953,604) | |
| Other book-to-tax adjustments | $ | (159,872) | |
| Undistributed ordinary income | — | |
| Accumulated short-term capital losses | $ | (399,229,177) | |
| Accumulated long-term capital losses | $ | (236,645,802) | |
The difference between book-basis and tax-basis unrealized appreciation (depreciation) is attributable primarily to the tax deferral of losses on wash sales and the realization for tax purposes of unrealized gains (losses) on futures contracts.
Accumulated capital losses represent net capital loss carryovers that may be used to offset future realized capital gains for federal income tax purposes. The capital loss carryovers may be carried forward for an unlimited period. Due to a shift in ownership of the fund, future capital loss carryover utilization in any given year is subject to Internal Revenue Code limitations. Any remaining accumulated gains after application of this limitation will be distributed to shareholders.
10. Reorganization
On December 16, 2021, the Board of Trustees approved an agreement and plan of reorganization (the reorganization), whereby the net assets of NT Diversified Bond Fund, one fund in a series issued by the trust, were transferred to Diversified Bond Fund in exchange for shares of Diversified Bond Fund. The purpose of the transaction was to combine two funds with substantially similar investment objectives and strategies. The financial statements and performance history of Diversified Bond Fund survived after the reorganization. The reorganization was effective at the close of the NYSE on May 27, 2022.
The reorganization was accomplished by a tax-free exchange of shares. On May 27, 2022, NT Diversified Bond Fund exchanged its shares for shares of Diversified Bond Fund as follows:
| | | | | | | | | | | |
| Original Fund/Class | Shares Exchanged | New Fund/Class | Shares Received |
| NT Diversified Bond Fund – G Class | 427,890,190 | | Diversified Bond Fund – G Class | 435,638,705 | |
The net assets of NT Diversified Bond Fund and Diversified Bond Fund immediately before the reorganization were $4,331,988,616 and $1,779,254,262, respectively. NT Diversified Bond Fund's unrealized depreciation of $(309,319,355) was combined with that of Diversified Bond Fund. Immediately after the reorganization, the combined net assets were $6,111,242,878.
Assuming the reorganization had been completed on April 1, 2022, the beginning of the annual reporting period, the pro forma results of operations for the period ended March 31, 2023 are as follows:
| | | | | |
| Net investment income (loss) | $ | 199,276,299 |
| Net realized and unrealized gain (loss) | (519,902,939) |
| Net increase (decrease) in net assets resulting from operations | $ | (320,626,640) |
Because the combined investment portfolios have been managed as a single integrated portfolio since the reorganization was completed, it is not practicable to separate the amounts of revenue and earnings of NT Diversified Bond Fund that have been included in the fund’s Statement of Operations since May 27, 2022.
| | | | | | | | | | | | | | | | | | | | | | | | | | | | | | | | | | | | | | | | | | | | | | | | | | |
| For a Share Outstanding Throughout the Years Ended March 31 (except as noted) | | | | | | | | | | |
| Per-Share Data | | | | | | | | | | Ratios and Supplemental Data |
| | Income From Investment Operations: | Distributions From: | | | Ratio to Average Net Assets of: | | |
| Net Asset
Value,
Beginning
of Period | Net Investment Income (Loss)(1) | Net Realized
and
Unrealized
Gain (Loss) | Total From
Investment
Operations | Net
Investment
Income | Net
Realized
Gains | Tax Return
of
Capital | Total
Distributions | Net Asset
Value,
End
of Period | Total Return(2) | Operating
Expenses | Operating
Expenses
(before
expense
waiver) | Net
Investment
Income
(Loss) | Net
Investment
Income
(Loss)
(before
expense
waiver) | Portfolio
Turnover
Rate | Net
Assets,
End of
Period
(in
thousands) |
| Investor Class | | | | | | | | | | | | | | | |
| 2023 | $10.28 | 0.28 | (0.85) | (0.57) | (0.28) | — | — | (0.28) | $9.43 | (5.56)% | 0.60% | 0.60% | 3.03% | 3.03% | 170% | $590,248 | |
| 2022 | $10.96 | 0.15 | (0.55) | (0.40) | (0.17) | (0.11) | — | (0.28) | $10.28 | (3.81)% | 0.59% | 0.59% | 1.41% | 1.41% | 238% | $755,003 | |
| 2021 | $11.10 | 0.17 | 0.17 | 0.34 | (0.17) | (0.31) | — | (0.48) | $10.96 | 2.95% | 0.60% | 0.60% | 1.42% | 1.42% | 238% | $750,959 | |
| 2020 | $10.61 | 0.26 | 0.50 | 0.76 | (0.27) | — | — | (0.27) | $11.10 | 7.18% | 0.60% | 0.60% | 2.40% | 2.40% | 82% | $1,302,958 | |
| 2019 | $10.54 | 0.29 | 0.03 | 0.32 | (0.23) | — | (0.02) | (0.25) | $10.61 | 3.15% | 0.60% | 0.60% | 2.80% | 2.80% | 184% | $1,646,934 | |
| I Class | | | | | | | | | | | | | | | |
| 2023 | $10.28 | 0.30 | (0.86) | (0.56) | (0.29) | — | — | (0.29) | $9.43 | (5.37)% | 0.40% | 0.40% | 3.23% | 3.23% | 170% | $689,974 | |
| 2022 | $10.96 | 0.18 | (0.56) | (0.38) | (0.19) | (0.11) | — | (0.30) | $10.28 | (3.62)% | 0.39% | 0.39% | 1.61% | 1.61% | 238% | $751,444 | |
| 2021 | $11.10 | 0.18 | 0.18 | 0.36 | (0.19) | (0.31) | — | (0.50) | $10.96 | 3.06% | 0.40% | 0.40% | 1.62% | 1.62% | 238% | $871,066 | |
| 2020 | $10.62 | 0.28 | 0.49 | 0.77 | (0.29) | — | — | (0.29) | $11.10 | 7.39% | 0.40% | 0.40% | 2.60% | 2.60% | 82% | $648,832 | |
| 2019 | $10.54 | 0.31 | 0.04 | 0.35 | (0.24) | — | (0.03) | (0.27) | $10.62 | 3.43% | 0.40% | 0.40% | 3.00% | 3.00% | 184% | $993,543 | |
| Y Class | | | | | | | | | | | | | | | |
| 2023 | $10.29 | 0.30 | (0.85) | (0.55) | (0.30) | — | — | (0.30) | $9.44 | (5.33)% | 0.37% | 0.37% | 3.26% | 3.26% | 170% | $119,167 | |
| 2022 | $10.96 | 0.18 | (0.54) | (0.36) | (0.20) | (0.11) | — | (0.31) | $10.29 | (3.50)% | 0.36% | 0.36% | 1.64% | 1.64% | 238% | $141,842 | |
| 2021 | $11.11 | 0.18 | 0.17 | 0.35 | (0.19) | (0.31) | — | (0.50) | $10.96 | 3.09% | 0.37% | 0.37% | 1.65% | 1.65% | 238% | $115,357 | |
| 2020 | $10.62 | 0.29 | 0.49 | 0.78 | (0.29) | — | — | (0.29) | $11.11 | 7.42% | 0.37% | 0.37% | 2.63% | 2.63% | 82% | $72,594 | |
| 2019 | $10.54 | 0.31 | 0.04 | 0.35 | (0.24) | — | (0.03) | (0.27) | $10.62 | 3.46% | 0.37% | 0.37% | 3.03% | 3.03% | 184% | $152,412 | |
| | | | | | | | | | | | | | | | | | | | | | | | | | | | | | | | | | | | | | | | | | | | | | | | | | |
| For a Share Outstanding Throughout the Years Ended March 31 (except as noted) | | | | | | | | | | |
| Per-Share Data | | | | | | | | | | Ratios and Supplemental Data |
| | Income From Investment Operations: | Distributions From: | | | Ratio to Average Net Assets of: | | |
| Net Asset
Value,
Beginning
of Period | Net Investment Income (Loss)(1) | Net Realized
and
Unrealized
Gain (Loss) | Total From
Investment
Operations | Net
Investment
Income | Net
Realized
Gains | Tax Return
of
Capital | Total
Distributions | Net Asset
Value,
End
of Period | Total Return(2) | Operating
Expenses | Operating
Expenses
(before
expense
waiver) | Net
Investment
Income
(Loss) | Net
Investment
Income
(Loss)
(before
expense
waiver) | Portfolio
Turnover
Rate | Net
Assets,
End of
Period
(in
thousands) |
| A Class | | | | | | | | | | | | | | | |
| 2023 | $10.28 | 0.25 | (0.85) | (0.60) | (0.25) | — | — | (0.25) | $9.43 | (5.79)% | 0.85% | 0.85% | 2.78% | 2.78% | 170% | $74,013 | |
| 2022 | $10.96 | 0.13 | (0.56) | (0.43) | (0.14) | (0.11) | — | (0.25) | $10.28 | (4.05)% | 0.84% | 0.84% | 1.16% | 1.16% | 238% | $89,094 | |
| 2021 | $11.10 | 0.13 | 0.18 | 0.31 | (0.14) | (0.31) | — | (0.45) | $10.96 | 2.69% | 0.85% | 0.85% | 1.17% | 1.17% | 238% | $113,848 | |
| 2020 | $10.62 | 0.23 | 0.49 | 0.72 | (0.24) | — | — | (0.24) | $11.10 | 6.81% | 0.85% | 0.85% | 2.15% | 2.15% | 82% | $118,924 | |
| 2019 | $10.54 | 0.27 | 0.04 | 0.31 | (0.21) | — | (0.02) | (0.23) | $10.62 | 3.02% | 0.85% | 0.85% | 2.55% | 2.55% | 184% | $98,899 | |
| C Class | | | | | | | | | | | | | | | |
| 2023 | $10.27 | 0.18 | (0.85) | (0.67) | (0.18) | — | — | (0.18) | $9.42 | (6.51)% | 1.60% | 1.60% | 2.03% | 2.03% | 170% | $7,638 | |
| 2022 | $10.95 | 0.04 | (0.55) | (0.51) | (0.06) | (0.11) | — | (0.17) | $10.27 | (4.78)% | 1.59% | 1.59% | 0.41% | 0.41% | 238% | $7,795 | |
| 2021 | $11.09 | 0.05 | 0.17 | 0.22 | (0.05) | (0.31) | — | (0.36) | $10.95 | 1.93% | 1.60% | 1.60% | 0.42% | 0.42% | 238% | $10,550 | |
| 2020 | $10.61 | 0.15 | 0.49 | 0.64 | (0.16) | — | — | (0.16) | $11.09 | 6.02% | 1.60% | 1.60% | 1.40% | 1.40% | 82% | $18,182 | |
| 2019 | $10.54 | 0.19 | 0.04 | 0.23 | (0.14) | — | (0.02) | (0.16) | $10.61 | 2.24% | 1.60% | 1.60% | 1.80% | 1.80% | 184% | $31,481 | |
| R Class | | | | | | | | | | | | | | | |
| 2023 | $10.28 | 0.23 | (0.85) | (0.62) | (0.23) | — | — | (0.23) | $9.43 | (6.03)% | 1.10% | 1.10% | 2.53% | 2.53% | 170% | $4,796 | |
| 2022 | $10.95 | 0.10 | (0.54) | (0.44) | (0.12) | (0.11) | — | (0.23) | $10.28 | (4.29)% | 1.09% | 1.09% | 0.91% | 0.91% | 238% | $5,334 | |
| 2021 | $11.10 | 0.10 | 0.17 | 0.27 | (0.11) | (0.31) | — | (0.42) | $10.95 | 2.44% | 1.10% | 1.10% | 0.92% | 0.92% | 238% | $7,274 | |
| 2020 | $10.61 | 0.21 | 0.49 | 0.70 | (0.21) | — | — | (0.21) | $11.10 | 6.65% | 1.10% | 1.10% | 1.90% | 1.90% | 82% | $7,211 | |
| 2019 | $10.54 | 0.24 | 0.04 | 0.28 | (0.19) | — | (0.02) | (0.21) | $10.61 | 2.69% | 1.10% | 1.10% | 2.30% | 2.30% | 184% | $8,748 | |
| | | | | | | | | | | | | | | | | | | | | | | | | | | | | | | | | | | | | | | | | | | | | | | | | | |
| For a Share Outstanding Throughout the Years Ended March 31 (except as noted) | | | | | | | | | | |
| Per-Share Data | | | | | | | | | | Ratios and Supplemental Data |
| | Income From Investment Operations: | Distributions From: | | | Ratio to Average Net Assets of: | | |
| Net Asset
Value,
Beginning
of Period | Net Investment Income (Loss)(1) | Net Realized
and
Unrealized
Gain (Loss) | Total From
Investment
Operations | Net
Investment
Income | Net
Realized
Gains | Tax Return
of
Capital | Total
Distributions | Net Asset
Value,
End
of Period | Total Return(2) | Operating
Expenses | Operating
Expenses
(before
expense
waiver) | Net
Investment
Income
(Loss) | Net
Investment
Income
(Loss)
(before
expense
waiver) | Portfolio
Turnover
Rate | Net
Assets,
End of
Period
(in
thousands) |
| R5 Class | | | | | | | | | | | | | | | |
| 2023 | $10.28 | 0.30 | (0.86) | (0.56) | (0.29) | — | — | (0.29) | $9.43 | (5.40)% | 0.40% | 0.40% | 3.23% | 3.23% | 170% | $5 | |
| 2022 | $10.96 | 0.19 | (0.57) | (0.38) | (0.19) | (0.11) | — | (0.30) | $10.28 | (3.61)% | 0.39% | 0.39% | 1.61% | 1.61% | 238% | $6 | |
| 2021 | $11.10 | 0.18 | 0.18 | 0.36 | (0.19) | (0.31) | — | (0.50) | $10.96 | 3.15% | 0.40% | 0.40% | 1.62% | 1.62% | 238% | $629 | |
| 2020 | $10.62 | 0.28 | 0.49 | 0.77 | (0.29) | — | — | (0.29) | $11.10 | 7.29% | 0.40% | 0.40% | 2.60% | 2.60% | 82% | $615 | |
| 2019 | $10.54 | 0.32 | 0.03 | 0.35 | (0.24) | — | (0.03) | (0.27) | $10.62 | 3.45% | 0.40% | 0.40% | 3.00% | 3.00% | 184% | $419 | |
| R6 Class | | | | | | | | | | | | | | | |
| 2023 | $10.29 | 0.30 | (0.85) | (0.55) | (0.30) | — | — | (0.30) | $9.44 | (5.31)% | 0.35% | 0.35% | 3.28% | 3.28% | 170% | $138,248 | |
| 2022 | $10.97 | 0.18 | (0.55) | (0.37) | (0.20) | (0.11) | — | (0.31) | $10.29 | (3.57)% | 0.34% | 0.34% | 1.66% | 1.66% | 238% | $122,753 | |
| 2021 | $11.11 | 0.19 | 0.17 | 0.36 | (0.19) | (0.31) | — | (0.50) | $10.97 | 3.20% | 0.35% | 0.35% | 1.67% | 1.67% | 238% | $128,121 | |
| 2020 | $10.63 | 0.29 | 0.48 | 0.77 | (0.29) | — | — | (0.29) | $11.11 | 7.34% | 0.35% | 0.35% | 2.65% | 2.65% | 82% | $143,473 | |
| 2019 | $10.54 | 0.32 | 0.05 | 0.37 | (0.25) | — | (0.03) | (0.28) | $10.63 | 3.58% | 0.35% | 0.35% | 3.05% | 3.05% | 184% | $301,853 | |
| G Class | | | | | | | | | | | | | | | |
2023(3) | $9.85 | 0.30 | (0.41) | (0.11) | (0.30) | — | — | (0.30) | $9.44 | (1.10)% | 0.01%(4) | 0.35%(4) | 3.67%(4) | 3.33%(4) | 170%(5) | $4,581,460 | |
| | |
| Notes to Financial Highlights |
(1)Computed using average shares outstanding throughout the period.
(2)Total returns are calculated based on the net asset value of the last business day and do not reflect applicable sales charges, if any. Total returns for periods less than one year are not annualized.
(3)May 19, 2022 (commencement of sale) through March 31, 2023.
(4)Annualized.
(5)Portfolio turnover is calculated at the fund level. Percentage indicated was calculated for the year ended March 31, 2023.
See Notes to Financial Statements.
| | |
| Report of Independent Registered Public Accounting Firm |
To the Shareholders and the Board of Trustees of American Century Investment Trust:
Opinion on the Financial Statements and Financial Highlights
We have audited the accompanying statement of assets and liabilities, including the schedule of investments, of Diversified Bond Fund (the “Fund”), one of the funds constituting the American Century Investment Trust, as of March 31, 2023, the related statement of operations for the year then ended, the statements of changes in net assets and financial highlights for the two years in the period then ended, and the related notes. In our opinion, the financial statements and financial highlights present fairly, in all material respects, the financial position of Diversified Bond Fund of the American Century Investment Trust, as of March 31, 2023, and the results of its operations for the year then ended and the changes in its net assets and the financial highlights for the two years then ended in conformity with accounting principles generally accepted in the United States of America. The financial highlights for each of the three years in the period ended March 31, 2021, were audited by other auditors, whose report, dated May 18, 2021, expressed an unqualified opinion on such financial highlights.
Basis for Opinion
These financial statements and financial highlights are the responsibility of the Fund's management. Our responsibility is to express an opinion on the Fund’s financial statements and financial highlights based on our audit. We are a public accounting firm registered with the Public Company Accounting Oversight Board (United States) (PCAOB) and are required to be independent with respect to the Fund in accordance with the U.S. federal securities laws and the applicable rules and regulations of the Securities and Exchange Commission and the PCAOB.
We conducted our audits in accordance with the standards of the PCAOB. Those standards require that we plan and perform the audit to obtain reasonable assurance about whether the financial statements and financial highlights are free of material misstatement, whether due to error or fraud. The Fund is not required to have, nor were we engaged to perform, an audit of its internal control over financial reporting. As part of our audit, we are required to obtain an understanding of internal control over financial reporting but not for the purpose of expressing an opinion on the effectiveness of the Fund’s internal control over financial reporting. Accordingly, we express no such opinion.
Our audits included performing procedures to assess the risks of material misstatement of the financial statements and financial highlights, whether due to error or fraud, and performing procedures that respond to those risks. Such procedures included examining, on a test basis, evidence regarding the amounts and disclosures in the financial statements and financial highlights. Our audits also included evaluating the accounting principles used and significant estimates made by management, as well as evaluating the overall presentation of the financial statements and financial highlights. Our procedures included confirmation of securities owned as of March 31, 2023, by correspondence with the custodian and brokers; when replies were not received from brokers, we performed other auditing procedures. We believe that our audits provide a reasonable basis for our opinion.
/s/ Deloitte & Touche LLP
Kansas City, Missouri
May 16, 2023
We have served as the auditor of one or more American Century investment companies since 1997.
Board of Trustees
The individuals listed below serve as trustees of the funds. Each trustee will continue to serve in this capacity until death, retirement, resignation or removal from office. The board has adopted a mandatory retirement age for trustees who are not “interested persons,” as that term is defined in the Investment Company Act (independent trustees). Independent trustees shall retire on December 31 of the year in which they reach their 76th birthday.
Jonathan S. Thomas is an “interested person” because he currently serves as President and Chief Executive Officer of American Century Companies, Inc. (ACC), the parent company of American Century Investment Management, Inc. (ACIM or the advisor). The other trustees (more than three-fourths of the total number) are independent. They are not employees, directors or officers of, and have no financial interest in, ACC or any of its wholly owned, direct or indirect, subsidiaries, including ACIM, American Century Investment Services, Inc. (ACIS) and American Century Services, LLC (ACS), and they do not have any other affiliations, positions or relationships that would cause them to be considered “interested persons” under the Investment Company Act. The trustees serve in this capacity for eight (in the case of Jonathan S. Thomas, 16; and Jeremy I. Bulow, 9) registered investment companies in the American Century Investments family of funds.
The following table presents additional information about the trustees. The mailing address for each trustee other than Jonathan S. Thomas is 3945 Freedom Circle, Suite #800, Santa Clara, California 95054. The mailing address for Jonathan S. Thomas is 4500 Main Street, Kansas City, Missouri 64111.
| | | | | | | | | | | | | | | | | |
Name
(Year of Birth) | Position(s) Held with Funds | Length of Time Served | Principal Occupation(s) During Past 5 Years | Number of American Century Portfolios Overseen by Trustee | Other Directorships Held During Past 5 Years |
| Independent Trustees | | |
Tanya S. Beder
(1955) | Trustee and Board Chair | Since 2011 (Board Chair since 2022) | Chairman and CEO, SBCC Group Inc. (independent advisory services) (2006 to present) | 32 | Kirby Corporation; Nabors Industries, Ltd. |
Jeremy I. Bulow
(1954) | Trustee | Since 2011 | Professor of Economics, Stanford University, Graduate School of Business (1979 to present) | 77 | None |
Jennifer Cabalquinto
(1968) | Trustee | Since 2021 | Chief Financial Officer, 2K (interactive entertainment) (2021 to present); Special Advisor, GSW Sports, LLC (2020 to 2021); Chief Financial Officer, GSW Sports, LLC (2013 to 2020) | 32 | Sabio Holdings, Inc. |
Anne Casscells
(1958) | Trustee | Since 2016 | Co-Chief Executive Officer and Chief Investment Officer, Aetos Alternatives Management (investment advisory firm) (2001 to present) | 32 | None |
| | | | | | | | | | | | | | | | | |
Name
(Year of Birth) | Position(s) Held with Funds | Length of Time Served | Principal Occupation(s) During Past 5 Years | Number of American Century Portfolios Overseen by Trustee | Other Directorships Held During Past 5 Years |
| Independent Trustees | | |
Jonathan D. Levin
(1972) | Trustee | Since 2016 | Philip H. Knight Professor and Dean, Graduate School of Business, Stanford University (2016 to present); Professor, Stanford University, (2000 to present) | 32 | None |
Peter F. Pervere
(1947) | Trustee | Since 2007 | Retired | 32 | None |
John B. Shoven
(1947) | Trustee | Since 2002 | Charles R. Schwab Professor of Economics, Stanford University (1973 to present, emeritus since 2019) | 32 | Cadence Design Systems; Exponent; Financial Engines |
| Interested Trustee | | |
Jonathan S. Thomas
(1963) | Trustee | Since 2007 | President and Chief Executive Officer, ACC (2007 to present). Also serves as Chief Executive Officer, ACS; Director, ACC and other ACC subsidiaries | 141 | None |
The Statement of Additional Information has additional information about the fund's trustees and is available without charge, upon request, by calling 1-800-345-2021.
Officers
The following table presents certain information about the executive officers of the funds. Each officer serves as an officer for 16 investment companies in the American Century family of funds. No officer is compensated for his or her service as an officer of the funds. The listed officers are interested persons of the funds and are appointed or re-appointed on an annual basis. The mailing address for each of the officers listed below is 4500 Main Street, Kansas City, Missouri 64111.
| | | | | | | | |
Name
(Year of Birth) | Offices with the Funds | Principal Occupation(s) During the Past Five Years |
Patrick Bannigan
(1965)
| President since 2019 | Executive Vice President and Director, ACC (2012 to present); Chief Financial Officer, Chief Accounting Officer and Treasurer, ACC (2015 to present). Also serves as President, ACS; Vice President, ACIM; Chief Financial Officer, Chief Accounting Officer and/or Director, ACIM, ACS and other ACC subsidiaries |
R. Wes Campbell
(1974)
| Chief Financial Officer and Treasurer since 2018 | Vice President, ACS (2020 to present); Investment Operations and Investment Accounting, ACS (2000 to present) |
Amy D. Shelton
(1964) | Chief Compliance Officer and Vice President since 2014 | Chief Compliance Officer, American Century funds, (2014 to present); Chief Compliance Officer, ACIM (2014 to present); Chief Compliance Officer, ACIS (2009 to present). Also serves as Vice President, ACIS |
John Pak
(1968) | General Counsel and Senior Vice President since 2021 | General Counsel and Senior Vice President, ACC (2021 to present); Also serves as General Counsel and Senior Vice President, ACIM, ACS and ACIS. Chief Legal Officer of Investment and Wealth Management, The Bank of New York Mellon (2014 to 2021) |
David H. Reinmiller
(1963) | Vice President since 2000 | Attorney, ACC (1994 to present). Also serves as Vice President, ACIM and ACS |
Ward D. Stauffer
(1960) | Secretary since 2005 | Attorney, ACC (2003 to present) |
| | |
| Liquidity Risk Management Program |
The Fund has adopted a liquidity risk management program (the “program”). The Fund’s Board of Trustees (the "Board") has designated American Century Investment Management, Inc. (“ACIM”) as the administrator of the program. Personnel of ACIM or its affiliates, including members of ACIM’s Investment Oversight Committee who are members of ACIM’s Investment Management and Global Analytics departments, conduct the day-to-day operation of the program pursuant to the program.
Under the program, ACIM manages the Fund’s liquidity risk, which is the risk that the Fund could not meet shareholder redemption requests without significant dilution of remaining shareholders’ interests in the Fund. This risk is managed by monitoring the degree of liquidity of the Fund’s investments, limiting the amount of the Fund’s illiquid investments, and utilizing various risk management tools and facilities available to the Fund for meeting shareholder redemptions, among other means. ACIM’s process of determining the degree of liquidity of certain investments held by the Fund is supported by a third-party liquidity assessment vendor.
The Board reviewed a report prepared by ACIM regarding the operation and effectiveness of the program for the period January 1, 2022 through December 31, 2022. No significant liquidity events impacting the Fund were noted in the report. In addition, ACIM provided its assessment that the program had been effective in managing the Fund’s liquidity risk.
Retirement Account Information
As required by law, distributions you receive from certain retirement accounts are subject to federal income tax withholding at the IRS default rate of 10%.* Tax will be withheld on the total amount withdrawn even though you may be receiving amounts that are not subject to withholding, such as nondeductible contributions. In such case, excess amounts of withholding could occur. You may adjust your withholding election so that a greater or lesser amount will be withheld.
You may elect a different withholding rate, or request zero withholding, by submitting an acceptable IRS Form W-4R election with your distribution request. You may notify us of your W-4R election by telephone, on our distribution forms, on IRS Form W-4R, or through other acceptable electronic means. If your withholding election is for an automatic withdrawal plan, you have the right to revoke your election at any time and any election you make will remain in effect until revoked by filing a new election.
Remember, even if you elect not to have income tax withheld, you are liable for paying income tax on the taxable portion of your withdrawal. If you elect not to have income tax withheld or you don’t have enough income tax withheld, you may be responsible for payment of estimated tax. You may incur penalties under the estimated tax rules if your withholding and estimated tax payments are not sufficient. You can reduce or defer the income tax on a distribution by directly or indirectly rolling such distribution over to another IRA or eligible plan. You should consult your tax advisor for additional information.
State tax will be withheld according to state regulations if, at the time of your distribution, your tax residency is within one of the mandatory withholding states.
*Some 403(b), 457 and qualified retirement plan distributions may be subject to 20% mandatory withholding, as they are subject to special tax and withholding rules. Your plan administrator or plan sponsor is required to provide you with a special tax notice explaining those rules at the time you request a distribution. If applicable, federal and/or state taxes may be withheld from your distribution amount.
Proxy Voting Policies
Descriptions of the principles and policies that the fund's investment advisor uses in exercising the voting rights associated with the securities purchased and/or held by the fund are available without charge, upon request, by calling 1-800-345-2021 or visiting American Century Investments’ website at americancentury.com/proxy. A description of the policies is also available on the Securities and Exchange Commission’s website at sec.gov. Information regarding how the investment advisor voted proxies relating to portfolio securities during the most recent 12-month period ended June 30 is available on americancentury.com/proxy. It is also available at sec.gov.
Quarterly Portfolio Disclosure
The fund files its complete schedule of portfolio holdings with the Securities and Exchange Commission (SEC) for the first and third quarters of each fiscal year as an exhibit to its reports on Form N-PORT. These portfolio holdings are available on the fund's website at americancentury.com and, upon request, by calling 1-800-345-2021. The fund’s Form N-PORT reports are available on the SEC’s website at sec.gov.
| | | | | | | | |
| |
| | |
| Contact Us | americancentury.com | |
| Automated Information Line | 1-800-345-8765 | |
| Investor Services Representative | 1-800-345-2021
or 816-531-5575 | |
| Investors Using Advisors | 1-800-378-9878 | |
| Business, Not-For-Profit, Employer-Sponsored Retirement Plans | 1-800-345-3533 | |
| Banks and Trust Companies, Broker-Dealers, Financial Professionals, Insurance Companies | 1-800-345-6488 | |
| Telecommunications Relay Service for the Deaf | 711 | |
| | |
| American Century Investment Trust | |
| | |
Investment Advisor: American Century Investment Management, Inc. Kansas City, Missouri | |
| | |
| This report and the statements it contains are submitted for the general information of our shareholders. The report is not authorized for distribution to prospective investors unless preceded or accompanied by an effective prospectus. | |
| | |
©2023 American Century Proprietary Holdings, Inc. All rights reserved.
CL-ANN-92280 2305 | |
| | | | | |
| |
| Annual Report |
| |
| March 31, 2023 |
| |
| High Income Fund |
| Investor Class (AHIVX) |
| I Class (AHIIX) |
| Y Class (NPHIX) |
| A Class (AHIAX) |
| R5 Class (AHIEX) |
| R6 Class (AHIDX) |
| G Class (ACHFX) |
| | | | | |
| President's Letter | |
| Performance | |
| Portfolio Commentary | |
| Fund Characteristics | |
| Shareholder Fee Example | |
| Schedule of Investments | |
| Statement of Assets and Liabilities | |
| Statement of Operations | |
| Statement of Changes in Net Assets | |
| Notes to Financial Statements | |
| Financial Highlights | |
| Report of Independent Registered Public Accounting Firm | |
| Management | |
| |
| Liquidity Risk Management Program | |
| Additional Information | |
Any opinions expressed in this report reflect those of the author as of the date of the report, and do not necessarily represent the opinions of American Century Investments® or any other person in the American Century Investments organization. Any such opinions are subject to change at any time based upon market or other conditions and American Century Investments disclaims any responsibility to update such opinions. These opinions may not be relied upon as investment advice and, because investment decisions made by American Century Investments funds are based on numerous factors, may not be relied upon as an indication of trading intent on behalf of any American Century Investments fund. Security examples are used for representational purposes only and are not intended as recommendations to purchase or sell securities. Performance information for comparative indices and securities is provided to American Century Investments by third party vendors. To the best of American Century Investments’ knowledge, such information is accurate at the time of printing.
Jonathan Thomas
Dear Investor:
Thank you for reviewing this annual report for the period ended March 31, 2023. Annual reports help convey important information about fund returns, including market factors that affected performance. For additional investment insights, please visit americancentury.com.
Challenging Conditions Weighed on Asset Class Returns
Prevailing headwinds early in the reporting period continued to challenge U.S. financial markets throughout the 12 months. Asset class performance seesawed but declined overall amid mixed economic data, elevated inflation and anticipated monetary policy responses. By period-end, a new headwind emerged: banking industry uncertainty.
After launching its inflation-fighting rate-hike campaign in March 2022, the Federal Reserve (Fed) lifted rates eight more times by period-end. The federal funds target rate ended the reporting period at 4.75% to 5%, its highest level since 2007, while Treasury yields climbed to multiyear highs. Amid the Fed’s efforts, the annual inflation rate peaked at 9.1% in June, a 40-year high, before easing to 5% by March.
In addition to helping tame inflation, rapidly rising rates also fueled recession worries and led to expectations for the Fed to change course. This sentiment helped spark a rebound among stock and bond indices in the second half of the reporting period. The collapse of two U.S. regional banks late in the period and fears of a looming credit crunch and likely recession also contributed to market expectations for a Fed policy change. Nevertheless, the Fed indicated a near-term course change was unlikely.
Despite delivering strong gains in the second half of the reporting period, stock returns succumbed to first-half losses and declined for the 12 months. Similarly, weakness in the first half of the period overwhelmed second-half gains, and bond returns were negative for the 12-month period.
Remaining Diligent in Uncertain Times
We expect market volatility to linger as investors navigate a complex environment of still-high inflation, tighter financial conditions, banking industry turbulence and economic uncertainty. In addition, increasingly tense geopolitical considerations complicate the market backdrop.
We appreciate your confidence in us during these extraordinary times. Our firm has a long history of helping clients weather unpredictable and volatile markets, and we’re confident we will continue to meet today’s challenges.
Sincerely,
Jonathan Thomas
President and Chief Executive Officer
American Century Investments
| | | | | | | | | | | | | | | | | | | | |
| Total Returns as of March 31, 2023 |
| | | Average Annual Returns | |
| Ticker
Symbol | 1 year | 5 years | 10 years | Since
Inception | Inception
Date |
| Y Class | NPHIX | -3.57% | 3.34% | 4.37% | — | 12/27/12 |
| ICE BofA U.S. High Yield Constrained Index | — | -3.58% | 3.03% | 4.02% | — | — |
| Investor Class | AHIVX | -3.76% | 3.11% | — | 2.88% | 10/2/17 |
| I Class | AHIIX | -3.56% | 3.23% | — | 2.98% | 10/2/17 |
| A Class | AHIAX | | | | | 10/2/17 |
| No sales charge | | -4.00% | 2.87% | — | 2.62% | |
| With sales charge | | -8.32% | 1.93% | — | 1.77% | |
| R5 Class | AHIEX | -3.57% | 3.34% | — | 3.09% | 10/2/17 |
| R6 Class | AHIDX | -3.41% | 3.39% | — | 3.14% | 10/2/17 |
| G Class | ACHFX | — | — | — | 4.39% | 5/19/22 |
Average annual returns since inception are presented when ten years of performance history is not available. Y Class and G Class returns would have been lower if a portion of the fees had not been waived.
Sales charges include initial sales charges and contingent deferred sales charges (CDSCs), as applicable. A Class shares have a 4.50% maximum initial sales charge and may be subject to a maximum CDSC of 1.00%. The SEC requires that mutual funds provide performance information net of maximum sales charges in all cases where charges could be applied.
The fund acquired the net assets and assumed the historical performance of the Nomura High Yield Fund, a series of The Advisors’ Inner Circle Fund III on October 2, 2017. Accordingly, the performance shown for periods prior to October 2, 2017 represents the performance of Class I shares of the Nomura High Yield Fund. In addition, the Nomura High Yield Fund acquired the net assets and assumed the historical performance of the High Yield Fund, a series of Nomura Partners Funds, Inc. on December 8, 2014. Accordingly, the performance shown for periods before December 8, 2014 represents the performance of Class I shares of the High Yield Fund. The Nomura High Yield Fund and the High Yield Fund returns in the performance tables and graphs have not been adjusted to reflect the fund’s expenses. If the Nomura High Yield Fund and the High Yield Fund performance information had been adjusted to reflect the fund’s expenses, the performance may have been higher or lower for a given period depending on the expenses incurred by the Nomura High Yield Fund and the High Yield Fund for that period.
Data presented reflect past performance. Past performance is no guarantee of future results. Current performance may be higher or lower than the performance shown. Total returns for periods less than one year are not annualized. Investment return and principal value will fluctuate, and redemption value may be more or less than original cost. Data assumes reinvestment of dividends and capital gains, and none of the charts reflect the deduction of taxes that a shareholder would pay on fund distributions or the redemption of fund shares. To obtain performance data current to the most recent month end, please call 1-800-345-2021 or visit americancentury.com. For additional information about the fund, please consult the prospectus.
| | |
| Growth of $10,000 Over 10 Years |
| $10,000 investment made March 31, 2013 |
| Performance for other share classes will vary due to differences in fee structure. |
| | | | | |
| Value on March 31, 2023 |
| Y Class — $15,332 |
|
| ICE BofA U.S. High Yield Constrained Index — $14,832 |
|
| |
|
Ending value of Y Class would have been lower if a portion of the fees had not been waived.
| | | | | | | | | | | | | | | | | | | | |
| Total Annual Fund Operating Expenses |
| Investor Class | I Class | Y Class | A Class | R5 Class | R6 Class | G Class |
| 0.78% | 0.68% | 0.58% | 1.03% | 0.58% | 0.53% | 0.53% |
The total annual fund operating expenses shown is as stated in the fund’s prospectus current as of the date of this report. The prospectus may vary from the expense ratio shown elsewhere in this report because it is based on a different time period, includes acquired fund fees and expenses, and, if applicable, does not include fee waivers or expense reimbursements.
Data presented reflect past performance. Past performance is no guarantee of future results. Current performance may be higher or lower than the performance shown. Total returns for periods less than one year are not annualized. Investment return and principal value will fluctuate, and redemption value may be more or less than original cost. Data assumes reinvestment of dividends and capital gains, and none of the charts reflect the deduction of taxes that a shareholder would pay on fund distributions or the redemption of fund shares. To obtain performance data current to the most recent month end, please call 1-800-345-2021 or visit americancentury.com. For additional information about the fund, please consult the prospectus.
Investment Advisor: American Century Investment Management, Inc.
Subadvisor: Nomura Corporate Research and Asset Management Inc.
Portfolio Managers: Steve Kotsen, David Crall, Amy Yu Chang and Derek Leung
Performance Summary
High Income returned -3.57%* for the 12-month period ended March 31, 2023. By comparison, the ICE BofA U.S. High Yield Constrained Index returned -3.58%. Fund returns reflect operating expenses, while index returns do not.
Inflation, Central Bank Policy Created Challenging Backdrop
2022 was a year to remember for investors, as neither equities nor fixed income provided any respite from the relentless bear market. The Federal Reserve (Fed) and other global central banks spent 2022 aggressively withdrawing the liquidity they had pumped into their economies during the pandemic. Russia’s invasion of Ukraine added to investors’ consternation, driving up commodity prices and further snarling supply chains. As the year progressed, the global economy softened, sapping demand for commodities and providing breathing room to normalize supply chains.
Early in 2023, evidence of disinflation was the key driver of the broad-based rally. However, February brought an array of better-than-expected economic data, and the market reset its expectations for near-term Fed policy and reconsidered a potential recession. Market sentiment shifted even more bearish in March as inflation data came in hotter than expected and central bankers reiterated a hawkish stance.
While the economy had remained resilient, the consequences of dramatic monetary tightening appeared in March when significant bank failures emerged in the U.S. and Europe. Fast action by the Fed and other central banks to furnish liquidity eased the emerging crisis of confidence. A relief rally ensued, helping high-yield bonds to strengthen into period-end.
Sector, Duration Positioning Contributed to Results
High yield slumped alongside other asset classes in 2022 but rallied to begin 2023. The fund performed in line with the index in a challenging market environment. Overweight positions versus the index to the energy and leisure sectors and an underweight to retail lifted the portfolio’s relative performance.
Despite falling oil and natural gas prices, the energy sector contributed throughout the period as bond issuers continued to generate cash flow. Underweighting or avoiding problem credits also helped, particularly among retailers. Examples included used car dealer Carvana, shopping network QVC, online shopping portal Rakuten Group and home furnishings company Bed Bath & Beyond.
Additionally, duration positioning added value. We shifted from underweight duration to moderately overweight in late 2022, which aided results as yields declined in the first quarter of 2023.
Health Care Exposure Detracted
Heath care was the most meaningful sector detractor for the period. Hospitals hit some bumps on
the road to recovery from COVID-19-related volume declines and labor challenges. Additionally, pharmaceutical company Endo International struggled as it worked through a restructuring.
The portfolio’s modest tilt toward credit risk (via bonds with B and CCC credit ratings) also weighed on performance. Issuers with BB credit ratings outperformed the broader market, but our positive security selection within this category mitigated the impact.
*All fund returns referenced in this commentary are for Y Class shares. Performance for other share classes will vary due to differences in fee structure; when Y Class performance exceeds that of the index, other share classes may not. See page 3 for returns for all share classes.
| | | | | |
| MARCH 31, 2023 | |
| Types of Investments in Portfolio | % of net assets |
| Corporate Bonds | 94.5% |
| Preferred Stocks | 1.4% |
| Bank Loan Obligations | 0.7% |
| Common Stocks | 0.5% |
| Convertible Bonds | 0.1% |
| Warrants | —* |
| Escrow Interests | —* |
| Rights | —* |
| Short-Term Investments | 1.4% |
| Other Assets and Liabilities | 1.4% |
*Category is less than 0.05% of total net assets.
Fund shareholders may incur two types of costs: (1) transaction costs, including sales charges (loads) on purchase payments and redemption/exchange fees; and (2) ongoing costs, including management fees; distribution and service (12b-1) fees; and other fund expenses. This example is intended to help you understand your ongoing costs (in dollars) of investing in your fund and to compare these costs with the ongoing cost of investing in other mutual funds.
The example is based on an investment of $1,000 made at the beginning of the period and held for the entire period from October 1, 2022 to March 31, 2023.
Actual Expenses
The table provides information about actual account values and actual expenses for each class. You may use the information, together with the amount you invested, to estimate the expenses that you paid over the period. First, identify the share class you own. Then simply divide your account value by $1,000 (for example, an $8,600 account value divided by $1,000 = 8.6), then multiply the result by the number under the heading “Expenses Paid During Period” to estimate the expenses you paid on your account during this period.
If you hold Investor Class shares of any American Century Investments mutual fund, or I Class shares of the American Century Diversified Bond Fund, in an American Century Investments account (i.e., not through a financial intermediary or employer-sponsored retirement plan account), American Century Investments may charge you a $25 annual account maintenance fee if the value of those shares is less than $10,000. We will redeem shares automatically in one of your accounts to pay the $25 fee. In determining your total eligible investment amount, we will include your investments in all personal accounts (including American Century Investments brokerage accounts) registered under your Social Security number. Personal accounts include individual accounts, joint accounts, UGMA/UTMA accounts, personal trusts, Coverdell Education Savings Accounts and IRAs (including traditional, Roth, Rollover, SEP-, SARSEP- and SIMPLE-IRAs), and certain other retirement accounts. If you have only business, business retirement, employer-sponsored or American Century Investments brokerage accounts, you are currently not subject to this fee. If you are subject to the account maintenance fee, your account value could be reduced by the fee amount.
Hypothetical Example for Comparison Purposes
The table also provides information about hypothetical account values and hypothetical expenses based on the actual expense ratio of each class of your fund and an assumed rate of return of 5% per year before expenses, which is not the actual return of a fund’s share class. The hypothetical account values and expenses may not be used to estimate the actual ending account balance or expenses you paid for the period. You may use this information to compare the ongoing costs of investing in your fund and other funds. To do so, compare this 5% hypothetical example with the 5% hypothetical examples that appear in the shareholder reports of the other funds.
Please note that the expenses shown in the table are meant to highlight your ongoing costs only and do not reflect any transactional costs, such as sales charges (loads) or redemption/exchange fees. Therefore, the table is useful in comparing ongoing costs only, and will not help you determine the relative total costs of owning different funds. In addition, if these transactional costs were included, your costs would have been higher.
| | | | | | | | | | | | | | |
| Beginning Account Value 10/1/22 | Ending Account Value 3/31/23 | Expenses Paid During Period(1) 10/1/22 - 3/31/23 | Annualized Expense Ratio(1) |
| Actual | | | | |
| Investor Class | $1,000 | $1,084.70 | $4.05 | 0.78% |
| I Class | $1,000 | $1,085.20 | $3.54 | 0.68% |
| Y Class | $1,000 | $1,085.80 | $3.02 | 0.58% |
| A Class | $1,000 | $1,083.40 | $5.35 | 1.03% |
| R5 Class | $1,000 | $1,085.80 | $3.02 | 0.58% |
| R6 Class | $1,000 | $1,087.40 | $2.76 | 0.53% |
| G Class | $1,000 | $1,088.90 | $0.00 | 0.00%(2) |
| Hypothetical | | | | |
| Investor Class | $1,000 | $1,021.04 | $3.93 | 0.78% |
| I Class | $1,000 | $1,021.54 | $3.43 | 0.68% |
| Y Class | $1,000 | $1,022.04 | $2.92 | 0.58% |
| A Class | $1,000 | $1,019.80 | $5.19 | 1.03% |
| R5 Class | $1,000 | $1,022.04 | $2.92 | 0.58% |
| R6 Class | $1,000 | $1,022.29 | $2.67 | 0.53% |
| G Class | $1,000 | $1,024.93 | $0.00 | 0.00%(2) |
(1)Expenses are equal to the class's annualized expense ratio listed in the table above, multiplied by the average account value over the period, multiplied by 182, the number of days in the most recent fiscal half-year, divided by 365, to reflect the one-half year period. Annualized expense ratio reflects actual expenses, including any applicable fee waivers or expense reimbursements and excluding any acquired fund fees and expenses.
(2)Other expenses, which include trustees' fees and expenses, did not exceed 0.005%.
MARCH 31, 2023
| | | | | | | | |
| Principal
Amount/Shares | Value |
| CORPORATE BONDS — 94.5% | | |
| Aerospace and Defense — 2.4% | | |
Bombardier, Inc., 7.50%, 3/15/25(1) | $ | 214,000 | | $ | 214,199 | |
Bombardier, Inc., 7.125%, 6/15/26(1) | 1,700,000 | | 1,707,650 | |
Bombardier, Inc., 7.875%, 4/15/27(1) | 5,100,000 | | 5,167,799 | |
Bombardier, Inc., 6.00%, 2/15/28(1) | 2,475,000 | | 2,413,125 | |
Bombardier, Inc., 7.50%, 2/1/29(1) | 1,650,000 | | 1,687,125 | |
BWX Technologies, Inc., 4.125%, 4/15/29(1) | 975,000 | | 865,769 | |
| Howmet Aerospace, Inc., 5.125%, 10/1/24 | 1,072,000 | | 1,077,532 | |
| Howmet Aerospace, Inc., 5.90%, 2/1/27 | 520,000 | | 529,586 | |
| Howmet Aerospace, Inc., 5.95%, 2/1/37 | 3,075,000 | | 3,101,752 | |
Rolls-Royce PLC, 3.625%, 10/14/25(1) | 250,000 | | 238,125 | |
Spirit AeroSystems, Inc., 7.50%, 4/15/25(1) | 1,500,000 | | 1,501,470 | |
| Spirit AeroSystems, Inc., 4.60%, 6/15/28 | 2,025,000 | | 1,718,557 | |
Spirit AeroSystems, Inc., 9.375%, 11/30/29(1) | 1,925,000 | | 2,103,062 | |
| TransDigm UK Holdings PLC, 6.875%, 5/15/26 | 450,000 | | 443,689 | |
TransDigm, Inc., 6.25%, 3/15/26(1) | 350,000 | | 350,674 | |
| TransDigm, Inc., 6.375%, 6/15/26 | 2,100,000 | | 2,054,965 | |
| TransDigm, Inc., 7.50%, 3/15/27 | 2,448,000 | | 2,444,365 | |
| TransDigm, Inc., 5.50%, 11/15/27 | 9,675,000 | | 9,133,228 | |
TransDigm, Inc., 6.75%, 8/15/28(1) | 2,925,000 | | 2,957,906 | |
| TransDigm, Inc., 4.625%, 1/15/29 | 2,000,000 | | 1,780,080 | |
| TransDigm, Inc., 4.875%, 5/1/29 | 2,800,000 | | 2,481,322 | |
| Triumph Group, Inc., 7.75%, 8/15/25 | 1,050,000 | | 964,792 | |
Triumph Group, Inc., 9.00%, 3/15/28(1) | 1,450,000 | | 1,453,335 | |
| | 46,390,107 | |
| Air Freight and Logistics — 0.1% | | |
Cargo Aircraft Management, Inc., 4.75%, 2/1/28(1) | 825,000 | | 738,598 | |
Rand Parent LLC, 8.50%, 2/15/30(1) | 1,525,000 | | 1,435,139 | |
Western Global Airlines LLC, 10.375%, 8/15/25(1) | 1,450,000 | | 593,239 | |
| | 2,766,976 | |
| Automobile Components — 1.0% | | |
Adient Global Holdings Ltd., 7.00%, 4/15/28(1) | 1,125,000 | | 1,157,490 | |
Adient Global Holdings Ltd., 8.25%, 4/15/31(1) | 1,475,000 | | 1,520,128 | |
Clarios Global LP, 6.75%, 5/15/25(1) | 518,000 | | 524,084 | |
Clarios Global LP / Clarios US Finance Co., 8.50%, 5/15/27(1) | 350,000 | | 351,969 | |
Dealer Tire LLC / DT Issuer LLC, 8.00%, 2/1/28(1) | 1,100,000 | | 988,603 | |
Dornoch Debt Merger Sub, Inc., 6.625%, 10/15/29(1) | 3,175,000 | | 2,145,923 | |
| Goodyear Tire & Rubber Co., 9.50%, 5/31/25 | 360,000 | | 370,333 | |
| Goodyear Tire & Rubber Co., 5.00%, 5/31/26 | 1,075,000 | | 1,040,611 | |
| Goodyear Tire & Rubber Co., 5.00%, 7/15/29 | 3,500,000 | | 3,131,380 | |
| Goodyear Tire & Rubber Co., 5.25%, 4/30/31 | 400,000 | | 352,120 | |
| Goodyear Tire & Rubber Co., 5.25%, 7/15/31 | 3,675,000 | | 3,178,360 | |
| Goodyear Tire & Rubber Co., 5.625%, 4/30/33 | 925,000 | | 801,328 | |
IHO Verwaltungs GmbH, 6.38% Cash or 7.13% PIK, 5/15/29(1) | 900,000 | | 794,050 | |
Patrick Industries, Inc., 7.50%, 10/15/27(1) | 1,743,000 | | 1,715,208 | |
Patrick Industries, Inc., 4.75%, 5/1/29(1) | 1,850,000 | | 1,607,252 | |
Wheel Pros, Inc., 6.50%, 5/15/29(1) | 1,600,000 | | 728,000 | |
| | 20,406,839 | |
| | | | | | | | |
| Principal
Amount/Shares | Value |
| Automobiles — 2.7% | | |
| Ford Motor Co., 3.25%, 2/12/32 | $ | 3,075,000 | | $ | 2,421,152 | |
| Ford Motor Co., 6.10%, 8/19/32 | 1,475,000 | | 1,431,430 | |
| Ford Motor Co., 4.75%, 1/15/43 | 3,534,000 | | 2,714,889 | |
| Ford Motor Co., 5.29%, 12/8/46 | 8,275,000 | | 6,798,285 | |
| Ford Motor Credit Co. LLC, 5.58%, 3/18/24 | 1,800,000 | | 1,784,250 | |
| Ford Motor Credit Co. LLC, 4.69%, 6/9/25 | 1,400,000 | | 1,347,409 | |
| Ford Motor Credit Co. LLC, 5.125%, 6/16/25 | 2,750,000 | | 2,695,674 | |
| Ford Motor Credit Co. LLC, 4.13%, 8/4/25 | 1,200,000 | | 1,143,248 | |
| Ford Motor Credit Co. LLC, 3.375%, 11/13/25 | 1,500,000 | | 1,407,923 | |
| Ford Motor Credit Co. LLC, 6.95%, 3/6/26 | 1,450,000 | | 1,473,446 | |
| Ford Motor Credit Co. LLC, 4.54%, 8/1/26 | 1,200,000 | | 1,139,364 | |
| Ford Motor Credit Co. LLC, 2.70%, 8/10/26 | 1,400,000 | | 1,247,750 | |
| Ford Motor Credit Co. LLC, 4.27%, 1/9/27 | 800,000 | | 746,000 | |
| Ford Motor Credit Co. LLC, 3.82%, 11/2/27 | 800,000 | | 718,112 | |
| Ford Motor Credit Co. LLC, 7.35%, 11/4/27 | 1,200,000 | | 1,239,012 | |
| Ford Motor Credit Co. LLC, 2.90%, 2/16/28 | 400,000 | | 344,392 | |
| Ford Motor Credit Co. LLC, 5.11%, 5/3/29 | 9,750,000 | | 9,166,999 | |
| Ford Motor Credit Co. LLC, 7.35%, 3/6/30 | 1,000,000 | | 1,028,500 | |
| Ford Motor Credit Co. LLC, 4.00%, 11/13/30 | 2,400,000 | | 2,042,657 | |
| Ford Motor Credit Co. LLC, 3.625%, 6/17/31 | 1,700,000 | | 1,403,070 | |
Jaguar Land Rover Automotive PLC, 7.75%, 10/15/25(1) | 1,800,000 | | 1,766,790 | |
Jaguar Land Rover Automotive PLC, 5.875%, 1/15/28(1) | 1,800,000 | | 1,517,597 | |
Jaguar Land Rover Automotive PLC, 5.50%, 7/15/29(1) | 1,400,000 | | 1,100,778 | |
Mclaren Finance PLC, 7.50%, 8/1/26(1) | 1,400,000 | | 1,167,250 | |
Nissan Motor Co. Ltd., 4.81%, 9/17/30(1) | 550,000 | | 498,396 | |
PM General Purchaser LLC, 9.50%, 10/1/28(1) | 1,275,000 | | 1,169,267 | |
Thor Industries, Inc., 4.00%, 10/15/29(1) | 1,475,000 | | 1,221,241 | |
Winnebago Industries, Inc., 6.25%, 7/15/28(1) | 1,525,000 | | 1,460,645 | |
| | 52,195,526 | |
| Banks — 0.1% | | |
UniCredit SpA, VRN, 5.46%, 6/30/35(1) | 2,500,000 | | 2,062,273 | |
| Beverages — 0.2% | | |
Primo Water Holdings, Inc., 4.375%, 4/30/29(1) | 2,550,000 | | 2,228,154 | |
Triton Water Holdings, Inc., 6.25%, 4/1/29(1) | 1,500,000 | | 1,192,515 | |
| | 3,420,669 | |
Biotechnology† | | |
Grifols Escrow Issuer SA, 4.75%, 10/15/28(1) | 1,125,000 | | 923,636 | |
| Broadline Retail — 0.7% | | |
Go Daddy Operating Co. LLC / GD Finance Co., Inc., 5.25%, 12/1/27(1) | 2,750,000 | | 2,678,637 | |
Go Daddy Operating Co. LLC / GD Finance Co., Inc., 3.50%, 3/1/29(1) | 1,100,000 | | 952,083 | |
| Kohl's Corp., 3.625%, 5/1/31 | 300,000 | | 202,758 | |
| Kohl's Corp., 5.55%, 7/17/45 | 325,000 | | 189,785 | |
Macy's Retail Holdings LLC, 5.875%, 4/1/29(1) | 2,075,000 | | 1,921,782 | |
Macy's Retail Holdings LLC, 5.875%, 3/15/30(1) | 175,000 | | 155,525 | |
Macy's Retail Holdings LLC, 6.125%, 3/15/32(1) | 225,000 | | 198,268 | |
| Macy's Retail Holdings LLC, 4.50%, 12/15/34 | 250,000 | | 182,173 | |
| Macy's Retail Holdings LLC, 6.375%, 3/15/37 | 775,000 | | 628,177 | |
| Macy's Retail Holdings LLC, 5.125%, 1/15/42 | 2,675,000 | | 1,782,580 | |
Match Group Holdings II LLC, 5.00%, 12/15/27(1) | 1,375,000 | | 1,303,727 | |
| | | | | | | | |
| Principal
Amount/Shares | Value |
Match Group Holdings II LLC, 4.625%, 6/1/28(1) | $ | 550,000 | | $ | 511,500 | |
Match Group Holdings II LLC, 4.125%, 8/1/30(1) | 450,000 | | 388,051 | |
Millennium Escrow Corp., 6.625%, 8/1/26(1) | 1,500,000 | | 976,890 | |
| Nordstrom, Inc., 4.375%, 4/1/30 | 300,000 | | 232,620 | |
| Nordstrom, Inc., 5.00%, 1/15/44 | 100,000 | | 63,000 | |
| QVC, Inc., 4.85%, 4/1/24 | 500,000 | | 400,635 | |
| QVC, Inc., 4.45%, 2/15/25 | 900,000 | | 532,854 | |
| QVC, Inc., 4.75%, 2/15/27 | 1,050,000 | | 442,391 | |
| QVC, Inc., 4.375%, 9/1/28 | 250,000 | | 101,596 | |
| QVC, Inc., 5.45%, 8/15/34 | 150,000 | | 56,204 | |
| | 13,901,236 | |
| Building Products — 1.3% | | |
Advanced Drainage Systems, Inc., 5.00%, 9/30/27(1) | 450,000 | | 428,202 | |
Advanced Drainage Systems, Inc., 6.375%, 6/15/30(1) | 675,000 | | 662,180 | |
APi Group DE, Inc., 4.125%, 7/15/29(1) | 2,175,000 | | 1,870,153 | |
APi Group DE, Inc., 4.75%, 10/15/29(1) | 750,000 | | 661,050 | |
Builders FirstSource, Inc., 5.00%, 3/1/30(1) | 1,450,000 | | 1,344,213 | |
Builders FirstSource, Inc., 4.25%, 2/1/32(1) | 4,350,000 | | 3,794,458 | |
Builders FirstSource, Inc., 6.375%, 6/15/32(1) | 3,900,000 | | 3,917,642 | |
Cornerstone Building Brands, Inc., 6.125%, 1/15/29(1) | 875,000 | | 625,527 | |
| Griffon Corp., 5.75%, 3/1/28 | 2,950,000 | | 2,739,149 | |
Jeld-Wen, Inc., 6.25%, 5/15/25(1) | 1,025,000 | | 1,023,791 | |
Jeld-Wen, Inc., 4.625%, 12/15/25(1) | 750,000 | | 696,581 | |
MIWD Holdco II LLC / MIWD Finance Corp., 5.50%, 2/1/30(1) | 775,000 | | 655,987 | |
Oscar AcquisitionCo. LLC / Oscar Finance, Inc., 9.50%, 4/15/30(1) | 1,400,000 | | 1,205,925 | |
PGT Innovations, Inc., 4.375%, 10/1/29(1) | 1,625,000 | | 1,470,625 | |
Standard Industries, Inc., 5.00%, 2/15/27(1) | 1,000,000 | | 951,110 | |
Standard Industries, Inc., 4.75%, 1/15/28(1) | 975,000 | | 912,205 | |
Standard Industries, Inc., 4.375%, 7/15/30(1) | 2,975,000 | | 2,591,612 | |
Standard Industries, Inc., 3.375%, 1/15/31(1) | 250,000 | | 201,205 | |
| | 25,751,615 | |
| Capital Markets — 2.1% | | |
AG Issuer LLC, 6.25%, 3/1/28(1) | 3,375,000 | | 3,043,615 | |
AG TTMT Escrow Issuer LLC, 8.625%, 9/30/27(1) | 350,000 | | 352,625 | |
Coinbase Global, Inc., 3.375%, 10/1/28(1) | 1,350,000 | | 835,022 | |
Coinbase Global, Inc., 3.625%, 10/1/31(1) | 2,825,000 | | 1,585,065 | |
Compass Group Diversified Holdings LLC, 5.25%, 4/15/29(1) | 1,775,000 | | 1,565,044 | |
Compass Group Diversified Holdings LLC, 5.00%, 1/15/32(1) | 1,025,000 | | 832,279 | |
| Icahn Enterprises LP / Icahn Enterprises Finance Corp., 4.75%, 9/15/24 | 5,454,000 | | 5,326,971 | |
| Icahn Enterprises LP / Icahn Enterprises Finance Corp., 6.375%, 12/15/25 | 875,000 | | 860,350 | |
| Icahn Enterprises LP / Icahn Enterprises Finance Corp., 6.25%, 5/15/26 | 4,100,000 | | 4,038,500 | |
| Icahn Enterprises LP / Icahn Enterprises Finance Corp., 5.25%, 5/15/27 | 5,567,000 | | 5,230,308 | |
| Icahn Enterprises LP / Icahn Enterprises Finance Corp., 4.375%, 2/1/29 | 1,525,000 | | 1,313,589 | |
Iliad Holding SASU, 6.50%, 10/15/26(1) | 1,200,000 | | 1,144,704 | |
Iliad Holding SASU, 7.00%, 10/15/28(1) | 600,000 | | 569,814 | |
Jane Street Group / JSG Finance, Inc., 4.50%, 11/15/29(1) | 1,825,000 | | 1,636,040 | |
LCM Investments Holdings II LLC, 4.875%, 5/1/29(1) | 3,250,000 | | 2,722,671 | |
| | | | | | | | |
| Principal
Amount/Shares | Value |
MSCI, Inc., 4.00%, 11/15/29(1) | $ | 4,825,000 | | $ | 4,407,637 | |
MSCI, Inc., 3.625%, 11/1/31(1) | 2,050,000 | | 1,757,588 | |
NFP Corp., 4.875%, 8/15/28(1) | 775,000 | | 700,034 | |
NFP Corp., 6.875%, 8/15/28(1) | 2,700,000 | | 2,319,489 | |
NFP Corp., 7.50%, 10/1/30(1) | 525,000 | | 507,825 | |
| | 40,749,170 | |
| Chemicals — 2.4% | | |
ASP Unifrax Holdings, Inc., 5.25%, 9/30/28(1) | 200,000 | | 160,060 | |
ASP Unifrax Holdings, Inc., 7.50%, 9/30/29(1) | 375,000 | | 255,203 | |
Avient Corp., 5.75%, 5/15/25(1) | 1,275,000 | | 1,262,807 | |
Avient Corp., 7.125%, 8/1/30(1) | 1,525,000 | | 1,574,181 | |
| Chemours Co., 5.375%, 5/15/27 | 650,000 | | 602,807 | |
Chemours Co., 5.75%, 11/15/28(1) | 1,025,000 | | 916,273 | |
Chemours Co., 4.625%, 11/15/29(1) | 875,000 | | 722,668 | |
Consolidated Energy Finance SA, 6.50%, 5/15/26(1) | 400,000 | | 376,965 | |
Consolidated Energy Finance SA, 5.625%, 10/15/28(1) | 625,000 | | 538,300 | |
Cornerstone Chemical Co., 8.25% Cash and 2.00% PIK, 9/1/27(1) | 650,000 | | 585,813 | |
FXI Holdings, Inc., 7.875%, 11/1/24(1) | 1,189,000 | | 1,110,437 | |
FXI Holdings, Inc., 12.25%, 11/15/26(1) | 3,795,000 | | 3,377,550 | |
Herens Holdco Sarl, 4.75%, 5/15/28(1) | 1,400,000 | | 1,128,491 | |
Illuminate Buyer LLC / Illuminate Holdings IV, Inc., 9.00%, 7/1/28(1) | 525,000 | | 465,893 | |
INEOS Finance PLC, 6.75%, 5/15/28(1) | 1,000,000 | | 966,496 | |
Innophos Holdings, Inc., 9.375%, 2/15/28(1) | 1,375,000 | | 1,407,038 | |
Iris Holdings, Inc., 8.75% Cash or 9.50% PIK, 2/15/26(1) | 1,600,000 | | 1,479,005 | |
LSB Industries, Inc., 6.25%, 10/15/28(1) | 525,000 | | 467,754 | |
| Methanex Corp., 5.125%, 10/15/27 | 750,000 | | 707,654 | |
Minerals Technologies, Inc., 5.00%, 7/1/28(1) | 1,075,000 | | 985,211 | |
NOVA Chemicals Corp., 5.00%, 5/1/25(1) | 100,000 | | 95,498 | |
NOVA Chemicals Corp., 5.25%, 6/1/27(1) | 1,150,000 | | 1,049,829 | |
NOVA Chemicals Corp., 4.25%, 5/15/29(1) | 725,000 | | 593,481 | |
OCI NV, 4.625%, 10/15/25(1) | 628,000 | | 596,655 | |
| Olin Corp., 5.625%, 8/1/29 | 3,150,000 | | 3,039,588 | |
Olympus Water US Holding Corp., 6.25%, 10/1/29(1) | 2,250,000 | | 1,667,512 | |
Polar US Borrower LLC / Schenectady International Group, Inc., 6.75%, 5/15/26(1) | 1,725,000 | | 891,443 | |
SCIH Salt Holdings, Inc., 4.875%, 5/1/28(1) | 2,400,000 | | 2,142,528 | |
SCIH Salt Holdings, Inc., 6.625%, 5/1/29(1) | 2,025,000 | | 1,678,259 | |
SCIL IV LLC / SCIL USA Holdings LLC, 5.375%, 11/1/26(1) | 1,850,000 | | 1,692,078 | |
| Scotts Miracle-Gro Co., 4.00%, 4/1/31 | 2,650,000 | | 2,116,379 | |
SPCM SA, 3.125%, 3/15/27(1) | 1,275,000 | | 1,119,160 | |
Trinseo Materials Operating SCA / Trinseo Materials Finance, Inc., 5.375%, 9/1/25(1) | 2,816,000 | | 2,291,576 | |
Trinseo Materials Operating SCA / Trinseo Materials Finance, Inc., 5.125%, 4/1/29(1) | 3,250,000 | | 2,001,302 | |
Tronox, Inc., 4.625%, 3/15/29(1) | 3,050,000 | | 2,557,623 | |
WR Grace Holdings LLC, 4.875%, 6/15/27(1) | 1,375,000 | | 1,327,095 | |
WR Grace Holdings LLC, 5.625%, 8/15/29(1) | 2,125,000 | | 1,806,250 | |
WR Grace Holdings LLC, 7.375%, 3/1/31(1) | 800,000 | | 803,788 | |
| | 46,560,650 | |
| Commercial Services and Supplies — 1.8% | | |
ADT Security Corp., 4.125%, 8/1/29(1) | 2,225,000 | | 1,986,981 | |
| | | | | | | | |
| Principal
Amount/Shares | Value |
ADT Security Corp., 4.875%, 7/15/32(1) | $ | 850,000 | | $ | 750,843 | |
Allied Universal Holdco LLC / Allied Universal Finance Corp., 6.625%, 7/15/26(1) | 3,075,000 | | 2,958,150 | |
Allied Universal Holdco LLC / Allied Universal Finance Corp., 9.75%, 7/15/27(1) | 4,225,000 | | 3,769,756 | |
Allied Universal Holdco LLC / Allied Universal Finance Corp., 4.625%, 6/1/28(1) | 2,200,000 | | 1,863,829 | |
Allied Universal Holdco LLC / Allied Universal Finance Corp., 4.625%, 6/1/28(1) | 1,300,000 | | 1,092,609 | |
Allied Universal Holdco LLC / Allied Universal Finance Corp., 6.00%, 6/1/29(1) | 3,272,000 | | 2,446,164 | |
APX Group, Inc., 5.75%, 7/15/29(1) | 2,300,000 | | 2,061,398 | |
Clean Harbors, Inc., 6.375%, 2/1/31(1) | 850,000 | | 868,105 | |
| Covanta Holding Corp., 5.00%, 9/1/30 | 1,200,000 | | 1,034,850 | |
Garda World Security Corp., 4.625%, 2/15/27(1) | 600,000 | | 539,320 | |
Garda World Security Corp., 7.75%, 2/15/28(1) | 950,000 | | 937,178 | |
Garda World Security Corp., 6.00%, 6/1/29(1) | 3,000,000 | | 2,388,855 | |
KAR Auction Services, Inc., 5.125%, 6/1/25(1) | 379,000 | | 374,659 | |
Madison IAQ LLC, 5.875%, 6/30/29(1) | 1,125,000 | | 870,176 | |
Matthews International Corp., 5.25%, 12/1/25(1) | 1,000,000 | | 955,625 | |
Metis Merger Sub LLC, 6.50%, 5/15/29(1) | 3,900,000 | | 3,251,898 | |
Neptune Bidco US, Inc., 9.29%, 4/15/29(1) | 4,025,000 | | 3,735,602 | |
Prime Security Services Borrower LLC / Prime Finance, Inc., 5.25%, 4/15/24(1) | 425,000 | | 420,792 | |
Prime Security Services Borrower LLC / Prime Finance, Inc., 6.25%, 1/15/28(1) | 575,000 | | 538,165 | |
Sotheby's/Bidfair Holdings, Inc., 5.875%, 6/1/29(1) | 600,000 | | 498,324 | |
WASH Multifamily Acquisition, Inc., 5.75%, 4/15/26(1) | 1,100,000 | | 1,042,096 | |
| | 34,385,375 | |
| Communications Equipment — 0.6% | | |
Ciena Corp., 4.00%, 1/31/30(1) | 1,450,000 | | 1,262,805 | |
CommScope Technologies LLC, 6.00%, 6/15/25(1) | 2,036,000 | | 1,919,410 | |
CommScope Technologies LLC, 5.00%, 3/15/27(1) | 535,000 | | 391,834 | |
CommScope, Inc., 6.00%, 3/1/26(1) | 1,975,000 | | 1,908,255 | |
CommScope, Inc., 8.25%, 3/1/27(1) | 725,000 | | 594,500 | |
CommScope, Inc., 7.125%, 7/1/28(1) | 2,225,000 | | 1,643,763 | |
CommScope, Inc., 4.75%, 9/1/29(1) | 625,000 | | 521,563 | |
| Nokia of America Corp., 6.45%, 3/15/29 | 3,231,000 | | 3,073,489 | |
| | 11,315,619 | |
| Construction and Engineering — 0.4% | | |
Brand Industrial Services, Inc., 8.50%, 7/15/25(1) | 675,000 | | 617,828 | |
Howard Midstream Energy Partners LLC, 6.75%, 1/15/27(1) | 1,375,000 | | 1,297,972 | |
New Enterprise Stone & Lime Co., Inc., 5.25%, 7/15/28(1) | 1,575,000 | | 1,394,220 | |
New Enterprise Stone & Lime Co., Inc., 9.75%, 7/15/28(1) | 2,650,000 | | 2,533,135 | |
Weekley Homes LLC / Weekley Finance Corp., 4.875%, 9/15/28(1) | 2,025,000 | | 1,709,797 | |
| | 7,552,952 | |
| Construction Materials — 0.5% | | |
Cemex SAB de CV, 5.45%, 11/19/29(1) | 2,800,000 | | 2,638,573 | |
Cemex SAB de CV, 5.20%, 9/17/30(1) | 800,000 | | 738,633 | |
Cemex SAB de CV, 3.875%, 7/11/31(1) | 1,600,000 | | 1,334,286 | |
Smyrna Ready Mix Concrete LLC, 6.00%, 11/1/28(1) | 3,225,000 | | 3,032,129 | |
Summit Materials LLC / Summit Materials Finance Corp., 6.50%, 3/15/27(1) | 875,000 | | 868,625 | |
| | | | | | | | |
| Principal
Amount/Shares | Value |
Summit Materials LLC / Summit Materials Finance Corp., 5.25%, 1/15/29(1) | $ | 1,725,000 | | $ | 1,632,652 | |
| | 10,244,898 | |
| Consumer Finance — 2.2% | | |
Acuris Finance US, Inc. / Acuris Finance Sarl, 5.00%, 5/1/28(1) | 1,075,000 | | 845,289 | |
| Ally Financial, Inc., 6.70%, 2/14/33 | 400,000 | | 355,866 | |
Curo Group Holdings Corp., 7.50%, 8/1/28(1) | 650,000 | | 260,170 | |
FirstCash, Inc., 4.625%, 9/1/28(1) | 1,625,000 | | 1,443,304 | |
FirstCash, Inc., 5.625%, 1/1/30(1) | 975,000 | | 900,773 | |
Global Aircraft Leasing Co. Ltd., 6.50% Cash or 7.25% PIK, 9/15/24(1) | 5,004,489 | | 4,521,105 | |
| Navient Corp., 6.125%, 3/25/24 | 2,160,000 | | 2,133,194 | |
| Navient Corp., 5.875%, 10/25/24 | 3,230,000 | | 3,141,620 | |
| Navient Corp., 6.75%, 6/25/25 | 4,175,000 | | 4,061,766 | |
| Navient Corp., 6.75%, 6/15/26 | 2,575,000 | | 2,513,792 | |
| Navient Corp., 5.00%, 3/15/27 | 300,000 | | 264,627 | |
| Navient Corp., 5.50%, 3/15/29 | 4,250,000 | | 3,596,711 | |
| OneMain Finance Corp., 8.25%, 10/1/23 | 75,000 | | 75,304 | |
| OneMain Finance Corp., 6.125%, 3/15/24 | 392,000 | | 382,235 | |
| OneMain Finance Corp., 6.875%, 3/15/25 | 1,267,000 | | 1,228,990 | |
| OneMain Finance Corp., 7.125%, 3/15/26 | 3,900,000 | | 3,752,970 | |
| OneMain Finance Corp., 6.625%, 1/15/28 | 1,765,000 | | 1,619,917 | |
| OneMain Finance Corp., 3.875%, 9/15/28 | 400,000 | | 317,550 | |
| OneMain Finance Corp., 5.375%, 11/15/29 | 750,000 | | 631,725 | |
| OneMain Finance Corp., 4.00%, 9/15/30 | 825,000 | | 619,493 | |
PRA Group, Inc., 8.375%, 2/1/28(1) | 1,500,000 | | 1,501,088 | |
PROG Holdings, Inc., 6.00%, 11/15/29(1) | 900,000 | | 766,293 | |
| SLM Corp., 3.125%, 11/2/26 | 3,600,000 | | 3,064,302 | |
| Synchrony Financial, 7.25%, 2/2/33 | 1,125,000 | | 993,877 | |
VistaJet Malta Finance PLC / XO Management Holding, Inc., 7.875%, 5/1/27(1) | 1,675,000 | | 1,621,341 | |
VistaJet Malta Finance PLC / XO Management Holding, Inc., 6.375%, 2/1/30(1) | 1,500,000 | | 1,338,377 | |
World Acceptance Corp., 7.00%, 11/1/26(1) | 2,100,000 | | 1,567,114 | |
| | 43,518,793 | |
| Consumer Staples Distribution & Retail — 0.7% | | |
Albertsons Cos., Inc. / Safeway, Inc. / New Albertsons LP / Albertsons LLC, 3.25%, 3/15/26(1) | 775,000 | | 730,027 | |
Albertsons Cos., Inc. / Safeway, Inc. / New Albertsons LP / Albertsons LLC, 7.50%, 3/15/26(1) | 575,000 | | 590,502 | |
Albertsons Cos., Inc. / Safeway, Inc. / New Albertsons LP / Albertsons LLC, 4.625%, 1/15/27(1) | 2,325,000 | | 2,250,832 | |
Albertsons Cos., Inc. / Safeway, Inc. / New Albertsons LP / Albertsons LLC, 5.875%, 2/15/28(1) | 1,000,000 | | 994,900 | |
Albertsons Cos., Inc. / Safeway, Inc. / New Albertsons LP / Albertsons LLC, 6.50%, 2/15/28(1) | 2,225,000 | | 2,232,910 | |
Albertsons Cos., Inc. / Safeway, Inc. / New Albertsons LP / Albertsons LLC, 3.50%, 3/15/29(1) | 325,000 | | 283,086 | |
Albertsons Cos., Inc. / Safeway, Inc. / New Albertsons LP / Albertsons LLC, 4.875%, 2/15/30(1) | 750,000 | | 700,852 | |
Ingles Markets, Inc., 4.00%, 6/15/31(1) | 2,150,000 | | 1,870,500 | |
Rite Aid Corp., 8.00%, 11/15/26(1) | 987,000 | | 472,462 | |
SEG Holding LLC / SEG Finance Corp., 5.625%, 10/15/28(1) | 2,450,000 | | 2,328,706 | |
United Natural Foods, Inc., 6.75%, 10/15/28(1) | 625,000 | | 581,444 | |
| | 13,036,221 | |
| | | | | | | | |
| Principal
Amount/Shares | Value |
| Containers and Packaging — 1.9% | | |
ARD Finance SA, 6.50% Cash or 7.25% PIK, 6/30/27(1) | $ | 3,377,586 | | $ | 2,587,906 | |
Ardagh Metal Packaging Finance USA LLC / Ardagh Metal Packaging Finance PLC, 6.00%, 6/15/27(1) | 1,400,000 | | 1,389,360 | |
Ardagh Packaging Finance PLC / Ardagh Holdings USA, Inc., 4.125%, 8/15/26(1) | 800,000 | | 747,084 | |
Ardagh Packaging Finance PLC / Ardagh Holdings USA, Inc., 5.25%, 8/15/27(1) | 2,750,000 | | 2,170,877 | |
Ardagh Packaging Finance PLC / Ardagh Holdings USA, Inc., 5.25%, 8/15/27(1) | 800,000 | | 631,528 | |
| Ball Corp., 4.875%, 3/15/26 | 1,000,000 | | 993,600 | |
| Ball Corp., 6.875%, 3/15/28 | 1,775,000 | | 1,838,935 | |
| Ball Corp., 3.125%, 9/15/31 | 750,000 | | 621,349 | |
Berry Global, Inc., 4.875%, 7/15/26(1) | 1,175,000 | | 1,146,459 | |
Berry Global, Inc., 5.625%, 7/15/27(1) | 750,000 | | 745,725 | |
Clydesdale Acquisition Holdings, Inc., 6.625%, 4/15/29(1) | 225,000 | | 216,765 | |
| Crown Americas LLC, 5.25%, 4/1/30 | 1,475,000 | | 1,422,077 | |
| Crown Americas LLC / Crown Americas Capital Corp. VI, 4.75%, 2/1/26 | 700,000 | | 682,406 | |
Intelligent Packaging Holdco Issuer LP, 9.00% Cash or 9.75% PIK, 1/15/26(1) | 925,000 | | 652,190 | |
Intelligent Packaging Ltd. Finco, Inc. / Intelligent Packaging Ltd. Co.-Issuer LLC, 6.00%, 9/15/28(1) | 1,650,000 | | 1,423,125 | |
LABL, Inc., 10.50%, 7/15/27(1) | 900,000 | | 833,454 | |
LABL, Inc., 5.875%, 11/1/28(1) | 600,000 | | 534,264 | |
LABL, Inc., 9.50%, 11/1/28(1)(2) | 250,000 | | 252,500 | |
LABL, Inc., 8.25%, 11/1/29(1) | 1,500,000 | | 1,281,900 | |
Mauser Packaging Solutions Holding Co., 9.25%, 4/15/27(1) | 425,000 | | 393,125 | |
OI European Group BV, 4.75%, 2/15/30(1) | 2,675,000 | | 2,451,049 | |
Owens-Brockway Glass Container, Inc., 5.875%, 8/15/23(1) | 217,000 | | 216,876 | |
Owens-Brockway Glass Container, Inc., 5.375%, 1/15/25(1) | 500,000 | | 492,625 | |
Owens-Brockway Glass Container, Inc., 6.375%, 8/15/25(1) | 700,000 | | 700,999 | |
Owens-Brockway Glass Container, Inc., 6.625%, 5/13/27(1) | 4,131,000 | | 4,140,088 | |
Sealed Air Corp., 4.00%, 12/1/27(1) | 1,614,000 | | 1,507,637 | |
Sealed Air Corp., 5.00%, 4/15/29(1) | 1,800,000 | | 1,693,697 | |
Sealed Air Corp. / Sealed Air Corp. US, 6.125%, 2/1/28(1) | 375,000 | | 379,575 | |
Trident TPI Holdings, Inc., 9.25%, 8/1/24(1) | 1,000,000 | | 991,835 | |
Trident TPI Holdings, Inc., 6.625%, 11/1/25(1) | 500,000 | | 462,963 | |
TriMas Corp., 4.125%, 4/15/29(1) | 2,050,000 | | 1,806,460 | |
Trivium Packaging Finance BV, 5.50%, 8/15/26(1) | 800,000 | | 767,368 | |
| | 36,175,801 | |
| Distributors — 0.4% | | |
American Builders & Contractors Supply Co., Inc., 4.00%, 1/15/28(1) | 600,000 | | 546,945 | |
BCPE Empire Holdings, Inc., 7.625%, 5/1/27(1) | 2,400,000 | | 2,195,160 | |
Performance Food Group, Inc., 5.50%, 10/15/27(1) | 650,000 | | 636,038 | |
Performance Food Group, Inc., 4.25%, 8/1/29(1) | 1,975,000 | | 1,775,638 | |
Resideo Funding, Inc., 4.00%, 9/1/29(1) | 425,000 | | 353,772 | |
Ritchie Bros Holdings, Inc., 6.75%, 3/15/28(1) | 925,000 | | 953,749 | |
Ritchie Bros Holdings, Inc., 7.75%, 3/15/31(1) | 600,000 | | 629,562 | |
| | 7,090,864 | |
| Diversified Consumer Services — 0.5% | | |
Adtalem Global Education, Inc., 5.50%, 3/1/28(1) | 1,733,000 | | 1,646,159 | |
Carriage Services, Inc., 4.25%, 5/15/29(1) | 1,825,000 | | 1,505,205 | |
| | | | | | | | |
| Principal
Amount/Shares | Value |
Graham Holdings Co., 5.75%, 6/1/26(1) | $ | 675,000 | | $ | 662,208 | |
| Service Corp. International, 5.125%, 6/1/29 | 500,000 | | 483,594 | |
| Service Corp. International, 3.375%, 8/15/30 | 800,000 | | 682,720 | |
| Service Corp. International, 4.00%, 5/15/31 | 4,200,000 | | 3,692,220 | |
Sotheby's, 7.375%, 10/15/27(1) | 1,200,000 | | 1,136,400 | |
| | 9,808,506 | |
| Diversified REITs — 2.9% | | |
Brookfield Property REIT, Inc. / BPR Cumulus LLC / BPR Nimbus LLC / GGSI Sellco LL, 4.50%, 4/1/27(1) | 400,000 | | 321,560 | |
| Diversified Healthcare Trust, 9.75%, 6/15/25 | 2,038,000 | | 1,973,915 | |
| Diversified Healthcare Trust, 4.375%, 3/1/31 | 275,000 | | 197,296 | |
HAT Holdings I LLC / HAT Holdings II LLC, 6.00%, 4/15/25(1) | 900,000 | | 865,580 | |
HAT Holdings I LLC / HAT Holdings II LLC, 3.375%, 6/15/26(1) | 1,350,000 | | 1,172,718 | |
HAT Holdings I LLC / HAT Holdings II LLC, 3.75%, 9/15/30(1) | 475,000 | | 359,304 | |
Iron Mountain Information Management Services, Inc., 5.00%, 7/15/32(1) | 4,700,000 | | 4,040,503 | |
Iron Mountain, Inc., 4.875%, 9/15/27(1) | 350,000 | | 331,277 | |
Iron Mountain, Inc., 5.25%, 3/15/28(1) | 1,400,000 | | 1,335,523 | |
Iron Mountain, Inc., 5.00%, 7/15/28(1) | 650,000 | | 605,550 | |
Iron Mountain, Inc., 4.875%, 9/15/29(1) | 200,000 | | 179,976 | |
Iron Mountain, Inc., 5.25%, 7/15/30(1) | 2,925,000 | | 2,640,183 | |
Iron Mountain, Inc., 4.50%, 2/15/31(1) | 2,475,000 | | 2,129,242 | |
Iron Mountain, Inc., 5.625%, 7/15/32(1) | 175,000 | | 160,038 | |
| MPT Operating Partnership LP / MPT Finance Corp., 5.25%, 8/1/26 | 1,200,000 | | 1,080,000 | |
| MPT Operating Partnership LP / MPT Finance Corp., 5.00%, 10/15/27 | 3,250,000 | | 2,676,716 | |
| MPT Operating Partnership LP / MPT Finance Corp., 4.625%, 8/1/29 | 1,100,000 | | 813,774 | |
| MPT Operating Partnership LP / MPT Finance Corp., 3.50%, 3/15/31 | 725,000 | | 488,722 | |
Park Intermediate Holdings LLC / PK Domestic Property LLC / PK Finance Co.-Issuer, 7.50%, 6/1/25(1) | 2,275,000 | | 2,285,380 | |
Park Intermediate Holdings LLC / PK Domestic Property LLC / PK Finance Co.-Issuer, 5.875%, 10/1/28(1) | 750,000 | | 691,410 | |
Park Intermediate Holdings LLC / PK Domestic Property LLC / PK Finance Co.-Issuer, 4.875%, 5/15/29(1) | 1,750,000 | | 1,507,564 | |
RHP Hotel Properties LP / RHP Finance Corp., 4.50%, 2/15/29(1) | 1,200,000 | | 1,085,364 | |
RLJ Lodging Trust LP, 3.75%, 7/1/26(1) | 2,225,000 | | 2,039,117 | |
RLJ Lodging Trust LP, 4.00%, 9/15/29(1) | 3,075,000 | | 2,571,216 | |
| SBA Communications Corp., 3.875%, 2/15/27 | 200,000 | | 188,987 | |
| SBA Communications Corp., 3.125%, 2/1/29 | 275,000 | | 239,485 | |
| Service Properties Trust, 4.35%, 10/1/24 | 2,450,000 | | 2,346,806 | |
| Service Properties Trust, 7.50%, 9/15/25 | 325,000 | | 321,008 | |
| Service Properties Trust, 5.25%, 2/15/26 | 1,925,000 | | 1,687,041 | |
| Service Properties Trust, 4.75%, 10/1/26 | 1,850,000 | | 1,546,568 | |
| Service Properties Trust, 4.95%, 2/15/27 | 375,000 | | 317,835 | |
| Service Properties Trust, 5.50%, 12/15/27 | 550,000 | | 492,822 | |
| Service Properties Trust, 4.95%, 10/1/29 | 1,900,000 | | 1,437,046 | |
| Service Properties Trust, 4.375%, 2/15/30 | 100,000 | | 74,760 | |
Uniti Group LP / Uniti Fiber Holdings, Inc. / CSL Capital LLC, 6.00%, 1/15/30(1) | 800,000 | | 469,000 | |
Uniti Group LP / Uniti Group Finance, Inc. / CSL Capital LLC, 10.50%, 2/15/28(1) | 3,850,000 | | 3,737,965 | |
| | | | | | | | |
| Principal
Amount/Shares | Value |
Uniti Group LP / Uniti Group Finance, Inc. / CSL Capital LLC, 4.75%, 4/15/28(1) | $ | 1,775,000 | | $ | 1,373,619 | |
Uniti Group LP / Uniti Group Finance, Inc. / CSL Capital LLC, 6.50%, 2/15/29(1) | 1,175,000 | | 718,225 | |
VICI Properties LP / VICI Note Co., Inc., 3.50%, 2/15/25(1) | 500,000 | | 474,482 | |
VICI Properties LP / VICI Note Co., Inc., 4.625%, 6/15/25(1) | 455,000 | | 440,485 | |
VICI Properties LP / VICI Note Co., Inc., 4.25%, 12/1/26(1) | 783,000 | | 731,288 | |
VICI Properties LP / VICI Note Co., Inc., 5.75%, 2/1/27(1) | 1,350,000 | | 1,326,540 | |
VICI Properties LP / VICI Note Co., Inc., 3.75%, 2/15/27(1) | 1,325,000 | | 1,224,386 | |
VICI Properties LP / VICI Note Co., Inc., 4.50%, 1/15/28(1) | 1,100,000 | | 1,020,083 | |
VICI Properties LP / VICI Note Co., Inc., 4.625%, 12/1/29(1) | 1,825,000 | | 1,663,003 | |
VICI Properties LP / VICI Note Co., Inc., 4.125%, 8/15/30(1) | 2,250,000 | | 1,989,419 | |
XHR LP, 6.375%, 8/15/25(1) | 1,325,000 | | 1,300,958 | |
XHR LP, 4.875%, 6/1/29(1) | 1,075,000 | | 912,839 | |
| | 57,586,578 | |
| Diversified Telecommunication Services — 2.6% | | |
Altice France Holding SA, 10.50%, 5/15/27(1) | 3,950,000 | | 3,025,305 | |
Altice France Holding SA, 6.00%, 2/15/28(1) | 4,950,000 | | 3,163,545 | |
Altice France SA, 8.125%, 2/1/27(1) | 3,925,000 | | 3,636,905 | |
Altice France SA, 5.50%, 1/15/28(1) | 1,250,000 | | 1,028,063 | |
Altice France SA, 5.125%, 1/15/29(1) | 1,950,000 | | 1,488,269 | |
Altice France SA, 5.125%, 7/15/29(1) | 4,525,000 | | 3,409,361 | |
Altice France SA, 5.50%, 10/15/29(1) | 3,100,000 | | 2,373,223 | |
Cablevision Lightpath LLC, 5.625%, 9/15/28(1) | 800,000 | | 552,928 | |
Cogent Communications Group, Inc., 7.00%, 6/15/27(1) | 2,100,000 | | 2,084,040 | |
Connect Finco Sarl / Connect US Finco LLC, 6.75%, 10/1/26(1) | 1,550,000 | | 1,458,395 | |
| Embarq Corp., 8.00%, 6/1/36 | 1,765,000 | | 743,833 | |
Frontier Communications Holdings LLC, 5.875%, 10/15/27(1) | 425,000 | | 386,750 | |
Frontier Communications Holdings LLC, 5.00%, 5/1/28(1) | 1,150,000 | | 999,212 | |
Frontier Communications Holdings LLC, 6.75%, 5/1/29(1) | 2,550,000 | | 2,023,348 | |
| Frontier Communications Holdings LLC, 5.875%, 11/1/29 | 685,398 | | 523,346 | |
Frontier Communications Holdings LLC, 6.00%, 1/15/30(1) | 875,000 | | 666,453 | |
Frontier Communications Holdings LLC, 8.625%, 3/15/31(1) | 775,000 | | 759,721 | |
| Hughes Satellite Systems Corp., 6.625%, 8/1/26 | 1,225,000 | | 1,161,052 | |
Level 3 Financing, Inc., 4.625%, 9/15/27(1) | 1,025,000 | | 617,204 | |
Level 3 Financing, Inc., 4.25%, 7/1/28(1) | 3,900,000 | | 2,204,377 | |
Level 3 Financing, Inc., 3.75%, 7/15/29(1) | 2,300,000 | | 1,229,281 | |
Level 3 Financing, Inc., 10.50%, 5/15/30(1) | 1,556,250 | | 1,488,164 | |
Lumen Technologies, Inc., 4.00%, 2/15/27(1) | 500,000 | | 330,458 | |
Northwest Fiber LLC / Northwest Fiber Finance Sub, Inc., 4.75%, 4/30/27(1) | 325,000 | | 277,973 | |
| Sprint Capital Corp., 6.875%, 11/15/28 | 2,275,000 | | 2,446,762 | |
| Sprint Capital Corp., 8.75%, 3/15/32 | 3,550,000 | | 4,325,888 | |
| Telecom Italia Capital SA, 6.375%, 11/15/33 | 1,825,000 | | 1,654,289 | |
| Telecom Italia Capital SA, 6.00%, 9/30/34 | 2,777,000 | | 2,384,749 | |
| Telecom Italia Capital SA, 7.20%, 7/18/36 | 325,000 | | 294,377 | |
Telecom Italia SpA, 5.30%, 5/30/24(1) | 375,000 | | 367,854 | |
Telesat Canada / Telesat LLC, 5.625%, 12/6/26(1) | 2,350,000 | | 1,214,833 | |
Telesat Canada / Telesat LLC, 4.875%, 6/1/27(1) | 500,000 | | 259,510 | |
Telesat Canada / Telesat LLC, 6.50%, 10/15/27(1) | 800,000 | | 256,000 | |
Zayo Group Holdings, Inc., 4.00%, 3/1/27(1) | 2,025,000 | | 1,540,823 | |
| | 50,376,291 | |
| | | | | | | | |
| Principal
Amount/Shares | Value |
| Electric Utilities — 0.7% | | |
Drax Finco PLC, 6.625%, 11/1/25(1) | $ | 1,350,000 | | $ | 1,330,209 | |
Leeward Renewable Energy Operations LLC, 4.25%, 7/1/29(1) | 500,000 | | 436,101 | |
NextEra Energy Operating Partners LP, 4.25%, 9/15/24(1) | 57,000 | | 54,891 | |
NextEra Energy Operating Partners LP, 3.875%, 10/15/26(1) | 1,975,000 | | 1,841,396 | |
| NRG Energy, Inc., 6.625%, 1/15/27 | 196,000 | | 195,820 | |
NRG Energy, Inc., 3.375%, 2/15/29(1) | 675,000 | | 559,661 | |
NRG Energy, Inc., 3.625%, 2/15/31(1) | 610,000 | | 489,805 | |
NRG Energy, Inc., 3.875%, 2/15/32(1) | 1,100,000 | | 881,199 | |
| Pacific Gas & Electric Co., 4.55%, 7/1/30 | 125,000 | | 117,202 | |
| PG&E Corp., 5.00%, 7/1/28 | 2,650,000 | | 2,505,045 | |
Talen Energy Supply LLC, 6.50%, 6/1/25(3)(4) | 175,000 | | 71,750 | |
Talen Energy Supply LLC, 7.25%, 5/15/27(1)(3)(4) | 75,000 | | 77,076 | |
Talen Energy Supply LLC, 6.625%, 1/15/28(1)(3)(4) | 1,192,000 | | 1,212,023 | |
Vistra Operations Co. LLC, 5.50%, 9/1/26(1) | 1,605,000 | | 1,560,548 | |
Vistra Operations Co. LLC, 5.625%, 2/15/27(1) | 600,000 | | 583,095 | |
Vistra Operations Co. LLC, 5.00%, 7/31/27(1) | 1,450,000 | | 1,373,012 | |
| | 13,288,833 | |
| Electrical Equipment — 0.1% | | |
Regal Rexnord Corp., 6.05%, 2/15/26(1) | 650,000 | | 653,524 | |
Regal Rexnord Corp., 6.40%, 4/15/33(1) | 575,000 | | 576,040 | |
WESCO Distribution, Inc., 7.25%, 6/15/28(1) | 650,000 | | 668,057 | |
| | 1,897,621 | |
| Electronic Equipment, Instruments and Components — 0.9% |
Coherent Corp., 5.00%, 12/15/29(1) | 1,150,000 | | 1,045,063 | |
Imola Merger Corp., 4.75%, 5/15/29(1) | 8,375,000 | | 7,501,655 | |
Likewize Corp., 9.75%, 10/15/25(1) | 975,000 | | 887,006 | |
Sensata Technologies BV, 5.00%, 10/1/25(1) | 250,000 | | 248,425 | |
Sensata Technologies BV, 4.00%, 4/15/29(1) | 4,225,000 | | 3,820,984 | |
Sensata Technologies BV, 5.875%, 9/1/30(1) | 1,200,000 | | 1,190,580 | |
Sensata Technologies, Inc., 3.75%, 2/15/31(1) | 375,000 | | 328,463 | |
TTM Technologies, Inc., 4.00%, 3/1/29(1) | 2,425,000 | | 2,113,157 | |
| | 17,135,333 | |
| Energy Equipment and Services — 2.5% | | |
Archrock Partners LP / Archrock Partners Finance Corp., 6.875%, 4/1/27(1) | 875,000 | | 859,447 | |
Archrock Partners LP / Archrock Partners Finance Corp., 6.25%, 4/1/28(1) | 2,700,000 | | 2,594,592 | |
Bristow Group, Inc., 6.875%, 3/1/28(1) | 2,075,000 | | 1,933,052 | |
Enerflex Ltd., 9.00%, 10/15/27(1) | 1,600,000 | | 1,557,544 | |
Ensign Drilling, Inc., 9.25%, 4/15/24(1) | 1,125,000 | | 1,082,319 | |
| Global Marine, Inc., 7.00%, 6/1/28 | 1,050,000 | | 813,750 | |
Nabors Industries Ltd., 7.25%, 1/15/26(1) | 550,000 | | 525,104 | |
Nabors Industries Ltd., 7.50%, 1/15/28(1) | 1,700,000 | | 1,570,463 | |
| Nabors Industries, Inc., 5.75%, 2/1/25 | 3,348,000 | | 3,247,309 | |
| Nine Energy Service, Inc., 13.00%, 2/1/28 | 1,975,000 | | 1,873,643 | |
Noble Finance Co., 11.00% Cash or 6.50% Cash and 6.50% PIK or 15.00% PIK, 2/15/28(1) | 25,850 | | 28,435 | |
Precision Drilling Corp., 7.125%, 1/15/26(1) | 1,375,000 | | 1,344,145 | |
Precision Drilling Corp., 6.875%, 1/15/29(1) | 2,100,000 | | 1,907,640 | |
Shelf Drilling Holdings Ltd., 8.875%, 11/15/24(1) | 1,075,000 | | 1,067,988 | |
Shelf Drilling Holdings Ltd., 8.25%, 2/15/25(1) | 4,650,000 | | 4,143,522 | |
| | | | | | | | |
| Principal
Amount/Shares | Value |
Shelf Drilling North Sea Holdings Ltd., 10.25%, 10/31/25(1) | $ | 1,000,000 | | $ | 999,351 | |
Transocean Poseidon Ltd., 6.875%, 2/1/27(1) | 670,313 | | 657,711 | |
Transocean Titan Financing Ltd., 8.375%, 2/1/28(1) | 1,325,000 | | 1,364,776 | |
Transocean, Inc., 7.25%, 11/1/25(1) | 2,475,000 | | 2,341,783 | |
Transocean, Inc., 7.50%, 1/15/26(1) | 2,225,000 | | 2,022,480 | |
Transocean, Inc., 11.50%, 1/30/27(1) | 2,673,000 | | 2,763,227 | |
Transocean, Inc., 8.00%, 2/1/27(1) | 1,400,000 | | 1,260,063 | |
Transocean, Inc., 8.75%, 2/15/30(1) | 1,600,000 | | 1,633,440 | |
| Transocean, Inc., 7.50%, 4/15/31 | 1,900,000 | | 1,445,957 | |
| Transocean, Inc., 6.80%, 3/15/38 | 950,000 | | 658,887 | |
| Transocean, Inc., 9.35%, 12/15/41 | 400,000 | | 311,788 | |
| USA Compression Partners LP / USA Compression Finance Corp., 6.875%, 4/1/26 | 1,500,000 | | 1,459,398 | |
| USA Compression Partners LP / USA Compression Finance Corp., 6.875%, 9/1/27 | 825,000 | | 789,158 | |
Vantage Drilling International, 9.50%, 2/15/28(1) | 1,250,000 | | 1,231,163 | |
Weatherford International Ltd., 11.00%, 12/1/24(1) | 129,000 | | 132,491 | |
Weatherford International Ltd., 8.625%, 4/30/30(1) | 6,100,000 | | 6,246,156 | |
| | 49,866,782 | |
| Entertainment — 1.3% | | |
Allen Media LLC / Allen Media Co.-Issuer, Inc., 10.50%, 2/15/28(1) | 2,250,000 | | 1,234,620 | |
| AMC Entertainment Holdings, Inc., 5.875%, 11/15/26 | 375,000 | | 150,938 | |
AMC Entertainment Holdings, Inc., 10.00% Cash or 12.00% PIK or 5.00% Cash plus 6.00% PIK, 6/15/26(1) | 9,445,980 | | 5,998,197 | |
Cinemark USA, Inc., 5.875%, 3/15/26(1) | 4,150,000 | | 3,918,969 | |
Cinemark USA, Inc., 5.25%, 7/15/28(1) | 5,325,000 | | 4,612,249 | |
Live Nation Entertainment, Inc., 4.875%, 11/1/24(1) | 1,125,000 | | 1,104,019 | |
Live Nation Entertainment, Inc., 5.625%, 3/15/26(1) | 3,025,000 | | 2,930,333 | |
Live Nation Entertainment, Inc., 6.50%, 5/15/27(1) | 1,500,000 | | 1,517,638 | |
Live Nation Entertainment, Inc., 4.75%, 10/15/27(1) | 500,000 | | 463,070 | |
Live Nation Entertainment, Inc., 3.75%, 1/15/28(1) | 1,025,000 | | 919,937 | |
| Netflix, Inc., 5.875%, 11/15/28 | 625,000 | | 658,344 | |
Odeon Finco PLC, 12.75%, 11/1/27(1) | 275,000 | | 253,250 | |
Playtika Holding Corp., 4.25%, 3/15/29(1) | 1,875,000 | | 1,563,234 | |
WMG Acquisition Corp., 3.00%, 2/15/31(1) | 375,000 | | 313,864 | |
| | 25,638,662 | |
| Financial Services — 0.6% | | |
Burford Capital Global Finance LLC, 6.25%, 4/15/28(1) | 600,000 | | 517,830 | |
Jefferies Finance LLC / JFIN Co.-Issuer Corp., 5.00%, 8/15/28(1) | 400,000 | | 339,120 | |
Jefferson Capital Holdings LLC, 6.00%, 8/15/26(1) | 2,004,000 | | 1,702,711 | |
Kinetik Holdings LP, 5.875%, 6/15/30(1) | 1,675,000 | | 1,614,700 | |
Midcap Financial Issuer Trust, 6.50%, 5/1/28(1) | 1,200,000 | | 1,021,908 | |
Midcap Financial Issuer Trust, 5.625%, 1/15/30(1) | 1,000,000 | | 791,255 | |
MPH Acquisition Holdings LLC, 5.50%, 9/1/28(1) | 600,000 | | 477,570 | |
MPH Acquisition Holdings LLC, 5.75%, 11/1/28(1) | 1,975,000 | | 1,422,817 | |
Paysafe Finance PLC / Paysafe Holdings US Corp., 4.00%, 6/15/29(1) | 1,475,000 | | 1,148,605 | |
Sabre Global, Inc., 9.25%, 4/15/25(1) | 850,000 | | 801,516 | |
Sabre Global, Inc., 7.375%, 9/1/25(1) | 250,000 | | 223,625 | |
Verscend Escrow Corp., 9.75%, 8/15/26(1) | 1,350,000 | | 1,351,289 | |
| | 11,412,946 | |
| | | | | | | | |
| Principal
Amount/Shares | Value |
| Food Products — 1.3% | | |
C&S Group Enterprises LLC, 5.00%, 12/15/28(1) | $ | 1,175,000 | | $ | 907,007 | |
Darling Ingredients, Inc., 5.25%, 4/15/27(1) | 1,100,000 | | 1,073,506 | |
Darling Ingredients, Inc., 6.00%, 6/15/30(1) | 1,800,000 | | 1,795,500 | |
Herbalife Nutrition Ltd. / HLF Financing, Inc., 7.875%, 9/1/25(1) | 2,300,000 | | 2,171,456 | |
HLF Financing Sarl LLC / Herbalife International, Inc., 4.875%, 6/1/29(1) | 425,000 | | 323,463 | |
JBS USA LUX SA / JBS USA Food Co. / JBS USA Finance, Inc., 5.50%, 1/15/30(1) | 1,500,000 | | 1,433,280 | |
Lamb Weston Holdings, Inc., 4.125%, 1/31/30(1) | 1,450,000 | | 1,328,120 | |
Lamb Weston Holdings, Inc., 4.375%, 1/31/32(1) | 1,450,000 | | 1,316,321 | |
Post Holdings, Inc., 5.75%, 3/1/27(1) | 1,107,000 | | 1,081,604 | |
Post Holdings, Inc., 5.625%, 1/15/28(1) | 1,100,000 | | 1,079,023 | |
Post Holdings, Inc., 5.50%, 12/15/29(1) | 4,675,000 | | 4,410,718 | |
Post Holdings, Inc., 4.50%, 9/15/31(1) | 825,000 | | 726,825 | |
Sigma Holdco BV, 7.875%, 5/15/26(1) | 2,400,000 | | 1,905,408 | |
Simmons Foods, Inc. / Simmons Prepared Foods, Inc. / Simmons Pet Food, Inc. / Simmons Feed, Inc., 4.625%, 3/1/29(1) | 2,025,000 | | 1,648,168 | |
US Foods, Inc., 6.25%, 4/15/25(1) | 575,000 | | 580,773 | |
US Foods, Inc., 4.75%, 2/15/29(1) | 3,925,000 | | 3,630,488 | |
| | 25,411,660 | |
| Gas Utilities — 0.1% | | |
| AmeriGas Partners LP / AmeriGas Finance Corp., 5.50%, 5/20/25 | 625,000 | | 600,229 | |
| AmeriGas Partners LP / AmeriGas Finance Corp., 5.75%, 5/20/27 | 1,645,000 | | 1,550,314 | |
| | 2,150,543 | |
| Ground Transportation — 1.4% | | |
Avis Budget Car Rental LLC / Avis Budget Finance, Inc., 5.75%, 7/15/27(1) | 750,000 | | 726,075 | |
Avis Budget Car Rental LLC / Avis Budget Finance, Inc., 4.75%, 4/1/28(1) | 2,625,000 | | 2,391,795 | |
Avis Budget Car Rental LLC / Avis Budget Finance, Inc., 5.375%, 3/1/29(1) | 1,250,000 | | 1,162,150 | |
Hertz Corp., 4.625%, 12/1/26(1) | 400,000 | | 362,732 | |
Hertz Corp., 5.00%, 12/1/29(1) | 3,600,000 | | 2,985,624 | |
NESCO Holdings II, Inc., 5.50%, 4/15/29(1) | 1,750,000 | | 1,584,966 | |
PECF USS Intermediate Holding III Corp., 8.00%, 11/15/29(1) | 1,625,000 | | 1,081,104 | |
Uber Technologies, Inc., 7.50%, 5/15/25(1) | 800,000 | | 811,042 | |
Uber Technologies, Inc., 8.00%, 11/1/26(1) | 2,728,000 | | 2,799,474 | |
Uber Technologies, Inc., 7.50%, 9/15/27(1) | 2,525,000 | | 2,606,255 | |
Uber Technologies, Inc., 6.25%, 1/15/28(1) | 2,300,000 | | 2,296,573 | |
Uber Technologies, Inc., 4.50%, 8/15/29(1) | 650,000 | | 593,531 | |
| United Rentals North America, Inc., 4.875%, 1/15/28 | 500,000 | | 478,650 | |
United Rentals North America, Inc., 6.00%, 12/15/29(1) | 900,000 | | 913,257 | |
| United Rentals North America, Inc., 5.25%, 1/15/30 | 2,300,000 | | 2,215,981 | |
| United Rentals North America, Inc., 4.00%, 7/15/30 | 2,700,000 | | 2,429,190 | |
| United Rentals North America, Inc., 3.875%, 2/15/31 | 500,000 | | 441,800 | |
| United Rentals North America, Inc., 3.75%, 1/15/32 | 1,625,000 | | 1,401,262 | |
| | 27,281,461 | |
| Health Care Equipment and Supplies — 0.7% | | |
Avantor Funding, Inc., 4.625%, 7/15/28(1) | 3,075,000 | | 2,916,361 | |
Avantor Funding, Inc., 3.875%, 11/1/29(1) | 2,975,000 | | 2,665,362 | |
Medline Borrower LP, 3.875%, 4/1/29(1) | 3,525,000 | | 3,062,026 | |
| | | | | | | | |
| Principal
Amount/Shares | Value |
Medline Borrower LP, 5.25%, 10/1/29(1) | $ | 6,525,000 | | $ | 5,667,403 | |
| | 14,311,152 | |
| Health Care Providers and Services — 4.2% | | |
Acadia Healthcare Co., Inc., 5.50%, 7/1/28(1) | 1,800,000 | | 1,745,370 | |
Acadia Healthcare Co., Inc., 5.00%, 4/15/29(1) | 1,100,000 | | 1,034,990 | |
AHP Health Partners, Inc., 5.75%, 7/15/29(1) | 1,100,000 | | 926,854 | |
Air Methods Corp., 8.00%, 5/15/25(1) | 2,700,000 | | 176,162 | |
Catalent Pharma Solutions, Inc., 5.00%, 7/15/27(1) | 275,000 | | 268,813 | |
| Centene Corp., 4.25%, 12/15/27 | 3,575,000 | | 3,447,944 | |
| Centene Corp., 4.625%, 12/15/29 | 2,853,000 | | 2,685,072 | |
| Centene Corp., 3.00%, 10/15/30 | 300,000 | | 252,894 | |
CHS / Community Health Systems, Inc., 8.00%, 3/15/26(1) | 3,350,000 | | 3,241,125 | |
CHS / Community Health Systems, Inc., 5.625%, 3/15/27(1) | 1,650,000 | | 1,450,251 | |
CHS / Community Health Systems, Inc., 8.00%, 12/15/27(1) | 3,542,000 | | 3,435,032 | |
CHS / Community Health Systems, Inc., 6.875%, 4/1/28(1) | 793,000 | | 492,588 | |
CHS / Community Health Systems, Inc., 6.00%, 1/15/29(1) | 1,925,000 | | 1,630,263 | |
CHS / Community Health Systems, Inc., 6.875%, 4/15/29(1) | 2,600,000 | | 1,612,780 | |
CHS / Community Health Systems, Inc., 6.125%, 4/1/30(1) | 2,850,000 | | 1,720,060 | |
CHS / Community Health Systems, Inc., 5.25%, 5/15/30(1) | 3,850,000 | | 3,023,597 | |
CHS / Community Health Systems, Inc., 4.75%, 2/15/31(1) | 2,628,000 | | 1,942,880 | |
DaVita, Inc., 4.625%, 6/1/30(1) | 7,050,000 | | 6,024,225 | |
DaVita, Inc., 3.75%, 2/15/31(1) | 250,000 | | 197,430 | |
| Encompass Health Corp., 4.75%, 2/1/30 | 1,790,000 | | 1,629,437 | |
Envision Healthcare Corp., 8.75%, 10/15/26(1)(3) | 1,925,000 | | 370,832 | |
| HCA, Inc., 5.375%, 2/1/25 | 1,250,000 | | 1,251,329 | |
| HCA, Inc., 7.69%, 6/15/25 | 1,020,000 | | 1,055,682 | |
| HCA, Inc., 7.58%, 9/15/25 | 1,250,000 | | 1,285,339 | |
| HCA, Inc., 5.875%, 2/15/26 | 575,000 | | 583,828 | |
| HCA, Inc., 5.375%, 9/1/26 | 1,025,000 | | 1,029,355 | |
HealthEquity, Inc., 4.50%, 10/1/29(1) | 1,025,000 | | 911,962 | |
IQVIA, Inc., 5.00%, 5/15/27(1) | 925,000 | | 909,867 | |
Legacy LifePoint Health LLC, 6.75%, 4/15/25(1) | 1,175,000 | | 1,116,250 | |
Legacy LifePoint Health LLC, 4.375%, 2/15/27(1) | 175,000 | | 143,296 | |
LifePoint Health, Inc., 5.375%, 1/15/29(1) | 1,375,000 | | 842,187 | |
ModivCare Escrow Issuer, Inc., 5.00%, 10/1/29(1) | 1,000,000 | | 850,105 | |
Molina Healthcare, Inc., 4.375%, 6/15/28(1) | 2,128,000 | | 1,981,594 | |
Molina Healthcare, Inc., 3.875%, 11/15/30(1) | 1,250,000 | | 1,091,772 | |
Molina Healthcare, Inc., 3.875%, 5/15/32(1) | 3,675,000 | | 3,091,782 | |
Owens & Minor, Inc., 4.50%, 3/31/29(1) | 2,450,000 | | 1,914,309 | |
Owens & Minor, Inc., 6.625%, 4/1/30(1) | 1,100,000 | | 945,615 | |
Pediatrix Medical Group, Inc., 5.375%, 2/15/30(1) | 325,000 | | 294,561 | |
Prime Healthcare Services, Inc., 7.25%, 11/1/25(1) | 2,025,000 | | 1,793,602 | |
RP Escrow Issuer LLC, 5.25%, 12/15/25(1) | 1,150,000 | | 872,482 | |
Select Medical Corp., 6.25%, 8/15/26(1) | 1,400,000 | | 1,359,407 | |
| Tenet Healthcare Corp., 4.625%, 7/15/24 | 175,000 | | 172,807 | |
| Tenet Healthcare Corp., 4.625%, 9/1/24 | 1,875,000 | | 1,843,862 | |
| Tenet Healthcare Corp., 4.875%, 1/1/26 | 3,350,000 | | 3,287,874 | |
| Tenet Healthcare Corp., 5.125%, 11/1/27 | 3,525,000 | | 3,387,528 | |
| Tenet Healthcare Corp., 4.625%, 6/15/28 | 504,000 | | 465,487 | |
| Tenet Healthcare Corp., 6.125%, 10/1/28 | 5,875,000 | | 5,636,152 | |
| Tenet Healthcare Corp., 4.25%, 6/1/29 | 2,350,000 | | 2,128,183 | |
| | | | | | | | |
| Principal
Amount/Shares | Value |
| Tenet Healthcare Corp., 4.375%, 1/15/30 | $ | 1,150,000 | | $ | 1,033,160 | |
Tenet Healthcare Corp., 6.125%, 6/15/30(1) | 2,750,000 | | 2,715,350 | |
| Tenet Healthcare Corp., 6.875%, 11/15/31 | 350,000 | | 334,616 | |
| | 81,637,942 | |
| Health Care Technology — 0.2% | | |
AthenaHealth Group, Inc., 6.50%, 2/15/30(1) | 5,157,000 | | 4,186,244 | |
| Hotels, Restaurants and Leisure — 12.2% | | |
1011778 BC ULC / New Red Finance, Inc., 4.375%, 1/15/28(1) | 1,025,000 | | 947,264 | |
1011778 BC ULC / New Red Finance, Inc., 4.00%, 10/15/30(1) | 7,425,000 | | 6,373,620 | |
Affinity Interactive, 6.875%, 12/15/27(1) | 1,850,000 | | 1,651,901 | |
Aramark Services, Inc., 5.00%, 4/1/25(1) | 820,000 | | 807,777 | |
Aramark Services, Inc., 6.375%, 5/1/25(1) | 2,575,000 | | 2,596,269 | |
Aramark Services, Inc., 5.00%, 2/1/28(1) | 1,350,000 | | 1,278,990 | |
| Boyd Gaming Corp., 4.75%, 12/1/27 | 800,000 | | 768,000 | |
Boyd Gaming Corp., 4.75%, 6/15/31(1) | 2,650,000 | | 2,409,115 | |
Boyne USA, Inc., 4.75%, 5/15/29(1) | 1,900,000 | | 1,698,476 | |
Caesars Entertainment, Inc., 6.25%, 7/1/25(1) | 2,400,000 | | 2,402,356 | |
Caesars Entertainment, Inc., 8.125%, 7/1/27(1) | 1,350,000 | | 1,378,215 | |
Caesars Entertainment, Inc., 4.625%, 10/15/29(1) | 8,275,000 | | 7,245,052 | |
Caesars Entertainment, Inc., 7.00%, 2/15/30(1) | 1,925,000 | | 1,960,449 | |
Caesars Resort Collection LLC / CRC Finco, Inc., 5.75%, 7/1/25(1) | 1,775,000 | | 1,777,004 | |
Carnival Corp., 10.50%, 2/1/26(1) | 500,000 | | 521,418 | |
Carnival Corp., 7.625%, 3/1/26(1) | 8,675,000 | | 7,924,439 | |
Carnival Corp., 5.75%, 3/1/27(1) | 24,025,000 | | 19,734,495 | |
Carnival Corp., 9.875%, 8/1/27(1) | 175,000 | | 180,429 | |
| Carnival Corp., 6.65%, 1/15/28 | 1,375,000 | | 1,046,698 | |
Carnival Corp., 6.00%, 5/1/29(1) | 10,525,000 | | 8,379,479 | |
Carnival Corp., 10.50%, 6/1/30(1) | 8,725,000 | | 8,383,852 | |
| Carnival PLC, 7.875%, 6/1/27 | 2,825,000 | | 2,777,867 | |
Carrols Restaurant Group, Inc., 5.875%, 7/1/29(1) | 1,525,000 | | 1,229,432 | |
CDI Escrow Issuer, Inc., 5.75%, 4/1/30(1) | 3,275,000 | | 3,166,090 | |
CEC Entertainment LLC, 6.75%, 5/1/26(1) | 275,000 | | 261,498 | |
| Cedar Fair LP, 5.25%, 7/15/29 | 725,000 | | 676,711 | |
Cedar Fair LP / Canada's Wonderland Co. / Magnum Management Corp. / Millennium Op, 5.50%, 5/1/25(1) | 900,000 | | 900,275 | |
| Cedar Fair LP / Canada's Wonderland Co. / Magnum Management Corp. / Millennium Op, 5.375%, 4/15/27 | 225,000 | | 215,286 | |
| Cedar Fair LP / Canada's Wonderland Co. / Magnum Management Corp. / Millennium Op, 6.50%, 10/1/28 | 2,000,000 | | 1,942,720 | |
Churchill Downs, Inc., 5.50%, 4/1/27(1) | 2,625,000 | | 2,572,500 | |
Churchill Downs, Inc., 4.75%, 1/15/28(1) | 675,000 | | 632,745 | |
Empire Resorts, Inc., 7.75%, 11/1/26(1) | 1,400,000 | | 1,159,937 | |
Everi Holdings, Inc., 5.00%, 7/15/29(1) | 925,000 | | 824,329 | |
Fertitta Entertainment LLC / Fertitta Entertainment Finance Co., Inc., 4.625%, 1/15/29(1) | 1,200,000 | | 1,054,620 | |
Fertitta Entertainment LLC / Fertitta Entertainment Finance Co., Inc., 6.75%, 1/15/30(1) | 3,275,000 | | 2,697,388 | |
Full House Resorts, Inc., 8.25%, 2/15/28(1) | 2,300,000 | | 2,095,070 | |
Golden Entertainment, Inc., 7.625%, 4/15/26(1) | 3,200,000 | | 3,230,080 | |
GPS Hospitality Holding Co. LLC / GPS Finco, Inc., 7.00%, 8/15/28(1) | 2,850,000 | | 1,755,600 | |
Hilton Domestic Operating Co., Inc., 5.375%, 5/1/25(1) | 1,525,000 | | 1,525,953 | |
Hilton Domestic Operating Co., Inc., 5.75%, 5/1/28(1) | 2,200,000 | | 2,201,980 | |
| | | | | | | | |
| Principal
Amount/Shares | Value |
Hilton Domestic Operating Co., Inc., 3.75%, 5/1/29(1) | $ | 600,000 | | $ | 537,594 | |
| Hilton Domestic Operating Co., Inc., 4.875%, 1/15/30 | 1,250,000 | | 1,198,519 | |
Hilton Domestic Operating Co., Inc., 4.00%, 5/1/31(1) | 4,575,000 | | 4,010,445 | |
Hilton Domestic Operating Co., Inc., 3.625%, 2/15/32(1) | 4,825,000 | | 4,075,436 | |
Hilton Grand Vacations Borrower Escrow LLC / Hilton Grand Vacations Borrower Esc, 5.00%, 6/1/29(1) | 3,100,000 | | 2,756,722 | |
Hilton Grand Vacations Borrower Escrow LLC / Hilton Grand Vacations Borrower Esc, 4.875%, 7/1/31(1) | 2,950,000 | | 2,521,984 | |
| Hilton Worldwide Finance LLC / Hilton Worldwide Finance Corp., 4.875%, 4/1/27 | 600,000 | | 592,434 | |
International Game Technology PLC, 4.125%, 4/15/26(1) | 3,150,000 | | 3,043,372 | |
International Game Technology PLC, 5.25%, 1/15/29(1) | 225,000 | | 215,663 | |
IRB Holding Corp., 7.00%, 6/15/25(1) | 1,400,000 | | 1,405,628 | |
Jacobs Entertainment, Inc., 6.75%, 2/15/29(1) | 3,075,000 | | 2,689,427 | |
KFC Holding Co. / Pizza Hut Holdings LLC / Taco Bell of America LLC, 4.75%, 6/1/27(1) | 775,000 | | 753,544 | |
Life Time, Inc., 5.75%, 1/15/26(1) | 5,475,000 | | 5,324,437 | |
Life Time, Inc., 8.00%, 4/15/26(1) | 7,600,000 | | 7,256,556 | |
Lindblad Expeditions LLC, 6.75%, 2/15/27(1) | 500,000 | | 484,660 | |
Merlin Entertainments Ltd., 5.75%, 6/15/26(1) | 625,000 | | 593,532 | |
MGM China Holdings Ltd., 5.375%, 5/15/24(1) | 1,000,000 | | 977,744 | |
MGM China Holdings Ltd., 5.875%, 5/15/26(1) | 900,000 | | 848,151 | |
MGM China Holdings Ltd., 4.75%, 2/1/27(1) | 1,575,000 | | 1,412,594 | |
| MGM Resorts International, 6.75%, 5/1/25 | 1,350,000 | | 1,361,868 | |
| MGM Resorts International, 5.75%, 6/15/25 | 825,000 | | 823,785 | |
| MGM Resorts International, 5.50%, 4/15/27 | 1,064,000 | | 1,033,483 | |
| MGM Resorts International, 4.75%, 10/15/28 | 850,000 | | 792,352 | |
Midwest Gaming Borrower LLC / Midwest Gaming Finance Corp., 4.875%, 5/1/29(1) | 1,450,000 | | 1,262,194 | |
Mohegan Tribal Gaming Authority, 7.875%, 10/15/24(1) | 1,185,000 | | 1,179,259 | |
Mohegan Tribal Gaming Authority, 8.00%, 2/1/26(1) | 2,025,000 | | 1,854,849 | |
Motion Bondco DAC, 6.625%, 11/15/27(1) | 2,075,000 | | 1,916,952 | |
Nathan's Famous, Inc., 6.625%, 11/1/25(1) | 507,000 | | 505,687 | |
NCL Corp. Ltd., 3.625%, 12/15/24(1) | 750,000 | | 698,336 | |
NCL Corp. Ltd., 5.875%, 3/15/26(1) | 7,000,000 | | 5,965,050 | |
NCL Corp. Ltd., 8.375%, 2/1/28(1) | 800,000 | | 803,462 | |
NCL Corp. Ltd., 7.75%, 2/15/29(1) | 900,000 | | 772,596 | |
NCL Finance Ltd., 6.125%, 3/15/28(1) | 1,500,000 | | 1,217,055 | |
Penn Entertainment, Inc., 4.125%, 7/1/29(1) | 2,675,000 | | 2,233,237 | |
Premier Entertainment Sub LLC / Premier Entertainment Finance Corp., 5.625%, 9/1/29(1) | 2,385,000 | | 1,763,409 | |
Premier Entertainment Sub LLC / Premier Entertainment Finance Corp., 5.875%, 9/1/31(1) | 1,975,000 | | 1,421,506 | |
Royal Caribbean Cruises Ltd., 4.25%, 7/1/26(1) | 1,150,000 | | 1,033,407 | |
Royal Caribbean Cruises Ltd., 5.50%, 8/31/26(1) | 1,750,000 | | 1,639,234 | |
Royal Caribbean Cruises Ltd., 5.375%, 7/15/27(1) | 5,575,000 | | 4,972,203 | |
Royal Caribbean Cruises Ltd., 11.625%, 8/15/27(1) | 600,000 | | 645,000 | |
| Royal Caribbean Cruises Ltd., 7.50%, 10/15/27 | 1,400,000 | | 1,310,659 | |
| Royal Caribbean Cruises Ltd., 3.70%, 3/15/28 | 1,970,000 | | 1,613,686 | |
Royal Caribbean Cruises Ltd., 5.50%, 4/1/28(1) | 3,975,000 | | 3,513,900 | |
Royal Caribbean Cruises Ltd., 8.25%, 1/15/29(1) | 725,000 | | 758,230 | |
Royal Caribbean Cruises Ltd., 9.25%, 1/15/29(1) | 3,100,000 | | 3,296,741 | |
Royal Caribbean Cruises Ltd., 7.25%, 1/15/30(1) | 1,025,000 | | 1,032,329 | |
| | | | | | | | |
| Principal
Amount/Shares | Value |
Scientific Games Holdings LP / Scientific Games US FinCo, Inc., 6.625%, 3/1/30(1) | $ | 650,000 | | $ | 575,012 | |
Scientific Games International, Inc., 8.625%, 7/1/25(1) | 225,000 | | 230,560 | |
Scientific Games International, Inc., 7.00%, 5/15/28(1) | 3,825,000 | | 3,790,479 | |
Scientific Games International, Inc., 7.25%, 11/15/29(1) | 825,000 | | 827,343 | |
SeaWorld Parks & Entertainment, Inc., 5.25%, 8/15/29(1) | 3,775,000 | | 3,411,581 | |
Sizzling Platter LLC / Sizzling Platter Finance Corp., 8.50%, 11/28/25(1) | 2,975,000 | | 2,672,223 | |
Station Casinos LLC, 4.50%, 2/15/28(1) | 400,000 | | 361,470 | |
Station Casinos LLC, 4.625%, 12/1/31(1) | 725,000 | | 612,962 | |
Studio City Finance Ltd., 6.00%, 7/15/25(1) | 1,400,000 | | 1,284,472 | |
Studio City Finance Ltd., 5.00%, 1/15/29(1) | 875,000 | | 672,687 | |
TKC Holdings, Inc., 10.50%, 5/15/29(1) | 1,550,000 | | 969,325 | |
Travel & Leisure Co., 6.625%, 7/31/26(1) | 2,450,000 | | 2,462,029 | |
Travel & Leisure Co., 4.625%, 3/1/30(1) | 600,000 | | 515,222 | |
Viking Cruises Ltd., 6.25%, 5/15/25(1) | 1,800,000 | | 1,692,798 | |
Viking Cruises Ltd., 13.00%, 5/15/25(1) | 700,000 | | 740,012 | |
Viking Cruises Ltd., 5.875%, 9/15/27(1) | 3,050,000 | | 2,629,405 | |
Viking Cruises Ltd., 7.00%, 2/15/29(1) | 2,350,000 | | 2,018,063 | |
Viking Ocean Cruises Ship VII Ltd., 5.625%, 2/15/29(1) | 975,000 | | 837,891 | |
VOC Escrow Ltd., 5.00%, 2/15/28(1) | 1,600,000 | | 1,421,832 | |
Wynn Las Vegas LLC / Wynn Las Vegas Capital Corp., 5.50%, 3/1/25(1) | 1,075,000 | | 1,056,112 | |
Wynn Las Vegas LLC / Wynn Las Vegas Capital Corp., 5.25%, 5/15/27(1) | 1,225,000 | | 1,159,071 | |
Wynn Macau Ltd., 5.50%, 1/15/26(1) | 2,030,000 | | 1,885,251 | |
Wynn Macau Ltd., 5.625%, 8/26/28(1) | 1,200,000 | | 1,021,944 | |
Wynn Macau Ltd., 5.125%, 12/15/29(1) | 3,150,000 | | 2,583,646 | |
Wynn Resorts Finance LLC / Wynn Resorts Capital Corp., 5.125%, 10/1/29(1) | 3,428,000 | | 3,117,749 | |
| Yum! Brands, Inc., 5.375%, 4/1/32 | 3,700,000 | | 3,585,041 | |
| | 238,638,470 | |
| Household Durables — 2.2% | | |
Adams Homes, Inc., 7.50%, 2/15/25(1) | 1,225,000 | | 1,091,107 | |
Ashton Woods USA LLC / Ashton Woods Finance Co., 6.625%, 1/15/28(1) | 1,525,000 | | 1,384,605 | |
Ashton Woods USA LLC / Ashton Woods Finance Co., 4.625%, 8/1/29(1) | 700,000 | | 568,617 | |
Ashton Woods USA LLC / Ashton Woods Finance Co., 4.625%, 4/1/30(1) | 1,700,000 | | 1,401,650 | |
| Beazer Homes USA, Inc., 6.75%, 3/15/25 | 1,102,000 | | 1,088,406 | |
| Beazer Homes USA, Inc., 5.875%, 10/15/27 | 425,000 | | 387,730 | |
| Beazer Homes USA, Inc., 7.25%, 10/15/29 | 2,500,000 | | 2,328,500 | |
Brookfield Residential Properties, Inc. / Brookfield Residential US LLC, 5.00%, 6/15/29(1) | 1,900,000 | | 1,457,167 | |
Brookfield Residential Properties, Inc. / Brookfield Residential US LLC, 4.875%, 2/15/30(1) | 400,000 | | 302,218 | |
| Century Communities, Inc., 6.75%, 6/1/27 | 875,000 | | 873,825 | |
Century Communities, Inc., 3.875%, 8/15/29(1) | 1,000,000 | | 858,805 | |
Empire Communities Corp., 7.00%, 12/15/25(1) | 1,350,000 | | 1,187,804 | |
Installed Building Products, Inc., 5.75%, 2/1/28(1) | 1,450,000 | | 1,337,076 | |
K Hovnanian Enterprises, Inc., 5.00%, 2/1/40(1) | 26,000 | | 13,260 | |
| KB Home, 6.875%, 6/15/27 | 1,300,000 | | 1,322,144 | |
| KB Home, 7.25%, 7/15/30 | 800,000 | | 812,390 | |
| | | | | | | | |
| Principal
Amount/Shares | Value |
| KB Home, 4.00%, 6/15/31 | $ | 1,775,000 | | $ | 1,539,191 | |
LGI Homes, Inc., 4.00%, 7/15/29(1) | 550,000 | | 447,420 | |
Mattamy Group Corp., 4.625%, 3/1/30(1) | 1,400,000 | | 1,219,849 | |
| Meritage Homes Corp., 6.00%, 6/1/25 | 2,575,000 | | 2,597,403 | |
| Meritage Homes Corp., 5.125%, 6/6/27 | 225,000 | | 219,140 | |
| Newell Brands, Inc., 4.70%, 4/1/26 | 3,575,000 | | 3,444,745 | |
| Newell Brands, Inc., 6.375%, 9/15/27 | 800,000 | | 808,240 | |
| Newell Brands, Inc., 6.625%, 9/15/29 | 1,450,000 | | 1,464,065 | |
| Newell Brands, Inc., 5.875%, 4/1/36 | 3,000,000 | | 2,660,910 | |
| Newell Brands, Inc., 6.00%, 4/1/46 | 925,000 | | 757,140 | |
| Shea Homes LP / Shea Homes Funding Corp., 4.75%, 2/15/28 | 1,400,000 | | 1,253,021 | |
| Shea Homes LP / Shea Homes Funding Corp., 4.75%, 4/1/29 | 2,275,000 | | 1,988,327 | |
STL Holding Co. LLC, 7.50%, 2/15/26(1) | 1,350,000 | | 1,187,082 | |
SWF Escrow Issuer Corp., 6.50%, 10/1/29(1) | 1,000,000 | | 616,450 | |
Taylor Morrison Communities, Inc., 5.75%, 1/15/28(1) | 1,225,000 | | 1,206,202 | |
Tempur Sealy International, Inc., 4.00%, 4/15/29(1) | 275,000 | | 242,314 | |
Tempur Sealy International, Inc., 3.875%, 10/15/31(1) | 1,075,000 | | 898,732 | |
TopBuild Corp., 4.125%, 2/15/32(1) | 1,075,000 | | 899,770 | |
| TRI Pointe Group, Inc. / TRI Pointe Homes, Inc., 5.875%, 6/15/24 | 324,000 | | 322,689 | |
| Tri Pointe Homes, Inc., 5.25%, 6/1/27 | 700,000 | | 665,984 | |
| Tri Pointe Homes, Inc., 5.70%, 6/15/28 | 600,000 | | 578,151 | |
Williams Scotsman International, Inc., 6.125%, 6/15/25(1) | 379,000 | | 377,014 | |
Williams Scotsman International, Inc., 4.625%, 8/15/28(1) | 1,125,000 | | 1,024,753 | |
| | 42,833,896 | |
| Household Products — 0.2% | | |
| Central Garden & Pet Co., 4.125%, 10/15/30 | 475,000 | | 420,137 | |
Central Garden & Pet Co., 4.125%, 4/30/31(1) | 1,300,000 | | 1,123,811 | |
Energizer Holdings, Inc., 6.50%, 12/31/27(1) | 725,000 | | 704,789 | |
Kronos Acquisition Holdings, Inc. / KIK Custom Products, Inc., 7.00%, 12/31/27(1) | 900,000 | | 786,060 | |
Spectrum Brands, Inc., 5.50%, 7/15/30(1) | 500,000 | | 440,429 | |
Spectrum Brands, Inc., 3.875%, 3/15/31(1) | 1,050,000 | | 859,716 | |
| | 4,334,942 | |
| Independent Power and Renewable Electricity Producers — 0.6% |
Atlantica Sustainable Infrastructure PLC, 4.125%, 6/15/28(1) | 200,000 | | 179,680 | |
Calpine Corp., 4.50%, 2/15/28(1) | 1,550,000 | | 1,439,669 | |
Calpine Corp., 5.125%, 3/15/28(1) | 1,525,000 | | 1,398,288 | |
Calpine Corp., 4.625%, 2/1/29(1) | 600,000 | | 518,873 | |
Calpine Corp., 5.00%, 2/1/31(1) | 1,000,000 | | 847,603 | |
Clearway Energy Operating LLC, 4.75%, 3/15/28(1) | 1,825,000 | | 1,744,901 | |
Clearway Energy Operating LLC, 3.75%, 1/15/32(1) | 850,000 | | 708,008 | |
NRG Energy, Inc., 7.00%, 3/15/33(1) | 1,325,000 | | 1,373,912 | |
TerraForm Power Operating LLC, 5.00%, 1/31/28(1) | 800,000 | | 761,003 | |
TerraForm Power Operating LLC, 4.75%, 1/15/30(1) | 1,325,000 | | 1,190,202 | |
| TransAlta Corp., 7.75%, 11/15/29 | 1,350,000 | | 1,420,362 | |
| | 11,582,501 | |
| Insurance — 0.5% | | |
Acrisure LLC / Acrisure Finance, Inc., 7.00%, 11/15/25(1) | 3,100,000 | | 2,908,404 | |
Acrisure LLC / Acrisure Finance, Inc., 10.125%, 8/1/26(1) | 800,000 | | 796,470 | |
Acrisure LLC / Acrisure Finance, Inc., 4.25%, 2/15/29(1) | 2,950,000 | | 2,518,902 | |
AssuredPartners, Inc., 7.00%, 8/15/25(1) | 625,000 | | 608,719 | |
| | | | | | | | |
| Principal
Amount/Shares | Value |
AssuredPartners, Inc., 5.625%, 1/15/29(1) | $ | 900,000 | | $ | 778,801 | |
| Genworth Holdings, Inc., VRN, 6.87%, (3-month LIBOR plus 2.00%), 11/15/66 | 450,000 | | 289,470 | |
HUB International Ltd., 5.625%, 12/1/29(1) | 625,000 | | 545,313 | |
MBIA Insurance Corp., VRN, 16.05%, (3-month LIBOR plus 11.26%), 1/15/33(1)(3)(4) | 125,000 | | 5,988 | |
Ryan Specialty Group LLC, 4.375%, 2/1/30(1) | 625,000 | | 547,267 | |
| | 8,999,334 | |
| Interactive Media and Services — 0.1% | | |
Arches Buyer, Inc., 4.25%, 6/1/28(1) | 875,000 | | 732,161 | |
Ziff Davis, Inc., 4.625%, 10/15/30(1) | 843,000 | | 728,128 | |
| | 1,460,289 | |
| IT Services — 0.4% | | |
| CDW LLC / CDW Finance Corp., 4.125%, 5/1/25 | 575,000 | | 558,441 | |
| CDW LLC / CDW Finance Corp., 3.25%, 2/15/29 | 1,100,000 | | 968,781 | |
Endurance International Group Holdings, Inc., 6.00%, 2/15/29(1) | 1,175,000 | | 795,113 | |
Exela Intermediate LLC / Exela Finance, Inc., 11.50%, 7/15/26(1) | 2,741,000 | | 359,153 | |
Presidio Holdings, Inc., 4.875%, 2/1/27(1) | 1,925,000 | | 1,841,879 | |
Presidio Holdings, Inc., 8.25%, 2/1/28(1) | 2,150,000 | | 2,045,381 | |
| Twilio, Inc., 3.875%, 3/15/31 | 1,050,000 | | 891,944 | |
Vericast Corp., 11.00%, 9/15/26(1) | 933,750 | | 986,273 | |
| | 8,446,965 | |
| Leisure Products — 0.2% | | |
MajorDrive Holdings IV LLC, 6.375%, 6/1/29(1) | 2,075,000 | | 1,539,151 | |
Mattel, Inc., 3.375%, 4/1/26(1) | 500,000 | | 471,135 | |
Mattel, Inc., 5.875%, 12/15/27(1) | 425,000 | | 423,272 | |
| Mattel, Inc., 6.20%, 10/1/40 | 200,000 | | 181,290 | |
| Mattel, Inc., 5.45%, 11/1/41 | 875,000 | | 737,625 | |
| | 3,352,473 | |
| Life Sciences Tools and Services — 0.1% | | |
Charles River Laboratories International, Inc., 4.25%, 5/1/28(1) | 750,000 | | 702,825 | |
Charles River Laboratories International, Inc., 4.00%, 3/15/31(1) | 500,000 | | 437,947 | |
PRA Health Sciences, Inc., 2.875%, 7/15/26(1) | 1,200,000 | | 1,107,984 | |
| | 2,248,756 | |
| Machinery — 0.9% | | |
Allison Transmission, Inc., 4.75%, 10/1/27(1) | 625,000 | | 591,098 | |
Chart Industries, Inc., 7.50%, 1/1/30(1) | 1,900,000 | | 1,965,493 | |
Chart Industries, Inc., 9.50%, 1/1/31(1) | 2,850,000 | | 3,009,472 | |
Husky III Holding Ltd., 13.00% Cash or 13.75% PIK, 2/15/25(1) | 1,175,000 | | 995,812 | |
JPW Industries Holding Corp., 9.00%, 10/1/24(1) | 575,000 | | 501,163 | |
Manitowoc Co., Inc., 9.00%, 4/1/26(1) | 375,000 | | 375,962 | |
OT Merger Corp., 7.875%, 10/15/29(1) | 650,000 | | 387,782 | |
Regal Rexnord Corp., 6.05%, 4/15/28(1) | 825,000 | | 825,970 | |
Regal Rexnord Corp., 6.30%, 2/15/30(1) | 575,000 | | 579,558 | |
Terex Corp., 5.00%, 5/15/29(1) | 2,600,000 | | 2,421,913 | |
Titan Acquisition Ltd. / Titan Co.-Borrower LLC, 7.75%, 4/15/26(1) | 2,550,000 | | 2,138,226 | |
| Titan International, Inc., 7.00%, 4/30/28 | 470,000 | | 423,907 | |
TK Elevator Holdco GmbH, 7.625%, 7/15/28(1) | 238,000 | | 205,903 | |
TK Elevator U.S. Newco, Inc., 5.25%, 7/15/27(1) | 1,150,000 | | 1,087,216 | |
Wabash National Corp., 4.50%, 10/15/28(1) | 525,000 | | 455,814 | |
Werner FinCo LP / Werner FinCo, Inc., 8.75%, 7/15/25(1) | 2,225,000 | | 1,805,320 | |
| | 17,770,609 | |
| | | | | | | | |
| Principal
Amount/Shares | Value |
| Marine Transportation — 0.1% | | |
Seaspan Corp., 5.50%, 8/1/29(1) | $ | 2,750,000 | | $ | 2,147,664 | |
| Media — 8.7% | | |
Altice Financing SA, 5.00%, 1/15/28(1) | 3,400,000 | | 2,767,940 | |
| AMC Networks, Inc., 4.75%, 8/1/25 | 525,000 | | 466,161 | |
| AMC Networks, Inc., 4.25%, 2/15/29 | 2,675,000 | | 1,647,519 | |
Audacy Capital Corp., 6.75%, 3/31/29(1) | 625,000 | | 44,922 | |
Cable One, Inc., 4.00%, 11/15/30(1) | 425,000 | | 346,431 | |
CCO Holdings LLC / CCO Holdings Capital Corp., 5.125%, 5/1/27(1) | 75,000 | | 70,968 | |
CCO Holdings LLC / CCO Holdings Capital Corp., 5.00%, 2/1/28(1) | 1,000,000 | | 923,715 | |
CCO Holdings LLC / CCO Holdings Capital Corp., 5.375%, 6/1/29(1) | 300,000 | | 275,799 | |
CCO Holdings LLC / CCO Holdings Capital Corp., 6.375%, 9/1/29(1) | 4,850,000 | | 4,636,115 | |
CCO Holdings LLC / CCO Holdings Capital Corp., 4.75%, 3/1/30(1) | 3,950,000 | | 3,426,625 | |
CCO Holdings LLC / CCO Holdings Capital Corp., 4.50%, 8/15/30(1) | 1,075,000 | | 909,595 | |
CCO Holdings LLC / CCO Holdings Capital Corp., 4.25%, 2/1/31(1) | 4,650,000 | | 3,807,559 | |
CCO Holdings LLC / CCO Holdings Capital Corp., 7.375%, 3/1/31(1) | 2,075,000 | | 2,043,875 | |
CCO Holdings LLC / CCO Holdings Capital Corp., 4.75%, 2/1/32(1) | 13,375,000 | | 11,249,813 | |
| CCO Holdings LLC / CCO Holdings Capital Corp., 4.50%, 5/1/32 | 9,525,000 | | 7,800,118 | |
CCO Holdings LLC / CCO Holdings Capital Corp., 4.50%, 6/1/33(1) | 7,200,000 | | 5,805,108 | |
CCO Holdings LLC / CCO Holdings Capital Corp., 4.25%, 1/15/34(1) | 4,975,000 | | 3,896,345 | |
Clear Channel International BV, 6.625%, 8/1/25(1) | 2,000,000 | | 1,947,965 | |
Clear Channel Outdoor Holdings, Inc., 5.125%, 8/15/27(1) | 4,000,000 | | 3,594,160 | |
Clear Channel Outdoor Holdings, Inc., 7.75%, 4/15/28(1) | 2,200,000 | | 1,651,980 | |
Clear Channel Outdoor Holdings, Inc., 7.50%, 6/1/29(1) | 1,525,000 | | 1,085,190 | |
| CSC Holdings LLC, 5.25%, 6/1/24 | 525,000 | | 507,224 | |
CSC Holdings LLC, 5.375%, 2/1/28(1) | 300,000 | | 246,062 | |
CSC Holdings LLC, 7.50%, 4/1/28(1) | 1,000,000 | | 638,400 | |
CSC Holdings LLC, 6.50%, 2/1/29(1) | 2,700,000 | | 2,244,827 | |
CSC Holdings LLC, 5.75%, 1/15/30(1) | 3,029,000 | | 1,597,798 | |
CSC Holdings LLC, 4.625%, 12/1/30(1) | 3,125,000 | | 1,543,906 | |
CSC Holdings LLC, 4.50%, 11/15/31(1) | 4,150,000 | | 2,996,175 | |
CSC Holdings LLC, 5.00%, 11/15/31(1) | 2,650,000 | | 1,345,114 | |
Diamond Sports Group LLC / Diamond Sports Finance Co., 5.375%, 8/15/26(1)(3)(4) | 3,350,000 | | 188,438 | |
Directv Financing LLC / Directv Financing Co-Obligor, Inc., 5.875%, 8/15/27(1) | 7,225,000 | | 6,550,618 | |
| DISH DBS Corp., 5.875%, 11/15/24 | 1,425,000 | | 1,272,240 | |
DISH DBS Corp., 5.25%, 12/1/26(1) | 3,850,000 | | 3,079,114 | |
| DISH DBS Corp., 7.375%, 7/1/28 | 2,650,000 | | 1,514,687 | |
DISH DBS Corp., 5.75%, 12/1/28(1) | 2,375,000 | | 1,776,797 | |
| DISH DBS Corp., 5.125%, 6/1/29 | 2,700,000 | | 1,440,666 | |
DISH Network Corp., 11.75%, 11/15/27(1) | 4,325,000 | | 4,199,813 | |
GCI LLC, 4.75%, 10/15/28(1) | 1,200,000 | | 1,036,638 | |
Gray Escrow II, Inc., 5.375%, 11/15/31(1) | 2,675,000 | | 1,779,236 | |
| | | | | | | | |
| Principal
Amount/Shares | Value |
Gray Television, Inc., 5.875%, 7/15/26(1) | $ | 500,000 | | $ | 433,030 | |
Gray Television, Inc., 7.00%, 5/15/27(1) | 1,175,000 | | 984,862 | |
Gray Television, Inc., 4.75%, 10/15/30(1) | 4,135,000 | | 2,749,775 | |
| iHeartCommunications, Inc., 6.375%, 5/1/26 | 726,342 | | 641,676 | |
| iHeartCommunications, Inc., 8.375%, 5/1/27 | 1,350,000 | | 983,360 | |
iHeartCommunications, Inc., 5.25%, 8/15/27(1) | 2,600,000 | | 2,127,996 | |
iHeartCommunications, Inc., 4.75%, 1/15/28(1) | 574,000 | | 453,988 | |
| Lamar Media Corp., 3.75%, 2/15/28 | 950,000 | | 879,700 | |
| Lamar Media Corp., 4.00%, 2/15/30 | 1,325,000 | | 1,174,745 | |
| Lamar Media Corp., 3.625%, 1/15/31 | 200,000 | | 172,180 | |
LCPR Senior Secured Financing DAC, 6.75%, 10/15/27(1) | 550,000 | | 519,973 | |
LCPR Senior Secured Financing DAC, 5.125%, 7/15/29(1) | 200,000 | | 168,789 | |
McGraw-Hill Education, Inc., 8.00%, 8/1/29(1) | 1,575,000 | | 1,293,477 | |
Midcontinent Communications / Midcontinent Finance Corp., 5.375%, 8/15/27(1) | 1,875,000 | | 1,698,881 | |
News Corp., 3.875%, 5/15/29(1) | 3,000,000 | | 2,669,100 | |
News Corp., 5.125%, 2/15/32(1) | 3,025,000 | | 2,840,445 | |
Nexstar Media, Inc., 5.625%, 7/15/27(1) | 1,375,000 | | 1,272,061 | |
Nexstar Media, Inc., 4.75%, 11/1/28(1) | 2,100,000 | | 1,870,134 | |
Outfront Media Capital LLC / Outfront Media Capital Corp., 5.00%, 8/15/27(1) | 4,450,000 | | 4,013,633 | |
Outfront Media Capital LLC / Outfront Media Capital Corp., 4.25%, 1/15/29(1) | 2,925,000 | | 2,431,041 | |
Outfront Media Capital LLC / Outfront Media Capital Corp., 4.625%, 3/15/30(1) | 1,300,000 | | 1,085,738 | |
Scripps Escrow II, Inc., 3.875%, 1/15/29(1) | 200,000 | | 157,188 | |
Scripps Escrow II, Inc., 5.375%, 1/15/31(1) | 625,000 | | 430,488 | |
Scripps Escrow, Inc., 5.875%, 7/15/27(1) | 775,000 | | 571,563 | |
Sinclair Television Group, Inc., 5.125%, 2/15/27(1) | 1,625,000 | | 1,423,719 | |
Sinclair Television Group, Inc., 5.50%, 3/1/30(1) | 1,075,000 | | 856,152 | |
Sinclair Television Group, Inc., 4.125%, 12/1/30(1) | 2,200,000 | | 1,776,390 | |
Sirius XM Radio, Inc., 3.125%, 9/1/26(1) | 5,100,000 | | 4,605,580 | |
Sirius XM Radio, Inc., 5.00%, 8/1/27(1) | 2,475,000 | | 2,319,817 | |
Sirius XM Radio, Inc., 4.00%, 7/15/28(1) | 2,650,000 | | 2,279,000 | |
Sirius XM Radio, Inc., 5.50%, 7/1/29(1) | 2,075,000 | | 1,890,750 | |
Sirius XM Radio, Inc., 3.875%, 9/1/31(1) | 7,050,000 | | 5,488,319 | |
| TEGNA, Inc., 4.625%, 3/15/28 | 3,050,000 | | 2,672,562 | |
| TEGNA, Inc., 5.00%, 9/15/29 | 1,025,000 | | 887,168 | |
Univision Communications, Inc., 5.125%, 2/15/25(1) | 1,250,000 | | 1,229,206 | |
Univision Communications, Inc., 6.625%, 6/1/27(1) | 3,550,000 | | 3,369,305 | |
Univision Communications, Inc., 4.50%, 5/1/29(1) | 4,450,000 | | 3,743,184 | |
Univision Communications, Inc., 7.375%, 6/30/30(1) | 1,725,000 | | 1,632,436 | |
UPC Broadband Finco BV, 4.875%, 7/15/31(1) | 4,350,000 | | 3,766,948 | |
UPC Holding BV, 5.50%, 1/15/28(1) | 1,000,000 | | 896,585 | |
Videotron Ltd., 5.375%, 6/15/24(1) | 375,000 | | 373,180 | |
Videotron Ltd., 5.125%, 4/15/27(1) | 1,150,000 | | 1,111,050 | |
Videotron Ltd., 3.625%, 6/15/29(1) | 600,000 | | 512,022 | |
Virgin Media Finance PLC, 5.00%, 7/15/30(1) | 2,400,000 | | 1,986,264 | |
Virgin Media Secured Finance PLC, 4.50%, 8/15/30(1) | 400,000 | | 344,462 | |
Virgin Media Vendor Financing Notes IV DAC, 5.00%, 7/15/28(1) | 1,300,000 | | 1,156,792 | |
Ziggo Bond Co. BV, 6.00%, 1/15/27(1) | 2,700,000 | | 2,494,273 | |
Ziggo Bond Co. BV, 5.125%, 2/28/30(1) | 400,000 | | 322,108 | |
| | 171,116,751 | |
| | | | | | | | |
| Principal
Amount/Shares | Value |
| Metals and Mining — 2.6% | | |
Alcoa Nederland Holding BV, 5.50%, 12/15/27(1) | $ | 900,000 | | $ | 890,001 | |
Alcoa Nederland Holding BV, 6.125%, 5/15/28(1) | 1,200,000 | | 1,202,586 | |
Alcoa Nederland Holding BV, 4.125%, 3/31/29(1) | 600,000 | | 534,702 | |
| ArcelorMittal SA, 7.00%, 10/15/39 | 575,000 | | 605,257 | |
Arconic Corp., 6.00%, 5/15/25(1) | 1,600,000 | | 1,604,000 | |
Arconic Corp., 6.125%, 2/15/28(1) | 625,000 | | 615,411 | |
| ATI, Inc., 5.875%, 12/1/27 | 1,550,000 | | 1,516,063 | |
| ATI, Inc., 4.875%, 10/1/29 | 825,000 | | 752,055 | |
| ATI, Inc., 5.125%, 10/1/31 | 1,550,000 | | 1,412,771 | |
Baffinland Iron Mines Corp. / Baffinland Iron Mines LP, 8.75%, 7/15/26(1) | 1,325,000 | | 1,265,651 | |
Big River Steel LLC / BRS Finance Corp., 6.625%, 1/31/29(1) | 1,920,000 | | 1,907,376 | |
| Carpenter Technology Corp., 6.375%, 7/15/28 | 2,294,000 | | 2,239,889 | |
| Cleveland-Cliffs, Inc., 5.875%, 6/1/27 | 2,615,000 | | 2,591,988 | |
Cleveland-Cliffs, Inc., 4.625%, 3/1/29(1) | 600,000 | | 551,164 | |
Cleveland-Cliffs, Inc., 4.875%, 3/1/31(1) | 1,300,000 | | 1,183,271 | |
Coeur Mining, Inc., 5.125%, 2/15/29(1) | 1,275,000 | | 1,082,201 | |
| Commercial Metals Co., 4.125%, 1/15/30 | 775,000 | | 684,756 | |
| Commercial Metals Co., 4.375%, 3/15/32 | 775,000 | | 667,864 | |
Compass Minerals International, Inc., 4.875%, 7/15/24(1) | 575,000 | | 546,819 | |
Compass Minerals International, Inc., 6.75%, 12/1/27(1) | 700,000 | | 667,107 | |
Constellium SE, 5.625%, 6/15/28(1) | 1,050,000 | | 992,498 | |
Constellium SE, 3.75%, 4/15/29(1) | 2,050,000 | | 1,778,375 | |
First Quantum Minerals Ltd., 7.50%, 4/1/25(1) | 1,450,000 | | 1,450,261 | |
FMG Resources August Pty Ltd., 5.875%, 4/15/30(1) | 2,800,000 | | 2,687,410 | |
FMG Resources August Pty Ltd., 6.125%, 4/15/32(1) | 1,450,000 | | 1,397,648 | |
| Freeport-McMoRan, Inc., 4.375%, 8/1/28 | 2,200,000 | | 2,064,456 | |
Hudbay Minerals, Inc., 4.50%, 4/1/26(1) | 950,000 | | 878,391 | |
IAMGOLD Corp., 5.75%, 10/15/28(1) | 1,200,000 | | 928,458 | |
Kaiser Aluminum Corp., 4.625%, 3/1/28(1) | 1,916,000 | | 1,707,714 | |
Mineral Resources Ltd., 8.125%, 5/1/27(1) | 1,625,000 | | 1,650,976 | |
Mineral Resources Ltd., 8.00%, 11/1/27(1) | 875,000 | | 900,812 | |
Mineral Resources Ltd., 8.50%, 5/1/30(1) | 2,042,000 | | 2,097,747 | |
Northwest Acquisitions ULC / Dominion Finco, Inc., 7.125%, 11/1/22(1)(4)(5) | 475,000 | | 28 | |
Novelis Corp., 3.25%, 11/15/26(1) | 475,000 | | 434,516 | |
Novelis Corp., 4.75%, 1/30/30(1) | 1,025,000 | | 943,000 | |
Novelis Corp., 3.875%, 8/15/31(1) | 1,150,000 | | 970,278 | |
| Park-Ohio Industries, Inc., 6.625%, 4/15/27 | 1,950,000 | | 1,512,095 | |
PT FMG Resources August 2006 Pty Ltd., 4.375%, 4/1/31(1) | 3,300,000 | | 2,899,099 | |
Roller Bearing Co. of America, Inc., 4.375%, 10/15/29(1) | 1,275,000 | | 1,140,054 | |
Taseko Mines Ltd., 7.00%, 2/15/26(1) | 1,100,000 | | 999,250 | |
TMS International Corp., 6.25%, 4/15/29(1) | 1,050,000 | | 810,738 | |
| | 50,764,736 | |
| Mortgage Real Estate Investment Trusts (REITs) — 0.2% | | |
Blackstone Mortgage Trust, Inc., 3.75%, 1/15/27(1) | 2,775,000 | | 2,181,307 | |
Ladder Capital Finance Holdings LLLP / Ladder Capital Finance Corp., 4.25%, 2/1/27(1) | 850,000 | | 672,316 | |
Ladder Capital Finance Holdings LLLP / Ladder Capital Finance Corp., 4.75%, 6/15/29(1) | 900,000 | | 651,524 | |
Starwood Property Trust, Inc., 3.75%, 12/31/24(1) | 500,000 | | 461,269 | |
| | 3,966,416 | |
| | | | | | | | |
| Principal
Amount/Shares | Value |
| Oil, Gas and Consumable Fuels — 10.8% | | |
Aethon United BR LP / Aethon United Finance Corp., 8.25%, 2/15/26(1) | $ | 1,300,000 | | $ | 1,276,880 | |
Antero Midstream Partners LP / Antero Midstream Finance Corp., 7.875%, 5/15/26(1) | 2,250,000 | | 2,293,258 | |
Antero Midstream Partners LP / Antero Midstream Finance Corp., 5.75%, 3/1/27(1) | 1,325,000 | | 1,296,248 | |
Antero Midstream Partners LP / Antero Midstream Finance Corp., 5.375%, 6/15/29(1) | 750,000 | | 706,733 | |
Antero Resources Corp., 7.625%, 2/1/29(1) | 681,000 | | 696,990 | |
Antero Resources Corp., 5.375%, 3/1/30(1) | 825,000 | | 768,384 | |
| Apache Corp., 4.25%, 1/15/30 | 1,850,000 | | 1,689,910 | |
| Apache Corp., 5.10%, 9/1/40 | 1,175,000 | | 997,604 | |
| Apache Corp., 4.75%, 4/15/43 | 500,000 | | 376,098 | |
| Apache Corp., 4.25%, 1/15/44 | 130,000 | | 95,521 | |
| Apache Corp., 7.375%, 8/15/47 | 600,000 | | 575,627 | |
| Apache Corp., 5.35%, 7/1/49 | 2,275,000 | | 1,761,404 | |
Ascent Resources Utica Holdings LLC / ARU Finance Corp., 9.00%, 11/1/27(1) | 2,150,000 | | 2,616,383 | |
Ascent Resources Utica Holdings LLC / ARU Finance Corp., 8.25%, 12/31/28(1) | 225,000 | | 217,899 | |
Ascent Resources Utica Holdings LLC / ARU Finance Corp., 5.875%, 6/30/29(1) | 280,000 | | 247,379 | |
Athabasca Oil Corp., 9.75%, 11/1/26(1) | 2,590,000 | | 2,709,658 | |
Blue Racer Midstream LLC / Blue Racer Finance Corp., 7.625%, 12/15/25(1) | 1,625,000 | | 1,610,212 | |
| Callon Petroleum Co., 8.25%, 7/15/25 | 893,000 | | 890,217 | |
| Callon Petroleum Co., 6.375%, 7/1/26 | 175,000 | | 166,464 | |
Callon Petroleum Co., 7.50%, 6/15/30(1) | 1,375,000 | | 1,293,827 | |
| Cheniere Energy Partners LP, 4.00%, 3/1/31 | 1,675,000 | | 1,492,391 | |
| Cheniere Energy Partners LP, 3.25%, 1/31/32 | 1,925,000 | | 1,592,148 | |
| Cheniere Energy, Inc., 4.625%, 10/15/28 | 400,000 | | 380,576 | |
Chesapeake Energy Corp., 5.50%, 2/1/26(1) | 850,000 | | 837,297 | |
Chesapeake Energy Corp., 5.875%, 2/1/29(1) | 1,450,000 | | 1,381,959 | |
Chesapeake Energy Corp., 6.75%, 4/15/29(1) | 875,000 | | 869,509 | |
Chord Energy Corp., 6.375%, 6/1/26(1) | 1,025,000 | | 1,016,477 | |
Citgo Holding, Inc., 9.25%, 8/1/24(1) | 6,400,000 | | 6,418,048 | |
CITGO Petroleum Corp., 7.00%, 6/15/25(1) | 1,475,000 | | 1,456,673 | |
CITGO Petroleum Corp., 6.375%, 6/15/26(1) | 2,250,000 | | 2,195,786 | |
Civitas Resources, Inc., 5.00%, 10/15/26(1) | 2,450,000 | | 2,306,078 | |
CNX Midstream Partners LP, 4.75%, 4/15/30(1) | 700,000 | | 602,910 | |
CNX Resources Corp., 7.25%, 3/14/27(1) | 1,531,000 | | 1,525,015 | |
CNX Resources Corp., 6.00%, 1/15/29(1) | 1,300,000 | | 1,217,060 | |
CNX Resources Corp., 7.375%, 1/15/31(1) | 825,000 | | 813,570 | |
Comstock Resources, Inc., 6.75%, 3/1/29(1) | 1,350,000 | | 1,236,519 | |
Comstock Resources, Inc., 5.875%, 1/15/30(1) | 1,625,000 | | 1,397,610 | |
CQP Holdco LP / BIP-V Chinook Holdco LLC, 5.50%, 6/15/31(1) | 5,850,000 | | 5,265,117 | |
Crescent Energy Finance LLC, 9.25%, 2/15/28(1) | 350,000 | | 335,914 | |
Crestwood Midstream Partners LP / Crestwood Midstream Finance Corp., 6.00%, 2/1/29(1) | 4,350,000 | | 4,146,616 | |
Crestwood Midstream Partners LP / Crestwood Midstream Finance Corp., 7.375%, 2/1/31(1) | 2,075,000 | | 2,077,002 | |
CrownRock LP / CrownRock Finance, Inc., 5.625%, 10/15/25(1) | 650,000 | | 637,844 | |
CrownRock LP / CrownRock Finance, Inc., 5.00%, 5/1/29(1) | 725,000 | | 676,280 | |
| | | | | | | | |
| Principal
Amount/Shares | Value |
| DCP Midstream Operating LP, 5.125%, 5/15/29 | $ | 2,475,000 | | $ | 2,438,791 | |
| Delek Logistics Partners LP / Delek Logistics Finance Corp., 6.75%, 5/15/25 | 909,000 | | 892,861 | |
Delek Logistics Partners LP / Delek Logistics Finance Corp., 7.125%, 6/1/28(1) | 1,875,000 | | 1,718,512 | |
DT Midstream, Inc., 4.125%, 6/15/29(1) | 450,000 | | 395,031 | |
Endeavor Energy Resources LP / EER Finance, Inc., 5.75%, 1/30/28(1) | 1,150,000 | | 1,142,514 | |
Energean Israel Finance Ltd., 5.375%, 3/30/28(1) | 575,000 | | 518,158 | |
Energean Israel Finance Ltd., 5.875%, 3/30/31(1) | 700,000 | | 615,878 | |
EnLink Midstream LLC, 5.625%, 1/15/28(1) | 275,000 | | 269,759 | |
| EnLink Midstream LLC, 5.375%, 6/1/29 | 2,350,000 | | 2,264,166 | |
EnLink Midstream LLC, 6.50%, 9/1/30(1) | 2,475,000 | | 2,505,442 | |
| EnLink Midstream Partners LP, 4.85%, 7/15/26 | 3,075,000 | | 2,962,870 | |
| EnLink Midstream Partners LP, 5.60%, 4/1/44 | 1,625,000 | | 1,328,649 | |
| EnLink Midstream Partners LP, 5.05%, 4/1/45 | 1,200,000 | | 922,753 | |
| EnLink Midstream Partners LP, 5.45%, 6/1/47 | 1,625,000 | | 1,297,546 | |
| EQM Midstream Partners LP, 4.00%, 8/1/24 | 400,000 | | 385,139 | |
EQM Midstream Partners LP, 6.00%, 7/1/25(1) | 1,100,000 | | 1,088,802 | |
EQM Midstream Partners LP, 7.50%, 6/1/27(1) | 1,200,000 | | 1,205,964 | |
EQM Midstream Partners LP, 6.50%, 7/1/27(1) | 750,000 | | 727,748 | |
| EQM Midstream Partners LP, 5.50%, 7/15/28 | 1,626,000 | | 1,478,945 | |
EQM Midstream Partners LP, 4.50%, 1/15/29(1) | 2,225,000 | | 1,894,131 | |
EQM Midstream Partners LP, 7.50%, 6/1/30(1) | 1,225,000 | | 1,188,170 | |
EQM Midstream Partners LP, 4.75%, 1/15/31(1) | 1,875,000 | | 1,558,856 | |
| EQM Midstream Partners LP, 6.50%, 7/15/48 | 1,075,000 | | 831,905 | |
| EQT Corp., 6.125%, 2/1/25 | 225,000 | | 226,563 | |
EQT Corp., 3.125%, 5/15/26(1) | 425,000 | | 393,486 | |
| EQT Corp., 3.90%, 10/1/27 | 375,000 | | 352,843 | |
| EQT Corp., 7.00%, 2/1/30 | 1,129,000 | | 1,182,791 | |
| Genesis Energy LP / Genesis Energy Finance Corp., 6.50%, 10/1/25 | 155,000 | | 150,284 | |
| Genesis Energy LP / Genesis Energy Finance Corp., 8.00%, 1/15/27 | 900,000 | | 890,829 | |
| Genesis Energy LP / Genesis Energy Finance Corp., 7.75%, 2/1/28 | 600,000 | | 582,467 | |
| Genesis Energy LP / Genesis Energy Finance Corp., 8.875%, 4/15/30 | 1,125,000 | | 1,140,075 | |
Gulfport Energy Corp., 8.00%, 5/17/26(1) | 2,544,641 | | 2,522,248 | |
Harbour Energy PLC, 5.50%, 10/15/26(1) | 225,000 | | 197,170 | |
Harvest Midstream I LP, 7.50%, 9/1/28(1) | 2,775,000 | | 2,770,948 | |
Hess Midstream Operations LP, 5.625%, 2/15/26(1) | 171,000 | | 169,441 | |
Hess Midstream Operations LP, 5.125%, 6/15/28(1) | 3,345,000 | | 3,178,961 | |
Hess Midstream Operations LP, 5.50%, 10/15/30(1) | 1,475,000 | | 1,373,750 | |
Hilcorp Energy I LP / Hilcorp Finance Co., 6.25%, 11/1/28(1) | 675,000 | | 641,438 | |
Hilcorp Energy I LP / Hilcorp Finance Co., 6.00%, 4/15/30(1) | 1,450,000 | | 1,338,930 | |
Hilcorp Energy I LP / Hilcorp Finance Co., 6.00%, 2/1/31(1) | 2,150,000 | | 1,987,650 | |
Hilcorp Energy I LP / Hilcorp Finance Co., 6.25%, 4/15/32(1) | 700,000 | | 648,298 | |
Holly Energy Partners LP / Holly Energy Finance Corp., 6.375%, 4/15/27(1) | 975,000 | | 965,211 | |
Holly Energy Partners LP / Holly Energy Finance Corp., 5.00%, 2/1/28(1) | 2,075,000 | | 1,939,847 | |
Ithaca Energy North Sea PLC, 9.00%, 7/15/26(1) | 2,600,000 | | 2,481,650 | |
ITT Holdings LLC, 6.50%, 8/1/29(1) | 1,675,000 | | 1,415,743 | |
| | | | | | | | |
| Principal
Amount/Shares | Value |
Leviathan Bond Ltd., 6.125%, 6/30/25(1) | $ | 1,100,000 | | $ | 1,074,489 | |
Magnolia Oil & Gas Operating LLC / Magnolia Oil & Gas Finance Corp., 6.00%, 8/1/26(1) | 2,009,000 | | 1,955,882 | |
Martin Midstream Partners LP / Martin Midstream Finance Corp., 11.50%, 2/15/28(1) | 2,225,000 | | 2,132,729 | |
| Matador Resources Co., 5.875%, 9/15/26 | 1,650,000 | | 1,630,002 | |
Moss Creek Resources Holdings, Inc., 7.50%, 1/15/26(1) | 1,150,000 | | 1,067,729 | |
| Murphy Oil Corp., 6.375%, 7/15/28 | 2,225,000 | | 2,194,446 | |
| Murphy Oil Corp., 7.05%, 5/1/29 | 375,000 | | 376,778 | |
Murray Energy Corp., 9.00% Cash plus 3.00% PIK, 4/15/24(1)(3)(4) | 5,425,447 | | 54 | |
New Fortress Energy, Inc., 6.50%, 9/30/26(1) | 550,000 | | 506,503 | |
NGL Energy Operating LLC / NGL Energy Finance Corp., 7.50%, 2/1/26(1) | 3,875,000 | | 3,742,411 | |
Northern Oil & Gas, Inc., 8.125%, 3/1/28(1) | 3,675,000 | | 3,648,724 | |
| NuStar Logistics LP, 6.00%, 6/1/26 | 275,000 | | 269,906 | |
| NuStar Logistics LP, 6.375%, 10/1/30 | 1,100,000 | | 1,056,671 | |
| Occidental Petroleum Corp., 6.95%, 7/1/24 | 281,000 | | 284,791 | |
| Occidental Petroleum Corp., 5.875%, 9/1/25 | 650,000 | | 655,682 | |
| Occidental Petroleum Corp., 5.50%, 12/1/25 | 775,000 | | 774,823 | |
| Occidental Petroleum Corp., 5.55%, 3/15/26 | 2,525,000 | | 2,546,387 | |
| Occidental Petroleum Corp., 8.50%, 7/15/27 | 2,175,000 | | 2,394,534 | |
| Occidental Petroleum Corp., 7.125%, 10/15/27 | 525,000 | | 548,796 | |
| Occidental Petroleum Corp., 8.875%, 7/15/30 | 950,000 | | 1,105,867 | |
| Occidental Petroleum Corp., 7.50%, 5/1/31 | 1,642,000 | | 1,812,752 | |
| Occidental Petroleum Corp., 7.875%, 9/15/31 | 2,600,000 | | 2,922,933 | |
| Occidental Petroleum Corp., 6.45%, 9/15/36 | 2,150,000 | | 2,262,875 | |
| Occidental Petroleum Corp., 7.95%, 6/15/39 | 460,000 | | 512,238 | |
| Occidental Petroleum Corp., 4.30%, 8/15/39 | 275,000 | | 220,747 | |
| Occidental Petroleum Corp., 6.20%, 3/15/40 | 2,750,000 | | 2,769,085 | |
| Occidental Petroleum Corp., 4.625%, 6/15/45 | 575,000 | | 461,467 | |
| Occidental Petroleum Corp., 6.60%, 3/15/46 | 3,000,000 | | 3,157,500 | |
| Occidental Petroleum Corp., 4.10%, 2/15/47 | 725,000 | | 553,434 | |
| Occidental Petroleum Corp., 4.20%, 3/15/48 | 700,000 | | 543,575 | |
| Ovintiv, Inc., 8.125%, 9/15/30 | 500,000 | | 555,624 | |
Parkland Corp., 5.875%, 7/15/27(1) | 1,000,000 | | 971,365 | |
Parkland Corp., 4.50%, 10/1/29(1) | 4,475,000 | | 3,981,721 | |
Parkland Corp., 4.625%, 5/1/30(1) | 1,625,000 | | 1,447,038 | |
| PBF Holding Co. LLC / PBF Finance Corp., 7.25%, 6/15/25 | 800,000 | | 795,048 | |
| PBF Holding Co. LLC / PBF Finance Corp., 6.00%, 2/15/28 | 3,600,000 | | 3,464,820 | |
| PDC Energy, Inc., 5.75%, 5/15/26 | 1,550,000 | | 1,510,979 | |
Permian Resources Operating LLC, 5.375%, 1/15/26(1) | 2,450,000 | | 2,324,896 | |
Permian Resources Operating LLC, 5.875%, 7/1/29(1) | 1,300,000 | | 1,232,400 | |
| Range Resources Corp., 8.25%, 1/15/29 | 2,195,000 | | 2,315,615 | |
Rockcliff Energy II LLC, 5.50%, 10/15/29(1) | 375,000 | | 332,726 | |
Rockies Express Pipeline LLC, 3.60%, 5/15/25(1) | 350,000 | | 327,675 | |
Rockies Express Pipeline LLC, 4.95%, 7/15/29(1) | 700,000 | | 624,520 | |
Rockies Express Pipeline LLC, 4.80%, 5/15/30(1) | 725,000 | | 637,094 | |
Rockies Express Pipeline LLC, 7.50%, 7/15/38(1) | 250,000 | | 229,903 | |
Rockies Express Pipeline LLC, 6.875%, 4/15/40(1) | 1,200,000 | | 1,003,049 | |
| SM Energy Co., 5.625%, 6/1/25 | 1,400,000 | | 1,358,981 | |
| SM Energy Co., 6.75%, 9/15/26 | 225,000 | | 220,856 | |
| Southwestern Energy Co., 5.70%, 1/23/25 | 508,000 | | 508,759 | |
| | | | | | | | |
| Principal
Amount/Shares | Value |
| Southwestern Energy Co., 8.375%, 9/15/28 | $ | 750,000 | | $ | 789,203 | |
| Southwestern Energy Co., 5.375%, 2/1/29 | 1,550,000 | | 1,462,665 | |
| Southwestern Energy Co., 5.375%, 3/15/30 | 1,500,000 | | 1,411,980 | |
| Southwestern Energy Co., 4.75%, 2/1/32 | 425,000 | | 375,891 | |
| Sunoco LP / Sunoco Finance Corp., 6.00%, 4/15/27 | 1,775,000 | | 1,754,582 | |
| Sunoco LP / Sunoco Finance Corp., 4.50%, 4/30/30 | 2,325,000 | | 2,105,299 | |
Tallgrass Energy Partners LP / Tallgrass Energy Finance Corp., 7.50%, 10/1/25(1) | 500,000 | | 500,275 | |
Tallgrass Energy Partners LP / Tallgrass Energy Finance Corp., 6.00%, 12/31/30(1) | 1,425,000 | | 1,275,382 | |
Tallgrass Energy Partners LP / Tallgrass Energy Finance Corp., 6.00%, 9/1/31(1) | 1,550,000 | | 1,372,614 | |
| Talos Production, Inc., 12.00%, 1/15/26 | 950,000 | | 1,016,130 | |
Tap Rock Resources LLC, 7.00%, 10/1/26(1) | 1,175,000 | | 1,030,437 | |
| Targa Resources Partners LP / Targa Resources Partners Finance Corp., 5.00%, 1/15/28 | 297,000 | | 287,457 | |
| Targa Resources Partners LP / Targa Resources Partners Finance Corp., 6.875%, 1/15/29 | 175,000 | | 178,532 | |
| Targa Resources Partners LP / Targa Resources Partners Finance Corp., 4.875%, 2/1/31 | 1,025,000 | | 960,163 | |
Teine Energy Ltd., 6.875%, 4/15/29(1) | 1,600,000 | | 1,465,888 | |
Venture Global Calcasieu Pass LLC, 3.875%, 8/15/29(1) | 550,000 | | 496,595 | |
Venture Global Calcasieu Pass LLC, 4.125%, 8/15/31(1) | 1,500,000 | | 1,319,385 | |
Venture Global Calcasieu Pass LLC, 3.875%, 11/1/33(1) | 1,350,000 | | 1,135,546 | |
Vermilion Energy, Inc., 6.875%, 5/1/30(1) | 1,425,000 | | 1,299,760 | |
| Western Midstream Operating LP, 4.65%, 7/1/26 | 575,000 | | 556,313 | |
| Western Midstream Operating LP, 4.50%, 3/1/28 | 1,300,000 | | 1,231,081 | |
| Western Midstream Operating LP, 4.75%, 8/15/28 | 725,000 | | 690,787 | |
Western Midstream Operating LP, 6.15%, 4/1/33(2) | 200,000 | | 202,962 | |
| Western Midstream Operating LP, 5.45%, 4/1/44 | 825,000 | | 720,625 | |
| Western Midstream Operating LP, 5.30%, 3/1/48 | 2,635,000 | | 2,236,720 | |
| Western Midstream Operating LP, 5.50%, 8/15/48 | 675,000 | | 582,265 | |
| | 211,833,724 | |
| Paper and Forest Products — 0.2% | | |
Ahlstrom-Munksjo Holding 3 Oy, 4.875%, 2/4/28(1) | 200,000 | | 170,412 | |
Domtar Corp., 6.75%, 10/1/28(1) | 1,388,000 | | 1,237,145 | |
Glatfelter Corp., 4.75%, 11/15/29(1) | 850,000 | | 562,329 | |
| Mercer International, Inc., 5.125%, 2/1/29 | 1,700,000 | | 1,457,750 | |
| | 3,427,636 | |
| Passenger Airlines — 1.1% | | |
Air Canada, 3.875%, 8/15/26(1) | 325,000 | | 295,445 | |
Allegiant Travel Co., 7.25%, 8/15/27(1) | 1,050,000 | | 1,046,367 | |
American Airlines, Inc., 11.75%, 7/15/25(1) | 4,275,000 | | 4,681,339 | |
American Airlines, Inc., 7.25%, 2/15/28(1) | 1,600,000 | | 1,557,544 | |
American Airlines, Inc. / AAdvantage Loyalty IP Ltd., 5.50%, 4/20/26(1) | 2,925,000 | | 2,882,125 | |
American Airlines, Inc. / AAdvantage Loyalty IP Ltd., 5.75%, 4/20/29(1) | 3,325,000 | | 3,193,000 | |
| Delta Air Lines, Inc., 7.375%, 1/15/26 | 675,000 | | 703,040 | |
| Delta Air Lines, Inc., 4.375%, 4/19/28 | 400,000 | | 372,038 | |
Delta Air Lines, Inc. / SkyMiles IP Ltd., 4.50%, 10/20/25(1) | 297,915 | | 293,100 | |
Delta Air Lines, Inc. / SkyMiles IP Ltd., 4.75%, 10/20/28(1) | 1,550,000 | | 1,497,064 | |
Hawaiian Brand Intellectual Property Ltd. / HawaiianMiles Loyalty Ltd., 5.75%, 1/20/26(1) | 2,000,000 | | 1,901,240 | |
| | | | | | | | |
| Principal
Amount/Shares | Value |
| United Airlines Pass Through Trust, Series 2020-1, Class A, 5.875%, 4/15/29 | $ | 603,627 | | $ | 602,611 | |
United Airlines, Inc., 4.375%, 4/15/26(1) | 825,000 | | 790,250 | |
United Airlines, Inc., 4.625%, 4/15/29(1) | 1,775,000 | | 1,607,833 | |
Virgin Australia Holdings Pty Ltd., VRN, 8.125%, 11/15/24(1)(3)(4) | 447,500 | | 727 | |
| | 21,423,723 | |
| Personal Care Products — 0.3% | | |
BellRing Brands, Inc., 7.00%, 3/15/30(1) | 3,050,000 | | 3,092,304 | |
Edgewell Personal Care Co., 5.50%, 6/1/28(1) | 1,550,000 | | 1,487,078 | |
Edgewell Personal Care Co., 4.125%, 4/1/29(1) | 2,250,000 | | 1,973,797 | |
| | 6,553,179 | |
| Pharmaceuticals — 1.2% | | |
180 Medical, Inc., 3.875%, 10/15/29(1) | 300,000 | | 265,532 | |
Bausch Health Americas, Inc., 8.50%, 1/31/27(1) | 3,285,000 | | 1,505,137 | |
Bausch Health Cos., Inc., 5.50%, 11/1/25(1) | 500,000 | | 411,654 | |
Bausch Health Cos., Inc., 9.00%, 12/15/25(1) | 2,550,000 | | 2,032,928 | |
Bausch Health Cos., Inc., 6.125%, 2/1/27(1) | 1,475,000 | | 956,125 | |
Bausch Health Cos., Inc., 7.00%, 1/15/28(1) | 2,075,000 | | 837,677 | |
Bausch Health Cos., Inc., 5.00%, 1/30/28(1) | 725,000 | | 276,428 | |
Bausch Health Cos., Inc., 6.25%, 2/15/29(1) | 400,000 | | 160,156 | |
Bausch Health Cos., Inc., 7.25%, 5/30/29(1) | 625,000 | | 239,928 | |
Bausch Health Cos., Inc., 5.25%, 1/30/30(1) | 825,000 | | 308,859 | |
Bausch Health Cos., Inc., 5.25%, 2/15/31(1) | 825,000 | | 319,688 | |
Endo Dac / Endo Finance LLC / Endo Finco, Inc., 9.50%, 7/31/27(1)(3)(4) | 3,986,000 | | 308,915 | |
Endo Dac / Endo Finance LLC / Endo Finco, Inc., 6.00%, 6/30/28(1)(3)(4) | 1,612,000 | | 124,930 | |
Endo Luxembourg Finance Co. I Sarl / Endo US, Inc., 6.125%, 4/1/29(1)(3)(4) | 1,350,000 | | 999,852 | |
Jazz Securities DAC, 4.375%, 1/15/29(1) | 1,800,000 | | 1,657,620 | |
Mallinckrodt International Finance SA / Mallinckrodt CB LLC, 10.00%, 4/15/25(1) | 1,350,000 | | 1,149,545 | |
Mallinckrodt International Finance SA / Mallinckrodt CB LLC, 10.00%, 6/15/29(1) | 1,017,204 | | 560,857 | |
Organon & Co. / Organon Foreign Debt Co-Issuer BV, 4.125%, 4/30/28(1) | 3,025,000 | | 2,767,905 | |
Organon & Co. / Organon Foreign Debt Co-Issuer BV, 5.125%, 4/30/31(1) | 3,000,000 | | 2,665,733 | |
P&L Development LLC / PLD Finance Corp., 7.75%, 11/15/25(1) | 1,450,000 | | 1,135,917 | |
Par Pharmaceutical, Inc., 7.50%, 4/1/27(1)(3)(4) | 3,606,000 | | 2,685,944 | |
| Perrigo Finance Unlimited Co., 4.90%, 12/15/44 | 200,000 | | 141,516 | |
Prestige Brands, Inc., 5.125%, 1/15/28(1) | 800,000 | | 776,481 | |
Prestige Brands, Inc., 3.75%, 4/1/31(1) | 1,125,000 | | 954,551 | |
| | 23,243,878 | |
| Professional Services — 0.6% | | |
AMN Healthcare, Inc., 4.625%, 10/1/27(1) | 1,600,000 | | 1,485,069 | |
AMN Healthcare, Inc., 4.00%, 4/15/29(1) | 5,975,000 | | 5,294,478 | |
ASGN, Inc., 4.625%, 5/15/28(1) | 2,875,000 | | 2,685,911 | |
Dun & Bradstreet Corp., 5.00%, 12/15/29(1) | 425,000 | | 368,469 | |
Science Applications International Corp., 4.875%, 4/1/28(1) | 1,875,000 | | 1,748,293 | |
| | 11,582,220 | |
| Real Estate Management and Development — 0.7% | | |
Cushman & Wakefield US Borrower LLC, 6.75%, 5/15/28(1) | 800,000 | | 716,940 | |
Forestar Group, Inc., 3.85%, 5/15/26(1) | 1,225,000 | | 1,103,614 | |
| | | | | | | | |
| Principal
Amount/Shares | Value |
Forestar Group, Inc., 5.00%, 3/1/28(1) | $ | 1,350,000 | | $ | 1,210,086 | |
Greystar Real Estate Partners LLC, 5.75%, 12/1/25(1) | 1,050,000 | | 1,024,039 | |
Howard Hughes Corp., 5.375%, 8/1/28(1) | 3,000,000 | | 2,736,300 | |
Howard Hughes Corp., 4.125%, 2/1/29(1) | 1,775,000 | | 1,505,937 | |
Howard Hughes Corp., 4.375%, 2/1/31(1) | 1,150,000 | | 927,222 | |
| Kennedy-Wilson, Inc., 4.75%, 2/1/30 | 1,250,000 | | 923,794 | |
Realogy Group LLC / Realogy Co.-Issuer Corp., 5.75%, 1/15/29(1) | 1,235,000 | | 925,633 | |
Realogy Group LLC / Realogy Co.-Issuer Corp., 5.25%, 4/15/30(1) | 2,225,000 | | 1,623,760 | |
| | 12,697,325 | |
| Semiconductors and Semiconductor Equipment — 0.2% | | |
Amkor Technology, Inc., 6.625%, 9/15/27(1) | 625,000 | | 625,691 | |
ams-OSRAM AG, 7.00%, 7/31/25(1) | 1,350,000 | | 1,267,805 | |
ON Semiconductor Corp., 3.875%, 9/1/28(1) | 1,000,000 | | 901,267 | |
Synaptics, Inc., 4.00%, 6/15/29(1) | 1,350,000 | | 1,164,619 | |
| | 3,959,382 | |
| Software — 2.2% | | |
Boxer Parent Co., Inc., 7.125%, 10/2/25(1) | 675,000 | | 672,616 | |
Boxer Parent Co., Inc., 9.125%, 3/1/26(1) | 1,200,000 | | 1,168,020 | |
Camelot Finance SA, 4.50%, 11/1/26(1) | 1,850,000 | | 1,750,535 | |
Castle US Holding Corp., 9.50%, 2/15/28(1) | 2,375,000 | | 976,386 | |
Cloud Software Group Holdings, Inc., 6.50%, 3/31/29(1) | 5,325,000 | | 4,715,389 | |
Consensus Cloud Solutions, Inc., 6.50%, 10/15/28(1) | 825,000 | | 684,914 | |
Elastic NV, 4.125%, 7/15/29(1) | 1,400,000 | | 1,196,748 | |
Fair Isaac Corp., 4.00%, 6/15/28(1) | 1,150,000 | | 1,067,677 | |
Gen Digital, Inc., 6.75%, 9/30/27(1) | 1,575,000 | | 1,584,844 | |
Gen Digital, Inc., 7.125%, 9/30/30(1) | 1,975,000 | | 1,966,902 | |
GoTo Group, Inc., 5.50%, 9/1/27(1) | 3,425,000 | | 1,756,853 | |
Helios Software Holdings, Inc. / ION Corporate Solutions Finance Sarl, 4.625%, 5/1/28(1) | 1,400,000 | | 1,138,896 | |
MSCI, Inc., 3.625%, 9/1/30(1) | 500,000 | | 435,105 | |
NCR Corp., 5.75%, 9/1/27(1) | 2,200,000 | | 2,164,349 | |
NCR Corp., 5.00%, 10/1/28(1) | 1,350,000 | | 1,188,000 | |
NCR Corp., 5.125%, 4/15/29(1) | 3,475,000 | | 3,010,214 | |
NCR Corp., 6.125%, 9/1/29(1) | 2,925,000 | | 2,887,765 | |
NCR Corp., 5.25%, 10/1/30(1) | 700,000 | | 572,096 | |
Open Text Corp., 6.90%, 12/1/27(1) | 700,000 | | 722,750 | |
Open Text Corp., 3.875%, 2/15/28(1) | 1,925,000 | | 1,720,469 | |
Open Text Corp., 3.875%, 12/1/29(1) | 2,425,000 | | 2,044,019 | |
Open Text Holdings, Inc., 4.125%, 2/15/30(1) | 2,400,000 | | 2,061,358 | |
Open Text Holdings, Inc., 4.125%, 12/1/31(1) | 3,275,000 | | 2,705,101 | |
Rocket Software, Inc., 6.50%, 2/15/29(1) | 525,000 | | 413,979 | |
SS&C Technologies, Inc., 5.50%, 9/30/27(1) | 3,220,000 | | 3,127,984 | |
Veritas US, Inc. / Veritas Bermuda Ltd., 7.50%, 9/1/25(1) | 1,925,000 | | 1,450,997 | |
| | 43,183,966 | |
| Specialty Retail — 2.8% | | |
Abercrombie & Fitch Management Co., 8.75%, 7/15/25(1) | 1,075,000 | | 1,084,276 | |
Arko Corp., 5.125%, 11/15/29(1) | 375,000 | | 310,841 | |
| Asbury Automotive Group, Inc., 4.50%, 3/1/28 | 745,000 | | 678,971 | |
Asbury Automotive Group, Inc., 4.625%, 11/15/29(1) | 825,000 | | 739,497 | |
| Asbury Automotive Group, Inc., 4.75%, 3/1/30 | 425,000 | | 380,879 | |
| | | | | | | | |
| Principal
Amount/Shares | Value |
Asbury Automotive Group, Inc., 5.00%, 2/15/32(1) | $ | 575,000 | | $ | 504,505 | |
Bath & Body Works, Inc., 9.375%, 7/1/25(1) | 303,000 | | 324,007 | |
| Bath & Body Works, Inc., 5.25%, 2/1/28 | 50,000 | | 47,823 | |
| Bath & Body Works, Inc., 7.50%, 6/15/29 | 943,000 | | 963,366 | |
Bath & Body Works, Inc., 6.625%, 10/1/30(1) | 1,925,000 | | 1,878,376 | |
| Bath & Body Works, Inc., 6.875%, 11/1/35 | 895,000 | | 807,636 | |
| Bath & Body Works, Inc., 6.75%, 7/1/36 | 3,775,000 | | 3,377,832 | |
BCPE Ulysses Intermediate, Inc., 7.75% Cash or 8.50% PIK, 4/1/27(1) | 1,175,000 | | 923,991 | |
eG Global Finance PLC, 6.75%, 2/7/25(1) | 1,400,000 | | 1,297,128 | |
eG Global Finance PLC, 8.50%, 10/30/25(1) | 1,000,000 | | 937,385 | |
Evergreen Acqco 1 LP / TVI, Inc., 9.75%, 4/26/28(1) | 575,000 | | 546,839 | |
Ferrellgas LP / Ferrellgas Finance Corp., 5.375%, 4/1/26(1) | 3,425,000 | | 3,210,732 | |
Ferrellgas LP / Ferrellgas Finance Corp., 5.875%, 4/1/29(1) | 3,250,000 | | 2,782,065 | |
Gap, Inc., 3.625%, 10/1/29(1) | 1,150,000 | | 821,330 | |
Gap, Inc., 3.875%, 10/1/31(1) | 500,000 | | 347,385 | |
Ken Garff Automotive LLC, 4.875%, 9/15/28(1) | 800,000 | | 681,126 | |
LBM Acquisition LLC, 6.25%, 1/15/29(1) | 1,600,000 | | 1,226,393 | |
Lithia Motors, Inc., 4.625%, 12/15/27(1) | 2,275,000 | | 2,118,589 | |
Lithia Motors, Inc., 3.875%, 6/1/29(1) | 3,250,000 | | 2,815,345 | |
LSF9 Atlantis Holdings LLC / Victra Finance Corp., 7.75%, 2/15/26(1) | 2,425,000 | | 2,205,236 | |
Michaels Cos., Inc., 5.25%, 5/1/28(1) | 425,000 | | 354,650 | |
Michaels Cos., Inc., 7.875%, 5/1/29(1) | 325,000 | | 227,807 | |
| Murphy Oil USA, Inc., 5.625%, 5/1/27 | 150,000 | | 145,366 | |
| Murphy Oil USA, Inc., 4.75%, 9/15/29 | 1,275,000 | | 1,163,055 | |
Park River Holdings, Inc., 5.625%, 2/1/29(1) | 600,000 | | 409,772 | |
PetSmart, Inc. / PetSmart Finance Corp., 4.75%, 2/15/28(1) | 2,200,000 | | 2,067,230 | |
PetSmart, Inc. / PetSmart Finance Corp., 7.75%, 2/15/29(1) | 1,250,000 | | 1,228,350 | |
Sonic Automotive, Inc., 4.625%, 11/15/29(1) | 1,225,000 | | 1,027,647 | |
Sonic Automotive, Inc., 4.875%, 11/15/31(1) | 1,950,000 | | 1,574,352 | |
Specialty Building Products Holdings LLC / SBP Finance Corp., 6.375%, 9/30/26(1) | 1,850,000 | | 1,702,000 | |
SRS Distribution, Inc., 4.625%, 7/1/28(1) | 1,025,000 | | 911,707 | |
SRS Distribution, Inc., 6.00%, 12/1/29(1) | 750,000 | | 620,348 | |
Staples, Inc., 7.50%, 4/15/26(1) | 4,355,000 | | 3,819,770 | |
Staples, Inc., 10.75%, 4/15/27(1) | 2,950,000 | | 2,142,659 | |
Suburban Propane Partners LP/Suburban Energy Finance Corp., 5.00%, 6/1/31(1) | 1,325,000 | | 1,159,342 | |
Superior Plus LP / Superior General Partner, Inc., 4.50%, 3/15/29(1) | 1,350,000 | | 1,207,038 | |
Victoria's Secret & Co., 4.625%, 7/15/29(1) | 650,000 | | 527,391 | |
White Cap Buyer LLC, 6.875%, 10/15/28(1) | 1,350,000 | | 1,172,284 | |
White Cap Parent LLC, 8.25% Cash or 9.00% PIK, 3/15/26(1) | 1,608,000 | | 1,464,534 | |
| | 53,936,855 | |
| Technology Hardware, Storage and Peripherals — 0.5% | | |
Diebold Nixdorf, Inc., 9.375%, 7/15/25(1) | 1,236,000 | | 633,450 | |
Diebold Nixdorf, Inc., 8.50% PIK, 10/15/26(1) | 1,373,587 | | 350,824 | |
| Seagate HDD Cayman, 4.09%, 6/1/29 | 450,000 | | 397,978 | |
| Seagate HDD Cayman, 4.125%, 1/15/31 | 3,385,000 | | 2,837,934 | |
Seagate HDD Cayman, 9.625%, 12/1/32(1) | 2,647,275 | | 2,969,441 | |
Xerox Holdings Corp., 5.00%, 8/15/25(1) | 1,775,000 | | 1,676,665 | |
Xerox Holdings Corp., 5.50%, 8/15/28(1) | 875,000 | | 758,214 | |
| | 9,624,506 | |
| | | | | | | | |
| Principal
Amount/Shares | Value |
| Textiles, Apparel and Luxury Goods — 0.2% | | |
Crocs, Inc., 4.25%, 3/15/29(1) | $ | 400,000 | | $ | 351,308 | |
Crocs, Inc., 4.125%, 8/15/31(1) | 2,000,000 | | 1,649,607 | |
Eagle Intermediate Global Holding BV / Eagle US Finance LLC, 7.50%, 5/1/25(1) | 900,000 | | 568,125 | |
Hanesbrands, Inc., 9.00%, 2/15/31(1) | 1,125,000 | | 1,152,793 | |
Kontoor Brands, Inc., 4.125%, 11/15/29(1) | 1,000,000 | | 859,593 | |
| | 4,581,426 | |
| Thrifts and Mortgage Finance — 1.7% | | |
Enact Holdings, Inc., 6.50%, 8/15/25(1) | 3,350,000 | | 3,269,700 | |
Freedom Mortgage Corp., 7.625%, 5/1/26(1) | 2,300,000 | | 1,850,648 | |
Freedom Mortgage Corp., 6.625%, 1/15/27(1) | 2,875,000 | | 2,215,116 | |
| MGIC Investment Corp., 5.25%, 8/15/28 | 5,855,000 | | 5,571,296 | |
Nationstar Mortgage Holdings, Inc., 6.00%, 1/15/27(1) | 1,075,000 | | 976,584 | |
Nationstar Mortgage Holdings, Inc., 5.50%, 8/15/28(1) | 1,975,000 | | 1,695,577 | |
Nationstar Mortgage Holdings, Inc., 5.125%, 12/15/30(1) | 1,675,000 | | 1,288,862 | |
Nationstar Mortgage Holdings, Inc., 5.75%, 11/15/31(1) | 700,000 | | 543,745 | |
NMI Holdings, Inc., 7.375%, 6/1/25(1) | 1,925,000 | | 1,929,250 | |
PennyMac Financial Services, Inc., 4.25%, 2/15/29(1) | 2,200,000 | | 1,753,994 | |
PennyMac Financial Services, Inc., 5.75%, 9/15/31(1) | 975,000 | | 773,165 | |
Provident Funding Associates LP / PFG Finance Corp., 6.375%, 6/15/25(1) | 580,000 | | 514,960 | |
| Radian Group, Inc., 4.50%, 10/1/24 | 950,000 | | 917,866 | |
| Radian Group, Inc., 4.875%, 3/15/27 | 2,879,000 | | 2,710,308 | |
Rocket Mortgage LLC / Rocket Mortgage Co.-Issuer, Inc., 3.625%, 3/1/29(1) | 3,050,000 | | 2,623,000 | |
Rocket Mortgage LLC / Rocket Mortgage Co.-Issuer, Inc., 3.875%, 3/1/31(1) | 75,000 | | 62,260 | |
Rocket Mortgage LLC / Rocket Mortgage Co.-Issuer, Inc., 4.00%, 10/15/33(1) | 3,500,000 | | 2,782,413 | |
United Wholesale Mortgage LLC, 5.75%, 6/15/27(1) | 825,000 | | 735,027 | |
United Wholesale Mortgage LLC, 5.50%, 4/15/29(1) | 2,300,000 | | 1,923,640 | |
| | 34,137,411 | |
| Trading Companies and Distributors — 0.5% | | |
Alta Equipment Group, Inc., 5.625%, 4/15/26(1) | 775,000 | | 724,637 | |
Beacon Roofing Supply, Inc., 4.50%, 11/15/26(1) | 550,000 | | 521,705 | |
Beacon Roofing Supply, Inc., 4.125%, 5/15/29(1) | 2,100,000 | | 1,855,518 | |
Fly Leasing Ltd., 7.00%, 10/15/24(1) | 1,500,000 | | 1,319,689 | |
Fortress Transportation & Infrastructure Investors LLC, 6.50%, 10/1/25(1) | 1,427,000 | | 1,429,554 | |
Fortress Transportation & Infrastructure Investors LLC, 9.75%, 8/1/27(1) | 1,800,000 | | 1,900,872 | |
Fortress Transportation & Infrastructure Investors LLC, 5.50%, 5/1/28(1) | 1,700,000 | | 1,553,052 | |
Foundation Building Materials, Inc., 6.00%, 3/1/29(1) | 1,400,000 | | 1,111,513 | |
| | 10,416,540 | |
Transportation Infrastructure† | | |
First Student Bidco, Inc. / First Transit Parent, Inc., 4.00%, 7/31/29(1) | 475,000 | | 413,748 | |
| Water Utilities — 0.1% | | |
Solaris Midstream Holdings LLC, 7.625%, 4/1/26(1) | 1,500,000 | | 1,444,035 | |
| Wireless Telecommunication Services — 0.9% | | |
Digicel Group Holdings Ltd., 5.00% Cash plus 3.00% PIK, 4/1/25(1) | 1,369,664 | | 549,084 | |
| Sprint LLC, 7.875%, 9/15/23 | 1,125,000 | | 1,134,331 | |
| | | | | | | | |
| Principal
Amount/Shares | Value |
| Sprint LLC, 7.125%, 6/15/24 | $ | 2,500,000 | | $ | 2,543,678 | |
| Sprint LLC, 7.625%, 3/1/26 | 750,000 | | 793,785 | |
| T-Mobile USA, Inc., 2.625%, 4/15/26 | 425,000 | | 397,075 | |
| T-Mobile USA, Inc., 4.75%, 2/1/28 | 2,000,000 | | 1,976,217 | |
| T-Mobile USA, Inc., 2.625%, 2/15/29 | 1,225,000 | | 1,080,463 | |
| T-Mobile USA, Inc., 3.375%, 4/15/29 | 2,800,000 | | 2,555,245 | |
Vmed O2 UK Financing I PLC, 4.25%, 1/31/31(1) | 3,150,000 | | 2,683,800 | |
Vmed O2 UK Financing I PLC, 4.75%, 7/15/31(1) | 2,800,000 | | 2,403,534 | |
| Vodafone Group PLC, VRN, 7.00%, 4/4/79 | 1,875,000 | | 1,867,678 | |
| | 17,984,890 | |
TOTAL CORPORATE BONDS (Cost $2,033,311,982) | | 1,848,548,020 | |
| PREFERRED STOCKS — 1.4% | | |
| Banks — 0.8% | | |
| Bank of America Corp., 5.125% | 1,200,000 | | 1,152,534 | |
| Bank of America Corp., 5.875% | 50,000 | | 45,050 | |
| Bank of America Corp., 6.25% | 1,250,000 | | 1,223,437 | |
| Bank of America Corp., 6.30% | 25,000 | | 25,094 | |
| Barclays PLC, 6.125% | 600,000 | | 510,160 | |
| Barclays PLC, 7.75% | 1,550,000 | | 1,425,669 | |
| Barclays PLC, 8.00% | 1,445,000 | | 1,304,112 | |
| Barclays PLC, 8.00% | 875,000 | | 749,219 | |
| Citigroup, Inc., 4.00% | 750,000 | | 664,688 | |
| Citigroup, Inc., 4.70% | 2,525,000 | | 2,215,687 | |
| Citigroup, Inc., 6.25% | 600,000 | | 576,000 | |
| Citigroup, Inc., 8.87% | 375,000 | | 373,125 | |
| Citigroup, Inc., 9.09% | 425,000 | | 423,406 | |
| JPMorgan Chase & Co., 4.60% | 2,050,000 | | 1,911,625 | |
| JPMorgan Chase & Co., 6.00% | 720,000 | | 706,500 | |
| JPMorgan Chase & Co., 6.10% | 725,000 | | 708,688 | |
| JPMorgan Chase & Co., 6.125% | 1,025,000 | | 1,002,963 | |
| JPMorgan Chase & Co., 6.75% | 31,000 | | 31,127 | |
| NatWest Group PLC, 8.00% | 550,000 | | 544,225 | |
| | 15,593,309 | |
| Capital Markets — 0.1% | | |
| Goldman Sachs Group, Inc., 4.95% | 1,750,000 | | 1,606,925 | |
Construction Materials† | | |
Cemex SAB de CV, 5.125%(1) | 725,000 | | 649,745 | |
| Consumer Finance — 0.1% | | |
| Ally Financial, Inc., 4.70% | 1,550,000 | | 1,116,969 | |
| Independent Power and Renewable Electricity Producers — 0.1% |
NRG Energy, Inc., 10.25%(1) | 1,325,000 | | 1,267,436 | |
Vistra Corp., 7.00%(1) | 1,325,000 | | 1,167,371 | |
| | 2,434,807 | |
| Oil, Gas and Consumable Fuels — 0.3% | | |
| Energy Transfer LP, 8.89% | 600,000 | | 534,387 | |
| Global Partners LP, 9.50% | 51,189 | | 1,305,319 | |
| Gulfport Energy Corp., 10.00% Cash or 15.00% PIK | 113 | | 638,450 | |
| Plains All American Pipeline LP, 8.97% | 4,450,000 | | 3,983,770 | |
| | 6,461,926 | |
TOTAL PREFERRED STOCKS (Cost $28,744,250) | | 27,863,681 | |
| | | | | | | | |
| Principal
Amount/Shares | Value |
BANK LOAN OBLIGATIONS(6) — 0.7% | | |
Automobile Components† | | |
| Clarios Global LP, 2021 USD Term Loan B, 8.09%, (1-month LIBOR plus 3.25%), 4/30/26 | $ | 333,189 | | $ | 332,078 | |
| Chemicals — 0.1% | | |
| Consolidated Energy Finance SA, Term Loan B, 7.34%, (1-month LIBOR plus 2.50%), 5/7/25 | 847,001 | | 840,649 | |
| Diversified Telecommunication Services — 0.1% | | |
| Consolidated Communications, Inc., 2021 Term Loan B, 8.38%, (1-month LIBOR plus 3.50%), 10/2/27 | 1,925,000 | | 1,539,278 | |
Energy Equipment and Services† | | |
| Parker Drilling Co., 2nd Lien PIK Term Loan, 11.00% Cash plus 2.00% PIK, 3/26/24 | 222,207 | | 219,151 | |
Entertainment† | | |
| Allen Media LLC, 2021 Term Loan B, 10.55%, (3-month LIBOR plus 5.50%), 2/10/27 | 841,093 | | 744,367 | |
Health Care Equipment and Supplies† | | |
| Avantor Funding, Inc., 2021 Term Loan B5, 7.09%, (1-month LIBOR plus 2.25%), 11/8/27 | 642,992 | | 643,346 | |
| Embecta Corp., Term Loan B, 7.79%, (6-month SOFR plus 3.00%), 3/30/29 | 122,674 | | 121,075 | |
| | 764,421 | |
| Hotels, Restaurants and Leisure — 0.2% | | |
| Formula One Holdings Ltd., Term Loan B, 8.06%, (1-month SOFR plus 3.25%), 1/15/30 | 450,000 | | 450,752 | |
| Scientific Games Holdings LP, 2022 USD Term Loan B, 8.10%, (3-month SOFR plus 3.50%), 4/4/29 | 1,940,250 | | 1,916,453 | |
| UFC Holdings LLC, 2021 Term Loan B, 7.57%, (3-month LIBOR plus 2.75%), 4/29/26 | 741,243 | | 738,174 | |
| | 3,105,379 | |
Insurance† | | |
| Hub International Ltd., 2018 Term Loan B, 7.82%, (3-month LIBOR plus 3.00%), 4/25/25 | 220,672 | | 220,302 | |
Media† | | |
Diamond Sports Group LLC, 2022 2nd Lien Term Loan, 8.03%, (3-month SOFR plus 3.25%), 8/24/26(3)(4) | 604,828 | | 34,651 | |
| DirecTV Financing LLC, Term Loan, 9.84%, (1-month LIBOR plus 5.00%), 8/2/27 | 589,423 | | 568,592 | |
| Univision Communications, Inc., 2022 First Lien Term Loan B, 9.15%, (3-month SOFR plus 4.25%), 6/24/29 | 74,438 | | 74,047 | |
| | 677,290 | |
| Oil, Gas and Consumable Fuels — 0.1% | | |
| Ascent Resources - Utica, 2020 Fixed 2nd Lien Term Loan, 13.82%, (3-month LIBOR plus 9.00%), 11/1/25 | 2,381,000 | | 2,528,824 | |
| Software — 0.1% | | |
| Cloud Software Group, Inc., 2022 USD Term Loan A, 9.50%, (3-month SOFR plus 4.50%), 9/29/28 | 1,275,000 | | 1,155,921 | |
| Specialty Retail — 0.1% | | |
| Staples, Inc., 7 Year Term Loan, 9.81%, (3-month LIBOR plus 5.00%), 4/16/26 | 909,266 | | 839,466 | |
TOTAL BANK LOAN OBLIGATIONS (Cost $14,010,986) | | 12,967,126 | |
| COMMON STOCKS — 0.5% | | |
Building Products† | | |
Hardwood Holdings LLC (Acquired 4/27/21, Cost $12,630)(4)(7) | 1,684 | | 143,140 | |
Diversified Telecommunication Services† | | |
Intelsat SA(4) | 32,303 | | 787,386 | |
| | | | | | | | |
| Principal
Amount/Shares | Value |
| Energy Equipment and Services — 0.1% | | |
Parker Drilling Co.(4) | 11,530 | | $ | 126,830 | |
Superior Energy Services (Acquired 2/16/21, Cost $1,781,815)(7) | 31,903 | | 2,197,319 | |
| | 2,324,149 | |
Gas Utilities† | | |
| Ferrellgas Partners LP, Class B | 364 | | 54,964 | |
| IT Services — 0.2% | | |
Carnelian Point Holdings LP(4) | 2,222 | | 3,095,401 | |
Machinery† | | |
UC Holdings, Inc. (Acquired 9/21/15 - 9/30/15, Cost $103,222)(4)(7) | 4,088 | | 31,682 | |
Media† | | |
Cumulus Media, Inc., Class A(4) | 1 | | 4 | |
iHeartMedia, Inc., Class A(4) | 342 | | 1,334 | |
TPC Holdings, Inc., A Shares (Acquired 11/16/22, Cost $97,580)(4)(7) | 7,517 | | 206,717 | |
| | 208,055 | |
Metals and Mining† | | |
Petra Diamonds Ltd.(4) | 108,200 | | 100,107 | |
| Oil, Gas and Consumable Fuels — 0.2% | | |
Athabasca Oil Corp. (Acquired 11/23/22 - 1/26/23, Cost $—)(4)(7) | 532,456 | | 1,272,570 | |
Bruin Blocker LLC (Acquired 7/23/18 - 9/19/19, Cost $29,473)(4)(7) | 1,651 | | 1,420 | |
Canvas Energy, Inc. (Acquired 6/26/18 - 7/1/22, Cost $1,472,667)(7) | 29,188 | | 1,313,460 | |
Sabine Oil & Gas Holdings, Inc. (Acquired 5/30/17, Cost $578)(4)(7) | 13 | | 182 | |
Summit Midstream Partners LP(4) | 45,521 | | 698,747 | |
Warren Resources, Inc.(4) | 960 | | — | |
| | 3,286,379 | |
Pharmaceuticals† | | |
Mallinckrodt PLC(4) | 59,811 | | 436,028 | |
TOTAL COMMON STOCKS (Cost $13,949,697) | | 10,467,291 | |
| CONVERTIBLE BONDS — 0.1% | | |
| IT Services — 0.1% | | |
Carnelian Point Holdings LP, 5.00% PIK, 6/30/28(1) | $ | 235,339 | | 1,074,229 | |
Wireless Telecommunication Services† | | |
Digicel Group Holdings Ltd., 7.00% PIK(1)(8) | 177,682 | | 20,672 | |
TOTAL CONVERTIBLE BONDS (Cost $2,392,043) | | 1,094,901 | |
WARRANTS† | | |
Diversified Telecommunication Services† | | |
Intelsat SA(4) | 6 | | 8 | |
Hotels, Restaurants and Leisure† | | |
CWT Travel Holdings Inc.(4) | 7,905 | | 498 | |
CWT Travel Holdings Inc.(4) | 8,321 | | 1,569 | |
| | 2,067 | |
Independent Power and Renewable Electricity Producers† | | |
Vistra Corp.(4) | 1,215 | | 127 | |
Oil, Gas and Consumable Fuels† | | |
California Resources Corp.(4) | 66 | | 561 | |
| | | | | | | | |
| Principal
Amount/Shares | Value |
Denbury, Inc.(4) | 8,187 | | $ | 465,513 | |
| | 466,074 | |
TOTAL WARRANTS (Cost $2,454,786) | | 468,276 | |
ESCROW INTERESTS†(9) | | |
Banks† | | |
Washington Mutual, Inc.(4) | $ | 250,000 | | 1,875 | |
Diversified Telecommunication Services† | | |
Intelsat Jackson Holdings SA(4) | 2,950,000 | | 295 | |
Intelsat Jackson Holdings SA(4) | 400,000 | | 40 | |
| | 335 | |
Electric Utilities† | | |
GenOn Energy, Inc.(4) | 450,000 | | — | |
RRI Energy, Inc.(4) | 75,000 | | — | |
| | — | |
Energy Equipment and Services† | | |
Basic Energy Services, Inc.(4) | 275,000 | | 5,500 | |
Ground Transportation† | | |
Hertz Corp.(4) | 1,075,000 | | 102,125 | |
Oil, Gas and Consumable Fuels† | | |
Cloud Peak Energy Resources LLC / Cloud Peak Energy Finance Corp.(4) | 950,000 | | 5,700 | |
Gulfport Energy Corp.(4) | 800,000 | | 1,504 | |
Gulfport Energy Corp.(4) | 1,020,000 | | 1,918 | |
Gulfport Energy Corp.(4) | 1,402,000 | | 2,636 | |
Sanchez Energy Corp.(4) | 3,990,000 | | 34,912 | |
Sanchez Energy Corp.(4) | 2,475,000 | | 21,656 | |
| | 68,326 | |
Paper and Forest Products† | | |
Appcion Esc(4) | 200,000 | | — | |
TOTAL ESCROW INTERESTS (Cost $5,688,579) | | 178,161 | |
RIGHTS† | | |
Diversified Telecommunication Services† | | |
Intelsat Jackson Holdings SA(4) | 3,381 | | 24,794 | |
Intelsat Jackson Holdings SA(4) | 3,381 | | 22,540 | |
| | 47,334 | |
Independent Power and Renewable Electricity Producers† | | |
| Vistra Corp. | 3,425 | | 4,238 | |
TOTAL RIGHTS (Cost $—) | | 51,572 | |
| SHORT-TERM INVESTMENTS — 1.4% | | |
| Money Market Funds — 1.4% | | |
State Street Institutional U.S. Government Money Market Fund, Premier Class
(Cost $27,465,483) | 27,465,483 | | 27,465,483 | |
TOTAL INVESTMENT SECURITIES — 98.6% (Cost $2,128,017,806) | | 1,929,104,511 | |
| OTHER ASSETS AND LIABILITIES — 1.4% | | 27,662,314 | |
| TOTAL NET ASSETS — 100.0% | | $ | 1,956,766,825 | |
| | | | | | | | |
| NOTES TO SCHEDULE OF INVESTMENTS |
| LIBOR | – | London Interbank Offered Rate |
| PIK | – | Payment in Kind. Security may elect to pay a cash rate and/or an in kind rate. |
| SOFR | – | Secured Overnight Financing Rate |
| USD | – | United States Dollar |
| VRN | – | Variable Rate Note. The rate adjusts periodically based upon the terms set forth in the security’s offering documents. The rate shown is effective at the period end and the reference rate and spread, if any, is indicated. The security's effective maturity date may be shorter than the final maturity date shown. |
†Category is less than 0.05% of total net assets.
(1)Security was purchased pursuant to Rule 144A or Section 4(2) under the Securities Act of 1933 and may be sold in transactions exempt from registration, normally to qualified institutional investors. The aggregate value of these securities at the period end was $1,408,320,762, which represented 72.0% of total net assets.
(2)When-issued security. The issue price and yield are fixed on the date of the commitment, but payment and delivery are scheduled for a future date.
(3)Security is in default.
(4)Non-income producing.
(5)Maturity is in default.
(6)The interest rate on a bank loan obligation adjusts periodically based on a predetermined schedule. Rate or range of rates shown is effective at period end. The maturity date on a bank loan obligation may be less than indicated as a result of contractual or optional prepayments. These prepayments cannot be predicted with certainty.
(7)Restricted security that may not be offered for public sale without being registered with the Securities and Exchange Commission and/or may be subject to resale, redemption or transferability restrictions. The aggregate value of these securities at the period end was $5,166,490, which represented 0.3% of total net assets.
(8)Perpetual maturity with no stated maturity date.
(9)Escrow interests represent beneficial interests in bankruptcy reorganizations or liquidation proceedings and may be subject to resale, redemption, or transferability restrictions. The amount and timing of future payments, if any, cannot be predicted with certainty.
See Notes to Financial Statements.
| | |
| Statement of Assets and Liabilities |
| | | | | |
| MARCH 31, 2023 | |
| Assets | |
| Investment securities, at value (cost of $2,128,017,806) | $ | 1,929,104,511 | |
| Cash | 410,695 | |
| Receivable for investments sold | 1,526,658 | |
| Receivable for capital shares sold | 1,338,719 | |
| Interest and dividends receivable | 33,876,484 | |
| 1,966,257,067 | |
| |
| Liabilities | |
| Payable for investments purchased | 6,750,438 | |
| Payable for capital shares redeemed | 1,531,928 | |
| Accrued management fees | 496,311 | |
| Distribution and service fees payable | 1,013 | |
| Dividends payable | 710,552 | |
| 9,490,242 | |
| |
| Net Assets | $ | 1,956,766,825 | |
| |
| Net Assets Consist of: | |
| Capital paid in | $ | 2,236,266,726 | |
| Distributable earnings (loss) | (279,499,901) | |
| $ | 1,956,766,825 | |
| | | | | | | | | | | |
| Net Assets | Shares Outstanding | Net Asset Value Per Share* |
| Investor Class | $117,101,199 | 14,190,971 | $8.25 |
| I Class | $340,612,881 | 41,296,031 | $8.25 |
| Y Class | $208,456,999 | 25,269,742 | $8.25 |
| A Class | $4,864,970 | 589,500 | $8.25 |
| R5 Class | $175,537 | 21,277 | $8.25 |
| R6 Class | $267,183,232 | 32,402,301 | $8.25 |
| G Class | $1,018,372,007 | 123,471,399 | $8.25 |
*Maximum offering price per share was equal to the net asset value per share for all share classes, except Class A, for which the maximum offering price per share was $8.64 (net asset value divided by 0.955). A contingent deferred sales charge may be imposed on redemptions of Class A.
See Notes to Financial Statements.
| | | | | |
| YEAR ENDED MARCH 31, 2023 |
| Investment Income (Loss) | |
| Income: | |
| Interest | $ | 114,717,699 | |
| Dividends | 820,057 | |
| 115,537,756 | |
| |
| Expenses: | |
| Management fees | 9,784,815 | |
| Distribution and service fees - A Class | 12,010 | |
| Trustees' fees and expenses | 110,278 | |
| Other expenses | 575 | |
| 9,907,678 | |
| Fees waived - G Class | (4,085,908) | |
| 5,821,770 | |
| |
| Net investment income (loss) | 109,715,986 | |
| |
| Realized and Unrealized Gain (Loss) | |
| Net realized gain (loss) on investment transactions | (51,205,995) | |
| Change in net unrealized appreciation (depreciation) on investments | (90,874,088) | |
| |
| Net realized and unrealized gain (loss) | (142,080,083) | |
| |
| Net Increase (Decrease) in Net Assets Resulting from Operations | $ | (32,364,097) | |
See Notes to Financial Statements.
| | |
| Statement of Changes in Net Assets |
| | | | | | | | |
| YEARS ENDED MARCH 31, 2023 AND MARCH 31, 2022 |
| Increase (Decrease) in Net Assets | March 31, 2023 | March 31, 2022 |
| Operations | | |
| Net investment income (loss) | $ | 109,715,986 | | $ | 54,628,327 | |
| Net realized gain (loss) | (51,205,995) | | 20,859,563 | |
| Change in net unrealized appreciation (depreciation) | (90,874,088) | | (69,293,689) | |
| Net increase (decrease) in net assets resulting from operations | (32,364,097) | | 6,194,201 | |
| | |
| Distributions to Shareholders | | |
| From earnings: | | |
| Investor Class | (7,094,687) | | (3,483,523) | |
| I Class | (17,626,474) | | (12,058,789) | |
| Y Class | (19,715,121) | | (34,173,571) | |
| A Class | (291,752) | | (321,642) | |
| R5 Class | (10,585) | | (8,628) | |
| R6 Class | (14,804,778) | | (16,182,933) | |
| G Class | (54,494,228) | | — | |
| Decrease in net assets from distributions | (114,037,625) | | (66,229,086) | |
| | |
| Capital Share Transactions | | |
| Net increase (decrease) in net assets from capital share transactions (Note 5) | 1,209,634,606 | | (117,591,464) | |
| | |
| Net increase (decrease) in net assets | 1,063,232,884 | | (177,626,349) | |
| | |
| Net Assets | | |
| Beginning of period | 893,533,941 | | 1,071,160,290 | |
| End of period | $ | 1,956,766,825 | | $ | 893,533,941 | |
See Notes to Financial Statements.
| | |
Notes to Financial Statements |
MARCH 31, 2023
1. Organization
American Century Investment Trust (the trust) is registered under the Investment Company Act of 1940, as amended (the 1940 Act), as an open-end management investment company and is organized as a Massachusetts business trust. High Income Fund (the fund) is one fund in a series issued by the trust. The fund’s investment objective is to seek current yield and capital growth.
The fund offers the Investor Class, I Class, Y Class, A Class, R5 Class, R6 Class and G Class. The A Class may incur an initial sales charge and may be subject to a contingent deferred sales charge. Sale of the G Class commenced on May 19, 2022.
2. Significant Accounting Policies
The following is a summary of significant accounting policies consistently followed by the fund in preparation of its financial statements. The fund is an investment company and follows accounting and reporting guidance in accordance with accounting principles generally accepted in the United States of America. This may require management to make certain estimates and assumptions at the date of the financial statements. Actual results could differ from these estimates. Management evaluated the impact of events or transactions occurring through the date the financial statements were issued that would merit recognition or disclosure.
Investment Valuations — The fund determines the fair value of its investments and computes its net asset value (NAV) per share at the close of regular trading (usually 4 p.m. Eastern time) on the New York Stock Exchange (NYSE) on each day the NYSE is open. The value of investments of the fund is determined by American Century Investment Management, Inc. (ACIM) (the investment advisor), as the valuation designee, pursuant to its valuation policies and procedures. The Board of Trustees oversees the valuation designee and reviews its valuation policies and procedures at least annually.
Fixed income securities are valued at the evaluated mean as provided by independent pricing services or at the mean of the most recent bid and asked prices as provided by investment dealers. Corporate bonds, bank loan obligations and convertible bonds are valued using market models that consider trade data, quotations from dealers and active market makers, relevant yield curve and spread data, creditworthiness, trade data or market information on comparable securities, and other relevant security specific information.
Equity securities that are listed or traded on a domestic securities exchange are valued at the last reported sales price or at the official closing price as provided by the exchange. Equity securities traded on foreign securities exchanges are generally valued at the closing price of such securities on the exchange where primarily traded or at the close of the NYSE, if that is earlier. If no last sales price is reported, or if local convention or regulation so provides, the mean of the latest bid and asked prices may be used. Securities traded over-the-counter are valued at the mean of the latest bid and asked prices, the last sales price, or the official closing price.
Hybrid securities are valued at the evaluated mean as provided by independent pricing services or at the mean of the most recent bid and asked prices as provided by investment dealers. Preferred stocks and convertible preferred stocks with perpetual maturities are valued using market models that consider trade data, quotations from dealers and active market makers, relevant yield curve and spread data, creditworthiness, trade data or market information on comparable securities, and other relevant security specific information.
Open-end management investment companies are valued at the reported NAV per share.
If the valuation designee determines that the market price for a portfolio security is not readily available or is believed by the valuation designee to be unreliable, such security is valued at fair value as determined in good faith by the valuation designee, in accordance with its policies and procedures. Circumstances that may cause the fund to determine that market quotations are not available or reliable include, but are not limited to: when there is a significant event subsequent to the market quotation; trading in a security has been halted during the trading day; or trading in a security is insufficient or did not take place due to a closure or holiday.
The valuation designee monitors for significant events occurring after the close of an investment’s primary exchange but before the fund’s NAV per share is determined. Significant events may include, but are not limited to: corporate announcements and transactions; regulatory news, governmental action and political unrest that could impact a specific investment or an investment sector; or armed conflicts, natural disasters and similar events that could affect investments in a specific country or region. The valuation designee also monitors for significant fluctuations between domestic and foreign markets, as evidenced by the U.S. market or such other indicators that it deems appropriate. The valuation designee may apply a model-derived factor to the closing price of equity securities traded on foreign securities exchanges. The factor is based on observable market data as provided by an independent pricing service.
Security Transactions — Security transactions are accounted for as of the trade date. Net realized gains and losses are determined on the identified cost basis, which is also used for federal income tax purposes.
Investment Income — Interest income is recorded on the accrual basis and includes paydown gain (loss) and accretion of discounts and amortization of premiums. For convertible bonds, the premiums attributable only to the debt instrument are amortized. Dividend income less foreign taxes withheld, if any, is recorded as of the ex-dividend date. Distributions received on securities that represent a return of capital or long-term capital gain are recorded as a reduction of cost of investments and/or as a realized gain. The fund may estimate the components of distributions received that may be considered nontaxable distributions or long-term capital gain distributions for income tax purposes.
Income Tax Status — It is the fund's policy to distribute substantially all net investment income and net realized gains to shareholders and to otherwise qualify as a regulated investment company under provisions of the Internal Revenue Code. Accordingly, no provision has been made for income taxes. The fund files U.S. federal, state, local and non-U.S. tax returns as applicable. The fund's tax returns are subject to examination by the relevant taxing authority until expiration of the applicable statute of limitations, which is generally three years from the date of filing but can be longer in certain jurisdictions. At this time, management believes there are no uncertain tax positions which, based on their technical merit, would not be sustained upon examination and for which it is reasonably possible that the total amounts of unrecognized tax benefits will significantly change in the next twelve months.
Multiple Class — All shares of the fund represent an equal pro rata interest in the net assets of the class to which such shares belong, and have identical voting, dividend, liquidation and other rights and the same terms and conditions, except for class specific expenses and exclusive rights to vote on matters affecting only individual classes. Income, non-class specific expenses, and realized and unrealized capital gains and losses of the fund are allocated to each class of shares based on their relative net assets.
Distributions to Shareholders — Distributions from net investment income, if any, are declared daily and paid monthly. Distributions from net realized gains, if any, are generally declared and paid annually.
Indemnifications — Under the trust’s organizational documents, its officers and trustees are indemnified against certain liabilities arising out of the performance of their duties to the fund. In addition, in the normal course of business, the fund enters into contracts that provide general indemnifications. The maximum exposure under these arrangements is unknown as this would involve future claims that may be made against a fund. The risk of material loss from such claims is considered by management to be remote.
3. Fees and Transactions with Related Parties
Certain officers and trustees of the trust are also officers and/or directors of American Century Companies, Inc. (ACC). The trust's investment advisor, ACIM, the trust's distributor, American Century Investment Services, Inc. (ACIS), and the trust's transfer agent, American Century Services, LLC, are wholly owned, directly or indirectly, by ACC. ACIM has engaged Nomura Corporate Research and Asset Management Inc. (NCRAM) to serve as a subadvisor for the fund and to manage the fund’s assets. NCRAM is responsible for the day-to-day management of the fund, subject to the general supervision of the Board of Trustees and the investment advisor and in accordance with the investment objective, policies and restrictions of the fund. ACIM pays all costs associated with retaining NCRAM as the subadvisor of the fund. A subsidiary of NCRAM’s parent company indirectly owns a non-controlling equity interest in ACC. Various funds issued by American Century Asset Allocation Portfolios, Inc. own, in aggregate, 28% of the shares of the fund. Related parties do not invest in the fund for the purpose of exercising management or control.
Management Fees — The trust has entered into a management agreement with ACIM, under which ACIM provides the fund with investment advisory and management services in exchange for a single, unified management fee (the fee) per class. The agreement provides that ACIM will pay all expenses of managing and operating the fund, except brokerage expenses, taxes, interest, fees and expenses of the independent trustees (including legal counsel fees), extraordinary expenses, and expenses incurred in connection with the provision of shareholder services and distribution services under a plan adopted pursuant to Rule 12b-1 under the 1940 Act. The fee is computed and accrued daily based on each class's daily net assets and paid monthly in arrears. The difference in the fee among the classes is a result of their separate arrangements for non-Rule 12b-1 shareholder services. It is not the result of any difference in advisory or custodial fees or other expenses related to the management of the fund’s assets, which do not vary by class. The investment advisor agreed to waive the G Class's management fee in its entirety. The investment advisor expects this waiver to remain in effect permanently and cannot terminate it without the approval of the Board of Trustees.
The annual management fee for each class is as follows:
| | | | | | | | | | | | | | | | | | | | |
| Investor Class | I Class | Y Class | A Class | R5 Class | R6 Class | G Class |
| 0.775% | 0.675% | 0.575% | 0.775% | 0.575% | 0.525% | 0.000%(1) |
(1)Effective annual management fee before waiver was 0.525%.
Distribution and Service Fees — The Board of Trustees has adopted a Master Distribution and Individual Shareholder Services Plan (the plan) for the A Class, pursuant to Rule 12b-1 of the 1940 Act. The plan provides that the A Class will pay ACIS an annual distribution and service fee of 0.25%. The fees are computed and accrued daily based on the A Class’s daily net assets and paid monthly in arrears. The fees are used to pay financial intermediaries for distribution and individual shareholder services. Fees incurred under the plan during the period ended March 31, 2023 are detailed in the Statement of Operations.
Trustees' Fees and Expenses — The Board of Trustees is responsible for overseeing the investment advisor’s management and operations of the fund. The trustees receive detailed information about the fund and its investment advisor regularly throughout the year, and meet at least quarterly with management of the investment advisor to review reports about fund operations. The fund's officers do not receive compensation from the fund.
Interfund Transactions — The fund may enter into security transactions with other American Century Investments funds and other client accounts of the investment advisor, in accordance with the 1940 Act rules and procedures adopted by the Board of Trustees. The rules and procedures require, among other things, that these transactions be effected at the independent current market price of the security. There were no interfund transactions during the period.
4. Investment Transactions
Purchases and sales of investment securities, excluding short-term investments, for the period ended March 31, 2023 were $670,068,980 and $524,290,272, respectively.
5. Capital Share Transactions
Transactions in shares of the fund were as follows (unlimited number of shares authorized):
| | | | | | | | | | | | | | |
| Year ended March 31, 2023(1) | Year ended March 31, 2022 |
| Shares | Amount | Shares | Amount |
| Investor Class | | | | |
| Sold | 7,263,408 | | $ | 59,053,505 | | 11,280,954 | | $ | 108,245,608 | |
| Issued in connection with reorganization (Note 9) | 9,811,652 | | 85,242,558 | | — | | — | |
| Issued in reinvestment of distributions | 834,595 | | 6,842,606 | | 341,140 | | 3,281,864 | |
| Redeemed | (10,370,806) | | (85,005,102) | | (9,167,809) | | (87,486,644) | |
| 7,538,849 | | 66,133,567 | | 2,454,285 | | 24,040,828 | |
| I Class | | | | |
| Sold | 50,187,897 | | 416,530,541 | | 18,006,378 | | 175,661,516 | |
| Issued in reinvestment of distributions | 2,143,221 | | 17,556,964 | | 1,253,489 | | 12,058,667 | |
| Redeemed | (32,635,794) | | (267,487,502) | | (10,822,367) | | (104,389,523) | |
| 19,695,324 | | 166,600,003 | | 8,437,500 | | 83,330,660 | |
| Y Class | | | | |
| Sold | 12,853,239 | | 106,904,217 | | 22,158,408 | | 216,138,407 | |
| Issued in reinvestment of distributions | 1,136,636 | | 9,378,711 | | 1,348,978 | | 13,010,723 | |
| Redeemed | (34,881,298) | | (284,831,035) | | (40,778,166) | | (394,865,725) | |
| (20,891,423) | | (168,548,107) | | (17,270,780) | | (165,716,595) | |
| A Class | | | | |
| Sold | 208,316 | | 1,741,659 | | 198,259 | | 1,922,932 | |
| Issued in reinvestment of distributions | 29,296 | | 241,685 | | 32,580 | | 313,533 | |
| Redeemed | (313,584) | | (2,715,138) | | (55,905) | | (540,450) | |
| (75,972) | | (731,794) | | 174,934 | | 1,696,015 | |
| R5 Class | | | | |
| Sold | 2,164 | | 17,860 | | 7,465 | | 72,363 | |
| Issued in reinvestment of distributions | 1,284 | | 10,585 | | 898 | | 8,628 | |
| Redeemed | (313) | | (2,558) | | (4,817) | | (47,047) | |
| 3,135 | | 25,887 | | 3,546 | | 33,944 | |
| R6 Class | | | | |
| Sold | 10,874,881 | | 90,464,936 | | 5,896,148 | | 57,186,768 | |
| Issued in reinvestment of distributions | 1,798,500 | | 14,800,628 | | 1,674,561 | | 16,165,715 | |
| Redeemed | (3,101,112) | | (25,618,355) | | (13,856,051) | | (134,328,799) | |
| 9,572,269 | | 79,647,209 | | (6,285,342) | | (60,976,316) | |
| G Class | | | N/A | |
| Sold | 12,897,141 | | 105,777,478 | | | |
| Issued in connection with reorganization (Note 9) | 111,810,857 | | 971,606,241 | | | |
| Issued in reinvestment of distributions | 6,680,368 | | 54,493,544 | | | |
| Redeemed | (7,916,967) | | (65,369,422) | | | |
| 123,471,399 | | 1,066,507,841 | | | |
| Net increase (decrease) | 139,313,581 | | $ | 1,209,634,606 | | (12,485,857) | | $ | (117,591,464) | |
(1)May 19, 2022 (commencement of sale) through March 31, 2023 for the G Class.
6. Fair Value Measurements
The fund's investments valuation process is based on several considerations and may use multiple inputs to determine the fair value of the investments held by the fund. In conformity with accounting principles generally accepted in the United States of America, the inputs used to determine a valuation are classified into three broad levels.
•Level 1 valuation inputs consist of unadjusted quoted prices in an active market for identical investments.
•Level 2 valuation inputs consist of direct or indirect observable market data (including quoted prices for comparable investments, evaluations of subsequent market events, interest rates, prepayment speeds, credit risk, etc.). These inputs also consist of quoted prices for identical investments initially expressed in local currencies that are adjusted through translation into U.S. dollars.
•Level 3 valuation inputs consist of unobservable data (including a fund’s own assumptions).
The level classification is based on the lowest level input that is significant to the fair valuation measurement. The valuation inputs are not necessarily an indication of the risks associated with investing in these securities or other financial instruments.
The following is a summary of the level classifications as of period end. The Schedule of Investments provides additional information on the fund's portfolio holdings.
| | | | | | | | | | | |
| Level 1 | Level 2 | Level 3 |
| Assets | | | |
| Investment Securities | | | |
| Corporate Bonds | — | | $ | 1,848,548,020 | | — | |
| Preferred Stocks | $ | 1,305,319 | | 26,558,362 | | — | |
| Bank Loan Obligations | — | | 12,967,126 | | — | |
| Common Stocks | 2,535,513 | | 7,931,778 | | — | |
| Convertible Bonds | — | | 1,094,901 | | — | |
| Warrants | 466,201 | | 2,075 | | — | |
| Escrow Interests | — | | 178,161 | | — | |
| Rights | — | | 51,572 | | — | |
| Short-Term Investments | 27,465,483 | | — | | — | |
| $ | 31,772,516 | | $ | 1,897,331,995 | | — | |
7. Risk Factors
The value of the fund’s shares will go up and down, sometimes rapidly or unpredictably, based on the performance of the securities owned by the fund and other factors generally affecting the securities market. Market risks, including political, regulatory, economic and social developments, can affect the value of the fund’s investments. Natural disasters, public health emergencies, war, terrorism and other unforeseeable events may lead to increased market volatility and may have adverse long-term effects on world economies and markets generally.
The fund invests primarily in high-yield and lower-quality debt securities, which are subject to substantial risks including liquidity risk and credit risk.
The fund may invest in instruments that have variable or floating coupon rates based on the London Interbank Offered Rate (LIBOR). LIBOR is a benchmark interest rate intended to be representative of the rate at which certain major international banks lend to one another over short-terms. Financial institutions have started the process of phasing out LIBOR and the transition process to a replacement rate may lead to increased volatility or illiquidity in markets for instruments that rely on LIBOR. This could result in a change to the value of such instruments or a change in the cost of temporary borrowing for the fund.
8. Federal Tax Information
The tax character of distributions paid during the years ended March 31, 2023 and March 31, 2022 were as follows:
| | | | | | | | |
| 2023 | 2022 |
| Distributions Paid From | | |
| Ordinary income | $ | 112,494,589 | | $ | 64,523,748 | |
| Long-term capital gains | $ | 1,543,036 | | $ | 1,705,338 | |
The book-basis character of distributions made during the year from net investment income or net realized gains may differ from their ultimate characterization for federal income tax purposes. These differences reflect the differing character of certain income items and net realized gains and losses for financial statement and tax purposes, and may result in reclassification among certain capital accounts on the financial statements.
The reclassifications, which are primarily due to merger adjustments, were made to capital $25,827,090 and
distributable earnings (loss) $(25,827,090).
As of period end, the federal tax cost of investments and the components of distributable earnings on a tax-basis were as follows:
| | | | | |
| Federal tax cost of investments | $ | 2,132,675,123 | |
| Gross tax appreciation of investments | $ | 18,633,115 | |
| Gross tax depreciation of investments | (222,203,727) | |
| Net tax appreciation (depreciation) of investments | $ | (203,570,612) | |
| Other book-to-tax adjustments | $ | (449,058) | |
| Undistributed ordinary income | — | |
| Accumulated short-term capital losses | $ | (9,976,723) | |
| Accumulated long-term capital losses | $ | (65,503,508) | |
The difference between book-basis and tax-basis unrealized appreciation (depreciation) is attributable primarily to the tax deferral of losses on wash sales.
Accumulated capital losses represent net capital loss carryovers that may be used to offset future realized
capital gains for federal income tax purposes. The capital loss carryovers may be carried forward for an
unlimited period. Due to a shift in ownership of the fund, future capital loss carryover utilization in any given
year is subject to Internal Revenue Code limitations. Any remaining accumulated gains after application of this
limitation will be distributed to shareholders.
9. Reorganization
On December 16, 2021, the Board of Trustees approved an agreement and plan of reorganization (the reorganization), whereby the net assets of NT High Income Fund, one fund in a series issued by the trust, were transferred to High Income Fund in exchange for shares of High Income Fund. The purpose of the transaction was to combine two funds with substantially similar investment objectives and strategies. The financial statements and performance history of High Income Fund survived after the reorganization. The reorganization was effective at the close of the NYSE on May 27, 2022.
The reorganization was accomplished by a tax-free exchange of shares. On May 27, 2022, NT High Income Fund exchanged its shares for shares of High Income Fund as follows:
| | | | | | | | | | | |
| Original Fund/Class | Shares Exchanged | New Fund/Class | Shares Received |
NT High Income
Fund - Investor Class | 9,547,957 | | High Income
Fund - Investor Class | 9,811,652 | |
NT High Income
Fund - G Class | 108,805,862 | | High Income
Fund – G Class | 111,810,857 | |
The net assets of NT High Income Fund and High Income Fund immediately before the reorganization were $1,056,848,799 and $796,025,363, respectively. NT High Income Fund's unrealized depreciation of $(82,568,854) was combined with that of High Income Fund. Immediately after the reorganization, the combined net assets were $1,852,874,162.
Assuming the reorganization had been completed on April 1, 2022, the beginning of the annual reporting period, the pro forma results of operations for the period ended March 31, 2023 are as follows:
| | | | | |
| Net investment income (loss) | $ | 120,533,688 |
| Net realized and unrealized gain (loss) | (191,033,995) |
| Net increase (decrease) in net assets resulting from operations | $ | (70,500,307) |
Because the combined investment portfolios have been managed as a single integrated portfolio since the reorganization was completed, it is not practicable to separate the amounts of revenue and earnings of NT High Income Fund that have been included in the fund’s Statement of Operations since May 27, 2022.
| | | | | | | | | | | | | | | | | | | | | | | | | | | | | | | | | | | | | | | | | | | | | | | |
| For a Share Outstanding Throughout the Years Ended March 31 (except as noted) | | |
| Per-Share Data | | | | | | Ratios and Supplemental Data | | | |
| | Income From Investment Operations: | Distributions From: | | | Ratio to Average Net Assets of: | | |
| Net Asset
Value,
Beginning
of Period | Net Investment Income (Loss)(1) | Net
Realized
and
Unrealized
Gain (Loss) | Total From
Investment
Operations | Net
Investment
Income | Net
Realized
Gains | Total
Distributions | Net Asset
Value,
End
of Period | Total Return(2) | Operating
Expenses | Operating
Expenses
(before
expense
waiver) | Net
Investment
Income
(Loss) | Net
Investment
Income
(Loss)
(before
expense
waiver) | Portfolio
Turnover
Rate | Net
Assets,
End of
Period
(in thousands) |
| Investor Class | | | | | | | | | | | | | | |
| 2023 | $9.13 | 0.49 | (0.85) | (0.36) | (0.50) | (0.02) | (0.52) | $8.25 | (3.76)% | 0.78% | 0.78% | 6.02% | 6.02% | 31% | $117,101 | |
| 2022 | $9.71 | 0.47 | (0.47) | — | (0.48) | (0.10) | (0.58) | $9.13 | (0.19)% | 0.78% | 0.78% | 4.84% | 4.84% | 49% | $60,727 | |
| 2021 | $8.15 | 0.48 | 1.57 | 2.05 | (0.49) | — | (0.49) | $9.71 | 25.69% | 0.78% | 0.78% | 5.21% | 5.21% | 52% | $40,746 | |
| 2020 | $9.32 | 0.48 | (1.16) | (0.68) | (0.49) | — | (0.49) | $8.15 | (7.76)% | 0.78% | 0.78% | 5.14% | 5.14% | 55% | $16,377 | |
| 2019 | $9.43 | 0.53 | (0.11) | 0.42 | (0.53) | — | (0.53) | $9.32 | 4.65% | 0.78% | 0.78% | 5.73% | 5.73% | 43% | $16,796 | |
| I Class | | | | | | | | | | | | | | |
| 2023 | $9.12 | 0.51 | (0.85) | (0.34) | (0.51) | (0.02) | (0.53) | $8.25 | (3.56)% | 0.68% | 0.68% | 6.12% | 6.12% | 31% | $340,613 | |
| 2022 | $9.70 | 0.48 | (0.47) | 0.01 | (0.49) | (0.10) | (0.59) | $9.12 | (0.10)% | 0.68% | 0.68% | 4.94% | 4.94% | 49% | $197,087 | |
| 2021 | $8.15 | 0.49 | 1.56 | 2.05 | (0.50) | — | (0.50) | $9.70 | 25.68% | 0.68% | 0.68% | 5.31% | 5.31% | 52% | $127,684 | |
| 2020 | $9.32 | 0.48 | (1.15) | (0.67) | (0.50) | — | (0.50) | $8.15 | (7.66)% | 0.68% | 0.68% | 5.24% | 5.24% | 55% | $54,346 | |
| 2019 | $9.42 | 0.54 | (0.10) | 0.44 | (0.54) | — | (0.54) | $9.32 | 4.86% | 0.68% | 0.68% | 5.83% | 5.83% | 43% | $24,825 | |
| | | | | | | | | | | | | | | | | | | | | | | | | | | | | | | | | | | | | | | | | | | | | | | |
| For a Share Outstanding Throughout the Years Ended March 31 (except as noted) | | |
| Per-Share Data | | | | | | Ratios and Supplemental Data | | | |
| | Income From Investment Operations: | Distributions From: | | | Ratio to Average Net Assets of: | | |
| Net Asset
Value,
Beginning
of Period | Net Investment Income (Loss)(1) | Net
Realized
and
Unrealized
Gain (Loss) | Total From
Investment
Operations | Net
Investment
Income | Net
Realized
Gains | Total
Distributions | Net Asset
Value,
End
of Period | Total Return(2) | Operating
Expenses | Operating
Expenses
(before
expense
waiver) | Net
Investment
Income
(Loss) | Net
Investment
Income
(Loss)
(before
expense
waiver) | Portfolio
Turnover
Rate | Net
Assets,
End of
Period
(in thousands) |
| Y Class | | | | | | | | | | | | | | |
| 2023 | $9.13 | 0.51 | (0.85) | (0.34) | (0.52) | (0.02) | (0.54) | $8.25 | (3.57)% | 0.58% | 0.58% | 6.22% | 6.22% | 31% | $208,457 | |
| 2022 | $9.70 | 0.49 | (0.46) | 0.03 | (0.50) | (0.10) | (0.60) | $9.13 | 0.11% | 0.58% | 0.58% | 5.04% | 5.04% | 49% | $421,257 | |
| 2021 | $8.15 | 0.50 | 1.56 | 2.06 | (0.51) | — | (0.51) | $9.70 | 25.81% | 0.58% | 0.58% | 5.41% | 5.41% | 52% | $615,479 | |
| 2020 | $9.32 | 0.49 | (1.15) | (0.66) | (0.51) | — | (0.51) | $8.15 | (7.57)% | 0.58% | 0.58% | 5.34% | 5.34% | 55% | $291,873 | |
| 2019 | $9.42 | 0.55 | (0.10) | 0.45 | (0.55) | — | (0.55) | $9.32 | 4.97% | 0.58% | 0.58% | 5.93% | 5.93% | 43% | $125,104 | |
| A Class | | | | | | | | | | | | | | |
| 2023 | $9.13 | 0.47 | (0.85) | (0.38) | (0.48) | (0.02) | (0.50) | $8.25 | (4.00)% | 1.03% | 1.03% | 5.77% | 5.77% | 31% | $4,865 | |
| 2022 | $9.71 | 0.45 | (0.47) | (0.02) | (0.46) | (0.10) | (0.56) | $9.13 | (0.44)% | 1.03% | 1.03% | 4.59% | 4.59% | 49% | $6,075 | |
| 2021 | $8.15 | 0.46 | 1.57 | 2.03 | (0.47) | — | (0.47) | $9.71 | 25.38% | 1.03% | 1.03% | 4.96% | 4.96% | 52% | $4,761 | |
| 2020 | $9.32 | 0.45 | (1.15) | (0.70) | (0.47) | — | (0.47) | $8.15 | (7.99)% | 1.03% | 1.03% | 4.89% | 4.89% | 55% | $2,793 | |
| 2019 | $9.42 | 0.51 | (0.10) | 0.41 | (0.51) | — | (0.51) | $9.32 | 4.50% | 1.03% | 1.03% | 5.48% | 5.48% | 43% | $924 | |
| R5 Class | | | | | | | | | | | | | | |
| 2023 | $9.13 | 0.51 | (0.85) | (0.34) | (0.52) | (0.02) | (0.54) | $8.25 | (3.57)% | 0.58% | 0.58% | 6.22% | 6.22% | 31% | $176 | |
| 2022 | $9.70 | 0.49 | (0.46) | 0.03 | (0.50) | (0.10) | (0.60) | $9.13 | 0.12% | 0.58% | 0.58% | 5.04% | 5.04% | 49% | $166 | |
| 2021 | $8.15 | 0.50 | 1.56 | 2.06 | (0.51) | — | (0.51) | $9.70 | 25.81% | 0.58% | 0.58% | 5.41% | 5.41% | 52% | $142 | |
| 2020 | $9.32 | 0.50 | (1.16) | (0.66) | (0.51) | — | (0.51) | $8.15 | (7.56)% | 0.58% | 0.58% | 5.34% | 5.34% | 55% | $106 | |
| 2019 | $9.42 | 0.55 | (0.10) | 0.45 | (0.55) | — | (0.55) | $9.32 | 4.96% | 0.58% | 0.58% | 5.93% | 5.93% | 43% | $146 | |
| | | | | | | | | | | | | | | | | | | | | | | | | | | | | | | | | | | | | | | | | | | | | | | |
| For a Share Outstanding Throughout the Years Ended March 31 (except as noted) | | |
| Per-Share Data | | | | | | Ratios and Supplemental Data | | | |
| | Income From Investment Operations: | Distributions From: | | | Ratio to Average Net Assets of: | | |
| Net Asset
Value,
Beginning
of Period | Net Investment Income (Loss)(1) | Net
Realized
and
Unrealized
Gain (Loss) | Total From
Investment
Operations | Net
Investment
Income | Net
Realized
Gains | Total
Distributions | Net Asset
Value,
End
of Period | Total Return(2) | Operating
Expenses | Operating
Expenses
(before
expense
waiver) | Net
Investment
Income
(Loss) | Net
Investment
Income
(Loss)
(before
expense
waiver) | Portfolio
Turnover
Rate | Net
Assets,
End of
Period
(in thousands) |
| R6 Class | | | | | | | | | | | | | | |
| 2023 | $9.12 | 0.52 | (0.84) | (0.32) | (0.53) | (0.02) | (0.55) | $8.25 | (3.41)% | 0.53% | 0.53% | 6.27% | 6.27% | 31% | $267,183 | |
| 2022 | $9.70 | 0.49 | (0.47) | 0.02 | (0.50) | (0.10) | (0.60) | $9.12 | 0.05% | 0.53% | 0.53% | 5.09% | 5.09% | 49% | $208,223 | |
| 2021 | $8.14 | 0.50 | 1.58 | 2.08 | (0.52) | — | (0.52) | $9.70 | 25.87% | 0.53% | 0.53% | 5.46% | 5.46% | 52% | $282,349 | |
| 2020 | $9.32 | 0.50 | (1.16) | (0.66) | (0.52) | — | (0.52) | $8.14 | (7.53)% | 0.53% | 0.53% | 5.39% | 5.39% | 55% | $105,526 | |
| 2019 | $9.42 | 0.56 | (0.10) | 0.46 | (0.56) | — | (0.56) | $9.32 | 5.02% | 0.53% | 0.53% | 5.98% | 5.98% | 43% | $97,599 | |
| G Class | | | | | | | | | | | | | | |
2023(3) | $8.41 | 0.48 | (0.12) | 0.36 | (0.50) | (0.02) | (0.52) | $8.25 | 4.39% | 0.00%(4)(5) | 0.53%(4) | 6.82%(4) | 6.29%(4) | 31%(6) | $1,018,372 | |
| | |
| Notes to Financial Highlights |
(1)Computed using average shares outstanding throughout the period.
(2)Total returns are calculated based on the net asset value of the last business day and do not reflect applicable sales charges, if any. Total returns for periods less than one year are not annualized.
(3)May 19, 2022 (commencement of sale) through March 31, 2023.
(4)Annualized.
(5)Ratio was less than 0.005%.
(6)Portfolio turnover is calculated at the fund level. Percentage indicated was calculated for the year ended March 31, 2023.
See Notes to Financial Statements.
| | |
| Report of Independent Registered Public Accounting Firm |
To the Shareholders and the Board of Trustees of American Century Investment Trust:
Opinion on the Financial Statements and Financial Highlights
We have audited the accompanying statement of assets and liabilities, including the schedule of investments, of High Income Fund (the “Fund”), one of the funds constituting the American Century Investment Trust, as of March 31, 2023, the related statement of operations for the year then ended, the statements of changes in net assets and financial highlights for the two years in the period then ended, and the related notes. In our opinion, the financial statements and financial highlights present fairly, in all material respects, the financial position of High Income Fund of the American Century Investment Trust, as of March 31, 2023, and the results of its operations for the year then ended and the changes in its net assets and the financial highlights for the two years then ended in conformity with accounting principles generally accepted in the United States of America. The financial highlights for each of the three years in the period ended March 31, 2021, were audited by other auditors, whose report, dated May 18, 2021, expressed an unqualified opinion on such financial highlights.
Basis for Opinion
These financial statements and financial highlights are the responsibility of the Fund's management. Our responsibility is to express an opinion on the Fund’s financial statements and financial highlights based on our audit. We are a public accounting firm registered with the Public Company Accounting Oversight Board (United States) (PCAOB) and are required to be independent with respect to the Fund in accordance with the U.S. federal securities laws and the applicable rules and regulations of the Securities and Exchange Commission and the PCAOB.
We conducted our audits in accordance with the standards of the PCAOB. Those standards require that we plan and perform the audit to obtain reasonable assurance about whether the financial statements and financial highlights are free of material misstatement, whether due to error or fraud. The Fund is not required to have, nor were we engaged to perform, an audit of its internal control over financial reporting. As part of our audit, we are required to obtain an understanding of internal control over financial reporting but not for the purpose of expressing an opinion on the effectiveness of the Fund’s internal control over financial reporting. Accordingly, we express no such opinion.
Our audits included performing procedures to assess the risks of material misstatement of the financial statements and financial highlights, whether due to error or fraud, and performing procedures that respond to those risks. Such procedures included examining, on a test basis, evidence regarding the amounts and disclosures in the financial statements and financial highlights. Our audits also included evaluating the accounting principles used and significant estimates made by management, as well as evaluating the overall presentation of the financial statements and financial highlights. Our procedures included confirmation of securities owned as of March 31, 2023, by correspondence with the custodian and brokers; when replies were not received from brokers, we performed other auditing procedures. We believe that our audits provide a reasonable basis for our opinion.
/s/ Deloitte & Touche LLP
Kansas City, Missouri
May 16, 2023
We have served as the auditor of one or more American Century investment companies since 1997.
Board of Trustees
The individuals listed below serve as trustees of the funds. Each trustee will continue to serve in this capacity until death, retirement, resignation or removal from office. The board has adopted a mandatory retirement age for trustees who are not “interested persons,” as that term is defined in the Investment Company Act (independent trustees). Independent trustees shall retire on December 31 of the year in which they reach their 76th birthday.
Jonathan S. Thomas is an “interested person” because he currently serves as President and Chief Executive Officer of American Century Companies, Inc. (ACC), the parent company of American Century Investment Management, Inc. (ACIM or the advisor). The other trustees (more than three-fourths of the total number) are independent. They are not employees, directors or officers of, and have no financial interest in, ACC or any of its wholly owned, direct or indirect, subsidiaries, including ACIM, American Century Investment Services, Inc. (ACIS) and American Century Services, LLC (ACS), and they do not have any other affiliations, positions or relationships that would cause them to be considered “interested persons” under the Investment Company Act. The trustees serve in this capacity for eight (in the case of Jonathan S. Thomas, 16; and Jeremy I. Bulow, 9) registered investment companies in the American Century Investments family of funds.
The following table presents additional information about the trustees. The mailing address for each trustee other than Jonathan S. Thomas is 3945 Freedom Circle, Suite #800, Santa Clara, California 95054. The mailing address for Jonathan S. Thomas is 4500 Main Street, Kansas City, Missouri 64111.
| | | | | | | | | | | | | | | | | |
Name
(Year of Birth) | Position(s) Held with Funds | Length of Time Served | Principal Occupation(s) During Past 5 Years | Number of American Century Portfolios Overseen by Trustee | Other Directorships Held During Past 5 Years |
| Independent Trustees | | |
Tanya S. Beder
(1955) | Trustee and Board Chair | Since 2011 (Board Chair since 2022) | Chairman and CEO, SBCC Group Inc. (independent advisory services) (2006 to present) | 32 | Kirby Corporation; Nabors Industries, Ltd. |
Jeremy I. Bulow
(1954) | Trustee | Since 2011 | Professor of Economics, Stanford University, Graduate School of Business (1979 to present) | 77 | None |
Jennifer Cabalquinto
(1968) | Trustee | Since 2021 | Chief Financial Officer, 2K (interactive entertainment) (2021 to present); Special Advisor, GSW Sports, LLC (2020 to 2021); Chief Financial Officer, GSW Sports, LLC (2013 to 2020) | 32 | Sabio Holdings, Inc. |
Anne Casscells
(1958) | Trustee | Since 2016 | Co-Chief Executive Officer and Chief Investment Officer, Aetos Alternatives Management (investment advisory firm) (2001 to present) | 32 | None |
| | | | | | | | | | | | | | | | | |
Name
(Year of Birth) | Position(s) Held with Funds | Length of Time Served | Principal Occupation(s) During Past 5 Years | Number of American Century Portfolios Overseen by Trustee | Other Directorships Held During Past 5 Years |
| Independent Trustees | | |
Jonathan D. Levin
(1972) | Trustee | Since 2016 | Philip H. Knight Professor and Dean, Graduate School of Business, Stanford University (2016 to present); Professor, Stanford University, (2000 to present) | 32 | None |
Peter F. Pervere
(1947) | Trustee | Since 2007 | Retired | 32 | None |
John B. Shoven
(1947) | Trustee | Since 2002 | Charles R. Schwab Professor of Economics, Stanford University (1973 to present, emeritus since 2019) | 32 | Cadence Design Systems; Exponent; Financial Engines |
| Interested Trustee | | |
Jonathan S. Thomas
(1963) | Trustee | Since 2007 | President and Chief Executive Officer, ACC (2007 to present). Also serves as Chief Executive Officer, ACS; Director, ACC and other ACC subsidiaries | 141 | None |
The Statement of Additional Information has additional information about the fund's trustees and is available without charge, upon request, by calling 1-800-345-2021.
Officers
The following table presents certain information about the executive officers of the funds. Each officer serves as an officer for 16 investment companies in the American Century family of funds. No officer is compensated for his or her service as an officer of the funds. The listed officers are interested persons of the funds and are appointed or re-appointed on an annual basis. The mailing address for each of the officers listed below is 4500 Main Street, Kansas City, Missouri 64111.
| | | | | | | | |
Name
(Year of Birth) | Offices with the Funds | Principal Occupation(s) During the Past Five Years |
Patrick Bannigan
(1965)
| President since 2019 | Executive Vice President and Director, ACC (2012 to present); Chief Financial Officer, Chief Accounting Officer and Treasurer, ACC (2015 to present). Also serves as President, ACS; Vice President, ACIM; Chief Financial Officer, Chief Accounting Officer and/or Director, ACIM, ACS and other ACC subsidiaries |
R. Wes Campbell
(1974)
| Chief Financial Officer and Treasurer since 2018 | Vice President, ACS (2020 to present); Investment Operations and Investment Accounting, ACS (2000 to present) |
Amy D. Shelton
(1964) | Chief Compliance Officer and Vice President since 2014 | Chief Compliance Officer, American Century funds, (2014 to present); Chief Compliance Officer, ACIM (2014 to present); Chief Compliance Officer, ACIS (2009 to present). Also serves as Vice President, ACIS |
John Pak
(1968) | General Counsel and Senior Vice President since 2021 | General Counsel and Senior Vice President, ACC (2021 to present); Also serves as General Counsel and Senior Vice President, ACIM, ACS and ACIS. Chief Legal Officer of Investment and Wealth Management, The Bank of New York Mellon (2014 to 2021) |
David H. Reinmiller
(1963) | Vice President since 2000 | Attorney, ACC (1994 to present). Also serves as Vice President, ACIM and ACS |
Ward D. Stauffer
(1960) | Secretary since 2005 | Attorney, ACC (2003 to present) |
| | |
| Liquidity Risk Management Program |
The Fund has adopted a liquidity risk management program (the “program”). The Fund’s Board of Trustees (the "Board") has designated American Century Investment Management, Inc. (“ACIM”) as the administrator of the program. Personnel of ACIM or its affiliates, including members of ACIM’s Investment Oversight Committee who are members of ACIM’s Investment Management and Global Analytics departments, conduct the day-to-day operation of the program pursuant to the program.
Under the program, ACIM manages the Fund’s liquidity risk, which is the risk that the Fund could not meet shareholder redemption requests without significant dilution of remaining shareholders’ interests in the Fund. This risk is managed by monitoring the degree of liquidity of the Fund’s investments, limiting the amount of the Fund’s illiquid investments, and utilizing various risk management tools and facilities available to the Fund for meeting shareholder redemptions, among other means. ACIM’s process of determining the degree of liquidity of certain investments held by the Fund is supported by a third-party liquidity assessment vendor.
The Board reviewed a report prepared by ACIM regarding the operation and effectiveness of the program for the period January 1, 2022 through December 31, 2022. No significant liquidity events impacting the Fund were noted in the report. In addition, ACIM provided its assessment that the program had been effective in managing the Fund’s liquidity risk.
Retirement Account Information
As required by law, distributions you receive from certain retirement accounts are subject to federal income tax withholding at the IRS default rate of 10%.* Tax will be withheld on the total amount withdrawn even though you may be receiving amounts that are not subject to withholding, such as nondeductible contributions. In such case, excess amounts of withholding could occur. You may adjust your withholding election so that a greater or lesser amount will be withheld.
You may elect a different withholding rate, or request zero withholding, by submitting an acceptable IRS Form W-4R election with your distribution request. You may notify us of your W-4R election by telephone, on our distribution forms, on IRS Form W-4R, or through other acceptable electronic means. If your withholding election is for an automatic withdrawal plan, you have the right to revoke your election at any time and any election you make will remain in effect until revoked by filing a new election.
Remember, even if you elect not to have income tax withheld, you are liable for paying income tax on the taxable portion of your withdrawal. If you elect not to have income tax withheld or you don’t have enough income tax withheld, you may be responsible for payment of estimated tax. You may incur penalties under the estimated tax rules if your withholding and estimated tax payments are not sufficient. You can reduce or defer the income tax on a distribution by directly or indirectly rolling such distribution over to another IRA or eligible plan. You should consult your tax advisor for additional information.
State tax will be withheld according to state regulations if, at the time of your distribution, your tax residency is within one of the mandatory withholding states.
*Some 403(b), 457 and qualified retirement plan distributions may be subject to 20% mandatory withholding, as they are subject to special tax and withholding rules. Your plan administrator or plan sponsor is required to provide you with a special tax notice explaining those rules at the time you request a distribution. If applicable, federal and/or state taxes may be withheld from your distribution amount.
Proxy Voting Policies
Descriptions of the principles and policies that the fund's investment advisor uses in exercising the voting rights associated with the securities purchased and/or held by the fund are available without charge, upon request, by calling 1-800-345-2021 or visiting American Century Investments’ website at americancentury.com/proxy. A description of the policies is also available on the Securities and Exchange Commission’s website at sec.gov. Information regarding how the investment advisor voted proxies relating to portfolio securities during the most recent 12-month period ended June 30 is available on americancentury.com/proxy. It is also available at sec.gov.
Quarterly Portfolio Disclosure
The fund files its complete schedule of portfolio holdings with the Securities and Exchange Commission (SEC) for the first and third quarters of each fiscal year as an exhibit to its reports on Form N-PORT. These portfolio holdings are available on the fund's website at americancentury.com and, upon request, by calling 1-800-345-2021. The fund’s Form N-PORT reports are available on the SEC’s website at sec.gov.
Other Tax Information
The following information is provided pursuant to provisions of the Internal Revenue Code.
The fund hereby designates up to the maximum amount allowable as qualified dividend income for the fiscal year ended March 31, 2023.
For corporate taxpayers, the fund hereby designates $820,057, or up to the maximum amount allowable, of ordinary income distributions paid during the fiscal year ended March 31, 2023 as qualified for the corporate dividends received deduction.
The fund hereby designates $1,543,036, or up to the maximum amount allowable, as long-term capital gain distributions (20% rate gain distributions) for the fiscal year ended March 31, 2023.
| | | | | | | | |
| |
| | |
| Contact Us | americancentury.com | |
| Automated Information Line | 1-800-345-8765 | |
| Investor Services Representative | 1-800-345-2021
or 816-531-5575 | |
| Investors Using Advisors | 1-800-378-9878 | |
| Business, Not-For-Profit, Employer-Sponsored Retirement Plans | 1-800-345-3533 | |
| Banks and Trust Companies, Broker-Dealers, Financial Professionals, Insurance Companies | 1-800-345-6488 | |
| Telecommunications Relay Service for the Deaf | 711 | |
| | |
| American Century Investment Trust | |
| | |
Investment Advisor: American Century Investment Management, Inc. Kansas City, Missouri | |
| | |
| This report and the statements it contains are submitted for the general information of our shareholders. The report is not authorized for distribution to prospective investors unless preceded or accompanied by an effective prospectus. | |
| | |
©2023 American Century Proprietary Holdings, Inc. All rights reserved.
CL-ANN-93333 2305 | |
| | | | | |
| |
| Annual Report |
| |
| March 31, 2023 |
| |
| High-Yield Fund |
| Investor Class (ABHIX) |
| I Class (AHYHX) |
| Y Class (AHYLX) |
| A Class (AHYVX) |
| C Class (AHDCX) |
| R Class (AHYRX) |
| R5 Class (ACYIX) |
| R6 Class (AHYDX) |
| | | | | |
| President’s Letter | |
| Performance | |
| Portfolio Commentary | |
| Fund Characteristics | |
| Shareholder Fee Example | |
| Schedule of Investments | |
| Statement of Assets and Liabilities | |
| Statement of Operations | |
| Statement of Changes in Net Assets | |
| Notes to Financial Statements | |
| Financial Highlights | |
| Report of Independent Registered Public Accounting Firm | |
| Management | |
| |
| Liquidity Risk Management Program | |
| |
| Additional Information | |
Any opinions expressed in this report reflect those of the author as of the date of the report, and do not necessarily represent the opinions of American Century Investments® or any other person in the American Century Investments organization. Any such opinions are subject to change at any time based upon market or other conditions and American Century Investments disclaims any responsibility to update such opinions. These opinions may not be relied upon as investment advice and, because investment decisions made by American Century Investments funds are based on numerous factors, may not be relied upon as an indication of trading intent on behalf of any American Century Investments fund. Security examples are used for representational purposes only and are not intended as recommendations to purchase or sell securities. Performance information for comparative indices and securities is provided to American Century Investments by third party vendors. To the best of American Century Investments’ knowledge, such information is accurate at the time of printing.
Jonathan Thomas
Dear Investor:
Thank you for reviewing this annual report for the period ended March 31, 2023. Annual reports help convey important information about fund returns, including market factors that affected performance. For additional investment insights, please visit americancentury.com.
Challenging Conditions Weighed on Asset Class Returns
Prevailing headwinds early in the reporting period continued to challenge U.S. financial markets throughout the 12 months. Asset class performance seesawed but declined overall amid mixed economic data, elevated inflation and anticipated monetary policy responses. By period-end, a new headwind emerged: banking industry uncertainty.
After launching its inflation-fighting rate-hike campaign in March 2022, the Federal Reserve (Fed) lifted rates eight more times by period-end. The federal funds target rate ended the reporting period at 4.75% to 5%, its highest level since 2007, while Treasury yields climbed to multiyear highs. Amid the Fed’s efforts, the annual inflation rate peaked at 9.1% in June, a 40-year high, before easing to 5% by March.
In addition to helping tame inflation, rapidly rising rates also fueled recession worries and led to expectations for the Fed to change course. This sentiment helped spark a rebound among stock and bond indices in the second half of the reporting period. The collapse of two U.S. regional banks late in the period and fears of a looming credit crunch and likely recession also contributed to market expectations for a Fed policy change. Nevertheless, the Fed indicated a near-term course change was unlikely.
Despite delivering strong gains in the second half of the reporting period, stock returns succumbed to first-half losses and declined for the 12 months. Similarly, weakness in the first half of the period overwhelmed second-half gains, and bond returns were negative for the 12-month period.
Remaining Diligent in Uncertain Times
We expect market volatility to linger as investors navigate a complex environment of still-high inflation, tighter financial conditions, banking industry turbulence and economic uncertainty. In addition, increasingly tense geopolitical considerations complicate the market backdrop.
We appreciate your confidence in us during these extraordinary times. Our firm has a long history of helping clients weather unpredictable and volatile markets, and we’re confident we will continue to meet today’s challenges.
Sincerely,
Jonathan Thomas
President and Chief Executive Officer
American Century Investments
| | | | | | | | | | | | | | | | | | | | |
| Total Returns as of March 31, 2023 |
| | | Average Annual Returns | |
| Ticker Symbol | 1 year | 5 years | 10 years | Since Inception | Inception Date |
| Investor Class | ABHIX | -4.61% | 2.14% | 2.76% | — | 9/30/97 |
| Bloomberg U.S. High-Yield 2% Issuer Capped Bond Index | — | -3.35% | 3.19% | 4.09% | — | — |
| I Class | AHYHX | -4.49% | 2.25% | — | 2.24% | 4/10/17 |
| Y Class | AHYLX | -4.40% | 2.35% | — | 2.34% | 4/10/17 |
| A Class | AHYVX | | | | | 3/8/02 |
| No sales charge | | -4.84% | 1.85% | 2.51% | — | |
| With sales charge | | -9.13% | 0.92% | 2.04% | — | |
| C Class | AHDCX | -5.56% | 1.13% | 1.74% | — | 12/10/01 |
| R Class | AHYRX | -5.08% | 1.63% | 2.25% | — | 7/29/05 |
| R5 Class | ACYIX | -4.59% | 2.31% | 2.97% | — | 8/2/04 |
| R6 Class | AHYDX | -4.37% | 2.40% | — | 3.07% | 7/26/13 |
Average annual returns since inception are presented when ten years of performance history is not available.
Fund returns would have been lower if a portion of the fees had not been waived.
C Class shares will automatically convert to A Class shares after being held for approximately eight years. C Class average annual returns do not reflect this conversion.
Sales charges include initial sales charges and contingent deferred sales charges (CDSCs), as applicable. A Class shares have a 4.50% maximum initial sales charge and may be subject to a maximum CDSC of 1.00%. C Class shares redeemed within 12 months of purchase are subject to a maximum CDSC of 1.00%. The SEC requires that mutual funds provide performance information net of maximum sales charges in all cases where charges could be applied.
Data presented reflect past performance. Past performance is no guarantee of future results. Current performance may be higher or lower than the performance shown. Total returns for periods less than one year are not annualized. Investment return and principal value will fluctuate, and redemption value may be more or less than original cost. Data assumes reinvestment of dividends and capital gains, and none of the charts reflect the deduction of taxes that a shareholder would pay on fund distributions or the redemption of fund shares. To obtain performance data current to the most recent month end, please call 1-800-345-2021 or visit americancentury.com. For additional information about the fund, please consult the prospectus.
| | |
| Growth of $10,000 Over 10 Years |
| $10,000 investment made March 31, 2013 |
| Performance for other share classes will vary due to differences in fee structure. |
| | | | | |
| Value on March 31, 2023 |
| Investor Class — $13,135 |
|
| Bloomberg U.S. High-Yield 2% Issuer Capped Bond Index — $14,936 |
|
| |
|
Ending value of Investor Class would have been lower if a portion of the fees had not been waived.
| | | | | | | | | | | | | | | | | | | | | | | |
| Total Annual Fund Operating Expenses | | |
| Investor Class | I Class | Y Class | A Class | C Class | R Class | R5 Class | R6 Class |
| 0.80% | 0.70% | 0.60% | 1.05% | 1.80% | 1.30% | 0.60% | 0.55% |
The total annual fund operating expenses shown is as stated in the fund’s prospectus current as of the date of this report. The prospectus may vary from the expense ratio shown elsewhere in this report because it is based on a different time period, includes acquired fund fees and expenses, and, if applicable, does not include fee waivers or expense reimbursements.
Data presented reflect past performance. Past performance is no guarantee of future results. Current performance may be higher or lower than the performance shown. Total returns for periods less than one year are not annualized. Investment return and principal value will fluctuate, and redemption value may be more or less than original cost. Data assumes reinvestment of dividends and capital gains, and none of the charts reflect the deduction of taxes that a shareholder would pay on fund distributions or the redemption of fund shares. To obtain performance data current to the most recent month end, please call 1-800-345-2021 or visit americancentury.com. For additional information about the fund, please consult the prospectus.
Portfolio Managers: Jeffrey Houston, Gavin Fleischman and Charles Tan
Performance Summary
High-Yield returned -4.61%* for the 12 months ended March 31, 2023, compared with the Bloomberg U.S. High-Yield 2% Issuer Capped Bond Index, which returned -3.35%. Fund returns reflect operating expenses, while index returns do not.
Inflation, Federal Reserve Policy Challenged Bond Market
Elevated inflation, aggressive Federal Reserve (Fed) policy, rising interest rates and mounting recession risk dominated the reporting period and contributed to heightened market volatility. After peaking in June, inflation moderated through March but remained well above the Fed’s target, which led to consistent interest rate hikes. In March, the collapse of two U.S. regional banks introduced a new market headwind, as banks moved to tighten lending standards amid industry uncertainty.
Against this backdrop, Treasury yields were volatile, particularly during the banking industry turmoil. For the period overall, yields rose sharply across the yield curve. This dynamic contributed to negative 12-month returns for most investment-grade bond market sectors, including Treasuries, mortgage-backed securities and corporate bonds. Concerns about slowing economic and earnings growth and a potential recession weighed on high-yield corporates, but the asset class generally fared better than investment-grade bonds and U.S. stocks.
Sector Allocations Detracted
Our sector allocations detracted from relative performance, largely due to consumer noncyclicals companies and the energy sector. Among consumer noncyclicals issuers, our overweight position versus the index in pharmaceuticals companies was a main detractor. In the energy sector, our underweight position in the oil field services industry, which delivered relatively strong performance, weighed on results.
From a quality perspective, an out-of-index position in investment-grade securities with BBB credit ratings modestly detracted. This was largely due to the position’s longer average duration, which hindered results as yields rose for the 12-month period.
On a positive note, our overweight position to the gaming industry and underweight to the retail sector aided relative performance.
Security Selection Added Value
Our security selection efforts were positive overall, particularly among consumer noncyclicals companies. Our selections in the pharmaceuticals industry boosted results due to our preference for higher quality holdings. Additionally, we underweighted Bausch Health, which significantly underperformed. In the energy sector, our investments in higher quality midstream companies aided relative performance.
Detractors included selections in the gaming industry, where our holdings in PENN Entertainment and Station Casinos underperformed their peers. In the finance sector, our position in longer-duration Air Lease Corporation, an aircraft leasing company, weighed on results. Elsewhere in the aircraft leasing industry, a position in Aircastle hybrid securities detracted. By period-end, we had exited our stakes in PENN Entertainment and Air Lease Corporation.
*All fund returns referenced in this commentary are for Investor Class shares. Performance for other share classes will vary due to differences in fee structure; when Investor Class performance exceeds that of the index, other share classes may not. See page 3 for returns for all share classes.
| | | | | |
| MARCH 31, 2023 | |
| Types of Investments in Portfolio | % of net assets |
| Corporate Bonds | 85.3% |
| Exchange-Traded Funds | 4.5% |
| Bank Loan Obligations | 1.8% |
| Preferred Stocks | 1.2% |
| Short-Term Investments | 18.9% |
| Other Assets and Liabilities | (11.7)% |
Fund shareholders may incur two types of costs: (1) transaction costs, including sales charges (loads) on purchase payments and redemption/exchange fees; and (2) ongoing costs, including management fees; distribution and service (12b-1) fees; and other fund expenses. This example is intended to help you understand your ongoing costs (in dollars) of investing in your fund and to compare these costs with the ongoing cost of investing in other mutual funds.
The example is based on an investment of $1,000 made at the beginning of the period and held for the entire period from October 1, 2022 to March 31, 2023.
Actual Expenses
The table provides information about actual account values and actual expenses for each class. You may use the information, together with the amount you invested, to estimate the expenses that you paid over the period. First, identify the share class you own. Then simply divide your account value by $1,000 (for example, an $8,600 account value divided by $1,000 = 8.6), then multiply the result by the number under the heading “Expenses Paid During Period” to estimate the expenses you paid on your account during this period.
If you hold Investor Class shares of any American Century Investments mutual fund, or I Class shares of the American Century Diversified Bond Fund, in an American Century Investments account (i.e., not through a financial intermediary or employer-sponsored retirement plan account), American Century Investments may charge you a $25 annual account maintenance fee if the value of those shares is less than $10,000. We will redeem shares automatically in one of your accounts to pay the $25 fee. In determining your total eligible investment amount, we will include your investments in all personal accounts (including American Century Investments brokerage accounts) registered under your Social Security number. Personal accounts include individual accounts, joint accounts, UGMA/UTMA accounts, personal trusts, Coverdell Education Savings Accounts and IRAs (including traditional, Roth, Rollover, SEP-, SARSEP- and SIMPLE-IRAs), and certain other retirement accounts. If you have only business, business retirement, employer-sponsored or American Century Investments brokerage accounts, you are currently not subject to this fee. If you are subject to the account maintenance fee, your account value could be reduced by the fee amount.
Hypothetical Example for Comparison Purposes
The table also provides information about hypothetical account values and hypothetical expenses based on the actual expense ratio of each class of your fund and an assumed rate of return of 5% per year before expenses, which is not the actual return of a fund’s share class. The hypothetical account values and expenses may not be used to estimate the actual ending account balance or expenses you paid for the period. You may use this information to compare the ongoing costs of investing in your fund and other funds. To do so, compare this 5% hypothetical example with the 5% hypothetical examples that appear in the shareholder reports of the other funds.
Please note that the expenses shown in the table are meant to highlight your ongoing costs only and do not reflect any transactional costs, such as sales charges (loads) or redemption/exchange fees. Therefore, the table is useful in comparing ongoing costs only, and will not help you determine the relative total costs of owning different funds. In addition, if these transactional costs were included, your costs would have been higher.
| | | | | | | | | | | | | | |
| Beginning Account Value 10/1/22 | Ending Account Value 3/31/23 | Expenses Paid During Period(1) 10/1/22 - 3/31/23 | Annualized Expense Ratio(1) |
| Actual | | | | |
| Investor Class | $1,000 | $1,068.10 | $4.02 | 0.78% |
| I Class | $1,000 | $1,068.50 | $3.51 | 0.68% |
| Y Class | $1,000 | $1,071.30 | $3.00 | 0.58% |
| A Class | $1,000 | $1,066.80 | $5.31 | 1.03% |
| C Class | $1,000 | $1,062.80 | $9.15 | 1.78% |
| R Class | $1,000 | $1,065.40 | $6.59 | 1.28% |
| R5 Class | $1,000 | $1,069.10 | $2.99 | 0.58% |
| R6 Class | $1,000 | $1,069.40 | $2.73 | 0.53% |
| Hypothetical | | | | |
| Investor Class | $1,000 | $1,021.04 | $3.93 | 0.78% |
| I Class | $1,000 | $1,021.54 | $3.43 | 0.68% |
| Y Class | $1,000 | $1,022.04 | $2.92 | 0.58% |
| A Class | $1,000 | $1,019.80 | $5.19 | 1.03% |
| C Class | $1,000 | $1,016.06 | $8.95 | 1.78% |
| R Class | $1,000 | $1,018.55 | $6.44 | 1.28% |
| R5 Class | $1,000 | $1,022.04 | $2.92 | 0.58% |
| R6 Class | $1,000 | $1,022.29 | $2.67 | 0.53% |
(1)Expenses are equal to the class's annualized expense ratio listed in the table above, multiplied by the average account value over the period, multiplied by 182, the number of days in the most recent fiscal half-year, divided by 365, to reflect the one-half year period. Annualized expense ratio reflects actual expenses, including any applicable fee waivers or expense reimbursements and excluding any acquired fund fees and expenses.
MARCH 31, 2023
| | | | | | | | |
| Principal
Amount/Shares | Value |
| CORPORATE BONDS — 85.3% | | |
| Aerospace and Defense — 2.3% | | |
Bombardier, Inc., 7.50%, 3/15/25(1) | $ | 113,000 | | $ | 113,105 | |
Bombardier, Inc., 7.50%, 2/1/29(1) | 175,000 | | 178,937 | |
Rolls-Royce PLC, 5.75%, 10/15/27(1) | 250,000 | | 249,279 | |
| TransDigm, Inc., 6.375%, 6/15/26 | 520,000 | | 508,849 | |
TransDigm, Inc., 6.75%, 8/15/28(1) | 600,000 | | 606,750 | |
| TransDigm, Inc., 4.625%, 1/15/29 | 500,000 | | 445,020 | |
| | 2,101,940 | |
| Air Freight and Logistics — 0.7% | | |
| GXO Logistics, Inc., 2.65%, 7/15/31 | 280,000 | | 218,024 | |
Rand Parent LLC, 8.50%, 2/15/30(1) | 495,000 | | 465,832 | |
| | 683,856 | |
| Automobile Components — 0.2% | | |
ZF North America Capital, Inc., 4.75%, 4/29/25(1) | 160,000 | | 157,422 | |
| Automobiles — 2.1% | | |
Ford Motor Co., 6.10%, 8/19/32(2) | 500,000 | | 485,230 | |
| Ford Motor Credit Co. LLC, 4.95%, 5/28/27 | 500,000 | | 477,650 | |
| Ford Motor Credit Co. LLC, 7.35%, 11/4/27 | 250,000 | | 258,127 | |
| Ford Motor Credit Co. LLC, 2.90%, 2/10/29 | 418,000 | | 346,604 | |
| Ford Motor Credit Co. LLC, 3.625%, 6/17/31 | 500,000 | | 412,668 | |
| | 1,980,279 | |
| Banks — 0.5% | | |
| HSBC Holdings PLC, 4.25%, 3/14/24 | 470,000 | | 457,947 | |
| Broadline Retail — 0.9% | | |
Macy's Retail Holdings LLC, 5.875%, 4/1/29(1)(2) | 250,000 | | 231,540 | |
Macy's Retail Holdings LLC, 5.875%, 3/15/30(1) | 95,000 | | 84,428 | |
Macy's Retail Holdings LLC, 6.125%, 3/15/32(1) | 550,000 | | 484,654 | |
| | 800,622 | |
| Building Products — 0.8% | | |
Builders FirstSource, Inc., 5.00%, 3/1/30(1) | 120,000 | | 111,245 | |
Standard Industries, Inc., 4.375%, 7/15/30(1) | 750,000 | | 653,348 | |
| | 764,593 | |
| Capital Markets — 0.3% | | |
| Deutsche Bank AG, VRN, 4.30%, 5/24/28 | 301,000 | | 296,916 | |
| Chemicals — 3.3% | | |
| Celanese US Holdings LLC, 6.17%, 7/15/27 | 750,000 | | 755,343 | |
Chemours Co., 5.75%, 11/15/28(1) | 400,000 | | 357,570 | |
Chemours Co., 4.625%, 11/15/29(1) | 400,000 | | 330,363 | |
| Olin Corp., 5.125%, 9/15/27 | 360,000 | | 345,602 | |
| Olin Corp., 5.625%, 8/1/29 | 500,000 | | 482,474 | |
Tronox, Inc., 4.625%, 3/15/29(1) | 490,000 | | 410,897 | |
Valvoline, Inc., 3.625%, 6/15/31(1) | 500,000 | | 425,145 | |
| | 3,107,394 | |
| Commercial Services and Supplies — 2.0% | | |
Clean Harbors, Inc., 4.875%, 7/15/27(1) | 500,000 | | 482,749 | |
Clean Harbors, Inc., 6.375%, 2/1/31(1) | 245,000 | | 250,218 | |
| | | | | | | | |
| Principal
Amount/Shares | Value |
GFL Environmental, Inc., 4.00%, 8/1/28(1) | $ | 700,000 | | $ | 636,629 | |
Prime Security Services Borrower LLC / Prime Finance, Inc., 5.25%, 4/15/24(1) | 500,000 | | 495,050 | |
| | 1,864,646 | |
| Consumer Finance — 0.8% | | |
| Navient Corp., 6.125%, 3/25/24 | 240,000 | | 237,022 | |
| OneMain Finance Corp., 8.25%, 10/1/23 | 465,000 | | 466,883 | |
| | 703,905 | |
| Consumer Staples Distribution & Retail — 1.1% | | |
Albertsons Cos., Inc. / Safeway, Inc. / New Albertsons LP / Albertsons LLC, 3.50%, 3/15/29(1) | 600,000 | | 522,620 | |
United Natural Foods, Inc., 6.75%, 10/15/28(1)(2) | 550,000 | | 511,671 | |
| | 1,034,291 | |
| Containers and Packaging — 4.3% | | |
ARD Finance SA, 6.50% Cash or 7.25% PIK, 6/30/27(1) | 800,000 | | 612,960 | |
| Ball Corp., 6.875%, 3/15/28 | 305,000 | | 315,986 | |
Berry Global, Inc., 5.50%, 4/15/28(1) | 500,000 | | 498,616 | |
| Graphic Packaging International LLC, 4.125%, 8/15/24 | 800,000 | | 782,140 | |
Owens-Brockway Glass Container, Inc., 5.375%, 1/15/25(1) | 530,000 | | 522,183 | |
Sealed Air Corp., 5.125%, 12/1/24(1) | 440,000 | | 437,417 | |
Sealed Air Corp., 5.00%, 4/15/29(1) | 380,000 | | 357,558 | |
Sealed Air Corp. / Sealed Air Corp. US, 6.125%, 2/1/28(1) | 450,000 | | 455,490 | |
| | 3,982,350 | |
| Diversified REITs — 2.0% | | |
Iron Mountain, Inc., 4.875%, 9/15/29(1) | 1,300,000 | | 1,169,844 | |
| SBA Communications Corp., 3.125%, 2/1/29 | 300,000 | | 261,256 | |
VICI Properties LP / VICI Note Co., Inc., 3.50%, 2/15/25(1) | 500,000 | | 474,482 | |
| | 1,905,582 | |
| Diversified Telecommunication Services — 2.7% | | |
Frontier Communications Holdings LLC, 8.75%, 5/15/30(1) | 600,000 | | 598,251 | |
| Hughes Satellite Systems Corp., 5.25%, 8/1/26 | 480,000 | | 455,873 | |
Level 3 Financing, Inc., 3.40%, 3/1/27(1) | 600,000 | | 475,105 | |
| Telecom Italia Capital SA, 6.375%, 11/15/33 | 1,080,000 | | 978,977 | |
| | 2,508,206 | |
| Electric Utilities — 0.3% | | |
| American Electric Power Co., Inc., VRN, 3.875%, 2/15/62 | 330,000 | | 264,548 | |
| Electrical Equipment — 0.3% | | |
Regal Rexnord Corp., 6.40%, 4/15/33(1) | 233,000 | | 233,421 | |
| Electronic Equipment, Instruments and Components — 0.4% | |
Sensata Technologies BV, 5.875%, 9/1/30(1) | 385,000 | | 381,978 | |
| Entertainment — 1.4% | | |
Live Nation Entertainment, Inc., 3.75%, 1/15/28(1) | 750,000 | | 673,125 | |
Netflix, Inc., 4.875%, 6/15/30(1) | 600,000 | | 597,942 | |
| | 1,271,067 | |
| Financial Services — 0.8% | | |
LPL Holdings, Inc., 4.625%, 11/15/27(1) | 532,000 | | 503,219 | |
| SLM Corp., 4.20%, 10/29/25 | 265,000 | | 238,752 | |
| | 741,971 | |
| Food Products — 1.0% | | |
| Kraft Heinz Foods Co., 4.375%, 6/1/46 | 500,000 | | 436,043 | |
Lamb Weston Holdings, Inc., 4.375%, 1/31/32(1) | 550,000 | | 499,294 | |
| | 935,337 | |
| | | | | | | | |
| Principal
Amount/Shares | Value |
| Ground Transportation — 2.3% | | |
Ashtead Capital, Inc., 5.50%, 8/11/32(1) | $ | 300,000 | | $ | 295,293 | |
Uber Technologies, Inc., 7.50%, 5/15/25(1) | 450,000 | | 456,211 | |
| United Rentals North America, Inc., 4.875%, 1/15/28 | 500,000 | | 478,650 | |
United Rentals North America, Inc., 6.00%, 12/15/29(1) | 500,000 | | 507,365 | |
| United Rentals North America, Inc., 3.875%, 2/15/31 | 500,000 | | 441,800 | |
| | 2,179,319 | |
| Health Care Equipment and Supplies — 2.1% | | |
Avantor Funding, Inc., 3.875%, 11/1/29(1) | 560,000 | | 501,715 | |
Garden Spinco Corp., 8.625%, 7/20/30(1) | 500,000 | | 534,748 | |
Hologic, Inc., 3.25%, 2/15/29(1) | 350,000 | | 311,699 | |
Medline Borrower LP, 5.25%, 10/1/29(1)(2) | 650,000 | | 564,569 | |
| | 1,912,731 | |
| Health Care Providers and Services — 7.7% | | |
Acadia Healthcare Co., Inc., 5.50%, 7/1/28(1) | 485,000 | | 470,280 | |
AHP Health Partners, Inc., 5.75%, 7/15/29(1) | 100,000 | | 84,260 | |
| Centene Corp., 4.625%, 12/15/29 | 320,000 | | 301,165 | |
CHS / Community Health Systems, Inc., 5.625%, 3/15/27(1) | 400,000 | | 351,576 | |
CHS / Community Health Systems, Inc., 6.875%, 4/15/29(1) | 250,000 | | 155,075 | |
CHS / Community Health Systems, Inc., 4.75%, 2/15/31(1) | 400,000 | | 295,720 | |
DaVita, Inc., 4.625%, 6/1/30(1) | 650,000 | | 555,425 | |
| Encompass Health Corp., 4.75%, 2/1/30 | 250,000 | | 227,575 | |
| HCA, Inc., 7.69%, 6/15/25 | 500,000 | | 517,491 | |
LifePoint Health, Inc., 5.375%, 1/15/29(1) | 300,000 | | 183,750 | |
Molina Healthcare, Inc., 4.375%, 6/15/28(1) | 420,000 | | 391,104 | |
Molina Healthcare, Inc., 3.875%, 11/15/30(1) | 100,000 | | 87,342 | |
Option Care Health, Inc., 4.375%, 10/31/29(1) | 500,000 | | 442,107 | |
Owens & Minor, Inc., 4.50%, 3/31/29(1)(2) | 350,000 | | 273,473 | |
Owens & Minor, Inc., 6.625%, 4/1/30(1) | 500,000 | | 429,825 | |
Surgery Center Holdings, Inc., 10.00%, 4/15/27(1)(2) | 1,100,000 | | 1,122,649 | |
| Tenet Healthcare Corp., 6.125%, 10/1/28 | 610,000 | | 585,200 | |
Tenet Healthcare Corp., 6.125%, 6/15/30(1) | 650,000 | | 641,810 | |
| | 7,115,827 | |
| Hotels, Restaurants and Leisure — 9.6% | | |
1011778 BC ULC / New Red Finance, Inc., 4.375%, 1/15/28(1) | 1,090,000 | | 1,007,334 | |
Bloomin' Brands, Inc. / OSI Restaurant Partners LLC, 5.125%, 4/15/29(1)(2) | 300,000 | | 268,901 | |
Boyd Gaming Corp., 4.75%, 12/1/27(2) | 400,000 | | 384,000 | |
Caesars Entertainment, Inc., 4.625%, 10/15/29(1)(2) | 929,000 | | 813,372 | |
Caesars Entertainment, Inc., 7.00%, 2/15/30(1) | 100,000 | | 101,842 | |
Carnival Corp., 5.75%, 3/1/27(1) | 600,000 | | 492,849 | |
CDI Escrow Issuer, Inc., 5.75%, 4/1/30(1) | 380,000 | | 367,363 | |
Hilton Domestic Operating Co., Inc., 4.00%, 5/1/31(1) | 670,000 | | 587,322 | |
International Game Technology PLC, 5.25%, 1/15/29(1) | 1,070,000 | | 1,025,595 | |
| MGM Resorts International, 4.625%, 9/1/26 | 215,000 | | 203,604 | |
Royal Caribbean Cruises Ltd., 5.375%, 7/15/27(1) | 1,000,000 | | 891,875 | |
Royal Caribbean Cruises Ltd., 7.25%, 1/15/30(1) | 500,000 | | 503,575 | |
Scientific Games International, Inc., 7.25%, 11/15/29(1) | 1,010,000 | | 1,012,868 | |
Six Flags Entertainment Corp., 4.875%, 7/31/24(1) | 500,000 | | 492,971 | |
Station Casinos LLC, 4.625%, 12/1/31(1) | 590,000 | | 498,824 | |
| | | | | | | | |
| Principal
Amount/Shares | Value |
Wynn Las Vegas LLC / Wynn Las Vegas Capital Corp., 5.25%, 5/15/27(1) | $ | 325,000 | | $ | 307,509 | |
| | 8,959,804 | |
| Household Durables — 1.1% | | |
| KB Home, 7.25%, 7/15/30 | 550,000 | | 558,518 | |
| Meritage Homes Corp., 5.125%, 6/6/27 | 230,000 | | 224,009 | |
Tempur Sealy International, Inc., 3.875%, 10/15/31(1) | 325,000 | | 271,710 | |
| | 1,054,237 | |
| Independent Power and Renewable Electricity Producers — 0.2% | |
Calpine Corp., 4.625%, 2/1/29(1) | 200,000 | | 172,958 | |
| Insurance — 0.4% | | |
SBL Holdings, Inc., VRN, 6.50%(1)(3) | 503,000 | | 355,873 | |
| Life Sciences Tools and Services — 0.5% | | |
Charles River Laboratories International, Inc., 4.25%, 5/1/28(1) | 500,000 | | 468,550 | |
| Machinery — 1.0% | | |
Chart Industries, Inc., 9.50%, 1/1/31(1) | 327,000 | | 345,297 | |
GrafTech Finance, Inc., 4.625%, 12/15/28(1) | 750,000 | | 626,325 | |
| | 971,622 | |
| Media — 8.1% | | |
CCO Holdings LLC / CCO Holdings Capital Corp., 6.375%, 9/1/29(1) | 500,000 | | 477,950 | |
CCO Holdings LLC / CCO Holdings Capital Corp., 4.25%, 2/1/31(1) | 2,402,000 | | 1,966,830 | |
CSC Holdings LLC, 5.375%, 2/1/28(1)(2) | 350,000 | | 287,072 | |
CSC Holdings LLC, 7.50%, 4/1/28(1)(2) | 680,000 | | 434,112 | |
CSC Holdings LLC, 4.50%, 11/15/31(1) | 365,000 | | 263,519 | |
Directv Financing LLC / Directv Financing Co-Obligor, Inc., 5.875%, 8/15/27(1) | 250,000 | | 226,665 | |
DISH DBS Corp., 5.25%, 12/1/26(1) | 435,000 | | 347,900 | |
DISH Network Corp., 11.75%, 11/15/27(1) | 180,000 | | 174,790 | |
Gray Escrow II, Inc., 5.375%, 11/15/31(1) | 496,000 | | 329,907 | |
Gray Television, Inc., 7.00%, 5/15/27(1)(2) | 475,000 | | 398,135 | |
iHeartCommunications, Inc., 8.375%, 5/1/27(2) | 505,000 | | 367,850 | |
Nexstar Media, Inc., 5.625%, 7/15/27(1) | 400,000 | | 370,054 | |
| Paramount Global, VRN, 6.25%, 2/28/57 | 355,000 | | 266,012 | |
| Paramount Global, VRN, 6.375%, 3/30/62 | 290,000 | | 230,145 | |
Sirius XM Radio, Inc., 4.00%, 7/15/28(1) | 500,000 | | 430,000 | |
Sirius XM Radio, Inc., 5.50%, 7/1/29(1) | 379,000 | | 345,347 | |
Univision Communications, Inc., 5.125%, 2/15/25(1) | 375,000 | | 368,762 | |
Virgin Media Secured Finance PLC, 4.50%, 8/15/30(1) | 270,000 | | 232,512 | |
| | 7,517,562 | |
| Metals and Mining — 3.1% | | |
| ATI, Inc., 4.875%, 10/1/29 | 690,000 | | 628,991 | |
| Cleveland-Cliffs, Inc., 7.00%, 3/15/27 | 400,000 | | 391,986 | |
Cleveland-Cliffs, Inc., 4.625%, 3/1/29(1)(2) | 875,000 | | 803,781 | |
Kaiser Aluminum Corp., 4.50%, 6/1/31(1) | 800,000 | | 658,000 | |
Novelis Corp., 3.875%, 8/15/31(1) | 251,000 | | 211,774 | |
Roller Bearing Co. of America, Inc., 4.375%, 10/15/29(1) | 250,000 | | 223,540 | |
| | 2,918,072 | |
| Mortgage Real Estate Investment Trusts (REITs) — 0.7% | | |
Ladder Capital Finance Holdings LLLP / Ladder Capital Finance Corp., 5.25%, 10/1/25(1) | 436,000 | | 384,050 | |
| | | | | | | | |
| Principal
Amount/Shares | Value |
Ladder Capital Finance Holdings LLLP / Ladder Capital Finance Corp., 4.25%, 2/1/27(1) | $ | 354,000 | | $ | 280,000 | |
| | 664,050 | |
| Multi-Utilities — 0.6% | | |
| Sempra Energy, VRN, 4.125%, 4/1/52 | 650,000 | | 525,538 | |
| Oil, Gas and Consumable Fuels — 10.6% | | |
Antero Resources Corp., 7.625%, 2/1/29(1)(2) | 244,000 | | 249,729 | |
Antero Resources Corp., 5.375%, 3/1/30(1)(2) | 370,000 | | 344,609 | |
Blue Racer Midstream LLC / Blue Racer Finance Corp., 7.625%, 12/15/25(1) | 750,000 | | 743,175 | |
Callon Petroleum Co., 7.50%, 6/15/30(1)(2) | 250,000 | | 235,241 | |
CNX Resources Corp., 7.375%, 1/15/31(1)(2) | 1,000,000 | | 986,145 | |
Crescent Energy Finance LLC, 9.25%, 2/15/28(1) | 300,000 | | 287,926 | |
| Crestwood Midstream Partners LP / Crestwood Midstream Finance Corp., 5.75%, 4/1/25 | 460,000 | | 449,788 | |
CrownRock LP / CrownRock Finance, Inc., 5.00%, 5/1/29(1) | 800,000 | | 746,240 | |
EnLink Midstream LLC, 6.50%, 9/1/30(1)(2) | 1,333,000 | | 1,349,396 | |
| EnLink Midstream Partners LP, 4.85%, 7/15/26 | 350,000 | | 337,237 | |
EQM Midstream Partners LP, 7.50%, 6/1/27(1) | 360,000 | | 361,789 | |
EQM Midstream Partners LP, 4.50%, 1/15/29(1) | 365,000 | | 310,723 | |
MEG Energy Corp., 5.875%, 2/1/29(1) | 375,000 | | 361,654 | |
| Occidental Petroleum Corp., 6.375%, 9/1/28 | 1,200,000 | | 1,243,812 | |
| Occidental Petroleum Corp., 6.45%, 9/15/36 | 500,000 | | 526,250 | |
| Southwestern Energy Co., 5.70%, 1/23/25 | 76,000 | | 76,114 | |
| Southwestern Energy Co., 5.375%, 3/15/30 | 850,000 | | 800,122 | |
| Western Midstream Operating LP, 3.95%, 6/1/25 | 500,000 | | 479,017 | |
| | 9,888,967 | |
| Passenger Airlines — 1.1% | | |
American Airlines, Inc., 7.25%, 2/15/28(1) | 260,000 | | 253,101 | |
American Airlines, Inc. / AAdvantage Loyalty IP Ltd., 5.50%, 4/20/26(1) | 262,846 | | 258,993 | |
Spirit Loyalty Cayman Ltd. / Spirit IP Cayman Ltd., 8.00%, 9/20/25(1) | 525,000 | | 528,775 | |
| | 1,040,869 | |
| Pharmaceuticals — 4.1% | | |
1375209 BC Ltd., 9.00%, 1/30/28(1) | 88,000 | | 87,340 | |
180 Medical, Inc., 3.875%, 10/15/29(1) | 700,000 | | 619,574 | |
AdaptHealth LLC, 4.625%, 8/1/29(1) | 375,000 | | 312,615 | |
Bausch Health Cos., Inc., 4.875%, 6/1/28(1) | 300,000 | | 177,270 | |
Bausch Health Cos., Inc., 11.00%, 9/30/28(1) | 158,000 | | 117,053 | |
Elanco Animal Health, Inc., 6.65%, 8/28/28(2) | 250,000 | | 236,743 | |
Horizon Therapeutics USA, Inc., 5.50%, 8/1/27(1) | 750,000 | | 761,970 | |
Jazz Securities DAC, 4.375%, 1/15/29(1) | 367,000 | | 337,970 | |
Organon & Co. / Organon Foreign Debt Co-Issuer BV, 5.125%, 4/30/31(1) | 750,000 | | 666,433 | |
| Perrigo Finance Unlimited Co., 4.40%, 6/15/30 | 250,000 | | 224,758 | |
| Teva Pharmaceutical Finance Netherlands III BV, 3.15%, 10/1/26 | 300,000 | | 271,794 | |
| | 3,813,520 | |
| Specialty Retail — 0.9% | | |
PetSmart, Inc. / PetSmart Finance Corp., 7.75%, 2/15/29(1) | 750,000 | | 737,010 | |
| | | | | | | | |
| Principal
Amount/Shares | Value |
Sonic Automotive, Inc., 4.625%, 11/15/29(1)(2) | $ | 100,000 | | $ | 83,890 | |
| | 820,900 | |
| Technology Hardware, Storage and Peripherals — 0.9% | | |
Seagate HDD Cayman, 9.625%, 12/1/32(1) | 748,800 | | 839,927 | |
| Trading Companies and Distributors — 0.2% | | |
Aircastle Ltd., 5.25%, 8/11/25(1) | 150,000 | | 146,739 | |
| Wireless Telecommunication Services — 1.9% | | |
| Sprint LLC, 7.125%, 6/15/24 | 550,000 | | 559,609 | |
| Sprint LLC, 7.625%, 2/15/25 | 280,000 | | 290,602 | |
| T-Mobile USA, Inc., 3.375%, 4/15/29 | 990,000 | | 903,462 | |
| | 1,753,673 | |
TOTAL CORPORATE BONDS (Cost $85,649,864) | | 79,299,009 | |
| EXCHANGE-TRADED FUNDS — 4.5% | | |
iShares Broad USD High Yield Corporate Bond ETF(2) | 30,600 | | 1,087,830 | |
iShares iBoxx High Yield Corporate Bond ETF(2) | 25,800 | | 1,949,190 | |
SPDR Bloomberg Short Term High Yield Bond ETF(2) | 44,700 | | 1,110,348 | |
TOTAL EXCHANGE-TRADED FUNDS (Cost $4,278,792) | | 4,147,368 | |
BANK LOAN OBLIGATIONS(4) — 1.8% | | |
| Consumer Staples Distribution & Retail — 0.3% | | |
| United Natural Foods, Inc., Term Loan B, 8.17%, (1-month SOFR plus 3.25%), 10/22/25 | $ | 272,955 | | 273,467 | |
| Health Care Equipment and Supplies — 0.5% | | |
| Medline Borrower LP, USD Term Loan B, 8.09%, (1-month LIBOR plus 3.25%), 10/23/28 | 498,741 | | 486,935 | |
| Passenger Airlines — 0.5% | | |
| American Airlines, Inc., 2023 Term Loan B, 8.15%, (6-month SOFR plus 2.75%), 2/15/28 | 485,000 | | 474,997 | |
| Pharmaceuticals — 0.5% | | |
| Horizon Therapeutics USA Inc., 2021 Term Loan B2, 6.56%, (1-month LIBOR plus 1.75%), 3/15/28 | 450,800 | | 450,482 | |
TOTAL BANK LOAN OBLIGATIONS (Cost $1,684,483) | | 1,685,881 | |
| PREFERRED STOCKS — 1.2% | | |
| Banks — 0.7% | | |
BNP Paribas SA, 7.75%(1) | 265,000 | | 254,321 | |
| Lloyds Banking Group PLC, 8.00% | 450,000 | | 415,687 | |
| | 670,008 | |
| Insurance — 0.1% | | |
Allianz SE, 3.20%(1) | 200,000 | | 140,798 | |
| Trading Companies and Distributors — 0.4% | | |
Aircastle Ltd., 5.25%(1) | 454,000 | | 333,508 | |
TOTAL PREFERRED STOCKS (Cost $1,341,692) | | 1,144,314 | |
| SHORT-TERM INVESTMENTS — 18.9% | | |
| Money Market Funds — 12.2% | | |
State Street Navigator Securities Lending Government Money Market Portfolio(5) | 11,341,090 | | 11,341,090 | |
| Repurchase Agreements — 6.7% | | |
| BMO Capital Markets Corp., (collateralized by various U.S. Treasury obligations, 1.125% - 4.375%, 8/15/40 - 5/15/49, valued at $1,661,616), in a joint trading account at 4.67%, dated 3/31/23, due 4/3/23 (Delivery value $1,603,306) | | 1,602,682 | |
| | | | | | | | |
| Principal
Amount/Shares | Value |
| Fixed Income Clearing Corp., (collateralized by various U.S. Treasury obligations, 3.625%, 3/31/28, valued at $4,727,749), at 4.81%, dated 3/31/23, due 4/3/23 (Delivery value $4,636,858) | | $ | 4,635,000 | |
| | 6,237,682 | |
TOTAL SHORT-TERM INVESTMENTS (Cost $17,578,772) | | 17,578,772 | |
TOTAL INVESTMENT SECURITIES — 111.7% (Cost $110,533,603) | | 103,855,344 | |
| OTHER ASSETS AND LIABILITIES — (11.7)% | | (10,859,585) | |
| TOTAL NET ASSETS — 100.0% | | $ | 92,995,759 | |
| | | | | | | | |
| NOTES TO SCHEDULE OF INVESTMENTS |
| LIBOR | – | London Interbank Offered Rate |
| PIK | – | Payment in Kind. Security may elect to pay a cash rate and/or an in kind rate. |
| SOFR | – | Secured Overnight Financing Rate |
| USD | – | United States Dollar |
| VRN | – | Variable Rate Note. The rate adjusts periodically based upon the terms set forth in the security’s offering documents. The rate shown is effective at the period end and the reference rate and spread, if any, is indicated. The security's effective maturity date may be shorter than the final maturity date shown. |
(1)Security was purchased pursuant to Rule 144A or Section 4(2) under the Securities Act of 1933 and may be sold in transactions exempt from registration, normally to qualified institutional investors. The aggregate value of these securities at the period end was $57,367,860, which represented 61.7% of total net assets.
(2)Security, or a portion thereof, is on loan. At the period end, the aggregate value of securities on loan was $12,879,090. The amount of securities on loan indicated may not correspond with the securities on loan identified because securities with pending sales are in the process of recall from the brokers.
(3)Perpetual maturity with no stated maturity date.
(4)The interest rate on a bank loan obligation adjusts periodically based on a predetermined schedule. Rate or range of rates shown is effective at period end. The maturity date on a bank loan obligation may be less than indicated as a result of contractual or optional prepayments. These prepayments cannot be predicted with certainty.
(5)Investment of cash collateral from securities on loan. At the period end, the aggregate value of the collateral held by the fund was $13,351,420, which includes securities collateral of $2,010,330.
See Notes to Financial Statements.
| | |
| Statement of Assets and Liabilities |
| | | | | |
| MARCH 31, 2023 | |
| Assets | |
| Investment securities, at value (cost of $99,192,513) — including $12,879,090 of securities on loan | $ | 92,514,254 | |
| Investment made with cash collateral received for securities on loan, at value (cost of $11,341,090) | 11,341,090 | |
| Total investment securities, at value (cost of $110,533,603) | 103,855,344 | |
| Cash | 6,392 | |
| Receivable for investments sold | 976,090 | |
| Receivable for capital shares sold | 5,322 | |
| Interest and dividends receivable | 1,250,865 | |
| Securities lending receivable | 8,764 | |
| 106,102,777 | |
| |
| Liabilities | |
| Payable for collateral received for securities on loan | 11,341,090 | |
| Payable for investments purchased | 1,504,423 | |
| Payable for capital shares redeemed | 140,319 | |
| Accrued management fees | 60,242 | |
| Distribution and service fees payable | 2,944 | |
| Dividends payable | 58,000 | |
| 13,107,018 | |
| |
| Net Assets | $ | 92,995,759 | |
| |
| Net Assets Consist of: | |
| Capital paid in | $ | 145,880,369 | |
| Distributable earnings (loss) | (52,884,610) | |
| $ | 92,995,759 | |
| | | | | | | | | | | |
| Net Assets | Shares Outstanding | Net Asset Value Per Share* |
| Investor Class | $77,430,570 | 15,778,969 | $4.91 |
| I Class | $4,202,155 | 853,981 | $4.92 |
| Y Class | $14,647 | 2,980 | $4.92 |
| A Class | $8,676,502 | 1,766,455 | $4.91 |
| C Class | $680,549 | 138,588 | $4.91 |
| R Class | $1,255,601 | 255,694 | $4.91 |
| R5 Class | $488,448 | 99,426 | $4.91 |
| R6 Class | $247,287 | 50,401 | $4.91 |
*Maximum offering price per share was equal to the net asset value per share for all share classes, except Class A, for which the maximum offering price per share was $5.14 (net asset value divided by 0.955). A contingent deferred sales charge may be imposed on redemptions of Class A and Class C.
See Notes to Financial Statements.
| | | | | |
| YEAR ENDED MARCH 31, 2023 | |
| Investment Income (Loss) | |
| Income: | |
| Interest | $ | 5,307,204 | |
| Dividends | 231,335 | |
| Securities lending, net | 89,040 | |
| 5,627,579 | |
| |
| Expenses: | |
| Management fees | 760,541 | |
| Distribution and service fees: | |
| A Class | 24,990 | |
| C Class | 7,260 | |
| R Class | 5,705 | |
| Trustees' fees and expenses | 6,535 | |
| 805,031 | |
| |
| Net investment income (loss) | 4,822,548 | |
| |
| Realized and Unrealized Gain (Loss) | |
| Net realized gain (loss) on investment transactions | (7,995,470) | |
| Change in net unrealized appreciation (depreciation) on investments | (2,437,373) | |
| |
| Net realized and unrealized gain (loss) | (10,432,843) | |
| |
| Net Increase (Decrease) in Net Assets Resulting from Operations | $ | (5,610,295) | |
See Notes to Financial Statements.
| | |
| Statement of Changes in Net Assets |
| | | | | | | | |
| YEARS ENDED MARCH 31, 2023 AND MARCH 31, 2022 |
| Increase (Decrease) in Net Assets | March 31, 2023 | March 31, 2022 |
| Operations | | |
| Net investment income (loss) | $ | 4,822,548 | | $ | 5,534,697 | |
| Net realized gain (loss) | (7,995,470) | | 2,535,163 | |
| Change in net unrealized appreciation (depreciation) | (2,437,373) | | (8,886,842) | |
| Net increase (decrease) in net assets resulting from operations | (5,610,295) | | (816,982) | |
| | |
| Distributions to Shareholders | | |
| From earnings: | | |
| Investor Class | (4,058,219) | | (3,978,645) | |
| I Class | (287,606) | | (286,588) | |
| Y Class | (478) | | (792,613) | |
| A Class | (470,998) | | (482,843) | |
| C Class | (28,907) | | (31,668) | |
| R Class | (51,483) | | (40,695) | |
| R5 Class | (26,630) | | (24,677) | |
| R6 Class | (15,242) | | (15,606) | |
| Decrease in net assets from distributions | (4,939,563) | | (5,653,335) | |
| | |
| Capital Share Transactions | | |
| Net increase (decrease) in net assets from capital share transactions (Note 5) | (14,578,019) | | (15,577,018) | |
| | |
| Net increase (decrease) in net assets | (25,127,877) | | (22,047,335) | |
| | |
| Net Assets | | |
| Beginning of period | 118,123,636 | | 140,170,971 | |
| End of period | $ | 92,995,759 | | $ | 118,123,636 | |
| | |
| | |
See Notes to Financial Statements.
| | |
Notes to Financial Statements |
MARCH 31, 2023
1. Organization
American Century Investment Trust (the trust) is registered under the Investment Company Act of 1940, as amended (the 1940 Act), as an open-end management investment company and is organized as a Massachusetts business trust. High-Yield Fund (the fund) is one fund in a series issued by the trust. The fund’s investment objective is to seek high current income. As a secondary objective, the fund seeks capital appreciation, but only when consistent with its primary objective of maximizing current income.
The fund offers the Investor Class, I Class, Y Class, A Class, C Class, R Class, R5 Class and R6 Class. The A Class may incur an initial sales charge. The A Class and C Class may be subject to a contingent deferred sales charge.
2. Significant Accounting Policies
The following is a summary of significant accounting policies consistently followed by the fund in preparation of its financial statements. The fund is an investment company and follows accounting and reporting guidance in accordance with accounting principles generally accepted in the United States of America. This may require management to make certain estimates and assumptions at the date of the financial statements. Actual results could differ from these estimates. Management evaluated the impact of events or transactions occurring through the date the financial statements were issued that would merit recognition or disclosure.
Investment Valuations — The fund determines the fair value of its investments and computes its net asset value (NAV) per share at the close of regular trading (usually 4 p.m. Eastern time) on the New York Stock Exchange (NYSE) on each day the NYSE is open. The value of investments of the fund is determined by American Century Investment Management, Inc. (ACIM) (the investment advisor), as the valuation designee, pursuant to its valuation policies and procedures. The Board of Trustees oversees the valuation designee and reviews its valuation policies and procedures at least annually.
Fixed income securities are valued at the evaluated mean as provided by independent pricing services or at the mean of the most recent bid and asked prices as provided by investment dealers. Corporate bonds and bank loan obligations are valued using market models that consider trade data, quotations from dealers and active market makers, relevant yield curve and spread data, creditworthiness, trade data or market information on comparable securities, and other relevant security specific information. Mortgage-related and asset-backed securities are valued based on models that consider trade data, prepayment and default projections, benchmark yield and spread data and estimated cash flows of each tranche of the issuer. Commercial paper is valued using a curve-based approach that considers money market rates for specific instruments, programs, currencies and maturity points from a variety of active market makers.
Equity securities that are listed or traded on a domestic securities exchange are valued at the last reported sales price or at the official closing price as provided by the exchange. Equity securities traded on foreign securities exchanges are generally valued at the closing price of such securities on the exchange where primarily traded or at the close of the NYSE, if that is earlier. If no last sales price is reported, or if local convention or regulation so provides, the mean of the latest bid and asked prices may be used. Securities traded over-the-counter are valued at the mean of the latest bid and asked prices, the last sales price, or the official closing price.
Hybrid securities are valued at the evaluated mean as provided by independent pricing services or at the mean of the most recent bid and asked prices as provided by investment dealers. Preferred stocks and convertible preferred stocks with perpetual maturities are valued using market models that consider trade data, quotations from dealers and active market makers, relevant yield curve and spread data, creditworthiness, trade data or market information on comparable securities, and other relevant security specific information.
Open-end management investment companies are valued at the reported NAV per share. Repurchase agreements are valued at cost, which approximates fair value.
If the valuation designee determines that the market price for a portfolio security is not readily available or is believed by the valuation designee to be unreliable, such security is valued at fair value as determined in good faith by the valuation designee, in accordance with its policies and procedures. Circumstances that may cause the fund to determine that market quotations are not available or reliable include, but are not limited to: when there is a significant event subsequent to the market quotation; trading in a security has been halted during the trading day; or trading in a security is insufficient or did not take place due to a closure or holiday.
The valuation designee monitors for significant events occurring after the close of an investment’s primary exchange but before the fund’s NAV per share is determined. Significant events may include, but are not limited to: corporate announcements and transactions; regulatory news, governmental action and political unrest that could impact a specific investment or an investment sector; or armed conflicts, natural disasters and similar events that could affect investments in a specific country or region. The valuation designee also monitors for significant fluctuations between domestic and foreign markets, as evidenced by the U.S. market or such other indicators that it deems appropriate. The valuation designee may apply a model-derived factor to the closing price of equity securities traded on foreign securities exchanges. The factor is based on observable market data as provided by an independent pricing service.
Security Transactions — Security transactions are accounted for as of the trade date. Net realized gains and losses are determined on the identified cost basis, which is also used for federal income tax purposes.
Investment Income — Interest income is recorded on the accrual basis and includes paydown gain (loss) and accretion of discounts and amortization of premiums. Dividend income less foreign taxes withheld, if any, is recorded as of the ex-dividend date. Distributions received on securities that represent a return of capital or long-term capital gain are recorded as a reduction of cost of investments and/or as a realized gain. The fund may estimate the components of distributions received that may be considered nontaxable distributions or long-term capital gain distributions for income tax purposes. Securities lending income is net of fees and rebates earned by the lending agent for its services.
Repurchase Agreements — The fund may enter into repurchase agreements with institutions that ACIM has determined are creditworthy pursuant to criteria adopted by the Board of Trustees. The fund requires that the collateral, represented by securities, received in a repurchase transaction be transferred to the custodian in a manner sufficient to enable the fund to obtain those securities in the event of a default under the repurchase agreement. ACIM monitors, on a daily basis, the securities transferred to ensure the value, including accrued interest, of the securities under each repurchase agreement is equal to or greater than amounts owed to the fund under each repurchase agreement.
Joint Trading Account — Pursuant to an Exemptive Order issued by the Securities and Exchange Commission, the fund, along with certain other funds in the American Century Investments family of funds, may transfer uninvested cash balances into a joint trading account. These balances are invested in one or more repurchase agreements that are collateralized by U.S. Treasury or Agency obligations.
Income Tax Status — It is the fund's policy to distribute substantially all net investment income and net realized gains to shareholders and to otherwise qualify as a regulated investment company under provisions of the Internal Revenue Code. Accordingly, no provision has been made for income taxes. The fund files U.S. federal, state, local and non-U.S. tax returns as applicable. The fund's tax returns are subject to examination by the relevant taxing authority until expiration of the applicable statute of limitations, which is generally three years from the date of filing but can be longer in certain jurisdictions. At this time, management believes there are no uncertain tax positions which, based on their technical merit, would not be sustained upon examination and for which it is reasonably possible that the total amounts of unrecognized tax benefits will significantly change in the next twelve months.
Multiple Class — All shares of the fund represent an equal pro rata interest in the net assets of the class to which such shares belong, and have identical voting, dividend, liquidation and other rights and the same terms and conditions, except for class specific expenses and exclusive rights to vote on matters affecting only individual classes. Income, non-class specific expenses, and realized and unrealized capital gains and losses of the fund are allocated to each class of shares based on their relative net assets.
Distributions to Shareholders — Distributions from net investment income, if any, are declared daily and paid monthly. Distributions from net realized gains, if any, are generally declared and paid annually.
Indemnifications — Under the trust’s organizational documents, its officers and trustees are indemnified against certain liabilities arising out of the performance of their duties to the fund. In addition, in the normal course of business, the fund enters into contracts that provide general indemnifications. The maximum exposure under these arrangements is unknown as this would involve future claims that may be made against a fund. The risk of material loss from such claims is considered by management to be remote.
Securities Lending — Securities are lent to qualified financial institutions and brokers. State Street Bank & Trust Co. serves as securities lending agent to the fund pursuant to a Securities Lending Agreement. The lending of securities exposes the fund to risks such as: the borrowers may fail to return the loaned securities, the borrowers may not be able to provide additional collateral, the fund may experience delays in recovery of the loaned securities or delays in access to collateral, or the fund may experience losses related to the investment collateral. To minimize certain risks, loan counterparties pledge collateral in the form of cash and/or securities. The lending agent has agreed to indemnify the fund in the case of default of any securities borrowed. Cash collateral received is invested in the State Street Navigator Securities Lending Government Money Market Portfolio, a money market mutual fund registered under the 1940 Act. The loans may also be secured by U.S. government securities in an amount at least equal to the market value of the securities loaned, plus accrued interest and dividends, determined on a daily basis and adjusted accordingly. By lending securities, the fund seeks to increase its net investment income through the receipt of interest and fees. Such income is reflected separately within the Statement of Operations. The value of loaned securities and related collateral outstanding at period end, if any, are shown on a gross basis within the Schedule of Investments and Statement of Assets and Liabilities.
The following table reflects a breakdown of transactions accounted for as secured borrowings, the gross obligation by the type of collateral pledged, and the remaining contractual maturity of those transactions as of March 31, 2023.
| | | | | | | | | | | | | | | | | |
| Remaining Contractual Maturity of Agreements |
| Overnight and Continuous | <30 days | Between 30 & 90 days | >90 days | Total |
Securities Lending Transactions(1) | | | | |
| Corporate Bonds | $ | 8,161,630 | | — | | — | | — | | $ | 8,161,630 | |
| Exchange-Traded Funds | 3,179,460 | | — | | — | | — | | 3,179,460 | |
| Total Borrowings | $ | 11,341,090 | | — | | — | | — | | $ | 11,341,090 | |
| Gross amount of recognized liabilities for securities lending transactions | $ | 11,341,090 | |
(1)Amount represents the payable for cash collateral received for securities on loan. This will generally be in the Overnight and Continuous column as the securities are typically callable on demand.
3. Fees and Transactions with Related Parties
Certain officers and trustees of the trust are also officers and/or directors of American Century Companies, Inc. (ACC). The trust's investment advisor, ACIM, the trust's distributor, American Century Investment Services, Inc. (ACIS), and the trust's transfer agent, American Century Services, LLC, are wholly owned, directly or indirectly, by ACC.
Management Fees — The trust has entered into a management agreement with ACIM, under which ACIM provides the fund with investment advisory and management services in exchange for a single, unified management fee (the fee) per class. The agreement provides that ACIM will pay all expenses of managing and operating the fund, except brokerage expenses, taxes, interest, fees and expenses of the independent trustees (including legal counsel fees), extraordinary expenses, and expenses incurred in connection with the provision of shareholder services and distribution services under a plan adopted pursuant to Rule 12b-1 under the 1940 Act. The fee is computed and accrued daily based on each class’s daily net assets and paid monthly in arrears. The difference in the fee among the classes is a result of their separate arrangements for non-Rule 12b-1 shareholder services. It is not the result of any difference in advisory or custodial fees or other expenses related to the management of the fund's assets, which do not vary by class. The fee consists of (1) an Investment Category Fee based on the daily net assets of the fund and certain other accounts managed by the investment advisor that are in the same broad investment category as the fund and (2) a Complex Fee based on the assets of all funds in the American Century Investments family of funds that have the same investment advisor and distributor as the fund. For purposes of determining the Investment Category Fee and Complex Fee, the assets of funds managed by the investment advisor that invest exclusively in the shares of other funds (funds of funds) are not included.
The Investment Category Fee range, the Complex Fee range and the effective annual management fee for each class for the period ended March 31, 2023 are as follows:
| | | | | | | | | | | |
| Investment Category Fee Range | Complex Fee Range | Effective Annual Management Fee |
| Investor Class | 0.4725% to 0.5900% | 0.2500% to 0.3100% | 0.77% |
| I Class | 0.1500% to 0.2100% | 0.67% |
| Y Class | 0.0500% to 0.1100% | 0.57% |
| A Class | 0.2500% to 0.3100% | 0.77% |
| C Class | 0.2500% to 0.3100% | 0.77% |
| R Class | 0.2500% to 0.3100% | 0.77% |
| R5 Class | 0.0500% to 0.1100% | 0.57% |
| R6 Class | 0.0000% to 0.0600% | 0.52% |
Distribution and Service Fees — The Board of Trustees has adopted a separate Master Distribution and Individual Shareholder Services Plan for each of the A Class, C Class and R Class (collectively the plans), pursuant to Rule 12b-1 of the 1940 Act. The plans provide that the A Class will pay ACIS an annual distribution and service fee of 0.25%. The plans provide that the C Class will pay ACIS an annual distribution and service fee of 1.00%, of which 0.25% is paid for individual shareholder services and 0.75% is paid for distribution services. The plans provide that the R Class will pay ACIS an annual distribution and service fee of 0.50%. The fees are computed and accrued daily based on each class’s daily net assets and paid monthly in arrears. The fees are used to pay financial intermediaries for distribution and individual shareholder services. Fees incurred under the plans during the period ended March 31, 2023 are detailed in the Statement of Operations.
Trustees' Fees and Expenses — The Board of Trustees is responsible for overseeing the investment advisor’s management and operations of the fund. The trustees receive detailed information about the fund and its investment advisor regularly throughout the year, and meet at least quarterly with management of the investment advisor to review reports about fund operations. The fund's officers do not receive compensation from the fund.
Interfund Transactions — The fund may enter into security transactions with other American Century Investments funds and other client accounts of the investment advisor, in accordance with the 1940 Act rules and procedures adopted by the Board of Trustees. The rules and procedures require, among other things, that these transactions be effected at the independent current market price of the security. There were no interfund transactions during the period.
4. Investment Transactions
Purchases and sales of investment securities, excluding short-term investments, for the period ended March 31, 2023 were $39,645,720 and $53,085,662, respectively.
5. Capital Share Transactions
Transactions in shares of the fund were as follows (unlimited number of shares authorized):
| | | | | | | | | | | | | | |
| Year ended
March 31, 2023 | Year ended
March 31, 2022 |
| Shares | Amount | Shares | Amount |
| Investor Class | | | | |
| Sold | 2,771,772 | | $ | 13,723,392 | | 5,014,658 | | $ | 28,633,607 | |
| Issued in reinvestment of distributions | 701,749 | | 3,459,510 | | 598,483 | | 3,406,113 | |
| Redeemed | (4,363,555) | | (21,604,084) | | (5,914,336) | | (33,537,797) | |
| (890,034) | | (4,421,182) | | (301,195) | | (1,498,077) | |
| I Class | | | | |
| Sold | 414,187 | | 2,112,096 | | 2,069,782 | | 11,516,094 | |
| Issued in reinvestment of distributions | 57,958 | | 287,588 | | 50,499 | | 286,587 | |
| Redeemed | (2,056,475) | | (10,534,745) | | (605,533) | | (3,395,355) | |
| (1,584,330) | | (8,135,061) | | 1,514,748 | | 8,407,326 | |
| Y Class | | | | |
| Sold | 1,775 | | 8,569 | | 879,316 | | 5,060,291 | |
| Issued in reinvestment of distributions | 97 | | 478 | | 137,966 | | 792,603 | |
| Redeemed | (1) | | (4) | | (4,720,979) | | (26,756,348) | |
| 1,871 | | 9,043 | | (3,703,697) | | (20,903,454) | |
| A Class | | | | |
| Sold | 53,246 | | 264,198 | | 187,232 | | 1,062,588 | |
| Issued in reinvestment of distributions | 89,196 | | 440,116 | | 79,549 | | 453,079 | |
| Redeemed | (579,949) | | (2,877,271) | | (482,228) | | (2,760,039) | |
| (437,507) | | (2,172,957) | | (215,447) | | (1,244,372) | |
| C Class | | | | |
| Sold | 23,794 | | 120,091 | | 1,539 | | 8,850 | |
| Issued in reinvestment of distributions | 5,864 | | 28,895 | | 5,549 | | 31,648 | |
| Redeemed | (41,926) | | (206,321) | | (71,211) | | (407,297) | |
| (12,268) | | (57,335) | | (64,123) | | (366,799) | |
| R Class | | | | |
| Sold | 108,206 | | 541,148 | | 98,160 | | 561,378 | |
| Issued in reinvestment of distributions | 10,361 | | 51,029 | | 7,044 | | 40,088 | |
| Redeemed | (59,798) | | (297,676) | | (120,018) | | (680,417) | |
| 58,769 | | 294,501 | | (14,814) | | (78,951) | |
| R5 Class | | | | |
| Sold | 9,464 | | 46,859 | | 34,072 | | 194,531 | |
| Issued in reinvestment of distributions | 5,397 | | 26,630 | | 4,335 | | 24,677 | |
| Redeemed | (24,061) | | (117,827) | | (16,328) | | (93,543) | |
| (9,200) | | (44,338) | | 22,079 | | 125,665 | |
| R6 Class | | | | |
| Sold | 9,434 | | 46,555 | | 21,910 | | 124,880 | |
| Issued in reinvestment of distributions | 3,093 | | 15,242 | | 2,744 | | 15,606 | |
| Redeemed | (22,894) | | (112,487) | | (27,941) | | (158,842) | |
| (10,367) | | (50,690) | | (3,287) | | (18,356) | |
| Net increase (decrease) | (2,883,066) | | $ | (14,578,019) | | (2,765,736) | | $ | (15,577,018) | |
6. Fair Value Measurements
The fund's investments valuation process is based on several considerations and may use multiple inputs to determine the fair value of the investments held by the fund. In conformity with accounting principles generally accepted in the United States of America, the inputs used to determine a valuation are classified into three broad levels.
•Level 1 valuation inputs consist of unadjusted quoted prices in an active market for identical investments.
•Level 2 valuation inputs consist of direct or indirect observable market data (including quoted prices for comparable investments, evaluations of subsequent market events, interest rates, prepayment speeds, credit risk, etc.). These inputs also consist of quoted prices for identical investments initially expressed in local currencies that are adjusted through translation into U.S. dollars.
•Level 3 valuation inputs consist of unobservable data (including a fund’s own assumptions).
The level classification is based on the lowest level input that is significant to the fair valuation measurement. The valuation inputs are not necessarily an indication of the risks associated with investing in these securities or other financial instruments.
The following is a summary of the level classifications as of period end. The Schedule of Investments provides additional information on the fund's portfolio holdings.
| | | | | | | | | | | |
| Level 1 | Level 2 | Level 3 |
| Assets | | | |
| Investment Securities | | | |
| Corporate Bonds | — | | $ | 79,299,009 | | — | |
| Exchange-Traded Funds | $ | 4,147,368 | | — | | — | |
| Bank Loan Obligations | — | | 1,685,881 | | — | |
| Preferred Stocks | — | | 1,144,314 | | — | |
| Short-Term Investments | 11,341,090 | | 6,237,682 | | — | |
| $ | 15,488,458 | | $ | 88,366,886 | | — | |
7. Risk Factors
The value of the fund’s shares will go up and down, sometimes rapidly or unpredictably, based on the performance of the securities owned by the fund and other factors generally affecting the securities market. Market risks, including political, regulatory, economic and social developments, can affect the value of the fund’s investments. Natural disasters, public health emergencies, war, terrorism and other unforeseeable events may lead to increased market volatility and may have adverse long-term effects on world economies and markets generally.
The fund invests primarily in lower-rated debt securities, which are subject to substantial risks including liquidity risk and credit risk.
The fund may invest in instruments that have variable or floating coupon rates based on the London Interbank Offered Rate (LIBOR). LIBOR is a benchmark interest rate intended to be representative of the rate at which certain major international banks lend to one another over short-terms. Financial institutions have started the process of phasing out LIBOR and the transition process to a replacement rate may lead to increased volatility or illiquidity in markets for instruments that rely on LIBOR. This could result in a change to the value of such instruments or a change in the cost of temporary borrowing for the fund.
8. Federal Tax Information
The tax character of distributions paid during the years ended March 31, 2023 and March 31, 2022 were as follows:
| | | | | | | | |
| 2023 | 2022 |
| Distributions Paid From | | |
| Ordinary income | $ | 4,939,563 | | $ | 5,653,335 | |
| Long-term capital gains | — | | — | |
The book-basis character of distributions made during the year from net investment income or net realized gains may differ from their ultimate characterization for federal income tax purposes. These differences reflect the differing character of certain income items and net realized gains and losses for financial statement and tax purposes, and may result in reclassification among certain capital accounts on the financial statements.
As of period end, the federal tax cost of investments and the components of distributable earnings on a tax-basis were as follows:
| | | | | |
| Federal tax cost of investments | $ | 110,574,268 | |
| Gross tax appreciation of investments | $ | 609,380 | |
| Gross tax depreciation of investments | (7,328,304) | |
| Net tax appreciation (depreciation) of investments | $ | (6,718,924) | |
| Other book-to-tax adjustments | $ | (24,466) | |
| Undistributed ordinary income | — | |
| Accumulated short-term capital losses | $ | (5,955,553) | |
| Accumulated long-term capital losses | $ | (40,185,667) | |
The difference between book-basis and tax-basis unrealized appreciation (depreciation) is attributable primarily to excess premium amortization.
Accumulated capital losses represent net capital loss carryovers that may be used to offset future realized capital gains for federal income tax purposes. The capital loss carryovers may be carried forward for an unlimited period. Future capital loss carryover utilization in any given year may be subject to Internal Revenue Code limitations.
| | | | | | | | | | | | | | | | | | | | | | | | | | | | | | | | | | | | | | | | | |
| For a Share Outstanding Throughout the Years Ended March 31 (except as noted) |
| Per-Share Data | | Ratios and Supplemental Data | | | |
| | Income From Investment Operations: | | Ratio to Average Net Assets of: | | |
| Net Asset
Value,
Beginning
of Period | Net Investment Income (Loss)(1) | Net
Realized
and
Unrealized
Gain (Loss) | Total From
Investment
Operations | Distributions From
Net
Investment
Income | Net Asset
Value,
End
of Period | Total Return(2) | Operating
Expenses | Operating
Expenses
(before
expense
waiver) | Net
Investment
Income
(Loss) | Net
Investment
Income
(Loss)
(before
expense
waiver) | Portfolio
Turnover
Rate | Net
Assets,
End of
Period
(in thousands) |
| Investor Class | | | | | | | | | | | | |
| 2023 | $5.41 | 0.24 | (0.49) | (0.25) | (0.25) | $4.91 | (4.61)% | 0.78% | 0.78% | 4.85% | 4.85% | 43% | $77,431 | |
| 2022 | $5.70 | 0.22 | (0.28) | (0.06) | (0.23) | $5.41 | (1.23)% | 0.77% | 0.77% | 3.90% | 3.90% | 83% | $90,165 | |
| 2021 | $5.02 | 0.23 | 0.69 | 0.92 | (0.24) | $5.70 | 18.52% | 0.78% | 0.78% | 4.25% | 4.25% | 100% | $96,679 | |
| 2020 | $5.54 | 0.25 | (0.51) | (0.26) | (0.26) | $5.02 | (5.09)% | 0.78% | 0.81% | 4.55% | 4.52% | 38% | $89,168 | |
| 2019 | $5.57 | 0.29 | (0.03) | 0.26 | (0.29) | $5.54 | 4.91% | 0.79% | 0.86% | 5.22% | 5.15% | 24% | $110,624 | |
| I Class | | | | | | | | | | | | |
| 2023 | $5.42 | 0.24 | (0.49) | (0.25) | (0.25) | $4.92 | (4.49)% | 0.68% | 0.68% | 4.95% | 4.95% | 43% | $4,202 | |
| 2022 | $5.71 | 0.23 | (0.29) | (0.06) | (0.23) | $5.42 | (1.12)% | 0.67% | 0.67% | 4.00% | 4.00% | 83% | $13,220 | |
| 2021 | $5.03 | 0.24 | 0.68 | 0.92 | (0.24) | $5.71 | 18.61% | 0.68% | 0.68% | 4.35% | 4.35% | 100% | $5,273 | |
| 2020 | $5.55 | 0.26 | (0.52) | (0.26) | (0.26) | $5.03 | (4.98)% | 0.68% | 0.71% | 4.65% | 4.62% | 38% | $4,063 | |
| 2019 | $5.58 | 0.30 | (0.03) | 0.27 | (0.30) | $5.55 | 5.01% | 0.69% | 0.76% | 5.32% | 5.25% | 24% | $2,300 | |
| | | | | | | | | | | | | | | | | | | | | | | | | | | | | | | | | | | | | | | | | |
| For a Share Outstanding Throughout the Years Ended March 31 (except as noted) |
| Per-Share Data | | Ratios and Supplemental Data | | | |
| | Income From Investment Operations: | | Ratio to Average Net Assets of: | | |
| Net Asset
Value,
Beginning
of Period | Net Investment Income (Loss)(1) | Net
Realized
and
Unrealized
Gain (Loss) | Total From
Investment
Operations | Distributions From
Net
Investment
Income | Net Asset
Value,
End
of Period | Total Return(2) | Operating
Expenses | Operating
Expenses
(before
expense
waiver) | Net
Investment
Income
(Loss) | Net
Investment
Income
(Loss)
(before
expense
waiver) | Portfolio
Turnover
Rate | Net
Assets,
End of
Period
(in thousands) |
| Y Class | | | | | | | | | | | | |
| 2023 | $5.42 | 0.26 | (0.50) | (0.24) | (0.26) | $4.92 | (4.40)% | 0.58% | 0.58% | 5.05% | 5.05% | 43% | $15 | |
| 2022 | $5.70 | 0.23 | (0.27) | (0.04) | (0.24) | $5.42 | (0.85)% | 0.57% | 0.57% | 4.10% | 4.10% | 83% | $6 | |
| 2021 | $5.02 | 0.25 | 0.68 | 0.93 | (0.25) | $5.70 | 18.76% | 0.58% | 0.58% | 4.45% | 4.45% | 100% | $21,131 | |
| 2020 | $5.55 | 0.26 | (0.52) | (0.26) | (0.27) | $5.02 | (5.08)% | 0.58% | 0.61% | 4.75% | 4.72% | 38% | $10,819 | |
| 2019 | $5.58 | 0.30 | (0.02) | 0.28 | (0.31) | $5.55 | 5.12% | 0.59% | 0.66% | 5.42% | 5.35% | 24% | $5,727 | |
| A Class | | | | | | | | | | | | |
| 2023 | $5.41 | 0.23 | (0.50) | (0.27) | (0.23) | $4.91 | (4.84)% | 1.03% | 1.03% | 4.60% | 4.60% | 43% | $8,677 | |
| 2022 | $5.70 | 0.21 | (0.29) | (0.08) | (0.21) | $5.41 | (1.47)% | 1.02% | 1.02% | 3.65% | 3.65% | 83% | $11,933 | |
| 2021 | $5.02 | 0.22 | 0.68 | 0.90 | (0.22) | $5.70 | 18.23% | 1.03% | 1.03% | 4.00% | 4.00% | 100% | $13,798 | |
| 2020 | $5.55 | 0.24 | (0.53) | (0.29) | (0.24) | $5.02 | (5.50)% | 1.03% | 1.06% | 4.30% | 4.27% | 38% | $11,314 | |
| 2019 | $5.58 | 0.28 | (0.03) | 0.25 | (0.28) | $5.55 | 4.65% | 1.04% | 1.11% | 4.97% | 4.90% | 24% | $11,868 | |
| C Class | | | | | | | | | | | | |
| 2023 | $5.41 | 0.19 | (0.49) | (0.30) | (0.20) | $4.91 | (5.56)% | 1.78% | 1.78% | 3.85% | 3.85% | 43% | $681 | |
| 2022 | $5.70 | 0.17 | (0.29) | (0.12) | (0.17) | $5.41 | (2.21)% | 1.77% | 1.77% | 2.90% | 2.90% | 83% | $816 | |
| 2021 | $5.02 | 0.18 | 0.68 | 0.86 | (0.18) | $5.70 | 17.35% | 1.78% | 1.78% | 3.25% | 3.25% | 100% | $1,225 | |
| 2020 | $5.54 | 0.20 | (0.52) | (0.32) | (0.20) | $5.02 | (6.04)% | 1.78% | 1.81% | 3.55% | 3.52% | 38% | $2,775 | |
| 2019 | $5.57 | 0.23 | (0.02) | 0.21 | (0.24) | $5.54 | 3.87% | 1.79% | 1.86% | 4.22% | 4.15% | 24% | $5,574 | |
| | | | | | | | | | | | | | | | | | | | | | | | | | | | | | | | | | | | | | | | | |
| For a Share Outstanding Throughout the Years Ended March 31 (except as noted) |
| Per-Share Data | | Ratios and Supplemental Data | | | |
| | Income From Investment Operations: | | Ratio to Average Net Assets of: | | |
| Net Asset
Value,
Beginning
of Period | Net Investment Income (Loss)(1) | Net
Realized
and
Unrealized
Gain (Loss) | Total From
Investment
Operations | Distributions From
Net
Investment
Income | Net Asset
Value,
End
of Period | Total Return(2) | Operating
Expenses | Operating
Expenses
(before
expense
waiver) | Net
Investment
Income
(Loss) | Net
Investment
Income
(Loss)
(before
expense
waiver) | Portfolio
Turnover
Rate | Net
Assets,
End of
Period
(in thousands) |
| R Class | | | | | | | | | | | | |
| 2023 | $5.41 | 0.22 | (0.50) | (0.28) | (0.22) | $4.91 | (5.08)% | 1.28% | 1.28% | 4.35% | 4.35% | 43% | $1,256 | |
| 2022 | $5.70 | 0.19 | (0.28) | (0.09) | (0.20) | $5.41 | (1.72)% | 1.27% | 1.27% | 3.40% | 3.40% | 83% | $1,066 | |
| 2021 | $5.02 | 0.21 | 0.68 | 0.89 | (0.21) | $5.70 | 17.94% | 1.28% | 1.28% | 3.75% | 3.75% | 100% | $1,207 | |
| 2020 | $5.54 | 0.22 | (0.51) | (0.29) | (0.23) | $5.02 | (5.57)% | 1.28% | 1.31% | 4.05% | 4.02% | 38% | $864 | |
| 2019 | $5.57 | 0.26 | (0.02) | 0.24 | (0.27) | $5.54 | 4.39% | 1.29% | 1.36% | 4.72% | 4.65% | 24% | $988 | |
| R5 Class | | | | | | | | | | | | |
| 2023 | $5.42 | 0.25 | (0.50) | (0.25) | (0.26) | $4.91 | (4.59)% | 0.58% | 0.58% | 5.05% | 5.05% | 43% | $488 | |
| 2022 | $5.70 | 0.23 | (0.27) | (0.04) | (0.24) | $5.42 | (0.85)% | 0.57% | 0.57% | 4.10% | 4.10% | 83% | $588 | |
| 2021 | $5.02 | 0.25 | 0.68 | 0.93 | (0.25) | $5.70 | 18.76% | 0.58% | 0.58% | 4.45% | 4.45% | 100% | $494 | |
| 2020 | $5.55 | 0.26 | (0.52) | (0.26) | (0.27) | $5.02 | (5.08)% | 0.58% | 0.61% | 4.75% | 4.72% | 38% | $1,013 | |
| 2019 | $5.58 | 0.30 | (0.02) | 0.28 | (0.31) | $5.55 | 5.12% | 0.59% | 0.66% | 5.42% | 5.35% | 24% | $1,656 | |
| R6 Class | | | | | | | | | | | | |
| 2023 | $5.41 | 0.25 | (0.49) | (0.24) | (0.26) | $4.91 | (4.37)% | 0.53% | 0.53% | 5.10% | 5.10% | 43% | $247 | |
| 2022 | $5.69 | 0.24 | (0.28) | (0.04) | (0.24) | $5.41 | (0.81)% | 0.52% | 0.52% | 4.15% | 4.15% | 83% | $329 | |
| 2021 | $5.02 | 0.25 | 0.67 | 0.92 | (0.25) | $5.69 | 18.61% | 0.53% | 0.53% | 4.50% | 4.50% | 100% | $365 | |
| 2020 | $5.54 | 0.27 | (0.52) | (0.25) | (0.27) | $5.02 | (4.85)% | 0.53% | 0.56% | 4.80% | 4.77% | 38% | $160 | |
| 2019 | $5.57 | 0.30 | (0.02) | 0.28 | (0.31) | $5.54 | 5.17% | 0.54% | 0.61% | 5.47% | 5.40% | 24% | $190 | |
| | | | | | | | | | | | | | |
| Notes to Financial Highlights | | |
(1)Computed using average shares outstanding throughout the period.
(2)Total returns are calculated based on the net asset value of the last business day and do not reflect applicable sales charges, if any. Total returns for periods less than one year are not annualized.
See Notes to Financial Statements.
| | |
| Report of Independent Registered Public Accounting Firm |
To the Shareholders and the Board of Trustees of American Century Investment Trust:
Opinion on the Financial Statements and Financial Highlights
We have audited the accompanying statement of assets and liabilities, including the schedule of investments, of High-Yield Fund (the “Fund”), one of the funds constituting the American Century Investment Trust, as of March 31, 2023, the related statement of operations for the year then ended, the statements of changes in net assets and financial highlights for the two years in the period then ended, and the related notes. In our opinion, the financial statements and financial highlights present fairly, in all material respects, the financial position of High-Yield Fund of the American Century Investment Trust, as of March 31, 2023, and the results of its operations for the year then ended and the changes in its net assets and the financial highlights for the two years then ended in conformity with accounting principles generally accepted in the United States of America. The financial highlights for each of the three years in the period ended March 31, 2021, were audited by other auditors, whose report, dated May 18, 2021, expressed an unqualified opinion on such financial highlights.
Basis for Opinion
These financial statements and financial highlights are the responsibility of the Fund's management. Our responsibility is to express an opinion on the Fund’s financial statements and financial highlights based on our audit. We are a public accounting firm registered with the Public Company Accounting Oversight Board (United States) (PCAOB) and are required to be independent with respect to the Fund in accordance with the U.S. federal securities laws and the applicable rules and regulations of the Securities and Exchange Commission and the PCAOB.
We conducted our audits in accordance with the standards of the PCAOB. Those standards require that we plan and perform the audit to obtain reasonable assurance about whether the financial statements and financial highlights are free of material misstatement, whether due to error or fraud. The Fund is not required to have, nor were we engaged to perform, an audit of its internal control over financial reporting. As part of our audit, we are required to obtain an understanding of internal control over financial reporting but not for the purpose of expressing an opinion on the effectiveness of the Fund’s internal control over financial reporting. Accordingly, we express no such opinion.
Our audits included performing procedures to assess the risks of material misstatement of the financial statements and financial highlights, whether due to error or fraud, and performing procedures that respond to those risks. Such procedures included examining, on a test basis, evidence regarding the amounts and disclosures in the financial statements and financial highlights. Our audits also included evaluating the accounting principles used and significant estimates made by management, as well as evaluating the overall presentation of the financial statements and financial highlights. Our procedures included confirmation of securities owned as of March 31, 2023, by correspondence with the custodian and brokers; when replies were not received from brokers, we performed other auditing procedures. We believe that our audits provide a reasonable basis for our opinion.
/s/ Deloitte & Touche LLP
Kansas City, Missouri
May 16, 2023
We have served as the auditor of one or more American Century investment companies since 1997.
Board of Trustees
The individuals listed below serve as trustees of the funds. Each trustee will continue to serve in this capacity until death, retirement, resignation or removal from office. The board has adopted a mandatory retirement age for trustees who are not “interested persons,” as that term is defined in the Investment Company Act (independent trustees). Independent trustees shall retire on December 31 of the year in which they reach their 76th birthday.
Jonathan S. Thomas is an “interested person” because he currently serves as President and Chief Executive Officer of American Century Companies, Inc. (ACC), the parent company of American Century Investment Management, Inc. (ACIM or the advisor). The other trustees (more than three-fourths of the total number) are independent. They are not employees, directors or officers of, and have no financial interest in, ACC or any of its wholly owned, direct or indirect, subsidiaries, including ACIM, American Century Investment Services, Inc. (ACIS) and American Century Services, LLC (ACS), and they do not have any other affiliations, positions or relationships that would cause them to be considered “interested persons” under the Investment Company Act. The trustees serve in this capacity for eight (in the case of Jonathan S. Thomas, 16; and Jeremy I. Bulow, 9) registered investment companies in the American Century Investments family of funds.
The following table presents additional information about the trustees. The mailing address for each trustee other than Jonathan S. Thomas is 3945 Freedom Circle, Suite #800, Santa Clara, California 95054. The mailing address for Jonathan S. Thomas is 4500 Main Street, Kansas City, Missouri 64111.
| | | | | | | | | | | | | | | | | |
Name
(Year of Birth) | Position(s) Held with Funds | Length of Time Served | Principal Occupation(s) During Past 5 Years | Number of American Century Portfolios Overseen by Trustee | Other Directorships Held During Past 5 Years |
| Independent Trustees | | |
Tanya S. Beder
(1955) | Trustee and Board Chair | Since 2011 (Board Chair since 2022) | Chairman and CEO, SBCC Group Inc. (independent advisory services) (2006 to present) | 32 | Kirby Corporation; Nabors Industries, Ltd. |
Jeremy I. Bulow
(1954) | Trustee | Since 2011 | Professor of Economics, Stanford University, Graduate School of Business (1979 to present) | 77 | None |
Jennifer Cabalquinto
(1968) | Trustee | Since 2021 | Chief Financial Officer, 2K (interactive entertainment) (2021 to present); Special Advisor, GSW Sports, LLC (2020 to 2021); Chief Financial Officer, GSW Sports, LLC (2013 to 2020) | 32 | Sabio Holdings, Inc. |
Anne Casscells
(1958) | Trustee | Since 2016 | Co-Chief Executive Officer and Chief Investment Officer, Aetos Alternatives Management (investment advisory firm) (2001 to present) | 32 | None |
| | | | | | | | | | | | | | | | | |
Name
(Year of Birth) | Position(s) Held with Funds | Length of Time Served | Principal Occupation(s) During Past 5 Years | Number of American Century Portfolios Overseen by Trustee | Other Directorships Held During Past 5 Years |
| Independent Trustees | | |
Jonathan D. Levin
(1972) | Trustee | Since 2016 | Philip H. Knight Professor and Dean, Graduate School of Business, Stanford University (2016 to present); Professor, Stanford University, (2000 to present) | 32 | None |
Peter F. Pervere
(1947) | Trustee | Since 2007 | Retired | 32 | None |
John B. Shoven
(1947) | Trustee | Since 2002 | Charles R. Schwab Professor of Economics, Stanford University (1973 to present, emeritus since 2019) | 32 | Cadence Design Systems; Exponent; Financial Engines |
| Interested Trustee | | |
Jonathan S. Thomas
(1963) | Trustee | Since 2007 | President and Chief Executive Officer, ACC (2007 to present). Also serves as Chief Executive Officer, ACS; Director, ACC and other ACC subsidiaries | 141 | None |
The Statement of Additional Information has additional information about the fund's trustees and is available without charge, upon request, by calling 1-800-345-2021.
Officers
The following table presents certain information about the executive officers of the funds. Each officer serves as an officer for 16 investment companies in the American Century family of funds. No officer is compensated for his or her service as an officer of the funds. The listed officers are interested persons of the funds and are appointed or re-appointed on an annual basis. The mailing address for each of the officers listed below is 4500 Main Street, Kansas City, Missouri 64111.
| | | | | | | | |
Name
(Year of Birth) | Offices with the Funds | Principal Occupation(s) During the Past Five Years |
Patrick Bannigan
(1965)
| President since 2019 | Executive Vice President and Director, ACC (2012 to present); Chief Financial Officer, Chief Accounting Officer and Treasurer, ACC (2015 to present). Also serves as President, ACS; Vice President, ACIM; Chief Financial Officer, Chief Accounting Officer and/or Director, ACIM, ACS and other ACC subsidiaries |
R. Wes Campbell
(1974)
| Chief Financial Officer and Treasurer since 2018 | Vice President, ACS (2020 to present); Investment Operations and Investment Accounting, ACS (2000 to present) |
Amy D. Shelton
(1964) | Chief Compliance Officer and Vice President since 2014 | Chief Compliance Officer, American Century funds, (2014 to present); Chief Compliance Officer, ACIM (2014 to present); Chief Compliance Officer, ACIS (2009 to present). Also serves as Vice President, ACIS |
John Pak
(1968) | General Counsel and Senior Vice President since 2021 | General Counsel and Senior Vice President, ACC (2021 to present); Also serves as General Counsel and Senior Vice President, ACIM, ACS and ACIS. Chief Legal Officer of Investment and Wealth Management, The Bank of New York Mellon (2014 to 2021) |
David H. Reinmiller
(1963) | Vice President since 2000 | Attorney, ACC (1994 to present). Also serves as Vice President, ACIM and ACS |
Ward D. Stauffer
(1960) | Secretary since 2005 | Attorney, ACC (2003 to present) |
| | |
| Liquidity Risk Management Program |
The Fund has adopted a liquidity risk management program (the “program”). The Fund’s Board of Trustees (the "Board") has designated American Century Investment Management, Inc. (“ACIM”) as the administrator of the program. Personnel of ACIM or its affiliates, including members of ACIM’s Investment Oversight Committee who are members of ACIM’s Investment Management and Global Analytics departments, conduct the day-to-day operation of the program pursuant to the program.
Under the program, ACIM manages the Fund’s liquidity risk, which is the risk that the Fund could not meet shareholder redemption requests without significant dilution of remaining shareholders’ interests in the Fund. This risk is managed by monitoring the degree of liquidity of the Fund’s investments, limiting the amount of the Fund’s illiquid investments, and utilizing various risk management tools and facilities available to the Fund for meeting shareholder redemptions, among other means. ACIM’s process of determining the degree of liquidity of certain investments held by the Fund is supported by a third-party liquidity assessment vendor.
The Board reviewed a report prepared by ACIM regarding the operation and effectiveness of the program for the period January 1, 2022 through December 31, 2022. No significant liquidity events impacting the Fund were noted in the report. In addition, ACIM provided its assessment that the program had been effective in managing the Fund’s liquidity risk.
Retirement Account Information
As required by law, distributions you receive from certain retirement accounts are subject to federal income tax withholding at the IRS default rate of 10%.* Tax will be withheld on the total amount withdrawn even though you may be receiving amounts that are not subject to withholding, such as nondeductible contributions. In such case, excess amounts of withholding could occur. You may adjust your withholding election so that a greater or lesser amount will be withheld.
You may elect a different withholding rate, or request zero withholding, by submitting an acceptable IRS Form W-4R election with your distribution request. You may notify us of your W-4R election by telephone, on our distribution forms, on IRS Form W-4R, or through other acceptable electronic means. If your withholding election is for an automatic withdrawal plan, you have the right to revoke your election at any time and any election you make will remain in effect until revoked by filing a new election.
Remember, even if you elect not to have income tax withheld, you are liable for paying income tax on the taxable portion of your withdrawal. If you elect not to have income tax withheld or you don’t have enough income tax withheld, you may be responsible for payment of estimated tax. You may incur penalties under the estimated tax rules if your withholding and estimated tax payments are not sufficient. You can reduce or defer the income tax on a distribution by directly or indirectly rolling such distribution over to another IRA or eligible plan. You should consult your tax advisor for additional information.
State tax will be withheld according to state regulations if, at the time of your distribution, your tax residency is within one of the mandatory withholding states.
*Some 403(b), 457 and qualified retirement plan distributions may be subject to 20% mandatory withholding, as they are subject to special tax and withholding rules. Your plan administrator or plan sponsor is required to provide you with a special tax notice explaining those rules at the time you request a distribution. If applicable, federal and/or state taxes may be withheld from your distribution amount.
Proxy Voting Policies
Descriptions of the principles and policies that the fund's investment advisor uses in exercising the voting rights associated with the securities purchased and/or held by the fund are available without charge, upon request, by calling 1-800-345-2021 or visiting American Century Investments’ website at americancentury.com/proxy. A description of the policies is also available on the Securities and Exchange Commission’s website at sec.gov. Information regarding how the investment advisor voted proxies relating to portfolio securities during the most recent 12-month period ended June 30 is available on americancentury.com/proxy. It is also available at sec.gov.
Quarterly Portfolio Disclosure
The fund files its complete schedule of portfolio holdings with the Securities and Exchange Commission (SEC) for the first and third quarters of each fiscal year as an exhibit to its reports on Form N-PORT. These portfolio holdings are available on the fund's website at americancentury.com and, upon request, by calling 1-800-345-2021. The fund’s Form N-PORT reports are available on the SEC’s website at sec.gov.
| | | | | | | | |
| |
| | |
| Contact Us | americancentury.com | |
| Automated Information Line | 1-800-345-8765 | |
| Investor Services Representative | 1-800-345-2021
or 816-531-5575 | |
| Investors Using Advisors | 1-800-378-9878 | |
| Business, Not-For-Profit, Employer-Sponsored Retirement Plans | 1-800-345-3533 | |
| Banks and Trust Companies, Broker-Dealers, Financial Professionals, Insurance Companies | 1-800-345-6488 | |
| Telecommunications Relay Service for the Deaf | 711 | |
| | |
| American Century Investment Trust | |
| | |
Investment Advisor: American Century Investment Management, Inc. Kansas City, Missouri | |
| | |
| This report and the statements it contains are submitted for the general information of our shareholders. The report is not authorized for distribution to prospective investors unless preceded or accompanied by an effective prospectus. | |
| | |
©2023 American Century Proprietary Holdings, Inc. All rights reserved.
CL-ANN-92281 2305 | |
| | | | | |
| |
| Annual Report |
| |
| March 31, 2023 |
| |
| Multisector Income Fund |
| Investor Class (ASIEX) |
| I Class (ASIGX) |
| Y Class (ASYIX) |
| A Class (ASIQX) |
| C Class (ASIHX) |
| R Class (ASIWX) |
| R5 Class (ASIJX) |
| R6 Class (ASIPX) |
| | | | | |
| President’s Letter | |
| Performance | |
| Portfolio Commentary | |
| Fund Characteristics | |
| Shareholder Fee Example | |
| Schedule of Investments | |
| Statement of Assets and Liabilities | |
| Statement of Operations | |
| Statement of Changes in Net Assets | |
| Notes to Financial Statements | |
| Financial Highlights | |
| Report of Independent Registered Public Accounting Firm | |
| Management | |
| |
| Liquidity Risk Management Program | |
| |
| Additional Information | |
Any opinions expressed in this report reflect those of the author as of the date of the report, and do not necessarily represent the opinions of American Century Investments® or any other person in the American Century Investments organization. Any such opinions are subject to change at any time based upon market or other conditions and American Century Investments disclaims any responsibility to update such opinions. These opinions may not be relied upon as investment advice and, because investment decisions made by American Century Investments funds are based on numerous factors, may not be relied upon as an indication of trading intent on behalf of any American Century Investments fund. Security examples are used for representational purposes only and are not intended as recommendations to purchase or sell securities. Performance information for comparative indices and securities is provided to American Century Investments by third party vendors. To the best of American Century Investments’ knowledge, such information is accurate at the time of printing.
Jonathan Thomas
Dear Investor:
Thank you for reviewing this annual report for the period ended March 31, 2023. Annual reports help convey important information about fund returns, including market factors that affected performance. For additional investment insights, please visit americancentury.com.
Challenging Conditions Weighed on Asset Class Returns
Prevailing headwinds early in the reporting period continued to challenge U.S. financial markets throughout the 12 months. Asset class performance seesawed but declined overall amid mixed economic data, elevated inflation and anticipated monetary policy responses. By period-end, a new headwind emerged: banking industry uncertainty.
After launching its inflation-fighting rate-hike campaign in March 2022, the Federal Reserve (Fed) lifted rates eight more times by period-end. The federal funds target rate ended the reporting period at 4.75% to 5%, its highest level since 2007, while Treasury yields climbed to multiyear highs. Amid the Fed’s efforts, the annual inflation rate peaked at 9.1% in June, a 40-year high, before easing to 5% by March.
In addition to helping tame inflation, rapidly rising rates also fueled recession worries and led to expectations for the Fed to change course. This sentiment helped spark a rebound among stock and bond indices in the second half of the reporting period. The collapse of two U.S. regional banks late in the period and fears of a looming credit crunch and likely recession also contributed to market expectations for a Fed policy change. Nevertheless, the Fed indicated a near-term course change was unlikely.
Despite delivering strong gains in the second half of the reporting period, stock returns succumbed to first-half losses and declined for the 12 months. Similarly, weakness in the first half of the period overwhelmed second-half gains, and bond returns were negative for the 12-month period.
Remaining Diligent in Uncertain Times
We expect market volatility to linger as investors navigate a complex environment of still-high inflation, tighter financial conditions, banking industry turbulence and economic uncertainty. In addition, increasingly tense geopolitical considerations complicate the market backdrop.
We appreciate your confidence in us during these extraordinary times. Our firm has a long history of helping clients weather unpredictable and volatile markets, and we’re confident we will continue to meet today’s challenges.
Sincerely,
Jonathan Thomas
President and Chief Executive Officer
American Century Investments
| | | | | | | | | | | | | | | | | |
| Total Returns as of March 31, 2023 |
| | | Average Annual Returns | |
| Ticker
Symbol | 1 year | 5 year | Since
Inception | Inception
Date |
| Investor Class | ASIEX | -2.87% | 2.31% | 2.61% | 7/28/14 |
| Bloomberg U.S. Aggregate Bond Index | — | -4.78% | 0.90% | 1.34% | — |
| I Class | ASIGX | -2.78% | 2.43% | 2.48% | 4/10/17 |
| Y Class | ASYIX | -2.70% | 2.56% | 2.60% | 4/10/17 |
| A Class | ASIQX | | | | 7/28/14 |
| No sales charge | | -3.01% | 2.08% | 2.37% | |
| With sales charge | | -7.37% | 1.14% | 1.83% | |
| C Class | ASIHX | -3.84% | 1.29% | 1.60% | 7/28/14 |
| R Class | ASIWX | -3.35% | 1.82% | 2.12% | 7/28/14 |
| R5 Class | ASIJX | -2.68% | 2.51% | 2.82% | 7/28/14 |
| R6 Class | ASIPX | -2.63% | 2.57% | 2.87% | 7/28/14 |
Fund returns would have been lower if a portion of the fees had not been waived.
C Class shares will automatically convert to A Class shares after being held for approximately eight years. C Class average annual returns do not reflect this conversion.
Sales charges include initial sales charges and contingent deferred sales charges (CDSCs), as applicable. A Class shares have a 4.50% maximum initial sales charge and may be subject to a maximum CDSC of 1.00%. C Class shares redeemed within 12 months of purchase are subject to a maximum CDSC of 1.00%. The SEC requires that mutual funds provide performance information net of maximum sales charges in all cases where charges could be applied.
Data presented reflect past performance. Past performance is no guarantee of future results. Current performance may be higher or lower than the performance shown. Total returns for periods less than one year are not annualized. Investment return and principal value will fluctuate, and redemption value may be more or less than original cost. Data assumes reinvestment of dividends and capital gains, and none of the charts reflect the deduction of taxes that a shareholder would pay on fund distributions or the redemption of fund shares. To obtain performance data current to the most recent month end, please call 1-800-345-2021 or visit americancentury.com. For additional information about the fund, please consult the prospectus.
| | |
| Growth of $10,000 Over Life of Class |
| $10,000 investment made July 28, 2014 |
| Performance for other share classes will vary due to differences in fee structure. |
| | | | | |
| Value on March 31, 2023 |
| Investor Class — $12,510 |
|
| Bloomberg U.S. Aggregate Bond Index — $11,229 |
|
| |
|
Ending value of Investor Class would have been lower if a portion of the fees had not been waived.
| | | | | | | | | | | | | | | | | | | | | | | |
| Total Annual Fund Operating Expenses |
| Investor Class | I Class | Y Class | A Class | C Class | R Class | R5 Class | R6 Class |
| 0.57% | 0.47% | 0.37% | 0.82% | 1.57% | 1.07% | 0.37% | 0.32% |
The total annual fund operating expenses shown is as stated in the fund’s prospectus current as of the date of this report. The prospectus may vary from the expense ratio shown elsewhere in this report because it is based on a different time period, includes acquired fund fees and expenses, and, if applicable, does not include fee waivers or expense reimbursements.
Data presented reflect past performance. Past performance is no guarantee of future results. Current performance may be higher or lower than the performance shown. Total returns for periods less than one year are not annualized. Investment return and principal value will fluctuate, and redemption value may be more or less than original cost. Data assumes reinvestment of dividends and capital gains, and none of the charts reflect the deduction of taxes that a shareholder would pay on fund distributions or the redemption of fund shares. To obtain performance data current to the most recent month end, please call 1-800-345-2021 or visit americancentury.com. For additional information about the fund, please consult the prospectus.
Portfolio Managers: Jason Greenblath, Jeff Houston, Peter Van Gelderen and Charles Tan
As of August 1, 2022, Bob Gahagan left the portfolio's management team.
Performance Summary
Multisector Income returned -2.87%* for the 12 months ended March 31, 2023. By comparison, the Bloomberg U.S. Aggregate Bond Index returned -4.78% for the same period. Fund returns reflect operating expenses, while index returns do not.
Inflation, Federal Reserve Policy Challenged Bond Market
Elevated inflation, aggressive Federal Reserve (Fed) policy, rising interest rates and mounting recession risk dominated the reporting period and contributed to heightened market volatility. After peaking in June, inflation moderated through March but remained well above the Fed’s target, which led to consistent interest rate hikes. In March, the collapse of two U.S. regional banks introduced a new market headwind, as banks moved to tighten lending standards amid industry uncertainty.
Against this backdrop, Treasury yields were volatile, particularly during the banking industry turmoil. For the period overall, yields rose sharply across the yield curve. This dynamic contributed to negative 12-month returns for most investment-grade bond market sectors, including Treasuries, mortgage-backed securities and corporate bonds. Credit-sensitive and longer maturity securities generally posted the largest losses.
Duration Position Drove Relative Results
Given our expectations for interest rates to rise, we positioned the portfolio with a shorter duration than the index. As rates rose, this positioning aided relative performance. We added to our duration positioning in the second half of the period amid rising recession risk.
Corporate Credit Contributed
Our position in corporate bonds, which comprised approximately 45% of the portfolio on March 31, 2023, delivered positive relative results. This was largely due to our out-of-index allocation to high-yield corporate bonds. Additionally, we hedged the portfolio’s high-yield exposure with credit default swaps at various points during the reporting period. Our timely purchases and sales of these derivative securities aided results.
Investment-grade corporate bonds delivered mixed results, detracting from performance in the first half of the period and contributing in the second half. Positions in the banking, life insurance, real estate investment trusts and information technology sectors were among the key drivers of performance within the allocation. Late in the period, as economic growth concerns mounted, we shifted our corporate exposure to favor higher-credit-quality securities.
Securitized Sector Detracted
We maintained a sizable position in securitized bonds, which comprised approximately 27% of the portfolio at period-end. We primarily focused on non-index sectors, including non-agency collateralized mortgage obligations, non-agency commercial mortgage-backed securities, asset-backed securities and collateralized loan obligations. These credit-sensitive sectors generally struggled in the first half of the reporting period amid spread widening and heightened volatility. They rebounded in the second half, but not enough to offset earlier losses.
Elsewhere, our allocation to emerging markets, which totaled approximately 4% of the portfolio at March-end, detracted. We significantly reduced exposure during the period on valuation concerns.
*All fund returns referenced in this commentary are for Investor Class shares. Performance for other share classes will vary due to differences in fee structure; when Investor Class performance exceeds that of the index, other share classes may not. See page 3 for returns for all share classes.
| | | | | |
| MARCH 31, 2023 | |
| Types of Investments in Portfolio | % of net assets |
| Corporate Bonds | 41.9% |
| U.S. Treasury Securities | 20.6% |
| Asset-Backed Securities | 9.4% |
| Collateralized Loan Obligations | 9.3% |
| Collateralized Mortgage Obligations | 4.8% |
| Commercial Mortgage-Backed Securities | 3.6% |
| Bank Loan Obligations | 1.8% |
| Sovereign Governments and Agencies | 1.8% |
| Preferred Stocks | 1.6% |
| Short-Term Investments | 6.3% |
| Other Assets and Liabilities | (1.1)% |
Fund shareholders may incur two types of costs: (1) transaction costs, including sales charges (loads) on purchase payments and redemption/exchange fees; and (2) ongoing costs, including management fees; distribution and service (12b-1) fees; and other fund expenses. This example is intended to help you understand your ongoing costs (in dollars) of investing in your fund and to compare these costs with the ongoing cost of investing in other mutual funds.
The example is based on an investment of $1,000 made at the beginning of the period and held for the entire period from October 1, 2022 to March 31, 2023.
Actual Expenses
The table provides information about actual account values and actual expenses for each class. You may use the information, together with the amount you invested, to estimate the expenses that you paid over the period. First, identify the share class you own. Then simply divide your account value by $1,000 (for example, an $8,600 account value divided by $1,000 = 8.6), then multiply the result by the number under the heading “Expenses Paid During Period” to estimate the expenses you paid on your account during this period.
If you hold Investor Class shares of any American Century Investments mutual fund, or I Class shares of the American Century Diversified Bond Fund, in an American Century Investments account (i.e., not through a financial intermediary or employer-sponsored retirement plan account), American Century Investments may charge you a $25 annual account maintenance fee if the value of those shares is less than $10,000. We will redeem shares automatically in one of your accounts to pay the $25 fee. In determining your total eligible investment amount, we will include your investments in all personal accounts (including American Century Investments brokerage accounts) registered under your Social Security number. Personal accounts include individual accounts, joint accounts, UGMA/UTMA accounts, personal trusts, Coverdell Education Savings Accounts and IRAs (including traditional, Roth, Rollover, SEP-, SARSEP- and SIMPLE-IRAs), and certain other retirement accounts. If you have only business, business retirement, employer-sponsored or American Century Investments brokerage accounts, you are currently not subject to this fee. If you are subject to the account maintenance fee, your account value could be reduced by the fee amount.
Hypothetical Example for Comparison Purposes
The table also provides information about hypothetical account values and hypothetical expenses based on the actual expense ratio of each class of your fund and an assumed rate of return of 5% per year before expenses, which is not the actual return of a fund’s share class. The hypothetical account values and expenses may not be used to estimate the actual ending account balance or expenses you paid for the period. You may use this information to compare the ongoing costs of investing in your fund and other funds. To do so, compare this 5% hypothetical example with the 5% hypothetical examples that appear in the shareholder reports of the other funds.
Please note that the expenses shown in the table are meant to highlight your ongoing costs only and do not reflect any transactional costs, such as sales charges (loads) or redemption/exchange fees. Therefore, the table is useful in comparing ongoing costs only, and will not help you determine the relative total costs of owning different funds. In addition, if these transactional costs were included, your costs would have been higher.
| | | | | | | | | | | | | | |
| Beginning Account Value 10/1/22 | Ending Account Value 3/31/23 | Expenses Paid During Period(1) 10/1/22 - 3/31/23 | Annualized Expense Ratio(1) |
| Actual | | | | |
| Investor Class | $1,000 | $1,046.00 | $3.57 | 0.70% |
| I Class | $1,000 | $1,046.50 | $3.06 | 0.60% |
| Y Class | $1,000 | $1,048.00 | $2.55 | 0.50% |
| A Class | $1,000 | $1,045.80 | $4.85 | 0.95% |
| C Class | $1,000 | $1,040.80 | $8.65 | 1.70% |
| R Class | $1,000 | $1,044.60 | $6.12 | 1.20% |
| R5 Class | $1,000 | $1,047.00 | $2.55 | 0.50% |
| R6 Class | $1,000 | $1,047.30 | $2.30 | 0.45% |
| Hypothetical | | | | |
| Investor Class | $1,000 | $1,021.44 | $3.53 | 0.70% |
| I Class | $1,000 | $1,021.94 | $3.02 | 0.60% |
| Y Class | $1,000 | $1,022.44 | $2.52 | 0.50% |
| A Class | $1,000 | $1,020.20 | $4.78 | 0.95% |
| C Class | $1,000 | $1,016.46 | $8.55 | 1.70% |
| R Class | $1,000 | $1,018.95 | $6.04 | 1.20% |
| R5 Class | $1,000 | $1,022.44 | $2.52 | 0.50% |
| R6 Class | $1,000 | $1,022.69 | $2.27 | 0.45% |
(1)Expenses are equal to the class's annualized expense ratio listed in the table above, multiplied by the average account value over the period, multiplied by 182, the number of days in the most recent fiscal half-year, divided by 365, to reflect the one-half year period. Annualized expense ratio reflects actual expenses, including any applicable fee waivers or expense reimbursements and excluding any acquired fund fees and expenses.
MARCH 31, 2023
| | | | | | | | | | | |
| | Principal
Amount/Shares | Value |
| CORPORATE BONDS — 41.9% | | | |
| Aerospace and Defense — 0.8% | | | |
| Boeing Co., 2.80%, 3/1/24 | | $ | 400,000 | | $ | 390,091 | |
Bombardier, Inc., 7.50%, 2/1/29(1) | | 115,000 | | 117,587 | |
Spirit AeroSystems, Inc., 9.375%, 11/30/29(1) | | 95,000 | | 103,788 | |
| TransDigm, Inc., 4.625%, 1/15/29 | | 120,000 | | 106,805 | |
| | | 718,271 | |
| Air Freight and Logistics — 0.5% | | | |
| GXO Logistics, Inc., 2.65%, 7/15/31 | | 80,000 | | 62,292 | |
Rand Parent LLC, 8.50%, 2/15/30(1) | | 345,000 | | 324,671 | |
| | | 386,963 | |
| Automobiles — 0.6% | | | |
| Ford Motor Co., 6.10%, 8/19/32 | | 200,000 | | 194,092 | |
| General Motors Financial Co., Inc., 3.80%, 4/7/25 | | 290,000 | | 282,134 | |
| | | 476,226 | |
| Banks — 5.5% | | | |
| Bank of America Corp., VRN, 1.73%, 7/22/27 | | 200,000 | | 179,506 | |
| Bank of America Corp., VRN, 2.88%, 10/22/30 | | 365,000 | | 317,786 | |
| Bank of America Corp., VRN, 2.57%, 10/20/32 | | 40,000 | | 32,720 | |
| Bank of America Corp., VRN, 4.57%, 4/27/33 | | 40,000 | | 38,106 | |
Banque Federative du Credit Mutuel SA, 4.94%, 1/26/26(1) | | 325,000 | | 321,441 | |
| Barclays PLC, VRN, 2.28%, 11/24/27 | | 260,000 | | 228,662 | |
BNP Paribas SA, VRN, 5.125%, 1/13/29(1) | | 190,000 | | 190,540 | |
| Citigroup, Inc., VRN, 2.01%, 1/25/26 | | 210,000 | | 197,884 | |
Credit Agricole SA, 5.30%, 7/12/28(1) | | 185,000 | | 187,691 | |
| Deutsche Bank AG, Series E, 0.96%, 11/8/23 | | 23,000 | | 21,965 | |
| Discover Bank, VRN, 4.68%, 8/9/28 | | 630,000 | | 576,714 | |
| HSBC Holdings PLC, 4.25%, 3/14/24 | | 440,000 | | 428,717 | |
| HSBC Holdings PLC, VRN, 2.80%, 5/24/32 | | 320,000 | | 261,511 | |
| JPMorgan Chase & Co., VRN, 1.58%, 4/22/27 | | 26,000 | | 23,380 | |
| JPMorgan Chase & Co., VRN, 2.07%, 6/1/29 | | 77,000 | | 66,867 | |
| Lloyds Banking Group PLC, VRN, 5.87%, 3/6/29 | | 135,000 | | 136,217 | |
| Mitsubishi UFJ Financial Group, Inc., VRN, 5.44%, 2/22/34 | | 135,000 | | 136,507 | |
| Royal Bank of Canada, 6.00%, 11/1/27 | | 137,000 | | 142,981 | |
Societe Generale SA, VRN, 6.69%, 1/10/34(1) | | 200,000 | | 204,775 | |
Societe Generale SA, VRN, 3.65%, 7/8/35(1) | | 200,000 | | 156,994 | |
| Toronto-Dominion Bank, 2.45%, 1/12/32 | | 95,000 | | 78,834 | |
| Truist Bank, VRN, 2.64%, 9/17/29 | | 520,000 | | 488,511 | |
| Truist Financial Corp., VRN, 5.12%, 1/26/34 | | 190,000 | | 185,453 | |
| Wells Fargo & Co., VRN, 4.54%, 8/15/26 | | 72,000 | | 70,740 | |
| | | 4,674,502 | |
| Biotechnology — 0.5% | | | |
| Amgen, Inc., 5.25%, 3/2/25 | | 166,000 | | 167,909 | |
| Amgen, Inc., 5.15%, 3/2/28 | | 290,000 | | 296,251 | |
| | | 464,160 | |
| Broadline Retail — 0.6% | | | |
| Advance Auto Parts, Inc., 5.90%, 3/9/26 | | 181,000 | | 184,801 | |
Macy's Retail Holdings LLC, 5.875%, 3/15/30(1) | | 60,000 | | 53,323 | |
| | | | | | | | | | | |
| | Principal
Amount/Shares | Value |
Macy's Retail Holdings LLC, 6.125%, 3/15/32(1) | | $ | 350,000 | | $ | 308,417 | |
| | | 546,541 | |
| Building Products — 0.6% | | | |
Builders FirstSource, Inc., 5.00%, 3/1/30(1) | | 404,000 | | 374,525 | |
Standard Industries, Inc., 4.375%, 7/15/30(1) | | 120,000 | | 104,536 | |
| | | 479,061 | |
| Capital Markets — 3.4% | | | |
| Bank of New York Mellon Corp., VRN, 4.54%, 2/1/29 | | 445,000 | | 441,259 | |
| Deutsche Bank AG, VRN, 4.30%, 5/24/28 | | 200,000 | | 197,286 | |
| Goldman Sachs Group, Inc., VRN, 1.43%, 3/9/27 | | 205,000 | | 183,629 | |
| Goldman Sachs Group, Inc., VRN, 1.95%, 10/21/27 | | 136,000 | | 121,633 | |
| Goldman Sachs Group, Inc., VRN, 3.81%, 4/23/29 | | 178,000 | | 167,356 | |
| Morgan Stanley, VRN, 2.63%, 2/18/26 | | 156,000 | | 148,176 | |
| Morgan Stanley, VRN, 5.05%, 1/28/27 | | 127,000 | | 126,745 | |
| Morgan Stanley, VRN, 5.12%, 2/1/29 | | 22,000 | | 22,192 | |
| Morgan Stanley, VRN, 2.70%, 1/22/31 | | 685,000 | | 590,431 | |
| Morgan Stanley, VRN, 2.51%, 10/20/32 | | 45,000 | | 36,896 | |
| Morgan Stanley, VRN, 6.34%, 10/18/33 | | 85,000 | | 92,911 | |
| Owl Rock Capital Corp., 3.40%, 7/15/26 | | 379,000 | | 335,185 | |
UBS Group AG, VRN, 2.75%, 2/11/33(1) | | 535,000 | | 429,084 | |
| | | 2,892,783 | |
| Chemicals — 0.6% | | | |
| Celanese US Holdings LLC, 5.90%, 7/5/24 | | 310,000 | | 310,257 | |
Tronox, Inc., 4.625%, 3/15/29(1) | | 260,000 | | 218,027 | |
| | | 528,284 | |
| Commercial Services and Supplies — 0.2% | | | |
Clean Harbors, Inc., 6.375%, 2/1/31(1) | | 200,000 | | 204,260 | |
| Consumer Finance — 2.2% | | | |
| AerCap Ireland Capital DAC / AerCap Global Aviation Trust, 1.75%, 10/29/24 | | 845,000 | | 787,852 | |
Avolon Holdings Funding Ltd., 2.125%, 2/21/26(1) | | 370,000 | | 329,225 | |
| Discover Financial Services, 4.10%, 2/9/27 | | 280,000 | | 265,219 | |
| Navient Corp., 6.125%, 3/25/24 | | 215,000 | | 212,332 | |
| OneMain Finance Corp., 8.25%, 10/1/23 | | 255,000 | | 256,033 | |
| | | 1,850,661 | |
| Consumer Staples Distribution & Retail — 0.5% | | | |
United Natural Foods, Inc., 6.75%, 10/15/28(1) | | 425,000 | | 395,382 | |
| Containers and Packaging — 1.5% | | | |
Berry Global, Inc., 5.50%, 4/15/28(1) | | 440,000 | | 438,782 | |
Owens-Brockway Glass Container, Inc., 5.375%, 1/15/25(1) | | 290,000 | | 285,722 | |
Sealed Air Corp., 5.00%, 4/15/29(1) | | 230,000 | | 216,417 | |
Sealed Air Corp. / Sealed Air Corp. US, 6.125%, 2/1/28(1) | | 360,000 | | 364,392 | |
| | | 1,305,313 | |
| Diversified REITs — 2.3% | | | |
| Healthpeak OP LLC, 5.25%, 12/15/32 | | 43,000 | | 43,175 | |
Iron Mountain, Inc., 5.625%, 7/15/32(1) | | 480,000 | | 438,960 | |
MPT Operating Partnership LP / MPT Finance Corp., 5.00%, 10/15/27(2) | | 435,000 | | 358,268 | |
| National Retail Properties, Inc., 4.30%, 10/15/28 | | 556,000 | | 523,969 | |
| VICI Properties LP, 4.375%, 5/15/25 | | 230,000 | | 222,883 | |
VICI Properties LP / VICI Note Co., Inc., 4.125%, 8/15/30(1) | | 270,000 | | 238,730 | |
| Welltower OP LLC, 4.25%, 4/15/28 | | 178,000 | | 170,407 | |
| | | 1,996,392 | |
| | | | | | | | | | | |
| | Principal
Amount/Shares | Value |
| Diversified Telecommunication Services — 0.5% | | | |
| AT&T, Inc., 4.50%, 5/15/35 | | $ | 110,000 | | $ | 103,096 | |
Level 3 Financing, Inc., 3.40%, 3/1/27(1) | | 415,000 | | 328,615 | |
| | | 431,711 | |
| Electric Utilities — 1.1% | | | |
| American Electric Power Co., Inc., VRN, 3.875%, 2/15/62 | | 300,000 | | 240,498 | |
FEL Energy VI Sarl, 5.75%, 12/1/40(1) | | 461,975 | | 381,536 | |
| Pacific Gas & Electric Co., 6.15%, 1/15/33 | | 63,000 | | 64,736 | |
| System Energy Resources, Inc., 6.00%, 4/15/28 | | 258,000 | | 265,290 | |
| | | 952,060 | |
| Electrical Equipment — 0.3% | | | |
Regal Rexnord Corp., 6.40%, 4/15/33(1) | | 222,000 | | 222,402 | |
| Entertainment — 0.1% | | | |
Warnermedia Holdings, Inc., 3.76%, 3/15/27(1) | | 89,000 | | 83,889 | |
| Financial Services — 1.5% | | | |
| Air Lease Corp., 5.30%, 2/1/28 | | 610,000 | | 602,523 | |
| Block Financial LLC, 3.875%, 8/15/30 | | 194,000 | | 166,972 | |
| Charles Schwab Corp., 0.90%, 3/11/26 | | 370,000 | | 324,842 | |
LPL Holdings, Inc., 4.625%, 11/15/27(1) | | 225,000 | | 212,827 | |
| | | 1,307,164 | |
| Ground Transportation — 0.5% | | | |
Ashtead Capital, Inc., 5.50%, 8/11/32(1) | | 200,000 | | 196,862 | |
United Rentals North America, Inc., 6.00%, 12/15/29(1) | | 255,000 | | 258,756 | |
| | | 455,618 | |
| Health Care Equipment and Supplies — 0.5% | | | |
Avantor Funding, Inc., 4.625%, 7/15/28(1) | | 235,000 | | 222,876 | |
Medline Borrower LP, 3.875%, 4/1/29(1) | | 245,000 | | 212,822 | |
| | | 435,698 | |
| Health Care Providers and Services — 1.3% | | | |
| Centene Corp., 3.375%, 2/15/30 | | 230,000 | | 200,869 | |
IQVIA, Inc., 5.00%, 5/15/27(1) | | 260,000 | | 255,746 | |
Owens & Minor, Inc., 6.625%, 4/1/30(1) | | 375,000 | | 322,369 | |
Tenet Healthcare Corp., 6.125%, 10/1/28(2) | | 180,000 | | 172,682 | |
| Tenet Healthcare Corp., 4.25%, 6/1/29 | | 150,000 | | 135,842 | |
| | | 1,087,508 | |
| Hotels, Restaurants and Leisure — 1.8% | | | |
Caesars Entertainment, Inc., 4.625%, 10/15/29(1)(2) | | 84,000 | | 73,545 | |
Caesars Entertainment, Inc., 7.00%, 2/15/30(1) | | 93,000 | | 94,713 | |
CDI Escrow Issuer, Inc., 5.75%, 4/1/30(1) | | 230,000 | | 222,351 | |
| Marriott International, Inc., 4.90%, 4/15/29 | | 250,000 | | 247,933 | |
Royal Caribbean Cruises Ltd., 7.25%, 1/15/30(1) | | 180,000 | | 181,287 | |
Scientific Games International, Inc., 7.25%, 11/15/29(1) | | 284,000 | | 284,806 | |
Station Casinos LLC, 4.625%, 12/1/31(1) | | 300,000 | | 253,639 | |
Wynn Las Vegas LLC / Wynn Las Vegas Capital Corp., 5.25%, 5/15/27(1) | | 215,000 | | 203,429 | |
| | | 1,561,703 | |
| Insurance — 0.4% | | | |
| Allstate Corp., 5.25%, 3/30/33 | | 147,000 | | 148,745 | |
SBL Holdings, Inc., VRN, 6.50%(1)(3) | | 247,000 | | 174,752 | |
| | | 323,497 | |
| IT Services — 0.4% | | | |
| Global Payments, Inc., 4.45%, 6/1/28 | | 355,000 | | 337,247 | |
| | | | | | | | | | | |
| | Principal
Amount/Shares | Value |
| Life Sciences Tools and Services — 0.4% | | | |
| Illumina, Inc., 5.80%, 12/12/25 | | $ | 380,000 | | $ | 383,797 | |
| Machinery — 0.3% | | | |
Chart Industries, Inc., 9.50%, 1/1/31(1) | | 254,000 | | 268,213 | |
| Media — 2.8% | | | |
CCO Holdings LLC / CCO Holdings Capital Corp., 6.375%, 9/1/29(1) | | 540,000 | | 516,186 | |
CCO Holdings LLC / CCO Holdings Capital Corp., 4.25%, 1/15/34(1) | | 295,000 | | 231,040 | |
Directv Financing LLC / Directv Financing Co-Obligor, Inc., 5.875%, 8/15/27(1) | | 345,000 | | 312,798 | |
DISH DBS Corp., 5.25%, 12/1/26(1) | | 380,000 | | 303,913 | |
Gray Escrow II, Inc., 5.375%, 11/15/31(1) | | 280,000 | | 186,238 | |
Gray Television, Inc., 7.00%, 5/15/27(1)(2) | | 235,000 | | 196,972 | |
iHeartCommunications, Inc., 8.375%, 5/1/27(2) | | 145,000 | | 105,620 | |
| Paramount Global, VRN, 6.25%, 2/28/57 | | 325,000 | | 243,532 | |
| Paramount Global, VRN, 6.375%, 3/30/62 | | 245,000 | | 194,433 | |
VTR Finance NV, 6.375%, 7/15/28(1) | | 200,000 | | 81,000 | |
| | | 2,371,732 | |
| Metals and Mining — 0.9% | | | |
Alcoa Nederland Holding BV, 4.125%, 3/31/29(1) | | 250,000 | | 222,792 | |
| ATI, Inc., 4.875%, 10/1/29 | | 230,000 | | 209,664 | |
Cleveland-Cliffs, Inc., 4.625%, 3/1/29(1)(2) | | 328,000 | | 301,303 | |
| | | 733,759 | |
| Mortgage Real Estate Investment Trusts (REITs) — 0.6% | |
Ladder Capital Finance Holdings LLLP / Ladder Capital Finance Corp., 5.25%, 10/1/25(1) | | 431,000 | | 379,646 | |
Ladder Capital Finance Holdings LLLP / Ladder Capital Finance Corp., 4.25%, 2/1/27(1) | | 172,000 | | 136,045 | |
| | | 515,691 | |
| Multi-Utilities — 0.3% | | | |
| Sempra Energy, VRN, 4.125%, 4/1/52 | | 300,000 | | 242,556 | |
| Oil, Gas and Consumable Fuels — 4.9% | | | |
Antero Resources Corp., 7.625%, 2/1/29(1)(2) | | 82,000 | | 83,925 | |
Antero Resources Corp., 5.375%, 3/1/30(1)(2) | | 330,000 | | 307,354 | |
Blue Racer Midstream LLC / Blue Racer Finance Corp., 7.625%, 12/15/25(1) | | 250,000 | | 247,725 | |
Callon Petroleum Co., 7.50%, 6/15/30(1)(2) | | 100,000 | | 94,097 | |
Crescent Energy Finance LLC, 9.25%, 2/15/28(1) | | 195,000 | | 187,152 | |
CrownRock LP / CrownRock Finance, Inc., 5.00%, 5/1/29(1) | | 400,000 | | 373,120 | |
| Ecopetrol SA, 5.875%, 9/18/23 | | 185,000 | | 185,094 | |
| Ecopetrol SA, 8.875%, 1/13/33 | | 89,000 | | 90,157 | |
EnLink Midstream LLC, 6.50%, 9/1/30(1) | | 240,000 | | 242,952 | |
EQM Midstream Partners LP, 7.50%, 6/1/27(1) | | 240,000 | | 241,193 | |
Geopark Ltd., 5.50%, 1/17/27(1) | | 600,000 | | 504,000 | |
MEG Energy Corp., 5.875%, 2/1/29(1) | | 375,000 | | 361,654 | |
| Occidental Petroleum Corp., 6.375%, 9/1/28 | | 350,000 | | 362,778 | |
Occidental Petroleum Corp., 6.125%, 1/1/31(2) | | 250,000 | | 259,629 | |
| Petroleos Mexicanos, 5.95%, 1/28/31 | | 300,000 | | 229,816 | |
| Southwestern Energy Co., 5.375%, 3/15/30 | | 400,000 | | 376,528 | |
| | | 4,147,174 | |
| Passenger Airlines — 1.2% | | | |
American Airlines, Inc., 11.75%, 7/15/25(1) | | 295,000 | | 323,040 | |
| | | | | | | | | | | |
| | Principal
Amount/Shares | Value |
American Airlines, Inc., 7.25%, 2/15/28(1) | | $ | 166,000 | | $ | 161,595 | |
American Airlines, Inc. / AAdvantage Loyalty IP Ltd., 5.50%, 4/20/26(1) | | 108,461 | | 106,871 | |
Mileage Plus Holdings LLC / Mileage Plus Intellectual Property Assets Ltd., 6.50%, 6/20/27(1) | | 9 | | 9 | |
Spirit Loyalty Cayman Ltd. / Spirit IP Cayman Ltd., 8.00%, 9/20/25(1) | | 415,000 | | 417,984 | |
| | | 1,009,499 | |
| Pharmaceuticals — 0.3% | | | |
Organon & Co. / Organon Foreign Debt Co-Issuer BV, 4.125%, 4/30/28(1) | | 245,000 | | 224,177 | |
| Semiconductors and Semiconductor Equipment — 0.3% | |
| Intel Corp., 2.45%, 11/15/29 | | 300,000 | | 264,332 | |
| Specialized REITs — 0.1% | | | |
| Equinix, Inc., 2.90%, 11/18/26 | | 110,000 | | 102,364 | |
| Wireless Telecommunication Services — 1.6% | | | |
Kenbourne Invest SA, 6.875%, 11/26/24(1) | | 84,000 | | 64,055 | |
Kenbourne Invest SA, 4.70%, 1/22/28(1) | | 300,000 | | 172,926 | |
| Sprint LLC, 7.125%, 6/15/24 | | 190,000 | | 193,319 | |
| Sprint LLC, 7.625%, 2/15/25 | | 545,000 | | 565,637 | |
| T-Mobile USA, Inc., 3.375%, 4/15/29 | | 340,000 | | 310,280 | |
| T-Mobile USA, Inc., 4.375%, 4/15/40 | | 90,000 | | 80,721 | |
| | | 1,386,938 | |
TOTAL CORPORATE BONDS (Cost $37,122,758) | | | 35,767,528 | |
| U.S. TREASURY SECURITIES — 20.6% | | | |
U.S. Treasury Notes, 1.50%, 2/15/25(4) | | 1,000,000 | | 952,930 | |
| U.S. Treasury Notes, 3.875%, 3/31/25 | | 1,300,000 | | 1,296,134 | |
| U.S. Treasury Notes, 4.00%, 12/15/25 | | 1,500,000 | | 1,505,931 | |
| U.S. Treasury Notes, 4.00%, 2/15/26 | | 900,000 | | 903,832 | |
| U.S. Treasury Notes, 4.625%, 3/15/26 | | 7,100,000 | | 7,262,246 | |
| U.S. Treasury Notes, 3.875%, 11/30/27 | | 3,800,000 | | 3,840,152 | |
| U.S. Treasury Notes, 4.00%, 2/29/28 | | 500,000 | | 509,082 | |
| U.S. Treasury Notes, 3.875%, 11/30/29 | | 200,000 | | 203,516 | |
| U.S. Treasury Notes, 4.125%, 11/15/32 | | 500,000 | | 525,469 | |
| U.S. Treasury Notes, 3.50%, 2/15/33 | | 600,000 | | 600,984 | |
TOTAL U.S. TREASURY SECURITIES (Cost $17,354,973) | | | 17,600,276 | |
| ASSET-BACKED SECURITIES — 9.4% | | | |
Aaset Trust, Series 2021-2A, Class B, 3.54%, 1/15/47(1) | | 214,451 | | 162,018 | |
Aligned Data Centers Issuer LLC, Series 2021-1A, Class A2, SEQ, 1.94%, 8/15/46(1) | | 100,000 | | 88,365 | |
Applebee's Funding LLC / IHOP Funding LLC, Series 2019-1A, Class A2I, SEQ, 4.19%, 6/5/49(1) | | 439,560 | | 430,960 | |
Blackbird Capital Aircraft, Series 2021-1A, Class B, 3.45%, 7/15/46(1) | | 234,646 | | 184,000 | |
Capital Automotive LLC, Series 2017-1A, Class A2, SEQ, 4.18%, 4/15/47(1) | | 124,967 | | 121,465 | |
CARS-DB4 LP, Series 2020-1A, Class B1, 4.17%, 2/15/50(1) | | 200,000 | | 188,548 | |
CARS-DB4 LP, Series 2020-1A, Class B2, 4.52%, 2/15/50(1) | | 100,000 | | 90,466 | |
Castlelake Aircraft Securitization Trust, Series 2018-1, Class A, SEQ, 4.125%, 6/15/43(1) | | 196,768 | | 177,944 | |
Castlelake Aircraft Structured Trust, Series 2017-1R, Class A, SEQ, 2.74%, 8/15/41(1) | | 250,177 | | 223,908 | |
| | | | | | | | | | | |
| | Principal
Amount/Shares | Value |
Castlelake Aircraft Structured Trust, Series 2021-1A, Class A, SEQ, 3.47%, 1/15/46(1) | | $ | 205,322 | | $ | 189,316 | |
Clsec Holdings 22t LLC, Series 2021-1, Class C, 6.17%, 5/11/37(1) | | 313,173 | | 260,760 | |
Cologix Canadian Issuer LP, Series 2022-1CAN, Class A2, SEQ, 4.94%, 1/25/52(1) | CAD | 250,000 | | 171,312 | |
Cologix Canadian Issuer LP, Series 2022-1CAN, Class C, 7.74%, 1/25/52(1) | CAD | 200,000 | | 137,171 | |
Credit Acceptance Auto Loan Trust, Series 2022-3A, Class A, SEQ, 6.57%, 10/15/32(1) | | $ | 250,000 | | 253,328 | |
Diamond Issuer, Series 2021-1A, Class A, SEQ, 2.31%, 11/20/51(1) | | 395,000 | | 341,688 | |
Diamond Issuer, Series 2021-1A, Class C, 3.79%, 11/20/51(1) | | 325,000 | | 263,122 | |
Domino's Pizza Master Issuer LLC, Series 2015-1A, Class A2II, SEQ, 4.47%, 10/25/45(1) | | 93,750 | | 90,730 | |
Edgeconnex Data Centers Issuer LLC, Series 2022-1, Class A2, SEQ, 4.25%, 3/25/52(1) | | 173,396 | | 162,685 | |
Flexential Issuer, Series 2021-1A, Class A2, SEQ, 3.25%, 11/27/51(1) | | 300,000 | | 268,012 | |
GAIA Aviation Ltd., Series 2019-1, Class A, 3.97%, 12/15/44(1) | | 142,013 | | 130,299 | |
Lunar Structured Aircraft Portfolio Notes, Series 2021-1, Class A, SEQ, 2.64%, 10/15/46(1) | | 214,599 | | 187,181 | |
Lunar Structured Aircraft Portfolio Notes, Series 2021-1, Class B, 3.43%, 10/15/46(1) | | 237,579 | | 202,153 | |
MACH 1 Cayman Ltd., Series 2019-1, Class A, SEQ, 3.47%, 10/15/39(1) | | 185,963 | | 158,424 | |
MAPS Trust, Series 2021-1A, Class A, SEQ, 2.52%, 6/15/46(1) | | 377,315 | | 331,337 | |
| Nelnet Student Loan Trust, Series 2005-4, Class A4, VRN, 5.13%, (3-month LIBOR plus 0.18%), 3/22/32 | | 81,784 | | 79,483 | |
NP SPE II LLC, Series 2019-1A, Class A1, SEQ, 2.57%, 9/20/49(1) | | 215,609 | | 202,188 | |
Progress Residential Trust, Series 2021-SFR1, Class F, 2.76%, 4/17/38(1) | | 300,000 | | 257,635 | |
Sabey Data Center Issuer LLC, Series 2020-1, Class A2, SEQ, 3.81%, 4/20/45(1) | | 350,000 | | 334,595 | |
Sabey Data Center Issuer LLC, Series 2021-1, Class A2, SEQ, 1.88%, 6/20/46(1) | | 395,000 | | 347,502 | |
Sapphire Aviation Finance II Ltd., Series 2020-1A, Class A, SEQ, 3.23%, 3/15/40(1) | | 180,772 | | 151,831 | |
Sierra Timeshare Receivables Funding LLC, Series 2019-3A, Class B, 2.75%, 8/20/36(1) | | 37,776 | | 35,829 | |
Sierra Timeshare Receivables Funding LLC, Series 2022-3A, Class C, 7.63%, 7/20/39(1) | | 269,174 | | 273,881 | |
Sierra Timeshare Receivables Funding LLC, Series 2023-1A, Class C, 7.00%, 1/20/40(1)(5) | | 125,000 | | 124,980 | |
Slam Ltd., Series 2021-1A, Class B, 3.42%, 6/15/46(1) | | 222,650 | | 186,231 | |
Stack Infrastructure Issuer LLC, Series 2019-1A, Class A2, SEQ, 4.54%, 2/25/44(1) | | 261,478 | | 256,909 | |
Start II Ltd., Series 2019-1, Class A, SEQ, 4.09%, 3/15/44(1) | | 255,474 | | 226,337 | |
Start Ltd., Series 2018-1, Class A, SEQ, 4.09%, 5/15/43(1) | | 275,575 | | 239,766 | |
Trinity Rail Leasing LP, Series 2009-1A, Class A, SEQ, 6.66%, 11/16/39(1) | | 116,342 | | 115,808 | |
Vantage Data Centers LLC, Series 2020-1A, Class A2, SEQ, 1.65%, 9/15/45(1) | | 192,000 | | 172,987 | |
VB-S1 Issuer LLC, Series 2022-1A, Class D, 4.29%, 2/15/52(1) | | 250,000 | | 228,160 | |
TOTAL ASSET-BACKED SECURITIES (Cost $8,701,357) | | | 8,049,314 | |
| | | | | | | | | | | |
| | Principal
Amount/Shares | Value |
| COLLATERALIZED LOAN OBLIGATIONS — 9.3% | | | |
ACRES Commercial Realty Ltd., Series 2021-FL1, Class A, VRN, 5.91%, (1-month LIBOR plus 1.20%), 6/15/36(1) | | $ | 260,000 | | $ | 255,197 | |
Arbor Realty Commercial Real Estate Notes Ltd., Series 2019-FL2, Class AS, VRN, 6.39%, (1-month SOFR plus 1.56%), 9/15/34(1) | | 261,457 | | 260,292 | |
Arbor Realty Commercial Real Estate Notes Ltd., Series 2019-FL2, Class D, VRN, 7.39%, (1-month SOFR plus 2.56%), 9/15/34(1) | | 261,500 | | 257,244 | |
ARES XLVII CLO Ltd., Series 2018-47A, Class C, VRN, 6.54%, (3-month LIBOR plus 1.75%), 4/15/30(1) | | 150,000 | | 141,833 | |
BDS Ltd., Series 2020-FL5, Class AS, VRN, 6.16%, (1-month SOFR plus 1.46%), 2/16/37(1) | | 200,000 | | 195,186 | |
BDS Ltd., Series 2020-FL6, Class E, VRN, 7.92%, (30-day average SOFR plus 3.36%), 9/15/35(1) | | 146,000 | | 138,480 | |
BDS Ltd., Series 2021-FL8, Class A, VRN, 5.68%, (1-month LIBOR plus 0.92%), 1/18/36(1) | | 148,156 | | 144,714 | |
BXMT Ltd., Series 2021-FL4, Class A, VRN, 5.73%, (1-month LIBOR plus 1.05%), 5/15/38(1) | | 265,000 | | 258,835 | |
CBAM Ltd., Series 2017-1A, Class B, VRN, 6.61%, (3-month LIBOR plus 1.80%), 7/20/30(1) | | 250,000 | | 243,118 | |
Cerberus Loan Funding XXVIII LP, Series 2020-1A, Class A, VRN, 6.64%, (3-month LIBOR plus 1.85%), 10/15/31(1) | | 190,599 | | 189,378 | |
CIFC Funding Ltd., Series 2017-3A, Class C, VRN, 8.46%, (3-month LIBOR plus 3.65%), 7/20/30(1) | | 250,000 | | 227,785 | |
CIFC Funding Ltd., Series 2017-5A, Class B, VRN, 6.64%, (3-month LIBOR plus 1.85%), 11/16/30(1) | | 100,000 | | 96,437 | |
Dryden 30 Senior Loan Fund, Series 2013-30A, Class CR, VRN, 6.56%, (3-month LIBOR plus 1.70%), 11/15/28(1) | | 250,000 | | 242,094 | |
Greystone CRE Notes Ltd., Series 2019-FL2, Class D, VRN, 7.08%, (1-month LIBOR plus 2.40%), 9/15/37(1) | | 132,500 | | 128,088 | |
HGI CRE CLO Ltd., Series 2021-FL1, Class AS, VRN, 6.13%, (1-month LIBOR plus 1.40%), 6/16/36(1) | | 330,000 | | 316,933 | |
HGI CRE CLO Ltd., Series 2021-FL2, Class B, VRN, 6.23%, (1-month LIBOR plus 1.50%), 9/17/36(1) | | 376,000 | | 358,533 | |
KKR Static CLO I Ltd., Series 2022-1A, Class B, VRN, 7.24%, (3-month SOFR plus 2.60%), 7/20/31(1) | | 250,000 | | 244,202 | |
KVK CLO Ltd., Series 2013-1A, Class DR, VRN, 7.74%, (3-month LIBOR plus 2.95%), 1/14/28(1) | | 250,000 | | 244,793 | |
Madison Park Funding XIX Ltd., Series 2015-19A, Class DR, VRN, 9.17%, (3-month LIBOR plus 4.35%), 1/22/28(1) | | 275,000 | | 248,223 | |
MF1 Ltd., Series 2020-FL4, Class D, VRN, 8.87%, (1-month SOFR plus 4.21%), 11/15/35(1) | | 356,000 | | 340,386 | |
Neuberger Berman CLO XVIII Ltd., Series 2014-18A, Class BR2, VRN, 6.97%, (3-month LIBOR plus 2.15%), 10/21/30(1) | | 275,000 | | 264,403 | |
Octagon Investment Partners XV Ltd., Series 2013-1A, Class CRR, VRN, 6.80%, (3-month LIBOR plus 2.00%), 7/19/30(1) | | 175,000 | | 166,128 | |
Palmer Square Loan Funding Ltd., Series 2021-3A, Class C, VRN, 7.31%, (3-month LIBOR plus 2.50%), 7/20/29(1) | | 175,000 | | 166,491 | |
Palmer Square Loan Funding Ltd., Series 2022-5A, Class A2, VRN, 7.31%, (3-month SOFR plus 2.65%), 1/15/31(1) | | 250,000 | | 247,649 | |
PFP Ltd., Series 2021-7, Class A, VRN, 5.53%, (1-month LIBOR plus 0.85%), 4/14/38(1) | | 28,291 | | 27,556 | |
Ready Capital Mortgage Financing LLC, Series 2021-FL6, Class A, VRN, 5.80%, (1-month LIBOR plus 0.95%), 7/25/36(1) | | 114,760 | | 111,194 | |
Ready Capital Mortgage Financing LLC, Series 2021-FL6, Class C, VRN, 6.75%, (1-month LIBOR plus 1.90%), 7/25/36(1) | | 250,000 | | 236,830 | |
Rockford Tower CLO Ltd., Series 2020-1A, Class C, VRN, 7.16%, (3-month LIBOR plus 2.35%), 1/20/32(1) | | 100,000 | | 96,499 | |
| | | | | | | | | | | |
| | Principal
Amount/Shares | Value |
Shelter Growth CRE Issuer Ltd., Series 2022-FL4, Class A, VRN, 7.05%, (1-month SOFR plus 2.30%), 6/17/37(1) | | $ | 198,000 | | $ | 196,969 | |
Silver Creek CLO Ltd., Series 2014-1A, Class CR, VRN, 7.11%, (3-month LIBOR plus 2.30%), 7/20/30(1) | | 300,000 | | 290,015 | |
Sound Point CLO XXII Ltd., Series 2019-1A, Class BR, VRN, 6.51%, (3-month LIBOR plus 1.70%), 1/20/32(1) | | 250,000 | | 241,529 | |
Stewart Park CLO Ltd., Series 2015-1A, Class CR, VRN, 6.59%, (3-month LIBOR plus 1.80%), 1/15/30(1) | | 250,000 | | 236,615 | |
Symphony CLO XIV Ltd., Series 2014-14A, Class CR, VRN, 6.89%, (3-month LIBOR plus 2.10%), 7/14/26(1) | | 275,000 | | 273,805 | |
TICP CLO I-2 Ltd., Series 2018-IA, Class C, VRN, 7.86%, (3-month LIBOR plus 3.04%), 4/26/28(1) | | 250,000 | | 249,875 | |
TRTX Issuer Ltd., Series 2021-FL4, Class A, VRN, 5.91%, (1-month LIBOR plus 1.20%), 3/15/38(1) | | 276,000 | | 269,665 | |
Vibrant CLO VII Ltd., Series 2017-7A, Class B, VRN, 7.21%, (3-month LIBOR plus 2.40%), 9/15/30(1) | | 200,000 | | 195,289 | |
Wind River CLO Ltd., Series 2013-1A, Class A1RR, VRN, 5.79%, (3-month LIBOR plus 0.98%), 7/20/30(1) | | 125,554 | | 124,472 | |
TOTAL COLLATERALIZED LOAN OBLIGATIONS (Cost $8,019,757) | | | 7,926,735 | |
| COLLATERALIZED MORTGAGE OBLIGATIONS — 4.8% | |
| Private Sponsor Collateralized Mortgage Obligations — 3.6% | |
Agate Bay Mortgage Trust, Series 2016-1, Class A3, VRN, 3.50%, 12/25/45(1) | | 9,547 | | 8,913 | |
Angel Oak Mortgage Trust, Series 2020-2, Class A2, VRN, 3.86%, 1/26/65(1) | | 118,968 | | 112,434 | |
Angel Oak Mortgage Trust, Series 2021-3, Class M1, VRN, 2.48%, 5/25/66(1) | | 400,000 | | 255,953 | |
Angel Oak Mortgage Trust I LLC, Series 2019-4, Class A3, SEQ, VRN, 3.30%, 7/26/49(1) | | 1,061 | | 1,057 | |
| Bear Stearns Adjustable Rate Mortgage Trust, Series 2006-1, Class A1, VRN, 6.80%, (1-year H15T1Y plus 2.25%), 2/25/36 | | 9,907 | | 9,326 | |
Bellemeade Re Ltd., Series 2018-1A, Class M2, VRN, 7.75%, (1-month LIBOR plus 2.90%), 4/25/28(1) | | 141,321 | | 142,091 | |
Bellemeade Re Ltd., Series 2018-3A, Class M1B, VRN, 6.70%, (1-month LIBOR plus 1.85%), 10/25/28(1) | | 9,245 | | 9,244 | |
Bellemeade Re Ltd., Series 2019-3A, Class M1C, VRN, 6.80%, (1-month LIBOR plus 1.95%), 7/25/29(1) | | 195,460 | | 194,826 | |
Bellemeade Re Ltd., Series 2020-2A, Class M2, VRN, 10.85%, (1-month LIBOR plus 6.00%), 8/26/30(1) | | 214,115 | | 218,450 | |
Bellemeade Re Ltd., Series 2020-4A, Class M2B, VRN, 8.45%, (1-month LIBOR plus 3.60%), 6/25/30(1) | | 191,641 | | 192,927 | |
Ellington Financial Mortgage Trust, Series 2023-1, Class A2, 6.24%, 2/25/68(1) | | 172,324 | | 170,224 | |
Farm Mortgage Trust, Series 2021-1, Class B, VRN, 3.24%, 7/25/51(1) | | 305,704 | | 191,754 | |
Home RE Ltd., Series 2020-1, Class B1, VRN, 11.85%, (1-month LIBOR plus 7.00%), 10/25/30(1) | | 225,000 | | 229,461 | |
Home RE Ltd., Series 2022-1, Class M1A, VRN, 7.41%, (30-day average SOFR plus 2.85%), 10/25/34(1) | | 75,000 | | 75,487 | |
Homeward Opportunities Fund I Trust, Series 2020-2, Class B3, VRN, 5.49%, 5/25/65(1) | | 250,000 | | 208,769 | |
MFA Trust, Series 2023-INV1, Class A2, 6.45%, 2/25/58(1) | | 273,751 | | 273,659 | |
Triangle Re Ltd., Series 2020-1, Class M2, VRN, 10.45%, (1-month LIBOR plus 5.60%), 10/25/30(1) | | 50,392 | | 50,720 | |
Triangle Re Ltd., Series 2021-1, Class M2, VRN, 8.75%, (1-month LIBOR plus 3.90%), 8/25/33(1) | | 137,831 | | 138,620 | |
Triangle Re Ltd., Series 2021-3, Class M1A, VRN, 6.46%, (30-day average SOFR plus 1.90%), 2/25/34(1) | | 182,042 | | 180,689 | |
| | | | | | | | | | | |
| | Principal
Amount/Shares | Value |
Verus Securitization Trust, Series 2021-R3, Class M1, SEQ, VRN, 2.41%, 4/25/64(1) | | $ | 315,000 | | $ | 229,142 | |
Vista Point Securitization Trust, Series 2020-1, Class B1, VRN, 5.375%, 3/25/65(1) | | 200,000 | | 185,146 | |
| Wells Fargo Mortgage-Backed Securities Trust, Series 2006-7, Class 3A1, SEQ, 6.00%, 6/25/36 | | 1,523 | | 1,313 | |
| | | 3,080,205 | |
| U.S. Government Agency Collateralized Mortgage Obligations — 1.2% | |
| FHLMC, Series 2017-HRP1, Class M2, VRN, 7.30%, (1-month LIBOR plus 2.45%), 12/25/42 | | 98,980 | | 99,143 | |
FHLMC, Series 2022-DNA3, Class M1A, VRN, 6.56%, (30-day average SOFR plus 2.00%), 4/25/42(1) | | 159,417 | | 159,487 | |
FHLMC, Series 2022-DNA5, Class M1A, VRN, 7.51%, (30-day average SOFR plus 2.95%), 6/25/42(1) | | 211,799 | | 215,543 | |
FHLMC, Series 2022-DNA6, Class M1A, VRN, 6.71%, (30-day average SOFR plus 2.15%), 9/25/42(1) | | 154,198 | | 154,659 | |
| FNMA, Series 2015-C02, Class 1M2, VRN, 8.85%, (1-month LIBOR plus 4.00%), 5/25/25 | | 63,667 | | 65,820 | |
| FNMA, Series 2016-55, Class PI, IO, 4.00%, 8/25/46 | | 345,713 | | 64,822 | |
| FNMA, Series 2017-7, Class AI, IO, 6.00%, 2/25/47 | | 277,982 | | 50,987 | |
| FNMA, Series 2018-C01, Class 1ED2, VRN, 5.70%, (1-month LIBOR plus 0.85%), 7/25/30 | | 56,406 | | 56,026 | |
FNMA, Series 2022-R06, Class 1M1, VRN, 7.31%, (30-day average SOFR plus 2.75%), 5/25/42(1) | | 123,992 | | 126,041 | |
| FNMA, Series 413, Class C27, IO, 4.00%, 7/25/42 | | 243,795 | | 36,125 | |
| | | 1,028,653 | |
TOTAL COLLATERALIZED MORTGAGE OBLIGATIONS (Cost $4,434,935) | | | 4,108,858 | |
| COMMERCIAL MORTGAGE-BACKED SECURITIES — 3.6% | |
BBCMS Mortgage Trust, Series 2017-DELC, Class F, VRN, 8.31%, (1-month LIBOR plus 3.63%), 8/15/36(1) | | 160,000 | | 155,626 | |
BBCMS Mortgage Trust, Series 2019-BWAY, Class D, VRN, 7.10%, (1-month LIBOR plus 2.27%), 11/15/34(1) | | 172,000 | | 88,565 | |
BBCMS Mortgage Trust, Series 2019-BWAY, Class E, VRN, 7.79%, (1-month LIBOR plus 2.96%), 11/15/34(1) | | 183,000 | | 80,154 | |
BX Commercial Mortgage Trust, Series 2020-VIVA, Class D, VRN, 3.55%, 3/11/44(1) | | 350,000 | | 274,746 | |
BX Commercial Mortgage Trust, Series 2021-VOLT, Class E, VRN, 6.68%, (1-month LIBOR plus 2.00%), 9/15/36(1) | | 400,000 | | 374,182 | |
BX Trust, Series 2018-GW, Class C, VRN, 5.90%, (1-month LIBOR plus 1.22%), 5/15/35(1) | | 249,000 | | 240,598 | |
BX Trust, Series 2021-ARIA, Class G, VRN, 7.83%, (1-month LIBOR plus 3.14%), 10/15/36(1) | | 186,000 | | 164,409 | |
BXP Trust, Series 2017-CC, Class D, VRN, 3.55%, 8/13/37(1) | | 180,000 | | 130,556 | |
Citigroup Commercial Mortgage Trust, Series 2019-SMRT, Class E, VRN, 4.74%, 1/10/36(1) | | 280,000 | | 269,068 | |
DBGS Mortgage Trust, Series 2018-BIOD, Class D, VRN, 5.98%, (1-month LIBOR plus 1.30%), 5/15/35(1) | | 319,817 | | 311,004 | |
Great Wolf Trust, Series 2019-WOLF, Class C, VRN, 6.57%, (1-month SOFR plus 1.75%), 12/15/36(1) | | 163,000 | | 158,496 | |
J.P. Morgan Chase Commercial Mortgage Securities Trust, Series 2018-AON, Class A, SEQ, 4.13%, 7/5/31(1) | | 175,000 | | 158,375 | |
Med Trust, Series 2021-MDLN, Class F, VRN, 8.69%, (1-month LIBOR plus 4.00%), 11/15/38(1) | | 218,650 | | 203,345 | |
MHP Trust, Series 2022-MHIL, Class D, VRN, 6.44%, (1-month SOFR plus 1.61%), 1/15/27(1) | | 294,413 | | 276,005 | |
One New York Plaza Trust, Series 2020-1NYP, Class B, VRN, 6.18%, (1-month LIBOR plus 1.50%), 1/15/36(1) | | 154,000 | | 142,481 | |
TOTAL COMMERCIAL MORTGAGE-BACKED SECURITIES (Cost $3,404,702) | | | 3,027,610 | |
| | | | | | | | | | | |
| | Principal
Amount/Shares | Value |
BANK LOAN OBLIGATIONS(6) — 1.8% | | | |
Consumer Staples Distribution & Retail† | | | |
| United Natural Foods, Inc., Term Loan B, 8.17%, (1-month SOFR plus 3.25%), 10/22/25 | | $ | 38,994 | | $ | 39,067 | |
| Entertainment — 0.2% | | | |
| Caesars Entertainment Corp., Term Loan B, 8.16%, (1-month SOFR plus 3.25%), 2/6/30 | | 180,000 | | 179,400 | |
| Health Care Providers and Services — 0.5% | | | |
Surgery Center Holdings, Inc., 2021 Term Loan, 8/31/26(7) | | 396,000 | | 394,178 | |
| Passenger Airlines — 0.5% | | | |
| American Airlines, Inc., 2023 Term Loan B, 8.15%, (6-month SOFR plus 2.75%), 2/15/28 | | 410,000 | | 401,544 | |
| Pharmaceuticals — 0.6% | | | |
| Horizon Therapeutics USA Inc., 2021 Term Loan B2, 6.56%, (1-month LIBOR plus 1.75%), 3/15/28 | | 164,640 | | 164,524 | |
| Jazz Financing Lux S.a.r.l., USD Term Loan, 8.34%, (1-month LIBOR plus 3.50%), 5/5/28 | | 390,223 | | 389,206 | |
| | | 553,730 | |
TOTAL BANK LOAN OBLIGATIONS (Cost $1,567,087) | | | 1,567,919 | |
| SOVEREIGN GOVERNMENTS AND AGENCIES — 1.8% | |
| Colombia — 0.4% | | | |
| Colombia Government International Bond, 3.875%, 4/25/27 | | 330,000 | | 300,319 | |
| Dominican Republic — 0.4% | | | |
| Dominican Republic International Bond, 6.875%, 1/29/26 | | 300,000 | | 305,310 | |
| Mexico — 0.2% | | | |
| Mexico Government International Bond, 4.875%, 5/19/33 | | 200,000 | | 191,727 | |
| Romania — 0.2% | | | |
Romanian Government International Bond, 6.625%, 2/17/28(1) | | 196,000 | | 203,814 | |
| Saudi Arabia — 0.3% | | | |
Saudi Government International Bond, 4.75%, 1/18/28(1) | | 122,000 | | 123,590 | |
Saudi Government International Bond, 5.50%, 10/25/32(1) | | 140,000 | | 149,576 | |
| | | 273,166 | |
| South Africa — 0.3% | | | |
| Republic of South Africa Government International Bond, 5.875%, 6/22/30 | | 300,000 | | 282,037 | |
TOTAL SOVEREIGN GOVERNMENTS AND AGENCIES (Cost $1,575,625) | | | 1,556,373 | |
| PREFERRED STOCKS — 1.6% | | | |
| Banks — 0.8% | | | |
Banco Mercantil del Norte SA, 8.375%(1) | | 200,000 | | 185,850 | |
BNP Paribas SA, 7.75%(1) | | 125,000 | | 119,962 | |
| JPMorgan Chase & Co., 4.60% | | 200,000 | | 186,500 | |
| Lloyds Banking Group PLC, 8.00% | | 155,000 | | 143,181 | |
| | | 635,493 | |
| Industrial Conglomerates — 0.4% | | | |
General Electric Co., Series D, 8.20%(2) | | 340,000 | | 340,935 | |
| Insurance — 0.2% | | | |
Allianz SE, 3.20%(1) | | 255,000 | | 179,517 | |
| Trading Companies and Distributors — 0.2% | | | |
Aircastle Ltd., 5.25%(1) | | 255,000 | | 187,323 | |
TOTAL PREFERRED STOCKS (Cost $1,450,892) | | | 1,343,268 | |
| | | | | | | | | | | |
| | Principal
Amount/Shares | Value |
| SHORT-TERM INVESTMENTS — 6.3% | | | |
| Money Market Funds — 2.4% | | | |
State Street Navigator Securities Lending Government Money Market Portfolio(8) | | 2,068,465 | | $ | 2,068,465 | |
| Repurchase Agreements — 2.8% | | | |
| BMO Capital Markets Corp., (collateralized by various U.S. Treasury obligations, 1.125% - 4.375%, 8/15/40 - 5/15/49, valued at $627,612), in a joint trading account at 4.67%, dated 3/31/23, due 4/3/23 (Delivery value $605,588) | | | 605,352 | |
| Fixed Income Clearing Corp., (collateralized by various U.S. Treasury obligations, 3.625%, 3/31/28, valued at $1,786,105), at 4.81%, dated 3/31/23, due 4/3/23 (Delivery value $1,751,702) | | | 1,751,000 | |
| | | 2,356,352 | |
Treasury Bills(9) — 1.1% | | | |
| U.S. Treasury Bills, 5.10%, 8/24/23 | | $ | 1,000,000 | | 981,380 | |
TOTAL SHORT-TERM INVESTMENTS (Cost $5,405,323) | | | 5,406,197 | |
TOTAL INVESTMENT SECURITIES — 101.1% (Cost $89,037,409) | | | 86,354,078 | |
| OTHER ASSETS AND LIABILITIES — (1.1)% | | | (976,937) | |
| TOTAL NET ASSETS — 100.0% | | | $ | 85,377,141 | |
| | | | | | | | | | | | | | | | | | | | |
| FORWARD FOREIGN CURRENCY EXCHANGE CONTRACTS |
| Currency Purchased | Currency Sold | Counterparty | Settlement
Date | Unrealized
Appreciation
(Depreciation) |
| USD | 307,018 | | CAD | 420,191 | | UBS AG | 6/15/23 | $ | (4,252) | |
| | | | | | | | | | | | | | |
| FUTURES CONTRACTS PURCHASED |
| Reference Entity | Contracts | Expiration Date | Notional
Amount | Unrealized
Appreciation
(Depreciation)^ |
| U.S. Treasury 2-Year Notes | 16 | June 2023 | $ | 3,303,250 | | $ | (1,976) | |
| U.S. Treasury 5-Year Notes | 58 | June 2023 | 6,351,453 | | 47,583 | |
| U.S. Treasury 10-Year Notes | 68 | June 2023 | 7,814,688 | | 205,153 | |
| U.S. Treasury 10-Year Ultra Notes | 80 | June 2023 | 9,691,250 | | 296,454 | |
| | | $ | 27,160,641 | | $ | 547,214 | |
^Amount represents value and unrealized appreciation (depreciation).
| | | | | | | | | | | | | | |
| FUTURES CONTRACTS SOLD |
| Reference Entity | Contracts | Expiration Date | Notional
Amount | Unrealized
Appreciation
(Depreciation)^ |
| U.S. Treasury Long Bonds | 4 | June 2023 | $ | 524,625 | | $ | (23,779) | |
| U.S. Treasury Ultra Bonds | 1 | June 2023 | 141,125 | | (5,861) | |
| | | $ | 665,750 | | $ | (29,640) | |
^Amount represents value and unrealized appreciation (depreciation).
| | | | | | | | |
| NOTES TO SCHEDULE OF INVESTMENTS |
| CAD | – | Canadian Dollar |
| FHLMC | – | Federal Home Loan Mortgage Corporation |
| FNMA | – | Federal National Mortgage Association |
| H15T1Y | – | Constant Maturity U.S. Treasury Note Yield Curve Rate Index |
| IO | – | Interest Only |
| LIBOR | – | London Interbank Offered Rate |
| SEQ | – | Sequential Payer |
| SOFR | – | Secured Overnight Financing Rate |
| USD | – | United States Dollar |
| VRN | – | Variable Rate Note. The rate adjusts periodically based upon the terms set forth in the security’s offering documents. The rate shown is effective at the period end and the reference rate and spread, if any, is indicated. The security's effective maturity date may be shorter than the final maturity date shown. |
†Category is less than 0.05% of total net assets.
(1)Security was purchased pursuant to Rule 144A or Section 4(2) under the Securities Act of 1933 and may be sold in transactions exempt from registration, normally to qualified institutional investors. The aggregate value of these securities at the period end was $41,243,570, which represented 48.3% of total net assets.
(2)Security, or a portion thereof, is on loan. At the period end, the aggregate value of securities on loan was $1,993,758. The amount of securities on loan indicated may not correspond with the securities on loan identified because securities with pending sales are in the process of recall from the brokers.
(3)Perpetual maturity with no stated maturity date.
(4)Security, or a portion thereof, has been pledged at the custodian bank or with a broker for collateral requirements on forward foreign currency exchange contracts and/or futures contracts. At the period end, the aggregate value of securities pledged was $688,968.
(5)When-issued security. The issue price and yield are fixed on the date of the commitment, but payment and delivery are scheduled for a future date.
(6)The interest rate on a bank loan obligation adjusts periodically based on a predetermined schedule. Rate or range of rates shown is effective at period end. The maturity date on a bank loan obligation may be less than indicated as a result of contractual or optional prepayments. These prepayments cannot be predicted with certainty.
(7)The interest rate will be determined upon settlement of the bank loan obligation after period end.
(8)Investment of cash collateral from securities on loan. At the period end, the aggregate value of the collateral held by the fund was $2,068,465.
(9)The rate indicated is the yield to maturity at purchase for non-interest bearing securities. For interest bearing securities, the stated coupon rate is shown.
See Notes to Financial Statements.
| | |
| Statement of Assets and Liabilities |
| | | | | |
| MARCH 31, 2023 | |
| Assets | |
| Investment securities, at value (cost of $86,968,944) — including $1,993,758 of securities on loan | $ | 84,285,613 | |
| Investment made with cash collateral received for securities on loan, at value (cost of $2,068,465) | 2,068,465 | |
| Total investment securities, at value (cost of $89,037,409) | 86,354,078 | |
| Cash | 517 | |
| Receivable for investments sold | 1,672,919 | |
| Receivable for capital shares sold | 59,757 | |
| Receivable for variation margin on futures contracts | 77,172 | |
| Interest receivable | 727,346 | |
| Securities lending receivable | 1,041 | |
| 88,892,830 | |
| |
| Liabilities | |
| Payable for collateral received for securities on loan | 2,068,465 | |
| Payable for investments purchased | 1,215,575 | |
| Payable for capital shares redeemed | 173,931 | |
| Unrealized depreciation on forward foreign currency exchange contracts | 4,252 | |
| Accrued management fees | 36,878 | |
| Distribution and service fees payable | 1,757 | |
| Dividends payable | 14,831 | |
| 3,515,689 | |
| |
| Net Assets | $ | 85,377,141 | |
| |
| Net Assets Consist of: | |
| Capital paid in | $ | 95,021,401 | |
| Distributable earnings (loss) | (9,644,260) | |
| $ | 85,377,141 | |
| | | | | | | | | | | |
| Net Assets | Shares Outstanding | Net Asset Value Per Share* |
| Investor Class | $55,861,684 | 6,254,401 | $8.93 |
| I Class | $14,106,077 | 1,579,821 | $8.93 |
| Y Class | $5,825 | 652 | $8.93 |
| A Class | $4,917,911 | 550,552 | $8.93 |
| C Class | $517,448 | 57,951 | $8.93 |
| R Class | $663,802 | 74,302 | $8.93 |
| R5 Class | $493,232 | 55,234 | $8.93 |
| R6 Class | $8,811,162 | 986,629 | $8.93 |
*Maximum offering price per share was equal to the net asset value per share for all share classes, except Class A, for which the maximum offering price per share was $9.35 (net asset value divided by 0.955). A contingent deferred sales charge may be imposed on redemptions of Class A and Class C.
See Notes to Financial Statements.
| | | | | |
| YEAR ENDED MARCH 31, 2023 | |
| Investment Income (Loss) | |
| Income: | |
| Interest | $ | 3,699,372 | |
| Securities lending, net | 17,942 | |
| 3,717,314 | |
| |
| Expenses: | |
| Management fees | 523,565 | |
| Distribution and service fees: | |
| A Class | 11,808 | |
| C Class | 3,762 | |
| R Class | 3,250 | |
| Trustees' fees and expenses | 4,931 | |
| Other expenses | 6,981 | |
| 554,297 | |
| |
| Net investment income (loss) | 3,163,017 | |
| |
| Realized and Unrealized Gain (Loss) | |
| Net realized gain (loss) on: | |
| Investment transactions | (6,001,227) | |
| Forward foreign currency exchange contract transactions | 22,934 | |
| Futures contract transactions | (239,499) | |
| Swap agreement transactions | 208,606 | |
| Foreign currency translation transactions | (191) | |
| (6,009,377) | |
| |
| Change in net unrealized appreciation (depreciation) on: | |
| Investments | 291,430 | |
| Forward foreign currency exchange contracts | 3,288 | |
| Futures contracts | 448,690 | |
| Swap agreements | 198,145 | |
| Translation of assets and liabilities in foreign currencies | 4 | |
| 941,557 | |
| |
| Net realized and unrealized gain (loss) | (5,067,820) | |
| |
| Net Increase (Decrease) in Net Assets Resulting from Operations | $ | (1,904,803) | |
See Notes to Financial Statements.
| | |
| Statement of Changes in Net Assets |
| | | | | | | | |
| YEARS ENDED MARCH 31, 2023 AND MARCH 31, 2022 |
| Increase (Decrease) in Net Assets | March 31, 2023 | March 31, 2022 |
| Operations | | |
| Net investment income (loss) | $ | 3,163,017 | | $ | 2,001,052 | |
| Net realized gain (loss) | (6,009,377) | | (741,805) | |
| Change in net unrealized appreciation (depreciation) | 941,557 | | (3,714,796) | |
| Net increase (decrease) in net assets resulting from operations | (1,904,803) | | (2,455,549) | |
| | |
| Distributions to Shareholders | | |
| From earnings: | | |
| Investor Class | (2,330,203) | | (2,664,801) | |
| I Class | (366,565) | | (337,667) | |
| Y Class | (247) | | (350) | |
| A Class | (183,206) | | (223,483) | |
| C Class | (12,196) | | (14,964) | |
| R Class | (23,917) | | (15,606) | |
| R5 Class | (21,785) | | (12,314) | |
| R6 Class | (265,916) | | (279,174) | |
| Decrease in net assets from distributions | (3,204,035) | | (3,548,359) | |
| | |
| Capital Share Transactions | | |
| Net increase (decrease) in net assets from capital share transactions (Note 5) | 18,237,775 | | 27,479,194 | |
| | |
| Net increase (decrease) in net assets | 13,128,937 | | 21,475,286 | |
| | |
| Net Assets | | |
| Beginning of period | 72,248,204 | | 50,772,918 | |
| End of period | $ | 85,377,141 | | $ | 72,248,204 | |
See Notes to Financial Statements.
| | |
| Notes to Financial Statements |
MARCH 31, 2023
1. Organization
American Century Investment Trust (the trust) is registered under the Investment Company Act of 1940, as amended (the 1940 Act), as an open-end management investment company and is organized as a Massachusetts business trust. Multisector Income Fund (formerly Strategic Income Fund) (the fund) is one fund in a series issued by the trust. The fund’s investment objective is to seek income. As a secondary objective, the fund seeks long-term capital appreciation.
The fund offers the Investor Class, I Class, Y Class, A Class, C Class, R Class, R5 Class and R6 Class. The A Class may incur an initial sales charge. The A Class and C Class may be subject to a contingent deferred sales charge.
2. Significant Accounting Policies
The following is a summary of significant accounting policies consistently followed by the fund in preparation of its financial statements. The fund is an investment company and follows accounting and reporting guidance in accordance with accounting principles generally accepted in the United States of America. This may require management to make certain estimates and assumptions at the date of the financial statements. Actual results could differ from these estimates. Management evaluated the impact of events or transactions occurring through the date the financial statements were issued that would merit recognition or disclosure.
Investment Valuations — The fund determines the fair value of its investments and computes its net asset value (NAV) per share at the close of regular trading (usually 4 p.m. Eastern time) on the New York Stock Exchange (NYSE) on each day the NYSE is open. The value of investments of the fund is determined by American Century Investment Management, Inc. (ACIM) (the investment advisor), as the valuation designee, pursuant to its valuation policies and procedures. The Board of Trustees oversees the valuation designee and reviews its valuation policies and procedures at least annually.
Fixed income securities are valued at the evaluated mean as provided by independent pricing services or at the mean of the most recent bid and asked prices as provided by investment dealers. Corporate bonds, U.S. Treasury and Government Agency securities, convertible bonds, bank loan obligations, and sovereign governments and agencies are valued using market models that consider trade data, quotations from dealers and active market makers, relevant yield curve and spread data, creditworthiness, trade data or market information on comparable securities, and other relevant security specific information. Mortgage-related and asset-backed securities are valued based on models that consider trade data, prepayment and default projections, benchmark yield and spread data and estimated cash flows of each tranche of the issuer. Collateralized loan obligations are valued based on discounted cash flow models that consider trade and economic data, prepayment assumptions and default projections. Fixed income securities initially expressed in local currencies are translated into U.S. dollars at the mean of the appropriate currency exchange rate at the close of the NYSE as provided by an independent pricing service.
Equity securities that are listed or traded on a domestic securities exchange are valued at the last reported sales price or at the official closing price as provided by the exchange. Equity securities traded on foreign securities exchanges are generally valued at the closing price of such securities on the exchange where primarily traded or at the close of the NYSE, if that is earlier. If no last sales price is reported, or if local convention or regulation so provides, the mean of the latest bid and asked prices may be used. Securities traded over-the-counter are valued at the mean of the latest bid and asked prices, the last sales price, or the official closing price.
Hybrid securities are valued at the evaluated mean as provided by independent pricing services or at the mean of the most recent bid and asked prices as provided by investment dealers. Preferred stocks and convertible preferred stocks with perpetual maturities are valued using market models that consider trade data, quotations from dealers and active market makers, relevant yield curve and spread data, creditworthiness, trade data or market information on comparable securities, and other relevant security specific information.
Open-end management investment companies are valued at the reported NAV per share. Repurchase agreements are valued at cost, which approximates fair value. Exchange-traded futures contracts are valued at the settlement price as provided by the appropriate exchange. Swap agreements are valued at an evaluated mean as provided by independent pricing services or independent brokers. Forward foreign currency exchange contracts are valued at the mean of the appropriate forward exchange rate at the close of the NYSE as provided by an independent pricing service.
If the valuation designee determines that the market price for a portfolio security is not readily available or is believed by the valuation designee to be unreliable, such security is valued at fair value as determined in good faith by the valuation designee, in accordance with its policies and procedures. Circumstances that may cause the fund to determine that market quotations are not available or reliable include, but are not limited to: when there is a significant event subsequent to the market quotation; trading in a security has been halted during the trading day; or trading in a security is insufficient or did not take place due to a closure or holiday.
The valuation designee monitors for significant events occurring after the close of an investment’s primary exchange but before the fund’s NAV per share is determined. Significant events may include, but are not limited to: corporate announcements and transactions; regulatory news, governmental action and political unrest that could impact a specific investment or an investment sector; or armed conflicts, natural disasters and similar events that could affect investments in a specific country or region. The valuation designee also monitors for significant fluctuations between domestic and foreign markets, as evidenced by the U.S. market or such other indicators that it deems appropriate. The valuation designee may apply a model-derived factor to the closing price of equity securities traded on foreign securities exchanges. The factor is based on observable market data as provided by an independent pricing service.
Security Transactions — Security transactions are accounted for as of the trade date. Net realized gains and losses are determined on the identified cost basis, which is also used for federal income tax purposes.
Investment Income — Interest income is recorded on the accrual basis and includes paydown gain (loss) and accretion of discounts and amortization of premiums. Inflation adjustments related to inflation-linked debt securities are reflected as interest income. Securities lending income is net of fees and rebates earned by the lending agent for its services.
Foreign Currency Translations — All assets and liabilities initially expressed in foreign currencies are translated into U.S. dollars at prevailing exchange rates at period end. The fund may enter into spot foreign currency exchange contracts to facilitate transactions denominated in a foreign currency. Purchases and sales of investment securities, dividend and interest income, spot foreign currency exchange contracts, and expenses are translated at the rates of exchange prevailing on the respective dates of such transactions. Net realized and unrealized foreign currency exchange gains or losses related to investment securities are a component of net realized gain (loss) on investment transactions and change in net unrealized appreciation (depreciation) on investments, respectively.
Repurchase Agreements — The fund may enter into repurchase agreements with institutions that ACIM has determined are creditworthy pursuant to criteria adopted by the Board of Trustees. The fund requires that the collateral, represented by securities, received in a repurchase transaction be transferred to the custodian in a manner sufficient to enable the fund to obtain those securities in the event of a default under the repurchase agreement. ACIM monitors, on a daily basis, the securities transferred to ensure the value, including accrued interest, of the securities under each repurchase agreement is equal to or greater than amounts owed to the fund under each repurchase agreement.
Joint Trading Account — Pursuant to an Exemptive Order issued by the Securities and Exchange Commission, the fund, along with certain other funds in the American Century Investments family of funds, may transfer uninvested cash balances into a joint trading account. These balances are invested in one or more repurchase agreements that are collateralized by U.S. Treasury or Agency obligations.
Income Tax Status — It is the fund's policy to distribute substantially all net investment income and net realized gains to shareholders and to otherwise qualify as a regulated investment company under provisions of the Internal Revenue Code. Accordingly, no provision has been made for income taxes. The fund files U.S. federal, state, local and non-U.S. tax returns as applicable. The fund's tax returns are subject to examination by the relevant taxing authority until expiration of the applicable statute of limitations, which is generally three years from the date of filing but can be longer in certain jurisdictions. At this time, management believes there are no uncertain tax positions which, based on their technical merit, would not be sustained upon examination and for which it is reasonably possible that the total amounts of unrecognized tax benefits will significantly change in the next twelve months.
Multiple Class — All shares of the fund represent an equal pro rata interest in the net assets of the class to which such shares belong, and have identical voting, dividend, liquidation and other rights and the same terms and conditions, except for class specific expenses and exclusive rights to vote on matters affecting only individual classes. Income, non-class specific expenses, and realized and unrealized capital gains and losses of the fund are allocated to each class of shares based on their relative net assets.
Distributions to Shareholders — Distributions from net investment income, if any, are declared daily and paid monthly. Distributions from net realized gains, if any, are generally declared and paid annually.
Indemnifications — Under the trust’s organizational documents, its officers and trustees are indemnified against certain liabilities arising out of the performance of their duties to the fund. In addition, in the normal course of business, the fund enters into contracts that provide general indemnifications. The maximum exposure under these arrangements is unknown as this would involve future claims that may be made against a fund. The risk of material loss from such claims is considered by management to be remote.
Securities Lending — Securities are lent to qualified financial institutions and brokers. State Street Bank & Trust Co. serves as securities lending agent to the fund pursuant to a Securities Lending Agreement. The lending of securities exposes the fund to risks such as: the borrowers may fail to return the loaned securities, the borrowers may not be able to provide additional collateral, the fund may experience delays in recovery of the loaned securities or delays in access to collateral, or the fund may experience losses related to the investment collateral. To minimize certain risks, loan counterparties pledge collateral in the form of cash and/or securities. The lending agent has agreed to indemnify the fund in the case of default of any securities borrowed. Cash collateral received is invested in the State Street Navigator Securities Lending Government Money Market Portfolio, a money market mutual fund registered under the 1940 Act. The loans may also be secured by U.S. government securities in an amount at least equal to the market value of the securities loaned, plus accrued interest and dividends, determined on a daily basis and adjusted accordingly. By lending securities, the fund seeks to increase its net investment income through the receipt of interest and fees. Such income is reflected separately within the Statement of Operations. The value of loaned securities and related collateral outstanding at period end, if any, are shown on a gross basis within the Schedule of Investments and Statement of Assets and Liabilities.
The following table reflects a breakdown of transactions accounted for as secured borrowings, the gross obligation by the type of collateral pledged, and the remaining contractual maturity of those transactions as of March 31, 2023.
| | | | | | | | | | | | | | | | | |
| Remaining Contractual Maturity of Agreements |
| Overnight and Continuous | <30 days | Between 30 & 90 days | >90 days | Total |
Securities Lending Transactions(1) |
| Corporate Bonds | $ | 1,714,755 | | — | | — | | — | | $ | 1,714,755 | |
| Preferred Stocks | 353,710 | | — | | — | | — | | 353,710 | |
| Total Borrowings | $ | 2,068,465 | | — | | — | | — | | $ | 2,068,465 | |
| Gross amount of recognized liabilities for securities lending transactions | $ | 2,068,465 | |
(1)Amount represents the payable for cash collateral received for securities on loan. This will generally be in the Overnight and Continuous column as the securities are typically callable on demand.
3. Fees and Transactions with Related Parties
Certain officers and trustees of the trust are also officers and/or directors of American Century Companies, Inc. (ACC). The trust's investment advisor, ACIM, the trust's distributor, American Century Investment Services, Inc. (ACIS), and the trust's transfer agent, American Century Services, LLC, are wholly owned, directly or indirectly, by ACC.
Management Fees — The trust has entered into a management agreement with ACIM, under which ACIM provides the fund with investment advisory and management services in exchange for a single, unified management fee (the fee) per class. The agreement provides that ACIM will pay all expenses of managing and operating the fund, except brokerage expenses, taxes, interest, fees and expenses of the independent trustees (including legal counsel fees), extraordinary expenses, and expenses incurred in connection with the provision of shareholder services and distribution services under a plan adopted pursuant to Rule 12b-1 under the 1940 Act. The fee is computed and accrued daily based on each class's daily net assets and paid monthly in arrears. The difference in the fee among the classes is a result of their separate arrangements for non-Rule 12b-1 shareholder services. It is not the result of any difference in advisory or custodial fees or other expenses related to the management of the fund’s assets, which do not vary by class.
The annual management fee and the effective annual management fee for each class for the period ended March 31, 2023 are as follows:
| | | | | | | | |
| Annual Management
Fee* | Effective Annual Management Fee |
| Investor Class | 0.55% | 0.72% |
| I Class | 0.45% | 0.62% |
| Y Class | 0.35% | 0.52% |
| A Class | 0.55% | 0.72% |
| C Class | 0.55% | 0.72% |
| R Class | 0.55% | 0.72% |
| R5 Class | 0.35% | 0.52% |
| R6 Class | 0.30% | 0.47% |
*Prior to February 14, 2023, the annual management fee was 0.74% for Investor Class, A Class, C Class and R Class, 0.64% for I Class, 0.54% for Y Class and R5 Class and 0.49% for R6 Class.
Distribution and Service Fees — The Board of Trustees has adopted a separate Master Distribution and Individual Shareholder Services Plan for each of the A Class, C Class and R Class (collectively the plans), pursuant to Rule 12b-1 of the 1940 Act. The plans provide that the A Class will pay ACIS an annual distribution and service fee of 0.25%. The plans provide that the C Class will pay ACIS an annual distribution and service fee of 1.00%, of which 0.25% is paid for individual shareholder services and 0.75% is paid for distribution services. The plans provide that the R Class will pay ACIS an annual distribution and service fee of 0.50%. The fees are computed and accrued daily based on each class’s daily net assets and paid monthly in arrears. The fees are used to pay financial intermediaries for distribution and individual shareholder services. Fees incurred under the plans during the period ended March 31, 2023 are detailed in the Statement of Operations.
Trustees' Fees and Expenses — The Board of Trustees is responsible for overseeing the investment advisor’s management and operations of the fund. The trustees receive detailed information about the fund and its investment advisor regularly throughout the year, and meet at least quarterly with management of the investment advisor to review reports about fund operations. The fund's officers do not receive compensation from the fund.
Interfund Transactions — The fund may enter into security transactions with other American Century Investments funds and other client accounts of the investment advisor, in accordance with the 1940 Act rules and procedures adopted by the Board of Trustees. The rules and procedures require, among other things, that these transactions be effected at the independent current market price of the security. There were no interfund transactions during the period.
4. Investment Transactions
Purchases of investment securities, excluding short-term investments, for the period ended March 31, 2023 totaled $145,541,074, of which $63,298,508 represented U.S. Treasury and Government Agency obligations.
Sales of investment securities, excluding short-term investments, for the period ended March 31, 2023 totaled $131,398,662, of which $60,067,405 represented U.S. Treasury and Government Agency obligations.
5. Capital Share Transactions
Transactions in shares of the fund were as follows (unlimited number of shares authorized):
| | | | | | | | | | | | | | |
| Year ended March 31, 2023 | Year ended March 31, 2022 |
| Shares | Amount | Shares | Amount |
| Investor Class | | | | |
| Sold | 2,657,310 | | $ | 24,040,677 | | 3,103,489 | | $ | 31,877,259 | |
| Issued in reinvestment of distributions | 252,813 | | 2,265,363 | | 252,758 | | 2,584,139 | |
| Redeemed | (2,329,142) | | (20,909,892) | | (1,192,920) | | (12,141,023) | |
| 580,981 | | 5,396,148 | | 2,163,327 | | 22,320,375 | |
| I Class | | | | |
| Sold | 1,212,673 | | 10,810,399 | | 991,822 | | 10,377,228 | |
| Issued in reinvestment of distributions | 40,987 | | 366,513 | | 32,936 | | 335,965 | |
| Redeemed | (405,506) | | (3,646,425) | | (1,032,303) | | (10,785,897) | |
| 848,154 | | 7,530,487 | | (7,545) | | (72,704) | |
| Y Class | | | | |
| Issued in reinvestment of distributions | 27 | | 247 | | 35 | | 350 | |
| A Class | | | | |
| Sold | 240,484 | | 2,183,818 | | 200,979 | | 2,030,909 | |
| Issued in reinvestment of distributions | 14,923 | | 133,870 | | 20,785 | | 212,966 | |
| Redeemed | (178,102) | | (1,606,632) | | (113,273) | | (1,145,138) | |
| 77,305 | | 711,056 | | 108,491 | | 1,098,737 | |
| C Class | | | | |
| Sold | 22,512 | | 199,864 | | 19,832 | | 207,118 | |
| Issued in reinvestment of distributions | 1,364 | | 12,196 | | 1,464 | | 14,964 | |
| Redeemed | (2,405) | | (21,610) | | (1,737) | | (17,738) | |
| 21,471 | | 190,450 | | 19,559 | | 204,344 | |
| R Class | | | | |
| Sold | 56,341 | | 509,358 | | 43,790 | | 436,288 | |
| Issued in reinvestment of distributions | 2,635 | | 23,593 | | 1,515 | | 15,500 | |
| Redeemed | (41,409) | | (369,326) | | (15,707) | | (162,567) | |
| 17,567 | | 163,625 | | 29,598 | | 289,221 | |
| R5 Class | | | | |
| Sold | 18,663 | | 176,124 | | 35,374 | | 363,569 | |
| Issued in reinvestment of distributions | 2,431 | | 21,785 | | 1,215 | | 12,314 | |
| Redeemed | (5,850) | | (51,884) | | (1,104) | | (11,060) | |
| 15,244 | | 146,025 | | 35,485 | | 364,823 | |
| R6 Class | | | | |
| Sold | 614,884 | | 5,520,194 | | 586,431 | | 6,067,561 | |
| Issued in reinvestment of distributions | 29,684 | | 265,796 | | 27,244 | | 277,479 | |
| Redeemed | (184,692) | | (1,686,253) | | (309,047) | | (3,070,992) | |
| 459,876 | | 4,099,737 | | 304,628 | | 3,274,048 | |
| Net increase (decrease) | 2,020,625 | | $ | 18,237,775 | | 2,653,578 | | $ | 27,479,194 | |
6. Fair Value Measurements
The fund's investments valuation process is based on several considerations and may use multiple inputs to determine the fair value of the investments held by the fund. In conformity with accounting principles generally accepted in the United States of America, the inputs used to determine a valuation are classified into three broad levels.
•Level 1 valuation inputs consist of unadjusted quoted prices in an active market for identical investments.
•Level 2 valuation inputs consist of direct or indirect observable market data (including quoted prices for comparable investments, evaluations of subsequent market events, interest rates, prepayment speeds, credit risk, etc.). These inputs also consist of quoted prices for identical investments initially expressed in local currencies that are adjusted through translation into U.S. dollars.
•Level 3 valuation inputs consist of unobservable data (including a fund’s own assumptions).
The level classification is based on the lowest level input that is significant to the fair valuation measurement. The valuation inputs are not necessarily an indication of the risks associated with investing in these securities or other financial instruments.
The following is a summary of the level classifications as of period end. The Schedule of Investments provides additional information on the fund's portfolio holdings.
| | | | | | | | | | | |
| Level 1 | Level 2 | Level 3 |
| Assets | | | |
| Investment Securities | | | |
| Corporate Bonds | — | | $ | 35,767,528 | | — | |
| U.S. Treasury Securities | — | | 17,600,276 | | — | |
| Asset-Backed Securities | — | | 8,049,314 | | — | |
| Collateralized Loan Obligations | — | | 7,926,735 | | — | |
| Collateralized Mortgage Obligations | — | | 4,108,858 | | — | |
| Commercial Mortgage-Backed Securities | — | | 3,027,610 | | — | |
| Bank Loan Obligations | — | | 1,567,919 | | — | |
| Sovereign Governments and Agencies | — | | 1,556,373 | | — | |
| Preferred Stocks | — | | 1,343,268 | | — | |
| Short-Term Investments | $ | 2,068,465 | | 3,337,732 | | — | |
| $ | 2,068,465 | | $ | 84,285,613 | | — | |
| Other Financial Instruments | | | |
| Futures Contracts | $ | 549,190 | | — | | — | |
| | | |
| Liabilities | | | |
| Other Financial Instruments | | | |
| Futures Contracts | $ | 31,616 | | — | | — | |
| Forward Foreign Currency Exchange Contracts | — | | $ | 4,252 | | — | |
| $ | 31,616 | | $ | 4,252 | | — | |
7. Derivative Instruments
Credit Risk — The fund is subject to credit risk in the normal course of pursuing its investment objectives. The value of a bond generally declines as the credit quality of its issuer declines. Credit default swap agreements enable a fund to buy/sell protection against a credit event of a specific issuer or index. A fund may attempt to enhance returns by selling protection or attempt to mitigate credit risk by buying protection. The buyer/seller of credit protection against a security or basket of securities may pay/receive an up-front or periodic payment to compensate for/against potential default events. Changes in value, including the periodic amounts of interest to be paid or received on swap agreements, are recorded as unrealized appreciation (depreciation) on swap agreements. Upon entering into a centrally cleared swap, a fund is required to deposit cash or securities (initial margin) with a financial intermediary in an amount equal to a certain percentage of the notional amount. A fund may incur charges or earn income on cash deposit balances, which are reflected in interest expenses or interest income, respectively. Subsequent payments (variation margin) are made or received daily, in cash, by a fund. The variation margin is equal to the daily change in the value and is a component of unrealized gains and losses. Realized gain or loss is recorded upon receipt or payment of a periodic settlement or termination of swap agreements. Net realized and unrealized gains or losses occurring during the holding period of swap agreements are a component of net realized gain (loss) on swap agreement transactions and change in net unrealized appreciation (depreciation) on swap agreements, respectively. The risks of entering into swap agreements include the possible lack of liquidity, failure of the counterparty to meet its obligations, and that there may be unfavorable changes in the underlying investments or instruments. The fund's average notional amount held during the period was $2,765,032.
Foreign Currency Risk — The fund is subject to foreign currency exchange rate risk in the normal course of pursuing its investment objectives. The value of foreign investments held by a fund may be significantly affected by changes in foreign currency exchange rates. The dollar value of a foreign security generally decreases when the value of the dollar rises against the foreign currency in which the security is denominated and tends to increase when the value of the dollar declines against such foreign currency. A fund may enter into forward foreign currency exchange contracts to reduce a fund's exposure to foreign currency exchange rate fluctuations or to gain exposure to the fluctuations in the value of foreign currencies. A fund will segregate cash, cash equivalents or other appropriate liquid securities on its records in amounts sufficient to meet requirements. The net U.S. dollar value of foreign currency underlying all contractual commitments held by a fund and the resulting unrealized appreciation or depreciation are determined daily. Realized gain or loss is recorded upon settlement of the contract. Net realized and unrealized gains or losses occurring during the holding period of forward foreign currency exchange contracts are a component of net realized gain (loss) on forward foreign currency exchange contract transactions and change in net unrealized appreciation (depreciation) on forward foreign currency exchange contracts, respectively. A fund bears the risk of an unfavorable change in the foreign currency exchange rate underlying the forward contract. Additionally, losses, up to the fair value, may arise if the counterparties do not perform under the contract terms. The fund's average U.S. dollar exposure to foreign currency risk derivative instruments held during the period was $331,481.
Interest Rate Risk — The fund is subject to interest rate risk in the normal course of pursuing its investment objectives. The value of bonds generally declines as interest rates rise. A fund may enter into futures contracts based on a bond index or a specific underlying security. A fund may purchase futures contracts to gain exposure to increases in market value or sell futures contracts to protect against a decline in market value. Upon entering into a futures contract, a fund will segregate cash, cash equivalents or other appropriate liquid securities on its records in amounts sufficient to meet requirements. A fund may incur charges or earn income on cash deposit balances, which are reflected in interest expenses or interest income, respectively. Subsequent payments (variation margin) are made or received daily, in cash, by a fund. The variation margin is equal to the daily change in the contract value and is recorded as unrealized gains and losses. A fund recognizes a realized gain or loss when the futures contract is closed or expires. Net realized and unrealized gains or losses occurring during the holding period of futures contracts are a component of net realized gain (loss) on futures contract transactions and change in net unrealized appreciation (depreciation) on futures contracts, respectively. One of the risks of entering into futures contracts is the possibility that the change in value of the contract may not correlate with the changes in value of the underlying securities. The fund's average notional exposure to interest rate risk derivative instruments held during the period was $16,010,725 futures contracts purchased and $1,591,736 futures contracts sold.
Value of Derivative Instruments as of March 31, 2023
| | | | | | | | | | | | | | |
| Asset Derivatives | Liability Derivatives |
| Type of Risk Exposure | Location on Statement of Assets and Liabilities | Value | Location on Statement of Assets and Liabilities | Value |
| Foreign Currency Risk | Unrealized appreciation on forward foreign currency exchange contracts | — | | Unrealized depreciation on forward foreign currency exchange contracts | $ | 4,252 | |
| Interest Rate Risk | Receivable for variation margin on futures contracts* | $ | 77,172 | | Payable for variation margin on futures contracts* | — | |
| | $ | 77,172 | | | $ | 4,252 | |
*Included in the unrealized appreciation (depreciation) on futures contracts, as reported in the Schedule of Investments.
Effect of Derivative Instruments on the Statement of Operations for the Year Ended March 31, 2023
| | | | | | | | | | | | | | |
| Net Realized Gain (Loss) | Change in Net Unrealized
Appreciation (Depreciation) |
| Type of Risk Exposure | Location on Statement of Operations | Value | Location on Statement of Operations | Value |
| Credit Risk | Net realized gain (loss) on swap agreement transactions | $ | 208,606 | | Change in net unrealized appreciation (depreciation) on swap agreements | $ | 198,145 | |
| Foreign Currency Risk | Net realized gain (loss) on forward foreign currency exchange contract transactions | 22,934 | | Change in net unrealized appreciation (depreciation) on forward foreign currency exchange contracts | 3,288 | |
| Interest Rate Risk | Net realized gain (loss) on futures contract transactions | (239,499) | | Change in net unrealized appreciation (depreciation) on futures contracts | 448,690 | |
| | $ | (7,959) | | | $ | 650,123 | |
8. Risk Factors
The value of the fund’s shares will go up and down, sometimes rapidly or unpredictably, based on the performance of the securities owned by the fund and other factors generally affecting the securities market. Market risks, including political, regulatory, economic and social developments, can affect the value of the fund’s investments. Natural disasters, public health emergencies, war, terrorism and other unforeseeable events may lead to increased market volatility and may have adverse long-term effects on world economies and markets generally.
The fund may invest in instruments that have variable or floating coupon rates based on the London Interbank Offered Rate (LIBOR). LIBOR is a benchmark interest rate intended to be representative of the rate at which certain major international banks lend to one another over short-terms. Financial institutions have started the process of phasing out LIBOR and the transition process to a replacement rate may lead to increased volatility or illiquidity in markets for instruments that rely on LIBOR. This could result in a change to the value of such instruments or a change in the cost of temporary borrowing for the fund.
There are certain risks involved in investing in foreign securities. These risks include those resulting from political events (such as civil unrest, national elections and imposition of exchange controls), social and economic events (such as labor strikes and rising inflation), and natural disasters. Securities of foreign issuers may be less liquid and more volatile. Investing in emerging markets or a significant portion of assets in one country or region may accentuate these risks.
The fund invests in lower-rated debt securities, which are subject to substantial risks including liquidity risk and credit risk.
The fund's investment process may result in high portfolio turnover, which could mean high transaction costs, affecting both performance and capital gains tax liabilities to investors.
9. Federal Tax Information
The tax character of distributions paid during the years ended March 31, 2023 and March 31, 2022 were as follows:
| | | | | | | | |
| 2023 | 2022 |
| Distributions Paid From | | |
| Ordinary income | $ | 3,204,035 | | $ | 3,271,308 | |
| Long-term capital gains | — | | $ | 277,051 | |
The book-basis character of distributions made during the year from net investment income or net realized gains may differ from their ultimate characterization for federal income tax purposes. These differences reflect the differing character of certain income items and net realized gains and losses for financial statement and tax purposes, and may result in reclassification among certain capital accounts on the financial statements.
As of period end, the federal tax cost of investments and the components of distributable earnings on a tax-basis were as follows:
| | | | | |
| Federal tax cost of investments | $ | 89,056,967 | |
| Gross tax appreciation of investments | $ | 846,461 | |
| Gross tax depreciation of investments | (3,549,350) | |
| Net tax appreciation (depreciation) of investments | (2,702,889) | |
| Net tax appreciation (depreciation) on derivatives and translation of assets and liabilities in foreign currencies | 3 | |
| Net tax appreciation (depreciation) | $ | (2,702,886) | |
| Other book-to-tax adjustments | $ | (25,347) | |
| Undistributed ordinary income | — | |
| Accumulated short-term capital losses | $ | (4,672,090) | |
| Accumulated long-term capital losses | $ | (2,243,937) | |
The difference between book-basis and tax-basis unrealized appreciation (depreciation) is attributable primarily to the realization for tax purposes of unrealized gains (losses) on futures contracts. Other book-to tax adjustments are attributable primarily to the tax deferral of losses on straddle positions.
Accumulated capital losses represent net capital loss carryovers that may be used to offset future realized
capital gains for federal income tax purposes. The capital loss carryovers may be carried forward for an
unlimited period. Future capital loss carryover utilization in any given year may be subject to Internal Revenue
Code limitations.
| | | | | | | | | | | | | | | | | | | | | | | | | | | | | | | | | | | | | | | | | | | | | | | |
| For a Share Outstanding Throughout the Years Ended March 31 (except as noted) |
| Per-Share Data | | | | | | | | Ratios and Supplemental Data | | |
| | Income From Investment Operations: | Distributions From: | | | Ratio to Average Net Assets of: | | |
| Net Asset
Value,
Beginning
of Period | Net Investment
Income (Loss)(1) | Net
Realized
and
Unrealized
Gain (Loss) | Total From
Investment
Operations | Net
Investment
Income | Net
Realized
Gains | Total
Distributions | Net Asset
Value,
End
of Period | Total Return(2) | Operating
Expenses | Operating
Expenses
(before
expense
waiver) | Net
Investment
Income
(Loss) | Net
Investment
Income
(Loss)
(before
expense
waiver) | Portfolio
Turnover
Rate | Net
Assets,
End
of
Period
(in thousands) |
| Investor Class | | | | | | | | | | | | | | |
| 2023 | $9.58 | 0.37 | (0.65) | (0.28) | (0.37) | — | (0.37) | $8.93 | (2.87)% | 0.73% | 0.73% | 4.11% | 4.11% | 176% | $55,862 | |
| 2022 | $10.39 | 0.33 | (0.59) | (0.26) | (0.34) | (0.21) | (0.55) | $9.58 | (2.65)% | 0.75% | 0.75% | 3.24% | 3.24% | 185% | $54,374 | |
| 2021 | $9.28 | 0.31 | 1.20 | 1.51 | (0.32) | (0.08) | (0.40) | $10.39 | 16.47% | 0.72% | 0.75% | 3.02% | 2.99% | 193% | $36,484 | |
| 2020 | $9.73 | 0.27 | (0.45) | (0.18) | (0.27) | — | (0.27) | $9.28 | (2.01)% | 0.71% | 0.75% | 2.70% | 2.66% | 88% | $20,836 | |
| 2019 | $9.74 | 0.34 | 0.03 | 0.37 | (0.38) | — | (0.38) | $9.73 | 3.88% | 0.70% | 0.76% | 3.55% | 3.49% | 60% | $15,718 | |
| I Class | | | | | | | | | | | | | | |
| 2023 | $9.58 | 0.39 | (0.66) | (0.27) | (0.38) | — | (0.38) | $8.93 | (2.78)% | 0.63% | 0.63% | 4.21% | 4.21% | 176% | $14,106 | |
| 2022 | $10.39 | 0.34 | (0.59) | (0.25) | (0.35) | (0.21) | (0.56) | $9.58 | (2.55)% | 0.65% | 0.65% | 3.34% | 3.34% | 185% | $7,009 | |
| 2021 | $9.28 | 0.32 | 1.20 | 1.52 | (0.33) | (0.08) | (0.41) | $10.39 | 16.59% | 0.62% | 0.65% | 3.12% | 3.09% | 193% | $7,679 | |
| 2020 | $9.73 | 0.28 | (0.45) | (0.17) | (0.28) | — | (0.28) | $9.28 | (1.91)% | 0.61% | 0.65% | 2.80% | 2.76% | 88% | $2,955 | |
| 2019 | $9.73 | 0.35 | 0.03 | 0.38 | (0.38) | — | (0.38) | $9.73 | 4.09% | 0.60% | 0.66% | 3.65% | 3.59% | 60% | $1,345 | |
| | | | | | | | | | | | | | | | | | | | | | | | | | | | | | | | | | | | | | | | | | | | | | | |
| For a Share Outstanding Throughout the Years Ended March 31 (except as noted) |
| Per-Share Data | | | | | | | | Ratios and Supplemental Data | | |
| | Income From Investment Operations: | Distributions From: | | | Ratio to Average Net Assets of: | | |
| Net Asset
Value,
Beginning
of Period | Net Investment
Income (Loss)(1) | Net
Realized
and
Unrealized
Gain (Loss) | Total From
Investment
Operations | Net
Investment
Income | Net
Realized
Gains | Total
Distributions | Net Asset
Value,
End
of Period | Total Return(2) | Operating
Expenses | Operating
Expenses
(before
expense
waiver) | Net
Investment
Income
(Loss) | Net
Investment
Income
(Loss)
(before
expense
waiver) | Portfolio
Turnover
Rate | Net
Assets,
End
of
Period
(in thousands) |
| Y Class | | | | | | | | | | | | | | |
| 2023 | $9.58 | 0.38 | (0.65) | (0.27) | (0.38) | — | (0.38) | $8.93 | (2.70)% | 0.53% | 0.53% | 4.31% | 4.31% | 176% | $6 | |
| 2022 | $10.39 | 0.35 | (0.59) | (0.24) | (0.36) | (0.21) | (0.57) | $9.58 | (2.36)% | 0.55% | 0.55% | 3.44% | 3.44% | 185% | $6 | |
| 2021 | $9.28 | 0.33 | 1.20 | 1.53 | (0.34) | (0.08) | (0.42) | $10.39 | 16.71% | 0.52% | 0.55% | 3.22% | 3.19% | 193% | $6 | |
| 2020 | $9.73 | 0.30 | (0.46) | (0.16) | (0.29) | — | (0.29) | $9.28 | (1.78)% | 0.51% | 0.55% | 2.90% | 2.86% | 88% | $5 | |
| 2019 | $9.73 | 0.36 | 0.03 | 0.39 | (0.39) | — | (0.39) | $9.73 | 4.18% | 0.50% | 0.56% | 3.75% | 3.69% | 60% | $5 | |
| A Class | | | | | | | | | | | | | | |
| 2023 | $9.58 | 0.35 | (0.65) | (0.30) | (0.35) | — | (0.35) | $8.93 | (3.01)% | 0.98% | 0.98% | 3.86% | 3.86% | 176% | $4,918 | |
| 2022 | $10.39 | 0.31 | (0.59) | (0.28) | (0.32) | (0.21) | (0.53) | $9.58 | (2.89)% | 1.00% | 1.00% | 2.99% | 2.99% | 185% | $4,535 | |
| 2021 | $9.28 | 0.28 | 1.21 | 1.49 | (0.30) | (0.08) | (0.38) | $10.39 | 16.18% | 0.97% | 1.00% | 2.77% | 2.74% | 193% | $3,791 | |
| 2020 | $9.73 | 0.24 | (0.45) | (0.21) | (0.24) | — | (0.24) | $9.28 | (2.26)% | 0.96% | 1.00% | 2.45% | 2.41% | 88% | $1,762 | |
| 2019 | $9.74 | 0.32 | 0.02 | 0.34 | (0.35) | — | (0.35) | $9.73 | 3.62% | 0.95% | 1.01% | 3.30% | 3.24% | 60% | $1,325 | |
| C Class | | | | | | | | | | | | | | |
| 2023 | $9.58 | 0.29 | (0.66) | (0.37) | (0.28) | — | (0.28) | $8.93 | (3.84)% | 1.73% | 1.73% | 3.11% | 3.11% | 176% | $517 | |
| 2022 | $10.39 | 0.23 | (0.59) | (0.36) | (0.24) | (0.21) | (0.45) | $9.58 | (3.62)% | 1.75% | 1.75% | 2.24% | 2.24% | 185% | $349 | |
| 2021 | $9.28 | 0.20 | 1.21 | 1.41 | (0.22) | (0.08) | (0.30) | $10.39 | 15.32% | 1.72% | 1.75% | 2.02% | 1.99% | 193% | $176 | |
| 2020 | $9.73 | 0.17 | (0.45) | (0.28) | (0.17) | — | (0.17) | $9.28 | (2.99)% | 1.71% | 1.75% | 1.70% | 1.66% | 88% | $202 | |
| 2019 | $9.74 | 0.24 | 0.03 | 0.27 | (0.28) | — | (0.28) | $9.73 | 2.85% | 1.70% | 1.76% | 2.55% | 2.49% | 60% | $182 | |
| | | | | | | | | | | | | | | | | | | | | | | | | | | | | | | | | | | | | | | | | | | | | | | |
| For a Share Outstanding Throughout the Years Ended March 31 (except as noted) |
| Per-Share Data | | | | | | | | Ratios and Supplemental Data | | |
| | Income From Investment Operations: | Distributions From: | | | Ratio to Average Net Assets of: | | |
| Net Asset
Value,
Beginning
of Period | Net Investment
Income (Loss)(1) | Net
Realized
and
Unrealized
Gain (Loss) | Total From
Investment
Operations | Net
Investment
Income | Net
Realized
Gains | Total
Distributions | Net Asset
Value,
End
of Period | Total Return(2) | Operating
Expenses | Operating
Expenses
(before
expense
waiver) | Net
Investment
Income
(Loss) | Net
Investment
Income
(Loss)
(before
expense
waiver) | Portfolio
Turnover
Rate | Net
Assets,
End
of
Period
(in thousands) |
| R Class | | | | | | | | | | | | | | |
| 2023 | $9.59 | 0.33 | (0.67) | (0.34) | (0.32) | — | (0.32) | $8.93 | (3.35)% | 1.23% | 1.23% | 3.61% | 3.61% | 176% | $664 | |
| 2022 | $10.40 | 0.28 | (0.59) | (0.31) | (0.29) | (0.21) | (0.50) | $9.59 | (3.13)% | 1.25% | 1.25% | 2.74% | 2.74% | 185% | $544 | |
| 2021 | $9.28 | 0.26 | 1.21 | 1.47 | (0.27) | (0.08) | (0.35) | $10.40 | 15.88% | 1.22% | 1.25% | 2.52% | 2.49% | 193% | $282 | |
| 2020 | $9.73 | 0.22 | (0.45) | (0.23) | (0.22) | — | (0.22) | $9.28 | (2.39)% | 1.21% | 1.25% | 2.20% | 2.16% | 88% | $181 | |
| 2019 | $9.74 | 0.29 | 0.03 | 0.32 | (0.33) | — | (0.33) | $9.73 | 3.36% | 1.20% | 1.26% | 3.05% | 2.99% | 60% | $112 | |
| R5 Class | | | | | | | | | | | | | | |
| 2023 | $9.58 | 0.39 | (0.65) | (0.26) | (0.39) | — | (0.39) | $8.93 | (2.68)% | 0.53% | 0.53% | 4.31% | 4.31% | 176% | $493 | |
| 2022 | $10.39 | 0.34 | (0.57) | (0.23) | (0.37) | (0.21) | (0.58) | $9.58 | (2.46)% | 0.55% | 0.55% | 3.44% | 3.44% | 185% | $383 | |
| 2021 | $9.28 | 0.31 | 1.22 | 1.53 | (0.34) | (0.08) | (0.42) | $10.39 | 16.70% | 0.52% | 0.55% | 3.22% | 3.19% | 193% | $47 | |
| 2020 | $9.73 | 0.29 | (0.45) | (0.16) | (0.29) | — | (0.29) | $9.28 | (1.82)% | 0.51% | 0.55% | 2.90% | 2.86% | 88% | $97 | |
| 2019 | $9.74 | 0.35 | 0.03 | 0.38 | (0.39) | — | (0.39) | $9.73 | 4.09% | 0.50% | 0.56% | 3.75% | 3.69% | 60% | $99 | |
| R6 Class | | | | | | | | | | | | | | |
| 2023 | $9.58 | 0.40 | (0.66) | (0.26) | (0.39) | — | (0.39) | $8.93 | (2.63)% | 0.48% | 0.48% | 4.36% | 4.36% | 176% | $8,811 | |
| 2022 | $10.39 | 0.36 | (0.59) | (0.23) | (0.37) | (0.21) | (0.58) | $9.58 | (2.41)% | 0.50% | 0.50% | 3.49% | 3.49% | 185% | $5,047 | |
| 2021 | $9.28 | 0.33 | 1.21 | 1.54 | (0.35) | (0.08) | (0.43) | $10.39 | 16.76% | 0.47% | 0.50% | 3.27% | 3.24% | 193% | $2,308 | |
| 2020 | $9.73 | 0.28 | (0.44) | (0.16) | (0.29) | — | (0.29) | $9.28 | (1.77)% | 0.46% | 0.50% | 2.95% | 2.91% | 88% | $1,861 | |
| 2019 | $9.74 | 0.36 | 0.03 | 0.39 | (0.40) | — | (0.40) | $9.73 | 4.14% | 0.45% | 0.51% | 3.80% | 3.74% | 60% | $137 | |
| | | | | | | | | | | | | | |
| Notes to Financial Highlights | | |
(1)Computed using average shares outstanding throughout the period.
(2)Total returns are calculated based on the net asset value of the last business day and do not reflect applicable sales charges, if any. Total returns for periods less than one year are not annualized.
See Notes to Financial Statements.
| | |
| Report of Independent Registered Public Accounting Firm |
To the Shareholders and the Board of Trustees of American Century Investment Trust:
Opinion on the Financial Statements and Financial Highlights
We have audited the accompanying statement of assets and liabilities, including the schedule of investments, of Multisector Income Fund (formerly Strategic Income Fund) (the “Fund”), one of the funds constituting the American Century Investment Trust, as of March 31, 2023, the related statement of operations for the year then ended, the statements of changes in net assets and financial highlights for the two years in the period then ended, and the related notes. In our opinion, the financial statements and financial highlights present fairly, in all material respects, the financial position of Multisector Income Fund of the American Century Investment Trust, as of March 31, 2023, and the results of its operations for the year then ended, the changes in its net assets, and the financial highlights for the two years then ended in conformity with accounting principles generally accepted in the United States of America. The financial highlights for each of the three years in the period ended March 31, 2021, were audited by other auditors, whose report, dated May 18, 2021, expressed an unqualified opinion on such financial highlights.
Basis for Opinion
These financial statements and financial highlights are the responsibility of the Fund's management. Our responsibility is to express an opinion on the Fund’s financial statements and financial highlights based on our audit. We are a public accounting firm registered with the Public Company Accounting Oversight Board (United States) (PCAOB) and are required to be independent with respect to the Fund in accordance with the U.S. federal securities laws and the applicable rules and regulations of the Securities and Exchange Commission and the PCAOB.
We conducted our audits in accordance with the standards of the PCAOB. Those standards require that we plan and perform the audit to obtain reasonable assurance about whether the financial statements and financial highlights are free of material misstatement, whether due to error or fraud. The Fund is not required to have, nor were we engaged to perform, an audit of its internal control over financial reporting. As part of our audit, we are required to obtain an understanding of internal control over financial reporting but not for the purpose of expressing an opinion on the effectiveness of the Fund’s internal control over financial reporting. Accordingly, we express no such opinion.
Our audits included performing procedures to assess the risks of material misstatement of the financial statements and financial highlights, whether due to error or fraud, and performing procedures that respond to those risks. Such procedures included examining, on a test basis, evidence regarding the amounts and disclosures in the financial statements and financial highlights. Our audits also included evaluating the accounting principles used and significant estimates made by management, as well as evaluating the overall presentation of the financial statements and financial highlights. Our procedures included confirmation of securities owned as of March 31, 2023, by correspondence with the custodian and brokers; when replies were not received from brokers, we performed other auditing procedures. We believe that our audits provide a reasonable basis for our opinion.
/s/ Deloitte & Touche LLP
Kansas City, Missouri
May 16, 2023
We have served as the auditor of one or more American Century investment companies since 1997.
Board of Trustees
The individuals listed below serve as trustees of the funds. Each trustee will continue to serve in this capacity until death, retirement, resignation or removal from office. The board has adopted a mandatory retirement age for trustees who are not “interested persons,” as that term is defined in the Investment Company Act (independent trustees). Independent trustees shall retire on December 31 of the year in which they reach their 76th birthday.
Jonathan S. Thomas is an “interested person” because he currently serves as President and Chief Executive Officer of American Century Companies, Inc. (ACC), the parent company of American Century Investment Management, Inc. (ACIM or the advisor). The other trustees (more than three-fourths of the total number) are independent. They are not employees, directors or officers of, and have no financial interest in, ACC or any of its wholly owned, direct or indirect, subsidiaries, including ACIM, American Century Investment Services, Inc. (ACIS) and American Century Services, LLC (ACS), and they do not have any other affiliations, positions or relationships that would cause them to be considered “interested persons” under the Investment Company Act. The trustees serve in this capacity for eight (in the case of Jonathan S. Thomas, 16; and Jeremy I. Bulow, 9) registered investment companies in the American Century Investments family of funds.
The following table presents additional information about the trustees. The mailing address for each trustee other than Jonathan S. Thomas is 3945 Freedom Circle, Suite #800, Santa Clara, California 95054. The mailing address for Jonathan S. Thomas is 4500 Main Street, Kansas City, Missouri 64111.
| | | | | | | | | | | | | | | | | |
Name
(Year of Birth) | Position(s) Held with Funds | Length of Time Served | Principal Occupation(s) During Past 5 Years | Number of American Century Portfolios Overseen by Trustee | Other Directorships Held During Past 5 Years |
| Independent Trustees | | |
Tanya S. Beder
(1955) | Trustee and Board Chair | Since 2011 (Board Chair since 2022) | Chairman and CEO, SBCC Group Inc. (independent advisory services) (2006 to present) | 32 | Kirby Corporation; Nabors Industries, Ltd. |
Jeremy I. Bulow
(1954) | Trustee | Since 2011 | Professor of Economics, Stanford University, Graduate School of Business (1979 to present) | 77 | None |
Jennifer Cabalquinto
(1968) | Trustee | Since 2021 | Chief Financial Officer, 2K (interactive entertainment) (2021 to present); Special Advisor, GSW Sports, LLC (2020 to 2021); Chief Financial Officer, GSW Sports, LLC (2013 to 2020) | 32 | Sabio Holdings, Inc. |
Anne Casscells
(1958) | Trustee | Since 2016 | Co-Chief Executive Officer and Chief Investment Officer, Aetos Alternatives Management (investment advisory firm) (2001 to present) | 32 | None |
| | | | | | | | | | | | | | | | | |
Name
(Year of Birth) | Position(s) Held with Funds | Length of Time Served | Principal Occupation(s) During Past 5 Years | Number of American Century Portfolios Overseen by Trustee | Other Directorships Held During Past 5 Years |
| Independent Trustees | | |
Jonathan D. Levin
(1972) | Trustee | Since 2016 | Philip H. Knight Professor and Dean, Graduate School of Business, Stanford University (2016 to present); Professor, Stanford University, (2000 to present) | 32 | None |
Peter F. Pervere
(1947) | Trustee | Since 2007 | Retired | 32 | None |
John B. Shoven
(1947) | Trustee | Since 2002 | Charles R. Schwab Professor of Economics, Stanford University (1973 to present, emeritus since 2019) | 32 | Cadence Design Systems; Exponent; Financial Engines |
| Interested Trustee | | |
Jonathan S. Thomas
(1963) | Trustee | Since 2007 | President and Chief Executive Officer, ACC (2007 to present). Also serves as Chief Executive Officer, ACS; Director, ACC and other ACC subsidiaries | 141 | None |
The Statement of Additional Information has additional information about the fund's trustees and is available without charge, upon request, by calling 1-800-345-2021.
Officers
The following table presents certain information about the executive officers of the funds. Each officer serves as an officer for 16 investment companies in the American Century family of funds. No officer is compensated for his or her service as an officer of the funds. The listed officers are interested persons of the funds and are appointed or re-appointed on an annual basis. The mailing address for each of the officers listed below is 4500 Main Street, Kansas City, Missouri 64111.
| | | | | | | | |
Name
(Year of Birth) | Offices with the Funds | Principal Occupation(s) During the Past Five Years |
Patrick Bannigan
(1965)
| President since 2019 | Executive Vice President and Director, ACC (2012 to present); Chief Financial Officer, Chief Accounting Officer and Treasurer, ACC (2015 to present). Also serves as President, ACS; Vice President, ACIM; Chief Financial Officer, Chief Accounting Officer and/or Director, ACIM, ACS and other ACC subsidiaries |
R. Wes Campbell
(1974)
| Chief Financial Officer and Treasurer since 2018 | Vice President, ACS (2020 to present); Investment Operations and Investment Accounting, ACS (2000 to present) |
Amy D. Shelton
(1964) | Chief Compliance Officer and Vice President since 2014 | Chief Compliance Officer, American Century funds, (2014 to present); Chief Compliance Officer, ACIM (2014 to present); Chief Compliance Officer, ACIS (2009 to present). Also serves as Vice President, ACIS |
John Pak
(1968) | General Counsel and Senior Vice President since 2021 | General Counsel and Senior Vice President, ACC (2021 to present); Also serves as General Counsel and Senior Vice President, ACIM, ACS and ACIS. Chief Legal Officer of Investment and Wealth Management, The Bank of New York Mellon (2014 to 2021) |
David H. Reinmiller
(1963) | Vice President since 2000 | Attorney, ACC (1994 to present). Also serves as Vice President, ACIM and ACS |
Ward D. Stauffer
(1960) | Secretary since 2005 | Attorney, ACC (2003 to present) |
| | |
| Liquidity Risk Management Program |
The Fund has adopted a liquidity risk management program (the “program”). The Fund’s Board of Trustees (the "Board") has designated American Century Investment Management, Inc. (“ACIM”) as the administrator of the program. Personnel of ACIM or its affiliates, including members of ACIM’s Investment Oversight Committee who are members of ACIM’s Investment Management and Global Analytics departments, conduct the day-to-day operation of the program pursuant to the program.
Under the program, ACIM manages the Fund’s liquidity risk, which is the risk that the Fund could not meet shareholder redemption requests without significant dilution of remaining shareholders’ interests in the Fund. This risk is managed by monitoring the degree of liquidity of the Fund’s investments, limiting the amount of the Fund’s illiquid investments, and utilizing various risk management tools and facilities available to the Fund for meeting shareholder redemptions, among other means. ACIM’s process of determining the degree of liquidity of certain investments held by the Fund is supported by a third-party liquidity assessment vendor.
The Board reviewed a report prepared by ACIM regarding the operation and effectiveness of the program for the period January 1, 2022 through December 31, 2022. No significant liquidity events impacting the Fund were noted in the report. In addition, ACIM provided its assessment that the program had been effective in managing the Fund’s liquidity risk.
Retirement Account Information
As required by law, distributions you receive from certain retirement accounts are subject to federal income tax withholding at the IRS default rate of 10%.* Tax will be withheld on the total amount withdrawn even though you may be receiving amounts that are not subject to withholding, such as nondeductible contributions. In such case, excess amounts of withholding could occur. You may adjust your withholding election so that a greater or lesser amount will be withheld.
You may elect a different withholding rate, or request zero withholding, by submitting an acceptable IRS Form W-4R election with your distribution request. You may notify us of your W-4R election by telephone, on our distribution forms, on IRS Form W-4R, or through other acceptable electronic means. If your withholding election is for an automatic withdrawal plan, you have the right to revoke your election at any time and any election you make will remain in effect until revoked by filing a new election.
Remember, even if you elect not to have income tax withheld, you are liable for paying income tax on the taxable portion of your withdrawal. If you elect not to have income tax withheld or you don’t have enough income tax withheld, you may be responsible for payment of estimated tax. You may incur penalties under the estimated tax rules if your withholding and estimated tax payments are not sufficient. You can reduce or defer the income tax on a distribution by directly or indirectly rolling such distribution over to another IRA or eligible plan. You should consult your tax advisor for additional information.
State tax will be withheld according to state regulations if, at the time of your distribution, your tax residency is within one of the mandatory withholding states.
*Some 403(b), 457 and qualified retirement plan distributions may be subject to 20% mandatory withholding, as they are subject to special tax and withholding rules. Your plan administrator or plan sponsor is required to provide you with a special tax notice explaining those rules at the time you request a distribution. If applicable, federal and/or state taxes may be withheld from your distribution amount.
Proxy Voting Policies
Descriptions of the principles and policies that the fund's investment advisor uses in exercising the voting rights associated with the securities purchased and/or held by the fund are available without charge, upon request, by calling 1-800-345-2021 or visiting American Century Investments’ website at americancentury.com/proxy. A description of the policies is also available on the Securities and Exchange Commission’s website at sec.gov. Information regarding how the investment advisor voted proxies relating to portfolio securities during the most recent 12-month period ended June 30 is available on americancentury.com/proxy. It is also available at sec.gov.
Quarterly Portfolio Disclosure
The fund files its complete schedule of portfolio holdings with the Securities and Exchange Commission (SEC) for the first and third quarters of each fiscal year as an exhibit to its reports on Form N-PORT. These portfolio holdings are available on the fund's website at americancentury.com and, upon request, by calling 1-800-345-2021. The fund’s Form N-PORT reports are available on the SEC’s website at sec.gov.
| | | | | | | | |
| |
| | |
| Contact Us | americancentury.com | |
| Automated Information Line | 1-800-345-8765 | |
| Investor Services Representative | 1-800-345-2021
or 816-531-5575 | |
| Investors Using Advisors | 1-800-378-9878 | |
| Business, Not-For-Profit, Employer-Sponsored Retirement Plans | 1-800-345-3533 | |
| Banks and Trust Companies, Broker-Dealers, Financial Professionals, Insurance Companies | 1-800-345-6488 | |
| Telecommunications Relay Service for the Deaf | 711 | |
| | |
| American Century Investment Trust | |
| | |
Investment Advisor: American Century Investment Management, Inc. Kansas City, Missouri | |
| | |
| This report and the statements it contains are submitted for the general information of our shareholders. The report is not authorized for distribution to prospective investors unless preceded or accompanied by an effective prospectus. | |
| | |
©2023 American Century Proprietary Holdings, Inc. All rights reserved.
CL-ANN-92287 2305 | |
| | | | | |
| |
| Annual Report |
| |
| March 31, 2023 |
| |
| Prime Money Market Fund |
| Investor Class (BPRXX) |
| A Class (ACAXX) |
| C Class (ARCXX) |
| | | | | |
| President’s Letter | |
| Performance | |
| Fund Characteristics | |
| Shareholder Fee Example | |
| Schedule of Investments | |
| Statement of Assets and Liabilities | |
| Statement of Operations | |
| Statement of Changes in Net Assets | |
| Notes to Financial Statements | |
| Financial Highlights | |
| Report of Independent Registered Public Accounting Firm | |
| Management | |
| |
| Liquidity Risk Management Program | |
| |
| Additional Information | |
Any opinions expressed in this report reflect those of the author as of the date of the report, and do not necessarily represent the opinions of American Century Investments® or any other person in the American Century Investments organization. Any such opinions are subject to change at any time based upon market or other conditions and American Century Investments disclaims any responsibility to update such opinions. These opinions may not be relied upon as investment advice and, because investment decisions made by American Century Investments funds are based on numerous factors, may not be relied upon as an indication of trading intent on behalf of any American Century Investments fund. Security examples are used for representational purposes only and are not intended as recommendations to purchase or sell securities. Performance information for comparative indices and securities is provided to American Century Investments by third party vendors. To the best of American Century Investments’ knowledge, such information is accurate at the time of printing.
Jonathan Thomas
Dear Investor:
Thank you for reviewing this annual report for the period ended March 31, 2023. Annual reports help convey important information about fund returns, including market factors that affected performance. For additional investment insights, please visit americancentury.com.
Challenging Conditions Weighed on Asset Class Returns
Prevailing headwinds early in the reporting period continued to challenge U.S. financial markets throughout the 12 months. Asset class performance seesawed but declined overall amid mixed economic data, elevated inflation and anticipated monetary policy responses. By period-end, a new headwind emerged: banking industry uncertainty.
After launching its inflation-fighting rate-hike campaign in March 2022, the Federal Reserve (Fed) lifted rates eight more times by period-end. The federal funds target rate ended the reporting period at 4.75% to 5%, its highest level since 2007, while Treasury yields climbed to multiyear highs. Amid the Fed’s efforts, the annual inflation rate peaked at 9.1% in June, a 40-year high, before easing to 5% by March.
In addition to helping tame inflation, rapidly rising rates also fueled recession worries and led to expectations for the Fed to change course. This sentiment helped spark a rebound among stock and bond indices in the second half of the reporting period. The collapse of two U.S. regional banks late in the period and fears of a looming credit crunch and likely recession also contributed to market expectations for a Fed policy change. Nevertheless, the Fed indicated a near-term course change was unlikely.
Despite delivering strong gains in the second half of the reporting period, stock returns succumbed to first-half losses and declined for the 12 months. Similarly, weakness in the first half of the period overwhelmed second-half gains, and bond returns were negative for the 12-month period.
Remaining Diligent in Uncertain Times
We expect market volatility to linger as investors navigate a complex environment of still-high inflation, tighter financial conditions, banking industry turbulence and economic uncertainty. In addition, increasingly tense geopolitical considerations complicate the market backdrop.
We appreciate your confidence in us during these extraordinary times. Our firm has a long history of helping clients weather unpredictable and volatile markets, and we’re confident we will continue to meet today’s challenges.
Sincerely,
Jonathan Thomas
President and Chief Executive Officer
American Century Investments
| | | | | | | | | | | | | | | | | |
| Total Returns as of March 31, 2023 | |
| | | Average Annual Returns | |
| | Ticker
Symbol | 1 year | 5 years | 10 years | Inception
Date |
| Investor Class | BPRXX | 2.38% | 1.17% | 0.68% | 11/17/93 |
| A Class | ACAXX | 2.15% | 1.02% | 0.59% | 8/28/98 |
| C Class | ARCXX | 1.73% | 0.73% | 0.42% | 5/7/02 |
Fund returns would have been lower if a portion of the fees had not been waived.
C Class shares will automatically convert to A Class shares after being held for approximately eight years. C Class average annual returns do not reflect this conversion.
| | | | | | | | |
| Total Annual Fund Operating Expenses |
| Investor Class | A Class | C Class |
| 0.58% | 0.83% | 1.33% |
The total annual fund operating expenses shown is as stated in the fund’s prospectus current as of the date of this report. The prospectus may vary from the expense ratio shown elsewhere in this report because it is based on a different time period, includes acquired fund fees and expenses, and, if applicable, does not include fee waivers or expense reimbursements.
Data presented reflect past performance. Past performance is no guarantee of future results. Current performance may be higher or lower than the performance shown. Total returns for periods less than one year are not annualized. To obtain performance data current to the most recent month end, please call 1-800-345-2021 or visit americancentury.com. For additional information about the fund, please consult the prospectus.
You could lose money by investing in the fund. Although the fund seeks to preserve the value of your investment at $1.00 per share, it cannot guarantee it will do so. The fund may impose a fee upon sale of your shares or may temporarily suspend your ability to sell shares if the fund’s liquidity falls below required minimums because of market conditions or other factors. An investment in the fund is not insured or guaranteed by the Federal Deposit Insurance Corporation or any other government agency. The fund’s sponsor has no legal obligation to provide financial support to the fund, and you should not expect that the sponsor will provide financial support to the fund at any time.
The 7-day current yield more closely reflects the current earnings of the fund than the total return.
| | | | | | | | | | | |
| MARCH 31, 2023 | | | |
| Yields | Investor Class | A Class | C Class |
| 7-Day Current Yields | 4.38% | 4.14% | 3.64% |
| 7-Day Effective Yields | 4.48% | 4.22% | 3.70% |
| | | | | |
| Portfolio at a Glance |
| Weighted Average Maturity | 51 days |
| Weighted Average Life | 96 days |
| |
| Portfolio Composition by Maturity | % of fund investments |
| 1-30 days | 65% |
| 31-90 days | 12% |
| 91-180 days | 16% |
| More than 180 days | 7% |
Fund shareholders may incur two types of costs: (1) transaction costs, including sales charges (loads) on purchase payments and redemption/exchange fees; and (2) ongoing costs, including management fees; distribution and service (12b-1) fees; and other fund expenses. This example is intended to help you understand your ongoing costs (in dollars) of investing in your fund and to compare these costs with the ongoing cost of investing in other mutual funds.
The example is based on an investment of $1,000 made at the beginning of the period and held for the entire period from October 1, 2022 to March 31, 2023.
Actual Expenses
The table provides information about actual account values and actual expenses for each class. You may use the information, together with the amount you invested, to estimate the expenses that you paid over the period. First, identify the share class you own. Then simply divide your account value by $1,000 (for example, an $8,600 account value divided by $1,000 = 8.6), then multiply the result by the number under the heading “Expenses Paid During Period” to estimate the expenses you paid on your account during this period.
If you hold Investor Class shares of any American Century Investments mutual fund, or I Class shares of the American Century Diversified Bond Fund, in an American Century Investments account (i.e., not through a financial intermediary or employer-sponsored retirement plan account), American Century Investments may charge you a $25 annual account maintenance fee if the value of those shares is less than $10,000. We will redeem shares automatically in one of your accounts to pay the $25 fee. In determining your total eligible investment amount, we will include your investments in all personal accounts (including American Century Investments brokerage accounts) registered under your Social Security number. Personal accounts include individual accounts, joint accounts, UGMA/UTMA accounts, personal trusts, Coverdell Education Savings Accounts and IRAs (including traditional, Roth, Rollover, SEP-, SARSEP- and SIMPLE-IRAs), and certain other retirement accounts. If you have only business, business retirement, employer-sponsored or American Century Investments brokerage accounts, you are currently not subject to this fee. If you are subject to the account maintenance fee, your account value could be reduced by the fee amount.
Hypothetical Example for Comparison Purposes
The table also provides information about hypothetical account values and hypothetical expenses based on the actual expense ratio of each class of your fund and an assumed rate of return of 5% per year before expenses, which is not the actual return of a fund’s share class. The hypothetical account values and expenses may not be used to estimate the actual ending account balance or expenses you paid for the period. You may use this information to compare the ongoing costs of investing in your fund and other funds. To do so, compare this 5% hypothetical example with the 5% hypothetical examples that appear in the shareholder reports of the other funds.
Please note that the expenses shown in the table are meant to highlight your ongoing costs only and do not reflect any transactional costs, such as sales charges (loads) or redemption/exchange fees. Therefore, the table is useful in comparing ongoing costs only, and will not help you determine the relative total costs of owning different funds. In addition, if these transactional costs were included, your costs would have been higher.
| | | | | | | | | | | | | | |
| Beginning
Account Value
10/1/22 | Ending
Account Value
3/31/23 | Expenses Paid During Period(1) 10/1/22 - 3/31/23 | Annualized Expense Ratio(1) |
| Actual | | | | |
| Investor Class | $1,000 | $1,018.40 | $2.92 | 0.58% |
| A Class | $1,000 | $1,017.10 | $4.17 | 0.83% |
| C Class | $1,000 | $1,014.60 | $6.68 | 1.33% |
| Hypothetical | | | | |
| Investor Class | $1,000 | $1,022.04 | $2.92 | 0.58% |
| A Class | $1,000 | $1,020.79 | $4.18 | 0.83% |
| C Class | $1,000 | $1,018.30 | $6.69 | 1.33% |
(1)Expenses are equal to the class's annualized expense ratio listed in the table above, multiplied by the average account value over the period, multiplied by 182, the number of days in the most recent fiscal half-year, divided by 365, to reflect the one-half year period. Annualized expense ratio reflects actual expenses, including any applicable fee waivers or expense reimbursements and excluding any acquired fund fees and expenses.
MARCH 31, 2023
| | | | | | | | |
| Principal Amount | Value |
COMMERCIAL PAPER(1) — 30.7% | | |
Alinghi Funding Co. LLC, 3.12%, 5/17/23 (LOC: UBS AG)(2) | $ | 9,750,000 | | $ | 9,714,488 | |
Alinghi Funding Co. LLC, 5.44%, 7/13/23 (LOC: UBS AG)(2) | 15,000,000 | | 14,781,167 | |
Australia & New Zealand Banking Group Ltd., 5.49%, 12/15/23(2) | 20,000,000 | | 19,260,444 | |
Australia & New Zealand Banking Group Ltd., VRN, 5.49%, (SOFR plus 0.67%), 5/2/23(2) | 1,219,000 | | 1,219,468 | |
Australia & New Zealand Banking Group Ltd., VRN, 5.22%, (SOFR plus 0.40%), 10/10/23(2) | 25,000,000 | | 25,000,000 | |
Australia & New Zealand Banking Group Ltd., VRN, 5.02%, (SOFR plus 0.20%), 11/13/23(2) | 10,000,000 | | 10,000,000 | |
Banco Santander SA, VRN, 5.23%, (SOFR plus 0.40%), 7/5/23(2) | 10,000,000 | | 10,000,000 | |
Banco Santander SA, VRN, 5.28%, (SOFR plus 0.45%), 7/5/23(2) | 21,500,000 | | 21,501,621 | |
| Bank of Montreal, VRN, 5.57%, (SOFR plus 0.75%), 12/5/23 | 5,000,000 | | 4,999,458 | |
Bank of Nova Scotia, VRN, 5.27%, (SOFR plus 0.45%), 1/18/24(2) | 20,500,000 | | 20,499,856 | |
| Barclays Capital, Inc., 5.82%, 6/16/23 | 3,300,000 | | 3,261,572 | |
Bedford Row Funding Corp., VRN, 5.57%, (SOFR plus 0.75%), 8/2/23 (LOC: Royal Bank of Canada)(2) | 15,000,000 | | 15,000,000 | |
| BNP Paribas SA, VRN, 5.28%, (SOFR plus 0.46%), 9/25/23 | 16,750,000 | | 16,750,000 | |
| Cabot Trail Funding LLC, 5.18%, 8/15/23 (LOC: Toronto-Dominion Bank) | 16,500,000 | | 16,194,145 | |
| Canadian Imperial Bank of Commerce, 3.66%, 5/2/23 | 305,000 | | 304,138 | |
Canadian Imperial Bank of Commerce, VRN, 5.38%, (SOFR plus 0.56%), 7/7/23(2) | 13,300,000 | | 13,300,000 | |
Canadian Imperial Bank of Commerce, VRN, 5.27%, (SOFR plus 0.45%), 3/20/24(2) | 12,500,000 | | 12,500,000 | |
Chesham Finance Ltd. / Chesham Finance LLC, 4.90%, 4/3/23 (LOC: Societe Generale SA)(2) | 9,950,000 | | 9,950,000 | |
Citigroup Global Markets, Inc., VRN, 5.23%, (SOFR plus 0.40%), 4/5/23(2) | 22,000,000 | | 22,000,077 | |
| Collateralized Commercial Paper FLEX Co. LLC, 5.21%, 7/5/23 (LOC: JPMorgan Securities LLC) | 10,000,000 | | 9,870,575 | |
Collateralized Commercial Paper FLEX Co. LLC, 5.25%, 11/1/23 (LOC: JPMorgan Securities LLC)(2) | 20,000,000 | | 20,000,000 | |
Collateralized Commercial Paper FLEX Co. LLC, VRN, 5.17%, (SOFR plus 0.35%), 7/19/23 (LOC: JPMorgan Securities LLC)(2) | 5,000,000 | | 5,000,000 | |
| Collateralized Commercial Paper V Co. LLC, VRN, 5.27%, (SOFR plus 0.45%), 4/5/23 (LOC: JPMorgan Securities LLC) | 10,000,000 | | 10,000,000 | |
| Collateralized Commercial Paper V Co. LLC, VRN, 5.37%, (SOFR plus 0.55%), 4/12/23 (LOC: JPMorgan Securities LLC) | 15,000,000 | | 15,000,000 | |
| Cooperatieve Rabobank UA, 5.28%, 9/5/23 | 21,150,000 | | 20,691,956 | |
| Cooperatieve Rabobank UA, 5.14%, 10/20/23 | 8,300,000 | | 8,074,517 | |
| CRC Funding LLC, 4.96%, 6/2/23 (LOC: Citibank N.A.) | 6,500,000 | | 6,447,892 | |
Fairway Finance Co. LLC, VRN, 5.47%, (SOFR plus 0.65%), 5/19/23 (LOC: Bank of Montreal)(2) | 10,500,000 | | 10,500,000 | |
| Great Bear Funding LLC, 5.07%, 6/26/23 (LOC: Bank of Nova Scotia) | 1,000,000 | | 988,578 | |
JP Morgan Securities LLC, 4.07%, 6/6/23(2) | 8,200,000 | | 8,143,147 | |
JP Morgan Securities LLC, 5.15%, 7/11/23(2) | 15,000,000 | | 15,000,000 | |
JP Morgan Securities LLC, 5.49%, 11/28/23(2) | 18,500,000 | | 18,500,000 | |
LMA-Americas LLC, 5.23%, 7/5/23 (LOC: Credit Agricole Corporate and Investment Bank)(2) | 15,000,000 | | 14,805,087 | |
| | | | | | | | |
| Principal Amount | Value |
LMA-Americas LLC, 5.12%, 8/8/23 (LOC: Credit Agricole Corporate and Investment Bank)(2) | $ | 3,595,000 | | $ | 3,532,603 | |
| Podium Funding Trust, VRN, 5.20%, (SOFR plus 0.38%), 10/16/23 (LOC: Bank of Montreal) | 25,000,000 | | 25,000,000 | |
| Ridgefield Funding Co. LLC, 5.17%, 8/8/23 (LOC: BNP Paribas) | 16,500,000 | | 16,210,705 | |
Skandinaviska Enskilda Banken AB, VRN, 5.14%, (SOFR plus 0.31%), 7/11/23(2) | 22,500,000 | | 22,500,000 | |
Svenska Handelsbanken AB, VRN, 5.36%, (SOFR plus 0.53%), 5/19/23(2) | 5,000,000 | | 5,000,000 | |
Svenska Handelsbanken AB, VRN, 5.62%, (SOFR plus 0.79%), 11/1/23(2) | 13,500,000 | | 13,500,000 | |
Toronto-Dominion Bank, VRN, 5.04%, 12/6/23(2) | 11,000,000 | | 11,000,000 | |
| Toyota Credit de Puerto Rico Corp., VRN, 5.46%, (SOFR plus 0.63%), 5/22/23 | 13,000,000 | | 13,000,000 | |
UBS AG, VRN, 5.47%, (SOFR plus 0.65%), 6/29/23(2) | 20,500,000 | | 20,500,000 | |
UBS AG, VRN, 5.41%, (SOFR plus 0.58%), 9/22/23(2) | 18,600,000 | | 18,600,000 | |
UBS AG, VRN, 5.65%, (SOFR plus 0.82%), 10/17/23(2) | 10,000,000 | | 10,000,000 | |
Versailles Commercial Paper LLC, 5.59%, 6/7/23 (LOC: Natixis)(2) | 10,000,000 | | 9,901,597 | |
| Washington Morgan Capital Co. LLC, 5.61%, 4/27/23 (LOC: Goldman Sachs & Co.) | 15,500,000 | | 15,500,000 | |
| TOTAL COMMERCIAL PAPER | | 593,503,091 | |
| MUNICIPAL SECURITIES — 20.4% | | |
| Alaska Housing Finance Corp. Rev., VRDN, 4.85%, 4/7/23 | 6,825,000 | | 6,825,000 | |
| Alaska Housing Finance Corp. Rev., VRDN, 4.93%, 4/7/23 | 17,780,000 | | 17,780,000 | |
| Board of Regents of the University of Texas System Rev., VRDN, 4.82%, 4/7/23 | 10,000,000 | | 10,000,000 | |
| Bridgeton Industrial Development Authority Rev., (Stolze Printing Obligated Group), VRDN, 5.07%, 4/7/23 (LOC: Carrollton Bank and U.S. Bank N.A.) | 1,300,000 | | 1,300,000 | |
| City of Philadelphia , 4.80%, 5/4/23 (LOC: TD Bank N.A.) | 7,500,000 | | 7,500,000 | |
| Colorado Housing & Finance Authority Rev., VRDN, 4.85%, 4/7/23 (SBBPA: Barclays Bank PLC) | 1,760,000 | | 1,760,000 | |
| Colorado Housing & Finance Authority Rev., VRDN, 4.85%, 4/7/23 (SBBPA: FHLB) | 12,500,000 | | 12,500,000 | |
| Illinois Housing Development Authority Rev., VRDN, 4.86%, 4/7/23 (LOC: FHLB)(LIQ FAC: FHLB) | 6,905,000 | | 6,905,000 | |
| Illinois Housing Development Authority Rev., VRDN, 4.88%, 4/7/23 (SBBPA: FHLB) | 12,070,000 | | 12,070,000 | |
| Kansas City Rev., VRDN, 4.90%, 4/7/23 (LOC: JPMorgan Chase Bank N.A.) | 1,590,000 | | 1,590,000 | |
| Massachusetts Development Finance Agency Rev., (Babson College), VRDN, 4.95%, 4/7/23 (LOC: Bank of America N.A.) | 1,110,000 | | 1,110,000 | |
| Memphis Health Educational & Housing Facility Board Rev., (Pedcor Investments 2007-CIII LP), VRDN, 4.90%, 4/7/23 (LOC: U.S. Bank N.A.) | 1,095,000 | | 1,095,000 | |
| Metropolitan Water District of Southern California Rev., VRDN, 4.86%, 4/7/23 (SBBPA: PNC Bank N.A.) | 14,625,000 | | 14,625,000 | |
| Metropolitan Water District of Southern California Rev., VRDN, 4.91%, 4/7/23 (SBBPA: Bank of America N.A.) | 46,870,000 | | 46,870,000 | |
| Michigan Finance Authority Rev., (School Loan Revolving Fund), VRDN, 4.87%, 4/7/23 (LOC: PNC Bank N.A.) | 8,000,000 | | 8,000,000 | |
| Michigan Finance Authority Rev., (School Loan Revolving Fund), VRDN, 4.90%, 4/7/23 (LOC: Bank of America N.A.) | 11,320,000 | | 11,320,000 | |
Mizuho Floater/Residual Trust Rev., VRDN, 5.08%, 5/5/23 (LOC: Mizuho Capital Markets LLC)(LIQ FAC: Mizuho Capital Markets LLC)(2) | 11,270,000 | | 11,270,000 | |
Mizuho Floater/Residual Trust Rev., VRDN, 5.09%, 5/5/23 (LOC: Mizuho Capital Markets LLC)(LIQ FAC: Mizuho Capital Markets LLC)(2) | 13,797,413 | | 13,797,413 | |
| | | | | | | | |
| Principal Amount | Value |
Mizuho Floater/Residual Trust Rev., VRDN, 5.09%, 5/5/23 (LOC: Mizuho Capital Markets LLC)(LIQ FAC: Mizuho Capital Markets LLC)(2) | $ | 14,164,340 | | $ | 14,164,340 | |
Mizuho Floater/Residual Trust Rev., VRDN, 5.12%, 5/5/23 (LOC: Mizuho Capital Markets LLC)(LIQ FAC: Mizuho Capital Markets LLC)(2) | 35,505,000 | | 35,505,000 | |
| New York State Housing Finance Agency Rev., (L&M 93rd Street LLC), VRDN, 4.91%, 4/7/23 (LOC: Landesbank Hessen-Thuringen Girozentrale) | 1,100,000 | | 1,100,000 | |
| New York State Housing Finance Agency Rev., (L&M 93rd Street LLC), VRDN, 4.92%, 4/7/23 (LOC: Landesbank Hessen-Thuringen Girozentrale) | 375,000 | | 375,000 | |
| New York State Housing Finance Agency Rev., VRDN, 4.85%, 4/7/23 (SBBPA: TD Bank N.A.) | 1,500,000 | | 1,500,000 | |
| North Dakota Housing Finance Agency Rev., VRDN, 4.85%, 4/7/23 (SBBPA: Royal Bank of Canada) | 2,300,000 | | 2,300,000 | |
| Pasadena Public Financing Authority Rev., VRDN, 4.98%, 4/7/23 (SBBPA: Bank of the West) | 11,935,000 | | 11,935,000 | |
| South Dakota Housing Development Authority Rev., VRDN, 4.90%, 4/7/23 | 10,000,000 | | 10,000,000 | |
| South Dakota Housing Development Authority Rev., VRDN, 4.90%, 4/7/23 (SBBPA: South Dakota Housing Development Authority) | 19,105,000 | | 19,105,000 | |
| St. Charles Parish Rev., (Randa Properties LLC), VRDN, 4.98%, 4/7/23 (LOC: Capital One N.A. and FHLB) | 1,345,000 | | 1,345,000 | |
| State of Oregon Housing & Community Services Department Rev., VRDN, 4.80%, 4/7/23 (SBBPA: U.S. Bank N.A.) | 10,500,000 | | 10,500,000 | |
Taxable Municipal Funding Trust Rev., VRDN, 5.02%, 4/7/23 (LOC: Barclays Bank PLC)(2) | 8,986,000 | | 8,986,000 | |
Taxable Municipal Funding Trust Rev., VRDN, 5.02%, 4/7/23 (LOC: Barclays Bank PLC)(2) | 31,240,000 | | 31,240,000 | |
Tender Option Bond Trust Receipts/Certificates COP, VRDN, 5.00%, 4/7/23 (LOC: Royal Bank of Canada)(2) | 13,395,000 | | 13,395,000 | |
Tender Option Bond Trust Receipts/Certificates Rev., VRDN, 4.88%, 4/7/23 (LOC: Barclays Bank PLC)(2) | 28,040,000 | | 28,040,000 | |
Tender Option Bond Trust Receipts/Certificates Rev., VRDN, 5.00%, 4/7/23 (LIQ FAC: Royal Bank of Canada)(2) | 5,000,000 | | 5,000,000 | |
Tender Option Bond Trust Receipts/Certificates Rev., VRDN, 5.02%, 4/7/23 (LIQ FAC: JP Morgan Chase Bank N.A)(2) | 5,625,000 | | 5,625,000 | |
| Triborough Bridge & Tunnel Authority Rev., VRDN, 4.82%, 4/7/23 (LOC: UBS AG) | 3,500,000 | | 3,500,000 | |
| University of California Rev., VRDN, 4.82%, 4/7/23 | 1,030,000 | | 1,030,000 | |
| Wisconsin Housing & Economic Development Authority Housing Rev., VRDN, 4.95%, 4/7/23 (SBBPA: JPMorgan Chase Bank N.A.) | 3,300,000 | | 3,300,000 | |
| TOTAL MUNICIPAL SECURITIES | | 394,262,753 | |
| CORPORATE BONDS — 18.2% | | |
| 12th & Yesler Owner LLC, VRDN, 4.92%, 4/7/23 (LOC: FHLB) | 27,000,000 | | 27,000,000 | |
| 412 Madison LLC, VRDN, 4.92%, 4/7/23 (LOC: FNMA) | 11,000,000 | | 11,000,000 | |
| 500 Columbia Place LLC, VRDN, 4.92%, 4/7/23 (LOC: FHLB) | 7,000,000 | | 7,000,000 | |
| Allen C Stonecipher Life Insurance Trust, VRDN, 4.91%, 4/7/23 (LOC: FHLB) | 17,880,000 | | 17,880,000 | |
| Anton Santa Cruz LLC, VRDN, 4.92%, 4/7/23 (LOC: FHLB) | 18,030,000 | | 18,030,000 | |
| Bank of Montreal, VRN, 5.09%, (SOFR plus 0.27%), 9/15/23 | 6,000,000 | | 5,989,341 | |
| Barbour Issuing Trust, VRDN, 4.91%, 4/7/23 (LOC: FHLB) | 11,000,000 | | 11,000,000 | |
| Bellevue 10 Apartments LLC, VRDN, 4.95%, 4/10/23 (LOC: Northern Trust Company) | 12,670,000 | | 12,670,000 | |
| CG-USA Simi Valley LP, VRDN, 4.92%, 4/7/23 (LOC: FHLB) | 9,500,000 | | 9,500,000 | |
| Champion Insurance Trust, VRDN, 4.91%, 4/7/23 (LOC: FHLB) | 4,320,000 | | 4,320,000 | |
| | | | | | | | |
| Principal Amount | Value |
| Cypress Bend Real Estate Development Co. LLC, VRDN, 4.92%, 4/7/23 (LOC: FHLB) | $ | 14,190,000 | | $ | 14,190,000 | |
| Fiore Capital LLC, VRDN, 5.00%, 4/7/23 (LOC: Wells Fargo Bank N.A.) | 13,975,000 | | 13,975,000 | |
| Foothill Garden NV Investors LLC, VRDN, 4.92%, 4/7/23 (LOC: FHLB) | 10,950,000 | | 10,950,000 | |
| General Secretariat of the Organization of American States, VRDN, 4.96%, 5/15/23 (LOC: Bank of America N.A.) | 12,530,000 | | 12,530,000 | |
| Gold River 659 LLC, VRDN, 4.92%, 4/7/23 (LOC: FHLB) | 12,000,000 | | 12,000,000 | |
| Hartsfield Family Trust 2021, VRDN, 4.91%, 4/7/23 (LOC: FHLB) | 5,210,000 | | 5,210,000 | |
| JL Irrevocable Trust, VRDN, 4.92%, 4/7/23 (LOC: FHLB) | 2,000,000 | | 2,000,000 | |
| KDF Glenview LP, VRDN, 4.92%, 4/7/23 (LOC: FHLB) | 8,000,000 | | 8,000,000 | |
| Krawitz Family Insurance Trust, VRDN, 4.91%, 4/7/23 (LOC: FHLB) | 4,000,000 | | 4,000,000 | |
| Labcon North America, VRDN, 4.93%, 4/5/23 (LOC: BMO Harris Bank N.A.) | 1,950,000 | | 1,950,000 | |
| Labcon North America, VRDN, 4.90%, 4/7/23 (LOC: BMO Harris Bank N.A.) | 5,820,000 | | 5,820,000 | |
| Ness Family Partners LP, VRDN, 4.93%, 4/7/23 (LOC: BMO Harris Bank N.A.) | 4,805,000 | | 4,805,000 | |
| Nicholas David Nurse 2020 Irrevocable Trust, VRDN, 4.91%, 4/7/23 (LOC: FHLB) | 8,175,000 | | 8,175,000 | |
Nuveen Credit Strategies Income Fund, VRDN, 4.94%, 4/7/23 (LOC: Societe Generale SA)(2) | 16,000,000 | | 16,000,000 | |
Nuveen Preferred & Income Opportunities Fund, VRDN, 4.94%, 4/7/23 (LOC: Sumitomo Mitsui Banking)(2) | 20,000,000 | | 20,000,000 | |
Nuveen Variable Rate Preferred & Income Fund, VRDN, 4.96%, 4/7/23 (LOC: Toronto-Dominion Bank)(2) | 42,500,000 | | 42,500,000 | |
| Royal Bank of Canada, VRN, 5.27%, (SOFR plus 0.45%), 10/26/23 | 4,500,000 | | 4,492,848 | |
| Shil Park Irrevocable Life Insurance Trust, VRDN, 4.91%, 4/7/23 (LOC: FHLB) | 6,000,000 | | 6,000,000 | |
| SRMHayward LLC, VRDN, 4.92%, 4/7/23 (LOC: FHLB) | 7,000,000 | | 7,000,000 | |
| Steve Welch Family Insurance Trust, VRDN, 4.91%, 4/7/23 (LOC: FHLB) | 2,805,000 | | 2,805,000 | |
| Synergy Colgan Creek LLC, VRDN, 4.92%, 4/7/23 (LOC: FHLB) | 1,000,000 | | 1,000,000 | |
| Toyota Motor Credit Corp., VRN, 5.18%, (SOFR plus 0.35%), 6/13/23 | 6,181,000 | | 6,181,361 | |
| Uptown Newport Building Owner LP, VRDN, 4.94%, 4/7/23 (LOC: Landesbank Hessen-Thuringen Girozentrale) | 17,355,000 | | 17,355,000 | |
| TOTAL CORPORATE BONDS | | 351,328,550 | |
| CERTIFICATES OF DEPOSIT — 17.3% | | |
| Banco Santander SA, 5.20%, 5/5/23 | 16,000,000 | | 16,000,000 | |
| Bank of Montreal, VRN, 5.43%, (SOFR plus 0.61%), 7/21/23 | 5,000,000 | | 5,000,000 | |
| Bank of Montreal, VRN, 5.57%, (SOFR plus 0.75%), 8/1/23 | 17,500,000 | | 17,500,000 | |
| Bank of Montreal, VRN, 5.45%, (SOFR plus 0.63%), 9/12/23 | 20,000,000 | | 20,000,000 | |
| Barclays Bank PLC, 5.20%, 7/7/23 | 23,250,000 | | 23,250,000 | |
| Canadian Imperial Bank of Commerce, 4.02%, 9/13/23 | 18,500,000 | | 18,500,000 | |
| Canadian Imperial Bank of Commerce, 5.00%, 10/12/23 | 20,000,000 | | 20,000,000 | |
| Canadian Imperial Bank of Commerce, VRN, 5.32%, (SOFR plus 0.50%), 5/8/23 | 5,020,000 | | 5,020,636 | |
| Cooperatieve Rabobank UA, 3.74%, 5/31/23 | 19,900,000 | | 19,902,487 | |
Credit Agricole Corporate & Investment Bank SA, 4.80%, 4/3/23(2) | 1,961,000 | | 1,961,000 | |
Credit Agricole Corporate & Investment Bank SA, 5.18%, 8/22/23(2) | 17,500,000 | | 17,500,000 | |
| Natixis SA, 5.52%, 9/5/23 | 10,000,000 | | 10,000,000 | |
| | | | | | | | |
| Principal Amount | Value |
| Nordea Bank Abp, VRN, 5.42%, (SOFR plus 0.60%), 10/11/23 | $ | 10,000,000 | | $ | 10,000,000 | |
| Nordea Bank Abp, VRN, 5.60%, (SOFR plus 0.78%), 11/1/23 | 500,000 | | 500,333 | |
| Royal Bank of Canada, 4.02%, 7/14/23 | 18,100,000 | | 18,100,000 | |
| Royal Bank of Canada, 4.22%, 9/1/23 | 5,000,000 | | 5,000,000 | |
| Royal Bank of Canada, 4.10%, 9/6/23 | 20,000,000 | | 20,000,000 | |
| Royal Bank of Canada, 5.41%, 12/21/23 | 15,000,000 | | 15,000,000 | |
| Svenska Handelsbanken, VRN, 5.30%, (SOFR plus 0.47%), 5/3/23 | 10,000,000 | | 10,000,000 | |
| Svenska Handelsbanken, VRN, 5.15%, (SOFR plus 0.32%), 3/15/24 | 20,000,000 | | 20,000,000 | |
| Toronto-Dominion Bank, 3.75%, 6/15/23 | 3,250,000 | | 3,242,466 | |
| Toronto-Dominion Bank, 3.75%, 6/16/23 | 7,500,000 | | 7,500,000 | |
| Toronto-Dominion Bank, 4.07%, 7/18/23 | 340,000 | | 339,258 | |
| Toronto-Dominion Bank, 5.38%, 8/1/23 | 5,000,000 | | 5,000,000 | |
| Toronto-Dominion Bank, 4.00%, 8/14/23 | 12,500,000 | | 12,500,000 | |
| Toronto-Dominion Bank, 4.25%, 9/8/23 | 10,000,000 | | 10,000,000 | |
| Toronto-Dominion Bank, 4.35%, 9/13/23 | 5,500,000 | | 5,500,000 | |
| Toronto-Dominion Bank, 5.30%, 1/24/24 | 7,500,000 | | 7,500,000 | |
| Toronto-Dominion Bank, 5.53%, 4/1/24 | 10,000,000 | | 10,000,000 | |
| TOTAL CERTIFICATES OF DEPOSIT | | 334,816,180 | |
U.S. TREASURY SECURITIES(1) — 14.3% | | |
| U.S. Treasury Bills, 1.93%, 4/20/23 | 16,275,000 | | 16,260,628 | |
| U.S. Treasury Bills, 4.75%, 5/2/23 | 35,000,000 | | 34,874,778 | |
| U.S. Treasury Bills, 4.74%, 5/30/23 | 25,000,000 | | 24,821,111 | |
| U.S. Treasury Bills, 4.75%, 6/29/23 | 35,000,000 | | 34,613,515 | |
| U.S. Treasury Bills, 3.09%, 7/13/23 | 20,000,000 | | 19,826,476 | |
| U.S. Treasury Bills, 4.89%, 7/18/23 | 25,000,000 | | 24,650,347 | |
| U.S. Treasury Bills, 4.86%, 8/3/23 | 10,000,000 | | 9,841,400 | |
| U.S. Treasury Bills, 3.64%, 9/7/23 | 10,750,000 | | 10,587,789 | |
| U.S. Treasury Notes, VRN, 4.76%, (3-month USBMMY plus 0.03%), 7/31/23 | 50,000,000 | | 49,955,006 | |
| U.S. Treasury Notes, VRN, 4.77%, (3-month USBMMY plus 0.04%), 10/31/23 | 50,000,000 | | 49,953,119 | |
| TOTAL U.S. TREASURY SECURITIES | | 275,384,169 | |
| U.S. GOVERNMENT AGENCY SECURITIES — 2.1% | | |
| FHLB, 4.50%, 11/3/23 | 5,000,000 | | 5,000,000 | |
| FHLB, 5.50%, 3/27/24 | 20,000,000 | | 20,000,000 | |
| FHLB, 5.62%, 3/27/24 | 15,000,000 | | 15,000,000 | |
| TOTAL U.S. GOVERNMENT AGENCY SECURITIES | | 40,000,000 | |
| TOTAL INVESTMENT SECURITIES — 103.0% | | 1,989,294,743 | |
| OTHER ASSETS AND LIABILITIES — (3.0)% | | (57,265,855) | |
| TOTAL NET ASSETS — 100.0% | | $ | 1,932,028,888 | |
| | | | | | | | |
| NOTES TO SCHEDULE OF INVESTMENTS |
| COP | – | Certificates of Participation |
| FHLB | – | Federal Home Loan Bank |
| FNMA | – | Federal National Mortgage Association |
| LIQ FAC | – | Liquidity Facilities |
| LOC | – | Letter of Credit |
| SBBPA | – | Standby Bond Purchase Agreement |
| SOFR | – | Secured Overnight Financing Rate |
| USBMMY | – | U.S. Treasury Bill Money Market Yield |
| VRDN | – | Variable Rate Demand Note. The instrument may be payable upon demand and adjusts periodically based upon the terms set forth in the security's offering documents. The rate shown is effective at the period end and the reference rate and spread, if any, is indicated. The date of the demand feature is disclosed. |
| VRN | – | Variable Rate Note. The rate adjusts periodically based upon the terms set forth in the security’s offering documents. The rate shown is effective at the period end and the reference rate and spread, if any, is indicated. The security's effective maturity date may be shorter than the final maturity date shown. |
(1)The rate indicated is the yield to maturity at purchase for non-interest bearing securities. For interest bearing securities, the stated coupon rate is shown.
(2)Security was purchased pursuant to Rule 144A or Section 4(2) under the Securities Act of 1933 and may be sold in transactions exempt from registration, normally to qualified institutional investors. The aggregate value of these securities at the period end was $676,193,308, which represented 35.0% of total net assets.
See Notes to Financial Statements.
| | |
| Statement of Assets and Liabilities |
| | | | | |
| MARCH 31, 2023 | |
| Assets | |
| Investment securities, at value (amortized cost and cost for federal income tax purposes) | $ | 1,989,294,743 | |
| Cash | 4,973,557 | |
| Receivable for investments sold | 380,000 | |
| Receivable for capital shares sold | 3,141,105 | |
| Interest receivable | 12,234,482 | |
| 2,010,023,887 | |
| |
| Liabilities | |
| Payable for investments purchased | 72,845,307 | |
| Payable for capital shares redeemed | 4,204,637 | |
| Accrued management fees | 938,561 | |
| Distribution and service fees payable | 6,494 | |
| 77,994,999 | |
| |
| Net Assets | $ | 1,932,028,888 | |
| |
| Net Assets Consist of: | |
| Capital paid in | $ | 1,932,205,439 | |
| Distributable earnings (loss) | (176,551) | |
| $ | 1,932,028,888 | |
| | | | | | | | | | | |
| Net Assets | Shares Outstanding | Net Asset Value Per Share |
| Investor Class | $1,905,923,902 | 1,906,246,401 | $1.00 |
| A Class | $23,957,504 | 23,948,177 | $1.00 |
| C Class | $2,147,482 | 2,146,114 | $1.00 |
See Notes to Financial Statements.
| | | | | |
| YEAR ENDED MARCH 31, 2023 | |
| Investment Income (Loss) | |
| Income: | |
| Interest | $ | 54,744,310 | |
| |
| Expenses: | |
| Management fees | 10,520,227 | |
| Distribution and service fees: | |
| A Class | 54,520 | |
| C Class | 37,426 | |
| Trustees' fees and expenses | 118,288 | |
| Other expenses | 14,888 | |
| 10,745,349 | |
| Fees waived | (73,066) | |
| 10,672,283 | |
| |
| Net investment income (loss) | 44,072,027 | |
| |
| Net realized gain (loss) on investment transactions | (155,511) | |
| |
| Net Increase (Decrease) in Net Assets Resulting from Operations | $ | 43,916,516 | |
See Notes to Financial Statements.
| | |
| Statement of Changes in Net Assets |
| | | | | | | | |
| YEARS ENDED MARCH 31, 2023 AND MARCH 31, 2022 |
| Increase (Decrease) in Net Assets | March 31, 2023 | March 31, 2022 |
| Operations | | |
| Net investment income (loss) | $ | 44,072,027 | | $ | 168,539 | |
| Net realized gain (loss) | (155,511) | | (15,353) | |
| Net increase (decrease) in net assets resulting from operations | 43,916,516 | | 153,186 | |
| | |
| Distributions to Shareholders | | |
| From earnings: | | |
| Investor Class | (43,531,140) | | (166,191) | |
| A Class | (474,260) | | (2,036) | |
| C Class | (66,914) | | (312) | |
| Decrease in net assets from distributions | (44,072,314) | | (168,539) | |
| | |
| Capital Share Transactions | | |
| Net increase (decrease) in net assets from capital share transactions (Note 4) | 196,338,596 | | 20,976,515 | |
| | |
| Net increase (decrease) in net assets | 196,182,798 | | 20,961,162 | |
| | |
| Net Assets | | |
| Beginning of period | 1,735,846,090 | | 1,714,884,928 | |
| End of period | $ | 1,932,028,888 | | $ | 1,735,846,090 | |
See Notes to Financial Statements.
| | |
| Notes to Financial Statements |
MARCH 31, 2023
1. Organization
American Century Investment Trust (the trust) is registered under the Investment Company Act of 1940, as amended (the 1940 Act), as an open-end management investment company and is organized as a Massachusetts business trust. Prime Money Market Fund (the fund) is one fund in a series issued by the trust. The fund’s investment objective is to seek to earn the highest level of current income while preserving the value of your investment.
The fund offers the Investor Class, A Class and C Class. The A Class and C Class may be subject to a contingent deferred sales charge.
2. Significant Accounting Policies
The following is a summary of significant accounting policies consistently followed by the fund in preparation of its financial statements. The fund is an investment company and follows accounting and reporting guidance in accordance with accounting principles generally accepted in the United States of America. This may require management to make certain estimates and assumptions at the date of the financial statements. Actual results could differ from these estimates. Management evaluated the impact of events or transactions occurring through the date the financial statements were issued that would merit recognition or disclosure.
Investment Valuations — The fund determines the fair value of its investments and computes its net asset value (NAV) per share at the close of regular trading (usually 4 p.m. Eastern time) on the New York Stock Exchange (NYSE) on each day the NYSE is open. The value of investments of the fund is determined by American Century Investment Management, Inc. (ACIM) (the investment advisor), as the valuation designee, pursuant to its valuation policies and procedures. The Board of Trustees oversees the valuation designee and reviews its valuation policies and procedures at least annually. Investments are generally valued at amortized cost, which approximates fair value. If the valuation designee determines that the valuation methods do not reflect an investment’s fair value, such investment is valued as determined in good faith by the valuation designee.
Security Transactions — Security transactions are accounted for as of the trade date. Net realized gains and losses are determined on the identified cost basis, which is also used for federal income tax purposes.
Investment Income — Interest income is recorded on the accrual basis and includes accretion of discounts and amortization of premiums. The fund may purchase a security and at the same time make a commitment to sell the same security at a future settlement date at a specified price. The difference between the purchase price and the sale price of these simultaneous transactions is reflected as interest income.
Income Tax Status — It is the fund's policy to distribute substantially all net investment income and net realized gains to shareholders and to otherwise qualify as a regulated investment company under provisions of the Internal Revenue Code. Accordingly, no provision has been made for income taxes. The fund files U.S. federal, state, local and non-U.S. tax returns as applicable. The fund's tax returns are subject to examination by the relevant taxing authority until expiration of the applicable statute of limitations, which is generally three years from the date of filing but can be longer in certain jurisdictions. At this time, management believes there are no uncertain tax positions which, based on their technical merit, would not be sustained upon examination and for which it is reasonably possible that the total amounts of unrecognized tax benefits will significantly change in the next twelve months.
Multiple Class — All shares of the fund represent an equal pro rata interest in the net assets of the class to which such shares belong, and have identical voting, dividend, liquidation and other rights and the same terms and conditions, except for class specific expenses and exclusive rights to vote on matters affecting only individual classes. Income, non-class specific expenses, and realized and unrealized capital gains and losses of the fund are allocated to each class of shares based on their relative net assets.
Distributions to Shareholders — Distributions from net investment income, if any, are declared daily and paid monthly. The fund may make capital gains distributions to comply with the distribution requirements of the Internal Revenue Code.
Indemnifications — Under the trust’s organizational documents, its officers and trustees are indemnified against certain liabilities arising out of the performance of their duties to the fund. In addition, in the normal course of business, the fund enters into contracts that provide general indemnifications. The maximum exposure under these arrangements is unknown as this would involve future claims that may be made against a fund. The risk of material loss from such claims is considered by management to be remote.
3. Fees and Transactions with Related Parties
Certain officers and trustees of the trust are also officers and/or directors of American Century Companies, Inc. (ACC). The trust's investment advisor, ACIM, the trust's distributor, American Century Investment Services, Inc. (ACIS), and the trust's transfer agent, American Century Services, LLC, are wholly owned, directly or indirectly, by ACC.
Management Fees — The trust has entered into a management agreement with ACIM, under which ACIM provides the fund with investment advisory and management services in exchange for a single, unified management fee (the fee) per class. The agreement provides that ACIM will pay all expenses of managing and operating the fund, except brokerage expenses, taxes, interest, fees and expenses of the independent trustees (including legal counsel fees), extraordinary expenses, and expenses incurred in connection with the provision of shareholder services and distribution services under a plan adopted pursuant to Rule 12b-1 under the 1940 Act. The fee is computed and accrued daily based on each class’s daily net assets and paid monthly in arrears. The fee consists of (1) an Investment Category Fee based on the daily net assets of the fund and certain other accounts managed by the investment advisor that are in the same broad investment category as the fund and (2) a Complex Fee based on the assets of all funds in the American Century Investments family of funds that have the same investment advisor and distributor as the fund. For purposes of determining the Investment Category Fee and Complex Fee, the assets of funds managed by the investment advisor that invest exclusively in the shares of other funds (funds of funds) are not included. The rates for the Investment Category Fee range from 0.2370% to 0.3500% and the rates for the Complex Fee range from 0.2500% to 0.3100%. In order to maintain a positive yield, ACIM may voluntarily waive a portion of the management fee on a daily basis. The fee waiver may be revised or terminated at any time by the investment advisor without notice. The total amount of the waiver for each class for the period ended March 31, 2023 was $59,999, $758 and $238 for Investor Class, A Class and C Class, respectively. The effective annual management fee before and after waiver for each class for the period ended March 31, 2023 was 0.57%.
Distribution and Service Fees — The Board of Trustees has adopted a separate Master Distribution and Individual Shareholder Services Plan for each of the A Class and C Class (collectively the plans), pursuant to Rule 12b-1 of the 1940 Act. The plans provide that the A Class will pay ACIS an annual distribution and service fee of 0.25%. The plans provide that the C Class will pay ACIS an annual distribution and service fee of 0.75%, of which 0.25% is paid for individual shareholder services and 0.50% is paid for distribution services. The fees are computed and accrued daily based on each class’s daily net assets and paid monthly in arrears. The fees are used to pay financial intermediaries for distribution and individual shareholder services. Fees incurred under the plans during the period ended March 31, 2023 are detailed in the Statement of Operations.
In order to maintain a positive yield, all or a portion of the distribution and/or service fee may voluntarily be waived on a daily basis. The fee waiver may be revised or terminated at any time without notice. The total amount of the waiver for the period ended March 31, 2023 was $4,899 and $7,172 for the A Class and C Class, respectively. The effective annual distribution and service fee after waiver was 0.23% for the A Class and 0.60% for C Class.
Trustees' Fees and Expenses — The Board of Trustees is responsible for overseeing the investment advisor’s management and operations of the fund. The trustees receive detailed information about the fund and its investment advisor regularly throughout the year, and meet at least quarterly with management of the investment advisor to review reports about fund operations. The fund's officers do not receive compensation from the fund.
Interfund Transactions — The fund may enter into security transactions with other American Century Investments funds and other client accounts of the investment advisor, in accordance with the 1940 Act rules and procedures adopted by the Board of Trustees. The rules and procedures require, among other things, that these transactions be effected at the independent current market price of the security. During the period, the interfund purchases and sales were $23,670,000 and $9,180,000, respectively. The interfund transactions had no effect on the Statement of Operations in net realized gain (loss) on investment transactions.
4. Capital Share Transactions
Transactions in shares of the fund were as follows (unlimited number of shares authorized):
| | | | | | | | | | | | | | |
| Year ended March 31, 2023 | Year ended
March 31, 2022 |
| Shares | Amount | Shares | Amount |
| Investor Class | | | | |
| Sold | 958,249,205 | | $ | 958,249,205 | | 877,620,928 | | $ | 877,620,928 | |
| Issued in reinvestment of distributions | 43,437,536 | | 43,437,536 | | 154,372 | | 154,372 | |
| Redeemed | (803,198,295) | | (803,198,295) | | (862,412,849) | | (862,412,849) | |
| 198,488,446 | | 198,488,446 | | 15,362,451 | | 15,362,451 | |
| A Class | | | | |
| Sold | 8,940,745 | | 8,940,745 | | 6,447,835 | | 6,447,835 | |
| Issued in reinvestment of distributions | 474,260 | | 474,260 | | 1,954 | | 1,954 | |
| Redeemed | (6,894,660) | | (6,894,660) | | (5,032,216) | | (5,032,216) | |
| 2,520,345 | | 2,520,345 | | 1,417,573 | | 1,417,573 | |
| C Class | | | | |
| Sold | 2,117,360 | | 2,117,360 | | 6,961,958 | | 6,961,958 | |
| Issued in reinvestment of distributions | 66,914 | | 66,914 | | 301 | | 301 | |
| Redeemed | (6,854,469) | | (6,854,469) | | (2,765,768) | | (2,765,768) | |
| (4,670,195) | | (4,670,195) | | 4,196,491 | | 4,196,491 | |
| Net increase (decrease) | 196,338,596 | | $ | 196,338,596 | | 20,976,515 | | $ | 20,976,515 | |
5. Fair Value Measurements
The fund's investments valuation process is based on several considerations and may use multiple inputs to determine the fair value of the investments held by the fund. In conformity with accounting principles generally accepted in the United States of America, the inputs used to determine a valuation are classified into three broad levels.
•Level 1 valuation inputs consist of unadjusted quoted prices in an active market for identical investments.
•Level 2 valuation inputs consist of direct or indirect observable market data (including quoted prices for comparable investments, evaluations of subsequent market events, interest rates, prepayment speeds, credit risk, etc.). These inputs also consist of quoted prices for identical investments initially expressed in local currencies that are adjusted through translation into U.S. dollars.
•Level 3 valuation inputs consist of unobservable data (including a fund’s own assumptions).
The level classification is based on the lowest level input that is significant to the fair valuation measurement. The valuation inputs are not necessarily an indication of the risks associated with investing in these securities or other financial instruments.
As of period end, the fund’s investment securities were classified as Level 2. The Schedule of Investments provides additional information on the fund’s portfolio holdings.
6. Federal Tax Information
The tax character of distributions paid during the years ended March 31, 2023 and March 31, 2022 were as follows:
| | | | | | | | |
| 2023 | 2022 |
| Distributions Paid From | | |
| Ordinary income | $ | 44,072,314 | | $ | 168,539 | |
| Long-term capital gains | — | | — | |
The book-basis character of distributions made during the year from net investment income or net realized gains may differ from their ultimate characterization for federal income tax purposes. These differences reflect the differing character of certain income items and net realized gains and losses for financial statement and tax purposes, and may result in reclassification among certain capital accounts on the financial statements.
As of March 31, 2023, the fund had accumulated short-term capital losses of $(176,551), which represent net
capital loss carryovers that may be used to offset future realized capital gains for federal income tax purposes.
The capital loss carryovers may be carried forward for an unlimited period. Future capital loss carryover
utilization in any given year may be subject to Internal Revenue Code limitations.
| | | | | | | | | | | | | | | | | | | | | | | | | | | | | | | | | | | | | | | | | | | | |
| For a Share Outstanding Throughout the Years Ended March 31 (except as noted) |
| Per-Share Data | | | | | | | | | Ratios and Supplemental Data | | |
| | Income From Investment Operations: | Distributions From: | | | Ratio to Average Net Assets of: | |
| Net Asset
Value,
Beginning
of Period | Net
Investment
Income
(Loss) | Net
Realized
and
Unrealized
Gain (Loss) | Total From
Investment
Operations | Net
Investment
Income | Net
Realized
Gains | Total
Distributions | Net Asset
Value,
End
of Period | Total Return(1) | Operating
Expenses | Operating
Expenses
(before
expense
waiver) | Net
Investment
Income
(Loss) | Net
Investment
Income (Loss)
(before
expense
waiver) | Net
Assets,
End of
Period
(in thousands) |
| Investor Class |
| 2023 | $1.00 | 0.02 | —(2) | 0.02 | (0.02) | — | (0.02) | $1.00 | 2.38% | 0.58% | 0.58% | 2.40% | 2.40% | $1,905,924 | |
| 2022 | $1.00 | —(2) | —(2) | —(2) | —(2) | — | —(2) | $1.00 | 0.01% | 0.18% | 0.58% | 0.01% | (0.39)% | $1,707,589 | |
| 2021 | $1.00 | —(2) | —(2) | —(2) | —(2) | — | —(2) | $1.00 | 0.10% | 0.35% | 0.58% | 0.09% | (0.14)% | $1,692,242 | |
| 2020 | $1.00 | 0.02 | —(2) | 0.02 | (0.02) | —(2) | (0.02) | $1.00 | 1.61% | 0.58% | 0.58% | 1.58% | 1.58% | $1,594,491 | |
| 2019 | $1.00 | 0.02 | —(2) | 0.02 | (0.02) | — | (0.02) | $1.00 | 1.79% | 0.58% | 0.58% | 1.78% | 1.78% | $1,336,785 | |
| A Class |
| 2023 | $1.00 | 0.02 | —(2) | 0.02 | (0.02) | — | (0.02) | $1.00 | 2.15% | 0.81% | 0.83% | 2.17% | 2.15% | $23,958 | |
| 2022 | $1.00 | —(2) | —(2) | —(2) | —(2) | — | —(2) | $1.00 | 0.01% | 0.18% | 0.83% | 0.01% | (0.64)% | $21,439 | |
| 2021 | $1.00 | —(2) | —(2) | —(2) | —(2) | — | —(2) | $1.00 | 0.05% | 0.40% | 0.83% | 0.04% | (0.39)% | $20,022 | |
| 2020 | $1.00 | 0.01 | —(2) | 0.01 | (0.01) | —(2) | (0.01) | $1.00 | 1.36% | 0.83% | 0.83% | 1.33% | 1.33% | $21,448 | |
| 2019 | $1.00 | 0.02 | —(2) | 0.02 | (0.02) | — | (0.02) | $1.00 | 1.54% | 0.83% | 0.83% | 1.53% | 1.53% | $19,847 | |
| C Class |
| 2023 | $1.00 | 0.02 | —(2) | 0.02 | (0.02) | — | (0.02) | $1.00 | 1.73% | 1.18% | 1.33% | 1.80% | 1.65% | $2,147 | |
| 2022 | $1.00 | —(2) | —(2) | —(2) | —(2) | — | —(2) | $1.00 | 0.01% | 0.21% | 1.33% | (0.02)% | (1.14)% | $6,818 | |
| 2021 | $1.00 | —(2) | —(2) | —(2) | —(2) | — | —(2) | $1.00 | 0.01% | 0.60% | 1.33% | (0.16)% | (0.89)% | $2,622 | |
| 2020 | $1.00 | 0.01 | —(2) | 0.01 | (0.01) | —(2) | (0.01) | $1.00 | 0.85% | 1.33% | 1.33% | 0.83% | 0.83% | $23,253 | |
| 2019 | $1.00 | 0.01 | —(2) | 0.01 | (0.01) | — | (0.01) | $1.00 | 1.03% | 1.33% | 1.33% | 1.03% | 1.03% | $12,843 | |
| | |
| Notes to Financial Highlights |
(1)Total returns are calculated based on the net asset value of the last business day and do not reflect applicable sales charges, if any. Total returns for periods less than one year are not annualized.
(2)Per-share amount was less than $0.005.
See Notes to Financial Statements.
| | |
| Report of Independent Registered Public Accounting Firm |
To the Shareholders and the Board of Trustees of American Century Investment Trust:
Opinion on the Financial Statements and Financial Highlights
We have audited the accompanying statement of assets and liabilities, including the schedule of investments, of Prime Money Market Fund (the “Fund”), one of the funds constituting the American Century Investment Trust, as of March 31, 2023, the related statement of operations for the year then ended, the statements of changes in net assets and financial highlights for the two years in the period then ended, and the related notes. In our opinion, the financial statements and financial highlights present fairly, in all material respects, the financial position of Prime Money Market Fund of the American Century Investment Trust, as of March 31, 2023, and the results of its operations for the year then ended and the changes in its net assets and the financial highlights for the two years then ended in conformity with accounting principles generally accepted in the United States of America. The financial highlights for each of the three years in the period ended March 31, 2021, were audited by other auditors, whose report, dated May 18, 2021, expressed an unqualified opinion on such financial highlights.
Basis for Opinion
These financial statements and financial highlights are the responsibility of the Fund's management. Our responsibility is to express an opinion on the Fund’s financial statements and financial highlights based on our audit. We are a public accounting firm registered with the Public Company Accounting Oversight Board (United States) (PCAOB) and are required to be independent with respect to the Fund in accordance with the U.S. federal securities laws and the applicable rules and regulations of the Securities and Exchange Commission and the PCAOB.
We conducted our audits in accordance with the standards of the PCAOB. Those standards require that we plan and perform the audit to obtain reasonable assurance about whether the financial statements and financial highlights are free of material misstatement, whether due to error or fraud. The Fund is not required to have, nor were we engaged to perform, an audit of its internal control over financial reporting. As part of our audit, we are required to obtain an understanding of internal control over financial reporting but not for the purpose of expressing an opinion on the effectiveness of the Fund’s internal control over financial reporting. Accordingly, we express no such opinion.
Our audits included performing procedures to assess the risks of material misstatement of the financial statements and financial highlights, whether due to error or fraud, and performing procedures that respond to those risks. Such procedures included examining, on a test basis, evidence regarding the amounts and disclosures in the financial statements and financial highlights. Our audits also included evaluating the accounting principles used and significant estimates made by management, as well as evaluating the overall presentation of the financial statements and financial highlights. Our procedures included confirmation of securities owned as of March 31, 2023, by correspondence with the custodian and brokers; when replies were not received from brokers, we performed other auditing procedures. We believe that our audits provide a reasonable basis for our opinion.
/s/ Deloitte & Touche LLP
Kansas City, Missouri
May 16, 2023
We have served as the auditor of one or more American Century investment companies since 1997.
Board of Trustees
The individuals listed below serve as trustees of the funds. Each trustee will continue to serve in this capacity until death, retirement, resignation or removal from office. The board has adopted a mandatory retirement age for trustees who are not “interested persons,” as that term is defined in the Investment Company Act (independent trustees). Independent trustees shall retire on December 31 of the year in which they reach their 76th birthday.
Jonathan S. Thomas is an “interested person” because he currently serves as President and Chief Executive Officer of American Century Companies, Inc. (ACC), the parent company of American Century Investment Management, Inc. (ACIM or the advisor). The other trustees (more than three-fourths of the total number) are independent. They are not employees, directors or officers of, and have no financial interest in, ACC or any of its wholly owned, direct or indirect, subsidiaries, including ACIM, American Century Investment Services, Inc. (ACIS) and American Century Services, LLC (ACS), and they do not have any other affiliations, positions or relationships that would cause them to be considered “interested persons” under the Investment Company Act. The trustees serve in this capacity for eight (in the case of Jonathan S. Thomas, 16; and Jeremy I. Bulow, 9) registered investment companies in the American Century Investments family of funds.
The following table presents additional information about the trustees. The mailing address for each trustee other than Jonathan S. Thomas is 3945 Freedom Circle, Suite #800, Santa Clara, California 95054. The mailing address for Jonathan S. Thomas is 4500 Main Street, Kansas City, Missouri 64111.
| | | | | | | | | | | | | | | | | |
Name
(Year of Birth) | Position(s) Held with Funds | Length of Time Served | Principal Occupation(s) During Past 5 Years | Number of American Century Portfolios Overseen by Trustee | Other Directorships Held During Past 5 Years |
| Independent Trustees | | |
Tanya S. Beder
(1955) | Trustee and Board Chair | Since 2011 (Board Chair since 2022) | Chairman and CEO, SBCC Group Inc. (independent advisory services) (2006 to present) | 32 | Kirby Corporation; Nabors Industries, Ltd. |
Jeremy I. Bulow
(1954) | Trustee | Since 2011 | Professor of Economics, Stanford University, Graduate School of Business (1979 to present) | 77 | None |
Jennifer Cabalquinto
(1968) | Trustee | Since 2021 | Chief Financial Officer, 2K (interactive entertainment) (2021 to present); Special Advisor, GSW Sports, LLC (2020 to 2021); Chief Financial Officer, GSW Sports, LLC (2013 to 2020) | 32 | Sabio Holdings, Inc. |
Anne Casscells
(1958) | Trustee | Since 2016 | Co-Chief Executive Officer and Chief Investment Officer, Aetos Alternatives Management (investment advisory firm) (2001 to present) | 32 | None |
| | | | | | | | | | | | | | | | | |
Name
(Year of Birth) | Position(s) Held with Funds | Length of Time Served | Principal Occupation(s) During Past 5 Years | Number of American Century Portfolios Overseen by Trustee | Other Directorships Held During Past 5 Years |
| Independent Trustees | | |
Jonathan D. Levin
(1972) | Trustee | Since 2016 | Philip H. Knight Professor and Dean, Graduate School of Business, Stanford University (2016 to present); Professor, Stanford University, (2000 to present) | 32 | None |
Peter F. Pervere
(1947) | Trustee | Since 2007 | Retired | 32 | None |
John B. Shoven
(1947) | Trustee | Since 2002 | Charles R. Schwab Professor of Economics, Stanford University (1973 to present, emeritus since 2019) | 32 | Cadence Design Systems; Exponent; Financial Engines |
| Interested Trustee | | |
Jonathan S. Thomas
(1963) | Trustee | Since 2007 | President and Chief Executive Officer, ACC (2007 to present). Also serves as Chief Executive Officer, ACS; Director, ACC and other ACC subsidiaries | 141 | None |
The Statement of Additional Information has additional information about the fund's trustees and is available without charge, upon request, by calling 1-800-345-2021.
Officers
The following table presents certain information about the executive officers of the funds. Each officer serves as an officer for 16 investment companies in the American Century family of funds. No officer is compensated for his or her service as an officer of the funds. The listed officers are interested persons of the funds and are appointed or re-appointed on an annual basis. The mailing address for each of the officers listed below is 4500 Main Street, Kansas City, Missouri 64111.
| | | | | | | | |
Name
(Year of Birth) | Offices with the Funds | Principal Occupation(s) During the Past Five Years |
Patrick Bannigan
(1965)
| President since 2019 | Executive Vice President and Director, ACC (2012 to present); Chief Financial Officer, Chief Accounting Officer and Treasurer, ACC (2015 to present). Also serves as President, ACS; Vice President, ACIM; Chief Financial Officer, Chief Accounting Officer and/or Director, ACIM, ACS and other ACC subsidiaries |
R. Wes Campbell
(1974)
| Chief Financial Officer and Treasurer since 2018 | Vice President, ACS (2020 to present); Investment Operations and Investment Accounting, ACS (2000 to present) |
Amy D. Shelton
(1964) | Chief Compliance Officer and Vice President since 2014 | Chief Compliance Officer, American Century funds, (2014 to present); Chief Compliance Officer, ACIM (2014 to present); Chief Compliance Officer, ACIS (2009 to present). Also serves as Vice President, ACIS |
John Pak
(1968) | General Counsel and Senior Vice President since 2021 | General Counsel and Senior Vice President, ACC (2021 to present); Also serves as General Counsel and Senior Vice President, ACIM, ACS and ACIS. Chief Legal Officer of Investment and Wealth Management, The Bank of New York Mellon (2014 to 2021) |
David H. Reinmiller
(1963) | Vice President since 2000 | Attorney, ACC (1994 to present). Also serves as Vice President, ACIM and ACS |
Ward D. Stauffer
(1960) | Secretary since 2005 | Attorney, ACC (2003 to present) |
| | |
| Liquidity Risk Management Program |
The Fund has adopted a liquidity risk management program (the “program”). The Fund’s Board of Trustees (the "Board") has designated American Century Investment Management, Inc. (“ACIM”) as the administrator of the program. Personnel of ACIM or its affiliates, including members of ACIM’s Investment Oversight Committee who are members of ACIM’s Investment Management and Global Analytics departments, conduct the day-to-day operation of the program pursuant to the program.
Under the program, ACIM manages the Fund’s liquidity risk, which is the risk that the Fund could not meet shareholder redemption requests without significant dilution of remaining shareholders’ interests in the Fund. This risk is managed by monitoring the degree of liquidity of the Fund’s investments, limiting the amount of the Fund’s illiquid investments, and utilizing various risk management tools and facilities available to the Fund for meeting shareholder redemptions, among other means. ACIM’s process of determining the degree of liquidity of certain investments held by the Fund is supported by a third-party liquidity assessment vendor.
The Board reviewed a report prepared by ACIM regarding the operation and effectiveness of the program for the period January 1, 2022 through December 31, 2022. No significant liquidity events impacting the Fund were noted in the report. In addition, ACIM provided its assessment that the program had been effective in managing the Fund’s liquidity risk.
Retirement Account Information
As required by law, distributions you receive from certain retirement accounts are subject to federal income tax withholding at the IRS default rate of 10%.* Tax will be withheld on the total amount withdrawn even though you may be receiving amounts that are not subject to withholding, such as nondeductible contributions. In such case, excess amounts of withholding could occur. You may adjust your withholding election so that a greater or lesser amount will be withheld.
You may elect a different withholding rate, or request zero withholding, by submitting an acceptable IRS Form W-4R election with your distribution request. You may notify us of your W-4R election by telephone, on our distribution forms, on IRS Form W-4R, or through other acceptable electronic means. If your withholding election is for an automatic withdrawal plan, you have the right to revoke your election at any time and any election you make will remain in effect until revoked by filing a new election.
Remember, even if you elect not to have income tax withheld, you are liable for paying income tax on the taxable portion of your withdrawal. If you elect not to have income tax withheld or you don’t have enough income tax withheld, you may be responsible for payment of estimated tax. You may incur penalties under the estimated tax rules if your withholding and estimated tax payments are not sufficient. You can reduce or defer the income tax on a distribution by directly or indirectly rolling such distribution over to another IRA or eligible plan. You should consult your tax advisor for additional information.
State tax will be withheld according to state regulations if, at the time of your distribution, your tax residency is within one of the mandatory withholding states.
*Some 403(b), 457 and qualified retirement plan distributions may be subject to 20% mandatory withholding, as they are subject to special tax and withholding rules. Your plan administrator or plan sponsor is required to provide you with a special tax notice explaining those rules at the time you request a distribution. If applicable, federal and/or state taxes may be withheld from your distribution amount.
Proxy Voting Policies
Descriptions of the principles and policies that the fund's investment advisor uses in exercising the voting rights associated with the securities purchased and/or held by the fund are available without charge, upon request, by calling 1-800-345-2021 or visiting American Century Investments’ website at americancentury.com/proxy. A description of the policies is also available on the Securities and Exchange Commission’s website at sec.gov. Information regarding how the investment advisor voted proxies relating to portfolio securities during the most recent 12-month period ended June 30 is available on americancentury.com/proxy. It is also available at sec.gov.
Portfolio Holdings Disclosure
The fund files its complete schedule of portfolio holdings with the Securities and Exchange Commission (SEC) each month on Form N-MFP. The fund’s Form N-MFP reports are available on its website at americancentury.com and on the SEC’s website at sec.gov. The fund also makes its complete schedule of portfolio holdings for the most recent first and third quarters of its fiscal year available on its website at americancentury.com and, upon request, by calling 1-800-345-2021.
| | | | | | | | |
| |
| | |
| Contact Us | americancentury.com | |
| Automated Information Line | 1-800-345-8765 | |
| Investor Services Representative | 1-800-345-2021
or 816-531-5575 | |
| Investors Using Advisors | 1-800-378-9878 | |
| Business, Not-For-Profit, Employer-Sponsored Retirement Plans | 1-800-345-3533 | |
| Banks and Trust Companies, Broker-Dealers, Financial Professionals, Insurance Companies | 1-800-345-6488 | |
| Telecommunications Relay Service for the Deaf | 711 | |
| | |
| American Century Investment Trust | |
| | |
Investment Advisor: American Century Investment Management, Inc. Kansas City, Missouri | |
| | |
| This report and the statements it contains are submitted for the general information of our shareholders. The report is not authorized for distribution to prospective investors unless preceded or accompanied by an effective prospectus. | |
| | |
©2023 American Century Proprietary Holdings, Inc. All rights reserved.
CL-ANN-92284 2305 | |
| | | | | |
| |
| Annual Report |
| |
| March 31, 2023 |
| |
| Short Duration Fund |
| Investor Class (ACSNX) |
| I Class (ASHHX) |
| A Class (ACSQX) |
| C Class (ACSKX) |
| R Class (ACSPX) |
| R5 Class (ACSUX) |
| R6 Class (ASDDX) |
| G Class (ASDOX) |
| | | | | |
| President’s Letter | |
| Performance | |
| Portfolio Commentary | |
| Fund Characteristics | |
| Shareholder Fee Example | |
| Schedule of Investments | |
| Statement of Assets and Liabilities | |
| Statement of Operations | |
| Statement of Changes in Net Assets | |
| Notes to Financial Statements | |
| Financial Highlights | |
| Report of Independent Registered Public Accounting Firm | |
| Management | |
| |
| Liquidity Risk Management Program | |
| |
| Additional Information | |
Any opinions expressed in this report reflect those of the author as of the date of the report, and do not necessarily represent the opinions of American Century Investments® or any other person in the American Century Investments organization. Any such opinions are subject to change at any time based upon market or other conditions and American Century Investments disclaims any responsibility to update such opinions. These opinions may not be relied upon as investment advice and, because investment decisions made by American Century Investments funds are based on numerous factors, may not be relied upon as an indication of trading intent on behalf of any American Century Investments fund. Security examples are used for representational purposes only and are not intended as recommendations to purchase or sell securities. Performance information for comparative indices and securities is provided to American Century Investments by third party vendors. To the best of American Century Investments’ knowledge, such information is accurate at the time of printing.
Jonathan Thomas
Dear Investor:
Thank you for reviewing this annual report for the period ended March 31, 2023. Annual reports help convey important information about fund returns, including market factors that affected performance. For additional investment insights, please visit americancentury.com.
Challenging Conditions Weighed on Asset Class Returns
Prevailing headwinds early in the reporting period continued to challenge U.S. financial markets throughout the 12 months. Asset class performance seesawed but declined overall amid mixed economic data, elevated inflation and anticipated monetary policy responses. By period-end, a new headwind emerged: banking industry uncertainty.
After launching its inflation-fighting rate-hike campaign in March 2022, the Federal Reserve (Fed) lifted rates eight more times by period-end. The federal funds target rate ended the reporting period at 4.75% to 5%, its highest level since 2007, while Treasury yields climbed to multiyear highs. Amid the Fed’s efforts, the annual inflation rate peaked at 9.1% in June, a 40-year high, before easing to 5% by March.
In addition to helping tame inflation, rapidly rising rates also fueled recession worries and led to expectations for the Fed to change course. This sentiment helped spark a rebound among stock and bond indices in the second half of the reporting period. The collapse of two U.S. regional banks late in the period and fears of a looming credit crunch and likely recession also contributed to market expectations for a Fed policy change. Nevertheless, the Fed indicated a near-term course change was unlikely.
Despite delivering strong gains in the second half of the reporting period, stock returns succumbed to first-half losses and declined for the 12 months. Similarly, weakness in the first half of the period overwhelmed second-half gains, and bond returns were negative for the 12-month period.
Remaining Diligent in Uncertain Times
We expect market volatility to linger as investors navigate a complex environment of still-high inflation, tighter financial conditions, banking industry turbulence and economic uncertainty. In addition, increasingly tense geopolitical considerations complicate the market backdrop.
We appreciate your confidence in us during these extraordinary times. Our firm has a long history of helping clients weather unpredictable and volatile markets, and we’re confident we will continue to meet today’s challenges.
Sincerely,
Jonathan Thomas
President and Chief Executive Officer
American Century Investments
| | | | | | | | | | | | | | | | | | | | |
| Total Returns as of March 31, 2023 | | |
| | | Average Annual Returns | |
| Ticker
Symbol | 1 year | 5 years | 10 years | Since Inception | Inception
Date |
| Investor Class | ACSNX | 0.00% | 1.50% | 1.22% | — | 11/30/06 |
| Bloomberg U.S. 1-3 Year Government/Credit Bond Index | — | 0.26% | 1.26% | 1.01% | — | — |
| I Class | ASHHX | 0.10% | 1.60% | — | 1.49% | 4/10/17 |
| A Class | ACSQX | | | | | 11/30/06 |
| No sales charge | | -0.15% | 1.25% | 0.97% | — | |
| With sales charge | | -2.39% | 0.79% | 0.74% | — | |
| C Class | ACSKX | -0.89% | 0.49% | 0.22% | — | 11/30/06 |
| R Class | ACSPX | -0.39% | 1.00% | 0.72% | — | 11/30/06 |
| R5 Class | ACSUX | 0.20% | 1.70% | 1.42% | — | 11/30/06 |
| R6 Class | ASDDX | 0.25% | 1.73% | — | 1.56% | 7/28/17 |
| G Class | ASDOX | 0.57% | — | — | 0.23% | 11/4/20 |
Average annual returns since inception are presented when ten years of performance history is not available.
Fund returns would have been lower if a portion of the fees had not been waived.
C Class shares will automatically convert to A Class shares after being held for approximately eight years. C Class average annual returns do not reflect this conversion.
Sales charges include initial sales charges and contingent deferred sales charges (CDSCs), as applicable. A Class shares have a 2.25% maximum initial sales charge and may be subject to a maximum CDSC of 1.00%. C Class shares redeemed within 12 months of purchase are subject to a maximum CDSC of 1.00%. The SEC requires that mutual funds provide performance information net of maximum sales charges in all cases where charges could be applied.
Data presented reflect past performance. Past performance is no guarantee of future results. Current performance may be higher or lower than the performance shown. Total returns for periods less than one year are not annualized. Investment return and principal value will fluctuate, and redemption value may be more or less than original cost. Data assumes reinvestment of dividends and capital gains, and none of the charts reflect the deduction of taxes that a shareholder would pay on fund distributions or the redemption of fund shares. To obtain performance data current to the most recent month end, please call 1-800-345-2021 or visit americancentury.com. For additional information about the fund, please consult the prospectus.
| | |
| Growth of $10,000 Over 10 Years |
| $10,000 investment made March 31, 2013 |
| Performance for other share classes will vary due to differences in fee structure. |
| | | | | |
| Value on March 31, 2023 |
| Investor Class — $11,288 |
|
| Bloomberg U.S. 1-3 Year Government/Credit Bond Index — $11,059 |
|
| |
|
Ending value of Investor Class would have been lower if a portion of the fees had not been waived.
| | | | | | | | | | | | | | | | | | | | | | | |
| Total Annual Fund Operating Expenses | |
| Investor Class | I Class | A Class | C Class | R Class | R5 Class | R6 Class | G Class |
| 0.59% | 0.49% | 0.84% | 1.59% | 1.09% | 0.39% | 0.34% | 0.34% |
The total annual fund operating expenses shown is as stated in the fund’s prospectus current as of the date of this report. The prospectus may vary from the expense ratio shown elsewhere in this report because it is based on a different time period, includes acquired fund fees and expenses, and, if applicable, does not include fee waivers or expense reimbursements.
Data presented reflect past performance. Past performance is no guarantee of future results. Current performance may be higher or lower than the performance shown. Total returns for periods less than one year are not annualized. Investment return and principal value will fluctuate, and redemption value may be more or less than original cost. Data assumes reinvestment of dividends and capital gains, and none of the charts reflect the deduction of taxes that a shareholder would pay on fund distributions or the redemption of fund shares. To obtain performance data current to the most recent month end, please call 1-800-345-2021 or visit americancentury.com. For additional information about the fund, please consult the prospectus.
Portfolio Managers: Bob Gahagan, Peter Van Gelderen, Jeff Houston, James Platz and Charles Tan
Performance Summary
Short Duration returned 0.00%* for the 12 months ended March 31, 2023. By comparison, the Bloomberg U.S. 1-3 Year Government/Credit Bond Index returned 0.26%. Fund returns reflect operating expenses, while index returns do not.
Inflation, Federal Reserve Policy Challenged Bond Market
Elevated inflation, aggressive Federal Reserve (Fed) policy, rising interest rates and mounting recession risk dominated the reporting period and contributed to heightened market volatility. After peaking in June, inflation moderated through March but remained well above the Fed’s target, which led to consistent interest rate hikes. In March, the collapse of two U.S. regional banks introduced a new market headwind, as banks moved to tighten lending standards amid industry uncertainty.
Against this backdrop, Treasury yields were volatile, particularly during the banking industry turmoil. For the period overall, yields rose sharply across the yield curve. This dynamic contributed to negative 12-month returns for most investment-grade bond market sectors, including Treasuries, mortgage-backed securities and corporate bonds. Credit-sensitive and longer maturity securities generally posted the largest losses.
Duration Was a Modest Detractor
We began modestly extending the portfolio’s duration in the second half of 2022, as short-maturity Treasury yields were climbing to multiyear highs. In our view, the combination of high inflation, rising Treasury yields and aggressive Fed tightening would eventually trigger a recession and push yields lower. However, yields rose overall, and our longer-than-index duration positioning detracted slightly.
Sector Allocation, Security Selection Enhanced Relative Performance
Overall, sector allocation was a top contributor to relative results, partly due to a slightly larger-than-usual position in cash and cash equivalents. These positions benefited from the Fed’s aggressive rate-hike campaign. Additionally, out-of-index exposure to high-yield securities boosted results, largely due to our hedging strategy, which included timely purchases of high-yield credit default swaps.
The cash and high-yield allocations more than offset slightly negative results from an out-of-index allocation to securitized securities. Our securitized exposure primarily consisted of credit-sensitive non-agency collateralized mortgage obligations, non-agency commercial mortgage-backed securities, asset-backed securities and collateralized loan obligations.
Security selection also had a broadly positive effect on relative performance. Our selections among government securities and investment-grade corporates were the main drivers, while our U.S. dollar-denominated emerging markets bonds had a flat effect on results.
*All fund returns referenced in this commentary are for Investor Class shares. Fund returns would have been lower if a portion of the fees had not been waived. Performance for other share classes will vary due to differences in fee structure; when Investor Class performance exceeds that of the index, other share classes may not. See page 3 for returns for all share classes.
| | | | | |
| MARCH 31, 2023 | |
| Types of Investments in Portfolio | % of net assets |
| U.S. Treasury Securities | 37.4% |
| Corporate Bonds | 33.5% |
| Collateralized Loan Obligations | 7.4% |
| Asset-Backed Securities | 7.0% |
| Collateralized Mortgage Obligations | 5.4% |
| Bank Loan Obligations | 1.7% |
| Commercial Mortgage-Backed Securities | 1.5% |
| U.S. Government Agency Mortgage-Backed Securities | —* |
| Short-Term Investments | 5.1% |
| Other Assets and Liabilities | 1.0% |
*Category is less than 0.05% of total net assets.
Fund shareholders may incur two types of costs: (1) transaction costs, including sales charges (loads) on purchase payments and redemption/exchange fees; and (2) ongoing costs, including management fees; distribution and service (12b-1) fees; and other fund expenses. This example is intended to help you understand your ongoing costs (in dollars) of investing in your fund and to compare these costs with the ongoing cost of investing in other mutual funds.
The example is based on an investment of $1,000 made at the beginning of the period and held for the entire period from October 1, 2022 to March 31, 2023.
Actual Expenses
The table provides information about actual account values and actual expenses for each class. You may use the information, together with the amount you invested, to estimate the expenses that you paid over the period. First, identify the share class you own. Then simply divide your account value by $1,000 (for example, an $8,600 account value divided by $1,000 = 8.6), then multiply the result by the number under the heading “Expenses Paid During Period” to estimate the expenses you paid on your account during this period.
If you hold Investor Class shares of any American Century Investments mutual fund, or I Class shares of the American Century Diversified Bond Fund, in an American Century Investments account (i.e., not through a financial intermediary or employer-sponsored retirement plan account), American Century Investments may charge you a $25 annual account maintenance fee if the value of those shares is less than $10,000. We will redeem shares automatically in one of your accounts to pay the $25 fee. In determining your total eligible investment amount, we will include your investments in all personal accounts (including American Century Investments brokerage accounts) registered under your Social Security number. Personal accounts include individual accounts, joint accounts, UGMA/UTMA accounts, personal trusts, Coverdell Education Savings Accounts and IRAs (including traditional, Roth, Rollover, SEP-, SARSEP- and SIMPLE-IRAs), and certain other retirement accounts. If you have only business, business retirement, employer-sponsored or American Century Investments brokerage accounts, you are currently not subject to this fee. If you are subject to the account maintenance fee, your account value could be reduced by the fee amount.
Hypothetical Example for Comparison Purposes
The table also provides information about hypothetical account values and hypothetical expenses based on the actual expense ratio of each class of your fund and an assumed rate of return of 5% per year before expenses, which is not the actual return of a fund’s share class. The hypothetical account values and expenses may not be used to estimate the actual ending account balance or expenses you paid for the period. You may use this information to compare the ongoing costs of investing in your fund and other funds. To do so, compare this 5% hypothetical example with the 5% hypothetical examples that appear in the shareholder reports of the other funds.
Please note that the expenses shown in the table are meant to highlight your ongoing costs only and do not reflect any transactional costs, such as sales charges (loads) or redemption/exchange fees. Therefore, the table is useful in comparing ongoing costs only, and will not help you determine the relative total costs of owning different funds. In addition, if these transactional costs were included, your costs would have been higher.
| | | | | | | | | | | | | | |
| Beginning
Account Value
10/1/22 | Ending
Account Value
3/31/23 | Expenses Paid During Period(1) 10/1/22 - 3/31/23 | Annualized Expense Ratio(1) |
| Actual | | | | |
| Investor Class | $1,000 | $1,023.60 | $2.88 | 0.57% |
| I Class | $1,000 | $1,024.10 | $2.37 | 0.47% |
| A Class | $1,000 | $1,022.30 | $4.13 | 0.82% |
| C Class | $1,000 | $1,018.50 | $7.90 | 1.57% |
| R Class | $1,000 | $1,021.10 | $5.39 | 1.07% |
| R5 Class | $1,000 | $1,024.60 | $1.87 | 0.37% |
| R6 Class | $1,000 | $1,024.90 | $1.62 | 0.32% |
| G Class | $1,000 | $1,025.40 | $0.05 | 0.01% |
| Hypothetical | | | | |
| Investor Class | $1,000 | $1,022.09 | $2.87 | 0.57% |
| I Class | $1,000 | $1,022.59 | $2.37 | 0.47% |
| A Class | $1,000 | $1,020.84 | $4.13 | 0.82% |
| C Class | $1,000 | $1,017.10 | $7.90 | 1.57% |
| R Class | $1,000 | $1,019.60 | $5.39 | 1.07% |
| R5 Class | $1,000 | $1,023.09 | $1.87 | 0.37% |
| R6 Class | $1,000 | $1,023.34 | $1.61 | 0.32% |
| G Class | $1,000 | $1,024.88 | $0.05 | 0.01% |
(1)Expenses are equal to the class's annualized expense ratio listed in the table above, multiplied by the average account value over the period, multiplied by 182, the number of days in the most recent fiscal half-year, divided by 365, to reflect the one-half year period. Annualized expense ratio reflects actual expenses, including any applicable fee waivers or expense reimbursements and excluding any acquired fund fees and expenses.
MARCH 31, 2023
| | | | | | | | |
| Principal
Amount/Shares | Value |
| U.S. TREASURY SECURITIES — 37.4% | | |
U.S. Treasury Notes, 1.50%, 2/15/25(1) | $ | 12,000,000 | | $ | 11,435,156 | |
| U.S. Treasury Notes, 4.625%, 2/28/25 | 30,000,000 | | 30,294,141 | |
| U.S. Treasury Notes, 3.875%, 3/31/25 | 21,000,000 | | 20,937,554 | |
| U.S. Treasury Notes, 3.50%, 9/15/25 | 50,000,000 | | 49,532,226 | |
| U.S. Treasury Notes, 3.00%, 9/30/25 | 55,000,000 | | 53,806,543 | |
| U.S. Treasury Notes, 4.00%, 12/15/25 | 160,000,000 | | 160,632,634 | |
| U.S. Treasury Notes, 4.625%, 3/15/26 | 180,000,000 | | 184,113,281 | |
TOTAL U.S. TREASURY SECURITIES (Cost $509,348,240) | | 510,751,535 | |
| CORPORATE BONDS — 33.5% | | |
| Aerospace and Defense — 0.4% | | |
| Boeing Co., 1.43%, 2/4/24 | 2,200,000 | | 2,126,172 | |
| Boeing Co., 2.80%, 3/1/24 | 3,400,000 | | 3,315,771 | |
| | 5,441,943 | |
| Automobiles — 3.0% | | |
| American Honda Finance Corp., 0.55%, 7/12/24 | 6,000,000 | | 5,688,804 | |
| Ford Motor Credit Co. LLC, 2.30%, 2/10/25 | 5,500,000 | | 5,105,210 | |
| Ford Motor Credit Co. LLC, 3.375%, 11/13/25 | 1,000,000 | | 938,615 | |
| General Motors Financial Co., Inc., 3.70%, 5/9/23 | 5,000,000 | | 4,992,641 | |
| General Motors Financial Co., Inc., 1.05%, 3/8/24 | 5,000,000 | | 4,783,756 | |
| General Motors Financial Co., Inc., 1.20%, 10/15/24 | 5,000,000 | | 4,682,689 | |
Hyundai Capital America, 1.00%, 9/17/24(2) | 7,000,000 | | 6,565,006 | |
Mercedes-Benz Finance North America LLC, 5.375%, 11/26/25(2) | 2,250,000 | | 2,278,270 | |
| Toyota Motor Credit Corp., 4.80%, 1/10/25 | 3,130,000 | | 3,150,918 | |
| Toyota Motor Credit Corp., 3.95%, 6/30/25 | 3,000,000 | | 2,964,236 | |
| | 41,150,145 | |
| Banks — 6.0% | | |
| Banco Santander SA, VRN, 1.72%, 9/14/27 | 3,384,000 | | 2,957,372 | |
| Bank of America Corp., VRN, 1.73%, 7/22/27 | 6,111,000 | | 5,484,809 | |
| Bank of America Corp., VRN, 4.95%, 7/22/28 | 3,325,000 | | 3,308,756 | |
| Bank of America Corp., VRN, 3.42%, 12/20/28 | 1,500,000 | | 1,394,860 | |
Banque Federative du Credit Mutuel SA, 4.94%, 1/26/26(2) | 1,985,000 | | 1,963,262 | |
| Barclays PLC, VRN, 2.28%, 11/24/27 | 761,000 | | 669,276 | |
| Barclays PLC, VRN, 7.39%, 11/2/28 | 380,000 | | 403,120 | |
BNP Paribas SA, VRN, 5.125%, 1/13/29(2) | 1,830,000 | | 1,835,203 | |
BPCE SA, 4.625%, 7/11/24(2) | 4,683,000 | | 4,571,256 | |
| Citigroup, Inc., VRN, 2.01%, 1/25/26 | 4,616,000 | | 4,349,686 | |
| Citigroup, Inc., VRN, 3.11%, 4/8/26 | 2,700,000 | | 2,583,129 | |
| Commonwealth Bank of Australia, 5.32%, 3/13/26 | 1,947,000 | | 1,981,239 | |
Cooperatieve Rabobank UA, VRN, 5.56%, 2/28/29(2) | 1,670,000 | | 1,682,838 | |
Credit Agricole SA, 5.30%, 7/12/28(2) | 625,000 | | 634,093 | |
| Discover Bank, VRN, 4.68%, 8/9/28 | 5,000,000 | | 4,577,095 | |
DNB Bank ASA, VRN, 2.97%, 3/28/25(2) | 3,265,000 | | 3,187,580 | |
| HSBC Holdings PLC, 4.25%, 3/14/24 | 3,045,000 | | 2,966,914 | |
| HSBC Holdings PLC, VRN, 1.16%, 11/22/24 | 5,262,000 | | 5,107,753 | |
| JPMorgan Chase & Co., VRN, 1.56%, 12/10/25 | 2,587,000 | | 2,427,866 | |
| | | | | | | | |
| Principal
Amount/Shares | Value |
| JPMorgan Chase & Co., VRN, 5.55%, 12/15/25 | $ | 1,242,000 | | $ | 1,251,178 | |
| JPMorgan Chase & Co., VRN, 1.04%, 2/4/27 | 2,362,000 | | 2,110,139 | |
| JPMorgan Chase & Co., VRN, 1.58%, 4/22/27 | 3,260,000 | | 2,931,487 | |
| JPMorgan Chase & Co., VRN, 1.47%, 9/22/27 | 1,844,000 | | 1,627,883 | |
| Lloyds Banking Group PLC, VRN, 4.72%, 8/11/26 | 2,265,000 | | 2,206,913 | |
| Lloyds Banking Group PLC, VRN, 5.87%, 3/6/29 | 1,107,000 | | 1,116,979 | |
| Mitsubishi UFJ Financial Group, Inc., VRN, 5.72%, 2/20/26 | 1,289,000 | | 1,293,211 | |
| Mitsubishi UFJ Financial Group, Inc., VRN, 5.42%, 2/22/29 | 1,154,000 | | 1,165,656 | |
Nordea Bank Abp, 4.75%, 9/22/25(2) | 3,075,000 | | 3,062,813 | |
| Royal Bank of Canada, 6.00%, 11/1/27 | 1,940,000 | | 2,024,688 | |
| Sumitomo Mitsui Financial Group, Inc., 5.46%, 1/13/26 | 933,000 | | 942,525 | |
Sumitomo Mitsui Trust Bank Ltd., 5.65%, 3/9/26(2) | 1,265,000 | | 1,286,625 | |
| Toronto-Dominion Bank, 4.11%, 6/8/27 | 2,325,000 | | 2,253,279 | |
| Truist Bank, 3.30%, 5/15/26 | 2,085,000 | | 1,922,095 | |
UniCredit SpA, VRN, 2.57%, 9/22/26(2) | 4,455,000 | | 4,036,350 | |
| Wells Fargo & Co., VRN, 4.54%, 8/15/26 | 871,000 | | 855,753 | |
| | 82,173,681 | |
| Beverages — 0.2% | | |
| Keurig Dr Pepper, Inc., 0.75%, 3/15/24 | 2,744,000 | | 2,628,873 | |
| Biotechnology — 0.8% | | |
| AbbVie, Inc., 2.60%, 11/21/24 | 5,000,000 | | 4,827,398 | |
| Amgen, Inc., 5.25%, 3/2/25 | 3,850,000 | | 3,894,287 | |
CSL Finance PLC, 3.85%, 4/27/27(2) | 2,500,000 | | 2,438,835 | |
| | 11,160,520 | |
| Broadline Retail — 0.1% | | |
| Amazon.com, Inc., 4.60%, 12/1/25 | 560,000 | | 564,853 | |
| Amazon.com, Inc., 4.55%, 12/1/27 | 1,020,000 | | 1,035,954 | |
| | 1,600,807 | |
| Capital Markets — 1.9% | | |
| Bank of New York Mellon Corp., VRN, 5.80%, 10/25/28 | 2,160,000 | | 2,252,217 | |
| Bank of New York Mellon Corp., VRN, 4.54%, 2/1/29 | 1,890,000 | | 1,874,110 | |
| Deutsche Bank AG, VRN, 4.30%, 5/24/28 | 1,570,000 | | 1,548,696 | |
| Goldman Sachs Group, Inc., VRN, 1.76%, 1/24/25 | 4,845,000 | | 4,690,941 | |
| Goldman Sachs Group, Inc., VRN, 1.43%, 3/9/27 | 1,025,000 | | 918,147 | |
| Goldman Sachs Group, Inc., VRN, 1.95%, 10/21/27 | 1,033,000 | | 923,872 | |
| Golub Capital BDC, Inc., 2.50%, 8/24/26 | 1,181,000 | | 1,013,956 | |
| Morgan Stanley, VRN, 0.79%, 5/30/25 | 1,570,000 | | 1,486,854 | |
| Morgan Stanley, VRN, 1.16%, 10/21/25 | 3,118,000 | | 2,913,742 | |
| Morgan Stanley, VRN, 2.63%, 2/18/26 | 2,538,000 | | 2,410,704 | |
| Morgan Stanley, VRN, 5.05%, 1/28/27 | 2,671,000 | | 2,665,648 | |
| Owl Rock Capital Corp., 3.40%, 7/15/26 | 461,000 | | 407,705 | |
| Owl Rock Core Income Corp., 3.125%, 9/23/26 | 791,000 | | 687,421 | |
UBS Group AG, VRN, 1.49%, 8/10/27(2) | 1,672,000 | | 1,441,541 | |
| | 25,235,554 | |
| Construction and Engineering — 0.3% | | |
| Quanta Services, Inc., 0.95%, 10/1/24 | 4,000,000 | | 3,732,825 | |
| Consumer Finance — 1.2% | | |
| AerCap Ireland Capital DAC / AerCap Global Aviation Trust, 1.65%, 10/29/24 | 1,891,000 | | 1,770,176 | |
| AerCap Ireland Capital DAC / AerCap Global Aviation Trust, 1.75%, 10/29/24 | 5,375,000 | | 5,011,486 | |
| AerCap Ireland Capital DAC / AerCap Global Aviation Trust, 6.50%, 7/15/25 | 2,002,000 | | 2,018,109 | |
| | | | | | | | |
| Principal
Amount/Shares | Value |
| AerCap Ireland Capital DAC / AerCap Global Aviation Trust, 2.45%, 10/29/26 | $ | 1,289,000 | | $ | 1,158,493 | |
BOC Aviation USA Corp., 1.625%, 4/29/24(2) | 3,030,000 | | 2,907,699 | |
| OneMain Finance Corp., 8.25%, 10/1/23 | 4,005,000 | | 4,021,220 | |
| | 16,887,183 | |
| Containers and Packaging — 0.7% | | |
| Amcor Flexibles North America, Inc., 4.00%, 5/17/25 | 1,045,000 | | 1,023,973 | |
Graphic Packaging International LLC, 0.82%, 4/15/24(2) | 8,500,000 | | 8,101,926 | |
| | 9,125,899 | |
| Diversified REITs — 1.3% | | |
| Brixmor Operating Partnership LP, 3.65%, 6/15/24 | 5,200,000 | | 5,038,247 | |
| National Retail Properties, Inc., 4.30%, 10/15/28 | 2,557,000 | | 2,409,691 | |
| Realty Income Corp., 5.05%, 1/13/26 | 1,171,000 | | 1,167,645 | |
| VICI Properties LP, 4.375%, 5/15/25 | 7,000,000 | | 6,783,389 | |
| Welltower OP LLC, 4.25%, 4/15/28 | 2,253,000 | | 2,156,891 | |
| | 17,555,863 | |
| Diversified Telecommunication Services — 0.4% | | |
| AT&T, Inc., 7.30%, 8/15/26 | 2,015,000 | | 2,124,107 | |
Level 3 Financing, Inc., 3.40%, 3/1/27(2) | 4,040,000 | | 3,199,045 | |
| | 5,323,152 | |
| Electric Utilities — 2.6% | | |
| American Electric Power Co., Inc., 0.75%, 11/1/23 | 5,000,000 | | 4,882,563 | |
| American Electric Power Co., Inc., 2.03%, 3/15/24 | 5,000,000 | | 4,839,316 | |
| Black Hills Corp., 1.04%, 8/23/24 | 7,000,000 | | 6,590,790 | |
| Emera US Finance LP, 0.83%, 6/15/24 | 6,000,000 | | 5,655,049 | |
| Entergy Louisiana LLC, 0.62%, 11/17/23 | 3,023,000 | | 2,934,541 | |
| NextEra Energy Capital Holdings, Inc., 4.26%, 9/1/24 | 3,000,000 | | 2,973,565 | |
| NextEra Energy Capital Holdings, Inc., 6.05%, 3/1/25 | 1,164,000 | | 1,184,743 | |
| NextEra Energy Capital Holdings, Inc., 4.45%, 6/20/25 | 5,280,000 | | 5,247,562 | |
Pennsylvania Electric Co., 5.15%, 3/30/26(2) | 1,000,000 | | 1,005,143 | |
| | 35,313,272 | |
| Electrical Equipment — 0.3% | | |
Regal Rexnord Corp., 6.05%, 2/15/26(2) | 4,380,000 | | 4,403,742 | |
| Electronic Equipment, Instruments and Components — 0.4% | |
| Teledyne Technologies, Inc., 0.95%, 4/1/24 | 5,250,000 | | 5,033,661 | |
| Energy Equipment and Services — 0.3% | | |
| Baker Hughes Holdings LLC / Baker Hughes Co-Obligor, Inc., 1.23%, 12/15/23 | 4,000,000 | | 3,884,710 | |
| Entertainment — 0.2% | | |
Warnermedia Holdings, Inc., 3.79%, 3/15/25(2) | 1,215,000 | | 1,177,272 | |
Warnermedia Holdings, Inc., 3.76%, 3/15/27(2) | 2,017,000 | | 1,901,173 | |
| | 3,078,445 | |
| Financial Services — 0.4% | | |
| Air Lease Corp., 5.30%, 2/1/28 | 4,990,000 | | 4,928,832 | |
Antares Holdings LP, 2.75%, 1/15/27(2) | 1,091,000 | | 889,823 | |
| | 5,818,655 | |
| Food Products — 0.5% | | |
| General Mills, Inc., 5.24%, 11/18/25 | 2,872,000 | | 2,881,155 | |
Mondelez International Holdings Netherlands BV, 4.25%, 9/15/25(2) | 2,476,000 | | 2,452,182 | |
| Mondelez International, Inc., 2.125%, 3/17/24 | 904,000 | | 878,878 | |
| | 6,212,215 | |
| | | | | | | | |
| Principal
Amount/Shares | Value |
| Ground Transportation — 0.6% | | |
DAE Funding LLC, 1.55%, 8/1/24(2) | $ | 2,588,000 | | $ | 2,435,396 | |
DAE Funding LLC, 2.625%, 3/20/25(2) | 3,925,000 | | 3,695,737 | |
SMBC Aviation Capital Finance DAC, 4.125%, 7/15/23(2) | 2,700,000 | | 2,682,401 | |
| | 8,813,534 | |
| Health Care Equipment and Supplies — 0.6% | | |
GE HealthCare Technologies, Inc., 5.55%, 11/15/24(2) | 5,000,000 | | 5,032,105 | |
| Zimmer Biomet Holdings, Inc., 1.45%, 11/22/24 | 3,920,000 | | 3,706,693 | |
| | 8,738,798 | |
| Health Care Providers and Services — 1.8% | | |
| Centene Corp., 4.25%, 12/15/27 | 8,370,000 | | 8,072,530 | |
| CVS Health Corp., 5.00%, 2/20/26 | 3,000,000 | | 3,035,235 | |
| HCA, Inc., 5.00%, 3/15/24 | 2,800,000 | | 2,784,295 | |
| Humana, Inc., 0.65%, 8/3/23 | 6,725,000 | | 6,630,501 | |
| Universal Health Services, Inc., 1.65%, 9/1/26 | 4,387,000 | | 3,863,839 | |
| | 24,386,400 | |
| Hotels, Restaurants and Leisure — 0.5% | | |
| Hyatt Hotels Corp., 1.30%, 10/1/23 | 5,000,000 | | 4,895,643 | |
International Game Technology PLC, 6.50%, 2/15/25(2) | 1,474,000 | | 1,490,937 | |
| | 6,386,580 | |
| Insurance — 1.1% | | |
Athene Global Funding, 2.51%, 3/8/24(2) | 3,750,000 | | 3,619,352 | |
GA Global Funding Trust, 0.80%, 9/13/24(2) | 3,200,000 | | 2,982,483 | |
Jackson National Life Global Funding, 1.75%, 1/12/25(2) | 2,326,000 | | 2,179,775 | |
Met Tower Global Funding, 1.25%, 9/14/26(2) | 2,741,000 | | 2,435,049 | |
Metropolitan Life Global Funding I, 5.00%, 1/6/26(2) | 4,250,000 | | 4,278,340 | |
| | 15,494,999 | |
| IT Services — 0.2% | | |
| Global Payments, Inc., 3.75%, 6/1/23 | 689,000 | | 686,895 | |
| International Business Machines Corp., 3.30%, 5/15/26 | 2,190,000 | | 2,113,274 | |
| | 2,800,169 | |
| Life Sciences Tools and Services — 1.0% | | |
| Illumina, Inc., 5.80%, 12/12/25 | 4,200,000 | | 4,241,967 | |
| PerkinElmer, Inc., 0.85%, 9/15/24 | 5,000,000 | | 4,696,337 | |
| Thermo Fisher Scientific, Inc., 1.22%, 10/18/24 | 5,250,000 | | 4,985,036 | |
| | 13,923,340 | |
| Machinery — 1.4% | | |
| Caterpillar Financial Services Corp., 5.40%, 3/10/25 | 5,580,000 | | 5,686,825 | |
| CNH Industrial Capital LLC, 3.95%, 5/23/25 | 4,543,000 | | 4,427,222 | |
| John Deere Capital Corp., 3.40%, 6/6/25 | 4,660,000 | | 4,568,218 | |
| Parker-Hannifin Corp., 3.65%, 6/15/24 | 5,000,000 | | 4,926,419 | |
| | 19,608,684 | |
| Media — 0.2% | | |
Cox Communications, Inc., 3.15%, 8/15/24(2) | 3,220,000 | | 3,139,742 | |
| Metals and Mining — 0.2% | | |
| Nucor Corp., 3.95%, 5/23/25 | 2,016,000 | | 1,985,236 | |
| Multi-Utilities — 0.9% | | |
| DTE Energy Co., 4.22%, 11/1/24 | 3,006,000 | | 2,974,063 | |
| Public Service Enterprise Group, Inc., 0.84%, 11/8/23 | 7,000,000 | | 6,801,211 | |
| Sempra Energy, 3.30%, 4/1/25 | 3,006,000 | | 2,911,195 | |
| | 12,686,469 | |
| | | | | | | | |
| Principal
Amount/Shares | Value |
| Oil, Gas and Consumable Fuels — 0.7% | | |
| Enbridge, Inc., VRN, 5.36%, (SOFR plus 0.63%), 2/16/24 | $ | 5,500,000 | | $ | 5,460,089 | |
| Hess Corp., 3.50%, 7/15/24 | 1,515,000 | | 1,480,688 | |
| HF Sinclair Corp., 2.625%, 10/1/23 | 1,350,000 | | 1,328,725 | |
SA Global Sukuk Ltd., 0.95%, 6/17/24(2) | 1,040,000 | | 992,709 | |
Saudi Arabian Oil Co., 1.25%, 11/24/23(2) | 750,000 | | 731,976 | |
| | 9,994,187 | |
| Paper and Forest Products — 0.4% | | |
Georgia-Pacific LLC, 0.625%, 5/15/24(2) | 5,000,000 | | 4,764,208 | |
| Passenger Airlines — 0.2% | | |
American Airlines, Inc. / AAdvantage Loyalty IP Ltd., 5.50%, 4/20/26(2) | 3,165,385 | | 3,118,986 | |
| Personal Care Products — 0.5% | | |
| Haleon UK Capital PLC, 3.125%, 3/24/25 | 3,236,000 | | 3,129,437 | |
Kenvue, Inc., 5.50%, 3/22/25(2) | 3,000,000 | | 3,050,968 | |
| | 6,180,405 | |
| Pharmaceuticals — 1.1% | | |
| Royalty Pharma PLC, 0.75%, 9/2/23 | 6,220,000 | | 6,065,879 | |
| Viatris, Inc., 1.65%, 6/22/25 | 5,000,000 | | 4,588,070 | |
| Zoetis, Inc., 5.40%, 11/14/25 | 4,167,000 | | 4,239,562 | |
| | 14,893,511 | |
| Semiconductors and Semiconductor Equipment — 0.1% | | |
| Intel Corp., 2.45%, 11/15/29 | 1,585,000 | | 1,396,552 | |
| Specialty Retail — 0.2% | | |
| Lowe's Cos., Inc., 4.40%, 9/8/25 | 2,487,000 | | 2,476,209 | |
| Trading Companies and Distributors — 0.1% | | |
Aircastle Ltd., 5.25%, 8/11/25(2) | 1,695,000 | | 1,658,148 | |
| Wireless Telecommunication Services — 0.7% | | |
| Sprint LLC, 7.125%, 6/15/24 | 3,975,000 | | 4,044,448 | |
| Sprint LLC, 7.625%, 2/15/25 | 3,455,000 | | 3,585,827 | |
| T-Mobile USA, Inc., 3.375%, 4/15/29 | 2,125,000 | | 1,939,248 | |
| | 9,569,523 | |
TOTAL CORPORATE BONDS (Cost $471,855,678) | | 457,776,825 | |
| COLLATERALIZED LOAN OBLIGATIONS — 7.4% | | |
AMMC CLO Ltd., Series 2015-16A, Class CR2, VRN, 6.74%, (3-month LIBOR plus 1.95%), 4/14/29(2) | 5,300,000 | | 5,151,429 | |
AMMC CLO XIII Ltd., Series 2020-2, Class A3R2, VRN, 7.07%, (3-month LIBOR plus 2.25%), 7/24/29(2) | 7,500,000 | | 7,267,257 | |
AMMC CLO XIV Ltd., Series 2014-14A, Class BL1R, VRN, 8.42%, (3-month LIBOR plus 3.60%), 7/25/29(2) | 2,500,000 | | 2,426,677 | |
Arbor Realty Commercial Real Estate Notes Ltd., Series 2019-FL2, Class AS, VRN, 6.39%, (1-month SOFR plus 1.56%), 9/15/34(2) | 2,841,925 | | 2,829,258 | |
Arbor Realty Commercial Real Estate Notes Ltd., Series 2019-FL2, Class D, VRN, 7.39%, (1-month SOFR plus 2.56%), 9/15/34(2) | 1,435,000 | | 1,411,642 | |
BDS Ltd., Series 2020-FL6, Class E, VRN, 7.92%, (30-day average SOFR plus 3.36%), 9/15/35(2) | 3,186,000 | | 3,021,906 | |
BDS Ltd., Series 2021-FL7, Class C, VRN, 6.46%, (1-month LIBOR plus 1.70%), 6/16/36(2) | 4,800,000 | | 4,511,076 | |
Blackrock Rainier CLO VI Ltd., Series 2021-6A, Class A, VRN, 6.51%, (3-month LIBOR plus 1.70%), 4/20/33(2) | 3,000,000 | | 2,918,418 | |
Carlyle Global Market Strategies CLO Ltd., Series 2013-1A, Class BRR, VRN, 7.07%, (3-month LIBOR plus 2.20%), 8/14/30(2) | 2,150,000 | | 2,099,967 | |
| | | | | | | | |
| Principal
Amount/Shares | Value |
Cerberus Loan Funding XXIX LP, Series 2020-2A, Class A, VRN, 6.69%, (3-month LIBOR plus 1.90%), 10/15/32(2) | $ | 2,000,000 | | $ | 1,968,735 | |
Cerberus Loan Funding XXXVI LP, Series 2021-6A, Class A, VRN, 6.19%, (3-month LIBOR plus 1.40%), 11/22/33(2) | 827,188 | | 822,737 | |
CIFC Funding Ltd., Series 2017-5A, Class B, VRN, 6.64%, (3-month LIBOR plus 1.85%), 11/16/30(2) | 3,000,000 | | 2,893,114 | |
Eaton Vance CLO Ltd., Series 2015-1A, Class CR, VRN, 6.71%, (3-month LIBOR plus 1.90%), 1/20/30(2) | 5,500,000 | | 5,271,169 | |
Greystone CRE Notes Ltd., Series 2019-FL2, Class B, VRN, 6.28%, (1-month LIBOR plus 1.60%), 9/15/37(2) | 2,000,000 | | 1,970,443 | |
KVK CLO Ltd., Series 2013-1A, Class DR, VRN, 7.74%, (3-month LIBOR plus 2.95%), 1/14/28(2) | 4,645,000 | | 4,548,254 | |
Marathon CLO Ltd., Series 2020-15A, Class A1S, VRN, 6.56%, (3-month LIBOR plus 1.70%), 11/15/31(2) | 1,950,000 | | 1,938,003 | |
Palmer Square Loan Funding Ltd., Series 2020-1A, Class D, VRN, 9.53%, (3-month LIBOR plus 4.85%), 2/20/28(2) | 5,500,000 | | 5,291,532 | |
Palmer Square Loan Funding Ltd., Series 2021-3A, Class B, VRN, 6.56%, (3-month LIBOR plus 1.75%), 7/20/29(2) | 5,125,000 | | 4,937,245 | |
Palmer Square Loan Funding Ltd., Series 2022-2A, Class A2, VRN, 6.56%, (3-month SOFR plus 1.90%), 10/15/30(2) | 2,350,000 | | 2,293,186 | |
Ready Capital Mortgage Financing LLC, Series 2020-FL4, Class B, VRN, 8.70%, (1-month LIBOR plus 3.85%), 2/25/35(2) | 4,250,000 | | 4,192,883 | |
Ready Capital Mortgage Financing LLC, Series 2021-FL6, Class B, VRN, 6.45%, (1-month LIBOR plus 1.60%), 7/25/36(2) | 8,400,000 | | 8,022,433 | |
Ready Capital Mortgage Financing LLC, Series 2021-FL6, Class C, VRN, 6.75%, (1-month LIBOR plus 1.90%), 7/25/36(2) | 2,000,000 | | 1,894,640 | |
TCP Waterman CLO LLC, Series 2017-1A, Class BR, VRN, 6.82%, (3-month LIBOR plus 1.90%), 8/20/33(2) | 8,400,000 | | 8,266,138 | |
TICP CLO I-2 Ltd., Series 2018-IA, Class C, VRN, 7.86%, (3-month LIBOR plus 3.04%), 4/26/28(2) | 1,500,000 | | 1,499,249 | |
Vibrant CLO VII Ltd., Series 2017-7A, Class B, VRN, 7.21%, (3-month LIBOR plus 2.40%), 9/15/30(2) | 2,000,000 | | 1,952,895 | |
Wellfleet CLO Ltd., Series 2015-1A, Class CR4, VRN, 6.91%, (3-month LIBOR plus 2.10%), 7/20/29(2) | 10,000,000 | | 9,698,003 | |
Wellfleet CLO Ltd., Series 2022-1A, Class B1, VRN, 7.01%, (3-month SOFR plus 2.35%), 4/15/34(2) | 2,125,000 | | 2,072,273 | |
TOTAL COLLATERALIZED LOAN OBLIGATIONS (Cost $104,099,027) | | 101,170,562 | |
| ASSET-BACKED SECURITIES — 7.0% | | |
Aligned Data Centers Issuer LLC, Series 2021-1A, Class B, 2.48%, 8/15/46(2) | 8,725,000 | | 7,563,398 | |
Applebee's Funding LLC / IHOP Funding LLC, Series 2019-1A, Class A2I, SEQ, 4.19%, 6/5/49(2) | 6,726,060 | | 6,594,470 | |
Blackbird Capital Aircraft, Series 2021-1A, Class B, 3.45%, 7/15/46(2) | 2,346,455 | | 1,840,004 | |
Castlelake Aircraft Structured Trust, Series 2017-1R, Class A, SEQ, 2.74%, 8/15/41(2) | 2,001,415 | | 1,791,266 | |
Clsec Holdings 22t LLC, Series 2021-1, Class C, 6.17%, 5/11/37(2) | 6,168,555 | | 5,136,192 | |
Cologix Data Centers US Issuer LLC, Series 2021-1A, Class A2, SEQ, 3.30%, 12/26/51(2) | 1,254,000 | | 1,128,140 | |
Credit Acceptance Auto Loan Trust, Series 2022-3A, Class A, SEQ, 6.57%, 10/15/32(2) | 1,883,000 | | 1,908,069 | |
Diamond Issuer, Series 2021-1A, Class C, 3.79%, 11/20/51(2) | 8,825,000 | | 7,144,771 | |
Domino's Pizza Master Issuer LLC, Series 2015-1A, Class A2II, SEQ, 4.47%, 10/25/45(2) | 2,578,125 | | 2,495,066 | |
Flexential Issuer, Series 2021-1A, Class A2, SEQ, 3.25%, 11/27/51(2) | 5,350,000 | | 4,779,549 | |
Global SC Finance VII Srl, Series 2021-2A, Class A, SEQ, 1.95%, 8/17/41(2) | 2,615,651 | | 2,304,762 | |
| | | | | | | | |
| Principal
Amount/Shares | Value |
Goodgreen Trust, Series 2018-1A, Class A, VRN, 3.93%, 10/15/53(2) | $ | 358,254 | | $ | 326,786 | |
Hilton Grand Vacations Trust, Series 2018-AA, Class B, 3.70%, 2/25/32(2) | 565,911 | | 545,794 | |
Lunar Aircarft Ltd., Series 2020-1A, Class A, SEQ, 3.38%, 2/15/45(2) | 5,940,497 | | 5,148,954 | |
Lunar Structured Aircraft Portfolio Notes, Series 2021-1, Class B, 3.43%, 10/15/46(2) | 5,529,107 | | 4,704,648 | |
MAPS Trust, Series 2021-1A, Class A, SEQ, 2.52%, 6/15/46(2) | 3,946,715 | | 3,465,787 | |
MVW LLC, Series 2019-2A, Class B, 2.44%, 10/20/38(2) | 815,514 | | 759,544 | |
Pioneer Aircraft Finance Ltd., Series 2019-1, Class A, SEQ, 3.97%, 6/15/44(2) | 2,512,775 | | 2,179,631 | |
Progress Residential Trust, Series 2020-SFR1, Class C, 2.18%, 4/17/37(2) | 1,250,000 | | 1,160,607 | |
Progress Residential Trust, Series 2020-SFR3, Class D, SEQ, 1.90%, 10/17/27(2) | 5,000,000 | | 4,509,230 | |
Progress Residential Trust, Series 2021-SFR1, Class E, 2.11%, 4/17/38(2) | 2,600,000 | | 2,232,649 | |
Progress Residential Trust, Series 2021-SFR8, Class E1, 2.38%, 10/17/38(2) | 2,000,000 | | 1,699,732 | |
Sabey Data Center Issuer LLC, Series 2020-1, Class A2, SEQ, 3.81%, 4/20/45(2) | 2,850,000 | | 2,724,557 | |
Sierra Timeshare Receivables Funding LLC, Series 2018-3A, Class C, 4.17%, 9/20/35(2) | 270,861 | | 264,290 | |
Sierra Timeshare Receivables Funding LLC, Series 2019-2A, Class D, 4.54%, 5/20/36(2) | 172,321 | | 163,238 | |
Sierra Timeshare Receivables Funding LLC, Series 2019-3A, Class D, 4.18%, 8/20/36(2) | 207,767 | | 197,609 | |
Sierra Timeshare Receivables Funding LLC, Series 2021-8, Class D, 3.17%, 11/20/37(2) | 655,488 | | 601,015 | |
Stack Infrastructure Issuer LLC, Series 2019-1A, Class A2, SEQ, 4.54%, 2/25/44(2) | 5,653,136 | | 5,554,359 | |
Stack Infrastructure Issuer LLC, Series 2019-2A, Class A2, SEQ, 3.08%, 10/25/44(2) | 1,540,000 | | 1,472,293 | |
Start II Ltd., Series 2019-1, Class A, SEQ, 4.09%, 3/15/44(2) | 3,157,811 | | 2,797,656 | |
Start Ltd., Series 2018-1, Class A, SEQ, 4.09%, 5/15/43(2) | 5,865,815 | | 5,103,581 | |
Stonepeak ABS, Series 2021-1A, Class AA, 2.30%, 2/28/33(2) | 2,509,186 | | 2,319,251 | |
Tricon American Homes, Series 2020-SFR1, Class C, 2.25%, 7/17/38(2) | 4,000,000 | | 3,619,852 | |
Tricon American Homes Trust, Series 2020-SFR2, Class C, 2.03%, 11/17/39(2) | 1,800,000 | | 1,517,076 | |
VSE VOI Mortgage LLC, Series 2018-A, Class B, 3.72%, 2/20/36(2) | 179,182 | | 173,489 | |
TOTAL ASSET-BACKED SECURITIES (Cost $107,454,209) | | 95,927,315 | |
| COLLATERALIZED MORTGAGE OBLIGATIONS — 5.4% | | |
| Private Sponsor Collateralized Mortgage Obligations — 3.4% | |
Angel Oak Mortgage Trust I LLC, Series 2019-1, Class B1, SEQ, VRN, 5.40%, 11/25/48(2) | 4,700,000 | | 4,545,853 | |
Angel Oak Mortgage Trust I LLC, Series 2019-1, Class M1, SEQ, VRN, 4.50%, 11/25/48(2) | 1,971,000 | | 1,938,530 | |
Angel Oak Mortgage Trust I LLC, Series 2019-4, Class A3, SEQ, VRN, 3.30%, 7/26/49(2) | 58,379 | | 58,161 | |
Arroyo Mortgage Trust, Series 2021-1R, Class A2, VRN, 1.48%, 10/25/48(2) | 1,260,574 | | 1,035,394 | |
Arroyo Mortgage Trust, Series 2021-1R, Class A3, VRN, 1.64%, 10/25/48(2) | 997,955 | | 819,109 | |
| Bear Stearns Adjustable Rate Mortgage Trust, Series 2006-1, Class A1, VRN, 6.80%, (1-year H15T1Y plus 2.25%), 2/25/36 | 137,775 | | 129,685 | |
| | | | | | | | |
| Principal
Amount/Shares | Value |
Bellemeade Re Ltd., Series 2018-1A, Class M2, VRN, 7.75%, (1-month LIBOR plus 2.90%), 4/25/28(2) | $ | 1,877,555 | | $ | 1,887,776 | |
Bellemeade Re Ltd., Series 2020-2A, Class M2, VRN, 10.85%, (1-month LIBOR plus 6.00%), 8/26/30(2) | 1,327,515 | | 1,354,389 | |
BRAVO Residential Funding Trust, Series 2021-NQM2, Class M1, VRN, 2.29%, 3/25/60(2) | 3,475,000 | | 2,870,281 | |
BRAVO Residential Funding Trust, Series 2022-NQM3, Class A2, SEQ, VRN, 5.50%, 7/25/62(2) | 3,669,044 | | 3,565,834 | |
Bunker Hill Loan Depositary Trust, Series 2019-2, Class A2, SEQ, 3.08%, 7/25/49(2) | 717,386 | | 672,568 | |
| Countrywide Home Loan Mortgage Pass-Through Trust, Series 2005-17, Class 1A11, 5.50%, 9/25/35 | 764 | | 699 | |
Credit Suisse Mortgage Trust, Series 2020-AFC1, Class A3, VRN, 2.51%, 2/25/50(2) | 648,021 | | 599,632 | |
GCAT Trust, Series 2021-CM2, Class A1, SEQ, VRN, 2.35%, 8/25/66(2) | 4,529,013 | | 4,120,556 | |
Home RE Ltd., Series 2018-1, Class M2, VRN, 7.85%, (1-month LIBOR plus 3.00%), 10/25/28(2) | 2,696,005 | | 2,717,025 | |
Home RE Ltd., Series 2020-1, Class M1C, VRN, 9.00%, (1-month LIBOR plus 4.15%), 10/25/30(2) | 227,858 | | 228,304 | |
Home RE Ltd., Series 2022-1, Class M1A, VRN, 7.41%, (30-day average SOFR plus 2.85%), 10/25/34(2) | 1,675,000 | | 1,685,875 | |
JP Morgan Mortgage Trust, Series 2014-5, Class A1, VRN, 2.78%, 10/25/29(2) | 101,751 | | 96,257 | |
JP Morgan Mortgage Trust, Series 2019-5, Class A15, VRN, 4.00%, 11/25/49(2) | 404,355 | | 375,163 | |
JP Morgan Mortgage Trust, Series 2020-5, Class A15, VRN, 3.00%, 12/25/50(2) | 3,169,355 | | 2,739,011 | |
Radnor RE Ltd., Series 2021-2, Class M1A, VRN, 6.41%, (30-day average SOFR plus 1.85%), 11/25/31(2) | 3,114,806 | | 3,103,528 | |
Triangle Re Ltd., Series 2020-1, Class M2, VRN, 10.45%, (1-month LIBOR plus 5.60%), 10/25/30(2) | 852,788 | | 858,333 | |
Triangle Re Ltd., Series 2021-1, Class M2, VRN, 8.75%, (1-month LIBOR plus 3.90%), 8/25/33(2) | 3,675,486 | | 3,696,535 | |
Verus Securitization Trust, Series 2019-INV2, Class A1, VRN, 2.91%, 7/25/59(2) | 264,449 | | 256,230 | |
Verus Securitization Trust, Series 2019-INV3, Class A3, SEQ, VRN, 3.10%, 11/25/59(2) | 3,924,419 | | 3,735,447 | |
Verus Securitization Trust, Series 2020-1, Class A3, SEQ, 2.72%, 1/25/60(2) | 3,135,872 | | 2,966,807 | |
Vista Point Securitization Trust, Series 2020-1, Class A2, SEQ, VRN, 2.77%, 3/25/65(2) | 675,487 | | 667,587 | |
| | 46,724,569 | |
| U.S. Government Agency Collateralized Mortgage Obligations — 2.0% | |
FHLMC, Series 2018-HRP1, Class M2, VRN, 6.50%, (1-month LIBOR plus 1.65%), 4/25/43(2) | 64,445 | | 64,447 | |
FHLMC, Series 2021-HQA3, Class M1, VRN, 5.41%, (30-day average SOFR plus 0.85%), 9/25/41(2) | 6,167,231 | | 5,954,303 | |
FHLMC, Series 2022-DNA3, Class M1A, VRN, 6.56%, (30-day average SOFR plus 2.00%), 4/25/42(2) | 3,646,665 | | 3,648,274 | |
FHLMC, Series 2022-DNA6, Class M1A, VRN, 6.71%, (30-day average SOFR plus 2.15%), 9/25/42(2) | 2,819,625 | | 2,828,048 | |
| FNMA, Series 2006-60, Class KF, VRN, 5.15%, (1-month LIBOR plus 0.30%), 7/25/36 | 325,937 | | 322,209 | |
| FNMA, Series 2009-33, Class FB, VRN, 5.67%, (1-month LIBOR plus 0.82%), 3/25/37 | 320,994 | | 322,908 | |
| FNMA, Series 2014-C01, Class M2, VRN, 9.25%, (1-month LIBOR plus 4.40%), 1/25/24 | 4,426,066 | | 4,526,821 | |
| FNMA, Series 2014-C02, Class 2M2, VRN, 7.45%, (1-month LIBOR plus 2.60%), 5/25/24 | 368,097 | | 370,980 | |
| | | | | | | | |
| Principal
Amount/Shares | Value |
| FNMA, Series 2016-55, Class PI, IO, 4.00%, 8/25/46 | $ | 10,168,440 | | $ | 1,906,595 | |
| FNMA, Series 2017-7, Class AI, IO, 6.00%, 2/25/47 | 7,006,962 | | 1,285,192 | |
| FNMA, Series 2017-C07, Class 1EB2, VRN, 5.85%, (1-month LIBOR plus 1.00%), 5/25/30 | 1,291,901 | | 1,287,274 | |
FNMA, Series 2022-R03, Class 1M1, VRN, 6.66%, (30-day average SOFR plus 2.10%), 3/25/42(2) | 2,067,724 | | 2,064,858 | |
FNMA, Series 2022-R09, Class 2M1, VRN, 7.07%, (30-day average SOFR plus 2.50%), 9/25/42(2) | 2,141,401 | | 2,145,462 | |
| FNMA, Series 413, Class C27, IO, 4.00%, 7/25/42 | 3,386,546 | | 501,806 | |
| | 27,229,177 | |
TOTAL COLLATERALIZED MORTGAGE OBLIGATIONS (Cost $75,440,219) | | 73,953,746 | |
BANK LOAN OBLIGATIONS(3) — 1.7% | | |
| Aerospace and Defense — 0.2% | | |
| TransDigm, Inc., 2023 Term Loan I, 8.15%, (3-month SOFR plus 3.25%), 8/24/28 | 3,000,000 | | 2,995,500 | |
| Consumer Staples Distribution & Retail — 0.4% | | |
| United Natural Foods, Inc., Term Loan B, 8.17%, (1-month SOFR plus 3.25%), 10/22/25 | 5,343,585 | | 5,353,605 | |
| Health Care Equipment and Supplies — 0.2% | | |
| Avantor Funding, Inc., 2021 Term Loan B5, 7.09%, (1-month LIBOR plus 2.25%), 11/8/27 | 2,748,277 | | 2,749,788 | |
| Pharmaceuticals — 0.9% | | |
| Horizon Therapeutics USA Inc., 2021 Term Loan B2, 6.56%, (1-month LIBOR plus 1.75%), 3/15/28 | 5,252,328 | | 5,248,626 | |
| Jazz Financing Lux S.a.r.l., USD Term Loan, 8.34%, (1-month LIBOR plus 3.50%), 5/5/28 | 6,955,167 | | 6,937,049 | |
| | 12,185,675 | |
TOTAL BANK LOAN OBLIGATIONS (Cost $23,293,883) | | 23,284,568 | |
| COMMERCIAL MORTGAGE-BACKED SECURITIES — 1.5% | | |
BBCMS Mortgage Trust, Series 2019-BWAY, Class D, VRN, 7.10%, (1-month LIBOR plus 2.27%), 11/15/34(2) | 4,370,000 | | 2,250,158 | |
Credit Suisse Mortgage Capital Certificates, Series 2019-ICE4, Class E, VRN, 6.83%, (1-month LIBOR plus 2.15%), 5/15/36(2) | 3,693,810 | | 3,579,136 | |
DBWF Mortgage Trust, Series 2018-GLKS, Class A, VRN, 5.89%, (1-month LIBOR plus 1.13%), 12/19/30(2) | 4,189,000 | | 4,114,748 | |
J.P. Morgan Chase Commercial Mortgage Securities Trust, Series 2018-AON, Class A, SEQ, 4.13%, 7/5/31(2) | 3,575,000 | | 3,235,375 | |
One Market Plaza Trust, Series 2017-1MKT, Class B, 3.85%, 2/10/32(2) | 3,533,000 | | 3,239,584 | |
SMRT, Series 2022-MINI, Class C, VRN, 6.38%, (1-month SOFR plus 1.55%), 1/15/39(2) | 4,500,000 | | 4,246,265 | |
TOTAL COMMERCIAL MORTGAGE-BACKED SECURITIES (Cost $23,627,085) | | 20,665,266 | |
U.S. GOVERNMENT AGENCY MORTGAGE-BACKED SECURITIES† | |
Adjustable-Rate U.S. Government Agency Mortgage-Backed Securities† | |
| FHLMC, VRN, 4.17%, (1-year H15T1Y plus 2.25%), 9/1/35 | 110,420 | | 113,183 | |
| FHLMC, VRN, 3.69%, (12-month LIBOR plus 1.87%), 7/1/36 | 14,548 | | 14,688 | |
| FHLMC, VRN, 4.09%, (12-month LIBOR plus 1.89%), 7/1/41 | 33,664 | | 33,309 | |
| FHLMC, VRN, 3.90%, (12-month LIBOR plus 1.65%), 12/1/42 | 58,582 | | 58,810 | |
| FNMA, VRN, 5.25%, (6-month LIBOR plus 1.57%), 6/1/35 | 74,911 | | 75,376 | |
| FNMA, VRN, 5.31%, (6-month LIBOR plus 1.57%), 6/1/35 | 31,530 | | 31,700 | |
| | 327,066 | |
Fixed-Rate U.S. Government Agency Mortgage-Backed Securities† | |
| FNMA, 3.50%, 3/1/34 | 84,652 | | 82,214 | |
TOTAL U.S. GOVERNMENT AGENCY MORTGAGE-BACKED SECURITIES (Cost $420,502) | 409,280 | |
| | | | | | | | |
| Principal
Amount/Shares | Value |
| SHORT-TERM INVESTMENTS — 5.1% | | |
Money Market Funds† | | |
| State Street Institutional U.S. Government Money Market Fund, Premier Class | 28,122 | | $ | 28,122 | |
| Repurchase Agreements — 3.6% | | |
| BMO Capital Markets Corp., (collateralized by various U.S. Treasury obligations, 1.125% - 4.375%, 8/15/40 - 5/15/49, valued at $13,176,970), in a joint trading account at 4.67%, dated 3/31/23, due 4/3/23 (Delivery value $12,714,554) | | 12,709,608 | |
| Fixed Income Clearing Corp., (collateralized by various U.S. Treasury obligations, 3.625%, 3/31/28, valued at $37,498,322), at 4.81%, dated 3/31/23, due 4/3/23 (Delivery value $36,777,736) | | 36,763,000 | |
| | 49,472,608 | |
Treasury Bills(4) — 1.5% | | |
| U.S. Treasury Bills, 5.11%, 2/22/24 | $ | 21,000,000 | | 20,159,672 | |
TOTAL SHORT-TERM INVESTMENTS (Cost $69,580,380) | | 69,660,402 | |
TOTAL INVESTMENT SECURITIES — 99.0% (Cost $1,385,119,223) | | 1,353,599,499 | |
| OTHER ASSETS AND LIABILITIES — 1.0% | | 13,880,757 | |
| TOTAL NET ASSETS — 100.0% | | $ | 1,367,480,256 | |
| | | | | | | | | | | | | | |
| FUTURES CONTRACTS PURCHASED |
| Reference Entity | Contracts | Expiration Date | Notional
Amount | Unrealized
Appreciation
(Depreciation)^ |
| U.S. Treasury 2-Year Notes | 2,079 | June 2023 | $ | 429,216,049 | | $ | 2,666,275 | |
^Amount represents value and unrealized appreciation (depreciation).
| | | | | | | | | | | | | | |
| FUTURES CONTRACTS SOLD |
| Reference Entity | Contracts | Expiration Date | Notional
Amount | Unrealized
Appreciation
(Depreciation)^ |
| U.S. Treasury 5-Year Notes | 956 | June 2023 | $ | 104,689,469 | | $ | (1,590,534) | |
| U.S. Treasury 10-Year Ultra Notes | 50 | June 2023 | 6,057,031 | | (64,183) | |
| U.S. Treasury 10-Year Notes | 161 | June 2023 | 18,502,422 | | (478,970) | |
| U.S. Treasury Long Bonds | 11 | June 2023 | 1,442,719 | | (63,959) | |
| U.S. Treasury Ultra Bonds | 1 | June 2023 | 141,125 | | (5,861) | |
| | | $ | 130,832,766 | | $ | (2,203,507) | |
^Amount represents value and unrealized appreciation (depreciation).
| | | | | | | | | | | | | | | | | | | | | | | |
| CENTRALLY CLEARED TOTAL RETURN SWAP AGREEMENTS |
| Floating Rate Index | Pay/Receive
Floating
Rate Index at Termination | Fixed
Rate | Termination
Date | Notional
Amount | Premiums
Paid
(Received) | Unrealized
Appreciation
(Depreciation) | Value |
| CPURNSA | Receive | 2.90% | 10/11/23 | $ | 6,600,000 | | $ | 269 | | $ | 37,788 | | $ | 38,057 | |
| CPURNSA | Receive | 2.97% | 10/14/23 | $ | 9,850,000 | | 276 | | 50,729 | | 51,005 | |
| CPURNSA | Receive | 2.97% | 10/14/23 | $ | 9,850,000 | | 276 | | 50,729 | | 51,005 | |
| | | | | $ | 821 | | $ | 139,246 | | $ | 140,067 | |
| | | | | | | | |
| NOTES TO SCHEDULE OF INVESTMENTS |
| CPURNSA | – | U.S. Consumer Price Index Urban Consumers Not Seasonally Adjusted Index |
| FHLMC | – | Federal Home Loan Mortgage Corporation |
| FNMA | – | Federal National Mortgage Association |
| H15T1Y | – | Constant Maturity U.S. Treasury Note Yield Curve Rate Index |
| IO | – | Interest Only |
| LIBOR | – | London Interbank Offered Rate |
| SEQ | – | Sequential Payer |
| SOFR | – | Secured Overnight Financing Rate |
| USD | – | United States Dollar |
| VRN | – | Variable Rate Note. The rate adjusts periodically based upon the terms set forth in the security’s offering documents. The rate shown is effective at the period end and the reference rate and spread, if any, is indicated. The security's effective maturity date may be shorter than the final maturity date shown. |
†Category is less than 0.05% of total net assets.
(1)Security, or a portion thereof, has been pledged at the custodian bank or with a broker for collateral requirements on futures contracts and/or swap agreements. At the period end, the aggregate value of securities pledged was $3,081,776.
(2)Security was purchased pursuant to Rule 144A or Section 4(2) under the Securities Act of 1933 and may be sold in transactions exempt from registration, normally to qualified institutional investors. The aggregate value of these securities at the period end was $390,372,709, which represented 28.5% of total net assets.
(3)The interest rate on a bank loan obligation adjusts periodically based on a predetermined schedule. Rate or range of rates shown is effective at period end. The maturity date on a bank loan obligation may be less than indicated as a result of contractual or optional prepayments. These prepayments cannot be predicted with certainty.
(4)The rate indicated is the yield to maturity at purchase for non-interest bearing securities. For interest bearing securities, the stated coupon rate is shown.
See Notes to Financial Statements.
| | |
| Statement of Assets and Liabilities |
| | | | | |
| MARCH 31, 2023 | |
| Assets | |
| Investment securities, at value (cost of $1,385,119,223) | $ | 1,353,599,499 | |
| Cash | 98,599 | |
| Receivable for investments sold | 12,848,233 | |
| Receivable for capital shares sold | 449,768 | |
| Receivable for variation margin on swap agreements | 14,690 | |
| Interest receivable | 7,449,381 | |
| 1,374,460,170 | |
| |
| Liabilities | |
| Payable for investments purchased | 5,414,796 | |
| Payable for capital shares redeemed | 1,152,348 | |
| Payable for variation margin on futures contracts | 49,629 | |
| Accrued management fees | 287,090 | |
| Distribution and service fees payable | 6,964 | |
| Dividends payable | 69,087 | |
| 6,979,914 | |
| |
| Net Assets | $ | 1,367,480,256 | |
| |
| Net Assets Consist of: | |
| Capital paid in | $ | 1,469,498,665 | |
| Distributable earnings (loss) | (102,018,409) | |
| $ | 1,367,480,256 | |
| | | | | | | | | | | |
| Net Assets | Shares Outstanding | Net Asset Value Per Share* |
| Investor Class | $353,984,787 | 36,117,082 | $9.80 |
| I Class | $215,664,937 | 22,008,442 | $9.80 |
| A Class | $20,054,805 | 2,046,780 | $9.80 |
| C Class | $2,703,924 | 275,768 | $9.81 |
| R Class | $668,954 | 68,215 | $9.81 |
| R5 Class | $11,061,089 | 1,128,732 | $9.80 |
| R6 Class | $58,649,870 | 5,990,065 | $9.79 |
| G Class | $704,691,890 | 71,963,670 | $9.79 |
*Maximum offering price per share was equal to the net asset value per share for all share classes, except Class A, for which the maximum offering price per share was $10.03 (net asset value divided by 0.9775). A contingent deferred sales charge may be imposed on redemptions of Class A and Class C.
See Notes to Financial Statements.
| | | | | |
| YEAR ENDED MARCH 31, 2023 | |
| Investment Income (Loss) | |
| Income: | |
| Interest (net of foreign taxes withheld of $8,363) | $ | 47,954,343 | |
| |
| Expenses: | |
| Management fees | 6,148,619 | |
| Distribution and service fees: | |
| A Class | 51,447 | |
| C Class | 37,864 | |
| R Class | 3,542 | |
| Trustees' fees and expenses | 96,193 | |
| Other expenses | 39,541 | |
| 6,377,206 | |
Fees waived(1) | (2,710,464) | |
| 3,666,742 | |
| |
| Net investment income (loss) | 44,287,601 | |
| |
| Realized and Unrealized Gain (Loss) | |
| Net realized gain (loss) on: | |
| Investment transactions | (74,953,555) | |
| Futures contract transactions | 8,306,543 | |
| Swap agreement transactions | 3,727,353 | |
| (62,919,659) | |
| |
| Change in net unrealized appreciation (depreciation) on: | |
| Investments | 25,380,387 | |
| Futures contracts | (3,660,623) | |
| Swap agreements | (1,679,472) | |
| 20,040,292 | |
| |
| Net realized and unrealized gain (loss) | (42,879,367) | |
| |
| Net Increase (Decrease) in Net Assets Resulting from Operations | $ | 1,408,234 | |
(1)Amount consists of $47,115, $30,273, $2,757, $444, $101, $2,149, $6,640 and $2,620,985 for Investor Class, I Class, A Class, C Class, R Class, R5 Class, R6 Class and G Class, respectively.
See Notes to Financial Statements.
| | |
| Statement of Changes in Net Assets |
| | | | | | | | |
| YEARS ENDED MARCH 31, 2023 AND MARCH 31, 2022 |
| Increase (Decrease) in Net Assets | March 31, 2023 | March 31, 2022 |
| Operations | | |
| Net investment income (loss) | $ | 44,287,601 | | $ | 29,539,338 | |
| Net realized gain (loss) | (62,919,659) | | 3,162,420 | |
| Change in net unrealized appreciation (depreciation) | 20,040,292 | | (63,519,815) | |
| Net increase (decrease) in net assets resulting from operations | 1,408,234 | | (30,818,057) | |
| | |
| Distributions to Shareholders | | |
| From earnings: | | |
| Investor Class | (9,458,964) | | (7,378,142) | |
| I Class | (6,164,782) | | (4,722,948) | |
| A Class | (493,471) | | (366,225) | |
| C Class | (56,633) | | (41,642) | |
| R Class | (15,529) | | (11,891) | |
| R5 Class | (460,043) | | (384,301) | |
| R6 Class | (1,447,127) | | (1,780,399) | |
| G Class | (24,972,606) | | (24,442,079) | |
| Decrease in net assets from distributions | (43,069,155) | | (39,127,627) | |
| | |
| Capital Share Transactions | | |
| Net increase (decrease) in net assets from capital share transactions (Note 5) | (235,048,463) | | 30,371,269 | |
| | |
| Net increase (decrease) in net assets | (276,709,384) | | (39,574,415) | |
| | |
| Net Assets | | |
| Beginning of period | 1,644,189,640 | | 1,683,764,055 | |
| End of period | $ | 1,367,480,256 | | $ | 1,644,189,640 | |
See Notes to Financial Statements.
| | |
| Notes to Financial Statements |
MARCH 31, 2023
1. Organization
American Century Investment Trust (the trust) is registered under the Investment Company Act of 1940, as amended (the 1940 Act), as an open-end management investment company and is organized as a Massachusetts business trust. Short Duration Fund (the fund) is one fund in a series issued by the trust. The fund’s investment objective is to seek to maximize total return. As a secondary objective, the fund seeks a high level of income.
The fund offers the Investor Class, I Class, A Class, C Class, R Class, R5 Class, R6 Class and G Class. The A Class may incur an initial sales charge. The A Class and C Class may be subject to a contingent deferred sales charge.
2. Significant Accounting Policies
The following is a summary of significant accounting policies consistently followed by the fund in preparation of its financial statements. The fund is an investment company and follows accounting and reporting guidance in accordance with accounting principles generally accepted in the United States of America. This may require management to make certain estimates and assumptions at the date of the financial statements. Actual results could differ from these estimates. Management evaluated the impact of events or transactions occurring through the date the financial statements were issued that would merit recognition or disclosure.
Investment Valuations — The fund determines the fair value of its investments and computes its net asset value (NAV) per share at the close of regular trading (usually 4 p.m. Eastern time) on the New York Stock Exchange (NYSE) on each day the NYSE is open. The value of investments of the fund is determined by American Century Investment Management, Inc. (ACIM) (the investment advisor), as the valuation designee, pursuant to its valuation policies and procedures. The Board of Trustees oversees the valuation designee and reviews its valuation policies and procedures at least annually.
Fixed income securities are valued at the evaluated mean as provided by independent pricing services or at the mean of the most recent bid and asked prices as provided by investment dealers. Corporate bonds, U.S. Treasury and Government Agency securities, and bank loan obligations are valued using market models that consider trade data, quotations from dealers and active market makers, relevant yield curve and spread data, creditworthiness, trade data or market information on comparable securities, and other relevant security specific information. Mortgage-related and asset-backed securities are valued based on models that consider trade data, prepayment and default projections, benchmark yield and spread data and estimated cash flows of each tranche of the issuer. Collateralized loan obligations are valued based on discounted cash flow models that consider trade and economic data, prepayment assumptions and default projections. Commercial paper is valued using a curve-based approach that considers money market rates for specific instruments, programs, currencies and maturity points from a variety of active market makers.
Equity securities that are listed or traded on a domestic securities exchange are valued at the last reported sales price or at the official closing price as provided by the exchange. Equity securities traded on foreign securities exchanges are generally valued at the closing price of such securities on the exchange where primarily traded or at the close of the NYSE, if that is earlier. If no last sales price is reported, or if local convention or regulation so provides, the mean of the latest bid and asked prices may be used. Securities traded over-the-counter are valued at the mean of the latest bid and asked prices, the last sales price, or the official closing price.
Hybrid securities are valued at the evaluated mean as provided by independent pricing services or at the mean of the most recent bid and asked prices as provided by investment dealers. Preferred stocks and convertible preferred stocks with perpetual maturities are valued using market models that consider trade data, quotations from dealers and active market makers, relevant yield curve and spread data, creditworthiness, trade data or market information on comparable securities, and other relevant security specific information.
Open-end management investment companies are valued at the reported NAV per share. Repurchase agreements are valued at cost, which approximates fair value. Exchange-traded futures contracts are valued at the settlement price as provided by the appropriate exchange. Swap agreements are valued at an evaluated mean as provided by independent pricing services or independent brokers.
If the valuation designee determines that the market price for a portfolio security is not readily available or is believed by the valuation designee to be unreliable, such security is valued at fair value as determined in good faith by the valuation designee, in accordance with its policies and procedures. Circumstances that may cause the fund to determine that market quotations are not available or reliable include, but are not limited to: when there is a significant event subsequent to the market quotation; trading in a security has been halted during the trading day; or trading in a security is insufficient or did not take place due to a closure or holiday.
The valuation designee monitors for significant events occurring after the close of an investment’s primary exchange but before the fund’s NAV per share is determined. Significant events may include, but are not limited to: corporate announcements and transactions; regulatory news, governmental action and political unrest that could impact a specific investment or an investment sector; or armed conflicts, natural disasters and similar events that could affect investments in a specific country or region. The valuation designee also monitors for significant fluctuations between domestic and foreign markets, as evidenced by the U.S. market or such other indicators that it deems appropriate. The valuation designee may apply a model-derived factor to the closing price of equity securities traded on foreign securities exchanges. The factor is based on observable market data as provided by an independent pricing service.
Security Transactions — Security transactions are accounted for as of the trade date. Net realized gains and losses are determined on the identified cost basis, which is also used for federal income tax purposes.
Investment Income — Interest income less foreign taxes withheld, if any, is recorded on the accrual basis and includes paydown gain (loss) and accretion of discounts and amortization of premiums. Inflation adjustments related to inflation-linked debt securities are reflected as interest income.
Repurchase Agreements — The fund may enter into repurchase agreements with institutions that ACIM has determined are creditworthy pursuant to criteria adopted by the Board of Trustees. The fund requires that the collateral, represented by securities, received in a repurchase transaction be transferred to the custodian in a manner sufficient to enable the fund to obtain those securities in the event of a default under the repurchase agreement. ACIM monitors, on a daily basis, the securities transferred to ensure the value, including accrued interest, of the securities under each repurchase agreement is equal to or greater than amounts owed to the fund under each repurchase agreement.
Joint Trading Account — Pursuant to an Exemptive Order issued by the Securities and Exchange Commission, the fund, along with certain other funds in the American Century Investments family of funds, may transfer uninvested cash balances into a joint trading account. These balances are invested in one or more repurchase agreements that are collateralized by U.S. Treasury or Agency obligations.
Income Tax Status — It is the fund's policy to distribute substantially all net investment income and net realized gains to shareholders and to otherwise qualify as a regulated investment company under provisions of the Internal Revenue Code. Accordingly, no provision has been made for income taxes. The fund files U.S. federal, state, local and non-U.S. tax returns as applicable. The fund's tax returns are subject to examination by the relevant taxing authority until expiration of the applicable statute of limitations, which is generally three years from the date of filing but can be longer in certain jurisdictions. At this time, management believes there are no uncertain tax positions which, based on their technical merit, would not be sustained upon examination and for which it is reasonably possible that the total amounts of unrecognized tax benefits will significantly change in the next twelve months.
Multiple Class — All shares of the fund represent an equal pro rata interest in the net assets of the class to which such shares belong, and have identical voting, dividend, liquidation and other rights and the same terms and conditions, except for class specific expenses and exclusive rights to vote on matters affecting only individual classes. Income, non-class specific expenses, and realized and unrealized capital gains and losses of the fund are allocated to each class of shares based on their relative net assets.
Distributions to Shareholders — Distributions from net investment income, if any, are declared daily and paid monthly. Distributions from net realized gains, if any, are generally declared and paid annually.
Indemnifications — Under the trust’s organizational documents, its officers and trustees are indemnified against certain liabilities arising out of the performance of their duties to the fund. In addition, in the normal course of business, the fund enters into contracts that provide general indemnifications. The maximum exposure under these arrangements is unknown as this would involve future claims that may be made against a fund. The risk of material loss from such claims is considered by management to be remote.
3. Fees and Transactions with Related Parties
Certain officers and trustees of the trust are also officers and/or directors of American Century Companies, Inc. (ACC). The trust's investment advisor, ACIM, the trust's distributor, American Century Investment Services, Inc. (ACIS), and the trust's transfer agent, American Century Services, LLC, are wholly owned, directly or indirectly, by ACC. Various funds issued by American Century Asset Allocation Portfolios, Inc. own, in aggregate, 46% of the shares of the fund. Related parties do not invest in the fund for the purpose of exercising management or control.
Management Fees — The trust has entered into a management agreement with ACIM, under which ACIM provides the fund with investment advisory and management services in exchange for a single, unified management fee (the fee) per class. The agreement provides that ACIM will pay all expenses of managing and operating the fund, except brokerage expenses, taxes, interest, fees and expenses of the independent trustees (including legal counsel fees), extraordinary expenses, and expenses incurred in connection with the provision of shareholder services and distribution services under a plan adopted pursuant to Rule 12b-1 under the 1940 Act. The fee is computed and accrued daily based on each class’s daily net assets and paid monthly in arrears. The difference in the fee among the classes is a result of their separate arrangements for non-Rule 12b-1 shareholder services. It is not the result of any difference in advisory or custodial fees or other expenses related to the management of the fund's assets, which do not vary by class. The fee consists of (1) an Investment Category Fee based on the daily net assets of the fund and certain other accounts managed by the investment advisor that are in the same broad investment category as the fund and (2) a Complex Fee based on the assets of all funds in the American Century Investments family of funds that have the same investment advisor and distributor as the fund. For purposes of determining the Investment Category Fee and Complex Fee, the assets of funds managed by the investment advisor that invest exclusively in the shares of other funds (funds of funds) are not included. Effective August 1, 2022, the investment advisor agreed to waive 0.02% of the fund's management fee. The investment advisor expects this waiver to continue until July 31, 2023 and cannot terminate it prior to such date without the approval of the Board of Trustees. The investment advisor agreed to waive the G Class's management fee in its entirety. The investment advisor expects this waiver to remain in effect permanently and cannot terminate it without the approval of the Board of Trustees.
The Investment Category Fee range, the Complex Fee range and the effective annual management fee before and after waiver for each class for the period ended March 31, 2023 are as follows:
| | | | | | | | | | | | | | |
| | | Effective Annual Management Fee |
| Investment Category Fee Range | Complex Fee Range | Before Waiver | After Waiver |
| Investor Class | 0.2825% to 0.4000% | 0.2500% to 0.3100% | 0.58% | 0.57% |
| I Class | 0.1500% to 0.2100% | 0.48% | 0.47% |
| A Class | 0.2500% to 0.3100% | 0.58% | 0.57% |
| C Class | 0.2500% to 0.3100% | 0.58% | 0.57% |
| R Class | 0.2500% to 0.3100% | 0.58% | 0.57% |
| R5 Class | 0.0500% to 0.1100% | 0.38% | 0.37% |
| R6 Class | 0.0000% to 0.0600% | 0.33% | 0.32% |
| G Class | 0.0000% to 0.0600% | 0.33% | 0.00% |
Distribution and Service Fees — The Board of Trustees has adopted a separate Master Distribution and Individual Shareholder Services Plan for each of the A Class, C Class and R Class (collectively the plans), pursuant to Rule 12b-1 of the 1940 Act. The plans provide that the A Class will pay ACIS an annual distribution and service fee of 0.25%. The plans provide that the C Class will pay ACIS an annual distribution and service fee of 1.00%, of which 0.25% is paid for individual shareholder services and 0.75% is paid for distribution services. The plans provide that the R Class will pay ACIS an annual distribution and service fee of 0.50%. The fees are computed and accrued daily based on each class’s daily net assets and paid monthly in arrears. The fees are used to pay financial intermediaries for distribution and individual shareholder services. Fees incurred under the plans during the period ended March 31, 2023 are detailed in the Statement of Operations.
Trustees' Fees and Expenses — The Board of Trustees is responsible for overseeing the investment advisor’s management and operations of the fund. The trustees receive detailed information about the fund and its investment advisor regularly throughout the year, and meet at least quarterly with management of the investment advisor to review reports about fund operations. The fund's officers do not receive compensation from the fund.
Interfund Transactions — The fund may enter into security transactions with other American Century Investments funds and other client accounts of the investment advisor, in accordance with the 1940 Act rules and procedures adopted by the Board of Trustees. The rules and procedures require, among other things, that these transactions be effected at the independent current market price of the security. There were no interfund transactions during the period.
4. Investment Transactions
Purchases of investment securities, excluding short-term investments, for the period ended March 31, 2023 totaled $2,601,050,503, of which $1,940,601,858 represented U.S. Treasury and Government Agency obligations.
Sales of investment securities, excluding short-term investments, for the period ended March 31, 2023 totaled $2,893,995,168, of which $1,929,794,306 represented U.S. Treasury and Government Agency obligations.
5. Capital Share Transactions
Transactions in shares of the fund were as follows (unlimited number of shares authorized):
| | | | | | | | | | | | | | |
| Year ended March 31, 2023 | Year ended March 31, 2022 |
| Shares | Amount | Shares | Amount |
| Investor Class | | | | |
| Sold | 6,536,597 | | $ | 64,122,195 | | 7,051,165 | | $ | 73,588,309 | |
| Issued in reinvestment of distributions | 948,051 | | 9,295,715 | | 700,524 | | 7,280,412 | |
| Redeemed | (9,999,712) | | (98,188,955) | | (5,773,347) | | (59,996,138) | |
| (2,515,064) | | (24,771,045) | | 1,978,342 | | 20,872,583 | |
| I Class | | | | |
| Sold | 14,950,425 | | 146,744,329 | | 19,744,816 | | 205,656,508 | |
| Issued in reinvestment of distributions | 608,255 | | 5,959,582 | | 438,958 | | 4,558,769 | |
| Redeemed | (17,689,709) | | (174,158,869) | | (12,504,878) | | (129,285,038) | |
| (2,131,029) | | (21,454,958) | | 7,678,896 | | 80,930,239 | |
| A Class | | | | |
| Sold | 638,870 | | 6,256,221 | | 639,216 | | 6,677,597 | |
| Issued in reinvestment of distributions | 38,054 | | 372,719 | | 24,100 | | 250,323 | |
| Redeemed | (745,627) | | (7,314,725) | | (783,186) | | (8,164,118) | |
| (68,703) | | (685,785) | | (119,870) | | (1,236,198) | |
| C Class | | | | |
| Sold | 92,700 | | 913,821 | | 256,773 | | 2,674,724 | |
| Issued in reinvestment of distributions | 5,315 | | 52,112 | | 3,791 | | 39,381 | |
| Redeemed | (329,099) | | (3,239,019) | | (184,905) | | (1,918,299) | |
| (231,084) | | (2,273,086) | | 75,659 | | 795,806 | |
| R Class | | | | |
| Sold | 34,920 | | 344,206 | | 37,430 | | 390,376 | |
| Issued in reinvestment of distributions | 1,570 | | 15,376 | | 1,117 | | 11,632 | |
| Redeemed | (34,515) | | (340,192) | | (61,803) | | (643,383) | |
| 1,975 | | 19,390 | | (23,256) | | (241,375) | |
| R5 Class | | | | |
| Sold | 538,221 | | 5,297,206 | | 360,415 | | 3,761,509 | |
| Issued in reinvestment of distributions | 46,936 | | 460,029 | | 36,916 | | 383,854 | |
| Redeemed | (1,080,127) | | (10,615,841) | | (1,001,778) | | (10,455,468) | |
| (494,970) | | (4,858,606) | | (604,447) | | (6,310,105) | |
| R6 Class | | | | |
| Sold | 4,185,684 | | 40,858,519 | | 1,154,309 | | 12,006,142 | |
| Issued in reinvestment of distributions | 147,752 | | 1,447,113 | | 171,275 | | 1,780,330 | |
| Redeemed | (3,603,670) | | (35,259,737) | | (4,232,685) | | (43,487,481) | |
| 729,766 | | 7,045,895 | | (2,907,101) | | (29,701,009) | |
| G Class | | | | |
| Sold | 5,719,955 | | 56,221,221 | | 10,764,498 | | 112,593,899 | |
| Issued in reinvestment of distributions | 2,546,341 | | 24,972,169 | | 2,352,956 | | 24,442,079 | |
| Redeemed | (27,529,408) | | (269,263,658) | | (16,577,488) | | (171,774,650) | |
| (19,263,112) | | (188,070,268) | | (3,460,034) | | (34,738,672) | |
| Net increase (decrease) | (23,972,221) | | $ | (235,048,463) | | 2,618,189 | | $ | 30,371,269 | |
6. Fair Value Measurements
The fund's investments valuation process is based on several considerations and may use multiple inputs to determine the fair value of the investments held by the fund. In conformity with accounting principles generally accepted in the United States of America, the inputs used to determine a valuation are classified into three broad levels.
•Level 1 valuation inputs consist of unadjusted quoted prices in an active market for identical investments.
•Level 2 valuation inputs consist of direct or indirect observable market data (including quoted prices for comparable investments, evaluations of subsequent market events, interest rates, prepayment speeds, credit risk, etc.). These inputs also consist of quoted prices for identical investments initially expressed in local currencies that are adjusted through translation into U.S. dollars.
•Level 3 valuation inputs consist of unobservable data (including a fund’s own assumptions).
The level classification is based on the lowest level input that is significant to the fair valuation measurement. The valuation inputs are not necessarily an indication of the risks associated with investing in these securities or other financial instruments.
The following is a summary of the level classifications as of period end. The Schedule of Investments provides additional information on the fund's portfolio holdings.
| | | | | | | | | | | |
| Level 1 | Level 2 | Level 3 |
| Assets | | | |
| Investment Securities | | | |
| U.S. Treasury Securities | — | | $ | 510,751,535 | | — | |
| Corporate Bonds | — | | 457,776,825 | | — | |
| Collateralized Loan Obligations | — | | 101,170,562 | | — | |
| Asset-Backed Securities | — | | 95,927,315 | | — | |
| Collateralized Mortgage Obligations | — | | 73,953,746 | | — | |
| Bank Loan Obligations | — | | 23,284,568 | | — | |
| Commercial Mortgage-Backed Securities | — | | 20,665,266 | | — | |
| U.S. Government Agency Mortgage-Backed Securities | — | | 409,280 | | — | |
| Short-Term Investments | $ | 28,122 | | 69,632,280 | | — | |
| $ | 28,122 | | $ | 1,353,571,377 | | — | |
| Other Financial Instruments | | | |
| Futures Contracts | $ | 2,666,275 | | — | | — | |
| Swap Agreements | — | | $ | 140,067 | | — | |
| $ | 2,666,275 | | $ | 140,067 | | — | |
| | | |
| Liabilities | | | |
| Other Financial Instruments | | | |
| Futures Contracts | $ | 2,203,507 | | — | | — | |
7. Derivative Instruments
Credit Risk — The fund is subject to credit risk in the normal course of pursuing its investment objectives. The value of a bond generally declines as the credit quality of its issuer declines. Credit default swap agreements enable a fund to buy/sell protection against a credit event of a specific issuer or index. A fund may attempt to enhance returns by selling protection or attempt to mitigate credit risk by buying protection. The buyer/seller of credit protection against a security or basket of securities may pay/receive an up-front or periodic payment to compensate for/against potential default events. Changes in value, including the periodic amounts of interest to be paid or received on swap agreements, are recorded as unrealized appreciation (depreciation) on swap agreements. Upon entering into a centrally cleared swap, a fund is required to deposit cash or securities (initial margin) with a financial intermediary in an amount equal to a certain percentage of the notional amount. A fund may incur charges or earn income on cash deposit balances, which are reflected in interest expenses or interest income, respectively. Subsequent payments (variation margin) are made or received daily, in cash, by a fund. The variation margin is equal to the daily change in the value and is a component of unrealized gains and losses. Realized gain or loss is recorded upon receipt or payment of a periodic settlement or termination of swap agreements. Net realized and unrealized gains or losses occurring during the holding period of swap agreements are a component of net realized gain (loss) on swap agreement transactions and change in net unrealized appreciation (depreciation) on swap agreements, respectively. The risks of entering into swap agreements include the possible lack of liquidity, failure of the counterparty to meet its obligations, and that there may be unfavorable changes in the underlying investments or instruments. The fund's average notional amount held during the period was $74,170,000.
Interest Rate Risk — The fund is subject to interest rate risk in the normal course of pursuing its investment objectives. The value of bonds generally declines as interest rates rise. A fund may enter into futures contracts based on a bond index or a specific underlying security. A fund may purchase futures contracts to gain exposure to increases in market value or sell futures contracts to protect against a decline in market value. Upon entering into a futures contract, a fund will segregate cash, cash equivalents or other appropriate liquid securities on its records in amounts sufficient to meet requirements. A fund may incur charges or earn income on cash deposit balances, which are reflected in interest expenses or interest income, respectively. Subsequent payments (variation margin) are made or received daily, in cash, by a fund. The variation margin is equal to the daily change in the contract value and is recorded as unrealized gains and losses. A fund recognizes a realized gain or loss when the futures contract is closed or expires. Net realized and unrealized gains or losses occurring during the holding period of futures contracts are a component of net realized gain (loss) on futures contract transactions and change in net unrealized appreciation (depreciation) on futures contracts, respectively. One of the risks of entering into futures contracts is the possibility that the change in value of the contract may not correlate with the changes in value of the underlying securities. The fund's average notional exposure to interest rate risk derivative instruments held during the period was $259,995,578 futures contracts purchased and $178,097,717 futures contracts sold.
Other Contracts — A fund may enter into total return swap agreements in order to attempt to obtain or preserve a particular return or spread at a lower cost than obtaining a return or spread through purchases and/or sales of instruments in other markets or gain exposure to certain markets in the most economical way possible. A fund will segregate cash, cash equivalents or other appropriate liquid securities on its records in amounts sufficient to meet requirements. Changes in value, including the periodic amounts of interest to be paid or received on swap agreements, are recorded as unrealized appreciation (depreciation) on swap agreements. Upon entering into a centrally cleared swap, a fund is required to deposit cash or securities (initial margin) with a financial intermediary in an amount equal to a certain percentage of the notional amount. A fund may incur charges or earn income on cash deposit balances, which are reflected in interest expenses or interest income, respectively. Subsequent payments (variation margin) are made or received daily, in cash, by a fund. The variation margin is equal to the daily change in the value and is a component of unrealized gains and losses. Realized gain or loss is recorded upon receipt or payment of a periodic settlement or termination of swap agreements. Net realized and unrealized gains or losses occurring during the holding period of swap agreements are a component of net realized gain (loss) on swap agreement transactions and change in net unrealized appreciation (depreciation) on swap agreements, respectively. The risks of entering into swap agreements include the possible lack of liquidity, failure of the counterparty to meet its obligations, and that there may be unfavorable changes in the underlying investments or instruments, including inflationary risk. The fund's average notional amount held during the period was $28,866,667.
Value of Derivative Instruments as of March 31, 2023
| | | | | | | | | | | | | | |
| Asset Derivatives | Liability Derivatives |
| Type of Risk Exposure | Location on Statement of Assets and Liabilities | Value | Location on Statement of Assets and Liabilities | Value |
| Interest Rate Risk | Receivable for variation margin on futures contracts* | — | | Payable for variation margin on futures contracts* | $ | 49,629 | |
| Other Contracts | Receivable for variation margin on swap agreements* | $ | 14,690 | | Payable for variation margin on swap agreements* | — | |
| | $ | 14,690 | | | $ | 49,629 | |
*Included in the unrealized appreciation (depreciation) on futures contracts or centrally cleared swap agreements, as applicable, as reported in the Schedule of Investments.
Effect of Derivative Instruments on the Statement of Operations for the Year Ended March 31, 2023
| | | | | | | | | | | | | | |
| Net Realized Gain (Loss) | Change in Net Unrealized Appreciation (Depreciation) |
| Type of Risk Exposure | Location on Statement of Operations | Value | Location on Statement of Operations | Value |
| Credit Risk | Net realized gain (loss) on swap agreement transactions | $ | 445,175 | | Change in net unrealized appreciation (depreciation) on swap agreements | $ | 1,912,813 | |
| Interest Rate Risk | Net realized gain (loss) on futures contract transactions | 8,306,543 | | Change in net unrealized appreciation (depreciation) on futures contracts | (3,660,623) | |
| Other Contracts | Net realized gain (loss) on swap agreement transactions | 3,282,178 | | Change in net unrealized appreciation (depreciation) on swap agreements | (3,592,285) | |
| | $ | 12,033,896 | | | $ | (5,340,095) | |
8. Risk Factors
The value of the fund’s shares will go up and down, sometimes rapidly or unpredictably, based on the performance of the securities owned by the fund and other factors generally affecting the securities market. Market risks, including political, regulatory, economic and social developments, can affect the value of the fund’s investments. Natural disasters, public health emergencies, war, terrorism and other unforeseeable events may lead to increased market volatility and may have adverse long-term effects on world economies and markets generally.
The fund may invest in instruments that have variable or floating coupon rates based on the London Interbank Offered Rate (LIBOR). LIBOR is a benchmark interest rate intended to be representative of the rate at which certain major international banks lend to one another over short-terms. Financial institutions have started the process of phasing out LIBOR and the transition process to a replacement rate may lead to increased volatility or illiquidity in markets for instruments that rely on LIBOR. This could result in a change to the value of such instruments or a change in the cost of temporary borrowing for the fund.
The fund's investment process may result in high portfolio turnover, which could mean high transaction costs, affecting both performance and capital gains tax liabilities to investors.
9. Federal Tax Information
The tax character of distributions paid during the years ended March 31, 2023 and March 31, 2022 were as follows:
| | | | | | | | |
| 2023 | 2022 |
| Distributions Paid From | | |
| Ordinary income | $ | 43,069,155 | | $ | 39,127,627 | |
| Long-term capital gains | — | | — | |
The book-basis character of distributions made during the year from net investment income or net realized gains may differ from their ultimate characterization for federal income tax purposes. These differences reflect the differing character of certain income items and net realized gains and losses for financial statement and tax purposes, and may result in reclassification among certain capital accounts on the financial statements.
As of period end, the federal tax cost of investments and the components of distributable earnings on a tax-basis were as follows:
| | | | | |
| Federal tax cost of investments | $ | 1,386,115,676 | |
| Gross tax appreciation of investments | $ | 5,219,830 | |
| Gross tax depreciation of investments | (37,736,007) | |
| Net tax appreciation (depreciation) of investments | (32,516,177) | |
| Net tax appreciation (depreciation) on derivatives | 139,257 | |
| Net tax appreciation (depreciation) | $ | (32,376,920) | |
| Other book-to-tax adjustments | $ | (1,984,603) | |
| Undistributed ordinary income | — | |
| Accumulated short-term capital losses | $ | (35,873,796) | |
| Accumulated long-term capital losses | $ | (31,783,090) | |
The difference between book-basis and tax-basis unrealized appreciation (depreciation) is attributable primarily to the tax deferral of losses on wash sales. Other book-to-tax adjustments are attributable primarily to the tax deferral of losses on straddle positions.
Accumulated capital losses represent net capital loss carryovers that may be used to offset future realized
capital gains for federal income tax purposes. The capital loss carryovers may be carried forward for an
unlimited period. Future capital loss carryover utilization in any given year may be subject to Internal Revenue
Code limitations.
| | | | | | | | | | | | | | | | | | | | | | | | | | | | | | | | | | | | | | | | | | | | | | | |
| For a Share Outstanding Throughout the Years Ended March 31 (except as noted) |
| Per-Share Data | | | | | | | | | Ratios and Supplemental Data | | |
| | Income From Investment Operations: | Distributions From: | | | Ratio to Average Net Assets of: | |
| Net Asset
Value,
Beginning
of Period | Net Investment Income (Loss)(1) | Net Realized and Unrealized Gain (Loss) | Total From
Investment
Operations | Net
Investment
Income | Net Realized Gains | Total Distributions | Net Asset
Value,
End
of Period | Total Return(2) | Operating
Expenses | Operating
Expenses
(before
expense
waiver) | Net
Investment
Income
(Loss) | Net
Investment
Income
(Loss)
(before
expense
waiver) | Portfolio
Turnover
Rate | Net
Assets,
End of
Period
(in thousands) |
| Investor Class | | | | | | | | | | | | | | |
| 2023 | $10.06 | 0.27 | (0.27) | — | (0.26) | — | (0.26) | $9.80 | 0.00% | 0.58% | 0.59% | 2.68% | 2.67% | 187% | $353,985 | |
| 2022 | $10.47 | 0.14 | (0.36) | (0.22) | (0.15) | (0.04) | (0.19) | $10.06 | (2.13)% | 0.58% | 0.58% | 1.31% | 1.31% | 178% | $388,521 | |
| 2021 | $10.05 | 0.11 | 0.45 | 0.56 | (0.14) | — | (0.14) | $10.47 | 5.62% | 0.59% | 0.59% | 1.03% | 1.03% | 183% | $383,653 | |
| 2020 | $10.15 | 0.20 | (0.07) | 0.13 | (0.23) | — | (0.23) | $10.05 | 1.31% | 0.59% | 0.59% | 1.98% | 1.98% | 156% | $155,169 | |
| 2019 | $10.13 | 0.24 | 0.05 | 0.29 | (0.27) | — | (0.27) | $10.15 | 2.87% | 0.60% | 0.60% | 2.39% | 2.39% | 72% | $226,341 | |
| I Class | | | | | | | | | | | | | | |
| 2023 | $10.06 | 0.28 | (0.27) | 0.01 | (0.27) | — | (0.27) | $9.80 | 0.10% | 0.48% | 0.49% | 2.78% | 2.77% | 187% | $215,665 | |
| 2022 | $10.47 | 0.15 | (0.36) | (0.21) | (0.16) | (0.04) | (0.20) | $10.06 | (2.03)% | 0.48% | 0.48% | 1.41% | 1.41% | 178% | $242,736 | |
| 2021 | $10.05 | 0.13 | 0.44 | 0.57 | (0.15) | — | (0.15) | $10.47 | 5.73% | 0.49% | 0.49% | 1.13% | 1.13% | 183% | $172,271 | |
| 2020 | $10.15 | 0.21 | (0.07) | 0.14 | (0.24) | — | (0.24) | $10.05 | 1.41% | 0.49% | 0.49% | 2.08% | 2.08% | 156% | $127,684 | |
| 2019 | $10.13 | 0.26 | 0.04 | 0.30 | (0.28) | — | (0.28) | $10.15 | 2.97% | 0.50% | 0.50% | 2.49% | 2.49% | 72% | $56,264 | |
| | | | | | | | | | | | | | | | | | | | | | | | | | | | | | | | | | | | | | | | | | | | | | | |
| For a Share Outstanding Throughout the Years Ended March 31 (except as noted) |
| Per-Share Data | | | | | | | | | Ratios and Supplemental Data | | |
| | Income From Investment Operations: | Distributions From: | | | Ratio to Average Net Assets of: | |
| Net Asset
Value,
Beginning
of Period | Net Investment Income (Loss)(1) | Net Realized and Unrealized Gain (Loss) | Total From
Investment
Operations | Net
Investment
Income | Net Realized Gains | Total Distributions | Net Asset
Value,
End
of Period | Total Return(2) | Operating
Expenses | Operating
Expenses
(before
expense
waiver) | Net
Investment
Income
(Loss) | Net
Investment
Income
(Loss)
(before
expense
waiver) | Portfolio
Turnover
Rate | Net
Assets,
End of
Period
(in thousands) |
| A Class | | | | | | | | | | | | | | |
| 2023 | $10.05 | 0.24 | (0.26) | (0.02) | (0.23) | — | (0.23) | $9.80 | (0.15)% | 0.83% | 0.84% | 2.43% | 2.42% | 187% | $20,055 | |
| 2022 | $10.46 | 0.11 | (0.35) | (0.24) | (0.13) | (0.04) | (0.17) | $10.05 | (2.38)% | 0.83% | 0.83% | 1.06% | 1.06% | 178% | $21,270 | |
| 2021 | $10.05 | 0.09 | 0.44 | 0.53 | (0.12) | — | (0.12) | $10.46 | 5.26% | 0.84% | 0.84% | 0.78% | 0.78% | 183% | $23,393 | |
| 2020 | $10.15 | 0.18 | (0.07) | 0.11 | (0.21) | — | (0.21) | $10.05 | 1.05% | 0.84% | 0.84% | 1.73% | 1.73% | 156% | $16,411 | |
| 2019 | $10.13 | 0.22 | 0.04 | 0.26 | (0.24) | — | (0.24) | $10.15 | 2.61% | 0.85% | 0.85% | 2.14% | 2.14% | 72% | $21,709 | |
| C Class | | | | | | | | | | | | | | |
| 2023 | $10.06 | 0.16 | (0.25) | (0.09) | (0.16) | — | (0.16) | $9.81 | (0.89)% | 1.58% | 1.59% | 1.68% | 1.67% | 187% | $2,704 | |
| 2022 | $10.47 | 0.03 | (0.35) | (0.32) | (0.05) | (0.04) | (0.09) | $10.06 | (3.10)% | 1.58% | 1.58% | 0.31% | 0.31% | 178% | $5,099 | |
| 2021 | $10.05 | 0.02 | 0.44 | 0.46 | (0.04) | — | (0.04) | $10.47 | 4.57% | 1.59% | 1.59% | 0.03% | 0.03% | 183% | $4,514 | |
| 2020 | $10.15 | 0.10 | (0.07) | 0.03 | (0.13) | — | (0.13) | $10.05 | 0.30% | 1.59% | 1.59% | 0.98% | 0.98% | 156% | $6,163 | |
| 2019 | $10.14 | 0.14 | 0.04 | 0.18 | (0.17) | — | (0.17) | $10.15 | 1.75% | 1.60% | 1.60% | 1.39% | 1.39% | 72% | $9,046 | |
| R Class | | | | | | | | | | | | | | |
| 2023 | $10.06 | 0.22 | (0.26) | (0.04) | (0.21) | — | (0.21) | $9.81 | (0.39)% | 1.08% | 1.09% | 2.18% | 2.17% | 187% | $669 | |
| 2022 | $10.47 | 0.08 | (0.35) | (0.27) | (0.10) | (0.04) | (0.14) | $10.06 | (2.62)% | 1.08% | 1.08% | 0.81% | 0.81% | 178% | $667 | |
| 2021 | $10.06 | 0.07 | 0.43 | 0.50 | (0.09) | — | (0.09) | $10.47 | 4.99% | 1.09% | 1.09% | 0.53% | 0.53% | 183% | $937 | |
| 2020 | $10.15 | 0.15 | (0.06) | 0.09 | (0.18) | — | (0.18) | $10.06 | 0.90% | 1.09% | 1.09% | 1.48% | 1.48% | 156% | $764 | |
| 2019 | $10.14 | 0.19 | 0.04 | 0.23 | (0.22) | — | (0.22) | $10.15 | 2.26% | 1.10% | 1.10% | 1.89% | 1.89% | 72% | $756 | |
| | | | | | | | | | | | | | | | | | | | | | | | | | | | | | | | | | | | | | | | | | | | | | | |
| For a Share Outstanding Throughout the Years Ended March 31 (except as noted) |
| Per-Share Data | | | | | | | | | Ratios and Supplemental Data | | |
| | Income From Investment Operations: | Distributions From: | | | Ratio to Average Net Assets of: | |
| Net Asset
Value,
Beginning
of Period | Net Investment Income (Loss)(1) | Net Realized and Unrealized Gain (Loss) | Total From
Investment
Operations | Net
Investment
Income | Net Realized Gains | Total Distributions | Net Asset
Value,
End
of Period | Total Return(2) | Operating
Expenses | Operating
Expenses
(before
expense
waiver) | Net
Investment
Income
(Loss) | Net
Investment
Income
(Loss)
(before
expense
waiver) | Portfolio
Turnover
Rate | Net
Assets,
End of
Period
(in thousands) |
| R5 Class | | | | | | | | | | | | | | |
| 2023 | $10.06 | 0.29 | (0.27) | 0.02 | (0.28) | — | (0.28) | $9.80 | 0.20% | 0.38% | 0.39% | 2.88% | 2.87% | 187% | $11,061 | |
| 2022 | $10.47 | 0.16 | (0.36) | (0.20) | (0.17) | (0.04) | (0.21) | $10.06 | (1.93)% | 0.38% | 0.38% | 1.51% | 1.51% | 178% | $16,327 | |
| 2021 | $10.05 | 0.14 | 0.44 | 0.58 | (0.16) | — | (0.16) | $10.47 | 5.83% | 0.39% | 0.39% | 1.23% | 1.23% | 183% | $23,320 | |
| 2020 | $10.15 | 0.22 | (0.07) | 0.15 | (0.25) | — | (0.25) | $10.05 | 1.51% | 0.39% | 0.39% | 2.18% | 2.18% | 156% | $23,612 | |
| 2019 | $10.13 | 0.26 | 0.05 | 0.31 | (0.29) | — | (0.29) | $10.15 | 3.08% | 0.40% | 0.40% | 2.59% | 2.59% | 72% | $20,662 | |
| R6 Class | | | | | | | | | | | | | | |
| 2023 | $10.05 | 0.29 | (0.27) | 0.02 | (0.28) | — | (0.28) | $9.79 | 0.25% | 0.33% | 0.34% | 2.93% | 2.92% | 187% | $58,650 | |
| 2022 | $10.46 | 0.16 | (0.35) | (0.19) | (0.18) | (0.04) | (0.22) | $10.05 | (1.89)% | 0.33% | 0.33% | 1.56% | 1.56% | 178% | $52,851 | |
| 2021 | $10.04 | 0.15 | 0.44 | 0.59 | (0.17) | — | (0.17) | $10.46 | 5.89% | 0.34% | 0.34% | 1.28% | 1.28% | 183% | $85,404 | |
| 2020 | $10.14 | 0.23 | (0.07) | 0.16 | (0.26) | — | (0.26) | $10.04 | 1.56% | 0.34% | 0.34% | 2.23% | 2.23% | 156% | $63,905 | |
| 2019 | $10.13 | 0.27 | 0.03 | 0.30 | (0.29) | — | (0.29) | $10.14 | 3.03% | 0.35% | 0.35% | 2.64% | 2.64% | 72% | $70,752 | |
| G Class | | | | | | | | | | | | | | |
| 2023 | $10.05 | 0.32 | (0.27) | 0.05 | (0.31) | — | (0.31) | $9.79 | 0.57% | 0.01% | 0.34% | 3.25% | 2.92% | 187% | $704,692 | |
| 2022 | $10.46 | 0.20 | (0.36) | (0.16) | (0.21) | (0.04) | (0.25) | $10.05 | (1.57)% | 0.01% | 0.33% | 1.88% | 1.56% | 178% | $916,720 | |
2021(3) | $10.37 | 0.06 | 0.10 | 0.16 | (0.07) | — | (0.07) | $10.46 | 1.57% | 0.01%(4) | 0.34%(4) | 1.48%(4) | 1.15%(4) | 183%(5) | $990,271 | |
| | |
| Notes to Financial Highlights |
(1)Computed using average shares outstanding throughout the period.
(2)Total returns are calculated based on the net asset value of the last business day and do not reflect applicable sales charges, if any. Total returns for periods less than one year are not annualized.
(3)November 4, 2020 (commencement of sale) through March 31, 2021.
(4)Annualized.
(5)Portfolio turnover is calculated at the fund level. Percentage indicated was calculated for the year ended March 31, 2021.
See Notes to Financial Statements.
| | |
| Report of Independent Registered Public Accounting Firm |
To the Shareholders and the Board of Trustees of American Century Investment Trust:
Opinion on the Financial Statements and Financial Highlights
We have audited the accompanying statement of assets and liabilities, including the schedule of investments, of Short Duration Fund (the “Fund”), one of the funds constituting the American Century Investment Trust, as of March 31, 2023, the related statement of operations for the year then ended, the statements of changes in net assets and financial highlights for the two years in the period then ended, and the related notes. In our opinion, the financial statements and financial highlights present fairly, in all material respects, the financial position of Short Duration Fund of the American Century Investment Trust, as of March 31, 2023, and the results of its operations for the year then ended and the changes in its net assets and the financial highlights for the two years then ended in conformity with accounting principles generally accepted in the United States of America. The financial highlights for each of the three years in the period ended March 31, 2021, were audited by other auditors, whose report, dated May 18, 2021, expressed an unqualified opinion on such financial highlights.
Basis for Opinion
These financial statements and financial highlights are the responsibility of the Fund's management. Our responsibility is to express an opinion on the Fund’s financial statements and financial highlights based on our audit. We are a public accounting firm registered with the Public Company Accounting Oversight Board (United States) (PCAOB) and are required to be independent with respect to the Fund in accordance with the U.S. federal securities laws and the applicable rules and regulations of the Securities and Exchange Commission and the PCAOB.
We conducted our audits in accordance with the standards of the PCAOB. Those standards require that we plan and perform the audit to obtain reasonable assurance about whether the financial statements and financial highlights are free of material misstatement, whether due to error or fraud. The Fund is not required to have, nor were we engaged to perform, an audit of its internal control over financial reporting. As part of our audit, we are required to obtain an understanding of internal control over financial reporting but not for the purpose of expressing an opinion on the effectiveness of the Fund’s internal control over financial reporting. Accordingly, we express no such opinion.
Our audits included performing procedures to assess the risks of material misstatement of the financial statements and financial highlights, whether due to error or fraud, and performing procedures that respond to those risks. Such procedures included examining, on a test basis, evidence regarding the amounts and disclosures in the financial statements and financial highlights. Our audits also included evaluating the accounting principles used and significant estimates made by management, as well as evaluating the overall presentation of the financial statements and financial highlights. Our procedures included confirmation of securities owned as of March 31, 2023, by correspondence with the custodian and brokers; when replies were not received from brokers, we performed other auditing procedures. We believe that our audits provide a reasonable basis for our opinion.
/s/ Deloitte & Touche LLP
Kansas City, Missouri
May 16, 2023
We have served as the auditor of one or more American Century investment companies since 1997.
Board of Trustees
The individuals listed below serve as trustees of the funds. Each trustee will continue to serve in this capacity until death, retirement, resignation or removal from office. The board has adopted a mandatory retirement age for trustees who are not “interested persons,” as that term is defined in the Investment Company Act (independent trustees). Independent trustees shall retire on December 31 of the year in which they reach their 76th birthday.
Jonathan S. Thomas is an “interested person” because he currently serves as President and Chief Executive Officer of American Century Companies, Inc. (ACC), the parent company of American Century Investment Management, Inc. (ACIM or the advisor). The other trustees (more than three-fourths of the total number) are independent. They are not employees, directors or officers of, and have no financial interest in, ACC or any of its wholly owned, direct or indirect, subsidiaries, including ACIM, American Century Investment Services, Inc. (ACIS) and American Century Services, LLC (ACS), and they do not have any other affiliations, positions or relationships that would cause them to be considered “interested persons” under the Investment Company Act. The trustees serve in this capacity for eight (in the case of Jonathan S. Thomas, 16; and Jeremy I. Bulow, 9) registered investment companies in the American Century Investments family of funds.
The following table presents additional information about the trustees. The mailing address for each trustee other than Jonathan S. Thomas is 3945 Freedom Circle, Suite #800, Santa Clara, California 95054. The mailing address for Jonathan S. Thomas is 4500 Main Street, Kansas City, Missouri 64111.
| | | | | | | | | | | | | | | | | |
Name
(Year of Birth) | Position(s) Held with Funds | Length of Time Served | Principal Occupation(s) During Past 5 Years | Number of American Century Portfolios Overseen by Trustee | Other Directorships Held During Past 5 Years |
| Independent Trustees | | |
Tanya S. Beder
(1955) | Trustee and Board Chair | Since 2011 (Board Chair since 2022) | Chairman and CEO, SBCC Group Inc. (independent advisory services) (2006 to present) | 32 | Kirby Corporation; Nabors Industries, Ltd. |
Jeremy I. Bulow
(1954) | Trustee | Since 2011 | Professor of Economics, Stanford University, Graduate School of Business (1979 to present) | 77 | None |
Jennifer Cabalquinto
(1968) | Trustee | Since 2021 | Chief Financial Officer, 2K (interactive entertainment) (2021 to present); Special Advisor, GSW Sports, LLC (2020 to 2021); Chief Financial Officer, GSW Sports, LLC (2013 to 2020) | 32 | Sabio Holdings, Inc. |
Anne Casscells
(1958) | Trustee | Since 2016 | Co-Chief Executive Officer and Chief Investment Officer, Aetos Alternatives Management (investment advisory firm) (2001 to present) | 32 | None |
| | | | | | | | | | | | | | | | | |
Name
(Year of Birth) | Position(s) Held with Funds | Length of Time Served | Principal Occupation(s) During Past 5 Years | Number of American Century Portfolios Overseen by Trustee | Other Directorships Held During Past 5 Years |
| Independent Trustees | | |
Jonathan D. Levin
(1972) | Trustee | Since 2016 | Philip H. Knight Professor and Dean, Graduate School of Business, Stanford University (2016 to present); Professor, Stanford University, (2000 to present) | 32 | None |
Peter F. Pervere
(1947) | Trustee | Since 2007 | Retired | 32 | None |
John B. Shoven
(1947) | Trustee | Since 2002 | Charles R. Schwab Professor of Economics, Stanford University (1973 to present, emeritus since 2019) | 32 | Cadence Design Systems; Exponent; Financial Engines |
| Interested Trustee | | |
Jonathan S. Thomas
(1963) | Trustee | Since 2007 | President and Chief Executive Officer, ACC (2007 to present). Also serves as Chief Executive Officer, ACS; Director, ACC and other ACC subsidiaries | 141 | None |
The Statement of Additional Information has additional information about the fund's trustees and is available without charge, upon request, by calling 1-800-345-2021.
Officers
The following table presents certain information about the executive officers of the funds. Each officer serves as an officer for 16 investment companies in the American Century family of funds. No officer is compensated for his or her service as an officer of the funds. The listed officers are interested persons of the funds and are appointed or re-appointed on an annual basis. The mailing address for each of the officers listed below is 4500 Main Street, Kansas City, Missouri 64111.
| | | | | | | | |
Name
(Year of Birth) | Offices with the Funds | Principal Occupation(s) During the Past Five Years |
Patrick Bannigan
(1965)
| President since 2019 | Executive Vice President and Director, ACC (2012 to present); Chief Financial Officer, Chief Accounting Officer and Treasurer, ACC (2015 to present). Also serves as President, ACS; Vice President, ACIM; Chief Financial Officer, Chief Accounting Officer and/or Director, ACIM, ACS and other ACC subsidiaries |
R. Wes Campbell
(1974)
| Chief Financial Officer and Treasurer since 2018 | Vice President, ACS (2020 to present); Investment Operations and Investment Accounting, ACS (2000 to present) |
Amy D. Shelton
(1964) | Chief Compliance Officer and Vice President since 2014 | Chief Compliance Officer, American Century funds, (2014 to present); Chief Compliance Officer, ACIM (2014 to present); Chief Compliance Officer, ACIS (2009 to present). Also serves as Vice President, ACIS |
John Pak
(1968) | General Counsel and Senior Vice President since 2021 | General Counsel and Senior Vice President, ACC (2021 to present); Also serves as General Counsel and Senior Vice President, ACIM, ACS and ACIS. Chief Legal Officer of Investment and Wealth Management, The Bank of New York Mellon (2014 to 2021) |
David H. Reinmiller
(1963) | Vice President since 2000 | Attorney, ACC (1994 to present). Also serves as Vice President, ACIM and ACS |
Ward D. Stauffer
(1960) | Secretary since 2005 | Attorney, ACC (2003 to present) |
| | |
| Liquidity Risk Management Program |
The Fund has adopted a liquidity risk management program (the “program”). The Fund’s Board of Trustees (the "Board") has designated American Century Investment Management, Inc. (“ACIM”) as the administrator of the program. Personnel of ACIM or its affiliates, including members of ACIM’s Investment Oversight Committee who are members of ACIM’s Investment Management and Global Analytics departments, conduct the day-to-day operation of the program pursuant to the program.
Under the program, ACIM manages the Fund’s liquidity risk, which is the risk that the Fund could not meet shareholder redemption requests without significant dilution of remaining shareholders’ interests in the Fund. This risk is managed by monitoring the degree of liquidity of the Fund’s investments, limiting the amount of the Fund’s illiquid investments, and utilizing various risk management tools and facilities available to the Fund for meeting shareholder redemptions, among other means. ACIM’s process of determining the degree of liquidity of certain investments held by the Fund is supported by a third-party liquidity assessment vendor.
The Board reviewed a report prepared by ACIM regarding the operation and effectiveness of the program for the period January 1, 2022 through December 31, 2022. No significant liquidity events impacting the Fund were noted in the report. In addition, ACIM provided its assessment that the program had been effective in managing the Fund’s liquidity risk.
Retirement Account Information
As required by law, distributions you receive from certain retirement accounts are subject to federal income tax withholding at the IRS default rate of 10%.* Tax will be withheld on the total amount withdrawn even though you may be receiving amounts that are not subject to withholding, such as nondeductible contributions. In such case, excess amounts of withholding could occur. You may adjust your withholding election so that a greater or lesser amount will be withheld.
You may elect a different withholding rate, or request zero withholding, by submitting an acceptable IRS Form W-4R election with your distribution request. You may notify us of your W-4R election by telephone, on our distribution forms, on IRS Form W-4R, or through other acceptable electronic means. If your withholding election is for an automatic withdrawal plan, you have the right to revoke your election at any time and any election you make will remain in effect until revoked by filing a new election.
Remember, even if you elect not to have income tax withheld, you are liable for paying income tax on the taxable portion of your withdrawal. If you elect not to have income tax withheld or you don’t have enough income tax withheld, you may be responsible for payment of estimated tax. You may incur penalties under the estimated tax rules if your withholding and estimated tax payments are not sufficient. You can reduce or defer the income tax on a distribution by directly or indirectly rolling such distribution over to another IRA or eligible plan. You should consult your tax advisor for additional information.
State tax will be withheld according to state regulations if, at the time of your distribution, your tax residency is within one of the mandatory withholding states.
*Some 403(b), 457 and qualified retirement plan distributions may be subject to 20% mandatory withholding, as they are subject to special tax and withholding rules. Your plan administrator or plan sponsor is required to provide you with a special tax notice explaining those rules at the time you request a distribution. If applicable, federal and/or state taxes may be withheld from your distribution amount.
Proxy Voting Policies
Descriptions of the principles and policies that the fund's investment advisor uses in exercising the voting rights associated with the securities purchased and/or held by the fund are available without charge, upon request, by calling 1-800-345-2021 or visiting American Century Investments’ website at americancentury.com/proxy. A description of the policies is also available on the Securities and Exchange Commission’s website at sec.gov. Information regarding how the investment advisor voted proxies relating to portfolio securities during the most recent 12-month period ended June 30 is available on americancentury.com/proxy. It is also available at sec.gov.
Quarterly Portfolio Disclosure
The fund files its complete schedule of portfolio holdings with the Securities and Exchange Commission (SEC) for the first and third quarters of each fiscal year as an exhibit to its reports on Form N-PORT. These portfolio holdings are available on the fund's website at americancentury.com and, upon request, by calling 1-800-345-2021. The fund’s Form N-PORT reports are available on the SEC’s website at sec.gov.
| | | | | | | | |
| |
| | |
| Contact Us | americancentury.com | |
| Automated Information Line | 1-800-345-8765 | |
| Investor Services Representative | 1-800-345-2021
or 816-531-5575 | |
| Investors Using Advisors | 1-800-378-9878 | |
| Business, Not-For-Profit, Employer-Sponsored Retirement Plans | 1-800-345-3533 | |
| Banks and Trust Companies, Broker-Dealers, Financial Professionals, Insurance Companies | 1-800-345-6488 | |
| Telecommunications Relay Service for the Deaf | 711 | |
| | |
| American Century Investment Trust | |
| | |
Investment Advisor: American Century Investment Management, Inc. Kansas City, Missouri | |
| | |
| This report and the statements it contains are submitted for the general information of our shareholders. The report is not authorized for distribution to prospective investors unless preceded or accompanied by an effective prospectus. | |
| | |
©2023 American Century Proprietary Holdings, Inc. All rights reserved.
CL-ANN-92285 2305 | |
| | | | | |
| |
| Annual Report |
| |
| March 31, 2023 |
| |
| Short Duration Inflation Protection Bond Fund |
| Investor Class (APOIX) |
| I Class (APOHX) |
| Y Class (APOYX) |
| A Class (APOAX) |
| C Class (APOCX) |
| R Class (APORX) |
| R5 Class (APISX) |
| R6 Class (APODX) |
| G Class (APOGX) |
| | | | | |
| President’s Letter | |
| Performance | |
| Portfolio Commentary | |
| Fund Characteristics | |
| Shareholder Fee Example | |
| Schedule of Investments | |
| Statement of Assets and Liabilities | |
| Statement of Operations | |
| Statement of Changes in Net Assets | |
| Notes to Financial Statements | |
| Financial Highlights | |
| Report of Independent Registered Public Accounting Firm | |
| Management | |
| |
| Liquidity Risk Management Program | |
| |
| Additional Information | |
Any opinions expressed in this report reflect those of the author as of the date of the report, and do not necessarily represent the opinions of American Century Investments® or any other person in the American Century Investments organization. Any such opinions are subject to change at any time based upon market or other conditions and American Century Investments disclaims any responsibility to update such opinions. These opinions may not be relied upon as investment advice and, because investment decisions made by American Century Investments funds are based on numerous factors, may not be relied upon as an indication of trading intent on behalf of any American Century Investments fund. Security examples are used for representational purposes only and are not intended as recommendations to purchase or sell securities. Performance information for comparative indices and securities is provided to American Century Investments by third party vendors. To the best of American Century Investments’ knowledge, such information is accurate at the time of printing.
Jonathan Thomas
Dear Investor:
Thank you for reviewing this annual report for the period ended March 31, 2023. Annual reports help convey important information about fund returns, including market factors that affected performance. For additional investment insights, please visit americancentury.com.
Challenging Conditions Weighed on Asset Class Returns
Prevailing headwinds early in the reporting period continued to challenge U.S. financial markets throughout the 12 months. Asset class performance seesawed but declined overall amid mixed economic data, elevated inflation and anticipated monetary policy responses. By period-end, a new headwind emerged: banking industry uncertainty.
After launching its inflation-fighting rate-hike campaign in March 2022, the Federal Reserve (Fed) lifted rates eight more times by period-end. The federal funds target rate ended the reporting period at 4.75% to 5%, its highest level since 2007, while Treasury yields climbed to multiyear highs. Amid the Fed’s efforts, the annual inflation rate peaked at 9.1% in June, a 40-year high, before easing to 5% by March.
In addition to helping tame inflation, rapidly rising rates also fueled recession worries and led to expectations for the Fed to change course. This sentiment helped spark a rebound among stock and bond indices in the second half of the reporting period. The collapse of two U.S. regional banks late in the period and fears of a looming credit crunch and likely recession also contributed to market expectations for a Fed policy change. Nevertheless, the Fed indicated a near-term course change was unlikely.
Despite delivering strong gains in the second half of the reporting period, stock returns succumbed to first-half losses and declined for the 12 months. Similarly, weakness in the first half of the period overwhelmed second-half gains, and bond returns were negative for the 12-month period.
Remaining Diligent in Uncertain Times
We expect market volatility to linger as investors navigate a complex environment of still-high inflation, tighter financial conditions, banking industry turbulence and economic uncertainty. In addition, increasingly tense geopolitical considerations complicate the market backdrop.
We appreciate your confidence in us during these extraordinary times. Our firm has a long history of helping clients weather unpredictable and volatile markets, and we’re confident we will continue to meet today’s challenges.
Sincerely,
Jonathan Thomas
President and Chief Executive Officer
American Century Investments
| | | | | | | | | | | | | | | | | | | | |
| Total Returns as of March 31, 2023 | | | | |
| | | | Average Annual Returns | |
| Ticker
Symbol | 1 year | 5 years | 10 years | Since
Inception | Inception
Date |
| Investor Class | APOIX | -1.48% | 2.86% | 1.33% | — | 5/31/05 |
| Bloomberg U.S. 1-5 Year Treasury Inflation Protected Securities (TIPS) Index | — | -1.14% | 2.91% | 1.48% | — | — |
| I Class | APOHX | -1.36% | 2.96% | — | 2.51% | 4/10/17 |
| Y Class | APOYX | -1.36% | 3.06% | — | 2.60% | 4/10/17 |
| A Class | APOAX | | | | | 5/31/05 |
| No sales charge | | -1.75% | 2.61% | 1.08% | — | |
| With sales charge | | -3.96% | 2.14% | 0.85% | — | |
| C Class | APOCX | -2.52% | 1.84% | 0.32% | — | 5/31/05 |
| R Class | APORX | -2.04% | 2.34% | 0.83% | — | 5/31/05 |
| R5 Class | APISX | -1.27% | 3.06% | 1.53% | — | 5/31/05 |
| R6 Class | APODX | -1.22% | 3.11% | — | 1.90% | 7/26/13 |
| G Class | APOGX | -1.01% | 3.43% | — | 3.13% | 7/28/17 |
Average annual returns since inception are presented when ten years of performance history is not available.
G Class returns would have been lower if a portion of the fees had not been waived.
C Class shares will automatically convert to A Class shares after being held for approximately eight years. C Class average annual returns do not reflect this conversion.
Sales charges include initial sales charges and contingent deferred sales charges (CDSCs), as applicable. A Class shares have a 2.25% maximum initial sales charge and may be subject to a maximum CDSC of 1.00%. C Class shares redeemed within 12 months of purchase are subject to a maximum CDSC of 1.00%. The SEC requires that mutual funds provide performance information net of maximum sales charges in all cases where charges could be applied.
Data presented reflect past performance. Past performance is no guarantee of future results. Current performance may be higher or lower than the performance shown. Total returns for periods less than one year are not annualized. Investment return and principal value will fluctuate, and redemption value may be more or less than original cost. Data assumes reinvestment of dividends and capital gains, and none of the charts reflect the deduction of taxes that a shareholder would pay on fund distributions or the redemption of fund shares. To obtain performance data current to the most recent month end, please call 1-800-345-2021 or visit americancentury.com. For additional information about the fund, please consult the prospectus.
| | |
| Growth of $10,000 Over 10 Years |
| $10,000 investment made March 31, 2013 |
| Performance for other share classes will vary due to differences in fee structure. |
| | | | | |
| Value on March 31, 2023 |
| Investor Class — $11,411 |
|
| Bloomberg U.S. 1-5 Year Treasury Inflation Protected Securities (TIPS) Index — $11,585 |
|
| |
|
| | | | | | | | | | | | | | | | | | | | | | | | | | |
| Total Annual Fund Operating Expenses | |
| Investor Class | I Class | Y Class | A Class | C Class | R Class | R5 Class | R6 Class | G Class |
| 0.56% | 0.46% | 0.36% | 0.81% | 1.56% | 1.06% | 0.36% | 0.31% | 0.31% |
The total annual fund operating expenses shown is as stated in the fund’s prospectus current as of the date of this report. The prospectus may vary from the expense ratio shown elsewhere in this report because it is based on a different time period, includes acquired fund fees and expenses, and, if applicable, does not include fee waivers or expense reimbursements.
Data presented reflect past performance. Past performance is no guarantee of future results. Current performance may be higher or lower than the performance shown. Total returns for periods less than one year are not annualized. Investment return and principal value will fluctuate, and redemption value may be more or less than original cost. Data assumes reinvestment of dividends and capital gains, and none of the charts reflect the deduction of taxes that a shareholder would pay on fund distributions or the redemption of fund shares. To obtain performance data current to the most recent month end, please call 1-800-345-2021 or visit americancentury.com. For additional information about the fund, please consult the prospectus.
Portfolio Managers: Bob Gahagan, Jim Platz and Miguel Castillo
Performance Summary
Short Duration Inflation Protection Bond returned -1.48%* for the 12 months ended March 31, 2023. By comparison, the Bloomberg U.S. 1-5 Year Treasury Inflation Protected Securities (TIPS) Index returned -1.14%. Fund returns reflect operating expenses, while index returns do not.
Inflation, Federal Reserve Policy Challenged Bond Market
Elevated inflation, aggressive Federal Reserve (Fed) policy, rising interest rates and mounting recession risk dominated the reporting period and contributed to heightened market volatility. After peaking in June, inflation moderated but remained well above the Fed’s target, which led to consistent interest rate hikes. In March, the collapse of two U.S. regional banks introduced a new market headwind, as banks moved to tighten lending standards amid industry uncertainty.
Meanwhile, the 10-year breakeven rate (the yield difference between nominal 10-year Treasuries and 10-year TIPS and a key measure of market-based inflation expectations) experienced quarter-to-quarter volatility but eased overall, from 2.84% to 2.32%. Theoretically, the breakeven rate indicates the market’s expectations for inflation for the next 10 years and also reflects the inflation rate required for TIPS to outperform nominal Treasuries during that period (2.32% or higher as of March 31).
Against this backdrop, Treasury yields were volatile, particularly during the banking industry turmoil. For the period overall, Treasury yields rose sharply across the yield curve. TIPS yields started the period in negative territory and climbed steadily into positive territory. Higher yields contributed to negative 12-month returns for most investment-grade bond market sectors, including TIPS, which were among the weakest.
Non-Index Holdings Weighed on Results
Out-of-index exposure to securitized and corporate securities detracted from results. Rising yields and heightened volatility during the reporting period broadly weighed on credit-sensitive securities.
Duration Detracted from Relative Performance
We began modestly extending the portfolio’s duration in the second half of 2022, as short-maturity Treasury yields were climbing to multiyear highs. In our view, the combination of high inflation, rising Treasury yields and aggressive Fed tightening would eventually trigger a recession and push yields lower. However, yields rose overall, and our longer-than-index duration positioning suffered.
Inflation Exposure Boosted Relative Results
We generally favored the shorter maturity inflation-protected securities in the portfolio’s maturity
range, which fared better than longer maturity securities amid elevated inflation. This strategy had
a positive effect on relative performance.
*All fund returns referenced in this commentary are for Investor Class shares. Performance for other share classes will vary due to differences in fee structure; when Investor Class performance exceeds that of the index, other share classes may not. See page 3 for returns for all share classes.
We also held inflation swaps in conjunction with out-of-index securitized and corporate bonds. Inflation swaps diversified the portfolio’s inflation protection and created an inflation overlay for non-inflation-linked securitized and corporate securities. Inflation swaps are fixed-maturity instruments, negotiated through a counterparty (investment bank), that return the rate of inflation (Consumer Price Index). All swaps bear counterparty credit risk, but American Century Investments applies stringent controls and oversight regarding this risk.Our swaps strategy generally aided results, most significantly early in the period when the swaps weighting gave the portfolio greater sensitivity to inflation than the index.
By mid-2022, we reduced the portfolio’s overweight inflation exposure. This was due to our expectations for inflation to continue moderating amid Fed hawkishness and a likely recession. We expect to increase the portfolio’s inflation sensitivity as TIPS valuations improve.
| | | | | |
| MARCH 31, 2023 | |
| Types of Investments in Portfolio | % of net assets |
| U.S. Treasury Securities | 85.5% |
| Corporate Bonds | 3.4% |
| Collateralized Loan Obligations | 2.0% |
| Asset-Backed Securities | 1.9% |
| Commercial Mortgage-Backed Securities | 1.2% |
| Collateralized Mortgage Obligations | 0.4% |
| Short-Term Investments | 5.6% |
| Other Assets and Liabilities | —* |
*Category is less than 0.05% of total net assets.
Fund shareholders may incur two types of costs: (1) transaction costs, including sales charges (loads) on purchase payments and redemption/exchange fees; and (2) ongoing costs, including management fees; distribution and service (12b-1) fees; and other fund expenses. This example is intended to help you understand your ongoing costs (in dollars) of investing in your fund and to compare these costs with the ongoing cost of investing in other mutual funds.
The example is based on an investment of $1,000 made at the beginning of the period and held for the entire period from October 1, 2022 to March 31, 2023.
Actual Expenses
The table provides information about actual account values and actual expenses for each class. You may use the information, together with the amount you invested, to estimate the expenses that you paid over the period. First, identify the share class you own. Then simply divide your account value by $1,000 (for example, an $8,600 account value divided by $1,000 = 8.6), then multiply the result by the number under the heading “Expenses Paid During Period” to estimate the expenses you paid on your account during this period.
If you hold Investor Class shares of any American Century Investments mutual fund, or I Class shares of the American Century Diversified Bond Fund, in an American Century Investments account (i.e., not through a financial intermediary or employer-sponsored retirement plan account), American Century Investments may charge you a $25 annual account maintenance fee if the value of those shares is less than $10,000. We will redeem shares automatically in one of your accounts to pay the $25 fee. In determining your total eligible investment amount, we will include your investments in all personal accounts (including American Century Investments brokerage accounts) registered under your Social Security number. Personal accounts include individual accounts, joint accounts, UGMA/UTMA accounts, personal trusts, Coverdell Education Savings Accounts and IRAs (including traditional, Roth, Rollover, SEP-, SARSEP- and SIMPLE-IRAs), and certain other retirement accounts. If you have only business, business retirement, employer-sponsored or American Century Investments brokerage accounts, you are currently not subject to this fee. If you are subject to the account maintenance fee, your account value could be reduced by the fee amount.
Hypothetical Example for Comparison Purposes
The table also provides information about hypothetical account values and hypothetical expenses based on the actual expense ratio of each class of your fund and an assumed rate of return of 5% per year before expenses, which is not the actual return of a fund’s share class. The hypothetical account values and expenses may not be used to estimate the actual ending account balance or expenses you paid for the period. You may use this information to compare the ongoing costs of investing in your fund and other funds. To do so, compare this 5% hypothetical example with the 5% hypothetical examples that appear in the shareholder reports of the other funds.
Please note that the expenses shown in the table are meant to highlight your ongoing costs only and do not reflect any transactional costs, such as sales charges (loads) or redemption/exchange fees. Therefore, the table is useful in comparing ongoing costs only, and will not help you determine the relative total costs of owning different funds. In addition, if these transactional costs were included, your costs would have been higher.
| | | | | | | | | | | | | | |
| Beginning
Account Value
10/1/22 | Ending
Account Value
3/31/23 | Expenses Paid During Period(1) 10/1/22 - 3/31/23 | Annualized Expense Ratio(1) |
| Actual | | | | |
| Investor Class | $1,000 | $1,037.50 | $3.35 | 0.66% |
| I Class | $1,000 | $1,037.80 | $2.85 | 0.56% |
| Y Class | $1,000 | $1,038.20 | $2.34 | 0.46% |
| A Class | $1,000 | $1,036.50 | $4.62 | 0.91% |
| C Class | $1,000 | $1,032.40 | $8.41 | 1.66% |
| R Class | $1,000 | $1,034.30 | $5.88 | 1.16% |
| R5 Class | $1,000 | $1,038.30 | $2.34 | 0.46% |
| R6 Class | $1,000 | $1,038.60 | $2.08 | 0.41% |
| G Class | $1,000 | $1,039.20 | $0.51 | 0.10% |
| Hypothetical | | | | |
| Investor Class | $1,000 | $1,021.64 | $3.33 | 0.66% |
| I Class | $1,000 | $1,022.14 | $2.82 | 0.56% |
| Y Class | $1,000 | $1,022.64 | $2.32 | 0.46% |
| A Class | $1,000 | $1,020.39 | $4.58 | 0.91% |
| C Class | $1,000 | $1,016.65 | $8.35 | 1.66% |
| R Class | $1,000 | $1,019.15 | $5.84 | 1.16% |
| R5 Class | $1,000 | $1,022.64 | $2.32 | 0.46% |
| R6 Class | $1,000 | $1,022.89 | $2.07 | 0.41% |
| G Class | $1,000 | $1,024.43 | $0.50 | 0.10% |
(1)Expenses are equal to the class's annualized expense ratio listed in the table above, multiplied by the average account value over the period, multiplied by 182, the number of days in the most recent fiscal half-year, divided by 365, to reflect the one-half year period. Annualized expense ratio reflects actual expenses, including any applicable fee waivers or expense reimbursements and excluding any acquired fund fees and expenses.
MARCH 31, 2023
| | | | | | | | |
| Principal
Amount/Shares | Value |
| U.S. TREASURY SECURITIES — 85.5% | | |
| U.S. Treasury Inflation Indexed Bonds, 1.75%, 1/15/28 | $ | 7,142,850 | | $ | 7,311,102 | |
| U.S. Treasury Inflation Indexed Bonds, 3.625%, 4/15/28 | 27,755,850 | | 30,996,497 | |
| U.S. Treasury Inflation Indexed Notes, 0.625%, 4/15/23 | 150,971,464 | | 151,080,995 | |
| U.S. Treasury Inflation Indexed Notes, 0.50%, 4/15/24 | 4,449,900 | | 4,378,558 | |
| U.S. Treasury Inflation Indexed Notes, 0.125%, 7/15/24 | 44,744,910 | | 43,876,573 | |
| U.S. Treasury Inflation Indexed Notes, 0.125%, 10/15/24 | 36,161,190 | | 35,323,266 | |
| U.S. Treasury Inflation Indexed Notes, 0.25%, 1/15/25 | 213,101,081 | | 207,968,471 | |
| U.S. Treasury Inflation Indexed Notes, 0.125%, 4/15/25 | 171,480,200 | | 166,164,958 | |
| U.S. Treasury Inflation Indexed Notes, 0.375%, 7/15/25 | 94,021,235 | | 91,982,876 | |
| U.S. Treasury Inflation Indexed Notes, 0.125%, 10/15/25 | 118,572,604 | | 114,896,077 | |
| U.S. Treasury Inflation Indexed Notes, 0.625%, 1/15/26 | 125,576,138 | | 122,799,100 | |
| U.S. Treasury Inflation Indexed Notes, 0.125%, 4/15/26 | 213,976,875 | | 205,390,379 | |
| U.S. Treasury Inflation Indexed Notes, 0.125%, 7/15/26 | 34,959,680 | | 33,683,793 | |
U.S. Treasury Inflation Indexed Notes, 0.125%, 10/15/26(1) | 248,507,687 | | 238,686,603 | |
| U.S. Treasury Inflation Indexed Notes, 0.375%, 1/15/27 | 58,231,120 | | 56,138,939 | |
| U.S. Treasury Inflation Indexed Notes, 0.125%, 4/15/27 | 306,705,213 | | 292,237,554 | |
| U.S. Treasury Inflation Indexed Notes, 0.375%, 7/15/27 | 12,234,600 | | 11,822,859 | |
| U.S. Treasury Inflation Indexed Notes, 1.625%, 10/15/27 | 22,731,975 | | 23,184,302 | |
| U.S. Treasury Inflation Indexed Notes, 0.50%, 1/15/28 | 90,998,250 | | 87,857,004 | |
TOTAL U.S. TREASURY SECURITIES (Cost $2,033,407,372) | | 1,925,779,906 | |
| CORPORATE BONDS — 3.4% | | |
| Automobiles — 0.3% | | |
| General Motors Financial Co., Inc., 3.80%, 4/7/25 | 7,570,000 | | 7,364,674 | |
| Banks — 0.9% | | |
| Bank of America Corp., VRN, 1.73%, 7/22/27 | 2,605,000 | | 2,338,067 | |
| Bank of America Corp., VRN, 2.55%, 2/4/28 | 1,960,000 | | 1,784,676 | |
| Bank of America Corp., VRN, 4.95%, 7/22/28 | 1,465,000 | | 1,457,843 | |
| Barclays PLC, VRN, 2.28%, 11/24/27 | 3,967,000 | | 3,488,856 | |
| Barclays PLC, VRN, 7.39%, 11/2/28 | 1,508,000 | | 1,599,752 | |
BPCE SA, 4.625%, 7/11/24(2) | 1,650,000 | | 1,610,628 | |
| JPMorgan Chase & Co., VRN, 1.04%, 2/4/27 | 3,687,000 | | 3,293,854 | |
| JPMorgan Chase & Co., VRN, 1.58%, 4/22/27 | 2,520,000 | | 2,266,057 | |
UniCredit SpA, 7.83%, 12/4/23(2) | 2,665,000 | | 2,689,725 | |
| | 20,529,458 | |
| Capital Markets — 0.4% | | |
| Golub Capital BDC, Inc., 2.50%, 8/24/26 | 756,000 | | 649,069 | |
| Morgan Stanley, VRN, 2.63%, 2/18/26 | 4,326,000 | | 4,109,026 | |
| Owl Rock Core Income Corp., 3.125%, 9/23/26 | 1,223,000 | | 1,062,852 | |
UBS Group AG, VRN, 1.49%, 8/10/27(2) | 3,277,000 | | 2,825,316 | |
| | 8,646,263 | |
| Consumer Finance — 0.1% | | |
| AerCap Ireland Capital DAC / AerCap Global Aviation Trust, 1.65%, 10/29/24 | 1,845,000 | | 1,727,116 | |
| Entertainment — 0.1% | | |
Warnermedia Holdings, Inc., 3.79%, 3/15/25(2) | 1,455,000 | | 1,409,820 | |
Warnermedia Holdings, Inc., 3.76%, 3/15/27(2) | 1,252,000 | | 1,180,103 | |
| | 2,589,923 | |
| | | | | | | | |
| Principal
Amount/Shares | Value |
| Financial Services — 0.2% | | |
Corebridge Financial, Inc., 3.50%, 4/4/25(2) | $ | 3,832,000 | | $ | 3,684,043 | |
| Gas Utilities — 0.2% | | |
East Ohio Gas Co., 1.30%, 6/15/25(2) | 3,740,000 | | 3,434,459 | |
| Ground Transportation — 0.1% | | |
DAE Funding LLC, 1.55%, 8/1/24(2) | 2,526,000 | | 2,377,052 | |
| Household Durables — 0.2% | | |
| Lennar Corp., 4.75%, 5/30/25 | 4,460,000 | | 4,396,730 | |
| Insurance — 0.1% | | |
GA Global Funding Trust, 0.80%, 9/13/24(2) | 2,800,000 | | 2,609,672 | |
| Multi-Utilities — 0.1% | | |
| Sempra Energy, 3.30%, 4/1/25 | 3,333,000 | | 3,227,882 | |
| Personal Care Products — 0.2% | | |
| Haleon UK Capital PLC, 3.125%, 3/24/25 | 5,325,000 | | 5,149,644 | |
| Pharmaceuticals — 0.5% | | |
| AbbVie, Inc., 2.95%, 11/21/26 | 4,180,000 | | 3,979,911 | |
| Royalty Pharma PLC, 1.20%, 9/2/25 | 5,380,000 | | 4,880,591 | |
| Viatris, Inc., 1.65%, 6/22/25 | 2,940,000 | | 2,697,785 | |
| | 11,558,287 | |
TOTAL CORPORATE BONDS (Cost $81,203,853) | | 77,295,203 | |
| COLLATERALIZED LOAN OBLIGATIONS — 2.0% | | |
Bristol Park CLO Ltd., Series 2016-1A, Class BR, VRN, 6.24%, (3-month LIBOR plus 1.45%), 4/15/29(2) | 5,000,000 | | 4,869,340 | |
BXMT Ltd., Series 2020-FL2, Class B, VRN, 6.26%, (1-month SOFR plus 1.51%), 2/15/38(2) | 2,970,000 | | 2,696,646 | |
Carlyle Global Market Strategies CLO Ltd., Series 2013-1A, Class BRR, VRN, 7.07%, (3-month LIBOR plus 2.20%), 8/14/30(2) | 4,625,000 | | 4,517,371 | |
Goldentree Loan Opportunities X Ltd., Series 2015-10A, Class BR, VRN, 6.46%, (3-month LIBOR plus 1.65%), 7/20/31(2) | 3,650,000 | | 3,587,360 | |
KKR CLO Ltd., Series 2022A, Class B, VRN, 6.41%, (3-month LIBOR plus 1.60%), 7/20/31(2) | 4,425,000 | | 4,282,396 | |
Magnetite VIII Ltd., Series 2014-8A, Class BR2, VRN, 6.29%, (3-month LIBOR plus 1.50%), 4/15/31(2) | 2,200,000 | | 2,155,242 | |
MF1 Ltd., Series 2021-FL7, Class AS, VRN, 6.21%, (1-month LIBOR plus 1.45%), 10/16/36(2) | 3,141,000 | | 3,003,102 | |
Palmer Square Loan Funding Ltd., Series 2022-1A, Class B, VRN, 6.63%, (3-month SOFR plus 2.00%), 4/15/30(2) | 4,000,000 | | 3,896,038 | |
Palmer Square Loan Funding Ltd., Series 2022-4A, Class A2, VRN, 7.08%, (3-month SOFR plus 2.30%), 7/24/31(2) | 3,100,000 | | 3,104,238 | |
Shelter Growth CRE Issuer Ltd., Series 2022-FL4, Class A, VRN, 7.05%, (1-month SOFR plus 2.30%), 6/17/37(2) | 7,580,000 | | 7,540,523 | |
THL Credit Wind River CLO Ltd., Series 2019-3A, Class CR, VRN, 6.99%, (3-month LIBOR plus 2.20%), 4/15/31(2) | 2,250,000 | | 2,147,704 | |
Wellfleet CLO Ltd., Series 2017-2A, Class A1R, VRN, 5.87%, (3-month LIBOR plus 1.06%), 10/20/29(2) | 2,280,695 | | 2,263,532 | |
TOTAL COLLATERALIZED LOAN OBLIGATIONS (Cost $44,906,986) | | 44,063,492 | |
| ASSET-BACKED SECURITIES — 1.9% | | |
Applebee's Funding LLC / IHOP Funding LLC, Series 2019-1A, Class A2I, SEQ, 4.19%, 6/5/49(2) | 11,533,500 | | 11,307,856 | |
BRE Grand Islander Timeshare Issuer LLC, Series 2017-1A, Class A, SEQ, 2.94%, 5/25/29(2) | 1,321,211 | | 1,282,778 | |
BRE Grand Islander Timeshare Issuer LLC, Series 2017-1A, Class B, 3.24%, 5/25/29(2) | 365,257 | | 353,937 | |
| | | | | | | | |
| Principal
Amount/Shares | Value |
CARS-DB5 LP, Series 2021-1A, Class A3, SEQ, 1.92%, 8/15/51(2) | $ | 3,941,771 | | $ | 3,459,418 | |
Cologix Data Centers US Issuer LLC, Series 2021-1A, Class A2, SEQ, 3.30%, 12/26/51(2) | 7,825,000 | | 7,039,630 | |
FirstKey Homes Trust, Series 2020-SFR2, Class D, 1.97%, 10/19/37(2) | 6,600,000 | | 5,932,591 | |
Progress Residential Trust, Series 2020-SFR1, Class B, 2.03%, 4/17/37(2) | 4,900,000 | | 4,556,527 | |
Stack Infrastructure Issuer LLC, Series 2019-1A, Class A2, SEQ, 4.54%, 2/25/44(2) | 4,334,470 | | 4,258,734 | |
Tricon Residential Trust, Series 2022-SFR1, Class D, 4.75%, 4/17/39(2) | 6,000,000 | | 5,711,050 | |
TOTAL ASSET-BACKED SECURITIES (Cost $46,388,519) | | 43,902,521 | |
| COMMERCIAL MORTGAGE-BACKED SECURITIES — 1.2% | | |
BX Commercial Mortgage Trust, Series 2021-VOLT, Class E, VRN, 6.68%, (1-month LIBOR plus 2.00%), 9/15/36(2) | 7,200,000 | | 6,735,283 | |
Credit Suisse Mortgage Capital Certificates, Series 2019-ICE4, Class D, VRN, 6.28%, (1-month LIBOR plus 1.60%), 5/15/36(2) | 5,726,753 | | 5,601,721 | |
Extended Stay America Trust, Series 2021-ESH, Class E, VRN, 7.54%, (1-month LIBOR plus 2.85%), 7/15/38(2) | 8,794,516 | | 8,336,506 | |
J.P. Morgan Chase Commercial Mortgage Securities Trust, Series 2018-AON, Class A, SEQ, 4.13%, 7/5/31(2) | 6,718,000 | | 6,079,790 | |
TOTAL COMMERCIAL MORTGAGE-BACKED SECURITIES (Cost $28,218,269) | | 26,753,300 | |
| COLLATERALIZED MORTGAGE OBLIGATIONS — 0.4% | | |
| Private Sponsor Collateralized Mortgage Obligations — 0.3% | |
| Bear Stearns Adjustable Rate Mortgage Trust, Series 2006-1, Class A1, VRN, 6.80%, (1-year H15T1Y plus 2.25%), 2/25/36 | 231,157 | | 217,583 | |
Bellemeade Re Ltd., Series 2021-3A, Class M1A, VRN, 5.56%, (30-day average SOFR plus 1.00%), 9/25/31(2) | 2,912,083 | | 2,889,788 | |
| JP Morgan Mortgage Trust, Series 2006-A4, Class 3A1, VRN, 3.35%, 6/25/36 | 174,060 | | 123,377 | |
Verus Securitization Trust, Series 2020-4, Class A2, SEQ, 1.91%, 5/25/65(2) | 1,743,972 | | 1,618,372 | |
Verus Securitization Trust, Series 2021-5, Class A3, VRN, 1.37%, 9/25/66(2) | 2,948,515 | | 2,323,630 | |
| Wells Fargo Mortgage-Backed Securities Trust, Series 2006-7, Class 3A1, SEQ, 6.00%, 6/25/36 | 41,121 | | 35,466 | |
| | 7,208,216 | |
| U.S. Government Agency Collateralized Mortgage Obligations — 0.1% | |
| FHLMC, Series 2015-SC02, Class M3, VRN, 3.66%, 9/25/45 | 980,883 | | 958,787 | |
| FNMA, Series 2014-C02, Class 2M2, VRN, 7.45%, (1-month LIBOR plus 2.60%), 5/25/24 | 629,562 | | 634,494 | |
| | 1,593,281 | |
TOTAL COLLATERALIZED MORTGAGE OBLIGATIONS (Cost $9,642,986) | | 8,801,497 | |
| SHORT-TERM INVESTMENTS — 5.6% | | |
Discount Notes(3) — 1.0% | | |
| Federal Home Loan Bank Discount Notes, 4.67%, 4/12/23 | 22,000,000 | | 21,975,274 | |
Money Market Funds† | | |
| State Street Institutional U.S. Government Money Market Fund, Premier Class | 34,668 | | 34,668 | |
| Repurchase Agreements — 3.5% | | |
| BMO Capital Markets Corp., (collateralized by various U.S. Treasury obligations, 1.125% - 4.375%, 8/15/40 - 5/15/49, valued at $20,702,036), in a joint trading account at 4.67%, dated 3/31/23, due 4/3/23 (Delivery value $19,975,546) | | 19,967,775 | |
| | | | | | | | |
| Principal
Amount/Shares | Value |
| Fixed Income Clearing Corp., (collateralized by various U.S. Treasury obligations, 3.625%, 3/31/28, valued at $58,913,217), at 4.81%, dated 3/31/23, due 4/3/23 (Delivery value $57,781,151) | | $ | 57,758,000 | |
| | 77,725,775 | |
Treasury Bills(3) — 1.1% | | |
| U.S. Treasury Bills, 4.77%, 4/6/23 | $ | 25,500,000 | | 25,490,198 | |
TOTAL SHORT-TERM INVESTMENTS (Cost $125,213,388) | | 125,225,915 | |
TOTAL INVESTMENT SECURITIES — 100.0% (Cost $2,368,981,373) | | 2,251,821,834 | |
OTHER ASSETS AND LIABILITIES† | | 709,155 | |
| TOTAL NET ASSETS — 100.0% | | $ | 2,252,530,989 | |
| | | | | | | | | | | | | | |
| FUTURES CONTRACTS PURCHASED |
| Reference Entity | Contracts | Expiration Date | Notional
Amount | Unrealized
Appreciation
(Depreciation)^ |
| U.S. Treasury 2-Year Notes | 559 | June 2023 | $ | 115,407,297 | | $ | 385,577 | |
| U.S. Treasury 5-Year Notes | 1,733 | June 2023 | 189,777,040 | | 3,695,629 | |
| | | $ | 305,184,337 | | $ | 4,081,206 | |
^Amount represents value and unrealized appreciation (depreciation).
| | | | | | | | | | | | | | | | | | | | | | | |
| CENTRALLY CLEARED TOTAL RETURN SWAP AGREEMENTS |
Floating
Rate Index | Pay/Receive Floating Rate Index at Termination | Fixed
Rate | Termination Date | Notional Amount | Premiums
Paid
(Received) | Unrealized Appreciation (Depreciation) | Value |
| CPURNSA | Receive | 1.79% | 8/26/23 | $ | 25,000,000 | | $ | 585 | | $ | 3,251,987 | | $ | 3,252,572 | |
| CPURNSA | Receive | 2.90% | 10/11/23 | $ | 65,750,000 | | 313 | | 378,817 | | 379,130 | |
| CPURNSA | Receive | 2.89% | 12/6/23 | $ | 25,000,000 | | 365 | | 119,396 | | 119,761 | |
| CPURNSA | Receive | 2.68% | 12/12/23 | $ | 25,000,000 | | 373 | | 150,762 | | 151,135 | |
| CPURNSA | Receive | 2.18% | 1/15/24 | $ | 50,000,000 | | 669 | | 5,379,733 | | 5,380,402 | |
| CPURNSA | Receive | 2.17% | 1/19/24 | $ | 50,000,000 | | 670 | | 5,377,445 | | 5,378,115 | |
| CPURNSA | Receive | 2.25% | 2/1/24 | $ | 50,000,000 | | 670 | | 5,240,746 | | 5,241,416 | |
| CPURNSA | Receive | 2.25% | 2/1/24 | $ | 25,000,000 | | 585 | | 2,622,012 | | 2,622,597 | |
| CPURNSA | Receive | 2.29% | 2/8/24 | $ | 50,000,000 | | 670 | | 5,167,762 | | 5,168,432 | |
| CPURNSA | Receive | 1.71% | 6/20/24 | $ | 30,000,000 | | (740) | | 3,686,612 | | 3,685,872 | |
| CPURNSA | Receive | 1.86% | 7/30/24 | $ | 26,500,000 | | (714) | | 3,040,215 | | 3,039,501 | |
| CPURNSA | Receive | 1.86% | 8/1/24 | $ | 23,700,000 | | (692) | | 2,721,476 | | 2,720,784 | |
| CPURNSA | Receive | 1.85% | 8/1/24 | $ | 43,000,000 | | (848) | | 4,949,280 | | 4,948,432 | |
| CPURNSA | Receive | 1.67% | 10/21/24 | $ | 45,000,000 | | (864) | | 5,676,734 | | 5,675,870 | |
| CPURNSA | Receive | 1.70% | 11/26/24 | $ | 25,000,000 | | (703) | | 3,132,690 | | 3,131,987 | |
| CPURNSA | Receive | 1.79% | 12/13/24 | $ | 16,000,000 | | (630) | | 1,919,012 | | 1,918,382 | |
| CPURNSA | Receive | 2.46% | 3/15/25 | $ | 25,000,000 | | 571 | | 119,301 | | 119,872 | |
| CPURNSA | Receive | 2.52% | 3/27/25 | $ | 20,000,000 | | 565 | | 38,443 | | 39,008 | |
| CPURNSA | Receive | 1.85% | 8/26/25 | $ | 16,000,000 | | 598 | | 2,150,854 | | 2,151,452 | |
| CPURNSA | Receive | 2.24% | 1/12/26 | $ | 20,000,000 | | 622 | | 2,135,047 | | 2,135,669 | |
| CPURNSA | Receive | 2.42% | 2/2/28 | $ | 85,000,000 | | 987 | | 876,318 | | 877,305 | |
| | | | | $ | 3,052 | | $ | 58,134,642 | | $ | 58,137,694 | |
| | | | | | | | |
| NOTES TO SCHEDULE OF INVESTMENTS |
| CPURNSA | – | U.S. Consumer Price Index Urban Consumers Not Seasonally Adjusted Index |
| FHLMC | – | Federal Home Loan Mortgage Corporation |
| FNMA | – | Federal National Mortgage Association |
| H15T1Y | – | Constant Maturity U.S. Treasury Note Yield Curve Rate Index |
| LIBOR | – | London Interbank Offered Rate |
| SEQ | – | Sequential Payer |
| SOFR | – | Secured Overnight Financing Rate |
| VRN | – | Variable Rate Note. The rate adjusts periodically based upon the terms set forth in the security’s offering documents. The rate shown is effective at the period end and the reference rate and spread, if any, is indicated. The security's effective maturity date may be shorter than the final maturity date shown. |
†Category is less than 0.05% of total net assets.
(1)Security, or a portion thereof, has been pledged at the custodian bank or with a broker for collateral requirements on futures contracts and/or swap agreements. At the period end, the aggregate value of securities pledged was $16,266,241.
(2)Security was purchased pursuant to Rule 144A or Section 4(2) under the Securities Act of 1933 and may be sold in transactions exempt from registration, normally to qualified institutional investors. The aggregate value of these securities at the period end was $143,371,921, which represented 6.4% of total net assets.
(3)The rate indicated is the yield to maturity at purchase for non-interest bearing securities. For interest bearing securities, the stated coupon rate is shown.
See Notes to Financial Statements.
| | |
| Statement of Assets and Liabilities |
| | | | | |
| MARCH 31, 2023 | |
| Assets | |
| Investment securities, at value (cost of $2,368,981,373) | $ | 2,251,821,834 | |
| Cash | 702 | |
| Receivable for capital shares sold | 1,175,633 | |
| Receivable for variation margin on futures contracts | 386,944 | |
| Receivable for variation margin on swap agreements | 647,335 | |
| Interest receivable | 2,862,468 | |
| 2,256,894,916 | |
| |
| Liabilities | |
| Payable for capital shares redeemed | 3,677,984 | |
| Accrued management fees | 659,880 | |
| Distribution and service fees payable | 26,063 | |
| 4,363,927 | |
| |
| Net Assets | $ | 2,252,530,989 | |
| |
| Net Assets Consist of: | |
| Capital paid in | $ | 2,347,155,824 | |
| Distributable earnings (loss) | (94,624,835) | |
| $ | 2,252,530,989 | |
| | | | | | | | | | | |
| Net Assets | Shares Outstanding | Net Asset Value Per Share* |
| Investor Class | $515,266,199 | 50,741,378 | $10.15 |
| I Class | $836,498,657 | 81,650,762 | $10.24 |
| Y Class | $13,125,314 | 1,280,358 | $10.25 |
| A Class | $52,427,008 | 5,219,102 | $10.05 |
| C Class | $8,851,422 | 916,209 | $9.66 |
| R Class | $17,660,086 | 1,719,829 | $10.27 |
| R5 Class | $111,102,192 | 10,844,041 | $10.25 |
| R6 Class | $22,373,091 | 2,183,644 | $10.25 |
| G Class | $675,227,020 | 65,787,258 | $10.26 |
*Maximum offering price per share was equal to the net asset value per share for all share classes, except Class A, for which the maximum offering price per share was $10.28 (net asset value divided by 0.9775). A contingent deferred sales charge may be imposed on redemptions of Class A and Class C.
See Notes to Financial Statements.
| | | | | |
| YEAR ENDED MARCH 31, 2023 | |
| Investment Income (Loss) | |
| Income: | |
| Interest | $ | 135,828,547 | |
| |
| Expenses: | |
| Management fees | 11,927,772 | |
| Interest expenses | 1,650,839 | |
| Distribution and service fees: | |
| A Class | 141,754 | |
| C Class | 93,771 | |
| R Class | 94,636 | |
| Trustees' fees and expenses | 174,042 | |
| 14,082,814 | |
| Fees waived - G Class | (1,936,128) | |
| 12,146,686 | |
| |
| Net investment income (loss) | 123,681,861 | |
| |
| Realized and Unrealized Gain (Loss) | |
| Net realized gain (loss) on: | |
| Investment transactions | (58,452,450) | |
| Futures contract transactions | (9,516,640) | |
| Swap agreement transactions | 18,602,564 | |
| (49,366,526) | |
| |
| Change in net unrealized appreciation (depreciation) on: | |
| Investments | (116,872,189) | |
| Futures contracts | 6,102,981 | |
| Swap agreements | (15,129,483) | |
| (125,898,691) | |
| |
| Net realized and unrealized gain (loss) | (175,265,217) | |
| |
| Net Increase (Decrease) in Net Assets Resulting from Operations | $ | (51,583,356) | |
See Notes to Financial Statements.
| | |
| Statement of Changes in Net Assets |
| | | | | | | | |
| YEARS ENDED MARCH 31, 2023 AND MARCH 31, 2022 |
| Increase (Decrease) in Net Assets | March 31, 2023 | March 31, 2022 |
| Operations | | |
| Net investment income (loss) | $ | 123,681,861 | | $ | 126,695,687 | |
| Net realized gain (loss) | (49,366,526) | | 41,246,515 | |
| Change in net unrealized appreciation (depreciation) | (125,898,691) | | (38,882,147) | |
| Net increase (decrease) in net assets resulting from operations | (51,583,356) | | 129,060,055 | |
| | |
| Distributions to Shareholders | | |
| From earnings: | | |
| Investor Class | (37,220,224) | | (18,377,213) | |
| I Class | (60,287,512) | | (49,288,277) | |
| Y Class | (745,139) | | (628,667) | |
| A Class | (2,850,094) | | (1,795,871) | |
| C Class | (460,917) | | (302,613) | |
| R Class | (849,799) | | (650,573) | |
| R5 Class | (6,138,167) | | (6,599,316) | |
| R6 Class | (1,162,758) | | (668,999) | |
| G Class | (36,518,518) | | (30,850,587) | |
| Decrease in net assets from distributions | (146,233,128) | | (109,162,116) | |
| | |
| Capital Share Transactions | | |
| Net increase (decrease) in net assets from capital share transactions (Note 5) | (190,639,143) | | 308,866,026 | |
| | |
| Net increase (decrease) in net assets | (388,455,627) | | 328,763,965 | |
| | |
| Net Assets | | |
| Beginning of period | 2,640,986,616 | | 2,312,222,651 | |
| End of period | $ | 2,252,530,989 | | $ | 2,640,986,616 | |
See Notes to Financial Statements.
| | |
| Notes to Financial Statements |
MARCH 31, 2023
1. Organization
American Century Investment Trust (the trust) is registered under the Investment Company Act of 1940, as amended (the 1940 Act), as an open-end management investment company and is organized as a Massachusetts business trust. Short Duration Inflation Protection Bond Fund (the fund) is one fund in a series issued by the trust. The fund’s investment objective is to pursue total return using a strategy that seeks to protect against U.S. inflation.
The fund offers the Investor Class, I Class, Y Class, A Class, C Class, R Class, R5 Class, R6 Class and G Class. The A Class may incur an initial sales charge. The A Class and C Class may be subject to a contingent deferred sales charge.
2. Significant Accounting Policies
The following is a summary of significant accounting policies consistently followed by the fund in preparation of its financial statements. The fund is an investment company and follows accounting and reporting guidance in accordance with accounting principles generally accepted in the United States of America. This may require management to make certain estimates and assumptions at the date of the financial statements. Actual results could differ from these estimates. Management evaluated the impact of events or transactions occurring through the date the financial statements were issued that would merit recognition or disclosure.
Investment Valuations — The fund determines the fair value of its investments and computes its net asset value (NAV) per share at the close of regular trading (usually 4 p.m. Eastern time) on the New York Stock Exchange (NYSE) on each day the NYSE is open. The value of investments of the fund is determined by American Century Investment Management, Inc. (ACIM) (the investment advisor), as the valuation designee, pursuant to its valuation policies and procedures. The Board of Trustees oversees the valuation designee and reviews its valuation policies and procedures at least annually.
Fixed income securities are valued at the evaluated mean as provided by independent pricing services or at the mean of the most recent bid and asked prices as provided by investment dealers. Corporate bonds and U.S. Treasury and Government Agency securities are valued using market models that consider trade data, quotations from dealers and active market makers, relevant yield curve and spread data, creditworthiness, trade data or market information on comparable securities, and other relevant security specific information. Mortgage-related and asset-backed securities are valued based on models that consider trade data, prepayment and default projections, benchmark yield and spread data and estimated cash flows of each tranche of the issuer. Collateralized loan obligations are valued based on discounted cash flow models that consider trade and economic data, prepayment assumptions and default projections. Commercial paper is valued using a curve-based approach that considers money market rates for specific instruments, programs, currencies and maturity points from a variety of active market makers.
Open-end management investment companies are valued at the reported NAV per share. Repurchase agreements are valued at cost, which approximates fair value. Exchange-traded futures contracts are valued at the settlement price as provided by the appropriate exchange. Swap agreements are valued at an evaluated mean as provided by independent pricing services or independent brokers.
If the valuation designee determines that the market price for a portfolio security is not readily available or is believed by the valuation designee to be unreliable, such security is valued at fair value as determined in good faith by the valuation designee, in accordance with its policies and procedures. Circumstances that may cause the fund to determine that market quotations are not available or reliable include, but are not limited to: when there is a significant event subsequent to the market quotation; trading in a security has been halted during the trading day; or trading in a security is insufficient or did not take place due to a closure or holiday.
The valuation designee monitors for significant events occurring after the close of an investment’s primary exchange but before the fund’s NAV per share is determined. Significant events may include, but are not limited to: corporate announcements and transactions; regulatory news, governmental action and political unrest that could impact a specific investment or an investment sector; or armed conflicts, natural disasters and similar events that could affect investments in a specific country or region.
Security Transactions — Security transactions are accounted for as of the trade date. Net realized gains and losses are determined on the identified cost basis, which is also used for federal income tax purposes.
Investment Income — Interest income is recorded on the accrual basis and includes paydown gain (loss) and accretion of discounts and amortization of premiums. Inflation adjustments related to inflation-linked debt securities are reflected as interest income.
Repurchase Agreements — The fund may enter into repurchase agreements with institutions that ACIM has determined are creditworthy pursuant to criteria adopted by the Board of Trustees. The fund requires that the collateral, represented by securities, received in a repurchase transaction be transferred to the custodian in a manner sufficient to enable the fund to obtain those securities in the event of a default under the repurchase agreement. ACIM monitors, on a daily basis, the securities transferred to ensure the value, including accrued interest, of the securities under each repurchase agreement is equal to or greater than amounts owed to the fund under each repurchase agreement.
Joint Trading Account — Pursuant to an Exemptive Order issued by the Securities and Exchange Commission, the fund, along with certain other funds in the American Century Investments family of funds, may transfer uninvested cash balances into a joint trading account. These balances are invested in one or more repurchase agreements that are collateralized by U.S. Treasury or Agency obligations.
Income Tax Status — It is the fund's policy to distribute substantially all net investment income and net realized gains to shareholders and to otherwise qualify as a regulated investment company under provisions of the Internal Revenue Code. Accordingly, no provision has been made for income taxes. The fund files U.S. federal, state, local and non-U.S. tax returns as applicable. The fund's tax returns are subject to examination by the relevant taxing authority until expiration of the applicable statute of limitations, which is generally three years from the date of filing but can be longer in certain jurisdictions. At this time, management believes there are no uncertain tax positions which, based on their technical merit, would not be sustained upon examination and for which it is reasonably possible that the total amounts of unrecognized tax benefits will significantly change in the next twelve months.
Multiple Class — All shares of the fund represent an equal pro rata interest in the net assets of the class to which such shares belong, and have identical voting, dividend, liquidation and other rights and the same terms and conditions, except for class specific expenses and exclusive rights to vote on matters affecting only individual classes. Income, non-class specific expenses, and realized and unrealized capital gains and losses of the fund are allocated to each class of shares based on their relative net assets.
Distributions to Shareholders — Distributions from net investment income, if any, are generally declared and paid quarterly, but may be paid less frequently. Distributions from net realized gains, if any, are generally declared and paid annually.
Indemnifications — Under the trust’s organizational documents, its officers and trustees are indemnified against certain liabilities arising out of the performance of their duties to the fund. In addition, in the normal course of business, the fund enters into contracts that provide general indemnifications. The maximum exposure under these arrangements is unknown as this would involve future claims that may be made against a fund. The risk of material loss from such claims is considered by management to be remote.
3. Fees and Transactions with Related Parties
Certain officers and trustees of the trust are also officers and/or directors of American Century Companies, Inc. (ACC). The trust's investment advisor, ACIM, the trust's distributor, American Century Investment Services, Inc. (ACIS), and the trust's transfer agent, American Century Services, LLC, are wholly owned, directly or indirectly, by ACC. Various funds issued by American Century Asset Allocation Portfolios, Inc. own, in aggregate, 23% of the shares of the fund.
Management Fees — The trust has entered into a management agreement with ACIM, under which ACIM provides the fund with investment advisory and management services in exchange for a single, unified management fee (the fee) per class. The agreement provides that ACIM will pay all expenses of managing and operating the fund, except brokerage expenses, taxes, interest, fees and expenses of the independent trustees (including legal counsel fees), extraordinary expenses, and expenses incurred in connection with the provision of shareholder services and distribution services under a plan adopted pursuant to Rule 12b-1 under
the 1940 Act. The fee is computed and accrued daily based on each class’s daily net assets and paid monthly in arrears. The difference in the fee among the classes is a result of their separate arrangements for non-Rule
12b-1 shareholder services. It is not the result of any difference in advisory or custodial fees or other expenses related to the management of the fund's assets, which do not vary by class. The fee consists of (1) an Investment Category Fee based on the daily net assets of the fund and certain other accounts managed by the investment advisor that are in the same broad investment category as the fund and (2) a Complex Fee based on the assets of all funds in the American Century Investments family of funds that have the same investment advisor and distributor as the fund. For purposes of determining the Investment Category Fee and Complex Fee, the assets of funds managed by the investment advisor that invest exclusively in the shares of other funds (funds of funds) are not included. The investment advisor agreed to waive the G Class's management fee in its entirety. The investment advisor expects this waiver to remain in effect permanently and cannot terminate it without the approval of the Board of Trustees.
The Investment Category Fee range, the Complex Fee range and the effective annual management fee for each class for the period ended March 31, 2023 are as follows:
| | | | | | | | | | | |
| Investment Category Fee Range | Complex Fee Range | Effective Annual Management Fee |
| Investor Class | 0.2625% to 0.3800% | 0.2500% to 0.3100% | 0.56% |
| I Class | 0.1500% to 0.2100% | 0.46% |
| Y Class | 0.0500% to 0.1100% | 0.36% |
| A Class | 0.2500% to 0.3100% | 0.56% |
| C Class | 0.2500% to 0.3100% | 0.56% |
| R Class | 0.2500% to 0.3100% | 0.56% |
| R5 Class | 0.0500% to 0.1100% | 0.36% |
| R6 Class | 0.0000% to 0.0600% | 0.31% |
| G Class | 0.0000% to 0.0600% | 0.00%(1) |
(1)Effective annual management fee before waiver was 0.31%.
Distribution and Service Fees — The Board of Trustees has adopted a separate Master Distribution and Individual Shareholder Services Plan for each of the A Class, C Class and R Class (collectively the plans), pursuant to Rule 12b-1 of the 1940 Act. The plans provide that the A Class will pay ACIS an annual distribution and service fee of 0.25%. The plans provide that the C Class will pay ACIS an annual distribution and service fee of 1.00%, of which 0.25% is paid for individual shareholder services and 0.75% is paid for distribution services. The plans provide that the R Class will pay ACIS an annual distribution and service fee of 0.50%. The fees are computed and accrued daily based on each class’s daily net assets and paid monthly in arrears. The fees are used to pay financial intermediaries for distribution and individual shareholder services. Fees incurred under the plans during the period ended March 31, 2023 are detailed in the Statement of Operations.
Trustees' Fees and Expenses — The Board of Trustees is responsible for overseeing the investment advisor’s management and operations of the fund. The trustees receive detailed information about the fund and its investment advisor regularly throughout the year, and meet at least quarterly with management of the investment advisor to review reports about fund operations. The fund's officers do not receive compensation from the fund.
Interfund Transactions — The fund may enter into security transactions with other American Century Investments funds and other client accounts of the investment advisor, in accordance with the 1940 Act rules and procedures adopted by the Board of Trustees. The rules and procedures require, among other things, that these transactions be effected at the independent current market price of the security. There were no interfund transactions during the period.
4. Investment Transactions
Purchases of investment securities, excluding short-term investments, for the period ended March 31, 2023 totaled $825,315,911, of which $675,249,975 represented U.S. Treasury and Government Agency obligations.
Sales of investment securities, excluding short-term investments, for the period ended March 31, 2023 totaled $1,065,962,447, of which $826,426,926 represented U.S. Treasury and Government Agency obligations.
5. Capital Share Transactions
Transactions in shares of the fund were as follows (unlimited number of shares authorized):
| | | | | | | | | | | | | | |
| Year ended March 31, 2023 | Year ended
March 31, 2022 |
| Shares | Amount | Shares | Amount |
| Investor Class | | | | |
| Sold | 33,138,696 | | $ | 351,748,968 | | 48,781,308 | | $ | 534,951,356 | |
| Issued in reinvestment of distributions | 3,714,203 | | 37,157,013 | | 1,694,882 | | 18,350,122 | |
| Redeemed | (50,146,670) | | (516,979,617) | | (17,802,459) | | (196,122,488) | |
| (13,293,771) | | (128,073,636) | | 32,673,731 | | 357,178,990 | |
| I Class | | | | |
| Sold | 65,704,683 | | 702,284,703 | | 91,832,421 | | 1,023,616,159 | |
| Issued in reinvestment of distributions | 5,629,467 | | 56,782,273 | | 4,374,386 | | 47,753,917 | |
| Redeemed | (84,864,585) | | (882,697,557) | | (63,511,866) | | (692,877,282) | |
| (13,530,435) | | (123,630,581) | | 32,694,941 | | 378,492,794 | |
| Y Class | | | | |
| Sold | 194,744 | | 2,053,884 | | 292,230 | | 3,235,741 | |
| Issued in reinvestment of distributions | 73,352 | | 740,992 | | 57,572 | | 628,667 | |
| Redeemed | (347,432) | | (3,653,193) | | (368,876) | | (4,075,884) | |
| (79,336) | | (858,317) | | (19,074) | | (211,476) | |
| A Class | | | | |
| Sold | 2,654,316 | | 27,738,082 | | 2,246,384 | | 24,522,123 | |
| Issued in reinvestment of distributions | 159,982 | | 1,582,262 | | 92,624 | | 992,421 | |
| Redeemed | (2,484,493) | | (25,552,038) | | (1,040,820) | | (11,293,734) | |
| 329,805 | | 3,768,306 | | 1,298,188 | | 14,220,810 | |
| C Class | | | | |
| Sold | 482,713 | | 4,894,305 | | 897,672 | | 9,531,882 | |
| Issued in reinvestment of distributions | 39,043 | | 370,521 | | 25,562 | | 264,565 | |
| Redeemed | (401,853) | | (3,962,348) | | (357,243) | | (3,713,481) | |
| 119,903 | | 1,302,478 | | 565,991 | | 6,082,966 | |
| R Class | | | | |
| Sold | 640,173 | | 6,820,723 | | 581,567 | | 6,478,314 | |
| Issued in reinvestment of distributions | 84,161 | | 849,773 | | 59,397 | | 650,532 | |
| Redeemed | (801,945) | | (8,487,216) | | (624,015) | | (6,948,096) | |
| (77,611) | | (816,720) | | 16,949 | | 180,750 | |
| R5 Class | | | | |
| Sold | 1,487,682 | | 15,717,320 | | 3,756,791 | | 41,688,125 | |
| Issued in reinvestment of distributions | 579,987 | | 5,854,346 | | 579,209 | | 6,334,559 | |
| Redeemed | (2,349,811) | | (24,814,373) | | (39,947,285) | | (456,718,806) | |
| (282,142) | | (3,242,707) | | (35,611,285) | | (408,696,122) | |
| R6 Class | | | | |
| Sold | 1,321,142 | | 14,026,477 | | 959,923 | | 10,632,052 | |
| Issued in reinvestment of distributions | 107,234 | | 1,082,347 | | 56,775 | | 619,384 | |
| Redeemed | (949,730) | | (10,048,449) | | (499,622) | | (5,498,149) | |
| 478,646 | | 5,060,375 | | 517,076 | | 5,753,287 | |
| G Class | | | | |
| Sold | 9,112,581 | | 95,592,590 | | 6,647,729 | | 74,207,804 | |
| Issued in reinvestment of distributions | 3,609,947 | | 36,518,518 | | 2,823,976 | | 30,850,587 | |
| Redeemed | (7,089,373) | | (76,259,449) | | (13,334,825) | | (149,194,364) | |
| 5,633,155 | | 55,851,659 | | (3,863,120) | | (44,135,973) | |
| Net increase (decrease) | (20,701,786) | | $ | (190,639,143) | | 28,273,397 | | $ | 308,866,026 | |
6. Fair Value Measurements
The fund's investments valuation process is based on several considerations and may use multiple inputs to determine the fair value of the investments held by the fund. In conformity with accounting principles generally accepted in the United States of America, the inputs used to determine a valuation are classified into three broad levels.
•Level 1 valuation inputs consist of unadjusted quoted prices in an active market for identical investments.
•Level 2 valuation inputs consist of direct or indirect observable market data (including quoted prices for comparable investments, evaluations of subsequent market events, interest rates, prepayment speeds, credit risk, etc.). These inputs also consist of quoted prices for identical investments initially expressed in local currencies that are adjusted through translation into U.S. dollars.
•Level 3 valuation inputs consist of unobservable data (including a fund’s own assumptions).
The level classification is based on the lowest level input that is significant to the fair valuation measurement. The valuation inputs are not necessarily an indication of the risks associated with investing in these securities or other financial instruments.
The following is a summary of the level classifications as of period end. The Schedule of Investments provides additional information on the fund's portfolio holdings.
| | | | | | | | | | | |
| Level 1 | Level 2 | Level 3 |
| Assets | | | |
| Investment Securities | | | |
| U.S. Treasury Securities | — | | $ | 1,925,779,906 | | — | |
| Corporate Bonds | — | | 77,295,203 | | — | |
| Collateralized Loan Obligations | — | | 44,063,492 | | — | |
| Asset-Backed Securities | — | | 43,902,521 | | — | |
| Commercial Mortgage-Backed Securities | — | | 26,753,300 | | — | |
| Collateralized Mortgage Obligations | — | | 8,801,497 | | — | |
| Short-Term Investments | $ | 34,668 | | 125,191,247 | | — | |
| $ | 34,668 | | $ | 2,251,787,166 | | — | |
| Other Financial Instruments | | | |
| Futures Contracts | $ | 4,081,206 | | — | | — | |
| Swap Agreements | — | | $ | 58,137,694 | | — | |
| $ | 4,081,206 | | $ | 58,137,694 | | — | |
7. Derivative Instruments
Interest Rate Risk — The fund is subject to interest rate risk in the normal course of pursuing its investment objectives. The value of bonds generally declines as interest rates rise. A fund may enter into futures contracts based on a bond index or a specific underlying security. A fund may purchase futures contracts to gain exposure to increases in market value or sell futures contracts to protect against a decline in market value. Upon entering into a futures contract, a fund will segregate cash, cash equivalents or other appropriate liquid securities on its records in amounts sufficient to meet requirements. A fund may incur charges or earn income on cash deposit balances, which are reflected in interest expenses or interest income, respectively. Subsequent payments (variation margin) are made or received daily, in cash, by a fund. The variation margin is equal to the daily change in the contract value and is recorded as unrealized gains and losses. A fund recognizes a realized gain or loss when the futures contract is closed or expires. Net realized and unrealized gains or losses occurring during the holding period of futures contracts are a component of net realized gain (loss) on futures contract transactions and change in net unrealized appreciation (depreciation) on futures contracts, respectively. One of the risks of entering into futures contracts is the possibility that the change in value of the contract may not correlate with the changes in value of the underlying securities. The fund's average notional exposure to interest rate risk derivative instruments held during the period was $112,133,906 futures contracts purchased and $42,655,000 futures contracts sold.
Other Contracts — A fund may enter into total return swap agreements in order to attempt to obtain or preserve a particular return or spread at a lower cost than obtaining a return or spread through purchases and/or sales of instruments in other markets or gain exposure to certain markets in the most economical way possible. A fund will segregate cash, cash equivalents or other appropriate liquid securities on its records in amounts sufficient to meet requirements. Changes in value, including the periodic amounts of interest to be paid or received on swap agreements, are recorded as unrealized appreciation (depreciation) on swap agreements. Upon entering into a centrally cleared swap, a fund is required to deposit cash or securities (initial margin) with a financial intermediary in an amount equal to a certain percentage of the notional amount. A fund may incur charges or earn income on cash deposit balances, which are reflected in interest expenses or interest income, respectively. Subsequent payments (variation margin) are made or received daily, in cash, by a fund. The variation margin is equal to the daily change in the value and is a component of unrealized gains and losses. Realized gain or loss is recorded upon receipt or payment of a periodic settlement or termination of swap agreements. Net realized and unrealized gains or losses occurring during the holding period of swap agreements are a component of net realized gain (loss) on swap agreement transactions and change in net unrealized appreciation (depreciation) on swap agreements, respectively. The risks of entering into swap agreements include the possible lack of liquidity, failure of the counterparty to meet its obligations, and that there may be unfavorable changes in the underlying investments or instruments, including inflationary risk. The fund's average notional amount held during the period was $626,575,000.
Value of Derivative Instruments as of March 31, 2023
| | | | | | | | | | | | | | |
| Asset Derivatives | Liability Derivatives |
Type of Risk
Exposure | Location on Statement of
Assets and Liabilities | Value | Location on Statement of
Assets and Liabilities | Value |
| Interest Rate Risk | Receivable for variation margin on futures contracts* | $ | 386,944 | | Payable for variation margin on futures contracts* | — | |
| Other Contracts | Receivable for variation margin on swap agreements* | 647,335 | | Payable for variation margin on swap agreements* | — | |
| | $ | 1,034,279 | | | — | |
*Included in the unrealized appreciation (depreciation) on futures contracts or centrally cleared swap agreements, as applicable, as reported in the Schedule of Investments.
Effect of Derivative Instruments on the Statement of Operations for the Year Ended March 31, 2023
| | | | | | | | | | | | | | |
| Net Realized Gain (Loss) | Change in Net Unrealized Appreciation
(Depreciation) |
| Type of Risk Exposure | Location on Statement of
Operations | Value | Location on Statement of
Operations | Value |
| Interest Rate Risk | Net realized gain (loss) on futures contract transactions | $ | (9,516,640) | | Change in net unrealized appreciation (depreciation) on futures contracts | $ | 6,102,981 | |
| Other Contracts | Net realized gain (loss) on swap agreement transactions | 18,602,564 | | Change in net unrealized appreciation (depreciation) on swap agreements | (15,129,483) | |
| | $ | 9,085,924 | | | $ | (9,026,502) | |
8. Risk Factors
The value of the fund’s shares will go up and down, sometimes rapidly or unpredictably, based on the performance of the securities owned by the fund and other factors generally affecting the securities market. Market risks, including political, regulatory, economic and social developments, can affect the value of the fund’s investments. Natural disasters, public health emergencies, war, terrorism and other unforeseeable events may lead to increased market volatility and may have adverse long-term effects on world economies and markets generally.
The fund may invest in instruments that have variable or floating coupon rates based on the London Interbank Offered Rate (LIBOR). LIBOR is a benchmark interest rate intended to be representative of the rate at which certain major international banks lend to one another over short-terms. Financial institutions have started the process of phasing out LIBOR and the transition process to a replacement rate may lead to increased volatility or illiquidity in markets for instruments that rely on LIBOR. This could result in a change to the value of such instruments or a change in the cost of temporary borrowing for the fund.
9. Federal Tax Information
The tax character of distributions paid during the years ended March 31, 2023 and March 31, 2022 were as follows:
| | | | | | | | |
| 2023 | 2022 |
| Distributions Paid From | | |
| Ordinary income | $ | 131,002,156 | | $ | 109,162,116 | |
| Long-term capital gains | $ | 15,230,972 | | — | |
The book-basis character of distributions made during the year from net investment income or net realized gains may differ from their ultimate characterization for federal income tax purposes. These differences reflect the differing character of certain income items and net realized gains and losses for financial statement and tax purposes, and may result in reclassification among certain capital accounts on the financial statements.
As of period end, the federal tax cost of investments and the components of distributable earnings on a tax-basis were as follows:
| | | | | |
| Federal tax cost of investments | $ | 2,370,661,055 | |
| Gross tax appreciation of investments | $ | 887,785 | |
| Gross tax depreciation of investments | (119,727,006) | |
| Net tax appreciation (depreciation) of investments | (118,839,221) | |
| Net tax appreciation (depreciation) on derivatives | 58,134,642 | |
| Net tax appreciation (depreciation) | $ | (60,704,579) | |
| Undistributed ordinary income | $ | 8,847,140 | |
| Accumulated short-term capital losses | $ | (23,821,315) | |
| Accumulated long-term capital losses | $ | (18,946,081) | |
The difference between book-basis and tax-basis unrealized appreciation (depreciation) is attributable primarily to the realization for tax purposes of unrealized gain (losses) on futures contracts.
Accumulated capital losses represent net capital loss carryovers that may be used to offset future realized
capital gains for federal income tax purposes. The capital loss carryovers may be carried forward for an
unlimited period. Future capital loss carryover utilization in any given year may be subject to Internal Revenue
Code limitations.
| | | | | | | | | | | | | | | | | | | | | | | | | | | | | | | | | | | | | | | | | | | | | | | |
| For a Share Outstanding Throughout the Years Ended March 31 (except as noted) | | |
| Per-Share Data | Ratios and Supplemental Data | | |
| | Income From Investment Operations: | Distributions From: | | | Ratio to Average Net Assets of: | | |
| Net Asset
Value,
Beginning
of Period | Net Investment
Income (Loss)(1) | Net
Realized
and
Unrealized
Gain (Loss) | Total From
Investment
Operations | Net
Investment
Income | Net
Realized
Gains | Total
Distributions | Net Asset
Value,
End
of Period | Total Return(2) | Operating
Expenses | Operating
Expenses
(before
expense
waiver) | Net
Investment
Income
(Loss) | Net
Investment
Income (Loss)
(before expense waiver) | Portfolio
Turnover
Rate | Net
Assets,
End of
Period
(in thousands) |
| Investor Class | | |
| 2023 | $10.89 | 0.47 | (0.65) | (0.18) | (0.49) | (0.07) | (0.56) | $10.15 | (1.48)% | 0.63% | 0.63% | 4.46% | 4.46% | 32% | $515,266 | |
| 2022 | $10.79 | 0.49 | 0.04 | 0.53 | (0.43) | — | (0.43) | $10.89 | 4.92% | 0.56% | 0.56% | 4.48% | 4.48% | 71% | $697,335 | |
| 2021 | $10.01 | 0.09 | 0.78 | 0.87 | (0.09) | — | (0.09) | $10.79 | 8.68% | 0.57% | 0.57% | 0.95% | 0.95% | 29% | $338,427 | |
| 2020 | $10.11 | 0.21 | (0.14) | 0.07 | (0.17) | — | (0.17) | $10.01 | 0.69% | 0.57% | 0.57% | 2.13% | 2.13% | 50% | $572,935 | |
| 2019 | $10.16 | 0.15 | 0.03 | 0.18 | (0.23) | — | (0.23) | $10.11 | 1.79% | 0.57% | 0.57% | 1.49% | 1.49% | 31% | $559,790 | |
| I Class | | |
| 2023 | $10.98 | 0.48 | (0.65) | (0.17) | (0.50) | (0.07) | (0.57) | $10.24 | (1.36)% | 0.53% | 0.53% | 4.56% | 4.56% | 32% | $836,499 | |
| 2022 | $10.88 | 0.50 | 0.04 | 0.54 | (0.44) | — | (0.44) | $10.98 | 4.98% | 0.46% | 0.46% | 4.58% | 4.58% | 71% | $1,045,280 | |
| 2021 | $10.09 | 0.10 | 0.79 | 0.89 | (0.10) | — | (0.10) | $10.88 | 8.82% | 0.47% | 0.47% | 1.05% | 1.05% | 29% | $679,719 | |
| 2020 | $10.19 | 0.23 | (0.15) | 0.08 | (0.18) | — | (0.18) | $10.09 | 0.79% | 0.47% | 0.47% | 2.23% | 2.23% | 50% | $150,405 | |
| 2019 | $10.24 | 0.15 | 0.04 | 0.19 | (0.24) | — | (0.24) | $10.19 | 1.87% | 0.47% | 0.47% | 1.59% | 1.59% | 31% | $186,378 | |
| | | | | | | | | | | | | | | | | | | | | | | | | | | | | | | | | | | | | | | | | | | | | | | |
| For a Share Outstanding Throughout the Years Ended March 31 (except as noted) | | |
| Per-Share Data | Ratios and Supplemental Data | | |
| | Income From Investment Operations: | Distributions From: | | | Ratio to Average Net Assets of: | | |
| Net Asset
Value,
Beginning
of Period | Net Investment
Income (Loss)(1) | Net
Realized
and
Unrealized
Gain (Loss) | Total From
Investment
Operations | Net
Investment
Income | Net
Realized
Gains | Total
Distributions | Net Asset
Value,
End
of Period | Total Return(2) | Operating
Expenses | Operating
Expenses
(before
expense
waiver) | Net
Investment
Income
(Loss) | Net
Investment
Income (Loss)
(before expense waiver) | Portfolio
Turnover
Rate | Net
Assets,
End of
Period
(in thousands) |
| Y Class | | |
| 2023 | $10.99 | 0.50 | (0.66) | (0.16) | (0.51) | (0.07) | (0.58) | $10.25 | (1.36)% | 0.43% | 0.43% | 4.66% | 4.66% | 32% | $13,125 | |
| 2022 | $10.88 | 0.52 | 0.04 | 0.56 | (0.45) | — | (0.45) | $10.99 | 5.18% | 0.36% | 0.36% | 4.68% | 4.68% | 71% | $14,941 | |
| 2021 | $10.09 | 0.12 | 0.78 | 0.90 | (0.11) | — | (0.11) | $10.88 | 8.92% | 0.37% | 0.37% | 1.15% | 1.15% | 29% | $15,006 | |
| 2020 | $10.19 | 0.22 | (0.13) | 0.09 | (0.19) | — | (0.19) | $10.09 | 0.89% | 0.37% | 0.37% | 2.33% | 2.33% | 50% | $10,494 | |
| 2019 | $10.24 | 0.15 | 0.05 | 0.20 | (0.25) | — | (0.25) | $10.19 | 1.98% | 0.37% | 0.37% | 1.69% | 1.69% | 31% | $4,471 | |
| A Class | | |
| 2023 | $10.78 | 0.43 | (0.63) | (0.20) | (0.46) | (0.07) | (0.53) | $10.05 | (1.75)% | 0.88% | 0.88% | 4.21% | 4.21% | 32% | $52,427 | |
| 2022 | $10.68 | 0.45 | 0.05 | 0.50 | (0.40) | — | (0.40) | $10.78 | 4.70% | 0.81% | 0.81% | 4.23% | 4.23% | 71% | $52,695 | |
| 2021 | $9.91 | 0.07 | 0.76 | 0.83 | (0.06) | — | (0.06) | $10.68 | 8.39% | 0.82% | 0.82% | 0.70% | 0.70% | 29% | $38,361 | |
| 2020 | $10.01 | 0.18 | (0.13) | 0.05 | (0.15) | — | (0.15) | $9.91 | 0.44% | 0.82% | 0.82% | 1.88% | 1.88% | 50% | $29,951 | |
| 2019 | $10.06 | 0.11 | 0.04 | 0.15 | (0.20) | — | (0.20) | $10.01 | 1.55% | 0.82% | 0.82% | 1.24% | 1.24% | 31% | $24,988 | |
| C Class | | |
| 2023 | $10.39 | 0.32 | (0.59) | (0.27) | (0.39) | (0.07) | (0.46) | $9.66 | (2.52)% | 1.63% | 1.63% | 3.46% | 3.46% | 32% | $8,851 | |
| 2022 | $10.32 | 0.34 | 0.06 | 0.40 | (0.33) | — | (0.33) | $10.39 | 3.92% | 1.56% | 1.56% | 3.48% | 3.48% | 71% | $8,274 | |
| 2021 | $9.59 | (0.03) | 0.76 | 0.73 | —(3) | — | —(3) | $10.32 | 7.62% | 1.57% | 1.57% | (0.05)% | (0.05)% | 29% | $2,378 | |
| 2020 | $9.69 | 0.17 | (0.20) | (0.03) | (0.07) | — | (0.07) | $9.59 | (0.33)% | 1.57% | 1.57% | 1.13% | 1.13% | 50% | $6,571 | |
| 2019 | $9.74 | 0.05 | 0.03 | 0.08 | (0.13) | — | (0.13) | $9.69 | 0.80% | 1.57% | 1.57% | 0.49% | 0.49% | 31% | $17,769 | |
| | | | | | | | | | | | | | | | | | | | | | | | | | | | | | | | | | | | | | | | | | | | | | | |
| For a Share Outstanding Throughout the Years Ended March 31 (except as noted) | | |
| Per-Share Data | Ratios and Supplemental Data | | |
| | Income From Investment Operations: | Distributions From: | | | Ratio to Average Net Assets of: | | |
| Net Asset
Value,
Beginning
of Period | Net Investment
Income (Loss)(1) | Net
Realized
and
Unrealized
Gain (Loss) | Total From
Investment
Operations | Net
Investment
Income | Net
Realized
Gains | Total
Distributions | Net Asset
Value,
End
of Period | Total Return(2) | Operating
Expenses | Operating
Expenses
(before
expense
waiver) | Net
Investment
Income
(Loss) | Net
Investment
Income (Loss)
(before expense waiver) | Portfolio
Turnover
Rate | Net
Assets,
End of
Period
(in thousands) |
| R Class | | |
| 2023 | $11.01 | 0.44 | (0.68) | (0.24) | (0.43) | (0.07) | (0.50) | $10.27 | (2.04)% | 1.13% | 1.13% | 3.96% | 3.96% | 32% | $17,660 | |
| 2022 | $10.90 | 0.45 | 0.03 | 0.48 | (0.37) | — | (0.37) | $11.01 | 4.44% | 1.06% | 1.06% | 3.98% | 3.98% | 71% | $19,782 | |
| 2021 | $10.11 | 0.05 | 0.77 | 0.82 | (0.03) | — | (0.03) | $10.90 | 8.15% | 1.07% | 1.07% | 0.45% | 0.45% | 29% | $19,408 | |
| 2020 | $10.21 | 0.16 | (0.14) | 0.02 | (0.12) | — | (0.12) | $10.11 | 0.18% | 1.07% | 1.07% | 1.63% | 1.63% | 50% | $18,099 | |
| 2019 | $10.26 | 0.08 | 0.05 | 0.13 | (0.18) | — | (0.18) | $10.21 | 1.26% | 1.07% | 1.07% | 0.99% | 0.99% | 31% | $15,253 | |
| R5 Class | | |
| 2023 | $10.98 | 0.50 | (0.65) | (0.15) | (0.51) | (0.07) | (0.58) | $10.25 | (1.27)% | 0.43% | 0.43% | 4.66% | 4.66% | 32% | $111,102 | |
| 2022 | $10.88 | 0.54 | 0.01 | 0.55 | (0.45) | — | (0.45) | $10.98 | 5.09% | 0.36% | 0.36% | 4.68% | 4.68% | 71% | $122,195 | |
| 2021 | $10.09 | 0.12 | 0.78 | 0.90 | (0.11) | — | (0.11) | $10.88 | 8.93% | 0.37% | 0.37% | 1.15% | 1.15% | 29% | $508,447 | |
| 2020 | $10.19 | 0.24 | (0.15) | 0.09 | (0.19) | — | (0.19) | $10.09 | 0.89% | 0.37% | 0.37% | 2.33% | 2.33% | 50% | $417,564 | |
| 2019 | $10.24 | 0.16 | 0.04 | 0.20 | (0.25) | — | (0.25) | $10.19 | 1.98% | 0.37% | 0.37% | 1.69% | 1.69% | 31% | $376,691 | |
| R6 Class | | |
| 2023 | $10.98 | 0.49 | (0.64) | (0.15) | (0.51) | (0.07) | (0.58) | $10.25 | (1.22)% | 0.38% | 0.38% | 4.71% | 4.71% | 32% | $22,373 | |
| 2022 | $10.88 | 0.52 | 0.03 | 0.55 | (0.45) | — | (0.45) | $10.98 | 5.14% | 0.31% | 0.31% | 4.73% | 4.73% | 71% | $18,725 | |
| 2021 | $10.09 | 0.12 | 0.78 | 0.90 | (0.11) | — | (0.11) | $10.88 | 8.98% | 0.32% | 0.32% | 1.20% | 1.20% | 29% | $12,923 | |
| 2020 | $10.19 | 0.25 | (0.15) | 0.10 | (0.20) | — | (0.20) | $10.09 | 0.94% | 0.32% | 0.32% | 2.38% | 2.38% | 50% | $10,261 | |
| 2019 | $10.24 | 0.16 | 0.04 | 0.20 | (0.25) | — | (0.25) | $10.19 | 2.03% | 0.32% | 0.32% | 1.74% | 1.74% | 31% | $8,920 | |
| | | | | | | | | | | | | | | | | | | | | | | | | | | | | | | | | | | | | | | | | | | | | | | |
| For a Share Outstanding Throughout the Years Ended March 31 (except as noted) | | |
| Per-Share Data | Ratios and Supplemental Data | | |
| | Income From Investment Operations: | Distributions From: | | | Ratio to Average Net Assets of: | | |
| Net Asset
Value,
Beginning
of Period | Net Investment
Income (Loss)(1) | Net
Realized
and
Unrealized
Gain (Loss) | Total From
Investment
Operations | Net
Investment
Income | Net
Realized
Gains | Total
Distributions | Net Asset
Value,
End
of Period | Total Return(2) | Operating
Expenses | Operating
Expenses
(before
expense
waiver) | Net
Investment
Income
(Loss) | Net
Investment
Income (Loss)
(before expense waiver) | Portfolio
Turnover
Rate | Net
Assets,
End of
Period
(in thousands) |
| G Class | | |
| 2023 | $11.00 | 0.53 | (0.65) | (0.12) | (0.55) | (0.07) | (0.62) | $10.26 | (1.01)% | 0.07% | 0.38% | 5.02% | 4.71% | 32% | $675,227 | |
| 2022 | $10.90 | 0.56 | 0.03 | 0.59 | (0.49) | — | (0.49) | $11.00 | 5.46% | 0.01% | 0.31% | 5.03% | 4.73% | 71% | $661,759 | |
| 2021 | $10.10 | 0.18 | 0.77 | 0.95 | (0.15) | — | (0.15) | $10.90 | 9.41% | 0.01% | 0.32% | 1.51% | 1.20% | 29% | $697,554 | |
| 2020 | $10.20 | 0.29 | (0.16) | 0.13 | (0.23) | — | (0.23) | $10.10 | 1.25% | 0.01% | 0.32% | 2.69% | 2.38% | 50% | $343,192 | |
| 2019 | $10.25 | 0.22 | 0.01 | 0.23 | (0.28) | — | (0.28) | $10.20 | 2.34% | 0.01% | 0.32% | 2.05% | 1.74% | 31% | $399,692 | |
| | |
| Notes to Financial Highlights |
(1)Computed using average shares outstanding throughout the period.
(2)Total returns are calculated based on the net asset value of the last business day and do not reflect applicable sales charges, if any. Total returns for periods less than one year are not annualized.
(3)Per-share amount was less than $0.005.
See Notes to Financial Statements.
| | |
| Report of Independent Registered Public Accounting Firm |
To the Shareholders and the Board of Trustees of American Century Investment Trust:
Opinion on the Financial Statements and Financial Highlights
We have audited the accompanying statement of assets and liabilities, including the schedule of investments, of Short Duration Inflation Protection Bond Fund (the “Fund”), one of the funds constituting the American Century Investment Trust, as of March 31, 2023, the related statement of operations for the year then ended, the statements of changes in net assets and financial highlights for the two years in the period then ended, and the related notes. In our opinion, the financial statements and financial highlights present fairly, in all material respects, the financial position of Short Duration Inflation Protection Bond Fund of the American Century Investment Trust, as of March 31, 2023, and the results of its operations for the year then ended and the changes in its net assets and the financial highlights for the two years then ended in conformity with accounting principles generally accepted in the United States of America. The financial highlights for each of the three years in the period ended March 31, 2021, were audited by other auditors, whose report, dated May 18, 2021, expressed an unqualified opinion on such financial highlights.
Basis for Opinion
These financial statements and financial highlights are the responsibility of the Fund's management. Our responsibility is to express an opinion on the Fund’s financial statements and financial highlights based on our audit. We are a public accounting firm registered with the Public Company Accounting Oversight Board (United States) (PCAOB) and are required to be independent with respect to the Fund in accordance with the U.S. federal securities laws and the applicable rules and regulations of the Securities and Exchange Commission and the PCAOB.
We conducted our audits in accordance with the standards of the PCAOB. Those standards require that we plan and perform the audit to obtain reasonable assurance about whether the financial statements and financial highlights are free of material misstatement, whether due to error or fraud. The Fund is not required to have, nor were we engaged to perform, an audit of its internal control over financial reporting. As part of our audit, we are required to obtain an understanding of internal control over financial reporting but not for the purpose of expressing an opinion on the effectiveness of the Fund’s internal control over financial reporting. Accordingly, we express no such opinion.
Our audits included performing procedures to assess the risks of material misstatement of the financial statements and financial highlights, whether due to error or fraud, and performing procedures that respond to those risks. Such procedures included examining, on a test basis, evidence regarding the amounts and disclosures in the financial statements and financial highlights. Our audits also included evaluating the accounting principles used and significant estimates made by management, as well as evaluating the overall presentation of the financial statements and financial highlights. Our procedures included confirmation of securities owned as of March 31, 2023, by correspondence with the custodian and brokers; when replies were not received from brokers, we performed other auditing procedures. We believe that our audits provide a reasonable basis for our opinion.
/s/ Deloitte & Touche LLP
Kansas City, Missouri
May 16, 2023
We have served as the auditor of one or more American Century investment companies since 1997.
Board of Trustees
The individuals listed below serve as trustees of the funds. Each trustee will continue to serve in this capacity until death, retirement, resignation or removal from office. The board has adopted a mandatory retirement age for trustees who are not “interested persons,” as that term is defined in the Investment Company Act (independent trustees). Independent trustees shall retire on December 31 of the year in which they reach their 76th birthday.
Jonathan S. Thomas is an “interested person” because he currently serves as President and Chief Executive Officer of American Century Companies, Inc. (ACC), the parent company of American Century Investment Management, Inc. (ACIM or the advisor). The other trustees (more than three-fourths of the total number) are independent. They are not employees, directors or officers of, and have no financial interest in, ACC or any of its wholly owned, direct or indirect, subsidiaries, including ACIM, American Century Investment Services, Inc. (ACIS) and American Century Services, LLC (ACS), and they do not have any other affiliations, positions or relationships that would cause them to be considered “interested persons” under the Investment Company Act. The trustees serve in this capacity for eight (in the case of Jonathan S. Thomas, 16; and Jeremy I. Bulow, 9) registered investment companies in the American Century Investments family of funds.
The following table presents additional information about the trustees. The mailing address for each trustee other than Jonathan S. Thomas is 3945 Freedom Circle, Suite #800, Santa Clara, California 95054. The mailing address for Jonathan S. Thomas is 4500 Main Street, Kansas City, Missouri 64111.
| | | | | | | | | | | | | | | | | |
Name
(Year of Birth) | Position(s) Held with Funds | Length of Time Served | Principal Occupation(s) During Past 5 Years | Number of American Century Portfolios Overseen by Trustee | Other Directorships Held During Past 5 Years |
| Independent Trustees | | |
Tanya S. Beder
(1955) | Trustee and Board Chair | Since 2011 (Board Chair since 2022) | Chairman and CEO, SBCC Group Inc. (independent advisory services) (2006 to present) | 32 | Kirby Corporation; Nabors Industries, Ltd. |
Jeremy I. Bulow
(1954) | Trustee | Since 2011 | Professor of Economics, Stanford University, Graduate School of Business (1979 to present) | 77 | None |
Jennifer Cabalquinto
(1968) | Trustee | Since 2021 | Chief Financial Officer, 2K (interactive entertainment) (2021 to present); Special Advisor, GSW Sports, LLC (2020 to 2021); Chief Financial Officer, GSW Sports, LLC (2013 to 2020) | 32 | Sabio Holdings, Inc. |
Anne Casscells
(1958) | Trustee | Since 2016 | Co-Chief Executive Officer and Chief Investment Officer, Aetos Alternatives Management (investment advisory firm) (2001 to present) | 32 | None |
| | | | | | | | | | | | | | | | | |
Name
(Year of Birth) | Position(s) Held with Funds | Length of Time Served | Principal Occupation(s) During Past 5 Years | Number of American Century Portfolios Overseen by Trustee | Other Directorships Held During Past 5 Years |
| Independent Trustees | | |
Jonathan D. Levin
(1972) | Trustee | Since 2016 | Philip H. Knight Professor and Dean, Graduate School of Business, Stanford University (2016 to present); Professor, Stanford University, (2000 to present) | 32 | None |
Peter F. Pervere
(1947) | Trustee | Since 2007 | Retired | 32 | None |
John B. Shoven
(1947) | Trustee | Since 2002 | Charles R. Schwab Professor of Economics, Stanford University (1973 to present, emeritus since 2019) | 32 | Cadence Design Systems; Exponent; Financial Engines |
| Interested Trustee | | |
Jonathan S. Thomas
(1963) | Trustee | Since 2007 | President and Chief Executive Officer, ACC (2007 to present). Also serves as Chief Executive Officer, ACS; Director, ACC and other ACC subsidiaries | 141 | None |
The Statement of Additional Information has additional information about the fund's trustees and is available without charge, upon request, by calling 1-800-345-2021.
Officers
The following table presents certain information about the executive officers of the funds. Each officer serves as an officer for 16 investment companies in the American Century family of funds. No officer is compensated for his or her service as an officer of the funds. The listed officers are interested persons of the funds and are appointed or re-appointed on an annual basis. The mailing address for each of the officers listed below is 4500 Main Street, Kansas City, Missouri 64111.
| | | | | | | | |
Name
(Year of Birth) | Offices with the Funds | Principal Occupation(s) During the Past Five Years |
Patrick Bannigan
(1965)
| President since 2019 | Executive Vice President and Director, ACC (2012 to present); Chief Financial Officer, Chief Accounting Officer and Treasurer, ACC (2015 to present). Also serves as President, ACS; Vice President, ACIM; Chief Financial Officer, Chief Accounting Officer and/or Director, ACIM, ACS and other ACC subsidiaries |
R. Wes Campbell
(1974)
| Chief Financial Officer and Treasurer since 2018 | Vice President, ACS (2020 to present); Investment Operations and Investment Accounting, ACS (2000 to present) |
Amy D. Shelton
(1964) | Chief Compliance Officer and Vice President since 2014 | Chief Compliance Officer, American Century funds, (2014 to present); Chief Compliance Officer, ACIM (2014 to present); Chief Compliance Officer, ACIS (2009 to present). Also serves as Vice President, ACIS |
John Pak
(1968) | General Counsel and Senior Vice President since 2021 | General Counsel and Senior Vice President, ACC (2021 to present); Also serves as General Counsel and Senior Vice President, ACIM, ACS and ACIS. Chief Legal Officer of Investment and Wealth Management, The Bank of New York Mellon (2014 to 2021) |
David H. Reinmiller
(1963) | Vice President since 2000 | Attorney, ACC (1994 to present). Also serves as Vice President, ACIM and ACS |
Ward D. Stauffer
(1960) | Secretary since 2005 | Attorney, ACC (2003 to present) |
| | |
| Liquidity Risk Management Program |
The Fund has adopted a liquidity risk management program (the “program”). The Fund’s Board of Trustees (the "Board") has designated American Century Investment Management, Inc. (“ACIM”) as the administrator of the program. Personnel of ACIM or its affiliates, including members of ACIM’s Investment Oversight Committee who are members of ACIM’s Investment Management and Global Analytics departments, conduct the day-to-day operation of the program pursuant to the program.
Under the program, ACIM manages the Fund’s liquidity risk, which is the risk that the Fund could not meet shareholder redemption requests without significant dilution of remaining shareholders’ interests in the Fund. This risk is managed by monitoring the degree of liquidity of the Fund’s investments, limiting the amount of the Fund’s illiquid investments, and utilizing various risk management tools and facilities available to the Fund for meeting shareholder redemptions, among other means. ACIM’s process of determining the degree of liquidity of certain investments held by the Fund is supported by a third-party liquidity assessment vendor.
The Board reviewed a report prepared by ACIM regarding the operation and effectiveness of the program for the period January 1, 2022 through December 31, 2022. No significant liquidity events impacting the Fund were noted in the report. In addition, ACIM provided its assessment that the program had been effective in managing the Fund’s liquidity risk.
Retirement Account Information
As required by law, distributions you receive from certain retirement accounts are subject to federal income tax withholding at the IRS default rate of 10%.* Tax will be withheld on the total amount withdrawn even though you may be receiving amounts that are not subject to withholding, such as nondeductible contributions. In such case, excess amounts of withholding could occur. You may adjust your withholding election so that a greater or lesser amount will be withheld.
You may elect a different withholding rate, or request zero withholding, by submitting an acceptable IRS Form W-4R election with your distribution request. You may notify us of your W-4R election by telephone, on our distribution forms, on IRS Form W-4R, or through other acceptable electronic means. If your withholding election is for an automatic withdrawal plan, you have the right to revoke your election at any time and any election you make will remain in effect until revoked by filing a new election.
Remember, even if you elect not to have income tax withheld, you are liable for paying income tax on the taxable portion of your withdrawal. If you elect not to have income tax withheld or you don’t have enough income tax withheld, you may be responsible for payment of estimated tax. You may incur penalties under the estimated tax rules if your withholding and estimated tax payments are not sufficient. You can reduce or defer the income tax on a distribution by directly or indirectly rolling such distribution over to another IRA or eligible plan. You should consult your tax advisor for additional information.
State tax will be withheld according to state regulations if, at the time of your distribution, your tax residency is within one of the mandatory withholding states.
*Some 403(b), 457 and qualified retirement plan distributions may be subject to 20% mandatory withholding, as they are subject to special tax and withholding rules. Your plan administrator or plan sponsor is required to provide you with a special tax notice explaining those rules at the time you request a distribution. If applicable, federal and/or state taxes may be withheld from your distribution amount.
Proxy Voting Policies
Descriptions of the principles and policies that the fund's investment advisor uses in exercising the voting rights associated with the securities purchased and/or held by the fund are available without charge, upon request, by calling 1-800-345-2021 or visiting American Century Investments’ website at americancentury.com/proxy. A description of the policies is also available on the Securities and Exchange Commission’s website at sec.gov. Information regarding how the investment advisor voted proxies relating to portfolio securities during the most recent 12-month period ended June 30 is available on americancentury.com/proxy. It is also available at sec.gov.
Quarterly Portfolio Disclosure
The fund files its complete schedule of portfolio holdings with the Securities and Exchange Commission (SEC) for the first and third quarters of each fiscal year as an exhibit to its reports on Form N-PORT. These portfolio holdings are available on the fund's website at americancentury.com and, upon request, by calling 1-800-345-2021. The fund’s Form N-PORT reports are available on the SEC’s website at sec.gov.
Other Tax Information
The following information is provided pursuant to provisions of the Internal Revenue Code.
The fund hereby designates $2,829,623 as qualified short-term capital gain distributions for purposes of Internal Revenue Code Section 871 for the fiscal year ended March 31, 2023.
The fund hereby designates $15,230,972, or up to the maximum amount allowable, as long-term capital gain distributions (20% rate gain distributions) for the fiscal year ended March 31, 2023.
| | | | | | | | |
| |
| | |
| Contact Us | americancentury.com | |
| Automated Information Line | 1-800-345-8765 | |
| Investor Services Representative | 1-800-345-2021
or 816-531-5575 | |
| Investors Using Advisors | 1-800-378-9878 | |
| Business, Not-For-Profit, Employer-Sponsored Retirement Plans | 1-800-345-3533 | |
| Banks and Trust Companies, Broker-Dealers, Financial Professionals, Insurance Companies | 1-800-345-6488 | |
| Telecommunications Relay Service for the Deaf | 711 | |
| | |
| American Century Investment Trust | |
| | |
Investment Advisor: American Century Investment Management, Inc. Kansas City, Missouri | |
| | |
| This report and the statements it contains are submitted for the general information of our shareholders. The report is not authorized for distribution to prospective investors unless preceded or accompanied by an effective prospectus. | |
| | |
©2023 American Century Proprietary Holdings, Inc. All rights reserved.
CL-ANN-92282 2305 | |
| | | | | |
| |
| Annual Report |
| |
| March 31, 2023 |
| |
| Short Duration Strategic Income Fund |
| Investor Class (ASDVX) |
| I Class (ASDHX) |
| Y Class (ASYDX) |
| A Class (ASADX) |
| C Class (ASCDX) |
| R Class (ASDRX) |
| R5 Class (ASDJX) |
| R6 Class (ASXDX) |
| | | | | |
| President’s Letter | |
| Performance | |
| Portfolio Commentary | |
| Fund Characteristics | |
| Shareholder Fee Example | |
| Schedule of Investments | |
| Statement of Assets and Liabilities | |
| Statement of Operations | |
| Statement of Changes in Net Assets | |
| Notes to Financial Statements | |
| Financial Highlights | |
| Report of Independent Registered Public Accounting Firm | |
| Management | |
| |
| Liquidity Risk Management Program | |
| |
| Additional Information | |
Any opinions expressed in this report reflect those of the author as of the date of the report, and do not necessarily represent the opinions of American Century Investments® or any other person in the American Century Investments organization. Any such opinions are subject to change at any time based upon market or other conditions and American Century Investments disclaims any responsibility to update such opinions. These opinions may not be relied upon as investment advice and, because investment decisions made by American Century Investments funds are based on numerous factors, may not be relied upon as an indication of trading intent on behalf of any American Century Investments fund. Security examples are used for representational purposes only and are not intended as recommendations to purchase or sell securities. Performance information for comparative indices and securities is provided to American Century Investments by third party vendors. To the best of American Century Investments’ knowledge, such information is accurate at the time of printing.
Jonathan Thomas
Dear Investor:
Thank you for reviewing this annual report for the period ended March 31, 2023. Annual reports help convey important information about fund returns, including market factors that affected performance. For additional investment insights, please visit americancentury.com.
Challenging Conditions Weighed on Asset Class Returns
Prevailing headwinds early in the reporting period continued to challenge U.S. financial markets throughout the 12 months. Asset class performance seesawed but declined overall amid mixed economic data, elevated inflation and anticipated monetary policy responses. By period-end, a new headwind emerged: banking industry uncertainty.
After launching its inflation-fighting rate-hike campaign in March 2022, the Federal Reserve (Fed) lifted rates eight more times by period-end. The federal funds target rate ended the reporting period at 4.75% to 5%, its highest level since 2007, while Treasury yields climbed to multiyear highs. Amid the Fed’s efforts, the annual inflation rate peaked at 9.1% in June, a 40-year high, before easing to 5% by March.
In addition to helping tame inflation, rapidly rising rates also fueled recession worries and led to expectations for the Fed to change course. This sentiment helped spark a rebound among stock and bond indices in the second half of the reporting period. The collapse of two U.S. regional banks late in the period and fears of a looming credit crunch and likely recession also contributed to market expectations for a Fed policy change. Nevertheless, the Fed indicated a near-term course change was unlikely.
Despite delivering strong gains in the second half of the reporting period, stock returns succumbed to first-half losses and declined for the 12 months. Similarly, weakness in the first half of the period overwhelmed second-half gains, and bond returns were negative for the 12-month period.
Remaining Diligent in Uncertain Times
We expect market volatility to linger as investors navigate a complex environment of still-high inflation, tighter financial conditions, banking industry turbulence and economic uncertainty. In addition, increasingly tense geopolitical considerations complicate the market backdrop.
We appreciate your confidence in us during these extraordinary times. Our firm has a long history of helping clients weather unpredictable and volatile markets, and we’re confident we will continue to meet today’s challenges.
Sincerely,
Jonathan Thomas
President and Chief Executive Officer
American Century Investments
| | | | | | | | | | | | | | | | | |
| Total Returns as of March 31, 2023 |
| | | Average Annual Returns | |
| Ticker
Symbol | 1 year | 5 years | Since
Inception | Inception
Date |
| Investor Class | ASDVX | -1.24% | 1.69% | 1.65% | 7/28/14 |
| Bloomberg U.S. 1-3 Year Government/Credit Bond Index | — | 0.26% | 1.26% | 1.06% | — |
| I Class | ASDHX | -1.15% | 1.77% | 1.71% | 4/10/17 |
| Y Class | ASYDX | -1.07% | 1.88% | 1.82% | 4/10/17 |
| A Class | ASADX | | | | 7/28/14 |
| No sales charge | | -1.49% | 1.44% | 1.40% | |
| With sales charge | | -3.71% | 0.97% | 1.13% | |
| C Class | ASCDX | -2.23% | 0.68% | 0.64% | 7/28/14 |
| R Class | ASDRX | -1.74% | 1.18% | 1.15% | 7/28/14 |
| R5 Class | ASDJX | -1.05% | 1.89% | 1.86% | 7/28/14 |
| R6 Class | ASXDX | -1.00% | 1.94% | 1.91% | 7/28/14 |
Fund returns would have been lower if a portion of the fees had not been waived.
C Class shares will automatically convert to A Class shares after being held for approximately eight years. C Class average annual returns do not reflect this conversion.
Sales charges include initial sales charges and contingent deferred sales charges (CDSCs), as applicable. A Class shares have a 2.25% maximum initial sales charge and may be subject to a maximum CDSC of 1.00%. C Class shares redeemed within 12 months of purchase are subject to a maximum CDSC of 1.00%. The SEC requires that mutual funds provide performance information net of maximum sales charges in all cases where charges could be applied.
Data presented reflect past performance. Past performance is no guarantee of future results. Current performance may be higher or lower than the performance shown. Total returns for periods less than one year are not annualized. Investment return and principal value will fluctuate, and redemption value may be more or less than original cost. Data assumes reinvestment of dividends and capital gains, and none of the charts reflect the deduction of taxes that a shareholder would pay on fund distributions or the redemption of fund shares. To obtain performance data current to the most recent month end, please call 1-800-345-2021 or visit americancentury.com. For additional information about the fund, please consult the prospectus.
| | |
| Growth of $10,000 Over Life of Class |
| $10,000 investment made July 28, 2014 |
| Performance for other share classes will vary due to differences in fee structure. |
| | | | | |
| Value on March 31, 2023 |
| Investor Class — $11,528 |
|
| Bloomberg U.S. 1-3 Year Government/Credit Bond Index — $10,955 |
|
| |
|
Ending value of Investor Class would have been lower if a portion of the fees had not been waived.
| | | | | | | | | | | | | | | | | | | | | | | |
| Total Annual Fund Operating Expenses |
| Investor Class | I Class | Y Class | A Class | C Class | R Class | R5 Class | R6 Class |
| 0.53% | 0.43% | 0.33% | 0.78% | 1.53% | 1.03% | 0.33% | 0.28% |
The total annual fund operating expenses shown is as stated in the fund’s prospectus current as of the date of this report. The prospectus may vary from the expense ratio shown elsewhere in this report because it is based on a different time period, includes acquired fund fees and expenses, and, if applicable, does not include fee waivers or expense reimbursements.
Data presented reflect past performance. Past performance is no guarantee of future results. Current performance may be higher or lower than the performance shown. Total returns for periods less than one year are not annualized. Investment return and principal value will fluctuate, and redemption value may be more or less than original cost. Data assumes reinvestment of dividends and capital gains, and none of the charts reflect the deduction of taxes that a shareholder would pay on fund distributions or the redemption of fund shares. To obtain performance data current to the most recent month end, please call 1-800-345-2021 or visit americancentury.com. For additional information about the fund, please consult the prospectus.
Portfolio Managers: Jason Greenblath, Jeff Houston, Peter Van Gelderen and Charles Tan
As of August 1, 2022, Bob Gahagan left the portfolio management team.
Performance Summary
Short Duration Strategic Income returned -1.24%* for the 12 months ended March 31, 2023. By comparison, the Bloomberg U.S. 1-3 Year Government/Credit Bond Index returned 0.26% for the same period. Fund returns reflect operating expenses, while index returns do not.
Inflation, Federal Reserve Policy Challenged Bond Market
Elevated inflation, aggressive Federal Reserve (Fed) policy, rising interest rates and mounting recession risk dominated the reporting period and contributed to heightened market volatility. After peaking in June, inflation moderated through March but remained well above the Fed’s target, which led to consistent interest rate hikes. In March, the collapse of two U.S. regional banks introduced a new market headwind, as banks moved to tighten lending standards amid industry uncertainty.
Against this backdrop, Treasury yields were volatile, particularly during the banking industry turmoil. For the period overall, yields rose sharply across the yield curve. This dynamic contributed to negative 12-month returns for most investment-grade bond market sectors, including Treasuries, mortgage-backed securities and corporate bonds. Credit-sensitive and longer maturity securities generally posted the largest losses.
Securitized, Credit Sectors Detracted
We allocated approximately 26% of the portfolio at period-end in various subsectors within the securitized asset class. We primarily focused on non-agency collateralized mortgage obligations (CMOs), non-agency commercial mortgage-backed securities (CMBS), asset-backed securities (ABS) and collateralized loan obligations (CLOs). Lagging results from CMOs and CMBS weighed down the overall results from the securitized sector. Positive relative results from CLOs and ABS helped offset some of the losses.
Although we reduced the portfolio’s credit exposure as the period progressed, we continued to uncover attractive yield-generating opportunities. These securities comprised approximately 44% of the portfolio at period-end. Our allocation included high-yield securities, which detracted from overall results. Our selections among investment-grade corporates also weighed on relative results for the period.
Elsewhere, our allocation to emerging markets, which we reduced during the period, and a small position in preferred stocks detracted.
Cash Holdings Provided a Lift
Our larger-than-usual position in cash and cash equivalents delivered a boost to relative results, benefiting from the Fed’s aggressive rate-hike campaign. We believe several factors, including rising recession risk, banking system uncertainty, slowing cash flows from weaker revenue growth and margin compression, will push credit spreads wider in the near term. In this environment, the portfolio’s higher liquidity gives us the flexibility to add back credit risk when we believe valuations appear attractive.
*All fund returns referenced in this commentary are for Investor Class shares. Performance for other share classes will vary due to differences in fee structure; when Investor Class performance exceeds that of the index, other share classes may not. See page 3 for returns for all share classes.
| | | | | |
| MARCH 31, 2023 | |
| Types of Investments in Portfolio | % of net assets |
| Corporate Bonds | 42.9% |
| U.S. Treasury Securities | 19.3% |
| Collateralized Loan Obligations | 9.2% |
| Asset-Backed Securities | 8.7% |
| Collateralized Mortgage Obligations | 5.3% |
| Commercial Mortgage-Backed Securities | 2.9% |
| Bank Loan Obligations | 1.5% |
| Preferred Stocks | 0.8% |
| Sovereign Governments and Agencies | 0.5% |
| Short-Term Investments | 6.9% |
| Other Assets and Liabilities | 2.0% |
Fund shareholders may incur two types of costs: (1) transaction costs, including sales charges (loads) on purchase payments and redemption/exchange fees; and (2) ongoing costs, including management fees; distribution and service (12b-1) fees; and other fund expenses. This example is intended to help you understand your ongoing costs (in dollars) of investing in your fund and to compare these costs with the ongoing cost of investing in other mutual funds.
The example is based on an investment of $1,000 made at the beginning of the period and held for the entire period from October 1, 2022 to March 31, 2023.
Actual Expenses
The table provides information about actual account values and actual expenses for each class. You may use the information, together with the amount you invested, to estimate the expenses that you paid over the period. First, identify the share class you own. Then simply divide your account value by $1,000 (for example, an $8,600 account value divided by $1,000 = 8.6), then multiply the result by the number under the heading “Expenses Paid During Period” to estimate the expenses you paid on your account during this period.
If you hold Investor Class shares of any American Century Investments mutual fund, or I Class shares of the American Century Diversified Bond Fund, in an American Century Investments account (i.e., not through a financial intermediary or employer-sponsored retirement plan account), American Century Investments may charge you a $25 annual account maintenance fee if the value of those shares is less than $10,000. We will redeem shares automatically in one of your accounts to pay the $25 fee. In determining your total eligible investment amount, we will include your investments in all personal accounts (including American Century Investments brokerage accounts) registered under your Social Security number. Personal accounts include individual accounts, joint accounts, UGMA/UTMA accounts, personal trusts, Coverdell Education Savings Accounts and IRAs (including traditional, Roth, Rollover, SEP-, SARSEP- and SIMPLE-IRAs), and certain other retirement accounts. If you have only business, business retirement, employer-sponsored or American Century Investments brokerage accounts, you are currently not subject to this fee. If you are subject to the account maintenance fee, your account value could be reduced by the fee amount.
Hypothetical Example for Comparison Purposes
The table also provides information about hypothetical account values and hypothetical expenses based on the actual expense ratio of each class of your fund and an assumed rate of return of 5% per year before expenses, which is not the actual return of a fund’s share class. The hypothetical account values and expenses may not be used to estimate the actual ending account balance or expenses you paid for the period. You may use this information to compare the ongoing costs of investing in your fund and other funds. To do so, compare this 5% hypothetical example with the 5% hypothetical examples that appear in the shareholder reports of the other funds.
Please note that the expenses shown in the table are meant to highlight your ongoing costs only and do not reflect any transactional costs, such as sales charges (loads) or redemption/exchange fees. Therefore, the table is useful in comparing ongoing costs only, and will not help you determine the relative total costs of owning different funds. In addition, if these transactional costs were included, your costs would have been higher.
| | | | | | | | | | | | | | |
| Beginning Account Value 10/1/22 | Ending Account Value 3/31/23 | Expenses Paid During Period(1) 10/1/22 - 3/31/23 | Annualized Expense Ratio(1) |
| Actual | | | | |
| Investor Class | $1,000 | $1,025.90 | $2.63 | 0.52% |
| I Class | $1,000 | $1,026.40 | $2.12 | 0.42% |
| Y Class | $1,000 | $1,026.90 | $1.62 | 0.32% |
| A Class | $1,000 | $1,024.60 | $3.89 | 0.77% |
| C Class | $1,000 | $1,020.80 | $7.66 | 1.52% |
| R Class | $1,000 | $1,023.40 | $5.15 | 1.02% |
| R5 Class | $1,000 | $1,026.90 | $1.62 | 0.32% |
| R6 Class | $1,000 | $1,027.20 | $1.36 | 0.27% |
| Hypothetical | | | | |
| Investor Class | $1,000 | $1,022.34 | $2.62 | 0.52% |
| I Class | $1,000 | $1,022.84 | $2.12 | 0.42% |
| Y Class | $1,000 | $1,023.34 | $1.61 | 0.32% |
| A Class | $1,000 | $1,021.09 | $3.88 | 0.77% |
| C Class | $1,000 | $1,017.35 | $7.64 | 1.52% |
| R Class | $1,000 | $1,019.85 | $5.14 | 1.02% |
| R5 Class | $1,000 | $1,023.34 | $1.61 | 0.32% |
| R6 Class | $1,000 | $1,023.59 | $1.36 | 0.27% |
(1)Expenses are equal to the class's annualized expense ratio listed in the table above, multiplied by the average account value over the period, multiplied by 182, the number of days in the most recent fiscal half-year, divided by 365, to reflect the one-half year period. Annualized expense ratio reflects actual expenses, including any applicable fee waivers or expense reimbursements and excluding any acquired fund fees and expenses.
MARCH 31, 2023
| | | | | | | | | | | |
| | Principal Amount/Shares | Value |
| CORPORATE BONDS — 42.9% | | | |
| Aerospace and Defense — 0.4% | | | |
| Boeing Co., 1.43%, 2/4/24 | | $ | 1,410,000 | | $ | 1,362,683 | |
| Boeing Co., 2.80%, 3/1/24 | | 1,930,000 | | 1,882,188 | |
| | | 3,244,871 | |
| Air Freight and Logistics — 0.6% | | | |
| GXO Logistics, Inc., 1.65%, 7/15/26 | | 3,000,000 | | 2,642,217 | |
Rand Parent LLC, 8.50%, 2/15/30(1) | | 2,445,000 | | 2,300,928 | |
| | | 4,943,145 | |
| Automobiles — 1.4% | | | |
| Ford Motor Credit Co. LLC, 2.30%, 2/10/25 | | 1,700,000 | | 1,577,974 | |
| General Motors Financial Co., Inc., 1.20%, 10/15/24 | | 2,000,000 | | 1,873,076 | |
| General Motors Financial Co., Inc., 3.80%, 4/7/25 | | 3,000,000 | | 2,918,629 | |
Mercedes-Benz Finance North America LLC, 5.375%, 11/26/25(1) | | 1,600,000 | | 1,620,103 | |
| Toyota Motor Credit Corp., 3.95%, 6/30/25 | | 3,000,000 | | 2,964,236 | |
| | | 10,954,018 | |
| Banks — 8.9% | | | |
| Banco Santander SA, VRN, 1.72%, 9/14/27 | | 1,400,000 | | 1,223,499 | |
| Bank of America Corp., VRN, 2.02%, 2/13/26 | | 1,125,000 | | 1,054,908 | |
| Bank of America Corp., VRN, 1.73%, 7/22/27 | | 3,952,000 | | 3,547,040 | |
| Bank of America Corp., VRN, 3.42%, 12/20/28 | | 1,245,000 | | 1,157,734 | |
Banque Federative du Credit Mutuel SA, 4.94%, 1/26/26(1) | | 2,975,000 | | 2,942,420 | |
| Barclays PLC, VRN, 2.28%, 11/24/27 | | 1,214,000 | | 1,067,676 | |
| Barclays PLC, VRN, 7.39%, 11/2/28 | | 556,000 | | 589,829 | |
BNP Paribas SA, VRN, 2.22%, 6/9/26(1) | | 2,600,000 | | 2,389,773 | |
BNP Paribas SA, VRN, 5.125%, 1/13/29(1) | | 1,235,000 | | 1,238,511 | |
BPCE SA, 1.625%, 1/14/25(1) | | 1,500,000 | | 1,404,684 | |
| Citigroup, Inc., VRN, 2.01%, 1/25/26 | | 2,626,000 | | 2,474,496 | |
| Citigroup, Inc., VRN, 3.11%, 4/8/26 | | 800,000 | | 765,371 | |
| Commonwealth Bank of Australia, 5.32%, 3/13/26 | | 2,139,000 | | 2,176,615 | |
Cooperatieve Rabobank UA, VRN, 5.56%, 2/28/29(1) | | 2,680,000 | | 2,700,603 | |
Credit Agricole SA, 5.30%, 7/12/28(1) | | 1,235,000 | | 1,252,967 | |
| Discover Bank, VRN, 4.68%, 8/9/28 | | 3,830,000 | | 3,506,055 | |
DNB Bank ASA, VRN, 2.97%, 3/28/25(1) | | 2,265,000 | | 2,211,292 | |
| HSBC Holdings PLC, 4.25%, 3/14/24 | | 5,045,000 | | 4,915,627 | |
| JPMorgan Chase & Co., VRN, 1.56%, 12/10/25 | | 337,000 | | 316,270 | |
| JPMorgan Chase & Co., VRN, 5.55%, 12/15/25 | | 560,000 | | 564,138 | |
| JPMorgan Chase & Co., VRN, 1.04%, 2/4/27 | | 715,000 | | 638,759 | |
| JPMorgan Chase & Co., VRN, 1.58%, 4/22/27 | | 895,000 | | 804,810 | |
| JPMorgan Chase & Co., VRN, 1.47%, 9/22/27 | | 781,000 | | 689,467 | |
| Lloyds Banking Group PLC, VRN, 4.72%, 8/11/26 | | 1,955,000 | | 1,904,863 | |
| Lloyds Banking Group PLC, VRN, 5.87%, 3/6/29 | | 1,065,000 | | 1,074,601 | |
| Mitsubishi UFJ Financial Group, Inc., VRN, 5.72%, 2/20/26 | | 1,911,000 | | 1,917,242 | |
| Mitsubishi UFJ Financial Group, Inc., VRN, 5.42%, 2/22/29 | | 1,465,000 | | 1,479,797 | |
| NatWest Group PLC, 4.80%, 4/5/26 | | 1,000,000 | | 970,461 | |
Nordea Bank Abp, 4.75%, 9/22/25(1) | | 1,870,000 | | 1,862,589 | |
| Royal Bank of Canada, 1.15%, 6/10/25 | | 1,632,000 | | 1,502,323 | |
| | | | | | | | | | | |
| | Principal Amount/Shares | Value |
| Royal Bank of Canada, 6.00%, 11/1/27 | | $ | 2,450,000 | | $ | 2,556,951 | |
Societe Generale SA, VRN, 2.23%, 1/21/26(1) | | 2,200,000 | | 2,029,897 | |
| Sumitomo Mitsui Financial Group, Inc., 5.46%, 1/13/26 | | 927,000 | | 936,464 | |
Sumitomo Mitsui Trust Bank Ltd., 5.65%, 3/9/26(1) | | 1,910,000 | | 1,942,651 | |
| Toronto-Dominion Bank, 4.11%, 6/8/27 | | 1,790,000 | | 1,734,783 | |
| Truist Bank, 3.30%, 5/15/26 | | 3,772,000 | | 3,477,287 | |
| Truist Bank, VRN, 2.64%, 9/17/29 | | 2,484,000 | | 2,333,580 | |
UniCredit SpA, 7.83%, 12/4/23(1) | | 2,660,000 | | 2,684,679 | |
UniCredit SpA, VRN, 2.57%, 9/22/26(1) | | 2,545,000 | | 2,305,839 | |
| | | 70,346,551 | |
| Beverages — 0.2% | | | |
| PepsiCo, Inc., 3.60%, 2/18/28 | | 1,363,000 | | 1,338,067 | |
| Biotechnology — 0.5% | | | |
| Amgen, Inc., 5.25%, 3/2/25 | | 2,240,000 | | 2,265,767 | |
CSL Finance PLC, 3.85%, 4/27/27(1) | | 1,667,000 | | 1,626,215 | |
| | | 3,891,982 | |
| Broadline Retail — 0.2% | | | |
| Amazon.com, Inc., 4.60%, 12/1/25 | | 380,000 | | 383,293 | |
| Amazon.com, Inc., 4.55%, 12/1/27 | | 1,075,000 | | 1,091,814 | |
| | | 1,475,107 | |
| Capital Markets — 3.3% | | | |
| Bank of New York Mellon Corp., VRN, 5.80%, 10/25/28 | | 2,470,000 | | 2,575,452 | |
| Bank of New York Mellon Corp., VRN, 4.54%, 2/1/29 | | 3,198,000 | | 3,171,114 | |
| Charles Schwab Corp., 0.90%, 3/11/26 | | 2,515,000 | | 2,208,050 | |
| Deutsche Bank AG, VRN, 4.30%, 5/24/28 | | 1,085,000 | | 1,070,277 | |
| Deutsche Bank AG, Series E, 0.96%, 11/8/23 | | 424,000 | | 404,927 | |
| Goldman Sachs Group, Inc., VRN, 1.76%, 1/24/25 | | 1,257,000 | | 1,217,030 | |
| Goldman Sachs Group, Inc., VRN, 1.43%, 3/9/27 | | 1,455,000 | | 1,303,321 | |
| Goldman Sachs Group, Inc., VRN, 1.95%, 10/21/27 | | 987,000 | | 882,731 | |
| Golub Capital BDC, Inc., 2.50%, 8/24/26 | | 1,976,000 | | 1,696,509 | |
LPL Holdings, Inc., 4.625%, 11/15/27(1) | | 1,640,000 | | 1,551,276 | |
| Morgan Stanley, VRN, 0.79%, 5/30/25 | | 875,000 | | 828,661 | |
| Morgan Stanley, VRN, 1.16%, 10/21/25 | | 1,560,000 | | 1,457,806 | |
| Morgan Stanley, VRN, 2.63%, 2/18/26 | | 4,702,000 | | 4,466,167 | |
| Owl Rock Capital Corp., 3.40%, 7/15/26 | | 1,380,000 | | 1,220,463 | |
| Owl Rock Core Income Corp., 3.125%, 9/23/26 | | 438,000 | | 380,645 | |
UBS Group AG, VRN, 1.49%, 8/10/27(1) | | 1,404,000 | | 1,210,480 | |
| | | 25,644,909 | |
| Chemicals — 0.3% | | | |
| Celanese US Holdings LLC, 5.90%, 7/5/24 | | 1,600,000 | | 1,601,327 | |
| Orbia Advance Corp. SAB de CV, 4.00%, 10/4/27 | | 1,000,000 | | 933,545 | |
| | | 2,534,872 | |
| Consumer Finance — 2.5% | | | |
| AerCap Ireland Capital DAC / AerCap Global Aviation Trust, 1.65%, 10/29/24 | | 610,000 | | 571,025 | |
| AerCap Ireland Capital DAC / AerCap Global Aviation Trust, 1.75%, 10/29/24 | | 6,415,000 | | 5,981,150 | |
| AerCap Ireland Capital DAC / AerCap Global Aviation Trust, 6.50%, 7/15/25 | | 1,374,000 | | 1,385,056 | |
| AerCap Ireland Capital DAC / AerCap Global Aviation Trust, 2.45%, 10/29/26 | | 1,950,000 | | 1,752,568 | |
Avolon Holdings Funding Ltd., 2.125%, 2/21/26(1) | | 2,655,000 | | 2,362,414 | |
BOC Aviation USA Corp., 1.625%, 4/29/24(1) | | 1,774,000 | | 1,702,395 | |
| | | | | | | | | | | |
| | Principal Amount/Shares | Value |
| Discover Financial Services, 4.10%, 2/9/27 | | $ | 1,900,000 | | $ | 1,799,699 | |
| Navient Corp., 6.125%, 3/25/24 | | 1,725,000 | | 1,703,593 | |
| OneMain Finance Corp., 8.25%, 10/1/23 | | 2,195,000 | | 2,203,890 | |
| | | 19,461,790 | |
| Containers and Packaging — 1.5% | | | |
| Amcor Flexibles North America, Inc., 4.00%, 5/17/25 | | 2,690,000 | | 2,635,872 | |
Owens-Brockway Glass Container, Inc., 5.375%, 1/15/25(1) | | 2,750,000 | | 2,709,438 | |
Sealed Air Corp., 1.57%, 10/15/26(1) | | 3,500,000 | | 3,064,016 | |
Sealed Air Corp. / Sealed Air Corp. US, 6.125%, 2/1/28(1) | | 3,400,000 | | 3,441,480 | |
| | | 11,850,806 | |
| Diversified REITs — 1.5% | | | |
| Boston Properties LP, 3.125%, 9/1/23 | | 2,255,000 | | 2,217,702 | |
| GLP Capital LP / GLP Financing II, Inc., 5.375%, 4/15/26 | | 2,740,000 | | 2,661,648 | |
| MPT Operating Partnership LP / MPT Finance Corp., 5.00%, 10/15/27 | | 3,190,000 | | 2,627,300 | |
| VICI Properties LP, 4.375%, 5/15/25 | | 1,890,000 | | 1,831,515 | |
VICI Properties LP / VICI Note Co., Inc., 3.50%, 2/15/25(1) | | 3,000,000 | | 2,846,891 | |
| | | 12,185,056 | |
| Diversified Telecommunication Services — 0.6% | | | |
| AT&T, Inc., 7.30%, 8/15/26 | | 1,725,000 | | 1,818,404 | |
Level 3 Financing, Inc., 3.40%, 3/1/27(1) | | 3,460,000 | | 2,739,776 | |
| | | 4,558,180 | |
| Electric Utilities — 2.7% | | | |
| American Electric Power Co., Inc., 2.03%, 3/15/24 | | 2,000,000 | | 1,935,726 | |
| American Electric Power Co., Inc., VRN, 3.875%, 2/15/62 | | 2,600,000 | | 2,084,318 | |
| Duke Energy Corp., VRN, 3.25%, 1/15/82 | | 1,580,000 | | 1,184,605 | |
FEL Energy VI Sarl, 5.75%, 12/1/40(1) | | 2,032,690 | | 1,678,758 | |
Jersey Central Power & Light Co., 4.30%, 1/15/26(1) | | 2,500,000 | | 2,455,667 | |
| NextEra Energy Capital Holdings, Inc., 4.26%, 9/1/24 | | 2,000,000 | | 1,982,377 | |
| NextEra Energy Capital Holdings, Inc., 6.05%, 3/1/25 | | 800,000 | | 814,256 | |
| NextEra Energy Capital Holdings, Inc., 4.45%, 6/20/25 | | 2,720,000 | | 2,703,290 | |
NextEra Energy Operating Partners LP, 4.25%, 7/15/24(1) | | 1,643,000 | | 1,623,892 | |
| System Energy Resources, Inc., 6.00%, 4/15/28 | | 2,208,000 | | 2,270,385 | |
Vistra Operations Co. LLC, 5.125%, 5/13/25(1) | | 2,500,000 | | 2,439,264 | |
| | | 21,172,538 | |
| Electrical Equipment — 0.3% | | | |
Regal Rexnord Corp., 6.05%, 2/15/26(1) | | 2,520,000 | | 2,533,660 | |
| Entertainment — 0.4% | | | |
Warnermedia Holdings, Inc., 3.79%, 3/15/25(1) | | 1,950,000 | | 1,889,449 | |
Warnermedia Holdings, Inc., 3.76%, 3/15/27(1) | | 1,658,000 | | 1,562,789 | |
| | | 3,452,238 | |
| Financial Services — 0.9% | | | |
Antares Holdings LP, 6.00%, 8/15/23(1) | | 1,840,000 | | 1,831,797 | |
Antares Holdings LP, 3.95%, 7/15/26(1) | | 1,200,000 | | 1,042,375 | |
Antares Holdings LP, 2.75%, 1/15/27(1) | | 1,531,000 | | 1,248,688 | |
| Global Payments, Inc., 3.75%, 6/1/23 | | 890,000 | | 887,280 | |
| Global Payments, Inc., 4.45%, 6/1/28 | | 1,955,000 | | 1,857,236 | |
| | | 6,867,376 | |
| Food Products — 0.2% | | | |
| General Mills, Inc., 5.24%, 11/18/25 | | 1,426,000 | | 1,430,546 | |
| Ground Transportation — 1.3% | | | |
Ashtead Capital, Inc., 4.375%, 8/15/27(1) | | 3,800,000 | | 3,643,940 | |
| | | | | | | | | | | |
| | Principal Amount/Shares | Value |
DAE Funding LLC, 1.55%, 8/1/24(1) | | $ | 865,000 | | $ | 813,994 | |
DAE Funding LLC, 2.625%, 3/20/25(1) | | 1,910,000 | | 1,798,435 | |
SMBC Aviation Capital Finance DAC, 4.125%, 7/15/23(1) | | 2,000,000 | | 1,986,964 | |
Triton Container International Ltd., 1.15%, 6/7/24(1) | | 2,250,000 | | 2,117,038 | |
| | | 10,360,371 | |
| Health Care Equipment and Supplies — 0.5% | | | |
GE HealthCare Technologies, Inc., 5.55%, 11/15/24(1) | | 3,600,000 | | 3,623,115 | |
| Health Care Providers and Services — 0.7% | | | |
| CVS Health Corp., 5.00%, 2/20/26 | | 1,915,000 | | 1,937,492 | |
HCA, Inc., 3.125%, 3/15/27(1) | | 1,395,000 | | 1,297,777 | |
| Universal Health Services, Inc., 1.65%, 9/1/26 | | 2,333,000 | | 2,054,784 | |
| | | 5,290,053 | |
| Health Care REITs — 0.5% | | | |
| Welltower OP LLC, 4.50%, 1/15/24 | | 2,635,000 | | 2,607,188 | |
| Welltower OP LLC, 4.25%, 4/15/28 | | 1,443,000 | | 1,381,444 | |
| | | 3,988,632 | |
| Hotels, Restaurants and Leisure — 0.7% | | | |
| Hyatt Hotels Corp., 1.80%, 10/1/24 | | 2,000,000 | | 1,894,642 | |
| Marriott International, Inc., 4.90%, 4/15/29 | | 2,220,000 | | 2,201,643 | |
| Starbucks Corp., 4.75%, 2/15/26 | | 1,525,000 | | 1,534,606 | |
| | | 5,630,891 | |
| Household Durables — 0.4% | | | |
| Meritage Homes Corp., 6.00%, 6/1/25 | | 3,014,000 | | 3,040,222 | |
| Insurance — 1.2% | | | |
Athene Global Funding, 2.51%, 3/8/24(1) | | 2,600,000 | | 2,509,418 | |
GA Global Funding Trust, 3.85%, 4/11/25(1) | | 1,966,000 | | 1,905,457 | |
Jackson National Life Global Funding, 1.75%, 1/12/25(1) | | 712,000 | | 667,240 | |
Met Tower Global Funding, 1.25%, 9/14/26(1) | | 885,000 | | 786,216 | |
Metropolitan Life Global Funding I, 5.00%, 1/6/26(1) | | 2,315,000 | | 2,330,437 | |
SBL Holdings, Inc., VRN, 6.50%(1)(2) | | 1,935,000 | | 1,369,012 | |
| | | 9,567,780 | |
| IT Services — 0.4% | | | |
| International Business Machines Corp., 3.30%, 5/15/26 | | 3,620,000 | | 3,493,175 | |
| Life Sciences Tools and Services — 0.5% | | | |
| Illumina, Inc., 5.80%, 12/12/25 | | 3,590,000 | | 3,625,872 | |
| Machinery — 0.6% | | | |
| CNH Industrial Capital LLC, 3.95%, 5/23/25 | | 2,207,000 | | 2,150,755 | |
| John Deere Capital Corp., 3.40%, 6/6/25 | | 2,340,000 | | 2,293,912 | |
| | | 4,444,667 | |
| Media — 1.9% | | | |
Cox Communications, Inc., 3.15%, 8/15/24(1) | | 2,075,000 | | 2,023,281 | |
Directv Financing LLC / Directv Financing Co-Obligor, Inc., 5.875%, 8/15/27(1) | | 2,300,000 | | 2,085,318 | |
DISH DBS Corp., 5.25%, 12/1/26(1) | | 2,635,000 | | 2,107,394 | |
Gray Television, Inc., 7.00%, 5/15/27(1) | | 2,105,000 | | 1,764,369 | |
| iHeartCommunications, Inc., 8.375%, 5/1/27 | | 1,365,000 | | 994,287 | |
| Paramount Global, VRN, 6.25%, 2/28/57 | | 2,095,000 | | 1,569,846 | |
| Paramount Global, VRN, 6.375%, 3/30/62 | | 1,735,000 | | 1,376,905 | |
| WPP Finance 2010, 3.75%, 9/19/24 | | 3,425,000 | | 3,344,938 | |
| | | 15,266,338 | |
| Metals and Mining — 0.5% | | | |
| Nucor Corp., 3.95%, 5/23/25 | | 984,000 | | 968,984 | |
| | | | | | | | | | | |
| | Principal Amount/Shares | Value |
| Steel Dynamics, Inc., 2.80%, 12/15/24 | | $ | 3,000,000 | | $ | 2,871,189 | |
| | | 3,840,173 | |
| Mortgage Real Estate Investment Trusts (REITs) — 0.5% | | | |
Ladder Capital Finance Holdings LLLP / Ladder Capital Finance Corp., 5.25%, 10/1/25(1) | | 3,459,000 | | 3,046,860 | |
Ladder Capital Finance Holdings LLLP / Ladder Capital Finance Corp., 4.25%, 2/1/27(1) | | 1,072,000 | | 847,909 | |
| | | 3,894,769 | |
| Multi-Utilities — 0.6% | | | |
| Ameren Corp., 1.75%, 3/15/28 | | 1,500,000 | | 1,304,869 | |
| DTE Energy Co., 4.22%, 11/1/24 | | 1,556,000 | | 1,539,468 | |
| Sempra Energy, VRN, 4.125%, 4/1/52 | | 2,560,000 | | 2,069,812 | |
| | | 4,914,149 | |
| Oil, Gas and Consumable Fuels — 2.2% | | | |
| Ecopetrol SA, 5.875%, 9/18/23 | | 1,900,000 | | 1,900,969 | |
| Enbridge, Inc., VRN, 5.36%, 2/16/24 | | 2,000,000 | | 1,985,487 | |
| Energy Transfer LP, 4.25%, 4/1/24 | | 1,500,000 | | 1,481,229 | |
| Enterprise Products Operating LLC, 3.70%, 2/15/26 | | 3,000,000 | | 2,930,972 | |
| EQT Corp., 5.68%, 10/1/25 | | 2,000,000 | | 1,996,124 | |
Geopark Ltd., 5.50%, 1/17/27(1) | | 800,000 | | 672,000 | |
| Hess Corp., 3.50%, 7/15/24 | | 2,200,000 | | 2,150,174 | |
| HF Sinclair Corp., 2.625%, 10/1/23 | | 1,750,000 | | 1,722,420 | |
| Petroleos Mexicanos, 6.50%, 3/13/27 | | 1,200,000 | | 1,091,602 | |
| Pioneer Natural Resources Co., 5.10%, 3/29/26 | | 1,473,000 | | 1,479,892 | |
| | | 17,410,869 | |
| Passenger Airlines — 0.8% | | | |
American Airlines, Inc., 11.75%, 7/15/25(1) | | 2,040,000 | | 2,233,902 | |
American Airlines, Inc., 7.25%, 2/15/28(1) | | 1,220,000 | | 1,187,627 | |
Spirit Loyalty Cayman Ltd. / Spirit IP Cayman Ltd., 8.00%, 9/20/25(1) | | 3,070,000 | | 3,092,074 | |
| | | 6,513,603 | |
| Pharmaceuticals — 0.2% | | | |
Horizon Therapeutics USA, Inc., 5.50%, 8/1/27(1) | | 1,700,000 | | 1,727,132 | |
| Retail REITs — 0.7% | | | |
| Federal Realty Investment Trust, 2.75%, 6/1/23 | | 2,250,000 | | 2,240,245 | |
| National Retail Properties, Inc., 4.30%, 10/15/28 | | 1,594,000 | | 1,502,170 | |
| Realty Income Corp., 5.05%, 1/13/26 | | 716,000 | | 713,948 | |
| SITE Centers Corp., 3.625%, 2/1/25 | | 1,500,000 | | 1,420,468 | |
| | | 5,876,831 | |
| Specialized REITs — 0.5% | | | |
| Crown Castle, Inc., 1.35%, 7/15/25 | | 2,100,000 | | 1,935,735 | |
| Equinix, Inc., 2.90%, 11/18/26 | | 1,915,000 | | 1,782,062 | |
| | | 3,717,797 | |
| Specialty Retail — 0.2% | | | |
| Advance Auto Parts, Inc., 5.90%, 3/9/26 | | 1,526,000 | | 1,558,048 | |
| Trading Companies and Distributors — 0.5% | | | |
| Air Lease Corp., 2.875%, 1/15/26 | | 852,000 | | 794,992 | |
| Air Lease Corp., 5.30%, 2/1/28 | | 2,580,000 | | 2,548,374 | |
Aircastle Ltd., 5.25%, 8/11/25(1) | | 766,000 | | 749,346 | |
| | | 4,092,712 | |
| Wireless Telecommunication Services — 1.1% | | | |
Kenbourne Invest SA, 6.875%, 11/26/24(1) | | 429,000 | | 327,138 | |
| | | | | | | | | | | |
| | Principal Amount/Shares | Value |
Kenbourne Invest SA, 4.70%, 1/22/28(1) | | $ | 369,000 | | $ | 212,698 | |
| Sprint LLC, 7.875%, 9/15/23 | | 2,500,000 | | 2,520,735 | |
| Sprint LLC, 7.125%, 6/15/24 | | 3,605,000 | | 3,667,983 | |
| Sprint LLC, 7.625%, 2/15/25 | | 1,860,000 | | 1,930,431 | |
| | | 8,658,985 | |
TOTAL CORPORATE BONDS (Cost $350,025,256) | | | 338,421,896 | |
| U.S. TREASURY SECURITIES — 19.3% | | | |
| U.S. Treasury Notes, 0.25%, 4/15/23 | | 200,000 | | 199,712 | |
| U.S. Treasury Notes, 0.125%, 12/15/23 | | 500,000 | | 484,333 | |
U.S. Treasury Notes, 1.125%, 1/15/25(3) | | 3,000,000 | | 2,843,906 | |
| U.S. Treasury Notes, 4.625%, 2/28/25 | | 106,000,000 | | 107,039,297 | |
| U.S. Treasury Notes, 3.875%, 3/31/25 | | 8,000,000 | | 7,976,211 | |
| U.S. Treasury Notes, 4.00%, 12/15/25 | | 13,000,000 | | 13,051,401 | |
| U.S. Treasury Notes, 4.625%, 3/15/26 | | 14,000,000 | | 14,319,922 | |
| U.S. Treasury Notes, 3.875%, 11/30/29 | | 5,800,000 | | 5,901,953 | |
TOTAL U.S. TREASURY SECURITIES (Cost $151,748,301) | | | 151,816,735 | |
| COLLATERALIZED LOAN OBLIGATIONS — 9.2% | | | |
AMMC CLO XI Ltd., Series 2012-11A, Class BR2, VRN, 6.40%, (3-month LIBOR plus 1.60%), 4/30/31(1) | | 1,000,000 | | 967,832 | |
AMMC CLO XIII Ltd., Series 2020-2, Class A3R2, VRN, 7.07%, (3-month LIBOR plus 2.25%), 7/24/29(1) | | 1,500,000 | | 1,453,451 | |
AMMC CLO XIV Ltd., Series 2014-14A, Class BL1R, VRN, 8.42%, (3-month LIBOR plus 3.60%), 7/25/29(1) | | 3,000,000 | | 2,912,012 | |
Arbor Realty Commercial Real Estate Notes Ltd., Series 2019-FL2, Class AS, VRN, 6.39%, (1-month SOFR plus 1.56%), 9/15/34(1) | | 2,655,305 | | 2,643,470 | |
Arbor Realty Commercial Real Estate Notes Ltd., Series 2019-FL2, Class D, VRN, 7.39%, (1-month SOFR plus 2.56%), 9/15/34(1) | | 2,313,500 | | 2,275,843 | |
Ares XLIX CLO Ltd., Series 2018-49A, Class C, VRN, 6.77%, (3-month LIBOR plus 1.95%), 7/22/30(1) | | 1,600,000 | | 1,524,264 | |
ARES XLVII CLO Ltd., Series 2018-47A, Class C, VRN, 6.54%, (3-month LIBOR plus 1.75%), 4/15/30(1) | | 1,550,000 | | 1,465,607 | |
BDS Ltd., Series 2020-FL6, Class E, VRN, 7.92%, (30-day average SOFR plus 3.36%), 9/15/35(1) | | 1,425,000 | | 1,351,606 | |
Carlyle Global Market Strategies CLO Ltd., Series 2013-1A, Class BRR, VRN, 7.07%, (3-month LIBOR plus 2.20%), 8/14/30(1) | | 1,050,000 | | 1,025,565 | |
CBAM Ltd., Series 2017-1A, Class B, VRN, 6.61%, (3-month LIBOR plus 1.80%), 7/20/30(1) | | 650,000 | | 632,108 | |
CIFC Funding Ltd., Series 2017-3A, Class C, VRN, 8.46%, (3-month LIBOR plus 3.65%), 7/20/30(1) | | 1,750,000 | | 1,594,492 | |
CIFC Funding Ltd., Series 2017-5A, Class B, VRN, 6.64%, (3-month LIBOR plus 1.85%), 11/16/30(1) | | 1,100,000 | | 1,060,808 | |
Cook Park CLO Ltd., Series 2018-1A, Class C, VRN, 6.54%, (3-month LIBOR plus 1.75%), 4/17/30(1) | | 2,000,000 | | 1,890,338 | |
Dryden 30 Senior Loan Fund, Series 2013-30A, Class CR, VRN, 6.56%, (3-month LIBOR plus 1.70%), 11/15/28(1) | | 1,775,000 | | 1,718,871 | |
HGI CRE CLO Ltd., Series 2021-FL1, Class AS, VRN, 6.13%, (1-month LIBOR plus 1.40%), 6/16/36(1) | | 3,042,000 | | 2,921,547 | |
HGI CRE CLO Ltd., Series 2021-FL2, Class B, VRN, 6.23%, (1-month LIBOR plus 1.50%), 9/17/36(1) | | 3,374,000 | | 3,217,258 | |
KKR CLO 10 Ltd., Series 10, Class BR, VRN, 6.57%, (3-month LIBOR plus 1.70%), 9/15/29(1) | | 2,750,000 | | 2,705,025 | |
KKR Static CLO I Ltd., Series 2022-1A, Class B, VRN, 7.24%, (3-month SOFR plus 2.60%), 7/20/31(1) | | 2,300,000 | | 2,246,661 | |
| | | | | | | | | | | |
| | Principal Amount/Shares | Value |
KVK CLO Ltd., Series 2013-1A, Class DR, VRN, 7.74%, (3-month LIBOR plus 2.95%), 1/14/28(1) | | $ | 1,000,000 | | $ | 979,172 | |
Madison Park Funding XIX Ltd., Series 2015-19A, Class DR, VRN, 9.17%, (3-month LIBOR plus 4.35%), 1/22/28(1) | | 2,500,000 | | 2,256,572 | |
Marathon CLO Ltd., Series 2020-15A, Class A1S, VRN, 6.56%, (3-month LIBOR plus 1.70%), 11/15/31(1) | | 975,000 | | 969,001 | |
MF1 Ltd., Series 2020-FL4, Class D, VRN, 8.87%, (1-month SOFR plus 4.21%), 11/15/35(1) | | 2,395,000 | | 2,289,955 | |
Nassau Ltd., Series 2019-IA, Class BR, VRN, 7.43%, (3-month LIBOR plus 2.60%), 4/15/31(1) | | 1,500,000 | | 1,433,275 | |
Neuberger Berman CLO XVIII Ltd., Series 2014-18A, Class BR2, VRN, 6.97%, (3-month LIBOR plus 2.15%), 10/21/30(1) | | 1,725,000 | | 1,658,526 | |
Palmer Square Loan Funding Ltd., Series 2020-1A, Class D, VRN, 9.53%, (3-month LIBOR plus 4.85%), 2/20/28(1) | | 2,500,000 | | 2,405,242 | |
Palmer Square Loan Funding Ltd., Series 2022-5A, Class A2, VRN, 7.31%, (3-month SOFR plus 2.65%), 1/15/31(1) | | 1,500,000 | | 1,485,893 | |
PFP Ltd., Series 2021-8, Class D, VRN, 6.88%, (1-month LIBOR plus 2.15%), 8/9/37(1) | | 900,000 | | 806,864 | |
Ready Capital Mortgage Financing LLC, Series 2021-FL5, Class C, VRN, 7.10%, (1-month LIBOR plus 2.25%), 4/25/38(1) | | 1,000,000 | | 954,442 | |
Ready Capital Mortgage Financing LLC, Series 2023-FL11, Class A, VRN, 7.17%, (1-month SOFR plus 2.37%), 10/25/39(1) | | 2,000,000 | | 1,982,242 | |
Rockford Tower CLO Ltd., Series 2017-3A, Class A, VRN, 6.00%, (3-month LIBOR plus 1.19%), 10/20/30(1) | | 1,900,000 | | 1,880,664 | |
Rockford Tower CLO Ltd., Series 2020-1A, Class C, VRN, 7.16%, (3-month LIBOR plus 2.35%), 1/20/32(1) | | 700,000 | | 675,496 | |
Shelter Growth CRE Issuer Ltd., Series 2022-FL4, Class A, VRN, 7.05%, (1-month SOFR plus 2.30%), 6/17/37(1) | | 2,099,000 | | 2,088,068 | |
Stewart Park CLO Ltd., Series 2015-1A, Class CR, VRN, 6.59%, (3-month LIBOR plus 1.80%), 1/15/30(1) | | 3,000,000 | | 2,839,385 | |
Stratus CLO Ltd., Series 2021-2A, Class C, VRN, 6.71%, (3-month LIBOR plus 1.90%), 12/28/29(1) | | 1,775,000 | | 1,674,890 | |
Symphony CLO XIV Ltd., Series 2014-14A, Class CR, VRN, 6.89%, (3-month LIBOR plus 2.10%), 7/14/26(1) | | 2,725,000 | | 2,713,154 | |
TICP CLO I-2 Ltd., Series 2018-IA, Class C, VRN, 7.86%, (3-month LIBOR plus 3.04%), 4/26/28(1) | | 2,100,000 | | 2,098,948 | |
TRTX Issuer Ltd., Series 2021-FL4, Class A, VRN, 5.91%, (1-month LIBOR plus 1.20%), 3/15/38(1) | | 2,473,000 | | 2,416,241 | |
Vibrant CLO VII Ltd., Series 2017-7A, Class B, VRN, 7.21%, (3-month LIBOR plus 2.40%), 9/15/30(1) | | 3,450,000 | | 3,368,744 | |
Wellfleet CLO Ltd., Series 2022-1A, Class B1, VRN, 7.01%, (3-month SOFR plus 2.35%), 4/15/34(1) | | 1,100,000 | | 1,072,706 | |
Wind River CLO Ltd., Series 2013-1A, Class A1RR, VRN, 5.79%, (3-month LIBOR plus 0.98%), 7/20/30(1) | | 1,171,838 | | 1,161,741 | |
TOTAL COLLATERALIZED LOAN OBLIGATIONS (Cost $74,384,916) | | | 72,817,979 | |
| ASSET-BACKED SECURITIES — 8.7% | | | |
Aaset Trust, Series 2021-2A, Class B, 3.54%, 1/15/47(1) | | 1,372,484 | | 1,036,915 | |
Applebee's Funding LLC / IHOP Funding LLC, Series 2019-1A, Class A2I, SEQ, 4.19%, 6/5/49(1) | | 3,937,230 | | 3,860,201 | |
Blackbird Capital Aircraft, Series 2021-1A, Class B, 3.45%, 7/15/46(1) | | 1,642,519 | | 1,288,003 | |
Blackbird Capital Aircraft Lease Securitization Ltd., Series 2016-1A, Class AA, SEQ, 2.49%, 12/16/41(1) | | 1,105,801 | | 1,059,417 | |
CARS-DB4 LP, Series 2020-1A, Class A4, 3.19%, 2/15/50(1) | | 1,288,354 | | 1,217,638 | |
Castlelake Aircraft Securitization Trust, Series 2018-1, Class A, SEQ, 4.125%, 6/15/43(1) | | 1,729,986 | | 1,564,485 | |
Castlelake Aircraft Structured Trust, Series 2017-1R, Class A, SEQ, 2.74%, 8/15/41(1) | | 562,898 | | 503,794 | |
| | | | | | | | | | | |
| | Principal Amount/Shares | Value |
Castlelake Aircraft Structured Trust, Series 2021-1A, Class A, SEQ, 3.47%, 1/15/46(1) | | $ | 2,023,886 | | $ | 1,866,117 | |
Clsec Holdings 22t LLC, Series 2021-1, Class C, 6.17%, 5/11/37(1) | | 1,898,017 | | 1,580,367 | |
Cologix Canadian Issuer LP, Series 2022-1CAN, Class A2, SEQ, 4.94%, 1/25/52(1) | CAD | 2,650,000 | | 1,815,902 | |
Cologix Canadian Issuer LP, Series 2022-1CAN, Class C, 7.74%, 1/25/52(1) | CAD | 1,850,000 | | 1,268,828 | |
Cologix Data Centers US Issuer LLC, Series 2021-1A, Class A2, SEQ, 3.30%, 12/26/51(1) | | $ | 2,950,000 | | 2,653,918 | |
Credit Acceptance Auto Loan Trust, Series 2022-3A, Class A, SEQ, 6.57%, 10/15/32(1) | | 1,078,000 | | 1,092,352 | |
Diamond Issuer, Series 2021-1A, Class C, 3.79%, 11/20/51(1) | | 2,875,000 | | 2,327,617 | |
Diamond Resorts Owner Trust, Series 2021-1A, Class C, 2.70%, 11/21/33(1) | | 335,083 | | 307,785 | |
Domino's Pizza Master Issuer LLC, Series 2015-1A, Class A2II, SEQ, 4.47%, 10/25/45(1) | | 1,265,625 | | 1,224,850 | |
Edgeconnex Data Centers Issuer LLC, Series 2022-1, Class A2, SEQ, 4.25%, 3/25/52(1) | | 1,694,325 | | 1,589,660 | |
FirstKey Homes Trust, Series 2021-SFR1, Class E1, 2.39%, 8/17/38(1) | | 3,300,000 | | 2,814,966 | |
Flexential Issuer, Series 2021-1A, Class A2, SEQ, 3.25%, 11/27/51(1) | | 3,025,000 | | 2,702,455 | |
GAIA Aviation Ltd., Series 2019-1, Class A, 3.97%, 12/15/44(1) | | 457,281 | | 419,562 | |
Lunar Aircarft Ltd., Series 2020-1A, Class A, SEQ, 3.38%, 2/15/45(1) | | 1,644,428 | | 1,425,316 | |
Lunar Structured Aircraft Portfolio Notes, Series 2021-1, Class B, 3.43%, 10/15/46(1) | | 2,526,975 | | 2,150,171 | |
MAPS Ltd., Series 2018-1A, Class A, SEQ, 4.21%, 5/15/43(1) | | 721,631 | | 649,688 | |
MAPS Trust, Series 2021-1A, Class A, SEQ, 2.52%, 6/15/46(1) | | 1,414,931 | | 1,242,515 | |
NP SPE II LLC, Series 2019-1A, Class A1, SEQ, 2.57%, 9/20/49(1) | | 1,309,889 | | 1,228,352 | |
Pioneer Aircraft Finance Ltd., Series 2019-1, Class A, SEQ, 3.97%, 6/15/44(1) | | 3,169,904 | | 2,749,638 | |
Progress Residential Trust, Series 2020-SFR2, Class D, 3.87%, 6/17/37(1) | | 1,250,000 | | 1,184,222 | |
Progress Residential Trust, Series 2021-SFR1, Class D, 1.81%, 4/17/38(1) | | 1,500,000 | | 1,304,021 | |
Progress Residential Trust, Series 2021-SFR1, Class E, 2.11%, 4/17/38(1) | | 400,000 | | 343,484 | |
Sabey Data Center Issuer LLC, Series 2020-1, Class A2, SEQ, 3.81%, 4/20/45(1) | | 3,596,000 | | 3,437,722 | |
Sabey Data Center Issuer LLC, Series 2021-1, Class A2, SEQ, 1.88%, 6/20/46(1) | | 1,850,000 | | 1,627,540 | |
SBA Tower Trust, Series 2014-2A, Class C, SEQ, 3.87%, 10/15/49(1) | | 2,335,000 | | 2,268,899 | |
Sierra Timeshare Receivables Funding LLC, Series 2019-2A, Class D, 4.54%, 5/20/36(1) | | 172,321 | | 163,238 | |
Sierra Timeshare Receivables Funding LLC, Series 2019-3A, Class D, 4.18%, 8/20/36(1) | | 113,328 | | 107,787 | |
Sierra Timeshare Receivables Funding LLC, Series 2023-1A, Class C, 7.00%, 1/20/40(1)(4) | | 1,150,000 | | 1,149,815 | |
Slam Ltd., Series 2021-1A, Class B, 3.42%, 6/15/46(1) | | 1,558,550 | | 1,303,618 | |
Stack Infrastructure Issuer LLC, Series 2019-1A, Class A2, SEQ, 4.54%, 2/25/44(1) | | 2,905,152 | | 2,854,391 | |
Start II Ltd., Series 2019-1, Class A, SEQ, 4.09%, 3/15/44(1) | | 2,546,668 | | 2,256,215 | |
Start Ltd., Series 2018-1, Class A, SEQ, 4.09%, 5/15/43(1) | | 3,831,808 | | 3,333,883 | |
| | | | | | | | | | | |
| | Principal Amount/Shares | Value |
Stonepeak ABS, Series 2021-1A, Class AA, 2.30%, 2/28/33(1) | | $ | 2,120,439 | | $ | 1,959,930 | |
Vantage Data Centers LLC, Series 2019-1A, Class A2, SEQ, 3.19%, 7/15/44(1) | | 733,731 | | 708,463 | |
Vantage Data Centers LLC, Series 2020-1A, Class A2, SEQ, 1.65%, 9/15/45(1) | | 619,000 | | 557,702 | |
VB-S1 Issuer LLC, Series 2022-1A, Class D, 4.29%, 2/15/52(1) | | 2,500,000 | | 2,281,595 | |
VSE VOI Mortgage LLC, Series 2018-A, Class B, 3.72%, 2/20/36(1) | | 21,331 | | 20,653 | |
TOTAL ASSET-BACKED SECURITIES (Cost $74,323,320) | | | 68,503,690 | |
| COLLATERALIZED MORTGAGE OBLIGATIONS — 5.3% | | | |
| Private Sponsor Collateralized Mortgage Obligations — 4.6% | |
Angel Oak Mortgage Trust, Series 2019-5, Class A3, VRN, 2.92%, 10/25/49(1) | | 1,061,589 | | 1,020,354 | |
Angel Oak Mortgage Trust, Series 2019-6, Class M1, VRN, 3.39%, 11/25/59(1) | | 1,750,000 | | 1,594,441 | |
Angel Oak Mortgage Trust, Series 2020-2, Class A2, VRN, 3.86%, 1/26/65(1) | | 1,138,424 | | 1,075,898 | |
Angel Oak Mortgage Trust I LLC, Series 2019-1, Class B1, SEQ, VRN, 5.40%, 11/25/48(1) | | 2,300,000 | | 2,224,566 | |
Angel Oak Mortgage Trust I LLC, Series 2019-4, Class A3, SEQ, VRN, 3.30%, 7/26/49(1) | | 13,799 | | 13,747 | |
| Bear Stearns Adjustable Rate Mortgage Trust, Series 2006-1, Class A1, VRN, 6.80%, (1-year H15T1Y plus 2.25%), 2/25/36 | | 5,270 | | 4,960 | |
Bellemeade Re Ltd., Series 2018-1A, Class M2, VRN, 7.75%, (1-month LIBOR plus 2.90%), 4/25/28(1) | | 1,756,423 | | 1,765,984 | |
Bellemeade Re Ltd., Series 2018-3A, Class M1B, VRN, 6.70%, (1-month LIBOR plus 1.85%), 10/25/28(1) | | 61,537 | | 61,526 | |
Bellemeade Re Ltd., Series 2019-3A, Class M1C, VRN, 6.80%, (1-month LIBOR plus 1.95%), 7/25/29(1) | | 2,296,656 | | 2,289,201 | |
Bellemeade Re Ltd., Series 2020-2A, Class M2, VRN, 10.85%, (1-month LIBOR plus 6.00%), 8/26/30(1) | | 1,884,215 | | 1,922,359 | |
Bellemeade Re Ltd., Series 2020-4A, Class M2B, VRN, 8.45%, (1-month LIBOR plus 3.60%), 6/25/30(1) | | 1,600,203 | | 1,610,940 | |
BRAVO Residential Funding Trust, Series 2021-NQM2, Class M1, VRN, 2.29%, 3/25/60(1) | | 887,000 | | 732,645 | |
BRAVO Residential Funding Trust, Series 2023-NQM1, Class A2, SEQ, 6.35%, 1/25/63(1) | | 2,124,827 | | 2,100,269 | |
Farm Mortgage Trust, Series 2021-1, Class B, VRN, 3.24%, 7/25/51(1) | | 2,270,942 | | 1,424,455 | |
GS Mortgage-Backed Securities Trust, Series 2020-NQM1, Class M1, VRN, 3.29%, 9/27/60(1) | | 1,600,000 | | 1,286,779 | |
Home RE Ltd., Series 2020-1, Class B1, VRN, 11.85%, (1-month LIBOR plus 7.00%), 10/25/30(1) | | 1,275,000 | | 1,300,280 | |
Home RE Ltd., Series 2022-1, Class M1A, VRN, 7.41%, (30-day average SOFR plus 2.85%), 10/25/34(1) | | 750,000 | | 754,870 | |
Homeward Opportunities Fund I Trust, Series 2020-2, Class B3, VRN, 5.49%, 5/25/65(1) | | 2,150,000 | | 1,795,410 | |
MFA Trust, Series 2023-INV1, Class A2, 6.45%, 2/25/58(1) | | 2,527,464 | | 2,526,623 | |
Radnor RE Ltd., Series 2021-1, Class M1B, VRN, 6.26%, (30-day average SOFR plus 1.70%), 12/27/33(1) | | 1,449,874 | | 1,446,829 | |
Radnor RE Ltd., Series 2021-2, Class M1A, VRN, 6.41%, (30-day average SOFR plus 1.85%), 11/25/31(1) | | 608,640 | | 606,437 | |
Residential Mortgage Loan Trust, Series 2020-2, Class M1, SEQ, VRN, 3.57%, 5/25/60(1) | | 1,800,000 | | 1,515,421 | |
Triangle Re Ltd., Series 2020-1, Class M2, VRN, 10.45%, (1-month LIBOR plus 5.60%), 10/25/30(1) | | 259,713 | | 261,402 | |
Triangle Re Ltd., Series 2021-1, Class M2, VRN, 8.75%, (1-month LIBOR plus 3.90%), 8/25/33(1) | | 1,102,646 | | 1,108,960 | |
| | | | | | | | | | | |
| | Principal Amount/Shares | Value |
Triangle Re Ltd., Series 2021-3, Class M1A, VRN, 6.46%, (30-day average SOFR plus 1.90%), 2/25/34(1) | | $ | 1,820,424 | | $ | 1,806,893 | |
Verus Securitization Trust, Series 2020-4, Class A3, SEQ, 2.32%, 5/25/65(1) | | 284,203 | | 265,614 | |
Verus Securitization Trust, Series 2021-R3, Class A3, VRN, 1.38%, 4/25/64(1) | | 583,812 | | 520,761 | |
Verus Securitization Trust, Series 2023-1, Class A2, 6.56%, 12/25/67(1) | | 2,422,373 | | 2,411,127 | |
Vista Point Securitization Trust, Series 2020-1, Class B1, VRN, 5.375%, 3/25/65(1) | | 1,000,000 | | 925,733 | |
| | | 36,374,484 | |
| U.S. Government Agency Collateralized Mortgage Obligations — 0.7% | |
| FHLMC, Series 2017-HRP1, Class M2, VRN, 7.30%, (1-month LIBOR plus 2.45%), 12/25/42 | | 802,447 | | 803,764 | |
FHLMC, Series 2019-CS03, Class M1, VRN, 4.85%, 10/25/32(1) | | 83,033 | | 82,858 | |
FHLMC, Series 2021-DNA2, Class M1, VRN, 5.36%, (30-day average SOFR plus 0.80%), 8/25/33(1) | | 75,823 | | 75,733 | |
FHLMC, Series 2022-DNA3, Class M1A, VRN, 6.56%, (30-day average SOFR plus 2.00%), 4/25/42(1) | | 1,315,191 | | 1,315,771 | |
FHLMC, Series 2022-DNA5, Class M1A, VRN, 7.51%, (30-day average SOFR plus 2.95%), 6/25/42(1) | | 1,482,590 | | 1,508,804 | |
FHLMC, Series 2022-DNA6, Class M1A, VRN, 6.71%, (30-day average SOFR plus 2.15%), 9/25/42(1) | | 793,019 | | 795,389 | |
| FNMA, Series 2016-55, Class PI, IO, 4.00%, 8/25/46 | | 1,570,608 | | 294,491 | |
| FNMA, Series 2017-7, Class AI, IO, 6.00%, 2/25/47 | | 1,175,381 | | 215,584 | |
| FNMA, Series 413, Class C27, IO, 4.00%, 7/25/42 | | 1,533,906 | | 227,289 | |
| | | 5,319,683 | |
TOTAL COLLATERALIZED MORTGAGE OBLIGATIONS (Cost $43,733,237) | | | 41,694,167 | |
| COMMERCIAL MORTGAGE-BACKED SECURITIES — 2.9% | |
BBCMS Mortgage Trust, Series 2019-BWAY, Class D, VRN, 7.10%, (1-month LIBOR plus 2.27%), 11/15/34(1) | | 1,683,000 | | 866,594 | |
BBCMS Mortgage Trust, Series 2019-BWAY, Class E, VRN, 7.79%, (1-month LIBOR plus 2.96%), 11/15/34(1) | | 1,581,000 | | 692,481 | |
BX Commercial Mortgage Trust, Series 2019-XL, Class E, VRN, 6.74%, (1-month SOFR plus 1.91%), 10/15/36(1) | | 1,207,157 | | 1,173,742 | |
BXHPP Trust, Series 2021-FILM, Class D, VRN, 6.18%, (1-month LIBOR plus 1.50%), 8/15/36(1) | | 1,700,000 | | 1,523,898 | |
BXHPP Trust, Series 2021-FILM, Class E, VRN, 6.68%, (1-month LIBOR plus 2.00%), 8/15/36(1) | | 1,400,000 | | 1,234,371 | |
Credit Suisse Mortgage Capital Certificates, Series 2019-ICE4, Class E, VRN, 6.83%, (1-month LIBOR plus 2.15%), 5/15/36(1) | | 2,497,786 | | 2,420,242 | |
Great Wolf Trust, Series 2019-WOLF, Class C, VRN, 6.57%, (1-month SOFR plus 1.75%), 12/15/36(1) | | 1,615,000 | | 1,570,369 | |
J.P. Morgan Chase Commercial Mortgage Securities Trust, Series 2018-AON, Class A, SEQ, 4.13%, 7/5/31(1) | | 1,853,000 | | 1,676,965 | |
Life Mortgage Trust, Series 2021-BMR, Class D, VRN, 6.34%, (1-month LIBOR plus 1.51%), 3/15/38(1) | | 3,061,952 | | 2,899,412 | |
Med Trust, Series 2021-MDLN, Class F, VRN, 8.69%, (1-month LIBOR plus 4.00%), 11/15/38(1) | | 1,988,193 | | 1,849,017 | |
MHP Trust, Series 2022-MHIL, Class D, VRN, 6.44%, (1-month SOFR plus 1.61%), 1/15/27(1) | | 3,102,506 | | 2,908,528 | |
One New York Plaza Trust, Series 2020-1NYP, Class B, VRN, 6.18%, (1-month LIBOR plus 1.50%), 1/15/36(1) | | 1,512,000 | | 1,398,908 | |
SMRT, Series 2022-MINI, Class F, VRN, 8.18%, (1-month SOFR plus 3.35%), 1/15/39(1) | | 3,254,000 | | 2,920,980 | |
TOTAL COMMERCIAL MORTGAGE-BACKED SECURITIES (Cost $25,854,554) | | 23,135,507 | |
| | | | | | | | | | | |
| | Principal Amount/Shares | Value |
BANK LOAN OBLIGATIONS(5) — 1.5% | | | |
| Aerospace and Defense — 0.1% | | | |
| TransDigm, Inc., 2023 Term Loan I, 8.15%, (3-month SOFR plus 3.25%), 8/24/28 | | $ | 1,000,000 | | $ | 998,500 | |
| Consumer Staples Distribution & Retail — 0.2% | | | |
| United Natural Foods, Inc., Term Loan B, 8.17%, (1-month SOFR plus 3.25%), 10/22/25 | | 1,258,844 | | 1,261,204 | |
| Health Care Equipment and Supplies — 0.3% | | | |
| Avantor Funding, Inc., 2021 Term Loan B5, 7.09%, (1-month LIBOR plus 2.25%), 11/8/27 | | 2,214,454 | | 2,215,672 | |
| Health Care Providers and Services — 0.2% | | | |
Surgery Center Holdings, Inc., 2021 Term Loan, 8/31/26(6) | | 1,802,000 | | 1,793,711 | |
| Passenger Airlines — 0.1% | | | |
| American Airlines, Inc., 2023 Term Loan B, 8.15%, (6-month SOFR plus 2.75%), 2/15/28 | | 485,000 | | 474,997 | |
| Pharmaceuticals — 0.5% | | | |
| Horizon Therapeutics USA Inc., 2021 Term Loan B2, 6.56%, (1-month LIBOR plus 1.75%), 3/15/28 | | 987,840 | | 987,144 | |
| Jazz Financing Lux S.a.r.l., USD Term Loan, 8.34%, (1-month LIBOR plus 3.50%), 5/5/28 | | 3,426,594 | | 3,417,667 | |
| | | 4,404,811 | |
| Textiles, Apparel and Luxury Goods — 0.1% | | | |
| Hanesbrands, Inc., 2023 Term Loan B, 8.56%, (1-month SOFR plus 3.75%), 3/8/30 | | 1,000,000 | | 997,500 | |
TOTAL BANK LOAN OBLIGATIONS (Cost $12,147,442) | | | 12,146,395 | |
| PREFERRED STOCKS — 0.8% | | | |
| Banks — 0.1% | | | |
| Lloyds Banking Group PLC, 8.00% | | 1,290,000 | | 1,191,638 | |
| Industrial Conglomerates — 0.4% | | | |
| General Electric Co., Series D, 8.20% | | 2,950,000 | | 2,958,112 | |
Insurance† | | | |
Allianz SE, 3.20%(1) | | 560,000 | | 394,233 | |
| Oil, Gas and Consumable Fuels — 0.1% | | | |
| BP Capital Markets PLC, 4.375% | | 600,000 | | 572,948 | |
| Trading Companies and Distributors — 0.2% | | | |
Aircastle Ltd., 5.25%(1) | | 1,738,000 | | 1,276,735 | |
TOTAL PREFERRED STOCKS (Cost $7,073,370) | | | 6,393,666 | |
| SOVEREIGN GOVERNMENTS AND AGENCIES — 0.5% | | | |
| Mexico — 0.1% | | | |
| Mexico Government International Bond, 5.40%, 2/9/28 | | $ | 800,000 | | 825,521 | |
| Romania — 0.2% | | | |
Romanian Government International Bond, 6.625%, 2/17/28(1) | | 1,362,000 | | 1,416,296 | |
| Saudi Arabia — 0.2% | | | |
Saudi Government International Bond, 4.75%, 1/18/28(1) | | 1,389,000 | | 1,407,106 | |
TOTAL SOVEREIGN GOVERNMENTS AND AGENCIES (Cost $3,539,671) | | | 3,648,923 | |
| SHORT-TERM INVESTMENTS — 6.9% | | | |
| Repurchase Agreements — 0.7% | | | |
| BMO Capital Markets Corp., (collateralized by various U.S. Treasury obligations, 1.125% - 4.375%, 8/15/40 - 5/15/49, valued at $1,377,094), in a joint trading account at 4.67%, dated 3/31/23, due 4/3/23 (Delivery value $1,328,768) | | | 1,328,251 | |
| | | | | | | | | | | |
| | Principal Amount/Shares | Value |
| Fixed Income Clearing Corp., (collateralized by various U.S. Treasury obligations, 3.625%, 3/31/28, valued at $3,918,931), at 4.81%, dated 3/31/23, due 4/3/23 (Delivery value $3,843,540) | | | $ | 3,842,000 | |
| | | 5,170,251 | |
Treasury Bills(7) — 6.2% | | | |
| U.S. Treasury Bills, 5.01%, 8/17/23 | | $ | 50,000,000 | | 49,114,584 | |
TOTAL SHORT-TERM INVESTMENTS (Cost $54,247,390) | | | 54,284,835 | |
TOTAL INVESTMENT SECURITIES — 98.0% (Cost $797,077,457) | | | 772,863,793 | |
| OTHER ASSETS AND LIABILITIES — 2.0% | | | 15,563,592 | |
| TOTAL NET ASSETS — 100.0% | | | $ | 788,427,385 | |
| | | | | | | | | | | | | | | | | | | | |
| FORWARD FOREIGN CURRENCY EXCHANGE CONTRACTS |
| Currency Purchased | Currency Sold | Counterparty | Settlement
Date | Unrealized
Appreciation
(Depreciation) |
| USD | 3,069,521 | | CAD | 4,201,008 | | UBS AG | 6/15/23 | $ | (42,506) | |
| | | | | | | | | | | | | | |
| FUTURES CONTRACTS PURCHASED |
| Reference Entity | Contracts | Expiration Date | Notional
Amount | Unrealized
Appreciation
(Depreciation)^ |
| U.S. Treasury 2-Year Notes | 862 | June 2023 | $ | 177,962,595 | | $ | 309,994 | |
| U.S. Treasury 10-Year Notes | 71 | June 2023 | 8,159,453 | | 100,707 | |
| | | $ | 186,122,048 | | $ | 410,701 | |
^Amount represents value and unrealized appreciation (depreciation).
| | | | | | | | | | | | | | |
| FUTURES CONTRACTS SOLD |
| Reference Entity | Contracts | Expiration Date | Notional
Amount | Unrealized
Appreciation
(Depreciation)^ |
| U.S. Treasury 5-Year Notes | 139 | June 2023 | $ | 15,221,586 | | $ | (288,759) | |
| U.S. Treasury 10-Year Ultra Notes | 47 | June 2023 | 5,693,610 | | (110,519) | |
| U.S. Treasury Long Bonds | 9 | June 2023 | 1,180,406 | | (54,413) | |
| U.S. Treasury Ultra Bonds | 3 | June 2023 | 423,375 | | (12,381) | |
| | | $ | 22,518,977 | | $ | (466,072) | |
^Amount represents value and unrealized appreciation (depreciation).
| | | | | | | | |
| NOTES TO SCHEDULE OF INVESTMENTS |
| CAD | – | Canadian Dollar |
| FHLMC | – | Federal Home Loan Mortgage Corporation |
| FNMA | – | Federal National Mortgage Association |
| H15T1Y | – | Constant Maturity U.S. Treasury Note Yield Curve Rate Index |
| IO | – | Interest Only |
| LIBOR | – | London Interbank Offered Rate |
| SEQ | – | Sequential Payer |
| SOFR | – | Secured Overnight Financing Rate |
| USD | – | United States Dollar |
| VRN | – | Variable Rate Note. The rate adjusts periodically based upon the terms set forth in the security’s offering documents. The rate shown is effective at the period end and the reference rate and spread, if any, is indicated. The security's effective maturity date may be shorter than the final maturity date shown. |
†Category is less than 0.05% of total net assets.
(1)Security was purchased pursuant to Rule 144A or Section 4(2) under the Securities Act of 1933 and may be sold in transactions exempt from registration, normally to qualified institutional investors. The aggregate value of these securities at the period end was $326,473,372, which represented 41.4% of total net assets.
(2)Perpetual maturity with no stated maturity date.
(3)Security, or a portion thereof, has been pledged at the custodian bank or with a broker for collateral requirements on forward foreign currency exchange contracts and/or futures contracts. At the period end, the aggregate value of securities pledged was $1,443,757.
(4)When-issued security. The issue price and yield are fixed on the date of the commitment, but payment and delivery are scheduled for a future date.
(5)The interest rate on a bank loan obligation adjusts periodically based on a predetermined schedule. Rate or range of rates shown is effective at period end. The maturity date on a bank loan obligation may be less than indicated as a result of contractual or optional prepayments. These prepayments cannot be predicted with certainty.
(6)The interest rate will be determined upon settlement of the bank loan obligation after period end.
(7)The rate indicated is the yield to maturity at purchase for non-interest bearing securities. For interest bearing securities, the stated coupon rate is shown.
See Notes to Financial Statements.
| | |
| Statement of Assets and Liabilities |
| | | | | |
| MARCH 31, 2023 | |
| Assets | |
| Investment securities, at value (cost of $797,077,457) | $ | 772,863,793 | |
| Cash | 9,234 | |
| Receivable for investments sold | 26,177,467 | |
| Receivable for capital shares sold | 855,831 | |
| Receivable for variation margin on futures contracts | 74,817 | |
| Interest receivable | 5,362,585 | |
| 805,343,727 | |
| |
| Liabilities | |
| Payable for investments purchased | 13,818,361 | |
| Payable for capital shares redeemed | 2,745,485 | |
| Unrealized depreciation on forward foreign currency exchange contracts | 42,506 | |
| Accrued management fees | 294,787 | |
| Distribution and service fees payable | 8,142 | |
| Dividends payable | 7,061 | |
| 16,916,342 | |
| |
| Net Assets | $ | 788,427,385 | |
| |
| Net Assets Consist of: | |
| Capital paid in | $ | 855,157,478 | |
| Distributable earnings (loss) | (66,730,093) | |
| $ | 788,427,385 | |
| | | | | | | | | | | |
| Net Assets | Shares Outstanding | Net Asset Value Per Share* |
| Investor Class | $229,572,393 | 25,810,412 | $8.89 |
| I Class | $519,131,199 | 58,390,131 | $8.89 |
| Y Class | $286,471 | 32,212 | $8.89 |
| A Class | $26,690,150 | 3,001,533 | $8.89 |
| C Class | $2,721,881 | 306,053 | $8.89 |
| R Class | $531,693 | 59,773 | $8.90 |
| R5 Class | $328,513 | 36,938 | $8.89 |
| R6 Class | $9,165,085 | 1,029,985 | $8.90 |
*Maximum offering price per share was equal to the net asset value per share for all share classes, except Class A, for which the maximum offering price per share was $9.09 (net asset value divided by 0.9775). A contingent deferred sales charge may be imposed on redemptions of Class A and Class C.
See Notes to Financial Statements.
| | | | | |
| YEAR ENDED MARCH 31, 2023 | |
| Investment Income (Loss) | |
| Income: | |
| Interest | $ | 31,340,887 | |
| |
| Expenses: | |
| Management fees | 3,366,777 | |
| Distribution and service fees: | |
| A Class | 51,499 | |
| C Class | 31,716 | |
| R Class | 1,884 | |
| Trustees' fees and expenses | 49,087 | |
| Other expenses | 23,699 | |
| 3,524,662 | |
| |
| Net investment income (loss) | 27,816,225 | |
| |
| Realized and Unrealized Gain (Loss) | |
| Net realized gain (loss) on: | |
| Investment transactions | (47,662,359) | |
| Forward foreign currency exchange contract transactions | 229,306 | |
| Futures contract transactions | 9,349,472 | |
| Swap agreement transactions | (869,140) | |
| Foreign currency translation transactions | (1,887) | |
| (38,954,608) | |
| |
| Change in net unrealized appreciation (depreciation) on: | |
| Investments | 4,212,901 | |
| Forward foreign currency exchange contracts | 32,896 | |
| Futures contracts | (3,471,038) | |
| Swap agreements | 1,051,211 | |
| Translation of assets and liabilities in foreign currencies | 37 | |
| 1,826,007 | |
| |
| Net realized and unrealized gain (loss) | (37,128,601) | |
| |
| Net Increase (Decrease) in Net Assets Resulting from Operations | $ | (9,312,376) | |
See Notes to Financial Statements.
| | |
| Statement of Changes in Net Assets |
| | | | | | | | |
| YEARS ENDED MARCH 31, 2023 AND MARCH 31, 2022 |
| Increase (Decrease) in Net Assets | March 31, 2023 | March 31, 2022 |
| Operations | | |
| Net investment income (loss) | $ | 27,816,225 | | $ | 12,155,016 | |
| Net realized gain (loss) | (38,954,608) | | 464,451 | |
| Change in net unrealized appreciation (depreciation) | 1,826,007 | | (29,017,509) | |
| Net increase (decrease) in net assets resulting from operations | (9,312,376) | | (16,398,042) | |
| | |
| Distributions to Shareholders | | |
| From earnings: | | |
| Investor Class | (8,340,051) | | (6,784,297) | |
| I Class | (18,296,159) | | (10,545,801) | |
| Y Class | (5,895) | | (70,316) | |
| A Class | (743,409) | | (533,414) | |
| C Class | (79,856) | | (79,249) | |
| R Class | (12,863) | | (6,200) | |
| R5 Class | (10,666) | | (2,165) | |
| R6 Class | (247,732) | | (134,492) | |
| Decrease in net assets from distributions | (27,736,631) | | (18,155,934) | |
| | |
| Capital Share Transactions | | |
| Net increase (decrease) in net assets from capital share transactions (Note 5) | 115,471,873 | | 428,901,961 | |
| | |
| Net increase (decrease) in net assets | 78,422,866 | | 394,347,985 | |
| | |
| Net Assets | | |
| Beginning of period | 710,004,519 | | 315,656,534 | |
| End of period | $ | 788,427,385 | | $ | 710,004,519 | |
See Notes to Financial Statements.
| | |
| Notes to Financial Statements |
MARCH 31, 2023
1. Organization
American Century Investment Trust (the trust) is registered under the Investment Company Act of 1940, as amended (the 1940 Act), as an open-end management investment company and is organized as a Massachusetts business trust. Short Duration Strategic Income Fund (the fund) is one fund in a series issued by the trust. The fund’s investment objective is to seek income. As a secondary objective, the fund seeks long-term capital appreciation.
The fund offers the Investor Class, I Class, Y Class, A Class, C Class, R Class, R5 Class and R6 Class. The A Class may incur an initial sales charge. The A Class and C Class may be subject to a contingent deferred sales charge.
2. Significant Accounting Policies
The following is a summary of significant accounting policies consistently followed by the fund in preparation of its financial statements. The fund is an investment company and follows accounting and reporting guidance in accordance with accounting principles generally accepted in the United States of America. This may require management to make certain estimates and assumptions at the date of the financial statements. Actual results could differ from these estimates. Management evaluated the impact of events or transactions occurring through the date the financial statements were issued that would merit recognition or disclosure.
Investment Valuations — The fund determines the fair value of its investments and computes its net asset value (NAV) per share at the close of regular trading (usually 4 p.m. Eastern time) on the New York Stock Exchange (NYSE) on each day the NYSE is open. The value of investments of the fund is determined by American Century Investment Management, Inc. (ACIM) (the investment advisor), as the valuation designee, pursuant to its valuation policies and procedures. The Board of Trustees oversees the valuation designee and reviews its valuation policies and procedures at least annually.
Fixed income securities are valued at the evaluated mean as provided by independent pricing services or at the mean of the most recent bid and asked prices as provided by investment dealers. Corporate bonds, U.S. Treasury and Government Agency securities, convertible bonds, bank loan obligations, and sovereign governments and agencies are valued using market models that consider trade data, quotations from dealers and active market makers, relevant yield curve and spread data, creditworthiness, trade data or market information on comparable securities, and other relevant security specific information. Mortgage-related and asset-backed securities are valued based on models that consider trade data, prepayment and default projections, benchmark yield and spread data and estimated cash flows of each tranche of the issuer. Collateralized loan obligations are valued based on discounted cash flow models that consider trade and economic data, prepayment assumptions and default projections. Fixed income securities initially expressed in local currencies are translated into U.S. dollars at the mean of the appropriate currency exchange rate at the close of the NYSE as provided by an independent pricing service.
Equity securities that are listed or traded on a domestic securities exchange are valued at the last reported sales price or at the official closing price as provided by the exchange. Equity securities traded on foreign securities exchanges are generally valued at the closing price of such securities on the exchange where primarily traded or at the close of the NYSE, if that is earlier. If no last sales price is reported, or if local convention or regulation so provides, the mean of the latest bid and asked prices may be used. Securities traded over-the-counter are valued at the mean of the latest bid and asked prices, the last sales price, or the official closing price.
Hybrid securities are valued at the evaluated mean as provided by independent pricing services or at the mean of the most recent bid and asked prices as provided by investment dealers. Preferred stocks and convertible preferred stocks with perpetual maturities are valued using market models that consider trade data, quotations from dealers and active market makers, relevant yield curve and spread data, creditworthiness, trade data or market information on comparable securities, and other relevant security specific information.
Open-end management investment companies are valued at the reported NAV per share. Repurchase agreements are valued at cost, which approximates fair value. Exchange-traded futures contracts are valued at the settlement price as provided by the appropriate exchange. Swap agreements are valued at an evaluated mean as provided by independent pricing services or independent brokers. Forward foreign currency exchange contracts are valued at the mean of the appropriate forward exchange rate at the close of the NYSE as provided by an independent pricing service.
If the valuation designee determines that the market price for a portfolio security is not readily available or is believed by the valuation designee to be unreliable, such security is valued at fair value as determined in good faith by the valuation designee, in accordance with its policies and procedures. Circumstances that may cause the fund to determine that market quotations are not available or reliable include, but are not limited to: when there is a significant event subsequent to the market quotation; trading in a security has been halted during the trading day; or trading in a security is insufficient or did not take place due to a closure or holiday.
The valuation designee monitors for significant events occurring after the close of an investment’s primary exchange but before the fund’s NAV per share is determined. Significant events may include, but are not limited to: corporate announcements and transactions; regulatory news, governmental action and political unrest that could impact a specific investment or an investment sector; or armed conflicts, natural disasters and similar events that could affect investments in a specific country or region. The valuation designee also monitors for significant fluctuations between domestic and foreign markets, as evidenced by the U.S. market or such other indicators that it deems appropriate. The valuation designee may apply a model-derived factor to the closing price of equity securities traded on foreign securities exchanges. The factor is based on observable market data as provided by an independent pricing service.
Security Transactions — Security transactions are accounted for as of the trade date. Net realized gains and losses are determined on the identified cost basis, which is also used for federal income tax purposes.
Investment Income — Interest income is recorded on the accrual basis and includes paydown gain (loss) and accretion of discounts and amortization of premiums. Inflation adjustments related to inflation-linked debt securities are reflected as interest income.
Foreign Currency Translations — All assets and liabilities initially expressed in foreign currencies are translated into U.S. dollars at prevailing exchange rates at period end. The fund may enter into spot foreign currency exchange contracts to facilitate transactions denominated in a foreign currency. Purchases and sales of investment securities, dividend and interest income, spot foreign currency exchange contracts, and expenses are translated at the rates of exchange prevailing on the respective dates of such transactions. Net realized and unrealized foreign currency exchange gains or losses related to investment securities are a component of net realized gain (loss) on investment transactions and change in net unrealized appreciation (depreciation) on investments, respectively.
Repurchase Agreements — The fund may enter into repurchase agreements with institutions that ACIM has determined are creditworthy pursuant to criteria adopted by the Board of Trustees. The fund requires that the collateral, represented by securities, received in a repurchase transaction be transferred to the custodian in a manner sufficient to enable the fund to obtain those securities in the event of a default under the repurchase agreement. ACIM monitors, on a daily basis, the securities transferred to ensure the value, including accrued interest, of the securities under each repurchase agreement is equal to or greater than amounts owed to the fund under each repurchase agreement.
Joint Trading Account — Pursuant to an Exemptive Order issued by the Securities and Exchange Commission, the fund, along with certain other funds in the American Century Investments family of funds, may transfer uninvested cash balances into a joint trading account. These balances are invested in one or more repurchase agreements that are collateralized by U.S. Treasury or Agency obligations.
Income Tax Status — It is the fund's policy to distribute substantially all net investment income and net realized gains to shareholders and to otherwise qualify as a regulated investment company under provisions of the Internal Revenue Code. Accordingly, no provision has been made for income taxes. The fund files U.S. federal, state, local and non-U.S. tax returns as applicable. The fund's tax returns are subject to examination by the relevant taxing authority until expiration of the applicable statute of limitations, which is generally three years from the date of filing but can be longer in certain jurisdictions. At this time, management believes there are no uncertain tax positions which, based on their technical merit, would not be sustained upon examination and for which it is reasonably possible that the total amounts of unrecognized tax benefits will significantly change in the next twelve months.
Multiple Class — All shares of the fund represent an equal pro rata interest in the net assets of the class to which such shares belong, and have identical voting, dividend, liquidation and other rights and the same terms and conditions, except for class specific expenses and exclusive rights to vote on matters affecting only individual classes. Income, non-class specific expenses, and realized and unrealized capital gains and losses of the fund are allocated to each class of shares based on their relative net assets.
Distributions to Shareholders — Distributions from net investment income, if any, are declared daily and paid monthly. Distributions from net realized gains, if any, are generally declared and paid annually.
Indemnifications — Under the trust’s organizational documents, its officers and trustees are indemnified against certain liabilities arising out of the performance of their duties to the fund. In addition, in the normal course of business, the fund enters into contracts that provide general indemnifications. The maximum exposure under these arrangements is unknown as this would involve future claims that may be made against a fund. The risk of material loss from such claims is considered by management to be remote.
3. Fees and Transactions with Related Parties
Certain officers and trustees of the trust are also officers and/or directors of American Century Companies, Inc. (ACC). The trust's investment advisor, ACIM, the trust's distributor, American Century Investment Services, Inc. (ACIS), and the trust's transfer agent, American Century Services, LLC, are wholly owned, directly or indirectly, by ACC.
Management Fees — The trust has entered into a management agreement with ACIM, under which ACIM provides the fund with investment advisory and management services in exchange for a single, unified management fee (the fee) per class. The agreement provides that ACIM will pay all expenses of managing and operating the fund, except brokerage expenses, taxes, interest, fees and expenses of the independent trustees (including legal counsel fees), extraordinary expenses, and expenses incurred in connection with the provision of shareholder services and distribution services under a plan adopted pursuant to Rule 12b-1 under the 1940 Act. The fee is computed and accrued daily based on each class's daily net assets and paid monthly in arrears. The difference in the fee among the classes is a result of their separate arrangements for non-Rule 12b-1 shareholder services. It is not the result of any difference in advisory or custodial fees or other expenses related to the management of the fund’s assets, which do not vary by class.
The annual management fee for each class is as follows:
| | | | | | | | | | | | | | | | | | | | | | | |
| Investor Class | I Class | Y Class | A Class | C Class | R Class | R5 Class | R6 Class |
| 0.51% | 0.41% | 0.31% | 0.51% | 0.51% | 0.51% | 0.31% | 0.26% |
Distribution and Service Fees — The Board of Trustees has adopted a separate Master Distribution and Individual Shareholder Services Plan for each of the A Class, C Class and R Class (collectively the plans), pursuant to Rule 12b-1 of the 1940 Act. The plans provide that the A Class will pay ACIS an annual distribution and service fee of 0.25%. The plans provide that the C Class will pay ACIS an annual distribution and service fee of 1.00%, of which 0.25% is paid for individual shareholder services and 0.75% is paid for distribution services. The plans provide that the R Class will pay ACIS an annual distribution and service fee of 0.50%. The fees are computed and accrued daily based on each class’s daily net assets and paid monthly in arrears. The fees are used to pay financial intermediaries for distribution and individual shareholder services. Fees incurred under the plans during the period ended March 31, 2023 are detailed in the Statement of Operations.
Trustees' Fees and Expenses — The Board of Trustees is responsible for overseeing the investment advisor’s management and operations of the fund. The trustees receive detailed information about the fund and its investment advisor regularly throughout the year, and meet at least quarterly with management of the investment advisor to review reports about fund operations. The fund's officers do not receive compensation from the fund.
Interfund Transactions — The fund may enter into security transactions with other American Century Investments funds and other client accounts of the investment advisor, in accordance with the 1940 Act rules and procedures adopted by the Board of Trustees. The rules and procedures require, among other things, that these transactions be effected at the independent current market price of the security. There were no interfund transactions during the period.
4. Investment Transactions
Purchases of investment securities, excluding short-term investments, for the period ended March 31, 2023 totaled $1,424,856,647, of which $717,835,353 represented U.S. Treasury and Government Agency obligations.
Sales of investment securities, excluding short-term investments, for the period ended March 31, 2023 totaled $1,370,293,161, of which $701,713,034 represented U.S. Treasury and Government Agency obligations.
5. Capital Share Transactions
Transactions in shares of the fund were as follows (unlimited number of shares authorized):
| | | | | | | | | | | | | | |
| Year ended March 31, 2023 | Year ended March 31, 2022 |
| Shares | Amount | Shares | Amount |
| Investor Class | | | | |
| Sold | 13,833,200 | | $ | 125,068,823 | | 24,251,606 | | $ | 236,473,152 | |
| Issued in reinvestment of distributions | 923,265 | | 8,275,565 | | 692,849 | | 6,726,985 | |
| Redeemed | (16,275,822) | | (146,833,192) | | (9,772,002) | | (94,589,941) | |
| (1,519,357) | | (13,488,804) | | 15,172,453 | | 148,610,196 | |
| I Class | | | | |
| Sold | 44,459,505 | | 402,361,464 | | 44,887,743 | | 436,859,518 | |
| Issued in reinvestment of distributions | 2,043,570 | | 18,295,280 | | 1,087,763 | | 10,544,761 | |
| Redeemed | (34,273,863) | | (308,559,681) | | (16,788,584) | | (162,636,110) | |
| 12,229,212 | | 112,097,063 | | 29,186,922 | | 284,768,169 | |
| Y Class | | | | |
| Sold | 36,562 | | 323,590 | | 63,792 | | 629,268 | |
| Issued in reinvestment of distributions | 663 | | 5,895 | | 6,548 | | 64,651 | |
| Redeemed | (5,616) | | (50,093) | | (649,161) | | (6,412,951) | |
| 31,609 | | 279,392 | | (578,821) | | (5,719,032) | |
| A Class | | | | |
| Sold | 2,656,799 | | 23,605,617 | | 472,225 | | 4,621,527 | |
| Issued in reinvestment of distributions | 83,196 | | 742,988 | | 54,340 | | 528,541 | |
| Redeemed | (1,564,580) | | (14,059,124) | | (778,056) | | (7,620,183) | |
| 1,175,415 | | 10,289,481 | | (251,491) | | (2,470,115) | |
| C Class | | | | |
| Sold | 63,090 | | 569,379 | | 200,584 | | 1,961,445 | |
| Issued in reinvestment of distributions | 8,595 | | 76,921 | | 8,094 | | 78,673 | |
| Redeemed | (145,875) | | (1,308,747) | | (126,394) | | (1,225,831) | |
| (74,190) | | (662,447) | | 82,284 | | 814,287 | |
| R Class | | | | |
| Sold | 56,602 | | 511,071 | | 20,639 | | 201,557 | |
| Issued in reinvestment of distributions | 1,423 | | 12,694 | | 618 | | 6,032 | |
| Redeemed | (18,285) | | (165,086) | | (38,202) | | (375,262) | |
| 39,740 | | 358,679 | | (16,945) | | (167,673) | |
| R5 Class | | | | |
| Sold | 43,073 | | 391,893 | | 13,588 | | 131,295 | |
| Issued in reinvestment of distributions | 1,192 | | 10,660 | | 224 | | 2,165 | |
| Redeemed | (21,351) | | (192,226) | | (2,462) | | (23,428) | |
| 22,914 | | 210,327 | | 11,350 | | 110,032 | |
| R6 Class | | | | |
| Sold | 865,149 | | 7,796,081 | | 869,985 | | 8,540,028 | |
| Issued in reinvestment of distributions | 27,707 | | 247,624 | | 13,779 | | 133,979 | |
| Redeemed | (184,839) | | (1,655,523) | | (589,003) | | (5,717,910) | |
| 708,017 | | 6,388,182 | | 294,761 | | 2,956,097 | |
| Net increase (decrease) | 12,613,360 | | $ | 115,471,873 | | 43,900,513 | | $ | 428,901,961 | |
6. Fair Value Measurements
The fund's investments valuation process is based on several considerations and may use multiple inputs to determine the fair value of the investments held by the fund. In conformity with accounting principles generally accepted in the United States of America, the inputs used to determine a valuation are classified into three broad levels.
•Level 1 valuation inputs consist of unadjusted quoted prices in an active market for identical investments.
•Level 2 valuation inputs consist of direct or indirect observable market data (including quoted prices for comparable investments, evaluations of subsequent market events, interest rates, prepayment speeds, credit risk, etc.). These inputs also consist of quoted prices for identical investments initially expressed in local currencies that are adjusted through translation into U.S. dollars.
•Level 3 valuation inputs consist of unobservable data (including a fund’s own assumptions).
The level classification is based on the lowest level input that is significant to the fair valuation measurement. The valuation inputs are not necessarily an indication of the risks associated with investing in these securities or other financial instruments.
The following is a summary of the level classifications as of period end. The Schedule of Investments provides additional information on the fund's portfolio holdings.
| | | | | | | | | | | |
| Level 1 | Level 2 | Level 3 |
| Assets | | | |
| Investment Securities | | | |
| Corporate Bonds | — | | $ | 338,421,896 | | — | |
| U.S. Treasury Securities | — | | 151,816,735 | | — | |
| Collateralized Loan Obligations | — | | 72,817,979 | | — | |
| Asset-Backed Securities | — | | 68,503,690 | | — | |
| Collateralized Mortgage Obligations | — | | 41,694,167 | | — | |
| Commercial Mortgage-Backed Securities | — | | 23,135,507 | | — | |
| Bank Loan Obligations | — | | 12,146,395 | | — | |
| Preferred Stocks | — | | 6,393,666 | | — | |
| Sovereign Governments and Agencies | — | | 3,648,923 | | — | |
| Short-Term Investments | — | | 54,284,835 | | — | |
| — | | $ | 772,863,793 | | — | |
| Other Financial Instruments | | | |
| Futures Contracts | $ | 410,701 | | — | | — | |
| | | |
| Liabilities | | | |
| Other Financial Instruments | | | |
| Futures Contracts | $ | 466,072 | | — | | — | |
| Forward Foreign Currency Exchange Contracts | — | | $ | 42,506 | | — | |
| $ | 466,072 | | $ | 42,506 | | — | |
7. Derivative Instruments
Credit Risk — The fund is subject to credit risk in the normal course of pursuing its investment objectives. The value of a bond generally declines as the credit quality of its issuer declines. Credit default swap agreements enable a fund to buy/sell protection against a credit event of a specific issuer or index. A fund may attempt to enhance returns by selling protection or attempt to mitigate credit risk by buying protection. The buyer/seller of credit protection against a security or basket of securities may pay/receive an up-front or periodic payment to compensate for/against potential default events. Changes in value, including the periodic amounts of interest to be paid or received on swap agreements, are recorded as unrealized appreciation (depreciation) on swap agreements. Upon entering into a centrally cleared swap, a fund is required to deposit cash or securities (initial margin) with a financial intermediary in an amount equal to a certain percentage of the notional amount. A fund may incur charges or earn income on cash deposit balances, which are reflected in interest expenses or interest income, respectively. Subsequent payments (variation margin) are made or received daily, in cash, by a fund. The variation margin is equal to the daily change in the value and is a component of unrealized gains and losses. Realized gain or loss is recorded upon receipt or payment of a periodic settlement or termination of swap agreements. Net realized and unrealized gains or losses occurring during the holding period of swap agreements are a component of net realized gain (loss) on swap agreement transactions and change in net unrealized appreciation (depreciation) on swap agreements, respectively. The risks of entering into swap agreements include the possible lack of liquidity, failure of the counterparty to meet its obligations, and that there may be unfavorable changes in the underlying investments or instruments. The fund's average notional amount held during the period was $45,043,605.
Foreign Currency Risk — The fund is subject to foreign currency exchange rate risk in the normal course of pursuing its investment objectives. The value of foreign investments held by a fund may be significantly affected by changes in foreign currency exchange rates. The dollar value of a foreign security generally decreases when the value of the dollar rises against the foreign currency in which the security is denominated and tends to increase when the value of the dollar declines against such foreign currency. A fund may enter into forward foreign currency exchange contracts to reduce a fund's exposure to foreign currency exchange rate fluctuations or to gain exposure to the fluctuations in the value of foreign currencies. A fund will segregate cash, cash equivalents or other appropriate liquid securities on its records in amounts sufficient to meet requirements. The net U.S. dollar value of foreign currency underlying all contractual commitments held by a fund and the resulting unrealized appreciation or depreciation are determined daily. Realized gain or loss is recorded upon settlement of the contract. Net realized and unrealized gains or losses occurring during the holding period of forward foreign currency exchange contracts are a component of net realized gain (loss) on forward foreign currency exchange contract transactions and change in net unrealized appreciation (depreciation) on forward foreign currency exchange contracts, respectively. A fund bears the risk of an unfavorable change in the foreign currency exchange rate underlying the forward contract. Additionally, losses, up to the fair value, may arise if the counterparties do not perform under the contract terms. The fund's average U.S. dollar exposure to foreign currency risk derivative instruments held during the period was $3,314,413.
Interest Rate Risk — The fund is subject to interest rate risk in the normal course of pursuing its investment objectives. The value of bonds generally declines as interest rates rise. A fund may enter into futures contracts based on a bond index or a specific underlying security. A fund may purchase futures contracts to gain exposure to increases in market value or sell futures contracts to protect against a decline in market value. Upon entering into a futures contract, a fund will segregate cash, cash equivalents or other appropriate liquid securities on its records in amounts sufficient to meet requirements. A fund may incur charges or earn income on cash deposit balances, which are reflected in interest expenses or interest income, respectively. Subsequent payments (variation margin) are made or received daily, in cash, by a fund. The variation margin is equal to the daily change in the contract value and is recorded as unrealized gains and losses. A fund recognizes a realized gain or loss when the futures contract is closed or expires. Net realized and unrealized gains or losses occurring during the holding period of futures contracts are a component of net realized gain (loss) on futures contract transactions and change in net unrealized appreciation (depreciation) on futures contracts, respectively. One of the risks of entering into futures contracts is the possibility that the change in value of the contract may not correlate with the changes in value of the underlying securities. The fund's average notional exposure to interest rate risk derivative instruments held during the period was $62,114,943 futures contracts purchased and $80,091,302 futures contracts sold.
Value of Derivative Instruments as of March 31, 2023
| | | | | | | | | | | | | | |
| Asset Derivatives | Liability Derivatives |
Type of Risk
Exposure | Location on Statement of
Assets and Liabilities | Value | Location on Statement of
Assets and Liabilities | Value |
| Foreign Currency Risk | Unrealized appreciation on forward foreign currency exchange contracts | — | | Unrealized depreciation on forward foreign currency exchange contracts | $ | 42,506 | |
| Interest Rate Risk | Receivable for variation margin on futures contracts* | $ | 74,817 | | Payable for variation margin on futures contracts* | — | |
| | $ | 74,817 | | | $ | 42,506 | |
*Included in the unrealized appreciation (depreciation) on futures contracts, as reported in the Schedule of Investments.
Effect of Derivative Instruments on the Statement of Operations for the Year Ended March 31, 2023
| | | | | | | | | | | | | | |
| Net Realized Gain (Loss) | Change in Net Unrealized Appreciation (Depreciation) |
Type of Risk
Exposure | Location on Statement of
Operations | Value | Location on Statement of
Operations | Value |
| Credit Risk | Net realized gain (loss) on swap agreement transactions | $ | (869,140) | | Change in net unrealized appreciation (depreciation) on swap agreements | $ | 1,051,211 | |
| Foreign Currency Risk | Net realized gain (loss) on forward foreign currency exchange contract transactions | 229,306 | | Change in net unrealized appreciation (depreciation) on forward foreign currency exchange contracts | 32,896 | |
| Interest Rate Risk | Net realized gain (loss) on futures contract transactions | 9,349,472 | | Change in net unrealized appreciation (depreciation) on futures contracts | (3,471,038) | |
| | $ | 8,709,638 | | | $ | (2,386,931) | |
8. Risk Factors
The value of the fund’s shares will go up and down, sometimes rapidly or unpredictably, based on the performance of the securities owned by the fund and other factors generally affecting the securities market. Market risks, including political, regulatory, economic and social developments, can affect the value of the fund’s investments. Natural disasters, public health emergencies, war, terrorism and other unforeseeable events may lead to increased market volatility and may have adverse long-term effects on world economies and markets generally.
The fund invests in lower-rated debt securities, which are subject to substantial risks including liquidity risk and credit risk.
The fund may invest in instruments that have variable or floating coupon rates based on the London Interbank Offered Rate (LIBOR). LIBOR is a benchmark interest rate intended to be representative of the rate at which certain major international banks lend to one another over short-terms. Financial institutions have started the process of phasing out LIBOR and the transition process to a replacement rate may lead to increased volatility or illiquidity in markets for instruments that rely on LIBOR. This could result in a change to the value of such instruments or a change in the cost of temporary borrowing for the fund.
There are certain risks involved in investing in foreign securities. These risks include those resulting from political events (such as civil unrest, national elections and imposition of exchange controls), social and economic events (such as labor strikes and rising inflation), and natural disasters. Securities of foreign issuers may be less liquid and more volatile. Investing in emerging markets or a significant portion of assets in one country or region may accentuate these risks.
The fund's investment process may result in high portfolio turnover, which could mean high transaction costs, affecting both performance and capital gains tax liabilities to investors.
9. Federal Tax Information
The tax character of distributions paid during the years ended March 31, 2023 and March 31, 2022 were as follows:
| | | | | | | | |
| 2023 | 2022 |
| Distributions Paid From | | |
| Ordinary income | $ | 27,736,631 | | $ | 17,298,008 | |
| Long-term capital gains | — | | $ | 857,926 | |
The book-basis character of distributions made during the year from net investment income or net realized gains may differ from their ultimate characterization for federal income tax purposes. These differences reflect the differing character of certain income items and net realized gains and losses for financial statement and tax purposes, and may result in reclassification among certain capital accounts on the financial statements.
As of period end, the federal tax cost of investments and the components of distributable earnings on a tax-basis were as follows:
| | | | | |
| Federal tax cost of investments | $ | 797,437,161 | |
| Gross tax appreciation of investments | $ | 2,517,422 | |
| Gross tax depreciation of investments | (27,090,790) | |
| Net tax appreciation (depreciation) of investments | (24,573,368) | |
Net tax appreciation (depreciation) on derivatives and translation of assets
and liabilities in foreign currencies | 40 | |
| Net tax appreciation (depreciation) | $ | (24,573,328) | |
| Other book-to-tax adjustments | $ | (212,953) | |
| Undistributed ordinary income | — | |
| Accumulated short-term capital losses | $ | (27,074,018) | |
| Accumulated long-term capital losses | $ | (14,869,794) | |
The difference between book-basis and tax-basis unrealized appreciation (depreciation) is attributable primarily to the tax deferral of losses on wash sales. Other book-to-tax adjustments are attributable primarily to the tax deferral of losses on straddle positions.
Accumulated capital losses represent net capital loss carryovers that may be used to offset future realized capital gains for federal income tax purposes. The capital loss carryovers may be carried forward for an unlimited period. Future capital loss carryover utilization in any given year may be subject to Internal Revenue Code limitations.
| | | | | | | | | | | | | | | | | | | | | | | | | | | | | | | | | | | | | | | | | | | | | | | |
| For a Share Outstanding Throughout the Years Ended March 31 (except as noted) |
| Per-Share Data | | | | | | | | | Ratios and Supplemental Data |
| | Income From Investment Operations: | Distributions From: | | | Ratio to Average Net Assets of: | | |
| Net Asset
Value,
Beginning
of Period | Net Investment Income (Loss)(1) | Net
Realized
and
Unrealized
Gain (Loss) | Total From
Investment
Operations | Net
Investment Income | Net
Realized
Gains | Total Distributions | Net Asset
Value,
End of Period | Total Return(2) | Operating
Expenses | Operating
Expenses
(before
expense
waiver) | Net
Investment
Income
(Loss) | Net
Investment
Income (Loss)
(before expense waiver) | Portfolio
Turnover
Rate | Net
Assets,
End of
Period (in thousands) |
| Investor Class | | | | | | | | | | | | | | |
| 2023 | $9.34 | 0.32 | (0.45) | (0.13) | (0.32) | — | (0.32) | $8.89 | (1.24)% | 0.52% | 0.52% | 3.60% | 3.60% | 188% | $229,572 | |
| 2022 | $9.82 | 0.22 | (0.38) | (0.16) | (0.24) | (0.08) | (0.32) | $9.34 | (1.72)% | 0.52% | 0.52% | 2.28% | 2.28% | 120% | $255,208 | |
| 2021 | $9.19 | 0.23 | 0.66 | 0.89 | (0.26) | — | (0.26) | $9.82 | 9.74% | 0.52% | 0.55% | 2.36% | 2.33% | 193% | $119,380 | |
| 2020 | $9.50 | 0.24 | (0.30) | (0.06) | (0.25) | — | (0.25) | $9.19 | (0.65)% | 0.52% | 0.61% | 2.48% | 2.39% | 98% | $96,773 | |
| 2019 | $9.53 | 0.28 | (0.02) | 0.26 | (0.29) | — | (0.29) | $9.50 | 2.75% | 0.58% | 0.66% | 2.97% | 2.89% | 61% | $109,863 | |
| I Class | | | | | | | | | | | | | | |
| 2023 | $9.33 | 0.33 | (0.44) | (0.11) | (0.33) | — | (0.33) | $8.89 | (1.15)% | 0.42% | 0.42% | 3.70% | 3.70% | 188% | $519,131 | |
| 2022 | $9.82 | 0.23 | (0.39) | (0.16) | (0.25) | (0.08) | (0.33) | $9.33 | (1.62)% | 0.42% | 0.42% | 2.38% | 2.38% | 120% | $430,865 | |
| 2021 | $9.19 | 0.24 | 0.66 | 0.90 | (0.27) | — | (0.27) | $9.82 | 9.73% | 0.42% | 0.45% | 2.46% | 2.43% | 193% | $166,606 | |
| 2020 | $9.49 | 0.25 | (0.29) | (0.04) | (0.26) | — | (0.26) | $9.19 | (0.44)% | 0.42% | 0.51% | 2.58% | 2.49% | 98% | $83,287 | |
| 2019 | $9.53 | 0.29 | (0.03) | 0.26 | (0.30) | — | (0.30) | $9.49 | 2.75% | 0.48% | 0.56% | 3.07% | 2.99% | 61% | $13,463 | |
| | | | | | | | | | | | | | | | | | | | | | | | | | | | | | | | | | | | | | | | | | | | | | | |
| For a Share Outstanding Throughout the Years Ended March 31 (except as noted) |
| Per-Share Data | | | | | | | | | Ratios and Supplemental Data |
| | Income From Investment Operations: | Distributions From: | | | Ratio to Average Net Assets of: | | |
| Net Asset
Value,
Beginning
of Period | Net Investment Income (Loss)(1) | Net
Realized
and
Unrealized
Gain (Loss) | Total From
Investment
Operations | Net
Investment Income | Net
Realized
Gains | Total Distributions | Net Asset
Value,
End of Period | Total Return(2) | Operating
Expenses | Operating
Expenses
(before
expense
waiver) | Net
Investment
Income
(Loss) | Net
Investment
Income (Loss)
(before expense waiver) | Portfolio
Turnover
Rate | Net
Assets,
End of
Period (in thousands) |
| Y Class | | | | | | | | | | | | | | |
| 2023 | $9.34 | 0.40 | (0.51) | (0.11) | (0.34) | — | (0.34) | $8.89 | (1.07)% | 0.32% | 0.32% | 3.80% | 3.80% | 188% | $286 | |
| 2022 | $9.82 | 0.25 | (0.39) | (0.14) | (0.26) | (0.08) | (0.34) | $9.34 | (1.52)% | 0.32% | 0.32% | 2.48% | 2.48% | 120% | $6 | |
| 2021 | $9.19 | 0.26 | 0.65 | 0.91 | (0.28) | — | (0.28) | $9.82 | 9.93% | 0.32% | 0.35% | 2.56% | 2.53% | 193% | $5,691 | |
| 2020 | $9.50 | 0.26 | (0.30) | (0.04) | (0.27) | — | (0.27) | $9.19 | (0.45)% | 0.32% | 0.41% | 2.68% | 2.59% | 98% | $5 | |
| 2019 | $9.53 | 0.29 | (0.02) | 0.27 | (0.30) | — | (0.30) | $9.50 | 2.92% | 0.38% | 0.46% | 3.17% | 3.09% | 61% | $5 | |
| A Class | | | | | | | | | | | | | | | |
| 2023 | $9.34 | 0.32 | (0.47) | (0.15) | (0.30) | — | (0.30) | $8.89 | (1.49)% | 0.77% | 0.77% | 3.35% | 3.35% | 188% | $26,690 | |
| 2022 | $9.82 | 0.20 | (0.39) | (0.19) | (0.21) | (0.08) | (0.29) | $9.34 | (1.96)% | 0.77% | 0.77% | 2.03% | 2.03% | 120% | $17,050 | |
| 2021 | $9.19 | 0.21 | 0.66 | 0.87 | (0.24) | — | (0.24) | $9.82 | 9.46% | 0.77% | 0.80% | 2.11% | 2.08% | 193% | $20,397 | |
| 2020 | $9.50 | 0.21 | (0.29) | (0.08) | (0.23) | — | (0.23) | $9.19 | (0.90)% | 0.77% | 0.86% | 2.23% | 2.14% | 98% | $13,826 | |
| 2019 | $9.53 | 0.26 | (0.03) | 0.23 | (0.26) | — | (0.26) | $9.50 | 2.50% | 0.83% | 0.91% | 2.72% | 2.64% | 61% | $5,870 | |
| C Class | | | | | | | | | | | | | | |
| 2023 | $9.34 | 0.23 | (0.45) | (0.22) | (0.23) | — | (0.23) | $8.89 | (2.23)% | 1.52% | 1.52% | 2.60% | 2.60% | 188% | $2,722 | |
| 2022 | $9.82 | 0.13 | (0.39) | (0.26) | (0.14) | (0.08) | (0.22) | $9.34 | (2.70)% | 1.52% | 1.52% | 1.28% | 1.28% | 120% | $3,550 | |
| 2021 | $9.19 | 0.14 | 0.65 | 0.79 | (0.16) | — | (0.16) | $9.82 | 8.65% | 1.52% | 1.55% | 1.36% | 1.33% | 193% | $2,926 | |
| 2020 | $9.50 | 0.14 | (0.29) | (0.15) | (0.16) | — | (0.16) | $9.19 | (1.63)% | 1.52% | 1.61% | 1.48% | 1.39% | 98% | $1,605 | |
| 2019 | $9.53 | 0.19 | (0.03) | 0.16 | (0.19) | — | (0.19) | $9.50 | 1.73% | 1.58% | 1.66% | 1.97% | 1.89% | 61% | $1,090 | |
| | | | | | | | | | | | | | | | | | | | | | | | | | | | | | | | | | | | | | | | | | | | | | | |
| For a Share Outstanding Throughout the Years Ended March 31 (except as noted) |
| Per-Share Data | | | | | | | | | Ratios and Supplemental Data |
| | Income From Investment Operations: | Distributions From: | | | Ratio to Average Net Assets of: | | |
| Net Asset
Value,
Beginning
of Period | Net Investment Income (Loss)(1) | Net
Realized
and
Unrealized
Gain (Loss) | Total From
Investment
Operations | Net
Investment Income | Net
Realized
Gains | Total Distributions | Net Asset
Value,
End of Period | Total Return(2) | Operating
Expenses | Operating
Expenses
(before
expense
waiver) | Net
Investment
Income
(Loss) | Net
Investment
Income (Loss)
(before expense waiver) | Portfolio
Turnover
Rate | Net
Assets,
End of
Period (in thousands) |
| R Class | | | | | | | | | | | | | | |
| 2023 | $9.34 | 0.30 | (0.46) | (0.16) | (0.28) | — | (0.28) | $8.90 | (1.74)% | 1.02% | 1.02% | 3.10% | 3.10% | 188% | $532 | |
| 2022 | $9.82 | 0.18 | (0.39) | (0.21) | (0.19) | (0.08) | (0.27) | $9.34 | (2.21)% | 1.02% | 1.02% | 1.78% | 1.78% | 120% | $187 | |
| 2021 | $9.19 | 0.18 | 0.66 | 0.84 | (0.21) | — | (0.21) | $9.82 | 9.20% | 1.02% | 1.05% | 1.86% | 1.83% | 193% | $363 | |
| 2020 | $9.50 | 0.19 | (0.29) | (0.10) | (0.21) | — | (0.21) | $9.19 | (1.14)% | 1.02% | 1.11% | 1.98% | 1.89% | 98% | $195 | |
| 2019 | $9.53 | 0.24 | (0.03) | 0.21 | (0.24) | — | (0.24) | $9.50 | 2.24% | 1.08% | 1.16% | 2.47% | 2.39% | 61% | $671 | |
| R5 Class | | | | | | | | | | | | | | |
| 2023 | $9.34 | 0.35 | (0.46) | (0.11) | (0.34) | — | (0.34) | $8.89 | (1.05)% | 0.32% | 0.32% | 3.80% | 3.80% | 188% | $329 | |
| 2022 | $9.82 | 0.24 | (0.38) | (0.14) | (0.26) | (0.08) | (0.34) | $9.34 | (1.52)% | 0.32% | 0.32% | 2.48% | 2.48% | 120% | $131 | |
| 2021 | $9.19 | 0.24 | 0.67 | 0.91 | (0.28) | — | (0.28) | $9.82 | 9.84% | 0.32% | 0.35% | 2.56% | 2.53% | 193% | $26 | |
| 2020 | $9.50 | 0.26 | (0.30) | (0.04) | (0.27) | — | (0.27) | $9.19 | (0.33)% | 0.32% | 0.41% | 2.68% | 2.59% | 98% | $225 | |
| 2019 | $9.53 | 0.28 | —(3) | 0.28 | (0.31) | — | (0.31) | $9.50 | 2.96% | 0.38% | 0.46% | 3.17% | 3.09% | 61% | $226 | |
| R6 Class | | | | | | | | | | | | | | |
| 2023 | $9.34 | 0.36 | (0.46) | (0.10) | (0.34) | — | (0.34) | $8.90 | (1.00)% | 0.27% | 0.27% | 3.85% | 3.85% | 188% | $9,165 | |
| 2022 | $9.82 | 0.25 | (0.39) | (0.14) | (0.26) | (0.08) | (0.34) | $9.34 | (1.47)% | 0.27% | 0.27% | 2.53% | 2.53% | 120% | $3,008 | |
| 2021 | $9.19 | 0.27 | 0.64 | 0.91 | (0.28) | — | (0.28) | $9.82 | 10.01% | 0.27% | 0.30% | 2.61% | 2.58% | 193% | $267 | |
| 2020 | $9.50 | 0.26 | (0.29) | (0.03) | (0.28) | — | (0.28) | $9.19 | (0.39)% | 0.27% | 0.36% | 2.73% | 2.64% | 98% | $184 | |
| 2019 | $9.53 | 0.29 | (0.01) | 0.28 | (0.31) | — | (0.31) | $9.50 | 3.01% | 0.33% | 0.41% | 3.22% | 3.14% | 61% | $164 | |
| | |
| Notes to Financial Highlights |
(1)Computed using average shares outstanding throughout the period.
(2)Total returns are calculated based on the net asset value of the last business day and do not reflect applicable sales charges, if any. Total returns for periods less than one year are not annualized.
(3)Per-share amount was less than $0.005.
See Notes to Financial Statements.
| | |
| Report of Independent Registered Public Accounting Firm |
To the Shareholders and the Board of Trustees of American Century Investment Trust:
Opinion on the Financial Statements and Financial Highlights
We have audited the accompanying statement of assets and liabilities, including the schedule of investments, of Short Duration Strategic Income Fund (the “Fund”), one of the funds constituting the American Century Investment Trust, as of March 31, 2023, the related statement of operations for the year then ended, the statements of changes in net assets and financial highlights for the two years in the period then ended, and the related notes. In our opinion, the financial statements and financial highlights present fairly, in all material respects, the financial position of Short Duration Strategic Income Fund of the American Century Investment Trust, as of March 31, 2023, and the results of its operations for the year then ended and the changes in its net assets and the financial highlights for the two years then ended in conformity with accounting principles generally accepted in the United States of America. The financial highlights for each of the three years in the period ended March 31, 2021, were audited by other auditors, whose report, dated May 18, 2021, expressed an unqualified opinion on such financial highlights.
Basis for Opinion
These financial statements and financial highlights are the responsibility of the Fund's management. Our responsibility is to express an opinion on the Fund’s financial statements and financial highlights based on our audit. We are a public accounting firm registered with the Public Company Accounting Oversight Board (United States) (PCAOB) and are required to be independent with respect to the Fund in accordance with the U.S. federal securities laws and the applicable rules and regulations of the Securities and Exchange Commission and the PCAOB.
We conducted our audits in accordance with the standards of the PCAOB. Those standards require that we plan and perform the audit to obtain reasonable assurance about whether the financial statements and financial highlights are free of material misstatement, whether due to error or fraud. The Fund is not required to have, nor were we engaged to perform, an audit of its internal control over financial reporting. As part of our audit, we are required to obtain an understanding of internal control over financial reporting but not for the purpose of expressing an opinion on the effectiveness of the Fund’s internal control over financial reporting. Accordingly, we express no such opinion.
Our audits included performing procedures to assess the risks of material misstatement of the financial statements and financial highlights, whether due to error or fraud, and performing procedures that respond to those risks. Such procedures included examining, on a test basis, evidence regarding the amounts and disclosures in the financial statements and financial highlights. Our audits also included evaluating the accounting principles used and significant estimates made by management, as well as evaluating the overall presentation of the financial statements and financial highlights. Our procedures included confirmation of securities owned as of March 31, 2023, by correspondence with the custodian and brokers; when replies were not received from brokers, we performed other auditing procedures. We believe that our audits provide a reasonable basis for our opinion.
/s/ Deloitte & Touche LLP
Kansas City, Missouri
May 16, 2023
We have served as the auditor of one or more American Century investment companies since 1997.
Board of Trustees
The individuals listed below serve as trustees of the funds. Each trustee will continue to serve in this capacity until death, retirement, resignation or removal from office. The board has adopted a mandatory retirement age for trustees who are not “interested persons,” as that term is defined in the Investment Company Act (independent trustees). Independent trustees shall retire on December 31 of the year in which they reach their 76th birthday.
Jonathan S. Thomas is an “interested person” because he currently serves as President and Chief Executive Officer of American Century Companies, Inc. (ACC), the parent company of American Century Investment Management, Inc. (ACIM or the advisor). The other trustees (more than three-fourths of the total number) are independent. They are not employees, directors or officers of, and have no financial interest in, ACC or any of its wholly owned, direct or indirect, subsidiaries, including ACIM, American Century Investment Services, Inc. (ACIS) and American Century Services, LLC (ACS), and they do not have any other affiliations, positions or relationships that would cause them to be considered “interested persons” under the Investment Company Act. The trustees serve in this capacity for eight (in the case of Jonathan S. Thomas, 16; and Jeremy I. Bulow, 9) registered investment companies in the American Century Investments family of funds.
The following table presents additional information about the trustees. The mailing address for each trustee other than Jonathan S. Thomas is 3945 Freedom Circle, Suite #800, Santa Clara, California 95054. The mailing address for Jonathan S. Thomas is 4500 Main Street, Kansas City, Missouri 64111.
| | | | | | | | | | | | | | | | | |
Name
(Year of Birth) | Position(s) Held with Funds | Length of Time Served | Principal Occupation(s) During Past 5 Years | Number of American Century Portfolios Overseen by Trustee | Other Directorships Held During Past 5 Years |
| Independent Trustees | | |
Tanya S. Beder
(1955) | Trustee and Board Chair | Since 2011 (Board Chair since 2022) | Chairman and CEO, SBCC Group Inc. (independent advisory services) (2006 to present) | 32 | Kirby Corporation; Nabors Industries, Ltd. |
Jeremy I. Bulow
(1954) | Trustee | Since 2011 | Professor of Economics, Stanford University, Graduate School of Business (1979 to present) | 77 | None |
Jennifer Cabalquinto
(1968) | Trustee | Since 2021 | Chief Financial Officer, 2K (interactive entertainment) (2021 to present); Special Advisor, GSW Sports, LLC (2020 to 2021); Chief Financial Officer, GSW Sports, LLC (2013 to 2020) | 32 | Sabio Holdings, Inc. |
Anne Casscells
(1958) | Trustee | Since 2016 | Co-Chief Executive Officer and Chief Investment Officer, Aetos Alternatives Management (investment advisory firm) (2001 to present) | 32 | None |
| | | | | | | | | | | | | | | | | |
Name
(Year of Birth) | Position(s) Held with Funds | Length of Time Served | Principal Occupation(s) During Past 5 Years | Number of American Century Portfolios Overseen by Trustee | Other Directorships Held During Past 5 Years |
| Independent Trustees | | |
Jonathan D. Levin
(1972) | Trustee | Since 2016 | Philip H. Knight Professor and Dean, Graduate School of Business, Stanford University (2016 to present); Professor, Stanford University, (2000 to present) | 32 | None |
Peter F. Pervere
(1947) | Trustee | Since 2007 | Retired | 32 | None |
John B. Shoven
(1947) | Trustee | Since 2002 | Charles R. Schwab Professor of Economics, Stanford University (1973 to present, emeritus since 2019) | 32 | Cadence Design Systems; Exponent; Financial Engines |
| Interested Trustee | | |
Jonathan S. Thomas
(1963) | Trustee | Since 2007 | President and Chief Executive Officer, ACC (2007 to present). Also serves as Chief Executive Officer, ACS; Director, ACC and other ACC subsidiaries | 141 | None |
The Statement of Additional Information has additional information about the fund's trustees and is available without charge, upon request, by calling 1-800-345-2021.
Officers
The following table presents certain information about the executive officers of the funds. Each officer serves as an officer for 16 investment companies in the American Century family of funds. No officer is compensated for his or her service as an officer of the funds. The listed officers are interested persons of the funds and are appointed or re-appointed on an annual basis. The mailing address for each of the officers listed below is 4500 Main Street, Kansas City, Missouri 64111.
| | | | | | | | |
Name
(Year of Birth) | Offices with the Funds | Principal Occupation(s) During the Past Five Years |
Patrick Bannigan
(1965)
| President since 2019 | Executive Vice President and Director, ACC (2012 to present); Chief Financial Officer, Chief Accounting Officer and Treasurer, ACC (2015 to present). Also serves as President, ACS; Vice President, ACIM; Chief Financial Officer, Chief Accounting Officer and/or Director, ACIM, ACS and other ACC subsidiaries |
R. Wes Campbell
(1974)
| Chief Financial Officer and Treasurer since 2018 | Vice President, ACS (2020 to present); Investment Operations and Investment Accounting, ACS (2000 to present) |
Amy D. Shelton
(1964) | Chief Compliance Officer and Vice President since 2014 | Chief Compliance Officer, American Century funds, (2014 to present); Chief Compliance Officer, ACIM (2014 to present); Chief Compliance Officer, ACIS (2009 to present). Also serves as Vice President, ACIS |
John Pak
(1968) | General Counsel and Senior Vice President since 2021 | General Counsel and Senior Vice President, ACC (2021 to present); Also serves as General Counsel and Senior Vice President, ACIM, ACS and ACIS. Chief Legal Officer of Investment and Wealth Management, The Bank of New York Mellon (2014 to 2021) |
David H. Reinmiller
(1963) | Vice President since 2000 | Attorney, ACC (1994 to present). Also serves as Vice President, ACIM and ACS |
Ward D. Stauffer
(1960) | Secretary since 2005 | Attorney, ACC (2003 to present) |
| | |
| Liquidity Risk Management Program |
The Fund has adopted a liquidity risk management program (the “program”). The Fund’s Board of Trustees (the "Board") has designated American Century Investment Management, Inc. (“ACIM”) as the administrator of the program. Personnel of ACIM or its affiliates, including members of ACIM’s Investment Oversight Committee who are members of ACIM’s Investment Management and Global Analytics departments, conduct the day-to-day operation of the program pursuant to the program.
Under the program, ACIM manages the Fund’s liquidity risk, which is the risk that the Fund could not meet shareholder redemption requests without significant dilution of remaining shareholders’ interests in the Fund. This risk is managed by monitoring the degree of liquidity of the Fund’s investments, limiting the amount of the Fund’s illiquid investments, and utilizing various risk management tools and facilities available to the Fund for meeting shareholder redemptions, among other means. ACIM’s process of determining the degree of liquidity of certain investments held by the Fund is supported by a third-party liquidity assessment vendor.
The Board reviewed a report prepared by ACIM regarding the operation and effectiveness of the program for the period January 1, 2022 through December 31, 2022. No significant liquidity events impacting the Fund were noted in the report. In addition, ACIM provided its assessment that the program had been effective in managing the Fund’s liquidity risk.
Retirement Account Information
As required by law, distributions you receive from certain retirement accounts are subject to federal income tax withholding at the IRS default rate of 10%.* Tax will be withheld on the total amount withdrawn even though you may be receiving amounts that are not subject to withholding, such as nondeductible contributions. In such case, excess amounts of withholding could occur. You may adjust your withholding election so that a greater or lesser amount will be withheld.
You may elect a different withholding rate, or request zero withholding, by submitting an acceptable IRS Form W-4R election with your distribution request. You may notify us of your W-4R election by telephone, on our distribution forms, on IRS Form W-4R, or through other acceptable electronic means. If your withholding election is for an automatic withdrawal plan, you have the right to revoke your election at any time and any election you make will remain in effect until revoked by filing a new election.
Remember, even if you elect not to have income tax withheld, you are liable for paying income tax on the taxable portion of your withdrawal. If you elect not to have income tax withheld or you don’t have enough income tax withheld, you may be responsible for payment of estimated tax. You may incur penalties under the estimated tax rules if your withholding and estimated tax payments are not sufficient. You can reduce or defer the income tax on a distribution by directly or indirectly rolling such distribution over to another IRA or eligible plan. You should consult your tax advisor for additional information.
State tax will be withheld according to state regulations if, at the time of your distribution, your tax residency is within one of the mandatory withholding states.
*Some 403(b), 457 and qualified retirement plan distributions may be subject to 20% mandatory withholding, as they are subject to special tax and withholding rules. Your plan administrator or plan sponsor is required to provide you with a special tax notice explaining those rules at the time you request a distribution. If applicable, federal and/or state taxes may be withheld from your distribution amount.
Proxy Voting Policies
Descriptions of the principles and policies that the fund's investment advisor uses in exercising the voting rights associated with the securities purchased and/or held by the fund are available without charge, upon request, by calling 1-800-345-2021 or visiting American Century Investments’ website at americancentury.com/proxy. A description of the policies is also available on the Securities and Exchange Commission’s website at sec.gov. Information regarding how the investment advisor voted proxies relating to portfolio securities during the most recent 12-month period ended June 30 is available on americancentury.com/proxy. It is also available at sec.gov.
Quarterly Portfolio Disclosure
The fund files its complete schedule of portfolio holdings with the Securities and Exchange Commission (SEC) for the first and third quarters of each fiscal year as an exhibit to its reports on Form N-PORT. These portfolio holdings are available on the fund's website at americancentury.com and, upon request, by calling 1-800-345-2021. The fund’s Form N-PORT reports are available on the SEC’s website at sec.gov.
| | | | | | | | |
| |
| | |
| Contact Us | americancentury.com | |
| Automated Information Line | 1-800-345-8765 | |
| Investor Services Representative | 1-800-345-2021
or 816-531-5575 | |
| Investors Using Advisors | 1-800-378-9878 | |
| Business, Not-For-Profit, Employer-Sponsored Retirement Plans | 1-800-345-3533 | |
| Banks and Trust Companies, Broker-Dealers, Financial Professionals, Insurance Companies | 1-800-345-6488 | |
| Telecommunications Relay Service for the Deaf | 711 | |
| | |
| American Century Investment Trust | |
| | |
Investment Advisor: American Century Investment Management, Inc. Kansas City, Missouri | |
| | |
| This report and the statements it contains are submitted for the general information of our shareholders. The report is not authorized for distribution to prospective investors unless preceded or accompanied by an effective prospectus. | |
| | |
©2023 American Century Proprietary Holdings, Inc. All rights reserved.
CL-ANN-92286 2305 | |
| | | | | |
| |
| Annual Report |
| |
| March 31, 2023 |
| |
| U.S. Government Money Market Fund |
| Investor Class (TCRXX) |
| A Class (AGQXX) |
| C Class (AGHXX) |
| | | | | |
| President's Letter | |
| Performance | |
| Fund Characteristics | |
| Shareholder Fee Example | |
| Schedule of Investments | |
| Statement of Assets and Liabilities | |
| Statement of Operations | |
| Statement of Changes in Net Assets. | |
| Notes to Financial Statements | |
| Financial Highlights | |
| Report of Independent Registered Public Accounting Firm | |
| Management | |
| |
| Liquidity Risk Management Program | |
| |
| Additional Information | |
Any opinions expressed in this report reflect those of the author as of the date of the report, and do not necessarily represent the opinions of American Century Investments® or any other person in the American Century Investments organization. Any such opinions are subject to change at any time based upon market or other conditions and American Century Investments disclaims any responsibility to update such opinions. These opinions may not be relied upon as investment advice and, because investment decisions made by American Century Investments funds are based on numerous factors, may not be relied upon as an indication of trading intent on behalf of any American Century Investments fund. Security examples are used for representational purposes only and are not intended as recommendations to purchase or sell securities. Performance information for comparative indices and securities is provided to American Century Investments by third party vendors. To the best of American Century Investments’ knowledge, such information is accurate at the time of printing.
Jonathan Thomas
Dear Investor:
Thank you for reviewing this annual report for the period ended March 31, 2023. Annual reports help convey important information about fund returns, including market factors that affected performance. For additional investment insights, please visit americancentury.com.
Challenging Conditions Weighed on Asset Class Returns
Prevailing headwinds early in the reporting period continued to challenge U.S. financial markets throughout the 12 months. Asset class performance seesawed but declined overall amid mixed economic data, elevated inflation and anticipated monetary policy responses. By period-end, a new headwind emerged: banking industry uncertainty.
After launching its inflation-fighting rate-hike campaign in March 2022, the Federal Reserve (Fed) lifted rates eight more times by period-end. The federal funds target rate ended the reporting period at 4.75% to 5%, its highest level since 2007, while Treasury yields climbed to multiyear highs. Amid the Fed’s efforts, the annual inflation rate peaked at 9.1% in June, a 40-year high, before easing to 5% by March.
In addition to helping tame inflation, rapidly rising rates also fueled recession worries and led to expectations for the Fed to change course. This sentiment helped spark a rebound among stock and bond indices in the second half of the reporting period. The collapse of two U.S. regional banks late in the period and fears of a looming credit crunch and likely recession also contributed to market expectations for a Fed policy change. Nevertheless, the Fed indicated a near-term course change was unlikely.
Despite delivering strong gains in the second half of the reporting period, stock returns succumbed to first-half losses and declined for the 12 months. Similarly, weakness in the first half of the period overwhelmed second-half gains, and bond returns were negative for the 12-month period.
Remaining Diligent in Uncertain Times
We expect market volatility to linger as investors navigate a complex environment of still-high inflation, tighter financial conditions, banking industry turbulence and economic uncertainty. In addition, increasingly tense geopolitical considerations complicate the market backdrop.
We appreciate your confidence in us during these extraordinary times. Our firm has a long history of helping clients weather unpredictable and volatile markets, and we’re confident we will continue to meet today’s challenges.
Sincerely,
Jonathan Thomas
President and Chief Executive Officer
American Century Investments
| | | | | | | | | | | | | | | | | | | | |
| Total Returns as of March 31, 2023 |
| | | Average Annual Returns | |
| Ticker Symbol | 1 year | 5 years | 10 years | Since Inception | Inception Date |
| Investor Class | TCRXX | 2.22% | 1.09% | 0.62% | — | 4/1/93 |
| A Class | AGQXX | 1.99% | 0.94% | — | 0.72% | 12/1/15 |
| C Class | AGHXX | 1.58% | 0.66% | — | 0.50% | 12/1/15 |
Average annual returns since inception are presented when ten years of performance history is not available.
Fund returns would have been lower if a portion of the fees had not been waived.
| | | | | | | | |
| Total Annual Fund Operating Expenses |
| Investor Class | A Class | C Class |
| 0.45% | 0.70% | 1.20% |
The total annual fund operating expenses shown is as stated in the fund’s prospectus current as of the date of this report. The prospectus may vary from the expense ratio shown elsewhere in this report because it is based on a different time period, includes acquired fund fees and expenses, and, if applicable, does not include fee waivers or expense reimbursements.
Data presented reflect past performance. Past performance is no guarantee of future results. Current performance may be higher or lower than the performance shown. Total returns for periods less than one year are not annualized. To obtain performance data current to the most recent month end, please call 1-800-345-2021 or visit americancentury.com. For additional information about the fund, please consult the prospectus.
You could lose money by investing in the fund. Although the fund seeks to preserve the value of your investment at $1.00 per share, it cannot guarantee it will do so. An investment in the fund is not insured or guaranteed by the Federal Deposit Insurance Corporation or any other government agency. The fund’s sponsor has no legal obligation to provide financial support to the fund, and you should not expect that the sponsor will provide financial support to the fund at any time.
The 7-day current yield more closely reflects the current earnings of the fund than the total return.
| | | | | | | | | | | |
| MARCH 31, 2023 | | | |
| Yields | Investor Class | A Class | C Class |
| 7-Day Current Yield | 4.28% | 4.03% | 3.53% |
| 7-Day Effective Yield | 4.37% | 4.11% | 3.60% |
| | | | | |
| Portfolio at a Glance | |
| Weighted Average Maturity | 41 days |
| Weighted Average Life | 84 days |
| |
| Portfolio Composition by Maturity | % of fund investments |
| 1-30 days | 72% |
| 31-90 days | 14% |
| 91-180 days | 9% |
| More than 180 days | 5% |
Fund shareholders may incur two types of costs: (1) transaction costs, including sales charges (loads) on purchase payments and redemption/exchange fees; and (2) ongoing costs, including management fees; distribution and service (12b-1) fees; and other fund expenses. This example is intended to help you understand your ongoing costs (in dollars) of investing in your fund and to compare these costs with the ongoing cost of investing in other mutual funds.
The example is based on an investment of $1,000 made at the beginning of the period and held for the entire period from October 1, 2022 to March 31, 2023.
Actual Expenses
The table provides information about actual account values and actual expenses for each class. You may use the information, together with the amount you invested, to estimate the expenses that you paid over the period. First, identify the share class you own. Then simply divide your account value by $1,000 (for example, an $8,600 account value divided by $1,000 = 8.6), then multiply the result by the number under the heading “Expenses Paid During Period” to estimate the expenses you paid on your account during this period.
If you hold Investor Class shares of any American Century Investments mutual fund, or I Class shares of the American Century Diversified Bond Fund, in an American Century Investments account (i.e., not through a financial intermediary or employer-sponsored retirement plan account), American Century Investments may charge you a $25 annual account maintenance fee if the value of those shares is less than $10,000. We will redeem shares automatically in one of your accounts to pay the $25 fee. In determining your total eligible investment amount, we will include your investments in all personal accounts (including American Century Investments brokerage accounts) registered under your Social Security number. Personal accounts include individual accounts, joint accounts, UGMA/UTMA accounts, personal trusts, Coverdell Education Savings Accounts and IRAs (including traditional, Roth, Rollover, SEP-, SARSEP- and SIMPLE-IRAs), and certain other retirement accounts. If you have only business, business retirement, employer-sponsored or American Century Investments brokerage accounts, you are currently not subject to this fee. If you are subject to the account maintenance fee, your account value could be reduced by the fee amount.
Hypothetical Example for Comparison Purposes
The table also provides information about hypothetical account values and hypothetical expenses based on the actual expense ratio of each class of your fund and an assumed rate of return of 5% per year before expenses, which is not the actual return of a fund’s share class. The hypothetical account values and expenses may not be used to estimate the actual ending account balance or expenses you paid for the period. You may use this information to compare the ongoing costs of investing in your fund and other funds. To do so, compare this 5% hypothetical example with the 5% hypothetical examples that appear in the shareholder reports of the other funds.
Please note that the expenses shown in the table are meant to highlight your ongoing costs only and do not reflect any transactional costs, such as sales charges (loads) or redemption/exchange fees. Therefore, the table is useful in comparing ongoing costs only, and will not help you determine the relative total costs of owning different funds. In addition, if these transactional costs were included, your costs would have been higher.
| | | | | | | | | | | | | | |
| Beginning
Account Value
10/1/22 | Ending
Account Value
3/31/23 | Expenses Paid During Period(1) 10/1/22 - 3/31/23 | Annualized Expense Ratio(1) |
| Actual | | | | |
| Investor Class | $1,000 | $1,017.20 | $2.31 | 0.46% |
| A Class | $1,000 | $1,015.90 | $3.57 | 0.71% |
| C Class | $1,000 | $1,013.40 | $6.07 | 1.21% |
| Hypothetical | | | | |
| Investor Class | $1,000 | $1,022.64 | $2.32 | 0.46% |
| A Class | $1,000 | $1,021.39 | $3.58 | 0.71% |
| C Class | $1,000 | $1,018.90 | $6.09 | 1.21% |
(1)Expenses are equal to the class's annualized expense ratio listed in the table above, multiplied by the average account value over the period, multiplied by 182, the number of days in the most recent fiscal half-year, divided by 365, to reflect the one-half year period. Annualized expense ratio reflects actual expenses, including any applicable fee waivers or expense reimbursements and excluding any acquired fund fees and expenses.
MARCH 31, 2023
| | | | | | | | |
| Principal Amount | Value |
| CORPORATE BONDS — 48.0% | | |
| 12th & Yesler Owner LLC, VRDN, 4.92%, 4/7/23 (LOC: FHLB) | $ | 13,000,000 | | $ | 13,000,000 | |
| 1450 Midvale Investors LLC, VRDN, 4.92%, 4/7/23 (LOC: FHLB) | 9,855,000 | | 9,855,000 | |
| 1834 Bentley Investors LLC, VRDN, 4.92%, 4/7/23 (LOC: FHLB) | 7,840,000 | | 7,840,000 | |
| 2140 Bentley Investors LLC, VRDN, 4.92%, 4/7/23 (LOC: FHLB) | 4,225,000 | | 4,225,000 | |
| 412 Madison LLC, VRDN, 4.92%, 4/7/23 (LOC: FNMA) | 14,500,000 | | 14,500,000 | |
| 500 Columbia Place LLC, VRDN, 4.92%, 4/7/23 (LOC: FHLB) | 23,000,000 | | 23,000,000 | |
| Anton Santa Cruz LLC, VRDN, 4.92%, 4/7/23 (LOC: FHLB) | 15,185,000 | | 15,185,000 | |
| Barbour Issuing Trust, VRDN, 4.91%, 4/7/23 (LOC: FHLB) | 9,005,000 | | 9,005,000 | |
| CG-USA Simi Valley LP, VRDN, 4.92%, 4/7/23 (LOC: FHLB) | 23,300,000 | | 23,300,000 | |
| Champion Insurance Trust, VRDN, 4.91%, 4/7/23 (LOC: FHLB) | 4,000,000 | | 4,000,000 | |
| Dennis Wesley Co., Inc., VRDN, 4.98%, 4/7/23 (LOC: FHLB) | 1,725,000 | | 1,725,000 | |
| EPR GO Zone Holdings LLC, VRDN, 4.94%, 4/7/23 (LOC: FHLB) | 24,995,000 | | 24,995,000 | |
| Fairfield North Texas Associates LP, VRDN, 4.92%, 4/12/23 (LOC: FHLB) | 9,550,000 | | 9,550,000 | |
| Flo Creek Issuing Trust, VRDN, 4.91%, 4/7/23 (LOC: FHLB) | 6,375,000 | | 6,375,000 | |
| Gold River 659 LLC, VRDN, 4.92%, 4/7/23 (LOC: FHLB) | 18,500,000 | | 18,500,000 | |
| Housing Venture I LP, VRDN, 4.92%, 4/7/23 (LOC: FHLB) | 9,345,000 | | 9,345,000 | |
| Jay Kenneth Devereaux 2021 Irrevocable Trust, VRDN, 4.91%, 4/7/23 (LOC: FHLB) | 3,635,000 | | 3,635,000 | |
| Jefferson Centerpointe LLC, VRDN, 4.92%, 4/7/23 (LOC: FHLB) | 7,300,000 | | 7,300,000 | |
| JL Irrevocable Trust, VRDN, 4.92%, 4/7/23 (LOC: FHLB) | 6,275,000 | | 6,275,000 | |
| Johnston Family Insurance LLC, VRDN, 4.91%, 4/7/23 (LOC: FHLB) | 4,035,000 | | 4,035,000 | |
| KDF Glenview LP, VRDN, 4.92%, 4/7/23 (LOC: FHLB) | 3,950,000 | | 3,950,000 | |
| Krawitz Family Insurance Trust, VRDN, 4.91%, 4/7/23 (LOC: FHLB) | 2,480,000 | | 2,480,000 | |
| Lee Bason Family Insurance Trust, VRDN, 4.91%, 4/7/23 (LOC: FHLB) | 7,240,000 | | 7,240,000 | |
| Marvin J Base 2019 Irrevocable Trust, VRDN, 4.91%, 4/7/23 (LOC: FHLB) | 2,985,000 | | 2,985,000 | |
| MJN Funding LLC, VRDN, 4.91%, 4/7/23 (LOC: FHLB) | 2,000,000 | | 2,000,000 | |
| Santa Monica Ocean Park Partners LP, VRDN, 4.92%, 4/7/23 (LOC: FHLB) | 9,370,000 | | 9,370,000 | |
| Sheryl P Werner Irrevocable Trust, VRDN, 4.91%, 4/7/23 (LOC: FHLB) | 3,830,000 | | 3,830,000 | |
| Shil Park Irrevocable Life Insurance Trust, VRDN, 4.91%, 4/7/23 (LOC: FHLB) | 5,065,000 | | 5,065,000 | |
| SRM Culver City LP, VRDN, 4.92%, 4/10/23 (LOC: FHLB) | 23,650,000 | | 23,650,000 | |
| SRMHayward LLC, VRDN, 4.92%, 4/7/23 (LOC: FHLB) | 5,500,000 | | 5,500,000 | |
| Synergy Colgan Creek LLC, VRDN, 4.92%, 4/7/23 (LOC: FHLB) | 5,500,000 | | 5,500,000 | |
| TSManion LLC, VRDN, 4.91%, 4/7/23 (LOC: FHLB) | 2,140,000 | | 2,140,000 | |
| Varenna Care Center LP, VRDN, 4.92%, 4/12/23 (LOC: FHLB) | 2,850,000 | | 2,850,000 | |
| West Valley MC LLC, VRDN, 4.92%, 4/7/23 (LOC: FHLB) | 12,500,000 | | 12,500,000 | |
| TOTAL CORPORATE BONDS | | 304,705,000 | |
U.S. GOVERNMENT AGENCY SECURITIES(1) — 29.5% | | |
| Adjustable-Rate U.S. Government Agency Securities — 10.5% | |
| Federal Farm Credit Banks Funding Corp., VRN, 4.72%, (3-month USBMMY minus 0.02%), 1/29/24 | 3,000,000 | | 3,004,823 | |
| Federal Farm Credit Banks Funding Corp., VRN, 4.84%, (SOFR plus 0.02%), 7/13/23 | 13,400,000 | | 13,399,433 | |
| | | | | | | | |
| Principal Amount | Value |
| Federal Farm Credit Banks Funding Corp., VRN, 4.87%, (SOFR plus 0.05%), 3/8/24 | $ | 5,000,000 | | $ | 5,000,000 | |
| Federal Farm Credit Banks Funding Corp., VRN, 4.87%, (SOFR plus 0.05%), 3/11/24 | 5,000,000 | | 5,000,000 | |
| Federal Farm Credit Banks Funding Corp., VRN, 4.87%, (SOFR plus 0.05%), 4/12/24 | 5,000,000 | | 5,000,000 | |
| Federal Farm Credit Banks Funding Corp., VRN, 4.90%, (Prime rate minus 3.10%), 8/26/24 | 5,000,000 | | 4,998,619 | |
| Federal Farm Credit Banks Funding Corp., VRN, 5.01%, (SOFR plus 0.19%), 12/27/24 | 5,000,000 | | 5,000,000 | |
| Federal Farm Credit Banks Funding Corp., VRN, 5.00%, (SOFR plus 0.18%), 1/17/25 | 10,000,000 | | 10,000,000 | |
| Federal Farm Credit Banks Funding Corp., VRN, 5.00%, (SOFR plus 0.18%), 3/20/25 | 5,000,000 | | 5,000,000 | |
| Federal Home Loan Bank, VRN, 4.90%, (SOFR plus 0.08%), 6/14/23 | 5,000,000 | | 5,000,000 | |
| Federal Home Loan Bank, VRN, 4.92%, (SOFR plus 0.10%), 10/6/23 | 5,000,000 | | 5,000,000 | |
| | 66,402,875 | |
| Fixed-Rate U.S. Government Agency Securities — 19.0% | | |
| Federal Home Loan Bank, 4.05%, 4/24/23 | 5,000,000 | | 5,000,000 | |
| Federal Home Loan Bank, 2.80%, 6/16/23 | 5,000,000 | | 5,000,000 | |
| Federal Home Loan Bank, 3.00%, 6/23/23 | 5,000,000 | | 5,000,000 | |
| Federal Home Loan Bank, 3.07%, 6/30/23 | 5,000,000 | | 5,000,000 | |
| Federal Home Loan Bank, 3.16%, 8/10/23 | 5,000,000 | | 5,000,000 | |
| Federal Home Loan Bank, 3.375%, 8/28/23 | 5,000,000 | | 5,000,000 | |
| Federal Home Loan Bank, 3.75%, 9/27/23 | 5,000,000 | | 5,000,000 | |
| Federal Home Loan Bank, 4.50%, 10/27/23 | 5,000,000 | | 5,000,000 | |
| Federal Home Loan Bank, 4.50%, 11/3/23 | 10,000,000 | | 10,000,000 | |
| Federal Home Loan Bank, 5.15%, 9/15/23 | 3,035,000 | | 3,034,253 | |
| Federal Home Loan Bank, 5.30%, 12/15/23 | 7,500,000 | | 7,500,000 | |
| Federal Home Loan Bank, 5.17%, 3/8/24 | 3,000,000 | | 3,000,000 | |
| Federal Home Loan Bank, 5.50%, 3/27/24 | 7,500,000 | | 7,500,000 | |
| Federal Home Loan Bank, 5.625%, 3/27/24 | 2,500,000 | | 2,500,000 | |
| Federal Home Loan Bank, 5.34%, 4/26/24 | 7,500,000 | | 7,500,000 | |
| Federal Home Loan Bank Discount Notes, 4.88%, 5/2/23 | 1,015,000 | | 1,010,818 | |
| Federal Home Loan Bank Discount Notes, 4.91%, 5/26/23 | 6,140,000 | | 6,095,171 | |
| Federal Home Loan Bank Discount Notes, 5.00%, 6/30/23 | 6,090,000 | | 6,016,113 | |
| Federal Home Loan Bank Discount Notes, 5.06%, 6/22/23 | 1,000,000 | | 988,793 | |
| Federal Home Loan Bank Discount Notes, 5.12%, 7/28/23 | 197,000 | | 193,804 | |
| Federal Home Loan Bank Discount Notes, 5.13%, 8/4/23 | 2,058,000 | | 2,022,593 | |
| Federal Home Loan Bank Discount Notes, 5.04%, 8/16/23 | 3,530,000 | | 3,464,847 | |
| Federal Home Loan Bank Discount Notes, 5.15%, 8/25/23 | 5,000,000 | | 4,899,625 | |
| Federal Home Loan Mortgage Corp., 2.35%, 4/12/23 | 15,000,000 | | 15,000,000 | |
| | 120,726,017 | |
| TOTAL U.S. GOVERNMENT AGENCY SECURITIES | | 187,128,892 | |
U.S. TREASURY SECURITIES(1) — 11.8% | | |
| U.S. Treasury Bills, 4.75%, 5/23/23 | 2,000,000 | | 1,986,682 | |
| U.S. Treasury Bills, 4.85%, 6/1/23 | 15,000,000 | | 14,879,601 | |
| U.S. Treasury Bills, 4.87%, 6/15/23 | 5,000,000 | | 4,950,521 | |
| U.S. Treasury Bills, 4.95%, 6/20/23 | 20,000,000 | | 19,787,733 | |
| U.S. Treasury Bills, 4.98%, 6/27/23 | 10,000,000 | | 9,883,275 | |
| U.S. Treasury Bills, 4.89%, 7/11/23 | 7,000,000 | | 6,906,764 | |
| U.S. Treasury Bills, 4.89%, 7/18/23 | 10,000,000 | | 9,857,500 | |
| U.S. Treasury Notes, VRN, 4.76%, (3-month USBMMY plus 0.03%), 7/31/23 | 7,000,000 | | 6,998,692 | |
| TOTAL U.S. TREASURY SECURITIES | | 75,250,768 | |
| | | | | | | | |
| Principal Amount | Value |
| MUNICIPAL SECURITIES — 4.1% | | |
Downtown Bainbridge Development Authority Rev., (Rivertown Development LLC), VRDN, 5.01%, 4/7/23 (LOC: First Port City Bank)(SBBPA: FHLB)(2) | $ | 4,000,000 | | $ | 4,000,000 | |
| Massachusetts Health & Educational Facilities Authority Rev., (Massachusetts Development Finance Agency), VRDN, 4.92%, 4/7/23 (LOC: RBS Citizens N.A. and FHLB) | 1,220,000 | | 1,220,000 | |
| New York City Housing Development Corp. Rev., (155 W 21st State LLC), VRDN, 4.90%, 4/7/23 (LOC: FNMA)(LIQ FAC: FNMA) | 4,300,000 | | 4,300,000 | |
| New York City Housing Development Corp. Rev., (2 Gold LLC), VRDN, 4.90%, 4/7/23 (LOC: FNMA)(LIQ FAC: FNMA) | 16,805,000 | | 16,805,000 | |
| TOTAL MUNICIPAL SECURITIES | | 26,325,000 | |
| REPURCHASE AGREEMENTS — 8.4% | | |
| Fixed Income Clearing Corp., (collateralized by various U.S. Treasury obligations, 3.625%, 3/31/28, valued at $54,164,110), at 4.81%, dated 3/31/23, due 4/3/23 (Delivery value $53,123,285) | | 53,102,000 | |
| TOTAL INVESTMENT SECURITIES — 101.8% | | 646,511,660 | |
| OTHER ASSETS AND LIABILITIES — (1.8)% | | (11,519,623) | |
| TOTAL NET ASSETS — 100.0% | | $ | 634,992,037 | |
| | | | | | | | |
| NOTES TO SCHEDULE OF INVESTMENTS |
| FHLB | – | Federal Home Loan Bank |
| FNMA | – | Federal National Mortgage Association |
| LIQ FAC | – | Liquidity Facilities |
| LOC | – | Letter of Credit |
| SBBPA | – | Standby Bond Purchase Agreement |
| SOFR | – | Secured Overnight Financing Rate |
| USBMMY | – | U.S. Treasury Bill Money Market Yield |
| VRDN | – | Variable Rate Demand Note. The instrument may be payable upon demand and adjusts periodically based upon the terms set forth in the security's offering documents. The rate shown is effective at the period end and the reference rate and spread, if any, is indicated. The date of the demand feature is disclosed. |
| VRN | – | Variable Rate Note. The rate adjusts periodically based upon the terms set forth in the security’s offering documents. The rate shown is effective at the period end and the reference rate and spread, if any, is indicated. The security's effective maturity date may be shorter than the final maturity date shown. |
(1)The rate indicated is the yield to maturity at purchase for non-interest bearing securities. For interest bearing securities, the stated coupon rate is shown.
(2)Security was purchased pursuant to Rule 144A or Section 4(2) under the Securities Act of 1933 and may be sold in transactions exempt from registration, normally to qualified institutional investors. The aggregate value of these securities at the period end was $4,000,000, which represented 0.6% of total net assets.
See Notes to Financial Statements.
| | |
| Statement of Assets and Liabilities |
| | | | | |
| MARCH 31, 2023 | |
| Assets | |
| Investment securities, at value (amortized cost and cost for federal income tax purposes) | $ | 646,511,660 | |
| Cash | 6,526 | |
| Receivable for capital shares sold | 422,355 | |
| Interest receivable | 2,244,847 | |
| 649,185,388 | |
| |
| Liabilities | |
| Payable for investments purchased | 11,100,000 | |
| Payable for capital shares redeemed | 2,836,590 | |
| Accrued management fees | 239,957 | |
| Distribution and service fees payable | 16,804 | |
| 14,193,351 | |
| |
| Net Assets | $ | 634,992,037 | |
| |
| Net Assets Consist of: | |
| Capital paid in | $ | 635,182,239 | |
| Distributable earnings (loss) | (190,202) | |
| $ | 634,992,037 | |
| | | | | | | | | | | |
| Net Assets | Shares Outstanding | Net Asset Value Per Share |
| Investor Class | $555,353,718 | 555,655,138 | $1.00 |
| A Class | $79,332,533 | 79,351,376 | $1.00 |
| C Class | $305,786 | 305,885 | $1.00 |
See Notes to Financial Statements.
| | | | | |
| YEAR ENDED MARCH 31, 2023 |
| Investment Income (Loss) | |
| Income: | |
| Interest | $ | 19,514,595 | |
| |
| Expenses: | |
| Management fees | 3,370,456 | |
| Distribution and service fees: | |
| A Class | 205,731 | |
| C Class | 3,093 | |
| Trustees' fees and expenses | 47,632 | |
| Other expenses | 1,147 | |
| 3,628,059 | |
| Fees waived | (73,353) | |
| 3,554,706 | |
| |
| Net investment income (loss) | 15,959,889 | |
| |
| Net realized gain (loss) on investment transactions | (142,286) | |
| |
| Net Increase (Decrease) in Net Assets Resulting from Operations | $ | 15,817,603 | |
See Notes to Financial Statements.
| | |
| Statement of Changes in Net Assets |
| | | | | | | | |
| YEARS ENDED MARCH 31, 2023 AND MARCH 31, 2022 |
| Increase (Decrease) in Net Assets | March 31, 2023 | March 31, 2022 |
| Operations | | |
| Net investment income (loss) | $ | 15,959,889 | | $ | 98,714 | |
| Net realized gain (loss) | (142,286) | | 6,919 | |
| Net increase (decrease) in net assets resulting from operations | 15,817,603 | | 105,633 | |
| | |
| Distributions to Shareholders | | |
| From earnings: | | |
| Investor Class | (14,106,455) | | (72,049) | |
| A Class | (1,604,528) | | (8,090) | |
| C Class | (6,745) | | (23) | |
| G Class | (242,160) | | (18,552) | |
| Decrease in net assets from distributions | (15,959,888) | | (98,714) | |
| | |
| Capital Share Transactions | | |
| Net increase (decrease) in net assets from capital share transactions (Note 4) | (44,982,713) | | (6,052,119) | |
| | |
| Net increase (decrease) in net assets | (45,124,998) | | (6,045,200) | |
| | |
| Net Assets | | |
| Beginning of period | 680,117,035 | | 686,162,235 | |
| End of period | $ | 634,992,037 | | $ | 680,117,035 | |
See Notes to Financial Statements.
| | |
Notes to Financial Statements |
MARCH 31, 2023
1. Organization
American Century Investment Trust (the trust) is registered under the Investment Company Act of 1940, as amended (the 1940 Act), as an open-end management investment company and is organized as a Massachusetts business trust. U.S. Government Money Market Fund (the fund) is one fund in a series issued by the trust. The fund’s investment objective is to seek current income while maintaining liquidity and preserving capital.
The fund offers the Investor Class, A Class and C Class. The A Class and C Class may be subject to a contingent deferred sales charge. On January 13, 2023, there were no outstanding G Class shares and the fund discontinued offering G Class.
2. Significant Accounting Policies
The following is a summary of significant accounting policies consistently followed by the fund in preparation of its financial statements. The fund is an investment company and follows accounting and reporting guidance in accordance with accounting principles generally accepted in the United States of America. This may require management to make certain estimates and assumptions at the date of the financial statements. Actual results could differ from these estimates. Management evaluated the impact of events or transactions occurring through the date the financial statements were issued that would merit recognition or disclosure.
Investment Valuations — The fund determines the fair value of its investments and computes its net asset value (NAV) per share at the close of regular trading (usually 4 p.m. Eastern time) on the New York Stock Exchange (NYSE) on each day the NYSE is open. The value of investments of the fund is determined by American Century Investment Management, Inc. (ACIM) (the investment advisor), as the valuation designee, pursuant to its valuation policies and procedures. The Board of Trustees oversees the valuation designee and reviews its valuation policies and procedures at least annually. Investments are generally valued at amortized cost, which approximates fair value. Repurchase agreements are valued at cost, which approximates fair value. If the valuation designee determines that the valuation methods do not reflect an investment’s fair value, such investment is valued as determined in good faith by the valuation designee.
Security Transactions — Security transactions are accounted for as of the trade date. Net realized gains and losses are determined on the identified cost basis, which is also used for federal income tax purposes.
Investment Income — Interest income is recorded on the accrual basis and includes accretion of discounts and amortization of premiums. The fund may purchase a security and at the same time make a commitment to sell the same security at a future settlement date at a specified price. The difference between the purchase price and the sale price of these simultaneous transactions is reflected as interest income.
Repurchase Agreements — The fund may enter into repurchase agreements with institutions that ACIM has determined are creditworthy pursuant to criteria adopted by the Board of Trustees. The fund requires that the collateral, represented by securities, received in a repurchase transaction be transferred to the custodian in a manner sufficient to enable the fund to obtain those securities in the event of a default under the repurchase agreement. ACIM monitors, on a daily basis, the securities transferred to ensure the value, including accrued interest, of the securities under each repurchase agreement is equal to or greater than amounts owed to the fund under each repurchase agreement.
Joint Trading Account — Pursuant to an Exemptive Order issued by the Securities and Exchange Commission, the fund, along with certain other funds in the American Century Investments family of funds, may transfer uninvested cash balances into a joint trading account. These balances are invested in one or more repurchase agreements that are collateralized by U.S. Treasury or Agency obligations.
Income Tax Status — It is the fund's policy to distribute substantially all net investment income and net realized gains to shareholders and to otherwise qualify as a regulated investment company under provisions of the Internal Revenue Code. Accordingly, no provision has been made for income taxes. The fund files U.S. federal, state, local and non-U.S. tax returns as applicable. The fund's tax returns are subject to examination by the relevant taxing authority until expiration of the applicable statute of limitations, which is generally three years from the date of filing but can be longer in certain jurisdictions. At this time, management believes there are no uncertain tax positions which, based on their technical merit, would not be sustained upon examination and for which it is reasonably possible that the total amounts of unrecognized tax benefits will significantly change in the next twelve months.
Multiple Class — All shares of the fund represent an equal pro rata interest in the net assets of the class to which such shares belong, and have identical voting, dividend, liquidation and other rights and the same terms and conditions, except for class specific expenses and exclusive rights to vote on matters affecting only individual classes. Income, non-class specific expenses, and realized and unrealized capital gains and losses of the fund are allocated to each class of shares based on their relative net assets.
Distributions to Shareholders — Distributions from net investment income, if any, are declared daily and paid monthly. The fund may make capital gains distributions to comply with the distribution requirements of the Internal Revenue Code.
Indemnifications — Under the trust’s organizational documents, its officers and trustees are indemnified against certain liabilities arising out of the performance of their duties to the fund. In addition, in the normal course of business, the fund enters into contracts that provide general indemnifications. The maximum exposure under these arrangements is unknown as this would involve future claims that may be made against a fund. The risk of material loss from such claims is considered by management to be remote.
3. Fees and Transactions with Related Parties
Certain officers and trustees of the trust are also officers and/or directors of American Century Companies, Inc. (ACC). The trust's investment advisor, ACIM, the trust's distributor, American Century Investment Services, Inc. (ACIS), and the trust's transfer agent, American Century Services, LLC, are wholly owned, directly or indirectly, by ACC. ACC and its subsidiaries own 26% of the shares of the fund. Related parties do not invest in the fund for the purpose of exercising management or control.
Management Fees — The trust has entered into a management agreement with ACIM, under which ACIM provides the fund with investment advisory and management services in exchange for a single, unified management fee (the fee) per class. The agreement provides that ACIM will pay all expenses of managing and operating the fund, except brokerage expenses, taxes, interest, fees and expenses of the independent trustees (including legal counsel fees), extraordinary expenses, and expenses incurred in connection with the provision of shareholder services and distribution services under a plan adopted pursuant to Rule 12b-1 under the 1940 Act. The fee is computed and accrued daily based on each class’s daily net assets and paid monthly in arrears. The fee consists of (1) an Investment Category Fee based on the daily net assets of the fund and certain other accounts managed by the investment advisor that are in the same broad investment category as the fund and (2) a Complex Fee based on the assets of all funds in the American Century Investments family of funds that have the same investment advisor and distributor as the fund. For purposes of determining the Investment Category Fee and Complex Fee, the assets of funds managed by the investment advisor that invest exclusively in the shares of other funds (funds of funds) are not included. During the period, the investment advisor waived the G Class's management fee in its entirety. In order to maintain a positive yield, ACIM may voluntarily waive a portion of the management fee on a daily basis. The fee waiver may be revised or terminated at any time by the investment advisor without notice. The total amount of the waiver for each class for the period ended March 31, 2023 was $94, $12 and $56,239 for Investor Class, A Class and G Class, respectively.
The Investment Category Fee range, the Complex Fee range and the effective annual management fee before and after waiver for each class for the period ended March 31, 2023 are as follows:
| | | | | | | | | | | | | | |
| | | Effective Annual Management Fee |
| Investment Category Fee Range | Complex Fee Range | Before Waiver | After Waiver |
| Investor Class | 0.1170%
to 0.2300% | 0.2500%
to 0.3100% | 0.45% | 0.45% |
| A Class | 0.45% | 0.45% |
| C Class | 0.45% | 0.45% |
| G Class | 0.45% | 0.00% |
Distribution and Service Fees — The Board of Trustees has adopted a separate Master Distribution and Individual Shareholder Services Plan for each of the A Class and C Class (collectively the plans), pursuant to Rule 12b-1 of the 1940 Act. The plans provide that the A Class will pay ACIS an annual distribution and service fee of 0.25%. The plans provide that the C Class will pay ACIS an annual distribution and service fee of 0.75%, of which 0.25% is paid for individual shareholder services and 0.50% is paid for distribution services. The fees are computed and accrued daily based on each class’s daily net assets and paid monthly in arrears. The fees are used to pay financial intermediaries for distribution and individual shareholder services. Fees incurred under the plans during the period ended March 31, 2023 are detailed in the Statement of Operations.
In order to maintain a positive yield, all or a portion of the distribution and/or service fee may voluntarily be waived on a daily basis. The fee waiver may be revised or terminated at any time without notice. The total amount of the waiver for the period ended March 31, 2023 was $16,674 and $334 for the A Class and C Class, respectively. The effective annual distribution and service fee after waiver was 0.23% for the A Class and 0.67% for C Class.
Trustees' Fees and Expenses — The Board of Trustees is responsible for overseeing the investment advisor’s management and operations of the fund. The trustees receive detailed information about the fund and its investment advisor regularly throughout the year, and meet at least quarterly with management of the investment advisor to review reports about fund operations. The fund's officers do not receive compensation from the fund.
4. Capital Share Transactions
Transactions in shares of the fund were as follows (unlimited number of shares authorized):
| | | | | | | | | | | | | | |
| Year ended
March 31, 2023 | Year ended
March 31, 2022 |
| Shares | Amount | Shares | Amount |
| Investor Class | | | | |
| Sold | 1,403,296,820 | | $ | 1,403,296,820 | | 1,439,360,947 | | $ | 1,439,360,947 | |
| Issued in reinvestment of distributions | 14,106,455 | | 14,106,455 | | 71,413 | | 71,413 | |
| Redeemed | (1,444,018,756) | | (1,444,018,756) | | (1,441,301,674) | | (1,441,301,674) | |
| (26,615,481) | | (26,615,481) | | (1,869,314) | | (1,869,314) | |
| A Class | | | | |
| Sold | 39,336,933 | | 39,336,933 | | 46,657,936 | | 46,657,936 | |
| Issued in reinvestment of distributions | 1,604,528 | | 1,604,528 | | 8,089 | | 8,089 | |
| Redeemed | (40,549,816) | | (40,549,816) | | (56,810,253) | | (56,810,253) | |
| 391,645 | | 391,645 | | (10,144,228) | | (10,144,228) | |
| C Class | | | | |
| Sold | 371,292 | | 371,292 | | 101,735 | | 101,735 | |
| Issued in reinvestment of distributions | 6,745 | | 6,745 | | 21 | | 21 | |
| Redeemed | (302,956) | | (302,956) | | (67,270) | | (67,270) | |
| 75,081 | | 75,081 | | 34,486 | | 34,486 | |
| G Class | | | | |
| Sold | 8,260,770 | | 8,260,770 | | 8,094,022 | | 8,094,022 | |
| Issued in reinvestment of distributions | 231,610 | | 231,610 | | 18,552 | | 18,552 | |
| Redeemed | (27,326,338) | | (27,326,338) | | (2,185,637) | | (2,185,637) | |
| (18,833,958) | | (18,833,958) | | 5,926,937 | | 5,926,937 | |
| Net increase (decrease) | (44,982,713) | | $ | (44,982,713) | | (6,052,119) | | $ | (6,052,119) | |
5. Fair Value Measurements
The fund's investments valuation process is based on several considerations and may use multiple inputs to determine the fair value of the investments held by the fund. In conformity with accounting principles generally accepted in the United States of America, the inputs used to determine a valuation are classified into three broad levels.
•Level 1 valuation inputs consist of unadjusted quoted prices in an active market for identical investments.
•Level 2 valuation inputs consist of direct or indirect observable market data (including quoted prices for comparable investments, evaluations of subsequent market events, interest rates, prepayment speeds, credit risk, etc.). These inputs also consist of quoted prices for identical investments initially expressed in local currencies that are adjusted through translation into U.S. dollars.
•Level 3 valuation inputs consist of unobservable data (including a fund’s own assumptions).
The level classification is based on the lowest level input that is significant to the fair valuation measurement. The valuation inputs are not necessarily an indication of the risks associated with investing in these securities or other financial instruments.
As of period end, the fund’s investment securities were classified as Level 2. The Schedule of Investments provides additional information on the fund’s portfolio holdings.
6. Federal Tax Information
The tax character of distributions paid during the years ended March 31, 2023 and March 31, 2022 were as follows:
| | | | | | | | |
| 2023 | 2022 |
| Distributions Paid From | | |
| Ordinary income | $ | 15,959,888 | | $ | 98,714 | |
| Long-term capital gains | — | | — | |
The book-basis character of distributions made during the year from net investment income or net realized gains may differ from their ultimate characterization for federal income tax purposes. These differences reflect the differing character of certain income items and net realized gains and losses for financial statement and tax purposes, and may result in reclassification among certain capital accounts on the financial statements.
As of March 31, 2023, the fund had accumulated short-term capital losses of $(185,588) and accumulated long-term capital losses of $(4,614), which represent net capital loss carryovers that may be used to offset future realized capital gains for federal income tax purposes. The capital loss carryovers may be carried forward for an unlimited period. Future capital loss carryover utilization in any given year may be subject to Internal Revenue Code limitations.
| | | | | | | | | | | | | | | | | | | | | | | | | | | | | | | | | | | | | | |
| For a Share Outstanding Throughout the Years Ended March 31 (except as noted) |
| Per-Share Data | | Ratios and Supplemental Data |
| | Income From Investment Operations: | | | Ratio to Average Net Assets of: | |
| Net Asset
Value,
Beginning
of Period | Net
Investment
Income
(Loss) | Net
Realized
and
Unrealized
Gain (Loss) | Total From Investment Operations | Distributions From Net
Investment
Income | Net Asset
Value,
End
of Period | Total Return(1) | Operating
Expenses | Operating
Expenses
(before
expense
waiver) | Net
Investment
Income
(Loss) | Net Investment Income (Loss) (before expense waiver) | Net
Assets,
End of
Period (in thousands) |
| Investor Class | | | | | | | | | | | | |
| 2023 | $1.00 | 0.02 | —(2) | 0.02 | (0.02) | $1.00 | 2.22% | 0.46% | 0.46% | 2.21% | 2.21% | $555,354 | |
| 2022 | $1.00 | —(2) | —(2) | —(2) | —(2) | $1.00 | 0.01% | 0.10% | 0.45% | 0.01% | (0.34)% | $582,093 | |
| 2021 | $1.00 | —(2) | —(2) | —(2) | —(2) | $1.00 | 0.02% | 0.16% | 0.45% | 0.02% | (0.27)% | $583,956 | |
| 2020 | $1.00 | 0.02 | —(2) | 0.02 | (0.02) | $1.00 | 1.56% | 0.46% | 0.46% | 1.56% | 1.56% | $845,564 | |
| 2019 | $1.00 | 0.02 | —(2) | 0.02 | (0.02) | $1.00 | 1.67% | 0.46% | 0.46% | 1.65% | 1.65% | $851,334 | |
| A Class | | | | | | | | | | | | |
| 2023 | $1.00 | 0.02 | —(2) | 0.02 | (0.02) | $1.00 | 1.99% | 0.69% | 0.71% | 1.98% | 1.96% | $79,333 | |
| 2022 | $1.00 | —(2) | —(2) | —(2) | —(2) | $1.00 | 0.01% | 0.10% | 0.70% | 0.01% | (0.59)% | $78,959 | |
| 2021 | $1.00 | —(2) | —(2) | —(2) | —(2) | $1.00 | 0.01% | 0.16% | 0.70% | 0.02% | (0.52)% | $89,103 | |
| 2020 | $1.00 | 0.01 | —(2) | 0.01 | (0.01) | $1.00 | 1.31% | 0.71% | 0.71% | 1.31% | 1.31% | $82,410 | |
| 2019 | $1.00 | 0.01 | —(2) | 0.01 | (0.01) | $1.00 | 1.41% | 0.71% | 0.71% | 1.40% | 1.40% | $67,516 | |
| C Class | | | | | | | | | | | | |
| 2023 | $1.00 | 0.02 | —(2) | 0.02 | (0.02) | $1.00 | 1.58% | 1.13% | 1.21% | 1.54% | 1.46% | $306 | |
| 2022 | $1.00 | —(2) | —(2) | —(2) | —(2) | $1.00 | 0.01% | 0.10% | 1.20% | 0.01% | (1.09)% | $231 | |
| 2021 | $1.00 | —(2) | —(2) | —(2) | —(2) | $1.00 | 0.01% | 0.17% | 1.20% | 0.01% | (1.02)% | $196 | |
| 2020 | $1.00 | 0.01 | —(2) | 0.01 | (0.01) | $1.00 | 0.81% | 1.20% | 1.21% | 0.82% | 0.81% | $396 | |
| 2019 | $1.00 | 0.01 | —(2) | 0.01 | (0.01) | $1.00 | 0.91% | 1.21% | 1.21% | 0.90% | 0.90% | $77 | |
| | |
| Notes to Financial Highlights |
(1)Total returns are calculated based on the net asset value of the last business day and do not reflect applicable sales charges, if any. Total returns for periods less than one year are not annualized.
(2)Per-share amount was less than $0.005.
See Notes to Financial Statements.
| | |
| Report of Independent Registered Public Accounting Firm |
To the Shareholders and the Board of Trustees of American Century Investment Trust:
Opinion on the Financial Statements and Financial Highlights
We have audited the accompanying statement of assets and liabilities, including the schedule of investments, of U.S. Government Money Market Fund (the “Fund”), one of the funds constituting the American Century Investment Trust, as of March 31, 2023, the related statement of operations for the year then ended, the statements of changes in net assets and financial highlights for the two years in the period then ended, and the related notes. In our opinion, the financial statements and financial highlights present fairly, in all material respects, the financial position of U.S. Government Money Market Fund of the American Century Investment Trust, as of March 31, 2023, and the results of its operations for the year then ended and the changes in its net assets and the financial highlights for the two years then ended in conformity with accounting principles generally accepted in the United States of America. The financial highlights for each of the three years in the period ended March 31, 2021, were audited by other auditors, whose report, dated May 18, 2021, expressed an unqualified opinion on such financial highlights.
Basis for Opinion
These financial statements and financial highlights are the responsibility of the Fund's management. Our responsibility is to express an opinion on the Fund’s financial statements and financial highlights based on our audit. We are a public accounting firm registered with the Public Company Accounting Oversight Board (United States) (PCAOB) and are required to be independent with respect to the Fund in accordance with the U.S. federal securities laws and the applicable rules and regulations of the Securities and Exchange Commission and the PCAOB.
We conducted our audits in accordance with the standards of the PCAOB. Those standards require that we plan and perform the audit to obtain reasonable assurance about whether the financial statements and financial highlights are free of material misstatement, whether due to error or fraud. The Fund is not required to have, nor were we engaged to perform, an audit of its internal control over financial reporting. As part of our audit, we are required to obtain an understanding of internal control over financial reporting but not for the purpose of expressing an opinion on the effectiveness of the Fund’s internal control over financial reporting. Accordingly, we express no such opinion.
Our audits included performing procedures to assess the risks of material misstatement of the financial statements and financial highlights, whether due to error or fraud, and performing procedures that respond to those risks. Such procedures included examining, on a test basis, evidence regarding the amounts and disclosures in the financial statements and financial highlights. Our audits also included evaluating the accounting principles used and significant estimates made by management, as well as evaluating the overall presentation of the financial statements and financial highlights. Our procedures included confirmation of securities owned as of March 31, 2023, by correspondence with the custodian and brokers; when replies were not received from brokers, we performed other auditing procedures. We believe that our audits provide a reasonable basis for our opinion.
/s/ Deloitte & Touche LLP
Kansas City, Missouri
May 16, 2023
We have served as the auditor of one or more American Century investment companies since 1997.
Board of Trustees
The individuals listed below serve as trustees of the funds. Each trustee will continue to serve in this capacity until death, retirement, resignation or removal from office. The board has adopted a mandatory retirement age for trustees who are not “interested persons,” as that term is defined in the Investment Company Act (independent trustees). Independent trustees shall retire on December 31 of the year in which they reach their 76th birthday.
Jonathan S. Thomas is an “interested person” because he currently serves as President and Chief Executive Officer of American Century Companies, Inc. (ACC), the parent company of American Century Investment Management, Inc. (ACIM or the advisor). The other trustees (more than three-fourths of the total number) are independent. They are not employees, directors or officers of, and have no financial interest in, ACC or any of its wholly owned, direct or indirect, subsidiaries, including ACIM, American Century Investment Services, Inc. (ACIS) and American Century Services, LLC (ACS), and they do not have any other affiliations, positions or relationships that would cause them to be considered “interested persons” under the Investment Company Act. The trustees serve in this capacity for eight (in the case of Jonathan S. Thomas, 16; and Jeremy I. Bulow, 9) registered investment companies in the American Century Investments family of funds.
The following table presents additional information about the trustees. The mailing address for each trustee other than Jonathan S. Thomas is 3945 Freedom Circle, Suite #800, Santa Clara, California 95054. The mailing address for Jonathan S. Thomas is 4500 Main Street, Kansas City, Missouri 64111.
| | | | | | | | | | | | | | | | | |
Name
(Year of Birth) | Position(s) Held with Funds | Length of Time Served | Principal Occupation(s) During Past 5 Years | Number of American Century Portfolios Overseen by Trustee | Other Directorships Held During Past 5 Years |
| Independent Trustees | | |
Tanya S. Beder
(1955) | Trustee and Board Chair | Since 2011 (Board Chair since 2022) | Chairman and CEO, SBCC Group Inc. (independent advisory services) (2006 to present) | 32 | Kirby Corporation; Nabors Industries, Ltd. |
Jeremy I. Bulow
(1954) | Trustee | Since 2011 | Professor of Economics, Stanford University, Graduate School of Business (1979 to present) | 77 | None |
Jennifer Cabalquinto
(1968) | Trustee | Since 2021 | Chief Financial Officer, 2K (interactive entertainment) (2021 to present); Special Advisor, GSW Sports, LLC (2020 to 2021); Chief Financial Officer, GSW Sports, LLC (2013 to 2020) | 32 | Sabio Holdings, Inc. |
Anne Casscells
(1958) | Trustee | Since 2016 | Co-Chief Executive Officer and Chief Investment Officer, Aetos Alternatives Management (investment advisory firm) (2001 to present) | 32 | None |
| | | | | | | | | | | | | | | | | |
Name
(Year of Birth) | Position(s) Held with Funds | Length of Time Served | Principal Occupation(s) During Past 5 Years | Number of American Century Portfolios Overseen by Trustee | Other Directorships Held During Past 5 Years |
| Independent Trustees | | |
Jonathan D. Levin
(1972) | Trustee | Since 2016 | Philip H. Knight Professor and Dean, Graduate School of Business, Stanford University (2016 to present); Professor, Stanford University, (2000 to present) | 32 | None |
Peter F. Pervere
(1947) | Trustee | Since 2007 | Retired | 32 | None |
John B. Shoven
(1947) | Trustee | Since 2002 | Charles R. Schwab Professor of Economics, Stanford University (1973 to present, emeritus since 2019) | 32 | Cadence Design Systems; Exponent; Financial Engines |
| Interested Trustee | | |
Jonathan S. Thomas
(1963) | Trustee | Since 2007 | President and Chief Executive Officer, ACC (2007 to present). Also serves as Chief Executive Officer, ACS; Director, ACC and other ACC subsidiaries | 141 | None |
The Statement of Additional Information has additional information about the fund's trustees and is available without charge, upon request, by calling 1-800-345-2021.
Officers
The following table presents certain information about the executive officers of the funds. Each officer serves as an officer for 16 investment companies in the American Century family of funds. No officer is compensated for his or her service as an officer of the funds. The listed officers are interested persons of the funds and are appointed or re-appointed on an annual basis. The mailing address for each of the officers listed below is 4500 Main Street, Kansas City, Missouri 64111.
| | | | | | | | |
Name
(Year of Birth) | Offices with the Funds | Principal Occupation(s) During the Past Five Years |
Patrick Bannigan
(1965)
| President since 2019 | Executive Vice President and Director, ACC (2012 to present); Chief Financial Officer, Chief Accounting Officer and Treasurer, ACC (2015 to present). Also serves as President, ACS; Vice President, ACIM; Chief Financial Officer, Chief Accounting Officer and/or Director, ACIM, ACS and other ACC subsidiaries |
R. Wes Campbell
(1974)
| Chief Financial Officer and Treasurer since 2018 | Vice President, ACS (2020 to present); Investment Operations and Investment Accounting, ACS (2000 to present) |
Amy D. Shelton
(1964) | Chief Compliance Officer and Vice President since 2014 | Chief Compliance Officer, American Century funds, (2014 to present); Chief Compliance Officer, ACIM (2014 to present); Chief Compliance Officer, ACIS (2009 to present). Also serves as Vice President, ACIS |
John Pak
(1968) | General Counsel and Senior Vice President since 2021 | General Counsel and Senior Vice President, ACC (2021 to present); Also serves as General Counsel and Senior Vice President, ACIM, ACS and ACIS. Chief Legal Officer of Investment and Wealth Management, The Bank of New York Mellon (2014 to 2021) |
David H. Reinmiller
(1963) | Vice President since 2000 | Attorney, ACC (1994 to present). Also serves as Vice President, ACIM and ACS |
Ward D. Stauffer
(1960) | Secretary since 2005 | Attorney, ACC (2003 to present) |
| | |
| Liquidity Risk Management Program |
The Fund has adopted a liquidity risk management program (the “program”). The Fund’s Board of Trustees (the "Board") has designated American Century Investment Management, Inc. (“ACIM”) as the administrator of the program. Personnel of ACIM or its affiliates, including members of ACIM’s Investment Oversight Committee who are members of ACIM’s Investment Management and Global Analytics departments, conduct the day-to-day operation of the program pursuant to the program.
Under the program, ACIM manages the Fund’s liquidity risk, which is the risk that the Fund could not meet shareholder redemption requests without significant dilution of remaining shareholders’ interests in the Fund. This risk is managed by monitoring the degree of liquidity of the Fund’s investments, limiting the amount of the Fund’s illiquid investments, and utilizing various risk management tools and facilities available to the Fund for meeting shareholder redemptions, among other means. ACIM’s process of determining the degree of liquidity of certain investments held by the Fund is supported by a third-party liquidity assessment vendor.
The Board reviewed a report prepared by ACIM regarding the operation and effectiveness of the program for the period January 1, 2022 through December 31, 2022. No significant liquidity events impacting the Fund were noted in the report. In addition, ACIM provided its assessment that the program had been effective in managing the Fund’s liquidity risk.
Retirement Account Information
As required by law, distributions you receive from certain retirement accounts are subject to federal income tax withholding at the IRS default rate of 10%.* Tax will be withheld on the total amount withdrawn even though you may be receiving amounts that are not subject to withholding, such as nondeductible contributions. In such case, excess amounts of withholding could occur. You may adjust your withholding election so that a greater or lesser amount will be withheld.
You may elect a different withholding rate, or request zero withholding, by submitting an acceptable IRS Form W-4R election with your distribution request. You may notify us of your W-4R election by telephone, on our distribution forms, on IRS Form W-4R, or through other acceptable electronic means. If your withholding election is for an automatic withdrawal plan, you have the right to revoke your election at any time and any election you make will remain in effect until revoked by filing a new election.
Remember, even if you elect not to have income tax withheld, you are liable for paying income tax on the taxable portion of your withdrawal. If you elect not to have income tax withheld or you don’t have enough income tax withheld, you may be responsible for payment of estimated tax. You may incur penalties under the estimated tax rules if your withholding and estimated tax payments are not sufficient. You can reduce or defer the income tax on a distribution by directly or indirectly rolling such distribution over to another IRA or eligible plan. You should consult your tax advisor for additional information.
State tax will be withheld according to state regulations if, at the time of your distribution, your tax residency is within one of the mandatory withholding states.
*Some 403(b), 457 and qualified retirement plan distributions may be subject to 20% mandatory withholding, as they are subject to special tax and withholding rules. Your plan administrator or plan sponsor is required to provide you with a special tax notice explaining those rules at the time you request a distribution. If applicable, federal and/or state taxes may be withheld from your distribution amount.
Proxy Voting Policies
Descriptions of the principles and policies that the fund's investment advisor uses in exercising the voting rights associated with the securities purchased and/or held by the fund are available without charge, upon request, by calling 1-800-345-2021 or visiting American Century Investments’ website at americancentury.com/proxy. A description of the policies is also available on the Securities and Exchange Commission’s website at sec.gov. Information regarding how the investment advisor voted proxies relating to portfolio securities during the most recent 12-month period ended June 30 is available on americancentury.com/proxy. It is also available at sec.gov.
Portfolio Holdings Disclosure
The fund files its complete schedule of portfolio holdings with the Securities and Exchange Commission (SEC) each month on Form N-MFP. The fund’s Form N-MFP reports are available on its website at americancentury.com and on the SEC’s website at sec.gov. The fund also makes its complete schedule of portfolio holdings for the most recent first and third quarters of its fiscal year available on its website at americancentury.com and, upon request, by calling 1-800-345-2021.
| | | | | | | | |
| |
| | |
| Contact Us | americancentury.com | |
| Automated Information Line | 1-800-345-8765 | |
| Investor Services Representative | 1-800-345-2021
or 816-531-5575 | |
| Investors Using Advisors | 1-800-378-9878 | |
| Business, Not-For-Profit, Employer-Sponsored Retirement Plans | 1-800-345-3533 | |
| Banks and Trust Companies, Broker-Dealers, Financial Professionals, Insurance Companies | 1-800-345-6488 | |
| Telecommunications Relay Service for the Deaf | 711 | |
| | |
| American Century Investment Trust | |
| | |
Investment Advisor: American Century Investment Management, Inc. Kansas City, Missouri | |
| | |
| This report and the statements it contains are submitted for the general information of our shareholders. The report is not authorized for distribution to prospective investors unless preceded or accompanied by an effective prospectus. | |
| | |
©2023 American Century Proprietary Holdings, Inc. All rights reserved.
CL-ANN-92283 2305 | |
(b) None.
ITEM 2. CODE OF ETHICS.
(a) The registrant has adopted a Code of Ethics for Senior Financial Officers that applies to the registrant’s principal executive officer, principal financial officer, principal accounting officer, and persons performing similar functions.
(b) No response required.
(c) None.
(d) None.
(e) Not applicable.
(f) The registrant’s Code of Ethics for Senior Financial Officers was filed as Exhibit 12 (a)(1) to American Century Asset Allocation Portfolios, Inc.’s Annual Certified Shareholder Report on Form N-CSR, File No. 811-21591, on September 29, 2005, and is incorporated herein by reference.
ITEM 3. AUDIT COMMITTEE FINANCIAL EXPERT.
(a)(1) The registrant's board has determined that the registrant has at least one audit committee financial expert serving on its audit committee.
(a)(2) Tanya S. Beder, Jennifer Cabalquinto, Anne Casscells and Peter F. Pervere are the registrant's designated audit committee financial experts. They are "independent" as defined in Item 3 of Form N-CSR.
(a)(3) Not applicable.
(b) No response required.
(c) No response required.
(d) No response required.
ITEM 4. PRINCIPAL ACCOUNTANT FEES AND SERVICES.
(a) Audit Fees.
The aggregate fees billed for each of the last two fiscal years for professional services rendered by the principal accountant for the audit of the registrant’s annual financial statements or services that are normally provided by the accountant in connection with statutory and regulatory filings or engagements for those fiscal years were as follows:
FY 2022: $278,502
FY 2023: $201,640
(b) Audit-Related Fees.
The aggregate fees billed in each of the last two fiscal years for assurance and related services by the principal accountant that are reasonably related to the performance of the audit of the registrant’s financial statements and are not reported under paragraph (a) of this Item were as follows:
For services rendered to the registrant:
FY 2022: $0
FY 2023: $0
Fees required to be approved pursuant to paragraph (c)(7)(ii) of Rule 2-01 of Regulation S-X (relating to certain engagements for non-audit services with the registrant’s investment adviser and its affiliates):
FY 2022: $0
FY 2023: $0
(c) Tax Fees.
The aggregate fees billed in each of the last two fiscal years for professional services rendered by the principal accountant for tax compliance, tax advice, and tax planning were as follows:
For services rendered to the registrant:
FY 2022: $0
FY 2023: $0
Fees required to be approved pursuant to paragraph (c)(7)(ii) of Rule 2-01 of Regulation S-X (relating to certain engagements for non-audit services with the registrant’s investment adviser and its affiliates):
FY 2022: $0
FY 2023: $0
(d) All Other Fees.
The aggregate fees billed in each of the last two fiscal years for products and services provided by the principal accountant, other than the services reported in paragraphs (a) through (c) of this Item were as follows:
For services rendered to the registrant:
FY 2022: $0
FY 2023: $0
Fees required to be approved pursuant to paragraph (c)(7)(ii) of Rule 2-01 of Regulation S-X (relating to certain engagements for non-audit services with the registrant’s investment adviser and its affiliates):
FY 2022: $0
FY 2023: $0
(e)(1) In accordance with paragraph (c)(7)(i)(A) of Rule 2-01 of Regulation S-X, before the accountant is engaged by the registrant to render audit or non-audit services, the engagement is approved by the registrant’s audit committee. Pursuant to paragraph (c)(7)(ii) of Rule 2-01 of Regulation S-X, the registrant’s audit committee also pre-approves its accountant’s engagements for non-audit services with the registrant’s investment adviser, its parent company, and any entity controlled by, or under common control with the investment adviser that provides ongoing services to the registrant, if the engagement relates directly to the operations and financial reporting of the registrant.
(e)(2) All services described in each of paragraphs (b) through (d) of this Item were pre-approved before the engagement by the registrant’s audit committee pursuant to paragraph (c)(7)(i)(A) of Rule 2-01 of Regulation S-X. Consequently, none of such services were required to be approved by the audit committee pursuant to paragraph (c)(7)(i)(C).
(f) The percentage of hours expended on the principal accountant’s engagement to audit the registrant’s financial statements for the most recent fiscal year that were attributed to work performed by persons other than the principal accountant’s full-time, permanent employees was less than 50%.
(g) The aggregate non-audit fees billed by the registrant’s accountant for services rendered to the registrant, and rendered to the registrant’s investment adviser (not including any sub-adviser whose role is primarily portfolio management and is subcontracted with or overseen by another investment adviser), and any entity controlling, controlled by, or under common control with the adviser that provides ongoing services to the registrant for each of the last two fiscal years of the registrant were as follows:
FY 2022: $2,832,126
FY 2023: $98,325
(h) The registrant’s investment adviser and accountant have notified the registrant’s audit committee of all non-audit services that were rendered by the registrant’s accountant to the registrant’s investment adviser, its parent company, and any entity controlled by, or under common control with the investment adviser that provides services to the registrant, which services were not required to be pre-approved pursuant to paragraph (c)(7)(ii) of Rule 2-01 of Regulation S-X. The notification provided to the registrant’s audit committee included sufficient details regarding such services to allow the registrant’s audit committee to consider the continuing independence of its principal accountant.
(i) Not applicable.
(j) Not applicable.
ITEM 5. AUDIT COMMITTEE OF LISTED REGISTRANTS.
Not applicable.
ITEM 6. INVESTMENTS.
(a) The schedule of investments is included as part of the report to stockholders filed under Item 1 of this Form.
(b) Not applicable.
ITEM 7. DISCLOSURE OF PROXY VOTING POLICIES AND PROCEDURES FOR CLOSED-END MANAGEMENT INVESTMENT COMPANIES.
Not applicable.
ITEM 8. PORTFOLIO MANAGERS OF CLOSED-END MANAGEMENT INVESTMENT COMPANIES.
Not applicable.
ITEM 9. PURCHASES OF EQUITY SECURITIES BY CLOSED-END MANAGEMENT INVESTMENT COMPANY AND AFFILIATED PURCHASERS.
Not applicable.
ITEM 10. SUBMISSION OF MATTERS TO A VOTE OF SECURITY HOLDERS.
During the reporting period, there were no material changes to the procedures by which shareholders may recommend nominees to the registrant’s board.
ITEM 11. CONTROLS AND PROCEDURES.
(a) The registrant's principal executive officer and principal financial officer have concluded that the registrant's disclosure controls and procedures (as defined in Rule 30a-3(c) under the Investment Company Act of 1940) are effective based on their evaluation of these controls and procedures as of a date within 90 days of the filing date of this report.
(b) There were no changes in the registrant's internal control over financial reporting (as defined in Rule 30a-3(d) under the Investment Company Act of 1940) that occurred during the period covered by this report that have materially affected, or are reasonably likely to materially affect, the registrant's internal control over financial reporting.
ITEM 12. DISCLOSURE OF SECURITIES LENDING ACTIVITIES FOR CLOSED-END MANAGEMENT INVESTMENT COMPANIES.
Not applicable.
ITEM 13. EXHIBITS.
(a)(1) Registrant’s Code of Ethics for Senior Financial Officers, which is the subject of the disclosure required by Item 2 of Form N-CSR, was filed as Exhibit 12(a)(1) to American Century Asset Allocation Portfolios, Inc.’s Certified Shareholder Report on Form N-CSR, File No. 811-21591, on September 29, 2005.
(a)(3) Not applicable.
(a)(4) Not applicable.
SIGNATURES
Pursuant to the requirements of the Securities Exchange Act of 1934 and the Investment Company Act of 1940, the registrant has duly caused this report to be signed on its behalf by the undersigned, thereunto duly authorized.
| | | | | | | | | | | |
| Registrant: | American Century Investment Trust |
| | |
| By: | /s/ Patrick Bannigan |
| Name: | Patrick Bannigan |
| Title: | President |
| | |
| Date: | May 25, 2023 |
Pursuant to the requirements of the Securities Exchange Act of 1934 and the Investment Company Act of 1940, this report has been signed below by the following persons on behalf of the registrant and in the capacities and on the dates indicated.
| | | | | | | | |
| By: | /s/ Patrick Bannigan |
| Name: | Patrick Bannigan |
| Title: | President |
| | (principal executive officer) |
| | |
| Date: | May 25, 2023 |
| | | | | | | | |
| By: | /s/ R. Wes Campbell |
| Name: | R. Wes Campbell |
| Title: | Treasurer and |
| | Chief Financial Officer |
| | (principal financial officer) |
| | |
| Date: | May 25, 2023 |