UNITED STATES
SECURITIES AND EXCHANGE COMMISSION
Washington, D.C. 20549
FORM N-CSR
CERTIFIED SHAREHOLDER REPORT OF REGISTERED
MANAGEMENT INVESTMENT COMPANIES
| Investment Company Act file number: | 811-07852 |
USAA Mutual Funds Trust
(Exact name of registrant as specified in charter)
| 15935 La Cantera Pkwy, San Antonio, Texas | 78256 |
| (Address of principal executive offices) | (Zip code) |
Citi Fund Services Ohio, Inc., 4400 Easton Commons, Suite 200, Columbus, Ohio 43219
(Name and address of agent for service)
Registrant’s telephone number, including area code: 800-235-8396
Date of fiscal year end: May 31
Date of reporting period: May 31, 2021
Item 1. Reports to Stockholders.

MAY 31, 2021
Annual Report
USAA Cornerstone Moderately
Conservative Fund
Victory Capital means Victory Capital Management Inc., the investment adviser of the USAA Mutual Funds. USAA Mutual Funds are distributed by Victory Capital Services, Inc., member of FINRA, an affiliate of Victory Capital. Victory Capital and its affiliates are not affiliated with United Services Automobile Association or its affiliates. USAA and the USAA logos are registered trademarks and the USAA Mutual Funds and USAA Investments logos are trademarks of United Services Automobile Association and are being used by Victory Capital and its affiliates under license.
www.vcm.com
News, Information And Education 24 Hours A Day, 7 Days A Week
The Victory Funds site gives fund shareholders, prospective shareholders, and investment professionals a convenient way to access fund information, get guidance, and track fund performance anywhere they can access the Internet. The site includes:
• Detailed performance records
• Daily share prices
• The latest fund news
• Investment resources to help you become a better investor
• A section dedicated to investment professionals
Whether you're a potential investor searching for the fund that matches your investment philosophy, a seasoned investor interested in planning tools, or an investment professional, www.vcm.com has what you seek. Visit us anytime. We're always open.
TABLE OF CONTENTS
Shareholder Letter (Unaudited) | | | 2 | | |
Managers' Commentary (Unaudited) | | | 4 | | |
Investment Overview (Unaudited) | | | 6 | | |
Investment Objective & Portfolio
Holdings (Unaudited) | | | 7 | | |
Schedule of Portfolio Investments | | | 8 | | |
Financial Statements | |
Statement of Assets and Liabilities | | | 21 | | |
Statement of Operations | | | 22 | | |
Statements of Changes in Net Assets | | | 23 | | |
Financial Highlights | | | 24 | | |
Notes to Financial Statements | | | 26 | | |
Report of Independent
Registered Public Accounting Firm | | | 38 | | |
Supplemental Information (Unaudited) | | | 39 | | |
Trustees' and Officers' Information | | | 39 | | |
Proxy Voting and Portfolio Holdings Information | | | 45 | | |
Expense Example | | | 45 | | |
Additional Federal Income Tax Information | | | 46 | | |
Advisory Contract Agreement | | | 47 | | |
Liquidity Risk Management Program | | | 50 | | |
Privacy Policy (inside back cover) | | | |
This report is for the information of the shareholders and others who have received a copy of the currently effective prospectus of the Fund, managed by Victory Capital Management Inc. It may be used as sales literature only when preceded or accompanied by a current prospectus, which provides further details about the Fund.
IRA DISTRIBUTION WITHHOLDING DISCLOSURE
We generally must withhold federal income tax at a rate of 10% of the taxable portion of your distribution and, if you live in a state that requires state income tax withholding, at your state's tax rate. However, you may elect not to have withholding apply or to have income tax withheld at a higher rate. Any withholding election that you make will apply to any subsequent distribution unless and until you change or revoke the election. If you wish to make a withholding election, or change or revoke a prior withholding election, call (800) 235-8396, and form W-4P (OMB No. 1545-0074 withholding certificate for pension or annuity payments) will be electronically sent.
If you do not have a withholding election in place by the date of a distribution, federal income tax will be withheld from the taxable portion of your distribution at a rate of 10%. If you must pay estimated taxes, you may be subject to estimated tax penalties if your estimated tax payments are not sufficient and sufficient tax is not withheld from your distribution.
For more specific information, please consult your tax adviser.
• NOT FDIC INSURED • NO BANK GUARANTEE • MAY LOSE VALUE
1
(Unaudited)
Dear Shareholder,
Never a dull moment. A year ago, we were still coming to grips with a global pandemic, hoping for an effective vaccine, and wondering whether the U.S. Federal Reserve's aggressive actions would continue to mollify financial markets. As it turns out, a vaccine was rolled out (domestically) faster than expectations, and the recovery that began during the second quarter of 2020 continued unabated.
Fast forward to today and investors are suddenly more concerned about labor shortages, rising commodity prices, and whether inflation will prove to be transitory or more lasting. If anything, this merely exemplifies that markets are unpredictable and the environment can change rapidly.
Reflecting on the past year, we must consider ourselves fortunate despite the myriad challenges. For starters, it was impressive how quickly the various forms of monetary and fiscal stimulus contributed to a rebound in GDP. Of course, it wasn't a straight line upward and there were bouts of elevated volatility in both bond and stock markets. Late in 2020, for example, financial markets were alternately fueled and roiled by a contentious election season, growing optimism for an effective vaccine, and a fluid debate regarding the need for even more stimulus. Ultimately, stocks were propelled higher in the fourth quarter of 2020 as it became clear Congress would provide another dose of stimulus in the form of direct payments, more unemployment insurance, and additional aid to businesses.
As we moved into 2021, stocks continued their upward trajectory. Meanwhile, the yield on the 10-Year U.S. Treasury continued rallying sharply as many investors began to shift their focus. Deflation was out; inflation was in. Indeed, the potential for a new era of inflation and higher interest rates seems to be the new worry du jour.
So how did the numbers shake out after this unusual year? The S&P 500® Index registered an impressive annual return of approximately 40% for this 12-month period ended May 31, 2021. Over this same period, the yield on the 10-Year U.S. Treasury jumped 94 basis points, reflecting both the very low starting rate and substantial fiscal stimulus. At the end of the reporting period, the yield on the 10-Year U.S. Treasury was 1.59%.
The past year is not one we will forget any time soon. There were many hardships, but we should not overlook the positives and remember our collective spirit and perseverance. Markets endured and even surprised to the upside, but perhaps the key takeaway is that investors need to remain calm in the face of adversity and focused on longer-term investment goals. We believe that's the best approach no matter what the markets throw at us.
On the following pages, you will find information relating to your USAA Mutual Funds, brought to you by Victory Capital. If you have any questions regarding the current market dynamics or your specific portfolio or investment plan, we encourage you to contact our Member Service Representatives. Call (800) 235-8396 or visit our website at www.vcm.com.
2
From all of us here at Victory Capital, thank you for letting us help you work toward your investment goals.

Christopher K. Dyer, CFA
President,
USAA Mutual Funds
3
USAA Cornerstone Moderately Conservative Fund
Managers' Commentary
(Unaudited)
• What were the market conditions during the reporting period?
The beginning of the reporting period brought a dramatic reversal from the difficult environment that characterized the first part of 2020. While COVID-19 cases continued to rise, investors grew increasingly confident that the economy would be able to recover from its sharp downturn of February and March. The optimism stemmed, in part, from a series of better-than-expected economic reports interpreted as evidence that the slump in growth would be less severe than was initially feared. The markets were further cheered by the aggressive response by the U.S. Federal Reserve (the "Fed"). In addition to reiterating its commitment to keep short-term interest rates near zero for an extended period, the Fed announced the direct purchase of both individual bonds and exchange-traded bond funds. The central bank's unusual steps offered corporations the latitude to issue debt at ultra-low rates, providing them with the cash necessary to help withstand the effects of the coronavirus.
The global financial markets produced healthy returns during the second half of 2020, wrapping up a positive year for the major asset classes. Investors' appetite for risk improved considerably in early November, when the approval of vaccines for COVID-19 raised expectations that the world economy could gradually return to normal in 2021. The conclusion of the U.S. elections, which removed a source of uncertainty that had depressed performance in September and October, was an additional tailwind. The markets were also aided by continued indications that the Fed and other central banks would maintain their highly accommodative policies indefinitely. Not least, an agreement on a new round of U.S. fiscal stimulus further cheered investors in late December. Together, these developments outweighed negative headlines surrounding renewed lockdowns and the persistence of the coronavirus.
The first quarter of 2021 proved to be a continuation of the strong equity markets investors experienced over the second half of 2020. Gains from global equity markets were fueled by optimism surrounding the successful rollout of the COVID-19 vaccines coupled with further monetary and fiscal stimulus proposals. Faster-than-expected economic growth produced a meaningful increase in real interest rates, which led to negative returns across most major fixed income asset classes. The 10-year U.S. Treasury bond yield finished at its highest level of the first quarter reporting period, climbing from under 1% to 1.74%.
During the last few months of the reporting period, equity markets have been consolidating and interest rates leveling off after large upswings. With strong first quarter GDP and corporate earnings growth in the rearview mirror, investors seem to be contemplating their next move. Inflation data has been increasing as the economy reopens more quickly than expected. The Fed maintains that inflationary pressure is transitory but could become more persistent. The inflationary environment will be a key metric moving into the second half of the year.
4
USAA Cornerstone Moderately Conservative Fund (continued)
Managers' Commentary (continued)
• How did the USAA Cornerstone Moderately Conservative Fund (the "Fund") perform during the reporting period?
For the reporting period ended May 31, 2021, the Fund had a total return of 16.30%. This compares to returns of 1.22% for the Bloomberg Barclays U.S. Universal Index and 16.79% for the Cornerstone Moderately Conservative Composite Index.
• What strategies did you employ during the reporting period?
The Fund delivered strong positive total returns during the reporting period as equity markets rebounded sharply off the market lows produced during the COVID-induced sell off early last year. All major equity asset classes participated in the rally with U.S. small-cap and emerging market stocks leading the way. The Fund's allocation to fixed income produced small positive returns. Despite the double-digit total returns, the Fund slightly underperformed the Cornerstone Moderately Conservative Composite Index.
Positive contributors to the relative performance included an overweight to emerging market stocks. The Fund also benefitted from a tactical underweight to fixed-income securities as the sharp increase in interest rates weighed on bond prices particularly during the first quarter of 2021. Security selection in the Fund's underlying fixed-income portfolio added value due to an overweight to credit-oriented securities.
These positive drivers were offset by weakness in the security selection within the U.S large-cap portion of the portfolio, primarily driven by the resurgence of what we believe are lower-quality stocks, which experienced a sharp relief rally following the rollout of the vaccine. Additionally, the Fund's commodity exposure was weighted more heavily towards gold-related securities, which underperformed a more diversified basket. A tactical underweight to real estate investment trusts also detracted slightly from performance.
Thank you for allowing us to assist you with your investment needs.
5
USAA Cornerstone Moderately Conservative Fund
Investment Overview
(Unaudited)
Average Annual Total Return
Year Ended May 31, 2021
| | | Fund Shares | | | | | |
INCEPTION DATE | | 6/8/12 | | | | | |
| | | Net Asset Value | | Bloomberg Barclays
U.S. Universal Index1 | | Cornerstone Moderately
Conservative Composite Index2 | |
One Year | | | 16.30 | % | | | 1.22 | % | | | 16.79 | % | |
Five Year | | | 6.65 | % | | | 3.69 | % | | | 8.07 | % | |
Since Inception | | | 5.83 | % | | | 3.32 | % | | | 7.11 | % | |
The performance data quoted represents past performance and current returns may be lower or higher. The investment return and principal value will fluctuate so that an investor's shares, when redeemed, may be worth more or less than the original cost. To obtain performance information current to the most recent month's end, please visit www.vcm.com.
Total return measures the price change in a share assuming the reinvestment of all net investment income and realized capital gain distributions, if any. The total returns quoted do not reflect adjustments made to the enclosed financial statements in accordance with U.S. Generally Accepted Accounting Principles or the deduction of taxes that a shareholder would pay on net investment income and realized capital gain distributions, including reinvested distributions, or redemptions of shares. The total return figures set forth above include all waivers of fees. Without such fee waivers, the total returns would have been lower.
USAA Cornerstone Moderately Conservative Fund — Growth of $10,000

*The performance of the Bloomberg Barclays U.S. Universal Index and Cornerstone Moderately Conservative Composite Index is calculated from the end of the month, May 31, 2012, while the inception date of the USAA Cornerstone Moderately Conservative Fund is June 8, 2012. There may be a slight variation of performance numbers because of this difference.
1The unmanaged Bloomberg Barclays U.S. Universal Index is an index that represents the union of the U.S. Aggregate Index, U.S. Corporate High-Yield Index, Investment Grade 144A Index, Eurodollar Index, U.S. Emerging Markets Index and the non-ERISA eligible portion of the CMBS Index. The index covers USD-denominated, taxable bonds that are rated either investment-grade or below-investment-grade. This index does not include the effect of sales charges, commissions, expenses, or taxes, is not representative of the Fund, and it is not possible to invest directly in an index.
2The Cornerstone Moderately Conservative Composite Index is a combination of unmanaged indexes representing the Fund's model allocation, and consists of the MSCI USA Investable Market Index (IMI) Gross (23%), the MSCI ACWI ex USA IMI Net (15%), the Bloomberg Barclays U.S. Universal Index (58%), the Bloomberg Commodity Index Total Return (1%), the MSCI U.S. Real Estate Investment Trust (REIT) Index Gross (1%), and the Bloomberg Barclays U.S. Treasury—Bills (1—3M) (2%). This index does not include the effect of sales charges, commissions, expenses, or taxes, is not representative of the Fund, and it is not possible to invest directly in an index.
The graph reflects investment of growth of a hypothetical $10,000 investment in the Fund.
The graph and table do not reflect the deduction of taxes that a shareholder would pay on Fund distributions or the redemption of Fund shares.
Past performance is not indicative of future results.
6
USAA Mutual Funds Trust
USAA Cornerstone Moderately Conservative Fund | | May 31, 2021 | |
(Unaudited)
Investment Objective and Portfolio Holdings:
The Fund's investment objective seeks current income with a secondary focus on capital appreciation.
Asset Allocation*:
May 31, 2021
(% of Net Assets)
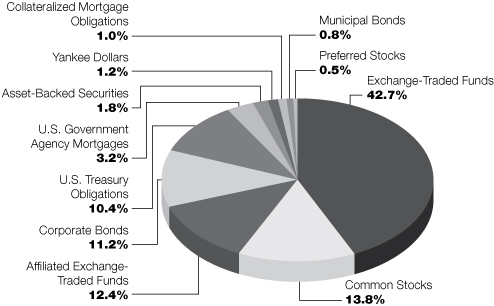
* Does not include futures, money market instruments, and short-term investments purchased with cash collateral from securities loaned.
Percentages are of the net assets of the Fund and may not equal 100%.
7
USAA Mutual Funds Trust
USAA Cornerstone Moderately Conservative Fund | | Schedule of Portfolio Investments
May 31, 2021 | |
(Amounts in Thousands, Except for Shares)
Security Description | | Principal
Amount | | Value | |
Asset-Backed Securities (1.8%) | |
Americredit Automobile Receivables Trust, Series 2018-1, Class C, 3.50%,
1/18/24, Callable 8/18/22 @ 100 | | $ | 480 | | | $ | 492 | | |
Americredit Automobile Receivables Trust, Series 2018-2, Class A3, 3.15%,
3/20/23, Callable 10/18/22 @ 100 | | | 19 | | | | 19 | | |
BCC Funding Corp. XVI LLC, Series 2019-1A, Class A2, 2.46%, 8/20/24,
Callable 6/20/23 @ 100 (a) | | | 806 | | | | 815 | | |
Canadian Pacer Auto Receivables Trust, Series 2018-1A, Class C, 3.82%, 4/19/24,
Callable 6/19/21 @ 100 (a) | | | 263 | | | | 264 | | |
CarMax Auto Owner Trust, Series 2020-1, Class B, 2.21%, 9/15/25, Callable
8/15/23 @ 100 | | | 137 | | | | 142 | | |
Credit Acceptance Auto Loan Trust, Series 2018-3A, Class A, 3.55%, 8/15/27,
Callable 10/15/21 @ 100 (a) | | | 4 | | | | 4 | | |
Drive Auto Receivables Trust, Series 2018-4, Class D, 4.09%, 1/15/26, Callable
8/15/22 @ 100 | | | 139 | | | | 143 | �� | |
Exeter Automobile Receivables Trust, Series 2020-1A, Class B, 2.26%, 4/15/24,
Callable 5/15/23 @ 100 (a) | | | 110 | | | | 111 | | |
Exeter Automobile Receivables Trust, Series 2017-3A, Class D, 5.28%, 10/15/24,
Callable 4/15/22 @ 100 (a) | | | 110 | | | | 113 | | |
Exeter Automobile Receivables Trust, Series 2019-2A, Class C, 3.30%, 3/15/24,
Callable 4/15/23 @ 100 (a) | | | 207 | | | | 210 | | |
Ford Credit Auto Owner Trust, Series 2020-1, Class B, 2.29%, 8/15/31, Callable
2/15/25 @ 100 (a) | | | 143 | | | | 150 | | |
Hertz Vehicle Financing II LP, Series 2019-3A, Class A, 2.67%, 12/26/25 (a) | | | 21 | | | | 21 | | |
HPEFS Equipment Trust, Series 2019-1A, Class C, 2.49%, 9/20/29, Callable
6/20/22 @ 100 (a) | | | 97 | | | | 99 | | |
HPEFS Equipment Trust, Series 2020-1A, Class B, 1.89%, 2/20/30, Callable
2/20/23 @ 100 (a) | | | 55 | | | | 56 | | |
Navient Student Loan Trust, Series 2015-2, Class B, 1.59% (LIBOR01M+150bps),
8/25/50, Callable 8/25/29 @ 100 (b) | | | 200 | | | | 200 | | |
NP SPE II LLC, Series 2017-1A, Class A1, 3.37%, 10/21/47, Callable
10/20/27 @ 100 (a) | | | 66 | | | | 68 | | |
SCF Equipment Leasing LLC, Series 2020-1A, Class B, 2.02%, 3/20/28,
Callable 5/20/25 @ 100 (a) | | | 107 | | | | 109 | | |
Trinity Rail Leasing LLC, Series 2019-2A, Class A1, 2.39%, 10/18/49, Callable
11/17/21 @ 100 (a) | | | 392 | | | | 401 | | |
Westlake Automobile Receivables Trust, Series 2020-1A, Class B, 1.94%,
4/15/25, Callable 4/15/23 @ 100 (a) | | | 358 | | | | 363 | | |
Westlake Automobile Receivables Trust, Series 2018-2A, Class D, 4.00%,
1/16/24, Callable 1/15/22 @ 100 (a) | | | 263 | | | | 265 | | |
Total Asset-Backed Securities (Cost $3,969) | | | 4,045 | | |
Collateralized Mortgage Obligations (1.0%) | |
Banc of America Commercial Mortgage Trust, Series 2006-3, Class AM,
5.66%, 7/10/44 (c) | | | 155 | | | | 22 | | |
Banc of America Commercial Mortgage Trust, Series 2008-1, Class AJ,
6.57%, 2/10/51 (c) | | | 26 | | | | 26 | | |
Benchmark Mortgage Trust, Series 2020-B17, Class ASB, 2.18%, 3/15/53,
Callable 11/15/29 @ 100 | | | 143 | | | | 147 | | |
See notes to financial statements.
8
USAA Mutual Funds Trust
USAA Cornerstone Moderately Conservative Fund | | Schedule of Portfolio Investments — continued
May 31, 2021 | |
(Amounts in Thousands, Except for Shares)
Security Description | | Shares or
Principal
Amount | | Value | |
BTH Mortgage-Backed Securities Trust, Series 2018-21, Class A, 2.61%
(LIBOR01M+250bps), 10/7/21 (a) (b) | | $ | 320 | | | $ | 320 | | |
BX Trust, Series 2019-OC11, Class A, 3.20%, 12/9/41 (a) | | | 132 | | | | 141 | | |
Citigroup Commercial Mortgage Trust, Series 2020-GC46, Class AAB, 2.61%,
1/15/53, Callable 11/15/29 @ 100 | | | 143 | | | | 152 | | |
Citigroup Commercial Mortgage Trust, Series 2020-555, Class A,
2.65%, 12/10/41 (a) | | | 215 | | | | 220 | | |
COMM Mortgage Trust, Series 2014-277P, Class A, 3.61%, 8/10/49, Callable
8/10/24 @ 100 (a) (c) | | | 140 | | | | 149 | | |
COMM Mortgage Trust, Series 2019-GC44, Class ASB, 2.87%, 8/15/57, Callable
5/15/29 @ 100 | | | 215 | | | | 231 | | |
Credit Suisse Commercial Mortgage Trust, Series 2007-C1, Class AMFL, 0.29%
(LIBOR01M+19bps), 2/15/40 (b) | | | 3 | | | | 3 | | |
CSAIL Commercial Mortgage Trust, Series 2016-C6, Class XA, 1.91%, 1/15/49,
Callable 11/15/25 @ 100 (c) (d) | | | 2,169 | | | | 148 | | |
DBJPM Mortgage Trust, Series 2016-SFC, Class A, 2.83%, 8/10/36, Callable
8/10/26 @ 100 (a) | | | 500 | | | | 514 | | |
GS Mortgage Securities Trust, Series 2020-GC45, Class AAB, 2.84%, 2/13/53,
Callable 9/13/29 @ 100 | | | 77 | | | | 83 | | |
Manhattan West, Series 2020-1MW, Class A, 2.13%, 9/10/40 (a) | | | 87 | | | | 89 | | |
UBS Commercial Mortgage Trust, Series 2012-C1, Class XA, 2.05%, 5/10/45,
Callable 4/10/22 @ 100 (a) (c) (d) | | | 2,369 | | | | 18 | | |
Total Collateralized Mortgage Obligations (Cost $2,392) | | | 2,263 | | |
Common Stocks (13.8%) | |
Communication Services (1.3%): | |
Alphabet, Inc. Class C (e) | | | 419 | | | | 1,010 | | |
AT&T, Inc. | | | 6,294 | | | | 185 | | |
Comcast Corp. Class A | | | 7,294 | | | | 418 | | |
Facebook, Inc. Class A (e) | | | 1,030 | | | | 339 | | |
Match Group, Inc. (e) | | | 973 | | | | 140 | | |
Pinterest, Inc. Class A (e) | | | 2,383 | | | | 156 | | |
Sirius XM Holdings, Inc. (f) | | | 21,360 | | | | 133 | | |
Snap, Inc. Class A (e) | | | 2,680 | | | | 166 | | |
Verizon Communications, Inc. | | | 6,989 | | | | 395 | | |
| | | | 2,942 | | |
Consumer Discretionary (1.1%): | |
Aptiv PLC (e) | | | 996 | | | | 150 | | |
AutoZone, Inc. (e) | | | 96 | | | | 135 | | |
Best Buy Co., Inc. | | | 1,181 | | | | 137 | | |
eBay, Inc. | | | 2,545 | | | | 155 | | |
Ford Motor Co. (e) | | | 12,920 | | | | 188 | | |
General Motors Co. (e) | | | 2,657 | | | | 157 | | |
Lennar Corp. Class A | | | 1,361 | | | | 135 | | |
Lowe's Cos., Inc. | | | 1,726 | | | | 336 | | |
O'Reilly Automotive, Inc. (e) | | | 261 | | | | 140 | | |
Roku, Inc. (e) | | | 456 | | | | 158 | | |
Target Corp. (g) | | | 1,555 | | | | 353 | | |
See notes to financial statements.
9
USAA Mutual Funds Trust
USAA Cornerstone Moderately Conservative Fund | | Schedule of Portfolio Investments — continued
May 31, 2021 | |
(Amounts in Thousands, Except for Shares)
Security Description | | Shares | | Value | |
Tesla, Inc. (e) | | | 395 | | | $ | 247 | | |
The Home Depot, Inc. | | | 687 | | | | 219 | | |
| | | | 2,510 | | |
Consumer Staples (0.9%): | |
Altria Group, Inc. | | | 9,838 | | | | 484 | | |
Archer-Daniels-Midland Co. | | | 2,265 | | | | 151 | | |
Colgate-Palmolive Co. | | | 1,802 | | | | 151 | | |
Keurig Dr Pepper, Inc. | | | 3,994 | | | | 148 | | |
Monster Beverage Corp. (e) | | | 1,639 | | | | 155 | | |
Philip Morris International, Inc. | | | 3,679 | | | | 355 | | |
The Clorox Co. | | | 783 | | | | 138 | | |
The Estee Lauder Cos., Inc. | | | 497 | | | | 152 | | |
Tyson Foods, Inc. Class A | | | 1,820 | | | | 145 | | |
Walgreens Boots Alliance, Inc. | | | 2,872 | | | | 151 | | |
| | | | 2,030 | | |
Energy (0.3%): | |
Chevron Corp. | | | 1,808 | | | | 188 | | |
ConocoPhillips | | | 5,636 | | | | 314 | | |
Marathon Petroleum Corp. | | | 2,526 | | | | 156 | | |
| | | | 658 | | |
Financials (1.8%): | |
AGNC Investment Corp. | | | 462 | | | | 9 | | |
Annaly Capital Management, Inc. | | | 1,158 | | | | 11 | | |
Aon PLC Class A | | | 586 | | | | 148 | | |
Berkshire Hathaway, Inc. Class B (e) | | | 850 | | | | 246 | | |
BlackRock, Inc. | | | 211 | | | | 185 | | |
Capital One Financial Corp. | | | 2,036 | | | | 327 | | |
Citigroup, Inc. | | | 2,429 | | | | 191 | | |
Fifth Third Bancorp | | | 3,520 | | | | 148 | | |
KeyCorp | | | 6,154 | | | | 142 | | |
MetLife, Inc. | | | 4,568 | | | | 299 | | |
Morgan Stanley | | | 3,955 | | | | 360 | | |
MSCI, Inc. | | | 300 | | | | 140 | | |
Prudential Financial, Inc. | | | 2,868 | | | | 307 | | |
S&P Global, Inc. | | | 413 | | | | 157 | | |
SVB Financial Group (e) | | | 494 | | | | 288 | | |
T. Rowe Price Group, Inc. | | | 777 | | | | 149 | | |
The Allstate Corp. | | | 1,125 | | | | 154 | | |
The Goldman Sachs Group, Inc. | | | 933 | | | | 347 | | |
The Progressive Corp. | | | 1,457 | | | | 144 | | |
Wells Fargo & Co. | | | 4,075 | | | | 190 | | |
| | | | 3,942 | | |
Health Care (2.7%): | |
Abbott Laboratories | | | 1,651 | | | | 193 | | |
AbbVie, Inc. | | | 1,699 | | | | 192 | | |
Agilent Technologies, Inc. | | | 1,077 | | | | 149 | | |
Align Technology, Inc. (e) | | | 247 | | | | 146 | | |
Amgen, Inc. | | | 1,408 | | | | 335 | | |
Anthem, Inc. | | | 421 | | | | 168 | | |
See notes to financial statements.
10
USAA Mutual Funds Trust
USAA Cornerstone Moderately Conservative Fund | | Schedule of Portfolio Investments — continued
May 31, 2021 | |
(Amounts in Thousands, Except for Shares)
Security Description | | Shares | | Value | |
Biogen, Inc. (e) | | | 1,095 | | | $ | 293 | | |
Bristol-Myers Squibb Co. | | | 2,803 | | | | 184 | | |
Cigna Corp. | | | 639 | | | | 165 | | |
CVS Health Corp. | | | 2,025 | | | | 175 | | |
Danaher Corp. | | | 700 | | | | 179 | | |
Eli Lilly & Co. | | | 923 | | | | 184 | | |
Gilead Sciences, Inc. (g) | | | 2,474 | | | | 164 | | |
HCA Healthcare, Inc. | | | 1,476 | | | | 317 | | |
IDEXX Laboratories, Inc. (e) | | | 542 | | | | 302 | | |
IQVIA Holdings, Inc. (e) | | | 648 | | | | 156 | | |
Johnson & Johnson (g) | | | 3,027 | | | | 512 | | |
Merck & Co., Inc. | | | 2,377 | | | | 180 | | |
Mettler-Toledo International, Inc. (e) | | | 226 | | | | 294 | | |
Pfizer, Inc. | | | 5,072 | | | | 196 | | |
Stryker Corp. | | | 646 | | | | 165 | | |
Thermo Fisher Scientific, Inc. | | | 403 | | | | 189 | | |
UnitedHealth Group, Inc. | | | 1,759 | | | | 725 | | |
Waters Corp. (e) | | | 462 | | | | 149 | | |
Zoetis, Inc. | | | 926 | | | | 164 | | |
| | | | 5,876 | | |
Industrials (1.5%): | |
3M Co. | | | 1,686 | | | | 342 | | |
Carrier Global Corp. | | | 3,362 | | | | 154 | | |
Caterpillar, Inc. | | | 733 | | | | 177 | | |
CSX Corp. | | | 1,568 | | | | 157 | | |
Cummins, Inc. | | | 571 | | | | 147 | | |
Deere & Co. | | | 436 | | | | 158 | | |
Eaton Corp. PLC | | | 2,114 | | | | 307 | | |
Fastenal Co. | | | 2,703 | | | | 143 | | |
General Dynamics Corp. | | | 789 | | | | 150 | | |
Illinois Tool Works, Inc. | | | 656 | | | | 152 | | |
Johnson Controls International PLC | | | 2,334 | | | | 155 | | |
Lockheed Martin Corp. | | | 848 | | | | 324 | | |
Northrop Grumman Corp. | | | 424 | | | | 155 | | |
Otis Worldwide Corp. | | | 1,851 | | | | 145 | | |
PACCAR, Inc. | | | 1,588 | | | | 145 | | |
Rockwell Automation, Inc. | | | 544 | | | | 144 | | |
Trane Technologies PLC | | | 832 | | | | 155 | | |
W.W. Grainger, Inc. | | | 306 | | | | 142 | | |
| | | | 3,252 | | |
Information Technology (3.2%): | |
Accenture PLC Class A | | | 633 | | | | 179 | | |
Adobe, Inc. (e) | | | 390 | | | | 197 | | |
Apple, Inc. | | | 10,947 | | | | 1,364 | | |
Applied Materials, Inc. | | | 2,515 | | | | 347 | | |
Broadcom, Inc. | | | 819 | | | | 387 | | |
Cadence Design Systems, Inc. (e) | | | 1,147 | | | | 146 | | |
CDW Corp. | | | 809 | | | | 134 | | |
Cisco Systems, Inc. | | | 7,563 | | | | 400 | | |
Cognizant Technology Solutions Corp. Class A | | | 1,916 | | | | 137 | | |
See notes to financial statements.
11
USAA Mutual Funds Trust
USAA Cornerstone Moderately Conservative Fund | | Schedule of Portfolio Investments — continued
May 31, 2021 | |
(Amounts in Thousands, Except for Shares)
Security Description | | Shares | | Value | |
HP, Inc. | | | 12,825 | | | $ | 375 | | |
Intel Corp. | | | 3,388 | | | | 193 | | |
International Business Machines Corp. | | | 1,203 | | | | 173 | | |
Intuit, Inc. | | | 400 | | | | 176 | | |
Lam Research Corp. | | | 503 | | | | 327 | | |
Mastercard, Inc. Class A | | | 612 | | | | 221 | | |
Micron Technology, Inc. (e) | | | 1,879 | | | | 158 | | |
Microsoft Corp. (g) | | | 2,459 | | | | 614 | | |
NVIDIA Corp. | | | 390 | | | | 253 | | |
NXP Semiconductors NV | | | 762 | | | | 161 | | |
Oracle Corp. | | | 2,225 | | | | 175 | | |
Square, Inc. Class A (e) | | | 672 | | | | 149 | | |
TE Connectivity Ltd. | | | 1,099 | | | | 149 | | |
Texas Instruments, Inc. | | | 1,912 | | | | 363 | | |
VeriSign, Inc. (e) | | | 662 | | | | 146 | | |
VMware, Inc. Class A (e) (f) | | | 880 | | | | 139 | | |
| | | | 7,063 | | |
Materials (0.3%): | |
Dow, Inc. | | | 2,309 | | | | 158 | | |
International Paper Co. | | | 2,389 | | | | 151 | | |
LyondellBasell Industries NV Class A | | | 1,306 | | | | 147 | | |
PPG Industries, Inc. | | | 818 | | | | 147 | | |
The Sherwin-Williams Co. | | | 541 | | | | 153 | | |
| | | | 756 | | |
Real Estate (0.4%): | |
Alexandria Real Estate Equities, Inc. | | | 105 | | | | 19 | | |
American Tower Corp. | | | 367 | | | | 94 | | |
AvalonBay Communities, Inc. | | | 117 | | | | 24 | | |
Boston Properties, Inc. | | | 123 | | | | 14 | | |
Camden Property Trust | | | 80 | | | | 10 | | |
CBRE Group, Inc. Class A (e) | | | 277 | | | | 24 | | |
Crown Castle International Corp. | | | 365 | | | | 69 | | |
Digital Realty Trust, Inc. | | | 226 | | | | 34 | | |
Duke Realty Corp. | | | 308 | | | | 14 | | |
Equinix, Inc. | | | 74 | | | | 55 | | |
Equity LifeStyle Properties, Inc. | | | 145 | | | | 10 | | |
Equity Residential | | | 308 | | | | 24 | | |
Essex Property Trust, Inc. | | | 54 | | | | 16 | | |
Extra Space Storage, Inc. | | | 109 | | | | 16 | | |
Healthpeak Properties, Inc. | | | 441 | | | | 15 | | |
Host Hotels & Resorts, Inc. (e) | | | 570 | | | | 10 | | |
Invitation Homes, Inc. | | | 469 | | | | 17 | | |
Iron Mountain, Inc. | | | 241 | | | | 11 | | |
Medical Properties Trust, Inc. | | | 476 | | | | 10 | | |
Mid-America Apartment Communities, Inc. | | | 95 | | | | 15 | | |
Omega Healthcare Investors, Inc. | | | 190 | | | | 7 | | |
Prologis, Inc. | | | 615 | | | | 73 | | |
Public Storage | | | 133 | | | | 38 | | |
Realty Income Corp. | | | 290 | | | | 20 | | |
Regency Centers Corp. | | | 142 | | | | 9 | | |
See notes to financial statements.
12
USAA Mutual Funds Trust
USAA Cornerstone Moderately Conservative Fund | | Schedule of Portfolio Investments — continued
May 31, 2021 | |
(Amounts in Thousands, Except for Shares)
Security Description | | Shares or
Principal
Amount | | Value | |
SBA Communications Corp. | | | 92 | | | $ | 27 | | |
Simon Property Group, Inc. | | | 280 | | | | 36 | | |
Sun Communities, Inc. | | | 83 | | | | 14 | | |
UDR, Inc. | | | 245 | | | | 12 | | |
Ventas, Inc. | | | 311 | | | | 17 | | |
VEREIT, Inc. | | | 178 | | | | 8 | | |
VICI Properties, Inc. | | | 440 | | | | 14 | | |
Vornado Realty Trust | | | 133 | | | | 6 | | |
Welltower, Inc. | | | 346 | | | | 26 | | |
Weyerhaeuser Co. | | | 611 | | | | 23 | | |
WP Carey, Inc. | | | 145 | | | | 11 | | |
| | | | 842 | | |
Utilities (0.3%): | |
Exelon Corp. | | | 3,311 | | | | 150 | | |
NextEra Energy, Inc. (g) | | | 2,405 | | | | 176 | | |
NRG Energy, Inc. | | | 3,983 | | | | 128 | | |
The AES Corp. | | | 10,824 | | | | 275 | | |
| | | | 729 | | |
Total Common Stocks (Cost $23,048) | | | 30,600 | | |
Preferred Stocks (0.5%) | |
Communication Services (0.2%): | |
Qwest Corp., 6.50%, 9/1/56 | | | 20,000 | | | | 507 | | |
Financials (0.3%): | |
Delphi Financial Group, Inc., 3.35% (LIBOR03M+319bps), 5/15/37 (b) (h) | | | 27,414 | | | | 610 | | |
Total Preferred Stocks (Cost $1,190) | | | 1,117 | | |
Corporate Bonds (11.2%) | |
Communication Services (0.2%): | |
Fox Corp., 3.05%, 4/7/25, Callable 3/7/25 @ 100 | | $ | 102 | | | | 109 | | |
The Walt Disney Co., 2.20%, 1/13/28 | | | 94 | | | | 97 | | |
T-Mobile USA, Inc., 3.88%, 4/15/30, Callable 1/15/30 @ 100 | | | 257 | | | | 282 | | |
| | | | 488 | | |
Consumer Discretionary (0.3%): | |
AutoNation, Inc., 4.75%, 6/1/30, Callable 3/1/30 @ 100 | | | 85 | | | | 100 | | |
Hasbro, Inc., 3.55%, 11/19/26, Callable 9/19/26 @ 100 | | | 172 | | | | 189 | | |
Nordstrom, Inc., 4.38%, 4/1/30, Callable 1/1/30 @ 100 (f) | | | 143 | | | | 147 | | |
VF Corp., 2.95%, 4/23/30, Callable 1/23/30 @ 100 | | | 106 | | | | 111 | | |
| | | | 547 | | |
Consumer Staples (0.9%): | |
Anheuser-Busch Cos. LLC/Anheuser-Busch InBev Worldwide, Inc., 4.70%,
2/1/36, Callable 8/1/35 @ 100 | | | 358 | | | | 427 | | |
Kraft Heinz Foods Co., 3.75%, 4/1/30, Callable 1/1/30 @ 100 | | | 161 | | | | 172 | | |
McCormick & Co., Inc., 2.50%, 4/15/30, Callable 1/15/30 @ 100 | | | 62 | | | | 63 | | |
PepsiCo, Inc., 2.25%, 3/19/25, Callable 2/19/25 @ 100 | | | 332 | | | | 351 | | |
Sysco Corp., 5.95%, 4/1/30, Callable 1/1/30 @ 100 | | | 83 | | | | 106 | | |
See notes to financial statements.
13
USAA Mutual Funds Trust
USAA Cornerstone Moderately Conservative Fund | | Schedule of Portfolio Investments — continued
May 31, 2021 | |
(Amounts in Thousands, Except for Shares)
Security Description | | Principal
Amount | | Value | |
The Coca-Cola Co., 2.00%, 3/5/31 | | $ | 500 | | | $ | 497 | | |
Unilever Capital Corp., 2.60%, 5/5/24, Callable 3/5/24 @ 100 | | | 350 | | | | 372 | | |
| | | | 1,988 | | |
Energy (1.6%): | |
Cameron LNG LLC, 3.30%, 1/15/35, Callable 9/15/34 @ 100 (a) | | | 273 | | | | 287 | | |
Enable Midstream Partners LP, 4.15%, 9/15/29, Callable 6/15/29 @ 100 | | | 350 | | | | 377 | | |
Enbridge Energy Partners LP, 7.38%, 10/15/45, Callable 4/15/45 @ 100 (g) | | | 650 | | | | 991 | | |
Enterprise Products Operating LLC, 2.80%, 1/31/30, Callable 10/31/29 @ 100 | | | 215 | | | | 224 | | |
Exxon Mobil Corp., 2.99%, 3/19/25, Callable 2/19/25 @ 100 (g) | | | 357 | | | | 385 | | |
Florida Gas Transmission Co. LLC, 2.55%, 7/1/30, Callable 4/1/30 @ 100 (a) | | | 89 | | | | 89 | | |
Marathon Petroleum Corp., 4.70%, 5/1/25, Callable 4/1/25 @ 100 | | | 99 | | | | 112 | | |
Midwest Connector Capital Co. LLC, 4.63%, 4/1/29, Callable 1/1/29 @ 100 (a) | | | 209 | | | | 220 | | |
National Oilwell Varco, Inc., 3.60%, 12/1/29, Callable 9/1/29 @ 100 | | | 286 | | | | 298 | | |
Occidental Petroleum Corp., 4.40%, 8/15/49, Callable 2/15/49 @ 100 | | | 143 | | | | 121 | | |
ONEOK, Inc., 6.35%, 1/15/31, Callable 10/15/30 @ 100 | | | 89 | | | | 113 | | |
Targa Resources Partners LP/Targa Resources Partners Finance Corp., 5.50%,
3/1/30, Callable 3/1/25 @ 102.75 | | | 143 | | | | 155 | | |
Western Midstream Operating LP, 4.35%, 2/1/25, Callable 1/1/25 @ 100 | | | 151 | | | | 158 | | |
| | | | 3,530 | | |
Financials (4.0%): | |
AmTrust Financial Services, Inc., 6.13%, 8/15/23 | | | 332 | | | | 337 | | |
Ares Capital Corp., 3.63%, 1/19/22, Callable 12/19/21 @ 100 (g) | | | 350 | | | | 356 | | |
BancorpSouth Bank, 4.13% (LIBOR03M+247bps), 11/20/29, Callable
11/20/24 @ 100 (b) | | | 184 | | | | 190 | | |
BBVA USA, 3.88%, 4/10/25, Callable 3/10/25 @ 100 | | | 100 | | | | 110 | | |
Belrose Funding Trust, 2.33%, 8/15/30, Callable 5/15/30 @ 100 (a) | | | 209 | | | | 203 | | |
Citizens Financial Group, Inc., 2.50%, 2/6/30, Callable 11/6/29 @ 100 | | | 215 | | | | 219 | | |
Cullen/Frost Capital Trust II, 1.74% (LIBOR03M+155bps), 3/1/34, Callable
7/12/21 @ 100 (b) | | | 1,000 | | | | 961 | | |
First Horizon Bank, 5.75%, 5/1/30, Callable 2/1/30 @ 100 | | | 106 | | | | 130 | | |
First Maryland Capital I, 1.18% (LIBOR03M+100bps), 1/15/27, Callable
7/12/21 @ 100 (b) | | | 100 | | | | 96 | | |
Glencore Funding LLC, 2.50%, 9/1/30, Callable 6/1/30 @ 100 (a) | | | 244 | | | | 239 | | |
Global Atlantic Financial Co., 4.40%, 10/15/29, Callable 7/15/29 @ 100 (a) | | | 184 | | | | 198 | | |
HSB Group, Inc., 1.09% (LIBOR03M+91bps), 7/15/27, Callable 7/12/21 @ 100 (b) | | | 550 | | | | 499 | | |
Hyundai Capital America, 3.75%, 7/8/21 (a) (g) | | | 700 | | | | 702 | | |
JPMorgan Chase & Co., 2.52% (SOFR+204bps), 4/22/31, Callable
4/22/30 @ 100 (b) | | | 124 | | | | 126 | | |
KeyCorp, 2.25%, 4/6/27, MTN | | | 215 | | | | 224 | | |
Level 3 Financing, Inc., 3.88%, 11/15/29, Callable 8/15/29 @ 100 (a) | | | 287 | | | | 305 | | |
Loews Corp., 3.20%, 5/15/30, Callable 2/15/30 @ 100 | | | 140 | | | | 150 | | |
Nationwide Mutual Insurance Co., 2.47% (LIBOR03M+229bps), 12/15/24,
Callable 7/12/21 @ 100 (a) (b) | | | 1,100 | | | | 1,096 | | |
New York Community Bancorp, Inc., 5.90% (LIBOR03M+278bps), 11/6/28,
Callable 11/6/23 @ 100 (b) | | | 52 | | | | 56 | | |
PPL Capital Funding, Inc., 4.13%, 4/15/30, Callable 1/15/30 @ 100 | | | 141 | | | | 160 | | |
Prudential Financial, Inc., 5.63% (LIBOR03M+392bps), 6/15/43, Callable
6/15/23 @ 100 (b) | | | 600 | | | | 649 | | |
Regions Financial Corp., 2.25%, 5/18/25, Callable 4/18/25 @ 100 | | | 158 | | | | 165 | | |
Santander Holdings USA, Inc., 3.45%, 6/2/25, Callable 5/2/25 @ 100 | | | 88 | | | | 95 | | |
See notes to financial statements.
14
USAA Mutual Funds Trust
USAA Cornerstone Moderately Conservative Fund | | Schedule of Portfolio Investments — continued
May 31, 2021 | |
(Amounts in Thousands, Except for Shares)
Security Description | | Principal
Amount | | Value | |
Signature Bank, 4.13% (LIBOR03M+256bps), 11/1/29, Callable 11/1/24 @ 100 (b) | | $ | 250 | | | $ | 259 | | |
Texas Capital Bank NA, 5.25%, 1/31/26 | | | 143 | | | | 153 | | |
The Progressive Corp., 3.20%, 3/26/30, Callable 12/26/29 @ 100 | | | 43 | | | | 47 | | |
Truist Bank, 0.83% (LIBOR03M+67bps), 5/15/27, Callable 7/12/21 @ 100 (b) | | | 1,000 | | | | 971 | | |
Wells Fargo & Co., 2.19% (SOFR+200bps), 4/30/26, Callable 4/30/25 @ 100 (b) | | | 159 | | | | 166 | | |
| | | | 8,862 | | |
Health Care (0.7%): | |
AbbVie, Inc., 3.20%, 11/21/29, Callable 8/21/29 @ 100 | | | 287 | | | | 309 | | |
CVS Health Corp., 3.25%, 8/15/29, Callable 5/15/29 @ 100 (g) | | | 534 | | | | 575 | | |
DENTSPLY SIRONA, Inc., 3.25%, 6/1/30, Callable 3/1/30 @ 100 | | | 158 | | | | 167 | | |
Duke University Health System, Inc., 2.60%, 6/1/30 | | | 105 | | | | 109 | | |
HCA, Inc., 5.13%, 6/15/39, Callable 12/15/38 @ 100 | | | 358 | | | | 437 | | |
Upjohn, Inc., 2.30%, 6/22/27, Callable 4/22/27 @ 100 (a) | | | 52 | | | | 53 | | |
| | | | 1,650 | | |
Industrials (1.3%): | |
Carlisle Cos., Inc., 2.75%, 3/1/30, Callable 12/1/29 @ 100 | | | 215 | | | | 221 | | |
Carrier Global Corp., 3.38%, 4/5/40, Callable 10/5/39 @ 100 | | | 107 | | | | 109 | | |
Caterpillar, Inc., 2.60%, 4/9/30, Callable 1/9/30 @ 100 | | | 106 | | | | 112 | | |
CoStar Group, Inc., 2.80%, 7/15/30, Callable 4/15/30 @ 100 (a) | | | 47 | | | | 47 | | |
Dover Corp., 2.95%, 11/4/29, Callable 8/4/29 @ 100 | | | 215 | | | | 229 | | |
Georgia-Pacific LLC, 2.10%, 4/30/27, Callable 2/28/27 @ 100 (a) | | | 248 | | | | 257 | | |
IDEX Corp., 3.00%, 5/1/30, Callable 2/1/30 @ 100 | | | 248 | | | | 259 | | |
Otis Worldwide Corp., 3.11%, 2/15/40, Callable 8/15/39 @ 100 | | | 143 | | | | 144 | | |
Penske Truck Leasing Co. LP/PTL Finance Corp., 4.00%, 7/15/25, Callable
6/15/25 @ 100 (a) | | | 141 | | | | 156 | | |
Ryder System, Inc., 2.90%, 12/1/26, MTN, Callable 10/1/26 @ 100 | | | 358 | | | | 384 | | |
Southwest Airlines Co., 5.13%, 6/15/27, Callable 4/15/27 @ 100 | | | 114 | | | | 133 | | |
The Boeing Co., 5.71%, 5/1/40, Callable 11/1/39 @ 100 | | | 212 | | | | 265 | | |
The Conservation Fund A Nonprofit Corp., 3.47%, 12/15/29, Callable
9/15/29 @ 100 | | | 325 | | | | 342 | | |
United Airlines Pass Through Trust, 2.90%, 11/1/29 | | | 287 | | | | 280 | | |
| | | | 2,938 | | |
Information Technology (0.5%): | |
Amphenol Corp., 2.80%, 2/15/30, Callable 11/15/29 @ 100 | | | 300 | | | | 311 | | |
HP, Inc., 3.40%, 6/17/30, Callable 3/17/30 @ 100 | | | 161 | | | | 172 | | |
Jabil, Inc., 3.00%, 1/15/31, Callable 10/15/30 @ 100 | | | 47 | | | | 48 | | |
Microsoft Corp., 3.45%, 8/8/36, Callable 2/8/36 @ 100 | | | 466 | | | | 523 | | |
| | | | 1,054 | | |
Materials (0.2%): | |
Avery Dennison Corp., 2.65%, 4/30/30, Callable 2/1/30 @ 100 | | | 86 | | | | 88 | | |
Colonial Enterprises, Inc., 3.25%, 5/15/30, Callable 2/15/30 @ 100 (a) | | | 44 | | | | 47 | | |
LYB International Finance III LLC, 3.38%, 5/1/30, Callable 2/1/30 @ 100 | | | 124 | | | | 133 | | |
Vulcan Materials Co., 3.50%, 6/1/30, Callable 3/1/30 @ 100 | | | 141 | | | | 155 | | |
WRKCo, Inc., 3.00%, 6/15/33, Callable 3/15/33 @ 100 (g) | | | 80 | | | | 83 | | |
| | | | 506 | | |
Real Estate (0.6%): | |
AvalonBay Communities, Inc., 2.45%, 1/15/31, MTN, Callable 10/15/30 @ 100 | | | 211 | | | | 213 | | |
Boston Properties LP, 3.25%, 1/30/31, Callable 10/30/30 @ 100 | | | 93 | | | | 98 | | |
Essex Portfolio LP, 2.65%, 3/15/32, Callable 12/15/31 @ 100 | | | 250 | | | | 250 | | |
See notes to financial statements.
15
USAA Mutual Funds Trust
USAA Cornerstone Moderately Conservative Fund | | Schedule of Portfolio Investments — continued
May 31, 2021 | |
(Amounts in Thousands, Except for Shares)
Security Description | | Principal
Amount | | Value | |
GLP Capital LP/GLP Financing II, Inc., 4.00%, 1/15/31, Callable 10/15/30 @ 100 | | $ | 52 | | | $ | 55 | | |
Host Hotels & Resorts LP, 3.50%, 9/15/30, Callable 6/15/30 @ 100 | | | 44 | | | | 45 | | |
Mid-America Apartments LP, 2.75%, 3/15/30, Callable 12/15/29 @ 100 | | | 358 | | | | 368 | | |
SBA Tower Trust, 2.84%, 1/15/25 (a) | | | 173 | | | | 181 | | |
VICI Properties LP/VICI Note Co., Inc., 4.63%, 12/1/29, Callable
12/1/24 @ 102.31 (a) | | | 33 | | | | 35 | | |
| | | | 1,245 | | |
Utilities (0.9%): | |
AEP Texas, Inc., 3.45%, 1/15/50, Callable 7/15/49 @ 100 | | | 251 | | | | 252 | | |
Alabama Power Co., 3.85%, 12/1/42 | | | 215 | | | | 239 | | |
Ameren Corp., 3.50%, 1/15/31, Callable 10/15/30 @ 100 | | | 71 | | | | 77 | | |
Duke Energy Florida LLC, 3.85%, 11/15/42, Callable 5/15/42 @ 100 | | | 215 | | | | 242 | | |
Exelon Generation Co. LLC, 3.25%, 6/1/25, Callable 5/1/25 @ 100 | | | 158 | | | | 170 | | |
IPALCO Enterprises, Inc., 4.25%, 5/1/30, Callable 2/1/30 @ 100 | | | 161 | | | | 180 | | |
ITC Holdings Corp., 2.95%, 5/14/30, Callable 2/14/30 @ 100 (a) | | | 158 | | | | 165 | | |
National Fuel Gas Co., 5.50%, 1/15/26, Callable 12/15/25 @ 100 | | | 211 | | | | 245 | | |
Union Electric Co., 2.95%, 3/15/30, Callable 12/15/29 @ 100 | | | 357 | | | | 379 | | |
| | | | 1,949 | | |
Total Corporate Bonds (Cost $23,240) | | | 24,757 | | |
Yankee Dollars (1.2%) | |
Consumer Staples (0.1%): | |
Alimentation Couche-Tard, Inc., 2.95%, 1/25/30, Callable 10/25/29 @ 100 (a) | | | 143 | | | | 148 | | |
Energy (0.0%): (i) | |
Petroleos Mexicanos, 6.49%, 1/23/27, Callable 11/23/26 @ 100 | | | 123 | | | | 131 | | |
Financials (0.5%): | |
Banco Santander Mexico SA Institucion de Banca Multiple Grupo Financiero
Santand, 5.38%, 4/17/25 (a) | | | 101 | | | | 115 | | |
Barclays PLC, 2.85% (LIBOR03M+245bps), 5/7/26, Callable 5/7/25 @ 100 (b) | | | 212 | | | | 225 | | |
Deutsche Bank AG, 3.96% (SOFR+258bps), 11/26/25, Callable 11/26/24 @ 100 (b) | | | 215 | | | | 234 | | |
Diageo Capital PLC, 2.13%, 4/29/32, Callable 1/29/32 @ 100 | | | 248 | | | | 244 | | |
Royal Bank of Canada, 1.60%, 4/17/23, MTN | | | 248 | | | | 254 | | |
| | | | 1,072 | | |
Industrials (0.2%): | |
CK Hutchison International 19 II Ltd., 2.75%, 9/6/29, Callable 6/6/29 @ 100 (a) | | | 300 | | | | 309 | | |
Ferguson Finance PLC, 3.25%, 6/2/30, Callable 3/2/30 @ 100 (a) | | | 95 | | | | 101 | | |
Heathrow Funding Ltd., 4.88%, 7/15/21 (a) | | | 142 | | | | 143 | | |
| | | | 553 | | |
Materials (0.4%): | |
Anglo American Capital PLC, 5.63%, 4/1/30, Callable 1/1/30 @ 100 (a) | | | 133 | | | | 162 | | |
Braskem Netherlands Finance BV, 4.50%, 1/31/30 (a) | | | 214 | | | | 222 | | |
CCL Industries, Inc., 3.05%, 6/1/30, Callable 3/1/30 @ 100 (a) | | | 159 | | | | 165 | | |
Teck Resources Ltd., 6.13%, 10/1/35 | | | 230 | | | | 289 | | |
| | | | 838 | | |
Total Yankee Dollars (Cost $2,590) | | | 2,742 | | |
See notes to financial statements.
16
USAA Mutual Funds Trust
USAA Cornerstone Moderately Conservative Fund | | Schedule of Portfolio Investments — continued
May 31, 2021 | |
(Amounts in Thousands, Except for Shares)
Security Description | | Principal
Amount | | Value | |
Municipal Bonds (0.8%) | |
Florida (0.1%): | |
County of Broward Florida Airport System Revenue, Series C, 2.50%, 10/1/28 | | $ | 143 | | | $ | 150 | | |
Louisiana (0.0%): (i) | |
Louisiana Local Government Environmental Facilities & Community
Development Authority Revenue, 1.55%, 2/1/27 | | | 140 | | | | 141 | | |
New Jersey (0.1%): | |
North Hudson Sewerage Authority Revenue, 2.88%, 6/1/28 | | | 72 | | | | 76 | | |
Rutgers The State University of New Jersey Revenue, Series S, 2.01%, 5/1/32 | | | 85 | | | | 82 | | |
| | | | 158 | | |
New York (0.0%): (i) | |
New York State Thruway Authority Revenue, Series M, 2.55%, 1/1/28 | | | 83 | | | | 88 | | |
Pennsylvania (0.2%): | |
State Public School Building Authority Revenue, 3.05%, 4/1/28 | | | 143 | | | | 144 | | |
University of Pittsburgh-of The Commonwealth System of Higher
Education Revenue
Series C, 2.53%, 9/15/31 | | | 145 | | | | 151 | | |
Series C, 2.58%, 9/15/32 | | | 70 | | | | 73 | | |
Series C, 2.63%, 9/15/33 | | | 145 | | | | 150 | | |
| | | | 518 | | |
Texas (0.4%): | |
City of Houston Texas Combined Utility System Revenue, 3.72%, 11/15/28 | | | 180 | | | | 208 | | |
City of San Antonio Texas, GO, 1.76%, 2/1/31, Continuously Callable @100 | | | 130 | | | | 130 | | |
Dallas Fort Worth International Airport Revenue, Series C, 1.75%, 11/1/27 | | | 85 | | | | 86 | | |
Harris County Cultural Education Facilities Finance Corp. Revenue, Series B,
2.81%, 5/15/29 | | | 145 | | | | 152 | | |
State of Texas, GO, 3.00%, 4/1/28 | | | 215 | | | | 238 | | |
| | | | 814 | | |
Total Municipal Bonds (Cost $1,803) | | | 1,869 | | |
U.S. Government Agency Mortgages (3.2%) | |
Federal Home Loan Mortgage Corporation
Series K047, Class A2, 3.33%, 5/25/25 (c) | | | 1,100 | | | | 1,206 | | |
3.50%, 4/1/46-4/1/48 | | | 1,928 | | | | 2,049 | | |
3.00%, 10/1/46-3/1/47 | | | 3,445 | | | | 3,626 | | |
| | | | 6,881 | | |
Federal National Mortgage Association | |
Series 2016-M2, Class AV2, 2.15%, 1/25/23 | | | 258 | | | | 261 | | |
Total U.S. Government Agency Mortgages (Cost $6,815) | | | 7,142 | | |
U.S. Treasury Obligations (10.4%) | |
U.S. Treasury Bonds
3.13%, 8/15/44 | | | 700 | | | | 815 | | |
3.00%, 8/15/48 (g) | | | 1,000 | | | | 1,152 | | |
2.38%, 11/15/49 | | | 1,000 | | | | 1,023 | | |
See notes to financial statements.
17
USAA Mutual Funds Trust
USAA Cornerstone Moderately Conservative Fund | | Schedule of Portfolio Investments — continued
May 31, 2021 | |
(Amounts in Thousands, Except for Shares)
Security Description | | Shares or
Principal
Amount | | Value | |
U.S. Treasury Notes
1.63%, 11/15/22 | | $ | 2,000 | | | $ | 2,044 | | |
2.00%, 2/15/23 | | | 618 | | | | 637 | | |
1.63%, 4/30/23 | | | 3,800 | | | | 3,908 | | |
2.50%, 5/15/24 | | | 1,500 | | | | 1,598 | | |
2.25%, 11/15/25 | | | 6,200 | | | | 6,634 | | |
1.63%, 2/15/26 | | | 2,000 | | | | 2,083 | | |
2.25%, 2/15/27 | | | 1,000 | | | | 1,072 | | |
2.38%, 5/15/27 (g) | | | 2,000 | | | | 2,158 | | |
Total U.S. Treasury Obligations (Cost $21,807) | | | 23,124 | | |
Commercial Paper (0.6%) | |
Ameren Corp., 0.52%, 6/1/21 (j) | | | 500 | | | | 500 | | |
Eaton Corp., 0.23%, 6/4/21 (a) (j) | | | 250 | | | | 250 | | |
Hannover Funding Co. LLC, 0.35%, 6/2/21 (a) (j) | | | 600 | | | | 600 | | |
Total Commercial Paper (Cost $1,350) | | | 1,350 | | |
Exchange-Traded Funds (42.7%) | |
Invesco DB Commodity Index Tracking Fund (e) | | | 22,900 | | | | 426 | | |
Invesco FTSE RAFI Developed Markets ex-US ETF | | | 35,176 | | | | 1,739 | | |
Invesco FTSE RAFI Emerging Markets ETF | | | 86,305 | | | | 2,042 | | |
iShares 7-10 Year Treasury Bond ETF (f) | | | 33,340 | | | | 3,814 | | |
iShares Core MSCI Emerging Markets ETF | | | 88,671 | | | | 5,910 | | |
iShares Core S&P 500 ETF | | | 20,486 | | | | 8,638 | | |
iShares Core S&P Small-Cap ETF | | | 5,458 | | | | 616 | | |
iShares Core US Aggregate Bond ETF | | | 96,272 | | | | 11,028 | | |
iShares MSCI Canada ETF (f) | | | 39,072 | | | | 1,479 | | |
iShares MSCI International Momentum Factor ETF | | | 57,626 | | | | 2,288 | | |
iShares MSCI International Quality Factor ETF (f) | | | 61,990 | | | | 2,443 | | |
iShares Russell 2000 ETF (f) | | | 4,675 | | | | 1,054 | | |
JPMorgan BetaBuilders Canada ETF | | | 8,551 | | | | 561 | | |
Schwab Fundamental Emerging Markets Large Co. Index ETF | | | 160,268 | | | | 5,193 | | |
Schwab Fundamental International Large Co. Index ETF | | | 237,343 | | | | 8,124 | | |
Schwab Fundamental International Small Co. Index ETF | | | 50,100 | | | | 1,999 | | |
SPDR Bloomberg Barclays High Yield Bond ETF (f) (g) | | | 5,106 | | | | 556 | | |
SPDR Gold Shares (e) | | | 2,632 | | | | 469 | | |
SPDR S&P Emerging Markets SmallCap ETF | | | 7,496 | | | | 446 | | |
U.S. Oil Fund LP (e) (f) | | | 8,673 | | | | 394 | | |
Vanguard FTSE All-World ex-US ETF | | | 46,063 | | | | 2,958 | | |
Vanguard FTSE Developed Markets ETF | | | 157,581 | | | | 8,260 | | |
Vanguard FTSE Europe ETF | | | 16,733 | | | | 1,154 | | |
Vanguard Mortgage-Backed Securities ETF | | | 42,318 | | | | 2,262 | | |
Vanguard Real Estate ETF | | | 9,799 | | | | 979 | | |
Vanguard S&P 500 ETF (g) | | | 8,129 | | | | 3,139 | | |
Vanguard Short-Term Bond ETF (f) | | | 14,239 | | | | 1,173 | | |
Vanguard Short-Term Corporate Bond ETF (e) | | | 12,478 | | | | 1,034 | | |
Vanguard Small-Cap Value ETF (g) | | | 16,475 | | | | 2,901 | | |
Vanguard Total Bond Market ETF | | | 98,542 | | | | 8,402 | | |
Vanguard Total Stock Market ETF (g) | | | 8,376 | | | | 1,827 | | |
See notes to financial statements.
18
USAA Mutual Funds Trust
USAA Cornerstone Moderately Conservative Fund | | Schedule of Portfolio Investments — continued
May 31, 2021 | |
(Amounts in Thousands, Except for Shares)
Security Description | | Shares | | Value | |
Wisdom Tree Trust — WisdomTree Emerging Markets SmallCap Dividend Fund | | | 5,259 | | | $ | 284 | | |
Xtrackers USD High Yield Corporate Bond ETF (f) | | | 28,050 | | | | 1,122 | | |
Total Exchange-Traded Funds (Cost $77,975) | | | 94,714 | | |
Affiliated Exchange-Traded Funds (12.4%) | |
VictoryShares USAA Core Intermediate-Term Bond ETF | | | 452,000 | | | | 24,121 | | |
VictoryShares USAA Core Short-Term Bond ETF | | | 54,683 | | | | 2,838 | | |
VictoryShares USAA MSCI Emerging Markets Value Momentum ETF (g) | | | 9,770 | | | | 503 | | |
Total Affiliated Exchange-Traded Funds (Cost $27,740) | | | 27,462 | | |
Collateral for Securities Loaned^ (5.7%) | |
Fidelity Investments Money Market Government Portfolio Institutional
Shares, 0.01% (k) | | | 2,685,517 | | | | 2,685 | | |
Goldman Sachs Financial Square Government Fund Institutional
Shares, 0.03% (k) | | | 3,196,255 | | | | 3,196 | | |
HSBC U.S. Government Money Market Fund I Shares, 0.03% (k) | | | 6,696,692 | | | | 6,697 | | |
Total Collateral for Securities Loaned (Cost $12,578) | | | 12,578 | | |
Total Investments (Cost $206,497) — 105.3% | | | 233,763 | | |
Liabilities in excess of other assets — (5.3)% | | | (11,871 | ) | |
NET ASSETS — 100.00% | | $ | 221,892 | | |
At May 31, 2021, the Fund's investments in foreign securities were 21.4% of net assets.
^ Purchased with cash collateral from securities on loan.
(a) Rule 144A security or other security that is restricted as to resale to institutional investors. The Fund's Adviser has deemed this security to be liquid based upon procedures approved by the Board of Trustees. As of May 31, 2021, the fair value of these securities was $10,995 (thousands) and amounted to 5.0% of net assets.
(b) Variable or Floating-Rate Security. Rate disclosed is as of May 31, 2021.
(c) The rate for certain asset-backed and mortgage-backed securities may vary based on factors relating to the pool of assets underlying the security. The rate disclosed is the rate in effect at May 31, 2021.
(d) Security is interest only.
(e) Non-income producing security.
(f) All or a portion of this security is on loan.
(g) All or a portion of this security has been segregated as collateral for derivative instruments.
(h) The Fund's Adviser has deemed this security to be illiquid based upon procedures approved by the Board of Trustees. As of May 31, 2021, illiquid securities were 0.3% of net assets.
(i) Amount represents less than 0.05% of net assets.
(j) Rate represents the effective yield at May 31, 2021.
(k) Rate disclosed is the daily yield on May 31, 2021.
See notes to financial statements.
19
USAA Mutual Funds Trust
USAA Cornerstone Moderately Conservative Fund | | Schedule of Portfolio Investments — continued
May 31, 2021 | |
bps — Basis points
Continuously callable — Investment is continuously callable or will be continuously callable on any date after the first call date until its maturity.
ETF — Exchange-Traded Fund
GO — General Obligation
LIBOR — London InterBank Offered Rate
LIBOR01M — 1 Month US Dollar LIBOR, rate disclosed as of May 31, 2021, based on the last reset date of the security
LIBOR03M — 3 Month US Dollar LIBOR, rate disclosed as of May 31, 2021, based on the last reset date of the security
LLC — Limited Liability Company
LP — Limited Partnership
MTN — Medium Term Note
PLC — Public Limited Company
SOFR — Secured Overnight Financing Rate
Futures Contracts Purchased
(Amounts not in thousands)
| | | Number of
Contracts | | Expiration
Date | | Notional
Amount | | Value | | Unrealized
Appreciation/
(Depreciation) | |
Swiss Market Index Futures | | | 18 | | | 6/18/21 | | $ | 2,070,127 | | | $ | 2,287,233 | | | $ | 150,057 | | |
Futures Contracts Sold
(Amounts not in thousands)
| | | Number of
Contracts | | Expiration
Date | | Notional
Amount | | Value | | Unrealized
Appreciation/
(Depreciation) | |
Euro Stoxx 50 Futures | | | 59 | | | 6/18/21 | | $ | 2,728,903 | | | $ | 2,925,037 | | | $ | (136,864 | ) | |
FTSE 100 Index Futures | | | 29 | | | 6/18/21 | | | 2,692,029 | | | | 2,890,042 | | | | (136,121 | ) | |
| | | $ | (272,985 | ) | |
Total unrealized appreciation | | $ | 150,057 | | |
Total unrealized depreciation | | | (272,985 | ) | |
Total net unrealized appreciation (depreciation) | | $ | (122,928 | ) | |
See notes to financial statements.
20
USAA Mutual Funds Trust | | Statement of Assets and Liabilities
May 31, 2021 | |
(Amounts in Thousands, Except Per Share Amounts)
| | | USAA Cornerstone
Moderately
Conservative Fund | |
Assets: | |
Affiliated investments, at value (Cost $27,740) | | $ | 27,462 | | |
Unaffiliated investments, at value (Cost $178,757) | | | 206,301 | (a) | |
Cash | | | 528 | | |
Deposit with brokers for futures contracts | | | 586 | | |
Receivables: | |
Interest and dividends | | | 375 | | |
Capital shares issued | | | 77 | | |
Investments sold | | | 310 | | |
Variation margin on open futures contracts | | | 19 | | |
From Adviser | | | 32 | | |
Prepaid expenses | | | 14 | | |
Total Assets | | | 235,704 | | |
Liabilities: | |
Payables: | |
Collateral received on loaned securities | | | 12,578 | | |
Collateral received from brokers for futures contract | | | 908 | | |
Capital shares redeemed | | | 84 | | |
Variation margin on open futures contracts | | | 25 | | |
Accrued expenses and other payables: | |
Investment advisory fees | | | 94 | | |
Administration fees | | | 28 | | |
Custodian fees | | | 3 | | |
Transfer agent fees | | | 39 | | |
Compliance fees | | | — | (b) | |
Trustees' fees | | | 1 | | |
Other accrued expenses | | | 52 | | |
Total Liabilities | | | 13,812 | | |
Net Assets: | |
Capital | | | 187,203 | | |
Total accumulated earnings/(loss) | | | 34,689 | | |
Net Assets | | $ | 221,892 | | |
Shares (unlimited number of shares authorized with no par value): | | | 17,422 | | |
Net asset value, offering and redemption price per share: (c) | | $ | 12.74 | | |
(a) Includes $12,260 of securities on loan.
(b) Rounds to less than $1 thousand.
(c) Per share amount may not recalculate due to rounding of net assets and/or shares outstanding.
See notes to financial statements.
21
USAA Mutual Funds Trust | | Statement of Operations
For the Year Ended May 31, 2021 | |
(Amounts in Thousands)
| | | USAA Cornerstone
Moderately
Conservative Fund | |
Investment Income: | |
Income distributions from affiliated funds | | $ | 244 | | |
Dividends | | | 2,491 | | |
Interest | | | 2,299 | | |
Securities lending (net of fees) | | | 46 | | |
Total Income | | | 5,080 | | |
Expenses: | |
Investment advisory fees | | | 1,129 | | |
Administration fees | | | 339 | | |
Sub-Administration fees | | | 72 | | |
Custodian fees | | | 27 | | |
Transfer agent fees | | | 543 | | |
Trustees' fees | | | 50 | | |
Compliance fees | | | 1 | | |
Legal and audit fees | | | 53 | | |
State registration and filing fees | | | 27 | | |
Other expenses | | | 69 | | |
Total Expenses | | | 2,310 | | |
Expenses waived/reimbursed by Adviser | | | (282 | ) | |
Net Expenses | | | 2,028 | | |
Net Investment Income (Loss) | | | 3,052 | | |
Realized/Unrealized Gains (Losses) from Investments: | |
Net realized gains (losses) from unaffiliated investment securities and foreign
currency translations | | | 9,191 | | |
Capital gain distributions received from affiliated funds | | | 20 | | |
Net realized gains (losses) from futures contracts | | | (361 | ) | |
Net change in unrealized appreciation/depreciation on affiliated funds | | | (169 | ) | |
Net change in unrealized appreciation/depreciation on unaffiliated
investment securities | | | 22,525 | | |
Net change in unrealized appreciation/depreciation on futures contracts | | | (123 | ) | |
Net realized/unrealized gains (losses) on investments | | | 31,083 | | |
Change in net assets resulting from operations | | $ | 34,135 | | |
See notes to financial statements.
22
USAA Mutual Funds Trust | | Statements of Changes in Net Assets | |
(Amounts in Thousands)
| | | USAA Cornerstone
Moderately
Conservative Fund | |
| | | Year
Ended
May 31,
2021 | | Year
Ended
May 31,
2020 | |
From Investments: | |
Operations: | |
Net investment income (loss) | | $ | 3,052 | | | $ | 4,698 | | |
Net realized gains (losses) from investments | | | 8,850 | | | | 450 | | |
Net change in unrealized appreciation/depreciation on
investments | | | 22,233 | | | | 3,478 | | |
Change in net assets resulting from operations | | | 34,135 | | | | 8,626 | | |
Change in net assets resulting from distributions to shareholders | | | (3,777 | ) | | | (5,060 | ) | |
Change in net assets resulting from capital transactions | | | (29,253 | ) | | | (9,263 | ) | |
Change in net assets | | | 1,105 | | | | (5,697 | ) | |
Net Assets: | |
Beginning of period | | | 220,787 | | | | 226,484 | | |
End of period | | $ | 221,892 | | | $ | 220,787 | | |
Capital Transactions: | |
Proceeds from shares issued | | $ | 24,253 | | | $ | 32,147 | | |
Distributions reinvested | | | 3,582 | | | | 4,808 | | |
Cost of shares redeemed | | | (57,088 | ) | | | (46,218 | ) | |
Change in net assets resulting from capital transactions | | $ | (29,253 | ) | | $ | (9,263 | ) | |
Share Transactions: | |
Issued | | | 2,002 | | | | 2,879 | | |
Reinvested | | | 303 | | | | 429 | | |
Redeemed | | | (4,710 | ) | | | (4,182 | ) | |
Change in Shares | | | (2,405 | ) | | | (874 | ) | |
See notes to financial statements.
23
USAA Mutual Funds Trust | | Financial Highlights | |
For a Share Outstanding Throughout Each Period
| | | | | Investment Activities | | Distributions to
Shareholders From | |
| | | Net Asset
Value,
Beginning of
Period | | Net
Investment
Income
(Loss) | | Net Realized
and Unrealized
Gains (Losses)
on Investments | | Total from
Investment
Activities | | Net
Investment
Income | | Net Realized
Gains from
Investments | |
USAA Cornerstone Moderately Conservative Fund | |
Year Ended: | |
May 31, 2021 | | $ | 11.14 | | | | 0.16 | (b) | | | 1.64 | | | | 1.80 | | | | (0.17 | ) | | | (0.03 | ) | |
May 31, 2020 | | $ | 10.94 | | | | 0.23 | (b) | | | 0.22 | | | | 0.45 | | | | (0.23 | ) | | | (0.02 | ) | |
May 31, 2019 | | $ | 11.29 | | | | 0.24 | | | | (0.14 | ) | | | 0.10 | | | | (0.24 | ) | | | (0.21 | ) | |
May 31, 2018 | | $ | 11.34 | | | | 0.21 | | | | 0.23 | | | | 0.44 | | | | (0.21 | ) | | | (0.28 | ) | |
May 31, 2017 | | $ | 10.67 | | | | 0.23 | | | | 0.68 | | | | 0.91 | | | | (0.24 | ) | | | — | | |
* Assumes reinvestment of all net investment income and realized capital gain distributions, if any, during the period. Includes adjustments in accordance with U.S. Generally Accepted Accounting Principles and could differ from the Lipper reported return.
^ The net expense ratio may not correlate to the applicable expense limits in place during the period since the current contractual expense limitation is applied for a period beginning July 1, 2019, and in effect through June 30, 2023, instead of coinciding with the Fund's fiscal year end. Details of the current contractual expense limitation in effect can be found in Note 4 of the accompanying Notes to Financial Statements.
(a) The expense ratios exclude the impact of expenses paid by each underlying fund.
(b) Per share net investment income (loss) has been calculated using the average daily shares method.
(c) Reflects increased usage of quantitative investment strategies.
See notes to financial statements.
24
USAA Mutual Funds Trust | | Financial Highlights — continued | |
For a Share Outstanding Throughout Each Period
| | | | | Ratios to Average Net Assets | | Supplemental Data | |
| | | Total
Distributions | | Net Asset
Value,
End of
Period | | Total
Return* | | Net
Expenses^(a) | | Net
Investment
Income
(Loss) | | Gross
Expenses(a) | | Net Assets,
End of
Period
(000's) | | Portfolio
Turnover | |
USAA Cornerstone Moderately Conservative Fund | |
Year Ended: | |
May 31, 2021 | | | (0.20 | ) | | $ | 12.74 | | | | 16.30 | % | | | 0.90 | % | | | 1.35 | % | | | 1.02 | % | | $ | 221,892 | | | | 52 | % | |
May 31, 2020 | | | (0.25 | ) | | $ | 11.14 | | | | 4.09 | % | | | 0.90 | % | | | 2.05 | % | | | 1.02 | % | | $ | 220,787 | | | | 84 | % | |
May 31, 2019 | | | (0.45 | ) | | $ | 10.94 | | | | 0.99 | % | | | 0.90 | % | | | 2.22 | % | | | 1.08 | % | | $ | 226,484 | | | | 77 | %(c) | |
May 31, 2018 | | | (0.49 | ) | | $ | 11.29 | | | | 3.89 | % | | | 0.90 | % | | | 1.84 | % | | | 1.07 | % | | $ | 221,721 | | | | 45 | % | |
May 31, 2017 | | | (0.24 | ) | | $ | 11.34 | | | | 8.65 | % | | | 0.90 | % | | | 2.12 | % | | | 1.09 | % | | $ | 209,270 | | | | 55 | % | |
See notes to financial statements.
25
USAA Mutual Funds Trust | | Notes to Financial Statements
May 31, 2021 | |
1. Organization:
USAA Mutual Funds Trust (the "Trust") is organized as a Delaware statutory trust and is registered under the Investment Company Act of 1940, as amended (the "1940 Act"), as an open-end investment company. The Trust is comprised of 46 funds and is authorized to issue an unlimited number of shares, which are units of beneficial interest with no par value.
The accompanying financial statements are those of the USAA Cornerstone Moderately Conservative Fund (the "Fund"). The Fund is classified as diversified under the 1940 Act.
Under the Trust's organizational documents, its officers and trustees are indemnified against certain liabilities arising out of the performance of their duties to the Fund. In addition, in the normal course of business, the Fund enters into contracts with its vendors and others that provide for general indemnifications. The Fund's maximum exposure under these arrangements is unknown, as this would involve future claims that may be made against the Fund. However, based on experience, the Fund expects that risk of loss to be remote.
2. Significant Accounting Policies:
The following is a summary of significant accounting policies followed by the Trust in the preparation of its financial statements. The policies are in conformity with Generally Accepted Accounting Principles in the United States of America ("GAAP"). The preparation of financial statements in accordance with GAAP requires management to make estimates and assumptions that affect the reported amounts of assets and liabilities and disclosure of contingent assets and liabilities at the date of the financial statements and the reported amounts of income and expenses for the period. Actual results could differ from those estimates. The Fund follows the specialized accounting and reporting requirements under GAAP that are applicable to investment companies under Accounting Standards Codification Topic 946.
Investment Valuation:
The Fund records investments at fair value. Fair value is defined as the price that would be received to sell an asset or paid to transfer a liability in an orderly transaction between market participants at the measurement date.
The valuation techniques described below maximize the use of observable inputs and minimize the use of unobservable inputs in determining fair value. The inputs used for valuing the Fund's investments are summarized in the three broad levels listed below:
• Level 1 — quoted prices in active markets for identical securities
• Level 2 — other significant observable inputs (including quoted prices for similar securities or interest rates applicable to those securities, etc.)
• Level 3 — significant unobservable inputs (including the Fund's own assumptions in determining the fair value of investments)
Changes in valuation techniques may result in transfers in or out of an assigned level within the disclosure hierarchy. The inputs or methodologies used for valuation techniques are not necessarily an indication of the risks associated with entering into those investments.
Victory Capital Management Inc. ("VCM" or the "Adviser") has established the Pricing and Liquidity Committee (the "Committee"), and subject to the Trust's Board of Trustees (the "Board") oversight, the Committee administers and oversees the Fund's valuation policies and procedures, which are approved by the Board.
Portfolio securities listed or traded on securities exchanges, including Exchange-Traded Funds ("ETFs"), American Depositary Receipts ("ADRs"), and Rights, are valued at the closing price on the exchange or system where the security is principally traded, if available, or at the Nasdaq Official Closing Price. If there have been no sales for that day on the exchange or system, then a security is valued at the last
26
USAA Mutual Funds Trust | | Notes to Financial Statements — continued
May 31, 2021 | |
available bid quotation on the exchange or system where the security is principally traded. In each of these situations, valuations are typically categorized as Level 1 in the fair value hierarchy.
Investments in open-end investment companies are valued at their net asset value ("NAV"). These valuations are typically categorized as Level 1 in the fair value hierarchy.
Debt securities are valued each business day by a pricing service approved by the Board. The approved pricing service uses the evaluated bid or the last sale price to value securities. Debt obligations maturing within 60 days may be valued at amortized cost, provided that the amortized cost represents the fair value of such securities. These valuations are typically categorized as Level 2 in the fair value hierarchy.
Futures contracts are valued at the settlement price established each day by the board of trade or an exchange on which they are traded. These valuations are typically categorized as Level 1 in the fair value hierarchy.
In the event that price quotations or valuations are not readily available, investments are valued at fair value in accordance with procedures established by and under the general supervision and responsibility of the Board. These valuations are typically categorized as Level 2 or Level 3 in the fair value hierarchy, based on the observability of inputs used to determine the fair value. The effect of fair value pricing is that securities may not be priced on the basis of quotations from the primary market in which they are traded and the actual price realized from the sale of a security may differ materially from the fair value price. Valuing these securities at fair value is intended to cause the Fund's NAV to be more reliable than it otherwise would be.
A summary of the valuations as of May 31, 2021, based upon the three levels defined above, is included in the table below while the breakdown, by category, of investments is disclosed on the Schedule of Portfolio Investments (amounts in thousands):
| | | Level 1 | | Level 2 | | Level 3 | | Total | |
Asset-Backed Securities | | $ | — | | | $ | 4,045 | | | $ | — | | | $ | 4,045 | | |
Collateralized Mortgage Obligations | | | — | | | | 2,263 | | | | — | | | | 2,263 | | |
Common Stocks | | | 30,600 | | | | — | | | | — | | | | 30,600 | | |
Preferred Stocks | | | 507 | | | | 610 | | | | — | | | | 1,117 | | |
Corporate Bonds | | | — | | | | 24,757 | | | | — | | | | 24,757 | | |
Yankee Dollars | | | — | | | | 2,742 | | | �� | — | | | | 2,742 | | |
Municipal Bonds | | | — | | | | 1,869 | | | | — | | | | 1,869 | | |
U.S. Government Agency Mortgages | | | — | | | | 7,142 | | | | — | | | | 7,142 | | |
U.S. Treasury Obligations | | | — | | | | 23,124 | | | | — | | | | 23,124 | | |
Commercial Paper | | | — | | | | 1,350 | | | | — | | | | 1,350 | | |
Exchange-Traded Funds | | | 94,714 | | | | — | | | | — | | | | 94,714 | | |
Affiliated Exchange-Traded Funds | | | 27,462 | | | | — | | | | — | | | | 27,462 | | |
Collateral for Securities Loaned | | | 12,578 | | | | — | | | | — | | | | 12,578 | | |
Total | | $ | 165,861 | | | $ | 67,902 | | | $ | — | | | $ | 233,763 | | |
Other Financial Investments^ | |
Assets: | |
Futures Contracts | | $ | 150 | | | $ | — | | | $ | — | | | $ | 150 | | |
Liabilities: | | | | | |
Futures Contracts | | $ | (273 | ) | | $ | — | | | $ | — | | | $ | (273 | ) | |
Total | | $ | (123 | ) | | $ | — | | | $ | — | | | $ | (123 | ) | |
^ Futures contracts are valued at the unrealized appreciation (depreciation) on the investment.
For the year ended May 31, 2021, there were no transfers in or out of Level 3 in the fair value hierarchy.
27
USAA Mutual Funds Trust | | Notes to Financial Statements — continued
May 31, 2021 | |
Real Estate Investment Trusts ("REITs"):
The Fund may invest in REITs, which report information on the source of their distributions annually. REITs are pooled investment vehicles that invest primarily in income producing real estate or real estate related loans or interests (such as mortgages). Certain distributions received from REITs during the year are recorded as realized gains or return of capital as estimated by the Fund or when such information becomes known.
Investment Companies:
Exchange-Traded Funds:
The Fund may invest in ETFs, the shares of which are bought and sold on a securities exchange. An ETF trades like common stock and represents a fixed portfolio of securities often designed to track the performance and dividend yield of a particular domestic or foreign market index. The Fund may purchase shares of an ETF to temporarily gain exposure to a portion of the U.S. or a foreign market while awaiting purchase of underlying securities. The risks of owning an ETF generally reflect the risks of owning the underlying securities they are designed to track, although the lack of liquidity of an ETF could result in it being more volatile. Additionally, ETFs have fees and expenses that reduce their value.
Open-End Funds:
The Fund may invest in portfolios of open-end investment companies. These investment companies value securities in their portfolios for which market quotations are readily available at their market values (generally the last reported sale price) and all other securities and assets at their fair value by the methods established by the board of directors of the underlying funds.
Municipal Obligations:
The values of municipal obligations can fluctuate and may be affected by adverse tax, legislative, or political changes, and by financial developments affecting municipal issuers. Payment of municipal obligations may depend on a relatively limited source of revenue, resulting in greater credit risk. Future changes in federal tax laws or the activity of an issuer may adversely affect the tax-exempt status of municipal obligations.
Mortgage- and Asset-Backed Securities:
The values of some mortgage-related or asset-backed securities may be particularly sensitive to changes in prevailing interest rates. Early repayment of principal on some mortgage-related securities may expose the Fund to a lower rate of return upon reinvestment of principal. The values of mortgage and asset-backed securities depend in part on the credit quality and adequacy of the underlying assets or collateral and may fluctuate in response to the market's perception of these factors as well as current and future repayment rates. Some mortgage-backed securities are backed by the full faith and credit of the U.S. government (e.g., mortgage-backed securities issued by the Government National Mortgage Association, commonly known as "Ginnie Mae"), while other mortgage-backed securities (e.g., mortgage-backed securities issued by the Federal National Mortgage Association and the Federal Home Loan Mortgage Corporation, commonly known as "Fannie Mae" and "Freddie Mac", respectively), are backed only by the credit of the government entity issuing them. In addition, some mortgage-backed securities are issued by private entities and, as such, are not guaranteed by the U.S. government or any agency or instrumentality of the U.S. government.
Derivative Instruments:
Futures Contracts:
The Fund may enter into contracts for the future delivery of securities or foreign currencies and futures contracts based on a specific security, class of securities, foreign currency or an index, and purchase
28
USAA Mutual Funds Trust | | Notes to Financial Statements — continued
May 31, 2021 | |
or sell options on any such futures contracts. A futures contract on a securities index is an agreement obligating either party to pay, and entitling the other party to receive, while the contract is outstanding, cash payments based on the level of a specified securities index. No physical delivery of the underlying asset is made. The Fund may enter into futures contracts in an effort to hedge against market risks. The acquisition of put and call options on futures contracts will give the Fund the right (but not the obligation), for a specified price, to sell or to purchase the underlying futures contract, upon exercise of the option, at any time during the option period. Futures transactions involve brokerage costs and require the Fund to segregate assets to cover contracts that would require it to purchase securities or currencies. A good faith margin deposit, known as initial margin, of cash or government securities with a broker or custodian is required to initiate and maintain open positions in futures contracts. Subsequent payments, known as variation margin, are made or received by the Fund based on the change in the market value of the position and are recorded as unrealized appreciation or depreciation until the contract is closed out, at which time the gain or loss is realized. The Fund may lose the expected benefit of futures transactions if interest rates, exchange rates or securities prices change in an unanticipated manner. Such unanticipated changes may also result in lower overall performance than if the Fund had not entered into any futures transactions. In addition, the value of the Fund's futures positions may not prove to be perfectly or even highly correlated with the value of its portfolio securities or foreign currencies, limiting the Fund's ability to hedge effectively against interest rate, exchange rate and/or market risk and giving rise to additional risks. There is no assurance of liquidity in the secondary market for purposes of closing out futures positions. The collateral held by the Fund is reflected on the Statement of Assets and Liabilities under Deposit with brokers for futures contracts and Collateral received from brokers for futures contracts. During the year ended May 31, 2021, the Fund entered into futures contracts primarily for the strategy of gaining exposure to a particular asset class or securities market.
Summary of Derivative Instruments:
The following table summarizes the fair values of derivative instruments on the Statement of Assets and Liabilities, categorized by risk exposure, as of May 31, 2021 (amounts in thousands):
| | | Assets | | Liabilities | |
| | | Variation Margin
Receivable on Open
Futures Contracts* | | Variation Margin
Payable on Open
Futures Contracts* | |
Equity Risk Exposure | | $ | 150 | | �� | $ | 273 | | |
* Includes cumulative unrealized appreciation (depreciation) of futures contracts as reported on the Schedule of Portfolio Investments. Only current day's variation margin for futures contracts is reported within the Statement of Assets and Liabilities.
The following table presents the effect of derivative instruments on the Statement of Operations, categorized by risk exposure, for the year ended May 31, 2021 (amounts in thousands):
| | Net Realized Gains (Losses) on
Derivatives Recognized
as a Result of Operations | | Net Change in Unrealized
Appreciation/Depreciation
on Derivatives Recognized
as a Result of Operations | |
| | | Net Realized Gains (Losses)
from Futures Contracts | | Net Change in Unrealized
Appreciation/Depreciation
on Futures Contracts | |
Equity Risk Exposure | | $ | (361 | ) | | $ | (123 | ) | |
All open derivative positions at year end are reflected on the Fund's Schedule of Portfolio Investments. The underlying face value of open derivative positions relative to the Fund's net assets at year end is generally representative of the notional amount of open positions to net assets throughout the year.
29
USAA Mutual Funds Trust | | Notes to Financial Statements — continued
May 31, 2021 | |
Investment Transactions and Related Income:
Changes in holdings of investments are accounted for no later than one business day following the trade date. For financial reporting purposes, however, investment transactions are accounted for on trade date on the last business day of the reporting period. Interest income is determined on the basis of coupon interest accrued using the effective interest method which adjusts, where applicable, the amortization of premiums or accretion of discount. Dividend income is recorded on the ex-dividend date. Gains or losses realized on sales of securities are recorded on the identified cost basis.
Withholding taxes on interest, dividends, and gains as a result of certain investments in ADRs by the Fund have been provided for in accordance with each investment's applicable country's tax rules and rates.
Securities Lending:
The Fund, through a securities lending agreement with Citibank, N.A. ("Citibank"), may lend its securities to qualified financial institutions, such as certain broker-dealers, to earn additional income, net of income retained by Citibank. Borrowers are required to secure their loans for collateral in the amount of at least 102% of the value of U.S. securities loaned or at least 105% of the value of non-U.S. securities loaned, marked-to-market daily. Any collateral shortfalls associated with increases in the valuation of the securities loaned are cured the next business day once the shortfall exceeds $100 thousand. Collateral may be cash, U.S. government securities, or other securities as permitted by Securities and Exchange Commission ("SEC") guidelines. Cash collateral may be invested in high-quality short-term investments, primarily open-end investment companies. Collateral requirements are determined daily based on the value of the Fund's securities on loan as of the end of the prior business day. During the time portfolio securities are on loan, the borrower will pay the Fund any dividends or interest paid on such securities plus any fee negotiated between the parties to the lending agreement. The Fund also earns a return from the collateral. The Fund pays Citibank various fees in connection with the investment of cash collateral and fees based on the investment income received from securities lending activities. Securities lending income (net of these fees) is disclosed on the Statement of Operations. Loans are terminable upon demand and the borrower must return the loaned securities within the lesser of one standard settlement period or five business days. Risks relating to securities-lending transactions include that the borrower may not provide additional collateral when required or return the securities when due, and that the value of the short-term investments will be less than the amount of cash collateral required to be returned to the borrower. The Fund's agreement with Citibank does not include master netting provisions. Non-cash collateral received by the Fund may not be sold or re-pledged, except to satisfy borrower default. Cash collateral is listed on the Fund's Schedule of Portfolio Investments and Financial Statements while non- cash collateral is not included.
The following table (amounts in thousands) is a summary of the Fund's securities lending transactions as of May 31, 2021.
Value of
Securities on Loan | | Non-Cash Collateral | | Cash Collateral | |
| $ | 12,260 | | | $ | — | | | $ | 12,578 | | |
Foreign Currency Translations:
The accounting records of the Fund are maintained in U.S. dollars. Investment securities and other assets and liabilities of the Fund denominated in a foreign currency are translated into U.S. dollars at current exchange rates. Purchases and sales of securities, income receipts, and expense payments are translated into U.S. dollars at the exchange rates on the date of the transactions. The Fund does not isolate the portion of the results of operations resulting from changes in foreign exchange rates on investments from fluctuations arising from changes in market prices of securities held. Such fluctuations are disclosed as net change in unrealized appreciation/depreciation on investments and foreign currency translations on the Statement of Operations. Any realized gains or losses from these fluctuations, including foreign currency arising from in-kind redemptions, are disclosed as net realized gains or losses from investment transactions and foreign currency translations on the Statement of Operations.
30
USAA Mutual Funds Trust | | Notes to Financial Statements — continued
May 31, 2021 | |
Foreign Taxes:
The Fund may be subject to foreign taxes related to foreign income received (a portion of which may be reclaimable), capital gains on the sale of securities, and certain foreign currency transactions. All foreign taxes are recorded in accordance with the applicable regulations and rates that exist in the foreign jurisdictions in which the Fund invests.
Federal Income Taxes:
It is the Fund's policy to continue to qualify as a regulated investment company by complying with the provisions available to certain investment companies, as defined in applicable sections of the Internal Revenue Code, and to make distributions of net investment income and net realized gains sufficient to relieve it from all, or substantially all, federal income taxes. Accordingly, no provision for federal income taxes is required in the financial statements. The Fund has a tax year end of May 31.
Management of the Fund has reviewed tax positions taken in tax years that remain subject to examination by all major tax jurisdictions, including federal (i.e., the last four tax years, which includes the current fiscal tax year end). Management believes that there is no tax liability resulting from unrecognized tax benefits related to uncertain tax positions taken.
Allocations:
Expenses directly attributable to the Fund are charged to the Fund, while expenses that are attributable to more than one fund in the Trust, or jointly with an affiliated trust, are allocated among the respective funds in the Trust and/or affiliated trust based upon net assets or another appropriate basis.
Cross-Trade Transactions:
Pursuant to Rule 17a-7 under the 1940 Act, the Fund may engage in cross-trades, which are securities transactions with affiliated investment companies and advisory accounts managed by the Adviser and any applicable sub-adviser. Any such purchase or sale transaction must be effected without brokerage commission or other remuneration, except for customary transfer fees. The transaction must be effected at the current market price, which is either the security's last sale price on an exchange or, if there are no transactions in the security that day, at the average of the highest bid and lowest asked price. For the year ended May 31, 2021, the Fund engaged in the following securities transactions with affiliated funds, which resulted in the following net realized gains (losses) (amounts in thousands):
| Purchases | | Sales | | Net Realized
Gains (Losses) | |
| $ | — | | | $ | 2,321 | | | $ | 75 | | |
3. Purchases and Sales:
Cost of purchases and proceeds from sales/maturities of securities (excluding securities maturing less than one year from acquisition) for the year ended May 31, 2021, were as follows for the Fund (amounts in thousands):
| | | Excluding
U.S. Government
Securities | | U.S. Government
Securities | |
| | | Purchases | | Sales | | Purchases | | Sales | |
| | | | | $ | 112,803 | | | $ | 122,930 | | | $ | — | | | $ | 17,172 | | |
31
USAA Mutual Funds Trust | | Notes to Financial Statements — continued
May 31, 2021 | |
4. Fees and Transactions with Affiliates and Related Parties:
Investment Advisory Fees:
Investment advisory services are provided to the Fund by the Adviser, which is a New York corporation registered as an investment adviser with the SEC. The Adviser is an indirect wholly owned subsidiary of Victory Capital Holdings, Inc., a publicly traded Delaware corporation, and a wholly owned direct subsidiary of Victory Capital Operating, LLC.
Under the terms of the Investment Advisory Agreement, the Adviser is entitled to receive fees accrued daily and paid monthly at an annualized rate of 0.50% of the Fund's average daily net assets. Amounts incurred and paid to VCM for the year ended May 31, 2021, are reflected on the Statement of Operations as Investment Advisory fees.
The Trust relies on an exemptive order granted to VCM and its affiliated funds by the SEC in March 2019 permitting the use of a "manager-of-managers" structure for certain funds. Under a manager-of-managers structure, the investment adviser may select (with approval of the Board and without shareholder approval) one or more subadvisers to manage the day-to-day investment of a fund's assets. For the year ended May 31, 2021, the Fund had no subadvisors.
Administration and Servicing Fees:
VCM serves as the Fund's administrator and fund accountant. Under the Fund Administration, Servicing and Accounting Agreement, VCM is paid for its services an annual fee at a rate of 0.15% of average daily net assets of the Fund. Amounts incurred for the year ended May 31, 2021, are reflected on the Statement of Operations as Administration fees.
The Fund (as part of the Trust) has entered into an agreement to provide compliance services with the Adviser, pursuant to which the Adviser furnishes its compliance personnel, including the services of the Chief Compliance Officer ("CCO"), and other resources reasonably necessary to provide the Trust with compliance oversight services related to the design, administration and oversight of a compliance program for the Trust in accordance with Rule 38a-1 under the 1940 Act. The CCO is an employee of the Adviser, which pays the compensation of the CCO and support staff. Funds in the Trust, Victory Variable Insurance Funds, Victory Portfolios, and Victory Portfolios II (collectively, the "Victory Funds Complex") in the aggregate, compensate the Adviser for these services. Amounts incurred for the year ended May 31, 2021, are reflected on the Statement of Operations as Compliance fees.
Citi Fund Services Ohio, Inc. ("Citi"), an affiliate of Citibank, acts as sub-administrator and sub-fund accountant to the Fund pursuant to a Sub-Administration and Sub-Fund Accounting Services Agreement between VCM and Citi. VCM pays Citi a fee for providing these services. The Fund reimburses VCM and Citi for out-of-pocket expenses incurred in providing these services and certain other expenses specifically allocated to the Fund. Amounts incurred for the year ended May 31, 2021, are reflected on the Statement of Operations as Sub-Administration fees.
Transfer Agency Fees:
Victory Capital Transfer Agency, Inc. ("VCTA"), an affiliate of the Adviser, provides transfer agency services to the Fund. VCTA provides transfer agent services to the Fund based on an annual charge of $23 per shareholder account plus out-of-pocket expenses. VCTA pays a portion of these fees to certain intermediaries for the administration and servicing of accounts that are held with such intermediaries. Amounts incurred and paid to VCTA for the year ended May 31, 2021, are reflected on the Statement of Operations as Transfer Agent fees.
FIS Investor Services LLC serves as sub-transfer agent and dividend disbursing agent for the Fund pursuant to a Sub-Transfer Agent Agreement between VCTA and FIS Investor Services LLC. VCTA provides FIS Investor Services LLC a fee for providing these services.
Distributor/Underwriting Services:
Victory Capital Services, Inc. (the "Distributor"), an affiliate of the Adviser, serves as distributor for the continuous offering of the shares of the Fund pursuant to a Distribution Agreement between the
32
USAA Mutual Funds Trust | | Notes to Financial Statements — continued
May 31, 2021 | |
Distributor and the Trust and receives no fee or other compensation for these services. Effective June 30, 2020, the Distributor's name was changed from Victory Capital Advisers, Inc.
Other Fees:
Citibank serves as the Fund's custodian. The Fund pays Citibank a fee for providing these services. Amounts incurred for the year ended May 31, 2021, are reflected on the Statement of Operations as Custodian fees.
K&L Gates LLP provides legal services to the Trust.
The Adviser has entered into an expense limitation agreement with the Fund until at least June 30, 2023. Under the terms of the agreement, the Adviser has agreed to waive fees or reimburse certain expenses to the extent that ordinary operating expenses incurred in any fiscal year exceed the expense limit for the Fund. Such excess amounts will be the liability of the Adviser. Acquired fund fees and expenses, interest, taxes, brokerage commissions, other expenditures, that are capitalized in accordance with GAAP, and other extraordinary expenses not incurred in the ordinary course of the Fund's business are excluded from the expense limits. As of May 31, 2021, the expense limit (excluding voluntary waivers) was 0.90%.
In addition, the Fund invests in affiliated VCM exchange-traded fund(s) ("affiliated ETFs"). The Fund's Adviser fee is reimbursed by VCM to the extent of the indirect Adviser fee incurred through the Fund's proportional investment in the affiliated ETF(s). These Adviser fee reimbursements are not available for recoupment. For the year ended May 31, 2021, the Fund's Adviser fee was reimbursed by VCM in an amount of $36 thousand, of which $19 thousand is receivable from VCM.
Under the terms of the expense limitation agreement, amended May 1, 2021, the Fund has agreed to repay fees and expenses that were waived or reimbursed by the Adviser for a period of up to three years (thirty six (36) months) after the waiver or reimbursement took place, subject to the lesser of any operating expense limits in effect at the time of: (a) the original waiver or expense reimbursement; or (b) the recoupment, after giving effect to the recoupment amount. Prior to May 1, 2021, the Fund was permitted to recoup fees waived and expenses reimbursed for up to three years after the fiscal year in which the waiver or reimbursement took place, subject to the limitations above. This change did not have any effect on the amounts previously reported for recoupment.
As of May 31, 2021, the following amounts are available to be repaid to the Adviser (amounts in thousands). The Fund has not recorded any amounts available to be repaid as a liability due to an assessment that such repayment is not probable at May 31, 2021.
| Expires 2023 | | Expires 2024 | | Total | |
| $ | 251 | | | $ | 246 | | | $ | 497 | | |
The Adviser may voluntarily waive or reimburse additional fees to assist the Fund in maintaining competitive expense ratios. Voluntary waivers and reimbursements applicable to the Fund are not available to be recouped at a future time. There were no voluntary waivers or reimbursements for the year ended May 31, 2021.
Certain officers and/or interested trustees of the Fund are also officers and/or employees of the Adviser, administrator, fund accountant, sub-administrator, sub-fund accountant, custodian, and Distributor.
5. Risks:
The Fund may be subject to other risks in addition to these identified risks.
Geopolitical/Natural Disaster Risk — Global economies and financial markets are increasingly interconnected, which increases the possibilities that conditions in one country or region might adversely affect issuers in another country or region. Geopolitical and other risks, including war, terrorism, trade disputes, political or economic dysfunction within some nations, public health crises and related geopolitical events, as well as environmental disasters such as earthquakes, fires, and floods, may add to instability in world economies and markets generally. Changes in trade policies and international trade agreements could affect the economies of many countries in unpredictable ways. Likewise,
33
USAA Mutual Funds Trust | | Notes to Financial Statements — continued
May 31, 2021 | |
systemic market dislocations of the kind that occurred during the financial crisis that began in 2008, if repeated, would be highly disruptive to economies and markets, adversely affecting individual companies and industries, securities markets, interest rates, credit ratings, inflation, investor sentiment, and other factors affecting the value of a Fund's investments. Some countries, including the United States, are adopting more protectionist trade policies and moving away from the tighter financial industry regulations that followed the 2008 financial crisis, which may also affect the value of a Fund's investments.
Political events within the United States at times have resulted, and may in the future result, in a shutdown of government services, which could negatively affect the U.S. economy, decrease the value of a Fund's investments, increase uncertainty in or impair the operation of the U.S. or other securities markets, and degrade investor and consumer confidence, perhaps suddenly and to a significant degree.
An outbreak of disease called COVID-19 has spread internationally. The transmission of COVID-19 and efforts to contain its spread have resulted in international, national, and local border closings and other significant travel restrictions and disruptions, significant disruptions to business operations, supply chains and consumer activity, significant challenges in healthcare service preparation and delivery, quarantines, and general concern and uncertainty. These negative impacts have caused significant volatility and declines in global financial markets, which have caused losses for Fund investors during and subsequent to period end. The impact of the COVID-19 pandemic may last for an extended period of time, and could result in a substantial economic downturn or recession. Public health crises may exacerbate other pre-existing political, social, economic, market, and financial risks. The extent of the impact to the financial performance of the Fund's investments will depend on future developments, including (i) the duration and spread of the outbreak, (ii) the restrictions and advisories, (iii) the effects on the financial markets, and (iv) the effects on the economy overall, all of which are highly uncertain and cannot be predicted.
Tactical Allocation Risk — The Fund has a targeted risk tolerance and a corresponding asset allocation target; however, mere asset allocation and volatility are not the sole determination of risk. The Fund's managers will tactically allocate away from the target allocation as market conditions and the perceived risks warrant. The Fund bears the risk that the managers' tactical allocation will not be successful.
Affiliated Funds Risk — The risks of the Fund directly correspond to the risks of the underlying affiliated funds in which the Fund invests. By investing in the underlying affiliated funds, the Fund has exposure to the risk of many different areas of the market. The degree to which the risks described below apply to the Fund varies according to the Fund's asset allocation. For instance, the more the Fund is allocated to stock funds, the greater the risk associated with equity securities. The Fund also is subject to asset allocation risk (i.e., the risk that allocations will not produce the intended results) and to management risk (i.e., the risk that the selection of underlying affiliated funds will not produce the intended results).
Conflict of Interest Risk — In managing a Fund that invests in underlying affiliated funds, the Adviser may have conflicts of interest in allocating the Fund's assets among the various underlying affiliated funds. This is because the fees payable by some of the underlying affiliated funds to the Adviser and/or its affiliates are higher than the fees payable by other underlying affiliated funds, and because the Adviser also manages and administers the underlying affiliated funds.
LIBOR Discontinuation Risk — Many debt securities, derivatives and other financial instruments, including some of the Fund's investments, use the London Interbank Offered Rate ("LIBOR") as the reference or benchmark rate for variable interest rate calculations. In June 2017, the Alternative Reference Rates Committee, a group of large U.S. banks working with the Federal Reserve, announced its selection of a new Secured Overnight Funding Rate ("SOFR"), which is intended to be a broad measure of secured overnight U.S. Treasury repo rates, as an appropriate replacement for LIBOR. The Federal Reserve Bank of New York began publishing the SOFR in 2018, expecting that it could be used on a voluntary basis in new instruments and transactions. Bank working groups and regulators in other countries have suggested other alternatives for their markets, including the Sterling Overnight Interbank Average Rate ("SONIA") in England. In July 2017, the Financial Conduct Authority (the "FCA"), the United Kingdom financial regulatory body, announced that after 2021 it will cease its active encouragement of UK banks to provide the quotations needed to sustain LIBOR. That announcement
34
USAA Mutual Funds Trust | | Notes to Financial Statements — continued
May 31, 2021 | |
suggests that LIBOR may cease to be published after that time. For U.S. dollar LIBOR, however, the relevant date may be deferred to June 30, 2023, for the most common tenors (overnight and one, three, six and 12 months). As to those tenors, the LIBOR administrator has published a consultation regarding its intention to cease publication of U.S. dollar LIBOR as of June 30, 2023, (instead of December 31, 2021, as previously expected), apparently based on continued rate submissions from banks. It is expected that there will be enough time for market participants to transition to the use of a different benchmark for both new and existing securities and transactions. Various financial industry groups have begun planning for that transition, but there are obstacles to converting certain longer-term securities and transactions to a new benchmark. Transition planning is at an early stage, and neither the effect of the transition process nor its ultimate success can yet be known. Although the foregoing may provide some sense of timing, there is no assurance that LIBOR, or any particular currency and tenor, will continue to be published until any particular date, and it appears highly likely that LIBOR will be discontinued or modified after December 31, 2021, or June 30, 2023, depending on the currency and tenor. The transition process might lead to increased volatility and illiquidity in markets that currently rely on the LIBOR to determine interest rates. It could also lead to a reduction in the value of some LIBOR-based investments and reduce the effectiveness of new hedges placed against existing LIBOR-based instruments. Since the usefulness of LIBOR as a benchmark could deteriorate during the transition period, these effects could occur before the end of 2021.
6. Borrowing and Interfund Lending:
Line of Credit:
The Victory Funds Complex participated in a short-term demand note "Line of Credit" agreement with Citibank. The Line of Credit agreement with Citibank was renewed on June 29, 2020, with a termination date of June 28, 2021. Under the agreement with Citibank, the Victory Funds Complex may borrow up to $600 million, of which $300 million is committed and $300 million is uncommitted. $40 million of the Line of Credit is reserved for use by the Victory Floating Rate Fund, another series of the Victory Funds Complex, with Victory Floating Rate Fund paying the related commitment fees for that amount. The purpose of the Line of Credit is to meet temporary or emergency cash needs. For the year ended May 31, 2021, Citibank received an annual commitment fee of 0.15% on $300 million for providing the Line of Credit. Each fund in the Victory Funds Complex pays a pro-rata portion of the commitment fees plus any interest (one month LIBOR plus one percent) on amounts borrowed. For the period June 29, 2020, through April 30, 2021, under an amended Line of Credit agreement, Citibank received an annual upfront fee of 0.10% on the $300 million committed line of credit. Each fund in the Victory Funds Complex paid a pro-rata portion of the upfront fee. Effective with the next amendment, the annual commitment fee of 0.15% will remain unchanged and the upfront fee of 0.10% is discontinued. Interest charged to each fund during the period, if applicable, is reflected on the Statement of Operations under Line of credit fees.
The Fund had no borrowings under the Line of Credit agreement during the year ended May 31, 2021.
Interfund Lending:
The Trust and Adviser rely on an exemptive order granted by the SEC in March 2017 (the "Order"), permitting the establishment and operation of an Interfund Lending Facility (the "Facility"). The Facility allows the Fund to directly lend and borrow money to or from any other fund in the Victory Funds Complex that is permitted to participate in the Facility, relying upon the Order at rates beneficial to both the borrowing and lending funds. Advances under the Facility are allowed for temporary or emergency purposes, including the meeting of redemption requests that otherwise might require the untimely disposition of securities, and are subject to each Fund's borrowing restrictions. The interfund loan rate is determined, as specified in the Order, by averaging the current repurchase agreement rate and the current bank loan rate. As a Borrower, interest charged to the Fund, if any, during the period is reflected on the Statement of Operations under Interfund lending fees. As a Lender, interest earned by the Fund, if any, during the period is presented on the Statement of Operations under Interfund lending.
The Fund did not utilize or participate in the Facility during the year ended May 31, 2021.
35
USAA Mutual Funds Trust | | Notes to Financial Statements — continued
May 31, 2021 | |
7. Federal Income Tax Information:
The Fund intends to distribute any net investment income quarterly. Distributable net realized gains, if any, are declared and paid at least annually.
The amounts of dividends from net investment income and distributions from net realized gains (collectively distributions to shareholders) are determined in accordance with federal income tax regulations, which may differ from GAAP. To the extent these "book/tax" differences are permanent in nature (e.g., net operating loss and distribution reclassification), such amounts are reclassified within the components of net assets based on their federal tax-basis treatment; temporary differences (e.g., wash sales) do not require reclassification. To the extent dividends and distributions exceed net investment income and net realized gains for tax purposes, they are reported as distributions of capital. Net investment losses incurred by the Fund may be reclassified as an offset to capital on the accompanying Statement of Assets and Liabilities.
As of May 31, 2021, on the Statement of Assets and Liabilities, as a result of permanent book-to-tax differences, reclassification adjustments were as follows (amounts in thousands):
Total
Accumulated
Earnings/(Loss) | | Capital | |
$ | 1 | | | $ | (1 | ) | |
The tax character of distributions paid during the tax years ended as noted below, were as follows (total distributions paid may differ from the Statement of Changes in Net Assets because, for tax purposes, dividends are recognized when actually paid) (amounts in thousands).
| | | Year Ended May 31, 2021 | | Year Ended May 31, 2020 | |
| | | Distributions paid from | | | | Distributions paid from | |
| | |
Ordinary
Income | | Net
Long-Term
Capital Gains | | Total
Distributions
Paid | |
Ordinary
Income | | Net
Long-Term
Capital Gains | | Total
Distributions
Paid | |
| | | | | $ | 3,243 | | | $ | 534 | | | $ | 3,777 | | | $ | 4,774 | | | $ | 286 | | | $ | 5,060 | | |
As of May 31, 2021, the components of accumulated earnings (loss) on a tax basis were as follows (amounts in thousands):
| | | Undistributed
Ordinary
Income | | Undistributed
Long-Term
Capital Gains | | Other
Earnings
(Deficit) | | Accumulated
Earnings | | Unrealized
Appreciation
(Depreciation)* | | Total
Accumulated
Earnings
(Loss) | |
| | | | | $ | 3,196 | | | $ | 4,274 | | | $ | 18 | | | $ | 7,488 | | | $ | 27,201 | | | $ | 34,689 | | |
* The difference between the book-basis and tax-basis of unrealized appreciation/depreciation is attributable to the tax deferral of losses on wash sales, futures, hybrid accruals interest purchased, partnership, and REITs/return of capital.
As of May 31, 2021, the Fund had no capital loss carryforwards, for federal income tax purposes.
As of May 31, 2021, the cost basis for federal income tax purposes, gross unrealized appreciation, gross unrealized depreciation, and net unrealized appreciation (depreciation) for investments were as follows (amounts in thousands):
| | | Cost of
Investments
for Federal
Tax Purposes | | Gross
Unrealized
Appreciation | | Gross
Unrealized
Depreciation | | Net Unrealized
Appreciation
(Depreciation) | |
| | | | | $ | 206,562 | | | $ | 28,451 | | | $ | (1,250 | ) | | $ | 27,201 | | |
36
USAA Mutual Funds Trust | | Notes to Financial Statements — continued
May 31, 2021 | |
8. Affiliated Securities:
An affiliated security is a security in which the Fund has ownership of at least 5% of the security's outstanding voting shares, an investment company managed by VCM, or an issuer under common control with a Fund or VCM. The Fund does not invest in affiliated securities for the purpose of exercising management or control. These securities are noted as affiliated on the Fund's Schedule of Portfolio Investments. Transactions in affiliated securities during the year ended May 31, 2021, were as follows (amounts in thousands):
| | | Fair
Value
5/31/2020 | | Purchases
at Cost | | Proceeds
from
Sales | | Realized
Gains
(Losses) | | Capital
Gain
Distribution | | Net
Change in
Unrealized
Appreciation/
Depreciation | | Fair Value
5/31/21 | | Dividend
Income | |
VictoryShares USAA Core
Intermediate-Term
Bond ETF | | $ | — | | | $ | 48,845 | | | $ | (24,406 | ) | | $ | — | | | $ | 16 | | | $ | (318 | ) | | $ | 24,121 | | | $ | 204 | | |
VictoryShares USAA Core
Short-Term Bond ETF | | | — | | | | 2,832 | | | | — | | | | — | | | | 4 | | | | 6 | | | | 2,838 | | | | 28 | | |
VictoryShares USAA MSCI
Emerging Markets Value
Momentum ETF | | | 360 | | | | — | | | | — | | | | — | | | | — | | | | 143 | | | | 503 | | | | 12 | | |
| | | $ | 360 | | | $ | 51,677 | | | $ | (24,406 | ) | | $ | — | | | $ | 20 | | | $ | (169 | ) | | $ | 27,462 | | | $ | 244 | | |
37
REPORT OF INDEPENDENT REGISTERED PUBLIC ACCOUNTING FIRM
To the Shareholders and the Board of Trustees of USAA Cornerstone Moderately Conservative Fund
Opinion on the Financial Statements
We have audited the accompanying statement of assets and liabilities of USAA Cornerstone Moderately Conservative Fund (the "Fund") (one of the funds constituting USAA Mutual Funds Trust (the "Trust")), including the schedule of portfolio investments, as of May 31, 2021, and the related statement of operations for the year then ended, the statements of changes in net assets for each of the two years in the period then ended, the financial highlights for each of the five years in the period then ended and the related notes (collectively referred to as the "financial statements"). In our opinion, the financial statements present fairly, in all material respects, the financial position of the Fund (one of the funds constituting USAA Mutual Funds Trust) at May 31, 2021, the results of its operations for the year then ended, the changes in its net assets for each of the two years in the period then ended and its financial highlights for each of the five years in the period then ended, in conformity with U.S. generally accepted accounting principles.
Basis for Opinion
These financial statements are the responsibility of the Trust's management. Our responsibility is to express an opinion on the Fund's financial statements based on our audits. We are a public accounting firm registered with the Public Company Accounting Oversight Board (United States) ("PCAOB") and are required to be independent with respect to the Trust in accordance with the U.S. federal securities laws and the applicable rules and regulations of the Securities and Exchange Commission and the PCAOB.
We conducted our audits in accordance with the standards of the PCAOB. Those standards require that we plan and perform the audit to obtain reasonable assurance about whether the financial statements are free of material misstatement, whether due to error or fraud. The Trust is not required to have, nor were we engaged to perform, an audit of the Trust's internal control over financial reporting. As part of our audits we are required to obtain an understanding of internal control over financial reporting, but not for the purpose of expressing an opinion on the effectiveness of the Trust's internal control over financial reporting. Accordingly, we express no such opinion.
Our audits included performing procedures to assess the risks of material misstatement of the financial statements, whether due to error or fraud, and performing procedures that respond to those risks. Such procedures included examining, on a test basis, evidence regarding the amounts and disclosures in the financial statements. Our procedures included confirmation of securities owned as of May 31, 2021, by correspondence with the custodian. Our audits also included evaluating the accounting principles used and significant estimates made by management, as well as evaluating the overall presentation of the financial statements. We believe that our audits provide a reasonable basis for our opinion.

We have served as the auditor of one or more Victory Capital investment companies since 1995.
San Antonio, Texas
July 28, 2021
38
USAA Mutual Funds Trust | | Supplemental Information
May 31, 2021 | |
(Unaudited)
Trustee and Officer Information
Board of Trustees:
Overall responsibility for management of the Trust rests with the Board. The Trust is managed by the Board in accordance with the laws of the state of Delaware. There are currently nine Trustees, seven of whom are not "interested persons" of the Trust within the meaning of that term under the 1940 Act ("Independent Trustees") and two of whom are "interested persons" of the Trust within the meaning of that term under the 1940 Act ("Interested Trustee"). The Trustees, in turn, elect the officers of the Trust to actively supervise its day-to-day operations.
The following tables list the Trustees, their ages, position with the Trust, commencement of service, principal occupations during the past five years and any directorships of other investment companies or companies whose securities are registered under the Securities Exchange Act of 1934, as amended, or who file reports under that Act. Each Trustee oversees 46 portfolios in the Trust. Each Trustee's address is 15935 La Cantera Pkwy, San Antonio, TX, 78256. Pursuant to a policy adopted by the Board, the term of office for each Trustee shall be until the Independent Trustee reaches age 75 or an Interested Trustee reaches age 75. The Board may change or grant exceptions from this policy at any time without shareholder approval. A Trustee may resign or be removed by a vote of the other Trustees or the holders of a majority of the outstanding shares of the Trust at any time. Vacancies on the Board can be filled by the action of a majority of the Trustees, provided that after filling such vacancy at least two-thirds of the Trustees have been elected by the shareholders.
Name and Date of Birth | | Position
Held with
the Trust | | Year
Commenced
Service | | Principal Occupation
During Past 5 Years | | Other
Directorships
Held During
Past 5 Years | |
Independent Trustees. | |
Jefferson C. Boyce, (c)
Born September 1957 | | Independent Chairman | | | 2021 | | | Senior Managing Director, New York Life Investments, LLC (1992-2012) | | Westhab, Inc. | |
John C. Walters,
Born February 1962 | | Trustee | | | 2019 | | | Retired. Mr. Walters brings significant Board experience including active involvement with the board of a Fortune 500 company, and a proven record of leading large, complex financial organizations. He has a demonstrated record of success in distribution, manufacturing, investment brokerage, and investment management in both the retail and institutional investment businesses. He has substantial experience in the investment management business with a demonstrated ability to develop and drive strategy while managing operation, financial, and investment risk. | | Guardian Variable Products Trust (16 series), Lead Independent Director; Amerilife Holdings LLC, Director; Stadion Money Management; Director; University of North Carolina (Chapel Hill), Member Board of Governors | |
39
USAA Mutual Funds Trust | | Supplemental Information — continued
May 31, 2021 | |
(Unaudited)
Name and Date of Birth | | Position
Held with
the Trust | | Year
Commenced
Service | | Principal Occupation
During Past 5 Years | | Other
Directorships
Held During
Past 5 Years | |
Robert L. Mason, Ph.D.,
Born July 1946 | | Trustee | | | 1997 | | | Adjunct Professor in the Department of Management Science and Statistics in the College of Business at the University of Texas at San Antonio (since 2001); Institute Analyst, Southwest Research Institute (March 2002-January 2016) | | None | |
Dawn M. Hawley,
Born February 1954 | | Trustee | | | 2014 | | | Manager of Finance, Menil Foundation, Inc. (May 2007-June 2011), which is a private foundation that oversees the assemblage of sculptures, prints, drawings, photographs, and rare books. Director of Financial Planning and Analysis and Chief Financial Officer, AIM Management Group, Inc. (October 1987-January 2006) | | None | |
Paul L. McNamara,
Born July 1948 | | Trustee | | | 2012 | | | Director, Cantor Opportunistic Alternatives Fund, LLC (March 2010-February 2014), which is a closed-end fund of funds by Cantor Fitzgerald Investment Advisors, LLC | | None | |
40
USAA Mutual Funds Trust | | Supplemental Information — continued
May 31, 2021 | |
(Unaudited)
Name and Date of Birth | | Position
Held with
the Trust | | Year
Commenced
Service | | Principal Occupation
During Past 5 Years | | Other
Directorships
Held During
Past 5 Years | |
Richard Y. Newton III,
Born January 1956 | | Trustee | | | 2017 | | | Director, Elta North America (01/18-present), which is a global leader in the design, manufacture, and support of innovative electronic systems in the ground, maritime, airborne, and security domains for the nation's warfighters, security personnel, and first responders; Managing Partner, Pioneer Partnership Development Group (December 2015-present)); Executive Director, The Union League Club of New York (June 2014-November 2015): Executive Vice President, Air Force Association (August 2012-May 2014); Lieutenant General, United States Air Force (January 2008-June 2012) | | PredaSAR Corp. | |
Barbara B. Ostdiek, Ph.D.,
Born March 1964 | | Trustee | | | 2008 | | | Senior Associate Dean of Degree Programs at Jesse H. Jones Graduate School of Business at Rice University (since 2013); Associate Professor of Finance at Jessie H. Jones Graduate School of Business at Rice University (since 2001) | | None | |
Effective at the close of business on December 31, 2020, Michael F. Reimherr retired from the Board of Trustees.
41
USAA Mutual Funds Trust | | Supplemental Information — continued
May 31, 2021 | |
(Unaudited)
Name and Date of Birth | | Position
Held with
the Trust | | Year
Commenced
Service | | Principal Occupation
During Past 5 Years | | Other
Directorships
Held During
Past 5 Years | |
Interested Trustees. | |
David C. Brown, (b)
Born May 1972 | | Trustee | | | 2019 | | | Chairman and Chief Executive Officer (since 2013), Victory Capital Management Inc.; Chairman and Chief Executive Officer, Victory Capital Holdings, Inc. (since 2013). Mr. Brown brings to the Board extensive business, finance and leadership skills gained and developed through years of experience in the financial services industry, including his tenure overseeing the strategic direction as CEO of Victory Capital. These skills, combined with Mr. Brown's extensive knowledge of the financial services industry and demonstrated success in the development and distribution of investment strategies and products, enable him to provide valuable insights to the Board and strategic direction for the Funds. | | Trustee, Victory Portfolios (41 series), Victory Portfolios II (26 series), Victory Variable Insurance Funds (8 series) | |
42
USAA Mutual Funds Trust | | Supplemental Information — continued
May 31, 2021 | |
(Unaudited)
Name and Date of Birth | | Position
Held with
the Trust | | Year
Commenced
Service | | Principal Occupation
During Past 5 Years | | Other
Directorships
Held During
Past 5 Years | |
Daniel S. McNamara, (b)(c)(d)
Born June 1966 | | Trustee | | | 2012 | | | Trustee, President, and Vice Chairman of USAA ETF Trust (June 2017-June 2019); President of Financial Advice & Solutions Group (FASG), USAA (February 2013-March 2021); Director of USAA Investment Services Company (ISCO) (formerly USAA Investment Management) (September 2009-March 2021); President, Asset Management Company (AMCO) (August, 2011-June 2019); Senior Vice President of USAA Financial Planning Services Insurance Agency, Inc. (FPS) (April 2011-March 2021); Chairman of Board of ISCO (April 2013-December 2020); Director of AMCO (August 2011-June 2019); President and Director of USAA Shareholder Account Services (SAS) (October 2009-June 2019); Director and Vice Chairman of FPS (December 2013-March 2021); President and Director of USAA Investment Corporation (ICORP) (March 2010-March 2021); Chairman of Board of ICORP (December 2013-March 2021); Director of USAA Financial Advisors, Inc. (FAI) (December 2013-March 2021); Chairman of Board of FAI (March 2015-March 2021). Mr. McNamara brings to the Board extensive experience in the financial services industry, including experience as an officer of the Trust. | | None | |
(b) Mr. Dan McNamara is deemed an "interested person" due to his previous position as Director of AMCO, the former investment adviser of the Funds. Mr. Brown is deemed an "interested person" due to his position as Chief Executive Officer of Victory Capital, investment adviser to the Funds.
(c) Effective at the close of business on December 31, 2020, Jefferson C. Boyce replaced Dan McNamara as Chair of the Board and assumed the title of Independent Chair.
(d) Effective July 2, 2021, Mr. Dan McNamara became an Independent Trustee to the Funds.
The Statement of Additional Information includes additional information about the Trustees of the Trust and is available, without charge, on the SEC's website at www.sec.gov and/or by calling (800)-235-8396.
43
USAA Mutual Funds Trust | | Supplemental Information — continued
May 31, 2021 | |
(Unaudited)
Officers:
The officers of the Trust, their ages, commencement of service and their principal occupations during the past five years, are detailed in the following table. Each officer serves until the earlier of his or her resignation, removal, retirement, death, or the election of a successor. The mailing address of each officer of the Trust is 15935 La Cantera Pkwy, San Antonio, TX, 78256. The officers of the Trust receive no compensation directly from the Trust for performing the duties of their offices.
Name and Date of Birth | | Position with
the Trust | | Year
Commenced
Service | | Principal Occupation During Past 5 Years | |
Interested Officers.
Christopher K. Dyer,
Born February 1962 | | President | | | 2019 | | | Director of Fund Administration, Victory Capital (since 2004); Chief Operating Officer, Victory Capital Services, Inc. (since 2020) | |
Scott A Stahorsky,
Born July 1969 | | Vice President | | | 2019 | | | Manager, Fund Administration, Victory Capital (since 2015) | |
James K. De Vries,
Born April 1969 | | Treasurer | | | 2018 | | | Executive Director, Victory Capital Management Inc. (since 2019); Treasurer, USAA ETF Trust (September 2018-June 2019); Executive Director, Investment and Financial Administration, USAA (April 2012-June 2019); Assistant Treasurer, USAA ETF Trust (June 2017-September 2018); Assistant Treasurer, USAA Mutual Funds Trust (December 2013-February 2018) | |
Allan Shaer,
Born March 1965 | | Assistant Treasurer | | | 2019 | | | Senior Vice President, Financial Administration, Citi Fund Services Ohio, Inc. (since 2016); Vice President, Mutual Fund Administration, JP Morgan Chase (2011-2016) | |
Carol D. Trevino,
Born October 1965 | | Assistant Treasurer | | | 2018 | | | Director, Accounting and Finance, Victory Capital Management Inc. (since 2019); Accounting/Financial Director, USAA (December 2013-June 2019); Assistant Treasurer, USAA ETF Trust (September 2018-June 2019) | |
Erin G. Wagner,
Born February 1974 | | Secretary | | | 2019 | | | Deputy General Counsel, the Adviser (since 2013) | |
Charles Booth,
Born April 1960 | | Anti-Money Laundering Compliance Officer and Identity Theft Officer | | | 2019 | | | Director, Regulatory Administration and CCO Support Services, Citi Fund Services Ohio, Inc. (since 2007) | |
Amy Campos,
Born July 1976 | | Chief Compliance Officer | | | 2019 | | | Chief Compliance Officer, USAA Mutual Funds Trust (since 2019); Executive Director, Deputy Chief Compliance Officer, USAA Mutual Funds Trust and USAA ETF Trust (July 2017-June 2019); Compliance Director, USAA Mutual Funds Trust (2014-July 2017) | |
44
USAA Mutual Funds Trust | | Supplemental Information — continued
May 31, 2021 | |
(Unaudited)
Proxy Voting and Portfolio Holdings Information
Proxy Voting:
Information regarding the policies and procedures the Fund uses to determine how to vote proxies relating to portfolio securities is available without charge, upon request, by calling (800) 235-8396. The information is also included in the Fund's Statement of Additional Information, which is available on the SEC's website at www.sec.gov.
Information relating to how the Fund voted proxies relating to portfolio securities held during the most recent 12 months ended June 30 is available on the SEC's website at www.sec.gov.
Availability of Schedules of Portfolio Investments:
The Trust files a complete list of Schedules of Portfolio Investments with the SEC for the first and third quarter of each fiscal year on Form N-PORT. Form N-PORT is available on the SEC's website at www.sec.gov.
Expense Example
As a shareholder of the Fund, you may incur two types of costs: (1) transaction costs, and (2) ongoing costs, including management fees and other Fund expenses. These examples are intended to help you understand your ongoing costs (in dollars) of investing in the Fund and to compare these costs with the ongoing costs of investing in other mutual funds.
These examples are based on an investment of $1,000 invested at the beginning of the period and held for the entire period from December 1, 2020, through May 31, 2021.
The Actual Expense figures in the table below provide information about actual account values and actual expenses. You may use the information below, together with the amount you invested, to estimate the expenses that you paid over the period. Simply divide your account value by $1,000 (for example, an $8,600 account value divided by $1,000 = 8.6), then multiply the result by the number in the table under the heading entitled "Actual Expenses Paid During Period" to estimate the expenses you paid on your account during this period.
The Hypothetical Expense figures in the table below provide information about hypothetical account values and hypothetical expenses based on the Fund's actual expense ratio and an assumed rate of return of 5% per year before expenses, which is not the Fund's actual return. The hypothetical account values and expenses may not be used to estimate the actual ending account balance or expenses you paid for the period. You may use this information to compare this 5% hypothetical example with the 5% hypothetical examples that appear in shareholder reports of other funds.
Please note the expenses shown in the table below are meant to highlight your ongoing costs only and do not reflect any transactional costs. If these transactional costs were included, your costs would have been higher.
Beginning
Account
Value
12/1/20 | | Actual
Ending
Account
Value
5/31/21 | | Hypothetical
Ending
Account
Value
5/31/21 | | Actual
Expenses
Paid
During
Period
12/1/20-
5/31/21* | | Hypothetical
Expenses
Paid
During
Period
12/1/20-
5/31/21* | | Annualized
Expense
Ratio
During
Period
12/1/20-
5/31/21 | |
| $ | 1,000.00 | | | $ | 1,067.50 | | | $ | 1,020.44 | | | $ | 4.64 | | | $ | 4.53 | | | | 0.90 | % | |
* Expenses are equal to the average account value multiplied by the Fund's annualized expense ratio multiplied by 182/365 (the number of days in the most recent fiscal half-year divided by the number of days in the fiscal year).
45
USAA Mutual Funds Trust | | Supplemental Information — continued
May 31, 2021 | |
(Unaudited)
Additional Federal Income Tax Information
The following federal tax information related to the Fund's fiscal year ended May 31, 2021, is provided for information purposes only and should not be used for reporting to federal or state revenue agencies. Federal tax information for the calendar year will be reported to you on Form 1099-DIV in January 2022.
With respect to distributions paid, the Fund designates the following amounts (or, if subsequently determined to be different, the maximum amount allowable) for the fiscal year ended May 31, 2021 (amounts in thousands):
| | Dividends
Received
Deduction
(corporate
shareholders) | | Qualified
Dividend
Income
(non-corporate
shareholders) | | Long-Term
Capital Gain
Distributions | |
| | | | | | 9 | % | | | 10 | % | | $ | 534 | | |
46
USAA Mutual Funds Trust | | Supplemental Information — continued
May 31, 2021 | |
(Unaudited)
Considerations of the Board in Continuing the Investment Advisory Agreement (the "Agreement")
USAA Cornerstone Moderately Conservative Fund (the "Fund")
At a meeting of the Board of Trustees (the "Board") held on December 10-11, 2020, the Board, including the Trustees who are not "interested persons" (as that term is defined in the Investment Company Act of 1940, as amended) of the Trust (the "Independent Trustees"), approved for an annual period the continuance of the Investment Advisory Agreement (the "Advisory Agreement") between the Trust and Victory Capital Management Inc. (the "Adviser") with respect to the Fund. Prior to the December 10-11, 2020 meeting at which the Advisory Agreement was approved, the Independent Trustees also discussed and considered information regarding the proposed continuation of the Advisory Agreement at a meeting held on November 19, 2020.
In advance of the foregoing meetings, the Trustees received and considered a variety of information relating to the Advisory Agreement and the Adviser, and were given the opportunity to ask questions and request additional information from management. The information provided to the Board included, among other things: (i) a separate report prepared by an independent third party of mutual fund data, which provided a statistical analysis comparing the Fund's investment performance, expenses, and fees to comparable investment companies; (ii) information concerning the services rendered to the Fund, as well as information regarding the Adviser's revenues and costs of providing services to the Fund and compensation paid to affiliates of the Adviser; and (iii) information about the Adviser's operations and personnel. Prior to voting, the Independent Trustees reviewed the proposed continuance of the Advisory Agreement with management and with experienced independent counsel retained by the Independent Trustees ("Independent Counsel") and received materials from such Independent Counsel discussing the legal standards for their consideration of the proposed continuation of the Advisory Agreement with respect to the Fund. The Independent Trustees also reviewed the proposed continuation of the Advisory Agreement with respect to the Fund in private sessions with Independent Counsel at which no representatives of management were present.
At each regularly scheduled meeting of the Board and its committees, the Board receives and reviews, among other things, information concerning the Fund's performance and related services provided by the Adviser. At the meeting at which the renewal of the Advisory Agreement is considered, particular focus is given to information concerning Fund performance, fees and total expenses as compared to comparable investment companies, and the Adviser's profitability with respect to the Fund. However, the Board noted that the evaluation process with respect to the Adviser is an ongoing one. In this regard, the Board's and its committees' consideration of the Advisory Agreement included information previously received at such meetings.
Advisory Agreement
After full consideration of a variety of factors, the Board, including the Independent Trustees, voted to approve the Advisory Agreement. In approving the Advisory Agreement, the Trustees did not identify any single factor as controlling, and each Trustee may have attributed different weights to various factors. Throughout their deliberations, the Independent Trustees were represented and assisted by Independent Counsel.
Nature, Extent, and Quality of Services — In considering the nature, extent, and quality of the services provided by the Adviser under the Advisory Agreement, the Board reviewed information provided by the Adviser relating to its operations and personnel. The Board also took into account its knowledge of the Adviser's management and the quality of the performance of the Adviser's duties through Board meetings, discussions, and reports during the preceding year. The Board considered the fees paid to the Adviser and the services provided to the Fund by the Adviser under the Advisory Agreement, as well as other services provided by the Adviser and its affiliates under other agreements, and the personnel who provide these services. In addition to the investment advisory services provided to the Fund, the Adviser and its affiliates provide administrative services, shareholder services, oversight of Fund accounting, marketing services, assistance in meeting legal and regulatory requirements, and other services necessary for the operation of the Fund and the Trust.
The Board considered the scope of services provided by, and the undertakings required of, the Adviser in connection with those services, including, among other things, maintaining (i) its own and the Fund's compliance programs, (ii) risk management programs, (iii) liquidity risk management programs, and (iv) cybersecurity
47
USAA Mutual Funds Trust | | Supplemental Information — continued
May 31, 2021 | |
(Unaudited)
programs, each of which had expanded over time as a result of regulatory, market, and other developments. The Board also considered the significant risks assumed by the Adviser in connection with the services provided to the Fund, including investment, operational, enterprise, litigation, regulatory, and compliance risks.
The Board considered the Adviser's management style and the performance of the Adviser's duties under the Advisory Agreement. The Board considered the level and depth of knowledge of the Adviser, including the professional experience and qualifications of its senior and investment personnel, as well as current staffing levels. The allocation of the Fund's brokerage, including the Adviser's process for monitoring "best execution," also was considered. The Adviser's role in coordinating the activities of the Fund's other service providers was also considered. The Board also considered the Adviser's risk management processes. The Board considered the Adviser's financial condition and that it had the financial wherewithal to continue to provide the same scope and high quality of services under the Advisory Agreement. In reviewing the Advisory Agreement, the Board focused on the experience, resources, and strengths of the Adviser and its affiliates in managing the Fund, as well as the other funds in the Trust.
The Board also reviewed the compliance and administrative services provided to the Fund by the Adviser and its affiliates, including the Adviser's oversight of the Fund's day-to-day operations and oversight of Fund accounting. The Trustees, guided also by information obtained from their experiences as trustees of the Trust, also focused on the quality of the Adviser's compliance and administrative staff.
Expenses and Performance — In connection with its consideration of the Advisory Agreement, the Board evaluated the Fund's advisory fees and total expense ratio as compared to other open-end investment companies deemed to be comparable to the Fund as determined by the independent third party in its report. The Fund's expenses were compared to (i) a group of investment companies chosen by the independent third party to be comparable to the Fund based upon certain factors, including fund type, comparability of investment objective and classification, sales load type, asset size, and expense components (the "expense group") and (ii) a larger group of investment companies with the same investment classification/objective as the Fund regardless of asset size, excluding outliers (the "expense universe"). Among other data, the Board noted that the Fund's management fee rate — which includes advisory and administrative services, as well as any fee waivers and reimbursements — was below the medians of its expense group and expense universe. The data indicated that the Fund's total expenses, including after any reimbursements, were above the medians of its expense group and expense universe. The Board also took into account the Adviser's current undertakings to maintain expense limitations for the Fund. The Board took into account the various other services provided to the Fund by the Adviser and its affiliates, and noted the high quality of services received by the Fund.
In considering the Fund's performance, the Board noted that it reviews at its regularly scheduled meetings information about the Fund's performance results. The Trustees also reviewed various comparative data provided to them in connection with their consideration of the renewal of the Advisory Agreement, including, among other information, a comparison of the Fund's average annual total returns relative to its Lipper index and other mutual funds deemed to be in its peer group by the independent third party in its report (the "performance universe"). The Fund's performance universe consisted of the Fund and all retail and institutional open-end investment companies with the same classification/objective as the Fund regardless of asset size or primary channel of distribution. This comparison indicated that, among other data, the Fund's performance was above the average of its performance universe for the one-year period ended September 30, 2020, and was below the average of its performance universe for the three- and five-year periods ended September 30, 2020, and was below its Lipper index for the one-, three- and five-year periods ended September 30, 2020. The Board took into account management's discussion of the Fund's performance, including the reasons for the Fund's underperformance relative to its peers.
Compensation and Profitability — The Board took into consideration the level and method of computing the management fee. The information considered by the Board included operating profit margin information for the Adviser's business as a whole. The Board also received and considered profitability information related to the management revenues from the Fund. This information included a review of the methodology used in the allocation of certain costs to the Fund. In considering the profitability data with respect to the Fund, the Trustees noted that the Adviser waived a portion of its management fees and/or reimbursed certain expenses with respect to the Fund. The Trustees reviewed the profitability of the Adviser's relationship with the Fund before tax expenses. The Board was also provided with a profitability analysis of other publicly traded asset managers
48
USAA Mutual Funds Trust | | Supplemental Information — continued
May 31, 2021 | |
(Unaudited)
prepared by an independent information service. In reviewing the overall profitability of the management fee to the Adviser, the Board also considered the fact that the Adviser and its affiliates provide shareholder servicing and administrative services to the Fund for which they receive compensation. The Board also considered the possible direct and indirect benefits to the Adviser from its relationship with the Trust, including that the Adviser may derive reputational and other benefits from its association with the Fund. The Trustees recognized that the Adviser should be entitled to earn a reasonable level of profits in exchange for the level of services it provides to the Fund and the entrepreneurial and other risks that it assumes as Adviser.
Economies of Scale — The Board considered whether there should be changes in the management fee rate or structure in order to enable the Fund to participate in any economies of scale. The Board also considered the fee waiver and expense reimbursement arrangements by the Adviser. The Board also considered the effect of the Fund's change in size, if any, on its performance and fees, noting that the Fund may realize other economies of scale if assets increase proportionally more than expenses. The Board determined that the current investment management fee structure was reasonable.
Conclusions — The Board reached the following conclusions regarding the Fund's Advisory Agreement with the Adviser: (i) the Adviser has demonstrated that it possesses the capability and resources to perform the duties required of it under the Advisory Agreement; (ii) the Adviser maintains an appropriate compliance program; (iii) the performance of the Fund is reasonable in relation to the performance of funds with similar investment objectives and to relevant indices in view of the Fund's investment approach and the Adviser is appropriately monitoring the Fund's performance; (iv) the Fund's advisory expenses are reasonable in relation to those of similar funds and to the services to be provided by the Adviser; and (v) the Adviser's and its affiliates' level of profitability from their relationship with the Fund is reasonable in light of the nature and high quality of services provided by the Adviser and the type of fund. Based on its conclusions, the Board determined that continuation of the Advisory Agreement would be in the best interests of the Fund and its shareholders.
49
USAA Mutual Funds Trust | | Supplemental Information — continued
May 31, 2021 | |
(Unaudited)
Liquidity Risk Management Program:
The USAA Mutual Funds have adopted and implemented a written liquidity risk management program (the "LRMP") as required by Rule 22e-4 under the Investment Company Act of 1940, as amended. The LRMP is reasonably designed to assess and manage the Fund's liquidity risk, taking into consideration the Fund's investment strategy and the liquidity of its portfolio investments during normal and reasonably foreseeable stressed market conditions; its short and long-term cash flow projections; and its cash holdings and access to other liquidity management tools such as available funding sources including the Victory Funds Complex Interfund Lending Facility and Line of Credit (discussed in the Notes to Financial Statements). The USAA Mutual Funds' Board of Trustees approved the appointment of the Fund's investment adviser, Victory Capital Management Inc. ("Victory Capital"), as the administrator of the LRMP.
Victory Capital manages liquidity risks associated with the Fund's investments by monitoring, among other things, cash and cash equivalents, any use of derivatives, the concentration of investments, the appropriateness of the Fund's investment strategy, and by classifying every Fund investment as either highly liquid, moderately liquid, less liquid, or illiquid on at least a monthly basis. To assist with the classification of Fund investments, Victory Capital has retained a third-party provider of liquidity evaluation services. This provider determines preliminary liquidity classifications for all portfolio holdings based upon portfolio-level data and certain assumptions provided by Victory Capital. Victory Capital reviews the preliminary liquidity classifications and, when appropriate, considers other information including input from the Fund's portfolio managers (including the portfolio managers employed by any investment sub-advisers) in determining final liquidity classifications.
At a meeting held on March 10, 2021, Victory Capital provided an oral and written report to the Trustees on the operation and effectiveness of the LRMP during the previous year. The report from Victory Capital concluded that the Fund did not experience any significant liquidity challenges during the covered period, and the Fund's LRMP is reasonably designed to assess and manage its liquidity risk. The report also concluded that the LRMP continues to operate adequately and effectively to enable Victory Capital to oversee and manage liquidity risk and ensure the Fund is able to meet redemption requests without significant dilution to the remaining investors' interest in the Fund. During the review period, the Fund's portfolio consisted primarily of highly liquid investments, which are defined as cash and any investments that the Fund reasonably expects to be converted to cash in current market conditions in three business days or less without significantly changing the market value of the investment. Therefore, the Fund has not adopted a highly liquid investment minimum. The Funds' investments were below the limitation on illiquid investments during the review period. Additionally, Victory Capital indicated that no events occurred that would require the filing of Form N-LIQUID and recommended no material changes to the LRMP.
50
Privacy Policy
Protecting the Privacy of Information
The Trust respects your right to privacy. We also know that you expect us to conduct and process your business in an accurate and efficient manner. To do so, we must collect and maintain certain personal information about you. This is the information we collect from you on applications or other forms, and from the transactions you make with us or third parties. It may include your name, address, social security number, account transactions and balances, and information about investment goals and risk tolerance.
We do not disclose any information about you or about former customers to anyone except as permitted or required by law. Specifically, we may disclose the information we collect to companies that perform services on our behalf, such as the transfer agent that processes shareholder accounts and printers and mailers that assist us in the distribution of investor materials. We may also disclose this information to companies that perform marketing services on our behalf. This allows us to continue to offer you Victory investment products and services that meet your investing needs, and to effect transactions that you request or authorize. These companies will use this information only in connection with the services for which we hired them. They are not permitted to use or share this information for any other purpose.
To protect your personal information internally, we permit access only by authorized employees and maintain physical, electronic, and procedural safeguards to guard your personal information.*
* You may have received communications regarding information about privacy policies from other financial institutions which gave you the opportunity to "opt-out" of certain information sharing with companies which are not affiliated with that financial institution. The Trust does not share information with other companies for purposes of marketing solicitations for products other than the Trust. Therefore, the Trust does not provide opt-out options to their shareholders.
P.O. Box 182593
Columbus, Ohio 43218-2593

Visit our website at: | | Call | |
vcm.com | | (800) 235-8396 | |

MAY 31, 2021
Annual Report
USAA Cornerstone Aggressive Fund
Victory Capital means Victory Capital Management Inc., the investment adviser of the USAA Mutual Funds. USAA Mutual Funds are distributed by Victory Capital Services, Inc., member of FINRA, an affiliate of Victory Capital. Victory Capital and its affiliates are not affiliated with United Services Automobile Association or its affiliates. USAA and the USAA logos are registered trademarks and the USAA Mutual Funds and USAA Investments logos are trademarks of United Services Automobile Association and are being used by Victory Capital and its affiliates under license.
www.vcm.com
News, Information And Education 24 Hours A Day, 7 Days A Week
The Victory Funds site gives fund shareholders, prospective shareholders, and investment professionals a convenient way to access fund information, get guidance, and track fund performance anywhere they can access the Internet. The site includes:
• Detailed performance records
• Daily share prices
• The latest fund news
• Investment resources to help you become a better investor
• A section dedicated to investment professionals
Whether you're a potential investor searching for the fund that matches your investment philosophy, a seasoned investor interested in planning tools, or an investment professional, www.vcm.com has what you seek. Visit us anytime. We're always open.
TABLE OF CONTENTS
Shareholder Letter (Unaudited) | | | 2 | | |
Managers' Commentary (Unaudited) | | | 4 | | |
Investment Overview (Unaudited) | | | 6 | | |
Investment Objective & Portfolio
Holdings (Unaudited) | | | 7 | | |
Schedule of Portfolio Investments | | | 8 | | |
Financial Statements | |
Statement of Assets and Liabilities | | | 25 | | |
Statement of Operations | | | 26 | | |
Statements of Changes in Net Assets | | | 27 | | |
Financial Highlights | | | 28 | | |
Notes to Financial Statements | | | 30 | | |
Report of Independent
Registered Public Accounting Firm | | | 42 | | |
Supplemental Information (Unaudited) | | | 43 | | |
Trustees' and Officers' Information | | | 43 | | |
Proxy Voting and Portfolio Holdings Information | | | 49 | | |
Expense Example | | | 49 | | |
Additional Federal Income Tax Information | | | 50 | | |
Advisory Contract Agreement | | | 51 | | |
Liquidity Risk Management Program | | | 54 | | |
Privacy Policy (inside back cover) | | | |
This report is for the information of the shareholders and others who have received a copy of the currently effective prospectus of the Fund, managed by Victory Capital Management Inc. It may be used as sales literature only when preceded or accompanied by a current prospectus, which provides further details about the Fund.
IRA DISTRIBUTION WITHHOLDING DISCLOSURE
We generally must withhold federal income tax at a rate of 10% of the taxable portion of your distribution and, if you live in a state that requires state income tax withholding, at your state's tax rate. However, you may elect not to have withholding apply or to have income tax withheld at a higher rate. Any withholding election that you make will apply to any subsequent distribution unless and until you change or revoke the election. If you wish to make a withholding election, or change or revoke a prior withholding election, call (800) 235-8396, and form W-4P (OMB No. 1545-0074 withholding certificate for pension or annuity payments) will be electronically sent.
If you do not have a withholding election in place by the date of a distribution, federal income tax will be withheld from the taxable portion of your distribution at a rate of 10%. If you must pay estimated taxes, you may be subject to estimated tax penalties if your estimated tax payments are not sufficient and sufficient tax is not withheld from your distribution.
For more specific information, please consult your tax adviser.
• NOT FDIC INSURED • NO BANK GUARANTEE • MAY LOSE VALUE
1
(Unaudited)
Dear Shareholder,
Never a dull moment. A year ago, we were still coming to grips with a global pandemic, hoping for an effective vaccine, and wondering whether the U.S. Federal Reserve's aggressive actions would continue to mollify financial markets. As it turns out, a vaccine was rolled out (domestically) faster than expectations, and the recovery that began during the second quarter of 2020 continued unabated.
Fast forward to today and investors are suddenly more concerned about labor shortages, rising commodity prices, and whether inflation will prove to be transitory or more lasting. If anything, this merely exemplifies that markets are unpredictable and the environment can change rapidly.
Reflecting on the past year, we must consider ourselves fortunate despite the myriad of challenges. For starters, it was impressive how quickly the various forms of monetary and fiscal stimulus contributed to a rebound in GDP. Of course, it wasn't a straight line upward and there were bouts of elevated volatility in both bond and stock markets. Late in 2020, for example, financial markets were alternately fueled and roiled by a contentious election season, growing optimism for an effective vaccine, and a fluid debate regarding the need for even more stimulus. Ultimately, stocks were propelled higher in the fourth quarter of 2020 as it became clear Congress would provide another dose of stimulus in the form of direct payments, more unemployment insurance, and additional aid to businesses.
As we moved into 2021, stocks continued their upward trajectory. Meanwhile, the yield on the 10-Year U.S. Treasury continued rallying sharply as many investors began to shift their focus. Deflation was out; inflation was in. Indeed, the potential for a new era of inflation and higher interest rates seems to be the new worry du jour.
So how did the numbers shake out after this unusual year? The S&P 500® Index registered an impressive annual return of approximately 40% for this 12-month period ended May 31, 2021. Over this same period, the yield on the 10-Year U.S. Treasury jumped 94 basis points, reflecting both the very low starting rate and substantial fiscal stimulus. At the end of the reporting period, the yield on the 10-Year U.S. Treasury was 1.59%.
The past year is not one we will forget any time soon. There were many hardships, but we should not overlook the positives and remember our collective spirit and perseverance. Markets endured and even surprised to the upside, but perhaps the key takeaway is that investors need to remain calm in the face of adversity and focused on longer-term investment goals. We believe that's the best approach no matter what the markets throw at us.
On the following pages, you will find information relating to your USAA Mutual Funds, brought to you by Victory Capital. If you have any questions regarding the current market dynamics or your specific portfolio or investment plan, we encourage you to contact our Member Service Representatives. Call (800) 235-8396 or visit our website at www.vcm.com.
2
From all of us here at Victory Capital, thank you for letting us help you work toward your investment goals.

Christopher K. Dyer, CFA
President,
USAA Mutual Funds
3
USAA Cornerstone Aggressive Fund
Managers' Commentary
(Unaudited)
• What were the market conditions during the reporting period?
The beginning of the reporting period brought a dramatic reversal from the difficult environment that characterized the first part of 2020. While COVID-19 cases continued to rise, investors grew increasingly confident that the economy would be able to recover from its sharp downturn of February and March. The optimism stemmed, in part, from a series of better-than-expected economic reports interpreted as evidence that the slump in growth would be less severe than was initially feared. The markets were further cheered by the aggressive response by the U.S. Federal Reserve (the "Fed"). In addition to reiterating its commitment to keep short-term interest rates near zero for an extended period, the Fed announced the direct purchase of both individual bonds and exchange-traded bond funds. The central bank's unusual steps offered corporations the latitude to issue debt at ultra-low rates, providing them with the cash necessary to help withstand the effects of the coronavirus.
The global financial markets produced healthy returns during the second half of 2020, wrapping up a positive year for the major asset classes. Investors' appetite for risk improved considerably in early November, when the approval of vaccines for COVID-19 raised expectations that the world economy could gradually return to normal in 2021. The conclusion of the U.S. elections, which removed a source of uncertainty that had depressed performance in September and October, was an additional tailwind. The markets were also aided by continued indications that the Fed and other central banks would maintain their highly accommodative policies indefinitely. Not least, an agreement on a new round of U.S. fiscal stimulus further cheered investors in late December. Together, these developments outweighed negative headlines surrounding renewed lockdowns and the persistence of the coronavirus.
The first quarter of 2021 proved to be a continuation of the strong equity markets investors experienced over the second half of 2020. Gains from global equity markets were fueled by optimism surrounding the successful rollout of the COVID-19 vaccines coupled with further monetary and fiscal stimulus proposals. Faster-than-expected economic growth produced a meaningful increase in real interest rates, which led to negative returns across most major fixed income asset classes. The 10-year U.S. Treasury bond yield finished at its highest level of the first quarter reporting period, climbing from under 1% to 1.74%.
During the last few months of the reporting period, equity markets have been consolidating and interest rates leveling off after large upswings. With strong first quarter GDP and corporate earnings growth in the rearview mirror, investors seem to be contemplating their next move. Inflation data has been increasing as the economy reopens more quickly than expected. The Fed maintains that inflationary pressure is transitory but could become more persistent. The inflationary environment will be a key metric moving into the second half of the year.
4
USAA Cornerstone Aggressive Fund (continued)
Managers' Commentary (continued)
• How did the USAA Cornerstone Aggressive Fund (the "Fund") perform during the reporting period?
For the reporting period ended May 31, 2021, the Fund had a total return of 32.91%. This compares to returns of 41.85% for the MSCI All-Country World Index and 34.27% for the Cornerstone Aggressive Composite Index.
• What strategies did you employ during the reporting period?
The Fund delivered strong positive total returns during the reporting period as equity markets rebounded sharply off the market lows produced during the COVID-induced sell off early last year. All major equity asset classes participated in the rally with U.S. small cap and emerging market stocks leading the way. The Fund's allocation to fixed income produced small positive returns. Despite the double-digit total returns, the Fund slightly underperformed the Cornerstone Aggressive Composite Index.
Positive contributors to the relative performance included an overweight to emerging market and small-cap stocks. The Fund also benefitted from a tactical underweight to fixed-income securities as the sharp increase in interest rates weighed on bond prices particularly during the first quarter of 2021. Security selection in the Fund's underlying fixed-income portfolio added value due to an overweight to credit-oriented securities.
These positive drivers were offset by weakness in the security selection within the U.S large-cap portion of the portfolio, primarily driven by the resurgence of what we believe are lower-quality stocks, which experienced a sharp relief rally following the rollout of the vaccine. Additionally, the Fund's commodity exposure was weighted more heavily towards gold-related securities, which underperformed a more diversified basket. A tactical underweight to real estate investment trusts also detracted slightly from performance.
Thank you for allowing us to assist you with your investment needs.
5
USAA Cornerstone Aggressive Fund
Investment Overview
(Unaudited)
Average Annual Total Return
Year Ended May 31, 2021
| | | Fund Shares | | | | | |
INCEPTION DATE | | 6/8/12 | | | | | |
| | | Net Asset Value | | MSCI All-Country
World Index1 | | Cornerstone Aggressive
Composite Index2 | |
One Year | | | 32.91 | % | | | 41.85 | % | | | 34.27 | % | |
Five Year | | | 9.96 | % | | | 14.18 | % | | | 12.30 | % | |
Since Inception | | | 8.15 | % | | | 12.24 | % | | | 10.86 | % | |
The performance data quoted represents past performance and current returns may be lower or higher. The investment return and principal value will fluctuate so that an investor's shares, when redeemed, may be worth more or less than the original cost. To obtain performance information current to the most recent month's end, please visit www.vcm.com.
Total return measures the price change in a share assuming the reinvestment of all net investment income and realized capital gain distributions, if any. The total returns quoted do not reflect adjustments made to the enclosed financial statements in accordance with U.S. Generally Accepted Accounting Principles or the deduction of taxes that a shareholder would pay on net investment income and realized capital gain distributions, including reinvested distributions, or redemptions of shares. The total return figures set forth above include all waivers of fees. Without such fee waivers, the total returns would have been lower.
USAA Cornerstone Aggressive Fund — Growth of $10,000
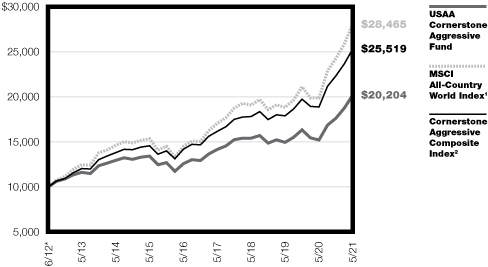
*The performance of the MSCI All-Country World Index and Cornerstone Aggressive Composite Index is calculated from the end of the month, May 31, 2012, while the inception date of the Cornerstone Aggressive Fund is June 8, 2012. There might be a slight variation of performance numbers because of the difference.
1The unmanaged MSCI All-Country World Index is a free float-adjusted, market capitalization-weighted index designed to measure the performance of large- and mid-cap stocks across developed and emerging markets. The index reflects the reinvestment of dividends paid on the stocks constituting the index net of withholding taxes. This index does not include the effect of sales charges, commissions, expenses, or taxes, is not representative of the Fund, and it is not possible to invest directly in an index.
2The Cornerstone Aggressive Composite Index is a combination of unmanaged indexes representing the Fund's model allocation, and consists of the MSCI USA Investable Market Index (IMI) Gross (46%), the MSCI ACWI ex USA IMI Net (30%), the Bloomberg Barclays U.S. Universal Index (18%), the Bloomberg Commodity Index Total Return (2%), the MSCI U.S. Real Estate Investment Trust (REIT) Index Gross (2%), and the Bloomberg Barclays U.S. Treasury — Bills (1-3M) (2%). This index does not include the effect of sales charges, commissions, expenses, or taxes, is not representative of the Fund, and it is not possible to invest directly in an index.
The graph reflects investment of growth of a hypothetical $10,000 investment in the Fund.
The graph and table do not reflect the deduction of taxes that a shareholder would pay on Fund distributions or the redemption of Fund shares.
Past performance is not indicative of future results.
6
USAA Mutual Funds Trust
USAA Cornerstone Aggressive Fund | | May 31, 2021 | |
(Unaudited)
Investment Objective and Portfolio Holdings:
The Fund's investment objective seeks capital appreciation over the long term and also considers the potential for current income.
Asset Allocation*:
May 31, 2021
(% of Net Assets)

* Does not include futures, money market instruments, and short-term investments purchased with cash collateral from securities loaned.
Percentages are of the net assets of the Fund and may not equal 100%.
7
USAA Mutual Funds Trust
USAA Cornerstone Aggressive Fund | | Schedule of Portfolio Investments
May 31, 2021 | |
(Amounts in Thousands, Except for Shares)
Security Description | | Principal
Amount | | Value | |
Asset-Backed Securities (0.4%) | |
Americredit Automobile Receivables Trust, Series 2018-1, Class C,
3.50%, 1/18/24, Callable 8/18/22 @100 | | $ | 240 | | | $ | 246 | | |
Americredit Automobile Receivables Trust, Series 2018-2, Class A3,
3.15%, 3/20/23, Callable 10/18/22 @100 | | | 12 | | | | 12 | | |
Canadian Pacer Auto Receivables Trust, Series 2018-1A, Class C,
3.82%, 4/19/24, Callable 6/19/21 @100 (a) | | | 137 | | | | 138 | | |
CarMax Auto Owner Trust, Series 2020-1, Class B, 2.21%, 9/15/25,
Callable 8/15/23 @100 | | | 71 | | | | 73 | | |
Credit Acceptance Auto Loan Trust, Series 2018-3A, Class A, 3.55%, 8/15/27,
Callable 10/15/21 @100 (a) | | | 2 | | | | 2 | | |
Drive Auto Receivables Trust, Series 2018-4, Class D, 4.09%, 1/15/26,
Callable 8/15/22 @100 | | | 62 | | | | 64 | | |
Exeter Automobile Receivables Trust, Series 2019-2A, Class C, 3.30%, 3/15/24,
Callable 4/15/23 @100 (a) | | | 106 | | | | 107 | | |
Exeter Automobile Receivables Trust, Series 2017-3A, Class D, 5.28%, 10/15/24,
Callable 4/15/22 @100 (a) | | | 50 | | | | 52 | | |
Exeter Automobile Receivables Trust, Series 2020-1A, Class B, 2.26%, 4/15/24,
Callable 5/15/23 @100 (a) | | | 57 | | | | 57 | | |
Ford Credit Auto Owner Trust, Series 2020-1, Class B, 2.29%, 8/15/31,
Callable 2/15/25 @100 (a) | | | 75 | | | | 78 | | |
Hertz Vehicle Financing II LP, Series 2019-3A, Class A, 2.67%, 12/26/25 (a) | | | 11 | | | | 11 | | |
HPEFS Equipment Trust, Series 2020-1A, Class B, 1.89%, 2/20/30,
Callable 2/20/23 @100 (a) | | | 29 | | | | 29 | | |
HPEFS Equipment Trust, Series 2019-1A, Class C, 2.49%, 9/20/29,
Callable 6/20/22 @100 (a) | | | 50 | | | | 51 | | |
Navient Student Loan Trust, Series 2015-2, Class B, 1.59% (LIBOR01M+150bps),
8/25/50, Callable 8/25/29 @100 (b) | | | 50 | | | | 50 | | |
NP SPE II LLC, Series 2017-1A, Class A1, 3.37%, 10/21/47,
Callable 10/20/27 @100 (a) | | | 28 | | | | 29 | | |
SCF Equipment Leasing LLC, Series 2020-1A, Class B, 2.02%, 3/20/28,
Callable 5/20/25 @100 (a) | | | 47 | | | | 48 | | |
Westlake Automobile Receivables Trust, Series 2018-2A, Class D, 4.00%, 1/16/24,
Callable 1/15/22 @100 (a) | | | 113 | | | | 114 | | |
Westlake Automobile Receivables Trust, Series 2020-1A, Class B, 1.94%, 4/15/25,
Callable 4/15/23 @100 (a) | | | 188 | | | | 191 | | |
Total Asset-Backed Securities (Cost $1,328) | | | 1,352 | | |
Collateralized Mortgage Obligations (0.2%) | |
Banc of America Commercial Mortgage Trust, Series 2006-3, Class AM, 5.66%,
7/10/44 (c) | | | 39 | | | | 6 | | |
Banc of America Commercial Mortgage Trust, Series 2008-1, Class AJ, 6.57%,
2/10/51 (c) | | | 7 | | | | 6 | | |
Benchmark Mortgage Trust, Series 2020-B17, Class ASB, 2.18%, 3/15/53,
Callable 11/15/29 @100 | | | 75 | | | | 77 | | |
BTH Mortgage-Backed Securities Trust, Series 2018-21, Class A, 2.61%
(LIBOR01M+250bps), 10/7/21 (a) (b) | | | 160 | | | | 160 | | |
BX Trust, Series 2019-OC11, Class A, 3.20%, 12/9/41 (a) | | | 69 | | | | 74 | | |
See notes to financial statements.
8
USAA Mutual Funds Trust
USAA Cornerstone Aggressive Fund | | Schedule of Portfolio Investments — continued
May 31, 2021 | |
(Amounts in Thousands, Except for Shares)
Security Description | | Shares or
Principal
Amount | | Value | |
Citigroup Commercial Mortgage Trust, Series 2020-GC46, Class AAB, 2.61%,
1/15/53, Callable 11/15/29 @100 | | $ | 75 | | | $ | 79 | | |
Citigroup Commercial Mortgage Trust, Series 2020-555, Class A, 2.65%,
12/10/41 (a) | | | 112 | | | | 114 | | |
COMM Mortgage Trust, Series 2019-GC44, Class ASB, 2.87%, 8/15/57,
Callable 5/15/29 @100 | | | 112 | | | | 121 | | |
COMM Mortgage Trust, Series 2014-277P, Class A, 3.61%, 8/10/49,
Callable 8/10/24 @100 (a) (c) | | | 61 | | | | 66 | | |
Credit Suisse Commercial Mortgage Trust, Series 2007-C1, Class AMFL, 0.29%
(LIBOR01M+19bps), 2/15/40 (b) | | | 1 | | | | 1 | | |
CSAIL Commercial Mortgage Trust, Series 2016-C6, Class XA, 1.91%, 1/15/49,
Callable 11/15/25 @100 (c) (d) | | | 546 | | | | 37 | | |
GS Mortgage Securities Trust, Series 2020-GC45, Class AAB, 2.84%, 2/13/53,
Callable 9/13/29 @100 | | | 40 | | | | 43 | | |
Manhattan West, Series 2020-1MW, Class A, 2.13%, 9/10/40 (a) | | | 39 | | | | 39 | | |
UBS Commercial Mortgage Trust, Series 2012-C1, Class XA, 2.05%, 5/10/45,
Callable 4/10/22 @100 (a) (c) (d) | | | 751 | | | | 6 | | |
Total Collateralized Mortgage Obligations (Cost $856) | | | 829 | | |
Common Stocks (32.2%) | |
Communication Services (2.6%): | |
Alphabet, Inc. Class C (e) | | | 1,418 | | | | 3,420 | | |
AMC Networks, Inc. Class A (e) | | | 2,517 | | | | 135 | | |
AT&T, Inc. | | | 21,308 | | | | 627 | | |
Cargurus, Inc. (e) | | | 2,679 | | | | 76 | | |
Comcast Corp. Class A | | | 24,693 | | | | 1,416 | | |
Facebook, Inc. Class A (e) | | | 3,489 | | | | 1,147 | | |
Gray Television, Inc. | | | 4,854 | | | | 113 | | |
Match Group, Inc. (e) | | | 3,296 | | | | 472 | | |
Pinterest, Inc. Class A (e) | | | 8,068 | | | | 527 | | |
Sirius XM Holdings, Inc. (f) | | | 72,308 | | | | 452 | | |
Snap, Inc. Class A (e) | | | 9,075 | | | | 564 | | |
Verizon Communications, Inc. | | | 23,658 | | | | 1,336 | | |
| | | | 10,285 | | |
Consumer Discretionary (3.0%): | |
Adtalem Global Education, Inc. (e) | | | 4,355 | | | | 158 | | |
Aptiv PLC (e) | | | 3,374 | | | | 508 | | |
AutoNation, Inc. (e) | | | 1,167 | | | | 119 | | |
AutoZone, Inc. (e) | | | 326 | | | | 459 | | |
Best Buy Co., Inc. | | | 3,998 | | | | 465 | | |
Big Lots, Inc. | | | 1,674 | | | | 102 | | |
Crocs, Inc. (e) | | | 1,092 | | | | 111 | | |
Deckers Outdoor Corp. (e) | | | 327 | | | | 110 | | |
Dick's Sporting Goods, Inc. (f) | | | 1,275 | | | | 124 | | |
eBay, Inc. | | | 8,617 | | | | 525 | | |
Foot Locker, Inc. | | | 2,100 | | | | 133 | | |
Ford Motor Co. (e) | | | 43,736 | | | | 635 | | |
General Motors Co. (e) | | | 8,993 | | | | 533 | | |
Gentex Corp. | | | 2,154 | | | | 76 | | |
See notes to financial statements.
9
USAA Mutual Funds Trust
USAA Cornerstone Aggressive Fund | | Schedule of Portfolio Investments — continued
May 31, 2021 | |
(Amounts in Thousands, Except for Shares)
Security Description | | Shares | | Value | |
G-III Apparel Group Ltd. (e) | | | 2,576 | | | $ | 85 | | |
Graham Holdings Co. Class B | | | 161 | | | | 107 | | |
Group 1 Automotive, Inc. | | | 776 | | | | 124 | | |
H&R Block, Inc. | | | 3,225 | | | | 80 | | |
Harley-Davidson, Inc. | | | 2,274 | | | | 110 | | |
KB Home | | | 1,274 | | | | 60 | | |
Kohl's Corp. (g) | | | 2,307 | | | | 128 | | |
Kontoor Brands, Inc. | | | 1,644 | | | | 105 | | |
La-Z-Boy, Inc. | | | 1,389 | | | | 57 | | |
Lennar Corp. Class A | | | 4,609 | | | | 456 | | |
Lithia Motors, Inc. Class A | | | 490 | | | | 172 | | |
Lowe's Cos., Inc. | | | 5,843 | | | | 1,138 | | |
O'Reilly Automotive, Inc. (e) | | | 883 | | | | 473 | | |
Qurate Retail, Inc. Class A | | | 8,272 | | | | 113 | | |
Rent-A-Center, Inc. | | | 2,446 | | | | 151 | | |
RH (e) | | | 169 | | | | 108 | | |
Roku, Inc. (e) | | | 1,543 | | | | 535 | | |
Sleep Number Corp. (e) | | | 734 | | | | 82 | | |
Sonos, Inc. (e) | | | 3,206 | | | | 119 | | |
Target Corp. (g) | | | 5,265 | | | | 1,195 | | |
Tesla, Inc. (e) | | | 1,339 | | | | 837 | | |
The Home Depot, Inc. | | | 2,325 | | | | 741 | | |
Toll Brothers, Inc. | | | 1,546 | | | | 101 | | |
Williams-Sonoma, Inc. | | | 784 | | | | 133 | | |
Wingstop, Inc. | | | 1,025 | | | | 146 | | |
YETI Holdings, Inc. (e) | | | 1,517 | | | | 133 | | |
| | | | 11,547 | | |
Consumer Staples (2.0%): | |
Altria Group, Inc. | | | 33,306 | | | | 1,639 | | |
Archer-Daniels-Midland Co. | | | 7,667 | | | | 510 | | |
BJ's Wholesale Club Holdings, Inc. (e) | | | 3,114 | | | | 140 | | |
Colgate-Palmolive Co. | | | 6,099 | | | | 511 | | |
Flowers Foods, Inc. | | | 2,670 | | | | 64 | | |
Hostess Brands, Inc. (e) | | | 3,715 | | | | 58 | | |
Ingles Markets, Inc. Class A | | | 1,764 | | | | 109 | | |
Keurig Dr Pepper, Inc. | | | 13,523 | | | | 500 | | |
Medifast, Inc. | | | 393 | | | | 131 | | |
Monster Beverage Corp. (e) | | | 5,550 | | | | 523 | | |
Philip Morris International, Inc. | | | 12,455 | | | | 1,201 | | |
Sprouts Farmers Market, Inc. (e) | | | 2,836 | | | | 75 | | |
The Clorox Co. | | | 2,651 | | | | 469 | | |
The Estee Lauder Cos., Inc. | | | 1,683 | | | | 516 | | |
Tyson Foods, Inc. Class A | | | 6,163 | | | | 490 | | |
Vector Group Ltd. | | | 10,289 | | | | 142 | | |
Walgreens Boots Alliance, Inc. | | | 9,723 | | | | 512 | | |
WD-40 Co. | | | 274 | | | | 67 | | |
Weis Markets, Inc. (g) | | | 2,955 | | | | 150 | | |
| | | | 7,807 | | |
See notes to financial statements.
10
USAA Mutual Funds Trust
USAA Cornerstone Aggressive Fund | | Schedule of Portfolio Investments — continued
May 31, 2021 | |
(Amounts in Thousands, Except for Shares)
Security Description | | Shares | | Value | |
Energy (0.7%): | |
Cactus, Inc. Class A | | | 2,265 | | | $ | 79 | | |
Chevron Corp. | | | 6,123 | | | | 635 | | |
ConocoPhillips | | | 19,081 | | | | 1,064 | | |
Continental Resources, Inc. (f) | | | 4,323 | | | | 141 | | |
Dorian LPG Ltd. (e) | | | 8,965 | | | | 127 | | |
HollyFrontier Corp. | | | 1,700 | | | | 55 | | |
Marathon Petroleum Corp. | | | 8,554 | | | | 529 | | |
Renewable Energy Group, Inc. (e) | | | 3,007 | | | | 184 | | |
| | | | 2,814 | | |
Financials (4.3%): | |
AGNC Investment Corp. | | | 1,563 | | | | 29 | | |
American National Group, Inc. | | | 1,218 | | | | 183 | | |
Annaly Capital Management, Inc. | | | 3,921 | | | | 36 | | |
Aon PLC Class A | | | 1,985 | | | | 503 | | |
Artisan Partners Asset Management, Inc. Class A | | | 1,020 | | | | 52 | | |
BancFirst Corp. | | | 788 | | | | 54 | | |
Bank of Hawaii Corp. | | | 1,398 | | | | 125 | | |
Berkshire Hathaway, Inc. Class B (e) | | | 2,879 | | | | 833 | | |
BlackRock, Inc. | | | 713 | | | | 625 | | |
Capital One Financial Corp. | | | 6,894 | | | | 1,108 | | |
Cathay General Bancorp | | | 3,063 | | | | 128 | | |
Citigroup, Inc. | | | 8,225 | | | | 647 | | |
Cohen & Steers, Inc. | | | 1,249 | | | | 91 | | |
Cowen, Inc. Class A (f) | | | 2,860 | | | | 113 | | |
Cullen/Frost Bankers, Inc. | | | 1,067 | | | | 129 | | |
Essent Group Ltd. | | | 2,376 | | | | 114 | | |
Fifth Third Bancorp | | | 11,919 | | | | 502 | | |
Hamilton Lane, Inc. Class A | | | 900 | | | | 81 | | |
International Bancshares Corp. | | | 4,483 | | | | 208 | | |
Jefferies Financial Group, Inc. | | | 5,012 | | | | 161 | | |
KeyCorp | | | 20,833 | | | | 480 | | |
Lakeland Financial Corp. | | | 1,699 | | | | 105 | | |
LPL Financial Holdings, Inc. | | | 488 | | | | 72 | | |
MetLife, Inc. | | | 15,465 | | | | 1,011 | | |
MGIC Investment Corp. | | | 4,556 | | | | 67 | | |
Morgan Stanley | | | 13,389 | | | | 1,218 | | |
Mr. Cooper Group, Inc. (e) | | | 3,685 | | | | 127 | | |
MSCI, Inc. | | | 1,018 | | | | 477 | | |
NMI Holdings, Inc. Class A (e) | | | 3,029 | | | | 73 | | |
OneMain Holdings, Inc. | | | 1,635 | | | | 95 | | |
Peoples Bancorp, Inc. | | | 4,845 | | | | 157 | | |
PJT Partners, Inc. Class A | | | 1,404 | | | | 102 | | |
Primerica, Inc. | | | 478 | | | | 78 | | |
Prudential Financial, Inc. | | | 9,710 | | | | 1,039 | | |
Radian Group, Inc. | | | 7,543 | | | | 176 | | |
RLI Corp. | | | 1,462 | | | | 154 | | |
S&P Global, Inc. | | | 1,399 | | | | 531 | | |
ServisFirst Bancshares, Inc. | | | 1,296 | | | | 90 | | |
Starwood Property Trust, Inc. | | | 3,489 | | | | 89 | | |
See notes to financial statements.
11
USAA Mutual Funds Trust
USAA Cornerstone Aggressive Fund | | Schedule of Portfolio Investments — continued
May 31, 2021 | |
(Amounts in Thousands, Except for Shares)
Security Description | | Shares | | Value | |
SVB Financial Group (e) | | | 1,673 | | | $ | 975 | | |
Synovus Financial Corp. | | | 1,394 | | | | 68 | | |
T. Rowe Price Group, Inc. | | | 2,630 | | | | 503 | | |
The Allstate Corp. | | | 3,810 | | | | 521 | | |
The Goldman Sachs Group, Inc. | | | 3,160 | | | | 1,176 | | |
The Progressive Corp. | | | 4,935 | | | | 489 | | |
Unum Group | | | 3,484 | | | | 108 | | |
Webster Financial Corp. | | | 1,214 | | | | 69 | | |
Wells Fargo & Co. | | | 13,795 | | | | 645 | | |
Western Alliance Bancorp | | | 1,293 | | | | 129 | | |
| | | | 16,546 | | |
Health Care (5.9%): | |
Abbott Laboratories | | | 5,590 | | | | 652 | | |
AbbVie, Inc. | | | 5,752 | | | | 651 | | |
Agilent Technologies, Inc. | | | 3,645 | | | | 504 | | |
Align Technology, Inc. (e) | | | 773 | | | | 456 | | |
Amedisys, Inc. (e) | | | 349 | | | | 90 | | |
Amgen, Inc. | | | 4,765 | | | | 1,134 | | |
AMN Healthcare Services, Inc. (e) | | | 1,377 | | | | 122 | | |
Amneal Pharmaceuticals, Inc. (e) | | | 12,646 | | | | 72 | | |
Anthem, Inc. | | | 1,425 | | | | 567 | | |
Biogen, Inc. (e) | | | 3,708 | | | | 992 | | |
Bristol-Myers Squibb Co. | | | 9,487 | | | | 624 | | |
Bruker Corp. | | | 1,712 | | | | 119 | | |
Chemed Corp. | | | 392 | | | | 193 | | |
Cigna Corp. | | | 2,163 | | | | 560 | | |
Corcept Therapeutics, Inc. (e) | | | 5,101 | | | | 110 | | |
CVS Health Corp. | | | 6,858 | | | | 593 | | |
Danaher Corp. | | | 2,368 | | | | 607 | | |
Eli Lilly & Co. | | | 3,126 | | | | 624 | | |
Emergent BioSolutions, Inc. (e) | | | 2,845 | | | | 173 | | |
Encompass Health Corp. | | | 1,179 | | | | 101 | | |
Exelixis, Inc. (e) | | | 6,708 | | | | 151 | | |
Gilead Sciences, Inc. (g) | | | 8,377 | | | | 554 | | |
HCA Healthcare, Inc. | | | 4,997 | | | | 1,073 | | |
Hill-Rom Holdings, Inc. | | | 1,069 | | | | 119 | | |
IDEXX Laboratories, Inc. (e) | | | 1,835 | | | | 1,024 | | |
Innoviva, Inc. (e) | | | 8,234 | | | | 111 | | |
IQVIA Holdings, Inc. (e) | | | 2,196 | | | | 527 | | |
Johnson & Johnson (g) | | | 10,247 | | | | 1,734 | | |
LHC Group, Inc. (e) | | | 701 | | | | 138 | | |
Ligand Pharmaceuticals, Inc. (e) | | | 717 | | | | 84 | | |
MEDNAX, Inc. (e) | | | 3,691 | | | | 118 | | |
Medpace Holdings, Inc. (e) | | | 544 | | | | 91 | | |
Merck & Co., Inc. | | | 8,047 | | | | 611 | | |
Mettler-Toledo International, Inc. (e) | | | 765 | | | | 995 | | |
Owens & Minor, Inc. | | | 3,648 | | | | 163 | | |
Pfizer, Inc. | | | 17,170 | | | | 665 | | |
Phibro Animal Health Corp. Class A | | | 3,658 | | | | 103 | | |
Premier, Inc. Class A | | | 2,707 | | | | 89 | | |
See notes to financial statements.
12
USAA Mutual Funds Trust
USAA Cornerstone Aggressive Fund | | Schedule of Portfolio Investments — continued
May 31, 2021 | |
(Amounts in Thousands, Except for Shares)
Security Description | | Shares | | Value | |
Prestige Consumer Healthcare, Inc. (e) | | | 2,694 | | | $ | 134 | | |
Quidel Corp. (e) | | | 1,235 | | | | 146 | | |
Select Medical Holdings Corp. | | | 4,230 | | | | 170 | | |
Stryker Corp. | | | 2,187 | | | | 558 | | |
Supernus Pharmaceuticals, Inc. (e) | | | 3,610 | | | | 108 | | |
Tenet Healthcare Corp. (e) | | | 2,380 | | | | 159 | | |
The Ensign Group, Inc. | | | 1,563 | | | | 130 | | |
Thermo Fisher Scientific, Inc. | | | 1,365 | | | | 641 | | |
United Therapeutics Corp. (e) | | | 773 | | | | 144 | | |
UnitedHealth Group, Inc. | | | 5,957 | | | | 2,454 | | |
Waters Corp. (e) | | | 1,565 | | | | 504 | | |
Zoetis, Inc. | | | 3,135 | | | | 554 | | |
| | | | 22,996 | | |
Industrials (3.6%): | |
3M Co. | | | 5,710 | | | | 1,159 | | |
Allison Transmission Holdings, Inc. | | | 2,308 | | | | 98 | | |
Atkore, Inc. (e) | | | 1,599 | | | | 123 | | |
Carrier Global Corp. | | | 10,557 | | | | 485 | | |
Caterpillar, Inc. | | | 2,484 | | | | 599 | | |
Cimpress PLC (e) | | | 627 | | | | 62 | | |
Crane Co. | | | 1,109 | | | | 106 | | |
CSX Corp. | | | 5,309 | | | | 532 | | |
Cummins, Inc. | | | 1,936 | | | | 498 | | |
Deere & Co. | | | 1,477 | | | | 533 | | |
Eaton Corp. PLC | | | 7,157 | | | | 1,040 | | |
EMCOR Group, Inc. | | | 1,512 | | | | 191 | | |
Fastenal Co. | | | 9,153 | | | | 485 | | |
General Dynamics Corp. | | | 2,672 | | | | 507 | | |
GrafTech International Ltd. | | | 9,190 | | | | 122 | | |
Herman Miller, Inc. | | | 2,450 | | | | 117 | | |
Hillenbrand, Inc. | | | 1,292 | | | | 59 | | |
HNI Corp. | | | 2,032 | | | | 93 | | |
Illinois Tool Works, Inc. | | | 2,221 | | | | 515 | | |
Insperity, Inc. | | | 1,004 | | | | 93 | | |
Johnson Controls International PLC | | | 7,902 | | | | 526 | | |
Kforce, Inc. | | | 1,191 | | | | 75 | | |
Landstar System, Inc. | | | 1,041 | | | | 177 | | |
Lockheed Martin Corp. | | | 2,872 | | | | 1,098 | | |
ManpowerGroup, Inc. | | | 544 | | | | 66 | | |
Masonite International Corp. (e) | | | 710 | | | | 85 | | |
MasTec, Inc. (e) | | | 1,456 | | | | 169 | | |
MSC Industrial Direct Co., Inc. | | | 1,141 | | | | 108 | | |
Mueller Industries, Inc. | | | 3,595 | | | | 167 | | |
Northrop Grumman Corp. | | | 1,438 | | | | 526 | | |
nVent Electric PLC | | | 2,182 | | | | 71 | | |
Oshkosh Corp. | | | 1,138 | | | | 150 | | |
Otis Worldwide Corp. | | | 6,266 | | | | 491 | | |
PACCAR, Inc. | | | 5,379 | | | | 492 | | |
Regal Beloit Corp. | | | 782 | | | | 111 | | |
Rockwell Automation, Inc. | | | 1,843 | | | | 486 | | |
See notes to financial statements.
13
USAA Mutual Funds Trust
USAA Cornerstone Aggressive Fund | | Schedule of Portfolio Investments — continued
May 31, 2021 | |
(Amounts in Thousands, Except for Shares)
Security Description | | Shares | | Value | |
Rush Enterprises, Inc. Class A | | | 2,641 | | | $ | 126 | | |
SkyWest, Inc. (e) | | | 1,904 | | | | 93 | | |
Steelcase, Inc. Class A | | | 6,924 | | | | 100 | | |
The Timken Co. | | | 1,291 | | | | 114 | | |
The Toro Co. | | | 547 | | | | 61 | | |
Trane Technologies PLC | | | 2,817 | | | | 525 | | |
TriNet Group, Inc. (e) | | | 1,154 | | | | 87 | | |
Triton International Ltd. | | | 1,434 | | | | 78 | | |
W.W. Grainger, Inc. | | | 1,037 | | | | 479 | | |
| | | | 13,878 | | |
Information Technology (7.1%): | |
Accenture PLC Class A | | | 2,143 | | | | 605 | | |
Adobe, Inc. (e) | | | 1,320 | | | | 666 | | |
Amkor Technology, Inc. | | | 7,651 | | | | 161 | | |
Apple, Inc. | | | 37,062 | | | | 4,618 | | |
Applied Materials, Inc. | | | 8,515 | | | | 1,176 | | |
Aspen Technology, Inc. (e) | | | 644 | | | | 88 | | |
Badger Meter, Inc. | | | 1,025 | | | | 98 | | |
Broadcom, Inc. | | | 2,775 | | | | 1,311 | | |
CACI International, Inc. Class A (e) | | | 365 | | | | 93 | | |
Cadence Design Systems, Inc. (e) | | | 3,884 | | | | 493 | | |
CDW Corp. | | | 2,741 | | | | 453 | | |
Cisco Systems, Inc. | | | 25,603 | | | | 1,354 | | |
Cognizant Technology Solutions Corp. Class A | | | 6,488 | | | | 464 | | |
CSG Systems International, Inc. | | | 3,587 | | | | 158 | | |
Digital Turbine, Inc. (e) | | | 1,380 | | | | 91 | | |
Diodes, Inc. (e) | | | 1,951 | | | | 148 | | |
DXC Technology Co. (e) | | | 4,142 | | | | 157 | | |
Ebix, Inc. | | | 3,687 | | | | 101 | | |
EVERTEC, Inc. | | | 3,704 | | | | 161 | | |
HP, Inc. | | | 43,417 | | | | 1,269 | | |
Insight Enterprises, Inc. (e) | | | 2,015 | | | | 211 | | |
Intel Corp. | | | 11,468 | | | | 655 | | |
International Business Machines Corp. | | | 4,073 | | | | 585 | | |
Intuit, Inc. | | | 1,355 | | | | 595 | | |
J2 Global, Inc. (e) | | | 1,276 | | | | 159 | | |
Jabil, Inc. | | | 2,316 | | | | 131 | | |
Kimball Electronics, Inc. (e) | | | 5,438 | | | | 122 | | |
Lam Research Corp. | | | 1,703 | | | | 1,107 | | |
Manhattan Associates, Inc. (e) | | | 818 | | | | 111 | | |
Mastercard, Inc. Class A | | | 2,071 | | | | 747 | | |
MAXIMUS, Inc. | | | 1,703 | | | | 158 | | |
Methode Electronics, Inc. | | | 1,580 | | | | 76 | | |
Micron Technology, Inc. (e) | | | 6,360 | | | | 535 | | |
Microsoft Corp. (g) | | | 8,323 | | | | 2,078 | | |
NCR Corp. (e) | | | 3,293 | | | | 159 | | |
NVIDIA Corp. | | | 1,322 | | | | 859 | | |
NXP Semiconductors NV | | | 2,581 | | | | 546 | | |
Oracle Corp. | | | 7,534 | | | | 593 | | |
Perficient, Inc. (e) | | | 2,259 | | | | 162 | | |
See notes to financial statements.
14
USAA Mutual Funds Trust
USAA Cornerstone Aggressive Fund | | Schedule of Portfolio Investments — continued
May 31, 2021 | |
(Amounts in Thousands, Except for Shares)
Security Description | | Shares | | Value | |
Sanmina Corp. (e) | | | 4,114 | | | $ | 173 | | |
SPS Commerce, Inc. (e) | | | 1,377 | | | | 129 | | |
Square, Inc. Class A (e) | | | 2,276 | | | | 506 | | |
Super Micro Computer, Inc. (e) | | | 2,583 | | | | 90 | | |
TE Connectivity Ltd. | | | 3,721 | | | | 505 | | |
Texas Instruments, Inc. | | | 6,471 | | | | 1,228 | | |
The Hackett Group, Inc. | | | 4,361 | | | | 78 | | |
TTEC Holdings, Inc. | | | 1,253 | | | | 136 | | |
VeriSign, Inc. (e) | | | 2,240 | | | | 493 | | |
Vishay Intertechnology, Inc. | | | 5,399 | | | | 130 | | |
VMware, Inc. Class A (e) (f) | | | 2,980 | | | | 471 | | |
Vontier Corp. (e) | | | 3,987 | | | | 140 | | |
Xperi Holding Corp. | | | 6,319 | | | | 135 | | |
| | | | 27,468 | | |
Materials (0.9%): | |
Berry Global Group, Inc. (e) | | | 1,024 | | | | 70 | | |
Dow, Inc. | | | 7,818 | | | | 535 | | |
FutureFuel Corp. | | | 7,004 | | | | 72 | | |
Huntsman Corp. | | | 3,658 | | | | 104 | | |
International Paper Co. | | | 8,089 | | | | 511 | | |
LyondellBasell Industries NV Class A | | | 4,423 | | | | 498 | | |
Minerals Technologies, Inc. | | | 2,108 | | | | 183 | | |
PPG Industries, Inc. | | | 2,772 | | | | 498 | | |
Reliance Steel & Aluminum Co. | | | 1,089 | | | | 183 | | |
Silgan Holdings, Inc. | | | 2,185 | | | | 92 | | |
The Sherwin-Williams Co. | | | 1,831 | | | | 519 | | |
Warrior Met Coal, Inc. | | | 4,904 | | | | 90 | | |
| | | | 3,355 | | |
Real Estate (1.2%): | |
Alexandria Real Estate Equities, Inc. | | | 356 | | | | 63 | | |
American Tower Corp. | | | 1,243 | | | | 318 | | |
AvalonBay Communities, Inc. | | | 396 | | | | 82 | | |
Boston Properties, Inc. | | | 417 | | | | 49 | | |
Brixmor Property Group, Inc. | | | 4,100 | | | | 93 | | |
Camden Property Trust | | | 272 | | | | 34 | | |
CBRE Group, Inc. Class A (e) | | | 938 | | | | 82 | | |
Colony Capital, Inc. (e) | | | 22,523 | | | | 155 | | |
Cousins Properties, Inc. | | | 2,330 | | | | 86 | | |
Crown Castle International Corp. | | | 1,235 | | | | 234 | | |
CubeSmart | | | 3,280 | | | | 144 | | |
Digital Realty Trust, Inc. | | | 766 | | | | 116 | | |
Duke Realty Corp. | | | 1,044 | | | | 48 | | |
Equinix, Inc. | | | 250 | | | | 184 | | |
Equity LifeStyle Properties, Inc. | | | 491 | | | | 35 | | |
Equity Residential | | | 1,044 | | | | 81 | | |
Essex Property Trust, Inc. | | | 182 | | | | 54 | | |
Extra Space Storage, Inc. | | | 369 | | | | 55 | | |
Federal Realty Investment Trust | | | 505 | | | | 58 | | |
First Industrial Realty Trust, Inc. | | | 3,612 | | | | 183 | | |
See notes to financial statements.
15
USAA Mutual Funds Trust
USAA Cornerstone Aggressive Fund | | Schedule of Portfolio Investments — continued
May 31, 2021 | |
(Amounts in Thousands, Except for Shares)
Security Description | | Shares | | Value | |
Gaming and Leisure Properties, Inc. | | | 2,466 | | | $ | 114 | | |
Healthpeak Properties, Inc. | | | 1,493 | | | | 50 | | |
Host Hotels & Resorts, Inc. (e) | | | 1,928 | | | | 33 | | |
Invitation Homes, Inc. | | | 1,589 | | | | 58 | | |
Iron Mountain, Inc. | | | 817 | | | | 36 | | |
Jones Lang LaSalle, Inc. (e) | | | 401 | | | | 81 | | |
Kimco Realty Corp. | | | 4,687 | | | | 100 | | |
Lamar Advertising Co. Class A | | | 779 | | | | 82 | | |
LTC Properties, Inc. | | | 2,898 | | | | 114 | | |
Medical Properties Trust, Inc. | | | 6,216 | | | | 132 | | |
Mid-America Apartment Communities, Inc. | | | 321 | | | | 52 | | |
National Health Investors, Inc. | | | 817 | | | | 54 | | |
Omega Healthcare Investors, Inc. | | | 642 | | | | 23 | | |
PotlatchDeltic Corp. | | | 1,706 | | | | 103 | | |
Prologis, Inc. | | | 2,081 | | | | 245 | | |
Public Storage | | | 449 | | | | 127 | | |
Realty Income Corp. | | | 981 | | | | 67 | | |
Regency Centers Corp. | | | 481 | | | | 31 | | |
SBA Communications Corp. | | | 313 | | | | 93 | | |
Simon Property Group, Inc. | | | 946 | | | | 122 | | |
SITE Centers Corp. | | | 5,242 | | | | 78 | | |
Sun Communities, Inc. | | | 280 | | | | 47 | | |
Terreno Realty Corp. | | | 2,488 | | | | 158 | | |
The GEO Group, Inc. (f) | | | 13,890 | | | | 72 | | |
UDR, Inc. | | | 831 | | | | 40 | | |
Ventas, Inc. | | | 1,052 | | | | 58 | | |
VEREIT, Inc. | | | 603 | | | | 29 | | |
VICI Properties, Inc. | | | 1,491 | | | | 46 | | |
Vornado Realty Trust | | | 451 | | | | 21 | | |
Welltower, Inc. | | | 1,171 | | | | 88 | | |
Weyerhaeuser Co. | | | 2,068 | | | | 78 | | |
WP Carey, Inc. | | | 492 | | | | 37 | | |
| | | | 4,623 | | |
Utilities (0.9%): | |
ALLETE, Inc. | | | 922 | | | | 64 | | |
American States Water Co. | | | 1,893 | | | | 150 | | |
Exelon Corp. | | | 11,208 | | | | 506 | | |
IDACORP, Inc. | | | 1,066 | | | | 104 | | |
MDU Resources Group, Inc. | | | 2,380 | | | | 80 | | |
National Fuel Gas Co. | | | 3,343 | | | | 173 | | |
NextEra Energy, Inc. (g) | | | 8,143 | | | | 596 | | |
NorthWestern Corp. | | | 913 | | | | 58 | | |
NRG Energy, Inc. | | | 13,484 | | | | 434 | | |
Otter Tail Corp. (g) | | | 3,504 | | | | 168 | | |
Southwest Gas Holdings, Inc. | | | 1,038 | | | | 69 | | |
The AES Corp. | | | 36,642 | | | | 931 | | |
| | | | 3,333 | | |
Total Common Stocks (Cost $94,078) | | | 124,652 | | |
See notes to financial statements.
16
USAA Mutual Funds Trust
USAA Cornerstone Aggressive Fund | | Schedule of Portfolio Investments — continued
May 31, 2021 | |
(Amounts in Thousands, Except for Shares)
Security Description | | Shares or
Principal
Amount | | Value | |
Preferred Stocks (0.1%) | |
Communication Services (0.0%): (h) | |
Qwest Corp., 6.50%, 9/1/56 | | | 8,000 | | | $ | 203 | | |
Financials (0.1%): | |
Delphi Financial Group, Inc., 3.35% (LIBOR03M+319bps), 5/15/37 (b) (i) | | | 12,000 | | | | 267 | | |
Total Preferred Stocks (Cost $502) | | | 470 | | |
Corporate Bonds (2.9%) | |
Communication Services (0.1%): | |
Fox Corp., 3.05%, 4/7/25, Callable 3/7/25 @100 | | $ | 53 | | | | 57 | | |
The Walt Disney Co., 2.20%, 1/13/28 | | | 45 | | | | 46 | | |
T-Mobile USA, Inc., 3.88%, 4/15/30, Callable 1/15/30 @100 | | | 133 | | | | 146 | | |
| | | | 249 | | |
Consumer Discretionary (0.1%): | |
AutoNation, Inc., 4.75%, 6/1/30, Callable 3/1/30 @100 | | | 38 | | | | 45 | | |
Hasbro, Inc., 3.55%, 11/19/26, Callable 9/19/26 @100 | | | 90 | | | | 99 | | |
Nordstrom, Inc., 4.38%, 4/1/30, Callable 1/1/30 @100 (f) | | | 75 | | | | 77 | | |
VF Corp., 2.95%, 4/23/30, Callable 1/23/30 @100 | | | 53 | | | | 55 | | |
| | | | 276 | | |
Consumer Staples (0.2%): | |
Anheuser-Busch Cos. LLC/Anheuser-Busch InBev Worldwide, Inc., 4.70%, 2/1/36,
Callable 8/1/35 @100 | | | 187 | | | | 223 | | |
Kraft Heinz Foods Co., 3.75%, 4/1/30, Callable 1/1/30 @100 | | | 84 | | | | 90 | | |
McCormick & Co., Inc., 2.50%, 4/15/30, Callable 1/15/30 @100 | | | 32 | | | | 33 | | |
PepsiCo, Inc., 2.25%, 3/19/25, Callable 2/19/25 @100 | | | 175 | | | | 185 | | |
Sysco Corp., 5.95%, 4/1/30, Callable 1/1/30 @100 | | | 44 | | | | 56 | | |
The Coca-Cola Co., 2.00%, 3/5/31 | | | 250 | | | | 249 | | |
Unilever Capital Corp., 2.60%, 5/5/24, Callable 3/5/24 @100 | | | 150 | | | | 159 | | |
| | | | 995 | | |
Energy (0.4%): | |
Cameron LNG LLC, 3.30%, 1/15/35, Callable 9/15/34 @100 (a) | | | 143 | | | | 150 | | |
Enable Midstream Partners LP, 4.15%, 9/15/29, Callable 6/15/29 @100 | | | 150 | | | | 162 | | |
Enbridge Energy Partners LP, 7.38%, 10/15/45, Callable 4/15/45 @100 (g) | | | 100 | | | | 152 | | |
Enterprise Products Operating LLC, 2.80%, 1/31/30, Callable 10/31/29 @100 | | | 112 | | | | 117 | | |
Exxon Mobil Corp., 2.99%, 3/19/25, Callable 2/19/25 @100 (g) | | | 188 | | | | 203 | | |
Florida Gas Transmission Co. LLC, 2.55%, 7/1/30, Callable 4/1/30 @100 (a) | | | 38 | | | | 38 | | |
Marathon Petroleum Corp., 4.70%, 5/1/25, Callable 4/1/25 @100 | | | 49 | | | | 56 | | |
Midwest Connector Capital Co. LLC, 4.63%, 4/1/29, Callable 1/1/29 @100 (a) | | | 92 | | | | 97 | | |
National Oilwell Varco, Inc., 3.60%, 12/1/29, Callable 9/1/29 @100 | | | 150 | | | | 156 | | |
Occidental Petroleum Corp., 4.40%, 8/15/49, Callable 2/15/49 @100 | | | 75 | | | | 63 | | |
ONEOK, Inc., 6.35%, 1/15/31, Callable 10/15/30 @100 | | | 46 | | | | 58 | | |
Targa Resources Partners LP/Targa Resources Partners Finance Corp.,
5.50%, 3/1/30, Callable 3/1/25 @102.75 | | | 75 | | | | 81 | | |
Western Midstream Operating LP, 4.35%, 2/1/25, Callable 1/1/25 @100 | | | 78 | | | | 82 | | |
| | | | 1,415 | | |
See notes to financial statements.
17
USAA Mutual Funds Trust
USAA Cornerstone Aggressive Fund | | Schedule of Portfolio Investments — continued
May 31, 2021 | |
(Amounts in Thousands, Except for Shares)
Security Description | | Principal
Amount | | Value | |
Financials (0.9%): | |
Ares Capital Corp., 3.63%, 1/19/22, Callable 12/19/21 @100 (g) | | $ | 100 | | | $ | 102 | | |
BancorpSouth Bank, 4.13% (LIBOR03M+247bps), 11/20/29,
Callable 11/20/24 @100 (b) | | | 96 | | | | 99 | | |
BBVA USA, 3.88%, 4/10/25, Callable 3/10/25 @100 | | | 200 | | | | 220 | | |
Belrose Funding Trust, 2.33%, 8/15/30, Callable 5/15/30 @100 (a) | | | 93 | | | | 91 | | |
Capital One NA, 2.15%, 9/6/22, Callable 8/6/22 @100 | | | 150 | | | | 153 | | |
Citizens Financial Group, Inc., 2.50%, 2/6/30, Callable 11/6/29 @100 | | | 112 | | | | 114 | | |
Cullen/Frost Capital Trust II, 1.74% (LIBOR03M+155bps), 3/1/34,
Callable 7/12/21 @100 (b) | | | 175 | | | | 168 | | |
First Horizon Bank, 5.75%, 5/1/30, Callable 2/1/30 @100 | | | 53 | | | | 65 | | |
First Maryland Capital I, 1.18% (LIBOR03M+100bps), 1/15/27,
Callable 7/12/21 @100 (b) | | | 50 | | | | 48 | | |
Glencore Funding LLC, 2.50%, 9/1/30, Callable 6/1/30 @100 (a) | | | 108 | | | | 106 | | |
Global Atlantic Financial Co., 4.40%, 10/15/29, Callable 7/15/29 @100 (a) | | | 96 | | | | 103 | | |
HSB Group, Inc., 1.09% (LIBOR03M+91bps), 7/15/27,
Callable 7/12/21 @100 (b) | | | 200 | | | | 182 | | |
Hyundai Capital America, 3.75%, 7/8/21 (a) (g) | | | 350 | | | | 351 | | |
JPMorgan Chase & Co., 2.52% (SOFR+204bps), 4/22/31,
Callable 4/22/30 @100 (b) | | | 62 | | | | 63 | | |
KeyCorp, 2.25%, 4/6/27, MTN | | | 112 | | | | 117 | | |
Level 3 Financing, Inc., 3.88%, 11/15/29, Callable 8/15/29 @100 (a) | | | 150 | | | | 159 | | |
Loews Corp., 3.20%, 5/15/30, Callable 2/15/30 @100 | | | 68 | | | | 73 | | |
Nationwide Mutual Insurance Co., 2.47% (LIBOR03M+229bps), 12/15/24,
Callable 7/12/21 @100 (a) (b) | | | 300 | | | | 299 | | |
New York Community Bancorp, Inc., 5.90% (LIBOR03M+278bps), 11/6/28,
Callable 11/6/23 @100 (b) | | | 23 | | | | 25 | | |
PPL Capital Funding, Inc., 4.13%, 4/15/30, Callable 1/15/30 @100 | | | 74 | | | | 84 | | |
Prudential Financial, Inc., 5.63% (LIBOR03M+392bps), 6/15/43,
Callable 6/15/23 @100 (b) | | | 200 | | | | 216 | | |
Regions Financial Corp., 2.25%, 5/18/25, Callable 4/18/25 @100 | | | 74 | | | | 78 | | |
Santander Holdings USA, Inc., 3.45%, 6/2/25, Callable 5/2/25 @100 | | | 39 | | | | 42 | | |
Signature Bank, 4.13% (LIBOR03M+256bps), 11/1/29,
Callable 11/1/24 @100 (b) | | | 150 | | | | 155 | | |
Texas Capital Bank NA, 5.25%, 1/31/26 | | | 75 | | | | 80 | | |
The Progressive Corp., 3.20%, 3/26/30, Callable 12/26/29 @100 | | | 23 | | | | 25 | | |
Truist Bank, 0.83% (LIBOR03M+67bps), 5/15/27, Callable 7/12/21 @100 (b) | | | 200 | | | | 194 | | |
Wells Fargo & Co., 2.19% (SOFR+200bps), 4/30/26, Callable 4/30/25 @100 (b) | | | 79 | | | | 82 | | |
| | | | 3,494 | | |
Health Care (0.2%): | |
AbbVie, Inc., 3.20%, 11/21/29, Callable 8/21/29 @100 | | | 150 | | | | 161 | | |
CVS Health Corp., 3.25%, 8/15/29, Callable 5/15/29 @100 (g) | | | 290 | | | | 312 | | |
DENTSPLY SIRONA, Inc., 3.25%, 6/1/30, Callable 3/1/30 @100 | | | 72 | | | | 76 | | |
Duke University Health System, Inc., 2.60%, 6/1/30 | | | 60 | | | | 62 | | |
HCA, Inc., 5.13%, 6/15/39, Callable 12/15/38 @100 | | | 187 | | | | 229 | | |
Upjohn, Inc., 2.30%, 6/22/27, Callable 4/22/27 @100 (a) | | | 23 | | | | 24 | | |
| | | | 864 | | |
Industrials (0.4%): | |
Carlisle Cos., Inc., 2.75%, 3/1/30, Callable 12/1/29 @100 | | | 112 | | | | 115 | | |
See notes to financial statements.
18
USAA Mutual Funds Trust
USAA Cornerstone Aggressive Fund | | Schedule of Portfolio Investments — continued
May 31, 2021 | |
(Amounts in Thousands, Except for Shares)
Security Description | | Principal
Amount | | Value | |
Carrier Global Corp., 3.38%, 4/5/40, Callable 10/5/39 @100 | | $ | 56 | | | $ | 57 | | |
Caterpillar, Inc., 2.60%, 4/9/30, Callable 1/9/30 @100 | | | 55 | | | | 58 | | |
CoStar Group, Inc., 2.80%, 7/15/30, Callable 4/15/30 @100 (a) | | | 21 | | | | 21 | | |
Dover Corp., 2.95%, 11/4/29, Callable 8/4/29 @100 | | | 112 | | | | 119 | | |
Georgia-Pacific LLC, 2.10%, 4/30/27, Callable 2/28/27 @100 (a) | | | 122 | | | | 127 | | |
IDEX Corp., 3.00%, 5/1/30, Callable 2/1/30 @100 | | | 122 | | | | 127 | | |
Otis Worldwide Corp., 3.11%, 2/15/40, Callable 8/15/39 @100 | | | 75 | | | | 76 | | |
Penske Truck Leasing Co. LP/PTL Finance Corp., 4.00%, 7/15/25,
Callable 6/15/25 @100 (a) | | | 74 | | | | 82 | | |
Ryder System, Inc., 2.90%, 12/1/26, MTN, Callable 10/1/26 @100 | | | 187 | | | | 201 | | |
Southwest Airlines Co., 5.13%, 6/15/27, Callable 4/15/27 @100 | | | 48 | | | | 56 | | |
The Boeing Co., 5.71%, 5/1/40, Callable 11/1/39 @100 | | | 103 | | | | 129 | | |
The Conservation Fund A Nonprofit Corp., 3.47%, 12/15/29,
Callable 9/15/29 @100 | | | 175 | | | | 184 | | |
United Airlines Pass Through Trust, 2.90%, 11/1/29 | | | 191 | | | | 186 | | |
| | | | 1,538 | | |
Information Technology (0.1%): | |
Amphenol Corp., 2.80%, 2/15/30, Callable 11/15/29 @100 | | | 200 | | | | 208 | | |
HP, Inc., 3.40%, 6/17/30, Callable 3/17/30 @100 | | | 68 | | | | 72 | | |
Jabil, Inc., 3.00%, 1/15/31, Callable 10/15/30 @100 | | | 21 | | | | 21 | | |
Microsoft Corp., 3.45%, 8/8/36, Callable 2/8/36 @100 | | | 243 | | | | 273 | | |
| | | | 574 | | |
Materials (0.1%): | |
Avery Dennison Corp., 2.65%, 4/30/30, Callable 2/1/30 @100 | | | 45 | | | | 46 | | |
Colonial Enterprises, Inc., 3.25%, 5/15/30, Callable 2/15/30 @100 (a) | | | 21 | | | | 23 | | |
LYB International Finance III LLC, 3.38%, 5/1/30, Callable 2/1/30 @100 | | | 63 | | | | 68 | | |
Vulcan Materials Co., 3.50%, 6/1/30, Callable 3/1/30 @100 | | | 68 | | | | 74 | | |
WRKCo, Inc., 3.00%, 6/15/33, Callable 3/15/33 @100 (g) | | | 35 | | | | 36 | | |
| | | | 247 | | |
Real Estate (0.2%): | |
AvalonBay Communities, Inc., 2.45%, 1/15/31, MTN, Callable 10/15/30 @100 | | | 101 | | | | 102 | | |
Boston Properties LP, 3.25%, 1/30/31, Callable 10/30/30 @100 | | | 45 | | | | 47 | | |
Essex Portfolio LP, 2.65%, 3/15/32, Callable 12/15/31 @100 | | | 131 | | | | 131 | | |
GLP Capital LP/GLP Financing II, Inc., 4.00%, 1/15/31,
Callable 10/15/30 @100 | | | 23 | | | | 24 | | |
Host Hotels & Resorts LP, 3.50%, 9/15/30, Callable 6/15/30 @100 | | | 19 | | | | 20 | | |
Mid-America Apartments LP, 2.75%, 3/15/30, Callable 12/15/29 @100 | | | 187 | | | | 192 | | |
SBA Tower Trust, 2.84%, 1/15/25 (a) | | | 87 | | | | 91 | | |
VICI Properties LP/VICI Note Co., Inc., 4.63%, 12/1/29,
Callable 12/1/24 @102.31 (a) | | | 17 | | | | 18 | | |
| | | | 625 | | |
Utilities (0.2%): | |
AEP Texas, Inc., 3.45%, 1/15/50, Callable 7/15/49 @100 | | | 131 | | | | 131 | | |
Alabama Power Co., 3.85%, 12/1/42 | | | 112 | | | | 125 | | |
Ameren Corp., 3.50%, 1/15/31, Callable 10/15/30 @100 | | | 37 | | | | 40 | | |
Duke Energy Florida LLC, 3.85%, 11/15/42, Callable 5/15/42 @100 | | | 112 | | | | 126 | | |
Exelon Generation Co. LLC, 3.25%, 6/1/25, Callable 5/1/25 @100 | | | 74 | | | | 80 | | |
IPALCO Enterprises, Inc., 4.25%, 5/1/30, Callable 2/1/30 @100 | | | 82 | | | | 92 | | |
See notes to financial statements.
19
USAA Mutual Funds Trust
USAA Cornerstone Aggressive Fund | | Schedule of Portfolio Investments — continued
May 31, 2021 | |
(Amounts in Thousands, Except for Shares)
Security Description | | Principal
Amount | | Value | |
ITC Holdings Corp., 2.95%, 5/14/30, Callable 2/14/30 @100 (a) | | $ | 76 | | | $ | 79 | | |
National Fuel Gas Co., 5.50%, 1/15/26, Callable 12/15/25 @100 | | | 96 | | | | 112 | | |
Union Electric Co., 2.95%, 3/15/30, Callable 12/15/29 @100 | | | 188 | | | | 199 | | |
| | | | 984 | | |
Total Corporate Bonds (Cost $10,651) | | | 11,261 | | |
Yankee Dollars (0.4%) | |
Consumer Staples (0.0%): (h) | |
Alimentation Couche-Tard, Inc., 2.95%, 1/25/30, Callable 10/25/29 @100 (a) | | | 75 | | | | 77 | | |
Energy (0.0%): (h) | |
Petroleos Mexicanos, 6.49%, 1/23/27, Callable 11/23/26 @100 | | | 64 | | | | 68 | | |
Financials (0.2%): | |
Banco Santander Mexico SA Institucion de Banca Multiple Grupo Financiero
Santand, 5.38%, 4/17/25 (a) | | | 51 | | | | 58 | | |
Barclays PLC, 2.85% (LIBOR03M+245bps), 5/7/26, Callable 5/7/25 @100 (b) | | | 103 | | | | 109 | | |
Deutsche Bank AG, 3.96% (SOFR+258bps), 11/26/25,
Callable 11/26/24 @100 (b) | | | 112 | | | | 122 | | |
Diageo Capital PLC, 2.13%, 4/29/32, Callable 1/29/32 @100 | | | 122 | | | | 120 | | |
Royal Bank of Canada, 1.60%, 4/17/23, MTN | | | 125 | | | | 128 | | |
| | | | 537 | | |
Industrials (0.1%): | |
CK Hutchison International 19 II Ltd., 2.75%, 9/6/29, Callable 6/6/29 @100 (a) | | | 200 | | | | 206 | | |
Ferguson Finance PLC, 3.25%, 6/2/30, Callable 3/2/30 @100 (a) | | | 42 | | | | 45 | | |
Heathrow Funding Ltd., 4.88%, 7/15/21 (a) | | | 71 | | | | 72 | | |
| | | | 323 | | |
Materials (0.1%): | |
Anglo American Capital PLC, 5.63%, 4/1/30, Callable 1/1/30 @100 (a) | | | 69 | | | | 84 | | |
Braskem Netherlands Finance BV, 4.50%, 1/31/30 (a) | | | 113 | | | | 117 | | |
CCL Industries, Inc., 3.05%, 6/1/30, Callable 3/1/30 @100 (a) | | | 71 | | | | 74 | | |
Teck Resources Ltd., 6.13%, 10/1/35 | | | 120 | | | | 151 | | |
| | | | 426 | | |
Total Yankee Dollars (Cost $1,352) | | | 1,431 | | |
Municipal Bonds (0.2%) | |
Florida (0.0%): (h) | |
County of Broward Florida Airport System Revenue, Series C, 2.50%, 10/1/28 | | | 75 | | | | 79 | | |
Louisiana (0.0%): (h) | |
Louisiana Local Government Environmental Facilities & Community
Development Authority Revenue, 1.55%, 2/1/27 | | | 60 | | | | 60 | | |
New Jersey (0.0%): (h) | |
North Hudson Sewerage Authority Revenue, 2.88%, 6/1/28 | | | 37 | | | | 39 | | |
Rutgers The State University of New Jersey Revenue, Series S, 2.01%, 5/1/32 | | | 40 | | | | 39 | | |
| | | | 78 | | |
See notes to financial statements.
20
USAA Mutual Funds Trust
USAA Cornerstone Aggressive Fund | | Schedule of Portfolio Investments — continued
May 31, 2021 | |
(Amounts in Thousands, Except for Shares)
| Security Description | | Principal
Amount | | Value | |
New York (0.0%): (h) | |
New York State Thruway Authority Revenue, Series M, 2.55%, 1/1/28 | | $ | 43 | | | $ | 45 | | |
Pennsylvania (0.1%): | |
State Public School Building Authority Revenue, 3.05%, 4/1/28 | | | 75 | | | | 75 | | |
University of Pittsburgh-of The Commonwealth System of Higher
Education Revenue
Series C, 2.53%, 9/15/31 | | | 75 | | | | 78 | | |
Series C, 2.58%, 9/15/32 | | | 40 | | | | 42 | | |
Series C, 2.63%, 9/15/33 | | | 75 | | | | 78 | | |
| | | | 273 | | |
Texas (0.1%): | |
City of Houston Texas Combined Utility System Revenue, 3.72%, 11/15/28 | | | 95 | | | | 110 | | |
City of San Antonio Texas, GO, 1.76%, 2/1/31, Continuously Callable @100 | | | 55 | | | | 55 | | |
Dallas Fort Worth International Airport Revenue, Series C, 1.75%, 11/1/27 | | | 40 | | | | 40 | | |
Harris County Cultural Education Facilities Finance Corp. Revenue,
Series B, 2.81%, 5/15/29 | | | 75 | | | | 79 | | |
State of Texas, GO, 3.00%, 4/1/28 | | | 112 | | | | 124 | | |
| | | | 408 | | |
Total Municipal Bonds (Cost $909) | | | 943 | | |
U.S. Government Agency Mortgages (0.6%) | |
Federal Home Loan Mortgage Corporation
Series K047, Class A2, 3.33%, 5/25/25 (c) | | | 300 | | | | 329 | | |
3.00%, 10/1/46-10/1/47 | | | 1,392 | | | | 1,463 | | |
3.50%, 4/1/48 | | | 150 | | | | 159 | | |
| | | | 1,951 | | |
Federal National Mortgage Association
Series 2016-M2, Class AV2, 2.15%, 1/25/23 | | | 129 | | | | 130 | | |
4.00%, 4/1/49 | | | 248 | | | | 264 | | |
| | | | 394 | | |
Total U.S. Government Agency Mortgages (Cost $2,231) | | | 2,345 | | |
U.S. Treasury Obligations (2.4%) | |
U.S. Treasury Bonds | |
3.00%, 8/15/48 (g) | | | 1,000 | | | | 1,152 | | |
3.38%, 11/15/48 (g) | | | 500 | | | | 616 | | |
U.S. Treasury Inflation Indexed Bonds, 0.13%, 7/15/26 | | | 1,105 | | | | 1,223 | | |
U.S. Treasury Notes | |
1.63%, 4/30/23 | | | 1,567 | | | | 1,611 | | |
1.63%, 2/15/26 | | | 2,250 | | | | 2,344 | | |
2.25%, 2/15/27 | | | 2,000 | | | | 2,144 | | |
Total U.S. Treasury Obligations (Cost $8,414) | | | 9,090 | | |
Commercial Paper (0.1%) | |
Ameren Corp., 0.52%, 6/1/21 (j) | | | 225 | | | | 225 | | |
Total Commercial Paper (Cost $225) | | | 225 | | |
See notes to financial statements.
21
USAA Mutual Funds Trust
USAA Cornerstone Aggressive Fund | | Schedule of Portfolio Investments — continued
May 31, 2021 | |
(Amounts in Thousands, Except for Shares)
Security Description | | Shares | | Value | |
Exchange-Traded Funds (55.7%) | |
Invesco DB Commodity Index Tracking Fund (e) | | | 28,600 | | | $ | 532 | | |
Invesco FTSE RAFI Developed Markets ex-US ETF | | | 43,991 | | | | 2,175 | | |
Invesco FTSE RAFI Emerging Markets ETF | | | 240,641 | | | | 5,694 | | |
iShares Core MSCI EAFE ETF | | | 135,210 | | | | 10,384 | | |
iShares Core MSCI Emerging Markets ETF | | | 279,962 | | | | 18,659 | | |
iShares Core S&P 500 ETF | | | 93,936 | | | | 39,608 | | |
iShares Core S&P Small-Cap ETF | | | 1,934 | | | | 218 | | |
iShares Core US Aggregate Bond ETF | | | 43,611 | | | | 4,996 | | |
iShares MSCI Canada ETF (f) | | | 150,928 | | | | 5,716 | | |
iShares MSCI International Momentum Factor ETF | | | 120,883 | | | | 4,799 | | |
iShares MSCI International Quality Factor ETF | | | 130,029 | | | | 5,124 | | |
iShares Russell 2000 ETF (f) | | | 14,537 | | | | 3,278 | | |
JPMorgan BetaBuilders Canada ETF | | | 24,954 | | | | 1,638 | | |
Schwab Fundamental Emerging Markets Large Co. Index ETF | | | 430,014 | | | | 13,932 | | |
Schwab Fundamental International Large Co. Index ETF | | | 829,619 | | | | 28,398 | | |
Schwab Fundamental International Small Co. Index ETF | | | 91,800 | | | | 3,663 | | |
SPDR Gold Shares (e) (f) | | | 6,990 | | | | 1,247 | | |
SPDR S&P Emerging Markets SmallCap ETF | | | 14,790 | | | | 879 | | |
U.S. Oil Fund LP (e) (f) | | | 19,330 | | | | 878 | | |
Vanguard FTSE All-World ex-US ETF | | | 128,254 | | | | 8,235 | | |
Vanguard FTSE Developed Markets ETF (f) | | | 414,220 | | | | 21,713 | | |
Vanguard FTSE Emerging Markets ETF (f) (g) | | | 23,072 | | | | 1,243 | | |
Vanguard FTSE Europe ETF | | | 60,357 | | | | 4,162 | | |
Vanguard Real Estate ETF (f) | | | 19,078 | | | | 1,906 | | |
Vanguard S&P 500 ETF (g) | | | 26,409 | | | | 10,197 | | |
Vanguard Short-Term Bond ETF (f) | | | 34,704 | | | | 2,860 | | |
Vanguard Short-Term Corporate Bond ETF (e) | | | 23,551 | | | | 1,951 | | |
Vanguard Total Bond Market ETF | | | 78,203 | | | | 6,668 | | |
Vanguard Total Stock Market ETF (g) | | | 19,331 | | | | 4,216 | | |
Wisdom Tree Trust — WisdomTree Emerging Markets SmallCap Dividend Fund | | | 16,645 | | | | 899 | | |
Total Exchange-Traded Funds (Cost $169,861) | | | 215,868 | | |
Affiliated Exchange-Traded Funds (4.6%) | |
VictoryShares USAA Core Intermediate-Term Bond ETF | | | 221,000 | | | | 11,794 | | |
VictoryShares USAA Core Short-Term Bond ETF | | | 103,145 | | | | 5,353 | | |
VictoryShares USAA MSCI Emerging Markets Value Momentum ETF (g) | | | 16,000 | | | | 824 | | |
Total Affiliated Exchange-Traded Funds (Cost $18,064) | | | 17,971 | | |
See notes to financial statements.
22
USAA Mutual Funds Trust
USAA Cornerstone Aggressive Fund | | Schedule of Portfolio Investments — continued
May 31, 2021 | |
(Amounts in Thousands, Except for Shares)
Security Description | | Shares | | Value | |
Collateral for Securities Loaned^ (3.9%) | |
Fidelity Investments Money Market Government Portfolio Institutional Shares,
0.01% (k) | | | 3,925,740 | | | $ | 3,926 | | |
Goldman Sachs Financial Square Government Fund Institutional Shares,
0.03% (k) | | | 2,952,401 | | | | 2,952 | | |
HSBC U.S. Government Money Market Fund I Shares, 0.03% (k) | | | 8,348,794 | | | | 8,349 | | |
Total Collateral for Securities Loaned (Cost $15,227) | | | 15,227 | | |
Total Investments (Cost $323,698) — 103.7% | | | 401,664 | | |
Liabilities in excess of other assets — (3.7)% | | | (14,168 | ) | |
NET ASSETS — 100.00% | | $ | 387,496 | | |
At May 31, 2021, the Fund's investments in foreign securities were 36.4% of net assets.
^ Purchased with cash collateral from securities on loan.
(a) Rule 144A security or other security that is restricted as to resale to institutional investors. The Fund's Adviser has deemed this security to be liquid based upon procedures approved by the Board of Trustees. As of May 31, 2021, the fair value of these securities was $3,958 (thousands) and amounted to 1.0% of net assets.
(b) Variable or Floating-Rate Security. Rate disclosed is as of May 31, 2021.
(c) The rate for certain asset-backed and mortgage-backed securities may vary based on factors relating to the pool of assets underlying the security. The rate disclosed is the rate in effect at May 31, 2021.
(d) Security is interest only.
(e) Non-income producing security.
(f) All or a portion of this security is on loan.
(g) All or a portion of this security has been segregated as collateral for derivative instruments.
(h) Amount represents less than 0.05% of net assets.
(i) The Fund's Adviser has deemed this security to be illiquid based upon procedures approved by the Board of Trustees. As of May 31, 2021, illiquid securities were 0.1% of net assets.
(j) Rate represents the effective yield at May 31, 2021.
(k) Rate disclosed is the daily yield on May 31, 2021.
bps — Basis points
Continuously callable — Investment is continuously callable or will be continuously callable on any date after the first call date until its maturity.
ETF — Exchange-Traded Fund
GO — General Obligation
LIBOR — London InterBank Offered Rate
LIBOR01M — 1 Month US Dollar LIBOR, rate disclosed as of May 31, 2021, based on the last reset date of the security
See notes to financial statements.
23
USAA Mutual Funds Trust
USAA Cornerstone Aggressive Fund | | Schedule of Portfolio Investments — continued
May 31, 2021 | |
LIBOR03M — 3 Month US Dollar LIBOR, rate disclosed as of May 31, 2021, based on the last reset date of the security
LLC — Limited Liability Company
LP — Limited Partnership
MTN — Medium Term Note
PLC — Public Limited Company
SOFR — Secured Overnight Financing Rate
Futures Contracts Purchased
(Amounts not in thousands)
| | | Number of
Contracts | | Expiration
Date | | Notional
Amount | | Value | | Unrealized
Appreciation/
(Depreciation) | |
Swiss Market Index Futures | | | 38 | | | 6/18/21 | | $ | 4,375,647 | | | $ | 4,828,603 | | | $ | 313,027 | | |
Futures Contracts Sold
(Amounts not in thousands)
| | | Number of
Contracts | | Expiration
Date | | Notional
Amount | | Value | | Unrealized
Appreciation/
(Depreciation) | |
Euro Stoxx 50 Futures | | | 48 | | | 6/18/21 | | $ | 2,289,785 | | | $ | 2,379,691 | | | $ | (62,372 | ) | |
FTSE 100 Index Futures | | | 52 | | | 6/18/21 | | | 4,831,084 | | | | 5,182,145 | | | | (241,854 | ) | |
Russell 2000 E-Mini Index Futures | | | 39 | | | 6/18/21 | | | 4,504,241 | | | | 4,423,770 | | | | 80,471 | | |
| | | $ | (223,755 | ) | |
Total unrealized appreciation | | $ | 393,498 | | |
Total unrealized depreciation | | | (304,226 | ) | |
Total net unrealized appreciation (depreciation) | | $ | 89,272 | | |
See notes to financial statements.
24
USAA Mutual Funds Trust | | Statement of Assets and Liabilities
May 31, 2021 | |
(Amounts in Thousands, Except Per Share Amounts)
| | | USAA Cornerstone
Aggressive Fund | |
Assets: | |
Affiliated investments, at value (Cost $18,064) | | $ | 17,971 | | |
Unaffiliated investments, at value (Cost $305,634) | | | 383,693 | (a) | |
Deposit with brokers for futures contracts | | | 1,562 | | |
Receivables: | |
Interest and dividends | | | 358 | | |
Capital shares issued | | | 188 | | |
Investments sold | | | 1,365 | | |
Variation margin on open futures contracts | | | 44 | | |
From Adviser | | | 29 | | |
Prepaid expenses | | | 14 | | |
Total Assets | | | 405,224 | | |
Liabilities: | |
Payables: | |
Collateral received on loaned securities | | | 15,227 | | |
Collateral received from brokers for futures contract | | | 929 | | |
To custodian | | | 870 | | |
Capital shares redeemed | | | 273 | | |
Variation margin on open futures contracts | | | 26 | | |
Accrued expenses and other payables: | |
Investment advisory fees | | | 196 | | |
Administration fees | | | 49 | | |
Custodian fees | | | 5 | | |
Transfer agent fees | | | 83 | | |
Compliance fees | | | — | (b) | |
Trustees' fees | | | 1 | | |
Other accrued expenses | | | 69 | | |
Total Liabilities | | | 17,728 | | |
Net Assets: | |
Capital | | | 290,363 | | |
Total accumulated earnings/(loss) | | | 97,133 | | |
Net Assets | | $ | 387,496 | | |
Shares (unlimited number of shares authorized with no par value): | | | 25,314 | | |
Net asset value, offering and redemption price per share: (c) | | $ | 15.31 | | |
(a) Includes $14,875 of securities on loan.
(b) Rounds to less than $1 thousand.
(c) Per share amount may not recalculate due to rounding of net assets and/or shares outstanding.
See notes to financial statements.
25
USAA Mutual Funds Trust | | Statement of Operations
For the Year Ended May 31, 2021 | |
(Amounts in Thousands)
| | | USAA Cornerstone
Aggressive Fund | |
Investment Income: | |
Income distributions from affiliated funds | | $ | 181 | | |
Dividends | | | 6,074 | | |
Interest | | | 1,005 | | |
Securities lending (net of fees) | | | 73 | | |
Foreign tax withholding | | | — | (a) | |
Total Income | | | 7,333 | | |
Expenses: | |
Investment advisory fees | | | 2,218 | | |
Administration fees | | | 555 | | |
Sub-Administration fees | | | 93 | | |
Custodian fees | | | 38 | | |
Transfer agent fees | | | 1,189 | | |
Trustees' fees | | | 50 | | |
Compliance fees | | | 2 | | |
Legal and audit fees | | | 54 | | |
State registration and filing fees | | | 29 | | |
Interfund lending fees | | | — | (a) | |
Other expenses | | | 106 | | |
Total Expenses | | | 4,334 | | |
Expenses waived/reimbursed by Adviser | | | (262 | ) | |
Net Expenses | | | 4,072 | | |
Net Investment Income (Loss) | | | 3,261 | | |
Realized/Unrealized Gains (Losses) from Investments: | |
Net realized gains (losses) from unaffiliated investment securities and
foreign currency translations | | | 27,635 | | |
Capital gain distributions received from affiliated funds | | | 17 | | |
Net realized gains (losses) from futures contracts | | | (755 | ) | |
Net change in unrealized appreciation/depreciation on affiliated funds | | | 88 | | |
Net change in unrealized appreciation/depreciation on unaffiliated investment
securities | | | 74,778 | | |
Net change in unrealized appreciation/depreciation on futures contracts | | | 89 | | |
Net realized/unrealized gains (losses) on investments | | | 101,852 | | |
Change in net assets resulting from operations | | $ | 105,113 | | |
(a) Rounds to less than $1 thousand.
See notes to financial statements.
26
USAA Mutual Funds Trust | | Statements of Changes in Net Assets | |
(Amounts in Thousands)
| | | USAA Cornerstone Aggressive Fund | |
| | | Year
Ended
May 31,
2021 | | Year
Ended
May 31,
2020 | |
From Investments: | |
Operations: | |
Net investment income (loss) | | $ | 3,261 | | | $ | 6,090 | | |
Net realized gains (losses) from investments | | | 26,897 | | | | (3,584 | ) | |
Net change in unrealized appreciation/depreciation on
investments | | | 74,955 | | | | 3,241 | | |
Change in net assets resulting from operations | | | 105,113 | | | | 5,747 | | |
Change in net assets resulting from distributions to shareholders | | | (7,114 | ) | | | (6,470 | ) | |
Change in net assets resulting from capital transactions | | | (54,063 | ) | | | (7,127 | ) | |
Change in net assets | | | 43,936 | | | | (7,850 | ) | |
Net Assets: | |
Beginning of period | | | 343,560 | | | | 351,410 | | |
End of period | | $ | 387,496 | | | $ | 343,560 | | |
Capital Transactions: | |
Proceeds from shares issued | | $ | 43,105 | | | $ | 54,179 | | |
Distributions reinvested | | | 6,811 | | | | 6,219 | | |
Cost of shares redeemed | | | (103,979 | ) | | | (67,525 | ) | |
Change in net assets resulting from capital transactions | | $ | (54,063 | ) | | $ | (7,127 | ) | |
Share Transactions: | |
Issued | | | 3,112 | | | | 4,491 | | |
Reinvested | | | 494 | | | | 480 | | |
Redeemed | | | (7,566 | ) | | | (5,660 | ) | |
Change in Shares | | | (3,960 | ) | | | (689 | ) | |
See notes to financial statements.
27
USAA Mutual Funds Trust | | Financial Highlights | |
For a Share Outstanding Throughout Each Period
| | | | | Investment Activities | | Distributions to
Shareholders From | |
| | | Net Asset
Value,
Beginning
of Period | | Net
Investment
Income
(Loss) | | Net
Realized
and
Unrealized
Gains
(Losses) on
Investments | | Total from
Investment
Activities | | Net
Investment
Income | | Net
Realized
Gains from
Investments | |
USAA Cornerstone Aggressive Fund | |
Year Ended: | |
May 31, 2021 | | $ | 11.74 | | | | 0.12 | (b) | | | 3.71 | | | | 3.83 | | | | (0.18 | ) | | | (0.08 | ) | |
May 31, 2020 | | $ | 11.73 | | | | 0.20 | (b) | | | 0.03 | (c) | | | 0.23 | | | | (0.15 | ) | | | (0.07 | ) | |
May 31, 2019 | | $ | 12.81 | | | | 0.15 | | | | (0.57 | ) | | | (0.42 | ) | | | (0.18 | ) | | | (0.48 | ) | |
May 31, 2018 | | $ | 12.57 | | | | 0.16 | | | | 0.94 | | | | 1.10 | | | | (0.14 | ) | | | (0.72 | ) | |
May 31, 2017 | | $ | 11.33 | | | | 0.15 | | | | 1.26 | | | | 1.41 | | | | (0.17 | ) | | | — | | |
* Assumes reinvestment of all net investment income and realized capital gain distributions, if any, during the period. Includes adjustments in accordance with U.S. Generally Accepted Accounting Principles and could differ from the Lipper reported return.
^ The net expense ratio may not correlate to the applicable expense limits in place during the period since the current contractual expense limitation is applied for a period beginning July 1, 2019, and in effect through June 30, 2023, instead of coinciding with the Fund's fiscal year end. Details of the current contractual expense limitation in effect can be found in Note 4 of the accompanying Notes to Financial Statements.
(a) The expense ratios exclude the impact of expenses paid by each underlying fund.
(b) Per share net investment income (loss) has been calculated using the average daily shares method.
(c) The amount shown for a share outstanding throughout the period does not accord with the change in aggregate gains and losses in the portfolio of securities during the period because of timing of sales and purchases of fund shares in relation to fluctuating market values during the period.
(d) Reflects increased trading activity due to usage of quantitative investment strategies.
See notes to financial statements.
28
USAA Mutual Funds Trust | | Financial Highlights — continued | |
For a Share Outstanding Throughout Each Period
| | | | | Ratios to Average Net Assets | | Supplemental Data | |
| | | Total
Distributions | | Net
Asset
Value,
End of
Period | | Total
Return* | | Net
Expenses^(a) | | Net
Investment
Income
(Loss) | | Gross
Expenses(a) | | Net
Assets,
End of
Period
(000's) | | Portfolio
Turnover | |
USAA Cornerstone Aggressive Fund | |
Year Ended: | |
May 31, 2021 | | | (0.26 | ) | | $ | 15.31 | | | | 32.91 | % | | | 1.10 | % | | | 0.88 | % | | | 1.17 | % | | $ | 387,496 | | | | 64 | % | |
May 31, 2020 | | | (0.22 | ) | | $ | 11.74 | | | | 1.78 | % | | | 1.10 | % | | | 1.68 | % | | | 1.18 | % | | $ | 343,560 | | | | 90 | % | |
May 31, 2019 | | | (0.66 | ) | | $ | 11.73 | | | | (3.04 | )% | | | 1.10 | % | | | 1.54 | % | | | 1.24 | % | | $ | 351,410 | | | | 95 | %(d) | |
May 31, 2018 | | | (0.86 | ) | | $ | 12.81 | | | | 8.85 | % | | | 1.10 | % | | | 1.18 | % | | | 1.25 | % | | $ | 344,768 | | | | 65 | % | |
May 31, 2017 | | | (0.17 | ) | | $ | 12.57 | | | | 12.59 | % | | | 1.10 | % | | | 1.32 | % | | | 1.36 | % | | $ | 283,867 | | | | 70 | % | |
See notes to financial statements.
29
USAA Mutual Funds Trust | | Notes to Financial Statements
May 31, 2021 | |
1. Organization:
USAA Mutual Funds Trust (the "Trust") is organized as a Delaware statutory trust and is registered under the Investment Company Act of 1940, as amended (the "1940 Act"), as an open-end investment company. The Trust is comprised of 46 funds and is authorized to issue an unlimited number of shares, which are units of beneficial interest with no par value.
The accompanying financial statements are those of the USAA Cornerstone Aggressive Fund (the "Fund"). The Fund is classified as diversified under the 1940 Act.
Under the Trust's organizational documents, its officers and trustees are indemnified against certain liabilities arising out of the performance of their duties to the Fund. In addition, in the normal course of business, the Fund enters into contracts with its vendors and others that provide for general indemnifications. The Fund's maximum exposure under these arrangements is unknown, as this would involve future claims that may be made against the Fund. However, based on experience, the Fund expects that risk of loss to be remote.
2. Significant Accounting Policies:
The following is a summary of significant accounting policies followed by the Trust in the preparation of its financial statements. The policies are in conformity with Generally Accepted Accounting Principles in the United States of America ("GAAP"). The preparation of financial statements in accordance with GAAP requires management to make estimates and assumptions that affect the reported amounts of assets and liabilities and disclosure of contingent assets and liabilities at the date of the financial statements and the reported amounts of income and expenses for the period. Actual results could differ from those estimates. The Fund follows the specialized accounting and reporting requirements under GAAP that are applicable to investment companies under Accounting Standards Codification Topic 946.
Investment Valuation:
The Fund records investments at fair value. Fair value is defined as the price that would be received to sell an asset or paid to transfer a liability in an orderly transaction between market participants at the measurement date.
The valuation techniques described below maximize the use of observable inputs and minimize the use of unobservable inputs in determining fair value. The inputs used for valuing the Fund's investments are summarized in the three broad levels listed below:
• Level 1 — quoted prices in active markets for identical securities
• Level 2 — other significant observable inputs (including quoted prices for similar securities or interest rates applicable to those securities, etc.)
• Level 3 — significant unobservable inputs (including the Fund's own assumptions in determining the fair value of investments)
Changes in valuation techniques may result in transfers in or out of an assigned level within the disclosure hierarchy. The inputs or methodologies used for valuation techniques are not necessarily an indication of the risks associated with entering into those investments.
Victory Capital Management Inc. ("VCM" or the "Adviser") has established the Pricing and Liquidity Committee (the "Committee"), and subject to the Trust's Board of Trustees (the "Board") oversight, the Committee administers and oversees the Fund's valuation policies and procedures, which are approved by the Board.
Investments in open-end investment companies, including underlying funds, are valued at their net asset value ("NAV"). These valuations are typically categorized as Level 1 in the fair value hierarchy.
Portfolio securities listed or traded on securities exchanges, including Exchange-Traded Funds ("ETFs"), American Depositary Receipts ("ADRs"), and Rights are valued at the closing price on the exchange or system where the security is principally traded, if available, or at the Nasdaq Official Closing Price. If
30
USAA Mutual Funds Trust | | Notes to Financial Statements — continued
May 31, 2021 | |
there have been no sales for that day on the exchange or system, then a security is valued at the last available bid quotation on the exchange or system where the security is principally traded. In each of these situations, valuations are typically categorized as Level 1 in the fair value hierarchy.
Debt securities are valued each business day by a pricing service approved by the Board of Trustees (the "Board"). The approved pricing service uses the evaluated bid or the last sale price to value securities. Debt obligations maturing within 60 days may be valued at amortized cost, provided that the amortized cost represents the fair value of such securities. These valuations are typically categorized as Level 2 in the fair value hierarchy.
Futures contracts are valued at the settlement price established each day by the board of trade or an exchange on which they are traded. These valuations are typically categorized as Level 1 in the fair value hierarchy.
In the event that price quotations or valuations are not readily available, investments are valued at fair value in accordance with procedures established by and under the general supervision and responsibility of the Board. These valuations are typically categorized as Level 2 or Level 3 in the fair value hierarchy, based on the observability of inputs used to determine the fair value. The effect of fair value pricing is that securities may not be priced on the basis of quotations from the primary market in which they are traded and the actual price realized from the sale of a security may differ materially from the fair value price. Valuing these securities at fair value is intended to cause the Fund's NAV to be more reliable than it otherwise would be.
A summary of the valuations as of May 31, 2021, based upon the three levels defined above, is included in the table below while the breakdown, by category, of investments is disclosed on the Schedule of Portfolio Investments (amounts in thousands):
| | | Level 1 | | Level 2 | | Level 3 | | Total | |
Asset-Backed Securities | | $ | — | | | $ | 1,352 | | | $ | — | | | $ | 1,352 | | |
Collateralized Mortgage
Obligations | | | — | | | | 829 | | | | — | | | | 829 | | |
Common Stocks | | | 124,652 | | | | — | | | | — | | | | 124,652 | | |
Preferred Stocks | | | 203 | | | | 267 | | | | — | | | | 470 | | |
Corporate Bonds | | | — | | | | 11,261 | | | | — | | | | 11,261 | | |
Yankee Dollars | | | — | | | | 1,431 | | | | — | | | | 1,431 | | |
Municipal Bonds | | | — | | | | 943 | | | | — | | | | 943 | | |
U.S. Government Agency
Mortgages | | | — | | | | 2,345 | | | | — | | | | 2,345 | | |
U.S. Treasury Obligations | | | — | | | | 9,090 | | | | — | | | | 9,090 | | |
Commercial Paper | | | — | | | | 225 | | | | — | | | | 225 | | |
Exchange-Traded Funds | | | 215,868 | | | | — | | | | — | | | | 215,868 | | |
Affiliated Exchange-Traded
Funds | | | 17,971 | | | | — | | | | — | | | | 17,971 | | |
Collateral for Securities
Loaned | | | 15,227 | | | | — | | | | — | | | | 15,227 | | |
Total | | $ | 373,921 | | | $ | 27,743 | | | $ | — | | | $ | 401,664 | | |
| Other Financial Investments^ | |
Assets: | |
Futures Contracts | | $ | 393 | | | $ | — | | | $ | — | | | $ | 393 | | |
Liabilities: | |
Futures Contracts | | $ | (304 | ) | | $ | — | | | $ | — | | | $ | (304 | ) | |
Total | | $ | 89 | | | $ | — | | | $ | — | | | $ | 89 | | |
^ Futures contracts are valued at the unrealized appreciation (depreciation) on the investment.
For the year ended May 31, 2021, there were no transfers in or out of Level 3 in the fair value hierarchy.
31
USAA Mutual Funds Trust | | Notes to Financial Statements — continued
May 31, 2021 | |
Real Estate Investment Trusts ("REITs"):
The Fund may invest in REITs, which report information on the source of their distributions annually. REITs are pooled investment vehicles that invest primarily in income producing real estate or real estate related loans or interests (such as mortgages). Certain distributions received from REITs during the year are recorded as realized gains or return of capital as estimated by the Fund or when such information becomes known.
Investment Companies:
Exchange-Traded Funds:
The Fund may invest in ETFs, the shares of which are bought and sold on a securities exchange. An ETF trades like common stock and represents a fixed portfolio of securities often designed to track the performance and dividend yield of a particular domestic or foreign market index. The Fund may purchase shares of an ETF to temporarily gain exposure to a portion of the U.S. or a foreign market while awaiting purchase of underlying securities. The risks of owning an ETF generally reflect the risks of owning the underlying securities they are designed to track, although the lack of liquidity of an ETF could result in it being more volatile. Additionally, ETFs have fees and expenses that reduce their value.
Open-End Funds:
The Fund may invest in portfolios of open-end investment companies. These investment companies value securities in their portfolios for which market quotations are readily available at their market values (generally the last reported sale price) and all other securities and assets at their fair value by the methods established by the board of directors of the underlying funds.
Municipal Obligations:
The values of municipal obligations can fluctuate and may be affected by adverse tax, legislative, or political changes, and by financial developments affecting municipal issuers. Payment of municipal obligations may depend on a relatively limited source of revenue, resulting in greater credit risk. Future changes in federal tax laws or the activity of an issuer may adversely affect the tax-exempt status of municipal obligations.
Mortgage- and Asset-Backed Securities:
The values of some mortgage-related or asset-backed securities may be particularly sensitive to changes in prevailing interest rates. Early repayment of principal on some mortgage-related securities may expose the Fund to a lower rate of return upon reinvestment of principal. The values of mortgage and asset-backed securities depend in part on the credit quality and adequacy of the underlying assets or collateral and may fluctuate in response to the market's perception of these factors as well as current and future repayment rates. Some mortgage-backed securities are backed by the full faith and credit of the U.S. government (e.g., mortgage-backed securities issued by the Government National Mortgage Association, commonly known as "Ginnie Mae"), while other mortgage-backed securities (e.g., mortgage-backed securities issued by the Federal National Mortgage Association and the Federal Home Loan Mortgage Corporation, commonly known as "Fannie Mae" and "Freddie Mac", respectively), are backed only by the credit of the government entity issuing them. In addition, some mortgage-backed securities are issued by private entities and, as such, are not guaranteed by the U.S. government or any agency or instrumentality of the U.S. government.
Derivative Instruments:
Futures Contracts:
The Fund may enter into contracts for the future delivery of securities or foreign currencies and futures contracts based on a specific security, class of securities, foreign currency or an index, and purchase or sell options on any such futures contracts. A futures contract on a securities index is an agreement
32
USAA Mutual Funds Trust | | Notes to Financial Statements — continued
May 31, 2021 | |
obligating either party to pay, and entitling the other party to receive, while the contract is outstanding, cash payments based on the level of a specified securities index. No physical delivery of the underlying asset is made. The Fund may enter into futures contracts in an effort to hedge against market risks. The acquisition of put and call options on futures contracts will give the Fund the right (but not the obligation), for a specified price, to sell or to purchase the underlying futures contract, upon exercise of the option, at any time during the option period. Futures transactions involve brokerage costs and require the Fund to segregate assets to cover contracts that would require it to purchase securities or currencies. A good faith margin deposit, known as initial margin, of cash or government securities with a broker or custodian is required to initiate and maintain open positions in futures contracts. Subsequent payments, known as variation margin, are made or received by the Fund based on the change in the market value of the position and are recorded as unrealized appreciation or depreciation until the contract is closed out, at which time the gain or loss is realized. The Fund may lose the expected benefit of futures transactions if interest rates, exchange rates or securities prices change in an unanticipated manner. Such unanticipated changes may also result in lower overall performance than if the Fund had not entered into any futures transactions. In addition, the value of the Fund's futures positions may not prove to be perfectly or even highly correlated with the value of its portfolio securities or foreign currencies, limiting the Fund's ability to hedge effectively against interest rate, exchange rate and/or market risk and giving rise to additional risks. There is no assurance of liquidity in the secondary market for purposes of closing out futures positions. The collateral held by the Fund is reflected on the Statement of Assets and Liabilities under Deposit with brokers for futures contracts and Collateral received from brokers for futures contracts. During the year ended May 31, 2021, the Fund entered into futures contracts primarily for the strategy of gaining exposure to a particular asset class or securities market.
Summary of Derivative Instruments:
The following table summarizes the fair values of derivative instruments on the Statement of Assets and Liabilities, categorized by risk exposure, as of May 31, 2021 (amounts in thousands):
| | | Assets | | Liabilities | |
| | | Variation Margin
Receivable on Open
Futures Contracts* | | Variation Margin
Payable on Open
Futures Contracts* | |
Equity Risk Exposure | | $ | 393 | | | $ | 304 | | |
* Includes cumulative unrealized appreciation (depreciation) of futures contracts as reported on the Schedule of Portfolio Investments. Only current day's variation margin for futures contracts is reported within the Statement of Assets and Liabilities.
The following table presents the effect of derivative instruments on the Statement of Operations, categorized by risk exposure, for the year ended May 31, 2021 (amounts in thousands):
| | Net Realized Gains (Losses) on
Derivatives Recognized as
a Result of Operations | | Net Change in Unrealized
Appreciation/Depreciation
on Derivatives Recognized
as a Result of Operations | |
| | | Net Realized Gains (Losses)
from Futures Contracts | | Net Change in Unrealized
Appreciation/Depreciation
on Futures Contracts | |
Equity Risk Exposure | | $ | (755 | ) | | $ | 89 | | |
All open derivative positions at year end are reflected on the Fund's Schedule of Portfolio Investments. The underlying face value of open derivative positions relative to the Fund's net assets at year end is generally representative of the notional amount of open positions to net assets throughout the year.
33
USAA Mutual Funds Trust | | Notes to Financial Statements — continued
May 31, 2021 | |
Investment Transactions and Related Income:
Changes in holdings of investments are accounted for no later than one business day following the trade date. For financial reporting purposes, however, investment transactions are accounted for on trade date on the last business day of the reporting period. Interest income is determined on the basis of coupon interest accrued using the effective interest method which adjusts, where applicable, the amortization of premiums or accretion of discount. Dividend income is recorded on the ex-dividend date. Gains or losses realized on sales of securities are recorded on the identified cost basis.
Withholding taxes on interest, dividends, and gains as a result of certain investments in ADRs by the Fund have been provided for in accordance with each investment's applicable country's tax rules and rates.
Securities Lending:
The Fund, through a securities lending agreement with Citibank, N.A. ("Citibank"), may lend its securities to qualified financial institutions, such as certain broker-dealers, to earn additional income, net of income retained by Citibank. Borrowers are required to secure their loans for collateral in the amount of at least 102% of the value of U.S. securities loaned or at least 105% of the value of non-U.S. securities loaned, marked-to-market daily. Any collateral shortfalls associated with increases in the valuation of the securities loaned are cured the next business day once the shortfall exceeds $100 thousand. Collateral may be cash, U.S. government securities, or other securities as permitted by Securities and Exchange Commission ("SEC") guidelines. Cash collateral may be invested in high-quality short-term investments, primarily open-end investment companies. Collateral requirements are determined daily based on the value of the Fund's securities on loan as of the end of the prior business day. During the time portfolio securities are on loan, the borrower will pay the Fund any dividends or interest paid on such securities plus any fee negotiated between the parties to the lending agreement. The Fund also earns a return from the collateral. The Fund pays Citibank various fees in connection with the investment of cash collateral and fees based on the investment income received from securities lending activities. Securities lending income (net of these fees) is disclosed on the Statement of Operations. Loans are terminable upon demand and the borrower must return the loaned securities within the lesser of one standard settlement period or five business days. Risks relating to securities-lending transactions include that the borrower may not provide additional collateral when required or return the securities when due, and that the value of the short-term investments will be less than the amount of cash collateral required to be returned to the borrower. The Fund's agreement with Citibank does not include master netting provisions. Non-cash collateral received by the Fund may not be sold or re-pledged, except to satisfy borrower default. Cash collateral is listed on the Fund's Schedule of Portfolio Investments and Financial Statements while non-cash collateral is not included.
The following table (amounts in thousands) is a summary of the Fund's securities lending transactions as of May 31, 2021.
Value of
Securities on Loan | | Non-Cash
Collateral | | Cash Collateral | |
| $ | 14,875 | | | $ | — | | | $ | 15,227 | | |
Foreign Currency Translations:
The accounting records of the Fund are maintained in U.S. dollars. Investment securities and other assets and liabilities of the Fund denominated in a foreign currency are translated into U.S. dollars at current exchange rates. Purchases and sales of securities, income receipts, and expense payments are translated into U.S. dollars at the exchange rates on the date of the transactions. The Fund does not isolate the portion of the results of operations resulting from changes in foreign exchange rates on investments from fluctuations arising from changes in market prices of securities held. Such fluctuations are disclosed as net change in unrealized appreciation/depreciation on investments and foreign currency translations on the Statement of Operations. Any realized gains or losses from these fluctuations,
34
USAA Mutual Funds Trust | | Notes to Financial Statements — continued
May 31, 2021 | |
including foreign currency arising from in-kind redemptions, are disclosed as net realized gains or losses from investment transactions and foreign currency translations on the Statement of Operations.
Foreign Taxes:
The Fund may be subject to foreign taxes related to foreign income received (a portion of which may be reclaimable), capital gains on the sale of securities, and certain foreign currency transactions. All foreign taxes are recorded in accordance with the applicable regulations and rates that exist in the foreign jurisdictions in which the Fund invests.
Federal Income Taxes:
It is the Fund's policy to continue to qualify as a regulated investment company by complying with the provisions available to certain investment companies, as defined in applicable sections of the Internal Revenue Code, and to make distributions of net investment income and net realized gains sufficient to relieve it from all, or substantially all, federal income taxes. Accordingly, no provision for federal income taxes is required in the financial statements. The Fund has a tax year end of May 31.
Management of the Fund has reviewed tax positions taken in tax years that remain subject to examination by all major tax jurisdictions, including federal (i.e., the last four tax years, which includes the current fiscal tax year end). Management believes that there is no tax liability resulting from unrecognized tax benefits related to uncertain tax positions taken.
Allocations:
Expenses directly attributable to the Fund are charged to the Fund, while expenses that are attributable to more than one fund in the Trust, or jointly with an affiliated trust, are allocated among the respective funds in the Trust and/or affiliated trust based upon net assets or another appropriate basis.
Cross-Trade Transactions:
Pursuant to Rule 17a-7 under the 1940 Act, the Fund may engage in cross-trades, which are securities transactions with affiliated investment companies and advisory accounts managed by the Adviser and any applicable sub-adviser. Any such purchase or sale transaction must be effected without brokerage commission or other remuneration, except for customary transfer fees. The transaction must be effected at the current market price, which is either the security's last sale price on an exchange or, if there are no transactions in the security that day, at the average of the highest bid and lowest asked price. For the year ended May 31, 2021, the Fund engaged in the following securities transactions with affiliated funds, which resulted in the following net realized gains (losses) (amounts in thousands):
| Purchases | | Sales | | Net Realized
Gains (Losses) | |
| $ | — | | | $ | 1,376 | | | $ | 56 | | |
3. Purchases and Sales:
Cost of purchases and proceeds from sales/maturities of securities (excluding securities maturing less than one year from acquisition) for the year ended May 31, 2021, were as follows for the Fund (amounts in thousands):
| | Excluding
U.S. Government Securities | | U.S. Government Securities | |
| | | Purchases | | Sales | | Purchases | | Sales | |
| | | | | $ | 229,412 | | | $ | 279,746 | | | $ | 798 | | | $ | 3,245 | | |
35
USAA Mutual Funds Trust | | Notes to Financial Statements — continued
May 31, 2021 | |
4. Fees and Transactions with Affiliates and Related Parties:
Investment Advisory Fees:
Investment advisory services are provided to the Fund by the Adviser, which is a New York corporation registered as an investment adviser with the SEC. The Adviser is an indirect wholly owned subsidiary of Victory Capital Holdings, Inc., a publicly traded Delaware corporation, and a wholly owned direct subsidiary of Victory Capital Operating, LLC. Under the terms of the Investment Advisory Agreement, the Adviser is entitled to receive fees accrued daily and paid monthly at an annualized rate of 0.60% of the Fund's average daily net assets. Amounts incurred and paid to VCM for the year ended May 31, 2021, are reflected on the Statement of Operations as Investment Advisory fees.
The Trust relies on an exemptive order granted to VCM and its affiliated funds by the SEC in March 2019 permitting the use of a "manager-of-managers" structure for certain funds. Under a manager-of-managers structure, the investment adviser may select (with approval of the Board and without shareholder approval) one or more subadvisers to manage the day-to-day investment of a fund's assets. For the year ended May 31, 2021, the Fund had no subadvisors.
Administration and Servicing Fees:
VCM serves as the Fund's administrator and fund accountant. Under the Fund Administration, Servicing and Accounting Agreement, VCM is paid for its services an annual fee at a rate of 0.15% of average daily net assets of the Fund. Amounts incurred for the year ended May 31, 2021, are reflected on the Statement of Operations as Administration fees.
The Fund (as part of the Trust) has entered into an agreement to provide compliance services with the Adviser, pursuant to which the Adviser furnishes its compliance personnel, including the services of the Chief Compliance Officer ("CCO"), and other resources reasonably necessary to provide the Trust with compliance oversight services related to the design, administration and oversight of a compliance program for the Trust in accordance with Rule 38a-1 under the 1940 Act. The CCO is an employee of the Adviser, which pays the compensation of the CCO and support staff. Funds in the Trust, Victory Variable Insurance Funds, Victory Portfolios, and Victory Portfolios II (collectively, the "Victory Funds Complex") in the aggregate, compensate the Adviser for these services. Amounts incurred for the year ended May 31, 2021, are reflected on the Statement of Operations as Compliance fees.
Citi Fund Services Ohio, Inc. ("Citi"), an affiliate of Citibank, acts as sub-administrator and sub-fund accountant to the Fund pursuant to a Sub-Administration and Sub-Fund Accounting Services Agreement between VCM and Citi. VCM pays Citi a fee for providing these services. The Fund reimburses VCM and Citi for out-of-pocket expenses incurred in providing these services and certain other expenses specifically allocated to the Fund. Amounts incurred for the year ended May 31, 2021, are reflected on the Statement of Operations as Sub-Administration fees.
Transfer Agency Fees:
Victory Capital Transfer Agency, Inc. ("VCTA"), an affiliate of the Adviser, provides transfer agency services to the Fund. VCTA provides transfer agent services to the Fund based on an annual charge of $23 per shareholder account plus out-of-pocket expenses. VCTA pays a portion of these fees to certain intermediaries for the administration and servicing of accounts that are held with such intermediaries. Amounts incurred and paid to VCTA for the year ended May 31, 2021, are reflected on the Statement of Operations as Transfer Agent fees.
FIS Investor Services LLC serves as sub-transfer agent and dividend disbursing agent for the Fund pursuant to a Sub-Transfer Agent Agreement between VCTA and FIS Investor Services LLC. VCTA provides FIS Investor Services LLC a fee for providing these services.
Distributor/Underwriting Services:
Victory Capital Services, Inc. (the "Distributor"), an affiliate of the Adviser, serves as distributor for the continuous offering of the shares of the Fund pursuant to a Distribution Agreement between the
36
USAA Mutual Funds Trust | | Notes to Financial Statements — continued
May 31, 2021 | |
Distributor and the Trust and receives no fee or other compensation for these services. Effective June 30, 2020, the Distributor's name was changed from Victory Capital Advisers, Inc.
Other Fees:
Citibank serves as the Fund's custodian. The Fund pays Citibank a fee for providing these services. Amounts incurred for the year ended May 31, 2021, are reflected on the Statement of Operations as Custodian fees.
K&L Gates LLP provides legal services to the Trust.
The Adviser has entered into an expense limitation agreement with the Fund until at least June 30, 2023. Under the terms of the agreement, the Adviser has agreed to waive fees or reimburse certain expenses to the extent that ordinary operating expenses incurred in any fiscal year exceed the expense limit for the Fund. Such excess amounts will be the liability of the Adviser. Acquired fund fees and expenses, interest, taxes, brokerage commissions, other expenditures, that are capitalized in accordance with GAAP, and other extraordinary expenses not incurred in the ordinary course of the Fund's business are excluded from the expense limits. As of May 31, 2021, the expense limit (excluding voluntary waivers) was 1.10%.
In addition, the Fund invests in affiliated VCM exchange-traded fund(s) ("affiliated ETFs"). The Fund's Adviser fee is reimbursed by VCM to the extent of the indirect Adviser fee incurred through the Fund's proportional investment in the affiliated ETF(s). These Adviser fee reimbursements are not available for recoupment. For the year ended May 31, 2021, the Fund's Adviser fee was reimbursed by VCM in an amount of $26 thousand, of which $13 thousand is receivable from VCM.
Under the terms of the expense limitation agreement, amended May 1, 2021, the Fund has agreed to repay fees and expenses that were waived or reimbursed by the Adviser for a period of up to three years (thirty six (36) months) after the waiver or reimbursement took place, subject to the lesser of any operating expense limits in effect at the time of: (a) the original waiver or expense reimbursement; or (b) the recoupment, after giving effect to the recoupment amount. Prior to May 1, 2021, the Fund was permitted to recoup fees waived and expenses reimbursed for up to three years after the fiscal year in which the waiver or reimbursement took place, subject to the limitations above. This change did not have any effect on the amounts previously reported for recoupment.
As of May 31, 2021, the following amounts are available to be repaid to the Adviser (amounts in thousands). The Fund has not recorded any amounts available to be repaid as a liability due to an assessment that such repayment is not probable at May 31, 2021.
| Expires 2023 | | Expires 2024 | | Total | |
| $ | 267 | | | $ | 236 | | | $ | 503 | | |
The Adviser may voluntarily waive or reimburse additional fees to assist the Fund in maintaining competitive expense ratios. Voluntary waivers and reimbursements applicable to the Fund are not available to be recouped at a future time. There were no voluntary waivers or reimbursements for the year ended May 31, 2021.
Certain officers and/or interested trustees of the Fund are also officers and/or employees of the Adviser, administrator, fund accountant, sub-administrator, sub-fund accountant, custodian, and Distributor.
5. Risks:
The Fund may be subject to other risks in addition to these identified risks.
Geopolitical/Natural Disaster Risk — Global economies and financial markets are increasingly interconnected, which increases the possibilities that conditions in one country or region might adversely affect issuers in another country or region. Geopolitical and other risks, including war, terrorism, trade disputes, political or economic dysfunction within some nations, public health crises and related geopolitical events, as well as environmental disasters such as earthquakes, fires, and floods, may add
37
USAA Mutual Funds Trust | | Notes to Financial Statements — continued
May 31, 2021 | |
to instability in world economies and markets generally. Changes in trade policies and international trade agreements could affect the economies of many countries in unpredictable ways. Likewise, systemic market dislocations of the kind that occurred during the financial crisis that began in 2008, if repeated, would be highly disruptive to economies and markets, adversely affecting individual companies and industries, securities markets, interest rates, credit ratings, inflation, investor sentiment, and other factors affecting the value of a Fund's investments. Some countries, including the United States, are adopting more protectionist trade policies and moving away from the tighter financial industry regulations that followed the 2008 financial crisis, which may also affect the value of a Fund's investments.
Political events within the United States at times have resulted, and may in the future result, in a shutdown of government services, which could negatively affect the U.S. economy, decrease the value of a Fund's investments, increase uncertainty in or impair the operation of the U.S. or other securities markets, and degrade investor and consumer confidence, perhaps suddenly and to a significant degree.
An outbreak of disease called COVID-19 has spread internationally. The transmission of COVID-19 and efforts to contain its spread have resulted in international, national, and local border closings and other significant travel restrictions and disruptions, significant disruptions to business operations, supply chains and consumer activity, significant challenges in healthcare service preparation and delivery, quarantines, and general concern and uncertainty. These negative impacts have caused significant volatility and declines in global financial markets, which have caused losses for Fund investors during and subsequent to period end. The impact of the COVID-19 pandemic may last for an extended period of time, and could result in a substantial economic downturn or recession. Public health crises may exacerbate other pre-existing political, social, economic, market, and financial risks. The extent of the impact to the financial performance of the Fund's investments will depend on future developments, including (i) the duration and spread of the outbreak, (ii) the restrictions and advisories, (iii) the effects on the financial markets, and (iv) the effects on the economy overall, all of which are highly uncertain and cannot be predicted.
Tactical Allocation Risk — The Fund has a targeted risk tolerance and a corresponding asset allocation target; however, mere asset allocation and volatility are not the sole determination of risk. The Fund's managers will tactically allocate away from the target allocation as market conditions and the perceived risks warrant. The Fund bears the risk that the managers' tactical allocation will not be successful.
Affiliated Funds Risk — The risks of the Fund directly correspond to the risks of the underlying affiliated funds in which the Fund invests. By investing in the underlying affiliated funds, the Fund has exposure to the risk of many different areas of the market. The degree to which the risks described below apply to the Fund varies according to the Fund's asset allocation. For instance, the more the Fund is allocated to stock funds, the greater the risk associated with equity securities. The Fund also is subject to asset allocation risk (i.e., the risk that allocations will not produce the intended results) and to management risk (i.e., the risk that the selection of underlying affiliated funds will not produce the intended results).
Conflict of Interest Risk — In managing a Fund that invests in underlying affiliated funds, the Adviser may have conflicts of interest in allocating the Fund's assets among the various underlying affiliated funds. This is because the fees payable by some of the underlying affiliated funds to the Adviser and/or its affiliates are higher than the fees payable by other underlying affiliated funds, and because the Adviser also manages and administers the underlying affiliated funds.
LIBOR Discontinuation Risk — Many debt securities, derivatives and other financial instruments, including some of the Fund's investments, use the London Interbank Offered Rate ("LIBOR") as the reference or benchmark rate for variable interest rate calculations. In June 2017, the Alternative Reference Rates Committee, a group of large U.S. banks working with the Federal Reserve, announced its selection of a new Secured Overnight Funding Rate ("SOFR"), which is intended to be a broad measure of secured overnight U.S. Treasury repo rates, as an appropriate replacement for LIBOR. The Federal Reserve Bank of New York began publishing the SOFR in 2018, expecting that it could be used on a voluntary basis in new instruments and transactions. Bank working groups and regulators in
38
USAA Mutual Funds Trust | | Notes to Financial Statements — continued
May 31, 2021 | |
other countries have suggested other alternatives for their markets, including the Sterling Overnight Interbank Average Rate ("SONIA") in England. In July 2017, the Financial Conduct Authority (the "FCA"), the United Kingdom financial regulatory body, announced that after 2021 it will cease its active encouragement of UK banks to provide the quotations needed to sustain LIBOR. That announcement suggests that LIBOR may cease to be published after that time. For U.S. dollar LIBOR, however, the relevant date may be deferred to June 30, 2023, for the most common tenors (overnight and one, three, six and 12 months). As to those tenors, the LIBOR administrator has published a consultation regarding its intention to cease publication of U.S. dollar LIBOR as of June 30, 2023, (instead of December 31, 2021, as previously expected), apparently based on continued rate submissions from banks. It is expected that there will be enough time for market participants to transition to the use of a different benchmark for both new and existing securities and transactions. Various financial industry groups have begun planning for that transition, but there are obstacles to converting certain longer-term securities and transactions to a new benchmark. Transition planning is at an early stage, and neither the effect of the transition process nor its ultimate success can yet be known. Although the foregoing may provide some sense of timing, there is no assurance that LIBOR, or any particular currency and tenor, will continue to be published until any particular date, and it appears highly likely that LIBOR will be discontinued or modified after December 31, 2021, or June 30, 2023, depending on the currency and tenor. The transition process might lead to increased volatility and illiquidity in markets that currently rely on the LIBOR to determine interest rates. It could also lead to a reduction in the value of some LIBOR-based investments and reduce the effectiveness of new hedges placed against existing LIBOR-based instruments. Since the usefulness of LIBOR as a benchmark could deteriorate during the transition period, these effects could occur before the end of 2021.
6. Borrowing and Interfund Lending:
Line of Credit:
The Victory Funds Complex participated in a short-term demand note "Line of Credit" agreement with Citibank. The Line of Credit agreement with Citibank was renewed on June 29, 2020, with a termination date of June 28, 2021. Under the agreement with Citibank, the Victory Funds Complex may borrow up to $600 million, of which $300 million is committed and $300 million is uncommitted. $40 million of the Line of Credit is reserved for use by the Victory Floating Rate Fund, another series of the Victory Funds Complex, with Victory Floating Rate Fund paying the related commitment fees for that amount. The purpose of the Line of Credit is to meet temporary or emergency cash needs. For the year ended May 31, 2021, Citibank received an annual commitment fee of 0.15% on $300 million for providing the Line of Credit. Each fund in the Victory Funds Complex pays a pro-rata portion of the commitment fees plus any interest (one month LIBOR plus one percent) on amounts borrowed. For the period June 29, 2020, through April 30, 2021, under an amended Line of Credit agreement, Citibank received an annual upfront fee of 0.10% on the $300 million committed line of credit. Each fund in the Victory Funds Complex paid a pro-rata portion of the upfront fee. Effective with the next amendment, the annual commitment fee of 0.15% will remain unchanged and the upfront fee of 0.10% is discontinued. Interest charged to each fund during the period, if applicable, is reflected on the Statement of Operations under Line of credit fees.
The Fund had no borrowings under the Line of Credit agreement during the year ended May 31, 2021.
Interfund Lending:
The Trust and Adviser rely on an exemptive order granted by the SEC in March 2017 (the "Order"), permitting the establishment and operation of an Interfund Lending Facility (the "Facility"). The Facility allows the Fund to directly lend and borrow money to or from any other fund in the Victory Funds Complex that is permitted to participate in the Facility, relying upon the Order at rates beneficial to both the borrowing and lending funds. Advances under the Facility are allowed for temporary or emergency purposes, including the meeting of redemption requests that otherwise might require the untimely disposition of securities, and are subject to each Fund's borrowing restrictions. The interfund
39
USAA Mutual Funds Trust | | Notes to Financial Statements — continued
May 31, 2021 | |
loan rate is determined, as specified in the Order, by averaging the current repurchase agreement rate and the current bank loan rate. As a Borrower, interest charged to the Fund, if any, during the period is reflected on the Statement of Operations under Interfund lending fees. As a Lender, interest earned by the Fund, if any, during the period is presented on the Statement of Operations under Interfund lending.
The average borrowing or lending for the days outstanding and average interest rate for the Fund during the year ended May 31, 2021, were as follows (amounts in thousands):
Borrower or
Lender | | Amount
Outstanding at
May 31, 2021 | | Average
Borrowing* | | Days
Borrowing
Outstanding | | Maximum
Average
Interest
Rate* | | Borrowing
During
the Period | |
Borrower | | $ | — | | | $ | 2,327 | | | | 3 | | | | 0.60 | % | | $ | 2,890 | | |
* For the year ended May 31, 2021, based on the number of days borrowings were outstanding.
7. Federal Income Tax Information:
The Fund intends to distribute any net investment income annually. Distributable net realized gains, if any, are declared and paid at least annually.
The amounts of dividends from net investment income and distributions from net realized gains (collectively distributions to shareholders) are determined in accordance with federal income tax regulations, which may differ from GAAP. To the extent these "book/tax" differences are permanent in nature (e.g., net operating loss and distribution reclassification), such amounts are reclassified within the components of net assets based on their federal tax-basis treatment; temporary differences (e.g., wash sales) do not require reclassification. To the extent dividends and distributions exceed net investment income and net realized gains for tax purposes, they are reported as distributions of capital. Net investment losses incurred by the Fund may be reclassified as an offset to capital on the accompanying Statement of Assets and Liabilities.
As of May 31, 2021, on the Statement of Assets and Liabilities, as a result of permanent book-to-tax differences, reclassification adjustments were as follows (amounts in thousands):
Total accumulated
earnings/(loss) | | Capital | |
| $ | (1,182 | ) | | $ | 1,182 | | |
The tax character of distributions paid during the tax years ended as noted below, were as follows (total distributions paid may differ from the Statement of Changes in Net Assets because, for tax purposes, dividends are recognized when actually paid) (amounts in thousands).
| | | Year Ended May 31, 2021 | | Year Ended May 31, 2020 | |
| | | Distributions paid from | | | | Distributions paid from | | | |
| |
Ordinary
Income | | Net
Long-Term
Capital Gains | | Total
Distributions
Paid | |
Ordinary
Income | | Net
Long-Term
Capital Gains | | Total
Distributions
Paid | |
| | | | | $ | 6,174 | | | $ | 940 | | | $ | 7,114 | | | $ | 4,500 | | | $ | 1,970 | | | $ | 6,470 | | |
40
USAA Mutual Funds Trust | | Notes to Financial Statements — continued
May 31, 2021 | |
As of May 31, 2021, the components of accumulated earnings (loss) on a tax basis were as follows (amounts in thousands):
| | | Undistributed
Ordinary
Income | | Undistributed
Long-Term
Capital Gains | | Other
Earnings
(Deficit) | | Accumulated
Earnings | | Unrealized
Appreciation
(Depreciation)* | | Total
Accumulated
Earnings
(Loss) | |
| | | | | $ | 9,575 | | | $ | 10,197 | | | $ | 18 | | | $ | 19,790 | | | $ | 77,343 | | | $ | 97,133 | | |
* The difference between the book-basis and tax-basis of unrealized appreciation/depreciation is attributable to the tax deferral of losses on wash sales, futures, hybrid accruals interest purchased, partnership, and REITs/return of capital.
As of May 31, 2021, the Fund had no capital loss carryforwards, for federal income tax purposes.
During the most recent tax year ended May 31, 2021, the Fund utilized $3,185 thousand of capital loss carryforwards.
As of May 31, 2021, the cost basis for federal income tax purposes, gross unrealized appreciation, gross unrealized depreciation, and net unrealized appreciation (depreciation) for investments were as follows (amounts in thousands):
| | Cost of
Investments
for Federal
Tax Purposes | | Gross
Unrealized
Appreciation | | Gross
Unrealized
Depreciation | | Net
Unrealized
Appreciation
(Depreciation) | |
| | | | | $ | 324,321 | | | $ | 79,248 | | | $ | (1,905 | ) | | $ | 77,343 | | |
8. Affiliated Securities:
An affiliated security is a security in which the Fund has ownership of at least 5% of the security's outstanding voting shares, an investment company managed by VCM, or an issuer under common control with a Fund or VCM. The Fund does not invest in affiliated securities for the purpose of exercising management or control. These securities are noted as affiliated on the Fund's Schedule of Portfolio Investments. Transactions in affiliated securities during the year ended May 31, 2021, were as follows (amounts in thousands):
| | | Fair
Value
5/31/2020 | | Purchases
at Cost | | Proceeds
from
Sales | | Realized
Gains
(Losses) | | Capital
Gain
Distribution | | Net
Change in
Unrealized
Appreciation/
Depreciation | | Fair
Value
5/31/2021 | | Dividend
Income | |
VictoryShares USAA Core
Intermediate-Term
Bond ETF | | $ | — | | | $ | 23,890 | | | $ | (11,938 | ) | | $ | — | | | $ | 8 | | | $ | (158 | ) | | $ | 11,794 | | | $ | 104 | | |
VictoryShares USAA Core
Short-Term Bond ETF | | | — | | | | 5,342 | | | | — | | | | — | | | | 9 | | | | 11 | | | | 5,353 | | | | 58 | | |
VictoryShares USAA MSCI
Emerging Markets Value
Momentum ETF | | | 589 | | | | — | | | | — | | | | — | | | | — | | | | 235 | | | | 824 | | | | 19 | | |
| | | $ | 589 | | | $ | 29,232 | | | $ | (11,938 | ) | | $ | — | | | $ | 17 | | | $ | 88 | | | $ | 17,971 | | | $ | 181 | | |
41
REPORT OF INDEPENDENT REGISTERED PUBLIC ACCOUNTING FIRM
To the Shareholders and the Board of Trustees of USAA Cornerstone Aggressive Fund
Opinion on the Financial Statements
We have audited the accompanying statement of assets and liabilities of USAA Cornerstone Aggressive Fund (the "Fund") (one of the funds constituting USAA Mutual Funds Trust (the "Trust")), including the schedule of portfolio investments, as of May 31, 2021, and the related statement of operations for the year then ended, the statements of changes in net assets for each of the two years in the period then ended, the financial highlights for each of the five years in the period then ended and the related notes (collectively referred to as the "financial statements"). In our opinion, the financial statements present fairly, in all material respects, the financial position of the Fund (one of the funds constituting USAA Mutual Funds Trust) at May 31, 2021, the results of its operations for the year then ended, the changes in its net assets for each of the two years in the period then ended and its financial highlights for each of the five years in the period then ended, in conformity with U.S. generally accepted accounting principles.
Basis for Opinion
These financial statements are the responsibility of the Trust's management. Our responsibility is to express an opinion on the Fund's financial statements based on our audits. We are a public accounting firm registered with the Public Company Accounting Oversight Board (United States) ("PCAOB") and are required to be independent with respect to the Trust in accordance with the U.S. federal securities laws and the applicable rules and regulations of the Securities and Exchange Commission and the PCAOB.
We conducted our audits in accordance with the standards of the PCAOB. Those standards require that we plan and perform the audit to obtain reasonable assurance about whether the financial statements are free of material misstatement, whether due to error or fraud. The Trust is not required to have, nor were we engaged to perform, an audit of the Trust's internal control over financial reporting. As part of our audits we are required to obtain an understanding of internal control over financial reporting, but not for the purpose of expressing an opinion on the effectiveness of the Trust's internal control over financial reporting. Accordingly, we express no such opinion.
Our audits included performing procedures to assess the risks of material misstatement of the financial statements, whether due to error or fraud, and performing procedures that respond to those risks. Such procedures included examining, on a test basis, evidence regarding the amounts and disclosures in the financial statements. Our procedures included confirmation of securities owned as of May 31, 2021, by correspondence with the custodian. Our audits also included evaluating the accounting principles used and significant estimates made by management, as well as evaluating the overall presentation of the financial statements. We believe that our audits provide a reasonable basis for our opinion.

We have served as the auditor of one or more Victory Capital investment companies since 1995.
San Antonio, Texas
July 28, 2021
42
USAA Mutual Funds Trust | | Supplemental Information
May 31, 2021 | |
(Unaudited)
Trustee and Officer Information
Board of Trustees:
Overall responsibility for management of the Trust rests with the Board. The Trust is managed by the Board in accordance with the laws of the state of Delaware. There are currently nine Trustees, seven of whom are not "interested persons" of the Trust within the meaning of that term under the 1940 Act ("Independent Trustees") and two of whom are "interested persons" of the Trust within the meaning of that term under the 1940 Act ("Interested Trustee"). The Trustees, in turn, elect the officers of the Trust to actively supervise its day-to-day operations.
The following tables list the Trustees, their ages, position with the Trust, commencement of service, principal occupations during the past five years and any directorships of other investment companies or companies whose securities are registered under the Securities Exchange Act of 1934, as amended, or who file reports under that Act. Each Trustee oversees 46 portfolios in the Trust. Each Trustee's address is 15935 La Cantera Pkwy, San Antonio, TX, 78256. Pursuant to a policy adopted by the Board, the term of office for each Trustee shall be until the Independent Trustee reaches age 75 or an Interested Trustee reaches age 75. The Board may change or grant exceptions from this policy at any time without shareholder approval. A Trustee may resign or be removed by a vote of the other Trustees or the holders of a majority of the outstanding shares of the Trust at any time. Vacancies on the Board can be filled by the action of a majority of the Trustees, provided that after filling such vacancy at least two-thirds of the Trustees have been elected by the shareholders.
Name and Date of Birth | | Position
Held with
the Trust | | Year
Commenced
Service | | Principal Occupation
During Past 5 Years | | Other
Directorships
Held During
Past 5 Years | |
Independent Trustees. | |
Jefferson C. Boyce, (c)
Born September 1957 | | Independent Chairman | | | 2021 | | | Senior Managing Director, New York Life Investments, LLC (1992-2012) | | Westhab, Inc. | |
John C. Walters,
Born February 1962 | | Trustee | | | 2019 | | | Retired. Mr. Walters brings significant Board experience including active involvement with the board of a Fortune 500 company, and a proven record of leading large, complex financial organizations. He has a demonstrated record of success in distribution, manufacturing, investment brokerage, and investment management in both the retail and institutional investment businesses. He has substantial experience in the investment management business with a demonstrated ability to develop and drive strategy while managing operation, financial, and investment risk. | | Guardian Variable Products Trust (16 series), Lead Independent Director; Amerilife Holdings LLC, Director; Stadion Money Management; Director; University of North Carolina (Chapel Hill), Member Board of Governors | |
43
USAA Mutual Funds Trust | | Supplemental Information — continued
May 31, 2021 | |
(Unaudited)
Name and Date of Birth | | Position
Held with
the Trust | | Year
Commenced
Service | | Principal Occupation
During Past 5 Years | | Other
Directorships
Held During
Past 5 Years | |
Robert L. Mason, Ph.D.,
Born July 1946 | | Trustee | | | 1997 | | | Adjunct Professor in the Department of Management Science and Statistics in the College of Business at the University of Texas at San Antonio (since 2001); Institute Analyst, Southwest Research Institute (March 2002-January 2016) | | None | |
Dawn M. Hawley,
Born February 1954 | | Trustee | | | 2014 | | | Manager of Finance, Menil Foundation, Inc. (May 2007-June 2011), which is a private foundation that oversees the assemblage of sculptures, prints, drawings, photographs, and rare books. Director of Financial Planning and Analysis and Chief Financial Officer, AIM Management Group, Inc. (October 1987-January 2006) | | None | |
Paul L. McNamara,
Born July 1948 | | Trustee | | | 2012 | | | Director, Cantor Opportunistic Alternatives Fund, LLC (March 2010-February 2014), which is a closed-end fund of funds by Cantor Fitzgerald Investment Advisors, LLC | | None | |
44
USAA Mutual Funds Trust | | Supplemental Information — continued
May 31, 2021 | |
(Unaudited)
Name and Date of Birth | | Position
Held with
the Trust | | Year
Commenced
Service | | Principal Occupation
During Past 5 Years | | Other
Directorships
Held During
Past 5 Years | |
Richard Y. Newton III,
Born January 1956 | | Trustee | | | 2017 | | | Director, Elta North America (01/18-present), which is a global leader in the design, manufacture, and support of innovative electronic systems in the ground, maritime, airborne, and security domains for the nation's warfighters, security personnel, and first responders; Managing Partner, Pioneer Partnership Development Group (December 2015-present)); Executive Director, The Union League Club of New York (June 2014-November 2015): Executive Vice President, Air Force Association (August 2012-May 2014); Lieutenant General, United States Air Force (January 2008-June 2012) | | PredaSAR Corp. | |
Barbara B. Ostdiek, Ph.D.,
Born March 1964 | | Trustee | | | 2008 | | | Senior Associate Dean of Degree Programs at Jesse H. Jones Graduate School of Business at Rice University (since 2013); Associate Professor of Finance at Jessie H. Jones Graduate School of Business at Rice University (since 2001) | | None | |
Effective at the close of business on December 31, 2020, Michael F. Reimherr retired from the Board of Trustees.
45
USAA Mutual Funds Trust | | Supplemental Information — continued
May 31, 2021 | |
(Unaudited)
Name and Date of Birth | | Position
Held with
the Trust | | Year
Commenced
Service | | Principal Occupation
During Past 5 Years | | Other
Directorships
Held During
Past 5 Years | |
Interested Trustees. | |
David C. Brown, (b)
Born May 1972 | | Trustee | | | 2019 | | | Chairman and Chief Executive Officer (since 2013), Victory Capital Management Inc.; Chairman and Chief Executive Officer, Victory Capital Holdings, Inc. (since 2013). Mr. Brown brings to the Board extensive business, finance and leadership skills gained and developed through years of experience in the financial services industry, including his tenure overseeing the strategic direction as CEO of Victory Capital. These skills, combined with Mr. Brown's extensive knowledge of the financial services industry and demonstrated success in the development and distribution of investment strategies and products, enable him to provide valuable insights to the Board and strategic direction for the Funds. | | Trustee, Victory Portfolios (41 series), Victory Portfolios II (26 series), Victory Variable Insurance Funds (8 series) | |
46
USAA Mutual Funds Trust | | Supplemental Information — continued
May 31, 2021 | |
(Unaudited)
Name and Date of Birth | | Position
Held with
the Trust | | Year
Commenced
Service | | Principal Occupation
During Past 5 Years | | Other
Directorships
Held During
Past 5 Years | |
Daniel S. McNamara, (b)(c)(d)
Born June 1966 | | Trustee | | | 2012 | | | Trustee, President, and Vice Chairman of USAA ETF Trust (June 2017-June 2019); President of Financial Advice & Solutions Group (FASG), USAA (February 2013-March 2021); Director of USAA Investment Services Company (ISCO) (formerly USAA Investment Management) (September 2009-March 2021); President, Asset Management Company (AMCO) (August, 2011-June 2019); Senior Vice President of USAA Financial Planning Services Insurance Agency, Inc. (FPS) (April 2011-March 2021); Chairman of Board of ISCO (April 2013-December 2020); Director of AMCO (August 2011-June 2019); President and Director of USAA Shareholder Account Services (SAS) (October 2009-June 2019); Director and Vice Chairman of FPS (December 2013-March 2021); President and Director of USAA Investment Corporation (ICORP) (March 2010-March 2021); Chairman of Board of ICORP (December 2013-March 2021); Director of USAA Financial Advisors, Inc. (FAI) (December 2013-March 2021); Chairman of Board of FAI (March 2015-March 2021). Mr. McNamara brings to the Board extensive experience in the financial services industry, including experience as an officer of the Trust. | | None | |
(b) Mr. Dan McNamara is deemed an "interested person" due to his previous position as Director of AMCO, the former investment adviser of the Funds. Mr. Brown is deemed an "interested person" due to his position as Chief Executive Officer of Victory Capital, investment adviser to the Funds.
(c) Effective at the close of business on December 31, 2020, Jefferson C. Boyce replaced Dan McNamara as Chair of the Board and assumed the title of Independent Chair.
(d) Effective July 2, 2021, Mr. Dan McNamara became an Independent Trustee to the Funds.
The Statement of Additional Information includes additional information about the Trustees of the Trust and is available, without charge, on the SEC's website at www.sec.gov and/or by calling (800)-235-8396.
47
USAA Mutual Funds Trust | | Supplemental Information — continued
May 31, 2021 | |
(Unaudited)
Officers:
The officers of the Trust, their ages, commencement of service and their principal occupations during the past five years, are detailed in the following table. Each officer serves until the earlier of his or her resignation, removal, retirement, death, or the election of a successor. The mailing address of each officer of the Trust is 15935 La Cantera Pkwy, San Antonio, TX, 78256. The officers of the Trust receive no compensation directly from the Trust for performing the duties of their offices.
Name and Date of Birth | | Position with
the Trust | | Year
Commenced
Service | | Principal Occupation During Past 5 Years | |
Interested Officers.
Christopher K. Dyer,
Born February 1962 | | President | | | 2019 | | | Director of Fund Administration, Victory Capital (since 2004); Chief Operating Officer, Victory Capital Services, Inc. (since 2020) | |
Scott A Stahorsky,
Born July 1969 | | Vice President | | | 2019 | | | Manager, Fund Administration, Victory Capital (since 2015) | |
James K. De Vries,
Born April 1969 | | Treasurer | | | 2018 | | | Executive Director, Victory Capital Management Inc. (since 2019); Treasurer, USAA ETF Trust (September 2018-June 2019); Executive Director, Investment and Financial Administration, USAA (April 2012-June 2019); Assistant Treasurer, USAA ETF Trust (June 2017-September 2018); Assistant Treasurer, USAA Mutual Funds Trust (December 2013-February 2018) | |
Allan Shaer,
Born March 1965 | | Assistant Treasurer | | | 2019 | | | Senior Vice President, Financial Administration, Citi Fund Services Ohio, Inc. (since 2016); Vice President, Mutual Fund Administration, JP Morgan Chase (2011-2016) | |
Carol D. Trevino,
Born October 1965 | | Assistant Treasurer | | | 2018 | | | Director, Accounting and Finance, Victory Capital Management Inc. (since 2019); Accounting/Financial Director, USAA (December 2013-June 2019); Assistant Treasurer, USAA ETF Trust (September 2018-June 2019) | |
Erin G. Wagner,
Born February 1974 | | Secretary | | | 2019 | | | Deputy General Counsel, the Adviser (since 2013) | |
Charles Booth,
Born April 1960 | | Anti-Money Laundering Compliance Officer and Identity Theft Officer | | | 2019 | | | Director, Regulatory Administration and CCO Support Services, Citi Fund Services Ohio, Inc. (since 2007) | |
Amy Campos,
Born July 1976 | | Chief Compliance Officer | | | 2019 | | | Chief Compliance Officer, USAA Mutual Funds Trust (since 2019); Executive Director, Deputy Chief Compliance Officer, USAA Mutual Funds Trust and USAA ETF Trust (July 2017-June 2019); Compliance Director, USAA Mutual Funds Trust (2014-July 2017) | |
48
USAA Mutual Funds Trust | | Supplemental Information — continued
May 31, 2021 | |
(Unaudited)
Proxy Voting and Portfolio Holdings Information
Proxy Voting:
Information regarding the policies and procedures the Fund uses to determine how to vote proxies relating to portfolio securities is available without charge, upon request, by calling (800) 235-8396. The information is also included in the Fund's Statement of Additional Information, which is available on the SEC's website at www.sec.gov.
Information relating to how the Fund voted proxies relating to portfolio securities held during the most recent 12 months ended June 30 is available on the SEC's website at www.sec.gov.
Availability of Schedules of Portfolio Investments:
The Trust files a complete list of Schedules of Portfolio Investments with the SEC for the first and third quarter of each fiscal year on Form N-PORT. Form N-PORT is available on the SEC's website at www.sec.gov.
Expense Example
As a shareholder of the Fund, you may incur two types of costs: (1) transaction costs, and (2) ongoing costs, including management fees and other Fund expenses. These examples are intended to help you understand your ongoing costs (in dollars) of investing in the Fund and to compare these costs with the ongoing costs of investing in other mutual funds.
These examples are based on an investment of $1,000 invested at the beginning of the period and held for the entire period from December 1, 2020, through May 31, 2021.
The Actual Expense figures in the table below provide information about actual account values and actual expenses. You may use the information below, together with the amount you invested, to estimate the expenses that you paid over the period. Simply divide your account value by $1,000 (for example, an $8,600 account value divided by $1,000 = 8.6), then multiply the result by the number in the table under the heading entitled "Actual Expenses Paid During Period" to estimate the expenses you paid on your account during this period.
The Hypothetical Expense figures in the table below provide information about hypothetical account values and hypothetical expenses based on the Fund's actual expense ratio and an assumed rate of return of 5% per year before expenses, which is not the Fund's actual return. The hypothetical account values and expenses may not be used to estimate the actual ending account balance or expenses you paid for the period. You may use this information to compare this 5% hypothetical example with the 5% hypothetical examples that appear in shareholder reports of other funds.
Please note the expenses shown in the table below are meant to highlight your ongoing costs only and do not reflect any transactional costs. If these transactional costs were included, your costs would have been higher.
Beginning
Account
Value
12/1/20 | | Actual
Ending
Account
Value
5/31/21 | | Hypothetical
Ending
Account
Value
5/31/21 | | Actual
Expenses
Paid
During
Period
12/1/20-
5/31/21* | | Hypothetical
Expenses
Paid
During
Period
12/1/20-
5/31/21* | | Annualized
Expense
Ratio
During
Period
12/1/20-
5/31/21 | |
| $ | 1,000.00 | | | $ | 1,146.50 | | | $ | 1,019.45 | | | $ | 5.89 | | | $ | 5.54 | | | | 1.10 | % | |
* Expenses are equal to the average account value multiplied by the Fund's annualized expense ratio multiplied by 182/365 (the number of days in the most recent fiscal half-year divided by the number of days in the fiscal year).
49
USAA Mutual Funds Trust | | Supplemental Information — continued
May 31, 2021 | |
(Unaudited)
Additional Federal Income Tax Information
The following federal tax information related to the Fund's fiscal year ended May 31, 2021, is provided for information purposes only and should not be used for reporting to federal or state revenue agencies. Federal tax information for the calendar year will be reported to you on Form 1099-DIV in January 2022.
With respect to distributions paid, the Fund designates the following amounts (or, if subsequently determined to be different, the maximum amount allowable) for the fiscal year ended May 31, 2021 (amounts in thousands):
| | Dividends
Received
Deduction
(corporate
shareholders) | | Qualified
Dividend
Income
(non-corporate
shareholders) | | Short-Term
Capital Gain
Distributions | | Long-Term
Capital Gain
Distributions | |
| | | | | | 17 | % | | | 19 | % | | $ | 1,916 | | | $ | 1,539 | | |
50
USAA Mutual Funds Trust | | Supplemental Information — continued
May 31, 2021 | |
(Unaudited)
Considerations of the Board in Continuing the Investment Advisory Agreement (the "Agreement")
USAA Cornerstone Aggressive Fund (the "Fund")
At a meeting of the Board of Trustees (the "Board") held on December 10-11, 2020, the Board, including the Trustees who are not "interested persons" (as that term is defined in the Investment Company Act of 1940, as amended) of the Trust (the "Independent Trustees"), approved for an annual period the continuance of the Investment Advisory Agreement (the "Advisory Agreement") between the Trust and Victory Capital Management Inc. (the "Adviser") with respect to the Fund. Prior to the December 10-11, 2020 meeting at which the Advisory Agreement was approved, the Independent Trustees also discussed and considered information regarding the proposed continuation of the Advisory Agreement at a meeting held on November 19, 2020.
In advance of the foregoing meetings, the Trustees received and considered a variety of information relating to the Advisory Agreement and the Adviser, and were given the opportunity to ask questions and request additional information from management. The information provided to the Board included, among other things: (i) a separate report prepared by an independent third party of mutual fund data, which provided a statistical analysis comparing the Fund's investment performance, expenses, and fees to comparable investment companies; (ii) information concerning the services rendered to the Fund, as well as information regarding the Adviser's revenues and costs of providing services to the Fund and compensation paid to affiliates of the Adviser; and (iii) information about the Adviser's operations and personnel. Prior to voting, the Independent Trustees reviewed the proposed continuance of the Advisory Agreement with management and with experienced independent counsel retained by the Independent Trustees ("Independent Counsel") and received materials from such Independent Counsel discussing the legal standards for their consideration of the proposed continuation of the Advisory Agreement with respect to the Fund. The Independent Trustees also reviewed the proposed continuation of the Advisory Agreement with respect to the Fund in private sessions with Independent Counsel at which no representatives of management were present.
At each regularly scheduled meeting of the Board and its committees, the Board receives and reviews, among other things, information concerning the Fund's performance and related services provided by the Adviser. At the meeting at which the renewal of the Advisory Agreement is considered, particular focus is given to information concerning Fund performance, fees and total expenses as compared to comparable investment companies, and the Adviser's profitability with respect to the Fund. However, the Board noted that the evaluation process with respect to the Adviser is an ongoing one. In this regard, the Board's and its committees' consideration of the Advisory Agreement included information previously received at such meetings.
Advisory Agreement
After full consideration of a variety of factors, the Board, including the Independent Trustees, voted to approve the Advisory Agreement. In approving the Advisory Agreement, the Trustees did not identify any single factor as controlling, and each Trustee may have attributed different weights to various factors. Throughout their deliberations, the Independent Trustees were represented and assisted by Independent Counsel.
Nature, Extent, and Quality of Services — In considering the nature, extent, and quality of the services provided by the Adviser under the Advisory Agreement, the Board reviewed information provided by the Adviser relating to its operations and personnel. The Board also took into account its knowledge of the Adviser's management and the quality of the performance of the Adviser's duties through Board meetings, discussions, and reports during the preceding year. The Board considered the fees paid to the Adviser and the services provided to the Fund by the Adviser under the Advisory Agreement, as well as other services provided by the Adviser and its affiliates under other agreements, and the personnel who provide these services. In addition to the investment advisory services provided to the Fund, the Adviser and its affiliates provide administrative services, shareholder services, oversight of Fund accounting, marketing services, assistance in meeting legal and regulatory requirements, and other services necessary for the operation of the Fund and the Trust.
The Board considered the scope of services provided by, and the undertakings required of, the Adviser in connection with those services, including, among other things, maintaining (i) its own and the Fund's compliance programs, (ii) risk management programs, (iii) liquidity risk management programs, and (iv) cybersecurity
51
USAA Mutual Funds Trust | | Supplemental Information — continued
May 31, 2021 | |
(Unaudited)
programs, each of which had expanded over time as a result of regulatory, market, and other developments. The Board also considered the significant risks assumed by the Adviser in connection with the services provided to the Fund, including investment, operational, enterprise, litigation, regulatory, and compliance risks.
The Board considered the Adviser's management style and the performance of the Adviser's duties under the Advisory Agreement. The Board considered the level and depth of knowledge of the Adviser, including the professional experience and qualifications of its senior and investment personnel, as well as current staffing levels. The allocation of the Fund's brokerage, including the Adviser's process for monitoring "best execution," also was considered. The Adviser's role in coordinating the activities of the Fund's other service providers was also considered. The Board also considered the Adviser's risk management processes. The Board considered the Adviser's financial condition and that it had the financial wherewithal to continue to provide the same scope and high quality of services under the Advisory Agreement. In reviewing the Advisory Agreement, the Board focused on the experience, resources, and strengths of the Adviser and its affiliates in managing the Fund, as well as the other funds in the Trust.
The Board also reviewed the compliance and administrative services provided to the Fund by the Adviser and its affiliates, including the Adviser's oversight of the Fund's day-to-day operations and oversight of Fund accounting. The Trustees, guided also by information obtained from their experiences as trustees of the Trust, also focused on the quality of the Adviser's compliance and administrative staff.
Expenses and Performance — In connection with its consideration of the Advisory Agreement, the Board evaluated the Fund's advisory fees and total expense ratio as compared to other open-end investment companies deemed to be comparable to the Fund as determined by the independent third party in its report. The Fund's expenses were compared to (i) a group of investment companies chosen by the independent third party to be comparable to the Fund based upon certain factors, including fund type, comparability of investment objective and classification, sales load type, asset size, and expense components (the "expense group") and (ii) a larger group of investment companies with the same investment classification/objective as the Fund regardless of asset size, excluding outliers (the "expense universe"). Among other data, the Board noted that the Fund's management fee rate — which includes advisory and administrative services, as well as any fee waivers and reimbursements — was below the medians of its expense group and expense universe. The data indicated that the Fund's total expenses, including after any reimbursements, were above the medians of its expense group and expense universe. The Board also took into account the Adviser's current undertakings to maintain expense limitations for the Fund. The Board took into account the various other services provided to the Fund by the Adviser and its affiliates, and noted the high quality of services received by the Fund.
In considering the Fund's performance, the Board noted that it reviews at its regularly scheduled meetings information about the Fund's performance results. The Trustees also reviewed various comparative data provided to them in connection with their consideration of the renewal of the Advisory Agreement, including, among other information, a comparison of the Fund's average annual total returns relative to its Lipper index and other mutual funds deemed to be in its peer group by the independent third party in its report (the "performance universe"). The Fund's performance universe consisted of the Fund and all retail and institutional open-end investment companies with the same classification/objective as the Fund regardless of asset size or primary channel of distribution. This comparison indicated that, among other data, the Fund's performance was below the average of its performance universe and its Lipper index for the one-, three- and five-year periods ended September 30, 2020. The Board took into account management's discussion of the Fund's performance, including the reasons for the Fund's underperformance relative to its peers.
Compensation and Profitability — The Board took into consideration the level and method of computing the management fee. The information considered by the Board included operating profit margin information for the Adviser's business as a whole. The Board also received and considered profitability information related to the management revenues from the Fund. This information included a review of the methodology used in the allocation of certain costs to the Fund. In considering the profitability data with respect to the Fund, the Trustees noted that the Adviser waived a portion of its management fees and/or reimbursed certain expenses with respect to the Fund. The Trustees reviewed the profitability of the Adviser's relationship with the Fund before tax expenses. The Board was also provided with a profitability analysis of other publicly traded asset managers prepared by an independent information service. In reviewing the overall profitability of the management fee to the Adviser, the Board also considered the fact that the Adviser and its affiliates provide shareholder servicing
52
USAA Mutual Funds Trust | | Supplemental Information — continued
May 31, 2021 | |
(Unaudited)
and administrative services to the Fund for which they receive compensation. The Board also considered the possible direct and indirect benefits to the Adviser from its relationship with the Trust, including that the Adviser may derive reputational and other benefits from its association with the Fund. The Trustees recognized that the Adviser should be entitled to earn a reasonable level of profits in exchange for the level of services it provides to the Fund and the entrepreneurial and other risks that it assumes as Adviser.
Economies of Scale — The Board considered whether there should be changes in the management fee rate or structure in order to enable the Fund to participate in any economies of scale. The Board also considered the fee waiver and expense reimbursement arrangements by the Adviser. The Board also considered the effect of the Fund's change in size, if any, on its performance and fees, noting that the Fund may realize other economies of scale if assets increase proportionally more than expenses. The Board determined that the current investment management fee structure was reasonable.
Conclusions — The Board reached the following conclusions regarding the Fund's Advisory Agreement with the Adviser: (i) the Adviser has demonstrated that it possesses the capability and resources to perform the duties required of it under the Advisory Agreement; (ii) the Adviser maintains an appropriate compliance program; (iii) the performance of the Fund is reasonable in relation to the performance of funds with similar investment objectives and to relevant indices in view of the Fund's investment approach and the Adviser is appropriately monitoring the Fund's performance; (iv) the Fund's advisory expenses are reasonable in relation to those of similar funds and to the services to be provided by the Adviser; and (v) the Adviser's and its affiliates' level of profitability from their relationship with the Fund is reasonable in light of the nature and high quality of services provided by the Adviser and the type of fund. Based on its conclusions, the Board determined that continuation of the Advisory Agreement would be in the best interests of the Fund and its shareholders.
53
USAA Mutual Funds Trust | | Supplemental Information — continued
May 31, 2021 | |
(Unaudited)
Liquidity Risk Management Program:
The USAA Mutual Funds have adopted and implemented a written liquidity risk management program (the "LRMP") as required by Rule 22e-4 under the Investment Company Act of 1940, as amended. The LRMP is reasonably designed to assess and manage the Fund's liquidity risk, taking into consideration the Fund's investment strategy and the liquidity of its portfolio investments during normal and reasonably foreseeable stressed market conditions; its short and long-term cash flow projections; and its cash holdings and access to other liquidity management tools such as available funding sources including the Victory Funds Complex Interfund Lending Facility and Line of Credit (discussed in the Notes to Financial Statements). The USAA Mutual Funds' Board of Trustees approved the appointment of the Fund's investment adviser, Victory Capital Management Inc. ("Victory Capital"), as the administrator of the LRMP.
Victory Capital manages liquidity risks associated with the Fund's investments by monitoring, among other things, cash and cash equivalents, any use of derivatives, the concentration of investments, the appropriateness of the Fund's investment strategy, and by classifying every Fund investment as either highly liquid, moderately liquid, less liquid, or illiquid on at least a monthly basis. To assist with the classification of Fund investments, Victory Capital has retained a third-party provider of liquidity evaluation services. This provider determines preliminary liquidity classifications for all portfolio holdings based upon portfolio-level data and certain assumptions provided by Victory Capital. Victory Capital reviews the preliminary liquidity classifications and, when appropriate, considers other information including input from the Fund's portfolio managers (including the portfolio managers employed by any investment sub-advisers) in determining final liquidity classifications.
At a meeting held on March 10, 2021, Victory Capital provided an oral and written report to the Trustees on the operation and effectiveness of the LRMP during the previous year. The report from Victory Capital concluded that the Fund did not experience any significant liquidity challenges during the covered period, and the Fund's LRMP is reasonably designed to assess and manage its liquidity risk. The report also concluded that the LRMP continues to operate adequately and effectively to enable Victory Capital to oversee and manage liquidity risk and ensure the Fund is able to meet redemption requests without significant dilution to the remaining investors' interest in the Fund. During the review period, the Fund's portfolio consisted primarily of highly liquid investments, which are defined as cash and any investments that the Fund reasonably expects to be converted to cash in current market conditions in three business days or less without significantly changing the market value of the investment. Therefore, the Fund has not adopted a highly liquid investment minimum. The Funds' investments were below the limitation on illiquid investments during the review period. Additionally, Victory Capital indicated that no events occurred that would require the filing of Form N-LIQUID and recommended no material changes to the LRMP.
54
Privacy Policy
Protecting the Privacy of Information
The Trust respects your right to privacy. We also know that you expect us to conduct and process your business in an accurate and efficient manner. To do so, we must collect and maintain certain personal information about you. This is the information we collect from you on applications or other forms, and from the transactions you make with us or third parties. It may include your name, address, social security number, account transactions and balances, and information about investment goals and risk tolerance.
We do not disclose any information about you or about former customers to anyone except as permitted or required by law. Specifically, we may disclose the information we collect to companies that perform services on our behalf, such as the transfer agent that processes shareholder accounts and printers and mailers that assist us in the distribution of investor materials. We may also disclose this information to companies that perform marketing services on our behalf. This allows us to continue to offer you Victory investment products and services that meet your investing needs, and to effect transactions that you request or authorize. These companies will use this information only in connection with the services for which we hired them. They are not permitted to use or share this information for any other purpose.
To protect your personal information internally, we permit access only by authorized employees and maintain physical, electronic, and procedural safeguards to guard your personal information.*
* You may have received communications regarding information about privacy policies from other financial institutions which gave you the opportunity to "opt-out" of certain information sharing with companies which are not affiliated with that financial institution. The Trust does not share information with other companies for purposes of marketing solicitations for products other than the Trust. Therefore, the Trust does not provide opt-out options to their shareholders.
P.O. Box 182593
Columbus, Ohio 43218-2593

Visit our website at: | | Call | |
vcm.com | | (800) 235-8396 | |

MAY 31, 2021
Annual Report
USAA Cornerstone Conservative Fund
Victory Capital means Victory Capital Management Inc., the investment adviser of the USAA Mutual Funds. USAA Mutual Funds are distributed by Victory Capital Services, Inc., member of FINRA, an affiliate of Victory Capital. Victory Capital and its affiliates are not affiliated with United Services Automobile Association or its affiliates. USAA and the USAA logos are registered trademarks and the USAA Mutual Funds and USAA Investments logos are trademarks of United Services Automobile Association and are being used by Victory Capital and its affiliates under license.
www.vcm.com
News, Information And Education 24 Hours A Day, 7 Days A Week
The Victory Funds site gives fund shareholders, prospective shareholders, and investment professionals a convenient way to access fund information, get guidance, and track fund performance anywhere they can access the Internet. The site includes:
• Detailed performance records
• Daily share prices
• The latest fund news
• Investment resources to help you become a better investor
• A section dedicated to investment professionals
Whether you're a potential investor searching for the fund that matches your investment philosophy, a seasoned investor interested in planning tools, or an investment professional, www.vcm.com has what you seek. Visit us anytime. We're always open.
TABLE OF CONTENTS
Shareholder Letter (Unaudited) | | | 2 | | |
Managers' Commentary (Unaudited) | | | 4 | | |
Investment Overview (Unaudited) | | | 6 | | |
Investment Objective & Portfolio
Holdings (Unaudited) | | | 7 | | |
Schedule of Portfolio Investments | | | 8 | | |
Financial Statements | |
Statement of Assets and Liabilities | | | 9 | | |
Statement of Operations | | | 10 | | |
Statements of Changes in Net Assets | | | 11 | | |
Financial Highlights | | | 12 | | |
Notes to Financial Statements | | | 14 | | |
Report of Independent
Registered Public Accounting Firm | | | 23 | | |
Supplemental Information (Unaudited) | | | 24 | | |
Trustees' and Officers' Information | | | 24 | | |
Proxy Voting and Portfolio Holdings Information | | | 30 | | |
Expense Example | | | 30 | | |
Additional Federal Income Tax Information | | | 31 | | |
Advisory Contract Agreement | | | 32 | | |
Liquidity Risk Management Program | | | 35 | | |
Privacy Policy (inside back cover) | | | |
This report is for the information of the shareholders and others who have received a copy of the currently effective prospectus of the Fund, managed by Victory Capital Management Inc. It may be used as sales literature only when preceded or accompanied by a current prospectus, which provides further details about the Fund.
IRA DISTRIBUTION WITHHOLDING DISCLOSURE
We generally must withhold federal income tax at a rate of 10% of the taxable portion of your distribution and, if you live in a state that requires state income tax withholding, at your state's tax rate. However, you may elect not to have withholding apply or to have income tax withheld at a higher rate. Any withholding election that you make will apply to any subsequent distribution unless and until you change or revoke the election. If you wish to make a withholding election, or change or revoke a prior withholding election, call (800) 235-8396, and form W-4P (OMB No. 1545-0074 withholding certificate for pension or annuity payments) will be electronically sent.
If you do not have a withholding election in place by the date of a distribution, federal income tax will be withheld from the taxable portion of your distribution at a rate of 10%. If you must pay estimated taxes, you may be subject to estimated tax penalties if your estimated tax payments are not sufficient and sufficient tax is not withheld from your distribution.
For more specific information, please consult your tax adviser.
• NOT FDIC INSURED • NO BANK GUARANTEE • MAY LOSE VALUE
1
(Unaudited)
Dear Shareholder,
Never a dull moment. A year ago, we were still coming to grips with a global pandemic, hoping for an effective vaccine, and wondering whether the U.S. Federal Reserve's aggressive actions would continue to mollify financial markets. As it turns out, a vaccine was rolled out (domestically) faster than expectations, and the recovery that began during the second quarter of 2020 continued unabated.
Fast forward to today and investors are suddenly more concerned about labor shortages, rising commodity prices, and whether inflation will prove to be transitory or more lasting. If anything, this merely exemplifies that markets are unpredictable and the environment can change rapidly.
Reflecting on the past year, we must consider ourselves fortunate despite the myriad of challenges. For starters, it was impressive how quickly the various forms of monetary and fiscal stimulus contributed to a rebound in GDP. Of course, it wasn't a straight line upward and there were bouts of elevated volatility in both bond and stock markets. Late in 2020, for example, financial markets were alternately fueled and roiled by a contentious election season, growing optimism for an effective vaccine, and a fluid debate regarding the need for even more stimulus. Ultimately, stocks were propelled higher in the fourth quarter of 2020 as it became clear Congress would provide another dose of stimulus in the form of direct payments, more unemployment insurance, and additional aid to businesses.
As we moved into 2021, stocks continued their upward trajectory. Meanwhile, the yield on the 10-Year U.S. Treasury continued rallying sharply as many investors began to shift their focus. Deflation was out; inflation was in. Indeed, the potential for a new era of inflation and higher interest rates seems to be the new worry du jour.
So how did the numbers shake out after this unusual year? The S&P 500® Index registered an impressive annual return of approximately 40% for this 12-month period ended May 31, 2021. Over this same period, the yield on the 10-Year U.S. Treasury jumped 94 basis points, reflecting both the very low starting rate and substantial fiscal stimulus. At the end of the reporting period, the yield on the 10-Year U.S. Treasury was 1.59%.
The past year is not one we will forget any time soon. There were many hardships, but we should not overlook the positives and remember our collective spirit and perseverance. Markets endured and even surprised to the upside, but perhaps the key takeaway is that investors need to remain calm in the face of adversity and focused on longer-term investment goals. We believe that's the best approach no matter what the markets throw at us.
On the following pages, you will find information relating to your USAA Mutual Funds, brought to you by Victory Capital. If you have any questions regarding the current market dynamics or your specific portfolio or investment plan, we encourage you to contact our Member Service Representatives. Call (800) 235-8396 or visit our website at www.vcm.com.
2
From all of us here at Victory Capital, thank you for letting us help you work toward your investment goals.

Christopher K. Dyer, CFA
President,
USAA Mutual Funds
3
USAA Cornerstone Conservative Fund
Managers' Commentary
(Unaudited)
• What were the market conditions during the reporting period?
The beginning of the reporting period brought a dramatic reversal from the difficult environment that characterized the first part of 2020. While COVID-19 cases continued to rise, investors grew increasingly confident that the economy would be able to recover from its sharp downturn of February and March. The optimism stemmed, in part, from a series of better-than-expected economic reports interpreted as evidence that the slump in growth would be less severe than was initially feared. The markets were further cheered by the aggressive response by the U.S. Federal Reserve (the "Fed"). In addition to reiterating its commitment to keep short-term interest rates near zero for an extended period, the Fed announced the direct purchase of both individual bonds and exchange-traded bond funds. The central bank's unusual steps offered corporations the latitude to issue debt at ultra-low rates, providing them with the cash necessary to help withstand the effects of the coronavirus.
The global financial markets produced healthy returns during the second half of 2020, wrapping up a positive year for the major asset classes. Investors' appetite for risk improved considerably in early November, when the approval of vaccines for COVID-19 raised expectations that the world economy could gradually return to normal in 2021. The conclusion of the U.S. elections, which removed a source of uncertainty that had depressed performance in September and October, was an additional tailwind. The markets were also aided by continued indications that the Fed and other central banks would maintain their highly accommodative policies indefinitely. Not least, an agreement on a new round of U.S. fiscal stimulus further cheered investors in late December. Together, these developments outweighed negative headlines surrounding renewed lockdowns and the persistence of the coronavirus.
The first quarter of 2021 proved to be a continuation of the strong equity markets investors experienced over the second half of 2020. Gains from global equity markets were fueled by optimism surrounding the successful rollout of the COVID-19 vaccines coupled with further monetary and fiscal stimulus proposals. Faster-than-expected economic growth produced a meaningful increase in real interest rates, which led to negative returns across most major fixed income asset classes. The 10-year U.S. Treasury bond yield finished at its highest level of the first quarter reporting period, climbing from under 1% to 1.74%.
During the last few months of the reporting period, equity markets have been consolidating and interest rates leveling off after large upswings. With strong first quarter GDP and corporate earnings growth in the rearview mirror, investors seem to be contemplating their next move. Inflation data has been increasing as the economy reopens more quickly than expected. The Fed maintains that inflationary pressure is transitory but could become more persistent. The inflationary environment will be a key metric moving into the second half of the year.
4
USAA Cornerstone Conservative Fund (continued)
Managers' Commentary (continued)
• How did the USAA Cornerstone Conservative Fund (the "Fund") perform during the reporting period?
For the reporting period ended May 31, 2021, the Fund had a total return of 12.28%. This compares to returns of 1.22% for the Bloomberg Barclays U.S. Universal Index and 8.77% for the Cornerstone Conservative Composite Index.
• What strategies did you employ during the reporting period?
The Fund delivered strong positive total returns during the reporting period as equity markets rebounded sharply off the market lows produced during the COVID-induced sell off early last year. All major equity asset classes participated in the rally with U.S. small- cap and emerging market stocks leading the way. The Fund's allocation to fixed income also produced positive returns. During the period, the Fund outperformed its Cornerstone Conservative Composite Index.
The most impactful driver of outperformance came from the fixed income portion of the portfolio, with the underlying basket of fixed income funds handily outperforming the broad-based benchmarks. Security selection in the Fund's underlying fixed-income portfolio added value due to an overweight to credit-oriented securities. Additionally, the Fund held higher than average positions in shorter duration fixed-income instruments, which benefitted during periods of rising interest rates.
These positive drivers were offset by weakness in the security selection within the U.S large-cap portion of the portfolio, primarily driven by the resurgence of what we believe are lower-quality stocks, which experienced a sharp relief rally following the rollout of the vaccine. Additionally, the Fund's commodity exposure was weighted more heavily towards gold-related securities, which underperformed a more diversified basket. A tactical underweight to real estate investment trusts also detracted slightly from performance.
Thank you for allowing us to assist you with your investment needs.
5
USAA Cornerstone Conservative Fund
Investment Overview
(Unaudited)
Average Annual Total Return
Year Ended May 31, 2021
| | | Fund Shares | | | | | |
INCEPTION DATE | | 6/8/12 | | | | | |
| | | Net Asset Value | | Bloomberg Barclays
U.S. Universal Index1 | | Cornerstone Conservative
Composite Index2 | |
One Year | | | 12.28 | % | | | 1.22 | % | | | 8.77 | % | |
Five Year | | | 6.20 | % | | | 3.69 | % | | | 5.84 | % | |
Since Inception | | | 5.14 | % | | | 3.32 | % | | | 5.15 | % | |
The performance data quoted represents past performance and current returns may be lower or higher. The investment return and principal value will fluctuate so that an investor's shares, when redeemed, may be worth more or less than the original cost. To obtain performance information current to the most recent month's end, please visit www.vcm.com.
Total return measures the price change in a share assuming the reinvestment of all net investment income and realized capital gain distributions, if any. The total returns quoted do not reflect adjustments made to the enclosed financial statements in accordance with U.S. Generally Accepted Accounting Principles or the deduction of taxes that a shareholder would pay on net investment income and realized capital gain distributions, including reinvested distributions, or redemptions of shares. The total return figures set forth above include all waivers of fees. Without such fee waivers, the total returns would have been lower.
USAA Cornerstone Conservative Fund — Growth of $10,000
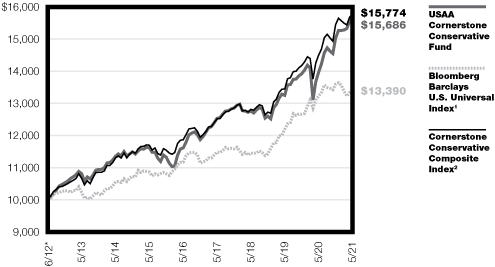
*The performance of the Bloomberg Barclays U.S. Universal Index and Cornerstone Conservative Composite Index is calculated from the end of the month, May 31, 2012, while the inception date of the Cornerstone Aggressive Fund is June 8, 2012. There might be a slight variation of performance numbers because of the difference.
1The unmanaged Bloomberg Barclays U.S. Universal Index is an index that represents the union of the U.S. Aggregate Index, U.S. Corporate High-Yield, Investment Grade 144A Index, Eurodollar Index, U.S. Emerging Markets Index, and the non-ERISA eligible portion of the CMBS Index. The index covers USD denominated, taxable bonds that are rated either investment-grade or below investment-grade. This index does not include the effect of sales charges, commissions, expenses, or taxes, is not representative of the Fund, and it is not possible to invest directly in an index.
2The Cornerstone Conservative Composite Index is a combination of unmanaged indexes representing the Fund's model allocation, and consists of the MSCI USA Investable Market Index (IMI) Gross (11%), the MSCI ACWI ex USA IMI Net (8%), the Bloomberg Barclays U.S. Universal Index (78%), the Bloomberg Commodity Index Total Return (0.5%), the MSCI U.S. Real Estate Investment Trust (REIT) Index Gross (0.5%), and the Bloomberg Barclays U.S. Treasury – Bills (1-3M) (2%). This index does not include the effect of sales charges, commissions, expenses, or taxes, is not representative of the Fund, and it is not possible to invest directly in an index.
The graph reflects investment of growth of a hypothetical $10,000 investment in the Fund.
The graph and table do not reflect the deduction of taxes that a shareholder would pay on Fund distributions or the redemption of Fund shares.
Past performance is not indicative of future results.
6
USAA Mutual Funds Trust
USAA Cornerstone Conservative Fund | | May 31, 2021 | |
(Unaudited)
Investment Objective and Portfolio Holdings:
The Fund's investment objective seeks current income and also considers the potential for capital appreciation.
Top 10 Holdings*:
May 31, 2021
(% of Net Assets)
USAA Government Securities Fund Institutional Shares | | | 17.4 | % | |
USAA Intermediate-Term Bond Fund Institutional Shares | | | 16.4 | % | |
USAA Income Fund Institutional Shares | | | 15.3 | % | |
VictoryShares USAA Core Short-Term Bond ETF | | | 12.7 | % | |
VictoryShares USAA Core Intermediate-Term Bond ETF | | | 7.3 | % | |
USAA High Income Fund Institutional Shares | | | 5.1 | % | |
USAA 500 Index Fund Reward Shares | | | 3.7 | % | |
USAA International Fund Institutional Shares | | | 3.5 | % | |
USAA Short-Term Bond Fund Institutional Shares | | | 2.8 | % | |
USAA Target Managed Allocation Fund | | | 2.6 | % | |
Asset Allocation*:
May 31, 2021
(% of Net Assets)

* Does not include futures, money market instruments, and short-term investments purchased with cash collateral from securities loaned.
Percentages are of the net assets of the Fund and may not equal 100%.
Refer to the Schedule of Portfolio Investments for a complete list of securities.
7
USAA Mutual Funds Trust
USAA Cornerstone Conservative Fund | | Schedule of Portfolio Investments
May 31, 2021 | |
(Amounts in Thousands, Except for Shares)
Security Description | | Shares | | Value | |
Affiliated Exchange-Traded Funds (26.9%) | |
VictoryShares USAA Core Intermediate-Term Bond ETF | | | 334,133 | | | $ | 17,831 | | |
VictoryShares USAA Core Short-Term Bond ETF | | | 596,805 | | | | 30,971 | | |
VictoryShares USAA MSCI Emerging Markets Value Momentum ETF | | | 67,940 | | | | 3,500 | | |
VictoryShares USAA MSCI International Value Momentum ETF | | | 113,561 | | | | 5,763 | | |
VictoryShares USAA MSCI USA Small Cap Value Momentum ETF | | | 18,550 | | | | 1,313 | | |
VictoryShares USAA MSCI USA Value Momentum ETF | | | 95,284 | | | | 6,261 | | |
Total Affiliated Exchange-Traded Funds (Cost $60,912) | | | 65,639 | | |
Affiliated Mutual Funds (72.7%) | |
USAA 500 Index Fund Reward Shares | | | 159,735 | | | | 9,138 | | |
USAA Aggressive Growth Fund Institutional Shares | | | 33,578 | | | | 1,899 | | |
USAA Emerging Markets Fund Institutional Shares | | | 107,882 | | | | 2,639 | | |
USAA Government Securities Fund Institutional Shares | | | 4,233,471 | | | | 42,504 | | |
USAA Growth Fund Institutional Shares | | | 59,347 | | | | 2,141 | | |
USAA High Income Fund Institutional Shares | | | 1,570,035 | | | | 12,325 | | |
USAA Income Fund Institutional Shares | | | 2,751,385 | | | | 37,419 | | |
USAA Income Stock Fund Institutional Shares | | | 136,205 | | | | 2,749 | | |
USAA Intermediate-Term Bond Fund Institutional Shares | | | 3,673,552 | | | | 40,005 | | |
USAA International Fund Institutional Shares | | | 286,163 | | | | 8,430 | | |
USAA Precious Metals and Minerals Fund Institutional Shares | | | 61,064 | | | | 1,408 | | |
USAA Short-Term Bond Fund Institutional Shares | | | 721,932 | | | | 6,750 | | |
USAA Small Cap Stock Fund Institutional Shares | | | 68,227 | | | | 1,486 | | |
USAA Target Managed Allocation Fund | | | 489,885 | | | | 6,359 | | |
USAA Value Fund Institutional Shares | | | 117,050 | | | | 2,195 | | |
Total Affiliated Mutual Funds (Cost $160,947) | | | 177,447 | | |
Total Investments (Cost $221,859) — 99.6% | | | 243,086 | | |
Other assets in excess of liabilities — 0.4% | | | 864 | | |
NET ASSETS — 100.00% | | $ | 243,950 | | |
At May 31, 2021, the Fund's investments in foreign securities were 8.3% of net assets.
ETF — Exchange-Traded Fund
See notes to financial statements.
8
USAA Mutual Funds Trust | | Statement of Assets and Liabilities
May 31, 2021 | |
(Amounts in Thousands, Except Per Share Amounts)
| | | USAA Cornerstone
Conservative Fund | |
Assets: | |
Affiliated investments, at value(Cost $221,859) | | $ | 243,086 | | |
Cash | | | 874 | | |
Receivables: | |
Capital shares issued | | | 38 | | |
Prepaid expenses | | | 17 | | |
Total Assets | | | 244,015 | | |
Liabilities: | |
Payables: | |
Capital shares redeemed | | | 20 | | |
Accrued expenses and other payables: | |
Custodian fees | | | 1 | | |
Compliance fees | | | — | (a) | |
Trustees' fees | | | 1 | | |
Other accrued expenses | | | 43 | | |
Total Liabilities | | | 65 | | |
Net Assets: | |
Capital | | | 219,816 | | |
Total accumulated earnings/(loss) | | | 24,134 | | |
Net Assets | | $ | 243,950 | | |
Shares (unlimited number of shares authorized with no par value): | | | 20,570 | | |
Net asset value, offering and redemption price per share: (b) | | $ | 11.86 | | |
(a) Rounds to less than $1 thousand.
(b) Per share amount may not recalculate due to rounding of net assets and/or shares outstanding.
See notes to financial statements.
9
USAA Mutual Funds Trust | | Statement of Operations
For the Year Ended May 31, 2021 | |
(Amounts in Thousands)
| | | USAA Cornerstone
Conservative Fund | |
Investment Income: | |
Income distributions from affiliated funds | | $ | 6,093 | | |
Interest | | | 1 | | |
Securities lending (net of fees) | | | — | (a) | |
Total Income | | | 6,094 | | |
Expenses: | |
Sub-Administration fees | | | 19 | | |
Custodian fees | | | 6 | | |
Trustees' fees | | | 50 | | |
Compliance fees | | | 1 | | |
Printing fees | | | 41 | | |
Legal and audit fees | | | 57 | | |
State registration and filing fees | | | 31 | | |
Other expenses | | | 18 | | |
Total Expenses | | | 223 | | |
Net Investment Income (Loss) | | | 5,871 | | |
Realized/Unrealized Gains (Losses) from Investments: | |
Net realized gains (losses) from sales of affiliated funds | | | 1,683 | | |
Capital gain distributions received from affiliated funds | | | 1,963 | | |
Net change in unrealized appreciation/depreciation on affiliated funds | | | 15,992 | | |
Net realized/unrealized gains (losses) on investments | | | 19,638 | | |
Change in net assets resulting from operations | | $ | 25,509 | | |
(a) Rounds to less than $1 thousand.
See notes to financial statements.
10
USAA Mutual Funds Trust | | Statements of Changes in Net Assets | |
(Amounts in Thousands)
| | | USAA Cornerstone
Conservative Fund | |
| | | Year
Ended
May 31,
2021 | | Year
Ended
May 31,
2020 | |
From Investments: | |
Operations: | |
Net investment income (loss) | | $ | 5,871 | | | $ | 6,048 | | |
Net realized gains (losses) from investments | | | 3,646 | | | | 3,426 | | |
Net change in unrealized appreciation/depreciation on
investments | | | 15,992 | | | | 564 | | |
Change in net assets resulting from operations | | | 25,509 | | | | 10,038 | | |
Change in net assets resulting from distributions to shareholders | | | (8,183 | ) | | | (6,280 | ) | |
Change in net assets resulting from capital transactions | | | 20,674 | | | | 8,927 | | |
Change in net assets | | | 38,000 | | | | 12,685 | | |
Net Assets: | |
Beginning of period | | | 205,950 | | | | 193,265 | | |
End of period | | $ | 243,950 | | | $ | 205,950 | | |
Capital Transactions: | |
Proceeds from shares issued | | $ | 66,446 | | | $ | 58,872 | | |
Distributions reinvested | | | 8,144 | | | | 6,254 | | |
Cost of shares redeemed | | | (53,916 | ) | | | (56,199 | ) | |
Change in net assets resulting from capital transactions | | $ | 20,674 | | | $ | 8,927 | | |
Share Transactions: | |
Issued | | | 5,750 | | | | 5,373 | | |
Reinvested | | | 711 | | | | 581 | | |
Redeemed | | | (4,674 | ) | | | (5,191 | ) | |
Change in Shares | | | 1,787 | | | | 763 | | |
See notes to financial statements.
11
USAA Mutual Funds Trust | | Financial Highlights | |
For a Share Outstanding Throughout Each Period
| | | | | Investment Activities | | Distributions to
Shareholders From | |
| | | Net Asset
Value,
Beginning
of Period | | Net
Investment
Income
(Loss) | | Net
Realized
and
Unrealized
Gains
(Losses) on
Investments | | Total from
Investment
Activities | | Net
Investment
Income | | Net
Realized
Gains from
Investments | |
USAA Cornerstone Conservative Fund | |
Year Ended:
May 31, 2021 | | $ | 10.96 | | | | 0.30 | (b) | | | 1.03 | | | | 1.33 | | | | (0.31 | ) | | | (0.12 | ) | |
May 31, 2020 | | $ | 10.72 | | | | 0.32 | (b) | | | 0.25 | | | | 0.57 | | | | (0.33 | ) | | | — | | |
May 31, 2019 | | $ | 10.64 | | | | 0.32 | | | | 0.08 | | | | 0.40 | | | | (0.32 | ) | | | — | | |
May 31, 2018 | | $ | 10.76 | | | | 0.30 | | | | (0.11 | ) | | | 0.19 | | | | (0.31 | ) | | | — | | |
May 31, 2017 | | $ | 10.27 | | | | 0.31 | | | | 0.49 | | | | 0.80 | | | | (0.31 | ) | | | — | | |
* Assumes reinvestment of all net investment income and realized capital gain distributions, if any, during the period. Includes adjustments in accordance with U.S. Generally Accepted Accounting Principles and could differ from the Lipper reported return.
^ The net expense ratio may not correlate to the applicable expense limits in place during the period since the current contractual expense limitation is applied for a period beginning July 1, 2019, and in effect through June 30, 2023, instead of coinciding with the Fund's fiscal year end. Details of the current contractual expense limitation in effect can be found in Note 4 of the accompanying Notes to Financial Statements.
(a) The expense ratios exclude the impact of expenses paid by each underlying fund.
(b) Per share net investment income (loss) has been calculated using the average daily shares method.
(c) Reflects a return to normal trading levels after a prior year transition or allocation shift.
See notes to financial statements.
12
USAA Mutual Funds Trust | | Financial Highlights — continued | |
For a Share Outstanding Throughout Each Period
| | | | | Ratios to Average Net Assets | | Supplemental Data | |
| | | Total
Distributions | | Net
Asset
Value,
End of
Period | | Total
Return* | | Net
Expenses^(a) | | Net
Investment
Income
(Loss) | | Gross
Expenses(a) | | Net
Assets,
End of
Period
(000's) | | Portfolio
Turnover | |
USAA Cornerstone Conservative Fund | |
Year Ended:
May 31, 2021 | | | (0.43 | ) | | $ | 11.86 | | | | 12.28 | % | | | 0.10 | % | | | 2.61 | % | | | 0.10 | % | | $ | 243,950 | | | | 15 | % | |
May 31, 2020 | | | (0.33 | ) | | $ | 10.96 | | | | 5.45 | % | | | 0.09 | % | | | 2.92 | % | | | 0.10 | % | | $ | 205,950 | | | | 8 | % | |
May 31, 2019 | | | (0.32 | ) | | $ | 10.72 | | | | 3.84 | % | | | 0.10 | % | | | 2.99 | % | | | 0.12 | % | | $ | 193,265 | | | | 22 | % | |
May 31, 2018 | | | (0.31 | ) | | $ | 10.64 | | | | 1.79 | % | | | 0.10 | % | | | 2.87 | % | | | 0.12 | % | | $ | 196,292 | | | | 5 | % | |
May 31, 2017 | | | (0.31 | ) | | $ | 10.76 | | | | 7.93 | % | | | 0.10 | % | | | 3.02 | % | | | 0.15 | % | | $ | 174,754 | | | | 7 | %(c) | |
See notes to financial statements.
13
USAA Mutual Funds Trust | | Notes to Financial Statements
May 31, 2021 | |
1. Organization:
USAA Mutual Funds Trust (the "Trust") is organized as a Delaware statutory trust and is registered under the Investment Company Act of 1940, as amended (the "1940 Act"), as an open-end investment company. The Trust is comprised of 46 funds and is authorized to issue an unlimited number of shares, which are units of beneficial interest with no par value.
The accompanying financial statements are those of the USAA Cornerstone Conservative Fund (the "Fund"). The Fund is classified as diversified under the 1940 Act. The Fund is a "fund of funds" in that it invests in a selection of affiliated mutual funds and exchange-traded funds managed by the Fund's Adviser, Victory Capital Management Inc. ("VCM"), an affiliate of the Fund.
Under the Trust's organizational documents, its officers and trustees are indemnified against certain liabilities arising out of the performance of their duties to the Fund. In addition, in the normal course of business, the Fund enters into contracts with its vendors and others that provide for general indemnifications. The Fund's maximum exposure under these arrangements is unknown, as this would involve future claims that may be made against the Fund. However, based on experience, the Fund expects that risk of loss to be remote.
2. Significant Accounting Policies:
The following is a summary of significant accounting policies followed by the Trust in the preparation of its financial statements. The policies are in conformity with Generally Accepted Accounting Principles in the United States of America ("GAAP"). The preparation of financial statements in accordance with GAAP requires management to make estimates and assumptions that affect the reported amounts of assets and liabilities and disclosure of contingent assets and liabilities at the date of the financial statements and the reported amounts of income and expenses for the period. Actual results could differ from those estimates. The Fund follows the specialized accounting and reporting requirements under GAAP that are applicable to investment companies under Accounting Standards Codification Topic 946.
Investment Valuation:
The Fund records investments at fair value. Fair value is defined as the price that would be received to sell an asset or paid to transfer a liability in an orderly transaction between market participants at the measurement date.
The valuation techniques described below maximize the use of observable inputs and minimize the use of unobservable inputs in determining fair value. The inputs used for valuing the Fund's investments are summarized in the three broad levels listed below:
• Level 1 — quoted prices in active markets for identical securities
• Level 2 — other significant observable inputs (including quoted prices for similar securities or interest rates applicable to those securities, etc.)
• Level 3 — significant unobservable inputs (including the Fund's own assumptions in determining the fair value of investments)
Changes in valuation techniques may result in transfers in or out of an assigned level within the disclosure hierarchy. The inputs or methodologies used for valuation techniques are not necessarily an indication of the risks associated with entering into those investments.
The Adviser has established the Pricing and Liquidity Committee (the "Committee"), and subject to the Trust's Board of Trustees (the "Board") oversight, the Committee administers and oversees the Fund's valuation policies and procedures, which are approved by the Board.
Investments in open-end investment companies, including underlying funds, are valued at their net asset value ("NAV"). These valuations are typically categorized as Level 1 in the fair value hierarchy.
Portfolio securities listed or traded on securities exchanges, including Exchange-Traded Funds ("ETFs"), American Depositary Receipts ("ADRs"), and Rights are valued at the closing price on the exchange or
14
USAA Mutual Funds Trust | | Notes to Financial Statements — continued
May 31, 2021 | |
system where the security is principally traded, if available, or at the Nasdaq Official Closing Price. If there have been no sales for that day on the exchange or system, then a security is valued at the last available bid quotation on the exchange or system where the security is principally traded. In each of these situations, valuations are typically categorized as Level 1 in the fair value hierarchy.
In the event that price quotations or valuations are not readily available, investments are valued at fair value in accordance with procedures established by and under the general supervision and responsibility of the Board. These valuations are typically categorized as Level 2 or Level 3 in the fair value hierarchy, based on the observability of inputs used to determine the fair value. The effect of fair value pricing is that securities may not be priced on the basis of quotations from the primary market in which they are traded and the actual price realized from the sale of a security may differ materially from the fair value price. Valuing these securities at fair value is intended to cause the Fund's NAV to be more reliable than it otherwise would be.
A summary of the valuations as of May 31, 2021, based upon the three levels defined above, is included in the table below while the breakdown, by category, of investments is disclosed on the Schedule of Portfolio Investments (amounts in thousands):
| | | Level 1 | | Level 2 | | Level 3 | | Total | |
Affiliated Exchange-Traded Funds | | $ | 65,639 | | | $ | — | | | $ | — | | | $ | 65,639 | | |
Affiliated Mutual Funds | | | 177,447 | | | | — | | | | — | | | | 177,447 | | |
Total | | $ | 243,086 | | | $ | — | | | $ | — | | | $ | 243,086 | | |
For the year ended May 31, 2021, there were no transfers in or out of Level 3 in the fair value hierarchy.
Investment Companies:
Exchange-Traded Funds:
The Fund may invest in ETFs, the shares of which are bought and sold on a securities exchange. An ETF trades like common stock and represents a fixed portfolio of securities often designed to track the performance and dividend yield of a particular domestic or foreign market index. The Fund may purchase shares of an ETF to temporarily gain exposure to a portion of the U.S. or a foreign market while awaiting purchase of underlying securities. The risks of owning an ETF generally reflect the risks of owning the underlying securities they are designed to track, although the lack of liquidity of an ETF could result in it being more volatile. Additionally, ETFs have fees and expenses that reduce their value.
Open-End Funds:
The Fund may invest in portfolios of open-end investment companies. These investment companies value securities in their portfolios for which market quotations are readily available at their market values (generally the last reported sale price) and all other securities and assets at their fair value by the methods established by the board of directors of the underlying funds.
Investment Transactions and Related Income:
Changes in holdings of investments are accounted for no later than one business day following the trade date. For financial reporting purposes, however, investment transactions are accounted for on trade date on the last business day of the reporting period. Interest income is determined on the basis of coupon interest accrued using the effective interest method which adjusts, where applicable, the amortization of premiums or accretion of discount. Dividend income is recorded on the ex-dividend date. Gains or losses realized on sales of securities are recorded on the identified cost basis.
15
USAA Mutual Funds Trust | | Notes to Financial Statements — continued
May 31, 2021 | |
Securities Lending:
The Fund, through a securities lending agreement with Citibank, N.A. ("Citibank"), may lend its securities to qualified financial institutions, such as certain broker-dealers, to earn additional income, net of income retained by Citibank. Borrowers are required to secure their loans for collateral in the amount of at least 102% of the value of U.S. securities loaned or at least 105% of the value of non-U.S. securities loaned, marked-to-market daily. Any collateral shortfalls associated with increases in the valuation of the securities loaned are cured the next business day once the shortfall exceeds $100 thousand. Collateral may be cash, U.S. government securities, or other securities as permitted by Securities and Exchange Commission ("SEC") guidelines. Cash collateral may be invested in high-quality short-term investments, primarily open-end investment companies. Collateral requirements are determined daily based on the value of the Fund's securities on loan as of the end of the prior business day. During the time portfolio securities are on loan, the borrower will pay the Fund any dividends or interest paid on such securities plus any fee negotiated between the parties to the lending agreement. The Fund also earns a return from the collateral. The Fund pays Citibank various fees in connection with the investment of cash collateral and fees based on the investment income received from securities lending activities. Securities lending income (net of these fees) is disclosed on the Statement of Operations. Loans are terminable upon demand and the borrower must return the loaned securities within the lesser of one standard settlement period or five business days. Risks relating to securities-lending transactions include that the borrower may not provide additional collateral when required or return the securities when due, and that the value of the short-term investments will be less than the amount of cash collateral required to be returned to the borrower. The Fund's agreement with Citibank does not include master netting provisions. Non-cash collateral received by the Fund may not be sold or re-pledged, except to satisfy borrower default. Cash collateral is listed on the Fund's Schedule of Portfolio Investments and Financial Statements while non-cash collateral is not included. As of May 31, 2021, the Fund did not have any securities on loan.
Federal Income Taxes:
It is the Fund's policy to continue to qualify as a regulated investment company by complying with the provisions available to certain investment companies, as defined in applicable sections of the Internal Revenue Code, and to make distributions of net investment income and net realized gains sufficient to relieve it from all, or substantially all, federal income taxes. Accordingly, no provision for federal income taxes is required in the financial statements. The Fund has a tax year end of May 31.
Management of the Fund has reviewed tax positions taken in tax years that remain subject to examination by all major tax jurisdictions, including federal (i.e., the last four tax years, which includes the current fiscal tax year end). Management believes that there is no tax liability resulting from unrecognized tax benefits related to uncertain tax positions taken.
Allocations:
Expenses directly attributable to the Fund are charged to the Fund, while expenses that are attributable to more than one fund in the Trust, or jointly with an affiliated trust, are allocated among the respective funds in the Trust and/or affiliated trust based upon net assets or another appropriate basis.
3. Purchases and Sales:
Cost of purchases and proceeds from sales/maturities of securities (excluding securities maturing less than one year from acquisition) for the year ended May 31, 2021, were as follows for the Fund (amounts in thousands):
| | | Excluding
U.S. Government Securities | |
| | | Purchases | | Sales | |
| | | | | $ | 53,684 | | | $ | 33,739 | | |
There were no purchases or sales of U.S. government securities during the year ended May 31, 2021.
16
USAA Mutual Funds Trust | | Notes to Financial Statements — continued
May 31, 2021 | |
4. Fees and Transactions with Affiliates and Related Parties:
Investment Advisory Fees:
Investment advisory services are provided to the Fund by the Adviser, which is a New York corporation registered as an investment adviser with the SEC. The Adviser is an indirect wholly owned subsidiary of Victory Capital Holdings, Inc., a publicly traded Delaware corporation, and a wholly owned direct subsidiary of Victory Capital Operating, LLC. The Adviser does not receive any fees from the Fund for these services.
The Trust relies on an exemptive order granted to VCM and its affiliated funds by the SEC in March 2019 permitting the use of a "manager-of-managers" structure for certain funds. Under a manager-of-managers structure, the investment adviser may select (with approval of the Board and without shareholder approval) one or more subadvisers to manage the day-to-day investment of a fund's assets. For the year ended May 31, 2021, the Fund had no subadvisors.
Administration and Servicing Fees:
VCM serves as the Fund's administrator and fund accountant. Under the Fund Administration, Servicing and Accounting Agreement, VCM does not receive any fees from the Fund for these services.
The Fund (as part of the Trust) has entered into an agreement to provide compliance services with the Adviser, pursuant to which the Adviser furnishes its compliance personnel, including the services of the Chief Compliance Officer ("CCO"), and other resources reasonably necessary to provide the Trust with compliance oversight services related to the design, administration and oversight of a compliance program for the Trust in accordance with Rule 38a-1 under the 1940 Act. The CCO is an employee of the Adviser, which pays the compensation of the CCO and support staff. Funds in the Trust, Victory Variable Insurance Funds, Victory Portfolios, and Victory Portfolios II (collectively, the "Victory Funds Complex") in the aggregate, compensate the Adviser for these services. Amounts incurred for the year ended May 31, 2021, are reflected on the Statement of Operations as Compliance fees.
Citi Fund Services Ohio, Inc. ("Citi"), an affiliate of Citibank, acts as sub-administrator and sub-fund accountant to the Fund pursuant to a Sub-Administration and Sub-Fund Accounting Services Agreement between VCM and Citi. VCM pays Citi a fee for providing these services. The Fund reimburses VCM and Citi for out-of-pocket expenses incurred in providing these services and certain other expenses specifically allocated to the Fund. Amounts incurred for the year ended May 31, 2021, are reflected on the Statement of Operations as Sub-Administration fees.
Transfer Agency Fees:
Victory Capital Transfer Agency, Inc. ("VCTA"), an affiliate of the Adviser, provides transfer agency services to the Fund. VCTA received no fees from the Fund for these services.
FIS Investor Services LLC serves as sub-transfer agent and dividend disbursing agent for the Fund pursuant to a Sub-Transfer Agent Agreement between VCTA and FIS Investor Services LLC. VCTA provides FIS Investor Services LLC a fee for providing these services.
Distributor/Underwriting Services:
Victory Capital Services, Inc. (the "Distributor"), an affiliate of the Adviser, serves as distributor for the continuous offering of the shares of the Fund pursuant to a Distribution Agreement between the Distributor and the Trust and receives no fee or other compensation for these services. Effective June 30, 2020, the Distributor's name was changed from Victory Capital Advisers, Inc.
Other Fees:
Citibank serves as the Fund's custodian. The Fund pays Citibank a fee for providing these services. Amounts incurred for the year ended May 31, 2021, are reflected on the Statement of Operations as Custodian fees.
K&L Gates LLP provides legal services to the Trust.
17
USAA Mutual Funds Trust | | Notes to Financial Statements — continued
May 31, 2021 | |
The Adviser has entered into an expense limitation agreement with the Fund until at least June 30, 2023. Under the terms of the agreement, the Adviser has agreed to waive fees or reimburse certain expenses to the extent that ordinary operating expenses incurred in any fiscal year exceed the expense limit for the Fund. Such excess amounts will be the liability of the Adviser. Acquired fund fees and expenses, interest, taxes, brokerage commissions, other expenditures, that are capitalized in accordance with GAAP, and other extraordinary expenses not incurred in the ordinary course of the Fund's business are excluded from the expense limits. As of May 31, 2021, the expense limit (excluding voluntary waivers) was 0.10%.
Under the terms of the expense limitation agreement, amended May 1, 2021, the Fund has agreed to repay fees and expenses that were waived or reimbursed by the Adviser for a period of up to three years (thirty six (36) months) after the waiver or reimbursement took place, subject to the lesser of any operating expense limits in effect at the time of: (a) the original waiver or expense reimbursement; or (b) the recoupment, after giving effect to the recoupment amount. Prior to May 1, 2021, the Fund was permitted to recoup fees waived and expenses reimbursed for up to three years after the fiscal year in which the waiver or reimbursement took place, subject to the limitations above. This change did not have any effect on the amounts previously reported for recoupment. As of May 31, 2021, there are no amounts available to be repaid to the Adviser.
The Adviser may voluntarily waive or reimburse additional fees to assist the Fund in maintaining competitive expense ratios. Voluntary waivers and reimbursements applicable to the Fund are not available to be recouped at a future time. There were no voluntary waivers or reimbursements for the year ended May 31, 2021.
Certain officers and/or interested trustees of the Fund are also officers and/or employees of the Adviser, administrator, fund accountant, sub-administrator, sub-fund accountant, custodian, and Distributor.
5. Risks:
The Fund may be subject to other risks in addition to these identified risks.
Geopolitical/Natural Disaster Risk — Global economies and financial markets are increasingly interconnected, which increases the possibilities that conditions in one country or region might adversely affect issuers in another country or region. Geopolitical and other risks, including war, terrorism, trade disputes, political or economic dysfunction within some nations, public health crises and related geopolitical events, as well as environmental disasters such as earthquakes, fires, and floods, may add to instability in world economies and markets generally. Changes in trade policies and international trade agreements could affect the economies of many countries in unpredictable ways. Likewise, systemic market dislocations of the kind that occurred during the financial crisis that began in 2008, if repeated, would be highly disruptive to economies and markets, adversely affecting individual companies and industries, securities markets, interest rates, credit ratings, inflation, investor sentiment, and other factors affecting the value of a Fund's investments. Some countries, including the United States, are adopting more protectionist trade policies and moving away from the tighter financial industry regulations that followed the 2008 financial crisis, which may also affect the value of a Fund's investments.
Political events within the United States at times have resulted, and may in the future result, in a shutdown of government services, which could negatively affect the U.S. economy, decrease the value of a Fund's investments, increase uncertainty in or impair the operation of the U.S. or other securities markets, and degrade investor and consumer confidence, perhaps suddenly and to a significant degree.
An outbreak of disease called COVID-19 has spread internationally. The transmission of COVID-19 and efforts to contain its spread have resulted in international, national, and local border closings and other significant travel restrictions and disruptions, significant disruptions to business operations, supply chains and consumer activity, significant challenges in healthcare service preparation and delivery, quarantines, and general concern and uncertainty. These negative impacts have caused significant volatility and declines in global financial markets, which have caused losses for Fund investors during and subsequent to period end. The impact of the COVID-19 pandemic may last for an extended period of time, and could result in a substantial economic downturn or recession. Public health crises may
18
USAA Mutual Funds Trust | | Notes to Financial Statements — continued
May 31, 2021 | |
exacerbate other pre-existing political, social, economic, market, and financial risks. The extent of the impact to the financial performance of the Fund's investments will depend on future developments, including (i) the duration and spread of the outbreak, (ii) the restrictions and advisories, (iii) the effects on the financial markets, and (iv) the effects on the economy overall, all of which are highly uncertain and cannot be predicted.
Tactical Allocation Risk — The Fund has a targeted risk tolerance and a corresponding asset allocation target; however, mere asset allocation and volatility are not the sole determination of risk. The Fund's managers will tactically allocate away from the target allocation as market conditions and the perceived risks warrant. The Fund bears the risk that the managers' tactical allocation will not be successful.
Affiliated Funds Risk — The risks of the Fund directly correspond to the risks of the underlying affiliated funds in which the Fund invests. By investing in the underlying affiliated funds, the Fund has exposure to the risk of many different areas of the market. The degree to which the risks described below apply to the Fund varies according to the Fund's asset allocation. For instance, the more the Fund is allocated to stock funds, the greater the risk associated with equity securities. The Fund also is subject to asset allocation risk (i.e., the risk that allocations will not produce the intended results) and to management risk (i.e., the risk that the selection of underlying affiliated funds will not produce the intended results).
Conflict of Interest Risk — In managing a Fund that invests in underlying affiliated funds, the Adviser may have conflicts of interest in allocating the Fund's assets among the various underlying affiliated funds. This is because the fees payable by some of the underlying affiliated funds to the Adviser and/or its affiliates are higher than the fees payable by other underlying affiliated funds, and because the Adviser also manages and administers the underlying affiliated funds.
6. Borrowing and Interfund Lending:
Line of Credit:
The Victory Funds Complex participated in a short-term demand note "Line of Credit" agreement with Citibank. The Line of Credit agreement with Citibank was renewed on June 29, 2020, with a termination date of June 28, 2021. Under the agreement with Citibank, the Victory Funds Complex may borrow up to $600 million, of which $300 million is committed and $300 million is uncommitted. $40 million of the Line of Credit is reserved for use by the Victory Floating Rate Fund, another series of the Victory Funds Complex, with Victory Floating Rate Fund paying the related commitment fees for that amount. The purpose of the Line of Credit is to meet temporary or emergency cash needs. For the year ended May 31, 2021, Citibank received an annual commitment fee of 0.15% on $300 million for providing the Line of Credit. Each fund in the Victory Funds Complex pays a pro-rata portion of the commitment fees plus any interest (one month LIBOR plus one percent) on amounts borrowed. For the period June 29, 2020, through April 30, 2021, under an amended Line of Credit agreement, Citibank received an annual upfront fee of 0.10% on the $300 million committed line of credit. Each fund in the Victory Funds Complex paid a pro-rata portion of the upfront fee. Effective with the next amendment, the annual commitment fee of 0.15% will remain unchanged and the upfront fee of 0.10% is discontinued. Interest charged to each fund during the period, if applicable, is reflected on the Statement of Operations under Line of credit fees.
The Fund had no borrowings under the Line of Credit agreement during the year ended May 31, 2021.
Interfund Lending:
The Trust and Adviser rely on an exemptive order granted by the SEC in March 2017 (the "Order"), permitting the establishment and operation of an Interfund Lending Facility (the "Facility"). The Facility allows the Fund to directly lend and borrow money to or from any other fund in the Victory Funds Complex that is permitted to participate in the Facility, relying upon the Order at rates beneficial to both the borrowing and lending funds. Advances under the Facility are allowed for temporary or emergency purposes, including the meeting of redemption requests that otherwise might require the
19
USAA Mutual Funds Trust | | Notes to Financial Statements — continued
May 31, 2021 | |
untimely disposition of securities, and are subject to each Fund's borrowing restrictions. The interfund loan rate is determined, as specified in the Order, by averaging the current repurchase agreement rate and the current bank loan rate. As a Borrower, interest charged to the Fund, if any, during the period is reflected on the Statement of Operations under Interfund lending fees. As a Lender, interest earned by the Fund, if any, during the period is presented on the Statement of Operations under Interfund lending.
The Fund did not utilize or participate in the Facility during the year ended May 31, 2021.
7. Federal Income Tax Information:
The Fund intends to distribute any net investment income quarterly. Distributable net realized gains, if any, are declared and paid at least annually.
The amounts of dividends from net investment income and distributions from net realized gains (collectively distributions to shareholders) are determined in accordance with federal income tax regulations, which may differ from GAAP. To the extent these "book/tax" differences are permanent in nature (e.g., net operating loss and distribution reclassification), such amounts are reclassified within the components of net assets based on their federal tax-basis treatment; temporary differences (e.g., wash sales) do not require reclassification. To the extent dividends and distributions exceed net investment income and net realized gains for tax purposes, they are reported as distributions of capital. Net investment losses incurred by the Fund may be reclassified as an offset to capital on the accompanying Statement of Assets and Liabilities.
As of May 31, 2021, on the Statement of Assets and Liabilities, there were no permanent book-to-tax difference reclassification adjustments.
The tax character of distributions paid during the tax years ended as noted below, were as follows (total distributions paid may differ from the Statement of Changes in Net Assets because, for tax purposes, dividends are recognized when actually paid) (amounts in thousands).
| | Year Ended May 31, 2021 | | Year Ended May 31, 2020 | |
| | | Distributions
paid from | |
| | Distributions
paid from | |
| |
| | | Ordinary
Income | | Net
Long-Term
Capital
Gains | | Total
Distributions
Paid | | Ordinary
Income | | Total
Distributions
Paid | |
| | | | | $ | 6,144 | | | $ | 2,039 | | | $ | 8,183 | | | $ | 6,280 | | | $ | 6,280 | | |
As of May 31, 2021, the components of accumulated earnings (loss) on a tax basis were as follows (amounts in thousands):
Undistributed
Ordinary
Income | | Undistributed
Long-Term
Capital Gains | | Accumulated
Earnings | | Unrealized
Appreciation
(Depreciation)* | | Total
Accumulated
Earnings
(Loss) | |
| $ | 829 | | | $ | 2,630 | | | $ | 3,459 | | | $ | 20,675 | | | $ | 24,134 | | |
* The difference between the book-basis and tax-basis of unrealized appreciation/depreciation is attributable to the tax deferral of losses on wash sales.
As of May 31, 2021, the Fund had no capital loss carryforwards, for federal income tax purposes.
20
USAA Mutual Funds Trust | | Notes to Financial Statements — continued
May 31, 2021 | |
As of May 31, 2021, the cost basis for federal income tax purposes, gross unrealized appreciation, gross unrealized depreciation, and net unrealized appreciation (depreciation) for investments were as follows (amounts in thousands):
| | Cost of
Investments for
Federal
Tax Purposes | | Gross
Unrealized
Appreciation | | Gross
Unrealized
Depreciation | | Net
Unrealized
Appreciation
(Depreciation) | |
| | | | | $ | 222,411 | | | $ | 21,226 | | | $ | (551 | ) | | $ | 20,675 | | |
8. Affiliated Securities:
An affiliated security is a security in which the Fund has ownership of at least 5% of the security's outstanding voting shares or an investment company managed by VCM. The Fund does not invest in affiliated underlying funds for the purpose of exercising management or control. These underlying funds are noted as affiliated on the Fund's Schedule of Portfolio Investments. The affiliated underlying fund's annual or semiannual reports may be viewed at vcm.com. Transactions in affiliated securities during the year ended May 31, 2021 were as follows (amount in thousands):
| | | Fair Value
5/31/2020 | | Purchases
at Cost | | Proceeds
from
Sales | | Realized
Gains
(Losses) | | Capital
Gain
Distribution | | Net Change
in Unrealized
Appreciation/
Depreciation | | Fair Value
5/31/21 | | Dividend
Income | |
USAA 500 Index Fund Reward
Shares | | $ | 6,523 | | | $ | 1,147 | | | $ | (856 | ) | | $ | 134 | | | $ | 158 | | | $ | 2,190 | | | $ | 9,138 | | | $ | 110 | | |
USAA Aggressive Growth Fund
Institutional Shares | | | 1,406 | | | | 3 | | | | — | | | | — | | | | 3 | | | | 490 | | | | 1,899 | | | | — | | |
USAA Capital Growth Fund
Institutional Shares | | | 1,858 | | | | — | | | | (2,084 | ) | | | 58 | | | | — | | | | 168 | | | | — | | | | — | | |
USAA Emerging Markets Fund
Institutional Shares | | | 2,368 | | | | 451 | | | | (1,333 | ) | | | 221 | | | | — | | | | 932 | | | | 2,639 | | | | 34 | | |
USAA Government Securities
Fund Institutional
Shares | | | 41,565 | | | | 1,734 | | | | — | | | | — | | | | 152 | | | | (795 | ) | | | 42,504 | | | | 956 | | |
USAA Growth Fund
Institutional Shares | | | 1,963 | | | | 84 | | | | (435 | ) | | | 82 | | | | 65 | | | | 447 | | | | 2,141 | | | | 19 | | |
USAA High Income Fund
Institutional Shares | | | 6,397 | | | | 5,195 | | | | — | | | | — | | | | — | | | | 733 | | | | 12,325 | | | | 431 | | |
USAA Income Fund
Institutional Shares | | | 56,887 | | | | 1,937 | | | | (22,479 | ) | | | 1,028 | | | | 539 | | | | 46 | | | | 37,419 | | | | 1,398 | | |
USAA Income Stock Fund
Institutional Shares | | | 3,177 | | | | 65 | | | | (1,391 | ) | | | (29 | ) | | | — | | | | 927 | | | | 2,749 | | | | 65 | | |
USAA Intermediate-Term
Bond Fund Institutional
Shares | | | 33,040 | | | | 6,765 | | | | — | | | | — | | | | 771 | | | | 200 | | | | 40,005 | | | | 1,411 | | |
USAA International Fund
Institutional Shares | | | 6,859 | | | | 569 | | | | (1,451 | ) | | | (168 | ) | | | — | | | | 2,621 | | | | 8,430 | | | | 152 | | |
USAA Precious Metals and
Minerals Fund
Institutional Shares | | | 1,385 | | | | 2 | | | | (228 | ) | | | 93 | | | | — | | | | 156 | | | | 1,408 | | | | 2 | | |
21
USAA Mutual Funds Trust | | Notes to Financial Statements — continued
May 31, 2021 | |
| | | Fair Value
5/31/2020 | | Purchases
at Cost | | Proceeds
from
Sales | | Realized
Gains
(Losses) | | Capital
Gain
Distribution | | Net Change
in Unrealized
Appreciation/
Depreciation | | Fair Value
5/31/21 | | Dividend
Income | |
USAA Short-Term Bond Fund
Institutional Shares | | $ | 6,382 | | | $ | 206 | | | $ | — | | | $ | — | | | $ | 11 | | | $ | 162 | | | $ | 6,750 | | | $ | 195 | | |
USAA Small Cap Stock Fund
Institutional Shares | | | 2,385 | | | | 135 | | | | (1,891 | ) | | | 104 | | | | 92 | | | | 753 | | | | 1,486 | | | | 43 | | |
USAA Target Managed
Allocation Fund | | | 4,074 | | | | 1,199 | | | | (203 | ) | | | 18 | | | | 93 | | | | 1,271 | | | | 6,359 | | | | 240 | | |
USAA Value Fund
Institutional Shares | | | 1,730 | | | | 30 | | | | (210 | ) | | | (103 | ) | | | — | | | | 748 | | | | 2,195 | | | | 30 | | |
VictoryShares USAA Core
Intermediate-Term
Bond ETF | | | 17,709 | | | | — | | | | — | | | | — | | | | 33 | | | | 122 | | | | 17,831 | | | | 411 | | |
VictoryShares USAA Core
Short-Term Bond ETF | | | 229 | | | | 30,683 | | | | — | | | | — | | | | 46 | | | | 59 | | | | 30,971 | | | | 336 | | |
VictoryShares USAA MSCI
Emerging Markets Value
Momentum ETF | | | 879 | | | | 1,746 | | | | — | | | | — | | | | — | | | | 875 | | | | 3,500 | | | | 50 | | |
VictoryShares USAA MSCI
International Value
Momentum ETF | | | 2,694 | | | | 1,733 | | | | — | | | | — | | | | — | | | | 1,336 | | | | 5,763 | | | | 100 | | |
VictoryShares USAA MSCI
USA Small Cap Value
Momentum ETF | | | 1,049 | | | | — | | | | (353 | ) | | | 102 | | | | — | | | | 515 | | | | 1,313 | | | | 18 | | |
VictoryShares USAA MSCI
USA Value Momentum
ETF | | | 4,907 | | | | — | | | | (825 | ) | | | 143 | | | | — | | | | 2,036 | | | | 6,261 | | | | 92 | | |
| | | $ | 205,466 | | | $ | 53,684 | | | $ | (33,739 | ) | | $ | 1,683 | | | $ | 1,963 | | | $ | 15,992 | | | $ | 243,086 | | | $ | 6,093 | | |
22
REPORT OF INDEPENDENT REGISTERED PUBLIC ACCOUNTING FIRM
To the Shareholders and the Board of Trustees of USAA Cornerstone Conservative Fund
Opinion on the Financial Statements
We have audited the accompanying statement of assets and liabilities of USAA Cornerstone Conservative Fund (the "Fund") (one of the funds constituting USAA Mutual Funds Trust (the "Trust")), including the schedule of portfolio investments, as of May 31, 2021, and the related statement of operations for the year then ended, the statements of changes in net assets for each of the two years in the period then ended, the financial highlights for each of the five years in the period then ended and the related notes (collectively referred to as the "financial statements"). In our opinion, the financial statements present fairly, in all material respects, the financial position of the Fund (one of the funds constituting USAA Mutual Funds Trust) at May 31, 2021, the results of its operations for the year then ended, the changes in its net assets for each of the two years in the period then ended and its financial highlights for each of the five years in the period then ended, in conformity with U.S. generally accepted accounting principles.
Basis for Opinion
These financial statements are the responsibility of the Trust's management. Our responsibility is to express an opinion on the Fund's financial statements based on our audits. We are a public accounting firm registered with the Public Company Accounting Oversight Board (United States) ("PCAOB") and are required to be independent with respect to the Trust in accordance with the U.S. federal securities laws and the applicable rules and regulations of the Securities and Exchange Commission and the PCAOB.
We conducted our audits in accordance with the standards of the PCAOB. Those standards require that we plan and perform the audit to obtain reasonable assurance about whether the financial statements are free of material misstatement, whether due to error or fraud. The Trust is not required to have, nor were we engaged to perform, an audit of the Trust's internal control over financial reporting. As part of our audits we are required to obtain an understanding of internal control over financial reporting, but not for the purpose of expressing an opinion on the effectiveness of the Trust's internal control over financial reporting. Accordingly, we express no such opinion.
Our audits included performing procedures to assess the risks of material misstatement of the financial statements, whether due to error or fraud, and performing procedures that respond to those risks. Such procedures included examining, on a test basis, evidence regarding the amounts and disclosures in the financial statements. Our procedures included confirmation of securities owned as of May 31, 2021, by correspondence with the custodian. Our audits also included evaluating the accounting principles used and significant estimates made by management, as well as evaluating the overall presentation of the financial statements. We believe that our audits provide a reasonable basis for our opinion.

We have served as the auditor of one or more Victory Capital investment companies since 1995.
San Antonio, Texas
July 28, 2021
23
USAA Mutual Funds Trust | | Supplemental Information
May 31, 2021 | |
(Unaudited)
Trustee and Officer Information
Board of Trustees:
Overall responsibility for management of the Trust rests with the Board. The Trust is managed by the Board in accordance with the laws of the state of Delaware. There are currently nine Trustees, seven of whom are not "interested persons" of the Trust within the meaning of that term under the 1940 Act ("Independent Trustees") and two of whom are "interested persons" of the Trust within the meaning of that term under the 1940 Act ("Interested Trustee"). The Trustees, in turn, elect the officers of the Trust to actively supervise its day-to-day operations.
The following tables list the Trustees, their ages, position with the Trust, commencement of service, principal occupations during the past five years and any directorships of other investment companies or companies whose securities are registered under the Securities Exchange Act of 1934, as amended, or who file reports under that Act. Each Trustee oversees 46 portfolios in the Trust. Each Trustee's address is 15935 La Cantera Pkwy, San Antonio, TX, 78256. Pursuant to a policy adopted by the Board, the term of office for each Trustee shall be until the Independent Trustee reaches age 75 or an Interested Trustee reaches age 75. The Board may change or grant exceptions from this policy at any time without shareholder approval. A Trustee may resign or be removed by a vote of the other Trustees or the holders of a majority of the outstanding shares of the Trust at any time. Vacancies on the Board can be filled by the action of a majority of the Trustees, provided that after filling such vacancy at least two-thirds of the Trustees have been elected by the shareholders.
Name and Date of Birth | | Position
Held with
the Trust | | Year
Commenced
Service | | Principal Occupation
During Past 5 Years | | Other
Directorships
Held During
Past 5 Years | |
Independent Trustees. | |
Jefferson C. Boyce, (c)
Born September 1957 | | Independent Chairman | | | 2021 | | | Senior Managing Director, New York Life Investments, LLC (1992-2012) | | Westhab, Inc. | |
John C. Walters,
Born February 1962 | | Trustee | | | 2019 | | | Retired. Mr. Walters brings significant Board experience including active involvement with the board of a Fortune 500 company, and a proven record of leading large, complex financial organizations. He has a demonstrated record of success in distribution, manufacturing, investment brokerage, and investment management in both the retail and institutional investment businesses. He has substantial experience in the investment management business with a demonstrated ability to develop and drive strategy while managing operation, financial, and investment risk. | | Guardian Variable Products Trust (16 series), Lead Independent Director; Amerilife Holdings LLC, Director; Stadion Money Management; Director; University of North Carolina (Chapel Hill), Member Board of Governors | |
24
USAA Mutual Funds Trust | | Supplemental Information — continued
May 31, 2021 | |
(Unaudited)
Name and Date of Birth | | Position
Held with
the Trust | | Year
Commenced
Service | | Principal Occupation
During Past 5 Years | | Other
Directorships
Held During
Past 5 Years | |
Robert L. Mason, Ph.D.,
Born July 1946 | | Trustee | | | 1997 | | | Adjunct Professor in the Department of Management Science and Statistics in the College of Business at the University of Texas at San Antonio (since 2001); Institute Analyst, Southwest Research Institute (March 2002-January 2016) | | None | |
Dawn M. Hawley,
Born February 1954 | | Trustee | | | 2014 | | | Manager of Finance, Menil Foundation, Inc. (May 2007-June 2011), which is a private foundation that oversees the assemblage of sculptures, prints, drawings, photographs, and rare books. Director of Financial Planning and Analysis and Chief Financial Officer, AIM Management Group, Inc. (October 1987-January 2006) | | None | |
Paul L. McNamara,
Born July 1948 | | Trustee | | | 2012 | | | Director, Cantor Opportunistic Alternatives Fund, LLC (March 2010-February 2014), which is a closed-end fund of funds by Cantor Fitzgerald Investment Advisors, LLC | | None | |
25
USAA Mutual Funds Trust | | Supplemental Information — continued
May 31, 2021 | |
(Unaudited)
Name and Date of Birth | | Position
Held with
the Trust | | Year
Commenced
Service | | Principal Occupation
During Past 5 Years | | Other
Directorships
Held During
Past 5 Years | |
Richard Y. Newton III,
Born January 1956 | | Trustee | | | 2017 | | | Director, Elta North America (01/18-present), which is a global leader in the design, manufacture, and support of innovative electronic systems in the ground, maritime, airborne, and security domains for the nation's warfighters, security personnel, and first responders; Managing Partner, Pioneer Partnership Development Group (December 2015-present)); Executive Director, The Union League Club of New York (June 2014-November 2015): Executive Vice President, Air Force Association (August 2012-May 2014); Lieutenant General, United States Air Force (January 2008-June 2012) | | PredaSAR Corp. | |
Barbara B. Ostdiek, Ph.D.,
Born March 1964 | | Trustee | | | 2008 | | | Senior Associate Dean of Degree Programs at Jesse H. Jones Graduate School of Business at Rice University (since 2013); Associate Professor of Finance at Jessie H. Jones Graduate School of Business at Rice University (since 2001) | | None | |
Effective at the close of business on December 31, 2020, Michael F. Reimherr retired from the Board of Trustees.
26
USAA Mutual Funds Trust | | Supplemental Information — continued
May 31, 2021 | |
(Unaudited)
Name and Date of Birth | | Position
Held with
the Trust | | Year
Commenced
Service | | Principal Occupation
During Past 5 Years | | Other
Directorships
Held During
Past 5 Years | |
Interested Trustees. | |
David C. Brown, (b)
Born May 1972 | | Trustee | | | 2019 | | | Chairman and Chief Executive Officer (since 2013), Victory Capital Management Inc.; Chairman and Chief Executive Officer, Victory Capital Holdings, Inc. (since 2013). Mr. Brown brings to the Board extensive business, finance and leadership skills gained and developed through years of experience in the financial services industry, including his tenure overseeing the strategic direction as CEO of Victory Capital. These skills, combined with Mr. Brown's extensive knowledge of the financial services industry and demonstrated success in the development and distribution of investment strategies and products, enable him to provide valuable insights to the Board and strategic direction for the Funds. | | Trustee, Victory Portfolios (41 series), Victory Portfolios II (26 series), Victory Variable Insurance Funds (8 series) | |
27
USAA Mutual Funds Trust | | Supplemental Information — continued
May 31, 2021 | |
(Unaudited)
Name and Date of Birth | | Position
Held with
the Trust | | Year
Commenced
Service | | Principal Occupation
During Past 5 Years | | Other
Directorships
Held During
Past 5 Years | |
Daniel S. McNamara, (b)(c)(d)
Born June 1966 | | Trustee | | | 2012 | | | Trustee, President, and Vice Chairman of USAA ETF Trust (June 2017-June 2019); President of Financial Advice & Solutions Group (FASG), USAA (February 2013-March 2021); Director of USAA Investment Services Company (ISCO) (formerly USAA Investment Management) (September 2009-March 2021); President, Asset Management Company (AMCO) (August, 2011-June 2019); Senior Vice President of USAA Financial Planning Services Insurance Agency, Inc. (FPS) (April 2011-March 2021); Chairman of Board of ISCO (April 2013-December 2020); Director of AMCO (August 2011-June 2019); President and Director of USAA Shareholder Account Services (SAS) (October 2009-June 2019); Director and Vice Chairman of FPS (December 2013-March 2021); President and Director of USAA Investment Corporation (ICORP) (March 2010-March 2021); Chairman of Board of ICORP (December 2013-March 2021); Director of USAA Financial Advisors, Inc. (FAI) (December 2013-March 2021); Chairman of Board of FAI (March 2015-March 2021). Mr. McNamara brings to the Board extensive experience in the financial services industry, including experience as an officer of the Trust. | | None | |
(b) Mr. Dan McNamara is deemed an "interested person" due to his previous position as Director of AMCO, the former investment adviser of the Funds. Mr. Brown is deemed an "interested person" due to his position as Chief Executive Officer of Victory Capital, investment adviser to the Funds.
(c) Effective at the close of business on December 31, 2020, Jefferson C. Boyce replaced Dan McNamara as Chair of the Board and assumed the title of Independent Chair.
(d) Effective July 2, 2021, Mr. Dan McNamara became an Independent Trustee to the Funds.
The Statement of Additional Information includes additional information about the Trustees of the Trust and is available, without charge, on the SEC's website at www.sec.gov and/or by calling (800)-235-8396.
28
USAA Mutual Funds Trust | | Supplemental Information — continued
May 31, 2021 | |
(Unaudited)
Officers:
The officers of the Trust, their ages, commencement of service and their principal occupations during the past five years, are detailed in the following table. Each officer serves until the earlier of his or her resignation, removal, retirement, death, or the election of a successor. The mailing address of each officer of the Trust is 15935 La Cantera Pkwy, San Antonio, TX, 78256. The officers of the Trust receive no compensation directly from the Trust for performing the duties of their offices.
Name and Date of Birth | | Position with
the Trust | | Year
Commenced
Service | | Principal Occupation During Past 5 Years | |
Interested Officers.
Christopher K. Dyer,
Born February 1962 | | President | | | 2019 | | | Director of Fund Administration, Victory Capital (since 2004); Chief Operating Officer, Victory Capital Services, Inc. (since 2020) | |
Scott A Stahorsky,
Born July 1969 | | Vice President | | | 2019 | | | Manager, Fund Administration, Victory Capital (since 2015) | |
James K. De Vries,
Born April 1969 | | Treasurer | | | 2018 | | | Executive Director, Victory Capital Management Inc. (since 2019); Treasurer, USAA ETF Trust (September 2018-June 2019); Executive Director, Investment and Financial Administration, USAA (April 2012-June 2019); Assistant Treasurer, USAA ETF Trust (June 2017-September 2018); Assistant Treasurer, USAA Mutual Funds Trust (December 2013-February 2018) | |
Allan Shaer,
Born March 1965 | | Assistant Treasurer | | | 2019 | | | Senior Vice President, Financial Administration, Citi Fund Services Ohio, Inc. (since 2016); Vice President, Mutual Fund Administration, JP Morgan Chase (2011-2016) | |
Carol D. Trevino,
Born October 1965 | | Assistant Treasurer | | | 2018 | | | Director, Accounting and Finance, Victory Capital Management Inc. (since 2019); Accounting/Financial Director, USAA (December 2013-June 2019); Assistant Treasurer, USAA ETF Trust (September 2018-June 2019) | |
Erin G. Wagner,
Born February 1974 | | Secretary | | | 2019 | | | Deputy General Counsel, the Adviser (since 2013) | |
Charles Booth,
Born April 1960 | | Anti-Money Laundering Compliance Officer and Identity Theft Officer | | | 2019 | | | Director, Regulatory Administration and CCO Support Services, Citi Fund Services Ohio, Inc. (since 2007) | |
Amy Campos,
Born July 1976 | | Chief Compliance Officer | | | 2019 | | | Chief Compliance Officer, USAA Mutual Funds Trust (since 2019); Executive Director, Deputy Chief Compliance Officer, USAA Mutual Funds Trust and USAA ETF Trust (July 2017-June 2019); Compliance Director, USAA Mutual Funds Trust (2014-July 2017) | |
29
USAA Mutual Funds Trust | | Supplemental Information — continued
May 31, 2021 | |
(Unaudited)
Proxy Voting and Portfolio Holdings Information
Proxy Voting:
Information regarding the policies and procedures the Fund uses to determine how to vote proxies relating to portfolio securities is available without charge, upon request, by calling (800) 235-8396. The information is also included in the Fund's Statement of Additional Information, which is available on the SEC's website at www.sec.gov.
Information relating to how the Fund voted proxies relating to portfolio securities held during the most recent 12 months ended June 30 is available on the SEC's website at www.sec.gov.
Availability of Schedules of Portfolio Investments:
The Trust files a complete list of Schedules of Portfolio Investments with the SEC for the first and third quarter of each fiscal year on Form N-PORT. Form N-PORT is available on the SEC's website at www.sec.gov.
Expense Example
As a shareholder of the Fund, you may incur two types of costs: (1) transaction costs, and (2) ongoing costs, including management fees and other Fund expenses. These examples are intended to help you understand your ongoing costs (in dollars) of investing in the Fund and to compare these costs with the ongoing costs of investing in other mutual funds.
These examples are based on an investment of $1,000 invested at the beginning of the period and held for the entire period from December 1, 2020, through May 31, 2021.
The Actual Expense figures in the table below provide information about actual account values and actual expenses. You may use the information below, together with the amount you invested, to estimate the expenses that you paid over the period. Simply divide your account value by $1,000 (for example, an $8,600 account value divided by $1,000 = 8.6), then multiply the result by the number in the table under the heading entitled "Actual Expenses Paid During Period" to estimate the expenses you paid on your account during this period.
The Hypothetical Expense figures in the table below provide information about hypothetical account values and hypothetical expenses based on the Fund's actual expense ratio and an assumed rate of return of 5% per year before expenses, which is not the Fund's actual return. The hypothetical account values and expenses may not be used to estimate the actual ending account balance or expenses you paid for the period. You may use this information to compare this 5% hypothetical example with the 5% hypothetical examples that appear in shareholder reports of other funds.
Please note the expenses shown in the table below are meant to highlight your ongoing costs only and do not reflect any transactional costs. If these transactional costs were included, your costs would have been higher.
Beginning
Account
Value
12/1/20 | | Actual
Ending
Account
Value
5/31/21 | | Hypothetical
Ending
Account
Value
5/31/21 | | Actual
Expenses
Paid
During
Period
12/1/20-
5/31/21* | | Hypothetical
Expenses
Paid
During
Period
12/1/20-
5/31/21* | | Annualized
Expense
Ratio
During
Period
12/1/20-
5/31/21 | |
| $ | 1,000.00 | | | $ | 1,043.80 | | | $ | 1,024.43 | | | $ | 0.51 | | | $ | 0.50 | | | | 0.10 | % | |
* Expenses are equal to the average account value multiplied by the Fund's annualized expense ratio multiplied by 182/365 (the number of days in the most recent fiscal half-year divided by the number of days in the fiscal year).
30
USAA Mutual Funds Trust | | Supplemental Information — continued
May 31, 2021 | |
(Unaudited)
Additional Federal Income Tax Information
The following federal tax information related to the Fund's fiscal year ended May 31, 2021, is provided for information purposes only and should not be used for reporting to federal or state revenue agencies. Federal tax information for the calendar year will be reported to you on Form 1099-DIV in January 2022.
With respect to distributions paid, the Fund designates the following amounts (or, if subsequently determined to be different, the maximum amount allowable) for the fiscal year ended May 31, 2021 (amounts in thousands):
| | Dividends
Received
Deduction
(corporate
shareholders) | | Qualified
Dividend
Income
(non-corporate
shareholders) | | Short-Term
Capital Gain
Distributions | | Long-Term
Capital Gain
Distributions | | Foreign
Taxes
Paid | |
| | | | | | 6 | % | | | 11 | % | | $ | 224 | | | $ | 2,039 | | | $ | 31 | | |
31
USAA Mutual Funds Trust | | Supplemental Information — continued
May 31, 2021 | |
(Unaudited)
Considerations of the Board in Continuing the Investment Advisory Agreement (the "Agreement")
USAA Cornerstone Conservative Fund (the "Fund")
At a meeting of the Board of Trustees (the "Board") held on December 10-11, 2020, the Board, including the Trustees who are not "interested persons" (as that term is defined in the Investment Company Act of 1940, as amended) of the Trust (the "Independent Trustees"), approved for an annual period the continuance of the Investment Advisory Agreement (the "Advisory Agreement") between the Trust and Victory Capital Management Inc. (the "Adviser") with respect to the Fund. Prior to the December 10-11, 2020 meeting at which the Advisory Agreement was approved, the Independent Trustees also discussed and considered information regarding the proposed continuation of the Advisory Agreement at a meeting held on November 19, 2020.
In advance of the foregoing meetings, the Trustees received and considered a variety of information relating to the Advisory Agreement and the Adviser, and were given the opportunity to ask questions and request additional information from management. The information provided to the Board included, among other things: (i) a separate report prepared by an independent third party of mutual fund data, which provided a statistical analysis comparing the Fund's investment performance, expenses, and fees to comparable investment companies; (ii) information concerning the services rendered to the Fund, as well as information regarding the Adviser's revenues and costs of providing services to the Fund and compensation paid to affiliates of the Adviser; and (iii) information about the Adviser's operations and personnel. Prior to voting, the Independent Trustees reviewed the proposed continuance of the Advisory Agreement with management and with experienced independent counsel retained by the Independent Trustees ("Independent Counsel") and received materials from such Independent Counsel discussing the legal standards for their consideration of the proposed continuation of the Advisory Agreement with respect to the Fund. The Independent Trustees also reviewed the proposed continuation of the Advisory Agreement with respect to the Fund in private sessions with Independent Counsel at which no representatives of management were present.
At each regularly scheduled meeting of the Board and its committees, the Board receives and reviews, among other things, information concerning the Fund's performance and related services provided by the Adviser. At the meeting at which the renewal of the Advisory Agreement is considered, particular focus is given to information concerning Fund performance, fees and total expenses as compared to comparable investment companies, and the Adviser's profitability with respect to the Fund. However, the Board noted that the evaluation process with respect to the Adviser is an ongoing one. In this regard, the Board's and its committees' consideration of the Advisory Agreement included information previously received at such meetings.
Advisory Agreement
After full consideration of a variety of factors, the Board, including the Independent Trustees, voted to approve the Advisory Agreement. In approving the Advisory Agreement, the Trustees did not identify any single factor as controlling, and each Trustee may have attributed different weights to various factors. Throughout their deliberations, the Independent Trustees were represented and assisted by Independent Counsel.
Nature, Extent, and Quality of Services — In considering the nature, extent, and quality of the services provided by the Adviser under the Advisory Agreement, the Board reviewed information provided by the Adviser relating to its operations and personnel. The Board also took into account its knowledge of the Adviser's management and the quality of the performance of the Adviser's duties through Board meetings, discussions, and reports during the preceding year. The Board considered the fees paid to the Adviser and the services provided to the Fund by the Adviser under the Advisory Agreement, as well as other services provided by the Adviser and its affiliates under other agreements, and the personnel who provide these services. In addition to the investment advisory services provided to the Fund, the Adviser and its affiliates provide administrative services, shareholder services, oversight of Fund accounting, marketing services, assistance in meeting legal and regulatory requirements, and other services necessary for the operation of the Fund and the Trust.
The Board considered the scope of services provided by, and the undertakings required of, the Adviser in connection with those services, including, among other things, maintaining (i) its own and the Fund's compliance programs, (ii) risk management programs, (iii) liquidity risk management programs, and (iv) cybersecurity
32
USAA Mutual Funds Trust | | Supplemental Information — continued
May 31, 2021 | |
(Unaudited)
programs, each of which had expanded over time as a result of regulatory, market, and other developments. The Board also considered the significant risks assumed by the Adviser in connection with the services provided to the Fund, including investment, operational, enterprise, litigation, regulatory and compliance risks.
The Board considered the Adviser's management style and the performance of the Adviser's duties under the Advisory Agreement. The Board considered the level and depth of knowledge of the Adviser, including the professional experience and qualifications of its senior and investment personnel, as well as current staffing levels. The allocation of the Fund's brokerage, including the Adviser's process for monitoring "best execution," also was considered. The Adviser's role in coordinating the activities of the Fund's other service providers was also considered. The Board also considered the Adviser's risk management processes. The Board considered the Adviser's financial condition and that it had the financial wherewithal to continue to provide the same scope and high quality of services under the Advisory Agreement. In reviewing the Advisory Agreement, the Board focused on the experience, resources, and strengths of the Adviser and its affiliates in managing the Fund, as well as the other funds in the Trust.
The Board also reviewed the compliance and administrative services provided to the Fund by the Adviser and its affiliates, including the Adviser's oversight of the Fund's day-to-day operations and oversight of Fund accounting. The Trustees, guided also by information obtained from their experiences as trustees of the Trust, also focused on the quality of the Adviser's compliance and administrative staff.
Expenses and Performance — In connection with its consideration of the Advisory Agreement, the Board evaluated the Fund's advisory fees and total expense ratio as compared to other open-end investment companies deemed to be comparable to the Fund as determined by the independent third party in its report. The Fund's expenses were compared to (i) a group of investment companies chosen by the independent third party to be comparable to the Fund based upon certain factors, including fund type, comparability of investment objective and classification, sales load type, asset size, and expense components (the "expense group") and (ii) a larger group of investment companies with the same investment classification/objective as the Fund regardless of asset size, excluding outliers (the "expense universe"). The Board noted that the Adviser does not receive a management fee from the Fund. The data indicated that the Fund's total expenses, which included underlying fund expenses, were below the medians of its expense group and expense universe. The Board also took into account the Adviser's current undertakings to maintain expense limitations for the Fund. The Board took into account the various other services provided to the Fund by the Adviser and its affiliates, and noted the high quality of services received by the Fund.
In considering the Fund's performance, the Board noted that it reviews at its regularly scheduled meetings information about the Fund's performance results. The Trustees also reviewed various comparative data provided to them in connection with their consideration of the renewal of the Advisory Agreement, including, among other information, a comparison of the Fund's average annual total returns relative to its Lipper index and other mutual funds deemed to be in its peer group by the independent third party in its report (the "performance universe"). The Fund's performance universe consisted of the Fund and all retail and institutional open-end investment companies with the same classification/objective as the Fund regardless of asset size or primary channel of distribution. This comparison indicated that, among other data, the Fund's performance was above the average of its performance universe and Lipper index for the one-, three- and five-year periods ended September 30, 2020.
Compensation and Profitability — The Board took into consideration that the Adviser does not collect a management fee from the Fund. The information considered by the Board included operating profit margin information for the Adviser's business as a whole. The Board also received and considered profitability information related to the management revenues from the Fund. This information included a review of the methodology used in the allocation of certain costs to the Fund. The Trustees reviewed the profitability of the Adviser's relationship with the Fund before tax expenses. The Board was also provided with a profitability analysis of other publicly traded asset managers prepared by an independent information service. In reviewing the overall profitability of the management fee to the Adviser, the Board also considered the fact that the Adviser and its affiliates provide shareholder servicing and administrative services to the Fund for which they receive compensation. The Board also considered the possible direct and indirect benefits to the Adviser from its relationship with the Trust, including that the Adviser may derive reputational and other benefits from its association with the Fund. The Trustees recognized that the Adviser should be entitled to earn a reasonable level of profits in exchange for the level of services it provides to the Fund and the entrepreneurial and other risks that it assumes as Adviser.
33
USAA Mutual Funds Trust | | Supplemental Information — continued
May 31, 2021 | |
(Unaudited)
Economies of Scale — With respect to the consideration of any economies of scale to be realized by the Fund, the Board took into account that the Adviser does not receive any advisory fees under the Advisory Agreement. The Board also considered the fee waiver and expense reimbursement arrangements by the Adviser. The Board also considered the effect of the Fund's change in size, if any, on its performance and fees, noting that the Fund may realize other economies of scale if assets increase proportionally more than expenses. The Board determined that the current investment management fee structure was reasonable.
Conclusions — The Board reached the following conclusions regarding the Fund's Advisory Agreement with the Adviser: (i) the Adviser has demonstrated that it possesses the capability and resources to perform the duties required of it under the Advisory Agreement; (ii) the Adviser maintains an appropriate compliance program; (iii) the performance of the Fund is reasonable in relation to the performance of funds with similar investment objectives and to relevant indices in view of the Fund's investment approach and the Adviser is appropriately monitoring the Fund's performance; (iv) the Fund's advisory expenses are reasonable in relation to those of similar funds and to the services to be provided by the Adviser; and (v) the Adviser's and its affiliates' level of profitability from their relationship with the Fund is reasonable in light of the nature and high quality of services provided by the Adviser and the type of fund. Based on its conclusions, the Board determined that continuation of the Advisory Agreement would be in the best interests of the Fund and its shareholders.
34
USAA Mutual Funds Trust | | Supplemental Information — continued
May 31, 2021 | |
(Unaudited)
Liquidity Risk Management Program:
The USAA Mutual Funds have adopted and implemented a written liquidity risk management program (the "LRMP") as required by Rule 22e-4 under the Investment Company Act of 1940, as amended. The LRMP is reasonably designed to assess and manage each Fund's liquidity risk, taking into consideration each Fund's investment strategy and the liquidity of its portfolio investments during normal and reasonably foreseeable stressed market conditions; its short and long-term cash flow projections; and its cash holdings and access to other liquidity management tools such as available funding sources including the Victory Funds Complex Interfund Lending Facility and Line of Credit (discussed in the Notes to Financial Statements). The USAA Mutual Funds' Board of Trustees approved the appointment of the Funds' investment adviser, Victory Capital Management Inc. ("Victory Capital"), as the administrator of the LRMP.
Victory Capital manages liquidity risks associated with the Funds' investments by monitoring, among other things, cash and cash equivalents, any use of derivatives, the concentration of investments, the appropriateness of each Fund's investment strategy, and by classifying every Fund investment as either highly liquid, moderately liquid, less liquid, or illiquid on at least a monthly basis. To assist with the classification of Fund investments, Victory Capital has retained a third-party provider of liquidity evaluation services. This provider determines preliminary liquidity classifications for all portfolio holdings based upon portfolio-level data and certain assumptions provided by Victory Capital. Victory Capital reviews the preliminary liquidity classifications and, when appropriate, considers other information including input from the Funds' portfolio managers (including the portfolio managers employed by any investment sub-advisers) in determining final liquidity classifications.
At a meeting held on March 10, 2021, Victory Capital provided an oral and written report to the Trustees on the operation and effectiveness of the LRMP during the previous year. The report from Victory Capital concluded that the Funds did not experience any significant liquidity challenges during the covered period, and the Funds' LRMP is reasonably designed to assess and manage its liquidity risk. The report also concluded that the LRMP continues to operate adequately and effectively to enable Victory Capital to oversee and manage liquidity risk and ensure each Fund is able to meet redemption requests without significant dilution to the remaining investors' interest in each Fund. During the review period, each Fund's portfolio consisted primarily of highly liquid investments, which are defined as cash and any investments that each Fund reasonably expects to be converted to cash in current market conditions in three business days or less without significantly changing the market value of the investment. Therefore, the Funds have not adopted a highly liquid investment minimum. The Funds' investments were below the limitation on illiquid investments during the review period. Additionally, Victory Capital indicated that no events occurred that would require the filing of Form N-LIQUID and recommended no material changes to the LRMP.
35
Privacy Policy
Protecting the Privacy of Information
The Trust respects your right to privacy. We also know that you expect us to conduct and process your business in an accurate and efficient manner. To do so, we must collect and maintain certain personal information about you. This is the information we collect from you on applications or other forms, and from the transactions you make with us or third parties. It may include your name, address, social security number, account transactions and balances, and information about investment goals and risk tolerance.
We do not disclose any information about you or about former customers to anyone except as permitted or required by law. Specifically, we may disclose the information we collect to companies that perform services on our behalf, such as the transfer agent that processes shareholder accounts and printers and mailers that assist us in the distribution of investor materials. We may also disclose this information to companies that perform marketing services on our behalf. This allows us to continue to offer you Victory investment products and services that meet your investing needs, and to effect transactions that you request or authorize. These companies will use this information only in connection with the services for which we hired them. They are not permitted to use or share this information for any other purpose.
To protect your personal information internally, we permit access only by authorized employees and maintain physical, electronic, and procedural safeguards to guard your personal information.*
* You may have received communications regarding information about privacy policies from other financial institutions which gave you the opportunity to "opt-out" of certain information sharing with companies which are not affiliated with that financial institution. The Trust does not share information with other companies for purposes of marketing solicitations for products other than the Trust. Therefore, the Trust does not provide opt-out options to their shareholders.
P.O. Box 182593
Columbus, Ohio 43218-2593

Visit our website at: | | Call | |
vcm.com | | (800) 235-8396 | |

MAY 31, 2021
Annual Report
USAA Cornerstone Equity Fund
Victory Capital means Victory Capital Management Inc., the investment adviser of the USAA Mutual Funds. USAA Mutual Funds are distributed by Victory Capital Services, Inc., member of FINRA, an affiliate of Victory Capital. Victory Capital and its affiliates are not affiliated with United Services Automobile Association or its affiliates. USAA and the USAA logos are registered trademarks and the USAA Mutual Funds and USAA Investments logos are trademarks of United Services Automobile Association and are being used by Victory Capital and its affiliates under license.
www.vcm.com
News, Information And Education 24 Hours A Day, 7 Days A Week
The Victory Funds site gives fund shareholders, prospective shareholders, and investment professionals a convenient way to access fund information, get guidance, and track fund performance anywhere they can access the Internet. The site includes:
• Detailed performance records
• Daily share prices
• The latest fund news
• Investment resources to help you become a better investor
• A section dedicated to investment professionals
Whether you're a potential investor searching for the fund that matches your investment philosophy, a seasoned investor interested in planning tools, or an investment professional, www.vcm.com has what you seek. Visit us anytime. We're always open.
TABLE OF CONTENTS
Shareholder Letter (Unaudited) | | | 2 | | |
Managers' Commentary (Unaudited) | | | 4 | | |
Investment Overview (Unaudited) | | | 6 | | |
Investment Objective & Portfolio
Holdings (Unaudited) | | | 7 | | |
Schedule of Portfolio Investments | | | 8 | | |
Financial Statements | |
Statement of Assets and Liabilities | | | 9 | | |
Statement of Operations | | | 10 | | |
Statements of Changes in Net Assets | | | 11 | | |
Financial Highlights | | | 12 | | |
Notes to Financial Statements | | | 14 | | |
Report of Independent
Registered Public Accounting Firm | | | 23 | | |
Supplemental Information (Unaudited) | | | 24 | | |
Trustees' and Officers' Information | | | 24 | | |
Proxy Voting and Portfolio Holdings Information | | | 30 | | |
Expense Example | | | 30 | | |
Additional Federal Income Tax Information | | | 31 | | |
Advisory Contract Agreement | | | 32 | | |
Liquidity Risk Management Program | | | 35 | | |
Privacy Policy (inside back cover) | | | |
This report is for the information of the shareholders and others who have received a copy of the currently effective prospectus of the Fund, managed by Victory Capital Management Inc. It may be used as sales literature only when preceded or accompanied by a current prospectus, which provides further details about the Fund.
IRA DISTRIBUTION WITHHOLDING DISCLOSURE
We generally must withhold federal income tax at a rate of 10% of the taxable portion of your distribution and, if you live in a state that requires state income tax withholding, at your state's tax rate. However, you may elect not to have withholding apply or to have income tax withheld at a higher rate. Any withholding election that you make will apply to any subsequent distribution unless and until you change or revoke the election. If you wish to make a withholding election, or change or revoke a prior withholding election, call (800) 235-8396, and form W-4P (OMB No. 1545-0074 withholding certificate for pension or annuity payments) will be electronically sent.
If you do not have a withholding election in place by the date of a distribution, federal income tax will be withheld from the taxable portion of your distribution at a rate of 10%. If you must pay estimated taxes, you may be subject to estimated tax penalties if your estimated tax payments are not sufficient and sufficient tax is not withheld from your distribution.
For more specific information, please consult your tax adviser.
• NOT FDIC INSURED • NO BANK GUARANTEE • MAY LOSE VALUE
1
(Unaudited)
Dear Shareholder,
Never a dull moment. A year ago, we were still coming to grips with a global pandemic, hoping for an effective vaccine, and wondering whether the U.S. Federal Reserve's aggressive actions would continue to mollify financial markets. As it turns out, a vaccine was rolled out (domestically) faster than expectations, and the recovery that began during the second quarter of 2020 continued unabated.
Fast forward to today and investors are suddenly more concerned about labor shortages, rising commodity prices, and whether inflation will prove to be transitory or more lasting. If anything, this merely exemplifies that markets are unpredictable and the environment can change rapidly.
Reflecting on the past year, we must consider ourselves fortunate despite the myriad of challenges. For starters, it was impressive how quickly the various forms of monetary and fiscal stimulus contributed to a rebound in GDP. Of course, it wasn't a straight line upward and there were bouts of elevated volatility in both bond and stock markets. Late in 2020, for example, financial markets were alternately fueled and roiled by a contentious election season, growing optimism for an effective vaccine, and a fluid debate regarding the need for even more stimulus. Ultimately, stocks were propelled higher in the fourth quarter of 2020 as it became clear Congress would provide another dose of stimulus in the form of direct payments, more unemployment insurance, and additional aid to businesses.
As we moved into 2021, stocks continued their upward trajectory. Meanwhile, the yield on the 10-Year U.S. Treasury continued rallying sharply as many investors began to shift their focus. Deflation was out; inflation was in. Indeed, the potential for a new era of inflation and higher interest rates seems to be the new worry du jour.
So how did the numbers shake out after this unusual year? The S&P 500® Index registered an impressive annual return of approximately 40% for this 12-month period ended May 31, 2021. Over this same period, the yield on the 10-Year U.S. Treasury jumped 94 basis points, reflecting both the very low starting rate and substantial fiscal stimulus. At the end of the reporting period, the yield on the 10-Year U.S. Treasury was 1.59%.
The past year is not one we will forget any time soon. There were many hardships, but we should not overlook the positives and remember our collective spirit and perseverance. Markets endured and even surprised to the upside, but perhaps the key takeaway is that investors need to remain calm in the face of adversity and focused on longer-term investment goals. We believe that's the best approach no matter what the markets throw at us.
On the following pages, you will find information relating to your USAA Mutual Funds, brought to you by Victory Capital. If you have any questions regarding the current market dynamics or your specific portfolio or investment plan, we encourage you to contact our Member Service Representatives. Call (800) 235-8396 or visit our website at www.vcm.com.
2
From all of us here at Victory Capital, thank you for letting us help you work toward your investment goals.

Christopher K. Dyer, CFA
President,
USAA Mutual Funds
3
USAA Cornerstone Equity Fund
Managers' Commentary
(Unaudited)
• What were the market conditions during the reporting period?
The beginning of the reporting period brought a dramatic reversal from the difficult environment that characterized the first part of 2020. While COVID-19 cases continued to rise, investors grew increasingly confident that the economy would be able to recover from its sharp downturn of February and March. The optimism stemmed, in part, from a series of better-than-expected economic reports interpreted as evidence that the slump in growth would be less severe than was initially feared. The markets were further cheered by the aggressive response by the U.S. Federal Reserve (the "Fed"). In addition to reiterating its commitment to keep short-term interest rates near zero for an extended period, the Fed announced the direct purchase of both individual bonds and exchange-traded bond funds. The central bank's unusual steps offered corporations the latitude to issue debt at ultra-low rates, providing them with the cash necessary to help withstand the effects of the coronavirus.
The global financial markets produced healthy returns during the second half of 2020, wrapping up a positive year for the major asset classes. Investors' appetite for risk improved considerably in early November, when the approval of vaccines for COVID-19 raised expectations that the world economy could gradually return to normal in 2021. The conclusion of the U.S. elections, which removed a source of uncertainty that had depressed performance in September and October, was an additional tailwind. The markets were also aided by continued indications that the Fed and other central banks would maintain their highly accommodative policies indefinitely. Not least, an agreement on a new round of U.S. fiscal stimulus further cheered investors in late December. Together, these developments outweighed negative headlines surrounding renewed lockdowns and the persistence of the coronavirus.
The first quarter of 2021 proved to be a continuation of the strong equity markets investors experienced over the second half of 2020. Gains from global equity markets were fueled by optimism surrounding the successful rollout of the COVID-19 vaccines coupled with further monetary and fiscal stimulus proposals. Faster-than-expected economic growth produced a meaningful increase in real interest rates, which led to negative returns across most major fixed income asset classes. The 10-year U.S. Treasury bond yield finished at its highest level of the first quarter reporting period, climbing from under 1% to 1.74%.
During the last few months of the reporting period, equity markets have been consolidating and interest rates leveling off after large upswings. With strong first quarter GDP and corporate earnings growth in the rearview mirror, investors seem to be contemplating their next move. Inflation data has been increasing as the economy reopens more quickly than expected. The Fed maintains that inflationary pressure is transitory but could become more persistent. The inflationary environment will be a key metric moving into the second half of the year.
4
USAA Cornerstone Equity Fund (continued)
Managers' Commentary (continued)
• How did the USAA Cornerstone Equity Fund (the "Fund") perform during the reporting period?
For the reporting period ended May 31, 2021, the Fund had a total return of 42.26%. This compares to a return of 41.85% for the MSCI All-Country World Index and 42.79% for the Cornerstone Equity Composite Index.
• What strategies did you employ during the reporting period?
The Fund delivered strong positive total returns during the reporting period as equity markets rebounded sharply off the market lows produced during the COVID-induced sell off early last year. All major equity asset classes participated in the rally with U.S. small-cap and emerging market stocks leading the way. Despite the double-digit total returns, the Fund slightly underperformed the Cornerstone Equity Composite Index.
Positive contributors to the relative performance included an overweight to small-cap stocks. The Fund also benefitted from a tactical underweight to cash. The Fund's holdings within U.S. small-cap contributed positively through stock selection. An underweight to real estate investment trusts also added slightly to performance.
These positive drivers were offset by weakness in the security selection within the U.S large-cap and emerging market segments of the portfolio. Additionally, the Fund's commodity exposure was weighted more heavily towards gold-related securities, which underperformed a more diversified basket.
Thank you for allowing us to assist you with your investment needs.
5
USAA Cornerstone Equity Fund
Investment Overview
(Unaudited)
Average Annual Total Return
Year Ended May 31, 2021
| | | Fund Shares | | | | | |
INCEPTION DATE | | 6/8/12 | | | | | |
| | | Net Asset Value | | MSCI All-Country
World Index1 | | Cornerstone Equity
Composite Index2 | |
One Year | | | 42.26 | % | | | 41.85 | % | | | 42.79 | % | |
Five Year | | | 12.14 | % | | | 14.18 | % | | | 14.11 | % | |
Since Inception | | | 10.31 | % | | | 12.24 | % | | | 12.41 | % | |
The performance data quoted represents past performance and current returns may be lower or higher. The investment return and principal value will fluctuate so that an investor's shares, when redeemed, may be worth more or less than the original cost. To obtain performance information current to the most recent month's end, please visit www.vcm.com.
Total return measures the price change in a share assuming the reinvestment of all net investment income and realized capital gain distributions, if any. The total returns quoted do not reflect adjustments made to the enclosed financial statements in accordance with U.S. Generally Accepted Accounting Principles or the deduction of taxes that a shareholder would pay on net investment income and realized capital gain distributions, including reinvested distributions, or redemptions of shares. The total return figures set forth above include all waivers of fees. Without such fee waivers, the total returns would have been lower.
USAA Cornerstone Equity Fund — Growth of $10,000
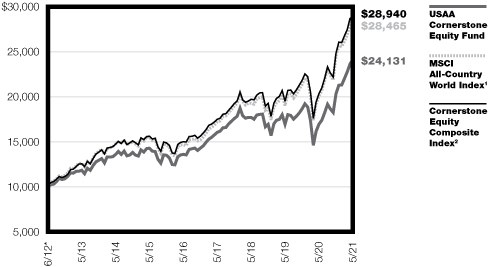
*The performance of the MSCI All-Country World Index and Cornerstone Equity Composite Index is calculated from the end of the month, May 31, 2012, while the inception date of the Cornerstone Equity Fund is June 8, 2012. There might be a slight variation of performance numbers because of the difference.
1The unmanaged MSCI All-Country World Index is a free float-adjusted, market capitalization-weighted index designed to measure the performance of large- and mid-cap stocks across developed and emerging markets. The index reflects the reinvestment of dividends paid on the stocks constituting the index net of withholding taxes. This index does not include the effect of sales charges, commissions, expenses, or taxes, is not representative of the Fund, and it is not possible to invest directly in an index.
2The Cornerstone Equity Composite Index is a combination of unmanaged indexes representing the Fund's model allocation, and consists of the MSCI USA Investable Market Index (IMI) Gross (56%), the MSCI ACWI ex USA IMI Net (37%), the Bloomberg Commodity Index Total Return (2.5%), the MSCI U.S. Real Estate Investment Trust (REIT) Index Gross (2.5%), and the Bloomberg Barclays U.S. Treasury Bills (1–3M) (2%). This index does not include the effect of sales charges, commissions, expenses, or taxes, is not representative of the Fund, and it is not possible to invest directly in an index.
The graph reflects investment of growth of a hypothetical $10,000 investment in the Fund.
The graph and table do not reflect the deduction of taxes that a shareholder would pay on Fund distributions or the redemption of Fund shares.
Past performance is not indicative of future results.
6
USAA Mutual Funds Trust
USAA Cornerstone Equity Fund | | May 31, 2021 | |
(Unaudited)
Investment Objective and Portfolio Holdings:
The Fund's investment objective seeks capital appreciation over the long term.
Top 10 Holdings*:
May 31, 2021
(% of Net Assets)
USAA 500 Index Fund Reward Shares | | | 16.9 | % | |
USAA International Fund Institutional Shares | | | 13.9 | % | |
VictoryShares USAA MSCI USA Value Momentum ETF | | | 13.8 | % | |
VictoryShares USAA MSCI International Value Momentum ETF | | | 12.7 | % | |
USAA Target Managed Allocation Fund | | | 6.5 | % | |
VictoryShares USAA MSCI Emerging Markets Value Momentum ETF | | | 5.9 | % | |
USAA Income Stock Fund Institutional Shares | | | 5.3 | % | |
USAA Value Fund Institutional Shares | | | 5.0 | % | |
USAA Growth Fund Institutional Shares | | | 4.8 | % | |
USAA Emerging Markets Fund Institutional Shares | | | 4.8 | % | |
Asset Allocation*:
May 31, 2021
(% of Net Assets)
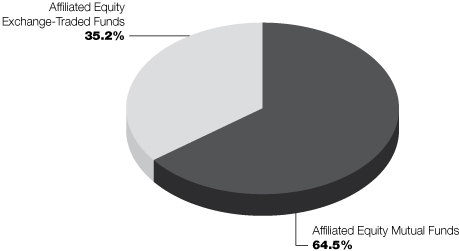
* Does not include futures, money market instruments, and short-term investments purchased with cash collateral from securities loaned.
Percentages are of the net assets of the Fund and may not equal 100%.
Refer to the Schedule of Portfolio Investments for a complete list of securities.
7
USAA Mutual Funds Trust
USAA Cornerstone Equity Fund | | Schedule of Portfolio Investments
May 31, 2021 | |
(Amounts in Thousands, Except for Shares)
Security Description | | Shares | | Value | |
Affiliated Exchange-Traded Funds (35.2%) | |
VictoryShares USAA MSCI Emerging Markets Value Momentum ETF | | | 266,858 | | | $ | 13,745 | | |
VictoryShares USAA MSCI International Value Momentum ETF | | | 582,422 | | | | 29,558 | | |
VictoryShares USAA MSCI USA Small Cap Value Momentum ETF | | | 93,813 | | | | 6,641 | | |
VictoryShares USAA MSCI USA Value Momentum ETF | | | 486,192 | | | | 31,949 | | |
Total Affiliated Exchange-Traded Funds (Cost $70,853) | | | 81,893 | | |
Affiliated Mutual Funds (64.5%) | |
USAA 500 Index Fund Reward Shares | | | 685,032 | | | | 39,191 | | |
USAA Aggressive Growth Fund Institutional Shares | | | 184,385 | | | | 10,431 | | |
USAA Emerging Markets Fund Institutional Shares | | | 451,418 | | | | 11,042 | | |
USAA Growth Fund Institutional Shares | | | 306,553 | | | | 11,057 | | |
USAA Income Stock Fund Institutional Shares | | | 610,581 | | | | 12,321 | | |
USAA International Fund Institutional Shares | | | 1,094,837 | | | | 32,254 | | |
USAA Precious Metals and Minerals Fund Institutional Shares | | | 43,865 | | | | 1,011 | | |
USAA Small Cap Stock Fund Institutional Shares | | | 265,433 | | | | 5,781 | | |
USAA Target Managed Allocation Fund | | | 1,162,728 | | | | 15,092 | | |
USAA Value Fund Institutional Shares | | | 619,656 | | | | 11,619 | | |
Total Affiliated Mutual Funds (Cost $106,805) | | | 149,799 | | |
Total Investments (Cost $177,658) — 99.7% | | | 231,692 | | |
Other assets in excess of liabilities — 0.3% | | | 544 | | |
NET ASSETS — 100.00% | | $ | 232,236 | | |
At May 31, 2021, the Fund's investments in foreign securities were 37.3% of net assets.
ETF — Exchange-Traded Fund
See notes to financial statements.
8
USAA Mutual Funds Trust | | Statement of Assets and Liabilities
May 31, 2021 | |
(Amounts in Thousands, Except Per Share Amounts)
| | | USAA Cornerstone
Equity Fund | |
Assets: | |
Affiliated investments, at value (Cost $177,658) | | $ | 231,692 | | |
Cash | | | 632 | | |
Receivables: | |
Capital shares issued | | | 62 | | |
From Adviser | | | 2 | | |
Prepaid expenses | | | 12 | | |
Total Assets | | | 232,400 | | |
Liabilities: | |
Payables: | |
Capital shares redeemed | | | 113 | | |
Accrued expenses and other payables: | |
Custodian fees | | | 1 | | |
Compliance fees | | | — | (a) | |
Trustees' fees | | | 1 | | |
Other accrued expenses | | | 49 | | |
Total Liabilities | | | 164 | | |
Net Assets: | |
Capital | | | 175,234 | | |
Total accumulated earnings/(loss) | | | 57,002 | | |
Net Assets | | $ | 232,236 | | |
Shares (unlimited number of shares authorized with no par value): | | | 13,318 | | |
Net asset value, offering and redemption price per share: (b) | | $ | 17.44 | | |
(a) Rounds to less than $1 thousand.
(b) Per share amount may not recalculate due to rounding of net assets and/or shares outstanding.
See notes to financial statements.
9
USAA Mutual Funds Trust | | Statement of Operations
For the Year Ended May 31, 2021 | |
(Amounts in Thousands)
| | | USAA Cornerstone
Equity Fund | |
Investment Income: | |
Income distributions from affiliated funds | | $ | 3,825 | | |
Interest | | | — | (a) | |
Securities lending (net of fees) | | | 1 | | |
Total Income | | | 3,826 | | |
Expenses: | |
Sub-Administration fees | | | 18 | | |
Custodian fees | | | 7 | | |
Trustees' fees | | | 50 | | |
Compliance fees | | | 1 | | |
Printing fees | | | 54 | | |
Legal and audit fees | | | 55 | | |
State registration and filing fees | | | 25 | | |
Interfund lending fees | | | — | (a) | |
Other expenses | | | 16 | | |
Total Expenses | | | 226 | | |
Expenses waived/reimbursed by Adviser | | | (18 | ) | |
Net Expenses | | | 208 | | |
Net Investment Income (Loss) | | | 3,618 | | |
Realized/Unrealized Gains (Losses) from Investments: | |
Net realized gains (losses) from sales of affiliated funds | | | 355 | | |
Capital gain distributions received from affiliated funds | | | 1,554 | | |
Net change in unrealized appreciation/depreciation on affiliated funds | | | 67,536 | | |
Net realized/unrealized gains (losses) on investments | | | 69,445 | | |
Change in net assets resulting from operations | | $ | 73,063 | | |
(a) Rounds to less than $1 thousand.
See notes to financial statements.
10
USAA Mutual Funds Trust | | Statements of Changes in Net Assets | |
(Amounts in Thousands)
| | | USAA Cornerstone Equity Fund | |
| | | Year
Ended
May 31,
2021 | | Year
Ended
May 31,
2020 | |
From Investments: | |
Operations: | |
Net investment income (loss) | | $ | 3,618 | | | $ | 4,906 | | |
Net realized gains (losses) from investments | | | 1,909 | | | | 13,841 | | |
Net change in unrealized appreciation/depreciation on
investments | | | 67,536 | | | | (18,537 | ) | |
Change in net assets resulting from operations | | | 73,063 | | | | 210 | | |
Change in net assets resulting from distributions to shareholders | | | (16,403 | ) | | | (10,384 | ) | |
Change in net assets resulting from capital transactions | | | (15,437 | ) | | | (1,101 | ) | |
Change in net assets | | | 41,223 | | | | (11,275 | ) | |
Net Assets: | |
Beginning of period | | | 191,013 | | | | 202,288 | | |
End of period | | $ | 232,236 | | | $ | 191,013 | | |
Capital Transactions: | |
Proceeds from shares issued | | $ | 26,443 | | | $ | 39,178 | | |
Distributions reinvested | | | 16,362 | | | | 10,364 | | |
Cost of shares redeemed | | | (58,242 | ) | | | (50,643 | ) | |
Change in net assets resulting from capital transactions | | $ | (15,437 | ) | | $ | (1,101 | ) | |
Share Transactions: | |
Issued | | | 1,681 | | | | 2,815 | | |
Reinvested | | | 1,061 | | | | 684 | | |
Redeemed | | | (3,809 | ) | | | (3,666 | ) | |
Change in Shares | | | (1,067 | ) | | | (167 | ) | |
See notes to financial statements.
11
USAA Mutual Funds Trust | | Financial Highlights | |
For a Share Outstanding Throughout Each Period
| | | | | Investment Activities | | Distributions to
Shareholders From | |
| | | Net Asset
Value,
Beginning of
Period | | Net
Investment
Income
(Loss) | | Net Realized
and Unrealized
Gains (Losses)
on Investments | | Total from
Investment
Activities | | Net
Investment
Income | | Net Realized
Gains From
Investments | |
USAA Cornerstone Equity Fund | |
Year Ended: | |
May 31, 2021 | | $ | 13.28 | | | | 0.27 | (b) | | | 5.16 | | | | 5.43 | | | | (0.20 | ) | | | (1.07 | ) | |
May 31, 2020 | | $ | 13.90 | | | | 0.34 | (b) | | | (0.24 | ) | | | 0.10 | | | | (0.32 | ) | | | (0.40 | ) | |
May 31, 2019 | | $ | 15.49 | | | | 0.26 | | | | (0.99 | ) | | | (0.73 | ) | | | (0.25 | ) | | | (0.61 | ) | |
May 31, 2018 | | $ | 14.31 | | | | 0.22 | | | | 1.26 | | | | 1.48 | | | | (0.22 | ) | | | (0.08 | ) | |
May 31, 2017 | | $ | 12.51 | | | | 0.19 | | | | 2.02 | | | | 2.21 | | | | (0.19 | ) | | | (0.22 | ) | |
* Assumes reinvestment of all net investment income and realized capital gain distributions, if any, during the period. Includes adjustments in accordance with U.S. Generally Accepted Accounting Principles and could differ from the Lipper reported return.
^ The net expense ratio may not correlate to the applicable expense limits in place during the period since the current contractual expense limitation is applied for a period beginning July 1, 2019, and in effect through June 30, 2023, instead of coinciding with the Fund's fiscal year end. Details of the current contractual expense limitation in effect can be found in Note 4 of the accompanying Notes to Financial Statements.
(a) The expense ratios exclude the impact of expenses paid by each underlying fund.
(b) Per share net investment income (loss) has been calculated using the average daily shares method.
(c) Reflects increased usage of quantitative investment strategies.
(d) Reflects an increase in trading activity due to asset allocation shifts.
See notes to financial statements.
12
USAA Mutual Funds Trust | | Financial Highlights — continued | |
For a Share Outstanding Throughout Each Period
| | | | | Ratios to Average Net Assets | | Supplemental Data | |
| | | Total
Distributions | | Net Asset
Value,
End of
Period | | Total
Return* | | Net
Expenses^(a) | | Net
Investment
Income
(Loss) | | Gross
Expenses(a) | | Net Assets,
End of
Period
(000's) | | Portfolio
Turnover | |
USAA Cornerstone Equity Fund | |
Year Ended: | |
May 31, 2021 | | | (1.27 | ) | | $ | 17.44 | | | | 42.26 | % | | | 0.10 | % | | | 1.74 | % | | | 0.11 | % | | $ | 232,236 | | | | 5 | % | |
May 31, 2020 | | | (0.72 | ) | | $ | 13.28 | | | | 0.14 | % | | | 0.10 | % | | | 2.38 | % | | | 0.10 | % | | $ | 191,013 | | | | 6 | % | |
May 31, 2019 | | | (0.86 | ) | | $ | 13.90 | | | | (4.35 | )% | | | 0.10 | % | | | 1.79 | % | | | 0.13 | % | | $ | 202,288 | | | | 11 | %(c) | |
May 31, 2018 | | | (0.30 | ) | | $ | 15.49 | | | | 10.32 | % | | | 0.10 | % | | | 1.46 | % | | | 0.13 | % | | $ | 200,186 | | | | 38 | %(d) | |
May 31, 2017 | | | (0.41 | ) | | $ | 14.31 | | | | 17.99 | % | | | 0.10 | % | | | 1.39 | % | | | 0.20 | % | | $ | 143,657 | | | | 7 | % | |
See notes to financial statements.
13
USAA Mutual Funds Trust | | Notes to Financial Statements
May 31, 2021 | |
1. Organization:
USAA Mutual Funds Trust (the "Trust") is organized as a Delaware statutory trust and is registered under the Investment Company Act of 1940, as amended (the "1940 Act"), as an open-end investment company. The Trust is comprised of 46 funds and is authorized to issue an unlimited number of shares, which are units of beneficial interest with no par value.
The accompanying financial statements are those of the USAA Cornerstone Equity Fund (the "Fund"). The Fund is classified as diversified under the 1940 Act. The Fund is a "fund of funds" in that it invests in a selection of affiliated mutual funds and exchange-traded funds managed by the Fund's Adviser, Victory Capital Management Inc. ("VCM"), an affiliate of the Fund.
Under the Trust's organizational documents, its officers and trustees are indemnified against certain liabilities arising out of the performance of their duties to the Fund. In addition, in the normal course of business, the Fund enters into contracts with its vendors and others that provide for general indemnifications. The Fund's maximum exposure under these arrangements is unknown, as this would involve future claims that may be made against the Fund. However, based on experience, the Fund expects that risk of loss to be remote.
2. Significant Accounting Policies:
The following is a summary of significant accounting policies followed by the Trust in the preparation of its financial statements. The policies are in conformity with Generally Accepted Accounting Principles in the United States of America ("GAAP"). The preparation of financial statements in accordance with GAAP requires management to make estimates and assumptions that affect the reported amounts of assets and liabilities and disclosure of contingent assets and liabilities at the date of the financial statements and the reported amounts of income and expenses for the period. Actual results could differ from those estimates. The Fund follows the specialized accounting and reporting requirements under GAAP that are applicable to investment companies under Accounting Standards Codification Topic 946.
Investment Valuation:
The Fund records investments at fair value. Fair value is defined as the price that would be received to sell an asset or paid to transfer a liability in an orderly transaction between market participants at the measurement date.
The valuation techniques described below maximize the use of observable inputs and minimize the use of unobservable inputs in determining fair value. The inputs used for valuing the Fund's investments are summarized in the three broad levels listed below:
• Level 1 — quoted prices in active markets for identical securities
• Level 2 — other significant observable inputs (including quoted prices for similar securities or interest rates applicable to those securities, etc.)
• Level 3 — significant unobservable inputs (including the Fund's own assumptions in determining the fair value of investments)
Changes in valuation techniques may result in transfers in or out of an assigned level within the disclosure hierarchy. The inputs or methodologies used for valuation techniques are not necessarily an indication of the risks associated with entering into those investments.
The Adviser has established the Pricing and Liquidity Committee (the "Committee"), and subject to the Trust's Board of Trustees (the "Board") oversight, the Committee administers and oversees the Fund's valuation policies and procedures, which are approved by the Board.
Portfolio securities listed or traded on securities exchanges, including Exchange-Traded Funds ("ETFs"), American Depositary Receipts ("ADRs"), and Rights are valued at the closing price on the exchange or system where the security is principally traded, if available, or at the Nasdaq Official Closing Price. If there have been no sales for that day on the exchange or system, then a security is valued at the last
14
USAA Mutual Funds Trust | | Notes to Financial Statements — continued
May 31, 2021 | |
available bid quotation on the exchange or system where the security is principally traded. In each of these situations, valuations are typically categorized as Level 1 in the fair value hierarchy.
Investments in open-end investment companies, including underlying funds, are valued at their NAV. These valuations are typically categorized as Level 1 in the fair value hierarchy.
In the event that price quotations or valuations are not readily available, investments are valued at fair value in accordance with procedures established by and under the general supervision and responsibility of the Board. These valuations are typically categorized as Level 2 or Level 3 in the fair value hierarchy, based on the observability of inputs used to determine the fair value. The effect of fair value pricing is that securities may not be priced on the basis of quotations from the primary market in which they are traded and the actual price realized from the sale of a security may differ materially from the fair value price. Valuing these securities at fair value is intended to cause the Fund's NAV to be more reliable than it otherwise would be.
A summary of the valuations as of May 31, 2021, based upon the three levels defined above, is included in the table below while the breakdown, by category, of investments is disclosed on the Schedule of Portfolio Investments (amounts in thousands):
| | | Level 1 | | Level 2 | | Level 3 | | Total | |
Affiliated Exchange-Traded Funds | | $ | 81,893 | | | $ | — | | | $ | — | | | $ | 81,893 | | |
Affiliated Mutual Funds | | | 149,799 | | | | — | | | | — | | | | 149,799 | | |
Total | | $ | 231,692 | | | $ | — | | | $ | — | | | $ | 231,692 | | |
For the year ended May 31, 2021, there were no transfers in or out of Level 3 in the fair value hierarchy.
Investment Companies:
Exchange-Traded Funds:
The Fund may invest in ETFs, the shares of which are bought and sold on a securities exchange. An ETF trades like common stock and represents a fixed portfolio of securities often designed to track the performance and dividend yield of a particular domestic or foreign market index. The Fund may purchase shares of an ETF to temporarily gain exposure to a portion of the U.S. or a foreign market while awaiting purchase of underlying securities. The risks of owning an ETF generally reflect the risks of owning the underlying securities they are designed to track, although the lack of liquidity of an ETF could result in it being more volatile. Additionally, ETFs have fees and expenses that reduce their value.
Open-End Funds:
The Fund may invest in portfolios of open-end investment companies. These investment companies value securities in their portfolios for which market quotations are readily available at their market values (generally the last reported sale price) and all other securities and assets at their fair value by the methods established by the board of directors of the underlying funds.
Investment Transactions and Related Income:
Changes in holdings of investments are accounted for no later than one business day following the trade date. For financial reporting purposes, however, investment transactions are accounted for on trade date on the last business day of the reporting period. Interest income is determined on the basis of coupon interest accrued using the effective interest method which adjusts, where applicable, the amortization of premiums or accretion of discount. Dividend income is recorded on the ex-dividend date. Gains or losses realized on sales of securities are recorded on the identified cost basis.
15
USAA Mutual Funds Trust | | Notes to Financial Statements — continued
May 31, 2021 | |
Securities Lending:
The Fund, through a securities lending agreement with Citibank, N.A. ("Citibank"), may lend its securities to qualified financial institutions, such as certain broker-dealers, to earn additional income, net of income retained by Citibank. Borrowers are required to secure their loans for collateral in the amount of at least 102% of the value of U.S. securities loaned or at least 105% of the value of non-U.S. securities loaned, marked-to-market daily. Any collateral shortfalls associated with increases in the valuation of the securities loaned are cured the next business day once the shortfall exceeds $100 thousand. Collateral may be cash, U.S. government securities, or other securities as permitted by Securities and Exchange Commission ("SEC") guidelines. Cash collateral may be invested in high-quality short-term investments, primarily open-end investment companies. Collateral requirements are determined daily based on the value of the Fund's securities on loan as of the end of the prior business day. During the time portfolio securities are on loan, the borrower will pay the Fund any dividends or interest paid on such securities plus any fee negotiated between the parties to the lending agreement. The Fund also earns a return from the collateral. The Fund pays Citibank various fees in connection with the investment of cash collateral and fees based on the investment income received from securities lending activities. Securities lending income (net of these fees) is disclosed on the Statement of Operations. Loans are terminable upon demand and the borrower must return the loaned securities within the lesser of one standard settlement period or five business days. Risks relating to securities-lending transactions include that the borrower may not provide additional collateral when required or return the securities when due, and that the value of the short-term investments will be less than the amount of cash collateral required to be returned to the borrower. The Fund's agreement with Citibank does not include master netting provisions. Non-cash collateral received by the Fund may not be sold or re-pledged, except to satisfy borrower default. Cash collateral is listed on the Fund's Schedule of Portfolio Investments and Financial Statements while non-cash collateral is not included. As of May 31, 2021, the Fund did not have any securities on loan.
Federal Income Taxes:
It is the Fund's policy to continue to qualify as a regulated investment company by complying with the provisions available to certain investment companies, as defined in applicable sections of the Internal Revenue Code, and to make distributions of net investment income and net realized gains sufficient to relieve it from all, or substantially all, federal income taxes. Accordingly, no provision for federal income taxes is required in the financial statements. The Fund has a tax year end of May 31.
Management of the Fund has reviewed tax positions taken in tax years that remain subject to examination by all major tax jurisdictions, including federal (i.e., the last four tax years, which includes the current fiscal tax year end). Management believes that there is no tax liability resulting from unrecognized tax benefits related to uncertain tax positions taken.
Allocations:
Expenses directly attributable to the Fund are charged to the Fund, while expenses that are attributable to more than one fund in the Trust, or jointly with an affiliated trust, are allocated among the respective funds in the Trust and/or affiliated trust based upon net assets or another appropriate basis.
3. Purchases and Sales:
Cost of purchases and proceeds from sales/maturities of securities (excluding securities maturing less than one year from acquisition) for the year ended May 31, 2021, were as follows for the Fund (amounts in thousands):
| | | Excluding
U.S. Government Securities | |
| | | Purchases | | Sales | |
| | | | | $ | 11,121 | | | $ | 38,111 | | |
16
USAA Mutual Funds Trust | | Notes to Financial Statements — continued
May 31, 2021 | |
There were no purchases or sales of U.S. government securities during the year ended May 31, 2021
4. Fees and Transactions with Affiliates and Related Parties:
Investment Advisory Fees:
Investment advisory services are provided to the Fund by the Adviser, which is a New York corporation registered as an investment adviser with the SEC. The Adviser is an indirect wholly owned subsidiary of Victory Capital Holdings, Inc., a publicly traded Delaware corporation, and a wholly owned direct subsidiary of Victory Capital Operating, LLC. The Adviser does not receive any fees from the Fund for these services.
The Trust relies on an exemptive order granted to VCM and its affiliated funds by the SEC in March 2019 permitting the use of a "manager-of-managers" structure for certain funds. Under a manager-of-managers structure, the investment adviser may select (with approval of the Board and without shareholder approval) one or more subadvisers to manage the day-to-day investment of a fund's assets. For the year ended May 31, 2021, the Fund had no subadvisors.
Administration and Servicing Fees:
VCM serves as the Fund's administrator and fund accountant. Under the Fund Administration, Servicing and Accounting Agreement, VCM does not receive any fees from the Fund for these services.
The Fund (as part of the Trust) has entered into an agreement to provide compliance services with the Adviser, pursuant to which the Adviser furnishes its compliance personnel, including the services of the Chief Compliance Officer ("CCO"), and other resources reasonably necessary to provide the Trust with compliance oversight services related to the design, administration and oversight of a compliance program for the Trust in accordance with Rule 38a-1 under the 1940 Act. The CCO is an employee of the Adviser, which pays the compensation of the CCO and support staff. Funds in the Trust, Victory Variable Insurance Funds, Victory Portfolios, and Victory Portfolios II (collectively, the "Victory Funds Complex") in the aggregate, compensate the Adviser for these services. Amounts incurred for the year ended May 31, 2021, are reflected on the Statement of Operations as Compliance fees.
Citi Fund Services Ohio, Inc. ("Citi"), an affiliate of Citibank, acts as sub-administrator and sub-fund accountant to the Fund pursuant to a Sub-Administration and Sub-Fund Accounting Services Agreement between VCM and Citi. VCM pays Citi a fee for providing these services. The Fund reimburses VCM and Citi for out-of-pocket expenses incurred in providing these services and certain other expenses specifically allocated to the Fund. Amounts incurred for the year ended May 31, 2021, are reflected on the Statement of Operations as Sub-Administration fees.
Transfer Agency Fees:
Victory Capital Transfer Agency, Inc. ("VCTA"), an affiliate of the Adviser, provides transfer agency services to the Fund. VCTA received no fees from the Fund for these services.
FIS Investor Services LLC serves as sub-transfer agent and dividend disbursing agent for the Fund pursuant to a Sub-Transfer Agent Agreement between VCTA and FIS Investor Services LLC. VCTA provides FIS Investor Services LLC a fee for providing these services.
Distributor/Underwriting Services:
Victory Capital Services, Inc. (the "Distributor"), an affiliate of the Adviser, serves as distributor for the continuous offering of the shares of the Fund pursuant to a Distribution Agreement between the Distributor and the Trust and receives no fee or other compensation for these services. Effective June 30, 2020, the Distributor's name was changed from Victory Capital Advisers, Inc.
17
USAA Mutual Funds Trust | | Notes to Financial Statements — continued
May 31, 2021 | |
Other Fees:
Citibank serves as the Fund's custodian. The Fund pays Citibank a fee for providing these services. Amounts incurred for the year ended May 31, 2021, are reflected on the Statement of Operations as Custodian fees.
K&L Gates LLP provides legal services to the Trust.
The Adviser has entered into an expense limitation agreement with the Fund until at least June 30, 2023. Under the terms of the agreement, the Adviser has agreed to waive fees or reimburse certain expenses to the extent that ordinary operating expenses incurred in any fiscal year exceed the expense limit for the Fund. Such excess amounts will be the liability of the Adviser. Acquired fund fees and expenses, interest, taxes, brokerage commissions, other expenditures, that are capitalized in accordance with GAAP, and other extraordinary expenses not incurred in the ordinary course of the Fund's business are excluded from the expense limits. As of May 31, 2021, the expense limit (excluding voluntary waivers) was 0.10%.
Under the terms of the expense limitation agreement, amended May 1, 2021, the Fund has agreed to repay fees and expenses that were waived or reimbursed by the Adviser for a period of up to three years (thirty six (36) months) after the waiver or reimbursement took place, subject to the lesser of any operating expense limits in effect at the time of: (a) the original waiver or expense reimbursement; or (b) the recoupment, after giving effect to the recoupment amount. Prior to May 1, 2021, the Fund was permitted to recoup fees waived and expenses reimbursed for up to three years after the fiscal year in which the waiver or reimbursement took place, subject to the limitations above. This change did not have any effect on the amounts previously reported for recoupment.
As of May 31, 2021, the following amounts are available to be repaid to the Adviser (amounts in thousands). The Fund has not recorded any amounts available to be repaid as a liability due to an assessment that such repayment is not probable at May 31, 2021.
| Expires 2024 | | Total | |
| $ | 18 | | | $ | 18 | | |
The Adviser may voluntarily waive or reimburse additional fees to assist the Fund in maintaining competitive expense ratios. Voluntary waivers and reimbursements applicable to the Fund are not available to be recouped at a future time. There were no voluntary waivers or reimbursements for the year ended May 31, 2021.
Certain officers and/or interested trustees of the Fund are also officers and/or employees of the Adviser, administrator, fund accountant, sub-administrator, sub-fund accountant, custodian, and Distributor.
5. Risks:
The Fund may be subject to other risks in addition to these identified risks.
Geopolitical/Natural Disaster Risk — Global economies and financial markets are increasingly interconnected, which increases the possibilities that conditions in one country or region might adversely affect issuers in another country or region. Geopolitical and other risks, including war, terrorism, trade disputes, political or economic dysfunction within some nations, public health crises and related geopolitical events, as well as environmental disasters such as earthquakes, fires, and floods, may add to instability in world economies and markets generally.
Changes in trade policies and international trade agreements could affect the economies of many countries in unpredictable ways. Likewise, systemic market dislocations of the kind that occurred during the financial crisis that began in 2008, if repeated, would be highly disruptive to economies and markets, adversely affecting individual companies and industries, securities markets, interest rates, credit ratings, inflation, investor sentiment, and other factors affecting the value of a Fund's investments. Some countries, including the United States, are adopting more protectionist trade policies and moving
18
USAA Mutual Funds Trust | | Notes to Financial Statements — continued
May 31, 2021 | |
away from the tighter financial industry regulations that followed the 2008 financial crisis, which may also affect the value of a Fund's investments.
Political events within the United States at times have resulted, and may in the future result, in a shutdown of government services, which could negatively affect the U.S. economy, decrease the value of a Fund's investments, increase uncertainty in or impair the operation of the U.S. or other securities markets, and degrade investor and consumer confidence, perhaps suddenly and to a significant degree.
An outbreak of disease called COVID-19 has spread internationally. The transmission of COVID-19 and efforts to contain its spread have resulted in international, national, and local border closings and other significant travel restrictions and disruptions, significant disruptions to business operations, supply chains and consumer activity, significant challenges in healthcare service preparation and delivery, quarantines, and general concern and uncertainty. These negative impacts have caused significant volatility and declines in global financial markets, which have caused losses for Fund investors during and subsequent to period end. The impact of the COVID-19 pandemic may last for an extended period of time, and could result in a substantial economic downturn or recession. Public health crises may exacerbate other pre-existing political, social, economic, market, and financial risks. The extent of the impact to the financial performance of the Fund's investments will depend on future developments, including (i) the duration and spread of the outbreak, (ii) the restrictions and advisories, (iii) the effects on the financial markets, and (iv) the effects on the economy overall, all of which are highly uncertain and cannot be predicted.
Affiliated Funds Risk — The risks of the Fund directly correspond to the risks of the underlying affiliated funds in which the Fund invests. By investing in the underlying affiliated funds, the Fund has exposure to the risk of many different areas of the market. The degree to which the risks described below apply to the Fund varies according to the Fund's asset allocation. For instance, the more the Fund is allocated to stock funds, the greater the risk associated with equity securities. The Fund also is subject to asset allocation risk (i.e., the risk that allocations will not produce the intended results) and to management risk (i.e., the risk that the selection of underlying affiliated funds will not produce the intended results).
Conflict of Interest Risk — In managing a Fund that invests in underlying affiliated funds, the Adviser may have conflicts of interest in allocating the Fund's assets among the various underlying affiliated funds. This is because the fees payable by some of the underlying affiliated funds to the Adviser and/or its affiliates are higher than the fees payable by other underlying affiliated funds, and because the Adviser also manages and administers the underlying affiliated funds.
Equity Risk — The Fund may invest in underlying affiliated funds that invest in equity securities. The value of the equity securities in which the Fund invests may decline in response to developments affecting individual companies and/or general economic conditions. A company's earnings or dividends may not increase as expected due to poor management decisions, competitive pressures, breakthroughs in technology, reliance on suppliers, labor problems or shortages, corporate restructurings, fraudulent disclosures, natural disasters, military confrontations, war, terrorism, public health crises, or other events, conditions, and factors. Price changes may be temporary or last for extended periods.
6. Borrowing and Interfund Lending:
Line of Credit:
The Victory Funds Complex participated in a short-term demand note "Line of Credit" agreement with Citibank. The Line of Credit agreement with Citibank was renewed on June 29, 2020, with a termination date of June 28, 2021. Under the agreement with Citibank, the Victory Funds Complex may borrow up to $600 million, of which $300 million is committed and $300 million is uncommitted. $40 million of the Line of Credit is reserved for use by the Victory Floating Rate Fund, another series of the Victory Funds Complex, with Victory Floating Rate Fund paying the related commitment fees for that amount.
19
USAA Mutual Funds Trust | | Notes to Financial Statements — continued
May 31, 2021 | |
The purpose of the Line of Credit is to meet temporary or emergency cash needs. For the year ended May 31, 2021, Citibank received an annual commitment fee of 0.15% on $300 million for providing the Line of Credit. Each fund in the Victory Funds Complex pays a pro-rata portion of the commitment fees plus any interest (one month LIBOR plus one percent) on amounts borrowed. For the period June 29, 2020, through April 30, 2021, under an amended Line of Credit agreement, Citibank received an annual upfront fee of 0.10% on the $300 million committed line of credit. Each fund in the Victory Funds Complex paid a pro-rata portion of the upfront fee. Effective with the next amendment, the annual commitment fee of 0.15% will remain unchanged and the upfront fee of 0.10% is discontinued. Interest charged to each fund during the period, if applicable, is reflected on the Statement of Operations under Line of credit fees.
The Fund had no borrowings under the Line of Credit agreement during the year ended May 31, 2021.
Interfund Lending:
The Trust and Adviser rely on an exemptive order granted by the SEC in March 2017 (the "Order"), permitting the establishment and operation of an Interfund Lending Facility (the "Facility"). The Facility allows the Fund to directly lend and borrow money to or from any other fund in the Victory Funds Complex that is permitted to participate in the Facility, relying upon the Order at rates beneficial to both the borrowing and lending funds. Advances under the Facility are allowed for temporary or emergency purposes, including the meeting of redemption requests that otherwise might require the untimely disposition of securities, and are subject to each Fund's borrowing restrictions. The interfund loan rate is determined, as specified in the Order, by averaging the current repurchase agreement rate and the current bank loan rate. As a Borrower, interest charged to the Fund, if any, during the period is reflected on the Statement of Operations under Interfund lending fees. As a Lender, interest earned by the Fund, if any, during the period is presented on the Statement of Operations under Interfund lending.
The average borrowing or lending for the days outstanding and average interest rate for the Fund during the year ended May 31, 2021, were as follows (amounts in thousands):
Borrower
or
Lender | | Amount
Outstanding at
May 31, 2021 | | Average
Borrowing* | | Days
Borrowing
Outstanding | | Average
Interest
Rate* | | Maximum
Borrowing
During
the Period | |
| Borrower | | $ | — | | | $ | 908 | | | | 1 | | | | 0.62 | % | | $ | 908 | | |
* For the year ended May 31, 2021, based on the number of days borrowings were outstanding.
7. Federal Income Tax Information:
The Fund intends to distribute any net investment income annually. Distributable net realized gains, if any, are declared and paid at least annually.
The amounts of dividends from net investment income and distributions from net realized gains (collectively distributions to shareholders) are determined in accordance with federal income tax regulations, which may differ from GAAP. To the extent these "book/tax" differences are permanent in nature (e.g., net operating loss and distribution reclassification), such amounts are reclassified within the components of net assets based on their federal tax-basis treatment; temporary differences (e.g., wash sales) do not require reclassification. To the extent dividends and distributions exceed net investment income and net realized gains for tax purposes, they are reported as distributions of capital. Net investment losses incurred by the Fund may be reclassified as an offset to capital on the accompanying Statement of Assets and Liabilities.
As of May 31, 2021, on the Statement of Assets and Liabilities, there were no permanent book-to-tax difference reclassification adjustments.
20
USAA Mutual Funds Trust | | Notes to Financial Statements — continued
May 31, 2021 | |
The tax character of distributions paid during the tax years ended as noted below, were as follows (total distributions paid may differ from the Statement of Changes in Net Assets because, for tax purposes, dividends are recognized when actually paid) (amounts in thousands).
| Year Ended May 31, 2021 | | Year Ended May 31, 2020 | |
Distributions paid from | | | | Distributions paid from | | | |
Ordinary
Income | | Net
Long-Term
Capital
Gains | | Total
Distributions
Paid | | Ordinary
Income | | Net
Long-Term
Capital
Gains | | Total
Distributions
Paid | |
| $ | 2,667 | | | $ | 13,736 | | | $ | 16,403 | | | $ | 4,702 | | | $ | 5,682 | | | $ | 10,384 | | |
As of May 31, 2021, the components of accumulated earnings (loss) on a tax basis were as follows (amounts in thousands):
Undistributed
Ordinary
Income | | Undistributed
Long-Term
Capital Gains | | Accumulated
Earnings | | Unrealized
Appreciation
(Depreciation)* | | Total
Accumulated
Earnings
(Loss) | |
| $ | 1,515 | | | $ | 1,817 | | | $ | 3,332 | | | $ | 53,670 | | | $ | 57,002 | | |
* The difference between the book-basis and tax-basis of unrealized appreciation/depreciation is attributable to the tax deferral of losses on wash sales.
As of May 31, 2021, the Fund had no capital loss carryforwards, for federal income tax purposes.
As of May 31, 2021, the cost basis for federal income tax purposes, gross unrealized appreciation, gross unrealized depreciation, and net unrealized appreciation (depreciation) for investments were as follows (amounts in thousands):
Cost of
Investments
for Federal
Tax Purposes | | Gross
Unrealized
Appreciation | | Gross
Unrealized
Depreciation | | Net
Unrealized
Appreciation
(Depreciation) | |
| $ | 178,022 | | | $ | 54,185 | | | $ | (515 | ) | | $ | 53,670 | | |
8. Affiliated Securities:
An affiliated security is a security in which the Fund has ownership of at least 5% of the security's outstanding voting shares or an investment company managed by VCM. The Fund does not invest in affiliated underlying funds for the purpose of exercising management or control. These underlying funds are noted as affiliated on the Fund's Schedule of Portfolio Investments. The affiliated underlying fund's annual or semiannual reports may be viewed at vcm.com. Transactions in affiliated securities during the year ended May 31, 2021, were as follows (amount in thousands):
| | | Fair
Value
5/31/2020 | | Purchases
at Cost | | Proceeds
from
Sales | | Realized
Gains
(Losses) | | Capital
Gain
Distribution | | Net
Change in
Unrealized
Appreciation/
Depreciation | | Fair
Value
5/31/2021 | | Dividend
Income | |
USAA 500 Index Fund
Reward Shares | | $ | 26,240 | | | $ | 5,148 | | | $ | (1,756 | ) | | $ | 185 | | | $ | 659 | | | $ | 9,374 | | | $ | 39,191 | | | $ | 461 | | |
USAA Aggressive Growth
Fund Institutional
Shares | | | 8,071 | | | | 18 | | | | (401 | ) | | | 7 | | | | 18 | | | | 2,736 | | | | 10,431 | | | | — | | |
USAA Capital Growth
Fund Institutional
Shares | | | 5,444 | | | | — | | | | (5,996 | ) | | | 75 | | | | — | | | | 477 | | | | — | * | | | — | | |
21
USAA Mutual Funds Trust | | Notes to Financial Statements — continued
May 31, 2021 | |
| | | Fair
Value
5/31/2020 | | Purchases
at Cost | | Proceeds
from
Sales | | Realized
Gains
(Losses) | | Capital
Gain
Distribution | | Net
Change in
Unrealized
Appreciation/
Depreciation | | Fair
Value
5/31/2021 | | Dividend
Income | |
USAA Emerging Markets
Fund Institutional
Shares | | $ | 8,232 | | | $ | 756 | | | $ | (1,761 | ) | | $ | 220 | | | $ | — | | | $ | 3,595 | | | $ | 11,042 | | | $ | 116 | | |
USAA Growth Fund
Institutional Shares | | | 9,479 | | | | 435 | | | | (1,391 | ) | | | 185 | | | | 338 | | | | 2,349 | | | | 11,057 | | | | 97 | | |
USAA Income Stock Fund
Institutional Shares | | | 8,495 | | | | 803 | | | | — | | | | — | | | | — | | | | 3,023 | | | | 12,321 | | | | 209 | | |
USAA International Fund
Institutional Shares | | | 27,920 | | | | 565 | | | | (5,460 | ) | | | (942 | ) | | | — | | | | 10,171 | | | | 32,254 | | | | 565 | | |
USAA Precious Metals and
Minerals Fund
Institutional Shares | | | 1,332 | | | | 2 | | | | (491 | ) | | | 241 | | | | — | | | | (73 | ) | | | 1,011 | | | | 2 | | |
USAA Small Cap Stock
Fund Institutional
Shares | | | 6,667 | | | | 473 | | | | (4,123 | ) | | | 33 | | | | 321 | | | | 2,731 | | | | 5,781 | | | | 151 | | |
USAA Target Managed
Allocation Fund | | | 12,716 | | | | 982 | | | | (1,873 | ) | | | 132 | | | | 218 | | | | 3,135 | | | | 15,092 | | | | 563 | | |
USAA Value Fund
Institutional Shares | | | 8,228 | | | | 160 | | | | (190 | ) | | | (94 | ) | | | — | | | | 3,515 | | | | 11,619 | | | | 160 | | |
VictoryShares USAA MSCI
Emerging Markets Value
Momentum ETF | | | 9,618 | | | | 1,779 | | | | (1,797 | ) | | | (274 | ) | | | — | | | | 4,419 | | | | 13,745 | | | | 324 | | |
VictoryShares USAA MSCI
International Value
Momentum ETF | | | 22,189 | | | | — | | | | (314 | ) | | | (72 | ) | | | — | | | | 7,755 | | | | 29,558 | | | | 577 | | |
VictoryShares USAA MSCI
USA Small Cap Value
Momentum ETF | | | 6,791 | | | | — | | | | (3,173 | ) | | | (62 | ) | | | — | | | | 3,085 | | | | 6,641 | | | | 93 | | |
VictoryShares USAA
MSCI USA Value
Momentum ETF | | | 29,369 | | | | — | | | | (9,385 | ) | | | 721 | | | | — | | | | 11,244 | | | | 31,949 | | | | 507 | | |
| | | $ | 190,791 | | | $ | 11,121 | | | $ | (38,111 | ) | | $ | 355 | | | $ | 1,554 | | | $ | 67,536 | | | $ | 231,692 | | | $ | 3,825 | | |
* Rounds to less than $1 thousand.
22
REPORT OF INDEPENDENT REGISTERED PUBLIC ACCOUNTING FIRM
To the Shareholders and the Board of Trustees of USAA Cornerstone Equity Fund
Opinion on the Financial Statements
We have audited the accompanying statement of assets and liabilities of USAA Cornerstone Equity Fund (the "Fund") (one of the funds constituting USAA Mutual Funds Trust (the "Trust")), including the schedule of portfolio investments, as of May 31, 2021, and the related statement of operations for the year then ended, the statements of changes in net assets for each of the two years in the period then ended, the financial highlights for each of the five years in the period then ended and the related notes (collectively referred to as the "financial statements"). In our opinion, the financial statements present fairly, in all material respects, the financial position of the Fund (one of the funds constituting USAA Mutual Funds Trust) at May 31, 2021, the results of its operations for the year then ended, the changes in its net assets for each of the two years in the period then ended and its financial highlights for each of the five years in the period then ended, in conformity with U.S. generally accepted accounting principles.
Basis for Opinion
These financial statements are the responsibility of the Trust's management. Our responsibility is to express an opinion on the Fund's financial statements based on our audits. We are a public accounting firm registered with the Public Company Accounting Oversight Board (United States) ("PCAOB") and are required to be independent with respect to the Trust in accordance with the U.S. federal securities laws and the applicable rules and regulations of the Securities and Exchange Commission and the PCAOB.
We conducted our audits in accordance with the standards of the PCAOB. Those standards require that we plan and perform the audit to obtain reasonable assurance about whether the financial statements are free of material misstatement, whether due to error or fraud. The Trust is not required to have, nor were we engaged to perform, an audit of the Trust's internal control over financial reporting. As part of our audits we are required to obtain an understanding of internal control over financial reporting, but not for the purpose of expressing an opinion on the effectiveness of the Trust's internal control over financial reporting. Accordingly, we express no such opinion.
Our audits included performing procedures to assess the risks of material misstatement of the financial statements, whether due to error or fraud, and performing procedures that respond to those risks. Such procedures included examining, on a test basis, evidence regarding the amounts and disclosures in the financial statements. Our procedures included confirmation of securities owned as of May 31, 2021, by correspondence with the custodian. Our audits also included evaluating the accounting principles used and significant estimates made by management, as well as evaluating the overall presentation of the financial statements. We believe that our audits provide a reasonable basis for our opinion.

We have served as the auditor of one or more Victory Capital investment companies since 1995.
San Antonio, Texas
July 28, 2021
23
USAA Mutual Funds Trust | | Supplemental Information
May 31, 2021 | |
(Unaudited)
Trustee and Officer Information
Board of Trustees:
Overall responsibility for management of the Trust rests with the Board. The Trust is managed by the Board in accordance with the laws of the state of Delaware. There are currently nine Trustees, seven of whom are not "interested persons" of the Trust within the meaning of that term under the 1940 Act ("Independent Trustees") and two of whom are "interested persons" of the Trust within the meaning of that term under the 1940 Act ("Interested Trustee"). The Trustees, in turn, elect the officers of the Trust to actively supervise its day-to-day operations.
The following tables list the Trustees, their ages, position with the Trust, commencement of service, principal occupations during the past five years and any directorships of other investment companies or companies whose securities are registered under the Securities Exchange Act of 1934, as amended, or who file reports under that Act. Each Trustee oversees 46 portfolios in the Trust. Each Trustee's address is 15935 La Cantera Pkwy, San Antonio, TX, 78256. Pursuant to a policy adopted by the Board, the term of office for each Trustee shall be until the Independent Trustee reaches age 75 or an Interested Trustee reaches age 75. The Board may change or grant exceptions from this policy at any time without shareholder approval. A Trustee may resign or be removed by a vote of the other Trustees or the holders of a majority of the outstanding shares of the Trust at any time. Vacancies on the Board can be filled by the action of a majority of the Trustees, provided that after filling such vacancy at least two-thirds of the Trustees have been elected by the shareholders.
Name and Date of Birth | | Position
Held with
the Trust | | Year
Commenced
Service | | Principal Occupation
During Past 5 Years | | Other
Directorships
Held During
Past 5 Years | |
Independent Trustees. | |
Jefferson C. Boyce, (c)
Born September 1957 | | Independent Chairman | | | 2021 | | | Senior Managing Director, New York Life Investments, LLC (1992-2012) | | Westhab, Inc. | |
John C. Walters,
Born February 1962 | | Trustee | | | 2019 | | | Retired. Mr. Walters brings significant Board experience including active involvement with the board of a Fortune 500 company, and a proven record of leading large, complex financial organizations. He has a demonstrated record of success in distribution, manufacturing, investment brokerage, and investment management in both the retail and institutional investment businesses. He has substantial experience in the investment management business with a demonstrated ability to develop and drive strategy while managing operation, financial, and investment risk. | | Guardian Variable Products Trust (16 series), Lead Independent Director; Amerilife Holdings LLC, Director; Stadion Money Management; Director; University of North Carolina (Chapel Hill), Member Board of Governors | |
24
USAA Mutual Funds Trust | | Supplemental Information — continued
May 31, 2021 | |
(Unaudited)
Name and Date of Birth | | Position
Held with
the Trust | | Year
Commenced
Service | | Principal Occupation
During Past 5 Years | | Other
Directorships
Held During
Past 5 Years | |
Robert L. Mason, Ph.D.,
Born July 1946 | | Trustee | | | 1997 | | | Adjunct Professor in the Department of Management Science and Statistics in the College of Business at the University of Texas at San Antonio (since 2001); Institute Analyst, Southwest Research Institute (March 2002-January 2016) | | None | |
Dawn M. Hawley,
Born February 1954 | | Trustee | | | 2014 | | | Manager of Finance, Menil Foundation, Inc. (May 2007-June 2011), which is a private foundation that oversees the assemblage of sculptures, prints, drawings, photographs, and rare books. Director of Financial Planning and Analysis and Chief Financial Officer, AIM Management Group, Inc. (October 1987-January 2006) | | None | |
Paul L. McNamara,
Born July 1948 | | Trustee | | | 2012 | | | Director, Cantor Opportunistic Alternatives Fund, LLC (March 2010-February 2014), which is a closed-end fund of funds by Cantor Fitzgerald Investment Advisors, LLC | | None | |
25
USAA Mutual Funds Trust | | Supplemental Information — continued
May 31, 2021 | |
(Unaudited)
Name and Date of Birth | | Position
Held with
the Trust | | Year
Commenced
Service | | Principal Occupation
During Past 5 Years | | Other
Directorships
Held During
Past 5 Years | |
Richard Y. Newton III,
Born January 1956 | | Trustee | | | 2017 | | | Director, Elta North America (01/18-present), which is a global leader in the design, manufacture, and support of innovative electronic systems in the ground, maritime, airborne, and security domains for the nation's warfighters, security personnel, and first responders; Managing Partner, Pioneer Partnership Development Group (December 2015-present)); Executive Director, The Union League Club of New York (June 2014-November 2015): Executive Vice President, Air Force Association (August 2012-May 2014); Lieutenant General, United States Air Force (January 2008-June 2012) | | PredaSAR Corp. | |
Barbara B. Ostdiek, Ph.D.,
Born March 1964 | | Trustee | | | 2008 | | | Senior Associate Dean of Degree Programs at Jesse H. Jones Graduate School of Business at Rice University (since 2013); Associate Professor of Finance at Jessie H. Jones Graduate School of Business at Rice University (since 2001) | | None | |
Effective at the close of business on December 31, 2020, Michael F. Reimherr retired from the Board of Trustees.
26
USAA Mutual Funds Trust | | Supplemental Information — continued
May 31, 2021 | |
(Unaudited)
Name and Date of Birth | | Position
Held with
the Trust | | Year
Commenced
Service | | Principal Occupation
During Past 5 Years | | Other
Directorships
Held During
Past 5 Years | |
Interested Trustees. | |
David C. Brown, (b)
Born May 1972 | | Trustee | | | 2019 | | | Chairman and Chief Executive Officer (since 2013), Victory Capital Management Inc.; Chairman and Chief Executive Officer, Victory Capital Holdings, Inc. (since 2013). Mr. Brown brings to the Board extensive business, finance and leadership skills gained and developed through years of experience in the financial services industry, including his tenure overseeing the strategic direction as CEO of Victory Capital. These skills, combined with Mr. Brown's extensive knowledge of the financial services industry and demonstrated success in the development and distribution of investment strategies and products, enable him to provide valuable insights to the Board and strategic direction for the Funds. | | Trustee, Victory Portfolios (41 series), Victory Portfolios II (26 series), Victory Variable Insurance Funds (8 series) | |
27
USAA Mutual Funds Trust | | Supplemental Information — continued
May 31, 2021 | |
(Unaudited)
Name and Date of Birth | | Position
Held with
the Trust | | Year
Commenced
Service | | Principal Occupation
During Past 5 Years | | Other
Directorships
Held During
Past 5 Years | |
Daniel S. McNamara, (b)(c)(d)
Born June 1966 | | Trustee | | | 2012 | | | Trustee, President, and Vice Chairman of USAA ETF Trust (June 2017-June 2019); President of Financial Advice & Solutions Group (FASG), USAA (February 2013-March 2021); Director of USAA Investment Services Company (ISCO) (formerly USAA Investment Management) (September 2009-March 2021); President, Asset Management Company (AMCO) (August, 2011-June 2019); Senior Vice President of USAA Financial Planning Services Insurance Agency, Inc. (FPS) (April 2011-March 2021); Chairman of Board of ISCO (April 2013-December 2020); Director of AMCO (August 2011-June 2019); President and Director of USAA Shareholder Account Services (SAS) (October 2009-June 2019); Director and Vice Chairman of FPS (December 2013-March 2021); President and Director of USAA Investment Corporation (ICORP) (March 2010-March 2021); Chairman of Board of ICORP (December 2013-March 2021); Director of USAA Financial Advisors, Inc. (FAI) (December 2013-March 2021); Chairman of Board of FAI (March 2015-March 2021). Mr. McNamara brings to the Board extensive experience in the financial services industry, including experience as an officer of the Trust. | | None | |
(b) Mr. Dan McNamara is deemed an "interested person" due to his previous position as Director of AMCO, the former investment adviser of the Funds. Mr. Brown is deemed an "interested person" due to his position as Chief Executive Officer of Victory Capital, investment adviser to the Funds.
(c) Effective at the close of business on December 31, 2020, Jefferson C. Boyce replaced Dan McNamara as Chair of the Board and assumed the title of Independent Chair.
(d) Effective July 2, 2021, Mr. Dan McNamara became an Independent Trustee to the Funds.
The Statement of Additional Information includes additional information about the Trustees of the Trust and is available, without charge, on the SEC's website at www.sec.gov and/or by calling (800)-235-8396.
28
USAA Mutual Funds Trust | | Supplemental Information — continued
May 31, 2021 | |
(Unaudited)
Officers:
The officers of the Trust, their ages, commencement of service and their principal occupations during the past five years, are detailed in the following table. Each officer serves until the earlier of his or her resignation, removal, retirement, death, or the election of a successor. The mailing address of each officer of the Trust is 15935 La Cantera Pkwy, San Antonio, TX, 78256. The officers of the Trust receive no compensation directly from the Trust for performing the duties of their offices.
Name and Date of Birth | | Position with
the Trust | | Year
Commenced
Service | | Principal Occupation During Past 5 Years | |
Interested Officers.
Christopher K. Dyer,
Born February 1962 | | President | | | 2019 | | | Director of Fund Administration, Victory Capital (since 2004); Chief Operating Officer, Victory Capital Services, Inc. (since 2020) | |
Scott A Stahorsky,
Born July 1969 | | Vice President | | | 2019 | | | Manager, Fund Administration, Victory Capital (since 2015) | |
James K. De Vries,
Born April 1969 | | Treasurer | | | 2018 | | | Executive Director, Victory Capital Management Inc. (since 2019); Treasurer, USAA ETF Trust (September 2018-June 2019); Executive Director, Investment and Financial Administration, USAA (April 2012-June 2019); Assistant Treasurer, USAA ETF Trust (June 2017-September 2018); Assistant Treasurer, USAA Mutual Funds Trust (December 2013-February 2018) | |
Allan Shaer,
Born March 1965 | | Assistant Treasurer | | | 2019 | | | Senior Vice President, Financial Administration, Citi Fund Services Ohio, Inc. (since 2016); Vice President, Mutual Fund Administration, JP Morgan Chase (2011-2016) | |
Carol D. Trevino,
Born October 1965 | | Assistant Treasurer | | | 2018 | | | Director, Accounting and Finance, Victory Capital Management Inc. (since 2019); Accounting/Financial Director, USAA (December 2013-June 2019); Assistant Treasurer, USAA ETF Trust (September 2018-June 2019) | |
Erin G. Wagner,
Born February 1974 | | Secretary | | | 2019 | | | Deputy General Counsel, the Adviser (since 2013) | |
Charles Booth,
Born April 1960 | | Anti-Money Laundering Compliance Officer and Identity Theft Officer | | | 2019 | | | Director, Regulatory Administration and CCO Support Services, Citi Fund Services Ohio, Inc. (since 2007) | |
Amy Campos,
Born July 1976 | | Chief Compliance Officer | | | 2019 | | | Chief Compliance Officer, USAA Mutual Funds Trust (since 2019); Executive Director, Deputy Chief Compliance Officer, USAA Mutual Funds Trust and USAA ETF Trust (July 2017-June 2019); Compliance Director, USAA Mutual Funds Trust (2014-July 2017) | |
29
USAA Mutual Funds Trust | | Supplemental Information — continued
May 31, 2021 | |
(Unaudited)
Proxy Voting and Portfolio Holdings Information
Proxy Voting:
Information regarding the policies and procedures the Fund uses to determine how to vote proxies relating to portfolio securities is available without charge, upon request, by calling (800) 235-8396. The information is also included in the Fund's Statement of Additional Information, which is available on the SEC's website at www.sec.gov.
Information relating to how the Fund voted proxies relating to portfolio securities held during the most recent 12 months ended June 30 is available on the SEC's website at www.sec.gov.
Availability of Schedules of Portfolio Investments:
The Trust files a complete list of Schedules of Portfolio Investments with the SEC for the first and third quarter of each fiscal year on Form N-PORT. Form N-PORT is available on the SEC's website at www.sec.gov.
Expense Example
As a shareholder of the Fund, you may incur two types of costs: (1) transaction costs, and (2) ongoing costs, including management fees and other Fund expenses. These examples are intended to help you understand your ongoing costs (in dollars) of investing in the Fund and to compare these costs with the ongoing costs of investing in other mutual funds.
These examples are based on an investment of $1,000 invested at the beginning of the period and held for the entire period from December 1, 2020, through May 31, 2021.
The Actual Expense figures in the table below provide information about actual account values and actual expenses. You may use the information below, together with the amount you invested, to estimate the expenses that you paid over the period. Simply divide your account value by $1,000 (for example, an $8,600 account value divided by $1,000 = 8.6), then multiply the result by the number in the table under the heading entitled "Actual Expenses Paid During Period" to estimate the expenses you paid on your account during this period.
The Hypothetical Expense figures in the table below provide information about hypothetical account values and hypothetical expenses based on the Fund's actual expense ratio and an assumed rate of return of 5% per year before expenses, which is not the Fund's actual return. The hypothetical account values and expenses may not be used to estimate the actual ending account balance or expenses you paid for the period. You may use this information to compare this 5% hypothetical example with the 5% hypothetical examples that appear in shareholder reports of other funds.
Please note the expenses shown in the table below are meant to highlight your ongoing costs only and do not reflect any transactional costs. If these transactional costs were included, your costs would have been higher.
Beginning
Account
Value
12/1/20 | | Actual
Ending
Account
Value
5/31/21 | | Hypothetical
Ending
Account
Value
5/31/21 | | Actual
Expenses
Paid During
Period
12/1/20-
5/31/21* | | Hypothetical
Expenses
Paid During
Period
12/1/20-
5/31/21* | | Annualized
Expense Ratio
During Period
12/1/20-
5/31/21 | |
| $ | 1,000.00 | | | $ | 1,187.40 | | | $ | 1,024.43 | | | $ | 0.55 | | | $ | 0.50 | | | | 0.10 | % | |
* Expenses are equal to the average account value multiplied by the Fund's annualized expense ratio multiplied by 182/365 (the number of days in the most recent fiscal half-year divided by the number of days in the fiscal year).
30
USAA Mutual Funds Trust | | Supplemental Information — continued
May 31, 2021 | |
(Unaudited)
Additional Federal Income Tax Information
The following federal tax information related to the Fund's fiscal year ended May 31, 2021, is provided for information purposes only and should not be used for reporting to federal or state revenue agencies. Federal tax information for the calendar year will be reported to you on Form 1099-DIV in January 2022.
With respect to distributions paid, the Fund designates the following amounts (or, if subsequently determined to be different, the maximum amount allowable) for the fiscal year ended May 31, 2021 (amounts in thousands):
| | Dividends
Received
Deduction
(corporate
shareholders) | | Qualified
Dividend
Income
(non-corporate
shareholders) | |
Long-Term
Capital Gain
Distributions | |
Foreign
Taxes
Paid | |
| | | | | | 37 | % | | | 77 | % | | $ | 13,736 | | | $ | 124 | | |
31
USAA Mutual Funds Trust | | Supplemental Information — continued
May 31, 2021 | |
(Unaudited)
Considerations of the Board in Continuing the Investment Advisory Agreement (the "Agreement")
USAA Cornerstone Equity Fund (the "Fund")
At a meeting of the Board of Trustees (the "Board") held on December 10-11, 2020, the Board, including the Trustees who are not "interested persons" (as that term is defined in the Investment Company Act of 1940, as amended) of the Trust (the "Independent Trustees"), approved for an annual period the continuance of the Investment Advisory Agreement (the "Advisory Agreement") between the Trust and Victory Capital Management Inc. (the "Adviser") with respect to the Fund. Prior to the December 10-11, 2020 meeting at which the Advisory Agreement was approved, the Independent Trustees also discussed and considered information regarding the proposed continuation of the Advisory Agreement at a meeting held on November 19, 2020.
In advance of the foregoing meetings, the Trustees received and considered a variety of information relating to the Advisory Agreement and the Adviser, and were given the opportunity to ask questions and request additional information from management. The information provided to the Board included, among other things: (i) a separate report prepared by an independent third party of mutual fund data, which provided a statistical analysis comparing the Fund's investment performance, expenses, and fees to comparable investment companies; (ii) information concerning the services rendered to the Fund, as well as information regarding the Adviser's revenues and costs of providing services to the Fund and compensation paid to affiliates of the Adviser; and (iii) information about the Adviser's operations and personnel. Prior to voting, the Independent Trustees reviewed the proposed continuance of the Advisory Agreement with management and with experienced independent counsel retained by the Independent Trustees ("Independent Counsel") and received materials from such Independent Counsel discussing the legal standards for their consideration of the proposed continuation of the Advisory Agreement with respect to the Fund. The Independent Trustees also reviewed the proposed continuation of the Advisory Agreement with respect to the Fund in private sessions with Independent Counsel at which no representatives of management were present.
At each regularly scheduled meeting of the Board and its committees, the Board receives and reviews, among other things, information concerning the Fund's performance and related services provided by the Adviser. At the meeting at which the renewal of the Advisory Agreement is considered, particular focus is given to information concerning Fund performance, fees and total expenses as compared to comparable investment companies, and the Adviser's profitability with respect to the Fund. However, the Board noted that the evaluation process with respect to the Adviser is an ongoing one. In this regard, the Board's and its committees' consideration of the Advisory Agreement included information previously received at such meetings.
Advisory Agreement
After full consideration of a variety of factors, the Board, including the Independent Trustees, voted to approve the Advisory Agreement. In approving the Advisory Agreement, the Trustees did not identify any single factor as controlling, and each Trustee may have attributed different weights to various factors. Throughout their deliberations, the Independent Trustees were represented and assisted by Independent Counsel.
Nature, Extent, and Quality of Services — In considering the nature, extent, and quality of the services provided by the Adviser under the Advisory Agreement, the Board reviewed information provided by the Adviser relating to its operations and personnel. The Board also took into account its knowledge of the Adviser's management and the quality of the performance of the Adviser's duties through Board meetings, discussions, and reports during the preceding year. The Board considered the fees paid to the Adviser and the services provided to the Fund by the Adviser under the Advisory Agreement, as well as other services provided by the Adviser and its affiliates under other agreements, and the personnel who provide these services. In addition to the investment advisory services provided to the Fund, the Adviser and its affiliates provide administrative services, shareholder services, oversight of Fund accounting, marketing services, assistance in meeting legal and regulatory requirements, and other services necessary for the operation of the Fund and the Trust.
The Board considered the scope of services provided by, and the undertakings required of, the Adviser in connection with those services, including, among other things, maintaining (i) its own and the Fund's compliance programs, (ii) risk management programs, (iii) liquidity risk management programs, and (iv) cybersecurity
32
USAA Mutual Funds Trust | | Supplemental Information — continued
May 31, 2021 | |
(Unaudited)
programs, each of which had expanded over time as a result of regulatory, market, and other developments. The Board also considered the significant risks assumed by the Adviser in connection with the services provided to the Fund, including investment, operational, enterprise, litigation, regulatory and compliance risks.
The Board considered the Adviser's management style and the performance of the Adviser's duties under the Advisory Agreement. The Board considered the level and depth of knowledge of the Adviser, including the professional experience and qualifications of its senior and investment personnel, as well as current staffing levels. The allocation of the Fund's brokerage, including the Adviser's process for monitoring "best execution," also was considered. The Adviser's role in coordinating the activities of the Fund's other service providers was also considered. The Board also considered the Adviser's risk management processes. The Board considered the Adviser's financial condition and that it had the financial wherewithal to continue to provide the same scope and high quality of services under the Advisory Agreement. In reviewing the Advisory Agreement, the Board focused on the experience, resources, and strengths of the Adviser and its affiliates in managing the Fund, as well as the other funds in the Trust.
The Board also reviewed the compliance and administrative services provided to the Fund by the Adviser and its affiliates, including the Adviser's oversight of the Fund's day-to-day operations and oversight of Fund accounting. The Trustees, guided also by information obtained from their experiences as trustees of the Trust, also focused on the quality of the Adviser's compliance and administrative staff.
Expenses and Performance — In connection with its consideration of the Advisory Agreement, the Board evaluated the Fund's advisory fees and total expense ratio as compared to other open-end investment companies deemed to be comparable to the Fund as determined by the independent third party in its report. The Fund's expenses were compared to (i) a group of investment companies chosen by the independent third party to be comparable to the Fund based upon certain factors, including fund type, comparability of investment objective and classification, sales load type, asset size, and expense components (the "expense group") and (ii) a larger group of investment companies with the same investment classification/objective as the Fund regardless of asset size, excluding outliers (the "expense universe"). The Board noted that the Adviser does not receive a management fee from the Fund. The data indicated that the Fund's total expenses, which included underlying fund expenses, were below the medians of its expense group and expense universe. The Board also took into account the Adviser's current undertakings to maintain expense limitations for the Fund. The Board took into account the various other services provided to the Fund by the Adviser and its affiliates, and noted the high quality of services received by the Fund.
In considering the Fund's performance, the Board noted that it reviews at its regularly scheduled meetings information about the Fund's performance results. The Trustees also reviewed various comparative data provided to them in connection with their consideration of the renewal of the Advisory Agreement, including, among other information, a comparison of the Fund's average annual total returns relative to its Lipper index and other mutual funds deemed to be in its peer group by the independent third party in its report (the "performance universe"). The Fund's performance universe consisted of the Fund and all retail and institutional open-end investment companies with the same classification/objective as the Fund regardless of asset size or primary channel of distribution. This comparison indicated that, among other data, the Fund's performance was below the average of its performance universe and its Lipper index for the one-, three- and five-year periods ended September 30, 2020. The Board took into account management's discussion of the Fund's performance, including the reasons for the Fund's underperformance relative to its peers.
Compensation and Profitability — The Board took into consideration that the Adviser does not collect a management fee from the Fund. The information considered by the Board included operating profit margin information for the Adviser's business as a whole. The Board also received and considered profitability information related to the management revenues from the Fund. This information included a review of the methodology used in the allocation of certain costs to the Fund. The Trustees reviewed the profitability of the Adviser's relationship with the Fund before tax expenses. The Board was also provided with a profitability analysis of other publicly traded asset managers prepared by an independent information service. In reviewing the overall profitability of the management fee to the Adviser, the Board also considered the fact that the Adviser and its affiliates provide shareholder servicing and administrative services to the Fund for which they receive compensation. The Board also considered the possible direct and indirect benefits to the Adviser from its relationship with the Trust, including that the Adviser may derive reputational and other benefits from its association with the Fund. The Trustees recognized that the Adviser should be entitled to earn a reasonable
33
USAA Mutual Funds Trust | | Supplemental Information — continued
May 31, 2021 | |
(Unaudited)
level of profits in exchange for the level of services it provides to the Fund and the entrepreneurial and other risks that it assumes as Adviser.
Economies of Scale — With respect to the consideration of any economies of scale to be realized by the Fund, the Board took into account that the Adviser does not receive any advisory fees under the Advisory Agreement. The Board also considered the fee waiver and expense reimbursement arrangements by the Adviser. The Board also considered the effect of the Fund's change in size, if any, on its performance and fees, noting that the Fund may realize other economies of scale if assets increase proportionally more than expenses. The Board determined that the current investment management fee structure was reasonable.
Conclusions — The Board reached the following conclusions regarding the Fund's Advisory Agreement with the Adviser: (i) the Adviser has demonstrated that it possesses the capability and resources to perform the duties required of it under the Advisory Agreement; (ii) the Adviser maintains an appropriate compliance program; (iii) the performance of the Fund is reasonable in relation to the performance of funds with similar investment objectives and to relevant indices in view of the Fund's investment approach and the Adviser is appropriately monitoring the Fund's performance; (iv) the Fund's advisory expenses are reasonable in relation to those of similar funds and to the services to be provided by the Adviser; and (v) the Adviser's and its affiliates' level of profitability from their relationship with the Fund is reasonable in light of the nature and high quality of services provided by the Adviser and the type of fund. Based on its conclusions, the Board determined that continuation of the Advisory Agreement would be in the best interests of the Fund and its shareholders.
34
USAA Mutual Funds Trust | | Supplemental Information — continued
May 31, 2021 | |
(Unaudited)
Liquidity Risk Management Program:
The USAA Mutual Funds have adopted and implemented a written liquidity risk management program (the "LRMP") as required by Rule 22e-4 under the Investment Company Act of 1940, as amended. The LRMP is reasonably designed to assess and manage each Fund's liquidity risk, taking into consideration each Fund's investment strategy and the liquidity of its portfolio investments during normal and reasonably foreseeable stressed market conditions; its short and long-term cash flow projections; and its cash holdings and access to other liquidity management tools such as available funding sources including the Victory Funds Complex Interfund Lending Facility and Line of Credit (discussed in the Notes to Financial Statements). The USAA Mutual Funds' Board of Trustees approved the appointment of the Funds' investment adviser, Victory Capital Management Inc. ("Victory Capital"), as the administrator of the LRMP.
Victory Capital manages liquidity risks associated with the Funds' investments by monitoring, among other things, cash and cash equivalents, any use of derivatives, the concentration of investments, the appropriateness of each Fund's investment strategy, and by classifying every Fund investment as either highly liquid, moderately liquid, less liquid, or illiquid on at least a monthly basis. To assist with the classification of Fund investments, Victory Capital has retained a third-party provider of liquidity evaluation services. This provider determines preliminary liquidity classifications for all portfolio holdings based upon portfolio-level data and certain assumptions provided by Victory Capital. Victory Capital reviews the preliminary liquidity classifications and, when appropriate, considers other information including input from the Funds' portfolio managers (including the portfolio managers employed by any investment sub-advisers) in determining final liquidity classifications.
At a meeting held on March 10, 2021, Victory Capital provided an oral and written report to the Trustees on the operation and effectiveness of the LRMP during the previous year. The report from Victory Capital concluded that the Funds did not experience any significant liquidity challenges during the covered period, and the Funds' LRMP is reasonably designed to assess and manage its liquidity risk. The report also concluded that the LRMP continues to operate adequately and effectively to enable Victory Capital to oversee and manage liquidity risk and ensure each Fund is able to meet redemption requests without significant dilution to the remaining investors' interest in each Fund. During the review period, each Fund's portfolio consisted primarily of highly liquid investments, which are defined as cash and any investments that each Fund reasonably expects to be converted to cash in current market conditions in three business days or less without significantly changing the market value of the investment. Therefore, the Funds have not adopted a highly liquid investment minimum. The Funds' investments were below the limitation on illiquid investments during the review period. Additionally, Victory Capital indicated that no events occurred that would require the filing of Form N-LIQUID and recommended no material changes to the LRMP.
35
Privacy Policy
Protecting the Privacy of Information
The Trust respects your right to privacy. We also know that you expect us to conduct and process your business in an accurate and efficient manner. To do so, we must collect and maintain certain personal information about you. This is the information we collect from you on applications or other forms, and from the transactions you make with us or third parties. It may include your name, address, social security number, account transactions and balances, and information about investment goals and risk tolerance.
We do not disclose any information about you or about former customers to anyone except as permitted or required by law. Specifically, we may disclose the information we collect to companies that perform services on our behalf, such as the transfer agent that processes shareholder accounts and printers and mailers that assist us in the distribution of investor materials. We may also disclose this information to companies that perform marketing services on our behalf. This allows us to continue to offer you Victory investment products and services that meet your investing needs, and to effect transactions that you request or authorize. These companies will use this information only in connection with the services for which we hired them. They are not permitted to use or share this information for any other purpose.
To protect your personal information internally, we permit access only by authorized employees and maintain physical, electronic, and procedural safeguards to guard your personal information.*
* You may have received communications regarding information about privacy policies from other financial institutions which gave you the opportunity to "opt-out" of certain information sharing with companies which are not affiliated with that financial institution. The Trust does not share information with other companies for purposes of marketing solicitations for products other than the Trust. Therefore, the Trust does not provide opt-out options to their shareholders.
P.O. Box 182593
Columbus, Ohio 43218-2593

Visit our website at: | | Call | |
vcm.com | | (800) 235-8396 | |

MAY 31, 2021
Annual Report
USAA Cornerstone Moderate Fund
Victory Capital means Victory Capital Management Inc., the investment adviser of the USAA Mutual Funds. USAA Mutual Funds are distributed by Victory Capital Services, Inc., member of FINRA, an affiliate of Victory Capital. Victory Capital and its affiliates are not affiliated with United Services Automobile Association or its affiliates. USAA and the USAA logos are registered trademarks and the USAA Mutual Funds and USAA Investments logos are trademarks of United Services Automobile Association and are being used by Victory Capital and its affiliates under license.
www.vcm.com
News, Information And Education 24 Hours A Day, 7 Days A Week
The Victory Funds site gives fund shareholders, prospective shareholders, and investment professionals a convenient way to access fund information, get guidance, and track fund performance anywhere they can access the Internet. The site includes:
• Detailed performance records
• Daily share prices
• The latest fund news
• Investment resources to help you become a better investor
• A section dedicated to investment professionals
Whether you're a potential investor searching for the fund that matches your investment philosophy, a seasoned investor interested in planning tools, or an investment professional, www.vcm.com has what you seek. Visit us anytime. We're always open.
TABLE OF CONTENTS
Shareholder Letter (Unaudited) | | | 2 | | |
Managers' Commentary (Unaudited) | | | 4 | | |
Investment Overview (Unaudited) | | | 6 | | |
Investment Objective & Portfolio
Holdings (Unaudited) | | | 7 | | |
Schedule of Portfolio Investments | | | 8 | | |
Financial Statements | |
Statement of Assets and Liabilities | | | 22 | | |
Statement of Operations | | | 23 | | |
Statements of Changes in Net Assets | | | 24 | | |
Financial Highlights | | | 26 | | |
Notes to Financial Statements | | | 28 | | |
Report of Independent
Registered Public Accounting Firm | | | 39 | | |
Supplemental Information (Unaudited) | | | 40 | | |
Trustees' and Officers' Information | | | 40 | | |
Proxy Voting and Portfolio Holdings Information | | | 46 | | |
Expense Example | | | 46 | | |
Additional Federal Income Tax Information | | | 47 | | |
Advisory Contract Agreement | | | 48 | | |
Liquidity Risk Management Program | | | 51 | | |
Privacy Policy (inside back cover) | | | |
This report is for the information of the shareholders and others who have received a copy of the currently effective prospectus of the Fund, managed by Victory Capital Management Inc. It may be used as sales literature only when preceded or accompanied by a current prospectus, which provides further details about the Fund.
IRA DISTRIBUTION WITHHOLDING DISCLOSURE
We generally must withhold federal income tax at a rate of 10% of the taxable portion of your distribution and, if you live in a state that requires state income tax withholding, at your state's tax rate. However, you may elect not to have withholding apply or to have income tax withheld at a higher rate. Any withholding election that you make will apply to any subsequent distribution unless and until you change or revoke the election. If you wish to make a withholding election, or change or revoke a prior withholding election, call (800) 235-8396, and form W-4P (OMB No. 1545-0074 withholding certificate for pension or annuity payments) will be electronically sent.
If you do not have a withholding election in place by the date of a distribution, federal income tax will be withheld from the taxable portion of your distribution at a rate of 10%. If you must pay estimated taxes, you may be subject to estimated tax penalties if your estimated tax payments are not sufficient and sufficient tax is not withheld from your distribution.
For more specific information, please consult your tax adviser.
• NOT FDIC INSURED • NO BANK GUARANTEE • MAY LOSE VALUE
1
(Unaudited)
Dear Shareholder,
Never a dull moment. A year ago, we were still coming to grips with a global pandemic, hoping for an effective vaccine, and wondering whether the U.S. Federal Reserve's aggressive actions would continue to mollify financial markets. As it turns out, a vaccine was rolled out (domestically) faster than expectations, and the recovery that began during the second quarter of 2020 continued unabated.
Fast forward to today and investors are suddenly more concerned about labor shortages, rising commodity prices, and whether inflation will prove to be transitory or more lasting. If anything, this merely exemplifies that markets are unpredictable and the environment can change rapidly.
Reflecting on the past year, we must consider ourselves fortunate despite the myriad of challenges. For starters, it was impressive how quickly the various forms of monetary and fiscal stimulus contributed to a rebound in GDP. Of course, it wasn't a straight line upward and there were bouts of elevated volatility in both bond and stock markets. Late in 2020, for example, financial markets were alternately fueled and roiled by a contentious election season, growing optimism for an effective vaccine, and a fluid debate regarding the need for even more stimulus. Ultimately, stocks were propelled higher in the fourth quarter of 2020 as it became clear Congress would provide another dose of stimulus in the form of direct payments, more unemployment insurance, and additional aid to businesses.
As we moved into 2021, stocks continued their upward trajectory. Meanwhile, the yield on the 10-Year U.S. Treasury continued rallying sharply as many investors began to shift their focus. Deflation was out; inflation was in. Indeed, the potential for a new era of inflation and higher interest rates seems to be the new worry du jour.
So how did the numbers shake out after this unusual year? The S&P 500® Index registered an impressive annual return of approximately 40% for this 12-month period ended May 31, 2021. Over this same period, the yield on the 10-Year U.S. Treasury jumped 94 basis points, reflecting both the very low starting rate and substantial fiscal stimulus. At the end of the reporting period, the yield on the 10-Year U.S. Treasury was 1.59%.
The past year is not one we will forget any time soon. There were many hardships, but we should not overlook the positives and remember our collective spirit and perseverance. Markets endured and even surprised to the upside, but perhaps the key takeaway is that investors need to remain calm in the face of adversity and focused on longer-term investment goals. We believe that's the best approach no matter what the markets throw at us.
On the following pages, you will find information relating to your USAA Mutual Funds, brought to you by Victory Capital. If you have any questions regarding the current market dynamics or your specific portfolio or investment plan, we encourage you to contact our Member Service Representatives. Call (800) 235-8396 or visit our website at www.vcm.com.
2
From all of us here at Victory Capital, thank you for letting us help you work toward your investment goals.

Christopher K. Dyer, CFA
President,
USAA Mutual Funds
3
USAA Cornerstone Moderate Fund
Managers' Commentary
(Unaudited)
• What were the market conditions during the reporting period?
The beginning of the reporting period brought a dramatic reversal from the difficult environment that characterized the first part of 2020. While COVID-19 cases continued to rise, investors grew increasingly confident that the economy would be able to recover from its sharp downturn of February and March. The optimism stemmed, in part, from a series of better-than-expected economic reports interpreted as evidence that the slump in growth would be less severe than was initially feared. The markets were further cheered by the aggressive response by the U.S. Federal Reserve (the "Fed"). In addition to reiterating its commitment to keep short-term interest rates near zero for an extended period, the Fed announced the direct purchase of both individual bonds and exchange-traded bond funds. The central bank's unusual steps offered corporations the latitude to issue debt at ultra-low rates, providing them with the cash necessary to help withstand the effects of the coronavirus.
The global financial markets produced healthy returns during the second half of 2020, wrapping up a positive year for the major asset classes. Investors' appetite for risk improved considerably in early November, when the approval of vaccines for COVID-19 raised expectations that the world economy could gradually return to normal in 2021. The conclusion of the U.S. elections, which removed a source of uncertainty that had depressed performance in September and October, was an additional tailwind. The markets were also aided by continued indications that the Fed and other central banks would maintain their highly accommodative policies indefinitely. Not least, an agreement on a new round of U.S. fiscal stimulus further cheered investors in late December. Together, these developments outweighed negative headlines surrounding renewed lockdowns and the persistence of the coronavirus.
The first quarter of 2021 proved to be a continuation of the strong equity markets investors experienced over the second half of 2020. Gains from global equity markets were fueled by optimism surrounding the successful rollout of the COVID-19 vaccines coupled with further monetary and fiscal stimulus proposals. Faster-than-expected economic growth produced a meaningful increase in real interest rates, which led to negative returns across most major fixed income asset classes. The 10-year U.S. Treasury bond yield finished at its highest level of the first quarter reporting period, climbing from under 1% to 1.74%.
During the last few months of the reporting period, equity markets have been consolidating and interest rates leveling off after large upswings. With strong first quarter GDP and corporate earnings growth in the rearview mirror, investors seem to be contemplating their next move. Inflation data has been increasing as the economy reopens more quickly than expected. The Fed maintains that inflationary pressure is transitory but could become more persistent. The inflationary environment will be a key metric moving into the second half of the year.
4
USAA Cornerstone Moderate Fund (continued)
Managers' Commentary (continued)
• How did the USAA Cornerstone Moderate Fund (the "Fund") perform during the reporting period?
For the reporting period ended May 31, 2021, the Fund had a total return of 21.00%. This compares to returns of 41.85% for the MSCI All-Country World Index and 20.98% for the Cornerstone Moderate Composite Index.
• What strategies did you employ during the reporting period?
The Fund delivered strong positive total returns during the reporting period as equity markets rebounded sharply off the market lows produced during the COVID-induced sell off early last year. All major equity asset classes participated in the rally with U.S. small-cap and emerging market stocks leading the way. The Fund's allocation to fixed income produced small positive returns. During the period, the Fund outperformed its Cornerstone Moderate Composite Index.
Positive contributors to the relative performance included an overweight to emerging market stocks. The Fund also benefitted from a tactical underweight to fixed-income securities as the sharp increase in interest rates weighed on bond prices particularly during the first quarter of 2021. Security selection in the Fund's underlying fixed-income portfolio added value due to an overweight to credit-oriented securities.
These positive drivers were offset by weakness in the security selection within the U.S large-cap portion of the portfolio, primarily driven by the resurgence of what we believe are lower-quality stocks, which experienced a sharp relief rally following the rollout of the vaccine. Additionally, the Fund's commodity exposure was weighted more heavily towards gold-related securities, which underperformed a more diversified basket. A tactical underweight to real estate investment trusts also detracted slightly from performance.
Thank you for allowing us to assist you with your investment needs.
5
USAA Cornerstone Moderate Fund
Investment Overview
(Unaudited)
Average Annual Total Return
Year Ended May 31, 2021
| | | Fund Shares | | | | | |
INCEPTION DATE | | 9/1/95 | | | | | |
| | Net Asset Value | | MSCI All-Country
World Index1 | | Cornerstone Moderate
Composite Index2 | |
One Year | | | 21.00 | % | | | 41.85 | % | | | 20.98 | % | |
Five Year | | | 7.65 | % | | | 14.18 | % | | | 9.19 | % | |
Ten Year | | | 5.28 | % | | | 9.58 | % | | | 7.18 | % | |
The performance data quoted represents past performance and current returns may be lower or higher. The investment return and principal value will fluctuate so that an investor's shares, when redeemed, may be worth more or less than the original cost. To obtain performance information current to the most recent month's end, please visit www.vcm.com.
Total return measures the price change in a share assuming the reinvestment of all net investment income and realized capital gain distributions, if any. The total returns quoted do not reflect adjustments made to the enclosed financial statements in accordance with U.S. Generally Accepted Accounting Principles or the deduction of taxes that a shareholder would pay on net investment income and realized capital gain distributions, including reinvested distributions, or redemptions of shares. The total return figures set forth above include all waivers of fees. Without such fee waivers, the total returns would have been lower.
USAA Cornerstone Moderate Fund — Growth of $10,000

1The unmanaged MSCI All-Country World Index is a free float-adjusted, market capitalization-weighted index designed to measure the performance of large- and mid-cap stocks across developed and emerging markets. The index reflects the reinvestment of dividends paid on the stocks constituting the index net of withholding taxes. This index does not include the effect of sales charges, commissions, expenses, or taxes, is not representative of the Fund, and it is not possible to invest directly in an index.
2The Cornerstone Moderate Composite Index is a combination of unmanaged indexes representing the Fund's model allocation, and consists of the MSCI USA Investable Market Index (IMI) Gross (29%), the MSCI ACWI ex USA IMI Net (19%), the Bloomberg Barclays U.S. Universal Index (48%), the Bloomberg Commodity Index Total Return (1%), the MSCI U.S. Real Estate Investment Trust (REIT) Index Gross (1%), and the Bloomberg Barclays U.S. Treasury — Bills (1-3M) (2%). This index does not include the effect of sales charges, commissions, expenses, or taxes, is not representative of the Fund, and it is not possible to invest directly in an index.
The graph reflects investment of growth of a hypothetical $10,000 investment in the Fund.
The graph and table do not reflect the deduction of taxes that a shareholder would pay on Fund distributions or the redemption of Fund shares.
Past performance is not indicative of future results.
6
USAA Mutual Funds Trust
USAA Cornerstone Moderate Fund | | May 31, 2021 | |
(Unaudited)
Investment Objective and Portfolio Holdings:
The Fund's investment objective seeks high total return.
Asset Allocation*:
May 31, 2021
(% of Net Assets)
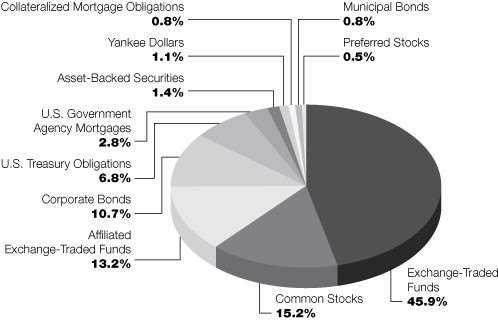
* Does not include futures, money market instruments, and short-term investments purchased with cash collateral from securities loaned.
Percentages are of the net assets of the Fund and may not equal 100%.
7
USAA Mutual Funds Trust
USAA Cornerstone Moderate Fund | | Schedule of Portfolio Investments
May 31, 2021 | |
(Amounts in Thousands, Except for Shares)
Security Description | | Principal
Amount | | Value | |
Asset-Backed Securities (1.4%) | |
Americredit Automobile Receivables Trust, Series 2018-1, Class C,
3.50%, 1/18/24, Callable 8/18/22 @ 100 | | $ | 2,640 | | | $ | 2,705 | | |
Americredit Automobile Receivables Trust, Series 2018-2, Class A3,
3.15%, 3/20/23, Callable 10/18/22 @ 100 | | | 46 | | | | 46 | | |
BCC Funding Corp. XVI LLC, Series 2019-1A, Class A2, 2.46%, 8/20/24,
Callable 6/20/23 @ 100 (a) | | | 1,344 | | | | 1,358 | | |
Canadian Pacer Auto Receivables Trust, Series 2018-1A, Class C, 3.82%,
4/19/24, Callable 6/19/21 @ 100 (a) | | | 1,190 | | | | 1,192 | | |
CarMax Auto Owner Trust, Series 2020-1, Class B, 2.21%, 9/15/25,
Callable 8/15/23 @ 100 | | | 620 | | | | 642 | | |
Credit Acceptance Auto Loan Trust, Series 2018-3A, Class A, 3.55%,
8/15/27, Callable 10/15/21 @ 100 (a) | | | 20 | | | | 20 | | |
Drive Auto Receivables Trust, Series 2018-4, Class D, 4.09%, 1/15/26,
Callable 8/15/22 @ 100 | | | 662 | | | | 680 | | |
Exeter Automobile Receivables Trust, Series 2019-2A, Class C, 3.30%,
3/15/24, Callable 4/15/23 @ 100 (a) | | | 935 | | | | 946 | | |
Exeter Automobile Receivables Trust, Series 2017-3A, Class D, 5.28%,
10/15/24, Callable 4/15/22 @ 100 (a) | | | 490 | | | | 505 | | |
Exeter Automobile Receivables Trust, Series 2020-1A, Class B, 2.26%,
4/15/24, Callable 5/15/23 @ 100 (a) | | | 499 | | | | 502 | | |
Ford Credit Auto Owner Trust, Series 2020-1, Class B, 2.29%, 8/15/31,
Callable 2/15/25 @ 100 (a) | | | 648 | | | | 677 | | |
Hertz Vehicle Financing II LP, Series 2019-3A, Class A, 2.67%, 12/26/25 (a) | | | 94 | | | | 94 | | |
HPEFS Equipment Trust, Series 2019-1A, Class C, 2.49%, 9/20/29,
Callable 6/20/22 @ 100 (a) | | | 437 | | | | 444 | | |
HPEFS Equipment Trust, Series 2020-1A, Class B, 1.89%, 2/20/30,
Callable 2/20/23 @ 100 (a) | | | 249 | | | | 253 | | |
Navient Student Loan Trust, Series 2015-2, Class B, 1.59%
(LIBOR01M+150bps), 8/25/50, Callable 8/25/29 @ 100 (b) | | | 950 | | | | 951 | | |
NP SPE II LLC, Series 2017-1A, Class A1, 3.37%, 10/21/47,
Callable 10/20/27 @ 100 (a) | | | 303 | | | | 313 | | |
SCF Equipment Leasing LLC, Series 2020-1A, Class B, 2.02%, 3/20/28,
Callable 5/20/25 @ 100 (a) | | | 506 | | | | 518 | | |
SLM Student Loan Trust, Series 2003-14, Class B, 0.73%
(LIBOR03M+55bps), 10/25/65, Callable 10/25/29 @ 100 (b) | | | 302 | | | | 287 | | |
Transportation Finance Equipment Trust, Series 2019-1, Class B, 2.06%,
5/23/24, Callable 6/23/23 @ 100 (a) | | | 900 | | | | 923 | | |
Trinity Rail Leasing LLC, Series 2019-2A, Class A1, 2.39%, 10/18/49,
Callable 11/17/21 @ 100 (a) | | | 392 | | | | 401 | | |
Trinity Rail Leasing LLC, Series 2019-2A, Class A2, 3.10%, 10/18/49,
Callable 5/17/23 @ 100 (a) | | | 2,000 | | | | 2,105 | | |
Westlake Automobile Receivables Trust, Series 2020-1A, Class B, 1.94%,
4/15/25, Callable 4/15/23 @ 100 (a) | | | 1,618 | | | | 1,641 | | |
Westlake Automobile Receivables Trust, Series 2018-2A, Class D, 4.00%,
1/16/24, Callable 1/15/22 @ 100 (a) | | | 751 | | | | 759 | | |
Total Asset-Backed Securities (Cost $17,546) | | | 17,962 | | |
See notes to financial statements.
8
USAA Mutual Funds Trust
USAA Cornerstone Moderate Fund | | Schedule of Portfolio Investments — continued
May 31, 2021 | |
(Amounts in Thousands, Except for Shares)
Security Description | | Shares or
Principal
Amount | | Value | |
Collateralized Mortgage Obligations (0.8%) | |
Banc of America Commercial Mortgage Trust, Series 2006-3,
Class AM, 5.66%, 7/10/44 (c) | | $ | 1,254 | | | $ | 181 | | |
Banc of America Commercial Mortgage Trust, Series 2008-1,
Class AJ, 6.57%, 2/10/51 (c) | | | 130 | | | | 129 | | |
Benchmark Mortgage Trust, Series 2020-B17, Class ASB, 2.18%, 3/15/53,
Callable 11/15/29 @ 100 | | | 648 | | | | 666 | | |
BTH Mortgage-Backed Securities Trust, Series 2018-21, Class A, 2.61%
(LIBOR01M+250bps), 10/7/21 (a) (b) | | | 1,200 | | | | 1,199 | | |
BX Trust, Series 2019-OC11, Class A, 3.20%, 12/9/41 (a) | | | 598 | | | | 639 | | |
Citigroup Commercial Mortgage Trust, Series 2019-PRM, Class A, 3.34%,
5/10/36 (a) | | | 1,000 | | | | 1,066 | | |
Citigroup Commercial Mortgage Trust, Series 2020-GC46, Class AAB, 2.61%,
1/15/53, Callable 11/15/29 @ 100 | | | 648 | | | | 687 | | |
Citigroup Commercial Mortgage Trust, Series 2020-555, Class A, 2.65%,
12/10/41 (a) | | | 972 | | | | 995 | | |
COMM Mortgage Trust, Series 2019-GC44, Class ASB, 2.87%, 8/15/57,
Callable 5/15/29 @ 100 | | | 971 | | | | 1,044 | | |
COMM Mortgage Trust, Series 2014-277P, Class A, 3.61%, 8/10/49,
Callable 8/10/24 @ 100 (a) (c) | | | 661 | | | | 708 | | |
Credit Suisse Commercial Mortgage Trust, Series 2007-C1, Class AMFL,
0.29% (LIBOR01M+19bps), 2/15/40 (b) | | | 25 | | | | 25 | | |
CSAIL Commercial Mortgage Trust, Series 2016-C6, Class XA, 1.91%,
1/15/49, Callable 11/15/25 @ 100 (c) (d) | | | 10,278 | | | | 703 | | |
DBJPM Mortgage Trust, Series 2016-SFC, Class A, 2.83%, 8/10/36,
Callable 8/10/26 @ 100 (a) | | | 1,500 | | | | 1,542 | | |
GS Mortgage Securities Trust, Series 2020-GC45, Class AAB, 2.84%,
2/13/53, Callable 9/13/29 @ 100 | | | 347 | | | | 372 | | |
Manhattan West, Series 2020-1MW, Class A, 2.13%, 9/10/40 (a) | | | 414 | | | | 421 | | |
UBS Commercial Mortgage Trust, Series 2012-C1, Class XA, 2.05%,
5/10/45, Callable 4/10/22 @ 100 (a) (c) (d) | | | 11,021 | | | | 83 | | |
Total Collateralized Mortgage Obligations (Cost $11,510) | | | 10,460 | | |
Common Stocks (15.2%) | |
Communication Services (1.5%): | |
Alphabet, Inc. Class C (e) | | | 2,621 | | | | 6,321 | | |
AT&T, Inc. | | | 39,692 | | | | 1,168 | | |
Comcast Corp. Class A | | | 45,633 | | | | 2,617 | | |
Facebook, Inc. Class A (e) | | | 6,498 | | | | 2,136 | | |
Match Group, Inc. (e) | | | 6,125 | | | | 878 | | |
Pinterest, Inc. Class A (e) | | | 14,948 | | | | 976 | | |
Sirius XM Holdings, Inc. (f) | | | 142,069 | | | | 888 | | |
Snap, Inc. Class A (e) | | | 16,837 | | | | 1,046 | | |
Verizon Communications, Inc. | | | 43,836 | | | | 2,476 | | |
| | | | 18,506 | | |
See notes to financial statements.
9
USAA Mutual Funds Trust
USAA Cornerstone Moderate Fund | | Schedule of Portfolio Investments — continued
May 31, 2021 | |
(Amounts in Thousands, Except for Shares)
Security Description | | Shares | | Value | |
Consumer Discretionary (1.2%): | |
Aptiv PLC (e) | | | 6,270 | | | $ | 943 | | |
AutoZone, Inc. (e) | | | 608 | | | | 855 | | |
Best Buy Co., Inc. | | | 7,330 | | | | 852 | | |
eBay, Inc. | | | 16,006 | | | | 975 | | |
Ford Motor Co. (e) | | | 80,454 | | | | 1,169 | | |
General Motors Co. (e) | | | 17,001 | | | | 1,008 | | |
Lennar Corp. Class A | | | 8,758 | | | | 867 | | |
Lowe's Cos., Inc. | | | 10,797 | | | | 2,104 | | |
O'Reilly Automotive, Inc. (e) | | | 1,645 | | | | 880 | | |
Roku, Inc. (e) | | | 2,861 | | | | 992 | | |
Target Corp. (g) | | | 9,725 | | | | 2,207 | | |
Tesla, Inc. (e) | | | 2,487 | | | | 1,555 | | |
The Home Depot, Inc. | | | 4,330 | | | | 1,381 | | |
| | | | 15,788 | | |
Consumer Staples (1.0%): | |
Altria Group, Inc. | | | 61,731 | | | | 3,039 | | |
Archer-Daniels-Midland Co. | | | 14,277 | | | | 950 | | |
Colgate-Palmolive Co. | | | 11,843 | | | | 992 | | |
Keurig Dr Pepper, Inc. | | | 24,794 | | | | 917 | | |
Monster Beverage Corp. (e) | | | 10,311 | | | | 972 | | |
Philip Morris International, Inc. | | | 23,191 | | | | 2,236 | | |
The Clorox Co. | | | 4,926 | | | | 871 | | |
The Estee Lauder Cos., Inc. | | | 3,289 | | | | 1,008 | | |
Tyson Foods, Inc. Class A | | | 11,300 | | | | 898 | | |
Walgreens Boots Alliance, Inc. | | | 17,401 | | | | 916 | | |
| | | | 12,799 | | |
Energy (0.3%): | |
Chevron Corp. | | | 11,401 | | | | 1,183 | | |
ConocoPhillips | | | 35,530 | | | | 1,981 | | |
Marathon Petroleum Corp. | | | 15,683 | | | | 969 | | |
| | | | 4,133 | | |
Financials (2.0%): | |
AGNC Investment Corp. | | | 2,798 | | | | 52 | | |
Annaly Capital Management, Inc. | | | 7,018 | | | | 65 | | |
Aon PLC Class A | | | 3,696 | | | | 937 | | |
Berkshire Hathaway, Inc. Class B (e) | | | 5,362 | | | | 1,552 | | |
BlackRock, Inc. | | | 1,277 | | | | 1,120 | | |
Capital One Financial Corp. | | | 12,759 | | | | 2,051 | | |
Citigroup, Inc. | | | 15,315 | | | | 1,205 | | |
Fifth Third Bancorp | | | 21,853 | | | | 921 | | |
KeyCorp | | | 38,196 | | | | 880 | | |
MetLife, Inc. | | | 28,604 | | | | 1,870 | | |
Morgan Stanley | | | 24,930 | | | | 2,267 | | |
MSCI, Inc. | | | 1,897 | | | | 888 | | |
Prudential Financial, Inc. | | | 17,967 | | | | 1,922 | | |
S&P Global, Inc. | | | 2,605 | | | | 989 | | |
See notes to financial statements.
10
USAA Mutual Funds Trust
USAA Cornerstone Moderate Fund | | Schedule of Portfolio Investments — continued
May 31, 2021 | |
(Amounts in Thousands, Except for Shares)
Security Description | | Shares | | Value | |
SVB Financial Group (e) | | | 3,115 | | | $ | 1,816 | | |
T. Rowe Price Group, Inc. | | | 4,898 | | | | 937 | | |
The Allstate Corp. | | | 7,094 | | | | 969 | | |
The Goldman Sachs Group, Inc. | | | 5,884 | | | | 2,189 | | |
The Progressive Corp. | | | 9,189 | | | | 910 | | |
Wells Fargo & Co. | | | 25,687 | | | | 1,200 | | |
| | | | 24,740 | | |
Health Care (2.9%): | |
Abbott Laboratories | | | 10,385 | | | | 1,211 | | |
AbbVie, Inc. | | | 10,662 | | | | 1,207 | | |
Agilent Technologies, Inc. | | | 7,086 | | | | 979 | | |
Align Technology, Inc. (e) | | | 1,557 | | | | 919 | | |
Amgen, Inc. | | | 8,868 | | | | 2,110 | | |
Anthem, Inc. | | | 2,654 | | | | 1,057 | | |
Biogen, Inc. (e) | | | 6,897 | | | | 1,845 | | |
Bristol-Myers Squibb Co. | | | 17,521 | | | | 1,151 | | |
Cigna Corp. | | | 4,029 | | | | 1,043 | | |
CVS Health Corp. | | | 12,770 | | | | 1,104 | | |
Danaher Corp. | | | 4,481 | | | | 1,148 | | |
Eli Lilly & Co. | | | 5,808 | | | | 1,160 | | |
Gilead Sciences, Inc. (g) | | | 15,570 | | | | 1,029 | | |
HCA Healthcare, Inc. | | | 9,237 | | | | 1,984 | | |
IDEXX Laboratories, Inc. (e) | | | 3,399 | | | | 1,897 | | |
IQVIA Holdings, Inc. (e) | | | 4,027 | | | | 967 | | |
Johnson & Johnson (g) | | | 19,266 | | | | 3,261 | | |
Merck & Co., Inc. | | | 15,170 | | | | 1,151 | | |
Mettler-Toledo International, Inc. (e) | | | 1,414 | | | | 1,840 | | |
Pfizer, Inc. | | | 31,971 | | | | 1,238 | | |
Stryker Corp. | | | 4,011 | | | | 1,024 | | |
Thermo Fisher Scientific, Inc. | | | 2,535 | | | | 1,190 | | |
UnitedHealth Group, Inc. | | | 11,047 | | | | 4,550 | | |
Waters Corp. (e) | | | 2,801 | | | | 903 | | |
Zoetis, Inc. | | | 5,780 | | | | 1,021 | | |
| | | | 36,989 | | |
Industrials (1.6%): | |
3M Co. | | | 10,653 | | | | 2,163 | | |
Carrier Global Corp. | | | 21,161 | | | | 972 | | |
Caterpillar, Inc. | | | 4,653 | | | | 1,122 | | |
CSX Corp. | | | 9,886 | | | | 990 | | |
Cummins, Inc. | | | 3,605 | | | | 927 | | |
Deere & Co. | | | 2,751 | | | | 993 | | |
Eaton Corp. PLC | | | 13,235 | | | | 1,922 | | |
Fastenal Co. | | | 16,781 | | | | 890 | | |
General Dynamics Corp. | | | 4,975 | | | | 945 | | |
Illinois Tool Works, Inc. | | | 4,137 | | | | 959 | | |
Johnson Controls International PLC | | | 14,487 | | | | 964 | | |
Lockheed Martin Corp. | | | 5,348 | | | | 2,044 | | |
Northrop Grumman Corp. | | | 2,678 | | | | 980 | | |
Otis Worldwide Corp. | | | 11,668 | | | | 914 | | |
See notes to financial statements.
11
USAA Mutual Funds Trust
USAA Cornerstone Moderate Fund | | Schedule of Portfolio Investments — continued
May 31, 2021 | |
(Amounts in Thousands, Except for Shares)
Security Description | | Shares | | Value | |
PACCAR, Inc. | | | 9,862 | | | $ | 903 | | |
Rockwell Automation, Inc. | | | 3,299 | | | | 870 | | |
Trane Technologies PLC | | | 5,164 | | | | 963 | | |
W.W. Grainger, Inc. | | | 1,932 | | | | 893 | | |
| | | | 20,414 | | |
Information Technology (3.5%): | |
Accenture PLC Class A | | | 3,991 | | | | 1,126 | | |
Adobe, Inc. (e) | | | 2,516 | | | | 1,270 | | |
Apple, Inc. | | | 69,010 | | | | 8,599 | | |
Applied Materials, Inc. | | | 15,752 | | | | 2,176 | | |
Broadcom, Inc. | | | 5,159 | | | | 2,437 | | |
Cadence Design Systems, Inc. (e) | | | 7,214 | | | | 916 | | |
CDW Corp. | | | 5,104 | | | | 844 | | |
Cisco Systems, Inc. | | | 46,804 | | | | 2,476 | | |
Cognizant Technology Solutions Corp. Class A | | | 12,667 | | | | 906 | | |
HP, Inc. | | | 80,563 | | | | 2,355 | | |
Intel Corp. | | | 21,583 | | | | 1,233 | | |
International Business Machines Corp. | | | 7,584 | | | | 1,090 | | |
Intuit, Inc. | | | 2,536 | | | | 1,114 | | |
Lam Research Corp. | | | 3,172 | | | | 2,061 | | |
Mastercard, Inc. Class A | | | 3,707 | | | | 1,337 | | |
Micron Technology, Inc. (e) | | | 11,383 | | | | 958 | | |
Microsoft Corp. (g) | | | 15,297 | | | | 3,819 | | |
NVIDIA Corp. | | | 2,462 | | | | 1,600 | | |
NXP Semiconductors NV | | | 4,732 | | | | 1,000 | | |
Oracle Corp. | | | 14,029 | | | | 1,105 | | |
Square, Inc. Class A (e) | | | 4,226 | | | | 940 | | |
TE Connectivity Ltd. | | | 6,822 | | | | 926 | | |
Texas Instruments, Inc. | | | 12,138 | | | | 2,304 | | |
VeriSign, Inc. (e) | | | 4,010 | | | | 882 | | |
VMware, Inc. Class A (e) (f) | | | 5,550 | | | | 876 | | |
| | | | 44,350 | | |
Materials (0.4%): | |
Dow, Inc. | | | 14,294 | | | | 978 | | |
International Paper Co. | | | 14,832 | | | | 936 | | |
LyondellBasell Industries NV Class A | | | 8,237 | | | | 927 | | |
PPG Industries, Inc. | | | 5,162 | | | | 928 | | |
The Sherwin-Williams Co. | | | 3,410 | | | | 967 | | |
| | | | 4,736 | | |
Real Estate (0.4%): | |
Alexandria Real Estate Equities, Inc. | | | 636 | | | | 113 | | |
American Tower Corp. | | | 2,224 | | | | 568 | | |
AvalonBay Communities, Inc. | | | 708 | | | | 147 | | |
Boston Properties, Inc. | | | 747 | | | | 88 | | |
Camden Property Trust | | | 487 | | | | 61 | | |
CBRE Group, Inc. Class A (e) | | | 1,679 | | | | 147 | | |
Crown Castle International Corp. | | | 2,209 | | | | 419 | | |
Digital Realty Trust, Inc. | | | 1,370 | | | | 208 | | |
See notes to financial statements.
12
USAA Mutual Funds Trust
USAA Cornerstone Moderate Fund | | Schedule of Portfolio Investments — continued
May 31, 2021 | |
(Amounts in Thousands, Except for Shares)
Security Description | | Shares | | Value | |
Duke Realty Corp. | | | 1,869 | | | $ | 87 | | |
Equinix, Inc. | | | 447 | | | | 329 | | |
Equity LifeStyle Properties, Inc. | | | 879 | | | | 62 | | |
Equity Residential | | | 1,868 | | | | 145 | | |
Essex Property Trust, Inc. | | | 327 | | | | 97 | | |
Extra Space Storage, Inc. | | | 661 | | | | 99 | | |
Gaming and Leisure Properties, Inc. | | | 32 | | | | 1 | | |
Healthpeak Properties, Inc. | | | 2,671 | | | | 89 | | |
Host Hotels & Resorts, Inc. (e) | | | 3,450 | | | | 59 | | |
Invitation Homes, Inc. | | | 2,844 | | | | 103 | | |
Iron Mountain, Inc. | | | 1,461 | | | | 64 | | |
Medical Properties Trust, Inc. | | | 2,885 | | | | 61 | | |
Mid-America Apartment Communities, Inc. | | | 574 | | | | 92 | | |
Omega Healthcare Investors, Inc. | | | 1,149 | | | | 42 | | |
Prologis, Inc. | | | 3,724 | | | | 439 | | |
Public Storage | | | 803 | | | | 227 | | |
Realty Income Corp. | | | 1,755 | | | | 120 | | |
Regency Centers Corp. | | | 861 | | | | 56 | | |
SBA Communications Corp. | | | 560 | | | | 167 | | |
Simon Property Group, Inc. | | | 1,694 | | | | 218 | | |
Sun Communities, Inc. | | | 501 | | | | 84 | | |
UDR, Inc. | | | 1,487 | | | | 71 | | |
Ventas, Inc. | | | 1,882 | | | | 104 | | |
VEREIT, Inc. | | | 1,080 | | | | 51 | | |
VICI Properties, Inc. | | | 2,668 | | | | 83 | | |
Vornado Realty Trust | | | 808 | | | | 38 | | |
Welltower, Inc. | | | 2,095 | | | | 157 | | |
Weyerhaeuser Co. | | | 3,701 | | | | 140 | | |
WP Carey, Inc. | | | 880 | | | | 66 | | |
| | | | 5,102 | | |
Utilities (0.4%): | |
Exelon Corp. | | | 21,418 | | | | 966 | | |
NextEra Energy, Inc. (g) | | | 15,118 | | | | 1,107 | | |
NRG Energy, Inc. | | | 24,722 | | | | 795 | | |
The AES Corp. | | | 67,180 | | | | 1,707 | | |
| | | | 4,575 | | |
Total Common Stocks (Cost $146,639) | | | 192,132 | | |
Preferred Stocks (0.5%) | |
Communication Services (0.2%): | |
| Qwest Corp., 6.50%, 9/1/56 | | | 112,000 | | | | 2,839 | | |
Financials (0.3%): | |
Delphi Financial Group, Inc., 3.35% (LIBOR03M+319bps), 5/15/37 (b) (h) | | | 167,198 | | | | 3,720 | | |
Total Preferred Stocks (Cost $6,862) | | | 6,559 | | |
See notes to financial statements.
13
USAA Mutual Funds Trust
USAA Cornerstone Moderate Fund | | Schedule of Portfolio Investments — continued
May 31, 2021 | |
(Amounts in Thousands, Except for Shares)
Security Description | | Principal
Amount | | Value | |
Corporate Bonds (10.7%) | |
Communication Services (0.2%): | |
Fox Corp., 3.05%, 4/7/25, Callable 3/7/25 @ 100 | | $ | 462 | | | $ | 495 | | |
The Walt Disney Co., 2.20%, 1/13/28 | | | 437 | | | | 450 | | |
T-Mobile USA, Inc., 3.88%, 4/15/30, Callable 1/15/30 @ 100 (f) | | | 1,174 | | | | 1,287 | | |
| | | | 2,232 | | |
Consumer Discretionary (0.2%): | |
AutoNation, Inc., 4.75%, 6/1/30, Callable 3/1/30 @ 100 | | | 394 | | | | 464 | | |
Hasbro, Inc., 3.55%, 11/19/26, Callable 9/19/26 @ 100 | | | 777 | | | | 852 | | |
Nordstrom, Inc., 4.38%, 4/1/30, Callable 1/1/30 @ 100 (f) | | | 648 | | | | 666 | | |
O'Reilly Automotive, Inc., 4.20%, 4/1/30, Callable 1/1/30 @ 100 | | | 500 | | | | 570 | | |
VF Corp., 2.95%, 4/23/30, Callable 1/23/30 @ 100 | | | 488 | | | | 511 | | |
| | | | 3,063 | | |
Consumer Staples (0.6%): | |
Anheuser-Busch Cos. LLC/Anheuser-Busch InBev Worldwide, Inc., 4.70%,
2/1/36, Callable 8/1/35 @ 100 | | | 1,619 | | | | 1,931 | | |
Kraft Heinz Foods Co., 3.75%, 4/1/30, Callable 1/1/30 @ 100 | | | 728 | | | | 780 | | |
McCormick & Co., Inc., 2.50%, 4/15/30, Callable 1/15/30 @ 100 | | | 284 | | | | 288 | | |
Mondelez International, Inc., 2.75%, 4/13/30, Callable 1/13/30 @ 100 | | | 250 | | | | 259 | | |
PepsiCo, Inc., 2.25%, 3/19/25, Callable 2/19/25 @ 100 | | | 1,505 | | | | 1,593 | | |
Sysco Corp., 5.95%, 4/1/30, Callable 1/1/30 @ 100 | | | 379 | | | | 484 | | |
The Coca-Cola Co., 2.00%, 3/5/31 (f) | | | 500 | | | | 497 | | |
Unilever Capital Corp., 2.60%, 5/5/24, Callable 3/5/24 @ 100 | | | 1,500 | | | | 1,592 | | |
| | | | 7,424 | | |
Energy (1.4%): | |
Cameron LNG LLC, 3.30%, 1/15/35, Callable 9/15/34 @ 100 (a) | | | 1,237 | | | | 1,300 | | |
Enable Midstream Partners LP, 4.15%, 9/15/29, Callable 6/15/29 @ 100 | | | 1,500 | | | | 1,616 | | |
Enbridge Energy Partners LP, 7.38%, 10/15/45, Callable 4/15/45 @ 100 (g) | | | 2,950 | | | | 4,495 | | |
Enterprise Products Operating LLC, 2.80%, 1/31/30, Callable
10/31/29 @ 100 (f) | | | 972 | | | | 1,013 | | |
Enterprise TE Partners LP, 2.97% (LIBOR03M+278bps), 6/1/67,
Callable 7/12/21 @ 100 (b) | | | 2,500 | | | | 2,075 | | |
Exxon Mobil Corp., 2.99%, 3/19/25, Callable 2/19/25 @ 100 (g) | | | 1,618 | | | | 1,747 | | |
Florida Gas Transmission Co. LLC, 2.55%, 7/1/30, Callable 4/1/30 @ 100 (a) | | | 412 | | | | 413 | | |
Marathon Petroleum Corp., 4.70%, 5/1/25, Callable 4/1/25 @ 100 | | | 458 | | | | 519 | | |
Midwest Connector Capital Co. LLC, 4.63%, 4/1/29, Callable 1/1/29 @ 100 (a) | | | 991 | | | | 1,042 | | |
National Oilwell Varco, Inc., 3.60%, 12/1/29, Callable 9/1/29 @ 100 | | | 1,295 | | | | 1,350 | | |
Occidental Petroleum Corp.
3.50%, 8/15/29, Callable 5/15/29 @ 100 | | | 209 | | | | 196 | | |
4.40%, 8/15/49, Callable 2/15/49 @ 100 | | | 648 | | | | 548 | | |
ONEOK, Inc., 6.35%, 1/15/31, Callable 10/15/30 @ 100 | | | 404 | | | | 513 | | |
Targa Resources Partners LP/Targa Resources Partners Finance Corp.,
5.50%, 3/1/30, Callable 3/1/25 @ 102.75 | | | 648 | | | | 700 | | |
Western Midstream Operating LP, 4.35%, 2/1/25, Callable 1/1/25 @ 100 | | | 682 | | | | 714 | | |
| | | | 18,241 | | |
See notes to financial statements.
14
USAA Mutual Funds Trust
USAA Cornerstone Moderate Fund | | Schedule of Portfolio Investments — continued
May 31, 2021 | |
(Amounts in Thousands, Except for Shares)
Security Description | | Principal
Amount | | Value | |
Financials (4.0%): | |
AmTrust Financial Services, Inc., 6.13%, 8/15/23 | | $ | 1,921 | | | $ | 1,951 | | |
Ares Capital Corp., 3.63%, 1/19/22, Callable 12/19/21 @ 100 (f) (g) | | | 1,600 | | | | 1,626 | | |
Assurant, Inc., 3.70%, 2/22/30, Callable 11/22/29 @ 100 | | | 1,154 | | | | 1,241 | | |
BancorpSouth Bank, 4.13% (LIBOR03M+247bps), 11/20/29, Callable
11/20/24 @ 100 (b) | | | 833 | | | | 859 | | |
BBVA USA, 3.88%, 4/10/25, Callable 3/10/25 @ 100 | | | 2,000 | | | | 2,201 | | |
Belrose Funding Trust, 2.33%, 8/15/30, Callable 5/15/30 @ 100 (a) | | | 994 | | | | 967 | | |
Citizens Financial Group, Inc., 2.50%, 2/6/30, Callable 11/6/29 @ 100 | | | 972 | | | | 988 | | |
Cullen/Frost Capital Trust II, 1.74% (LIBOR03M+155bps), 3/1/34, Callable
7/12/21 @ 100 (b) | | | 4,000 | | | | 3,843 | | |
First Horizon Bank, 5.75%, 5/1/30, Callable 2/1/30 @ 100 | | | 488 | | | | 598 | | |
First Maryland Capital I, 1.18% (LIBOR03M+100bps), 1/15/27, Callable
7/12/21 @ 100 (b) | | | 2,850 | | | | 2,722 | | |
Glencore Funding LLC, 2.50%, 9/1/30, Callable 6/1/30 @ 100 (a) | | | 1,159 | | | | 1,137 | | |
Global Atlantic Financial Co., 4.40%, 10/15/29, Callable 7/15/29 @ 100 (a) | | | 832 | | | | 896 | | |
HSB Group, Inc., 1.09% (LIBOR03M+91bps), 7/15/27, Callable
7/12/21 @ 100 (b) | | | 2,575 | | | | 2,337 | | |
Hyundai Capital America, 3.75%, 7/8/21 (a) (g) | | | 3,250 | | | | 3,260 | | |
JPMorgan Chase & Co., 2.52% (SOFR+204bps), 4/22/31, Callable
4/22/30 @ 100 (b) | | | 569 | | | | 578 | | |
KeyCorp, 2.25%, 4/6/27, MTN | | | 972 | | | | 1,012 | | |
Level 3 Financing, Inc., 3.88%, 11/15/29, Callable 8/15/29 @ 100 (a) | | | 1,295 | | | | 1,376 | | |
Loews Corp., 3.20%, 5/15/30, Callable 2/15/30 @ 100 | | | 654 | | | | 702 | | |
Nationwide Mutual Insurance Co., 2.47% (LIBOR03M+229bps), 12/15/24,
Callable 7/12/21 @ 100 (a) (b) | | | 5,670 | | | | 5,651 | | |
New York Community Bancorp, Inc., 5.90% (LIBOR03M+278bps), 11/6/28,
Callable 11/6/23 @ 100 (b) (f) | | | 249 | | | | 269 | | |
Pinnacle Financial Partners, Inc., 4.13% (LIBOR03M+278bps), 9/15/29,
Callable 9/15/24 @ 100 (b) | | | 1,000 | | | | 991 | | |
PPL Capital Funding, Inc., 4.13%, 4/15/30, Callable 1/15/30 @ 100 | | | 647 | | | | 734 | | |
Prudential Financial, Inc., 5.63% (LIBOR03M+392bps), 6/15/43, Callable
6/15/23 @ 100 (b) | | | 2,800 | | | | 3,027 | | |
Regions Financial Corp., 2.25%, 5/18/25, Callable 4/18/25 @ 100 | | | 737 | | | | 772 | | |
Santander Holdings USA, Inc., 3.45%, 6/2/25, Callable 5/2/25 @ 100 | | | 412 | | | | 444 | | |
Signature Bank, 4.13% (LIBOR03M+256bps), 11/1/29, Callable
11/1/24 @ 100 (b) | | | 2,600 | | | | 2,692 | | |
Texas Capital Bank NA, 5.25%, 1/31/26 | | | 647 | | | | 694 | | |
The Progressive Corp., 3.20%, 3/26/30, Callable 12/26/29 @ 100 | | | 194 | | | | 211 | | |
Toyota Motor Credit Corp., 3.38%, 4/1/30, MTN | | | 714 | | | | 789 | | |
Truist Bank, 0.83% (LIBOR03M+67bps), 5/15/27, Callable 7/12/21 @ 100 (b) | | | 6,000 | | | | 5,827 | | |
Wells Fargo & Co., 2.19% (SOFR+200bps), 4/30/26, Callable 4/30/25 @ 100 (b) | | | 733 | | | | 765 | | |
| | | | 51,160 | | |
Health Care (0.6%): | |
AbbVie, Inc., 3.20%, 11/21/29, Callable 8/21/29 @ 100 | | | 1,295 | | | | 1,392 | | |
Commonspirit Health, 3.35%, 10/1/29, Callable 4/1/29 @ 100 | | | 1,000 | | | | 1,074 | | |
CVS Health Corp., 3.25%, 8/15/29, Callable 5/15/29 @ 100 (g) | | | 1,998 | | | | 2,151 | | |
DENTSPLY SIRONA, Inc., 3.25%, 6/1/30, Callable 3/1/30 @ 100 | | | 738 | | | | 780 | | |
Duke University Health System, Inc., 2.60%, 6/1/30 | | | 485 | | | | 502 | | |
HCA, Inc., 5.13%, 6/15/39, Callable 12/15/38 @ 100 | | | 1,619 | | | | 1,979 | | |
See notes to financial statements.
15
USAA Mutual Funds Trust
USAA Cornerstone Moderate Fund | | Schedule of Portfolio Investments — continued
May 31, 2021 | |
(Amounts in Thousands, Except for Shares)
Security Description | | Principal
Amount | | Value | |
Upjohn, Inc., 2.30%, 6/22/27, Callable 4/22/27 @ 100 (a) | | $ | 248 | | | $ | 253 | | |
| | | | 8,131 | | |
Industrials (1.5%): | |
BNSF Funding Trust, 6.61% (LIBOR03M+235bps), 12/15/55, Callable
1/15/26 @ 100 (b) | | | 3,000 | | | | 3,430 | | |
Carlisle Cos., Inc., 2.75%, 3/1/30, Callable 12/1/29 @ 100 | | | 972 | | | | 998 | | |
Carrier Global Corp., 3.38%, 4/5/40, Callable 10/5/39 @ 100 | | | 486 | | | | 496 | | |
Caterpillar, Inc., 2.60%, 4/9/30, Callable 1/9/30 @ 100 | | | 486 | | | | 511 | | |
CoStar Group, Inc., 2.80%, 7/15/30, Callable 4/15/30 @ 100 (a) | | | 222 | | | | 222 | | |
Dover Corp., 2.95%, 11/4/29, Callable 8/4/29 @ 100 | | | 971 | | | | 1,034 | | |
Georgia-Pacific LLC, 2.10%, 4/30/27, Callable 2/28/27 @ 100 (a) | | | 1,140 | | | | 1,182 | | |
Hillenbrand, Inc., 5.00%, 9/15/26, Callable 7/15/26 @ 100 (g) | | | 1,500 | | | | 1,665 | | |
IDEX Corp., 3.00%, 5/1/30, Callable 2/1/30 @ 100 | | | 1,140 | | | | 1,191 | | |
Otis Worldwide Corp., 3.11%, 2/15/40, Callable 8/15/39 @ 100 | | | 648 | | | | 654 | | |
Penske Truck Leasing Co. LP/PTL Finance Corp., 4.00%, 7/15/25,
Callable 6/15/25 @ 100 (a) | | | 647 | | | | 716 | | |
Ryder System, Inc., 2.90%, 12/1/26, MTN, Callable 10/1/26 @ 100 | | | 1,618 | | | | 1,737 | | |
Southwest Airlines Co., 5.13%, 6/15/27, Callable 4/15/27 @ 100 | | | 526 | | | | 616 | | |
The Boeing Co., 5.71%, 5/1/40, Callable 11/1/39 @ 100 | | | 979 | | | | 1,223 | | |
The Conservation Fund A Nonprofit Corp., 3.47%, 12/15/29, Callable
9/15/29 @ 100 | | | 1,300 | | | | 1,367 | | |
United Airlines Pass Through Trust, 2.90%, 11/1/29 | | | 1,434 | | | | 1,398 | | |
| | | | 18,440 | | |
Information Technology (0.4%): | |
Amphenol Corp., 2.80%, 2/15/30, Callable 11/15/29 @ 100 | | | 1,500 | | | | 1,558 | | |
HP, Inc., 3.40%, 6/17/30, Callable 3/17/30 @ 100 | | | 743 | | | | 793 | | |
Jabil, Inc., 3.00%, 1/15/31, Callable 10/15/30 @ 100 | | | 222 | | | | 226 | | |
Microsoft Corp., 3.45%, 8/8/36, Callable 2/8/36 @ 100 | | | 2,105 | | | | 2,363 | | |
| | | | 4,940 | | |
Materials (0.2%): | |
Avery Dennison Corp., 2.65%, 4/30/30, Callable 2/1/30 @ 100 | | | 389 | | | | 397 | | |
Colonial Enterprises, Inc., 3.25%, 5/15/30, Callable 2/15/30 @ 100 (a) | | | 204 | | | | 219 | | |
LYB International Finance III LLC, 3.38%, 5/1/30, Callable 2/1/30 @ 100 | | | 569 | | | | 612 | | |
Vulcan Materials Co., 3.50%, 6/1/30, Callable 3/1/30 @ 100 | | | 654 | | | | 716 | | |
WRKCo, Inc., 3.00%, 6/15/33, Callable 3/15/33 @ 100 (g) | | | 373 | | | | 387 | | |
| | | | 2,331 | | |
Real Estate (0.7%): | |
AvalonBay Communities, Inc., 2.45%, 1/15/31, MTN, Callable
10/15/30 @ 100 | | | 983 | | | | 993 | | |
Boston Properties LP, 3.25%, 1/30/31, Callable 10/30/30 @ 100 | | | 428 | | | | 451 | | |
Essex Portfolio LP, 2.65%, 3/15/32, Callable 12/15/31 @ 100 | | | 1,134 | | | | 1,133 | | |
GLP Capital LP/GLP Financing II, Inc., 4.00%, 1/15/31, Callable
10/15/30 @ 100 | | | 249 | | | | 264 | | |
Host Hotels & Resorts LP, 3.50%, 9/15/30, Callable 6/15/30 @ 100 | | | 206 | | | | 212 | | |
Lexington Realty Trust, 4.25%, 6/15/23, Callable 3/15/23 @ 100 | | | 1,400 | | | | 1,480 | | |
Mid-America Apartments LP, 2.75%, 3/15/30, Callable 12/15/29 @ 100 | | | 1,619 | | | | 1,665 | | |
Sabra Health Care LP, 5.13%, 8/15/26, Callable 5/15/26 @ 100 | | | 1,000 | | | | 1,123 | | |
SBA Tower Trust, 2.84%, 1/15/25 (a) | | | 692 | | | | 725 | | |
See notes to financial statements.
16
USAA Mutual Funds Trust
USAA Cornerstone Moderate Fund | | Schedule of Portfolio Investments — continued
May 31, 2021 | |
(Amounts in Thousands, Except for Shares)
Security Description | | Principal
Amount | | Value | |
VICI Properties LP/VICI Note Co., Inc., 4.63%, 12/1/29, Callable
12/1/24 @ 102.31 (a) | | $ | 149 | | | $ | 156 | | |
| | | | 8,202 | | |
Utilities (0.9%): | |
AEP Texas, Inc., 3.45%, 1/15/50, Callable 7/15/49 @ 100 | | | 1,133 | | | | 1,137 | | |
Alabama Power Co., 3.85%, 12/1/42 | | | 971 | | | | 1,082 | | |
Ameren Corp., 3.50%, 1/15/31, Callable 10/15/30 @ 100 | | | 323 | | | | 351 | | |
CenterPoint Energy, Inc., 2.50%, 9/1/24, Callable 8/1/24 @ 100 | | | 2,000 | | | | 2,104 | | |
Duke Energy Florida LLC, 3.85%, 11/15/42, Callable 5/15/42 @ 100 | | | 971 | | | | 1,093 | | |
Exelon Generation Co. LLC, 3.25%, 6/1/25, Callable 5/1/25 @ 100 | | | 737 | | | | 795 | | |
IPALCO Enterprises, Inc., 4.25%, 5/1/30, Callable 2/1/30 @ 100 | | | 738 | | | | 824 | | |
ITC Holdings Corp., 2.95%, 5/14/30, Callable 2/14/30 @ 100 (a) | | | 737 | | | | 768 | | |
National Fuel Gas Co., 5.50%, 1/15/26, Callable 12/15/25 @ 100 | | | 984 | | | | 1,144 | | |
Union Electric Co., 2.95%, 3/15/30, Callable 12/15/29 @ 100 | | | 1,618 | | | | 1,716 | | |
| | | | 11,014 | | |
Total Corporate Bonds (Cost $127,166) | | | 135,178 | | |
Yankee Dollars (1.1%) | |
Consumer Staples (0.1%): | |
Alimentation Couche-Tard, Inc., 2.95%, 1/25/30, Callable 10/25/29 @ 100 (a) | | | 648 | | | | 668 | | |
Energy (0.0%):(i) | |
Petroleos Mexicanos, 6.49%, 1/23/27, Callable 11/23/26 @ 100 | | | 554 | | | | 592 | | |
Financials (0.4%): | |
Banco Santander Mexico SA Institucion de Banca Multiple Grupo
Financiero Santand, 5.38%, 4/17/25 (a) | | | 464 | | | | 527 | | |
Barclays PLC, 2.85% (LIBOR03M+245bps), 5/7/26, Callable 5/7/25 @ 100 (b) | | | 979 | | | | 1,038 | | |
Deutsche Bank AG, 3.96% (SOFR+258bps), 11/26/25,
Callable 11/26/24 @ 100 (b) | | | 972 | | | | 1,056 | | |
Diageo Capital PLC, 2.13%, 4/29/32, Callable 1/29/32 @ 100 | | | 1,140 | | | | 1,124 | | |
Royal Bank of Canada, 1.60%, 4/17/23, MTN | | | 1,138 | | | | 1,166 | | |
| | | | 4,911 | | |
Industrials (0.3%): | |
BAE Systems PLC, 3.40%, 4/15/30, Callable 1/15/30 @ 100 (a) | | | 750 | | | | 805 | | |
CK Hutchison International 19 II Ltd., 2.75%, 9/6/29, Callable 6/6/29 @ 100 (a) | | | 1,500 | | | | 1,546 | | |
Ferguson Finance PLC, 3.25%, 6/2/30, Callable 3/2/30 @ 100 (a) | | | 444 | | | | 475 | | |
Heathrow Funding Ltd., 4.88%, 7/15/21 (a) | | | 650 | | | | 653 | | |
| | | | 3,479 | | |
Materials (0.3%): | |
Anglo American Capital PLC, 5.63%, 4/1/30, Callable 1/1/30 @ 100 (a) | | | 606 | | | | 737 | | |
Braskem Netherlands Finance BV, 4.50%, 1/31/30 (a) | | | 971 | | | | 1,010 | | |
CCL Industries, Inc., 3.05%, 6/1/30, Callable 3/1/30 @ 100 (a) | | | 739 | | | | 765 | | |
Teck Resources Ltd., 6.13%, 10/1/35 | | | 1,038 | | | | 1,303 | | |
| | | | 3,815 | | |
Total Yankee Dollars (Cost $12,707) | | | 13,465 | | |
See notes to financial statements.
17
USAA Mutual Funds Trust
USAA Cornerstone Moderate Fund | | Schedule of Portfolio Investments — continued
May 31, 2021 | |
(Amounts in Thousands, Except for Shares)
Security Description | | Principal
Amount | | Value | |
Municipal Bonds (0.8%) | |
Arizona (0.0%): (i) | |
City of Phoenix Civic Improvement Corp. Revenue, 1.26%, 7/1/27 | | $ | 500 | | | $ | 496 | | |
Florida (0.1%): | |
County of Broward Florida Airport System Revenue, Series C, 2.50%, 10/1/28 | | | 648 | | | | 679 | | |
Louisiana (0.1%): | |
Louisiana Local Government Environmental Facilities & Community
Development Authority Revenue, 1.55%, 2/1/27 | | | 665 | | | | 668 | | |
New Jersey (0.1%): | |
North Hudson Sewerage Authority Revenue, 2.88%, 6/1/28 | | | 324 | | | | 345 | | |
Rutgers The State University of New Jersey Revenue, Series S, 2.01%, 5/1/32 | | | 415 | | | | 398 | | |
| | | | 743 | | |
New York (0.0%): (i) | |
New York State Thruway Authority Revenue, Series M, 2.55%, 1/1/28 | | | 373 | | | | 396 | | |
Pennsylvania (0.2%): | |
State Public School Building Authority Revenue, 3.05%, 4/1/28 | | | 647 | | | | 651 | | |
University of Pittsburgh-of The Commonwealth System of
Higher Education Revenue
Series C, 2.53%, 9/15/31 | | | 645 | | | | 672 | | |
Series C, 2.58%, 9/15/32 | | | 325 | | | | 338 | | |
Series C, 2.63%, 9/15/33 | | | 645 | | | | 670 | | |
| | | | 2,331 | | |
Texas (0.3%): | |
City of Houston Texas Combined Utility System Revenue, 3.72%, 11/15/28 | | | 810 | | | | 937 | | |
City of San Antonio Texas, GO, 1.76%, 2/1/31, Continuously Callable @100 | | | 620 | | | | 618 | | |
Dallas Fort Worth International Airport Revenue, Series C, 1.75%, 11/1/27 | | | 415 | | | | 421 | | |
Harris County Cultural Education Facilities Finance Corp. Revenue,
Series B, 2.81%, 5/15/29 | | | 645 | | | | 676 | | |
State of Texas, GO, 3.00%, 4/1/28 | | | 972 | | | | 1,074 | | |
Waco Educational Finance Corp. Revenue, 1.38%, 3/1/26 | | | 575 | | | | 582 | | |
| | | | 4,308 | | |
Total Municipal Bonds (Cost $9,325) | | | 9,621 | | |
U.S. Government Agency Mortgages (2.8%) | |
Federal Home Loan Mortgage Corporation
Series K047, Class A2, 3.33%, 5/25/25 (c) | | | 5,200 | | | | 5,703 | | |
3.50%, 4/1/46-4/1/48 | | | 5,133 | | | | 5,448 | | |
3.00%, 6/1/46-8/1/47 | | | 22,600 | | | | 23,772 | | |
| | | | 34,923 | | |
Federal National Mortgage Association
Series 2016-M2, Class AV2, 2.15%, 1/25/23 | | | 1,160 | | | | 1,174 | | |
Total U.S. Government Agency Mortgages (Cost $34,396) | | | 36,097 | | |
See notes to financial statements.
18
USAA Mutual Funds Trust
USAA Cornerstone Moderate Fund | | Schedule of Portfolio Investments — continued
May 31, 2021 | |
(Amounts in Thousands, Except for Shares)
Security Description | | Shares or
Principal
Amount | | Value | |
U.S. Treasury Obligations (6.8%) | |
U.S. Treasury Bonds
3.13%, 8/15/44 | | $ | 8,600 | | | $ | 10,018 | | |
3.00%, 11/15/44 | | | 6,000 | | | | 6,847 | | |
2.38%, 11/15/49 | | | 5,000 | | | | 5,115 | | |
U.S. Treasury Notes
1.63%, 11/15/22 | | | 10,000 | | | | 10,221 | | |
1.63%, 4/30/23 | | | 14,658 | | | | 15,073 | | |
2.25%, 11/15/25 | | | 5,000 | | | | 5,350 | | |
1.63%, 2/15/26 | | | 20,000 | | | | 20,833 | | |
2.25%, 2/15/27 | | | 3,500 | | | | 3,751 | | |
2.38%, 5/15/29 | | | 7,850 | | | | 8,438 | | |
Total U.S. Treasury Obligations (Cost $80,712) | | | 85,646 | | |
Commercial Paper (0.4%) | |
Duke Energy Corp., 0.48%, 6/1/21 (a) (j) | | | 1,400 | | | | 1,400 | | |
Eaton Corp., 0.23%, 6/4/21 (a) (j) | | | 250 | | | | 250 | | |
Phillips 66, 6/2/21 (a) (j) | | | 2,300 | | | | 2,300 | | |
PPL Electric Utilities Corp., 0.56%, 6/1/21 (a) (j) | | | 1,400 | | | | 1,400 | | |
Total Commercial Paper (Cost $5,350) | | | 5,350 | | |
Exchange-Traded Funds (45.9%) | |
Invesco DB Commodity Index Tracking Fund (e) | | | 114,500 | | | | 2,130 | | |
Invesco FTSE RAFI Developed Markets ex-US ETF (f) | | | 335,920 | | | | 16,608 | | |
Invesco FTSE RAFI Emerging Markets ETF (f) | | | 686,690 | | | | 16,247 | | |
iShares 7-10 Year Treasury Bond ETF (f) | | | 133,366 | | | | 15,257 | | |
iShares Core MSCI EAFE ETF | | | 230,665 | | | | 17,715 | | |
iShares Core MSCI Emerging Markets ETF | | | 599,871 | | | | 39,981 | | |
iShares Core S&P 500 ETF | | | 224,441 | | | | 94,636 | | |
iShares Core S&P Small-Cap ETF | | | 279,776 | | | | 31,573 | | |
iShares Core US Aggregate Bond ETF | | | 424,552 | | | | 48,632 | | |
iShares MSCI Canada ETF (f) | | | 269,929 | | | | 10,222 | | |
iShares MSCI International Momentum Factor ETF | | | 314,978 | | | | 12,505 | | |
iShares MSCI International Quality Factor ETF (f) | | | 338,816 | | | | 13,353 | | |
iShares Russell 2000 ETF (f) | | | 28,266 | | | | 6,374 | | |
JPMorgan BetaBuilders Canada ETF | | | 56,001 | | | | 3,675 | | |
Schwab Fundamental Emerging Markets Large Co. Index ETF (f) | | | 920,892 | | | | 29,837 | | |
Schwab Fundamental International Large Co. Index ETF | | | 1,549,839 | | | | 53,051 | | |
Schwab Fundamental International Small Co. Index ETF | | | 266,700 | | | | 10,641 | | |
SPDR Gold Shares (e) | | | 16,344 | | | | 2,915 | | |
SPDR S&P Emerging Markets SmallCap ETF | | | 34,497 | | | | 2,051 | | |
U.S. Oil Fund LP (e) (f) | | | 49,426 | | | | 2,245 | | |
Vanguard FTSE All-World ex-US ETF | | | 307,282 | | | | 19,731 | | |
Vanguard FTSE Developed Markets ETF | | | 943,990 | | | | 49,484 | | |
Vanguard FTSE Emerging Markets ETF (f) (g) | | | 47,000 | | | | 2,532 | | |
Vanguard FTSE Europe ETF | | | 107,025 | | | | 7,379 | | |
Vanguard Real Estate ETF (f) | | | 55,850 | | | | 5,578 | | |
See notes to financial statements.
19
USAA Mutual Funds Trust
USAA Cornerstone Moderate Fund | | Schedule of Portfolio Investments — continued
May 31, 2021 | |
(Amounts in Thousands, Except for Shares)
Security Description | | Shares | | Value | |
Vanguard S&P 500 ETF (g) | | | 60,958 | | | $ | 23,538 | | |
Vanguard Short-Term Bond ETF | | | 78,165 | | | | 6,441 | | |
Vanguard Short-Term Corporate Bond ETF (e) | | | 73,962 | | | | 6,129 | | |
Vanguard Total Bond Market ETF | | | 175,441 | | | | 14,958 | | |
Vanguard Total Stock Market ETF (g) | | | 41,524 | | | | 9,056 | | |
Wisdom Tree Trust — WisdomTree Emerging Markets SmallCap Dividend
Fund | | | 59,797 | | | | 3,230 | | |
Xtrackers USD High Yield Corporate Bond ETF (f) | | | 97,710 | | | | 3,907 | | |
Total Exchange-Traded Funds (Cost $456,545) | | | 581,611 | | |
Affiliated Exchange-Traded Funds (13.2%) | |
VictoryShares USAA Core Intermediate-Term Bond ETF | | | 2,742,000 | | | | 146,328 | | |
VictoryShares USAA Core Short-Term Bond ETF | | | 341,251 | | | | 17,709 | | |
VictoryShares USAA MSCI Emerging Markets Value Momentum ETF (g) | | | 51,500 | | | | 2,653 | | |
Total Affiliated Exchange-Traded Funds (Cost $168,173) | | | 166,690 | | |
Collateral for Securities Loaned^ (3.4%) | |
Fidelity Investments Money Market Government Portfolio Institutional
Shares, 0.01% (k) | | | 5,067,614 | | | | 5,068 | | |
Goldman Sachs Financial Square Government Fund Institutional Shares,
0.03% (k) | | | 7,114,437 | | | | 7,114 | | |
HSBC U.S. Government Money Market Fund I Shares, 0.03% (k) | | | 30,867,732 | | | | 30,868 | | |
Total Collateral for Securities Loaned (Cost $43,050) | | | 43,050 | | |
Total Investments (Cost $1,119,981) — 103.0% | | | 1,303,821 | | |
Liabilities in excess of other assets — (3.0)% | | | (38,289 | ) | |
NET ASSETS — 100.00% | | $ | 1,265,532 | | |
At May 31, 2021, the Fund's investments in foreign securities were 24.8% of net assets.
^ Purchased with cash collateral from securities on loan.
(a) Rule 144A security or other security that is restricted as to resale to institutional investors. The Fund's Adviser has deemed this security to be liquid based upon procedures approved by the Board of Trustees. As of May 31, 2021, the fair value of these securities was $52,123 (thousands) and amounted to 4.1% of net assets.
(b) Variable or Floating-Rate Security. Rate disclosed is as of May 31, 2021.
(c) The rate for certain asset-backed and mortgage-backed securities may vary based on factors relating to the pool of assets underlying the security. The rate disclosed is the rate in effect at May 31, 2021.
(d) Security is interest only.
(e) Non-income producing security.
(f) All or a portion of this security is on loan.
(g) All or a portion of this security has been segregated as collateral for derivative instruments.
See notes to financial statements.
20
USAA Mutual Funds Trust
USAA Cornerstone Moderate Fund | | Schedule of Portfolio Investments — continued
May 31, 2021 | |
(h) The Fund's Adviser has deemed this security to be illiquid based upon procedures approved by the Board of Trustees. As of May 31, 2021, illiquid securities were 0.3% of net assets.
(i) Amount represents less than 0.05% of net assets.
(j) Rate represents the effective yield at May 31, 2021.
(k) Rate disclosed is the daily yield on May 31, 2021.
bps — Basis points
Continuously callable — Investment is continuously callable or will be continuously callable on any date after the first call date until its maturity.
ETF — Exchange-Traded Fund
GO — General Obligation
LIBOR — London InterBank Offered Rate
LIBOR01M — 1 Month US Dollar LIBOR, rate disclosed as of May 31, 2021, based on the last reset date of the security
LIBOR03M — 3 Month US Dollar LIBOR, rate disclosed as of May 31, 2021, based on the last reset date of the security
LLC — Limited Liability Company
LP — Limited Partnership
MTN — Medium Term Note
PLC — Public Limited Company
SOFR — Secured Overnight Financing Rate
Futures Contracts Purchased
(Amounts not in thousands)
| | | Number of
Contracts | | Expiration
Date | | Notional
Amount | | Value | | Unrealized
Appreciation
(Depreciation) | |
Swiss Market Index Futures | | | 110 | | | 6/18/21 | | $ | 12,650,779 | | | $ | 13,977,536 | | | $ | 917,016 | | |
Futures Contracts Sold
(Amounts not in thousands)
| | | Number of
Contracts | | Expiration
Date | | Notional
Amount | | Value | | Unrealized
Appreciation
(Depreciation) | |
Euro Stoxx 50 Futures | | | 309 | | | 6/18/21 | | $ | 14,486,875 | | | $ | 15,319,263 | | | $ | (571,410 | ) | |
FTSE 100 Index Futures | | | 178 | | | 6/18/21 | | | 16,537,171 | | | | 17,738,879 | | | | (827,886 | ) | |
Russell 2000 E-Mini Index Futures | | | 45 | | | 6/18/21 | | | 5,285,306 | | | | 5,104,350 | | | | 180,955 | | |
| | | $ | (1,218,341 | ) | |
Total unrealized appreciation | | $ | 1,097,971 | | |
Total unrealized depreciation | | | (1,399,296 | ) | |
Total net unrealized appreciation (depreciation) | | $ | (301,325 | ) | |
See notes to financial statements.
21
USAA Mutual Funds Trust | | Statement of Assets and Liabilities
May 31, 2021 | |
(Amounts in Thousands, Except Per Share Amounts)
| | | USAA Cornerstone
Moderate Fund | |
Assets: | |
Affiliated investments, at value(Cost $168,173) | | $ | 166,690 | | |
Unaffiliated investments, at value (Cost $951,808) | | | 1,137,131 | (a) | |
Cash | | | 3,671 | | |
Deposit with brokers for futures contracts | | | 4,993 | | |
Receivables: | |
Interest and dividends | | | 2,052 | | |
Capital shares issued | | | 367 | | |
Variation margin on open futures contracts | | | 120 | | |
From Adviser | | | 101 | | |
Prepaid expenses | | | 9 | | |
Total Assets | | | 1,315,134 | | |
Liabilities: | |
Payables: | |
Collateral received on loaned securities | | | 43,050 | | |
Collateral received from brokers for futures contract | | | 4,518 | | |
Capital shares redeemed | | | 799 | | |
Variation margin on open futures contracts | | | 138 | | |
Accrued expenses and other payables: | |
Investment advisory fees | | | 630 | | |
Administration fees | | | 160 | | |
Custodian fees | | | 11 | | |
Transfer agent fees | | | 179 | | |
Compliance fees | | | 1 | | |
Trustees' fees | | | 1 | | |
Other accrued expenses | | | 115 | | |
Total Liabilities | | | 49,602 | | |
Net Assets: | |
Capital | | | 1,040,531 | | |
Total accumulated earnings/(loss) | | | 225,001 | | |
Net Assets | | $ | 1,265,532 | | |
Shares (unlimited number of shares authorized with no par value): | | | 74,640 | | |
Net asset value, offering and redemption price per share: (b) | | $ | 16.96 | | |
(a) Includes $42,149 of securities on loan.
(b) Per share amount may not recalculate due to rounding of net assets and/or shares outstanding.
See notes to financial statements.
22
USAA Mutual Funds Trust | | Statement of Operations
For the Year Ended May 31, 2021 | |
(Amounts in Thousands)
| | | USAA Cornerstone
Moderate Fund | |
Investment Income: | |
Income distributions from affiliated funds | | $ | 1,214 | | |
Dividends | | | 14,267 | | |
Interest | | | 11,535 | | |
Securities lending (net of fees) | | | 172 | | |
Total Income | | | 27,188 | | |
Expenses: | |
Investment advisory fees | | | 7,093 | | |
Administration fees | | | 1,803 | | |
Sub-Administration fees | | | 107 | | |
Custodian fees | | | 75 | | |
Transfer agent fees | | | 2,417 | | |
Trustees' fees | | | 51 | | |
Compliance fees | | | 8 | | |
Legal and audit fees | | | 68 | | |
State registration and filing fees | | | 31 | | |
Interfund lending fees | | | — | (a) | |
Other expenses | | | 194 | | |
Total Expenses | | | 11,847 | | |
Expenses waived/reimbursed by Adviser | | | (183 | ) | |
Net Expenses | | | 11,664 | | |
Net Investment Income (Loss) | | | 15,524 | | |
Realized/Unrealized Gains (Losses) from Investments: | |
Net realized gains (losses) from unaffiliated investment securities and foreign
currency translations | | | 51,872 | | |
Capital gain distributions received from affiliated funds | | | 94 | | |
Net realized gains (losses) from futures contracts | | | (3,573 | ) | |
Net change in unrealized appreciation/depreciation on unaffiliated investment
securities | | | 164,721 | | |
Net change in unrealized appreciation/depreciation on affiliated funds | | | (744 | ) | |
Net change in unrealized appreciation/depreciation on futures contracts | | | (301 | ) | |
Net realized/unrealized gains (losses) on investments | | | 212,069 | | |
Change in net assets resulting from operations | | $ | 227,593 | | |
(a) Rounds to less than $1 thousand.
See notes to financial statements.
23
USAA Mutual Funds Trust | | Statements of Changes in Net Assets | |
(Amounts in Thousands)
| | | USAA Cornerstone
Moderate Fund | |
| | | Year
Ended
May 31,
2021 | | Year
Ended
May 31,
2020 | |
From Investments: | |
Operations: | |
Net investment income (loss) | | $ | 15,524 | | | $ | 23,702 | | |
Net realized gains (losses) from investments | | | 48,393 | | | | 1,856 | | |
Net change in unrealized appreciation/depreciation on
investments | | | 163,676 | | | | 8,743 | | |
Change in net assets resulting from operations | | | 227,593 | | | | 34,301 | | |
Change in net assets resulting from distributions to shareholders | | | (18,770 | ) | | | (23,992 | ) | |
Change in net assets resulting from capital transactions | | | (74,749 | ) | | | (42,225 | ) | |
Change in net assets | | | 134,074 | | | | (31,916 | ) | |
Net Assets: | |
Beginning of period | | | 1,131,458 | | | | 1,163,374 | | |
End of period | | $ | 1,265,532 | | | $ | 1,131,458 | | |
Capital Transactions: | |
Proceeds from shares issued | | $ | 92,413 | | | $ | 90,971 | | |
Distributions reinvested | | | 18,673 | | | | 23,878 | | |
Cost of shares redeemed | | | (185,835 | ) | | | (157,074 | ) | |
Change in net assets resulting from capital transactions | | $ | (74,749 | ) | | $ | (42,225 | ) | |
Share Transactions: | |
Issued | | | 5,807 | | | | 6,302 | | |
Reinvested | | | 1,216 | | | | 1,646 | | |
Redeemed | | | (11,817 | ) | | | (10,983 | ) | |
Change in Shares | | | (4,794 | ) | | | (3,035 | ) | |
See notes to financial statements.
24
This page is intentionally left blank.
25
USAA Mutual Funds Trust | | Financial Highlights | |
For a Share Outstanding Throughout Each Period
| | | | | Investment Activities | | Distributions to
Shareholders From | |
| | | Net Asset
Value,
Beginning
of Period | | Net
Investment
Income
(Loss) | | Net Realized
and Unrealized
Gains (Losses)
on Investments | | Total from
Investment
Activities | | Net
Investment
Income | | Net Realized
Gains from
Investments | |
USAA Cornerstone Moderate Fund | |
Year Ended:
May 31, 2021 | | $ | 14.24 | | | | 0.20 | (b) | | | 2.76 | | | | 2.96 | | | | (0.21 | ) | | | (0.03 | ) | |
May 31, 2020 | | $ | 14.11 | | | | 0.29 | (b) | | | 0.13 | | | | 0.42 | | | | (0.29 | ) | | | — | | |
May 31, 2019 | | $ | 14.83 | | | | 0.30 | | | | (0.31 | ) | | | (0.01 | ) | | | (0.29 | ) | | | (0.42 | ) | |
May 31, 2018 | | $ | 15.05 | | | | 0.26 | | | | 0.55 | | | | 0.81 | | | | (0.26 | ) | | | (0.77 | ) | |
May 31, 2017 | | $ | 14.01 | | | | 0.31 | | | | 1.06 | | | | 1.37 | | | | (0.33 | ) | | | — | | |
* Assumes reinvestment of all net investment income and realized capital gain distributions, if any, during the period. Includes adjustments in accordance with U.S. Generally Accepted Accounting Principles and could differ from the Lipper reported return.
^ The net expense ratio may not correlate to the applicable expense limits in place during the period since the current contractual expense limitation is applied for a period beginning July 1, 2019, and in effect through June 30, 2023, instead of coinciding with the Fund's fiscal year end. Details of the current contractual expense limitation in effect can be found in Note 4 of the accompanying Notes to Financial Statements.
(a) The expense ratios exclude the impact of expenses paid by each underlying fund.
(b) Per share net investment income (loss) has been calculated using the average daily shares method.
(c) Reflects increased trading activity due to usage of quantitative investment strategies.
See notes to financial statements.
26
USAA Mutual Funds Trust | | Financial Highlights — continued | |
For a Share Outstanding Throughout Each Period
| | | | | Ratios to Average Net Assets | | Supplemental Data | |
| | | Total
Distributions | | Net Asset
Value,
End of
Period | | Total
Return* | | Net
Expenses^(a) | | Net
Investment
Income
(Loss) | | Gross
Expenses(a) | | Net Assets,
End of
Period
(000's) | | Portfolio
Turnover | |
USAA Cornerstone Moderate Fund | |
Year Ended:
May 31, 2021 | | | (0.24 | ) | | $ | 16.96 | | | | 21.00 | % | | | 0.97 | % | | | 1.29 | % | | | 0.98 | % | | $ | 1,265,532 | | | | 53 | % | |
May 31, 2020 | | | (0.29 | ) | | $ | 14.24 | | | | 2.98 | % | | | 1.00 | % | | | 2.01 | % | | | 1.00 | % | | $ | 1,131,458 | | | | 87 | % | |
May 31, 2019 | | | (0.71 | ) | | $ | 14.11 | | | | 0.13 | % | | | 1.00 | % | | | 2.10 | % | | | 1.02 | % | | $ | 1,163,374 | | | | 81 | %(c) | |
May 31, 2018 | | | (1.03 | ) | | $ | 14.83 | | | | 5.42 | % | | | 1.00 | % | | | 1.73 | % | | | 1.03 | % | | $ | 1,184,032 | | | | 51 | % | |
May 31, 2017 | | | (0.33 | ) | | $ | 15.05 | | | | 9.91 | % | | | 1.00 | % | | | 2.14 | % | | | 1.10 | % | | $ | 1,119,494 | | | | 66 | % | |
See notes to financial statements.
27
USAA Mutual Funds Trust | | Notes to Financial Statements
May 31, 2021 | |
1. Organization:
USAA Mutual Funds Trust (the "Trust") is organized as a Delaware statutory trust and is registered under the Investment Company Act of 1940, as amended (the "1940 Act"), as an open-end investment company. The Trust is comprised of 46 funds and is authorized to issue an unlimited number of shares, which are units of beneficial interest with no par value.
The accompanying financial statements are those of the USAA Cornerstone Moderate Fund (the "Fund"). The Fund is classified as diversified under the 1940 Act.
Under the Trust's organizational documents, its officers and trustees are indemnified against certain liabilities arising out of the performance of their duties to the Fund. In addition, in the normal course of business, the Fund enters into contracts with its vendors and others that provide for general indemnifications. The Fund's maximum exposure under these arrangements is unknown, as this would involve future claims that may be made against the Fund. However, based on experience, the Fund expects that risk of loss to be remote.
2. Significant Accounting Policies:
The following is a summary of significant accounting policies followed by the Trust in the preparation of its financial statements. The policies are in conformity with Generally Accepted Accounting Principles in the United States of America ("GAAP"). The preparation of financial statements in accordance with GAAP requires management to make estimates and assumptions that affect the reported amounts of assets and liabilities and disclosure of contingent assets and liabilities at the date of the financial statements and the reported amounts of income and expenses for the period. Actual results could differ from those estimates. The Fund follows the specialized accounting and reporting requirements under GAAP that are applicable to investment companies under Accounting Standards Codification Topic 946.
Investment Valuation:
The Fund records investments at fair value. Fair value is defined as the price that would be received to sell an asset or paid to transfer a liability in an orderly transaction between market participants at the measurement date.
The valuation techniques described below maximize the use of observable inputs and minimize the use of unobservable inputs in determining fair value. The inputs used for valuing the Fund's investments are summarized in the three broad levels listed below:
• Level 1 — quoted prices in active markets for identical securities
• Level 2 — other significant observable inputs (including quoted prices for similar securities or interest rates applicable to those securities, etc.)
• Level 3 — significant unobservable inputs (including the Fund's own assumptions in determining the fair value of investments)
Changes in valuation techniques may result in transfers in or out of an assigned level within the disclosure hierarchy. The inputs or methodologies used for valuation techniques are not necessarily an indication of the risks associated with entering into those investments.
Victory Capital Management Inc. ("VCM" or the "Adviser") has established the Pricing and Liquidity Committee (the "Committee"), and subject to the Trust's Board of Trustees (the "Board") oversight, the Committee administers and oversees the Fund's valuation policies and procedures, which are approved by the Board.
Portfolio securities listed or traded on securities exchanges, including Exchange-Traded Funds ("ETFs"), American Depositary Receipts ("ADRs"), and Rights are valued at the closing price on the exchange or system where the security is principally traded, if available, or at the Nasdaq Official Closing Price. If there have been no sales for that day on the exchange or system, then a security is valued at the last available bid quotation on the exchange or system where the security is principally traded. In each of these situations, valuations are typically categorized as Level 1 in the fair value hierarchy.
28
USAA Mutual Funds Trust | | Notes to Financial Statements — continued
May 31, 2021 | |
Investments in open-end investment companies, including underlying funds, are valued at their net asset value ("NAV"). These valuations are typically categorized as Level 1 in the fair value hierarchy.
Debt securities are valued each business day by a pricing service approved by the Board. The approved pricing service uses the evaluated bid or the last sale price to value securities. Debt obligations maturing within 60 days may be valued at amortized cost, provided that the amortized cost represents the fair value of such securities. These valuations are typically categorized as Level 2 in the fair value hierarchy.
Futures contracts are valued at the settlement price established each day by the board of trade or an exchange on which they are traded. These valuations are typically categorized as Level 1 in the fair value hierarchy.
In the event that price quotations or valuations are not readily available, investments are valued at fair value in accordance with procedures established by and under the general supervision and responsibility of the Board. These valuations are typically categorized as Level 2 or Level 3 in the fair value hierarchy, based on the observability of inputs used to determine the fair value. The effect of fair value pricing is that securities may not be priced on the basis of quotations from the primary market in which they are traded and the actual price realized from the sale of a security may differ materially from the fair value price. Valuing these securities at fair value is intended to cause the Fund's NAV to be more reliable than it otherwise would be.
A summary of the valuations as of May 31, 2021, based upon the three levels defined above, is included in the table below while the breakdown, by category, of investments is disclosed on the Schedule of Portfolio Investments (amounts in thousands):
| | | Level 1 | | Level 2 | | Level 3 | | Total | |
Asset-Backed Securities | | $ | — | | | $ | 17,962 | | | $ | — | | | $ | 17,962 | | |
Collateralized Mortgage Obligations | | | — | | | | 10,460 | | | | — | | | | 10,460 | | |
Common Stocks | | | 192,132 | | | | — | | | | — | | | | 192,132 | | |
Preferred Stocks | | | 2,839 | | | | 3,720 | | | | — | | | | 6,559 | | |
Corporate Bonds | | | — | | | | 135,178 | | | | — | | | | 135,178 | | |
Yankee Dollars | | | — | | | | 13,465 | | | | — | | | | 13,465 | | |
Municipal Bonds | | | — | | | | 9,621 | | | | — | | | | 9,621 | | |
U.S. Government Agency Mortgages | | | — | | | | 36,097 | | | | — | | | | 36,097 | | |
U.S. Treasury Obligations | | | — | | | | 85,646 | | | | — | | | | 85,646 | | |
Commercial Paper | | | — | | | | 5,350 | | | | — | | | | 5,350 | | |
Exchange-Traded Funds | | | 581,611 | | | | — | | | | — | | | | 581,611 | | |
Affiliated Exchange-Traded Funds | | | 166,690 | | | | — | | | | — | | | | 166,690 | | |
Collateral for Securities Loaned | | | 43,050 | | | | — | | | | — | | | | 43,050 | | |
Total | | $ | 986,322 | | | $ | 317,499 | | | $ | — | | | $ | 1,303,821 | | |
| Other Financial Investments^ | |
Assets: | |
Futures Contracts | | $ | 1,098 | | | $ | — | | | $ | — | | | $ | 1,098 | | |
Liabilities: | |
Futures Contracts | | $ | (1,399 | ) | | $ | — | | | $ | — | | | $ | (1,399 | ) | |
Total | | $ | (301 | ) | | $ | — | | | $ | — | | | $ | (301 | ) | |
^ Futures contracts are valued at the unrealized appreciation (depreciation) on the investment.
For the year ended May 31, 2021, there were no transfers in or out of Level 3 in the fair value hierarchy.
Real Estate Investment Trusts ("REITs"):
The Fund may invest in REITs, which report information on the source of their distributions annually. REITs are pooled investment vehicles that invest primarily in income producing real estate or real estate related loans or interests (such as mortgages). Certain distributions received from REITs during
29
USAA Mutual Funds Trust | | Notes to Financial Statements — continued
May 31, 2021 | |
the year are recorded as realized gains or return of capital as estimated by the Fund or when such information becomes known.
Investment Companies:
Exchange-Traded Funds:
The Fund may invest in ETFs, the shares of which are bought and sold on a securities exchange. An ETF trades like common stock and represents a fixed portfolio of securities often designed to track the performance and dividend yield of a particular domestic or foreign market index. The Fund may purchase shares of an ETF to temporarily gain exposure to a portion of the U.S. or a foreign market while awaiting purchase of underlying securities. The risks of owning an ETF generally reflect the risks of owning the underlying securities they are designed to track, although the lack of liquidity of an ETF could result in it being more volatile. Additionally, ETFs have fees and expenses that reduce their value.
Open-End Funds:
The Fund may invest in portfolios of open-end investment companies. These investment companies value securities in their portfolios for which market quotations are readily available at their market values (generally the last reported sale price) and all other securities and assets at their fair value by the methods established by the board of directors of the underlying funds.
Municipal Obligations:
The values of municipal obligations can fluctuate and may be affected by adverse tax, legislative, or political changes, and by financial developments affecting municipal issuers. Payment of municipal obligations may depend on a relatively limited source of revenue, resulting in greater credit risk. Future changes in federal tax laws or the activity of an issuer may adversely affect the tax-exempt status of municipal obligations.
Mortgage- and Asset-Backed Securities:
The values of some mortgage-related or asset-backed securities may be particularly sensitive to changes in prevailing interest rates. Early repayment of principal on some mortgage-related securities may expose the Fund to a lower rate of return upon reinvestment of principal. The values of mortgage and asset-backed securities depend in part on the credit quality and adequacy of the underlying assets or collateral and may fluctuate in response to the market's perception of these factors as well as current and future repayment rates. Some mortgage-backed securities are backed by the full faith and credit of the U.S. government (e.g., mortgage-backed securities issued by the Government National Mortgage Association, commonly known as "Ginnie Mae"), while other mortgage-backed securities (e.g., mortgage-backed securities issued by the Federal National Mortgage Association and the Federal Home Loan Mortgage Corporation, commonly known as "Fannie Mae" and "Freddie Mac", respectively), are backed only by the credit of the government entity issuing them. In addition, some mortgage-backed securities are issued by private entities and, as such, are not guaranteed by the U.S. government or any agency or instrumentality of the U.S. government.
Derivative Instruments:
Futures Contracts:
The Fund may enter into contracts for the future delivery of securities or foreign currencies and futures contracts based on a specific security, class of securities, foreign currency or an index, and purchase or sell options on any such futures contracts. A futures contract on a securities index is an agreement obligating either party to pay, and entitling the other party to receive, while the contract is outstanding, cash payments based on the level of a specified securities index. No physical delivery of the underlying asset is made. The Fund may enter into futures contracts in an effort to hedge against market risks. The acquisition of put and call options on futures contracts will give the Fund the right (but not the obligation), for a specified price, to sell or to purchase the underlying futures contract, upon exercise
30
USAA Mutual Funds Trust | | Notes to Financial Statements — continued
May 31, 2021 | |
of the option, at any time during the option period. Futures transactions involve brokerage costs and require the Fund to segregate assets to cover contracts that would require it to purchase securities or currencies. A good faith margin deposit, known as initial margin, of cash or government securities with a broker or custodian is required to initiate and maintain open positions in futures contracts. Subsequent payments, known as variation margin, are made or received by the Fund based on the change in the market value of the position and are recorded as unrealized appreciation or depreciation until the contract is closed out, at which time the gain or loss is realized. The Fund may lose the expected benefit of futures transactions if interest rates, exchange rates or securities prices change in an unanticipated manner. Such unanticipated changes may also result in lower overall performance than if the Fund had not entered into any futures transactions. In addition, the value of the Fund's futures positions may not prove to be perfectly or even highly correlated with the value of its portfolio securities or foreign currencies, limiting the Fund's ability to hedge effectively against interest rate, exchange rate and/or market risk and giving rise to additional risks. There is no assurance of liquidity in the secondary market for purposes of closing out futures positions. The collateral held by the Fund is reflected on the Statement of Assets and Liabilities under Deposit with brokers for futures contracts and Collateral received from brokers for futures contracts. During the year ended May 31, 2021, the Fund entered into futures contracts primarily for the strategy of gaining exposure to a particular asset class or securities market.
Summary of Derivative Instruments:
The following table summarizes the fair values of derivative instruments on the Statement of Assets and Liabilities, categorized by risk exposure, as of May 31, 2021 (amounts in thousands):
| | | Assets | | Liabilities | |
| | | Variation Margin
Receivable on Open
Futures Contracts* | | Variation Margin
Payable on Open
Futures Contracts* | |
| Equity Risk Exposure | | $ | 1,098 | | | $ | 1,399 | | |
* Includes cumulative unrealized appreciation (depreciation) of futures contracts as reported on the Schedule of Portfolio Investments. Only current day's variation margin for futures contracts is reported within the Statement of Assets and Liabilities.
The following table presents the effect of derivative instruments on the Statement of Operations, categorized by risk exposure, for the year ended May 31, 2021 (amounts in thousands):
| | | Net Realized Gains (Losses) on
Derivatives Recognized as
a Result of Operations | | Net Change in Unrealized
Appreciation/Depreciation
on Derivatives Recognized
as a Result of Operations | |
| | | Net Realized Gains (Losses)
from Futures Contracts | | Net Change in Unrealized
Appreciation/Depreciation
on Futures Contracts | |
Equity Risk Exposure | | $ | (3,573 | ) | | $ | (301 | ) | |
All open derivative positions at year end are reflected on the Fund's Schedule of Portfolio Investments. The underlying face value of open derivative positions relative to the Fund's net assets at year end is generally representative of the notional amount of open positions to net assets throughout the year.
Investment Transactions and Related Income:
Changes in holdings of investments are accounted for no later than one business day following the trade date. For financial reporting purposes, however, investment transactions are accounted for on trade date on the last business day of the reporting period. Interest income is determined on the basis of coupon interest accrued using the effective interest method which adjusts, where applicable, the amortization of premiums or accretion of discount. Dividend income is recorded on the ex-dividend date. Gains or losses realized on sales of securities are recorded on the identified cost basis.
31
USAA Mutual Funds Trust | | Notes to Financial Statements — continued
May 31, 2021 | |
Withholding taxes on interest, dividends, and gains as a result of certain investments in ADRs by the Fund have been provided for in accordance with each investment's applicable country's tax rules and rates.
Securities Lending:
The Fund, through a securities lending agreement with Citibank, N.A. ("Citibank"), may lend its securities to qualified financial institutions, such as certain broker-dealers, to earn additional income, net of income retained by Citibank. Borrowers are required to secure their loans for collateral in the amount of at least 102% of the value of U.S. securities loaned or at least 105% of the value of non-U.S. securities loaned, marked-to-market daily. Any collateral shortfalls associated with increases in the valuation of the securities loaned are cured the next business day once the shortfall exceeds $100 thousand. Collateral may be cash, U.S. government securities, or other securities as permitted by Securities and Exchange Commission ("SEC") guidelines. Cash collateral may be invested in high-quality short-term investments, primarily open-end investment companies. Collateral requirements are determined daily based on the value of the Fund's securities on loan as of the end of the prior business day. During the time portfolio securities are on loan, the borrower will pay the Fund any dividends or interest paid on such securities plus any fee negotiated between the parties to the lending agreement. The Fund also earns a return from the collateral. The Fund pays Citibank various fees in connection with the investment of cash collateral and fees based on the investment income received from securities lending activities. Securities lending income (net of these fees) is disclosed on the Statement of Operations. Loans are terminable upon demand and the borrower must return the loaned securities within the lesser of one standard settlement period or five business days. Risks relating to securities-lending transactions include that the borrower may not provide additional collateral when required or return the securities when due, and that the value of the short-term investments will be less than the amount of cash collateral required to be returned to the borrower. The Fund's agreement with Citibank does not include master netting provisions. Non-cash collateral received by the Fund may not be sold or re-pledged, except to satisfy borrower default. Cash collateral is listed on the Fund's Schedule of Portfolio Investments and Financial Statements while non-cash collateral is not included.
The following table (amounts in thousands) is a summary of the Fund's securities lending transactions as of May 31, 2021.
Value of
Securities on Loan | | Non-Cash Collateral | | Cash Collateral | |
| $ | 42,149 | | | $ | — | | | $ | 43,050 | | |
Foreign Currency Translations:
The accounting records of the Fund are maintained in U.S. dollars. Investment securities and other assets and liabilities of the Fund denominated in a foreign currency are translated into U.S. dollars at current exchange rates. Purchases and sales of securities, income receipts, and expense payments are translated into U.S. dollars at the exchange rates on the date of the transactions. The Fund does not isolate the portion of the results of operations resulting from changes in foreign exchange rates on investments from fluctuations arising from changes in market prices of securities held. Such fluctuations are disclosed as net change in unrealized appreciation/depreciation on investments and foreign currency translations on the Statement of Operations. Any realized gains or losses from these fluctuations, including foreign currency arising from in-kind redemptions, are disclosed as net realized gains or losses from investment transactions and foreign currency translations on the Statement of Operations.
Foreign Taxes:
The Fund may be subject to foreign taxes related to foreign income received (a portion of which may be reclaimable), capital gains on the sale of securities, and certain foreign currency transactions. All foreign taxes are recorded in accordance with the applicable regulations and rates that exist in the foreign jurisdictions in which the Fund invests.
32
USAA Mutual Funds Trust | | Notes to Financial Statements — continued
May 31, 2021 | |
Federal Income Taxes:
It is the Fund's policy to continue to qualify as a regulated investment company by complying with the provisions available to certain investment companies, as defined in applicable sections of the Internal Revenue Code, and to make distributions of net investment income and net realized gains sufficient to relieve it from all, or substantially all, federal income taxes. Accordingly, no provision for federal income taxes is required in the financial statements. The Fund has a tax year end of May 31.
Management of the Fund has reviewed tax positions taken in tax years that remain subject to examination by all major tax jurisdictions, including federal (i.e., the last four tax years, which includes the current fiscal tax year end). Management believes that there is no tax liability resulting from unrecognized tax benefits related to uncertain tax positions taken.
Allocations:
Expenses directly attributable to the Fund are charged to the Fund, while expenses that are attributable to more than one fund in the Trust, or jointly with an affiliated trust, are allocated among the respective funds in the Trust and/or affiliated trust based upon net assets or another appropriate basis.
Cross-Trade Transactions:
Pursuant to Rule 17a-7 under the 1940 Act, the Fund may engage in cross-trades, which are securities transactions with affiliated investment companies and advisory accounts managed by the Adviser and any applicable sub-adviser. Any such purchase or sale transaction must be effected without brokerage commission or other remuneration, except for customary transfer fees. The transaction must be effected at the current market price, which is either the security's last sale price on an exchange or, if there are no transactions in the security that day, at the average of the highest bid and lowest asked price. For the year ended May 31, 2021, the Fund engaged in the following securities transactions with affiliated funds, which resulted in the following net realized gains (losses) (amounts in thousands):
| Purchases | | Sales | | Net Realized
Gains (Losses) | |
| $ | — | | | $ | 13,416 | | | $ | 1,314 | | |
3. Purchases and Sales:
Cost of purchases and proceeds from sales/maturities of securities (excluding securities maturing less than one year from acquisition) for the year ended May 31, 2021, were as follows for the Fund (amounts in thousands):
Excluding
U.S. Government Securities | |
U.S. Government Securities | |
Purchases | | Sales | | Purchases | | Sales | |
$ | 625,727 | | | $ | 629,801 | | | $ | — | | | $ | 67,428 | | |
4. Fees and Transactions with Affiliates and Related Parties:
Investment Advisory Fees:
Investment advisory services are provided to the Fund by the Adviser, which is a New York corporation registered as an investment adviser with the SEC. The Adviser is an indirect wholly owned subsidiary of Victory Capital Holdings, Inc., a publicly traded Delaware corporation, and a wholly owned direct subsidiary of Victory Capital Operating, LLC. Under the terms of the Investment Advisory Agreement, the Adviser is entitled to receive fees accrued daily and paid monthly at an annualized rate of 0.59% of the Fund's average daily net assets. Amounts incurred and paid to VCM for the year ended May 31, 2021, are reflected on the Statement of Operations as Investment Advisory fees.
33
USAA Mutual Funds Trust | | Notes to Financial Statements — continued
May 31, 2021 | |
The Trust relies on an exemptive order granted to VCM and its affiliated funds by the SEC in March 2019 permitting the use of a "manager-of-managers" structure for certain funds. Under a manager-of-managers structure, the investment adviser may select (with approval of the Board and without shareholder approval) one or more subadvisers to manage the day-to-day investment of a fund's assets. For the year ended May 31, 2021, the Fund had no subadvisors.
Administration and Servicing Fees:
VCM serves as the Fund's administrator and fund accountant. Under the Fund Administration, Servicing and Accounting Agreement, VCM is paid for its services an annual fee at a rate of 0.15% of average daily net assets of the Fund. Amounts incurred for the year ended May 31, 2021, are reflected on the Statement of Operations as Administration fees.
The Fund (as part of the Trust) has entered into an agreement to provide compliance services with the Adviser, pursuant to which the Adviser furnishes its compliance personnel, including the services of the Chief Compliance Officer ("CCO"), and other resources reasonably necessary to provide the Trust with compliance oversight services related to the design, administration and oversight of a compliance program for the Trust in accordance with Rule 38a-1 under the 1940 Act. The CCO is an employee of the Adviser, which pays the compensation of the CCO and support staff. Funds in the Trust, Victory Variable Insurance Funds, Victory Portfolios, and Victory Portfolios II (collectively, the "Victory Funds Complex") in the aggregate, compensate the Adviser for these services. Amounts incurred for the year ended May 31, 2021, are reflected on the Statement of Operations as Compliance fees.
Citi Fund Services Ohio, Inc. ("Citi"), an affiliate of Citibank, acts as sub-administrator and sub-fund accountant to the Fund pursuant to a Sub-Administration and Sub-Fund Accounting Services Agreement between VCM and Citi. VCM pays Citi a fee for providing these services. The Fund reimburses VCM and Citi for out-of-pocket expenses incurred in providing these services and certain other expenses specifically allocated to the Fund. Amounts incurred for the year ended May 31, 2021, are reflected on the Statement of Operations as Sub-Administration fees.
Transfer Agency Fees:
Victory Capital Transfer Agency, Inc. ("VCTA"), an affiliate of the Adviser, provides transfer agency services to the Fund. VCTA provides transfer agent services to the Fund based on an annual charge of $23 per shareholder account plus out-of-pocket expenses. VCTA pays a portion of these fees to certain intermediaries for the administration and servicing of accounts that are held with such intermediaries. Amounts incurred and paid to VCTA for the year ended May 31, 2021, are reflected on the Statement of Operations as Transfer Agent fees.
FIS Investor Services LLC serves as sub-transfer agent and dividend disbursing agent for the Fund pursuant to a Sub-Transfer Agent Agreement between VCTA and FIS Investor Services LLC. VCTA provides FIS Investor Services LLC a fee for providing these services.
Distributor/Underwriting Services:
Victory Capital Services, Inc. (the "Distributor"), an affiliate of the Adviser, serves as distributor for the continuous offering of the shares of the Fund pursuant to a Distribution Agreement between the Distributor and the Trust and receives no fee or other compensation for these services. Effective June 30, 2020, the Distributor's name was changed from Victory Capital Advisers, Inc.
Other Fees:
Citibank serves as the Fund's custodian. The Fund pays Citibank a fee for providing these services. Amounts incurred for the year ended May 31, 2021, are reflected on the Statement of Operations as Custodian fees.
K&L Gates LLP provides legal services to the Trust.
34
USAA Mutual Funds Trust | | Notes to Financial Statements — continued
May 31, 2021 | |
The Adviser has entered into an expense limitation agreement with the Fund until at least June 30, 2023. Under the terms of the agreement, the Adviser has agreed to waive fees or reimburse certain expenses to the extent that ordinary operating expenses incurred in any fiscal year exceed the expense limit for the Fund. Such excess amounts will be the liability of the Adviser. Acquired fund fees and expenses, interest, taxes, brokerage commissions, other expenditures, that are capitalized in accordance with GAAP, and other extraordinary expenses not incurred in the ordinary course of the Fund's business are excluded from the expense limits. As of May 31, 2021, the expense limit (excluding voluntary waivers) was 1.00%.
In addition, the Fund invests in affiliated VCM exchange-traded fund(s) ("affiliated ETFs"). The Fund's Adviser fee is reimbursed by VCM to the extent of the indirect Adviser fee incurred through the Fund's proportional investment in the affiliated ETF(s). These Adviser fee reimbursements are not available for recoupment. For the year ended May 31, 2021, the Fund's Adviser fee was reimbursed by VCM in an amount of $183 thousand, of which $104 thousand is receivable from VCM.
Under the terms of the expense limitation agreement, amended May 1, 2021, the Fund has agreed to repay fees and expenses that were waived or reimbursed by the Adviser for a period of up to three years (thirty six (36) months) after the waiver or reimbursement took place, subject to the lesser of any operating expense limits in effect at the time of: (a) the original waiver or expense reimbursement; or (b) the recoupment, after giving effect to the recoupment amount. Prior to May 1, 2021, the Fund was permitted to recoup fees waived and expenses reimbursed for up to three years after the fiscal year in which the waiver or reimbursement took place, subject to the limitations above. This change did not have any effect on the amounts previously reported for recoupment. As of May 31, 2021, there are no amounts available to be repaid to the Adviser.
The Adviser may voluntarily waive or reimburse additional fees to assist the Fund in maintaining competitive expense ratios. Voluntary waivers and reimbursements applicable to the Fund are not available to be recouped at a future time. There were no voluntary waivers or reimbursements for the year ended May 31, 2021.
Certain officers and/or interested trustees of the Fund are also officers and/or employees of the Adviser, administrator, fund accountant, sub-administrator, sub-fund accountant, custodian, and Distributor.
5. Risks:
The Fund may be subject to other risks in addition to these identified risks.
Geopolitical/Natural Disaster Risk — Global economies and financial markets are increasingly interconnected, which increases the possibilities that conditions in one country or region might adversely affect issuers in another country or region. Geopolitical and other risks, including war, terrorism, trade disputes, political or economic dysfunction within some nations, public health crises and related geopolitical events, as well as environmental disasters such as earthquakes, fires, and floods, may add to instability in world economies and markets generally. Changes in trade policies and international trade agreements could affect the economies of many countries in unpredictable ways. Likewise, systemic market dislocations of the kind that occurred during the financial crisis that began in 2008, if repeated, would be highly disruptive to economies and markets, adversely affecting individual companies and industries, securities markets, interest rates, credit ratings, inflation, investor sentiment, and other factors affecting the value of a Fund's investments. Some countries, including the United States, are adopting more protectionist trade policies and moving away from the tighter financial industry regulations that followed the 2008 financial crisis, which may also affect the value of a Fund's investments.
Political events within the United States at times have resulted, and may in the future result, in a shutdown of government services, which could negatively affect the U.S. economy, decrease the value of a Fund's investments, increase uncertainty in or impair the operation of the U.S. or other securities markets, and degrade investor and consumer confidence, perhaps suddenly and to a significant degree.
35
USAA Mutual Funds Trust | | Notes to Financial Statements — continued
May 31, 2021 | |
An outbreak of disease called COVID-19 has spread internationally. The transmission of COVID-19 and efforts to contain its spread have resulted in international, national, and local border closings and other significant travel restrictions and disruptions, significant disruptions to business operations, supply chains and consumer activity, significant challenges in healthcare service preparation and delivery, quarantines, and general concern and uncertainty. These negative impacts have caused significant volatility and declines in global financial markets, which have caused losses for Fund investors during and subsequent to period end. The impact of the COVID-19 pandemic may last for an extended period of time, and could result in a substantial economic downturn or recession. Public health crises may exacerbate other pre-existing political, social, economic, market, and financial risks. The extent of the impact to the financial performance of the Fund's investments will depend on future developments, including (i) the duration and spread of the outbreak, (ii) the restrictions and advisories, (iii) the effects on the financial markets, and (iv) the effects on the economy overall, all of which are highly uncertain and cannot be predicted.
Tactical Allocation Risk — The Fund has a targeted risk tolerance and a corresponding asset allocation target; however, mere asset allocation and volatility are not the sole determination of risk. The Fund's managers will tactically allocate away from the target allocation as market conditions and the perceived risks warrant. The Fund bears the risk that the managers' tactical allocation will not be successful.
Affiliated Funds Risk — The risks of the Fund directly correspond to the risks of the underlying affiliated funds in which the Fund invests. By investing in the underlying affiliated funds, the Fund has exposure to the risk of many different areas of the market. The degree to which the risks described below apply to the Fund varies according to the Fund's asset allocation. For instance, the more the Fund is allocated to stock funds, the greater the risk associated with equity securities. The Fund also is subject to asset allocation risk (i.e., the risk that allocations will not produce the intended results) and to management risk (i.e., the risk that the selection of underlying affiliated funds will not produce the intended results).
Conflict of Interest Risk — In managing a Fund that invests in underlying affiliated funds, the Adviser may have conflicts of interest in allocating the Fund's assets among the various underlying affiliated funds. This is because the fees payable by some of the underlying affiliated funds to the Adviser and/or its affiliates are higher than the fees payable by other underlying affiliated funds, and because the Adviser also manages and administers the underlying affiliated funds.
6. Borrowing and Interfund Lending:
Line of Credit:
The Victory Funds Complex participated in a short-term demand note "Line of Credit" agreement with Citibank. The Line of Credit agreement with Citibank was renewed on June 29, 2020, with a termination date of June 28, 2021. Under the agreement with Citibank, the Victory Funds Complex may borrow up to $600 million, of which $300 million is committed and $300 million is uncommitted. $40 million of the Line of Credit is reserved for use by the Victory Floating Rate Fund, another series of the Victory Funds Complex, with Victory Floating Rate Fund paying the related commitment fees for that amount. The purpose of the Line of Credit is to meet temporary or emergency cash needs. For the year ended May 31, 2021, Citibank received an annual commitment fee of 0.15% on $300 million for providing the Line of Credit. Each fund in the Victory Funds Complex pays a pro-rata portion of the commitment fees plus any interest (one month LIBOR plus one percent) on amounts borrowed. For the period June 29, 2020, through April 30, 2021, under an amended Line of Credit agreement, Citibank received an annual upfront fee of 0.10% on the $300 million committed line of credit. Each fund in the Victory Funds Complex paid a pro-rata portion of the upfront fee. Effective with the next amendment, the annual commitment fee of 0.15% will remain unchanged and the upfront fee of 0.10% is discontinued. Interest charged to each fund during the period, if applicable, is reflected on the Statement of Operations under Line of credit fees.
The Fund had no borrowings under the Line of Credit agreement during the year ended May 31, 2021.
36
USAA Mutual Funds Trust | | Notes to Financial Statements — continued
May 31, 2021 | |
Interfund Lending:
The Trust and Adviser rely on an exemptive order granted by the SEC in March 2017 (the "Order"), permitting the establishment and operation of an Interfund Lending Facility (the "Facility"). The Facility allows the Fund to directly lend and borrow money to or from any other fund in the Victory Funds Complex that is permitted to participate in the Facility, relying upon the Order at rates beneficial to both the borrowing and lending funds. Advances under the Facility are allowed for temporary or emergency purposes, including the meeting of redemption requests that otherwise might require the untimely disposition of securities, and are subject to each Fund's borrowing restrictions. The interfund loan rate is determined, as specified in the Order, by averaging the current repurchase agreement rate and the current bank loan rate. As a Borrower, interest charged to the Fund, if any, during the period is reflected on the Statement of Operations under Interfund lending fees. As a Lender, interest earned by the Fund, if any, during the period is presented on the Statement of Operations under Interfund lending.
The average borrowing or lending for the days outstanding and average interest rate for the Fund during the year ended May 31, 2021, were as follows (amounts in thousands):
Borrower or
Lender | | Amount
Outstanding at
May 31, 2021 | |
Average
Borrowing* | | Days
Borrowing
Outstanding | | Average
Interest
Rate* | | Maximum
Borrowing During
the Period | |
Borrower | | $ | — | | | $ | 3,293 | | | | 1 | | | | 0.57 | % | | $ | 3,293 | | |
* For the year ended May 31, 2021, based on the number of days borrowings were outstanding.
7. Federal Income Tax Information:
The Fund intends to distribute any net investment income quarterly. Distributable net realized gains, if any, are declared and paid at least annually.
The amounts of dividends from net investment income and distributions from net realized gains (collectively distributions to shareholders) are determined in accordance with federal income tax regulations, which may differ from GAAP. To the extent these "book/tax" differences are permanent in nature (e.g., net operating loss and distribution reclassification), such amounts are reclassified within the components of net assets based on their federal tax-basis treatment; temporary differences (e.g., wash sales) do not require reclassification. To the extent dividends and distributions exceed net investment income and net realized gains for tax purposes, they are reported as distributions of capital. Net investment losses incurred by the Fund may be reclassified as an offset to capital on the accompanying Statement of Assets and Liabilities.
As of May 31, 2021, on the Statement of Assets and Liabilities, as a result of permanent book-to-tax differences, reclassification adjustments were as follows (amounts in thousands):
| | Total Accumulated
Earnings/(Loss) | | Capital | |
| | | | | $ | 5 | | | $ | (5 | ) | |
The tax character of distributions paid during the tax years ended as noted below, were as follows (total distributions paid may differ from the Statement of Changes in Net Assets because, for tax purposes, dividends are recognized when actually paid) (amounts in thousands).
| | Year Ended May 31, 2021 | | Year Ended May 31, 2020 | |
| | | Distributions
paid from | |
| | Distributions
paid from | |
| |
| | | Ordinary
Income | | Total
Distributions
Paid | | Ordinary
Income | | Total
Distributions
Paid | |
| | | | | $ | 18,770 | | | $ | 18,770 | | | $ | 23,992 | | | $ | 23,992 | | |
37
USAA Mutual Funds Trust | | Notes to Financial Statements — continued
May 31, 2021 | |
As of May 31, 2021, the components of accumulated earnings (loss) on a tax basis were as follows (amounts in thousands):
Undistributed
Ordinary
Income | | Undistributed
Long-Term
Capital Gains | | Other
Earnings
(Deficit) | | Accumulated
Earnings | | Unrealized
Appreciation
(Depreciation)* | | Total
Accumulated
Earnings
(Loss) | |
| $ | 21,095 | | | $ | 21,319 | | | $ | (426 | ) | | $ | 41,988 | | | $ | 183,013 | | | $ | 225,001 | | |
* The difference between the book-basis and tax-basis of unrealized appreciation/depreciation is attributable to the tax deferral of losses on wash sales, futures, hybrid accruals interest purchased, partnership, and REITs/return or capital.
As of May 31, 2021, the Fund had no capital loss carryforwards, for federal income tax purposes.
During the most recent tax year ended May 31, 2021, the Fund utilized $2,034 thousand of capital loss carryforwards.
As of May 31, 2021, the cost basis for federal income tax purposes, gross unrealized appreciation, gross unrealized depreciation, and net unrealized appreciation (depreciation) for investments were as follows (amounts in thousands):
Cost of
Investments
for Federal
Tax Purposes | | Gross
Unrealized
Appreciation | | Gross
Unrealized
Depreciation | | Net Unrealized
Appreciation
(Depreciation) | |
| $ | 1,120,808 | | | $ | 190,843 | | | $ | (7,830 | ) | | $ | 183,013 | | |
8. Affiliated Securities:
An affiliated security is a security in which the Fund has ownership of at least 5% of the security's outstanding voting shares, an investment company managed by VCM, or an issuer under common control with a Fund or VCM. The Fund does not invest in affiliated securities for the purpose of exercising management or control. These securities are noted as affiliated on the Fund's Schedule of Portfolio Investments. Transactions in affiliated securities during the year ended May 31, 2021, were as follows (amounts in thousands):
| | | Fair
Value
5/31/2020 | | Purchases
at Cost | | Proceeds
from
Sales | | Realized
Gains
(Losses) | | Capital
Gain
Distribution | | Net
Change in
Unrealized
Appreciation/
Depreciation | | Fair
Value
5/31/21 | | Dividend
Income | |
VictoryShares USAA Core
Intermediate-Term
Bond ETF | | $ | — | | | $ | 295,581 | | | $ | (147,715 | ) | | $ | — | | | $ | 71 | | | $ | (1,538 | ) | | $ | 146,328 | | | $ | 996 | | |
VictoryShares USAA Core
Short-Term Bond ETF | | | — | | | | 17,671 | | | | — | | | | — | | | | 23 | | | | 38 | | | | 17,709 | | | | 156 | | |
VictoryShares USAA MSCI
Emerging Markets Value
Momentum ETF | | | 1,897 | | | | — | | | | — | | | | — | | | | — | | | | 756 | | | | 2,653 | | | | 62 | | |
| | | $ | 1,897 | | | $ | 313,252 | | | $ | (147,715 | ) | | $ | — | | | $ | 94 | | | $ | (744 | ) | | $ | 166,690 | | | $ | 1,214 | | |
38
REPORT OF INDEPENDENT REGISTERED PUBLIC ACCOUNTING FIRM
To the Shareholders and the Board of Trustees of USAA Cornerstone Moderate Fund
Opinion on the Financial Statements
We have audited the accompanying statement of assets and liabilities of USAA Cornerstone Moderate Fund (the "Fund") (one of the funds constituting USAA Mutual Funds Trust (the "Trust")), including the schedule of portfolio investments, as of May 31, 2021, and the related statement of operations for the year then ended, the statements of changes in net assets for each of the two years in the period then ended, the financial highlights for each of the five years in the period then ended and the related notes (collectively referred to as the "financial statements"). In our opinion, the financial statements present fairly, in all material respects, the financial position of the Fund (one of the funds constituting USAA Mutual Funds Trust) at May 31, 2021, the results of its operations for the year then ended, the changes in its net assets for each of the two years in the period then ended and its financial highlights for each of the five years in the period then ended, in conformity with U.S. generally accepted accounting principles.
Basis for Opinion
These financial statements are the responsibility of the Trust's management. Our responsibility is to express an opinion on the Fund's financial statements based on our audits. We are a public accounting firm registered with the Public Company Accounting Oversight Board (United States) ("PCAOB") and are required to be independent with respect to the Trust in accordance with the U.S. federal securities laws and the applicable rules and regulations of the Securities and Exchange Commission and the PCAOB.
We conducted our audits in accordance with the standards of the PCAOB. Those standards require that we plan and perform the audit to obtain reasonable assurance about whether the financial statements are free of material misstatement, whether due to error or fraud. The Trust is not required to have, nor were we engaged to perform, an audit of the Trust's internal control over financial reporting. As part of our audits we are required to obtain an understanding of internal control over financial reporting, but not for the purpose of expressing an opinion on the effectiveness of the Trust's internal control over financial reporting. Accordingly, we express no such opinion.
Our audits included performing procedures to assess the risks of material misstatement of the financial statements, whether due to error or fraud, and performing procedures that respond to those risks. Such procedures included examining, on a test basis, evidence regarding the amounts and disclosures in the financial statements. Our procedures included confirmation of securities owned as of May 31, 2021, by correspondence with the custodian. Our audits also included evaluating the accounting principles used and significant estimates made by management, as well as evaluating the overall presentation of the financial statements. We believe that our audits provide a reasonable basis for our opinion.

We have served as the auditor of one or more Victory Capital investment companies since 1995.
San Antonio, Texas
July 28, 2021
39
USAA Mutual Funds Trust | | Supplemental Information
May 31, 2021 | |
(Unaudited)
Trustee and Officer Information
Board of Trustees:
Overall responsibility for management of the Trust rests with the Board. The Trust is managed by the Board in accordance with the laws of the state of Delaware. There are currently nine Trustees, seven of whom are not "interested persons" of the Trust within the meaning of that term under the 1940 Act ("Independent Trustees") and two of whom are "interested persons" of the Trust within the meaning of that term under the 1940 Act ("Interested Trustee"). The Trustees, in turn, elect the officers of the Trust to actively supervise its day-to-day operations.
The following tables list the Trustees, their ages, position with the Trust, commencement of service, principal occupations during the past five years and any directorships of other investment companies or companies whose securities are registered under the Securities Exchange Act of 1934, as amended, or who file reports under that Act. Each Trustee oversees 46 portfolios in the Trust. Each Trustee's address is 15935 La Cantera Pkwy, San Antonio, TX, 78256. Pursuant to a policy adopted by the Board, the term of office for each Trustee shall be until the Independent Trustee reaches age 75 or an Interested Trustee reaches age 75. The Board may change or grant exceptions from this policy at any time without shareholder approval. A Trustee may resign or be removed by a vote of the other Trustees or the holders of a majority of the outstanding shares of the Trust at any time. Vacancies on the Board can be filled by the action of a majority of the Trustees, provided that after filling such vacancy at least two-thirds of the Trustees have been elected by the shareholders.
Name and Date of Birth | | Position
Held with
the Trust | | Year
Commenced
Service | | Principal Occupation
During Past 5 Years | | Other
Directorships
Held During
Past 5 Years | |
Independent Trustees. | |
Jefferson C. Boyce, (c)
Born September 1957 | | Independent Chairman | | | 2021 | | | Senior Managing Director, New York Life Investments, LLC (1992-2012) | | Westhab, Inc. | |
John C. Walters,
Born February 1962 | | Trustee | | | 2019 | | | Retired. Mr. Walters brings significant Board experience including active involvement with the board of a Fortune 500 company, and a proven record of leading large, complex financial organizations. He has a demonstrated record of success in distribution, manufacturing, investment brokerage, and investment management in both the retail and institutional investment businesses. He has substantial experience in the investment management business with a demonstrated ability to develop and drive strategy while managing operation, financial, and investment risk. | | Guardian Variable Products Trust (16 series), Lead Independent Director; Amerilife Holdings LLC, Director; Stadion Money Management; Director; University of North Carolina (Chapel Hill), Member Board of Governors | |
40
USAA Mutual Funds Trust | | Supplemental Information — continued
May 31, 2021 | |
(Unaudited)
Name and Date of Birth | | Position
Held with
the Trust | | Year
Commenced
Service | | Principal Occupation
During Past 5 Years | | Other
Directorships
Held During
Past 5 Years | |
Robert L. Mason, Ph.D.,
Born July 1946 | | Trustee | | | 1997 | | | Adjunct Professor in the Department of Management Science and Statistics in the College of Business at the University of Texas at San Antonio (since 2001); Institute Analyst, Southwest Research Institute (March 2002-January 2016) | | None | |
Dawn M. Hawley,
Born February 1954 | | Trustee | | | 2014 | | | Manager of Finance, Menil Foundation, Inc. (May 2007-June 2011), which is a private foundation that oversees the assemblage of sculptures, prints, drawings, photographs, and rare books. Director of Financial Planning and Analysis and Chief Financial Officer, AIM Management Group, Inc. (October 1987-January 2006) | | None | |
Paul L. McNamara,
Born July 1948 | | Trustee | | | 2012 | | | Director, Cantor Opportunistic Alternatives Fund, LLC (March 2010-February 2014), which is a closed-end fund of funds by Cantor Fitzgerald Investment Advisors, LLC | | None | |
41
USAA Mutual Funds Trust | | Supplemental Information — continued
May 31, 2021 | |
(Unaudited)
Name and Date of Birth | | Position
Held with
the Trust | | Year
Commenced
Service | | Principal Occupation
During Past 5 Years | | Other
Directorships
Held During
Past 5 Years | |
Richard Y. Newton III,
Born January 1956 | | Trustee | | | 2017 | | | Director, Elta North America (01/18-present), which is a global leader in the design, manufacture, and support of innovative electronic systems in the ground, maritime, airborne, and security domains for the nation's warfighters, security personnel, and first responders; Managing Partner, Pioneer Partnership Development Group (December 2015-present)); Executive Director, The Union League Club of New York (June 2014-November 2015): Executive Vice President, Air Force Association (August 2012-May 2014); Lieutenant General, United States Air Force (January 2008-June 2012) | | PredaSAR Corp. | |
Barbara B. Ostdiek, Ph.D.,
Born March 1964 | | Trustee | | | 2008 | | | Senior Associate Dean of Degree Programs at Jesse H. Jones Graduate School of Business at Rice University (since 2013); Associate Professor of Finance at Jessie H. Jones Graduate School of Business at Rice University (since 2001) | | None | |
Effective at the close of business on December 31, 2020, Michael F. Reimherr retired from the Board of Trustees.
42
USAA Mutual Funds Trust | | Supplemental Information — continued
May 31, 2021 | |
(Unaudited)
Name and Date of Birth | | Position
Held with
the Trust | | Year
Commenced
Service | | Principal Occupation
During Past 5 Years | | Other
Directorships
Held During
Past 5 Years | |
Interested Trustees. | |
David C. Brown, (b)
Born May 1972 | | Trustee | | | 2019 | | | Chairman and Chief Executive Officer (since 2013), Victory Capital Management Inc.; Chairman and Chief Executive Officer, Victory Capital Holdings, Inc. (since 2013). Mr. Brown brings to the Board extensive business, finance and leadership skills gained and developed through years of experience in the financial services industry, including his tenure overseeing the strategic direction as CEO of Victory Capital. These skills, combined with Mr. Brown's extensive knowledge of the financial services industry and demonstrated success in the development and distribution of investment strategies and products, enable him to provide valuable insights to the Board and strategic direction for the Funds. | | Trustee, Victory Portfolios (41 series), Victory Portfolios II (26 series), Victory Variable Insurance Funds (8 series) | |
43
USAA Mutual Funds Trust | | Supplemental Information — continued
May 31, 2021 | |
(Unaudited)
Name and Date of Birth | | Position
Held with
the Trust | | Year
Commenced
Service | | Principal Occupation
During Past 5 Years | | Other
Directorships
Held During
Past 5 Years | |
Daniel S. McNamara, (b)(c)(d)
Born June 1966 | | Trustee | | | 2012 | | | Trustee, President, and Vice Chairman of USAA ETF Trust (June 2017-June 2019); President of Financial Advice & Solutions Group (FASG), USAA (February 2013-March 2021); Director of USAA Investment Services Company (ISCO) (formerly USAA Investment Management) (September 2009-March 2021); President, Asset Management Company (AMCO) (August, 2011-June 2019); Senior Vice President of USAA Financial Planning Services Insurance Agency, Inc. (FPS) (April 2011-March 2021); Chairman of Board of ISCO (April 2013-December 2020); Director of AMCO (August 2011-June 2019); President and Director of USAA Shareholder Account Services (SAS) (October 2009-June 2019); Director and Vice Chairman of FPS (December 2013-March 2021); President and Director of USAA Investment Corporation (ICORP) (March 2010-March 2021); Chairman of Board of ICORP (December 2013-March 2021); Director of USAA Financial Advisors, Inc. (FAI) (December 2013-March 2021); Chairman of Board of FAI (March 2015-March 2021). Mr. McNamara brings to the Board extensive experience in the financial services industry, including experience as an officer of the Trust. | | None | |
(b) Mr. Dan McNamara is deemed an "interested person" due to his previous position as Director of AMCO, the former investment adviser of the Funds. Mr. Brown is deemed an "interested person" due to his position as Chief Executive Officer of Victory Capital, investment adviser to the Funds.
(c) Effective at the close of business on December 31, 2020, Jefferson C. Boyce replaced Dan McNamara as Chair of the Board and assumed the title of Independent Chair.
(d) Effective July 2, 2021, Mr. Dan McNamara became an Independent Trustee to the Funds.
The Statement of Additional Information includes additional information about the Trustees of the Trust and is available, without charge, on the SEC's website at www.sec.gov and/or by calling (800)-235-8396.
44
USAA Mutual Funds Trust | | Supplemental Information — continued
May 31, 2021 | |
(Unaudited)
Officers:
The officers of the Trust, their ages, commencement of service and their principal occupations during the past five years, are detailed in the following table. Each officer serves until the earlier of his or her resignation, removal, retirement, death, or the election of a successor. The mailing address of each officer of the Trust is 15935 La Cantera Pkwy, San Antonio, TX, 78256. The officers of the Trust receive no compensation directly from the Trust for performing the duties of their offices.
Name and Date of Birth | | Position with
the Trust | | Year
Commenced
Service | | Principal Occupation During Past 5 Years | |
Interested Officers.
Christopher K. Dyer,
Born February 1962 | | President | | | 2019 | | | Director of Fund Administration, Victory Capital (since 2004); Chief Operating Officer, Victory Capital Services, Inc. (since 2020) | |
Scott A Stahorsky,
Born July 1969 | | Vice President | | | 2019 | | | Manager, Fund Administration, Victory Capital (since 2015) | |
James K. De Vries,
Born April 1969 | | Treasurer | | | 2018 | | | Executive Director, Victory Capital Management Inc. (since 2019); Treasurer, USAA ETF Trust (September 2018-June 2019); Executive Director, Investment and Financial Administration, USAA (April 2012-June 2019); Assistant Treasurer, USAA ETF Trust (June 2017-September 2018); Assistant Treasurer, USAA Mutual Funds Trust (December 2013-February 2018) | |
Allan Shaer,
Born March 1965 | | Assistant Treasurer | | | 2019 | | | Senior Vice President, Financial Administration, Citi Fund Services Ohio, Inc. (since 2016); Vice President, Mutual Fund Administration, JP Morgan Chase (2011-2016) | |
Carol D. Trevino,
Born October 1965 | | Assistant Treasurer | | | 2018 | | | Director, Accounting and Finance, Victory Capital Management Inc. (since 2019); Accounting/Financial Director, USAA (December 2013-June 2019); Assistant Treasurer, USAA ETF Trust (September 2018-June 2019) | |
Erin G. Wagner,
Born February 1974 | | Secretary | | | 2019 | | | Deputy General Counsel, the Adviser (since 2013) | |
Charles Booth,
Born April 1960 | | Anti-Money Laundering Compliance Officer and Identity Theft Officer | | | 2019 | | | Director, Regulatory Administration and CCO Support Services, Citi Fund Services Ohio, Inc. (since 2007) | |
Amy Campos,
Born July 1976 | | Chief Compliance Officer | | | 2019 | | | Chief Compliance Officer, USAA Mutual Funds Trust (since 2019); Executive Director, Deputy Chief Compliance Officer, USAA Mutual Funds Trust and USAA ETF Trust (July 2017-June 2019); Compliance Director, USAA Mutual Funds Trust (2014-July 2017) | |
45
USAA Mutual Funds Trust | | Supplemental Information — continued
May 31, 2021 | |
(Unaudited)
Proxy Voting and Portfolio Holdings Information
Proxy Voting:
Information regarding the policies and procedures the Fund uses to determine how to vote proxies relating to portfolio securities is available without charge, upon request, by calling (800) 235-8396. The information is also included in the Fund's Statement of Additional Information, which is available on the SEC's website at www.sec.gov.
Information relating to how the Fund voted proxies relating to portfolio securities held during the most recent 12 months ended June 30 is available on the SEC's website at www.sec.gov.
Availability of Schedules of Portfolio Investments:
The Trust files a complete list of Schedules of Portfolio Investments with the SEC for the first and third quarter of each fiscal year on Form N-PORT. Form N-PORT is available on the SEC's website at www.sec.gov.
Expense Example
As a shareholder of the Fund, you may incur two types of costs: (1) transaction costs, and (2) ongoing costs, including management fees and other Fund expenses. These examples are intended to help you understand your ongoing costs (in dollars) of investing in the Fund and to compare these costs with the ongoing costs of investing in other mutual funds.
These examples are based on an investment of $1,000 invested at the beginning of the period and held for the entire period from December 1, 2020, through May 31, 2021.
The Actual Expense figures in the table below provide information about actual account values and actual expenses. You may use the information below, together with the amount you invested, to estimate the expenses that you paid over the period. Simply divide your account value by $1,000 (for example, an $8,600 account value divided by $1,000 = 8.6), then multiply the result by the number in the table under the heading entitled "Actual Expenses Paid During Period" to estimate the expenses you paid on your account during this period.
The Hypothetical Expense figures in the table below provide information about hypothetical account values and hypothetical expenses based on the Fund's actual expense ratio and an assumed rate of return of 5% per year before expenses, which is not the Fund's actual return. The hypothetical account values and expenses may not be used to estimate the actual ending account balance or expenses you paid for the period. You may use this information to compare this 5% hypothetical example with the 5% hypothetical examples that appear in shareholder reports of other funds.
Please note the expenses shown in the table below are meant to highlight your ongoing costs only and do not reflect any transactional costs. If these transactional costs were included, your costs would have been higher.
Beginning
Account
Value
12/1/20 | | Actual
Ending
Account
Value
5/31/21 | | Hypothetical
Ending
Account
Value
5/31/21 | | Actual
Expenses
Paid
During
Period
12/1/20-
5/31/21* | | Hypothetical
Expenses
Paid
During
Period
12/1/20-
5/31/21* | | Annualized
Expense
Ratio
During
Period
12/1/20-
5/31/21 | |
| $ | 1,000.00 | | | $ | 1,087.90 | | | $ | 1,020.19 | | | $ | 4.95 | | | $ | 4.78 | | | | 0.95 | % | |
* Expenses are equal to the average account value multiplied by the Fund's annualized expense ratio multiplied by 182/365 (the number of days in the most recent fiscal half-year divided by the number of days in the fiscal year).
46
USAA Mutual Funds Trust | | Supplemental Information — continued
May 31, 2021 | |
(Unaudited)
Additional Federal Income Tax Information
The following federal tax information related to the Fund's fiscal year ended May 31, 2021, is provided for information purposes only and should not be used for reporting to federal or state revenue agencies. Federal tax information for the calendar year will be reported to you on Form 1099-DIV in January 2022.
With respect to distributions paid, the Fund designates the following amounts (or, if subsequently determined to be different, the maximum amount allowable) for the fiscal year ended May 31, 2021 (amounts in thousands):
| | Dividends
Received
Deduction
(corporate
shareholders) | | Qualified
Dividend
Income
(non-corporate
shareholders) | | Short-Term
Capital Gain
Distributions | |
| | | | | | 9 | % | | | 10 | % | | $ | 2,470 | | |
47
USAA Mutual Funds Trust | | Supplemental Information — continued
May 31, 2021 | |
(Unaudited)
Considerations of the Board in Continuing the Investment Advisory Agreement (the "Agreement")
USAA Cornerstone Moderate Fund (the "Fund")
At a meeting of the Board of Trustees (the "Board") held on December 10-11, 2020, the Board, including the Trustees who are not "interested persons" (as that term is defined in the Investment Company Act of 1940, as amended) of the Trust (the "Independent Trustees"), approved for an annual period the continuance of the Investment Advisory Agreement (the "Advisory Agreement") between the Trust and Victory Capital Management Inc. (the "Adviser") with respect to the Fund. Prior to the December 10-11, 2020 meeting at which the Advisory Agreement was approved, the Independent Trustees also discussed and considered information regarding the proposed continuation of the Advisory Agreement at a meeting held on November 19, 2020.
In advance of the foregoing meetings, the Trustees received and considered a variety of information relating to the Advisory Agreement and the Adviser, and were given the opportunity to ask questions and request additional information from management. The information provided to the Board included, among other things: (i) a separate report prepared by an independent third party of mutual fund data, which provided a statistical analysis comparing the Fund's investment performance, expenses, and fees to comparable investment companies; (ii) information concerning the services rendered to the Fund, as well as information regarding the Adviser's revenues and costs of providing services to the Fund and compensation paid to affiliates of the Adviser; and (iii) information about the Adviser's operations and personnel. Prior to voting, the Independent Trustees reviewed the proposed continuance of the Advisory Agreement with management and with experienced independent counsel retained by the Independent Trustees ("Independent Counsel") and received materials from such Independent Counsel discussing the legal standards for their consideration of the proposed continuation of the Advisory Agreement with respect to the Fund. The Independent Trustees also reviewed the proposed continuation of the Advisory Agreement with respect to the Fund in private sessions with Independent Counsel at which no representatives of management were present.
At each regularly scheduled meeting of the Board and its committees, the Board receives and reviews, among other things, information concerning the Fund's performance and related services provided by the Adviser. At the meeting at which the renewal of the Advisory Agreement is considered, particular focus is given to information concerning Fund performance, fees and total expenses as compared to comparable investment companies, and the Adviser's profitability with respect to the Fund. However, the Board noted that the evaluation process with respect to the Adviser is an ongoing one. In this regard, the Board's and its committees' consideration of the Advisory Agreement included information previously received at such meetings.
Advisory Agreement
After full consideration of a variety of factors, the Board, including the Independent Trustees, voted to approve the Advisory Agreement. In approving the Advisory Agreement, the Trustees did not identify any single factor as controlling, and each Trustee may have attributed different weights to various factors. Throughout their deliberations, the Independent Trustees were represented and assisted by Independent Counsel.
Nature, Extent, and Quality of Services — In considering the nature, extent, and quality of the services provided by the Adviser under the Advisory Agreement, the Board reviewed information provided by the Adviser relating to its operations and personnel. The Board also took into account its knowledge of the Adviser's management and the quality of the performance of the Adviser's duties through Board meetings, discussions, and reports during the preceding year. The Board considered the fees paid to the Adviser and the services provided to the Fund by the Adviser under the Advisory Agreement, as well as other services provided by the Adviser and its affiliates under other agreements, and the personnel who provide these services. In addition to the investment advisory services provided to the Fund, the Adviser and its affiliates provide administrative services, shareholder services, oversight of Fund accounting, marketing services, assistance in meeting legal and regulatory requirements, and other services necessary for the operation of the Fund and the Trust.
The Board considered the scope of services provided by, and the undertakings required of, the Adviser in connection with those services, including, among other things, maintaining (i) its own and the Fund's compliance programs, (ii) risk management programs, (iii) liquidity risk management programs, and (iv) cybersecurity programs, each of which had expanded over time as a result of regulatory, market, and other developments.
48
USAA Mutual Funds Trust | | Supplemental Information — continued
May 31, 2021 | |
(Unaudited)
The Board also considered the significant risks assumed by the Adviser in connection with the services provided to the Fund, including investment, operational, enterprise, litigation, regulatory, and compliance risks.
The Board considered the Adviser's management style and the performance of the Adviser's duties under the Advisory Agreement. The Board considered the level and depth of knowledge of the Adviser, including the professional experience and qualifications of its senior and investment personnel, as well as current staffing levels. The allocation of the Fund's brokerage, including the Adviser's process for monitoring "best execution," also was considered. The Adviser's role in coordinating the activities of the Fund's other service providers was also considered. The Board also considered the Adviser's risk management processes. The Board considered the Adviser's financial condition and that it had the financial wherewithal to continue to provide the same scope and high quality of services under the Advisory Agreement. In reviewing the Advisory Agreement, the Board focused on the experience, resources, and strengths of the Adviser and its affiliates in managing the Fund, as well as the other funds in the Trust.
The Board also reviewed the compliance and administrative services provided to the Fund by the Adviser and its affiliates, including the Adviser's oversight of the Fund's day-to-day operations and oversight of Fund accounting. The Trustees, guided also by information obtained from their experiences as trustees of the Trust, also focused on the quality of the Adviser's compliance and administrative staff.
Expenses and Performance — In connection with its consideration of the Advisory Agreement, the Board evaluated the Fund's advisory fees and total expense ratio as compared to other open-end investment companies deemed to be comparable to the Fund as determined by the independent third party in its report. The Fund's expenses were compared to (i) a group of investment companies chosen by the independent third party to be comparable to the Fund based upon certain factors, including fund type, comparability of investment objective and classification, sales load type, asset size, and expense components (the "expense group") and (ii) a larger group of investment companies with the same investment classification/objective as the Fund regardless of asset size, excluding outliers (the "expense universe"). Among other data, the Board noted that the Fund's management fee rate — which includes advisory and administrative services, as well as any fee waivers and reimbursements — was above the medians of its expense group and expense universe. The data indicated that the Fund's total expenses, including after any reimbursements, were above the medians of its expense group and expense universe. The Board also took into account the Adviser's current undertakings to maintain expense limitations for the Fund. The Board took into account the various other services provided to the Fund by the Adviser and its affiliates, and noted the high quality of services received by the Fund.
In considering the Fund's performance, the Board noted that it reviews at its regularly scheduled meetings information about the Fund's performance results. The Trustees also reviewed various comparative data provided to them in connection with their consideration of the renewal of the Advisory Agreement, including, among other information, a comparison of the Fund's average annual total returns relative to its Lipper index and other mutual funds deemed to be in its peer group by the independent third party in its report (the "performance universe"). The Fund's performance universe consisted of the Fund and all retail and institutional open-end investment companies with the same classification/objective as the Fund regardless of asset size or primary channel of distribution. This comparison indicated that, among other data, the Fund's performance was below the average of its performance universe and its Lipper index for the one-, three-, five- and ten-year periods ended September 30, 2020. The Board took into account management's discussion of the Fund's performance, including the reasons for the Fund's underperformance relative to its peers.
Compensation and Profitability — The Board took into consideration the level and method of computing the management fee. The information considered by the Board included operating profit margin information for the Adviser's business as a whole. The Board also received and considered profitability information related to the management revenues from the Fund. This information included a review of the methodology used in the allocation of certain costs to the Fund. In considering the profitability data with respect to the Fund, the Trustees noted that the Adviser waived a portion of its management fees and/or reimbursed certain expenses with respect to the Fund. The Trustees reviewed the profitability of the Adviser's relationship with the Fund before tax expenses. The Board was also provided with a profitability analysis of other publicly traded asset managers prepared by an independent information service. In reviewing the overall profitability of the management fee to the Adviser, the Board also considered the fact that the Adviser and its affiliates provide shareholder servicing and administrative services to the Fund for which they receive compensation. The Board also considered the possible direct and indirect benefits to the Adviser from its relationship with the Trust, including that the Adviser may derive reputational and other benefits from its association with the Fund. The Trustees recognized that the
49
USAA Mutual Funds Trust | | Supplemental Information — continued
May 31, 2021 | |
(Unaudited)
Adviser should be entitled to earn a reasonable level of profits in exchange for the level of services it provides to the Fund and the entrepreneurial and other risks that it assumes as Adviser.
Economies of Scale — The Board considered whether there should be changes in the management fee rate or structure in order to enable the Fund to participate in any economies of scale. The Board also considered the fee waiver and expense reimbursement arrangements by the Adviser. The Board also considered the effect of the Fund's change in size, if any, on its performance and fees, noting that the Fund may realize other economies of scale if assets increase proportionally more than expenses. The Board determined that the current investment management fee structure was reasonable.
Conclusions — The Board reached the following conclusions regarding the Fund's Advisory Agreement with the Adviser: (i) the Adviser has demonstrated that it possesses the capability and resources to perform the duties required of it under the Advisory Agreement; (ii) the Adviser maintains an appropriate compliance program; (iii) the performance of the Fund is reasonable in relation to the performance of funds with similar investment objectives and to relevant indices in view of the Fund's investment approach and the Adviser is appropriately monitoring the Fund's performance; (iv) the Fund's advisory expenses are reasonable in relation to those of similar funds and to the services to be provided by the Adviser; and (v) the Adviser's and its affiliates' level of profitability from their relationship with the Fund is reasonable in light of the nature and high quality of services provided by the Adviser and the type of fund. Based on its conclusions, the Board determined that continuation of the Advisory Agreement would be in the best interests of the Fund and its shareholders.
50
USAA Mutual Funds Trust | | Supplemental Information — continued
May 31, 2021 | |
(Unaudited)
Liquidity Risk Management Program:
The USAA Mutual Funds have adopted and implemented a written liquidity risk management program (the "LRMP") as required by Rule 22e-4 under the Investment Company Act of 1940, as amended. The LRMP is reasonably designed to assess and manage the Fund's liquidity risk, taking into consideration the Fund's investment strategy and the liquidity of its portfolio investments during normal and reasonably foreseeable stressed market conditions; its short and long-term cash flow projections; and its cash holdings and access to other liquidity management tools such as available funding sources including the Victory Funds Complex Interfund Lending Facility and Line of Credit (discussed in the Notes to Financial Statements). The USAA Mutual Funds' Board of Trustees approved the appointment of the Fund's investment adviser, Victory Capital Management Inc. ("Victory Capital"), as the administrator of the LRMP.
Victory Capital manages liquidity risks associated with the Fund's investments by monitoring, among other things, cash and cash equivalents, any use of derivatives, the concentration of investments, the appropriateness of the Fund's investment strategy, and by classifying every Fund investment as either highly liquid, moderately liquid, less liquid, or illiquid on at least a monthly basis. To assist with the classification of Fund investments, Victory Capital has retained a third-party provider of liquidity evaluation services. This provider determines preliminary liquidity classifications for all portfolio holdings based upon portfolio-level data and certain assumptions provided by Victory Capital. Victory Capital reviews the preliminary liquidity classifications and, when appropriate, considers other information including input from the Fund's portfolio managers (including the portfolio managers employed by any investment sub-advisers) in determining final liquidity classifications.
At a meeting held on March 10, 2021, Victory Capital provided an oral and written report to the Trustees on the operation and effectiveness of the LRMP during the previous year. The report from Victory Capital concluded that the Fund did not experience any significant liquidity challenges during the covered period, and the Fund's LRMP is reasonably designed to assess and manage its liquidity risk. The report also concluded that the LRMP continues to operate adequately and effectively to enable Victory Capital to oversee and manage liquidity risk and ensure the Fund is able to meet redemption requests without significant dilution to the remaining investors' interest in the Fund. During the review period, the Fund's portfolio consisted primarily of highly liquid investments, which are defined as cash and any investments that the Fund reasonably expects to be converted to cash in current market conditions in three business days or less without significantly changing the market value of the investment. Therefore, the Fund has not adopted a highly liquid investment minimum. The Funds' investments were below the limitation on illiquid investments during the review period. Additionally, Victory Capital indicated that no events occurred that would require the filing of Form N-LIQUID and recommended no material changes to the LRMP.
51
Privacy Policy
Protecting the Privacy of Information
The Trust respects your right to privacy. We also know that you expect us to conduct and process your business in an accurate and efficient manner. To do so, we must collect and maintain certain personal information about you. This is the information we collect from you on applications or other forms, and from the transactions you make with us or third parties. It may include your name, address, social security number, account transactions and balances, and information about investment goals and risk tolerance.
We do not disclose any information about you or about former customers to anyone except as permitted or required by law. Specifically, we may disclose the information we collect to companies that perform services on our behalf, such as the transfer agent that processes shareholder accounts and printers and mailers that assist us in the distribution of investor materials. We may also disclose this information to companies that perform marketing services on our behalf. This allows us to continue to offer you Victory investment products and services that meet your investing needs, and to effect transactions that you request or authorize. These companies will use this information only in connection with the services for which we hired them. They are not permitted to use or share this information for any other purpose.
To protect your personal information internally, we permit access only by authorized employees and maintain physical, electronic, and procedural safeguards to guard your personal information.*
* You may have received communications regarding information about privacy policies from other financial institutions which gave you the opportunity to "opt-out" of certain information sharing with companies which are not affiliated with that financial institution. The Trust does not share information with other companies for purposes of marketing solicitations for products other than the Trust. Therefore, the Trust does not provide opt-out options to their shareholders.
P.O. Box 182593
Columbus, Ohio 43218-2593

Visit our website at: | | Call | |
vcm.com | | (800) 235-8396 | |

MAY 31, 2021
Annual Report
USAA Cornerstone Moderately
Aggressive Fund
Victory Capital means Victory Capital Management Inc., the investment adviser of the USAA Mutual Funds. USAA Mutual Funds are distributed by Victory Capital Services, Inc., member of FINRA, an affiliate of Victory Capital. Victory Capital and its affiliates are not affiliated with United Services Automobile Association or its affiliates. USAA and the USAA logos are registered trademarks and the USAA Mutual Funds and USAA Investments logos are trademarks of United Services Automobile Association and are being used by Victory Capital and its affiliates under license.
www.vcm.com
News, Information And Education 24 Hours A Day, 7 Days A Week
The Victory Funds site gives fund shareholders, prospective shareholders, and investment professionals a convenient way to access fund information, get guidance, and track fund performance anywhere they can access the Internet. The site includes:
• Detailed performance records
• Daily share prices
• The latest fund news
• Investment resources to help you become a better investor
• A section dedicated to investment professionals
Whether you're a potential investor searching for the fund that matches your investment philosophy, a seasoned investor interested in planning tools, or an investment professional, www.vcm.com has what you seek. Visit us anytime. We're always open.
TABLE OF CONTENTS
Shareholder Letter (Unaudited) | | | 2 | | |
Managers' Commentary (Unaudited) | | | 4 | | |
Investment Overview (Unaudited) | | | 6 | | |
Investment Objective & Portfolio
Holdings (Unaudited) | | | 7 | | |
Schedule of Portfolio Investments | | | 8 | | |
Financial Statements | |
Statement of Assets and Liabilities | | | 22 | | |
Statement of Operations | | | 23 | | |
Statements of Changes in Net Assets | | | 24 | | |
Financial Highlights | | | 26 | | |
Notes to Financial Statements | | | 28 | | |
Report of Independent
Registered Public Accounting Firm | | | 40 | | |
Supplemental Information (Unaudited) | | | 41 | | |
Trustees' and Officers' Information | | | 41 | | |
Proxy Voting and Portfolio Holdings Information | | | 47 | | |
Expense Example | | | 47 | | |
Additional Federal Income Tax Information | | | 48 | | |
Advisory Contract Agreement | | | 49 | | |
Liquidity Risk Management Program | | | 52 | | |
Privacy Policy (inside back cover) | | | |
This report is for the information of the shareholders and others who have received a copy of the currently effective prospectus of the Fund, managed by Victory Capital Management Inc. It may be used as sales literature only when preceded or accompanied by a current prospectus, which provides further details about the Fund.
IRA DISTRIBUTION WITHHOLDING DISCLOSURE
We generally must withhold federal income tax at a rate of 10% of the taxable portion of your distribution and, if you live in a state that requires state income tax withholding, at your state's tax rate. However, you may elect not to have withholding apply or to have income tax withheld at a higher rate. Any withholding election that you make will apply to any subsequent distribution unless and until you change or revoke the election. If you wish to make a withholding election, or change or revoke a prior withholding election, call (800) 235-8396, and form W-4P (OMB No. 1545-0074 withholding certificate for pension or annuity payments) will be electronically sent.
If you do not have a withholding election in place by the date of a distribution, federal income tax will be withheld from the taxable portion of your distribution at a rate of 10%. If you must pay estimated taxes, you may be subject to estimated tax penalties if your estimated tax payments are not sufficient and sufficient tax is not withheld from your distribution.
For more specific information, please consult your tax adviser.
• NOT FDIC INSURED • NO BANK GUARANTEE • MAY LOSE VALUE
1
(Unaudited)
Dear Shareholder,
Never a dull moment. A year ago, we were still coming to grips with a global pandemic, hoping for an effective vaccine, and wondering whether the U.S. Federal Reserve's aggressive actions would continue to mollify financial markets. As it turns out, a vaccine was rolled out (domestically) faster than expectations, and the recovery that began during the second quarter of 2020 continued unabated.
Fast forward to today and investors are suddenly more concerned about labor shortages, rising commodity prices, and whether inflation will prove to be transitory or more lasting. If anything, this merely exemplifies that markets are unpredictable and the environment can change rapidly.
Reflecting on the past year, we must consider ourselves fortunate despite the myriad challenges. For starters, it was impressive how quickly the various forms of monetary and fiscal stimulus contributed to a rebound in GDP. Of course, it wasn't a straight line upward and there were bouts of elevated volatility in both bond and stock markets. Late in 2020, for example, financial markets were alternately fueled and roiled by a contentious election season, growing optimism for an effective vaccine, and a fluid debate regarding the need for even more stimulus. Ultimately, stocks were propelled higher in the fourth quarter of 2020 as it became clear Congress would provide another dose of stimulus in the form of direct payments, more unemployment insurance, and additional aid to businesses.
As we moved into 2021, stocks continued their upward trajectory. Meanwhile, the yield on the 10-Year U.S. Treasury continued rallying sharply as many investors began to shift their focus. Deflation was out; inflation was in. Indeed, the potential for a new era of inflation and higher interest rates seems to be the new worry du jour.
So how did the numbers shake out after this unusual year? The S&P 500® Index registered an impressive annual return of approximately 40% for this 12-month period ended May 31, 2021. Over this same period, the yield on the 10-Year U.S. Treasury jumped 94 basis points, reflecting both the very low starting rate and substantial fiscal stimulus. At the end of the reporting period, the yield on the 10-Year U.S. Treasury was 1.59%.
The past year is not one we will forget any time soon. There were many hardships, but we should not overlook the positives and remember our collective spirit and perseverance. Markets endured and even surprised to the upside, but perhaps the key takeaway is that investors need to remain calm in the face of adversity and focused on longer-term investment goals. We believe that's the best approach no matter what the markets throw at us.
On the following pages, you will find information relating to your USAA Mutual Funds, brought to you by Victory Capital. If you have any questions regarding the current market dynamics or your specific portfolio or investment plan, we encourage you to contact our Member Service Representatives. Call (800) 235-8396 or visit our website at www.vcm.com.
2
From all of us here at Victory Capital, thank you for letting us help you work toward your investment goals.

Christopher K. Dyer, CFA
President,
USAA Mutual Funds
3
USAA Cornerstone Moderately Aggressive Fund
Managers' Commentary
(Unaudited)
• What were the market conditions during the reporting period?
The beginning of the reporting period brought a dramatic reversal from the difficult environment that characterized the first part of 2020. While COVID-19 cases continued to rise, investors grew increasingly confident that the economy would be able to recover from its sharp downturn of February and March. The optimism stemmed, in part, from a series of better-than-expected economic reports interpreted as evidence that the slump in growth would be less severe than was initially feared. The markets were further cheered by the aggressive response by the U.S. Federal Reserve (the "Fed"). In addition to reiterating its commitment to keep short-term interest rates near zero for an extended period, the Fed announced the direct purchase of both individual bonds and exchange-traded bond funds. The central bank's unusual steps offered corporations the latitude to issue debt at ultra-low rates, providing them with the cash necessary to help withstand the effects of the coronavirus.
The global financial markets produced healthy returns during the second half of 2020, wrapping up a positive year for the major asset classes. Investors' appetite for risk improved considerably in early November, when the approval of vaccines for COVID-19 raised expectations that the world economy could gradually return to normal in 2021. The conclusion of the U.S. elections, which removed a source of uncertainty that had depressed performance in September and October, was an additional tailwind. The markets were also aided by continued indications that the Fed and other central banks would maintain their highly accommodative policies indefinitely. Not least, an agreement on a new round of U.S. fiscal stimulus further cheered investors in late December. Together, these developments outweighed negative headlines surrounding renewed lockdowns and the persistence of the coronavirus.
The first quarter of 2021 proved to be a continuation of the strong equity markets investors experienced over the second half of 2020. Gains from global equity markets were fueled by optimism surrounding the successful rollout of the COVID-19 vaccines coupled with further monetary and fiscal stimulus proposals. Faster-than-expected economic growth produced a meaningful increase in real interest rates, which led to negative returns across most major fixed income asset classes. The 10-year U.S. Treasury bond yield finished at its highest level of the first quarter reporting period, climbing from under 1% to 1.74%.
During the last few months of the reporting period, equity markets have been consolidating and interest rates leveling off after large upswings. With strong first quarter GDP and corporate earnings growth in the rearview mirror, investors seem to be contemplating their next move. Inflation data has been increasing as the economy reopens more quickly than expected. The Fed maintains that inflationary pressure is transitory but could become more persistent. The inflationary environment will be a key metric moving into the second half of the year.
4
USAA Cornerstone Moderately Aggressive Fund (continued)
Managers' Commentary (continued)
• How did the USAA Cornerstone Moderately Aggressive Fund (the "Fund") perform during the reporting period?
For the reporting period ended May 31, 2021, the Fund had a total return of 24.58%. This compares to returns of 41.85% for the MSCI All-Country World Index and 25.28% for the Cornerstone Moderately Aggressive Composite Index.
• What strategies did you employ during the reporting period?
The Fund delivered strong positive total returns during the reporting period as equity markets rebounded sharply off the market lows produced during the COVID-induced sell off early last year. All major equity asset classes participated in the rally with U.S. small cap and emerging market stocks leading the way. The Fund's allocation to fixed income produced small positive returns. Despite the double-digit total returns, the Fund slightly underperformed the Cornerstone Moderately Aggressive Composite Index.
Positive contributors to the relative performance included an overweight to emerging market stocks. The Fund also benefitted from a tactical underweight to fixed-income securities as the sharp increase in interest rates weighed on bond prices particularly during the first quarter of 2021. Security selection in the Fund's underlying fixed-income portfolio added value due to an overweight to credit-oriented securities.
These positive drivers were offset by weakness in the security selection within the U.S large-cap portion of the portfolio, primarily driven by the resurgence of what we believe are lower-quality stocks, which experienced a sharp relief rally following the rollout of the vaccine. Additionally, the Fund's commodity exposure was weighted more heavily towards gold-related securities, which underperformed a more diversified basket. A tactical underweight to real estate investment trusts also detracted slightly from performance.
Thank you for allowing us to assist you with your investment needs.
5
USAA Cornerstone Moderately Aggressive Fund
Investment Overview
(Unaudited)
Average Annual Total Return
Year Ended May 31, 2021
| | Fund Shares | | | | | |
INCEPTION DATE | | 8/15/84 | | | | | |
| | Net Asset Value | | MSCI All-Country World Index1 | | Cornerstone Moderately Aggressive Composite Index2 | |
One Year | | | 24.58 | % | | | 41.85 | % | | | 25.28 | % | |
Five Year | | | 8.27 | % | | | 14.18 | % | | | 10.18 | % | |
Ten Year | | | 5.45 | % | | | 9.58 | % | | | 7.77 | % | |
The performance data quoted represents past performance and current returns may be lower or higher. The investment return and principal value will fluctuate so that an investor's shares, when redeemed, may be worth more or less than the original cost. To obtain performance information current to the most recent month's end, please visit www.vcm.com.
Total return measures the price change in a share assuming the reinvestment of all net investment income and realized capital gain distributions, if any. The total returns quoted do not reflect adjustments made to the enclosed financial statements in accordance with U.S. Generally Accepted Accounting Principles or the deduction of taxes that a shareholder would pay on net investment income and realized capital gain distributions, including reinvested distributions, or redemptions of shares. The total return figures set forth above include all waivers of fees. Without such fee waivers, the total returns would have been lower.
USAA Cornerstone Moderately Aggressive Fund — Growth of $10,000
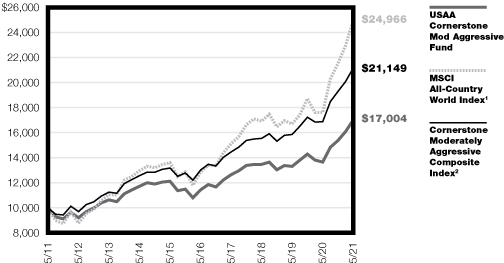
1 The unmanaged MSCI All-Country World Index is a free float-adjusted, market capitalization-weighted index designed to measure the performance of large-and mid-cap stocks across developed and emerging markets. The index reflects the reinvestment of dividends paid on the stocks constituting the index net of withholding taxes. This index does not include the effect of sales charges, commissions, expenses, or taxes, is not representative of the Fund, and it is not possible to invest directly in an index.
2 The Cornerstone Moderately Aggressive Composite Index is a combination of unmanaged indexes representing the Fund's model allocation, and consists of the MSCI USA Investable Market Index (IMI) Gross (34%), the MSCI ACWI ex USA IMI Net (23%), the Bloomberg Barclays U.S. Universal Index (38%), the Bloomberg Commodity Index Total Return (1.5%), the MSCI U.S. Real Estate Investment Trust (REIT) Index Gross (1.5%), and the Bloomberg Barclays U.S. Treasury – Bills (1-3M) (2%). This index does not include the effect of sales charges, commissions, expenses, or taxes, is not representative of the Fund, and it is not possible to invest directly in an index.
The graph reflects investment of growth of a hypothetical $10,000 investment in the Fund.
The graph and table do not reflect the deduction of taxes that a shareholder would pay on Fund distributions or the redemption of Fund shares.
Past performance is not indicative of future results.
6
USAA Mutual Funds Trust
USAA Cornerstone Moderately Aggressive Fund | | May 31, 2021 | |
(Unaudited)
Investment Objective and Portfolio Holdings:
The Fund's investment objective seeks capital appreciation with a secondary focus on current income.
Asset Allocation*:
May 31, 2021
(% of Net Assets)

* Does not include futures, money market instruments, and short-term investments purchased with cash collateral from securities loaned.
Percentages are of the net assets of the Fund and may not equal 100%.
7
USAA Mutual Funds Trust
USAA Cornerstone Moderately Aggressive Fund | | Schedule of Portfolio Investments
May 31, 2021 | |
(Amounts in Thousands, Except for Shares)
Security Description | | Principal
Amount | | Value | |
Asset-Backed Securities (0.9%) | |
Americredit Automobile Receivables Trust, Series 2018-1, Class C,
3.50%, 1/18/24, Callable 8/18/22 @ 100 | | $ | 4,640 | | | $ | 4,755 | | |
Americredit Automobile Receivables Trust, Series 2018-2, Class A3,
3.15%, 3/20/23, Callable 10/18/22 @ 100 | | | 77 | | | | 77 | | |
Canadian Pacer Auto Receivables Trust, Series 2018-1A, Class C,
3.82%, 4/19/24, Callable 6/19/21 @ 100 (a) | | | 2,084 | | | | 2,087 | | |
CarMax Auto Owner Trust, Series 2020-1, Class B, 2.21%, 9/15/25,
Callable 8/15/23 @ 100 | | | 1,084 | | | | 1,123 | | |
Credit Acceptance Auto Loan Trust, Series 2018-3A, Class A, 3.55%, 8/15/27,
Callable 10/15/21 @ 100 (a) | | | 35 | | | | 35 | | |
Drive Auto Receivables Trust, Series 2018-4, Class D, 4.09%, 1/15/26,
Callable 8/15/22 @ 100 | | | 1,137 | | | | 1,168 | | |
Exeter Automobile Receivables Trust, Series 2020-1A, Class B, 2.26%, 4/15/24,
Callable 5/15/23 @ 100 (a) | | | 873 | | | | 879 | | |
Exeter Automobile Receivables Trust, Series 2017-3A, Class D, 5.28%, 10/15/24,
Callable 4/15/22 @ 100 (a) | | | 850 | | | | 877 | | |
Exeter Automobile Receivables Trust, Series 2019-2A, Class C, 3.30%, 3/15/24,
Callable 4/15/23 @ 100 (a) | | | 1,644 | | | | 1,662 | | |
Ford Credit Auto Owner Trust, Series 2020-1, Class B, 2.29%, 8/15/31,
Callable 2/15/25 @ 100 (a) | | | 1,134 | | | | 1,186 | | |
Hertz Vehicle Financing II LP, Series 2019-3A, Class A, 2.67%, 12/26/25 (a) | | | 164 | | | | 164 | | |
HPEFS Equipment Trust, Series 2019-1A, Class C, 2.49%, 9/20/29,
Callable 6/20/22 @ 100 (a) | | | 766 | | | | 778 | | |
HPEFS Equipment Trust, Series 2020-1A, Class B, 1.89%, 2/20/30,
Callable 2/20/23 @ 100 (a) | | | 436 | | | | 444 | | |
Navient Student Loan Trust, Series 2015-2, Class B, 1.59% (LIBOR01M+150bps),
8/25/50, Callable 8/25/29 @ 100 (b) | | | 1,800 | | | | 1,802 | | |
NP SPE II LLC, Series 2017-1A, Class A1, 3.37%, 10/21/47,
Callable 10/20/27 @ 100 (a) | | | 549 | | | | 567 | | |
SCF Equipment Leasing LLC, Series 2020-1A, Class B, 2.02%, 3/20/28,
Callable 5/20/25 @ 100 (a) | | | 869 | | | | 889 | | |
SLM Student Loan Trust, Series 2006-2, Class B, 0.40% (LIBOR03M+22bps),
1/25/41, Callable 10/25/32 @ 100 (b) | | | 1,714 | | | | 1,590 | | |
SLM Student Loan Trust, Series 2003-14, Class B, 0.73% (LIBOR03M+55bps),
10/25/65, Callable 10/25/29 @ 100 (b) | | | 603 | | | | 574 | | |
Transportation Finance Equipment Trust, Series 2019-1, Class B, 2.06%, 5/23/24,
Callable 6/23/23 @ 100 (a) | | | 600 | | | | 615 | | |
Trinity Rail Leasing LLC, Series 2019-2A, Class A2, 3.10%, 10/18/49,
Callable 5/17/23 @ 100 (a) | | | 1,000 | | | | 1,052 | | |
Westlake Automobile Receivables Trust, Series 2018-2A, Class D, 4.00%, 1/16/24,
Callable 1/15/22 @ 100 (a) | | | 1,127 | | | | 1,138 | | |
Westlake Automobile Receivables Trust, Series 2020-1A, Class B, 1.94%, 4/15/25,
Callable 4/15/23 @ 100 (a) | | | 2,836 | | | | 2,876 | | |
Total Asset-Backed Securities (Cost $25,749) | | | 26,338 | | |
Collateralized Mortgage Obligations (0.5%) | |
Banc of America Commercial Mortgage Trust, Series 2006-3, Class AM,
5.66%, 7/10/44 (c) | | | 3,874 | | | | 558 | | |
Banc of America Commercial Mortgage Trust, Series 2008-1, Class AJ,
6.57%, 2/10/51 (c) | | | 130 | | | | 129 | | |
See notes to financial statements.
8
USAA Mutual Funds Trust
USAA Cornerstone Moderately Aggressive Fund | | Schedule of Portfolio Investments — continued
May 31, 2021 | |
(Amounts in Thousands, Except for Shares)
Security Description | | Shares or
Principal
Amount | | Value | |
Benchmark Mortgage Trust, Series 2020-B17, Class ASB, 2.18%, 3/15/53,
Callable 11/15/29 @ 100 | | $ | 1,134 | | | $ | 1,166 | | |
BTH Mortgage-Backed Securities Trust, Series 2018-21, Class A,
2.61% (LIBOR01M+250bps), 10/7/21 (a) (b) | | | 2,320 | | | | 2,319 | | |
BX Trust, Series 2019-OC11, Class A, 3.20%, 12/9/41 (a) | | | 1,047 | | | | 1,119 | | |
Citigroup Commercial Mortgage Trust, Series 2020-GC46, Class AAB,
2.61%, 1/15/53, Callable 11/15/29 @ 100 | | | 1,134 | | | | 1,201 | | |
Citigroup Commercial Mortgage Trust, Series 2020-555, Class A,
2.65%, 12/10/41 (a) | | | 1,701 | | | | 1,741 | | |
COMM Mortgage Trust, Series 2014-277P, Class A, 3.61%, 8/10/49,
Callable 8/10/24 @ 100 (a) (c) | | | 1,138 | | | | 1,220 | | |
COMM Mortgage Trust, Series 2019-GC44, Class ASB, 2.87%, 8/15/57,
Callable 5/15/29 @ 100 | | | 1,701 | | | | 1,829 | | |
Credit Suisse Commercial Mortgage Trust, Series 2007-C1, Class AMFL,
0.29% (LIBOR01M+19bps), 2/15/40 (b) | | | 55 | | | | 55 | | |
CSAIL Commercial Mortgage Trust, Series 2016-C6, Class XA, 1.91%, 1/15/49,
Callable 11/15/25 @ 100 (c) (d) | | | 19,456 | | | | 1,331 | | |
DBJPM Mortgage Trust, Series 2016-SFC, Class A, 2.83%, 8/10/36,
Callable 8/10/26 @ 100 (a) | | | 1,000 | | | | 1,028 | | |
GS Mortgage Securities Trust, Series 2020-GC45, Class AAB, 2.84%, 2/13/53,
Callable 9/13/29 @ 100 | | | 608 | | | | 653 | | |
Manhattan West, Series 2020-1MW, Class A, 2.13%, 9/10/40 (a) | | | 711 | | | | 723 | | |
UBS Commercial Mortgage Trust, Series 2012-C1, Class XA, 2.05%, 5/10/45,
Callable 4/10/22 @ 100 (a) (c) (d) | | | 20,322 | | | | 152 | | |
Total Collateralized Mortgage Obligations (Cost $18,546) | | | 15,224 | | |
Common Stocks (19.4%) | |
Communication Services (1.9%): | |
Alphabet, Inc. Class C (e) | | | 8,009 | | | | 19,314 | | |
AT&T, Inc. | | | 120,310 | | | | 3,541 | | |
Comcast Corp. Class A | | | 139,418 | | | | 7,994 | | |
Facebook, Inc. Class A (e) | | | 19,703 | | | | 6,477 | | |
Match Group, Inc. (e) | | | 18,613 | | | | 2,669 | | |
Pinterest, Inc. Class A (e) | | | 45,557 | | | | 2,975 | | |
Sirius XM Holdings, Inc. (f) | | | 431,383 | | | | 2,696 | | |
Snap, Inc. Class A (e) | | | 51,239 | | | | 3,183 | | |
Verizon Communications, Inc. | | | 133,567 | | | | 7,545 | | |
| | | | 56,394 | | |
Consumer Discretionary (1.6%): | |
Aptiv PLC (e) | | | 19,052 | | | | 2,866 | | |
AutoZone, Inc. (e) | | | 1,844 | | | | 2,594 | | |
Best Buy Co., Inc. | | | 22,575 | | | | 2,624 | | |
eBay, Inc. | | | 48,653 | | | | 2,962 | | |
Ford Motor Co. (e) | | | 246,918 | | | | 3,588 | | |
General Motors Co. (e) | | | 50,772 | | | | 3,011 | | |
Lennar Corp. Class A | | | 26,024 | | | | 2,577 | | |
Lowe's Cos., Inc. | | | 32,990 | | | | 6,427 | | |
O'Reilly Automotive, Inc. (e) | | | 4,990 | | | | 2,670 | | |
Roku, Inc. (e) | | | 8,716 | | | | 3,022 | | |
See notes to financial statements.
9
USAA Mutual Funds Trust
USAA Cornerstone Moderately Aggressive Fund | | Schedule of Portfolio Investments — continued
May 31, 2021 | |
(Amounts in Thousands, Except for Shares)
Security Description | | Shares | | Value | |
Target Corp. (g) | | | 29,729 | | | $ | 6,746 | | |
Tesla, Inc. (e) | | | 7,565 | | | | 4,730 | | |
The Home Depot, Inc. | | | 13,132 | | | | 4,188 | | |
| | | | 48,005 | | |
Consumer Staples (1.3%): | |
Altria Group, Inc. | | | 188,051 | | | | 9,256 | | |
Archer-Daniels-Midland Co. | | | 43,292 | | | | 2,880 | | |
Colgate-Palmolive Co. | | | 35,955 | | | | 3,012 | | |
Keurig Dr Pepper, Inc. | | | 76,355 | | | | 2,822 | | |
Monster Beverage Corp. (e) | | | 31,337 | | | | 2,954 | | |
Philip Morris International, Inc. | | | 70,322 | | | | 6,781 | | |
The Clorox Co. | | | 14,970 | | | | 2,646 | | |
The Estee Lauder Cos., Inc. | | | 9,986 | | | | 3,061 | | |
Tyson Foods, Inc. Class A | | | 34,801 | | | | 2,767 | | |
Walgreens Boots Alliance, Inc. | | | 54,890 | | | | 2,890 | | |
| | | | 39,069 | | |
Energy (0.4%): | |
Chevron Corp. | | | 34,572 | | | | 3,588 | | |
ConocoPhillips | | | 107,735 | | | | 6,005 | | |
Marathon Petroleum Corp. | | | 48,296 | | | | 2,985 | | |
| | | | 12,578 | | |
Financials (2.5%): | |
AGNC Investment Corp. | | | 8,827 | | | | 164 | | |
Annaly Capital Management, Inc. | | | 22,137 | | | | 205 | | |
Aon PLC Class A | | | 11,207 | | | | 2,839 | | |
Berkshire Hathaway, Inc. Class B (e) | | | 16,260 | | | | 4,706 | | |
BlackRock, Inc. | | | 4,027 | | | | 3,532 | | |
Capital One Financial Corp. | | | 38,926 | | | | 6,258 | | |
Citigroup, Inc. | | | 46,439 | | | | 3,655 | | |
Fifth Third Bancorp | | | 67,297 | | | | 2,836 | | |
KeyCorp | | | 117,627 | | | | 2,710 | | |
MetLife, Inc. | | | 87,317 | | | | 5,707 | | |
Morgan Stanley | | | 75,595 | | | | 6,875 | | |
MSCI, Inc. | | | 5,752 | | | | 2,693 | | |
Prudential Financial, Inc. | | | 54,824 | | | | 5,865 | | |
S&P Global, Inc. | | | 7,900 | | | | 2,998 | | |
SVB Financial Group (e) | | | 9,446 | | | | 5,506 | | |
T. Rowe Price Group, Inc. | | | 14,852 | | | | 2,842 | | |
The Allstate Corp. | | | 21,511 | | | | 2,939 | | |
The Goldman Sachs Group, Inc. | | | 17,843 | | | | 6,638 | | |
The Progressive Corp. | | | 27,865 | | | | 2,761 | | |
Wells Fargo & Co. | | | 77,890 | | | | 3,639 | | |
| | | | 75,368 | | |
Health Care (3.7%): | |
Abbott Laboratories | | | 31,562 | | | | 3,682 | | |
AbbVie, Inc. | | | 32,476 | | | | 3,676 | | |
Agilent Technologies, Inc. | | | 21,514 | | | | 2,972 | | |
Align Technology, Inc. (e) | | | 4,729 | | | | 2,791 | | |
See notes to financial statements.
10
USAA Mutual Funds Trust
USAA Cornerstone Moderately Aggressive Fund | | Schedule of Portfolio Investments — continued
May 31, 2021 | |
(Amounts in Thousands, Except for Shares)
Security Description | | Shares | | Value | |
Amgen, Inc. | | | 26,903 | | | $ | 6,401 | | |
Anthem, Inc. | | | 8,047 | | | | 3,204 | | |
Biogen, Inc. (e) | | | 20,940 | | | | 5,601 | | |
Bristol-Myers Squibb Co. | | | 53,561 | | | | 3,520 | | |
Cigna Corp. | | | 12,217 | | | | 3,162 | | |
CVS Health Corp. | | | 38,721 | | | | 3,347 | | |
Danaher Corp. | | | 13,371 | | | | 3,425 | | |
Eli Lilly & Co. | | | 17,649 | | | | 3,525 | | |
Gilead Sciences, Inc. (g) | | | 47,297 | | | | 3,127 | | |
HCA Healthcare, Inc. | | | 28,214 | | | | 6,060 | | |
IDEXX Laboratories, Inc. (e) | | | 10,363 | | | | 5,784 | | |
IQVIA Holdings, Inc. (e) | | | 12,401 | | | | 2,978 | | |
Johnson & Johnson (g) | | | 58,462 | | | | 9,895 | | |
Merck & Co., Inc. | | | 45,433 | | | | 3,448 | | |
Mettler-Toledo International, Inc. (e) | | | 4,322 | | | | 5,623 | | |
Pfizer, Inc. | | | 96,944 | | | | 3,755 | | |
Stryker Corp. | | | 12,352 | | | | 3,153 | | |
Thermo Fisher Scientific, Inc. | | | 7,708 | | | | 3,619 | | |
UnitedHealth Group, Inc. | | | 33,634 | | | | 13,854 | | |
Waters Corp. (e) | | | 8,837 | | | | 2,848 | | |
Zoetis, Inc. | | | 17,698 | | | | 3,127 | | |
| | | | 112,577 | | |
Industrials (2.0%): | |
3M Co. | | | 32,239 | | | | 6,546 | | |
Carrier Global Corp. | | | 64,273 | | | | 2,952 | | |
Caterpillar, Inc. | | | 14,024 | | | | 3,381 | | |
CSX Corp. | | | 29,976 | | | | 3,001 | | |
Cummins, Inc. | | | 10,932 | | | | 2,813 | | |
Deere & Co. | | | 8,343 | | | | 3,013 | | |
Eaton Corp. PLC | | | 40,409 | | | | 5,869 | | |
Fastenal Co. | | | 51,679 | | | | 2,741 | | |
General Dynamics Corp. | | | 15,086 | | | | 2,865 | | |
Illinois Tool Works, Inc. | | | 12,545 | | | | 2,907 | | |
Johnson Controls International PLC | | | 44,616 | | | | 2,969 | | |
Lockheed Martin Corp. | | | 16,217 | | | | 6,198 | | |
Northrop Grumman Corp. | | | 8,120 | | | | 2,971 | | |
Otis Worldwide Corp. | | | 35,381 | | | | 2,771 | | |
PACCAR, Inc. | | | 30,371 | | | | 2,781 | | |
Rockwell Automation, Inc. | | | 10,405 | | | | 2,744 | | |
Trane Technologies PLC | | | 15,904 | | | | 2,964 | | |
W.W. Grainger, Inc. | | | 5,859 | | | | 2,708 | | |
| | | | 62,194 | | |
Information Technology (4.5%): | |
Accenture PLC Class A | | | 12,102 | | | | 3,415 | | |
Adobe, Inc. (e) | | | 7,452 | | | | 3,760 | | |
Apple, Inc. | | | 209,254 | | | | 26,075 | | |
Applied Materials, Inc. | | | 48,079 | | | | 6,641 | | |
Broadcom, Inc. | | | 15,670 | | | | 7,401 | | |
Cadence Design Systems, Inc. (e) | | | 21,934 | | | | 2,785 | | |
See notes to financial statements.
11
USAA Mutual Funds Trust
USAA Cornerstone Moderately Aggressive Fund | | Schedule of Portfolio Investments — continued
May 31, 2021 | |
(Amounts in Thousands, Except for Shares)
Security Description | | Shares | | Value | |
CDW Corp. | | | 15,477 | | | $ | 2,560 | | |
Cisco Systems, Inc. | | | 144,543 | | | | 7,646 | | |
Cognizant Technology Solutions Corp. Class A | | | 38,461 | | | | 2,752 | | |
HP, Inc. | | | 245,134 | | | | 7,165 | | |
Intel Corp. | | | 64,743 | | | | 3,698 | | |
International Business Machines Corp. | | | 22,996 | | | | 3,306 | | |
Intuit, Inc. | | | 7,649 | | | | 3,359 | | |
Lam Research Corp. | | | 9,620 | | | | 6,252 | | |
Mastercard, Inc. Class A | | | 11,693 | | | | 4,216 | | |
Micron Technology, Inc. (e) | | | 35,908 | | | | 3,021 | | |
Microsoft Corp. (g) | | | 46,988 | | | | 11,732 | | |
NVIDIA Corp. | | | 7,467 | | | | 4,852 | | |
NXP Semiconductors NV | | | 14,573 | | | | 3,081 | | |
Oracle Corp. | | | 42,539 | | | | 3,350 | | |
Square, Inc. Class A (e) | | | 12,851 | | | | 2,860 | | |
TE Connectivity Ltd. | | | 21,010 | | | | 2,851 | | |
Texas Instruments, Inc. | | | 36,534 | | | | 6,935 | | |
VeriSign, Inc. (e) | | | 12,649 | | | | 2,782 | | |
VMware, Inc. Class A (e) (f) | | | 16,830 | | | | 2,657 | | |
| | | | 135,152 | | |
Materials (0.5%): | |
Dow, Inc. | | | 44,136 | | | | 3,020 | | |
International Paper Co. | | | 45,675 | | | | 2,882 | | |
LyondellBasell Industries NV Class A | | | 24,977 | | | | 2,813 | | |
PPG Industries, Inc. | | | 15,652 | | | | 2,813 | | |
The Sherwin-Williams Co. | | | 10,341 | | | | 2,932 | | |
| | | | 14,460 | | |
Real Estate (0.5%): | |
Alexandria Real Estate Equities, Inc. | | | 2,007 | | | | 358 | | |
American Tower Corp. | | | 7,016 | | | | 1,792 | | |
AvalonBay Communities, Inc. | | | 2,235 | | | | 463 | | |
Boston Properties, Inc. | | | 2,356 | | | | 277 | | |
Camden Property Trust | | | 1,537 | | | | 193 | | |
CBRE Group, Inc. Class A (e) | | | 5,297 | | | | 465 | | |
Crown Castle International Corp. | | | 6,970 | | | | 1,321 | | |
Digital Realty Trust, Inc. | | | 4,323 | | | | 655 | | |
Duke Realty Corp. | | | 5,896 | | | | 274 | | |
Equinix, Inc. | | | 1,410 | | | | 1,039 | | |
Equity LifeStyle Properties, Inc. | | | 2,774 | | | | 197 | | |
Equity Residential | | | 5,893 | | | | 456 | | |
Essex Property Trust, Inc. | | | 1,030 | | | | 304 | | |
Extra Space Storage, Inc. | | | 2,085 | | | | 312 | | |
Gaming and Leisure Properties, Inc. | | | 58 | | | | 3 | | |
Healthpeak Properties, Inc. | | | 8,426 | | | | 281 | | |
Host Hotels & Resorts, Inc. (e) | | | 10,884 | | | | 187 | | |
Invitation Homes, Inc. | | | 8,971 | | | | 325 | | |
Iron Mountain, Inc. | | | 4,610 | | | | 201 | | |
Medical Properties Trust, Inc. | | | 9,101 | | | | 193 | | |
Mid-America Apartment Communities, Inc. | | | 1,812 | | | | 291 | | |
See notes to financial statements.
12
USAA Mutual Funds Trust
USAA Cornerstone Moderately Aggressive Fund | | Schedule of Portfolio Investments — continued
May 31, 2021 | |
(Amounts in Thousands, Except for Shares)
Security Description | | Shares or
Principal
Amount | | Value | |
Omega Healthcare Investors, Inc. | | | 3,626 | | | $ | 133 | | |
Prologis, Inc. | | | 11,747 | | | | 1,384 | | |
Public Storage | | | 2,533 | | | | 716 | | |
Realty Income Corp. | | | 5,537 | | | | 379 | | |
Regency Centers Corp. | | | 2,715 | | | | 175 | | |
SBA Communications Corp. | | | 1,767 | | | | 527 | | |
Simon Property Group, Inc. | | | 5,343 | | | | 687 | | |
Sun Communities, Inc. | | | 1,582 | | | | 265 | | |
UDR, Inc. | | | 4,691 | | | | 223 | | |
Ventas, Inc. | | | 5,937 | | | | 329 | | |
VEREIT, Inc. | | | 3,406 | | | | 162 | | |
VICI Properties, Inc. | | | 8,417 | | | | 262 | | |
Vornado Realty Trust | | | 2,548 | | | | 120 | | |
Welltower, Inc. | | | 6,609 | | | | 494 | | |
Weyerhaeuser Co. | | | 11,676 | | | | 443 | | |
WP Carey, Inc. | | | 2,776 | | | | 209 | | |
| | | | 16,095 | | |
Utilities (0.5%): | |
Exelon Corp. | | | 63,276 | | | | 2,855 | | |
NextEra Energy, Inc. (g) | | | 45,980 | | | | 3,366 | | |
NRG Energy, Inc. | | | 76,133 | | | | 2,448 | | |
The AES Corp. | | | 206,886 | | | | 5,257 | | |
| | | | 13,926 | | |
Total Common Stocks (Cost $438,399) | | | 585,818 | | |
Preferred Stocks (0.4%) | |
Communication Services (0.2%): | |
Qwest Corp., 6.50%, 9/1/56 | | | 220,000 | | | | 5,577 | | |
Financials (0.2%): | |
Delphi Financial Group, Inc., 3.35% (LIBOR03M+319bps), 5/15/37 (b) (k) | | | 309,253 | | | | 6,881 | | |
Total Preferred Stocks (Cost $12,889) | | | 12,458 | | |
Corporate Bonds (7.2%) | |
Communication Services (0.1%): | |
Fox Corp., 3.05%, 4/7/25, Callable 3/7/25 @ 100 | | $ | 812 | | | | 871 | | |
The Walt Disney Co., 2.20%, 1/13/28 | | | 758 | | | | 781 | | |
T-Mobile USA, Inc., 3.88%, 4/15/30, Callable 1/15/30 @ 100 (g) | | | 2,064 | | | | 2,262 | | |
| | | | 3,914 | | |
Consumer Discretionary (0.2%): | |
AutoNation, Inc., 4.75%, 6/1/30, Callable 3/1/30 @ 100 | | | 683 | | | | 804 | | |
Hasbro, Inc., 3.55%, 11/19/26, Callable 9/19/26 @ 100 | | | 1,361 | | | | 1,493 | | |
Nordstrom, Inc., 4.38%, 4/1/30, Callable 1/1/30 @ 100 (f) | | | 1,134 | | | | 1,165 | | |
O'Reilly Automotive, Inc., 4.20%, 4/1/30, Callable 1/1/30 @ 100 | | | 1,500 | | | | 1,710 | | |
VF Corp., 2.95%, 4/23/30, Callable 1/23/30 @ 100 | | | 853 | | | | 894 | | |
Volkswagen Group of America Finance LLC, 3.20%, 9/26/26 (a) | | | 711 | | | | 773 | | |
| | | | 6,839 | | |
See notes to financial statements.
13
USAA Mutual Funds Trust
USAA Cornerstone Moderately Aggressive Fund | | Schedule of Portfolio Investments — continued
May 31, 2021 | |
(Amounts in Thousands, Except for Shares)
Security Description | | Principal
Amount | | Value | |
Consumer Staples (0.5%): | |
Anheuser-Busch Cos. LLC/Anheuser-Busch InBev Worldwide, Inc., 4.70%, 2/1/36,
Callable 8/1/35 @ 100 | | $ | 2,836 | | | $ | 3,383 | | |
Kraft Heinz Foods Co., 3.75%, 4/1/30, Callable 1/1/30 @ 100 | | | 1,277 | | | | 1,367 | | |
McCormick & Co., Inc., 2.50%, 4/15/30, Callable 1/15/30 @ 100 | | | 497 | | | | 505 | | |
Mondelez International, Inc., 2.75%, 4/13/30, Callable 1/13/30 @ 100 | | | 375 | | | | 389 | | |
PepsiCo, Inc., 2.25%, 3/19/25, Callable 2/19/25 @ 100 | | | 2,639 | | | | 2,793 | | |
Sysco Corp., 5.95%, 4/1/30, Callable 1/1/30 @ 100 | | | 668 | | | | 852 | | |
The Coca-Cola Co., 2.00%, 3/5/31 (f) | | | 1,750 | | | | 1,740 | | |
Unilever Capital Corp., 2.60%, 5/5/24, Callable 3/5/24 @ 100 | | | 3,000 | | | | 3,185 | | |
| | | | 14,214 | | |
Energy (0.8%): | |
Cameron LNG LLC, 3.30%, 1/15/35, Callable 9/15/34 @ 100 (a) | | | 2,165 | | | | 2,276 | | |
Enable Midstream Partners LP, 4.15%, 9/15/29, Callable 6/15/29 @ 100 | | | 3,000 | | | | 3,233 | | |
Enbridge Energy Partners LP, 7.38%, 10/15/45, Callable 4/15/45 @ 100 (g) | | | 1,300 | | | | 1,981 | | |
Enterprise Products Operating LLC, 2.80%, 1/31/30, Callable 10/31/29 @ 100 (f) | | | 1,701 | | | | 1,773 | | |
Enterprise TE Partners LP, 2.97% (LIBOR03M+278bps), 6/1/67,
Callable 7/12/21 @ 100 (b) | | | 500 | | | | 415 | | |
Exxon Mobil Corp., 2.99%, 3/19/25, Callable 2/19/25 @ 100 (g) | | | 2,837 | | | | 3,062 | | |
Florida Gas Transmission Co. LLC, 2.55%, 7/1/30, Callable 4/1/30 @ 100 (a) | | | 711 | | | | 713 | | |
Marathon Petroleum Corp., 4.70%, 5/1/25, Callable 4/1/25 @ 100 | | | 800 | | | | 907 | | |
Midwest Connector Capital Co. LLC, 4.63%, 4/1/29, Callable 1/1/29 @ 100 (a) | | | 1,708 | | | | 1,795 | | |
National Oilwell Varco, Inc., 3.60%, 12/1/29, Callable 9/1/29 @ 100 | | | 2,269 | | | | 2,364 | | |
Occidental Petroleum Corp.
3.50%, 8/15/29, Callable 5/15/29 @ 100 | | | 419 | | | | 393 | | |
4.40%, 8/15/49, Callable 2/15/49 @ 100 | | | 1,134 | | | | 959 | | |
ONEOK, Inc., 6.35%, 1/15/31, Callable 10/15/30 @ 100 | | | 711 | | | | 904 | | |
Targa Resources Partners LP/Targa Resources Partners Finance Corp.,
5.50%, 3/1/30, Callable 3/1/25 @ 102.75 | | | 1,134 | | | | 1,225 | | |
Western Midstream Operating LP, 4.35%, 2/1/25, Callable 1/1/25 @ 100 | | | 1,194 | | | | 1,249 | | |
| | | | 23,249 | | |
Financials (2.7%): | |
AmTrust Financial Services, Inc., 6.13%, 8/15/23 | | | 3,607 | | | | 3,664 | | |
Ares Capital Corp., 3.63%, 1/19/22, Callable 12/19/21 @ 100 (f) (g) | | | 5,950 | | | | 6,047 | | �� |
Assurant, Inc., 3.70%, 2/22/30, Callable 11/22/29 @ 100 | | | 1,154 | | | | 1,241 | | |
BancorpSouth Bank, 4.13% (LIBOR03M+247bps), 11/20/29,
Callable 11/20/24 @ 100 (b) | | | 1,458 | | | | 1,504 | | |
BBVA USA, 3.88%, 4/10/25, Callable 3/10/25 @ 100 | | | 2,700 | | | | 2,971 | | |
Belrose Funding Trust, 2.33%, 8/15/30, Callable 5/15/30 @ 100 (a) | | | 1,704 | | | | 1,659 | | |
Citizens Financial Group, Inc., 2.50%, 2/6/30, Callable 11/6/29 @ 100 | | | 1,701 | | | | 1,729 | | |
Cullen/Frost Capital Trust II, 1.74% (LIBOR03M+155bps), 3/1/34,
Callable 7/12/21 @ 100 (b) | | | 9,000 | | | | 8,648 | | |
First Horizon Bank, 5.75%, 5/1/30, Callable 2/1/30 @ 100 | | | 853 | | | | 1,045 | | |
First Maryland Capital I, 1.18% (LIBOR03M+100bps), 1/15/27,
Callable 7/12/21 @ 100 (b) | | | 4,000 | | | | 3,821 | | |
Glencore Funding LLC, 2.50%, 9/1/30, Callable 6/1/30 @ 100 (a) | | | 1,989 | | | | 1,951 | | |
Global Atlantic Financial Co., 4.40%, 10/15/29, Callable 7/15/29 @ 100 (a) | | | 1,459 | | | | 1,571 | | |
HSB Group, Inc., 1.09% (LIBOR03M+91bps), 7/15/27,
Callable 7/12/21 @ 100 (b) | | | 4,550 | | | | 4,129 | | |
See notes to financial statements.
14
USAA Mutual Funds Trust
USAA Cornerstone Moderately Aggressive Fund | | Schedule of Portfolio Investments — continued
May 31, 2021 | |
(Amounts in Thousands, Except for Shares)
Security Description | | Principal
Amount | | Value | |
Hyundai Capital America, 3.75%, 7/8/21 (a) (g) | | $ | 5,700 | | | $ | 5,718 | | |
JPMorgan Chase & Co., 2.52% (SOFR+204bps), 4/22/31,
Callable 4/22/30 @ 100 (b) | | | 995 | | | | 1,011 | | |
KeyCorp, 2.25%, 4/6/27, MTN | | | 1,701 | | | | 1,770 | | |
Level 3 Financing, Inc., 3.88%, 11/15/29, Callable 8/15/29 @ 100 (a) | | | 2,268 | | | | 2,409 | | |
Loews Corp., 3.20%, 5/15/30, Callable 2/15/30 @ 100 | | | 1,138 | | | | 1,222 | | |
Nationwide Mutual Insurance Co., 2.47% (LIBOR03M+229bps), 12/15/24,
Callable 7/12/21 @ 100 (a) (b) | | | 11,510 | | | | 11,471 | | |
New York Community Bancorp, Inc., 5.90% (LIBOR03M+278bps), 11/6/28,
Callable 11/6/23 @ 100 (b) | | | 426 | | | | 461 | | |
Pinnacle Financial Partners, Inc., 4.13% (LIBOR03M+278bps), 9/15/29,
Callable 9/15/24 @ 100 (b) | | | 2,000 | | | | 1,982 | | |
PPL Capital Funding, Inc., 4.13%, 4/15/30, Callable 1/15/30 @ 100 | | | 1,138 | | | | 1,291 | | |
Prudential Financial, Inc., 5.63% (LIBOR03M+392bps), 6/15/43,
Callable 6/15/23 @ 100 (b) | | | 5,400 | | | | 5,837 | | |
Regions Financial Corp., 2.25%, 5/18/25, Callable 4/18/25 @ 100 | | | 1,281 | | | | 1,341 | | |
Santander Holdings USA, Inc., 3.45%, 6/2/25, Callable 5/2/25 @ 100 | | | 714 | | | | 769 | | |
Signature Bank, 4.13% (LIBOR03M+256bps), 11/1/29,
Callable 11/1/24 @ 100 (b) | | | 2,000 | | | | 2,071 | | |
Texas Capital Bank NA, 5.25%, 1/31/26 | | | 1,135 | | | | 1,218 | | |
The Progressive Corp., 3.20%, 3/26/30, Callable 12/26/29 @ 100 | | | 340 | | | | 369 | | |
Toyota Motor Credit Corp., 3.38%, 4/1/30, MTN | | | 1,071 | | | | 1,184 | | |
Truist Bank, 0.83% (LIBOR03M+67bps), 5/15/27, Callable 7/12/21 @ 100 (b) | | | 1,000 | | | | 971 | | |
Wells Fargo & Co., 2.19% (SOFR+200bps), 4/30/26, Callable 4/30/25 @ 100 (b) | | | 1,279 | | | | 1,335 | | |
| | | | 82,410 | | |
Health Care (0.5%): | |
AbbVie, Inc., 3.20%, 11/21/29, Callable 8/21/29 @ 100 | | | 2,268 | | | | 2,438 | | |
Commonspirit Health, 3.35%, 10/1/29, Callable 4/1/29 @ 100 | | | 1,500 | | | | 1,610 | | |
CVS Health Corp., 3.25%, 8/15/29, Callable 5/15/29 @ 100 (g) | | | 3,747 | | | | 4,035 | | |
DENTSPLY SIRONA, Inc., 3.25%, 6/1/30, Callable 3/1/30 @ 100 | | | 1,282 | | | | 1,355 | | |
Duke University Health System, Inc., 2.60%, 6/1/30 | | | 850 | | | | 879 | | |
HCA, Inc., 5.13%, 6/15/39, Callable 12/15/38 @ 100 | | | 2,836 | | | | 3,466 | | |
Upjohn, Inc., 2.30%, 6/22/27, Callable 4/22/27 @ 100 (a) | | | 427 | | | | 436 | | |
| | | | 14,219 | | |
Industrials (1.0%): | |
BNSF Funding Trust, 6.61% (LIBOR03M+235bps), 12/15/55,
Callable 1/15/26 @ 100 (b) | | | 5,325 | | | | 6,089 | | |
Carlisle Cos., Inc., 2.75%, 3/1/30, Callable 12/1/29 @ 100 | | | 1,701 | | | | 1,747 | | |
Carrier Global Corp., 3.38%, 4/5/40, Callable 10/5/39 @ 100 | | | 851 | | | | 868 | | |
Caterpillar, Inc., 2.60%, 4/9/30, Callable 1/9/30 @ 100 | | | 853 | | | | 897 | | |
CoStar Group, Inc., 2.80%, 7/15/30, Callable 4/15/30 @ 100 (a) | | | 382 | | | | 382 | | |
Dover Corp., 2.95%, 11/4/29, Callable 8/4/29 @ 100 | | | 1,702 | | | | 1,813 | | |
Georgia-Pacific LLC, 2.10%, 4/30/27, Callable 2/28/27 @ 100 (a) (f) | | | 1,990 | | | | 2,063 | | |
Hillenbrand, Inc., 5.00%, 9/15/26, Callable 7/15/26 @ 100 (g) | | | 1,500 | | | | 1,665 | | |
IDEX Corp., 3.00%, 5/1/30, Callable 2/1/30 @ 100 | | | 1,990 | | | | 2,078 | | |
Otis Worldwide Corp., 3.11%, 2/15/40, Callable 8/15/39 @ 100 | | | 1,134 | | | | 1,144 | | |
Penske Truck Leasing Co. LP/PTL Finance Corp., 4.00%, 7/15/25,
Callable 6/15/25 @ 100 (a) | | | 1,138 | | | | 1,259 | | |
Ryder System, Inc., 2.90%, 12/1/26, MTN, Callable 10/1/26 @ 100 | | | 2,837 | | | | 3,046 | | |
See notes to financial statements.
15
USAA Mutual Funds Trust
USAA Cornerstone Moderately Aggressive Fund | | Schedule of Portfolio Investments — continued
May 31, 2021 | |
(Amounts in Thousands, Except for Shares)
Security Description | | Principal
Amount | | Value | |
Southwest Airlines Co., 5.13%, 6/15/27, Callable 4/15/27 @ 100 | | $ | 912 | | | $ | 1,068 | | |
The Boeing Co., 5.71%, 5/1/40, Callable 11/1/39 @ 100 | | | 1,706 | | | | 2,132 | | |
The Conservation Fund A Nonprofit Corp., 3.47%, 12/15/29,
Callable 9/15/29 @ 100 | | | 2,300 | | | | 2,419 | | |
United Airlines Pass Through Trust, 2.90%, 11/1/29 | | | 2,867 | | | | 2,796 | | |
| | | | 31,466 | | |
Information Technology (0.3%): | |
Amphenol Corp., 2.80%, 2/15/30, Callable 11/15/29 @ 100 | | | 3,000 | | | | 3,116 | | |
HP, Inc., 3.40%, 6/17/30, Callable 3/17/30 @ 100 | | | 1,285 | | | | 1,370 | | |
Jabil, Inc., 3.00%, 1/15/31, Callable 10/15/30 @ 100 | | | 382 | | | | 389 | | |
Microsoft Corp., 3.45%, 8/8/36, Callable 2/8/36 @ 100 | | | 3,686 | | | | 4,138 | | |
| | | | 9,013 | | |
Materials (0.1%): | |
Avery Dennison Corp., 2.65%, 4/30/30, Callable 2/1/30 @ 100 | | | 680 | | | | 694 | | |
Colonial Enterprises, Inc., 3.25%, 5/15/30, Callable 2/15/30 @ 100 (a) | | | 356 | | | | 382 | | |
LYB International Finance III LLC, 3.38%, 5/1/30, Callable 2/1/30 @ 100 | | | 994 | | | | 1,069 | | |
Vulcan Materials Co., 3.50%, 6/1/30, Callable 3/1/30 @ 100 | | | 1,137 | | | | 1,245 | | |
WRKCo, Inc., 3.00%, 6/15/33, Callable 3/15/33 @ 100 (g) | | | 647 | | | | 671 | | |
| | | | 4,061 | | |
Real Estate (0.4%): | |
AvalonBay Communities, Inc., 2.45%, 1/15/31, MTN, Callable 10/15/30 @ 100 | | | 1,705 | | | | 1,722 | | |
Boston Properties LP, 3.25%, 1/30/31, Callable 10/30/30 @ 100 | | | 746 | | | | 786 | | |
Essex Portfolio LP, 2.65%, 3/15/32, Callable 12/15/31 @ 100 | | | 1,985 | | | | 1,983 | | |
GLP Capital LP/GLP Financing II, Inc., 4.00%, 1/15/31, Callable 10/15/30 @ 100 | | | 426 | | | | 452 | | |
Host Hotels & Resorts LP, 3.50%, 9/15/30, Callable 6/15/30 @ 100 | | | 354 | | | | 365 | | |
Lexington Realty Trust, 4.25%, 6/15/23, Callable 3/15/23 @ 100 | | | 1,400 | | | | 1,480 | | |
Mid-America Apartments LP, 2.75%, 3/15/30, Callable 12/15/29 @ 100 | | | 2,836 | | | | 2,916 | | |
Sabra Health Care LP, 5.13%, 8/15/26, Callable 5/15/26 @ 100 | | | 1,000 | | | | 1,123 | | |
SBA Tower Trust, 2.84%, 1/15/25 (a) | | | 1,125 | | | | 1,179 | | |
VICI Properties LP/VICI Note Co., Inc., 4.63%, 12/1/29,
Callable 12/1/24 @ 102.31 (a) | | | 262 | | | | 274 | | |
| | | | 12,280 | | |
Utilities (0.6%): | |
AEP Texas, Inc., 3.45%, 1/15/50, Callable 7/15/49 @ 100 | | | 1,985 | | | | 1,992 | | |
Alabama Power Co., 3.85%, 12/1/42 | | | 1,702 | | | | 1,896 | | |
Ameren Corp., 3.50%, 1/15/31, Callable 10/15/30 @ 100 | | | 569 | | | | 618 | | |
CenterPoint Energy, Inc., 2.50%, 9/1/24, Callable 8/1/24 @ 100 | | | 2,000 | | | | 2,104 | | |
Duke Energy Florida LLC, 3.85%, 11/15/42, Callable 5/15/42 @ 100 | | | 1,702 | | | | 1,915 | | |
Exelon Generation Co. LLC, 3.25%, 6/1/25, Callable 5/1/25 @ 100 | | | 1,281 | | | | 1,382 | | |
IPALCO Enterprises, Inc., 4.25%, 5/1/30, Callable 2/1/30 @ 100 | | | 1,294 | | | | 1,444 | | |
ITC Holdings Corp., 2.95%, 5/14/30, Callable 2/14/30 @ 100 (a) | | | 1,279 | | | | 1,333 | | |
National Fuel Gas Co., 5.50%, 1/15/26, Callable 12/15/25 @ 100 | | | 1,709 | | | | 1,988 | | |
Union Electric Co., 2.95%, 3/15/30, Callable 12/15/29 @ 100 | | | 2,837 | | | | 3,009 | | |
| | | | 17,681 | | |
Total Corporate Bonds (Cost $207,193) | | | 219,346 | | |
See notes to financial statements.
16
USAA Mutual Funds Trust
USAA Cornerstone Moderately Aggressive Fund | | Schedule of Portfolio Investments — continued
May 31, 2021 | |
(Amounts in Thousands, Except for Shares)
Security Description | | Principal
Amount | | Value | |
Yankee Dollars (0.8%) | |
Consumer Staples (0.0%): (h) | |
Alimentation Couche-Tard, Inc., 2.95%, 1/25/30, Callable 10/25/29 @ 100 (a) | | $ | 1,134 | | | $ | 1,170 | | |
Energy (0.0%): (h) | |
Petroleos Mexicanos, 6.49%, 1/23/27, Callable 11/23/26 @ 100 | | | 973 | | | | 1,040 | | |
Financials (0.3%): | |
Banco Santander Mexico SA Institucion de Banca Multiple Grupo Financiero
Santand, 5.38%, 4/17/25 (a) | | | 812 | | | | 922 | | |
Barclays PLC, 2.85% (LIBOR03M+245bps), 5/7/26, Callable 5/7/25 @ 100 (b) | | | 1,706 | | | | 1,808 | | |
Deutsche Bank AG, 3.96% (SOFR+258bps), 11/26/25,
Callable 11/26/24 @ 100 (b) (f) | | | 1,701 | | | | 1,848 | | |
Diageo Capital PLC, 2.13%, 4/29/32, Callable 1/29/32 @ 100 | | | 1,990 | | | | 1,963 | | |
Royal Bank of Canada, 1.60%, 4/17/23, MTN | | | 1,989 | | | | 2,039 | | |
| | | | 8,580 | | |
Industrials (0.2%): | |
BAE Systems PLC, 3.40%, 4/15/30, Callable 1/15/30 @ 100 (a) | | | 1,500 | | | | 1,610 | | |
CK Hutchison International 19 II Ltd., 2.75%, 9/6/29, Callable 6/6/29 @ 100 (a) | | | 3,000 | | | | 3,092 | | |
Ferguson Finance PLC, 3.25%, 6/2/30, Callable 3/2/30 @ 100 (a) | | | 769 | | | | 822 | | |
Heathrow Funding Ltd., 4.88%, 7/15/21 (a) | | | 1,137 | | | | 1,142 | | |
| | | | 6,666 | | |
Materials (0.3%): | |
Anglo American Capital PLC, 5.63%, 4/1/30, Callable 1/1/30 @ 100 (a) | | | 1,067 | | | | 1,297 | | |
Braskem Finance Ltd., 6.45%, 2/3/24 | | | 500 | | | | 566 | | |
Braskem Netherlands Finance BV, 4.50%, 1/31/30 (a) | | | 1,702 | | | | 1,770 | | |
CCL Industries, Inc., 3.05%, 6/1/30, Callable 3/1/30 @ 100 (a) | | | 1,281 | | | | 1,327 | | |
Teck Resources Ltd., 6.13%, 10/1/35 | | | 1,818 | | | | 2,281 | | |
| | | | 7,241 | | |
Total Yankee Dollars (Cost $23,277) | | | 24,697 | | |
Municipal Bonds (0.5%) | |
Arizona (0.0%): (h) | |
City of Phoenix Civic Improvement Corp. Revenue, 1.26%, 7/1/27 | | | 1,000 | | | | 991 | | |
Florida (0.0%): (h) | |
County of Broward Florida Airport System Revenue, Series C,
2.50%, 10/1/28 | | | 1,134 | | | | 1,189 | | |
Louisiana (0.0%): (h) | |
Louisiana Local Government Environmental Facilities & Community Development
Authority Revenue, 1.55%, 2/1/27 | | | 1,140 | | | | 1,145 | | |
New Jersey (0.1%): | |
North Hudson Sewerage Authority Revenue, 2.88%, 6/1/28 | | | 567 | | | | 603 | | |
Rutgers The State University of New Jersey Revenue, Series S, 2.01%, 5/1/32 | | | 710 | | | | 682 | | |
| | | | 1,285 | | |
New York (0.0%): (h) | |
New York State Thruway Authority Revenue, Series M, 2.55%, 1/1/28 | | | 655 | | | | 695 | | |
See notes to financial statements.
17
USAA Mutual Funds Trust
USAA Cornerstone Moderately Aggressive Fund | | Schedule of Portfolio Investments — continued
May 31, 2021 | |
(Amounts in Thousands, Except for Shares)
Security Description | | Principal
Amount | | Value | |
Pennsylvania (0.1%): | |
State Public School Building Authority Revenue, 3.05%, 4/1/28 | | $ | 1,135 | | | $ | 1,143 | | |
University of Pittsburgh-of The Commonwealth System of Higher
Education Revenue
Series C, 2.53%, 9/15/31 | | | 1,135 | | | | 1,183 | | |
Series C, 2.58%, 9/15/32 | | | 565 | | | | 587 | | |
Series C, 2.63%, 9/15/33 | | | 1,135 | | | | 1,178 | | |
| | | | 4,091 | | |
Texas (0.3%): | |
City of Houston Texas Combined Utility System Revenue, 3.72%, 11/15/28 | | | 1,415 | | | | 1,637 | | |
City of San Antonio Texas, GO, 1.76%, 2/1/31, Continuously Callable @100 | | | 1,065 | | | | 1,062 | | |
Dallas Fort Worth International Airport Revenue, Series C, 1.75%, 11/1/27 | | | 710 | | | | 720 | | |
Harris County Cultural Education Facilities Finance Corp. Revenue,
Series B, 2.81%, 5/15/29 | | | 1,135 | | | | 1,189 | | |
State of Texas, GO, 3.00%, 4/1/28 | | | 1,701 | | | | 1,880 | | |
Waco Educational Finance Corp. Revenue, 1.38%, 3/1/26 | | | 800 | | | | 810 | | |
| | | | 7,298 | | |
Total Municipal Bonds (Cost $16,178) | | | 16,694 | | |
U.S. Government Agency Mortgages (2.6%) | |
Federal Home Loan Mortgage Corporation | |
Series K047, Class A2, 3.33%, 5/25/25 (c) | | | 8,400 | | | | 9,212 | | |
Series K053, Class A2, 3.00%, 12/25/25 | | | 14,000 | | | | 15,266 | | |
3.50%, 4/1/46-4/1/48 | | | 8,967 | | | | 9,533 | | |
3.00%, 6/1/46-6/1/47 | | | 38,908 | | | | 40,923 | | |
4.00%, 7/1/48 | | | 2,149 | | | | 2,293 | | |
| | | | 77,227 | | |
Federal National Mortgage Association
Series 2016-M2, Class AV2, 2.15%, 1/25/23 | | | 1,934 | | | | 1,957 | | |
Government National Mortgage Association
6.50%, 4/15/24 | | | 2 | | | | 3 | | |
Total U.S. Government Agency Mortgages (Cost $75,176) | | | 79,187 | | |
U.S. Treasury Obligations (4.8%) | |
U.S. Treasury Bonds
3.13%, 8/15/44 | | | 19,200 | | | | 22,365 | | |
2.38%, 11/15/49 | | | 10,000 | | | | 10,230 | | |
U.S. Treasury Notes
1.63%, 8/15/22 | | | 10,000 | | | | 10,186 | | |
1.63%, 11/15/22 | | | 20,000 | | | | 20,442 | | |
1.63%, 4/30/23 | | | 29,000 | | | | 29,821 | | |
2.75%, 11/15/23 | | | 1,000 | | | | 1,063 | | |
2.25%, 11/15/25 | | | 5,000 | | | | 5,350 | | |
1.63%, 2/15/26 | | | 37,000 | | | | 38,541 | | |
2.38%, 5/15/27 (g) | | | 6,100 | | | | 6,580 | | |
Total U.S. Treasury Obligations (Cost $136,475) | | | 144,578 | | |
See notes to financial statements.
18
USAA Mutual Funds Trust
USAA Cornerstone Moderately Aggressive Fund | | Schedule of Portfolio Investments — continued
May 31, 2021 | |
(Amounts in Thousands, Except for Shares)
Security Description | | Shares or
Principal
Amount | | Value | |
Commercial Paper (0.3%) | |
Duke Energy Corp., 0.23%, 6/4/21 (a) (i) | | $ | 2,600 | | | $ | 2,600 | | |
Hannover Funding Co. LLC, 0.35%, 6/2/21 (a) (i) | | | 3,400 | | | | 3,400 | | |
OGE Energy Corp., 0.52%, 6/1/21 (a) (i) | | | 2,750 | | | | 2,750 | | |
Total Commercial Paper (Cost $8,750) | | | 8,750 | | |
Exchange-Traded Funds (51.9%) | |
Invesco DB Commodity Index Tracking Fund (e) | | | 256,100 | | | | 4,763 | | |
Invesco FTSE RAFI Developed Markets ex-US ETF | | | 653,206 | | | | 32,294 | | |
Invesco FTSE RAFI Emerging Markets ETF | | | 1,539,501 | | | | 36,425 | | |
iShares 7-10 Year Treasury Bond ETF (f) | | | 341,652 | | | | 39,085 | | |
iShares Core MSCI EAFE ETF | | | 315,868 | | | | 24,259 | | |
iShares Core MSCI Emerging Markets ETF | | | 2,042,451 | | | | 136,129 | | |
iShares Core S&P 500 ETF | | | 551,947 | | | | 232,728 | | |
iShares Core S&P Small-Cap ETF | | | 594,645 | | | | 67,106 | | |
iShares Core US Aggregate Bond ETF | | | 836,063 | | | | 95,771 | | |
iShares MSCI Canada ETF (f) | | | 714,142 | | | | 27,045 | | |
iShares MSCI International Momentum Factor ETF | | | 952,016 | | | | 37,795 | | |
iShares MSCI International Quality Factor ETF (f) | | | 1,024,048 | | | | 40,358 | | |
iShares Russell 2000 ETF (f) | | | 87,019 | | | | 19,623 | | |
JPMorgan BetaBuilders Canada ETF | | | 135,647 | | | | 8,903 | | |
Schwab Fundamental Emerging Markets Large Co. Index ETF | | | 2,206,197 | | | | 71,481 | | |
Schwab Fundamental International Large Co. Index ETF | | | 3,168,339 | | | | 108,452 | | |
Schwab Fundamental International Small Co. Index ETF | | | 593,600 | | | | 23,685 | | |
SPDR Gold Shares (e) | | | 46,476 | | | | 8,290 | | |
SPDR S&P Emerging Markets SmallCap ETF (f) | | | 107,983 | | | | 6,421 | | |
U.S. Oil Fund LP (e) (f) | | | 134,220 | | | | 6,096 | | |
Vanguard FTSE All-World ex-US ETF | | | 908,055 | | | | 58,306 | | |
Vanguard FTSE Developed Markets ETF | | | 4,321,484 | | | | 226,532 | | |
Vanguard FTSE Europe ETF | | | 326,731 | | | | 22,528 | | |
Vanguard Mid-Capital ETF | | | 30,077 | | | | 7,035 | | |
Vanguard Mortgage-Backed Securities ETF (f) | | | 104,857 | | | | 5,605 | | |
Vanguard Real Estate ETF | | | 130,232 | | | | 13,008 | | |
Vanguard S&P 500 ETF (g) | | | 219,096 | | | | 84,600 | | |
Vanguard Short-Term Bond ETF (f) | | | 325,167 | | | | 26,794 | | |
Vanguard Short-Term Corporate Bond ETF (e) | | | 186,391 | | | | 15,444 | | |
Vanguard Small-Cap Value ETF (g) | | | 96,209 | | | | 16,942 | | |
Vanguard Total Bond Market ETF | | | 424,389 | | | | 36,183 | | |
Vanguard Total Stock Market ETF (g) | | | 53,865 | | | | 11,747 | | |
Wisdom Tree Trust — WisdomTree Emerging Markets SmallCap Dividend Fund | | | 202,622 | | | | 10,944 | | |
Xtrackers USD High Yield Corporate Bond ETF (f) | | | 237,755 | | | | 9,508 | | |
Total Exchange-Traded Funds (Cost $1,256,463) | | | 1,571,885 | | |
Affiliated Exchange-Traded Funds (10.3%) | |
VictoryShares USAA Core Intermediate-Term Bond ETF | | | 4,822,500 | | | | 257,355 | | |
VictoryShares USAA Core Short-Term Bond ETF | | | 969,310 | | | | 50,302 | | |
VictoryShares USAA MSCI Emerging Markets Value Momentum ETF (g) | | | 68,000 | | | | 3,503 | | |
Total Affiliated Exchange-Traded Funds (Cost $313,713) | | | 311,160 | | |
See notes to financial statements.
19
USAA Mutual Funds Trust
USAA Cornerstone Moderately Aggressive Fund | | Schedule of Portfolio Investments — continued
May 31, 2021 | |
(Amounts in Thousands, Except for Shares)
Security Description | | Shares | | Value | |
Collateral for Securities Loaned^ (3.5%) | |
Fidelity Investments Money Market Government Portfolio Institutional Shares,
0.01% (j) | | | 7,026,976 | | | $ | 7,027 | | |
Goldman Sachs Financial Square Government Fund Institutional Shares,
0.03% (j) | | | 45,482,518 | | | | 45,483 | | |
HSBC U.S. Government Money Market Fund I Shares, 0.03% (j) | | | 51,950,299 | | | | 51,950 | | |
Total Collateral for Securities Loaned (Cost $104,460) | | | 104,460 | | |
Total Investments (Cost $2,637,268) — 103.1% | | | 3,120,595 | | |
Liabilities in excess of other assets — (3.1)% | | | (93,620 | ) | |
NET ASSETS — 100.00% | | $ | 3,026,975 | | |
At May 31, 2021, the Fund's investments in foreign securities were 29.3% of net assets.
^ Purchased with cash collateral from securities on loan.
(a) Rule 144A security or other security that is restricted as to resale to institutional investors. The Fund's Adviser has deemed this security to be liquid based upon procedures approved by the Board of Trustees. As of May 31, 2021, the fair value of these securities was $83,097 (thousands) and amounted to 2.7% of net assets.
(b) Variable or Floating-Rate Security. Rate disclosed is as of May 31, 2021.
(c) The rate for certain asset-backed and mortgage-backed securities may vary based on factors relating to the pool of assets underlying the security. The rate disclosed is the rate in effect at May 31, 2021.
(d) Security is interest only.
(e) Non-income producing security.
(f) All or a portion of this security is on loan.
(g) All or a portion of this security has been segregated as collateral for derivative instruments.
(h) Amount represents less than 0.05% of net assets.
(i) Rate represents the effective yield at May 31, 2021.
(j) Rate disclosed is the daily yield on May 31, 2021.
(k) The Fund's Adviser has deemed this security to be illiquid based upon procedures approved by the Board of Trustees. As of May 31, 2021, illiquid securities were 0.2% of net assets.
bps — Basis points
Continuously callable — Investment is continuously callable or will be continuously callable on any date after the first call date until its maturity.
ETF — Exchange-Traded Fund
GO — General Obligation
LIBOR — London InterBank Offered Rate
LIBOR01M — 1 Month US Dollar LIBOR, rate disclosed as of May 31, 2021, based on the last reset date of the security
See notes to financial statements.
20
USAA Mutual Funds Trust
USAA Cornerstone Moderately Aggressive Fund | | Schedule of Portfolio Investments — continued
May 31, 2021 | |
LIBOR03M — 3 Month US Dollar LIBOR, rate disclosed as of May 31, 2021, based on the last reset date of the security
LLC — Limited Liability Company
LP — Limited Partnership
MTN — Medium Term Note
PLC — Public Limited Company
SOFR — Secured Overnight Financing Rate
Futures Contracts Purchased
(Amounts not in thousands)
| | | Number of
Contracts | | Expiration
Date | | Notional
Amount | | Value | | Unrealized
Appreciation/
(Depreciation) | |
Swiss Market Index Futures | | | 250 | | | 6/18/21 | | $ | 28,751,771 | | | $ | 31,767,126 | | | $ | 2,084,127 | | |
Futures Contracts Sold
(Amounts not in thousands)
| | | Number of
Contracts | | Expiration
Date | | Notional
Amount | | Value | | Unrealized
Appreciation/
(Depreciation) | |
Euro Stoxx 50 Futures | | | 749 | | | 6/18/21 | | $ | 34,929,838 | | | $ | 37,133,099 | | | $ | (1,538,862 | ) | |
FTSE 100 Index Futures | | | 455 | | | 6/18/21 | | | 42,244,671 | | | | 45,343,765 | | | | (2,131,423 | ) | |
| E-Mini Russell 2000 Index Futures346/18/213,993,3423,856,620 | | | 136,722 | | |
| | | $ | (3,533,563 | ) | |
Total unrealized appreciation | | $ | 2,220,849 | | |
Total unrealized depreciation | | | (3,670,285 | ) | |
Total net unrealized appreciation (depreciation) | | $ | (1,449,436 | ) | |
See notes to financial statements.
21
USAA Mutual Funds Trust | | Statement of Assets and Liabilities
May 31, 2021 | |
(Amounts in Thousands, Except Per Share Amounts)
| | | USAA Cornerstone
Moderately
Aggressive Fund | |
Assets: | |
Affiliated investments, at value (Cost $313,713) | | $ | 311,160 | | |
Unaffiliated investments, at value (Cost $2,323,555) | | | 2,809,435 | (a) | |
Cash | | | 10,169 | | |
Deposit with brokers for futures contracts | | | 9,610 | | |
Receivables: | |
Interest and dividends | | | 4,040 | | |
Capital shares issued | | | 1,000 | | |
Investments sold | | | 7,171 | | |
Variation margin on open futures contracts | | | 265 | | |
Reclaims | | | 9 | | |
From Adviser | | | 65 | | |
Prepaid expenses | | | 15 | | |
Total Assets | | | 3,152,939 | | |
Liabilities: | |
Payables: | |
Collateral received on loaned securities | | | 104,460 | | |
Collateral received from brokers for futures contract | | | 10,677 | | |
To affiliate for interfund lending | | | 6,654 | | |
Capital shares redeemed | | | 1,302 | | |
Variation margin on open futures contracts | | | 340 | | |
Accrued expenses and other payables: | |
Investment advisory fees | | | 1,507 | | |
Administration fees | | | 383 | | |
Custodian fees | | | 26 | | |
Transfer agent fees | | | 438 | | |
Compliance fees | | | 2 | | |
Trustees' fees | | | 1 | | |
Other accrued expenses | | | 174 | | |
Total Liabilities | | | 125,964 | | |
Net Assets: | |
Capital | | | 2,394,391 | | |
Total accumulated earnings/(loss) | | | 632,584 | | |
Net Assets | | $ | 3,026,975 | | |
Shares (unlimited number of shares authorized with no par value): | | | 102,783 | | |
Net asset value, offering and redemption price per share: (b) | | $ | 29.45 | | |
(a) Includes $100,940 of securities on loan.
(b) Per share amount may not recalculate due to rounding of net assets and/or shares outstanding.
See notes to financial statements.
22
USAA Mutual Funds Trust | | Statement of Operations
For the Year Ended May 31, 2021 | |
(Amounts in Thousands)
| | | USAA Cornerstone
Moderately
Aggressive Fund | |
Investment Income: | |
Income distributions from affiliated funds | | $ | 2,310 | | |
Dividends | | | 38,704 | | |
Interest | | | 19,774 | | |
Securities lending (net of fees) | | | 446 | | |
Foreign tax withholding | | | (3 | ) | |
Total Income | | | 61,231 | | |
Expenses: | |
Investment advisory fees | | | 16,845 | | |
Administration fees | | | 4,283 | | |
Sub-Administration fees | | | 101 | | |
Custodian fees | | | 156 | | |
Transfer agent fees | | | 5,790 | | |
Trustees' fees | | | 52 | | |
Compliance fees | | | 18 | | |
Legal and audit fees | | | 71 | | |
State registration and filing fees | | | 38 | | |
Interfund lending fees | | | 2 | | |
Other expenses | | | 376 | | |
Recoupment of prior expenses waived/reimbursed by Adviser | | | 120 | | |
Total Expenses | | | 27,852 | | |
Expenses waived/reimbursed by Adviser | | | (345 | ) | |
Net Expenses | | | 27,507 | | |
Net Investment Income (Loss) | | | 33,724 | | |
Realized/Unrealized Gains (Losses) from Investments: | |
Net realized gains (losses) from unaffiliated investment securities and
foreign currency translations | | | 181,615 | | |
Capital gain distributions received from affiliated funds | | | 202 | | |
Net realized gains (losses) from futures contracts | | | (5,630 | ) | |
Net change in unrealized appreciation/depreciation on unaffiliated
investment securities and foreign currency translations | | | 418,374 | | |
Net change in unrealized appreciation/depreciation on affiliated funds | | | (1,595 | ) | |
Net change in unrealized appreciation/depreciation on futures contracts | | | (1,449 | ) | |
Net realized/unrealized gains (losses) on investments | | | 591,517 | | |
Change in net assets resulting from operations | | $ | 625,241 | | |
See notes to financial statements.
23
USAA Mutual Funds Trust | | Statements of Changes in Net Assets | |
(Amounts in Thousands)
| | | USAA Cornerstone
Moderately
Aggressive Fund | |
| | | Year
Ended
May 31, 2021 | | Year
Ended
May 31, 2020 | |
From Investments: | |
Operations: | |
Net investment income (loss) | | $ | 33,724 | | | $ | 54,303 | | |
Net realized gains (losses) from investments | | | 176,187 | | | | (16,457 | ) | |
Net change in unrealized appreciation/depreciation on
investments | | | 415,330 | | | | 33,755 | | |
Change in net assets resulting from operations | | | 625,241 | | | | 71,601 | | |
Change in net assets resulting from distributions to shareholders | | | (55,505 | ) | | | (59,152 | ) | |
Change in net assets resulting from capital transactions | | | (205,115 | ) | | | (127,133 | ) | |
Change in net assets | | | 364,621 | | | | (114,684 | ) | |
Net Assets: | |
Beginning of period | | | 2,662,354 | | | | 2,777,038 | | |
End of period | | $ | 3,026,975 | | | $ | 2,662,354 | | |
Capital Transactions: | |
Proceeds from shares issued | | $ | 174,743 | | | $ | 170,755 | | |
Distributions reinvested | | | 55,021 | | | | 58,672 | | |
Cost of shares redeemed | | | (434,879 | ) | | | (356,560 | ) | |
Change in net assets resulting from capital transactions | | $ | (205,115 | ) | | $ | (127,133 | ) | |
Share Transactions: | |
Issued | | | 6,386 | | | | 6,942 | | |
Reinvested | | | 2,015 | | | | 2,273 | | |
Redeemed | | | (16,102 | ) | | | (14,578 | ) | |
Change in Shares | | | (7,701 | ) | | | (5,363 | ) | |
See notes to financial statements.
24
This page is intentionally left blank.
25
USAA Mutual Funds Trust | | Financial Highlights | |
For a Share Outstanding Throughout Each Period
| | | | | Investment Activities | | Distributions to
Shareholders From | | | |
| | | Net Asset
Value,
Beginning of
Period | | Net
Investment
Income (Loss) | | Net Realized
and Unrealized
Gains (Losses)
on Investments | | Total from
Investment
Activities | | Net
Investment
Income | | Net Realized
Gains From
Investments | | Total
Distributions | |
USAA Cornerstone Moderately Aggressive Fund | |
Year Ended: | |
May 31, 2021 | | $ | 24.10 | | | | 0.32 | (b) | | | 5.56 | | | | 5.88 | | | | (0.37 | ) | | | (0.16 | ) | | | (0.53 | ) | |
May 31, 2020 | | $ | 23.97 | | | | 0.48 | (b) | | | 0.18 | | | | 0.66 | | | | (0.39 | ) | | | (0.14 | ) | | | (0.53 | ) | |
May 31, 2019 | | $ | 25.78 | | | | 0.46 | | | | (0.79 | ) | | | (0.33 | ) | | | (0.39 | ) | | | (1.09 | ) | | | (1.48 | ) | |
May 31, 2018 | | $ | 26.09 | | | | 0.42 | | | | 1.28 | | | | 1.70 | | | | (0.44 | ) | | | (1.57 | ) | | | (2.01 | ) | |
May 31, 2017 | | $ | 24.08 | | | | 0.45 | | | | 2.06 | | | | 2.51 | | | | (0.50 | ) | | | — | | | | (0.50 | ) | |
* Assumes reinvestment of all net investment income and realized capital gain distributions, if any, during the period. Includes adjustments in accordance with U.S. Generally Accepted Accounting Principles and could differ from the Lipper reported return.
^ The net expense ratio may not correlate to the applicable expense limits in place during the period since the current contractual expense limitation is applied for a period beginning July 1, 2019, and in effect through June 30, 2023, instead of coinciding with the Fund's fiscal year end. Details of the current contractual expense limitation in effect can be found in Note 4 of the accompanying Notes to Financial Statements.
(a) The expense ratios exclude the impact of expenses paid by each underlying fund.
(b) Per share net investment income (loss) has been calculated using the average daily shares method.
(c) Effective June 22, 2018, USAA Asset Management Company ("AMCO") (previous Investment Adviser) voluntarily agreed to limit the annual expenses of the Fund to 0.98% of the Fund's average daily net assets.
(d) For the year ended May 31, 2019, the portfolio turnover calculation excludes the value of securities purchased of $370,785 thousand and sold of $3,096 thousand after the Fund's acquisition of First Start Growth Fund. Reflects increased trading activity due to usage of quantitative investment strategies.
See notes to financial statements.
26
USAA Mutual Funds Trust | | Financial Highlights — continued | |
For a Share Outstanding Throughout Each Period
| | | | | | | Ratios to Average Net Assets | | Supplemental Data | |
| | | Net Asset
Value,
End of
Period | | Total
Return* | | Net
Expenses^(a) | | Net
Investment
Income
(Loss) | | Gross
Expenses(a) | | Net Assets,
End of
Period
(000's) | | Portfolio
Turnover | |
USAA Cornerstone Moderately Aggressive Fund | |
Year Ended: | |
May 31, 2021 | | $ | 29.45 | | | | 24.58 | % | | | 0.96 | % | | | 1.18 | % | | | 0.97 | % | | $ | 3,026,975 | | | | 64 | % | |
May 31, 2020 | | $ | 24.10 | | | | 2.59 | % | | | 0.98 | % | | | 1.94 | % | | | 0.99 | % | | $ | 2,662,354 | | | | 92 | % | |
May 31, 2019 | | $ | 23.97 | | | | (1.20 | )% | | | 0.98 | %(c) | | | 1.91 | % | | | 1.01 | % | | $ | 2,777,038 | | | | 95 | %(d) | |
May 31, 2018 | | $ | 25.78 | | | | 6.52 | % | | | 0.97 | % | | | 1.64 | % | | | 0.97 | % | | $ | 2,493,883 | | | | 56 | % | |
May 31, 2017 | | $ | 26.09 | | | | 10.59 | % | | | 1.06 | % | | | 1.78 | % | | | 1.06 | % | | $ | 2,398,407 | | | | 69 | % | |
See notes to financial statements.
27
USAA Mutual Funds Trust | | Notes to Financial Statements
May 31, 2021 | |
1. Organization:
USAA Mutual Funds Trust (the "Trust") is organized as a Delaware statutory trust and is registered under the Investment Company Act of 1940, as amended (the "1940 Act"), as an open-end investment company. The Trust is comprised of 46 funds and is authorized to issue an unlimited number of shares, which are units of beneficial interest with no par value.
The accompanying financial statements are those of the USAA Cornerstone Moderately Aggressive Fund (the "Fund"). The Fund is classified as diversified under the 1940 Act.
Under the Trust's organizational documents, its officers and trustees are indemnified against certain liabilities arising out of the performance of their duties to the Fund. In addition, in the normal course of business, the Fund enters into contracts with its vendors and others that provide for general indemnifications. The Fund's maximum exposure under these arrangements is unknown, as this would involve future claims that may be made against the Fund. However, based on experience, the Fund expects that risk of loss to be remote.
2. Significant Accounting Policies:
The following is a summary of significant accounting policies followed by the Trust in the preparation of its financial statements. The policies are in conformity with Generally Accepted Accounting Principles in the United States of America ("GAAP"). The preparation of financial statements in accordance with GAAP requires management to make estimates and assumptions that affect the reported amounts of assets and liabilities and disclosure of contingent assets and liabilities at the date of the financial statements and the reported amounts of income and expenses for the period. Actual results could differ from those estimates. The Fund follows the specialized accounting and reporting requirements under GAAP that are applicable to investment companies under Accounting Standards Codification Topic 946.
Investment Valuation:
The Fund records investments at fair value. Fair value is defined as the price that would be received to sell an asset or paid to transfer a liability in an orderly transaction between market participants at the measurement date.
The valuation techniques described below maximize the use of observable inputs and minimize the use of unobservable inputs in determining fair value. The inputs used for valuing the Fund's investments are summarized in the three broad levels listed below:
• Level 1 — quoted prices in active markets for identical securities
• Level 2 — other significant observable inputs (including quoted prices for similar securities or interest rates applicable to those securities, etc.)
• Level 3 — significant unobservable inputs (including the Fund's own assumptions in determining the fair value of investments)
Changes in valuation techniques may result in transfers in or out of an assigned level within the disclosure hierarchy. The inputs or methodologies used for valuation techniques are not necessarily an indication of the risks associated with entering into those investments.
Victory Capital Management Inc. ("VCM" or the "Adviser") has established the Pricing and Liquidity Committee (the "Committee"), and subject to the Trust's Board of Trustees (the "Board") oversight, the Committee administers and oversees the Fund's valuation policies and procedures, which are approved by the Board.
Portfolio securities listed or traded on securities exchanges, including Exchange-Traded Funds ("ETFs"), American Depositary Receipts ("ADRs"), and Rights, are valued at the closing price on the exchange or system where the security is principally traded, if available, or at the Nasdaq Official Closing Price. If there have been no sales for that day on the exchange or system, then a security is valued at the last available bid quotation on the exchange or system where the security is principally traded. In each of these situations, valuations are typically categorized as Level 1 in the fair value hierarchy.
28
USAA Mutual Funds Trust | | Notes to Financial Statements — continued
May 31, 2021 | |
Investments in open-end investment companies, including underlying funds, are valued at their net asset value ("NAV"). These valuations are typically categorized as Level 1 in the fair value hierarchy.
Debt securities are valued each business day by a pricing service approved by the Board. The approved pricing service uses the evaluated bid or the last sale price to value securities. Debt obligations maturing within 60 days may be valued at amortized cost, provided that the amortized cost represents the fair value of such securities. These valuations are typically categorized as Level 2 in the fair value hierarchy.
Futures contracts are valued at the settlement price established each day by the board of trade or an exchange on which they are traded. These valuations are typically categorized as Level 1 in the fair value hierarchy.
In the event that price quotations or valuations are not readily available, investments are valued at fair value in accordance with procedures established by and under the general supervision and responsibility of the Board. These valuations are typically categorized as Level 2 or Level 3 in the fair value hierarchy, based on the observability of inputs used to determine the fair value. The effect of fair value pricing is that securities may not be priced on the basis of quotations from the primary market in which they are traded and the actual price realized from the sale of a security may differ materially from the fair value price. Valuing these securities at fair value is intended to cause the Fund's NAV to be more reliable than it otherwise would be.
A summary of the valuations as of May 31, 2021, based upon the three levels defined above, is included in the table below while the breakdown, by category, of investments is disclosed on the Schedule of Portfolio Investments (amounts in thousands):
| | | Level 1 | | Level 2 | | Level 3 | | Total | |
Asset-Backed Securities | | $ | — | | | $ | 26,338 | | | $ | — | | | $ | 26,338 | | |
Collateralized Mortgage Obligations | | | — | | | | 15,224 | | | | — | | | | 15,224 | | |
Common Stocks | | | 585,818 | | | | — | | | | — | | | | 585,818 | | |
Preferred Stocks | | | 5,577 | | | | 6,881 | | | | — | | | | 12,458 | | |
Corporate Bonds | | | — | | | | 219,346 | | | | — | | | | 219,346 | | |
Yankee Dollars | | | — | | | | 24,697 | | | | — | | | | 24,697 | | |
Municipal Bonds | | | — | | | | 16,694 | | | | — | | | | 16,694 | | |
U.S. Government Agency Mortgages | | | — | | | | 79,187 | | | | — | | | | 79,187 | | |
U.S. Treasury Obligations | | | — | | | | 144,578 | | | | — | | | | 144,578 | | |
Commercial Paper | | | — | | | | 8,750 | | | | — | | | | 8,750 | | |
Exchange-Traded Funds | | | 1,571,885 | | | | — | | | | — | | | | 1,571,885 | | |
Affiliated Exchange-Traded Funds | | | 311,160 | | | | — | | | | — | | | | 311,160 | | |
Collateral for Securities Loaned | | | 104,460 | | | | — | | | | — | | | | 104,460 | | |
Total | | $ | 2,578,900 | | | $ | 541,695 | | | $ | — | | | $ | 3,120,595 | | |
Other Financial Investments^ | |
Assets: | |
Futures Contracts | | $ | 2,221 | | | $ | — | | | $ | — | | | $ | 2,221 | | |
Liabilities: | |
Futures Contracts | | $ | (3,670 | ) | | $ | — | | | $ | — | | | $ | (3,670 | ) | |
Total | | $ | (1,449 | ) | | $ | — | | | $ | — | | | $ | (1,449 | ) | |
^ Futures contracts are valued at the unrealized appreciation (depreciation) on the investment.
For the year ended May 31, 2021, there were no transfers in or out of Level 3 in the fair value hierarchy.
29
USAA Mutual Funds Trust | | Notes to Financial Statements — continued
May 31, 2021 | |
Real Estate Investment Trusts ("REITs"):
The Fund may invest in REITs, which report information on the source of their distributions annually. REITs are pooled investment vehicles that invest primarily in income producing real estate or real estate related loans or interests (such as mortgages). Certain distributions received from REITs during the year are recorded as realized gains or return of capital as estimated by the Fund or when such information becomes known.
Investment Companies:
Exchange-Traded Funds:
The Fund may invest in ETFs, the shares of which are bought and sold on a securities exchange. An ETF trades like common stock and represents a fixed portfolio of securities often designed to track the performance and dividend yield of a particular domestic or foreign market index. The Fund may purchase shares of an ETF to temporarily gain exposure to a portion of the U.S. or a foreign market while awaiting purchase of underlying securities. The risks of owning an ETF generally reflect the risks of owning the underlying securities they are designed to track, although the lack of liquidity of an ETF could result in it being more volatile. Additionally, ETFs have fees and expenses that reduce their value.
Open-End Funds:
The Fund may invest in portfolios of open-end investment companies. These investment companies value securities in their portfolios for which market quotations are readily available at their market values (generally the last reported sale price) and all other securities and assets at their fair value by the methods established by the board of directors of the underlying funds.
Municipal Obligations:
The values of municipal obligations can fluctuate and may be affected by adverse tax, legislative, or political changes, and by financial developments affecting municipal issuers. Payment of municipal obligations may depend on a relatively limited source of revenue, resulting in greater credit risk. Future changes in federal tax laws or the activity of an issuer may adversely affect the tax-exempt status of municipal obligations.
Mortgage- and Asset-Backed Securities:
The values of some mortgage-related or asset-backed securities may be particularly sensitive to changes in prevailing interest rates. Early repayment of principal on some mortgage-related securities may expose the Fund to a lower rate of return upon reinvestment of principal. The values of mortgage and asset-backed securities depend in part on the credit quality and adequacy of the underlying assets or collateral and may fluctuate in response to the market's perception of these factors as well as current and future repayment rates. Some mortgage-backed securities are backed by the full faith and credit of the U.S. government (e.g., mortgage-backed securities issued by the Government National Mortgage Association, commonly known as "Ginnie Mae"), while other mortgage-backed securities (e.g., mortgage-backed securities issued by the Federal National Mortgage Association and the Federal Home Loan Mortgage Corporation, commonly known as "Fannie Mae" and "Freddie Mac", respectively), are backed only by the credit of the government entity issuing them. In addition, some mortgage-backed securities are issued by private entities and, as such, are not guaranteed by the U.S. government or any agency or instrumentality of the U.S. government.
30
USAA Mutual Funds Trust | | Notes to Financial Statements — continued
May 31, 2021 | |
Derivative Instruments:
Futures Contracts:
The Fund may enter into contracts for the future delivery of securities or foreign currencies and futures contracts based on a specific security, class of securities, foreign currency or an index, and purchase or sell options on any such futures contracts. A futures contract on a securities index is an agreement obligating either party to pay, and entitling the other party to receive, while the contract is outstanding, cash payments based on the level of a specified securities index. No physical delivery of the underlying asset is made. The Fund may enter into futures contracts in an effort to hedge against market risks. The acquisition of put and call options on futures contracts will give the Fund the right (but not the obligation), for a specified price, to sell or to purchase the underlying futures contract, upon exercise of the option, at any time during the option period. Futures transactions involve brokerage costs and require the Fund to segregate assets to cover contracts that would require it to purchase securities or currencies. A good faith margin deposit, known as initial margin, of cash or government securities with a broker or custodian is required to initiate and maintain open positions in futures contracts. Subsequent payments, known as variation margin, are made or received by the Fund based on the change in the market value of the position and are recorded as unrealized appreciation or depreciation until the contract is closed out, at which time the gain or loss is realized. The Fund may lose the expected benefit of futures transactions if interest rates, exchange rates or securities prices change in an unanticipated manner. Such unanticipated changes may also result in lower overall performance than if the Fund had not entered into any futures transactions. In addition, the value of the Fund's futures positions may not prove to be perfectly or even highly correlated with the value of its portfolio securities or foreign currencies, limiting the Fund's ability to hedge effectively against interest rate, exchange rate and/or market risk and giving rise to additional risks. There is no assurance of liquidity in the secondary market for purposes of closing out futures positions. The collateral held by the Fund is reflected on the Statement of Assets and Liabilities under Deposit with brokers for futures contracts and Collateral received from brokers for futures contracts. During the year ended May 31, 2021, the Fund entered into futures contracts primarily for the strategy of gaining exposure to a particular asset class or securities market.
Summary of Derivative Instruments:
The following table summarizes the fair values of derivative instruments on the Statement of Assets and Liabilities, categorized by risk exposure, as of May 31, 2021 (amounts in thousands):
| | | Assets | | Liabilities | |
| | | Variation Margin
Receivable on Open
Futures Contracts* | | Variation Margin
Payable on Open
Futures Contracts* | |
| Equity Risk Exposure | | $ | 2,221 | | | $ | 3,670 | | |
* Includes cumulative unrealized appreciation (depreciation) of futures contracts as reported on the Schedule of Portfolio Investments. Only current day's variation margin for futures contracts is reported within the Statement of Assets and Liabilities.
The following table presents the effect of derivative instruments on the Statement of Operations, categorized by risk exposure, for the year ended May 31, 2021 (amounts in thousands):
| | Net Realized Gains (Losses) on
Derivatives Recognized as
a Result of Operations | | Net Change in Unrealized
Appreciation/Depreciation
on Derivatives Recognized
as a Result of Operations | |
| | | Net Realized Gains (Losses)
from Futures Contracts | | Net Change in Unrealized
Appreciation/Depreciation
on Futures Contracts | |
Equity Risk Exposure | | $ | (5,630 | ) | | $ | (1,449 | ) | |
31
USAA Mutual Funds Trust | | Notes to Financial Statements — continued
May 31, 2021 | |
All open derivative positions at year end are reflected on the Fund's Schedule of Portfolio Investments. The underlying face value of open derivative positions relative to the Fund's net assets at year end is generally representative of the notional amount of open positions to net assets throughout the year.
Investment Transactions and Related Income:
Changes in holdings of investments are accounted for no later than one business day following the trade date. For financial reporting purposes, however, investment transactions are accounted for on trade date on the last business day of the reporting period. Interest income is determined on the basis of coupon interest accrued using the effective interest method which adjusts, where applicable, the amortization of premiums or accretion of discount. Dividend income is recorded on the ex-dividend date. Gains or losses realized on sales of securities are recorded on the identified cost basis.
Withholding taxes on interest, dividends, and gains as a result of certain investments in ADRs by the Fund have been provided for in accordance with each investment's applicable country's tax rules and rates.
Securities Lending:
The Fund, through a securities lending agreement with Citibank, N.A. ("Citibank"), may lend its securities to qualified financial institutions, such as certain broker-dealers, to earn additional income, net of income retained by Citibank. Borrowers are required to secure their loans for collateral in the amount of at least 102% of the value of U.S. securities loaned or at least 105% of the value of non-U.S. securities loaned, marked-to-market daily. Any collateral shortfalls associated with increases in the valuation of the securities loaned are cured the next business day once the shortfall exceeds $100 thousand. Collateral may be cash, U.S. government securities, or other securities as permitted by Securities and Exchange Commission ("SEC") guidelines. Cash collateral may be invested in high-quality short-term investments, primarily open-end investment companies. Collateral requirements are determined daily based on the value of the Fund's securities on loan as of the end of the prior business day. During the time portfolio securities are on loan, the borrower will pay the Fund any dividends or interest paid on such securities plus any fee negotiated between the parties to the lending agreement. The Fund also earns a return from the collateral. The Fund pays Citibank various fees in connection with the investment of cash collateral and fees based on the investment income received from securities lending activities. Securities lending income (net of these fees) is disclosed on the Statement of Operations. Loans are terminable upon demand and the borrower must return the loaned securities within the lesser of one standard settlement period or five business days. Risks relating to securities-lending transactions include that the borrower may not provide additional collateral when required or return the securities when due, and that the value of the short-term investments will be less than the amount of cash collateral required to be returned to the borrower. The Fund's agreement with Citibank does not include master netting provisions. Non-cash collateral received by the Fund may not be sold or re-pledged, except to satisfy borrower default. Cash collateral is listed on the Fund's Schedule of Portfolio Investments and Financial Statements while non-cash collateral is not included.
The following table (amounts in thousands) is a summary of the Fund's securities lending transactions as of May 31, 2021.
| | | Value of
Securities on Loan* | | Non-Cash Collateral | | Cash Collateral | |
| | | | | $ | 101,933 | | | $ | — | | | $ | 104,460 | | |
* Includes $993 (thousand) of securities on loan that were sold prior to May 31, 2021.
Foreign Currency Translations:
The accounting records of the Fund are maintained in U.S. dollars. Investment securities and other assets and liabilities of the Fund denominated in a foreign currency are translated into U.S. dollars at current exchange rates. Purchases and sales of securities, income receipts, and expense payments are translated into U.S. dollars at the exchange rates on the date of the transactions. The Fund does not isolate the portion of the results of operations resulting from changes in foreign exchange rates on
32
USAA Mutual Funds Trust | | Notes to Financial Statements — continued
May 31, 2021 | |
investments from fluctuations arising from changes in market prices of securities held. Such fluctuations are disclosed as net change in unrealized appreciation/depreciation on investments and foreign currency translations on the Statement of Operations. Any realized gains or losses from these fluctuations, including foreign currency arising from in-kind redemptions, are disclosed as net realized gains or losses from investment transactions and foreign currency translations on the Statement of Operations.
Foreign Taxes:
The Fund may be subject to foreign taxes related to foreign income received (a portion of which may be reclaimable), capital gains on the sale of securities, and certain foreign currency transactions. All foreign taxes are recorded in accordance with the applicable regulations and rates that exist in the foreign jurisdictions in which the Fund invests.
Federal Income Taxes:
It is the Fund's policy to continue to qualify as a regulated investment company by complying with the provisions available to certain investment companies, as defined in applicable sections of the Internal Revenue Code, and to make distributions of net investment income and net realized gains sufficient to relieve it from all, or substantially all, federal income taxes. Accordingly, no provision for federal income taxes is required in the financial statements. The Fund has a tax year end of May 31.
Management of the Fund has reviewed tax positions taken in tax years that remain subject to examination by all major tax jurisdictions, including federal (i.e., the last four tax years, which includes the current fiscal tax year end). Management believes that there is no tax liability resulting from unrecognized tax benefits related to uncertain tax positions taken.
Allocations:
Expenses directly attributable to the Fund are charged to the Fund, while expenses that are attributable to more than one fund in the Trust, or jointly with an affiliated trust, are allocated among the respective funds in the Trust and/or affiliated trust based upon net assets or another appropriate basis.
Cross-Trade Transactions:
Pursuant to Rule 17a-7 under the 1940 Act, the Fund may engage in cross-trades, which are securities transactions with affiliated investment companies and advisory accounts managed by the Adviser and any applicable sub-adviser. Any such purchase or sale transaction must be effected without brokerage commission or other remuneration, except for customary transfer fees. The transaction must be effected at the current market price, which is either the security's last sale price on an exchange or, if there are no transactions in the security that day, at the average of the highest bid and lowest asked price. For the year ended May 31, 2021, the Fund engaged in the following securities transactions with affiliated funds, which resulted in the following net realized gains (losses) (amounts in thousands):
| Purchases | | Sales | | Net Realized
Gains (Losses) | |
| $ | — | | | $ | 21,946 | | | $ | 2,642 | | |
3. Purchases and Sales:
Cost of purchases and proceeds from sales/maturities of securities (excluding securities maturing less than one year from acquisition) for the year ended May 31, 2021, were as follows for the Fund (amounts in thousands):
| | Excluding
U.S. Government Securities | |
U.S. Government Securities | |
| | | Purchases | | Sales | | Purchases | | Sales | |
| | | | | $ | 1,765,524 | | | $ | 1,833,636 | | | $ | — | | | $ | 148,457 | | |
33
USAA Mutual Funds Trust | | Notes to Financial Statements — continued
May 31, 2021 | |
4. Fees and Transactions with Affiliates and Related Parties:
Investment Advisory Fees:
Investment advisory services are provided to the Fund by the Adviser, which is a New York corporation registered as an investment adviser with the SEC. The Adviser is an indirect wholly owned subsidiary of Victory Capital Holdings, Inc., a publicly traded Delaware corporation, and a wholly owned direct subsidiary of Victory Capital Operating, LLC.
Under the terms of the Investment Advisory Agreement, the Adviser is entitled to receive fees accrued daily and paid monthly at an annualized rate of 0.59% of the Fund's average daily net assets. Amounts incurred and paid to VCM for the year ended May 31, 2021, are reflected on the Statement of Operations as Investment Advisory fees.
The Trust relies on an exemptive order granted to VCM and its affiliated funds by the SEC in March 2019 permitting the use of a "manager-of-managers" structure for certain funds. Under a manager-of-managers structure, the investment adviser may select (with approval of the Board and without shareholder approval) one or more subadvisers to manage the day-to-day investment of a fund's assets. For the year ended May 31, 2021, the Fund had no subadvisors.
Administration and Servicing Fees:
VCM serves as the Fund's administrator and fund accountant. Under the Fund Administration, Servicing and Accounting Agreement, VCM is paid for its services an annual fee at a rate of 0.15% of average daily net assets of the Fund. Amounts incurred for the year ended May 31, 2021, are reflected on the Statement of Operations as Administration fees.
The Fund (as part of the Trust) has entered into an agreement to provide compliance services with the Adviser, pursuant to which the Adviser furnishes its compliance personnel, including the services of the Chief Compliance Officer ("CCO"), and other resources reasonably necessary to provide the Trust with compliance oversight services related to the design, administration and oversight of a compliance program for the Trust in accordance with Rule 38a-1 under the 1940 Act. The CCO is an employee of the Adviser, which pays the compensation of the CCO and support staff. Funds in the Trust, Victory Variable Insurance Funds, Victory Portfolios, and Victory Portfolios II (collectively, the "Victory Funds Complex") in the aggregate, compensate the Adviser for these services. Amounts incurred for the year ended May 31, 2021, are reflected on the Statement of Operations as Compliance fees.
Citi Fund Services Ohio, Inc. ("Citi"), an affiliate of Citibank, acts as sub-administrator and sub-fund accountant to the Fund pursuant to a Sub-Administration and Sub-Fund Accounting Services Agreement between VCM and Citi. VCM pays Citi a fee for providing these services. The Fund reimburses VCM and Citi for out-of-pocket expenses incurred in providing these services and certain other expenses specifically allocated to the Fund. Amounts incurred for the year ended May 31, 2021, are reflected on the Statement of Operations as Sub-Administration fees.
Transfer Agency Fees:
Victory Capital Transfer Agency, Inc. ("VCTA"), an affiliate of the Adviser, provides transfer agency services to the Fund. VCTA provides transfer agent services to the Fund based on an annual charge of $23 per shareholder account plus out-of-pocket expenses. VCTA pays a portion of these fees to certain intermediaries for the administration and servicing of accounts that are held with such intermediaries. Amounts incurred and paid to VCTA for the year ended May 31, 2021, are reflected on the Statement of Operations as Transfer Agent fees.
FIS Investor Services LLC serves as sub-transfer agent and dividend disbursing agent for the Fund pursuant to a Sub-Transfer Agent Agreement between VCTA and FIS Investor Services LLC. VCTA provides FIS Investor Services LLC a fee for providing these services.
34
USAA Mutual Funds Trust | | Notes to Financial Statements — continued
May 31, 2021 | |
Distributor/Underwriting Services:
Victory Capital Services, Inc. (the "Distributor"), an affiliate of the Adviser, serves as distributor for the continuous offering of the shares of the Fund pursuant to a Distribution Agreement between the Distributor and the Trust and receives no fee or other compensation for these services. Effective June 30, 2020, the Distributor's name was changed from Victory Capital Advisers, Inc.
Other Fees:
Citibank serves as the Fund's custodian. The Fund pays Citibank a fee for providing these services. Amounts incurred for the year ended May 31, 2021, are reflected on the Statement of Operations as Custodian fees.
K&L Gates LLP provides legal services to the Trust.
The Adviser has entered into an expense limitation agreement with the Fund until at least June 30, 2023. Under the terms of the agreement, the Adviser has agreed to waive fees or reimburse certain expenses to the extent that ordinary operating expenses incurred in any fiscal year exceed the expense limit for the Fund. Such excess amounts will be the liability of the Adviser. Acquired fund fees and expenses, interest, taxes, brokerage commissions, other expenditures, that are capitalized in accordance with GAAP, and other extraordinary expenses not incurred in the ordinary course of the Fund's business are excluded from the expense limits. As of May 31, 2021, the expense limit (excluding voluntary waivers) was 0.98%.
In addition, the Fund invests in affiliated VCM exchange-traded fund(s) ("affiliated ETFs"). The Fund's Adviser fee is reimbursed by VCM to the extent of the indirect Adviser fee incurred through the Fund's proportional investment in the affiliated ETF(s). These Adviser fee reimbursements are not available for recoupment. For the year ended May 31, 2021, the Fund's Adviser fee was reimbursed by VCM in an amount of $345 thousand, of which $188 thousand is receivable from VCM.
Under the terms of the expense limitation agreement, amended May 1, 2021, the Fund has agreed to repay fees and expenses that were waived or reimbursed by the Adviser for a period of up to three years (thirty six (36) months) after the waiver or reimbursement took place, subject to the lesser of any operating expense limits in effect at the time of: (a) the original waiver or expense reimbursement; or (b) the recoupment, after giving effect to the recoupment amount. Prior to May 1, 2021, the Fund was permitted to recoup fees waived and expenses reimbursed for up to three years after the fiscal year in which the waiver or reimbursement took place, subject to the limitations above. This change did not have any effect on the amounts previously reported for recoupment. As of May 31, 2021, there are no amounts available to be repaid to the Adviser.
The Adviser may voluntarily waive or reimburse additional fees to assist the Fund in maintaining competitive expense ratios. Voluntary waivers and reimbursements applicable to the Fund are not available to be recouped at a future time. There were no voluntary waivers or reimbursements for the year ended May 31, 2021.
Certain officers and/or interested trustees of the Fund are also officers and/or employees of the Adviser, administrator, fund accountant, sub-administrator, sub-fund accountant, custodian, and Distributor.
5. Risks:
The Fund may be subject to other risks in addition to these identified risks.
Geopolitical/Natural Disaster Risk — Global economies and financial markets are increasingly interconnected, which increases the possibilities that conditions in one country or region might adversely affect issuers in another country or region. Geopolitical and other risks, including war, terrorism, trade disputes, political or economic dysfunction within some nations, public health crises and related geopolitical events, as well as environmental disasters such as earthquakes, fires, and floods, may add to instability in world economies and markets generally. Changes in trade policies and international trade agreements could affect the economies of many countries in unpredictable ways. Likewise, systemic market dislocations of the kind that occurred during the financial crisis that began in 2008, if repeated, would be highly disruptive to economies and markets, adversely affecting individual
35
USAA Mutual Funds Trust | | Notes to Financial Statements — continued
May 31, 2021 | |
companies and industries, securities markets, interest rates, credit ratings, inflation, investor sentiment, and other factors affecting the value of a Fund's investments. Some countries, including the United States, are adopting more protectionist trade policies and moving away from the tighter financial industry regulations that followed the 2008 financial crisis, which may also affect the value of a Fund's investments.
Political events within the United States at times have resulted, and may in the future result, in a shutdown of government services, which could negatively affect the U.S. economy, decrease the value of a Fund's investments, increase uncertainty in or impair the operation of the U.S. or other securities markets, and degrade investor and consumer confidence, perhaps suddenly and to a significant degree.
An outbreak of disease called COVID-19 has spread internationally. The transmission of COVID-19 and efforts to contain its spread have resulted in international, national, and local border closings and other significant travel restrictions and disruptions, significant disruptions to business operations, supply chains and consumer activity, significant challenges in healthcare service preparation and delivery, quarantines, and general concern and uncertainty. These negative impacts have caused significant volatility and declines in global financial markets, which have caused losses for Fund investors during and subsequent to period end. The impact of the COVID-19 pandemic may last for an extended period of time, and could result in a substantial economic downturn or recession. Public health crises may exacerbate other pre-existing political, social, economic, market, and financial risks. The extent of the impact to the financial performance of the Fund's investments will depend on future developments, including (i) the duration and spread of the outbreak, (ii) the restrictions and advisories, (iii) the effects on the financial markets, and (iv) the effects on the economy overall, all of which are highly uncertain and cannot be predicted.
Tactical Allocation Risk — The Fund has a targeted risk tolerance and a corresponding asset allocation target; however, mere asset allocation and volatility are not the sole determination of risk. The Fund's managers will tactically allocate away from the target allocation as market conditions and the perceived risks warrant. The Fund bears the risk that the managers' tactical allocation will not be successful.
Affiliated Funds Risk — The risks of the Fund directly correspond to the risks of the underlying affiliated funds in which the Fund invests. By investing in the underlying affiliated funds, the Fund has exposure to the risk of many different areas of the market. The degree to which the risks described below apply to the Fund varies according to the Fund's asset allocation. For instance, the more the Fund is allocated to stock funds, the greater the risk associated with equity securities. The Fund also is subject to asset allocation risk (i.e., the risk that allocations will not produce the intended results) and to management risk (i.e., the risk that the selection of underlying affiliated funds will not produce the intended results).
Conflict of Interest Risk — In managing a Fund that invests in underlying affiliated funds, the Adviser may have conflicts of interest in allocating the Fund's assets among the various underlying affiliated funds. This is because the fees payable by some of the underlying affiliated funds to the Adviser and/or its affiliates are higher than the fees payable by other underlying affiliated funds, and because the Adviser also manages and administers the underlying affiliated funds.
6. Borrowing and Interfund Lending:
Line of Credit:
The Victory Funds Complex participated in a short-term demand note "Line of Credit" agreement with Citibank. The Line of Credit agreement with Citibank was renewed on June 29, 2020, with a termination date of June 28, 2021. Under the agreement with Citibank, the Victory Funds Complex may borrow up to $600 million, of which $300 million is committed and $300 million is uncommitted. $40 million of the Line of Credit is reserved for use by the Victory Floating Rate Fund, another series of the Victory Funds Complex, with Victory Floating Rate Fund paying the related commitment fees for that amount. The purpose of the Line of Credit is to meet temporary or emergency cash needs. For the year ended
36
USAA Mutual Funds Trust | | Notes to Financial Statements — continued
May 31, 2021 | |
May 31, 2021, Citibank received an annual commitment fee of 0.15% on $300 million for providing the Line of Credit. Each fund in the Victory Funds Complex pays a pro-rata portion of the commitment fees plus any interest (one month LIBOR plus one percent) on amounts borrowed. For the period June 29, 2020, through April 30, 2021, under an amended Line of Credit agreement, Citibank received an annual upfront fee of 0.10% on the $300 million committed line of credit. Each fund in the Victory Funds Complex paid a pro-rata portion of the upfront fee. Effective with the next amendment, the annual commitment fee of 0.15% will remain unchanged and the upfront fee of 0.10% is discontinued. Interest charged to each fund during the period, if applicable, is reflected on the Statement of Operations under Line of credit fees.
The Fund had no borrowings under the Line of Credit agreement during the year ended May 31, 2021.
Interfund Lending:
The Trust and Adviser rely on an exemptive order granted by the SEC in March 2017 (the "Order"), permitting the establishment and operation of an Interfund Lending Facility (the "Facility"). The Facility allows the Fund to directly lend and borrow money to or from any other fund in the Victory Funds Complex that is permitted to participate in the Facility, relying upon the Order at rates beneficial to both the borrowing and lending funds. Advances under the Facility are allowed for temporary or emergency purposes, including the meeting of redemption requests that otherwise might require the untimely disposition of securities, and are subject to each Fund's borrowing restrictions. The interfund loan rate is determined, as specified in the Order, by averaging the current repurchase agreement rate and the current bank loan rate. As a Borrower, interest charged to the Fund, if any, during the period is reflected on the Statement of Operations under Interfund lending fees. As a Lender, interest earned by the Fund, if any, during the period is presented on the Statement of Operations under Interfund lending.
The average borrowing or lending for the days outstanding and average interest rate for the Fund during the year ended May 31, 2021, were as follows (amounts in thousands):
Borrower or
Lender | | Amount
Outstanding at
May 31, 2021 | | Average
Borrowing* | | Days
Borrowing
Outstanding | | Average
Interest
Rate* | | Maximum
Borrowing
During
the Period | |
| Borrower | | $ | 6,654 | | | $ | 10,262 | | | | 9 | | | | 0.58 | % | | $ | 14,193 | | |
* For the year ended May 31, 2021, based on the number of days borrowings were outstanding.
7. Federal Income Tax Information:
The Fund intends to distribute any net investment income annually. Distributable net realized gains, if any, are declared and paid at least annually.
The amounts of dividends from net investment income and distributions from net realized gains (collectively distributions to shareholders) are determined in accordance with federal income tax regulations, which may differ from GAAP. To the extent these "book/tax" differences are permanent in nature (e.g., net operating loss and distribution reclassification), such amounts are reclassified within the components of net assets based on their federal tax-basis treatment; temporary differences (e.g., wash sales) do not require reclassification. To the extent dividends and distributions exceed net investment income and net realized gains for tax purposes, they are reported as distributions of capital. Net investment losses incurred by the Fund may be reclassified as an offset to capital on the accompanying Statement of Assets and Liabilities.
As of May 31, 2021, on the Statement of Assets and Liabilities, as a result of permanent book-to-tax differences, reclassification adjustments were as follows (amounts in thousands):
| | Total Accumulated
Earnings/(Loss) | | Capital | |
| | | | | $ | (4,856 | ) | | $ | 4,856 | | |
37
USAA Mutual Funds Trust | | Notes to Financial Statements — continued
May 31, 2021 | |
The tax character of distributions paid during the tax years ended as noted below, were as follows (total distributions paid may differ from the Statement of Changes in Net Assets because, for tax purposes, dividends are recognized when actually paid) (amounts in thousands).
| | | Year Ended May 31, 2021 | | Year Ended May 31, 2020 | |
| | | Distributions paid from | | | | Distributions paid from | | | |
| |
Ordinary
Income | | Net
Long-Term
Capital
Gains | |
Total
Distributions
Paid | |
Ordinary
Income | | Net
Long-Term
Capital
Gains | |
Total
Distributions
Paid | |
| | | | | $ | 51,092 | | | $ | 4,413 | | | $ | 55,505 | | | $ | 43,926 | | | $ | 15,226 | | | $ | 59,152 | | |
As of May 31, 2021, the components of accumulated earnings (loss) on a tax basis were as follows (amounts in thousands):
Undistributed
Ordinary
Income | | Undistributed
Long-Term
Capital Gains | | Other
Earnings
(Deficit) | | Accumulated
Earnings | | Unrealized
Appreciation
(Depreciation)* | | Total
Accumulated
Earnings
(Loss) | |
| $ | 79,460 | | | $ | 70,969 | | | $ | (10 | ) | | $ | 150,419 | | | $ | 482,165 | | | $ | 632,584 | | |
* The difference between the book-basis and tax-basis of unrealized appreciation/depreciation is attributable to the tax deferral of losses on wash sales, futures, hybrid accruals interest purchased, partnership, and REITs/return of capital.
As of May 31, 2021, the Fund had no capital loss carryforwards, for federal income tax purposes.
During the most recent tax year ended May 31, 2021, the Fund utilized $13,206 thousand of capital loss carryforwards.
As of May 31, 2021, the cost basis for federal income tax purposes, gross unrealized appreciation, gross unrealized depreciation, and net unrealized appreciation (depreciation) for investments were as follows (amounts in thousands):
Cost of
Investments
for Federal
Tax Purposes | | Gross
Unrealized
Appreciation | | Gross
Unrealized
Depreciation | | Net Unrealized
Appreciation
(Depreciation) | |
| $ | 2,638,430 | | | $ | 498,357 | | | $ | (16,192 | ) | | $ | 482,165 | | |
8. Affiliated Securities:
An affiliated security is a security in which the Fund has ownership of at least 5% of the security's outstanding voting shares, an investment company managed by VCM, or an issuer under common control with a Fund or VCM. The Fund does not invest in affiliated securities for the purpose of exercising management or control. These securities are noted as affiliated on the Fund's Schedule of Portfolio Investments. Transactions in affiliated securities during the year ended May 31, 2021, were as follows (amounts in thousands):
| | | Fair
Value
5/31/2020 | | Purchases
at Cost | | Proceeds
from
Sales | | Realized
Gains
(Losses) | | Capital
Gain
Distribution | | Net
Change in
Unrealized
Appreciation/
Depreciation | | Fair
Value
5/31/21 | | Dividend
Income | |
VictoryShares USAA Core
Intermediate-Term
Bond ETF | | $ | — | | | $ | 519,896 | | | $ | (259,836 | ) | | $ | — | | | $ | 148 | | | $ | (2,705 | ) | | $ | 257,355 | | | $ | 1,847 | | |
38
USAA Mutual Funds Trust | | Notes to Financial Statements — continued
May 31, 2021 | |
| | | Fair
Value
5/31/2020 | | Purchases
at Cost | | Proceeds
from
Sales | | Realized
Gains
(Losses) | | Capital
Gain
Distribution | | Net
Change in
Unrealized
Appreciation/
Depreciation | | Fair
Value
5/31/21 | | Dividend
Income | |
VictoryShares USAA Core
Short-Term Bond ETF | | $ | — | | | $ | 50,190 | | | $ | — | | | $ | — | | | $ | 54 | | | $ | 112 | | | $ | 50,302 | | | $ | 381 | | |
VictoryShares USAA MSCI
Emerging Markets Value
Momentum ETF | | | 2,505 | | | | — | | | | — | | | | — | | | | — | | | | 998 | | | | 3,503 | | | | 82 | | |
| | | $ | 2,505 | | | $ | 570,086 | | | $ | (259,836 | ) | | $ | — | | | $ | 202 | | | $ | (1,595 | ) | | $ | 311,160 | | | $ | 2,310 | | |
39
REPORT OF INDEPENDENT REGISTERED PUBLIC ACCOUNTING FIRM
To the Shareholders and the Board of Trustees of USAA Cornerstone Moderately Aggressive Fund:
Opinion on the Financial Statements
We have audited the accompanying statement of assets and liabilities of USAA Cornerstone Moderately Aggressive Fund (the "Fund") (one of the funds constituting USAA Mutual Funds Trust (the "Trust")), including the schedule of portfolio investments, as of May 31, 2021, and the related statement of operations for the year then ended, the statements of changes in net assets for each of the two years in the period then ended, the financial highlights for each of the five years in the period then ended and the related notes (collectively referred to as the "financial statements"). In our opinion, the financial statements present fairly, in all material respects, the financial position of the Fund (one of the funds constituting USAA Mutual Funds Trust) at May 31, 2021, the results of its operations for the year then ended, the changes in its net assets for each of the two years in the period then ended and its financial highlights for each of the five years in the period then ended, in conformity with U.S. generally accepted accounting principles.
Basis for Opinion
These financial statements are the responsibility of the Trust's management. Our responsibility is to express an opinion on the Fund's financial statements based on our audits. We are a public accounting firm registered with the Public Company Accounting Oversight Board (United States) ("PCAOB") and are required to be independent with respect to the Trust in accordance with the U.S. federal securities laws and the applicable rules and regulations of the Securities and Exchange Commission and the PCAOB.
We conducted our audits in accordance with the standards of the PCAOB. Those standards require that we plan and perform the audit to obtain reasonable assurance about whether the financial statements are free of material misstatement, whether due to error or fraud. The Trust is not required to have, nor were we engaged to perform, an audit of the Trust's internal control over financial reporting. As part of our audits we are required to obtain an understanding of internal control over financial reporting, but not for the purpose of expressing an opinion on the effectiveness of the Trust's internal control over financial reporting. Accordingly, we express no such opinion.
Our audits included performing procedures to assess the risks of material misstatement of the financial statements, whether due to error or fraud, and performing procedures that respond to those risks. Such procedures included examining, on a test basis, evidence regarding the amounts and disclosures in the financial statements. Our procedures included confirmation of securities owned as of May 31, 2021, by correspondence with the custodian. Our audits also included evaluating the accounting principles used and significant estimates made by management, as well as evaluating the overall presentation of the financial statements. We believe that our audits provide a reasonable basis for our opinion.

We have served as the auditor of one or more Victory Capital investment companies since 1995.
San Antonio, Texas
July 28, 2021
40
USAA Mutual Funds Trust | | Supplemental Information
May 31, 2021 | |
(Unaudited)
Trustee and Officer Information
Board of Trustees:
Overall responsibility for management of the Trust rests with the Board. The Trust is managed by the Board in accordance with the laws of the state of Delaware. There are currently nine Trustees, seven of whom are not "interested persons" of the Trust within the meaning of that term under the 1940 Act ("Independent Trustees") and two of whom are "interested persons" of the Trust within the meaning of that term under the 1940 Act ("Interested Trustee"). The Trustees, in turn, elect the officers of the Trust to actively supervise its day-to-day operations.
The following tables list the Trustees, their ages, position with the Trust, commencement of service, principal occupations during the past five years and any directorships of other investment companies or companies whose securities are registered under the Securities Exchange Act of 1934, as amended, or who file reports under that Act. Each Trustee oversees 46 portfolios in the Trust. Each Trustee's address is 15935 La Cantera Pkwy, San Antonio, TX, 78256. Pursuant to a policy adopted by the Board, the term of office for each Trustee shall be until the Independent Trustee reaches age 75 or an Interested Trustee reaches age 75. The Board may change or grant exceptions from this policy at any time without shareholder approval. A Trustee may resign or be removed by a vote of the other Trustees or the holders of a majority of the outstanding shares of the Trust at any time. Vacancies on the Board can be filled by the action of a majority of the Trustees, provided that after filling such vacancy at least two-thirds of the Trustees have been elected by the shareholders.
Name and Date of Birth | | Position
Held with
the Trust | | Year
Commenced
Service | | Principal Occupation
During Past 5 Years | | Other
Directorships
Held During
Past 5 Years | |
Independent Trustees. | |
Jefferson C. Boyce, (c)
Born September 1957 | | Independent Chairman | | | 2021 | | | Senior Managing Director, New York Life Investments, LLC (1992-2012) | | Westhab, Inc. | |
John C. Walters,
Born February 1962 | | Trustee | | | 2019 | | | Retired. Mr. Walters brings significant Board experience including active involvement with the board of a Fortune 500 company, and a proven record of leading large, complex financial organizations. He has a demonstrated record of success in distribution, manufacturing, investment brokerage, and investment management in both the retail and institutional investment businesses. He has substantial experience in the investment management business with a demonstrated ability to develop and drive strategy while managing operation, financial, and investment risk. | | Guardian Variable Products Trust (16 series), Lead Independent Director; Amerilife Holdings LLC, Director; Stadion Money Management; Director; University of North Carolina (Chapel Hill), Member Board of Governors | |
41
USAA Mutual Funds Trust | | Supplemental Information — continued
May 31, 2021 | |
(Unaudited)
Name and Date of Birth | | Position
Held with
the Trust | | Year
Commenced
Service | | Principal Occupation
During Past 5 Years | | Other
Directorships
Held During
Past 5 Years | |
Robert L. Mason, Ph.D.,
Born July 1946 | | Trustee | | | 1997 | | | Adjunct Professor in the Department of Management Science and Statistics in the College of Business at the University of Texas at San Antonio (since 2001); Institute Analyst, Southwest Research Institute (March 2002-January 2016) | | None | |
Dawn M. Hawley,
Born February 1954 | | Trustee | | | 2014 | | | Manager of Finance, Menil Foundation, Inc. (May 2007-June 2011), which is a private foundation that oversees the assemblage of sculptures, prints, drawings, photographs, and rare books. Director of Financial Planning and Analysis and Chief Financial Officer, AIM Management Group, Inc. (October 1987-January 2006) | | None | |
Paul L. McNamara,
Born July 1948 | | Trustee | | | 2012 | | | Director, Cantor Opportunistic Alternatives Fund, LLC (March 2010-February 2014), which is a closed-end fund of funds by Cantor Fitzgerald Investment Advisors, LLC | | None | |
42
USAA Mutual Funds Trust | | Supplemental Information — continued
May 31, 2021 | |
(Unaudited)
Name and Date of Birth | | Position
Held with
the Trust | | Year
Commenced
Service | | Principal Occupation
During Past 5 Years | | Other
Directorships
Held During
Past 5 Years | |
Richard Y. Newton III,
Born January 1956 | | Trustee | | | 2017 | | | Director, Elta North America (01/18-present), which is a global leader in the design, manufacture, and support of innovative electronic systems in the ground, maritime, airborne, and security domains for the nation's warfighters, security personnel, and first responders; Managing Partner, Pioneer Partnership Development Group (December 2015-present)); Executive Director, The Union League Club of New York (June 2014-November 2015): Executive Vice President, Air Force Association (August 2012-May 2014); Lieutenant General, United States Air Force (January 2008-June 2012) | | PredaSAR Corp. | |
Barbara B. Ostdiek, Ph.D.,
Born March 1964 | | Trustee | | | 2008 | | | Senior Associate Dean of Degree Programs at Jesse H. Jones Graduate School of Business at Rice University (since 2013); Associate Professor of Finance at Jessie H. Jones Graduate School of Business at Rice University (since 2001) | | None | |
Effective at the close of business on December 31, 2020, Michael F. Reimherr retired from the Board of Trustees.
43
USAA Mutual Funds Trust | | Supplemental Information — continued
May 31, 2021 | |
(Unaudited)
Name and Date of Birth | | Position
Held with
the Trust | | Year
Commenced
Service | | Principal Occupation
During Past 5 Years | | Other
Directorships
Held During
Past 5 Years | |
Interested Trustees. | |
David C. Brown, (b)
Born May 1972 | | Trustee | | | 2019 | | | Chairman and Chief Executive Officer (since 2013), Victory Capital Management Inc.; Chairman and Chief Executive Officer, Victory Capital Holdings, Inc. (since 2013). Mr. Brown brings to the Board extensive business, finance and leadership skills gained and developed through years of experience in the financial services industry, including his tenure overseeing the strategic direction as CEO of Victory Capital. These skills, combined with Mr. Brown's extensive knowledge of the financial services industry and demonstrated success in the development and distribution of investment strategies and products, enable him to provide valuable insights to the Board and strategic direction for the Funds. | | Trustee, Victory Portfolios (41 series), Victory Portfolios II (26 series), Victory Variable Insurance Funds (8 series) | |
44
USAA Mutual Funds Trust | | Supplemental Information — continued
May 31, 2021 | |
(Unaudited)
Name and Date of Birth | | Position
Held with
the Trust | | Year
Commenced
Service | | Principal Occupation
During Past 5 Years | | Other
Directorships
Held During
Past 5 Years | |
Daniel S. McNamara, (b)(c)(d)
Born June 1966 | | Trustee | | | 2012 | | | Trustee, President, and Vice Chairman of USAA ETF Trust (June 2017-June 2019); President of Financial Advice & Solutions Group (FASG), USAA (February 2013-March 2021); Director of USAA Investment Services Company (ISCO) (formerly USAA Investment Management) (September 2009-March 2021); President, Asset Management Company (AMCO) (August, 2011-June 2019); Senior Vice President of USAA Financial Planning Services Insurance Agency, Inc. (FPS) (April 2011-March 2021); Chairman of Board of ISCO (April 2013-December 2020); Director of AMCO (August 2011-June 2019); President and Director of USAA Shareholder Account Services (SAS) (October 2009-June 2019); Director and Vice Chairman of FPS (December 2013-March 2021); President and Director of USAA Investment Corporation (ICORP) (March 2010-March 2021); Chairman of Board of ICORP (December 2013-March 2021); Director of USAA Financial Advisors, Inc. (FAI) (December 2013-March 2021); Chairman of Board of FAI (March 2015-March 2021). Mr. McNamara brings to the Board extensive experience in the financial services industry, including experience as an officer of the Trust. | | None | |
(b) Mr. Dan McNamara is deemed an "interested person" due to his previous position as Director of AMCO, the former investment adviser of the Funds. Mr. Brown is deemed an "interested person" due to his position as Chief Executive Officer of Victory Capital, investment adviser to the Funds.
(c) Effective at the close of business on December 31, 2020, Jefferson C. Boyce replaced Dan McNamara as Chair of the Board and assumed the title of Independent Chair.
(d) Effective July 2, 2021, Mr. Dan McNamara became an Independent Trustee to the Funds.
The Statement of Additional Information includes additional information about the Trustees of the Trust and is available, without charge, on the SEC's website at www.sec.gov and/or by calling (800)-235-8396.
45
USAA Mutual Funds Trust | | Supplemental Information — continued
May 31, 2021 | |
(Unaudited)
Officers:
The officers of the Trust, their ages, commencement of service and their principal occupations during the past five years, are detailed in the following table. Each officer serves until the earlier of his or her resignation, removal, retirement, death, or the election of a successor. The mailing address of each officer of the Trust is 15935 La Cantera Pkwy, San Antonio, TX, 78256. The officers of the Trust receive no compensation directly from the Trust for performing the duties of their offices.
Name and Date of Birth | | Position with
the Trust | | Year
Commenced
Service | | Principal Occupation During Past 5 Years | |
Interested Officers.
Christopher K. Dyer,
Born February 1962 | | President | | | 2019 | | | Director of Fund Administration, Victory Capital (since 2004); Chief Operating Officer, Victory Capital Services, Inc. (since 2020) | |
Scott A Stahorsky,
Born July 1969 | | Vice President | | | 2019 | | | Manager, Fund Administration, Victory Capital (since 2015) | |
James K. De Vries,
Born April 1969 | | Treasurer | | | 2018 | | | Executive Director, Victory Capital Management Inc. (since 2019); Treasurer, USAA ETF Trust (September 2018-June 2019); Executive Director, Investment and Financial Administration, USAA (April 2012-June 2019); Assistant Treasurer, USAA ETF Trust (June 2017-September 2018); Assistant Treasurer, USAA Mutual Funds Trust (December 2013-February 2018) | |
Allan Shaer,
Born March 1965 | | Assistant Treasurer | | | 2019 | | | Senior Vice President, Financial Administration, Citi Fund Services Ohio, Inc. (since 2016); Vice President, Mutual Fund Administration, JP Morgan Chase (2011-2016) | |
Carol D. Trevino,
Born October 1965 | | Assistant Treasurer | | | 2018 | | | Director, Accounting and Finance, Victory Capital Management Inc. (since 2019); Accounting/Financial Director, USAA (December 2013-June 2019); Assistant Treasurer, USAA ETF Trust (September 2018-June 2019) | |
Erin G. Wagner,
Born February 1974 | | Secretary | | | 2019 | | | Deputy General Counsel, the Adviser (since 2013) | |
Charles Booth,
Born April 1960 | | Anti-Money Laundering Compliance Officer and Identity Theft Officer | | | 2019 | | | Director, Regulatory Administration and CCO Support Services, Citi Fund Services Ohio, Inc. (since 2007) | |
Amy Campos,
Born July 1976 | | Chief Compliance Officer | | | 2019 | | | Chief Compliance Officer, USAA Mutual Funds Trust (since 2019); Executive Director, Deputy Chief Compliance Officer, USAA Mutual Funds Trust and USAA ETF Trust (July 2017-June 2019); Compliance Director, USAA Mutual Funds Trust (2014-July 2017) | |
46
USAA Mutual Funds Trust | | Supplemental Information — continued
May 31, 2021 | |
(Unaudited)
Proxy Voting and Portfolio Holdings Information
Proxy Voting:
Information regarding the policies and procedures the Fund uses to determine how to vote proxies relating to portfolio securities is available without charge, upon request, by calling (800) 235-8396. The information is also included in the Fund's Statement of Additional Information, which is available on the SEC's website at www.sec.gov.
Information relating to how the Fund voted proxies relating to portfolio securities held during the most recent 12 months ended June 30 is available on the SEC's website at www.sec.gov.
Availability of Schedules of Portfolio Investments:
The Trust files a complete list of Schedules of Portfolio Investments with the SEC for the first and third quarter of each fiscal year on Form N-PORT. Form N-PORT is available on the SEC's website at www.sec.gov.
Expense Example
As a shareholder of the Fund, you may incur two types of costs: (1) transaction costs, and (2) ongoing costs, including management fees and other Fund expenses. These examples are intended to help you understand your ongoing costs (in dollars) of investing in the Fund and to compare these costs with the ongoing costs of investing in other mutual funds.
These examples are based on an investment of $1,000 invested at the beginning of the period and held for the entire period from December 1, 2020, through May 31, 2021.
The Actual Expense figures in the table below provide information about actual account values and actual expenses. You may use the information below, together with the amount you invested, to estimate the expenses that you paid over the period. Simply divide your account value by $1,000 (for example, an $8,600 account value divided by $1,000 = 8.6), then multiply the result by the number in the table under the heading entitled "Actual Expenses Paid During Period" to estimate the expenses you paid on your account during this period.
The Hypothetical Expense figures in the table below provide information about hypothetical account values and hypothetical expenses based on the Fund's actual expense ratio and an assumed rate of return of 5% per year before expenses, which is not the Fund's actual return. The hypothetical account values and expenses may not be used to estimate the actual ending account balance or expenses you paid for the period. You may use this information to compare this 5% hypothetical example with the 5% hypothetical examples that appear in shareholder reports of other funds.
Please note the expenses shown in the table below are meant to highlight your ongoing costs only and do not reflect any transactional costs. If these transactional costs were included, your costs would have been higher.
Beginning
Account
Value
12/1/20 | | Actual
Ending
Account
Value
5/31/21 | | Hypothetical
Ending
Account
Value
5/31/21 | | Actual
Expenses
Paid
During
Period
12/1/20-
5/31/21* | | Hypothetical
Expenses
Paid
During
Period
12/1/20-
5/31/21* | | Annualized
Expense
Ratio
During
Period
12/1/20-
5/31/21 | |
| $ | 1,000.00 | | | $ | 1,106.20 | | | $ | 1,020.19 | | | $ | 4.99 | | | $ | 4.78 | | | | 0.95 | % | |
* Expenses are equal to the average account value multiplied by the Fund's annualized expense ratio multiplied by 182/365 (the number of days in the most recent fiscal half-year divided by the number of days in the fiscal year).
47
USAA Mutual Funds Trust | | Supplemental Information — continued
May 31, 2021 | |
(Unaudited)
Additional Federal Income Tax Information
The following federal tax information related to the Fund's fiscal year ended May 31, 2021, is provided for information purposes only and should not be used for reporting to federal or state revenue agencies. Federal tax information for the calendar year will be reported to you on Form 1099-DIV in January 2022.
With respect to distributions paid, the Fund designates the following amounts (or, if subsequently determined to be different, the maximum amount allowable) for the fiscal year ended May 31, 2021 (amounts in thousands):
| | | Dividends
Received
Deduction
(corporate
shareholders) | | Qualified
Dividend
Income
(non-corporate
shareholders) | | Short-Term
Capital Gain
Distributions | | Long-Term
Capital Gain
Distributions | |
| | | | | | 14 | % | | | 17 | % | | $ | 14,566 | | | $ | 6,855 | | |
48
USAA Mutual Funds Trust | | Supplemental Information — continued
May 31, 2021 | |
(Unaudited)
Considerations of the Board in Continuing the Investment Advisory Agreement (the "Agreement")
USAA Cornerstone Moderately Aggressive Fund (the "Fund")
At a meeting of the Board of Trustees (the "Board") held on December 10-11, 2020, the Board, including the Trustees who are not "interested persons" (as that term is defined in the Investment Company Act of 1940, as amended) of the Trust (the "Independent Trustees"), approved for an annual period the continuance of the Investment Advisory Agreement (the "Advisory Agreement") between the Trust and Victory Capital Management Inc. (the "Adviser") with respect to the Fund. Prior to the December 10-11, 2020 meeting at which the Advisory Agreement was approved, the Independent Trustees also discussed and considered information regarding the proposed continuation of the Advisory Agreement at a meeting held on November 19, 2020.
In advance of the foregoing meetings, the Trustees received and considered a variety of information relating to the Advisory Agreement and the Adviser, and were given the opportunity to ask questions and request additional information from management. The information provided to the Board included, among other things: (i) a separate report prepared by an independent third party of mutual fund data, which provided a statistical analysis comparing the Fund's investment performance, expenses, and fees to comparable investment companies; (ii) information concerning the services rendered to the Fund, as well as information regarding the Adviser's revenues and costs of providing services to the Fund and compensation paid to affiliates of the Adviser; and (iii) information about the Adviser's operations and personnel. Prior to voting, the Independent Trustees reviewed the proposed continuance of the Advisory Agreement with management and with experienced independent counsel retained by the Independent Trustees ("Independent Counsel") and received materials from such Independent Counsel discussing the legal standards for their consideration of the proposed continuation of the Advisory Agreement with respect to the Fund. The Independent Trustees also reviewed the proposed continuation of the Advisory Agreement with respect to the Fund in private sessions with Independent Counsel at which no representatives of management were present.
At each regularly scheduled meeting of the Board and its committees, the Board receives and reviews, among other things, information concerning the Fund's performance and related services provided by the Adviser. At the meeting at which the renewal of the Advisory Agreement is considered, particular focus is given to information concerning Fund performance, fees and total expenses as compared to comparable investment companies, and the Adviser's profitability with respect to the Fund. However, the Board noted that the evaluation process with respect to the Adviser is an ongoing one. In this regard, the Board's and its committees' consideration of the Advisory Agreement included information previously received at such meetings.
Advisory Agreement
After full consideration of a variety of factors, the Board, including the Independent Trustees, voted to approve the Advisory Agreement. In approving the Advisory Agreement, the Trustees did not identify any single factor as controlling, and each Trustee may have attributed different weights to various factors. Throughout their deliberations, the Independent Trustees were represented and assisted by Independent Counsel.
Nature, Extent, and Quality of Services — In considering the nature, extent, and quality of the services provided by the Adviser under the Advisory Agreement, the Board reviewed information provided by the Adviser relating to its operations and personnel. The Board also took into account its knowledge of the Adviser's management and the quality of the performance of the Adviser's duties through Board meetings, discussions, and reports during the preceding year. The Board considered the fees paid to the Adviser and the services provided to the Fund by the Adviser under the Advisory Agreement, as well as other services provided by the Adviser and its affiliates under other agreements, and the personnel who provide these services. In addition to the investment advisory services provided to the Fund, the Adviser and its affiliates provide administrative services, shareholder services, oversight of Fund accounting, marketing services, assistance in meeting legal and regulatory requirements, and other services necessary for the operation of the Fund and the Trust.
The Board considered the scope of services provided by, and the undertakings required of, the Adviser in connection with those services, including, among other things, maintaining (i) its own and the Fund's compliance programs, (ii) risk management programs, (iii) liquidity risk management programs, and (iv) cybersecurity
49
USAA Mutual Funds Trust | | Supplemental Information — continued
May 31, 2021 | |
(Unaudited)
programs, each of which had expanded over time as a result of regulatory, market, and other developments. The Board also considered the significant risks assumed by the Adviser in connection with the services provided to the Fund, including investment, operational, enterprise, litigation, regulatory, and compliance risks.
The Board considered the Adviser's management style and the performance of the Adviser's duties under the Advisory Agreement. The Board considered the level and depth of knowledge of the Adviser, including the professional experience and qualifications of its senior and investment personnel, as well as current staffing levels. The allocation of the Fund's brokerage, including the Adviser's process for monitoring "best execution," also was considered. The Adviser's role in coordinating the activities of the Fund's other service providers was also considered. The Board also considered the Adviser's risk management processes. The Board considered the Adviser's financial condition and that it had the financial wherewithal to continue to provide the same scope and high quality of services under the Advisory Agreement. In reviewing the Advisory Agreement, the Board focused on the experience, resources, and strengths of the Adviser and its affiliates in managing the Fund, as well as the other funds in the Trust.
The Board also reviewed the compliance and administrative services provided to the Fund by the Adviser and its affiliates, including the Adviser's oversight of the Fund's day-to-day operations and oversight of Fund accounting. The Trustees, guided also by information obtained from their experiences as trustees of the Trust, also focused on the quality of the Adviser's compliance and administrative staff.
Expenses and Performance — In connection with its consideration of the Advisory Agreement, the Board evaluated the Fund's advisory fees and total expense ratio as compared to other open-end investment companies deemed to be comparable to the Fund as determined by the independent third party in its report. The Fund's expenses were compared to (i) a group of investment companies chosen by the independent third party to be comparable to the Fund based upon certain factors, including fund type, comparability of investment objective and classification, sales load type, asset size, and expense components (the "expense group") and (ii) a larger group of investment companies with the same investment classification/objective as the Fund regardless of asset size, excluding outliers (the "expense universe"). Among other data, the Board noted that the Fund's management fee rate — which includes advisory and administrative services, as well as any fee waivers and reimbursements — was above the medians of its expense group and expense universe. The data indicated that the Fund's total expenses, including after any reimbursements, were above the medians of its expense group and expense universe. The Board also took into account the Adviser's current undertakings to maintain expense limitations for the Fund. The Board took into account the various other services provided to the Fund by the Adviser and its affiliates, and noted the high quality of services received by the Fund.
In considering the Fund's performance, the Board noted that it reviews at its regularly scheduled meetings information about the Fund's performance results. The Trustees also reviewed various comparative data provided to them in connection with their consideration of the renewal of the Advisory Agreement, including, among other information, a comparison of the Fund's average annual total returns relative to its Lipper index and other mutual funds deemed to be in its peer group by the independent third party in its report (the "performance universe"). The Fund's performance universe consisted of the Fund and all retail and institutional open-end investment companies with the same classification/objective as the Fund regardless of asset size or primary channel of distribution. This comparison indicated that, among other data, the Fund's performance was below the average of its performance universe and its Lipper index for the one-, three-, five- and ten-year periods ended September 30, 2020. The Board took into account management's discussion of the Fund's performance, including the reasons for the Fund's underperformance relative to its peers.
Compensation and Profitability — The Board took into consideration the level and method of computing the management fee. The information considered by the Board included operating profit margin information for the Adviser's business as a whole. The Board also received and considered profitability information related to the management revenues from the Fund. This information included a review of the methodology used in the allocation of certain costs to the Fund. In considering the profitability data with respect to the Fund, the Trustees noted that the Adviser waived a portion of its management fees and/or reimbursed certain expenses with respect to the Fund. The Trustees reviewed the profitability of the Adviser's relationship with the Fund before tax expenses. The Board was also provided with a profitability analysis of other publicly traded asset managers prepared by an independent information service. In reviewing the overall profitability of the management fee to the Adviser, the Board also considered the fact that the Adviser and its affiliates provide shareholder servicing
50
USAA Mutual Funds Trust | | Supplemental Information — continued
May 31, 2021 | |
(Unaudited)
and administrative services to the Fund for which they receive compensation. The Board also considered the possible direct and indirect benefits to the Adviser from its relationship with the Trust, including that the Adviser may derive reputational and other benefits from its association with the Fund. The Trustees recognized that the Adviser should be entitled to earn a reasonable level of profits in exchange for the level of services it provides to the Fund and the entrepreneurial and other risks that it assumes as Adviser.
Economies of Scale — The Board considered whether there should be changes in the management fee rate or structure in order to enable the Fund to participate in any economies of scale. The Board also considered the fee waiver and expense reimbursement arrangements by the Adviser. The Board also considered the effect of the Fund's change in size, if any, on its performance and fees, noting that the Fund may realize other economies of scale if assets increase proportionally more than expenses. The Board determined that the current investment management fee structure was reasonable.
Conclusions — The Board reached the following conclusions regarding the Fund's Advisory Agreement with the Adviser: (i) the Adviser has demonstrated that it possesses the capability and resources to perform the duties required of it under the Advisory Agreement; (ii) the Adviser maintains an appropriate compliance program; (iii) the performance of the Fund is reasonable in relation to the performance of funds with similar investment objectives and to relevant indices in view of the Fund's investment approach and the Adviser is appropriately monitoring the Fund's performance; (iv) the Fund's advisory expenses are reasonable in relation to those of similar funds and to the services to be provided by the Adviser; and (v) the Adviser's and its affiliates' level of profitability from their relationship with the Fund is reasonable in light of the nature and high quality of services provided by the Adviser and the type of fund. Based on its conclusions, the Board determined that continuation of the Advisory Agreement would be in the best interests of the Fund and its shareholders.
51
USAA Mutual Funds Trust | | Supplemental Information — continued
May 31, 2021 | |
(Unaudited)
Liquidity Risk Management Program:
The USAA Mutual Funds have adopted and implemented a written liquidity risk management program (the "LRMP") as required by Rule 22e-4 under the Investment Company Act of 1940, as amended. The LRMP is reasonably designed to assess and manage the Fund's liquidity risk, taking into consideration the Fund's investment strategy and the liquidity of its portfolio investments during normal and reasonably foreseeable stressed market conditions; its short and long-term cash flow projections; and its cash holdings and access to other liquidity management tools such as available funding sources including the Victory Funds Complex Interfund Lending Facility and Line of Credit (discussed in the Notes to Financial Statements). The USAA Mutual Funds' Board of Trustees approved the appointment of the Fund's investment adviser, Victory Capital Management Inc. ("Victory Capital"), as the administrator of the LRMP.
Victory Capital manages liquidity risks associated with the Fund's investments by monitoring, among other things, cash and cash equivalents, any use of derivatives, the concentration of investments, the appropriateness of the Fund's investment strategy, and by classifying every Fund investment as either highly liquid, moderately liquid, less liquid, or illiquid on at least a monthly basis. To assist with the classification of Fund investments, Victory Capital has retained a third-party provider of liquidity evaluation services. This provider determines preliminary liquidity classifications for all portfolio holdings based upon portfolio-level data and certain assumptions provided by Victory Capital. Victory Capital reviews the preliminary liquidity classifications and, when appropriate, considers other information including input from the Fund's portfolio managers (including the portfolio managers employed by any investment sub-advisers) in determining final liquidity classifications.
At a meeting held on March 10, 2021, Victory Capital provided an oral and written report to the Trustees on the operation and effectiveness of the LRMP during the previous year. The report from Victory Capital concluded that the Fund did not experience any significant liquidity challenges during the covered period, and the Fund's LRMP is reasonably designed to assess and manage its liquidity risk. The report also concluded that the LRMP continues to operate adequately and effectively to enable Victory Capital to oversee and manage liquidity risk and ensure the Fund is able to meet redemption requests without significant dilution to the remaining investors' interest in the Fund. During the review period, the Fund's portfolio consisted primarily of highly liquid investments, which are defined as cash and any investments that the Fund reasonably expects to be converted to cash in current market conditions in three business days or less without significantly changing the market value of the investment. Therefore, the Fund has not adopted a highly liquid investment minimum. The Funds' investments were below the limitation on illiquid investments during the review period. Additionally, Victory Capital indicated that no events occurred that would require the filing of Form N-LIQUID and recommended no material changes to the LRMP.
52
Privacy Policy
Protecting the Privacy of Information
The Trust respects your right to privacy. We also know that you expect us to conduct and process your business in an accurate and efficient manner. To do so, we must collect and maintain certain personal information about you. This is the information we collect from you on applications or other forms, and from the transactions you make with us or third parties. It may include your name, address, social security number, account transactions and balances, and information about investment goals and risk tolerance.
We do not disclose any information about you or about former customers to anyone except as permitted or required by law. Specifically, we may disclose the information we collect to companies that perform services on our behalf, such as the transfer agent that processes shareholder accounts and printers and mailers that assist us in the distribution of investor materials. We may also disclose this information to companies that perform marketing services on our behalf. This allows us to continue to offer you Victory investment products and services that meet your investing needs, and to effect transactions that you request or authorize. These companies will use this information only in connection with the services for which we hired them. They are not permitted to use or share this information for any other purpose.
To protect your personal information internally, we permit access only by authorized employees and maintain physical, electronic, and procedural safeguards to guard your personal information.*
* You may have received communications regarding information about privacy policies from other financial institutions which gave you the opportunity to "opt-out" of certain information sharing with companies which are not affiliated with that financial institution. The Trust does not share information with other companies for purposes of marketing solicitations for products other than the Trust. Therefore, the Trust does not provide opt-out options to their shareholders.
P.O. Box 182593
Columbus, Ohio 43218-2593

Visit our website at: | | Call | |
vcm.com | | (800) 235-8396 | |

MAY 31, 2021
Annual Report
USAA Growth and Tax Strategy Fund
Victory Capital means Victory Capital Management Inc., the investment adviser of the USAA Mutual Funds. USAA Mutual Funds are distributed by Victory Capital Services, Inc., member of FINRA, an affiliate of Victory Capital. Victory Capital and its affiliates are not affiliated with United Services Automobile Association or its affiliates. USAA and the USAA logos are registered trademarks and the USAA Mutual Funds and USAA Investments logos are trademarks of United Services Automobile Association and are being used by Victory Capital and its affiliates under license.
www.vcm.com
News, Information And Education 24 Hours A Day, 7 Days A Week
The Victory Funds site gives fund shareholders, prospective shareholders, and investment professionals a convenient way to access fund information, get guidance, and track fund performance anywhere they can access the Internet. The site includes:
• Detailed performance records
• Daily share prices
• The latest fund news
• Investment resources to help you become a better investor
• A section dedicated to investment professionals
Whether you're a potential investor searching for the fund that matches your investment philosophy, a seasoned investor interested in planning tools, or an investment professional, www.vcm.com has what you seek. Visit us anytime. We're always open.
TABLE OF CONTENTS
Shareholder Letter (Unaudited) | | | 2 | | |
Managers' Commentary (Unaudited) | | | 4 | | |
Investment Overview (Unaudited) | | | 7 | | |
Investment Objective & Portfolio
Holdings (Unaudited) | | | 8 | | |
Schedule of Portfolio Investments | | | 9 | | |
Financial Statements | |
Statement of Assets and Liabilities | | | 34 | | |
Statement of Operations | | | 35 | | |
Statements of Changes in Net Assets | | | 36 | | |
Financial Highlights | | | 38 | | |
Notes to Financial Statements | | | 40 | | |
Report of Independent
Registered Public Accounting Firm | | | 52 | | |
Supplemental Information (Unaudited) | | | 53 | | |
Trustees' and Officers' Information | | | 53 | | |
Proxy Voting and Portfolio Holdings Information | | | 59 | | |
Expense Example | | | 59 | | |
Additional Federal Income Tax Information | | | 60 | | |
Advisory Contract Agreement | | | 61 | | |
Liquidity Risk Management Program | | | 65 | | |
Privacy Policy (inside back cover) | | | |
This report is for the information of the shareholders and others who have received a copy of the currently effective prospectus of the Fund, managed by Victory Capital Management Inc. It may be used as sales literature only when preceded or accompanied by a current prospectus, which provides further details about the Fund.
IRA DISTRIBUTION WITHHOLDING DISCLOSURE
We generally must withhold federal income tax at a rate of 10% of the taxable portion of your distribution and, if you live in a state that requires state income tax withholding, at your state's tax rate. However, you may elect not to have withholding apply or to have income tax withheld at a higher rate. Any withholding election that you make will apply to any subsequent distribution unless and until you change or revoke the election. If you wish to make a withholding election, or change or revoke a prior withholding election, call (800) 235-8396, and form W-4P (OMB No. 1545-0074 withholding certificate for pension or annuity payments) will be electronically sent.
If you do not have a withholding election in place by the date of a distribution, federal income tax will be withheld from the taxable portion of your distribution at a rate of 10%. If you must pay estimated taxes, you may be subject to estimated tax penalties if your estimated tax payments are not sufficient and sufficient tax is not withheld from your distribution.
For more specific information, please consult your tax adviser.
• NOT FDIC INSURED • NO BANK GUARANTEE • MAY LOSE VALUE
1
(Unaudited)
Dear Shareholder,
Never a dull moment. A year ago, we were still coming to grips with a global pandemic, hoping for an effective vaccine, and wondering whether the U.S. Federal Reserve's aggressive actions would continue to mollify financial markets. As it turns out, a vaccine was rolled out (domestically) faster than expectations, and the recovery that began during the second quarter of 2020 continued unabated.
Fast forward to today and investors are suddenly more concerned about labor shortages, rising commodity prices, and whether inflation will prove to be transitory or more lasting. If anything, this merely exemplifies that markets are unpredictable and the environment can change rapidly.
Reflecting on the past year, we must consider ourselves fortunate despite the myriad of challenges. For starters, it was impressive how quickly the various forms of monetary and fiscal stimulus contributed to a rebound in GDP. Of course, it wasn't a straight line upward and there were bouts of elevated volatility in both bond and stock markets. Late in 2020, for example, financial markets were alternately fueled and roiled by a contentious election season, growing optimism for an effective vaccine, and a fluid debate regarding the need for even more stimulus. Ultimately, stocks were propelled higher in the fourth quarter of 2020 as it became clear Congress would provide another dose of stimulus in the form of direct payments, more unemployment insurance, and additional aid to businesses.
As we moved into 2021, stocks continued their upward trajectory. Meanwhile, the yield on the 10-Year U.S. Treasury continued rallying sharply as many investors began to shift their focus. Deflation was out; inflation was in. Indeed, the potential for a new era of inflation and higher interest rates seems to be the new worry du jour.
So how did the numbers shake out after this unusual year? The S&P 500® Index registered an impressive annual return of approximately 40% for this 12-month period ended May 31, 2021. Over this same period, the yield on the 10-Year U.S. Treasury jumped 94 basis points, reflecting both the very low starting rate and substantial fiscal stimulus. At the end of the reporting period, the yield on the 10-Year U.S. Treasury was 1.59%.
The past year is not one we will forget any time soon. There were many hardships, but we should not overlook the positives and remember our collective spirit and perseverance. Markets endured and even surprised to the upside, but perhaps the key takeaway is that investors need to remain calm in the face of adversity and focused on longer-term investment goals. We believe that's the best approach no matter what the markets throw at us.
On the following pages, you will find information relating to your USAA Mutual Funds, brought to you by Victory Capital. If you have any questions regarding the current market dynamics or your specific portfolio or investment plan, we encourage you to contact our Member Service Representatives. Call (800) 235-8396 or visit our website at www.vcm.com.
2
From all of us here at Victory Capital, thank you for letting us help you work toward your investment goals.

Christopher K. Dyer, CFA
President,
USAA Mutual Funds
3
USAA Growth and Tax Strategy Fund
Managers' Commentary
(Unaudited)
• What were the market conditions during the reporting period?
Tax-exempt bonds as measured by the Bloomberg Barclays Municipal Bond Index generated positive returns during the 12-month reporting period ended May 31, 2021, due in part to falling municipal bond yields. (Bond prices and yields move in opposite directions.) However, the market saw volatility during the reporting period due primarily to COVID-19 and related economic and government reactions.
The reporting period began several months into the COVID-19 crisis in the United States. Starting in May 2020, the municipal market began a long, uneven recovery for the rest of the calendar year, driven by significant government intervention and investor expectations of a future return to normalcy. The recovery was marked by sizeable fund flows into tax-exempt mutual funds and material tightening of credit spreads (the difference between riskier bond yields and the safest bond yields). The recovery took a slight pause in the months ahead of the election, as uncertainty surrounding the election, as well as uncertainty around aid for municipal borrowers weighed on the market for a couple of months. However, the year ended with the market up significantly from the start of both the calendar year and the reporting period. For the first five months of 2021, heavy investor demand caused the municipal market to earn slightly positive returns despite the meaningful increase in Treasury yields over that time period.
The beginning of the reporting period brought a dramatic reversal in equity markets from the difficult environment that characterized the first part of 2020. While COVID-19 cases continued to rise, investors grew increasingly confident that the economy would be able to recover from its sharp downturn of February and March. The optimism stemmed, in part, from a series of better-than-expected economic reports interpreted as evidence that the slump in growth would be less severe than was initially feared. The markets were further cheered by the aggressive response by the U.S. Federal Reserve (the "Fed"). In addition to reiterating its commitment to keep short-term interest rates near zero for an extended period, the Fed announced the direct purchase of both individual bonds and exchange-traded bond funds. The central bank's unusual steps offered corporations the latitude to issue debt at ultra-low rates, providing them with the cash necessary to withstand the effects of the coronavirus.
The equity markets produced healthy returns during the second half of 2020, wrapping up a positive year for the major asset classes. Investors' appetite for risk improved considerably in early November, when the approval of vaccines for COVID-19 raised expectations that the world economy could gradually return to normal in 2021. The conclusion of the U.S. elections, which removed a source of uncertainty that had depressed performance in September and October, was an additional tailwind. The markets were also aided by continued indications that the Fed and other central banks would maintain their highly accommodative policies indefinitely. Not least, an agreement on a new round of U.S. fiscal stimulus further cheered investors in late December. Together, these developments outweighed negative headlines surrounding renewed lockdowns and the persistence of the coronavirus.
4
USAA Growth and Tax Strategy Fund (continued)
Managers' Commentary (continued)
The first quarter of 2021 proved to be a continuation of the strong equity markets investors experienced over the second half of 2020. Gains from global equity markets were fueled by optimism surrounding the successful rollout of the COVID-19 vaccines coupled with further monetary and fiscal stimulus proposals. Faster-than-expected economic growth produced a meaningful increase in real interest rates, which led to negative returns across most major fixed income asset classes. The 10-year U.S. Treasury bond yield finished at its highest level of the first quarter reporting period, climbing from under 1% to 1.74%.
During the last few months of the reporting period, equity markets have been consolidating and interest rates leveling off after large upswings. With strong first quarter GDP and corporate earnings growth in the rearview mirror, investors seem to be contemplating their next move. Inflation data has been increasing as the economy reopens more quickly than expected. The Fed maintains that inflationary pressure is transitory but could become more persistent. The inflationary environment will be a key metric moving into the second half of the year.
• How did the USAA Growth and Tax Strategy Fund (the "Fund") perform during the reporting period?
The Fund has four share classes: Fund Shares, Institutional Shares, Class A, and Class C. For the reporting period ended May 31, 2021, the Fund Shares had a total return of 22.79%. This compares to a total return of 40.32% for the S&P 500® Index (the Index), 4.74% for the Bloomberg Barclays Municipal Bond Index, 22.53% for the Composite Index, and 6.31% for the Lipper Composite Index (51% of the Lipper General & Insured Municipal Debt Funds Index and 49% of the Lipper Large-Cap Core Funds Index). The Institutional Shares, Class A, and Class C commenced operations on June 29, 2020, and from that time through May 31, 2021, had a total return of 21.62%, 21.35%, and 20.47%, respectively.
Victory Capital Management Inc. ("VCM") is the Fund's investment adviser. As the investment adviser, VCM employs dedicated resources to support the research, selection, and monitoring of the Fund's subadviser. Northern Trust Investments, Inc., is a subadviser to the Fund. The investment adviser and the subadviser each provide day-to-day discretionary management for a portion of the Fund's assets.
• What strategies did you employ during the reporting period?
In keeping with our investment approach in the municipal bond portion of the Fund, we continued to focus on income generation. The Fund's long-term income distribution, not its price appreciation, accounts for most of its total return. Because of the Fund's income orientation, it has a higher allocation to BBB and A rated categories when compared to its peer group.
Our commitment to independent credit research continued to help us identify attractive opportunities for the Fund. We employ fundamental analysis that emphasizes an issuer's
5
USAA Growth and Tax Strategy Fund (continued)
Managers' Commentary (continued)
ability and willingness to repay its debt. Through our credit research, we strive both to recognize relative value and to avoid potential pitfalls, which is especially important in volatile times like the present. As always, we worked with our in-house team of analysts to select investments for the Fund on a bond-by-bond basis. Our team continuously monitors all the holdings in the Fund's portfolio.
The Fund continues to hold a diversified portfolio of longer-term, primarily investment- grade municipal bonds. To limit exposure to an unexpected event, the Fund is diversified by sector, issuer, and geography. In addition, we avoid bonds subject to the federal alternative minimum tax for individuals.
The equity portion of the Fund through the one-year period ending May 31, 2021, produced a positive absolute return in-line with the S&P 500® Index (the "Index"). The relative strength or weakness of certain sectors in the Index did not have an outsized impact on the equity portion of the Fund as its sector exposures are similar to those of the Index. In keeping with our investment approach, we sought to limit both short-term and long-term capital gains. More specifically, we kept realized capital gains down by limiting the sale of securities that had increased in value and realizing capital losses on securities that had decreased in value. In addition, our investment process continued to manage the "active risk" (the risk that the equity portion of the Fund will not perform in line with the Index because of our efforts to achieve tax efficiency) in the portfolio. During the month of February, the Fund realized some capital gains as part of a scheduled rebalance, which was driven by strong equity returns. To the extent the Fund has a loss carryforward position, it will help offset any potential future capital gains.
Thank you for allowing us to assist you with your investment needs.
6
USAA Growth and Tax Strategy Fund
Investment Overview
(Unaudited)
Average Annual Total Return
Year Ended May 31, 2021
| | Fund
Shares | | Institutional
Shares | | Class A | | Class C | | | | | | | | | |
INCEPTION DATE | | 1/11/89 | | 6/29/20 | | 6/29/20 | | 6/29/20 | | | | | | | | | | | | | |
| | Net Asset
Value | | Net Asset
Value | | Net Asset
Value | | Net Asset
Value | | S&P 5001 | | Bloomberg
Barclays
Municpal
Bond
Index2 | | Composite
Index1,2,3 | | Lipper
Composite
Index4 | |
One Year | | | 22.79 | % | | | NA | | | | NA | | | | NA | | | | 40.32 | % | | | 4.74 | % | | | 22.53 | % | | | 6.31 | % | |
Five Year | | | 9.73 | % | | | NA | | | | NA | | | | NA | | | | 17.16 | % | | | 3.52 | % | | | 10.34 | % | | | 2.74 | % | |
Ten Year | | | 9.12 | % | | | NA | | | | NA | | | | NA | | | | 14.38 | % | | | 4.29 | % | | | 9.34 | % | | | 3.10 | % | |
Since Inception | | | NA | | | | 21.62 | % | | | 21.35 | % | | | 20.47 | % | | | NA | | | | NA | | | | NA | | | | NA | | |
The performance data quoted represents past performance and current returns may be lower or higher. The investment return and principal value will fluctuate so that an investor's shares, when redeemed, may be worth more or less than the original cost. To obtain performance information current to the most recent month's end, please visit www.vcm.com.
The maximum offering price figures reflect a maximum sales charge of 2.25% for Class A. Net Asset Value does not reflect sales charges.
Total return measures the price change in a share assuming the reinvestment of all net investment income and realized capital gain distributions, if any. The total returns quoted do not reflect adjustments made to the enclosed financial statements in accordance with U.S. Generally Accepted Accounting Principles or the deduction of taxes that a shareholder would pay on net investment income and realized capital gain distributions, including reinvested distributions, or redemptions of shares. The total return figures set forth above include all waivers of fees. Without such fee waivers, the total returns would have been lower.
USAA Growth and Tax Strategy Fund — Growth of $10,000
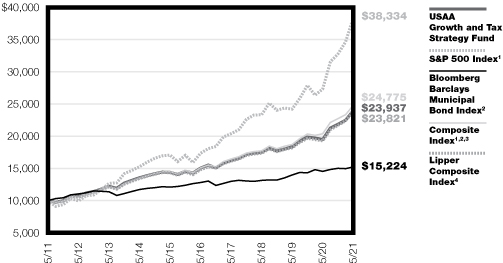
1The unmanaged S&P 500 Index is a market-capitalization-weighted index that measures the performance of the common stocks of 500 leading U.S. companies. The index reflects the reinvestment of dividends paid on the stocks constituting the index net of withholding taxes. This index does not include the effect of sales charges, commissions, expenses, or taxes, is not representative of the Fund, and it is not possible to invest directly in an index.
2The unmanaged Bloomberg Barclays Municipal Bond Index is a benchmark of total return performance for the long-term, investment-grade, tax-exempt bond market. This index does not include the effect of sales charges, commissions, expenses, or taxes, is not representative of the Fund, it is not possible to invest directly in an index.
3The Composite Index is comprised of 50% of the S&P 500 Index and 50% of the Bloomberg Barclays Municipal Bond Index. This index does not include the effect of sales charges, commissions, expenses, or taxes, is not representative of the Fund, is is not possible to invest directly in an index.
4The Lipper Composite Index is comprised of 51% of the Lipper General & Insured Municipal Debt Funds Index and 49% of the Lipper Large-Cap Core Funds Index. The unmanaged Lipper General & Municipal Debt Funds Index tracks the total return performance of the funds within this same category. The unmanaged Lipper Large-Cap Core Funds Index tracks the total return performance of the funds within this same category. This index does not include the effect of sales charges, commissions, expenses, or taxes, is not representative of the Fund, is is not possible to invest directly in an index.
The graph reflects investment of growth of a hypothetical $10,000 investment in the Fund.
The graph and table do not reflect the deduction of taxes that a shareholder would pay on Fund distributions or the redemption of Fund shares.
Past performance is not indicative of future results.
7
USAA Mutual Funds Trust
USAA Growth and Tax Strategy Fund | | May 31, 2021 | |
(Unaudited)
Investment Objective and Portfolio Holdings:
The Fund's investment objective seeks a conservative balance for the investor between income, the majority of which is exempt from federal income tax, and the potential for long-term growth of capital to preserve purchasing power.
Top 10 Sectors*:
May 31, 2021
(% of Net Assets)
Information Technology | | | 12.4 | % | |
Health Care | | | 6.0 | % | |
Financials | | | 5.8 | % | |
Consumer Discretionary | | | 5.7 | % | |
Communication Services | | | 5.3 | % | |
Industrials | | | 4.3 | % | |
Consumer Staples | | | 2.8 | % | |
Materials | | | 1.4 | % | |
Energy | | | 1.4 | % | |
Real Estate | | | 1.2 | % | |
Top 5 Tax-Exempt Bonds:
May 31, 2021
(% of Net Assets)
Port of Port Arthur Navigation District Revenue | | | 1.9 | % | |
Massachusetts Development Finance Agency Revenue | | | 1.6 | % | |
Illinois Finance Authority Revenue | | | 1.2 | % | |
New Jersey Economic Development Authority Revenue | | | 1.1 | % | |
Public Finance Authority Revenue | | | 0.8 | % | |
Top 5 Blue Chip Stocks:
May 31, 2021
(% of Net Assets)
Apple, Inc. | | | 2.7 | % | |
Microsoft Corp. | | | 2.5 | % | |
Amazon.com, Inc. | | | 1.8 | % | |
Facebook, Inc. Class A | | | 1.1 | % | |
Alphabet, Inc. Class A | | | 1.0 | % | |
Refer to the Schedule of Portfolio Investments for a complete list of securities.
* Does not include futures, money market instruments, and short-term investments purchased with cash collateral from securities loaned.
8
USAA Mutual Funds Trust
USAA Growth and Tax Strategy Fund | | Schedule of Portfolio Investments
May 31, 2021 | |
(Amounts in Thousands, Except for Shares)
Security Description | | Shares | | Value | |
Common Stocks (47.5%) | |
Blue Chip Stocks: | |
Communication Services (5.3%): | |
Activision Blizzard, Inc. | | | 9,016 | | | $ | 877 | | |
Alphabet, Inc. Class A (a) | | | 3,091 | | | | 7,285 | | |
Alphabet, Inc. Class C (a) | | | 2,961 | | | | 7,141 | | |
AT&T, Inc. | | | 58,206 | | | | 1,713 | | |
Charter Communications, Inc. Class A (a) | | | 1,764 | | | | 1,225 | | |
Comcast Corp. Class A | | | 49,729 | | | | 2,851 | | |
Discovery, Inc. Class C (a) | | | 2,733 | | | | 82 | | |
DISH Network Corp. Class A (a) | | | 603 | | | | 26 | | |
Electronic Arts, Inc. | | | 2,332 | | | | 333 | | |
Facebook, Inc. Class A (a) | | | 24,295 | | | | 7,987 | | |
Fox Corp. Class A | | | 4,287 | | | | 160 | | |
Fox Corp. Class B | | | 1,992 | | | | 72 | | |
Live Nation Entertainment, Inc. (a) | | | 1,845 | | | | 166 | | |
Lumen Technologies, Inc. (b) | | | 11,485 | | | | 159 | | |
Netflix, Inc. (a) | | | 4,641 | | | | 2,334 | | |
News Corp. Class A | | | 2,721 | | | | 73 | | |
Omnicom Group, Inc. | | | 2,667 | | | | 219 | | |
Take-Two Interactive Software, Inc. (a) | | | 1,508 | | | | 280 | | |
The Interpublic Group of Cos., Inc. | | | 4,839 | | | | 163 | | |
The Walt Disney Co. (a) | | | 18,753 | | | | 3,350 | | |
T-Mobile U.S., Inc. (a) | | | 5,490 | | | | 777 | | |
Twitter, Inc. (a) | | | 7,251 | | | | 421 | | |
Verizon Communications, Inc. | | | 32,638 | | | | 1,844 | | |
ViacomCBS, Inc. Class B | | | 6,762 | | | | 287 | | |
| | | | 39,825 | | |
Consumer Discretionary (5.7%): | |
Advance Auto Parts, Inc. | | | 832 | | | | 158 | | |
Amazon.com, Inc. (a) | | | 4,335 | | | | 13,972 | | |
Aptiv PLC (a) | | | 2,354 | | | | 354 | | |
AutoZone, Inc. (a) | | | 255 | | | | 359 | | |
Best Buy Co., Inc. | | | 2,415 | | | | 281 | | |
Booking Holdings, Inc. (a) | | | 441 | | | | 1,041 | | |
BorgWarner, Inc. | | | 2,421 | | | | 124 | | |
Caesars Entertainment, Inc. (a) | | | 675 | | | | 72 | | |
CarMax, Inc. (a) | | | 2,090 | | | | 241 | | |
Carnival Corp. (a) | | | 8,370 | | | | 247 | | |
Chipotle Mexican Grill, Inc. (a) | | | 325 | | | | 446 | | |
D.R. Horton, Inc. | | | 3,030 | | | | 289 | | |
Darden Restaurants, Inc. | | | 1,633 | | | | 234 | | |
Dollar General Corp. | | | 2,615 | | | | 531 | | |
Dollar Tree, Inc. (a) | | | 1,591 | | | | 155 | | |
Domino's Pizza, Inc. | | | 408 | | | | 174 | | |
eBay, Inc. | | | 7,658 | | | | 466 | | |
Etsy, Inc. (a) | | | 754 | | | | 124 | | |
Expedia Group, Inc. (a) | | | 1,583 | | | | 280 | | |
Ford Motor Co. (a) | | | 48,980 | | | | 712 | | |
Garmin Ltd. | | | 1,580 | | | | 225 | | |
See notes to financial statements.
9
USAA Mutual Funds Trust
USAA Growth and Tax Strategy Fund | | Schedule of Portfolio Investments — continued
May 31, 2021 | |
(Amounts in Thousands, Except for Shares)
Security Description | | Shares | | Value | |
General Motors Co. (a) | | | 13,698 | | | $ | 812 | | |
Genuine Parts Co. | | | 1,110 | | | | 146 | | |
Hanesbrands, Inc. | | | 4,535 | | | | 89 | | |
Hasbro, Inc. | | | 1,600 | | | | 154 | | |
Hilton Worldwide Holdings, Inc. (a) | | | 3,015 | | | | 378 | | |
L Brands, Inc. (a) | | | 2,727 | | | | 191 | | |
Las Vegas Sands Corp. (a) (c) | | | 1,042 | | | | 60 | | |
Leggett & Platt, Inc. | | | 859 | | | | 47 | | |
Lennar Corp. Class A | | | 2,669 | | | | 264 | | |
Lennar Corp. Class B | | | 1 | | | | — | (d) | |
LKQ Corp. (a) | | | 3,837 | | | | 196 | | |
Lowe's Cos., Inc. | | | 7,623 | | | | 1,485 | | |
Marriott International, Inc. Class A (a) | | | 2,953 | | | | 424 | | |
McDonald's Corp. | | | 7,151 | | | | 1,673 | | |
MGM Resorts International | | | 5,858 | | | | 251 | | |
Mohawk Industries, Inc. (a) | | | 618 | | | | 130 | | |
Newell Brands, Inc. | | | 4,177 | | | | 120 | | |
NIKE, Inc. Class B | | | 14,322 | | | | 1,954 | | |
Norwegian Cruise Line Holdings Ltd. (a) (b) | | | 3,415 | | | | 109 | | |
NVR, Inc. (a) | | | 38 | | | | 186 | | |
O'Reilly Automotive, Inc. (a) | | | 961 | | | | 514 | | |
PulteGroup, Inc. | | | 2,360 | | | | 136 | | |
PVH Corp. (a) | | | 928 | | | | 107 | | |
Ralph Lauren Corp. (a) | | | 420 | | | | 52 | | |
Ross Stores, Inc. | | | 3,683 | | | | 465 | | |
Royal Caribbean Cruises Ltd. (a) | | | 2,147 | | | | 200 | | |
Starbucks Corp. | | | 12,390 | | | | 1,411 | | |
Tapestry, Inc. (a) | | | 3,021 | | | | 136 | | |
Target Corp. (c) | | | 5,209 | | | | 1,182 | | |
Tesla, Inc. (a) | | | 6,491 | | | | 4,058 | | |
The Gap, Inc. | | | 2,315 | | | | 77 | | |
The Home Depot, Inc. | | | 11,047 | | | | 3,523 | | |
The TJX Cos., Inc. | | | 11,818 | | | | 798 | | |
Tractor Supply Co. | | | 1,578 | | | | 287 | | |
Ulta Beauty, Inc. (a) | | | 550 | | | | 190 | | |
Under Armour, Inc. Class A (a) | | | 2,357 | | | | 53 | | |
Under Armour, Inc. Class C (a) | | | 2,104 | | | | 40 | | |
VF Corp. | | | 3,213 | | | | 256 | | |
Whirlpool Corp. | | | 792 | | | | 188 | | |
Wynn Resorts Ltd. (a) | | | 1,047 | | | | 138 | | |
Yum! Brands, Inc. | | | 3,711 | | | | 445 | | |
| | | | 43,410 | | |
Consumer Staples (2.8%): | |
Altria Group, Inc. | | | 18,982 | | | | 934 | | |
Archer-Daniels-Midland Co. | | | 6,080 | | | | 405 | | |
Brown-Forman Corp. Class B | | | 2,315 | | | | 186 | | |
Campbell Soup Co. | | | 2,319 | | | | 113 | | |
Church & Dwight Co., Inc. | | | 2,959 | | | | 254 | | |
Colgate-Palmolive Co. | | | 7,487 | | | | 627 | | |
Conagra Brands, Inc. | | | 6,489 | | | | 247 | | |
See notes to financial statements.
10
USAA Mutual Funds Trust
USAA Growth and Tax Strategy Fund | | Schedule of Portfolio Investments — continued
May 31, 2021 | |
(Amounts in Thousands, Except for Shares)
Security Description | | Shares | | Value | |
Constellation Brands, Inc. Class A | | | 1,572 | | | $ | 377 | | |
Costco Wholesale Corp. | | | 4,892 | | | | 1,851 | | |
General Mills, Inc. | | | 6,777 | | | | 426 | | |
Hormel Foods Corp. | | | 2,891 | | | | 140 | | |
Kellogg Co. | | | 2,529 | | | | 166 | | |
Kimberly-Clark Corp. | | | 2,741 | | | | 358 | | |
Lamb Weston Holdings, Inc. | | | 1,591 | | | | 131 | | |
McCormick & Co., Inc. | | | 2,942 | | | | 262 | | |
Molson Coors Beverage Co. Class B (a) | | | 2,045 | | | | 119 | | |
Mondelez International, Inc. Class A | | | 16,326 | | | | 1,037 | | |
Monster Beverage Corp. (a) | | | 3,965 | | | | 374 | | |
PepsiCo, Inc. | | | 11,883 | | | | 1,758 | | |
Philip Morris International, Inc. | | | 16,390 | | | | 1,581 | | |
Sysco Corp. | | | 5,774 | | | | 468 | | |
The Clorox Co. | | | 1,311 | | | | 232 | | |
The Coca-Cola Co. | | | 30,968 | | | | 1,712 | | |
The Estee Lauder Cos., Inc. | | | 2,324 | | | | 712 | | |
The Hershey Co. | | | 1,885 | | | | 326 | | |
The J.M. Smucker Co. | | | 828 | | | | 110 | | |
The Kraft Heinz Co. | | | 6,993 | | | | 305 | | |
The Kroger Co. | | | 8,771 | | | | 324 | | |
The Procter & Gamble Co. | | | 24,735 | | | | 3,336 | | |
Tyson Foods, Inc. Class A | | | 2,142 | | | | 170 | | |
Walgreens Boots Alliance, Inc. | | | 7,770 | | | | 409 | | |
Walmart, Inc. | | | 13,998 | | | | 1,988 | | |
| | | | 21,438 | | |
Energy (1.4%): | |
APA Corp. | | | 1,129 | | | | 24 | | |
Baker Hughes Co. | | | 8,513 | | | | 208 | | |
Cabot Oil & Gas Corp. | | | 2,120 | | | | 35 | | |
Chevron Corp. | | | 21,588 | | | | 2,241 | | |
ConocoPhillips | | | 15,168 | | | | 845 | | |
Devon Energy Corp. | | | 4,751 | | | | 126 | | |
Diamondback Energy, Inc. | | | 2,111 | | | | 169 | | |
EOG Resources, Inc. | | | 4,759 | | | | 382 | | |
Exxon Mobil Corp. | | | 40,045 | | | | 2,337 | | |
Halliburton Co. | | | 9,010 | | | | 202 | | |
Hess Corp. | | | 2,683 | | | | 225 | | |
HollyFrontier Corp. | | | 1,850 | | | | 60 | | |
Kinder Morgan, Inc. | | | 19,808 | | | | 363 | | |
Marathon Oil Corp. | | | 10,479 | | | | 127 | | |
Marathon Petroleum Corp. | | | 8,076 | | | | 499 | | |
NOV, Inc. (a) | | | 4,819 | | | | 78 | | |
Occidental Petroleum Corp. | | | 6,234 | | | | 162 | | |
ONEOK, Inc. | | | 5,513 | | | | 291 | | |
Phillips 66 | | | 5,195 | | | | 438 | | |
Pioneer Natural Resources Co. | | | 2,039 | | | | 310 | | |
Schlumberger Ltd. | | | 18,134 | | | | 568 | | |
The Williams Cos., Inc. | | | 14,342 | | | | 378 | | |
See notes to financial statements.
11
USAA Mutual Funds Trust
USAA Growth and Tax Strategy Fund | | Schedule of Portfolio Investments — continued
May 31, 2021 | |
(Amounts in Thousands, Except for Shares)
Security Description | | Shares | | Value | |
Valero Energy Corp. | | | 3,087 | | | $ | 248 | | |
| | | | 10,316 | | |
Financials (5.8%): | |
Aflac, Inc. | | | 6,526 | | | | 370 | | |
American Express Co. | | | 7,083 | | | | 1,134 | | |
American International Group, Inc. | | | 10,328 | | | | 546 | | |
Ameriprise Financial, Inc. | | | 1,259 | | | | 327 | | |
Aon PLC Class A | | | 2,698 | | | | 684 | | |
Arthur J. Gallagher & Co. | | | 2,370 | | | | 347 | | |
Assurant, Inc. | | | 653 | | | | 105 | | |
Bank of America Corp. | | | 80,700 | | | | 3,421 | | |
Berkshire Hathaway, Inc. Class B (a) | | | 18,026 | | | | 5,217 | | |
BlackRock, Inc. | | | 1,475 | | | | 1,294 | | |
Capital One Financial Corp. | | | 4,854 | | | | 780 | | |
Cboe Global Markets, Inc. | | | 680 | | | | 76 | | |
Chubb Ltd. | | | 4,174 | | | | 710 | | |
Cincinnati Financial Corp. | | | 1,898 | | | | 231 | | |
Citigroup, Inc. | | | 21,251 | | | | 1,673 | | |
Citizens Financial Group, Inc. | | | 5,249 | | | | 262 | | |
CME Group, Inc. | | | 3,122 | | | | 683 | | |
Comerica, Inc. | | | 1,808 | | | | 142 | | |
Discover Financial Services | | | 3,983 | | | | 467 | | |
Everest Re Group Ltd. | | | 440 | | | | 114 | | |
Fifth Third Bancorp | | | 8,885 | | | | 374 | | |
First Republic Bank | | | 833 | | | | 159 | | |
Franklin Resources, Inc. | | | 2,567 | | | | 88 | | |
Globe Life, Inc. | | | 1,211 | | | | 128 | | |
Huntington Bancshares, Inc. | | | 12,687 | | | | 201 | | |
Intercontinental Exchange, Inc. | | | 5,422 | | | | 612 | | |
Invesco Ltd. | | | 4,735 | | | | 135 | | |
JPMorgan Chase & Co. | | | 32,894 | | | | 5,403 | | |
KeyCorp | | | 12,202 | | | | 281 | | |
Lincoln National Corp. | | | 1,769 | | | | 123 | | |
Loews Corp. | | | 3,046 | | | | 178 | | |
M&T Bank Corp. | | | 1,592 | | | | 256 | | |
Marsh & McLennan Cos., Inc. | | | 5,030 | | | | 696 | | |
MetLife, Inc. | | | 8,569 | | | | 560 | | |
Moody's Corp. | | | 1,624 | | | | 545 | | |
Morgan Stanley | | | 14,869 | | | | 1,352 | | |
MSCI, Inc. | | | 992 | | | | 464 | | |
Nasdaq, Inc. | | | 1,159 | | | | 194 | | |
Northern Trust Corp. (e) | | | 1,926 | | | | 233 | | |
People's United Financial, Inc. | | | 5,272 | | | | 100 | | |
Principal Financial Group, Inc. | | | 2,476 | | | | 162 | | |
Prudential Financial, Inc. | | | 4,971 | | | | 532 | | |
Raymond James Financial, Inc. | | | 1,326 | | | | 176 | | |
Regions Financial Corp. | | | 9,790 | | | | 229 | | |
S&P Global, Inc. | | | 2,529 | | | | 960 | | |
State Street Corp. | | | 3,118 | | | | 271 | | |
SVB Financial Group (a) | | | 645 | | | | 376 | | |
See notes to financial statements.
12
USAA Mutual Funds Trust
USAA Growth and Tax Strategy Fund | | Schedule of Portfolio Investments — continued
May 31, 2021 | |
(Amounts in Thousands, Except for Shares)
Security Description | | Shares | | Value | |
Synchrony Financial | | | 6,793 | | | $ | 322 | | |
T. Rowe Price Group, Inc. | | | 2,189 | | | | 419 | | |
The Allstate Corp. | | | 3,329 | | | | 455 | | |
The Bank of New York Mellon Corp. | | | 8,002 | | | | 417 | | |
The Charles Schwab Corp. | | | 15,986 | | | | 1,181 | | |
The Goldman Sachs Group, Inc. | | | 3,240 | | | | 1,205 | | |
The Hartford Financial Services Group, Inc. | | | 2,900 | | | | 190 | | |
The PNC Financial Services Group, Inc. | | | 4,807 | | | | 936 | | |
The Progressive Corp. | | | 5,434 | | | | 538 | | |
The Travelers Cos., Inc. | | | 3,045 | | | | 486 | | |
Truist Financial Corp. | | | 14,396 | | | | 889 | | |
U.S. Bancorp | | | 14,810 | | | | 900 | | |
Unum Group | | | 2,526 | | | | 78 | | |
W.R. Berkley Corp. | | | 1,826 | | | | 142 | | |
Wells Fargo & Co. | | | 37,277 | | | | 1,742 | | |
Willis Towers Watson PLC | | | 1,546 | | | | 404 | | |
Zions Bancorp NA | | | 2,017 | | | | 117 | | |
| | | | 43,792 | | |
Health Care (6.0%): | |
Abbott Laboratories | | | 19,358 | | | | 2,258 | | |
AbbVie, Inc. | | | 17,884 | | | | 2,024 | | |
ABIOMED, Inc. (a) | | | 568 | | | | 162 | | |
Agilent Technologies, Inc. | | | 4,127 | | | | 570 | | |
Alexion Pharmaceuticals, Inc. (a) | | | 2,369 | | | | 418 | | |
Align Technology, Inc. (a) | | | 809 | | | | 477 | | |
AmerisourceBergen Corp. | | | 1,410 | | | | 162 | | |
Amgen, Inc. | | | 6,365 | | | | 1,515 | | |
Anthem, Inc. | | | 2,398 | | | | 955 | | |
Baxter International, Inc. | | | 4,622 | | | | 380 | | |
Becton, Dickinson & Co. | | | 2,074 | | | | 502 | | |
Biogen, Inc. (a) | | | 1,601 | | | | 428 | | |
Bio-Rad Laboratories, Inc. Class A (a) | | | 83 | | | | 50 | | |
Boston Scientific Corp. (a) | | | 12,299 | | | | 523 | | |
Bristol-Myers Squibb Co. | | | 23,723 | | | | 1,559 | | |
Cardinal Health, Inc. | | | 2,538 | | | | 142 | | |
Catalent, Inc. (a) | | | 1,060 | | | | 111 | | |
Centene Corp. (a) | | | 5,336 | | | | 393 | | |
Cerner Corp. | | | 2,787 | | | | 218 | | |
Cigna Corp. | | | 3,968 | | | | 1,027 | | |
CVS Health Corp. | | | 13,617 | | | | 1,177 | | |
Danaher Corp. | | | 6,992 | | | | 1,791 | | |
DaVita, Inc. (a) | | | 972 | | | | 117 | | |
DENTSPLY SIRONA, Inc. | | | 2,714 | | | | 182 | | |
DexCom, Inc. (a) | | | 197 | | | | 73 | | |
Edwards Lifesciences Corp. (a) | | | 6,150 | | | | 590 | | |
Eli Lilly & Co. | | | 8,712 | | | | 1,740 | | |
Gilead Sciences, Inc. (c) | | | 12,961 | | | | 857 | | |
HCA Healthcare, Inc. | | | 2,625 | | | | 564 | | |
Henry Schein, Inc. (a) | | | 1,136 | | | | 86 | | |
Hologic, Inc. (a) | | | 2,461 | | | | 155 | | |
See notes to financial statements.
13
USAA Mutual Funds Trust
USAA Growth and Tax Strategy Fund | | Schedule of Portfolio Investments — continued
May 31, 2021 | |
(Amounts in Thousands, Except for Shares)
Security Description | | Shares | | Value | |
Humana, Inc. | | | 1,376 | | | $ | 602 | | |
IDEXX Laboratories, Inc. (a) | | | 1,036 | | | | 578 | | |
Illumina, Inc. (a) | | | 1,477 | | | | 599 | | |
Incyte Corp. (a) | | | 483 | | | | 40 | | |
Intuitive Surgical, Inc. (a) | | | 1,235 | | | | 1,040 | | |
IQVIA Holdings, Inc. (a) | | | 1,890 | | | | 454 | | |
Johnson & Johnson (c) | | | 24,692 | | | | 4,179 | | |
Laboratory Corp. of America Holdings (a) | | | 1,063 | | | | 292 | | |
McKesson Corp. | | | 1,670 | | | | 321 | | |
Medtronic PLC | | | 11,850 | | | | 1,500 | | |
Merck & Co., Inc. | | | 23,177 | | | | 1,759 | | |
Mettler-Toledo International, Inc. (a) | | | 250 | | | | 325 | | |
PerkinElmer, Inc. | | | 1,164 | | | | 169 | | |
Perrigo Co. PLC | | | 1,550 | | | | 72 | | |
Pfizer, Inc. | | | 48,701 | | | | 1,886 | | |
Quest Diagnostics, Inc. | | | 1,226 | | | | 161 | | |
Regeneron Pharmaceuticals, Inc. (a) | | | 873 | | | | 439 | | |
ResMed, Inc. | | | 1,423 | | | | 293 | | |
STERIS PLC | | | 864 | | | | 165 | | |
Stryker Corp. | | | 3,361 | | | | 858 | | |
Teleflex, Inc. | | | 536 | | | | 216 | | |
The Cooper Cos., Inc. | | | 445 | | | | 175 | | |
Thermo Fisher Scientific, Inc. | | | 4,163 | | | | 1,955 | | |
UnitedHealth Group, Inc. | | | 10,015 | | | | 4,125 | | |
Universal Health Services, Inc. Class B | | | 844 | | | | 135 | | |
Vertex Pharmaceuticals, Inc. (a) | | | 2,828 | | | | 590 | | |
Viatris, Inc. | | | 6,265 | | | | 96 | | |
Waters Corp. (a) | | | 690 | | | | 222 | | |
West Pharmaceutical Services, Inc. | | | 489 | | | | 170 | | |
Zimmer Biomet Holdings, Inc. | | | 1,629 | | | | 274 | | |
Zoetis, Inc. | | | 4,796 | | | | 847 | | |
| | | | 45,743 | | |
Industrials (4.3%): | |
3M Co. | | | 6,795 | | | | 1,380 | | |
Alaska Air Group, Inc. (a) | | | 1,550 | | | | 107 | | |
Allegion PLC | | | 880 | | | | 124 | | |
American Airlines Group, Inc. (a) | | | 6,217 | | | | 151 | | |
AMETEK, Inc. | | | 2,905 | | | | 392 | | |
AO Smith Corp. | | | 1,795 | | | | 128 | | |
C.H. Robinson Worldwide, Inc. | | | 779 | | | | 76 | | |
Carrier Global Corp. | | | 7,990 | | | | 367 | | |
Caterpillar, Inc. | | | 6,025 | | | | 1,452 | | |
Cintas Corp. | | | 1,066 | | | | 377 | | |
Copart, Inc. (a) | | | 2,286 | | | | 295 | | |
CSX Corp. | | | 8,013 | | | | 802 | | |
Cummins, Inc. | | | 1,364 | | | | 351 | | |
Deere & Co. | | | 3,919 | | | | 1,415 | | |
Delta Air Lines, Inc. (a) | | | 7,217 | | | | 344 | | |
Dover Corp. | | | 1,435 | | | | 216 | | |
Eaton Corp. PLC | | | 4,316 | | | | 627 | | |
See notes to financial statements.
14
USAA Mutual Funds Trust
USAA Growth and Tax Strategy Fund | | Schedule of Portfolio Investments — continued
May 31, 2021 | |
(Amounts in Thousands, Except for Shares)
Security Description | | Shares | | Value | |
Emerson Electric Co. | | | 5,920 | | | $ | 566 | | |
Equifax, Inc. | | | 1,334 | | | | 313 | | |
Expeditors International of Washington, Inc. | | | 1,610 | | | | 202 | | |
Fastenal Co. | | | 5,972 | | | | 317 | | |
FedEx Corp. | | | 2,126 | | | | 669 | | |
Fortive Corp. | | | 2,506 | | | | 182 | | |
Fortune Brands Home & Security, Inc. | | | 1,743 | | | | 180 | | |
General Dynamics Corp. | | | 1,726 | | | | 328 | | |
General Electric Co. | | | 94,576 | | | | 1,330 | | |
Honeywell International, Inc. | | | 7,574 | | | | 1,749 | | |
Howmet Aerospace, Inc. (a) | | | 3,713 | | | | 132 | | |
Huntington Ingalls Industries, Inc. | | | 470 | | | | 102 | | |
IDEX Corp. | | | 757 | | | | 169 | | |
IHS Markit Ltd. | | | 3,349 | | | | 353 | | |
Illinois Tool Works, Inc. | | | 3,048 | | | | 706 | | |
Ingersoll Rand, Inc. (a) (c) | | | 4,166 | | | | 207 | | |
J.B. Hunt Transport Services, Inc. | | | 757 | | | | 130 | | |
Jacobs Engineering Group, Inc. | | | 1,348 | | | | 191 | | |
Johnson Controls International PLC | | | 6,676 | | | | 444 | | |
Kansas City Southern | | | 960 | | | | 286 | | |
L3Harris Technologies, Inc. | | | 2,683 | | | | 585 | | |
Lockheed Martin Corp. | | | 2,228 | | | | 851 | | |
Masco Corp. | | | 2,915 | | | | 176 | | |
Nielsen Holdings PLC | | | 4,460 | | | | 121 | | |
Norfolk Southern Corp. | | | 2,671 | | | | 750 | | |
Northrop Grumman Corp. | | | 1,594 | | | | 583 | | |
Old Dominion Freight Line, Inc. | | | 1,111 | | | | 295 | | |
Otis Worldwide Corp. | | | 3,056 | | | | 239 | | |
PACCAR, Inc. | | | 3,278 | | | | 300 | | |
Parker-Hannifin Corp. | | | 1,216 | | | | 375 | | |
Pentair PLC | | | 909 | | | | 63 | | |
Quanta Services, Inc. | | | 1,444 | | | | 138 | | |
Raytheon Technologies Corp. | | | 14,809 | | | | 1,314 | | |
Republic Services, Inc. (c) | | | 2,086 | | | | 228 | | |
Robert Half International, Inc. | | | 1,284 | | | | 114 | | |
Rockwell Automation, Inc. | | | 1,436 | | | | 379 | | |
Roper Technologies, Inc. | | | 1,322 | | | | 595 | | |
Snap-on, Inc. | | | 594 | | | | 151 | | |
Southwest Airlines Co. (a) | | | 6,366 | | | | 391 | | |
Stanley Black & Decker, Inc. | | | 1,786 | | | | 387 | | |
Teledyne Technologies, Inc. (a) | | | 398 | | | | 167 | | |
Textron, Inc. | | | 2,070 | | | | 142 | | |
The Boeing Co. (a) | | | 5,520 | | | | 1,363 | | |
Trane Technologies PLC | | | 2,877 | | | | 536 | | |
TransDigm Group, Inc. (a) | | | 593 | | | | 385 | | |
Union Pacific Corp. | | | 7,288 | | | | 1,638 | | |
United Airlines Holdings, Inc. (a) | | | 3,124 | | | | 182 | | |
United Parcel Service, Inc. Class B | | | 7,664 | | | | 1,645 | | |
United Rentals, Inc. (a) | | | 750 | | | | 250 | | |
Verisk Analytics, Inc. | | | 1,450 | | | | 251 | | |
See notes to financial statements.
15
USAA Mutual Funds Trust
USAA Growth and Tax Strategy Fund | | Schedule of Portfolio Investments — continued
May 31, 2021 | |
(Amounts in Thousands, Except for Shares)
Security Description | | Shares | | Value | |
W.W. Grainger, Inc. | | | 582 | | | $ | 269 | | |
Waste Management, Inc. | | | 3,869 | | | | 544 | | |
Westinghouse Air Brake Technologies Corp. | | | 1,745 | | | | 144 | | |
Xylem, Inc. | | | 1,548 | | | | 183 | | |
| | | | 32,894 | | |
Information Technology (12.4%): | |
Accenture PLC Class A | | | 6,903 | | | | 1,948 | | |
Adobe, Inc. (a) | | | 4,939 | | | | 2,492 | | |
Advanced Micro Devices, Inc. (a) | | | 12,513 | | | | 1,002 | | |
Akamai Technologies, Inc. (a) | | | 1,627 | | | | 186 | | |
Amphenol Corp. Class A | | | 5,984 | | | | 402 | | |
Analog Devices, Inc. | | | 3,989 | | | | 657 | | |
ANSYS, Inc. (a) | | | 796 | | | | 269 | | |
Apple, Inc. | | | 166,329 | | | | 20,726 | | |
Applied Materials, Inc. | | | 10,258 | | | | 1,417 | | |
Arista Networks, Inc. (a) | | | 591 | | | | 201 | | |
Autodesk, Inc. (a) | | | 2,385 | | | | 682 | | |
Automatic Data Processing, Inc. | | | 4,190 | | | | 821 | | |
Broadcom, Inc. | | | 4,130 | | | | 1,951 | | |
Broadridge Financial Solutions, Inc. | | | 1,502 | | | | 240 | | |
Cadence Design Systems, Inc. (a) | | | 2,583 | | | | 328 | | |
CDW Corp. | | | 1,428 | | | | 236 | | |
Cisco Systems, Inc. | | | 44,288 | | | | 2,343 | | |
Citrix Systems, Inc. | | | 1,327 | | | | 153 | | |
Cognizant Technology Solutions Corp. Class A | | | 5,181 | | | | 371 | | |
Corning, Inc. | | | 8,056 | | | | 351 | | |
DXC Technology Co. (a) | | | 3,194 | | | | 121 | | |
F5 Networks, Inc. (a) | | | 561 | | | | 104 | | |
Fidelity National Information Services, Inc. | | | 4,079 | | | | 608 | | |
Fiserv, Inc. (a) | | | 6,030 | | | | 695 | | |
FleetCor Technologies, Inc. (a) | | | 223 | | | | 61 | | |
Fortinet, Inc. (a) | | | 1,459 | | | | 319 | | |
Gartner, Inc. (a) | | | 1,089 | | | | 252 | | |
Global Payments, Inc. | | | 3,409 | | | | 660 | | |
Hewlett Packard Enterprise Co. | | | 12,525 | | | | 200 | | |
HP, Inc. | | | 13,953 | | | | 408 | | |
Intel Corp. | | | 42,806 | | | | 2,445 | | |
International Business Machines Corp. | | | 6,781 | | | | 975 | | |
Intuit, Inc. | | | 2,547 | | | | 1,118 | | |
IPG Photonics Corp. (a) | | | 466 | | | | 98 | | |
Juniper Networks, Inc. | | | 2,447 | | | | 64 | | |
Keysight Technologies, Inc. (a) | | | 2,383 | | | | 339 | | |
KLA Corp. | | | 1,555 | | | | 493 | | |
Lam Research Corp. | | | 1,595 | | | | 1,036 | | |
Mastercard, Inc. Class A | | | 9,019 | | | | 3,252 | | |
Maxim Integrated Products, Inc. | | | 2,767 | | | | 282 | | |
Microchip Technology, Inc. | | | 2,724 | | | | 428 | | |
Micron Technology, Inc. (a) | | | 10,918 | | | | 919 | | |
Microsoft Corp. (c) | | | 77,209 | | | | 19,278 | | |
Motorola Solutions, Inc. | | | 1,485 | | | | 305 | | |
See notes to financial statements.
16
USAA Mutual Funds Trust
USAA Growth and Tax Strategy Fund | | Schedule of Portfolio Investments — continued
May 31, 2021 | |
(Amounts in Thousands, Except for Shares)
Security Description | | Shares | | Value | |
NetApp, Inc. | | | 2,488 | | | $ | 192 | | |
NortonLifeLock, Inc. | | | 2,608 | | | | 72 | | |
NVIDIA Corp. | | | 6,493 | | | | 4,219 | | |
Oracle Corp. | | | 21,349 | | | | 1,681 | | |
Paychex, Inc. | | | 2,957 | | | | 299 | | |
Paycom Software, Inc. (a) | | | 617 | | | | 203 | | |
PayPal Holdings, Inc. (a) | | | 12,173 | | | | 3,165 | | |
Qorvo, Inc. (a) | | | 1,188 | | | | 217 | | |
QUALCOMM, Inc. | | | 12,125 | | | | 1,631 | | |
salesforce.com, Inc. (a) | | | 9,408 | | | | 2,240 | | |
Seagate Technology Holdings PLC | | | 2,345 | | | | 225 | | |
ServiceNow, Inc. (a) (c) | | | 2,007 | | | | 951 | | |
Skyworks Solutions, Inc. | | | 1,128 | | | | 192 | | |
Synopsys, Inc. (a) | | | 1,398 | | | | 356 | | |
TE Connectivity Ltd. | | | 3,470 | | | | 471 | | |
Teradyne, Inc. | | | 945 | | | | 125 | | |
Texas Instruments, Inc. | | | 8,950 | | | | 1,699 | | |
The Western Union Co. | | | 3,004 | | | | 73 | | |
VeriSign, Inc. (a) | | | 1,007 | | | | 221 | | |
Visa, Inc. Class A | | | 16,996 | | | | 3,863 | | |
Western Digital Corp. (a) | | | 3,265 | | | | 246 | | |
Xerox Holdings Corp. | | | 1 | | | | — | (d) | |
Xilinx, Inc. | | | 2,527 | | | | 321 | | |
Zebra Technologies Corp. (a) | | | 706 | | | | 351 | | |
| | | | 94,249 | | |
Materials (1.4%): | |
Air Products & Chemicals, Inc. | | | 2,193 | | | | 657 | | |
Albemarle Corp. | | | 1,201 | | | | 201 | | |
Amcor PLC | | | 17,474 | | | | 206 | | |
Avery Dennison Corp. | | | 906 | | | | 200 | | |
Ball Corp. | | | 3,726 | | | | 306 | | |
Celanese Corp. | | | 1,286 | | | | 213 | | |
CF Industries Holdings, Inc. | | | 2,763 | | | | 147 | | |
Corteva, Inc. | | | 8,159 | | | | 371 | | |
Dow, Inc. | | | 9,091 | | | | 622 | | |
DuPont de Nemours, Inc. | | | 6,803 | | | | 576 | | |
Eastman Chemical Co. | | | 1,432 | | | | 180 | | |
Ecolab, Inc. | | | 2,743 | | | | 590 | | |
FMC Corp. | | | 1,425 | | | | 166 | | |
Freeport-McMoRan, Inc. | | | 15,889 | | | | 679 | | |
International Flavors & Fragrances, Inc. | | | 2,366 | | | | 335 | | |
International Paper Co. | | | 4,916 | | | | 310 | | |
Linde PLC | | | 5,503 | | | | 1,654 | | |
LyondellBasell Industries NV Class A | | | 2,696 | | | | 304 | | |
Martin Marietta Materials, Inc. | | | 721 | | | | 262 | | |
Newmont Corp. | | | 9,032 | | | | 664 | | |
Nucor Corp. | | | 2,642 | | | | 271 | | |
Packaging Corp. of America | | | 736 | | | | 109 | | |
PPG Industries, Inc. | | | 2,183 | | | | 392 | | |
Sealed Air Corp. | | | 1,340 | | | | 76 | | |
See notes to financial statements.
17
USAA Mutual Funds Trust
USAA Growth and Tax Strategy Fund | | Schedule of Portfolio Investments — continued
May 31, 2021 | |
(Amounts in Thousands, Except for Shares)
Security Description | | Shares | | Value | |
The Mosaic Co. | | | 4,580 | | | $ | 166 | | |
The Sherwin-Williams Co. | | | 2,769 | | | | 785 | | |
Vulcan Materials Co. | | | 1,213 | | | | 222 | | |
Westrock Co. | | | 2,863 | | | | 167 | | |
| | | | 10,831 | | |
Real Estate (1.2%): | |
Alexandria Real Estate Equities, Inc. | | | 1,101 | | | | 196 | | |
American Tower Corp. | | | 4,297 | | | | 1,098 | | |
AvalonBay Communities, Inc. | | | 740 | | | | 153 | | |
Boston Properties, Inc. | | | 1,758 | | | | 207 | | |
CBRE Group, Inc. Class A (a) | | | 3,167 | | | | 278 | | |
Crown Castle International Corp. | | | 5,001 | | | | 948 | | |
Digital Realty Trust, Inc. | | | 2,408 | | | | 365 | | |
Duke Realty Corp. | | | 4,814 | | | | 224 | | |
Equinix, Inc. | | | 1,002 | | | | 738 | | |
Equity Residential | | | 2,215 | | | | 171 | | |
Essex Property Trust, Inc. | | | 290 | | | | 86 | | |
Extra Space Storage, Inc. | | | 1,147 | | | | 172 | | |
Federal Realty Investment Trust | | | 884 | | | | 101 | | |
Healthpeak Properties, Inc. | | | 4,797 | | | | 160 | | |
Host Hotels & Resorts, Inc. (a) | | | 8,818 | | | | 151 | | |
Iron Mountain, Inc. | | | 3,600 | | | | 157 | | |
Kimco Realty Corp. | | | 5,368 | | | | 114 | | |
Mid-America Apartment Communities, Inc. | | | 1,273 | | | | 205 | | |
Prologis, Inc. | | | 7,489 | | | | 882 | | |
Public Storage | | | 1,221 | | | | 345 | | |
Realty Income Corp. | | | 3,322 | | | | 227 | | |
Regency Centers Corp. | | | 1,923 | | | | 124 | | |
SBA Communications Corp. | | | 1,109 | | | | 331 | | |
Simon Property Group, Inc. | | | 3,796 | | | | 488 | | |
UDR, Inc. | | | 3,662 | | | | 174 | | |
Ventas, Inc. | | | 4,666 | | | | 259 | | |
Vornado Realty Trust | | | 1,244 | | | | 59 | | |
Welltower, Inc. | | | 4,568 | | | | 341 | | |
Weyerhaeuser Co. | | | 6,892 | | | | 262 | | |
| | | | 9,016 | | |
Utilities (1.2%): | |
Alliant Energy Corp. | | | 3,054 | | | | 175 | | |
Ameren Corp. | | | 2,468 | | | | 208 | | |
American Electric Power Co., Inc. (c) | | | 4,277 | | | | 368 | | |
American Water Works Co., Inc. | | | 2,297 | | | | 356 | | |
CenterPoint Energy, Inc. | | | 6,318 | | | | 160 | | |
CMS Energy Corp. | | | 3,607 | | | | 226 | | |
Consolidated Edison, Inc. (c) | | | 1,808 | | | | 140 | | |
Dominion Energy, Inc. | | | 4,760 | | | | 362 | | |
DTE Energy Co. | | | 2,162 | | | | 298 | | |
Duke Energy Corp. (c) | | | 6,693 | | | | 671 | | |
Edison International | | | 4,086 | | | | 228 | | |
Entergy Corp. | | | 2,505 | | | | 264 | | |
See notes to financial statements.
18
USAA Mutual Funds Trust
USAA Growth and Tax Strategy Fund | | Schedule of Portfolio Investments — continued
May 31, 2021 | |
(Amounts in Thousands, Except for Shares)
Security Description | | Shares or
Principal
Amount | | Value | |
Evergy, Inc. (c) | | | 2,714 | | | $ | 168 | | |
Eversource Energy (c) | | | 3,443 | | | | 280 | | |
Exelon Corp. | | | 10,726 | | | | 484 | | |
FirstEnergy Corp. | | | 5,729 | | | | 217 | | |
NextEra Energy, Inc. (c) | | | 21,138 | | | | 1,548 | | |
NiSource, Inc. | | | 4,671 | | | | 119 | | |
NRG Energy, Inc. | | | 2,789 | | | | 90 | | |
PPL Corp. | | | 8,145 | | | | 237 | | |
Public Service Enterprise Group, Inc. | | | 6,188 | | | | 384 | | |
Sempra Energy | | | 2,344 | | | | 318 | | |
The AES Corp. | | | 6,122 | | | | 156 | | |
The Southern Co. (c) | | | 9,551 | | | | 610 | | |
WEC Energy Group, Inc. (c) | | | 4,007 | | | | 376 | | |
Xcel Energy, Inc. (c) | | | 6,662 | | | | 472 | | |
| | | | 8,915 | | |
Total Common Stocks (Cost $112,852) | | | 360,429 | | |
Municipal Bonds (52.5%) | |
Alabama (0.7%): | |
Columbia Industrial Development Board Revenue, Series C, 0.04%, 12/1/37,
Continuously Callable @100 (f) | | $ | 4,000 | | | | 4,000 | | |
Columbia Industrial Development Board Revenue (NBGA — Southern Co.),
Series A, 0.04%, 12/1/37, Continuously Callable @100 (f) | | | 100 | | | | 100 | | |
The Lower Alabama Gas District Revenue, Series A, 5.00%, 9/1/46 | | | 1,000 | | | | 1,518 | | |
| | | | 5,618 | | |
Arizona (1.4%): | |
Arizona IDA Revenue
4.00%, 7/1/41 (g) | | | 400 | | | | 462 | | |
5.00%, 7/1/47, Continuously Callable @100 | | | 1,000 | | | | 1,167 | | |
4.00%, 7/1/52 (g) | | | 840 | | | | 953 | | |
City of Phoenix IDA Revenue, 5.00%, 7/1/46, Continuously Callable @100 | | | 1,300 | | | | 1,463 | | |
La Paz County IDA Revenue
4.00%, 2/15/41, Continuously Callable @100 | | | 425 | | | | 476 | | |
4.00%, 2/15/46, Continuously Callable @100 | | | 345 | | | | 383 | | |
4.00%, 2/15/51, Continuously Callable @100 | | | 300 | | | | 332 | | |
Maricopa County IDA Revenue
Series A, 5.00%, 9/1/42, Continuously Callable @100 | | | 500 | | | | 625 | | |
Series A, 5.00%, 7/1/49, Continuously Callable @100 | | | 1,000 | | | | 1,176 | | |
Series A, 5.00%, 7/1/54, Continuously Callable @100 | | | 1,275 | | | | 1,498 | | |
Pima County IDA Revenue, 5.00%, 6/15/47, Continuously Callable @100 (h) | | | 1,000 | | | | 1,022 | | |
Student & Academic Services LLC Revenue, 5.00%, 6/1/44, Continuously
Callable @100 | | | 1,000 | | | | 1,120 | | |
| | | | 10,677 | | |
Arkansas (0.1%): | |
Arkansas Development Finance Authority Revenue, 4.00%, 12/1/44,
Continuously Callable @100 | | | 1,000 | | | | 1,109 | | |
See notes to financial statements.
19
USAA Mutual Funds Trust
USAA Growth and Tax Strategy Fund | | Schedule of Portfolio Investments — continued
May 31, 2021 | |
(Amounts in Thousands, Except for Shares)
Security Description | | Principal
Amount | | Value | |
California (2.7%): | |
California Statewide Communities Development Authority Revenue
(INS — Assured Guaranty Municipal Corp.), 5.00%, 11/15/49,
Pre-refunded 11/15/24 @100 | | $ | 1,000 | | | $ | 1,162 | | |
City & County of San Francisco Revenue (LIQ — Deutsche Bank A.G.),
Series DBE-8059, 0.55%, 12/1/52, Callable 12/1/21 @100 (f) (h) | | | 6,000 | | | | 6,000 | | |
Jurupa Public Financing Authority Special Tax, Series A, 5.00%, 9/1/42,
Continuously Callable @100 | | | 1,200 | | | | 1,362 | | |
Monterey Peninsula Unified School District, GO (INS — Assured Guaranty
Municipal Corp.), Series A, 5.50%, 8/1/34, Pre-refunded 8/1/21 @100 | | | 2,000 | | | | 2,018 | | |
Sacramento City Financing Authority Revenue (LIQ — Deutsche Bank A.G.),
Series XG0100, 0.12%, 12/1/33 (f) (h) | | | 600 | | | | 600 | | |
State of California, GO
5.00%, 2/1/43, Continuously Callable @100 | | | 1,000 | | | | 1,075 | | |
5.00%, 8/1/45, Continuously Callable @100 | | | 1,000 | | | | 1,161 | | |
Sutter Butte Flood Agency Special Assessment (INS — Build America Mutual
Assurance Co.), 5.00%, 10/1/40, Continuously Callable @100 | | | 1,000 | | | | 1,171 | | |
Twin Rivers Unified School District, GO (INS — Build America Mutual
Assurance Co.), Series A, 5.00%, 8/1/40, Pre-refunded 2/1/24 @100 | | | 1,500 | | | | 1,690 | | |
Val Verde Unified School District, GO (INS — Build America Mutual
Assurance Co.), Series B, 5.00%, 8/1/44, Continuously Callable @100 | | | 1,000 | | | | 1,166 | | |
West Contra Costa Unified School District, GO (INS — National Public
Finance Guarantee Corp.), 8/1/34 (i) | | | 4,435 | | | | 3,440 | | |
| | | | 20,845 | | |
Colorado (1.7%): | |
Colorado Educational & Cultural Facilities Authority Revenue
5.00%, 12/1/38, Continuously Callable @100 | | | 1,000 | | | | 1,212 | | |
5.00%, 4/1/48, Continuously Callable @100 | | | 710 | | | | 852 | | |
Colorado Health Facilities Authority Revenue
5.00%, 12/1/42, Pre-refunded 6/1/22 @100 | | | 1,000 | | | | 1,049 | | |
5.00%, 6/1/45, Pre-refunded 6/1/25 @100 | | | 1,000 | | | | 1,181 | | |
4.00%, 12/1/50, Continuously Callable @103 | | | 1,000 | | | | 1,139 | | |
Series A, 4.00%, 9/1/50, Continuously Callable @100 | | | 1,000 | | | | 1,141 | | |
Denver Convention Center Hotel Authority Revenue, 5.00%, 12/1/40,
Continuously Callable @100 | | | 1,000 | | | | 1,152 | | |
Denver Health & Hospital Authority Certificate of Participation, 5.00%, 12/1/48,
Continuously Callable @100 | | | 1,900 | | | | 2,214 | | |
Park Creek Metropolitan District Revenue
5.00%, 12/1/41, Continuously Callable @100 | | | 250 | | | | 289 | | |
5.00%, 12/1/45, Continuously Callable @100 | | | 1,000 | | | | 1,150 | | |
Rampart Range Metropolitan District No. 1 Revenue (INS — Assured
Guaranty Municipal Corp.), 5.00%, 12/1/47, Continuously Callable @100 | | | 1,000 | | | | 1,208 | | |
| | | | 12,587 | | |
Connecticut (0.7%): | |
Connecticut State Health & Educational Facilities Authority Revenue, Series T,
4.00%, 7/1/55, Continuously Callable @100 | | | 1,000 | | | | 1,165 | | |
Mashantucket Western Pequot Tribe Revenue, 6.05%, 7/1/31 (j) | | | 4,889 | | | | 733 | | |
See notes to financial statements.
20
USAA Mutual Funds Trust
USAA Growth and Tax Strategy Fund | | Schedule of Portfolio Investments — continued
May 31, 2021 | |
(Amounts in Thousands, Except for Shares)
Security Description | | Principal
Amount | | Value | |
State of Connecticut, GO
Series A, 5.00%, 4/15/36, Continuously Callable @100 | | $ | 1,500 | | | $ | 1,898 | | |
Series A, 5.00%, 4/15/37, Continuously Callable @100 | | | 1,000 | | | | 1,239 | | |
| | | | 5,035 | | |
District of Columbia (0.1%): | |
District of Columbia Revenue, 5.00%, 7/1/42, Pre-refunded 7/1/22 @100 | | | 1,100 | | | | 1,158 | | |
Florida (3.3%): | |
Capital Trust Agency, Inc. Revenue
5.00%, 8/1/40, Continuously Callable @100 | | | 300 | | | | 355 | | |
5.00%, 8/1/55, Continuously Callable @100 | | | 400 | | | | 471 | | |
City of Atlantic Beach Revenue, Series A, 5.00%, 11/15/53, Continuously
Callable @103 | | | 1,000 | | | | 1,131 | | |
City of Jacksonville Revenue, 5.00%, 10/1/29, Continuously Callable @100 | | | 1,000 | | | | 1,063 | | |
City of Pompano Beach Revenue, 4.00%, 9/1/50, Continuously Callable @103 | | | 1,500 | | | | 1,608 | | |
County of Escambia Revenue, 0.05%, 7/1/22 (c) (f) | | | 1,700 | | | | 1,700 | | |
County of Miami-Dade Florida Water & Sewer System Revenue, 4.00%, 10/1/51,
Continuously Callable @100 | | | 1,500 | | | | 1,784 | | |
County of Polk Florida Utility System Revenue, 4.00%, 10/1/43, Continuously
Callable @100 | | | 2,000 | | | | 2,401 | | |
County of St Lucie Revenue, 0.04%, 9/1/28, Continuously Callable @100 (f) | | | 6,000 | | | | 6,000 | | |
Halifax Hospital Medical Center Revenue, 5.00%, 6/1/46, Continuously
Callable @100 | | | 1,000 | | | | 1,150 | | |
Lee County IDA Revenue, 5.50%, 10/1/47, Pre-refunded 10/1/22 @102 | | | 645 | | | | 703 | | |
Lee Memorial Health System Revenue, Series A-1, 5.00%, 4/1/44, Continuously
Callable @100 | | | 1,450 | | | | 1,796 | | |
Sarasota County Health Facilities Authority Revenue, 5.00%, 5/15/38,
Continuously Callable @103 | | | 700 | | | | 797 | | |
Southeast Overtown Park West Community Redevelopment Agency Tax
Allocation, Series A-1, 5.00%, 3/1/30, Continuously Callable @100 (h) | | | 1,000 | | | | 1,105 | | |
Tampa-Hillsborough County Expressway Authority Revenue, Series A, 5.00%,
7/1/37, Pre-refunded 7/1/22 @100 | | | 1,505 | | | | 1,583 | | |
Volusia County Educational Facility Authority Revenue, Series B, 5.00%,
10/15/45, Pre-refunded 4/15/25 @100 | | | 1,000 | | | | 1,175 | | |
| | | | 24,822 | | |
Georgia (3.0%): | |
Appling County Development Authority Revenue
0.07%, 9/1/29, Continuously Callable @100 (f) | | | 800 | | | | 800 | | |
0.07%, 9/1/41, Continuously Callable @100 (f) | | | 2,400 | | | | 2,400 | | |
Development Authority of Heard County Revenue, 0.10%, 9/1/26,
Continuously Callable @100 (f) | | | 1,600 | | | | 1,600 | | |
Gainesville & Hall County Hospital Authority Revenue, 4.00%, 2/15/45,
Continuously Callable @100 | | | 2,000 | | | | 2,325 | | |
Glynn-Brunswick Memorial Hospital Authority Revenue, 5.00%, 8/1/47,
Continuously Callable @100 | | | 1,000 | | | | 1,163 | | |
Milledgeville & Baldwin County Development Authority Revenue, 4.00%,
6/15/37, Continuously Callable @100 | | | 1,300 | | | | 1,575 | | |
Private Colleges & Universities Authority Revenue, 4.00%, 6/1/45, Continuously
Callable @100 | | | 750 | | | | 853 | | |
See notes to financial statements.
21
USAA Mutual Funds Trust
USAA Growth and Tax Strategy Fund | | Schedule of Portfolio Investments — continued
May 31, 2021 | |
(Amounts in Thousands, Except for Shares)
Security Description | | Principal
Amount | | Value | |
The Burke County Development Authority Revenue, Series 1, 0.06%, 7/1/49,
Continuously Callable @100 (f) | | $ | 1,000 | | | $ | 1,000 | | |
The Burke County Development Authority Revenue (NBGA — Southern Co.),
0.05%, 11/1/52, Continuously Callable @100 (f) | | | 2,000 | | | | 2,000 | | |
The Development Authority of Monroe County Revenue, 0.07%, 11/1/48,
Continuously Callable @100 (f) | | | 5,300 | | | | 5,300 | | |
Valdosta Housing Authority Revenue (LIQ — Deutsche Bank A.G.),
Series 2020-XF1089, 0.35%, 4/1/60, Callable 4/1/35 @100 (f) (h) | | | 3,900 | | | | 3,900 | | |
| | | | 22,916 | | |
Guam (0.3%): | |
Antonio B Won Pat International Airport Authority Revenue (INS — Assured
Guaranty Municipal Corp.), 5.50%, 10/1/33, Continuously Callable @100 | | | 750 | | | | 831 | | |
Guam Government Waterworks Authority Revenue, 5.50%, 7/1/43,
Pre-refunded 7/1/23 @100 | | | 1,000 | | | | 1,111 | | |
| | | | 1,942 | | |
Illinois (4.7%): | |
Bureau County Township High School District No. 502, GO (INS — Build
America Mutual Assurance Co.), Series A, 5.00%, 12/1/37, Continuously
Callable @100 | | | 1,000 | | | | 1,210 | | |
Chicago Board of Education, GO (LIQ — Deutsche Bank A.G.),
Series 2017-XM0188, 0.18%, 12/1/39, Callable 12/1/21 @100 (f) (h) | | | 1,000 | | | | 1,000 | | |
Chicago Midway International Airport Revenue, Series B, 5.00%, 1/1/41,
Continuously Callable @100 | | | 1,000 | | | | 1,180 | | |
Chicago O'Hare International Airport Revenue, Series C, 5.00%, 1/1/41,
Continuously Callable @100 | | | 1,000 | | | | 1,213 | | |
Chicago O'Hare International Airport Revenue (INS — Assured Guaranty
Municipal Corp.), 5.25%, 1/1/33, Continuously Callable @100 | | | 1,000 | | | | 1,071 | | |
Chicago Park District, GO, Series C, 4.00%, 1/1/42, Continuously Callable @100 | | | 1,250 | | | | 1,433 | | |
Chicago Transit Authority Sales Tax Receipts Fund Revenue, Series A, 4.00%,
12/1/55, Continuously Callable @100 | | | 2,000 | | | | 2,279 | | |
City of Chicago Wastewater Transmission Revenue
5.00%, 1/1/44, Continuously Callable @100 | | | 1,000 | | | | 1,107 | | |
Series A, 5.00%, 1/1/47, Continuously Callable @100 | | | 1,000 | | | | 1,197 | | |
City of Chicago Waterworks Revenue, 5.00%, 11/1/44, Continuously
Callable @100 | | | 1,000 | | | | 1,118 | | |
Cook County Community College District No. 508, GO (INS — Build America
Mutual Assurance Co.), 5.00%, 12/1/47, Continuously Callable @100 | | | 1,000 | | | | 1,170 | | |
County of Cook Sales Tax Revenue, 5.00%, 11/15/38, Continuously
Callable @100 | | | 1,000 | | | | 1,225 | | |
Illinois Educational Facilities Authority Revenue, 4.00%, 11/1/36, Continuously
Callable @102 | | | 1,000 | | | | 1,157 | | |
Illinois Finance Authority Revenue
3.90%, 3/1/30, Continuously Callable @100 | | | 1,000 | | | | 1,103 | | |
5.00%, 5/15/37, Continuously Callable @100 | | | 1,000 | | | | 1,134 | | |
5.00%, 5/15/40, Continuously Callable @100 | | | 1,275 | | | | 1,425 | | |
5.00%, 8/15/44, Continuously Callable @100 | | | 1,000 | | | | 1,120 | | |
See notes to financial statements.
22
USAA Mutual Funds Trust
USAA Growth and Tax Strategy Fund | | Schedule of Portfolio Investments — continued
May 31, 2021 | |
(Amounts in Thousands, Except for Shares)
Security Description | | Principal
Amount | | Value | |
5.00%, 10/1/44, Continuously Callable @100 | | $ | 1,000 | | | $ | 1,238 | | |
5.00%, 5/15/45, Continuously Callable @100 | | | 1,000 | | | | 1,112 | | |
Series A, 4.00%, 10/1/40, Continuously Callable @100 | | | 1,000 | | | | 1,130 | | |
Series C, 4.00%, 2/15/41, Pre-refunded 2/15/27 @100 | | | 45 | | | | 53 | | |
Series C, 4.00%, 2/15/41, Continuously Callable @100 | | | 955 | | | | 1,068 | | |
Northern Illinois Municipal Power Agency Revenue, Series A, 4.00%, 12/1/41,
Continuously Callable @100 | | | 1,000 | | | | 1,124 | | |
Northern Illinois University Revenue
4.00%, 10/1/37, Continuously Callable @100 (g) | | | 550 | | | | 648 | | |
4.00%, 10/1/39, Continuously Callable @100 (g) | | | 425 | | | | 499 | | |
Northern Illinois University Revenue (INS — Build America Mutual
Assurance Co.), Series B, 4.00%, 4/1/40, Continuously Callable @100 | | | 600 | | | | 689 | | |
Sangamon County Water Reclamation District, GO
Series A, 4.00%, 1/1/49, Continuously Callable @100 | | | 1,000 | | | | 1,124 | | |
Series A, 5.75%, 1/1/53, Continuously Callable @100 | | | 1,235 | | | | 1,474 | | |
State of Illinois, GO
5.50%, 5/1/39, Continuously Callable @100 | | | 225 | | | | 289 | | |
Series A, 5.00%, 3/1/46, Continuously Callable @100 | | | 1,000 | | | | 1,245 | | |
Series B, 4.00%, 10/1/32, Continuously Callable @100 | | | 2,300 | | | | 2,700 | | |
| | | | 35,535 | | |
Indiana (0.7%): | |
Evansville Redevelopment Authority Revenue (INS — Build America Mutual
Assurance Co.), 4.00%, 2/1/39, Continuously Callable @100 | | | 1,000 | | | | 1,120 | | |
Indiana Finance Authority Revenue
5.00%, 2/1/40, Continuously Callable @100 | | | 1,000 | | | | 1,111 | | |
5.00%, 10/1/44, Pre-refunded 10/1/23 @100 | | | 1,000 | | | | 1,111 | | |
Richmond Hospital Authority Revenue, 5.00%, 1/1/39, Continuously
Callable @100 | | | 1,500 | | | | 1,719 | | |
| | | | 5,061 | | |
Iowa (0.1%): | |
Iowa Tobacco Settlement Authority Revenue, Series A-2, 4.00%, 6/1/49,
Continuously Callable @100 | | | 1,000 | | | | 1,155 | | |
Kansas (1.1%): | |
City of Coffeyville Electric System Revenue (INS — National Public Finance
Guarantee Corp.), Series B, 5.00%, 6/1/42, Pre-refunded 6/1/25 @100 (h) | | | 1,000 | | | | 1,181 | | |
City of Lawrence Revenue
5.00%, 7/1/43, Continuously Callable @100 | | | 1,500 | | | | 1,806 | | |
Series A, 4.00%, 7/1/36, Continuously Callable @100 | | | 1,500 | | | | 1,711 | | |
City of Wichita Revenue, 4.63%, 9/1/33, Continuously Callable @100 | | | 1,000 | | | | 1,013 | | |
Wyandotte County-Kansas City Unified Government Utility System Revenue
Series A, 5.00%, 9/1/44, Continuously Callable @100 | | | 1,250 | | | | 1,416 | | |
Series A, 5.00%, 9/1/45, Continuously Callable @100 | | | 1,000 | | | | 1,167 | | |
| | | | 8,294 | | |
See notes to financial statements.
23
USAA Mutual Funds Trust
USAA Growth and Tax Strategy Fund | | Schedule of Portfolio Investments — continued
May 31, 2021 | |
(Amounts in Thousands, Except for Shares)
Security Description | | Principal
Amount | | Value | |
Kentucky (0.6%): | |
City of Ashland Revenue, 5.00%, 2/1/40, Continuously Callable @100 | | $ | 1,000 | | | $ | 1,101 | | |
Kentucky Bond Development Corp. Revenue, 4.00%, 6/1/46, Continuously
Callable @100 (g) | | | 750 | | | | 883 | | |
Kentucky Economic Development Finance Authority Revenue, 5.00%, 5/15/46,
Continuously Callable @100 | | | 1,000 | | | | 1,023 | | |
Kentucky Economic Development Finance Authority Revenue (INS — Assured
Guaranty Municipal Corp.), Series A, 5.00%, 12/1/45, Continuously
Callable @100 | | | 1,000 | | | | 1,216 | | |
| | | | 4,223 | | |
Louisiana (2.4%): | |
City of Shreveport Water & Sewer Revenue
5.00%, 12/1/40, Continuously Callable @100 | | | 1,000 | | | | 1,154 | | |
Series B, 4.00%, 12/1/44, Continuously Callable @100 | | | 500 | | | | 568 | | |
City of Shreveport Water & Sewer Revenue (INS — Build America Mutual
Assurance Co.), Series C, 5.00%, 12/1/39, Continuously Callable @100 | | | 1,000 | | | | 1,144 | | |
Jefferson Sales Tax District Revenue, Series B, 4.00%, 12/1/42, Continuously
Callable @100 | | | 1,500 | | | | 1,812 | | |
Louisiana Local Government Environmental Facilities & Community
Development Authority Revenue (INS — Assured Guaranty Municipal Corp.)
5.00%, 10/1/39, Continuously Callable @100 | | | 1,000 | | | | 1,204 | | |
5.00%, 10/1/43, Continuously Callable @100 | | | 1,000 | | | | 1,167 | | |
4.00%, 10/1/46, Continuously Callable @100 | | | 1,000 | | | | 1,083 | | |
Louisiana Public Facilities Authority Revenue
5.00%, 11/1/45, Pre-refunded 11/1/25 @100 | | | 1,000 | | | | 1,198 | | |
5.00%, 7/1/52, Continuously Callable @100 | | | 1,000 | | | | 1,166 | | |
4.00%, 1/1/56, Continuously Callable @100 | | | 1,000 | | | | 1,081 | | |
Louisiana Public Facilities Authority Revenue (INS — Build America Mutual
Assurance Co.), 5.25%, 6/1/51, Continuously Callable @100 | | | 1,000 | | | | 1,148 | | |
Parish of East Baton Rouge Capital Improvements District Revenue,
4.00%, 8/1/44, Continuously Callable @100 | | | 1,400 | | | | 1,649 | | |
Parish of St. James Revenue, Series A-1, 0.13%, 11/1/40, Continuously
Callable @100 (f) | | | 1,000 | | | | 1,000 | | |
State of Louisiana Gasoline & Fuels Tax Revenue, Series C, 5.00%, 5/1/45,
Continuously Callable @100 | | | 1,500 | | | | 1,868 | | |
Tobacco Settlement Financing Corp. Revenue, Series A, 5.25%, 5/15/35,
Continuously Callable @100 | | | 1,000 | | | | 1,084 | | |
| | | | 18,326 | | |
Maine (0.3%): | |
Maine Health & Higher Educational Facilities Authority Revenue
Series A, 4.00%, 7/1/46, Continuously Callable @100 | | | 1,000 | | | | 1,062 | | |
Series A, 4.00%, 7/1/50, Continuously Callable @100 | | | 1,175 | | | | 1,377 | | |
| | | | 2,439 | | |
Maryland (0.2%): | |
Maryland Health & Higher Educational Facilities Authority Revenue,
4.00%, 7/1/45, Continuously Callable @100 | | | 1,100 | | | | 1,264 | | |
See notes to financial statements.
24
USAA Mutual Funds Trust
USAA Growth and Tax Strategy Fund | | Schedule of Portfolio Investments — continued
May 31, 2021 | |
(Amounts in Thousands, Except for Shares)
Security Description | | Principal
Amount | | Value | |
Massachusetts (1.6%): | |
Massachusetts Development Finance Agency Revenue
5.00%, 4/15/40, Continuously Callable @100 | | $ | 1,000 | | | $ | 1,078 | | |
5.25%, 11/15/41, Pre-refunded 11/15/23 @100 | | | 1,000 | | | | 1,123 | | |
5.00%, 7/1/46, Continuously Callable @100 | | | 1,000 | | | | 1,166 | | |
4.00%, 7/1/51, Continuously Callable @100 | | | 1,500 | | | | 1,751 | | |
5.00%, 10/1/57, Continuously Callable @105 (h) | | | 1,000 | | | | 1,086 | | |
Series A, 5.00%, 6/1/39, Continuously Callable @100 | | | 1,000 | | | | 1,235 | | |
Series A, 5.50%, 7/1/44, Continuously Callable @100 | | | 500 | | | | 507 | | |
Series A, 5.00%, 7/1/44, Continuously Callable @100 | | | 1,600 | | | | 1,939 | | |
Series D, 5.00%, 7/1/44, Continuously Callable @100 | | | 1,000 | | | | 1,132 | | |
Series F, 5.75%, 7/15/43, Continuously Callable @100 | | | 1,000 | | | | 1,058 | | |
| | | | 12,075 | | |
Michigan (1.4%): | |
City of Wyandotte Electric System Revenue (INS — Build America Mutual
Assurance Co.), Series A, 5.00%, 10/1/44, Continuously Callable @100 | | | 1,000 | | | | 1,135 | | |
Detroit Downtown Development Authority Tax Allocation (INS — Assured
Guaranty Municipal Corp.), 5.00%, 7/1/43, Continuously Callable @100 | | | 1,750 | | | | 1,942 | | |
Jackson Public Schools, GO (NBGA — Michigan School Bond Qualification &
Loan Program), 5.00%, 5/1/42, Continuously Callable @100 | | | 1,000 | | | | 1,235 | | |
Karegnondi Water Authority Revenue, 5.00%, 11/1/41, Continuously
Callable @100 | | | 1,000 | | | | 1,196 | | |
Lincoln Consolidated School District, GO (INS — Assured Guaranty
Municipal Corp.), Series A, 5.00%, 5/1/40, Continuously Callable @100 | | | 1,250 | | | | 1,475 | | |
Livonia Public Schools, GO (INS — Assured Guaranty Municipal Corp.),
5.00%, 5/1/45, Continuously Callable @100 | | | 1,000 | | | | 1,172 | | |
Michigan Finance Authority Revenue, 4.00%, 9/1/45, Continuously
Callable @100 | | | 1,000 | | | | 1,143 | | |
Wayne County Airport Authority Revenue, 5.00%, 12/1/44, Continuously
Callable @100 | | | 1,000 | | | | 1,146 | | |
| | | | 10,444 | | |
Minnesota (0.3%): | |
Housing & Redevelopment Authority Revenue
5.00%, 11/15/44, Pre-refunded 11/15/25 @100 | | | 1,000 | | | | 1,199 | | |
5.00%, 11/15/47, Continuously Callable @100 | | | 1,000 | | | | 1,202 | | |
| | | | 2,401 | | |
Missouri (0.9%): | |
Cape Girardeau County IDA Revenue, 4.00%, 3/1/46, Continuously
Callable @100 | | | 750 | | | | 852 | | |
Health & Educational Facilities Authority of the State of Missouri Revenue,
4.00%, 2/1/48, Continuously Callable @100 | | | 1,500 | | | | 1,635 | | |
Health & Educational Facilities Authority Revenue
5.00%, 8/1/45, Continuously Callable @100 | | | 1,270 | | | | 1,371 | | |
4.00%, 2/15/49, Continuously Callable @100 | | | 250 | | | | 284 | | |
See notes to financial statements.
25
USAA Mutual Funds Trust
USAA Growth and Tax Strategy Fund | | Schedule of Portfolio Investments — continued
May 31, 2021 | |
(Amounts in Thousands, Except for Shares)
Security Description | | Principal
Amount | | Value | |
St. Louis Municipal Finance Corp. Revenue (INS — Assured Guaranty
Municipal Corp.), 5.00%, 10/1/38, Continuously Callable @100 | | $ | 1,000 | | | $ | 1,206 | | |
St. Louis Municipal Finance Corp. Revenue (INS — Assured Guaranty
Municipal Corp.), 5.00%, 10/1/49, Continuously Callable @100 | | | 1,000 | | | | 1,249 | | |
| | | | 6,597 | | |
Nebraska (0.2%): | |
Douglas County Hospital Authority No. 3 Revenue, 5.00%, 11/1/48,
Continuously Callable @100 | | | 1,000 | | | | 1,160 | | |
Nevada (0.6%): | |
City of Carson City Revenue, 5.00%, 9/1/42, Continuously Callable @100 | | | 1,000 | | | | 1,204 | | |
Las Vegas Convention & Visitors Authority Revenue, Series C, 4.00%, 7/1/41,
Continuously Callable @100 | | | 1,555 | | | | 1,708 | | |
Las Vegas Redevelopment Agency Tax Allocation, 5.00%, 6/15/45, Continuously
Callable @100 | | | 1,500 | | | | 1,677 | | |
| | | | 4,589 | | |
New Jersey (2.7%): | |
New Jersey Economic Development Authority Revenue
5.00%, 6/15/29, Continuously Callable @100 | | | 1,000 | | | | 1,044 | | |
5.00%, 6/15/42, Continuously Callable @100 | | | 2,000 | | | | 2,366 | | |
5.00%, 6/15/43, Continuously Callable @100 | | | 1,000 | | | | 1,213 | | |
Series A, 4.00%, 7/1/34, Continuously Callable @100 | | | 1,000 | | | | 1,106 | | |
Series A, 5.00%, 6/15/47, Continuously Callable @100 | | | 1,000 | | | | 1,184 | | |
Series B, 5.00%, 6/15/43, Continuously Callable @100 | | | 1,000 | | | | 1,210 | | |
New Jersey Economic Development Authority Revenue (INS — Assured
Guaranty Municipal Corp.), 5.00%, 6/1/37, Continuously Callable @100 | | | 500 | | | | 596 | | |
New Jersey Educational Facilities Authority Revenue, Series B, 5.00%, 9/1/36,
Continuously Callable @100 | | | 1,000 | | | | 1,177 | | |
New Jersey Educational Facilities Authority Revenue (INS — Assured
Guaranty Municipal Corp.), Series C, 4.00%, 7/1/50, Continuously
Callable @100 | | | 1,000 | | | | 1,134 | | |
New Jersey Health Care Facilities Financing Authority Revenue, 5.00%, 10/1/37,
Continuously Callable @100 | | | 1,000 | | | | 1,183 | | |
New Jersey Transportation Trust Fund Authority Revenue
Series A, 5.00%, 12/15/35, Continuously Callable @100 | | | 1,000 | | | | 1,228 | | |
Series AA, 5.00%, 6/15/44, Continuously Callable @100 | | | 1,000 | | | | 1,100 | | |
Series AA, 4.00%, 6/15/50, Continuously Callable @100 | | | 1,000 | | | | 1,142 | | |
New Jersey Turnpike Authority Revenue, Series A, 4.00%, 1/1/51, Continuously
Callable @100 | | | 1,000 | | | | 1,180 | | |
South Jersey Transportation Authority LLC Revenue, Series A, 5.00%, 11/1/39,
Continuously Callable @100 | | | 1,250 | | | | 1,386 | | |
South Jersey Transportation Authority Revenue, Series A, 4.00%, 11/1/50,
Continuously Callable @100 | | | 1,000 | | | | 1,144 | | |
The Atlantic County Improvement Authority Revenue, 4.00%, 7/1/53,
Continuously Callable @100 | | | 750 | | | | 882 | | |
See notes to financial statements.
26
USAA Mutual Funds Trust
USAA Growth and Tax Strategy Fund | | Schedule of Portfolio Investments — continued
May 31, 2021 | |
(Amounts in Thousands, Except for Shares)
Security Description | | Principal
Amount | | Value | |
Tobacco Settlement Financing Corp. Revenue, Series A, 5.25%, 6/1/46,
Continuously Callable @100 | | $ | 500 | | | $ | 603 | | |
| | | | 20,878 | | |
New Mexico (0.2%): | |
New Mexico Hospital Equipment Loan Council Revenue, Series LA,
5.00%, 7/1/49, Continuously Callable @102 | | | 1,500 | | | | 1,666 | | |
New York (1.5%): | |
Metropolitan Transportation Authority Revenue, Series C, 5.00%, 11/15/42,
Continuously Callable @100 | | | 1,000 | | | | 1,069 | | |
New York Liberty Development Corp. Revenue
5.25%, 10/1/35 | | | 630 | | | | 907 | | |
5.50%, 10/1/37 | | | 1,500 | | | | 2,265 | | |
2.80%, 9/15/69, Continuously Callable @100 | | | 1,000 | | | | 1,012 | | |
New York State Dormitory Authority Revenue
Series A, 4.00%, 3/15/47, Continuously Callable @100 | | | 2,000 | | | | 2,368 | | |
Series A, 4.00%, 9/1/50, Continuously Callable @100 | | | 2,000 | | | | 2,277 | | |
New York State Dormitory Authority Revenue (INS — AMBAC Assurance Corp.),
Series 1, 5.50%, 7/1/40 | | | 1,205 | | | | 1,826 | | |
| | | | 11,724 | | |
North Carolina (0.4%): | |
North Carolina Medical Care Commission Revenue
5.00%, 10/1/35, Continuously Callable @100 | | | 1,000 | | | | 1,150 | | |
5.00%, 1/1/49, Continuously Callable @104 | | | 1,500 | | | | 1,671 | | |
| | | | 2,821 | | |
North Dakota (0.2%): | |
County of Ward Revenue, Series C, 5.00%, 6/1/43, Continuously Callable @100 | | | 1,000 | | | | 1,175 | | |
Ohio (0.2%): | |
County of Warren Revenue, Series A, 4.00%, 7/1/45, Continuously
Callable @100 | | | 735 | | | | 820 | | |
Southeastern Ohio Port Authority Revenue, 5.00%, 12/1/43, Continuously
Callable @100 | | | 750 | | | | 795 | | |
| | | | 1,615 | | |
Oklahoma (0.7%): | |
Comanche County Hospital Authority Revenue, Series A, 5.00%, 7/1/32,
Continuously Callable @100 | | | 1,315 | | | | 1,351 | | |
Garfield County Industrial Authority Revenue, 0.20%, 1/1/25,
Callable 7/7/21 @100 (c) (f) | | | 2,000 | | | | 2,000 | | |
Oklahoma Development Finance Authority Revenue, Series B, 5.50%, 8/15/57,
Continuously Callable @100 | | | 1,000 | | | | 1,225 | | |
Tulsa County Industrial Authority Revenue, 5.25%, 11/15/37, Continuously
Callable @102 | | | 750 | | | | 840 | | |
| | | | 5,416 | | |
Oregon (0.5%): | |
Medford Hospital Facilities Authority Revenue, Series A, 4.00%, 8/15/50,
Continuously Callable @100 | | | 1,000 | | | | 1,164 | | |
See notes to financial statements.
27
USAA Mutual Funds Trust
USAA Growth and Tax Strategy Fund | | Schedule of Portfolio Investments — continued
May 31, 2021 | |
(Amounts in Thousands, Except for Shares)
Security Description | | Principal
Amount | | Value | |
Oregon State Facilities Authority Revenue, 4.00%, 10/1/51, Continuously
Callable @100 | | $ | 1,000 | | | $ | 1,158 | | |
Salem Hospital Facility Authority Revenue, 5.00%, 5/15/53, Continuously
Callable @102 | | | 1,250 | | | | 1,409 | | |
| | | | 3,731 | | |
Pennsylvania (5.1%): | |
Adams County General Authority Revenue, 4.00%, 8/15/45, Continuously
Callable @100 | | | 1,455 | | | | 1,712 | | |
Allegheny County Hospital Development Authority Revenue
4.00%, 7/15/39, Continuously Callable @100 | | | 1,185 | | | | 1,375 | | |
5.00%, 4/1/47, Continuously Callable @100 | | | 1,000 | | | | 1,212 | | |
Altoona Area School District, GO (INS — Build America Mutual Assurance Co.),
5.00%, 12/1/48, Continuously Callable @100 | | | 1,000 | | | | 1,155 | | |
Berks County IDA Revenue
5.00%, 5/15/43, Continuously Callable @102 | | | 350 | | | | 394 | | |
5.00%, 11/1/50, Continuously Callable @100 | | | 1,500 | | | | 1,564 | | |
Bucks County IDA Revenue, 4.00%, 8/15/44, Continuously Callable @100 | | | 1,000 | | | | 1,134 | | |
Butler County Hospital Authority Revenue, 5.00%, 7/1/39, Continuously
Callable @100 | | | 1,125 | | | | 1,277 | | |
Canon Mcmillan School District, GO, 4.00%, 6/1/48, Continuously
Callable @100 | | | 1,500 | | | | 1,674 | | |
Chester County IDA Revenue, 5.00%, 10/1/44, Continuously Callable @100 | | | 1,000 | | | | 1,057 | | |
City of Erie Higher Education Building Authority Revenue, 5.00%, 5/1/47,
Continuously Callable @100 | | | 1,050 | | | | 1,265 | | |
Commonwealth Financing Authority Revenue, 5.00%, 6/1/35, Continuously
Callable @100 | | | 1,000 | | | | 1,226 | | |
Commonwealth of Pennsylvania Certificate of Participation, Series A,
5.00%, 7/1/43, Continuously Callable @100 | | | 1,000 | | | | 1,212 | | |
County of Lehigh Revenue, 4.00%, 7/1/49, Continuously Callable @100 | | | 1,000 | | | | 1,156 | | |
Indiana County Hospital Authority Revenue, Series A, 6.00%, 6/1/39,
Continuously Callable @100 | | | 1,625 | | | | 1,710 | | |
Lancaster County Hospital Authority Revenue, 5.00%, 11/1/35, Continuously
Callable @100 | | | 1,000 | | | | 1,144 | | |
Latrobe IDA Revenue, 4.00%, 3/1/51, Continuously Callable @100 | | | 800 | | | | 869 | | |
Montgomery County IDA Revenue
5.25%, 1/15/45, Continuously Callable @100 | | | 1,000 | | | | 1,104 | | |
Series C, 4.00%, 11/15/43, Continuously Callable @103 | | | 600 | | | | 674 | | |
Northampton County General Purpose Authority Revenue
4.00%, 8/15/40, Continuously Callable @100 | | | 1,000 | | | | 1,122 | | |
5.00%, 8/15/43, Continuously Callable @100 | | | 1,000 | | | | 1,229 | | |
Pennsylvania Economic Development Financing Authority Revenue, Series A,
4.00%, 10/15/51, Continuously Callable @100 | | | 1,000 | | | | 1,180 | | |
Pennsylvania Turnpike Commission Revenue
Series A-1, 5.00%, 12/1/46, Continuously Callable @100 | | | 1,000 | | | | 1,157 | | |
Series A-1, 5.00%, 12/1/47, Continuously Callable @100 | | | 1,000 | | | | 1,222 | | |
Series B, 5.00%, 12/1/39, Continuously Callable @100 | | | 1,000 | | | | 1,237 | | |
Series B, 5.25%, 12/1/44, Continuously Callable @100 | | | 1,000 | | | | 1,147 | | |
See notes to financial statements.
28
USAA Mutual Funds Trust
USAA Growth and Tax Strategy Fund | | Schedule of Portfolio Investments — continued
May 31, 2021 | |
(Amounts in Thousands, Except for Shares)
Security Description | | Principal
Amount | | Value | |
Philadelphia IDA Revenue, 5.00%, 8/1/50, Continuously Callable @100 | | $ | 1,050 | | | $ | 1,221 | | |
Reading School District, GO (INS — Assured Guaranty Municipal Corp.),
5.00%, 3/1/38, Continuously Callable @100 | | | 1,500 | | | | 1,811 | | |
School District of Philadelphia, GO, Series F, 5.00%, 9/1/37, Continuously
Callable @100 | | | 1,000 | | | | 1,197 | | |
The Philadelphia School District, GO, Series A, 5.00%, 9/1/38, Continuously
Callable @100 | | | 1,000 | | | | 1,238 | | |
Wilkes-Barre Area School District, GO (INS — Build America Mutual
Assurance Co.), 4.00%, 4/15/49, Continuously Callable @100 | | | 1,500 | | | | 1,713 | | |
| | | | 38,388 | | |
Puerto Rico (0.1%): | |
Commonwealth of Puerto Rico, GO (INS — Assured Guaranty Municipal Corp.),
Series A, 5.00%, 7/1/35, Continuously Callable @100 | | | 1,000 | | | | 1,034 | | |
Rhode Island (0.2%): | |
Rhode Island Housing & Mortgage Finance Corp. Revenue, Series 15-A, 6.85%,
10/1/24, Continuously Callable @100 | | | 40 | | | | 40 | | |
Rhode Island Turnpike & Bridge Authority Revenue, Series A, 5.00%, 10/1/40,
Continuously Callable @100 | | | 1,000 | | | | 1,184 | | |
| | | | 1,224 | | |
South Carolina (0.5%): | |
Piedmont Municipal Power Agency Revenue (INS — Assured Guaranty
Municipal Corp.), Series D, 5.75%, 1/1/34, Continuously Callable @100 | | | 2,000 | | | | 2,008 | | |
South Carolina Jobs-Economic Development Authority Revenue
5.00%, 11/15/47, Continuously Callable @103 | | | 1,000 | | | | 1,157 | | |
4.00%, 4/1/49, Continuously Callable @103 | | | 620 | | | | 661 | | |
| | | | 3,826 | | |
Tennessee (0.8%): | |
Greeneville Health & Educational Facilities Board Revenue, 5.00%, 7/1/37,
Continuously Callable @100 | | | 1,500 | | | | 1,815 | | |
Metropolitan Government Nashville & Davidson County Health & Educational
Facilities Board Revenue
5.00%, 10/1/45, Continuously Callable @100 | | | 1,000 | | | | 1,125 | | |
5.00%, 7/1/46, Continuously Callable @100 | | | 1,000 | | | | 1,181 | | |
5.00%, 10/1/48, Continuously Callable @100 | | | 500 | | | | 584 | | |
The Metropolitan Nashville Airport Authority Revenue,
Series A, 4.00%, 7/1/49, Continuously Callable @100 | | | 1,000 | | | | 1,170 | | |
| | | | 5,875 | | |
Texas (8.0%): | |
Arlington Higher Education Finance Corp. Revenue (NBGA — Texas Permanent
School Fund), 4.00%, 8/15/44, Continuously Callable @100 | | | 2,165 | | | | 2,510 | | |
Austin Convention Enterprises, Inc. Revenue, 5.00%, 1/1/34, Continuously
Callable @100 | | | 1,380 | | | | 1,394 | | |
Bexar County Health Facilities Development Corp. Revenue, 5.00%, 7/15/37,
Continuously Callable @105 | | | 1,000 | | | | 1,113 | | |
Central Texas Regional Mobility Authority Revenue
4.00%, 1/1/41, Continuously Callable @100 | | | 1,000 | | | | 1,100 | | |
Series A, 5.00%, 1/1/45, Continuously Callable @100 | | | 1,000 | | | | 1,152 | | |
See notes to financial statements.
29
USAA Mutual Funds Trust
USAA Growth and Tax Strategy Fund | | Schedule of Portfolio Investments — continued
May 31, 2021 | |
(Amounts in Thousands, Except for Shares)
Security Description | | Principal
Amount | | Value | |
Central Texas Turnpike System Revenue, Series C, 5.00%, 8/15/42, Continuously
Callable @100 | | $ | 1,000 | | | $ | 1,125 | | |
City of Arlington Special Tax (INS — Assured Guaranty Municipal Corp.),
Series A, 5.00%, 2/15/48, Continuously Callable @100 | | | 1,000 | | | | 1,226 | | |
City of Houston Hotel Occupancy Tax & Special Revenue
5.00%, 9/1/39, Continuously Callable @100 | | | 1,000 | | | | 1,121 | | |
5.00%, 9/1/40, Continuously Callable @100 | | | 1,000 | | | | 1,119 | | |
City of Irving Texas Revenue, 5.00%, 8/15/43, Continuously Callable @100 | | | 1,000 | | | | 1,136 | | |
City of Laredo Waterworks & Sewer System Revenue, 4.00%, 3/1/41,
Continuously Callable @100 | | | 1,000 | | | | 1,116 | | |
City of Lewisville Special Assessment (INS — ACA Financial Guaranty Corp.),
5.80%, 9/1/25 (c) | | | 3,420 | | | | 3,577 | | |
Clifton Higher Education Finance Corp. Revenue (NBGA — Texas Permanent
School Fund)
5.00%, 8/15/39, Continuously Callable @100 | | | 1,000 | | | | 1,132 | | |
4.00%, 8/15/44, Continuously Callable @100 | | | 1,000 | | | | 1,179 | | |
County of Bexar Revenue, 4.00%, 8/15/44, Continuously Callable @100 | | | 1,500 | | | | 1,645 | | |
Everman Independent School District, GO (NBGA — Texas Permanent
School Fund),
4.00%, 2/15/50, Continuously Callable @100 | | | 1,500 | | | | 1,764 | | |
Harris County Cultural Education Facilities Finance Corp. Revenue,
5.00%, 6/1/38, Continuously Callable @100 | | | 1,000 | | | | 1,045 | | |
Harris County Hospital District Revenue, 4.00%, 2/15/42, Continuously
Callable @100 | | | 1,000 | | | | 1,115 | | |
Houston Higher Education Finance Corp. Revenue, 4.00%, 10/1/51,
Continuously Callable @100 | | | 1,100 | | | | 1,172 | | |
Karnes County Hospital District Revenue, 5.00%, 2/1/44, Continuously
Callable @100 | | | 1,000 | | | | 1,107 | | |
Martin County Hospital District, GO, 4.00%, 4/1/36, Continuously
Callable @100 (g) | | | 350 | | | | 400 | | |
Matagorda County Navigation District No. 1 Revenue, 4.00%, 6/1/30,
Continuously Callable @100 | | | 1,000 | | | | 1,066 | | |
Mesquite Health Facilities Development Corp. Revenue, 5.00%, 2/15/35,
Continuously Callable @100 | | | 1,000 | | | | 793 | | |
New Hope Cultural Education Facilities Finance Corp. Revenue
Series A, 5.00%, 4/1/47, Pre-refunded 4/1/25 @100 | | | 1,600 | | | | 1,875 | | |
Series A, 5.00%, 7/1/47, Continuously Callable @100 | | | 1,000 | | | | 850 | | |
New Hope Cultural Education Facilities Finance Corp. Revenue (INS — Assured
Guaranty Municipal Corp.), Series A1, 5.00%, 7/1/38, Continuously
Callable @100 | | | 225 | | | | 275 | | |
North Texas Tollway Authority Revenue
Series B, 5.00%, 1/1/31, Continuously Callable @100 | | | 1,500 | | | | 1,676 | | |
Series B, 5.00%, 1/1/45, Continuously Callable @100 | | | 1,000 | | | | 1,145 | | |
Port of Arthur Navigation District Industrial Development Corp. Revenue,
0.10%, 3/1/42, Callable 9/1/21 @100 (f) | | | 3,000 | | | | 3,000 | | |
Port of Port Arthur Navigation District Revenue
0.06%, 4/1/40, Continuously Callable @100 (f) | | | 1,850 | | | | 1,850 | | |
0.16%, 11/1/40, Continuously Callable @100 (c) (f) | | | 4,650 | | | | 4,650 | | |
Series B, 0.06%, 4/1/40, Continuously Callable @100 (f) | | | 4,300 | | | | 4,300 | | |
Series C, 0.08%, 4/1/40, Continuously Callable @100 (f) | | | 3,400 | | | | 3,400 | | |
See notes to financial statements.
30
USAA Mutual Funds Trust
USAA Growth and Tax Strategy Fund | | Schedule of Portfolio Investments — continued
May 31, 2021 | |
(Amounts in Thousands, Except for Shares)
Security Description | | Principal
Amount | | Value | |
Princeton Independent School District, GO (NBGA — Texas Permanent School
Fund), 5.00%, 2/15/43, Continuously Callable @100 | | $ | 1,000 | | | $ | 1,238 | | |
Prosper Independent School District, GO (NBGA — Texas Permanent School
Fund), 5.00%, 2/15/48, Continuously Callable @100 | | | 1,000 | | | | 1,233 | | |
Tarrant County Cultural Education Facilities Finance Corp. Revenue
5.00%, 11/15/46, Continuously Callable @100 | | | 1,000 | | | | 1,164 | | |
Series A, 5.00%, 11/15/45, Continuously Callable @100 | | | 1,000 | | | | 910 | | |
Series B, 5.00%, 11/15/36, Continuously Callable @100 | | | 1,000 | | | | 965 | | |
Series B, 5.00%, 7/1/48, Continuously Callable @100 | | | 1,500 | | | | 1,831 | | |
| | | | 60,469 | | |
Virginia (0.1%): | |
Alexandria IDA Revenue, 5.00%, 10/1/45, Continuously Callable @100 | | | 1,000 | | | | 1,119 | | |
Washington (0.8%): | |
King County Public Hospital District No 2, GO, Series A, 4.00%, 12/1/41,
Continuously Callable @100 | | | 1,000 | | | | 1,162 | | |
Washington Health Care Facilities Authority Revenue
4.00%, 7/1/42, Continuously Callable @100 | | | 1,000 | | | | 1,122 | | |
5.00%, 1/1/47, Continuously Callable @100 | | | 1,000 | | | | 1,157 | | |
Washington Higher Education Facilities Authority Revenue, 4.00%, 5/1/45,
Continuously Callable @100 | | | 1,100 | | | | 1,289 | | |
Washington State Housing Finance Commission Revenue
5.00%, 1/1/38, Continuously Callable @102 (h) | | | 1,000 | | | | 1,155 | | |
Series A-1, 3.50%, 12/20/35 | | | 300 | | | | 349 | | |
| | | | 6,234 | | |
West Virginia (0.2%): | |
West Virginia Hospital Finance Authority Revenue, 4.00%, 1/1/38, Continuously
Callable @100 | | | 1,500 | | | | 1,713 | | |
Wisconsin (1.2%): | |
Public Finance Authority Revenue
5.00%, 7/1/38, Continuously Callable @100 | | | 1,000 | | | | 1,231 | | |
4.00%, 1/1/45, Continuously Callable @100 | | | 1,440 | | | | 1,659 | | |
Series A, 5.25%, 10/1/48, Continuously Callable @100 | | | 1,500 | | | | 1,742 | | |
Series A, 4.00%, 10/1/49, Continuously Callable @100 | | | 1,500 | | | | 1,711 | | |
Public Finance Authority Revenue (INS — Assured Guaranty Municipal Corp.),
5.00%, 7/1/44, Continuously Callable @100 | | | 600 | | | | 728 | | |
Wisconsin Health & Educational Facilities Authority Revenue
5.25%, 4/15/35, Pre-refunded 4/15/23 @100 | | | 1,000 | | | | 1,094 | | |
5.00%, 9/15/45, Continuously Callable @100 | | | 1,000 | | | | 1,061 | | |
| | | | 9,226 | | |
Total Municipal Bonds (Cost $375,123) | | | 398,406 | | |
U.S. Treasury Obligations (0.1%) | |
U.S. Treasury Bills, 0.04%, 7/15/21 (k) | | | 700 | | | | 700 | | |
Total U.S. Treasury Obligations (Cost $700) | | | 700 | | |
See notes to financial statements.
31
USAA Mutual Funds Trust
USAA Growth and Tax Strategy Fund | | Schedule of Portfolio Investments — continued
May 31, 2021 | |
(Amounts in Thousands, Except for Shares)
Security Description | | Shares | | Value | |
Collateral for Securities Loaned^ (0.0%) (l) | |
Fidelity Investments Money Market Government Portfolio Institutional
Shares, 0.01% (m) | | | 244,235 | | | $ | 244 | | |
HSBC U.S. Government Money Market Fund I Shares, 0.03% (m) | | | 38,700 | | | | 39 | | |
Total Collateral for Securities Loaned (Cost $283) | | | 283 | | |
Total Investments (Cost $488,958) — 100.1% | | | 759,818 | | |
Liabilities in excess of other assets — (0.1)% | | | (690 | ) | |
NET ASSETS — 100.00% | | $ | 759,128 | | |
^ Purchased with cash collateral from securities on loan.
(a) Non-income producing security.
(b) All or a portion of this security is on loan.
(c) All or a portion of this security has been segregated as collateral for derivative instruments, delayed delivery, and/or when-issued securities.
(d) Rounds to less than $1 thousand.
(e) Northern Trust Corp. is the parent of Northern Trust Investments Inc., which is the sub adviser of the Fund.
(f) Variable Rate Demand Notes that provide the rights to sell the security at face value on either that day or within the rate-reset period. The interest rate is reset on the put date at a stipulated daily, weekly, monthly, quarterly, or other specified time interval to reflect current market conditions. These securities do not indicate a reference rate and spread in their description.
(g) Security or portion of security purchased on a delayed-delivery and/or when-issued basis.
(h) Rule 144A security or other security that is restricted as to resale to institutional investors. The Fund's Adviser has deemed this security to be liquid based upon procedures approved by the Board of Trustees. As of May 31, 2021, the fair value of these securities was $17,049 (thousands) and amounted to 2.2% of net assets.
(i) Zero-coupon bond.
(j) The Fund's Adviser has deemed this security to be illiquid based upon procedures approved by the Board of Trustees. As of May 31, 2021, illiquid securities were 0.1% of net assets.
(k) Rate represents the effective yield at May 31, 2021.
(l) Amount represents less than 0.05% of net assets.
(m) Rate disclosed is the daily yield on May 31, 2021.
AMBAC — American Municipal Bond Assurance Corporation
Continuously callable — Investment is continuously callable or will be continuously callable on any date after the first call date until its maturity.
See notes to financial statements.
32
USAA Mutual Funds Trust
USAA Growth and Tax Strategy Fund | | Schedule of Portfolio Investments — continued
May 31, 2021 | |
GO — General Obligation
IDA — Industrial Development Authority
LLC — Limited Liability Company
PLC — Public Limited Company
Credit Enhancements — Adds the financial strength of the provider of the enhancement to support the issuer's ability to repay the principal and interest payments when due. The enhancement may be provided by a high-quality bank, insurance company or other corporation, or a collateral trust. The enhancements do not guarantee the market values of the securities.
INS Principal and interest payments are insured by the name listed. Although bond insurance reduces the risk of loss due to default by an issuer, such bonds remain subject to the risk that value may fluctuate for other reasons, and there is no assurance that the insurance company will meet its obligations.
LIQ Liquidity enhancement that may, under certain circumstances, provide for repayment of principal and interest upon demand from the name listed.
NBGA Principal and interest payments or, under certain circumstances, underlying mortgages are guaranteed by a nonbank guarantee agreement from the name listed.
Futures Contracts Purchased
(Amounts not in thousands)
| | | Number of
Contracts | | Expiration
Date | | Notional
Amount | | Value | | Unrealized
Appreciation/
(Depreciation) | |
E-Mini S&P 500 Futures | | | 11 | | | 6/18/21 | | $ | 2,196,197 | | | $ | 2,311,320 | | | $ | 115,123 | | |
| | | Total unrealized appreciation | | | | | | | | $ | 115,123 | | |
| | | Total unrealized depreciation | | | | | | | | | — | | |
| | | Total net unrealized appreciation (depreciation) | | | | | | | | $ | 115,123 | | |
See notes to financial statements.
33
USAA Mutual Funds Trust | | Statement of Assets and Liabilities
May 31, 2021 | |
(Amounts in Thousands, Except Per Share Amounts)
| | | USAA Growth and
Tax Strategy Fund | |
Assets: | |
Investments, at value (Cost $488,958) | | $ | 759,818 | (a) | |
Cash | | | 3,457 | | |
Receivables: | |
Interest and dividends | | | 4,682 | | |
Capital shares issued | | | 269 | | |
Variation margin on open futures contracts | | | 2 | | |
From Adviser | | | 5 | | |
Prepaid expenses | | | 39 | | |
Total Assets | | | 768,272 | | |
Liabilities: | |
Payables: | |
Collateral received on loaned securities | | | 283 | | |
Investments purchased | | | 8,238 | | |
Capital shares redeemed | | | 221 | | |
Accrued expenses and other payables: | |
Investment advisory fees | | | 192 | | |
Administration fees | | | 94 | | |
Custodian fees | | | 3 | | |
Transfer agent fees | | | 44 | | |
Compliance fees | | | — | (b) | |
Trustees' fees | | | 1 | | |
| 12b-1 fees | | | 1 | | |
Other accrued expenses | | | 67 | | |
Total Liabilities | | | 9,144 | | |
Net Assets: | |
Capital | | | 497,153 | | |
Total accumulated earnings/(loss) | | | 261,975 | | |
Net Assets | | $ | 759,128 | | |
Net Assets | |
Fund Shares | | $ | 701,841 | | |
Institutional Shares | | | 55,541 | | |
Class A | | | 525 | | |
Class C | | | 1,221 | | |
Total | | $ | 759,128 | | |
Shares (unlimited number of shares authorized with no par value): | |
Fund Shares | | | 27,790 | | |
Institutional Shares | | | 2,201 | | |
Class A | | | 21 | | |
Class C | | | 49 | | |
Total | | | 30,061 | | |
Net asset value, offering and redemption price per share: (c) | |
Fund Shares | | $ | 25.25 | | |
Institutional Shares | | $ | 25.24 | | |
Class A | | $ | 25.22 | | |
Class C (d) | | $ | 25.12 | | |
Maximum Sales Charge — Class A | | | 2.25 | % | |
Maximum offering price
(100%/(100%-maximum sales charge) of net asset value adjusted to
the nearest cent) per share — Class A | | $ | 25.80 | | |
(a) Includes $265 of securities on loan.
(b) Rounds to less than $1 thousand.
(c) Per share amount may not recalculate due to rounding of net assets and/or shares outstanding.
(d) Redemption price per share varies by the length of time shares are held.
See notes to financial statements.
34
USAA Mutual Funds Trust | | Statement of Operations
For the Year Ended May 31, 2021 | |
(Amounts in Thousands)
| | | USAA Growth and
Tax Strategy Fund | |
Investment Income: | |
Dividends | | $ | 5,053 | | |
Interest | | | 11,292 | | |
Securities lending (net of fees) | | | 4 | | |
Total Income | | | 16,349 | | |
Expenses: | |
Investment advisory fees | | | 2,161 | | |
Administration fees — Fund Shares | | | 956 | | |
Administration fees — Institutional Shares (a) | | | 29 | | |
Administration fees — Class A (a) | | | — | (b) | |
Administration fees — Class C (a) | | | 1 | | |
Sub-Administration fees | | | 45 | | |
12b-1 fees — Class A (a) | | | — | (b) | |
12b-1 fees — Class C (a) | | | 4 | | |
Custodian fees | | | 24 | | |
Transfer agent fees — Fund Shares (a) | | | 412 | | |
Transfer agent fees — Institutional Shares (a) | | | 29 | | |
Transfer agent fees — Class A (a) | | | — | (b) | |
Transfer agent fees — Class C (a) | | | — | (b) | |
Trustees' fees | | | 50 | | |
Compliance fees | | | 4 | | |
Legal and audit fees | | | 65 | | |
State registration and filing fees | | | 99 | | |
Other expenses | | | 109 | | |
Total Expenses | | | 3,988 | | |
Expenses waived/reimbursed by Adviser | | | (38 | ) | |
Net Expenses | | | 3,950 | | |
Net Investment Income (Loss) | | | 12,399 | | |
Realized/Unrealized Gains (Losses) from Investments: | |
Net realized gains (losses) from investment securities | | | 5,222 | | |
Net realized gains (losses) from futures contracts | | | 1,602 | | |
Net change in unrealized appreciation/depreciation on investment securities | | | 117,105 | | |
Net change in unrealized appreciation/depreciation on futures contracts | | | (896 | ) | |
Net realized/unrealized gains (losses) on investments | | | 123,033 | | |
Change in net assets resulting from operations | | $ | 135,432 | | |
(a) Institutional Shares, Class A and Class C commenced operations on June 29, 2020.
(b) Rounds to less than $1 thousand.
See notes to financial statements.
35
USAA Mutual Funds Trust | | Statements of Changes in Net Assets | |
(Amounts in Thousands)
| | | USAA Growth and Tax Strategy Fund | |
| | | Year
Ended
May 31,
2021 | | Year
Ended
May 31,
2020 | |
From Investments: | |
Operations: | |
Net investment income (loss) | | $ | 12,399 | | | $ | 13,142 | | |
Net realized gains (losses) from investments | | | 6,824 | | | | (14,260 | ) | |
Net change in unrealized appreciation/depreciation
on investments | | | 116,209 | | | | 30,136 | | |
Change in net assets resulting from operations | | | 135,432 | | | | 29,018 | | |
Distributions to Shareholders: | |
Fund Shares | | | (11,933 | ) | | | (12,679 | ) | |
Institutional Shares (a) | | | (467 | ) | | | — | | |
Class A (a) | | | (1 | ) | | | — | | |
Class C (a) | | | (5 | ) | | | — | | |
Change in net assets resulting from distributions to shareholders | | | (12,406 | ) | | | (12,679 | ) | |
Change in net assets resulting from capital transactions | | | 42,523 | | | | 50,920 | | |
Change in net assets | | | 165,549 | | | | 67,259 | | |
Net Assets: | |
Beginning of period | | | 593,579 | | | | 526,320 | | |
End of period | | $ | 759,128 | | | $ | 593,579 | | |
(a) Institutional Shares, Class A and Class C commenced operations on June 29, 2020.
(continues on next page)
See notes to financial statements.
36
USAA Mutual Funds Trust | | Statements of Changes in Net Assets | |
(Amounts in Thousands) (continued)
| | | USAA Growth and Tax Strategy Fund | |
| | | Year
Ended
May 31,
2021 | | Year
Ended
May 31,
2020 | |
Capital Transactions: | |
Fund Shares | |
Proceeds from shares issued | | $ | 128,688 | | | $ | 180,586 | | |
Distributions reinvested | | | 11,096 | | | | 11,553 | | |
Cost of shares redeemed | | | (149,077 | ) | | | (141,219 | ) | |
Total Fund Shares | | $ | (9,293 | ) | | $ | 50,920 | | |
Institutional Shares (a) | |
Proceeds from shares issued | | $ | 56,777 | | | $ | — | | |
Distributions reinvested | | | 130 | | | | — | | |
Cost of shares redeemed | | | (6,753 | ) | | | — | | |
Total Institutional Shares | | $ | 50,154 | | | $ | — | | |
Class A (a) | |
Proceeds from shares issued | | $ | 520 | | | $ | — | | |
Distributions reinvested | | | 1 | | | | — | | |
Cost of shares redeemed | | | (22 | ) | | | — | | |
Total Class A | | $ | 499 | | | $ | — | | |
Class C (a) | |
Proceeds from shares issued | | $ | 1,181 | | | $ | — | | |
Distributions reinvested | | | 4 | | | | — | | |
Cost of shares redeemed | | | (22 | ) | | | — | | |
Total Class C | | $ | 1,163 | | | $ | — | | |
Change in net assets resulting from capital transactions | | $ | 42,523 | | | $ | 50,920 | | |
Share Transactions: | |
Fund Shares | |
Issued | | | 5,514 | | | | 8,571 | | |
Reinvested | | | 491 | | | | 571 | | |
Redeemed | | | (6,530 | ) | | | (6,904 | ) | |
Total Fund Shares | | | (525 | ) | | | 2,238 | | |
Institutional Shares (a) | |
Issued | | | 2,477 | | | | — | | |
Reinvested | | | 6 | | | | — | | |
Redeemed | | | (282 | ) | | | — | | |
Total Institutional Shares | | | 2,201 | | | | — | | |
Class A (a) | |
Issued | | | 22 | | | | — | | |
Reinvested | | | — | (b) | | | — | | |
Redeemed | | | (1 | ) | | | — | | |
Total Class A | | | 21 | | | | — | | |
Class C (a) | |
Issued | | | 50 | | | | — | | |
Reinvested | | | — | (b) | | | — | | |
Redeemed | | | (1 | ) | | | — | | |
Total Class C | | | 49 | | | | — | | |
Change in Shares | | | 1,746 | | | | 2,238 | | |
(a) Institutional Shares, Class A and Class C commenced operations on June 29, 2020.
(b) Rounds to less than 1 thousand shares.
See notes to financial statements.
37
USAA Mutual Funds Trust | | Financial Highlights | |
For a Share Outstanding Throughout Each Period
| | | | | Investment Activities | | Distributions to
Shareholders From | |
| | | Net Asset
Value,
Beginning
of Period | | Net
Investment
Income
(Loss) | | Net
Realized
and
Unrealized
Gains
(Losses) on
Investments | | Total from
Investment
Activities | | Net
Investment
Income | | Net
Realized
Gains from
Investments | |
USAA Growth and Tax Strategy Fund | |
Fund Shares | |
Year Ended:
May 31, 2021 | | $ | 20.96 | | | | 0.43 | (d) | | | 4.29 | | | | 4.72 | | | | (0.43 | ) | | | — | | |
May 31, 2020 | | $ | 20.18 | | | | 0.47 | (d) | | | 0.77 | | | | 1.24 | | | | (0.46 | ) | | | — | | |
May 31, 2019 | | $ | 19.77 | | | | 0.47 | | | | 0.47 | | | | 0.94 | | | | (0.48 | ) | | | (0.05 | ) | |
May 31, 2018 | | $ | 18.76 | | | | 0.44 | | | | 1.01 | | | | 1.45 | | | | (0.44 | ) | | | — | | |
May 31, 2017 | | $ | 17.79 | | | | 0.42 | | | | 0.96 | | | | 1.38 | | | | (0.41 | ) | | | — | | |
Institutional Shares | |
June 29, 2020 (f)
through
May 31, 2021 | | $ | 21.05 | | | | 0.40 | (d) | | | 4.12 | | | | 4.52 | | | | (0.33 | ) | | | — | | |
Class A | |
June 29, 2020 (f)
through
May 31, 2021 | | $ | 21.05 | | | | 0.31 | (d) | | | 4.16 | | | | 4.47 | | | | (0.30 | ) | | | — | | |
Class C | |
June 29, 2020 (f)
through
May 31, 2021 | | $ | 21.05 | | | | 0.16 | (d) | | | 4.13 | | | | 4.29 | | | | (0.22 | ) | | | — | | |
* Assumes reinvestment of all net investment income and realized capital gain distributions, if any, during the period. Includes adjustments in accordance with U.S. Generally Accepted Accounting Principles and could differ from the Lipper reported return.
^ The net expense ratio may not correlate to the applicable expense limits in place during the period since the current contractual expense limitation is applied for a period beginning July 1, 2019, and in effect through June 30, 2023, instead of coinciding with the Fund's fiscal year end. Details of the current contractual expense limitation in effect can be found in Note 4 of the accompanying Notes to Financial Statements.
(a) Not annualized for periods less than one year.
(b) Annualized for periods less than one year.
(c) Portfolio turnover is calculated on the basis of the Fund as a whole without distinguishing between the classes of shares.
(d) Per share net investment income (loss) has been calculated using the average daily shares method.
(e) Reflects an overall increase in purchases and sales of securities.
(f) Commencement of operations.
See notes to financial statements.
38
USAA Mutual Funds Trust | | Financial Highlights — continued | |
For a Share Outstanding Throughout Each Period
| | | | | Ratios to Average Net Assets | | Supplemental Data | |
| | | Total
Distributions | | Net
Asset
Value,
End of
Period | | Total
Return
(Excludes
Sales
Charge)*(a) | | Net
Expenses^(b) | | Net
Investment
Income
(Loss)(b) | | Gross
Expenses(b) | | Net
Assets,
End of
Period
(000's) | | Portfolio
Turnover(a)(c) | |
USAA Growth and Tax Strategy Fund | |
Fund Shares | |
Year Ended:
May 31, 2021 | | | (0.43 | ) | | $ | 25.25 | | | | 22.79 | % | | | 0.59 | % | | | 1.86 | % | | | 0.59 | % | | $ | 701,841 | | | | 11 | % | |
May 31, 2020 | | | (0.46 | ) | | $ | 20.96 | | | | 6.25 | % | | | 0.57 | % | | | 2.25 | % | | | 0.57 | % | | $ | 593,579 | | | | 34 | %(e) | |
May 31, 2019 | | | (0.53 | ) | | $ | 20.18 | | | | 4.83 | % | | | 0.60 | % | | | 2.44 | % | | | 0.60 | % | | $ | 526,320 | | | | 7 | % | |
May 31, 2018 | | | (0.44 | ) | | $ | 19.77 | | | | 7.81 | % | | | 0.68 | % | | | 2.32 | % | | | 0.68 | % | | $ | 459,682 | | | | 10 | % | |
May 31, 2017 | | | (0.41 | ) | | $ | 18.76 | | | | 7.88 | % | | | 0.84 | % | | | 2.33 | % | | | 0.84 | % | | $ | 391,020 | | | | 4 | % | |
Institutional Shares | |
June 29, 2020 (f)
through
May 31, 2021 | | | (0.33 | ) | | $ | 25.24 | | | | 21.62 | % | | | 0.56 | % | | | 1.80 | % | | | 0.59 | % | | $ | 55,541 | | | | 11 | % | |
Class A | |
June 29, 2020 (f)
through
May 31, 2021 | | | (0.30 | ) | | $ | 25.22 | | | | 21.35 | % | | | 0.86 | % | | | 1.38 | % | | | 13.45 | % | | $ | 525 | | | | 11 | % | |
Class C | |
June 29, 2020 (f)
through
May 31, 2021 | | | (0.22 | ) | | $ | 25.12 | | | | 20.47 | % | | | 1.60 | % | | | 0.70 | % | | | 5.63 | % | | $ | 1,221 | | | | 11 | % | |
See notes to financial statements.
39
USAA Mutual Funds Trust | | Notes to Financial Statements
May 31, 2021 | |
1. Organization:
USAA Mutual Funds Trust (the "Trust") is organized as a Delaware statutory trust and is registered under the Investment Company Act of 1940, as amended (the "1940 Act"), as an open-end investment company. The Trust is comprised of 46 funds and is authorized to issue an unlimited number of shares, which are units of beneficial interest with no par value.
The accompanying financial statements are those of the USAA Growth and Tax Strategy Fund (the "Fund"). The Fund offers four classes of shares: Fund Shares, Institutional Shares, Class A and Class C. The Fund is classified as diversified under the 1940 Act. The Institutional Shares, Class A and Class C commenced operations on June 29, 2020. Effective June 29, 2020, the Fund's Adviser Shares were redesignated Class A and became subject to a front-end sales charge.
Each class of shares of the Fund has substantially identical rights and privileges, except with respect to sales charges, fees paid under distribution plans, expenses allocable exclusively to each class of shares, voting rights on matters solely affecting a single class of shares, and the exchange privilege of each class of shares.
Under the Trust's organizational documents, its officers and trustees are indemnified against certain liabilities arising out of the performance of their duties to the Fund. In addition, in the normal course of business, the Fund enters into contracts with its vendors and others that provide for general indemnifications. The Fund's maximum exposure under these arrangements is unknown, as this would involve future claims that may be made against the Fund. However, based on experience, the Fund expects that risk of loss to be remote.
2. Significant Accounting Policies:
The following is a summary of significant accounting policies followed by the Trust in the preparation of its financial statements. The policies are in conformity with Generally Accepted Accounting Principles in the United States of America ("GAAP"). The preparation of financial statements in accordance with GAAP requires management to make estimates and assumptions that affect the reported amounts of assets and liabilities and disclosure of contingent assets and liabilities at the date of the financial statements and the reported amounts of income and expenses for the period. Actual results could differ from those estimates. The Fund follows the specialized accounting and reporting requirements under GAAP that are applicable to investment companies under Accounting Standards Codification Topic 946.
Investment Valuation:
The Fund records investments at fair value. Fair value is defined as the price that would be received to sell an asset or paid to transfer a liability in an orderly transaction between market participants at the measurement date.
The valuation techniques described below maximize the use of observable inputs and minimize the use of unobservable inputs in determining fair value. The inputs used for valuing the Fund's investments are summarized in the three broad levels listed below:
• Level 1 — quoted prices in active markets for identical securities
• Level 2 — other significant observable inputs (including quoted prices for similar securities or interest rates applicable to those securities, etc.)
• Level 3 — significant unobservable inputs (including the Fund's own assumptions in determining the fair value of investments)
Changes in valuation techniques may result in transfers in or out of an assigned level within the disclosure hierarchy. The inputs or methodologies used for valuation techniques are not necessarily an indication of the risks associated with entering into those investments.
Victory Capital Management Inc. ("VCM" or the "Adviser") has established the Pricing and Liquidity Committee (the "Committee"), and subject to the Trust's Board of Trustees (the "Board") oversight, the Committee administers and oversees the Fund's valuation policies and procedures, which are approved by the Board.
40
USAA Mutual Funds Trust | | Notes to Financial Statements — continued
May 31, 2021 | |
Portfolio securities listed or traded on securities exchanges, including Exchange-Traded Funds ("ETFs"), American Depositary Receipts ("ADRs"), and Rights are valued at the closing price on the exchange or system where the security is principally traded, if available, or at the Nasdaq Official Closing Price. If there have been no sales for that day on the exchange or system, then a security is valued at the last available bid quotation on the exchange or system where the security is principally traded. In each of these situations, valuations are typically categorized as Level 1 in the fair value hierarchy.
Investments in open-end investment companies are valued at their net asset value ("NAV"). These valuations are typically categorized as Level 1 in the fair value hierarchy.
Debt securities are valued each business day by a pricing service approved by the Board. The approved pricing service uses the evaluated bid or the last sale price to value securities. Debt obligations maturing within 60 days may be valued at amortized cost, provided that the amortized cost represents the fair value of such securities. These valuations are typically categorized as Level 2 in the fair value hierarchy.
Futures contracts are valued at the settlement price established each day by the board of trade or an exchange on which they are traded. These valuations are typically categorized as Level 1 in the fair value hierarchy.
In the event that price quotations or valuations are not readily available, investments are valued at fair value in accordance with procedures established by and under the general supervision and responsibility of the Board. These valuations are typically categorized as Level 2 or Level 3 in the fair value hierarchy, based on the observability of inputs used to determine the fair value. The effect of fair value pricing is that securities may not be priced on the basis of quotations from the primary market in which they are traded and the actual price realized from the sale of a security may differ materially from the fair value price. Valuing these securities at fair value is intended to cause the Fund's NAV to be more reliable than it otherwise would be.
A summary of the valuations as of May 31, 2021, based upon the three levels defined above, is included in the table below while the breakdown, by category, of investments is disclosed on the Schedule of Portfolio Investments (amounts in thousands):
| | | Level 1 | | Level 2 | | Level 3 | | Total | |
Common Stocks | | $ | 360,429 | | | $ | — | | | $ | — | | | $ | 360,429 | | |
Municipal Bonds | | | — | | | | 398,406 | | | | — | | | | 398,406 | | |
U.S. Treasury Obligations | | | — | | | | 700 | | | | — | | | | 700 | | |
Collateral for Securities Loaned | | | 283 | | | | — | | | | — | | | | 283 | | |
Total | | $ | 360,712 | | | $ | 399,106 | | | $ | — | | | $ | 759,818 | | |
Other Financial Investments^ | |
Assets: | |
Futures Contracts | | | 115 | | | | — | | | | — | | | | 115 | | |
Total | | $ | 115 | | | $ | — | | | $ | — | | | $ | 115 | | |
^ Futures contracts are valued at the unrealized appreciation (depreciation) on the investment.
For the year ended May 31, 2021, there were no transfers in or out of Level 3 in the fair value hierarchy.
Real Estate Investment Trusts ("REITs"):
The Fund may invest in REITs, which report information on the source of their distributions annually. REITs are pooled investment vehicles that invest primarily in income producing real estate or real estate related loans or interests (such as mortgages). Certain distributions received from REITs during the year are recorded as realized gains or return of capital as estimated by the Fund or when such information becomes known.
41
USAA Mutual Funds Trust | | Notes to Financial Statements — continued
May 31, 2021 | |
Investment Companies:
Open-End Funds:
The Fund may invest in portfolios of open-end investment companies. These investment companies value securities in their portfolios for which market quotations are readily available at their market values (generally the last reported sale price) and all other securities and assets at their fair value by the methods established by the board of directors of the underlying funds.
Securities Purchased on a Delayed-Delivery or When-Issued Basis:
The Fund may purchase securities on a delayed-delivery or when-issued basis. Delivery and payment for securities that have been purchased by the Fund on a delayed-delivery or when-issued basis, or for delayed draws on loans can take place a month or more after the trade date. At the time the Fund makes the commitment to purchase a security on a delayed-delivery or when-issued basis, the Fund records the transaction and reflects the value of the security in determining net asset value ("NAV"). No interest accrues to the Fund until the transaction settles and payment takes place. A segregated account is established and the Fund maintains cash and/or marketable securities at least equal in value to commitments for delayed-delivery or when-issued securities. If the Fund owns delayed-delivery or when-issued securities, these values are included in Payable for investments purchased on the accompanying Statement of Assets and Liabilities and the segregated assets are identified on the Schedule of Portfolio Investments.
Municipal Obligations:
The values of municipal obligations can fluctuate and may be affected by adverse tax, legislative, or political changes, and by financial developments affecting municipal issuers. Payment of municipal obligations may depend on a relatively limited source of revenue, resulting in greater credit risk. Future changes in federal tax laws or the activity of an issuer may adversely affect the tax-exempt status of municipal obligations.
Below-Investment-Grade Securities:
The Fund may invest in below-investment-grade securities (i.e. lower-quality, "junk" debt), which are subject to various risks. Lower-quality debt is considered to be speculative because it is less certain that the issuer will be able to pay interest or repay the principal than in the case of investment grade debt. These securities can involve a substantially greater risk of default than higher-rated securities, and their values can decline significantly over short periods of time. Lower-quality debt securities tend to be more sensitive to adverse news about their issuers, the market and the economy in general, than higher-quality debt securities. The market for these securities can be less liquid, especially during periods of recession or general market decline.
Derivative Instruments:
Futures Contracts:
The Fund may enter into contracts for the future delivery of securities or foreign currencies and futures contracts based on a specific security, class of securities, foreign currency or an index, and purchase or sell options on any such futures contracts. A futures contract on a securities index is an agreement obligating either party to pay, and entitling the other party to receive, while the contract is outstanding, cash payments based on the level of a specified securities index. No physical delivery of the underlying asset is made. The Fund may enter into futures contracts in an effort to hedge against market risks. The acquisition of put and call options on futures contracts will give the Fund the right (but not the obligation), for a specified price, to sell or to purchase the underlying futures contract, upon exercise of the option, at any time during the option period. Futures transactions involve brokerage costs and require the Fund to segregate assets to cover contracts that would require it to purchase securities or currencies. A good faith margin deposit, known as initial margin, of cash or government securities with
42
USAA Mutual Funds Trust | | Notes to Financial Statements — continued
May 31, 2021 | |
a broker or custodian is required to initiate and maintain open positions in futures contracts. Subsequent payments, known as variation margin, are made or received by the Fund based on the change in the market value of the position and are recorded as unrealized appreciation or depreciation until the contract is closed out, at which time the gain or loss is realized. The Fund may lose the expected benefit of futures transactions if interest rates, exchange rates or securities prices change in an unanticipated manner. Such unanticipated changes may also result in lower overall performance than if the Fund had not entered into any futures transactions. In addition, the value of the Fund's futures positions may not prove to be perfectly or even highly correlated with the value of its portfolio securities or foreign currencies, limiting the Fund's ability to hedge effectively against interest rate, exchange rate and/or market risk and giving rise to additional risks. There is no assurance of liquidity in the secondary market for purposes of closing out futures positions. The collateral held by the Fund is reflected on the Schedule of Portfolio Investments. During the year ended May 31, 2021, the Fund entered into futures contracts primarily for the strategy of hedging or other purposes, including but not limited to, providing liquidity and equitizing cash.
Summary of Derivative Instruments:
The following table summarizes the fair values of derivative instruments on the Statement of Assets and Liabilities, categorized by risk exposure, as of May 31, 2021 (amounts in thousands):
| | | Assets | | Liabilities | |
| | | Variation Margin
Receivable on Open
Futures Contracts* | | Variation Margin
Payable on Open
Futures Contracts* | |
Equity Risk Exposure | | $ | 115 | | | $ | — | | |
* Includes cumulative unrealized appreciation (depreciation) of futures contracts as reported on the Schedule of Portfolio Investments. Only current day's variation margin for futures contracts is reported within the Statement of Assets and Liabilities.
The following table presents the effect of derivative instruments on the Statement of Operations, categorized by risk exposure, for the year ended May 31, 2021 (amounts in thousands):
| | Net Realized Gains (Losses) on
Derivatives Recognized as
a Result of Operations | | Net Change in Unrealized
Appreciation/Depreciation
on Derivatives Recognized
as a Result of Operations | |
| | | Net Realized Gains (Losses)
from Futures Contracts | | Net Change in Unrealized
Appreciation/Depreciation
on Futures Contracts | |
Equity Risk Exposure | | $ | 1,602 | | | $ | (896 | ) | |
All open derivative positions at year end are reflected on the Fund's Schedule of Portfolio Investments. The underlying face value of open derivative positions relative to the Fund's net assets at year end is generally representative of the notional amount of open positions to net assets throughout the year.
Investment Transactions and Related Income:
Changes in holdings of investments are accounted for no later than one business day following the trade date. For financial reporting purposes, however, investment transactions are accounted for on trade date on the last business day of the reporting period. Interest income is determined on the basis of coupon interest accrued using the effective interest method which adjusts, where applicable, the amortization of premiums or accretion of discount. Dividend income is recorded on the ex-dividend date. Gains or losses realized on sales of securities are recorded on the identified cost basis.
Securities Lending:
The Fund, through a securities lending agreement with Citibank, N.A. ("Citibank"), may lend its securities to qualified financial institutions, such as certain broker-dealers, to earn additional income, net of
43
USAA Mutual Funds Trust | | Notes to Financial Statements — continued
May 31, 2021 | |
income retained by Citibank. Borrowers are required to secure their loans for collateral in the amount of at least 102% of the value of U.S. securities loaned or at least 105% of the value of non-U.S. securities loaned, marked-to-market daily. Any collateral shortfalls associated with increases in the valuation of the securities loaned are cured the next business day once the shortfall exceeds $100 thousand. Collateral may be cash, U.S. government securities, or other securities as permitted by Securities and Exchange Commission ("SEC") guidelines. Cash collateral may be invested in high-quality short-term investments, primarily open-end investment companies. Collateral requirements are determined daily based on the value of the Fund's securities on loan as of the end of the prior business day. During the time portfolio securities are on loan, the borrower will pay the Fund any dividends or interest paid on such securities plus any fee negotiated between the parties to the lending agreement. The Fund also earns a return from the collateral. The Fund pays Citibank various fees in connection with the investment of cash collateral and fees based on the investment income received from securities lending activities. Securities lending income (net of these fees) is disclosed on the Statement of Operations. Loans are terminable upon demand and the borrower must return the loaned securities within the lesser of one standard settlement period or five business days. Risks relating to securities-lending transactions include that the borrower may not provide additional collateral when required or return the securities when due, and that the value of the short-term investments will be less than the amount of cash collateral required to be returned to the borrower. The Fund's agreement with Citibank does not include master netting provisions. Non-cash collateral received by the Fund may not be sold or re-pledged, except to satisfy borrower default. Cash collateral is listed on the Fund's Schedule of Portfolio Investments and Financial Statements while non-cash collateral is not included.
The following table (amounts in thousands) is a summary of the Fund's securities lending transactions as of May 31, 2021.
Value of
Securities on Loan | | Non-Cash Collateral | | Cash Collateral | |
| $ | 265 | | | $ | — | | | $ | 283 | | |
Federal Income Taxes:
It is the Fund's policy to continue to qualify as a regulated investment company by complying with the provisions available to certain investment companies, as defined in applicable sections of the Internal Revenue Code, and to make distributions of net investment income and net realized gains sufficient to relieve it from all, or substantially all, federal income taxes. Accordingly, no provision for federal income taxes is required in the financial statements. The Fund has a tax year end of May 31.
Management of the Fund has reviewed tax positions taken in tax years that remain subject to examination by all major tax jurisdictions, including federal (i.e., the last four tax years, which includes the current fiscal tax year end). Management believes that there is no tax liability resulting from unrecognized tax benefits related to uncertain tax positions taken.
Allocations:
Expenses directly attributable to the Fund are charged to the Fund, while expenses that are attributable to more than one fund in the Trust, or jointly with an affiliated trust, are allocated among the respective funds in the Trust and/or affiliated trust based upon net assets or another appropriate basis.
Income, expenses (other than class-specific expenses such as transfer agent fees, state registration fees, printing fees and 12b-1 fees), and realized and unrealized gains or losses on investments are allocated to each class of shares based on its relative net assets on the date income is earned or expenses and realized and unrealized gains and losses are incurred.
Cross-Trade Transactions:
Pursuant to Rule 17a-7 under the 1940 Act, the Fund may engage in cross-trades, which are securities transactions with affiliated investment companies and advisory accounts managed by the Adviser and any applicable sub-adviser. Any such purchase or sale transaction must be effected without brokerage commission or other remuneration, except for customary transfer fees. The transaction must be effected
44
USAA Mutual Funds Trust | | Notes to Financial Statements — continued
May 31, 2021 | |
at the current market price, which is either the security's last sale price on an exchange or, if there are no transactions in the security that day, at the average of the highest bid and lowest asked price. For the year ended May 31, 2021, the Fund engaged in the following securities transactions with affiliated funds, which resulted in the following net realized gains (losses) (amounts in thousands):
| Purchases | | Sales | | Net Realized
Gains (Losses) | |
| $ | 34,625 | | | $ | 28,940 | | | $ | — | | |
Fees Paid Indirectly:
Expense offsets to custody fees that arise from credits on cash balances maintained on deposit are reflected on the Statement of Operations, as applicable, as Fees paid indirectly.
3. Purchases and Sales:
Cost of purchases and proceeds from sales/maturities of securities (excluding securities maturing less than one year from acquisition) for the year ended May 31, 2021, were as follows for the Fund (amounts in thousands):
| | | Excluding
U.S. Government Securities | |
| | | Purchases | | Sales | |
| | | | | $ | 97,033 | | | $ | 68,148 | | |
There were no purchases or sales of U.S. government securities during the year ended May 31, 2021.
4. Fees and Transactions with Affiliates and Related Parties:
Investment Advisory Fees:
Investment advisory services are provided to the Fund by the Adviser, which is a New York corporation registered as an investment adviser with the SEC. The Adviser is an indirect wholly owned subsidiary of Victory Capital Holdings, Inc., a publicly traded Delaware corporation, and a wholly owned direct subsidiary of Victory Capital Operating, LLC.
Under the terms of the Investment Advisory Agreement, the Adviser is entitled to receive a base fee and a performance adjustment. The Fund's base fee is accrued daily and paid monthly at an annualized rate of 0.30% of the Fund's average daily net assets. Amounts incurred and paid to VCM for the year ended May 31, 2021, are reflected on the Statement of Operations as Investment Advisory fees.
On November 6, 2018, United Services Automobile Association ("USAA"), the parent company of USAA Asset Management Company ("AMCO"), the prior investment adviser to the Fund announced that AMCO would be acquired by Victory Capital Holdings Inc. (the "Transaction"). A special shareholder meeting was held on April 18, 2019, at which shareholders of the Fund approved a new investment advisory agreement between the Trust, on behalf of the Fund, and VCM. The Transaction closed on July 1, 2019, and effective July 1, 2019, VCM replaced AMCO as the investment adviser to the Fund and no performance adjustments were made for the period beginning July 1, 2019, through June 30, 2020. Only performance beginning as of July 1, 2019, and thereafter is utilized in calculating future performance adjustments.
The performance adjustment for each share class is accrued daily and calculated monthly by comparing each class' performance to that of the Lipper Composite Index which is comprised of 51% of the Lipper General & Insured Municipal Bond Funds Index and 49% of the Lipper Large-Cap Core Funds Index.
45
USAA Mutual Funds Trust | | Notes to Financial Statements — continued
May 31, 2021 | |
The performance period for each share class consists of the current month plus the previous 35 months (or the number of months beginning July 1, 2019, if fewer). The following table is utilized to determine the extent of the performance adjustment:
Over/Under Performance Relative to Index
(in basis points)(a) | | Annual Adjustment Rate
(in basis points)(a) | |
| | +/- 20 to 50 | | | | +/- 4 | | |
| | +/- 51 to 100 | | | | +/- 5 | | |
| | +/- 101 and greater | | | | +/- 6 | | |
(a) Based on the difference between average annual performance of the relevant share class of the Fund and its relevant Lipper index, rounded to the nearest basis point.
Each class' annual performance adjustment rate is multiplied by the average daily net assets of each respective class over the entire performance period, which is then multiplied by a fraction, the numerator of which is the number of days in the month and the denominator of which is 365 (366 in leap years). The resulting amount is then added to (in the case of overperformance), or subtracted from (in the case of underperformance) the base fee.
Under the performance fee arrangement, each class pays a positive performance fee adjustment for a performance period whenever the class outperforms the Lipper Composite Index over that period, even if the class has overall negative returns during the performance period.
For the performance period July 1, 2020, to May 31, 2021, performance adjustments were $161, $(1), less than $1 thousand and less than $(1) thousand for Fund Shares, Institutional Shares, Class A, and Class C, in thousands, respectively. Performance adjustments were 0.03%, less than (0.01)%, less than 0.01%, and less than (0.01)%, for Fund Shares, Institutional Shares, Class A, and Class C, respectively. The performance adjustment rate included in the investment advisory fee may differ from the maximum over/under Annual Adjustment Rate due to differences in average net assets for the reporting period and rolling 36 month performance periods.
The Trust relies on an exemptive order granted to VCM and its affiliated funds by the SEC in March 2019 permitting the use of a "manager-of-managers" structure for certain funds. Under a manager-of-managers structure, the investment adviser may select (with approval of the Board and without shareholder approval) one or more subadvisers to manage the day-to-day investment of a fund's assets.
VCM entered into a Subadvisory Agreement with Northern Trust Investments, Inc. ("NTI") under which NTI directs the investment and reinvestment of the Fund's assets allocated to it in accordance with the Fund's investment objective, policies, and restrictions, subject to the general supervision of the Board and VCM. This arrangement provides for monthly fees that are paid by VCM. VCM (not the Fund) pays the subadviser fees.
Administration and Servicing Fees:
VCM serves as the Fund's administrator and fund accountant. Under the Fund Administration, Servicing and Accounting Agreement, VCM is paid for its services an annual fee at a rate of 0.15%, 0.10%, 0.15% and 0.15% of average daily net assets of the Fund Shares, Institutional Shares, Class A and Class C, respectively. Amounts incurred for the year ended May 31, 2021, are reflected on the Statement of Operations as Administration fees.
The Fund (as part of the Trust) has entered into an agreement to provide compliance services with the Adviser, pursuant to which the Adviser furnishes its compliance personnel, including the services of the Chief Compliance Officer ("CCO"), and other resources reasonably necessary to provide the Trust with compliance oversight services related to the design, administration and oversight of a compliance program for the Trust in accordance with Rule 38a-1 under the 1940 Act. The CCO is an employee of the Adviser, which pays the compensation of the CCO and support staff. Funds in the Trust, Victory Variable Insurance Funds, Victory Portfolios, and Victory Portfolios II (collectively, the "Victory Funds Complex") in the aggregate, compensate the Adviser for these services. Amounts incurred for the year ended May 31, 2021, are reflected on the Statement of Operations as Compliance fees.
46
USAA Mutual Funds Trust | | Notes to Financial Statements — continued
May 31, 2021 | |
Citi Fund Services Ohio, Inc. ("Citi"), an affiliate of Citibank, acts as sub-administrator and sub-fund accountant to the Fund pursuant to a Sub-Administration and Sub-Fund Accounting Services Agreement between VCM and Citi. VCM pays Citi a fee for providing these services. The Fund reimburses VCM and Citi for out-of-pocket expenses incurred in providing these services and certain other expenses specifically allocated to the Fund. Amounts incurred for the year ended May 31, 2021, are reflected on the Statement of Operations as Sub-Administration fees.
Transfer Agency Fees:
Victory Capital Transfer Agency, Inc. ("VCTA"), an affiliate of the Adviser, provides transfer agency services to the Fund. VCTA provides transfer agent services to the Fund Shares based on an annual charge of $23 per shareholder account plus out-of-pocket expenses. VCTA pays a portion of these fees to certain intermediaries for the administration and servicing of accounts that are held with such intermediaries. Transfer agent's fees for Institutional Shares, Class C and Class A are paid monthly based on a fee accrued daily at an annualized rate of 0.10%, 0.10% and 0.10%, respectively, of average daily net assets, plus out-of-pocket expenses. Amounts incurred and paid to VCTA for the year ended May 31, 2021, are reflected on the Statement of Operations as Transfer Agent fees
FIS Investor Services LLC serves as sub-transfer agent and dividend disbursing agent for the Fund pursuant to a Sub-Transfer Agent Agreement between VCTA and FIS Investor Services LLC. VCTA provides FIS Investor Services LLC a fee for providing these services.
Distributor/Underwriting Services:
Victory Capital Services, Inc. (the "Distributor"), an affiliate of the Adviser, serves as distributor for the continuous offering of the shares of the Fund pursuant to a Distribution Agreement between the Distributor and the Trust. Effective June 30, 2020, the Distributor's name was changed from Victory Capital Advisers, Inc.
Pursuant to the Distribution and Service Plans adopted in accordance with Rule 12b-1 under the 1940 Act, the Distributor may receive a monthly distribution and service fee, at an annual rate of up to 0.25% of the average daily net assets of Class A and 1.00% of the average daily net assets of Class C. The distribution and service fees paid to the Distributor may be used by the Distributor to pay for activity primarily intended to result in the sale of Class A and Class C. Amounts incurred and paid to the Distributor for the year ended May 31, 2021, are reflected on the Statement of Operations as 12b-1 fees.
In addition, the Distributor is entitled to receive commissions on sales of Class A. For the year ended May 31, 2021, the Distributor received less than $1 thousand dollars from commissions earned on the sale of Class A.
Other Fees:
Citibank serves as the Fund's custodian. The Fund pays Citibank a fee for providing these services. Amounts incurred for the year ended May 31, 2021, are reflected on the Statement of Operations as Custodian fees.
K&L Gates LLP provides legal services to the Trust.
The Adviser has entered into an expense limitation agreement with the Fund until at least June 30, 2023. Under the terms of the agreement, the Adviser has agreed to waive fees or reimburse certain expenses to the extent that ordinary operating expenses incurred by certain classes of the Fund in any fiscal year exceed the expense limit for such classes of the Fund. Such excess amounts will be the liability of the Adviser. Acquired fund fees and expenses, interest, taxes, brokerage commissions, other expenditures, that are capitalized in accordance with GAAP, and other extraordinary expenses not incurred in the ordinary course of the Fund's business are excluded from the expense limits. As of May 31, 2021, the expense limits (excluding voluntary waivers) were 0.61%, 0.57%, 0.86% and 1.61% for Fund Shares, Institutional Shares, Class A and Class C, respectively.
Under the terms of the expense limitation agreement, amended May 1, 2021, the Fund has agreed to repay fees and expenses that were waived or reimbursed by the Adviser for a period of up to three years (thirty six (36) months) after the waiver or reimbursement took place, subject to the lesser of any
47
USAA Mutual Funds Trust | | Notes to Financial Statements — continued
May 31, 2021 | |
operating expense limits in effect at the time of: (a) the original waiver or expense reimbursement; or (b) the recoupment, after giving effect to the recoupment amount. Prior to May 1, 2021, the fund was permitted to recoup fees waived and expenses reimbursed for up to three years after the fiscal year in which the waiver or reimbursement took place, subject to the limitations above. This change did not have any effect on the amounts previously reported for recoupment.
As of May 31, 2021, the following amounts are available to be repaid to the Adviser (amounts in thousands). The Fund has not recorded any amounts available to be repaid as a liability due to an assessment that such repayment is not probable at May 31, 2021.
| Expires 2024 | | Total | |
| $ | 38 | | | $ | 38 | | |
The Adviser may voluntarily waive or reimburse additional fees to assist the Fund in maintaining competitive expense ratios. Voluntary waivers and reimbursements applicable to the Fund are not available to be recouped at a future time. There were no voluntary waivers or reimbursements for the year ended May 31, 2021.
Certain officers and/or interested trustees of the Fund are also officers and/or employees of the Adviser, administrator, fund accountant, sub-administrator, sub-fund accountant, custodian, and Distributor.
5. Risks:
The Fund may be subject to other risks in addition to these identified risks.
Geopolitical/Natural Disaster Risk — Global economies and financial markets are increasingly interconnected, which increases the possibilities that conditions in one country or region might adversely affect issuers in another country or region. Geopolitical and other risks, including war, terrorism, trade disputes, political or economic dysfunction within some nations, public health crises and related geopolitical events, as well as environmental disasters such as earthquakes, fires, and floods, may add to instability in world economies and markets generally. Changes in trade policies and international trade agreements could affect the economies of many countries in unpredictable ways. Likewise, systemic market dislocations of the kind that occurred during the financial crisis that began in 2008, if repeated, would be highly disruptive to economies and markets, adversely affecting individual companies and industries, securities markets, interest rates, credit ratings, inflation, investor sentiment, and other factors affecting the value of a Fund's investments. Some countries, including the United States, are adopting more protectionist trade policies and moving away from the tighter financial industry regulations that followed the 2008 financial crisis, which may also affect the value of a Fund's investments.
Political events within the United States at times have resulted, and may in the future result, in a shutdown of government services, which could negatively affect the U.S. economy, decrease the value of a Fund's investments, increase uncertainty in or impair the operation of the U.S. or other securities markets, and degrade investor and consumer confidence, perhaps suddenly and to a significant degree.
An outbreak of disease called COVID-19 has spread internationally. The transmission of COVID-19 and efforts to contain its spread have resulted in international, national, and local border closings and other significant travel restrictions and disruptions, significant disruptions to business operations, supply chains and consumer activity, significant challenges in healthcare service preparation and delivery, quarantines, and general concern and uncertainty. These negative impacts have caused significant volatility and declines in global financial markets, which have caused losses for Fund investors during and subsequent to period end. The impact of the COVID-19 pandemic may last for an extended period of time, and could result in a substantial economic downturn or recession. Public health crises may exacerbate other pre-existing political, social, economic, market, and financial risks. The extent of the impact to the financial performance of the Fund's investments will depend on future developments, including (i) the duration and spread of the outbreak, (ii) the restrictions and advisories, (iii) the effects on the financial markets, and (iv) the effects on the economy overall, all of which are highly uncertain and cannot be predicted.
48
USAA Mutual Funds Trust | | Notes to Financial Statements — continued
May 31, 2021 | |
Debt Securities Risk — The value of a debt security or other income-producing security changes in response to various factors including, for example, market-related factors (such as changes in interest rates or changes in the risk appetite of investors generally) and changes in the actual or perceived ability of the issuer (or of issuers generally) to meet its (or their) obligations.
Other factors that may affect the value of debt securities include, among others, public health crises and responses by governments and companies to such crises. These and other events may affect the creditworthiness of the issuer of a debt security and may impair an issuer's ability to timely meet its debt obligations as they come due.
Credit Risk — The fixed-income securities in the Fund's portfolio are subject to credit risk, which is the possibility that an issuer of a fixed-income security will fail to make timely interest and/or principal payments on its securities or that negative market perceptions of the issuer's ability to make such payments will cause the price of that security to decline. The Fund accepts some credit risk as a recognized means to enhance an investor's return. All fixed-income securities, varying from the highest quality to the very speculative, have some degree of credit risk. Fixed-income securities rated below investment grade, also known as "junk" or high-yield bonds, generally entail greater economic, credit, and liquidity risk than investment-grade securities. Their prices may be more volatile, especially during economic downturns, financial setbacks, or liquidity events.
Interest Rate Risk — The Fund is subject to the risk that the market value of the bonds in its portfolio will fluctuate because of changes in interest rates, changes in the supply of and demand for tax-exempt securities, and other market factors. Bond prices generally are linked to the prevailing market interest rates. In general, when interest rates rise, bond prices fall; conversely, when interest rates fall, bond prices rise. The price volatility of a bond also depends on its duration. Generally, the longer the duration of a bond, the greater is its sensitivity to interest rates. To compensate investors for this higher interest rate risk, bonds with longer durations generally offer higher yields than bonds with shorter durations. The ability of an issuer of a debt security to repay principal prior to a security's maturity can increase the security's sensitivity to interest rate changes.
Decisions by the U.S. Federal Reserve (also known as the "Fed") regarding interest rate and monetary policy, which can be difficult to predict and sometimes change direction suddenly in response to economic and market events, can have a significant effect on the value of fixed-income securities as well as the overall strength of the U.S. economy. Precise interest rate predictions are difficult to make, and interest rates may change unexpectedly and dramatically in response to extreme changes in market or economic conditions. As a result, the value of fixed-income securities may vary widely under certain market conditions.
LIBOR Discontinuation Risk — Many debt securities, derivatives and other financial instruments, including some of the Fund's investments, use the London Interbank Offered Rate ("LIBOR") as the reference or benchmark rate for variable interest rate calculations. In June 2017, the Alternative Reference Rates Committee, a group of large U.S. banks working with the Federal Reserve, announced its selection of a new Secured Overnight Funding Rate ("SOFR"), which is intended to be a broad measure of secured overnight U.S. Treasury repo rates, as an appropriate replacement for LIBOR. The Federal Reserve Bank of New York began publishing the SOFR in 2018, expecting that it could be used on a voluntary basis in new instruments and transactions. Bank working groups and regulators in other countries have suggested other alternatives for their markets, including the Sterling Overnight Interbank Average Rate ("SONIA") in England. In July 2017, the Financial Conduct Authority (the "FCA"), the United Kingdom financial regulatory body, announced that after 2021 it will cease its active encouragement of UK banks to provide the quotations needed to sustain LIBOR. That announcement suggests that LIBOR may cease to be published after that time. For U.S. dollar LIBOR, however, the relevant date may be deferred to June 30, 2023, for the most common tenors (overnight and one, three, six and 12 months). As to those tenors, the LIBOR administrator has published a consultation regarding its intention to cease publication of U.S. dollar LIBOR as of June 30, 2023, (instead of December 31, 2021, as previously expected), apparently based on continued rate submissions from banks. It is expected that there will be enough time for market participants to transition to the use of a different benchmark for both new and existing securities and transactions. Various financial industry groups
49
USAA Mutual Funds Trust | | Notes to Financial Statements — continued
May 31, 2021 | |
have begun planning for that transition, but there are obstacles to converting certain longer-term securities and transactions to a new benchmark. Transition planning is at an early stage, and neither the effect of the transition process nor its ultimate success can yet be known. Although the foregoing may provide some sense of timing, there is no assurance that LIBOR, or any particular currency and tenor, will continue to be published until any particular date, and it appears highly likely that LIBOR will be discontinued or modified after December 31, 2021, or June 30, 2023, depending on the currency and tenor. The transition process might lead to increased volatility and illiquidity in markets that currently rely on the LIBOR to determine interest rates. It could also lead to a reduction in the value of some LIBOR-based investments and reduce the effectiveness of new hedges placed against existing LIBOR-based instruments. Since the usefulness of LIBOR as a benchmark could deteriorate during the transition period, these effects could occur before the end of 2021.
6. Borrowing and Interfund Lending:
Line of Credit:
The Victory Funds Complex participated in a short-term demand note "Line of Credit" agreement with Citibank. The Line of Credit agreement with Citibank was renewed on June 29, 2020, with a termination date of June 28, 2021. Under the agreement with Citibank, the Victory Funds Complex may borrow up to $600 million, of which $300 million is committed and $300 million is uncommitted. $40 million of the Line of Credit is reserved for use by the Victory Floating Rate Fund, another series of the Victory Funds Complex, with Victory Floating Rate Fund paying the related commitment fees for that amount. The purpose of the Line of Credit is to meet temporary or emergency cash needs. For the year ended May 31, 2021, Citibank received an annual commitment fee of 0.15% on $300 million for providing the Line of Credit. Each fund in the Victory Funds Complex pays a pro-rata portion of the commitment fees plus any interest (one month LIBOR plus one percent) on amounts borrowed. For the period June 29, 2020, through April 30, 2021, under an amended Line of Credit agreement, Citibank received an annual upfront fee of 0.10% on the $300 million committed line of credit. Each fund in the Victory Funds Complex paid a pro-rata portion of the upfront fee. Effective with the next amendment, the annual commitment fee of 0.15% will remain unchanged and the upfront fee of 0.10% is discontinued. Interest charged to each fund during the period, if applicable, is reflected on the Statement of Operations under Line of credit fees.
The Fund had no borrowings under the Line of Credit agreement during the year ended May 31, 2021.
Interfund Lending:
The Trust and Adviser rely on an exemptive order granted by the SEC in March 2017 (the "Order"), permitting the establishment and operation of an Interfund Lending Facility (the "Facility"). The Facility allows the Fund to directly lend and borrow money to or from any other fund in the Victory Funds Complex that is permitted to participate in the Facility, relying upon the Order at rates beneficial to both the borrowing and lending funds. Advances under the Facility are allowed for temporary or emergency purposes, including the meeting of redemption requests that otherwise might require the untimely disposition of securities, and are subject to each Fund's borrowing restrictions. The interfund loan rate is determined, as specified in the Order, by averaging the current repurchase agreement rate and the current bank loan rate. As a Borrower, interest charged to the Fund, if any, during the period is reflected on the Statement of Operations under Interfund lending fees. As a Lender, interest earned by the Fund, if any, during the period is presented on the Statement of Operations under Interfund lending.
The Fund did not utilize or participate in the Facility during the year ended May 31, 2021.
7. Federal Income Tax Information:
The Fund intends to distribute any net investment income quarterly. Distributable net realized gains, if any, are declared and paid at least annually.
50
USAA Mutual Funds Trust | | Notes to Financial Statements — continued
May 31, 2021 | |
The amounts of dividends from net investment income and distributions from net realized gains (collectively distributions to shareholders) are determined in accordance with federal income tax regulations, which may differ from GAAP. To the extent these "book/tax" differences are permanent in nature (e.g., net operating loss and distribution reclassification), such amounts are reclassified within the components of net assets based on their federal tax-basis treatment; temporary differences (e.g., wash sales) do not require reclassification. To the extent dividends and distributions exceed net investment income and net realized gains for tax purposes, they are reported as distributions of capital. Net investment losses incurred by the Fund may be reclassified as an offset to capital on the accompanying Statement of Assets and Liabilities.
As of May 31, 2021, on the Statement of Assets and Liabilities, there were no permanent book-to-tax difference reclassification adjustments.
The tax character of distributions paid during the tax years ended as noted below, were as follows (total distributions paid may differ from the Statement of Changes in Net Assets because, for tax purposes, dividends are recognized when actually paid) (amounts in thousands).
| | Year Ended May 31, 2021 | | Year Ended May 31, 2020 | |
| | | Distributions
paid from | |
| | Distributions
paid from | |
| |
| | |
Ordinary
Income | |
Tax-Exempt
Income | |
Total
Distributions
Paid | |
Ordinary
Income | | Net
Long-Term
Capital
Gains | | Tax-Exempt
Income | | Total
Distributions
Paid | |
| | | | | $ | 3,509 | | | $ | 8,897 | | | $ | 12,406 | | | $ | 3,912 | | | $ | 83 | | | $ | 8,684 | | | $ | 12,679 | | |
As of May 31, 2021, the components of accumulated earnings (loss) on a tax basis were as follows (amounts in thousands):
| | | Undistributed
Ordinary
Income | | Undistributed
Tax-Exempt
Income | | Accumulated
Earnings | | Accumulated
Capital and
Other
Losses | | Unrealized
Appreciation
(Depreciation)* | | Total
Accumulated
Earnings
(Loss) | |
| | | | | $ | 2,473 | | | $ | 102 | | | $ | 2,575 | | | $ | (11,277 | ) | | $ | 270,677 | | | $ | 261,975 | | |
* The difference between the book-basis and tax-basis of unrealized appreciation/depreciation is attributable to the tax deferral of losses on wash sales, futures, and REITs/return of capital.
As of May 31, 2021, the Fund had net capital loss carryforwards as shown in the table below (amounts in thousands). It is unlikely that the Board will authorize a distribution of capital gains realized in the future until the capital loss carryforwards have been used.
| Short-Term Amount | | Total | |
$ | 11,277 | | | $ | 11,277 | | |
During the most recent tax year ended May 31, 2021, the Fund utilized $5,857 thousand of capital loss carryforwards.
As of May 31, 2021, the cost basis for federal income tax purposes, gross unrealized appreciation, gross unrealized depreciation, and net unrealized appreciation (depreciation) for investments were as follows (amounts in thousands):
Cost of
Investments
for Federal
Tax Purposes | | Gross
Unrealized
Appreciation | | Gross
Unrealized
Depreciation | | Net
Unrealized
Appreciation
(Depreciation) | |
| $ | 489,141 | | | $ | 274,588 | | | $ | (3,911 | ) | | $ | 270,677 | | |
51
REPORT OF INDEPENDENT REGISTERED PUBLIC ACCOUNTING FIRM
To the Shareholders and the Board of Trustees of USAA Growth and Tax Strategy Fund
Opinion on the Financial Statements
We have audited the accompanying statement of assets and liabilities of USAA Growth and Tax Strategy Fund (the "Fund") (one of the funds constituting USAA Mutual Funds Trust (the "Trust")), including the schedule of portfolio investments, as of May 31, 2021, and the related statement of operations for the year then ended, the statements of changes in net assets for each of the two years in the period then ended, the financial highlights for each of the five years in the period then ended and the related notes (collectively referred to as the "financial statements"). In our opinion, the financial statements present fairly, in all material respects, the financial position of the Fund (one of the funds constituting USAA Mutual Funds Trust) at May 31, 2021, the results of its operations for the year then ended, the changes in its net assets for each of the two years in the period then ended and its financial highlights for each of the five years in the period then ended, in conformity with U.S. generally accepted accounting principles.
Basis for Opinion
These financial statements are the responsibility of the Trust's management. Our responsibility is to express an opinion on the Fund's financial statements based on our audits. We are a public accounting firm registered with the Public Company Accounting Oversight Board (United States) ("PCAOB") and are required to be independent with respect to the Trust in accordance with the U.S. federal securities laws and the applicable rules and regulations of the Securities and Exchange Commission and the PCAOB.
We conducted our audits in accordance with the standards of the PCAOB. Those standards require that we plan and perform the audit to obtain reasonable assurance about whether the financial statements are free of material misstatement, whether due to error or fraud. The Trust is not required to have, nor were we engaged to perform, an audit of the Trust's internal control over financial reporting. As part of our audits we are required to obtain an understanding of internal control over financial reporting, but not for the purpose of expressing an opinion on the effectiveness of the Trust's internal control over financial reporting. Accordingly, we express no such opinion.
Our audits included performing procedures to assess the risks of material misstatement of the financial statements, whether due to error or fraud, and performing procedures that respond to those risks. Such procedures included examining, on a test basis, evidence regarding the amounts and disclosures in the financial statements. Our procedures included confirmation of securities owned as of May 31, 2021, by correspondence with the custodian and brokers or by other appropriate auditing procedures where replies from brokers were not received. Our audits also included evaluating the accounting principles used and significant estimates made by management, as well as evaluating the overall presentation of the financial statements. We believe that our audits provide a reasonable basis for our opinion.

We have served as the auditor of one or more Victory Capital investment companies since 1995.
San Antonio, Texas
July 28, 2021
52
USAA Mutual Funds Trust | | Supplemental Information
May 31, 2021 | |
(Unaudited)
Trustee and Officer Information
Board of Trustees:
Overall responsibility for management of the Trust rests with the Board. The Trust is managed by the Board in accordance with the laws of the state of Delaware. There are currently nine Trustees, seven of whom are not "interested persons" of the Trust within the meaning of that term under the 1940 Act ("Independent Trustees") and two of whom are "interested persons" of the Trust within the meaning of that term under the 1940 Act ("Interested Trustee"). The Trustees, in turn, elect the officers of the Trust to actively supervise its day-to-day operations.
The following tables list the Trustees, their ages, position with the Trust, commencement of service, principal occupations during the past five years and any directorships of other investment companies or companies whose securities are registered under the Securities Exchange Act of 1934, as amended, or who file reports under that Act. Each Trustee oversees 46 portfolios in the Trust. Each Trustee's address is 15935 La Cantera Pkwy, San Antonio, TX, 78256. Pursuant to a policy adopted by the Board, the term of office for each Trustee shall be until the Independent Trustee reaches age 75 or an Interested Trustee reaches age 75. The Board may change or grant exceptions from this policy at any time without shareholder approval. A Trustee may resign or be removed by a vote of the other Trustees or the holders of a majority of the outstanding shares of the Trust at any time. Vacancies on the Board can be filled by the action of a majority of the Trustees, provided that after filling such vacancy at least two-thirds of the Trustees have been elected by the shareholders.
Name and Date of Birth | | Position
Held with
the Trust | | Year
Commenced
Service | | Principal Occupation
During Past 5 Years | | Other
Directorships
Held During
Past 5 Years | |
Independent Trustees. | |
Jefferson C. Boyce, (c)
Born September 1957 | | Independent Chairman | | | 2021 | | | Senior Managing Director, New York Life Investments, LLC (1992-2012) | | Westhab, Inc. | |
John C. Walters,
Born February 1962 | | Trustee | | | 2019 | | | Retired. Mr. Walters brings significant Board experience including active involvement with the board of a Fortune 500 company, and a proven record of leading large, complex financial organizations. He has a demonstrated record of success in distribution, manufacturing, investment brokerage, and investment management in both the retail and institutional investment businesses. He has substantial experience in the investment management business with a demonstrated ability to develop and drive strategy while managing operation, financial, and investment risk. | | Guardian Variable Products Trust (16 series), Lead Independent Director; Amerilife Holdings LLC, Director; Stadion Money Management; Director; University of North Carolina (Chapel Hill), Member Board of Governors | |
53
USAA Mutual Funds Trust | | Supplemental Information — continued
May 31, 2021 | |
(Unaudited)
Name and Date of Birth | | Position
Held with
the Trust | | Year
Commenced
Service | | Principal Occupation
During Past 5 Years | | Other
Directorships
Held During
Past 5 Years | |
Robert L. Mason, Ph.D.,
Born July 1946 | | Trustee | | | 1997 | | | Adjunct Professor in the Department of Management Science and Statistics in the College of Business at the University of Texas at San Antonio (since 2001); Institute Analyst, Southwest Research Institute (March 2002-January 2016) | | None | |
Dawn M. Hawley,
Born February 1954 | | Trustee | | | 2014 | | | Manager of Finance, Menil Foundation, Inc. (May 2007-June 2011), which is a private foundation that oversees the assemblage of sculptures, prints, drawings, photographs, and rare books. Director of Financial Planning and Analysis and Chief Financial Officer, AIM Management Group, Inc. (October 1987-January 2006) | | None | |
Paul L. McNamara,
Born July 1948 | | Trustee | | | 2012 | | | Director, Cantor Opportunistic Alternatives Fund, LLC (March 2010-February 2014), which is a closed-end fund of funds by Cantor Fitzgerald Investment Advisors, LLC | | None | |
54
USAA Mutual Funds Trust | | Supplemental Information — continued
May 31, 2021 | |
(Unaudited)
Name and Date of Birth | | Position
Held with
the Trust | | Year
Commenced
Service | | Principal Occupation
During Past 5 Years | | Other
Directorships
Held During
Past 5 Years | |
Richard Y. Newton III,
Born January 1956 | | Trustee | | | 2017 | | | Director, Elta North America (01/18-present), which is a global leader in the design, manufacture, and support of innovative electronic systems in the ground, maritime, airborne, and security domains for the nation's warfighters, security personnel, and first responders; Managing Partner, Pioneer Partnership Development Group (December 2015-present)); Executive Director, The Union League Club of New York (June 2014-November 2015): Executive Vice President, Air Force Association (August 2012-May 2014); Lieutenant General, United States Air Force (January 2008-June 2012) | | PredaSAR Corp. | |
Barbara B. Ostdiek, Ph.D.,
Born March 1964 | | Trustee | | | 2008 | | | Senior Associate Dean of Degree Programs at Jesse H. Jones Graduate School of Business at Rice University (since 2013); Associate Professor of Finance at Jessie H. Jones Graduate School of Business at Rice University (since 2001) | | None | |
Effective at the close of business on December 31, 2020, Michael F. Reimherr retired from the Board of Trustees.
55
USAA Mutual Funds Trust | | Supplemental Information — continued
May 31, 2021 | |
(Unaudited)
Name and Date of Birth | | Position
Held with
the Trust | | Year
Commenced
Service | | Principal Occupation
During Past 5 Years | | Other
Directorships
Held During
Past 5 Years | |
Interested Trustees. | |
David C. Brown, (b)
Born May 1972 | | Trustee | | | 2019 | | | Chairman and Chief Executive Officer (since 2013), Victory Capital Management Inc.; Chairman and Chief Executive Officer, Victory Capital Holdings, Inc. (since 2013). Mr. Brown brings to the Board extensive business, finance and leadership skills gained and developed through years of experience in the financial services industry, including his tenure overseeing the strategic direction as CEO of Victory Capital. These skills, combined with Mr. Brown's extensive knowledge of the financial services industry and demonstrated success in the development and distribution of investment strategies and products, enable him to provide valuable insights to the Board and strategic direction for the Funds. | | Trustee, Victory Portfolios (41 series), Victory Portfolios II (26 series), Victory Variable Insurance Funds (8 series) | |
56
USAA Mutual Funds Trust | | Supplemental Information — continued
May 31, 2021 | |
(Unaudited)
Name and Date of Birth | | Position
Held with
the Trust | | Year
Commenced
Service | | Principal Occupation
During Past 5 Years | | Other
Directorships
Held During
Past 5 Years | |
Daniel S. McNamara, (b)(c)(d)
Born June 1966 | | Trustee | | | 2012 | | | Trustee, President, and Vice Chairman of USAA ETF Trust (June 2017-June 2019); President of Financial Advice & Solutions Group (FASG), USAA (February 2013-March 2021); Director of USAA Investment Services Company (ISCO) (formerly USAA Investment Management) (September 2009-March 2021); President, Asset Management Company (AMCO) (August, 2011-June 2019); Senior Vice President of USAA Financial Planning Services Insurance Agency, Inc. (FPS) (April 2011-March 2021); Chairman of Board of ISCO (April 2013-December 2020); Director of AMCO (August 2011-June 2019); President and Director of USAA Shareholder Account Services (SAS) (October 2009-June 2019); Director and Vice Chairman of FPS (December 2013-March 2021); President and Director of USAA Investment Corporation (ICORP) (March 2010-March 2021); Chairman of Board of ICORP (December 2013-March 2021); Director of USAA Financial Advisors, Inc. (FAI) (December 2013-March 2021); Chairman of Board of FAI (March 2015-March 2021). Mr. McNamara brings to the Board extensive experience in the financial services industry, including experience as an officer of the Trust. | | None | |
(b) Mr. Dan McNamara is deemed an "interested person" due to his previous position as Director of AMCO, the former investment adviser of the Funds. Mr. Brown is deemed an "interested person" due to his position as Chief Executive Officer of Victory Capital, investment adviser to the Funds.
(c) Effective at the close of business on December 31, 2020, Jefferson C. Boyce replaced Dan McNamara as Chair of the Board and assumed the title of Independent Chair.
(d) Effective July 2, 2021, Mr. Dan McNamara became an Independent Trustee to the Funds.
The Statement of Additional Information includes additional information about the Trustees of the Trust and is available, without charge, on the SEC's website at www.sec.gov and/or by calling (800)-235-8396.
57
USAA Mutual Funds Trust | | Supplemental Information — continued
May 31, 2021 | |
(Unaudited)
Officers:
The officers of the Trust, their ages, commencement of service and their principal occupations during the past five years, are detailed in the following table. Each officer serves until the earlier of his or her resignation, removal, retirement, death, or the election of a successor. The mailing address of each officer of the Trust is 15935 La Cantera Pkwy, San Antonio, TX, 78256. The officers of the Trust receive no compensation directly from the Trust for performing the duties of their offices.
Name and Date of Birth | | Position with
the Trust | | Year
Commenced
Service | | Principal Occupation During Past 5 Years | |
Interested Officers.
Christopher K. Dyer,
Born February 1962 | | President | | | 2019 | | | Director of Fund Administration, Victory Capital (since 2004); Chief Operating Officer, Victory Capital Services, Inc. (since 2020) | |
Scott A Stahorsky,
Born July 1969 | | Vice President | | | 2019 | | | Manager, Fund Administration, Victory Capital (since 2015) | |
James K. De Vries,
Born April 1969 | | Treasurer | | | 2018 | | | Executive Director, Victory Capital Management Inc. (since 2019); Treasurer, USAA ETF Trust (September 2018-June 2019); Executive Director, Investment and Financial Administration, USAA (April 2012-June 2019); Assistant Treasurer, USAA ETF Trust (June 2017-September 2018); Assistant Treasurer, USAA Mutual Funds Trust (December 2013-February 2018) | |
Allan Shaer,
Born March 1965 | | Assistant Treasurer | | | 2019 | | | Senior Vice President, Financial Administration, Citi Fund Services Ohio, Inc. (since 2016); Vice President, Mutual Fund Administration, JP Morgan Chase (2011-2016) | |
Carol D. Trevino,
Born October 1965 | | Assistant Treasurer | | | 2018 | | | Director, Accounting and Finance, Victory Capital Management Inc. (since 2019); Accounting/Financial Director, USAA (December 2013-June 2019); Assistant Treasurer, USAA ETF Trust (September 2018-June 2019) | |
Erin G. Wagner,
Born February 1974 | | Secretary | | | 2019 | | | Deputy General Counsel, the Adviser (since 2013) | |
Charles Booth,
Born April 1960 | | Anti-Money Laundering Compliance Officer and Identity Theft Officer | | | 2019 | | | Director, Regulatory Administration and CCO Support Services, Citi Fund Services Ohio, Inc. (since 2007) | |
Amy Campos,
Born July 1976 | | Chief Compliance Officer | | | 2019 | | | Chief Compliance Officer, USAA Mutual Funds Trust (since 2019); Executive Director, Deputy Chief Compliance Officer, USAA Mutual Funds Trust and USAA ETF Trust (July 2017-June 2019); Compliance Director, USAA Mutual Funds Trust (2014-July 2017) | |
58
USAA Mutual Funds Trust | | Supplemental Information — continued
May 31, 2021 | |
(Unaudited)
Proxy Voting and Portfolio Holdings Information
Proxy Voting:
Information regarding the policies and procedures the Fund uses to determine how to vote proxies relating to portfolio securities is available without charge, upon request, by calling (800) 235-8396. The information is also included in the Fund's Statement of Additional Information, which is available on the SEC's website at www.sec.gov.
Information relating to how the Fund voted proxies relating to portfolio securities held during the most recent 12 months ended June 30 is available on the SEC's website at www.sec.gov.
Availability of Schedules of Portfolio Investments:
The Trust files a complete list of Schedules of Portfolio Investments with the SEC for the first and third quarter of each fiscal year on Form N-PORT. Form N-PORT is available on the SEC's website at www.sec.gov.
Expense Examples
As a shareholder of the Fund, you may incur two types of costs: (1) transaction costs, including sales charges (loads) on purchases; and (2) ongoing costs, including management fees and other Fund expenses. These examples are intended to help you understand your ongoing costs (in dollars) of investing in the Fund and to compare these costs with the ongoing costs of investing in other mutual funds.
These examples are based on an investment of $1,000 invested at the beginning of the period and held for the entire period from December 1, 2020, through May 31, 2021.
The Actual Expense figures in the table below provide information about actual account values and actual expenses. You may use the information below, together with the amount you invested, to estimate the expenses that you paid over the period. Simply divide your account value by $1,000 (for example, an $8,600 account value divided by $1,000 = 8.6), then multiply the result by the number in the table under the heading entitled "Actual Expenses Paid During Period" to estimate the expenses you paid on your account during this period.
The Hypothetical Expense figures in the table below provide information about hypothetical account values and hypothetical expenses based on the Fund's actual expense ratio and an assumed rate of return of 5% per year before expenses, which is not the Fund's actual return. The hypothetical account values and expenses may not be used to estimate the actual ending account balance or expenses you paid for the period. You may use this information to compare this 5% hypothetical example with the 5% hypothetical examples that appear in shareholder reports of other funds.
Please note the expenses shown in the table below are meant to highlight your ongoing costs only and do not reflect any transactional costs. If these transactional costs were included, your costs would have been higher.
| | Beginning
Account
Value
12/1/20 | | Actual
Ending
Account
Value
5/31/21 | | Hypothetical
Ending
Account
Value
5/31/21 | | Actual
Expenses
Paid
During
Period
12/1/20-
5/31/21* | | Hypothetical
Expenses
Paid
During
Period
12/1/20-
5/31/21* | | Annualized
Expense
Ratio
During
Period
12/1/20-
5/31/21 | |
Fund Shares | | $ | 1,000.00 | | | $ | 1,095.00 | | | $ | 1,022.09 | | | $ | 2.98 | | | $ | 2.87 | | | | 0.57 | % | |
Institutional Shares | | | 1,000.00 | | | | 1,095.00 | | | | 1,022.14 | | | | 2.92 | | | | 2.82 | | | | 0.56 | % | |
Class A | | | 1,000.00 | | | | 1,093.70 | | | | 1,020.64 | | | | 4.49 | | | | 4.33 | | | | 0.86 | % | |
Class C | | | 1,000.00 | | | | 1,089.50 | | | | 1,016.90 | | | | 8.39 | | | | 8.10 | | | | 1.61 | % | |
* Expenses are equal to the average account value multiplied by the Fund's annualized expense ratio multiplied by 182/365 (the number of days in the most recent fiscal half-year divided by the number of days in the fiscal year).
59
USAA Mutual Funds Trust | | Supplemental Information — continued
May 31, 2021 | |
(Unaudited)
Additional Federal Income Tax Information
The following federal tax information related to the Fund's fiscal year ended May 31, 2021, is provided for information purposes only and should not be used for reporting to federal or state revenue agencies. Federal tax information for the calendar year will be reported to you on Form 1099-DIV in January 2022.
With respect to distributions paid, the Fund designates the following amounts (or, if subsequently determined to be different, the maximum amount allowable) for the fiscal year ended May 31, 2021 (amounts in thousands):
| | Dividends
Received
Deduction
(corporate
shareholders) | | Qualified
Dividend
Income
(non-corporate
shareholders) | | Tax Exempt
Distributions | |
| | | | | | 100 | % | | | 100 | % | | $ | 8,897 | | |
60
USAA Mutual Funds Trust | | Supplemental Information — continued
May 31, 2021 | |
(Unaudited)
Considerations of the Board in Continuing the Investment Advisory Agreement (the "Agreement")
USAA Growth & Tax Strategy Fund (the "Fund")
At a meeting of the Board of Trustees (the "Board") held on December 10-11, 2020, the Board, including the Trustees who are not "interested persons" (as that term is defined in the Investment Company Act of 1940, as amended) of the Trust (the "Independent Trustees"), approved for an annual period the continuance of the Investment Advisory Agreement (the "Advisory Agreement") between the Trust and Victory Capital Management Inc. (the "Adviser") and the Subadvisory Agreement between the Adviser and Northern Trust Investments, Inc. (the "Subadviser") with respect to the Fund. Prior to the December 10-11, 2020 meeting at which the Advisory Agreement was approved, the Independent Trustees also discussed and considered information regarding the proposed continuation of the Advisory Agreement and Subadvisory Agreement at a meeting held on November 19, 2020.
In advance of the foregoing meetings, the Trustees received and considered a variety of information relating to the Advisory Agreement and Subadvisory Agreement and the Adviser and the Subadviser, and were given the opportunity to ask questions and request additional information from management. The information provided to the Board included, among other things: (i) a separate report prepared by an independent third party of mutual fund data, which provided a statistical analysis comparing the Fund's investment performance, expenses, and fees to comparable investment companies; (ii) information concerning the services rendered to the Fund, as well as information regarding the Adviser's revenues and costs of providing services to the Fund and compensation paid to affiliates of the Adviser; and (iii) information about the Adviser's and the Subadviser's operations and personnel. Prior to voting, the Independent Trustees reviewed the proposed continuance of the Advisory Agreement and Subadvisory Agreement with management and with experienced independent counsel retained by the Independent Trustees ("Independent Counsel") and received materials from such Independent Counsel discussing the legal standards for their consideration of the proposed continuation of the Advisory Agreement and the Subadvisory Agreement with respect to the Fund. The Independent Trustees also reviewed the proposed continuation of the Advisory Agreement and the Subadvisory Agreement with respect to the Fund in private sessions with Independent Counsel at which no representatives of management were present.
The Board considered the Advisory Agreement and the Subadvisory Agreement separately in the course of its review. In doing so, the Board noted the respective roles of the Adviser and the Subadviser in providing services to the Fund.
At each regularly scheduled meeting of the Board and its committees, the Board receives and reviews, among other things, information concerning the Fund's performance and related services provided by the Adviser and the Subadviser. At the meeting at which the renewal of the Advisory Agreement and Subadvisory Agreement is considered, particular focus is given to information concerning Fund performance, fees and total expenses as compared to comparable investment companies, and the Adviser's profitability with respect to the Fund. However, the Board noted that the evaluation process with respect to the Adviser and the Subadviser is an ongoing one. In this regard, the Board's and its committees' consideration of the Advisory Agreement and Subadvisory Agreement included information previously received at such meetings.
Advisory Agreement
After full consideration of a variety of factors, the Board, including the Independent Trustees, voted to approve the Advisory Agreement. In approving the Advisory Agreement, the Trustees did not identify any single factor as controlling, and each Trustee may have attributed different weights to various factors. Throughout their deliberations, the Independent Trustees were represented and assisted by Independent Counsel.
Nature, Extent, and Quality of Services — In considering the nature, extent, and quality of the services provided by the Adviser under the Advisory Agreement, the Board reviewed information provided by the Adviser relating to its operations and personnel. The Board also took into account its knowledge of the Adviser's management and the quality of the performance of the Adviser's duties through Board meetings, discussions, and reports during the preceding year. The Board considered the fees paid to the Adviser and the services provided to the Fund by the Adviser under the Advisory Agreement, as well as other services provided by the Adviser and its affiliates under other agreements, and the personnel who provide these services. In addition to the investment
61
USAA Mutual Funds Trust | | Supplemental Information — continued
May 31, 2021 | |
(Unaudited)
advisory services provided to the Fund, the Adviser and its affiliates provide administrative services, shareholder services, oversight of Fund accounting, marketing services, assistance in meeting legal and regulatory requirements, and other services necessary for the operation of the Fund and the Trust.
The Board considered the scope of services provided by, and the undertakings required of, the Adviser in connection with those services, including, among other things, maintaining (i) its own and the Fund's compliance programs, (ii) risk management programs, (iii) liquidity risk management programs, and (iv) cybersecurity programs, each of which had expanded over time as a result of regulatory, market, and other developments. The Board also considered the significant risks assumed by the Adviser in connection with the services provided to the Fund, including investment, operational, enterprise, litigation, regulatory and compliance risks.
The Board considered the Adviser's management style and the performance of the Adviser's duties under the Advisory Agreement. The Board considered the level and depth of knowledge of the Adviser, including the professional experience and qualifications of its senior and investment personnel, as well as current staffing levels. The Board considered the Adviser's process for monitoring the performance of the Subadviser and the Adviser's timeliness in responding to performance issues. The allocation of the Fund's brokerage, including the Adviser's process for monitoring "best execution," also was considered. The Adviser's role in coordinating the activities of the Fund's other service providers was also considered. The Board also considered the Adviser's risk management processes. The Board considered the Adviser's financial condition and that it had the financial wherewithal to continue to provide the same scope and high quality of services under the Advisory Agreement. In reviewing the Advisory Agreement, the Board focused on the experience, resources, and strengths of the Adviser and its affiliates in managing the Fund, as well as the other funds in the Trust.
The Board also reviewed the compliance and administrative services provided to the Fund by the Adviser and its affiliates, including the Adviser's oversight of the Fund's day-to-day operations and oversight of Fund accounting. The Trustees, guided also by information obtained from their experiences as trustees of the Trust, also focused on the quality of the Adviser's compliance and administrative staff.
Expenses and Performance — In connection with its consideration of the Advisory Agreement, the Board evaluated the Fund's advisory fees and total expense ratio as compared to other open-end investment companies deemed to be comparable to the Fund as determined by the independent third party in its report. The Fund's expenses were compared to (i) a group of investment companies chosen by the independent third party to be comparable to the Fund based upon certain factors, including fund type, comparability of investment objective and classification, sales load type, asset size, and expense components (the "expense group") and (ii) a larger group of investment companies with the same investment classification/objective as the Fund regardless of asset size, excluding outliers (the "expense universe"). Among other data, the Board noted that the Fund's management fee rate — which includes advisory and administrative services and the effects of any performance adjustment1, as well as any fee waivers and reimbursements — was below the medians of its expense group and expense universe. The data indicated that the Fund's total expenses, including after any reimbursements, were below the medians of its expense group and its expense universe. The Board also took into account the Adviser's current undertakings to maintain expense limitations for the Fund. The Board took into account the various other services provided to the Fund by the Adviser and its affiliates, and noted the high quality of services received by the Fund. The Board also took into account that the subadvisory fees under the Subadvisory Agreement are paid by the Adviser. The Board also considered and discussed information about the Subadviser's fees, including the amount of management fees retained by the Adviser after payment of the subadvisory fees.
In considering the Fund's performance, the Board noted that it reviews at its regularly scheduled meetings information about the Fund's performance results. The Trustees also reviewed various comparative data provided to them in connection with their consideration of the renewal of the Advisory Agreement, including, among other information, a comparison of the Fund's average annual total returns relative to its Lipper index and other mutual funds deemed to be in its peer group by the independent third party in its report (the "performance universe"). The Fund's performance universe consisted of the Fund and all retail and institutional open-end investment companies with the same classification/objective as the Fund regardless of asset size or primary channel of distribution. This comparison indicated that, among other data, the Fund's performance was above the average of its performance universe and its Lipper index for the one-, three-, five- and ten-year periods ended September 30, 2020.
1 The Adviser has agreed that no performance adjustment (positive or negative) would be made to the amount payable to the Adviser from July 1, 2019, through June 30, 2020.
62
USAA Mutual Funds Trust | | Supplemental Information — continued
May 31, 2021 | |
(Unaudited)
Compensation and Profitability — The Board took into consideration the level and method of computing the management fee. The information considered by the Board included operating profit margin information for the Adviser's business as a whole. The Board also received and considered profitability information related to the management revenues from the Fund. This information included a review of the methodology used in the allocation of certain costs to the Fund. In considering the profitability data with respect to the Fund, the Trustees noted that the Adviser pays the Fund's subadvisory fees and also noted that the Adviser waived a portion of its management fee and/or reimbursed certain expenses with respect to the Fund. The Trustees reviewed the profitability of the Adviser's relationship with the Fund before tax expenses. The Board was also provided with a profitability analysis of other publicly traded asset managers prepared by an independent information service. In reviewing the overall profitability of the management fee to the Adviser, the Board also considered the fact that the Adviser and its affiliates provide shareholder servicing and administrative services to the Fund for which they receive compensation. The Board also considered the possible direct and indirect benefits to the Adviser from its relationship with the Trust, including that the Adviser may derive reputational and other benefits from its association with the Fund. The Trustees recognized that the Adviser should be entitled to earn a reasonable level of profits in exchange for the level of services it provides to the Fund and the entrepreneurial and other risks that it assumes as Adviser.
Economies of Scale — The Board considered whether there should be changes in the management fee rate or structure in order to enable the Fund to participate in any economies of scale. The Board also considered the fee waiver and expense reimbursement arrangements by the Adviser. The Board considered the fact that the Adviser also pays the Fund's subadvisory fees. The Board also considered the effect of the Fund's change in size, if any, on its performance and fees, noting that the Fund may realize other economies of scale if assets increase proportionally more than expenses. The Board determined that the current investment management fee structure was reasonable.
Conclusions — The Board reached the following conclusions regarding the Fund's Advisory Agreement with the Adviser: (i) the Adviser has demonstrated that it possesses the capability and resources to perform the duties required of it under the Advisory Agreement; (ii) the Adviser maintains an appropriate compliance program; (iii) the overall performance of the Fund is reasonable in relation to the performance of funds with similar investment objectives and to relevant indices; (iv) the Fund's advisory expenses are reasonable in relation to those of similar funds and to the services to be provided by the Adviser; and (v) the Adviser's and its affiliates' level of profitability from their relationship with the Fund is reasonable in light of the nature and high quality of services provided by the Adviser and the type of fund. Based on its conclusions, the Board determined that continuation of the Advisory Agreement would be in the best interests of the Fund and its shareholders.
Subadvisory Agreement
In approving the Subadvisory Agreement with respect to the Fund, the Board considered various factors, among them: (i) the nature, extent, and quality of services provided to the Fund by the Subadviser, including the personnel providing services; (ii) the Subadviser's compensation and any other benefits derived from the subadvisory relationship; (iii) comparisons, to the extent applicable, of subadvisory fees and performance to comparable investment companies; and (iv) the terms of the Subadvisory Agreement. A summary of the Board's analysis of these factors is set forth below. After full consideration of a variety of factors, the Board, including the Independent Trustees, voted to approve the Subadvisory Agreement. In approving the Subadvisory Agreement, the Trustees did not identify any single factor as controlling, and each Trustee may have attributed different weights to various factors. Throughout their deliberations, the Independent Trustees were represented and assisted by Independent Counsel.
Nature, Extent, and Quality of Services Provided; Investment Personnel — The Trustees considered information provided to them regarding the services provided by the Subadviser, including information presented periodically throughout the previous year. The Board considered the Subadviser's level of knowledge and investment style. The Board reviewed the experience and credentials of the investment personnel who are responsible for managing the investment of portfolio securities with respect to the Fund and the Subadviser's level of staffing. The Trustees considered, based on the materials provided to them by the Subadviser, whether the method of compensating portfolio managers is reasonable and includes mechanisms to prevent a manager with underperformance from taking undue risks. The Trustees also noted the Subadviser's brokerage practices. The
63
USAA Mutual Funds Trust | | Supplemental Information — continued
May 31, 2021 | |
(Unaudited)
Board also considered the Subadviser's regulatory and compliance history. The Board also took into account the Subadviser's risk management processes. The Board noted that the Adviser's monitoring processes of the Subadviser include: (i) regular telephonic meetings to discuss, among other matters, investment strategies, and to review portfolio performance; (ii) quarterly portfolio compliance checklists and quarterly compliance certifications to the Board; and (iii) due diligence visits to the Subadviser.
Subadviser Compensation — The Board also took into consideration the financial condition of the Subadviser. In considering the cost of services to be provided by the Subadviser and the profitability to the Subadviser of its relationship with the Fund, the Trustees noted that the fees under the Subadvisory Agreement were paid by the Adviser. The Trustees also relied on the ability of the Adviser to negotiate the Subadvisory Agreement and the fees thereunder at arm's length. For the above reasons, the Board determined that the profitability of the Subadviser from its relationship with the Fund was not a material factor in its deliberations with respect to the consideration of the approval of the Subadvisory Agreement. For similar reasons, the Board concluded that the potential for economies of scale in the Subadviser's management of the Fund was not a material factor in considering the Subadvisory Agreement.
Subadvisory Fees and Fund Performance — The Board compared the subadvisory fees for the Fund with the fees that the Subadviser charges to comparable clients, as applicable. The Board considered that the Fund pays a management fee to the Adviser and that, in turn, the Adviser pays a subadvisory fee to the Subadviser. As noted above, the Board considered the Fund's performance during the one-, three-, five-, and ten-year periods ended September 30, 2020, as compared to the Fund's peer group and noted that the Board reviews at its regularly scheduled meetings information about the Fund's performance results. The Board also considered the performance of the Subadviser. The Board noted the Adviser's experience and resources in monitoring the performance, investment style, and risk-adjusted performance of the Subadviser. The Board was mindful of the Adviser's focus on the Subadviser's performance. The Board also noted the Subadviser's performance record for similar accounts, as applicable.
Conclusions — The Board reached the following conclusions regarding the Subadvisory Agreement: (i) the Subadviser is qualified to manage the Fund's assets in accordance with its investment objectives and policies; (ii) the Subadviser maintains an appropriate compliance program; (iii) the overall performance of the Fund is reasonable in relation to the performance of funds with similar investment objectives and relevant indices; and (iv) the Fund's advisory expenses are reasonable in relation to those of similar funds and to the services to be provided by the Adviser and the Subadviser. Based on its conclusions, the Board determined that approval of the Subadvisory Agreement with respect to the Fund would be in the best interests of the Fund and its shareholders.
64
USAA Mutual Funds Trust | | Supplemental Information — continued
May 31, 2021 | |
(Unaudited)
Liquidity Risk Management Program:
The USAA Mutual Funds have adopted and implemented a written liquidity risk management program (the "LRMP") as required by Rule 22e-4 under the Investment Company Act of 1940, as amended. The LRMP is reasonably designed to assess and manage the Fund's liquidity risk, taking into consideration the Fund's investment strategy and the liquidity of its portfolio investments during normal and reasonably foreseeable stressed market conditions; its short and long-term cash flow projections; and its cash holdings and access to other liquidity management tools such as available funding sources including the Victory Funds Complex Interfund Lending Facility and Line of Credit (discussed in the Notes to Financial Statements). The USAA Mutual Funds' Board of Trustees approved the appointment of the Fund's investment adviser, Victory Capital Management Inc. ("Victory Capital"), as the administrator of the LRMP.
Victory Capital manages liquidity risks associated with the Fund's investments by monitoring, among other things, cash and cash equivalents, any use of derivatives, the concentration of investments, the appropriateness of the Fund's investment strategy, and by classifying every Fund investment as either highly liquid, moderately liquid, less liquid, or illiquid on at least a monthly basis. To assist with the classification of Fund investments, Victory Capital has retained a third-party provider of liquidity evaluation services. This provider determines preliminary liquidity classifications for all portfolio holdings based upon portfolio-level data and certain assumptions provided by Victory Capital. Victory Capital reviews the preliminary liquidity classifications and, when appropriate, considers other information including input from the Fund's portfolio managers (including the portfolio managers employed by any investment sub-advisers) in determining final liquidity classifications.
At a meeting held on March 10, 2021, Victory Capital provided an oral and written report to the Trustees on the operation and effectiveness of the LRMP during the previous year. The report from Victory Capital concluded that the Fund did not experience any significant liquidity challenges during the covered period, and the Fund's LRMP is reasonably designed to assess and manage its liquidity risk. The report also concluded that the LRMP continues to operate adequately and effectively to enable Victory Capital to oversee and manage liquidity risk and ensure the Fund is able to meet redemption requests without significant dilution to the remaining investors' interest in the Fund. During the review period, the Fund's portfolio consisted primarily of highly liquid investments, which are defined as cash and any investments that the Fund reasonably expects to be converted to cash in current market conditions in three business days or less without significantly changing the market value of the investment. Therefore, the Fund has not adopted a highly liquid investment minimum. The Funds' investments were below the limitation on illiquid investments during the review period. Additionally, Victory Capital indicated that no events occurred that would require the filing of Form N-LIQUID and recommended no material changes to the LRMP.
65
Privacy Policy
Protecting the Privacy of Information
The Trust respects your right to privacy. We also know that you expect us to conduct and process your business in an accurate and efficient manner. To do so, we must collect and maintain certain personal information about you. This is the information we collect from you on applications or other forms, and from the transactions you make with us or third parties. It may include your name, address, social security number, account transactions and balances, and information about investment goals and risk tolerance.
We do not disclose any information about you or about former customers to anyone except as permitted or required by law. Specifically, we may disclose the information we collect to companies that perform services on our behalf, such as the transfer agent that processes shareholder accounts and printers and mailers that assist us in the distribution of investor materials. We may also disclose this information to companies that perform marketing services on our behalf. This allows us to continue to offer you Victory investment products and services that meet your investing needs, and to effect transactions that you request or authorize. These companies will use this information only in connection with the services for which we hired them. They are not permitted to use or share this information for any other purpose.
To protect your personal information internally, we permit access only by authorized employees and maintain physical, electronic, and procedural safeguards to guard your personal information.*
* You may have received communications regarding information about privacy policies from other financial institutions which gave you the opportunity to "opt-out" of certain information sharing with companies which are not affiliated with that financial institution. The Trust does not share information with other companies for purposes of marketing solicitations for products other than the Trust. Therefore, the Trust does not provide opt-out options to their shareholders.
P.O. Box 182593
Columbus, Ohio 43218-2593

Visit our website at: | | Call | |
vcm.com | | (800) 235-8396 | |

MAY 31, 2021
Annual Report
USAA Managed Allocation Fund
Victory Capital means Victory Capital Management Inc., the investment adviser of the USAA Mutual Funds. USAA Mutual Funds are distributed by Victory Capital Services, Inc., member of FINRA, an affiliate of Victory Capital. Victory Capital and its affiliates are not affiliated with United Services Automobile Association or its affiliates. USAA and the USAA logos are registered trademarks and the USAA Mutual Funds and USAA Investments logos are trademarks of United Services Automobile Association and are being used by Victory Capital and its affiliates under license.
www.vcm.com
News, Information And Education 24 Hours A Day, 7 Days A Week
The Victory Funds site gives fund shareholders, prospective shareholders, and investment professionals a convenient way to access fund information, get guidance, and track fund performance anywhere they can access the Internet. The site includes:
• Detailed performance records
• Daily share prices
• The latest fund news
• Investment resources to help you become a better investor
• A section dedicated to investment professionals
Whether you're a potential investor searching for the fund that matches your investment philosophy, a seasoned investor interested in planning tools, or an investment professional, www.vcm.com has what you seek. Visit us anytime. We're always open.
TABLE OF CONTENTS
Shareholder Letter (Unaudited) | | | 2 | | |
Managers' Commentary (Unaudited) | | | 4 | | |
Investment Overview (Unaudited) | | | 6 | | |
Investment Objective & Portfolio
Holdings (Unaudited) | | | 7 | | |
Schedule of Portfolio Investments | | | 8 | | |
Financial Statements | |
Statement of Assets and Liabilities | | | 9 | | |
Statement of Operations | | | 10 | | |
Statements of Changes in Net Assets | | | 11 | | |
Financial Highlights | | | 12 | | |
Notes to Financial Statements | | | 14 | | |
Report of Independent
Registered Public Accounting Firm | | | 22 | | |
Supplemental Information (Unaudited) | | | 23 | | |
Trustees' and Officers' Information | | | 23 | | |
Proxy Voting and Portfolio Holdings Information | | | 29 | | |
Expense Example | | | 29 | | |
Advisory Contract Agreement | | | 30 | | |
Liquidity Risk Management Program | | | 33 | | |
Privacy Policy (inside back cover) | | | |
This report is for the information of the shareholders and others who have received a copy of the currently effective prospectus of the Fund, managed by Victory Capital Management Inc. It may be used as sales literature only when preceded or accompanied by a current prospectus, which provides further details about the Fund.
IRA DISTRIBUTION WITHHOLDING DISCLOSURE
We generally must withhold federal income tax at a rate of 10% of the taxable portion of your distribution and, if you live in a state that requires state income tax withholding, at your state's tax rate. However, you may elect not to have withholding apply or to have income tax withheld at a higher rate. Any withholding election that you make will apply to any subsequent distribution unless and until you change or revoke the election. If you wish to make a withholding election, or change or revoke a prior withholding election, call (800) 235-8396, and form W-4P (OMB No. 1545-0074 withholding certificate for pension or annuity payments) will be electronically sent.
If you do not have a withholding election in place by the date of a distribution, federal income tax will be withheld from the taxable portion of your distribution at a rate of 10%. If you must pay estimated taxes, you may be subject to estimated tax penalties if your estimated tax payments are not sufficient and sufficient tax is not withheld from your distribution.
For more specific information, please consult your tax adviser.
• NOT FDIC INSURED • NO BANK GUARANTEE • MAY LOSE VALUE
1
(Unaudited)
Dear Shareholder,
Never a dull moment. A year ago, we were still coming to grips with a global pandemic, hoping for an effective vaccine, and wondering whether the U.S. Federal Reserve's aggressive actions would continue to mollify financial markets. As it turns out, a vaccine was rolled out (domestically) faster than expectations, and the recovery that began during the second quarter of 2020 continued unabated.
Fast forward to today and investors are suddenly more concerned about labor shortages, rising commodity prices, and whether inflation will prove to be transitory or more lasting. If anything, this merely exemplifies that markets are unpredictable and the environment can and will change rapidly.
Reflecting on the past year, we must consider ourselves fortunate despite the myriad challenges. For starters, it was impressive how quickly the various forms of monetary and fiscal stimulus contributed to a rebound in GDP. Of course, it wasn't a straight line upward and there were bouts of elevated volatility in both bond and stock markets. Late in 2020, for example, financial markets were alternately fueled and roiled by a contentious election season, growing optimism for an effective vaccine, and a fluid debate regarding the need for even more stimulus. Ultimately, stocks were propelled higher in the fourth quarter of 2020 as it became clear Congress would provide another dose of stimulus in the form of direct payments, more unemployment insurance, and additional aid to businesses.
As we moved into 2021, stocks continued their upward trajectory. Meanwhile, the yield on the 10-Year U.S. Treasury continued rallying sharply as many investors began to shift their focus. Deflation was out; inflation was in. Indeed, the potential for a new era of inflation and higher interest rates seems to be the new worry du jour.
So how did the numbers shake out after this unusual year? The S&P 500® Index registered an impressive annual return of approximately 40% for this 12-month period ended May 31, 2021. Over this same period, the yield on the 10-Year U.S. Treasury jumped 94 basis points, reflecting both the very low starting rate and substantial fiscal stimulus. At the end of the reporting period, the yield on the 10-Year U.S. Treasury was 1.59%.
The past year is not one we will forget any time soon. There were many hardships, but we should not overlook the positives and remember our collective spirit and perseverance. Markets endured and even surprised to the upside, but perhaps the key takeaway is that investors need to remain calm in the face of adversity and focused on longer-term investment goals. We believe that's the best approach no matter what the markets throw at us.
On the following pages, you will find information relating to your USAA Mutual Funds, brought to you by Victory Capital. If you have any questions regarding the current market dynamics or your specific portfolio or investment plan, we encourage you to contact our Member Service Representatives. Call (800) 235-8396 or visit our website at www.vcm.com.
2
From all of us here at Victory Capital, thank you for letting us help you work toward your investment goals.

Christopher K. Dyer, CFA
President,
USAA Mutual Funds
3
USAA Managed Allocation Fund
Managers' Commentary
(Unaudited)
• What were the market conditions during the reporting period?
The beginning of the reporting period brought a dramatic reversal from the difficult environment that characterized the first part of 2020. While COVID-19 cases continued to rise, investors grew increasingly confident that the economy would be able to recover from its sharp downturn of February and March. The optimism stemmed, in part, from a series of better-than-expected economic reports interpreted as evidence that the slump in growth would be less severe than was initially feared. The markets were further cheered by the aggressive response by the U.S. Federal Reserve (the "Fed"). In addition to reiterating its commitment to keep short-term interest rates near zero for an extended period, the Fed announced the direct purchase of both individual bonds and exchange-traded bond funds. The central bank's unusual steps offered corporations the latitude to issue debt at ultra-low rates, providing them with the cash necessary to help withstand the effects of the coronavirus.
The global financial markets produced healthy returns during the second half of 2020, wrapping up a positive year for the major asset classes. Investors' appetite for risk improved considerably in early November, when the approval of vaccines for COVID-19 raised expectations that the world economy could gradually return to normal in 2021. The conclusion of the U.S. elections, which removed a source of uncertainty that had depressed performance in September and October, was an additional tailwind. The markets were also aided by continued indications that the Fed and other central banks would maintain their highly accommodative policies indefinitely. Not least, an agreement on a new round of U.S. fiscal stimulus further cheered investors in late December. Together, these developments outweighed negative headlines surrounding renewed lockdowns and the persistence of the coronavirus.
The first quarter of 2021 proved to be a continuation of the strong equity markets investors experienced over the second half of 2020. Gains from global equity markets were fueled by optimism surrounding the successful rollout of the COVID-19 vaccines coupled with further monetary and fiscal stimulus proposals. Faster-than-expected economic growth produced a meaningful increase in real interest rates, which led to negative returns across most major fixed income asset classes. The 10-year U.S Treasury bond yield finished at its highest level of the first quarter reporting period, climbing from under 1% to 1.74%.
During the last few months of the reporting period, equity markets have been consolidating and interest rates leveling off after large upswings. With strong first quarter GDP and corporate earnings growth in the rearview mirror, investors seem to be contemplating their next move. Inflation data has been increasing as the economy reopens more quickly than expected. The Fed maintains that inflationary pressure is transitory but could become more persistent. The inflationary environment will be a key metric moving into the second half of the year.
4
USAA Managed Allocation Fund (continued)
Managers' Commentary (continued)
• How did the USAA Managed Allocation Fund (the "Fund") perform during the reporting period?
For the reporting period ended May 31, 2021, the Fund had a total return of 24.31%. This compares to returns of 40.32% for the S&P 500® Index and -0.40% for the Bloomberg Barclays U.S. Aggregate Bond Index.
• What strategies did you employ during the reporting period?
This Fund is designed to provide us with the flexibility to implement tactical asset allocation shifts within a client's managed portfolio program. By using the Fund in this manner, we can make allocation changes to the managed portfolios quicker and with less disruption than we would by shifting their existing holdings. The Fund primarily uses exchange-traded funds, or ETFs, to implement our asset allocation views since ETFs are highly liquid vehicles that allow us to apply our tactical allocation decisions efficiently. The Fund's allocations reflect the need to round out the USAA Managed Portfolios, rather than representing an active strategy.
With this in mind, the Fund's positive reporting period mainly reflected our exposure to equity during the reporting period. On the domestic side, we held a position in large-cap U.S. stocks, which benefitted the Fund relative to other investable asset classes. We held both a global fund and emerging markets fund that both positively contributed to relative performance.
Within the fixed-income portion of the portfolio, the Fund held a position in an ETF that tracked the performance of investment grade corporate bonds that slightly contributed to performance. An emerging market bond ETF contributed positively to performance.
Thank you for allowing us to help you manage your investments.
5
USAA Managed Allocation Fund
Investment Overview
(Unaudited)
Average Annual Total Return
Year Ended May 31, 2021
| | Fund Shares | | | | | |
INCEPTION DATE | | 2/1/10 | | | | | |
| | | Net Asset Value | | S&P 500 Index1 | | Bloomberg Barclays
U.S. Aggregate Bond Index2 | |
One Year | | | 24.31 | % | | | 40.32 | % | | | -0.40 | % | |
Five Year | | | 7.55 | % | | | 17.16 | % | | | 3.25 | % | |
Ten Year | | | 5.22 | % | | | 14.38 | % | | | 3.29 | % | |
The performance data quoted represents past performance and current returns may be lower or higher. The investment return and principal value will fluctuate so that an investor's shares, when redeemed, may be worth more or less than the original cost. To obtain performance information current to the most recent month's end, please visit www.vcm.com.
Total return measures the price change in a share assuming the reinvestment of all net investment income and realized capital gain distributions, if any. The total returns quoted do not reflect adjustments made to the enclosed financial statements in accordance with U.S. Generally Accepted Accounting Principles or the deduction of taxes that a shareholder would pay on net investment income and realized capital gain distributions, including reinvested distributions, or redemptions of shares. The total return figures set forth above include all waivers of fees. Without such fee waivers, the total returns would have been lower.
USAA Managed Allocation Fund — Growth of $10,000

1The unmanaged S&P 500 Index is a market-capitalization-weighted index that measures the performance of the common stocks of 500 leading U.S. companies. The index reflects the reinvestment of dividends paid on the stocks constituting the index net of withholding taxes. This index does not include the effect of sales charges, commissions, expenses, or taxes, is not representative of the Fund, and it is not possible to invest directly in an index.
2The unmanaged Bloomberg Barclays U.S. Aggregate Bond Index covers the U.S. investment-grade fixed-rate bond market, including government and credit securities, agency mortgage pass-through securities, asset-backed securities, and commercial mortgage-backed securities that have remaining maturities of more than one year. This index does not include the effect of sales charges, commissions, expenses, or taxes, is not representative of the Fund, and it is not possible to invest directly in an index.
The graph reflects investment of growth of a hypothetical $10,000 investment in the Fund.
The graph and table do not reflect the deduction of taxes that a shareholder would pay on Fund distributions or the redemption of Fund shares.
Past performance is not indicative of future results.
6
USAA Mutual Funds Trust
USAA Managed Allocation Fund | | May 31, 2021 | |
(Unaudited)
Investment Objective and Portfolio Holdings:
The Fund's investment objective seeks to maximize total return, consisting primarily of capital appreciation.
Asset Allocation*:
May 31, 2021
(% of Net Assets)
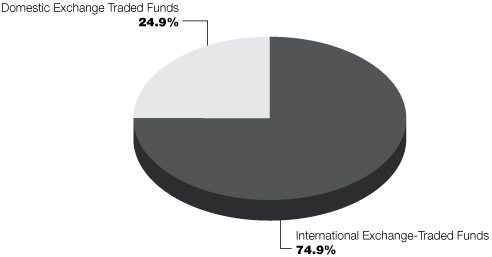
* Does not include futures, money market instruments, and short-term investments purchased with cash collateral from securities loaned.
Percentages are of the net assets of the Fund and may not equal 100%.
Refer to the Schedule of Portfolio Investments for a complete list of securities.
7
USAA Mutual Funds Trust
USAA Managed Allocation Fund | | Schedule of Portfolio Investments
May 31, 2021 | |
(Amounts in Thousands, Except for Shares)
Security Description | | Shares | | Value | |
Exchange-Traded Funds (99.8%) | |
iShares Core S&P 500 ETF | | | 390,527 | | | $ | 164,666 | | |
Vanguard Total World Stock ETF (a) | | | 4,811,365 | | | | 495,137 | | |
Total Exchange-Traded Funds (Cost $561,658) | | | 659,803 | | |
Collateral for Securities Loaned^ (2.4%) | |
Fidelity Investments Money Market Government Portfolio Institutional Shares,
0.01% (b) | | | 992,950 | | | | 993 | | |
Goldman Sachs Financial Square Government Fund Institutional Shares,
0.03% (b) | | | 4,097,175 | | | | 4,097 | | |
HSBC U.S. Government Money Market Fund I Shares, 0.03% (b) | | | 10,778,425 | | | | 10,779 | | |
Total Collateral for Securities Loaned (Cost $15,869) | | | 15,869 | | |
Total Investments (Cost $577,527) — 102.2% | | | 675,672 | | |
Liabilities in excess of other assets — (2.2)% | | | (14,372 | ) | |
NET ASSETS — 100.00% | | $ | 661,300 | | |
At May 31, 2021, the Fund's investments in foreign securities were 74.9% of net assets.
ETF — Exchange-Traded Fund
^ Purchased with cash collateral from securities on loan.
(a) All or a portion of this security is on loan.
(b) Rate disclosed is the daily yield on May 31, 2021.
See notes to financial statements.
8
USAA Mutual Funds Trust | | Statement of Assets and Liabilities
May 31, 2021 | |
(Amounts in Thousands, Except Per Share Amounts)
| | | USAA Managed
Allocation Fund | |
Assets: | |
Investments, at value (Cost $577,527) | | $ | 675,672 | (a) | |
Cash | | | 2,117 | | |
Receivables: | |
Interest and dividends | | | 3 | | |
Capital shares issued | | | 66 | | |
From Adviser | | | 89 | | |
Prepaid expenses | | | 4 | | |
Total Assets | | | 677,951 | | |
Liabilities: | |
Payables: | |
Collateral received on loaned securities | | | 15,869 | | |
Capital shares redeemed | | | 308 | | |
Accrued expenses and other payables: | |
Investment advisory fees | | | 335 | | |
Administration fees | | | 28 | | |
Custodian fees | | | 5 | | |
Transfer agent fees | | | 28 | | |
Compliance fees | | | — | (b) | |
Trustees' fees | | | 1 | | |
Other accrued expenses | | | 77 | | |
Total Liabilities | | | 16,651 | | |
Net Assets: | |
Capital | | | 537,572 | | |
Total accumulated earnings/(loss) | | | 123,728 | | |
Net Assets | | $ | 661,300 | | |
Shares (unlimited number of shares authorized with no par value): | | | 46,764 | | |
Net asset value, offering and redemption price per share: (c) | | $ | 14.14 | | |
(a) Includes $15,560 of securities on loan.
(b) Rounds to less than $1 thousand.
(c) Per share amount may not recalculate due to rounding of net assets and/or shares outstanding.
See notes to financial statements.
9
USAA Mutual Funds Trust | | Statement of Operations
For the Year Ended May 31, 2021 | |
(Amounts in Thousands)
| | | USAA Managed
Allocation Fund | |
Investment Income: | |
Dividends | | $ | 11,047 | | |
Interest | | | 14 | | |
Securities lending (net of fees) | | | 185 | | |
Total Income | | | 11,246 | | |
Expenses: | |
Investment advisory fees | | | 3,939 | | |
Administration fees | | | 328 | | |
Sub-Administration fees | | | 18 | | |
Custodian fees | | | 29 | | |
Transfer agent fees | | | 328 | | |
Trustees' fees | | | 51 | | |
Compliance fees | | | 4 | | |
Legal and audit fees | | | 57 | | |
State registration and filing fees | | | 30 | | |
Interfund lending fees | | | 1 | | |
Line of credit fees | | | 1 | | |
Other expenses | | | 137 | | |
Total Expenses | | | 4,923 | | |
Expenses waived/reimbursed by Adviser | | | (1,050 | ) | |
Net Expenses | | | 3,873 | | |
Net Investment Income (Loss) | | | 7,373 | | |
Realized/Unrealized Gains (Losses) from Investments: | |
Net realized gains (losses) from investment securities | | | 77,147 | | |
Net change in unrealized appreciation/depreciation on investment securities | | | 58,529 | | |
Net realized/unrealized gains (losses) on investments | | | 135,676 | | |
Change in net assets resulting from operations | | $ | 143,049 | | |
See notes to financial statements.
10
USAA Mutual Funds Trust | | Statements of Changes in Net Assets | |
(Amounts in Thousands)
| | | USAA Managed Allocation Fund | |
| | | Year
Ended
May 31,
2021 | | Year
Ended
May 31,
2020 | |
From Investments: | |
Operations: | |
Net investment income (loss) | | $ | 7,373 | | | $ | 17,207 | | |
Net realized gains (losses) from investments | | | 77,147 | | | | (28,991 | ) | |
Net change in unrealized appreciation/depreciation
on investments | | | 58,529 | | | | 57,008 | | |
Change in net assets resulting from operations | | | 143,049 | | | | 45,224 | | |
Change in net assets resulting from distributions to
shareholders | | | (8,738 | ) | | | (19,579 | ) | |
Change in net assets resulting from capital transactions | | | (133,803 | ) | | | (89,372 | ) | |
Change in net assets | | | 508 | | | | (63,727 | ) | |
Net Assets: | |
Beginning of period | | | 660,792 | | | | 724,519 | | |
End of period | | $ | 661,300 | | | $ | 660,792 | | |
Capital Transactions: | |
Proceeds from shares issued | | $ | 31,378 | | | $ | 54,008 | | |
Distributions reinvested | | | 8,737 | | | | 19,579 | | |
Cost of shares redeemed | | | (173,918 | ) | | | (162,959 | ) | |
Change in net assets resulting from capital transactions | | $ | (133,803 | ) | | $ | (89,372 | ) | |
Share Transactions: | |
Issued | | | 2,457 | | | | 4,613 | | |
Reinvested | | | 682 | | | | 1,636 | | |
Redeemed | | | (13,694 | ) | | | (14,195 | ) | |
Change in Shares | | | (10,555 | ) | | | (7,946 | ) | |
See notes to financial statements.
11
USAA Mutual Funds Trust | | Financial Highlights | |
For a Share Outstanding Throughout Each Period
| | | | | Investment Activities | | Distributions to
Shareholders From | |
| | | Net Asset
Value,
Beginning of
Period | | Net
Investment
Income
(Loss) | | Net Realized
and Unrealized
Gains (Losses)
on Investments | | Total from
Investment
Activities | | Net
Investment
Income | | Net Realized
Gains From
Investments | |
USAA Managed Allocation Fund | |
Year Ended:
May 31, 2021 | | $ | 11.53 | | | | 0.14 | (a) | | | 2.64 | | | | 2.78 | | | | (0.17 | ) | | | — | | |
May 31, 2020 | | $ | 11.10 | | | | 0.28 | (a) | | | 0.47 | | | | 0.75 | | | | (0.32 | ) | | | — | | |
May 31, 2019 | | $ | 12.01 | | | | 0.20 | | | | (0.92 | ) | | | (0.72 | ) | | | (0.11 | ) | | | (0.08 | ) | |
May 31, 2018 | | $ | 11.61 | | | | 0.23 | | | | 0.46 | | | | 0.69 | | | | (0.29 | ) | | | — | | |
May 31, 2017 | | $ | 10.90 | | | | 0.24 | | | | 0.72 | | | | 0.96 | | | | (0.25 | ) | | | — | | |
* Assumes reinvestment of all net investment income and realized capital gain distributions, if any, during the period. Includes adjustments in accordance with U.S. Generally Accepted Accounting Principles and could differ from the Lipper reported return.
^ The net expense ratio may not correlate to the applicable expense limits in place during the period since the current contractual expense limitation is applied for a period beginning July 1, 2019 and in effect through June 30, 2023, instead of coinciding with the Fund's fiscal year end. Details of the current contractual expense limitation in effect can be found in Note 4 of the accompanying Notes to Financial Statements.
(a) Per share net investment income (loss) has been calculated using the average daily shares method.
(b) Reflects an increase in trading activity due to asset allocation shifts.
(c) Reflects a return to normal trading levels after a prior year transition or allocation shift.
See notes to financial statements.
12
USAA Mutual Funds Trust | | Financial Highlights — continued | |
For a Share Outstanding Throughout Each Period
| | | | | Ratios to Average Net Assets | | Supplemental Data | |
| | | Total
Distributions | | Net Asset
Value,
End of
Period | | Total
Return* | | Net
Expenses^ | | Net
Investment
Income
(Loss) | | Gross
Expenses | | Net Assets,
End of
Period
(000's) | | Portfolio
Turnover | |
USAA Managed Allocation Fund | |
Year Ended:
May 31, 2021 | | | (0.17 | ) | | $ | 14.14 | | | | 24.31 | % | | | 0.59 | % | | | 1.12 | % | | | 0.75 | % | | $ | 661,300 | | | | 152 | % | |
May 31, 2020 | | | (0.32 | ) | | $ | 11.53 | | | | 6.66 | % | | | 0.60 | % | | | 2.38 | % | | | 0.74 | % | | $ | 660,792 | | | | 167 | % | |
May 31, 2019 | | | (0.19 | ) | | $ | 11.10 | | | | (5.92 | )% | | | 0.75 | % | | | 1.72 | % | | | 0.75 | % | | $ | 724,519 | | | | 156 | %(b) | |
May 31, 2018 | | | (0.29 | ) | | $ | 12.01 | | | | 5.91 | % | | | 0.74 | % | | | 1.83 | % | | | 0.74 | % | | $ | 808,509 | | | | 97 | %(c) | |
May 31, 2017 | | | (0.25 | ) | | $ | 11.61 | | | | 8.94 | % | | | 0.76 | % | | | 2.13 | % | | | 0.76 | % | | $ | 765,879 | | | | 194 | %(b) | |
See notes to financial statements.
13
USAA Mutual Funds Trust | | Notes to Financial Statements
May 31, 2021 | |
1. Organization:
USAA Mutual Funds Trust (the "Trust") is organized as a Delaware statutory trust and is registered under the Investment Company Act of 1940, as amended (the "1940 Act"), as an open-end investment company. The Trust is comprised of 46 funds and is authorized to issue an unlimited number of shares, which are units of beneficial interest with no par value.
The accompanying financial statements are those of the USAA Managed Allocation Fund (the "Fund"). The Fund is classified as diversified under the 1940 Act.
Under the Trust's organizational documents, its officers and trustees are indemnified against certain liabilities arising out of the performance of their duties to the Fund. In addition, in the normal course of business, the Fund enters into contracts with its vendors and others that provide for general indemnifications. The Fund's maximum exposure under these arrangements is unknown, as this would involve future claims that may be made against the Fund. However, based on experience, the Fund expects that risk of loss to be remote.
2. Significant Accounting Policies:
The following is a summary of significant accounting policies followed by the Trust in the preparation of its financial statements. The policies are in conformity with Generally Accepted Accounting Principles in the United States of America ("GAAP"). The preparation of financial statements in accordance with GAAP requires management to make estimates and assumptions that affect the reported amounts of assets and liabilities and disclosure of contingent assets and liabilities at the date of the financial statements and the reported amounts of income and expenses for the period. Actual results could differ from those estimates. The Fund follows the specialized accounting and reporting requirements under GAAP that are applicable to investment companies under Accounting Standards Codification Topic 946.
Investment Valuation:
The Fund records investments at fair value. Fair value is defined as the price that would be received to sell an asset or paid to transfer a liability in an orderly transaction between market participants at the measurement date.
The valuation techniques described below maximize the use of observable inputs and minimize the use of unobservable inputs in determining fair value. The inputs used for valuing the Fund's investments are summarized in the three broad levels listed below:
• Level 1 — quoted prices in active markets for identical securities
• Level 2 — other significant observable inputs (including quoted prices for similar securities or interest rates applicable to those securities, etc.)
• Level 3 — significant unobservable inputs (including the Fund's own assumptions in determining the fair value of investments)
Changes in valuation techniques may result in transfers in or out of an assigned level within the disclosure hierarchy. The inputs or methodologies used for valuation techniques are not necessarily an indication of the risks associated with entering into those investments.
Victory Capital Management Inc. ("VCM" or the "Adviser") has established the Pricing and Liquidity Committee (the "Committee"), and subject to the Trust's Board of Trustees (the "Board") oversight, the Committee administers and oversees the Fund's valuation policies and procedures, which are approved by the Board.
Portfolio securities listed or traded on securities exchanges, including Exchange-Traded Funds ("ETFs"), American Depositary Receipts ("ADRs"), and Rights are valued at the closing price on the exchange or system where the security is principally traded, if available, or at the Nasdaq Official Closing Price. If there have been no sales for that day on the exchange or system, then a security is valued at the last available bid quotation on the exchange or system where the security is principally traded. In each of these situations, valuations are typically categorized as Level 1 in the fair value hierarchy.
14
USAA Mutual Funds Trust | | Notes to Financial Statements — continued
May 31, 2021 | |
Investments in open-end investment companies are valued at their net asset value ("NAV"). These valuations are typically categorized as Level 1 in the fair value hierarchy.
In the event that price quotations or valuations are not readily available, investments are valued at fair value in accordance with procedures established by and under the general supervision and responsibility of the Board. These valuations are typically categorized as Level 2 or Level 3 in the fair value hierarchy, based on the observability of inputs used to determine the fair value. The effect of fair value pricing is that securities may not be priced on the basis of quotations from the primary market in which they are traded and the actual price realized from the sale of a security may differ materially from the fair value price. Valuing these securities at fair value is intended to cause the Fund's NAV to be more reliable than it otherwise would be.
A summary of the valuations as of May 31, 2021, based upon the three levels defined above, is included in the table below while the breakdown, by category, of investments is disclosed on the Schedule of Portfolio Investments (amounts in thousands):
| | | Level 1 | | Level 2 | | Level 3 | | Total | |
Exchange-Traded Funds | | $ | 659,803 | | | $ | — | | | $ | — | | | $ | 659,803 | | |
Collateral for Securities Loaned | | | 15,869 | | | | — | | | | — | | | | 15,869 | | |
Total | | $ | 675,672 | | | $ | — | | | $ | — | | | $ | 675,672 | | |
For the year ended May 31, 2021, there were no transfers in or out of Level 3 in the fair value hierarchy.
Investment Companies:
Exchange-Traded Funds:
The Fund may invest in ETFs, the shares of which are bought and sold on a securities exchange. An ETF trades like common stock and represents a fixed portfolio of securities often designed to track the performance and dividend yield of a particular domestic or foreign market index. The Fund may purchase shares of an ETF to temporarily gain exposure to a portion of the U.S. or a foreign market while awaiting purchase of underlying securities. The risks of owning an ETF generally reflect the risks of owning the underlying securities they are designed to track, although the lack of liquidity of an ETF could result in it being more volatile. Additionally, ETFs have fees and expenses that reduce their value.
Open-End Funds:
The Fund may invest in portfolios of open-end investment companies. These investment companies value securities in their portfolios for which market quotations are readily available at their market values (generally the last reported sale price) and all other securities and assets at their fair value by the methods established by the board of directors of the underlying funds.
Investment Transactions and Related Income:
Changes in holdings of investments are accounted for no later than one business day following the trade date. For financial reporting purposes, however, investment transactions are accounted for on trade date on the last business day of the reporting period. Interest income is determined on the basis of coupon interest accrued using the effective interest method which adjusts, where applicable, the amortization of premiums or accretion of discount. Dividend income is recorded on the ex-dividend date. Gains or losses realized on sales of securities are recorded on the identified cost basis.
Securities Lending:
The Fund, through a securities lending agreement with Citibank, N.A. ("Citibank"), may lend its securities to qualified financial institutions, such as certain broker-dealers, to earn additional income, net of income retained by Citibank. Borrowers are required to secure their loans for collateral in the amount of at least 102% of the value of U.S. securities loaned or at least 105% of the value of non-U.S. securities loaned, marked-to-market daily. Any collateral shortfalls associated with increases in the valuation of
15
USAA Mutual Funds Trust | | Notes to Financial Statements — continued
May 31, 2021 | |
the securities loaned are cured the next business day once the shortfall exceeds $100 thousand. Collateral may be cash, U.S. government securities, or other securities as permitted by Securities and Exchange Commission ("SEC") guidelines. Cash collateral may be invested in high-quality short-term investments, primarily open-end investment companies. Collateral requirements are determined daily based on the value of the Fund's securities on loan as of the end of the prior business day. During the time portfolio securities are on loan, the borrower will pay the Fund any dividends or interest paid on such securities plus any fee negotiated between the parties to the lending agreement. The Fund also earns a return from the collateral. The Fund pays Citibank various fees in connection with the investment of cash collateral and fees based on the investment income received from securities lending activities. Securities lending income (net of these fees) is disclosed on the Statement of Operations. Loans are terminable upon demand and the borrower must return the loaned securities within the lesser of one standard settlement period or five business days. Risks relating to securities-lending transactions include that the borrower may not provide additional collateral when required or return the securities when due, and that the value of the short-term investments will be less than the amount of cash collateral required to be returned to the borrower. The Fund's agreement with Citibank does not include master netting provisions. Non-cash collateral received by the Fund may not be sold or re-pledged, except to satisfy borrower default. Cash collateral is listed on the Fund's Schedule of Portfolio Investments and Financial Statements while non-cash collateral is not included.
The following table (amounts in thousands) is a summary of the Fund's securities lending transactions as of May 31, 2021.
Value of
Securities on Loan | | Non-Cash Collateral | | Cash Collateral | |
| $ | 15,560 | | | $ | — | | | $ | 15,869 | | |
Federal Income Taxes:
It is the Fund's policy to continue to qualify as a regulated investment company by complying with the provisions available to certain investment companies, as defined in applicable sections of the Internal Revenue Code, and to make distributions of net investment income and net realized gains sufficient to relieve it from all, or substantially all, federal income taxes. Accordingly, no provision for federal income taxes is required in the financial statements. The Fund has a tax year end of May 31.
Management of the Fund has reviewed tax positions taken in tax years that remain subject to examination by all major tax jurisdictions, including federal (i.e., the last four tax years, which includes the current fiscal tax year end). Management believes that there is no tax liability resulting from unrecognized tax benefits related to uncertain tax positions taken.
Allocations:
Expenses directly attributable to the Fund are charged to the Fund, while expenses that are attributable to more than one fund in the Trust, or jointly with an affiliated trust, are allocated among the respective funds in the Trust and/or affiliated trust based upon net assets or another appropriate basis.
3. Purchases and Sales:
Cost of purchases and proceeds from sales/maturities of securities (excluding securities maturing less than one year from acquisition) for the year ended May 31, 2021, were as follows for the Fund (amounts in thousands):
| | Excluding
U.S. Government Securities | |
| | | Purchases | | Sales | |
| | | | | $ | 961,007 | | | $ | 952,589 | | |
There were no purchases or sales of U.S. government securities during the year ended May 31, 2021.
16
USAA Mutual Funds Trust | | Notes to Financial Statements — continued
May 31, 2021 | |
4. Fees and Transactions with Affiliates and Related Parties:
Investment Advisory Fees:
Investment advisory services are provided to the Fund by the Adviser, which is a New York corporation registered as an investment adviser with the SEC. The Adviser is an indirect wholly owned subsidiary of Victory Capital Holdings, Inc., a publicly traded Delaware corporation, and a wholly owned direct subsidiary of Victory Capital Operating, LLC.
Under the terms of the Investment Advisory Agreement, the Adviser is entitled to receive fees accrued daily and paid monthly at an annualized rate of 0.60% of the Fund's average daily net assets. The Adviser has contractually agreed to waive its management fee from 0.60% to 0.44%. Amounts incurred and paid to VCM for the year ended May 31, 2021, are reflected on the Statement of Operations as Investment Advisory fees.
The Trust relies on an exemptive order granted to VCM and its affiliated funds by the SEC in March 2019 permitting the use of a "manager-of-managers" structure for certain funds. Under a manager-of-managers structure, the investment adviser may select (with approval of the Board and without shareholder approval) one or more subadvisers to manage the day-to-day investment of a fund's assets. For the year ended May 31, 2021, the Fund had no subadvisors.
Administration and Servicing Fees:
VCM serves as the Fund's administrator and fund accountant. Under the Fund Administration, Servicing and Accounting Agreement, VCM is paid for its services an annual fee at a rate of 0.05% of average daily net assets of the Fund. Amounts incurred for the year ended May 31, 2021, are reflected on the Statement of Operations as Administration fees.
The Fund (as part of the Trust) has entered into an agreement to provide compliance services with the Adviser, pursuant to which the Adviser furnishes its compliance personnel, including the services of the Chief Compliance Officer ("CCO"), and other resources reasonably necessary to provide the Trust with compliance oversight services related to the design, administration and oversight of a compliance program for the Trust in accordance with Rule 38a-1 under the 1940 Act. The CCO is an employee of the Adviser, which pays the compensation of the CCO and support staff. Funds in the Trust, Victory Variable Insurance Funds, Victory Portfolios, and Victory Portfolios II (collectively, the "Victory Funds Complex") in the aggregate, compensate the Adviser for these services. Amounts incurred for the year ended May 31, 2021, are reflected on the Statement of Operations as Compliance fees.
Citi Fund Services Ohio, Inc. ("Citi"), an affiliate of Citibank, acts as sub-administrator and sub-fund accountant to the Fund pursuant to a Sub-Administration and Sub-Fund Accounting Services Agreement between VCM and Citi. VCM pays Citi a fee for providing these services. The Fund reimburses VCM and Citi for out-of-pocket expenses incurred in providing these services and certain other expenses specifically allocated to the Fund. Amounts incurred for the year ended May 31, 2021, are reflected on the Statement of Operations as Sub-Administration fees.
Transfer Agency Fees:
Victory Capital Transfer Agency, Inc. ("VCTA"), an affiliate of the Adviser, provides transfer agency services to the Fund. VCTA provides transfer agent services to the Fund based on an annual rate of 0.05% of average daily net assets plus out-of-pocket expenses. VCTA pays a portion of these fees to certain intermediaries for the administration and servicing of accounts that are held with such intermediaries. Amounts incurred and paid to VCTA for the year ended May 31, 2021, are reflected on the Statement of Operations as Transfer Agent fees.
FIS Investor Services LLC serves as sub-transfer agent and dividend disbursing agent for the Fund pursuant to a Sub-Transfer Agent Agreement between VCTA and FIS Investor Services LLC. VCTA provides FIS Investor Services LLC a fee for providing these services.
17
USAA Mutual Funds Trust | | Notes to Financial Statements — continued
May 31, 2021 | |
Distributor/Underwriting Services:
Victory Capital Services, Inc. (the "Distributor"), an affiliate of the Adviser, serves as distributor for the continuous offering of the shares of the Fund pursuant to a Distribution Agreement between the Distributor and the Trust and receives no fee or other compensation for these services. Effective June 30, 2020, the Distributor's name was changed from Victory Capital Advisers, Inc.
Other Fees:
Citibank serves as the Fund's custodian. The Fund pays Citibank a fee for providing these services. Amounts incurred for the year ended May 31, 2021, are reflected on the Statement of Operations as Custodian fees.
K&L Gates LLP provides legal services to the Trust.
The Adviser has entered into an expense limitation agreement with the Fund until at least June 30, 2023. Under the terms of the agreement, the Adviser has agreed to waive fees or reimburse certain expenses to the extent that ordinary operating expenses incurred in any fiscal year exceed the expense limit for the Fund. Such excess amounts will be the liability of the Adviser. Acquired fund fees and expenses, interest, taxes, brokerage commissions, other expenditures, that are capitalized in accordance with GAAP, and other extraordinary expenses not incurred in the ordinary course of the Fund's business are excluded from the expense limits. As of May 31, 2021, the expense limit (excluding voluntary waivers) was 0.74%.
Under the terms of the expense limitation agreement, amended May 1, 2021, the Fund has agreed to repay fees and expenses that were waived or reimbursed by the Adviser for a period of up to three years (thirty six (36) months) after the waiver or reimbursement took place, subject to the lesser of any operating expense limits in effect at the time of: (a) the original waiver or expense reimbursement; or (b) the recoupment, after giving effect to the recoupment amount. Prior to May 1, 2021, the Fund was permitted to recoup fees waived and expenses reimbursed for up to three years after the fiscal year in which the waiver or reimbursement took place, subject to the limitations above. This change did not have any effect on the amounts previously reported for recoupment. As of May 31, 2021, there were no amounts available to be repaid to the Adviser.
The Adviser may voluntarily waive or reimburse additional fees to assist the Fund in maintaining competitive expense ratios. These waivers are not available for recoupment and are reflected on the Statement of Operations as Expenses waived/reimbursed by Adviser.
Certain officers and/or interested trustees of the Fund are also officers and/or employees of the Adviser, administrator, sub-administrator, sub-fund accountant, custodian, and Distributor.
5. Risks:
The Fund may be subject to other risks in addition to these identified risks.
Geopolitical/Natural Disaster Risk — Global economies and financial markets are increasingly interconnected, which increases the possibilities that conditions in one country or region might adversely affect issuers in another country or region. Geopolitical and other risks, including war, terrorism, trade disputes, political or economic dysfunction within some nations, public health crises and related geopolitical events, as well as environmental disasters such as earthquakes, fires, and floods, may add to instability in world economies and markets generally. Changes in trade policies and international trade agreements could affect the economies of many countries in unpredictable ways. Likewise, systemic market dislocations of the kind that occurred during the financial crisis that began in 2008, if repeated, would be highly disruptive to economies and markets, adversely affecting individual companies and industries, securities markets, interest rates, credit ratings, inflation, investor sentiment, and other factors affecting the value of a Fund's investments. Some countries, including the United States, are adopting more protectionist trade policies and moving away from the tighter financial industry regulations that followed the 2008 financial crisis, which may also affect the value of a Fund's investments.
18
USAA Mutual Funds Trust | | Notes to Financial Statements — continued
May 31, 2021 | |
Political events within the United States at times have resulted, and may in the future result, in a shutdown of government services, which could negatively affect the U.S. economy, decrease the value of a Fund's investments, increase uncertainty in or impair the operation of the U.S. or other securities markets, and degrade investor and consumer confidence, perhaps suddenly and to a significant degree.
An outbreak of disease called COVID-19 has spread internationally. The transmission of COVID-19 and efforts to contain its spread have resulted in international, national, and local border closings and other significant travel restrictions and disruptions, significant disruptions to business operations, supply chains and consumer activity, significant challenges in healthcare service preparation and delivery, quarantines, and general concern and uncertainty. These negative impacts have caused significant volatility and declines in global financial markets, which have caused losses for Fund investors during and subsequent to period end. The impact of the COVID-19 pandemic may last for an extended period of time, and could result in a substantial economic downturn or recession. Public health crises may exacerbate other pre-existing political, social, economic, market, and financial risks. The extent of the impact to the financial performance of the Fund's investments will depend on future developments, including (i) the duration and spread of the outbreak, (ii) the restrictions and advisories, (iii) the effects on the financial markets, and (iv) the effects on the economy overall, all of which are highly uncertain and cannot be predicted.
Portfolio Reallocation Risk — The frequent changes in the allocation of the Fund's portfolio holdings may result in higher portfolio turnover. In purchasing and selling securities in order to reallocate the portfolio, the Fund will pay more brokerage commissions than it would without a reallocation policy. In addition, the Fund may have a higher proportion of capital gains and a potentially lower return than a fund that does not reallocate from time to time.
ETF Risk — ETFs, which generally are registered investment companies, incur their own management and other fees and expenses, such as trustees' fees, operating expenses, registration fees, and marketing expenses, a proportionate share of which will be borne indirectly by the Fund as a shareholder in an ETF. As a result, the Fund's investment in an ETF will cause the Fund to indirectly bear the fees and expenses of the ETF and, in turn, the Fund's performance may be lower than if the Fund were to invest directly in the underlying securities held by the ETF. For investments in affiliated ETFs, the Fund's management fee is reimbursed by the Adviser to the extent of the indirect management fee incurred through the Fund's investment in the affiliated ETFs. The Adviser may have conflicts of interest in allocating assets among affiliated and unaffiliated ETFs, because the Adviser also manages and administers the affiliated ETFs, and the Adviser and its affiliates receive other fees from the affiliated ETFs. In addition, the Fund also will be subject to the risks associated with the securities or other investments held by the ETFs.
Stock Market Risk — Overall stock market risks may affect the value of the Fund. Domestic and international factors such as political events, war, trade disputes, interest rate levels and other fiscal and monetary policy changes, pandemics and other public health crises, and related geopolitical events, as well as environmental disasters such as earthquakes, fires, and floods, may add to instability in world economies and markets generally. The impact of these and other factors may be short-term or may last for extended periods.
6. Borrowing and Interfund Lending:
Line of Credit:
The Victory Funds Complex participated in a short-term demand note "Line of Credit" agreement with Citibank. The Line of Credit agreement with Citibank was renewed on June 29, 2020, with a termination date of June 28, 2021. Under the agreement with Citibank, the Victory Funds Complex may borrow up to $600 million, of which $300 million is committed and $300 million is uncommitted. $40 million of the Line of Credit is reserved for use by the Victory Floating Rate Fund, another series of the Victory Funds Complex, with Victory Floating Rate Fund paying the related commitment fees for that amount. The purpose of the Line of Credit is to meet temporary or emergency cash needs. For the year ended May 31, 2021, Citibank received an annual commitment fee of 0.15% on $300 million for providing the Line of Credit. Each fund in the Victory Funds Complex pays a pro-rata portion of the commitment fees
19
USAA Mutual Funds Trust | | Notes to Financial Statements — continued
May 31, 2021 | |
plus any interest (one month LIBOR plus one percent) on amounts borrowed. For the period June 29, 2020, through April 30, 2021, under an amended Line of Credit agreement, Citibank received an annual upfront fee of 0.10% on the $300 million committed line of credit. Each fund in the Victory Funds Complex paid a pro-rata portion of the upfront fee. Effective with the next amendment, the annual commitment fee of 0.15% will remain unchanged and the upfront fee of 0.10% is discontinued. Interest charged to each fund during the period, if applicable, is reflected on the Statement of Operations under Line of credit fees.
The average borrowing for the days outstanding and average interest rate for the Fund during the year ended May 31, 2021, were as follows (amounts in thousands):
Amount
Outstanding at
May 31, 2021 | | Average
Borrowing | | Days
Borrowing
Outstanding | | Average
Interest
Rate* | | Maximum
Borrowing
During the
Period | |
| $ | — | | | $ | 5,700 | | | | 5 | | | | 1.24 | % | | | 5,700 | | |
* For the year ended May 31, 2021, based on the number of days borrowings were outstanding.
Interfund Lending:
The Trust and Adviser rely on an exemptive order granted by the SEC in March 2017 (the "Order"), permitting the establishment and operation of an Interfund Lending Facility (the "Facility"). The Facility allows the Fund to directly lend and borrow money to or from any other fund in the Victory Funds Complex that is permitted to participate in the Facility, relying upon the Order at rates beneficial to both the borrowing and lending funds. Advances under the Facility are allowed for temporary or emergency purposes, including the meeting of redemption requests that otherwise might require the untimely disposition of securities, and are subject to each Fund's borrowing restrictions. The interfund loan rate is determined, as specified in the Order, by averaging the current repurchase agreement rate and the current bank loan rate. As a Borrower, interest charged to the Fund, if any, during the period is reflected on the Statement of Operations under Interfund lending fees. As a Lender, interest earned by the Fund, if any, during the period is presented on the Statement of Operations under Interfund lending.
The average borrowing or lending for the days outstanding and average interest rate for the Fund during the year ended May 31, 2021, were as follows (amounts in thousands):
Borrower or
Lender | | Amount
Outstanding at
May 31, 2021 | | Average
Borrowing* | | Days
Borrowing
Outstanding | | Average
Interest
Rate* | | Maximum
Borrowing
During the
Period | |
| Borrower | | $ | — | | | $ | 42,473 | | | | 2 | | | | 0.58 | % | | $ | 64,000 | | |
* For the year ended May 31, 2021, based on the number of days borrowings were outstanding.
7. Federal Income Tax Information:
The Fund intends to declare daily and distribute any net investment income annually. Distributable net realized gains, if any, are declared and paid at least annually.
The amounts of dividends from net investment income and distributions from net realized gains (collectively distributions to shareholders) are determined in accordance with federal income tax regulations, which may differ from GAAP. To the extent these "book/tax" differences are permanent in nature (e.g., net operating loss and distribution reclassification), such amounts are reclassified within the components of net assets based on their federal tax-basis treatment; temporary differences (e.g., wash sales) do not require reclassification. To the extent dividends and distributions exceed net investment income and net realized gains for tax purposes, they are reported as distributions of capital.
20
USAA Mutual Funds Trust | | Notes to Financial Statements — continued
May 31, 2021 | |
Net investment losses incurred by the Fund may be reclassified as an offset to capital on the accompanying Statement of Assets and Liabilities.
As of May 31, 2021, on the Statement of Assets and Liabilities, as a result of permanent book-to-tax differences, reclassification adjustments were as follows (amounts in thousands):
Total
Accumulated
Earnings/(Loss) | | Capital | |
| $ | 1 | | | $ | (1 | ) | |
The tax character of distributions paid during the tax years ended as noted below, were as follows (total distributions paid may differ from the Statements of Changes in Net Assets because, for tax purposes, dividends are recognized when actually paid) (amounts in thousands).
| Year Ended May 31, 2021 | | Year Ended May 31, 2020 | |
Distributions
paid from | |
| | Distributions
paid from | |
| |
Ordinary
Income | | Total
Distributions
Paid | | Ordinary
Income | | Total
Distributions
Paid | |
| $ | 8,738 | | | $ | 8,738 | | | $ | 19,579 | | | $ | 19,579 | | |
As of May 31, 2021, the components of accumulated earnings (loss) on a tax basis were as follows (amounts in thousands):
Undistributed
Ordinary
Income | | Undistributed
Long-Term
Capital Gains | | Accumulated
Earnings | | Unrealized
Appreciation
(Depreciation)* | | Total
Accumulated
Earnings
(Loss) | |
| $ | 18,737 | | | $ | 6,937 | | | $ | 25,674 | | | $ | 98,054 | | | $ | 123,728 | | |
* The difference between the book-basis and tax-basis of unrealized appreciation/depreciation is attributable to the tax deferral of losses on wash sales.
As of May 31, 2021, the Fund had no capital loss carryforwards, for federal income tax purposes.
During the most recent tax year ended May 31, 2021, the Fund utilized $52,213 thousand of capital loss carryforwards.
As of May 31, 2021, the cost basis for federal income tax purposes, gross unrealized appreciation, gross unrealized depreciation, and net unrealized appreciation (depreciation) for investments were as follows (amounts in thousands):
Cost of
Investments
for Federal
Tax Purposes | | Gross
Unrealized
Appreciation | | Gross
Unrealized
Depreciation | | Net Unrealized
Appreciation
(Depreciation) | |
| $ | 577,618 | | | $ | 98,054 | | | $ | — | | | $ | 98,054 | | |
21
REPORT OF INDEPENDENT REGISTERED PUBLIC ACCOUNTING FIRM
To the Shareholders and the Board of Trustees of USAA Managed Allocation Fund
Opinion on the Financial Statements
We have audited the accompanying statement of assets and liabilities of USAA Managed Allocation Fund (the "Fund") (one of the funds constituting USAA Mutual Funds Trust (the "Trust")), including the schedule of portfolio investments, as of May 31, 2021, and the related statement of operations for the year then ended, the statements of changes in net assets for each of the two years in the period then ended, the financial highlights for each of the five years in the period then ended and the related notes (collectively referred to as the "financial statements"). In our opinion, the financial statements present fairly, in all material respects, the financial position of the Fund (one of the funds constituting USAA Mutual Funds Trust) at May 31, 2021, the results of its operations for the year then ended, the changes in its net assets for each of the two years in the period then ended and its financial highlights for each of the five years in the period then ended, in conformity with U.S. generally accepted accounting principles.
Basis for Opinion
These financial statements are the responsibility of the Trust's management. Our responsibility is to express an opinion on the Fund's financial statements based on our audits. We are a public accounting firm registered with the Public Company Accounting Oversight Board (United States) ("PCAOB") and are required to be independent with respect to the Trust in accordance with the U.S. federal securities laws and the applicable rules and regulations of the Securities and Exchange Commission and the PCAOB.
We conducted our audits in accordance with the standards of the PCAOB. Those standards require that we plan and perform the audit to obtain reasonable assurance about whether the financial statements are free of material misstatement, whether due to error or fraud. The Trust is not required to have, nor were we engaged to perform, an audit of the Trust's internal control over financial reporting. As part of our audits we are required to obtain an understanding of internal control over financial reporting, but not for the purpose of expressing an opinion on the effectiveness of the Trust's internal control over financial reporting. Accordingly, we express no such opinion.
Our audits included performing procedures to assess the risks of material misstatement of the financial statements, whether due to error or fraud, and performing procedures that respond to those risks. Such procedures included examining, on a test basis, evidence regarding the amounts and disclosures in the financial statements. Our procedures included confirmation of securities owned as of May 31, 2021, by correspondence with the custodian. Our audits also included evaluating the accounting principles used and significant estimates made by management, as well as evaluating the overall presentation of the financial statements. We believe that our audits provide a reasonable basis for our opinion.

We have served as the auditor of one or more Victory Capital investment companies since 1995.
San Antonio, Texas
July 28, 2021
22
USAA Mutual Funds Trust | | Supplemental Information
May 31, 2021 | |
(Unaudited)
Trustee and Officer Information
Board of Trustees:
Overall responsibility for management of the Trust rests with the Board. The Trust is managed by the Board in accordance with the laws of the state of Delaware. There are currently nine Trustees, seven of whom are not "interested persons" of the Trust within the meaning of that term under the 1940 Act ("Independent Trustees") and two of whom are "interested persons" of the Trust within the meaning of that term under the 1940 Act ("Interested Trustee"). The Trustees, in turn, elect the officers of the Trust to actively supervise its day-to-day operations.
The following tables list the Trustees, their ages, position with the Trust, commencement of service, principal occupations during the past five years and any directorships of other investment companies or companies whose securities are registered under the Securities Exchange Act of 1934, as amended, or who file reports under that Act. Each Trustee oversees 46 portfolios in the Trust. Each Trustee's address is 15935 La Cantera Pkwy, San Antonio, TX, 78256. Pursuant to a policy adopted by the Board, the term of office for each Trustee shall be until the Independent Trustee reaches age 75 or an Interested Trustee reaches age 75. The Board may change or grant exceptions from this policy at any time without shareholder approval. A Trustee may resign or be removed by a vote of the other Trustees or the holders of a majority of the outstanding shares of the Trust at any time. Vacancies on the Board can be filled by the action of a majority of the Trustees, provided that after filling such vacancy at least two-thirds of the Trustees have been elected by the shareholders.
Name and Date of Birth | | Position
Held with
the Trust | | Year
Commenced
Service | | Principal Occupation
During Past 5 Years | | Other
Directorships
Held During
Past 5 Years | |
Independent Trustees. | |
Jefferson C. Boyce, (c)
Born September 1957 | | Independent Chairman | | | 2021 | | | Senior Managing Director, New York Life Investments, LLC (1992-2012) | | Westhab, Inc. | |
John C. Walters,
Born February 1962 | | Trustee | | | 2019 | | | Retired. Mr. Walters brings significant Board experience including active involvement with the board of a Fortune 500 company, and a proven record of leading large, complex financial organizations. He has a demonstrated record of success in distribution, manufacturing, investment brokerage, and investment management in both the retail and institutional investment businesses. He has substantial experience in the investment management business with a demonstrated ability to develop and drive strategy while managing operation, financial, and investment risk. | | Guardian Variable Products Trust (16 series), Lead Independent Director; Amerilife Holdings LLC, Director; Stadion Money Management; Director; University of North Carolina (Chapel Hill), Member Board of Governors | |
23
USAA Mutual Funds Trust | | Supplemental Information — continued
May 31, 2021 | |
(Unaudited)
Name and Date of Birth | | Position
Held with
the Trust | | Year
Commenced
Service | | Principal Occupation
During Past 5 Years | | Other
Directorships
Held During
Past 5 Years | |
Robert L. Mason, Ph.D.,
Born July 1946 | | Trustee | | | 1997 | | | Adjunct Professor in the Department of Management Science and Statistics in the College of Business at the University of Texas at San Antonio (since 2001); Institute Analyst, Southwest Research Institute (March 2002-January 2016) | | None | |
Dawn M. Hawley,
Born February 1954 | | Trustee | | | 2014 | | | Manager of Finance, Menil Foundation, Inc. (May 2007-June 2011), which is a private foundation that oversees the assemblage of sculptures, prints, drawings, photographs, and rare books. Director of Financial Planning and Analysis and Chief Financial Officer, AIM Management Group, Inc. (October 1987-January 2006) | | None | |
Paul L. McNamara,
Born July 1948 | | Trustee | | | 2012 | | | Director, Cantor Opportunistic Alternatives Fund, LLC (March 2010-February 2014), which is a closed-end fund of funds by Cantor Fitzgerald Investment Advisors, LLC | | None | |
24
USAA Mutual Funds Trust | | Supplemental Information — continued
May 31, 2021 | |
(Unaudited)
Name and Date of Birth | | Position
Held with
the Trust | | Year
Commenced
Service | | Principal Occupation
During Past 5 Years | | Other
Directorships
Held During
Past 5 Years | |
Richard Y. Newton III,
Born January 1956 | | Trustee | | | 2017 | | | Director, Elta North America (01/18-present), which is a global leader in the design, manufacture, and support of innovative electronic systems in the ground, maritime, airborne, and security domains for the nation's warfighters, security personnel, and first responders; Managing Partner, Pioneer Partnership Development Group (December 2015-present)); Executive Director, The Union League Club of New York (June 2014-November 2015): Executive Vice President, Air Force Association (August 2012-May 2014); Lieutenant General, United States Air Force (January 2008-June 2012) | | PredaSAR Corp. | |
Barbara B. Ostdiek, Ph.D.,
Born March 1964 | | Trustee | | | 2008 | | | Senior Associate Dean of Degree Programs at Jesse H. Jones Graduate School of Business at Rice University (since 2013); Associate Professor of Finance at Jessie H. Jones Graduate School of Business at Rice University (since 2001) | | None | |
Effective at the close of business on December 31, 2020, Michael F. Reimherr retired from the Board of Trustees.
25
USAA Mutual Funds Trust | | Supplemental Information — continued
May 31, 2021 | |
(Unaudited)
Name and Date of Birth | | Position
Held with
the Trust | | Year
Commenced
Service | | Principal Occupation
During Past 5 Years | | Other
Directorships
Held During
Past 5 Years | |
Interested Trustees. | |
David C. Brown, (b)
Born May 1972 | | Trustee | | | 2019 | | | Chairman and Chief Executive Officer (since 2013), Victory Capital Management Inc.; Chairman and Chief Executive Officer, Victory Capital Holdings, Inc. (since 2013). Mr. Brown brings to the Board extensive business, finance and leadership skills gained and developed through years of experience in the financial services industry, including his tenure overseeing the strategic direction as CEO of Victory Capital. These skills, combined with Mr. Brown's extensive knowledge of the financial services industry and demonstrated success in the development and distribution of investment strategies and products, enable him to provide valuable insights to the Board and strategic direction for the Funds. | | Trustee, Victory Portfolios (41 series), Victory Portfolios II (26 series), Victory Variable Insurance Funds (8 series) | |
26
USAA Mutual Funds Trust | | Supplemental Information — continued
May 31, 2021 | |
(Unaudited)
Name and Date of Birth | | Position
Held with
the Trust | | Year
Commenced
Service | | Principal Occupation
During Past 5 Years | | Other
Directorships
Held During
Past 5 Years | |
Daniel S. McNamara, (b)(c)(d)
Born June 1966 | | Trustee | | | 2012 | | | Trustee, President, and Vice Chairman of USAA ETF Trust (June 2017-June 2019); President of Financial Advice & Solutions Group (FASG), USAA (February 2013-March 2021); Director of USAA Investment Services Company (ISCO) (formerly USAA Investment Management) (September 2009-March 2021); President, Asset Management Company (AMCO) (August, 2011-June 2019); Senior Vice President of USAA Financial Planning Services Insurance Agency, Inc. (FPS) (April 2011-March 2021); Chairman of Board of ISCO (April 2013-December 2020); Director of AMCO (August 2011-June 2019); President and Director of USAA Shareholder Account Services (SAS) (October 2009-June 2019); Director and Vice Chairman of FPS (December 2013-March 2021); President and Director of USAA Investment Corporation (ICORP) (March 2010-March 2021); Chairman of Board of ICORP (December 2013-March 2021); Director of USAA Financial Advisors, Inc. (FAI) (December 2013-March 2021); Chairman of Board of FAI (March 2015-March 2021). Mr. McNamara brings to the Board extensive experience in the financial services industry, including experience as an officer of the Trust. | | None | |
(b) Mr. Dan McNamara is deemed an "interested person" due to his previous position as Director of AMCO, the former investment adviser of the Funds. Mr. Brown is deemed an "interested person" due to his position as Chief Executive Officer of Victory Capital, investment adviser to the Funds.
(c) Effective at the close of business on December 31, 2020, Jefferson C. Boyce replaced Dan McNamara as Chair of the Board and assumed the title of Independent Chair.
(d) Effective July 2, 2021, Mr. Dan McNamara became an Independent Trustee to the Funds.
The Statement of Additional Information includes additional information about the Trustees of the Trust and is available, without charge, on the SEC's website at www.sec.gov and/or by calling (800)-235-8396.
27
USAA Mutual Funds Trust | | Supplemental Information — continued
May 31, 2021 | |
(Unaudited)
Officers:
The officers of the Trust, their ages, commencement of service and their principal occupations during the past five years, are detailed in the following table. Each officer serves until the earlier of his or her resignation, removal, retirement, death, or the election of a successor. The mailing address of each officer of the Trust is 15935 La Cantera Pkwy, San Antonio, TX, 78256. The officers of the Trust receive no compensation directly from the Trust for performing the duties of their offices.
Name and Date of Birth | | Position with
the Trust | | Year
Commenced
Service | | Principal Occupation During Past 5 Years | |
Interested Officers.
Christopher K. Dyer,
Born February 1962 | | President | | | 2019 | | | Director of Fund Administration, Victory Capital (since 2004); Chief Operating Officer, Victory Capital Services, Inc. (since 2020) | |
Scott A Stahorsky,
Born July 1969 | | Vice President | | | 2019 | | | Manager, Fund Administration, Victory Capital (since 2015) | |
James K. De Vries,
Born April 1969 | | Treasurer | | | 2018 | | | Executive Director, Victory Capital Management Inc. (since 2019); Treasurer, USAA ETF Trust (September 2018-June 2019); Executive Director, Investment and Financial Administration, USAA (April 2012-June 2019); Assistant Treasurer, USAA ETF Trust (June 2017-September 2018); Assistant Treasurer, USAA Mutual Funds Trust (December 2013-February 2018) | |
Allan Shaer,
Born March 1965 | | Assistant Treasurer | | | 2019 | | | Senior Vice President, Financial Administration, Citi Fund Services Ohio, Inc. (since 2016); Vice President, Mutual Fund Administration, JP Morgan Chase (2011-2016) | |
Carol D. Trevino,
Born October 1965 | | Assistant Treasurer | | | 2018 | | | Director, Accounting and Finance, Victory Capital Management Inc. (since 2019); Accounting/Financial Director, USAA (December 2013-June 2019); Assistant Treasurer, USAA ETF Trust (September 2018-June 2019) | |
Erin G. Wagner,
Born February 1974 | | Secretary | | | 2019 | | | Deputy General Counsel, the Adviser (since 2013) | |
Charles Booth,
Born April 1960 | | Anti-Money Laundering Compliance Officer and Identity Theft Officer | | | 2019 | | | Director, Regulatory Administration and CCO Support Services, Citi Fund Services Ohio, Inc. (since 2007) | |
Amy Campos,
Born July 1976 | | Chief Compliance Officer | | | 2019 | | | Chief Compliance Officer, USAA Mutual Funds Trust (since 2019); Executive Director, Deputy Chief Compliance Officer, USAA Mutual Funds Trust and USAA ETF Trust (July 2017-June 2019); Compliance Director, USAA Mutual Funds Trust (2014-July 2017) | |
28
USAA Mutual Funds Trust | | Supplemental Information — continued
May 31, 2021 | |
(Unaudited)
Proxy Voting and Portfolio Holdings Information
Proxy Voting:
Information regarding the policies and procedures the Fund uses to determine how to vote proxies relating to portfolio securities is available without charge, upon request, by calling (800) 235-8396. The information is also included in the Fund's Statement of Additional Information, which is available on the SEC's website at www.sec.gov.
Information relating to how the Fund voted proxies relating to portfolio securities held during the most recent 12 months ended June 30 is available on the SEC's website at www.sec.gov.
Availability of Schedules of Portfolio Investments:
The Trust files a complete list of Schedules of Portfolio Investments with the SEC for the first and third quarter of each fiscal year on Form N-PORT. Form N-PORT is available on the SEC's website at www.sec.gov.
Expense Example
As a shareholder of the Fund, you may incur two types of costs: (1) transaction costs, and (2) ongoing costs, including management fees and other Fund expenses. These examples are intended to help you understand your ongoing costs (in dollars) of investing in the Fund and to compare these costs with the ongoing costs of investing in other mutual funds.
These examples are based on an investment of $1,000 invested at the beginning of the period and held for the entire period from December 1, 2020, through May 31, 2021.
The Actual Expense figures in the table below provide information about actual account values and actual expenses. You may use the information below, together with the amount you invested, to estimate the expenses that you paid over the period. Simply divide your account value by $1,000 (for example, an $8,600 account value divided by $1,000 = 8.6), then multiply the result by the number in the table under the heading entitled "Actual Expenses Paid During Period" to estimate the expenses you paid on your account during this period.
The Hypothetical Expense figures in the table below provide information about hypothetical account values and hypothetical expenses based on the Fund's actual expense ratio and an assumed rate of return of 5% per year before expenses, which is not the Fund's actual return. The hypothetical account values and expenses may not be used to estimate the actual ending account balance or expenses you paid for the period. You may use this information to compare this 5% hypothetical example with the 5% hypothetical examples that appear in shareholder reports of other funds.
Please note the expenses shown in the table below are meant to highlight your ongoing costs only and do not reflect any transactional costs. If these transactional costs were included, your costs would have been higher.
Beginning
Account
Value
12/1/20 | | Actual
Ending
Account
Value
5/31/21 | | Hypothetical
Ending
Account
Value
5/31/21 | | Actual
Expenses
Paid
During
Period
12/1/20-
5/31/21* | | Hypothetical
Expenses
Paid
During
Period
12/1/20-
5/31/21* | | Annualized
Expense
Ratio
During
Period
12/1/20-
5/31/21 | |
| $ | 1,000.00 | | | $ | 1,117.10 | | | $ | 1,021.99 | | | $ | 3.11 | | | $ | 2.97 | | | | 0.59 | % | |
* Expenses are equal to the average account value multiplied by the Fund's annualized expense ratio multiplied by 182/365 (the number of days in the most recent fiscal half-year divided by the number of days in the fiscal year).
29
USAA Mutual Funds Trust | | Supplemental Information — continued
May 31, 2021 | |
(Unaudited)
Considerations of the Board in Continuing the Investment Advisory Agreement (the "Agreement")
USAA Managed Allocation Fund (the "Fund")
At a meeting of the Board of Trustees (the "Board") held on December 10-11, 2020, the Board, including the Trustees who are not "interested persons" (as that term is defined in the Investment Company Act of 1940, as amended) of the Trust (the "Independent Trustees"), approved for an annual period the continuance of the Investment Advisory Agreement (the "Advisory Agreement") between the Trust and Victory Capital Management Inc. (the "Adviser") with respect to the Fund. Prior to the December 10-11, 2020 meeting at which the Advisory Agreement was approved, the Independent Trustees also discussed and considered information regarding the proposed continuation of the Advisory Agreement at a meeting held on November 19, 2020.
In advance of the foregoing meetings, the Trustees received and considered a variety of information relating to the Advisory Agreement and the Adviser, and were given the opportunity to ask questions and request additional information from management. The information provided to the Board included, among other things: (i) a separate report prepared by an independent third party of mutual fund data, which provided a statistical analysis comparing the Fund's investment performance, expenses, and fees to comparable investment companies; (ii) information concerning the services rendered to the Fund, as well as information regarding the Adviser's revenues and costs of providing services to the Fund and compensation paid to affiliates of the Adviser; and (iii) information about the Adviser's operations and personnel. Prior to voting, the Independent Trustees reviewed the proposed continuance of the Advisory Agreement with management and with experienced independent counsel retained by the Independent Trustees ("Independent Counsel") and received materials from such Independent Counsel discussing the legal standards for their consideration of the proposed continuation of the Advisory Agreement with respect to the Fund. The Independent Trustees also reviewed the proposed continuation of the Advisory Agreement with respect to the Fund in private sessions with Independent Counsel at which no representatives of management were present.
At each regularly scheduled meeting of the Board and its committees, the Board receives and reviews, among other things, information concerning the Fund's performance and related services provided by the Adviser. At the meeting at which the renewal of the Advisory Agreement is considered, particular focus is given to information concerning Fund performance, fees and total expenses as compared to comparable investment companies, and the Adviser's profitability with respect to the Fund. However, the Board noted that the evaluation process with respect to the Adviser is an ongoing one. In this regard, the Board's and its committees' consideration of the Advisory Agreement included information previously received at such meetings.
Advisory Agreement
After full consideration of a variety of factors, the Board, including the Independent Trustees, voted to approve the Advisory Agreement. In approving the Advisory Agreement, the Trustees did not identify any single factor as controlling, and each Trustee may have attributed different weights to various factors. Throughout their deliberations, the Independent Trustees were represented and assisted by Independent Counsel.
Nature, Extent, and Quality of Services — In considering the nature, extent, and quality of the services provided by the Adviser under the Advisory Agreement, the Board reviewed information provided by the Adviser relating to its operations and personnel. The Board also took into account its knowledge of the Adviser's management and the quality of the performance of the Adviser's duties through Board meetings, discussions, and reports during the preceding year. The Board considered the fees paid to the Adviser and the services provided to the Fund by the Adviser under the Advisory Agreement, as well as other services provided by the Adviser and its affiliates under other agreements, and the personnel who provide these services. In addition to the investment advisory services provided to the Fund, the Adviser and its affiliates provide administrative services, shareholder services, oversight of Fund accounting, marketing services, assistance in meeting legal and regulatory requirements, and other services necessary for the operation of the Fund and the Trust.
The Board considered the scope of services provided by, and the undertakings required of, the Adviser in connection with those services, including, among other things, maintaining (i) its own and the Fund's compliance programs, (ii) risk management programs, (iii) liquidity risk management programs, and (iv) cybersecurity
30
USAA Mutual Funds Trust | | Supplemental Information — continued
May 31, 2021 | |
(Unaudited)
programs, each of which had expanded over time as a result of regulatory, market, and other developments. The Board also considered the significant risks assumed by the Adviser in connection with the services provided to the Fund, including investment, operational, enterprise, litigation, regulatory, and compliance risks.
The Board considered the Adviser's management style and the performance of the Adviser's duties under the Advisory Agreement. The Board considered the level and depth of knowledge of the Adviser, including the professional experience and qualifications of its senior and investment personnel, as well as current staffing levels. The allocation of the Fund's brokerage, including the Adviser's process for monitoring "best execution," also was considered. The Adviser's role in coordinating the activities of the Fund's other service providers was also considered. The Board also considered the Adviser's risk management processes. The Board considered the Adviser's financial condition and that it had the financial wherewithal to continue to provide the same scope and high quality of services under the Advisory Agreement. In reviewing the Advisory Agreement, the Board focused on the experience, resources, and strengths of the Adviser and its affiliates in managing the Fund, as well as the other funds in the Trust.
The Board also reviewed the compliance and administrative services provided to the Fund by the Adviser and its affiliates, including the Adviser's oversight of the Fund's day-to-day operations and oversight of Fund accounting. The Trustees, guided also by information obtained from their experiences as trustees of the Trust, also focused on the quality of the Adviser's compliance and administrative staff.
Expenses and Performance — In connection with its consideration of the Advisory Agreement, the Board evaluated the Fund's advisory fees and total expense ratio as compared to other open-end investment companies deemed to be comparable to the Fund as determined by the independent third party in its report. The Fund's expenses were compared to (i) a group of investment companies chosen by the independent third party to be comparable to the Fund based upon certain factors, including fund type, comparability of investment objective and classification, sales load type, asset size, and expense components (the "expense group") and (ii) a larger group of investment companies with the same investment classification/objective as the Fund regardless of asset size, excluding outliers (the "expense universe"). Among other data, the Board noted that the Fund's management fee rate — which includes advisory and administrative services, as well as any fee waivers and reimbursements — was below the medians of its expense group and expense universe. The data indicated that the Fund's total expenses, which included underlying fund expenses and after any reimbursements, were below the medians of its expense group and expense universe. The Board also took into account the Adviser's current undertakings to maintain expense limitations for the Fund. The Board took into account the various other services provided to the Fund by the Adviser and its affiliates, and noted the high quality of services received by the Fund.
In considering the Fund's performance, the Board noted that it reviews at its regularly scheduled meetings information about the Fund's performance results. The Trustees also reviewed various comparative data provided to them in connection with their consideration of the renewal of the Advisory Agreement, including, among other information, a comparison of the Fund's average annual total returns relative to its Lipper index and other mutual funds deemed to be in its peer group by the independent third party in its report (the "performance universe"). The Fund's performance universe consisted of the Fund and all retail and institutional open-end investment companies with the same classification/objective as the Fund regardless of asset size or primary channel of distribution. This comparison indicated that, among other data, the Fund's performance was above the average of its performance universe for the one-year period ended September 30, 2020, and was below the average of its performance universe for the three-, five- and ten-year periods ended September 30, 2020, and was below its Lipper index for the one-, three-, five- and ten-year periods ended September 30, 2020. The Board took into account management's discussion of the Fund's performance, including the reasons for the Fund's underperformance relative to its peers.
Compensation and Profitability — The Board took into consideration the level and method of computing the management fee. The information considered by the Board included operating profit margin information for the Adviser's business as a whole. The Board also received and considered profitability information related to the management revenues from the Fund. This information included a review of the methodology used in the allocation of certain costs to the Fund. In considering the profitability data with respect to the Fund, the Trustees noted that the Adviser waived a portion of its management fees and/or reimbursed certain expenses with respect to the Fund. The Trustees reviewed the profitability of the Adviser's relationship with the Fund before tax
31
USAA Mutual Funds Trust | | Supplemental Information — continued
May 31, 2021 | |
(Unaudited)
expenses. The Board was also provided with a profitability analysis of other publicly traded asset managers prepared by an independent information service. In reviewing the overall profitability of the management fee to the Adviser, the Board also considered the fact that the Adviser and its affiliates provide shareholder servicing and administrative services to the Fund for which they receive compensation. The Board also considered the possible direct and indirect benefits to the Adviser from its relationship with the Trust, including that the Adviser may derive reputational and other benefits from its association with the Fund. The Trustees recognized that the Adviser should be entitled to earn a reasonable level of profits in exchange for the level of services it provides to the Fund and the entrepreneurial and other risks that it assumes as Adviser.
Economies of Scale — The Board considered whether there should be changes in the management fee rate or structure in order to enable the Fund to participate in any economies of scale. The Board also considered the fee waiver and expense reimbursement arrangements by the Adviser. The Board also considered the effect of the Fund's change in size, if any, on its performance and fees, noting that the Fund may realize other economies of scale if assets increase proportionally more than expenses. The Board determined that the current investment management fee structure was reasonable.
Conclusions — The Board reached the following conclusions regarding the Fund's Advisory Agreement with the Adviser: (i) the Adviser has demonstrated that it possesses the capability and resources to perform the duties required of it under the Advisory Agreement; (ii) the Adviser maintains an appropriate compliance program; (iii) the performance of the Fund is reasonable in relation to the performance of funds with similar investment objectives and to relevant indices in view of the Fund's investment approach and the Adviser is appropriately monitoring the Fund's performance; (iv) the Fund's advisory expenses are reasonable in relation to those of similar funds and to the services to be provided by the Adviser; and (v) the Adviser's and its affiliates' level of profitability from their relationship with the Fund is reasonable in light of the nature and high quality of services provided by the Adviser and the type of fund. Based on its conclusions, the Board determined that continuation of the Advisory Agreement would be in the best interests of the Fund and its shareholders.
32
USAA Mutual Funds Trust | | Supplemental Information — continued
May 31, 2021 | |
(Unaudited)
Liquidity Risk Management Program:
The USAA Mutual Funds have adopted and implemented a written liquidity risk management program (the "LRMP") as required by Rule 22e-4 under the Investment Company Act of 1940, as amended. The LRMP is reasonably designed to assess and manage the Fund's liquidity risk, taking into consideration the Fund's investment strategy and the liquidity of its portfolio investments during normal and reasonably foreseeable stressed market conditions; its short and long-term cash flow projections; and its cash holdings and access to other liquidity management tools such as available funding sources including the Victory Funds Complex Interfund Lending Facility and Line of Credit (discussed in the Notes to Financial Statements). The USAA Mutual Funds' Board of Trustees approved the appointment of the Fund's investment adviser, Victory Capital Management Inc. ("Victory Capital"), as the administrator of the LRMP.
Victory Capital manages liquidity risks associated with the Fund's investments by monitoring, among other things, cash and cash equivalents, any use of derivatives, the concentration of investments, the appropriateness of the Fund's investment strategy, and by classifying every Fund investment as either highly liquid, moderately liquid, less liquid, or illiquid on at least a monthly basis. To assist with the classification of Fund investments, Victory Capital has retained a third-party provider of liquidity evaluation services. This provider determines preliminary liquidity classifications for all portfolio holdings based upon portfolio-level data and certain assumptions provided by Victory Capital. Victory Capital reviews the preliminary liquidity classifications and, when appropriate, considers other information including input from the Fund's portfolio managers (including the portfolio managers employed by any investment sub-advisers) in determining final liquidity classifications.
At a meeting held on March 10, 2021, Victory Capital provided an oral and written report to the Trustees on the operation and effectiveness of the LRMP during the previous year. The report from Victory Capital concluded that the Fund did not experience any significant liquidity challenges during the covered period, and the Fund's LRMP is reasonably designed to assess and manage its liquidity risk. The report also concluded that the LRMP continues to operate adequately and effectively to enable Victory Capital to oversee and manage liquidity risk and ensure the Fund is able to meet redemption requests without significant dilution to the remaining investors' interest in the Fund. During the review period, the Fund's portfolio consisted primarily of highly liquid investments, which are defined as cash and any investments that the Fund reasonably expects to be converted to cash in current market conditions in three business days or less without significantly changing the market value of the investment. Therefore, the Fund has not adopted a highly liquid investment minimum. The Funds' investments were below the limitation on illiquid investments during the review period. Additionally, Victory Capital indicated that no events occurred that would require the filing of Form N-LIQUID and recommended no material changes to the LRMP.
33
Privacy Policy
Protecting the Privacy of Information
The Trust respects your right to privacy. We also know that you expect us to conduct and process your business in an accurate and efficient manner. To do so, we must collect and maintain certain personal information about you. This is the information we collect from you on applications or other forms, and from the transactions you make with us or third parties. It may include your name, address, social security number, account transactions and balances, and information about investment goals and risk tolerance.
We do not disclose any information about you or about former customers to anyone except as permitted or required by law. Specifically, we may disclose the information we collect to companies that perform services on our behalf, such as the transfer agent that processes shareholder accounts and printers and mailers that assist us in the distribution of investor materials. We may also disclose this information to companies that perform marketing services on our behalf. This allows us to continue to offer you Victory investment products and services that meet your investing needs, and to effect transactions that you request or authorize. These companies will use this information only in connection with the services for which we hired them. They are not permitted to use or share this information for any other purpose.
To protect your personal information internally, we permit access only by authorized employees and maintain physical, electronic, and procedural safeguards to guard your personal information.*
* You may have received communications regarding information about privacy policies from other financial institutions which gave you the opportunity to "opt-out" of certain information sharing with companies which are not affiliated with that financial institution. The Trust does not share information with other companies for purposes of marketing solicitations for products other than the Trust. Therefore, the Trust does not provide opt-out options to their shareholders.
P.O. Box 182593
Columbus, Ohio 43218-2593

Visit our website at: | | Call | |
vcm.com | | (800) 235-8396 | |

MAY 31, 2021
Annual Report
USAA Emerging Markets Fund
Victory Capital means Victory Capital Management Inc., the investment adviser of the USAA Mutual Funds. USAA Mutual Funds are distributed by Victory Capital Services, Inc., member of FINRA, an affiliate of Victory Capital. Victory Capital and its affiliates are not affiliated with United Services Automobile Association or its affiliates. USAA and the USAA logos are registered trademarks and the USAA Mutual Funds and USAA Investments logos are trademarks of United Services Automobile Association and are being used by Victory Capital and its affiliates under license.
www.vcm.com
News, Information And Education 24 Hours A Day, 7 Days A Week
The Victory Funds site gives fund shareholders, prospective shareholders, and investment professionals a convenient way to access fund information, get guidance, and track fund performance anywhere they can access the Internet. The site includes:
• Detailed performance records
• Daily share prices
• The latest fund news
• Investment resources to help you become a better investor
• A section dedicated to investment professionals
Whether you're a potential investor searching for the fund that matches your investment philosophy, a seasoned investor interested in planning tools, or an investment professional, www.vcm.com has what you seek. Visit us anytime. We're always open.
TABLE OF CONTENTS
Shareholder Letter (Unaudited) | | | 2 | | |
Managers' Commentary (Unaudited) | | | 4 | | |
Investment Overview (Unaudited) | | | 6 | | |
Investment Objective & Portfolio
Holdings (Unaudited) | | | 7 | | |
Schedule of Portfolio Investments | | | 8 | | |
Financial Statements | |
Statement of Assets and Liabilities | | | 21 | | |
Statement of Operations | | | 22 | | |
Statements of Changes in Net Assets | | | 23 | | |
Financial Highlights | | | 26 | | |
Notes to Financial Statements | | | 28 | | |
Report of Independent
Registered Public Accounting Firm | | | 39 | | |
Supplemental Information (Unaudited) | | | 40 | | |
Trustees' and Officers' Information | | | 40 | | |
Proxy Voting and Portfolio Holdings Information | | | 46 | | |
Expense Examples | | | 46 | | |
Additional Federal Income Tax Information | | | 47 | | |
Advisory Contract Agreement | | | 48 | | |
Liquidity Risk Management Program | | | 52 | | |
Privacy Policy (inside back cover) | | | |
This report is for the information of the shareholders and others who have received a copy of the currently effective prospectus of the Fund, managed by Victory Capital Management Inc. It may be used as sales literature only when preceded or accompanied by a current prospectus, which provides further details about the Fund.
IRA DISTRIBUTION WITHHOLDING DISCLOSURE
We generally must withhold federal income tax at a rate of 10% of the taxable portion of your distribution and, if you live in a state that requires state income tax withholding, at your state's tax rate. However, you may elect not to have withholding apply or to have income tax withheld at a higher rate. Any withholding election that you make will apply to any subsequent distribution unless and until you change or revoke the election. If you wish to make a withholding election, or change or revoke a prior withholding election, call (800) 235-8396, and form W-4P (OMB No. 1545-0074 withholding certificate for pension or annuity payments) will be electronically sent.
If you do not have a withholding election in place by the date of a distribution, federal income tax will be withheld from the taxable portion of your distribution at a rate of 10%. If you must pay estimated taxes, you may be subject to estimated tax penalties if your estimated tax payments are not sufficient and sufficient tax is not withheld from your distribution.
For more specific information, please consult your tax adviser.
• NOT FDIC INSURED • NO BANK GUARANTEE • MAY LOSE VALUE
1
(Unaudited)
Dear Shareholder,
Never a dull moment. A year ago, we were still coming to grips with a global pandemic, hoping for an effective vaccine, and wondering whether the U.S. Federal Reserve's aggressive actions would continue to mollify financial markets. As it turns out, a vaccine was rolled out (domestically) faster than expectations, and the recovery that began during the second quarter of 2020 continued unabated.
Fast forward to today and investors are suddenly more concerned about labor shortages, rising commodity prices, and whether inflation will prove to be transitory or more lasting. If anything, this merely exemplifies that markets are unpredictable and the environment can and will change rapidly.
Reflecting on the past year, we must consider ourselves fortunate despite the myriad challenges. For starters, it was impressive how quickly the various forms of monetary and fiscal stimulus contributed to a rebound in GDP. Of course, it wasn't a straight line upward and there were bouts of elevated volatility in both bond and stock markets. Late in 2020, for example, financial markets were alternately fueled and roiled by a contentious election season, growing optimism for an effective vaccine, and a fluid debate regarding the need for even more stimulus. Ultimately, stocks were propelled higher in the fourth quarter of 2020 as it became clear Congress would provide another dose of stimulus in the form of direct payments, more unemployment insurance, and additional aid to businesses.
As we moved into 2021, stocks continued their upward trajectory. Meanwhile, the yield on the 10-Year U.S. Treasury continued rallying sharply as many investors began to shift their focus. Deflation was out; inflation was in. Indeed, the potential for a new era of inflation and higher interest rates seems to be the new worry du jour.
So how did the numbers shake out after this unusual year? The S&P 500® Index registered an impressive annual return of approximately 40% for this 12-month period ended May 31, 2021. Over this same period, the yield on the 10-Year U.S. Treasury jumped 94 basis points, reflecting both the very low starting rate and substantial fiscal stimulus. At the end of the reporting period, the yield on the 10-Year U.S. Treasury was 1.59%.
The past year is not one we will forget any time soon. There were many hardships, but we should not overlook the positives and remember our collective spirit and perseverance. Markets endured and even surprised to the upside, but perhaps the key takeaway is that investors need to remain calm in the face of adversity and focused on longer-term investment goals. We believe that's the best approach no matter what the markets throw at us.
On the following pages, you will find information relating to your USAA Mutual Funds, brought to you by Victory Capital. If you have any questions regarding the current market dynamics or your specific portfolio or investment plan, we encourage you to contact our Member Service Representatives. Call (800) 235-8396 or visit our website at www.vcm.com.
2
From all of us here at Victory Capital, thank you for letting us help you work toward your investment goals.

Christopher K. Dyer, CFA
President,
USAA Mutual Funds
3
USAA Emerging Markets Fund
Managers' Commentary
(Unaudited)
• What were the market conditions during the reporting period?
The beginning of the reporting period brought a dramatic reversal from the difficult environment that characterized the first part of 2020. While COVID-19 cases continued to rise, investors grew increasingly confident that the economy would be able to recover from its sharp downturn of February and March. The optimism stemmed, in part, from a series of better-than-expected economic reports interpreted as evidence that the slump in growth would be less severe than was initially feared. The markets were further cheered by the aggressive response by the U.S. Federal Reserve (the "Fed"). In addition to reiterating its commitment to keep short-term interest rates near zero for an extended period, the Fed announced the direct purchase of both individual bonds and exchange-traded bond funds. The central bank's unusual steps offered corporations the latitude to issue debt at ultra-low rates, providing them with the cash necessary to help withstand the effects of the coronavirus.
The global financial markets produced healthy returns during the second half of 2020, wrapping up a positive year for the major asset classes. Investors' appetite for risk improved considerably in early November, when the approval of vaccines for COVID-19 raised expectations that the world economy could gradually return to normal in 2021. The conclusion of the U.S. elections, which removed a source of uncertainty that had depressed performance in September and October, was an additional tailwind. The markets were also aided by continued indications that the Fed and other central banks would maintain their highly accommodative policies indefinitely. Not least, an agreement on a new round of U.S. fiscal stimulus further cheered investors in late December. Together, these developments outweighed negative headlines surrounding renewed lockdowns and the persistence of the coronavirus.
The first quarter of 2021 proved to be a continuation of the strong equity markets investors experienced over the second half of 2020. Gains from global equity markets were fueled by optimism surrounding the successful rollout of the COVID-19 vaccines coupled with further monetary and fiscal stimulus proposals. Faster-than-expected economic growth produced a meaningful increase in real interest rates, which led to negative returns across most major fixed income asset classes. The 10-year U.S Treasury bond yield finished at its highest level of the first quarter reporting period, climbing from under 1% to 1.74%.
During the last few months of the reporting period, equity markets have been consolidating and interest rates leveling off after large upswings. With strong first quarter GDP and corporate earnings growth in the rearview mirror, investors seem to be contemplating their next move. Inflation data has been increasing as the economy reopens more quickly than expected. The Fed maintains that inflationary pressure is transitory but could become more persistent. The inflationary environment will be a key metric moving into the second half of the year.
4
USAA Emerging Markets Fund (continued)
Managers' Commentary (continued)
• How did the USAA Emerging Markets Fund (the "Fund") perform during the reporting period?
The Fund has three share classes: Fund Shares, Institutional Shares, and Class A (effective June 29, 2020, the Adviser Shares were redesignated Class A and became subject to a front-end sales charge). For the reporting period ended May 31, 2021, the Fund Shares, Institutional Shares, and Class A had total returns of 53.16%, 53.46%, and 53.15%, respectively. This compares to returns of 51.00% for the MSCI Emerging Markets Index and 56.01% for the Lipper Emerging Markets Funds Index.
Victory Capital Management Inc. ("VCM") is the Fund's investment adviser. As the investment adviser, VCM employs dedicated resources to support the research, selection and monitoring of the Fund's subadvisers. Lazard Asset Management is an external subadviser to the Fund, while Sophus Capital and Trivalent Investments are Victory Capital Management investment franchises that each manage portions of the Fund. Primary responsibility for the day-to-day discretionary management of the Fund lies with the subadviser and the investment franchises.
• What strategies did you employ during the reporting period?
During the one-year period ending on May 31, 2021, the Fund outperformed the benchmark MSCI Emerging Markets Index. On a country basis, stock selection in India, Malaysia, and Mexico helped performance. On the negative side, stock selection was a detractor in South Korea and Brazil.
Looking at performance from a sector standpoint, cyclical sectors helped the portfolio as market participants rotated out of growth names in favor of cyclicals during the first quarter of 2021. Stock selection in Industrials was the largest contributor and stock selection in Financials and Materials also had a strong positive impact. On the negative side, stock selection in Information Technology and Consumer Discretionary hurt performance, but both were slightly offset by positive allocation effects given an overweight allocation to the well performing Information Technology sector and an underweight to Consumer Discretionary, which lagged the overall index.
Thank you for allowing us to assist in your investment needs.
5
USAA Emerging Markets Fund
Investment Overview
(Unaudited)
Average Annual Total Return
Year Ended May 31, 2021
| | Fund Shares | | Institutional Shares | | Class A | | | | | |
INCEPTION DATE | | 11/7/94 | | 8/1/08 | | 8/1/10 | | | | | |
| | Net Asset Value | | Net Asset Value | | Net Asset Value | | MSCI Emerging
Markets Index1 | | Lipper Emerging
Market Funds
Index2 | |
One Year | | | 53.16 | % | | | 53.46 | % | | | 53.15 | % | | | 51.00 | % | | | 56.01 | % | |
Five Year | | | 12.35 | % | | | 12.58 | % | | | 12.13 | % | | | 13.88 | % | | | 14.20 | % | |
Ten Year | | | 2.50 | % | | | 2.74 | % | | | 2.24 | % | | | 4.10 | % | | | 4.81 | % | |
The performance data quoted represents past performance and current returns may be lower or higher. The investment return and principal value will fluctuate so that an investor's shares, when redeemed, may be worth more or less than the original cost. To obtain performance information current to the most recent month's end, please visit www.vcm.com.
The maximum offering price figures reflect a maximum sales charge of 2.25% for Class A. Net Asset Value does not reflect sales charges.
Total return measures the price change in a share assuming the reinvestment of all net investment income and realized capital gain distributions, if any. The total returns quoted do not reflect adjustments made to the enclosed financial statements in accordance with U.S. Generally Accepted Accounting Principles or the deduction of taxes that a shareholder would pay on net investment income and realized capital gain distributions, including reinvested distributions, or redemptions of shares. The total return figures set forth above include all waivers of fees. Without such fee waivers, the total returns would have been lower.
USAA Emerging Markets Fund — Growth of $10,000
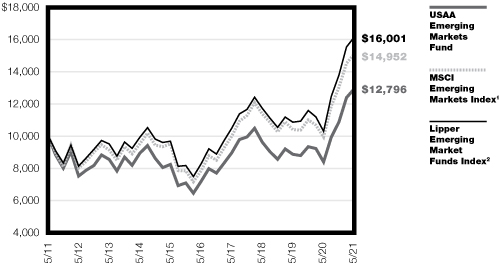
1The unmanaged MSCI Emerging Markets Index is a free-float-adjusted market capitalization index designed to measure equity market performance in the global emerging markets. The index reflects the reinvestment of dividends paid on the stocks constituting the index net of withholding taxes. This index does not include the effect of sales charges, commissions, expenses, or taxes, is not representative of the Fund, and it is not possible to invest directly in an index.
2The unmanaged Lipper Emerging Markets Funds Index tracks the total return performance of the Lipper Emerging Markets Funds category. The index reflects the reinvestment of dividends paid on the stocks constituting the index net of withholding taxes. This index does not include the effect of sales charges, commissions, expenses, or taxes, is not representative of the Fund, and it is not possible to invest directly in an index.
The graph reflects investment of growth of a hypothetical $10,000 investment in the Fund.
The graph and table do not reflect the deduction of taxes that a shareholder would pay on Fund distributions or the redemption of Fund shares.
Past performance is not indicative of future results.
6
USAA Mutual Funds Trust
USAA Emerging Markets Fund | | May 31, 2021 | |
(Unaudited)
Investment Objective and Portfolio Holdings:
The Fund's investment objective seeks capital appreciation.
Top 10 Sectors:
May 31, 2021
(% of Net Assets)
Information Technology | | | 22.0 | % | |
Financials | | | 21.8 | % | |
Communication Services | | | 11.4 | % | |
Consumer Discretionary | | | 11.1 | % | |
Materials | | | 10.2 | % | |
Industrials | | | 7.2 | % | |
Energy | | | 3.9 | % | |
Health Care | | | 3.4 | % | |
Consumer Staples | | | 3.2 | % | |
Real Estate | | | 2.4 | % | |
Country Allocation:
May 31, 2021
(% of Net Assets)
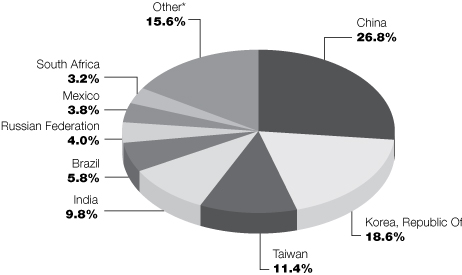
* Includes countries with less than 3.0% of portfolio and short-term investments purchased with cash collateral from securities loaned.
Percentages are of the net assets of the Fund and may not equal 100%.
Refer to the Schedule of Portfolio Investments for a complete list of securities.
7
USAA Mutual Funds Trust
USAA Emerging Markets Fund | | Schedule of Portfolio Investments
May 31, 2021 | |
(Amounts in Thousands, Except for Shares)
Security Description | | Shares | | Value | |
Common Stocks (97.9%) | |
Brazil (5.8%): | |
Communication Services (0.3%): | |
TIM SA | | | 953,679 | | | $ | 2,227 | | |
Consumer Discretionary (0.7%): | |
MRV Engenharia e Participacoes SA | | | 141,800 | | | | 473 | | |
Petrobras Distribuidora SA | | | 1,054,700 | | | | 5,222 | | |
| | | | 5,695 | | |
Consumer Staples (0.2%): | |
Sendas Distribuidora SA | | | 23,137 | | | | 397 | | |
SLC Agricola SA | | | 80,700 | | | | 821 | | |
| | | | 1,218 | | |
Energy (0.0%): (a) | |
Petro Rio SA (b) | | | 100,000 | | | | 379 | | |
Financials (1.4%): | |
B3 SA - Brasil Bolsa Balcao | | | 1,167,900 | | | | 3,931 | | |
Banco Bradesco SA, ADR | | | 638,001 | | | | 3,241 | | |
Banco do Brasil SA | | | 508,495 | | | | 3,268 | | |
Banco do Estado do Rio Grande do Sul SA Preference Shares | | | 111,800 | | | | 292 | | |
Porto Seguro SA | | | 34,400 | | | | 351 | | |
| | | | 11,083 | | |
Industrials (1.1%): | |
CCR SA | | | 916,020 | | | | 2,422 | | |
Randon SA Implementos e Participacoes Preference Shares | | | 876,500 | | | | 2,481 | | |
SIMPAR SA | | | 342,189 | | | | 3,412 | | |
| | | | 8,315 | | |
Information Technology (0.6%): | |
Cielo SA | | | 648,400 | | | | 524 | | |
Pagseguro Digital Ltd. Class A (b) | | | 76,660 | | | | 3,764 | | |
| | | | 4,288 | | |
Materials (0.9%): | |
Klabin SA (b) | | | 416,200 | | | | 2,104 | | |
Vale SA | | | 202,600 | | | | 4,462 | | |
| | | | 6,566 | | |
Real Estate (0.3%): | |
Multiplan Empreendimentos Imobiliarios SA | | | 484,700 | | | | 2,387 | | |
Utilities (0.3%): | |
Equatorial Energia SA | | | 81,700 | | | | 388 | | |
Neoenergia SA | | | 463,800 | | | | 1,677 | | |
Omega Geracao SA (b) | | | 47,000 | | | | 358 | | |
| | | | 2,423 | | |
| | | | 44,581 | | |
See notes to financial statements.
8
USAA Mutual Funds Trust
USAA Emerging Markets Fund | | Schedule of Portfolio Investments — continued
May 31, 2021 | |
(Amounts in Thousands, Except for Shares)
Security Description | | Shares | | Value | |
Canada (1.7%): | |
Energy (0.3%): | |
Parex Resources, Inc. (b) | | | 120,816 | | | $ | 2,112 | | |
Materials (1.4%): | |
First Quantum Minerals Ltd. | | | 450,329 | | | | 11,073 | | |
| | | | 13,185 | | |
Chile (0.3%): | |
Financials (0.3%): | |
Banco de Chile | | | 23,511,586 | | | | 2,425 | | |
China (26.8%): | |
Communication Services (6.2%): | |
Baidu, Inc., ADR (b) | | | 21,634 | | | | 4,246 | | |
NetEase, Inc., ADR | | | 42,950 | | | | 5,065 | | |
Tencent Holdings Ltd. | | | 481,663 | | | | 38,266 | | |
| | | | 47,577 | | |
Consumer Discretionary (5.1%): | |
Alibaba Group Holding Ltd., ADR (b) | | | 116,699 | | | | 24,971 | | |
China Yongda Automobiles Services Holdings Ltd. | | | 1,264,500 | | | | 2,216 | | |
JD.com, Inc., ADR (b) | | | 50,414 | | | | 3,728 | | |
Jiumaojiu International Holdings Ltd. (b) (c) (d) | | | 704,000 | | | | 2,783 | | |
JNBY Design Ltd. (d) | | | 192,500 | | | | 352 | | |
Meituan Class B (b) (c) | | | 126,300 | | | | 4,760 | | |
Q Technology Group Co. Ltd. | | | 259,000 | | | | 428 | | |
Tianneng Power International Ltd. (b) (d) | | | 208,000 | | | | 381 | | |
| | | 39,619 | | |
Consumer Staples (1.5%): | |
By-health Co. Ltd. Class A | | | 391,800 | | | | 2,243 | | |
China Feihe Ltd. (c) | | | 930,000 | | | | 2,601 | | |
China Modern Dairy Holdings Ltd. (b) (d) | | | 1,841,000 | | | | 459 | | |
Hengan International Group Co. Ltd. | | | 455,000 | | | | 3,049 | | |
Wuliangye Yibin Co. Ltd. Class A | | | 58,000 | | | | 2,872 | | |
| | | | 11,224 | | |
Energy (0.8%): | |
China Oilfield Services Ltd. Class H | | | 2,202,000 | | | | 2,066 | | |
China Shenhua Energy Co. Ltd. Class H (d) | | | 1,768,000 | | | | 4,000 | | |
| | | | 6,066 | | |
Financials (4.7%): | |
360 DigiTech, Inc., ADR (b) | | | 10,263 | | | | 288 | | |
China Construction Bank Corp. Class H | | | 7,595,000 | | | | 6,238 | | |
China Merchants Bank Co. Ltd. Class H | | | 1,315,000 | | | | 12,135 | | |
Ping An Insurance Group Co. of China Ltd. | | | 1,292,000 | | | | 14,037 | | |
Postal Savings Bank of China Co. Ltd. Class H (c) | | | 5,376,000 | | | | 3,867 | | |
| | | | 36,565 | | |
See notes to financial statements.
9
USAA Mutual Funds Trust
USAA Emerging Markets Fund | | Schedule of Portfolio Investments — continued
May 31, 2021 | |
(Amounts in Thousands, Except for Shares)
Security Description | | Shares | | Value | |
Health Care (1.4%): | |
China Animal Healthcare Ltd. (b) (e) (f) | | | 1,673,000 | | | $ | — | | |
China Medical System Holdings Ltd. | | | 207,000 | | | | 530 | | |
Pharmaron Beijing Co. Ltd. Class H (c) | | | 100,100 | | | | 2,390 | | |
Sinopharm Group Co. Ltd. Class H | | | 1,114,399 | | | | 3,786 | | |
Wuxi Biologics Cayman, Inc. (b) (c) | | | 276,431 | | | | 4,305 | | |
| | | | 11,011 | | |
Industrials (2.3%): | |
Airtac International Group | | | 177,000 | | | | 6,368 | | |
China Lesso Group Holdings Ltd. | | | 326,000 | | | | 857 | | |
COSCO SHIPPING Holdings Co. Ltd. Class H (b) | | | 1,593,000 | | | | 3,344 | | |
Hangcha Group Co. Ltd. Class A | | | 508,100 | | | | 1,588 | | |
Luxshare Precision Industry Co. Ltd. Class A (b) | | | 330,300 | | | | 2,022 | | |
Zhejiang Expressway Co. Ltd. Class H | | | 390,000 | | | | 338 | | |
Zoomlion Heavy Industry Science and Technology Co. Ltd. Class H | | | 2,782,000 | | | | 3,347 | | |
| | | | 17,864 | | |
Information Technology (1.5%): | |
21Vianet Group, Inc., ADR (b) | | | 90,725 | | | | 2,025 | | |
Chinasoft International Ltd. | | | 3,300,000 | | | | 4,240 | | |
Xiaomi Corp. Class B (b) (c) | | | 902,400 | | | | 3,387 | | |
Yonyou Network Technology Co. Ltd. Class A | | | 393,600 | | | | 2,241 | | |
| | | | 11,893 | | |
Materials (1.7%): | |
Anhui Conch Cement Co. Ltd. Class H | | | 535,500 | | | | 3,341 | | |
China Hongqiao Group Ltd. | | | 2,221,000 | | | | 3,578 | | |
China Molybdenum Co. Ltd. Class H | | | 4,023,000 | | | | 2,764 | | |
Wanhua Chemical Group Co. Ltd. Class A | | | 192,700 | | | | 3,290 | | |
| | | | 12,973 | | |
Real Estate (0.9%): | |
China SCE Group Holdings Ltd. | | | 841,132 | | | | 382 | | |
China Vanke Co. Ltd. Class H | | | 591,100 | | | | 2,043 | | |
KWG Living Group Holdings Ltd. (b) | | | 481,000 | | | | 500 | | |
Shimao Services Holdings Ltd. (c) | | | 1,473,728 | | | | 4,073 | | |
Times Neighborhood Holdings Ltd. | | | 430,806 | | | | 351 | | |
| | | | 7,349 | | |
Utilities (0.7%): | |
China Gas Holdings Ltd. | | | 881,600 | | | | 3,287 | | |
China Longyuan Power Group Corp. Ltd. Class H | | | 1,277,000 | | | | 1,802 | | |
China Tian Lun Gas Holdings Ltd. (d) | | | 406,000 | | | | 430 | | |
| | | 5,519 | | |
| | | 207,660 | | |
See notes to financial statements.
10
USAA Mutual Funds Trust
USAA Emerging Markets Fund | | Schedule of Portfolio Investments — continued
May 31, 2021 | |
(Amounts in Thousands, Except for Shares)
Security Description | | Shares | | Value | |
Colombia (0.5%): | |
Financials (0.5%): | |
Bancolombia SA, ADR | | | 128,169 | | | $ | 3,848 | | |
Cyprus (0.1%): | |
Financials (0.1%): | |
TCS Group Holding PLC, GDR | | | 8,314 | | | | 622 | | |
Egypt (0.3%): | |
Communication Services (0.0%): (a) | |
Telecom Egypt Co. | | | 488,956 | | | | 357 | | |
Financials (0.3%): | |
Commercial International Bank Egypt SAE Registered Shares, GDR (b) | | | 573,172 | | | | 1,993 | | |
| | | | 2,350 | | |
Greece (0.7%): | |
Financials (0.4%): | |
National Bank of Greece SA (b) | | | 897,964 | | | | 2,825 | | |
Industrials (0.3%): | |
Mytilineos SA (b) | | | 115,795 | | | | 2,170 | | |
Utilities (0.0%): (a) | |
Terna Energy SA | | | 32,657 | | | | 466 | | |
| | | | 5,461 | | |
Hong Kong (2.7%): | |
Communication Services (0.0%): (a) | |
NetDragon Websoft Holdings Ltd. | | | 140,000 | | | | 413 | | |
Consumer Discretionary (1.2%): | |
JS Global Lifestyle Co. Ltd. (b) (c) | | | 901,500 | | | | 2,651 | | |
Techtronic Industries Co. Ltd. | | | 379,000 | | | | 6,981 | | |
| | | | 9,632 | | |
Financials (0.5%): | |
BOC Hong Kong Holdings Ltd. | | | 892,500 | | | | 3,224 | | |
Far East Horizon Ltd. | | | 278,000 | | | | 304 | | |
| | | | 3,528 | | |
Health Care (0.1%): | |
The United Laboratories International Holdings Ltd. | | | 446,000 | | | | 416 | | |
Industrials (0.3%): | |
Pacific Basin Shipping Ltd. (b) | | | 5,648,000 | | | | 2,144 | | |
Sinotruk Hong Kong Ltd. | | | 171,000 | | | | 400 | | |
| | | | 2,544 | | |
Information Technology (0.3%): | |
ASM Pacific Technology Ltd. | | | 190,000 | | | | 2,507 | | |
GCL-Poly Energy Holdings Ltd. (b) (d) (e) (g) | | | 874,000 | | | | 197 | | |
| | | | 2,704 | | |
See notes to financial statements.
11
USAA Mutual Funds Trust
USAA Emerging Markets Fund | | Schedule of Portfolio Investments — continued
May 31, 2021 | |
(Amounts in Thousands, Except for Shares)
Security Description | | Shares | | Value | |
Materials (0.1%): | |
Nine Dragons Paper Holdings Ltd. | | | 335,000 | | | $ | 505 | | |
Real Estate (0.1%): | |
China Overseas Grand Oceans Group Ltd. | | | 1,093,000 | | | | 692 | | |
Utilities (0.1%): | |
Canvest Environmental Protection Group Co. Ltd. | | | 674,000 | | | | 353 | | |
China Water Affairs Group Ltd. (d) | | | 418,000 | | | | 322 | | |
| | | | 675 | | |
| | | | 21,109 | | |
Hungary (0.7%): | |
Financials (0.6%): | |
OTP Bank Nyrt (b) | | | 84,900 | | | | 4,642 | | |
Health Care (0.1%): | |
Richter Gedeon Nyrt | | | 19,106 | | | | 542 | | |
| | | | 5,184 | | |
India (9.8%): | |
Consumer Discretionary (0.6%): | |
Apollo Tyres Ltd. (b) | | | 163,565 | | | | 501 | | |
Bajaj Auto Ltd. (b) | | | 52,777 | | | | 3,053 | | |
Mahindra CIE Automotive Ltd. (b) | | | 148,616 | | | | 412 | | |
Orient Electric Ltd. (b) | | | 91,378 | | | | 384 | | |
Welspun India Ltd. | | | 287,184 | | | | 352 | | |
| | | | 4,702 | | |
Consumer Staples (0.1%): | |
Kaveri Seed Co. Ltd. | | | 58,406 | | | | 580 | | |
Energy (1.2%): | |
Hindustan Petroleum Corp. Ltd. | | | 1,031,533 | | | | 3,980 | | |
Petronet LNG Ltd. | | | 626,305 | | | | 2,087 | | |
Reliance Industries Ltd. | | | 109,150 | | | | 3,252 | | |
| | | | 9,319 | | |
Financials (3.8%): | |
Axis Bank Ltd. (b) | | | 121,830 | | | | 1,261 | | |
Axis Bank Ltd., GDR (b) | | | 80,081 | | | | 4,081 | | |
Cholamandalam Investment & Finance Co. Ltd. | | | 435,590 | | | | 3,299 | | |
Federal Bank Ltd. (b) | | | 2,102,332 | | | | 2,528 | | |
HDFC Bank Ltd., ADR (b) | | | 36,089 | | | | 2,762 | | |
ICICI Bank Ltd., ADR (b) | | | 579,518 | | | | 10,437 | | |
LIC Housing Finance Ltd. | | | 587,604 | | | | 3,777 | | |
Muthoot Finance Ltd. | | | 39,153 | | | | 708 | | |
Power Finance Corp. Ltd. | | | 248,845 | | | | 413 | | |
| | | | 29,266 | | |
See notes to financial statements.
12
USAA Mutual Funds Trust
USAA Emerging Markets Fund | | Schedule of Portfolio Investments — continued
May 31, 2021 | |
(Amounts in Thousands, Except for Shares)
Security Description | | Shares | | Value | |
Health Care (0.8%): | |
Ajanta Pharma Ltd. | | | 15,952 | | | $ | 423 | | |
Alembic Pharmaceuticals Ltd. (b) | | | 39,920 | | | | 524 | | |
Divi's Laboratories Ltd. (b) | | | 40,742 | | | | 2,357 | | |
Dr Reddy's Laboratories Ltd. | | | 34,410 | | | | 2,521 | | |
Laurus Labs Ltd. (c) | | | 69,389 | | | | 501 | | |
| | | | 6,326 | | |
Industrials (0.2%): | |
Bharat Electronics Ltd. | | | 201,201 | | | | 403 | | |
Engineers India Ltd. | | | 303,326 | | | | 356 | | |
Escorts Ltd. | | | 34,048 | | | | 550 | | |
Grindwell Norton Ltd. (b) | | | 23,747 | | | | 400 | | |
| | | | 1,709 | | |
Information Technology (1.7%): | |
eClerx Services Ltd. | | | 36,659 | | | | 637 | | |
Infosys Ltd., ADR | | | 505,638 | | | | 9,779 | | |
Mindtree Ltd. | | | 23,346 | | | | 771 | | |
Tata Consultancy Services Ltd. | | | 50,325 | | | | 2,193 | | |
| | | | 13,380 | | |
Materials (1.2%): | |
Asian Paints Ltd. | | | 63,180 | | | | 2,595 | | |
Birla Corp. Ltd. | | | 38,843 | | | | 673 | | |
Coromandel International Ltd. | | | 36,823 | | | | 407 | | |
Dalmia Bharat Ltd. (b) | | | 58,626 | | | | 1,427 | | |
Jindal Steel & Power Ltd. (b) | | | 137,214 | | | | 770 | | |
NMDC Ltd. | | | 1,361,380 | | | | 3,418 | | |
| | | | 9,290 | | |
Utilities (0.2%): | |
CESC Ltd. | | | 42,522 | | | | 402 | | |
Gujarat Gas Ltd. | | | 103,485 | | | | 765 | | |
| | | | 1,167 | | |
| | | | 75,739 | | |
Indonesia (1.8%): | |
Communication Services (0.4%): | |
PT Media Nusantara Citra Tbk (b) | | | 5,579,200 | | | | 361 | | |
PT Telekomunikasi Indonesia Persero Tbk, ADR | | | 128,484 | | | | 2,983 | | |
| | | | 3,344 | | |
Financials (1.3%): | |
PT Bank Mandiri Persero Tbk | | | 6,859,790 | | | | 2,876 | | |
PT Bank Negara Indonesia Persero Tbk | | | 6,954,600 | | | | 2,625 | | |
PT Bank Rakyat Indonesia Persero Tbk | | | 16,319,064 | | | | 4,858 | | |
| | | | 10,359 | | |
Real Estate (0.1%): | |
PT Puradelta Lestari Tbk | | | 26,178,300 | | | | 392 | | |
| | | | 14,095 | | |
See notes to financial statements.
13
USAA Mutual Funds Trust
USAA Emerging Markets Fund | | Schedule of Portfolio Investments — continued
May 31, 2021 | |
(Amounts in Thousands, Except for Shares)
Security Description | | Shares | | Value | |
Korea, Republic Of (18.6%): | |
Communication Services (2.2%): | |
AfreecaTV Co. Ltd. | | | 6,809 | | | $ | 600 | | |
LG Uplus Corp. | | | 274,260 | | | | 3,710 | | |
NAVER Corp. | | | 12,413 | | | | 4,029 | | |
NCSoft Corp. | | | 10,801 | | | | 8,403 | | |
Neowiz (b) | | | 15,494 | | | | 323 | | |
| | | | 17,065 | | |
Consumer Discretionary (0.8%): | |
Coway Co. Ltd. | | | 5,106 | | | | 381 | | |
GS Home Shopping, Inc. | | | 2,508 | | | | 356 | | |
Hyundai Mobis Co. Ltd. | | | 15,717 | | | | 3,938 | | |
SL Corp. | | | 24,474 | | | | 728 | | |
SNT Motiv Co. Ltd. | | | 8,508 | | | | 490 | | |
Youngone Corp. | | | 11,329 | | | | 480 | | |
| | | | 6,373 | | |
Consumer Staples (0.4%): | |
Dongwon F&B Co. Ltd. | | | 1,977 | | | | 419 | | |
KT&G Corp. | | | 29,108 | | | | 2,199 | | |
Maeil Dairies Co. Ltd. | | | 8,807 | | | | 624 | | |
| | | | 3,242 | | |
Financials (2.2%): | |
DB Insurance Co. Ltd. | | | 50,578 | | | | 2,298 | | |
Hana Financial Group, Inc. | | | 88,329 | | | | 3,677 | | |
KIWOOM Securities Co. Ltd. | | | 5,307 | | | | 580 | | |
LX Holdings Corp. (b) | | | 12,202 | | | | 120 | | |
Samsung Securities Co. Ltd. | | | 65,888 | | | | 2,799 | | |
Shinhan Financial Group Co. Ltd. | | | 89,779 | | | | 3,408 | | |
Woori Financial Group, Inc. | | | 366,759 | | | | 3,659 | | |
| | | | 16,541 | | |
Health Care (0.9%): | |
Chong Kun Dang Pharmaceutical Corp. | | | 2,595 | | | | 303 | | |
Dongkook Pharmaceutical Co. Ltd. | | | 14,455 | | | | 373 | | |
Hugel, Inc. (b) | | | 10,487 | | | | 1,887 | | |
InBody Co. Ltd. | | | 33,766 | | | | 901 | | |
Osstem Implant Co. Ltd. | | | 7,566 | | | | 598 | | |
PharmaResearch Co. Ltd. | | | 8,303 | | | | 626 | | |
Samsung Biologics Co. Ltd. (b) (c) | | | 2,778 | | | | 2,107 | | |
| | | | 6,795 | | |
Industrials (1.8%): | |
CJ Corp. | | | 24,195 | | | | 2,484 | | |
CJ Logistics Corp. (b) | | | 10,509 | | | | 1,603 | | |
DL E&C Co. Ltd. (b) | | | 4,448 | | | | 536 | | |
Hanwha Aerospace Co. Ltd. | | | 67,853 | | | | 2,847 | | |
Hyundai Engineering & Construction Co. Ltd. | | | 62,731 | | | | 3,224 | | |
Hyundai Glovis Co. Ltd. | | | 2,687 | | | | 454 | | |
LG Corp. | | | 25,161 | | | | 2,279 | | |
Samsung Engineering Co. Ltd. (b) | | | 40,173 | | | | 681 | | |
| | | | 14,108 | | |
See notes to financial statements.
14
USAA Mutual Funds Trust
USAA Emerging Markets Fund | | Schedule of Portfolio Investments — continued
May 31, 2021 | |
(Amounts in Thousands, Except for Shares)
Security Description | | Shares | | Value | |
Information Technology (9.1%): | |
Partron Co. Ltd. | | | 35,799 | | | $ | 335 | | |
Samsung Electronics Co. Ltd. | | | 641,422 | | | | 46,282 | | |
Seoul Semiconductor Co. Ltd. | | | 25,314 | | | | 448 | | |
SFA Engineering Corp. | | | 12,848 | | | | 487 | | |
Silicon Works Co. Ltd. | | | 10,248 | | | | 987 | | |
SK Hynix, Inc. | | | 191,041 | | | | 21,773 | | |
| | | | 70,312 | | |
Materials (1.2%): | |
Korea Petrochemical Ind Co. Ltd. | | | 15,425 | | | | 3,681 | | |
LG Chem Ltd. | | | 3,030 | | | | 2,219 | | |
PI Advanced Materials Co. Ltd. | | | 56,930 | | | | 2,301 | | |
Poongsan Corp. | | | 10,266 | | | | 370 | | |
Soulbrain Co. Ltd. | | | 2,658 | | | | 782 | | |
| | | | 9,353 | | |
| | | | 143,789 | | |
Luxembourg (0.4%): | |
Materials (0.4%): | |
Ternium SA, ADR | | | 89,567 | | | | 3,279 | | |
Malaysia (0.5%): | |
Communication Services (0.0%): (a) | |
Astro Malaysia Holdings Bhd | | | 1,523,400 | | | | 390 | | |
Energy (0.0%): (a) | |
Serba Dinamik Holdings Bhd | | | 856,690 | | | | 234 | | |
Financials (0.3%): | |
Public Bank Bhd | | | 2,016,800 | | | | 2,054 | | |
Information Technology (0.1%): | |
V.S. Industry Bhd | | | 1,587,200 | | | | 472 | | |
Real Estate (0.1%): | |
Eco World Development Group Bhd | | | 3,406,400 | | | | 507 | | |
Utilities (0.0%): (a) | |
Mega First Corp. Bhd | | | 202,500 | | | | 362 | | |
| | | | 4,019 | | |
Mexico (3.8%): | |
Communication Services (0.5%): | |
America Movil SAB de CV, ADR | | | 234,928 | | | | 3,611 | | |
Megacable Holdings SAB de CV | | | 91,904 | | | | 350 | | |
| | | | 3,961 | | |
Consumer Discretionary (0.3%): | |
Alsea SAB de CV (b) (d) | | | 962,119 | | | | 1,614 | | |
Betterware de Mexico SAB de CV | | | 22,311 | | | | 969 | | |
| | | | 2,583 | | |
Consumer Staples (0.3%): | |
Kimberly-Clark de Mexico SAB de CV Class A (d) | | | 1,220,800 | | | | 2,211 | | |
See notes to financial statements.
15
USAA Mutual Funds Trust
USAA Emerging Markets Fund | | Schedule of Portfolio Investments — continued
May 31, 2021 | |
(Amounts in Thousands, Except for Shares)
Security Description | | Shares | | Value | |
Energy (0.1%): | |
Vista Oil & Gas SAB de CV, ADR (b) | | | 116,319 | | | $ | 416 | | |
Financials (0.9%): | |
Banco del Bajio SA (c) (d) | | | 228,525 | | | | 397 | | |
Grupo Financiero Banorte SAB de CV Class O | | | 970,008 | | | | 6,697 | | |
| | | | 7,094 | | |
Industrials (0.2%): | |
Controladora Vuela Cia de Aviacion SAB de CV, ADR (b) | | | 105,167 | | | | 1,814 | | |
Materials (1.1%): | |
Cemex SAB de CV, ADR (b) | | | 453,727 | | | | 3,757 | | |
Grupo Cementos de Chihuahua SAB de CV | | | 128,734 | | | | 954 | | |
Grupo Mexico SAB de CV Class B | | | 769,309 | | | | 3,753 | | |
| | | | 8,464 | | |
Real Estate (0.4%): | |
Corp Inmobiliaria Vesta SAB de CV (d) | | | 1,126,230 | | | | 2,321 | | |
Prologis Property Mexico SA de CV (d) | | | 183,041 | | | | 429 | | |
| | | | 2,750 | | |
| | | | 29,293 | | |
Netherlands (0.2%): | |
Communication Services (0.2%): | |
Yandex NV Class A (b) | | | 27,885 | | | | 1,883 | | |
Qatar (0.1%): | |
Energy (0.1%): | |
Qatar Gas Transport Co. Ltd. | | | 469,533 | | | | 400 | | |
Russian Federation (4.0%): | |
Communication Services (0.4%): | |
Mobile TeleSystems PJSC, ADR | | | 395,878 | | | | 3,610 | | |
Consumer Discretionary (0.4%): | |
Detsky Mir PJSC (c) | | | 1,385,430 | | | | 2,875 | | |
Energy (1.0%): | |
LUKOIL PJSC, ADR | | | 70,919 | | | | 5,759 | | |
Rosneft Oil Co. PJSC, GDR | | | 279,346 | | | | 1,982 | | |
| | | | 7,741 | | |
Financials (2.1%): | |
Moscow Exchange MICEX PJSC | | | 153,080 | | | | 351 | | |
Sberbank of Russia PJSC, ADR | | | 303,236 | | | | 5,119 | | |
Sberbank of Russia PJSC | | | 2,501,304 | | | | 10,587 | | |
| | | | 16,057 | | |
Materials (0.1%): | |
Polymetal International PLC | | | 27,500 | | | | 663 | | |
| | | | 30,946 | | |
See notes to financial statements.
16
USAA Mutual Funds Trust
USAA Emerging Markets Fund | | Schedule of Portfolio Investments — continued
May 31, 2021 | |
(Amounts in Thousands, Except for Shares)
Security Description | | Shares | | Value | |
Saudi Arabia (0.3%): | |
Financials (0.3%): | |
The Saudi National Bank | | | 144,889 | | | $ | 2,052 | | |
Health Care (0.0%): (a) | |
Mouwasat Medical Services Co. | | | 9,067 | | | | 446 | | |
| | | | 2,498 | | |
Singapore (0.3%): | |
Communication Services (0.3%): | |
Sea Ltd., ADR (b) | | | 8,546 | | | | 2,164 | | |
South Africa (3.2%): | |
Communication Services (0.5%): | |
MTN Group (b) | | | 544,282 | | | | 3,930 | | |
Consumer Discretionary (0.6%): | |
Imperial Logistics Ltd. | | | 130,575 | | | | 472 | | |
Mr Price Group Ltd. | | | 230,370 | | | | 3,901 | | |
| | | | 4,373 | | |
Energy (0.0%): (a) | |
Exxaro Resources Ltd. | | | 39,936 | | | | 446 | | |
Financials (1.1%): | |
Absa Group Ltd. (b) | | | 275,549 | | | | 2,863 | | |
Capitec Bank Holdings Ltd. | | | 22,631 | | | | 2,739 | | |
Standard Bank Group Ltd. | | | 275,279 | | | | 2,711 | | |
| | | | 8,313 | | |
Industrials (0.1%): | |
KAP Industrial Holdings Ltd. (b) | | | 1,396,113 | | | | 466 | | |
Materials (0.8%): | |
African Rainbow Minerals Ltd. | | | 42,284 | | | | 817 | | |
Impala Platinum Holdings Ltd. | | | 309,972 | | | | 5,638 | | |
| | | | 6,455 | | |
Real Estate (0.1%): | |
Redefine Properties Ltd. (b) | | | 1,658,857 | | | | 499 | | |
| | | | 24,482 | | |
Taiwan (11.4%): | |
Communication Services (0.1%): | |
International Games System Co. Ltd. | | | 16,000 | | | | 530 | | |
Consumer Discretionary (1.2%): | |
Gourmet Master Co. Ltd. (b) | | | 371,000 | | | | 2,232 | | |
Kenda Rubber Industrial Co. Ltd. (b) | | | 257,000 | | | | 375 | | |
Makalot Industrial Co. Ltd. | | | 350,127 | | | | 3,547 | | |
Merida Industry Co. Ltd. | | | 87,000 | | | | 1,011 | | |
Taiwan Paiho Ltd. (b) | | | 125,000 | | | | 430 | | |
Topkey Corp. | | | 277,000 | | | | 1,653 | | |
| | | | 9,248 | | |
See notes to financial statements.
17
USAA Mutual Funds Trust
USAA Emerging Markets Fund | | Schedule of Portfolio Investments — continued
May 31, 2021 | |
(Amounts in Thousands, Except for Shares)
Security Description | | Shares | | Value | |
Financials (0.6%): | |
King's Town Bank Co. Ltd. (b) | | | 356,000 | | | $ | 527 | | |
Yuanta Financial Holding Co. Ltd. | | | 4,240,640 | | | | 3,913 | | |
| | | | 4,440 | | |
Health Care (0.1%): | |
Ginko International Co. Ltd. (b) | | | 78,000 | | | | 486 | | |
Industrials (0.6%): | |
Chicony Power Technology Co. Ltd. | | | 191,000 | | | | 476 | | |
China Airlines Ltd. (b) | | | 496,000 | | | | 314 | | |
Evergreen Marine Corp. Taiwan Ltd. (b) | | | 1,164,000 | | | | 4,134 | | |
| | | | 4,924 | | |
Information Technology (8.4%): | |
Arcadyan Technology Corp. | | | 93,000 | | | | 325 | | |
ASE Technology Holding Co. Ltd., ADR | | | 320,811 | | | | 2,573 | | |
AU Optronics Corp. (b) | | | 550,000 | | | | 513 | | |
Chipbond Technology Corp. | | | 290,000 | | | | 713 | | |
Compal Electronics, Inc. | | | 456,000 | | | | 385 | | |
Elan Microelectronics Corp. (b) | | | 150,000 | | | | 1,140 | | |
Elite Material Co. Ltd. | | | 63,000 | | | | 372 | | |
Gigabyte Technology Co. Ltd. | | | 176,000 | | | | 698 | | |
Hon Hai Precision Industry Co. Ltd., GDR | | | 381,269 | | | | 3,058 | | |
Hon Hai Precision Industry Co. Ltd. | | | 746,000 | | | | 3,052 | | |
Lite-On Technology Corp. | | | 195,000 | | | | 465 | | |
Macronix International | | | 277,000 | | | | 421 | | |
MediaTek, Inc. | | | 243,000 | | | | 8,712 | | |
Nanya Technology Corp. | | | 1,317,000 | | | | 3,885 | | |
Parade Technologies Ltd. | | | 15,000 | | | | 826 | | |
Radiant Opto-Electronics Corp. | | | 163,000 | | | | 693 | | |
Silicon Motion Technology Corp., ADR | | | 98,136 | | | | 6,474 | | |
Simplo Technology Co. Ltd. | | | 44,000 | | | | 579 | | |
Sinbon Electronics Co. Ltd. | | | 41,000 | | | | 393 | | |
Taiwan Semiconductor Manufacturing Co. Ltd., ADR | | | 11,479 | | | | 1,347 | | |
Taiwan Semiconductor Manufacturing Co. Ltd. | | | 1,162,000 | | | | 25,017 | | |
Tripod Technology Corp. | | | 136,000 | | | | 630 | | |
Walsin Technology Corp. | | | 392,000 | | | | 2,965 | | |
| | | | 65,236 | | |
Materials (0.4%): | |
Cheng Loong Corp. (b) | | | 311,000 | | | | 463 | | |
China General Plastics Corp. (b) | | | 416,000 | | | | 533 | | |
Formosa Plastics Corp. | | | 642,000 | | | | 2,394 | | |
| | | | 3,390 | | |
| | | | 88,254 | | |
Thailand (1.7%): | |
Communication Services (0.0%): (a) | |
Major Cineplex Group PCL (b) | | | 524,300 | | | | 342 | | |
See notes to financial statements.
18
USAA Mutual Funds Trust
USAA Emerging Markets Fund | | Schedule of Portfolio Investments — continued
May 31, 2021 | |
(Amounts in Thousands, Except for Shares)
Security Description | | Shares | | Value | |
Consumer Discretionary (0.1%): | |
Sri Trang Agro-Industry PCL | | | 354,100 | | | $ | 490 | | |
Energy (0.4%): | |
PTT PCL | | | 2,383,200 | | | | 3,009 | | |
Financials (0.4%): | |
Thanachart Capital PCL | | | 332,600 | | | | 364 | | |
The Siam Commercial Bank PCL | | | 848,200 | | | | 2,778 | | |
| | | | 3,142 | | |
Health Care (0.0%): (a) | |
Chularat Hospital PCL | | | 3,685,000 | | | | 415 | | |
Information Technology (0.1%): | |
Hana Microelectronics PCL Class R | | | 239,700 | | | | 461 | | |
Materials (0.3%): | |
The Siam Cement PCL (e) | | | 170,100 | | | | 2,392 | | |
Real Estate (0.4%): | |
AP Thailand PCL | | | 8,490,300 | | | | 2,321 | | |
Origin Property PCL | | | 1,583,500 | | | | 463 | | |
| | | | 2,784 | | |
| | | | 13,035 | | |
Turkey (1.2%): | |
Communication Services (0.3%): | |
Turk Telekomunikasyon A/S | | | 3,004,581 | | | | 2,450 | | |
Consumer Discretionary (0.1%): | |
Arcelik A/S (d) | | | 151,931 | | | | 561 | | |
Consumer Staples (0.3%): | |
Anadolu Efes Biracilik Ve Malt Sanayii A/S | | | 610,986 | | | | 1,632 | | |
Coca-Cola Icecek A/S | | | 78,338 | | | | 726 | | |
| | | | 2,358 | | |
Industrials (0.3%): | |
Tekfen Holding A/S (d) | | | 103,552 | | | | 182 | | |
Turkiye Sise ve Cam Fabrikalari A/S | | | 2,002,229 | | | | 1,814 | | |
| | | | 1,996 | | |
Information Technology (0.2%): | |
Logo Yazilim Sanayi Ve Ticaret A/S | | | 86,824 | | | | 1,407 | | |
Utilities (0.0%): (a) | |
Enerjisa Enerji A/S (c) | | | 258,099 | | | | 322 | | |
| | | | 9,094 | | |
United Kingdom (1.0%): | |
Consumer Staples (0.4%): | |
Unilever PLC | | | 57,925 | | | | 3,445 | | |
See notes to financial statements.
19
USAA Mutual Funds Trust
USAA Emerging Markets Fund | | Schedule of Portfolio Investments — continued
May 31, 2021 | |
(Amounts in Thousands, Except for Shares)
Security Description | | Shares | | Value | |
Materials (0.6%): | |
Anglo American PLC | | | 95,414 | | | $ | 4,231 | | |
| | | | 7,676 | | |
Total Common Stocks (Cost $498,429) | | | 757,071 | | |
Exchange-Traded Funds (0.2%) | |
United States (0.2%): | |
iShares MSCI Emerging Markets Small-Cap ETF (d) | | | 16,905 | | | | 1,038 | | |
Total Exchange-Traded Funds (Cost $992) | | | 1,038 | | |
Collateral for Securities Loaned^ (0.9%) | |
United States (0.9%): | |
Fidelity Investments Money Market Government Portfolio
Institutional Shares, 0.01% (h) | | | 691,821 | | | | 692 | | |
Goldman Sachs Financial Square Government Fund
Institutional Shares, 0.03% (h) | | | 2,433,290 | | | | 2,433 | | |
HSBC U.S. Government Money Market Fund I Shares, 0.03% (h) | | | 3,986,308 | | | | 3,986 | | |
Total Collateral for Securities Loaned (Cost $7,111) | | | 7,111 | | |
Total Investments (Cost $506,532) — 99.0% | | | 765,220 | | |
Other assets in excess of liabilities — 1.0% | | | 7,959 | | |
NET ASSETS — 100.00% | | $ | 773,179 | | |
^ Purchased with cash collateral from securities on loan.
(a) Amount represents less than 0.05% of net assets.
(b) Non-income producing security.
(c) Rule 144A security or other security that is restricted as to resale to institutional investors. The Fund's Adviser has deemed this security to be liquid based upon procedures approved by the Board of Trustees. As of May 31, 2021, the fair value of these securities was $37,019 (thousands) and amounted to 4.8% of net assets.
(d) All or a portion of this security is on loan.
(e) The Fund's Adviser has deemed this security to be illiquid based upon procedures approved by the Board of Trustees. As of May 31, 2021, illiquid securities were 0.3% of the Fund's net assets.
(f) Security was fair valued based upon procedures approved by the Board of Trustees and represents 0.0% of the Fund's net assets as of May 31, 2021. This security is classified as Level 3 within the fair value hierarchy. (See Note 2 in the Notes to Financial Statements)
(g) Security was fair valued based upon procedures approved by the Board of Trustees and represents less than 0.05% of the Fund's net assets as of May 31, 2021. (See Note 2 in the Notes to Financial Statements)
(h) Rate disclosed is the daily yield on May 31, 2021.
ADR — American Depositary Receipt
ETF — Exchange-Traded Fund
GDR — Global Depositary Receipt
PCL — Public Company Limited
PLC — Public Limited Company
See notes to financial statements.
20
USAA Mutual Funds Trust | | Statement of Assets and Liabilities
May 31, 2021 | |
(Amounts in Thousands, Except Per Share Amounts)
| | | USAA Emerging
Markets Fund | |
Assets: | |
Investments, at value (Cost $506,532) | | $ | 765,220 | (a) | |
Foreign currency, at value (Cost $2,064) | | | 2,075 | | |
Cash | | | 12,039 | | |
Receivables: | |
Interest and dividends | | | 1,960 | | |
Capital shares issued | | | 92 | | |
Investments sold | | | 5,322 | | |
Reclaims | | | 18 | | |
From Adviser | | | 36 | | |
Prepaid expenses | | | 18 | | |
Total Assets | | | 786,780 | | |
Liabilities: | |
Payables: | |
Collateral received on loaned securities | | | 7,111 | | |
Investments purchased | | | 3,184 | | |
Capital shares redeemed | | | 292 | | |
Accrued foreign capital gains taxes | | | 1,912 | | |
To Custodian | | | 109 | | |
Accrued expenses and other payables: | |
Investment advisory fees | | | 630 | | |
Administration fees | | | 80 | | |
Custodian fees | | | 81 | | |
Transfer agent fees | | | 90 | | |
Compliance fees | | | — | (b) | |
Trustees' fees | | | 1 | | |
| 12b-1 fees | | | — | (b) | |
Other accrued expenses | | | 111 | | |
Total Liabilities | | | 13,601 | | |
Net Assets: | |
Capital | | | 562,707 | | |
Total accumulated earnings/(loss) | | | 210,472 | | |
Net Assets | | $ | 773,179 | | |
Net Assets | |
Fund Shares | | $ | 372,624 | | |
Institutional Shares | | | 400,408 | | |
Class A | | | 147 | | |
Total | | $ | 773,179 | | |
Shares (unlimited number of shares authorized with no par value): | |
Fund Shares | | | 15,112 | | |
Institutional Shares | | | 16,264 | | |
Class A | | | 6 | | |
Total | | | 31,382 | | |
Net asset value, offering and redemption price per share: (c) | |
Fund Shares | | $ | 24.66 | | |
Institutional Shares | | $ | 24.62 | | |
Class A | | $ | 24.58 | | |
Maximum Sales Charge — Class A | | | 5.75 | % | |
Maximum offering price
(100%/(100%-maximum sales charge) of net asset value adjusted to
the nearest cent) per share — Class A | | $ | 26.08 | | |
(a) Includes $6,435 of securities on loan.
(b) Rounds to less than $1 thousand.
(c) Per share amount may not recalculate due to rounding of net assets and/or shares outstanding.
See notes to financial statements.
21
USAA Mutual Funds Trust | | Statement of Operations
For the Year Ended May 31, 2021 | |
(Amounts in Thousands)
| | | USAA Emerging
Markets Fund | |
Investment Income: | |
Dividends | | $ | 18,333 | | |
Interest | | | 4 | | |
Securities lending (net of fees) | | | 72 | | |
Foreign tax withholding | | | (2,174 | ) | |
Total Income | | | 16,235 | | |
Expenses: | |
Investment advisory fees | | | 7,086 | | |
Administration fees — Fund Shares | | | 507 | | |
Administration fees — Institutional Shares | | | 388 | | |
Administration fees — Class A | | | 8 | | |
Sub-Administration fees | | | 72 | | |
| 12b-1 fees — Class A | | | 13 | | |
Custodian fees | | | 466 | | |
Transfer agent fees — Fund Shares | | | 774 | | |
Transfer agent fees — Institutional Shares | | | 388 | | |
Transfer agent fees — Class A | | | 5 | | |
Trustees' fees | | | 50 | | |
Compliance fees | | | 5 | | |
Legal and audit fees | | | 130 | | |
State registration and filing fees | | | 58 | | |
Interfund lending fees | | | 1 | | |
Interest fees | | | 5 | | |
Other expenses | | | 160 | | |
Total Expenses | | | 10,116 | | |
Expenses waived/reimbursed by Adviser | | | (215 | ) | |
Net Expenses | | | 9,901 | | |
Net Investment Income (Loss) | | | 6,334 | | |
Realized/Unrealized Gains (Losses) from Investments: | |
Net realized gains (losses) from investment securities and foreign currency
translations | | | 107,188 | | |
Foreign taxes on realized gains | | | (1,155 | ) | |
Net change in unrealized appreciation/depreciation on investment securities and
foreign currency transactions | | | 197,487 | | |
Net change in accrued foreign taxes on unrealized gains | | | (1,861 | ) | |
Net realized/unrealized gains (losses) on investments | | | 301,659 | | |
Change in net assets resulting from operations | | $ | 307,993 | | |
See notes to financial statements.
22
USAA Mutual Funds Trust | | Statements of Changes in Net Assets | |
(Amounts in Thousands)
| | | USAA Emerging
Markets Fund | |
| | | Year
Ended
May 31, 2021 | | Year
Ended
May 31, 2020 | |
From Investments: | |
Operations: | |
Net investment income (loss) | | $ | 6,334 | | | $ | 11,331 | | |
Net realized gains (losses) from investments | | | 106,033 | | | | 2,277 | | |
Net change in unrealized appreciation/depreciation on
investments | | | 195,626 | | | | (43,928 | ) | |
Change in net assets resulting from operations | | | 307,993 | | | | (30,320 | ) | |
Distributions to Shareholders: | |
Fund Shares | | | (3,653 | ) | | | (1,181 | ) | |
Institutional Shares | | | (4,890 | ) | | | (1,681 | ) | |
Class A | | | (53 | ) | | | (12 | ) | |
Change in net assets resulting from distributions to shareholders | | | (8,596 | ) | | | (2,874 | ) | |
Change in net assets resulting from capital transactions | | | (139,789 | ) | | | (190,423 | ) | |
Change in net assets | | | 159,608 | | | | (223,617 | ) | |
Net Assets: | |
Beginning of period | | | 613,571 | | | | 837,188 | | |
End of period | | $ | 773,179 | | | $ | 613,571 | | |
Capital Transactions: | |
Fund Shares | |
Proceeds from shares issued | | $ | 26,675 | | | $ | 35,895 | | |
Distributions reinvested | | | 3,610 | | | | 1,167 | | |
Cost of shares redeemed | | | (77,583 | ) | | | (78,125 | ) | |
Total Fund Shares | | $ | (47,298 | ) | | $ | (41,063 | ) | |
Institutional Shares | |
Proceeds from shares issued | | $ | 11,577 | | | $ | 28,712 | | |
Distributions reinvested | | | 4,886 | | | | 1,680 | | |
Cost of shares redeemed | | | (102,386 | ) | | | (179,763 | ) | |
Total Institutional Shares | | $ | (85,923 | ) | | $ | (149,371 | ) | |
Class A | |
Proceeds from shares issued | | $ | 4,791 | | | $ | 18 | | |
Distributions reinvested | | | 1 | | | | — | (a) | |
Cost of shares redeemed | | | (11,360 | ) | | | (7 | ) | |
Total Class A | | $ | (6,568 | ) | | $ | 11 | | |
Change in net assets resulting from capital transactions | | $ | (139,789 | ) | | $ | (190,423 | ) | |
(a) Rounds to less than $1 thousand.
See notes to financial statements.
23
USAA Mutual Funds Trust | | Statements of Changes in Net Assets — continued | |
(Amounts in Thousands)
| | | USAA Emerging
Markets Fund | |
| | | Year
Ended
May 31, 2021 | | Year
Ended
May 31, 2020 | |
Share Transactions: | |
Fund Shares | |
Issued | | | 1,211 | | | | 2,094 | | |
Reinvested | | | 167 | | | | 61 | | |
Redeemed | | | (3,708 | ) | | | (4,572 | ) | |
Total Fund Shares | | | (2,330 | ) | | | (2,417 | ) | |
Institutional Shares | |
Issued | | | 537 | | | | 1,679 | | |
Reinvested | | | 227 | | | | 88 | | |
Redeemed | | | (4,773 | ) | | | (10,272 | ) | |
Total Institutional Shares | | | (4,009 | ) | | | (8,505 | ) | |
Class A | |
Issued | | | 278 | | | | 1 | | |
Reinvested | | | — | (b) | | | — | (b) | |
Redeemed | | | (551 | ) | | | — | (b) | |
Total Class A | | | (273 | ) | | | 1 | | |
Change in Shares | | | (6,612 | ) | | | (10,921 | ) | |
(b) Rounds to less than 500 shares.
See notes to financial statements.
24
This page is intentionally left blank.
25
USAA Mutual Funds Trust | | Financial Highlights | |
For a Share Outstanding Throughout Each Period
| | | | | Investment Activities | | Distributions to
Shareholders From | |
| | | Net Asset
Value,
Beginning of
Period | | Net
Investment
Income (Loss) | | Net Realized
and Unrealized
Gains (Losses)
on Investments | | Total from
Investment
Activities | | Net
Investment
Income | | Total
Distributions | |
USAA Emerging Markets Fund | |
Fund Shares | |
Year Ended:
May 31, 2021 | | $ | 16.16 | | | | 0.16 | (c) | | | 8.57 | | | | 8.73 | | | | (0.23 | ) | | | (0.23 | ) | |
May 31, 2020 | | $ | 17.14 | | | | 0.25 | (c) | | | (1.17 | ) | | | (0.92 | ) | | | (0.06 | ) | | | (0.06 | ) | |
May 31, 2019 | | $ | 18.84 | | | | 0.17 | | | | (1.67 | ) | | | (1.50 | ) | | | (0.20 | ) | | | (0.20 | ) | |
May 31, 2018 | | $ | 17.60 | | | | 0.16 | | | | 1.15 | | | | 1.31 | | | | (0.07 | ) | | | (0.07 | ) | |
May 31, 2017 | | $ | 14.24 | | | | 0.07 | | | | 3.43 | | | | 3.50 | | | | (0.14 | ) | | | (0.14 | ) | |
Institutional Shares | |
Year Ended:
May 31, 2021 | | $ | 16.14 | | | | 0.20 | (c) | | | 8.55 | | | | 8.75 | | | | (0.27 | ) | | | (0.27 | ) | |
May 31, 2020 | | $ | 17.10 | | | | 0.29 | (c) | | | (1.17 | ) | | | (0.88 | ) | | | (0.08 | ) | | | (0.08 | ) | |
May 31, 2019 | | $ | 18.79 | | | | 0.18 | | | | (1.62 | ) | | | (1.44 | ) | | | (0.25 | ) | | | (0.25 | ) | |
May 31, 2018 | | $ | 17.55 | | | | 0.20 | | | | 1.14 | | | | 1.34 | | | | (0.10 | ) | | | (0.10 | ) | |
May 31, 2017 | | $ | 14.21 | | | | 0.12 | (c) | | | 3.40 | | | | 3.52 | | | | (0.18 | ) | | | (0.18 | ) | |
Class A | |
Year Ended:
May 31, 2021 | | $ | 16.08 | | | | 0.07 | (c) | | | 8.62 | | | | 8.69 | | | | (0.19 | ) | | | (0.19 | ) | |
May 31, 2020 | | $ | 17.08 | | | | 0.20 | (c) | | | (1.16 | ) | | | (0.96 | ) | | | (0.04 | ) | | | (0.04 | ) | |
May 31, 2019 | | $ | 18.76 | | | | 0.10 | | | | (1.62 | ) | | | (1.52 | ) | | | (0.16 | ) | | | (0.16 | ) | |
May 31, 2018 | | $ | 17.55 | | | | 0.12 | | | | 1.13 | | | | 1.25 | | | | (0.04 | ) | | | (0.04 | ) | |
May 31, 2017 | | $ | 14.20 | | | | 0.05 | | | | 3.42 | | | | 3.47 | | | | (0.12 | ) | | | (0.12 | ) | |
* Assumes reinvestment of all net investment income and realized capital gain distributions, if any, during the period. Includes adjustments in accordance with U.S. Generally Accepted Accounting Principles and could differ from the Lipper reported return.
^ The net expense ratio may not correlate to the applicable expense limits in place during the period since the current contractual expense limitation is applied for a period beginning July 1, 2019 and in effect through June 30, 2023, instead of coinciding with the Fund's fiscal year end. Details of the current contractual expense limitation in effect can be found in Note 5 of the accompanying Notes to Financial Statements.
(a) Reflects total annual operating expenses for reductions of expenses paid indirectly for the May 31 fiscal years ended 2019, 2018 and 2017. Expenses paid indirectly decreased the expense ratio for each of these respective years by less than 0.01%.
(b) Portfolio turnover is calculated on the basis of the Fund as a whole without distinguishing between the classes of shares.
(c) Per share net investment income (loss) has been calculated using the average daily shares method.
(d) Reflects a return to normal trading levels after a prior year transition.
(e) Reflects increased trading activity due to current year transition or asset allocation shift.
(f) Prior to October 1, 2017, USAA Asset Management Company (AMCO) (previous Adviser) voluntarily agreed to limit the annual expenses of Class A to 1.65% of the Class A shares' average daily net assets.
(g) Prior to October 1, 2016, AMCO voluntarily agreed to limit the annual expenses of Class A to 1.75% of the Class A shares' average daily net assets.
See notes to financial statements.
26
USAA Mutual Funds Trust | | Financial Highlights — continued | |
For a Share Outstanding Throughout Each Period
| | | | | Ratios to Average Net Assets | | Supplemental Data | |
| | | Net Asset
Value,
End of
Period | | Total
Return
(Excludes
Sales
Charge)* | | Net
Expenses^(a) | | Net
Investment
Income
(Loss) | | Gross
Expenses(a) | | Net Assets,
End of
Period
(000's) | | Portfolio
Turnover(b) | |
USAA Emerging Markets Fund | |
Fund Shares | |
Year Ended:
May 31, 2021 | | $ | 24.66 | | | | 54.25 | % | | | 1.45 | % | | | 0.77 | % | | | 1.47 | % | | $ | 372,624 | | | | 73 | %(d) | |
May 31, 2020 | | $ | 16.16 | | | | (5.41 | )% | | | 1.48 | % | | | 1.44 | % | | | 1.54 | % | | $ | 281,937 | | | | 124 | %(e) | |
May 31, 2019 | | $ | 17.14 | | | | (7.86 | )% | | | 1.48 | % | | | 1.02 | % | | | 1.48 | % | | $ | 340,465 | | | | 68 | % | |
May 31, 2018 | | $ | 18.84 | | | | 7.41 | % | | | 1.46 | % | | | 0.86 | % | | | 1.46 | % | | $ | 402,401 | | | | 59 | % | |
May 31, 2017 | | $ | 17.60 | | | | 24.70 | % | | | 1.51 | % | | | 0.50 | % | | | 1.51 | % | | $ | 374,130 | | | | 45 | % | |
Institutional Shares | |
Year Ended:
May 31, 2021 | | $ | 24.62 | | | | 54.46 | % | | | 1.26 | % | | | 0.96 | % | | | 1.29 | % | | $ | 400,408 | | | | 73 | %(d) | |
May 31, 2020 | | $ | 16.14 | | | | (5.17 | )% | | | 1.29 | % | | | 1.67 | % | | | 1.33 | % | | $ | 327,156 | | | | 124 | %(e) | |
May 31, 2019 | | $ | 17.10 | | | | (7.58 | )% | | | 1.25 | % | | | 1.24 | % | | | 1.25 | % | | $ | 491,978 | | | | 68 | % | |
May 31, 2018 | | $ | 18.79 | | | | 7.62 | % | | | 1.28 | % | | | 1.09 | % | | | 1.28 | % | | $ | 596,185 | | | | 59 | % | |
May 31, 2017 | | $ | 17.55 | | | | 24.93 | % | | | 1.29 | % | | | 0.75 | % | | | 1.29 | % | | $ | 585,468 | | | | 45 | % | |
Class A | |
Year Ended:
May 31, 2021 | | $ | 24.58 | | | | 54.22 | % | | | 1.72 | % | | | 0.36 | % | | | 1.98 | % | | $ | 147 | | | | 73 | %(d) | |
May 31, 2020 | | $ | 16.08 | | | | (5.65 | )% | | | 1.75 | % | | | 1.13 | % | | | 1.76 | % | | $ | 4,478 | | | | 124 | %(e) | |
May 31, 2019 | | $ | 17.08 | | | | (8.07 | )% | | | 1.75 | % | | | 0.73 | % | | | 1.79 | % | | $ | 4,745 | | | | 68 | % | |
May 31, 2018 | | $ | 18.76 | | | | 7.09 | % | | | 1.72 | %(f) | | | 0.61 | % | | | 1.81 | % | | $ | 5,186 | | | | 59 | % | |
May 31, 2017 | | $ | 17.55 | | | | 24.53 | % | | | 1.66 | %(g) | | | 0.35 | % | | | 1.87 | % | | $ | 4,864 | | | | 45 | % | |
See notes to financial statements.
27
USAA Mutual Funds Trust | | Notes to Financial Statements
May 31, 2021 | |
1. Organization:
USAA Mutual Funds Trust (the "Trust") is organized as a Delaware statutory trust and is registered under the Investment Company Act of 1940, as amended (the "1940 Act"), as an open-end investment company. The Trust is comprised of 46 funds and is authorized to issue an unlimited number of shares, which are units of beneficial interest with no par value.
The accompanying financial statements are those of the USAA Emerging Markets Fund (the "Fund"). The Fund offers three classes of shares: Fund Shares, Institutional Shares, and Class A. The Fund is classified as diversified under the 1940 Act. Effective June 29, 2020, the Fund's Adviser Shares were redesignated Class A and became subject to a front-end sales charge.
Each class of shares of the Fund has substantially identical rights and privileges, except with respect to sales charges, fees paid under distribution plans, expenses allocable exclusively to each class of shares, voting rights on matters solely affecting a single class of shares, and the exchange privilege of each class of shares.
Under the Trust's organizational documents, its officers and trustees are indemnified against certain liabilities arising out of the performance of their duties to the Fund. In addition, in the normal course of business, the Fund enters into contracts with its vendors and others that provide for general indemnifications. The Fund's maximum exposure under these arrangements is unknown, as this would involve future claims that may be made against the Fund. However, based on experience, the Fund expects that risk of loss to be remote.
2. Significant Accounting Policies:
The following is a summary of significant accounting policies followed by the Trust in the preparation of its financial statements. The policies are in conformity with Generally Accepted Accounting Principles in the United States of America ("GAAP"). The preparation of financial statements in accordance with GAAP requires management to make estimates and assumptions that affect the reported amounts of assets and liabilities and disclosure of contingent assets and liabilities at the date of the financial statements and the reported amounts of income and expenses for the period. Actual results could differ from those estimates. The Fund follows the specialized accounting and reporting requirements under GAAP that are applicable to investment companies under Accounting Standards Codification Topic 946.
Investment Valuation:
The Fund records investments at fair value. Fair value is defined as the price that would be received to sell an asset or paid to transfer a liability in an orderly transaction between market participants at the measurement date.
The valuation techniques described below maximize the use of observable inputs and minimize the use of unobservable inputs in determining fair value. The inputs used for valuing the Fund's investments are summarized in the three broad levels listed below:
• Level 1 — quoted prices in active markets for identical securities
• Level 2 — other significant observable inputs (including quoted prices for similar securities or interest rates applicable to those securities, etc.)
• Level 3 — significant unobservable inputs (including the Fund's own assumptions in determining the fair value of investments)
Changes in valuation techniques may result in transfers in or out of an assigned level within the disclosure hierarchy. The inputs or methodologies used for valuation techniques are not necessarily an indication of the risks associated with entering into those investments.
Victory Capital Management Inc. ("VCM" or the "Adviser") has established the Pricing and Liquidity Committee (the "Committee"), and subject to the Trust's Board of Trustees (the "Board") oversight, the Committee administers and oversees the Fund's valuation policies and procedures, which are approved by the Board.
28
USAA Mutual Funds Trust | | Notes to Financial Statements — continued
May 31, 2021 | |
Portfolio securities listed or traded on securities exchanges, including Exchange-Traded Funds ("ETFs"), American Depositary Receipts ("ADRs"), and Rights, are valued at the closing price on the exchange or system where the security is principally traded, if available, or at the Nasdaq Official Closing Price. If there have been no sales for that day on the exchange or system, then a security is valued at the last available bid quotation on the exchange or system where the security is principally traded. In each of these situations, valuations are typically categorized as Level 1 in the fair value hierarchy.
Investments in open-end investment companies are valued at their net asset value ("NAV"). These valuations are typically categorized as Level 1 in the fair value hierarchy.
In the event that price quotations or valuations are not readily available, investments are valued at fair value in accordance with procedures established by and under the general supervision and responsibility of the Board. These valuations are typically categorized as Level 2 or Level 3 in the fair value hierarchy, based on the observability of inputs used to determine the fair value. The effect of fair value pricing is that securities may not be priced on the basis of quotations from the primary market in which they are traded and the actual price realized from the sale of a security may differ materially from the fair value price. Valuing these securities at fair value is intended to cause the Fund's NAV to be more reliable than it otherwise would be.
In accordance with procedures adopted by the Board, fair value pricing may be used if events materially affecting the value of foreign securities occur between the time the exchange on which they are traded closes and the time the Fund's NAV is calculated. The Fund uses a systematic valuation model, provided daily by an independent third party to fair value its international equity securities. The valuations are considered as Level 2 in the fair value hierarchy.
A summary of the valuations as of May 31, 2021, based upon the three levels defined above, is included in the table below while the breakdown, by category, of investments is disclosed on the Schedule of Portfolio Investments (amounts in thousands):
| | | Level 1 | | Level 2 | | Level 3 | | Total | |
Common Stocks | | $ | 194,338 | | | $ | 562,733 | | | $ | — | (a) | | $ | 757,071 | | |
Exchange-Traded Funds | | | 1,038 | | | | — | | | | — | | | | 1,038 | | |
Collateral for Securities Loaned | | | 7,111 | | | | — | | | | — | | | | 7,111 | | |
Total | | $ | 202,487 | | | $ | 562,733 | | | $ | — | (a) | | $ | 765,220 | | |
(a) Includes securities with a zero value, please refer to the Schedule of Portfolio Investments for a complete list of securities.
For the year ended May 31, 2021, there were no transfers in or out of Level 3 in the fair value hierarchy.
Real Estate Investment Trusts ("REITs"):
The Fund may invest in REITs, which report information on the source of their distributions annually. REITs are pooled investment vehicles that invest primarily in income producing real estate or real estate related loans or interests (such as mortgages). Certain distributions received from REITs during the year are recorded as realized gains or return of capital as estimated by the Fund or when such information becomes known.
Investment Companies:
Exchange-Traded Funds:
The Fund may invest in ETFs, the shares of which are bought and sold on a securities exchange. An ETF trades like common stock and represents a fixed portfolio of securities often designed to track the performance and dividend yield of a particular domestic or foreign market index. The Fund may purchase shares of an ETF to temporarily gain exposure to a portion of the U.S. or a foreign market while awaiting purchase of underlying securities. The risks of owning an ETF generally reflect the risks of owning the underlying securities they are designed to track, although the lack of liquidity of an ETF could result in it being more volatile. Additionally, ETFs have fees and expenses that reduce their value.
29
USAA Mutual Funds Trust | | Notes to Financial Statements — continued
May 31, 2021 | |
Open-End Funds:
The Fund may invest in portfolios of open-end investment companies. These investment companies value securities in their portfolios for which market quotations are readily available at their market values (generally the last reported sale price) and all other securities and assets at their fair value by the methods established by the board of directors of the underlying funds.
Foreign Exchange Currency Contracts:
The Fund may enter into foreign exchange currency contracts to convert U.S. dollars to and from various foreign currencies. A foreign exchange currency contract is an obligation by the Fund to purchase or sell a specific currency at a future date at a price (in U.S. dollars) set at the time of the contract. The Fund does not engage in "cross-currency" foreign exchange contracts (i.e., contracts to purchase or sell one foreign currency in exchange for another foreign currency). The Fund's foreign exchange currency contracts might be considered spot contracts (typically a contract of one week or less) or forward contracts (typically a contract term over one week). A spot contract is entered into for purposes of hedging against foreign currency fluctuations relating to a specific portfolio transaction, such as the delay between a security transaction trade date and settlement date. Forward contracts are entered into for purposes of hedging portfolio holdings or concentrations of such holdings. Each foreign exchange currency contract is adjusted daily by the prevailing spot or forward rate of the underlying currency, and any appreciation or depreciation is recorded for financial statement purposes as unrealized until the contract settlement date, at which time the Fund records realized gains or losses equal to the difference between the value of a contract at the time it was opened and the value at the time it was closed. The Fund could be exposed to risk if a counterparty is unable to meet the terms of a foreign exchange currency contract or if the value of the foreign currency changes unfavorably. In addition, the use of foreign exchange currency contracts does not eliminate fluctuations in the underlying prices of the securities. As of May 31, 2021, the Fund had no open forward foreign exchange currency contracts.
Investment Transactions and Related Income:
Changes in holdings of investments are accounted for no later than one business day following the trade date. For financial reporting purposes, however, investment transactions are accounted for on trade date on the last business day of the reporting period. Interest income is determined on the basis of coupon interest accrued using the effective interest method which adjusts, where applicable, the amortization of premiums or accretion of discount. Dividend income is recorded on the ex-dividend date. Gains or losses realized on sales of securities are recorded on the identified cost basis.
Withholding taxes on interest, dividends, and gains as a result of certain investments in ADRs by the Fund have been provided for in accordance with each investment's applicable country's tax rules and rates.
Securities Lending:
The Fund, through a securities lending agreement with Citibank, N.A. ("Citibank"), may lend its securities to qualified financial institutions, such as certain broker-dealers, to earn additional income, net of income retained by Citibank. Borrowers are required to secure their loans for collateral in the amount of at least 102% of the value of U.S. securities loaned or at least 105% of the value of non-U.S. securities loaned, marked-to-market daily. Any collateral shortfalls associated with increases in the valuation of the securities loaned are cured the next business day once the shortfall exceeds $100 thousand. Collateral may be cash, U.S. government securities, or other securities as permitted by Securities and Exchange Commission ("SEC") guidelines. Cash collateral may be invested in high-quality short-term investments, primarily open-end investment companies. Collateral requirements are determined daily based on the value of the Fund's securities on loan as of the end of the prior business day. During the time portfolio securities are on loan, the borrower will pay the Fund any dividends or interest paid on such securities plus any fee negotiated between the parties to the lending agreement. The Fund also earns a return from the collateral. The Fund pays Citibank various fees in connection with the investment of cash collateral and fees based on the investment income received from securities lending
30
USAA Mutual Funds Trust | | Notes to Financial Statements — continued
May 31, 2021 | |
activities. Securities lending income (net of these fees) is disclosed on the Statement of Operations. Loans are terminable upon demand and the borrower must return the loaned securities within the lesser of one standard settlement period or five business days. Risks relating to securities-lending transactions include that the borrower may not provide additional collateral when required or return the securities when due, and that the value of the short-term investments will be less than the amount of cash collateral required to be returned to the borrower. The Fund's agreement with Citibank does not include master netting provisions. Non-cash collateral received by the Fund may not be sold or re-pledged, except to satisfy borrower default. Cash collateral is listed on the Fund's Schedule of Portfolio Investments and Financial Statements while non-cash collateral is not included.
The following table (amounts in thousands) is a summary of the Fund's securities lending transactions as of May 31, 2021.
Value of
Securities on Loan | | Non-Cash Collateral | | Cash Collateral | |
| $ | 6,435 | | | $ | — | | | $ | 7,111 | | |
Foreign Currency Translations:
The accounting records of the Fund are maintained in U.S. dollars. Investment securities and other assets and liabilities of the Fund denominated in a foreign currency are translated into U.S. dollars at current exchange rates. Purchases and sales of securities, income receipts, and expense payments are translated into U.S. dollars at the exchange rates on the date of the transactions. The Fund does not isolate the portion of the results of operations resulting from changes in foreign exchange rates on investments from fluctuations arising from changes in market prices of securities held. Such fluctuations are disclosed as net change in unrealized appreciation/depreciation on investments and foreign currency translations on the Statement of Operations. Any realized gains or losses from these fluctuations, including foreign currency arising from in-kind redemptions, are disclosed as net realized gains or losses from investment transactions and foreign currency translations on the Statement of Operations.
Foreign Taxes:
The Fund may be subject to foreign taxes related to foreign income received (a portion of which may be reclaimable), capital gains on the sale of securities, and certain foreign currency transactions. All foreign taxes are recorded in accordance with the applicable regulations and rates that exist in the foreign jurisdictions in which the Fund invests.
Federal Income Taxes:
It is the Fund's policy to continue to qualify as a regulated investment company by complying with the provisions available to certain investment companies, as defined in applicable sections of the Internal Revenue Code, and to make distributions of net investment income and net realized gains sufficient to relieve it from all, or substantially all, federal income taxes. Accordingly, no provision for federal income taxes is required in the financial statements. The Fund has a tax year end of May 31.
Management of the Fund has reviewed tax positions taken in tax years that remain subject to examination by all major tax jurisdictions, including federal (i.e., the last four tax years, which includes the current fiscal tax year end). Management believes that there is no tax liability resulting from unrecognized tax benefits related to uncertain tax positions taken.
Allocations:
Expenses directly attributable to the Fund are charged to the Fund, while expenses that are attributable to more than one fund in the Trust, or jointly with an affiliated trust, are allocated among the respective funds in the Trust and/or affiliated trust based upon net assets or another appropriate basis.
Income, expenses (other than class-specific expenses such as transfer agent fees, state registration fees, printing fees, and 12b-1 fees), and realized and unrealized gains or losses on investments are
31
USAA Mutual Funds Trust | | Notes to Financial Statements — continued
May 31, 2021 | |
allocated to each class of shares based on its relative net assets on the date income is earned or expenses and realized and unrealized gains and losses are incurred.
3. Purchases and Sales:
Cost of purchases and proceeds from sales/maturities of securities (excluding securities maturing less than one year from acquisition) for the year ended May 31, 2021, were as follows for the Fund (amounts in thousands):
| | | Excluding
U.S. Government Securities | |
| | | Purchases | | Sales | |
| | | | | $ | 517,909 | | | $ | 671,017 | | |
There were no purchases or sales of U.S. government securities during the year ended May 31, 2021.
4. Affiliated Fund Ownership:
The Fund offers its shares for investment by other USAA Mutual Funds. The fund-of-funds do not invest in the underlying funds for the purpose of exercising management or control, and the affiliated fund-of-funds' annual and semi-annual reports may be viewed at vcm.com. As of May 31, 2021, certain fund-of-funds owned total outstanding shares of the Fund as follows:
Affiliated USAA Mutual Funds | | Ownership % | |
USAA Cornerstone Conservative Fund | | | 0.3 | | |
USAA Cornerstone Equity Fund | | | 1.4 | | |
5. Fees and Transactions with Affiliates and Related Parties:
Investment Advisory Fees:
Investment advisory services are provided to the Fund by the Adviser, which is a New York corporation registered as an investment adviser with the SEC. The Adviser is an indirect wholly owned subsidiary of Victory Capital Holdings, Inc., a publicly traded Delaware corporation, and a wholly owned direct subsidiary of Victory Capital Operating, LLC. Under the terms of the Investment Advisory Agreement, the Adviser is entitled to receive a base fee and a performance adjustment. The Fund's base fee is accrued daily and paid monthly at an annualized rate of 1.00% of the Fund's average daily net assets. Amounts incurred and paid to VCM for the year ended May 31, 2021, are reflected on the Statement of Operations as Investment Advisory fees.
On November 6, 2018, United Services Automobile Association ("USAA"), the parent company of USAA Asset Management Company ("AMCO"), the prior investment adviser to the Fund announced that AMCO would be acquired by Victory Capital Holdings Inc. (the "Transaction"). A special shareholder meeting was held on April 18, 2019, at which shareholders of the Fund approved a new investment advisory agreement between the Trust, on behalf of the Fund, and VCM. The Transaction closed on July 1, 2019, and effective July 1, 2019, VCM replaced AMCO as the investment adviser to the Fund and no performance adjustments were made for the period beginning July 1, 2019, through June 30, 2020. Only performance beginning as of July 1, 2019, and thereafter is utilized in calculating future performance adjustments.
The performance adjustment for each share class is accrued daily and calculated monthly by comparing each class' performance to that of the Lipper Emerging Market Funds Index. The Lipper Emerging Market Funds Index tracks the total return performance of the largest funds within the Lipper Emerging Market Funds category.
32
USAA Mutual Funds Trust | | Notes to Financial Statements — continued
May 31, 2021 | |
The performance period for each share class consists of the current month plus the previous 35 months (or the number of months beginning July 1, 2019, if fewer). The following table is utilized to determine the extent of the performance adjustment:
Over/Under Performance
Relative to Index (in basis
points)(a) | | Annual Adjustment Rate
(in basis points) | |
| | +/- 100 to 400 | | | | +/- 4 | | |
| | +/- 401 to 700 | | | | +/- 5 | | |
| | +/- 701 and greater | | | | +/- 6 | | |
(a) Based on the difference between average annual performance of the relevant share class of the Fund and its relevant Lipper index, rounded to the nearest basis point.
Each class' annual performance adjustment rate is multiplied by the average daily net assets of each respective class over the entire performance period, which is then multiplied by a fraction, the numerator of which is the number of days in the month and the denominator of which is 365 (366 in leap years). The resulting amount is then added to (in the case of overperformance), or subtracted from (in the case of underperformance) the base fee.
Under the performance fee arrangement, each class pays a positive performance fee adjustment for a performance period whenever the class outperforms the Lipper Emerging Market Funds Index over that period, even if the class has overall negative returns during the performance period.
For the performance period July 1, 2020, to May 31, 2021, performance adjustments were $(108), $(115), and $(2) for Fund Shares, Institutional Shares, and Class A, in thousands, respectively. Performance adjustments were (0.03)%, (0.03)%, and (0.04)% for Fund Shares, Institutional Shares, and Class A, respectively. The performance adjustment rate included in the investment advisory fee may differ from the maximum over/under Annual Adjustment Rate due to differences in average net assets for the reporting period and rolling 36 month performance periods.
The Trust relies on an exemptive order granted to VCM and its affiliated funds by the SEC in March 2019 permitting the use of a "manager-of-managers" structure for certain funds. Under a manager-of-managers structure, the investment adviser may select (with approval of the Board and without shareholder approval) one or more subadvisers to manage the day-to-day investment of a fund's assets.
VCM entered into Investment Subadvisory Agreements with Brandes Investment Partners, L.P. and Lazard Asset Management LLC ("Lazard"), under which Brandes and Lazard, each direct the investment and reinvestment of a portion of the Fund's assets (as allocated from time to time by VCM). This arrangement provides for monthly fees that are paid by VCM. VCM (not the Fund) pays the subadviser fees. Effective June 30, 2020, Brandes is no longer a subadviser to the Fund.
Administration and Servicing Fees:
VCM serves as the Fund's administrator and fund accountant. Under the Fund Administration, Servicing and Accounting Agreement, VCM is paid for its services an annual fee at a rate of 0.15%, 0.10% and 0.15% of average daily net assets of the Fund Shares, Institutional Shares, and Class A, respectively. Amounts incurred for the year ended May 31, 2021, are reflected on the Statement of Operations as Administration fees.
The Fund (as part of the Trust) has entered into an agreement to provide compliance services with the Adviser, pursuant to which the Adviser furnishes its compliance personnel, including the services of the Chief Compliance Officer ("CCO"), and other resources reasonably necessary to provide the Trust with compliance oversight services related to the design, administration and oversight of a compliance program for the Trust in accordance with Rule 38a-1 under the 1940 Act. The CCO is an employee of the Adviser, which pays the compensation of the CCO and support staff. Funds in the Trust, Victory Variable Insurance Funds, Victory Portfolios, and Victory Portfolios II (collectively, the "Victory Funds Complex") in the aggregate, compensate the Adviser for these services. Amounts incurred for the year ended May 31, 2021, are reflected on the Statement of Operations as Compliance fees.
33
USAA Mutual Funds Trust | | Notes to Financial Statements — continued
May 31, 2021 | |
Citi Fund Services Ohio, Inc. ("Citi"), an affiliate of Citibank, acts as sub-administrator and sub-fund accountant to the Fund pursuant to a Sub-Administration and Sub-Fund Accounting Services Agreement between VCM and Citi. VCM pays Citi a fee for providing these services. The Fund reimburses VCM and Citi for out-of-pocket expenses incurred in providing these services and certain other expenses specifically allocated to the Fund. Amounts incurred for the year ended May 31, 2021, are reflected on the Statement of Operations as Sub-Administration fees.
Transfer Agency Fees:
Victory Capital Transfer Agency, Inc. ("VCTA"), an affiliate of the Adviser, provides transfer agency services to the Fund. VCTA provides transfer agent services to the Fund Shares based on an annual charge of $23 per shareholder account plus out-of-pocket expenses. VCTA pays a portion of these fees to certain intermediaries for the administration and servicing of accounts that are held with such intermediaries. Transfer agent's fees for Institutional Shares and Class A are paid monthly based on a fee accrued daily at an annualized rate of 0.10% of average daily net assets, plus out-of-pocket expenses. Amounts incurred and paid to VCTA for the year ended May 31, 2021, are reflected on the Statement of Operations as Transfer Agent fees.
FIS Investor Services LLC serves as sub-transfer agent and dividend disbursing agent for the Fund pursuant to a Sub-Transfer Agent Agreement between VCTA and FIS Investor Services LLC. VCTA provides FIS Investor Services LLC a fee for providing these services.
Distributor/Underwriting Services:
Victory Capital Services, Inc. (the "Distributor"), an affiliate of the Adviser, serves as distributor for the continuous offering of the shares of the Fund pursuant to a Distribution Agreement between the Distributor and the Trust. Effective June 30, 2020, the Distributor's name was changed from Victory Capital Advisers, Inc.
Pursuant to the Distribution and Service Plans adopted in accordance with Rule 12b-1 under the 1940 Act, the Distributor may receive a monthly distribution and service fee, at an annual rate of up to 0.25% of the average daily net assets of Class A. The distribution and service fees paid to the Distributor may be used by the Distributor to pay for activity primarily intended to result in the sale of Class A. Amounts incurred and paid to the Distributor for the year ended May 31, 2021, are reflected on the Statement of Operations as 12b-1 fees. In addition, the Distributor is entitled to receive commissions on sales of Class A. For the year ended May 31, 2021, the Distributor did not receive any commissions.
Other Fees:
Citibank serves as the Fund's custodian. The Fund pays Citibank a fee for providing these services. Amounts incurred for the year ended May 31, 2021, are reflected on the Statement of Operations as Custodian fees.
K&L Gates LLP provides legal services to the Trust.
The Adviser has entered into an expense limitation agreement with the Fund until at least June 30, 2023. Under the terms of the agreement, the Adviser has agreed to waive fees or reimburse certain expenses to the extent that ordinary operating expenses incurred by certain classes of the Fund in any fiscal year exceed the expense limit for such classes of the Fund. Such excess amounts will be the liability of the Adviser. Acquired fund fees and expenses, interest, taxes, brokerage commissions, other expenditures, that are capitalized in accordance with GAAP, and other extraordinary expenses not incurred in the ordinary course of the Fund's business are excluded from the expense limits. As of May 31, 2021, the expense limits (excluding voluntary waivers) were 1.48%, 1.29%, and 1.75% for Fund Shares, Institutional Shares, and Class A, respectively.
Under the terms of the expense limitation agreement, amended May 1, 2021, the Fund has agreed to repay fees and expenses that were waived or reimbursed by the Adviser for a period of up to three years (thirty six (36) months) after the waiver or reimbursement took place, subject to the lesser of any operating expense limits in effect at the time of: (a) the original waiver or expense reimbursement; or
34
USAA Mutual Funds Trust | | Notes to Financial Statements — continued
May 31, 2021 | |
(b) the recoupment, after giving effect to the recoupment amount. Prior to May 1, 2021, the Fund was permitted to recoup fees waived and expenses reimbursed for up to three years after the fiscal year in which the waiver or reimbursement took place, subject to the limitations above. This change did not have any effect on the amounts previously reported for recoupment.
As of May 31, 2021, the following amounts are available to be repaid to the Adviser (amounts in thousands). The Fund has not recorded any amounts available to be repaid as a liability due to an assessment that such repayment is not probable at May 31, 2021.
| Expires 2023 | | Expires 2024 | | Total | |
| $ | 345 | | | $ | 215 | | | $ | 560 | | |
The Adviser may voluntarily waive or reimburse additional fees to assist the Fund in maintaining competitive expense ratios. Voluntary waivers and reimbursements applicable to the Fund are not available to be recouped at a future time. There were no voluntary waivers or reimbursements for the year ended May 31, 2021.
Certain officers and/or interested trustees of the Fund are also officers and/or employees of the Adviser, administrator, fund accountant, sub-administrator, sub-fund accountant, custodian, and Distributor.
6. Risks:
The Fund may be subject to other risks in addition to these identified risks.
Geopolitical/Natural Disaster Risk — Global economies and financial markets are increasingly interconnected, which increases the possibilities that conditions in one country or region might adversely affect issuers in another country or region. Geopolitical and other risks, including war, terrorism, trade disputes, political or economic dysfunction within some nations, public health crises and related geopolitical events, as well as environmental disasters such as earthquakes, fires, and floods, may add to instability in world economies and markets generally. Changes in trade policies and international trade agreements could affect the economies of many countries in unpredictable ways. Likewise, systemic market dislocations of the kind that occurred during the financial crisis that began in 2008, if repeated, would be highly disruptive to economies and markets, adversely affecting individual companies and industries, securities markets, interest rates, credit ratings, inflation, investor sentiment, and other factors affecting the value of a Fund's investments. Some countries, including the United States, are adopting more protectionist trade policies and moving away from the tighter financial industry regulations that followed the 2008 financial crisis, which may also affect the value of a Fund's investments.
Political events within the United States at times have resulted, and may in the future result, in a shutdown of government services, which could negatively affect the U.S. economy, decrease the value of a Fund's investments, increase uncertainty in or impair the operation of the U.S. or other securities markets, and degrade investor and consumer confidence, perhaps suddenly and to a significant degree.
An outbreak of disease called COVID-19 has spread internationally. The transmission of COVID-19 and efforts to contain its spread have resulted in international, national, and local border closings and other significant travel restrictions and disruptions, significant disruptions to business operations, supply chains and consumer activity, significant challenges in healthcare service preparation and delivery, quarantines, and general concern and uncertainty. These negative impacts have caused significant volatility and declines in global financial markets, which have caused losses for Fund investors during and subsequent to period end. The impact of the COVID-19 pandemic may last for an extended period of time, and could result in a substantial economic downturn or recession. Public health crises may exacerbate other pre-existing political, social, economic, market, and financial risks. The extent of the impact to the financial performance of the Fund's investments will depend on future developments, including (i) the duration and spread of the outbreak, (ii) the restrictions and advisories, (iii) the effects on the financial markets, and (iv) the effects on the economy overall, all of which are highly uncertain and cannot be predicted.
35
USAA Mutual Funds Trust | | Notes to Financial Statements — continued
May 31, 2021 | |
Stock Market Risk — Overall stock market risks may affect the value of the Fund. Domestic and international factors such as political events, war, trade disputes, interest rate levels and other fiscal and monetary policy changes, pandemics and other public health crises, and related geopolitical events, as well as environmental disasters such as earthquakes, fires, and floods, may add to instability in world economies and markets generally. The impact of these and other factors may be short-term or may last for extended periods.
Equity Risk — The value of the equity securities in which the Fund invests may decline in response to developments affecting individual companies and/or general economic conditions. A company's earnings or dividends may not increase as expected due to poor management decisions, competitive pressures, breakthroughs in technology, reliance on suppliers, labor problems or shortages, corporate restructurings, fraudulent disclosures, natural disasters, military confrontations, war, terrorism, public health crises, or other events, conditions, and factors. Price changes may be temporary or last for extended periods.
Foreign Securities Risk — Foreign markets can be more volatile than the U.S. market due to increased risks of adverse issuer, political, regulatory, market, or economic developments and can perform differently from the U.S. market.
7. Borrowing and Interfund Lending:
Line of Credit:
The Victory Funds Complex participated in a short-term demand note "Line of Credit" agreement with Citibank. The Line of Credit agreement with Citibank was renewed on June 29, 2020, with a termination date of June 28, 2021. Under the agreement with Citibank, the Victory Funds Complex may borrow up to $600 million, of which $300 million is committed and $300 million is uncommitted. $40 million of the Line of Credit is reserved for use by the Victory Floating Rate Fund, another series of the Victory Funds Complex, with Victory Floating Rate Fund paying the related commitment fees for that amount. The purpose of the Line of Credit is to meet temporary or emergency cash needs. For the year ended May 31, 2021, Citibank received an annual commitment fee of 0.15% on $300 million for providing the Line of Credit. Each fund in the Victory Funds Complex pays a pro-rata portion of the commitment fees plus any interest (one month LIBOR plus one percent) on amounts borrowed. For the period June 29, 2020, through April 30, 2021, under an amended Line of Credit agreement, Citibank received an annual upfront fee of 0.10% on the $300 million committed line of credit. Each fund in the Victory Funds Complex paid a pro-rata portion of the upfront fee. Effective with the next amendment, the annual commitment fee of 0.15% will remain unchanged and the upfront fee of 0.10% is discontinued. Interest charged to each fund during the period, if applicable, is reflected on the Statement of Operations under Line of credit fees.
The Fund had no borrowings under the Line of Credit agreement during the year ended May 31, 2021.
Interfund Lending:
The Trust and Adviser rely on an exemptive order granted by the SEC in March 2017 (the "Order"), permitting the establishment and operation of an Interfund Lending Facility (the "Facility"). The Facility allows the Fund to directly lend and borrow money to or from any other fund in the Victory Funds Complex that is permitted to participate in the Facility, relying upon the Order at rates beneficial to both the borrowing and lending funds. Advances under the Facility are allowed for temporary or emergency purposes, including the meeting of redemption requests that otherwise might require the untimely disposition of securities, and are subject to each Fund's borrowing restrictions. The interfund loan rate is determined, as specified in the Order, by averaging the current repurchase agreement rate and the current bank loan rate. As a Borrower, interest charged to the Fund, if any, during the period is reflected on the Statement of Operations under Interfund lending fees. As a Lender, interest earned by the Fund, if any, during the period is presented on the Statement of Operations under Interfund lending fees.
36
USAA Mutual Funds Trust | | Notes to Financial Statements — continued
May 31, 2021 | |
The average borrowing or lending for the days outstanding and average interest rate for the Fund during the year ended May 31, 2021, were as follows (amounts in thousands):
Borrower or
Lender | | Amount
Outstanding at
May 31, 2021 | | Average
Borrowing* | | Days
Borrowing
Outstanding | | Average
Interest
Rate* | | Maximum
Borrowing
During
the Period | |
| Borrower | | $ | — | | | $ | 2,759 | | | | 15 | | | | 0.60 | % | | $ | 10,252 | | |
* For the year ended May 31, 2021, based on the number of days borrowings were outstanding.
8. Federal Income Tax Information:
The Fund intends to distribute any net investment income annually. Distributable net realized gains, if any, are declared and paid at least annually.
The amounts of dividends from net investment income and distributions from net realized gains (collectively distributions to shareholders) are determined in accordance with federal income tax regulations, which may differ from GAAP. To the extent these "book/tax" differences are permanent in nature (e.g., net operating loss and distribution reclassification), such amounts are reclassified within the components of net assets based on their federal tax-basis treatment; temporary differences (e.g., wash sales) do not require reclassification. To the extent dividends and distributions exceed net investment income and net realized gains for tax purposes, they are reported as distributions of capital. Net investment losses incurred by the Fund may be reclassified as an offset to capital on the accompanying Statement of Assets and Liabilities.
As of May 31, 2021, on the Statement of Assets and Liabilities, there were no permanent book-to-tax difference reclassification adjustments.
The tax character of distributions paid during the tax years ended as noted below, were as follows (total distributions paid may differ from the Statements of Changes in Net Assets because, for tax purposes, dividends are recognized when actually paid) (amounts in thousands).
| Year Ended May 31, 2021 | | Year Ended May 31, 2020 | |
Distributions
paid from | |
| | Distributions
paid from | |
| |
Ordinary
Income | | Total
Distributions
Paid | | Ordinary
Income | | Total
Distributions
Paid | |
| $ | 8,596 | | | $ | 8,596 | | | $ | 2,874 | | | $ | 2,874 | | |
As of May 31, 2021, the components of accumulated earnings (loss) on a tax basis were as follows (amounts in thousands):
Undistributed
Ordinary
Income | | Other
Earnings
(Deficit) | | Accumulated
Earnings | | Accumulated
Capital and
Other Losses | | Unrealized
Appreciation
(Depreciation)* | | Total
Accumulated
Earnings
(Loss) | |
| $ | 5,581 | | | $ | (1,867 | ) | | $ | 3,714 | | | $ | (43,301 | ) | | $ | 250,059 | | | $ | 210,472 | | |
* The difference between the book-basis and tax-basis of unrealized appreciation/depreciation is attributable to the tax deferral of losses on wash sales and passive foreign investment company.
37
USAA Mutual Funds Trust | | Notes to Financial Statements — continued
May 31, 2021 | |
As of May 31, 2021, the Fund had net capital loss carryforwards as shown in the table below (amounts in thousands). It is unlikely that the Board will authorize a distribution of capital gains realized in the future until the capital loss carryforwards have been used.
| Short-Term Amount | | Total | |
| $ | 43,301 | | | $ | 43,301 | | |
During the most recent tax year ended May 31, 2021, the Fund utilized $102,251 thousand of capital loss carryforwards.
As of May 31, 2021, the cost basis for federal income tax purposes, gross unrealized appreciation, gross unrealized depreciation, and net unrealized appreciation (depreciation) for investments were as follows (amounts in thousands):
Cost of
Investments
for Federal
Tax Purposes | | Gross
Unrealized
Appreciation | | Gross
Unrealized
Depreciation | | Net Unrealized
Appreciation
(Depreciation) | |
| $ | 515,161 | | | $ | 267,601 | | | $ | (17,542 | ) | | $ | 250,059 | | |
38
REPORT OF INDEPENDENT REGISTERED PUBLIC ACCOUNTING FIRM
To the Shareholders and the Board of Trustees of USAA Emerging Markets Fund
Opinion on the Financial Statements
We have audited the accompanying statement of assets and liabilities of USAA Emerging Markets Fund (the "Fund") (one of the funds constituting USAA Mutual Funds Trust (the "Trust")), including the schedule of portfolio investments, as of May 31, 2021, and the related statement of operations for the year then ended, the statements of changes in net assets for each of the two years in the period then ended, the financial highlights for each of the five years in the period then ended and the related notes (collectively referred to as the "financial statements"). In our opinion, the financial statements present fairly, in all material respects, the financial position of the Fund (one of the funds constituting USAA Mutual Funds Trust) at May 31, 2021, the results of its operations for the year then ended, the changes in its net assets for each of the two years in the period then ended and its financial highlights for each of the five years in the period then ended, in conformity with U.S. generally accepted accounting principles.
Basis for Opinion
These financial statements are the responsibility of the Trust's management. Our responsibility is to express an opinion on the Fund's financial statements based on our audits. We are a public accounting firm registered with the Public Company Accounting Oversight Board (United States) ("PCAOB") and are required to be independent with respect to the Trust in accordance with the U.S. federal securities laws and the applicable rules and regulations of the Securities and Exchange Commission and the PCAOB.
We conducted our audits in accordance with the standards of the PCAOB. Those standards require that we plan and perform the audit to obtain reasonable assurance about whether the financial statements are free of material misstatement, whether due to error or fraud. The Trust is not required to have, nor were we engaged to perform, an audit of the Trust's internal control over financial reporting. As part of our audits we are required to obtain an understanding of internal control over financial reporting, but not for the purpose of expressing an opinion on the effectiveness of the Trust's internal control over financial reporting. Accordingly, we express no such opinion.
Our audits included performing procedures to assess the risks of material misstatement of the financial statements, whether due to error or fraud, and performing procedures that respond to those risks. Such procedures included examining, on a test basis, evidence regarding the amounts and disclosures in the financial statements. Our procedures included confirmation of securities owned as of May 31, 2021, by correspondence with the custodian and brokers or by other appropriate auditing procedures where replies from brokers were not received. Our audits also included evaluating the accounting principles used and significant estimates made by management, as well as evaluating the overall presentation of the financial statements. We believe that our audits provide a reasonable basis for our opinion.

We have served as the auditor of one or more Victory Capital investment companies since 1995.
San Antonio, Texas
July 28, 2021
39
USAA Mutual Funds Trust | | Supplemental Information
May 31, 2021 | |
(Unaudited)
Trustee and Officer Information
Board of Trustees:
Overall responsibility for management of the Trust rests with the Board. The Trust is managed by the Board in accordance with the laws of the state of Delaware. There are currently nine Trustees, seven of whom are not "interested persons" of the Trust within the meaning of that term under the 1940 Act ("Independent Trustees") and two of whom are "interested persons" of the Trust within the meaning of that term under the 1940 Act ("Interested Trustee"). The Trustees, in turn, elect the officers of the Trust to actively supervise its day-to-day operations.
The following tables list the Trustees, their ages, position with the Trust, commencement of service, principal occupations during the past five years and any directorships of other investment companies or companies whose securities are registered under the Securities Exchange Act of 1934, as amended, or who file reports under that Act. Each Trustee oversees 46 portfolios in the Trust. Each Trustee's address is 15935 La Cantera Pkwy, San Antonio, TX, 78256. Pursuant to a policy adopted by the Board, the term of office for each Trustee shall be until the Independent Trustee reaches age 75 or an Interested Trustee reaches age 75. The Board may change or grant exceptions from this policy at any time without shareholder approval. A Trustee may resign or be removed by a vote of the other Trustees or the holders of a majority of the outstanding shares of the Trust at any time. Vacancies on the Board can be filled by the action of a majority of the Trustees, provided that after filling such vacancy at least two-thirds of the Trustees have been elected by the shareholders.
Name and Date of Birth | | Position
Held with
the Trust | | Year
Commenced
Service | | Principal Occupation
During Past 5 Years | | Other
Directorships
Held During
Past 5 Years | |
Independent Trustees. | |
Jefferson C. Boyce, (c)
Born September 1957 | | Independent Chairman | | | 2021 | | | Senior Managing Director, New York Life Investments, LLC (1992-2012) | | Westhab, Inc. | |
John C. Walters,
Born February 1962 | | Trustee | | | 2019 | | | Retired. Mr. Walters brings significant Board experience including active involvement with the board of a Fortune 500 company, and a proven record of leading large, complex financial organizations. He has a demonstrated record of success in distribution, manufacturing, investment brokerage, and investment management in both the retail and institutional investment businesses. He has substantial experience in the investment management business with a demonstrated ability to develop and drive strategy while managing operation, financial, and investment risk. | | Guardian Variable Products Trust (16 series), Lead Independent Director; Amerilife Holdings LLC, Director; Stadion Money Management; Director; University of North Carolina (Chapel Hill), Member Board of Governors | |
40
USAA Mutual Funds Trust | | Supplemental Information — continued
May 31, 2021 | |
(Unaudited)
Name and Date of Birth | | Position
Held with
the Trust | | Year
Commenced
Service | | Principal Occupation
During Past 5 Years | | Other
Directorships
Held During
Past 5 Years | |
Robert L. Mason, Ph.D.,
Born July 1946 | | Trustee | | | 1997 | | | Adjunct Professor in the Department of Management Science and Statistics in the College of Business at the University of Texas at San Antonio (since 2001); Institute Analyst, Southwest Research Institute (March 2002-January 2016) | | None | |
Dawn M. Hawley,
Born February 1954 | | Trustee | | | 2014 | | | Manager of Finance, Menil Foundation, Inc. (May 2007-June 2011), which is a private foundation that oversees the assemblage of sculptures, prints, drawings, photographs, and rare books. Director of Financial Planning and Analysis and Chief Financial Officer, AIM Management Group, Inc. (October 1987-January 2006) | | None | |
Paul L. McNamara,
Born July 1948 | | Trustee | | | 2012 | | | Director, Cantor Opportunistic Alternatives Fund, LLC (March 2010-February 2014), which is a closed-end fund of funds by Cantor Fitzgerald Investment Advisors, LLC | | None | |
41
USAA Mutual Funds Trust | | Supplemental Information — continued
May 31, 2021 | |
(Unaudited)
Name and Date of Birth | | Position
Held with
the Trust | | Year
Commenced
Service | | Principal Occupation
During Past 5 Years | | Other
Directorships
Held During
Past 5 Years | |
Richard Y. Newton III,
Born January 1956 | | Trustee | | | 2017 | | | Director, Elta North America (01/18-present), which is a global leader in the design, manufacture, and support of innovative electronic systems in the ground, maritime, airborne, and security domains for the nation's warfighters, security personnel, and first responders; Managing Partner, Pioneer Partnership Development Group (December 2015-present)); Executive Director, The Union League Club of New York (June 2014-November 2015): Executive Vice President, Air Force Association (August 2012-May 2014); Lieutenant General, United States Air Force (January 2008-June 2012) | | PredaSAR Corp. | |
Barbara B. Ostdiek, Ph.D.,
Born March 1964 | | Trustee | | | 2008 | | | Senior Associate Dean of Degree Programs at Jesse H. Jones Graduate School of Business at Rice University (since 2013); Associate Professor of Finance at Jessie H. Jones Graduate School of Business at Rice University (since 2001) | | None | |
Effective at the close of business on December 31, 2020, Michael F. Reimherr retired from the Board of Trustees.
42
USAA Mutual Funds Trust | | Supplemental Information — continued
May 31, 2021 | |
(Unaudited)
Name and Date of Birth | | Position
Held with
the Trust | | Year
Commenced
Service | | Principal Occupation
During Past 5 Years | | Other
Directorships
Held During
Past 5 Years | |
Interested Trustees. | |
David C. Brown, (b)
Born May 1972 | | Trustee | | | 2019 | | | Chairman and Chief Executive Officer (since 2013), Victory Capital Management Inc.; Chairman and Chief Executive Officer, Victory Capital Holdings, Inc. (since 2013). Mr. Brown brings to the Board extensive business, finance and leadership skills gained and developed through years of experience in the financial services industry, including his tenure overseeing the strategic direction as CEO of Victory Capital. These skills, combined with Mr. Brown's extensive knowledge of the financial services industry and demonstrated success in the development and distribution of investment strategies and products, enable him to provide valuable insights to the Board and strategic direction for the Funds. | | Trustee, Victory Portfolios (41 series), Victory Portfolios II (26 series), Victory Variable Insurance Funds (8 series) | |
43
USAA Mutual Funds Trust | | Supplemental Information — continued
May 31, 2021 | |
(Unaudited)
Name and Date of Birth | | Position
Held with
the Trust | | Year
Commenced
Service | | Principal Occupation
During Past 5 Years | | Other
Directorships
Held During
Past 5 Years | |
Daniel S. McNamara, (b)(c)(d)
Born June 1966 | | Trustee | | | 2012 | | | Trustee, President, and Vice Chairman of USAA ETF Trust (June 2017-June 2019); President of Financial Advice & Solutions Group (FASG), USAA (February 2013-March 2021); Director of USAA Investment Services Company (ISCO) (formerly USAA Investment Management) (September 2009-March 2021); President, Asset Management Company (AMCO) (August, 2011-June 2019); Senior Vice President of USAA Financial Planning Services Insurance Agency, Inc. (FPS) (April 2011-March 2021); Chairman of Board of ISCO (April 2013-December 2020); Director of AMCO (August 2011-June 2019); President and Director of USAA Shareholder Account Services (SAS) (October 2009-June 2019); Director and Vice Chairman of FPS (December 2013-March 2021); President and Director of USAA Investment Corporation (ICORP) (March 2010-March 2021); Chairman of Board of ICORP (December 2013-March 2021); Director of USAA Financial Advisors, Inc. (FAI) (December 2013-March 2021); Chairman of Board of FAI (March 2015-March 2021). Mr. McNamara brings to the Board extensive experience in the financial services industry, including experience as an officer of the Trust. | | None | |
(b) Mr. Dan McNamara is deemed an "interested person" due to his previous position as Director of AMCO, the former investment adviser of the Funds. Mr. Brown is deemed an "interested person" due to his position as Chief Executive Officer of Victory Capital, investment adviser to the Funds.
(c) Effective at the close of business on December 31, 2020, Jefferson C. Boyce replaced Dan McNamara as Chair of the Board and assumed the title of Independent Chair.
(d) Effective July 2, 2021, Mr. Dan McNamara became an Independent Trustee to the Funds.
The Statement of Additional Information includes additional information about the Trustees of the Trust and is available, without charge, on the SEC's website at www.sec.gov and/or by calling (800)-235-8396.
44
USAA Mutual Funds Trust | | Supplemental Information — continued
May 31, 2021 | |
(Unaudited)
Officers:
The officers of the Trust, their ages, commencement of service and their principal occupations during the past five years, are detailed in the following table. Each officer serves until the earlier of his or her resignation, removal, retirement, death, or the election of a successor. The mailing address of each officer of the Trust is 15935 La Cantera Pkwy, San Antonio, TX, 78256. The officers of the Trust receive no compensation directly from the Trust for performing the duties of their offices.
Name and Date of Birth | | Position with
the Trust | | Year
Commenced
Service | | Principal Occupation During Past 5 Years | |
Interested Officers.
Christopher K. Dyer,
Born February 1962 | | President | | | 2019 | | | Director of Fund Administration, Victory Capital (since 2004); Chief Operating Officer, Victory Capital Services, Inc. (since 2020) | |
Scott A Stahorsky,
Born July 1969 | | Vice President | | | 2019 | | | Manager, Fund Administration, Victory Capital (since 2015) | |
James K. De Vries,
Born April 1969 | | Treasurer | | | 2018 | | | Executive Director, Victory Capital Management Inc. (since 2019); Treasurer, USAA ETF Trust (September 2018-June 2019); Executive Director, Investment and Financial Administration, USAA (April 2012-June 2019); Assistant Treasurer, USAA ETF Trust (June 2017-September 2018); Assistant Treasurer, USAA Mutual Funds Trust (December 2013-February 2018) | |
Allan Shaer,
Born March 1965 | | Assistant Treasurer | | | 2019 | | | Senior Vice President, Financial Administration, Citi Fund Services Ohio, Inc. (since 2016); Vice President, Mutual Fund Administration, JP Morgan Chase (2011-2016) | |
Carol D. Trevino,
Born October 1965 | | Assistant Treasurer | | | 2018 | | | Director, Accounting and Finance, Victory Capital Management Inc. (since 2019); Accounting/Financial Director, USAA (December 2013-June 2019); Assistant Treasurer, USAA ETF Trust (September 2018-June 2019) | |
Erin G. Wagner,
Born February 1974 | | Secretary | | | 2019 | | | Deputy General Counsel, the Adviser (since 2013) | |
Charles Booth,
Born April 1960 | | Anti-Money Laundering Compliance Officer and Identity Theft Officer | | | 2019 | | | Director, Regulatory Administration and CCO Support Services, Citi Fund Services Ohio, Inc. (since 2007) | |
Amy Campos,
Born July 1976 | | Chief Compliance Officer | | | 2019 | | | Chief Compliance Officer, USAA Mutual Funds Trust (since 2019); Executive Director, Deputy Chief Compliance Officer, USAA Mutual Funds Trust and USAA ETF Trust (July 2017-June 2019); Compliance Director, USAA Mutual Funds Trust (2014-July 2017) | |
45
USAA Mutual Funds Trust | | Supplemental Information — continued
May 31, 2021 | |
(Unaudited)
Proxy Voting and Portfolio Holdings Information
Proxy Voting:
Information regarding the policies and procedures the Fund uses to determine how to vote proxies relating to portfolio securities is available without charge, upon request, by calling (800) 235-8396. The information is also included in the Fund's Statement of Additional Information, which is available on the SEC's website at www.sec.gov.
Information relating to how the Fund voted proxies relating to portfolio securities held during the most recent 12 months ended June 30 is available on the SEC's website at www.sec.gov.
Availability of Schedules of Portfolio Investments:
The Trust files a complete list of Schedules of Portfolio Investments with the SEC for the first and third quarter of each fiscal year on Form N-PORT. Form N-PORT is available on the SEC's website at www.sec.gov.
Expense Examples
As a shareholder of the Fund, you may incur two types of costs: (1) transaction costs, including sales charges (loads) on purchases; and (2) ongoing costs, including management fees and other Fund expenses. These examples are intended to help you understand your ongoing costs (in dollars) of investing in the Fund and to compare these costs with the ongoing costs of investing in other mutual funds.
These examples are based on an investment of $1,000 invested at the beginning of the period and held for the entire period from December 1, 2020, through May 31, 2021.
The Actual Expense figures in the table below provide information about actual account values and actual expenses. You may use the information below, together with the amount you invested, to estimate the expenses that you paid over the period. Simply divide your account value by $1,000 (for example, an $8,600 account value divided by $1,000 = 8.6), then multiply the result by the number in the table under the heading entitled "Actual Expenses Paid During Period" to estimate the expenses you paid on your account during this period.
The Hypothetical Expense figures in the table below provide information about hypothetical account values and hypothetical expenses based on the Fund's actual expense ratio and an assumed rate of return of 5% per year before expenses, which is not the Fund's actual return. The hypothetical account values and expenses may not be used to estimate the actual ending account balance or expenses you paid for the period. You may use this information to compare this 5% hypothetical example with the 5% hypothetical examples that appear in shareholder reports of other funds.
Please note the expenses shown in the table below are meant to highlight your ongoing costs only and do not reflect any transactional costs. If these transactional costs were included, your costs would have been higher.
| | | Beginning
Account
Value
12/1/20 | | Actual
Ending
Account
Value
5/31/21 | | Hypothetical
Ending
Account
Value
5/31/21 | | Actual
Expenses
Paid
During
Period
12/1/20-
5/31/21* | | Hypothetical
Expenses
Paid
During
Period
12/1/20-
5/31/21* | | Annualized
Expense
Ratio
During
Period
12/1/20-
5/31/21 | |
Fund Shares | | $ | 1,000.00 | | | $ | 1,188.70 | | | $ | 1,017.70 | | | $ | 7.91 | | | $ | 7.29 | | | | 1.45 | % | |
Institutional Shares | | | 1,000.00 | | | | 1,190.00 | | | | 1,018.65 | | | | 6.88 | | | | 6.34 | | | | 1.26 | % | |
Class A | | | 1,000.00 | | | | 1,190.50 | | | | 1,016.45 | | | | 9.28 | | | | 8.55 | | | | 1.70 | % | |
* Expenses are equal to the average account value multiplied by the Fund's annualized expense ratio multiplied by 182/365 (the number of days in the most recent fiscal half-year divided by the number of days in the fiscal year).
46
USAA Mutual Funds Trust | | Supplemental Information — continued
May 31, 2021 | |
(Unaudited)
Additional Federal Income Tax Information
The following federal tax information related to the Fund's fiscal year ended May 31, 2021, is provided for information purposes only and should not be used for reporting to federal or state revenue agencies. Federal tax information for the calendar year will be reported to you on Form 1099-DIV in January 2022.
With respect to distributions paid, the Fund designates the following amounts (or, if subsequently determined to be different, the maximum amount allowable) for the fiscal year ended May 31, 2021 (amounts in thousands):
| | Qualified
Dividend
Income
(non-corporate
shareholders) | | Foreign
Taxes
Paid | |
| | | | | | 75 | % | | $ | 3,608 | | |
47
USAA Mutual Funds Trust | | Supplemental Information — continued
May 31, 2021 | |
(Unaudited)
Considerations of the Board in Continuing the Investment Advisory Agreement (the "Agreement")
USAA Emerging Markets Fund (the "Fund")
At a meeting of the Board of Trustees (the "Board") held on December 10-11, 2020, the Board, including the Trustees who are not "interested persons" (as that term is defined in the Investment Company Act of 1940, as amended) of the Trust (the "Independent Trustees"), approved for an annual period the continuance of the Investment Advisory Agreement (the "Advisory Agreement") between the Trust and Victory Capital Management Inc. (the "Adviser") and the Subadvisory Agreement between the Adviser and Lazard Asset Management LLC (the "Subadviser") with respect to the Fund. Prior to the December 10-11, 2020 meeting at which the Advisory Agreement was approved, the Independent Trustees also discussed and considered information regarding the proposed continuation of the Advisory Agreement and Subadvisory Agreement at a meeting held on November 19, 2020.
In advance of the foregoing meetings, the Trustees received and considered a variety of information relating to the Advisory Agreement and Subadvisory Agreement and the Adviser and the Subadviser, and were given the opportunity to ask questions and request additional information from management. The information provided to the Board included, among other things: (i) a separate report prepared by an independent third party of mutual fund data, which provided a statistical analysis comparing the Fund's investment performance, expenses, and fees to comparable investment companies; (ii) information concerning the services rendered to the Fund, as well as information regarding the Adviser's revenues and costs of providing services to the Fund and compensation paid to affiliates of the Adviser; and (iii) information about the Adviser's and the Subadviser's operations and personnel. Prior to voting, the Independent Trustees reviewed the proposed continuance of the Advisory Agreement and Subadvisory Agreement with management and with experienced independent counsel retained by the Independent Trustees ("Independent Counsel") and received materials from such Independent Counsel discussing the legal standards for their consideration of the proposed continuation of the Advisory Agreement and the Subadvisory Agreement with respect to the Fund. The Independent Trustees also reviewed the proposed continuation of the Advisory Agreement and the Subadvisory Agreement with respect to the Fund in private sessions with Independent Counsel at which no representatives of management were present.
The Board considered the Advisory Agreement and the Subadvisory Agreement separately in the course of its review. In doing so, the Board noted the respective roles of the Adviser and the Subadviser in providing services to the Fund.
At each regularly scheduled meeting of the Board and its committees, the Board receives and reviews, among other things, information concerning the Fund's performance and related services provided by the Adviser and the Subadviser. At the meeting at which the renewal of the Advisory Agreement and Subadvisory Agreement is considered, particular focus is given to information concerning Fund performance, fees and total expenses as compared to comparable investment companies, and the Adviser's profitability with respect to the Fund. However, the Board noted that the evaluation process with respect to the Adviser and the Subadviser is an ongoing one. In this regard, the Board's and its committees' consideration of the Advisory Agreement and Subadvisory Agreement included information previously received at such meetings.
Advisory Agreement
After full consideration of a variety of factors, the Board, including the Independent Trustees, voted to approve the Advisory Agreement. In approving the Advisory Agreement, the Trustees did not identify any single factor as controlling, and each Trustee may have attributed different weights to various factors. Throughout their deliberations, the Independent Trustees were represented and assisted by Independent Counsel.
Nature, Extent, and Quality of Services — In considering the nature, extent, and quality of the services provided by the Adviser under the Advisory Agreement, the Board reviewed information provided by the Adviser relating to its operations and personnel. The Board also took into account its knowledge of the Adviser's management and the quality of the performance of the Adviser's duties through Board meetings, discussions, and reports during the preceding year. The Board considered the fees paid to the Adviser and the services provided to the Fund by the Adviser under the Advisory Agreement, as well as other services provided by the Adviser and its affiliates under other agreements, and the personnel who provide these services. In addition to the investment
48
USAA Mutual Funds Trust | | Supplemental Information — continued
May 31, 2021 | |
(Unaudited)
advisory services provided to the Fund, the Adviser and its affiliates provide administrative services, shareholder services, oversight of Fund accounting, marketing services, assistance in meeting legal and regulatory requirements, and other services necessary for the operation of the Fund and the Trust.
The Board considered the scope of services provided by, and the undertakings required of, the Adviser in connection with those services, including, among other things, maintaining (i) its own and the Fund's compliance programs, (ii) risk management programs, (iii) liquidity risk management programs, and (iv) cybersecurity programs, each of which had expanded over time as a result of regulatory, market, and other developments. The Board also considered the significant risks assumed by the Adviser in connection with the services provided to the Fund, including investment, operational, enterprise, litigation, regulatory and compliance risks.
The Board considered the Adviser's management style and the performance of the Adviser's duties under the Advisory Agreement. The Board considered the level and depth of knowledge of the Adviser, including the professional experience and qualifications of its senior and investment personnel, as well as current staffing levels. The Board considered the Adviser's process for monitoring the performance of the Subadviser and the Adviser's timeliness in responding to performance issues. The allocation of the Fund's brokerage, including the Adviser's process for monitoring "best execution," also was considered. The Adviser's role in coordinating the activities of the Fund's other service providers was also considered. The Board also considered the Adviser's risk management processes. The Board considered the Adviser's financial condition and that it had the financial wherewithal to continue to provide the same scope and high quality of services under the Advisory Agreement. In reviewing the Advisory Agreement, the Board focused on the experience, resources, and strengths of the Adviser and its affiliates in managing the Fund, as well as the other funds in the Trust.
The Board also reviewed the compliance and administrative services provided to the Fund by the Adviser and its affiliates, including the Adviser's oversight of the Fund's day-to-day operations and oversight of Fund accounting. The Trustees, guided also by information obtained from their experiences as trustees of the Trust, also focused on the quality of the Adviser's compliance and administrative staff.
Expenses and Performance — In connection with its consideration of the Advisory Agreement, the Board evaluated the Fund's advisory fees and total expense ratio as compared to other open-end investment companies deemed to be comparable to the Fund as determined by the independent third party in its report. The Fund's expenses were compared to (i) a group of investment companies chosen by the independent third party to be comparable to the Fund based upon certain factors, including fund type, comparability of investment objective and classification, sales load type, asset size, and expense components (the "expense group") and (ii) a larger group of investment companies with the same investment classification/objective as the Fund regardless of asset size, excluding outliers (the "expense universe"). Among other data, the Board noted that the Fund's management fee rate — which includes advisory and administrative services and the effects of any performance adjustment1, as well as any fee waivers and reimbursements — was equal to the median of its expense group and above the median of its expense universe. The data indicated that the Fund's total expenses, including after any reimbursements, were above the medians of its expense group and its expense universe. The Board also took into account the Adviser's current undertakings to maintain expense limitations for the Fund. The Board took into account the various other services provided to the Fund by the Adviser and its affiliates, and noted the high quality of services received by the Fund. The Board also took into account that the subadvisory fees under the Subadvisory Agreement are paid by the Adviser. The Board also considered and discussed information about the Subadviser's fees, including the amount of management fees retained by the Adviser after payment of the subadvisory fees.
In considering the Fund's performance, the Board noted that it reviews at its regularly scheduled meetings information about the Fund's performance results. The Trustees also reviewed various comparative data provided to them in connection with their consideration of the renewal of the Advisory Agreement, including, among other information, a comparison of the Fund's average annual total returns relative to its Lipper index and other mutual funds deemed to be in its peer group by the independent third party in its report (the "performance universe"). The Fund's performance universe consisted of the Fund and all retail and institutional open-end investment companies with the same classification/objective as the Fund regardless of asset size or primary channel of distribution. This comparison indicated that, among other data, the Fund's performance was below
1 The Adviser has agreed that no performance adjustment (positive or negative) would be made to the amount payable to the Adviser from July 1, 2019, through June 30, 2020.
49
USAA Mutual Funds Trust | | Supplemental Information — continued
May 31, 2021 | |
(Unaudited)
the average of its performance universe and its Lipper index for the one-, three-, five- and ten-year periods ended September 30, 2020. The Board took into account management's discussion of the Fund's performance, including the reasons for the Fund's longer-term underperformance. The Board also considered management's discussion of recent changes made to the Fund and the Fund's more recent improved performance.
Compensation and Profitability — The Board took into consideration the level and method of computing the management fee. The information considered by the Board included operating profit margin information for the Adviser's business as a whole. The Board also received and considered profitability information related to the management revenues from the Fund. This information included a review of the methodology used in the allocation of certain costs to the Fund. In considering the profitability data with respect to the Fund, the Trustees noted that the Adviser pays the Fund's subadvisory fees and also noted that the Adviser waived a portion of its management fee and/or reimbursed certain expenses with respect to the Fund. The Trustees reviewed the profitability of the Adviser's relationship with the Fund before tax expenses. The Board was also provided with a profitability analysis of other publicly traded asset managers prepared by an independent information service. In reviewing the overall profitability of the management fee to the Adviser, the Board also considered the fact that the Adviser and its affiliates provide shareholder servicing and administrative services to the Fund for which they receive compensation. The Board also considered the possible direct and indirect benefits to the Adviser from its relationship with the Trust, including that the Adviser may derive reputational and other benefits from its association with the Fund. The Trustees recognized that the Adviser should be entitled to earn a reasonable level of profits in exchange for the level of services it provides to the Fund and the entrepreneurial and other risks that it assumes as Adviser.
Economies of Scale — The Board considered whether there should be changes in the management fee rate or structure in order to enable the Fund to participate in any economies of scale. The Board also considered the fee waiver and expense reimbursement arrangements by the Adviser. The Board considered the fact that the Adviser also pays the Fund's subadvisory fees. The Board also considered the effect of the Fund's change in size, if any, on its performance and fees, noting that the Fund may realize other economies of scale if assets increase proportionally more than expenses. The Board determined that the current investment management fee structure was reasonable.
Conclusions — The Board reached the following conclusions regarding the Fund's Advisory Agreement with the Adviser: (i) the Adviser has demonstrated that it possesses the capability and resources to perform the duties required of it under the Advisory Agreement; (ii) the Adviser maintains an appropriate compliance program; (iii) the overall performance of the Fund is reasonable in relation to the performance of funds with similar investment objectives and to relevant indices; (iv) the Fund's advisory expenses are reasonable in relation to those of similar funds and to the services to be provided by the Adviser; and (v) the Adviser's and its affiliates' level of profitability from their relationship with the Fund is reasonable in light of the nature and high quality of services provided by the Adviser and the type of fund. Based on its conclusions, the Board determined that continuation of the Advisory Agreement would be in the best interests of the Fund and its shareholders.
Subadvisory Agreement
In approving the Subadvisory Agreement with respect to the Fund, the Board considered various factors, among them: (i) the nature, extent, and quality of services provided to the Fund by the Subadviser, including the personnel providing services; (ii) the Subadviser's compensation and any other benefits derived from the subadvisory relationship; (iii) comparisons, to the extent applicable, of subadvisory fees and performance to comparable investment companies; and (iv) the terms of the Subadvisory Agreement. A summary of the Board's analysis of these factors is set forth below. After full consideration of a variety of factors, the Board, including the Independent Trustees, voted to approve the Subadvisory Agreement. In approving the Subadvisory Agreement, the Trustees did not identify any single factor as controlling, and each Trustee may have attributed different weights to various factors. Throughout their deliberations, the Independent Trustees were represented and assisted by Independent Counsel.
Nature, Extent, and Quality of Services Provided; Investment Personnel — The Trustees considered information provided to them regarding the services provided by the Subadviser, including information presented periodically throughout the previous year. The Board considered the Subadviser's level of knowledge and investment style. The Board reviewed the experience and credentials of the investment personnel who are responsible for managing the investment of portfolio securities with respect to the Fund and the Subadviser's level of staffing.
50
USAA Mutual Funds Trust | | Supplemental Information — continued
May 31, 2021 | |
(Unaudited)
The Trustees considered, based on the materials provided to them by the Subadviser, whether the method of compensating portfolio managers is reasonable and includes mechanisms to prevent a manager with underperformance from taking undue risks. The Trustees also noted the Subadviser's brokerage practices. The Board also considered the Subadviser's regulatory and compliance history. The Board also took into account the Subadviser's risk management processes. The Board noted that the Adviser's monitoring processes of the Subadviser include: (i) regular telephonic meetings to discuss, among other matters, investment strategies, and to review portfolio performance; (ii) quarterly portfolio compliance checklists and quarterly compliance certifications to the Board; and (iii) due diligence visits to the Subadviser.
Subadviser Compensation — The Board also took into consideration the financial condition of the Subadviser. In considering the cost of services to be provided by the Subadviser and the profitability to the Subadviser of its relationship with the Fund, the Trustees noted that the fees under the Subadvisory Agreement were paid by the Adviser. The Trustees also relied on the ability of the Adviser to negotiate the Subadvisory Agreement and the fees thereunder at arm's length. For the above reasons, the Board determined that the profitability of the Subadviser from its relationship with the Fund was not a material factor in its deliberations with respect to the consideration of the approval of the Subadvisory Agreement. For similar reasons, the Board concluded that the potential for economies of scale in the Subadviser's management of the Fund was not a material factor in considering the Subadvisory Agreement.
Subadvisory Fees and Fund Performance — The Board compared the subadvisory fees for the Fund with the fees that the Subadviser charges to comparable clients, as applicable. The Board considered that the Fund pays a management fee to the Adviser and that, in turn, the Adviser pays a subadvisory fee to the Subadviser. As noted above, the Board considered the Fund's performance during the one-, three-, five-, and ten-year periods ended September 30, 2020, as compared to the Fund's peer group and noted that the Board reviews at its regularly scheduled meetings information about the Fund's performance results. The Board also considered the performance of the Subadviser. The Board noted the Adviser's experience and resources in monitoring the performance, investment style, and risk-adjusted performance of the Subadviser. The Board was mindful of the Adviser's focus on the Subadviser's performance. The Board also noted the Subadviser's performance record for similar accounts, as applicable.
Conclusions — The Board reached the following conclusions regarding the Subadvisory Agreement: (i) the Subadviser is qualified to manage the Fund's assets in accordance with its investment objectives and policies; (ii) the Subadviser maintains an appropriate compliance program; (iii) the overall performance of the Fund is reasonable in relation to the performance of funds with similar investment objectives and relevant indices; and (iv) the Fund's advisory expenses are reasonable in relation to those of similar funds and to the services to be provided by the Adviser and the Subadviser. Based on its conclusions, the Board determined that approval of the Subadvisory Agreement with respect to the Fund would be in the best interests of the Fund and its shareholders.
51
USAA Mutual Funds Trust | | Supplemental Information — continued
May 31, 2021 | |
(Unaudited)
Liquidity Risk Management Program:
The USAA Mutual Funds have adopted and implemented a written liquidity risk management program (the "LRMP") as required by Rule 22e-4 under the Investment Company Act of 1940, as amended. The LRMP is reasonably designed to assess and manage each Fund's liquidity risk, taking into consideration the Fund's investment strategy and the liquidity of its portfolio investments during normal and reasonably foreseeable stressed market conditions; its short and long-term cash flow projections; and its cash holdings and access to other liquidity management tools such as available funding sources including the Victory Funds Complex Interfund Lending Facility and Line of Credit (discussed in the Notes to Financial Statements). The USAA Mutual Funds' Board of Trustees approved the appointment of the Funds' investment adviser, Victory Capital Management Inc. ("Victory Capital"), as the administrator of the LRMP.
Victory Capital manages liquidity risks associated with the Fund's investments by monitoring, among other things, cash and cash equivalents, any use of derivatives, the concentration of investments, the appropriateness of the Fund's investment strategy, and by classifying every Fund investment as either highly liquid, moderately liquid, less liquid or illiquid on at least a monthly basis. To assist with the classification of Fund investments, Victory Capital has retained a third-party provider of liquidity evaluation services. This provider determines preliminary liquidity classifications for all portfolio holdings based upon portfolio-level data and certain assumptions provided by Victory Capital. Victory Capital reviews the preliminary liquidity classifications and, when appropriate, considers other information including input from the Fund's portfolio managers (including the portfolio managers employed by any investment sub-advisers) in determining final liquidity classifications.
At a meeting held on March 10, 2021, Victory Capital provided an oral and written report to the Trustees on the operation and effectiveness of the LRMP during the previous year. The report from Victory Capital concluded that the Fund did not experience any significant liquidity challenges during the covered period, and the Fund's LRMP is reasonably designed to assess and manage its liquidity risk. The report also concluded that the LRMP continues to operate adequately and effectively to enable Victory Capital to oversee and manage liquidity risk and ensure the Fund is able to meet redemption requests without significant dilution to the remaining investors' interest in the Fund. During the review period, each Fund's portfolio consisted primarily of highly liquid investments, which are defined as cash and any investments reasonably expects to be converted to cash in current market conditions in three business days or less without significantly changing the market value of the investment. Therefore, the Fund has not adopted a highly liquid investment minimum. The Funds' investments were below the limitation on illiquid investments during the review period. Additionally, Victory Capital indicated that no events occurred that would require the filing of Form N-LIQUID and recommended no material changes to the LRMP.
52
Privacy Policy
Protecting the Privacy of Information
The Trust respects your right to privacy. We also know that you expect us to conduct and process your business in an accurate and efficient manner. To do so, we must collect and maintain certain personal information about you. This is the information we collect from you on applications or other forms, and from the transactions you make with us or third parties. It may include your name, address, social security number, account transactions and balances, and information about investment goals and risk tolerance.
We do not disclose any information about you or about former customers to anyone except as permitted or required by law. Specifically, we may disclose the information we collect to companies that perform services on our behalf, such as the transfer agent that processes shareholder accounts and printers and mailers that assist us in the distribution of investor materials. We may also disclose this information to companies that perform marketing services on our behalf. This allows us to continue to offer you Victory investment products and services that meet your investing needs, and to effect transactions that you request or authorize. These companies will use this information only in connection with the services for which we hired them. They are not permitted to use or share this information for any other purpose.
To protect your personal information internally, we permit access only by authorized employees and maintain physical, electronic, and procedural safeguards to guard your personal information.*
* You may have received communications regarding information about privacy policies from other financial institutions which gave you the opportunity to "opt-out" of certain information sharing with companies which are not affiliated with that financial institution. The Trust does not share information with other companies for purposes of marketing solicitations for products other than the Trust. Therefore, the Trust does not provide opt-out options to their shareholders.
P.O. Box 182593,
Columbus, Ohio 43218-2593

Visit our website at: | | Call | |
vcm.com | | (800) 235-8396 | |

MAY 31, 2021
Annual Report
USAA Precious Metals and Minerals Fund
Victory Capital means Victory Capital Management Inc., the investment adviser of the USAA Mutual Funds. USAA Mutual Funds are distributed by Victory Capital Services, Inc., member of FINRA, an affiliate of Victory Capital. Victory Capital and its affiliates are not affiliated with United Services Automobile Association or its affiliates. USAA and the USAA logos are registered trademarks and the USAA Mutual Funds and USAA Investments logos are trademarks of United Services Automobile Association and are being used by Victory Capital and its affiliates under license.
www.vcm.com
News, Information And Education 24 Hours A Day, 7 Days A Week
The Victory Funds site gives fund shareholders, prospective shareholders, and investment professionals a convenient way to access fund information, get guidance, and track fund performance anywhere they can access the Internet. The site includes:
• Detailed performance records
• Daily share prices
• The latest fund news
• Investment resources to help you become a better investor
• A section dedicated to investment professionals
Whether you're a potential investor searching for the fund that matches your investment philosophy, a seasoned investor interested in planning tools, or an investment professional, www.vcm.com has what you seek. Visit us anytime. We're always open.
TABLE OF CONTENTS
Shareholder Letter (Unaudited) | | | 2 | | |
Managers' Commentary (Unaudited) | | | 4 | | |
Investment Overview (Unaudited) | | | 6 | | |
Investment Objective & Portfolio
Holdings (Unaudited) | | | 7 | | |
Schedule of Portfolio Investments | | | 8 | | |
Financial Statements | |
Statement of Assets and Liabilities | | | 11 | | |
Statement of Operations | | | 12 | | |
Statements of Changes in Net Assets | | | 13 | | |
Financial Highlights | | | 14 | | |
Notes to Financial Statements | | | 16 | | |
Report of Independent
Registered Public Accounting Firm | | | 27 | | |
Supplemental Information (Unaudited) | | | 28 | | |
Trustees' and Officers' Information | | | 28 | | |
Proxy Voting and Portfolio Holdings Information | | | 34 | | |
Expense Examples | | | 34 | | |
Additional Federal Income Tax Information | | | 35 | | |
Advisory Contract Agreement | | | 36 | | |
Liquidity Risk Management Program | | | 39 | | |
Privacy Policy (inside back cover) | | | |
This report is for the information of the shareholders and others who have received a copy of the currently effective prospectus of the Fund, managed by Victory Capital Management Inc. It may be used as sales literature only when preceded or accompanied by a current prospectus, which provides further details about the Fund.
IRA DISTRIBUTION WITHHOLDING DISCLOSURE
We generally must withhold federal income tax at a rate of 10% of the taxable portion of your distribution and, if you live in a state that requires state income tax withholding, at your state's tax rate. However, you may elect not to have withholding apply or to have income tax withheld at a higher rate. Any withholding election that you make will apply to any subsequent distribution unless and until you change or revoke the election. If you wish to make a withholding election, or change or revoke a prior withholding election, call (800) 235-8396, and form W-4P (OMB No. 1545-0074 withholding certificate for pension or annuity payments) will be electronically sent.
If you do not have a withholding election in place by the date of a distribution, federal income tax will be withheld from the taxable portion of your distribution at a rate of 10%. If you must pay estimated taxes, you may be subject to estimated tax penalties if your estimated tax payments are not sufficient and sufficient tax is not withheld from your distribution.
For more specific information, please consult your tax adviser.
• NOT FDIC INSURED • NO BANK GUARANTEE • MAY LOSE VALUE
1
(Unaudited)
Dear Shareholder,
Never a dull moment. A year ago, we were still coming to grips with a global pandemic, hoping for an effective vaccine, and wondering whether the U.S. Federal Reserve's aggressive actions would continue to mollify financial markets. As it turns out, a vaccine was rolled out (domestically) faster than expectations, and the recovery that began during the second quarter of 2020 continued unabated.
Fast forward to today and investors are suddenly more concerned about labor shortages, rising commodity prices, and whether inflation will prove to be transitory or more lasting. If anything, this merely exemplifies that markets are unpredictable and the environment can and will change rapidly.
Reflecting on the past year, we must consider ourselves fortunate despite the myriad challenges. For starters, it was impressive how quickly the various forms of monetary and fiscal stimulus contributed to a rebound in GDP. Of course, it wasn't a straight line upward and there were bouts of elevated volatility in both bond and stock markets. Late in 2020, for example, financial markets were alternately fueled and roiled by a contentious election season, growing optimism for an effective vaccine, and a fluid debate regarding the need for even more stimulus. Ultimately, stocks were propelled higher in the fourth quarter of 2020 as it became clear Congress would provide another dose of stimulus in the form of direct payments, more unemployment insurance, and additional aid to businesses.
As we moved into 2021, stocks continued their upward trajectory. Meanwhile, the yield on the 10-Year U.S. Treasury continued rallying sharply as many investors began to shift their focus. Deflation was out; inflation was in. Indeed, the potential for a new era of inflation and higher interest rates seems to be the new worry du jour.
So how did the numbers shake out after this unusual year? The S&P 500® Index registered an impressive annual return of approximately 40% for this 12-month period ended May 31, 2021. Over this same period, the yield on the 10-Year U.S. Treasury jumped 94 basis points, reflecting both the very low starting rate and substantial fiscal stimulus. At the end of the reporting period, the yield on the 10-Year U.S. Treasury was 1.59%.
The past year is not one we will forget any time soon. There were many hardships, but we should not overlook the positives and remember our collective spirit and perseverance. Markets endured and even surprised to the upside, but perhaps the key takeaway is that investors need to remain calm in the face of adversity and focused on longer-term investment goals. We believe that's the best approach no matter what the markets throw at us.
On the following pages, you will find information relating to your USAA Mutual Funds, brought to you by Victory Capital. If you have any questions regarding the current market dynamics or your specific portfolio or investment plan, we encourage you to contact our Member Service Representatives. Call (800) 235-8396 or visit our website at www.vcm.com.
2
From all of us here at Victory Capital, thank you for letting us help you work toward your investment goals.

Christopher K. Dyer, CFA
President,
USAA Mutual Funds
3
USAA Precious Metals and Minerals Fund
Managers' Commentary
(Unaudited)
• What were the market conditions during the reporting period?
The beginning of the reporting period brought a dramatic reversal from the difficult environment that characterized the first part of 2020. While COVID-19 cases continued to rise, investors grew increasingly confident that the economy would be able to recover from its sharp downturn of February and March. The optimism stemmed, in part, from a series of better-than-expected economic reports interpreted as evidence that the slump in growth would be less severe than was initially feared. The markets were further cheered by the aggressive response by the U.S. Federal Reserve (the "Fed"). In addition to reiterating its commitment to keep short-term interest rates near zero for an extended period, the Fed announced the direct purchase of both individual bonds and exchange-traded bond funds. The central bank's unusual steps offered corporations the latitude to issue debt at ultra-low rates, providing them with the cash necessary to help withstand the effects of the coronavirus.
The global financial markets produced healthy returns during the second half of 2020, wrapping up a positive year for the major asset classes. Investors' appetite for risk improved considerably in early November, when the approval of vaccines for COVID-19 raised expectations that the world economy could gradually return to normal in 2021. The conclusion of the U.S. elections, which removed a source of uncertainty that had depressed performance in September and October, was an additional tailwind. The markets were also aided by continued indications that the Fed and other central banks would maintain their highly accommodative policies indefinitely. Not least, an agreement on a new round of U.S. fiscal stimulus further cheered investors in late December. Together, these developments outweighed negative headlines surrounding renewed lockdowns and the persistence of the coronavirus.
The first quarter of 2021 proved to be a continuation of the strong equity markets investors experienced over the second half of 2020. Gains from global equity markets were fueled by optimism surrounding the successful rollout of the COVID-19 vaccines coupled with further monetary and fiscal stimulus proposals. Faster-than-expected economic growth produced a meaningful increase in real interest rates, which led to negative returns across most major fixed income asset classes. The 10-year U.S. Treasury bond yield finished at its highest level of the first quarter reporting period, climbing from under 1% to 1.74%.
During the last few months of the reporting period, equity markets have been consolidating and interest rates leveling off after large upswings. With strong first quarter GDP and corporate earnings growth in the rearview mirror, investors seem to be contemplating their next move. Inflation data has been increasing as the economy reopens more quickly than expected. The Fed maintains that inflationary pressure is transitory but could become more persistent. The inflationary environment will be a key metric moving into the second half of the year.
4
USAA Precious Metals and Minerals Fund (continued)
Managers' Commentary (continued)
Gold continued to march higher during the one-year period ending on May 31, 2021. The GOLDS Commodities Index posted a return of 10.21% return during that one-year period, underperfroming stocks and outperfrorming bonds. The stocks of gold mining companies, as represented by the NYSE Arca Gold Miners Index, fared even better with a 15.82% return.
• How did the USAA Precious Metals and Minerals Fund (the "Fund") perform during the reporting period?
The Fund has three share classes: Fund Shares, Institutional Shares, and Class A (effective June 29, 2020, the Adviser Shares were redesignated Class A and became subject to a front-end shares charge). For the reporting period ended May 31, 2021, the Fund Shares, Institutional Shares, and Class A had a total return of 16.69%, 16.90%, and 16.52%, respectively. This compares to a total return of 40.32% for the S&P 500® Index, 41.85% for the MSCI All-Country World Index, 20.37% for the MSCI ACWI Gold Miners IMI Index, and 17.62% for the Lipper Precious Metals Equity Funds Index.
• What strategies did you employ during the reporting period?
At the end of May 2021, the Fund held approximately 99% of its net assets in gold stocks. For the period the Fund underperformed the S&P 500® Index and MSCI ACWI Gold Miners IMI Index.
Within the MSCI ACWI Gold Miners IMI Index, two securities, Newmont Corp. and Barrick Gold Corp., accounted for approximately 30% of the index. Over the reporting period, Newmont Corp. outperformed, and Barrick Gold Corp. underperformed the index, overall the Fund's active weight to those securities were additive to the performance.
An overweight to Ziing Minning, up over approximately 300%, and Goldfields up approximately 60%, were the largest contributors to relative performance. Detractors included an overweight to Centerra Gold Inc., Regis Resources Ltd., and Centamin Plc.
As always, we believe the primary purpose of maintaining exposure to gold should be to help diversify investor portfolios.
Thank you for allowing us to assist you with your investment needs.
Holdings are subject to change. There is no guarantee that securities mentioned remain in or out of the Fund.
5
USAA Precious Metals and Minerals Fund
Investment Overview
(Unaudited)
Average Annual Total Return
Year Ended May 31, 2021
| | | Fund Shares | | Institutional
Shares | | Class A | | | | | | | | | |
INCEPTION DATE | | 8/15/84 | | 8/1/08 | | 8/1/10 | | | | | | | | | |
| | | Net Asset
Value | | Net Asset
Value | | Net Asset
Value | | S&P 500
Index1 | | MSCI
All-Country
World Index2 | | MSCI ACWI
Gold Miners IMI
Index3 | | Lipper Precious
Metals Equity
Funds Index4 | |
One Year | | | 16.69 | % | | | 16.90 | % | | | 16.52 | % | | | 40.32 | % | | | 41.85 | % | | | 20.37 | % | | | 17.62 | % | |
Five Year | | | 11.19 | % | | | 11.56 | % | | | 11.09 | % | | | 17.16 | % | | | 14.18 | % | | | 12.70 | % | | | 11.59 | % | |
Ten Year | | | –3.91 | % | | | –3.65 | % | | | –4.04 | % | | | 14.38 | % | | | 9.58 | % | | | –3.56 | % | | | –2.90 | % | |
The performance data quoted represents past performance and current returns may be lower or higher. The investment return and principal value will fluctuate so that an investor's shares, when redeemed, may be worth more or less than the original cost. To obtain performance information current to the most recent month's end, please visit www.vcm.com.
The maximum offering price figures reflect a maximum sales charge of 2.25% for Class A. Net Asset Value does not reflect sales charges.
Total return measures the price change in a share assuming the reinvestment of all net investment income and realized capital gain distributions, if any. The total returns quoted do not reflect adjustments made to the enclosed financial statements in accordance with U.S. Generally Accepted Accounting Principles or the deduction of taxes that a shareholder would pay on net investment income and realized capital gain distributions, including reinvested distributions, or redemptions of shares. The total return figures set forth above include all waivers of fees. Without such fee waivers, the total returns would have been lower.
USAA Precious Metals and Minerals Fund — Growth of $10,000
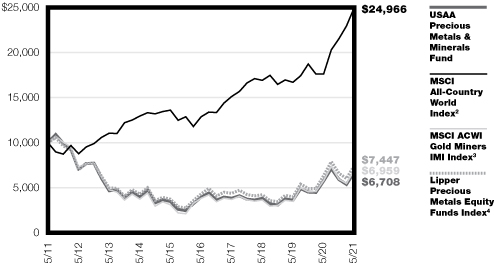
1 The unmanaged S&P 500 Index represents the weighted average performance of a group of 500 widely held, publicly traded stocks. The index reflects the reinvestment of dividends paid on the stocks constituting the index net of withholding taxes. This index does not include the effect of sales charges, commissions, expenses, or taxes, is not representative of the Fund, and it is not possible to invest directly in an index.
2 The unmanaged MSCI All?Country World Index is a free float?adjusted, market?capitalization?weighted index designed to measure the performance of large? and mid?cap stocks across developed and emerging markets. The index reflects the reinvestment of dividends paid on the stocks constituting the index net of withholding taxes. This index does not include the effect of sales charges, commissions, expenses, or taxes, is not representative of the Fund, and it is not possible to invest directly in an index.
3 The MSCI ACWI Select Gold Miners IMI aims to focus on companies in the gold mining industry that are highly sensitive to underlying prices of gold. The index reflects the reinvestment of dividends paid on the stocks constituting the index net of withholding taxes. This index does not include the effect of sales charges, commissions, expenses, or taxes, is not representative of the Fund, and it is not possible to invest directly in an index.
4 The unmanaged Lipper Precious Metals Equity Funds Index tracks the total return performance of the 10 largest funds within the Lipper Precious Metals Equity Funds category. The index reflects the reinvestment of dividends paid on the stocks constituting the index net of withholding taxes. This index does not include the effect of sales charges, commissions, expenses, or taxes, is not representative of the Fund, and it is not possible to invest directly in an index.
The graph reflects investment of growth of a hypothetical $10,000 investment in the Fund.
The graph and table do not reflect the deduction of taxes that a shareholder would pay on Fund distributions or the redemption of Fund shares.
Past performance is not indicative of future results.
6
USAA Mutual Funds Trust
USAA Precious Metals and Minerals Fund | | May 31, 2021 | |
(Unaudited)
Investment Objective & Portfolio Holdings:
The Fund's investment objective seeks long-term capital appreciation and to protect the purchasing power of shareholders' capital against inflation.
Top 10 Equity Holdings*:
May 31, 2021
(% of Net Assets)
Newmont Corp. | | | 13.1 | % | |
Barrick Gold Corp. | | | 8.8 | % | |
Franco-Nevada Corp. | | | 5.3 | % | |
Kinross Gold Corp. | | | 4.7 | % | |
Agnico Eagle Mines Ltd. | | | 4.1 | % | |
Wheaton Precious Metals Corp. | | | 3.9 | % | |
Newcrest Mining Ltd. | | | 3.8 | % | |
B2Gold Corp. | | | 3.7 | % | |
Kirkland Lake Gold Ltd. | | | 3.7 | % | |
Royal Gold, Inc. | | | 2.7 | % | |
Portfolio Composition*:
May 31, 2021
(% of Net Assets)
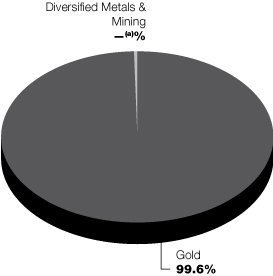
* Does not include short-term investments purchased with cash collateral from securities loaned.
Percentages are of the net assets of the Fund and may not equal 100%.
(a) Percentage is less than 0.05%.
Refer to the Schedule of Portfolio Investments for a complete list of securities.
7
USAA Mutual Funds Trust
USAA Precious Metals and Minerals Fund | | Schedule of Portfolio Investments
May 31, 2021 | |
(Amounts in Thousands, Except for Shares)
Security Description | | Shares | | Value | |
Common Stocks (99.6%) | |
Metals & Mining (99.6%): | |
Agnico Eagle Mines Ltd. | | | 431,673 | | | $ | 30,973 | | |
Alamos Gold, Inc. | | | 982,100 | | | | 8,968 | | |
Aneka Tambang Tbk | | | 20,089,500 | | | | 3,461 | | |
AngloGold Ashanti Ltd. | | | 760,198 | | | | 18,213 | | |
Argonaut Gold, Inc. (a) (b) | | | 655,200 | | | | 1,644 | | |
B2Gold Corp. | | | 5,459,170 | | | | 27,931 | | |
Barrick Gold Corp. (b) | | | 2,735,027 | | | | 65,859 | | |
Centamin PLC | | | 4,216,310 | | | | 6,597 | | |
Centerra Gold, Inc. (b) | | | 1,499,019 | | | | 12,187 | | |
Cia de Minas Buenaventura SAA, ADR (a) | | | 68,157 | | | | 785 | | |
Coeur Mining, Inc. (a) | | | 969,748 | | | | 10,085 | | |
Dundee Precious Metals, Inc. (b) | | | 1,781,264 | | | | 12,992 | | |
Eldorado Gold Corp. (a) | | | 640,839 | | | | 7,613 | | |
Endeavour Mining Corp. | | | 544,418 | | | | 13,071 | | |
Equinox Gold Corp. (a) | | | 68,782 | | | | 639 | | |
Evolution Mining Ltd. | | | 4,178,674 | | | | 17,004 | | |
Franco-Nevada Corp. | | | 267,224 | | | | 39,979 | | |
Gold Fields Ltd., ADR | | | 1,606,199 | | | | 19,451 | | |
Gold Resource Corp. | | | 202,002 | | | | 562 | | |
Gold Road Resources Ltd. | | | 313,388 | | | | 363 | | |
Golden Star Resources Ltd. (a) | | | 464,607 | | | | 1,529 | | |
Great Basin Gold Ltd. (a) (c) (d) | | | 8,566,400 | | | | — | (e) | |
Great Basin Gold Ltd. (a) (c) (d) | | | 6,500,000 | | | | — | (e) | |
Harmony Gold Mining Co. Ltd. | | | 1,463,504 | | | | 7,534 | | |
IAMGOLD Corp. (a) | | | 1,265,194 | | | | 4,580 | | |
IAMGOLD Corp. (a) | | | 411,532 | | | | 1,489 | | |
Kinross Gold Corp. | | | 4,337,099 | | | | 35,130 | | |
Kirkland Lake Gold Ltd. (b) | | | 639,234 | | | | 27,709 | | |
Koza Altin Isletmeleri A/S (a) (b) | | | 298,319 | | | | 4,174 | | |
Lundin Gold, Inc. (a) (b) | | | 78,200 | | | | 775 | | |
McEwen Mining, Inc. (a) (b) | | | 494,100 | | | | 726 | | |
Nautilus Minerals, Inc. (a) (c) (d) | | | 5,757,622 | | | | — | (e) | |
New Gold, Inc. (a) | | | 1,183,000 | | | | 2,497 | | |
Newcrest Mining Ltd. | | | 1,309,823 | | | | 28,387 | | |
Newmont Corp. | | | 1,336,516 | | | | 98,207 | | |
Northern Star Mining Corp. (a) (c) (d) | | | 375,000 | | | | — | | |
Northern Star Resources Ltd. | | | 1,226,203 | | | | 10,811 | | |
Novagold Resources, Inc. (a) (b) | | | 421,400 | | | | 4,319 | | |
OceanaGold Corp. (a) (b) | | | 3,283,648 | | | | 6,959 | | |
Osisko Gold Royalties Ltd. (b) | | | 303,400 | | | | 4,330 | | |
Perseus Mining Ltd. (a) | | | 5,838,238 | | | | 6,332 | | |
Polymetal International PLC | | | 704,177 | | | | 16,951 | | |
Polyus PJSC (f) | | | 62,088 | | | | 13,447 | | |
Pretium Resources, Inc. (a) | | | 431,655 | | | | 4,921 | | |
Ramelius Resources Ltd. | | | 5,473,285 | | | | 8,247 | | |
Regis Resources Ltd. | | | 2,733,555 | | | | 5,541 | | |
Resolute Mining Ltd. (a) (b) | | | 490,758 | | | | 221 | | |
Royal Gold, Inc. | | | 165,192 | | | | 20,446 | | |
See notes to financial statements.
8
USAA Mutual Funds Trust
USAA Precious Metals and Minerals Fund | | Schedule of Portfolio Investments — continued
May 31, 2021 | |
(Amounts in Thousands, Except for Shares)
Security Description | | Shares | | Value | |
Sandstorm Gold Ltd. (a) (b) | | | 1,079,600 | | | $ | 9,420 | | |
Seabridge Gold, Inc. (a) | | | 95,100 | | | | 1,822 | | |
Shandong Gold Mining Co. Ltd. Class H (a) (g) | | | 1,656,200 | | | | 3,594 | | |
Silver Lake Resources Ltd. (a) | | | 4,268,850 | | | | 6,514 | | |
SSR Mining, Inc. | | | 803,122 | | | | 14,898 | | |
St Barbara Ltd. | | | 3,096,281 | | | | 4,522 | | |
Torex Gold Resources, Inc. (a) | | | 976,108 | | | | 14,247 | | |
Wesdome Gold Mines Ltd. (a) (b) | | | 578,000 | | | | 5,331 | | |
Wheaton Precious Metals Corp. (b) | | | 604,258 | | | | 28,990 | | |
Yamana Gold, Inc. | | | 3,023,400 | | | | 15,843 | | |
Yamana Gold, Inc. | | | 1,190,747 | | | | 6,240 | | |
Zhaojin Mining Industry Co. Ltd. Class H | | | 2,609,000 | | | | 2,710 | | |
Zijin Mining Group Co. Ltd. Class H | | | 12,694,000 | | | | 19,661 | | |
| | | | 747,431 | | |
Total Common Stocks (Cost $461,440) | | | 747,431 | | |
Collateral for Securities Loaned^ (2.0%) | |
Fidelity Investments Money Market Government Portfolio
Institutional Shares, 0.01% (h) | | | 7,132,483 | | | | 7,132 | | |
Goldman Sachs Financial Square Government Fund Institutional
Shares, 0.03% (h) | | | 2,499,033 | | | | 2,499 | | |
HSBC U.S. Government Money Market Fund I Shares, 0.03% (h) | | | 5,742,736 | | | | 5,743 | | |
Total Collateral for Securities Loaned (Cost $15,374) | | | 15,374 | | |
Total Investments (Cost $476,814) — 101.6% | | | 762,805 | | |
Liabilities in excess of other assets — (1.6)% | | | (12,216 | ) | |
NET ASSETS — 100.00% | | $ | 750,589 | | |
At May 31, 2021, the Fund's investments in foreign securities were 82.1% of net assets.
^ Purchased with cash collateral from securities on loan.
(a) Non-income producing security.
(b) All or a portion of this security is on loan.
(c) The Fund's Adviser has deemed this security to be illiquid based upon procedures approved by the Board of Trustees. As of May 31, 2021, illiquid securities were 0.0% of net assets.
(d) Security was fair valued based upon procedures approved by the Board of Trustees and represents 0.0% of the Fund's net assets as of May 31, 2021. This security is classified as Level 3 within the fair value hierarchy. (See Note 2 in the Notes to Financial Statements)
(e) Rounds to less than $1 thousand.
(f) Security was fair valued based upon procedures approved by the Board of Trustees and represents 1.8% of the Fund's net assets as of May 31, 2021. (See Note 2 in the Notes to Financial Statements)
(g) Rule 144A security or other security that is restricted as to resale to institutional investors. The Fund's Adviser has deemed this security to be liquid based upon procedures approved by the Board of Trustees. As of May 31, 2021, the fair value of these securities was $3,594 (thousands) and amounted to 0.5% of net assets.
See notes to financial statements.
9
USAA Mutual Funds Trust
USAA Precious Metals and Minerals Fund | | Schedule of Portfolio Investments — continued
May 31, 2021 | |
(h) Rate disclosed is the daily yield on May 31, 2021.
ADR — American Depositary Receipt
PLC — Public Limited Company
See notes to financial statements.
10
USAA Mutual Funds Trust | | Statement of Assets and Liabilities
May 31, 2021 | |
(Amounts in Thousands, Except Per Share Amounts)
| | | USAA Precious Metals
and Minerals Fund | |
Assets: | |
Investments, at value (Cost $476,814) | | $ | 762,805 | (a) | |
Cash | | | 1,939 | | |
Receivables: | |
Interest and dividends | | | 958 | | |
Capital shares issued | | | 172 | | |
Investments sold | | | 1,909 | | |
From Adviser | | | 3 | | |
Prepaid expenses | | | 20 | | |
Total Assets | | | 767,806 | | |
Liabilities: | |
Payables: | |
Collateral received on loaned securities | | | 15,374 | | |
Capital shares redeemed | | | 224 | | |
Accrued foreign capital gains taxes | | | 877 | | |
Accrued expenses and other payables: | |
Investment advisory fees | | | 463 | | |
Administration fees | | | 92 | | |
Custodian fees | | | 16 | | |
Transfer agent fees | | | 103 | | |
Compliance fees | | | — | (b) | |
Trustees' fees | | | 1 | | |
| 12b-1 fees | | | 3 | | |
Other accrued expenses | | | 64 | | |
Total Liabilities | | | 17,217 | | |
Net Assets: | |
Capital | | | 1,237,849 | | |
Total accumulated earnings/(loss) | | | (487,260 | ) | |
Net Assets | | $ | 750,589 | | |
Net Assets | |
Fund Shares | | $ | 697,969 | | |
Institutional Shares | | | 26,338 | | |
Class A | | | 26,282 | | |
Total | | $ | 750,589 | | |
Shares (unlimited number of shares authorized with no par value): | |
Fund Shares | | | 30,923 | | |
Institutional Shares | | | 1,142 | | |
Class A | | | 1,179 | | |
Total | | | 33,244 | | |
Net asset value, offering and redemption price per share: (c) | |
Fund Shares | | $ | 22.57 | | |
Institutional Shares | | $ | 23.06 | | |
Class A | | $ | 22.29 | | |
Maximum Sales Charge — Class A | | | 5.75 | % | |
Maximum offering price | |
(100%/(100%-maximum sales charge) of net asset value adjusted to
the nearest cent) per share — Class A | | $ | 23.65 | | |
(a) Includes $12,295 of securities on loan.
(b) Rounds to less than $1 thousand.
(c) Per share amount may not recalculate due to rounding of net assets and/or shares outstanding.
See notes to financial statements.
11
USAA Mutual Funds Trust | | Statement of Operations
For the Year Ended May 31, 2021 | |
(Amounts in Thousands)
| | | USAA Precious Metals
and Minerals Fund | |
Investment Income: | |
Dividends | | $ | 13,005 | | |
Interest | | | 1 | | |
Securities lending (net of fees) | | | 109 | | |
Foreign tax withholding | | | (1,682 | ) | |
Total Income | | | 11,433 | | |
Expenses: | |
Investment advisory fees | | | 5,463 | | |
Administration fees — Fund Shares | | | 1,035 | | |
Administration fees — Institutional Shares | | | 25 | | |
Administration fees — Class A | | | 44 | | |
Sub-Administration fees | | | 23 | | |
| 12b-1 fees — Class A | | | 73 | | |
Custodian fees | | | 100 | | |
Transfer agent fees — Fund Shares | | | 1,254 | | |
Transfer agent fees — Institutional Shares | | | 25 | | |
Transfer agent fees — Class A | | | 28 | | |
Trustees' fees | | | 50 | | |
Compliance fees | | | 5 | | |
Legal and audit fees | | | 73 | | |
State registration and filing fees | | | 72 | | |
Interfund lending fees | | | — | (a) | |
Other expenses | | | 130 | | |
Total Expenses | | | 8,400 | | |
Expenses waived/reimbursed by Adviser | | | (23 | ) | |
Net Expenses | | | 8,377 | | |
Net Investment Income (Loss) | | | 3,056 | | |
Realized/Unrealized Gains (Losses) from Investments: | |
Net realized gains (losses) from investment securities and foreign currency
translations | | | 54,050 | | |
Net change in unrealized appreciation/depreciation on investment securities | | | 55,454 | | |
Net realized/unrealized gains (losses) on investments | | | 109,504 | | |
Change in net assets resulting from operations | | $ | 112,560 | | |
(a) Rounds to less than $1 thousand.
See notes to financial statements.
12
USAA Mutual Funds Trust | | Statements of Changes in Net Assets | |
(Amounts in Thousands)
| | | USAA Precious Metals
and Minerals Fund | |
| | | Year
Ended
May 31, 2021 | | Year
Ended
May 31, 2020 | |
From Investments: | |
Operations: | |
Net investment income (loss) | | $ | 3,056 | | | $ | (1,522 | ) | |
Net realized gains (losses) from investments | | | 54,050 | | | | (113,742 | ) | |
Net change in unrealized appreciation/depreciation on
investments | | | 55,454 | | | | 395,654 | | |
Change in net assets resulting from operations | | | 112,560 | | | | 280,390 | | |
Distributions to Shareholders: | |
Fund Shares | | | (302 | ) | | | — | | |
Institutional Shares | | | (40 | ) | | | — | | |
Change in net assets resulting from distributions to shareholders | | | (342 | ) | | | — | | |
Change in net assets resulting from capital transactions | | | (72,907 | ) | | | (76,391 | ) | |
Change in net assets | | | 39,311 | | | | 203,999 | | |
Net Assets: | |
Beginning of period | | | 711,278 | | | | 507,279 | | |
End of period | | $ | 750,589 | | | $ | 711,278 | | |
Capital Transactions: | |
Fund Shares | |
Proceeds from shares issued | | $ | 104,788 | | | $ | 95,260 | | |
Distributions reinvested | | | 294 | | | | — | | |
Cost of shares redeemed | | | (172,453 | ) | | | (164,383 | ) | |
Total Fund Shares | | $ | (67,371 | ) | | $ | (69,123 | ) | |
Institutional Shares | |
Proceeds from shares issued | | $ | 4,482 | | | $ | 1,928 | | |
Distributions reinvested | | | 37 | | | | — | | |
Cost of shares redeemed | | | (3,514 | ) | | | (9,661 | ) | |
Total Institutional Shares | | $ | 1,005 | | | $ | (7,733 | ) | |
Class A | |
Proceeds from shares issued | | $ | 37,689 | | | $ | 14,218 | | |
Cost of shares redeemed | | | (44,230 | ) | | | (13,753 | ) | |
Total Class A | | $ | (6,541 | ) | | $ | 465 | | |
Change in net assets resulting from capital transactions | | $ | (72,907 | ) | | $ | (76,391 | ) | |
Share Transactions: | |
Fund Shares | |
Issued | | | 4,879 | | | | 6,001 | | |
Reinvested | | | 14 | | | | — | | |
Redeemed | | | (8,129 | ) | | | (10,335 | ) | |
Total Fund Shares | | | (3,236 | ) | | | (4,334 | ) | |
Institutional Shares | |
Issued | | | 194 | | | | 119 | | |
Reinvested | | | 2 | | | | — | | |
Redeemed | | | (160 | ) | | | (733 | ) | |
Total Institutional Shares | | | 36 | | | | (614 | ) | |
Class A | |
Issued | | | 1,864 | | | | 895 | | |
Redeemed | | | (2,183 | ) | | | (871 | ) | |
Total Class A | | | (319 | ) | | | 24 | | |
Change in Shares | | | (3,519 | ) | | | (4,924 | ) | |
See notes to financial statements.
13
USAA Mutual Funds Trust | | Financial Highlights | |
For a Share Outstanding Throughout Each Period
| | | | | Investment Activities | | Distributions to
Shareholders From | |
| | | Net Asset
Value,
Beginning of
Period | | Net
Investment
Income
(Loss) | | Net Realized
and Unrealized
Gains (Losses)
on Investments | | Total from
Investment
Activities | | Net
Investment
Income | | Total
Distributions | |
USAA Precious Metals and Minerals Fund | |
Fund Shares | |
Year Ended: | |
May 31, 2021 | | $ | 19.34 | | | | 0.09 | (b) | | | 3.15 | | | | 3.24 | | | | (0.01 | ) | | | (0.01 | ) | |
May 31, 2020 | | $ | 12.16 | | | | (0.04 | )(b) | | | 7.22 | | | | 7.18 | | | | — | | | | — | | |
May 31, 2019 | | $ | 12.87 | | | | (0.03 | )(b) | | | (0.68 | ) | | | (0.71 | ) | | | — | | | | — | | |
May 31, 2018 | | $ | 12.93 | | | | (0.05 | )(b) | | | (0.01 | ) | | | (0.06 | ) | | | — | | | | — | | |
May 31, 2017 | | $ | 13.90 | | | | 0.14 | | | | (0.60 | ) | | | (0.46 | ) | | | (0.51 | ) | | | (0.51 | ) | |
Institutional Shares | |
Year Ended: | |
May 31, 2021 | | $ | 19.76 | | | | 0.12 | (b) | | | 3.22 | | | | 3.34 | | | | (0.04 | ) | | | (0.04 | ) | |
May 31, 2020 | | $ | 12.40 | | | | (0.01 | )(b) | | | 7.37 | | | | 7.36 | | | | — | | | | — | | |
May 31, 2019 | | $ | 13.06 | | | | 0.01 | (b) | | | (0.67 | ) | | | (0.66 | ) | | | — | | | | — | | |
May 31, 2018 | | $ | 13.07 | | | | (0.01 | )(b) | | | — | (e) | | | (0.01 | ) | | | — | | | | — | | |
May 31, 2017 | | $ | 13.98 | | | | 0.07 | (b) | | | (0.47 | ) | | | (0.40 | ) | | | (0.51 | ) | | | (0.51 | ) | |
Class A | |
Year Ended: | |
May 31, 2021 | | $ | 19.13 | | | | 0.04 | (b) | | | 3.12 | | | | 3.16 | | | | — | | | | — | | |
May 31, 2020 | | $ | 12.04 | | | | (0.05 | )(b) | | | 7.14 | | | | 7.09 | | | | — | | | | — | | |
May 31, 2019 | | $ | 12.74 | | | | (0.03 | )(b) | | | (0.67 | ) | | | (0.70 | ) | | | — | | | | — | | |
May 31, 2018 | | $ | 12.82 | | | | 0.16 | | | | (0.24 | ) | | | (0.08 | ) | | | — | | | | — | | |
May 31, 2017 | | $ | 13.79 | | | | 0.04 | | | | (0.50 | ) | | | (0.46 | ) | | | (0.51 | ) | | | (0.51 | ) | |
* Assumes reinvestment of all net investment income and realized capital gain distributions, if any, during the period. Includes adjustments in accordance with U.S. Generally Accepted Accounting Principles and could differ from the Lipper reported return.
^ The net expense ratio may not correlate to the applicable expense limits in place during the period since the current contractual expense limitation is applied for a period beginning July 1, 2019, and in effect through June 30, 2023, instead of coinciding with the Fund's fiscal year end. Details of the current contractual expense limitation in effect can be found in Note 5 of the accompanying Notes to Financial Statements.
(a) Portfolio turnover is calculated on the basis of the Fund as a whole without distinguishing between the classes of shares.
(b) Per share net investment income (loss) has been calculated using the average daily shares method.
(c) Reflects increased trading activity due to current year transition or asset allocation shift.
(d) Effective June 6, 2018, USAA Asset Management Company ("AMCO") (previous Adviser) had voluntarily agreed to limit the annual expenses of the Institutional Shares to 1.00% of the Institutional Shares' average daily net assets.
(e) Amount is less than $0.005 per share.
See notes to financial statements.
14
USAA Mutual Funds Trust | | Financial Highlights — continued | |
For a Share Outstanding Throughout Each Period
| | | | | Ratios to Average Net Assets | | Supplemental Data | |
| | | Redemption
Fees Added to
Beneficial
Interests | | Net Asset
Value,
End of
Period | | Total
Return
(Excludes
Sales
Charge)* | | Net
Expenses^ | | Net
Investment
Income
(Loss) | | Gross
Expenses | | Net Assets,
End of
Period
(000's) | | Portfolio
Turnover(a) | |
USAA Precious Metals and Minerals Fund | |
Fund Shares | |
Year Ended: | |
May 31, 2021 | | | — | | | $ | 22.57 | | | | 16.69 | % | | | 1.12 | % | | | 0.41 | % | | | 1.12 | % | | $ | 697,969 | | | | 7 | % | |
May 31, 2020 | | | — | | | $ | 19.34 | | | | 59.13 | % | | | 1.19 | % | | | (0.25 | )% | | | 1.19 | % | | $ | 660,770 | | | | 47 | %(c) | |
May 31, 2019 | | | — | | | $ | 12.16 | | | | (5.52 | )% | | | 1.31 | % | | | (0.22 | )% | | | 1.31 | % | | $ | 468,208 | | | | 7 | % | |
May 31, 2018 | | | — | | | $ | 12.87 | | | | (0.46 | )% | | | 1.23 | % | | | (0.36 | )% | | | 1.23 | % | | $ | 540,952 | | | | 13 | % | |
May 31, 2017 | | | — | | | $ | 12.93 | | | | (2.68 | )% | | | 1.22 | % | | | 0.02 | % | | | 1.22 | % | | $ | 585,515 | | | | 14 | % | |
Institutional Shares | |
Year Ended: | |
May 31, 2021 | | | | | | $ | 23.06 | | | | 16.90 | % | | | 0.99 | % | | | 0.55 | % | | | 1.05 | % | | $ | 26,338 | | | | 7 | % | |
May 31, 2020 | | | — | | | $ | 19.76 | | | | 59.35 | % | | | 1.00 | % | | | (0.05 | )% | | | 1.06 | % | | $ | 21,855 | | | | 47 | %(c) | |
May 31, 2019 | | | — | | | $ | 12.40 | | | | (5.05 | )% | | | 1.00 | %(d) | | | 0.12 | % | | | 1.19 | % | | $ | 21,327 | | | | 7 | % | |
May 31, 2018 | | | — | | | $ | 13.06 | | | | (0.08 | )% | | | 0.89 | % | | | (0.07 | )% | | | 0.89 | % | | $ | 3,632 | | | | 13 | % | |
May 31, 2017 | | | — | | | $ | 13.07 | | | | (2.23 | )% | | | 0.76 | % | | | 0.46 | % | | | 0.76 | % | | $ | 2,893 | | | | 14 | % | |
Class A | |
Year Ended: | |
May 31, 2021 | | | | | | $ | 22.29 | | | | 16.52 | % | | | 1.31 | % | | | 0.21 | % | | | 1.34 | % | | $ | 26,282 | | | | 7 | % | |
May 31, 2020 | | | — | | | $ | 19.13 | | | | 58.89 | % | | | 1.27 | % | | | (0.32 | )% | | | 1.27 | % | | $ | 28,653 | | | | 47 | %(c) | |
May 31, 2019 | | | — | | | $ | 12.04 | | | | (5.49 | )% | | | 1.38 | % | | | (0.27 | )% | | | 1.38 | % | | $ | 17,744 | | | | 7 | % | |
May 31, 2018 | | | — | (e) | | $ | 12.74 | | | | (0.62 | )% | | | 1.30 | % | | | (0.43 | )% | | | 1.30 | % | | $ | 16,881 | | | | 13 | % | |
May 31, 2017 | | | — | (e) | | $ | 12.82 | | | | (2.68 | )% | | | 1.30 | % | | | (0.04 | )% | | | 1.30 | % | | $ | 18,309 | | | | 14 | % | |
See notes to financial statements.
15
USAA Mutual Funds Trust | | Notes to Financial Statements
May 31, 2021 | |
1. Organization:
USAA Mutual Funds Trust (the "Trust") is organized as a Delaware statutory trust and is registered under the Investment Company Act of 1940, as amended (the "1940 Act"), as an open-end investment company. The Trust is comprised of 46 funds and is authorized to issue an unlimited number of shares, which are units of beneficial interest with no par value.
The accompanying financial statements are those of the USAA Precious Metals and Minerals Fund (the "Fund"). The Fund offers three classes of shares: Fund Shares, Institutional Shares, and Class A. The Fund is classified as non-diversified under the 1940 Act. Effective June 29, 2020, the Fund's Adviser Shares were redesignated Class A and became subject to a front-end sales charge.
Each class of shares of the Fund has substantially identical rights and privileges, except with respect to sales charges, fees paid under distribution plans, expenses allocable exclusively to each class of shares, voting rights on matters solely affecting a single class of shares, and the exchange privilege of each class of shares.
Under the Trust's organizational documents, its officers and trustees are indemnified against certain liabilities arising out of the performance of their duties to the Fund. In addition, in the normal course of business, the Fund enters into contracts with its vendors and others that provide for general indemnifications. The Fund's maximum exposure under these arrangements is unknown, as this would involve future claims that may be made against the Fund. However, based on experience, the Fund expects that risk of loss to be remote.
2. Significant Accounting Policies:
The following is a summary of significant accounting policies followed by the Trust in the preparation of its financial statements. The policies are in conformity with Generally Accepted Accounting Principles in the United States of America ("GAAP"). The preparation of financial statements in accordance with GAAP requires management to make estimates and assumptions that affect the reported amounts of assets and liabilities and disclosure of contingent assets and liabilities at the date of the financial statements and the reported amounts of income and expenses for the period. Actual results could differ from those estimates. The Fund follows the specialized accounting and reporting requirements under GAAP that are applicable to investment companies under Accounting Standards Codification Topic 946.
Investment Valuation:
The Fund records investments at fair value. Fair value is defined as the price that would be received to sell an asset or paid to transfer a liability in an orderly transaction between market participants at the measurement date.
The valuation techniques described below maximize the use of observable inputs and minimize the use of unobservable inputs in determining fair value. The inputs used for valuing the Fund's investments are summarized in the three broad levels listed below:
• Level 1 — quoted prices in active markets for identical securities
• Level 2 — other significant observable inputs (including quoted prices for similar securities or interest rates applicable to those securities, etc.)
• Level 3 — significant unobservable inputs (including the Fund's own assumptions in determining the fair value of investments)
Changes in valuation techniques may result in transfers in or out of an assigned level within the disclosure hierarchy. The inputs or methodologies used for valuation techniques are not necessarily an indication of the risks associated with entering into those investments.
16
USAA Mutual Funds Trust | | Notes to Financial Statements — continued
May 31, 2021 | |
Victory Capital Management Inc. ("VCM" or the "Adviser") has established the Pricing and Liquidity Committee (the "Committee"), and subject to the Trust's Board of Trustees (the "Board") oversight, the Committee administers and oversees the Fund's valuation policies and procedures, which are approved by the Board.
Portfolio securities listed or traded on securities exchanges, including Exchange-Traded Funds ("ETFs"), American Depositary Receipts ("ADRs"), and Rights, are valued at the closing price on the exchange or system where the security is principally traded, if available, or at the Nasdaq Official Closing Price. If there have been no sales for that day on the exchange or system, then a security is valued at the last available bid quotation on the exchange or system where the security is principally traded. In each of these situations, valuations are typically categorized as Level 1 in the fair value hierarchy.
Investments in open-end investment companies are valued at their net asset value ("NAV"). These valuations are typically categorized as Level 1 in the fair value hierarchy.
In the event that price quotations or valuations are not readily available, investments are valued at fair value in accordance with procedures established by and under the general supervision and responsibility of the Board. These valuations are typically categorized as Level 2 or Level 3 in the fair value hierarchy, based on the observability of inputs used to determine the fair value. The effect of fair value pricing is that securities may not be priced on the basis of quotations from the primary market in which they are traded and the actual price realized from the sale of a security may differ materially from the fair value price. Valuing these securities at fair value is intended to cause the Fund's NAV to be more reliable than it otherwise would be.
In accordance with procedures adopted by the Board, fair value pricing may be used if events materially affecting the value of foreign securities occur between the time the exchange on which they are traded closes and the time the Fund's NAV is calculated. The Fund uses a systematic valuation model, provided daily by an independent third party to fair value its international equity securities. The valuations are considered as Level 2 in the fair value hierarchy.
A summary of the valuations as of May 31, 2021, based upon the three levels defined above, is included in the table below while the breakdown, by category, of investments is disclosed on the Schedule of Portfolio Investments (amounts in thousands):
| | | Level 1 | | Level 2 | | Level 3 | | Total | |
Common Stocks | | $ | 733,984 | | | $ | 13,447 | | | $ | — | (a) | | $ | 747,431 | | |
Collateral for Securities Loaned | | | 15,374 | | | | — | | | | — | | | | 15,374 | | |
Total | | $ | 749,358 | | | $ | 13,447 | | | $ | — | (a) | | $ | 762,805 | | |
(a) Includes securities with a zero value, please refer to the Schedule of Portfolio Investments for a complete list of securities.
For the year ended May 31, 2021, there were no transfers in or out of Level 3 in the fair value hierarchy.
Investment Companies:
Open-End Funds:
The Fund may invest in portfolios of open-end investment companies. These investment companies value securities in their portfolios for which market quotations are readily available at their market values (generally the last reported sale price) and all other securities and assets at their fair value by the methods established by the board of directors of the underlying funds.
Foreign Exchange Currency Contracts:
The Fund may enter into foreign exchange currency contracts to convert U.S. dollars to and from various foreign currencies. A foreign exchange currency contract is an obligation by the Fund to purchase or sell a specific currency at a future date at a price (in U.S. dollars) set at the time of the contract. The Fund does not engage in "cross-currency" foreign exchange contracts (i.e., contracts to purchase or sell one foreign currency in exchange for another foreign currency). The Fund's foreign
17
USAA Mutual Funds Trust | | Notes to Financial Statements — continued
May 31, 2021 | |
exchange currency contracts might be considered spot contracts (typically a contract of one week or less) or forward contracts (typically a contract term over one week). A spot contract is entered into for purposes of hedging against foreign currency fluctuations relating to a specific portfolio transaction, such as the delay between a security transaction trade date and settlement date. Forward contracts are entered into for purposes of hedging portfolio holdings or concentrations of such holdings. Each foreign exchange currency contract is adjusted daily by the prevailing spot or forward rate of the underlying currency, and any appreciation or depreciation is recorded for financial statement purposes as unrealized until the contract settlement date, at which time the Fund records realized gains or losses equal to the difference between the value of a contract at the time it was opened and the value at the time it was closed. The Fund could be exposed to risk if a counterparty is unable to meet the terms of a foreign exchange currency contract or if the value of the foreign currency changes unfavorably. In addition, the use of foreign exchange currency contracts does not eliminate fluctuations in the underlying prices of the securities. As of May 31, 2021, the Fund had no open forward foreign exchange currency contracts.
Investment Transactions and Related Income:
Changes in holdings of investments are accounted for no later than one business day following the trade date. For financial reporting purposes, however, investment transactions are accounted for on trade date on the last business day of the reporting period. Interest income is determined on the basis of coupon interest accrued using the effective interest method which adjusts, where applicable, the amortization of premiums or accretion of discount. Dividend income is recorded on the ex-dividend date. Gains or losses realized on sales of securities are recorded on the identified cost basis.
Withholding taxes on interest, dividends, and gains as a result of certain investments in ADRs by the Fund have been provided for in accordance with each investment's applicable country's tax rules and rates.
Securities Lending:
The Fund, through a securities lending agreement with Citibank, N.A. ("Citibank"), may lend its securities to qualified financial institutions, such as certain broker-dealers, to earn additional income, net of income retained by Citibank. Borrowers are required to secure their loans for collateral in the amount of at least 102% of the value of U.S. securities loaned or at least 105% of the value of non-U.S. securities loaned, marked-to-market daily. Any collateral shortfalls associated with increases in the valuation of the securities loaned are cured the next business day once the shortfall exceeds $100 thousand. Collateral may be cash, U.S. government securities, or other securities as permitted by Securities and Exchange Commission ("SEC") guidelines. Cash collateral may be invested in high-quality short-term investments, primarily open-end investment companies. Collateral requirements are determined daily based on the value of the Fund's securities on loan as of the end of the prior business day. During the time portfolio securities are on loan, the borrower will pay the Fund any dividends or interest paid on such securities plus any fee negotiated between the parties to the lending agreement. The Fund also earns a return from the collateral. The Fund pays Citibank various fees in connection with the investment of cash collateral and fees based on the investment income received from securities lending activities. Securities lending income (net of these fees) is disclosed on the Statement of Operations. Loans are terminable upon demand and the borrower must return the loaned securities within the lesser of one standard settlement period or five business days. Risks relating to securities-lending transactions include that the borrower may not provide additional collateral when required or return the securities when due, and that the value of the short-term investments will be less than the amount of cash collateral required to be returned to the borrower. The Fund's agreement with Citibank does not include master netting provisions. Non-cash collateral received by the Fund may not be sold or re-pledged, except to satisfy borrower default. Cash collateral is listed on the Fund's Schedule of Portfolio Investments and Financial Statements while non-cash collateral is not included.
18
USAA Mutual Funds Trust | | Notes to Financial Statements — continued
May 31, 2021 | |
The following table (amounts in thousands) is a summary of the Fund's securities lending transactions as of May 31, 2021.
Value of
Securities on Loan | | Non-Cash Collateral | | Cash Collateral | |
| $ | 12,295 | | | $ | — | | | $ | 15,374 | | |
Foreign Currency Translations:
The accounting records of the Fund are maintained in U.S. dollars. Investment securities and other assets and liabilities of the Fund denominated in a foreign currency are translated into U.S. dollars at current exchange rates. Purchases and sales of securities, income receipts, and expense payments are translated into U.S. dollars at the exchange rates on the date of the transactions. The Fund does not isolate the portion of the results of operations resulting from changes in foreign exchange rates on investments from fluctuations arising from changes in market prices of securities held. Such fluctuations are disclosed as net change in unrealized appreciation/depreciation on investments and foreign currency translations on the Statement of Operations. Any realized gains or losses from these fluctuations, including foreign currency arising from in-kind redemptions, are disclosed as net realized gains or losses from investment transactions and foreign currency translations on the Statement of Operations.
Foreign Taxes:
The Fund may be subject to foreign taxes related to foreign income received (a portion of which may be reclaimable), capital gains on the sale of securities, and certain foreign currency transactions. All foreign taxes are recorded in accordance with the applicable regulations and rates that exist in the foreign jurisdictions in which the Fund invests.
Federal Income Taxes:
It is the Fund's policy to continue to qualify as a regulated investment company by complying with the provisions available to certain investment companies, as defined in applicable sections of the Internal Revenue Code, and to make distributions of net investment income and net realized gains sufficient to relieve it from all, or substantially all, federal income taxes. Accordingly, no provision for federal income taxes is required in the financial statements. The Fund has a tax year end of May 31.
Management of the Fund has reviewed tax positions taken in tax years that remain subject to examination by all major tax jurisdictions, including federal (i.e., the last four tax years, which includes the current fiscal tax year end). Management believes that there is no tax liability resulting from unrecognized tax benefits related to uncertain tax positions taken.
Allocations:
Expenses directly attributable to the Fund are charged to the Fund, while expenses that are attributable to more than one fund in the Trust, or jointly with an affiliated trust, are allocated among the respective funds in the Trust and/or affiliated trust based upon net assets or another appropriate basis.
Income, expenses (other than class-specific expenses such as transfer agent fees, state registration fees, printing fees, and 12b-1 fees) and realized and unrealized gains or losses on investments are allocated to each class of shares based on its relative net assets on the date income is earned or expenses and realized and unrealized gains and losses are incurred.
19
USAA Mutual Funds Trust | | Notes to Financial Statements — continued
May 31, 2021 | |
3. Purchases and Sales:
Cost of purchases and proceeds from sales/maturities of securities (excluding securities maturing less than one year from acquisition) for the year ended May 31, 2021, were as follows for the Fund (amounts in thousands):
| | Excluding
U.S. Government Securities | |
| | | Purchases | | Sales | |
| | | | | $ | 51,068 | | | $ | 124,125 | | |
There were no purchases or sales of U.S. government securities during the year ended May 31, 2021.
4. Affiliated Fund Ownership:
The Fund offers its shares for investment by other USAA Mutual Funds. The fund-of-funds do not invest in the underlying funds for the purpose of exercising management or control, and the affiliated fund-of-funds' annual and semi-annual reports may be viewed at vcm.com. As of May 31, 2021, certain fund-of-funds owned total outstanding shares of the Fund as follows:
Affiliated USAA Mutual Funds | | Ownership % | |
USAA Cornerstone Conservative Fund | | | 0.2 | | |
USAA Cornerstone Equity Fund | | | 0.1 | | |
USAA Target Retirement Income Fund | | | 0.4 | | |
USAA Target Retirement 2030 Fund | | | 0.8 | | |
USAA Target Retirement 2040 Fund | | | 0.8 | | |
USAA Target Retirement 2050 Fund | | | 0.5 | | |
USAA Target Retirement 2060 Fund | | | 0.1 | | |
5. Fees and Transactions with Affiliates and Related Parties:
Investment Advisory Fees:
Investment advisory services are provided to the Fund by the Adviser, which is a New York corporation registered as an investment adviser with the SEC. The Adviser is an indirect wholly owned subsidiary of Victory Capital Holdings, Inc., a publicly traded Delaware corporation, and a wholly owned direct subsidiary of Victory Capital Operating, LLC.
Under the terms of the Investment Advisory Agreement, the Adviser is entitled to receive a base fee and a performance adjustment. The Fund's base fee is accrued daily and paid monthly at an annualized rate of 0.75% of the Fund's average daily net assets. Amounts incurred and paid to VCM for the year ended May 31, 2021, are reflected on the Statement of Operations as Investment Advisory fees.
On November 6, 2018, United Services Automobile Association ("USAA"), the parent company of USAA Asset Management Company ("AMCO"), the prior investment adviser to the Fund announced that AMCO would be acquired by Victory Capital Holdings Inc. (the "Transaction"). A special shareholder meeting was held on April 18, 2019, at which shareholders of the Fund approved a new investment advisory agreement between the Trust, on behalf of the Fund, and VCM. The Transaction closed on July 1, 2019, and effective July 1, 2019, VCM replaced AMCO as the investment adviser to the Fund and no performance adjustments were made for the period beginning July 1, 2019, through June 30, 2020. Only performance beginning as of July 1, 2019, and thereafter is utilized in calculating future performance adjustments.
The performance adjustment for each share class is accrued daily and calculated monthly by comparing each class' performance to that of the Lipper Precious Metals Equity Funds Index. The Lipper Precious Metals Equity Funds Index tracks the total return performance of the largest funds within the Lipper Precious Metals Equity Funds category.
20
USAA Mutual Funds Trust | | Notes to Financial Statements — continued
May 31, 2021 | |
The performance period for each share class consists of the current month plus the previous 35 months (or the number of months beginning July 1, 2019, if fewer). The following table is utilized to determine the extent of the performance adjustment:
Over/Under Performance Relative to Index
(in basis points)(a) | | Annual Adjustment Rate
(in basis points) | |
| | +/- 100 to 400 | | | | +/- 4 | | |
| | +/- 401 to 700 | | | | +/- 5 | | |
| | +/- 701 and greater | | | | +/- 6 | | |
(a) Based on the difference between average annual performance of the relevant share class of the Fund and its relevant Lipper index, rounded to the nearest basis point.
Each class' annual performance adjustment rate is multiplied by the average daily net assets of each respective class over the entire performance period, which is then multiplied by a fraction, the numerator of which is the number of days in the month and the denominator of which is 365 (366 in leap years). The resulting amount is then added to (in the case of overperformance), or subtracted from (in the case of underperformance) the base fee.
Under the performance fee arrangement, each class pays a positive performance fee adjustment for a performance period whenever the class outperforms the Lipper Precious Metals Equity Funds Index over that period, even if the class has overall negative returns during the performance period.
For the performance period July 1, 2020, to May 31, 2021, performance adjustments were $(105), $(3), and $(5) for Fund shares, Institutional Shares, and Class A, in thousands, respectively. Performance adjustments were (0.02)%, (0.01)%, and (0.02)% for Fund Shares, Institutional Shares, and Class A, respectively. The performance adjustment rate included in the investment advisory fee may differ from the maximum over/under Annual Adjustment Rate due to differences in average net assets for the reporting period and rolling 36 month performance periods.
The Trust relies on an exemptive order granted to VCM and its affiliated funds by the SEC in March 2019 permitting the use of a "manager-of-managers" structure for certain funds. Under a manager-of-managers structure, the investment adviser may select (with approval of the Board and without shareholder approval) one or more subadvisers to manage the day-to-day investment of a fund's assets. For the year ended May 31, 2021, the Fund had no subadvisors.
Administration and Servicing Fees:
VCM serves as the Fund's administrator and fund accountant. Under the Fund Administration, Servicing and Accounting Agreement, VCM is paid for its services an annual fee at a rate of 0.15%, 0.10%, and 0.15% of average daily net assets of the Fund Shares, Institutional Shares and Class A, respectively. Amounts incurred for the year ended May 31, 2021, are reflected on the Statement of Operations as Administration fees.
The Fund (as part of the Trust) has entered into an agreement to provide compliance services with the Adviser, pursuant to which the Adviser furnishes its compliance personnel, including the services of the Chief Compliance Officer ("CCO"), and other resources reasonably necessary to provide the Trust with compliance oversight services related to the design, administration and oversight of a compliance program for the Trust in accordance with Rule 38a-1 under the 1940 Act. The CCO is an employee of the Adviser, which pays the compensation of the CCO and support staff. Funds in the Trust, Victory Variable Insurance Funds, Victory Portfolios, and Victory Portfolios II (collectively, the "Victory Funds Complex") in the aggregate, compensate the Adviser for these services. Amounts incurred for the year ended May 31, 2021, are reflected on the Statement of Operations as Compliance fees.
21
USAA Mutual Funds Trust | | Notes to Financial Statements — continued
May 31, 2021 | |
Citi Fund Services Ohio, Inc. ("Citi"), an affiliate of Citibank, acts as sub-administrator and sub-fund accountant to the Fund pursuant to a Sub-Administration and Sub-Fund Accounting Services Agreement between VCM and Citi. VCM pays Citi a fee for providing these services. The Fund reimburses VCM and Citi for out-of-pocket expenses incurred in providing these services and certain other expenses specifically allocated to the Fund. Amounts incurred for the year ended May 31, 2021, are reflected on the Statement of Operations as Sub-Administration fees.
Transfer Agency Fees:
Victory Capital Transfer Agency, Inc. ("VCTA"), an affiliate of the Adviser, provides transfer agency services to the Fund. VCTA provides transfer agent services to the Fund Shares based on an annual charge of $23 per shareholder account plus out-of-pocket expenses. VCTA pays a portion of these fees to certain intermediaries for the administration and servicing of accounts that are held with such intermediaries. Transfer agent's fees for Institutional Shares and Class A are paid monthly based on a fee accrued daily at an annualized rate of 0.10% and 0.10% , respectively, of average daily net assets, plus out-of-pocket expenses. Amounts incurred and paid to VCTA for the year ended May 31, 2021, are reflected on the Statement of Operations as Transfer Agent fees.
FIS Investor Services LLC serves as sub-transfer agent and dividend disbursing agent for the Fund pursuant to a Sub-Transfer Agent Agreement between VCTA and FIS Investor Services LLC. VCTA provides FIS Investor Services LLC a fee for providing these services.
Distributor/Underwriting Services:
Victory Capital Services, Inc. (the "Distributor"), an affiliate of the Adviser, serves as distributor for the continuous offering of the shares of the Fund pursuant to a Distribution Agreement between the Distributor and the Trust. Effective June 30, 2020, the Distributor's name was changed from Victory Capital Advisers, Inc.
Pursuant to the Distribution and Service Plans adopted in accordance with Rule 12b-1 under the 1940 Act, the Distributor may receive a monthly distribution and service fee, at an annual rate of up to 0.25% of the average daily net assets of Class A. The distribution and service fees paid to the Distributor may be used by the Distributor to pay for activity primarily intended to result in the sale of Class A. Amounts incurred and paid to the Distributor for the year ended May 31, 2021, are reflected on the Statement of Operations as 12b-1 fees.
In addition, the Distributor is entitled to receive commissions on sales of Class A. For the year ended May 31, 2021, the Distributor received approximately $1 thousand from commissions earned on sales of Class A.
Other Fees:
Citibank serves as the Fund's custodian. The Fund pays Citibank a fee for providing these services. Amounts incurred for the year ended May 31, 2021, are reflected on the Statement of Operations as Custodian fees.
K&L Gates LLP provides legal services to the Trust.
The Adviser has entered into an expense limitation agreement with the Fund until at least June 30, 2023. Under the terms of the agreement, the Adviser has agreed to waive fees or reimburse certain expenses to the extent that ordinary operating expenses incurred by certain classes of the Fund in any fiscal year exceed the expense limit for such classes of the Fund. Such excess amounts will be the liability of the Adviser. Acquired fund fees and expenses, interest, taxes, brokerage commissions, other expenditures, that are capitalized in accordance with GAAP, and other extraordinary expenses not incurred in the ordinary course of the Fund's business are excluded from the expense limits. As of May 31, 2021, the expense limits (excluding voluntary waivers) were 1.27%, 1.00%, and 1.34% for Fund Shares, Institutional Shares, and Class A, respectively.
22
USAA Mutual Funds Trust | | Notes to Financial Statements — continued
May 31, 2021 | |
Under the terms of the expense limitation agreement, amended May 1, 2021, the Fund has agreed to repay fees and expenses that were waived or reimbursed by the Adviser for a period of up to three years (thirty six (36) months) after the waiver or reimbursement took place, subject to the lesser of any operating expense limits in effect at the time of: (a) the original waiver or expense reimbursement; or (b) the recoupment, after giving effect to the recoupment amount. Prior to May 1, 2021, the Fund was permitted to recoup fees waived and expenses reimbursed for up to three years after the fiscal year in which the waiver or reimbursement took place, subject to the limitations above. This change did not have any effect on the amounts previously reported for recoupment.
As of May 31, 2021, the following amounts are available to be repaid to the Adviser (amounts in thousands). The Fund has not recorded any amounts available to be repaid as a liability due to an assessment that such repayment is not probable at May 31, 2021.
| Expires 2023 | | Expires 2024 | | Total | |
| $ | 12 | | | $ | 23 | | | $ | 35 | | |
The Adviser may voluntarily waive or reimburse additional fees to assist the Fund in maintaining competitive expense ratios. Voluntary waivers and reimbursements applicable to the Fund are not available to be recouped at a future time. There were no voluntary waivers or reimbursements for the year ended May 31, 2021.
Certain officers and/or interested trustees of the Fund are also officers and/or employees of the Adviser, administrator, fund accountant, sub-administrator, sub-fund accountant, custodian, and Distributor.
6. Risks:
The Fund may be subject to other risks in addition to these identified risks.
Geopolitical/Natural Disaster Risk — Global economies and financial markets are increasingly interconnected, which increases the possibilities that conditions in one country or region might adversely affect issuers in another country or region. Geopolitical and other risks, including war, terrorism, trade disputes, political or economic dysfunction within some nations, public health crises and related geopolitical events, as well as environmental disasters such as earthquakes, fires, and floods, may add to instability in world economies and markets generally. Changes in trade policies and international trade agreements could affect the economies of many countries in unpredictable ways. Likewise, systemic market dislocations of the kind that occurred during the financial crisis that began in 2008, if repeated, would be highly disruptive to economies and markets, adversely affecting individual companies and industries, securities markets, interest rates, credit ratings, inflation, investor sentiment, and other factors affecting the value of a Fund's investments. Some countries, including the United States, are adopting more protectionist trade policies and moving away from the tighter financial industry regulations that followed the 2008 financial crisis, which may also affect the value of a Fund's investments.
Political events within the United States at times have resulted, and may in the future result, in a shutdown of government services, which could negatively affect the U.S. economy, decrease the value of a Fund's investments, increase uncertainty in or impair the operation of the U.S. or other securities markets, and degrade investor and consumer confidence, perhaps suddenly and to a significant degree.
An outbreak of disease called COVID-19 has spread internationally. The transmission of COVID-19 and efforts to contain its spread have resulted in international, national, and local border closings and other significant travel restrictions and disruptions, significant disruptions to business operations, supply chains and consumer activity, significant challenges in healthcare service preparation and delivery, quarantines, and general concern and uncertainty. These negative impacts have caused significant volatility and declines in global financial markets, which have caused losses for Fund investors during and subsequent to period end. The impact of the COVID-19 pandemic may last for an extended period of time, and could result in a substantial economic downturn or recession. Public health crises may exacerbate other pre-existing political, social, economic, market, and financial risks. The extent of the impact to the financial performance of the Fund's investments will depend on future developments,
23
USAA Mutual Funds Trust | | Notes to Financial Statements — continued
May 31, 2021 | |
including (i) the duration and spread of the outbreak, (ii) the restrictions and advisories, (iii) the effects on the financial markets, and (iv) the effects on the economy overall, all of which are highly uncertain and cannot be predicted.
Stock Market Risk — Overall stock market risks may affect the value of the Fund. Domestic and international factors such as political events, war, trade disputes, interest rate levels and other fiscal and monetary policy changes, pandemics and other public health crises, and related geopolitical events, as well as environmental disasters such as earthquakes, fires, and floods, may add to instability in world economies and markets generally. The impact of these and other factors may be short-term or may last for extended periods.
Equity Risk — The value of the equity securities in which the Fund invests may decline in response to developments affecting individual companies and/or general economic conditions. A company's earnings or dividends may not increase as expected due to poor management decisions, competitive pressures, breakthroughs in technology, reliance on suppliers, labor problems or shortages, corporate restructurings, fraudulent disclosures, natural disasters, military confrontations, war, terrorism, public health crises, or other events, conditions, and factors. Price changes may be temporary or last for extended periods.
Foreign Securities Risk — Foreign markets can be more volatile than the U.S. market due to increased risks of adverse issuer, political, regulatory, market, or economic developments and can perform differently from the U.S. market.
7. Borrowing and Interfund Lending:
Line of Credit:
The Victory Funds Complex participated in a short-term demand note "Line of Credit" agreement with Citibank. The Line of Credit agreement with Citibank was renewed on June 29, 2020, with a termination date of June 28, 2021. Under the agreement with Citibank, the Victory Funds Complex may borrow up to $600 million, of which $300 million is committed and $300 million is uncommitted. $40 million of the Line of Credit is reserved for use by the Victory Floating Rate Fund, another series of the Victory Funds Complex, with Victory Floating Rate Fund paying the related commitment fees for that amount. The purpose of the Line of Credit is to meet temporary or emergency cash needs. For the year ended May 31, 2021, Citibank received an annual commitment fee of 0.15% on $300 million for providing the Line of Credit. Each fund in the Victory Funds Complex pays a pro-rata portion of the commitment fees plus any interest (one month LIBOR plus one percent) on amounts borrowed. For the period June 29, 2020, through April 30, 2021, under an amended Line of Credit agreement, Citibank received an annual upfront fee of 0.10% on the $300 million committed line of credit. Each fund in the Victory Funds Complex paid a pro-rata portion of the upfront fee. Effective with the next amendment, the annual commitment fee of 0.15% will remain unchanged and the upfront fee of 0.10% is discontinued. Interest charged to each fund during the period, if applicable, is reflected on the Statement of Operations under Line of credit fees.
The Fund had no borrowings under the Line of Credit agreement during the year ended May 31, 2021.
Interfund Lending:
The Trust and Adviser rely on an exemptive order granted by the SEC in March 2017 (the "Order"), permitting the establishment and operation of an Interfund Lending Facility (the "Facility"). The Facility allows the Fund to directly lend and borrow money to or from any other fund in the Victory Funds Complex that is permitted to participate in the Facility, relying upon the Order at rates beneficial to both the borrowing and lending funds. Advances under the Facility are allowed for temporary or emergency purposes, including the meeting of redemption requests that otherwise might require the untimely disposition of securities, and are subject to each Fund's borrowing restrictions. The interfund loan rate is determined, as specified in the Order, by averaging the current repurchase agreement rate and the current bank loan rate. As a Borrower, interest charged to the Fund, if any, during the period is reflected on the Statement of Operations under Interfund lending fees. As a Lender, interest earned
24
USAA Mutual Funds Trust | | Notes to Financial Statements — continued
May 31, 2021 | |
by the Fund, if any, during the period is presented on the Statement of Operations under Interfund lending fees.
The average borrowing or lending for the days outstanding and average interest rate for the Fund during the year ended May 31, 2021, were as follows (amounts in thousands):
Borrower or
Lender | | Amount
Outstanding at
May 31, 2021 | | Average
Borrowing* | | Days
Borrowing
Outstanding | | Average
Interest
Rate* | | Maximum
Borrowing
During the
Period | |
| Borrower | | $ | — | | | $ | 2,124 | | | | 11 | | | | 0.60 | % | | $ | 4,767 | | |
* For the year ended May 31, 2021, based on the number of days borrowings were outstanding.
8. Federal Income Tax Information:
The Fund intends to distribute any net investment income annually. Distributable net realized gains, if any, are declared and paid at least annually.
The amounts of dividends from net investment income and distributions from net realized gains (collectively distributions to shareholders) are determined in accordance with federal income tax regulations, which may differ from GAAP. To the extent these "book/tax" differences are permanent in nature (e.g., net operating loss and distribution reclassification), such amounts are reclassified within the components of net assets based on their federal tax-basis treatment; temporary differences (e.g., wash sales) do not require reclassification. To the extent dividends and distributions exceed net investment income and net realized gains for tax purposes, they are reported as distributions of capital. Net investment losses incurred by the Fund may be reclassified as an offset to capital on the accompanying Statement of Assets and Liabilities.
As of May 31, 2021, on the Statement of Assets and Liabilities, there were no permanent book-to-tax difference reclassification adjustments.
The tax character of distributions paid during the tax years ended as noted below, were as follows (total distributions paid may differ from the Statements of Changes in Net Assets because, for tax purposes, dividends are recognized when actually paid) (amounts in thousands).
| | | Year Ended May 31, 2021 | |
| | Distributions
paid from | | | |
| | | Ordinary
Income | | Total
Distributions
Paid | |
| | | $ | 342 | | | $ | 342 | | |
As of May 31, 2021, the components of accumulated earnings (loss) on a tax basis were as follows (amounts in thousands):
Undistributed
Ordinary
Income | | Other
Earnings
(Deficit) | | Accumulated
Earnings | | Accumulated
Capital and
Other Losses | | Unrealized
Appreciation
(Depreciation)* | | Total
Accumulated
Earnings
(Loss) | |
| $ | 5,009 | | | $ | (877 | ) | | $ | 4,132 | | | $ | (760,581 | ) | | $ | 269,189 | | | $ | (487,260 | ) | |
* The difference between the book-basis and tax-basis of unrealized appreciation/depreciation is attributable to the tax deferral of losses on wash sales and passive foreign investment company.
25
USAA Mutual Funds Trust | | Notes to Financial Statements — continued
May 31, 2021 | |
As of May 31, 2021, the Fund had net capital loss carryforwards as shown in the table below (amounts in thousands). It is unlikely that the Board will authorize a distribution of capital gains realized in the future until the capital loss carryforwards have been used.
| Short-Term Amount | | Long-Term Amount | | Total | |
| $ | 9,939 | | | $ | 750,642 | | | $ | 760,581 | | |
During the most recent tax year ended May 31, 2021, the Fund utilized $49,321 thousand of capital loss carryforwards.
As of May 31, 2021, the cost basis for federal income tax purposes, gross unrealized appreciation, gross unrealized depreciation, and net unrealized appreciation (depreciation) for investments were as follows (amounts in thousands):
Cost of
Investments
for Federal
Tax Purposes | | Gross
Unrealized
Appreciation | | Gross
Unrealized
Depreciation | | Net Unrealized
Appreciation
(Depreciation) | |
| $ | 493,616 | | | $ | 312,270 | | | $ | (43,081 | ) | | $ | 269,189 | | |
26
REPORT OF INDEPENDENT REGISTERED PUBLIC ACCOUNTING FIRM
To the Shareholders and the Board of Trustees of USAA Precious Metals and Minerals Fund
Opinion on the Financial Statements
We have audited the accompanying statement of assets and liabilities of USAA Precious Metals and Minerals Fund (the "Fund") (one of the funds constituting USAA Mutual Funds Trust (the "Trust")), including the schedule of portfolio investments, as of May 31, 2021, and the related statement of operations for the year then ended, the statements of changes in net assets for each of the two years in the period then ended, the financial highlights for each of the five years in the period then ended and the related notes (collectively referred to as the "financial statements"). In our opinion, the financial statements present fairly, in all material respects, the financial position of the Fund (one of the funds constituting USAA Mutual Funds Trust) at May 31, 2021, the results of its operations for the year then ended, the changes in its net assets for each of the two years in the period then ended and its financial highlights for each of the five years in the period then ended, in conformity with U.S. generally accepted accounting principles.
Basis for Opinion
These financial statements are the responsibility of the Trust's management. Our responsibility is to express an opinion on the Fund's financial statements based on our audits. We are a public accounting firm registered with the Public Company Accounting Oversight Board (United States) ("PCAOB") and are required to be independent with respect to the Trust in accordance with the U.S. federal securities laws and the applicable rules and regulations of the Securities and Exchange Commission and the PCAOB.
We conducted our audits in accordance with the standards of the PCAOB. Those standards require that we plan and perform the audit to obtain reasonable assurance about whether the financial statements are free of material misstatement, whether due to error or fraud. The Trust is not required to have, nor were we engaged to perform, an audit of the Trust's internal control over financial reporting. As part of our audits we are required to obtain an understanding of internal control over financial reporting, but not for the purpose of expressing an opinion on the effectiveness of the Trust's internal control over financial reporting. Accordingly, we express no such opinion.
Our audits included performing procedures to assess the risks of material misstatement of the financial statements, whether due to error or fraud, and performing procedures that respond to those risks. Such procedures included examining, on a test basis, evidence regarding the amounts and disclosures in the financial statements. Our procedures included confirmation of securities owned as of May 31, 2021, by correspondence with the custodian. Our audits also included evaluating the accounting principles used and significant estimates made by management, as well as evaluating the overall presentation of the financial statements. We believe that our audits provide a reasonable basis for our opinion.

We have served as the auditor of one or more Victory Capital investment companies since 1995.
San Antonio, Texas
July 28, 2021
27
USAA Mutual Funds Trust | | Supplemental Information
May 31, 2021 | |
(Unaudited)
Trustee and Officer Information
Board of Trustees:
Overall responsibility for management of the Trust rests with the Board. The Trust is managed by the Board in accordance with the laws of the state of Delaware. There are currently nine Trustees, seven of whom are not "interested persons" of the Trust within the meaning of that term under the 1940 Act ("Independent Trustees") and two of whom are "interested persons" of the Trust within the meaning of that term under the 1940 Act ("Interested Trustee"). The Trustees, in turn, elect the officers of the Trust to actively supervise its day-to-day operations.
The following tables list the Trustees, their ages, position with the Trust, commencement of service, principal occupations during the past five years and any directorships of other investment companies or companies whose securities are registered under the Securities Exchange Act of 1934, as amended, or who file reports under that Act. Each Trustee oversees 46 portfolios in the Trust. Each Trustee's address is 15935 La Cantera Pkwy, San Antonio, TX, 78256. Pursuant to a policy adopted by the Board, the term of office for each Trustee shall be until the Independent Trustee reaches age 75 or an Interested Trustee reaches age 75. The Board may change or grant exceptions from this policy at any time without shareholder approval. A Trustee may resign or be removed by a vote of the other Trustees or the holders of a majority of the outstanding shares of the Trust at any time. Vacancies on the Board can be filled by the action of a majority of the Trustees, provided that after filling such vacancy at least two-thirds of the Trustees have been elected by the shareholders.
Name and Date of Birth | | Position
Held with
the Trust | | Year
Commenced
Service | | Principal Occupation
During Past 5 Years | | Other
Directorships
Held During
Past 5 Years | |
Independent Trustees. | |
Jefferson C. Boyce, (c)
Born September 1957 | | Independent Chairman | | | 2021 | | | Senior Managing Director, New York Life Investments, LLC (1992-2012) | | Westhab, Inc. | |
John C. Walters,
Born February 1962 | | Trustee | | | 2019 | | | Retired. Mr. Walters brings significant Board experience including active involvement with the board of a Fortune 500 company, and a proven record of leading large, complex financial organizations. He has a demonstrated record of success in distribution, manufacturing, investment brokerage, and investment management in both the retail and institutional investment businesses. He has substantial experience in the investment management business with a demonstrated ability to develop and drive strategy while managing operation, financial, and investment risk. | | Guardian Variable Products Trust (16 series), Lead Independent Director; Amerilife Holdings LLC, Director; Stadion Money Management; Director; University of North Carolina (Chapel Hill), Member Board of Governors | |
28
USAA Mutual Funds Trust | | Supplemental Information — continued
May 31, 2021 | |
(Unaudited)
Name and Date of Birth | | Position
Held with
the Trust | | Year
Commenced
Service | | Principal Occupation
During Past 5 Years | | Other
Directorships
Held During
Past 5 Years | |
Robert L. Mason, Ph.D.,
Born July 1946 | | Trustee | | | 1997 | | | Adjunct Professor in the Department of Management Science and Statistics in the College of Business at the University of Texas at San Antonio (since 2001); Institute Analyst, Southwest Research Institute (March 2002-January 2016) | | None | |
Dawn M. Hawley,
Born February 1954 | | Trustee | | | 2014 | | | Manager of Finance, Menil Foundation, Inc. (May 2007-June 2011), which is a private foundation that oversees the assemblage of sculptures, prints, drawings, photographs, and rare books. Director of Financial Planning and Analysis and Chief Financial Officer, AIM Management Group, Inc. (October 1987-January 2006) | | None | |
Paul L. McNamara,
Born July 1948 | | Trustee | | | 2012 | | | Director, Cantor Opportunistic Alternatives Fund, LLC (March 2010-February 2014), which is a closed-end fund of funds by Cantor Fitzgerald Investment Advisors, LLC | | None | |
29
USAA Mutual Funds Trust | | Supplemental Information — continued
May 31, 2021 | |
(Unaudited)
Name and Date of Birth | | Position
Held with
the Trust | | Year
Commenced
Service | | Principal Occupation
During Past 5 Years | | Other
Directorships
Held During
Past 5 Years | |
Richard Y. Newton III,
Born January 1956 | | Trustee | | | 2017 | | | Director, Elta North America (01/18-present), which is a global leader in the design, manufacture, and support of innovative electronic systems in the ground, maritime, airborne, and security domains for the nation's warfighters, security personnel, and first responders; Managing Partner, Pioneer Partnership Development Group (December 2015-present)); Executive Director, The Union League Club of New York (June 2014-November 2015): Executive Vice President, Air Force Association (August 2012-May 2014); Lieutenant General, United States Air Force (January 2008-June 2012) | | PredaSAR Corp. | |
Barbara B. Ostdiek, Ph.D.,
Born March 1964 | | Trustee | | | 2008 | | | Senior Associate Dean of Degree Programs at Jesse H. Jones Graduate School of Business at Rice University (since 2013); Associate Professor of Finance at Jessie H. Jones Graduate School of Business at Rice University (since 2001) | | None | |
Effective at the close of business on December 31, 2020, Michael F. Reimherr retired from the Board of Trustees.
30
USAA Mutual Funds Trust | | Supplemental Information — continued
May 31, 2021 | |
(Unaudited)
Name and Date of Birth | | Position
Held with
the Trust | | Year
Commenced
Service | | Principal Occupation
During Past 5 Years | | Other
Directorships
Held During
Past 5 Years | |
Interested Trustees. | |
David C. Brown, (b)
Born May 1972 | | Trustee | | | 2019 | | | Chairman and Chief Executive Officer (since 2013), Victory Capital Management Inc.; Chairman and Chief Executive Officer, Victory Capital Holdings, Inc. (since 2013). Mr. Brown brings to the Board extensive business, finance and leadership skills gained and developed through years of experience in the financial services industry, including his tenure overseeing the strategic direction as CEO of Victory Capital. These skills, combined with Mr. Brown's extensive knowledge of the financial services industry and demonstrated success in the development and distribution of investment strategies and products, enable him to provide valuable insights to the Board and strategic direction for the Funds. | | Trustee, Victory Portfolios (41 series), Victory Portfolios II (26 series), Victory Variable Insurance Funds (8 series) | |
31
USAA Mutual Funds Trust | | Supplemental Information — continued
May 31, 2021 | |
(Unaudited)
Name and Date of Birth | | Position
Held with
the Trust | | Year
Commenced
Service | | Principal Occupation
During Past 5 Years | | Other
Directorships
Held During
Past 5 Years | |
Daniel S. McNamara, (b)(c)(d)
Born June 1966 | | Trustee | | | 2012 | | | Trustee, President, and Vice Chairman of USAA ETF Trust (June 2017-June 2019); President of Financial Advice & Solutions Group (FASG), USAA (February 2013-March 2021); Director of USAA Investment Services Company (ISCO) (formerly USAA Investment Management) (September 2009-March 2021); President, Asset Management Company (AMCO) (August, 2011-June 2019); Senior Vice President of USAA Financial Planning Services Insurance Agency, Inc. (FPS) (April 2011-March 2021); Chairman of Board of ISCO (April 2013-December 2020); Director of AMCO (August 2011-June 2019); President and Director of USAA Shareholder Account Services (SAS) (October 2009-June 2019); Director and Vice Chairman of FPS (December 2013-March 2021); President and Director of USAA Investment Corporation (ICORP) (March 2010-March 2021); Chairman of Board of ICORP (December 2013-March 2021); Director of USAA Financial Advisors, Inc. (FAI) (December 2013-March 2021); Chairman of Board of FAI (March 2015-March 2021). Mr. McNamara brings to the Board extensive experience in the financial services industry, including experience as an officer of the Trust. | | None | |
(b) Mr. Dan McNamara is deemed an "interested person" due to his previous position as Director of AMCO, the former investment adviser of the Funds. Mr. Brown is deemed an "interested person" due to his position as Chief Executive Officer of Victory Capital, investment adviser to the Funds.
(c) Effective at the close of business on December 31, 2020, Jefferson C. Boyce replaced Dan McNamara as Chair of the Board and assumed the title of Independent Chair.
(d) Effective July 2, 2021, Mr. Dan McNamara became an Independent Trustee to the Funds.
The Statement of Additional Information includes additional information about the Trustees of the Trust and is available, without charge, on the SEC's website at www.sec.gov and/or by calling (800)-235-8396.
32
USAA Mutual Funds Trust | | Supplemental Information — continued
May 31, 2021 | |
(Unaudited)
Officers:
The officers of the Trust, their ages, commencement of service and their principal occupations during the past five years, are detailed in the following table. Each officer serves until the earlier of his or her resignation, removal, retirement, death, or the election of a successor. The mailing address of each officer of the Trust is 15935 La Cantera Pkwy, San Antonio, TX, 78256. The officers of the Trust receive no compensation directly from the Trust for performing the duties of their offices.
Name and Date of Birth | | Position with
the Trust | | Year
Commenced
Service | | Principal Occupation During Past 5 Years | |
Interested Officers.
Christopher K. Dyer,
Born February 1962 | | President | | | 2019 | | | Director of Fund Administration, Victory Capital (since 2004); Chief Operating Officer, Victory Capital Services, Inc. (since 2020) | |
Scott A Stahorsky,
Born July 1969 | | Vice President | | | 2019 | | | Manager, Fund Administration, Victory Capital (since 2015) | |
James K. De Vries,
Born April 1969 | | Treasurer | | | 2018 | | | Executive Director, Victory Capital Management Inc. (since 2019); Treasurer, USAA ETF Trust (September 2018-June 2019); Executive Director, Investment and Financial Administration, USAA (April 2012-June 2019); Assistant Treasurer, USAA ETF Trust (June 2017-September 2018); Assistant Treasurer, USAA Mutual Funds Trust (December 2013-February 2018) | |
Allan Shaer,
Born March 1965 | | Assistant Treasurer | | | 2019 | | | Senior Vice President, Financial Administration, Citi Fund Services Ohio, Inc. (since 2016); Vice President, Mutual Fund Administration, JP Morgan Chase (2011-2016) | |
Carol D. Trevino,
Born October 1965 | | Assistant Treasurer | | | 2018 | | | Director, Accounting and Finance, Victory Capital Management Inc. (since 2019); Accounting/Financial Director, USAA (December 2013-June 2019); Assistant Treasurer, USAA ETF Trust (September 2018-June 2019) | |
Erin G. Wagner,
Born February 1974 | | Secretary | | | 2019 | | | Deputy General Counsel, the Adviser (since 2013) | |
Charles Booth,
Born April 1960 | | Anti-Money Laundering Compliance Officer and Identity Theft Officer | | | 2019 | | | Director, Regulatory Administration and CCO Support Services, Citi Fund Services Ohio, Inc. (since 2007) | |
Amy Campos,
Born July 1976 | | Chief Compliance Officer | | | 2019 | | | Chief Compliance Officer, USAA Mutual Funds Trust (since 2019); Executive Director, Deputy Chief Compliance Officer, USAA Mutual Funds Trust and USAA ETF Trust (July 2017-June 2019); Compliance Director, USAA Mutual Funds Trust (2014-July 2017) | |
33
USAA Mutual Funds Trust | | Supplemental Information — continued
May 31, 2021 | |
(Unaudited)
Proxy Voting and Portfolio Holdings Information
Proxy Voting:
Information regarding the policies and procedures the Fund uses to determine how to vote proxies relating to portfolio securities is available without charge, upon request, by calling (800) 235-8396. The information is also included in the Fund's Statement of Additional Information, which is available on the SEC's website at www.sec.gov.
Information relating to how the Fund voted proxies relating to portfolio securities held during the most recent 12 months ended June 30 is available on the SEC's website at www.sec.gov.
Availability of Schedules of Portfolio Investments:
The Trust files a complete list of Schedules of Portfolio Investments with the SEC for the first and third quarter of each fiscal year on Form N-PORT. Form N-PORT is available on the SEC's website at www.sec.gov.
Expense Examples
As a shareholder of the Fund, you may incur two types of costs: (1) transaction costs, including sales charges (loads) on purchases; and (2) ongoing costs, including management fees and other Fund expenses. These examples are intended to help you understand your ongoing costs (in dollars) of investing in the Fund and to compare these costs with the ongoing costs of investing in other mutual funds.
These examples are based on an investment of $1,000 invested at the beginning of the period and held for the entire period from December 1, 2020, through May 31, 2021.
The Actual Expense figures in the table below provide information about actual account values and actual expenses. You may use the information below, together with the amount you invested, to estimate the expenses that you paid over the period. Simply divide your account value by $1,000 (for example, an $8,600 account value divided by $1,000 = 8.6), then multiply the result by the number in the table under the heading entitled "Actual Expenses Paid During Period" to estimate the expenses you paid on your account during this period.
The Hypothetical Expense figures in the table below provide information about hypothetical account values and hypothetical expenses based on the Fund's actual expense ratio and an assumed rate of return of 5% per year before expenses, which is not the Fund's actual return. The hypothetical account values and expenses may not be used to estimate the actual ending account balance or expenses you paid for the period. You may use this information to compare this 5% hypothetical example with the 5% hypothetical examples that appear in shareholder reports of other funds.
Please note the expenses shown in the table below are meant to highlight your ongoing costs only and do not reflect any transactional costs. If these transactional costs were included, your costs would have been higher.
| | | Beginning
Account
Value
12/1/20 | | Actual
Ending
Account
Value
5/31/21 | | Hypothetical
Ending
Account
Value
5/31/21 | | Actual
Expenses
Paid
During
Period
12/1/20-
5/31/21* | | Hypothetical
Expenses
Paid
During
Period
12/1/20-
5/31/21* | | Annualized
Expense
Ratio
During
Period
12/1/20-
5/31/21 | |
Fund Shares | | $ | 1,000.00 | | | $ | 1,134.70 | | | $ | 1,019.25 | | | $ | 6.07 | | | $ | 5.74 | | | | 1.14 | % | |
Institutional Shares | | | 1,000.00 | | | | 1,135.60 | | | | 1,020.00 | | | | 5.27 | | | | 4.99 | | | | 0.99 | | |
Class A | | | 1,000.00 | | | | 1,133.80 | | | | 1,018.40 | | | | 6.97 | | | | 6.59 | | | | 1.31 | | |
* Expenses are equal to the average account value multiplied by the Fund's annualized expense ratio multiplied by 182/365 (the number of days in the most recent fiscal half-year divided by the number of days in the fiscal year).
34
USAA Mutual Funds Trust | | Supplemental Information — continued
May 31, 2021 | |
(Unaudited)
Additional Federal Income Tax Information
The following federal tax information related to the Fund's fiscal year ended May 31, 2021, is provided for information purposes only and should not be used for reporting to federal or state revenue agencies. Federal tax information for the calendar year will be reported to you on Form 1099-DIV in January 2022.
With respect to distributions paid, the Fund designates the following amounts (or, if subsequently determined to be different, the maximum amount allowable) for the fiscal year ended May 31, 2021 (amounts in thousands):
| | Dividends
Received
Deduction
(corporate
shareholders) | | Qualified
Dividend
Income
(non-corporate
shareholders) | | Foreign
Taxes
Paid | |
| | | | | | 56 | % | | | 100 | % | | $ | 1,446 | | |
35
USAA Mutual Funds Trust | | Supplemental Information — continued
May 31, 2021 | |
(Unaudited)
Considerations of the Board in Continuing the Investment Advisory Agreement (the "Agreement")
USAA Precious Metals & Minerals Fund (the "Fund")
At a meeting of the Board of Trustees (the "Board") held on December 10-11, 2020, the Board, including the Trustees who are not "interested persons" (as that term is defined in the Investment Company Act of 1940, as amended) of the Trust (the "Independent Trustees"), approved for an annual period the continuance of the Investment Advisory Agreement (the "Advisory Agreement") between the Trust and Victory Capital Management Inc. (the "Adviser") with respect to the Fund. Prior to the December 10-11, 2020 meeting at which the Advisory Agreement was approved, the Independent Trustees also discussed and considered information regarding the proposed continuation of the Advisory Agreement at a meeting held on November 19, 2020.
In advance of the foregoing meetings, the Trustees received and considered a variety of information relating to the Advisory Agreement and the Adviser, and were given the opportunity to ask questions and request additional information from management. The information provided to the Board included, among other things: (i) a separate report prepared by an independent third party of mutual fund data, which provided a statistical analysis comparing the Fund's investment performance, expenses, and fees to comparable investment companies; (ii) information concerning the services rendered to the Fund, as well as information regarding the Adviser's revenues and costs of providing services to the Fund and compensation paid to affiliates of the Adviser; and (iii) information about the Adviser's operations and personnel. Prior to voting, the Independent Trustees reviewed the proposed continuance of the Advisory Agreement with management and with experienced independent counsel retained by the Independent Trustees ("Independent Counsel") and received materials from such Independent Counsel discussing the legal standards for their consideration of the proposed continuation of the Advisory Agreement with respect to the Fund. The Independent Trustees also reviewed the proposed continuation of the Advisory Agreement with respect to the Fund in private sessions with Independent Counsel at which no representatives of management were present.
At each regularly scheduled meeting of the Board and its committees, the Board receives and reviews, among other things, information concerning the Fund's performance and related services provided by the Adviser. At the meeting at which the renewal of the Advisory Agreement is considered, particular focus is given to information concerning Fund performance, fees and total expenses as compared to comparable investment companies, and the Adviser's profitability with respect to the Fund. However, the Board noted that the evaluation process with respect to the Adviser is an ongoing one. In this regard, the Board's and its committees' consideration of the Advisory Agreement included information previously received at such meetings.
Advisory Agreement
After full consideration of a variety of factors, the Board, including the Independent Trustees, voted to approve the Advisory Agreement. In approving the Advisory Agreement, the Trustees did not identify any single factor as controlling, and each Trustee may have attributed different weights to various factors. Throughout their deliberations, the Independent Trustees were represented and assisted by Independent Counsel.
Nature, Extent, and Quality of Services — In considering the nature, extent, and quality of the services provided by the Adviser under the Advisory Agreement, the Board reviewed information provided by the Adviser relating to its operations and personnel. The Board also took into account its knowledge of the Adviser's management and the quality of the performance of the Adviser's duties through Board meetings, discussions, and reports during the preceding year. The Board considered the fees paid to the Adviser and the services provided to the Fund by the Adviser under the Advisory Agreement, as well as other services provided by the Adviser and its affiliates under other agreements, and the personnel who provide these services. In addition to the investment advisory services provided to the Fund, the Adviser and its affiliates provide administrative services, shareholder services, oversight of Fund accounting, marketing services, assistance in meeting legal and regulatory requirements, and other services necessary for the operation of the Fund and the Trust.
The Board considered the scope of services provided by, and the undertakings required of, the Adviser in connection with those services, including, among other things, maintaining (i) its own and the Fund's compliance programs, (ii) risk management programs, (iii) liquidity risk management programs, and (iv) cybersecurity
36
USAA Mutual Funds Trust | | Supplemental Information — continued
May 31, 2021 | |
(Unaudited)
programs, each of which had expanded over time as a result of regulatory, market, and other developments. The Board also considered the significant risks assumed by the Adviser in connection with the services provided to the Fund, including investment, operational, enterprise, litigation, regulatory and compliance risks.
The Board considered the Adviser's management style and the performance of the Adviser's duties under the Advisory Agreement. The Board considered the level and depth of knowledge of the Adviser, including the professional experience and qualifications of its senior and investment personnel, as well as current staffing levels. The allocation of the Fund's brokerage, including the Adviser's process for monitoring "best execution," also was considered. The Adviser's role in coordinating the activities of the Fund's other service providers was also considered. The Board also considered the Adviser's risk management processes. The Board considered the Adviser's financial condition and that it had the financial wherewithal to continue to provide the same scope and high quality of services under the Advisory Agreement. In reviewing the Advisory Agreement, the Board focused on the experience, resources, and strengths of the Adviser and its affiliates in managing the Fund, as well as the other funds in the Trust.
The Board also reviewed the compliance and administrative services provided to the Fund by the Adviser and its affiliates, including the Adviser's oversight of the Fund's day-to-day operations and oversight of Fund accounting. The Trustees, guided also by information obtained from their experiences as trustees of the Trust, also focused on the quality of the Adviser's compliance and administrative staff.
Expenses and Performance — In connection with its consideration of the Advisory Agreement, the Board evaluated the Fund's advisory fees and total expense ratio as compared to other open-end investment companies deemed to be comparable to the Fund as determined by the independent third party in its report. The Fund's expenses were compared to (i) a group of investment companies chosen by the independent third party to be comparable to the Fund based upon certain factors, including fund type, comparability of investment objective and classification, sales load type, asset size, and expense components (the "expense group") and (ii) a larger group of investment companies with the same investment classification/objective as the Fund regardless of asset size, excluding outliers (the "expense universe"). Among other data, the Board noted that the Fund's management fee rate — which includes advisory and administrative services and the effects of any performance adjustment1, as well as any fee waivers and reimbursements — was equal to the median of its expense group and below the median of its expense universe. The data indicated that the Fund's total expenses, including after any reimbursements, were below the medians of its expense group and its expense universe. The Board also took into account the Adviser's current undertakings to maintain expense limitations for the Fund. The Board took into account the various other services provided to the Fund by the Adviser and its affiliates, and noted the high quality of services received by the Fund.
In considering the Fund's performance, the Board noted that it reviews at its regularly scheduled meetings information about the Fund's performance results. The Trustees also reviewed various comparative data provided to them in connection with their consideration of the renewal of the Advisory Agreement, including, among other information, a comparison of the Fund's average annual total returns relative to its Lipper index and other mutual funds deemed to be in its peer group by the independent third party in its report (the "performance universe"). The Fund's performance universe consisted of the Fund and all retail and institutional open-end investment companies with the same classification/objective as the Fund regardless of asset size or primary channel of distribution. This comparison indicated that, among other data, the Fund's performance was above the average of its performance universe for the three-year period ended September 30, 2020, and was below the average of its performance universe for the one-, five- and ten-year periods, and was above its Lipper index for the three- and five-year periods ended September 30, 2020, and was below its Lipper index for the one- and ten-year periods ended September 30, 2020. The Board took into account management's discussion of the Fund's performance, including the impact of market conditions on the Fund's performance.
Compensation and Profitability — The Board took into consideration the level and method of computing the management fee. The information considered by the Board included operating profit margin information for the Adviser's business as a whole. The Board also received and considered profitability information related to the management revenues from the Fund. This information included a review of the methodology used in the allocation of certain costs to the Fund. In considering the profitability data with respect to the Fund, the Trustees
1 The Adviser has agreed that no performance adjustment (positive or negative) would be made to the amount payable to the Adviser from July 1, 2019, through June 30, 2020.
37
USAA Mutual Funds Trust | | Supplemental Information — continued
May 31, 2021 | |
(Unaudited)
noted that the Adviser waived a portion of its management fee and/or reimbursed certain expenses with respect to the Fund. The Trustees reviewed the profitability of the Adviser's relationship with the Fund before tax expenses. The Board was also provided with a profitability analysis of other publicly traded asset managers prepared by an independent information service. In reviewing the overall profitability of the management fee to the Adviser, the Board also considered the fact that the Adviser and its affiliates provide shareholder servicing and administrative services to the Fund for which they receive compensation. The Board also considered the possible direct and indirect benefits to the Adviser from its relationship with the Trust, including that the Adviser may derive reputational and other benefits from its association with the Fund. The Trustees recognized that the Adviser should be entitled to earn a reasonable level of profits in exchange for the level of services it provides to the Fund and the entrepreneurial and other risks that it assumes as Adviser.
Economies of Scale — The Board considered whether there should be changes in the management fee rate or structure in order to enable the Fund to participate in any economies of scale. The Board also considered the fee waiver and expense reimbursement arrangements by the Adviser. The Board also considered the effect of the Fund's change in size, if any, on its performance and fees, noting that the Fund may realize other economies of scale if assets increase proportionally more than expenses. The Board determined that the current investment management fee structure was reasonable.
Conclusions — The Board reached the following conclusions regarding the Fund's Advisory Agreement with the Adviser: (i) the Adviser has demonstrated that it possesses the capability and resources to perform the duties required of it under the Advisory Agreement; (ii) the Adviser maintains an appropriate compliance program; (iii) the overall performance of the Fund is reasonable in relation to the performance of funds with similar investment objectives and to relevant indices; (iv) the Fund's advisory expenses are reasonable in relation to those of similar funds and to the services to be provided by the Adviser; and (v) the Adviser's and its affiliates' level of profitability from their relationship with the Fund is reasonable in light of the nature and high quality of services provided by the Adviser and the type of fund. Based on its conclusions, the Board determined that continuation of the Advisory Agreement would be in the best interests of the Fund and its shareholders.
38
USAA Mutual Funds Trust | | Supplemental Information — continued
May 31, 2021 | |
(Unaudited)
Liquidity Risk Management Program:
The USAA Mutual Funds have adopted and implemented a written liquidity risk management program (the "LRMP") as required by Rule 22e-4 under the Investment Company Act of 1940, as amended. The LRMP is reasonably designed to assess and manage the Fund's liquidity risk, taking into consideration the Fund's investment strategy and the liquidity of its portfolio investments during normal and reasonably foreseeable stressed market conditions; its short and long-term cash flow projections; and its cash holdings and access to other liquidity management tools such as available funding sources including the Victory Funds Complex Interfund Lending Facility and Line of Credit (discussed in the Notes to Financial Statements). The USAA Mutual Funds' Board of Trustees approved the appointment of the Fund's investment adviser, Victory Capital Management Inc. ("Victory Capital"), as the administrator of the LRMP.
Victory Capital manages liquidity risks associated with the Fund's investments by monitoring, among other things, cash and cash equivalents, any use of derivatives, the concentration of investments, the appropriateness of the Fund's investment strategy, and by classifying every Fund investment as either highly liquid, moderately liquid, less liquid, or illiquid on at least a monthly basis. To assist with the classification of Fund investments, Victory Capital has retained a third-party provider of liquidity evaluation services. This provider determines preliminary liquidity classifications for all portfolio holdings based upon portfolio-level data and certain assumptions provided by Victory Capital. Victory Capital reviews the preliminary liquidity classifications and, when appropriate, considers other information including input from the Fund's portfolio managers (including the portfolio managers employed by any investment sub-advisers) in determining final liquidity classifications.
At a meeting held on March 10, 2021, Victory Capital provided an oral and written report to the Trustees on the operation and effectiveness of the LRMP during the previous year. The report from Victory Capital concluded that the Fund did not experience any significant liquidity challenges during the covered period, and the Fund's LRMP is reasonably designed to assess and manage its liquidity risk. The report also concluded that the LRMP continues to operate adequately and effectively to enable Victory Capital to oversee and manage liquidity risk and ensure the Fund is able to meet redemption requests without significant dilution to the remaining investors' interest in the Fund. During the review period, the Fund's portfolio consisted primarily of highly liquid investments, which are defined as cash and any investments that the Fund reasonably expects to be converted to cash in current market conditions in three business days or less without significantly changing the market value of the investment. Therefore, the Fund has not adopted a highly liquid investment minimum. The Funds' investments were below the limitation on illiquid investments during the review period. Additionally, Victory Capital indicated that no events occurred that would require the filing of Form N-LIQUID and recommended no material changes to the LRMP.
39
Privacy Policy
Protecting the Privacy of Information
The Trust respects your right to privacy. We also know that you expect us to conduct and process your business in an accurate and efficient manner. To do so, we must collect and maintain certain personal information about you. This is the information we collect from you on applications or other forms, and from the transactions you make with us or third parties. It may include your name, address, social security number, account transactions and balances, and information about investment goals and risk tolerance.
We do not disclose any information about you or about former customers to anyone except as permitted or required by law. Specifically, we may disclose the information we collect to companies that perform services on our behalf, such as the transfer agent that processes shareholder accounts and printers and mailers that assist us in the distribution of investor materials. We may also disclose this information to companies that perform marketing services on our behalf. This allows us to continue to offer you Victory investment products and services that meet your investing needs, and to effect transactions that you request or authorize. These companies will use this information only in connection with the services for which we hired them. They are not permitted to use or share this information for any other purpose.
To protect your personal information internally, we permit access only by authorized employees and maintain physical, electronic, and procedural safeguards to guard your personal information.*
* You may have received communications regarding information about privacy policies from other financial institutions which gave you the opportunity to "opt-out" of certain information sharing with companies which are not affiliated with that financial institution. The Trust does not share information with other companies for purposes of marketing solicitations for products other than the Trust. Therefore, the Trust does not provide opt-out options to their shareholders.
P.O. Box 182593
Columbus, Ohio 43218-2593

Visit our website at: | | Call | |
vcm.com | | (800) 235-8396 | |

MAY 31, 2021
Annual Report
USAA International Fund
Victory Capital means Victory Capital Management Inc., the investment adviser of the USAA Mutual Funds. USAA Mutual Funds are distributed by Victory Capital Services, Inc., member of FINRA, an affiliate of Victory Capital. Victory Capital and its affiliates are not affiliated with United Services Automobile Association or its affiliates. USAA and the USAA logos are registered trademarks and the USAA Mutual Funds and USAA Investments logos are trademarks of United Services Automobile Association and are being used by Victory Capital and its affiliates under license.
www.vcm.com
News, Information And Education 24 Hours A Day, 7 Days A Week
The Victory Funds site gives fund shareholders, prospective shareholders, and investment professionals a convenient way to access fund information, get guidance, and track fund performance anywhere they can access the Internet. The site includes:
• Detailed performance records
• Daily share prices
• The latest fund news
• Investment resources to help you become a better investor
• A section dedicated to investment professionals
Whether you're a potential investor searching for the fund that matches your investment philosophy, a seasoned investor interested in planning tools, or an investment professional, www.vcm.com has what you seek. Visit us anytime. We're always open.
USAA Mutual Funds Trust
TABLE OF CONTENTS
Shareholder Letter (Unaudited) | | | 2 | | |
Managers' Commentary (Unaudited) | | | 4 | | |
Investment Overview (Unaudited) | | | 6 | | |
Investment Objective & Portfolio
Holdings (Unaudited) | | | 7 | | |
Schedule of Portfolio Investments | | | 8 | | |
Financial Statements | |
Statement of Assets and Liabilities | | | 28 | | |
Statement of Operations | | | 30 | | |
Statements of Changes in Net Assets | | | 31 | | |
Financial Highlights | | | 34 | | |
Notes to Financial Statements | | | 36 | | |
Report of Independent
Registered Public Accounting Firm | | | 47 | | |
Supplemental Information (Unaudited) | | | 48 | | |
Trustees' and Officers' Information | | | 48 | | |
Proxy Voting and Portfolio Holdings Information | | | 54 | | |
Expense Examples | | | 54 | | |
Additional Federal Income Tax Information | | | 55 | | |
Advisory Contract Agreement | | | 56 | | |
Liquidity Risk Management Program | | | 60 | | |
Privacy Policy (inside back cover) | | | |
This report is for the information of the shareholders and others who have received a copy of the currently effective prospectus of the Fund, managed by Victory Capital Management Inc. It may be used as sales literature only when preceded or accompanied by a current prospectus, which provides further details about the Fund.
IRA DISTRIBUTION WITHHOLDING DISCLOSURE
We generally must withhold federal income tax at a rate of 10% of the taxable portion of your distribution and, if you live in a state that requires state income tax withholding, at your state's tax rate. However, you may elect not to have withholding apply or to have income tax withheld at a higher rate. Any withholding election that you make will apply to any subsequent distribution unless and until you change or revoke the election. If you wish to make a withholding election, or change or revoke a prior withholding election, call (800) 235-8396, and form W-4P (OMB No. 1545-0074 withholding certificate for pension or annuity payments) will be electronically sent.
If you do not have a withholding election in place by the date of a distribution, federal income tax will be withheld from the taxable portion of your distribution at a rate of 10%. If you must pay estimated taxes, you may be subject to estimated tax penalties if your estimated tax payments are not sufficient and sufficient tax is not withheld from your distribution.
For more specific information, please consult your tax adviser.
• NOT FDIC INSURED • NO BANK GUARANTEE • MAY LOSE VALUE
1
(Unaudited)
Dear Shareholder,
Never a dull moment. A year ago, we were still coming to grips with a global pandemic, hoping for an effective vaccine, and wondering whether the U.S. Federal Reserve's aggressive actions would continue to mollify financial markets. As it turns out, a vaccine was rolled out (domestically) faster than expectations, and the recovery that began during the second quarter of 2020 continued unabated.
Fast forward to today and investors are suddenly more concerned about labor shortages, rising commodity prices, and whether inflation will prove to be transitory or more lasting. If anything, this merely exemplifies that markets are unpredictable and the environment can and will change rapidly.
Reflecting on the past year, we must consider ourselves fortunate despite the myriad challenges. For starters, it was impressive how quickly the various forms of monetary and fiscal stimulus contributed to a rebound in GDP. Of course, it wasn't a straight line upward and there were bouts of elevated volatility in both bond and stock markets. Late in 2020, for example, financial markets were alternately fueled and roiled by a contentious election season, growing optimism for an effective vaccine, and a fluid debate regarding the need for even more stimulus. Ultimately, stocks were propelled higher in the fourth quarter of 2020 as it became clear Congress would provide another dose of stimulus in the form of direct payments, more unemployment insurance, and additional aid to businesses.
As we moved into 2021, stocks continued their upward trajectory. Meanwhile, the yield on the 10-Year U.S. Treasury continued rallying sharply as many investors began to shift their focus. Deflation was out; inflation was in. Indeed, the potential for a new era of inflation and higher interest rates seems to be the new worry du jour.
So how did the numbers shake out after this unusual year? The S&P 500® Index registered an impressive annual return of approximately 40% for this 12-month period ended May 31, 2021. Over this same period, the yield on the 10-Year U.S. Treasury jumped 94 basis points, reflecting both the very low starting rate and substantial fiscal stimulus. At the end of the reporting period, the yield on the 10-Year U.S. Treasury was 1.59%.
The past year is not one we will forget any time soon. There were many hardships, but we should not overlook the positives and remember our collective spirit and perseverance. Markets endured and even surprised to the upside, but perhaps the key takeaway is that investors need to remain calm in the face of adversity and focused on longer-term investment goals. We believe that's the best approach no matter what the markets throw at us.
On the following pages, you will find information relating to your USAA Mutual Funds, brought to you by Victory Capital. If you have any questions regarding the current market dynamics or your specific portfolio or investment plan, we encourage you to contact our Member Service Representatives. Call (800) 235-8396 or visit our website at www.vcm.com.
2
From all of us here at Victory Capital, thank you for letting us help you work toward your investment goals.

Christopher K. Dyer, CFA
President,
USAA Mutual Funds
3
Managers' Commentary
(Unaudited)
• What were the market conditions during the reporting period?
The beginning of the reporting period brought a dramatic reversal from the difficult environment that characterized the first part of 2020. While COVID-19 cases continued to rise, investors grew increasingly confident that the economy would be able to recover from its sharp downturn of February and March. The optimism stemmed, in part, from a series of better-than-expected economic reports interpreted as evidence that the slump in growth would be less severe than was initially feared. The markets were further cheered by the aggressive response by the U.S. Federal Reserve (the "Fed"). In addition to reiterating its commitment to keep short-term interest rates near zero for an extended period, the Fed announced the direct purchase of both individual bonds and exchange-traded bond funds. The central bank's unusual steps offered corporations the latitude to issue debt at ultra-low rates, providing them with the cash necessary to help withstand the effects of the coronavirus.
The global financial markets produced healthy returns during the second half of 2020, wrapping up a positive year for the major asset classes. Investors' appetite for risk improved considerably in early November, when the approval of vaccines for COVID-19 raised expectations that the world economy could gradually return to normal in 2021. The conclusion of the U.S. elections, which removed a source of uncertainty that had depressed performance in September and October, was an additional tailwind. The markets were also aided by continued indications that the Fed and other central banks would maintain their highly accommodative policies indefinitely. Not least, an agreement on a new round of U.S. fiscal stimulus further cheered investors in late December. Together, these developments outweighed negative headlines surrounding renewed lockdowns and the persistence of the coronavirus.
The first quarter of 2021 proved to be a continuation of the strong equity markets investors experienced over the second half of 2020. Gains from global equity markets were fueled by optimism surrounding the successful rollout of the COVID-19 vaccines coupled with further monetary and fiscal stimulus proposals. Faster-than-expected economic growth produced a meaningful increase in real interest rates, which led to negative returns across most major fixed income asset classes. The 10-year U.S Treasury bond yield finished at its highest level of the first quarter reporting period, climbing from under 1% to 1.74%.
During the last few months of the reporting period, equity markets have been consolidating and interest rates leveling off after large upswings. With strong first quarter GDP and corporate earnings growth in the rearview mirror, investors seem to be contemplating their next move. Inflation data has been increasing as the economy reopens more quickly than expected. The Fed maintains that inflationary pressure is transitory but could become more persistent. The inflationary environment will be a key metric moving into the second half of the year.
4
USAA International Fund (continued)
Managers' Commentary (continued)
• How did the USAA International Fund (the "Fund") perform during the reporting period?
The Fund has four share classes: Fund Shares, Institutional Shares, Class A (effective June 29, 2020, the Adviser Shares were redesignated Class A and became subject to a front-end sales charge), and R6 Shares. For the reporting period ended May 31, 2021, the Fund Shares, Institutional Shares, Class A, and R6 Shares had a total return of 39.99%, 40.08%, 39.59%, and 41.16%, respectively. This compares to returns of 43.10% for the Lipper International Funds Index and 38.41% for the MSCI EAFE Index.
Victory Capital Management Inc. ("VCM") is the Fund's investment adviser. As the investment adviser, VCM employs dedicated resources to support the research, selection and monitoring of the Fund's subadvisers. Lazard Asset Management* and Wellington Management Company are external subadvisers to the Fund, while RS Investments Global, Trivalent Investments, and THB Asset Management* are Victory Capital Management investment franchises that each manage portions of the Fund. Primary responsibility for the day-to-day discretionary management of the Fund lies with the subadviser and the investment franchises.
• What strategies did you employ during the reporting period?
During the one-year period ending on May 31, 2021, the Fund outperformed the benchmark MSCI EAFE Index primarily due to stock selection across various countries and sectors. On a country basis, stock selection in the United Kingdom, France, and Germany contributed to overall performance while Japan and Italy were detractors.
Looking at performance from a sector standpoint, stock selection was a positive contributor in Financials, Industrials, and Materials as a cyclical rally took place throughout the first quarter of 2021. Consumer Discretionary was the only sector that had a negative stock selection effect. From an asset allocation perspective, the Fund had an underweight to the Health Care sector, which underperformed the overall index, resulting in a positive allocation effect.
Thank you for allowing us to assist in your investment needs.
*Effective March 1, 2021, Lazard no longer manages the Fund and THB was added as a Victory Capital Management investment franchise on the Fund.
5
Investment Overview
(Unaudited)
Average Annual Total Return
Year Ended May 31, 2021
| | Fund Shares | | Institutional Shares | | Class A | | Class R6 | | | | | |
INCEPTION DATE | | 2/1/91 | | 8/1/08 | | 8/1/10 | | 12/1/16 | | | | | |
| | Net Asset Value | | Net Asset Value | | Net Asset Value | | Net Asset Value | | MSCI EAFE Index1 | | Lipper
International
Funds Index2 | |
One Year | | | 39.99 | % | | | 40.08 | % | | | 39.59 | % | | | 41.16 | % | | | 38.41 | % | | | 43.10 | % | |
Five Year | | | 10.18 | % | | | 10.27 | % | | | 9.89 | % | | | NA | | | | 9.77 | % | | | 10.97 | % | |
Ten Year | | | 6.29 | % | | | 6.42 | % | | | 5.98 | % | | | NA | | | | 5.88 | % | | | 6.46 | % | |
Since Inception | | | NA | | | | NA | | | | NA | | | | 9.70 | % | | | NA | | | | NA | | |
The performance data quoted represents past performance and current returns may be lower or higher. The investment return and principal value will fluctuate so that an investor's shares, when redeemed, may be worth more or less than the original cost. To obtain performance information current to the most recent month's end, please visit www.vcm.com.
The maximum offering price figures reflect a maximum sales charge of 2.25% for Class A. Net Asset Value does not reflect sales charges.
Total return measures the price change in a share assuming the reinvestment of all net investment income and realized capital gain distributions, if any. The total returns quoted do not reflect adjustments made to the enclosed financial statements in accordance with U.S. Generally Accepted Accounting Principles or the deduction of taxes that a shareholder would pay on net investment income and realized capital gain distributions, including reinvested distributions, or redemptions of shares. The total return figures set forth above include all waivers of fees. Without such fee waivers, the total returns would have been lower.
USAA International Fund — Growth of $10,000
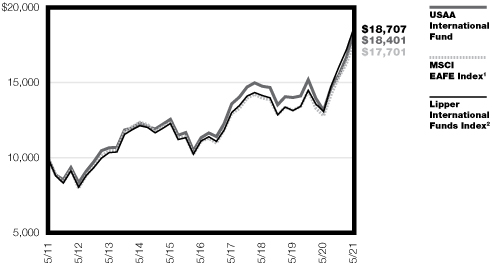
1The unmanaged MSCI EAFE Index reflects the movements of stock markets in Europe, Australasia, and the Far East by representing a broad selection of domestically listed companies within each market. The index reflects the reinvestment of dividends paid on the stocks constituting the index net of withholding taxes. This index does not include the effect of sales charges, commissions, expenses, or taxes, is not representative of the Fund, and it is not possible to invest directly in an index.
2The unmanaged Lipper International Funds Index tracks the total return performance of funds within the Lipper International Funds category. The index reflects the reinvestment of dividends paid on the stocks constituting the index net of withholding taxes. This index does not include the effect of sales charges, commissions, expenses, or taxes, is not representative of the Fund, and it is not possible to invest directly in an index.
The graph reflects investment of growth of a hypothetical $10,000 investment in the Fund.
The graph and table do not reflect the deduction of taxes that a shareholder would pay on Fund distributions or the redemption of Fund shares.
Past performance is not indicative of future results.
6
USAA Mutual Funds Trust
USAA International Fund | | May 31, 2021 | |
(Unaudited)
Investment Objective and Portfolio Holdings:
The Fund's investment objective seeks capital appreciation.
Top 10 Sectors:
May 31, 2021
(% of Net Assets)
Financials | | | 16.8 | % | |
Industrials | | | 15.9 | % | |
Consumer Discretionary | | | 11.4 | % | |
Information Technology | | | 10.8 | % | |
Health Care | | | 10.6 | % | |
Consumer Staples | | | 8.1 | % | |
Materials | | | 7.0 | % | |
Communication Services | | | 6.6 | % | |
Energy | | | 5.4 | % | |
Real Estate | | | 3.1 | % | |
Country Allocation:
May 31, 2021
(% of Net Assets)

* Includes countries with less than 3.0% of portfolio and short-term investments purchased with cash collateral from securities loaned.
Percentages are of the net assets of the Fund and may not equal 100%.
Refer to the Schedule of Portfolio Investments for a complete list of securities.
7
USAA Mutual Funds Trust
USAA International Fund | | Schedule of Portfolio Investments
May 31, 2021 | |
(Amounts in Thousands, Except for Shares)
Security Description | | Shares | | Value | |
Common Stocks (98.1%) | |
Argentina (0.0%): (a) | |
Energy (0.0%): | |
YPF SA, ADR (b) | | | 102,643 | | | $ | 482 | | |
Australia (4.6%): | |
Consumer Discretionary (0.7%): | |
Aristocrat Leisure Ltd. | | | 549,191 | | | | 17,264 | | |
Lovisa Holdings Ltd. | | | 226,325 | | | | 2,459 | | |
PWR Holdings Ltd. | | | 829,574 | | | | 4,082 | | |
| | | | 23,805 | | |
Consumer Staples (0.1%): | |
Select Harvests Ltd. | | | 402,288 | | | | 1,796 | | |
Energy (0.1%): | |
Santos Ltd. | | | 333,288 | | | | 1,729 | | |
Financials (0.6%): | |
Australia & New Zealand Banking Group Ltd. | | | 143,814 | | | | 3,166 | | |
Macquarie Group Ltd. | | | 145,879 | | | | 16,997 | | |
| | | | 20,163 | | |
Health Care (0.8%): | |
CSL Ltd. | | | 98,770 | | | | 22,012 | | |
Nanosonics Ltd. (b) | | | 435,857 | | | | 1,855 | | |
Sonic Healthcare Ltd. | | | 77,317 | | | | 2,066 | | |
| | | | 25,933 | | |
Industrials (0.3%): | |
Austal Ltd. | | | 1,436,152 | | | | 2,492 | | |
IPH Ltd. | | | 420,261 | | | | 2,226 | | |
Johns Lyng Group Ltd. | | | 984,536 | | | | 3,207 | | |
Service Stream Ltd. | | | 1,078,312 | | | | 806 | | |
SmartGroup Corp. Ltd. | | | 396,034 | | | | 2,024 | | |
| | | | 10,755 | | |
Information Technology (0.1%): | |
Bravura Solutions Ltd. | | | 722,992 | | | | 1,902 | | |
Infomedia Ltd. | | | 1,535,148 | | | | 1,599 | | |
Integrated Research Ltd. | | | 540,361 | | | | 959 | | |
| | | | 4,460 | | |
Materials (1.3%): | |
Aurelia Metals Ltd. | | | 4,303,133 | | | | 1,476 | | |
BHP Group Ltd. | | | 828,478 | | | | 30,426 | | |
Ramelius Resources Ltd. | | | 3,600,830 | | | | 5,471 | | |
Rio Tinto Ltd. | | | 62,081 | | | | 5,894 | | |
| | | | 43,267 | | |
Real Estate (0.6%): | |
Charter Hall Group | | | 212,695 | | | | 2,333 | | |
Scentre Group | | | 7,033,973 | | | | 14,655 | | |
Stockland | | | 594,155 | | | | 2,126 | | |
| | | | 19,114 | | |
| | | | 151,022 | | |
See notes to financial statements.
8
USAA Mutual Funds Trust
USAA International Fund | | Schedule of Portfolio Investments — continued
May 31, 2021 | |
(Amounts in Thousands, Except for Shares)
Security Description | | Shares | | Value | |
Austria (0.1%): | |
Financials (0.1%): | |
Erste Group Bank AG | | | 75,668 | | | $ | 3,104 | | |
Raiffeisen Bank International AG | | | 66,039 | | | | 1,568 | | |
| | | | 4,672 | | |
Belgium (0.8%): | |
Consumer Staples (0.1%): | |
Anheuser-Busch InBev SA | | | 31,599 | | | | 2,373 | | |
Financials (0.2%): | |
Ageas SA | | | 75,484 | | | | 4,926 | | |
KBC Group NV | | | 25,137 | | | | 2,050 | | |
| | | | 6,976 | | |
Health Care (0.1%): | |
UCB SA | | | 28,886 | | | | 2,695 | | |
Information Technology (0.4%): | |
Melexis NV | | | 141,886 | | | | 14,772 | | |
| | | | 26,816 | | |
Brazil (0.4%): | |
Consumer Staples (0.1%): | |
Sendas Distribuidora SA | | | 161,031 | | | | 2,764 | | |
Energy (0.1%): | |
Petro Rio SA (b) | | | 716,000 | | | | 2,711 | | |
Financials (0.1%): | |
Banco Santander Brasil SA | | | 477,200 | | | | 3,774 | | |
Utilities (0.1%): | |
Cia de Saneamento Basico do Estado de Sao Paulo | | | 304,074 | | | | 2,283 | | |
Cia Energetica de Minas Gerais Preference Shares | | | 678,300 | | | | 1,768 | | |
| | | | 4,051 | | |
| | | | 13,300 | | |
Canada (1.8%): | |
Energy (0.4%): | |
ARC Resources Ltd. | | | 180,976 | | | | 1,392 | | |
Cameco Corp. | | | 104,673 | | | | 2,058 | | |
Ovintiv, Inc. | | | 97,618 | | | | 2,614 | | |
Parex Resources, Inc. (b) | | | 199,677 | | | | 3,491 | | |
Suncor Energy, Inc. | | | 86,415 | | | | 2,008 | | |
Tourmaline Oil Corp. | | | 54,512 | | | | 1,329 | | |
| | | | 12,892 | | |
Financials (0.6%): | |
Bank of Montreal | | | 33,039 | | | | 3,452 | | |
iA Financial Corp., Inc. | | | 52,405 | | | | 3,003 | | |
IGM Financial, Inc. | | | 88,307 | | | | 3,253 | | |
National Bank of Canada | | | 59,124 | | | | 4,650 | | |
Sun Life Financial, Inc. | | | 72,943 | | | | 3,906 | | |
| | | | 18,264 | | |
See notes to financial statements.
9
USAA Mutual Funds Trust
USAA International Fund | | Schedule of Portfolio Investments — continued
May 31, 2021 | |
(Amounts in Thousands, Except for Shares)
Security Description | | Shares | | Value | |
Industrials (0.2%): | |
Canadian Pacific Railway Ltd. | | | 56,925 | | | $ | 4,574 | | |
Savaria Corp. | | | 197,119 | | | | 3,166 | | |
| | | | 7,740 | | |
Information Technology (0.1%): | |
Quarterhill, Inc. | | | 1,098,659 | | | | 2,256 | | |
Materials (0.5%): | |
Barrick Gold Corp. (c) | | | 185,322 | | | | 4,394 | | |
First Quantum Minerals Ltd. | | | 118,454 | | | | 2,913 | | |
Kinross Gold Corp. | | | 323,428 | | | | 2,620 | | |
Nutrien Ltd. | | | 32,998 | | | | 2,031 | | |
Wesdome Gold Mines Ltd. (b) (c) | | | 288,239 | | | | 2,656 | | |
West Fraser Timber Co. Ltd. | | | 30,762 | | | | 2,379 | | |
| | | | 16,993 | | |
| | | | 58,145 | | |
China (2.8%): | |
Communication Services (0.8%): | |
Baidu, Inc., ADR (b) | | | 11,745 | | | | 2,305 | | |
Tencent Holdings Ltd. | | | 303,200 | | | | 24,088 | | |
| | | | 26,393 | | |
Consumer Discretionary (0.9%): | |
Alibaba Group Holding Ltd., ADR (b) | | | 26,627 | | | | 5,697 | | |
China Meidong Auto Holdings Ltd. | | | 1,648,000 | | | | 8,676 | | |
China Tourism Group Duty Free Corp. Ltd. Class A | | | 48,572 | | | | 2,552 | | |
Dongfeng Motor Group Co. Ltd. Class H | | | 4,239,402 | | | | 3,963 | | |
Haier Smart Home Co. Ltd. Class H (b) | | | 620,173 | | | | 2,601 | | |
Vipshop Holdings Ltd., ADR (b) | | | 82,655 | | | | 1,912 | | |
Zhongsheng Group Holdings Ltd. | | | 545,500 | | | | 4,680 | | |
| | | | 30,081 | | |
Consumer Staples (0.1%): | |
Tingyi Cayman Islands Holding Corp. | | | 1,236,000 | | | | 2,345 | | |
Financials (0.6%): | |
Bank of China Ltd. Class H | | | 6,113,000 | | | | 2,290 | | |
China Construction Bank Corp. Class H | | | 2,728,000 | | | | 2,240 | | |
China Merchants Bank Co. Ltd. Class H | | | 1,186,000 | | | | 10,945 | | |
Huatai Securities Co. Ltd. Class H (d) | | | 1,677,000 | | | | 2,594 | | |
New China Life Insurance Co. Ltd. Class H | | | 650,800 | | | | 2,431 | | |
| | | | 20,500 | | |
Health Care (0.1%): | |
Shanghai Fosun Pharmaceutical Group Co. Ltd. Class H (c) | | | 442,000 | | | | 3,673 | | |
Industrials (0.1%): | |
China Railway Group Ltd. Class H | | | 4,401,000 | | | | 2,322 | | |
Materials (0.1%): | |
Anhui Conch Cement Co. Ltd. Class H | | | 721,500 | | | | 4,501 | | |
See notes to financial statements.
10
USAA Mutual Funds Trust
USAA International Fund | | Schedule of Portfolio Investments — continued
May 31, 2021 | |
(Amounts in Thousands, Except for Shares)
Security Description | | Shares | | Value | |
Real Estate (0.1%): | |
Agile Group Holdings Ltd. | | | 1,556,000 | | | $ | 2,211 | | |
| | | | 92,026 | | |
Denmark (1.5%): | |
Consumer Discretionary (0.1%): | |
Pandora A/S | | | 16,452 | | | | 2,220 | | |
TCM Group A/S | | | 93,642 | | | | 2,471 | | |
| | | | 4,691 | | |
Consumer Staples (0.8%): | |
Carlsberg A/S Class B | | | 19,391 | | | | 3,544 | | |
Royal Unibrew A/S | | | 166,421 | | | | 21,481 | | |
| | | | 25,025 | | |
Energy (0.0%): (a) | |
The Drilling Co. of 1972 A/S (b) | | | 5,700 | | | | 240 | | |
Health Care (0.1%): | |
GN Store Nord A/S | | | 26,486 | | | | 2,243 | | |
Industrials (0.4%): | |
AP Moller - Maersk A/S Class B | | | 2,930 | | | | 8,074 | | |
INVISIO AB | | | 188,153 | | | | 4,688 | | |
Per Aarsleff Holding A/S | | | 44,295 | | | | 2,142 | | |
| | | | 14,904 | | |
Utilities (0.1%): | |
Orsted A/S (d) | | | 14,704 | | | | 2,224 | | |
| | | | 49,327 | | |
Finland (0.6%): | |
Health Care (0.3%): | |
Revenio Group Oyj | | | 103,973 | | | | 8,033 | | |
Industrials (0.1%): | |
Detection Technology Oy | | | 15,924 | | | | 545 | | |
Metso Outotec Oyj | | | 283,333 | | | | 3,353 | | |
| | | | 3,898 | | |
Information Technology (0.2%): | |
Nokia Oyj (b) | | | 1,261,101 | | | | 6,535 | | |
| | | | 18,466 | | |
France (8.5%): | |
Communication Services (0.2%): | |
Orange SA | | | 365,810 | | | | 4,645 | | |
Publicis Groupe SA | | | 48,577 | | | | 3,289 | | |
| | | | 7,934 | | |
Consumer Discretionary (2.6%): | |
Cie Generale des Etablissements Michelin SCA (c) | | | 102,941 | | | | 15,797 | | |
Faurecia SE (b) | | | 220,092 | | | | 11,877 | | |
LVMH Moet Hennessy Louis Vuitton SE | | | 66,278 | | | | 52,708 | | |
Renault SA (b) | | | 71,084 | | | | 2,935 | | |
| | | | 83,317 | | |
See notes to financial statements.
11
USAA Mutual Funds Trust
USAA International Fund | | Schedule of Portfolio Investments — continued
May 31, 2021 | |
(Amounts in Thousands, Except for Shares)
Security Description | | Shares | | Value | |
Energy (1.1%): | |
Gaztransport Et Technigaz SA | | | 64,334 | | | $ | 5,383 | | |
TotalEnergies SE | | | 640,989 | | | | 29,643 | | |
| | | | 35,026 | | |
Financials (0.9%): | |
Amundi SA (d) | | | 20,177 | | | | 1,789 | | |
AXA SA (c) | | | 310,589 | | | | 8,555 | | |
BNP Paribas SA (c) | | | 169,001 | | | | 11,519 | | |
SCOR SE (b) | | | 72,608 | | | | 2,356 | | |
Societe Generale SA | | | 177,182 | | | | 5,666 | | |
| | | | 29,885 | | |
Health Care (0.3%): | |
Korian SA (b) | | | 1 | | | | — | (e) | |
Pharmagest Interactive (b) | | | 24,859 | | | | 2,752 | | |
Sanofi | | | 24,273 | | | | 2,575 | | |
Sartorius Stedim Biotech | | | 6,293 | | | | 2,720 | | |
Vetoquinol SA (b) | | | 20,263 | | | | 2,619 | | |
| | | | 10,666 | | |
Industrials (1.4%): | |
Alstom SA (b) | | | 28,572 | | | | 1,602 | | |
Cie de Saint-Gobain (b) | | | 206,510 | | | | 13,809 | | |
Dassault Aviation SA (c) | | | 1,348 | | | | 1,689 | | |
Rexel SA | | | 202,359 | | | | 4,118 | | |
Safran SA | | | 109,633 | | | | 16,367 | | |
Teleperformance | | | 5,376 | | | | 2,063 | | |
Thermador Groupe | | | 43,233 | | | | 4,577 | | |
| | | | 44,225 | | |
Information Technology (1.3%): | |
Capgemini SE (c) | | | 160,902 | | | | 29,954 | | |
Esker SA (b) | | | 14,670 | | | | 4,043 | | |
Lectra | | | 104,275 | | | | 4,184 | | |
MGI Digital Graphic Technology (b) | | | 42,231 | | | | 2,383 | | |
| | | | 40,564 | | |
Materials (0.5%): | |
Arkema SA (c) | | | 132,768 | | | | 17,452 | | |
Utilities (0.2%): | |
Engie SA (c) | | | 393,334 | | | | 5,828 | | |
| | | | 274,897 | | |
Germany (7.9%): | |
Communication Services (0.1%): | |
Deutsche Telekom AG | | | 224,612 | | | | 4,656 | | |
Consumer Discretionary (1.2%): | |
Ceconomy AG (b) | | | 235,936 | | | | 1,353 | | |
Continental AG | | | 20,961 | | | | 3,091 | | |
Daimler AG | | | 69,445 | | | | 6,453 | | |
HelloFresh SE (b) (c) | | | 24,184 | | | | 2,205 | | |
Volkswagen AG Preference Shares | | | 90,372 | | | | 25,180 | | |
| | | | 38,282 | | |
See notes to financial statements.
12
USAA Mutual Funds Trust
USAA International Fund | | Schedule of Portfolio Investments — continued
May 31, 2021 | |
(Amounts in Thousands, Except for Shares)
Security Description | | Shares | | Value | |
Consumer Staples (0.0%): (a) | |
METRO AG | | | 81,100 | | | $ | 1,040 | | |
Energy (0.2%): | |
CropEnergies AG | | | 180,221 | | | | 2,436 | | |
VERBIO Vereinigte BioEnergie AG | | | 83,545 | | | | 4,713 | | |
| | | | 7,149 | | |
Financials (1.2%): | |
Allianz SE Registered Shares | | | 132,812 | | | | 34,904 | | |
Hannover Rueck SE | | | 9,488 | | | | 1,656 | | |
Muenchener Rueckversicherungs-Gesellschaft AG Class R | | | 5,608 | | | | 1,616 | | |
| | | | 38,176 | | |
Health Care (0.7%): | |
Eckert & Ziegler Strahlen- und Medizintechnik AG | | | 47,789 | | | | 5,350 | | |
Fresenius SE & Co. KGaA | | | 126,327 | | | | 6,800 | | |
Merck KGaA | | | 18,598 | | | | 3,347 | | |
Nexus AG | | | 86,370 | | | | 6,681 | | |
| | | | 22,178 | | |
Industrials (1.7%): | |
| 2G Energy AG (b) | | | 29,918 | | | | 3,372 | | |
Amadeus Fire AG | | | 24,284 | | | | 4,508 | | |
Cewe Stiftung & Co. KGaA | | | 22,217 | | | | 3,598 | | |
Deutsche Post AG Registered Shares | | | 78,808 | | | | 5,364 | | |
Dr Hoenle AG | | | 61,613 | | | | 3,653 | | |
Siemens AG Registered Shares | | | 215,695 | | | | 34,898 | | |
| | | | 55,393 | | |
Information Technology (1.9%): | |
Basler AG | | | 46,924 | | | | 6,182 | | |
Infineon Technologies AG | | | 52,440 | | | | 2,128 | | |
PVA TePla AG (b) | | | 80,722 | | | | 2,392 | | |
SAP SE | | | 300,189 | | | | 41,563 | | |
Secunet Security Networks AG | | | 18,174 | | | | 8,842 | | |
| | | | 61,107 | | |
Materials (0.1%): | |
Covestro AG (d) | | | 27,217 | | | | 1,902 | | |
HeidelbergCement AG | | | 18,396 | | | | 1,676 | | |
| | | | 3,578 | | |
Real Estate (0.7%): | |
alstria office REIT-AG | | | 88,537 | | | | 1,609 | | |
LEG Immobilien SE | | | 14,785 | | | | 2,162 | | |
Vonovia SE | | | 295,161 | | | | 18,409 | | |
| | | | 22,180 | | |
Utilities (0.1%): | |
E.ON SE | | | 279,412 | | | | 3,369 | | |
| | | | 257,108 | | |
See notes to financial statements.
13
USAA Mutual Funds Trust
USAA International Fund | | Schedule of Portfolio Investments — continued
May 31, 2021 | |
(Amounts in Thousands, Except for Shares)
Security Description | | Shares | | Value | |
Hong Kong (2.4%): | |
Communication Services (0.1%): | |
NetDragon Websoft Holdings Ltd. | | | 883,500 | | | $ | 2,607 | | |
Consumer Discretionary (0.1%): | |
Xinyi Glass Holdings Ltd. | | | 732,000 | | | | 2,918 | | |
Consumer Staples (0.1%): | |
Vinda International Holdings Ltd. | | | 568,000 | | | | 1,801 | | |
WH Group Ltd. (d) | | | 2,179,000 | | | | 1,859 | | |
| | | | 3,660 | | |
Energy (0.0%): (a) | |
Kunlun Energy Co. Ltd. | | | 2,514,000 | | | | 1,895 | | |
Financials (1.0%): | |
AIA Group Ltd. | | | 2,356,400 | | | | 30,065 | | |
BOC Hong Kong Holdings Ltd. | | | 607,500 | | | | 2,195 | | |
| | | | 32,260 | | |
Information Technology (0.2%): | |
Lenovo Group Ltd. | | | 4,376,000 | | | | 5,233 | | |
Real Estate (0.9%): | |
CK Asset Holdings Ltd. | | | 4,340,475 | | | | 28,713 | | |
Sun Hung Kai Properties Ltd. | | | 132,000 | | | | 2,026 | | |
| | | | 30,739 | | |
Utilities (0.0%): (a) | |
China Water Affairs Group Ltd. (c) | | | 136,000 | | | | 105 | | |
| | | | 79,417 | | |
Hungary (0.1%): | |
Financials (0.1%): | |
OTP Bank Nyrt (b) | | | 66,218 | | | | 3,621 | | |
India (0.8%): | |
Communication Services (0.1%): | |
Zee Entertainment Enterprises Ltd. | | | 527,492 | | | | 1,523 | | |
Energy (0.2%): | |
Oil & Natural Gas Corp. Ltd. | | | 1,654,092 | | | | 2,592 | | |
Reliance Industries Ltd. | | | 117,595 | | | | 3,504 | | |
| | | | 6,096 | | |
Financials (0.2%): | |
Canara Bank (b) | | | 656,752 | | | | 1,455 | | |
LIC Housing Finance Ltd. | | | 413,655 | | | | 2,659 | | |
Muthoot Finance Ltd. | | | 128,615 | | | | 2,327 | | |
| | | | 6,441 | | |
Health Care (0.1%): | |
Ipca Laboratories Ltd. | | | 145,351 | | | | 4,153 | | |
Information Technology (0.1%): | |
Infosys Ltd. | | | 181,445 | | | | 3,487 | | |
See notes to financial statements.
14
USAA Mutual Funds Trust
USAA International Fund | | Schedule of Portfolio Investments — continued
May 31, 2021 | |
(Amounts in Thousands, Except for Shares)
Security Description | | Shares | | Value | |
Utilities (0.1%): | |
NTPC Ltd. | | | 242,344 | | | $ | 369 | | |
Power Grid Corp. of India Ltd. | | | 728,138 | | | | 2,267 | | |
| | | | 2,636 | | |
| | | | 24,336 | | |
Indonesia (0.1%): | |
Communication Services (0.1%): | |
PT Sarana Menara Nusantara Tbk | | | 27,222,900 | | | | 2,238 | | |
Financials (0.0%): (a) | |
PT Bank Mandiri Persero Tbk | | | 5,206,304 | | | | 2,183 | | |
| | | | 4,421 | | |
Ireland (0.5%): | |
Financials (0.2%): | |
AIB Group PLC (b) | | | 970,575 | | | | 3,225 | | |
Bank of Ireland Group PLC (b) | | | 568,245 | | | | 3,631 | | |
| | | | 6,856 | | |
Health Care (0.2%): | |
ICON PLC (b) (c) | | | 19,896 | | | | 4,452 | | |
Industrials (0.1%): | |
DCC PLC | | | 41,432 | | | | 3,510 | | |
| | | | 14,818 | | |
Israel (0.1%): | |
Consumer Discretionary (0.1%): | |
Maytronics Ltd. | | | 134,933 | | | | 2,620 | | |
Italy (3.8%): | |
Energy (0.8%): | |
Eni SpA | | | 538,016 | | | | 6,599 | | |
Saipem SpA (b) (c) | | | 651,287 | | | | 1,638 | | |
Snam SpA (c) | | | 2,951,519 | | | | 17,305 | | |
| | | | 25,542 | | |
Financials (0.9%): | |
Assicurazioni Generali SpA (c) | | | 253,360 | | | | 5,197 | | |
Banca Generali SpA (b) | | | 346,589 | | | | 14,136 | | |
| BPER Banca | | | 700,527 | | | | 1,733 | | |
UniCredit SpA | | | 491,644 | | | | 6,301 | | |
| | | | 27,367 | | |
Health Care (0.6%): | |
El.En. SpA | | | 131,016 | | | | 7,110 | | |
Recordati Industria Chimica e Farmaceutica SpA (c) | | | 237,576 | | | | 13,179 | | |
| | | | 20,289 | | |
Industrials (0.1%): | |
Leonardo SpA | | | 219,113 | | | | 1,901 | | |
See notes to financial statements.
15
USAA Mutual Funds Trust
USAA International Fund | | Schedule of Portfolio Investments — continued
May 31, 2021 | |
(Amounts in Thousands, Except for Shares)
Security Description | | Shares | | Value | |
Information Technology (0.3%): | |
Nexi SpA (b) (c) (d) | | | 114,024 | | | $ | 2,300 | | |
Sesa SpA (b) | | | 53,099 | | | | 8,368 | | |
| | | | 10,668 | | |
Utilities (1.1%): | |
ACEA SpA | | | 98,332 | | | | 2,392 | | |
Enel SpA | | | 3,519,173 | | | | 34,575 | | |
| | | | 36,967 | | |
| | | | 122,734 | | |
Japan (22.2%): | |
Communication Services (2.2%): | |
Akatsuki, Inc. | | | 67,700 | | | | 2,162 | | |
Amuse, Inc. | | | 58,500 | | | | 1,161 | | |
Capcom Co. Ltd. | | | 598,200 | | | | 19,560 | | |
DeNA Co. Ltd. | | | 117,480 | | | | 2,345 | | |
Fuji Media Holdings, Inc. | | | 75,288 | | | | 849 | | |
Gree, Inc. | | | 319,165 | | | | 1,642 | | |
Intage Holdings, Inc. | | | 283,600 | | | | 4,006 | | |
Kakaku.com, Inc. | | | 562,700 | | | | 17,106 | | |
KDDI Corp. | | | 96,800 | | | | 3,275 | | |
MarkLines Co. Ltd. | | | 133,200 | | | | 3,575 | | |
Nintendo Co. Ltd. | | | 6,000 | | | | 3,699 | | |
Nippon Telegraph & Telephone Corp. | | | 123,400 | | | | 3,293 | | |
Nippon Television Holdings, Inc. | | | 144,994 | | | | 1,726 | | |
SoftBank Group Corp. | | | 19,200 | | | | 1,444 | | |
ValueCommerce Co. Ltd. | | | 123,000 | | | | 3,360 | | |
ZIGExN Co. Ltd. | | | 394,100 | | | | 1,434 | | |
| | | | 70,637 | | |
Consumer Discretionary (3.7%): | |
Arcland Service Holdings Co. Ltd. (c) | | | 67,800 | | | | 1,403 | | |
Benesse Holdings, Inc. | | | 9,569 | | | | 219 | | |
Honda Motor Co. Ltd. | | | 309,032 | | | | 9,446 | | |
IBJ, Inc. | | | 248,100 | | | | 2,367 | | |
Isuzu Motors Ltd. | | | 444,684 | | | | 5,847 | | |
Mitsubishi Motors Corp. (b) | | | 351,724 | | | | 976 | | |
Nikon Corp. | | | 237,715 | | | | 2,432 | | |
Nissan Motor Co. Ltd. (b) | | | 706,313 | | | | 3,469 | | |
Shimamura Co. Ltd. | | | 38,488 | | | | 3,654 | | |
Shoei Co. Ltd. | | | 112,100 | | | | 4,024 | | |
Sony Group Corp. | | | 109,600 | | | | 10,777 | | |
The Furukawa Battery Co. Ltd. (b) | | | 210,200 | | | | 2,997 | | |
Toyo Tire Corp. | | | 108,100 | | | | 2,167 | | |
Toyota Motor Corp. | | | 677,300 | | | | 56,237 | | |
ZOZO, Inc. | | | 434,400 | | | | 14,661 | | |
| | | | 120,676 | | |
See notes to financial statements.
16
USAA Mutual Funds Trust
USAA International Fund | | Schedule of Portfolio Investments — continued
May 31, 2021 | |
(Amounts in Thousands, Except for Shares)
Security Description | | Shares | | Value | |
Consumer Staples (1.3%): | |
Asahi Group Holdings Ltd. | | | 59,700 | | | $ | 2,840 | | |
Create SD Holdings Co. Ltd. (c) | | | 85,700 | | | | 2,515 | | |
G-7 Holdings, Inc. | | | 65,600 | | | | 1,775 | | |
Retail Partners Co. Ltd. | | | 189,300 | | | | 1,960 | | |
Rock Field Co. Ltd. | | | 104,800 | | | | 1,500 | | |
Seven & i Holdings Co. Ltd. | | | 47,300 | | | | 2,041 | | |
Soiken Holdings, Inc. (b) (c) | | | 700,900 | | | | 3,038 | | |
Toyo Suisan Kaisha Ltd. | | | 546,800 | | | | 21,840 | | |
Transaction Co. Ltd. | | | 274,300 | | | | 3,409 | | |
| | | | 40,918 | | |
Energy (0.1%): | |
Inpex Corp. | | | 497,674 | | | | 3,418 | | |
Financials (2.7%): | |
Dai-ichi Life Holdings, Inc. | | | 226,863 | | | | 4,618 | | |
JAFCO Group Co. Ltd. | | | 179,200 | | | | 12,954 | | |
Mitsubishi UFJ Financial Group, Inc. | | | 4,223,272 | | | | 23,899 | | |
Mizuho Financial Group, Inc. | | | 209,650 | | | | 3,199 | | |
Nomura Holdings, Inc. | | | 675,344 | | | | 3,696 | | |
ORIX Corp. | | | 223,700 | | | | 3,940 | | |
Resona Holdings, Inc. | | | 1,162,376 | | | | 4,957 | | |
Sumitomo Mitsui Financial Group, Inc. | | | 228,014 | | | | 8,220 | | |
Sumitomo Mitsui Trust Holdings, Inc. | | | 166,247 | | | | 5,717 | | |
T&D Holdings, Inc. | | | 465,793 | | | | 6,333 | | |
Tokio Marine Holdings, Inc. | | | 237,900 | | | | 11,239 | | |
| | | | 88,772 | | |
Health Care (1.9%): | |
BML, Inc. | | | 71,400 | | | | 2,430 | | |
Eisai Co. Ltd. | | | 24,186 | | | | 1,623 | | |
EPS Holdings, Inc. | | | 174,000 | | | | 2,849 | | |
Hoya Corp. | | | 228,000 | | | | 29,902 | | |
Japan Lifeline Co. Ltd. | | | 180,000 | | | | 2,271 | | |
Japan Medical Dynamic Marketing, Inc. | | | 131,500 | | | | 2,416 | | |
Ono Pharmaceutical Co. Ltd. | | | 109,000 | | | | 2,460 | | |
Shionogi & Co. Ltd. | | | 232,582 | | | | 11,782 | | |
Takeda Pharmaceutical Co. Ltd. | | | 220,851 | | | | 7,483 | | |
| | | | 63,216 | | |
Industrials (5.6%): | |
Altech Corp. | | | 141,100 | | | | 2,507 | | |
Anest Iwata Corp. | | | 110,000 | | | | 1,014 | | |
BeNext-Yumeshin Group Co. | | | 220,118 | | | | 2,573 | | |
Chiyoda Corp. (b) | | | 146,971 | | | | 522 | | |
Chudenko Corp. | | | 114,900 | | | | 2,438 | | |
CTI Engineering Co. Ltd. | | | 119,900 | | | | 2,728 | | |
Dai-Dan Co. Ltd. | | | 97,800 | | | | 2,374 | | |
Denyo Co. Ltd. | | | 172,500 | | | | 3,187 | | |
en-japan, Inc. | | | 299,500 | | | | 10,477 | | |
Fuji Corp. | | | 108,100 | | | | 2,677 | | |
Fuji Electric Co. Ltd. | | | 668,600 | | | | 31,329 | | |
Giken Ltd. | | | 38,600 | | | | 1,573 | | |
gremz, Inc. (b) | | | 176,500 | | | | 2,936 | | |
See notes to financial statements.
17
USAA Mutual Funds Trust
USAA International Fund | | Schedule of Portfolio Investments — continued
May 31, 2021 | |
(Amounts in Thousands, Except for Shares)
Security Description | | Shares | | Value | |
Hino Motors Ltd. | | | 439,732 | | | $ | 4,078 | | |
ITOCHU Corp. | | | 202,500 | | | | 5,998 | | |
JAC Recruitment Co. Ltd. | | | 120,200 | | | | 1,963 | | |
Japan Airlines Co. Ltd. Class C (b) | | | 186,030 | | | | 4,242 | | |
JGC Holdings Corp. | | | 272,918 | | | | 2,604 | | |
Kamigumi Co. Ltd. | | | 88,300 | | | | 1,745 | | |
Komatsu Ltd. | | | 63,500 | | | | 1,859 | | |
Maeda Kosen Co. Ltd. | | | 108,300 | | | | 3,380 | | |
METAWATER Co. Ltd. | | | 102,100 | | | | 1,873 | | |
Mirait Holdings Corp. | | | 140,300 | | | | 2,468 | | |
Mitsubishi Electric Corp. | | | 140,000 | | | | 2,162 | | |
Mitsubishi Heavy Industries Ltd. | | | 57,818 | | | | 1,748 | | |
Mitsui & Co. Ltd. | | | 122,200 | | | | 2,693 | | |
Nichireki Co. Ltd. | | | 240,800 | | | | 2,934 | | |
Nihon Flush Co. Ltd. (b) | | | 169,800 | | | | 1,946 | | |
Nippon Parking Development Co. Ltd. | | | 411,800 | | | | 571 | | |
Nippon Yusen | | | 459,600 | | | | 18,937 | | |
NS Tool Co. Ltd. | | | 214,200 | | | | 2,835 | | |
Obayashi Corp. | | | 169,500 | | | | 1,425 | | |
OKUMA Corp. | | | 236,300 | | | | 12,204 | | |
Rheon Automatic Machinery Co. Ltd. | | | 154,400 | | | | 1,794 | | |
Rozetta Corp. (c) | | | 59,200 | | | | 1,081 | | |
Sanwa Holdings Corp. | | | 1,243,400 | | | | 15,044 | | |
Shinwa Co. Ltd. | | | 64,000 | | | | 1,228 | | |
Sinko Industries Ltd. | | | 149,800 | | | | 2,599 | | |
S-Pool, Inc. | | | 402,100 | | | | 3,132 | | |
Sumitomo Heavy Industries Ltd. | | | 71,570 | | | | 2,210 | | |
Taisei Corp. | | | 46,600 | | | | 1,624 | | |
THK Co. Ltd. | | | 73,546 | | | | 2,391 | | |
Tocalo Co. Ltd. | | | 222,000 | | | | 2,843 | | |
Toppan Printing Co. Ltd. | | | 86,570 | | | | 1,514 | | |
Weathernews, Inc. | | | 54,700 | | | | 2,651 | | |
Yamato Holdings Co. Ltd. | | | 59,900 | | | | 1,644 | | |
| | | | 183,755 | | |
Information Technology (3.2%): | |
Alps Alpine Co. Ltd. | | | 109,500 | | | | 1,173 | | |
Canon, Inc. | | | 78,886 | | | | 1,843 | | |
Citizen Watch Co. Ltd. | | | 352,302 | | | | 1,386 | | |
Comture Corp. | | | 130,800 | | | | 2,724 | | |
Cresco Ltd. | | | 110,100 | | | | 1,683 | | |
Digital Arts, Inc. | | | 41,600 | | | | 3,037 | | |
Double Standard, Inc. (b) | | | 40,500 | | | | 1,790 | | |
Fixstars Corp. | | | 209,800 | | | | 1,642 | | |
Fujitsu Ltd. | | | 187,304 | | | | 30,314 | | |
Fukui Computer Holdings, Inc. | | | 117,000 | | | | 4,608 | | |
Future Corp. | | | 166,700 | | | | 3,079 | | |
Hitachi Ltd. | | | 54,500 | | | | 2,852 | | |
Kanematsu Electronics Ltd. | | | 56,700 | | | | 1,850 | | |
Murata Manufacturing Co. Ltd. | | | 33,500 | | | | 2,530 | | |
NTT Data Corp. | | | 121,000 | | | | 1,961 | | |
Oracle Corp. (c) | | | 98,400 | | | | 8,926 | | |
Poletowin Pitcrew Holdings, Inc. | | | 177,500 | | | | 1,732 | | |
SHIFT, Inc. (b) | | | 36,300 | | | | 5,124 | | |
See notes to financial statements.
18
USAA Mutual Funds Trust
USAA International Fund | | Schedule of Portfolio Investments — continued
May 31, 2021 | |
(Amounts in Thousands, Except for Shares)
Security Description | | Shares | | Value | |
Softcreate Holdings Corp. (b) | | | 126,900 | | | $ | 2,609 | | |
TDK Corp. | | | 13,800 | | | | 1,756 | | |
TechMatrix Corp. | | | 128,000 | | | | 2,027 | | |
Tokyo Electron Ltd. | | | 8,000 | | | | 3,550 | | |
Ulvac, Inc. | | | 286,200 | | | | 13,428 | | |
V Technology Co. Ltd. | | | 49,000 | | | | 2,350 | | |
| | | | 103,974 | | |
Materials (0.4%): | |
Hokuetsu Industries Co. Ltd. (b) | | | 127,900 | | | | 1,318 | | |
JCU Corp. | | | 122,300 | | | | 3,981 | | |
Rengo Co. Ltd. | | | 178,400 | | | | 1,494 | | |
Shin-Etsu Chemical Co. Ltd. | | | 13,500 | | | | 2,323 | | |
Taiheiyo Cement Corp. | | | 90,130 | | | | 2,072 | | |
Tosoh Corp. | | | 103,100 | | | | 1,802 | | |
| | | | 12,990 | | |
Real Estate (0.6%): | |
Daiwa House Industry Co. Ltd. | | | 59,700 | | | | 1,746 | | |
Mitsubishi Estate Co. Ltd. | | | 251,646 | | | | 4,073 | | |
Open House Co. Ltd. | | | 44,400 | | | | 2,058 | | |
Sumitomo Realty & Development Co. Ltd. | | | 352,200 | | | | 11,688 | | |
| | | | 19,565 | | |
Utilities (0.5%): | |
Chubu Electric Power Co., Inc. | | | 1,187,200 | | | | 14,180 | | |
Osaka Gas Co. Ltd. | | | 94,900 | | | | 1,781 | | |
| | | | 15,961 | | |
| | | | 723,882 | | |
Jersey (0.1%): | |
Consumer Discretionary (0.1%): | |
boohoo Group PLC (b) | | | 382,694 | | | | 1,730 | | |
Korea, Republic Of (1.5%): | |
Communication Services (0.2%): | |
KT Corp. | | | 193,448 | | | | 5,928 | | |
NAVER Corp. | | | 5,537 | | | | 1,797 | | |
| | | | 7,725 | | |
Consumer Discretionary (0.3%): | |
Hankook Tire & Technology Co. Ltd. | | | 57,939 | | | | 2,535 | | |
Kia Corp. | | | 26,297 | | | | 2,010 | | |
LG Electronics, Inc. | | | 29,645 | | | | 4,046 | | |
| | | | 8,591 | | |
Consumer Staples (0.1%): | |
E-MART, Inc. | | | 12,616 | | | | 1,799 | | |
Financials (0.4%): | |
Hana Financial Group, Inc. | | | 58,138 | | | | 2,420 | | |
KB Financial Group, Inc. | | | 127,377 | | | | 6,690 | | |
Shinhan Financial Group Co. Ltd. | | | 145,090 | | | | 5,508 | | |
| | | | 14,618 | | |
See notes to financial statements.
19
USAA Mutual Funds Trust
USAA International Fund | | Schedule of Portfolio Investments — continued
May 31, 2021 | |
(Amounts in Thousands, Except for Shares)
Security Description | | Shares | | Value | |
Industrials (0.1%): | |
Samsung Engineering Co. Ltd. (b) | | | 185,858 | | | $ | 3,150 | | |
Information Technology (0.4%): | |
LG Innotek Co. Ltd. | | | 27,199 | | | | 4,985 | | |
Samsung Electronics Co. Ltd. | | | 85,407 | | | | 6,163 | | |
SK Hynix, Inc. | | | 21,702 | | | | 2,473 | | |
| | | | 13,621 | | |
| | | | 49,504 | | |
Luxembourg (0.3%): | |
Communication Services (0.1%): | |
RTL Group SA | | | 45,431 | | | | 2,697 | | |
Energy (0.0%): (a) | |
Tenaris SA | | | 177,227 | | | | 2,018 | | |
Health Care (0.1%): | |
Eurofins Scientific SE (b) | | | 25,700 | | | | 2,766 | | |
Materials (0.1%): | |
ArcelorMittal SA (b) | | | 74,133 | | | | 2,432 | | |
| | | | 9,913 | | |
Malaysia (0.2%): | |
Communication Services (0.1%): | |
Telekom Malaysia Bhd | | | 1,731,000 | | | | 2,575 | | |
Financials (0.1%): | |
CIMB Group Holdings Bhd | | | 1,622,873 | | | | 1,679 | | |
RHB Bank Bhd | | | 2,555,400 | | | | 3,274 | | |
| | | | 4,953 | | |
| | | | 7,528 | | |
Mexico (0.1%): | |
Communication Services (0.1%): | |
America Movil SAB de CV, ADR | | | 281,160 | | | | 4,321 | | |
Monaco (0.0%): (a) | |
Materials (0.0%): | |
Endeavour Mining Corp. | | | 52,312 | | | | 1,263 | | |
Netherlands (3.8%): | |
Communication Services (0.6%): | |
Koninklijke KPN NV | | | 5,168,391 | | | | 17,133 | | |
VEON Ltd., ADR (b) | | | 800,743 | | | | 1,458 | | |
| | | | 18,591 | | |
Consumer Discretionary (0.1%): | |
Prosus NV | | | 30,020 | | | | 3,109 | | |
Consumer Staples (0.1%): | |
Koninklijke Ahold Delhaize NV | | | 145,380 | | | | 4,189 | | |
Energy (0.3%): | |
Royal Dutch Shell PLC Class B | | | 603,664 | | | | 10,957 | | |
See notes to financial statements.
20
USAA Mutual Funds Trust
USAA International Fund | | Schedule of Portfolio Investments — continued
May 31, 2021 | |
(Amounts in Thousands, Except for Shares)
Security Description | | Shares | | Value | |
Financials (1.1%): | |
ABN AMRO Bank NV (b) (c) (d) | | | 319,835 | | | $ | 4,261 | | |
ING Groep NV | | | 2,092,482 | | | | 28,955 | | |
NN Group NV (c) | | | 53,627 | | | | 2,716 | | |
| | | | 35,932 | | |
Health Care (0.1%): | |
Pharming Group NV (b) (c) | | | 1,546,697 | | | | 1,895 | | |
QIAGEN NV (b) | | | 36,756 | | | | 1,806 | | |
| | | | 3,701 | | |
Industrials (0.7%): | |
PostNL NV | | | 310,277 | | | | 1,820 | | |
SIF Holding NV | | | 160,874 | | | | 3,187 | | |
Wolters Kluwer NV | | | 174,011 | | | | 16,647 | | |
| | | | 21,654 | | |
Information Technology (0.7%): | |
ASM International NV | | | 54,853 | | | | 17,207 | | |
| ASML Holding NV | | | 5,260 | | | | 3,511 | | |
STMicroelectronics NV | | | 95,896 | | | | 3,586 | | |
| | | | 24,304 | | |
Materials (0.1%): | |
Akzo Nobel NV | | | 15,334 | | | | 1,969 | | |
| | | | 124,406 | | |
New Zealand (0.5%): | |
Consumer Staples (0.1%): | |
Scales Corp. Ltd. | | | 625,798 | | | | 2,093 | | |
Health Care (0.3%): | |
Fisher & Paykel Healthcare Corp. Ltd. | | | 539,840 | | | | 11,627 | | |
Information Technology (0.1%): | |
Pushpay Holdings Ltd. (b) | | | 2,575,878 | | | | 3,187 | | |
| | | | 16,907 | | |
Norway (1.1%): | |
Energy (0.2%): | |
Aker BP ASA | | | 277,049 | | | | 8,079 | | |
Financials (0.5%): | |
SpareBank 1 SMN | | | 1,182,053 | | | | 16,695 | | |
Health Care (0.1%): | |
Medistim ASA | | | 80,939 | | | | 2,570 | | |
Information Technology (0.1%): | |
Bouvet ASA | | | 42,977 | | | | 3,333 | | |
Materials (0.2%): | |
Norsk Hydro ASA | | | 865,001 | | | | 5,654 | | |
| | | | 36,331 | | |
Portugal (0.1%): | |
Energy (0.1%): | |
Galp Energia SGPS SA | | | 153,190 | | | | 1,902 | | |
See notes to financial statements.
21
USAA Mutual Funds Trust
USAA International Fund | | Schedule of Portfolio Investments — continued
May 31, 2021 | |
(Amounts in Thousands, Except for Shares)
Security Description | | Shares | | Value | |
Russian Federation (0.5%): | |
Energy (0.3%): | |
Gazprom PJSC, ADR | | | 514,988 | | | $ | 3,658 | | |
LUKOIL PJSC, ADR | | | 55,935 | | | | 4,543 | | |
| | | | 8,201 | | |
Financials (0.1%): | |
Sberbank of Russia PJSC | | | 607,050 | | | | 2,569 | | |
Sberbank of Russia PJSC, ADR | | | 133,507 | | | | 2,254 | | |
| | | | 4,823 | | |
Materials (0.1%): | |
Polymetal International PLC | | | 87,213 | | | | 2,103 | | |
| | | | 15,127 | | |
Singapore (0.4%): | |
Consumer Discretionary (0.0%): (a) | |
Genting Singapore Ltd. | | | 2,844,500 | | | | 1,815 | | |
Consumer Staples (0.1%): | |
Wilmar International Ltd. | | | 707,200 | | | | 2,549 | | |
Financials (0.3%): | |
DBS Group Holdings Ltd. | | | 111,400 | | | | 2,525 | | |
iFAST Corp. Ltd. | | | 600,200 | | | | 3,891 | | |
Singapore Exchange Ltd. | | | 303,600 | | | | 2,369 | | |
| | | | 8,785 | | |
| | | | 13,149 | | |
South Africa (0.6%): | |
Communication Services (0.2%): | |
MTN Group (b) | | | 311,113 | | | | 2,247 | | |
Naspers Ltd. Class N | | | 21,876 | | | | 4,840 | | |
| | | | 7,087 | | |
Financials (0.1%): | |
Old Mutual Ltd. | | | 2,318,128 | | | | 2,404 | | |
Materials (0.3%): | |
Gold Fields Ltd. | | | 207,954 | | | | 2,624 | | |
Impala Platinum Holdings Ltd. | | | 146,946 | | | | 2,673 | | |
Kumba Iron Ore Ltd. | | | 69,832 | | | | 3,243 | | |
| | | | 8,540 | | |
| | | | 18,031 | | |
Spain (1.1%): | |
Communication Services (0.5%): | |
Telefonica SA (c) | | | 3,517,441 | | | | 17,255 | | |
Financials (0.2%): | |
CaixaBank SA | | | 1,815,059 | | | | 6,215 | | |
Health Care (0.1%): | |
Faes Farma SA | | | 600,210 | | | | 2,475 | | |
Industrials (0.1%): | |
ACS Actividades de Construccion y Servicios SA | | | 77,761 | | | | 2,419 | | |
See notes to financial statements.
22
USAA Mutual Funds Trust
USAA International Fund | | Schedule of Portfolio Investments — continued
May 31, 2021 | |
(Amounts in Thousands, Except for Shares)
Security Description | | Shares | | Value | |
Information Technology (0.1%): | |
Global Dominion Access SA (d) | | | 667,551 | | | $ | 3,653 | | |
Utilities (0.1%): | |
Acciona SA | | | 11,938 | | | | 2,012 | | |
EDP Renovaveis SA | | | 99,666 | | | | 2,345 | | |
| | | | 4,357 | | |
| | | | 36,374 | | |
Sweden (3.1%): | |
Consumer Discretionary (0.1%): | |
Boozt AB (b) (d) | | | 114,228 | | | | 2,702 | | |
Consumer Staples (0.1%): | |
Swedish Match AB | | | 348,220 | | | | 3,226 | | |
Financials (0.1%): | |
Skandinaviska Enskilda Banken AB Class A | | | 197,577 | | | | 2,526 | | |
Health Care (0.9%): | |
BioGaia AB B Shares | | | 50,223 | | | | 2,694 | | |
Biotage AB | | | 214,653 | | | | 4,765 | | |
Cellavision AB | | | 72,700 | | | | 3,092 | | |
Probi AB | | | 56,623 | | | | 3,328 | | |
RaySearch Laboratories AB (b) | | | 135,652 | | | | 1,520 | | |
Sectra AB Class B | | | 62,144 | | | | 4,222 | | |
SwedenCare AB | | | 291,595 | | | | 3,730 | | |
Xvivo Perfusion AB (b) | | | 125,432 | | | | 4,799 | | |
| | | | 28,150 | | |
Industrials (1.7%): | |
Atlas Copco AB Class B | | | 548,217 | | | | 28,272 | | |
BTS Group AB B Shares | | | 122,226 | | | | 4,779 | | |
CTT Systems AB | | | 150,464 | | | | 3,571 | | |
Eolus Vind AB Class B (c) | | | 139,230 | | | | 3,337 | | |
GARO AB | | | 205,520 | | | | 3,139 | | |
Hexatronic Group AB | | | 347,102 | | | | 6,064 | | |
Sandvik AB | | | 78,418 | | | | 2,066 | | |
| SKF AB B Shares | | | 98,309 | | | | 2,653 | | |
Volvo AB Class B | | | 120,760 | | | | 3,160 | | |
| | | | 57,041 | | |
Information Technology (0.1%): | |
Telefonaktiebolaget LM Ericsson Class B | | | 197,217 | | | | 2,613 | | |
Materials (0.1%): | |
Boliden AB | | | 78,147 | | | | 3,131 | | |
Real Estate (0.0%): (a) | |
Fastighets AB Balder B Shares (b) | | | 31,251 | | | | 1,985 | | |
| | | | 101,374 | | |
Switzerland (10.3%): | |
Consumer Staples (2.8%): | |
Coca-Cola HBC AG | | | 487,633 | | | | 17,750 | | |
Nestle SA Registered Shares | | | 586,083 | | | | 72,166 | | |
| | | | 89,916 | | |
See notes to financial statements.
23
USAA Mutual Funds Trust
USAA International Fund | | Schedule of Portfolio Investments — continued
May 31, 2021 | |
(Amounts in Thousands, Except for Shares)
Security Description | | Shares | | Value | |
Financials (2.2%): | |
Cembra Money Bank AG | | | 109,581 | | | $ | 12,448 | | |
Julius Baer Group Ltd. | | | 68,571 | | | | 4,700 | | |
Partners Group Holding AG (c) | | | 14,325 | | | | 21,779 | | |
Swiss Life Holding AG | | | 10,740 | | | | 5,572 | | |
UBS Group AG | | | 1,722,143 | | | | 27,948 | | |
| | | | 72,447 | | |
Health Care (3.1%): | |
Coltene Holding AG Registered Shares | | | 29,667 | | | | 4,165 | | |
Lonza Group AG Registered Shares | | | 3,975 | | | | 2,560 | | |
Novartis AG Registered Shares | | | 422,335 | | | | 37,079 | | |
Roche Holding AG | | | 164,546 | | | | 57,241 | | |
| | | | 101,045 | | |
Industrials (1.3%): | |
Adecco Group AG | | | 477,349 | | | | 32,896 | | |
Kardex Holding AG Registered Shares | | | 12,654 | | | | 2,843 | | |
Schweiter Technologies AG Class BR | | | 1,883 | | | | 3,213 | | |
Zehnder Group AG Registered Shares | | | 26,839 | | | | 2,490 | | |
| | | | 41,442 | | |
Information Technology (0.3%): | |
Logitech International SA Class R | | | 50,156 | | | | 6,214 | | |
u-blox Holding AG | | | 44,878 | | | | 2,886 | | |
| | | | 9,100 | | |
Materials (0.6%): | |
Gurit Holding AG Class BR | | | 2,381 | | | | 6,332 | | |
Holcim Ltd. | | | 171,042 | | | | 10,173 | | |
Vetropack Holding AG | | | 57,162 | | | | 3,650 | | |
| | | | 20,155 | | |
| | | | 334,105 | | |
Taiwan (1.0%): | |
Financials (0.2%): | |
Chailease Holding Co. Ltd. (b) | | | 308,520 | | | | 2,319 | | |
Fubon Financial Holding Co. Ltd. | | | 1,224,000 | | | | 3,189 | | |
Shin Kong Financial Holding Co. Ltd. | | | 4,812,076 | | | | 1,744 | | |
| | | | 7,252 | | |
Information Technology (0.8%): | |
Catcher Technology Co. Ltd. | | | 506,247 | | | | 3,354 | | |
Hon Hai Precision Industry Co. Ltd. | | | 919,478 | | | | 3,761 | | |
Radiant Opto-Electronics Corp. | | | 662,000 | | | | 2,815 | | |
Realtek Semiconductor Corp. | | | 282,000 | | | | 5,069 | | |
Taiwan Semiconductor Manufacturing Co. Ltd. | | | 507,000 | | | | 10,915 | | |
| | | | 25,914 | | |
| | | | 33,166 | | |
Thailand (0.2%): | |
Consumer Staples (0.1%): | |
Charoen Pokphand Foods PCL | | | 1,866,400 | | | | 1,627 | | |
See notes to financial statements.
24
USAA Mutual Funds Trust
USAA International Fund | | Schedule of Portfolio Investments — continued
May 31, 2021 | |
(Amounts in Thousands, Except for Shares)
Security Description | | Shares | | Value | |
Financials (0.1%): | |
Kasikornbank PCL | | | 1,044,921 | | | $ | 3,971 | | |
| | | | 5,598 | | |
Turkey (0.1%): | |
Communication Services (0.1%): | |
Turk Telekomunikasyon A/S | | | 1,513,165 | | | | 1,234 | | |
Turkcell Iletisim Hizmetleri A/S | | | 808,005 | | | | 1,495 | | |
| | | | 2,729 | | |
United Kingdom (14.1%): | |
Communication Services (1.1%): | |
4imprint Group PLC (b) | | | 80,861 | | | | 3,288 | | |
BT Group PLC (b) | | | 1,779,860 | | | | 4,405 | | |
Frontier Developments PLC (b) | | | 72,473 | | | | 2,634 | | |
ITV PLC (b) | | | 8,268,701 | | | | 14,947 | | |
Team17 Group PLC (b) | | | 257,944 | | | | 2,478 | | |
Vodafone Group PLC | | | 1,348,511 | | | | 2,440 | | |
WPP PLC | | | 498,472 | | | | 6,873 | | |
| | | | 37,065 | | |
Consumer Discretionary (1.4%): | |
AB Dynamics PLC | | | 146,035 | | | | 4,456 | | |
Barratt Developments PLC | | | 250,796 | | | | 2,673 | | |
Focusrite PLC | | | 414,133 | | | | 7,412 | | |
Kingfisher PLC (b) | | | 942,983 | | | | 4,778 | | |
Marks & Spencer Group PLC (b) | | | 921,665 | | | | 2,146 | | |
MJ Gleeson PLC | | | 248,202 | | | | 3,068 | | |
Next PLC (b) | | | 155,989 | | | | 17,977 | | |
Stellantis NV | | | 216,712 | | | | 4,297 | | |
| | | | 46,807 | | |
Consumer Staples (2.1%): | |
British American Tobacco PLC | | | 49,992 | | | | 1,925 | | |
Diageo PLC | | | 682,014 | | | | 32,866 | | |
Imperial Brands PLC | | | 829,672 | | | | 18,803 | | |
J Sainsbury PLC | | | 1,784,848 | | | | 6,709 | | |
Nichols PLC | | | 66,792 | | | | 1,486 | | |
Tate & Lyle PLC | | | 209,244 | | | | 2,274 | | |
Tesco PLC | | | 1,023,182 | | | | 3,237 | | |
Unilever PLC | | | 41,296 | | | | 2,473 | | |
| | | | 69,773 | | |
Energy (1.5%): | |
| BP PLC | | | 6,135,645 | | | | 26,741 | | |
Cairn Energy PLC | | | 617,818 | | | | 1,421 | | |
Royal Dutch Shell PLC Class A | | | 1,131,845 | | | | 21,566 | | |
| | | | 49,728 | | |
Financials (2.0%): | |
| 3i Group PLC | | | 247,771 | | | | 4,347 | | |
Barclays PLC | | | 1,030,742 | | | | 2,675 | | |
See notes to financial statements.
25
USAA Mutual Funds Trust
USAA International Fund | | Schedule of Portfolio Investments — continued
May 31, 2021 | |
(Amounts in Thousands, Except for Shares)
Security Description | | Shares | | Value | |
Close Brothers Group PLC | | | 642,830 | | | $ | 14,914 | | |
CMC Markets PLC (d) | | | 518,529 | | | | 3,623 | | |
Intermediate Capital Group PLC | | | 395,322 | | | | 11,711 | | |
Legal & General Group PLC | | | 4,681,603 | | | | 18,849 | | |
Standard Chartered PLC | | | 1,057,655 | | | | 7,598 | | |
| | | | 63,717 | | |
Health Care (0.7%): | |
Advanced Medical Solutions Group PLC | | | 613,350 | | | | 2,385 | | |
AstraZeneca PLC | | | 19,262 | | | | 2,193 | | |
EKF Diagnostics Holdings PLC | | | 1,989,087 | | | | 2,209 | | |
Ergomed PLC (b) | | | 192,616 | | | | 3,382 | | |
Hikma Pharmaceuticals PLC | | | 59,997 | | | | 2,079 | | |
Smith & Nephew PLC | | | 337,977 | | | | 7,350 | | |
Tristel PLC | | | 222,075 | | | | 1,924 | | |
| | | | 21,522 | | |
Industrials (2.0%): | |
Ashtead Group PLC | | | 352,545 | | | | 25,671 | | |
Avon Rubber PLC | | | 93,933 | | | | 4,097 | | |
Babcock International Group PLC (b) | | | 517,485 | | | | 2,190 | | |
BAE Systems PLC | | | 1,310,341 | | | | 9,745 | | |
Concentric AB | | | 153,993 | | | | 3,355 | | |
Judges Scientific PLC | | | 62,976 | | | | 5,644 | | |
Porvair PLC | | | 182,102 | | | | 1,480 | | |
Renew Holdings PLC | | | 364,203 | | | | 3,290 | | |
Robert Walters PLC | | | 348,391 | | | | 3,303 | | |
SThree PLC | | | 617,434 | | | | 3,657 | | |
Volex PLC | | | 665,724 | | | | 3,232 | | |
| | | | 65,664 | | |
Information Technology (0.4%): | |
Aptitude Software Group PLC | | | 378,291 | | | | 3,239 | | |
GB Group PLC | | | 262,773 | | | | 3,457 | | |
Kainos Group PLC | | | 270,035 | | | | 5,442 | | |
| | | | 12,138 | | |
Materials (2.6%): | |
Anglo American PLC | | | 325,286 | | | | 14,425 | | |
Croda International PLC | | | 161,077 | | | | 15,931 | | |
Evraz PLC | | | 1,596,214 | | | | 14,349 | | |
Rio Tinto PLC | | | 374,410 | | | | 32,181 | | |
Treatt PLC | | | 368,496 | | | | 5,985 | | |
| | | | 82,871 | | |
Real Estate (0.2%): | |
Land Securities Group PLC | | | 201,597 | | | | 2,002 | | |
The British Land Co. PLC | | | 303,708 | | | | 2,191 | | |
Watkin Jones PLC | | | 878,435 | | | | 2,796 | | |
| | | | 6,989 | | |
See notes to financial statements.
26
USAA Mutual Funds Trust
USAA International Fund | | Schedule of Portfolio Investments — continued
May 31, 2021 | |
(Amounts in Thousands, Except for Shares)
Security Description | | Shares | | Value | |
Utilities (0.1%): | |
Centrica PLC (b) | | | 2,418,313 | | | $ | 1,869 | | |
| | | | 458,143 | | |
Total Common Stocks (Cost $2,477,843) | | | 3,193,711 | | |
Exchange-Traded Funds (0.2%) | |
United States (0.2%): | |
iShares Core MSCI EAFE ETF | | | 47,614 | | | | 3,657 | | |
iShares Core MSCI Emerging Markets ETF | | | 8,375 | | | | 558 | | |
iShares MSCI EAFE Small-Cap ETF | | | 31,603 | | | | 2,406 | | |
| | | | 6,621 | | |
Total Exchange-Traded Funds (Cost $6,353) | | | 6,621 | | |
Collateral for Securities Loaned^ (5.3%) | |
United States (5.3%): | |
Fidelity Investments Money Market Government Portfolio
Institutional Shares, 0.01% (f) | | | 31,350,317 | | | | 31,350 | | |
Goldman Sachs Financial Square Government Fund
Institutional Shares, 0.03% (f) | | | 9,723,970 | | | | 9,724 | | |
HSBC U.S. Government Money Market Fund I Shares, 0.03% (f) | | | 130,078,324 | | | | 130,079 | | |
Total Collateral for Securities Loaned (Cost $171,153) | | | 171,153 | | |
Total Investments (Cost $2,655,349) — 103.6% | | | 3,371,485 | | |
Liabilities in excess of other assets — (3.6)% | | | (117,588 | ) | |
NET ASSETS — 100.00% | | $ | 3,253,897 | | |
^ Purchased with cash collateral from securities on loan.
(a) Amount represents less than 0.05% of net assets.
(b) Non-income producing security.
(c) All or a portion of this security is on loan.
(d) Rule 144A security or other security that is restricted as to resale to institutional investors. The Fund's Adviser has deemed this security to be liquid based upon procedures approved by the Board of Trustees. As of May 31, 2021, the fair value of these securities was $26,907 (thousands) and amounted to 0.8% of net assets.
(e) Rounds to less than $1 thousand.
(f) Rate disclosed is the daily yield on May 31, 2021.
ADR — American Depositary Receipt
ETF — Exchange-Traded Fund
PCL — Public Company Limited
PLC — Public Limited Company
REIT — Real Estate Investment Trust
See notes to financial statements.
27
USAA Mutual Funds Trust | | Statement of Assets and Liabilities
May 31, 2021 | |
(Amounts in Thousands, Except Per Share Amounts)
| | | USAA International
Fund | |
Assets: | |
Investments, at value (Cost $2,655,349) | | $ | 3,371,485 | (a) | |
Foreign currency, at value (Cost $11,312) | | | 11,316 | | |
Cash | | | 24,050 | | |
Receivables: | |
Interest and dividends | | | 13,200 | | |
Capital shares issued | | | 779 | | |
Investments sold | | | 4,129 | | |
Reclaims | | | 7,544 | | |
From Adviser | | | 135 | | |
Prepaid expenses | | | 22 | | |
Total Assets | | | 3,432,660 | | |
Liabilities: | |
Payables: | |
Collateral received on loaned securities | | | 171,153 | | |
Investments purchased | | | 3,608 | | |
Capital shares redeemed | | | 641 | | |
Accrued foreign capital gains taxes | | | 533 | | |
Accrued expenses and other payables: | |
Investment advisory fees | | | 1,919 | | |
Administration fees | | | 342 | | |
Custodian fees | | | 127 | | |
Transfer agent fees | | | 276 | | |
Compliance fees | | | 2 | | |
Trustees' fees | | | 1 | | |
| 12b-1 fees | | | — | (b) | |
Other accrued expenses | | | 161 | | |
Total Liabilities | | | 178,763 | | |
Net Assets: | |
Capital | | | 2,434,651 | | |
Total accumulated earnings/(loss) | | | 819,246 | | |
Net Assets | | $ | 3,253,897 | | |
Net Assets | |
Fund Shares | | $ | 1,608,436 | | |
Institutional Shares | | | 1,644,340 | | |
Class A | | | 1,093 | | |
Class R6 | | | 28 | | |
Total | | $ | 3,253,897 | | |
Shares (unlimited number of shares authorized with no par value): | |
Fund Shares | | | 54,606 | | |
Institutional Shares | | | 56,013 | | |
Class A | | | 37 | | |
Class R6 | | | 1 | | |
Total | | | 110,657 | | |
(continues on next page)
See notes to financial statements.
28
USAA Mutual Funds Trust | | Statement of Assets and Liabilities
May 31, 2021 | |
(Amounts in Thousands, Except Per Share Amounts) (continued)
| | | USAA International
Fund | |
Net asset value, offering and redemption price per share: (c) | |
Fund Shares | | $ | 29.46 | | |
Institutional Shares | | $ | 29.36 | | |
Class A | | $ | 29.25 | | |
Class R6 | | $ | 29.65 | | |
Maximum Sales Charge — Class A | | | 5.75 | % | |
Maximum offering price
(100%/(100%-maximum sales charge) of net asset value adjusted to
the nearest cent) per share — Class A | | $ | 31.04 | | |
(a) Includes $165,346 of securities on loan.
(b) Rounds to less than $1 thousand.
(c) Per share amount may not recalculate due to rounding of net assets and/or shares outstanding.
See notes to financial statements.
29
USAA Mutual Funds Trust | | Statement of Operations
For the Year Ended May 31, 2021 | |
(Amounts in Thousands)
| | | USAA International
Fund | |
Investment Income: | |
Dividends | | $ | 99,069 | | |
Interest | | | 11 | | |
Securities lending (net of fees) | | | 792 | | |
Foreign tax withholding | | | (9,718 | ) | |
Total Income | | | 90,154 | | |
Expenses: | |
Investment advisory fees | | | 21,394 | | |
Administration fees — Fund Shares | | | 2,239 | | |
Administration fees — Institutional Shares | | | 1,555 | | |
Administration fees — Class A | | | 10 | | |
Administration fees — R6 | | | 2 | | |
Sub-Administration fees | | | 91 | | |
| 12b-1 fees — Class A | | | 17 | | |
Custodian fees | | | 803 | | |
Transfer agent fees — Fund Shares | | | 1,854 | | |
Transfer agent fees — Institutional Shares | | | 1,555 | | |
Transfer agent fees — Class A | | | 6 | | |
Transfer agent fees — Class R6 | | | — | (a) | |
Trustees' fees | | | 52 | | |
Compliance fees | | | 19 | | |
Legal and audit fees | | | 213 | | |
State registration and filing fees | | | 83 | | |
Interfund lending fees | | | 1 | | |
Interest fees | | | 20 | | |
Other expenses | | | 411 | | |
Total Expenses | | | 30,325 | | |
Expenses waived/reimbursed by Adviser | | | (446 | ) | |
Net Expenses | | | 29,879 | | |
Net Investment Income (Loss) | | | 60,275 | | |
Realized/Unrealized Gains (Losses) from Investments: | |
Net realized gains (losses) from investment securities and foreign currency
translations | | | 194,594 | | |
Foreign taxes on realized gains | | | (169 | ) | |
Net change in unrealized appreciation/depreciation on investment securities
and foreign currency translations | | | 765,064 | | |
Net change in accrued foreign taxes on unrealized gains | | | (515 | ) | |
Net realized/unrealized gains (losses) on investments | | | 958,974 | | |
Change in net assets resulting from operations | | $ | 1,019,249 | | |
(a) Rounds to less than $1 thousand.
See notes to financial statements.
30
USAA Mutual Funds Trust | | Statements of Changes in Net Assets | |
(Amounts in Thousands)
| | | USAA International Fund | |
| | | Year
Ended
May 31,
2021 | | Year
Ended
May 31,
2020 | |
From Investments: | |
Operations: | |
Net investment income (loss) | | $ | 60,275 | | | $ | 58,220 | | |
Net realized gains (losses) from investments | | | 194,425 | | | | 554,267 | | |
Net change in unrealized appreciation/depreciation on
investments | | | 764,549 | | | | (769,995 | ) | |
Change in net assets resulting from operations | | | 1,019,249 | | | | (157,508 | ) | |
Distributions to Shareholders: | |
Fund Shares | | | (28,796 | ) | | | (374,850 | ) | |
Institutional Shares | | | (31,477 | ) | | | (364,227 | ) | |
Class A | | | (127 | ) | | | (1,941 | ) | |
Class R6 | | | (87 | ) | | | (1,190 | ) | |
Change in net assets resulting from distributions to shareholders | | | (60,487 | ) | | | (742,208 | ) | |
Change in net assets resulting from capital transactions | | | (537,018 | ) | | | 49,137 | | |
Change in net assets | | | 421,744 | | | | (850,579 | ) | |
Net Assets: | |
Beginning of period | | | 2,832,153 | | | | 3,682,732 | | |
End of period | | $ | 3,253,897 | | | $ | 2,832,153 | | |
(continues on next page)
See notes to financial statements.
31
USAA Mutual Funds Trust | | Statements of Changes in Net Assets | |
(Amounts in Thousands) (continued)
| | | USAA International Fund | |
| | | Year
Ended
May 31,
2021 | | Year
Ended
May 31,
2020 | |
Capital Transactions: | |
Fund Shares | |
Proceeds from shares issued | | $ | 80,765 | | | $ | 168,101 | | |
Distributions reinvested | | | 28,329 | | | | 367,804 | | |
Cost of shares redeemed | | | (359,583 | ) | | | (369,347 | ) | |
Total Fund Shares | | $ | (250,489 | ) | | $ | 166,558 | | |
Institutional Shares | |
Proceeds from shares issued | | $ | 78,811 | | | $ | 226,207 | | |
Distributions reinvested | | | 31,451 | | | | 363,973 | | |
Cost of shares redeemed | | | (384,872 | ) | | | (708,658 | ) | |
Total Institutional Shares | | $ | (274,610 | ) | | $ | (118,478 | ) | |
Class A | |
Proceeds from shares issued | | $ | 6,788 | | | $ | 1,350 | | |
Distributions reinvested | | | 16 | | | | 309 | | |
Cost of shares redeemed | | | (14,243 | ) | | | (727 | ) | |
Total Class A | | $ | (7,439 | ) | | $ | 932 | | |
Class R6 | |
Proceeds from shares issued | | $ | 50 | | | $ | 938 | | |
Distributions reinvested | | | — | (a) | | | 172 | | |
Cost of shares redeemed | | | (4,530 | ) | | | (985 | ) | |
Total Class R6 | | $ | (4,480 | ) | | $ | 125 | | |
Change in net assets resulting from capital transactions | | $ | (537,018 | ) | | $ | 49,137 | | |
Share Transactions: | |
Fund Shares | |
Issued | | | 3,115 | | | | 6,674 | | |
Reinvested | | | 1,111 | | | | 13,947 | | |
Redeemed | | | (14,241 | ) | | | (14,914 | ) | |
Total Fund Shares | | | (10,015 | ) | | | 5,707 | | |
Institutional Shares | |
Issued | | | 3,189 | | | | 9,486 | | |
Reinvested | | | 1,238 | | | | 13,849 | | |
Redeemed | | | (15,106 | ) | | | (25,837 | ) | |
Total Institutional Shares | | | (10,679 | ) | | | (2,502 | ) | |
Class A | |
Issued | | | 305 | | | | 47 | | |
Reinvested | | | 1 | | | | 12 | | |
Redeemed | | | (568 | ) | | | (30 | ) | |
Total Class A | | | (262 | ) | | | 29 | | |
Class R6 | |
Issued | | | 2 | | | | 31 | | |
Reinvested | | | — | (b) | | | 6 | | |
Redeemed | | | (157 | ) | | | (37 | ) | |
Total Class R6 | | | (155 | ) | | | — | (b) | |
Change in Shares | | | (21,111 | ) | | | 3,234 | | |
(a) Rounds to less than $1 thousand.
(b) Rounds to less than 500 shares.
See notes to financial statements.
32
This page is intentionally left blank.
33
USAA Mutual Funds Trust | | Financial Highlights | |
For a Share Outstanding Throughout Each Period
| | | | | Investment Activities | | Distributions to
Shareholders From | |
| | | Net Asset
Value,
Beginning of
Period | | Net
Investment
Income
(Loss) | | Net Realized
and Unrealized
Gains (Losses)
on Investments | | Total from
Investment
Activities | | Net
Investment
Income | | Net Realized
Gains From
Investments | |
USAA International Fund | |
Fund Shares | |
Year Ended:
May 31, 2021 | | $ | 21.53 | | | | 0.49 | (e) | | | 7.94 | | | | 8.43 | | | | (0.50 | ) | | | — | | |
May 31, 2020 | | $ | 28.70 | | | | 0.44 | (e) | | | (1.12 | ) | | | (0.68 | ) | | | (0.73 | ) | | | (5.76 | ) | |
May 31, 2019 | | $ | 32.82 | | | | 0.53 | | | | (2.41 | ) | | | (1.88 | ) | | | (0.44 | ) | | | (1.80 | ) | |
May 31, 2018 | | $ | 31.16 | | | | 0.60 | | | | 2.08 | | | | 2.68 | | | | (0.63 | ) | | | (0.39 | ) | |
May 31, 2017 | | $ | 26.40 | | | | 0.42 | | | | 4.76 | | | | 5.18 | | | | (0.42 | ) | | | — | | |
Institutional Shares | |
Year Ended:
May 31, 2021 | | $ | 21.46 | | | | 0.51 | (e) | | | 7.91 | | | | 8.42 | | | | (0.52 | ) | | | — | | |
May 31, 2020 | | $ | 28.61 | | | | 0.47 | (e) | | | (1.12 | ) | | | (0.65 | ) | | | (0.74 | ) | | | (5.76 | ) | |
May 31, 2019 | | $ | 32.72 | | | | 0.56 | | | | (2.41 | ) | | | (1.85 | ) | | | (0.46 | ) | | | (1.80 | ) | |
May 31, 2018 | | $ | 31.07 | | | | 0.64 | | | | 2.06 | | | | 2.70 | | | | (0.66 | ) | | | (0.39 | ) | |
May 31, 2017 | | $ | 26.34 | | | | 0.45 | | | | 4.74 | | | | 5.19 | | | | (0.46 | ) | | | — | | |
Class A | |
Year Ended:
May 31, 2021 | | $ | 21.39 | | | | 0.37 | (e) | | | 7.93 | | | | 8.30 | | | | (0.44 | ) | | | — | | |
May 31, 2020 | | $ | 28.58 | | | | 0.36 | (e) | | | (1.10 | ) | | | (0.74 | ) | | | (0.69 | ) | | | (5.76 | ) | |
May 31, 2019 | | $ | 32.67 | | | | 0.47 | | | | (2.41 | ) | | | (1.94 | ) | | | (0.35 | ) | | | (1.80 | ) | |
May 31, 2018 | | $ | 31.04 | | | | 0.53 | | | | 2.04 | | | | 2.57 | | | | (0.55 | ) | | | (0.39 | ) | |
May 31, 2017 | | $ | 26.31 | | | | 0.35 | | | | 4.74 | | | | 5.09 | | | | (0.36 | ) | | | — | | |
Class R6 | |
Year Ended: | |
May 31, 2021 | | $ | 21.52 | | | | 0.49 | (e) | | | 8.19 | | | | 8.68 | | | | (0.55 | ) | | | — | | |
May 31, 2020 | | $ | 28.66 | | | | 0.49 | (e) | | | (1.12 | ) | | | (0.63 | ) | | | (0.75 | ) | | | (5.76 | ) | |
August 17, 2018 (h)
through May 31, 2019 | | $ | 32.01 | | | | 0.52 | (e) | | | (1.54 | ) | | | (1.02 | ) | | | (0.53 | ) | | | (1.80 | ) | |
* Assumes reinvestment of all net investment income and realized capital gain distributions, if any, during the period. Includes adjustments in accordance with U.S. Generally Accepted Accounting Principles and could differ from the Lipper reported return.
^ The net expense ratio may not correlate to the applicable expense limits in place during the period since the current contractual expense limitation is applied for a period beginning July 1, 2020 and in effect through June 30, 2023, instead of coinciding with the Fund's fiscal year end. Details of the current contractual expense limitation in effect can be found in Note 5 of the accompanying Notes to Financial Statements.
(a) Not annualized for periods less than one year.
(b) Annualized for periods less than one year.
See notes to financial statements.
34
USAA Mutual Funds Trust | | Financial Highlights — continued | |
For a Share Outstanding Throughout Each Period
| | | | | Ratios to Average Net Assets | | Supplemental Data | |
| | | Total
Distributions | | Net Asset
Value,
End of
Period | | Total
Return
(Excludes
Sales
Charge)*(a) | | Net
Expenses^(b)(c) | | Net
Investment
Income
(Loss)(b) | | Gross
Expenses(b)(c) | | Net Assets,
End of
Period
(000's) | | Portfolio
Turnover(a)(d) | |
USAA International Fund | |
Fund Shares | |
Year Ended:
May 31, 2021 | | | (0.50 | ) | | $ | 29.46 | | | | 39.52 | % | | | 1.01 | % | | | 1.94 | % | | | 1.03 | % | | $ | 1,608,436 | | | | 67 | %(f) | |
May 31, 2020 | | | (6.49 | ) | | $ | 21.53 | | | | (6.13 | )% | | | 1.06 | % | | | 1.68 | % | | | 1.07 | % | | $ | 1,391,279 | | | | 119 | %(g) | |
May 31, 2019 | | | (2.24 | ) | | $ | 28.70 | | | | (5.14 | )% | | | 1.08 | % | | | 1.76 | % | | | 1.08 | % | | $ | 1,690,782 | | | | 30 | % | |
May 31, 2018 | | | (1.02 | ) | | $ | 32.82 | | | | 8.61 | % | | | 1.08 | % | | | 1.58 | % | | | 1.08 | % | | $ | 1,876,020 | | | | 36 | % | |
May 31, 2017 | | | (0.42 | ) | | $ | 31.16 | | | | 19.87 | % | | | 1.11 | % | | | 1.33 | % | | | 1.11 | % | | $ | 1,696,372 | | | | 40 | % | |
Institutional Shares | |
Year Ended:
May 31, 2021 | | | (0.52 | ) | | $ | 29.36 | | | | 39.61 | % | | | 0.94 | % | | | 2.00 | % | | | 0.95 | % | | $ | 1,644,340 | | | | 67 | %(f) | |
May 31, 2020 | | | (6.50 | ) | | $ | 21.46 | | | | (6.05 | )% | | | 0.99 | % | | | 1.77 | % | | | 0.99 | % | | $ | 1,431,107 | | | | 119 | %(g) | |
May 31, 2019 | | | (2.26 | ) | | $ | 28.61 | | | | (5.06 | )% | | | 1.00 | % | | | 1.81 | % | | | 1.00 | % | | $ | 1,979,758 | | | | 30 | % | |
May 31, 2018 | | | (1.05 | ) | | $ | 32.72 | | | | 8.68 | % | | | 1.00 | % | | | 1.62 | % | | | 1.00 | % | | $ | 2,349,281 | | | | 36 | % | |
May 31, 2017 | | | (0.46 | ) | | $ | 31.07 | | | | 19.97 | % | | | 1.00 | % | | | 1.43 | % | | | 1.00 | % | | $ | 2,308,470 | | | | 40 | % | |
Class A | |
Year Ended:
May 31, 2021 | | | (0.44 | ) | | $ | 29.25 | | | | 39.11 | % | | | 1.30 | % | | | 1.47 | % | | | 1.56 | % | | $ | 1,093 | | | | 67 | %(f) | |
May 31, 2020 | | | (6.45 | ) | | $ | 21.39 | | | | (6.37 | )% | | | 1.35 | % | | | 1.37 | % | | | 1.39 | % | | $ | 6,402 | | | | 119 | %(g) | |
May 31, 2019 | | | (2.15 | ) | | $ | 28.58 | | | | (5.39 | )% | | | 1.35 | % | | | 1.52 | % | | | 1.41 | % | | $ | 7,715 | | | | 30 | % | |
May 31, 2018 | | | (0.94 | ) | | $ | 32.67 | | | | 8.29 | % | | | 1.35 | % | | | 1.29 | % | | | 1.42 | % | | $ | 8,101 | | | | 36 | % | |
May 31, 2017 | | | (0.36 | ) | | $ | 31.04 | | | | 19.58 | % | | | 1.35 | % | | | 1.08 | % | | | 1.51 | % | | $ | 7,540 | | | | 40 | % | |
Class R6 | |
Year Ended: | |
May 31, 2021 | | | (0.55 | ) | | $ | 29.65 | | | | 40.78 | % | | | 0.80 | % | | | 1.95 | % | | | 1.22 | % | | $ | 28 | | | | 67 | %(f) | |
May 31, 2020 | | | (6.51 | ) | | $ | 21.52 | | | | (5.95 | )% | | | 0.85 | % | | | 1.83 | % | | | 1.18 | % | | $ | 3,365 | | | | 119 | %(g) | |
August 17, 2018 (h)
through May 31, 2019 | | | (2.33 | ) | | $ | 28.66 | | | | (2.55 | )% | | | 0.85 | % | | | 2.19 | % | | | 2.03 | % | | $ | 4,477 | | | | 30 | % | |
(c) Reflects total annual operating expenses for reductions of expenses paid indirectly for the May 31 fiscal years ended 2020, 2019, 2018, and 2017. Expenses paid indirectly decreased the expense ratio for each of these respective years by less than 0.01%.
(d) Portfolio turnover is calculated on the basis of the Fund as a whole without distinguishing between the classes of shares issued.
(e) Per share net investment income (loss) has been calculated using the average daily shares method.
(f) Reflects a return to normal trading levels after a prior year transition.
(g) Reflects increased trading activity due to current year transition or asset allocation shift.
(h) Commencement of operations.
See notes to financial statements.
35
USAA Mutual Funds Trust | | Notes to Financial Statements
May 31, 2021 | |
1. Organization:
USAA Mutual Funds Trust (the "Trust") is organized as a Delaware statutory trust and is registered under the Investment Company Act of 1940, as amended (the "1940 Act"), as an open-end investment company. The Trust is comprised of 46 funds and is authorized to issue an unlimited number of shares, which are units of beneficial interest with no par value.
The accompanying financial statements are those of the USAA International Fund (the "Fund"). The Fund offers four classes of shares: Fund Shares, Institutional Shares, Class A, and Class R6. The Fund is classified as diversified under the 1940 Act.
Effective June 29, 2020, the Fund's Adviser Shares were redesignated Class A and became subject to a front-end sales charge.
Each class of shares of the Fund has substantially identical rights and privileges, except with respect to sales charges, fees paid under distribution plans, expenses allocable exclusively to each class of shares, voting rights on matters solely affecting a single class of shares, and the exchange privilege of each class of shares.
Under the Trust's organizational documents, its officers and trustees are indemnified against certain liabilities arising out of the performance of their duties to the Fund. In addition, in the normal course of business, the Fund enters into contracts with its vendors and others that provide for general indemnifications. The Fund's maximum exposure under these arrangements is unknown, as this would involve future claims that may be made against the Fund. However, based on experience, the Fund expects that risk of loss to be remote.
2. Significant Accounting Policies:
The following is a summary of significant accounting policies followed by the Trust in the preparation of its financial statements. The policies are in conformity with Generally Accepted Accounting Principles in the United States of America ("GAAP"). The preparation of financial statements in accordance with GAAP requires management to make estimates and assumptions that affect the reported amounts of assets and liabilities and disclosure of contingent assets and liabilities at the date of the financial statements and the reported amounts of income and expenses for the period. Actual results could differ from those estimates. The Fund follows the specialized accounting and reporting requirements under GAAP that are applicable to investment companies under Accounting Standards Codification Topic 946.
Investment Valuation:
The Fund records investments at fair value. Fair value is defined as the price that would be received to sell an asset or paid to transfer a liability in an orderly transaction between market participants at the measurement date.
The valuation techniques described below maximize the use of observable inputs and minimize the use of unobservable inputs in determining fair value. The inputs used for valuing the Fund's investments are summarized in the three broad levels listed below:
• Level 1 — quoted prices in active markets for identical securities
• Level 2 — other significant observable inputs (including quoted prices for similar securities or interest rates applicable to those securities, etc.)
• Level 3 — significant unobservable inputs (including the Fund's own assumptions in determining the fair value of investments)
Changes in valuation techniques may result in transfers in or out of an assigned level within the disclosure hierarchy. The inputs or methodologies used for valuation techniques are not necessarily an indication of the risks associated with entering into those investments.
Victory Capital Management Inc. ("VCM" or the "Adviser") has established the Pricing and Liquidity Committee (the "Committee"), and subject to the Trust's Board of Trustees (the "Board") oversight, the
36
USAA Mutual Funds Trust | | Notes to Financial Statements — continued
May 31, 2021 | |
Committee administers and oversees the Fund's valuation policies and procedures, which are approved by the Board.
Portfolio securities listed or traded on securities exchanges, including Exchange-Traded Funds ("ETFs"), American Depositary Receipts ("ADRs"), and Rights are valued at the closing price on the exchange or system where the security is principally traded, if available, or at the Nasdaq Official Closing Price. If there have been no sales for that day on the exchange or system, then a security is valued at the last available bid quotation on the exchange or system where the security is principally traded. In each of these situations, valuations are typically categorized as Level 1 in the fair value hierarchy.
Investments in open-end investment companies are valued at their net asset value ("NAV"). These valuations are typically categorized as Level 1 in the fair value hierarchy.
In the event that price quotations or valuations are not readily available, investments are valued at fair value in accordance with procedures established by and under the general supervision and responsibility of the Board. These valuations are typically categorized as Level 2 or Level 3 in the fair value hierarchy, based on the observability of inputs used to determine the fair value. The effect of fair value pricing is that securities may not be priced on the basis of quotations from the primary market in which they are traded and the actual price realized from the sale of a security may differ materially from the fair value price. Valuing these securities at fair value is intended to cause the Fund's NAV to be more reliable than it otherwise would be.
In accordance with procedures adopted by the Board, fair value pricing may be used if events materially affecting the value of foreign securities occur between the time the exchange on which they are traded closes and the time the Fund's NAV is calculated. The Fund uses a systematic valuation model, provided daily by an independent third party to fair value its international equity securities. The valuations are considered as Level 2 in the fair value hierarchy.
A summary of the valuations as of May 31, 2021, based upon the three levels defined above, is included in the table below while the breakdown, by category, of investments is disclosed on the Schedule of Portfolio Investments (amounts in thousands):
| | | Level 1 | | Level 2 | | Level 3 | | Total | |
Common Stocks | | $ | 103,791 | | | $ | 3,089,920 | | | $ | — | | | $ | 3,193,711 | | |
Exchange-Traded Funds | | | 6,621 | | | | — | | | | — | | | | 6,621 | | |
Collateral for Securities Loaned | | | 171,153 | | | | — | | | | — | | | | 171,153 | | |
Total | | $ | 281,565 | | | $ | 3,089,920 | | | $ | — | | | $ | 3,371,485 | | |
For the year ended May 31, 2021, there were no transfers in or out of Level 3 in the fair value hierarchy.
Real Estate Investment Trusts ("REITs"):
The Fund may invest in REITs, which report information on the source of their distributions annually. REITs are pooled investment vehicles that invest primarily in income producing real estate or real estate related loans or interests (such as mortgages). Certain distributions received from REITs during the year are recorded as realized gains or return of capital as estimated by the Fund or when such information becomes known.
Investment Companies:
Exchange-Traded Funds:
The Fund may invest in ETFs, the shares of which are bought and sold on a securities exchange. An ETF trades like common stock and represents a fixed portfolio of securities often designed to track the performance and dividend yield of a particular domestic or foreign market index. The Fund may purchase shares of an ETF to temporarily gain exposure to a portion of the U.S. or a foreign market while awaiting purchase of underlying securities. The risks of owning an ETF generally reflect the risks of owning the underlying securities they are designed to track, although the lack of liquidity of an
37
USAA Mutual Funds Trust | | Notes to Financial Statements — continued
May 31, 2021 | |
ETF could result in it being more volatile. Additionally, ETFs have fees and expenses that reduce their value.
Open-End Funds:
The Fund may invest in portfolios of open-end investment companies. These investment companies value securities in their portfolios for which market quotations are readily available at their market values (generally the last reported sale price) and all other securities and assets at their fair value by the methods established by the board of directors of the underlying funds.
Foreign Exchange Currency Contracts:
The Fund may enter into foreign exchange currency contracts to convert U.S. dollars to and from various foreign currencies. A foreign exchange currency contract is an obligation by the Fund to purchase or sell a specific currency at a future date at a price (in U.S. dollars) set at the time of the contract. The Fund does not engage in "cross-currency" foreign exchange contracts (i.e., contracts to purchase or sell one foreign currency in exchange for another foreign currency). The Fund's foreign exchange currency contracts might be considered spot contracts (typically a contract of one week or less) or forward contracts (typically a contract term over one week). A spot contract is entered into for purposes of hedging against foreign currency fluctuations relating to a specific portfolio transaction, such as the delay between a security transaction trade date and settlement date. Forward contracts are entered into for purposes of hedging portfolio holdings or concentrations of such holdings. Each foreign exchange currency contract is adjusted daily by the prevailing spot or forward rate of the underlying currency, and any appreciation or depreciation is recorded for financial statement purposes as unrealized until the contract settlement date, at which time the Fund records realized gains or losses equal to the difference between the value of a contract at the time it was opened and the value at the time it was closed. The Fund could be exposed to risk if a counterparty is unable to meet the terms of a foreign exchange currency contract or if the value of the foreign currency changes unfavorably. In addition, the use of foreign exchange currency contracts does not eliminate fluctuations in the underlying prices of the securities. As of May 31, 2021, the Fund had no open forward foreign exchange currency contracts.
Investment Transactions and Related Income:
Changes in holdings of investments are accounted for no later than one business day following the trade date. For financial reporting purposes, however, investment transactions are accounted for on trade date on the last business day of the reporting period. Interest income is determined on the basis of coupon interest accrued using the effective interest method which adjusts, where applicable, the amortization of premiums or accretion of discount. Dividend income is recorded on the ex-dividend date. Gains or losses realized on sales of securities are recorded on the identified cost basis.
Withholding taxes on interest, dividends, and gains as a result of certain investments in ADRs by the Fund have been provided for in accordance with each investment's applicable country's tax rules and rates.
Securities Lending:
The Fund, through a securities lending agreement with Citibank, N.A. ("Citibank"), may lend its securities to qualified financial institutions, such as certain broker-dealers, to earn additional income, net of income retained by Citibank. Borrowers are required to secure their loans for collateral in the amount of at least 102% of the value of U.S. securities loaned or at least 105% of the value of non-U.S. securities loaned, marked-to-market daily. Any collateral shortfalls associated with increases in the valuation of the securities loaned are cured the next business day once the shortfall exceeds $100 thousand. Collateral may be cash, U.S. government securities, or other securities as permitted by Securities and Exchange Commission ("SEC") guidelines. Cash collateral may be invested in high-quality short-term investments, primarily open-end investment companies. Collateral requirements are determined daily based on the value of the Fund's securities on loan as of the end of the prior business day. During the
38
USAA Mutual Funds Trust | | Notes to Financial Statements — continued
May 31, 2021 | |
time portfolio securities are on loan, the borrower will pay the Fund any dividends or interest paid on such securities plus any fee negotiated between the parties to the lending agreement. The Fund also earns a return from the collateral. The Fund pays Citibank various fees in connection with the investment of cash collateral and fees based on the investment income received from securities lending activities. Securities lending income (net of these fees) is disclosed on the Statement of Operations. Loans are terminable upon demand and the borrower must return the loaned securities within the lesser of one standard settlement period or five business days. Risks relating to securities-lending transactions include that the borrower may not provide additional collateral when required or return the securities when due, and that the value of the short-term investments will be less than the amount of cash collateral required to be returned to the borrower. The Fund's agreement with Citibank does not include master netting provisions. Non-cash collateral received by the Fund may not be sold or re-pledged, except to satisfy borrower default. Cash collateral is listed on the Fund's Schedule of Portfolio Investments and Financial Statements while non-cash collateral is not included.
The following table (amounts in thousands) is a summary of the Fund's securities lending transactions as of May 31, 2021.
Value of
Securities on Loan | | Non-Cash Collateral | | Cash Collateral | |
| $ | 165,346 | | | $ | — | | | $ | 171,153 | | |
Foreign Currency Translations:
The accounting records of the Fund are maintained in U.S. dollars. Investment securities and other assets and liabilities of the Fund denominated in a foreign currency are translated into U.S. dollars at current exchange rates. Purchases and sales of securities, income receipts, and expense payments are translated into U.S. dollars at the exchange rates on the date of the transactions. The Fund does not isolate the portion of the results of operations resulting from changes in foreign exchange rates on investments from fluctuations arising from changes in market prices of securities held. Such fluctuations are disclosed as net change in unrealized appreciation/depreciation on investments and foreign currency translations on the Statement of Operations. Any realized gains or losses from these fluctuations, including foreign currency arising from in-kind redemptions, are disclosed as net realized gains or losses from investment transactions and foreign currency translations on the Statement of Operations.
Foreign Taxes:
The Fund may be subject to foreign taxes related to foreign income received (a portion of which may be reclaimable), capital gains on the sale of securities, and certain foreign currency transactions. All foreign taxes are recorded in accordance with the applicable regulations and rates that exist in the foreign jurisdictions in which the Fund invests.
Federal Income Taxes:
It is the Fund's policy to continue to qualify as a regulated investment company by complying with the provisions available to certain investment companies, as defined in applicable sections of the Internal Revenue Code, and to make distributions of net investment income and net realized gains sufficient to relieve it from all, or substantially all, federal income taxes. Accordingly, no provision for federal income taxes is required in the financial statements. The Fund has a tax year end of May 31.
Management of the Fund has reviewed tax positions taken in tax years that remain subject to examination by all major tax jurisdictions, including federal (i.e., the last four tax years, which includes the current fiscal tax year end). Management believes that there is no tax liability resulting from unrecognized tax benefits related to uncertain tax positions taken.
Allocations:
Expenses directly attributable to the Fund are charged to the Fund, while expenses that are attributable to more than one fund in the Trust, or jointly with an affiliated trust, are allocated among the respective funds in the Trust and/or affiliated trust based upon net assets or another appropriate basis.
39
USAA Mutual Funds Trust | | Notes to Financial Statements — continued
May 31, 2021 | |
Income, expenses (other than class-specific expenses such as transfer agent fees, state registration fees, printing fees, and 12b-1 fees), and realized and unrealized gains or losses on investments are allocated to each class of shares based on its relative net assets on the date income is earned or expenses and realized and unrealized gains and losses are incurred.
3. Purchases and Sales:
Cost of purchases and proceeds from sales/maturities of securities (excluding securities maturing less than one year from acquisition) for the year ended May 31, 2021, were as follows for the Fund (amounts in thousands):
| | | Excluding
U.S. Government Securities | |
| | | Purchases | | Sales | |
| | | | | $ | 1,975,248 | | | $ | 2,520,295 | | |
There were no purchases or sales of U.S. government securities during the year ended May 31, 2021.
4. Affiliated Fund Ownership:
The Fund offers its shares for investment by other USAA Mutual Funds. The fund-of-funds do not invest in the underlying funds for the purpose of exercising management or control, and the affiliated fund-of-funds' annual and semi-annual reports may be viewed at vcm.com. As of May 31, 2021, certain fund-of-funds owned total outstanding shares of the Fund as follows:
Affiliated USAA Mutual Funds | | Ownership % | |
USAA Cornerstone Conservative Fund | | | 0.3 | | |
USAA Cornerstone Equity Fund | | | 1.0 | | |
USAA Target Retirement Income Fund | | | 0.0 | (a) | |
USAA Target Retirement 2040 Fund | | | 0.0 | (a) | |
USAA Target Retirement 2050 Fund | | | 0.0 | (a) | |
USAA Target Retirement 2060 Fund | | | 0.0 | (a) | |
(a) Amount is less than 0.05%.
5. Fees and Transactions with Affiliates and Related Parties:
Investment Advisory Fees:
Investment advisory services are provided to the Fund by the Adviser, which is a New York corporation registered as an investment adviser with the SEC. The Adviser is an indirect wholly owned subsidiary of Victory Capital Holdings, Inc., a publicly traded Delaware corporation, and a wholly owned direct subsidiary of Victory Capital Operating, LLC. Under the terms of the Investment Advisory Agreement, the Adviser is entitled to receive a base fee and a performance adjustment. The Fund's base fee is accrued daily and paid monthly at an annualized rate of 0.75% of the Fund's average daily net assets. Amounts incurred and paid to VCM for the year ended May 31, 2021, are reflected on the Statement of Operations as Investment Advisory fees.
On November 6, 2018, United Services Automobile Association ("USAA"), the parent company of USAA Asset Management Company ("AMCO"), the prior investment adviser to the Fund announced that AMCO would be acquired by Victory Capital Holdings Inc. (the "Transaction"). A special shareholder meeting was held on April 18, 2019, at which shareholders of the Fund approved a new investment advisory agreement between the Trust, on behalf of the Fund, and VCM. The Transaction closed on July 1, 2019, and effective July 1, 2019, VCM replaced AMCO as the investment adviser to the Fund and no performance adjustments were made for the period beginning July 1, 2019, through June 30, 2020. Only performance beginning as of July 1, 2019, and thereafter is utilized in calculating future performance adjustments.
40
USAA Mutual Funds Trust | | Notes to Financial Statements — continued
May 31, 2021 | |
The performance adjustment for each share class is accrued daily and calculated monthly by comparing each class' performance to that of the Lipper International Funds Index. The Lipper International Funds Index tracks the total return performance of the largest funds within the Lipper International Funds category.
The performance period for each share class consists of the current month plus the previous 35 months (or the number of months beginning July 1, 2019, if fewer). The following table is utilized to determine the extent of the performance adjustment:
Over/Under Performance Relative to Index
(in basis points)(a) | | Annual Adjustment Rate
(in basis points) | |
| | +/- 100 to 400 | | | | +/- 4 | | |
| | +/- 401 to 700 | | | | +/- 5 | | |
| | +/- 701 and greater | | | | +/- 6 | | |
(a) Based on the difference between average annual performance of the relevant share class of the Fund and its relevant Lipper index, rounded to the nearest basis point.
Each class' annual performance adjustment rate is multiplied by the average daily net assets of each respective class over the entire performance period, which is then multiplied by a fraction, the numerator of which is the number of days in the month and the denominator of which is 365 (366 in leap years). The resulting amount is then added to (in the case of overperformance), or subtracted from (in the case of underperformance) the base fee.
Under the performance fee arrangement, each class pays a positive performance fee adjustment for a performance period whenever the class outperforms the Lipper International Funds Index over that period, even if the class has overall negative returns during the performance period.
For the performance period July 1, 2020, to May 31, 2021, performance adjustments were $(758), $(776), $(4), and $(2) for Fund Shares, Institutional Shares, Class A, and Class R6, in thousands, respectively. Performance adjustments were (0.05)%, (0.05)%, (0.06)%, and (0.05)% for Fund Shares, Institutional Shares, Class A, and Class R6, respectively. The performance adjustment rate included in the investment advisory fee may differ from the maximum over/under Annual Adjustment Rate due to differences in average net assets for the reporting period and rolling 36 month performance periods.
The Trust relies on an exemptive order granted to VCM and its affiliated funds by the SEC in March 2019 permitting the use of a "manager-of-managers" structure for certain funds. Under a manager-of-managers structure, the investment adviser may select (with approval of the Board and without shareholder approval) one or more subadvisers to manage the day-to-day investment of a fund's assets.
VCM entered into Investment Subadvisory Agreements with Lazard Asset Management LLC ("Lazard") and Wellington Management Company LLP ("Wellington Management"). Lazard and Wellington Management each directed the investment and reinvestment of a portion of the Fund's assets (as allocated from time to time by VCM). These arrangements provide for monthly fees that are paid by VCM. VCM (not the Fund) pays the subadviser fees. Effective March 1, 2021, Lazard is no longer a subadviser to the Fund.
Administration and Servicing Fees:
VCM serves as the Fund's administrator and fund accountant. Under the Fund Administration, Servicing and Accounting Agreement, VCM is paid for its services an annual fee at a rate of 0.15%, 0.10%, 0.15%, and 0.05% of average daily net assets of the Fund Shares, Institutional Shares, Class A, and Class R6, respectively. Amounts incurred for the year ended May 31, 2021, are reflected on the Statement of Operations as Administration fees.
The Fund (as part of the Trust) has entered into an agreement to provide compliance services with the Adviser, pursuant to which the Adviser furnishes its compliance personnel, including the services of the Chief Compliance Officer ("CCO"), and other resources reasonably necessary to provide the Trust with compliance oversight services related to the design, administration and oversight of a compliance program for the Trust in accordance with Rule 38a-1 under the 1940 Act. The CCO is an employee of the Adviser, which pays the compensation of the CCO and support staff. Funds in the Trust, Victory
41
USAA Mutual Funds Trust | | Notes to Financial Statements — continued
May 31, 2021 | |
Variable Insurance Funds, Victory Portfolios, and Victory Portfolios II (collectively, the "Victory Funds Complex") in the aggregate, compensate the Adviser for these services. Amounts incurred for the year ended May 31, 2021, are reflected on the Statement of Operations as Compliance fees.
Citi Fund Services Ohio, Inc. ("Citi"), an affiliate of Citibank, acts as sub-administrator and sub-fund accountant to the Fund pursuant to a Sub-Administration and Sub-Fund Accounting Services Agreement between VCM and Citi. VCM pays Citi a fee for providing these services. The Fund reimburses VCM and Citi for out-of-pocket expenses incurred in providing these services and certain other expenses specifically allocated to the Fund. Amounts incurred for the year ended May 31, 2021, are reflected on the Statement of Operations as Sub-Administration fees.
Transfer Agency Fees:
Victory Capital Transfer Agency, Inc. ("VCTA"), an affiliate of the Adviser, provides transfer agency services to the Fund. VCTA provides transfer agent services to the Fund Shares based on an annual charge of $23 per shareholder account plus out-of-pocket expenses. VCTA pays a portion of these fees to certain intermediaries for the administration and servicing of accounts that are held with such intermediaries. Transfer agent's fees for Institutional Shares, Class A, and Class R6 are paid monthly based on a fee accrued daily at an annualized rate of 0.10%, 0.10%, and 0.01%, respectively, of average daily net assets, plus out-of-pocket expenses. Amounts incurred and paid to VCTA for the year ended May 31, 2021, are reflected on the Statement of Operations as Transfer Agent fees.
FIS Investor Services LLC serves as sub-transfer agent and dividend disbursing agent for the Fund pursuant to a Sub-Transfer Agent Agreement between VCTA and FIS Investor Services LLC. VCTA provides FIS Investor Services LLC a fee for providing these services.
Distributor/Underwriting Services:
Victory Capital Services, Inc. (the "Distributor"), an affiliate of the Adviser, serves as distributor for the continuous offering of the shares of the Fund pursuant to a Distribution Agreement between the Distributor and the Trust. Effective June 30, 2020, the Distributor's name was changed from Victory Capital Advisers, Inc.
Pursuant to the Distribution and Service Plans adopted in accordance with Rule 12b-1 under the 1940 Act, the Distributor may receive a monthly distribution and service fee, at an annual rate of up to 0.25% of the average daily net assets of Class A. The distribution and service fees paid to the Distributor may be used by the Distributor to pay for activity primarily intended to result in the sale of Class A of the Fund. Amounts incurred and paid to the Distributor for the year ended May 31, 2021, are reflected on the Statement of Operations as 12b-1 fees.
In addition, the Distributor is entitled to receive commissions on sales of Class A. For the year ended May 31, 2021, the Distributor received less than $1 thousand in commissions on the sales of Class A.
Other Fees:
Citibank serves as the Fund's custodian. The Fund pays Citibank a fee for providing these services. Amounts incurred for the year ended May 31, 2021, are reflected on the Statement of Operations as Custodian fees.
K&L Gates LLP provides legal services to the Trust.
The Adviser has entered into an expense limitation agreement with the Fund until at least June 30, 2023. Under the terms of the agreement, the Adviser has agreed to waive fees or reimburse certain expenses to the extent that ordinary operating expenses incurred by certain classes of the Fund in any fiscal year exceed the expense limit for such classes of the Fund. Such excess amounts will be the liability of the Adviser. Acquired fund fees and expenses, interest, taxes, brokerage commissions, other expenditures, that are capitalized in accordance with GAAP, and other extraordinary expenses not incurred in the ordinary course of the Fund's business are excluded from the expense limits. As of
42
USAA Mutual Funds Trust | | Notes to Financial Statements — continued
May 31, 2021 | |
May 31, 2021, the expense limits (excluding voluntary waivers) were 1.06%, 0.99%, 1.35% and 0.85% for Fund Shares, Institutional Shares, Class A, and Class R6, respectively.
Under the terms of the expense limitation agreement, amended May 1, 2021, the Fund has agreed to repay fees and expenses that were waived or reimbursed by the Adviser for a period of up to three years (thirty six (36) months) after the waiver or reimbursement took place, subject to the lesser of any operating expense limits in effect at the time of: (a) the original waiver or expense reimbursement; or (b) the recoupment, after giving effect to the recoupment amount. Prior to May 1, 2021, the Fund was permitted to recoup fees waived and expenses reimbursed for up to three years after the fiscal year in which the waiver or reimbursement took place, subject to the limitations above. This change did not have any effect on the amounts previously reported for recoupment.
As of May 31, 2021, the following amounts are available to be repaid to the Adviser (amounts in thousands). The Fund has not recorded any amounts available to be repaid as a liability due to an assessment that such repayment is not probable at May 31, 2021.
| Expires 2023 | | Expires 2024 | | Total | |
| $ | 91 | | | $ | 446 | | | $ | 537 | | |
The Adviser may voluntarily waive or reimburse additional fees to assist the Fund in maintaining competitive expense ratios. Voluntary waivers and reimbursements applicable to the Fund are not available to be recouped at a future time. There were no voluntary waivers or reimbursements for the year ended May 31, 2021.
Certain officers and/or interested trustees of the Fund are also officers and/or employees of the Adviser, administrator, fund accountant sub-administrator, sub-fund accountant, custodian, and Distributor.
6. Risks:
The Fund may be subject to other risks in addition to these identified risks.
Geopolitical/Natural Disaster Risk — Global economies and financial markets are increasingly interconnected, which increases the possibilities that conditions in one country or region might adversely affect issuers in another country or region. Geopolitical and other risks, including war, terrorism, trade disputes, political or economic dysfunction within some nations, public health crises and related geopolitical events, as well as environmental disasters such as earthquakes, fires, and floods, may add to instability in world economies and markets generally. Changes in trade policies and international trade agreements could affect the economies of many countries in unpredictable ways. Likewise, systemic market dislocations of the kind that occurred during the financial crisis that began in 2008, if repeated, would be highly disruptive to economies and markets, adversely affecting individual companies and industries, securities markets, interest rates, credit ratings, inflation, investor sentiment, and other factors affecting the value of a Fund's investments. Some countries, including the United States, are adopting more protectionist trade policies and moving away from the tighter financial industry regulations that followed the 2008 financial crisis, which may also affect the value of a Fund's investments.
Political events within the United States at times have resulted, and may in the future result, in a shutdown of government services, which could negatively affect the U.S. economy, decrease the value of a Fund's investments, increase uncertainty in or impair the operation of the U.S. or other securities markets, and degrade investor and consumer confidence, perhaps suddenly and to a significant degree.
An outbreak of disease called COVID-19 has spread internationally. The transmission of COVID-19 and efforts to contain its spread have resulted in international, national, and local border closings and other significant travel restrictions and disruptions, significant disruptions to business operations, supply chains and consumer activity, significant challenges in healthcare service preparation and delivery, quarantines, and general concern and uncertainty. These negative impacts have caused significant volatility and declines in global financial markets, which have caused losses for Fund
43
USAA Mutual Funds Trust | | Notes to Financial Statements — continued
May 31, 2021 | |
investors during and subsequent to period end. The impact of the COVID-19 pandemic may last for an extended period of time, and could result in a substantial economic downturn or recession. Public health crises may exacerbate other pre-existing political, social, economic, market, and financial risks. The extent of the impact to the financial performance of the Fund's investments will depend on future developments, including (i) the duration and spread of the outbreak, (ii) the restrictions and advisories, (iii) the effects on the financial markets, and (iv) the effects on the economy overall, all of which are highly uncertain and cannot be predicted.
Stock Market Risk — Overall stock market risks may affect the value of the Fund. Domestic and international factors such as political events, war, trade disputes, interest rate levels and other fiscal and monetary policy changes, pandemics and other public health crises, and related geopolitical events, as well as environmental disasters such as earthquakes, fires, and floods, may add to instability in world economies and markets generally. The impact of these and other factors may be short-term or may last for extended periods.
Equity Risk — The value of the equity securities in which the Fund invests may decline in response to developments affecting individual companies and/or general economic conditions. A company's earnings or dividends may not increase as expected due to poor management decisions, competitive pressures, breakthroughs in technology, reliance on suppliers, labor problems or shortages, corporate restructurings, fraudulent disclosures, natural disasters, military confrontations, war, terrorism, public health crises, or other events, conditions, and factors. Price changes may be temporary or last for extended periods.
Foreign Securities Risk — Foreign markets can be more volatile than the U.S. market due to increased risks of adverse issuer, political, regulatory, market, or economic developments and can perform differently from the U.S. market.
7. Borrowing and Interfund Lending:
Line of Credit:
The Victory Funds Complex participated in a short-term demand note "Line of Credit" agreement with Citibank. The Line of Credit agreement with Citibank was renewed on June 29, 2020, with a termination date of June 28, 2021. Under the agreement with Citibank, the Victory Funds Complex may borrow up to $600 million, of which $300 million is committed and $300 million is uncommitted. $40 million of the Line of Credit is reserved for use by the Victory Floating Rate Fund, another series of the Victory Funds Complex, with Victory Floating Rate Fund paying the related commitment fees for that amount. The purpose of the Line of Credit is to meet temporary or emergency cash needs. For the year ended May 31, 2021, Citibank received an annual commitment fee of 0.15% on $300 million for providing the Line of Credit. Each fund in the Victory Funds Complex pays a pro-rata portion of the commitment fees plus any interest (one month LIBOR plus one percent) on amounts borrowed. For the period June 29, 2020, through April 30, 2021, under an amended Line of Credit agreement, Citibank received an annual upfront fee of 0.10% on the $300 million committed line of credit. Each fund in the Victory Funds Complex paid a pro-rata portion of the upfront fee. Effective with the next amendment the annual commitment fee of 0.15% will remain unchanged and the upfront fee of 0.10% is discontinued. Interest charged to each fund during the period, if applicable, is reflected on the Statement of Operations under Line of credit fees.
The Fund had no borrowings under the Line of Credit agreement during the year ended May 31, 2021.
Interfund Lending:
The Trust and Adviser rely on an exemptive order granted by the SEC in March 2017 (the "Order"), permitting the establishment and operation of an Interfund Lending Facility (the "Facility"). The Facility allows the Fund to directly lend and borrow money to or from any other fund in the Victory Funds Complex that is permitted to participate in the Facility, relying upon the Order at rates beneficial to both the borrowing and lending funds. Advances under the Facility are allowed for temporary or emergency purposes, including the meeting of redemption requests that otherwise might require the
44
USAA Mutual Funds Trust | | Notes to Financial Statements — continued
May 31, 2021 | |
untimely disposition of securities, and are subject to each Fund's borrowing restrictions. The interfund loan rate is determined, as specified in the Order, by averaging the current repurchase agreement rate and the current bank loan rate. As a Borrower, interest charged to the Fund, if any, during the period is reflected on the Statement of Operations under Interfund lending fees. As a Lender, interest earned by the Fund, if any, during the period is presented on the Statement of Operations under Interfund lending.
The average borrowing or lending for the days outstanding and average interest rate for the Fund during the year ended May 31, 2021, were as follows (amounts in thousands):
Borrower or
Lender | | Amount
Outstanding at
May 31, 2021 | | Average
Borrowing* | | Days
Borrowing
Outstanding | | Average
Interest
Rate* | | Maximum
Borrowing
During the
Period | |
| Borrower | | $ | — | | | $ | 1,632 | | | | 26 | | | | 0.58 | % | | $ | 3,992 | | |
* For the year ended May 31, 2021, based on the number of days borrowings were outstanding.
8. Federal Income Tax Information:
The Fund intends to distribute any net investment income annually. Distributable net realized gains, if any, are declared and paid at least annually.
The amounts of dividends from net investment income and distributions from net realized gains (collectively distributions to shareholders) are determined in accordance with federal income tax regulations, which may differ from GAAP. To the extent these "book/tax" differences are permanent in nature (e.g., net operating loss and distribution reclassification), such amounts are reclassified within the components of net assets based on their federal tax-basis treatment; temporary differences (e.g., wash sales) do not require reclassification. To the extent dividends and distributions exceed net investment income and net realized gains for tax purposes, they are reported as distributions of capital. Net investment losses incurred by the Fund may be reclassified as an offset to capital on the accompanying Statement of Assets and Liabilities.
As of May 31, 2021, on the Statement of Assets and Liabilities, as a result of permanent book-to-tax differences, reclassification adjustments were as follows (amounts in thousands):
Total
Accumulated
Earnings/(Loss) | | Capital | |
| $ | (4,122 | ) | | $ | 4,122 | | |
The tax character of distributions paid during the tax years ended as noted below, were as follows (total distributions paid may differ from the Statements of Changes in Net Assets because, for tax purposes, dividends are recognized when actually paid) (amounts in thousands).
| | | Year Ended May 31, 2021 | | Year Ended May 31, 2020 | |
| | Distributions
paid from | |
| | Distributions
paid from | | | |
| | Ordinary Income | | Total
Distributions
Paid | | Ordinary Income | | Net
Long-Term
Capital Gains | | Total
Distributions
Paid | |
| | | | | $ | 60,487 | | | $ | 60,487 | | | $ | 98,693 | | | $ | 643,515 | | | $ | 742,208 | | |
45
USAA Mutual Funds Trust | | Notes to Financial Statements — continued
May 31, 2021 | |
As of May 31, 2021, the components of accumulated earnings (loss) on a tax basis were as follows (amounts in thousands):
Undistributed
Ordinary
Income | | Undistributed
Long-Term
Capital Gains | | Other
Earnings
(Deficit) | | Accumulated
Earnings | | Unrealized
Appreciation
(Depreciation)* | | Total
Accumulated
Earnings
(Loss) | |
| $ | 57,751 | | | $ | 110,339 | | | $ | 111 | | | $ | 168,201 | | | $ | 651,045 | | | $ | 819,246 | | |
* The difference between the book-basis and tax-basis of unrealized appreciation/depreciation is attributable to the tax deferral of losses on wash sales and passive foreign investment company.
As of May 31, 2021, the Fund had no capital loss carryforwards, for federal income tax purposes.
As of May 31, 2021, the cost basis for federal income tax purposes, gross unrealized appreciation, gross unrealized depreciation, and net unrealized appreciation (depreciation) for investments were as follows (amounts in thousands):
| | | Cost of
Investments
for Federal Tax
Purposes | | Gross
Unrealized
Appreciation | | Gross
Unrealized
Depreciation | | Net
Unrealized
Appreciation
(Depreciation) | |
| | | | | $ | 2,720,440 | | | $ | 798,120 | | | $ | (147,075 | ) | | $ | 651,045 | | |
46
REPORT OF INDEPENDENT REGISTERED PUBLIC ACCOUNTING FIRM
To the Shareholders and the Board of Trustees of USAA International Fund
Opinion on the Financial Statements
We have audited the accompanying statement of assets and liabilities of USAA International Fund (the "Fund") (one of the funds constituting USAA Mutual Funds Trust (the "Trust")), including the schedule of portfolio investments, as of May 31, 2021, and the related statement of operations for the year then ended, the statements of changes in net assets for each of the two years in the period then ended, the financial highlights for each of the five years in the period then ended and the related notes (collectively referred to as the "financial statements"). In our opinion, the financial statements present fairly, in all material respects, the financial position of the Fund (one of the funds constituting USAA Mutual Funds Trust) at May 31, 2021, the results of its operations for the year then ended, the changes in its net assets for each of the two years in the period then ended and its financial highlights for each of the five years in the period then ended, in conformity with U.S. generally accepted accounting principles.
Basis for Opinion
These financial statements are the responsibility of the Trust's management. Our responsibility is to express an opinion on the Fund's financial statements based on our audits. We are a public accounting firm registered with the Public Company Accounting Oversight Board (United States) ("PCAOB") and are required to be independent with respect to the Trust in accordance with the U.S. federal securities laws and the applicable rules and regulations of the Securities and Exchange Commission and the PCAOB.
We conducted our audits in accordance with the standards of the PCAOB. Those standards require that we plan and perform the audit to obtain reasonable assurance about whether the financial statements are free of material misstatement, whether due to error or fraud. The Trust is not required to have, nor were we engaged to perform, an audit of the Trust's internal control over financial reporting. As part of our audits we are required to obtain an understanding of internal control over financial reporting, but not for the purpose of expressing an opinion on the effectiveness of the Trust's internal control over financial reporting. Accordingly, we express no such opinion.
Our audits included performing procedures to assess the risks of material misstatement of the financial statements, whether due to error or fraud, and performing procedures that respond to those risks. Such procedures included examining, on a test basis, evidence regarding the amounts and disclosures in the financial statements. Our procedures included confirmation of securities owned as of May 31, 2021, by correspondence with the custodian and brokers or by other appropriate auditing procedures where replies from brokers were not received. Our audits also included evaluating the accounting principles used and significant estimates made by management, as well as evaluating the overall presentation of the financial statements. We believe that our audits provide a reasonable basis for our opinion.

We have served as the auditor of one or more Victory Capital investment companies since 1995.
San Antonio, Texas
July 28, 2021
47
USAA Mutual Funds Trust | | Supplemental Information
May 31, 2021 | |
(Unaudited)
Trustee and Officer Information
Board of Trustees:
Overall responsibility for management of the Trust rests with the Board. The Trust is managed by the Board in accordance with the laws of the state of Delaware. There are currently nine Trustees, seven of whom are not "interested persons" of the Trust within the meaning of that term under the 1940 Act ("Independent Trustees") and two of whom are "interested persons" of the Trust within the meaning of that term under the 1940 Act ("Interested Trustee"). The Trustees, in turn, elect the officers of the Trust to actively supervise its day-to-day operations.
The following tables list the Trustees, their ages, position with the Trust, commencement of service, principal occupations during the past five years and any directorships of other investment companies or companies whose securities are registered under the Securities Exchange Act of 1934, as amended, or who file reports under that Act. Each Trustee oversees 46 portfolios in the Trust. Each Trustee's address is 15935 La Cantera Pkwy, San Antonio, TX, 78256. Pursuant to a policy adopted by the Board, the term of office for each Trustee shall be until the Independent Trustee reaches age 75 or an Interested Trustee reaches age 75. The Board may change or grant exceptions from this policy at any time without shareholder approval. A Trustee may resign or be removed by a vote of the other Trustees or the holders of a majority of the outstanding shares of the Trust at any time. Vacancies on the Board can be filled by the action of a majority of the Trustees, provided that after filling such vacancy at least two-thirds of the Trustees have been elected by the shareholders.
Name and Date of Birth | | Position
Held with
the Trust | | Year
Commenced
Service | | Principal Occupation
During Past 5 Years | | Other
Directorships
Held During
Past 5 Years | |
Independent Trustees. | |
Jefferson C. Boyce, (c)
Born September 1957 | | Independent Chairman | | | 2021 | | | Senior Managing Director, New York Life Investments, LLC (1992-2012) | | Westhab, Inc. | |
John C. Walters,
Born February 1962 | | Trustee | | | 2019 | | | Retired. Mr. Walters brings significant Board experience including active involvement with the board of a Fortune 500 company, and a proven record of leading large, complex financial organizations. He has a demonstrated record of success in distribution, manufacturing, investment brokerage, and investment management in both the retail and institutional investment businesses. He has substantial experience in the investment management business with a demonstrated ability to develop and drive strategy while managing operation, financial, and investment risk. | | Guardian Variable Products Trust (16 series), Lead Independent Director; Amerilife Holdings LLC, Director; Stadion Money Management; Director; University of North Carolina (Chapel Hill), Member Board of Governors | |
48
USAA Mutual Funds Trust | | Supplemental Information — continued
May 31, 2021 | |
(Unaudited)
Name and Date of Birth | | Position
Held with
the Trust | | Year
Commenced
Service | | Principal Occupation
During Past 5 Years | | Other
Directorships
Held During
Past 5 Years | |
Robert L. Mason, Ph.D.,
Born July 1946 | | Trustee | | | 1997 | | | Adjunct Professor in the Department of Management Science and Statistics in the College of Business at the University of Texas at San Antonio (since 2001); Institute Analyst, Southwest Research Institute (March 2002-January 2016) | | None | |
Dawn M. Hawley,
Born February 1954 | | Trustee | | | 2014 | | | Manager of Finance, Menil Foundation, Inc. (May 2007-June 2011), which is a private foundation that oversees the assemblage of sculptures, prints, drawings, photographs, and rare books. Director of Financial Planning and Analysis and Chief Financial Officer, AIM Management Group, Inc. (October 1987-January 2006) | | None | |
Paul L. McNamara,
Born July 1948 | | Trustee | | | 2012 | | | Director, Cantor Opportunistic Alternatives Fund, LLC (March 2010-February 2014), which is a closed-end fund of funds by Cantor Fitzgerald Investment Advisors, LLC | | None | |
49
USAA Mutual Funds Trust | | Supplemental Information — continued
May 31, 2021 | |
(Unaudited)
Name and Date of Birth | | Position
Held with
the Trust | | Year
Commenced
Service | | Principal Occupation
During Past 5 Years | | Other
Directorships
Held During
Past 5 Years | |
Richard Y. Newton III,
Born January 1956 | | Trustee | | | 2017 | | | Director, Elta North America (01/18-present), which is a global leader in the design, manufacture, and support of innovative electronic systems in the ground, maritime, airborne, and security domains for the nation's warfighters, security personnel, and first responders; Managing Partner, Pioneer Partnership Development Group (December 2015-present)); Executive Director, The Union League Club of New York (June 2014-November 2015): Executive Vice President, Air Force Association (August 2012-May 2014); Lieutenant General, United States Air Force (January 2008-June 2012) | | PredaSAR Corp. | |
Barbara B. Ostdiek, Ph.D.,
Born March 1964 | | Trustee | | | 2008 | | | Senior Associate Dean of Degree Programs at Jesse H. Jones Graduate School of Business at Rice University (since 2013); Associate Professor of Finance at Jessie H. Jones Graduate School of Business at Rice University (since 2001) | | None | |
Effective at the close of business on December 31, 2020, Michael F. Reimherr retired from the Board of Trustees.
50
USAA Mutual Funds Trust | | Supplemental Information — continued
May 31, 2021 | |
(Unaudited)
Name and Date of Birth | | Position
Held with
the Trust | | Year
Commenced
Service | | Principal Occupation
During Past 5 Years | | Other
Directorships
Held During
Past 5 Years | |
Interested Trustees. | |
David C. Brown, (b)
Born May 1972 | | Trustee | | | 2019 | | | Chairman and Chief Executive Officer (since 2013), Victory Capital Management Inc.; Chairman and Chief Executive Officer, Victory Capital Holdings, Inc. (since 2013). Mr. Brown brings to the Board extensive business, finance and leadership skills gained and developed through years of experience in the financial services industry, including his tenure overseeing the strategic direction as CEO of Victory Capital. These skills, combined with Mr. Brown's extensive knowledge of the financial services industry and demonstrated success in the development and distribution of investment strategies and products, enable him to provide valuable insights to the Board and strategic direction for the Funds. | | Trustee, Victory Portfolios (41 series), Victory Portfolios II (26 series), Victory Variable Insurance Funds (8 series) | |
51
USAA Mutual Funds Trust | | Supplemental Information — continued
May 31, 2021 | |
(Unaudited)
Name and Date of Birth | | Position
Held with
the Trust | | Year
Commenced
Service | | Principal Occupation
During Past 5 Years | | Other
Directorships
Held During
Past 5 Years | |
Daniel S. McNamara, (b)(c)(d)
Born June 1966 | | Trustee | | | 2012 | | | Trustee, President, and Vice Chairman of USAA ETF Trust (June 2017-June 2019); President of Financial Advice & Solutions Group (FASG), USAA (February 2013-March 2021); Director of USAA Investment Services Company (ISCO) (formerly USAA Investment Management) (September 2009-March 2021); President, Asset Management Company (AMCO) (August, 2011-June 2019); Senior Vice President of USAA Financial Planning Services Insurance Agency, Inc. (FPS) (April 2011-March 2021); Chairman of Board of ISCO (April 2013-December 2020); Director of AMCO (August 2011-June 2019); President and Director of USAA Shareholder Account Services (SAS) (October 2009-June 2019); Director and Vice Chairman of FPS (December 2013-March 2021); President and Director of USAA Investment Corporation (ICORP) (March 2010-March 2021); Chairman of Board of ICORP (December 2013-March 2021); Director of USAA Financial Advisors, Inc. (FAI) (December 2013-March 2021); Chairman of Board of FAI (March 2015-March 2021). Mr. McNamara brings to the Board extensive experience in the financial services industry, including experience as an officer of the Trust. | | None | |
(b) Mr. Dan McNamara is deemed an "interested person" due to his previous position as Director of AMCO, the former investment adviser of the Funds. Mr. Brown is deemed an "interested person" due to his position as Chief Executive Officer of Victory Capital, investment adviser to the Funds.
(c) Effective at the close of business on December 31, 2020, Jefferson C. Boyce replaced Dan McNamara as Chair of the Board and assumed the title of Independent Chair.
(d) Effective July 2, 2021, Mr. Dan McNamara became an Independent Trustee to the Funds.
The Statement of Additional Information includes additional information about the Trustees of the Trust and is available, without charge, on the SEC's website at www.sec.gov and/or by calling (800)-235-8396.
52
USAA Mutual Funds Trust | | Supplemental Information — continued
May 31, 2021 | |
(Unaudited)
Officers:
The officers of the Trust, their ages, commencement of service and their principal occupations during the past five years, are detailed in the following table. Each officer serves until the earlier of his or her resignation, removal, retirement, death, or the election of a successor. The mailing address of each officer of the Trust is 15935 La Cantera Pkwy, San Antonio, TX, 78256. The officers of the Trust receive no compensation directly from the Trust for performing the duties of their offices.
Name and Date of Birth | | Position with
the Trust | | Year
Commenced
Service | | Principal Occupation During Past 5 Years | |
Interested Officers.
Christopher K. Dyer,
Born February 1962 | | President | | | 2019 | | | Director of Fund Administration, Victory Capital (since 2004); Chief Operating Officer, Victory Capital Services, Inc. (since 2020) | |
Scott A Stahorsky,
Born July 1969 | | Vice President | | | 2019 | | | Manager, Fund Administration, Victory Capital (since 2015) | |
James K. De Vries,
Born April 1969 | | Treasurer | | | 2018 | | | Executive Director, Victory Capital Management Inc. (since 2019); Treasurer, USAA ETF Trust (September 2018-June 2019); Executive Director, Investment and Financial Administration, USAA (April 2012-June 2019); Assistant Treasurer, USAA ETF Trust (June 2017-September 2018); Assistant Treasurer, USAA Mutual Funds Trust (December 2013-February 2018) | |
Allan Shaer,
Born March 1965 | | Assistant Treasurer | | | 2019 | | | Senior Vice President, Financial Administration, Citi Fund Services Ohio, Inc. (since 2016); Vice President, Mutual Fund Administration, JP Morgan Chase (2011-2016) | |
Carol D. Trevino,
Born October 1965 | | Assistant Treasurer | | | 2018 | | | Director, Accounting and Finance, Victory Capital Management Inc. (since 2019); Accounting/Financial Director, USAA (December 2013-June 2019); Assistant Treasurer, USAA ETF Trust (September 2018-June 2019) | |
Erin G. Wagner,
Born February 1974 | | Secretary | | | 2019 | | | Deputy General Counsel, the Adviser (since 2013) | |
Charles Booth,
Born April 1960 | | Anti-Money Laundering Compliance Officer and Identity Theft Officer | | | 2019 | | | Director, Regulatory Administration and CCO Support Services, Citi Fund Services Ohio, Inc. (since 2007) | |
Amy Campos,
Born July 1976 | | Chief Compliance Officer | | | 2019 | | | Chief Compliance Officer, USAA Mutual Funds Trust (since 2019); Executive Director, Deputy Chief Compliance Officer, USAA Mutual Funds Trust and USAA ETF Trust (July 2017-June 2019); Compliance Director, USAA Mutual Funds Trust (2014-July 2017) | |
53
USAA Mutual Funds Trust | | Supplemental Information — continued
May 31, 2021 | |
(Unaudited)
Proxy Voting and Portfolio Holdings Information
Proxy Voting:
Information regarding the policies and procedures the Fund uses to determine how to vote proxies relating to portfolio securities is available without charge, upon request, by calling (800) 235-8396. The information is also included in the Fund's Statement of Additional Information, which is available on the SEC's website at www.sec.gov.
Information relating to how the Fund voted proxies relating to portfolio securities held during the most recent 12 months ended June 30 is available on the SEC's website at www.sec.gov.
Availability of Schedules of Portfolio Investments:
The Trust files a complete list of Schedules of Portfolio Investments with the SEC for the first and third quarter of each fiscal year on Form N-PORT. Form N-PORT is available on the SEC's website at www.sec.gov.
Expense Examples
As a shareholder of the Fund, you may incur two types of costs: (1) transaction costs, including sales charges (loads) on purchases; and (2) ongoing costs, including management fees and other Fund expenses. These examples are intended to help you understand your ongoing costs (in dollars) of investing in the Fund and to compare these costs with the ongoing costs of investing in other mutual funds.
These examples are based on an investment of $1,000 invested at the beginning of the period and held for the entire period from December 1, 2020, through May 31, 2021.
The Actual Expense figures in the table below provide information about actual account values and actual expenses. You may use the information below, together with the amount you invested, to estimate the expenses that you paid over the period. Simply divide your account value by $1,000 (for example, an $8,600 account value divided by $1,000 = 8.6), then multiply the result by the number in the table under the heading entitled "Actual Expenses Paid During Period" to estimate the expenses you paid on your account during this period.
The Hypothetical Expense figures in the table below provide information about hypothetical account values and hypothetical expenses based on the Fund's actual expense ratio and an assumed rate of return of 5% per year before expenses, which is not the Fund's actual return. The hypothetical account values and expenses may not be used to estimate the actual ending account balance or expenses you paid for the period. You may use this information to compare this 5% hypothetical example with the 5% hypothetical examples that appear in shareholder reports of other funds.
Please note the expenses shown in the table below are meant to highlight your ongoing costs only and do not reflect any transactional costs. If these transactional costs were included, your costs would have been higher.
| | | Beginning
Account
Value
12/1/20 | | Actual
Ending
Account
Value
5/31/21 | | Hypothetical
Ending
Account
Value
5/31/21 | | Actual
Expenses Paid
During Period
12/1/20-
5/31/21* | | Hypothetical
Expenses Paid
During Period
12/1/20-
5/31/21* | | Annualized
Expense Ratio
During Period
12/1/20-
5/31/21 | |
Fund Shares | | $ | 1,000.00 | | | $ | 1,183.10 | | | $ | 1,019.90 | | | $ | 5.50 | | | $ | 5.09 | | | | 1.01 | % | |
Institutional Shares | | | 1,000.00 | | | | 1,183.20 | | | | 1,020.24 | | | | 5.12 | | | | 4.73 | | | | 0.94 | | |
Class A | | | 1,000.00 | | | | 1,181.80 | | | | 1,018.55 | | | | 6.96 | | | | 6.44 | | | | 1.28 | | |
Class R6 | | | 1,000.00 | | | | 1,192.30 | | | | 1,020.99 | | | | 4.32 | | | | 3.98 | | | | 0.79 | | |
* Expenses are equal to the average account value multiplied by the Fund's annualized expense ratio multiplied by 182/365 (the number of days in the most recent fiscal half-year divided by the number of days in the fiscal year).
54
USAA Mutual Funds Trust | | Supplemental Information — continued
May 31, 2021 | |
(Unaudited)
Additional Federal Income Tax Information
The following federal tax information related to the Fund's fiscal year ended May 31, 2021, is provided for information purposes only and should not be used for reporting to federal or state revenue agencies. Federal tax information for the calendar year will be reported to you on Form 1099-DIV in January 2022.
With respect to distributions paid, the Fund designates the following amounts (or, if subsequently determined to be different, the maximum amount allowable) for the fiscal year ended May 31, 2021 (amounts in thousands):
| | Dividends
Received
Deduction
(corporate
shareholders) | | Qualified
Dividend
Income
(non-corporate
shareholders) | | Short-Term
Capital Gain
Distributions | | Long-Term
Capital Gain
Distributions | | Foreign
Taxes
Paid | |
| | | | | | — | %(a) | | | 80 | % | | $ | 722 | | | $ | 3,400 | | | $ | 9,120 | | |
(a) Less than 1%.
55
USAA Mutual Funds Trust | | Supplemental Information — continued
May 31, 2021 | |
(Unaudited)
Considerations of the Board in Continuing the Investment Advisory Agreement (the "Agreement")
USAA International Fund (the "Fund")
At a meeting of the Board of Trustees (the "Board") held on December 10-11, 2020, the Board, including the Trustees who are not "interested persons" (as that term is defined in the Investment Company Act of 1940, as amended) of the Trust (the "Independent Trustees"), approved for an annual period the continuance of the Investment Advisory Agreement (the "Advisory Agreement") between the Trust and Victory Capital Management Inc. (the "Adviser") and the Subadvisory Agreements between the Adviser and Lazard Asset Management LLC1 and Wellington Management Company LLP (each, a "Subadviser" and together, the "Subadvisers") with respect to the Fund. Prior to the December 10-11, 2020 meeting at which the Advisory Agreement was approved, the Independent Trustees also discussed and considered information regarding the proposed continuation of the Advisory Agreement and Subadvisory Agreements at a meeting held on November 19, 2020.
In advance of the foregoing meetings, the Trustees received and considered a variety of information relating to the Advisory Agreement and Subadvisory Agreements and the Adviser and the Subadvisers, and were given the opportunity to ask questions and request additional information from management. The information provided to the Board included, among other things: (i) a separate report prepared by an independent third party of mutual fund data, which provided a statistical analysis comparing the Fund's investment performance, expenses, and fees to comparable investment companies; (ii) information concerning the services rendered to the Fund, as well as information regarding the Adviser's revenues and costs of providing services to the Fund and compensation paid to affiliates of the Adviser; and (iii) information about the Adviser's and the Subadvisers' operations and personnel. Prior to voting, the Independent Trustees reviewed the proposed continuance of the Advisory Agreement and Subadvisory Agreements with management and with experienced independent counsel retained by the Independent Trustees ("Independent Counsel") and received materials from such Independent Counsel discussing the legal standards for their consideration of the proposed continuation of the Advisory Agreement and the Subadvisory Agreements with respect to the Fund. The Independent Trustees also reviewed the proposed continuation of the Advisory Agreement and the Subadvisory Agreements with respect to the Fund in private sessions with Independent Counsel at which no representatives of management were present.
The Board considered the Advisory Agreement and each Subadvisory Agreement separately in the course of its review. In doing so, the Board noted the respective roles of the Adviser and the Subadvisers in providing services to the Fund.
At each regularly scheduled meeting of the Board and its committees, the Board receives and reviews, among other things, information concerning the Fund's performance and related services provided by the Adviser and the Subadvisers. At the meeting at which the renewal of the Advisory Agreement and Subadvisory Agreements is considered, particular focus is given to information concerning Fund performance, fees and total expenses as compared to comparable investment companies, and the Adviser's profitability with respect to the Fund. However, the Board noted that the evaluation process with respect to the Adviser and the Subadvisers is an ongoing one. In this regard, the Board's and its committees' consideration of the Advisory Agreement and Subadvisory Agreements included information previously received at such meetings.
Advisory Agreement
After full consideration of a variety of factors, the Board, including the Independent Trustees, voted to approve the Advisory Agreement. In approving the Advisory Agreement, the Trustees did not identify any single factor as controlling, and each Trustee may have attributed different weights to various factors. Throughout their deliberations, the Independent Trustees were represented and assisted by Independent Counsel.
Nature, Extent, and Quality of Services — In considering the nature, extent, and quality of the services provided by the Adviser under the Advisory Agreement, the Board reviewed information provided by the Adviser relating to its operations and personnel. The Board also took into account its knowledge of the Adviser's management
1 Effective March 1, 2021, the Subadviser is no longer a subadviser to the Fund.
56
USAA Mutual Funds Trust | | Supplemental Information — continued
May 31, 2021 | |
(Unaudited)
and the quality of the performance of the Adviser's duties through Board meetings, discussions, and reports during the preceding year. The Board considered the fees paid to the Adviser and the services provided to the Fund by the Adviser under the Advisory Agreement, as well as other services provided by the Adviser and its affiliates under other agreements, and the personnel who provide these services. In addition to the investment advisory services provided to the Fund, the Adviser and its affiliates provide administrative services, shareholder services, oversight of Fund accounting, marketing services, assistance in meeting legal and regulatory requirements, and other services necessary for the operation of the Fund and the Trust.
The Board considered the scope of services provided by, and the undertakings required of, the Adviser in connection with those services, including, among other things, maintaining (i) its own and the Fund's compliance programs, (ii) risk management programs, (iii) liquidity risk management programs, and (iv) cybersecurity programs, each of which had expanded over time as a result of regulatory, market, and other developments. The Board also considered the significant risks assumed by the Adviser in connection with the services provided to the Fund, including investment, operational, enterprise, litigation, regulatory and compliance risks.
The Board considered the Adviser's management style and the performance of the Adviser's duties under the Advisory Agreement. The Board considered the level and depth of knowledge of the Adviser, including the professional experience and qualifications of its senior and investment personnel, as well as current staffing levels. The Board considered the Adviser's process for monitoring the performance of the Subadvisers and the Adviser's timeliness in responding to performance issues. The allocation of the Fund's brokerage, including the Adviser's process for monitoring "best execution," also was considered. The Adviser's role in coordinating the activities of the Fund's other service providers was also considered. The Board also considered the Adviser's risk management processes. The Board considered the Adviser's financial condition and that it had the financial wherewithal to continue to provide the same scope and high quality of services under the Advisory Agreement. In reviewing the Advisory Agreement, the Board focused on the experience, resources, and strengths of the Adviser and its affiliates in managing the Fund, as well as the other funds in the Trust.
The Board also reviewed the compliance and administrative services provided to the Fund by the Adviser and its affiliates, including the Adviser's oversight of the Fund's day-to-day operations and oversight of Fund accounting. The Trustees, guided also by information obtained from their experiences as trustees of the Trust, also focused on the quality of the Adviser's compliance and administrative staff.
Expenses and Performance — In connection with its consideration of the Advisory Agreement, the Board evaluated the Fund's advisory fees and total expense ratio as compared to other open-end investment companies deemed to be comparable to the Fund as determined by the independent third party in its report. The Fund's expenses were compared to (i) a group of investment companies chosen by the independent third party to be comparable to the Fund based upon certain factors, including fund type, comparability of investment objective and classification, sales load type, asset size, and expense components (the "expense group") and (ii) a larger group of investment companies with the same investment classification/objective as the Fund regardless of asset size, excluding outliers (the "expense universe"). Among other data, the Board noted that the Fund's management fee rate — which includes advisory and administrative services and the effects of any performance adjustment2, as well as any fee waivers and reimbursements — was above the medians of its expense group and expense universe. The data indicated that the Fund's total expenses, including after any reimbursements, were equal to the median of its expense group and below the median of its expense universe. The Board also took into account the Adviser's current undertakings to maintain expense limitations for the Fund. The Board took into account the various other services provided to the Fund by the Adviser and its affiliates, and noted the high quality of services received by the Fund. The Board also took into account that the subadvisory fees under the Subadvisory Agreements are paid by the Adviser. The Board also considered and discussed information about the Subadvisers' fees, including the amount of management fees retained by the Adviser after payment of the subadvisory fees.
In considering the Fund's performance, the Board noted that it reviews at its regularly scheduled meetings information about the Fund's performance results. The Trustees also reviewed various comparative data provided to them in connection with their consideration of the renewal of the Advisory Agreement, including, among other information, a comparison of the Fund's average annual total returns relative to its Lipper index and
2 The Adviser has agreed that no performance adjustment (positive or negative) would be made to the amount payable to the Adviser from July 1, 2019, through June 30, 2020.
57
USAA Mutual Funds Trust | | Supplemental Information — continued
May 31, 2021 | |
(Unaudited)
other mutual funds deemed to be in its peer group by the independent third party in its report (the "performance universe"). The Fund's performance universe consisted of the Fund and all retail and institutional open-end investment companies with the same classification/objective as the Fund regardless of asset size or primary channel of distribution. This comparison indicated that, among other data, the Fund's performance was below the average of its performance universe and Lipper index for the one-, three-, five- and ten-year periods ended September 30, 2020. The Board took into account management's discussion of the Fund's performance, including the reasons for the Fund's underperformance.
Compensation and Profitability — The Board took into consideration the level and method of computing the management fee. The information considered by the Board included operating profit margin information for the Adviser's business as a whole. The Board also received and considered profitability information related to the management revenues from the Fund. This information included a review of the methodology used in the allocation of certain costs to the Fund. In considering the profitability data with respect to the Fund, the Trustees noted that the Adviser pays the Fund's subadvisory fees and also noted that the Adviser waived a portion of its management fee and/or reimbursed certain expenses with respect to the Fund. The Trustees reviewed the profitability of the Adviser's relationship with the Fund before tax expenses. The Board was also provided with a profitability analysis of other publicly traded asset managers prepared by an independent information service. In reviewing the overall profitability of the management fee to the Adviser, the Board also considered the fact that the Adviser and its affiliates provide shareholder servicing and administrative services to the Fund for which they receive compensation. The Board also considered the possible direct and indirect benefits to the Adviser from its relationship with the Trust, including that the Adviser may derive reputational and other benefits from its association with the Fund. The Trustees recognized that the Adviser should be entitled to earn a reasonable level of profits in exchange for the level of services it provides to the Fund and the entrepreneurial and other risks that it assumes as Adviser.
Economies of Scale — The Board considered whether there should be changes in the management fee rate or structure in order to enable the Fund to participate in any economies of scale. The Board also considered the fee waiver and expense reimbursement arrangements by the Adviser. The Board considered the fact that the Adviser also pays the Fund's subadvisory fees. The Board also considered the effect of the Fund's change in size, if any, on its performance and fees, noting that the Fund may realize other economies of scale if assets increase proportionally more than expenses. The Board determined that the current investment management fee structure was reasonable.
Conclusions — The Board reached the following conclusions regarding the Fund's Advisory Agreement with the Adviser: (i) the Adviser has demonstrated that it possesses the capability and resources to perform the duties required of it under the Advisory Agreement; (ii) the Adviser maintains an appropriate compliance program; (iii) the overall performance of the Fund is reasonable in relation to the performance of funds with similar investment objectives and to relevant indices; (iv) the Fund's advisory expenses are reasonable in relation to those of similar funds and to the services to be provided by the Adviser; and (v) the Adviser's and its affiliates' level of profitability from their relationship with the Fund is reasonable in light of the nature and high quality of services provided by the Adviser and the type of fund. Based on its conclusions, the Board determined that continuation of the Advisory Agreement would be in the best interests of the Fund and its shareholders.
Subadvisory Agreements
In approving the Subadvisory Agreements with respect to the Fund, the Board considered various factors, among them: (i) the nature, extent, and quality of services provided to the Fund by the Subadvisers, including the personnel providing services; (ii) the Subadvisers' compensation and any other benefits derived from the subadvisory relationships; (iii) comparisons, to the extent applicable, of subadvisory fees and performance to comparable investment companies; and (iv) the terms of the Subadvisory Agreements. A summary of the Board's analysis of these factors is set forth below. After full consideration of a variety of factors, the Board, including the Independent Trustees, voted to approve the Subadvisory Agreements. In approving the Subadvisory Agreements, the Trustees did not identify any single factor as controlling, and each Trustee may have attributed different weights to various factors. Throughout their deliberations, the Independent Trustees were represented and assisted by Independent Counsel.
58
USAA Mutual Funds Trust | | Supplemental Information — continued
May 31, 2021 | |
(Unaudited)
Nature, Extent, and Quality of Services Provided; Investment Personnel — The Trustees considered information provided to them regarding the services provided by the Subadvisers, including information presented periodically throughout the previous year. The Board considered the Subadvisers' level of knowledge and investment style. The Board reviewed the experience and credentials of the investment personnel who are responsible for managing the investment of portfolio securities with respect to the Fund and the Subadvisers' levels of staffing. The Trustees considered, based on the materials provided to them by the Subadvisers, whether the method of compensating portfolio managers is reasonable and includes mechanisms to prevent a manager with underperformance from taking undue risks. The Trustees also noted the Subadvisers' brokerage practices. The Board also considered each Subadviser's regulatory and compliance history. The Board also took into account the Subadvisers' risk management processes. The Board noted that the Adviser's monitoring processes of the Subadvisers include: (i) regular telephonic meetings to discuss, among other matters, investment strategies, and to review portfolio performance; (ii) quarterly portfolio compliance checklists and quarterly compliance certifications to the Board; and (iii) due diligence visits to the Subadvisers.
Subadviser Compensation — The Board also took into consideration the financial condition of the Subadvisers. In considering the cost of services to be provided by the Subadvisers and the profitability to the Subadvisers of their relationships with the Fund, the Trustees noted that the fees under the Subadvisory Agreements were paid by the Adviser. The Trustees also relied on the ability of the Adviser to negotiate the Subadvisory Agreements and the fees thereunder at arm's length. For the above reasons, the Board determined that the profitability of the Subadvisers from their relationships with the Fund was not a material factor in its deliberations with respect to the consideration of the approval of the Subadvisory Agreements. For similar reasons, the Board concluded that the potential for economies of scale in the Subadvisers' management of the Fund was not a material factor in considering the Subadvisory Agreements.
Subadvisory Fees and Fund Performance — The Board compared the subadvisory fees for the Fund with the fees that the Subadvisers charge to comparable clients, as applicable. The Board considered that the Fund pays a management fee to the Adviser and that, in turn, the Adviser pays a subadvisory fee to each Subadviser. As noted above, the Board considered the Fund's performance during the one-, three-, five-, and ten-year periods ended September 30, 2020, as compared to the Fund's peer group and noted that the Board reviews at its regularly scheduled meetings information about the Fund's performance results. The Board also considered the performance of the Subadvisers. The Board noted the Adviser's experience and resources in monitoring the performance, investment style, and risk-adjusted performance of the Subadvisers. The Board was mindful of the Adviser's focus on the Subadvisers' performance. The Board also noted the Subadvisers' performance record for similar accounts, as applicable.
Conclusions — The Board reached the following conclusions regarding each Subadvisory Agreement: (i) the Subadviser is qualified to manage the Fund's assets in accordance with its investment objectives and policies; (ii) the Subadviser maintains an appropriate compliance program; (iii) the overall performance of the Fund is reasonable in relation to the performance of funds with similar investment objectives and relevant indices; and (iv) the Fund's advisory expenses are reasonable in relation to those of similar funds and to the services to be provided by the Adviser and the Subadviser. Based on its conclusions, the Board determined that approval of each Subadvisory Agreement with respect to the Fund would be in the best interests of the Fund and its shareholders.
59
USAA Mutual Funds Trust | | Supplemental Information — continued
May 31, 2021 | |
(Unaudited)
Liquidity Risk Management Program:
The USAA Mutual Funds have adopted and implemented a written liquidity risk management program (the "LRMP") as required by Rule 22e-4 under the Investment Company Act of 1940, as amended. The LRMP is reasonably designed to assess and manage the Fund's liquidity risk, taking into consideration the Fund's investment strategy and the liquidity of its portfolio investments during normal and reasonably foreseeable stressed market conditions; its short and long-term cash flow projections; and its cash holdings and access to other liquidity management tools such as available funding sources including the Victory Funds Complex Interfund Lending Facility and Line of Credit (discussed in the Notes to Financial Statements). The USAA Mutual Funds' Board of Trustees approved the appointment of the Fund's investment adviser, Victory Capital Management Inc. ("Victory Capital"), as the administrator of the LRMP.
Victory Capital manages liquidity risks associated with the Fund's investments by monitoring, among other things, cash and cash equivalents, any use of derivatives, the concentration of investments, the appropriateness of the Fund's investment strategy, and by classifying every Fund investment as either highly liquid, moderately liquid, less liquid, or illiquid on at least a monthly basis. To assist with the classification of Fund investments, Victory Capital has retained a third-party provider of liquidity evaluation services. This provider determines preliminary liquidity classifications for all portfolio holdings based upon portfolio-level data and certain assumptions provided by Victory Capital. Victory Capital reviews the preliminary liquidity classifications and, when appropriate, considers other information including input from the Fund's portfolio managers (including the portfolio managers employed by any investment sub-advisers) in determining final liquidity classifications.
At a meeting held on March 10, 2021, Victory Capital provided an oral and written report to the Trustees on the operation and effectiveness of the LRMP during the previous year. The report from Victory Capital concluded that the Fund did not experience any significant liquidity challenges during the covered period, and the Fund's LRMP is reasonably designed to assess and manage its liquidity risk. The report also concluded that the LRMP continues to operate adequately and effectively to enable Victory Capital to oversee and manage liquidity risk and ensure the Fund is able to meet redemption requests without significant dilution to the remaining investors' interest in the Fund. During the review period, the Fund's portfolio consisted primarily of highly liquid investments, which are defined as cash and any investments that the Fund reasonably expects to be converted to cash in current market conditions in three business days or less without significantly changing the market value of the investment. Therefore, the Fund has not adopted a highly liquid investment minimum. The Funds' investments were below the limitation on illiquid investments during the review period. Additionally, Victory Capital indicated that no events occurred that would require the filing of Form N-LIQUID and recommended no material changes to the LRMP.
60
Privacy Policy
Protecting the Privacy of Information
The Trust respects your right to privacy. We also know that you expect us to conduct and process your business in an accurate and efficient manner. To do so, we must collect and maintain certain personal information about you. This is the information we collect from you on applications or other forms, and from the transactions you make with us or third parties. It may include your name, address, social security number, account transactions and balances, and information about investment goals and risk tolerance.
We do not disclose any information about you or about former customers to anyone except as permitted or required by law. Specifically, we may disclose the information we collect to companies that perform services on our behalf, such as the transfer agent that processes shareholder accounts and printers and mailers that assist us in the distribution of investor materials. We may also disclose this information to companies that perform marketing services on our behalf. This allows us to continue to offer you Victory investment products and services that meet your investing needs, and to effect transactions that you request or authorize. These companies will use this information only in connection with the services for which we hired them. They are not permitted to use or share this information for any other purpose.
To protect your personal information internally, we permit access only by authorized employees and maintain physical, electronic, and procedural safeguards to guard your personal information.*
* You may have received communications regarding information about privacy policies from other financial institutions which gave you the opportunity to "opt-out" of certain information sharing with companies which are not affiliated with that financial institution. The Trust does not share information with other companies for purposes of marketing solicitations for products other than the Trust. Therefore, the Trust does not provide opt-out options to their shareholders.
P.O. Box 182593
Columbus, Ohio 43218-2593

Visit our website at: | | Call | |
vcm.com | | (800) 235-8396 | |

MAY 31, 2021
Annual Report
USAA Sustainable World Fund
(Formerly USAA World Growth Fund)
Victory Capital means Victory Capital Management Inc., the investment adviser of the USAA Mutual Funds. USAA Mutual Funds are distributed by Victory Capital Services, Inc., member of FINRA, an affiliate of Victory Capital. Victory Capital and its affiliates are not affiliated with United Services Automobile Association or its affiliates. USAA and the USAA logos are registered trademarks and the USAA Mutual Funds and USAA Investments logos are trademarks of United Services Automobile Association and are being used by Victory Capital and its affiliates under license.
www.vcm.com
News, Information And Education 24 Hours A Day, 7 Days A Week
The Victory Funds site gives fund shareholders, prospective shareholders, and investment professionals a convenient way to access fund information, get guidance, and track fund performance anywhere they can access the Internet. The site includes:
• Detailed performance records
• Daily share prices
• The latest fund news
• Investment resources to help you become a better investor
• A section dedicated to investment professionals
Whether you're a potential investor searching for the fund that matches your investment philosophy, a seasoned investor interested in planning tools, or an investment professional, www.vcm.com has what you seek. Visit us anytime. We're always open.
TABLE OF CONTENTS
Shareholder Letter (Unaudited) | | | 2 | | |
Managers' Commentary (Unaudited) | | | 4 | | |
Investment Overview (Unaudited) | | | 6 | | |
Investment Objective & Portfolio
Holdings (Unaudited) | | | 7 | | |
Schedule of Portfolio Investments | | | 8 | | |
Financial Statements | |
Statement of Assets and Liabilities | | | 31 | | |
Statement of Operations | | | 32 | | |
Statements of Changes in Net Assets | | | 33 | | |
Financial Highlights | | | 36 | | |
Notes to Financial Statements | | | 38 | | |
Report of Independent
Registered Public Accounting Firm | | | 49 | | |
Supplemental Information (Unaudited) | | | 50 | | |
Trustees' and Officers' Information | | | 50 | | |
Proxy Voting and Portfolio Holdings Information | | | 56 | | |
Expense Examples | | | 56 | | |
Additional Federal Income Tax Information | | | 57 | | |
Advisory Contract Agreement | | | 58 | | |
Liquidity Risk Management Program | | | 62 | | |
Privacy Policy (inside back cover) | | | |
This report is for the information of the shareholders and others who have received a copy of the currently effective prospectus of the Fund, managed by Victory Capital Management Inc. It may be used as sales literature only when preceded or accompanied by a current prospectus, which provides further details about the Fund.
IRA DISTRIBUTION WITHHOLDING DISCLOSURE
We generally must withhold federal income tax at a rate of 10% of the taxable portion of your distribution and, if you live in a state that requires state income tax withholding, at your state's tax rate. However, you may elect not to have withholding apply or to have income tax withheld at a higher rate. Any withholding election that you make will apply to any subsequent distribution unless and until you change or revoke the election. If you wish to make a withholding election, or change or revoke a prior withholding election, call (800) 235-8396, and form W-4P (OMB No. 1545-0074 withholding certificate for pension or annuity payments) will be electronically sent.
If you do not have a withholding election in place by the date of a distribution, federal income tax will be withheld from the taxable portion of your distribution at a rate of 10%. If you must pay estimated taxes, you may be subject to estimated tax penalties if your estimated tax payments are not sufficient and sufficient tax is not withheld from your distribution.
For more specific information, please consult your tax adviser.
• NOT FDIC INSURED • NO BANK GUARANTEE • MAY LOSE VALUE
1
(Unaudited)
Dear Shareholder,
Never a dull moment. A year ago, we were still coming to grips with a global pandemic, hoping for an effective vaccine, and wondering whether the U.S. Federal Reserve's aggressive actions would continue to mollify financial markets. As it turns out, a vaccine was rolled out (domestically) faster than expectations, and the recovery that began during the second quarter of 2020 continued unabated.
Fast forward to today and investors are suddenly more concerned about labor shortages, rising commodity prices, and whether inflation will prove to be transitory or more lasting. If anything, this merely exemplifies that markets are unpredictable and the environment can and will change rapidly.
Reflecting on the past year, we must consider ourselves fortunate despite the myriad challenges. For starters, it was impressive how quickly the various forms of monetary and fiscal stimulus contributed to a rebound in GDP. Of course, it wasn't a straight line upward and there were bouts of elevated volatility in both bond and stock markets. Late in 2020, for example, financial markets were alternately fueled and roiled by a contentious election season, growing optimism for an effective vaccine, and a fluid debate regarding the need for even more stimulus. Ultimately, stocks were propelled higher in the fourth quarter of 2020 as it became clear Congress would provide another dose of stimulus in the form of direct payments, more unemployment insurance, and additional aid to businesses.
As we moved into 2021, stocks continued their upward trajectory. Meanwhile, the yield on the 10-Year U.S. Treasury continued rallying sharply as many investors began to shift their focus. Deflation was out; inflation was in. Indeed, the potential for a new era of inflation and higher interest rates seems to be the new worry du jour.
So how did the numbers shake out after this unusual year? The S&P 500® Index registered an impressive annual return of approximately 40% for this 12-month period ended May 31, 2021. Over this same period, the yield on the 10-Year U.S. Treasury jumped 94 basis points, reflecting both the very low starting rate and substantial fiscal stimulus. At the end of the reporting period, the yield on the 10-Year U.S. Treasury was 1.59%.
The past year is not one we will forget any time soon. There were many hardships, but we should not overlook the positives and remember our collective spirit and perseverance. Markets endured and even surprised to the upside, but perhaps the key takeaway is that investors need to remain calm in the face of adversity and focused on longer-term investment goals. We believe that's the best approach no matter what the markets throw at us.
On the following pages, you will find information relating to your USAA Mutual Funds, brought to you by Victory Capital. If you have any questions regarding the current market dynamics or your specific portfolio or investment plan, we encourage you to contact our Member Service Representatives. Call (800) 235-8396 or visit our website at www.vcm.com.
2
From all of us here at Victory Capital, thank you for letting us help you work toward your investment goals.

Christopher K. Dyer, CFA
President,
USAA Mutual Funds
3
USAA Sustainable World Fund
(Formerly USAA World Growth Fund)
Managers' Commentary
(Unaudited)
• What were the market conditions during the reporting period?
The beginning of the reporting period brought a dramatic reversal from the difficult environment that characterized the first part of 2020. While COVID-19 cases continued to rise, investors grew increasingly confident that the economy would be able to recover from its sharp downturn of February and March. The optimism stemmed, in part, from a series of better-than-expected economic reports interpreted as evidence that the slump in growth would be less severe than was initially feared. The markets were further cheered by the aggressive response by the U.S. Federal Reserve (the "Fed"). In addition to reiterating its commitment to keep short-term interest rates near zero for an extended period, the Fed announced the direct purchase of both individual bonds and exchange-traded bond funds. The central bank's unusual steps offered corporations the latitude to issue debt at ultra-low rates, providing them with the cash necessary to help withstand the effects of the coronavirus.
The global financial markets produced healthy returns during the second half of 2020, wrapping up a positive year for the major asset classes. Investors' appetite for risk improved considerably in early November, when the approval of vaccines for COVID-19 raised expectations that the world economy could gradually return to normal in 2021. The conclusion of the U.S. elections, which removed a source of uncertainty that had depressed performance in September and October, was an additional tailwind. The markets were also aided by continued indications that the Fed and other central banks would maintain their highly accommodative policies indefinitely. Not least, an agreement on a new round of U.S. fiscal stimulus further cheered investors in late December. Together, these developments outweighed negative headlines surrounding renewed lockdowns and the persistence of the coronavirus.
The first quarter of 2021 proved to be a continuation of the strong equity markets investors experienced over the second half of 2020. Gains from global equity markets were fueled by optimism surrounding the successful rollout of the COVID-19 vaccines coupled with further monetary and fiscal stimulus proposals. Faster-than-expected economic growth produced a meaningful increase in real interest rates, which led to negative returns across most major fixed income asset classes. The 10-year U.S. Treasury bond yield finished at its highest level of the first quarter reporting period, climbing from under 1% to 1.74%.
During the last few months of the reporting period, equity markets have been consolidating and interest rates leveling off after large upswings. With strong first quarter GDP and corporate earnings growth in the rearview mirror, investors seem to be contemplating their next move. Inflation data has been increasing as the economy reopens more quickly than expected. The Fed maintains that inflationary pressure is transitory but could become more persistent. The inflationary environment will be a key metric moving into the second half of the year.
4
USAA Sustainable World Fund (continued)
Managers' Commentary (continued)
• How did the USAA Sustainable World Fund (the "Fund") perform during the reporting period?
The Fund has three share classes: Fund Shares, Institutional Shares, and Class A (effective June 29, 2020, the Adviser Shares were redesignated Class A and became subject to a front-end sales charge). For the reporting period ended May 31, 2021, the Fund Shares, Institutional Shares, and Class A had a total return of 39.07%, 39.21%, and 38.73% respectively. This compares to returns of 41.85% for the MSCI All Country World Index,1 40.63% for the MSCI World Index, and 44.99% for the Lipper Global Funds Index.
Victory Capital Management Inc. ("VCM") is the Fund's investment adviser. As the investment adviser, VCM employs dedicated resources to support the research, selection, and monitoring of the Fund's subadvisers. MFS Investment Management2 is an external subadviser to the Fund, while RS Investments Global, RS Investments Value3, Sophus Capital3, Trivalent Investments3, NewBridge Asset Management3, and THB Asset Management3 are Victory Capital Management investment franchises that each manage portions of the Fund. Primary responsibility for the day-to-day discretionary management of the Fund lies with the subadviser and the investment franchises.
• What strategies did you employ during the reporting period?
Effective October 1, 2020, the Fund's name changed to USAA Sustainable World Fund. In addition, the Fund's investment strategy and risks were updated to reflect the fact that the Fund's managers will utilize sustainability, responsible investing or environmental, social and governance ("ESG") criteria to enhance their fundamental, qualitative, and/or quantitative investment processes. ESG and sustainability data and research inform the manager's views of investment opportunities or risk assessments.
During the one-year period ending on May 31, 2021, the Fund underperformed the MSCI All Country World Index. On a country basis, China, Taiwan, and India were detractors from overall performance, mainly driven by negative stock selection. This was offset by positive stock selection in the United Kingdom, Japan, and Norway.
From a sector perspective, Consumer Discretionary detracted the most, driven by negative stock selection, which was somewhat offset by positive stock selection and allocation effects in Industrials and the Utilities sector. The Information Technology sector, which is the largest sector in the benchmark, had a positive stock selection effect, even in the face of a rotation out of growth tech names that was underway during the first quarter of 2021.
Thank you for allowing us to assist you with your investment needs.
1As of October 1, 2020, the MSCI All Country World Index replaced the MSCI World Index as the Fund's primary benchmark because this index is more representative of the Fund's investment universe.
2Effective March 19, 2021, MFS no longer manages the Fund.
3Victory Capital Management investment franchises added to the Fund during the reporting period were RS Investments Value, Sophus Capital, Trivalent Investments, NewBridge Asset Management, and THB Asset Management.
5
USAA Sustainable World Fund
Investment Overview
(Unaudited)
Average Annual Total Return
Year Ended May 31, 2021
| | Fund Shares | | Institutional Shares | | Class A | | | | | | | |
INCEPTION DATE | | 10/1/92 | | 8/7/15 | | 8/1/10 | | | | | | | |
| | Net Asset Value | | Net Asset Value | | Net Asset Value | | MSCI All-Country
World Index1 | | MSCI World Index | | Lipper Global
Funds Index2 | |
One Year | | | 39.07 | % | | | 39.21 | % | | | 38.73 | % | | | 41.85 | % | | | 40.63 | % | | | 44.99 | % | |
Five Year | | | 14.23 | % | | | 14.30 | % | | | 13.93 | % | | | 14.18 | % | | | 14.23 | % | | | 13.73 | % | |
Ten Year | | | 11.05 | % | | | NA | | | | 10.77 | % | | | 9.58 | % | | | 10.31 | % | | | 9.31 | % | |
Since Inception | | | NA | | | | 11.62 | % | | | NA | | | | NA | | | | NA | | | | NA | | |
The performance data quoted represents past performance and current returns may be lower or higher. The investment return and principal value will fluctuate so that an investor's shares, when redeemed, may be worth more or less than the original cost. To obtain performance information current to the most recent month's end, please visit www.vcm.com.
The maximum offering price figures reflect a maximum sales charge of 2.25% for Class A. Net Asset Value does not reflect sales charges.
Total return measures the price change in a share assuming the reinvestment of all net investment income and realized capital gain distributions, if any. The total returns quoted do not reflect adjustments made to the enclosed financial statements in accordance with U.S. Generally Accepted Accounting Principles or the deduction of taxes that a shareholder would pay on net investment income and realized capital gain distributions, including reinvested distributions, or redemptions of shares. The total return figures set forth above include all waivers of fees. Without such fee waivers, the total returns would have been lower.
USAA Sustainable World Fund — Growth of $10,000
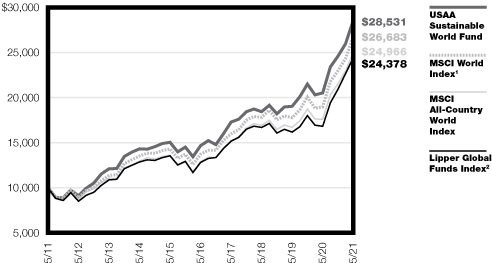
1As of October 1, 2020, the MSCI All Country World Index replaced the MSCI World Index as the Fund's primary benchmark because this index is more representative of the Fund's investment universe. The unmanaged MSCI All-Country World Index is a free float-adjusted, market capitalization-weighted index designed to measure the performance of large- and mid-cap stocks across developed and emerging markets. The index reflects the reinvestment of dividends paid on the stocks constituting the index net of withholding taxes. This index does not include the effect of sales charges, commissions, expenses, or taxes, is not representative of the Fund, and it is not possible to invest directly in an index.
2The unmanaged MSCI World Index reflects the movements of world stock markets by representing a broad selection of domestically listed companies within each market. The index reflects the reinvestment of dividends paid on the stocks constituting the index net of withholding taxes. This index does not include the effect of sales charges, commissions, expenses, or taxes, is not representative of the Fund, and it is not possible to invest directly in an index.
3The unmanaged Lipper Global Funds Index tracks the total return performance of funds within the Lipper Global Funds category. The index reflects the reinvestment of dividends paid on the stocks constituting the index net of withholding taxes. This index does not include the effect of sales charges, commissions, expenses, or taxes, is not representative of the Fund, and it is not possible to invest directly in an index.
The graph reflects investment of growth of a hypothetical $10,000 investment in the Fund.
The graph and table do not reflect the deduction of taxes that a shareholder would pay on Fund distributions or the redemption of Fund shares.
Past performance is not indicative of future results.
6
USAA Mutual Funds Trust
USAA Sustainable World Fund | | May 31, 2021 | |
(Unaudited)
Investment Objective and Portfolio Holdings:
The Fund's investment objective seeks capital appreciation.
Top 10 Sectors:
May 31, 2021
(% of Net Assets)
Information Technology | | | 21.8 | % | |
Financials | | | 15.1 | % | |
Consumer Discretionary | | | 12.7 | % | |
Industrials | | | 11.5 | % | |
Health Care | | | 11.4 | % | |
Communication Services | | | 9.1 | % | |
Consumer Staples | | | 6.0 | % | |
Materials | | | 4.9 | % | |
Energy | | | 3.7 | % | |
Utilities | | | 1.7 | % | |
Country Allocation:
May 31, 2021
(% of Net Assets)
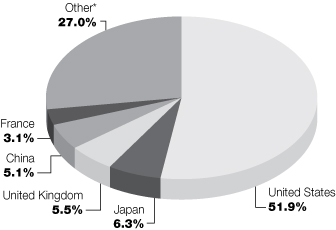
* Includes countries with less than 3.0% of portfolio and short-term investments purchased with cash collateral from securities loaned.
Percentages are of the net assets of the Fund and may not equal 100%.
Refer to the Schedule of Portfolio Investments for a complete list of securities.
7
USAA Mutual Funds Trust
USAA Sustainable World Fund | | Schedule of Portfolio Investments
May 31, 2021 | |
(Amounts in Thousands, Except for Shares)
Security Description | | Shares | | Value | |
Common Stocks (98.9%) | |
Australia (1.8%): | |
Consumer Discretionary (0.5%): | |
Aristocrat Leisure Ltd. | | | 236,613 | | | $ | 7,653 | | |
Lovisa Holdings Ltd. | | | 26,411 | | | | 286 | | |
PWR Holdings Ltd. | | | 69,861 | | | | 336 | | |
| | | | 8,275 | | |
Energy (0.0%): (a) | |
Santos Ltd. | | | 64,859 | | | | 344 | | |
Financials (0.5%): | |
Australia & New Zealand Banking Group Ltd. | | | 34,389 | | | | 767 | | |
Macquarie Group Ltd. | | | 53,949 | | | | 6,347 | | |
| | | | 7,114 | | |
Health Care (0.5%): | |
CSL Ltd. | | | 32,708 | | | | 7,303 | | |
Nanosonics Ltd. (b) | | | 61,977 | | | | 266 | | |
Sonic Healthcare Ltd. | | | 15,323 | | | | 411 | | |
| | | | 7,980 | | |
Industrials (0.1%): | |
Austal Ltd. | | | 248,175 | | | | 456 | | |
Johns Lyng Group Ltd. | | | 97,070 | | | | 321 | | |
| | | | 777 | | |
Materials (0.1%): | |
Ramelius Resources Ltd. | | | 412,835 | | | | 620 | | |
Rio Tinto Ltd. | | | 14,938 | | | | 1,417 | | |
| | | | 2,037 | | |
Real Estate (0.1%): | |
Charter Hall Group | | | 39,929 | | | | 437 | | |
Stockland | | | 111,630 | | | | 402 | | |
| | | | 839 | | |
| | | | 27,366 | | |
Austria (0.0%): (a) | |
Financials (0.0%): | |
Raiffeisen Bank International AG | | | 9,447 | | | | 225 | | |
Belgium (0.4%): | |
Consumer Staples (0.0%): (a) | |
Anheuser-Busch InBev SA | | | 5,834 | | | | 442 | | |
Financials (0.0%): (a) | |
KBC Group NV | | | 5,110 | | | | 418 | | |
Health Care (0.0%): (a) | |
UCB SA | | | 5,298 | | | | 497 | | |
See notes to financial statements.
8
USAA Mutual Funds Trust
USAA Sustainable World Fund | | Schedule of Portfolio Investments — continued
May 31, 2021 | |
(Amounts in Thousands, Except for Shares)
Security Description | | Shares | | Value | |
Information Technology (0.4%): | |
Melexis NV | | | 48,384 | | | $ | 5,046 | | |
| | | | 6,403 | | |
Bermuda (0.9%): | |
Financials (0.2%): | |
RenaissanceRe Holdings Ltd. | | | 20,200 | | | | 3,113 | | |
Industrials (0.6%): | |
Triton International Ltd. | | | 169,751 | | | | 9,209 | | |
Utilities (0.1%): | |
China Gas Holdings Ltd. | | | 253,000 | | | | 962 | | |
| | | | 13,284 | | |
Brazil (0.6%): | |
Communication Services (0.0%): (a) | |
TIM SA | | | 269,300 | | | | 625 | | |
Consumer Discretionary (0.1%): | |
Petrobras Distribuidora SA | | | 161,700 | | | | 793 | | |
Financials (0.1%): | |
B3 SA - Brasil Bolsa Balcao | | | 324,600 | | | | 1,089 | | |
Industrials (0.1%): | |
Randon SA Implementos e Participacoes Preference Shares | | | 172,800 | | | | 495 | | |
SIMPAR SA | | | 78,200 | | | | 746 | | |
| | | | 1,241 | | |
Materials (0.3%): | |
Klabin SA (b) | | | 127,200 | | | | 639 | | |
Vale SA | | | 58,400 | | | | 1,251 | | |
Vale SA, ADR | | | 94,800 | | | | 2,040 | | |
| | | | 3,930 | | |
Real Estate (0.0%): (a) | |
Multiplan Empreendimentos Imobiliarios SA | | | 149,200 | | | | 733 | | |
Utilities (0.0%): (a) | |
Neoenergia SA | | | 158,300 | | | | 567 | | |
| | | | 8,978 | | |
Canada (2.8%): | |
Consumer Discretionary (0.3%): | |
Lululemon Athletica, Inc. (b) | | | 9,977 | | | | 3,224 | | |
Magna International, Inc. | | | 12,200 | | | | 1,227 | | |
| | | | 4,451 | | |
Energy (0.4%): | |
Parex Resources, Inc. (b) | | | 373,704 | | | | 6,380 | | |
Industrials (0.7%): | |
Canadian Pacific Railway Ltd. (c) | | | 118,560 | | | | 9,629 | | |
Exco Technologies, Ltd. | | | 32,741 | | | | 297 | | |
See notes to financial statements.
9
USAA Mutual Funds Trust
USAA Sustainable World Fund | | Schedule of Portfolio Investments — continued
May 31, 2021 | |
(Amounts in Thousands, Except for Shares)
Security Description | | Shares | | Value | |
Savaria Corp. | | | 19,253 | | | $ | 310 | | |
| | | | 10,236 | | |
Information Technology (0.9%): | |
Constellation Software, Inc. | | | 7,926 | | | | 11,377 | | |
Shopify, Inc. Class A (b) | | | 2,297 | | | | 2,855 | | |
| | | | 14,232 | | |
Materials (0.5%): | |
Kirkland Lake Gold Ltd. (c) | | | 151,810 | | | | 6,581 | | |
Wesdome Gold Mines Ltd. (b) | | | 60,276 | | | | 556 | | |
| | | | 7,137 | | |
| | | | 42,436 | | |
Chile (0.1%): | |
Financials (0.1%): | |
Banco de Chile | | | 7,042,115 | | | | 705 | | |
China (5.1%): | |
Communication Services (1.7%): | |
Baidu, Inc., ADR (b) | | | 34,311 | | | | 6,734 | | |
Tencent Holdings Ltd. | | | 245,100 | | | | 19,163 | | |
| | | | 25,897 | | |
Consumer Discretionary (0.9%): | |
Alibaba Group Holding Ltd., ADR (b) | | | 22,794 | | | | 4,877 | | |
China Meidong Auto Holdings Ltd. | | | 851,212 | | | | 4,539 | | |
China Yongda Automobiles Services Holdings Ltd. | | | 375,500 | | | | 662 | | |
JD.com, Inc., ADR (b) | | | 14,732 | | | | 1,089 | | |
Jiumaojiu International Holdings Ltd. (b) (d) | | | 231,000 | | | | 908 | | |
Meituan Class B (b) (d) | | | 36,200 | | | | 1,269 | | |
| | | | 13,344 | | |
Consumer Staples (0.7%): | |
By-health Co. Ltd. Class A | | | 106,700 | | | | 620 | | |
China Feihe Ltd. (d) | | | 262,000 | | | | 714 | | |
Foshan Haitan Flavouring & Food Co. Ltd. Class A | | | 388,316 | | | | 8,296 | | |
Wuliangye Yibin Co. Ltd. Class A | | | 16,888 | | | | 842 | | |
| | | | 10,472 | | |
Energy (0.0%): (a) | |
China Oilfield Services Ltd. Class H | | | 646,000 | | | | 602 | | |
Financials (0.9%): | |
China Merchants Bank Co. Ltd. Class H | | | 231,000 | | | | 2,137 | | |
Industrial & Commercial Bank of China Ltd. Class H (c) | | | 13,040,370 | | | | 8,561 | | |
Ping An Insurance Group Co. of China Ltd. | | | 121,000 | | | | 1,322 | | |
Postal Savings Bank of China Co. Ltd. Class H (d) | | | 1,494,000 | | | | 1,073 | | |
| | | | 13,093 | | |
See notes to financial statements.
10
USAA Mutual Funds Trust
USAA Sustainable World Fund | | Schedule of Portfolio Investments — continued
May 31, 2021 | |
(Amounts in Thousands, Except for Shares)
Security Description | | Shares | | Value | |
Health Care (0.1%): | |
Pharmaron Beijing Co. Ltd. Class H (d) | | | 28,800 | | | $ | 677 | | |
Wuxi Biologics Cayman, Inc. (b) (d) | | | 81,500 | | | | 1,210 | | |
| | | | 1,887 | | |
Industrials (0.3%): | |
Airtac International Group | | | 19,000 | | | | 688 | | |
COSCO SHIPPING Holdings Co. Ltd. Class H (b) | | | 457,500 | | | | 956 | | |
Hangcha Group Co. Ltd. Class A | | | 145,854 | | | | 453 | | |
Luxshare Precision Industry Co. Ltd. Class A (b) | | | 94,800 | | | | 586 | | |
Zoomlion Heavy Industry Science and Technology Co. Ltd. Class H | | | 798,800 | | | | 993 | | |
| | | | 3,676 | | |
Information Technology (0.2%): | |
21Vianet Group, Inc., ADR (b) | | | 28,338 | | | | 632 | | |
Chinasoft International Ltd. | | | 722,000 | | | | 928 | | |
Xiaomi Corp. Class B (b) (d) | | | 243,200 | | | | 898 | | |
Yonyou Network Technology Co. Ltd. Class A | | | 106,575 | | | | 607 | | |
| | | | 3,065 | | |
Materials (0.2%): | |
China Hongqiao Group Ltd. | | | 658,500 | | | | 1,062 | | |
China Molybdenum Co. Ltd. Class H | | | 1,083,000 | | | | 726 | | |
Wanhua Chemical Group Co. Ltd. Class A | | | 55,300 | | | | 950 | | |
| | | | 2,738 | | |
Real Estate (0.1%): | |
Shimao Services Holdings Ltd. (d) | | | 435,000 | | | | 1,169 | | |
Utilities (0.0%): (a) | |
China Longyuan Power Group Corp. Ltd. Class H | | | 346,000 | | | | 497 | | |
| | | | 76,440 | | |
Denmark (0.7%): | |
Consumer Discretionary (0.0%): (a) | |
Pandora A/S | | | 3,012 | | | | 407 | | |
TCM Group A/S | | | 9,036 | | | | 240 | | |
| | | | 647 | | |
Consumer Staples (0.6%): | |
Carlsberg A/S Class B | | | 4,152 | | | | 763 | | |
Royal Unibrew A/S | | | 59,719 | | | | 7,717 | | |
| | | | 8,480 | | |
Health Care (0.0%): (a) | |
GN Store Nord A/S | | | 5,801 | | | | 493 | | |
Industrials (0.1%): | |
AP Moller - Maersk A/S Class B | | | 290 | | | | 800 | | |
INVISIO AB | | | 15,234 | | | | 375 | | |
| | | | 1,175 | | |
See notes to financial statements.
11
USAA Mutual Funds Trust
USAA Sustainable World Fund | | Schedule of Portfolio Investments — continued
May 31, 2021 | |
(Amounts in Thousands, Except for Shares)
Security Description | | Shares | | Value | |
Utilities (0.0%): (a) | |
Orsted A/S (d) | | | 2,838 | | | $ | 434 | | |
| | | | 11,229 | | |
Finland (0.0%): (a) | |
Industrials (0.0%): | |
Metso Outotec Oyj | | | 57,284 | | | | 679 | | |
France (3.1%): | |
Communication Services (0.0%): (a) | |
Publicis Groupe SA | | | 9,301 | | | | 628 | | |
Consumer Discretionary (0.5%): | |
Faurecia SE (b) | | | 99,592 | | | | 5,464 | | |
LVMH Moet Hennessy Louis Vuitton SE | | | 1,607 | | | | 1,287 | | |
| | | | 6,751 | | |
Energy (0.4%): | |
Gaztransport Et Technigaz SA | | | 54,488 | | | | 4,534 | | |
TotalEnergies SE | | | 17,336 | | | | 809 | | |
| | | | 5,343 | | |
Financials (0.7%): | |
Amundi SA (d) | | | 3,780 | | | | 336 | | |
AXA SA | | | 21,880 | | | | 609 | | |
BNP Paribas SA (c) | | | 143,471 | | | | 9,876 | | |
| | | | 10,821 | | |
Health Care (0.1%): | |
Pharmagest Interactive (b) | | | 1,254 | | | | 139 | | |
Sanofi | | | 6,193 | | | | 663 | | |
Sartorius Stedim Biotech | | | 1,270 | | | | 550 | | |
Vetoquinol SA (b) | | | 2,414 | | | | 311 | | |
| | | | 1,663 | | |
Industrials (0.6%): | |
Alstom SA (b) | | | 5,593 | | | | 315 | | |
Cie de Saint-Gobain (b) | | | 11,441 | | | | 768 | | |
Safran SA | | | 46,860 | | | | 7,085 | | |
Teleperformance | | | 1,224 | | | | 469 | | |
Thermador Groupe | | | 4,487 | | | | 477 | | |
| | | | 9,114 | | |
Information Technology (0.1%): | |
Capgemini SE | | | 3,655 | | | | 683 | | |
Esker SA (b) | | | 2,648 | | | | 733 | | |
Lectra | | | 8,890 | | | | 352 | | |
| | | | 1,768 | | |
Materials (0.7%): | |
Arkema SA | | | 80,268 | | | | 10,634 | | |
| | | | 46,722 | | |
See notes to financial statements.
12
USAA Mutual Funds Trust
USAA Sustainable World Fund | | Schedule of Portfolio Investments — continued
May 31, 2021 | |
(Amounts in Thousands, Except for Shares)
Security Description | | Shares | | Value | |
Germany (1.6%): | |
Communication Services (0.1%): | |
Deutsche Telekom AG | | | 44,991 | | | $ | 936 | | |
Consumer Discretionary (0.7%): | |
HelloFresh SE (b) | | | 4,304 | | | | 389 | | |
Volkswagen AG Preference Shares | | | 39,526 | | | | 10,880 | | |
| | | | 11,269 | | |
Energy (0.1%): | |
CropEnergies AG | | | 21,667 | | | | 287 | | |
VERBIO Vereinigte BioEnergie AG | | | 10,041 | | | | 553 | | |
| | | | 840 | | |
Financials (0.1%): | |
Allianz SE Registered Shares | | | 3,337 | | | | 886 | | |
Hannover Rueck SE | | | 1,711 | | | | 300 | | |
Muenchener Rueckversicherungs-Gesellschaft AG Class R | | | 1,009 | | | | 290 | | |
| | | | 1,476 | | |
Health Care (0.1%): | |
Eckert & Ziegler Strahlen- und Medizintechnik AG | | | 5,404 | | | | 585 | | |
Merck KGaA | | | 3,698 | | | | 665 | | |
Nexus AG | | | 6,905 | | | | 542 | | |
| | | | 1,792 | | |
Industrials (0.2%): | |
| 2G Energy AG (b) | | | 2,978 | | | | 339 | | |
Amadeus Fire AG | | | 1,977 | | | | 366 | | |
Cewe Stiftung & Co. KGaA | | | 1,518 | | | | 249 | | |
Deutsche Post AG Registered Shares | | | 15,353 | | | | 1,043 | | |
Dr Hoenle AG | | | 7,496 | | | | 419 | | |
Siemens AG Registered Shares | | | 2,942 | | | | 483 | | |
| | | | 2,899 | | |
Information Technology (0.2%): | |
AIXTRON SE | | | 13,296 | | | | 271 | | |
Basler AG | | | 4,173 | | | | 555 | | |
Infineon Technologies AG | | | 10,022 | | | | 405 | | |
LPKF Laser & Electronics AG | | | 10,544 | | | | 294 | | |
PVA TePla AG (b) | | | 9,470 | | | | 272 | | |
SAP SE | | | 3,607 | | | | 505 | | |
Secunet Security Networks AG | | | 1,272 | | | | 591 | | |
| | | | 2,893 | | |
Materials (0.0%): (a) | |
Covestro AG (d) | | | 4,866 | | | | 340 | | |
HeidelbergCement AG | | | 3,683 | | | | 336 | | |
| | | | 676 | | |
See notes to financial statements.
13
USAA Mutual Funds Trust
USAA Sustainable World Fund | | Schedule of Portfolio Investments — continued
May 31, 2021 | |
(Amounts in Thousands, Except for Shares)
Security Description | | Shares | | Value | |
Real Estate (0.1%): | |
alstria office REIT-AG | | | 14,487 | | | $ | 265 | | |
LEG Immobilien SE | | | 2,982 | | | | 439 | | |
| | | | 704 | | |
Utilities (0.0%): (a) | |
E.ON SE | | | 55,481 | | | | 675 | | |
| | | | 24,160 | | |
Greece (0.1%): | |
Financials (0.0%): (a) | |
National Bank of Greece SA (b) | | | 217,952 | | | | 657 | | |
Industrials (0.1%): | |
Mytilineos SA (b) | | | 35,685 | | | | 662 | | |
| | | | 1,319 | | |
Hong Kong (0.3%): | |
Consumer Discretionary (0.1%): | |
JS Global Lifestyle Co. Ltd. (b) (d) | | | 259,000 | | | | 762 | | |
Xinyi Glass Holdings Ltd. | | | 129,813 | | | | 508 | | |
| | | | 1,270 | | |
Consumer Staples (0.0%): (a) | |
WH Group Ltd. (d) | | | 414,171 | | | | 357 | | |
Financials (0.1%): | |
BOC Hong Kong Holdings Ltd. | | | 360,273 | | | | 1,329 | | |
Industrials (0.0%): (a) | |
Pacific Basin Shipping Ltd. (b) | | | 1,622,000 | | | | 612 | | |
Information Technology (0.1%): | |
ASM Pacific Technology Ltd. | | | 54,500 | | | | 719 | | |
Real Estate (0.0%): (a) | |
CK Asset Holdings Ltd. | | | 46,817 | | | | 319 | | |
Sun Hung Kai Properties Ltd. | | | 23,409 | | | | 366 | | |
| | | | 685 | | |
| | | | 4,972 | | |
India (0.7%): | |
Energy (0.1%): | |
Hindustan Petroleum Corp. Ltd. | | | 250,372 | | | | 969 | | |
Petronet LNG Ltd. | | | 187,096 | | | | 622 | | |
| | | | 1,591 | | |
Financials (0.2%): | |
Bandhan Bank Ltd. (b) (d) | | | 4,330 | | | | 18 | | |
Cholamandalam Investment & Finance Co. Ltd. | | | 133,935 | | | | 1,004 | | |
Federal Bank Ltd. (b) | | | 658,112 | | | | 807 | | |
HDFC Bank Ltd., ADR (b) | | | 9,479 | | | | 726 | | |
LIC Housing Finance Ltd. | | | 139,889 | | | | 879 | | |
| | | | 3,434 | | |
See notes to financial statements.
14
USAA Mutual Funds Trust
USAA Sustainable World Fund | | Schedule of Portfolio Investments — continued
May 31, 2021 | |
(Amounts in Thousands, Except for Shares)
Security Description | | Shares | | Value | |
Health Care (0.1%): | |
Divi's Laboratories Ltd. (b) | | | 11,698 | | | $ | 665 | | |
Dr Reddy's Laboratories Ltd. | | | 10,785 | | | | 772 | | |
| | | | 1,437 | | |
Information Technology (0.2%): | |
Infosys Ltd., ADR | | | 110,830 | | | | 2,143 | | |
Materials (0.1%): | |
Asian Paints Ltd. | | | 17,768 | | | | 721 | | |
Dalmia Bharat Ltd. (b) | | | 16,834 | | | | 412 | | |
NMDC Ltd. | | | 378,551 | | | | 935 | | |
| | | | 2,068 | | |
| | | | 10,673 | | |
Indonesia (0.7%): | |
Communication Services (0.6%): | |
PT Telkom Indonesia Persero Tbk | | | 42,718,338 | | | | 9,798 | | |
Financials (0.1%): | |
PT Bank Negara Indonesia Persero Tbk | | | 2,020,300 | | | | 735 | | |
| | | | 10,533 | | |
Ireland (1.4%): | |
Health Care (0.1%): | |
ICON PLC (b) | | | 3,722 | | | | 833 | | |
Industrials (1.3%): | |
DCC PLC | | | 7,563 | | | | 642 | | |
Eaton Corp. PLC | | | 102,785 | | | | 14,930 | | |
Trane Technologies PLC | | | 21,596 | | | | 4,025 | | |
| | | | 19,597 | | |
| | | | 20,430 | | |
Italy (2.0%): | |
Energy (0.5%): | |
Snam SpA | | | 1,292,734 | | | | 7,607 | | |
Financials (0.3%): | |
Banca Generali SpA (b) | | | 98,315 | | | | 3,958 | | |
Health Care (0.6%): | |
El.En. SpA | | | 13,882 | | | | 738 | | |
Recordati Industria Chimica e Farmaceutica SpA (c) | | | 144,235 | | | | 8,038 | | |
| | | | 8,776 | | |
Industrials (0.0%): (a) | |
Leonardo SpA | | | 41,198 | | | | 360 | | |
Information Technology (0.1%): | |
Nexi SpA (b) (d) | | | 22,938 | | | | 466 | | |
Sesa SpA (b) | | | 4,257 | | | | 666 | | |
| | | | 1,132 | | |
See notes to financial statements.
15
USAA Mutual Funds Trust
USAA Sustainable World Fund | | Schedule of Portfolio Investments — continued
May 31, 2021 | |
(Amounts in Thousands, Except for Shares)
Security Description | | Shares | | Value | |
Utilities (0.5%): | |
ACEA SpA | | | 19,103 | | | $ | 457 | | |
Enel SpA (c) | | | 769,611 | | | | 7,631 | | |
| | | | 8,088 | | |
| | | | 29,921 | | |
Japan (6.3%): | |
Communication Services (1.2%): | |
Capcom Co. Ltd. | | | 275,908 | | | | 8,868 | | |
Kakaku.com, Inc. | | | 189,591 | | | | 5,644 | | |
KDDI Corp. | | | 21,049 | | | | 718 | | |
Nintendo Co. Ltd. | | | 1,276 | | | | 790 | | |
Nippon Telegraph & Telephone Corp. | | | 29,234 | | | | 792 | | |
SoftBank Group Corp. | | | 3,406 | | | | 259 | | |
ValueCommerce Co. Ltd. | | | 11,200 | | | | 312 | | |
ZIGExN Co. Ltd. | | | 71,700 | | | | 258 | | |
| | | | 17,641 | | |
Consumer Discretionary (0.9%): | |
Shoei Co. Ltd. | | | 13,100 | | | | 477 | | |
Sony Group Corp. | | | 22,551 | | | | 2,242 | | |
The Furukawa Battery Co. Ltd. (b) | | | 18,300 | | | | 265 | | |
Toyo Tire Corp. | | | 20,409 | | | | 415 | | |
Toyota Motor Corp. | | | 14,900 | | | | 1,237 | | |
ZOZO, Inc. | | | 245,100 | | | | 8,340 | | |
| | | | 12,976 | | |
Consumer Staples (0.5%): | |
Asahi Group Holdings Ltd. | | | 12,191 | | | | 589 | | |
Create SD Holdings Co. Ltd. | | | 6,300 | | | | 186 | | |
Rock Field Co. Ltd. | | | 18,000 | | | | 260 | | |
Seven & i Holdings Co. Ltd. | | | 8,616 | | | | 379 | | |
Toyo Suisan Kaisha Ltd. | | | 137,449 | | | | 5,604 | | |
Transaction Co. Ltd. | | | 20,600 | | | | 257 | | |
| | | | 7,275 | | |
Financials (0.9%): | |
JAFCO Group Co. Ltd. | | | 74,331 | | | | 5,434 | | |
Mitsubishi UFJ Financial Group, Inc. | | | 936,912 | | | | 5,381 | | |
Mizuho Financial Group, Inc. | | | 43,111 | | | | 668 | | |
Nomura Holdings, Inc. | | | 61,772 | | | | 339 | | |
ORIX Corp. | | | 50,074 | | | | 885 | | |
Sumitomo Mitsui Financial Group, Inc. | | | 9,675 | | | | 354 | | |
Sumitomo Mitsui Trust Holdings, Inc. | | | 7,332 | | | | 256 | | |
| | | | 13,317 | | |
Health Care (0.5%): | |
As One Corp. | | | 3,844 | | | | 445 | | |
BML, Inc. | | | 10,700 | | | | 364 | | |
EPS Holdings, Inc. | | | 13,000 | | | | 192 | | |
Hoya Corp. | | | 44,702 | | | | 5,875 | | |
See notes to financial statements.
16
USAA Mutual Funds Trust
USAA Sustainable World Fund | | Schedule of Portfolio Investments — continued
May 31, 2021 | |
(Amounts in Thousands, Except for Shares)
Security Description | | Shares | | Value | |
Japan Lifeline Co. Ltd. | | | 20,800 | | | $ | 266 | | |
Japan Medical Dynamic Marketing, Inc. | | | 17,700 | | | | 327 | | |
Ono Pharmaceutical Co. Ltd. | | | 21,799 | | | | 497 | | |
Takeda Pharmaceutical Co. Ltd. | | | 8,600 | | | | 294 | | |
| | | | 8,260 | | |
Industrials (1.4%): | |
Altech Corp. | | | 14,900 | | | | 269 | | |
Dai-Dan Co. Ltd. | | | 10,500 | | | | 259 | | |
Denyo Co. Ltd. | | | 14,700 | | | | 274 | | |
Fuji Electric Co. Ltd. | | | 8,000 | | | | 376 | | |
Giken Ltd. | | | 5,300 | | | | 217 | | |
gremz, Inc. (b) | | | 15,200 | | | | 256 | | |
ITOCHU Corp. | | | 42,209 | | | | 1,273 | | |
JAC Recruitment Co. Ltd. | | | 15,100 | | | | 253 | | |
Komatsu Ltd. | | | 11,700 | | | | 353 | | |
Maeda Kosen Co. Ltd. | | | 13,900 | | | | 440 | | |
Mirait Holdings Corp. | | | 16,400 | | | | 292 | | |
Mitsubishi Electric Corp. | | | 27,001 | | | | 421 | | |
Mitsui & Co. Ltd. | | | 27,220 | | | | 602 | | |
Nippon Parking Development Co. Ltd. | | | 198,500 | | | | 276 | | |
Nippon Yusen | | | 221,754 | | | | 9,036 | | |
Obayashi Corp. | | | 34,125 | | | | 290 | | |
OKUMA Corp. | | | 86,800 | | | | 4,552 | | |
Rheon Automatic Machinery Co. Ltd. | | | 22,400 | | | | 268 | | |
Rozetta Corp. | | | 9,500 | | | | 174 | | |
S-Pool, Inc. | | | 79,100 | | | | 633 | | |
Taisei Corp. | | | 7,549 | | | | 267 | | |
Yamato Holdings Co. Ltd. | | | 11,161 | | | | 305 | | |
| | | | 21,086 | | |
Information Technology (0.8%): | |
Comture Corp. | | | 14,400 | | | | 303 | | |
Digital Arts, Inc. | | | 1,800 | | | | 132 | | |
Double Standard, Inc. (b) | | | 3,700 | | | | 158 | | |
Fujitsu Ltd. | | | 4,359 | | | | 711 | | |
Fukui Computer Holdings, Inc. | | | 14,900 | | | | 591 | | |
Future Corp. | | | 14,900 | | | | 270 | | |
Hitachi Ltd. | | | 10,945 | | | | 577 | | |
Murata Manufacturing Co. Ltd. | | | 6,641 | | | | 503 | | |
NTT Data Corp. | | | 24,461 | | | | 396 | | |
Poletowin Pitcrew Holdings, Inc. | | | 21,800 | | | | 214 | | |
SHIFT, Inc. (b) | | | 3,000 | | | | 415 | | |
Softcreate Holdings Corp. (b) | | | 11,200 | | | | 233 | | |
TDK Corp. | | | 2,768 | | | | 349 | | |
TechMatrix Corp. | | | 15,700 | | | | 252 | | |
Tokyo Electron Ltd. | | | 1,701 | | | | 746 | | |
Ulvac, Inc. | | | 126,400 | | | | 5,839 | | |
V Technology Co. Ltd. | | | 7,200 | | | | 341 | | |
| | | | 12,030 | | |
See notes to financial statements.
17
USAA Mutual Funds Trust
USAA Sustainable World Fund | | Schedule of Portfolio Investments — continued
May 31, 2021 | |
(Amounts in Thousands, Except for Shares)
Security Description | | Shares | | Value | |
Materials (0.1%): | |
Rengo Co. Ltd. | | | 36,786 | | | $ | 311 | | |
Shin-Etsu Chemical Co. Ltd. | | | 2,343 | | | | 406 | | |
Tosoh Corp. | | | 19,882 | | | | 353 | | |
| | | | 1,070 | | |
Real Estate (0.0%): (a) | |
Daiwa House Industry Co. Ltd. | | | 11,372 | | | | 331 | | |
Open House Co. Ltd. | | | 8,291 | | | | 384 | | |
| | | | 715 | | |
Utilities (0.0%): (a) | |
Osaka Gas Co. Ltd. | | | 19,137 | | | | 366 | | |
| | | | 94,736 | | |
Jersey (0.0%): (a) | |
Consumer Discretionary (0.0%): (a) | |
boohoo Group PLC (b) | | | 73,089 | | | | 331 | | |
Korea, Republic Of (2.5%): | |
Communication Services (0.2%): | |
LG Uplus Corp. | | | 78,675 | | | | 1,050 | | |
NAVER Corp. | | | 3,507 | | | | 1,126 | | |
| | | | 2,176 | | |
Financials (0.2%): | |
DB Insurance Co. Ltd. | | | 12,609 | | | | 572 | | |
Hana Financial Group, Inc. | | | 25,584 | | | | 1,045 | | |
LX Holdings Corp. (b) | | | 3,315 | | | | 36 | | |
Samsung Securities Co. Ltd. | | | 18,213 | | | | 757 | | |
Woori Financial Group, Inc. | | | 105,302 | | | | 1,042 | | |
| | | | 3,452 | | |
Health Care (0.1%): | |
Hugel, Inc. (b) | | | 3,011 | | | | 542 | | |
InBody Co. Ltd. | | | 9,695 | | | | 254 | | |
Samsung Biologics Co. Ltd. (b) (d) | | | 813 | | | | 603 | | |
| | | | 1,399 | | |
Industrials (0.3%): | |
CJ Corp. | | | 6,401 | | | | 628 | | |
CJ Logistics Corp. (b) | | | 3,128 | | | | 477 | | |
Hanwha Aerospace Co. Ltd. | | | 22,074 | | | | 936 | | |
Hyundai Engineering & Construction Co. Ltd. | | | 17,990 | | | | 904 | | |
LG Corp. | | | 6,837 | | | | 656 | | |
| | | | 3,601 | | |
Information Technology (1.6%): | |
Samsung Electronics Co. Ltd. | | | 318,446 | | | | 22,860 | | |
SK Hynix, Inc. | | | 17,208 | | | | 1,930 | | |
| | | | 24,790 | | |
See notes to financial statements.
18
USAA Mutual Funds Trust
USAA Sustainable World Fund | | Schedule of Portfolio Investments — continued
May 31, 2021 | |
(Amounts in Thousands, Except for Shares)
Security Description | | Shares | | Value | |
Materials (0.1%): | |
Korea Petrochemical Ind Co. Ltd. | | | 3,301 | | | $ | 800 | | |
LG Chem Ltd. | | | 886 | | | | 660 | | |
PI Advanced Materials Co. Ltd. | | | 15,369 | | | | 627 | | |
| | | | 2,087 | | |
| | | | 37,505 | | |
Luxembourg (0.2%): | |
Energy (0.0%): (a) | |
Tenaris SA | | | 40,307 | | | | 460 | | |
Health Care (0.1%): | |
Eurofins Scientific SE (b) | | | 5,113 | | | | 548 | | |
Materials (0.1%): | |
ArcelorMittal SA (b) | | | 15,256 | | | | 493 | | |
Ternium SA, ADR | | | 25,967 | | | | 951 | | |
| | | | 1,444 | | |
| | | | 2,452 | | |
Malaysia (0.0%): (a) | |
Financials (0.0%): | |
Public Bank Bhd | | | 579,000 | | | | 598 | | |
Mexico (0.2%): | |
Consumer Discretionary (0.1%): | |
Alsea SAB de CV (b) | | | 275,324 | | | | 457 | | |
Betterware de Mexico SAB de CV | | | 6,406 | | | | 278 | | |
| | | | 735 | | |
Industrials (0.0%): (a) | |
Controladora Vuela Cia de Aviacion SAB de CV, ADR (b) | | | 33,166 | | | | 572 | | |
Materials (0.1%): | |
Cemex SAB de CV, ADR (b) | | | 135,552 | | | | 1,122 | | |
Real Estate (0.0%): (a) | |
Corp Inmobiliaria Vesta SAB de CV | | | 321,642 | | | | 655 | | |
| | | | 3,084 | | |
Netherlands (1.0%): | |
Consumer Discretionary (0.1%): | |
Prosus NV | | | 6,950 | | | | 720 | | |
Consumer Staples (0.1%): | |
Koninklijke Ahold Delhaize NV | | | 28,510 | | | | 830 | | |
Energy (0.0%): (a) | |
Frank's International NV | | | 103,464 | | | | 348 | | |
Financials (0.1%): | |
ING Groep NV | | | 29,541 | | | | 413 | | |
NN Group NV | | | 10,164 | | | | 517 | | |
| | | | 930 | | |
See notes to financial statements.
19
USAA Mutual Funds Trust
USAA Sustainable World Fund | | Schedule of Portfolio Investments — continued
May 31, 2021 | |
(Amounts in Thousands, Except for Shares)
Security Description | | Shares | | Value | |
Health Care (0.0%): (a) | |
Pharming Group NV (b) (c) | | | 135,332 | | | $ | 166 | | |
QIAGEN NV (b) | | | 7,279 | | | | 361 | | |
| | | | 527 | | |
Industrials (0.0%): (a) | |
SIF Holding NV | | | 15,077 | | | | 291 | | |
Information Technology (0.7%): | |
ASM International NV | | | 30,086 | | | | 9,409 | | |
| ASML Holding NV | | | 1,002 | | | | 677 | | |
STMicroelectronics NV | | | 19,412 | | | | 724 | | |
| | | | 10,810 | | |
Materials (0.0%): (a) | |
Akzo Nobel NV | | | 2,742 | | | | 350 | | |
| | | | 14,806 | | |
New Zealand (0.3%): | |
Health Care (0.3%): | |
Fisher & Paykel Healthcare Corp. Ltd. | | | 221,210 | | | | 4,681 | | |
Norway (0.6%): | |
Energy (0.3%): | |
Aker BP ASA | | | 183,447 | | | | 5,406 | | |
Financials (0.3%): | |
SpareBank 1 SMN | | | 281,983 | | | | 4,002 | | |
| | | | 9,408 | | |
Portugal (0.0%): (a) | |
Energy (0.0%): | |
Galp Energia SGPS SA | | | 32,215 | | | | 404 | | |
Russian Federation (0.2%): | |
Consumer Discretionary (0.1%): | |
Detsky Mir PJSC (d) | | | 405,475 | | | | 841 | | |
Energy (0.0%): (a) | |
Rosneft Oil Co. PJSC, GDR | | | 85,114 | | | | 604 | | |
Financials (0.1%): | |
Sberbank of Russia PJSC, ADR | | | 84,375 | | | | 1,424 | | |
| | | | 2,869 | | |
Saudi Arabia (0.0%): (a) | |
Financials (0.0%): | |
The Saudi National Bank | | | 41,596 | | | | 589 | | |
Singapore (0.6%): | |
Communication Services (0.1%): | |
Sea Ltd., ADR (b) | | | 2,509 | | | | 636 | | |
Consumer Discretionary (0.0%): (a) | |
Genting Singapore Ltd. | | | 501,654 | | | | 320 | | |
See notes to financial statements.
20
USAA Mutual Funds Trust
USAA Sustainable World Fund | | Schedule of Portfolio Investments — continued
May 31, 2021 | |
(Amounts in Thousands, Except for Shares)
Security Description | | Shares | | Value | |
Consumer Staples (0.0%): (a) | |
Wilmar International Ltd. | | | 146,729 | | | $ | 531 | | |
Financials (0.5%): | |
DBS Group Holdings Ltd. | | | 23,605 | | | | 543 | | |
iFAST Corp. Ltd. | | | 64,300 | | | | 412 | | |
Singapore Exchange Ltd. | | | 762,681 | | | | 5,988 | | |
| | | | 6,943 | | |
| | | | 8,430 | | |
South Africa (1.0%): | |
Communication Services (0.1%): | |
MTN Group (b) | | | 158,148 | | | | 1,164 | | |
Consumer Discretionary (0.7%): | |
Mr Price Group Ltd. | | | 629,549 | | | | 10,579 | | |
Financials (0.1%): | |
Absa Group Ltd. (b) | | | 76,430 | | | | 792 | | |
Capitec Bank Holdings Ltd. | | | 6,293 | | | | 756 | | |
| | | | 1,548 | | |
Materials (0.1%): | |
Impala Platinum Holdings Ltd. | | | 75,996 | | | | 1,313 | | |
| | | | 14,604 | | |
Spain (0.1%): | |
Health Care (0.0%): (a) | |
Faes Farma SA | | | 50,265 | | | | 208 | | |
Industrials (0.0%): (a) | |
ACS Actividades de Construccion y Servicios SA | | | 16,283 | | | | 502 | | |
Information Technology (0.0%): (a) | |
Global Dominion Access SA (d) | | | 57,640 | | | | 312 | | |
Utilities (0.1%): | |
Acciona SA | | | 2,135 | | | | 369 | | |
EDP Renovaveis SA | | | 19,666 | | | | 467 | | |
| | | | 836 | | |
| | | | 1,858 | | |
Sweden (1.3%): | |
Consumer Discretionary (0.1%): | |
Boozt AB (b) (d) | | | 17,110 | | | | 395 | | |
MIPS AB | | | 3,510 | | | | 281 | | |
| | | | 676 | | |
Consumer Staples (0.1%): | |
Swedish Match AB | | | 75,350 | | | | 699 | | |
Financials (0.0%): (a) | |
Skandinaviska Enskilda Banken AB Class A | | | 38,361 | | | | 496 | | |
See notes to financial statements.
21
USAA Mutual Funds Trust
USAA Sustainable World Fund | | Schedule of Portfolio Investments — continued
May 31, 2021 | |
(Amounts in Thousands, Except for Shares)
Security Description | | Shares | | Value | |
Health Care (0.2%): | |
BioGaia AB B Shares | | | 7,645 | | | $ | 418 | | |
Biotage AB | | | 21,349 | | | | 468 | | |
Cellavision AB | | | 5,705 | | | | 239 | | |
Probi AB | | | 7,667 | | | | 453 | | |
RaySearch Laboratories AB (b) | | | 27,410 | | | | 299 | | |
Sectra AB Class B | | | 8,043 | | | | 582 | | |
SwedenCare AB | | | 47,060 | | | | 605 | | |
Xvivo Perfusion AB (b) | | | 9,235 | | | | 354 | | |
| | | | 3,418 | | |
Industrials (0.9%): | |
Atlas Copco AB Class B | | | 178,436 | | | | 9,303 | | |
BTS Group AB B Shares | | | 10,552 | | | | 412 | | |
CTT Systems AB | | | 15,739 | | | | 364 | | |
Eolus Vind AB Class B | | | 18,355 | | | | 454 | | |
GARO AB | | | 27,790 | | | | 438 | | |
Hexatronic Group AB | | | 23,501 | | | | 417 | | |
Sandvik AB | | | 15,760 | | | | 419 | | |
| SKF AB B Shares | | | 18,363 | | | | 497 | | |
Volvo AB Class B | | | 24,112 | | | | 636 | | |
| | | | 12,940 | | |
Information Technology (0.0%): (a) | |
Telefonaktiebolaget LM Ericsson Class B | | | 36,686 | | | | 492 | | |
Materials (0.0%): (a) | |
Boliden AB | | | 14,410 | | | | 579 | | |
Real Estate (0.0%): (a) | |
Fastighets AB Balder B Shares (b) | | | 5,564 | | | | 351 | | |
| | | | 19,651 | | |
Switzerland (2.8%): | |
Consumer Staples (0.1%): | |
Coca-Cola HBC AG | | | 11,494 | | | | 418 | | |
Nestle SA Registered Shares | | | 11,576 | | | | 1,431 | | |
| | | | 1,849 | | |
Financials (0.7%): | |
Julius Baer Group Ltd. | | | 8,391 | | | | 570 | | |
Partners Group Holding AG (c) | | | 4,974 | | | | 7,510 | | |
Swiss Life Holding AG | | | 2,330 | | | | 1,215 | | |
UBS Group AG | | | 24,527 | | | | 400 | | |
| | | | 9,695 | | |
Health Care (1.1%): | |
Coltene Holding AG Registered Shares | | | 4,194 | | | | 602 | | |
Lonza Group AG Registered Shares | | | 724 | | | | 468 | | |
Novartis AG Registered Shares | | | 14,717 | | | | 1,301 | | |
Roche Holding AG | | | 40,677 | | | | 14,244 | | |
| | | | 16,615 | | |
See notes to financial statements.
22
USAA Mutual Funds Trust
USAA Sustainable World Fund | | Schedule of Portfolio Investments — continued
May 31, 2021 | |
(Amounts in Thousands, Except for Shares)
Security Description | | Shares | | Value | |
Industrials (0.7%): | |
Adecco Group AG | | | 144,941 | | | $ | 10,035 | | |
Kardex Holding AG Registered Shares | | | 1,367 | | | | 307 | | |
Schweiter Technologies AG Class BR | | | 209 | | | | 354 | | |
| | | | 10,696 | | |
Information Technology (0.1%): | |
Landis+Gyr Group AG | | | 5,534 | | | | 404 | | |
Logitech International SA Class R | | | 9,778 | | | | 1,203 | | |
u-blox Holding AG | | | 5,743 | | | | 360 | | |
| | | | 1,967 | | |
Materials (0.1%): | |
Gurit Holding AG Class BR | | | 233 | | | | 623 | | |
Holcim Ltd. | | | 8,004 | | | | 479 | | |
Vetropack Holding AG | | | 5,570 | | | | 352 | | |
| | | | 1,454 | | |
| | | | 42,276 | | |
Taiwan (1.8%): | |
Consumer Discretionary (0.1%): | |
Gourmet Master Co. Ltd. (b) | | | 75,000 | | | | 446 | | |
Makalot Industrial Co. Ltd. | | | 86,000 | | | | 880 | | |
Topkey Corp. | | | 72,000 | | | | 433 | | |
| | | | 1,759 | | |
Financials (0.5%): | |
Cathay Financial Holding Co. Ltd. | | | 3,067,000 | | | | 6,130 | | |
Yuanta Financial Holding Co. Ltd. | | | 1,203,000 | | | | 1,110 | | |
| | | | 7,240 | | |
Industrials (0.0%): (a) | |
Evergreen Marine Corp. Taiwan Ltd. (b) | | | 199,000 | | | | 691 | | |
Information Technology (1.2%): | |
Hon Hai Precision Industry Co. Ltd. | | | 202,000 | | | | 807 | | |
Lite-On Technology Corp. | | | 2,558,000 | | | | 6,059 | | |
MediaTek, Inc. | | | 47,000 | | | | 1,624 | | |
Nanya Technology Corp. | | | 378,000 | | | | 1,096 | | |
Taiwan Semiconductor Manufacturing Co. Ltd. | | | 333,000 | | | | 7,071 | | |
Walsin Technology Corp. | | | 112,000 | | | | 836 | | |
| | | | 17,493 | | |
Materials (0.0%): (a) | |
Formosa Plastics Corp. | | | 184,000 | | | | 673 | | |
| | | | 27,856 | | |
Thailand (0.2%): | |
Energy (0.1%): | |
PTT PCL | | | 684,000 | | | | 858 | | |
See notes to financial statements.
23
USAA Mutual Funds Trust
USAA Sustainable World Fund | | Schedule of Portfolio Investments — continued
May 31, 2021 | |
(Amounts in Thousands, Except for Shares)
Security Description | | Shares | | Value | |
Financials (0.1%): | |
The Siam Commercial Bank PCL | | | 236,100 | | | $ | 770 | | |
Real Estate (0.0%): (a) | |
AP Thailand PCL | | | 2,262,000 | | | | 623 | | |
| | | | 2,251 | | |
Turkey (0.1%): | |
Communication Services (0.1%): | |
Turk Telekomunikasyon A/S | | | 685,075 | | | | 553 | | |
Consumer Staples (0.0%): (a) | |
Anadolu Efes Biracilik Ve Malt Sanayii A/S | | | 165,133 | | | | 444 | | |
Industrials (0.0%): (a) | |
Turkiye Sise ve Cam Fabrikalari A/S | | | 574,870 | | | | 533 | | |
Information Technology (0.0%): (a) | |
Logo Yazilim Sanayi Ve Ticaret A/S | | | 25,566 | | | | 435 | | |
| | | | 1,965 | | |
United Kingdom (5.5%): | |
Communication Services (0.4%): | |
4imprint Group PLC (b) | | | 6,897 | | | | 281 | | |
ITV PLC (b) | | | 2,838,179 | | | | 5,157 | | |
Team17 Group PLC (b) | | | 28,650 | | | | 275 | | |
Vodafone Group PLC | | | 291,423 | | | | 528 | | |
| | | | 6,241 | | |
Consumer Discretionary (0.5%): | |
AB Dynamics PLC | | | 18,021 | | | | 551 | | |
Barratt Developments PLC | | | 50,062 | | | | 536 | | |
Focusrite PLC | | | 42,801 | | | | 765 | | |
MJ Gleeson PLC | | | 29,314 | | | | 362 | | |
Next PLC (b) | | | 42,702 | | | | 4,930 | | |
Stellantis NV | | | 45,225 | | | | 887 | | |
| | | | 8,031 | | |
Consumer Staples (0.6%): | |
British American Tobacco PLC | | | 10,429 | | | | 402 | | |
Imperial Brands PLC | | | 275,113 | | | | 6,236 | | |
Nichols PLC | | | 10,874 | | | | 242 | | |
Tate & Lyle PLC | | | 42,419 | | | | 461 | | |
Tesco PLC | | | 198,788 | | | | 629 | | |
Unilever PLC | | | 8,362 | | | | 501 | | |
| | | | 8,471 | | |
Energy (0.1%): | |
| BP PLC | | | 180,682 | | | | 787 | | |
Cairn Energy PLC | | | 130,185 | | | | 300 | | |
| | | | 1,087 | | |
See notes to financial statements.
24
USAA Mutual Funds Trust
USAA Sustainable World Fund | | Schedule of Portfolio Investments — continued
May 31, 2021 | |
(Amounts in Thousands, Except for Shares)
Security Description | | Shares | | Value | |
Financials (0.8%): | |
| 3i Group PLC | | | 48,597 | | | $ | 855 | | |
Barclays PLC | | | 202,101 | | | | 524 | | |
Close Brothers Group PLC | | | 301,801 | | | | 7,016 | | |
CMC Markets PLC (d) | | | 45,163 | | | | 314 | | |
Intermediate Capital Group PLC | | | 66,426 | | | | 1,976 | | |
Legal & General Group PLC | | | 115,072 | | | | 464 | | |
Standard Chartered PLC | | | 56,831 | | | | 409 | | |
| | | | 11,558 | | |
Health Care (0.1%): | |
Advanced Medical Solutions Group PLC | | | 46,232 | | | | 179 | | |
AstraZeneca PLC | | | 3,538 | | | | 403 | | |
EKF Diagnostics Holdings PLC | | | 291,709 | | | | 323 | | |
Hikma Pharmaceuticals PLC | | | 10,804 | | | | 374 | | |
Tristel PLC | | | 56,437 | | | | 489 | | |
| | | | 1,768 | | |
Industrials (0.9%): | |
Alpha Financial Markets Consulting PLC | | | 49,436 | | | | 260 | | |
Ashtead Group PLC | | | 138,002 | | | | 10,065 | | |
BAE Systems PLC | | | 96,823 | | | | 721 | | |
Concentric AB | | | 13,990 | | | | 310 | | |
Robert Walters PLC | | | 34,399 | | | | 327 | | |
Sensata Technologies Holding PLC | | | 32,900 | | | | 1,955 | | |
SThree PLC | | | 60,542 | | | | 359 | | |
Volex PLC | | | 61,981 | | | | 300 | | |
| | | | 14,297 | | |
Information Technology (0.1%): | |
Aptitude Software Group PLC | | | 41,195 | | | | 353 | | |
GB Group PLC | | | 24,928 | | | | 330 | | |
Kainos Group PLC | | | 22,249 | | | | 449 | | |
| | | | 1,132 | | |
Materials (2.0%): | |
Anglo American PLC | | | 65,402 | | | | 2,903 | | |
Croda International PLC | | | 95,068 | | | | 9,407 | | |
Evraz PLC | | | 728,725 | | | | 6,579 | | |
Rio Tinto PLC | | | 123,360 | | | | 10,607 | | |
Treatt PLC | | | 51,034 | | | | 831 | | |
| | | | 30,327 | | |
Real Estate (0.0%): (a) | |
Watkin Jones PLC | | | 61,684 | | | | 197 | | |
| | | | 83,109 | | |
United States (51.9%): | |
Communication Services (4.6%): | |
Activision Blizzard, Inc. | | | 32,595 | | | | 3,170 | | |
Alphabet, Inc. Class C (b) | | | 13,464 | | | | 32,469 | | |
Alphabet, Inc. Class A (b) | | | 1,000 | | | | 2,357 | | |
See notes to financial statements.
25
USAA Mutual Funds Trust
USAA Sustainable World Fund | | Schedule of Portfolio Investments — continued
May 31, 2021 | |
(Amounts in Thousands, Except for Shares)
Security Description | | Shares | | Value | |
Facebook, Inc. Class A (b) | | | 90,350 | | | $ | 29,701 | | |
Snap, Inc. Class A (b) | | | 35,692 | | | | 2,217 | | |
| | | | 69,914 | | |
Consumer Discretionary (7.0%): | |
Airbnb, Inc. Class A (b) | | | 12,968 | | | | 1,821 | | |
Amazon.com, Inc. (b) | | | 11,225 | | | | 36,179 | | |
America's Car-Mart, Inc. | | | 4,193 | | | | 689 | | |
BJ's Restaurants, Inc. | | | 20,006 | | | | 1,106 | | |
Burlington Stores, Inc. (b) | | | 12,173 | | | | 3,936 | | |
Century Communities, Inc. | | | 13,557 | | | | 1,103 | | |
Dollar Tree, Inc. (b) | | | 23,200 | | | | 2,262 | | |
General Motors Co. (b) | | | 30,500 | | | | 1,809 | | |
Jack in the Box, Inc. | | | 3,162 | | | | 359 | | |
Johnson Outdoors, Inc. Class A | | | 4,723 | | | | 577 | | |
LKQ Corp. (b) | | | 44,400 | | | | 2,263 | | |
M/I Homes, Inc. | | | 10,999 | | | | 776 | | |
McDonald's Corp. | | | 73,626 | | | | 17,220 | | |
NIKE, Inc. Class B | | | 24,139 | | | | 3,294 | | |
PulteGroup, Inc. | | | 214,028 | | | | 12,369 | | |
Red Robin Gourmet Burgers, Inc. | | | 16,729 | | | | 600 | | |
Ross Stores, Inc. | | | 110,646 | | | | 13,985 | | |
Sleep Number Corp. (b) | | | 5,960 | | | | 665 | | |
Sonos, Inc. (b) | | | 16,464 | | | | 609 | | |
Tesla, Inc. (b) | | | 5,960 | | | | 3,726 | | |
The Cheesecake Factory, Inc. | | | 12,396 | | | | 729 | | |
| | | | 106,077 | | |
Consumer Staples (3.3%): | |
Colgate-Palmolive Co. | | | 150,169 | | | | 12,581 | | |
Keurig Dr Pepper, Inc. | | | 118,900 | | | | 4,394 | | |
Mondelez International, Inc. Class A | | | 59,100 | | | | 3,755 | | |
PepsiCo, Inc. | | | 94,956 | | | | 14,048 | | |
The Estee Lauder Cos., Inc. | | | 48,509 | | | | 14,869 | | |
| | | | 49,647 | | |
Energy (1.7%): | |
Cactus, Inc. Class A | | | 130,322 | | | | 4,566 | | |
Clean Energy Fuels Corp. | | | 61,934 | | | | 491 | | |
ConocoPhillips | | | 143,508 | | | | 7,999 | | |
Enterprise Products Partners LP | | | 108,100 | | | | 2,552 | | |
Hess Corp. | | | 25,700 | | | | 2,154 | | |
Phillips 66 | | | 57,370 | | | | 4,832 | | |
Pioneer Natural Resources Co. | | | 11,600 | | | | 1,765 | | |
Renewable Energy Group, Inc. (b) | | | 11,939 | | | | 729 | | |
RPC, Inc. | | | 106,668 | | | | 524 | | |
Valero Energy Corp. | | | 14,000 | | | | 1,126 | | |
| | | | 26,738 | | |
See notes to financial statements.
26
USAA Mutual Funds Trust
USAA Sustainable World Fund | | Schedule of Portfolio Investments — continued
May 31, 2021 | |
(Amounts in Thousands, Except for Shares)
Security Description | | Shares | | Value | |
Financials (7.5%): | |
Aflac, Inc. | | | 39,100 | | | $ | 2,216 | | |
Bank of America Corp. | | | 431,494 | | | | 18,291 | | |
Cboe Global Markets, Inc. | | | 44,400 | | | | 4,942 | | |
Citigroup, Inc. | | | 47,800 | | | | 3,762 | | |
Comerica, Inc. | | | 51,100 | | | | 4,011 | | |
Discover Financial Services | | | 23,000 | | | | 2,697 | | |
First Busey Corp. | | | 21,971 | | | | 589 | | |
JPMorgan Chase & Co. | | | 142,588 | | | | 23,419 | | |
KeyCorp | | | 119,200 | | | | 2,746 | | |
LPL Financial Holdings, Inc. | | | 53,170 | | | | 7,863 | | |
MSCI, Inc. | | | 20,001 | | | | 9,363 | | |
S&P Global, Inc. | | | 26,806 | | | | 10,172 | | |
The PNC Financial Services Group, Inc. | | | 47,643 | | | | 9,275 | | |
The Progressive Corp. | | | 97,882 | | | | 9,698 | | |
U.S. Bancorp | | | 58,100 | | | | 3,531 | | |
Voya Financial, Inc. | | | 22,700 | | | | 1,487 | | |
| | | | 114,062 | | |
Health Care (7.3%): | |
Addus HomeCare Corp. | | | 3,623 | | | | 348 | | |
Align Technology, Inc. (b) | | | 5,160 | | | | 3,045 | | |
Amedisys, Inc. (b) | | | 17,838 | | | | 4,609 | | |
Amgen, Inc. | | | 45,921 | | | | 10,926 | | |
Amneal Pharmaceuticals, Inc. (b) | | | 88,456 | | | | 501 | | |
Cardiovascular Systems, Inc. | | | 5,372 | | | | 211 | | |
Cigna Corp. | | | 13,000 | | | | 3,365 | | |
Coherus Biosciences, Inc. | | | 23,000 | | | | 303 | | |
CryoLife, Inc. | | | 20,582 | | | | 593 | | |
CVS Health Corp. | | | 149,639 | | | | 12,935 | | |
Eli Lilly & Co. | | | 56,846 | | | | 11,354 | | |
Hill-Rom Holdings, Inc. | | | 29,000 | | | | 3,227 | | |
Humana, Inc. | | | 5,500 | | | | 2,407 | | |
IDEXX Laboratories, Inc. (b) | | | 25,598 | | | | 14,287 | | |
Johnson & Johnson | | | 114,309 | | | | 19,347 | | |
Lantheus Holdings, Inc. | | | 24,779 | | | | 601 | | |
LeMaitre Vascular, Inc. | | | 14,839 | | | | 760 | | |
Masimo Corp. (b) | | | 8,962 | | | | 1,932 | | |
Medtronic PLC | | | 17,900 | | | | 2,266 | | |
Orthofix Medical, Inc. | | | 11,546 | | | | 470 | | |
Pacira BioSciences, Inc. | | | 7,266 | | | | 441 | | |
Quest Diagnostics, Inc. | | | 10,100 | | | | 1,330 | | |
TG Therapeutics, Inc. (b) | | | 19,415 | | | | 677 | | |
The Joint Corp. (b) | | | 15,253 | | | | 1,084 | | |
Thermo Fisher Scientific, Inc. | | | 6,326 | | | | 2,970 | | |
UnitedHealth Group, Inc. | | | 4,900 | | | | 2,018 | | |
Veeva Systems, Inc. Class A (b) | | | 11,393 | | | | 3,319 | | |
Vertex Pharmaceuticals, Inc. (b) | | | 8,745 | | | | 1,825 | | |
Zoetis, Inc. | | | 17,693 | | | | 3,126 | | |
| | | | 110,277 | | |
See notes to financial statements.
27
USAA Mutual Funds Trust
USAA Sustainable World Fund | | Schedule of Portfolio Investments — continued
May 31, 2021 | |
(Amounts in Thousands, Except for Shares)
Security Description | | Shares | | Value | |
Industrials (3.2%): | |
3M Co. | | | 7,287 | | | $ | 1,479 | | |
Allied Motion Technologies, Inc. | | | 20,412 | | | | 723 | | |
CoStar Group, Inc. (b) | | | 3,988 | | | | 3,406 | | |
Forward Air Corp. | | | 4,574 | | | | 443 | | |
Generac Holdings, Inc. (b) | | | 7,779 | | | | 2,557 | | |
Graham Corp. | | | 19,564 | | | | 287 | | |
Harsco Corp. | | | 48,168 | | | | 1,080 | | |
Honeywell International, Inc. | | | 73,358 | | | | 16,939 | | |
Hyster-Yale Materials Handling, Inc. | | | 10,250 | | | | 775 | | |
Insteel Industries, Inc. | | | 21,982 | | | | 768 | | |
Johnson Controls International PLC | | | 37,200 | | | | 2,475 | | |
L3Harris Technologies, Inc. | | | 6,800 | | | | 1,483 | | |
Orion Energy Systems, Inc. | | | 20,801 | | | | 133 | | |
Orion Group Holdings, Inc. | | | 107,198 | | | | 641 | | |
Parker-Hannifin Corp. | | | 6,600 | | | | 2,034 | | |
Raytheon Technologies Corp. | | | 22,800 | | | | 2,023 | | |
TPI Composites, Inc. (b) | | | 20,772 | | | | 1,003 | | |
Transcat, Inc. | | | 13,476 | | | | 712 | | |
U.S. Xpress Enterprise, Inc. Class A | | | 56,100 | | | | 631 | | |
Uber Technologies, Inc. (b) | | | 72,836 | | | | 3,702 | | |
Ultralife Corp. | | | 31,289 | | | | 286 | | |
Union Pacific Corp. | | | 11,000 | | | | 2,472 | | |
United Rentals, Inc. (b) | | | 5,200 | | | | 1,737 | | |
Willdan Group, Inc. | | | 11,772 | | | | 428 | | |
| | | | 48,217 | | |
Information Technology (15.1%): | |
Adobe, Inc. (b) | | | 8,976 | | | | 4,529 | | |
Advanced Energy Industries, Inc. | | | 6,467 | | | | 660 | | |
Ambarella, Inc. | | | 7,029 | | | | 706 | | |
Apple, Inc. | | | 350,666 | | | | 43,696 | | |
Autodesk, Inc. (b) | | | 7,331 | | | | 2,096 | | |
Cadence Design Systems, Inc. (b) | | | 18,238 | | | | 2,316 | | |
Cisco Systems, Inc. | | | 305,406 | | | | 16,156 | | |
Diodes, Inc. (b) | | | 9,472 | | | | 717 | | |
EPAM Systems, Inc. (b) | | | 9,223 | | | | 4,405 | | |
ePlus, Inc. | | | 7,668 | | | | 725 | | |
Euronet Worldwide, Inc. | | | 21,700 | | | | 3,247 | | |
Fidelity National Information Services, Inc. | | | 14,500 | | | | 2,160 | | |
FleetCor Technologies, Inc. (b) | | | 9,800 | | | | 2,690 | | |
Fortinet, Inc. (b) | | | 56,876 | | | | 12,430 | | |
Leidos Holdings, Inc. | | | 14,200 | | | | 1,459 | | |
Mastercard, Inc. Class A | | | 49,968 | | | | 18,017 | | |
Mesa Laboratories, Inc. | | | 1,758 | | | | 433 | | |
Micron Technology, Inc. (b) | | | 41,560 | | | | 3,497 | | |
Microsoft Corp. | | | 156,424 | | | | 39,056 | | |
NVIDIA Corp. | | | 38,683 | | | | 25,135 | | |
Onto Innovation, Inc. | | | 9,994 | | | | 717 | | |
PAR Technology Corp. | | | 15,075 | | | | 1,009 | | |
PayPal Holdings, Inc. (b) | | | 24,032 | | | | 6,249 | | |
See notes to financial statements.
28
USAA Mutual Funds Trust
USAA Sustainable World Fund | | Schedule of Portfolio Investments — continued
May 31, 2021 | |
(Amounts in Thousands, Except for Shares)
Security Description | | Shares | | Value | |
Perficient, Inc. (b) | | | 14,188 | | | $ | 1,016 | | |
Rogers Corp. | | | 3,036 | | | | 569 | | |
ServiceNow, Inc. (b) | | | 8,205 | | | | 3,888 | | |
Texas Instruments, Inc. | | | 92,799 | | | | 17,615 | | |
The Trade Desk, Inc. Class A (b) | | | 4,440 | | | | 2,611 | | |
Twilio, Inc. Class A (b) | | | 8,067 | | | | 2,710 | | |
Ultra Clean Holdings, Inc. | | | 13,455 | | | | 758 | | |
Upland Software, Inc. | | | 12,313 | | | | 505 | | |
Visa, Inc. Class A | | | 27,857 | | | | 6,332 | | |
| | | | 228,109 | | |
Materials (0.4%): | |
Freeport-McMoRan, Inc. | | | 29,500 | | | | 1,260 | | |
Koppers Holdings, Inc. (b) | | | 21,978 | | | | 762 | | |
Sealed Air Corp. | | | 75,700 | | | | 4,304 | | |
| | | | 6,326 | | |
Real Estate (0.8%): | |
Host Hotels & Resorts, Inc. (b) | | | 136,400 | | | | 2,342 | | |
Prologis, Inc. | | | 79,521 | | | | 9,371 | | |
| | | | 11,713 | | |
Utilities (1.0%): | |
Exelon Corp. | | | 61,200 | | | | 2,761 | | |
FirstEnergy Corp. | | | 27,000 | | | | 1,024 | | |
MGE Energy, Inc. | | | 109,361 | | | | 8,204 | | |
Vistra Corp. | | | 185,200 | | | | 2,995 | | |
| | | | 14,984 | | |
| | | | 786,064 | | |
Total Common Stocks (Cost $1,113,477) | | | 1,496,002 | | |
Exchange-Traded Funds (0.0%) (a) | |
United States (0.0%): | |
iShares Core MSCI EAFE ETF | | | 7,941 | | | | 610 | | |
Total Exchange-Traded Funds (Cost $582) | | | 610 | | |
Collateral for Securities Loaned^ (1.1%) | |
United States (1.1%): | |
HSBC U.S. Government Money Market Fund I Shares, 0.03% (e) | | | 15,239,412 | | | | 15,239 | | |
Invesco Government & Agency Portfolio, Institutional Shares, 0.03% (e) | | | 2,168,873 | | | | 2,169 | | |
Total Collateral for Securities Loaned (Cost $17,408) | | | 17,408 | | |
Total Investments (Cost $1,131,467) — 100.0% | | | 1,514,020 | | |
Liabilities in excess of other assets — 0.0% | | | (507 | ) | |
NET ASSETS — 100.00% | | $ | 1,513,513 | | |
^ Purchased with cash collateral from securities on loan.
(a) Amount represents less than 0.05% of net assets.
See notes to financial statements.
29
USAA Mutual Funds Trust
USAA Sustainable World Fund | | Schedule of Portfolio Investments — continued
May 31, 2021 | |
(b) Non-income producing security.
(c) All or a portion of this security is on loan.
(d) Rule 144A security or other security that is restricted as to resale to institutional investors. The Fund's Adviser has deemed this security to be liquid based upon procedures approved by the Board of Trustees. As of May 31, 2021, the fair value of these securities was $13,096 (thousands) and amounted to 0.9% of net assets.
(e) Rate disclosed is the daily yield on May 31, 2021.
ADR — American Depositary Receipt
ETF — Exchange-Traded Fund
GDR — Global Depositary Receipt
LP — Limited Partnership
PCL — Public Company Limited
PLC — Public Limited Company
REIT — Real Estate Investment Trust
See notes to financial statements.
30
USAA Mutual Funds Trust | | Statement of Assets and Liabilities
May 31, 2021 | |
(Amounts in Thousands, Except Per Share Amounts)
| | | USAA Sustainable
World Fund | |
Assets: | |
Investments, at value (Cost $1,131,467) | | $ | 1,514,020 | (a) | |
Foreign currency, at value (Cost $7,459) | | | 7,466 | | |
Cash | | | 6,115 | | |
Receivables: | |
Interest and dividends | | | 2,829 | | |
Capital shares issued | | | 184 | | |
Investments sold | | | 2,749 | | |
Reclaims | | | 1,906 | | |
From Adviser | | | 8 | | |
Prepaid expenses | | | 15 | | |
Total Assets | | | 1,535,292 | | |
Liabilities: | |
Payables: | |
Collateral received on loaned securities | | | 17,408 | | |
To custodian | | | 29 | | |
Investments purchased | | | 2,300 | | |
Capital shares redeemed | | | 555 | | |
Accrued foreign capital gains taxes | | | 137 | | |
Accrued expenses and other payables: | |
Investment advisory fees | | | 908 | | |
Administration fees | | | 191 | | |
Custodian fees | | | 39 | | |
Transfer agent fees | | | 119 | | |
Compliance fees | | | 1 | | |
Trustees' fees | | | 1 | | |
| 12b-1 fees | | | — | (b) | |
Other accrued expenses | | | 91 | | |
Total Liabilities | | | 21,779 | | |
Net Assets: | |
Capital | | | 939,580 | | |
Total accumulated earnings/(loss) | | | 573,933 | | |
Net Assets | | $ | 1,513,513 | | |
Net Assets | |
Fund Shares | | $ | 1,507,963 | | |
Institutional Shares | | | 2,660 | | |
Class A | | | 2,890 | | |
Total | | $ | 1,513,513 | | |
Shares (unlimited number of shares authorized with no par value): | |
Fund Shares | | | 48,597 | | |
Institutional Shares | | | 86 | | |
Class A | | | 93 | | |
Total | | | 48,776 | | |
Net asset value, offering and redemption price per share: (c) | |
Fund Shares | | $ | 31.03 | | |
Institutional Shares | | $ | 31.10 | | |
Class A | | $ | 31.06 | | |
Maximum Sales Charge — Class A | | | 5.75 | % | |
Maximum offering price
(100%/(100%-maximum sales charge) of net asset value adjusted to
the nearest cent) per share — Class A | | $ | 32.95 | | |
(a) Includes $16,437 of securities on loan.
(b) Rounds to less than $1 thousand.
(c) Per share amount may not recalculate due to rounding of net assets and/or shares outstanding.
See notes to financial statements.
31
USAA Mutual Funds Trust | | Statement of Operations
For the Year Ended May 31, 2021 | |
(Amounts in Thousands)
| | | USAA Sustainable
World Fund | |
Investment Income: | |
Dividends | | $ | 28,066 | | |
Interest | | | 5 | | |
Securities lending (net of fees) | | | 61 | | |
Foreign tax withholding | | | (1,675 | ) | |
Total Income | | | 26,457 | | |
Expenses: | |
Investment advisory fees | | | 10,192 | | |
Administration fees — Fund Shares | | | 2,055 | | |
Administration fees — Institutional Shares | | | 6 | | |
Administration fees — Class A | | | 10 | | |
Sub-Administration fees | | | 76 | | |
| 12b-1 fees — Class A | | | 16 | | |
Custodian fees | | | 261 | | |
Transfer agent fees — Fund Shares | | | 1,565 | | |
Transfer agent fees — Institutional Shares | | | 6 | | |
Transfer agent fees — Class A | | | 7 | | |
Trustees' fees | | | 51 | | |
Compliance fees | | | 8 | | |
Legal and audit fees | | | 104 | | |
State registration and filing fees | | | 71 | | |
Interfund lending fees | | | — | (a) | |
Interest fees | | | 26 | | |
Other expenses | | | 195 | | |
Total Expenses | | | 14,649 | | |
Expenses waived/reimbursed by Adviser | | | (37 | ) | |
Net Expenses | | | 14,612 | | |
Net Investment Income (Loss) | | | 11,845 | | |
Realized/Unrealized Gains (Losses) from Investments: | |
Net realized gains (losses) from investment securities and foreign currency
translations | | | 265,689 | | |
Foreign taxes on realized gains | | | (28 | ) | |
Net change in unrealized appreciation/depreciation on investment securities
and foreign currency translations | | | 176,287 | | |
Net change in accrued foreign taxes on unrealized gains | | | (75 | ) | |
Net realized/unrealized gains (losses) on investments | | | 441,873 | | |
Change in net assets resulting from operations | | $ | 453,718 | | |
(a) Rounds to less than $1 thousand.
See notes to financial statements.
32
USAA Mutual Funds Trust | | Statements of Changes in Net Assets | |
(Amounts in Thousands)
| | | USAA Sustainable World Fund | |
| | | Year
Ended
May 31,
2021 | | Year
Ended
May 31,
2020 | |
From Investments: | |
Operations: | |
Net investment income (loss) | | $ | 11,845 | | | $ | 13,124 | | |
Net realized gains (losses) from investments | | | 265,661 | | | | 406,737 | | |
Net change in unrealized appreciation/depreciation on
investments | | | 176,212 | | | | (320,704 | ) | |
Change in net assets resulting from operations | | | 453,718 | | | | 99,157 | | |
Distributions to Shareholders: | |
Fund Shares | | | (64,664 | ) | | | (426,145 | ) | |
Institutional Shares | | | (328 | ) | | | (4,055 | ) | |
Class A | | | (321 | ) | | | (2,733 | ) | |
Change in net assets resulting from distributions to shareholders | | | (65,313 | ) | | | (432,933 | ) | |
Change in net assets resulting from capital transactions | | | (116,446 | ) | | | 273,969 | | |
Change in net assets | | | 271,959 | | | | (59,807 | ) | |
Net Assets: | |
Beginning of period | | | 1,241,554 | | | | 1,301,361 | | |
End of period | | $ | 1,513,513 | | | $ | 1,241,554 | | |
(continues on next page)
See notes to financial statements.
33
USAA Mutual Funds Trust | | Statements of Changes in Net Assets | |
(Amounts in Thousands) (continued)
| | | USAA Sustainable World Fund | |
| | | Year
Ended
May 31,
2021 | | Year
Ended
May 31,
2020 | |
Capital Transactions: | |
Fund Shares | |
Proceeds from shares issued | | $ | 72,139 | | | $ | 85,742 | | |
Distributions reinvested | | | 63,933 | | | | 419,589 | | |
Cost of shares redeemed | | | (241,694 | ) | | | (228,526 | ) | |
Total Fund Shares | | $ | (105,622 | ) | | $ | 276,805 | | |
Institutional Shares | |
Proceeds from shares issued | | $ | 1,307 | | | $ | 958 | | |
Distributions reinvested | | | 96 | | | | 2,199 | | |
Cost of shares redeemed | | | (6,761 | ) | | | (6,304 | ) | |
Total Institutional Shares | | $ | (5,358 | ) | | $ | (3,147 | ) | |
Class A | |
Proceeds from shares issued | | $ | 6,709 | | | $ | 969 | | |
Distributions reinvested | | | 61 | | | | 556 | | |
Cost of shares redeemed | | | (12,236 | ) | | | (1,214 | ) | |
Total Class A | | $ | (5,466 | ) | | $ | 311 | | |
Change in net assets resulting from capital transactions | | $ | (116,446 | ) | | $ | 273,969 | | |
Share Transactions: | |
Fund Shares | |
Issued | | | 2,582 | | | | 3,075 | | |
Reinvested | | | 2,305 | | | | 16,485 | | |
Redeemed | | | (8,859 | ) | | | (8,689 | ) | |
Total Fund Shares | | | (3,972 | ) | | | 10,871 | | |
Institutional Shares | |
Issued | | | 48 | | | | 36 | | |
Reinvested | | | 3 | | | | 86 | | |
Redeemed | | | (227 | ) | | | (269 | ) | |
Total Institutional Shares | | | (176 | ) | | | (147 | ) | |
Class A | |
Issued | | | 280 | | | | 36 | | |
Reinvested | | | 2 | | | | 22 | | |
Redeemed | | | (464 | ) | | | (47 | ) | |
Total Class A | | | (182 | ) | | | 11 | | |
Change in Shares | | | (4,330 | ) | | | 10,735 | | |
See notes to financial statements.
34
This page is intentionally left blank.
35
USAA Mutual Funds Trust | | Financial Highlights | |
For a Share Outstanding Throughout Each Period
| | | | | Investment Activities | | Distributions to
Shareholders From | |
| | | Net Asset
Value,
Beginning of
Period | | Net
Investment
Income (Loss) | | Net Realized
and Unrealized
Gains (Losses)
on Investments | | Total from
Investment
Activities | | Net
Investment
Income | | Net Realized
Gains from
Investments | |
USAA Sustainable World Fund | |
Fund Shares | |
Year Ended:
May 31, 2021 | | $ | 23.38 | | | | 0.23 | (b) | | | 8.74 | | | | 8.97 | | | | (0.18 | ) | | | (1.14 | ) | |
May 31, 2020 | | $ | 30.71 | | | | 0.27 | (b) | | | 2.87 | | | | 3.14 | | | | (0.32 | ) | | | (10.15 | ) | |
May 31, 2019 | | $ | 31.82 | | | | 0.33 | | | | 0.51 | | | | 0.84 | | | | (0.28 | ) | | | (1.67 | ) | |
May 31, 2018 | | $ | 31.16 | | | | 0.30 | | | | 1.78 | | | | 2.08 | | | | (0.23 | ) | | | (1.19 | ) | |
May 31, 2017 | | $ | 27.20 | | | | 0.19 | | | | 4.55 | | | | 4.74 | | | | (0.21 | ) | | | (0.57 | ) | |
Institutional Shares | |
Year Ended:
May 31, 2021 | | $ | 23.42 | | | | 0.24 | (b) | | | 8.77 | | | | 9.01 | | | | (0.19 | ) | | | (1.14 | ) | |
May 31, 2020 | | $ | 30.74 | | | | 0.29 | (b) | | | 2.86 | | | | 3.15 | | | | (0.32 | ) | | | (10.15 | ) | |
May 31, 2019 | | $ | 31.75 | | | | 0.38 | | | | 0.48 | | | | 0.86 | | | | (0.20 | ) | | | (1.67 | ) | |
May 31, 2018 | | $ | 31.14 | | | | 0.29 | | | | 1.80 | | | | 2.09 | | | | (0.29 | ) | | | (1.19 | ) | |
May 31, 2017 | | $ | 27.14 | | | | 0.20 | | | | 4.55 | | | | 4.75 | | | | (0.18 | ) | | | (0.57 | ) | |
Class A | |
Year Ended:
May 31, 2021 | | $ | 23.40 | | | | 0.15 | (b) | | | 8.76 | | | | 8.91 | | | | (0.11 | ) | | | (1.14 | ) | |
May 31, 2020 | | $ | 30.77 | | | | 0.19 | (b) | | | 2.86 | | | | 3.05 | | | | (0.27 | ) | | | (10.15 | ) | |
May 31, 2019 | | $ | 31.86 | | | | 0.24 | (b) | | | 0.53 | | | | 0.77 | | | | (0.19 | ) | | | (1.67 | ) | |
May 31, 2018 | | $ | 31.07 | | | | 0.18 | (b) | | | 1.80 | | | | 1.98 | | | | — | (f) | | | (1.19 | ) | |
May 31, 2017 | | $ | 27.13 | | | | 0.12 | | | | 4.53 | | | | 4.65 | | | | (0.14 | ) | | | (0.57 | ) | |
* Assumes reinvestment of all net investment income and realized capital gain distributions, if any, during the period. Includes adjustments in accordance with U.S. Generally Accepted Accounting Principles and could differ from the Lipper reported return.
^ The net expense ratio may not correlate to the applicable expense limits in place during the period since the current contractual expense limitation is applied for a period beginning July 1, 2019 and in effect through June 30, 2023, instead of coinciding with the Fund's fiscal year end. Details of the current contractual expense limitation in effect can be found in Note 4 of the accompanying Notes to Financial Statements.
(a) Portfolio turnover is calculated on the basis of the Fund as a whole without distinguishing between classes of shares issued.
(b) Per share net investment income (loss) has been calculated using the average daily shares method.
(c) Reflects increased trading activity due to current year transitions or asset allocation shifts.
(d) Effective October 1, 2018, USAA Asset Management Company (AMCO) voluntarily agreed to limit the annual expenses of the Institutional Shares to 1.00% of the Institutional Shares' average daily net assets.
(e) Effective October 1, 2017, AMCO voluntarily agreed to limit the annual expenses of Class A to 1.35% of the Class A shares' average daily net assets.
(f) Amount is less than $0.005 per share.
See notes to financial statements.
36
USAA Mutual Funds Trust | | Financial Highlights — continued | |
For a Share Outstanding Throughout Each Period
| | | | | Ratios to Average Net Assets | | Supplemental Data | |
| | | Total
Distributions | | Redemption
Fees
Added to
Beneficial
Interests | | Net
Asset
Value,
End of
Period | | Total
Return
(Excludes
Sales
Charge)* | | Net
Expenses^ | | Net
Investment
Income
(Loss) | | Gross
Expenses | | Net
Assets,
End of
Period
(000's) | | Portfolio
Turnover(a) | |
USAA Sustainable World Fund | |
Fund Shares | |
Year Ended:
May 31, 2021 | | | (1.32 | ) | | $ | — | | | $ | 31.03 | | | | 39.07 | % | | | 1.05 | % | | | 0.86 | % | | | 1.05 | % | | $ | 1,507,963 | | | | 88 | % | |
May 31, 2020 | | | (10.47 | ) | | | — | | | $ | 23.38 | | | | 7.81 | % | | | 1.07 | % | | | 0.98 | % | | | 1.07 | % | | $ | 1,228,986 | | | | 103 | %(c) | |
May 31, 2019 | | | (1.95 | ) | | | — | | | $ | 30.71 | | | | 3.23 | % | | | 1.09 | % | | | 1.09 | % | | | 1.09 | % | | $ | 1,280,661 | | | | 8 | % | |
May 31, 2018 | | | (1.42 | ) | | | — | | | $ | 31.82 | | | | 6.68 | % | | | 1.10 | % | | | 0.98 | % | | | 1.10 | % | | $ | 1,353,880 | | | | 10 | % | |
May 31, 2017 | | | (0.78 | ) | | | — | | | $ | 31.16 | | | | 17.81 | % | | | 1.13 | % | | | 0.72 | % | | | 1.13 | % | | $ | 1,319,357 | | | | 12 | % | |
Institutional Shares | |
Year Ended:
May 31, 2021 | | | (1.33 | ) | | $ | — | | | $ | 31.10 | | | | 39.17 | % | | | 0.99 | % | | | 0.87 | % | | | 1.27 | % | | $ | 2,660 | | | | 88 | % | |
May 31, 2020 | | | (10.47 | ) | | | — | | | $ | 23.42 | | | | 7.85 | % | | | 1.00 | % | | | 1.00 | % | | | 1.13 | % | | $ | 6,143 | | | | 103 | %(c) | |
May 31, 2019 | | | (1.87 | ) | | | — | | | $ | 30.74 | | | | 3.29 | % | | | 1.05 | %(d) | | | 1.13 | % | | | 1.11 | % | | $ | 12,567 | | | | 8 | % | |
May 31, 2018 | | | (1.48 | ) | | | — | | | $ | 31.75 | | | | 6.70 | % | | | 1.10 | % | | | 1.19 | % | | | 1.10 | % | | $ | 30,127 | | | | 10 | % | |
May 31, 2017 | | | (0.75 | ) | | | — | | | $ | 31.14 | | | | 17.89 | % | | | 1.09 | % | | | 0.78 | % | | | 1.37 | % | | $ | 6,877 | | | | 12 | % | |
Class A | |
Year Ended:
May 31, 2021 | | | (1.25 | ) | | $ | — | | | $ | 31.06 | | | | 38.73 | % | | | 1.32 | % | | | 0.53 | % | | | 1.62 | % | | $ | 2,890 | | | | 88 | % | |
May 31, 2020 | | | (10.42 | ) | | | — | | | $ | 23.40 | | | | 7.49 | % | | | 1.35 | % | | | 0.68 | % | | | 1.43 | % | | $ | 6,425 | | | | 103 | %(c) | |
May 31, 2019 | | | (1.86 | ) | | | — | | | $ | 30.77 | | | | 2.98 | % | | | 1.35 | % | | | 0.76 | % | | | 1.46 | % | | $ | 8,133 | | | | 8 | % | |
May 31, 2018 | | | (1.19 | ) | | | — | (f) | | $ | 31.86 | | | | 6.36 | % | | | 1.39 | %(e) | | | 0.57 | % | | | 1.43 | % | | $ | 10,114 | | | | 10 | % | |
May 31, 2017 | | | (0.71 | ) | | | — | (f) | | $ | 31.07 | | | | 17.50 | % | | | 1.42 | % | | | 0.45 | % | | | 1.42 | % | | $ | 19,722 | | | | 12 | % | |
See notes to financial statements.
37
USAA Mutual Funds Trust | | Notes to Financial Statements
May 31, 2021 | |
1. Organization:
USAA Mutual Funds Trust (the "Trust") is organized as a Delaware statutory trust and is registered under the Investment Company Act of 1940, as amended (the "1940 Act"), as an open-end investment company. The Trust is comprised of 46 funds and is authorized to issue an unlimited number of shares, which are units of beneficial interest with no par value.
The accompanying financial statements are those of the USAA Sustainable World Fund (the "Fund"). Effective October 1, 2020, the Fund's name changed from USAA World Growth Fund. The Fund offers three classes of shares: Fund Shares, Institutional Shares, and Class A. The Fund is classified as diversified under the 1940 Act. Effective June 29, 2020, the Fund's Adviser Shares were redesignated Class A and became subject to a front-end sales charge.
Each class of shares of the Fund has substantially identical rights and privileges, except with respect to sales charges, fees paid under distribution plans, expenses allocable exclusively to each class of shares, voting rights on matters solely affecting a single class of shares, and the exchange privilege of each class of shares.
Under the Trust's organizational documents, its officers and trustees are indemnified against certain liabilities arising out of the performance of their duties to the Fund. In addition, in the normal course of business, the Fund enters into contracts with its vendors and others that provide for general indemnifications. The Fund's maximum exposure under these arrangements is unknown, as this would involve future claims that may be made against the Fund. However, based on experience, the Fund expects that risk of loss to be remote.
2. Significant Accounting Policies:
The following is a summary of significant accounting policies followed by the Trust in the preparation of its financial statements. The policies are in conformity with Generally Accepted Accounting Principles in the United States of America ("GAAP"). The preparation of financial statements in accordance with GAAP requires management to make estimates and assumptions that affect the reported amounts of assets and liabilities and disclosure of contingent assets and liabilities at the date of the financial statements and the reported amounts of income and expenses for the period. Actual results could differ from those estimates. The Fund follows the specialized accounting and reporting requirements under GAAP that are applicable to investment companies under Accounting Standards Codification Topic 946.
Investment Valuation:
The Fund records investments at fair value. Fair value is defined as the price that would be received to sell an asset or paid to transfer a liability in an orderly transaction between market participants at the measurement date.
The valuation techniques described below maximize the use of observable inputs and minimize the use of unobservable inputs in determining fair value. The inputs used for valuing the Fund's investments are summarized in the three broad levels listed below:
• Level 1 — quoted prices in active markets for identical securities
• Level 2 — other significant observable inputs (including quoted prices for similar securities or interest rates applicable to those securities, etc.)
• Level 3 — significant unobservable inputs (including the Fund's own assumptions in determining the fair value of investments)
Changes in valuation techniques may result in transfers in or out of an assigned level within the disclosure hierarchy. The inputs or methodologies used for valuation techniques are not necessarily an indication of the risks associated with entering into those investments.
Victory Capital Management Inc. ("VCM" or the "Adviser") has established the Pricing and Liquidity Committee (the "Committee"), and subject to the Trust's Board of Trustees (the "Board") oversight, the Committee administers and oversees the Fund's valuation policies and procedures, which are approved by the Board.
38
USAA Mutual Funds Trust | | Notes to Financial Statements — continued
May 31, 2021 | |
Portfolio securities listed or traded on securities exchanges, including Exchange-Traded Funds ("ETFs"), American Depositary Receipts ("ADRs"), and Rights are valued at the closing price on the exchange or system where the security is principally traded, if available, or at the Nasdaq Official Closing Price. If there have been no sales for that day on the exchange or system, then a security is valued at the last available bid quotation on the exchange or system where the security is principally traded. In each of these situations, valuations are typically categorized as Level 1 in the fair value hierarchy.
Investments in open-end investment companies are valued at their net asset value ("NAV"). These valuations are typically categorized as Level 1 in the fair value hierarchy.
In the event that price quotations or valuations are not readily available, investments are valued at fair value in accordance with procedures established by and under the general supervision and responsibility of the Board. These valuations are typically categorized as Level 2 or Level 3 in the fair value hierarchy, based on the observability of inputs used to determine the fair value. The effect of fair value pricing is that securities may not be priced on the basis of quotations from the primary market in which they are traded and the actual price realized from the sale of a security may differ materially from the fair value price. Valuing these securities at fair value is intended to cause the Fund's NAV to be more reliable than it otherwise would be.
In accordance with procedures adopted by the Board, fair value pricing may be used if events materially affecting the value of foreign securities occur between the time the exchange on which they are traded closes and the time the Fund's NAV is calculated. The Fund uses a systematic valuation model, provided daily by an independent third party to fair value its international equity securities. The valuations are considered as Level 2 in the fair value hierarchy.
A summary of the valuations as of May 31, 2021, based upon the three levels defined above, is included in the table below while the breakdown, by category, of investments is disclosed on the Schedule of Portfolio Investments (amounts in thousands):
| | | Level 1 | | Level 2 | | Level 3 | | Total | |
Common Stocks | | $ | 894,929 | | | $ | 601,073 | | | $ | — | | | $ | 1,496,002 | | |
Exchange-Traded Funds | | | 610 | | | | — | | | | — | | | | 610 | | |
Collateral for Securities Loaned | | | 17,408 | | | | — | | | | — | | | | 17,408 | | |
Total | | $ | 912,947 | | | $ | 601,073 | | | $ | — | | | $ | 1,514,020 | | |
For the year ended May 31, 2021, there were no transfers in or out of Level 3 in the fair value hierarchy.
Real Estate Investment Trusts ("REITs"):
The Fund may invest in REITs, which report information on the source of their distributions annually. REITs are pooled investment vehicles that invest primarily in income producing real estate or real estate related loans or interests (such as mortgages). Certain distributions received from REITs during the year are recorded as realized gains or return of capital as estimated by the Fund or when such information becomes known.
Investment Companies:
Exchange-Traded Funds:
The Fund may invest in ETFs, the shares of which are bought and sold on a securities exchange. An ETF trades like common stock and represents a fixed portfolio of securities often designed to track the performance and dividend yield of a particular domestic or foreign market index. The Fund may purchase shares of an ETF to temporarily gain exposure to a portion of the U.S. or a foreign market while awaiting purchase of underlying securities. The risks of owning an ETF generally reflect the risks of owning the underlying securities they are designed to track, although the lack of liquidity of an ETF could result in it being more volatile. Additionally, ETFs have fees and expenses that reduce their value.
39
USAA Mutual Funds Trust | | Notes to Financial Statements — continued
May 31, 2021 | |
Open-End Funds:
The Fund may invest in portfolios of open-end investment companies. These investment companies value securities in their portfolios for which market quotations are readily available at their market values (generally the last reported sale price) and all other securities and assets at their fair value by the methods established by the board of directors of the underlying funds.
Foreign Exchange Currency Contracts:
The Fund may enter into foreign exchange currency contracts to convert U.S. dollars to and from various foreign currencies. A foreign exchange currency contract is an obligation by the Fund to purchase or sell a specific currency at a future date at a price (in U.S. dollars) set at the time of the contract. The Fund does not engage in "cross-currency" foreign exchange contracts (i.e., contracts to purchase or sell one foreign currency in exchange for another foreign currency). The Fund's foreign exchange currency contracts might be considered spot contracts (typically a contract of one week or less) or forward contracts (typically a contract term over one week). A spot contract is entered into for purposes of hedging against foreign currency fluctuations relating to a specific portfolio transaction, such as the delay between a security transaction trade date and settlement date. Forward contracts are entered into for purposes of hedging portfolio holdings or concentrations of such holdings. Each foreign exchange currency contract is adjusted daily by the prevailing spot or forward rate of the underlying currency, and any appreciation or depreciation is recorded for financial statement purposes as unrealized until the contract settlement date, at which time the Fund records realized gains or losses equal to the difference between the value of a contract at the time it was opened and the value at the time it was closed. The Fund could be exposed to risk if a counterparty is unable to meet the terms of a foreign exchange currency contract or if the value of the foreign currency changes unfavorably. In addition, the use of foreign exchange currency contracts does not eliminate fluctuations in the underlying prices of the securities. As of May 31, 2021, the Fund had no open forward foreign exchange currency contracts.
Investment Transactions and Related Income:
Changes in holdings of investments are accounted for no later than one business day following the trade date. For financial reporting purposes, however, investment transactions are accounted for on trade date on the last business day of the reporting period. Interest income is determined on the basis of coupon interest accrued using the effective interest method which adjusts, where applicable, the amortization of premiums or accretion of discount. Dividend income is recorded on the ex-dividend date. Gains or losses realized on sales of securities are recorded on the identified cost basis.
Withholding taxes on interest, dividends, and gains as a result of certain investments in ADRs by the Fund have been provided for in accordance with each investment's applicable country's tax rules and rates.
Securities Lending:
The Fund, through a securities lending agreement with Citibank, N.A. ("Citibank"), may lend its securities to qualified financial institutions, such as certain broker-dealers, to earn additional income, net of income retained by Citibank. Borrowers are required to secure their loans for collateral in the amount of at least 102% of the value of U.S. securities loaned or at least 105% of the value of non-U.S. securities loaned, marked-to-market daily. Any collateral shortfalls associated with increases in the valuation of the securities loaned are cured the next business day once the shortfall exceeds $100 thousand. Collateral may be cash, U.S. government securities, or other securities as permitted by Securities and Exchange Commission ("SEC") guidelines. Cash collateral may be invested in high-quality short-term investments, primarily open-end investment companies. Collateral requirements are determined daily based on the value of the Fund's securities on loan as of the end of the prior business day. During the time portfolio securities are on loan, the borrower will pay the Fund any dividends or interest paid on such securities plus any fee negotiated between the parties to the lending agreement. The Fund also earns a return from the collateral. The Fund pays Citibank various fees in connection with the investment of cash collateral and fees based on the investment income received from securities lending activities. Securities lending income (net of these fees) is disclosed on the Statement of Operations.
40
USAA Mutual Funds Trust | | Notes to Financial Statements — continued
May 31, 2021 | |
Loans are terminable upon demand and the borrower must return the loaned securities within the lesser of one standard settlement period or five business days. Risks relating to securities-lending transactions include that the borrower may not provide additional collateral when required or return the securities when due, and that the value of the short-term investments will be less than the amount of cash collateral required to be returned to the borrower. The Fund's agreement with Citibank does not include master netting provisions. Non-cash collateral received by the Fund may not be sold or re-pledged, except to satisfy borrower default. Cash collateral is listed on the Fund's Schedule of Portfolio Investments and Financial Statements while non-cash collateral is not included.
The following table (amounts in thousands) is a summary of the Fund's securities lending transactions as of May 31, 2021.
Value of
Securities on Loan | | Non-Cash Collateral | | Cash Collateral | |
| $ | 16,437 | | | $ | — | | | $ | 17,408 | | |
Foreign Currency Translations:
The accounting records of the Fund are maintained in U.S. dollars. Investment securities and other assets and liabilities of the Fund denominated in a foreign currency are translated into U.S. dollars at current exchange rates. Purchases and sales of securities, income receipts, and expense payments are translated into U.S. dollars at the exchange rates on the date of the transactions. The Fund does not isolate the portion of the results of operations resulting from changes in foreign exchange rates on investments from fluctuations arising from changes in market prices of securities held. Such fluctuations are disclosed as net change in unrealized appreciation/depreciation on investments and foreign currency translations on the Statement of Operations. Any realized gains or losses from these fluctuations, including foreign currency arising from in-kind redemptions, are disclosed as net realized gains or losses from investment transactions and foreign currency translations on the Statement of Operations.
Foreign Taxes:
The Fund may be subject to foreign taxes related to foreign income received (a portion of which may be reclaimable), capital gains on the sale of securities, and certain foreign currency transactions. All foreign taxes are recorded in accordance with the applicable regulations and rates that exist in the foreign jurisdictions in which the Fund invests.
Federal Income Taxes:
It is the Fund's policy to continue to qualify as a regulated investment company by complying with the provisions available to certain investment companies, as defined in applicable sections of the Internal Revenue Code, and to make distributions of net investment income and net realized gains sufficient to relieve it from all, or substantially all, federal income taxes. Accordingly, no provision for federal income taxes is required in the financial statements. The Fund has a tax year end of May 31.
Management of the Fund has reviewed tax positions taken in tax years that remain subject to examination by all major tax jurisdictions, including federal (i.e., the last four tax years, which includes the current fiscal tax year end). Management believes that there is no tax liability resulting from unrecognized tax benefits related to uncertain tax positions taken.
Allocations:
Expenses directly attributable to the Fund are charged to the Fund, while expenses that are attributable to more than one fund in the Trust, or jointly with an affiliated trust, are allocated among the respective funds in the Trust and/or affiliated trust based upon net assets or another appropriate basis.
Income, expenses (other than class-specific expenses such as transfer agent fees, state registration fees, printing fees, and 12b-1 fees), and realized and unrealized gains or losses on investments are allocated to each class of shares based on its relative net assets on the date income is earned or expenses and realized and unrealized gains and losses are incurred.
41
USAA Mutual Funds Trust | | Notes to Financial Statements — continued
May 31, 2021 | |
Cross-Trade Transactions:
Pursuant to Rule 17a-7 under the 1940 Act, the Fund may engage in cross-trades, which are securities transactions with affiliated investment companies and advisory accounts managed by the Adviser and any applicable sub-adviser. Any such purchase or sale transaction must be effected without brokerage commission or other remuneration, except for customary transfer fees. The transaction must be effected at the current market price, which is either the security's last sale price on an exchange or, if there are no transactions in the security that day, at the average of the highest bid and lowest asked price. For the year ended May 31, 2021, the Fund engaged in the following securities transactions with affiliated funds, which resulted in the following net realized gains (losses) (amounts in thousands):
| Purchases | | Sales | | Net Realized
Gains (Losses) | |
| $ | 114 | | | $ | 30 | | | $ | 10 | | |
3. Purchases and Sales:
Cost of purchases and proceeds from sales/maturities of securities (excluding securities maturing less than one year from acquisition) for the year ended May 31, 2021, were as follows for the Fund (amounts in thousands):
| | | Excluding
U.S. Government Securities | |
| | | Purchases | | Sales | |
| | | | | $ | 1,186,904 | | | $ | 1,363,520 | | |
There were no purchases or sales of U.S. government securities during the year ended May 31, 2021.
4. Fees and Transactions with Affiliates and Related Parties:
Investment Advisory Fees:
Investment advisory services are provided to the Fund by the Adviser, which is a New York corporation registered as an investment adviser with the SEC. The Adviser is an indirect wholly owned subsidiary of Victory Capital Holdings, Inc., a publicly traded Delaware corporation, and a wholly owned direct subsidiary of Victory Capital Operating, LLC. Under the terms of the Investment Advisory Agreement, the Adviser is entitled to receive a base fee and a performance adjustment. The Fund's base fee is accrued daily and paid monthly at an annualized rate of 0.75% of the Fund's average daily net assets. Amounts incurred and paid to VCM for the year ended May 31, 2021, are reflected on the Statement of Operations as Investment Advisory fees.
On November 6, 2018, United Services Automobile Association ("USAA"), the parent company of USAA Asset Management Company ("AMCO"), the prior investment adviser to the Fund announced that AMCO would be acquired by Victory Capital Holdings Inc. (the "Transaction"). A special shareholder meeting was held on April 18, 2019, at which shareholders of the Fund approved a new investment advisory agreement between the Trust, on behalf of the Fund, and VCM. The Transaction closed on July 1, 2019, and effective July 1, 2019, VCM replaced AMCO as the investment adviser to the Fund and no performance adjustments were made for the period beginning July 1, 2019, through June 30, 2020. Only performance beginning as of July 1, 2019, and thereafter is utilized in calculating future performance adjustments.
The performance adjustment for each share class is accrued daily and calculated monthly by comparing each class' performance to that of the Lipper Global Funds Index. The Lipper Global Funds Index tracks the total return performance of the largest funds within the Lipper Global Funds category.
42
USAA Mutual Funds Trust | | Notes to Financial Statements — continued
May 31, 2021 | |
The performance period for each share class consists of the current month plus the previous 35 months (or the number of months beginning July 1, 2019, if fewer). The following table is utilized to determine the extent of the performance adjustment:
Over/Under Performance Relative to Index
(in basis points)(a) | | Annual Adjustment Rate
(in basis points) | |
| | +/- 100 to 400 | | | | +/- 4 | | |
| | +/- 401 to 700 | | | | +/- 5 | | |
| | +/- 701 and greater | | | | +/- 6 | | |
(a) Based on the difference between average annual performance of the relevant share class of the Fund and its relevant Lipper index, rounded to the nearest basis point.
Each class' annual performance adjustment rate is multiplied by the average daily net assets of each respective class over the entire performance period, which is then multiplied by a fraction, the numerator of which is the number of days in the month and the denominator of which is 365 (366 in leap years). The resulting amount is then added to (in the case of overperformance), or subtracted from (in the case of underperformance) the base fee.
Under the performance fee arrangement, each class pays a positive performance fee adjustment for a performance period whenever the class outperforms the Lipper Global Funds Index over that period, even if the class has overall negative returns during the performance period.
For the performance period July 1, 2020, to May 31, 2021, performance adjustments were $(175), $(1), and $(2) for Fund Shares, Institutional Shares, and Class A, in thousands, respectively. Performance adjustments were (0.01)%, (0.01)%, and (0.03)% for Fund Shares, Institutional Shares, and Class A, respectively. The performance adjustment rate included in the investment advisory fee may differ from the maximum over/under Annual Adjustment Rate due to differences in average net assets for the reporting period and rolling 36 month performance periods.
The Trust relies on an exemptive order granted to VCM and its affiliated funds by the SEC in March 2019 permitting the use of a "manager-of-managers" structure for certain funds. Under a manager-of-managers structure, the investment adviser may select (with approval of the Board and without shareholder approval) one or more subadvisers to manage the day-to-day investment of a fund's assets.
VCM entered into an Investment Subadvisory Agreement with MFS Investment Management ("MFS"), under which MFS directs the investment and reinvestment of the Fund's assets (as allocated from time to time by VCM). This arrangement provides for monthly fees that are paid by VCM. VCM (not the Fund) pays the subadviser fees. Effective March 19, 2021, MFS is no longer a subadviser to the Fund.
Administration and Servicing Fees:
VCM serves as the Fund's administrator and fund accountant. Under the Fund Administration, Servicing and Accounting Agreement, VCM is paid for its services an annual fee at a rate of 0.15%, 0.10%, and 0.15% of average daily net assets of the Fund Shares, Institutional Shares, and Class A, respectively. Amounts incurred for the year ended May 31, 2021, are reflected on the Statement of Operations as Administration fees.
The Fund (as part of the Trust) has entered into an agreement to provide compliance services with the Adviser, pursuant to which the Adviser furnishes its compliance personnel, including the services of the Chief Compliance Officer ("CCO"), and other resources reasonably necessary to provide the Trust with compliance oversight services related to the design, administration and oversight of a compliance program for the Trust in accordance with Rule 38a-1 under the 1940 Act. The CCO is an employee of the Adviser, which pays the compensation of the CCO and support staff. Funds in the Trust, Victory Variable Insurance Funds, Victory Portfolios, and Victory Portfolios II (collectively, the "Victory Funds Complex") in the aggregate, compensate the Adviser for these services. Amounts incurred for the year ended May 31, 2021, are reflected on the Statement of Operations as Compliance fees.
43
USAA Mutual Funds Trust | | Notes to Financial Statements — continued
May 31, 2021 | |
Citi Fund Services Ohio, Inc. ("Citi"), an affiliate of Citibank, acts as sub-administrator and sub-fund accountant to the Fund pursuant to a Sub-Administration and Sub-Fund Accounting Services Agreement between VCM and Citi. VCM pays Citi a fee for providing these services. The Fund reimburses VCM and Citi for out-of-pocket expenses incurred in providing these services and certain other expenses specifically allocated to the Fund. Amounts incurred for the year ended May 31, 2021, are reflected on the Statement of Operations as Sub-Administration fees.
Transfer Agency Fees:
Victory Capital Transfer Agency, Inc. ("VCTA"), an affiliate of the Adviser, provides transfer agency services to the Fund. VCTA provides transfer agent services to the Fund Shares based on an annual charge of $23 per shareholder account plus out-of-pocket expenses. VCTA pays a portion of these fees to certain intermediaries for the administration and servicing of accounts that are held with such intermediaries. Transfer agent's fees for Institutional Shares and Class A are paid monthly based on a fee accrued daily at an annualized rate of 0.10% and 0.10%, respectively, of average daily net assets, plus out-of-pocket expenses. Amounts incurred and paid to VCTA for the year ended May 31, 2021, are reflected on the Statement of Operations as Transfer Agent fees.
FIS Investor Services LLC serves as sub-transfer agent and dividend disbursing agent for the Fund pursuant to a Sub-Transfer Agent Agreement between VCTA and FIS Investor Services LLC. VCTA provides FIS Investor Services LLC a fee for providing these services.
Distributor/Underwriting Services:
Victory Capital Services, Inc. (the "Distributor"), an affiliate of the Adviser, serves as distributor for the continuous offering of the shares of the Fund pursuant to a Distribution Agreement between the Distributor and the Trust. Effective June 30, 2020, the Distributor's name was changed from Victory Capital Advisers, Inc.
Pursuant to the Distribution and Service Plans adopted in accordance with Rule 12b-1 under the 1940 Act, the Distributor may receive a monthly distribution and service fee, at an annual rate of up to 0.25% of the average daily net assets of Class A. The distribution and service fees paid to the Distributor may be used by the Distributor to pay for activity primarily intended to result in the sale of Class A. Amounts incurred and paid to the Distributor for the year ended May 31, 2021, are reflected on the Statement of Operations as 12b-1 fees.
In addition, the Distributor is entitled to receive commissions on sales of Class A. For the year ended May 31, 2021, the Distributor did not receive any commissions.
Other Fees:
Citibank serves as the Fund's custodian. The Fund pays Citibank a fee for providing these services. Amounts incurred for the year ended May 31, 2021, are reflected on the Statement of Operations as Custodian fees.
K&L Gates LLP provides legal services to the Trust.
The Adviser has entered into an expense limitation agreement with the Fund until at least June 30, 2023. Under the terms of the agreement, the Adviser has agreed to waive fees or reimburse certain expenses to the extent that ordinary operating expenses incurred by certain classes of the Fund in any fiscal year exceed the expense limit for such classes of the Fund. Such excess amounts will be the liability of the Adviser. Acquired fund fees and expenses, interest, taxes, brokerage commissions, other expenditures, that are capitalized in accordance with GAAP, and other extraordinary expenses not incurred in the ordinary course of the Fund's business are excluded from the expense limits. As of May 31, 2021, the expense limits (excluding voluntary waivers) were 1.09%, 1.00%, and 1.35% for Fund Shares, Institutional Shares, and Class A, respectively.
Under the terms of the expense limitation agreement, amended May 1, 2021, the Fund has agreed to repay fees and expenses that were waived or reimbursed by the Adviser for a period of up to three years (thirty six (36) months) after the waiver or reimbursement took place, subject to the lesser of any operating expense limits in effect at the time of: (a) the original waiver or expense reimbursement; or
44
USAA Mutual Funds Trust | | Notes to Financial Statements — continued
May 31, 2021 | |
(b) the recoupment, after giving effect to the recoupment amount. Prior to May 1, 2021, the Fund was permitted to recoup fees waived and expenses reimbursed for up to three years after the fiscal year in which the waiver or reimbursement took place, subject to the limitations above. This change did not have any effect on the amounts previously reported for recoupment.
As of May 31, 2021, the following amounts are available to be repaid to the Adviser (amounts in thousands). The Fund has not recorded any amounts available to be repaid as a liability due to an assessment that such repayment is not probable at May 31, 2021.
| Expires 2023 | | Expires 2024 | | Total | |
| $ | 14 | | | $ | 37 | | | $ | 51 | | |
The Adviser may voluntarily waive or reimburse additional fees to assist the Fund in maintaining competitive expense ratios. Voluntary waivers and reimbursements applicable to the Fund are not available to be recouped at a future time. There were no voluntary waivers or reimbursements for the year ended May 31, 2021.
Certain officers and/or interested trustees of the Fund are also officers and/or employees of the Adviser, administrator, fund accountant, sub-administrator, sub-fund accountant, custodian, and Distributor.
5. Risks:
The Fund may be subject to other risks in addition to these identified risks.
Geopolitical/Natural Disaster Risk — Global economies and financial markets are increasingly interconnected, which increases the possibilities that conditions in one country or region might adversely affect issuers in another country or region. Geopolitical and other risks, including war, terrorism, trade disputes, political or economic dysfunction within some nations, public health crises and related geopolitical events, as well as environmental disasters such as earthquakes, fires, and floods, may add to instability in world economies and markets generally. Changes in trade policies and international trade agreements could affect the economies of many countries in unpredictable ways. Likewise, systemic market dislocations of the kind that occurred during the financial crisis that began in 2008, if repeated, would be highly disruptive to economies and markets, adversely affecting individual companies and industries, securities markets, interest rates, credit ratings, inflation, investor sentiment, and other factors affecting the value of a Fund's investments. Some countries, including the United States, are adopting more protectionist trade policies and moving away from the tighter financial industry regulations that followed the 2008 financial crisis, which may also affect the value of a Fund's investments.
Political events within the United States at times have resulted, and may in the future result, in a shutdown of government services, which could negatively affect the U.S. economy, decrease the value of a Fund's investments, increase uncertainty in or impair the operation of the U.S. or other securities markets, and degrade investor and consumer confidence, perhaps suddenly and to a significant degree.
An outbreak of disease called COVID-19 has spread internationally. The transmission of COVID-19 and efforts to contain its spread have resulted in international, national, and local border closings and other significant travel restrictions and disruptions, significant disruptions to business operations, supply chains and consumer activity, significant challenges in healthcare service preparation and delivery, quarantines, and general concern and uncertainty. These negative impacts have caused significant volatility and declines in global financial markets, which have caused losses for Fund investors during and subsequent to period end. The impact of the COVID-19 pandemic may last for an extended period of time, and could result in a substantial economic downturn or recession. Public health crises may exacerbate other pre-existing political, social, economic, market, and financial risks. The extent of the impact to the financial performance of the Fund's investments will depend on future developments, including (i) the duration and spread of the outbreak, (ii) the restrictions and advisories, (iii) the effects on the financial markets, and (iv) the effects on the economy overall, all of which are highly uncertain and cannot be predicted.
45
USAA Mutual Funds Trust | | Notes to Financial Statements — continued
May 31, 2021 | |
Stock Market Risk — Overall stock market risks may affect the value of the Fund. Domestic and international factors such as political events, war, trade disputes, interest rate levels and other fiscal and monetary policy changes, pandemics and other public health crises, and related geopolitical events, as well as environmental disasters such as earthquakes, fires, and floods, may add to instability in world economies and markets generally. The impact of these and other factors may be short-term or may last for extended periods.
Equity Risk — The value of the equity securities in which the Fund invests may decline in response to developments affecting individual companies and/or general economic conditions. A company's earnings or dividends may not increase as expected due to poor management decisions, competitive pressures, breakthroughs in technology, reliance on suppliers, labor problems or shortages, corporate restructurings, fraudulent disclosures, natural disasters, military confrontations, war, terrorism, public health crises, or other events, conditions, and factors. Price changes may be temporary or last for extended periods.
Foreign Securities Risk — Foreign markets can be more volatile than the U.S. market due to increased risks of adverse issuer, political, regulatory, market, or economic developments and can perform differently from the U.S. market.
6. Borrowing and Interfund Lending:
Line of Credit:
The Victory Funds Complex participated in a short-term demand note "Line of Credit" agreement with Citibank. The Line of Credit agreement with Citibank was renewed on June 29, 2020, with a termination date of June 28, 2021. Under the agreement with Citibank, the Victory Funds Complex may borrow up to $600 million, of which $300 million is committed and $300 million is uncommitted. $40 million of the Line of Credit is reserved for use by the Victory Floating Rate Fund, another series of the Victory Funds Complex, with Victory Floating Rate Fund paying the related commitment fees for that amount. The purpose of the Line of Credit is to meet temporary or emergency cash needs. For the year ended May 31, 2021, Citibank received an annual commitment fee of 0.15% on $300 million for providing the Line of Credit. Each fund in the Victory Funds Complex pays a pro-rata portion of the commitment fees plus any interest (one month LIBOR plus one percent) on amounts borrowed. For the period June 29, 2020, through April 30, 2021, under an amended Line of Credit agreement, Citibank received an annual upfront fee of 0.10% on the $300 million committed line of credit. Each fund in the Victory Funds Complex paid a pro-rata portion of the upfront fee. Effective with the next amendment, the annual commitment fee of 0.15% will remain unchanged and the upfront fee of 0.10% is discontinued. Interest charged to each fund during the period, if applicable, is reflected on the Statement of Operations under Line of credit fees.
The Fund had no borrowings under the Line of Credit agreement during the year ended May 31, 2021.
Interfund Lending:
The Trust and Adviser rely on an exemptive order granted by the SEC in March 2017 (the "Order"), permitting the establishment and operation of an Interfund Lending Facility (the "Facility"). The Facility allows the Fund to directly lend and borrow money to or from any other fund in the Victory Funds Complex that is permitted to participate in the Facility, relying upon the Order at rates beneficial to both the borrowing and lending funds. Advances under the Facility are allowed for temporary or emergency purposes, including the meeting of redemption requests that otherwise might require the untimely disposition of securities, and are subject to each Fund's borrowing restrictions. The interfund loan rate is determined, as specified in the Order, by averaging the current repurchase agreement rate and the current bank loan rate. As a Borrower, interest charged to the Fund, if any, during the period is reflected on the Statement of Operations under Interfund lending fees. As a Lender, interest earned by the Fund, if any, during the period is presented on the Statement of Operations under Interfund lending.
46
USAA Mutual Funds Trust | | Notes to Financial Statements — continued
May 31, 2021 | |
The average borrowing or lending for the days outstanding and average interest rate for the Fund during the year ended May 31, 2021, were as follows (amounts in thousands):
Borrower or
Lender | | Amount
Outstanding at
May 31, 2021 | | Average
Borrowing* | | Days
Borrowing
Outstanding | | Average
Interest
Rate* | | Maximum
Borrowing
During
the Period | |
| Borrower | | $ | — | | | $ | 1,340 | | | | 12 | | | | 0.61 | % | | $ | 1,793 | | |
* For the year ended May 31, 2021, based on the number of days borrowings were outstanding.
7. Federal Income Tax Information:
The Fund intends to distribute any net investment income annually. Distributable net realized gains, if any, are declared and paid at least annually.
The amounts of dividends from net investment income and distributions from net realized gains (collectively distributions to shareholders) are determined in accordance with federal income tax regulations, which may differ from GAAP. To the extent these "book/tax" differences are permanent in nature (e.g., net operating loss and distribution reclassification), such amounts are reclassified within the components of net assets based on their federal tax-basis treatment; temporary differences (e.g., wash sales) do not require reclassification. To the extent dividends and distributions exceed net investment income and net realized gains for tax purposes, they are reported as distributions of capital. Net investment losses incurred by the Fund may be reclassified as an offset to capital on the accompanying Statement of Assets and Liabilities.
As of May 31, 2021, on the Statement of Assets and Liabilities, as a result of permanent book-to-tax differences, reclassification adjustments were as follows (amounts in thousands):
Total
Accumulated
Earnings/(Loss) | | Capital | |
| $ | (6,785 | ) | | $ | 6,785 | | |
The tax character of distributions paid during the tax years ended as noted below, were as follows (total distributions paid may differ from the Statements of Changes in Net Assets because, for tax purposes, dividends are recognized when actually paid) (amounts in thousands).
| | | Year Ended May 31, 2021 | | Year Ended May 31, 2020 | |
| | | Distributions paid from | | | | Distributions paid from | | | |
| | Ordinary
Income | | Net
Long-Term
Capital Gains | | Total
Distributions
Paid | | Ordinary
Income | | Net
Long-Term
Capital Gains | | Total
Distributions
Paid | |
| | | | | $ | 9,425 | | | $ | 55,888 | | | $ | 65,313 | | | $ | 22,510 | | | $ | 410,423 | | | $ | 432,933 | | |
As of May 31, 2021, the components of accumulated earnings (loss) on a tax basis were as follows (amounts in thousands):
Undistributed
Ordinary
Income | | Undistributed
Long-Term
Capital Gains | | Other
Earnings
(Deficit) | | Accumulated
Earnings | | Unrealized
Appreciation
(Depreciation)* | | Total
Accumulated
Earnings
(Loss) | |
| $ | 36,860 | | | $ | 171,263 | | | $ | 6 | | | $ | 208,129 | | | $ | 365,804 | | | $ | 573,933 | | |
* The difference between the book-basis and tax-basis of unrealized appreciation/depreciation is attributable to the tax deferral of losses on wash sales, passive foreign investment company, partnership, and REITs/return of capital.
47
USAA Mutual Funds Trust | | Notes to Financial Statements — continued
May 31, 2021 | |
As of May 31, 2021, the Fund had no capital loss carryforwards, for federal income tax purposes.
As of May 31, 2021, the cost basis for federal income tax purposes, gross unrealized appreciation, gross unrealized depreciation, and net unrealized appreciation (depreciation) for investments were as follows (amounts in thousands):
Cost of
Investments
for Federal
Tax Purposes | | Gross
Unrealized
Appreciation | | Gross
Unrealized
Depreciation | | Net
Unrealized
Appreciation
(Depreciation) | |
| $ | 1,148,216 | | | $ | 395,864 | | | $ | (30,060 | ) | | $ | 365,804 | | |
48
REPORT OF INDEPENDENT REGISTERED PUBLIC ACCOUNTING FIRM
To the Shareholders and the Board of Trustees of USAA Sustainable World Fund
Opinion on the Financial Statements
We have audited the accompanying statement of assets and liabilities of USAA Sustainable World Fund (formerly USAA World Growth Fund) (the "Fund") (one of the funds constituting USAA Mutual Funds Trust (the "Trust")), including the schedule of portfolio investments, as of May 31, 2021, and the related statement of operations for the year then ended, the statements of changes in net assets for each of the two years in the period then ended, the financial highlights for each of the five years in the period then ended and the related notes (collectively referred to as the "financial statements"). In our opinion, the financial statements present fairly, in all material respects, the financial position of the Fund (one of the funds constituting USAA Mutual Funds Trust) at May 31, 2021, the results of its operations for the year then ended, the changes in its net assets for each of the two years in the period then ended and its financial highlights for each of the five years in the period then ended, in conformity with U.S. generally accepted accounting principles.
Basis for Opinion
These financial statements are the responsibility of the Trust's management. Our responsibility is to express an opinion on the Fund's financial statements based on our audits. We are a public accounting firm registered with the Public Company Accounting Oversight Board (United States) ("PCAOB") and are required to be independent with respect to the Trust in accordance with the U.S. federal securities laws and the applicable rules and regulations of the Securities and Exchange Commission and the PCAOB.
We conducted our audits in accordance with the standards of the PCAOB. Those standards require that we plan and perform the audit to obtain reasonable assurance about whether the financial statements are free of material misstatement, whether due to error or fraud. The Trust is not required to have, nor were we engaged to perform, an audit of the Trust's internal control over financial reporting. As part of our audits we are required to obtain an understanding of internal control over financial reporting, but not for the purpose of expressing an opinion on the effectiveness of the Trust's internal control over financial reporting. Accordingly, we express no such opinion.
Our audits included performing procedures to assess the risks of material misstatement of the financial statements, whether due to error or fraud, and performing procedures that respond to those risks. Such procedures included examining, on a test basis, evidence regarding the amounts and disclosures in the financial statements. Our procedures included confirmation of securities owned as of May 31, 2021, by correspondence with the custodian and brokers or by other appropriate auditing procedures where replies from brokers were not received. Our audits also included evaluating the accounting principles used and significant estimates made by management, as well as evaluating the overall presentation of the financial statements. We believe that our audits provide a reasonable basis for our opinion.

We have served as the auditor of one or more Victory Capital investment companies since 1995.
San Antonio, Texas
July 28, 2021
49
USAA Mutual Funds Trust | | Supplemental Information
May 31, 2021 | |
(Unaudited)
Trustee and Officer Information
Board of Trustees:
Overall responsibility for management of the Trust rests with the Board. The Trust is managed by the Board in accordance with the laws of the state of Delaware. There are currently nine Trustees, seven of whom are not "interested persons" of the Trust within the meaning of that term under the 1940 Act ("Independent Trustees") and two of whom are "interested persons" of the Trust within the meaning of that term under the 1940 Act ("Interested Trustee"). The Trustees, in turn, elect the officers of the Trust to actively supervise its day-to-day operations.
The following tables list the Trustees, their ages, position with the Trust, commencement of service, principal occupations during the past five years and any directorships of other investment companies or companies whose securities are registered under the Securities Exchange Act of 1934, as amended, or who file reports under that Act. Each Trustee oversees 46 portfolios in the Trust. Each Trustee's address is 15935 La Cantera Pkwy, San Antonio, TX, 78256. Pursuant to a policy adopted by the Board, the term of office for each Trustee shall be until the Independent Trustee reaches age 75 or an Interested Trustee reaches age 75. The Board may change or grant exceptions from this policy at any time without shareholder approval. A Trustee may resign or be removed by a vote of the other Trustees or the holders of a majority of the outstanding shares of the Trust at any time. Vacancies on the Board can be filled by the action of a majority of the Trustees, provided that after filling such vacancy at least two-thirds of the Trustees have been elected by the shareholders.
Name and Date of Birth | | Position
Held with
the Trust | | Year
Commenced
Service | | Principal Occupation
During Past 5 Years | | Other
Directorships
Held During
Past 5 Years | |
Independent Trustees. | |
Jefferson C. Boyce, (c)
Born September 1957 | | Independent Chairman | | | 2021 | | | Senior Managing Director, New York Life Investments, LLC (1992-2012) | | Westhab, Inc. | |
John C. Walters,
Born February 1962 | | Trustee | | | 2019 | | | Retired. Mr. Walters brings significant Board experience including active involvement with the board of a Fortune 500 company, and a proven record of leading large, complex financial organizations. He has a demonstrated record of success in distribution, manufacturing, investment brokerage, and investment management in both the retail and institutional investment businesses. He has substantial experience in the investment management business with a demonstrated ability to develop and drive strategy while managing operation, financial, and investment risk. | | Guardian Variable Products Trust (16 series), Lead Independent Director; Amerilife Holdings LLC, Director; Stadion Money Management; Director; University of North Carolina (Chapel Hill), Member Board of Governors | |
50
USAA Mutual Funds Trust | | Supplemental Information — continued
May 31, 2021 | |
(Unaudited)
Name and Date of Birth | | Position
Held with
the Trust | | Year
Commenced
Service | | Principal Occupation
During Past 5 Years | | Other
Directorships
Held During
Past 5 Years | |
Robert L. Mason, Ph.D.,
Born July 1946 | | Trustee | | | 1997 | | | Adjunct Professor in the Department of Management Science and Statistics in the College of Business at the University of Texas at San Antonio (since 2001); Institute Analyst, Southwest Research Institute (March 2002-January 2016) | | None | |
Dawn M. Hawley,
Born February 1954 | | Trustee | | | 2014 | | | Manager of Finance, Menil Foundation, Inc. (May 2007-June 2011), which is a private foundation that oversees the assemblage of sculptures, prints, drawings, photographs, and rare books. Director of Financial Planning and Analysis and Chief Financial Officer, AIM Management Group, Inc. (October 1987-January 2006) | | None | |
Paul L. McNamara,
Born July 1948 | | Trustee | | | 2012 | | | Director, Cantor Opportunistic Alternatives Fund, LLC (March 2010-February 2014), which is a closed-end fund of funds by Cantor Fitzgerald Investment Advisors, LLC | | None | |
51
USAA Mutual Funds Trust | | Supplemental Information — continued
May 31, 2021 | |
(Unaudited)
Name and Date of Birth | | Position
Held with
the Trust | | Year
Commenced
Service | | Principal Occupation
During Past 5 Years | | Other
Directorships
Held During
Past 5 Years | |
Richard Y. Newton III,
Born January 1956 | | Trustee | | | 2017 | | | Director, Elta North America (01/18-present), which is a global leader in the design, manufacture, and support of innovative electronic systems in the ground, maritime, airborne, and security domains for the nation's warfighters, security personnel, and first responders; Managing Partner, Pioneer Partnership Development Group (December 2015-present)); Executive Director, The Union League Club of New York (June 2014-November 2015): Executive Vice President, Air Force Association (August 2012-May 2014); Lieutenant General, United States Air Force (January 2008-June 2012) | | PredaSAR Corp. | |
Barbara B. Ostdiek, Ph.D.,
Born March 1964 | | Trustee | | | 2008 | | | Senior Associate Dean of Degree Programs at Jesse H. Jones Graduate School of Business at Rice University (since 2013); Associate Professor of Finance at Jessie H. Jones Graduate School of Business at Rice University (since 2001) | | None | |
Effective at the close of business on December 31, 2020, Michael F. Reimherr retired from the Board of Trustees.
52
USAA Mutual Funds Trust | | Supplemental Information — continued
May 31, 2021 | |
(Unaudited)
Name and Date of Birth | | Position
Held with
the Trust | | Year
Commenced
Service | | Principal Occupation
During Past 5 Years | | Other
Directorships
Held During
Past 5 Years | |
Interested Trustees. | |
David C. Brown, (b)
Born May 1972 | | Trustee | | | 2019 | | | Chairman and Chief Executive Officer (since 2013), Victory Capital Management Inc.; Chairman and Chief Executive Officer, Victory Capital Holdings, Inc. (since 2013). Mr. Brown brings to the Board extensive business, finance and leadership skills gained and developed through years of experience in the financial services industry, including his tenure overseeing the strategic direction as CEO of Victory Capital. These skills, combined with Mr. Brown's extensive knowledge of the financial services industry and demonstrated success in the development and distribution of investment strategies and products, enable him to provide valuable insights to the Board and strategic direction for the Funds. | | Trustee, Victory Portfolios (41 series), Victory Portfolios II (26 series), Victory Variable Insurance Funds (8 series) | |
53
USAA Mutual Funds Trust | | Supplemental Information — continued
May 31, 2021 | |
(Unaudited)
Name and Date of Birth | | Position
Held with
the Trust | | Year
Commenced
Service | | Principal Occupation
During Past 5 Years | | Other
Directorships
Held During
Past 5 Years | |
Daniel S. McNamara, (b)(c)(d)
Born June 1966 | | Trustee | | | 2012 | | | Trustee, President, and Vice Chairman of USAA ETF Trust (June 2017-June 2019); President of Financial Advice & Solutions Group (FASG), USAA (February 2013-March 2021); Director of USAA Investment Services Company (ISCO) (formerly USAA Investment Management) (September 2009-March 2021); President, Asset Management Company (AMCO) (August, 2011-June 2019); Senior Vice President of USAA Financial Planning Services Insurance Agency, Inc. (FPS) (April 2011-March 2021); Chairman of Board of ISCO (April 2013-December 2020); Director of AMCO (August 2011-June 2019); President and Director of USAA Shareholder Account Services (SAS) (October 2009-June 2019); Director and Vice Chairman of FPS (December 2013-March 2021); President and Director of USAA Investment Corporation (ICORP) (March 2010-March 2021); Chairman of Board of ICORP (December 2013-March 2021); Director of USAA Financial Advisors, Inc. (FAI) (December 2013-March 2021); Chairman of Board of FAI (March 2015-March 2021). Mr. McNamara brings to the Board extensive experience in the financial services industry, including experience as an officer of the Trust. | | None | |
(b) Mr. Dan McNamara is deemed an "interested person" due to his previous position as Director of AMCO, the former investment adviser of the Funds. Mr. Brown is deemed an "interested person" due to his position as Chief Executive Officer of Victory Capital, investment adviser to the Funds.
(c) Effective at the close of business on December 31, 2020, Jefferson C. Boyce replaced Dan McNamara as Chair of the Board and assumed the title of Independent Chair.
(d) Effective July 2, 2021, Mr. Dan McNamara became an Independent Trustee to the Funds.
The Statement of Additional Information includes additional information about the Trustees of the Trust and is available, without charge, on the SEC's website at www.sec.gov and/or by calling (800)-235-8396.
54
USAA Mutual Funds Trust | | Supplemental Information — continued
May 31, 2021 | |
(Unaudited)
Officers:
The officers of the Trust, their ages, commencement of service and their principal occupations during the past five years, are detailed in the following table. Each officer serves until the earlier of his or her resignation, removal, retirement, death, or the election of a successor. The mailing address of each officer of the Trust is 15935 La Cantera Pkwy, San Antonio, TX, 78256. The officers of the Trust receive no compensation directly from the Trust for performing the duties of their offices.
Name and Date of Birth | | Position with
the Trust | | Year
Commenced
Service | | Principal Occupation During Past 5 Years | |
Interested Officers.
Christopher K. Dyer,
Born February 1962 | | President | | | 2019 | | | Director of Fund Administration, Victory Capital (since 2004); Chief Operating Officer, Victory Capital Services, Inc. (since 2020) | |
Scott A Stahorsky,
Born July 1969 | | Vice President | | | 2019 | | | Manager, Fund Administration, Victory Capital (since 2015) | |
James K. De Vries,
Born April 1969 | | Treasurer | | | 2018 | | | Executive Director, Victory Capital Management Inc. (since 2019); Treasurer, USAA ETF Trust (September 2018-June 2019); Executive Director, Investment and Financial Administration, USAA (April 2012-June 2019); Assistant Treasurer, USAA ETF Trust (June 2017-September 2018); Assistant Treasurer, USAA Mutual Funds Trust (December 2013-February 2018) | |
Allan Shaer,
Born March 1965 | | Assistant Treasurer | | | 2019 | | | Senior Vice President, Financial Administration, Citi Fund Services Ohio, Inc. (since 2016); Vice President, Mutual Fund Administration, JP Morgan Chase (2011-2016) | |
Carol D. Trevino,
Born October 1965 | | Assistant Treasurer | | | 2018 | | | Director, Accounting and Finance, Victory Capital Management Inc. (since 2019); Accounting/Financial Director, USAA (December 2013-June 2019); Assistant Treasurer, USAA ETF Trust (September 2018-June 2019) | |
Erin G. Wagner,
Born February 1974 | | Secretary | | | 2019 | | | Deputy General Counsel, the Adviser (since 2013) | |
Charles Booth,
Born April 1960 | | Anti-Money Laundering Compliance Officer and Identity Theft Officer | | | 2019 | | | Director, Regulatory Administration and CCO Support Services, Citi Fund Services Ohio, Inc. (since 2007) | |
Amy Campos,
Born July 1976 | | Chief Compliance Officer | | | 2019 | | | Chief Compliance Officer, USAA Mutual Funds Trust (since 2019); Executive Director, Deputy Chief Compliance Officer, USAA Mutual Funds Trust and USAA ETF Trust (July 2017-June 2019); Compliance Director, USAA Mutual Funds Trust (2014-July 2017) | |
55
USAA Mutual Funds Trust | | Supplemental Information — continued
May 31, 2021 | |
(Unaudited)
Proxy Voting and Portfolio Holdings Information
Proxy Voting:
Information regarding the policies and procedures the Fund uses to determine how to vote proxies relating to portfolio securities is available without charge, upon request, by calling (800) 235-8396. The information is also included in the Fund's Statement of Additional Information, which is available on the SEC's website at www.sec.gov.
Information relating to how the Fund voted proxies relating to portfolio securities held during the most recent 12 months ended June 30 is available on the SEC's website at www.sec.gov.
Availability of Schedules of Portfolio Investments:
The Trust files a complete list of Schedules of Portfolio Investments with the SEC for the first and third quarter of each fiscal year on Form N-PORT. Form N-PORT is available on the SEC's website at www.sec.gov.
Expense Examples
As a shareholder of the Fund, you may incur two types of costs: (1) transaction costs, including sales charges (loads) on purchases; and (2) ongoing costs, including management fees and other Fund expenses. These examples are intended to help you understand your ongoing costs (in dollars) of investing in the Fund and to compare these costs with the ongoing costs of investing in other mutual funds.
These examples are based on an investment of $1,000 invested at the beginning of the period and held for the entire period from December 1, 2020, through May 31, 2021.
The Actual Expense figures in the table below provide information about actual account values and actual expenses. You may use the information below, together with the amount you invested, to estimate the expenses that you paid over the period. Simply divide your account value by $1,000 (for example, an $8,600 account value divided by $1,000 = 8.6), then multiply the result by the number in the table under the heading entitled "Actual Expenses Paid During Period" to estimate the expenses you paid on your account during this period.
The Hypothetical Expense figures in the table below provide information about hypothetical account values and hypothetical expenses based on the Fund's actual expense ratio and an assumed rate of return of 5% per year before expenses, which is not the Fund's actual return. The hypothetical account values and expenses may not be used to estimate the actual ending account balance or expenses you paid for the period. You may use this information to compare this 5% hypothetical example with the 5% hypothetical examples that appear in shareholder reports of other funds.
Please note the expenses shown in the table below are meant to highlight your ongoing costs only and do not reflect any transactional costs. If these transactional costs were included, your costs would have been higher.
| | | Beginning
Account
Value
12/1/20 | | Actual
Ending
Account
Value
5/31/21 | | Hypothetical
Ending
Account
Value
5/31/21 | | Actual
Expenses
Paid
During
Period
12/1/20-
5/31/21* | | Hypothetical
Expenses
Paid
During
Period
12/1/20-
5/31/21* | | Annualized
Expense
Ratio
During
Period
12/1/20-
5/31/21 | |
Fund Shares | | $ | 1,000.00 | | | $ | 1,160.00 | | | $ | 1,019.80 | | | $ | 5.55 | | | $ | 5.19 | | | | 1.03 | % | |
Institutional Shares | | | 1,000.00 | | | | 1,160.70 | | | | 1,020.14 | | | | 5.17 | | | | 4.84 | | | | 0.96 | % | |
Class A | | | 1,000.00 | | | | 1,159.00 | | | | 1,018.50 | | | | 6.94 | | | | 6.49 | | | | 1.29 | % | |
* Expenses are equal to the average account value multiplied by the Fund's annualized expense ratio multiplied by 182/365 (the number of days in the most recent fiscal half-year divided by the number of days in the fiscal year).
56
USAA Mutual Funds Trust | | Supplemental Information — continued
May 31, 2021 | |
(Unaudited)
Additional Federal Income Tax Information
The following federal tax information related to the Fund's fiscal year ended May 31, 2021, is provided for information purposes only and should not be used for reporting to federal or state revenue agencies. Federal tax information for the calendar year will be reported to you on Form 1099-DIV in January 2022.
With respect to distributions paid, the Fund designates the following amounts (or, if subsequently determined to be different, the maximum amount allowable) for the fiscal year ended May 31, 2021 (amounts in thousands):
| | Dividends
Received
Deduction
(corporate
shareholders) | | Qualified
Dividend
Income
(non-corporate
shareholders) | | Short-Term
Capital Gain
Distributions | | Long-Term
Capital Gain
Distributions | | Foreign
Taxes
Paid | |
| | | | | | 36 | % | | | 70 | % | | $ | 739 | | | $ | 61,932 | | | $ | 1,362 | | |
57
USAA Mutual Funds Trust | | Supplemental Information — continued
May 31, 2021 | |
(Unaudited)
Considerations of the Board in Continuing the Investment Advisory Agreement (the "Agreement")
USAA Sustainable World Fund (formerly, USAA World Growth Fund) (the "Fund")
At a meeting of the Board of Trustees (the "Board") held on December 10-11, 2020, the Board, including the Trustees who are not "interested persons" (as that term is defined in the Investment Company Act of 1940, as amended) of the Trust (the "Independent Trustees"), approved for an annual period the continuance of the Investment Advisory Agreement (the "Advisory Agreement") between the Trust and Victory Capital Management Inc. (the "Adviser") and the Subadvisory Agreement between the Adviser and MFS Investment Management (the "Subadviser") with respect to the Fund.1 Prior to the December 10-11, 2020 meeting at which the Advisory Agreement was approved, the Independent Trustees also discussed and considered information regarding the proposed continuation of the Advisory Agreement and Subadvisory Agreement at a meeting held on November 19, 2020.
In advance of the foregoing meetings, the Trustees received and considered a variety of information relating to the Advisory Agreement and Subadvisory Agreement and the Adviser and the Subadviser, and were given the opportunity to ask questions and request additional information from management. The information provided to the Board included, among other things: (i) a separate report prepared by an independent third party of mutual fund data, which provided a statistical analysis comparing the Fund's investment performance, expenses, and fees to comparable investment companies; (ii) information concerning the services rendered to the Fund, as well as information regarding the Adviser's revenues and costs of providing services to the Fund and compensation paid to affiliates of the Adviser; and (iii) information about the Adviser's and the Subadviser's operations and personnel. Prior to voting, the Independent Trustees reviewed the proposed continuance of the Advisory Agreement and Subadvisory Agreement with management and with experienced independent counsel retained by the Independent Trustees ("Independent Counsel") and received materials from such Independent Counsel discussing the legal standards for their consideration of the proposed continuation of the Advisory Agreement and the Subadvisory Agreement with respect to the Fund. The Independent Trustees also reviewed the proposed continuation of the Advisory Agreement and the Subadvisory Agreement with respect to the Fund in private sessions with Independent Counsel at which no representatives of management were present.
The Board considered the Advisory Agreement and the Subadvisory Agreement separately in the course of its review. In doing so, the Board noted the respective roles of the Adviser and the Subadviser in providing services to the Fund.
At each regularly scheduled meeting of the Board and its committees, the Board receives and reviews, among other things, information concerning the Fund's performance and related services provided by the Adviser and the Subadviser. At the meeting at which the renewal of the Advisory Agreement and Subadvisory Agreement is considered, particular focus is given to information concerning Fund performance, fees and total expenses as compared to comparable investment companies, and the Adviser's profitability with respect to the Fund. However, the Board noted that the evaluation process with respect to the Adviser and the Subadviser is an ongoing one. In this regard, the Board's and its committees' consideration of the Advisory Agreement and Subadvisory Agreement included information previously received at such meetings.
Advisory Agreement
After full consideration of a variety of factors, the Board, including the Independent Trustees, voted to approve the Advisory Agreement. In approving the Advisory Agreement, the Trustees did not identify any single factor as controlling, and each Trustee may have attributed different weights to various factors. Throughout their deliberations, the Independent Trustees were represented and assisted by Independent Counsel.
Nature, Extent, and Quality of Services — In considering the nature, extent, and quality of the services provided by the Adviser under the Advisory Agreement, the Board reviewed information provided by the Adviser relating to its operations and personnel. The Board also took into account its knowledge of the Adviser's management
1 Effective March 19, 2021, the Subadviser is no longer a subadviser to the Fund.
58
USAA Mutual Funds Trust | | Supplemental Information — continued
May 31, 2021 | |
(Unaudited)
and the quality of the performance of the Adviser's duties through Board meetings, discussions, and reports during the preceding year. The Board considered the fees paid to the Adviser and the services provided to the Fund by the Adviser under the Advisory Agreement, as well as other services provided by the Adviser and its affiliates under other agreements, and the personnel who provide these services. In addition to the investment advisory services provided to the Fund, the Adviser and its affiliates provide administrative services, shareholder services, oversight of Fund accounting, marketing services, assistance in meeting legal and regulatory requirements, and other services necessary for the operation of the Fund and the Trust.
The Board considered the scope of services provided by, and the undertakings required of, the Adviser in connection with those services, including, among other things, maintaining (i) its own and the Fund's compliance programs, (ii) risk management programs, (iii) liquidity risk management programs, and (iv) cybersecurity programs, each of which had expanded over time as a result of regulatory, market, and other developments. The Board also considered the significant risks assumed by the Adviser in connection with the services provided to the Fund, including investment, operational, enterprise, litigation, regulatory and compliance risks.
The Board considered the Adviser's management style and the performance of the Adviser's duties under the Advisory Agreement. The Board considered the level and depth of knowledge of the Adviser, including the professional experience and qualifications of its senior and investment personnel, as well as current staffing levels. The Board considered the Adviser's process for monitoring the performance of the Subadviser and the Adviser's timeliness in responding to performance issues. The allocation of the Fund's brokerage, including the Adviser's process for monitoring "best execution," also was considered. The Adviser's role in coordinating the activities of the Fund's other service providers was also considered. The Board also considered the Adviser's risk management processes. The Board considered the Adviser's financial condition and that it had the financial wherewithal to continue to provide the same scope and high quality of services under the Advisory Agreement. In reviewing the Advisory Agreement, the Board focused on the experience, resources, and strengths of the Adviser and its affiliates in managing the Fund, as well as the other funds in the Trust.
The Board also reviewed the compliance and administrative services provided to the Fund by the Adviser and its affiliates, including the Adviser's oversight of the Fund's day-to-day operations and oversight of Fund accounting. The Trustees, guided also by information obtained from their experiences as trustees of the Trust, also focused on the quality of the Adviser's compliance and administrative staff.
Expenses and Performance — In connection with its consideration of the Advisory Agreement, the Board evaluated the Fund's advisory fees and total expense ratio as compared to other open-end investment companies deemed to be comparable to the Fund as determined by the independent third party in its report. The Fund's expenses were compared to (i) a group of investment companies chosen by the independent third party to be comparable to the Fund based upon certain factors, including fund type, comparability of investment objective and classification, sales load type, asset size, and expense components (the "expense group") and (ii) a larger group of investment companies with the same investment classification/objective as the Fund regardless of asset size, excluding outliers (the "expense universe"). Among other data, the Board noted that the Fund's management fee rate — which includes advisory and administrative services and the effects of any performance adjustment2, as well as any fee waivers and reimbursements — was above the medians of its expense group and expense universe. The data indicated that the Fund's total expenses, including after any reimbursements, were below the medians of its expense group and its expense universe. The Board also took into account the Adviser's current undertakings to maintain expense limitations for the Fund. The Board took into account the various other services provided to the Fund by the Adviser and its affiliates, and noted the high quality of services received by the Fund. The Board also took into account that the subadvisory fees under the Subadvisory Agreement are paid by the Adviser. The Board also considered and discussed information about the Subadviser's fees, including the amount of management fees retained by the Adviser after payment of the subadvisory fees.
In considering the Fund's performance, the Board noted that it reviews at its regularly scheduled meetings information about the Fund's performance results. The Trustees also reviewed various comparative data provided to them in connection with their consideration of the renewal of the Advisory Agreement, including, among other information, a comparison of the Fund's average annual total returns relative to its Lipper index and
2 The Adviser has agreed that no performance adjustment (positive or negative) would be made to the amount payable to the Adviser from July 1, 2019, through June 30, 2020.
59
USAA Mutual Funds Trust | | Supplemental Information — continued
May 31, 2021 | |
(Unaudited)
other mutual funds deemed to be in its peer group by the independent third party in its report (the "performance universe"). The Fund's performance universe consisted of the Fund and all retail and institutional open-end investment companies with the same classification/objective as the Fund regardless of asset size or primary channel of distribution. This comparison indicated that, among other data, the Fund's performance was above the average of its Lipper index for the one-, three-, five- and ten-year periods ended September 30, 2020, and was below the average of its performance universe for the one-, three- and five-year periods ended September 30, 2020, and was above the average of its performance universe for the ten-year period ended September 30, 2020. The Board also considered management's discussion of recent changes made to the Fund.
Compensation and Profitability — The Board took into consideration the level and method of computing the management fee. The information considered by the Board included operating profit margin information for the Adviser's business as a whole. The Board also received and considered profitability information related to the management revenues from the Fund. This information included a review of the methodology used in the allocation of certain costs to the Fund. In considering the profitability data with respect to the Fund, the Trustees noted that the Adviser pays the Fund's subadvisory fees and also noted that the Adviser waived a portion of its management fee and/or reimbursed certain expenses with respect to the Fund. The Trustees reviewed the profitability of the Adviser's relationship with the Fund before tax expenses. The Board was also provided with a profitability analysis of other publicly traded asset managers prepared by an independent information service. In reviewing the overall profitability of the management fee to the Adviser, the Board also considered the fact that the Adviser and its affiliates provide shareholder servicing and administrative services to the Fund for which they receive compensation. The Board also considered the possible direct and indirect benefits to the Adviser from its relationship with the Trust, including that the Adviser may derive reputational and other benefits from its association with the Fund. The Trustees recognized that the Adviser should be entitled to earn a reasonable level of profits in exchange for the level of services it provides to the Fund and the entrepreneurial and other risks that it assumes as Adviser.
Economies of Scale — The Board considered whether there should be changes in the management fee rate or structure in order to enable the Fund to participate in any economies of scale. The Board also considered the fee waiver and expense reimbursement arrangements by the Adviser. The Board considered the fact that the Adviser also pays the Fund's subadvisory fees. The Board also considered the effect of the Fund's change in size, if any, on its performance and fees, noting that the Fund may realize other economies of scale if assets increase proportionally more than expenses. The Board determined that the current investment management fee structure was reasonable.
Conclusions — The Board reached the following conclusions regarding the Fund's Advisory Agreement with the Adviser: (i) the Adviser has demonstrated that it possesses the capability and resources to perform the duties required of it under the Advisory Agreement; (ii) the Adviser maintains an appropriate compliance program; (iii) the overall performance of the Fund is reasonable in relation to the performance of funds with similar investment objectives and to relevant indices; (iv) the Fund's advisory expenses are reasonable in relation to those of similar funds and to the services to be provided by the Adviser; and (v) the Adviser's and its affiliates' level of profitability from their relationship with the Fund is reasonable in light of the nature and high quality of services provided by the Adviser and the type of fund. Based on its conclusions, the Board determined that continuation of the Advisory Agreement would be in the best interests of the Fund and its shareholders.
Subadvisory Agreement
In approving the Subadvisory Agreement with respect to the Fund, the Board considered various factors, among them: (i) the nature, extent, and quality of services provided to the Fund by the Subadviser, including the personnel providing services; (ii) the Subadviser's compensation and any other benefits derived from the subadvisory relationship; (iii) comparisons, to the extent applicable, of subadvisory fees and performance to comparable investment companies; and (iv) the terms of the Subadvisory Agreement. A summary of the Board's analysis of these factors is set forth below. After full consideration of a variety of factors, the Board, including the Independent Trustees, voted to approve the Subadvisory Agreement. In approving the Subadvisory Agreement, the Trustees did not identify any single factor as controlling, and each Trustee may have attributed different weights to various factors. Throughout their deliberations, the Independent Trustees were represented and assisted by Independent Counsel.
60
USAA Mutual Funds Trust | | Supplemental Information — continued
May 31, 2021 | |
(Unaudited)
Nature, Extent, and Quality of Services Provided; Investment Personnel — The Trustees considered information provided to them regarding the services provided by the Subadviser, including information presented periodically throughout the previous year. The Board considered the Subadviser's level of knowledge and investment style. The Board reviewed the experience and credentials of the investment personnel who are responsible for managing the investment of portfolio securities with respect to the Fund and the Subadviser's level of staffing. The Trustees considered, based on the materials provided to them by the Subadviser, whether the method of compensating portfolio managers is reasonable and includes mechanisms to prevent a manager with underperformance from taking undue risks. The Trustees also noted the Subadviser's brokerage practices. The Board also considered the Subadviser's regulatory and compliance history. The Board also took into account the Subadviser's risk management processes. The Board noted that the Adviser's monitoring processes of the Subadviser include: (i) regular telephonic meetings to discuss, among other matters, investment strategies, and to review portfolio performance; (ii) quarterly portfolio compliance checklists and quarterly compliance certifications to the Board; and (iii) due diligence visits to the Subadviser.
Subadviser Compensation — The Board also took into consideration the financial condition of the Subadviser. In considering the cost of services to be provided by the Subadviser and the profitability to the Subadviser of its relationship with the Fund, the Trustees noted that the fees under the Subadvisory Agreement were paid by the Adviser. The Trustees also relied on the ability of the Adviser to negotiate the Subadvisory Agreement and the fees thereunder at arm's length. For the above reasons, the Board determined that the profitability of the Subadviser from its relationship with the Fund was not a material factor in its deliberations with respect to the consideration of the approval of the Subadvisory Agreement. For similar reasons, the Board concluded that the potential for economies of scale in the Subadviser's management of the Fund was not a material factor in considering the Subadvisory Agreement.
Subadvisory Fees and Fund Performance — The Board compared the subadvisory fees for the Fund with the fees that the Subadviser charges to comparable clients, as applicable. The Board considered that the Fund pays a management fee to the Adviser and that, in turn, the Adviser pays a subadvisory fee to the Subadviser. As noted above, the Board considered the Fund's performance during the one-, three-, five-, and ten-year periods ended September 30, 2020, as compared to the Fund's peer group and noted that the Board reviews at its regularly scheduled meetings information about the Fund's performance results. The Board also considered the performance of the Subadviser. The Board noted the Adviser's experience and resources in monitoring the performance, investment style, and risk-adjusted performance of the Subadviser. The Board was mindful of the Adviser's focus on the Subadviser's performance. The Board also noted the Subadviser's performance record for similar accounts, as applicable.
Conclusions — The Board reached the following conclusions regarding the Subadvisory Agreement: (i) the Subadviser is qualified to manage the Fund's assets in accordance with its investment objectives and policies; (ii) the Subadviser maintains an appropriate compliance program; (iii) the overall performance of the Fund is reasonable in relation to the performance of funds with similar investment objectives and relevant indices; and (iv) the Fund's advisory expenses are reasonable in relation to those of similar funds and to the services to be provided by the Adviser and the Subadviser. Based on its conclusions, the Board determined that approval of the Subadvisory Agreement with respect to the Fund would be in the best interests of the Fund and its shareholders.
61
USAA Mutual Funds Trust | | Supplemental Information — continued
May 31, 2021 | |
(Unaudited)
Liquidity Risk Management Program:
The USAA Mutual Funds have adopted and implemented a written liquidity risk management program (the "LRMP") as required by Rule 22e-4 under the Investment Company Act of 1940, as amended. The LRMP is reasonably designed to assess and manage the Fund's liquidity risk, taking into consideration the Fund's investment strategy and the liquidity of its portfolio investments during normal and reasonably foreseeable stressed market conditions; its short and long-term cash flow projections; and its cash holdings and access to other liquidity management tools such as available funding sources including the Victory Funds Complex Interfund Lending Facility and Line of Credit (discussed in the Notes to Financial Statements). The USAA Mutual Funds' Board of Trustees approved the appointment of the Fund's investment adviser, Victory Capital Management Inc. ("Victory Capital"), as the administrator of the LRMP.
Victory Capital manages liquidity risks associated with the Fund's investments by monitoring, among other things, cash and cash equivalents, any use of derivatives, the concentration of investments, the appropriateness of the Fund's investment strategy, and by classifying every Fund investment as either highly liquid, moderately liquid, less liquid, or illiquid on at least a monthly basis. To assist with the classification of Fund investments, Victory Capital has retained a third-party provider of liquidity evaluation services. This provider determines preliminary liquidity classifications for all portfolio holdings based upon portfolio-level data and certain assumptions provided by Victory Capital. Victory Capital reviews the preliminary liquidity classifications and, when appropriate, considers other information including input from the Fund's portfolio managers (including the portfolio managers employed by any investment sub-advisers) in determining final liquidity classifications.
At a meeting held on March 10, 2021, Victory Capital provided an oral and written report to the Trustees on the operation and effectiveness of the LRMP during the previous year. The report from Victory Capital concluded that the Fund did not experience any significant liquidity challenges during the covered period, and the Fund's LRMP is reasonably designed to assess and manage its liquidity risk. The report also concluded that the LRMP continues to operate adequately and effectively to enable Victory Capital to oversee and manage liquidity risk and ensure the Fund is able to meet redemption requests without significant dilution to the remaining investors' interest in the Fund. During the review period, the Fund's portfolio consisted primarily of highly liquid investments, which are defined as cash and any investments that the Fund reasonably expects to be converted to cash in current market conditions in three business days or less without significantly changing the market value of the investment. Therefore, the Fund has not adopted a highly liquid investment minimum. The Funds' investments were below the limitation on illiquid investments during the review period. Additionally, Victory Capital indicated that no events occurred that would require the filing of Form N-LIQUID and recommended no material changes to the LRMP.
62
Privacy Policy
Protecting the Privacy of Information
The Trust respects your right to privacy. We also know that you expect us to conduct and process your business in an accurate and efficient manner. To do so, we must collect and maintain certain personal information about you. This is the information we collect from you on applications or other forms, and from the transactions you make with us or third parties. It may include your name, address, social security number, account transactions and balances, and information about investment goals and risk tolerance.
We do not disclose any information about you or about former customers to anyone except as permitted or required by law. Specifically, we may disclose the information we collect to companies that perform services on our behalf, such as the transfer agent that processes shareholder accounts and printers and mailers that assist us in the distribution of investor materials. We may also disclose this information to companies that perform marketing services on our behalf. This allows us to continue to offer you Victory investment products and services that meet your investing needs, and to effect transactions that you request or authorize. These companies will use this information only in connection with the services for which we hired them. They are not permitted to use or share this information for any other purpose.
To protect your personal information internally, we permit access only by authorized employees and maintain physical, electronic, and procedural safeguards to guard your personal information.*
* You may have received communications regarding information about privacy policies from other financial institutions which gave you the opportunity to "opt-out" of certain information sharing with companies which are not affiliated with that financial institution. The Trust does not share information with other companies for purposes of marketing solicitations for products other than the Trust. Therefore, the Trust does not provide opt-out options to their shareholders.
P.O. Box 182593
Columbus, Ohio 43218-2593

Visit our website at: | | Call | |
vcm.com | | (800) 235-8396 | |

MAY 31, 2021
Annual Report
USAA Government Securities Fund
Victory Capital means Victory Capital Management Inc., the investment adviser of the USAA Mutual Funds. USAA Mutual Funds are distributed by Victory Capital Services, Inc., member of FINRA, an affiliate of Victory Capital. Victory Capital and its affiliates are not affiliated with United Services Automobile Association or its affiliates. USAA and the USAA logos are registered trademarks and the USAA Mutual Funds and USAA Investments logos are trademarks of United Services Automobile Association and are being used by Victory Capital and its affiliates under license.
www.vcm.com
News, Information And Education 24 Hours A Day, 7 Days A Week
The Victory Funds site gives fund shareholders, prospective shareholders, and investment professionals a convenient way to access fund information, get guidance, and track fund performance anywhere they can access the Internet. The site includes:
• Detailed performance records
• Daily share prices
• The latest fund news
• Investment resources to help you become a better investor
• A section dedicated to investment professionals
Whether you're a potential investor searching for the fund that matches your investment philosophy, a seasoned investor interested in planning tools, or an investment professional, www.vcm.com has what you seek. Visit us anytime. We're always open.
TABLE OF CONTENTS
Shareholder Letter (Unaudited) | | | 2 | | |
Managers' Commentary (Unaudited) | | | 4 | | |
Investment Overview (Unaudited) | | | 6 | | |
Investment Objective & Portfolio
Holdings (Unaudited) | | | 7 | | |
Schedule of Portfolio Investments | | | 8 | | |
Financial Statements | |
Statement of Assets and Liabilities | | | 13 | | |
Statement of Operations | | | 14 | | |
Statements of Changes in Net Assets | | | 15 | | |
Financial Highlights | | | 18 | | |
Notes to Financial Statements | | | 22 | | |
Report of Independent
Registered Public Accounting Firm | | | 33 | | |
Supplemental Information (Unaudited) | | | 34 | | |
Trustees' and Officers' Information | | | 34 | | |
Proxy Voting and Portfolio Holdings Information | | | 40 | | |
Expense Examples | | | 40 | | |
Additional Federal Income Tax Information | | | 41 | | |
Advisory Contract Agreement | | | 42 | | |
Liquidity Risk Management Program | | | 45 | | |
Privacy Policy (inside back cover) | | | |
This report is for the information of the shareholders and others who have received a copy of the currently effective prospectus of the Fund, managed by Victory Capital Management Inc. It may be used as sales literature only when preceded or accompanied by a current prospectus, which provides further details about the Fund.
IRA DISTRIBUTION WITHHOLDING DISCLOSURE
We generally must withhold federal income tax at a rate of 10% of the taxable portion of your distribution and, if you live in a state that requires state income tax withholding, at your state's tax rate. However, you may elect not to have withholding apply or to have income tax withheld at a higher rate. Any withholding election that you make will apply to any subsequent distribution unless and until you change or revoke the election. If you wish to make a withholding election, or change or revoke a prior withholding election, call (800) 235-8396, and form W-4P (OMB No. 1545-0074 withholding certificate for pension or annuity payments) will be electronically sent.
If you do not have a withholding election in place by the date of a distribution, federal income tax will be withheld from the taxable portion of your distribution at a rate of 10%. If you must pay estimated taxes, you may be subject to estimated tax penalties if your estimated tax payments are not sufficient and sufficient tax is not withheld from your distribution.
For more specific information, please consult your tax adviser.
• NOT FDIC INSURED • NO BANK GUARANTEE • MAY LOSE VALUE
1
(Unaudited)
Dear Shareholder,
Never a dull moment. A year ago, we were still coming to grips with a global pandemic, hoping for an effective vaccine, and wondering whether the U.S. Federal Reserve's aggressive actions would continue to mollify financial markets. As it turns out, a vaccine was rolled out (domestically) faster than expectations, and the recovery that began during the second quarter of 2020 continued unabated.
Fast forward to today and investors are suddenly more concerned about labor shortages, rising commodity prices, and whether inflation will prove to be transitory or more lasting. If anything, this merely exemplifies that markets are unpredictable and the environment can and will change rapidly.
Reflecting on the past year, we must consider ourselves fortunate despite the myriad challenges. For starters, it was impressive how quickly the various forms of monetary and fiscal stimulus contributed to a rebound in GDP. Of course, it wasn't a straight line upward and there were bouts of elevated volatility in both bond and stock markets. Late in 2020, for example, financial markets were alternately fueled and roiled by a contentious election season, growing optimism for an effective vaccine, and a fluid debate regarding the need for even more stimulus. Ultimately, stocks were propelled higher in the fourth quarter of 2020 as it became clear Congress would provide another dose of stimulus in the form of direct payments, more unemployment insurance, and additional aid to businesses.
As we moved into 2021, stocks continued their upward trajectory. Meanwhile, the yield on the 10-Year U.S. Treasury continued rallying sharply as many investors began to shift their focus. Deflation was out; inflation was in. Indeed, the potential for a new era of inflation and higher interest rates seems to be the new worry du jour.
So how did the numbers shake out after this unusual year? The S&P 500® Index registered an impressive annual return of approximately 40% for this 12-month period ended May 31, 2021. Over this same period, the yield on the 10-Year U.S. Treasury jumped 94 basis points, reflecting both the very low starting rate and substantial fiscal stimulus. At the end of the reporting period, the yield on the 10-Year U.S. Treasury was 1.59%.
The past year is not one we will forget any time soon. There were many hardships, but we should not overlook the positives and remember our collective spirit and perseverance. Markets endured and even surprised to the upside, but perhaps the key takeaway is that investors need to remain calm in the face of adversity and focused on longer-term investment goals. We believe that's the best approach no matter what the markets throw at us.
On the following pages, you will find information relating to your USAA Mutual Funds, brought to you by Victory Capital. If you have any questions regarding the current market dynamics or your specific portfolio or investment plan, we encourage you to contact our Member Service Representatives. Call (800) 235-8396 or visit our website at www.vcm.com.
2
From all of us here at Victory Capital, thank you for letting us help you work toward your investment goals.

Christopher K. Dyer, CFA
President,
USAA Mutual Funds
3
USAA Government Securities Fund
Managers' Commentary
(Unaudited)
• What were the market conditions during the reporting period?
As we began the reporting year in June of 2020, the world and its economies were largely in lockdown as a result of the COVID-19 pandemic and countries tried to contain the rapid spread of this coronavirus. Within the United States, the lockdowns began in March, and significantly affected almost every area of the economy. Real GDP fell 5% in the first quarter of 2020, and a record 32.9% in the second quarter of 2020, thus officially marking the economy as being in recession for the first time since 2009. The policy response to restore financial system order from the country's monetary authorities and the federal government was quick and substantial. The U.S. Federal Reserve ("the Fed") reduced its federal funds rate nearly to zero, re-instituted various Financial Crisis-era credit support programs, and even added new tools to support an economy under fierce assault from the pandemic. The federal government acted to support the economy with Congress and the president passing a $2 trillion relief package in March 2020, along with a second round of stimulus of $900 billion passing in December 2020.
The significant government support and the approval of multiple COVID-19 vaccines sparked hopes of a return to pre-COVID normalcy and rallied markets through the remainder of 2020 and into 2021. The U.S. Treasury curve steepened significantly in the first part of 2021 on expectations of stronger economic growth and the potential for inflation.
U.S. Treasury yields ended the reporting period higher than they started. When the period began in June 2020, the Fed Funds Target Rate was at a target range of between zero and 0.25%, which is where it still stands today. Despite continued uncertainty, and the Fed keeping rates near zero, the Treasury curve steepened in the first part of 2021 on expectations of stronger economic growth and the potential for inflation. The two-year Treasury yield fell two basis points from the beginning of the reporting period, to end at 0.14%; however, the 10-year Treasury yield rose 94 basis points, to finish the period at 1.59%. (A basis point is 1/100th of a percentage point.)
Residential mortgage interest rates, which have historically been tied to the 10-year U.S. Treasury yield, fell during the reporting period, despite the increase in overall treasury rates. Higher mortgage rates at the beginning of the period, were driven by the severe COVID-19 induced disruption in the mortgage-backed securities market, as well as the reduced ability of mortgage companies to originate new loans because of social distancing concerns and lockdowns. As the reporting period progressed, the mortgage market re-opened and rates fell, driving increased lending activity for both new home purchases as well as refinancing of existing mortgages. The interest rate on a 15-year residential mortgage started the period near its high at 2.84%, dropped to a low of 2.30% on January 4, 2021, and ended the period at 2.37%. The interest rate on a 30-year residential mortgage decreased from a high of 3.52% at the beginning of the period, dropped to a low of 2.82% on February 9, 2021, and ended the period at 3.08%.
4
USAA Government Securities Fund (continued)
Managers' Commentary (continued)
• How did the USAA Government Securities Fund (the "Fund") perform during the reporting period?
The Fund has four share classes: Fund Shares, Institutional Shares, Class A (effective June 29, 2020, the Adviser Shares were redesignated Class A and became subject to a front-end sales charge), and R6 Shares. For the reporting period ended May 31, 2021, the Fund Shares, Institutional Shares, Class A, and R6 Shares had total returns of 0.56%, 0.75%, 0.43%, and 0.85%, respectively. This compares to a total return of -0.74% for the Bloomberg Barclays U.S. Aggregate Government Intermediate & Mortgage-Backed Securities Index (the "Index"), and -1.53% for the Lipper Intermediate U.S. Government Funds Index.
• What strategies did you employ during the reporting period?
The Fund benefited from its holdings of Agency Commercial Mortgage-Backed Securities ("CMBS") during the period, as spread tightening in the sector offset the impact of increasing treasury rates. The Fund also benefited from its under-allocation to U.S. Treasury securities and mortgage-backed securities, as both performed poorly over the reporting period, as an increase in interest rates and steepening of the Treasury yield curve negatively impacted these securities. The MBS extension risk that we have discussed in previous commentaries occurred as the duration of the MBS portion of the Index extended significantly in response to the move up in interest rates during the first quarter of 2021. Asset Backed Securities (ABS), which include floating rate Student Loan ABS, and high-quality taxable Municipal bonds, also contributed positively to performance, as tightening spreads in these sectors produced positive overall returns. Our holdings of cash distracted slightly from returns.
During the reporting period, we reduced our exposure to CMBS, as spreads tightened considerably in this sector, and we chose to take advantage of the associated increase in prices. We invested proceeds in high-quality municipal bonds that were priced at attractive yields as a result of the uncertainty caused by the pandemic. We also increased the Fund's allocation to longer treasuries due to the increased overall duration of the Index and purchased modest amounts of higher coupon MBS to take advantage of the market disruption caused by rising rates. We have managed the Fund over the past several years to minimize both contraction and extension risk that exists in mortgage pass throughs. (Contraction risk is the risk that mortgage prepayments will accelerate, causing the average life of a mortgage to shorten and forcing us to reinvest proceeds at lower yields. Extension risk is the risk that mortgage prepayments will decelerate, causing the average life of a mortgage to lengthen — or, extend — and become more sensitive to upward interest rate movement.) We expect to continue to manage the portfolio in a similar fashion going forward.
Thank you for allowing us to assist in your investment needs.
5
USAA Government Securities Fund
Investment Overview
(Unaudited)
Average Annual Total Return
Year Ended May 31, 2021
| | Fund Shares | | Institutional Shares | | Class A | | Class R6 | | | | | |
INCEPTION DATE | | 2/1/91 | | 8/10/15 | | 8/1/10 | | 12/1/16 | | | | | | | | | |
| | Net Asset Value | | Net Asset Value | | Net Asset Value | | Net Asset Value | | Bloomberg
Barclays U.S.
Aggregate
Government
Intermediate &
Mortgage-Backed
Securities Index1 | | Lipper
Intermediate
U.S. Government
Funds Index2 | |
One Year | | | 0.56 | % | | | 0.75 | % | | | 0.43 | % | | | 0.85 | % | | | -0.74 | % | | | -1.53 | % | |
Five Year | | | 2.39 | % | | | 2.49 | % | | | 2.11 | % | | | NA | | | | 2.34 | % | | | 2.32 | % | |
Ten Year | | | 2.25 | % | | | NA | | | | 1.93 | % | | | NA | | | | 2.37 | % | | | 2.44 | % | |
Since Inception | | | NA | | | | 2.56 | % | | | NA | | | | 3.02 | % | | | NA | | | | NA | | |
The performance data quoted represents past performance and current returns may be lower or higher. The investment return and principal value will fluctuate so that an investor's shares, when redeemed, may be worth more or less than the original cost. To obtain performance information current to the most recent month's end, please visit www.vcm.com.
The maximum offering price figures reflect a maximum sales charge of 2.25% for Class A. Net Asset Value does not reflect sales charges.
Total return measures the price change in a share assuming the reinvestment of all net investment income and realized capital gain distributions, if any. The total returns quoted do not reflect adjustments made to the enclosed financial statements in accordance with U.S. Generally Accepted Accounting Principles or the deduction of taxes that a shareholder would pay on net investment income and realized capital gain distributions, including reinvested distributions, or redemptions of shares. The total return figures set forth above include all waivers of fees. Without such fee waivers, the total returns would have been lower.
USAA Government Securities Fund — Growth of $10,000
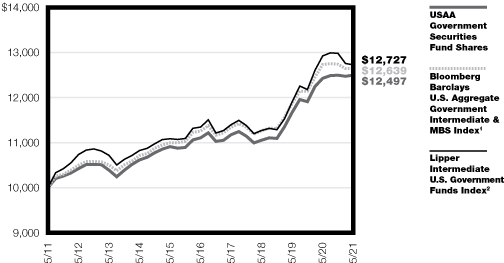
1The unmanaged Bloomberg Barclays U.S. Aggregate Government Intermediate & Mortgage?Backed Securities Index consists of intermediate U.S. Treasury and Agency unsecured notes and securities backed by pools of mortgages issued by U.S. Government Agencies, GNMA, Fannie Mae, or Freddie Mac. This index does not include the effect of sales charges, commissions, expenses, or taxes, is not representative of the Fund, and it is not possible to invest directly in an index.
2The unmanaged Lipper Intermediate U.S. Government Funds Index is considered representative of intermediate U.S. government funds. This index does not include the effect of sales charges, commissions, expenses, or taxes, is not representative of the Fund, and it is not possible to invest directly in an index.
The graph reflects investment of growth of a hypothetical $10,000 investment in the Fund.
The graph and table do not reflect the deduction of taxes that a shareholder would pay on Fund distributions or the redemption of Fund shares.
Past performance is not indicative of future results.
6
USAA Mutual Funds Trust
USAA Government Securities Fund | | May 31, 2021 | |
(Unaudited)
Investment Objective and Portfolio Holdings:
The Fund's investment objective seeks to provide investors with a high level of current income consistent with preservation of principal.
Asset Allocation:
May 31, 2021
(% of Net Assets)
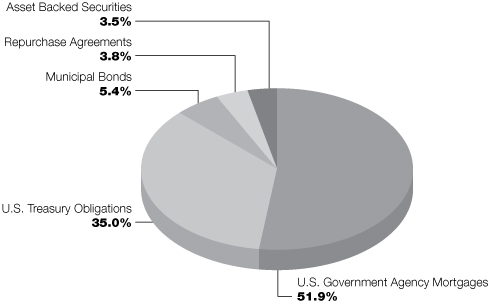
Percentages are of the net assets of the Fund and may not equal 100%.
Refer to the Schedule of Portfolio Investments for a complete list of securities.
7
USAA Mutual Funds Trust
USAA Government Securities Fund | | Schedule of Portfolio Investments
May 31, 2021 | |
(Amounts in Thousands, Except for Shares)
Security Description | | Principal
Amount | | Value | |
Asset-Backed Securities (3.5%) | |
Montana Higher Education Student Assistance Corp., Series 2012-1, Class A2,
1.10% (LIBOR01M+100bps), 5/20/30, Callable 1/20/31 @100 (a) | | $ | 4,603 | | | $ | 4,630 | | |
Navient Student Loan Trust, Series 2014-1, Class A3, 0.60% (LIBOR01M+51bps),
6/25/31, Callable 2/25/32 @100 (a) | | | 2,234 | | | | 2,205 | | |
Navient Student Loan Trust, Series 2016-2, Class A2, 1.14% (LIBOR01M+105bps),
6/25/65, Callable 12/25/32 @100 (a) (b) | | | 442 | | | | 443 | | |
Nelnet Student Loan Trust, Series 2006-3, Class B, 0.45% (LIBOR03M+25bps),
6/25/41, Callable 9/25/24 @100 (a) | | | 2,568 | | | | 2,361 | | |
Nelnet Student Loan Trust, Series 2015-3, Class A2, 0.69% (LIBOR01M+60bps),
2/27/51, Callable 6/25/34 @100 (a) (b) | | | 3,602 | | | | 3,583 | | |
Nelnet Student Loan Trust, Series 2019-5, Class A, 2.53%, 10/25/67, Callable
12/25/35 @100 (b) | | | 3,443 | | | | 3,569 | | |
PHEAA Student Loan Trust, Series 2011-1, Class A1, 1.30% (LIBOR03M+110bps),
6/25/38, Callable 3/25/29 @100 (a) (b) | | | 2,065 | | | | 2,092 | | |
SLM Student Loan Trust, Series 2013-6, Class A3, 0.74% (LIBOR01M+65bps),
6/25/55, Callable 5/25/29 @100 (a) | | | 2,926 | | | | 2,922 | | |
SLM Student Loan Trust, Series 2006-4, Class B, 0.38% (LIBOR03M+20bps),
1/25/70, Callable 7/25/32 @100 (a) | | | 3,853 | | | | 3,668 | | |
SunTrust Student Loan Trust, Series 2006-1A, Class B, 0.45% (LIBOR03M+27bps),
10/28/37, Callable 4/28/26 @100 (a) (b) | | | 1,033 | | | | 950 | | |
Wepco Environmental Trust Finance I LLC, Series 2021-1, Class A,
1.58%, 12/15/35 | | | 4,500 | | | | 4,497 | | |
Total Asset-Backed Securities (Cost $31,005) | | | 30,920 | | |
Municipal Bonds (5.4%) | |
Hawaii (0.0%): (c) | |
State of Hawaii Department of Business Economic Development &
Tourism Revenue, Series A-2, 3.24%, 1/1/31 | | | 199 | | | | 212 | | |
Kansas (0.4%): | |
Kansas Development Finance Authority Revenue, Series H, 3.94%, 4/15/26 | | | 3,000 | | | | 3,373 | | |
Louisiana (0.6%): | |
State of Louisiana, GO, Series C-1, 0.84%, 6/1/25 | | | 5,000 | | | | 5,043 | | |
Michigan (0.2%): | |
Michigan State Building Authority Revenue, Series II, 0.46%, 10/15/22 | | | 1,500 | | | | 1,503 | | |
Ohio (0.3%): | |
State of Ohio, GO, Series A, 1.78%, 8/1/32 | | | 3,000 | | | | 2,982 | | |
Texas (2.9%): | |
Boerne School District, GO, 1.77%, 2/1/32, Continuously Callable @100 | | | 650 | | | | 638 | | |
City of Abilene, GO
2.41%, 2/15/26 | | | 1,715 | | | | 1,831 | | |
2.54%, 2/15/27 | | | 1,195 | | | | 1,283 | | |
2.64%, 2/15/29 | | | 1,000 | | | | 1,074 | | |
City of Houston Texas Combined Utility System Revenue
3.72%, 11/15/28 | | | 1,530 | | | | 1,770 | | |
3.82%, 11/15/29, Continuously Callable @100 | | | 3,000 | | | | 3,459 | | |
See notes to financial statements.
8
USAA Mutual Funds Trust
USAA Government Securities Fund | | Schedule of Portfolio Investments — continued
May 31, 2021 | |
(Amounts in Thousands, Except for Shares)
Security Description | | Principal
Amount | | Value | |
State of Texas, GO
1.61%, 10/1/22 | | $ | 1,585 | | | $ | 1,615 | | |
2.53%, 10/1/31, Continuously Callable @100 | | | 3,500 | | | | 3,714 | | |
Texas Public Finance Authority Revenue, 0.93%, 2/1/26 | | | 2,000 | | | | 2,001 | | |
Texas Public Finance Authority State of Texas, GO | |
Series C, 2.83%, 10/1/25 | | | 3,000 | | | | 3,265 | | |
Series C, 3.01%, 10/1/26, Continuously Callable @100 | | | 4,000 | | | | 4,348 | | |
| | | | 24,998 | | |
Virginia (1.0%): | |
Virginia Public Building Authority Revenue
Series C, 2.25%, 8/1/26 | | | 1,370 | | | | 1,448 | | |
Series C, 2.40%, 8/1/27 | | | 1,475 | | | | 1,564 | | |
Series C, 2.56%, 8/1/29 | | | 2,700 | | | | 2,865 | | |
Virginia Public School Authority Revenue, Series C, 0.55%, 8/1/23 | | | 3,000 | | | | 3,013 | | |
| | | | 8,890 | | |
Total Municipal Bonds (Cost $44,509) | | | 47,001 | | |
U.S. Government Agency Mortgages (51.9%) | |
Federal Home Loan Mortgage Corporation
Series K019, Class A2, 2.27%, 3/25/22 | | | 2,119 | | | | 2,142 | | |
Series K026, Class A1, 1.69%, 4/25/22 | | | 660 | | | | 664 | | |
Series K720, Class A2, 2.72%, 6/25/22 | | | 4,000 | | | | 4,065 | | |
Series K022, Class A2, 2.36%, 7/25/22 | | | 2,989 | | | | 3,041 | | |
Series K026, Class A2, 2.51%, 11/25/22 | | | 5,000 | | | | 5,143 | | |
Series K027, Class A2, 2.64%, 1/25/23 | | | 5,000 | | | | 5,166 | | |
Series K029, Class A2, 3.32%, 2/25/23 (d) | | | 3,000 | | | | 3,139 | | |
Series K725, Class A2, 3.00%, 1/25/24 | | | 5,000 | | | | 5,308 | | |
Series K037, Class A2, 3.49%, 1/25/24 | | | 10,030 | | | | 10,763 | | |
Series K038, Class A2, 3.39%, 3/25/24 | | | 3,000 | | | | 3,223 | | |
Series K727, Class A2, 2.95%, 7/25/24 | | | 20,000 | | | | 21,308 | | |
Series K052, Class A1, 2.60%, 1/25/25 | | | 2,240 | | | | 2,310 | | |
Series K045, Class A2, 3.02%, 1/25/25 | | | 3,000 | | | | 3,235 | | |
Series K730, Class A2, 3.59%, 1/25/25 | | | 5,000 | | | | 5,477 | | |
Series K048, Class A2, 3.28%, 6/25/25 (d) | | | 10,000 | | | | 10,940 | | |
Series K056, Class A1, 2.20%, 7/25/25 | | | 3,857 | | | | 3,990 | | |
Series K049, Class A2, 3.01%, 7/25/25 | | | 4,000 | | | | 4,347 | | |
Series KC02, Class A2, 3.37%, 7/25/25 | | | 30,000 | | | | 31,934 | | |
Series K051, Class A2, 3.31%, 9/25/25 | | | 10,000 | | | | 11,006 | | |
Series K733, Class AM, 3.75%, 9/25/25 | | | 5,000 | | | | 5,548 | | |
Series KIR1, Class A2, 2.85%, 3/25/26 | | | 7,709 | | | | 8,305 | | |
Series K056, Class A2, 2.53%, 5/25/26 | | | 5,000 | | | | 5,366 | | |
Series K057, Class A2, 2.57%, 7/25/26 | | | 7,000 | | | | 7,535 | | |
Series K061, Class A1, 3.01%, 8/25/26 | | | 2,074 | | | | 2,199 | | |
Series 3987, Class A, 2.00%, 9/15/26 | | | 843 | | | | 858 | | |
Series K059, Class A2, 3.12%, 9/25/26 (d) | | | 4,500 | | | | 4,967 | | |
Series K061, Class A2, 3.35%, 11/25/26 (d) | | | 4,000 | | | | 4,469 | | |
Series K066, Class A2, 3.12%, 6/25/27 | | | 3,000 | | | | 3,329 | | |
Series K067, Class A2, 3.19%, 7/25/27 | | | 9,274 | | | | 10,345 | | |
Series K069, Class A2, 3.19%, 9/25/27 (d) | | | 2,879 | | | | 3,213 | | |
See notes to financial statements.
9
USAA Mutual Funds Trust
USAA Government Securities Fund | | Schedule of Portfolio Investments — continued
May 31, 2021 | |
(Amounts in Thousands, Except for Shares)
Security Description | | Principal
Amount | | Value | |
Series K071, Class A2, 3.29%, 11/25/27 | | $ | 5,000 | | | $ | 5,608 | | |
Series K080, Class A2, 3.93%, 7/25/28 (d) | | | 15,000 | | | | 17,522 | | |
3.00%, 3/1/32-6/1/42 | | | 13,923 | | | | 14,725 | | |
3.50%, 10/1/33-8/1/48 | | | 11,458 | | | | 12,252 | | |
4.00%, 10/1/33-8/1/48 | | | 10,736 | | | | 11,471 | | |
5.50%, 12/1/35 | | | 277 | | | | 321 | | |
Series 3134, Class FA, 0.40% (LIBOR01M+30bps), 3/15/36 (a) | | | 564 | | | | 567 | | |
Series 4023, Class PF, 0.65% (LIBOR01M+55bps), 10/15/41 (a) | | | 635 | | | | 641 | | |
4.50%, 9/1/48 | | | 2,050 | | | | 2,210 | | |
Series K078, Class A2, 3.85%, 6/25/51 | | | 12,500 | | | | 14,515 | | |
| | | | 273,167 | | |
Federal National Mortgage Association
2.63%, 9/1/21 | | | 10,000 | | | | 10,000 | | |
2.42%, 11/1/22 | | | 19,316 | | | | 19,619 | | |
2.50%, 4/1/23 | | | 8,265 | | | | 8,470 | | |
Series M1, Class A2, 3.11%, 7/25/23 (d) | | | 872 | | | | 905 | | |
Series M7, Class AV2, 2.16%, 10/25/23 | | | 4,416 | | | | 4,505 | | |
Series M13, Class A2, 2.71%, 6/25/25 (d) | | | 2,257 | | | | 2,402 | | |
3.00%, 2/1/27-2/1/50 | | | 7,474 | | | | 7,846 | | |
Series M8, Class A2, 3.06%, 5/25/27 (d) | | | 4,000 | | | | 4,403 | | |
Series M12, Class A2, 3.08%, 6/25/27 (d) | | | 6,090 | | | | 6,722 | | |
Series 73, Class DC, 1.50%, 7/25/27-10/25/27 | | | 3,719 | | | | 3,781 | | |
Series 102, Class GA, 1.38%, 9/25/27 | | | 848 | | | | 858 | | |
Series M4, Class A2, 3.05%, 3/25/28 (d) | | | 2,842 | | | | 3,163 | | |
Series M10, Class A2, 3.37%, 7/25/28 (d) | | | 8,049 | | | | 9,144 | | |
Series 29, Class FY, 0.39% (LIBOR01M+60bps), 4/25/35-8/25/37 (a) | | | 1,811 | | | | 1,819 | | |
5.00%, 12/1/35 | | | 455 | | | | 519 | | |
5.50%, 11/1/37 | | | 168 | | | | 196 | | |
6.00%, 5/1/38 | | | 234 | | | | 266 | | |
4.00%, 8/1/39-2/1/50 | | | 20,295 | | | | 21,684 | | |
3.50%, 1/1/42-2/1/50 | | | 22,620 | | | | 24,003 | | |
| | | | 130,305 | | |
Government National Mortgage Association
6.00%, 8/15/22-12/15/38 | | | 6,979 | | | | 8,152 | | |
8.00%, 12/20/22-9/15/30 | | | 293 | | | | 330 | | |
4.50%, 4/20/24-1/15/41 | | | 16,007 | | | | 17,867 | | |
7.00%, 5/15/27-7/15/32 | | | 945 | | | | 1,074 | | |
7.50%, 2/15/28-11/15/31 | | | 191 | | | | 215 | | |
6.50%, 5/15/28-8/20/34 | | | 1,974 | | | | 2,293 | | |
6.75%, 5/15/28 | | | 6 | | | | 7 | | |
5.50%, 4/20/33-6/15/39 | | | 11,070 | | | | 12,852 | | |
5.00%, 5/20/33-2/15/39 | | | 3,181 | | | | 3,543 | | |
4.00%, 7/15/40-11/20/40 | | | 3,667 | | | | 4,032 | | |
| | | | 50,365 | | |
Total U.S. Government Agency Mortgages (Cost $423,891) | | | 453,837 | | |
See notes to financial statements.
10
USAA Mutual Funds Trust
USAA Government Securities Fund | | Schedule of Portfolio Investments — continued
May 31, 2021 | |
(Amounts in Thousands, Except for Shares)
Security Description | | Shares or
Principal
Amount | | Value | |
U.S. Treasury Obligations (35.0%) | |
U.S. Treasury Notes
2.63%, 6/15/21 | | $ | 20,000 | | | $ | 20,019 | | |
2.13%, 6/30/21 | | | 3,000 | | | | 3,005 | | |
2.63%, 7/15/21 | | | 15,000 | | | | 15,047 | | |
2.75%, 8/15/21 | | | 10,000 | | | | 10,056 | | |
2.88%, 11/15/21 | | | 10,000 | | | | 10,128 | | |
2.00%, 2/15/22 | | | 3,000 | | | | 3,041 | | |
0.13%, 5/31/22 | | | 14,000 | | | | 14,007 | | |
2.13%, 6/30/22 | | | 20,000 | | | | 20,441 | | |
1.88%, 7/31/22 | | | 10,000 | | | | 10,209 | | |
1.63%, 8/31/22 | | | 20,000 | | | | 20,383 | | |
2.00%, 11/30/22 | | | 11,000 | | | | 11,312 | | |
1.38%, 6/30/23 | | | 5,000 | | | | 5,127 | | |
0.13%, 9/15/23 | | | 6,000 | | | | 5,992 | | |
2.13%, 11/30/23 | | | 22,000 | | | | 23,054 | | |
2.00%, 6/30/24 | | | 20,000 | | | | 21,030 | | |
1.88%, 8/31/24 | | | 10,000 | | | | 10,487 | | |
2.25%, 11/15/24 | | | 5,000 | | | | 5,316 | | |
2.13%, 11/30/24 | | | 4,000 | | | | 4,236 | | |
2.50%, 1/31/25 | | | 7,000 | | | | 7,520 | | |
2.00%, 2/15/25 | | | 4,000 | | | | 4,225 | | |
2.13%, 5/15/25 | | | 4,500 | | | | 4,781 | | |
0.25%, 7/31/25 | | | 6,000 | | | | 5,916 | | |
0.25%, 10/31/25 | | | 20,000 | | | | 19,644 | | |
1.38%, 8/31/26 | | | 7,000 | | | | 7,189 | | |
1.63%, 10/31/26 | | | 7,000 | | | | 7,272 | | |
1.13%, 2/29/28 | | | 15,000 | | | | 14,937 | | |
1.25%, 4/30/28 | | | 5,000 | | | | 5,007 | | |
0.88%, 11/15/30 | | | 7,000 | | | | 6,587 | | |
1.63%, 5/15/31 (e) | | | 10,000 | | | | 10,042 | | |
Total U.S. Treasury Obligations (Cost $299,942) | | | 306,010 | | |
Investment Companies (0.0%) (c) | |
Federated Treasury Obligations Fund Institutional Shares, 0.35% (f) | | | 302,504 | | | | 303 | | |
Total Investment Companies (Cost $303) | | | 303 | | |
Repurchase Agreements (3.8%) | |
Credit Agricole CIB NY, 0.01%, 6/1/21, purchased on 5/28/21,
with maturity date of 6/1/21,with a value of $32,800 (collateralized by
U.S. Treasury Inflation Bond Index, 1.00%, 2/15/49,
with a value of $33,456) | | | 32,800 | | | | 32,800 | | |
Total Repurchase Agreements (Cost $32,800) | | | 32,800 | | |
See notes to financial statements.
11
USAA Mutual Funds Trust
USAA Government Securities Fund | | Schedule of Portfolio Investments — continued
May 31, 2021 | |
(Amounts in Thousands, Except for Shares)
Security Description | | Shares | | Value | |
Collateral for Securities Loaned^ (1.2%) | |
Fidelity Investments Money Market Government Portfolio
Institutional Shares, 0.01% (f) | | | 962,875 | | | $ | 963 | | |
HSBC U.S. Government Money Market Fund I Shares, 0.03% (f) | | | 9,159,875 | | | | 9,160 | | |
Total Collateral for Securities Loaned (Cost $10,123) | | | 10,123 | | |
Total Investments (Cost $842,573) — 100.8% | | | 880,994 | | |
Liabilities in excess of other assets — (0.8)% | | | (7,421 | ) | |
NET ASSETS — 100.00% | | $ | 873,573 | | |
^ Purchased with cash collateral from securities on loan.
(a) Variable or Floating-Rate Security. Rate disclosed is as of May 31, 2021.
(b) Rule 144A security or other security that is restricted as to resale to institutional investors. The Fund's Adviser has deemed this security to be liquid based upon procedures approved by the Board of Trustees. As of May 31, 2021, the fair value of these securities was $10,637 (thousands) and amounted to 1.2% of net assets.
(c) Amount represents less than 0.05% of net assets.
(d) The rate for certain asset-backed and mortgage-backed securities may vary based on factors relating to the pool of assets underlying the security. The rate disclosed is the rate in effect at May 31, 2021.
(e) All or a portion of this security is on loan.
(f) Rate disclosed is the daily yield on May 31, 2021.
bps — Basis points
Continuously callable — Investment is continuously callable or will be continuously callable on any date after the first call date until its maturity.
GO — General Obligation
LIBOR — London InterBank Offered Rate
LIBOR01M — 1 Month US Dollar LIBOR, rate disclosed as of May 31, 2021, based on the last reset date of the security
LIBOR03M — 3 Month US Dollar LIBOR, rate disclosed as of May 31, 2021, based on the last reset date of the security
LLC — Limited Liability Company
See notes to financial statements.
12
USAA Mutual Funds Trust | | Statement of Assets and Liabilities
May 31, 2021 | |
(Amounts in Thousands, Except Per Share Amounts)
| | | USAA Government
Securities Fund | |
Assets: | |
Investments, at value (Cost $809,773) | | $ | 848,194 | (a) | |
Repurchase agreements, at value (Cost $32,800) | | | 32,800 | | |
Receivables: | |
Interest | | | 3,103 | | |
Capital shares issued | | | 207 | | |
From Adviser | | | 4 | | |
Prepaid expenses | | | 16 | | |
Total Assets | | | 884,324 | | |
Liabilities: | |
Payables: | |
Collateral received on loaned securities | | | 10,123 | | |
Distributions | | | 31 | | |
Capital shares redeemed | | | 254 | | |
Accrued expenses and other payables: | |
Investment advisory fees | | | 93 | | |
Administration fees | | | 88 | | |
Custodian fees | | | 7 | | |
Transfer agent fees | | | 77 | | |
Compliance fees | | | — | (b) | |
Trustees' fees | | | 1 | | |
| 12b-1 fees | | | — | (b) | |
Other accrued expenses | | | 77 | | |
Total Liabilities | | | 10,751 | | |
Net Assets: | |
Capital | | | 823,939 | | |
Total accumulated earnings/(loss) | | | 49,634 | | |
Net Assets | | $ | 873,573 | | |
Net Assets | |
Fund Shares | | $ | 327,111 | | |
Institutional Shares | | | 545,930 | | |
Class A | | | 365 | | |
Class R6 | | | 167 | | |
Total | | $ | 873,573 | | |
Shares (unlimited number of shares authorized with no par value): | |
Fund Shares | | | 32,603 | | |
Institutional Shares | | | 54,402 | | |
Class A | | | 36 | | |
Class R6 | | | 17 | | |
Total | | | 87,058 | | |
Net asset value, offering and redemption price per share: (c) | |
Fund Shares | | $ | 10.03 | | |
Institutional Shares | | $ | 10.04 | | |
Class A | | $ | 10.03 | | |
Class R6 | | $ | 10.01 | | |
Maximum Sales Charge — Class A | | | 2.25 | % | |
Maximum offering price
(100%/(100%-maximum sales charge) of net asset value adjusted to
the nearest cent) per share — Class A | | $ | 10.26 | | |
(a) Includes $9,942 of securities on loan.
(b) Rounds to less than $1 thousand.
(c) Per share amount may not recalculate due to rounding of net assets and/or shares outstanding.
See notes to financial statements.
13
USAA Mutual Funds Trust | | Statement of Operations
For the Year Ended May 31, 2021 | |
(Amounts in Thousands)
| | | USAA Government
Securities Fund | |
Investment Income: | |
Dividends | | $ | 1 | | |
Interest | | | 22,912 | | |
Securities lending (net of fees) | | | — | (a) | |
Total Income | | | 22,913 | | |
Expenses: | |
Investment advisory fees | | | 839 | | |
Administration fees — Fund Shares | | | 524 | | |
Administration fees — Institutional Shares | | | 575 | | |
Administration fees — Class A | | | 7 | | |
Administration fees — Class R6 | | | 3 | | |
Sub-Administration fees | | | 23 | | |
| 12b-1 fees — Class A | | | 12 | | |
Custodian fees | | | 45 | | |
Transfer agent fees — Fund Shares | | | 401 | | |
Transfer agent fees — Institutional Shares | | | 575 | | |
Transfer agent fees — Class A | | | 4 | | |
Transfer agent fees — Class R6 | | | 1 | | |
Trustees' fees | | | 51 | | |
Compliance fees | | | 6 | | |
Legal and audit fees | | | 73 | | |
State registration and filing fees | | | 93 | | |
Other expenses | | | 120 | | |
Total Expenses | | | 3,352 | | |
Expenses waived/reimbursed by Adviser | | | (25 | ) | |
Net Expenses | | | 3,327 | | |
Net Investment Income (Loss) | | | 19,586 | | |
Realized/Unrealized Gains (Losses) from Investments: | |
Net realized gains (losses) from investment securities | | | 12,560 | | |
Net change in unrealized appreciation/depreciation on investment securities | | | (25,484 | ) | |
Net realized/unrealized gains (losses) on investments | | | (12,924 | ) | |
Change in net assets resulting from operations | | $ | 6,662 | | |
(a) Rounds to less than $1 thousand.
See notes to financial statements.
14
USAA Mutual Funds Trust | | Statements of Changes in Net Assets | |
(Amounts in Thousands)
| | | USAA Government
Securities Fund | |
| | | Year
Ended
May 31,
2021 | | Year
Ended
May 31,
2020 | |
From Investments: | |
Operations: | |
Net investment income (loss) | | $ | 19,586 | | | $ | 26,082 | | |
Net realized gains (losses) from investments | | | 12,560 | | | | 6,122 | | |
Net change in unrealized appreciation/depreciation on
investments | | | (25,484 | ) | | | 36,218 | | |
Change in net assets resulting from operations | | | 6,662 | | | | 68,422 | | |
Distributions to Shareholders: | |
Fund Shares | | | (8,877 | ) | | | (8,215 | ) | |
Institutional Shares | | | (15,022 | ) | | | (18,360 | ) | |
Class A | | | (110 | ) | | | (108 | ) | |
Class R6 | | | (146 | ) | | | (169 | ) | |
Change in net assets resulting from distributions to shareholders | | | (24,155 | ) | | | (26,852 | ) | |
Change in net assets resulting from capital transactions | | | (124,512 | ) | | | (107,815 | ) | |
Change in net assets | | | (142,005 | ) | | | (66,245 | ) | |
Net Assets: | |
Beginning of period | | | 1,015,578 | | | | 1,081,823 | | |
End of period | | $ | 873,573 | | | $ | 1,015,578 | | |
(continues on next page)
See notes to financial statements.
15
USAA Mutual Funds Trust | | Statements of Changes in Net Assets | |
(Amounts in Thousands) (continued)
| | | USAA Government
Securities Fund | |
| | | Year
Ended
May 31,
2021 | | Year
Ended
May 31,
2020 | |
Capital Transactions: | |
Fund Shares | |
Proceeds from shares issued | | $ | 56,454 | | | $ | 94,729 | | |
Distributions reinvested | | | 8,356 | | | | 7,575 | | |
Cost of shares redeemed | | | (95,166 | ) | | | (79,266 | ) | |
Total Fund Shares | | $ | (30,356 | ) | | $ | 23,038 | | |
Institutional Shares | |
Proceeds from shares issued | | $ | 7,535 | | | $ | 34,931 | | |
Distributions reinvested | | | 15,018 | | | | 18,170 | | |
Cost of shares redeemed | | | (104,247 | ) | | | (185,234 | ) | |
Total Institutional Shares | | $ | (81,694 | ) | | $ | (132,133 | ) | |
Class A | |
Proceeds from shares issued | | $ | 5,434 | | | $ | 114 | | |
Distributions reinvested | | | 20 | | | | 4 | | |
Cost of shares redeemed | | | (10,287 | ) | | | (58 | ) | |
Total Class A | | $ | (4,833 | ) | | $ | 60 | | |
Class R6 | |
Proceeds from shares issued | | $ | 186 | | | $ | 1,713 | | |
Distributions reinvested | | | 27 | | | | 41 | | |
Cost of shares redeemed | | | (7,842 | ) | | | (534 | ) | |
Total Class R6 | | $ | (7,629 | ) | | $ | 1,220 | | |
Change in net assets resulting from capital transactions | | $ | (124,512 | ) | | $ | (107,815 | ) | |
Share Transactions: | |
Fund Shares | |
Issued | | | 5,550 | | | | 9,416 | | |
Reinvested | | | 824 | | | | 756 | | |
Redeemed | | | (9,376 | ) | | | (7,902 | ) | |
Total Fund Shares | | | (3,002 | ) | | | 2,270 | | |
Institutional Shares | |
Issued | | | 739 | | | | 3,520 | | |
Reinvested | | | 1,480 | | | | 1,814 | | |
Redeemed | | | (10,224 | ) | | | (18,326 | ) | |
Total Institutional Shares | | | (8,005 | ) | | | (12,992 | ) | |
Class A | |
Issued | | | 531 | | | | 12 | | |
Reinvested | | | 2 | | | | — | (a) | |
Redeemed | | | (1,015 | ) | | | (6 | ) | |
Total Class A | | | (482 | ) | | | 6 | | |
Class R6 | |
Issued | | | 18 | | | | 169 | | |
Reinvested | | | 3 | | | | 4 | | |
Redeemed | | | (777 | ) | | | (53 | ) | |
Total Class R6 | | | (756 | ) | | | 120 | | |
Change in Shares | | | (12,245 | ) | | | (10,596 | ) | |
(a) Rounds to less than $1 thousand.
See notes to financial statements.
16
This page is intentionally left blank.
17
USAA Mutual Funds Trust | | Financial Highlights | |
For a Share Outstanding Throughout Each Period
| | | | | Investment Activities | | Distributions to
Shareholders From | |
| | | Net Asset
Value,
Beginning of
Period | | Net
Investment
Income (Loss) | | Net Realized
and Unrealized
Gains (Losses)
on Investments | | Total from
Investment
Activities | | Net
Investment
Income | | Net Realized
Gains from
Investments | |
USAA Government Securities Fund | |
Fund Shares | |
Year Ended:
May 31, 2021 | | $ | 10.23 | | | | 0.21 | (b) | | | (0.15 | ) | | | 0.06 | | | | (0.22 | ) | | | (0.04 | ) | |
May 31, 2020 | | $ | 9.84 | | | | 0.24 | (b) | | | 0.39 | | | | 0.63 | | | | (0.24 | ) | | | — | | |
May 31, 2019 | | $ | 9.55 | | | | 0.23 | | | | 0.29 | | | | 0.52 | | | | (0.23 | ) | | | — | | |
May 31, 2018 | | $ | 9.86 | | | | 0.20 | | | | (0.31 | ) | | | (0.11 | ) | | | (0.20 | ) | | | — | | |
May 31, 2017 | | $ | 10.00 | | | | 0.20 | | | | (0.14 | ) | | | 0.06 | | | | (0.20 | ) | | | — | | |
Institutional Shares | |
Year Ended:
May 31, 2021 | | $ | 10.23 | | | | 0.22 | (b) | | | (0.14 | ) | | | 0.08 | | | | (0.23 | ) | | | (0.04 | ) | |
May 31, 2020 | | $ | 9.85 | | | | 0.24 | (b) | | | 0.39 | | | | 0.63 | | | | (0.25 | ) | | | — | | |
May 31, 2019 | | $ | 9.55 | | | | 0.24 | | | | 0.30 | | | | 0.54 | | | | (0.24 | ) | | | — | | |
May 31, 2018 | | $ | 9.86 | | | | 0.21 | | | | (0.31 | ) | | | (0.10 | ) | | | (0.21 | ) | | | — | | |
May 31, 2017 | | $ | 10.00 | | | | 0.21 | | | | (0.14 | ) | | | 0.07 | | | | (0.21 | ) | | | — | | |
* Assumes reinvestment of all net investment income and realized capital gain distributions, if any, during the period. Includes adjustments in accordance with U.S. Generally Accepted Accounting Principles and could differ from the Lipper reported return.
^ The net expense ratio may not correlate to the applicable expense limits in place during the period since the current contractual expense limitation is applied for a period beginning July 1, 2019 and in effect through June 30, 2023, instead of coinciding with the Fund's fiscal year end. Details of the current contractual expense limitation in effect can be found in Note 5 of the accompanying Notes to Financial Statements.
(a) Portfolio turnover is calculated on the basis of the Fund as a whole without distinguishing between the classes of shares issued.
(b) Per share net investment income (loss) has been calculated using the average daily shares method.
See notes to financial statements.
18
USAA Mutual Funds Trust | | Financial Highlights — continued | |
For a Share Outstanding Throughout Each Period
| | | | | Ratios to Average Net Assets | | Supplemental Data | |
| | | Total
Distributions | | Redemption
Fees
Added to
Beneficial
Interests | | Net
Asset
Value,
End of
Period | | Total
Return* | | Net
Expenses^ | | Net
Investment
Income
(Loss) | | Gross
Expenses | | Net
Assets,
End of
Period
(000's) | | Portfolio
Turnover(a) | |
USAA Government Securities Fund | |
Fund Shares | |
Year Ended:
May 31, 2021 | | | (0.26 | ) | | | — | | | $ | 10.03 | | | | 0.56 | % | | | 0.41 | % | | | 2.04 | % | | | 0.41 | % | | $ | 327,111 | | | | 15 | % | |
May 31, 2020 | | | (0.24 | ) | | | — | | | $ | 10.23 | | | | 6.49 | % | | | 0.43 | % | | | 2.36 | % | | | 0.43 | % | | $ | 364,077 | | | | 11 | % | |
May 31, 2019 | | | (0.23 | ) | | | — | | | $ | 9.84 | | | | 5.56 | % | | | 0.47 | % | | | 2.42 | % | | | 0.47 | % | | $ | 328,123 | | | | 9 | % | |
May 31, 2018 | | | (0.20 | ) | | | — | | | $ | 9.55 | | | | (1.09 | )% | | | 0.48 | % | | | 2.09 | % | | | 0.48 | % | | $ | 333,464 | | | | 15 | % | |
May 31, 2017 | | | (0.20 | ) | | | — | | | $ | 9.86 | | | | 0.62 | % | | | 0.48 | % | | | 2.02 | % | | | 0.48 | % | | $ | 390,897 | | | | 18 | % | |
Institutional Shares | |
Year Ended:
May 31, 2021 | | | (0.27 | ) | | | — | | | $ | 10.04 | | | | 0.75 | % | | | 0.32 | % | | | 2.12 | % | | | 0.32 | % | | $ | 545,930 | | | | 15 | % | |
May 31, 2020 | | | (0.25 | ) | | | — | | | $ | 10.23 | | | | 6.45 | % | | | 0.36 | % | | | 2.43 | % | | | 0.36 | % | | $ | 638,299 | | | | 11 | % | |
May 31, 2019 | | | (0.24 | ) | | | — | | | $ | 9.85 | | | | 5.76 | % | | | 0.38 | % | | | 2.55 | % | | | 0.38 | % | | $ | 742,233 | | | | 9 | % | |
May 31, 2018 | | | (0.21 | ) | | | — | | | $ | 9.55 | | | | (1.01 | )% | | | 0.39 | % | | | 2.18 | % | | | 0.39 | % | | $ | 251,297 | | | | 15 | % | |
May 31, 2017 | | | (0.21 | ) | | | — | | | $ | 9.86 | | | | 0.71 | % | | | 0.40 | % | | | 2.12 | % | | | 0.40 | % | | $ | 133,607 | | | | 18 | % | |
(continues on next page)
See notes to financial statements.
19
USAA Mutual Funds Trust | | Financial Highlights | |
For a Share Outstanding Throughout Each Period
| | | | | Investment Activities | | Distributions to
Shareholders From | |
| | | Net Asset
Value,
Beginning of
Period | | Net
Investment
Income (Loss) | | Net Realized
and Unrealized
Gains (Losses)
on Investments | | Total from
Investment
Activities | | Net
Investment
Income | | Net Realized
Gains from
Investments | |
USAA Government Securities Fund | |
Class A | |
Year Ended:
May 31, 2021 | | $ | 10.22 | | | | 0.19 | (d) | | | (0.14 | ) | | | 0.05 | | | | (0.20 | ) | | | (0.04 | ) | |
May 31, 2020 | | $ | 9.84 | | | | 0.20 | (d) | | | 0.39 | | | | 0.59 | | | | (0.21 | ) | | | — | | |
May 31, 2019 | | $ | 9.54 | | | | 0.21 | | | | 0.30 | | | | 0.51 | | | | (0.21 | ) | | | — | | |
May 31, 2018 | | $ | 9.85 | | | | 0.18 | | | | (0.31 | ) | | | (0.13 | ) | | | (0.18 | ) | | | — | | |
May 31, 2017 | | $ | 10.00 | | | | 0.17 | | | | (0.15 | ) | | | 0.02 | | | | (0.17 | ) | | | — | | |
Class R6 | |
Year Ended:
May 31, 2021 | | $ | 10.22 | | | | 0.23 | (d) | | | (0.15 | ) | | | 0.08 | | | | (0.25 | ) | | | (0.04 | ) | |
May 31, 2020 | | $ | 9.84 | | | | 0.24 | (d) | | | 0.39 | | | | 0.63 | | | | (0.25 | ) | | | — | | |
May 31, 2019 | | $ | 9.55 | | | | 0.24 | | | | 0.29 | | | | 0.53 | | | | (0.24 | ) | | | — | | |
May 31, 2018 | | $ | 9.85 | | | | 0.22 | | | | (0.30 | ) | | | (0.08 | ) | | | (0.22 | ) | | | — | | |
December 1, 2016 (f)
through
May 31, 2017 | | $ | 9.80 | | | | 0.11 | | | | 0.05 | | | | 0.16 | | | | (0.11 | ) | | | — | | |
* Assumes reinvestment of all net investment income and realized capital gain distributions, if any, during the period. Includes adjustments in accordance with U.S. Generally Accepted Accounting Principles and could differ from the Lipper reported return.
^ The net expense ratio may not correlate to the applicable expense limits in place during the period since the current contractual expense limitation is applied for a period beginning July 1, 2019 and in effect through June 30, 2023, instead of coinciding with the Fund's fiscal year end. Details of the current contractual expense limitation in effect can be found in Note 5 of the accompanying Notes to Financial Statements.
(a) Not annualized for periods less than one year.
(b) Annualized for periods less than one year.
(c) Portfolio turnover is calculated on the basis of the Fund as a whole without distinguishing between the classes of shares issued.
(d) Per share net investment income (loss) has been calculated using the average daily shares method.
(e) Amount is less than $0.005 per share.
(f) Commencement of operations.
See notes to financial statements.
20
USAA Mutual Funds Trust | | Financial Highlights — continued | |
For a Share Outstanding Throughout Each Period (continued)
| | | | | Ratios to Average Net Assets | | Supplemental Data | |
| | | Total
Distributions | | Redemption
Fees
Added to
Beneficial
Interests | | Net
Asset
Value,
End of
Period | | Total
Return
(Excludes
Sales
Charge)*(a) | | Net
Expenses^(b) | | Net
Investment
Income
(Loss)(b) | | Gross
Expenses(b) | | Net
Assets,
End of
Period
(000's) | | Portfolio
Turnover(a)(c) | |
USAA Government Securities Fund | |
Class A | |
Year Ended:
May 31, 2021 | | | (0.24 | ) | | | — | | | $ | 10.03 | | | | 0.43 | % | | | 0.70 | % | | | 1.89 | % | | | 1.06 | % | | $ | 365 | | | | 15 | % | |
May 31, 2020 | | | (0.21 | ) | | | — | | | $ | 10.22 | | | | 6.04 | % | | | 0.75 | % | | | 2.03 | % | | | 0.80 | % | | $ | 5,299 | | | | 11 | % | |
May 31, 2019 | | | (0.21 | ) | | | — | | | $ | 9.84 | | | | 5.37 | % | | | 0.75 | % | | | 2.14 | % | | | 0.87 | % | | $ | 5,042 | | | | 9 | % | |
May 31, 2018 | | | (0.18 | ) | | | — | (e) | �� | $ | 9.54 | | | | (1.36 | )% | | | 0.75 | % | | | 1.82 | % | | | 0.87 | % | | $ | 4,804 | | | | 15 | % | |
May 31, 2017 | | | (0.17 | ) | | | — | | | $ | 9.85 | | | | 0.25 | % | | | 0.75 | % | | | 1.76 | % | | | 0.93 | % | | $ | 6,089 | | | | 18 | % | |
Class R6 | |
Year Ended:
May 31, 2021 | | | (0.29 | ) | | | — | | | $ | 10.01 | | | | 0.75 | % | | | 0.31 | % | | | 2.30 | % | | | 0.46 | % | | $ | 167 | | | | 15 | % | |
May 31, 2020 | | | (0.25 | ) | | | — | | | $ | 10.22 | | | | 6.46 | % | | | 0.35 | % | | | 2.43 | % | | | 0.39 | % | | $ | 7,903 | | | | 11 | % | |
May 31, 2019 | | | (0.24 | ) | | | — | | | $ | 9.84 | | | | 5.68 | % | | | 0.35 | % | | | 2.54 | % | | | 0.51 | % | | $ | 6,425 | | | | 9 | % | |
May 31, 2018 | | | (0.22 | ) | | | — | | | $ | 9.55 | | | | (0.87 | )% | | | 0.35 | % | | | 2.22 | % | | | 0.64 | % | | $ | 6,345 | | | | 15 | % | |
December 1, 2016 (f)
through
May 31, 2017 | | | (0.11 | ) | | | — | | | $ | 9.85 | | | | 1.62 | % | | | 0.35 | % | | | 2.22 | % | | | 1.12 | % | | $ | 5,027 | | | | 18 | % | |
See notes to financial statements.
21
USAA Mutual Funds Trust | | Notes to Financial Statements
May 31, 2021 | |
1. Organization:
USAA Mutual Funds Trust (the "Trust") is organized as a Delaware statutory trust and is registered under the Investment Company Act of 1940, as amended (the "1940 Act"), as an open-end investment company. The Trust is comprised of 46 funds and is authorized to issue an unlimited number of shares, which are units of beneficial interest with no par value.
The accompanying financial statements are those of the USAA Government Securities Fund (the "Fund"). The Fund offers four classes of shares: Fund Shares, Institutional Shares, Class A, and Class R6. The Fund is classified as diversified under the 1940 Act. Effective June 29, 2020, the Fund's Adviser Shares were redesignated Class A and became subject to a front-end sales charge.
Each class of shares of the Fund has substantially identical rights and privileges, except with respect to sales charges, fees paid under distribution plans, expenses allocable exclusively to each class of shares, voting rights on matters solely affecting a single class of shares, and the exchange privilege of each class of shares.
Under the Trust's organizational documents, its officers and trustees are indemnified against certain liabilities arising out of the performance of their duties to the Fund. In addition, in the normal course of business, the Fund enters into contracts with its vendors and others that provide for general indemnifications. The Fund's maximum exposure under these arrangements is unknown, as this would involve future claims that may be made against the Fund. However, based on experience, the Fund expects that risk of loss to be remote.
2. Significant Accounting Policies:
The following is a summary of significant accounting policies followed by the Trust in the preparation of its financial statements. The policies are in conformity with Generally Accepted Accounting Principles in the United States of America ("GAAP"). The preparation of financial statements in accordance with GAAP requires management to make estimates and assumptions that affect the reported amounts of assets and liabilities and disclosure of contingent assets and liabilities at the date of the financial statements and the reported amounts of income and expenses for the period. Actual results could differ from those estimates. The Fund follows the specialized accounting and reporting requirements under GAAP that are applicable to investment companies under Accounting Standards Codification Topic 946.
Investment Valuation:
The Fund records investments at fair value. Fair value is defined as the price that would be received to sell an asset or paid to transfer a liability in an orderly transaction between market participants at the measurement date.
The valuation techniques described below maximize the use of observable inputs and minimize the use of unobservable inputs in determining fair value. The inputs used for valuing the Fund's investments are summarized in the three broad levels listed below:
• Level 1 — quoted prices in active markets for identical securities
• Level 2 — other significant observable inputs (including quoted prices for similar securities or interest rates applicable to those securities, etc.)
• Level 3 — significant unobservable inputs (including the Fund's own assumptions in determining the fair value of investments)
Changes in valuation techniques may result in transfers in or out of an assigned level within the disclosure hierarchy. The inputs or methodologies used for valuation techniques are not necessarily an indication of the risks associated with entering into those investments.
Victory Capital Management Inc. ("VCM" or the "Adviser") has established the Pricing and Liquidity Committee (the "Committee"), and subject to the Trust's Board of Trustees (the "Board") oversight, the Committee administers and oversees the Fund's valuation policies and procedures, which are approved by the Board.
22
USAA Mutual Funds Trust | | Notes to Financial Statements — continued
May 31, 2021 | |
Investments in open-end investment companies are valued at their net asset value ("NAV"). These valuations are typically categorized as Level 1 in the fair value hierarchy.
Debt securities are valued each business day by a pricing service approved by the Board. The approved pricing service uses evaluated bid or the last sale price to value securities. Debt obligations maturing within 60 days may be valued at amortized cost provided that amortized cost represents the fair value of such securities. These valuations are typically categorized as Level 2 in the fair value hierarchy.
Repurchase agreements are valued at cost.
In the event that price quotations or valuations are not readily available, investments are valued at fair value in accordance with procedures established by and under the general supervision and responsibility of the Board. These valuations are typically categorized as Level 2 or Level 3 in the fair value hierarchy, based on the observability of inputs used to determine the fair value. The effect of fair value pricing is that securities may not be priced on the basis of quotations from the primary market in which they are traded, and the actual price realized from the sale of a security may differ materially from the fair value price. Valuing these securities at fair value is intended to cause the Fund's NAV to be more reliable than it otherwise would be.
A summary of the valuations as of May 31, 2021, based upon the three levels defined above, is included in the table below while the breakdown, by category, of investments is disclosed on the Schedule of Portfolio Investments (amounts in thousands):
| | | Level 1 | | Level 2 | | Level 3 | | Total | |
Asset-Backed Securities | | $ | — | | | $ | 30,920 | | | $ | — | | | $ | 30,920 | | |
Municipal Bonds | | | — | | | | 47,001 | | | | — | | | | 47,001 | | |
U.S. Government Agency
Mortgages | | | — | | | | 453,837 | | | | — | | | | 453,837 | | |
U.S. Treasury Obligations | | | — | | | | 306,010 | | | | — | | | | 306,010 | | |
Investment Company | | | 303 | | | | — | | | | — | | | | 303 | | |
Repurchase Agreements | | | — | | | | 32,800 | | | | — | | | | 32,800 | | |
Collateral for Securities Loaned | | | 10,123 | | | | — | | | | — | | | | 10,123 | | |
Total | | $ | 10,426 | | | $ | 870,568 | | | $ | — | | | $ | 880,994 | | |
For the year ended May 31, 2021, there were no transfers in or out of Level 3 in the fair value hierarchy.
Repurchase Agreements:
The Fund may enter into repurchase agreements with commercial banks or recognized security dealers pursuant to the terms of a Master Repurchase Agreement. A repurchase agreement is an arrangement wherein the Fund purchases securities and the seller agrees to repurchase the securities at an agreed upon time and at an agreed upon price. The purchased securities are marked-to-market daily to ensure their value is equal to at least 102% of principal including accrued interest and are held by the Fund, either through its regular custodian or through a special "tri-party" custodian that maintains separate accounts for both the Fund and its counterparty, until maturity of the repurchase agreement. Master Repurchase Agreements typically contain netting provisions, which provide for the net settlement of all transactions and collateral with the Fund through a single payment in the event of default or termination. Repurchase agreements are subject to credit risk, and the Fund's Manager monitors the creditworthiness of sellers with which the Fund may enter into repurchase agreements.
Investments in repurchase agreements as presented on the Schedule of Portfolio Investments are not net settlement amounts but gross. At May 31, 2021, the value of the related collateral exceeded the value of the repurchase agreements, reducing the net settlement amount to zero. Details on the collateral are included on the Schedule of Portfolio Investments
23
USAA Mutual Funds Trust | | Notes to Financial Statements — continued
May 31, 2021 | |
Investment Companies:
Open-End Funds:
The Fund may invest in portfolios of open-end investment companies. These investment companies value securities in their portfolios for which market quotations are readily available at their market values (generally the last reported sale price) and all other securities and assets at their fair value by the methods established by the board of directors of the underlying funds.
Securities Purchased on a Delayed-Delivery or When-Issued Basis:
The Fund may purchase securities on a delayed-delivery or when-issued basis. Delivery and payment for securities that have been purchased by the Fund on a delayed-delivery or when-issued basis, or for delayed draws on loans can take place a month or more after the trade date. At the time the Fund makes the commitment to purchase a security on a delayed-delivery or when-issued basis, the Fund records the transaction and reflects the value of the security in determining NAV. No interest accrues to the Fund until the transaction settles and payment takes place. A segregated account is established and the Fund maintains cash and/or marketable securities at least equal in value to commitments for delayed-delivery or when-issued securities. If the Fund owns delayed-delivery or when-issued securities, these values are included in Payable for investments purchased on the accompanying Statement of Assets and Liabilities and the segregated assets are identified on the Schedule of Portfolio Investments.
Municipal Obligations:
The values of municipal obligations can fluctuate and may be affected by adverse tax, legislative, or political changes, and by financial developments affecting municipal issuers. Payment of municipal obligations may depend on a relatively limited source of revenue, resulting in greater credit risk. Future changes in federal tax laws or the activity of an issuer may adversely affect the tax-exempt status of municipal obligations.
Mortgage- and Asset-Backed Securities:
The values of some mortgage-related or asset-backed securities may be particularly sensitive to changes in prevailing interest rates. Early repayment of principal on some mortgage-related securities may expose the Fund to a lower rate of return upon reinvestment of principal. The values of mortgage and asset-backed securities depend in part on the credit quality and adequacy of the underlying assets or collateral and may fluctuate in response to the market's perception of these factors as well as current and future repayment rates. Some mortgage-backed securities are backed by the full faith and credit of the U.S. government (e.g., mortgage-backed securities issued by the Government National Mortgage Association, commonly known as "Ginnie Mae"), while other mortgage-backed securities (e.g., mortgage-backed securities issued by the Federal National Mortgage Association and the Federal Home Loan Mortgage Corporation, commonly known as "Fannie Mae" and "Freddie Mac", respectively), are backed only by the credit of the government entity issuing them. In addition, some mortgage-backed securities are issued by private entities and, as such, are not guaranteed by the U.S. government or any agency or instrumentality of the U.S. government.
Investment Transactions and Related Income:
Changes in holdings of investments are accounted for no later than one business day following the trade date. For financial reporting purposes, however, investment transactions are accounted for on trade date on the last business day of the reporting period. Interest income is determined on the basis of coupon interest accrued using the effective interest method which adjusts, where applicable, the amortization of premiums or accretion of discount. Dividend income is recorded on the ex-dividend date. Gains or losses realized on sales of securities are recorded on the identified cost basis.
Securities Lending:
The Fund, through a securities lending agreement with Citibank, N.A. ("Citibank"), may lend its securities to qualified financial institutions, such as certain broker-dealers, to earn additional income, net of income retained by Citibank. Borrowers are required to secure their loans for collateral in the amount
24
USAA Mutual Funds Trust | | Notes to Financial Statements — continued
May 31, 2021 | |
of at least 102% of the value of U.S. securities loaned or at least 105% of the value of non-U.S. securities loaned, marked-to-market daily. Any collateral shortfalls associated with increases in the valuation of the securities loaned are cured the next business day once the shortfall exceeds $100 thousand. Collateral may be cash, U.S. government securities, or other securities as permitted by Securities and Exchange Commission ("SEC") guidelines. Cash collateral may be invested in high-quality short-term investments, primarily open-end investment companies. Collateral requirements are determined daily based on the value of the Fund's securities on loan as of the end of the prior business day. During the time portfolio securities are on loan, the borrower will pay the Fund any dividends or interest paid on such securities plus any fee negotiated between the parties to the lending agreement. The Fund also earns a return from the collateral. The Fund pays Citibank various fees in connection with the investment of cash collateral and fees based on the investment income received from securities lending activities. Securities lending income (net of these fees) is disclosed on the Statement of Operations. Loans are terminable upon demand and the borrower must return the loaned securities within the lesser of one standard settlement period or five business days. Risks relating to securities-lending transactions include that the borrower may not provide additional collateral when required or return the securities when due, and that the value of the short-term investments will be less than the amount of cash collateral required to be returned to the borrower. The Fund's agreement with Citibank does not include master netting provisions. Non-cash collateral received by the Fund may not be sold or re-pledged, except to satisfy borrower default. Cash collateral is listed on the Fund's Schedule of Portfolio Investments and Financial Statements while non-cash collateral is not included.
The following table (amounts in thousands) is a summary of the Fund's securities lending transactions as of May 31, 2021.
Value of
Securities on Loan | | Non-Cash Collateral | | Cash Collateral | |
| $ | 9,942 | | | $ | — | | | $ | 10,123 | | |
Federal Income Taxes:
It is the Fund's policy to continue to qualify as a regulated investment company by complying with the provisions available to certain investment companies, as defined in applicable sections of the Internal Revenue Code, and to make distributions of net investment income and net realized gains sufficient to relieve it from all, or substantially all, federal income taxes. Accordingly, no provision for federal income taxes is required in the financial statements. The Fund has a tax year end of May 31.
Management of the Fund has reviewed tax positions taken in tax years that remain subject to examination by all major tax jurisdictions, including federal (i.e., the last four tax years, which includes the current fiscal tax year end). Management believes that there is no tax liability resulting from unrecognized tax benefits related to uncertain tax positions taken.
Allocations:
Expenses directly attributable to the Fund are charged to the Fund, while expenses that are attributable to more than one fund in the Trust, or jointly with an affiliated trust, are allocated among the respective funds in the Trust and/or affiliated trust based upon net assets or another appropriate basis.
Income, expenses (other than class-specific expenses such as transfer agent fees, state registration fees, printing fees, and 12b-1 fees) and realized and unrealized gains or losses on investments are allocated to each class of shares based on its relative net assets on the date income is earned or expenses and realized and unrealized gains and losses are incurred.
25
USAA Mutual Funds Trust | | Notes to Financial Statements — continued
May 31, 2021 | |
3. Purchases and Sales:
Cost of purchases and proceeds from sales/maturities of securities (excluding securities maturing less than one year from acquisition) for the year ended May 31, 2021, were as follows for the Fund (amounts in thousands):
Excluding
U.S. Government Securities | | U.S. Government Securities | |
Purchases | | Sales | | Purchases | | Sales | |
$ | 23,562 | | | $ | 31,610 | | | $ | 117,599 | | | $ | 254,484 | | |
4. Affiliated Fund Ownership:
The Fund offers its shares for investment by other USAA Mutual Funds. The fund-of-funds do not invest in the underlying funds for the purpose of exercising management or control, and the affiliated fund-of-funds' annual and semi annual reports may be viewed at vcm.com. As of May 31, 2021, certain fund-of-funds owned total outstanding shares of the Fund as follows:
Affiliated USAA Mutual Funds | | Ownership % | |
USAA Cornerstone Conservative Fund | | | 4.9 | | |
USAA Target Retirement Income Fund | | | 23.8 | | |
USAA Target Retirement 2030 Fund | | | 21.0 | | |
USAA Target Retirement 2040 Fund | | | 10.3 | | |
USAA Target Retirement 2050 Fund | | | 1.7 | | |
USAA Target Retirement 2060 Fund | | | 0.3 | | |
5. Fees and Transactions with Affiliates and Related Parties:
Investment Advisory Fees:
Investment advisory services are provided to the Fund by the Adviser, which is a New York corporation registered as an investment adviser with the SEC. The Adviser is an indirect wholly owned subsidiary of Victory Capital Holdings, Inc., a publicly traded Delaware corporation, and a wholly owned direct subsidiary of Victory Capital Operating, LLC.
Under the terms of the Investment Advisory Agreement, the Adviser is entitled to receive a base fee and a performance adjustment. The Fund's base fee is accrued daily and paid monthly at an annualized rate of 0.125% of the Fund's average daily net assets. Amounts incurred and paid to VCM for the year ended May 31, 2021, are reflected on the Statement of Operations as Investment Advisory fees.
On November 6, 2018, United Services Automobile Association ("USAA"), the parent company of USAA Asset Management Company ("AMCO"), the prior investment adviser to the Fund announced that AMCO would be acquired by Victory Capital Holdings Inc. (the "Transaction"). A special shareholder meeting was held on April 18, 2019, at which shareholders of the Fund approved a new investment advisory agreement between the Trust, on behalf of the Fund, and VCM. The Transaction closed on July 1, 2019, and effective July 1, 2019, VCM replaced AMCO as the investment adviser to the Fund and no performance adjustments were made for the period beginning July 1, 2019, through June 30, 2020. Only performance beginning as of July 1, 2019, and thereafter is utilized in calculating future performance adjustments.
The performance adjustment for each share class is accrued daily and calculated monthly by comparing each class' performance to that of the Lipper Intermediate U.S. Government Funds Index. The Lipper Intermediate U.S. Government Funds Index tracks the total return performance of the largest funds within the Lipper Intermediate U.S. Government Funds category.
26
USAA Mutual Funds Trust | | Notes to Financial Statements — continued
May 31, 2021 | |
The performance period for each share class consists of the current month plus the previous 35 months (or the number of months beginning July 1, 2019, if fewer). The following table is utilized to determine the extent of the performance adjustment:
Over/Under Performance Relative to Index
(in basis points)(a) | | Annual Adjustment Rate
(in basis points) | |
| | +/- 20 to 50 | | | | +/- 4 | | |
| | +/- 51 to 100 | | | | +/- 5 | | |
| | +/- 101 and greater | | | | +/- 6 | | |
(a) Based on the difference between average annual performance of the relevant share class of the Fund and its relevant Lipper index, rounded to the nearest basis point.
Each class' annual performance adjustment rate is multiplied by the average daily net assets of each respective class over the entire performance period, which is then multiplied by a fraction, the numerator of which is the number of days in the month and the denominator of which is 365 (366 in leap years). The resulting amount is then added to (in the case of overperformance), or subtracted from (in the case of underperformance) the base fee.
Under the performance fee arrangement, each class pays a positive performance fee adjustment for a performance period whenever the class outperforms the Lipper Intermediate U.S. Government Funds Index over that period, even if the class has overall negative returns during the performance period.
For the performance period July 1, 2020, to May 31, 2021, performance adjustments were $(107), $(217), $(2), and $(2) for Fund Shares, Institutional Shares, Class A, and Class R6, in thousands, respectively. Performance adjustments were (0.03)%, (0.04)%, (0.05)%, and (0.03)% for Fund Shares, Institutional Shares, Class A, and Class R6, respectively. The performance adjustment rate included in the investment advisory fee may differ from the maximum over/under Annual Adjustment Rate due to differences in average net assets for the reporting period and rolling 36 month performance periods.
The Trust relies on an exemptive order granted to VCM and its affiliated funds by the SEC in March 2019 permitting the use of a "manager-of-managers" structure for certain funds. Under a manager-of-managers structure, the investment adviser may select (with approval of the Board and without shareholder approval) one or more subadvisers to manage the day-to-day investment of a fund's assets. For the year ended May 31, 2021, the Fund had no subadvisors.
Administration and Servicing Fees:
VCM serves as the Fund's administrator and fund accountant. Under the Fund Administration, Servicing and Accounting Agreement, VCM is paid for its services an annual fee at a rate of 0.15%, 0.10%, 0.15% and 0.05% of average daily net assets of the Fund Shares, Institutional Shares, Class A, and Class R6, respectively. Amounts incurred for the year ended May 31, 2021, are reflected on the Statement of Operations as Administration fees.
The Fund (as part of the Trust) has entered into an agreement to provide compliance services with the Adviser, pursuant to which the Adviser furnishes its compliance personnel, including the services of the Chief Compliance Officer ("CCO"), and other resources reasonably necessary to provide the Trust with compliance oversight services related to the design, administration and oversight of a compliance program for the Trust in accordance with Rule 38a-1 under the 1940 Act. The CCO is an employee of the Adviser, which pays the compensation of the CCO and support staff. Funds in the Trust, Victory Variable Insurance Funds, Victory Portfolios, and Victory Portfolios II (collectively, the "Victory Funds Complex") in the aggregate, compensate the Adviser for these services. Amounts incurred for the year ended May 31, 2021, are reflected on the Statement of Operations as Compliance fees.
Citi Fund Services Ohio, Inc. ("Citi"), an affiliate of Citibank, acts as sub-administrator and sub-fund accountant to the Fund pursuant to a Sub-Administration and Sub-Fund Accounting Services Agreement between VCM and Citi. VCM pays Citi a fee for providing these services. The Fund reimburses VCM and Citi for out-of-pocket expenses incurred in providing these services and certain other expenses
27
USAA Mutual Funds Trust | | Notes to Financial Statements — continued
May 31, 2021 | |
specifically allocated to the Fund. Amounts incurred for the year ended May 31, 2021, are reflected on the Statement of Operations as Sub-Administration fees.
Transfer Agency Fees:
Victory Capital Transfer Agency, Inc. ("VCTA"), an affiliate of the Adviser, provides transfer agency services to the Fund. VCTA provides transfer agent services to the Fund Shares based on an annual charge of $25.50 per shareholder account plus out-of-pocket expenses. VCTA pays a portion of these fees to certain intermediaries for the administration and servicing of accounts that are held with such intermediaries. Transfer agent's fees for Institutional Shares and Class R6 Shares are paid monthly based on a fee accrued daily at an annualized rate of 0.10% and 0.01%, average daily net assets, respectively, plus out-of-pocket expenses. Amounts incurred and paid to VCTA for the year ended May 31, 2021, are reflected on the Statement of Operations as Transfer Agent fees.
FIS Investor Services LLC serves as sub-transfer agent and dividend disbursing agent for the Fund pursuant to a Sub-Transfer Agent Agreement between VCTA and FIS Investor Services LLC. VCTA provides FIS Investor Services LLC a fee for providing these services.
Distributor/Underwriting Services:
Victory Capital Services, Inc. (the "Distributor"), an affiliate of the Adviser, serves as distributor for the continuous offering of the shares of the Fund pursuant to a Distribution Agreement between the Distributor and the Trust and receives no fee or other compensation for these services. Effective June 30, 2020, the Distributor's name was changed from Victory Capital Advisers, Inc.
Pursuant to the Distribution and Service Plans adopted in accordance with Rule 12b-1 under the 1940 Act, the Distributor may receive a monthly distribution and service fee, at an annual rate of up to 0.25% of the average daily net assets of Class A shares. The distribution and service fees paid to the Distributor may be used by the Distributor to pay for activity primarily intended to result in the sale of Class A of the Fund. Amounts incurred and paid to the Distributor for the year ended May 31, 2021, are reflected on the Statement of Operations as 12b-1 fees. In addition, the Distributor is entitled to receive commissions on sale of Class A. For the year ended May 31, 2021, the Distributor did not receive any commissions.
Other Fees:
Citibank serves as the Fund's custodian. The Fund pays Citibank a fee for providing these services. Amounts incurred for the year ended May 31, 2021, are reflected on the Statement of Operations as Custodian fees.
K&L Gates LLP provides legal services to the Trust.
The Adviser has entered into an expense limitation agreement with the Fund until at least June 30, 2023. Under the terms of the agreement, the Adviser has agreed to waive fees or reimburse certain expenses to the extent that ordinary operating expenses incurred by certain classes of the Fund in any fiscal year exceed the expense limit for such classes of the Fund. Such excess amounts will be the liability of the Adviser. Acquired fund fees and expenses, interest, taxes, brokerage commissions, and other expenditures that are capitalized in accordance with GAAP, and other extraordinary expenses not incurred in the ordinary course of the Fund's business are excluded from the expense limits. As of May 31, 2021, the expense limits (excluding voluntary waivers) were 0.48%, 0.39%, 0.75%, and 0.35% for Fund Shares, Institutional Shares, Class A, and Class R6, respectively.
Under the terms of the expense limitation agreement, amended May 1, 2021, the Fund has agreed to repay fees and expenses that were waived or reimbursed by the Adviser for a period of up to three years (thirty six (36) months) after the waiver or reimbursement took place, subject to the lesser of any operating expense limits in effect at the time of: (a) the original waiver or expense reimbursement; or (b) the recoupment, after giving effect to the recoupment amount. Prior to May 1, 2021, the Fund was permitted to recoup fees waived and expenses reimbursed for up to three years after the fiscal year in which the waiver or reimbursement took place, subject to the limitations above. This change did not have any effect on the amounts previously reported for recoupment.
28
USAA Mutual Funds Trust | | Notes to Financial Statements — continued
May 31, 2021 | |
As of May 31, 2021, the following amounts are available to be repaid to the Adviser (amounts in thousands). The Fund has not recorded any amounts available to be repaid as a liability due to an assessment that such repayment is not probable at May 31, 2021.
| Expires 2023 | | Expires 2024 | | Total | |
| $ | 1 | | | $ | 25 | | | $ | 26 | | |
The Adviser may voluntarily waive or reimburse additional fees to assist the Fund in maintaining competitive expense ratios. Voluntary waivers and reimbursements applicable to the Fund are not available to be recouped at a future time. There were no voluntary waivers or reimbursements for the year ended May 31, 2021.
Certain officers and/or interested trustees of the Fund are also officers and/or employees of the Adviser, administrator, fund accountant, sub-administrator, sub-fund accountant, custodian, and Distributor.
6. Risks:
The Fund may be subject to other risks in addition to these identified risks.
Geopolitical/Natural Disaster Risk — Global economies and financial markets are increasingly interconnected, which increases the possibilities that conditions in one country or region might adversely affect issuers in another country or region. Geopolitical and other risks, including war, terrorism, trade disputes, political or economic dysfunction within some nations, public health crises and related geopolitical events, as well as environmental disasters such as earthquakes, fires, and floods, may add to instability in world economies and markets generally. Changes in trade policies and international trade agreements could affect the economies of many countries in unpredictable ways. Likewise, systemic market dislocations of the kind that occurred during the financial crisis that began in 2008, if repeated, would be highly disruptive to economies and markets, adversely affecting individual companies and industries, securities markets, interest rates, credit ratings, inflation, investor sentiment, and other factors affecting the value of a Fund's investments. Some countries, including the United States, are adopting more protectionist trade policies and moving away from the tighter financial industry regulations that followed the 2008 financial crisis, which may also affect the value of a Fund's investments.
Political events within the United States at times have resulted, and may in the future result, in a shutdown of government services, which could negatively affect the U.S. economy, decrease the value of a Fund's investments, increase uncertainty in or impair the operation of the U.S. or other securities markets, and degrade investor and consumer confidence, perhaps suddenly and to a significant degree.
An outbreak of disease called COVID-19 has spread internationally. The transmission of COVID-19 and efforts to contain its spread have resulted in international, national, and local border closings and other significant travel restrictions and disruptions, significant disruptions to business operations, supply chains and consumer activity, significant challenges in healthcare service preparation and delivery, quarantines, and general concern and uncertainty. These negative impacts have caused significant volatility and declines in global financial markets, which have caused losses for Fund investors during and subsequent to period end. The impact of the COVID-19 pandemic may last for an extended period of time, and could result in a substantial economic downturn or recession. Public health crises may exacerbate other pre-existing political, social, economic, market, and financial risks. The extent of the impact to the financial performance of the Fund's investments will depend on future developments, including (i) the duration and spread of the outbreak, (ii) the restrictions and advisories, (iii) the effects on the financial markets, and (iv) the effects on the economy overall, all of which are highly uncertain and cannot be predicted.
Interest Rate Risk — The Fund is subject to the risk that the market value of the bonds in its portfolio will fluctuate because of changes in interest rates, changes in the supply of and demand for debt securities securities, and other market factors. Bond prices generally are linked to the prevailing market interest rates. In general, when interest rates rise, bond prices fall; conversely, when interest rates fall, bond prices rise. The price volatility of a bond also depends on its duration. Generally, the longer the duration of a bond, the greater is its sensitivity to interest rates. To compensate investors for this higher interest rate risk, bonds with longer durations generally offer higher yields than bonds with shorter
29
USAA Mutual Funds Trust | | Notes to Financial Statements — continued
May 31, 2021 | |
durations. The ability of an issuer of a debt security to repay principal prior to a security's maturity can increase the security's sensitivity to interest rate changes.
Decisions by the U.S. Federal Reserve (also known as the "Fed") regarding interest rate and monetary policy, which can be difficult to predict and sometimes change direction suddenly in response to economic and market events, can have a significant effect on the value of fixed-income securities as well as the overall strength of the U.S. economy. Precise interest rate predictions are difficult to make, and interest rates may change unexpectedly and dramatically in response to extreme changes in market or economic conditions. As a result, the value of fixed income securities may vary widely under certain market conditions.
Prepayment and Extension Risk — Mortgage-backed securities make regularly scheduled payments of principal along with interest payments. In addition, mortgagors generally have the option of paying off their mortgages without penalty at any time. For example, when a mortgaged property is sold, the old mortgage is usually prepaid. Also, when interest rates fall, the mortgagor may refinance the mortgage and prepay the old mortgage. A homeowner's default on the mortgage also may cause a prepayment of the mortgage. This unpredictability of the mortgage's cash flow is called prepayment risk. For the investor, prepayment risk usually means that principal is received at the least opportune time. For example, when interest rates fall, homeowners may find it advantageous to refinance their mortgages and prepay principal. In this case, the investor is forced to reinvest the principal at the current lower rate. On the other hand, when interest rates rise, homeowners generally will not refinance their mortgages and prepayments will fall. This causes the average life of the mortgage to extend and be more sensitive to interest rates, which is called extension risk. In addition, the amount of principal the investor has to invest in these higher interest rates is reduced.
Liquidity Risk — Market developments and other factors, including a general rise in interest rates, have the potential to cause investors to move out of fixed-income securities on a large scale, which may increase redemptions from mutual funds that hold large amounts of fixed-income securities. Such a move, coupled with a reduction in the ability or willingness of dealers and other institutional investors to buy or hold fixed-income securities, may result in decreased liquidity and increased volatility in the fixed-income markets. Heavy redemptions of fixed-income mutual funds and decreased liquidity from fixed-income securities could hurt the Fund's performance. In addition, significant securities market disruptions related to outbreaks of the coronavirus disease ("COVID-19") have led to dislocation in the market for a variety of fixed-income securities (including municipal obligations), which has decreased liquidity and sharply reduced returns.
LIBOR Discontinuation Risk — Many debt securities, derivatives, and other financial instruments, including some of the Fund's investments, use the London Interbank Offered Rate ("LIBOR") as the reference or benchmark rate for variable interest rate calculations. In June 2017, the Alternative Reference Rates Committee, a group of large U.S. banks working with the Federal Reserve, announced its selection of a new Secured Overnight Funding Rate ("SOFR"), which is intended to be a broad measure of secured overnight U.S. Treasury repo rates, as an appropriate replacement for LIBOR. The Federal Reserve Bank of New York began publishing the SOFR in 2018, expecting that it could be used on a voluntary basis in new instruments and transactions. Bank working groups and regulators in other countries have suggested other alternatives for their markets, including the Sterling Overnight Interbank Average Rate ("SONIA") in England. In July 2017, the Financial Conduct Authority (the "FCA"), the United Kingdom financial regulatory body, announced that after 2021 it will cease its active encouragement of UK banks to provide the quotations needed to sustain LIBOR. That announcement suggests that LIBOR may cease to be published after that time. For U.S. dollar LIBOR, however, the relevant date may be deferred to June 30, 2023, for the most common tenors (overnight and one, three, six, and 12 months). As to those tenors, the LIBOR administrator has published a consultation regarding its intention to cease publication of U.S. dollar LIBOR as of June 30, 2023, (instead of December 31, 2021, as previously expected), apparently based on continued rate submissions from banks. It is expected that there will be enough time for market participants to transition to the use of a different benchmark for both new and existing securities and transactions. Various financial industry groups have begun planning for that transition, but there are obstacles to converting certain longer-term securities and transactions to a new benchmark. Transition planning is at an early stage, and neither the effect of the transition process nor its ultimate success can yet be known. Although the foregoing may provide some sense of timing, there is no assurance that LIBOR, or any particular currency and
30
USAA Mutual Funds Trust | | Notes to Financial Statements — continued
May 31, 2021 | |
tenor, will continue to be published until any particular date, and it appears highly likely that LIBOR will be discontinued or modified after December 31, 2021, or June 30, 2023, depending on the currency and tenor. The transition process might lead to increased volatility and illiquidity in markets that currently rely on the LIBOR to determine interest rates. It could also lead to a reduction in the value of some LIBOR-based investments and reduce the effectiveness of new hedges placed against existing LIBOR-based instruments. Since the usefulness of LIBOR as a benchmark could deteriorate during the transition period, these effects could occur before the end of 2021.
7. Borrowing and Interfund Lending:
Line of Credit:
The Victory Funds Complex participated in a short-term demand note "Line of Credit" agreement with Citibank. The Line of Credit agreement with Citibank was renewed on June 29, 2020, with a termination date of June 28, 2021. Under the agreement with Citibank, the Victory Funds Complex may borrow up to $600 million, of which $300 million is committed and $300 million is uncommitted. $40 million of the Line of Credit is reserved for use by the Victory Floating Rate Fund, another series of the Victory Funds Complex, with Victory Floating Rate Fund paying the related commitment fees for that amount. The purpose of the Line of Credit is to meet temporary or emergency cash needs. For the year ended May 31, 2021, Citibank received an annual commitment fee of 0.15% on $300 million for providing the Line of Credit. Each fund in the Victory Funds Complex pays a pro-rata portion of the commitment fees plus any interest (one month LIBOR plus one percent) on amounts borrowed. For the period June 29, 2020, through April 30, 2021, under an amended Line of Credit agreement, Citibank received an annual upfront fee of 0.10% on the $300 million committed line of credit. Each fund in the Victory Funds Complex paid a pro-rata portion of the upfront fee. Effective with the next amendment, the annual commitment fee of 0.15% will remain unchanged and the upfront fee of 0.10% is discontinued. Interest charged to each fund during the period, if applicable, is reflected on the Statement of Operations under Line of credit fees.
The Fund had no borrowings under the Line of Credit agreement during the year ended May 31, 2021.
Interfund Lending:
The Trust and Adviser rely on an exemptive order granted by the SEC in March 2017 (the "Order"), permitting the establishment and operation of an Interfund Lending Facility (the "Facility"). The Facility allows the Fund to directly lend and borrow money to or from any other fund in the Victory Funds Complex that is permitted to participate in the Facility, relying upon the Order at rates beneficial to both the borrowing and lending funds. Advances under the Facility are allowed for temporary or emergency purposes, including the meeting of redemption requests that otherwise might require the untimely disposition of securities, and are subject to each Fund's borrowing restrictions. The interfund loan rate is determined, as specified in the Order, by averaging the current repurchase agreement rate and the current bank loan rate. As a Borrower, interest charged to the Fund, if any, during the period is reflected on the Statement of Operations under Interfund lending fees. As a Lender, interest earned by the Fund, if any, during the period is presented on the Statement of Operations under Interfund lending.
The Fund did not utilize or participate in the Facility during the year ended May 31, 2021.
8. Federal Income Tax Information:
Distributions from the Fund's net investment income are accrued daily and distributed on the last business day of each month. Distributable net realized gains, if any, are declared and paid at least annually.
The amounts of dividends from net investment income and distributions from net realized gains (collectively distributions to shareholders) are determined in accordance with federal income tax regulations, which may differ from GAAP. To the extent these "book/tax" differences are permanent in nature (e.g., net operating loss and distribution reclassification), such amounts are reclassified within the components of net assets based on their federal tax-basis treatment; temporary differences (e.g., wash
31
USAA Mutual Funds Trust | | Notes to Financial Statements — continued
May 31, 2021 | |
sales) do not require reclassification. To the extent dividends and distributions exceed net investment income and net realized gains for tax purposes, they are reported as distributions of capital. Net investment losses incurred by the Fund may be reclassified as an offset to capital on the accompanying Statement of Assets and Liabilities.
As of May 31, 2021, on the Statement of Assets and Liabilities, there were no permanent book-to-tax difference reclassification adjustments.
The tax character of distributions paid during the tax years ended as noted below, were as follows (total distributions paid may differ from the Statements of Changes in Net Assets because, for tax purposes, dividends are recognized when actually paid) (amounts in thousands):
| | | Year Ended May 31, 2021 | | Year Ended May 31, 2020 | |
| | | Distributions paid from | | | | Distributions paid from | | | |
| |
Ordinary
Income | | Net
Long-Term
Capital Gains | | Total
Distributions
Paid | |
Ordinary
Income | | Net
Long-Term
Capital Gains | | Total
Distributions
Paid | |
| | | | | $ | 20,872 | | | $ | 3,283 | | | $ | 24,155 | | | $ | 26,305 | | | $ | 547 | | | $ | 26,852 | | |
As of May 31, 2021, the components of accumulated earnings (loss) on a tax basis were as follows (amounts in thousands):
Undistributed
Ordinary
Income | |
Undistributed
Long-Term
Capital Gains | |
Distributions
Payable | |
Accumulated
Earnings | |
Unrealized
Appreciation
(Depreciation)* | | Total
Accumulated
Earnings
(Loss) | |
$ | 81 | | | $ | 12,541 | | | $ | (1,409 | ) | | $ | 11,213 | | | $ | 38,421 | | | $ | 49,634 | | |
* The difference between the book-basis and tax-basis of unrealized appreciation/depreciation is attributable to the tax deferral of losses on wash sales.
As of May 31, 2021, the Fund had no capital loss carryforwards, for federal income tax purposes.
As of May 31, 2021, the cost basis for federal income tax purposes, gross unrealized appreciation, gross unrealized depreciation, and net unrealized appreciation (depreciation) for investments were as follows (amounts in thousands):
Cost of
Investments
for Federal
Tax Purposes | | Gross
Unrealized
Appreciation | | Gross
Unrealized
Depreciation | | Net Unrealized
Appreciation
(Depreciation) | |
| $ | 842,573 | | | $ | 38,718 | | | $ | (297 | ) | | $ | 38,421 | | |
32
REPORT OF INDEPENDENT REGISTERED PUBLIC ACCOUNTING FIRM
To the Shareholders and the Board of Trustees of USAA Government Securities Fund
Opinion on the Financial Statements
We have audited the accompanying statement of assets and liabilities of USAA Government Securities Fund (the "Fund") (one of the funds constituting USAA Mutual Funds Trust (the "Trust")), including the schedule of portfolio investments, as of May 31, 2021, and the related statement of operations for the year then ended, the statements of changes in net assets for each of the two years in the period then ended, the financial highlights for each of the five years in the period then ended and the related notes (collectively referred to as the "financial statements"). In our opinion, the financial statements present fairly, in all material respects, the financial position of the Fund (one of the funds constituting USAA Mutual Funds Trust) at May 31, 2021, the results of its operations for the year then ended, the changes in its net assets for each of the two years in the period then ended and its financial highlights for each of the five years in the period then ended, in conformity with U.S. generally accepted accounting principles.
Basis for Opinion
These financial statements are the responsibility of the Trust's management. Our responsibility is to express an opinion on the Fund's financial statements based on our audits. We are a public accounting firm registered with the Public Company Accounting Oversight Board (United States) ("PCAOB") and are required to be independent with respect to the Trust in accordance with the U.S. federal securities laws and the applicable rules and regulations of the Securities and Exchange Commission and the PCAOB.
We conducted our audits in accordance with the standards of the PCAOB. Those standards require that we plan and perform the audit to obtain reasonable assurance about whether the financial statements are free of material misstatement, whether due to error or fraud. The Trust is not required to have, nor were we engaged to perform, an audit of the Trust's internal control over financial reporting. As part of our audits we are required to obtain an understanding of internal control over financial reporting, but not for the purpose of expressing an opinion on the effectiveness of the Trust's internal control over financial reporting. Accordingly, we express no such opinion.
Our audits included performing procedures to assess the risks of material misstatement of the financial statements, whether due to error or fraud, and performing procedures that respond to those risks. Such procedures included examining, on a test basis, evidence regarding the amounts and disclosures in the financial statements. Our procedures included confirmation of securities owned as of May 31, 2021, by correspondence with the custodian. Our audits also included evaluating the accounting principles used and significant estimates made by management, as well as evaluating the overall presentation of the financial statements. We believe that our audits provide a reasonable basis for our opinion.

We have served as the auditor of one or more Victory Capital investment companies since 1995.
San Antonio, Texas
July 28, 2021
33
USAA Mutual Funds Trust | | Supplemental Information
May 31, 2021 | |
(Unaudited)
Trustee and Officer Information
Board of Trustees:
Overall responsibility for management of the Trust rests with the Board. The Trust is managed by the Board in accordance with the laws of the state of Delaware. There are currently nine Trustees, seven of whom are not "interested persons" of the Trust within the meaning of that term under the 1940 Act ("Independent Trustees") and two of whom are "interested persons" of the Trust within the meaning of that term under the 1940 Act ("Interested Trustee"). The Trustees, in turn, elect the officers of the Trust to actively supervise its day-to-day operations.
The following tables list the Trustees, their ages, position with the Trust, commencement of service, principal occupations during the past five years and any directorships of other investment companies or companies whose securities are registered under the Securities Exchange Act of 1934, as amended, or who file reports under that Act. Each Trustee oversees 46 portfolios in the Trust. Each Trustee's address is 15935 La Cantera Pkwy, San Antonio, TX, 78256. Pursuant to a policy adopted by the Board, the term of office for each Trustee shall be until the Independent Trustee reaches age 75 or an Interested Trustee reaches age 75. The Board may change or grant exceptions from this policy at any time without shareholder approval. A Trustee may resign or be removed by a vote of the other Trustees or the holders of a majority of the outstanding shares of the Trust at any time. Vacancies on the Board can be filled by the action of a majority of the Trustees, provided that after filling such vacancy at least two-thirds of the Trustees have been elected by the shareholders.
Name and Date of Birth | | Position
Held with
the Trust | | Year
Commenced
Service | | Principal Occupation
During Past 5 Years | | Other
Directorships
Held During
Past 5 Years | |
Independent Trustees. | |
Jefferson C. Boyce, (c)
Born September 1957 | | Independent Chairman | | | 2021 | | | Senior Managing Director, New York Life Investments, LLC (1992-2012) | | Westhab, Inc. | |
John C. Walters,
Born February 1962 | | Trustee | | | 2019 | | | Retired. Mr. Walters brings significant Board experience including active involvement with the board of a Fortune 500 company, and a proven record of leading large, complex financial organizations. He has a demonstrated record of success in distribution, manufacturing, investment brokerage, and investment management in both the retail and institutional investment businesses. He has substantial experience in the investment management business with a demonstrated ability to develop and drive strategy while managing operation, financial, and investment risk. | | Guardian Variable Products Trust (16 series), Lead Independent Director; Amerilife Holdings LLC, Director; Stadion Money Management; Director; University of North Carolina (Chapel Hill), Member Board of Governors | |
34
USAA Mutual Funds Trust | | Supplemental Information — continued
May 31, 2021 | |
(Unaudited)
Name and Date of Birth | | Position
Held with
the Trust | | Year
Commenced
Service | | Principal Occupation
During Past 5 Years | | Other
Directorships
Held During
Past 5 Years | |
Robert L. Mason, Ph.D.,
Born July 1946 | | Trustee | | | 1997 | | | Adjunct Professor in the Department of Management Science and Statistics in the College of Business at the University of Texas at San Antonio (since 2001); Institute Analyst, Southwest Research Institute (March 2002-January 2016) | | None | |
Dawn M. Hawley,
Born February 1954 | | Trustee | | | 2014 | | | Manager of Finance, Menil Foundation, Inc. (May 2007-June 2011), which is a private foundation that oversees the assemblage of sculptures, prints, drawings, photographs, and rare books. Director of Financial Planning and Analysis and Chief Financial Officer, AIM Management Group, Inc. (October 1987-January 2006) | | None | |
Paul L. McNamara,
Born July 1948 | | Trustee | | | 2012 | | | Director, Cantor Opportunistic Alternatives Fund, LLC (March 2010-February 2014), which is a closed-end fund of funds by Cantor Fitzgerald Investment Advisors, LLC | | None | |
35
USAA Mutual Funds Trust | | Supplemental Information — continued
May 31, 2021 | |
(Unaudited)
Name and Date of Birth | | Position
Held with
the Trust | | Year
Commenced
Service | | Principal Occupation
During Past 5 Years | | Other
Directorships
Held During
Past 5 Years | |
Richard Y. Newton III,
Born January 1956 | | Trustee | | | 2017 | | | Director, Elta North America (01/18-present), which is a global leader in the design, manufacture, and support of innovative electronic systems in the ground, maritime, airborne, and security domains for the nation's warfighters, security personnel, and first responders; Managing Partner, Pioneer Partnership Development Group (December 2015-present)); Executive Director, The Union League Club of New York (June 2014-November 2015): Executive Vice President, Air Force Association (August 2012-May 2014); Lieutenant General, United States Air Force (January 2008-June 2012) | | PredaSAR Corp. | |
Barbara B. Ostdiek, Ph.D.,
Born March 1964 | | Trustee | | | 2008 | | | Senior Associate Dean of Degree Programs at Jesse H. Jones Graduate School of Business at Rice University (since 2013); Associate Professor of Finance at Jessie H. Jones Graduate School of Business at Rice University (since 2001) | | None | |
Effective at the close of business on December 31, 2020, Michael F. Reimherr retired from the Board of Trustees.
36
USAA Mutual Funds Trust | | Supplemental Information — continued
May 31, 2021 | |
(Unaudited)
Name and Date of Birth | | Position
Held with
the Trust | | Year
Commenced
Service | | Principal Occupation
During Past 5 Years | | Other
Directorships
Held During
Past 5 Years | |
Interested Trustees. | |
David C. Brown, (b)
Born May 1972 | | Trustee | | | 2019 | | | Chairman and Chief Executive Officer (since 2013), Victory Capital Management Inc.; Chairman and Chief Executive Officer, Victory Capital Holdings, Inc. (since 2013). Mr. Brown brings to the Board extensive business, finance and leadership skills gained and developed through years of experience in the financial services industry, including his tenure overseeing the strategic direction as CEO of Victory Capital. These skills, combined with Mr. Brown's extensive knowledge of the financial services industry and demonstrated success in the development and distribution of investment strategies and products, enable him to provide valuable insights to the Board and strategic direction for the Funds. | | Trustee, Victory Portfolios (41 series), Victory Portfolios II (26 series), Victory Variable Insurance Funds (8 series) | |
37
USAA Mutual Funds Trust | | Supplemental Information — continued
May 31, 2021 | |
(Unaudited)
Name and Date of Birth | | Position
Held with
the Trust | | Year
Commenced
Service | | Principal Occupation
During Past 5 Years | | Other
Directorships
Held During
Past 5 Years | |
Daniel S. McNamara, (b)(c)(d)
Born June 1966 | | Trustee | | | 2012 | | | Trustee, President, and Vice Chairman of USAA ETF Trust (June 2017-June 2019); President of Financial Advice & Solutions Group (FASG), USAA (February 2013-March 2021); Director of USAA Investment Services Company (ISCO) (formerly USAA Investment Management) (September 2009-March 2021); President, Asset Management Company (AMCO) (August, 2011-June 2019); Senior Vice President of USAA Financial Planning Services Insurance Agency, Inc. (FPS) (April 2011-March 2021); Chairman of Board of ISCO (April 2013-December 2020); Director of AMCO (August 2011-June 2019); President and Director of USAA Shareholder Account Services (SAS) (October 2009-June 2019); Director and Vice Chairman of FPS (December 2013-March 2021); President and Director of USAA Investment Corporation (ICORP) (March 2010-March 2021); Chairman of Board of ICORP (December 2013-March 2021); Director of USAA Financial Advisors, Inc. (FAI) (December 2013-March 2021); Chairman of Board of FAI (March 2015-March 2021). Mr. McNamara brings to the Board extensive experience in the financial services industry, including experience as an officer of the Trust. | | None | |
(b) Mr. Dan McNamara is deemed an "interested person" due to his previous position as Director of AMCO, the former investment adviser of the Funds. Mr. Brown is deemed an "interested person" due to his position as Chief Executive Officer of Victory Capital, investment adviser to the Funds.
(c) Effective at the close of business on December 31, 2020, Jefferson C. Boyce replaced Dan McNamara as Chair of the Board and assumed the title of Independent Chair.
(d) Effective July 2, 2021, Mr. Dan McNamara became an Independent Trustee to the Funds.
The Statement of Additional Information includes additional information about the Trustees of the Trust and is available, without charge, on the SEC's website at www.sec.gov and/or by calling (800)-235-8396.
38
USAA Mutual Funds Trust | | Supplemental Information — continued
May 31, 2021 | |
(Unaudited)
Officers:
The officers of the Trust, their ages, commencement of service and their principal occupations during the past five years, are detailed in the following table. Each officer serves until the earlier of his or her resignation, removal, retirement, death, or the election of a successor. The mailing address of each officer of the Trust is 15935 La Cantera Pkwy, San Antonio, TX, 78256. The officers of the Trust receive no compensation directly from the Trust for performing the duties of their offices.
Name and Date of Birth | | Position with
the Trust | | Year
Commenced
Service | | Principal Occupation During Past 5 Years | |
Interested Officers.
Christopher K. Dyer,
Born February 1962 | | President | | | 2019 | | | Director of Fund Administration, Victory Capital (since 2004); Chief Operating Officer, Victory Capital Services, Inc. (since 2020) | |
Scott A Stahorsky,
Born July 1969 | | Vice President | | | 2019 | | | Manager, Fund Administration, Victory Capital (since 2015) | |
James K. De Vries,
Born April 1969 | | Treasurer | | | 2018 | | | Executive Director, Victory Capital Management Inc. (since 2019); Treasurer, USAA ETF Trust (September 2018-June 2019); Executive Director, Investment and Financial Administration, USAA (April 2012-June 2019); Assistant Treasurer, USAA ETF Trust (June 2017-September 2018); Assistant Treasurer, USAA Mutual Funds Trust (December 2013-February 2018) | |
Allan Shaer,
Born March 1965 | | Assistant Treasurer | | | 2019 | | | Senior Vice President, Financial Administration, Citi Fund Services Ohio, Inc. (since 2016); Vice President, Mutual Fund Administration, JP Morgan Chase (2011-2016) | |
Carol D. Trevino,
Born October 1965 | | Assistant Treasurer | | | 2018 | | | Director, Accounting and Finance, Victory Capital Management Inc. (since 2019); Accounting/Financial Director, USAA (December 2013-June 2019); Assistant Treasurer, USAA ETF Trust (September 2018-June 2019) | |
Erin G. Wagner,
Born February 1974 | | Secretary | | | 2019 | | | Deputy General Counsel, the Adviser (since 2013) | |
Charles Booth,
Born April 1960 | | Anti-Money Laundering Compliance Officer and Identity Theft Officer | | | 2019 | | | Director, Regulatory Administration and CCO Support Services, Citi Fund Services Ohio, Inc. (since 2007) | |
Amy Campos,
Born July 1976 | | Chief Compliance Officer | | | 2019 | | | Chief Compliance Officer, USAA Mutual Funds Trust (since 2019); Executive Director, Deputy Chief Compliance Officer, USAA Mutual Funds Trust and USAA ETF Trust (July 2017-June 2019); Compliance Director, USAA Mutual Funds Trust (2014-July 2017) | |
39
USAA Mutual Funds Trust | | Supplemental Information — continued
May 31, 2021 | |
(Unaudited)
Proxy Voting and Portfolio Holdings Information
Proxy Voting:
Information regarding the policies and procedures the Fund uses to determine how to vote proxies relating to portfolio securities is available without charge, upon request, by calling (800) 235-8396. The information is also included in the Fund's Statement of Additional Information, which is available on the SEC's website at www.sec.gov.
Information relating to how the Fund voted proxies relating to portfolio securities held during the most recent 12 months ended June 30 is available on the SEC's website at www.sec.gov.
Availability of Schedules of Portfolio Investments:
The Trust files a complete list of Schedules of Portfolio Investments with the SEC for the first and third quarter of each fiscal year on Form N-PORT. Form N-PORT is available on the SEC's website at www.sec.gov.
Expense Examples
As a shareholder of the Fund, you may incur two types of costs: (1) transaction costs, including sales charges (loads) on purchases; and (2) ongoing costs, including management fees and other Fund expenses. These examples are intended to help you understand your ongoing costs (in dollars) of investing in the Fund and to compare these costs with the ongoing costs of investing in other mutual funds.
These examples are based on an investment of $1,000 invested at the beginning of the period and held for the entire period from December 1, 2020, through May 31, 2021.
The Actual Expense figures in the table below provide information about actual account values and actual expenses. You may use the information below, together with the amount you invested, to estimate the expenses that you paid over the period. Simply divide your account value by $1,000 (for example, an $8,600 account value divided by $1,000 = 8.6), then multiply the result by the number in the table under the heading entitled "Actual Expenses Paid During Period" to estimate the expenses you paid on your account during this period.
The Hypothetical Expense figures in the table below provide information about hypothetical account values and hypothetical expenses based on the Fund's actual expense ratio and an assumed rate of return of 5% per year before expenses, which is not the Fund's actual return. The hypothetical account values and expenses may not be used to estimate the actual ending account balance or expenses you paid for the period. You may use this information to compare this 5% hypothetical example with the 5% hypothetical examples that appear in shareholder reports of other funds.
Please note the expenses shown in the table below are meant to highlight your ongoing costs only and do not reflect any transactional costs. If these transactional costs were included, your costs would have been higher.
| | | Beginning
Account
Value
12/1/20 | | Actual
Ending
Account
Value
5/31/21 | | Hypothetical
Ending
Account
Value
5/31/21 | | Actual
Expenses
Paid
During
Period
12/1/20-
5/31/21* | | Hypothetical
Expenses
Paid
During
Period
12/1/20-
5/31/21* | | Annualized
Expense
Ratio
During
Period
12/1/20-
5/31/21 | |
Fund Shares | | $ | 1,000.00 | | | $ | 1,000.10 | | | $ | 1,022.79 | | | $ | 2.14 | | | $ | 2.17 | | | | 0.43 | % | |
Institutional Shares | | | 1,000.00 | | | | 1,001.50 | | | | 1,023.19 | | | | 1.75 | | | | 1.77 | | | | 0.35 | % | |
Class A | | | 1,000.00 | | | | 999.40 | | | | 1,021.44 | | | | 3.49 | | | | 3.53 | | | | 0.70 | % | |
Class R6 | | | 1,000.00 | | | | 1,001.60 | | | | 1,023.29 | | | | 1.65 | | | | 1.66 | | | | 0.33 | % | |
* Expenses are equal to the average account value multiplied by the Fund's annualized expense ratio multiplied by 182/365 (the number of days in the most recent fiscal half-year divided by the number of days in the fiscal year).
40
USAA Mutual Funds Trust | | Supplemental Information — continued
May 31, 2021 | |
(Unaudited)
Additional Federal Income Tax Information
The following federal tax information related to the Fund's fiscal year ended May 31, 2021, is provided for information purposes only and should not be used for reporting to federal or state revenue agencies. Federal tax information for the calendar year will be reported to you on Form 1099-DIV in January 2022.
With respect to distributions paid, the Fund designates the following amounts (or, if subsequently determined to be different, the maximum amount allowable) for the fiscal year ended May 31, 2021 (amounts in thousands):
| | Long-Term
Capital Gain
Distributions | |
| | | | | $ | 3,283 | | |
41
USAA Mutual Funds Trust | | Supplemental Information — continued
May 31, 2021 | |
(Unaudited)
Considerations of the Board in Continuing the Investment Advisory Agreement (the "Agreement")
USAA Government Securities Fund (the "Fund")
At a meeting of the Board of Trustees (the "Board") held on December 10-11, 2020, the Board, including the Trustees who are not "interested persons" (as that term is defined in the Investment Company Act of 1940, as amended) of the Trust (the "Independent Trustees"), approved for an annual period the continuance of the Investment Advisory Agreement (the "Advisory Agreement") between the Trust and Victory Capital Management Inc. (the "Adviser") with respect to the Fund. Prior to the December 10-11, 2020 meeting at which the Advisory Agreement was approved, the Independent Trustees also discussed and considered information regarding the proposed continuation of the Advisory Agreement at a meeting held on November 19, 2020.
In advance of the foregoing meetings, the Trustees received and considered a variety of information relating to the Advisory Agreement and the Adviser, and were given the opportunity to ask questions and request additional information from management. The information provided to the Board included, among other things: (i) a separate report prepared by an independent third party of mutual fund data, which provided a statistical analysis comparing the Fund's investment performance, expenses, and fees to comparable investment companies; (ii) information concerning the services rendered to the Fund, as well as information regarding the Adviser's revenues and costs of providing services to the Fund and compensation paid to affiliates of the Adviser; and (iii) information about the Adviser's operations and personnel. Prior to voting, the Independent Trustees reviewed the proposed continuance of the Advisory Agreement with management and with experienced independent counsel retained by the Independent Trustees ("Independent Counsel") and received materials from such Independent Counsel discussing the legal standards for their consideration of the proposed continuation of the Advisory Agreement with respect to the Fund. The Independent Trustees also reviewed the proposed continuation of the Advisory Agreement with respect to the Fund in private sessions with Independent Counsel at which no representatives of management were present.
At each regularly scheduled meeting of the Board and its committees, the Board receives and reviews, among other things, information concerning the Fund's performance and related services provided by the Adviser. At the meeting at which the renewal of the Advisory Agreement is considered, particular focus is given to information concerning Fund performance, fees and total expenses as compared to comparable investment companies, and the Adviser's profitability with respect to the Fund. However, the Board noted that the evaluation process with respect to the Adviser is an ongoing one. In this regard, the Board's and its committees' consideration of the Advisory Agreement included information previously received at such meetings.
Advisory Agreement
After full consideration of a variety of factors, the Board, including the Independent Trustees, voted to approve the Advisory Agreement. In approving the Advisory Agreement, the Trustees did not identify any single factor as controlling, and each Trustee may have attributed different weights to various factors. Throughout their deliberations, the Independent Trustees were represented and assisted by Independent Counsel.
Nature, Extent, and Quality of Services — In considering the nature, extent, and quality of the services provided by the Adviser under the Advisory Agreement, the Board reviewed information provided by the Adviser relating to its operations and personnel. The Board also took into account its knowledge of the Adviser's management and the quality of the performance of the Adviser's duties through Board meetings, discussions, and reports during the preceding year. The Board considered the fees paid to the Adviser and the services provided to the Fund by the Adviser under the Advisory Agreement, as well as other services provided by the Adviser and its affiliates under other agreements, and the personnel who provide these services. In addition to the investment advisory services provided to the Fund, the Adviser and its affiliates provide administrative services, shareholder services, oversight of Fund accounting, marketing services, assistance in meeting legal and regulatory requirements, and other services necessary for the operation of the Fund and the Trust.
The Board considered the scope of services provided by, and the undertakings required of, the Adviser in connection with those services, including, among other things, maintaining (i) its own and the Fund's compliance programs, (ii) risk management programs, (iii) liquidity risk management programs, and (iv) cybersecurity programs, each of which had expanded over time as a result of regulatory, market, and other developments.
42
USAA Mutual Funds Trust | | Supplemental Information — continued
May 31, 2021 | |
(Unaudited)
The Board also considered the significant risks assumed by the Adviser in connection with the services provided to the Fund, including investment, operational, enterprise, litigation, regulatory, and compliance risks.
The Board considered the Adviser's management style and the performance of the Adviser's duties under the Advisory Agreement. The Board considered the level and depth of knowledge of the Adviser, including the professional experience and qualifications of its senior and investment personnel, as well as current staffing levels. The allocation of the Fund's brokerage, including the Adviser's process for monitoring "best execution," also was considered. The Adviser's role in coordinating the activities of the Fund's other service providers was also considered. The Board also considered the Adviser's risk management processes. The Board considered the Adviser's financial condition and that it had the financial wherewithal to continue to provide the same scope and high quality of services under the Advisory Agreement. In reviewing the Advisory Agreement, the Board focused on the experience, resources, and strengths of the Adviser and its affiliates in managing the Fund, as well as the other funds in the Trust.
The Board also reviewed the compliance and administrative services provided to the Fund by the Adviser and its affiliates, including the Adviser's oversight of the Fund's day-to-day operations and oversight of Fund accounting. The Trustees, guided also by information obtained from their experiences as trustees of the Trust, also focused on the quality of the Adviser's compliance and administrative staff.
Expenses and Performance — In connection with its consideration of the Advisory Agreement, the Board evaluated the Fund's advisory fees and total expense ratio as compared to other open-end investment companies deemed to be comparable to the Fund as determined by the independent third party in its report. The Fund's expenses were compared to (i) a group of investment companies chosen by the independent third party to be comparable to the Fund based upon certain factors, including fund type, comparability of investment objective and classification, sales load type, asset size, and expense components (the "expense group") and (ii) a larger group of investment companies with the same investment classification/objective as the Fund regardless of asset size, excluding outliers (the "expense universe"). Among other data, the Board noted that the Fund's management fee rate — which includes advisory and administrative services and the effects of any performance adjustment1, as well as any fee waivers and reimbursements — was below the medians of its expense group and its expense universe. The data indicated that the Fund's total expenses, including after any reimbursements, were below the medians of its expense group and its expense universe. The Board also took into account the Adviser's current undertakings to maintain expense limitations for the Fund. The Board took into account the various other services provided to the Fund by the Adviser and its affiliates, and noted the high quality of services received by the Fund.
In considering the Fund's performance, the Board noted that it reviews, at its regularly scheduled meetings, information about the Fund's performance results. The Trustees also reviewed various comparative data provided to them in connection with their consideration of the renewal of the Advisory Agreement, including, among other information, a comparison of the Fund's average annual total returns relative to its Lipper index, and other mutual funds deemed to be in its peer group by the independent third party in its report (the "performance universe"). The Fund's performance universe consisted of the Fund and all retail and institutional open-end investment companies with the same classification/objective as the Fund, regardless of asset size or primary channel of distribution. This comparison indicated that, among other data, the Fund's performance was below the average of its performance universe for the one-, three-, and five-year periods ended September 30, 2020, and was above the average of its performance universe for the ten-year period ended September 30, 2020, and was below its Lipper index for the one-, three-, five-, and ten-year periods ended September 30, 2020. The Board took into account management's discussion of the Fund's performance, including the impact of market conditions on the Fund's performance.
Compensation and Profitability — The Board took into consideration the level and method of computing the management fee. The information considered by the Board included operating profit margin information for the Adviser's business as a whole. The Board also received and considered profitability information related to the management revenues from the Fund. This information included a review of the methodology used in the allocation of certain costs to the Fund. In considering the profitability data with respect to the Fund, the Trustees noted that the Adviser waived a portion of its management fee and/or reimbursed certain expenses with respect
1 The Adviser has agreed that no performance adjustment (positive or negative) would be made to the amount payable to the Adviser from July 1, 2019, through June 30, 2020.
43
USAA Mutual Funds Trust | | Supplemental Information — continued
May 31, 2021 | |
(Unaudited)
to the Fund. The Trustees reviewed the profitability of the Adviser's relationship with the Fund before tax expenses. The Board was also provided with a profitability analysis of other publicly traded asset managers prepared by an independent information service. In reviewing the overall profitability of the management fee to the Adviser, the Board also considered the fact that the Adviser and its affiliates provide shareholder servicing and administrative services to the Fund for which they receive compensation. The Board also considered the possible direct and indirect benefits to the Adviser from its relationship with the Trust, including that the Adviser may derive reputational and other benefits from its association with the Fund. The Trustees recognized that the Adviser should be entitled to earn a reasonable level of profits in exchange for the level of services it provides to the Fund and the entrepreneurial and other risks that it assumes as Adviser.
Economies of Scale — The Board considered whether there should be changes in the management fee rate or structure in order to enable the Fund to participate in any economies of scale. The Board also considered the fee waiver and expense reimbursement arrangements by the Adviser. The Board also considered the effect of the Fund's change in size, if any, on its performance and fees, noting that the Fund may realize other economies of scale if assets increase proportionally more than expenses. The Board determined that the current investment management fee structure was reasonable.
Conclusions — The Board reached the following conclusions regarding the Fund's Advisory Agreement with the Adviser: (i) the Adviser has demonstrated that it possesses the capability and resources to perform the duties required of it under the Advisory Agreement; (ii) the Adviser maintains an appropriate compliance program; (iii) the overall performance of the Fund is reasonable in relation to the performance of funds with similar investment objectives and to relevant indices; (iv) the Fund's advisory expenses are reasonable in relation to those of similar funds and to the services to be provided by the Adviser; and (v) the Adviser's and its affiliates' level of profitability from their relationship with the Fund is reasonable in light of the nature and high quality of services provided by the Adviser and the type of fund. Based on its conclusions, the Board determined that continuation of the Advisory Agreement would be in the best interests of the Fund and its shareholders.
44
USAA Mutual Funds Trust | | Supplemental Information — continued
May 31, 2021 | |
(Unaudited)
Liquidity Risk Management Program:
The USAA Mutual Funds have adopted and implemented a written liquidity risk management program (the "LRMP") as required by Rule 22e-4 under the Investment Company Act of 1940, as amended. The LRMP is reasonably designed to assess and manage the Fund's liquidity risk, taking into consideration the Fund's investment strategy and the liquidity of its portfolio investments during normal and reasonably foreseeable stressed market conditions; its short and long-term cash flow projections; and its cash holdings and access to other liquidity management tools such as available funding sources including the Victory Funds Complex Interfund Lending Facility and Line of Credit (discussed in the Notes to Financial Statements). The USAA Mutual Funds' Board of Trustees approved the appointment of the Fund's investment adviser, Victory Capital Management Inc. ("Victory Capital"), as the administrator of the LRMP.
Victory Capital manages liquidity risks associated with the Fund's investments by monitoring, among other things, cash and cash equivalents, any use of derivatives, the concentration of investments, the appropriateness of the Fund's investment strategy, and by classifying every Fund investment as either highly liquid, moderately liquid, less liquid, or illiquid on at least a monthly basis. To assist with the classification of Fund investments, Victory Capital has retained a third-party provider of liquidity evaluation services. This provider determines preliminary liquidity classifications for all portfolio holdings based upon portfolio-level data and certain assumptions provided by Victory Capital. Victory Capital reviews the preliminary liquidity classifications and, when appropriate, considers other information including input from the Fund's portfolio managers (including the portfolio managers employed by any investment sub-advisers) in determining final liquidity classifications.
At a meeting held on March 10, 2021, Victory Capital provided an oral and written report to the Trustees on the operation and effectiveness of the LRMP during the previous year. The report from Victory Capital concluded that the Fund did not experience any significant liquidity challenges during the covered period, and the Fund's LRMP is reasonably designed to assess and manage its liquidity risk. The report also concluded that the LRMP continues to operate adequately and effectively to enable Victory Capital to oversee and manage liquidity risk and ensure the Fund is able to meet redemption requests without significant dilution to the remaining investors' interest in the Fund. During the review period, the Fund's portfolio consisted primarily of highly liquid investments, which are defined as cash and any investments that the Fund reasonably expects to be converted to cash in current market conditions in three business days or less without significantly changing the market value of the investment. Therefore, the Fund has not adopted a highly liquid investment minimum. The Funds' investments were below the limitation on illiquid investments during the review period. Additionally, Victory Capital indicated that no events occurred that would require the filing of Form N-LIQUID and recommended no material changes to the LRMP.
45
Privacy Policy
Protecting the Privacy of Information
The Trust respects your right to privacy. We also know that you expect us to conduct and process your business in an accurate and efficient manner. To do so, we must collect and maintain certain personal information about you. This is the information we collect from you on applications or other forms, and from the transactions you make with us or third parties. It may include your name, address, social security number, account transactions and balances, and information about investment goals and risk tolerance.
We do not disclose any information about you or about former customers to anyone except as permitted or required by law. Specifically, we may disclose the information we collect to companies that perform services on our behalf, such as the transfer agent that processes shareholder accounts and printers and mailers that assist us in the distribution of investor materials. We may also disclose this information to companies that perform marketing services on our behalf. This allows us to continue to offer you Victory investment products and services that meet your investing needs, and to effect transactions that you request or authorize. These companies will use this information only in connection with the services for which we hired them. They are not permitted to use or share this information for any other purpose.
To protect your personal information internally, we permit access only by authorized employees and maintain physical, electronic, and procedural safeguards to guard your personal information.*
* You may have received communications regarding information about privacy policies from other financial institutions which gave you the opportunity to "opt-out" of certain information sharing with companies which are not affiliated with that financial institution. The Trust does not share information with other companies for purposes of marketing solicitations for products other than the Trust. Therefore, the Trust does not provide opt-out options to their shareholders.
P.O. Box 182593
Columbus, Ohio 43218-2593

Visit our website at: | | Call | |
vcm.com | | (800) 235-8396 | |

MAY 31, 2021
Annual Report
USAA Treasury Money Market Trust®
Victory Capital means Victory Capital Management Inc., the investment adviser of the USAA Mutual Funds. USAA Mutual Funds are distributed by Victory Capital Services, Inc., member of FINRA, an affiliate of Victory Capital. Victory Capital and its affiliates are not affiliated with United Services Automobile Association or its affiliates. USAA and the USAA logos are registered trademarks and the USAA Mutual Funds and USAA Investments logos are trademarks of United Services Automobile Association and are being used by Victory Capital and its affiliates under license.
www.vcm.com
News, Information And Education 24 Hours A Day, 7 Days A Week
The Victory Funds site gives fund shareholders, prospective shareholders, and investment professionals a convenient way to access fund information, get guidance, and track fund performance anywhere they can access the Internet. The site includes:
• Detailed performance records
• Daily share prices
• The latest fund news
• Investment resources to help you become a better investor
• A section dedicated to investment professionals
Whether you're a potential investor searching for the fund that matches your investment philosophy, a seasoned investor interested in planning tools, or an investment professional, www.vcm.com has what you seek. Visit us anytime. We're always open.
TABLE OF CONTENTS
Shareholder Letter (Unaudited) | | | 2 | | |
Managers' Commentary (Unaudited) | | | 4 | | |
Investment Overview (Unaudited) | | | 5 | | |
Investment Objective & Portfolio
Holdings (Unaudited) | | | 6 | | |
Schedule of Portfolio Investments | | | 7 | | |
Financial Statements | |
Statement of Assets and Liabilities | | | 8 | | |
Statement of Operations | | | 9 | | |
Statements of Changes in Net Assets | | | 10 | | |
Financial Highlights | | | 12 | | |
Notes to Financial Statements | | | 14 | | |
Report of Independent
Registered Public Accounting Firm | | | 21 | | |
Supplemental Information (Unaudited) | | | 22 | | |
Trustees' and Officers' Information | | | 22 | | |
Proxy Voting and Portfolio Holdings Information | | | 28 | | |
Expense Example | | | 28 | | |
Advisory Contract Agreement | | | 29 | | |
Privacy Policy (inside back cover) | | | |
This report is for the information of the shareholders and others who have received a copy of the currently effective prospectus of the Fund, managed by Victory Capital Management Inc. It may be used as sales literature only when preceded or accompanied by a current prospectus, which provides further details about the Fund.
IRA DISTRIBUTION WITHHOLDING DISCLOSURE
We generally must withhold federal income tax at a rate of 10% of the taxable portion of your distribution and, if you live in a state that requires state income tax withholding, at your state's tax rate. However, you may elect not to have withholding apply or to have income tax withheld at a higher rate. Any withholding election that you make will apply to any subsequent distribution unless and until you change or revoke the election. If you wish to make a withholding election, or change or revoke a prior withholding election, call (800) 235-8396, and form W-4P (OMB No. 1545-0074 withholding certificate for pension or annuity payments) will be electronically sent.
If you do not have a withholding election in place by the date of a distribution, federal income tax will be withheld from the taxable portion of your distribution at a rate of 10%. If you must pay estimated taxes, you may be subject to estimated tax penalties if your estimated tax payments are not sufficient and sufficient tax is not withheld from your distribution.
For more specific information, please consult your tax adviser.
• NOT FDIC INSURED • NO BANK GUARANTEE • MAY LOSE VALUE
1
(Unaudited)
Dear Shareholder,
Never a dull moment. A year ago, we were still coming to grips with a global pandemic, hoping for an effective vaccine, and wondering whether the U.S. Federal Reserve's aggressive actions would continue to mollify financial markets. As it turns out, a vaccine was rolled out (domestically) faster than expectations, and the recovery that began during the second quarter of 2020 continued unabated.
Fast forward to today and investors are suddenly more concerned about labor shortages, rising commodity prices, and whether inflation will prove to be transitory or more lasting. If anything, this merely exemplifies that markets are unpredictable and the environment can and will change rapidly.
Reflecting on the past year, we must consider ourselves fortunate despite the myriad challenges. For starters, it was impressive how quickly the various forms of monetary and fiscal stimulus contributed to a rebound in GDP. Of course, it wasn't a straight line upward and there were bouts of elevated volatility in both bond and stock markets. Late in 2020, for example, financial markets were alternately fueled and roiled by a contentious election season, growing optimism for an effective vaccine, and a fluid debate regarding the need for even more stimulus. Ultimately, stocks were propelled higher in the fourth quarter of 2020 as it became clear Congress would provide another dose of stimulus in the form of direct payments, more unemployment insurance, and additional aid to businesses.
As we moved into 2021, stocks continued their upward trajectory. Meanwhile, the yield on the 10-Year U.S. Treasury continued rallying sharply as many investors began to shift their focus. Deflation was out; inflation was in. Indeed, the potential for a new era of inflation and higher interest rates seems to be the new worry du jour.
So how did the numbers shake out after this unusual year? The S&P 500® Index registered an impressive annual return of approximately 40% for this 12-month period ended May 31, 2021. Over this same period, the yield on the 10-Year U.S. Treasury jumped 94 basis points, reflecting both the very low starting rate and substantial fiscal stimulus. At the end of the reporting period, the yield on the 10-Year U.S. Treasury was 1.59%.
The past year is not one we will forget any time soon. There were many hardships, but we should not overlook the positives and remember our collective spirit and perseverance. Markets endured and even surprised to the upside, but perhaps the key takeaway is that investors need to remain calm in the face of adversity and focused on longer-term investment goals. We believe that's the best approach no matter what the markets throw at us.
On the following pages, you will find information relating to your USAA Mutual Funds, brought to you by Victory Capital. If you have any questions regarding the current market dynamics or your specific portfolio or investment plan, we encourage you to contact our Member Service Representatives. Call (800) 235-8396 or visit our website at www.vcm.com.
2
From all of us here at Victory Capital, thank you for letting us help you work toward your investment goals.

Christopher K. Dyer, CFA
President,
USAA Mutual Funds
3
USAA Treasury Money Market Trust
Managers' Commentary
(Unaudited)
• What were the market conditions during the reporting period?
Throughout the 12-month reporting period ending May 31, 2021, the target federal funds ("fed funds") rate was unchanged at a range of between 0.00% and 0.25%. Officials at the U.S. Federal Reserve (the "Fed") set the short-term rate to these low levels in order to support the U.S. economy during the country's battle with COVID-19. Commentary from the Fed indicates that it doesn't expect to raise rates anytime soon. The Fed has said it will keep rates at zero "until it is confident that the economy has weathered recent events and is on track" to achieve its goals of stable prices and strong employment. As a result of the Fed's interest rate target of zero during the reporting period, short-term interest rates remained extremely low. This resulted in extremely low yields on U.S Treasury bills and short-term notes during the reporting period.
• How did the USAA Treasury Money Market Trust (the "Fund") perform during the reporting period?
For the reporting period ended May 31, 2021, the Fund had a return of 0.03%, compared to an average of 0.02% for the funds in the Lipper U.S. Treasury Money Market Funds category.
• What strategies did you employ during the period?
In keeping with our investment approach, we continued to invest the Fund in securities with maturities of 397 days or less, that are backed by the full faith and credit of the U.S. government. During the reporting period, the Fund lengthened its weighted average maturity in order to earn as much yield as possible. The Fund also lowered its weighting in U.S. Treasury floating-rate notes in anticipation that short-term interest rates would continue to move down over the near term.
Thank you for allowing us to assist in your investment needs.
4
USAA Treasury Money Market Trust
Investment Overview
(Unaudited)
Average Annual Total Return
Year Ended May 31, 2021
| | Fund Shares | |
INCEPTION DATE | | 2/1/91 | |
| | Net Asset Value | |
One Year | | | 0.03 | % | |
Five Year | | | 0.82 | % | |
Ten Year | | | 0.41 | % | |
The performance data quoted represents past performance and current returns may be lower or higher. The investment return and principal value will fluctuate so that an investor's shares, when redeemed, may be worth more or less than the original cost. To obtain performance information current to the most recent month's end, please visit www.vcm.com.
You could lose money by investing in the Fund. Although the Fund seeks to preserve the value of your investment at $1 per share, it cannot guarantee it will do so. The Fund may impose a fee upon the sale of your shares or may temporarily suspend your ability to sell shares if the Fund's liquidity falls below required minimums because of market conditions or other factors.
An investment in the Fund is not a deposit in a bank, and is not insured or guaranteed by the Federal Deposit Insurance Corporation or any other government agency. The Fund's sponsor has no legal obligation to provide financial support to the Fund, and you should not expect that the sponsor will provide financial support to the Fund at any time.
Total return measures the price change in a share assuming the reinvestment of all net investment income and realized capital gain distributions, if any. The total returns quoted do not reflect adjustments made to the enclosed financial statements in accordance with U.S. Generally Accepted Accounting Principles or the deduction of taxes that a shareholder would pay on net investment income and realized capital gain distributions, including reinvested distributions, or redemptions of shares. The total return figures set forth above include all waivers of fees. Without such fee waivers, the total returns would have been lower.
USAA Treasury Money Market Trust — Growth of $10,000
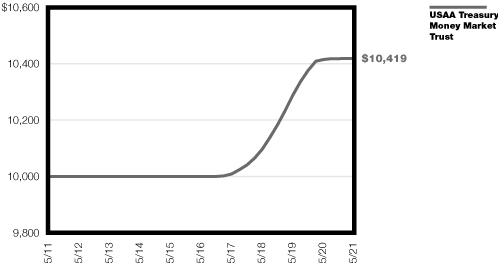
The graph reflects investment of growth of a hypothetical $10,000 investment in the Fund.
The graph and table do not reflect the deduction of taxes that a shareholder would pay on Fund distributions or the redemption of Fund shares.
Past performance is not indicative of future results.
5
USAA Mutual Funds Trust
USAA Treasury Money Market Trust | | May 31, 2021 | |
(Unaudited)
Investment Objective and Portfolio Holdings:
The Fund's investment objective seeks to provide investors maximum current income while maintaining the highest degree of safety and liquidity.
Portfolio Mix
May 31, 2021
(% of Net Assets)
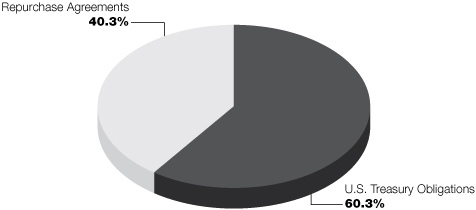
Percentages are of the net assets of the Fund and may not equal 100%.
Refer to the Schedule of Portfolio Investments for a complete list of securities.
6
USAA Mutual Funds Trust
USAA Treasury Money Market Trust | | Schedule of Portfolio Investments
May 31, 2021 | |
(Amounts in Thousands, Except for Shares)
Security Description | | Principal
Amount | | Value | |
U.S. Treasury Obligations (60.3%) | |
U.S. Treasury Bills
0.03%, 6/17/21 (a) | | $ | 25,000 | | | $ | 24,999 | | |
0.02%, 7/1/21 (a) | | | 25,000 | | | | 24,999 | | |
0.04%, 7/6/21 (a) | | | 25,000 | | | | 24,999 | | |
0.04%, 7/15/21 (a) | | | 25,000 | | | | 25,000 | | |
0.02%, 8/12/21 (a) | | | 25,000 | | | | 24,999 | | |
0.05%, 8/26/21 (a) | | | 25,000 | | | | 24,997 | | |
0.02%, 8/31/21 (a) | | | 25,000 | | | | 24,999 | | |
0.04%, 9/9/21 (a) | | | 25,000 | | | | 24,997 | | |
0.05%, 9/16/21 (a) | | | 25,000 | | | | 24,996 | | |
0.04%, 9/23/21 (a) | | | 25,000 | | | | 24,997 | | |
0.04%, 10/14/21 (a) | | | 25,000 | | | | 24,997 | | |
0.03%, 11/26/21 (a) | | | 25,000 | | | | 24,997 | | |
Total U.S. Treasury Obligations (Cost $299,976) | | | 299,976 | | |
Repurchase Agreements (40.3%) | |
Bank of America Corp., 0.01%, 6/1/21, purchased on 5/28/21, with a
maturity date of 6/1/21, with a value of $200,000
(collateralized by U.S. Treasury Inflation Note Index, 0.25%,
due 7/15/29, with a value of $204,000) (b) | | | 200,000 | | | | 200,000 | | |
Total Repurchase Agreements (Cost $200,000) | | | 200,000 | | |
Total Investments (Cost $499,976) — 100.6% | | | 499,976 | | |
Liabilities in excess of other assets — (0.6)% | | | (3,199 | ) | |
NET ASSETS — 100.00% | | $ | 496,777 | | |
(a) Rate represents the effective yield at May 31, 2021.
(b) U.S. Treasury inflation-indexed notes — designed to provide a real rate of return after being adjusted over time to reflect the impact of inflation. Their principal value periodically adjusts to the rate of inflation. They trade at the prevailing real, or after inflation, interest rates. The U.S. Treasury guarantees repayment of these securities of at least their face value in the event of sustained deflation or a drop in prices.
See notes to financial statements.
7
USAA Mutual Funds Trust | | Statement of Assets and Liabilities
May 31, 2021 | |
(Amounts in Thousands, Except Per Share Amounts)
| | | USAA
Treasury Money
Market Trust | |
Assets: | |
Investments, at value (Cost $299,976) | | $ | 299,976 | | |
Repurchase agreements, at value (Cost $200,000) | | | 200,000 | | |
Receivables: | |
Interest | | | — | (a) | |
Capital shares issued | | | 306 | | |
From Adviser | | | 303 | | |
Prepaid expenses | | | 17 | | |
Total Assets | | | 500,602 | | |
Liabilities: | |
Payables: | |
Distributions | | | — | (a) | |
To custodian | | | 3,555 | | |
Capital shares redeemed | | | 71 | | |
Accrued expenses and other payables: | |
Investment advisory fees | | | 53 | | |
Administration fees | | | 42 | | |
Custodian fees | | | 2 | | |
Transfer agent fees | | | 44 | | |
Compliance fees | | | — | (a) | |
Trustees' fees | | | 1 | | |
Other accrued expenses | | | 57 | | |
Total Liabilities | | | 3,825 | | |
Net Assets: | |
Capital | | | 496,777 | | |
Total accumulated earnings/(loss) | | | — | (a) | |
Net Assets | | $ | 496,777 | | |
Shares (unlimited number of shares authorized with no par value): | | | 496,778 | | |
Net asset value, offering and redemption price per share: (b) | | $ | 1.00 | | |
(a) Rounds to less than $1 thousand.
(b) Per share amount may not recalculate due to rounding of net assets and/or shares outstanding.
See notes to financial statements.
8
USAA Mutual Funds Trust | | Statement of Operations
For the Year Ended May 31, 2021 | |
(Amounts in Thousands)
| | | USAA
Treasury Money
Market Trust | |
Investment Income: | |
Interest | | $ | 821 | | |
Total Income | | | 821 | | |
Expenses: | |
Investment advisory fees | | | 649 | | |
Administration fees | | | 519 | | |
Sub-Administration fees | | | 7 | | |
Custodian fees | | | 21 | | |
Transfer agent fees | | | 520 | | |
Trustees' fees | | | 53 | | |
Compliance fees | | | 6 | | |
Legal and audit fees | | | 59 | | |
State registration and filing fees | | | 59 | | |
Other expenses | | | 103 | | |
Total Expenses | | | 1,996 | | |
Expenses waived/reimbursed by Adviser | | | (1,348 | ) | |
Net Expenses | | | 648 | | |
Net Investment Income | | | 173 | | |
Net realized gains (losses) from investments | | | — | (a) | |
Change in net assets resulting from operations | | $ | 173 | | |
(a) Rounds to less than $1 thousand.
See notes to financial statements.
9
USAA Mutual Funds Trust | | Statements of Changes in Net Assets | |
(Amounts in Thousands)
| | | USAA
Treasury Money
Market Trust | |
| | | Year
Ended
May 31, 2021 | | Year
Ended
May 31, 2020 | |
From Investments: | |
Operations: | |
Net investment income | | $ | 173 | | | $ | 65,177 | | |
Net realized gains (losses) from investments | | | — | (a) | | | — | | |
Change in net assets resulting from operations | | | 173 | | | | 65,177 | | |
Change in net assets resulting from distributions to shareholders | | | (173 | ) | | | (65,177 | ) | |
Change in net assets resulting from capital transactions | | | (47,136 | ) | | | (4,315,085 | ) | |
Change in net assets | | | (47,136 | ) | | | (4,315,085 | ) | |
Net Assets: | |
Beginning of period | | | 543,913 | | | | 4,858,998 | | |
End of period | | $ | 496,777 | | | $ | 543,913 | | |
Capital Transactions: | |
Proceeds from shares issued | | $ | 161,288 | | | $ | 15,634,427 | | |
Distributions reinvested | | | 171 | | | | 65,132 | | |
Cost of shares redeemed | | | (208,595 | ) | | | (20,014,644 | ) | |
Change in net assets resulting from capital transactions | | $ | (47,136 | ) | | $ | (4,315,085 | ) | |
Share Transactions: | |
Issued | | | 161,289 | | | | 15,634,427 | | |
Reinvested | | | 171 | | | | 65,132 | | |
Redeemed | | | (208,595 | ) | | | (20,014,644 | ) | |
Change in Shares | | | (47,135 | ) | | | (4,315,085 | ) | |
(a) Rounds to less than $1 thousand.
See notes to financial statements.
10
This page is intentionally left blank.
11
USAA Mutual Funds Trust | | Financial Highlights | |
For a Share Outstanding Throughout Each Period
| | | | | Investment Activities | | Distributions to
Shareholders From | |
| | | Net Asset
Value,
Beginning
of Period | | Net
Investment
Income | | Net Realized
and Unrealized
Gains (Losses)
on Investments | | Total from
Investment
Activities | | Net
Investment
Income | | Total
Distributions | |
USAA Treasury Money Market Trust | |
Year Ended:
May 31, 2021 | | $ | 1.00 | | | | — | (a)(b) | | | — | (b) | | | — | (b) | | | — | (b) | | | — | (b) | |
May 31, 2020 | | $ | 1.00 | | | | 0.01 | (a) | | | — | | | | 0.01 | | | | (0.01 | ) | | | (0.01 | ) | |
May 31, 2019 | | $ | 1.00 | | | | 0.02 | | | | — | | | | 0.02 | | | | (0.02 | ) | | | (0.02 | ) | |
May 31, 2018 | | $ | 1.00 | | | | 0.01 | | | | — | | | | 0.01 | | | | (0.01 | ) | | | (0.01 | ) | |
May 31, 2017 | | $ | 1.00 | | | | — | (b) | | | — | | | | — | (b) | | | — | (b) | | | — | (b) | |
* Assumes reinvestment of all net investment income and realized capital gain distributions, if any, during the period. Includes adjustments in accordance with U.S. Generally Accepted Accounting Principles and could differ from the Lipper reported return.
^ The net expense ratio may not correlate to the applicable expense limits in place during the period since the current contractual expense limitation is applied for a period beginning July 1, 2019 and in effect through June 30, 2023, instead of coinciding with the Fund's fiscal year end. Details of the current contractual expense limitation in effect can be found in Note 3 of the accompanying Notes to Financial Statements.
(a) Per share net investment income has been calculated using the average daily shares method.
(b) Amount is less than $0.005.
(c) Prior to August 1, 2017, USAA Asset Management Company ("AMCO") (previous Adviser) voluntarily agreed, on a temporary basis, to reimburse management, administrative, or other fees to limit the Fund's expenses and attempt to prevent a negative yield.
See notes to financial statements.
12
USAA Mutual Funds Trust | | Financial Highlights — continued | |
For a Share Outstanding Throughout Each Period
| | | | | Ratios to Average Net Assets | | Supplemental
Data | |
| | | Net Asset
Value,
End of
Period | | Total
Return* | | Net
Expenses^ | | Net
Investment
Income | | Gross
Expenses | | Net Assets,
End of
Period
(000's) | |
USAA Treasury Money Market Trust | |
Year Ended:
May 31, 2021 | | $ | 1.00 | | | | 0.03 | % | | | 0.12 | % | | | 0.03 | % | | | 0.38 | % | | $ | 496,777 | | |
May 31, 2020 | | $ | 1.00 | | | | 1.23 | % | | | 0.33 | % | | | 1.21 | % | | | 0.34 | % | | $ | 543,913 | | |
May 31, 2019 | | $ | 1.00 | | | | 1.88 | % | | | 0.35 | % | | | 1.88 | % | | | 0.35 | % | | $ | 4,858,998 | | |
May 31, 2018 | | $ | 1.00 | | | | 0.89 | %(c) | | | 0.35 | %(c) | | | 0.91 | % | | | 0.35 | % | | $ | 3,732,359 | | |
May 31, 2017 | | $ | 1.00 | | | | 0.08 | % | | | 0.35 | % | | | 0.12 | % | | | 0.39 | % | | $ | 2,626,050 | | |
See notes to financial statements.
13
USAA Mutual Funds Trust | | Notes to Financial Statements
May 31, 2021 | |
1. Organization:
USAA Mutual Funds Trust (the "Trust") is organized as a Delaware statutory trust and is registered under the Investment Company Act of 1940, as amended (the "1940 Act"), as an open-end investment company. The Trust is comprised of 46 funds and is authorized to issue an unlimited number of shares, which are units of beneficial interest with no par value.
The accompanying financial statements are those of the USAA Treasury Money Market Trust (the "Fund"). The Fund is classified as diversified under the 1940 Act.
The Fund operates as a government money market fund in compliance with the requirements of Rule 2a-7 under the 1940 Act; and as a government money market fund, shares of the Fund are available for sale only to accounts that are beneficially owned by natural persons.
The Fund has adopted policies and procedures permitting the Board of Trustees (the "Board") of the Fund to impose a liquidity fee or to temporarily suspend redemptions from the Fund (a "redemption gate") if the Fund's weekly liquid assets fall below specific thresholds, such as during times of market stress. The imposition of a liquidity fee would reduce the amount you would receive upon redemption of your shares of the Fund. The imposition of a redemption gate would temporarily delay your ability to redeem your investments in the Fund.
Under the Trust's organizational documents, its officers and trustees are indemnified against certain liabilities arising out of the performance of their duties to the Fund. In addition, in the normal course of business, the Fund enters into contracts with its vendors and others that provide for general indemnifications. The Fund's maximum exposure under these arrangements is unknown, as this would involve future claims that may be made against the Fund. However, based on experience, the Fund expects that risk of loss to be remote.
2. Significant Accounting Policies:
The following is a summary of significant accounting policies followed by the Trust in the preparation of its financial statements. The policies are in conformity with Generally Accepted Accounting Principles in the United States of America ("GAAP"). The preparation of financial statements in accordance with GAAP requires management to make estimates and assumptions that affect the reported amounts of assets and liabilities and disclosure of contingent assets and liabilities at the date of the financial statements and the reported amounts of income and expenses for the period. Actual results could differ from those estimates. The Fund follows the specialized accounting and reporting requirements under GAAP that are applicable to investment companies under Accounting Standards Codification Topic 946.
Investment Valuation:
The inputs or methodologies used for valuing securities are not necessarily an indication of the risks associated with investing in those securities. For example, money market securities are valued using amortized cost, in accordance with rules under the 1940 Act. Generally, amortized cost approximates the current fair value of a security, but since the value is not obtained from a quoted price in an active market, such securities are reflected as Level 2.
The Fund records investments at fair value. Fair value is defined as the price that would be received to sell an asset or paid to transfer a liability in an orderly transaction between market participants at the measurement date.
The valuation techniques described below maximize the use of observable inputs and minimize the use of unobservable inputs in determining fair value. The inputs used for valuing the Fund's investments are summarized in the three broad levels listed below:
• Level 1 — quoted prices in active markets for identical securities
• Level 2 — other significant observable inputs (including quoted prices for similar securities or interest rates applicable to those securities, etc.)
• Level 3 — significant unobservable inputs (including the Fund's own assumptions in determining the fair value of investments)
14
USAA Mutual Funds Trust | | Notes to Financial Statements — continued
May 31, 2021 | |
Victory Capital Management Inc. ("VCM" or the "Adviser") has established the Pricing and Liquidity Committee (the "Committee"), and subject to the Board oversight, the Committee administers and oversees the Fund's valuation policies and procedures, which are approved by the Board.
Repurchase agreements are valued at cost.
All securities held in the Fund are short-term debt securities, which are valued pursuant to Rule 2a-7 under the 1940 Act. This method values a security at its purchase price, and thereafter, assumes a constant amortization to maturity of any premiums or discounts. Securities for which amortized cost valuations are considered unreliable or for whose values have been materially affected by a significant event are valued in good faith, at fair value, using methods determined by the Committee, under procedures to stabilize net assets and valuation procedures approved by the Board.
Repurchase Agreements:
The Fund may enter into repurchase agreements with commercial banks or recognized security dealers pursuant to the terms of a Master Repurchase Agreement. A repurchase agreement is an arrangement wherein the Fund purchases securities and the seller agrees to repurchase the securities at an agreed upon time and at an agreed upon price. The purchased securities are marked-to-market daily to ensure their value is equal to at least 102% of principal including accrued interest and are held by the Fund, either through its regular custodian or through a special "tri-party" custodian that maintains separate accounts for both the Fund and its counterparty, until maturity of the repurchase agreement. Master Repurchase Agreements typically contain netting provisions, which provide for the net settlement of all transactions and collateral with the Fund through a single payment in the event of default or termination. Repurchase agreements are subject to credit risk, and the Fund's Manager monitors the creditworthiness of sellers with which the Fund may enter into repurchase agreements.
Investments in repurchase agreements as presented on the Schedule of Portfolio Investments are not net settlement amounts but gross. At May 31, 2021, the value of the related collateral exceeded the value of the repurchase agreements, reducing the net settlement amount to zero. Details on the collateral are included on the Schedule of Portfolio Investments.
Investment Transactions and Related Income:
Changes in holdings of investments are accounted for no later than one business day following the trade date. For financial reporting purposes, however, investment transactions are accounted for on trade date on the last business day of the reporting period. Interest income is determined on the basis of coupon interest accrued using the effective interest method which adjusts, where applicable, the amortization of premiums or accretion of discount. Gains or losses realized on sales of securities are recorded on the identified cost basis.
Federal Income Taxes:
It is the Fund's policy to continue to qualify as a regulated investment company by complying with the provisions available to certain investment companies, as defined in applicable sections of the Internal Revenue Code, and to make distributions of net investment income and net realized gains sufficient to relieve it from all, or substantially all, federal income taxes. Accordingly, no provision for federal income taxes is required in the financial statements. The Fund has a tax year end of May 31.
Management of the Fund has reviewed tax positions taken in tax years that remain subject to examination by all major tax jurisdictions, including federal (i.e., the last four tax years, which includes the current fiscal tax year end). Management believes that there is no tax liability resulting from unrecognized tax benefits related to uncertain tax positions taken.
Allocations:
Expenses directly attributable to the Fund are charged to the Fund, while expenses that are attributable to more than one fund in the Trust, or jointly with an affiliated trust, are allocated among the respective funds in the Trust and/or affiliated trust based upon net assets or another appropriate basis.
15
USAA Mutual Funds Trust | | Notes to Financial Statements — continued
May 31, 2021 | |
3. Fees and Transactions with Affiliates and Related Parties:
Investment Advisory Fees:
Investment advisory services are provided to the Fund by the Adviser, which is a New York corporation registered as an investment adviser with the SEC. The Adviser is an indirect wholly owned subsidiary of Victory Capital Holdings, Inc., a publicly traded Delaware corporation, and a wholly owned direct subsidiary of Victory Capital Operating, LLC. The Fund's Investment Adviser fee is accrued daily and paid monthly at an annualized rate of 0.125% of the Fund's average daily net assets. Amounts incurred and paid to VCM for the year ended May 31, 2021, are reflected on the Statement of Operations as Investment Advisory fees.
Administration and Servicing Fees:
VCM serves as the Fund's administrator and fund accountant. Under the Fund Administration, Servicing and Accounting Agreement, VCM is paid for its services an annual fee at a rate of 0.10% of average daily net assets of the Fund. Amounts incurred for the year ended May 31, 2021, are reflected on the Statement of Operations as Administration fees.
The Fund (as part of the Trust) has entered into an agreement to provide compliance services with the Adviser, pursuant to which the Adviser furnishes its compliance personnel, including the services of the Chief Compliance Officer ("CCO"), and other resources reasonably necessary to provide the Trust with compliance oversight services related to the design, administration and oversight of a compliance program for the Trust in accordance with Rule 38a-1 under the 1940 Act. The CCO is an employee of the Adviser, which pays the compensation of the CCO and support staff. Funds in the Trust, Victory Variable Insurance Funds, Victory Portfolios, and Victory Portfolios II (collectively, the "Victory Funds Complex") in the aggregate, compensate the Adviser for these services. Amounts incurred for the year ended May 31, 2021, are reflected on the Statement of Operations as Compliance fees.
Citi Fund Services Ohio, Inc. ("Citi"), an affiliate of Citibank, acts as sub-administrator and sub-fund accountant to the Fund pursuant to a Sub-Administration and Sub-Fund Accounting Services Agreement between VCM and Citi. VCM pays Citi a fee for providing these services. The Fund reimburses VCM and Citi for out-of-pocket expenses incurred in providing these services and certain other expenses specifically allocated to the Fund. Amounts incurred for the year ended May 31, 2021, are reflected on the Statement of Operations as Sub-Administration fees.
Transfer Agency Fees:
Victory Capital Transfer Agency, Inc. ("VCTA"), an affiliate of the Adviser, provides transfer agency services to the Fund. VCTA, an affiliate of the Adviser, provides transfer agent services to the Fund. Transfer agent's fees for the Fund are paid monthly based on a fee accrued daily at an annualized rate of 0.10%, of average daily net assets, plus out-of-pocket expenses. VCTA pays a portion of these fees to certain intermediaries for the administration and servicing of accounts that are held with such intermediaries. Amounts incurred and paid to VCTA for the year ended May 31, 2021, are reflected on the Statement of Operations as Transfer Agent fees.
FIS Investor Services LLC serves as sub-transfer agent and dividend disbursing agent for the Fund pursuant to a Sub-Transfer Agent Agreement between VCTA and FIS Investor Services LLC. VCTA provides FIS Investor Services LLC a fee for providing these services.
Distributor/Underwriting Services:
Victory Capital Services, Inc. (the "Distributor"), an affiliate of the Adviser, serves as distributor for the continuous offering of the shares of the Fund pursuant to a Distribution Agreement between the Distributor and the Trust and receives no fee or other compensation for these services. Effective June 30, 2020, the Distributor's name was changed from Victory Capital Advisers, Inc. The Distributor received no fees or other compensation for such distribution services.
16
USAA Mutual Funds Trust | | Notes to Financial Statements — continued
May 31, 2021 | |
Other Fees:
Citibank serves as the Fund's custodian. The Fund pays Citibank a fee for providing these services. Amounts incurred for the year ended May 31, 2021, are reflected on the Statement of Operations as Custodian fees.
K&L Gates LLP provides legal services to the Trust.
The Adviser has entered into an expense limitation agreement with the Fund until at least June 30, 2023. Under the terms of the agreement, the Adviser has agreed to waive fees or reimburse certain expenses to the extent that ordinary operating expenses incurred in any fiscal year exceed the expense limit for the Fund. Such excess amounts will be the liability of the Adviser. Expenses, interest, taxes, brokerage commissions, and other expenditures that are capitalized in accordance with GAAP, and other extraordinary expenses not incurred in the ordinary course of the Fund's business are excluded from the expense limits. As of May 31, 2021, the expense limit (excluding voluntary waivers) was 0.35%.
Under the terms of the expense limitation agreement, amended May 1, 2021, the Fund has agreed to repay fees and expenses that were waived or reimbursed by the Adviser for a period of up to three years (thirty six (36) months) after the waiver or reimbursement took place, subject to the lesser of any operating expense limits in effect at the time of: (a) the original waiver or expense reimbursement; or (b) the recoupment, after giving effect to the recoupment amount. Prior to May 1, 2021, the Fund was permitted to recoup fees waived and expenses reimbursed for up to three years after the fiscal year in which the waiver or reimbursement took place, subject to the limitations above. This change did not have any effect on the amounts previously reported for recoupment.
In addition, the Adviser agreed to further reimburse fees in excess of the Fund's expense limit agreement of 0.35%. These voluntary reductions, to the extent necessary, are to maintain a certain minimum net yield of the Fund. Under this agreement to reimburse additional fees,the Fund has agreed to repay fees and expenses that were waived or reimbursed by the Adviser for a period up to three years after the fiscal year in which the waiver or reimbursement took place, to the extent any repayments would not cause the Fund's net yield to fall below the Fund's minimum yield at the time of: (a) the original waiver or expense reimbursement; or (b) the expense limit in effect at the time of the extra waiver.
As of May 31, 2021, the following amounts are available to be repaid to the Adviser (amounts in thousands). The Fund has not recorded any amounts available to be repaid as a liability due to an assessment that such repayment is not probable at May 31, 2021.
| Expires 2023 | | Expires 2024 | | Total | |
| $ | 745 | | | $ | 1,348 | | | $ | 2,093 | | |
Certain officers and/or interested trustees of the Fund are also officers and/or employees of the Adviser, administrator, fund accountant, sub-administrator, sub-fund accountant, custodian, and Distributor.
4. Risks:
The Fund may be subject to other risks in addition to these identified risks.
Geopolitical/Natural Disaster Risk — Global economies and financial markets are increasingly interconnected, which increases the possibilities that conditions in one country or region might adversely affect issuers in another country or region. Geopolitical and other risks, including war, terrorism, trade disputes, political or economic dysfunction within some nations, public health crises and related geopolitical events, as well as environmental disasters such as earthquakes, fires, and floods, may add to instability in world economies and markets generally. Changes in trade policies and international trade agreements could affect the economies of many countries in unpredictable ways. Likewise, systemic market dislocations of the kind that occurred during the financial crisis that began in 2008, if repeated, would be highly disruptive to economies and markets, adversely affecting individual companies and industries, securities markets, interest rates, credit ratings, inflation, investor sentiment, and other factors affecting the value of a Fund's investments. Some countries, including the United States, are adopting more protectionist trade policies and moving away from the tighter financial
17
USAA Mutual Funds Trust | | Notes to Financial Statements — continued
May 31, 2021 | |
industry regulations that followed the 2008 financial crisis, which may also affect the value of a Fund's investments.
Political events within the United States at times have resulted, and may in the future result, in a shutdown of government services, which could negatively affect the U.S. economy, decrease the value of a Fund's investments, increase uncertainty in or impair the operation of the U.S. or other securities markets, and degrade investor and consumer confidence, perhaps suddenly and to a significant degree.
An outbreak of disease called COVID-19 has spread internationally. The transmission of COVID-19 and efforts, to contain its spread have resulted in international, national, and local border closings and other significant travel restrictions and disruptions, significant disruptions to business operations, supply chains and consumer activity, significant challenges in healthcare service preparation and delivery, quarantines, and general concern and uncertainty. These negative impacts have caused significant volatility and declines in global financial markets, which have caused losses for Fund investors during and subsequent to period end. The impact of the COVID-19 pandemic may last for an extended period of time, and could result in a substantial economic downturn or recession. Public health crises may exacerbate other pre-existing political, social, economic, market, and financial risks. The extent of the impact to the financial performance of the Fund's investments will depend on future developments, including (i) the duration and spread of the outbreak, (ii) the restrictions and advisories, (iii) the effects on the financial markets, and (iv) the effects on the economy overall, all of which are highly uncertain and cannot be predicted.
Stable Net Asset Value Risk — You could lose money by investing in the Fund. Although the Fund seeks to preserve the value of your investment at $1 per share, it cannot guarantee it will do so. The Fund may impose a fee upon the sale of your shares or may temporarily suspend your ability to sell shares if the Fund's liquidity falls below required minimums because of market conditions or other factors. An investment in the Fund is not a deposit in a bank and is not insured or guaranteed by the Federal Deposit Insurance Corporation ("FDIC") or any other government agency. The Fund's sponsor has no legal obligation to provide financial support to the Fund, and you should not expect that the sponsor will provide financial support to the Fund at any time.
Interest Rate Risk — When interest rates rise, debt security prices generally fall. The opposite also generally is true: debt security prices rise when interest rates fall. Interest rate changes are influenced by a number of factors including government policy, monetary policy, inflation expectations, perceptions of risk, and supply and demand of debt securities. The Fund's yield will vary. A sharp and unexpected rise in interest rates could cause the Fund's share price to drop below a dollar. A low interest rate environment may prevent the Fund from providing a positive yield and could also impair the Fund's ability to maintain a stable net asset value ("NAV").
Large Shareholders Risk — The actions by one shareholder or multiple shareholders may have an impact on the Fund and, therefore, indirectly on other shareholders. Shareholder purchase and redemption activity may affect the per share amount of the Fund's distributions of its net investment income and net realized capital gains, if any, thereby affecting the tax burden on the Fund's shareholders subject to federal income tax. To the extent a larger shareholder (including, for example, an Affiliated Fund that operates as a fund-of-funds or 529 college savings plan) is permitted to invest in the Fund, the Fund may experience large inflows or outflows of cash from time to time. This activity could magnify these adverse effects on the Fund.
5. Borrowing and Interfund Lending:
Line of Credit:
The Victory Funds Complex participated in a short-term demand note "Line of Credit" agreement with Citibank. The Line of Credit agreement with Citibank was renewed on June 29, 2020, with a termination date of June 28, 2021. Under the agreement with Citibank, the Victory Funds Complex may borrow up to $600 million, of which $300 million is committed and $300 million is uncommitted. $40 million of the committed Line of Credit is reserved for use by the Victory Floating Rate Fund, another series of the Victory Funds Complex, with Victory Floating Rate Fund paying the related commitment fees for
18
USAA Mutual Funds Trust | | Notes to Financial Statements — continued
May 31, 2021 | |
that amount. The purpose of the Line of Credit is to meet temporary or emergency cash needs. For the year ended May 31, 2021, Citibank received an annual commitment fee of 0.15% on the $300 million committed Line of Credit. Each fund in the Victory Funds Complex paid a pro-rata portion of the commitment fees plus any interest (one month LIBOR plus one percent) on amounts borrowed. For the period June 29, 2020, through April 30, 2021, under an amended Line of Credit agreement, Citibank received an annual upfront fee of 0.10% on the $300 million committed line of credit. Each fund in the Victory Funds Complex paid a pro-rata portion of the upfront fee. Effective with the next amendment, the annual commitment fee of 0.15% will remain unchanged and the upfront fee of 0.10% is discontinued. Interest charged to each fund during the period, if applicable, is reflected on the Statement of Operations under Line of credit fees.
The Fund had no borrowings under the Line of Credit agreement during the year ended May 31, 2021.
6. Federal Income Tax Information:
The Fund intends to declare daily and distribute any net investment income monthly. Distributable net realized gains, if any, are declared and paid at least annually.
The amounts of dividends from net investment income and distributions from net realized gains (collectively distributions to shareholders) are determined in accordance with federal income tax regulations, which may differ from GAAP. To the extent these "book/tax" differences are permanent in nature (e.g., net operating loss and distribution reclassification), such amounts are reclassified within the components of net assets based on their federal tax-basis treatment; temporary differences (e.g., wash sales) do not require reclassification. To the extent dividends and distributions exceed net investment income and net realized gains for tax purposes, they are reported as distributions of capital. Net investment losses incurred by the Fund may be reclassified as an offset to capital on the accompanying Statement of Assets and Liabilities.
As of May 31, 2021, on the Statement of Assets and Liabilities, there were no permanent book-to-tax difference reclassification adjustments.
The tax character of distributions paid during the tax years ended as noted below, were as follows (total distributions paid may differ from the Statements of Changes in Net Assets because, for tax purposes, dividends are recognized when actually paid) (amounts in thousands):
| Year Ended May 31, 2021 | | Year Ended May 31, 2020 | |
Distributions
paid from | |
| | Distributions
paid from | |
| |
Ordinary
Income | | Total
Distributions
Paid | | Ordinary
Income | | Total
Distributions
Paid | |
| $ | 173 | | | $ | 173 | | | $ | 65,177 | | | $ | 65,177 | | |
As of May 31, 2021, the components of accumulated earnings (loss) on a tax basis were as follows (amounts in thousands):
Undistributed
Ordinary
Income | | Distributions
Payable | | Accumulated
Earnings | | Accumulated
Capital and
Other
Losses | | Total
Accumulated
Earnings
(Loss) | |
| $ | 5 | | | $ | (4 | ) | | $ | 1 | | | $ | (1 | ) | | $ | — | | |
As of May 31, 2021, the Fund had net capital loss carryforwards as shown in the table below (amounts in thousands). It is unlikely that the Board will authorize a distribution of capital gains realized in the future until the capital loss carryforwards have been used.
| Short-Term Amount | | Total | |
| $ | 1 | | | $ | 1 | | |
19
USAA Mutual Funds Trust | | Notes to Financial Statements — continued
May 31, 2021 | |
As of May 31, 2021, the cost basis for federal income tax purposes, gross unrealized appreciation, gross unrealized depreciation, and net unrealized appreciation (depreciation) for investments were as follows (amounts in thousands):
Cost of
Investments
for Federal
Tax Purposes | | Gross
Unrealized
Appreciation | | Gross
Unrealized
Depreciation | | Net Unrealized
Appreciation
(Depreciation) | |
| $ | 499,976 | | | $ | — | | | $ | — | | | $ | — | | |
20
REPORT OF INDEPENDENT REGISTERED PUBLIC ACCOUNTING FIRM
To the Shareholders and the Board of Trustees of USAA Treasury Money Market Trust
Opinion on the Financial Statements
We have audited the accompanying statement of assets and liabilities of USAA Treasury Money Market Trust (the "Fund") (one of the funds constituting USAA Mutual Funds Trust (the "Trust")), including the schedule of portfolio investments, as of May 31, 2021, and the related statement of operations for the year then ended, the statements of changes in net assets for each of the two years in the period then ended, the financial highlights for each of the five years in the period then ended and the related notes (collectively referred to as the "financial statements"). In our opinion, the financial statements present fairly, in all material respects, the financial position of the Fund (one of the funds constituting USAA Mutual Funds Trust) at May 31, 2021, the results of its operations for the year then ended, the changes in its net assets for each of the two years in the period then ended and its financial highlights for each of the five years in the period then ended, in conformity with U.S. generally accepted accounting principles.
Basis for Opinion
These financial statements are the responsibility of the Trust's management. Our responsibility is to express an opinion on the Fund's financial statements based on our audits. We are a public accounting firm registered with the Public Company Accounting Oversight Board (United States) ("PCAOB") and are required to be independent with respect to the Trust in accordance with the U.S. federal securities laws and the applicable rules and regulations of the Securities and Exchange Commission and the PCAOB.
We conducted our audits in accordance with the standards of the PCAOB. Those standards require that we plan and perform the audit to obtain reasonable assurance about whether the financial statements are free of material misstatement, whether due to error or fraud. The Trust is not required to have, nor were we engaged to perform, an audit of the Trust's internal control over financial reporting. As part of our audits we are required to obtain an understanding of internal control over financial reporting, but not for the purpose of expressing an opinion on the effectiveness of the Trust's internal control over financial reporting. Accordingly, we express no such opinion.
Our audits included performing procedures to assess the risks of material misstatement of the financial statements, whether due to error or fraud, and performing procedures that respond to those risks. Such procedures included examining, on a test basis, evidence regarding the amounts and disclosures in the financial statements. Our procedures included confirmation of securities owned as of May 31, 2021, by correspondence with the custodian. Our audits also included evaluating the accounting principles used and significant estimates made by management, as well as evaluating the overall presentation of the financial statements. We believe that our audits provide a reasonable basis for our opinion.

We have served as the auditor of one or more Victory Capital investment companies since 1995.
San Antonio, Texas
July 28, 2021
21
USAA Mutual Funds Trust | | Supplemental Information
May 31, 2021 | |
(Unaudited)
Trustee and Officer Information
Board of Trustees:
Overall responsibility for management of the Trust rests with the Board. The Trust is managed by the Board in accordance with the laws of the state of Delaware. There are currently nine Trustees, seven of whom are not "interested persons" of the Trust within the meaning of that term under the 1940 Act ("Independent Trustees") and two of whom are "interested persons" of the Trust within the meaning of that term under the 1940 Act ("Interested Trustee"). The Trustees, in turn, elect the officers of the Trust to actively supervise its day-to-day operations.
The following tables list the Trustees, their ages, position with the Trust, commencement of service, principal occupations during the past five years and any directorships of other investment companies or companies whose securities are registered under the Securities Exchange Act of 1934, as amended, or who file reports under that Act. Each Trustee oversees 46 portfolios in the Trust. Each Trustee's address is 15935 La Cantera Pkwy, San Antonio, TX, 78256. Pursuant to a policy adopted by the Board, the term of office for each Trustee shall be until the Independent Trustee reaches age 75 or an Interested Trustee reaches age 75. The Board may change or grant exceptions from this policy at any time without shareholder approval. A Trustee may resign or be removed by a vote of the other Trustees or the holders of a majority of the outstanding shares of the Trust at any time. Vacancies on the Board can be filled by the action of a majority of the Trustees, provided that after filling such vacancy at least two-thirds of the Trustees have been elected by the shareholders.
Name and Date of Birth | | Position
Held with
the Trust | | Year
Commenced
Service | | Principal Occupation
During Past 5 Years | | Other
Directorships
Held During
Past 5 Years | |
Independent Trustees. | |
Jefferson C. Boyce, (c)
Born September 1957 | | Independent Chairman | | | 2021 | | | Senior Managing Director, New York Life Investments, LLC (1992-2012) | | Westhab, Inc. | |
John C. Walters,
Born February 1962 | | Trustee | | | 2019 | | | Retired. Mr. Walters brings significant Board experience including active involvement with the board of a Fortune 500 company, and a proven record of leading large, complex financial organizations. He has a demonstrated record of success in distribution, manufacturing, investment brokerage, and investment management in both the retail and institutional investment businesses. He has substantial experience in the investment management business with a demonstrated ability to develop and drive strategy while managing operation, financial, and investment risk. | | Guardian Variable Products Trust (16 series), Lead Independent Director; Amerilife Holdings LLC, Director; Stadion Money Management; Director; University of North Carolina (Chapel Hill), Member Board of Governors | |
22
USAA Mutual Funds Trust | | Supplemental Information — continued
May 31, 2021 | |
(Unaudited)
Name and Date of Birth | | Position
Held with
the Trust | | Year
Commenced
Service | | Principal Occupation
During Past 5 Years | | Other
Directorships
Held During
Past 5 Years | |
Robert L. Mason, Ph.D.,
Born July 1946 | | Trustee | | | 1997 | | | Adjunct Professor in the Department of Management Science and Statistics in the College of Business at the University of Texas at San Antonio (since 2001); Institute Analyst, Southwest Research Institute (March 2002-January 2016) | | None | |
Dawn M. Hawley,
Born February 1954 | | Trustee | | | 2014 | | | Manager of Finance, Menil Foundation, Inc. (May 2007-June 2011), which is a private foundation that oversees the assemblage of sculptures, prints, drawings, photographs, and rare books. Director of Financial Planning and Analysis and Chief Financial Officer, AIM Management Group, Inc. (October 1987-January 2006) | | None | |
Paul L. McNamara,
Born July 1948 | | Trustee | | | 2012 | | | Director, Cantor Opportunistic Alternatives Fund, LLC (March 2010-February 2014), which is a closed-end fund of funds by Cantor Fitzgerald Investment Advisors, LLC | | None | |
23
USAA Mutual Funds Trust | | Supplemental Information — continued
May 31, 2021 | |
(Unaudited)
Name and Date of Birth | | Position
Held with
the Trust | | Year
Commenced
Service | | Principal Occupation
During Past 5 Years | | Other
Directorships
Held During
Past 5 Years | |
Richard Y. Newton III,
Born January 1956 | | Trustee | | | 2017 | | | Director, Elta North America (01/18-present), which is a global leader in the design, manufacture, and support of innovative electronic systems in the ground, maritime, airborne, and security domains for the nation's warfighters, security personnel, and first responders; Managing Partner, Pioneer Partnership Development Group (December 2015-present)); Executive Director, The Union League Club of New York (June 2014-November 2015): Executive Vice President, Air Force Association (August 2012-May 2014); Lieutenant General, United States Air Force (January 2008-June 2012) | | PredaSAR Corp. | |
Barbara B. Ostdiek, Ph.D.,
Born March 1964 | | Trustee | | | 2008 | | | Senior Associate Dean of Degree Programs at Jesse H. Jones Graduate School of Business at Rice University (since 2013); Associate Professor of Finance at Jessie H. Jones Graduate School of Business at Rice University (since 2001) | | None | |
Effective at the close of business on December 31, 2020, Michael F. Reimherr retired from the Board of Trustees.
24
USAA Mutual Funds Trust | | Supplemental Information — continued
May 31, 2021 | |
(Unaudited)
Name and Date of Birth | | Position
Held with
the Trust | | Year
Commenced
Service | | Principal Occupation
During Past 5 Years | | Other
Directorships
Held During
Past 5 Years | |
Interested Trustees. | |
David C. Brown, (b)
Born May 1972 | | Trustee | | | 2019 | | | Chairman and Chief Executive Officer (since 2013), Victory Capital Management Inc.; Chairman and Chief Executive Officer, Victory Capital Holdings, Inc. (since 2013). Mr. Brown brings to the Board extensive business, finance and leadership skills gained and developed through years of experience in the financial services industry, including his tenure overseeing the strategic direction as CEO of Victory Capital. These skills, combined with Mr. Brown's extensive knowledge of the financial services industry and demonstrated success in the development and distribution of investment strategies and products, enable him to provide valuable insights to the Board and strategic direction for the Funds. | | Trustee, Victory Portfolios (41 series), Victory Portfolios II (26 series), Victory Variable Insurance Funds (8 series) | |
25
USAA Mutual Funds Trust | | Supplemental Information — continued
May 31, 2021 | |
(Unaudited)
Name and Date of Birth | | Position
Held with
the Trust | | Year
Commenced
Service | | Principal Occupation
During Past 5 Years | | Other
Directorships
Held During
Past 5 Years | |
Daniel S. McNamara, (b)(c)(d)
Born June 1966 | | Trustee | | | 2012 | | | Trustee, President, and Vice Chairman of USAA ETF Trust (June 2017-June 2019); President of Financial Advice & Solutions Group (FASG), USAA (February 2013-March 2021); Director of USAA Investment Services Company (ISCO) (formerly USAA Investment Management) (September 2009-March 2021); President, Asset Management Company (AMCO) (August, 2011-June 2019); Senior Vice President of USAA Financial Planning Services Insurance Agency, Inc. (FPS) (April 2011-March 2021); Chairman of Board of ISCO (April 2013-December 2020); Director of AMCO (August 2011-June 2019); President and Director of USAA Shareholder Account Services (SAS) (October 2009-June 2019); Director and Vice Chairman of FPS (December 2013-March 2021); President and Director of USAA Investment Corporation (ICORP) (March 2010-March 2021); Chairman of Board of ICORP (December 2013-March 2021); Director of USAA Financial Advisors, Inc. (FAI) (December 2013-March 2021); Chairman of Board of FAI (March 2015-March 2021). Mr. McNamara brings to the Board extensive experience in the financial services industry, including experience as an officer of the Trust. | | None | |
(b) Mr. Dan McNamara is deemed an "interested person" due to his previous position as Director of AMCO, the former investment adviser of the Funds. Mr. Brown is deemed an "interested person" due to his position as Chief Executive Officer of Victory Capital, investment adviser to the Funds.
(c) Effective at the close of business on December 31, 2020, Jefferson C. Boyce replaced Dan McNamara as Chair of the Board and assumed the title of Independent Chair.
(d) Effective July 2, 2021, Mr. Dan McNamara became an Independent Trustee to the Funds.
The Statement of Additional Information includes additional information about the Trustees of the Trust and is available, without charge, on the SEC's website at www.sec.gov and/or by calling (800)-235-8396.
26
USAA Mutual Funds Trust | | Supplemental Information — continued
May 31, 2021 | |
(Unaudited)
Officers:
The officers of the Trust, their ages, commencement of service and their principal occupations during the past five years, are detailed in the following table. Each officer serves until the earlier of his or her resignation, removal, retirement, death, or the election of a successor. The mailing address of each officer of the Trust is 15935 La Cantera Pkwy, San Antonio, TX, 78256. The officers of the Trust receive no compensation directly from the Trust for performing the duties of their offices.
Name and Date of Birth | | Position with
the Trust | | Year
Commenced
Service | | Principal Occupation During Past 5 Years | |
Interested Officers.
Christopher K. Dyer,
Born February 1962 | | President | | | 2019 | | | Director of Fund Administration, Victory Capital (since 2004); Chief Operating Officer, Victory Capital Services, Inc. (since 2020) | |
Scott A Stahorsky,
Born July 1969 | | Vice President | | | 2019 | | | Manager, Fund Administration, Victory Capital (since 2015) | |
James K. De Vries,
Born April 1969 | | Treasurer | | | 2018 | | | Executive Director, Victory Capital Management Inc. (since 2019); Treasurer, USAA ETF Trust (September 2018-June 2019); Executive Director, Investment and Financial Administration, USAA (April 2012-June 2019); Assistant Treasurer, USAA ETF Trust (June 2017-September 2018); Assistant Treasurer, USAA Mutual Funds Trust (December 2013-February 2018) | |
Allan Shaer,
Born March 1965 | | Assistant Treasurer | | | 2019 | | | Senior Vice President, Financial Administration, Citi Fund Services Ohio, Inc. (since 2016); Vice President, Mutual Fund Administration, JP Morgan Chase (2011-2016) | |
Carol D. Trevino,
Born October 1965 | | Assistant Treasurer | | | 2018 | | | Director, Accounting and Finance, Victory Capital Management Inc. (since 2019); Accounting/Financial Director, USAA (December 2013-June 2019); Assistant Treasurer, USAA ETF Trust (September 2018-June 2019) | |
Erin G. Wagner,
Born February 1974 | | Secretary | | | 2019 | | | Deputy General Counsel, the Adviser (since 2013) | |
Charles Booth,
Born April 1960 | | Anti-Money Laundering Compliance Officer and Identity Theft Officer | | | 2019 | | | Director, Regulatory Administration and CCO Support Services, Citi Fund Services Ohio, Inc. (since 2007) | |
Amy Campos,
Born July 1976 | | Chief Compliance Officer | | | 2019 | | | Chief Compliance Officer, USAA Mutual Funds Trust (since 2019); Executive Director, Deputy Chief Compliance Officer, USAA Mutual Funds Trust and USAA ETF Trust (July 2017-June 2019); Compliance Director, USAA Mutual Funds Trust (2014-July 2017) | |
27
USAA Mutual Funds Trust | | Supplemental Information — continued
May 31, 2021 | |
(Unaudited)
Proxy Voting and Portfolio Holdings Information
Proxy Voting:
Information regarding the policies and procedures the Fund uses to determine how to vote proxies relating to portfolio securities is available without charge, upon request, by calling (800) 235-8396. The information is also included in the Fund's Statement of Additional Information, which is available on the SEC's website at www.sec.gov.
Information relating to how the Fund voted proxies relating to portfolio securities held during the most recent 12 months ended June 30 is available on the SEC's website at www.sec.gov.
Availability of Schedules of Portfolio Investments:
The Fund makes available on VCM.com a complete list of portfolio holdings No sooner than 5 business days after the end of each month. Form N-MFP is available on the SEC's website at www.sec.gov.
Expense Example
As a shareholder of the Fund, you may incur two types of costs: (1) transaction costs, and (2) ongoing costs, including management fees and other Fund expenses. These examples are intended to help you understand your ongoing costs (in dollars) of investing in the Fund and to compare these costs with the ongoing costs of investing in other mutual funds.
These examples are based on an investment of $1,000 invested at the beginning of the period and held for the entire period from December 1, 2020, through May 31, 2021.
The Actual Expense figures in the table below provide information about actual account values and actual expenses. You may use the information below, together with the amount you invested, to estimate the expenses that you paid over the period. Simply divide your account value by $1,000 (for example, an $8,600 account value divided by $1,000 = 8.6), then multiply the result by the number in the table under the heading entitled "Actual Expenses Paid During Period" to estimate the expenses you paid on your account during this period.
The Hypothetical Expense figures in the table below provide information about hypothetical account values and hypothetical expenses based on the Fund's actual expense ratio and an assumed rate of return of 5% per year before expenses, which is not the Fund's actual return. The hypothetical account values and expenses may not be used to estimate the actual ending account balance or expenses you paid for the period. You may use this information to compare this 5% hypothetical example with the 5% hypothetical examples that appear in shareholder reports of other funds.
Please note the expenses shown in the table below are meant to highlight your ongoing costs only and do not reflect any transactional costs. If these transactional costs were included, your costs would have been higher.
Beginning
Account Value
12/1/20 | | Actual
Ending
Account Value
5/31/21 | | Hypothetical
Ending
Account Value
5/31/21 | | Actual
Expenses Paid
During Period
12/1/20-5/31/21* | | Hypothetical
Expenses Paid
During Period
12/1/20-5/31/21* | | Annualized
Expense Ratio
During Period
12/1/20-5/31/21 | |
| $ | 1,000.00 | | | $ | 1,000.00 | | | $ | 1,024.68 | | | $ | 0.25 | | | $ | 0.25 | | | | 0.05 | % | |
* Expenses are equal to the average account value multiplied by the Fund's annualized expense ratio multiplied by 182/365 (the number of days in the most recent fiscal half-year divided by the number of days in the fiscal year).
28
USAA Mutual Funds Trust | | Supplemental Information — continued
May 31, 2021 | |
(Unaudited)
Considerations of the Board in Continuing the Investment Advisory Agreement (the "Agreement")
USAA Treasury Money Market Trust (the "Fund")
At a meeting of the Board of Trustees (the "Board") held on December 10-11, 2020, the Board, including the Trustees who are not "interested persons" (as that term is defined in the Investment Company Act of 1940, as amended) of the Trust (the "Independent Trustees"), approved for an annual period the continuance of the Investment Advisory Agreement (the "Advisory Agreement") between the Trust and Victory Capital Management Inc. (the "Adviser") with respect to the Fund. Prior to the December 10-11, 2020 meeting at which the Advisory Agreement was approved, the Independent Trustees also discussed and considered information regarding the proposed continuation of the Advisory Agreement at a meeting held on November 19, 2020.
In advance of the foregoing meetings, the Trustees received and considered a variety of information relating to the Advisory Agreement and the Adviser, and were given the opportunity to ask questions and request additional information from management. The information provided to the Board included, among other things: (i) a separate report prepared by an independent third party of mutual fund data, which provided a statistical analysis comparing the Fund's investment performance, expenses, and fees to comparable investment companies; (ii) information concerning the services rendered to the Fund, as well as information regarding the Adviser's revenues and costs of providing services to the Fund and compensation paid to affiliates of the Adviser; and (iii) information about the Adviser's operations and personnel. Prior to voting, the Independent Trustees reviewed the proposed continuance of the Advisory Agreement with management and with experienced independent counsel retained by the Independent Trustees ("Independent Counsel") and received materials from such Independent Counsel discussing the legal standards for their consideration of the proposed continuation of the Advisory Agreement with respect to the Fund. The Independent Trustees also reviewed the proposed continuation of the Advisory Agreement with respect to the Fund in private sessions with Independent Counsel at which no representatives of management were present.
At each regularly scheduled meeting of the Board and its committees, the Board receives and reviews, among other things, information concerning the Fund's performance and related services provided by the Adviser. At the meeting at which the renewal of the Advisory Agreement is considered, particular focus is given to information concerning Fund performance, fees and total expenses as compared to comparable investment companies, and the Adviser's profitability with respect to the Fund. However, the Board noted that the evaluation process with respect to the Adviser is an ongoing one. In this regard, the Board's and its committees' consideration of the Advisory Agreement included information previously received at such meetings.
Advisory Agreement
After full consideration of a variety of factors, the Board, including the Independent Trustees, voted to approve the Advisory Agreement. In approving the Advisory Agreement, the Trustees did not identify any single factor as controlling, and each Trustee may have attributed different weights to various factors. Throughout their deliberations, the Independent Trustees were represented and assisted by Independent Counsel.
Nature, Extent, and Quality of Services — In considering the nature, extent, and quality of the services provided by the Adviser under the Advisory Agreement, the Board reviewed information provided by the Adviser relating to its operations and personnel. The Board also took into account its knowledge of the Adviser's management and the quality of the performance of the Adviser's duties through Board meetings, discussions, and reports during the preceding year. The Board considered the fees paid to the Adviser and the services provided to the Fund by the Adviser under the Advisory Agreement, as well as other services provided by the Adviser and its affiliates under other agreements, and the personnel who provide these services. In addition to the investment advisory services provided to the Fund, the Adviser and its affiliates provide administrative services, shareholder services, oversight of Fund accounting, marketing services, assistance in meeting legal and regulatory requirements, and other services necessary for the operation of the Fund and the Trust.
The Board considered the scope of services provided by, and the undertakings required of, the Adviser in connection with those services, including, among other things, maintaining (i) its own and the Fund's compliance programs, (ii) risk management programs, (iii) liquidity risk management programs, and (iv) cybersecurity programs, each of which had expanded over time as a result of regulatory, market, and other developments.
29
USAA Mutual Funds Trust | | Supplemental Information — continued
May 31, 2021 | |
(Unaudited)
The Board also considered the significant risks assumed by the Adviser in connection with the services provided to the Fund, including investment, operational, enterprise, litigation, regulatory, and compliance risks.
The Board considered the Adviser's management style and the performance of the Adviser's duties under the Advisory Agreement. The Board considered the level and depth of knowledge of the Adviser, including the professional experience and qualifications of its senior and investment personnel, as well as current staffing levels. The allocation of the Fund's brokerage, including the Adviser's process for monitoring "best execution," also was considered. The Adviser's role in coordinating the activities of the Fund's other service providers was also considered. The Board also considered the Adviser's risk management processes. The Board considered the Adviser's financial condition and that it had the financial wherewithal to continue to provide the same scope and high quality of services under the Advisory Agreement. In reviewing the Advisory Agreement, the Board focused on the experience, resources, and strengths of the Adviser and its affiliates in managing the Fund, as well as the other funds in the Trust.
The Board also reviewed the compliance and administrative services provided to the Fund by the Adviser and its affiliates, including the Adviser's oversight of the Fund's day-to-day operations and oversight of Fund accounting. The Trustees, guided also by information obtained from their experiences as trustees of the Trust, also focused on the quality of the Adviser's compliance and administrative staff.
Expenses and Performance — In connection with its consideration of the Advisory Agreement, the Board evaluated the Fund's advisory fees and total expense ratio as compared to other open-end investment companies deemed to be comparable to the Fund as determined by the independent third party in its report. The Fund's expenses were compared to (i) a group of investment companies chosen by the independent third party to be comparable to the Fund based upon certain factors, including fund type, comparability of investment objective and classification, sales load type, asset size, and expense components (the "expense group") and (ii) a larger group of investment companies with the same investment classification/objective as the Fund regardless of asset size, excluding outliers (the "expense universe"). Among other data, the Board noted that the Fund's management fee rate — which includes advisory and administrative services, as well as any fee waivers and reimbursements — was below the medians of its expense group and expense universe. The data indicated that the Fund's total expenses, including after any reimbursements, were below the medians of its expense group and expense universe. The Board also took into account the Adviser's current undertakings to maintain expense limitations for the Fund. The Board took into account the various other services provided to the Fund by the Adviser and its affiliates, and noted the high quality of services received by the Fund.
In considering the Fund's performance, the Board noted that it reviews, at its regularly scheduled meetings, information about the Fund's performance results. The Trustees also reviewed various comparative data provided to them in connection with their consideration of the renewal of the Advisory Agreement, including, among other information, a comparison of the Fund's average annual total returns relative to its Lipper index, and other mutual funds deemed to be in its peer group by the independent third party in its report (the "performance universe"). The Fund's performance universe consisted of the Fund and all retail open-end investment companies with the same classification/objective as the Fund, regardless of asset size or primary channel of distribution. This comparison indicated that, among other data, the Fund's performance was above the average of its performance universe for the one-, three-, five-, and ten-year periods ended September 30, 2020, and was below its Lipper index for the one-, three-, five-, and ten-year periods ended September 30, 2020. The Board took into account management's discussion of the Fund's performance, including the reasons for the Fund's underperformance relative to its peers.
Compensation and Profitability — The Board took into consideration the level and method of computing the management fee. The information considered by the Board included operating profit margin information for the Adviser's business as a whole. The Board also received and considered profitability information related to the management revenues from the Fund. This information included a review of the methodology used in the allocation of certain costs to the Fund. In considering the profitability data with respect to the Fund, the Trustees noted that the Adviser waived a portion of its management fees and/or reimbursed certain expenses with respect to the Fund. The Trustees reviewed the profitability of the Adviser's relationship with the Fund before tax expenses. The Board was also provided with a profitability analysis of other publicly traded asset managers prepared by an independent information service. In reviewing the overall profitability of the management fee to the Adviser, the Board also considered the fact that the Adviser and its affiliates provide shareholder servicing and administrative services to the Fund for which they receive compensation. The Board also considered the possible direct and indirect benefits to the Adviser from its relationship with the Trust, including that the Adviser
30
USAA Mutual Funds Trust | | Supplemental Information — continued
May 31, 2021 | |
(Unaudited)
may derive reputational and other benefits from its association with the Fund. The Trustees recognized that the Adviser should be entitled to earn a reasonable level of profits in exchange for the level of services it provides to the Fund and the entrepreneurial and other risks that it assumes as Adviser.
Economies of Scale — The Board considered whether there should be changes in the management fee rate or structure in order to enable the Fund to participate in any economies of scale. The Board also considered the fee waiver and expense reimbursement arrangements by the Adviser. The Board also considered the effect of the Fund's change in size, if any, on its performance and fees, noting that the Fund may realize other economies of scale if assets increase proportionally more than expenses. The Board determined that the current investment management fee structure was reasonable.
Conclusions — The Board reached the following conclusions regarding the Fund's Advisory Agreement with the Adviser: (i) the Adviser has demonstrated that it possesses the capability and resources to perform the duties required of it under the Advisory Agreement; (ii) the Adviser maintains an appropriate compliance program; (iii) the performance of the Fund is reasonable in relation to the performance of funds with similar investment objectives and to relevant indices in view of the Fund's investment approach and the Adviser is appropriately monitoring the Fund's performance; (iv) the Fund's advisory expenses are reasonable in relation to those of similar funds and to the services to be provided by the Adviser; and (v) the Adviser's and its affiliates' level of profitability from their relationship with the Fund is reasonable in light of the nature and high quality of services provided by the Adviser and the type of fund. Based on its conclusions, the Board determined that continuation of the Advisory Agreement would be in the best interests of the Fund and its shareholders.
31
Privacy Policy
Protecting the Privacy of Information
The Trust respects your right to privacy. We also know that you expect us to conduct and process your business in an accurate and efficient manner. To do so, we must collect and maintain certain personal information about you. This is the information we collect from you on applications or other forms, and from the transactions you make with us or third parties. It may include your name, address, social security number, account transactions and balances, and information about investment goals and risk tolerance.
We do not disclose any information about you or about former customers to anyone except as permitted or required by law. Specifically, we may disclose the information we collect to companies that perform services on our behalf, such as the transfer agent that processes shareholder accounts and printers and mailers that assist us in the distribution of investor materials. We may also disclose this information to companies that perform marketing services on our behalf. This allows us to continue to offer you Victory investment products and services that meet your investing needs, and to effect transactions that you request or authorize. These companies will use this information only in connection with the services for which we hired them. They are not permitted to use or share this information for any other purpose.
To protect your personal information internally, we permit access only by authorized employees and maintain physical, electronic, and procedural safeguards to guard your personal information.*
* You may have received communications regarding information about privacy policies from other financial institutions which gave you the opportunity to "opt-out" of certain information sharing with companies which are not affiliated with that financial institution. The Trust does not share information with other companies for purposes of marketing solicitations for products other than the Trust. Therefore, the Trust does not provide opt-out options to their shareholders.
P.O. Box 182593
Columbus, Ohio 43218-2593

Visit our website at: | | Call | |
vcm.com | | (800) 235-8396 | |
Item 2. Code of Ethics.
| (a) | The registrant has adopted a code of ethics that applies to the registrant’s principal executive officer, principal financial officer, principal accounting officer or controller, or persons performing similar functions. This code of ethics in included as an Exhibit. |
| (b) | During the period covered by the report, with respect to the registrant’s code of ethics that applies to its principal executive officer, principal financial officer, principal accounting officer or controller, or persons performing similar functions; on July 1, 2019, the Board of Trustees of USAA Mutual Funds Trust approved a Code of Ethics ("Sarbanes Code") applicable solely to its senior financial officers, including its principal executive officer (President), as defined under the Sarbanes-Oxley Act of 2002 and implementing regulations of the Securities and Exchange Commission. A copy of the Sarbanes Code is attached as an Exhibit to this Form N-CSR. |
No waivers (explicit or implicit) have been granted from a provision of the Sarbanes Code.
Item 3. Audit Committee Financial Expert.
(a)(1) The registrant’s board of trustees has determined that the registrant has at least one audit committee financial expert serving on its audit committee.
(a)(2) The audit committee financial experts are Dr. Barbara B. Ostdiek, Ph.D. and Dawn M. Hawley, who are “independent” for purposes of this Item 3 of Form N-CSR.
Dr. Ostdiek has served as an Associate Professor of Management at Rice University since 2001. Dr. Ostdiek also has served as an Academic Director at El Paso Corporation Finance Center since 2002. Ms. Hawley was Chief Financial Officer, Director of Financial Planning and Analysis for AIM Management Group Inc. from October 1987 through January 2006 and was Manager of Finance at Menil Foundation, Inc. from May 2007 through June 2011. Each of Dr. Ostdiek and Ms. Hawley is an independent trustee who serves as a member of the Audit and Compliance Committee, Investments Committee, Product Management and Distribution Committee, and the Corporate Governance Committee of the Board of Trustees of USAA Mutual Funds Trust.
Item 4. Principal Accountant Fees and Services.
| | 2021 | | | 2020 | |
| (a) Audit Fees (1) | | $ | 329,388 | | | $ | 360,330 | |
| (b) Audit-Related Fees (2) | | | - | | | | - | |
| (c) Tax Fees (3) | | | 46,446 | | | | 67,388 | |
| (d) All Other Fees (4) | | | - | | | | - | |
(1) Audit fees include amounts related to the audit of the Registrant’s annual financial statements and services normally provided by the accountant in connection with statutory and regulatory filings. Audit fees billed were for professional services provided by Ernst & Young LLP for statutory and regulatory filings.
(2) For the fiscal years ended May 31, 2021 and May 31, 2020, there were no audit-related fees billed by Ernst & Young LLP to the Registrant.
(3) Represents the aggregate tax fee billed for professional services rendered by Ernst & Young LLP for assistance with PFIC Analyzer Service and tax consulting services.
(4) For the fiscal years ended May 31, 2021 and May 31, 2020, there were no other fees billed by Ernst & Young LLP to the Registrant.
(e)(1) All audit and non-audit services to be performed for the Registrant by Ernst & Young LLP must be pre-approved by the Audit and Compliance Committee. The Audit and Compliance Committee Charter also permits the Chair of the Audit and Compliance Committee to pre-approve any permissible non-audit service that must be commenced prior to a scheduled meeting of the Audit and Compliance Committee. All non-audit services were pre-approved by the Audit and Compliance Committee or its Chair, consistent with the Audit and Compliance Committee's preapproval procedures.
(e)(2) There were no services performed under Rule 2.01 (c)(7)(i)(C).
(f) Not applicable.
(g) Aggregate non-audit fees for services rendered to the:
| | | | Registrant | | | Adviser | |
| 2021 | | | $ | 46,446 | | | $ | 123,184 | |
| 2020 | | | $ | 67,388 | | | $ | 155,957 | |
(h) The aggregate non-audit fees related to fees billed by Ernst & Young LLP for services rendered to the Registrant; the investment adviser, USAA Asset Management Company (AMCO) and its affiliate, USAA Investment Management Company (IMCO); and the Funds' transfer agent, Victory Capital Transfer Agency Inc. and prior transfer agent, USAA Shareholder Account Services (SAS), which includes aggregate fees accrued or paid to Ernst & Young, LLP for professional services rendered related to the annual study of internal controls of the transfer agent for fiscal years listed above. All services were preapproved by the Audit Committee.
Effective July 1, 2019, AMCO, the prior investment adviser to the Funds, and SAS, the prior transfer agent to the Funds, were acquired by Victory Capital Holdings, Inc. Effective July 1, 2019, Victory Capital Management Inc. is the new investment adviser and administrator to the Funds; SAS was renamed Victory Capital Transfer Agency, Inc. and is the new transfer agent to the Funds.
Ernst & Young LLP provided non-audit services to AMCO and IMCO in 2020 and also provided certain tax services to Victory Capital Holdings, Inc. in 2019 that were not required to be pre-approved by the Registrant's Audit and Compliance Committee because the services were not directly related to the operations of the Registrant's Funds. The Board of Trustees will consider Ernst & Young LLP's independence and will consider whether the provision of these non-audit services to AMCO is compatible with maintaining Ernst & Young LLP's independence.
Item 5. Audit Committee of Listed Registrants.
Not applicable.
Item 6. Investments.
(a) Not applicable.
(b) Not applicable.
Item 7. Disclosure of Proxy Voting Policies and Procedures for Closed-End Management Investment Companies.
Not applicable.
Item 8. Portfolio Managers of Closed-End Management Investment Companies.
Not applicable.
Item 9. Purchases of Equity Securities by Closed-End Management Investment Company and Affiliated Purchasers.
Not applicable.
Item 10. Submission of Matters to a Vote of Security Holders.
The Corporate Governance Committee selects and nominates candidates for membership on the Board as independent trustees. The Corporate Governance Committee has adopted procedures to consider Board candidates suggested by shareholders. The procedures are initiated by the receipt of nominations submitted by a fund shareholder sent to Board member(s) at the address specified in fund disclosure documents or as received by the Adviser or a fund officer. Any recommendations for a nomination by a shareholder, to be considered by the Board, must include at least the following information: name; date of birth; contact information; education; business profession and other expertise; affiliations; experience relating to serving on the Board; and references. The Corporate Governance Committee gives shareholder recommendations the same consideration as any other candidate.
Item 11. Controls and Procedures.
(a)The registrant’s principal executive officer and principal financial officer have concluded, based on their evaluation of the registrant's disclosure controls and procedures as conducted within 90 days of the filing date of this report, that these disclosure controls and procedures are adequately designed and are operating effectively to ensure that information required to be disclosed by the registrant on Form N-CSR is recorded, processed, summarized and reported within the time periods specified in the Securities and Exchange Commission's rules and forms.
(b)There were no changes in the registrant’s internal control over financial reporting (as defined in Rule 30a-3(d) under the Investment Company Act of 1940 (17 CFR 270.30a-3(d)) that occurred during the period covered by this report that have materially affected or are reasonably likely to materially affect, the registrant’s internal control over financial reporting.
Item 12. Disclosure of Securities Lending Activities for Closed-End Management Investment Companies.
(a)(1) Not applicable.
(a)(2) Not applicable.
(a)(3) Not applicable.
(a)(4) Not applicable.
(b) Not applicable.
Item 13. Exhibits.
(a)(1) The code of ethics that is the subject of the disclosure required by Item 2 is attached hereto.
(a)(2) Certifications pursuant to Rule 30a-2(a) are attached hereto.
(a)(3) Not applicable.
(a)(4) Not applicable.
(b) Certifications pursuant to Rule 30a-2(b) are attached hereto.
SIGNATURES
Pursuant to the requirements of the Securities Exchange Act of 1934 and the Investment Company Act of 1940, the registrant has duly caused this report to be signed on its behalf by the undersigned, thereunto duly authorized.
| (Registrant) | USAA Mutual Fund Trust | |
| By (Signature and Title)* | /s/ James K. De Vries | |
| | James K. De Vries, Principal Financial Officer | |
Pursuant to the requirements of the Securities Exchange Act of 1934 and the Investment Company Act of 1940, this report has been signed below by the following persons on behalf of the registrant and in the capacities and on the dates indicated.
| By (Signature and Title)* | /s/ Christopher K. Dyer | |
| | Christopher K. Dyer, Principal Executive Officer | |
| By (Signature and Title)* | /s/ James K. De Vries | |
| | James K. De Vries, Principal Financial Officer | |