UNITED STATES
SECURITIES AND EXCHANGE COMMISSION
Washington, D.C. 20549
FORM N-CSR
CERTIFIED SHAREHOLDER REPORT OF REGISTERED
MANAGEMENT INVESTMENT COMPANIES
Investment Company Act file number: 811-07874
JPMorgan Insurance Trust
(Exact name of registrant as specified in charter)
277 Park Avenue
New York, NY 10172
(Address of principal executive offices) (Zip code)
Gregory S. Samuels
277 Park Avenue
New York, NY 10172
(Name and Address of Agent for Service)
Registrant’s telephone number, including area code: (800) 480-4111
Date of fiscal year end: December 31
Date of reporting period: January 1, 2020 through December 31, 2020
Form N-CSR is to be used by management investment companies to file reports with the Commission not later than 10 days after the transmission to stockholders of any report that is required to be transmitted to stockholders under Rule 30e-1 under the Investment Company Act of 1940 (17 CFR 270.30e-1). The Commission may use the information provided on Form N-CSR in its regulatory, disclosure review, inspection, and policymaking roles.
A registrant is required to disclose the information specified by Form N-CSR, and the Commission will make this information public. A registrant is not required to respond to the collection of information contained in Form N-CSR unless the Form displays a currently valid Office of Management and Budget (“OMB”) control number. Please direct comments concerning the accuracy of the information collection burden estimate and any suggestions for reducing the burden to Secretary, Securities and Exchange Commission, 450 Fifth Street, NW, Washington, DC 20549-0609. The OMB has reviewed this collection of information under the clearance requirements of 44 U.S.C. Section 3507.
ITEM 1. REPORTS TO STOCKHOLDERS.
The following is a copy of the report transmitted to shareholders pursuant to Rule 30e-1 under the Investment Company Act of 1940 (17 CFR 270.30e-1).
Annual Report
JPMorgan Insurance Trust
December 31, 2020
JPMorgan Insurance Trust Core Bond Portfolio
| | | | |
NOT FDIC INSURED • NO BANK GUARANTEE • MAY LOSE VALUE
| | |  | |
CONTENTS
Investments in the Portfolio are not deposits or obligations of, or guaranteed or endorsed by, any bank and are not insured or guaranteed by the FDIC, the Federal Reserve Board or any other government agency. You could lose money if you sell when the Portfolio’s share price is lower than when you invested.
Past performance is no guarantee of future performance. The general market views expressed in this report are opinions based on market and other conditions through the end of the reporting period and are subject to change without notice. These views are not intended to predict the future performance of the Portfolio or the securities markets. References to specific securities and their issuers are for illustrative purposes only and are not intended to be, and should not be interpreted as, recommendations to purchase or sell such securities. Such views are not meant as investment advice and may not be relied on as an indication of trading intent on behalf of the Portfolio.
This Portfolio is intended to be a funding vehicle for variable annuity contracts and variable life insurance policies (collectively “Policies”) offered by the separate accounts of various insurance companies. Portfolio shares may also be offered to qualified pension and retirement plans and accounts permitting accumulation of assets on a tax-deferred basis (“Eligible Plans”). Individuals may not purchase shares directly from the Portfolio.
Prospective investors should refer to the Portfolio’s prospectuses for a discussion of the Portfolio’s investment objective, strategies and risks. Call J.P. Morgan Funds Service Center at 1-800-480-4111 for a prospectus containing more complete information about the Portfolio, including management fees and other expenses. Please read it carefully before investing.
LETTER TO SHAREHOLDERS
February 4, 2021 (Unaudited)
Dear Shareholders,
The immense efforts of central banks, government and researchers in the public and private sectors appear to have shepherded the world through the most difficult days of a profound crisis caused by the pandemic. While the economic and health care challenges are not behind us, the uncertainty and turbulence of 2020 has abated.
| | |
 | | “We believe the clear lesson is that investors who remained fully invested over the past year, in the face of uncertainty over the direction of the pandemic and the unprecedented responses to it, were likely rewarded for their resolve.” — Andrea L. Lisher |
The development of multiple vaccines against Covid-19 toward the end of 2020 provided hope that the pandemic would be halted and that economic and social activity could begin to resume in the year ahead. That optimism spread to global financial markets. While leading equity indexes fell by 20% or more in the first quarter of 2020, financial markets stabilized and equity markets largely rebounded — slowly at first and then rapidly the second half of the year. At the end of 2020, the S&P 500 Index had generated a total return of 18.10% for the full 12 months and 22.16% for the final six months of the year.
We believe the clear lesson is that investors who remained fully invested over the past year, in the face of uncertainty over the
direction of the pandemic and the unprecedented responses to it, were likely rewarded for their resolve.
Certainly, enormous challenges remain in both the implementation of global vaccinations and in the rebuilding of economies at the local, national and international levels. However, the advances in the fight against Covid-19 provide policymakers and investors with the opportunity to plan for the future and meet those challenges. J.P. Morgan Asset Management has thrived amid the many challenges presented by the pandemic. Moreover, our deep experience in risk management enabled us to better navigate increased volatility in global financial markets. Throughout 2020, we continued to seek to operate under the same fundamental practices and principles that have driven our success for more than a century with an unwavering focus on putting our clients at the center of everything we do.
On behalf of J.P. Morgan Asset Management, thank you for entrusting us to manage your investment. Should you have any questions, please visit www.jpmorganfunds.com or contact the J.P. Morgan Funds Service Center at 1-800-480-4111.
Sincerely yours,

Andrea L. Lisher
Head of Americas, Client
J.P. Morgan Asset Management
| | | | | | | | | | |
| | | | | |
| DECEMBER 31, 2020 | | JPMORGAN INSURANCE TRUST | | | | | | | | 1 |
JPMorgan Insurance Trust Core Bond Portfolio
PORTFOLIO COMMENTARY
TWELVE MONTHS ENDED DECEMBER 31, 2020 (Unaudited)
| | | | |
| REPORTING PERIOD RETURN: | |
| Portfolio (Class 1 Shares)* | | | 7.84% | |
| Bloomberg Barclays U.S. Aggregate Index | | | 7.51% | |
| |
| Net Assets as of 12/31/2020 (In Thousands) | | | $531,776 | |
| Duration as of 12/31/2020 | | | 5.9 years | |
INVESTMENT OBJECTIVE**
The JPMorgan Insurance Trust Core Bond Portfolio (the “Portfolio”) seeks to maximize total return by investing primarily in a diversified portfolio of intermediate- and long-term debt securities.
HOW DID THE MARKET PERFORM?
Global financial markets generally recovered from a sharp sell-off in the first quarter of 2020, led by a rally in equity markets in the second half of the year. Investor demand for equity was largely fueled by continued support from central banks, relief spending by governments across the globe and the development and approvals of the first vaccines against Covid-19.
In the first days of January 2020, financial markets largely shrugged off a brief flare-up in military tensions between the U.S. and Iran. However, the emergence and spread of Covid-19 fed increasing investor uncertainty and by early March, the novel coronavirus was declared a pandemic by the World Health Organization. The closure of large sectors of national economies on a global scale sparked a dramatic sell-off in financial markets. Yields on developed market sovereign bonds fell sharply and prices for commodity gold spiked. By the end of the first quarter of 2020, leading developed market equity indexes had lost 20% or more of their value from the start of the year. Corporate bond prices fell and the price of crude oil ended the first quarter down by 60%.
Leading central banks promptly responded with lower interest rates and/or asset purchasing programs, which helped to support asset price stability and head off a potential liquidity crunch in credit markets. Governments also responded with a range of fiscal stimulus or paycheck protection programs designed to cushion the economic impact of the pandemic. In the ensuing months, global equity markets staged a slow and uneven rebound, led by U.S. and emerging markets.
At the start of the second half of the year, U.S. equity led a broad rebound in both developed markets and emerging markets equity. The U.S. Federal Reserve (the “Fed”) signaled its continued support for asset purchases and low benchmark interest rates. While the spread of Covid-19 accelerated in the U.S., multiple candidate vaccines were being developed around the world and the number of hospitalizations at the end of the summer was relatively small compared with what was to come at the end of the year.
U.S. equity markets continued to outperformed bond markets in the final months of the year amid investor optimism following the U.S. Food and Drug Administration’s approval of the first vaccines against Covid-19. While the results of the U.S. presidential election were contested, President-elect Joe Biden’s early cabinet choices — including former Fed Chairwoman Janet Yellen — removed some investor uncertainty. The Fed kept interest rates and policies unchanged and Congressional negotiations over proposed relief and stimulus spending continued through the month.
WHAT WERE THE MAIN DRIVERS OF THE PORTFOLIO’S PERFORMANCE?
The Portfolio’s Class 1 shares outperformed the Bloomberg Barclays U.S. Aggregate Index (the “Benchmark”) for the twelve months ended December 31, 2020.
Relative to the Benchmark, the Portfolio’s overweight allocations to asset-backed securities and corporate credit were leading contributors to performance during the period. The Portfolio’s security selection in corporate credit also contributed to performance. The Portfolio’s slightly longer duration profile relative to the Benchmark, its overweight position in the 5-10 year portion of the yield curve and its underweight position in the 20-plus year portion of the yield curve also contributed to relative performance. Generally, bonds with longer duration will experience a greater increase in price as interest rates fall versus bonds with shorter duration. The yield curve shows the relationship between yields and maturity dates for a set of similar bonds at a given point in time.
The Portfolio’s overweight allocation to non- agency commercial mortgage-backed securities (CMBS) was the leading detractor from relative performance as CMBS generally underperformed other credit sectors during the year.
HOW WAS THE PORTFOLIO POSITIONED?
The Portfolio’s primary strategy was to focus on security selection and relative value, which seeks to identify undervalued bonds among individual securities and across market sectors. The portfolio managers used bottom-up fundamental research to construct what they believed to be a portfolio of undervalued fixed income securities.
| | | | | | | | | | |
| | | | | |
| 2 | | | | | | | | JPMORGAN INSURANCE TRUST | | DECEMBER 31, 2020 |
Relative to the Benchmark, the Portfolio ended the reporting period with an underweight position in U.S. Treasury securities and an overweight position in corporate credit and securitized debt sectors, including asset-backed securities, commercial mortgage-backed securities and mortgage-backed securities, which included both agency and non-agency debt. The Portfolio was overweight in the intermediate part of the yield curve, underweight in the long end of the yield curve and maintained a longer duration profile before finishing the year shorter in duration than the Benchmark.
| | | | |
PORTFOLIO COMPOSITION*** | |
| Corporate Bonds | | | 28.1 | % |
| Mortgage-Backed Securities | | | 20.1 | |
| U.S. Treasury Obligations | | | 18.3 | |
| Asset-Backed Securities | | | 9.5 | |
| Collateralized Mortgage Obligations | | | 6.3 | |
| Commercial Mortgage-Backed Securities | | | 4.6 | |
| Others (each less than 1.0%) | | | 0.7 | |
| Short-Term Investments | | | 12.4 | |
| * | | The return shown is based on net asset values calculated for shareholder transactions and may differ from the return shown in the financial highlights, which reflects adjustments made to the net asset values in accordance with accounting principles generally accepted in the United States of America. |
| ** | | The adviser seeks to achieve the Portfolio’s objective. There can be no guarantee it will be achieved. |
| *** | | Percentages indicated are based on total investments as of December 31, 2020. The Portfolio’s composition is subject to change. |
| | | | | | | | | | |
| | | | | |
| DECEMBER 31, 2020 | | JPMORGAN INSURANCE TRUST | | | | | | | | 3 |
JPMorgan Insurance Trust Core Bond Portfolio
PORTFOLIO COMMENTARY
TWELVE MONTHS ENDED DECEMBER 31, 2020 (Unaudited) (continued)
| | | | | | | | | | | | | | |
AVERAGE ANNUAL TOTAL RETURNS AS OF DECEMBER 31, 2020 | |
| | | | |
| | | INCEPTION DATE OF
CLASS | | 1 YEAR | | | 5 YEAR | | | 10 YEAR | |
CLASS 1 SHARES | | May 1, 1997 | | | 7.84 | % | | | 4.30 | % | | | 3.86 | % |
CLASS 2 SHARES | | August 16, 2006 | | | 7.68 | | | | 4.04 | | | | 3.61 | |
TEN YEAR PERFORMANCE 12/31/10 TO 12/31/20
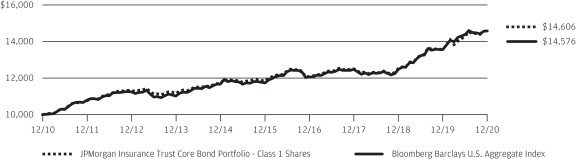
The performance quoted is past performance and is not a guarantee of future results. Mutual funds are subject to certain market risks. Investment returns and principal value of an investment will fluctuate so that an investor’s shares, when redeemed, may be worth more or less than their original cost. Current performance may be higher or lower than the performance data shown. For up-to-date month-end performance information please call 1-800-480-4111.
The graph illustrates comparative performance for $10,000 invested in Class 1 Shares of the JPMorgan Insurance Trust Core Bond Portfolio and the Bloomberg Barclays U.S. Aggregate Index from December 31, 2010 to December 31, 2020. The performance of the Portfolio assumes reinvestment of all dividends and capital gain distributions, if any. The performance of the Bloomberg Barclays U.S. Aggregate Index does not reflect the deduction of expenses associated with a mutual fund and has been adjusted to reflect reinvestment of all dividends and capital gain distributions of the securities included in the benchmark,
if applicable. The Bloomberg Barclays U.S. Aggregate Index is an unmanaged index that represents securities that are SEC-registered, taxable, and dollar denominated. The index covers the U.S. investment grade fixed rate bond market, with index components for government and corporate securities, mortgage pass-through securities, and asset-backed securities. Investors cannot invest directly in an index.
Portfolio performance does not reflect any charges imposed by the Policies or Eligible Plans. If these charges were included, the returns would be lower than shown. Portfolio performance may reflect the waiver of the Portfolio’s fees and reimbursement of expenses for certain periods. Without these waivers and reimbursements, performance would have been lower. The returns shown are based on net asset values calculated for shareholder transactions and may differ from the returns shown in the financial highlights, which reflect adjustments made to the net asset values in accordance with accounting principles generally accepted in the United States of America.
| | | | | | | | | | |
| | | | | |
| 4 | | | | | | | | JPMORGAN INSURANCE TRUST | | DECEMBER 31, 2020 |
JPMorgan Insurance Trust Core Bond Portfolio
SCHEDULE OF PORTFOLIO INVESTMENTS
AS OF DECEMBER 31, 2020
| | | | | | | | |
| INVESTMENTS | | PRINCIPAL
AMOUNT ($000) | | | VALUE ($000) | |
Corporate Bonds — 30.6% | |
|
Aerospace & Defense — 0.8% | |
| | |
Airbus Finance BV (France) 2.70%, 4/17/2023 (a) | | | 32 | | | | 34 | |
| | |
Airbus SE (France) 3.15%, 4/10/2027 (a) | | | 164 | | | | 178 | |
| | |
BAE Systems Holdings, Inc. (United Kingdom) 3.80%, 10/7/2024 (a) | | | 45 | | | | 50 | |
| | |
BAE Systems plc (United Kingdom)
1.90%, 2/15/2031 (a) | | | 200 | | | | 202 | |
| | |
5.80%, 10/11/2041 (a) | | | 51 | | | | 73 | |
| | |
Boeing Co. (The)
4.51%, 5/1/2023 | | | 513 | | | | 554 | |
| | |
1.95%, 2/1/2024 | | | 185 | | | | 191 | |
| | |
4.88%, 5/1/2025 | | | 125 | | | | 143 | |
| | |
2.75%, 2/1/2026 | | | 180 | | | | 189 | |
| | |
2.70%, 2/1/2027 | | | 640 | | | | 665 | |
| | |
5.15%, 5/1/2030 | | | 190 | | | | 230 | |
| | |
5.71%, 5/1/2040 | | | 175 | | | | 226 | |
| | |
L3Harris Technologies, Inc.
3.83%, 4/27/2025 | | | 60 | | | | 67 | |
| | |
1.80%, 1/15/2031 | | | 220 | | | | 224 | |
| | |
Leidos, Inc. 2.30%, 2/15/2031 (a) | | | 120 | | | | 122 | |
| | |
Lockheed Martin Corp. 4.50%, 5/15/2036 | | | 70 | | | | 92 | |
| | |
Northrop Grumman Corp.
3.20%, 2/1/2027 | | | 76 | | | | 86 | |
| | |
3.25%, 1/15/2028 | | | 50 | | | | 56 | |
| | |
5.15%, 5/1/2040 | | | 140 | | | | 193 | |
| | |
Precision Castparts Corp. 3.25%, 6/15/2025 | | | 30 | | | | 33 | |
| | |
Raytheon Technologies Corp.
3.20%, 3/15/2024 | | | 28 | | | | 30 | |
| | |
4.50%, 6/1/2042 | | | 80 | | | | 104 | |
| | |
4.15%, 5/15/2045 | | | 138 | | | | 175 | |
| | |
3.75%, 11/1/2046 | | | 80 | | | | 95 | |
| | |
4.35%, 4/15/2047 | | | 90 | | | | 118 | |
| | | | | | | | |
| | |
| | | | | | | 4,130 | |
| | | | | | | | |
|
Airlines — 0.0% (b) | |
| | |
Continental Airlines Pass-Through Trust | | | | | | | | |
| | |
Series 2012-2, Class A Shares, 4.00%, 10/29/2024 | | | 16 | | | | 16 | |
| | | | | | | | |
|
Automobiles — 0.3% | |
| | |
BMW US Capital LLC (Germany) 2.25%, 9/15/2023 (a) | | | 45 | | | | 47 | |
| | |
General Motors Co. 6.13%, 10/1/2025 | | | 130 | | | | 158 | |
| | |
Hyundai Capital America
1.15%, 11/10/2022 (a) | | | 394 | | | | 396 | |
| | |
1.80%, 10/15/2025 (a) | | | 140 | | | | 143 | |
| | |
2.38%, 10/15/2027 (a) | | | 130 | | | | 134 | |
| | | | | | | | |
| INVESTMENTS | | PRINCIPAL
AMOUNT ($000) | | | VALUE ($000) | |
| | | | | | | | |
|
Automobiles — continued | |
| | |
Nissan Motor Co. Ltd. (Japan) 3.52%, 9/17/2025 (a) | | | 481 | | | | 515 | |
| | |
4.35%, 9/17/2027 (a) | | | 200 | | | | 221 | |
| | |
Volkswagen Group of America Finance LLC (Germany) 1.63%, 11/24/2027 (a) | | | 200 | | | | 202 | |
| | | | | | | | |
| | |
| | | | | | | 1,816 | |
| | | | | | | | |
|
Banks — 5.4% | |
| | |
ABN AMRO Bank NV (Netherlands) 4.75%, 7/28/2025 (a) | | | 200 | | | | 230 | |
| | |
AIB Group plc (Ireland) | | | | | | | | |
| | |
(ICE LIBOR USD 3 Month + 1.87%), 4.26%, 4/10/2025 (a) (c) | | | 250 | | | | 273 | |
| | |
ANZ New Zealand Int’l Ltd. (New Zealand)
3.45%, 1/21/2028 (a) | | | 200 | | | | 229 | |
| | |
2.55%, 2/13/2030 (a) | | | 200 | | | | 218 | |
| | |
ASB Bank Ltd. (New Zealand) 3.13%, 5/23/2024 (a) | | | 230 | | | | 248 | |
| | |
Banco Nacional de Panama (Panama) 2.50%, 8/11/2030 (a) | | | 300 | | | | 300 | |
| | |
Banco Santander SA (Spain)
2.75%, 5/28/2025 | | | 200 | | | | 214 | |
| | |
2.75%, 12/3/2030 | | | 200 | | | | 206 | |
| | |
Bank of America Corp. | | | | | | | | |
| | |
(ICE LIBOR USD 3 Month + 1.16%), 3.12%, 1/20/2023 (c) | | | 100 | | | | 103 | |
| | |
(ICE LIBOR USD 3 Month + 0.79%), 3.00%, 12/20/2023 (c) | | | 26 | | | | 27 | |
| | |
4.00%, 1/22/2025 | | | 114 | | | | 128 | |
| | |
Series L, 3.95%, 4/21/2025 | | | 92 | | | | 104 | |
| | |
(ICE LIBOR USD 3 Month + 0.81%), 3.37%, 1/23/2026 (c) | | | 100 | | | | 110 | |
| | |
4.45%, 3/3/2026 | | | 69 | | | | 81 | |
| | |
3.25%, 10/21/2027 | | | 514 | | | | 575 | |
| | |
(ICE LIBOR USD 3 Month + 1.51%), 3.71%, 4/24/2028 (c) | | | 260 | | | | 296 | |
| | |
(ICE LIBOR USD 3 Month + 1.04%), 3.42%, 12/20/2028 (c) | | | 408 | | | | 461 | |
| | |
(ICE LIBOR USD 3 Month + 1.07%), 3.97%, 3/5/2029 (c) | | | 280 | | | | 326 | |
| | |
(ICE LIBOR USD 3 Month + 0.99%), 2.50%, 2/13/2031 (c) | | | 525 | | | | 557 | |
| | |
(SOFR + 2.15%), 2.59%, 4/29/2031 (c) | | | 313 | | | | 335 | |
| | |
(SOFR + 1.53%), 1.90%, 7/23/2031 (c) | | | 150 | | | | 152 | |
| | |
(SOFR + 1.93%), 2.68%, 6/19/2041 (c) | | | 1,158 | | | | 1,205 | |
| | |
Bank of Montreal (Canada)
1.85%, 5/1/2025 | | | 200 | | | | 210 | |
SEE NOTES TO FINANCIAL STATEMENTS.
| | | | | | | | | | |
| | | | | |
| DECEMBER 31, 2020 | | JPMORGAN INSURANCE TRUST | | | | | | | | 5 |
JPMorgan Insurance Trust Core Bond Portfolio
SCHEDULE OF PORTFOLIO INVESTMENTS
AS OF DECEMBER 31, 2020 (Unaudited) (continued)
(Amounts in thousands)
| | | | | | | | |
| INVESTMENTS | | PRINCIPAL
AMOUNT ($000) | | | VALUE ($000) | |
Corporate Bonds — continued | |
|
Banks — continued | |
| | |
(USD Swap Semi 5 Year + 1.43%), 3.80%, 12/15/2032 (c) | | | 47 | | | | 53 | |
| | |
Bank of Nova Scotia (The) (Canada)
1.63%, 5/1/2023 | | | 680 | | | | 700 | |
| | |
4.50%, 12/16/2025 | | | 25 | | | | 29 | |
| | |
Banque Federative du Credit Mutuel SA (France) 2.38%, 11/21/2024 (a) | | | 254 | | | | 269 | |
| | |
Barclays plc (United Kingdom) | | | | | | | | |
| | |
(US Treasury Yield Curve Rate T Note Constant Maturity 1 Year + 0.80%), 1.01%, 12/10/2024 (c) | | | 369 | | | | 372 | |
| | |
3.65%, 3/16/2025 | | | 200 | | | | 220 | |
| | |
(US Treasury Yield Curve Rate T Note Constant Maturity 1 Year + 1.90%), 2.64%, 6/24/2031 (c) | | | 440 | | | | 458 | |
| | |
BBVA USA 2.50%, 8/27/2024 | | | 250 | | | | 265 | |
| | |
BNP Paribas SA (France) | | | | | | | | |
| | |
(SOFR + 2.07%), 2.22%, 6/9/2026 (a) (c) | | | 525 | | | | 549 | |
| | |
(SOFR + 1.51%), 3.05%, 1/13/2031 (a) (c) | | | 320 | | | | 349 | |
| | |
BNZ International Funding Ltd. (New Zealand) 2.90%, 2/21/2022 (a) | | | 250 | | | | 257 | |
| | |
Citigroup, Inc.
2.90%, 12/8/2021 | | | 100 | | | | 102 | |
| | |
2.75%, 4/25/2022 | | | 200 | | | | 206 | |
| | |
(ICE LIBOR USD 3 Month + 0.72%), 3.14%, 1/24/2023 (c) | | | 74 | | | | 76 | |
| | |
(ICE LIBOR USD 3 Month + 0.90%), 3.35%, 4/24/2025 (c) | | | 90 | | | | 98 | |
| | |
4.40%, 6/10/2025 | | | 78 | | | | 89 | |
| | |
(SOFR + 2.75%), 3.11%, 4/8/2026 (c) | | | 380 | | | | 415 | |
| | |
3.40%, 5/1/2026 | | | 75 | | | | 85 | |
| | |
4.45%, 9/29/2027 | | | 210 | | | | 248 | |
| | |
(ICE LIBOR USD 3 Month + 1.39%), 3.67%, 7/24/2028 (c) | | | 250 | | | | 283 | |
| | |
(ICE LIBOR USD 3 Month + 1.34%), 3.98%, 3/20/2030 (c) | | | 220 | | | | 259 | |
| | |
(ICE LIBOR USD 3 Month + 1.17%), 3.88%, 1/24/2039 (c) | | | 50 | | | | 59 | |
| | |
8.13%, 7/15/2039 | | | 56 | | | | 100 | |
| | |
Citizens Financial Group, Inc.
2.38%, 7/28/2021 | | | 24 | | | | 24 | |
| | |
2.85%, 7/27/2026 | | | 200 | | | | 223 | |
| | |
Comerica, Inc. 4.00%, 2/1/2029 | | | 150 | | | | 179 | |
| | |
Commonwealth Bank of Australia (Australia) 2.85%, 5/18/2026 (a) | | | 80 | | | | 89 | |
| | |
Cooperatieve Rabobank UA (Netherlands) 3.75%, 7/21/2026 | | | 450 | | | | 509 | |
| | | | | | | | |
| INVESTMENTS | | PRINCIPAL
AMOUNT ($000) | | | VALUE ($000) | |
| | | | | | | | |
|
Banks — continued | |
| | |
Credit Agricole SA (France) (SOFR + 1.68%), 1.91%, 6/16/2026 (a) (c) | | | 650 | | | | 674 | |
| | |
Danske Bank A/S (Denmark) 2.00%, 9/8/2021 (a) | | | 200 | | | | 202 | |
| | |
(US Treasury Yield Curve Rate T Note Constant Maturity 1 Year + 1.03%), 1.17%, 12/8/2023 (a) (c) | | | 480 | | | | 482 | |
| | |
Fifth Third Bancorp | | | | | | | | |
| | |
3.65%, 1/25/2024 | | | 90 | | | | 98 | |
| | |
HSBC Holdings plc (United Kingdom) | | | | | | | | |
| | |
(ICE LIBOR USD 3 Month + 0.99%), 3.95%, 5/18/2024 (c) | | | 229 | | | | 247 | |
| | |
4.38%, 11/23/2026 | | | 200 | | | | 231 | |
| | |
(SOFR + 1.95%), 2.36%, 8/18/2031 (c) | | | 300 | | | | 310 | |
| | |
6.50%, 9/15/2037 | | | 250 | | | | 365 | |
| | |
6.10%, 1/14/2042 | | | 120 | | | | 182 | |
| | |
Huntington Bancshares, Inc. 2.55%, 2/4/2030 | | | 315 | | | | 338 | |
| | |
ING Groep NV (Netherlands) 4.10%, 10/2/2023 | | | 200 | | | | 220 | |
| | |
(US Treasury Yield Curve Rate T Note Constant Maturity 1 Year + 1.10%),
1.40%, 7/1/2026 (a) (c) | | | 210 | | | | 214 | |
| | |
3.95%, 3/29/2027 | | | 200 | | | | 231 | |
| | |
KeyCorp 4.15%, 10/29/2025 | | | 65 | | | | 76 | |
| | |
Lloyds Banking Group plc (United Kingdom) | | | | | | | | |
| | |
(US Treasury Yield Curve Rate T Note Constant Maturity 1 Year + 1.10%),
1.33%, 6/15/2023 (c) | | | 200 | | | | 202 | |
| | |
4.50%, 11/4/2024 | | | 220 | | | | 246 | |
| | |
4.58%, 12/10/2025 | | | 200 | | | | 229 | |
| | |
Mitsubishi UFJ Financial Group, Inc.
(Japan) 3.00%, 2/22/2022 | | | 38 | | | | 39 | |
| | |
2.67%, 7/25/2022 | | | 80 | | | | 83 | |
| | |
3.76%, 7/26/2023 | | | 172 | | | | 187 | |
| | |
3.41%, 3/7/2024 | | | 170 | | | | 185 | |
| | |
2.19%, 2/25/2025 | | | 200 | | | | 211 | |
| | |
2.05%, 7/17/2030 | | | 340 | | | | 355 | |
| | |
3.75%, 7/18/2039 | | | 515 | | | | 626 | |
| | |
Mizuho Financial Group, Inc. (Japan) (ICE LIBOR USD 3 Month + 1.31%), 2.87%, 9/13/2030 (c) | | | 220 | | | | 239 | |
| | |
National Australia Bank Ltd. (Australia)
3.38%, 1/14/2026 | | | 300 | | | | 337 | |
| | |
2.33%, 8/21/2030 (a) | | | 250 | | | | 254 | |
| | |
(US Treasury Yield Curve Rate T Note Constant Maturity 5 Year + 1.88%), 3.93%, 8/2/2034 (a) (c) | | | 440 | | | | 494 | |
SEE NOTES TO FINANCIAL STATEMENTS.
| | | | | | | | | | |
| | | | | |
| 6 | | | | | | | | JPMORGAN INSURANCE TRUST | | DECEMBER 31, 2020 |
| | | | | | | | |
| INVESTMENTS | | PRINCIPAL
AMOUNT ($000) | | | VALUE ($000) | |
Corporate Bonds — continued | |
|
Banks — continued | |
| | |
Natwest Group plc (United Kingdom) | | | | | | | | |
| | |
(US Treasury Yield Curve Rate T Note Constant Maturity 1 Year + 2.55%), 3.07%, 5/22/2028 (c) | | | 440 | | | | 477 | |
| | |
(US Treasury Yield Curve Rate T Note Constant Maturity 5 Year + 2.10%), 3.75%, 11/1/2029 (c) | | | 200 | | | | 213 | |
| | |
(ICE LIBOR USD 3 Month + 1.87%), 4.44%, 5/8/2030 (c) | | | 200 | | | | 238 | |
| | |
NatWest Markets plc (United Kingdom) 3.63%, 9/29/2022 (a) | | | 315 | | | | 332 | |
| | |
Regions Financial Corp. 3.80%, 8/14/2023 | | | 27 | | | | 29 | |
| | |
Royal Bank of Canada (Canada)
2.75%, 2/1/2022 | | | 66 | | | | 68 | |
| | |
3.70%, 10/5/2023 | | | 300 | | | | 327 | |
| | |
4.65%, 1/27/2026 | | | 30 | | | | 35 | |
| | |
Societe Generale SA (France)
3.88%, 3/28/2024 (a) | | | 380 | | | | 414 | |
| | |
2.63%, 10/16/2024 (a) | | | 200 | | | | 212 | |
| | |
(US Treasury Yield Curve Rate T Note Constant Maturity 1 Year + 1.10%), 1.49%, 12/14/2026 (a) (c) | | | 260 | | | | 262 | |
| | |
3.00%, 1/22/2030 (a) | | | 331 | | | | 353 | |
| | |
Standard Chartered plc (United Kingdom) | | | | | | | | |
| | |
(ICE LIBOR USD 3 Month + 1.15%), 4.25%, 1/20/2023 (a) (c) | | | 220 | | | | 228 | |
| | |
(ICE LIBOR USD 3 Month + 1.91%), 4.30%, 5/21/2030 (a) (c) | | | 200 | | | | 234 | |
| | |
Sumitomo Mitsui Financial Group, Inc. (Japan)
2.44%, 10/19/2021 | | | 45 | | | | 46 | |
| | |
2.85%, 1/11/2022 | | | 130 | | | | 133 | |
| | |
2.78%, 10/18/2022 | | | 82 | | | | 85 | |
| | |
3.10%, 1/17/2023 | | | 55 | | | | 58 | |
| | |
3.94%, 10/16/2023 | | | 300 | | | | 329 | |
| | |
3.01%, 10/19/2026 | | | 25 | | | | 28 | |
| | |
3.04%, 7/16/2029 | | | 345 | | | | 382 | |
| | |
Toronto-Dominion Bank (The) (Canada) 3.25%, 3/11/2024 | | | 140 | | | | 152 | |
| | |
Truist Financial Corp.
2.70%, 1/27/2022 | | | 91 | | | | 93 | |
| | |
1.95%, 6/5/2030 | | | 140 | | | | 145 | |
| | |
US Bancorp
3.38%, 2/5/2024 | | | 120 | | | | 131 | |
| | |
7.50%, 6/1/2026 | | | 100 | | | | 132 | |
| | |
Wells Fargo & Co.
3.07%, 1/24/2023 | | | 245 | | | | 252 | |
| | |
3.75%, 1/24/2024 | | | 105 | | | | 115 | |
| | | | | | | | |
| INVESTMENTS | | PRINCIPAL
AMOUNT ($000) | | | VALUE ($000) | |
| | | | | | | | |
|
Banks — continued | |
| | |
3.30%, 9/9/2024 | | | 80 | | | | 88 | |
| | |
3.00%, 4/22/2026 | | | 284 | | | | 312 | |
| | |
4.10%, 6/3/2026 | | | 24 | | | | 27 | |
| | |
(ICE LIBOR USD 3 Month + 1.17%), 3.20%, 6/17/2027 (c) | | | 470 | | | | 521 | |
| | |
(SOFR + 2.10%), 2.39%, 6/2/2028 (c) | | | 400 | | | | 426 | |
| | |
(SOFR + 2.53%), 3.07%, 4/30/2041 (c) | | | 255 | | | | 277 | |
| | |
5.38%, 11/2/2043 | | | 200 | | | | 278 | |
| | |
4.40%, 6/14/2046 | | | 47 | | | | 59 | |
| | |
4.75%, 12/7/2046 | | | 53 | | | | 69 | |
| | |
Westpac Banking Corp. (Australia) | | | | | | | | |
| | |
2.85%, 5/13/2026 | | | 100 | | | | 111 | |
| | |
(USD ICE Swap Rate 5 Year + 2.24%), 4.32%, 11/23/2031 (c) | | | 140 | | | | 160 | |
| | |
4.42%, 7/24/2039 | | | 100 | | | | 127 | |
| | | | | | | | |
| | |
| | | | | | | 28,668 | |
| | | | | | | | |
|
Beverages — 0.9% | |
| | |
Anheuser-Busch Cos. LLC (Belgium)
4.70%, 2/1/2036 | | | 571 | | | | 724 | |
| | |
4.90%, 2/1/2046 | | | 260 | | | | 339 | |
| | |
Anheuser-Busch InBev Finance, Inc. (Belgium) 4.70%, 2/1/2036 | | | 120 | | | | 151 | |
| | |
Anheuser-Busch InBev Worldwide, Inc. (Belgium)
4.38%, 4/15/2038 | | | 150 | | | | 185 | |
| | |
4.35%, 6/1/2040 | | | 225 | | | | 276 | |
| | |
4.44%, 10/6/2048 | | | 130 | | | | 162 | |
| | |
4.50%, 6/1/2050 | | | 295 | | | | 371 | |
| | |
4.75%, 4/15/2058 | | | 95 | | | | 124 | |
| | |
4.60%, 6/1/2060 | | | 105 | | | | 134 | |
| | |
Coca-Cola Femsa SAB de CV (Mexico)
2.75%, 1/22/2030 | | | 155 | | | | 167 | |
| | |
1.85%, 9/1/2032 | | | 215 | | | | 214 | |
| | |
Constellation Brands, Inc.
4.40%, 11/15/2025 | | | 50 | | | | 58 | |
| | |
2.88%, 5/1/2030 | | | 420 | | | | 460 | |
| | |
5.25%, 11/15/2048 | | | 25 | | | | 35 | |
| | |
Diageo Capital plc (United Kingdom)
1.38%, 9/29/2025 | | | 350 | | | | 360 | |
| | |
2.00%, 4/29/2030 | | | 350 | | | | 365 | |
| | |
Fomento Economico Mexicano SAB de CV (Mexico) 3.50%, 1/16/2050 | | | 260 | | | | 288 | |
| | |
Keurig Dr Pepper, Inc.
3.13%, 12/15/2023 | | | 100 | | | | 108 | |
| | |
4.42%, 5/25/2025 | | | 30 | | | | 35 | |
| | |
3.43%, 6/15/2027 | | | 20 | | | | 23 | |
SEE NOTES TO FINANCIAL STATEMENTS.
| | | | | | | | | | |
| | | | | |
| DECEMBER 31, 2020 | | JPMORGAN INSURANCE TRUST | | | | | | | | 7 |
JPMorgan Insurance Trust Core Bond Portfolio
SCHEDULE OF PORTFOLIO INVESTMENTS
AS OF DECEMBER 31, 2020 (continued)
| | | | | | | | |
| INVESTMENTS | | PRINCIPAL
AMOUNT ($000) | | | VALUE ($000) | |
Corporate Bonds — continued | |
|
Beverages — continued | |
| | |
4.99%, 5/25/2038 | | | 43 | | | | 57 | |
| | |
4.42%, 12/15/2046 | | | 64 | | | | 81 | |
| | |
5.09%, 5/25/2048 | | | 60 | | | | 84 | |
| | | | | | | | |
| | |
| | | | | | | 4,801 | |
| | | | | | | | |
|
Biotechnology — 0.7% | |
| | |
AbbVie, Inc.
3.45%, 3/15/2022 | | | 52 | | | | 54 | |
| | |
2.80%, 3/15/2023 | | | 100 | | | | 105 | |
| | |
3.85%, 6/15/2024 | | | 42 | | | | 46 | |
| | |
3.20%, 11/21/2029 | | | 516 | | | | 578 | |
| | |
4.50%, 5/14/2035 | | | 100 | | | | 126 | |
| | |
4.05%, 11/21/2039 | | | 510 | | | | 615 | |
| | |
4.40%, 11/6/2042 | | | 370 | | | | 464 | |
| | |
4.85%, 6/15/2044 | | | 200 | | | | 264 | |
| | |
Amgen, Inc. 2.20%, 2/21/2027 | | | 120 | | | | 129 | |
| | |
Baxalta, Inc.
3.60%, 6/23/2022 | | | 7 | | | | 7 | |
| | |
5.25%, 6/23/2045 | | | 3 | | | | 4 | |
| | |
Biogen, Inc. | | | | | | | | |
| | |
2.25%, 5/1/2030 | | | 289 | | | | 302 | |
| | |
3.15%, 5/1/2050 | | | 75 | | | | 77 | |
| | |
Gilead Sciences, Inc. 2.60%, 10/1/2040 | | | 310 | | | | 312 | |
| | |
Regeneron Pharmaceuticals, Inc. 1.75%, 9/15/2030 | | | 460 | | | | 453 | |
| | | | | | | | |
| | |
| | | | | | | 3,536 | |
| | | | | | | | |
|
Building Products — 0.1% | |
| | |
Lennox International, Inc. 1.35%, 8/1/2025 | | | 540 | | | | 552 | |
| | |
Masco Corp.
2.00%, 10/1/2030 | | | 90 | | | | 92 | |
| | |
6.50%, 8/15/2032 | | | 80 | | | | 107 | |
| | | | | | | | |
| | |
| | | | | | | 751 | |
| | | | | | | | |
|
Capital Markets — 2.3% | |
| | |
Bank of New York Mellon Corp. (The) 3.25%, 9/11/2024 | | | 100 | | | | 110 | |
| | |
BlackRock, Inc. 1.90%, 1/28/2031 | | | 189 | | | | 198 | |
| | |
Blackstone Holdings Finance Co. LLC 4.45%, 7/15/2045 (a) | | | 21 | | | | 27 | |
| | |
Brookfield Finance, Inc. (Canada)
3.90%, 1/25/2028 | | | 55 | | | | 63 | |
| | |
4.85%, 3/29/2029 | | | 54 | | | | 66 | |
| | |
4.70%, 9/20/2047 | | | 44 | | | | 56 | |
| | |
Charles Schwab Corp. (The)
0.90%, 3/11/2026 | | | 75 | | | | 76 | |
| | |
3.20%, 3/2/2027 | | | 100 | | | | 112 | |
| | | | | | | | |
| INVESTMENTS | | PRINCIPAL
AMOUNT ($000) | | | VALUE ($000) | |
| | | | | | | | |
|
Capital Markets — continued | |
| | |
Series H, (US Treasury Yield Curve Rate T Note Constant Maturity 10 Year + 3.08%), 4.00%, 12/1/2030 (c) (d) (e) | | | 190 | | | | 200 | |
| | |
CME Group, Inc. 3.00%, 3/15/2025 | | | 97 | | | | 106 | |
| | |
Credit Suisse Group AG (Switzerland)
3.80%, 6/9/2023 | | | 350 | | | | 377 | |
| | |
3.75%, 3/26/2025 | | | 250 | | | | 278 | |
| | |
(SOFR + 1.56%), 2.59%, 9/11/2025 (a) (c) | | | 250 | | | | 263 | |
| | |
(SOFR + 2.04%), 2.19%, 6/5/2026 (a) (c) | | | 250 | | | | 261 | |
| | |
Daiwa Securities Group, Inc. (Japan) 3.13%, 4/19/2022 (a) | | | 49 | | | | 51 | |
| | |
Deutsche Bank AG (Germany)
4.25%, 10/14/2021 | | | 100 | | | | 102 | |
| | |
3.30%, 11/16/2022 | | | 100 | | | | 104 | |
| | |
(SOFR + 2.16%), 2.22%, 9/18/2024 (c) | | | 380 | | | | 391 | |
| | |
(SOFR + 1.87%), 2.13%, 11/24/2026 (c) | | | 205 | | | | 210 | |
| | |
Goldman Sachs Group, Inc. (The) | | | | | | | | |
| | |
(ICE LIBOR USD 3 Month + 0.82%), 2.88%, 10/31/2022 (c) | | | 100 | | | | 102 | |
| | |
(ICE LIBOR USD 3 Month + 1.05%), 2.91%, 6/5/2023 (c) | | | 598 | | | | 619 | |
| | |
(ICE LIBOR USD 3 Month + 0.99%), 2.90%, 7/24/2023 (c) | | | 213 | | | | 221 | |
| | |
3.50%, 1/23/2025 | | | 100 | | | | 110 | |
| | |
(ICE LIBOR USD 3 Month + 1.20%), 3.27%, 9/29/2025 (c) | | | 137 | | | | 150 | |
| | |
4.25%, 10/21/2025 | | | 105 | | | | 121 | |
| | |
3.50%, 11/16/2026 | | | 142 | | | | 160 | |
| | |
3.85%, 1/26/2027 | | | 45 | | | | 51 | |
| | |
(ICE LIBOR USD 3 Month + 1.51%), 3.69%, 6/5/2028 (c) | | | 209 | | | | 241 | |
| | |
2.60%, 2/7/2030 | | | 400 | | | | 430 | |
| | |
6.75%, 10/1/2037 | | | 80 | | | | 122 | |
| | |
(ICE LIBOR USD 3 Month + 1.43%), 4.41%, 4/23/2039 (c) | | | 215 | | | | 275 | |
| | |
4.75%, 10/21/2045 | | | 400 | | | | 556 | |
| | |
Intercontinental Exchange, Inc. 4.00%, 10/15/2023 | | | 59 | | | | 65 | |
| | |
Invesco Finance plc
4.00%, 1/30/2024 | | | 29 | | | | 32 | |
| | |
3.75%, 1/15/2026 | | | 36 | | | | 40 | |
| | |
Jefferies Group LLC 6.45%, 6/8/2027 | | | 81 | | | | 103 | |
| | |
Macquarie Bank Ltd. (Australia) 4.00%, 7/29/2025 (a) | | | 100 | | | | 114 | |
| | |
Macquarie Group Ltd. (Australia) | | | | | | | | |
| | |
(ICE LIBOR USD 3 Month + 1.37%), 3.76%, 11/28/2028 (a) (c) | | | 145 | | | | 161 | |
SEE NOTES TO FINANCIAL STATEMENTS.
| | | | | | | | | | |
| | | | | |
| 8 | | | | | | | | JPMORGAN INSURANCE TRUST | | DECEMBER 31, 2020 |
| | | | | | | | |
| INVESTMENTS | | PRINCIPAL
AMOUNT ($000) | | | VALUE ($000) | |
Corporate Bonds — continued | |
|
Capital Markets — continued | |
| | |
(ICE LIBOR USD 3 Month + 1.75%), 5.03%, 1/15/2030 (a) (c) | | | 220 | | | | 266 | |
| | |
Morgan Stanley
5.50%, 7/28/2021 | | | 35 | | | | 36 | |
| | |
2.63%, 11/17/2021 | | | 170 | | | | 173 | |
| | |
3.75%, 2/25/2023 | | | 142 | | | | 152 | |
| | |
4.10%, 5/22/2023 | | | 100 | | | | 109 | |
| | |
3.70%, 10/23/2024 | | | 69 | | | | 77 | |
| | |
4.00%, 7/23/2025 | | | 276 | | | | 316 | |
| | |
5.00%, 11/24/2025 | | | 70 | | | | 84 | |
| | |
3.88%, 1/27/2026 | | | 341 | | | | 391 | |
| | |
(SOFR + 1.99%), 2.19%, 4/28/2026 (c) | | | 980 | | | | 1,035 | |
| | |
4.35%, 9/8/2026 | | | 20 | | | | 24 | |
| | |
3.63%, 1/20/2027 | | | 159 | | | | 182 | |
| | |
(ICE LIBOR USD 3 Month + 1.34%), 3.59%, 7/22/2028 (c) | | | 222 | | | | 253 | |
| | |
(ICE LIBOR USD 3 Month + 1.14%), 3.77%, 1/24/2029 (c) | | | 96 | | | | 111 | |
| | |
(SOFR + 1.03%), 1.79%, 2/13/2032 (c) | | | 280 | | | | 282 | |
| | |
4.30%, 1/27/2045 | | | 85 | | | | 113 | |
| | |
Nomura Holdings, Inc. (Japan)
2.65%, 1/16/2025 | | | 212 | | | | 226 | |
| | |
2.68%, 7/16/2030 | | | 200 | | | | 212 | |
| | |
Northern Trust Corp.
1.95%, 5/1/2030 | | | 375 | | | | 390 | |
| | |
(ICE LIBOR USD 3 Month + 1.13%), 3.38%, 5/8/2032 (c) | | | 29 | | | | 32 | |
| | |
Nuveen LLC 4.00%, 11/1/2028 (a) | | | 160 | | | | 191 | |
| | |
S&P Global, Inc. 3.25%, 12/1/2049 | | | 150 | | | | 175 | |
| | |
TD Ameritrade Holding Corp. 2.95%, 4/1/2022 | | | 17 | | | | 17 | |
| | |
UBS AG (Switzerland) 1.75%, 4/21/2022 (a) | | | 200 | | | | 203 | |
| | |
UBS Group AG (Switzerland)
4.13%, 9/24/2025 (a) | | | 200 | | | | 229 | |
| | |
(US Treasury Yield Curve Rate T Note Constant Maturity 1 Year + 1.08%), 1.36%, 1/30/2027 (a) (c) | | | 200 | | | | 202 | |
| | | | | | | | |
| | |
| | | | | | | 12,205 | |
| | | | | | | | |
|
Chemicals — 0.8% | |
| | |
Air Products and Chemicals, Inc. 1.85%, 5/15/2027 | | | 310 | | | | 328 | |
| | |
Albemarle Corp. 5.45%, 12/1/2044 | | | 50 | | | | 60 | |
| | |
Celanese US Holdings LLC 3.50%, 5/8/2024 | | | 151 | | | | 163 | |
| | |
Chevron Phillips Chemical Co. LLC 5.13%, 4/1/2025 (a) | | | 485 | | | | 569 | |
| | |
Dow Chemical Co. (The)
4.55%, 11/30/2025 | | | 200 | | | | 234 | |
| | | | | | | | |
| INVESTMENTS | | PRINCIPAL
AMOUNT ($000) | | | VALUE ($000) | |
| | | | | | | | |
|
Chemicals — continued | |
| | |
3.60%, 11/15/2050 | | | 245 | | | | 275 | |
| | |
DuPont de Nemours, Inc. 5.32%, 11/15/2038 | | | 595 | | | | 805 | |
| | |
Eastman Chemical Co. 4.50%, 12/1/2028 | | | 220 | | | | 265 | |
| | |
Ecolab, Inc. 3.25%, 1/14/2023 | | | 90 | | | | 95 | |
| | |
International Flavors & Fragrances, Inc.
4.45%, 9/26/2028 | | | 45 | | | | 53 | |
| | |
5.00%, 9/26/2048 | | | 52 | | | | 70 | |
| | |
LYB International Finance III LLC
1.25%, 10/1/2025 | | | 80 | | | | 82 | |
| | |
3.38%, 5/1/2030 | | | 235 | | | | 263 | |
| | |
Nutrien Ltd. (Canada)
4.00%, 12/15/2026 | | | 70 | | | | 82 | |
| | |
4.20%, 4/1/2029 | | | 25 | | | | 30 | |
| | |
4.13%, 3/15/2035 | | | 90 | | | | 107 | |
| | |
5.00%, 4/1/2049 | | | 40 | | | | 55 | |
| | |
Nutrition & Biosciences, Inc.
1.83%, 10/15/2027 (a) | | | 190 | | | | 196 | |
| | |
3.27%, 11/15/2040 (a) | | | 110 | | | | 118 | |
| | |
3.47%, 12/1/2050 (a) | | | 85 | | | | 92 | |
| | |
Sherwin-Williams Co. (The) 3.13%, 6/1/2024 | | | 29 | | | | 31 | |
| | |
Union Carbide Corp. 7.75%, 10/1/2096 | | | 80 | | | | 123 | |
| | | | | | | | |
| | |
| | | | | | | 4,096 | |
| | | | | | | | |
|
Commercial Services & Supplies — 0.1% | |
| | |
Brambles USA, Inc. (Australia) 4.13%, 10/23/2025 (a) | | | 70 | | | | 79 | |
| | |
Ford Foundation (The) Series 2020, 2.82%, 6/1/2070 | | | 90 | | | | 96 | |
| | |
Republic Services, Inc. 1.45%, 2/15/2031 | | | 230 | | | | 225 | |
| | | | | | | | |
| | |
| | | | | | | 400 | |
| | | | | | | | |
|
Construction & Engineering — 0.1% | |
| | |
Quanta Services, Inc. 2.90%, 10/1/2030 | | | 360 | | | | 386 | |
| | | | | | | | |
|
Construction Materials — 0.0% (b) | |
| | |
Martin Marietta Materials, Inc.
3.45%, 6/1/2027 | | | 52 | | | | 58 | |
| | |
3.50%, 12/15/2027 | | | 100 | | | | 114 | |
| | | | | | | | |
| | |
| | | | | | | 172 | |
| | | | | | | | |
|
Consumer Finance — 1.0% | |
| | |
AerCap Ireland Capital DAC (Ireland)
4.45%, 12/16/2021 | | | 150 | | | | 154 | |
| | |
4.13%, 7/3/2023 | | | 150 | | | | 161 | |
| | |
4.50%, 9/15/2023 | | | 600 | | | | 651 | |
| | |
3.15%, 2/15/2024 | | | 650 | | | | 681 | |
| | |
2.88%, 8/14/2024 | | | 150 | | | | 156 | |
| | |
American Express Co. 4.20%, 11/6/2025 | | | 150 | | | | 174 | |
SEE NOTES TO FINANCIAL STATEMENTS.
| | | | | | | | | | |
| | | | | |
| DECEMBER 31, 2020 | | JPMORGAN INSURANCE TRUST | | | | | | | | 9 |
JPMorgan Insurance Trust Core Bond Portfolio
SCHEDULE OF PORTFOLIO INVESTMENTS
AS OF DECEMBER 31, 2020 (continued)
| | | | | | | | |
| INVESTMENTS | | PRINCIPAL
AMOUNT ($000) | | | VALUE ($000) | |
Corporate Bonds — continued | |
|
Consumer Finance — continued | |
| | |
American Express Credit Corp. 2.25%, 5/5/2021 | | | 73 | | | | 73 | |
| | |
American Honda Finance Corp. 2.30%, 9/9/2026 | | | 17 | | | | 19 | |
| | |
Avolon Holdings Funding Ltd. (Ireland)
5.50%, 1/15/2023 (a) | | | 195 | | | | 207 | |
| | |
2.88%, 2/15/2025 (a) | | | 194 | | | | 198 | |
| | |
5.50%, 1/15/2026 (a) | | | 395 | | | | 447 | |
| | |
4.25%, 4/15/2026 (a) | | | 245 | | | | 264 | |
| | |
4.38%, 5/1/2026 (a) | | | 150 | | | | 163 | |
| | |
Capital One Financial Corp.
3.75%, 4/24/2024 | | | 130 | | | | 142 | |
| | |
4.20%, 10/29/2025 | | | 40 | | | | 46 | |
| | |
3.75%, 7/28/2026 | | | 196 | | | | 222 | |
| | |
John Deere Capital Corp. 2.25%, 9/14/2026 | | | 125 | | | | 135 | |
| | |
Park Aerospace Holdings Ltd. (Ireland)
5.25%, 8/15/2022 (a) | | | 995 | | | | 1,044 | |
| | |
4.50%, 3/15/2023 (a) | | | 475 | | | | 498 | |
| | |
5.50%, 2/15/2024 (a) | | | 160 | | | | 174 | |
| | | | | | | | |
| | |
| | | | | | | 5,609 | |
| | | | | | | | |
|
Containers & Packaging — 0.1% | |
| | |
Packaging Corp. of America 4.05%, 12/15/2049 | | | 155 | | | | 192 | |
| | |
WRKCo, Inc.
3.00%, 9/15/2024 | | | 80 | | | | 86 | |
| | |
3.90%, 6/1/2028 | | | 35 | | | | 41 | |
| | | | | | | | |
| | |
| | | | | | | 319 | |
| | | | | | | | |
|
Diversified Consumer Services — 0.1% | |
| | |
Emory University Series 2020, 2.14%, 9/1/2030 | | | 240 | | | | 252 | |
| | |
Pepperdine University Series 2020, 3.30%, 12/1/2059 | | | 110 | | | | 117 | |
| | |
University of Southern California Series A, 3.23%, 10/1/2120 | | | 110 | | | | 110 | |
| | | | | | | | |
| | |
| | | | | | | 479 | |
| | | | | | | | |
|
Diversified Financial Services — 0.4% | |
| | |
AIG Global Funding 1.90%, 10/6/2021 (a) | | | 100 | | | | 101 | |
| | |
Blackstone Secured Lending Fund 3.65%, 7/14/2023 (a) | | | 200 | | | | 208 | |
| | |
CK Hutchison International 16 Ltd. (United Kingdom) 1.88%, 10/3/2021 (a) | | | 200 | | | | 202 | |
| | |
GE Capital Funding LLC 4.40%, 5/15/2030 (a) | | | 445 | | | | 524 | |
| | |
GE Capital International Funding Co. Unlimited Co. 4.42%, 11/15/2035 | | | 600 | | | | 715 | |
| | |
GTP Acquisition Partners I LLC 3.48%, 6/16/2025 (a) | | | 67 | | | | 72 | |
| | | | | | | | |
| INVESTMENTS | | PRINCIPAL
AMOUNT ($000) | | | VALUE ($000) | |
| | | | | | | | |
|
Diversified Financial Services — continued | |
| | |
Mitsubishi UFJ Lease & Finance Co. Ltd. (Japan) 2.65%, 9/19/2022 (a) | | | 200 | | | | 206 | |
| | |
National Rural Utilities Cooperative Finance Corp. 2.95%, 2/7/2024 | | | 44 | | | | 47 | |
| | |
ORIX Corp. (Japan)
2.90%, 7/18/2022 | | | 40 | | | | 42 | |
| | |
3.25%, 12/4/2024 | | | 100 | | | | 109 | |
| | |
3.70%, 7/18/2027 | | | 100 | | | | 114 | |
| | | | | | | | |
| | |
| | | | | | | 2,340 | |
| | | | | | | | |
|
Diversified Telecommunication Services — 0.9% | |
| | |
AT&T, Inc.
2.30%, 6/1/2027 | | | 520 | | | | 554 | |
| | |
1.65%, 2/1/2028 | | | 255 | | | | 260 | |
| | |
4.30%, 2/15/2030 | | | 178 | | | | 213 | |
| | |
2.25%, 2/1/2032 | | | 430 | | | | 436 | |
| | |
3.50%, 6/1/2041 | | | 154 | | | | 166 | |
| | |
3.10%, 2/1/2043 | | | 645 | | | | 652 | |
| | |
3.50%, 9/15/2053 (a) | | | 436 | | | | 434 | |
| | |
Deutsche Telekom International Finance BV (Germany) 4.88%, 3/6/2042 (a) | | | 150 | | | | 199 | |
| | |
Telefonica Emisiones SA (Spain) 5.46%, 2/16/2021 | | | 19 | | | | 19 | |
| | |
Verizon Communications, Inc.
2.63%, 8/15/2026 | | | 12 | | | | 13 | |
| | |
3.88%, 2/8/2029 | | | 75 | | | | 88 | |
| | |
3.15%, 3/22/2030 | | | 40 | | | | 45 | |
| | |
4.50%, 8/10/2033 | | | 125 | | | | 158 | |
| | |
4.40%, 11/1/2034 | | | 209 | | | | 261 | |
| | |
4.27%, 1/15/2036 | | | 85 | | | | 105 | |
| | |
2.65%, 11/20/2040 | | | 260 | | | | 263 | |
| | |
4.86%, 8/21/2046 | | | 134 | | | | 181 | |
| | |
4.67%, 3/15/2055 | | | 340 | | | | 456 | |
| | |
2.99%, 10/30/2056 (a) | | | 82 | | | | 82 | |
| | | | | | | | |
| | |
| | | | | | | 4,585 | |
| | | | | | | | |
|
Electric Utilities — 1.6% | |
| | |
AEP Transmission Co. LLC 3.15%, 9/15/2049 | | | 35 | | | | 39 | |
| | |
Alabama Power Co. 6.13%, 5/15/2038 | | | 62 | | | | 92 | |
| | |
Avangrid, Inc. 3.15%, 12/1/2024 | | | 72 | | | | 78 | |
| | |
Baltimore Gas and Electric Co.
3.50%, 8/15/2046 | | | 47 | | | | 55 | |
| | |
2.90%, 6/15/2050 | | | 110 | | | | 118 | |
| | |
CenterPoint Energy Houston Electric LLC
3.95%, 3/1/2048 | | | 10 | | | | 12 | |
| | |
Series AD, 2.90%, 7/1/2050 | | | 200 | | | | 217 | |
| | |
China Southern Power Grid International Finance BVI Co. Ltd. (China) 3.50%, 5/8/2027 (a) | | | 200 | | | | 220 | |
SEE NOTES TO FINANCIAL STATEMENTS.
| | | | | | | | | | |
| | | | | |
| 10 | | | | | | | | JPMORGAN INSURANCE TRUST | | DECEMBER 31, 2020 |
| | | | | | | | |
| INVESTMENTS | | PRINCIPAL
AMOUNT ($000) | | | VALUE ($000) | |
Corporate Bonds — continued | |
|
Electric Utilities — continued | |
| | |
Cleveland Electric Illuminating Co. (The)
3.50%, 4/1/2028 (a) | | | 95 | | | | 101 | |
| | |
4.55%, 11/15/2030 (a) | | | 65 | | | | 75 | |
| | |
Commonwealth Edison Co. 3.65%, 6/15/2046 | | | 30 | | | | 36 | |
| | |
Duke Energy Corp.
2.65%, 9/1/2026 | | | 100 | | | | 109 | |
| | |
3.40%, 6/15/2029 | | | 61 | | | | 69 | |
| | |
Duke Energy Indiana LLC 3.75%, 5/15/2046 | | | 60 | | | | 72 | |
| | |
Duke Energy Ohio, Inc. 3.70%, 6/15/2046 | | | 46 | | | | 54 | |
| | |
Duke Energy Progress LLC 3.70%, 10/15/2046 | | | 54 | | | | 65 | |
| | |
Duquesne Light Holdings, Inc.
3.62%, 8/1/2027 (a) | | | 160 | | | | 177 | |
| | |
2.53%, 10/1/2030 (a) | | | 210 | | | | 217 | |
| | |
Edison International
3.55%, 11/15/2024 | | | 284 | | | | 306 | |
| | |
4.13%, 3/15/2028 | | | 100 | | | | 111 | |
| | |
Emera US Finance LP (Canada) 4.75%, 6/15/2046 | | | 130 | | | | 166 | |
| | |
Enel Finance International NV (Italy) 3.63%, 5/25/2027 (a) | | | 220 | | | | 250 | |
| | |
Entergy Arkansas LLC 3.50%, 4/1/2026 | | | 22 | | | | 25 | |
| | |
Entergy Corp. 2.95%, 9/1/2026 | | | 21 | | | | 23 | |
| | |
Entergy Louisiana LLC
2.40%, 10/1/2026 | | | 59 | | | | 64 | |
| | |
3.05%, 6/1/2031 | | | 38 | | | | 43 | |
| | |
4.00%, 3/15/2033 | | | 40 | | | | 50 | |
| | |
2.90%, 3/15/2051 | | | 130 | | | | 138 | |
| | |
Entergy Mississippi LLC 3.85%, 6/1/2049 | | | 135 | | | | 164 | |
| | |
Evergy Metro, Inc.
3.15%, 3/15/2023 | | | 24 | | | | 25 | |
| | |
5.30%, 10/1/2041 | | | 50 | | | | 68 | |
| | |
4.20%, 3/15/2048 | | | 50 | | | | 65 | |
| | |
Evergy, Inc. 2.90%, 9/15/2029 | | | 170 | | | | 186 | |
| | |
Florida Power & Light Co. 5.40%, 9/1/2035 | | | 50 | | | | 71 | |
| | |
Fortis, Inc. (Canada) 3.06%, 10/4/2026 | | | 124 | | | | 136 | |
| | |
Hydro-Quebec (Canada) Series IO, 8.05%, 7/7/2024 | | | 100 | | | | 125 | |
| | |
Interstate Power and Light Co. 2.30%, 6/1/2030 | | | 315 | | | | 333 | |
| | |
ITC Holdings Corp. | | | | | | | | |
| | |
2.70%, 11/15/2022 | | | 100 | | | | 104 | |
| | |
2.95%, 5/14/2030 (a) | | | 100 | | | | 109 | |
| | |
Jersey Central Power & Light Co.
4.30%, 1/15/2026 (a) | | | 40 | | | | 45 | |
| | |
6.15%, 6/1/2037 | | | 30 | | | | 38 | |
| | |
Massachusetts Electric Co. 4.00%, 8/15/2046 (a) | | | 56 | | | | 68 | |
| | |
MidAmerican Energy Co. 3.50%, 10/15/2024 | | | 59 | | | | 65 | |
| | | | | | | | |
| INVESTMENTS | | PRINCIPAL
AMOUNT ($000) | | | VALUE ($000) | |
| | | | | | | | |
|
Electric Utilities — continued | |
| | |
Mid-Atlantic Interstate Transmission LLC 4.10%, 5/15/2028 (a) | | | 40 | | | | 45 | |
| | |
Nevada Power Co. Series CC, 3.70%, 5/1/2029 | | | 100 | | | | 117 | |
| | |
New England Power Co. (United Kingdom) 3.80%, 12/5/2047 (a) | | | 45 | | | | 53 | |
| | |
NextEra Energy Capital Holdings, Inc. 3.55%, 5/1/2027 | | | 27 | | | | 31 | |
| | |
Niagara Mohawk Power Corp.
3.51%, 10/1/2024 (a) | | | 19 | | | | 21 | |
| | |
1.96%, 6/27/2030 (a) | | | 250 | | | | 257 | |
| | |
NRG Energy, Inc.
2.00%, 12/2/2025 (a) | | | 185 | | | | 192 | |
| | |
2.45%, 12/2/2027 (a) | | | 210 | | | | 221 | |
| | |
4.45%, 6/15/2029 (a) | | | 110 | | | | 127 | |
| | |
Oncor Electric Delivery Co. LLC
5.75%, 3/15/2029 | | | 25 | | | | 33 | |
| | |
3.10%, 9/15/2049 | | | 215 | | | | 247 | |
| | |
Pacific Gas and Electric Co.
(ICE LIBOR USD 3 Month + 1.38%), 1.60%, 11/15/2021 (c) | | | 330 | | | | 330 | |
| | |
1.75%, 6/16/2022 | | | 320 | | | | 321 | |
| | |
3.45%, 7/1/2025 | | | 145 | | | | 157 | |
| | |
2.95%, 3/1/2026 | | | 90 | | | | 95 | |
| | |
3.75%, 8/15/2042 (f) | | | 33 | | | | 33 | |
| | |
4.30%, 3/15/2045 | | | 55 | | | | 59 | |
| | |
4.00%, 12/1/2046 | | | 230 | | | | 238 | |
| | |
PECO Energy Co. 2.80%, 6/15/2050 | | | 100 | | | | 106 | |
| | |
Pennsylvania Electric Co. 3.25%, 3/15/2028 (a) | | | 19 | | | | 20 | |
| | |
Potomac Electric Power Co. 6.50%, 11/15/2037 | | | 75 | | | | 114 | |
| | |
PPL Capital Funding, Inc.
3.40%, 6/1/2023 | | | 30 | | | | 32 | |
| | |
4.00%, 9/15/2047 | | | 20 | | | | 23 | |
| | |
Public Service Co. of Oklahoma Series G, 6.63%, 11/15/2037 | | | 175 | | | | 257 | |
| | |
Public Service Electric and Gas Co.
3.00%, 5/15/2025 | | | 83 | | | | 91 | |
| | |
5.38%, 11/1/2039 | | | 28 | | | | 39 | |
| | |
Southern California Edison Co. | | | | | | | | |
| | |
Series C, 3.50%, 10/1/2023 | | | 53 | | | | 57 | |
| | |
Series B, 3.65%, 3/1/2028 | | | 80 | | | | 90 | |
| | |
Series 05-B, 5.55%, 1/15/2036 | | | 80 | | | | 102 | |
| | |
4.05%, 3/15/2042 | | | 100 | | | | 114 | |
| | |
Tampa Electric Co. 4.45%, 6/15/2049 | | | 100 | | | | 131 | |
| | |
Toledo Edison Co. (The) 6.15%, 5/15/2037 | | | 50 | | | | 68 | |
| | |
Union Electric Co. 2.95%, 6/15/2027 | | | 36 | | | | 40 | |
| | |
Virginia Electric and Power Co. 6.35%, 11/30/2037 | | | 70 | | | | 106 | |
| | | | | | | | |
| | |
| | | | | | | 8,551 | |
| | | | | | | | |
SEE NOTES TO FINANCIAL STATEMENTS.
| | | | | | | | | | |
| | | | | |
| DECEMBER 31, 2020 | | JPMORGAN INSURANCE TRUST | | | | | | | | 11 |
JPMorgan Insurance Trust Core Bond Portfolio
SCHEDULE OF PORTFOLIO INVESTMENTS
AS OF DECEMBER 31, 2020 (continued)
| | | | | | | | |
| INVESTMENTS | | PRINCIPAL
AMOUNT ($000) | | | VALUE ($000) | |
Corporate Bonds — continued | |
|
Electronic Equipment, Instruments & Components — 0.1% | |
| | |
Arrow Electronics, Inc.
4.50%, 3/1/2023 | | | 8 | | | | 8 | |
| | |
3.25%, 9/8/2024 | | | 44 | | | | 48 | |
| | |
3.88%, 1/12/2028 | | | 22 | | | | 25 | |
| | |
Corning, Inc.
5.35%, 11/15/2048 | | | 110 | | | | 155 | |
| | |
3.90%, 11/15/2049 | | | 174 | | | | 213 | |
| | | | | | | | |
| | |
| | | | | | | 449 | |
| | | | | | | | |
|
Energy Equipment & Services — 0.2% | |
| | |
Baker Hughes a GE Co. LLC
3.14%, 11/7/2029 | | | 180 | | | | 198 | |
| | |
4.49%, 5/1/2030 | | | 115 | | | | 138 | |
| | |
Baker Hughes Holdings LLC 5.13%, 9/15/2040 | | | 40 | | | | 53 | |
| | |
Halliburton Co.
3.80%, 11/15/2025 | | | 4 | | | | 4 | |
| | |
4.85%, 11/15/2035 | | | 30 | | | | 35 | |
| | |
6.70%, 9/15/2038 | | | 60 | | | | 80 | |
| | |
National Oilwell Varco, Inc. 3.60%, 12/1/2029 | | | 200 | | | | 209 | |
| | |
Schlumberger Finance Canada Ltd. 1.40%, 9/17/2025 | | | 300 | | | | 308 | |
| | |
Schlumberger Holdings Corp.
3.75%, 5/1/2024 (a) | | | 55 | | | | 60 | |
| | |
3.90%, 5/17/2028 (a) | | | 62 | | | | 70 | |
| | | | | | | | |
| | |
| | | | | | | 1,155 | |
| | | | | | | | |
|
Entertainment — 0.1% | |
| | |
NBCUniversal Media LLC 5.95%, 4/1/2041 | | | 75 | | | | 114 | |
| | |
Walt Disney Co. (The) 7.30%, 4/30/2028 | | | 150 | | | | 207 | |
| | | | | | | | |
| | |
| | | | | | | 321 | |
| | | | | | | | |
|
Equity Real Estate Investment Trusts (REITs) — 1.7% | |
| | |
Alexandria Real Estate Equities, Inc.
3.80%, 4/15/2026 | | | 23 | | | | 26 | |
| | |
1.88%, 2/1/2033 | | | 140 | | | | 140 | |
| | |
4.00%, 2/1/2050 | | | 125 | | | | 155 | |
| | |
American Campus Communities Operating Partnership LP
3.63%, 11/15/2027 | | | 100 | | | | 110 | |
| | |
2.85%, 2/1/2030 | | | 190 | | | | 199 | |
| | |
American Tower Corp.
5.00%, 2/15/2024 | | | 71 | | | | 80 | |
| | |
3.38%, 10/15/2026 | | | 44 | | | | 49 | |
| | |
1.50%, 1/31/2028 | | | 325 | | | | 327 | |
| | |
2.90%, 1/15/2030 | | | 30 | | | | 33 | |
| | |
2.10%, 6/15/2030 | | | 150 | | | | 154 | |
| | |
1.88%, 10/15/2030 | | | 275 | | | | 277 | |
| | |
3.70%, 10/15/2049 | | | 230 | | | | 261 | |
| | |
2.95%, 1/15/2051 | | | 215 | | | | 215 | |
| | | | | | | | |
| INVESTMENTS | | PRINCIPAL
AMOUNT ($000) | | | VALUE ($000) | |
| | | | | | | | |
|
Equity Real Estate Investment Trusts (REITs) — continued | |
| | |
Boston Properties LP
3.13%, 9/1/2023 | | | 30 | | | | 32 | |
| | |
3.20%, 1/15/2025 | | | 61 | | | | 67 | |
| | |
3.65%, 2/1/2026 | | | 67 | | | | 76 | |
| | |
Brixmor Operating Partnership LP
3.65%, 6/15/2024 | | | 50 | | | | 54 | |
| | |
3.85%, 2/1/2025 | | | 50 | | | | 55 | |
| | |
Corporate Office Properties LP 2.25%, 3/15/2026 | | | 470 | | | | 490 | |
| | |
Crown Castle International Corp.
5.25%, 1/15/2023 | | | 60 | | | | 66 | |
| | |
4.00%, 3/1/2027 | | | 24 | | | | 27 | |
| | |
2.25%, 1/15/2031 | | | 295 | | | | 306 | |
| | |
Digital Realty Trust LP 3.70%, 8/15/2027 | | | 31 | | | | 36 | |
| | |
Duke Realty LP
3.25%, 6/30/2026 | | | 18 | | | | 20 | |
| | |
2.88%, 11/15/2029 | | | 95 | | | | 105 | |
| | |
Equinix, Inc. 1.55%, 3/15/2028 | | | 285 | | | | 290 | |
| | |
Essex Portfolio LP
1.65%, 1/15/2031 | | | 200 | | | | 199 | |
| | |
2.65%, 3/15/2032 | | | 145 | | | | 155 | |
| | |
GAIF Bond Issuer Pty. Ltd. (Australia) 3.40%, 9/30/2026 (a) | | | 79 | | | | 85 | |
| | |
Goodman US Finance Three LLC (Australia) 3.70%, 3/15/2028 (a) | | | 43 | | | | 47 | |
| | |
Healthcare Trust of America Holdings LP
3.10%, 2/15/2030 | | | 310 | | | | 338 | |
| | |
2.00%, 3/15/2031 | | | 160 | | | | 160 | |
| | |
Healthpeak Properties, Inc.
3.88%, 8/15/2024 | | | 115 | | | | 127 | |
| | |
3.50%, 7/15/2029 | | | 132 | | | | 150 | |
| | |
3.00%, 1/15/2030 | | | 90 | | | | 98 | |
| | |
Kimco Realty Corp. 2.70%, 10/1/2030 | | | 320 | | | | 344 | |
| | |
Life Storage LP
4.00%, 6/15/2029 | | | 150 | | | | 175 | |
| | |
2.20%, 10/15/2030 | | | 300 | | | | 306 | |
| | |
Mid-America Apartments LP 1.70%, 2/15/2031 | | | 150 | | | | 149 | |
| | |
National Retail Properties, Inc.
3.60%, 12/15/2026 | | | 58 | | | | 64 | |
| | |
4.30%, 10/15/2028 | | | 150 | | | | 174 | |
| | |
Office Properties Income Trust 4.00%, 7/15/2022 | | | 78 | | | | 80 | |
| | |
Prologis LP
3.25%, 10/1/2026 | | | 19 | | | | 22 | |
| | |
1.25%, 10/15/2030 | | | 165 | | | | 163 | |
| | |
2.13%, 10/15/2050 | | | 150 | | | | 139 | |
SEE NOTES TO FINANCIAL STATEMENTS.
| | | | | | | | | | |
| | | | | |
| 12 | | | | | | | | JPMORGAN INSURANCE TRUST | | DECEMBER 31, 2020 |
| | | | | | | | |
| INVESTMENTS | | PRINCIPAL
AMOUNT ($000) | | | VALUE ($000) | |
Corporate Bonds — continued | |
|
Equity Real Estate Investment Trusts (REITs) — continued | |
| | |
Realty Income Corp.
3.88%, 7/15/2024 | | | 20 | | | | 22 | |
| | |
3.88%, 4/15/2025 | | | 60 | | | | 67 | |
| | |
3.25%, 1/15/2031 | | | 170 | | | | 193 | |
| | |
4.65%, 3/15/2047 | | | 38 | | | | 52 | |
| | |
Regency Centers LP 2.95%, 9/15/2029 | | | 215 | | | | 230 | |
| | |
Scentre Group Trust 1 (Australia) 3.50%, 2/12/2025 (a) | | | 170 | | | | 182 | |
| | |
SITE Centers Corp. 3.63%, 2/1/2025 | | | 61 | | | | 63 | |
| | |
UDR, Inc.
2.95%, 9/1/2026 | | | 28 | | | | 31 | |
| | |
3.20%, 1/15/2030 | | | 150 | | | | 167 | |
| | |
3.00%, 8/15/2031 | | | 25 | | | | 27 | |
| | |
2.10%, 8/1/2032 | | | 160 | | | | 163 | |
| | |
1.90%, 3/15/2033 | | | 240 | | | | 240 | |
| | |
Ventas Realty LP
4.13%, 1/15/2026 | | | 34 | | | | 39 | |
| | |
3.85%, 4/1/2027 | | | 49 | | | | 55 | |
| | |
Vornado Realty LP 3.50%, 1/15/2025 | | | 60 | | | | 63 | |
| | |
Welltower, Inc.
2.70%, 2/15/2027 | | | 63 | | | | 69 | |
| | |
3.10%, 1/15/2030 | | | 85 | | | | 93 | |
| | |
6.50%, 3/15/2041 | | | 125 | | | | 175 | |
| | |
WP Carey, Inc. 4.25%, 10/1/2026 | | | 245 | | | | 282 | |
| | | | | | | | |
| | |
| | | | | | | 8,838 | |
| | | | | | | | |
|
Food & Staples Retailing — 0.3% | |
| | |
Alimentation Couche-Tard, Inc. (Canada)
2.95%, 1/25/2030 (a) | | | 90 | | | | 98 | |
| | |
3.80%, 1/25/2050 (a) | | | 230 | | | | 272 | |
| | |
Costco Wholesale Corp.
2.75%, 5/18/2024 | | | 21 | | | | 23 | |
| | |
1.38%, 6/20/2027 | | | 450 | | | | 463 | |
| | |
CVS Pass-Through Trust
7.51%, 1/10/2032 (a) | | | 68 | | | | 84 | |
| | |
5.93%, 1/10/2034 (a) | | | 74 | | | | 90 | |
| | |
Series 2013, 4.70%, 1/10/2036 (a) | | | 158 | | | | 178 | |
| | |
Kroger Co. (The)
2.20%, 5/1/2030 | | | 500 | | | | 525 | |
| | |
5.40%, 7/15/2040 | | | 18 | | | | 25 | |
| | | | | | | | |
| | |
| | | | | | | 1,758 | |
| | | | | | | | |
|
Food Products — 0.5% | |
| | |
Campbell Soup Co. 3.13%, 4/24/2050 | | | 47 | | | | 50 | |
| | |
Cargill, Inc.
3.25%, 3/1/2023 (a) | | | 25 | | | | 26 | |
| | |
2.13%, 4/23/2030 (a) | | | 291 | | | | 306 | |
| | | | | | | | |
| INVESTMENTS | | PRINCIPAL
AMOUNT ($000) | | | VALUE ($000) | |
| | | | | | | | |
|
Food Products — continued | |
| | |
Conagra Brands, Inc.
5.30%, 11/1/2038 | | | 35 | | | | 47 | |
| | |
5.40%, 11/1/2048 | | | 105 | | | | 149 | |
| | |
General Mills, Inc.
4.00%, 4/17/2025 | | | 60 | | | | 68 | |
| | |
4.15%, 2/15/2043 | | | 100 | | | | 125 | |
| | |
Kellogg Co. 2.10%, 6/1/2030 | | | 140 | | | | 147 | |
| | |
Mars, Inc. 1.63%, 7/16/2032 (a) | | | 390 | | | | 387 | |
| | |
McCormick & Co., Inc. 2.50%, 4/15/2030 | | | 342 | | | | 366 | |
| | |
Mead Johnson Nutrition Co. (United Kingdom) | | | | | | | | |
| | |
4.13%, 11/15/2025 | | | 27 | | | | 31 | |
| | |
Mondelez International, Inc. 1.50%, 5/4/2025 | | | 80 | | | | 83 | |
| | |
Smithfield Foods, Inc.
5.20%, 4/1/2029 (a) | | | 160 | | | | 190 | |
| | |
3.00%, 10/15/2030 (a) | | | 380 | | | | 402 | |
| | |
Tyson Foods, Inc.
4.88%, 8/15/2034 | | | 20 | | | | 26 | |
| | |
5.15%, 8/15/2044 | | | 90 | | | | 124 | |
| | |
4.55%, 6/2/2047 | | | 100 | | | | 133 | |
| | | | | | | | |
| | |
| | | | | | | 2,660 | |
| | | | | | | | |
|
Gas Utilities — 0.3% | |
| | |
Atmos Energy Corp.
4.13%, 10/15/2044 | | | 50 | | | | 63 | |
| | |
4.13%, 3/15/2049 | | | 155 | | | | 200 | |
| | |
Boston Gas Co. 4.49%, 2/15/2042 (a) | | | 22 | | | | 28 | |
| | |
Brooklyn Union Gas Co. (The) 4.27%, 3/15/2048 (a) | | | 80 | | | | 102 | |
| | |
Eastern Energy Gas Holdings LLC Series C, 3.90%, 11/15/2049 | | | 137 | | | | 161 | |
| | |
ONE Gas, Inc. 2.00%, 5/15/2030 | | | 200 | | | | 209 | |
| | |
Piedmont Natural Gas Co., Inc. 3.50%, 6/1/2029 | | | 200 | | | | 229 | |
| | |
Southern California Gas Co. Series XX, 2.55%, 2/1/2030 | | | 195 | | | | 211 | |
| | |
Southern Natural Gas Co. LLC
8.00%, 3/1/2032 | | | 53 | | | | 76 | |
| | |
4.80%, 3/15/2047 (a) | | | 26 | | | | 30 | |
| | |
Southwest Gas Corp. 3.80%, 9/29/2046 | | | 44 | | | | 51 | |
| | | | | | | | |
| | |
| | | | | | | 1,360 | |
| | | | | | | | |
|
Health Care Equipment & Supplies — 0.2% | |
| | |
Abbott Laboratories
1.15%, 1/30/2028 | | | 170 | | | | 172 | |
| | |
4.75%, 11/30/2036 | | | 130 | | | | 179 | |
| | |
Becton Dickinson and Co. 4.67%, 6/6/2047 | | | 160 | | | | 210 | |
| | |
Boston Scientific Corp.
4.00%, 3/1/2029 | | | 101 | | | | 119 | |
SEE NOTES TO FINANCIAL STATEMENTS.
| | | | | | | | | | |
| | | | | |
| DECEMBER 31, 2020 | | JPMORGAN INSURANCE TRUST | | | | | | | | 13 |
JPMorgan Insurance Trust Core Bond Portfolio
SCHEDULE OF PORTFOLIO INVESTMENTS
AS OF DECEMBER 31, 2020 (continued)
| | | | | | | | |
| INVESTMENTS | | PRINCIPAL
AMOUNT ($000) | | | VALUE ($000) | |
Corporate Bonds — continued | |
|
Health Care Equipment & Supplies — continued | |
| | |
4.55%, 3/1/2039 | | | 100 | | | | 128 | |
| | |
DH Europe Finance II SARL 3.25%, 11/15/2039 | | | 184 | | | | 209 | |
| | |
Zimmer Biomet Holdings, Inc. 3.70%, 3/19/2023 | | | 27 | | | | 29 | |
| | | | | | | | |
| | |
| | | | | | | 1,046 | |
| | | | | | | | |
|
Health Care Providers & Services — 1.0% | |
| | |
Advocate Health & Hospitals Corp. Series 2020, 2.21%, 6/15/2030 | | | 130 | | | | 135 | |
| | |
Anthem, Inc.
3.30%, 1/15/2023 | | | 18 | | | | 19 | |
| | |
3.35%, 12/1/2024 | | | 70 | | | | 77 | |
| | |
4.10%, 3/1/2028 | | | 55 | | | | 65 | |
| | |
4.65%, 1/15/2043 | | | 18 | | | | 24 | |
| | |
4.65%, 8/15/2044 | | | 65 | | | | 85 | |
| | |
Ascension Health Series B, 2.53%, 11/15/2029 | | | 190 | | | | 208 | |
| | |
Children’s Hospital Series 2020, 2.93%, 7/15/2050 | | | 180 | | | | 180 | |
| | |
Cigna Corp. 4.50%, 2/25/2026 | | | 127 | | | | 149 | |
| | |
CommonSpirit Health
1.55%, 10/1/2025 | | | 145 | | | | 149 | |
| | |
2.78%, 10/1/2030 | | | 145 | | | | 153 | |
| | |
3.91%, 10/1/2050 | | | 140 | | | | 156 | |
| | |
CVS Health Corp.
4.30%, 3/25/2028 | | | 54 | | | | 64 | |
| | |
3.25%, 8/15/2029 | | | 155 | | | | 175 | |
| | |
1.88%, 2/28/2031 | | | 312 | | | | 315 | |
| | |
2.70%, 8/21/2040 | | | 130 | | | | 132 | |
| | |
5.05%, 3/25/2048 | | | 323 | | | | 437 | |
| | |
Hackensack Meridian Health, Inc. Series 2020, 2.88%, 9/1/2050 | | | 230 | | | | 237 | |
| | |
HCA, Inc.
5.25%, 6/15/2026 | | | 340 | | | | 402 | |
| | |
5.13%, 6/15/2039 | | | 125 | | | | 160 | |
| | |
5.50%, 6/15/2047 | | | 245 | | | | 327 | |
| | |
Memorial Health Services 3.45%, 11/1/2049 | | | 245 | | | | 262 | |
| | |
MidMichigan Health Series 2020, 3.41%, 6/1/2050 | | | 80 | | | | 89 | |
| | |
Mount Sinai Hospitals Group, Inc. Series 2017, 3.98%, 7/1/2048 | | | 83 | | | | 94 | |
| | |
MultiCare Health System 2.80%, 8/15/2050 | | | 120 | | | | 124 | |
| | |
Providence St Joseph Health Obligated Group Series H, 2.75%, 10/1/2026 | | | 36 | | | | 39 | |
| | |
Quest Diagnostics, Inc.
3.45%, 6/1/2026 | | | 17 | | | | 19 | |
| | |
2.80%, 6/30/2031 | | | 95 | | | | 104 | |
| | |
Rush Obligated Group Series 2020, 3.92%, 11/15/2029 | | | 233 | | | | 275 | |
| | | | | | | | |
| INVESTMENTS | | PRINCIPAL
AMOUNT ($000) | | | VALUE ($000) | |
| | | | | | | | |
|
Health Care Providers & Services — continued | |
| | |
Texas Health Resources 2.33%, 11/15/2050 | | | 140 | | | | 132 | |
| | |
UnitedHealth Group, Inc.
4.63%, 7/15/2035 | | | 34 | | | | 46 | |
| | |
3.50%, 8/15/2039 | | | 160 | | | | 190 | |
| | |
Universal Health Services, Inc. 2.65%, 10/15/2030 (a) | | | 170 | | | | 177 | |
| | |
Yale-New Haven Health Services Corp.
Series 2020, 2.50%, 7/1/2050 | | | 200 | | | | 195 | |
| | | | | | | | |
| | |
| | | | | | | 5,395 | |
| | | | | | | | |
|
Hotels, Restaurants & Leisure — 0.0% (b) | |
| | |
McDonald’s Corp. 4.70%, 12/9/2035 | | | 60 | | | | 77 | |
| | |
Starbucks Corp. 2.55%, 11/15/2030 | | | 170 | | | | 184 | |
| | | | | | | | |
| | |
| | | | | | | 261 | |
| | | | | | | | |
|
Household Products — 0.0% (b) | |
| | |
Procter & Gamble — ESOP Series A, 9.36%, 1/1/2021 | | | 6 | | | | 6 | |
| | | | | | | | |
|
Independent Power and Renewable Electricity Producers — 0.2% | |
| | |
Alexander Funding Trust 1.84%, 11/15/2023 (a) | | | 200 | | | | 202 | |
| | |
Exelon Generation Co. LLC | | | | | | | | |
| | |
3.40%, 3/15/2022 | | | 50 | | | | 52 | |
| | |
4.25%, 6/15/2022 | | | 38 | | | | 40 | |
| | |
3.25%, 6/1/2025 | | | 250 | | | | 273 | |
| | |
6.25%, 10/1/2039 | | | 100 | | | | 120 | |
| | |
5.75%, 10/1/2041 | | | 29 | | | | 33 | |
| | |
PSEG Power LLC 4.15%, 9/15/2021 | | | 37 | | | | 38 | |
| | |
Southern Power Co. 5.15%, 9/15/2041 | | | 50 | | | | 61 | |
| | |
Tri-State Generation and Transmission Association, Inc. 4.25%, 6/1/2046 | | | 25 | | | | 29 | |
| | | | | | | | |
| | |
| | | | | | | 848 | |
| | | | | | | | |
|
Industrial Conglomerates — 0.3% | |
| | |
General Electric Co. | | | | | | | | |
| | |
3.45%, 5/1/2027 | | | 105 | | | | 119 | |
| | |
3.63%, 5/1/2030 | | | 160 | | | | 183 | |
| | |
5.88%, 1/14/2038 | | | 100 | | | | 135 | |
| | |
Honeywell International, Inc. | | | | | | | | |
| | |
1.35%, 6/1/2025 | | | 400 | | | | 414 | |
| | |
2.50%, 11/1/2026 | | | 150 | | | | 165 | |
| | |
Roper Technologies, Inc. | | | | | | | | |
| | |
1.40%, 9/15/2027 | | | 350 | | | | 354 | |
| | |
2.00%, 6/30/2030 | | | 160 | | | | 164 | |
| | | | | | | | |
| | |
| | | | | | | 1,534 | |
| | | | | | | | |
SEE NOTES TO FINANCIAL STATEMENTS.
| | | | | | | | | | |
| | | | | |
| 14 | | | | | | | | JPMORGAN INSURANCE TRUST | | DECEMBER 31, 2020 |
| | | | | | | | |
| INVESTMENTS | | PRINCIPAL
AMOUNT ($000) | | | VALUE ($000) | |
Corporate Bonds — continued | |
|
Insurance — 0.9% | |
| | |
AIA Group Ltd. (Hong Kong) | | | | | | | | |
| | |
3.20%, 3/11/2025 (a) | | | 200 | | | | 215 | |
| | |
3.90%, 4/6/2028 (a) | | | 210 | | | | 239 | |
| | |
3.60%, 4/9/2029 (a) | | | 200 | | | | 225 | |
| | |
American Financial Group, Inc. 3.50%, 8/15/2026 | | | 100 | | | | 109 | |
| | |
American International Group, Inc. 3.88%, 1/15/2035 | | | 180 | | | | 216 | |
| | |
Assurant, Inc. 4.20%, 9/27/2023 | | | 85 | | | | 93 | |
| | |
Athene Global Funding | | | | | | | | |
| | |
2.75%, 6/25/2024 (a) | | | 155 | | | | 164 | |
| | |
2.95%, 11/12/2026 (a) | | | 410 | | | | 440 | |
| | |
Berkshire Hathaway Finance Corp. 4.30%, 5/15/2043 | | | 62 | | | | 82 | |
| | |
Brown & Brown, Inc. 2.38%, 3/15/2031 | | | 460 | | | | 481 | |
| | |
Chubb INA Holdings, Inc. | | | | | | | | |
| | |
2.88%, 11/3/2022 | | | 42 | | | | 44 | |
| | |
2.70%, 3/13/2023 | | | 120 | | | | 126 | |
| | |
CNA Financial Corp. 3.95%, 5/15/2024 | | | 44 | | | | 49 | |
| | |
Dai-ichi Life Insurance Co. Ltd. (The) (Japan) (ICE LIBOR USD 3 Month + 3.66%), 4.00%, 7/24/2026 (a) (c) (d) (e) | | | 200 | | | | 221 | |
| | |
Guardian Life Insurance Co. of America (The) | | | | | | | | |
| | |
4.85%, 1/24/2077 (a) | | | 21 | | | | 29 | |
| | |
Hanover Insurance Group, Inc. (The) 2.50%, 9/1/2030 | | | 120 | | | | 125 | |
| | |
Hartford Financial Services Group, Inc. (The) 4.30%, 4/15/2043 | | | 70 | | | | 88 | |
| | |
Intact US Holdings, Inc. 4.60%, 11/9/2022 | | | 100 | | | | 106 | |
| | |
Jackson National Life Global Funding | | | | | | | | |
| | |
3.88%, 6/11/2025 (a) | | | 87 | | | | 98 | |
| | |
3.05%, 4/29/2026 (a) | | | 104 | | | | 116 | |
| | |
Liberty Mutual Group, Inc. | | | | | | | | |
| | |
4.57%, 2/1/2029 (a) | | | 27 | | | | 33 | |
| | |
3.95%, 10/15/2050 (a) | | | 207 | | | | 248 | |
| | |
Lincoln National Corp. | | | | | | | | |
| | |
4.20%, 3/15/2022 | | | 20 | | | | 21 | |
| | |
4.00%, 9/1/2023 | | | 50 | | | | 54 | |
| | |
Manulife Financial Corp. (Canada) (USD ICE Swap Rate 5 Year + 1.65%), 4.06%, 2/24/2032 (c) | | | 100 | | | | 109 | |
| | |
Markel Corp. 3.63%, 3/30/2023 | | | 40 | | | | 43 | |
| | |
MetLife, Inc. 4.13%, 8/13/2042 | | | 28 | | | | 35 | |
| | |
New York Life Global Funding | | | | | | | | |
| | |
2.00%, 4/13/2021 (a) | | | 29 | | | | 29 | |
| | |
2.35%, 7/14/2026 (a) | | | 65 | | | | 70 | |
| | |
New York Life Insurance Co. 4.45%, 5/15/2069 (a) | | | 105 | | | | 141 | |
| | | | | | | | |
| INVESTMENTS | | PRINCIPAL
AMOUNT ($000) | | | VALUE ($000) | |
| | | | | | | | |
|
Insurance — continued | |
| | |
Pacific Life Insurance Co. (ICE LIBOR USD 3 Month + 2.80%), 4.30%, 10/24/2067 (a) (c) | | | 134 | | | | 152 | |
| | |
Principal Financial Group, Inc. | | | | | | | | |
| | |
3.13%, 5/15/2023 | | | 30 | | | | 32 | |
| | |
3.70%, 5/15/2029 | | | 30 | | | | 35 | |
| | |
Progressive Corp. (The) Series B, (ICE LIBOR USD 3 Month + 2.54%), 5.38%, 3/15/2023 (c) (d) (e) | | | 50 | | | | 52 | |
| | |
Prudential Financial, Inc. 3.91%, 12/7/2047 | | | 61 | | | | 73 | |
| | |
Prudential Insurance Co. of America (The) 8.30%, 7/1/2025 (a) | | | 150 | | | | 194 | |
| | |
Reliance Standard Life Global Funding II 3.85%, 9/19/2023 (a) | | | 105 | | | | 113 | |
| | |
Teachers Insurance & Annuity Association of America 4.27%, 5/15/2047 (a) | | | 50 | | | | 62 | |
| | | | | | | | |
| | |
| | | | | | | 4,762 | |
| | | | | | | | |
|
Internet & Direct Marketing Retail — 0.0% (b) | |
| | |
Amazon.com, Inc. 3.88%, 8/22/2037 | | | 80 | | | | 100 | |
| | | | | | | | |
|
IT Services — 0.3% | |
| | |
DXC Technology Co. 4.25%, 4/15/2024 | | | 34 | | | | 37 | |
| | |
Fiserv, Inc. | | | | | | | | |
| | |
3.20%, 7/1/2026 | | | 70 | | | | 78 | |
| | |
4.40%, 7/1/2049 | | | 65 | | | | 87 | |
| | |
Global Payments, Inc. 4.15%, 8/15/2049 | | | 140 | | | | 173 | |
| | |
International Business Machines Corp. | | | | | | | | |
| | |
3.30%, 5/15/2026 | | | 260 | | | | 294 | |
| | |
1.70%, 5/15/2027 | | | 535 | | | | 555 | |
| | |
6.22%, 8/1/2027 | | | 50 | | | | 66 | |
| | |
Western Union Co. (The) 3.60%, 3/15/2022 | | | 100 | | | | 103 | |
| | | | | | | | |
| | |
| | | | | | | 1,393 | |
| | | | | | | | |
|
Leisure Products — 0.1% | |
| | |
Hasbro, Inc. 3.90%, 11/19/2029 | | | 332 | | | | 376 | |
| | | | | | | | |
|
Life Sciences Tools & Services — 0.0% (b) | |
| | |
Thermo Fisher Scientific, Inc. 2.95%, 9/19/2026 | | | 30 | | | | 33 | |
| | | | | | | | |
|
Machinery — 0.1% | |
| | |
nVent Finance SARL (United Kingdom) 4.55%, 4/15/2028 | | | 75 | | | | 81 | |
| | |
Otis Worldwide Corp. 2.57%, 2/15/2030 | | | 280 | | | | 301 | |
| | |
Parker-Hannifin Corp. | | | | | | | | |
| | |
4.45%, 11/21/2044 | | | 30 | | | | 38 | |
| | |
4.10%, 3/1/2047 | | | 21 | | | | 26 | |
| | |
Xylem, Inc. 2.25%, 1/30/2031 | | | 110 | | | | 116 | |
| | | | | | | | |
| | |
| | | | | | | 562 | |
| | | | | | | | |
SEE NOTES TO FINANCIAL STATEMENTS.
| | | | | | | | | | |
| | | | | |
| DECEMBER 31, 2020 | | JPMORGAN INSURANCE TRUST | | | | | | | | 15 |
JPMorgan Insurance Trust Core Bond Portfolio
SCHEDULE OF PORTFOLIO INVESTMENTS
AS OF DECEMBER 31, 2020 (continued)
| | | | | | | | |
| INVESTMENTS | | PRINCIPAL
AMOUNT ($000) | | | VALUE ($000) | |
Corporate Bonds — continued | |
|
Media — 0.9% | |
| | |
Charter Communications Operating LLC | | | | | | | | |
| | |
3.75%, 2/15/2028 | | | 245 | | | | 275 | |
| | |
5.38%, 4/1/2038 | | | 38 | | | | 48 | |
| | |
4.80%, 3/1/2050 | | | 240 | | | | 286 | |
| | |
3.70%, 4/1/2051 | | | 120 | | | | 124 | |
| | |
Comcast Cable Holdings LLC 10.13%, 4/15/2022 | | | 75 | | | | 84 | |
| | |
Comcast Corp. | | | | | | | | |
| | |
3.95%, 10/15/2025 | | | 119 | | | | 137 | |
| | |
3.15%, 3/1/2026 | | | 127 | | | | 142 | |
| | |
3.55%, 5/1/2028 | | | 66 | | | | 76 | |
| | |
1.95%, 1/15/2031 | | | 170 | | | | 175 | |
| | |
1.50%, 2/15/2031 | | | 300 | | | | 298 | |
| | |
4.25%, 1/15/2033 | | | 167 | | | | 210 | |
| | |
4.20%, 8/15/2034 | | | 89 | | | | 111 | |
| | |
3.90%, 3/1/2038 | | | 32 | | | | 39 | |
| | |
4.60%, 10/15/2038 | | | 145 | | | | 191 | |
| | |
3.25%, 11/1/2039 | | | 130 | | | | 147 | |
| | |
3.75%, 4/1/2040 | | | 160 | | | | 192 | |
| | |
4.00%, 11/1/2049 | | | 52 | | | | 65 | |
| | |
3.45%, 2/1/2050 | | | 246 | | | | 289 | |
| | |
4.95%, 10/15/2058 | | | 180 | | | | 273 | |
| | |
Cox Communications, Inc. | | | | | | | | |
| | |
3.35%, 9/15/2026 (a) | | | 67 | | | | 75 | |
| | |
1.80%, 10/1/2030 (a) | | | 235 | | | | 235 | |
| | |
4.60%, 8/15/2047 (a) | | | 39 | | | | 50 | |
| | |
2.95%, 10/1/2050 (a) | | | 180 | | | | 184 | |
| | |
Discovery Communications LLC | | | | | | | | |
| | |
5.20%, 9/20/2047 | | | 80 | | | | 104 | |
| | |
4.00%, 9/15/2055 (a) | | | 124 | | | | 139 | |
| | |
Fox Corp. 5.58%, 1/25/2049 | | | 170 | | | | 248 | |
| | |
Time Warner Cable LLC | | | | | | | | |
| | |
6.55%, 5/1/2037 | | | 50 | | | | 69 | |
| | |
7.30%, 7/1/2038 | | | 50 | | | | 74 | |
| | |
5.50%, 9/1/2041 | | | 100 | | | | 128 | |
| | |
Time Warner Entertainment Co. LP 8.38%, 7/15/2033 | | | 90 | | | | 139 | |
| | |
ViacomCBS, Inc. | | | | | | | | |
| | |
3.70%, 8/15/2024 | | | 99 | | | | 109 | |
| | |
4.00%, 1/15/2026 | | | 42 | | | | 48 | |
| | | | | | | | |
| | |
| | | | | | | 4,764 | |
| | | | | | | | |
|
Metals & Mining — 0.6% | |
| | |
Anglo American Capital plc (South Africa) | | | | | | | | |
| | |
4.00%, 9/11/2027 (a) | | | 200 | | | | 230 | |
| | | | | | | | |
| INVESTMENTS | | PRINCIPAL
AMOUNT ($000) | | | VALUE ($000) | |
| | | | | | | | |
|
Metals & Mining — continued | |
| | |
2.63%, 9/10/2030 (a) | | | 200 | | | | 209 | |
| | |
Glencore Funding LLC (Australia) | | | | | | | | |
| | |
4.13%, 5/30/2023 (a) | | | 112 | | | | 121 | |
| | |
1.63%, 9/1/2025 (a) | | | 705 | | | | 725 | |
| | |
2.50%, 9/1/2030 (a) | | | 750 | | | | 765 | |
| | |
Nucor Corp. 2.98%, 12/15/2055 (a) | | | 30 | | | | 31 | |
| | |
Reliance Steel & Aluminum Co. 1.30%, 8/15/2025 | | | 600 | | | | 609 | |
| | |
Steel Dynamics, Inc. | | | | | | | | |
| | |
1.65%, 10/15/2027 | | | 126 | | | | 130 | |
| | |
3.45%, 4/15/2030 | | | 177 | | | | 200 | |
| | |
Vale Overseas Ltd. (Brazil) 3.75%, 7/8/2030 | | | 130 | | | | 144 | |
| | | | | | | | |
| | |
| | | | | | | 3,164 | |
| | | | | | | | |
|
Multiline Retail — 0.0% (b) | |
| | |
Dollar General Corp. 4.13%, 5/1/2028 | | | 55 | | | | 65 | |
| | | | | | | | |
|
Multi-Utilities — 0.3% | |
| | |
Ameren Illinois Co. 3.25%, 3/15/2050 | | | 185 | | | | 216 | |
| | |
CMS Energy Corp. | | | | | | | | |
| | |
3.88%, 3/1/2024 | | | 110 | | | | 120 | |
| | |
2.95%, 2/15/2027 | | | 47 | | | | 51 | |
| | |
Consolidated Edison Co. of New York, Inc. | | | | | | | | |
| | |
5.70%, 6/15/2040 | | | 38 | | | | 53 | |
| | |
4.50%, 5/15/2058 | | | 54 | | | | 71 | |
| | |
Consumers Energy Co. 3.25%, 8/15/2046 | | | 19 | | | | 22 | |
| | |
Delmarva Power & Light Co. 4.15%, 5/15/2045 | | | 50 | | | | 62 | |
| | |
Dominion Energy, Inc. Series B, 2.75%, 9/15/2022 | | | 60 | | | | 62 | |
| | |
New York State Electric & Gas Corp. 3.25%, 12/1/2026 (a) | | | 50 | | | | 56 | |
| | |
NiSource, Inc.
2.95%, 9/1/2029 | | | 85 | | | | 93 | |
| | |
1.70%, 2/15/2031 | | | 190 | | | | 189 | |
| | |
San Diego Gas & Electric Co. 5.35%, 5/15/2035 | | | 70 | | | | 91 | |
| | |
Sempra Energy 4.05%, 12/1/2023 | | | 62 | | | | 68 | |
| | |
Southern Co. Gas Capital Corp.
3.50%, 9/15/2021 | | | 37 | | | | 38 | |
| | |
2.45%, 10/1/2023 | | | 19 | | | | 20 | |
| | |
3.25%, 6/15/2026 | | | 17 | | | | 19 | |
| | |
5.88%, 3/15/2041 | | | 96 | | | | 140 | |
| | |
4.40%, 6/1/2043 | | | 42 | | | | 51 | |
| | |
3.95%, 10/1/2046 | | | 21 | | | | 25 | |
| | |
WEC Energy Group, Inc. 3.55%, 6/15/2025 | | | 37 | | | | 41 | |
| | | | | | | | |
| | |
| | | | | | | 1,488 | |
| | | | | | | | |
SEE NOTES TO FINANCIAL STATEMENTS.
| | | | | | | | | | |
| | | | | |
| 16 | | | | | | | | JPMORGAN INSURANCE TRUST | | DECEMBER 31, 2020 |
| | | | | | | | |
| INVESTMENTS | | PRINCIPAL
AMOUNT ($000) | | | VALUE ($000) | |
Corporate Bonds — continued | |
|
Oil, Gas & Consumable Fuels — 2.9% | |
| | |
APT Pipelines Ltd. (Australia)
4.20%, 3/23/2025 (a) | | | 120 | | | | 132 | |
| | |
4.25%, 7/15/2027 (a) | | | 73 | | | | 83 | |
| | |
Boardwalk Pipelines LP
4.80%, 5/3/2029 | | | 70 | | | | 80 | |
| | |
3.40%, 2/15/2031 | | | 170 | | | | 177 | |
| | |
BP Capital Markets America, Inc.
3.02%, 1/16/2027 | | | 35 | | | | 39 | |
| | |
1.75%, 8/10/2030 | | | 205 | | | | 206 | |
| | |
2.77%, 11/10/2050 | | | 130 | | | | 128 | |
| | |
2.94%, 6/4/2051 | | | 205 | | | | 209 | |
| | |
BP Capital Markets plc (United Kingdom)
3.51%, 3/17/2025 | | | 15 | | | | 17 | |
| | |
3.28%, 9/19/2027 | | | 259 | | | | 290 | |
| | |
Buckeye Partners LP 5.85%, 11/15/2043 | | | 100 | | | | 98 | |
| | |
Cameron LNG LLC 3.70%, 1/15/2039 (a) | | | 188 | | | | 212 | |
| | |
Chevron Corp.
2.41%, 3/3/2022 | | | 150 | | | | 153 | |
| | |
2.57%, 5/16/2023 | | | 200 | | | | 210 | |
| | |
2.24%, 5/11/2030 | | | 125 | | | | 134 | |
| | |
Cimarex Energy Co. 3.90%, 5/15/2027 | | | 235 | | | | 259 | |
| | |
Concho Resources, Inc.
3.75%, 10/1/2027 | | | 135 | | | | 154 | |
| | |
2.40%, 2/15/2031 | | | 130 | | | | 136 | |
| | |
Diamondback Energy, Inc.
4.75%, 5/31/2025 | | | 550 | | | | 619 | |
| | |
3.25%, 12/1/2026 | | | 145 | | | | 155 | |
| | |
Ecopetrol SA (Colombia)
5.88%, 9/18/2023 | | | 28 | | | | 31 | |
| | |
4.13%, 1/16/2025 | | | 33 | | | | 36 | |
| | |
5.38%, 6/26/2026 | | | 39 | | | | 45 | |
| | |
Enable Midstream Partners LP
4.95%, 5/15/2028 | | | 40 | | | | 41 | |
| | |
4.15%, 9/15/2029 | | | 102 | | | | 102 | |
| | |
Enbridge, Inc. (Canada)
3.70%, 7/15/2027 | | | 27 | | | | 31 | |
| | |
4.50%, 6/10/2044 | | | 75 | | | | 87 | |
| | |
(ICE LIBOR USD 3 Month + 3.64%), 6.25%, 3/1/2078 (c) | | | 60 | | | | 66 | |
| | |
Series 20-A, (US Treasury Yield Curve Rate T Note Constant Maturity 5 Year + 5.31%), 5.75%, 7/15/2080 (c) | | | 175 | | | | 197 | |
| | |
Energy Transfer Operating LP
4.75%, 1/15/2026 | | | 242 | | | | 274 | |
| | |
6.05%, 6/1/2041 | | | 100 | | | | 117 | |
| | |
6.00%, 6/15/2048 | | | 235 | | | | 279 | |
| | |
5.00%, 5/15/2050 | | | 815 | | | | 881 | |
| | | | | | | | |
| INVESTMENTS | | PRINCIPAL
AMOUNT ($000) | | | VALUE ($000) | |
| | | | | | | | |
|
Oil, Gas & Consumable Fuels — continued | |
| | |
Eni USA, Inc. (Italy) 7.30%, 11/15/2027 | | | 50 | | | | 68 | |
| | |
Enterprise Products Operating LLC
3.90%, 2/15/2024 | | | 25 | | | | 27 | |
| | |
3.70%, 2/15/2026 | | | 38 | | | | 43 | |
| | |
7.55%, 4/15/2038 | | | 86 | | | | 131 | |
| | |
4.45%, 2/15/2043 | | | 87 | | | | 105 | |
| | |
5.10%, 2/15/2045 | | | 16 | | | | 21 | |
| | |
3.20%, 2/15/2052 | | | 50 | | | | 51 | |
| | |
4.95%, 10/15/2054 | | | 6 | | | | 8 | |
| | |
EQM Midstream Partners LP 5.50%, 7/15/2028 | | | 130 | | | | 142 | |
| | |
EQT Corp. 3.90%, 10/1/2027 | | | 60 | | | | 60 | |
| | |
Equinor ASA (Norway)
3.25%, 11/10/2024 | | | 23 | | | | 25 | |
| | |
2.88%, 4/6/2025 | | | 145 | | | | 159 | |
| | |
Exxon Mobil Corp.
2.99%, 3/19/2025 | | | 290 | | | | 317 | |
| | |
2.61%, 10/15/2030 | | | 270 | | | | 295 | |
| | |
3.00%, 8/16/2039 | | | 405 | | | | 438 | |
| | |
Gray Oak Pipeline LLC
2.00%, 9/15/2023 (a) | | | 135 | | | | 137 | |
| | |
2.60%, 10/15/2025 (a) | | | 165 | | | | 170 | |
| | |
Hess Corp. 6.00%, 1/15/2040 | | | 67 | | | | 83 | |
| | |
HollyFrontier Corp. 2.63%, 10/1/2023 | | | 255 | | | | 261 | |
| | |
Kinder Morgan, Inc.
2.00%, 2/15/2031 | | | 140 | | | | 142 | |
| | |
3.25%, 8/1/2050 | | | 170 | | | | 170 | |
| | |
Magellan Midstream Partners LP
3.20%, 3/15/2025 | | | 14 | | | | 15 | |
| | |
6.40%, 5/1/2037 | | | 70 | | | | 92 | |
| | |
4.20%, 12/1/2042 | | | 27 | | | | 30 | |
| | |
Marathon Petroleum Corp.
4.50%, 5/1/2023 | | | 213 | | | | 231 | |
| | |
3.63%, 9/15/2024 | | | 29 | | | | 32 | |
| | |
4.70%, 5/1/2025 | | | 127 | | | | 145 | |
| | |
MPLX LP
4.50%, 7/15/2023 | | | 213 | | | | 232 | |
| | |
5.25%, 1/15/2025 | | | 45 | | | | 46 | |
| | |
4.00%, 2/15/2025 | | | 235 | | | | 262 | |
| | |
4.13%, 3/1/2027 | | | 52 | | | | 60 | |
| | |
4.80%, 2/15/2029 | | | 261 | | | | 315 | |
| | |
2.65%, 8/15/2030 | | | 210 | | | | 220 | |
| | |
4.50%, 4/15/2038 | | | 140 | | | | 160 | |
| | |
4.70%, 4/15/2048 | | | 10 | | | | 12 | |
| | |
5.50%, 2/15/2049 | | | 85 | | | | 112 | |
| | |
Noble Energy, Inc. | | | | | | | | |
| | |
3.25%, 10/15/2029 | | | 110 | | | | 126 | |
| | |
6.00%, 3/1/2041 | | | 114 | | | | 173 | |
SEE NOTES TO FINANCIAL STATEMENTS.
| | | | | | | | | | |
| | | | | |
| DECEMBER 31, 2020 | | JPMORGAN INSURANCE TRUST | | | | | | | | 17 |
JPMorgan Insurance Trust Core Bond Portfolio
SCHEDULE OF PORTFOLIO INVESTMENTS
AS OF DECEMBER 31, 2020 (continued)
| | | | | | | | |
| INVESTMENTS | | PRINCIPAL
AMOUNT ($000) | | | VALUE ($000) | |
Corporate Bonds — continued | |
|
Oil, Gas & Consumable Fuels — continued | |
| | |
ONEOK Partners LP
3.38%, 10/1/2022 | | | 8 | | | | 8 | |
| | |
5.00%, 9/15/2023 | | | 72 | | | | 79 | |
| | |
6.65%, 10/1/2036 | | | 15 | | | | 19 | |
| | |
ONEOK, Inc.
2.20%, 9/15/2025 | | | 250 | | | | 261 | |
| | |
3.40%, 9/1/2029 | | | 60 | | | | 64 | |
| | |
4.45%, 9/1/2049 | | | 220 | | | | 231 | |
| | |
Ovintiv, Inc. 7.20%, 11/1/2031 | | | 80 | | | | 95 | |
| | |
Phillips 66 Partners LP
3.15%, 12/15/2029 | | | 95 | | | | 99 | |
| | |
4.90%, 10/1/2046 | | | 37 | | | | 41 | |
| | |
Pioneer Natural Resources Co. 1.90%, 8/15/2030 | | | 270 | | | | 267 | |
| | |
Plains All American Pipeline LP
4.65%, 10/15/2025 | | | 235 | | | | 263 | |
| | |
3.80%, 9/15/2030 | | | 120 | | | | 129 | |
| | |
4.30%, 1/31/2043 | | | 30 | | | | 29 | |
| | |
4.70%, 6/15/2044 | | | 110 | | | | 114 | |
| | |
Sabine Pass Liquefaction LLC
5.75%, 5/15/2024 | | | 235 | | | | 269 | |
| | |
5.00%, 3/15/2027 | | | 450 | | | | 530 | |
| | |
Spectra Energy Partners LP
3.50%, 3/15/2025 | | | 19 | | | | 21 | |
| | |
5.95%, 9/25/2043 | | | 25 | | | | 32 | |
| | |
4.50%, 3/15/2045 | | | 7 | | | | 8 | |
| | |
Suncor Energy, Inc. (Canada)
5.95%, 12/1/2034 | | | 60 | | | | 78 | |
| | |
6.80%, 5/15/2038 | | | 145 | | | | 203 | |
| | |
Sunoco Logistics Partners Operations LP
3.90%, 7/15/2026 | | | 24 | | | | 26 | |
| | |
6.10%, 2/15/2042 | | | 60 | | | | 70 | |
| | |
TC PipeLines LP 3.90%, 5/25/2027 | | | 26 | | | | 29 | |
| | |
Tennessee Gas Pipeline Co. LLC 2.90%, 3/1/2030 (a) | | | 120 | | | | 128 | |
| | |
Texas Eastern Transmission LP 3.50%, 1/15/2028 (a) | | | 15 | | | | 16 | |
| | |
Total Capital International SA (France)
2.99%, 6/29/2041 | | | 350 | | | | 382 | |
| | |
3.46%, 7/12/2049 | | | 145 | | | | 169 | |
| | |
3.13%, 5/29/2050 | | | 260 | | | | 281 | |
| | |
TransCanada PipeLines Ltd. (Canada)
6.20%, 10/15/2037 | | | 70 | | | | 97 | |
| | |
4.75%, 5/15/2038 | | | 80 | | | | 100 | |
| | |
Valero Energy Corp.
2.70%, 4/15/2023 | | | 155 | | | | 162 | |
| | |
1.20%, 3/15/2024 | | | 230 | | | | 232 | |
| | | | | | | | |
| INVESTMENTS | | PRINCIPAL
AMOUNT ($000) | | | VALUE ($000) | |
| | | | | | | | |
|
Oil, Gas & Consumable Fuels — continued | |
| | |
2.15%, 9/15/2027 | | | 210 | | | | 214 | |
| | |
7.50%, 4/15/2032 | | | 14 | | | | 20 | |
| | |
Williams Cos., Inc. (The)
3.90%, 1/15/2025 | | | 25 | | | | 28 | |
| | |
4.85%, 3/1/2048 | | | 53 | | | | 65 | |
| | | | | | | | |
| | |
| | | | | | | 15,653 | |
| | | | | | | | |
|
Personal Products — 0.1% | |
| | |
Estee Lauder Cos., Inc. (The)
2.60%, 4/15/2030 | | | 404 | | | | 443 | |
| | |
3.13%, 12/1/2049 | | | 150 | | | | 174 | |
| | | | | | | | |
| | |
| | | | | | | 617 | |
| | | | | | | | |
|
Pharmaceuticals — 1.0% | |
| | |
AstraZeneca plc (United Kingdom)
1.38%, 8/6/2030 | | | 130 | | | | 129 | |
| | |
6.45%, 9/15/2037 | | | 50 | | | | 77 | |
| | |
4.00%, 9/18/2042 | | | 40 | | | | 49 | |
| | |
2.13%, 8/6/2050 | | | 140 | | | | 130 | |
| | |
Bristol-Myers Squibb Co.
3.20%, 6/15/2026 | | | 187 | | | | 210 | |
| | |
1.13%, 11/13/2027 | | | 375 | | | | 379 | |
| | |
3.90%, 2/20/2028 | | | 100 | | | | 118 | |
| | |
4.13%, 6/15/2039 | | | 114 | | | | 145 | |
| | |
5.70%, 10/15/2040 | | | 53 | | | | 77 | |
| | |
2.35%, 11/13/2040 | | | 175 | | | | 180 | |
| | |
5.00%, 8/15/2045 | | | 165 | | | | 239 | |
| | |
4.55%, 2/20/2048 | | | 60 | | | | 84 | |
| | |
Mylan, Inc.
3.13%, 1/15/2023 (a) | | | 25 | | | | 26 | |
| | |
5.40%, 11/29/2043 | | | 21 | | | | 28 | |
| | |
Pfizer, Inc. 3.90%, 3/15/2039 | | | 150 | | | | 188 | |
| | |
Royalty Pharma plc
0.75%, 9/2/2023 (a) | | | 240 | | | | 241 | |
| | |
1.20%, 9/2/2025 (a) | | | 235 | | | | 238 | |
| | |
1.75%, 9/2/2027 (a) | | | 235 | | | | 242 | |
| | |
3.30%, 9/2/2040 (a) | | | 195 | | | | 205 | |
| | |
3.55%, 9/2/2050 (a) | | | 200 | | | | 213 | |
| | |
Shire Acquisitions Investments Ireland DAC
2.88%, 9/23/2023 | | | 83 | | | | 88 | |
| | |
3.20%, 9/23/2026 | | | 234 | | | | 262 | |
| | |
Takeda Pharmaceutical Co. Ltd. (Japan)
3.03%, 7/9/2040 | | | 230 | | | | 242 | |
| | |
3.18%, 7/9/2050 | | | 225 | | | | 240 | |
| | |
3.38%, 7/9/2060 | | | 200 | | | | 221 | |
| | |
Utah Acquisition Sub, Inc. 3.95%, 6/15/2026 | | | 210 | | | | 240 | |
| | |
Viatris, Inc. 2.30%, 6/22/2027 (a) | | | 589 | | | | 627 | |
SEE NOTES TO FINANCIAL STATEMENTS.
| | | | | | | | | | |
| | | | | |
| 18 | | | | | | | | JPMORGAN INSURANCE TRUST | | DECEMBER 31, 2020 |
| | | | | | | | |
| INVESTMENTS | | PRINCIPAL
AMOUNT ($000) | | | VALUE ($000) | |
Corporate Bonds — continued | |
|
Pharmaceuticals — continued | |
| | |
Zoetis, Inc.
2.00%, 5/15/2030 | | | 170 | | | | 176 | |
| | |
3.00%, 5/15/2050 | | | 60 | | | | 66 | |
| | | | | | | | |
| | |
| | | | | | | 5,360 | |
| | | | | | | | |
|
Real Estate Management & Development — 0.0% (b) | |
| | |
Ontario Teachers’ Cadillac Fairview Properties Trust (Canada) 3.13%, 3/20/2022 (a) | | | 200 | | | | 206 | |
| | | | | | | | |
|
Road & Rail — 0.3% | |
| | |
Burlington Northern Santa Fe LLC
5.75%, 5/1/2040 | | | 85 | | | | 126 | |
| | |
5.40%, 6/1/2041 | | | 126 | | | | 183 | |
| | |
4.38%, 9/1/2042 | | | 25 | | | | 33 | |
| | |
5.15%, 9/1/2043 | | | 77 | | | | 111 | |
| | |
4.70%, 9/1/2045 | | | 35 | | | | 49 | |
| | |
CSX Corp.
5.50%, 4/15/2041 | | | 50 | | | | 70 | |
| | |
4.75%, 11/15/2048 | | | 108 | | | | 148 | |
| | |
3.35%, 9/15/2049 | | | 10 | | | | 11 | |
| | |
ERAC USA Finance LLC
4.50%, 8/16/2021 (a) | | | 45 | | | | 46 | |
| | |
2.60%, 12/1/2021 (a) | | | 50 | | | | 51 | |
| | |
7.00%, 10/15/2037 (a) | | | 160 | | | | 248 | |
| | |
5.63%, 3/15/2042 (a) | | | 12 | | | | 17 | |
| | |
JB Hunt Transport Services, Inc.
3.85%, 3/15/2024 | | | 70 | | | | 76 | |
| | |
3.88%, 3/1/2026 | | | 85 | | | | 98 | |
| | |
Norfolk Southern Corp.
3.95%, 10/1/2042 | | | 70 | | | | 85 | |
| | |
4.05%, 8/15/2052 | | | 40 | | | | 51 | |
| | |
Penske Truck Leasing Co. LP
3.95%, 3/10/2025 (a) | | | 25 | | | | 28 | |
| | |
3.40%, 11/15/2026 (a) | | | 25 | | | | 28 | |
| | |
4.20%, 4/1/2027 (a) | | | 75 | | | | 86 | |
| | |
Union Pacific Corp. 4.10%, 9/15/2067 | | | 150 | | | | 188 | |
| | | | | | | | |
| | |
| | | | | | | 1,733 | |
| | | | | | | | |
|
Semiconductors & Semiconductor Equipment — 0.3% | |
| | |
Analog Devices, Inc. 4.50%, 12/5/2036 | | | 64 | | | | 77 | |
| | |
Broadcom Corp. 3.88%, 1/15/2027 | | | 100 | | | | 112 | |
| | |
Broadcom, Inc.
4.25%, 4/15/2026 | | | 250 | | | | 287 | |
| | |
4.11%, 9/15/2028 | | | 126 | | | | 144 | |
| | |
4.75%, 4/15/2029 | | | 370 | | | | 442 | |
| | |
Intel Corp. 3.10%, 2/15/2060 | | | 50 | | | | 55 | |
| | |
Microchip Technology, Inc. 0.97%, 2/15/2024 (a) | | | 330 | | | | 331 | |
| | | | | | | | |
| | |
| | | | | | | 1,448 | |
| | | | | | | | |
| | | | | | | | |
| INVESTMENTS | | PRINCIPAL
AMOUNT ($000) | | | VALUE ($000) | |
| | | | | | | | |
|
Software — 0.3% | |
| | |
Microsoft Corp.
2.65%, 11/3/2022 | | | 160 | | | | 166 | |
| | |
2.00%, 8/8/2023 | | | 125 | | | | 130 | |
| | |
3.50%, 2/12/2035 | | | 68 | | | | 84 | |
| | |
3.45%, 8/8/2036 | | | 125 | | | | 154 | |
| | |
3.95%, 8/8/2056 | | | 40 | | | | 55 | |
| | |
Oracle Corp. 2.50%, 5/15/2022 | | | 52 | | | | 53 | |
| | |
2.40%, 9/15/2023 | | | 101 | | | | 106 | |
| | |
4.30%, 7/8/2034 | | | 23 | | | | 29 | |
| | |
3.90%, 5/15/2035 | | | 93 | | | | 114 | |
| | |
3.85%, 7/15/2036 | | | 107 | | | | 129 | |
| | |
3.60%, 4/1/2040 | | | 450 | | | | 527 | |
| | |
4.00%, 7/15/2046 | | | 110 | | | | 135 | |
| | |
VMware, Inc. 2.95%, 8/21/2022 | | | 101 | | | | 105 | |
| | | | | | | | |
| | |
| | | | | | | 1,787 | |
| | | | | | | | |
|
Specialty Retail — 0.2% | |
| | |
AutoZone, Inc. 1.65%, 1/15/2031 | | | 180 | | | | 179 | |
| | |
Home Depot, Inc. (The) 3.90%, 12/6/2028 | | | 110 | | | | 132 | |
| | |
Lowe’s Cos., Inc.
1.30%, 4/15/2028 | | | 432 | | | | 436 | |
| | |
3.65%, 4/5/2029 | | | 141 | | | | 164 | |
| | |
O’Reilly Automotive, Inc.
3.55%, 3/15/2026 | | | 80 | | | | 90 | |
| | |
3.60%, 9/1/2027 | | | 49 | | | | 56 | |
| | |
1.75%, 3/15/2031 | | | 85 | | | | 85 | |
| | | | | | | | |
| | |
| | | | | | | 1,142 | |
| | | | | | | | |
|
Technology Hardware, Storage & Peripherals — 0.4% | |
| | |
Apple, Inc.
3.20%, 5/13/2025 | | | 32 | | | | 36 | |
| | |
2.45%, 8/4/2026 | | | 74 | | | | 81 | |
| | |
3.20%, 5/11/2027 | | | 57 | | | | 64 | |
| | |
3.00%, 6/20/2027 | | | 56 | | | | 63 | |
| | |
1.65%, 5/11/2030 | | | 285 | | | | 294 | |
| | |
3.45%, 2/9/2045 | | | 82 | | | | 99 | |
| | |
3.85%, 8/4/2046 | | | 117 | | | | 150 | |
| | |
3.75%, 9/12/2047 | | | 140 | | | | 175 | |
| | |
Dell International LLC
5.45%, 6/15/2023 (a) | | | 120 | | | | 133 | |
| | |
6.02%, 6/15/2026 (a) | | | 345 | | | | 421 | |
| | |
Hewlett Packard Enterprise Co. 1.45%, 4/1/2024 | | | 270 | | | | 277 | |
| | |
HP, Inc. 3.00%, 6/17/2027 | | | 160 | | | | 176 | |
| | | | | | | | |
| | |
| | | | | | | 1,969 | |
| | | | | | | | |
SEE NOTES TO FINANCIAL STATEMENTS.
| | | | | | | | | | |
| | | | | |
| DECEMBER 31, 2020 | | JPMORGAN INSURANCE TRUST | | | | | | | | 19 |
JPMorgan Insurance Trust Core Bond Portfolio
SCHEDULE OF PORTFOLIO INVESTMENTS
AS OF DECEMBER 31, 2020 (continued)
| | | | | | | | |
| INVESTMENTS | | PRINCIPAL
AMOUNT ($000) | | | VALUE ($000) | |
Corporate Bonds — continued | |
|
Thrifts & Mortgage Finance — 0.1% | |
| | |
BPCE SA (France) 4.63%, 7/11/2024 (a) | | | 200 | | | | 223 | |
| | |
(SOFR + 1.52%), 1.65%, 10/6/2026 (a) (c) | | | 250 | | | | 256 | |
| | |
Nationwide Building Society (United Kingdom) 1.00%, 8/28/2025 (a) | | | 200 | | | | 200 | |
| | | | | | | | |
| | |
| | | | | | | 679 | |
| | | | | | | | |
|
Tobacco — 0.1% | |
| | |
BAT Capital Corp. (United Kingdom)
2.26%, 3/25/2028 | | | 210 | | | | 218 | |
| | |
3.73%, 9/25/2040 | | | 140 | | | | 146 | |
| | |
4.54%, 8/15/2047 | | | 60 | | | | 66 | |
| | |
3.98%, 9/25/2050 | | | 220 | | | | 229 | |
| | |
BAT International Finance plc (United Kingdom) 1.67%, 3/25/2026 | | | 160 | | | | 164 | |
| | | | | | | | |
| | |
| | | | | | | 823 | |
| | | | | | | | |
|
Trading Companies & Distributors — 0.4% | |
| | |
Air Lease Corp.
2.30%, 2/1/2025 | | | 245 | | | | 254 | |
| | |
3.25%, 3/1/2025 | | | 48 | | | | 51 | |
| | |
3.38%, 7/1/2025 | | | 378 | | | | 407 | |
| | |
2.88%, 1/15/2026 | | | 160 | | | | 169 | |
| | |
3.25%, 10/1/2029 | | | 220 | | | | 232 | |
| | |
Aviation Capital Group LLC
2.88%, 1/20/2022 (a) | | | 100 | | | | 101 | |
| | |
5.50%, 12/15/2024 (a) | | | 174 | | | | 193 | |
| | |
BOC Aviation Ltd. (Singapore) | | | | | | | | |
| | |
2.38%, 9/15/2021 (a) | | | 200 | | | | 201 | |
| | |
International Lease Finance Corp.
8.63%, 1/15/2022 | | | 70 | | | | 76 | |
| | |
5.88%, 8/15/2022 | | | 150 | | | | 162 | |
| | |
WW Grainger, Inc. 4.60%, 6/15/2045 | | | 77 | | | | 103 | |
| | | | | | | | |
| | |
| | | | | | | 1,949 | |
| | | | | | | | |
|
Transportation Infrastructure — 0.1% | |
| | |
Sydney Airport Finance Co. Pty. Ltd. (Australia) 3.38%, 4/30/2025 (a) | | | 360 | | | | 388 | |
| | |
Transurban Finance Co. Pty. Ltd. (Australia) 2.45%, 3/16/2031 (a) | | | 140 | | | | 147 | |
| | | | | | | | |
| | |
| | | | | | | 535 | |
| | | | | | | | |
|
Water Utilities — 0.1% | |
| | |
American Water Capital Corp.
3.45%, 6/1/2029 | | | 35 | | | | 40 | |
| | |
4.00%, 12/1/2046 | | | 52 | | | | 65 | |
| | |
3.45%, 5/1/2050 | | | 225 | | | | 266 | |
| | | | | | | | |
| | |
| | | | | | | 371 | |
| | | | | | | | |
| | | | | | | | |
| INVESTMENTS | | PRINCIPAL
AMOUNT ($000) | | | VALUE ($000) | |
| | | | | | | | |
|
Wireless Telecommunication Services — 0.6% | |
| | |
America Movil SAB de CV (Mexico)
3.63%, 4/22/2029 | | | 200 | | | | 227 | |
| | |
4.38%, 4/22/2049 | | | 200 | | | | 257 | |
| | |
Rogers Communications, Inc. (Canada) 4.35%, 5/1/2049 | | | 100 | | | | 129 | |
| | |
T-Mobile USA, Inc.
1.50%, 2/15/2026 (a) | | | 280 | | | | 287 | |
| | |
3.75%, 4/15/2027 (a) | | | 460 | | | | 524 | |
| | |
2.05%, 2/15/2028 (a) | | | 370 | | | | 385 | |
| | |
3.88%, 4/15/2030 (a) | | | 850 | | | | 984 | |
| | |
Vodafone Group plc (United Kingdom)
5.25%, 5/30/2048 | | | 64 | | | | 89 | |
| | |
4.88%, 6/19/2049 | | | 255 | | | | 340 | |
| | | | | | | | |
| | |
| | | | | | | 3,222 | |
| | | | | | | | |
| |
Total Corporate Bonds
(Cost $149,289) | | | | 162,692 | |
| | | | | |
Mortgage-Backed Securities — 21.9% | |
| |
FHLMC | | | | | |
| | |
Pool # 611141, ARM, 2.72%, 1/1/2027 (g) | | | 13 | | | | 13 | |
| | |
Pool # 846812, ARM, 2.86%, 4/1/2030 (g) | | | 3 | | | | 3 | |
| | |
Pool # 1B1665, ARM, 3.64%, 4/1/2034 (g) | | | 16 | | | | 16 | |
| | |
Pool # 1B2844, ARM, 3.58%, 3/1/2035 (g) | | | 29 | | | | 29 | |
| | |
Pool # 1B3209, ARM, 2.82%, 1/1/2037 (g) | | | 10 | | | | 10 | |
| |
FHLMC Gold Pools, 30 Year | | | | | |
| | |
Pool # G00981, 8.50%, 7/1/2028 | | | 1 | | | | 1 | |
| | |
Pool # C00785, 6.50%, 6/1/2029 | | | 7 | | | | 8 | |
| | |
Pool # C01292, 6.00%, 2/1/2032 | | | 5 | | | | 5 | |
| | |
Pool # A13625, 5.50%, 10/1/2033 | | | 29 | | | | 35 | |
| | |
Pool # A28796, 6.50%, 11/1/2034 | | | 7 | | | | 9 | |
| | |
Pool # A46417, 7.00%, 4/1/2035 | | | 33 | | | | 40 | |
| | |
Pool # V83115, 4.50%, 3/1/2047 | | | 1,053 | | | | 1,152 | |
| | |
Pool # Q48338, 4.50%, 5/1/2047 | | | 124 | | | | 136 | |
| | |
Pool # G61060, 4.50%, 6/1/2047 | | | 1,352 | | | | 1,480 | |
| |
FHLMC Gold Pools, Other | | | | | |
| | |
Pool # P20570, 7.00%, 7/1/2029 | | | 31 | | | | 34 | |
| | |
Pool # U80265, 3.50%, 4/1/2033 | | | 354 | | | | 381 | |
| | |
Pool # U90690, 3.50%, 6/1/2042 | | | 357 | | | | 390 | |
| | |
Pool # U90975, 4.00%, 6/1/2042 | | | 143 | | | | 156 | |
| | |
Pool # U99134, 4.00%, 1/1/2046 | | | 220 | | | | 242 | |
| |
FHLMC UMBS, 20 Year | | | | | |
| | |
Pool # RB5085, 2.00%, 11/1/2040 | | | 1,289 | | | | 1,342 | |
| |
FHLMC UMBS, 30 Year | | | | | |
| | |
Pool # RA2008, 4.00%, 1/1/2050 | | | 716 | | | | 784 | |
| | |
Pool # QB1284, 3.50%, 7/1/2050 | | | 961 | | | | 1,017 | |
SEE NOTES TO FINANCIAL STATEMENTS.
| | | | | | | | | | |
| | | | | |
| 20 | | | | | | | | JPMORGAN INSURANCE TRUST | | DECEMBER 31, 2020 |
| | | | | | | | |
| INVESTMENTS | | PRINCIPAL
AMOUNT ($000) | | | VALUE ($000) | |
Mortgage-Backed Securities — continued | |
| | |
Pool # QB1248, 4.00%, 7/1/2050 | | | 1,036 | | | | 1,142 | |
| |
FNMA | | | | | |
| | |
Pool # 303532, ARM, 3.94%, 3/1/2029 (g) | | | 1 | | | | 1 | |
| | |
Pool # BS0448, 1.27%, 12/1/2029 (h) | | | 1,300 | | | | 1,300 | |
| | |
Pool # BL9645, 1.50%, 1/1/2031 (h) | | | 1,100 | | | | 1,123 | |
| | |
Pool # 745446, ARM, 3.03%, 4/1/2033 (g) | | | 17 | | | | 18 | |
| | |
Pool # 722985, ARM, 2.53%, 7/1/2033 (g) | | | 14 | | | | 14 | |
| | |
Pool # 766610, ARM, 2.22%, 1/1/2034 (g) | | | 30 | | | | 31 | |
| | |
Pool # 735332, ARM, 2.88%, 8/1/2034 (g) | | | 30 | | | | 31 | |
| | |
Pool # 735740, ARM, 2.79%, 10/1/2034 (g) | | | 18 | | | | 18 | |
| | |
Pool # 810896, ARM, 1.77%, 1/1/2035 (g) | | | 63 | | | | 65 | |
| | |
Pool # 823660, ARM, 2.88%, 5/1/2035 (g) | | | 27 | | | | 27 | |
| |
FNMA UMBS, 15 Year | | | | | |
| | |
Pool # 840495, 5.50%, 4/1/2022 | | | 2 | | | | 2 | |
| | |
Pool # 899316, 5.50%, 4/1/2022 | | | — | (i) | | | — | (i) |
| | |
Pool # 928637, 6.00%, 9/1/2022 | | | 1 | | | | 1 | |
| | |
Pool # 949415, 4.50%, 3/1/2023 | | | 3 | | | | 3 | |
| | |
Pool # 962871, 4.50%, 5/1/2023 | | | 4 | | | | 4 | |
| |
FNMA UMBS, 20 Year | | | | | |
| | |
Pool # 254305, 6.50%, 5/1/2022 | | | 1 | | | | 2 | |
| | |
Pool # 555791, 6.50%, 12/1/2022 | | | 1 | | | | 1 | |
| | |
Pool # 762498, 5.00%, 11/1/2023 | | | 42 | | | | 47 | |
| | |
Pool # 255609, 4.50%, 1/1/2025 | | | 6 | | | | 6 | |
| | |
Pool # FM1345, 4.50%, 11/1/2038 | | | 922 | | | | 1,018 | |
| |
FNMA UMBS, 30 Year | | | | | |
| | |
Pool # 250375, 6.50%, 9/1/2025 | | | 1 | | | | 1 | |
| | |
Pool # 338417, 6.50%, 5/1/2026 | | | — | (i) | | | — | (i) |
| | |
Pool # 689977, 8.00%, 3/1/2027 | | | 9 | | | | 10 | |
| | |
Pool # 755973, 8.00%, 11/1/2028 | | | 20 | | | | 23 | |
| | |
Pool # 252211, 6.00%, 1/1/2029 | | | 1 | | | | 1 | |
| | |
Pool # 524949, 7.50%, 3/1/2030 | | | 6 | | | | 6 | |
| | |
Pool # 622534, 3.00%, 9/1/2031 | | | 104 | | | | 109 | |
| | |
Pool # 788150, 6.00%, 3/1/2032 | | | 16 | | | | 18 | |
| | |
Pool # 545639, 6.50%, 4/1/2032 | | | 32 | | | | 37 | |
| | |
Pool # 674349, 6.00%, 3/1/2033 | | | 5 | | | | 6 | |
| | |
Pool # AD0755, 7.00%, 6/1/2035 | | | 421 | | | | 495 | |
| | |
Pool # 833039, 5.00%, 9/1/2035 | | | 21 | | | | 25 | |
| | |
Pool # 745932, 6.50%, 11/1/2036 | | | 42 | | | | 49 | |
| | |
Pool # 944831, 5.50%, 2/1/2038 | | | 4 | | | | 5 | |
| | |
Pool # 961799, 5.50%, 3/1/2038 | | | 2 | | | | 3 | |
| | |
Pool # 976582, 4.50%, 4/1/2038 | | | 2 | | | | 2 | |
| | |
Pool # 985558, 5.50%, 6/1/2038 | | | 1 | | | | 1 | |
| | |
Pool # AL3438, 6.50%, 10/1/2038 | | | 409 | | | | 466 | |
| | |
Pool # AA4236, 4.50%, 4/1/2039 | | | 144 | | | | 161 | |
| | |
Pool # 935241, 4.50%, 5/1/2039 | | | 5 | | | | 6 | |
| | |
Pool # MA2535, 4.50%, 2/1/2046 | | | 345 | | | | 381 | |
| | | | | | | | |
| INVESTMENTS | | PRINCIPAL
AMOUNT ($000) | | | VALUE ($000) | |
| | | | | | | | |
| | |
Pool # BH4683, 4.00%, 6/1/2047 | | | 385 | | | | 424 | |
| | |
Pool # BH4684, 4.00%, 6/1/2047 | | | 371 | | | | 407 | |
| | |
Pool # BH4685, 4.00%, 6/1/2047 | | | 361 | | | | 400 | |
| | |
Pool # BK9030, 5.00%, 10/1/2048 | | | 1,074 | | | | 1,189 | |
| | |
Pool # BM5430, 5.00%, 1/1/2049 | | | 597 | | | | 681 | |
| | |
Pool # BN5899, 5.00%, 2/1/2049 | | | 187 | | | | 206 | |
| | |
Pool # BK8745, 4.50%, 4/1/2049 | | | 696 | | | | 754 | |
| | |
Pool # BN4707, 5.00%, 4/1/2049 | | | 1,049 | | | | 1,178 | |
| | |
Pool # FM1939, 4.50%, 5/1/2049 | | | 600 | | | | 649 | |
| | |
Pool # CA3713, 5.00%, 6/1/2049 | | | 683 | | | | 755 | |
| | |
Pool # BN6475, 4.00%, 7/1/2049 | | | 446 | | | | 477 | |
| | |
Pool # BO2170, 4.00%, 7/1/2049 | | | 709 | | | | 758 | |
| | |
Pool # BO2305, 4.00%, 7/1/2049 | | | 169 | | | | 180 | |
| | |
Pool # BK8758, 4.50%, 7/1/2049 | | | 664 | | | | 727 | |
| | |
Pool # BO5625, 3.50%, 8/1/2049 | | | 1,024 | | | | 1,102 | |
| | |
Pool # BP4357, 3.00%, 2/1/2050 | | | 1,099 | | | | 1,183 | |
| |
FNMA, 30 Year | | | | | |
| | |
Pool # 506427, 9.00%, 4/1/2025 | | | 8 | | | | 8 | |
| | |
Pool # 535442, 8.50%, 6/1/2030 | | | 2 | | | | 2 | |
| |
FNMA, Other | | | | | |
| | |
Pool # AM0806, 2.45%, 11/1/2022 | | | 489 | | | | 502 | |
| | |
Pool # AM1619, 2.34%, 12/1/2022 | | | 257 | | | | 263 | |
| | |
Pool # AM2747, 2.50%, 4/1/2023 | | | 500 | | | | 518 | |
| | |
Pool # AM3244, 2.52%, 5/1/2023 | | | 1,000 | | | | 1,037 | |
| | |
Pool # AM3851, 3.02%, 7/1/2023 | | | 1,000 | | | | 1,056 | |
| | |
Pool # AN0029, 3.10%, 9/1/2025 | | | 966 | | | | 1,065 | |
| | |
Pool # AM4660, 3.77%, 12/1/2025 | | | 291 | | | | 326 | |
| | |
Pool # AN0890, 2.63%, 3/1/2026 | | | 475 | | | | 516 | |
| | |
Pool # AM6381, 3.29%, 8/1/2026 | | | 994 | | | | 1,109 | |
| | |
Pool # BL0044, 3.71%, 8/1/2026 | | | 788 | | | | 888 | |
| | |
Pool # AM7321, 3.12%, 11/1/2026 | | | 948 | | | | 1,057 | |
| | |
Pool # AM7515, 3.34%, 2/1/2027 | | | 1,000 | | | | 1,124 | |
| | |
Pool # AN1600, 2.59%, 6/1/2028 | | | 860 | | | | 946 | |
| | |
Pool # AN9686, 3.52%, 6/1/2028 | | | 500 | | | | 578 | |
| | |
Pool # 109452, 3.64%, 8/1/2028 | | | 970 | | | | 1,117 | |
| | |
Pool # 405220, 6.00%, 9/1/2028 | | | 8 | | | | 9 | |
| | |
Pool # BL5798, 2.47%, 12/1/2028 | | | 1,260 | | | | 1,372 | |
| | |
Pool # BL1040, 3.81%, 12/1/2028 | | | 300 | | | | 352 | |
| | |
Pool # AN4559, 3.28%, 2/1/2029 | | | 1,482 | | | | 1,688 | |
| | |
Pool # AN5672, 3.20%, 6/1/2029 | | | 1,465 | | | | 1,662 | |
| | |
Pool # BL4435, 2.42%, 10/1/2029 | | | 700 | | | | 767 | |
| | |
Pool # AN6846, 2.93%, 10/1/2029 | | | 1,100 | | | | 1,242 | |
| | |
Pool # BL4333, 2.52%, 11/1/2029 | | | 1,098 | | | | 1,209 | |
| | |
Pool # AN9976, 3.96%, 2/1/2030 | | | 1,200 | | | | 1,431 | |
| | |
Pool # BL6267, 2.01%, 4/1/2030 | | | 1,350 | | | | 1,422 | |
SEE NOTES TO FINANCIAL STATEMENTS.
| | | | | | | | | | |
| | | | | |
| DECEMBER 31, 2020 | | JPMORGAN INSURANCE TRUST | | | | | | | | 21 |
JPMorgan Insurance Trust Core Bond Portfolio
SCHEDULE OF PORTFOLIO INVESTMENTS
AS OF DECEMBER 31, 2020 (continued)
| | | | | | | | |
| INVESTMENTS | | PRINCIPAL
AMOUNT ($000) | | | VALUE ($000) | |
Mortgage-Backed Securities — continued | |
| | |
Pool # AM8692, 3.03%, 4/1/2030 | | | 650 | | | | 733 | |
| | |
Pool # AM8544, 3.08%, 4/1/2030 | | | 476 | | | | 540 | |
| | |
Pool # BL6386, 2.02%, 8/1/2030 | | | 1,059 | | | | 1,122 | |
| | |
Pool # BL9627, 1.56%, 1/1/2031 | | | 1,300 | | | | 1,334 | |
| | |
Pool # 754922, 5.50%, 9/1/2033 | | | 28 | | | | 33 | |
| | |
Pool # BL4886, 2.84%, 11/1/2034 | | | 797 | | | | 892 | |
| | |
Pool # 847108, 6.50%, 10/1/2035 | | | 73 | | | | 83 | |
| | |
Pool # AL9678, 4.00%, 2/1/2036 | | | 951 | | | | 1,021 | |
| | |
Pool # AN1330, 3.19%, 3/1/2036 | | | 1,045 | | | | 1,187 | |
| | |
Pool # 257172, 5.50%, 4/1/2038 | | | 4 | | | | 4 | |
| | |
Pool # AO9352, 4.00%, 7/1/2042 | | | 189 | | | | 208 | |
| | |
Pool # MA1125, 4.00%, 7/1/2042 | | | 255 | | | | 277 | |
| | |
Pool # MA1178, 4.00%, 9/1/2042 | | | 133 | | | | 145 | |
| | |
Pool # MA1437, 3.50%, 5/1/2043 | | | 405 | | | | 442 | |
| | |
Pool # AL6167, 3.50%, 1/1/2044 | | | 431 | | | | 471 | |
| | |
Pool # MA2545, 3.50%, 2/1/2046 | | | 837 | | | | 915 | |
| | |
Pool # MA2793, 3.50%, 10/1/2046 | | | 282 | | | | 306 | |
| | |
Pool # BF0464, 3.50%, 3/1/2060 | | | 1,188 | | | | 1,312 | |
| |
FNMA/FHLMC UMBS, Single Family, 30 Year | | | | | |
| | |
TBA, 2.00%, 1/25/2051 (h) | | | 42,390 | | | | 44,028 | |
| |
GNMA I, 30 Year | | | | | |
| | |
Pool # 326977, 7.50%, 5/15/2023 | | | 1 | | | | 1 | |
| | |
Pool # 359588, 7.50%, 6/15/2023 | | | — | (i) | | | — | (i) |
| | |
Pool # 782507, 9.50%, 10/15/2024 | | | — | (i) | | | — | (i) |
| | |
Pool # 780029, 9.00%, 11/15/2024 | | | — | (i) | | | — | (i) |
| | |
Pool # 405535, 7.00%, 12/15/2025 | | | 1 | | | | 1 | |
| | |
Pool # 412336, 8.00%, 10/15/2027 | | | 1 | | | | 2 | |
| | |
Pool # 451507, 8.00%, 10/15/2027 | | | 2 | | | | 2 | |
| | |
Pool # 412369, 7.00%, 11/15/2027 | | | 1 | | | | 1 | |
| | |
Pool # 467705, 6.50%, 3/15/2028 | | | 1 | | | | 1 | |
| | |
Pool # 472679, 7.00%, 6/15/2028 | | | 3 | | | | 3 | |
| | |
Pool # 486537, 7.50%, 9/15/2028 | | | 2 | | | | 2 | |
| | |
Pool # 781614, 7.00%, 6/15/2033 | | | 5 | | | | 6 | |
| | |
Pool # 617653, 6.00%, 5/15/2037 | | | 29 | | | | 32 | |
| | |
Pool # 678574, 5.50%, 6/15/2038 | | | 667 | | | | 787 | |
| | |
Pool # 681554, 5.50%, 7/15/2038 | | | 573 | | | | 675 | |
| | |
Pool # 678169, 5.50%, 9/15/2038 | | | 348 | | | | 411 | |
| | |
Pool # 681568, 5.50%, 9/15/2038 | | | 605 | | | | 712 | |
| | |
Pool # 694458, 6.00%, 10/15/2038 | | | 6 | | | | 8 | |
| | |
Pool # 782510, 6.50%, 12/15/2038 | | | 17 | | | | 20 | |
| |
GNMA II | | | | | |
| | |
Pool # 81074, ARM, 2.75%, 9/20/2034 (g) | | | 70 | | | | 71 | |
| |
GNMA II, 30 Year | | | | | |
| | |
Pool # 2006, 8.50%, 5/20/2025 | | | 1 | | | | 1 | |
| | |
Pool # 2324, 8.00%, 11/20/2026 | | | 14 | | | | 16 | |
| | | | | | | | |
| INVESTMENTS | | PRINCIPAL
AMOUNT ($000) | | | VALUE ($000) | |
| | | | | | | | |
| | |
Pool # 2341, 7.50%, 12/20/2026 | | | 1 | | | | 1 | |
| | |
Pool # 2362, 8.00%, 1/20/2027 | | | 2 | | | | 2 | |
| | |
Pool # BJ9823, 3.75%, 4/20/2048 | | | 1,515 | | | | 1,695 | |
| | |
Pool # BP4337, 4.50%, 9/20/2049 | | | 759 | | | | 839 | |
| | |
Pool # BP5551, 4.50%, 9/20/2049 | | | 931 | | | | 1,030 | |
| | |
Pool # BR0553, 4.50%, 2/20/2050 | | | 693 | | | | 779 | |
| | |
Pool # BS7393, 4.00%, 3/20/2050 | | | 995 | | | | 1,086 | |
| | |
Pool # BT8093, 3.50%, 4/20/2050 | | | 1,183 | | | | 1,280 | |
| | |
Pool # BS7411, 4.00%, 4/20/2050 | | | 1,817 | | | | 1,984 | |
| | |
Pool # BT4341, 3.00%, 7/20/2050 | | | 1,390 | | | | 1,486 | |
| |
GNMA II, Other | | | | | |
| | |
Pool # AD0018, 3.75%, 12/20/2032 | | | 115 | | | | 122 | |
| | | | | | | | |
| |
Total Mortgage-Backed Securities
(Cost $112,555) | | | | 116,387 | |
| | | | | |
U.S. Treasury Obligations — 20.0% | |
| | |
U.S. Treasury Bonds
8.00%, 11/15/2021 | | | 338 | | | | 361 | |
| | |
5.38%, 2/15/2031 | | | 5 | | | | 6 | |
| | |
4.25%, 5/15/2039 | | | 105 | | | | 156 | |
| | |
1.13%, 5/15/2040 | | | 285 | | | | 270 | |
| | |
3.88%, 8/15/2040 | | | 100 | | | | 143 | |
| | |
3.13%, 11/15/2041 | | | 950 | | | | 1,240 | |
| | |
3.13%, 2/15/2043 | | | 500 | | | | 655 | |
| | |
2.88%, 5/15/2043 | | | 2,420 | | | | 3,054 | |
| | |
3.63%, 8/15/2043 | | | 2,350 | | | | 3,313 | |
| | |
3.75%, 11/15/2043 | | | 1,952 | | | | 2,805 | |
| | |
3.63%, 2/15/2044 | | | 2,345 | | | | 3,315 | |
| | |
3.38%, 5/15/2044 | | | 1,000 | | | | 1,365 | |
| | |
3.00%, 11/15/2044 | | | 663 | | | | 857 | |
| | |
2.50%, 2/15/2045 | | | 2,000 | | | | 2,381 | |
| | |
2.88%, 8/15/2045 | | | 500 | | | | 635 | |
| | |
3.00%, 11/15/2045 | | | 1,000 | | | | 1,299 | |
| | |
2.25%, 8/15/2046 | | | 3,704 | | | | 4,219 | |
| | |
3.00%, 2/15/2048 | | | 90 | | | | 118 | |
| | |
3.13%, 5/15/2048 | | | 176 | | | | 236 | |
| | |
2.88%, 5/15/2049 | | | 160 | | | | 206 | |
| | |
2.25%, 8/15/2049 | | | 1,095 | | | | 1,251 | |
| | |
2.38%, 11/15/2049 | | | 265 | | | | 311 | |
| | |
2.00%, 2/15/2050 | | | 3,045 | | | | 3,300 | |
| | |
1.25%, 5/15/2050 | | | 2,380 | | | | 2,154 | |
| | |
1.38%, 8/15/2050 | | | 140 | | | | 131 | |
| | |
1.63%, 11/15/2050 | | | 2,000 | | | | 1,988 | |
| | |
U.S. Treasury Inflation Indexed Bonds
3.63%, 4/15/2028 | | | 300 | | | | 664 | |
| | |
2.50%, 1/15/2029 | | | 100 | | | | 159 | |
SEE NOTES TO FINANCIAL STATEMENTS.
| | | | | | | | | | |
| | | | | |
| 22 | | | | | | | | JPMORGAN INSURANCE TRUST | | DECEMBER 31, 2020 |
| | | | | | | | |
| INVESTMENTS | | PRINCIPAL
AMOUNT ($000) | | | VALUE ($000) | |
U.S. Treasury Obligations — continued | |
| | |
U.S. Treasury Notes
3.63%, 2/15/2021 | | | 4,900 | | | | 4,919 | |
| | |
2.25%, 4/30/2021 | | | 115 | | | | 116 | |
| | |
2.63%, 5/15/2021 | | | 155 | | | | 156 | |
| | |
3.13%, 5/15/2021 | | | 600 | | | | 607 | |
| | |
2.00%, 5/31/2021 | | | 300 | | | | 302 | |
| | |
2.13%, 8/15/2021 | | | 500 | | | | 506 | |
| | |
1.25%, 10/31/2021 | | | 3,500 | | | | 3,533 | |
| | |
2.00%, 10/31/2021 | | | 100 | | | | 102 | |
| | |
1.88%, 11/30/2021 | | | 950 | | | | 965 | |
| | |
1.38%, 1/31/2022 | | | 9,000 | | | | 9,121 | |
| | |
1.75%, 2/28/2022 | | | 3,300 | | | | 3,362 | |
| | |
1.63%, 8/31/2022 | | | 1,000 | | | | 1,025 | |
| | |
1.75%, 9/30/2022 | | | 150 | | | | 154 | |
| | |
1.50%, 2/28/2023 | | | 525 | | | | 540 | |
| | |
1.75%, 5/15/2023 | | | 3,079 | | | | 3,196 | |
| | |
2.75%, 5/31/2023 | | | 46 | | | | 49 | |
| | |
2.50%, 8/15/2023 | | | 600 | | | | 637 | |
| | |
1.38%, 8/31/2023 | | | 700 | | | | 723 | |
| | |
1.63%, 10/31/2023 | | | 2,000 | | | | 2,083 | |
| | |
2.13%, 2/29/2024 | | | 94 | | | | 100 | |
| | |
2.50%, 5/15/2024 | | | 30 | | | | 32 | |
| | |
2.00%, 6/30/2024 | | | 10 | | | | 11 | |
| | |
2.25%, 11/15/2024 | | | 112 | | | | 121 | |
| | |
1.75%, 12/31/2024 | | | 2,621 | | | | 2,776 | |
| | |
2.00%, 2/15/2025 | | | 1,000 | | | | 1,070 | |
| | |
2.88%, 4/30/2025 | | | 146 | | | | 162 | |
| | |
2.13%, 5/15/2025 | | | 500 | | | | 540 | |
| | |
2.88%, 5/31/2025 | | | 318 | | | | 354 | |
| | |
2.00%, 8/15/2025 | | | 729 | | | | 785 | |
| | |
2.25%, 11/15/2025 | | | 610 | | | | 666 | |
| | |
1.63%, 2/15/2026 | | | 59 | | | | 63 | |
| | |
1.50%, 8/15/2026 | | | 28 | | | | 30 | |
| | |
2.00%, 11/15/2026 | | | 84 | | | | 91 | |
| | |
1.75%, 12/31/2026 | | | 2,282 | | | | 2,452 | |
| | |
2.25%, 2/15/2027 | | | 108 | | | | 119 | |
| | |
0.38%, 9/30/2027 | | | 1,160 | | | | 1,142 | |
| | |
2.75%, 2/15/2028 | | | 65 | | | | 74 | |
| | |
2.88%, 5/15/2028 | | | 991 | | | | 1,147 | |
| | |
1.63%, 8/15/2029 | | | 135 | | | | 144 | |
| | |
1.75%, 11/15/2029 | | | 265 | | | | 286 | |
| | |
1.50%, 2/15/2030 | | | 129 | | | | 136 | |
| | |
0.63%, 8/15/2030 | | | 435 | | | | 424 | |
| | | | | | | | |
| INVESTMENTS | | PRINCIPAL
AMOUNT ($000) | | | VALUE ($000) | |
| | | | | | | | |
| | |
U.S. Treasury STRIPS Bonds
2.43%, 2/15/2021 (j) | | | 910 | | | | 910 | |
| | |
2.09%, 5/15/2021 (j) | | | 1,590 | | | | 1,589 | |
| | |
2.21%, 8/15/2021 (j) | | | 1,800 | | | | 1,799 | |
| | |
3.32%, 11/15/2021 (j) | | | 675 | | | | 674 | |
| | |
2.96%, 2/15/2022 (j) | | | 720 | | | | 719 | |
| | |
2.81%, 5/15/2022 (j) | | | 760 | | | | 759 | |
| | |
3.24%, 8/15/2022 (j) | | | 75 | | | | 75 | |
| | |
1.91%, 11/15/2022 (j) | | | 750 | | | | 748 | |
| | |
3.08%, 2/15/2023 (j) | | | 2,690 | | | | 2,682 | |
| | |
2.75%, 5/15/2023 (j) | | | 2,420 | | | | 2,412 | |
| | |
2.28%, 8/15/2023 (j) | | | 1,890 | | | | 1,880 | |
| | |
2.77%, 11/15/2023 (j) | | | 173 | | | | 172 | |
| | |
1.72%, 2/15/2024 (j) | | | 327 | | | | 325 | |
| | |
3.43%, 11/15/2024 (j) | | | 110 | | | | 109 | |
| | |
3.87%, 2/15/2025 (j) | | | 50 | | | | 49 | |
| | |
5.34%, 5/15/2026 (j) | | | 100 | | | | 97 | |
| | |
3.62%, 8/15/2026 (j) | | | 23 | | | | 22 | |
| | |
3.79%, 11/15/2026 (j) | | | 250 | | | | 241 | |
| | |
4.32%, 2/15/2027 (j) | | | 300 | | | | 289 | |
| | |
3.84%, 5/15/2027 (j) | | | 725 | | | | 695 | |
| | |
3.41%, 8/15/2027 (j) | | | 250 | | | | 239 | |
| | |
4.21%, 11/15/2027 (j) | | | 710 | | | | 672 | |
| | |
3.17%, 2/15/2028 (j) | | | 27 | | | | 26 | |
| | |
3.06%, 5/15/2028 (j) | | | 140 | | | | 132 | |
| | |
7.80%, 8/15/2028 (j) | | | 50 | | | | 47 | |
| | |
4.29%, 2/15/2029 (j) | | | 658 | | | | 611 | |
| | |
4.11%, 11/15/2029 (j) | | | 200 | | | | 183 | |
| | |
5.05%, 5/15/2030 (j) | | | 300 | | | | 272 | |
| | |
4.13%, 8/15/2030 (j) | | | 300 | | | | 271 | |
| | |
3.77%, 11/15/2030 (j) | | | 500 | | | | 448 | |
| | |
4.73%, 2/15/2031 (j) | | | 350 | | | | 313 | |
| | |
4.13%, 5/15/2031 (j) | | | 275 | | | | 245 | |
| | |
3.45%, 11/15/2031 (j) | | | 760 | | | | 669 | |
| | |
3.92%, 2/15/2032 (j) | | | 350 | | | | 307 | |
| | |
4.47%, 11/15/2032 (j) | | | 800 | | | | 691 | |
| | |
3.95%, 2/15/2033 (j) | | | 400 | | | | 343 | |
| | |
4.12%, 5/15/2033 (j) | | | 1,175 | | | | 1,005 | |
| | |
6.68%, 8/15/2033 (j) | | | 100 | | | | 85 | |
| | |
4.62%, 11/15/2033 (j) | | | 1,025 | | | | 868 | |
| | |
4.07%, 2/15/2034 (j) | | | 775 | | | | 652 | |
| | |
3.49%, 11/15/2034 (j) | | | 50 | | | | 41 | |
| | |
3.39%, 2/15/2035 (j) | | | 65 | | | | 54 | |
| | |
3.75%, 5/15/2035 (j) | | | 250 | | | | 205 | |
SEE NOTES TO FINANCIAL STATEMENTS.
| | | | | | | | | | |
| | | | | |
| DECEMBER 31, 2020 | | JPMORGAN INSURANCE TRUST | | | | | | | | 23 |
JPMorgan Insurance Trust Core Bond Portfolio
SCHEDULE OF PORTFOLIO INVESTMENTS
AS OF DECEMBER 31, 2020 (continued)
| | | | | | | | |
| INVESTMENTS | | PRINCIPAL
AMOUNT ($000) | | | VALUE ($000) | |
U.S. Treasury Obligations — continued | |
| | |
2.43%, 11/15/2041 (j) | | | 100 | | | | 72 | |
| | | | | | | | |
| |
Total U.S. Treasury Obligations
(Cost $97,135) | | | | 106,110 | |
| | | | | |
Asset-Backed Securities — 10.3% | |
| | |
ACC Trust Series 2019-2, Class A, 2.82%, 2/21/2023 (a) | | | 203 | | | | 204 | |
| | |
Air Canada Pass-Through Trust (Canada)
Series 2013-1, Class A, 4.13%, 5/15/2025 (a) | | | 101 | | | | 97 | |
| | |
Series 2015-1, Class A, 3.60%, 3/15/2027 (a) | | | 77 | | | | 76 | |
| | |
Series 2017-1, Class AA, 3.30%, 1/15/2030 (a) | | | 233 | | | | 228 | |
| | |
Series 2017-1, Class A, 3.55%, 1/15/2030 (a) | | | 166 | | | | 145 | |
| | |
American Airlines Pass-Through Trust
Series 2011-1, Class A, 5.25%, 1/31/2021 | | | 9 | | | | 9 | |
| | |
Series 2014-1, Class A, 3.70%, 10/1/2026 | | | 34 | | | | 32 | |
| | |
Series 2016-3, Class AA, 3.00%, 10/15/2028 | | | 195 | | | | 191 | |
| | |
Series 2017-1, Class AA, 3.65%, 2/15/2029 | | | 133 | | | | 134 | |
| | |
American Homes 4 Rent
Series 2015-SFR1, Class D, 4.41%, 4/17/2052 ‡ (a) | | | 380 | | | | 407 | |
| | |
Series 2015-SFR1, Class E, 5.64%, 4/17/2052 ‡ (a) | | | 100 | | | | 111 | |
| | |
American Homes 4 Rent Trust
Series 2014-SFR2, Class A, 3.79%, 10/17/2036 (a) | | | 402 | | | | 434 | |
| | |
Series 2014-SFR2, Class C, 4.71%, 10/17/2036 ‡ (a) | | | 200 | | | | 217 | |
| | |
Series 2014-SFR3, Class A, 3.68%, 12/17/2036 (a) | | | 223 | | | | 241 | |
| | |
Series 2014-SFR3, Class E, 6.42%, 12/17/2036 ‡ (a) | | | 200 | | | | 224 | |
| | |
Series 2015-SFR2, Class C, 4.69%, 10/17/2052 ‡ (a) | | | 200 | | | | 220 | |
| | |
American Tower Trust #1
3.07%, 3/15/2023 (a) | | | 80 | | | | 81 | |
| | |
3.65%, 3/23/2028 (a) | | | 160 | | | | 176 | |
| | |
AMSR Trust
Series 2020-SFR1, Class E, 3.22%, 4/17/2037 (a) | | | 850 | | | | 868 | |
| | |
Series 2020-SFR2, Class C, 2.53%, 7/17/2037 ‡ (a) | | | 1,000 | | | | 1,025 | |
| | |
Series 2020-SFR3, Class E2, 2.76%, 9/17/2037 ‡ (a) | | | 750 | | | | 755 | |
| | |
Series 2020-SFR4, Class C, 1.86%, 11/17/2037 ‡ (a) | | | 1,000 | | | | 1,003 | |
| | | | | | | | |
| INVESTMENTS | | PRINCIPAL
AMOUNT ($000) | | | VALUE ($000) | |
| | | | | | | | |
| | |
British Airways Pass-Through Trust (United Kingdom)
Series 2018-1, Class AA, 3.80%, 9/20/2031 (a) | | | 75 | | | | 75 | |
| | |
Series 2018-1, Class A, 4.13%, 9/20/2031 (a) | | | 100 | | | | 97 | |
| | |
Series 2019-1, Class AA, 3.30%, 12/15/2032 (a) | | | 148 | | | | 148 | |
| | |
Business Jet Securities LLC
Series 2018-2, Class A, 4.45%, 6/15/2033 (a) | | | 248 | | | | 253 | |
| | |
Series 2019-1, Class A, 4.21%, 7/15/2034 (a) | | | 573 | | | | 585 | |
| | |
Series 2020-1A, Class A, 2.98%, 11/15/2035 (a) | | | 1,107 | | | | 1,122 | |
| | |
Camillo Issuer LLC Series 2016-SFR, Class 1-A-1, 5.00%, 12/5/2023 ‡ | | | 359 | | | | 358 | |
| | |
Cars Net Lease Mortgage Notes Series 2020-1A, Class A3, 3.10%, 12/15/2050 (a) | | | 160 | | | | 160 | |
| | |
Carvana Auto Receivables Trust
Series 2019-2A, Class C, 3.00%, 6/17/2024 (a) | | | 675 | | | | 693 | |
| | |
Series 2019-3A, Class C, 2.71%, 10/15/2024 (a) | | | 875 | | | | 900 | |
| | |
Series 2019-4A, Class D, 3.07%, 7/15/2025 (a) | | | 940 | | | | 974 | |
| | |
Series 2020-N1A, Class D, 3.43%, 1/15/2026 (a) | | | 1,000 | | | | 1,041 | |
| | |
CIG Auto Receivables Trust Series 2020-1A, Class C, 1.75%, 1/12/2026 (a) | | | 1,000 | | | | 1,004 | |
| | |
Continental Airlines Pass-Through Trust Series 2012-1, Class A, 4.15%, 4/11/2024 | | | 126 | | | | 127 | |
| | |
CoreVest American Finance Trust
Series 2019-2, Class D, 4.22%, 6/15/2052 ‡ (a) | | | 500 | | | | 545 | |
| | |
Series 2019-3, Class B, 3.16%, 10/15/2052 ‡ (a) | | | 700 | | | | 726 | |
| | |
Series 2020-3, Class B, 2.20%, 8/15/2053 ‡ (a) | | | 810 | | | | 812 | |
| | |
CPS Auto Receivables Trust Series 2015-C, Class D, 4.63%, 8/16/2021 (a) | | | 4 | | | | 4 | |
| | |
CPS Auto Trust Series 2018-C, Class C, 3.68%, 6/17/2024 (a) | | | 1,537 | | | | 1,554 | |
| | |
Credit Acceptance Auto Loan Trust
Series 2018-1A, Class A, 3.01%, 2/16/2027 (a) | | | 15 | | | | 15 | |
| | |
Series 2020-1A, Class B, 2.39%, 4/16/2029 (a) | | | 645 | | | | 660 | |
| | |
Credit Suisse ABS Trust Series 2020-AT1, Class A, 2.63%, 10/15/2026 (a) | | | 870 | | | | 871 | |
SEE NOTES TO FINANCIAL STATEMENTS.
| | | | | | | | | | |
| | | | | |
| 24 | | | | | | | | JPMORGAN INSURANCE TRUST | | DECEMBER 31, 2020 |
| | | | | | | | |
| INVESTMENTS | | PRINCIPAL
AMOUNT ($000) | | | VALUE ($000) | |
Asset-Backed Securities — continued | |
| | |
Crown Castle Towers LLC
3.22%, 5/15/2022 (a) | | | 42 | | | | 42 | |
| | |
3.66%, 5/15/2025 (a) | | | 60 | | | | 65 | |
| | |
CWABS Revolving Home Equity Loan Trust Series 2004-K, Class 2A, 0.46%, 2/15/2034 ‡ (g) | | | 1 | | | | 1 | |
| | |
CWABS, Inc. Asset-Backed Certificates
Series 2004-1, Class M1, 0.90%, 3/25/2034 ‡ (g) | | | 14 | | | | 14 | |
| | |
Series 2004-1, Class M2, 0.97%, 3/25/2034 ‡ (g) | | | 6 | | | | 5 | |
| | |
Series 2004-1, Class 3A, 0.71%, 4/25/2034 ‡ (g) | | | 1 | | | | 1 | |
| | |
Delta Air Lines Pass-Through Trust Series 2015-1, Class AA, 3.63%, 7/30/2027 | | | 313 | | | | 322 | |
| | |
Drive Auto Receivables Trust
Series 2017-1, Class D, 3.84%, 3/15/2023 | | | 99 | | | | 100 | |
| | |
Series 2017-3, Class D, 3.53%, 12/15/2023 (a) | | | 290 | | | | 294 | |
| | |
Series 2016-CA, Class D, 4.18%, 3/15/2024 (a) | | | 106 | | | | 108 | |
| | |
Series 2017-AA, Class D, 4.16%, 5/15/2024 (a) | | | 69 | | | | 70 | |
| | |
Series 2019-4, Class C, 2.51%, 11/17/2025 | | | 375 | | | | 383 | |
| | |
Series 2019-1, Class D, 4.09%, 6/15/2026 | | | 170 | | | | 178 | |
| | |
Series 2020-2, Class D, 3.05%, 5/15/2028 | | | 1,000 | | | | 1,055 | |
| | |
DT Auto Owner Trust
Series 2017-1A, Class D, 3.55%, 11/15/2022 (a) | | | — | (i) | | | — | (i) |
| | |
Series 2017-3A, Class D, 3.58%, 5/15/2023 (a) | | | 30 | | | | 30 | |
| | |
Series 2019-4A, Class C, 2.73%, 7/15/2025 (a) | | | 604 | | | | 619 | |
| | |
Series 2020-2A, Class B, 2.08%, 3/16/2026 (a) | | | 850 | | | | 867 | |
| | |
Exeter Automobile Receivables Trust
Series 2017-1A, Class C, 3.95%, 12/15/2022 (a) | | | 16 | | | | 16 | |
| | |
Series 2018-1A, Class C, 3.03%, 1/17/2023 (a) | | | 36 | | | | 36 | |
| | |
Series 2019-4A, Class C, 2.44%, 9/16/2024 (a) | | | 415 | | | | 424 | |
| | |
Series 2019-3A, Class D, 3.11%, 8/15/2025 (a) | | | 590 | | | | 610 | |
| | |
Series 2019-4A, Class D, 2.58%, 9/15/2025 (a) | | | 1,315 | | | | 1,352 | |
| | |
FirstKey Homes Trust
Series 2020-SFR1, Class D, 2.24%, 9/17/2025 ‡ (a) | | | 800 | | | | 799 | |
| | |
Series 2020-SFR1, Class E, 2.79%, 8/17/2037 ‡ (a) | | | 500 | | | | 510 | |
| | | | | | | | |
| INVESTMENTS | | PRINCIPAL
AMOUNT ($000) | | | VALUE ($000) | |
| | | | | | | | |
| | |
Series 2020-SFR2, Class E, 2.67%, 10/19/2037 ‡ (a) | | | 850 | | | | 848 | |
| | |
Flagship Credit Auto Trust
Series 2016-1, Class C, 6.22%, 6/15/2022 (a) | | | 88 | | | | 89 | |
| | |
Series 2016-4, Class C, 2.71%, 11/15/2022 (a) | | | 40 | | | | 40 | |
| | |
FNMA, Grantor Trust Series 2017-T1, Class A, 2.90%, 6/25/2027 | | | 428 | | | | 473 | |
| | |
FORT CRE LLC Series 2018-1A, Class C, 2.98%, 11/16/2035 ‡ (a) (g) | | | 760 | | | | 739 | |
| | |
Foundation Finance Trust Series 2020-1A, Class A, 3.54%, 7/16/2040 (a) | | | 718 | | | | 743 | |
| | |
FREED ABS Trust
Series 2018-2, Class A, 3.99%, 10/20/2025 (a) | | | 22 | | | | 22 | |
| | |
Series 2019-2, Class A, 2.62%, 11/18/2026 (a) | | | 121 | | | | 121 | |
| | |
Series 2020-FP1, Class B, 3.06%, 3/18/2027 ‡ (a) | | | 800 | | | | 813 | |
| | |
Gold Key Resorts LLC Series 2014-A, Class A, 3.22%, 3/17/2031 (a) | | | 10 | | | | 10 | |
| | |
Goodgreen Trust
Series 2017-1A, Class A, 3.74%, 10/15/2052 (a) | | | 53 | | | | 56 | |
| | |
Series 2017-2A, Class A, 3.26%, 10/15/2053 (a) | | | 217 | | | | 226 | |
| | |
Series 2019-2A, Class A, 2.76%, 10/15/2054 (a) | | | 390 | | | | 403 | |
| | |
HERO (Cayman Islands) Series 2018-1ASI, Class A, 4.00%, 9/20/2047 (a) | | | 87 | | | | 83 | |
| | |
HERO Funding (Cayman Islands) Series 2017-3A, Class A2, 3.95%, 9/20/2048 (a) | | | 172 | | | | 181 | |
| | |
HERO Funding Trust (Cayman Islands)
Series 2016-3A, Class A1, 3.08%, 9/20/2042 (a) | | | 44 | | | | 45 | |
| | |
Series 2017-1A, Class A2, 4.46%, 9/20/2047 (a) | | | 125 | | | | 134 | |
| | |
Hilton Grand Vacations Trust Series 2017-AA, Class A, 2.66%, 12/26/2028 (a) | | | 76 | | | | 77 | |
| | |
LL ABS Trust Series 2019-1A, Class A, 2.87%, 3/15/2027 (a) | | | 125 | | | | 126 | |
| | |
Long Beach Mortgage Loan Trust
Series 2003-4, Class M1, 1.17%, 8/25/2033 ‡ (g) | | | 16 | | | | 16 | |
| | |
Series 2004-1, Class M1, 0.90%, 2/25/2034 ‡ (g) | | | 42 | | | | 41 | |
| | |
Series 2004-1, Class M2, 0.97%, 2/25/2034 ‡ (g) | | | 6 | | | | 6 | |
SEE NOTES TO FINANCIAL STATEMENTS.
| | | | | | | | | | |
| | | | | |
| DECEMBER 31, 2020 | | JPMORGAN INSURANCE TRUST | | | | | | | | 25 |
JPMorgan Insurance Trust Core Bond Portfolio
SCHEDULE OF PORTFOLIO INVESTMENTS
AS OF DECEMBER 31, 2020 (continued)
| | | | | | | | |
| INVESTMENTS | | PRINCIPAL
AMOUNT ($000) | | | VALUE ($000) | |
Asset-Backed Securities — continued | |
| | |
Mariner Finance Issuance Trust Series 2019-AA, Class A, 2.96%, 7/20/2032 (a) | | | 925 | | | | 946 | |
| | |
MVW LLC Series 2019-2A, Class B, 2.44%, 10/20/2038 ‡ (a) | | | 634 | | | | 645 | |
| | |
MVW Owner Trust Series 2019-1A, Class A, 2.89%, 11/20/2036 (a) | | | 155 | | | | 161 | |
| | |
New Century Home Equity Loan Trust Series 2005-1, Class M1, 0.82%, 3/25/2035 ‡ (g) | | | 72 | | | | 72 | |
| | |
NMEF Funding LLC Series 2019-A, Class B, 3.06%, 8/17/2026 ‡ (a) | | | 870 | | | | 884 | |
| | |
NRZ Excess Spread-Collateralized Notes Series 2020-PLS1, Class A, 3.84%, 12/25/2025 (a) | | | 1,100 | | | | 1,100 | |
| | |
OneMain Direct Auto Receivables Trust Series 2018-1A, Class B, 3.71%, 4/14/2025 (a) | | | 270 | | | | 276 | |
| | |
Oportun Funding LLC Series 2020-1, Class A, 2.20%, 5/15/2024 (a) | | | 1,156 | | | | 1,159 | |
| | |
Oportun Funding VIII LLC Series 2018-A, Class A, 3.61%, 3/8/2024 (a) | | | 253 | | | | 253 | |
| | |
Oportun Funding X LLC Series 2018-C, Class A, 4.10%, 10/8/2024 (a) | | | 801 | | | | 814 | |
| | |
Oportun Funding XIII LLC Series 2019-A, Class A, 3.08%, 8/8/2025 (a) | | | 560 | | | | 568 | |
| | |
Pretium Mortgage Credit Partners I LLC
Series 2020-CFL1, Class A1, 3.10%, 2/27/2060 (a) (f) | | | 666 | | | | 667 | |
| | |
Series 2020-NPL3, Class A1, 3.10%, 6/27/2060 ‡ (a) (f) | | | 719 | | | | 721 | |
| | |
Progress Residential Trust Series 2019-SFR4, Class D, 3.14%, 10/17/2036 ‡ (a) | | | 800 | | | | 825 | |
| | |
Prosper Marketplace Issuance Trust Series 2019-3A, Class A, 3.19%, 7/15/2025 (a) | | | 24 | | | | 24 | |
| | |
Renew (Cayman Islands) Series 2017-1A, Class A, 3.67%, 9/20/2052 (a) | | | 54 | | | | 56 | |
| | |
Santander Drive Auto Receivables Trust
Series 2018-1, Class D, 3.32%, 3/15/2024 | | | 346 | | | | 354 | |
| | |
Series 2019-2, Class C, 2.90%, 10/15/2024 | | | 190 | | | | 194 | |
| | |
Sierra Timeshare Receivables Funding LLC
Series 2019-3A, Class C, 3.00%, 8/20/2036 ‡ (a) | | | 515 | | | | 520 | |
| | |
Series 2020-2A, Class A, 1.33%, 7/20/2037 (a) | | | 647 | | | | 651 | |
| | |
Small Business Lending Trust Series 2020-A, Class B, 3.20%, 12/15/2026 ‡ (a) | | | 2,300 | | | | 2,215 | |
| | |
Spirit Airlines Pass-Through Trust Series 2017-1, Class AA, 3.38%, 2/15/2030 | | | 53 | | | | 51 | |
| | |
Spruce ABS Trust Series 2016-E1, Class A, 4.32%, 6/15/2028 (a) | | | 9 | | | | 9 | |
| | |
Synchrony Card Funding LLC
Series 2019-A1, Class A, 2.95%, 3/15/2025 | | | 809 | | | | 835 | |
| | |
Series 2019-A2, Class A, 2.34%, 6/15/2025 | | | 850 | | | | 875 | |
| | | | | | | | |
| INVESTMENTS | | PRINCIPAL
AMOUNT ($000) | | | VALUE ($000) | |
| | | | | | | | |
| | |
Synchrony Card Issuance Trust Series 2018-A1, Class A, 3.38%, 9/15/2024 | | | 370 | | | | 378 | |
| | |
Tricolor Auto Securitization Trust Series 2020-1A, Class A, 4.88%, 11/15/2026 (a) | | | 955 | | | | 957 | |
| | |
United Airlines Pass-Through Trust
Series 2013-1, Class A, 4.30%, 8/15/2025 | | | 141 | | | | 142 | |
| | |
Series 2016-1, Class B, 3.65%, 1/7/2026 | | | 49 | | | | 48 | |
| | |
Series 2018-1, Class B, 4.60%, 3/1/2026 | | | 33 | | | | 33 | |
| | |
Series 2014-1, Class A, 4.00%, 4/11/2026 | | | 52 | | | | 53 | |
| | |
Series 2016-2, Class AA, 2.88%, 10/7/2028 | | | 84 | | | | 84 | |
| | |
Series 2019-1, Class AA, 4.15%, 8/25/2031 | | | 242 | | | | 253 | |
| | |
Series 2019-2, Class AA, 2.70%, 5/1/2032 | | | 215 | | | | 208 | |
| | |
US Auto Funding LLC
Series 2019-1A, Class B, 3.99%, 12/15/2022 (a) | | | 550 | | | | 558 | |
| | |
Series 2018-1A, Class A, 5.50%, 7/15/2023 (a) | | | 99 | | | | 102 | |
| | |
Vericrest Opportunity Loan Trust
Series 2019-NPL7, Class A1A, 3.18%, 10/25/2049 ‡ (a) (f) | | | 135 | | | | 135 | |
| | |
Series 2019-NPL8, Class A1A, 3.28%, 11/25/2049 ‡ (a) (f) | | | 329 | | | | 329 | |
| | |
Series 2020-NPL2, Class A1A, 2.98%, 2/25/2050 ‡ (a) (f) | | | 426 | | | | 427 | |
| | |
Series 2020-NPL6, Class A1A, 3.97%, 4/25/2050 ‡ (a) (f) | | | 575 | | | | 578 | |
| | |
Verizon Owner Trust Series 2018-A, Class A1A, 3.23%, 4/20/2023 | | | 312 | | | | 316 | |
| | |
VOLT LXXX LLC Series 2019-NPL6, Class A1B, 4.09%, 10/25/2049 ‡ (a) (f) | | | 715 | | | | 715 | |
| | |
VOLT LXXXV LLC Series 2020-NPL1, Class A1A, 3.23%, 1/25/2050 ‡ (a) (f) | | | 357 | | | | 358 | |
| | |
VOLT LXXXVII LLC Series 2020-NPL3, Class A1A, 2.98%, 2/25/2050 (a) (f) | | | 428 | | | | 428 | |
| | |
Westgate Resorts LLC
Series 2017-1A, Class A, 3.05%, 12/20/2030 (a) | | | 57 | | | | 57 | |
| | |
Series 2020-1A, Class B, 3.96%, 3/20/2034 ‡ (a) | | | 615 | | | | 635 | |
| | |
World Financial Network Credit Card Master Trust Series 2019-A, Class A, 3.14%, 12/15/2025 | | | 375 | | | | 387 | |
| | | | | | | | |
| | |
Total Asset-Backed Securities
(Cost $54,053) | | | | | | | 54,851 | |
| | | | | |
Collateralized Mortgage Obligations — 6.8% | |
| | |
Acre Series 2017-A, 6.25%, 12/22/2021‡ | | | 500 | | | | 495 | |
| | |
Alternative Loan Trust
Series 2004-2CB, Class 1A9, 5.75%, 3/25/2034 | | | 661 | | | | 669 | |
SEE NOTES TO FINANCIAL STATEMENTS.
| | | | | | | | | | |
| | | | | |
| 26 | | | | | | | | JPMORGAN INSURANCE TRUST | | DECEMBER 31, 2020 |
| | | | | | | | |
| INVESTMENTS | | PRINCIPAL
AMOUNT ($000) | | | VALUE ($000) | |
Collateralized Mortgage Obligations — continued | |
| | |
Series 2005-22T1, Class A2, IF, IO, 4.92%, 6/25/2035 ‡ (g) | | | 344 | | | | 58 | |
| | |
Series 2005-20CB, Class 3A8, IF, IO, 4.60%, 7/25/2035 ‡ (g) | | | 198 | | | | 29 | |
| | |
Series 2005-28CB, Class 1A4, 5.50%, 8/25/2035 | | | 268 | | | | 265 | |
| | |
Series 2005-54CB, Class 1A11, 5.50%, 11/25/2035 | | | 102 | | | | 98 | |
| | |
Banc of America Alternative Loan Trust Series 2004-6, Class 15, PO, 7/25/2019 ‡ | | | 2 | | | | 1 | |
| | |
Banc of America Funding Trust
Series 2004-1, PO, 3/25/2034 ‡ | | | 13 | | | | 11 | |
| | |
Series 2005-E, Class 4A1, 3.05%, 3/20/2035 (g) | | | 3 | | | | 3 | |
| | |
Series 2005-6, Class 2A7, 5.50%, 10/25/2035 | | | 69 | | | | 67 | |
| | |
Series 2005-7, Class 30, PO, 11/25/2035 ‡ | | | 11 | | | | 10 | |
| | |
Bayview Financing Trust Series 2020-3F, Class A, 3.15%, 11/10/2022 ‡ (a) (g) | | | 1,300 | | | | 1,300 | |
| | |
Bear Stearns ARM Trust
Series 2003-7, Class 3A, 2.60%, 10/25/2033 (g) | | | 12 | | | | 11 | |
| | |
Series 2006-1, Class A1, 2.37%, 2/25/2036 (g) | | | 52 | | | | 53 | |
| | |
CHL Mortgage Pass-Through Trust
Series 2004-HYB1, Class 2A, 2.84%, 5/20/2034 (g) | | | 9 | | | | 9 | |
| | |
Series 2004-HYB3, Class 2A, 3.00%, 6/20/2034 (g) | | | 18 | | | | 18 | |
| | |
Series 2004-7, Class 2A1, 3.58%, 6/25/2034 (g) | | | 18 | | | | 18 | |
| | |
Series 2005-16, Class A23, 5.50%, 9/25/2035 | | | 37 | | | | 33 | |
| | |
Series 2005-22, Class 2A1, 2.71%, 11/25/2035 (g) | | | 87 | | | | 81 | |
| | |
Citigroup Global Markets Mortgage Securities VII, Inc. Series 2003-UP2, Class 1, PO, 6/25/2033 ‡ | | | — | (i) | | | — | (i) |
| | |
Series 2003-HYB1, Class A, 2.60%, 9/25/2033 (g) | | | 8 | | | | 9 | |
| | |
Citigroup Mortgage Loan Trust, Inc.
Series 2003-UP3, Class A3, 7.00%, 9/25/2033 | | | 1 | | | | 1 | |
| | |
Series 2005-1, Class 2A1A, 2.35%, 2/25/2035 (g) | | | 43 | | | | 39 | |
| | |
CVS Pass-Through Trust Series 2009, 8.35%, 7/10/2031 (a) | | | 69 | | | | 91 | |
| | |
FHLMC — GNMA Series 8, Class ZA, 7.00%, 3/25/2023 | | | 11 | | | | 11 | |
| | | | | | | | |
| INVESTMENTS | | PRINCIPAL
AMOUNT ($000) | | | VALUE ($000) | |
| | | | | | | | |
| | |
FHLMC, REMIC
Series 1065, Class J, 9.00%, 4/15/2021 | | | — | (i) | | | — | (i) |
| | |
Series 1250, Class J, 7.00%, 5/15/2022 | | | — | (i) | | | — | (i) |
| | |
Series 1316, Class Z, 8.00%, 6/15/2022 | | | 1 | | | | 1 | |
| | |
Series 1324, Class Z, 7.00%, 7/15/2022 | | | 1 | | | | 1 | |
| | |
Series 1343, Class LB, 7.50%, 8/15/2022 | | | 1 | | | | 1 | |
| | |
Series 1343, Class LA, 8.00%, 8/15/2022 | | | 5 | | | | 5 | |
| | |
Series 1395, Class G, 6.00%, 10/15/2022 | | | 1 | | | | 1 | |
| | |
Series 1394, Class ID, IF, 9.57%, 10/15/2022 (g) | | | 1 | | | | 1 | |
| | |
Series 2535, Class BK, 5.50%, 12/15/2022 | | | 6 | | | | 6 | |
| | |
Series 1798, Class F, 5.00%, 5/15/2023 | | | 3 | | | | 3 | |
| | |
Series 1505, Class Q, 7.00%, 5/15/2023 | | | 1 | | | | 1 | |
| | |
Series 1518, Class G, IF, 8.82%, 5/15/2023 (g) | | | 1 | | | | 1 | |
| | |
Series 1541, Class O, 0.12%, 7/15/2023 (g) | | | 1 | | | | 1 | |
| | |
Series 2638, Class DS, IF, 8.44%, 7/15/2023 (g) | | | 9 | | | | 9 | |
| | |
Series 1577, Class PV, 6.50%, 9/15/2023 | | | 42 | | | | 45 | |
| | |
Series 1584, Class L, 6.50%, 9/15/2023 | | | 24 | | | | 25 | |
| | |
Series 1633, Class Z, 6.50%, 12/15/2023 | | | 25 | | | | 27 | |
| | |
Series 1638, Class H, 6.50%, 12/15/2023 | | | 33 | | | | 35 | |
| | |
Series 2283, Class K, 6.50%, 12/15/2023 | | | 3 | | | | 3 | |
| | |
Series 1700, Class GA, PO, 2/15/2024 | | | — | (i) | | | — | (i) |
| | |
Series 1865, Class D, PO, 2/15/2024 | | | 3 | | | | 3 | |
| | |
Series 1671, Class QC, IF, 10.00%, 2/15/2024 (g) | | | 2 | | | | 2 | |
| | |
Series 1694, Class PK, 6.50%, 3/15/2024 | | | 3 | | | | 3 | |
| | |
Series 2033, Class SN, HB, IF, 29.17%, 3/15/2024 (g) | | | 1 | | | | — | (i) |
| | |
Series 2306, Class K, PO, 5/15/2024 | | | 1 | | | | 1 | |
| | |
Series 2306, Class SE, IF, IO, 9.73%, 5/15/2024 (g) | | | 3 | | | | — | (i) |
| | |
Series 1863, Class Z, 6.50%, 7/15/2026 | | | 8 | | | | 8 | |
| | |
Series 1981, Class Z, 6.00%, 5/15/2027 | | | 5 | | | | 5 | |
| | |
Series 1987, Class PE, 7.50%, 9/15/2027 | | | 6 | | | | 8 | |
| | |
Series 1999, Class PU, 7.00%, 10/15/2027 | | | 19 | | | | 21 | |
| | |
Series 2031, Class PG, 7.00%, 2/15/2028 | | | 39 | | | | 45 | |
| | |
Series 2035, Class PC, 6.95%, 3/15/2028 | | | 40 | | | | 45 | |
| | |
Series 2038, Class PN, IO, 7.00%, 3/15/2028 | | | 3 | | | | — | (i) |
| | |
Series 2057, Class PE, 6.75%, 5/15/2028 | | | 52 | | | | 60 | |
| | |
Series 2054, Class PV, 7.50%, 5/15/2028 | | | 7 | | | | 9 | |
| | |
Series 2064, Class TE, 7.00%, 6/15/2028 | | | 9 | | | | 11 | |
| | |
Series 2075, Class PH, 6.50%, 8/15/2028 | | | 8 | | | | 10 | |
| | |
Series 2095, Class PE, 6.00%, 11/15/2028 | | | 27 | | | | 30 | |
| | |
Series 2132, Class SB, HB, IF, 29.88%, 3/15/2029 (g) | | | 2 | | | | 3 | |
SEE NOTES TO FINANCIAL STATEMENTS.
| | | | | | | | | | |
| | | | | |
| DECEMBER 31, 2020 | | JPMORGAN INSURANCE TRUST | | | | | | | | 27 |
JPMorgan Insurance Trust Core Bond Portfolio
SCHEDULE OF PORTFOLIO INVESTMENTS
AS OF DECEMBER 31, 2020 (continued)
| | | | | | | | |
| INVESTMENTS | | PRINCIPAL
AMOUNT ($000) | | | VALUE ($000) | |
Collateralized Mortgage Obligations — continued | |
| | |
Series 2178, Class PB, 7.00%, 8/15/2029 | | | 15 | | | | 18 | |
| | |
Series 2182, Class ZB, 8.00%, 9/15/2029 | | | 26 | | | | 31 | |
| | |
Series 2204, Class GB, 8.00%, 12/20/2029 ‡ (g) | | | — | (i) | | | — | (i) |
| | |
Series 2247, Class Z, 7.50%, 8/15/2030 | | | 5 | | | | 6 | |
| | |
Series 2259, Class ZC, 7.35%, 10/15/2030 | | | 107 | | | | 130 | |
| | |
Series 2325, Class PM, 7.00%, 6/15/2031 | | | 4 | | | | 5 | |
| | |
Series 2359, Class ZB, 8.50%, 6/15/2031 | | | 18 | | | | 22 | |
| | |
Series 2344, Class ZD, 6.50%, 8/15/2031 | | | 33 | | | | 38 | |
| | |
Series 2344, Class ZJ, 6.50%, 8/15/2031 | | | 6 | | | | 7 | |
| | |
Series 2345, Class NE, 6.50%, 8/15/2031 | | | 3 | | | | 3 | |
| | |
Series 2367, Class ME, 6.50%, 10/15/2031 | | | 53 | | | | 60 | |
| | |
Series 2390, Class DO, PO, 12/15/2031 | | | 5 | | | | 5 | |
| | |
Series 2410, Class OE, 6.38%, 2/15/2032 | | | 7 | | | | 7 | |
| | |
Series 2410, Class QX, IF, IO, 8.49%, 2/15/2032 (g) | | | 10 | | | | 2 | |
| | |
Series 2412, Class SP, IF, 15.78%, 2/15/2032 (g) | | | 10 | | | | 13 | |
| | |
Series 2410, Class QS, IF, 19.09%, 2/15/2032 (g) | | | 8 | | | | 12 | |
| | |
Series 2423, Class MC, 7.00%, 3/15/2032 | | | 19 | | | | 23 | |
| | |
Series 2423, Class MT, 7.00%, 3/15/2032 | | | 29 | | | | 35 | |
| | |
Series 2444, Class ES, IF, IO, 7.79%, 3/15/2032 (g) | | | 12 | | | | 2 | |
| | |
Series 2450, Class SW, IF, IO, 7.84%, 3/15/2032 (g) | | | 8 | | | | 2 | |
| | |
Series 2647, Class A, 3.25%, 4/15/2032 | | | 35 | | | | 38 | |
| | |
Series 2435, Class CJ, 6.50%, 4/15/2032 | | | 66 | | | | 77 | |
| | |
Series 2455, Class GK, 6.50%, 5/15/2032 | | | 20 | | | | 23 | |
| | |
Series 2484, Class LZ, 6.50%, 7/15/2032 | | | 14 | | | | 17 | |
| | |
Series 2500, Class MC, 6.00%, 9/15/2032 | | | 42 | | | | 49 | |
| | |
Series 2543, Class YX, 6.00%, 12/15/2032 | | | 607 | | | | 698 | |
| | |
Series 2544, Class HC, 6.00%, 12/15/2032 | | | 44 | | | | 52 | |
| | |
Series 2574, Class PE, 5.50%, 2/15/2033 | | | 200 | | | | 233 | |
| | |
Series 2575, Class ME, 6.00%, 2/15/2033 | | | 86 | | | | 100 | |
| | |
Series 2586, Class WI, IO, 6.50%, 3/15/2033 | | | 6 | | | | 1 | |
| | |
Series 4189, Class MI, IO, 3.00%, 6/15/2033 | | | 1,189 | | | | 10 | |
| | |
Series 2764, Class UG, 5.00%, 3/15/2034 | | | 168 | | | | 187 | |
| | |
Series 2949, Class GE, 5.50%, 3/15/2035 | | | 218 | | | | 254 | |
| | |
Series 3047, Class OD, 5.50%, 10/15/2035 | | | 270 | | | | 302 | |
| | |
Series 3085, Class VS, HB, IF, 28.09%, 12/15/2035 (g) | | | 50 | | | | 85 | |
| | |
Series 3098, Class KG, 5.50%, 1/15/2036 | | | 175 | | | | 203 | |
| | |
Series 3117, Class EO, PO, 2/15/2036 | | | 16 | | | | 15 | |
| | |
Series 3260, Class CS, IF, IO, 5.98%, 1/15/2037 (g) | | | 16 | | | | 3 | |
| | | | | | | | |
| INVESTMENTS | | PRINCIPAL
AMOUNT ($000) | | | VALUE ($000) | |
| | | | | | | | |
| | |
Series 3380, Class SI, IF, IO, 6.21%, 10/15/2037 (g) | | | 924 | | | | 213 | |
| | |
Series 3385, Class SN, IF, IO, 5.84%, 11/15/2037 (g) | | | 10 | | | | 2 | |
| | |
Series 3387, Class SA, IF, IO, 6.26%, 11/15/2037 (g) | | | 36 | | | | 7 | |
| | |
Series 3423, Class PB, 5.50%, 3/15/2038 | | | 189 | | | | 220 | |
| | |
Series 3451, Class SA, IF, IO, 5.89%, 5/15/2038 (g) | | | 12 | | | | 1 | |
| | |
Series 3455, Class SE, IF, IO, 6.04%, 6/15/2038 (g) | | | 117 | | | | 20 | |
| | |
Series 3786, Class PD, 4.50%, 1/15/2041 | | | 407 | | | | 487 | |
| | |
Series 4029, Class MU, 3.50%, 4/15/2042 | | | 427 | | | | 437 | |
| |
FHLMC, STRIPS | | | | | |
| | |
Series 233, Class 11, IO, 5.00%, 9/15/2035 | | | 30 | | | | 6 | |
| | |
Series 239, Class S30, IF, IO, 7.54%, 8/15/2036 (g) | | | 33 | | | | 8 | |
| | |
Series 262, Class 35, 3.50%, 7/15/2042 | | | 171 | | | | 188 | |
| | |
Series 299, Class 300, 3.00%, 1/15/2043 | | | 137 | | | | 144 | |
| | |
FHLMC, Structured Pass-Through Certificates, Whole Loan | | | | | | | | |
| | |
Series T-41, Class 3A, 5.21%, 7/25/2032 (g) | | | 8 | | | | 9 | |
| | |
Series T-54, Class 2A, 6.50%, 2/25/2043 | | | 59 | | | | 72 | |
| | |
Series T-54, Class 3A, 7.00%, 2/25/2043 | | | 25 | | | | 31 | |
| | |
Series T-56, Class A, PO, 5/25/2043 | | | 146 | | | | 143 | |
| | |
Series T-58, Class A, PO, 9/25/2043 | | | 11 | | | | 10 | |
| | |
First Horizon Alternative Mortgage Securities Trust
Series 2005-FA8, Class 1A19, 5.50%, 11/25/2035 | | | 78 | | | | 59 | |
| | |
FMC GMSR Issuer Trust Series 2020-GT1, Class A, 4.45%, 1/25/2026 (a) (g) | | | 1,500 | | | | 1,499 | |
| | |
Fn feb30 0.00%, 2/1/2030 (h) | | | 1,200 | | | | 1,200 | |
| | |
FNMA Trust, Whole Loan Series 2004-W2, Class 2A2, 7.00%, 2/25/2044 | | | 12 | | | | 14 | |
| | |
FNMA, REMIC | | | | | | | | |
| | |
Series 2001-4, Class PC, 7.00%, 3/25/2021 | | | — | (i) | | | — | (i) |
| | |
Series 2002-1, Class HC, 6.50%, 2/25/2022 | | | 1 | | | | 1 | |
| | |
Series 1992-101, Class J, 7.50%, 6/25/2022 | | | 3 | | | | 3 | |
| | |
Series G92-42, Class Z, 7.00%, 7/25/2022 | | | — | (i) | | | — | (i) |
| | |
Series G92-44, Class ZQ, 8.00%, 7/25/2022 | | | — | (i) | | | — | (i) |
| | |
Series 1996-59, Class J, 6.50%, 8/25/2022 | | | — | (i) | | | — | (i) |
| | |
Series 1992-143, Class MA, 5.50%, 9/25/2022 | | | — | (i) | | | — | (i) |
| | |
Series G92-54, Class ZQ, 7.50%, 9/25/2022 | | | 1 | | | | 1 | |
| | |
Series G92-59, Class F, 1.20%, 10/25/2022 (g) | | | — | (i) | | | — | (i) |
SEE NOTES TO FINANCIAL STATEMENTS.
| | | | | | | | | | |
| | | | | |
| 28 | | | | | | | | JPMORGAN INSURANCE TRUST | | DECEMBER 31, 2020 |
| | | | | | | | |
| INVESTMENTS | | PRINCIPAL
AMOUNT ($000) | | | VALUE ($000) | |
Collateralized Mortgage Obligations — continued | |
| | |
Series G92-61, Class Z, 7.00%, 10/25/2022 | | | — | (i) | | | — | (i) |
| | |
Series G92-66, Class KA, 6.00%, 12/25/2022 | | | 1 | | | | 1 | |
| | |
Series G92-66, Class KB, 7.00%, 12/25/2022 | | | 4 | | | | 4 | |
| | |
Series G93-1, Class KA, 7.90%, 1/25/2023 | | | 1 | | | | 1 | |
| | |
Series 1997-61, Class ZC, 7.00%, 2/25/2023 | | | 10 | | | | 10 | |
| | |
Series G93-17, Class SI, IF, 6.00%, 4/25/2023 (g) | | | 1 | | | | 2 | |
| | |
Series 1998-43, Class SA, HB, IF, 20.81%, 4/25/2023 (g) | | | 4 | | | | 1 | |
| | |
Series 1993-146, Class E, PO, 5/25/2023 | | | 3 | | | | 3 | |
| | |
Series 1993-84, Class M, 7.50%, 6/25/2023 | | | 182 | | | | 191 | |
| | |
Series 1993-205, Class H, PO, 9/25/2023 | | | 1 | | | | 1 | |
| | |
Series 1993-155, Class PJ, 7.00%, 9/25/2023 | | | 9 | | | | 10 | |
| | |
Series 1993-165, Class SK, IF, 12.50%, 9/25/2023 (g) | | | 1 | | | | 2 | |
| | |
Series 1993-165, Class SD, IF, 13.79%, 9/25/2023 (g) | | | — | (i) | | | — | (i) |
| | |
Series 1993-203, Class PL, 6.50%, 10/25/2023 | | | 13 | | | | 13 | |
| | |
Series 1995-19, Class Z, 6.50%, 11/25/2023 | | | 15 | | | | 16 | |
| | |
Series 1993-230, Class FA, 0.75%, 12/25/2023 (g) | | | — | (i) | | | — | (i) |
| | |
Series 1993-223, Class PZ, 6.50%, 12/25/2023 | | | 27 | | | | 28 | |
| | |
Series 1993-225, Class UB, 6.50%, 12/25/2023 | | | 13 | | | | 14 | |
| | |
Series 2003-128, Class DY, 4.50%, 1/25/2024 | | | 144 | | | | 149 | |
| | |
Series 1994-37, Class L, 6.50%, 3/25/2024 | | | 27 | | | | 28 | |
| | |
Series 1994-72, Class K, 6.00%, 4/25/2024 | | | 237 | | | | 250 | |
| | |
Series 1995-2, Class Z, 8.50%, 1/25/2025 | | | 3 | | | | 3 | |
| | |
Series 1997-20, Class IB, IO, 1.84%, 3/25/2027 (g) | | | 11 | | | | — | (i) |
| | |
Series 1997-39, Class PD, 7.50%, 5/20/2027 | | | 4 | | | | 5 | |
| | |
Series 1997-46, Class PL, 6.00%, 7/18/2027 | | | 8 | | | | 8 | |
| | |
Series 1998-36, Class ZB, 6.00%, 7/18/2028 | | | 3 | | | | 3 | |
| | |
Series 1998-46, Class GZ, 6.50%, 8/18/2028 | | | 10 | | | | 11 | |
| | |
Series 1998-58, Class PC, 6.50%, 10/25/2028 | | | 23 | | | | 26 | |
| | |
Series 2014-15, Class JI, IO, 3.50%, 4/25/2029 | | | 4,510 | | | | 383 | |
| | |
Series 1999-39, Class JH, IO, 6.50%, 8/25/2029 | | | 47 | | | | 4 | |
| | |
Series 2000-52, IO, 8.50%, 1/25/2031 | | | 2 | | | | — | (i) |
| | |
Series 2001-33, Class ID, IO, 6.00%, 7/25/2031 | | | 62 | | | | 9 | |
| | | | | | | | |
| INVESTMENTS | | PRINCIPAL
AMOUNT ($000) | | | VALUE ($000) | |
| | | | | | | | |
| | |
Series 2001-30, Class PM, 7.00%, 7/25/2031 | | | 17 | | | | 20 | |
| | |
Series 2001-36, Class DE, 7.00%, 8/25/2031 | | | 28 | | | | 34 | |
| | |
Series 2001-44, Class PD, 7.00%, 9/25/2031 | | | 3 | | | | 4 | |
| | |
Series 2001-61, Class Z, 7.00%, 11/25/2031 | | | 48 | | | | 58 | |
| | |
Series 2002-1, Class SA, HB, IF, 24.71%, 2/25/2032 (g) | | | 1 | | | | 1 | |
| | |
Series 2002-13, Class SJ, IF, IO, 1.60%, 3/25/2032 (g) | | | 48 | | | | 2 | |
| | |
Series 2002-15, PO, 4/25/2032 | | | 40 | | | | 39 | |
| | |
Series 2002-28, Class PK, 6.50%, 5/25/2032 | | | 19 | | | | 22 | |
| | |
Series 2002-68, Class SH, IF, IO, 7.84%, 10/18/2032 (g) | | | 41 | | | | 7 | |
| | |
Series 2004-61, Class SK, IF, 8.50%, 11/25/2032 (g) | | | 22 | | | | 27 | |
| | |
Series 2002-77, Class S, IF, 14.21%, 12/25/2032 (g) | | | 4 | | | | 5 | |
| | |
Series 2003-22, Class UD, 4.00%, 4/25/2033 | | | 96 | | | | 107 | |
| | |
Series 2003-47, Class PE, 5.75%, 6/25/2033 | | | 17 | | | | 19 | |
| | |
Series 2003-44, Class IU, IO, 7.00%, 6/25/2033 | | | 23 | | | | 5 | |
| | |
Series 2004-4, Class QM, IF, 13.90%, 6/25/2033 (g) | | | 12 | | | | 13 | |
| | |
Series 2003-64, Class SX, IF, 13.36%, 7/25/2033 (g) | | | 4 | | | | 5 | |
| | |
Series 2003-132, Class OA, PO, 8/25/2033 | | | 4 | | | | 4 | |
| | |
Series 2003-71, Class DS, IF, 7.26%, 8/25/2033 (g) | | | 25 | | | | 29 | |
| | |
Series 2003-91, Class SD, IF, 12.25%, 9/25/2033 (g) | | | 6 | | | | 7 | |
| | |
Series 2003-116, Class SB, IF, IO, 7.45%, 11/25/2033 (g) | | | 56 | | | | 12 | |
| | |
Series 2003-131, Class CH, 5.50%, 1/25/2034 | | | 72 | | | | 82 | |
| | |
Series 2003-130, Class SX, IF, 11.30%, 1/25/2034 (g) | | | 1 | | | | 1 | |
| | |
Series 2004-35, Class AZ, 4.50%, 5/25/2034 | | | 87 | | | | 96 | |
| | |
Series 2004-46, Class SK, IF, 16.09%, 5/25/2034 (g) | | | 18 | | | | 25 | |
| | |
Series 2004-36, Class SA, IF, 19.12%, 5/25/2034 (g) | | | 42 | | | | 64 | |
| | |
Series 2004-51, Class SY, IF, 13.94%, 7/25/2034 (g) | | | 4 | | | | 4 | |
| | |
Series 2004-79, Class ZE, 5.50%, 11/25/2034 | | | 469 | | | | 554 | |
| | |
Series 2004-91, Class HC, 6.00%, 12/25/2034 | | | 688 | | | | 794 | |
| | |
Series 2005-45, Class DC, HB, IF, 23.77%, 6/25/2035 (g) | | | 62 | | | | 95 | |
SEE NOTES TO FINANCIAL STATEMENTS.
| | | | | | | | | | |
| | | | | |
| DECEMBER 31, 2020 | | JPMORGAN INSURANCE TRUST | | | | | | | | 29 |
JPMorgan Insurance Trust Core Bond Portfolio
SCHEDULE OF PORTFOLIO INVESTMENTS
AS OF DECEMBER 31, 2020 (continued)
| | | | | | | | |
| INVESTMENTS | | PRINCIPAL
AMOUNT ($000) | | | VALUE ($000) | |
Collateralized Mortgage Obligations — continued | |
| | |
Series 2005-84, Class XM, 5.75%, 10/25/2035 | | | 40 | | | | 45 | |
| | |
Series 2006-22, Class AO, PO, 4/25/2036 | | | 26 | | | | 25 | |
| | |
Series 2006-46, Class SW, HB, IF, 23.66%, 6/25/2036 (g) | | | 8 | | | | 13 | |
| | |
Series 2007-7, Class SG, IF, IO, 6.35%, 8/25/2036 (g) | | | 42 | | | | 14 | |
| | |
Series 2006-110, PO, 11/25/2036 | | | 23 | | | | 21 | |
| | |
Series 2006-117, Class GS, IF, IO, 6.50%, 12/25/2036 (g) | | | 30 | | | | 5 | |
| | |
Series 2007-53, Class SH, IF, IO, 5.95%, 6/25/2037 (g) | | | 42 | | | | 7 | |
| | |
Series 2007-88, Class VI, IF, IO, 6.39%, 9/25/2037 (g) | | | 69 | | | | 15 | |
| | |
Series 2007-100, Class SM, IF, IO, 6.30%, 10/25/2037 (g) | | | 38 | | | | 8 | |
| | |
Series 2008-1, Class BI, IF, IO, 5.76%, 2/25/2038 (g) | | | 37 | | | | 7 | |
| | |
Series 2008-16, Class IS, IF, IO, 6.05%, 3/25/2038 (g) | | | 9 | | | | 2 | |
| | |
Series 2008-46, Class HI, IO, 2.07%, 6/25/2038 (g) | | | 36 | | | | 2 | |
| | |
Series 2008-53, Class CI, IF, IO, 7.05%, 7/25/2038 (g) | | | 18 | | | | 3 | |
| | |
Series 2009-112, Class ST, IF, IO, 6.10%, 1/25/2040 (g) | | | 36 | | | | 8 | |
| | |
Series 2010-35, Class SB, IF, IO, 6.27%, 4/25/2040 (g) | | | 16 | | | | 3 | |
| | |
Series 2010-80, Class PZ, 5.00%, 7/25/2040 | | | 338 | | | | 415 | |
| | |
Series 2010-102, Class PN, 5.00%, 9/25/2040 | | | 580 | | | | 674 | |
| | |
Series 2010-134, Class KZ, 4.50%, 12/25/2040 | | | 910 | | | | 975 | |
| | |
Series 2012-30, Class DZ, 4.00%, 4/25/2042 | | | 284 | | | | 314 | |
| | |
Series 2013-67, Class KZ, 2.50%, 4/25/2043 | | | 844 | | | | 874 | |
| | |
Series 2013-128, PO, 12/25/2043 | | | 150 | | | | 138 | |
| | |
Series 2014-38, Class QI, IO, 5.50%, 12/25/2043 | | | 523 | | | | 87 | |
| | |
Series 2014-19, Class Z, 4.50%, 4/25/2044 | | | 501 | | | | 590 | |
| | |
Series 2016-38, Class NA, 3.00%, 1/25/2046 | | | 132 | | | | 141 | |
| |
FNMA, REMIC Trust, Whole Loan | | | | | |
| | |
Series 1999-W1, PO, 2/25/2029 | | | 15 | | | | 13 | |
| | |
Series 1999-W4, Class A9, 6.25%, 2/25/2029 | | | 61 | | | | 68 | |
| | |
Series 2002-W7, Class A4, 6.00%, 6/25/2029 | | | 150 | | | | 174 | |
| | |
Series 2003-W1, Class 1A1, 5.18%, 12/25/2042 (g) | | | 158 | | | | 174 | |
| | | | | | | | |
| INVESTMENTS | | PRINCIPAL
AMOUNT ($000) | | | VALUE ($000) | |
| | | | | | | | |
| | |
Series 2003-W1, Class 2A, 5.66%, 12/25/2042 (g) | | | 22 | | | | 25 | |
| | |
FNMA, REMIC, Whole Loan Series 2003-7, Class A1, 6.50%, 12/25/2042 | | | 120 | | | | 138 | |
| | |
FNMA, STRIPS | | | | | | | | |
| | |
Series 329, Class 1, PO, 1/25/2033 | | | 3 | | | | 3 | |
| | |
Series 365, Class 8, IO, 5.50%, 5/25/2036 | | | 13 | | | | 3 | |
| | |
GMACM Mortgage Loan Trust Series 2005-AR3, Class 3A4, 3.50%, 6/19/2035 (g) | | | 68 | | | | 65 | |
| | |
GNMA | | | | | | | | |
| | |
Series 2001-10, Class PE, 6.50%, 3/16/2031 | | | 297 | | | | 296 | |
| | |
Series 2003-24, PO, 3/16/2033 | | | 2 | | | | 2 | |
| | |
Series 2004-28, Class S, IF, 19.24%, 4/16/2034 (g) | | | 14 | | | | 20 | |
| | |
Series 2006-38, Class OH, 6.50%, 8/20/2036 | | | 500 | | | | 610 | |
| | |
Series 2007-45, Class QA, IF, IO, 6.49%, 7/20/2037 (g) | | | 54 | | | | 8 | |
| | |
Series 2009-79, Class OK, PO, 11/16/2037 | | | 30 | | | | 29 | |
| | |
Series 2007-76, Class SA, IF, IO, 6.38%, 11/20/2037 (g) | | | 43 | | | | 6 | |
| | |
Series 2008-2, Class MS, IF, IO, 7.01%, 1/16/2038 (g) | | | 40 | | | | 8 | |
| | |
Series 2015-137, Class WA, 5.52%, 1/20/2038 (g) | | | 236 | | | | 278 | |
| | |
Series 2009-106, Class ST, IF, IO, 5.85%, 2/20/2038 (g) | | | 141 | | | | 25 | |
| | |
Series 2008-55, Class SA, IF, IO, 6.05%, 6/20/2038 (g) | | | 25 | | | | 4 | |
| | |
Series 2009-6, Class SA, IF, IO, 5.95%, 2/16/2039 (g) | | | 15 | | | | 2 | |
| | |
Series 2009-6, Class SH, IF, IO, 5.89%, 2/20/2039 (g) | | | 53 | | | | 9 | |
| | |
Series 2009-31, Class TS, IF, IO, 6.15%, 3/20/2039 (g) | | | 53 | | | | 4 | |
| | |
Series 2009-14, Class KI, IO, 6.50%, 3/20/2039 | | | 40 | | | | 7 | |
| | |
Series 2009-14, Class NI, IO, 6.50%, 3/20/2039 | | | 30 | | | | 6 | |
| | |
Series 2009-22, Class SA, IF, IO, 6.12%, 4/20/2039 (g) | | | 73 | | | | 12 | |
| | |
Series 2009-64, Class SN, IF, IO, 5.95%, 7/16/2039 (g) | | | 60 | | | | 9 | |
| | |
Series 2009-104, Class KB, 5.50%, 11/16/2039 | | | 236 | | | | 304 | |
| | |
Series 2010-130, Class CP, 7.00%, 10/16/2040 | | | 45 | | | | 54 | |
| | |
Series 2011-75, Class SM, IF, IO, 6.45%, 5/20/2041 (g) | | | 82 | | | | 12 | |
SEE NOTES TO FINANCIAL STATEMENTS.
| | | | | | | | | | |
| | | | | |
| 30 | | | | | | | | JPMORGAN INSURANCE TRUST | | DECEMBER 31, 2020 |
| | | | | | | | |
| INVESTMENTS | | PRINCIPAL
AMOUNT ($000) | | | VALUE ($000) | |
Collateralized Mortgage Obligations — continued | |
| | |
Series 2013-69, Class MA, 1.50%, 8/20/2042 | | | 322 | | | | 325 | |
| | |
Series 2016-135, Class Z, 3.00%, 10/20/2046 | | | 227 | | | | 240 | |
| | |
Series 2020-30, Class PT, 4.75%, 3/20/2048 (g) | | | 1,060 | | | | 1,206 | |
| | |
Series 2011-H19, Class FA, 0.61%, 8/20/2061 (g) | | | 426 | | | | 426 | |
| | |
Series 2012-H23, Class SA, 0.67%, 10/20/2062 (g) | | | 515 | | | | 516 | |
| | |
Series 2013-H08, Class FC, 0.59%, 2/20/2063 (g) | | | 437 | | | | 438 | |
| | |
Series 2013-H09, Class HA, 1.65%, 4/20/2063 | | | 45 | | | | 45 | |
| | |
Series 2014-H17, Class FC, 0.64%, 7/20/2064 (g) | | | 244 | | | | 245 | |
| | |
Series 2015-H16, Class FG, 0.58%, 7/20/2065 (g) | | | 536 | | | | 536 | |
| | |
Series 2015-H30, Class FE, 0.74%, 11/20/2065 (g) | | | 704 | | | | 709 | |
| | |
Series 2016-H11, Class FD, 1.40%, 5/20/2066 (g) | | | 180 | | | | 180 | |
| | |
Series 2016-H26, Class FC, 1.14%, 12/20/2066 (g) | | | 138 | | | | 141 | |
| | |
Series 2017-H14, Class FV, 0.64%, 6/20/2067 (g) | | | 352 | | | | 353 | |
| | |
Goodgreen Trust Series 2017-R1, 5.00%, 10/20/2051 ‡ | | | 300 | | | | 291 | |
| | |
GSR Mortgage Loan Trust | | | | | | | | |
| | |
Series 2004-6F, Class 1A2, 5.00%, 5/25/2034 | | | 40 | | | | 39 | |
| | |
Series 2004-6F, Class 3A4, 6.50%, 5/25/2034 | | | 100 | | | | 107 | |
| | |
Series 2004-13F, Class 3A3, 6.00%, 11/25/2034 | | | 29 | | | | 31 | |
| | |
Headlands Residential LLC | | | | | | | | |
| | |
Series 2019-RPL1, Class NOTE, 3.97%, 6/25/2024 (a) (f) | | | 675 | | | | 678 | |
| | |
Series 2017-RPL1, Class A, 3.88%, 11/25/2024 (a) (f) | | | 390 | | | | 393 | |
| | |
Impac Secured Assets Trust Series 2006-1, Class 2A1, 0.50%, 5/25/2036 (g) | | | 18 | | | | 17 | |
| | |
JPMorgan Mortgage Trust Series 2006-A2, Class 5A3, 2.53%, 11/25/2033 (g) | | | 18 | | | | 19 | |
| | |
LHOME Mortgage Trust Series 2019-RTL3, Class A1, 3.87%, 7/25/2024 (a) | | | 730 | | | | 738 | |
| | |
MASTR Adjustable Rate Mortgages Trust Series 2004-13, Class 2A1, 3.11%, 4/21/2034 (g) | | | 11 | | | | 11 | |
| | | | | | | | |
| INVESTMENTS | | PRINCIPAL
AMOUNT ($000) | | | VALUE ($000) | |
| | | | | | | | |
| | |
MASTR Alternative Loan Trust | | | | | | | | |
| | |
Series 2004-10, Class 1A1, 4.50%, 9/25/2019 | | | 2 | | | | 2 | |
| | |
Series 2004-8, Class 6A1, 5.50%, 9/25/2019 | | | — | (i) | | | — | (i) |
| | |
Series 2004-4, Class 10A1, 5.00%, 5/25/2024 | | | 32 | | | | 33 | |
| | |
Series 2003-9, Class 8A1, 6.00%, 1/25/2034 | | | 45 | | | | 47 | |
| | |
Series 2004-6, Class 7A1, 6.00%, 7/25/2034 | | | 79 | | | | 84 | |
| | |
Series 2004-7, Class 30, PO, 8/25/2034 ‡ | | | 6 | | | | 5 | |
| | |
MASTR Asset Securitization Trust | | | | | | | | |
| | |
Series 2003-12, Class 15, PO, 12/25/2018 ‡ | | | — | (i) | | | — | (i) |
| | |
Series 2004-6, Class 15, PO, 7/25/2019 ‡ | | | — | (i) | | | — | (i) |
| | |
Series 2003-11, Class 9A6, 5.25%, 12/25/2033 | | | 67 | | | | 69 | |
| | |
MASTR Resecuritization Trust Series 2005-PO, Class 3, PO, 5/28/2035 ‡ (a) | | | 11 | | | | 9 | |
| | |
NACC Reperforming Loan REMIC Trust Series 2004-R2, Class A1, 6.50%, 10/25/2034 (a) (g) | | | 24 | | | | 24 | |
| | |
PHH Alternative Mortgage Trust Series 2007-2, Class 2X, IO, 6.00%, 5/25/2037 ‡ | | | 112 | | | | 25 | |
| | |
PRPM LLC Series 2020-5, Class A1, 3.10%, 11/25/2025 (a) (f) | | | 979 | | | | 985 | |
| | |
RALI Trust | | | | | | | | |
| | |
Series 2003-QS9, Class A3, IF, IO, 7.40%, 5/25/2018 ‡ (g) | | | — | (i) | | | — | |
| | |
Series 2003-QS14, Class A1, 5.00%, 7/25/2018 | | | 1 | | | | 1 | |
| | |
RCO V Mortgage LLC Series 2020-1, Class A1, 3.10%, 9/25/2025 (a) (f) | | | 946 | | | | 948 | |
| | |
RFMSI Trust Series 2005-SA4, Class 1A1, 2.90%, 9/25/2035 (g) | | | 22 | | | | 20 | |
| | |
RMIP 5.60%, 8/25/2021 ‡ | | | 485 | | | | 476 | |
| | |
SACO I, Inc. Series 1997-2, Class 1A5, 7.00%, 8/25/2036 (a) | | | 2 | | | | 2 | |
| | |
SART
4.75%, 7/15/2024 | | | 379 | | | | 383 | |
| | |
4.76%, 6/15/2025 | | | 463 | | | | 471 | |
| | |
Seasoned Credit Risk Transfer Trust | | | | | | | | |
| | |
Series 2019-1, Class MT, 3.50%, 7/25/2058 ‡ | | | 644 | | | | 703 | |
| | |
Series 2019-3, Class MB, 3.50%, 10/25/2058 ‡ | | | 295 | | | | 343 | |
| | |
Toorak Mortgage Corp. Ltd. Series 2019-2, Class A1, 3.72%, 9/25/2022 (f) | | | 495 | | | | 502 | |
| | |
TVC Mortgage Trust Series 2020-RTL1, Class A1, 3.47%, 9/25/2024 (a) | | | 980 | | | | 990 | |
SEE NOTES TO FINANCIAL STATEMENTS.
| | | | | | | | | | |
| | | | | |
| DECEMBER 31, 2020 | | JPMORGAN INSURANCE TRUST | | | | | | | | 31 |
JPMorgan Insurance Trust Core Bond Portfolio
SCHEDULE OF PORTFOLIO INVESTMENTS
AS OF DECEMBER 31, 2020 (continued)
| | | | | | | | |
| INVESTMENTS | | PRINCIPAL
AMOUNT ($000) | | | VALUE ($000) | |
Collateralized Mortgage Obligations — continued | |
| | |
Vendee Mortgage Trust | | | | | | | | |
| | |
Series 1994-1, Class 1, 5.24%, 2/15/2024 (g) | | | 11 | | | | 11 | |
| | |
Series 1994-1, Class 2ZB, 6.50%, 2/15/2024 | | | 145 | | | | 155 | |
| | |
Series 1996-1, Class 1Z, 6.75%, 2/15/2026 | | | 40 | | | | 45 | |
| | |
Series 1996-2, Class 1Z, 6.75%, 6/15/2026 | | | 21 | | | | 24 | |
| | |
Series 1997-1, Class 2Z, 7.50%, 2/15/2027 | | | 86 | | | | 98 | |
| | |
Series 1998-1, Class 2E, 7.00%, 3/15/2028 | | | 24 | | | | 26 | |
| | |
vMobo, Inc. 7.50%, 5/31/2024 | | | 570 | | | | 561 | |
| | |
WaMu Mortgage Pass-Through Certificates Trust
Series 2003-AR8, Class A, 2.90%, 8/25/2033 (g) | | | 4 | | | | 5 | |
| | |
Series 2003-AR9, Class 1A6, 2.78%, 9/25/2033 (g) | | | 22 | | | | 22 | |
| | |
Series 2004-AR3, Class A2, 3.66%, 6/25/2034 (g) | | | 7 | | | | 7 | |
| | |
Washington Mutual Mortgage Pass-Through Certificates WMALT Trust | | | | | | | | |
| | |
Series 2005-2, Class 2A3, IF, IO, 4.85%, 4/25/2035 ‡ (g) | | | 156 | | | | 25 | |
| | |
Series 2005-2, Class 1A4, IF, IO, 4.90%, 4/25/2035 ‡ (g) | | | 444 | | | | 65 | |
| | |
Series 2005-3, Class CX, IO, 5.50%, 5/25/2035 ‡ | | | 130 | | | | 22 | |
| | |
Series 2005-4, Class CB7, 5.50%, 6/25/2035 | | | 114 | | | | 109 | |
| | |
Series 2005-6, Class 2A4, 5.50%, 8/25/2035 | | | 29 | | | | 28 | |
| | | | | | | | |
| | |
Total Collateralized Mortgage Obligations
(Cost $34,868) | | | | | | | 36,427 | |
| | | | | | | | |
|
Commercial Mortgage-Backed Securities — 5.0% | |
| | |
BB-UBS Trust Series 2012-SHOW, Class A, 3.43%, 11/5/2036 (a) | | | 300 | | | | 312 | |
| | |
BXMT Ltd. Series 2017-FL1, Class C, 2.10%, 6/15/2035 ‡ (a) (g) | | | 300 | | | | 298 | |
| | |
CD Commercial Mortgage Trust Series 2007-CD4, Class XC, IO, 1.38%, 12/11/2049 ‡ (a) (g) | | | 7 | | | | – | (i) |
| | |
Citigroup Commercial Mortgage Trust Series 2020-GC46, Class A5, 2.72%, 2/15/2053 | | | 1,100 | | | | 1,206 | |
| | |
Commercial Mortgage Trust | | | | | | | | |
| | |
Series 2013-SFS, Class A2, 2.99%, 4/12/2035 (a) (g) | | | 125 | | | | 125 | |
| | |
Series 2020-CBM, Class A2, 2.90%, 2/10/2037 (a) | | | 750 | | | | 748 | |
| | |
Series 2020-CBM, Class C, 3.40%, 2/10/2037 ‡ (a) | | | 500 | | | | 494 | |
| | |
Series 2014-CR19, Class A5, 3.80%, 8/10/2047 | | | 200 | | | | 221 | |
| | |
Series 2015-CR25, Class A4, 3.76%, 8/10/2048 | | | 156 | | | | 175 | |
| | | | | | | | |
| INVESTMENTS | | PRINCIPAL
AMOUNT ($000) | | | VALUE ($000) | |
| | | | | | | | |
| | |
CSMC OA LLC | | | | | | | | |
| | |
Series 2014-USA, Class A2, 3.95%, 9/15/2037 (a) | | | 885 | | | | 896 | |
| | |
Series 2014-USA, Class D, 4.37%, 9/15/2037 ‡ (a) | | | 100 | | | | 83 | |
| | |
FHLMC, Multi-Family Structured Pass-Through Certificates | | | | | | | | |
| | |
Series KF12, Class A, 0.85%, 9/25/2022 (g) | | | 5 | | | | 5 | |
| | |
Series KJ09, Class A2, 2.84%, 9/25/2022 | | | 82 | | | | 84 | |
| | |
Series KJ11, Class A2, 2.93%, 1/25/2023 | | | 172 | | | | 180 | |
| | |
Series K038, Class A2, 3.39%, 3/25/2024 | | | 229 | | | | 249 | |
| | |
Series KJ14, Class A2, 2.81%, 9/25/2024 | | | 591 | | | | 630 | |
| | |
Series KPLB, Class A, 2.77%, 5/25/2025 | | | 250 | | | | 270 | |
| | |
Series K065, Class A2, 3.24%, 4/25/2027 | | | 215 | | | | 245 | |
| | |
Series K065, Class AM, 3.33%, 5/25/2027 | | | 115 | | | | 132 | |
| | |
Series K066, Class A2, 3.12%, 6/25/2027 | | | 267 | | | | 303 | |
| | |
Series K070, Class A2, 3.30%, 11/25/2027 (g) | | | 208 | | | | 240 | |
| | |
Series K072, Class AM, 3.50%, 12/25/2027 (g) | | | 1,000 | | | | 1,163 | |
| | |
Series K073, Class A2, 3.35%, 1/25/2028 | | | 346 | | | | 400 | |
| | |
Series K079, Class AM, 3.93%, 6/25/2028 | | | 588 | | | | 702 | |
| | |
Series K081, Class A2, 3.90%, 8/25/2028 (g) | | | 395 | | | | 473 | |
| | |
Series K082, Class A2, 3.92%, 9/25/2028 (g) | | | 1,054 | | | | 1,268 | |
| | |
Series KL06, Class XFX, IO, 1.36%, 12/25/2029 | | | 4,215 | | | | 399 | |
| | |
Series Q013, Class APT2, 1.29%, 5/25/2050 (g) | | | 1,123 | | | | 1,133 | |
| | |
FNMA ACES | | | | | | | | |
| | |
Series 2015-M17, Class FA, 1.08%, 11/25/2022 (g) | | | 73 | | | | 73 | |
| | |
Series 2016-M2, Class AV2, 2.15%, 1/25/2023 | | | 295 | | | | 303 | |
| | |
Series 2014-M3, Class A2, 3.49%, 1/25/2024 (g) | | | 671 | | | | 724 | |
| | |
Series 2015-M3, Class A2, 2.72%, 10/25/2024 | | | 917 | | | | 980 | |
| | |
Series 2017-M7, Class A2, 2.96%, 2/25/2027 (g) | | | 803 | | | | 897 | |
| | |
Series 2015-M10, Class A2, 3.09%, 4/25/2027 (g) | | | 389 | | | | 435 | |
| | |
Series 2017-M8, Class A2, 3.06%, 5/25/2027 (g) | | | 335 | | | | 376 | |
| | |
Series 2017-M12, Class A2, 3.08%, 6/25/2027 (g) | | | 381 | | | | 429 | |
| | |
Series 2018-M10, Class A2, 3.37%, 7/25/2028 (g) | | | 460 | | | | 534 | |
SEE NOTES TO FINANCIAL STATEMENTS.
| | | | | | | | | | |
| | | | | |
| 32 | | | | | | | | JPMORGAN INSURANCE TRUST | | DECEMBER 31, 2020 |
| | | | | | | | |
| INVESTMENTS | | PRINCIPAL
AMOUNT ($000) | | | VALUE ($000) | |
Collateralized Mortgage Obligations — continued | |
| | |
Series 2017-M5, Class A2, 3.17%, 4/25/2029 (g) | | | 305 | | | | 351 | |
| | |
Series 2018-M3, Class A2, 3.09%, 2/25/2030 (g) | | | 185 | | | | 211 | |
| | |
Series 2020-M50, Class A1, 0.67%, 10/25/2030 | | | 1,305 | | | | 1,295 | |
| | |
Series 2020-M50, Class A2, 1.20%, 10/25/2030 | | | 330 | | | | 335 | |
| | |
Series 2020-M50, Class X1, IO, 1.94%, 10/25/2030 (g) | | | 5,910 | | | | 687 | |
| | |
FREMF Mortgage Trust | | | | | | | | |
| | |
Series 2014-K40, Class C, 4.07%, 11/25/2047 (a) (g) | | | 168 | | | | 183 | |
| | |
Series 2015-K44, Class B, 3.68%, 1/25/2048 (a) (g) | | | 640 | | | | 695 | |
| | |
Series 2015-K45, Class B, 3.59%, 4/25/2048 (a) (g) | | | 500 | | | | 542 | |
| | |
Series 2016-K722, Class B, 3.85%, 7/25/2049 (a) (g) | | | 110 | | | | 117 | |
| | |
Series 2016-K59, Class B, 3.58%, 11/25/2049 (a) (g) | | | 180 | | | | 196 | |
| | |
Series 2018-K730, Class B, 3.80%, 2/25/2050 (a) (g) | | | 551 | | | | 599 | |
| | |
Series 2019-K102, Class B, 3.53%, 12/25/2051 (a) (g) | | | 750 | | | | 823 | |
| | |
Morgan Stanley Capital I Trust | | | | | | | | |
| | |
Series 2006-IQ12, Class X1, IO, 0.29%, 12/15/2043 ‡ (a) (g) | | | 31 | | | | — | (i) |
| | |
MRCD MARK Mortgage Trust | | | | | | | | |
| | |
Series 2019-PARK, Class A, 2.72%, 12/15/2036 (a) | | | 740 | | | | 778 | |
| | |
Series 2019-PARK, Class D, 2.72%, 12/15/2036 ‡ (a) | | | 987 | | | | 984 | |
| | |
SBALR Commercial Mortgage Trust | | | | | | | | |
| | |
Series 2020-RR1, Class A3, 2.83%, 2/13/2053 (a) | | | 975 | | | | 1,002 | |
| | |
UBS-BAMLL Trust | | | | | | | | |
| | |
Series 2012-WRM, Class A, 3.66%, 6/10/2030 (a) | | | 116 | | | | 117 | |
| | |
UBS-Barclays Commercial Mortgage Trust | | | | | | | | |
| | |
Series 2012-C2, Class A4, 3.53%, 5/10/2063 | | | 104 | | | | 107 | |
| | |
WFRBS Commercial Mortgage Trust | | | | | | | | |
| | |
Series 2011-C3, Class A4, 4.38%, 3/15/2044 (a) | | | 84 | | | | 84 | |
| | | | | | | | |
| |
Total Commercial Mortgage-Backed Securities
(Cost $24,663) | | | | 26,291 | |
| | | | | |
Foreign Government Securities — 0.4% | |
| | |
Republic of Colombia (Colombia)
3.13%, 4/15/2031 | | | 395 | | | | 419 | |
| | | | | | | | |
| INVESTMENTS | | PRINCIPAL
AMOUNT ($000) | | | VALUE ($000) | |
| | | | | | | | |
| | |
7.38%, 9/18/2037 | | | 100 | | | | 146 | |
| | |
United Mexican States (Mexico)
3.60%, 1/30/2025 | | | 200 | | | | 222 | |
| | |
4.13%, 1/21/2026 | | | 200 | | | | 230 | |
| | |
3.75%, 1/11/2028 | | | 280 | | | | 316 | |
| | |
2.66%, 5/24/2031 | | | 283 | | | | 291 | |
| | |
4.75%, 3/8/2044 | | | 50 | | | | 60 | |
| | |
4.35%, 1/15/2047 | | | 58 | | | | 66 | |
| | |
4.50%, 1/31/2050 | | | 315 | | | | 368 | |
| | |
3.77%, 5/24/2061 | | | 211 | | | | 219 | |
| | | | | | | | |
| |
Total Foreign Government Securities
(Cost $2,150) | | | | 2,337 | |
| | | | | |
U.S. Government Agency Securities — 0.2% | |
| | |
FNMA, STRIPS 17.76%, 3/23/2028 (j) | | | 630 | | | | 587 | |
| | |
Tennessee Valley Authority
5.88%, 4/1/2036 | | | 140 | | | | 216 | |
| | |
4.63%, 9/15/2060 | | | 93 | | | | 146 | |
| | |
4.25%, 9/15/2065 | | | 101 | | | | 152 | |
| | | | | | | | |
| |
Total U.S. Government Agency Securities
(Cost $786) | | | | 1,101 | |
| | | | | |
Municipal Bonds — 0.1% (k) | |
|
New York — 0.1% | |
| | |
New York State Dormitory Authority, State Personal Income Tax, General Purpose Series 2010-D, Rev., 5.60%, 3/15/2040 | | | 30 | | | | 42 | |
| | |
Port Authority of New York and New Jersey, Consolidated Series 164, Rev., 5.65%, 11/1/2040 | | | 130 | | | | 186 | |
| | | | | | | | |
| | |
Total New York | | | | | | | 228 | |
| | | | | | | | |
|
Ohio — 0.0% (b) | |
| | |
Ohio State University (The), General Receipts Series 2011-A, Rev., 4.80%, 6/1/2111 | | | 98 | | | | 143 | |
| | | | | | | | |
| |
Total Municipal Bonds
(Cost $256) | | | | 371 | |
| | | | | |
| | | SHARES (000) | | | | |
Short-Term Investments — 13.5% | |
|
Investment Companies — 13.5% | |
| | |
JPMorgan Prime Money Market Fund Class Institutional Shares, 0.09% (l) (m)
(Cost $71,867) | | | 71,838 | | | | 71,874 | |
| | | | | | | | |
Total Investments — 108.8%
(Cost $547,622) | | | | 578,441 | |
Liabilities in Excess of
Other Assets — (8.8)% | | | | (46,665 | ) |
| | | | | | | | |
NET ASSETS — 100.0% | | | | 531,776 | |
| | | | | |
Percentages indicated are based on net assets.
SEE NOTES TO FINANCIAL STATEMENTS.
| | | | | | | | | | |
| | | | | |
| DECEMBER 31, 2020 | | JPMORGAN INSURANCE TRUST | | | | | | | | 33 |
JPMorgan Insurance Trust Core Bond Portfolio
SCHEDULE OF PORTFOLIO INVESTMENTS
AS OF DECEMBER 31, 2020 (continued)
Abbreviations
| | |
| ABS | | Asset-Backed Securities |
| ACES | | Alternative Credit Enhancement Securities |
| ARM | | Adjustable Rate Mortgage. The interest rate shown is the rate in effect as of December 31, 2020. |
| CSMC | | Credit Suisse Mortgage Trust |
| ESOP | | Employee Stock Ownership Program |
| FHLMC | | Federal Home Loan Mortgage Corp. |
| FNMA | | Federal National Mortgage Association |
| GNMA | | Government National Mortgage Association |
| HB | | High Coupon Bonds (a.k.a. “IOettes”) represent the right to receive interest payments on an underlying pool of mortgages with similar features as those associated with IO securities. Unlike IO’s the owner also has a right to receive a very small portion of principal. The high interest rates result from taking interest payments from other classes in the Real Estate Mortgage Investment Conduit trust and allocating them to the small principal of the HB class. |
| ICE | | Intercontinental Exchange |
| IF | | Inverse Floaters represent securities that pay interest at a rate that increases (decreases) with a decline (incline) in a specified index or have an interest rate that adjusts periodically based on changes in current interest rates and prepayments on the underlying pool of assets. The interest rate shown is the rate in effect as of December 31, 2020. The rate may be subject to a cap and floor. |
| IO | | Interest Only represents the right to receive the monthly interest payments on an underlying pool of mortgage loans. The principal amount shown represents the par value on the underlying pool. The yields on these securities are subject to accelerated principal paydowns as a result of prepayment or refinancing of the underlying pool of mortgage instruments. As a result, interest income may be reduced considerably. |
| LIBOR | | London Interbank Offered Rate |
| PO | | Principal Only represents the right to receive the principal portion only on an underlying pool of mortgage loans. The market value of these securities is extremely volatile in response to changes in market interest rates. As prepayments on the underlying mortgages of these securities increase, the yield on these securities increases. |
| REMIC | | Real Estate Mortgage Investment Conduit |
| Rev. | | Revenue |
| SOFR | | Secured Overnight Financing Rate |
| STRIPS | | Separate Trading of Registered Interest and Principal of Securities. The STRIPS Program lets investors hold and trade individual interest and principal components of eligible notes and bonds as separate securities. |
| TBA | | To Be Announced; Security is subject to delayed delivery |
| UMBS | | Uniform Mortgage-Backed Securities |
| USD | | United States Dollar |
| (a) | | Securities exempt from registration under Rule 144A or section 4(a)(2), of the Securities Act of 1933, as amended. |
| (b) | | Amount rounds to less than 0.1% of net assets. |
| (c) | | Variable or floating rate security, linked to the referenced benchmark. The interest rate shown is the current rate as of December 31, 2020. |
| | |
| (d) | | Security is perpetual and thus, does not have a predetermined maturity date. The coupon rate for this security is fixed for a period of time and may be structured to adjust thereafter. The date shown, if applicable, reflects the next call date. The coupon rate shown is the rate in effect as of December 31, 2020. |
| (e) | | Security is an interest bearing note with preferred security characteristics. |
| (f) | | Step bond. Interest rate is a fixed rate for an initial period that either resets at a specific date or may reset in the future contingent upon a predetermined trigger. The interest rate shown is the current rate as of December 31, 2020. |
| (g) | | Variable or floating rate security, the interest rate of which adjusts periodically based on changes in current interest rates and prepayments on the underlying pool of assets. The interest rate shown is the current rate as of December 31, 2020. |
| (h) | | All or a portion of the security is a when-issued security, delayed delivery security, or forward commitment. |
| (i) | | Amount rounds to less than one thousand. |
| (j) | | The rate shown is the effective yield as of December 31, 2020. |
| (k) | | The date shown represents the earliest of the prerefunded date, next put date or final maturity date. |
| (l) | | Investment in an affiliated fund, which is registered under the Investment Company Act of 1940, as amended, and is advised by J.P. Morgan Investment Management Inc. |
| (m) | | The rate shown is the current yield as of December 31, 2020. |
| ‡ | | Value determined using significant unobservable inputs. |
SEE NOTES TO FINANCIAL STATEMENTS.
| | | | | | | | | | |
| | | | | |
| 34 | | | | | | | | JPMORGAN INSURANCE TRUST | | DECEMBER 31, 2020 |
STATEMENT OF ASSETS AND LIABILITIES
AS OF DECEMBER 31, 2020
(Amounts in thousands, except per share amounts)
| | | | |
| | | JPMorgan Insurance
Trust Core Bond
Portfolio | |
ASSETS: | | | | |
Investments in non-affiliates, at value | | $ | 506,567 | |
Investments in affiliates, at value | | | 71,874 | |
Cash | | | 1 | |
Receivables: | | | | |
Investment securities sold | | | 7 | |
Portfolio shares sold | | | 298 | |
Interest from non-affiliates | | | 2,196 | |
Dividends from affiliates | | | 5 | |
| | | | |
Total Assets | | | 580,948 | |
| | | | |
| |
LIABILITIES: | | | | |
Payables: | | | | |
Investment securities purchased | | | 1,315 | |
Investment securities purchased — delayed delivery securities | | | 47,432 | |
Portfolio shares redeemed | | | 49 | |
Accrued liabilities: | | | | |
Investment advisory fees | | | 168 | |
Administration fees | | | 33 | |
Distribution fees | | | 71 | |
Custodian and accounting fees | | | 17 | |
Trustees’ and Chief Compliance Officer’s fees | | | — | (a) |
Other | | | 87 | |
| | | | |
Total Liabilities | | | 49,172 | |
| | | | |
Net Assets | | $ | 531,776 | |
| | | | |
| |
NET ASSETS: | | | | |
Paid-in-Capital | | $ | 485,622 | |
Total distributable earnings (loss) | | | 46,154 | |
| | | | |
Total Net Assets | | $ | 531,776 | |
| | | | |
| |
Net Assets: | | | | |
Class 1 | | $ | 190,891 | |
Class 2 | | | 340,885 | |
| | | | |
Total | | $ | 531,776 | |
| | | | |
| |
Outstanding units of beneficial interest (shares) | | | | |
(unlimited number of shares authorized, no par value): | | | | |
Class 1 | | | 16,072 | |
Class 2 | | | 29,097 | |
| |
Net Asset Value (b): | | | | |
Class 1 — Offering and redemption price per share | | $ | 11.88 | |
Class 2 — Offering and redemption price per share | | | 11.72 | |
Cost of investments in non-affiliates | | $ | 475,755 | |
Cost of investments in affiliates | | | 71,867 | |
| (a) | Amount rounds to less than one thousand. |
| (b) | Per share amounts may not recalculate due to rounding of net assets and/or shares outstanding. |
SEE NOTES TO FINANCIAL STATEMENTS.
| | | | | | | | | | |
| | | | | |
| DECEMBER 31, 2020 | | JPMORGAN INSURANCE TRUST | | | | | | | | 35 |
STATEMENT OF OPERATIONS
FOR THE YEAR ENDED DECEMBER 31, 2020
(Amounts in thousands)
| | | | |
| | | JPMorgan Insurance
Trust Core Bond
Portfolio | |
INVESTMENT INCOME: | |
Interest income from non-affiliates | | $ | 11,845 | |
Interest income from affiliates | | | — | (a) |
Dividend income from affiliates | | | 170 | |
Income from securities lending (net) (See Note 2.D.) | | | — | (a) |
| | | | |
Total investment income | | | 12,015 | |
| | | | |
|
EXPENSES: | |
Investment advisory fees | | | 1,844 | |
Administration fees | | | 346 | |
Distribution fees: | | | | |
Class 2 | | | 709 | |
Custodian and accounting fees | | | 92 | |
Interest expense to affiliates | | | — | (a) |
Professional fees | | | 99 | |
Trustees’ and Chief Compliance Officer’s fees | | | 26 | |
Printing and mailing costs | | | 70 | |
Transfer agency fees (See Note 2.G.) | | | 5 | |
Other | | | 30 | |
| | | | |
Total expenses | | | 3,221 | |
| | | | |
Less fees waived | | | (75 | ) |
| | | | |
Net expenses | | | 3,146 | |
| | | | |
Net investment income (loss) | | | 8,869 | |
| | | | |
| |
REALIZED/UNREALIZED GAINS (LOSSES): | | | | |
Net realized gain (loss) on transactions from: | |
Investments in non-affiliates | | | 7,159 | |
Investments in affiliates | | | (16 | ) |
| | | | |
Net realized gain (loss) | | | 7,143 | |
| | | | |
Change in net unrealized appreciation/depreciation on: | |
Investments in non-affiliates | | | 16,628 | |
Investments in affiliates | | | 6 | |
| | | | |
Change in net unrealized appreciation/depreciation | | | 16,634 | |
| | | | |
Net realized/unrealized gains (losses) | | | 23,777 | |
| | | | |
Change in net assets resulting from operations | | $ | 32,646 | |
| | | | |
| (a) | Amount rounds to less than one thousand. |
SEE NOTES TO FINANCIAL STATEMENTS.
| | | | | | | | | | |
| | | | | |
| 36 | | | | | | | | JPMORGAN INSURANCE TRUST | | DECEMBER 31, 2020 |
STATEMENTS OF CHANGES IN NET ASSETS
FOR THE PERIODS INDICATED
(Amounts in thousands)
| | | | | | | | |
| | | JPMorgan Insurance Trust
Core Bond Portfolio | |
| | | Year Ended
December 31, 2020 | | | Year Ended
December 31, 2019 | |
CHANGE IN NET ASSETS RESULTING FROM OPERATIONS: | | | | | | | | |
Net investment income (loss) | | $ | 8,869 | | | $ | 8,730 | |
Net realized gain (loss) | | | 7,143 | | | | 616 | |
Change in net unrealized appreciation/depreciation | | | 16,634 | | | | 16,188 | |
| | | | | | | | |
Change in net assets resulting from operations | | | 32,646 | | | | 25,534 | |
| | | | | | | | |
| | |
DISTRIBUTIONS TO SHAREHOLDERS: | | | | | | | | |
Class 1 | | | (3,683 | ) | | | (3,946 | ) |
Class 2 | | | (5,095 | ) | | | (4,092 | ) |
| | | | | | | | |
Total distributions to shareholders | | | (8,778 | ) | | | (8,038 | ) |
| | | | | | | | |
| | |
CAPITAL TRANSACTIONS: | | | | | | | | |
Change in net assets resulting from capital transactions | | | 127,448 | | | | 54,641 | |
| | | | | | | | |
| | |
NET ASSETS: | | | | | | | | |
Change in net assets | | | 151,316 | | | | 72,137 | |
Beginning of period | | | 380,460 | | | | 308,323 | |
| | | | | | | | |
End of period | | $ | 531,776 | | | $ | 380,460 | |
| | | | | | | | |
| | |
CAPITAL TRANSACTIONS: | | | | | | | | |
Class 1 | | | | | | | | |
Proceeds from shares issued | | $ | 96,027 | | | $ | 25,620 | |
Distributions reinvested | | | 3,683 | | | | 3,946 | |
Cost of shares redeemed | | | (80,449 | ) | | | (34,012 | ) |
| | | | | | | | |
Change in net assets resulting from Class 1 capital transactions | | | 19,261 | | | | (4,446 | ) |
| | | | | | | | |
Class 2 | | | | | | | | |
Proceeds from shares issued | | | 154,155 | | | | 77,161 | |
Distributions reinvested | | | 5,095 | | | | 4,092 | |
Cost of shares redeemed | | | (51,063 | ) | | | (22,166 | ) |
| | | | | | | | |
Change in net assets resulting from Class 2 capital transactions | | | 108,187 | | | | 59,087 | |
| | | | | | | | |
Total change in net assets resulting from capital transactions | | $ | 127,448 | | | $ | 54,641 | |
| | | | | | | | |
| | |
SHARE TRANSACTIONS: | | | | | | | | |
Class 1 | | | | | | | | |
Issued | | | 8,234 | | | | 2,328 | |
Reinvested | | | 321 | | | | 366 | |
Redeemed | | | (6,919 | ) | | | (3,102 | ) |
| | | | | | | | |
Change in Class 1 Shares | | | 1,636 | | | | (408 | ) |
| | | | | | | | |
Class 2 | | | | | | | | |
Issued | | | 13,429 | | | | 7,067 | |
Reinvested | | | 450 | | | | 384 | |
Redeemed | | | (4,456 | ) | | | (2,037 | ) |
| | | | | | | | |
Change in Class 2 Shares | | | 9,423 | | | | 5,414 | |
| | | | | | | | |
SEE NOTES TO FINANCIAL STATEMENTS.
| | | | | | | | | | |
| | | | | |
| DECEMBER 31, 2020 | | JPMORGAN INSURANCE TRUST | | | | | | | | 37 |
FINANCIAL HIGHLIGHTS
FOR THE PERIODS INDICATED
| | | | | | | | | | | | | | | | | | | | | | | | | | | | |
| | | Per share operating performance | |
| | | | | | Investment operations | | | Distributions | |
| | | Net asset
value,
beginning
of period | | | Net
investment
income
(loss) (a) | | | Net realized
and unrealized
gains (losses) on
investments | | | Total from
investment
operations | | | Net
investment
income | | | Net
realized
gain | | | Total
distributions | |
JPMorgan Insurance Trust Core Bond Portfolio | |
Class 1 | |
Year Ended December 31, 2020 | | $ | 11.24 | | | $ | 0.24 | | | $ | 0.63 | | | $ | 0.87 | | | $ | (0.23 | ) | | $ | — | | | $ | (0.23 | ) |
Year Ended December 31, 2019 | | | 10.66 | | | | 0.30 | | | | 0.56 | | | | 0.86 | | | | (0.28 | ) | | | — | | | | (0.28 | ) |
Year Ended December 31, 2018 | | | 10.94 | | | | 0.29 | | | | (0.29 | ) | | | — | (e) | | | (0.26 | ) | | | (0.02 | ) | | | (0.28 | ) |
Year Ended December 31, 2017 | | | 10.84 | | | | 0.29 | | | | 0.09 | | | | 0.38 | | | | (0.28 | ) | | | — | | | | (0.28 | ) |
Year Ended December 31, 2016 | | | 10.91 | | | | 0.30 | | | | (0.07 | ) | | | 0.23 | | | | (0.30 | ) | | | — | | | | (0.30 | ) |
|
Class 2 | |
Year Ended December 31, 2020 | | | 11.09 | | | | 0.21 | | | | 0.63 | | | | 0.84 | | | | (0.21 | ) | | | — | | | | (0.21 | ) |
Year Ended December 31, 2019 | | | 10.53 | | | | 0.27 | | | | 0.55 | | | | 0.82 | | | | (0.26 | ) | | | — | | | | (0.26 | ) |
Year Ended December 31, 2018 | | | 10.82 | | | | 0.26 | | | | (0.29 | ) | | | (0.03 | ) | | | (0.24 | ) | | | (0.02 | ) | | | (0.26 | ) |
Year Ended December 31, 2017 | | | 10.73 | | | | 0.26 | | | | 0.09 | | | | 0.35 | | | | (0.26 | ) | | | — | | | | (0.26 | ) |
Year Ended December 31, 2016 | | | 10.81 | | | | 0.27 | | | | (0.07 | ) | | | 0.20 | | | | (0.28 | ) | | | — | | | | (0.28 | ) |
| (a) | Calculated based upon average shares outstanding. |
| (b) | Includes adjustments in accordance with accounting principles generally accepted in the United States of America and as such, the net asset values for financial reporting purposes and the returns based upon those net asset values may differ from the net asset values and returns for shareholder transactions. |
| (c) | Total returns do not include charges that will be imposed by variable insurance contracts or by Eligible Plans. If these charges were reflected, returns would be lower than those shown. |
| (d) | Includes earnings credits and interest expense, if applicable, each of which is less than 0.005% unless otherwise noted. |
| (e) | Amount rounds to less than $0.005. |
SEE NOTES TO FINANCIAL STATEMENTS.
| | | | | | | | | | |
| | | | | |
| 38 | | | | | | | | JPMORGAN INSURANCE TRUST | | DECEMBER 31, 2020 |
| | | | | | | | | | | | | | | | | | | | | | | | | | |
| | | Ratios/Supplemental data | |
| | | | | | | | | | Ratios to average net assets | | | | |
Net asset
value,
end of
period | | | Total return (b) (c) | | | Net assets,
end of
period
(000’s) | | | Net expenses (d) | | | Net
investment income
(loss) | | | Expenses without
waivers,
reimbursements and
earnings credits | | | Portfolio
turnover
rate | |
| | |
| | |
| $ | 11.88 | | | | 7.84 | % | | $ | 190,891 | | | | 0.53 | % | | | 2.09 | % | | | 0.55 | % | | | 92 | % |
| | 11.24 | | | | 8.18 | | | | 162,192 | | | | 0.58 | | | | 2.70 | | | | 0.58 | | | | 20 | |
| | 10.66 | | | | 0.05 | | | | 158,167 | | | | 0.56 | | | | 2.76 | | | | 0.61 | | | | 20 | |
| | 10.94 | | | | 3.57 | | | | 171,382 | | | | 0.57 | | | | 2.66 | | | | 0.63 | | | | 21 | |
| | 10.84 | | | | 2.12 | | | | 176,566 | | | | 0.59 | | | | 2.73 | | | | 0.64 | | | | 29 | |
|
| | |
| | 11.72 | | | | 7.68 | | | | 340,885 | | | | 0.78 | | | | 1.82 | | | | 0.79 | | | | 92 | |
| | 11.09 | | | | 7.87 | | | | 218,268 | | | | 0.83 | | | | 2.45 | | | | 0.83 | | | | 20 | |
| | 10.53 | | | | (0.23 | ) | | | 150,156 | | | | 0.81 | | | | 2.51 | | | | 0.85 | | | | 20 | |
| | 10.82 | | | | 3.30 | | | | 123,282 | | | | 0.82 | | | | 2.41 | | | | 0.87 | | | | 21 | |
| | 10.73 | | | | 1.84 | | | | 73,940 | | | | 0.84 | | | | 2.47 | | | | 0.89 | | | | 29 | |
SEE NOTES TO FINANCIAL STATEMENTS.
| | | | | | | | | | |
| | | | | |
| DECEMBER 31, 2020 | | JPMORGAN INSURANCE TRUST | | | | | | | | 39 |
NOTES TO FINANCIAL STATEMENTS
AS OF DECEMBER 31, 2020
1. Organization
JPMorgan Insurance Trust (the “Trust”) is registered under the Investment Company Act of 1940, as amended (the “1940 Act”), as an open-end management investment company and is a Massachusetts business trust.
The following is a separate portfolio of the Trust (the “Portfolio”) covered by this report:
| | | | |
| | | Classes Offered | | Diversification Classification |
| JPMorgan Insurance Trust Core Bond Portfolio | | Class 1 and Class 2 | | Diversified |
The investment objective of the Portfolio is to seek to maximize total return by investing primarily in a diversified portfolio of intermediate- and long-term debt securities.
Portfolio shares are offered only to separate accounts of participating insurance companies and Eligible Plans. Individuals may not purchase shares directly from the Portfolio.
All classes of shares have equal rights as to earnings, assets and voting privileges, except that each class may bear different transfer agency fees and distribution fees and each class has exclusive voting rights with respect to its distribution plan and administrative services plan.
J.P. Morgan Investment Management Inc. (“JPMIM”), an indirect, wholly-owned subsidiary of JPMorgan Chase & Co. (“JPMorgan”), acts as Adviser (the “Adviser”) and Administrator (the “Administrator”) to the Portfolio.
2. Significant Accounting Policies
The following is a summary of significant accounting policies followed by the Portfolio in the preparation of its financial statements. The Portfolio is an investment company and, accordingly, follows the investment company accounting and reporting guidance of the Financial Accounting Standards Board (“FASB”) Accounting Standards Codification Topic 946 — Investment Companies, which is part of U.S. generally accepted accounting principles (“GAAP”). The preparation of financial statements in conformity with GAAP requires management to make estimates and assumptions that affect (i) the reported amounts of assets and liabilities, (ii) disclosure of contingent assets and liabilities at the date of the financial statements, and (iii) the reported amounts of increases and decreases in net assets from operations during the reporting period. Actual results could differ from those estimates.
A. Valuation of Investments — Investments are valued in accordance with GAAP and the Portfolio’s valuation policies set forth by, and under the supervision and responsibility of, the Board of Trustees of the Trust (the “Board”), which established the following approach to valuation, as described more fully below: (i) investments for which market quotations are readily available shall be valued at their market value and (ii) all other investments for which market quotations are not readily available shall be valued at their fair value as determined in good faith by the Board.
The Administrator has established the J.P. Morgan Asset Management Americas Valuation Committee (“AVC”) to assist the Board with the oversight and monitoring of the valuation of the Portfolio’s investments. The Administrator implements the valuation policies of the Portfolio’s investments, as directed by the Board. The AVC oversees and carries out the policies for the valuation of investments held in the Portfolio. This includes monitoring the appropriateness of fair values based on results of ongoing valuation oversight including, but not limited to, consideration of macro or security specific events, market events, and pricing vendor and broker due diligence. The Administrator is responsible for discussing and assessing the potential impacts to the fair values on an ongoing basis, and, at least on a quarterly basis, with the AVC and the Board.
A market-based approach is primarily used to value the Portfolio’s investments. Investments for which market quotations are not readily available are fair valued by approved affiliated and/or unaffiliated pricing vendors or third party broker-dealers (collectively referred to as “Pricing Services”) or may be internally fair valued using methods set forth by the valuation policies approved by the Board. This may include the use of related or comparable assets or liabilities, recent transactions, market multiples, book values and other relevant information for the investment. An income-based valuation approach may be used in which the anticipated future cash flows of the investment are discounted to calculate the fair value. Discounts may also be applied due to the nature or duration of any restrictions on the disposition of the investments. Valuations may be based upon current market prices of securities that are comparable in coupon, rating, maturity and industry. It is possible that the estimated values may differ significantly from the values that would have been used had a ready market for the investments existed, and such differences could be material.
Fixed income instruments are valued based on prices received from Pricing Services. The Pricing Services use multiple valuation techniques to determine the valuation of fixed income instruments. In instances where sufficient market activity exists, the Pricing Services may utilize a market-based approach through which trades or quotes from market makers are used to determine the valuation of these instruments. In instances where sufficient market activity may not exist, the Pricing Services also utilize proprietary valuation models which may consider market transactions in comparable securities and the various relationships between securities in determining fair value and/or market characteristics in order to estimate the relevant cash flows, which are then discounted to calculate the fair values.
Investments in open-end investment companies (“Underlying Funds”) are valued at each Underlying Fund’s net asset values ("NAV") per share as of the report date.
See the table on “Quantitative Information about Level 3 Fair Value Measurements” for information on the valuation techniques and inputs used to value level 3 securities held by the Portfolio at December 31, 2020.
Valuations reflected in this report are as of the report date. As a result, changes in valuation due to market events and/or issuer-related events after the report date and prior to issuance of the report are not reflected herein.
| | | | | | | | | | |
| | | | | |
| 40 | | | | | | | | JPMORGAN INSURANCE TRUST | | DECEMBER 31, 2020 |
The various inputs that are used in determining the valuation of the Portfolio’s investments are summarized into the three broad levels listed below.
| • | | Level 1 — Unadjusted inputs using quoted prices in active markets for identical investments. |
| • | | Level 2 — Other significant observable inputs including, but not limited to, quoted prices for similar investments, inputs other than quoted prices that are observable for investments (such as interest rates, prepayment speeds, credit risk, etc.) or other market corroborated inputs. |
| • | | Level 3 — Significant inputs based on the best information available in the circumstances, to the extent observable inputs are not available (including the Portfolio’s assumptions in determining the fair value of investments). |
A financial instrument’s level within the fair value hierarchy is based on the lowest level of any input, both individually and in the aggregate, that is significant to the fair value measurement. The inputs or methodology used for valuing instruments are not necessarily an indication of the risk associated with investing in those instruments.
The following table represents each valuation input as presented on the Schedule of Portfolio Investments ("SOI") (amounts in thousands):
| | | | | | | | | | | | | | | | |
| | | Level 1
Quoted prices | | | Level 2
Other significant
observable inputs | | | Level 3
Significant
unobservable inputs | | | Total | |
Investments in Securities | | | | | | | | | |
Asset-Backed Securities | | $ | — | | | $ | 35,596 | | | $ | 19,255 | | | $ | 54,851 | |
Collateralized Mortgage Obligations | | | — | | | | 32,559 | | | | 3,868 | | | | 36,427 | |
Commercial Mortgage-Backed Securities | | | — | | | | 24,432 | | | | 1,859 | | | | 26,291 | |
Corporate Bonds | | | — | | | | 162,692 | | | | — | | | | 162,692 | |
Foreign Government Securities | | | — | | | | 2,337 | | | | — | | | | 2,337 | |
Mortgage-Backed Securities | | | — | | | | 116,387 | | | | — | | | | 116,387 | |
Municipal Bonds | | | — | | | | 371 | | | | — | | | | 371 | |
U.S. Government Agency Securities | | | — | | | | 1,101 | | | | — | | | | 1,101 | |
U.S. Treasury Obligations | | | — | | | | 106,110 | | | | — | | | | 106,110 | |
Short-Term Investments | | | | | | | | | |
Investment Companies | | | 71,874 | | | | — | | | | — | | | | 71,874 | |
| | | | | | | | | | | | | | | | |
Total Investments in Securities | | $ | 71,874 | | | $ | 481,585 | | | $ | 24,982 | | | $ | 578,441 | |
| | | | | | | | | | | | | | | | |
The following is a summary of investments for which significant unobservable inputs (level 3) were used in determining fair value (amounts in thousands):
| | | | | | | | | | | | | | | | | | | | | | | | | | | | | | | | | | | | |
| | | Balance as of
December 31,
2019 | | | Realized
gain (loss) | | | Change in net
unrealized
appreciation
(depreciation) | | | Net
accretion
(amortization) | | | Purchases1 | | | Sales2 | | | Transfers into Level 3 | | | Transfers
out
of Level 3 | | | Balance as of
December 31,
2020 | |
Investments in Securities: | | | | | | | | | | | | | | | | | | | | | | | | | | | | | | | | | | | | |
Asset-Backed Securities | | $ | 10,225 | | | $ | — | (a) | | $ | 130 | | | $ | (1 | ) | | $ | 12,253 | | | $ | (4,775 | ) | | $ | 1,423 | | | $ | — | | | $ | 19,255 | |
Collateralized Mortgage Obligations | | | 2,959 | | | | — | (a) | | | 39 | | | | (68 | ) | | | 1,371 | | | | (1,349 | ) | | | 916 | | | | — | | | | 3,868 | |
Commercial Mortgage-Backed Securities | | | 397 | | | | — | | | | (5 | ) | | | — | (a) | | | 997 | | | | — | (a) | | | 470 | | | | — | | | | 1,859 | |
| | | | | | | | | | | | | | | | | | | | | | | | | | | | | | | | | | | | |
Total | | $ | 13,581 | | | $ | — | (a) | | $ | 164 | | | $ | (69 | ) | | $ | 14,621 | | | $ | (6,124 | ) | | $ | 2,809 | | | $ | — | | | $ | 24,982 | |
| | | | | | | | | | | | | | | | | | | | | | | | | | | | | | | | | | | | |
| 1 | Purchases include all purchases of securities and securities received in corporate actions. |
| 2 | Sales include all sales of securities, maturities, paydowns and securities tendered in corporate actions. |
| (a) | Amount rounds to less than one thousand. |
The changes in net unrealized appreciation (depreciation) attributable to securities owned at December 31, 2020, which were valued using significant unobservable inputs (level 3) amounted to approximately $166,000. This amount is included in Change in net unrealized appreciation/depreciation on investments in non-affiliates on the Statement of Operations.
Transfers from level 2 to level 3 are due to a decline in market activity (e.g. frequency of trades), which resulted in a lack of available market inputs to determine the price for the year ended December 31, 2020.
The significant unobservable inputs used in the fair value measurement of the Portfolio’s investments are listed below. Generally, a change in the assumptions used in any input in isolation may be accompanied by a change in another input. Significant changes in any of the unobservable inputs may significantly impact the fair value measurement. The impact is based on the relationship between each unobservable input and the fair value measurement. Significant increases (decreases) in enterprise multiples may increase (decrease) the fair value measurement. Significant increases (decreases) in the discount for lack of marketability, liquidity discount, probability of default, yield and default rate may decrease (increase) the fair value measurement. A significant change in the discount rate or prepayment rate (Constant Prepayment Rate or PSA Prepayment Model) may decrease or increase the fair value measurement.
| | | | | | | | | | |
| | | | | |
| DECEMBER 31, 2020 | | JPMORGAN INSURANCE TRUST | | | | | | | | 41 |
NOTES TO FINANCIAL STATEMENTS
AS OF DECEMBER 31, 2020 (continued)
Quantitative Information about Level 3 Fair Value Measurements #
(Amounts in thousands)
| | | | | | | | | | | | |
| | | Fair Value at
December 31, 2020 | | | Valuation Technique(s) | | Unobservable Input | | Range (Weighted Average) (a) | |
| | $ | 16,724 | | | Discounted Cash Flow | | Constant Prepayment Rate | | | 0.00% - 20.00% (7.37%) | |
| | | | | | | | Constant Default Rate | | | 0.00% - 4.00% (0.03%) | |
| | | | | | | | Yield (Discount Rate of Cash Flows) | | | 1.27% - 5.62% (2.84%) | |
| | | | | | | | | | | | |
| Asset-Backed Securities | | | 16,724 | | | | | | | | | |
| |
| | | 1,793 | | | Discounted Cash Flow | | Constant Prepayment Rate | | | 0.00% - 100.00% (59.65%) | |
| | | | | | | | Constant Default Rate | | | 0.00% - 4.60% (0.25%) | |
| | | | | | | | Yield (Discount Rate of Cash Flows) | | | 0.95% - 21.42% (4.53%) | |
| | | | | | | | | | | | |
| Collateralized Mortgage Obligations | | | 1,793 | | | | | | | | | |
| |
| | | 1,561 | | | Discounted Cash Flow | | Constant Prepayment Rate | | | 0.00% - 100.00% (0.00%) | |
| | | | | | | | Yield (Discount Rate of Cash Flows) | | | 2.77% - 9.04% (3.41%) | |
| | | | | | | | | | | | |
| Commercial Mortgage-Backed Securities | | | 1,561 | | | | | | | | | |
| |
| Total | | $ | 20,078 | | | | | | | | | |
| |
| # | The table above does not include certain Level 3 investments that are valued by brokers and Pricing Services. At December 31, 2020, the value of these investments was approximately $4,904,000. The inputs for these investments are not readily available or cannot be reasonably estimated and generally are those inputs described in Note 2.A. |
| (a) | Unobservable inputs were weighted by the relative fair value of the instruments. |
B. Restricted Securities — Certain securities held by the Portfolio may be subject to legal or contractual restrictions on resale. Restricted securities generally are resold in transactions exempt from registration under the Securities Act of 1933, as amended (the “Securities Act”). Disposal of these securities may involve time-consuming negotiations and expense. Prompt sale at the current valuation may be difficult and could adversely affect the NAVs of the Portfolio.
As of December 31, 2020, the Portfolio had no investments in restricted securities other than securities sold to the Portfolio under Rule 144A and/or Regulation S under the Securities Act.
C. When-Issued Securities, Delayed Delivery Securities and Forward Commitments — The Portfolio purchased when-issued securities, including To Be Announced (“TBA”) securities, and entered into contracts to purchase or sell securities for a fixed price that may be settled a month or more after the trade date, or purchased delayed delivery securities which generally settle seven days after the trade date. When-issued securities are securities that have been authorized, but not issued in the market. A forward commitment involves entering into a contract to purchase or sell securities for a fixed price at a future date that may be settled a month or more after the trade date. A delayed delivery security is agreed upon in advance between the buyer and the seller of the security and is generally delivered beyond seven days of the agreed upon date. The purchase of securities on a when-issued, delayed delivery or forward commitment basis involves the risk that the value of the security to be purchased declines before the settlement date. The sale of securities on a forward commitment basis involves the risk that the value of the securities sold may increase before the settlement date. The Portfolio may be exposed to credit risk if the counterparty fails to perform under the terms of the transaction. Interest income for securities purchased on a when-issued, delayed delivery or forward commitment basis is not accrued until the settlement date.
The Portfolio had forward commitments and delayed delivery securities outstanding as of December 31, 2020, which are shown as a Payable for Investment securities purchased — delayed delivery securities on the Statement of Assets and Liabilities. The values of these securities held at December 31, 2020 are detailed on the SOI.
D. Securities Lending — The Portfolio is authorized to engage in securities lending in order to generate additional income. The Portfolio is able to lend to approved borrowers. Citibank N.A. (“Citibank”) serves as lending agent for the Portfolio, pursuant to a Securities Lending Agency Agreement (the “Securities Lending Agency Agreement”). Securities loaned are collateralized by cash equal to at least 100% of the market value plus accrued interest on the securities lent, which is invested in the Class IM Shares of the JPMorgan U.S. Government Money Market Fund. The Portfolio retains loan fees and the interest on cash collateral investments but is required to pay the borrower a rebate for the use of cash collateral. In cases where the lent security is of high value to borrowers, there may be a negative rebate (i.e., a net payment from the borrower to the Portfolio). Upon termination of a loan, the Portfolio is required to return to the borrower an amount equal to the cash collateral, plus any rebate owed to the borrowers. The remaining maturities of the securities lending transactions are considered overnight and continuous. Loans are subject to termination by the Portfolio or the borrower at any time.
The net income earned on the securities lending (after payment of rebates and Citibank’s fee) is included on the Statement of Operations as Income from securities lending (net). The Portfolio also receives payments from the borrower during the period of the loan, equivalent to dividends and interest earned on the securities loaned, which are recorded as Dividend or Interest income, respectively, on the Statement of Operations.
| | | | | | | | | | |
| | | | | |
| 42 | | | | | | | | JPMORGAN INSURANCE TRUST | | DECEMBER 31, 2020 |
Under the Securities Lending Agency Agreement, Citibank marks to market the loaned securities on a daily basis. In the event the cash received from the borrower is less than 102% of the value of the loaned securities (105% for loans of non-U.S. securities), Citibank requests additional cash from the borrower so as to maintain a collateralization level of at least 102% of the value of the loaned securities plus accrued interest (105% for loans of non-U.S. securities), subject to certain de minimis amounts.
The value of securities out on loan is recorded as an asset on the Statement of Assets and Liabilities. The value of the cash collateral received is recorded as a liability on the Statement of Assets and Liabilities and details of collateral investments are disclosed on the SOI.
The Portfolio bears the risk of loss associated with the collateral investments and is not entitled to additional collateral from the borrower to cover any such losses. To the extent that the value of the collateral investments declines below the amount owed to a borrower, the Portfolio may incur losses that exceed the amount it earned on lending the security. Upon termination of a loan, the Portfolio may use leverage (borrow money) to repay the borrower for cash collateral posted if the Adviser does not believe that it is prudent to sell the collateral investments to fund the payment of this liability. Securities lending activity is subject to master netting arrangements.
Securities lending also involves counterparty risks, including the risk that the loaned securities may not be returned in a timely manner or at all. Subject to certain conditions, Citibank has agreed to indemnify the Portfolio from losses resulting from a borrower’s failure to return a loaned security.
JPMIM voluntarily waived investment advisory fees charged to the Portfolio to reduce the impact of the cash collateral investment in the JPMorgan U.S. Government Money Market Fund from 0.15% to 0.06%. For the year ended December 31, 2020, JPMIM waived fees associated with the Portfolio’s investment in the JPMorgan U.S. Government Money Market Fund as follows (amounts in thousands):
| (a) | Amount rounds to less than one thousand. |
The above waiver is included in the determination of earnings on cash collateral investment and in the calculation of Citibank’s compensation and is included on the Statement of Operations as Income from securities lending (net).
The Portfolio did not have any securities out on loan at December 31, 2020.
E. Investment Transactions with Affiliates — The Portfolio invested in Underlying Funds which are advised by the Adviser. An issuer which is under common control with the Portfolio may be considered an affiliate. For the purposes of the financial statements, the Portfolio assumes the issuers listed in the table below to be affiliated issuers. Underlying Funds’ distributions may be reinvested into the Underlying Funds. Reinvestment amounts are included in the purchase cost amounts in the table below. Amounts in the table below are in thousands.
| | | | | | | | | | | | | | | | | | | | | | | | | | | | | | | | | | | | |
For the year ended December 31, 2020 | |
| Security Description | | Value at
December 31,
2019 | | | Purchases at
Cost | | | Proceeds
from
Sales | | | Net
Realized
Gain
(Loss) | | | Change in
Unrealized
Appreciation/
(Depreciation) | | | Value at
December 31,
2020 | | | Shares at
December 31,
2020 | | | Dividend
Income | | | Capital Gain
Distributions | |
JPMorgan Prime Money Market Fund Class Institutional Shares, 0.09% (a) (b) | | $ | 17,076 | | | $ | 240,519 | | | $ | 185,711 | | | $ | (16 | ) | | $ | 6 | | | $ | 71,874 | | | | 71,838 | | | $ | 170 | | | $ | — | |
JPMorgan U.S. Government Money Market Fund Class IM Shares (a) | | | 52 | | | | 346 | | | | 398 | | | | — | | | | — | | | | — | | | | — | | | | — | *(c) | | | — | |
| | | | | | | | | | | | | | | | | | | | | | | | | | | | | | | | | | | | |
Total | | $ | 17,128 | | | $ | 240,865 | | | $ | 186,109 | | | $ | (16 | ) | | $ | 6 | | | $ | 71,874 | | | | | | | $ | 170 | | | $ | — | |
| | | | | | | | | | | | | | | | | | | | | | | | | | | | | | | | | | | | |
| (a) | Investment in an affiliated fund, which is registered under the Investment Company Act of 1940, as amended, and is advised by J.P. Morgan Investment Management Inc. |
| (b) | The rate shown is the current yield as of December 31, 2020. |
| (c) | Amount rounds to less than one thousand. |
| * | Amount is included on the Statement of Operations as Income from securities lending (net) (after payments of rebates and Citibank’s fee). |
F. Security Transactions and Investment Income — Investment transactions are accounted for on the trade date (the date the order to buy or sell is executed). Securities gains and losses are calculated on a specifically identified cost basis. Interest income is determined on the basis of coupon interest accrued using the effective interest method, which adjusts for amortization of premiums and accretion of discounts. Dividend income is recorded on the ex-dividend date or when the Portfolio first learns of the dividend.
The Portfolio invests in treasury inflation protected securities (TIPS). The principal amount of TIPS is adjusted periodically and is increased for inflation or decreased for deflation based on a monthly published index. These adjustments are recorded as increases or decreases to interest income on the Statement of Operations. Coupon payments are based on the adjusted principal at the time the interest is paid.
| | | | | | | | | | |
| | | | | |
| DECEMBER 31, 2020 | | JPMORGAN INSURANCE TRUST | | | | | | | | 43 |
NOTES TO FINANCIAL STATEMENTS
AS OF DECEMBER 31, 2020 (continued)
To the extent such information is publicly available, the Portfolio records distributions received in excess of income earned from underlying investments as a reduction of cost of investments and/or realized gain. Such amounts are based on estimates if actual amounts are not available and actual amounts of income, realized gain and return of capital may differ from the estimated amounts. The Portfolio adjusts the estimated amounts of the components of distributions (and consequently its net investment income) as necessary, once the issuers provide information about the actual composition of the distributions.
G. Allocation of Income and Expenses — Expenses directly attributable to the Portfolio are charged directly to the Portfolio, while the expenses attributable to more than one portfolio of the Trust are allocated among the applicable portfolios. Investment income, realized and unrealized gains and losses and expenses, other than class-specific expenses, are allocated daily to each class of shares based upon the proportion of net assets of each class at the beginning of each day.
Transfer agency fees are class-specific expenses. The amount of the transfer agency fees charged to each share class of the Portfolio for the year ended December 31, 2020 are as follows (amounts in thousands):
| | | | | | | | | | | | |
| | | Class 1 | | | Class 2 | | | Total | |
Transfer agency fees | | $ | 3 | | | $ | 2 | | | $ | 5 | |
H. Federal Income Taxes — The Portfolio is treated as a separate taxable entity for Federal income tax purposes. The Portfolio’s policy is to comply with the provisions of the Internal Revenue Code (the “Code”) applicable to regulated investment companies and to distribute to shareholders all of its distributable net investment income and net realized capital gains on investments. Accordingly, no provision for Federal income tax is necessary. The Portfolio is also a segregated portfolio of assets for insurance purposes and intends to comply with the diversification requirements of Subchapter L of the Code. Management has reviewed the Portfolio’s tax positions for all open tax years and has determined that as of December 31, 2020, no liability for Federal income tax is required in the Portfolio’s financial statements for net unrecognized tax benefits. However, management’s conclusions may be subject to future review based on changes in, or the interpretation of, the accounting standards or tax laws and regulations. The Portfolio’s Federal tax returns for the prior three fiscal years remain subject to examination by the Internal Revenue Service.
I. Distributions to Shareholders — Distributions from net investment income, if any, are generally declared and paid at least annually and are declared separately for each class. No class has preferential dividend rights; differences in per share rates are due to differences in separate class expenses. Net realized capital gains, if any, are distributed at least annually. The amount of distributions from net investment income and net realized capital gains is determined in accordance with Federal income tax regulations, which may differ from GAAP. To the extent these “book/tax” differences are permanent in nature (i.e., that they result from other than timing of recognition — “temporary differences”), such amounts are reclassified within the capital accounts based on their Federal tax basis treatment.
The following amounts were reclassified within the capital accounts (amounts in thousands):
| | | | | | | | | | | | |
| | | Paid-in-Capital | | | Accumulated
undistributed
(distributions
in excess of)
net investment
income | | | Accumulated
net realized
gains (losses) | |
| | $ | (57 | ) | | $ | 42 | | | $ | 15 | |
The reclassifications for the Portfolio relate primarily to callable bonds.
J. Recent Accounting Pronouncement — In March 2020, the FASB issued Accounting Standards Update No. 2020-04 (“ASU 2020-04”), Reference Rate Reform (Topic 848) – Facilitation of the Effects of Reference Rate Reform on Financial Reporting. ASU 2020-04 provides optional temporary financial reporting relief from the effect of certain types of contract modifications due to the planned discontinuation of the London Interbank Offered Rate (“LIBOR”) and other interbank-offered based reference rates as of the end of 2021. ASU 2020-04 became effective upon the issuance and its optional relief can be applied through December 31, 2022. Management is currently evaluating the impact, if any, to the Portfolio’s financial statements of applying ASU 2020-04.
3. Fees and Other Transactions with Affiliates
A. Investment Advisory Fee — Pursuant to an Investment Advisory Agreement, the Adviser manages the investments of the Portfolio and for such services is paid a fee. The investment advisory fee is accrued daily and paid monthly at an annual rate of 0.40% of the Portfolio’s average daily net assets.
The Adviser waived investment advisory fees and/or reimbursed expenses as outlined in Note 3.E.
B. Administration Fee — Pursuant to an Administration Agreement, the Administrator provides certain administration services to the Portfolio. In consideration of these services, the Administrator receives a fee accrued daily and paid monthly at an annual rate of 0.075% of the first $10 billion of the Portfolio’s average daily net assets, plus 0.050% of the Portfolio’s average daily net assets between $10 billion and $20 billion, plus 0.025% of the Portfolio’s average daily net assets between $20 billion and $25 billion, plus 0.01% of the Portfolio’s average daily net assets in excess of $25 billion. For the year ended December 31, 2020, the effective rate was 0.075% of the Portfolio’s average daily net assets, notwithstanding any fee waivers and/or expense reimbursements.
| | | | | | | | | | |
| | | | | |
| 44 | | | | | | | | JPMORGAN INSURANCE TRUST | | DECEMBER 31, 2020 |
The Administrator waived administration fees as outlined in Note 3.E.
JPMorgan Chase Bank, N.A. (“JPMCB”), a wholly-owned subsidiary of JPMorgan, serves as the Portfolio’s sub-administrator (the “Sub-administrator”). For its services as Sub-administrator, JPMCB receives a portion of the fees payable to the Administrator.
C. Distribution Fees — Pursuant to a Distribution Agreement, JPMorgan Distribution Services, Inc. (“JPMDS”), an indirect, wholly-owned subsidiary of JPMorgan, serves as the Portfolio’s principal underwriter and promotes and arranges for the sale of the Portfolio’s shares.
The Board has adopted a Distribution Plan (the “Distribution Plan”) for Class 2 Shares of the Portfolio pursuant to Rule 12b-1 under the 1940 Act. Class 1 Shares of the Portfolio do not charge a distribution fee. The Distribution Plan provides that the Portfolio shall pay, with respect to the applicable share classes, distribution fees, including payments to JPMDS, at an annual rate of 0.25% of the average daily net assets of Class 2 Shares.
D. Custodian and Accounting Fees — JPMCB provides portfolio custody and accounting services to the Portfolio. For performing these services, the Portfolio pays JPMCB transaction and asset-based fees that vary according to the number of transactions and positions, plus out-of-pocket expenses. The amounts paid directly to JPMCB by the Portfolio for custody and accounting services are included in Custodian and accounting fees on the Statement of Operations.
Interest income earned on cash balances at the custodian, if any, is included in Interest income from affiliates on the Statement of Operations.
Interest expense paid to the custodian related to cash overdrafts, if any, is included in Interest expense to affiliates on the Statement of Operations.
E. Waivers and Reimbursements — The Adviser (for all share classes), Administrator (for all share classes) and/or JPMDS (for Class 2 Shares) have contractually agreed to waive fees and/or reimburse the Portfolio to the extent that total annual operating expenses of the Portfolio (excluding acquired fund fees and expenses other than certain money market fund fees as described below, dividend and interest expenses related to short sales, interest, taxes, expenses related to litigation and potential litigation, expenses related to trustee elections and extraordinary expenses) exceed the percentages of the Portfolio’s respective average daily net assets as shown in the table below:
| | | | | | |
| | | Class 1 | | Class 2 | |
| | 0.60% | | | 0.85 | % |
The expense limitation agreement was in effect for the year ended December 31, 2020 and the contractual expense limitation percentages in the table above are in place until at least April 30, 2021.
For the year ended December 31, 2020, the Portfolio’s service providers did not waive fees and/or reimburse expenses for the Portfolio.
Additionally, the Portfolio may invest in one or more money market funds advised by the Adviser (affiliated money market funds). The Adviser, Administrator and/or JPMDS have contractually agreed to waive fees and/or reimburse expenses in an amount sufficient to offset the respective net fees each collects from the affiliated money market fund on the Portfolio’s investment in such affiliated money market fund, except for investments of securities lending cash collateral. None of these parties expect the Portfolio to repay any such waived fees and/or reimbursed expenses in future years.
The amount of these waivers resulting from investments in these money market funds for the year ended December 31, 2020 was approximately $75,000.
F. Other — Certain officers of the Trust are affiliated with the Adviser, the Administrator and JPMDS. Such officers, with the exception of the Chief Compliance Officer, receive no compensation from the Portfolio for serving in their respective roles.
The Board designated and appointed a Chief Compliance Officer to the Portfolio pursuant to Rule 38a-1 under the 1940 Act. The Portfolio, along with affiliated portfolios, makes reimbursement payments, on a pro-rata basis, to the Administrator for a portion of the fees associated with the office of the Chief Compliance Officer. Such fees are included in Trustees’ and Chief Compliance Officer’s fees on the Statement of Operations.
The Trust adopted a Trustee Deferred Compensation Plan (the “Plan”) which allows the independent Trustees to defer the receipt of all or a portion of compensation related to performance of their duties as Trustees. The deferred fees are invested in various J.P. Morgan Funds until distribution in accordance with the Plan.
During the year ended December 31, 2020, the Portfolio purchased securities from an underwriting syndicate in which the principal underwriter or members of the syndicate were affiliated with the Adviser.
The Securities and Exchange Commission (“SEC”) has granted an exemptive order permitting the Portfolio to engage in principal transactions with J.P. Morgan Securities LLC, an affiliated broker, involving taxable money market instruments, subject to certain conditions.
4. Investment Transactions
During the year ended December 31, 2020, purchases and sales of investments (excluding short-term investments) were as follows (amounts in thousands):
| | | | | | | | | | | | | | | | |
| | | Purchases
(excluding
U.S. Government) | | | Sales
(excluding
U.S. Government) | | | Purchases
of U.S.
Government | | | Sales
of U.S.
Government | |
| | | $485,345 | | | $ | 367,460 | | | $ | 36,134 | | | $ | 36,925 | |
| | | | | | | | | | |
| | | | | |
| DECEMBER 31, 2020 | | JPMORGAN INSURANCE TRUST | | | | | | | | 45 |
NOTES TO FINANCIAL STATEMENTS
AS OF DECEMBER 31, 2020 (continued)
5. Federal Income Tax Matters
For Federal income tax purposes, the estimated cost and unrealized appreciation (depreciation) in value of investments held at December 31, 2020 were as follows (amounts in thousands):
| | | | | | | | | | | | | | | | |
| | | Aggregate
Cost | | | Gross
Unrealized
Appreciation | | | Gross
Unrealized
Depreciation | | | Net Unrealized
Appreciation
(Depreciation) | |
| | | $547,691 | | | $ | 31,517 | | | $ | 767 | | | $ | 30,750 | |
The difference between book and tax basis appreciation (depreciation) on investments is primarily attributed to callable bonds.
The tax character of distributions paid during the year ended December 31, 2020 was as follows (amounts in thousands):
| | | | | | | | |
| | | Ordinary
Income* | | | Total
Distributions
Paid | |
| | $ | 8,778 | | | $ | 8,778 | |
* Short-term gain distributions are treated as ordinary income for income tax purposes.
The tax character of distributions paid during the year ended December 31, 2019 was as follows (amounts in thousands):
| | | | | | | | |
| | | Ordinary
Income* | | | Total
Distributions
Paid | |
| | $ | 8,038 | | | $ | 8,038 | |
* Short-term gain distributions are treated as ordinary income for income tax purposes.
As of December 31, 2020, the estimated components of net assets (excluding paid-in-capital) on a tax basis were as follows (amounts in thousands):
| | | | | | | | | | | | |
| | | Current
Distributable
Ordinary
Income | | | Current
Distributable
Long-Term
Capital Gain
(Tax Basis Capital
Loss Carryover) | | | Unrealized
Appreciation
(Depreciation) | |
| | $ | 9,648 | | | $ | 5,796 | | | $ | 30,750 | |
The cumulative timing differences primarily consist of callable bonds.
During the year ended December 31, 2020, the Portfolio utilized capital loss carryforwards as follows (amounts in thousands):
| | | | | | | | |
| | | Capital Loss Utilized | |
| | | Short-Term | | | Long-Term | |
| | $ | 141 | | | $ | 16 | |
As of December 31, 2020, the Portfolio did not have any net capital loss carryforwards.
6. Borrowings
The Portfolio relies upon an exemptive order granted by the SEC (the “Order”) permitting the establishment and operation of an Interfund Lending Facility (the “Facility”). The Facility allows the Portfolio to directly lend and borrow money to or from any other fund relying upon the Order at rates beneficial to both the borrowing and lending funds. Advances under the Facility are taken primarily for temporary or emergency purposes, including the meeting of redemption requests that otherwise might require the untimely disposition of securities, and are subject to the Portfolio’s borrowing restrictions. The Interfund loan rate is determined, as specified in the Order, by averaging the current repurchase agreement rate and the current bank loan rate. The Order was granted to the Trust and may be relied upon by the Portfolio because the Portfolio and the series of the Trust are all investment companies in the same “group of investment companies” (as defined in Section 12(d)(1)(G) of the 1940 Act).
The Portfolio had no borrowings outstanding from another fund during the year ended December 31, 2020.
The Trust and JPMCB have entered into a financing arrangement. Under this arrangement, JPMCB provides an unsecured, uncommitted credit facility in the aggregate amount of $100 million to certain of the J.P. Morgan Funds, including the Portfolio. Advances under the arrangement are taken primarily for temporary or emergency purposes, including the meeting of redemption requests that otherwise might require the untimely disposition of securities, and are subject to the Portfolio’s borrowing restrictions. Interest on borrowings is payable at a rate determined by JPMCB at the time of borrowing. This agreement has been extended until November 1, 2021.
The Portfolio had no borrowings outstanding from the unsecured, uncommitted credit facility during the year ended December 31, 2020.
| | | | | | | | | | |
| | | | | |
| 46 | | | | | | | | JPMORGAN INSURANCE TRUST | | DECEMBER 31, 2020 |
The Trust, along with certain other trusts for J.P. Morgan Funds (“Borrowers”), has entered into a joint syndicated senior unsecured revolving credit facility totaling $1.5 billion (“Credit Facility”) with various lenders and The Bank of New York Mellon, as administrative agent for the lenders. This Credit Facility provides a source of funds to the Borrowers for temporary and emergency purposes, including the meeting of redemption requests that otherwise might require the untimely disposition of securities. Under the terms of the Credit Facility, a borrowing portfolio must have a minimum of $25,000,000 in adjusted net asset value and not exceed certain adjusted net asset coverage ratios prior to and during the time in which any borrowings are outstanding. If a portfolio does not comply with the aforementioned requirements, the portfolio must remediate within three business days with respect to the $25,000,000 minimum adjusted net asset value or within one business day with respect to certain asset coverage ratios or the administrative agent at the request of, or with the consent of, the lenders may terminate the Credit Facility and declare any outstanding borrowings to be due and payable immediately.
Interest associated with any borrowing under the Credit Facility is charged to the borrowing portfolio at a rate of interest equal to 1.00%, which has increased to 1.25% pursuant to the amendment referenced below, plus the greater of the federal funds effective rate or one month LIBOR. The annual commitment fee to maintain the Credit Facility is 0.15% and is incurred on the unused portion of the Credit Facility and is allocated to all participating portfolios pro rata based on their respective net assets. Effective August 11, 2020, this agreement has been amended and restated for a term of 364 days, unless extended, and to include the change to the interest rate charged for borrowing from the Credit Facility to 1.25%, as noted above, and an upfront fee of 0.075% of the Credit Facility to be charged and paid by all participating funds of the Credit Facility.
The Portfolio did not utilize the Credit Facility during the year ended December 31, 2020.
7. Risks, Concentrations and Indemnifications
In the normal course of business, the Portfolio enters into contracts that contain a variety of representations which provide general indemnifications. The Portfolio’s maximum exposure under these arrangements is unknown. The amount of exposure would depend on future claims that may be brought against the Portfolio. However, based on experience, the Portfolio expects the risk of loss to be remote.
As of December 31, 2020, the Portfolio had two individual shareholder and/or non-affiliated omnibus accounts, which owned 57.9% of the Portfolio’s outstanding shares.
Significant shareholder transactions by these shareholders may impact the Portfolio’s performance and liquidity.
The Portfolio is subject to risks associated with securities with contractual cash flows including asset-backed and mortgage-related securities such as collateralized mortgage obligations, mortgage-pass-through securities and commercial mortgage-backed securities, including securities backed by sub-prime mortgage loans. The value, liquidity and related income of these securities are sensitive to changes in economic conditions, including real estate value, pre-payments, delinquencies and/or defaults, and may be adversely affected by shifts in the market’s perception of the issuers and changes in interest rates.
The Portfolio is subject to the risk that, should the Portfolio decide to sell an illiquid investment when a ready buyer is not available at a price the Portfolio deems to be representative of its value, the value of the Portfolio’s net assets could be adversely affected.
The Portfolio is subject to interest rate and credit risk. The value of debt securities may decline as interest rates increase. The Portfolio could lose money if the issuer of a fixed income security is unable to pay interest or repay principal when it is due. The Portfolio invests in floating rate loans and other floating rate debt securities. Although these investments are generally less sensitive to interest rate changes than other fixed rate instruments, the value of floating rate loans and other floating rate investments may decline if their interest rates do not rise as quickly, or as much, as general interest rates. Many factors can cause interest rates to rise. Some examples include central bank monetary policy, rising inflation rates and general economic conditions. The Portfolio may face a heightened level of interest rate risk due to certain changes in monetary policy. During periods when interest rates are low or there are negative interest rates, the Portfolio’s yield (and total return) also may be low or the Portfolio may be unable to maintain positive returns. The ability of the issuers of debt to meet their obligations may be affected by economic and political developments in a specific industry or region. The value of a Portfolio’s investments may be adversely affected if any of the issuers or counterparties it is invested in are subject to an actual or perceived deterioration in their credit quality.
The Portfolio invests in preferred securities. These securities are typically issued by corporations, generally in the form of interest bearing notes with preferred security characteristics and may include provisions that permit the issuer, in its discretion, to defer or omit distributions for a certain period of time.
LIBOR is intended to represent the rate at which contributing banks may obtain short-term borrowings from each other in the London interbank market. The regulatory authority that oversees financial services firms and financial markets in the U.K. has announced that, after the end of 2021, it would no longer persuade or compel contributing banks to make rate submissions for purposes of determining the LIBOR rate. As a result, it is possible that commencing in 2022, LIBOR may no longer be available or no longer deemed an appropriate reference rate upon which to determine the interest rate on or impacting certain loans, notes, derivatives and other instruments or investments comprising some or all of the Portfolio’s portfolio. In light of this eventuality, public and private sector industry initiatives are currently underway to identify new or alternative reference rates to be used in place of LIBOR. There is no assurance that the composition or characteristics of any such alternative reference rate will be similar to or produce the same value or economic equivalence as LIBOR or that it will have the same volume or liquidity as did LIBOR prior to its discontinuance or unavailability, which may affect the value or liquidity or return on certain investments of the Portfolio and result in costs incurred in connection with closing out positions and entering into new trades. These risks may also apply with respect to changes in connection with other
| | | | | | | | | | |
| | | | | |
| DECEMBER 31, 2020 | | JPMORGAN INSURANCE TRUST | | | | | | | | 47 |
NOTES TO FINANCIAL STATEMENTS
AS OF DECEMBER 31, 2020 (continued)
interbank offering rates (e.g., Euribor) and a wide range of other index levels, rates and values that are treated as “benchmarks” and are the subject of recent regulatory reform.
The Portfolio is subject to infectious disease epidemics/pandemics risk. The worldwide outbreak of COVID-19, a novel coronavirus disease, has negatively affected economies, markets and individual companies throughout the world. The effects of this COVID-19 pandemic to public health, and business and market conditions, including exchange trading suspensions and closures may continue to have a significant negative impact on the performance of the Portfolio’s investments, increase the Portfolio’s volatility, exacerbate other pre-existing political, social and economic risks to the Portfolio and negatively impact broad segments of businesses and populations. The Portfolio’s operations may be interrupted as a result, which may have a significant negative impact on investment performance. In addition, governments, their regulatory agencies, or self-regulatory organizations may take actions in response to the pandemic that affect the instruments in which the Portfolio invests, or the issuers of such instruments, in ways that could also have a significant negative impact on the Portfolio’s investment performance. The full impact of this COVID-19 pandemic, or other future epidemics/pandemics, is currently unknown.
8. Subsequent Event
On February 10, 2021, the contractual expense limitations of Class 1 Shares and Class 2 Shares were extended until at least April 30, 2022.
| | | | | | | | | | |
| | | | | |
| 48 | | | | | | | | JPMORGAN INSURANCE TRUST | | DECEMBER 31, 2020 |
REPORT OF INDEPENDENT REGISTERED PUBLIC ACCOUNTING FIRM
To the Board of Trustees of JPMorgan Insurance Trust and Shareholders of JPMorgan Insurance Trust Core Bond Portfolio
Opinion on the Financial Statements
We have audited the accompanying statement of assets and liabilities, including the schedule of portfolio investments, of JPMorgan Insurance Trust Core Bond Portfolio (one of the portfolios constituting JPMorgan Insurance Trust, referred to hereafter as the “Portfolio”) as of December 31, 2020, the related statement of operations for the year ended December 31, 2020, the statements of changes in net assets for each of the two years in the period ended December 31, 2020, including the related notes, and the financial highlights for each of the five years in the period ended December 31, 2020 (collectively referred to as the “financial statements”). In our opinion, the financial statements present fairly, in all material respects, the financial position of the Portfolio as of December 31, 2020, the results of its operations for the year then ended, the changes in its net assets for each of the two years in the period ended December 31, 2020 and the financial highlights for each of the five years in the period ended December 31, 2020 in conformity with accounting principles generally accepted in the United States of America.
Basis for Opinion
These financial statements are the responsibility of the Portfolio’s management. Our responsibility is to express an opinion on the Portfolio’s financial statements based on our audits. We are a public accounting firm registered with the Public Company Accounting Oversight Board (United States) (PCAOB) and are required to be independent with respect to the Portfolio in accordance with the U.S. federal securities laws and the applicable rules and regulations of the Securities and Exchange Commission and the PCAOB.
We conducted our audits of these financial statements in accordance with the standards of the PCAOB. Those standards require that we plan and perform the audit to obtain reasonable assurance about whether the financial statements are free of material misstatement, whether due to error or fraud.
Our audits included performing procedures to assess the risks of material misstatement of the financial statements, whether due to error or fraud, and performing procedures that respond to those risks. Such procedures included examining, on a test basis, evidence regarding the amounts and disclosures in the financial statements. Our audits also included evaluating the accounting principles used and significant estimates made by management, as well as evaluating the overall presentation of the financial statements. Our procedures included confirmation of securities owned as of December 31, 2020 by correspondence with the custodian, transfer agent and brokers; when replies were not received from brokers, we performed other auditing procedures. We believe that our audits provide a reasonable basis for our opinion.
/s/ PricewaterhouseCoopers LLP
New York, New York
February 12, 2021
We have served as the auditor of one or more investment companies in the JPMorgan Funds complex since 1993.
| | | | | | | | | | |
| | | | | |
| DECEMBER 31, 2020 | | JPMORGAN INSURANCE TRUST | | | | | | | | 49 |
TRUSTEES
(Unaudited)
The Portfolio’s Statement of Additional Information includes additional information about the Portfolio’s Trustees and is available, without charge, upon request by calling 1-800-480-4111 or on the J.P. Morgan Funds’ website at www.jpmorganfunds.com.
| | | | | | |
Name (Year of Birth); Positions With the Portfolio (1) | | Principal Occupation During Past 5 Years | | Number of
Portfolios in Fund
Complex Overseen
by Trustee (2) | | Other Directorships Held During the Past 5 Years |
Independent Trustees | | |
| | | |
| John F. Finn (1947); Chairman since 2020; Trustee of Trust since 2005; Trustee of heritage One Group Mutual Funds since 1998. | | Chairman, Gardner, Inc. (supply chain management company serving industrial and consumer markets) (serving in various roles 1974-present). | | 128 | | Director, Greif, Inc. (GEF) (industrial package products and services) (2007-present); Trustee, Columbus Association for the Performing Arts (1988-present); Director, Cardinal Health, Inc. (CAH) (1994-2014). |
| | | |
| Stephen P. Fisher (1959); Trustee of Trust since 2018. | | Retired; Chairman and Chief Executive Officer, NYLIFE Distributors LLC (registered broker-dealer) (serving in various roles 2008-2013); Chairman, NYLIM Service Company LLC (transfer agent) (2008-2017); New York Life Investment Management LLC (registered investment adviser) (serving in various roles 2005-2017); Chairman, IndexIQ Advisors LLC (registered investment adviser for ETFs) (2014-2017); President, MainStay VP Funds Trust (2007-2017), MainStay DefinedTerm Municipal Opportunities Fund (2011-2017) and MainStay Funds Trust (2007-2017) (registered investment companies). | | 128 | | Honors Program Advisory Board Member, The Zicklin School of Business, Baruch College, The City University of New York (2017-present). |
| | | |
| Kathleen M. Gallagher (1958); Trustee of Trust since 2018. | | Retired; Chief Investment Officer — Benefit Plans, Ford Motor Company (serving in various roles 1985-2016). | | 128 | | Non-Executive Director, Legal & General Investment Management (Holdings) (2018-present); Non-Executive Director, Legal & General Investment Management America (financial services and insurance) (2017-present); Advisory Board Member, Fiduciary Solutions, State Street Global Advisors (2017-present); Member, Client Advisory Council, Financial Engines, LLC (registered investment adviser) (2011-2016); Director, Ford Pension Funds Investment Management Ltd. (2007-2016). |
| | | |
| Dennis P. Harrington* (1950); Trustee of Trust since 2017. | | Retired; Partner, Deloitte LLP (accounting firm) (serving in various roles 1984-2012). | | 128 | | None |
| | | |
| Frankie D. Hughes (1952); Trustee of Trust since 2008. | | President, Ashland Hughes Properties (property management) (2014-present); President and Chief Investment Officer, Hughes Capital Management, Inc. (fixed income asset management) (1993-2014). | | 128 | | None |
| | | | | | | | | | |
| | | | | |
| 50 | | | | | | | | JPMORGAN INSURANCE TRUST | | DECEMBER 31, 2020 |
| | | | | | |
Name (Year of Birth); Positions With the Portfolio (1) | | Principal Occupation During Past 5 Years | | Number of
Portfolios in Fund
Complex Overseen
by Trustee (2) | | Other Directorships Held During the Past 5 Years |
Independent Trustees (continued) | | |
| | | |
Raymond Kanner** (1953); Trustee of Trust since 2017. | | Retired; Managing Director & Chief Investment Officer, IBM Retirement Funds (2007-2016). | | 128 | | Advisory Board Member, Penso Advisors LLC (2020-present); Advisory Board Member, Los Angeles Capital (2018-present); Advisory Board Member, State Street Global Advisors Fiduciary Solutions Board (2017-present); Acting Executive Director, Committee on Investment of Employee Benefit Assets (CIEBA) (2016-2017); Advisory Board Member, Betterment for Business (robo advisor) (2016-2017); Advisory Board Member, BlueStar Indexes (index creator) (2013-2017); Director, Emerging Markets Growth Fund (registered investment company) (1997-2016); Member, Russell Index Client Advisory Board (2001-2015). |
| | | |
| Peter C. Marshall (1942); Trustee of Trust since 2005; Trustee of heritage One Group Mutual Funds since 1985. (3) | | Self-employed business consultant
(2002-present). | | 128 | | None |
| | | |
| Mary E. Martinez (1960); Trustee of Trust since 2013. | | Associate, Special Properties, a Christie’s International Real Estate Affiliate (2010-present); Managing Director, Bank of America (Asset Management) (2007-2008); Chief Operating Officer, U.S. Trust Asset Management, U.S. Trust Company (asset management) (2003-2007); President, Excelsior Funds (registered investment companies) (2004-2005). | | 128 | | None |
| | | |
| Marilyn McCoy (1948); Trustee of Trust since 2005; Trustee of heritage One Group Mutual Funds since 1999. | | Vice President of Administration and Planning, Northwestern University (1985-present). | | 128 | | None |
| | | |
| Mitchell M. Merin (1953); Trustee of Trust since 2013. (4) | | Retired; President and Chief Operating Officer, Morgan Stanley Investment Management, Member, Morgan Stanley & Co. Management Committee (serving in various roles 1981-2006). | | 128 | | Director, Sun Life Financial (SLF) (financial services and insurance) (2007-2013). |
| | | |
| Dr. Robert A. Oden, Jr. (1946); Trustee of Trust since 2005; Trustee of heritage One Group Mutual Funds since 1997. | | Retired; President, Carleton College (2002-2010); President, Kenyon College (1995-2002). | | 128 | | Trustee and Vice Chair, Trout Unlimited (2017-present); Trustee, American Museum of Fly Fishing (2013-present); Vice Chair, Dartmouth-Hitchcock Medical Center (2011-present); Trustee, American University in Cairo (1999-2014). |
| | | | | | | | | | |
| | | | | |
| DECEMBER 31, 2020 | | JPMORGAN INSURANCE TRUST | | | | | | | | 51 |
TRUSTEES
(Unaudited) (continued)
| | | | | | |
Name (Year of Birth); Positions With the Portfolio (1) | | Principal Occupation During Past 5 Years | | Number of
Portfolios in Fund
Complex Overseen
by Trustee (2) | | Other Directorships Held During the Past 5 Years |
| | | |
| Marian U. Pardo*** (1946); Trustee of Trust since 2013. | | Managing Director and Founder, Virtual Capital Management LLC (investment consulting) (2007-present); Managing Director, Credit Suisse Asset Management (portfolio manager) (2003-2006). | | 128 | | President and Member, Board of Governors, Columbus Citizens Foundation (not-for-profit supporting philanthropic and cultural programs) (2006-present). |
| (1) | The Trustees serve for an indefinite term, subject to the Trust’s current retirement policy, which is age 78 for all Trustees. |
| (2) | A Fund Complex means two or more registered investment companies that hold themselves out to investors as related companies for purposes of investment and investor services or have a common investment adviser or have an investment adviser that is an affiliated person of the investment adviser of any of the other registered investment companies. The J.P. Morgan Funds Complex for which the Board of Trustees serves currently includes ten registered investment companies (128 funds). |
| (3) | Mr. Marshall retired from the Board of Trustees effective the close of business on December 31, 2020. |
| (4) | Mr. Merin retired from the Board of Trustees effective the close of business on January 31, 2021. |
| * | Two family members of Mr. Harrington are partner and managing director, respectively, of the Portfolio’s independent registered public accounting firm. Such firm has represented to the Board that those family members are not involved in the audit of the Portfolio’s financial statements and do not provide other services to the Portfolio. The Board has concluded that such association does not interfere with Mr. Harrington’s exercise of independent judgment as an Independent Trustee. |
| ** | A family member of Mr. Kanner is employed by JPMorgan Chase Bank, which is affiliated with JPMIM and JPMDS. In that capacity, this employee provides services to various JPMorgan affiliates including JPMIM and JPMDS and for which JPMIM and JPMDS bear some portion of the expense thereof. |
| *** | In connection with prior employment with JPMorgan Chase, Ms. Pardo was the recipient of non-qualified pension plan payments from JPMorgan Chase in the amount of approximately $2,055 per month, which she irrevocably waived effective January 1, 2013, and deferred compensation payments from JPMorgan Chase in the amount of approximately $7,294 per year, which ended in January 2013. In addition, Ms. Pardo receives payments from a fully-funded qualified plan, which is not an obligation of JPMorgan Chase. |
The contact address for each of the Trustees is 277 Park Avenue, New York, NY 10172.
| | | | | | | | | | |
| | | | | |
| 52 | | | | | | | | JPMORGAN INSURANCE TRUST | | DECEMBER 31, 2020 |
OFFICERS
(Unaudited)
| | |
Name (Year of Birth), Positions Held with the Trust (Since) | | Principal Occupations During Past 5 Years |
| |
Brian S. Shlissel (1964),
President and Principal Executive Officer (2016)* | | Managing Director and Chief Administrative Officer for J.P. Morgan pooled vehicles, J.P. Morgan Investment Management Inc. (formerly JPMorgan Funds Management, Inc.) (from 2014 to present); Managing Director and Head of Mutual Fund Services, Allianz Global Investors; President and Chief Executive Officer, Allianz Global Investors Mutual Funds and PIMCO Closed-End Funds (from 1999 to 2014). |
| |
Timothy J. Clemens (1975), Treasurer and Principal Financial Officer (2018)** | | Executive Director, J.P. Morgan Investment Management Inc. (formerly JPMorgan Funds Management, Inc.) since February 2016; Vice President, JPMorgan Funds Management, Inc. from October 2013 to January 2016. |
| |
Gregory S. Samuels (1980),
Secretary (2019) (formerly Assistant Secretary since 2010)** | | Executive Director and Assistant General Counsel, JPMorgan Chase. Mr. Samuels has been with JPMorgan Chase since 2010. |
| |
Stephen M. Ungerman (1953),
Chief Compliance Officer (2005) | | Managing Director, JPMorgan Chase & Co.; Mr. Ungerman has been with JPMorgan Chase & Co. since 2000. |
| |
Elizabeth A. Davin (1964), Assistant Secretary (2005)*** | | Executive Director and Assistant General Counsel, JPMorgan Chase since February 2012; formerly Vice President and Assistant General Counsel, JPMorgan Chase from 2005 to February 2012; Senior Counsel, JPMorgan Chase (formerly Bank One Corporation) from 2004 to 2005. |
| |
Jessica K. Ditullio (1962),
Assistant Secretary (2005)*** | | Executive Director and Assistant General Counsel, JPMorgan Chase. Ms. Ditullio has been with JPMorgan Chase (formerly Bank One Corporation) since 1990. |
| |
Anthony Geron (1971),
Assistant Secretary (2018)** | | Vice President and Assistant General Counsel, JPMorgan Chase since September 2018; Lead Director and Counsel, AXA Equitable Life Insurance Company from 2015 to 2018 and Senior Director and Counsel, AXA Equitable Life Insurance Company from 2014 to 2015. |
| |
Carmine Lekstutis (1980),
Assistant Secretary (2011)** | | Executive Director and Assistant General Counsel, JPMorgan Chase. Mr. Lekstutis has been with JPMorgan Chase since 2011. |
| |
Zachary E. Vonnegut-Gabovitch (1986), Assistant Secretary (2017)** | | Vice President and Assistant General Counsel, JPMorgan Chase since September 2016; Associate, Morgan, Lewis & Bockius (law firm) from 2012 to 2016. |
| |
Michael M. D’Ambrosio (1969),
Assistant Treasurer (2012) | | Managing Director, J.P. Morgan Investment Management Inc. (formerly JPMorgan Funds Management, Inc.). Mr. D’Ambrosio has been with J.P. Morgan Investment Management Inc. since 2012. |
| |
Aleksandr Fleytekh (1972), Assistant Treasurer (2019)** | | Vice President, J.P. Morgan Investment Management Inc. (formerly JPMorgan Funds Management, Inc.) since February 2012. |
| |
Shannon Gaines (1977),
Assistant Treasurer (2018)*** | | Vice President, J.P. Morgan Investment Management Inc. (formerly JPMorgan Funds Management, Inc.) since January 2014. |
| |
Jeffrey D. House (1972), Assistant Treasurer (2017)*** | | Vice President, J.P. Morgan Investment Management Inc. (formerly JPMorgan Funds Management, Inc.) since July 2006. |
| |
Michael Mannarino (1985),
Assistant Treasurer (2020) | | Vice President, J.P. Morgan Investment Management Inc. (formerly JPMorgan Funds Management, Inc.) since 2014. |
| |
Joseph Parascondola (1963),
Assistant Treasurer (2011)* | | Executive Director, J.P. Morgan Investment Management, Inc. since February 2020, formerly Vice President, J.P. Morgan Investment Management Inc. (formerly JPMorgan Funds Management, Inc.) from August 2006 to January 2020. |
| |
Gillian I. Sands (1969),
Assistant Treasurer (2012)** | | Vice President, J.P. Morgan Investment Management Inc. (formerly JPMorgan Funds Management, Inc.) since September 2012. |
The contact address for each of the officers, unless otherwise noted, is 277 Park Avenue, New York, NY 10172.
| * | The contact address for the officer is 575 Washington Boulevard, Jersey City, NJ 07310. |
| ** | The contact address for the officer is 4 New York Plaza, New York, NY 10004. |
| *** | The contact address for the officer is 1111 Polaris Parkway, Columbus, OH 43240. |
| | | | | | | | | | |
| | | | | |
| DECEMBER 31, 2020 | | JPMORGAN INSURANCE TRUST | | | | | | | | 53 |
SCHEDULE OF SHAREHOLDER EXPENSES
(Unaudited)
Hypothetical $1,000 Investment
As a shareholder of the Portfolio, you incur ongoing costs, including investment advisory fees, administration fees, distribution fees (for Class 2 Shares) and other Portfolio expenses. Because the Portfolio is a funding vehicle for Policies and Eligible Plans, you may also incur sales charges and other fees relating to the Policies or Eligible Plans. The examples below are intended to help you understand your ongoing costs (in dollars) of investing in the Portfolio, but not the costs of the Policies or Eligible Plans, and to compare these ongoing costs with the ongoing costs of investing in other mutual funds. The examples assume that you had a $1,000 investment in each Class at the beginning of the reporting period, July 1, 2020, and continued to hold your shares at the end of the reporting period, December 31, 2020.
Actual Expenses
For each Class of the Portfolio in the table below, the first line provides information about actual account values and actual expenses. You may use the information in this line, together with the amount you invested, to estimate the expenses that you paid over the period. Simply divide your account value by $1,000 (for example, an $8,600 account value divided by $1,000 = 8.6), then multiply the result by the number in the first line of each Class under the heading titled “Expenses Paid During the Period” to estimate the expenses you paid on your account during this period.
Hypothetical Example for Comparison Purposes
The second line of each Class in the table below provides information about hypothetical account values and hypothetical expenses based on the Class’ actual expense ratio and an assumed rate of return of 5% per year before expenses, which is not the Class’ actual return. The hypothetical account values and expenses may not be used to estimate the actual ending account balance or expenses you paid for the period. You may use this information to compare the ongoing costs of investing in the Class of the Portfolio and other funds. To do so, compare this 5% hypothetical example with the 5% hypothetical examples that appear in the shareholder reports of the other funds. Please note that the expenses shown in the table are meant to highlight your ongoing costs only and do not reflect any transaction costs, such as sales charges (loads) or redemption fees or the costs associated with the Policies and Eligible Plans through which the Portfolio is held. Therefore, the second line for each Class in the table is useful in comparing ongoing costs only, and will not help you determine the relative total costs of owning different funds. In addition, if these transaction costs were included, your costs would have been higher. The examples also assume all dividends and distributions have been reinvested.
| | | | | | | | | | | | | | | | |
| | | Beginning
Account Value
July 1, 2020 | | | Ending
Account Value
December 31, 2020 | | | Expenses
Paid During
the Period* | | | Annualized
Expense
Ratio | |
JPMorgan Insurance Trust Core Bond Portfolio | | | | | | | | | | | | | | | | |
Class 1 | | | | | | | | | | | | | | | | |
Actual | | $ | 1,000.00 | | | $ | 1,021.50 | | | $ | 2.59 | | | | 0.51 | % |
Hypothetical | | | 1,000.00 | | | | 1,022.57 | | | | 2.59 | | | | 0.51 | |
Class 2 | | | | | | | | | | | | | | | | |
Actual | | | 1,000.00 | | | | 1,020.00 | | | | 3.86 | | | | 0.76 | |
Hypothetical | | | 1,000.00 | | | | 1,021.32 | | | | 3.86 | | | | 0.76 | |
| * | Expenses are equal to each Class' respective annualized expense ratio, multiplied by the average account value over the period, multiplied by 184/366 (to reflect the one-half year period). |
| | | | | | | | | | |
| | | | | |
| 54 | | | | | | | | JPMORGAN INSURANCE TRUST | | DECEMBER 31, 2020 |
BOARD APPROVAL OF INVESTMENT ADVISORY AGREEMENT
(Unaudited)
The Board of Trustees has established various standing committees composed of Trustees with diverse backgrounds, to which the Board of Trustees has assigned specific subject matter responsibilities to further enhance the effectiveness of the Board’s oversight and decision making. The Board of Trustees and its investment committees (money market and alternative products, equity, and fixed income) meet regularly throughout the year and consider factors that are relevant to their annual consideration of investment advisory agreements at each meeting. They also meet for the specific purpose of considering investment advisory agreement annual renewals. The Board of Trustees held meetings in June and August 2020, at which the Trustees considered the continuation of the investment advisory agreement for the Portfolio whose annual report is contained herein (the “Advisory Agreement”). In accordance with SEC guidance, due to the COVID-19 pandemic, the meetings were conducted through video conference. At the June meeting, the Board’s investment committees met to review and consider performance, expense and related information for the J.P. Morgan Funds. Each investment committee reported to the full Board, which then considered the investment committee’s preliminary findings. At the August meeting, the Trustees continued their review and consideration. The Trustees, including a majority of the Trustees who are not parties to the Advisory Agreement or “interested persons” (as defined in the 1940 Act) of any party to the Advisory Agreement or any of their affiliates, approved the continuation of the Advisory Agreement on August 11, 2020.
As part of their review of the Advisory Agreement, the Trustees considered and reviewed performance and other information about the Portfolio received from the Adviser. This information includes the Portfolio’s performance as compared to the performance of its peers and benchmarks and analyses by the Adviser of the Portfolio’s performance. In addition, at each of their regular meetings throughout the year, the Trustees considered reports on the performance of certain J.P. Morgan Funds provided by an independent management consulting firm (“independent consultant”). In addition, in preparation for the June and August meetings, the Trustees requested, received and evaluated extensive materials from the Adviser, including performance and expense information compiled by Broadridge, using data from Lipper Inc. and/or Morningstar Inc., independent providers of investment company data (together, “Broadridge”). Before voting on the Advisory Agreement, the Trustees reviewed the Advisory Agreement with representatives of the Adviser, counsel to the Trust and independent legal counsel and received a memorandum from independent legal counsel to the Trustees discussing the legal standards for their consideration of the Advisory Agreement. The Trustees also discussed the Advisory Agreement in executive sessions with independent legal counsel at which no representatives of the Adviser were present.
A summary of the material factors evaluated by the Trustees in determining whether to approve the Advisory Agreement is provided below. Each Trustee attributed different weights to the various factors and no factor alone was considered determinative. The Trustees considered information provided with respect to the Portfolio throughout the year, including additional reporting and information provided in connection with the market volatility caused by the COVID-19 pandemic, as well as materials furnished specifically in connection with the annual review process. From year to year, the Trustees consider and place emphasis on relevant information in light of changing circumstances in market and economic conditions.
After considering and weighing the factors and information they had received, the Trustees found that the compensation to be received by the Adviser from the Portfolio under the Advisory Agreement was fair and reasonable under the circumstances and determined that the continuance of the Advisory Agreement was in the best interests of the Portfolio and its shareholders.
Nature, Extent and Quality of Services Provided by the Adviser
The Trustees received and considered information regarding the nature, extent and quality of services provided to the Portfolio under the Advisory Agreement. The Trustees took into account information furnished throughout the year at Trustee meetings, as well as the materials furnished specifically in connection with this annual review process. The Trustees considered the background and experience of the Adviser’s senior management, personnel changes, if any, and the expertise of, and the amount of attention given to the Portfolio by, investment personnel of the Adviser. In addition, the Trustees reviewed the qualifications, backgrounds and responsibilities of the portfolio management team primarily responsible for the day-to-day management of the Portfolio and the infrastructure supporting the team, including personnel changes, if any. In addition, the Board considered its discussions with the Adviser regarding the Adviser’s business continuity plan and steps the Adviser was taking to provide ongoing services to the Portfolio during the COVID-19 pandemic, and the Adviser’s success in continuing to provide services to the Portfolio and their shareholders throughout this period. The Trustees also considered information provided by the Adviser and JPMorgan Distribution Services, Inc. (“JPMDS”) about the structure and distribution strategy of the Portfolio. The Trustees reviewed information relating to the Adviser’s risk governance model and reports showing the Adviser’s compliance structure and ongoing compliance processes. The Trustees also considered the quality of the administration services provided by the Adviser in its role as administrator.
The Trustees also considered their knowledge of the nature and quality of services provided by the Adviser and its affiliates to the Portfolio gained from their experience as Trustees of the
| | | | | | | | | | |
| | | | | |
| DECEMBER 31, 2020 | | JPMORGAN INSURANCE TRUST | | | | | | | | 55 |
BOARD APPROVAL OF INVESTMENT ADVISORY AGREEMENT
(Unaudited) (continued)
J.P. Morgan Funds. In addition, they considered the overall reputation and capabilities of the Adviser and its affiliates, the commitment of the Adviser to provide high quality service to the Portfolio, their overall confidence in the Adviser’s integrity and the Adviser’s responsiveness to questions or concerns raised by them, including the Adviser’s willingness to consider and implement organizational and operational changes designed to improve investment results and the services provided to the Portfolio.
Based upon these considerations and other factors, the Trustees concluded that they were satisfied with the nature, extent and quality of the investment advisory services provided to the Portfolio by the Adviser.
Costs of Services Provided and Profitability to the Adviser and its Affiliates
The Trustees received and considered information regarding the profitability to the Adviser and its affiliates in providing services to the Portfolio. The Trustees reviewed and discussed this information. The Trustees recognized that this information is not audited and represents the Adviser’s determination of its and its affiliates’ revenues from the contractual services provided to the Portfolio, less expenses of providing such services. Expenses include direct and indirect costs and are calculated using an allocation methodology developed by the Adviser. The Trustees also recognized that it is difficult to make comparisons of profitability from fund investment advisory contracts because comparative information is not generally publicly available and is affected by numerous factors, including the structure of the particular adviser, the types of funds it manages, its business mix, numerous assumptions regarding allocations and the fact that publicly-traded fund managers’ operating profits and net income are net of distribution and marketing expenses. Based upon their review, and taking into consideration the factors noted above, the Trustees concluded that the profitability to the Adviser under the Advisory Agreement was not unreasonable in light of the services and benefits provided to the Portfolio.
The Trustees also considered that the Adviser earns fees from the Portfolio for providing administration services. These fees were shown separately in the profitability analysis presented to the Trustees. The Trustees also considered the payments of Rule 12b-1 fees to JPMDS, an affiliate of the Adviser, which also acts as the Portfolio’s distributor and that these fees are in turn generally paid to financial intermediaries that sell the Portfolio, including financial intermediaries that are affiliates of the Adviser (although they are retained by JPMDS in certain instances). The Trustees also considered the fees paid to JPMorgan Chase Bank, N.A. (“JPMCB”) for custody and fund accounting and other related services.
Fall-Out Benefits
The Trustees reviewed information regarding potential “fall-out” or ancillary benefits received by the Adviser and its affiliates as a result of their relationship with the Portfolio. The Trustees considered that the J.P. Morgan Funds’ operating accounts are held at JPMCB, which, as a result, will receive float benefits for certain J.P. Morgan Funds, as applicable. The Trustees also noted that the Adviser supports a diverse set of products and services, which benefits the Adviser by allowing it to leverage its infrastructure to serve additional clients, including benefits that may be received by the Adviser and its affiliates in connection with the Portfolio’s potential investments in other funds advised by the Adviser. The Trustees also reviewed the Adviser’s allocation of fund brokerage for the J.P. Morgan Funds complex, including allocations to brokers who provide research to the Adviser.
Economies of Scale
The Trustees considered the extent to which the Portfolio may benefit from economies of scale. The Trustees considered that there may not be a direct relationship between economies of scale realized by the Portfolio and those realized by the Adviser as assets increase. The Trustees considered the extent to which the Portfolio was priced to scale and whether it would be appropriate to add advisory fee breakpoints, but noted that the Portfolio has implemented fee waivers and contractual expense limitations (“Fee Caps”) which allow the Portfolio’s shareholders to share potential economies of scale from its inception and that the fees remain satisfactory relative to peer funds. The Trustees considered the benefits to the Portfolio of the use of an affiliated distributor and custodian, including the ability to rely on existing infrastructure supporting distribution, custodial and transfer agent services, and the ability to negotiate competitive fees for the Portfolio. The Trustees further considered the Adviser’s and JPMDS’s ongoing investments in their business in support of the Portfolio, including the Adviser’s and/or JPMDS’s investments in trading systems, technology (including improvements to the J.P. Morgan Funds’ website, and cybersecurity improvements), retention of key talent, and regulatory support enhancements. The Trustees concluded that the current fee structure for the Portfolio, including Fee Caps that the Adviser has in place that serve to limit the overall net expense ratios of the Portfolio at competitive levels, was reasonable. The Trustees concluded that the Portfolio’s shareholders received the benefits of potential economies of scale through the Fee Caps and the Adviser’s reinvestment in its operations to serve the Portfolio and its shareholders. The Trustees noted that the Adviser’s reinvestment ensures sufficient resources in terms of personnel and infrastructure to support the Portfolio.
| | | | | | | | | | |
| | | | | |
| 56 | | | | | | | | JPMORGAN INSURANCE TRUST | | DECEMBER 31, 2020 |
Independent Written Evaluation of the Portfolio’s Chief Compliance Officer
The Trustees noted that, upon their direction, the Chief Compliance Officer for the Portfolio had prepared an independent written evaluation in order to assist the Trustees in determining the reasonableness of the proposed management fees. The Trustees considered the written evaluation in determining whether to continue the Advisory Agreement.
Fees Relative to Adviser’s Other Clients
The Trustees received and considered information about the nature and extent of investment advisory services and fee rates offered to other clients of the Adviser, including institutional separate accounts, collective investment trusts, ETFs and/or funds sub-advised by the Adviser, for investment management styles substantially similar to that of the Portfolio. The Trustees considered the complexity of investment management for registered mutual funds relative to the Adviser’s other clients and noted differences, as applicable, in the regulatory, legal and other risks and responsibilities of providing services to the different clients. The Trustees considered that serving as an adviser to a registered mutual fund involves greater responsibilities and risks than acting as a sub-adviser and observed that sub-advisory fees may be lower than those charged by the Adviser to the Portfolio. The Trustees also noted that the adviser, not the mutual fund, pays the sub-advisory fee and that many responsibilities related to the advisory function are retained by the primary adviser. The Trustees concluded that the fee rates charged to the Portfolio in comparison to those charged to the Adviser’s other clients were reasonable.
Investment Performance
The Trustees received and considered absolute and/or relative performance information for the Portfolio in a report prepared by Broadridge. The Trustees considered the total return performance information, which included the ranking of the Portfolio within a performance universe made up of funds with the same Broadridge investment classification and objective (the “Universe”), as well as a subset of funds within the Universe (the “Peer Group”), by total return for the applicable one-, three- and five-year periods. The Trustees reviewed a description of Broadridge’s methodology for selecting mutual funds in the Portfolio’s Universe and Peer Group and noted that Universe and Peer Group rankings were not calculated if the number of funds in the Universe and/or Peer Group did not meet a predetermined minimum. The Broadridge materials provided to the Trustees highlighted information with respect to a representative class to assist the Trustees in their review. As part of this review, the Trustees also reviewed the Portfolio’s performance against its benchmark and considered the
performance information provided for the Portfolio at regular Board meetings by the Adviser. The Trustees also engaged with the Adviser to consider what steps might be taken to improve performance, as applicable. The Broadridge performance data noted by the Trustees as part of their review and the determinations made by the Trustees with respect to the Portfolio’s performance are summarized below:
The Trustees noted that the Portfolio’s performance for Class 1 shares was in the fourth, third and fourth quintiles, based upon the Peer Group, and in the fourth, third and third quintiles, based upon the Universe, for the one-, three- and five-year periods ended December 31, 2019, respectively. The Trustees discussed the performance and investment strategy of the Portfolio with the Adviser and based upon this discussion and various other factors, concluded that the Portfolio’s performance was satisfactory under the circumstances.
Advisory Fees and Expense Ratios
The Trustees considered the contractual advisory fee rate and administration fee rate paid by the Portfolio to the Adviser and compared the combined rate to the information prepared by Broadridge concerning management fee rates paid by other funds in the same Broadridge category as the Portfolio. The Trustees recognized that Broadridge reported the Portfolio’s management fee rate as the combined contractual advisory fee and administration fee rates. The Trustees also reviewed information about other expenses and the expense ratios for the Portfolio and noted that Universe and Peer Group rankings were not calculated if the number of funds in the Universe and/or Peer Groups did not meet a predetermined minimum. The Trustees considered the Fee Caps currently in place for the Portfolio, the net advisory fee rate after taking into account any waivers and/or reimbursements, and, where deemed appropriate by the Trustees, additional waivers and/or reimbursements. The Trustees recognized that it is difficult to make comparisons of advisory fees because there are variations in the services that are included in the fees paid by other funds. The Trustees’ determinations as a result of the review of the Portfolio’s advisory fees and expense ratios are summarized below:
The Trustees noted that the Portfolio’s net advisory fee for Class 1 shares was in the third quintile based upon both the Peer Group and Universe, and that the actual total expenses for Class 1 shares were in the fourth quintile based upon both the Peer Group and Universe. After considering the factors identified above, in light of this information, the Trustees concluded that the advisory fee was satisfactory in light of the services provided to the Portfolio.
| | | | | | | | | | |
| | | | | |
| DECEMBER 31, 2020 | | JPMORGAN INSURANCE TRUST | | | | | | | | 57 |
J.P. Morgan Funds are distributed by JPMorgan Distribution Services, Inc., which is an affiliate of JPMorgan Chase & Co. Affiliates of JPMorgan Chase & Co. receive fees for providing various services to the funds.
Contact JPMorgan Distribution Services, Inc. at 1-800-480-4111 for a portfolio prospectus. You can also visit us at www.jpmorganfunds.com. Investors should carefully consider the investment objectives and risk as well as charges and expenses of the mutual fund before investing. The prospectus contains this and other information about the mutual fund. Read the prospectus carefully before investing.
The Portfolio files a complete schedule of its portfolio holdings for the first and third quarters of its fiscal year with the SEC as an exhibit to its report on Form N-PORT. The Portfolio’s Form N-PORT reports are available on the SEC’s website at http://www.sec.gov. The Portfolio’s quarterly holdings can be found by visiting the J.P. Morgan Funds’ website at www.jpmorganfunds.com.
A description of the Portfolio’s policies and procedures with respect to the disclosure of the Portfolio’s holdings is available in the prospectuses and Statement of Additional Information.
A copy of proxy policies and procedures is available without charge upon request by calling 1-800-480-4111 and on the Portfolio’s website at www.jpmorganfunds.com. A description of such policies and procedures is on the SEC’s website at www.sec.gov. The Trustees have delegated the authority to vote proxies for securities owned by the Portfolio to the Adviser. A copy of the Portfolio’s voting record for the most recent 12-month period ended June 30 is available on the SEC’s website at www.sec.gov or at the Portfolio’s website at www.jpmorganfunds.com no later than August 31 of each year. The Portfolio’s proxy voting record will include, among other things, a brief description of the matter voted on for each portfolio security, and will state how each vote was cast, for example, for or against the proposal.


J.P. Morgan Asset Management is the brand name for the asset management business of JPMorgan Chase & Co. and its affiliates worldwide.
| | | | |
| | © JPMorgan Chase & Co., 2020. All rights reserved. December 2020. | | AN-JPMITCBP-1220 |
Annual Report
JPMorgan Insurance Trust
December 31, 2020
JPMorgan Insurance Trust Mid Cap Value Portfolio
| | | | |
NOT FDIC INSURED • NO BANK GUARANTEE • MAY LOSE VALUE
| | |  | |
CONTENTS
Investments in the Portfolio are not deposits or obligations of, or guaranteed or endorsed by, any bank and are not insured or guaranteed by the FDIC, the Federal Reserve Board or any other government agency. You could lose money if you sell when the Portfolio’s share price is lower than when you invested.
Past performance is no guarantee of future performance. The general market views expressed in this report are opinions based on market and other conditions through the end of the reporting period and are subject to change without notice. These views are not intended to predict the future performance of the Portfolio or the securities markets. References to specific securities and their issuers are for illustrative purposes only and are not intended to be, and should not be interpreted as, recommendations to purchase or sell such securities. Such views are not meant as investment advice and may not be relied on as an indication of trading intent on behalf of the Portfolio.
This Portfolio is intended to be a funding vehicle for variable annuity contracts and variable life insurance policies (collectively “Policies”) offered by the separate accounts of various insurance companies. Portfolio shares may also be offered to qualified pension and retirement plans and accounts permitting accumulation of assets on a tax-deferred basis (“Eligible Plans”). Individuals may not purchase shares directly from the Portfolio.
Prospective investors should refer to the Portfolio’s prospectus for a discussion of the Portfolio’s investment objective, strategies and risks. Call J.P. Morgan Funds Service Center at 1-800-480-4111 for a prospectus containing more complete information about the Portfolio, including management fees and other expenses. Please read it carefully before investing.
LETTER TO SHAREHOLDERS
February 4, 2021 (Unaudited)
Dear Shareholders,
The immense efforts of central banks, government and researchers in the public and private sectors appear to have shepherded the world through the most difficult days of a profound crisis caused by the pandemic. While the economic and health care challenges are not behind us, the uncertainty and turbulence of 2020 has abated.
| | |
 | | “We believe the clear lesson is that investors who remained fully invested over the past year, in the face of uncertainty over the direction of the pandemic and the unprecedented responses to it, were likely rewarded for their resolve.” — Andrea L. Lisher |
The development of multiple vaccines against Covid-19 toward the end of 2020 provided hope that the pandemic would be halted and that economic and social activity could begin to resume in the year ahead. That optimism spread to global financial markets. While leading equity indexes fell by 20% or more in the first quarter of 2020, financial markets stabilized and equity markets largely rebounded — slowly at first and then rapidly the second half of the year. At the end of 2020, the S&P 500 Index had generated a total return of 18.10% for the full 12 months and 22.16% for the final six months of the year.
We believe the clear lesson is that investors who remained fully invested over the past year, in the face of uncertainty over the
direction of the pandemic and the unprecedented responses to it, were likely rewarded for their resolve.
Certainly, enormous challenges remain in both the implementation of global vaccinations and in the rebuilding of economies at the local, national and international levels. However, the advances in the fight against Covid-19 provide policymakers and investors with the opportunity to plan for the future and meet those challenges. J.P. Morgan Asset Management has thrived amid the many challenges presented by the pandemic. Moreover, our deep experience in risk management enabled us to better navigate increased volatility in global financial markets. Throughout 2020, we continued to seek to operate under the same fundamental practices and principles that have driven our success for more than a century with an unwavering focus on putting our clients at the center of everything we do.
On behalf of J.P. Morgan Asset Management, thank you for entrusting us to manage your investment. Should you have any questions, please visit www.jpmorganfunds.com or contact the J.P. Morgan Funds Service Center at 1-800-480-4111.
Sincerely yours,

Andrea L. Lisher
Head of Americas, Client
J.P. Morgan Asset Management
| | | | | | | | | | |
| | | | | |
| DECEMBER 31, 2020 | | JPMORGAN INSURANCE TRUST | | | | | | | | 1 |
JPMorgan Insurance Trust Mid Cap Value Portfolio
PORTFOLIO COMMENTARY
TWELVE MONTHS ENDED DECEMBER 31, 2020 (Unaudited)
| | | | |
| REPORTING PERIOD RETURN: | |
| Portfolio (Class 1 Shares)* | | | 0.37% | |
| Russell Midcap Value Index | | | 4.96% | |
| |
| Net Assets as of 12/31/2020 (In Thousands) | | $ | 447,529 | |
INVESTMENT OBJECTIVE**
The JPMorgan Insurance Trust Mid Cap Value Portfolio (the “Portfolio”) seeks capital appreciation with the secondary goal of achieving current income by investing primarily in equity securities.
HOW DID THE MARKET PERFORM?
Global financial markets generally recovered from a sharp sell-off in the first quarter of 2020, led by a rally in equity markets in the second half of the year. Investor demand for equity was largely fueled by continued support from central banks, relief spending by governments across the globe and the development and approvals of the first vaccines against Covid-19.
In the first days of January 2020, financial markets largely shrugged off a brief flare-up in military tensions between the U.S. and Iran. However, the emergence and spread of Covid-19 fed increasing investor uncertainty and by early March, the novel coronavirus was declared a pandemic by the World Health Organization. The closure of large sectors of national economies on a global scale sparked a dramatic sell-off in financial markets. Yields on developed market sovereign bonds fell sharply and prices for commodity gold spiked. By the end of the first quarter of 2020, leading developed market equity indexes had lost 20% or more of their value from the start of the year. Corporate bond prices fell and the price of crude oil ended the first quarter down by 60%.
Leading central banks promptly responded with lower interest rates and/or asset purchasing programs, which helped to support asset price stability and head off a potential liquidity crunch in credit markets. Governments also responded with a range of fiscal stimulus or paycheck protection programs designed to cushion the economic impact of the pandemic. In the ensuing months, global equity markets staged a slow and uneven rebound, led by U.S. and emerging markets.
At the start of the second half of the year, U.S. equity led a broad rebound in both developed markets and emerging markets equity. Leading U.S. equity indexes rose in July and August 2020, punctuated by five consecutive record high closings for the S&P 500 in late August — a stretch not seen since 2017. Notably, Apple Inc. issued a 4-for-1 stock split in August and became the first publicly listed company with a valuation surpassing $2 trillion. The U.S. Federal Reserve (the “Fed”) signaled its continued support for asset purchases and low benchmark interest rates. While the spread of Covid-19 accelerated in the
U.S., multiple candidate vaccines were being developed around the world and the number of hospitalizations at the end of the summer was relatively small compared with what was to come at the end of the year.
Equity prices across the globe largely declined over September and October 2020. Re-closings across Asia and Europe in response to Covid-19 dented investor optimism. The inability of the U.S. Congress to adopt further spending for pandemic relief put acute pressure on the S&P 500 in the final week of October.
U.S. equity prices began to rebound in November and by mid-month the S&P 500 reached a closing high and crossed 3,600 points for the first time amid the U.S. Food and Drug Administration’s approval of the first Covid-19 vaccines. While the results of the U.S. presidential election were contested, President-elect Joe Biden’s early cabinet choices — including former Fed Chairwoman Janet Yellen — removed some investor uncertainty. The Fed kept interest rates and policies unchanged and Congressional negotiations over proposed relief and stimulus spending continued through the month.
Globally, equity markets maintained upward momentum through the end of December, largely driven by investor expectations that mass vaccinations and the re-opening of economies would unleash pent up demand from consumers, businesses and governments. Notably, emerging markets equity outperformed developed markets equity, including U.S. equity in the second half of 2020 as China, Taiwan and South Korea appeared to have greater success in containing the pandemic.
In the U.S., growth stocks continued to outperform value stocks but the difference narrowed somewhat during the period as share price valuations rose. Additionally, shares of select companies that had seen their stock prices plummet in the first half of 2020 benefitted from increased investor appetite for bargains in the second half of the year. At year’s end, the largest 10 companies in the S&P 500 made up 27.4% of the index’s value, compared with 22.7% at the end of 2019 and 21.0% at the end of 2018.
WHAT WERE THE MAIN DRIVERS OF THE PORTFOLIO’S PERFORMANCE?
The Portfolio’s Class 1 Shares underperformed the Russell Midcap Value Index (the “Benchmark”) for the twelve months ended December 31, 2020. The Portfolio’s security selection in the real estate and health care sectors was a leading detractor
| | | | | | | | | | |
| | | | | |
| 2 | | | | | | | | JPMORGAN INSURANCE TRUST | | DECEMBER 31, 2020 |
to performance relative to the Benchmark, while the Portfolio’s security selection in the energy and financials sectors was a leading contributor to relative performance.
Leading individual detractors from relative performance included the Portfolio’s underweight positions in Newmont Corp. and Digital Realty Trust Inc. and its overweight position in PVH Corp. Shares of Newmont, a gold mining and processing company not held in the Portfolio, rose due to increased investor demand for commodity gold amid financial market volatility in response to the pandemic. Shares of Digital Realty Trust, a real estate trust operating in the data center sector not held in the Portfolio, rose amid investor expectations for increased demand for data centers in response to office closures during the pandemic. Shares of PVH, a brand-name apparel and accessories company, fell early in the period after the company reported lower-than-expected earnings and revenue for its fiscal first quarter 2020.
Leading individual contributors to relative performance included the Portfolio’s overweight positions in Synopsys Inc., Williams Cos. and T. Rowe Price Group Inc. Shares of Synopsys, a provider of software and consulting to the semiconductor industry, rose after the company reported better-than-expected earnings and revenue for its fiscal fourth quarter. Shares of Williams Cos., a natural gas and petroleum producer, rose amid investor expectations for growth in natural gas demand and a broader rebound in energy prices. Shares of T. Rowe Price Group, provider of mutual funds and other investment services, rose after the company reported better-than-expected earnings and revenue for the third quarter of 2021.
HOW WAS THE PORTFOLIO POSITIONED?
The portfolio managers utilized a bottom-up approach to stock selection and sought to identify durable franchises possessing the ability to generate, in the portfolio managers’ view, sustainable levels of free cash flow. During the reporting period, the Portfolio maintained overweight positions in the financials and real estate sectors, while maintaining underweight positions in the industrials and materials sectors.
| | | | | | | | |
| TOP TEN EQUITY HOLDINGS OF THE PORTFOLIO*** | |
| | 1. | | | Loews Corp. | | | 1.8 | % |
| | 2. | | | Ameriprise Financial, Inc. | | | 1.7 | |
| | 3. | | | Xcel Energy, Inc. | | | 1.6 | |
| | 4. | | | T. Rowe Price Group, Inc. | | | 1.5 | |
| | 5. | | | Zimmer Biomet Holdings, Inc. | | | 1.5 | |
| | 6. | | | Diamondback Energy, Inc. | | | 1.5 | |
| | 7. | | | M&T Bank Corp. | | | 1.5 | |
| | 8. | | | WEC Energy Group, Inc. | | | 1.5 | |
| | 9. | | | Fifth Third Bancorp | | | 1.4 | |
| | 10. | | | ITT, Inc. | | | 1.4 | |
| | | | |
PORTFOLIO COMPOSITION BY SECTOR*** | |
| Financials | | | 22.0 | % |
| Industrials | | | 12.7 | |
| Real Estate | | | 10.6 | |
| Consumer Discretionary | | | 10.4 | |
| Information Technology | | | 9.0 | |
| Utilities | | | 8.1 | |
| Health Care | | | 7.3 | |
| Materials | | | 5.8 | |
| Consumer Staples | | | 4.7 | |
| Communication Services | | | 4.3 | |
| Energy | | | 3.7 | |
| Short-Term Investments | | | 1.4 | |
| * | | The return shown is based on net asset values calculated for shareholder transactions and may differ from the return shown in the financial highlights, which reflects adjustments made to the net asset values in accordance with accounting principles generally accepted in the United States of America. |
| ** | | The adviser seeks to achieve the Portfolio’s objective. There can be no guarantee it will be achieved. |
| *** | | Percentages indicated are based on total investments as of December 31, 2020. The Portfolio’s composition is subject to change. |
| | | | | | | | | | |
| | | | | |
| DECEMBER 31, 2020 | | JPMORGAN INSURANCE TRUST | | | | | | | | 3 |
JPMorgan Insurance Trust Mid Cap Value Portfolio
PORTFOLIO COMMENTARY
TWELVE MONTHS ENDED DECEMBER 31, 2020 (Unaudited) (continued)
| | | | | | | | | | | | | | | | |
AVERAGE ANNUAL TOTAL RETURNS AS OF DECEMBER 31, 2020 | |
| | | | |
| | | INCEPTION DATE OF
CLASS | | | 1 YEAR | | | 5 YEAR | | | 10 YEAR | |
CLASS 1 SHARES | | | September 28, 2001 | | | | 0.37 | % | | | 7.92 | % | | | 10.31 | % |
TEN YEAR PERFORMANCE (12/31/10 TO 12/31/20)
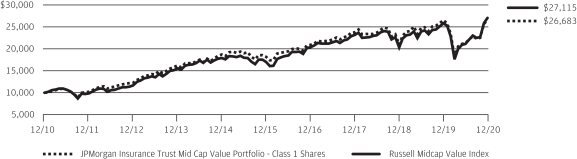
The performance quoted is past performance and is not a guarantee of future results. Mutual funds are subject to certain market risks. Investment returns and principal value of an investment will fluctuate so that an investor’s shares, when redeemed, may be worth more or less than their original cost. Current performance may be higher or lower than the performance data shown. For up-to-date month-end performance information please call 1-800-480-4111.
The graph illustrates comparative performance for $10,000 invested in Class 1 Shares of the JPMorgan Insurance Trust Mid Cap Value Portfolio and the Russell Midcap Value Index from December 31, 2010 to December 31, 2020. The performance of the Portfolio assumes reinvestment of all dividends and capital gain distributions, if any. The performance of the Russell Midcap Value Index does not reflect the deduction of expenses associated with a mutual fund and has been adjusted to reflect reinvestment of all dividends and capital gain distributions of the
securities included in the benchmark, if applicable. The Russell Midcap Value Index is an unmanaged index which measures the performance of those Russell Midcap companies with lower price-to-book ratios and lower forecasted growth values. Investors cannot invest directly in an index.
Portfolio performance does not reflect any charges imposed by the Policies or Eligible Plans. If these charges were included, the returns would be lower than shown. Portfolio performance may reflect the waiver of the Portfolio’s fees and reimbursement of expenses for certain periods. Without these waivers and reimbursements, performance would have been lower.
The returns shown are based on net asset values calculated for shareholder transactions and may differ from the returns shown in the financial highlights, which reflect adjustments made to the net asset values in accordance with accounting principles generally accepted in the United States of America.
| | | | | | | | | | |
| | | | | |
| 4 | | | | | | | | JPMORGAN INSURANCE TRUST | | DECEMBER 31, 2020 |
JPMorgan Insurance Trust Mid Cap Value Portfolio
SCHEDULE OF PORTFOLIO INVESTMENTS
AS OF DECEMBER 31, 2020
| | | | | | | | |
| INVESTMENTS | | SHARES
(000) | | | VALUE
($000) | |
| | | | | | | | |
Common Stocks — 99.1% | | | | | | | | |
|
Airlines — 0.7% | |
| | |
Southwest Airlines Co. | | | 64 | | | | 2,998 | |
| | | | | | | | |
| | |
Auto Components — 0.4% | | | | | | | | |
| | |
BorgWarner, Inc. | | | 45 | | | | 1,744 | |
| | | | | | | | |
| | |
Banks — 8.4% | | | | | | | | |
| | |
Citizens Financial Group, Inc. | | | 156 | | | | 5,589 | |
| | |
Fifth Third Bancorp | | | 234 | | | | 6,454 | |
| | |
First Republic Bank | | | 23 | | | | 3,322 | |
| | |
Huntington Bancshares, Inc. | | | 311 | | | | 3,934 | |
| | |
M&T Bank Corp. | | | 52 | | | | 6,635 | |
| | |
Regions Financial Corp. | | | 314 | | | | 5,058 | |
| | |
TCF Financial Corp. | | | 100 | | | | 3,717 | |
| | |
Zions Bancorp NA | | | 71 | | | | 3,065 | |
| | | | | | | | |
| | |
| | | | | | | 37,774 | |
| | | | | | | | |
| | |
Beverages — 1.7% | | | | | | | | |
| | |
Constellation Brands, Inc., Class A | | | 22 | | | | 4,898 | |
| | |
Keurig Dr Pepper, Inc. | | | 77 | | | | 2,469 | |
| | | | | | | | |
| | |
| | | | | | | 7,367 | |
| | | | | | | | |
| | |
Building Products — 1.1% | | | | | | | | |
| | |
Fortune Brands Home & Security, Inc. | | | 55 | | | | 4,755 | |
| | | | | | | | |
| | |
Capital Markets — 5.8% | | | | | | | | |
| | |
Ameriprise Financial, Inc. | | | 40 | | | | 7,839 | |
| | |
Northern Trust Corp. | | | 55 | | | | 5,164 | |
| | |
Raymond James Financial, Inc. | | | 64 | | | | 6,078 | |
| | |
T. Rowe Price Group, Inc. | | | 46 | | | | 6,897 | |
| | | | | | | | |
| | |
| | | | | | | 25,978 | |
| | | | | | | | |
| | |
Chemicals — 1.9% | | | | | | | | |
| | |
Celanese Corp. | | | 27 | | | | 3,472 | |
| | |
Sherwin-Williams Co. (The) | | | 7 | | | | 4,897 | |
| | | | | | | | |
| | |
| | | | | | | 8,369 | |
| | | | | | | | |
| | |
Communications Equipment — 1.7% | | | | | | | | |
| | |
CommScope Holding Co., Inc. * | | | 123 | | | | 1,647 | |
| | |
Motorola Solutions, Inc. | | | 34 | | | | 5,823 | |
| | | | | | | | |
| | |
| | | | | | | 7,470 | |
| | | | | | | | |
| | |
Construction Materials — 1.2% | | | | | | | | |
| | |
Martin Marietta Materials, Inc. | | | 20 | | | | 5,546 | |
| | | | | | | | |
| | |
Consumer Finance — 0.9% | | | | | | | | |
| | |
Discover Financial Services | | | 45 | | | | 4,113 | |
| | | | | | | | |
| | |
Containers & Packaging — 2.7% | | | | | | | | |
| | |
Ball Corp. | | | 39 | | | | 3,629 | |
| | |
Packaging Corp. of America | | | 25 | | | | 3,393 | |
| | | | | | | | |
| INVESTMENTS | | SHARES
(000) | | | VALUE
($000) | |
| | | | | | | | |
| | | | | | | | |
| | |
Containers & Packaging — continued | | | | | | | | |
| | |
Pactiv Evergreen, Inc. * | | | 57 | | | | 1,031 | |
| | |
Silgan Holdings, Inc. | | | 110 | | | | 4,072 | |
| | | | | | | | |
| | |
| | | | | | | 12,125 | |
| | | | | | | | |
| | |
Distributors — 0.9% | | | | | | | | |
| | |
Genuine Parts Co. | | | 27 | | | | 2,756 | |
| | |
LKQ Corp. * | | | 30 | | | | 1,067 | |
| | | | | | | | |
| | |
| | | | | | | 3,823 | |
| | | | | | | | |
| | |
Diversified Financial Services — 0.2% | | | | | | | | |
| | |
Voya Financial, Inc. | | | 18 | | | | 1,054 | |
| | | | | | | | |
| | |
Electric Utilities — 4.1% | | | | | | | | |
| | |
Edison International | | | 85 | | | | 5,339 | |
| | |
Entergy Corp. | | | 57 | | | | 5,661 | |
| | |
Xcel Energy, Inc. | | | 108 | | | | 7,189 | |
| | | | | | | | |
| | |
| | | | | | | 18,189 | |
| | | | | | | | |
| | |
Electrical Equipment — 3.4% | | | | | | | | |
| | |
Acuity Brands, Inc. | | | 35 | | | | 4,187 | |
| | |
AMETEK, Inc. | | | 49 | | | | 5,920 | |
| | |
Hubbell, Inc. | | | 34 | | | | 5,254 | |
| | | | | | | | |
| | |
| | | | | | | 15,361 | |
| | | | | | | | |
| |
Electronic Equipment, Instruments & Components — 4.0% | | | | | |
| | |
Amphenol Corp., Class A | | | 44 | | | | 5,740 | |
| | |
CDW Corp. | | | 33 | | | | 4,304 | |
| | |
Keysight Technologies, Inc. * | | | 31 | | | | 4,063 | |
| | |
SYNNEX Corp. | | | 44 | | | | 3,570 | |
| | | | | | | | |
| | |
| | | | | | | 17,677 | |
| | | | | | | | |
| |
Equity Real Estate Investment Trusts (REITs) — 9.1% | | | | | |
| | |
American Campus Communities, Inc. | | | 39 | | | | 1,658 | |
| | |
American Homes 4 Rent, Class A | | | 119 | | | | 3,570 | |
| | |
AvalonBay Communities, Inc. | | | 29 | | | | 4,680 | |
| | |
Boston Properties, Inc. | | | 43 | | | | 4,088 | |
| | |
Brixmor Property Group, Inc. | | | 137 | | | | 2,262 | |
| | |
Essex Property Trust, Inc. | | | 10 | | | | 2,284 | |
| | |
Federal Realty Investment Trust | | | 25 | | | | 2,090 | |
| | |
Host Hotels & Resorts, Inc. | | | 60 | | | | 878 | |
| | |
JBG SMITH Properties | | | 55 | | | | 1,717 | |
| | |
Kimco Realty Corp. | | | 164 | | | | 2,463 | |
| | |
Outfront Media, Inc. | | | 68 | | | | 1,323 | |
| | |
Rayonier, Inc. | | | 124 | | | | 3,639 | |
| | |
Regency Centers Corp. | | | 38 | | | | 1,723 | |
| | |
Ventas, Inc. | | | 39 | | | | 1,895 | |
| | |
Weyerhaeuser Co. | | | 125 | | | | 4,204 | |
| | |
WP Carey, Inc. | | | 31 | | | | 2,161 | |
| | | | | | | | |
| | |
| | | | | | | 40,635 | |
| | | | | | | | |
SEE NOTES TO FINANCIAL STATEMENTS.
| | | | | | | | | | |
| | | | | |
| DECEMBER 31, 2020 | | JPMORGAN INSURANCE TRUST | | | | | | | | 5 |
JPMorgan Insurance Trust Mid Cap Value Portfolio
SCHEDULE OF PORTFOLIO INVESTMENTS
AS OF DECEMBER 31, 2020 (continued)
| | | | | | | | |
| INVESTMENTS | | SHARES
(000) | | | VALUE
($000) | |
| | | | | | | | |
Common Stocks — continued | | | | | | | | |
| | |
Food & Staples Retailing — 1.4% | | | | | | | | |
| | |
Kroger Co. (The) | | | 121 | | | | 3,834 | |
| | |
US Foods Holding Corp. * | | | 75 | | | | 2,514 | |
| | | | | | | | |
| | |
| | | | | | | 6,348 | |
| | | | | | | | |
| | |
Food Products — 0.9% | | | | | | | | |
| | |
Post Holdings, Inc. * | | | 42 | | | | 4,198 | |
| | | | | | | | |
| | |
Gas Utilities — 1.0% | | | | | | | | |
| | |
National Fuel Gas Co. | | | 108 | | | | 4,457 | |
| | | | | | | | |
| | |
Health Care Equipment & Supplies — 1.5% | | | | | | | | |
| | |
Zimmer Biomet Holdings, Inc. | | | 44 | | | | 6,806 | |
| | | | | | | | |
| | |
Health Care Providers & Services — 5.8% | | | | | | | | |
| | |
AmerisourceBergen Corp. | | | 47 | | | | 4,565 | |
| | |
Cigna Corp. | | | 21 | | | | 4,436 | |
| | |
Henry Schein, Inc. * | | | 50 | | | | 3,358 | |
| | |
Humana, Inc. | | | 4 | | | | 1,818 | |
| | |
Laboratory Corp. of America Holdings * | | | 31 | | | | 6,282 | |
| | |
Universal Health Services, Inc., Class B | | | 41 | | | | 5,665 | |
| | | | | | | | |
| | |
| | | | | | | 26,124 | |
| | | | | | | | |
| | |
Hotels, Restaurants & Leisure — 0.4% | | | | | | | | |
| | |
Darden Restaurants, Inc. | | | 15 | | | | 1,830 | |
| | | | | | | | |
| | |
Household Durables — 2.2% | | | | | | | | |
| | |
Mohawk Industries, Inc. * | | | 36 | | | | 5,139 | |
| | |
Newell Brands, Inc. | | | 228 | | | | 4,846 | |
| | | | | | | | |
| | |
| | | | | | | 9,985 | |
| | | | | | | | |
| | |
Household Products — 0.7% | | | | | | | | |
| | |
Energizer Holdings, Inc. | | | 76 | | | | 3,187 | |
| | | | | | | | |
| | |
Industrial Conglomerates — 1.4% | | | | | | | | |
| | |
Carlisle Cos., Inc. | | | 39 | | | | 6,125 | |
| | | | | | | | |
| | |
Insurance — 6.7% | | | | | | | | |
| | |
Alleghany Corp. | | | 5 | | | | 2,951 | |
| | |
Hartford Financial Services Group, Inc. (The) | | | 111 | | | | 5,428 | |
| | |
Lincoln National Corp. | | | 61 | | | | 3,068 | |
| | |
Loews Corp. | | | 176 | | | | 7,926 | |
| | |
Marsh & McLennan Cos., Inc. | | | 31 | | | | 3,653 | |
| | |
Progressive Corp. (The) | | | 39 | | | | 3,827 | |
| | |
WR Berkley Corp. | | | 49 | | | | 3,287 | |
| | | | | | | | |
| | |
| | | | | | | 30,140 | |
| | | | | | | | |
| | |
Interactive Media & Services — 0.6% | | | | | | | | |
| | |
InterActiveCorp. * | | | 15 | | | | 2,797 | |
| | | | | | | | |
| | |
Internet & Direct Marketing Retail — 0.5% | | | | | | | | |
| | |
Expedia Group, Inc. | | | 18 | | | | 2,437 | |
| | | | | | | | |
| | | | | | | | |
| INVESTMENTS | | SHARES
(000) | | | VALUE
($000) | |
| | | | | | | | |
| | | | | | | | |
| | |
IT Services — 1.3% | | | | | | | | |
| | |
Concentrix Corp. * | | | 24 | | | | 2,417 | |
| | |
Jack Henry & Associates, Inc. | | | 10 | | | | 1,557 | |
| | |
Leidos Holdings, Inc. | | | 19 | | | | 2,015 | |
| | | | | | | | |
| | |
| | | | | | | 5,989 | |
| | | | | | | | |
| | |
Machinery — 6.2% | | | | | | | | |
| | |
IDEX Corp. | | | 26 | | | | 5,122 | |
| | |
ITT, Inc. | | | 83 | | | | 6,400 | |
| | |
Lincoln Electric Holdings, Inc. | | | 48 | | | | 5,589 | |
| | |
Middleby Corp. (The) * | | | 41 | | | | 5,332 | |
| | |
Snap-on, Inc. | | | 25 | | | | 4,327 | |
| | |
Timken Co. (The) | | | 12 | | | | 932 | |
| | | | | | | | |
| | |
| | | | | | | 27,702 | |
| | | | | | | | |
| | |
Media — 3.7% | | | | | | | | |
| | |
Discovery, Inc., Class C * | | | 192 | | | | 5,034 | |
| | |
Liberty Broadband Corp., Class C * | | | 32 | | | | 5,095 | |
| | |
Liberty Media Corp. — Liberty SiriusXM, Class C * | | | 143 | | | | 6,209 | |
| | | | | | | | |
| | |
| | | | | | | 16,338 | |
| | | | | | | | |
| | |
Multiline Retail — 1.0% | | | | | | | | |
| | |
Kohl’s Corp. | | | 66 | | | | 2,692 | |
| | |
Nordstrom, Inc. (a) | | | 54 | | | | 1,682 | |
| | | | | | | | |
| | |
| | | | | | | 4,374 | |
| | | | | | | | |
| | |
Multi-Utilities — 3.1% | | | | | | | | |
| | |
CMS Energy Corp. | | | 94 | | | | 5,718 | |
| | |
Sempra Energy | | | 13 | | | | 1,644 | |
| | |
WEC Energy Group, Inc. | | | 71 | | | | 6,528 | |
| | | | | | | | |
| | |
| | | | | | | 13,890 | |
| | | | | | | | |
| | |
Oil, Gas & Consumable Fuels — 3.7% | | | | | | | | |
| | |
Cabot Oil & Gas Corp. | | | 166 | | | | 2,707 | |
| | |
Diamondback Energy, Inc. | | | 140 | | | | 6,798 | |
| | |
EQT Corp. | | | 145 | | | | 1,838 | |
| | |
Equitrans Midstream Corp. | | | 176 | | | | 1,417 | |
| | |
Williams Cos., Inc. (The) | | | 185 | | | | 3,703 | |
| | | | | | | | |
| | |
| | | | | | | 16,463 | |
| | | | | | | | |
| | |
Real Estate Management & Development — 1.6% | | | | | | | | |
| | |
CBRE Group, Inc., Class A * | | | 92 | | | | 5,774 | |
| | |
Cushman & Wakefield plc * | | | 95 | | | | 1,410 | |
| | | | | | | | |
| | |
| | | | | | | 7,184 | |
| | | | | | | | |
| |
Semiconductors & Semiconductor Equipment — 1.2% | | | | | |
| | |
Analog Devices, Inc. | | | 35 | | | | 5,196 | |
| | | | | | | | |
SEE NOTES TO FINANCIAL STATEMENTS.
| | | | | | | | | | |
| | | | | |
| 6 | | | | | | | | JPMORGAN INSURANCE TRUST | | DECEMBER 31, 2020 |
| | | | | | | | |
| INVESTMENTS | | SHARES
(000) | | | VALUE
($000) | |
| | | | | | | | |
Common Stocks — continued | | | | | | | | |
| | |
Software — 0.9% | | | | | | | | |
| | |
Synopsys, Inc. * | | | 16 | | | | 4,210 | |
| | | | | | | | |
| | |
Specialty Retail — 3.4% | | | | | | | | |
| | |
AutoZone, Inc. * | | | 5 | | | | 6,174 | |
| | |
Best Buy Co., Inc. | | | 56 | | | | 5,573 | |
| | |
Gap, Inc. (The) | | | 165 | | | | 3,337 | |
| | | | | | | | |
| | |
| | | | | | | 15,084 | |
| | | | | | | | |
| | |
Textiles, Apparel & Luxury Goods — 1.7% | | | | | | | | |
| | |
Carter’s, Inc. | | | 32 | | | | 3,000 | |
| | |
Ralph Lauren Corp. | | | 43 | | | | 4,489 | |
| | | | | | | | |
| | |
| | | | | | | 7,489 | |
| | | | | | | | |
| | |
Total Common Stocks
(Cost $275,108) | | | | | | | 443,331 | |
| | | | | | | | |
Short-Term Investments — 1.4% | | | | | | | | |
| | |
Investment Companies — 1.1% | | | | | | | | |
| | |
JPMorgan U.S. Government Money Market Fund Class Institutional Shares, 0.03% (b) (c)
(Cost $4,891) | | | 4,891 | | | | 4,891 | |
| | | | | | | | |
| | | | | | | | |
| INVESTMENTS | | SHARES
(000) | | | VALUE
($000) | |
| | | | | | | | |
| | | | | | | | |
Investment of Cash Collateral from Securities Loaned — 0.3% | | | | | |
| | |
JPMorgan Securities Lending Money Market Fund Agency SL Class Shares, 0.15% (b) (c) | | | 400 | | | | 400 | |
| | |
JPMorgan U.S. Government Money Market Fund Class IM Shares, 0.03% (b) (c) | | | 987 | | | | 987 | |
| | | | | | | | |
| |
Total Investment of Cash Collateral from Securities Loaned
(Cost $1,387) | | | | 1,387 | |
| | | | | | | | |
| | |
Total Short-Term Investments
(Cost $6,278) | | | | | | | 6,278 | |
| | | | | | | | |
Total Investments — 100.5%
(Cost $281,386) | | | | | | | 449,609 | |
Liabilities in Excess of
Other Assets — (0.5)% | | | | | | | (2,080 | ) |
| | | | | | | | |
NET ASSETS — 100.0% | | | | | | | 447,529 | |
| | | | | | | | |
Percentages indicated are based on net assets.
| | |
| (a) | | The security or a portion of this security is on loan at December 31, 2020. The total value of securities on loan at December 31, 2020 is approximately $1,342,000. |
| (b) | | Investment in an affiliated fund, which is registered under the Investment Company Act of 1940, as amended, and is advised by J.P. Morgan Investment Management Inc. |
| (c) | | The rate shown is the current yield as of December 31, 2020. |
| * | | Non-income producing security. |
SEE NOTES TO FINANCIAL STATEMENTS.
| | | | | | | | | | |
| | | | | |
| DECEMBER 31, 2020 | | JPMORGAN INSURANCE TRUST | | | | | | | | 7 |
STATEMENT OF ASSETS AND LIABILITIES
AS OF DECEMBER 31, 2020
(Amounts in thousands, except per share amounts)
| | | | |
| | | JPMorgan Insurance Trust Mid Cap Value Portfolio | |
ASSETS: | |
Investments in non-affiliates, at value | | $ | 443,331 | |
Investments in affiliates, at value | | | 4,891 | |
Investment of cash collateral received from securities loaned, at value (See Note 2.B.) | | | 1,387 | |
Receivables: | | | | |
Investment securities sold | | | 69 | |
Portfolio shares sold | | | 258 | |
Dividends from non-affiliates | | | 776 | |
Dividends from affiliates | | | — | (a) |
Securities lending income (See Note 2.B.) | | | 1 | |
| | | | |
Total Assets | | | 450,713 | |
| | | | |
|
LIABILITIES: | |
Payables: | | | | |
Collateral received on securities loaned (See Note 2.B.) | | | 1,387 | |
Portfolio shares redeemed | | | 1,468 | |
Accrued liabilities: | | | | |
Investment advisory fees | | | 244 | |
Administration fees | | | 28 | |
Custodian and accounting fees | | | 5 | |
Trustees’ and Chief Compliance Officer’s fees | | | — | (a) |
Other | | | 52 | |
| | | | |
Total Liabilities | | | 3,184 | |
| | | | |
Net Assets | | $ | 447,529 | |
| | | | |
|
NET ASSETS: | |
Paid-in-Capital | | $ | 251,453 | |
Total distributable earnings (loss) | | | 196,076 | |
| | | | |
Total Net Assets | | $ | 447,529 | |
| | | | |
|
Net Assets: | |
Class 1 | | $ | 447,529 | |
|
Outstanding units of beneficial interest (shares) (unlimited number of shares authorized, no par value): | |
Class 1 | | | 41,083 | |
| |
Net Asset Value (b): | | | | |
Class 1 — Offering and redemption price per share | | $ | 10.89 | |
| |
Cost of investments in non-affiliates | | $ | 275,108 | |
Cost of investments in affiliates | | | 4,891 | |
Investment securities on loan, at value (See Note 2.B.) | | | 1,342 | |
Cost of investment of cash collateral (See Note 2.B.) | | | 1,387 | |
| (a) | Amount rounds to less than one thousand. |
| (b) | Per share amounts may not recalculate due to rounding of net assets and/or shares outstanding. |
SEE NOTES TO FINANCIAL STATEMENTS.
| | | | | | | | | | |
| | | | | |
| 8 | | | | | | | | JPMORGAN INSURANCE TRUST | | DECEMBER 31, 2020 |
STATEMENT OF OPERATIONS
FOR THE YEAR ENDED DECEMBER 31, 2020
(Amounts in thousands)
| | | | |
| | | JPMorgan Insurance Trust Mid Cap Value Portfolio | |
INVESTMENT INCOME: | | | | |
Interest income from non-affiliates | | $ | — | (a) |
Dividend income from non-affiliates | | | 8,004 | |
Dividend income from affiliates | | | 28 | |
Income from securities lending (net) (See Note 2.B.) | | | 18 | |
| | | | |
Total investment income | | | 8,050 | |
| | | | |
| |
EXPENSES: | | | | |
Investment advisory fees | | | 2,671 | |
Administration fees | | | 308 | |
Custodian and accounting fees | | | 28 | |
Interest expense to affiliates | | | — | (a) |
Professional fees | | | 60 | |
Trustees’ and Chief Compliance Officer’s fees | | | 27 | |
Printing and mailing costs | | | 18 | |
Transfer agency fees | | | 5 | |
Other | | | 35 | |
| | | | |
Total expenses | | | 3,152 | |
| | | | |
Less fees waived | | | (18 | ) |
| | | | |
Net expenses | | | 3,134 | |
| | | | |
Net investment income (loss) | | | 4,916 | |
| | | | |
| |
REALIZED/UNREALIZED GAINS (LOSSES): | | | | |
Net realized gain (loss) on transactions from investments in non-affiliates | | | 24,855 | |
Change in net unrealized appreciation/depreciation on: | | | | |
Investments in non-affiliates | | | (30,483 | ) |
Investments in affiliates | | | — | (a) |
| | | | |
Change in net unrealized appreciation/depreciation | | | (30,483 | ) |
| | | | |
Net realized/unrealized gains (losses) | | | (5,628 | ) |
| | | | |
Change in net assets resulting from operations | | $ | (712 | ) |
| | | | |
| (a) | Amount rounds to less than one thousand. |
SEE NOTES TO FINANCIAL STATEMENTS.
| | | | | | | | | | |
| | | | | |
| DECEMBER 31, 2020 | | JPMORGAN INSURANCE TRUST | | | | | | | | 9 |
STATEMENTS OF CHANGES IN NET ASSETS
FOR THE PERIODS INDICATED
(Amounts in thousands)
| | | | | | | | |
| | | JPMorgan Insurance Trust Mid Cap
Value Portfolio | |
| | | Year Ended
December 31, 2020 | | | Year Ended
December 31, 2019 | |
CHANGE IN NET ASSETS RESULTING FROM OPERATIONS: | | | | | | | | |
Net investment income (loss) | | $ | 4,916 | | | $ | 6,316 | |
Net realized gain (loss) | | | 24,855 | | | | 26,401 | |
Change in net unrealized appreciation/depreciation | | | (30,483 | ) | | | 80,490 | |
| | | | | | | | |
Change in net assets resulting from operations | | | (712 | ) | | | 113,207 | |
| | | | | | | | |
| | |
DISTRIBUTIONS TO SHAREHOLDERS: | | | | | | | | |
Class 1 | | | (31,576 | ) | | | (40,131 | ) |
| | | | | | | | |
Total distributions to shareholders | | | (31,576 | ) | | | (40,131 | ) |
| | | | | | | | |
| | |
CAPITAL TRANSACTIONS: | | | | | | | | |
Change in net assets resulting from capital transactions | | | (14,480 | ) | | | (24,742 | ) |
| | | | | | | | |
| | |
NET ASSETS: | | | | | | | | |
Change in net assets | | | (46,768 | ) | | | 48,334 | |
Beginning of period | | | 494,297 | | | | 445,963 | |
| | | | | | | | |
End of period | | $ | 447,529 | | | $ | 494,297 | |
| | | | | | | | |
| | |
CAPITAL TRANSACTIONS: | | | | | | | | |
Class 1 | | | | | | | | |
Proceeds from shares issued | | $ | 72,722 | | | $ | 35,724 | |
Distributions reinvested | | | 31,576 | | | | 40,131 | |
Cost of shares redeemed | | | (118,778 | ) | | | (100,597 | ) |
| | | | | | | | |
Change in net assets resulting from Class 1 capital transactions | | $ | (14,480 | ) | | $ | (24,742 | ) |
| | | | | | | | |
| | |
SHARE TRANSACTIONS: | | | | | | | | |
Class 1 | | | | | | | | |
Issued | | | 8,067 | | | | 3,180 | |
Reinvested | | | 3,680 | | | | 3,737 | |
Redeemed | | | (12,503 | ) | | | (8,985 | ) |
| | | | | | | | |
Change in Class 1 Shares | | | (756 | ) | | | (2,068 | ) |
| | | | | | | | |
SEE NOTES TO FINANCIAL STATEMENTS.
| | | | | | | | | | |
| | | | | |
| 10 | | | | | | | | JPMORGAN INSURANCE TRUST | | DECEMBER 31, 2020 |
THIS PAGE IS INTENTIONALLY LEFT BLANK
| | | | | | | | | | |
| | | | | |
| DECEMBER 31, 2020 | | JPMORGAN INSURANCE TRUST | | | | | | | | 11 |
FINANCIAL HIGHLIGHTS
FOR THE PERIODS INDICATED
| | | | | | | | | | | | | | | | | | | | | | | | | | | | |
| | | Per share operating performance | |
| | | | | | Investment operations | | | Distributions | |
| | | Net asset
value,
beginning
of period | | | Net
investment
income
(loss) (a) | | | Net realized
and unrealized gains (losses) on
investments | | | Total from
investment
operations | | | Net
investment
income | | | Net realized gain | | | Total
distributions | |
JPMorgan Insurance Trust Mid Cap Value Portfolio | | | | | | | | | | | | | | | | | | | | | | | | | | | | |
Class 1 | | | | | | | | | | | | | | | | | | | | | | | | | | | | |
Year Ended December 31, 2020 | | $ | 11.81 | | | $ | 0.12 | | | $ | (0.28 | ) | | $ | (0.16 | ) | | $ | (0.15 | ) | | $ | (0.61 | ) | | $ | (0.76 | ) |
Year Ended December 31, 2019 | | | 10.16 | | | | 0.15 | | | | 2.47 | | | | 2.62 | | | | (0.19 | ) | | | (0.78 | ) | | | (0.97 | ) |
Year Ended December 31, 2018 | | | 11.83 | | | | 0.17 | | | | (1.54 | ) | | | (1.37 | ) | | | (0.11 | ) | | | (0.19 | ) | | | (0.30 | ) |
Year Ended December 31, 2017 | | | 10.98 | | | | 0.11 | | | | 1.34 | | | | 1.45 | | | | (0.09 | ) | | | (0.51 | ) | | | (0.60 | ) |
Year Ended December 31, 2016 | | | 10.19 | | | | 0.10 | | | | 1.33 | | | | 1.43 | | | | (0.09 | ) | | | (0.55 | ) | | | (0.64 | ) |
| (a) | Calculated based upon average shares outstanding. |
| (b) | Includes adjustments in accordance with accounting principles generally accepted in the United States of America and as such, the net asset values for financial reporting purposes and the returns based upon those net asset values may differ from the net asset values and returns for shareholder transactions. |
| (c) | Total returns do not include charges that will be imposed by variable insurance contracts or by Eligible Plans. If these charges were reflected, returns would be lower than those shown. |
| (d) | Includes earnings credits and interest expense, if applicable, each of which is less than 0.005% unless otherwise noted. |
SEE NOTES TO FINANCIAL STATEMENTS.
| | | | | | | | | | |
| | | | | |
| 12 | | | | | | | | JPMORGAN INSURANCE TRUST | | DECEMBER 31, 2020 |
| | | | | | | | | | | | | | | | | | | | | | | | |
| | Ratios/Supplemental data | |
| | | | | | | | | Ratios to average net assets | | | | |
Net asset value, end of period | | Total return (b)(c) | | | Net assets, end of
period (000’s) | | | Net expenses (d) | | | Net investment income (loss) | | | Expenses without waivers, reimbursements and earnings credits | | | Portfolio turnover rate | |
| | | | | | | | | | | | | | | | | | | | | | | | |
| | | | | | | | | | | | | | | | | | | | | | | | |
| $10.89 | | | 0.37 | % | | $ | 447,529 | | | | 0.76 | % | | | 1.20 | % | | | 0.77 | % | | | 20 | % |
| 11.81 | | | 26.76 | | | | 494,297 | | | | 0.76 | | | | 1.31 | | | | 0.77 | | | | 10 | |
| 10.16 | | | (11.84 | ) | | | 445,963 | | | | 0.76 | | | | 1.43 | | | | 0.77 | | | | 13 | |
| 11.83 | | | 13.76 | | | | 572,520 | | | | 0.77 | | | | 0.95 | | | | 0.78 | | | | 14 | |
| 10.98 | | | 14.69 | | | | 544,170 | | | | 0.77 | | | | 0.95 | | | | 0.78 | | |
| 28
|
|
SEE NOTES TO FINANCIAL STATEMENTS.
| | | | | | | | | | |
| | | | | |
| DECEMBER 31, 2020 | | JPMORGAN INSURANCE TRUST | | | | | | | | 13 |
NOTES TO FINANCIAL STATEMENTS
AS OF DECEMBER 31, 2020
1. Organization
JPMorgan Insurance Trust (the “Trust”) is registered under the Investment Company Act of 1940, as amended (the “1940 Act”), as an open-end management investment company and is a Massachusetts business trust.
The following is a separate portfolio of the Trust (the “Portfolio”) covered by this report:
| | | | |
| | | Class Offered | | Diversification Classification |
| JPMorgan Insurance Trust Mid Cap Value Portfolio | | Class 1 | | Diversified |
The investment objective of the Portfolio is to seek capital appreciation with the secondary goal of achieving current income by investing primarily in equity securities.
Portfolio shares are offered only to separate accounts of participating insurance companies and Eligible Plans. Individuals may not purchase shares directly from the Portfolio.
J.P. Morgan Investment Management Inc. (“JPMIM”), an indirect, wholly-owned subsidiary of JPMorgan Chase & Co. (“JPMorgan”), acts as Adviser (the “Adviser”) and Administrator (the “Administrator”) to the Portfolio.
2. Significant Accounting Policies
The following is a summary of significant accounting policies followed by the Portfolio in the preparation of its financial statements. The Portfolio is an investment company and, accordingly, follows the investment company accounting and reporting guidance of the Financial Accounting Standards Board (“FASB”) Accounting Standards Codification Topic 946 — Investment Companies, which is part of U.S. generally accepted accounting principles (“GAAP”). The preparation of financial statements in conformity with GAAP requires management to make estimates and assumptions that affect (i) the reported amounts of assets and liabilities, (ii) disclosure of contingent assets and liabilities at the date of the financial statements, and (iii) the reported amounts of increases and decreases in net assets from operations during the reporting period. Actual results could differ from those estimates.
A. Valuation of Investments — Investments are valued in accordance with GAAP and the Portfolio’s valuation policies set forth by, and under the supervision and responsibility of, the Board of Trustees of the Trust (the “Board”), which established the following approach to valuation, as described more fully below: (i) investments for which market quotations are readily available shall be valued at their market value and (ii) all other investments for which market quotations are not readily available shall be valued at their fair value as determined in good faith by the Board.
The Administrator has established the J.P. Morgan Asset Management Americas Valuation Committee (“AVC”) to assist the Board with the oversight and monitoring of the valuation of the Portfolio’s investments. The Administrator implements the valuation policies of the Portfolio’s investments, as directed by the Board. The AVC oversees and carries out the policies for the valuation of investments held in the Portfolio. This includes monitoring the appropriateness of fair values based on results of ongoing valuation oversight including, but not limited to, consideration of macro or security specific events, market events, and pricing vendor and broker due diligence. The Administrator is responsible for discussing and assessing the potential impacts to the fair values on an ongoing basis, and, at least on a quarterly basis, with the AVC and the Board.
Equities and other exchange-traded instruments are valued at the last sale price or official market closing price on the primary exchange on which the instrument is traded before the net asset value (“NAV”) of the Portfolio is calculated on a valuation date.
Investments in open-end investment companies (“Underlying Funds”) are valued at each Underlying Fund’s NAV per share as of the report date.
Valuations reflected in this report are as of the report date. As a result, changes in valuation due to market events and/or issuer-related events after the report date and prior to issuance of the report are not reflected herein.
The various inputs that are used in determining the valuation of the Portfolio’s investments are summarized into the three broad levels listed below.
| • | | Level 1 — Unadjusted inputs using quoted prices in active markets for identical investments. |
| • | | Level 2 — Other significant observable inputs including, but not limited to, quoted prices for similar investments, inputs other than quoted prices that are observable for investments (such as interest rates, prepayment speeds, credit risk, etc.) or other market corroborated inputs. |
| • | | Level 3 — Significant inputs based on the best information available in the circumstances, to the extent observable inputs are not available (including the Portfolio’s assumptions in determining the fair value of investments). |
A financial instrument’s level within the fair value hierarchy is based on the lowest level of any input, both individually and in the aggregate, that is significant to the fair value measurement. The inputs or methodology used for valuing instruments are not necessarily an indication of the risk associated with investing in those instruments.
| | | | | | | | | | |
| | | | | |
| 14 | | | | | | | | JPMORGAN INSURANCE TRUST | | DECEMBER 31, 2020 |
The following table represents each valuation input as presented on the Schedule of Portfolio Investments (“SOI”) (amounts in thousands):
| | | | | | | | | | | | | | | | |
| | | Level 1
Quoted prices | | | Level 2
Other significant
observable inputs | | | Level 3
Significant
unobservable inputs | | | Total | |
Total Investments in Securities (a) | | $ | 449,609 | | | $ | – | | | $ | – | | | $ | 449,609 | |
| | | | | | | | | | | | | | | | |
| |
| (a) | Please refer to the SOI for specifics of portfolio holdings. |
B. Securities Lending — The Portfolio is authorized to engage in securities lending in order to generate additional income. The Portfolio is able to lend to approved borrowers. Citibank N.A. (“Citibank”) serves as lending agent for the Portfolio, pursuant to a Securities Lending Agency Agreement (the “Securities Lending Agency Agreement”). Securities loaned are collateralized by cash equal to at least 100% of the market value plus accrued interest on the securities lent, which is invested in the Class IM Shares of the JPMorgan U.S. Government Money Market Fund and the Agency SL Class Shares of the JPMorgan Securities Lending Money Market Fund. The Portfolio retains loan fees and the interest on cash collateral investments but is required to pay the borrower a rebate for the use of cash collateral. In cases where the lent security is of high value to borrowers, there may be a negative rebate (i.e., a net payment from the borrower to the Portfolio). Upon termination of a loan, the Portfolio is required to return to the borrower an amount equal to the cash collateral, plus any rebate owed to the borrowers. The remaining maturities of the securities lending transactions are considered overnight and continuous. Loans are subject to termination by the Portfolio or the borrower at any time.
The net income earned on the securities lending (after payment of rebates and Citibank’s fee) is included on the Statement of Operations as Income from securities lending (net). The Portfolio also receives payments from the borrower during the period of the loan, equivalent to dividends and interest earned on the securities loaned, which are recorded as Dividend or Interest income, respectively, on the Statement of Operations.
Under the Securities Lending Agency Agreement, Citibank marks to market the loaned securities on a daily basis. In the event the cash received from the borrower is less than 102% of the value of the loaned securities (105% for loans of non-U.S. securities), Citibank requests additional cash from the borrower so as to maintain a collateralization level of at least 102% of the value of the loaned securities plus accrued interest (105% for loans of non-U.S. securities), subject to certain de minimis amounts.
The value of securities out on loan is recorded as an asset on the Statement of Assets and Liabilities. The value of the cash collateral received is recorded as a liability on the Statement of Assets and Liabilities and details of collateral investments are disclosed on the SOI.
The Portfolio bears the risk of loss associated with the collateral investments and is not entitled to additional collateral from the borrower to cover any such losses. To the extent that the value of the collateral investments declines below the amount owed to a borrower, the Portfolio may incur losses that exceed the amount it earned on lending the security. Upon termination of a loan, the Portfolio may use leverage (borrow money) to repay the borrower for cash collateral posted if the Adviser does not believe that it is prudent to sell the collateral investments to fund the payment of this liability. Securities lending activity is subject to master netting arrangements.
The following table presents the Portfolio’s value of the securities on loan with Citibank, net of amounts available for offset under the master netting arrangements and any related collateral received or posted by the Portfolio as of December 31, 2020 (amounts in thousands).
| | | | | | | | | | |
| | | Investment Securities
on Loan, at value,
Presented on the
Statement of Assets
and Liabilities | | Cash Collateral
Posted by Borrower* | | | Net Amount Due
to Counterparty
(not less than zero) | |
| | $1,342 | | $ | (1,342 | ) | | $ | — | |
| * | Collateral posted reflects the value of securities on loan and does not include any additional amounts received from the borrower. |
Securities lending also involves counterparty risks, including the risk that the loaned securities may not be returned in a timely manner or at all. Subject to certain conditions, Citibank has agreed to indemnify the Portfolio from losses resulting from a borrower’s failure to return a loaned security.
JPMIM voluntarily waived investment advisory fees charged to the Portfolio to reduce the impact of the cash collateral investment in the JPMorgan U.S. Government Money Market Fund from 0.15% to 0.06%. For the year ended December 31, 2020, JPMIM waived fees associated with the Portfolio’s investment in the JPMorgan U.S. Government Money Market Fund as follows (amounts in thousands):
The above waiver is included in the determination of earnings on cash collateral investment and in the calculation of Citibank’s compensation and is included on the Statement of Operations as Income from securities lending (net).
| | | | | | | | | | |
| | | | | |
| DECEMBER 31, 2020 | | JPMORGAN INSURANCE TRUST | | | | | | | | 15 |
NOTES TO FINANCIAL STATEMENTS
AS OF DECEMBER 31, 2020 (continued)
C. Investment Transactions with Affiliates — The Portfolio invested in Underlying Funds which are advised by the Adviser. An issuer which is under common control with the Portfolio may be considered an affiliate. For the purposes of the financial statements, the Portfolio assumes the issuers listed in the table below to be affiliated issuers. Underlying Funds’ distributions may be reinvested into the Underlying Funds. Reinvestment amounts are included in the purchase cost amounts in the table below. Amounts in the table below are in thousands.
| | | | | | | | | | | | | | | | | | | | | | | | | | | | | | | | | | | | |
For the year ended December 31, 2020 | |
| Security Description | | Value at
December 31,
2019 | | | Purchases at
Cost | | | Proceeds
from
Sales | | | Net
Realized
Gain
(Loss) | | | Change in
Unrealized
Appreciation/
(Depreciation) | | | Value at
December 31,
2020 | | | Shares at
December 31,
2020 | | | Dividend
Income | | | Capital Gain
Distributions | |
JPMorgan Securities Lending Money Market Fund Agency SL Class Shares, 0.15% (a) (b) | | $ | — | | | $ | 11,400 | | | $ | 11,000 | | | $ | — | *(c) | | $ | — | (c) | | $ | 400 | | | | 400 | | | $ | 8 | * | | $ | — | |
JPMorgan U.S. Government Money Market Fund Class IM Shares, 0.03% (a) (b) | | | — | | | | 80,935 | | | | 79,948 | | | | — | | | | — | | | | 987 | | | | 987 | | | | 7 | * | | | — | |
JPMorgan U.S. Government Money Market Fund Class Institutional Shares, 0.03% (a) (b) | | | 9,286 | | | | 72,282 | | | | 76,677 | | | | — | | | | — | | | | 4,891 | | | | 4,891 | | | | 28 | | | | — | |
| | | | | | | | | | | | | | | | | | | | | | | | | | | | | | | | | | | | |
Total | | $ | 9,286 | | | $ | 164,617 | | | $ | 167,625 | | | $ | — | (c) | | $ | — | (c) | | $ | 6,278 | | | | | | | $ | 43 | | | $ | — | |
| | | | | | | | | | | | | | | | | | | | | | | | | | | | | | | | | | | | |
| (a) | Investment in an affiliated fund, which is registered under the Investment Company Act of 1940, as amended, and is advised by J.P. Morgan Investment Management Inc. |
| (b) | The rate shown is the current yield as of December 31, 2020. |
| (c) | Amount rounds to less than one thousand. |
| * | Amount is included on the Statement of Operations as Income from securities lending (net) (after payments of rebates and Citibank’s fee). |
D. Security Transactions and Investment Income — Investment transactions are accounted for on the trade date (the date the order to buy or sell is executed). Securities gains and losses are calculated on a specifically identified cost basis. Dividend income is recorded on the ex-dividend date or when the Portfolio first learns of the dividend.
To the extent such information is publicly available, the Portfolio records distributions received in excess of income earned from underlying investments as a reduction of cost of investments and/or realized gain. Such amounts are based on estimates if actual amounts are not available and actual amounts of income, realized gain and return of capital may differ from the estimated amounts. The Portfolio adjusts the estimated amounts of the components of distributions (and consequently its net investment income) as necessary, once the issuers provide information about the actual composition of the distributions.
E. Allocation of Expenses — Expenses directly attributable to the Portfolio are charged directly to the Portfolio, while the expenses attributable to more than one portfolio of the Trust are allocated among the applicable portfolios.
F. Federal Income Taxes — The Portfolio is treated as a separate taxable entity for Federal income tax purposes. The Portfolio’s policy is to comply with the provisions of the Internal Revenue Code (the “Code”) applicable to regulated investment companies and to distribute to shareholders all of its distributable net investment income and net realized capital gains on investments. Accordingly, no provision for Federal income tax is necessary. The Portfolio is also a segregated portfolio of assets for insurance purposes and intends to comply with the diversification requirements of Subchapter L of the Code. Management has reviewed the Portfolio’s tax positions for all open tax years and has determined that as of December 31, 2020, no liability for Federal income tax is required in the Portfolio’s financial statements for net unrecognized tax benefits. However, management’s conclusions may be subject to future review based on changes in, or the interpretation of, the accounting standards or tax laws and regulations. The Portfolio’s Federal tax returns for the prior three fiscal years remain subject to examination by the Internal Revenue Service.
G. Distributions to Shareholders — Distributions from net investment income, if any, are generally declared and paid at least annually. Net realized capital gains, if any, are distributed at least annually. The amount of distributions from net investment income and net realized capital gains is determined in accordance with Federal income tax regulations, which may differ from GAAP. To the extent these “book/tax” differences are permanent in nature (i.e., that they result from other than timing of recognition — “temporary differences”), such amounts are reclassified within the capital accounts based on their Federal tax basis treatment.
H. Recent Accounting Pronouncement — In March 2020, the FASB issued Accounting Standards Update No. 2020-04 (“ASU 2020-04”), Reference Rate Reform (Topic 848) – Facilitation of the Effects of Reference Rate Reform on Financial Reporting. ASU 2020-04 provides optional temporary financial reporting relief from the effect of certain types of contract modifications due to the planned discontinuation of the London Interbank Offered Rate (“LIBOR”) and other interbank-offered based reference rates as of the end of 2021. ASU 2020-04 became effective upon the issuance and its optional relief can be applied through December 31, 2022. Management is currently evaluating the impact, if any, to the Portfolio’s financial statements of applying ASU 2020-04.
| | | | | | | | | | |
| | | | | |
| 16 | | | | | | | | JPMORGAN INSURANCE TRUST | | DECEMBER 31, 2020 |
3. Fees and Other Transactions with Affiliates
A. Investment Advisory Fee — Pursuant to an Investment Advisory Agreement, the Adviser manages the investments of the Portfolio and for such services is paid a fee. The investment advisory fee is accrued daily and paid monthly at an annual rate of 0.65% of the Portfolio’s average daily net assets.
The Adviser waived investment advisory fees and/or reimbursed expenses as outlined in Note 3.E.
B. Administration Fee — Pursuant to an Administration Agreement, the Administrator provides certain administration services to the Portfolio. In consideration of these services, the Administrator receives a fee accrued daily and paid monthly at an annual rate of 0.075% of the first $10 billion of the Portfolio’s average daily net assets, plus 0.050% of the Portfolio’s average daily net assets between $10 billion and $20 billion, plus 0.025% of the Portfolio’s average daily net assets between $20 billion and $25 billion, plus 0.01% of the Portfolio’s average daily net assets in excess of $25 billion. For the year ended December 31, 2020, the effective rate was 0.075% of the Portfolio’s average daily net assets, notwithstanding any fee waivers and/or expense reimbursements.
The Administrator waived administration fees as outlined in Note 3.E.
JPMorgan Chase Bank, N.A. (“JPMCB”), a wholly-owned subsidiary of JPMorgan, serves as the Portfolio’s sub-administrator (the “Sub-administrator”). For its services as Sub-administrator, JPMCB receives a portion of the fees payable to the Administrator.
C. Distribution Fees — Pursuant to a Distribution Agreement, JPMorgan Distribution Services, Inc. (“JPMDS”), an indirect, wholly-owned subsidiary of JPMorgan, serves as the Portfolio’s principal underwriter and promotes and arranges for the sale of the Portfolio’s shares.
D. Custodian and Accounting Fees — JPMCB provides portfolio custody and accounting services to the Portfolio. For performing these services, the Portfolio pays JPMCB transaction and asset-based fees that vary according to the number of transactions and positions, plus out-of-pocket expenses. The amounts paid directly to JPMCB by the Portfolio for custody and accounting services are included in Custodian and accounting fees on the Statement of Operations.
Interest income earned on cash balances at the custodian, if any, is included in Interest income from affiliates on the Statement of Operations.
Interest expense paid to the custodian related to cash overdrafts, if any, is included in Interest expense to affiliates on the Statement of Operations.
E. Waivers and Reimbursements — The Adviser and/or Administrator have contractually agreed to waive fees and/or reimburse the Portfolio to the extent that total annual operating expenses of the Portfolio (excluding acquired fund fees and expenses other than certain money market fund fees as described below, dividend and interest expenses related to short sales, interest, taxes, expenses related to litigation and potential litigation, expenses related to trustee elections and extraordinary expenses) exceed 0.90% of the Portfolio’s average daily net assets.
The expense limitation agreement was in effect for the year ended December 31, 2020 and the contractual expense limitation percentage is in place until at least April 30, 2021.
For the year ended December 31, 2020, the Portfolio’s service providers did not waive fees and/or reimburse expenses for the Portfolio.
Additionally, the Portfolio may invest in one or more money market funds advised by the Adviser (affiliated money market funds). The Adviser and/or Administrator have contractually agreed to waive fees and/or reimburse expenses in an amount sufficient to offset the respective net fees each collects from the affiliated money market fund on the Portfolio’s investment in such affiliated money market fund, except for investments of securities lending cash collateral. None of these parties expect the Portfolio to repay any such waived fees and/or reimbursed expenses in future years.
The amount of these waivers resulting from investments in these money market funds for the year ended December 31, 2020 was approximately $18,000.
F. Other — Certain officers of the Trust are affiliated with the Adviser, the Administrator and JPMDS. Such officers, with the exception of the Chief Compliance Officer, receive no compensation from the Portfolio for serving in their respective roles.
The Board designated and appointed a Chief Compliance Officer to the Portfolio pursuant to Rule 38a-1 under the 1940 Act. The Portfolio, along with affiliated portfolios, makes reimbursement payments, on a pro-rata basis, to the Administrator for a portion of the fees associated with the office of the Chief Compliance Officer. Such fees are included in Trustees’ and Chief Compliance Officer’s fees on the Statement of Operations.
The Trust adopted a Trustee Deferred Compensation Plan (the “Plan”) which allows the independent Trustees to defer the receipt of all or a portion of compensation related to performance of their duties as Trustees. The deferred fees are invested in various J.P. Morgan Funds until distribution in accordance with the Plan.
During the year ended December 31, 2020, the Portfolio purchased securities from an underwriting syndicate in which the principal underwriter or members of the syndicate were affiliated with the Adviser.
The Securities and Exchange Commission (“SEC”) has granted an exemptive order permitting the Portfolio to engage in principal transactions with J.P. Morgan Securities LLC, an affiliated broker, involving taxable money market instruments, subject to certain conditions.
| | | | | | | | | | |
| | | | | |
| DECEMBER 31, 2020 | | JPMORGAN INSURANCE TRUST | | | | | | | | 17 |
NOTES TO FINANCIAL STATEMENTS
AS OF DECEMBER 31, 2020 (continued)
4. Investment Transactions
During the year ended December 31, 2020, purchases and sales of investments (excluding short-term investments) were as follows (amounts in thousands):
| | | | | | | | |
| | | Purchases
(excluding U.S.
Government) | | | Sales
(excluding U.S.
Government) | |
| | $ | 80,794 | | | $ | 114,900 | |
During the year ended December 31, 2020, there were no purchases or sales of U.S. Government securities.
5. Federal Income Tax Matters
For Federal income tax purposes, the estimated cost and unrealized appreciation (depreciation) in value of investments held at December 31, 2020 were as follows (amounts in thousands):
| | | | | | | | | | | | | | | | |
| | | Aggregate Cost | | | Gross
Unrealized
Appreciation | | | Gross
Unrealized
Depreciation | | | Net Unrealized
Appreciation
(Depreciation) | |
| | $ | 283,435 | | | $ | 178,803 | | | $ | 12,629 | | | $ | 166,174 | |
The difference between book and tax basis appreciation (depreciation) on investments is primarily attributed to wash sale loss deferrals.
The tax character of distributions paid during the year ended December 31, 2020 was as follows (amounts in thousands):
| | | | | | | | | | | | |
| | | Ordinary
Income* | | | Net
Long-Term
Capital Gains | | | Total
Distributions
Paid | |
| | $ | 6,105 | | | $ | 25,471 | | | $ | 31,576 | |
* Short-term gain distributions are treated as ordinary income for income tax purposes.
The tax character of distributions paid during the year ended December 31, 2019 was as follows (amounts in thousands):
| | | | | | | | | | | | |
| | | Ordinary
Income* | | | Net
Long-Term
Capital Gains | | | Total
Distributions
Paid | |
| | $ | 9,269 | | | $ | 30,862 | | | $ | 40,131 | |
* Short-term gain distributions are treated as ordinary income for income tax purposes.
As of December 31, 2020, the estimated components of net assets (excluding paid-in-capital) on a tax basis were as follows (amounts in thousands):
| | | | | | | | | | | | |
| | | Current
Distributable
Ordinary
Income | | | Current
Distributable
Long-Term
Capital Gain
(Tax Basis Capital
Loss Carryover) | | | Unrealized
Appreciation
(Depreciation) | |
| | $ | 5,355 | | | $ | 24,528 | | | $ | 166,174 | |
The cumulative timing differences primarily consist of wash sale loss deferrals.
As of December 31, 2020, the Portfolio did not have any net capital loss carryforwards.
6. Borrowings
The Portfolio relies upon an exemptive order granted by the SEC (the “Order”) permitting the establishment and operation of an Interfund Lending Facility (the “Facility”). The Facility allows the Portfolio to directly lend and borrow money to or from any other fund relying upon the Order at rates beneficial to both the borrowing and lending funds. Advances under the Facility are taken primarily for temporary or emergency purposes, including the meeting of redemption requests that otherwise might require the untimely disposition of securities, and are subject to the Portfolio’s borrowing restrictions. The Interfund loan rate is determined, as specified in the Order, by averaging the current repurchase agreement rate and the current bank loan rate. The Order was granted to the Trust and may be relied upon by the Portfolio because the Portfolio and the series of the Trust are all investment companies in the same “group of investment companies” (as defined in Section 12(d)(1)(G) of the 1940 Act).
The Portfolio had no borrowings outstanding from another fund during the year ended December 31, 2020.
| | | | | | | | | | |
| | | | | |
| 18 | | | | | | | | JPMORGAN INSURANCE TRUST | | DECEMBER 31, 2020 |
The Trust and JPMCB have entered into a financing arrangement. Under this arrangement, JPMCB provides an unsecured, uncommitted credit facility in the aggregate amount of $100 million to certain of the J.P. Morgan Funds, including the Portfolio. Advances under the arrangement are taken primarily for temporary or emergency purposes, including the meeting of redemption requests that otherwise might require the untimely disposition of securities, and are subject to the Portfolio’s borrowing restrictions. Interest on borrowings is payable at a rate determined by JPMCB at the time of borrowing. This agreement has been extended until November 1, 2021.
The Portfolio had no borrowings outstanding from the unsecured, uncommitted credit facility during the year ended December 31, 2020.
The Trust, along with certain other trusts for J.P. Morgan Funds (“Borrowers”), has entered into a joint syndicated senior unsecured revolving credit facility totaling $1.5 billion (“Credit Facility”) with various lenders and The Bank of New York Mellon, as administrative agent for the lenders. This Credit Facility provides a source of funds to the Borrowers for temporary and emergency purposes, including the meeting of redemption requests that otherwise might require the untimely disposition of securities. Under the terms of the Credit Facility, a borrowing portfolio must have a minimum of $25,000,000 in adjusted net asset value and not exceed certain adjusted net asset coverage ratios prior to and during the time in which any borrowings are outstanding. If a portfolio does not comply with the aforementioned requirements, the portfolio must remediate within three business days with respect to the $25,000,000 minimum adjusted net asset value or within one business day with respect to certain asset coverage ratios or the administrative agent at the request of, or with the consent of, the lenders may terminate the Credit Facility and declare any outstanding borrowings to be due and payable immediately.
Interest associated with any borrowing under the Credit Facility is charged to the borrowing portfolio at a rate of interest equal to 1.00%, which has increased to 1.25% pursuant to the amendment referenced below, plus the greater of the federal funds effective rate or one month LIBOR. The annual commitment fee to maintain the Credit Facility is 0.15% and is incurred on the unused portion of the Credit Facility and is allocated to all participating portfolios pro rata based on their respective net assets. Effective August 11, 2020, this agreement has been amended and restated for a term of 364 days, unless extended, and to include the change to the interest rate charged for borrowing from the Credit Facility to 1.25%, as noted above, and an upfront fee of 0.075% of the Credit Facility to be charged and paid by all participating funds of the Credit Facility.
The Portfolio did not utilize the Credit Facility during the year ended December 31, 2020.
7. Risks, Concentrations and Indemnifications
In the normal course of business, the Portfolio enters into contracts that contain a variety of representations which provide general indemnifications. The Portfolio’s maximum exposure under these arrangements is unknown. The amount of exposure would depend on future claims that may be brought against the Portfolio. However, based on experience, the Portfolio expects the risk of loss to be remote.
As of December 31, 2020, the Portfolio had two individual shareholder and/or non-affiliated omnibus accounts, which owned 76.4% of the Portfolio’s outstanding shares.
Significant shareholder transactions by these shareholders may impact the Portfolio’s performance and liquidity.
Derivatives may be riskier than other types of investments because they may be more sensitive to changes in economic and market conditions and could result in losses that significantly exceed the Portfolio’s original investment. Many derivatives create leverage thereby causing the Portfolio to be more volatile than they would have been if they had not used derivatives. Derivatives also expose the Portfolio to counterparty risk (the risk that the derivative counterparty will not fulfill its contractual obligations), including credit risk of the derivative counterparty. The possible lack of a liquid secondary market for derivatives and the resulting inability of the Portfolio to sell or otherwise close a derivatives position could expose the Portfolio to losses.
LIBOR is intended to represent the rate at which contributing banks may obtain short-term borrowings from each other in the London interbank market. The regulatory authority that oversees financial services firms and financial markets in the U.K. has announced that, after the end of 2021, it would no longer persuade or compel contributing banks to make rate submissions for purposes of determining the LIBOR rate. As a result, it is possible that commencing in 2022, LIBOR may no longer be available or no longer deemed an appropriate reference rate upon which to determine the interest rate on or impacting certain loans, notes, derivatives and other instruments or investments comprising some or all of the Portfolio’s portfolio. In light of this eventuality, public and private sector industry initiatives are currently underway to identify new or alternative reference rates to be used in place of LIBOR. There is no assurance that the composition or characteristics of any such alternative reference rate will be similar to or produce the same value or economic equivalence as LIBOR or that it will have the same volume or liquidity as did LIBOR prior to its discontinuance or unavailability, which may affect the value or liquidity or return on certain investments of the Portfolio and result in costs incurred in connection with closing out positions and entering into new trades. These risks may also apply with respect to changes in connection with other interbank offering rates (e.g., Euribor) and a wide range of other index levels, rates and values that are treated as “benchmarks” and are the subject of recent regulatory reform.
The Portfolio is subject to infectious disease epidemics/pandemics risk. The worldwide outbreak of COVID-19, a novel coronavirus disease, has negatively affected economies, markets and individual companies throughout the world. The effects of this COVID-19 pandemic to public health, and business and market conditions, including exchange trading suspensions and closures may continue to have a significant negative impact on the performance of the Portfolio’s investments, increase the Portfolio’s volatility, exacerbate other pre-existing political, social and economic risks to the Portfolio and negatively impact broad segments of businesses and populations. The Portfolio’s operations may be interrupted as a result, which may have a significant negative impact on investment performance. In addition, governments, their regulatory agencies, or self-regulatory organizations may take actions in response to the pandemic that affect the instruments in which the Portfolio invests, or the issuers of such instruments, in ways that could also have a significant negative impact on the Portfolio’s investment performance. The full impact of this COVID-19 pandemic, or other future epidemics/pandemics, is currently unknown.
8. Subsequent Event
On February 10, 2021, the contractual expense limitation for Class 1 Shares was extended until at least April 30, 2022.
| | | | | | | | | | |
| | | | | |
| DECEMBER 31, 2020 | | JPMORGAN INSURANCE TRUST | | | | | | | | 19 |
REPORT OF INDEPENDENT REGISTERED PUBLIC ACCOUNTING FIRM
To the Board of Trustees of JPMorgan Insurance Trust and Shareholders of JPMorgan Insurance Trust Mid Cap Value Portfolio
Opinion on the Financial Statements
We have audited the accompanying statement of assets and liabilities, including the schedule of portfolio investments, of JPMorgan Insurance Trust Mid Cap Value Portfolio (one of the portfolios constituting JPMorgan Insurance Trust, referred to hereafter as the “Portfolio”) as of December 31, 2020, the related statement of operations for the year ended December 31, 2020, the statements of changes in net assets for each of the two years in the period ended December 31, 2020, including the related notes, and the financial highlights for each of the five years in the period ended December 31, 2020 (collectively referred to as the “financial statements”). In our opinion, the financial statements present fairly, in all material respects, the financial position of the Portfolio as of December 31, 2020, the results of its operations for the year then ended, the changes in its net assets for each of the two years in the period ended December 31, 2020 and the financial highlights for each of the five years in the period ended December 31, 2020 in conformity with accounting principles generally accepted in the United States of America.
Basis for Opinion
These financial statements are the responsibility of the Portfolio’s management. Our responsibility is to express an opinion on the Portfolio’s financial statements based on our audits. We are a public accounting firm registered with the Public Company Accounting Oversight Board (United States) (PCAOB) and are required to be independent with respect to the Portfolio in accordance with the U.S. federal securities laws and the applicable rules and regulations of the Securities and Exchange Commission and the PCAOB.
We conducted our audits of these financial statements in accordance with the standards of the PCAOB. Those standards require that we plan and perform the audit to obtain reasonable assurance about whether the financial statements are free of material misstatement, whether due to error or fraud.
Our audits included performing procedures to assess the risks of material misstatement of the financial statements, whether due to error or fraud, and performing procedures that respond to those risks. Such procedures included examining, on a test basis, evidence regarding the amounts and disclosures in the financial statements. Our audits also included evaluating the accounting principles used and significant estimates made by management, as well as evaluating the overall presentation of the financial statements. Our procedures included confirmation of securities owned as of December 31, 2020 by correspondence with the custodian and transfer agent. We believe that our audits provide a reasonable basis for our opinion.
/s/ PricewaterhouseCoopers LLP
New York, New York
February 12, 2021
We have served as the auditor of one or more investment companies in the JPMorgan Funds complex since 1993.
| | | | | | | | | | |
| | | | | |
| 20 | | | | | | | | JPMORGAN INSURANCE TRUST | | DECEMBER 31, 2020 |
TRUSTEES
(Unaudited)
The Portfolio’s Statement of Additional Information includes additional information about the Portfolio’s Trustees and is available, without charge, upon request by calling 1-800-480-4111 or on the J.P. Morgan Funds’ website at www.jpmorganfunds.com.
| | | | | | |
Name (Year of Birth); Positions With the Portfolio (1) | | Principal Occupation During Past 5 Years | | Number of
Portfolios in Fund
Complex Overseen
by Trustee (2) | | Other Directorships Held During the Past 5 Years |
Independent Trustees | | |
| | | |
John F. Finn (1947);
Chairman since 2020;
Trustee of Trust since 2005;
Trustee of heritage One Group Mutual Funds since 1998. | | Chairman, Gardner, Inc. (supply chain management company serving industrial and consumer markets) (serving in various roles 1974-present). | | 128 | | Director, Greif, Inc. (GEF) (industrial package products and services) (2007-present); Trustee, Columbus Association for the Performing Arts (1988-present); Director, Cardinal Health, Inc. (CAH) (1994-2014). |
| | | |
| Stephen P. Fisher (1959); Trustee of Trust since 2018. | | Retired; Chairman and Chief Executive Officer, NYLIFE Distributors LLC (registered broker-dealer) (serving in various roles 2008-2013); Chairman, NYLIM Service Company LLC (transfer agent) (2008-2017); New York Life Investment Management LLC (registered investment adviser) (serving in various roles 2005-2017); Chairman, IndexIQ Advisors LLC (registered investment adviser for ETFs) (2014-2017); President, MainStay VP Funds Trust (2007-2017), MainStay DefinedTerm Municipal Opportunities Fund (2011-2017) and MainStay Funds Trust (2007-2017) (registered investment companies). | | 128 | | Honors Program Advisory Board Member, The Zicklin School of Business, Baruch College, The City University of New York (2017-present). |
| | | |
| Kathleen M. Gallagher (1958); Trustee of Trust since 2018. | | Retired; Chief Investment Officer — Benefit Plans, Ford Motor Company (serving in various roles 1985-2016). | | 128 | | Non-Executive Director, Legal & General Investment Management (Holdings) (2018-present); Non-Executive Director, Legal & General Investment Management America (financial services and insurance) (2017-present); Advisory Board Member, Fiduciary Solutions, State Street Global Advisors (2017-present); Member, Client Advisory Council, Financial Engines, LLC (registered investment adviser) (2011-2016); Director, Ford Pension Funds Investment Management Ltd. (2007-2016). |
| | | |
| Dennis P. Harrington* (1950); Trustee of Trust since 2017. | | Retired; Partner, Deloitte LLP (accounting firm) (serving in various roles 1984-2012). | | 128 | | None |
| | | |
| Frankie D. Hughes (1952); Trustee of Trust since 2008. | | President, Ashland Hughes Properties (property management) (2014-present); President and Chief Investment Officer, Hughes Capital Management, Inc. (fixed income asset management) (1993-2014). | | 128 | | None |
| | | | | | | | | | |
| | | | | |
| DECEMBER 31, 2020 | | JPMORGAN INSURANCE TRUST | | | | | | | | 21 |
TRUSTEES
(Unaudited) (continued)
| | | | | | |
Name (Year of Birth); Positions With the Portfolio (1) | | Principal Occupation During Past 5 Years | | Number of
Portfolios in Fund
Complex Overseen
by Trustee (2) | | Other Directorships Held During the Past 5 Years |
Independent Trustees (continued) | | |
| | | |
Raymond Kanner** (1953); Trustee of Trust since 2017. | | Retired; Managing Director & Chief Investment Officer, IBM Retirement Funds (2007-2016). | | 128 | | Advisory Board Member, Penso Advisors LLC (2020-present); Advisory Board Member, Los Angeles Capital (2018-present); Advisory Board Member, State Street Global Advisors Fiduciary Solutions Board (2017-present); Acting Executive Director, Committee on Investment of Employee Benefit Assets (CIEBA) (2016-2017); Advisory Board Member, Betterment for Business (robo advisor) (2016-2017); Advisory Board Member, BlueStar Indexes (index creator) (2013-2017); Director, Emerging Markets Growth Fund (registered investment company) (1997-2016); Member, Russell Index Client Advisory Board (2001-2015). |
| | | |
| Peter C. Marshall (1942); Trustee of Trust since 2005; Trustee of heritage One Group Mutual Funds since 1985. (3) | | Self-employed business consultant
(2002-present). | | 128 | | None |
| | | |
| Mary E. Martinez (1960); Trustee of Trust since 2013. | | Associate, Special Properties, a Christie’s International Real Estate Affiliate (2010-present); Managing Director, Bank of America (Asset Management) (2007-2008); Chief Operating Officer, U.S. Trust Asset Management, U.S. Trust Company (asset management) (2003-2007); President, Excelsior Funds (registered investment companies) (2004-2005). | | 128 | | None |
| | | |
| Marilyn McCoy (1948); Trustee of Trust since 2005; Trustee of heritage One Group Mutual Funds since 1999. | | Vice President of Administration and Planning, Northwestern University (1985-present). | | 128 | | None |
| | | |
| Mitchell M. Merin (1953); Trustee of Trust since 2013. (4) | | Retired; President and Chief Operating Officer, Morgan Stanley Investment Management, Member, Morgan Stanley & Co. Management Committee (serving in various roles 1981-2006). | | 128 | | Director, Sun Life Financial (SLF) (financial services and insurance) (2007-2013). |
| | | |
Dr. Robert A. Oden, Jr. (1946);
Trustee of Trust since 2005; Trustee of heritage One Group Mutual Funds since 1997. | | Retired; President, Carleton College (2002-2010); President, Kenyon College (1995-2002). | | 128 | | Trustee and Vice Chair, Trout Unlimited (2017-present); Trustee, American Museum of Fly Fishing (2013-present); Vice Chair, Dartmouth-Hitchcock Medical Center (2011-present); Trustee, American University in Cairo (1999-2014). |
| | | | | | | | | | |
| | | | | |
| 22 | | | | | | | | JPMORGAN INSURANCE TRUST | | DECEMBER 31, 2020 |
| | | | | | |
Name (Year of Birth); Positions With the Portfolio (1) | | Principal Occupation During Past 5 Years | | Number of
Portfolios in Fund
Complex Overseen
by Trustee (2) | | Other Directorships Held During the Past 5 Years |
Independent Trustees (continued) | | |
| | | |
| Marian U. Pardo*** (1946); Trustee of Trust since 2013. | | Managing Director and Founder, Virtual Capital Management LLC (investment consulting) (2007-present); Managing Director, Credit Suisse Asset Management (portfolio manager) (2003-2006). | | 128 | | President and Member, Board of Governors, Columbus Citizens Foundation (not-for-profit supporting philanthropic and cultural programs) (2006-present). |
| (1) | The Trustees serve for an indefinite term, subject to the Trust’s current retirement policy, which is age 78 for all Trustees. |
| (2) | A Fund Complex means two or more registered investment companies that hold themselves out to investors as related companies for purposes of investment and investor services or have a common investment adviser or have an investment adviser that is an affiliated person of the investment adviser of any of the other registered investment companies. The J.P. Morgan Funds Complex for which the Board of Trustees serves currently includes ten registered investment companies (128 funds). |
| (3) | Mr. Marshall retired from the Board of Trustees effective the close of business on December 31, 2020. |
| (4) | Mr. Merin retired from the Board of Trustees effective the close of business on January 31, 2021. |
| * | Two family members of Mr. Harrington are partner and managing director, respectively, of the Portfolio’s independent registered public accounting firm. Such firm has represented to the Board that those family members are not involved in the audit of the Portfolio’s financial statements and do not provide other services to the Portfolio. The Board has concluded that such association does not interfere with Mr. Harrington’s exercise of independent judgment as an Independent Trustee. |
| ** | A family member of Mr. Kanner is employed by JPMorgan Chase Bank, which is affiliated with JPMIM and JPMDS. In that capacity, this employee provides services to various JPMorgan affiliates including JPMIM and JPMDS and for which JPMIM and JPMDS bear some portion of the expense thereof. |
| *** | In connection with prior employment with JPMorgan Chase, Ms. Pardo was the recipient of non-qualified pension plan payments from JPMorgan Chase in the amount of approximately $2,055 per month, which she irrevocably waived effective January 1, 2013, and deferred compensation payments from JPMorgan Chase in the amount of approximately $7,294 per year, which ended in January 2013. In addition, Ms. Pardo receives payments from a fully-funded qualified plan, which is not an obligation of JPMorgan Chase. |
The contact address for each of the Trustees is 277 Park Avenue, New York, NY 10172.
| | | | | | | | | | |
| | | | | |
| DECEMBER 31, 2020 | | JPMORGAN INSURANCE TRUST | | | | | | | | 23 |
OFFICERS
(Unaudited)
| | |
Name (Year of Birth), Positions Held with the Trust (Since) | | Principal Occupations During Past 5 Years |
| |
Brian S. Shlissel (1964),
President and Principal Executive Officer (2016)* | | Managing Director and Chief Administrative Officer for J.P. Morgan pooled vehicles, J.P. Morgan Investment Management Inc. (formerly JPMorgan Funds Management, Inc.) (from 2014 to present); Managing Director and Head of Mutual Fund Services, Allianz Global Investors; President and Chief Executive Officer, Allianz Global Investors Mutual Funds and PIMCO Closed-End Funds (from 1999 to 2014). |
| |
Timothy J. Clemens (1975), Treasurer and Principal Financial Officer (2018)** | | Executive Director, J.P. Morgan Investment Management Inc. (formerly JPMorgan Funds Management, Inc.) since February 2016; Vice President, JPMorgan Funds Management, Inc. from October 2013 to January 2016. |
| |
Gregory S. Samuels (1980),
Secretary (2019) (formerly Assistant Secretary since 2010)** | | Executive Director and Assistant General Counsel, JPMorgan Chase. Mr. Samuels has been with JPMorgan Chase since 2010. |
| |
Stephen M. Ungerman (1953),
Chief Compliance Officer (2005) | | Managing Director, JPMorgan Chase & Co.; Mr. Ungerman has been with JPMorgan Chase & Co. since 2000. |
| |
Elizabeth A. Davin (1964), Assistant Secretary (2005)*** | | Executive Director and Assistant General Counsel, JPMorgan Chase since February 2012; formerly Vice President and Assistant General Counsel, JPMorgan Chase from 2005 to February 2012; Senior Counsel, JPMorgan Chase (formerly Bank One Corporation) from 2004 to 2005. |
| |
Jessica K. Ditullio (1962),
Assistant Secretary (2005)*** | | Executive Director and Assistant General Counsel, JPMorgan Chase. Ms. Ditullio has been with JPMorgan Chase (formerly Bank One Corporation) since 1990. |
| |
Anthony Geron (1971),
Assistant Secretary (2018)** | | Vice President and Assistant General Counsel, JPMorgan Chase since September 2018; Lead Director and Counsel, AXA Equitable Life Insurance Company from 2015 to 2018 and Senior Director and Counsel, AXA Equitable Life Insurance Company from 2014 to 2015. |
| |
Carmine Lekstutis (1980),
Assistant Secretary (2011)** | | Executive Director and Assistant General Counsel, JPMorgan Chase. Mr. Lekstutis has been with JPMorgan Chase since 2011. |
| |
Zachary E. Vonnegut-Gabovitch (1986), Assistant Secretary (2017)** | | Vice President and Assistant General Counsel, JPMorgan Chase since September 2016; Associate, Morgan, Lewis & Bockius (law firm) from 2012 to 2016. |
| |
Michael M. D’Ambrosio (1969),
Assistant Treasurer (2012) | | Managing Director, J.P. Morgan Investment Management Inc. (formerly JPMorgan Funds Management, Inc.). Mr. D’Ambrosio has been with J.P. Morgan Investment Management Inc. since 2012. |
| |
Aleksandr Fleytekh (1972), Assistant Treasurer (2019)** | | Vice President, J.P. Morgan Investment Management Inc. (formerly JPMorgan Funds Management, Inc.) since February 2012. |
| |
Shannon Gaines (1977),
Assistant Treasurer (2018)*** | | Vice President, J.P. Morgan Investment Management Inc. (formerly JPMorgan Funds Management, Inc.) since January 2014. |
| |
Jeffrey D. House (1972), Assistant Treasurer (2017)*** | | Vice President, J.P. Morgan Investment Management Inc. (formerly JPMorgan Funds Management, Inc.) since July 2006. |
| |
Michael Mannarino (1985),
Assistant Treasurer (2020) | | Vice President, J.P. Morgan Investment Management Inc. (formerly JPMorgan Funds Management, Inc.) since 2014. |
| |
Joseph Parascondola (1963),
Assistant Treasurer (2011)* | | Executive Director, J.P. Morgan Investment Management, Inc. since February 2020, formerly Vice President, J.P. Morgan Investment Management Inc. (formerly JPMorgan Funds Management, Inc.) from August 2006 to January 2020. |
| |
Gillian I. Sands (1969),
Assistant Treasurer (2012)** | | Vice President, J.P. Morgan Investment Management Inc. (formerly JPMorgan Funds Management, Inc.) since September 2012. |
The contact address for each of the officers, unless otherwise noted, is 277 Park Avenue, New York, NY 10172.
| * | The contact address for the officer is 575 Washington Boulevard, Jersey City, NJ 07310. |
| ** | The contact address for the officer is 4 New York Plaza, New York, NY 10004. |
| *** | The contact address for the officer is 1111 Polaris Parkway, Columbus, OH 43240. |
| | | | | | | | | | |
| | | | | |
| 24 | | | | | | | | JPMORGAN INSURANCE TRUST | | DECEMBER 31, 2020 |
SCHEDULE OF SHAREHOLDER EXPENSES
(Unaudited)
Hypothetical $1,000 Investment
As a shareholder of the Portfolio, you incur ongoing costs, including investment advisory fees, administration fees and other Portfolio expenses. Because the Portfolio is a funding vehicle for Policies and Eligible Plans, you may also incur sales charges and other fees relating to the Policies or Eligible Plans. The examples below are intended to help you understand your ongoing costs (in dollars) of investing in the Portfolio, but not the costs of the Policies or Eligible Plans, and to compare these ongoing costs with the ongoing costs of investing in other mutual funds. The examples assume that you had a $1,000 investment in the Portfolio at the beginning of the reporting period, July 1, 2020, and continued to hold your shares at the end of the reporting period, December 31, 2020.
Actual Expenses
The first line provides information about actual account values and actual expenses. You may use the information in this line, together with the amount you invested, to estimate the expenses that you paid over the period. Simply divide your account value by $1,000 (for example, an $8,600 account value divided by $1,000 = 8.6), then multiply the result by the number in the first line under the heading titled “Expenses Paid During the Period” to estimate the expenses you paid on your account during this period.
Hypothetical Example for Comparison Purposes
The second line in the table below provides information about hypothetical account values and hypothetical expenses based on the actual expense ratio and an assumed rate of return of 5% per year before expenses, which is not the Portfolio’s actual return. The hypothetical account values and expenses may not be used to estimate the actual ending account balance or expenses you paid for the period. You may use this information to compare the ongoing costs of investing in the Portfolio and other funds. To do so, compare this 5% hypothetical example with the 5% hypothetical examples that appear in the shareholder reports of the other funds. Please note that the expenses shown in the table are meant to highlight your ongoing costs only and do not reflect any transaction costs, such as sales charges (loads) or redemption fees or the costs associated with the Policies and Eligible Plans through which the Portfolio is held. Therefore, the second line in the table is useful in comparing ongoing costs only, and will not help you determine the relative total costs of owning different funds. In addition, if these transaction costs were included, your costs would have been higher. The examples also assume all dividends and distributions have been reinvested.
| | | | | | | | | | | | | | | | |
| | | Beginning
Account Value
July 1, 2020 | | | Ending
Account Value
December 31, 2020 | | | Expenses
Paid During
the Period* | | | Annualized
Expense
Ratio | |
| | | | | | | | | | | | | | | | |
JPMorgan Insurance Trust Mid Cap Value Portfolio | | | | | | | | | | | | | | | | |
Class 1 | | | | | | | | | | | | | | | | |
Actual | | $ | 1,000.00 | | | $ | 1,248.90 | | | $ | 4.35 | | | | 0.77 | % |
Hypothetical | | | 1,000.00 | | | | 1,021.27 | | | | 3.91 | | | | 0.77 | |
| * | Expenses are equal to the Portfolio’s annualized expense ratio, multiplied by the average account value over the period, multiplied by 184/366 (to reflect the one-half year period). |
| | | | | | | | | | |
| | | | | |
| DECEMBER 31, 2020 | | JPMORGAN INSURANCE TRUST | | | | | | | | 25 |
BOARD APPROVAL OF INVESTMENT ADVISORY AGREEMENT
(Unaudited)
The Board of Trustees has established various standing committees composed of Trustees with diverse backgrounds, to which the Board of Trustees has assigned specific subject matter responsibilities to further enhance the effectiveness of the Board’s oversight and decision making. The Board of Trustees and its investment committees (money market and alternative products, equity, and fixed income) meet regularly throughout the year and consider factors that are relevant to their annual consideration of investment advisory agreements at each meeting. They also meet for the specific purpose of considering investment advisory agreement annual renewals. The Board of Trustees held meetings in June and August 2020, at which the Trustees considered the continuation of the investment advisory agreement for the Portfolio whose annual report is contained herein (the “Advisory Agreement”). In accordance with SEC guidance, due to the COVID-19 pandemic, the meetings were conducted through video conference. At the June meeting, the Board’s investment committees met to review and consider performance, expense and related information for the J.P. Morgan Funds. Each investment committee reported to the full Board, which then considered the investment committee’s preliminary findings. At the August meeting, the Trustees continued their review and consideration. The Trustees, including a majority of the Trustees who are not parties to the Advisory Agreement or “interested persons” (as defined in the 1940 Act) of any party to the Advisory Agreement or any of their affiliates, approved the continuation of the Advisory Agreement on August 11, 2020.
As part of their review of the Advisory Agreement, the Trustees considered and reviewed performance and other information about the Portfolio received from the Adviser. This information includes the Portfolio’s performance as compared to the performance of its peers and benchmarks and analyses by the Adviser of the Portfolio’s performance. In addition, at each of their regular meetings throughout the year, the Trustees considered reports on the performance of certain J.P. Morgan Funds provided by an independent management consulting firm (“independent consultant”). In addition, in preparation for the June and August meetings, the Trustees requested, received and evaluated extensive materials from the Adviser, including performance and expense information compiled by Broadridge, using data from Lipper Inc. and/or Morningstar Inc., independent providers of investment company data (together, “Broadridge”). Before voting on the Advisory Agreement, the Trustees reviewed the Advisory Agreement with representatives of the Adviser, counsel to the Trust and independent legal counsel and received a memorandum from independent legal counsel to the Trustees discussing the legal standards for their consideration of the Advisory Agreement. The Trustees also discussed the Advisory Agreement in executive sessions with independent legal counsel at which no representatives of the Adviser were present.
A summary of the material factors evaluated by the Trustees in determining whether to approve the Advisory Agreement is provided below. Each Trustee attributed different weights to the various factors and no factor alone was considered determinative. The Trustees considered information provided with respect to the Portfolio throughout the year, including additional reporting and information provided in connection with the market volatility caused by the COVID-19 pandemic, as well as materials furnished specifically in connection with the annual review process. From year to year, the Trustees consider and place emphasis on relevant information in light of changing circumstances in market and economic conditions.
After considering and weighing the factors and information they had received, the Trustees found that the compensation to be received by the Adviser from the Portfolio under the Advisory Agreement was fair and reasonable under the circumstances and determined that the continuance of the Advisory Agreement was in the best interests of the Portfolio and its shareholders.
Nature, Extent and Quality of Services Provided by the Adviser
The Trustees received and considered information regarding the nature, extent and quality of services provided to the Portfolio under the Advisory Agreement. The Trustees took into account information furnished throughout the year at Trustee meetings, as well as the materials furnished specifically in connection with this annual review process. The Trustees considered the background and experience of the Adviser’s senior management, personnel changes, if any, and the expertise of, and the amount of attention given to the Portfolio by, investment personnel of the Adviser. In addition, the Trustees reviewed the qualifications, backgrounds and responsibilities of the portfolio management team primarily responsible for the day-to-day management of the Portfolio and the infrastructure supporting the team, including personnel changes, if any. In addition, the Board considered its discussions with the Adviser regarding the Adviser’s business continuity plan and steps the Adviser was taking to provide ongoing services to the Portfolio during the COVID-19 pandemic, and the Adviser’s success in continuing to provide services to the Portfolio and their shareholders throughout this period. The Trustees also considered information provided by the Adviser and JPMorgan Distribution Services, Inc. (“JPMDS”) about the structure and distribution strategy of the Portfolio. The Trustees reviewed information relating to the Adviser’s risk governance model and reports showing the Adviser’s compliance structure and ongoing compliance processes. The Trustees also considered the quality of the administration services provided by the Adviser in its role as administrator.
The Trustees also considered their knowledge of the nature and quality of services provided by the Adviser and its affiliates to the Portfolio gained from their experience as Trustees of the
| | | | | | | | | | |
| | | | | |
| 26 | | | | | | | | JPMORGAN INSURANCE TRUST | | DECEMBER 31, 2020 |
J.P. Morgan Funds. In addition, they considered the overall reputation and capabilities of the Adviser and its affiliates, the commitment of the Adviser to provide high quality service to the Portfolio, their overall confidence in the Adviser’s integrity and the Adviser’s responsiveness to questions or concerns raised by them, including the Adviser’s willingness to consider and implement organizational and operational changes designed to improve investment results and the services provided to the Portfolio.
Based upon these considerations and other factors, the Trustees concluded that they were satisfied with the nature, extent and quality of the investment advisory services provided to the Portfolio by the Adviser.
Costs of Services Provided and Profitability to the Adviser and its Affiliates
The Trustees received and considered information regarding the profitability to the Adviser and its affiliates in providing services to the Portfolio. The Trustees reviewed and discussed this information. The Trustees recognized that this information
is not audited and represents the Adviser’s determination of its and its affiliates’ revenues from the contractual services provided to the Portfolio, less expenses of providing such services. Expenses include direct and indirect costs and are calculated using an allocation methodology developed by the Adviser. The Trustees also recognized that it is difficult to make comparisons of profitability from fund investment advisory contracts because comparative information is not generally publicly available and is affected by numerous factors, including the structure of the particular adviser, the types of funds it manages, its business mix, numerous assumptions regarding allocations and the fact that publicly-traded fund managers’ operating profits and net income are net of distribution and marketing expenses. Based upon their review, and taking into consideration the factors noted above, the Trustees concluded that the profitability to the Adviser under the Advisory Agreement was not unreasonable in light of the services and benefits provided to the Portfolio.
The Trustees also considered that the Adviser earns fees from the Portfolio for providing administration services. These fees were shown separately in the profitability analysis presented to the Trustees. The Trustees also considered the fees paid to JPMorgan Chase Bank, N.A. (“JPMCB”) for custody and fund accounting and other related services.
Fall-Out Benefits
The Trustees reviewed information regarding potential “fall-out” or ancillary benefits received by the Adviser and its affiliates as a result of their relationship with the Portfolio. The Trustees considered that the J.P. Morgan Funds’ operating accounts are held at JPMCB, which, as a result, will receive float benefits for certain J.P. Morgan Funds, as applicable. The
Trustees also noted that the Adviser supports a diverse set of products and services, which benefits the Adviser by allowing it to leverage its infrastructure to serve additional clients, including benefits that may be received by the Adviser and its affiliates in connection with the Portfolio’s potential investments in other funds advised by the Adviser. The Trustees also reviewed the Adviser’s allocation of fund brokerage for the J.P. Morgan Funds complex, including allocations to brokers who provide research to the Adviser.
Economies of Scale
The Trustees considered the extent to which the Portfolio may benefit from economies of scale. The Trustees considered that there may not be a direct relationship between economies of scale realized by the Portfolio and those realized by the Adviser as assets increase. The Trustees considered the extent to which the Portfolio was priced to scale and whether it would be appropriate to add advisory fee breakpoints, but noted that the Portfolio has implemented fee waivers and contractual expense limitations (“Fee Caps”) which allow the Portfolio’s shareholders to share potential economies of scale from its inception and that the fees remain satisfactory relative to peer funds. The Trustees considered the benefits to the Portfolio of the use of an affiliated distributor and custodian, including the ability to rely on existing infrastructure supporting distribution, custodial and transfer agent services, and the ability to negotiate competitive fees for the Portfolio. The Trustees further considered the Adviser’s and JPMDS’s ongoing investments in their business in support of the Portfolio, including the Adviser’s and/or JPMDS’s investments in trading systems, technology (including improvements to the J.P. Morgan Funds’ website, and cybersecurity improvements), retention of key talent, and regulatory support enhancements. The Trustees concluded that the current fee structure for the Portfolio, including Fee Caps that the Adviser has in place that serve to limit the overall net expense ratios of the Portfolio at competitive levels, was reasonable. The Trustees concluded that the Portfolio’s shareholders received the benefits of potential economies of scale through the Fee Caps and the Adviser’s reinvestment in its operations to serve the Portfolio and its shareholders. The Trustees noted that the Adviser’s reinvestment ensures sufficient resources in terms of personnel and infrastructure to support the Portfolio.
Independent Written Evaluation of the Portfolio’s Chief Compliance Officer
The Trustees noted that, upon their direction, the Chief Compliance Officer for the Portfolio had prepared an independent written evaluation in order to assist the Trustees in determining the reasonableness of the proposed management fees. The Trustees considered the written evaluation in determining whether to continue the Advisory Agreement.
| | | | | | | | | | |
| | | | | |
| DECEMBER 31, 2020 | | JPMORGAN INSURANCE TRUST | | | | | | | | 27 |
BOARD APPROVAL OF INVESTMENT ADVISORY AGREEMENT
(Unaudited) (continued)
Fees Relative to Adviser’s Other Clients
The Trustees received and considered information about the nature and extent of investment advisory services and fee rates offered to other clients of the Adviser, including institutional separate accounts, collective investment trusts, ETFs and/or funds sub-advised by the Adviser, for investment management styles substantially similar to that of the Portfolio. The Trustees considered the complexity of investment management for registered mutual funds relative to the Adviser’s other clients and noted differences, as applicable, in the regulatory, legal and other risks and responsibilities of providing services to the different clients. The Trustees considered that serving as an adviser to a registered mutual fund involves greater responsibilities and risks than acting as a sub-adviser and observed that sub-advisory fees may be lower than those charged by the Adviser to the Portfolio. The Trustees also noted that the adviser, not the mutual fund, pays the sub-advisory fee and that many responsibilities related to the advisory function are retained by the primary adviser. The Trustees concluded that the fee rates charged to the Portfolio in comparison to those charged to the Adviser’s other clients were reasonable.
Investment Performance
The Trustees received and considered absolute and/or relative performance information for the Portfolio in a report prepared by Broadridge. The Trustees considered the total return performance information, which included the ranking of the Portfolio within a performance universe made up of funds with the same Broadridge investment classification and objective (the “Universe”), as well as a subset of funds within the Universe (the “Peer Group”), by total return for the applicable one-, three- and five-year periods. The Trustees reviewed a description of Broadridge’s methodology for selecting mutual funds in the Portfolio’s Universe and Peer Group and noted that Universe and Peer Group rankings were not calculated if the number of funds in the Universe and/or Peer Group did not meet a predetermined minimum. The Broadridge materials provided to the Trustees highlighted information with respect to a representative class to assist the Trustees in their review. As part of this review, the Trustees also reviewed the Portfolio’s performance against its benchmark and considered the performance information provided for the Portfolio at regular Board meetings by the Adviser. The Trustees also engaged with the Adviser to consider what steps might be taken to improve performance, as applicable. The Broadridge performance data
noted by the Trustees as part of their review and the determinations made by the Trustees with respect to the Portfolio’s performance are summarized below:
The Trustees noted that the Portfolio’s performance for Class 1 shares was in the fourth, fourth and second quintiles, based upon the Peer Group, and in the fourth, fourth and third quintiles, based upon the Universe, for the one-, three- and five-year periods ended December 31, 2019, respectively. The Trustees discussed the performance and investment strategy of the Portfolio with the Adviser and based upon this discussion and various other factors, concluded that the Portfolio’s performance was satisfactory under the circumstances.
Advisory Fees and Expense Ratios
The Trustees considered the contractual advisory fee rate and administration fee rate paid by the Portfolio to the Adviser and compared the combined rate to the information prepared by Broadridge concerning management fee rates paid by other funds in the same Broadridge category as the Portfolio. The Trustees recognized that Broadridge reported the Portfolio’s management fee rate as the combined contractual advisory fee and administration fee rates. The Trustees also reviewed information about other expenses and the expense ratios for the Portfolio and noted that Universe and Peer Group rankings were not calculated if the number of funds in the Universe and/or Peer Groups did not meet a predetermined minimum. The Trustees considered the Fee Caps currently in place for the Portfolio, the net advisory fee rate after taking into account any waivers and/or reimbursements and, where deemed appropriate by the Trustees, additional waivers and/or reimbursements. The Trustees recognized that it is difficult to make comparisons of advisory fees because there are variations in the services that are included in the fees paid by other funds. The Trustees’ determinations as a result of the review of the Portfolio’s advisory fees and expense ratios are summarized below:
The Trustees noted that the Portfolio’s net advisory fee and actual total expenses for Class 1 shares were both in the second quintile based upon the Peer Group and were both in the third quintile based upon the Universe. After considering the factors identified above, in light of this information, the Trustees concluded that the advisory fee was satisfactory in light of the services provided to the Portfolio.
| | | | | | | | | | |
| | | | | |
| 28 | | | | | | | | JPMORGAN INSURANCE TRUST | | DECEMBER 31, 2020 |
TAX LETTER
(Unaudited)
Dividends Received Deduction (DRD)
The Portfolio had 100.00%, or maximum allowable percentage, of ordinary income distributions eligible for the dividends received deduction for corporate shareholders for the fiscal year ended December 31, 2020.
Long Term Capital Gain
The Portfolio distributed approximately $25,471,000, or maximum allowable amount, of long-term capital gain dividends for the fiscal year ended December 31, 2020.
| | | | | | | | | | |
| | | | | |
| DECEMBER 31, 2020 | | JPMORGAN INSURANCE TRUST | | | | | | | | 29 |
J.P. Morgan Funds are distributed by JPMorgan Distribution Services, Inc., which is an affiliate of JPMorgan Chase & Co. Affiliates of JPMorgan Chase & Co. receive fees for providing various services to the funds.
Contact JPMorgan Distribution Services, Inc. at 1-800-480-4111 for a portfolio prospectus. You can also visit us at www.jpmorganfunds.com. Investors should carefully consider the investment objectives and risk as well as charges and expenses of the mutual fund before investing. The prospectus contains this and other information about the mutual fund. Read the prospectus carefully before investing.
The Portfolio files a complete schedule of its portfolio holdings for the first and third quarters of its fiscal year with the SEC as an exhibit to its report on Form N-PORT. The Portfolio’s Form N-PORT reports are available on the SEC’s website at http://www.sec.gov. The Portfolio’s quarterly holdings can be found by visiting the J.P. Morgan Funds’ website at www.jpmorganfunds.com.
A description of the Portfolio’s policies and procedures with respect to the disclosure of the Portfolio’s holdings is available in the prospectuses and Statement of Additional Information.
A copy of proxy policies and procedures is available without charge upon request by calling 1-800-480-4111 and on the Portfolio’s website at www.jpmorganfunds.com. A description of such policies and procedures is on the SEC’s website at www.sec.gov. The Trustees have delegated the authority to vote proxies for securities owned by the Portfolio to the Adviser. A copy of the Portfolio’s voting record for the most recent 12-month period ended June 30 is available on the SEC’s website at www.sec.gov or at the Portfolio’s website at www.jpmorganfunds.com no later than August 31 of each year. The Portfolio’s proxy voting record will include, among other things, a brief description of the matter voted on for each portfolio security, and will state how each vote was cast, for example, for or against the proposal.

J.P. Morgan Asset Management is the brand name for the asset management business of JPMorgan Chase & Co. and its affiliates worldwide.
| | | | |
| | © JPMorgan Chase & Co., 2020. All rights reserved. December 2020. | | AN-JPMITMCVP-1220 |
Annual Report
JPMorgan Insurance Trust
December 31, 2020
JPMorgan Insurance Trust Small Cap Core Portfolio
| | | | |
NOT FDIC INSURED • NO BANK GUARANTEE • MAY LOSE VALUE
| | |  | |
CONTENTS
Investments in the Portfolio are not deposits or obligations of, or guaranteed or endorsed by, any bank and are not insured or guaranteed by the FDIC, the Federal Reserve Board or any other government agency. You could lose money if you sell when the Portfolio’s share price is lower than when you invested.
Past performance is no guarantee of future performance. The general market views expressed in this report are opinions based on market and other conditions through the end of the reporting period and are subject to change without notice. These views are not intended to predict the future performance of the Portfolio or the securities markets. References to specific securities and their issuers are for illustrative purposes only and are not intended to be, and should not be interpreted as, recommendations to purchase or sell such securities. Such views are not meant as investment advice and may not be relied on as an indication of trading intent on behalf of the Portfolio.
This Portfolio is intended to be a funding vehicle for variable annuity contracts and variable life insurance policies (collectively “Policies”) offered by the separate accounts of various insurance companies. Portfolio shares may also be offered to qualified pension and retirement plans and accounts permitting accumulation of assets on a tax-deferred basis (“Eligible Plans”). Individuals may not purchase shares directly from the Portfolio.
Prospective investors should refer to the Portfolio’s prospectuses for a discussion of the Portfolio’s investment objective, strategies and risks. Call J.P. Morgan Funds Service Center at 1-800-480-4111 for a prospectus containing more complete information about the Portfolio, including management fees and other expenses. Please read it carefully before investing.
LETTER TO SHAREHOLDERS
February 4, 2021 (Unaudited)
Dear Shareholders,
The immense efforts of central banks, government and researchers in the public and private sectors appear to have shepherded the world through the most difficult days of a profound crisis caused by the pandemic. While the economic and health care challenges are not behind us, the uncertainty and turbulence of 2020 has abated.
| | |
 | | “We believe the clear lesson is that investors who remained fully invested over the past year, in the face of uncertainty over the direction of the pandemic and the unprecedented responses to it, were likely rewarded for their resolve.” — Andrea L. Lisher |
The development of multiple vaccines against Covid-19 toward the end of 2020 provided hope that the pandemic would be halted and that economic and social activity could begin to resume in the year ahead. That optimism spread to global financial markets. While leading equity indexes fell by 20% or more in the first quarter of 2020, financial markets stabilized and equity markets largely rebounded — slowly at first and then rapidly the second half of the year. At the end of 2020, the S&P 500 Index had generated a total return of 18.10% for the full 12 months and 22.16% for the final six months of the year.
We believe the clear lesson is that investors who remained fully invested over the past year, in the face of uncertainty over the
direction of the pandemic and the unprecedented responses to it, were likely rewarded for their resolve.
Certainly, enormous challenges remain in both the implementation of global vaccinations and in the rebuilding of economies at the local, national and international levels. However, the advances in the fight against Covid-19 provide policymakers and investors with the opportunity to plan for the future and meet those challenges. J.P. Morgan Asset Management has thrived amid the many challenges presented by the pandemic. Moreover, our deep experience in risk management enabled us to better navigate increased volatility in global financial markets. Throughout 2020, we continued to seek to operate under the same fundamental practices and principles that have driven our success for more than a century with an unwavering focus on putting our clients at the center of everything we do.
On behalf of J.P. Morgan Asset Management, thank you for entrusting us to manage your investment. Should you have any questions, please visit www.jpmorganfunds.com or contact the J.P. Morgan Funds Service Center at 1-800-480-4111.
Sincerely yours,

Andrea L. Lisher
Head of Americas, Client
J.P. Morgan Asset Management
| | | | | | | | | | |
| | | | | |
| DECEMBER 31, 2020 | | JPMORGAN INSURANCE TRUST | | | | | | | | 1 |
JPMorgan Insurance Trust Small Cap Core Portfolio
PORTFOLIO COMMENTARY
TWELVE MONTHS ENDED DECEMBER 31, 2020 (Unaudited)
| | | | |
| REPORTING PERIOD RETURN: | |
| Portfolio (Class 1 Shares)* | | | 13.69% | |
| Russell 2000 Index | | | 19.96% | |
| |
| Net Assets as of 12/31/2020 (In Thousands) | | $ | 202,939 | |
INVESTMENT OBJECTIVE**
The JPMorgan Insurance Trust Small Cap Core Portfolio (the “Portfolio”) seeks capital growth over the long term.
HOW DID THE MARKET PERFORM?
Global financial markets generally recovered from a sharp sell-off in the first quarter of 2020, led by a rally in equity markets in the second half of the year. Investor demand for equity was largely fueled by continued support from central banks, relief spending by governments across the globe and the development and approvals of the first vaccines against Covid-19.
In the first days of January 2020, financial markets largely shrugged off a brief flare-up in military tensions between the U.S. and Iran. However, the emergence and spread of Covid-19 fed increasing investor uncertainty and by early March, the novel coronavirus was declared a pandemic by the World Health Organization. The closure of large sectors of national economies on a global scale sparked a dramatic sell-off in financial markets. Yields on developed market sovereign bonds fell sharply and prices for commodity gold spiked. By the end of the first quarter of 2020, leading developed market equity indexes had lost 20% or more of their value from the start of the year. Corporate bond prices fell and the price of crude oil ended the first quarter down by 60%.
Leading central banks promptly responded with lower interest rates and/or asset purchasing programs, which helped to support asset price stability and head off a potential liquidity crunch in credit markets. Governments also responded with a range of fiscal stimulus or paycheck protection programs designed to cushion the economic impact of the pandemic. In the ensuing months, global equity markets staged a slow and uneven rebound, led by U.S. and emerging markets.
At the start of the second half of the year, U.S. equity led a broad rebound in both developed markets and emerging markets equity. Leading U.S. equity indexes rose in July and August 2020, punctuated by five consecutive record high closings for the S&P 500 in late August — a stretch not seen since 2017. Notably, Apple Inc. issued a 4-for-1 stock split in August and became the first publicly listed company with a valuation surpassing $2 trillion. The U.S. Federal Reserve (the “Fed”) signaled its continued support for asset purchases and low benchmark interest rates. While the spread of Covid-19 accelerated in the U.S., multiple candidate vaccines were being
developed around the world and the number of hospitalizations at the end of the summer was relatively small compared with what was to come at the end of the year.
Equity prices across the globe largely declined over September and October 2020. Re-closings across Asia and Europe in response to Covid-19 dented investor optimism. The inability of the U.S. Congress to adopt further spending for pandemic relief put acute pressure on the S&P 500 in the final week of October.
U.S. equity prices began to rebound in November and by mid-month the S&P 500 reached a closing high and crossed 3,600 points for the first time amid the U.S. Food and Drug Administration’s approval of the first Covid-19 vaccines. While the results of the U.S. presidential election were contested, President-elect Joe Biden’s early cabinet choices — including former Fed Chairwoman Janet Yellen — removed some investor uncertainty. The Fed kept interest rates and policies unchanged and Congressional negotiations over proposed relief and stimulus spending continued through the month.
Globally, equity markets maintained upward momentum through the end of December, largely driven by investor expectations that mass vaccinations and the re-opening of economies would unleash pent up demand from consumers, businesses and governments. Notably, emerging markets equity outperformed developed markets equity, including U.S. equity in the second half of 2020 as China, Taiwan and South Korea appeared to have greater success in containing the pandemic.
In the U.S., growth stocks continued to outperform value stocks but the difference narrowed somewhat during the period as share price valuations rose. Additionally, shares of select companies that had seen their stock prices plummet in the first half of 2020 benefitted from increased investor appetite for bargains in the second half of the year. At year’s end, the largest 10 companies in the S&P 500 made up 27.4% of the index’s value, compared with 22.7% at the end of 2019 and 21.0% at the end of 2018.
WHAT WERE THE MAIN DRIVERS OF THE PORTFOLIO’S PERFORMANCE?
The Portfolio’s Class 1 Shares underperformed the Russell 2000 Index (the “Benchmark”) for the twelve months ended December 31, 2020. The Portfolio’s security selection in the industrials and information technology sectors was a leading detractor from performance relative to the Benchmark, while
| | | | | | | | | | |
| | | | | |
| 2 | | | | | | | | JPMORGAN INSURANCE TRUST | | DECEMBER 31, 2020 |
the Portfolio’s security selection in the utilities sector and its overweight position and security selection in the energy sector were leading contributors to relative performance.
Leading individual detractors from relative performance included the Portfolio’s underweight positions in Teladoc Health Inc. and Plug Power Inc., and its overweight position in Tivity Health Inc. Shares of Teladoc Health, a provider of online health care services, rose amid increased consumer demand for its services during the pandemic. Shares of Plug Power, a developer of hydrogen fuel cell systems that was not held in the Portfolio, rose after reporting better-than-expected results for the third quarter amid increased industry adoption of fuel cell technology. Shares of Tivity Health, a provider of weight loss and fitness products, fell after a run-up in the stock price early in the period.
Leading individual contributors to relative performance included the Portfolio’s overweight positions in Immunomedics Inc., Owens & Minor Inc. and Stamps.com Inc. Shares of Immunomedics, a drug development company, rose ahead of its $21 billion acquisition by Gilead Sciences Inc. Shares of Owens & Minor, a surgical products manufacturer, rose after the company raised its earnings forecast for the full year 2020. Shares of Stamps.com, an internet provider of postal services, rose after the company reported consecutive quarters of better-than-expected earnings and revenue.
HOW WAS THE PORTFOLIO POSITIONED?
In accordance with its investment process, the portfolio managers take limited sector bets and construct the Portfolio so that stock selection is typically the primary driver of its relative performance versus the Benchmark. The portfolio managers employ a bottom-up approach to stock selection, using quantitative screening and the adviser’s proprietary analysis to construct a portfolio of companies that the portfolio managers believe are attractively valued and possess strong momentum. During the reporting period, the Portfolio was managed and positioned in accordance with this investment process.
| | | | | | | | |
| TOP TEN EQUITY HOLDINGS OF THE PORTFOLIO*** | |
| | 1. | | | Deckers Outdoor Corp. | | | 1.1 | % |
| | 2. | | | WESCO International, Inc. | | | 0.9 | |
| | 3. | | | ArcBest Corp. | | | 0.8 | |
| | 4. | | | AdaptHealth Corp. | | | 0.8 | |
| | 5. | | | MicroStrategy, Inc. Class A | | | 0.7 | |
| | 6. | | | Renewable Energy Group, Inc. | | | 0.7 | |
| | 7. | | | Cornerstone OnDemand, Inc. | | | 0.7 | |
| | 8. | | | TTEC Holdings, Inc. | | | 0.7 | |
| | 9. | | | Korn Ferry | | | 0.7 | |
| | 10. | | | Horizon Therapeutics plc | | | 0.7 | |
| | | | |
PORTFOLIO COMPOSITION BY SECTOR*** | |
Health Care | | | 18.5 | % |
Industrials | | | 14.9 | |
Financials | | | 14.2 | |
Information Technology | | | 12.2 | |
Consumer Discretionary | | | 9.9 | |
Real Estate | | | 5.5 | |
Materials | | | 5.4 | |
Communication Services | | | 4.3 | |
Energy | | | 2.6 | |
Utilities | | | 2.3 | |
Consumer Staples | | | 1.9 | |
Short-Term Investments | | | 8.3 | |
| * | | The return shown is based on net asset values calculated for shareholder transactions and may differ from the return shown in the financial highlights, which reflects adjustments made to the net asset values in accordance with accounting principles generally accepted in the United States of America. |
| ** | | The adviser seeks to achieve the Portfolio’s objective. There can be no guarantee it will be achieved. |
| *** | | Percentages indicated are based on total investments as of December 31, 2020. The Portfolio’s composition is subject to change. |
| | | | | | | | | | |
| | | | | |
| DECEMBER 31, 2020 | | JPMORGAN INSURANCE TRUST | | | | | | | | 3 |
JPMorgan Insurance Trust Small Cap Core Portfolio
PORTFOLIO COMMENTARY
TWELVE MONTHS ENDED DECEMBER 31, 2020 (Unaudited) (continued)
| | | | | | | | | | | | | | |
AVERAGE ANNUAL TOTAL RETURNS AS OF DECEMBER 31, 2020 | |
| | | | |
| | | INCEPTION DATE OF
CLASS | | 1 YEAR | | | 5 YEAR | | | 10 YEAR | |
CLASS 1 SHARES | | January 3, 1995 | | | 13.69 | % | | | 11.56 | % | | | 11.27 | % |
CLASS 2 SHARES | | April 24, 2009 | | | 13.34 | | | | 11.25 | | | | 10.97 | |
TEN YEAR PERFORMANCE (12/31/10 TO 12/31/20)
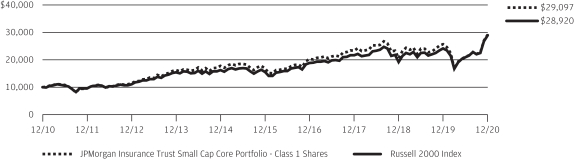
The performance quoted is past performance and is not a guarantee of future results. Mutual funds are subject to certain market risks. Investment returns and principal value of an investment will fluctuate so that an investor’s shares, when redeemed, may be worth more or less than their original cost. Current performance may be higher or lower than the performance data shown. For up-to-date month-end performance information please call 1-800-480-4111.
The graph illustrates comparative performance for $10,000 invested in Class 1 Shares of the JPMorgan Insurance Trust Small Cap Core Portfolio and the Russell 2000 Index from December 31, 2010 to December 31, 2020. The performance of the Portfolio assumes reinvestment of all dividends and capital gain distributions, if any. The performance of the Russell 2000 Index does not reflect the deduction of expenses associated with a mutual fund and has been adjusted to reflect reinvestment of all dividends and capital gain distributions of the securities included in the benchmark, if applicable.
The Russell 2000 Index is an unmanaged index which measures the performance of the 2000 smallest stocks (on the basis of capitalization) in the Russell 3000 Index. Investors cannot invest directly in an index.
Portfolio performance does not reflect any charges imposed by the Policies or Eligible Plans. If these charges were included, the returns would be lower than shown. Portfolio performance may reflect the waiver of the Portfolio’s fees and reimbursement of expenses for certain periods. Without these waivers and reimbursements, performance would have been lower.
The returns shown are based on net asset values calculated for shareholder transactions and may differ from the returns shown in the financial highlights, which reflect adjustments made to the net asset values in accordance with accounting principles generally accepted in the United States of America.
| | | | | | | | | | |
| | | | | |
| 4 | | | | | | | | JPMORGAN INSURANCE TRUST | | DECEMBER 31, 2020 |
JPMorgan Insurance Trust Small Cap Core Portfolio
SCHEDULE OF PORTFOLIO INVESTMENTS
AS OF DECEMBER 31, 2020
| | | | | | | | |
| INVESTMENTS | | SHARES
(000) | | | VALUE
($000) | |
Common Stocks — 98.8% | | | | | | | | |
|
Aerospace & Defense — 1.0% | |
| | |
AAR Corp. | | | 18 | | | | 648 | |
| | |
Aerojet Rocketdyne Holdings, Inc. * | | | 2 | | | | 106 | |
| | |
Astronics Corp. * | | | 17 | | | | 225 | |
| | |
Ducommun, Inc. * | | | 5 | | | | 263 | |
| | |
Moog, Inc., Class A | | | 2 | | | | 151 | |
| | |
Park Aerospace Corp. | | | 4 | | | | 49 | |
| | |
Triumph Group, Inc. | | | 6 | | | | 78 | |
| | |
Vectrus, Inc. * | | | 8 | | | | 403 | |
| | | | | | | | |
| | |
| | | | | | | 1,923 | |
| | | | | | | | |
|
Air Freight & Logistics — 0.6% | |
| | |
Atlas Air Worldwide Holdings, Inc. * | | | 1 | | | | 33 | |
| | |
Echo Global Logistics, Inc. * | | | 4 | | | | 107 | |
| | |
Hub Group, Inc., Class A * | | | 18 | | | | 1,003 | |
| | | | | | | | |
| | |
| | | | | | | 1,143 | |
| | | | | | | | |
|
Airlines — 0.5% | |
| | |
Alaska Air Group, Inc. | | | 5 | | | | 276 | |
| | |
Allegiant Travel Co. | | | 4 | | | | 662 | |
| | | | | | | | |
| | |
| | | | | | | 938 | |
| | | | | | | | |
|
Auto Components — 1.5% | |
| | |
Adient plc * | | | 25 | | | | 869 | |
| | |
American Axle & Manufacturing Holdings, Inc. * | | | 50 | | | | 418 | |
| | |
Cooper Tire & Rubber Co. | | | 16 | | | | 632 | |
| | |
Dana, Inc. | | | 59 | | | | 1,152 | |
| | | | | | | | |
| | |
| | | | | | | 3,071 | |
| | | | | | | | |
|
Banks — 6.9% | |
| | |
Ameris Bancorp | | | 6 | | | | 230 | |
| | |
Associated Banc-Corp. | | | 9 | | | | 157 | |
| | |
Bancorp, Inc. (The) * | | | 26 | | | | 359 | |
| | |
Bank of NT Butterfield & Son Ltd. (The) (Bermuda) | | | 26 | | | | 798 | |
| | |
Bar Harbor Bankshares | | | 4 | | | | 90 | |
| | |
Business First Bancshares, Inc. | | | 5 | | | | 108 | |
| | |
California BanCorp * | | | 2 | | | | 26 | |
| | |
Capital Bancorp, Inc. * | | | 2 | | | | 28 | |
| | |
Capstar Financial Holdings, Inc. | | | 4 | | | | 65 | |
| | |
Cathay General Bancorp | | | 4 | | | | 142 | |
| | |
CB Financial Services, Inc. | | | 1 | | | | 20 | |
| | |
Community Trust Bancorp, Inc. | | | 1 | | | | 32 | |
| | |
ConnectOne Bancorp, Inc. | | | 43 | | | | 843 | |
| | |
Customers Bancorp, Inc. * | | | 20 | | | | 356 | |
| | |
Enterprise Financial Services Corp. | | | 1 | | | | 31 | |
| | |
Financial Institutions, Inc. | | | 10 | | | | 225 | |
| | |
First BanCorp (Puerto Rico) | | | 98 | | | | 901 | |
| | |
First Bank | | | 3 | | | | 23 | |
| | | | | | | | |
| INVESTMENTS | | SHARES
(000) | | | VALUE
($000) | |
| | | | | | | | |
|
Banks — continued | |
| | |
First Business Financial Services, Inc. | | | 3 | | | | 46 | |
| | |
First Choice Bancorp | | | 1 | | | | 15 | |
| | |
First Community Bankshares, Inc. | | | 2 | | | | 41 | |
| | |
First Horizon National Corp. | | | 25 | | | | 315 | |
| | |
First Internet Bancorp | | | 3 | | | | 89 | |
| | |
Great Southern Bancorp, Inc. | | | 4 | | | | 176 | |
| | |
Hancock Whitney Corp. | | | 13 | | | | 449 | |
| | |
Hanmi Financial Corp. | | | 19 | | | | 210 | |
| | |
HBT Financial, Inc. | | | 7 | | | | 98 | |
| | |
Hilltop Holdings, Inc. | | | 15 | | | | 413 | |
| | |
Investar Holding Corp. | | | 5 | | | | 81 | |
| | |
Investors Bancorp, Inc. | | | 119 | | | | 1,255 | |
| | |
Meridian Corp. | | | 2 | | | | 33 | |
| | |
Metropolitan Bank Holding Corp. * | | | 2 | | | | 73 | |
| | |
Mid Penn Bancorp, Inc. | | | 2 | | | | 37 | |
| | |
Northeast Bank | | | 2 | | | | 50 | |
| | |
OceanFirst Financial Corp. | | | 45 | | | | 844 | |
| | |
PacWest Bancorp | | | 13 | | | | 341 | |
| | |
Peapack-Gladstone Financial Corp. | | | 4 | | | | 96 | |
| | |
Popular, Inc. (Puerto Rico) | | | 17 | | | | 946 | |
| | |
RBB Bancorp | | | 3 | | | | 40 | |
| | |
Select Bancorp, Inc. * | | | 20 | | | | 190 | |
| | |
Shore Bancshares, Inc. | | | 3 | | | | 48 | |
| | |
Sierra Bancorp | | | 2 | | | | 39 | |
| | |
Signature Bank | | | 6 | | | | 785 | |
| | |
Sterling Bancorp | | | 14 | | | | 252 | |
| | |
Synovus Financial Corp. | | | 12 | | | | 401 | |
| | |
Umpqua Holdings Corp. | | | 43 | | | | 653 | |
| | |
United Community Banks, Inc. | | | 10 | | | | 276 | |
| | |
Wintrust Financial Corp. | | | 4 | | | | 269 | |
| | |
Zions Bancorp NA | | | 23 | | | | 986 | |
| | | | | | | | |
| | |
| | | | | | | 13,981 | |
| | | | | | | | |
|
Beverages — 0.1% | |
| | |
Coca-Cola Consolidated, Inc. | | | — | (a) | | | 120 | |
| | | | | | | | |
|
Biotechnology — 7.5% | |
| | |
Akebia Therapeutics, Inc. * | | | 18 | | | | 50 | |
| | |
Alector, Inc. * | | | 15 | | | | 227 | |
| | |
Allogene Therapeutics, Inc. * (b) | | | 14 | | | | 363 | |
| | |
Amicus Therapeutics, Inc. * | | | 30 | | | | 695 | |
| | |
AnaptysBio, Inc. * | | | 26 | | | | 553 | |
| | |
Arrowhead Pharmaceuticals, Inc. * | | | 16 | | | | 1,220 | |
| | |
Assembly Biosciences, Inc. * | | | 14 | | | | 83 | |
| | |
Atara Biotherapeutics, Inc. * | | | 3 | | | | 53 | |
| | |
Bluebird Bio, Inc. * | | | 2 | | | | 95 | |
SEE NOTES TO FINANCIAL STATEMENTS.
| | | | | | | | | | |
| | | | | |
| DECEMBER 31, 2020 | | JPMORGAN INSURANCE TRUST | | | | | | | | 5 |
JPMorgan Insurance Trust Small Cap Core Portfolio
SCHEDULE OF PORTFOLIO INVESTMENTS
AS OF DECEMBER 31, 2020 (continued)
| | | | | | | | |
| INVESTMENTS | | SHARES
(000) | | | VALUE
($000) | |
Common Stocks — continued | | | | | | | | |
| | |
Biotechnology — continued | | | | | | | | |
| | |
Blueprint Medicines Corp. * | | | 6 | | | | 718 | |
| | |
Bridgebio Pharma, Inc. * (b) | | | 8 | | | | 540 | |
| | |
CareDx, Inc. * | | | 9 | | | | 630 | |
| | |
Catalyst Pharmaceuticals, Inc. * (b) | | | 63 | | | | 211 | |
| | |
Chinook Therapeutics, Inc. * | | | 19 | | | | 305 | |
| | |
Coherus Biosciences, Inc. * (b) | | | 19 | | | | 337 | |
| | |
Concert Pharmaceuticals, Inc. * | | | 10 | | | | 125 | |
| | |
Dicerna Pharmaceuticals, Inc. * | | | 22 | | | | 494 | |
| | |
Esperion Therapeutics, Inc. * (b) | | | 8 | | | | 195 | |
| | |
FibroGen, Inc. * | | | 6 | | | | 237 | |
| | |
Gritstone Oncology, Inc. * | | | 4 | | | | 17 | |
| | |
Heron Therapeutics, Inc. * | | | 32 | | | | 675 | |
| | |
Homology Medicines, Inc. * | | | 12 | | | | 131 | |
| | |
Insmed, Inc. * | | | 14 | | | | 453 | |
| | |
Jounce Therapeutics, Inc. * | | | 12 | | | | 85 | |
| | |
Kronos Bio, Inc. *(b) | | | 21 | | | | 624 | |
| | |
Kura Oncology, Inc. * | | | 2 | | | | 62 | |
| | |
MeiraGTx Holdings plc * | | | 10 | | | | 157 | |
| | |
Mustang Bio, Inc. * (b) | | | 182 | | | | 687 | |
| | |
Natera, Inc. * | | | 7 | | | | 717 | |
| | |
Radius Health, Inc. * | | | 2 | | | | 29 | |
| | |
REVOLUTION Medicines, Inc. * | | | 5 | | | | 186 | |
| | |
Rhythm Pharmaceuticals, Inc. * | | | 8 | | | | 229 | |
| | |
Sage Therapeutics, Inc. * | | | 6 | | | | 554 | |
| | |
Sarepta Therapeutics, Inc. * | | | 3 | | | | 494 | |
| | |
Spruce Biosciences, Inc. * | | | 19 | | | | 450 | |
| | |
Sutro Biopharma, Inc. * | | | 4 | | | | 76 | |
| | |
Syros Pharmaceuticals, Inc. * | | | 74 | | | | 800 | |
| | |
TCR2 Therapeutics, Inc. * | | | 7 | | | | 226 | |
| | |
Translate Bio, Inc. * | | | 29 | | | | 529 | |
| | |
Viela Bio, Inc. * (b) | | | 9 | | | | 331 | |
| | |
Vir Biotechnology, Inc. * (b) | | | 10 | | | | 268 | |
| | |
Xencor, Inc. * | | | 6 | | | | 253 | |
| | |
Y-mAbs Therapeutics, Inc. * | | | 1 | | | | 54 | |
| | | | | | | | |
| | |
| | | | | | | 15,218 | |
| | | | | | | | |
|
Building Products — 1.1% | |
| | |
Advanced Drainage Systems, Inc. | | | 2 | | | | 200 | |
| | |
Builders FirstSource, Inc. * | | | 28 | | | | 1,139 | |
| | |
Cornerstone Building Brands, Inc. * | | | 23 | | | | 212 | |
| | |
Gibraltar Industries, Inc. * | | | 4 | | | | 273 | |
| | |
Quanex Building Products Corp. | | | 11 | | | | 242 | |
| | |
UFP Industries, Inc. | | | 3 | | | | 167 | |
| | | | | | | | |
| | |
| | | | | | | 2,233 | |
| | | | | | | | |
|
Capital Markets — 2.0% | |
| | |
Artisan Partners Asset Management, Inc., Class A | | | 2 | | | | 121 | |
| | | | | | | | |
| INVESTMENTS | | SHARES
(000) | | | VALUE
($000) | |
| | | | | | | | |
| | |
Capital Markets — continued | | | | | | | | |
| | |
Blucora, Inc. * | | | 37 | | | | 592 | |
| | |
Brightsphere Investment Group, Inc. | | | 5 | | | | 102 | |
| | |
Cohen & Steers, Inc. | | | 2 | | | | 149 | |
| | |
Cowen, Inc., Class A (b) | | | 14 | | | | 359 | |
| | |
Federated Hermes, Inc. | | | 27 | | | | 786 | |
| | |
Focus Financial Partners, Inc., Class A * | | | 9 | | | | 409 | |
| | |
Piper Sandler Cos. | | | 3 | | | | 262 | |
| | |
Stifel Financial Corp. | | | 16 | | | | 785 | |
| | |
Virtus Investment Partners, Inc. | | | 2 | | | | 477 | |
| | | | | | | | |
| | |
| | | | | | | 4,042 | |
| | | | | | | | |
|
Chemicals — 1.9% | |
| | |
Avient Corp. | | | 21 | | | | 850 | |
| | |
FutureFuel Corp. | | | 10 | | | | 126 | |
| | |
Ingevity Corp. * | | | 6 | | | | 462 | |
| | |
Koppers Holdings, Inc. * | | | 22 | | | | 695 | |
| | |
Kraton Corp. * | | | 2 | | | | 64 | |
| | |
Minerals Technologies, Inc. | | | 4 | | | | 248 | |
| | |
Orion Engineered Carbons SA (Germany) | | | 16 | | | | 271 | |
| | |
PQ Group Holdings, Inc. | | | 9 | | | | 128 | |
| | |
Trinseo SA | | | 8 | | | | 394 | |
| | |
Tronox Holdings plc, Class A | | | 46 | | | | 667 | |
| | | | | | | | |
| | |
| | | | | | | 3,905 | |
| | | | | | | | |
|
Commercial Services & Supplies — 1.8% | |
| | |
ABM Industries, Inc. | | | 26 | | | | 995 | |
| | |
ACCO Brands Corp. (b) | | | 40 | | | | 342 | |
| | |
Brink’s Co. (The) | | | 5 | | | | 374 | |
| | |
Herman Miller, Inc. | | | 9 | | | | 301 | |
| | |
HNI Corp. | | | 8 | | | | 286 | |
| | |
KAR Auction Services, Inc. | | | 9 | | | | 164 | |
| | |
Knoll, Inc. | | | 33 | | | | 478 | |
| | |
Quad/Graphics, Inc. | | | 35 | | | | 135 | |
| | |
Steelcase, Inc., Class A | | | 32 | | | | 434 | |
| | |
Team, Inc. * | | | 7 | | | | 80 | |
| | | | | | | | |
| | |
| | | | | | | 3,589 | |
| | | | | | | | |
|
Communications Equipment — 0.4% | |
| | |
Ciena Corp. * | | | 3 | | | | 172 | |
| | |
Extreme Networks, Inc. * | | | 79 | | | | 544 | |
| | |
PCTEL, Inc. * | | | 20 | | | | 134 | |
| | | | | | | | |
| | |
| | | | | | | 850 | |
| | | | | | | | |
|
Construction & Engineering — 2.8% | |
| | |
Argan, Inc. | | | 30 | | | | 1,344 | |
| | |
Comfort Systems USA, Inc. | | | 13 | | | | 706 | |
| | |
EMCOR Group, Inc. | | | 9 | | | | 784 | |
SEE NOTES TO FINANCIAL STATEMENTS.
| | | | | | | | | | |
| | | | | |
| 6 | | | | | | | | JPMORGAN INSURANCE TRUST | | DECEMBER 31, 2020 |
| | | | | | | | |
| INVESTMENTS | | SHARES
(000) | | | VALUE
($000) | |
Common Stocks — continued | | | | | | | | |
|
Construction & Engineering — continued | |
| | |
Great Lakes Dredge & Dock Corp. * | | | 42 | | | | 558 | |
| | |
MasTec, Inc. * (b) | | | 16 | | | | 1,064 | |
| | |
Primoris Services Corp. | | | 20 | | | | 541 | |
| | |
Sterling Construction Co., Inc. * | | | 27 | | | | 495 | |
| | |
Tutor Perini Corp. * | | | 18 | | | | 230 | |
| | | | | | | | |
| | |
| | | | | | | 5,722 | |
| | | | | | | | |
|
Construction Materials — 0.2% | |
| | |
Summit Materials, Inc., Class A * | | | 5 | | | | 100 | |
| | |
US Concrete, Inc. * | | | 10 | | | | 392 | |
| | | | | | | | |
| | |
| | | | | | | 492 | |
| | | | | | | | |
|
Consumer Finance — 1.0% | |
| | |
Enova International, Inc. * | | | 6 | | | | 158 | |
| | |
Green Dot Corp., Class A * | | | 12 | | | | 642 | |
| | |
Nelnet, Inc., Class A | | | 7 | | | | 484 | |
| | |
Oportun Financial Corp. * | | | 10 | | | | 192 | |
| | |
PROG Holdings Inc. | | | 10 | | | | 512 | |
| | | | | | | | |
| | |
| | | | | | | 1,988 | |
| | | | | | | | |
|
Containers & Packaging — 0.3% | |
| | |
Myers Industries, Inc. | | | 7 | | | | 137 | |
| | |
O-I Glass, Inc. | | | 29 | | | | 344 | |
| | |
Pactiv Evergreen, Inc. * | | | 6 | | | | 100 | |
| | | | | | | | |
| | |
| | | | | | | 581 | |
| | | | | | | | |
|
Distributors — 0.3% | |
| | |
Core-Mark Holding Co., Inc. | | | 20 | | | | 596 | |
| | | | | | | | |
|
Diversified Consumer Services — 0.4% | |
| | |
American Public Education, Inc. * | | | 4 | | | | 131 | |
| | |
Houghton Mifflin Harcourt Co. * | | | 139 | | | | 464 | |
| | |
WW International, Inc. * | | | 9 | | | | 224 | |
| | | | | | | | |
| | |
| | | | | | | 819 | |
| | | | | | | | |
|
Diversified Telecommunication Services — 1.3% | |
| | |
ATN International, Inc. | | | 2 | | | | 71 | |
| | |
Cogent Communications Holdings, Inc. | | | 15 | | | | 922 | |
| | |
IDT Corp., Class B * | | | 68 | | | | 837 | |
| | |
Liberty Latin America Ltd., Class A (Chile) * | | | 30 | | | | 328 | |
| | |
Liberty Latin America Ltd., Class C (Chile) * | | | 27 | | | | 297 | |
| | |
Ooma, Inc. * | | | 17 | | | | 240 | |
| | | | | | | | |
| | |
| | | | | | | 2,695 | |
| | | | | | | | |
|
Electric Utilities—0.9% | |
| | |
ALLETE, Inc. (b) | | | 7 | | | | 440 | |
| | |
Genie Energy Ltd., Class B | | | 4 | | | | 27 | |
| | |
IDACORP, Inc. | | | 3 | | | | 288 | |
| | |
Portland General Electric Co. | | | 12 | | | | 534 | |
| | | | | | | | |
| INVESTMENTS | | SHARES
(000) | | | VALUE
($000) | |
| | | | | | | | |
| | |
Electric Utilities — continued | | | | | | | | |
| | |
Spark Energy, Inc., Class A (b) | | | 47 | | | | 445 | |
| | | | | | | | |
| | |
| | | | | | | 1,734 | |
| | | | | | | | |
|
Electrical Equipment — 0.8% | |
| | |
Atkore International Group, Inc. * | | | 30 | | | | 1,221 | |
| | |
Generac Holdings, Inc. * | | | 2 | | | | 398 | |
| | |
Powell Industries, Inc. | | | 3 | | | | 85 | |
| | | | | | | | |
| | |
| | | | | | | 1,704 | |
| | | | | | | | |
|
Electronic Equipment, Instruments & Components — 2.9% | |
| | |
Bel Fuse, Inc., Class B | | | 19 | | | | 284 | |
| | |
Benchmark Electronics, Inc. | | | 42 | | | | 1,142 | |
| | |
Fabrinet (Thailand) * | | | 10 | | | | 737 | |
| | |
Itron, Inc. * (b) | | | 2 | | | | 221 | |
| | |
Kimball Electronics, Inc. * | | | 3 | | | | 55 | |
| | |
Methode Electronics, Inc. | | | 15 | | | | 563 | |
| | |
Sanmina Corp. * | | | 45 | | | | 1,425 | |
| | |
ScanSource, Inc. * | | | 21 | | | | 562 | |
| | |
Vishay Intertechnology, Inc. | | | 23 | | | | 474 | |
| | |
Vishay Precision Group, Inc. * | | | 16 | | | | 501 | |
| | | | | | | | |
| | |
| | | | | | | 5,964 | |
| | | | | | | | |
|
Energy Equipment & Services — 0.7% | |
| | |
Cactus, Inc., Class A | | | 13 | | | | 329 | |
| | |
ChampionX Corp. * (b) | | | 3 | | | | 47 | |
| | |
Helix Energy Solutions Group, Inc. * | | | 9 | | | | 38 | |
| | |
National Energy Services Reunited Corp. * | | | 12 | | | | 119 | |
| | |
NexTier Oilfield Solutions, Inc. * | | | 33 | | | | 114 | |
| | |
Oil States International, Inc. * | | | 22 | | | | 112 | |
| | |
Patterson-UTI Energy, Inc. | | | 19 | | | | 100 | |
| | |
Select Energy Services, Inc., Class A * | | | 63 | | | | 259 | |
| | |
Solaris Oilfield Infrastructure, Inc., Class A | | | 27 | | | | 221 | |
| | | | | | | | |
| | |
| | | | | | | 1,339 | |
| | | | | | | | |
|
Entertainment — 0.7% | |
| | |
Cinemark Holdings, Inc. (b) | | | 79 | | | | 1,374 | |
| | | | | | | | |
|
Equity Real Estate Investment Trusts (REITs) — 5.4% | |
| | |
Acadia Realty Trust | | | 7 | | | | 96 | |
| | |
Agree Realty Corp. (b) | | | 2 | | | | 113 | |
| | |
Alexander & Baldwin, Inc. | | | 11 | | | | 191 | |
| | |
American Assets Trust, Inc. | | | 3 | | | | 98 | |
| | |
American Finance Trust, Inc. | | | 20 | | | | 145 | |
| | |
Armada Hoffler Properties, Inc. | | | 38 | | | | 422 | |
| | |
Broadstone Net Lease, Inc., Class A (b) | | | 17 | | | | 333 | |
| | |
BRT Apartments Corp. | | | 3 | | | | 43 | |
| | |
CareTrust REIT, Inc. | | | 3 | | | | 71 | |
| | |
CatchMark Timber Trust, Inc., Class A | | | 24 | | | | 226 | |
| | |
Centerspace | | | 3 | | | | 233 | |
SEE NOTES TO FINANCIAL STATEMENTS.
| | | | | | | | | | |
| | | | | |
| DECEMBER 31, 2020 | | JPMORGAN INSURANCE TRUST | | | | | | | | 7 |
JPMorgan Insurance Trust Small Cap Core Portfolio
SCHEDULE OF PORTFOLIO INVESTMENTS
AS OF DECEMBER 31, 2020 (continued)
| | | | | | | | |
| INVESTMENTS | | SHARES
(000) | | | VALUE
($000) | |
Common Stocks — continued | | | | | | | | |
|
Equity Real Estate Investment Trusts (REITs) — continued | |
| | |
Chatham Lodging Trust | | | 3 | | | | 37 | |
| | |
City Office REIT, Inc. | | | 40 | | | | 386 | |
| | |
Columbia Property Trust, Inc. | | | 9 | | | | 125 | |
| | |
Community Healthcare Trust, Inc. | | | 1 | | | | 38 | |
| | |
CorePoint Lodging, Inc. | | | 3 | | | | 22 | |
| | |
Cousins Properties, Inc. | | | 10 | | | | 334 | |
| | |
DiamondRock Hospitality Co.* | | | 25 | | | | 205 | |
| | |
Essential Properties Realty Trust, Inc. | | | 12 | | | | 248 | |
| | |
First Industrial Realty Trust, Inc. | | | 10 | | | | 430 | |
| | |
Four Corners Property Trust, Inc. | | | 6 | | | | 179 | |
| | |
Getty Realty Corp. | | | 2 | | | | 55 | |
| | |
Gladstone Commercial Corp. | | | 21 | | | | 383 | |
| | |
Global Medical REIT, Inc. | | | 2 | | | | 31 | |
| | |
Global Net Lease, Inc. | | | 40 | | | | 689 | |
| | |
Healthcare Realty Trust, Inc. | | | 16 | | | | 459 | |
| | |
Highwoods Properties, Inc. | | | 2 | | | | 59 | |
| | |
Hudson Pacific Properties, Inc. | | | 6 | | | | 139 | |
| | |
Innovative Industrial Properties, Inc. (b) | | | 1 | | | | 92 | |
| | |
Kite Realty Group Trust | | | 4 | | | | 55 | |
| | |
Monmouth Real Estate Investment Corp. | | | 7 | | | | 126 | |
| | |
National Health Investors, Inc. | | | 1 | | | | 41 | |
| | |
New Senior Investment Group, Inc. | | | 40 | | | | 205 | |
| | |
Physicians Realty Trust | | | 15 | | | | 265 | |
| | |
Piedmont Office Realty Trust, Inc., Class A | | | 10 | | | | 161 | |
| | |
Plymouth Industrial REIT, Inc. | | | 10 | | | | 153 | |
| | |
PotlatchDeltic Corp. | | | 11 | | | | 525 | |
| | |
QTS Realty Trust, Inc., Class A (b) | | | 4 | | | | 217 | |
| | |
Retail Properties of America, Inc., Class A | | | 41 | | | | 354 | |
| | |
Retail Value, Inc. | | | 6 | | | | 89 | |
| | |
Ryman Hospitality Properties, Inc. | | | 1 | | | | 75 | |
| | |
Sabra Health Care REIT, Inc. | | | 22 | | | | 377 | |
| | |
Service Properties Trust | | | 6 | | | | 68 | |
| | |
SITE Centers Corp. | | | 13 | | | | 126 | |
| | |
STAG Industrial, Inc. | | | 25 | | | | 786 | |
| | |
Summit Hotel Properties, Inc. | | | 7 | | | | 60 | |
| | |
Sunstone Hotel Investors, Inc. | | | 54 | | | | 612 | |
| | |
Urban Edge Properties | | | 14 | | | | 184 | |
| | |
Xenia Hotels & Resorts, Inc. | | | 41 | | | | 623 | |
| | | | | | | | |
| | |
| | | | | | | 10,984 | |
| | | | | | | | |
|
Food & Staples Retailing — 0.9% | |
| | |
Andersons, Inc. (The) | | | 2 | | | | 41 | |
| | |
BJ’s Wholesale Club Holdings, Inc. * | | | 9 | | | | 332 | |
| | |
Performance Food Group Co. * | | | 21 | | | | 981 | |
| | |
PriceSmart, Inc. | | | 5 | | | | 483 | |
| | | | | | | | |
| | |
| | | | | | | 1,837 | |
| | | | | | | | |
| | | | | | | | |
| INVESTMENTS | | SHARES
(000) | | | VALUE
($000) | |
| | | | | | | | |
|
Food Products — 0.3% | |
| | |
Bunge Ltd. | | | 5 | | | | 302 | |
| | |
Sanderson Farms, Inc.(b) | | | 1 | | | | 172 | |
| | |
Seneca Foods Corp., Class A * | | | 3 | | | | 135 | |
| | | | | | | | |
| | |
| | | | | | | 609 | |
| | | | | | | | |
|
Gas Utilities — 0.7% | |
| | |
Chesapeake Utilities Corp. | | | 3 | | | | 335 | |
| | |
New Jersey Resources Corp. | | | 6 | | | | 228 | |
| | |
Northwest Natural Holding Co. | | | 4 | | | | 166 | |
| | |
Southwest Gas Holdings, Inc. | | | 7 | | | | 419 | |
| | |
Spire, Inc. | | | 5 | | | | 339 | |
| | | | | | | | |
| | |
| | | | | | | 1,487 | |
| | | | | | | | |
|
Health Care Equipment & Supplies — 3.2% | |
| | |
Accuray, Inc. * | | | 99 | | | | 412 | |
| | |
Alphatec Holdings, Inc. * | | | 40 | | | | 575 | |
| | |
Apyx Medical Corp. * | | | 44 | | | | 318 | |
| | |
Axogen, Inc. * | | | 23 | | | | 417 | |
| | |
CONMED Corp. | | | 1 | | | | 67 | |
| | |
Cutera, Inc. * | | | 24 | | | | 586 | |
| | |
Inogen, Inc. * | | | 13 | | | | 567 | |
| | |
Integer Holdings Corp. * | | | 2 | | | | 195 | |
| | |
Invacare Corp. | | | 45 | | | | 404 | |
| | |
Natus Medical, Inc. * | | | 12 | | | | 233 | |
| | |
NuVasive, Inc. * | | | 6 | | | | 349 | |
| | |
Orthofix Medical, Inc. * | | | 25 | | | | 1,079 | |
| | |
Outset Medical, Inc. * | | | 7 | | | | 387 | |
| | |
SI-BONE, Inc. * | | | 19 | | | | 562 | |
| | |
Sientra, Inc. * (b) | | | 28 | | | | 107 | |
| | |
Utah Medical Products, Inc. | | | 2 | | | | 186 | |
| | | | | | | | |
| | |
| | | | | | | 6,444 | |
| | | | | | | | |
|
Health Care Providers & Services — 4.6% | |
| | |
AdaptHealth Corp. * | | | 44 | | | | 1,649 | |
| | |
American Renal Associates Holdings, Inc. * | | | 31 | | | | 351 | |
| | |
AMN Healthcare Services, Inc. * | | | 9 | | | | 642 | |
| | |
Apollo Medical Holdings, Inc. * (b) | | | 12 | | | | 212 | |
| | |
Cross Country Healthcare, Inc. * | | | 47 | | | | 420 | |
| | |
Hanger, Inc. * | | | 14 | | | | 308 | |
| | |
LHC Group, Inc. * | | | 2 | | | | 320 | |
| | |
Magellan Health, Inc. * | | | 11 | | | | 903 | |
| | |
MEDNAX, Inc. * | | | 6 | | | | 147 | |
| | |
National HealthCare Corp. | | | 13 | | | | 883 | |
| | |
Owens & Minor, Inc. | | | 33 | | | | 901 | |
| | |
Providence Service Corp. (The) * | | | 3 | | | | 388 | |
| | |
Select Medical Holdings Corp. * | | | 36 | | | | 1,007 | |
SEE NOTES TO FINANCIAL STATEMENTS.
| | | | | | | | | | |
| | | | | |
| 8 | | | | | | | | JPMORGAN INSURANCE TRUST | | DECEMBER 31, 2020 |
| | | | | | | | |
| INVESTMENTS | | SHARES
(000) | | | VALUE
($000) | |
Common Stocks — continued | | | | | | | | |
| |
Health Care Providers & Services — continued | | | | | |
| | |
Surgery Partners, Inc. * | | | 19 | | | | 557 | |
| | |
Tivity Health, Inc. * | | | 30 | | | | 582 | |
| | | | | | | | |
| | |
| | | | | | | 9,270 | |
| | | | | | | | |
|
Health Care Technology — 0.6% | |
| | |
NextGen Healthcare, Inc. * | | | 22 | | | | 401 | |
| | |
Omnicell, Inc. * | | | 2 | | | | 240 | |
| | |
Schrodinger, Inc. * | | | 8 | | | | 610 | |
| | | | | | | | |
| | |
| | | | | | | 1,251 | |
| | | | | | | | |
|
Hotels, Restaurants & Leisure — 2.5% | |
| | |
Bloomin’ Brands, Inc. | | | 27 | | | | 518 | |
| | |
Boyd Gaming Corp. * | | | 5 | | | | 202 | |
| | |
Brinker International, Inc. (b) | | | 13 | | | | 735 | |
| | |
Caesars Entertainment, Inc. * (b) | | | 16 | | | | 1,196 | |
| | |
Dine Brands Global, Inc. | | | 6 | | | | 348 | |
| | |
Marriott Vacations Worldwide Corp. | | | 6 | | | | 810 | |
| | |
Penn National Gaming, Inc. * | | | 12 | | | | 1,014 | |
| | |
Scientific Games Corp. * | | | 7 | | | | 290 | |
| | | | | | | | |
| | |
| | | | | | | 5,113 | |
| | | | | | | | |
|
Household Durables — 1.7% | |
| | |
Helen of Troy Ltd. * | | | 2 | | | | 422 | |
| | |
Hooker Furniture Corp. | | | 11 | | | | 368 | |
| | |
KB Home | | | 12 | | | | 412 | |
| | |
Lifetime Brands, Inc. | | | 30 | | | | 449 | |
| | |
Meritage Homes Corp. * | | | 7 | | | | 547 | |
| | |
Taylor Morrison Home Corp. * | | | 22 | | | | 572 | |
| | |
Tupperware Brands Corp. * | | | 8 | | | | 262 | |
| | |
Universal Electronics, Inc. * | | | 9 | | | | 493 | |
| | | | | | | | |
| | |
| | | | | | | 3,525 | |
| | | | | | | | |
|
Household Products — 0.3% | |
| | |
Central Garden & Pet Co., Class A * | | | 18 | | | | 647 | |
| | | | | | | | |
|
Independent Power and Renewable Electricity Producers — 0.8% | |
| | |
Atlantic Power Corp. * | | | 25 | | | | 53 | |
| | |
Clearway Energy, Inc. | | | 25 | | | | 730 | |
| | |
Clearway Energy, Inc., Class C | | | 22 | | | | 705 | |
| | |
Vistra Corp. | | | 5 | | | | 103 | |
| | | | | | | | |
| | |
| | | | | | | 1,591 | |
| | | | | | | | |
|
Insurance — 0.9% | |
| | |
Ambac Financial Group, Inc. * | | | 8 | | | | 123 | |
| | |
American Equity Investment Life Holding Co. | | | 10 | | | | 271 | |
| | |
Argo Group International Holdings Ltd. | | | 6 | | | | 249 | |
| | |
CNO Financial Group, Inc. | | | 20 | | | | 442 | |
| | |
FedNat Holding Co. | | | 5 | | | | 29 | |
| | | | | | | | |
| INVESTMENTS | | SHARES
(000) | | | VALUE
($000) | |
| | | | | | | | |
| | |
Insurance — continued | | | | | | | | |
| | |
Heritage Insurance Holdings, Inc. | | | 2 | | | | 24 | |
| | |
Horace Mann Educators Corp. | | | 1 | | | | 55 | |
| | |
James River Group Holdings Ltd. | | | 2 | | | | 118 | |
| | |
ProAssurance Corp. | | | 8 | | | | 139 | |
| | |
ProSight Global, Inc. * (b) | | | 11 | | | | 140 | |
| | |
Selective Insurance Group, Inc. | | | 2 | | | | 121 | |
| | |
Stewart Information Services Corp. | | | 2 | | | | 97 | |
| | |
United Insurance Holdings Corp. | | | 14 | | | | 82 | |
| | | | | | | | |
| | |
| | | | | | | 1,890 | |
| | | | | | | | |
|
Interactive Media & Services — 1.2% | |
| | |
Cars.com, Inc. * | | | 25 | | | | 280 | |
| | |
Liberty TripAdvisor Holdings, Inc., Class A * | | | 326 | | | | 1,416 | |
| | |
Yelp, Inc. * | | | 21 | | | | 696 | |
| | | | | | | | |
| | |
| | | | | | | 2,392 | |
| | | | | | | | |
|
Internet & Direct Marketing Retail — 0.3% | |
| | |
Groupon, Inc. * (b) | | | 9 | | | | 347 | |
| | |
Overstock.com, Inc. * (b) | | | 4 | | | | 177 | |
| | | | | | | | |
| | |
| | | | | | | 524 | |
| | | | | | | | |
|
IT Services — 2.6% | |
| | |
Evo Payments, Inc., Class A * | | | 20 | | | | 540 | |
| | |
KBR, Inc. | | | 36 | | | | 1,107 | |
| | |
NIC, Inc. | | | 14 | | | | 362 | |
| | |
Perspecta, Inc. | | | 17 | | | | 410 | |
| | |
Science Applications International Corp. | | | 7 | | | | 700 | |
| | |
StarTek, Inc. * | | | 80 | | | | 600 | |
| | |
TTEC Holdings, Inc. (b) | | | 21 | | | | 1,532 | |
| | | | | | | | |
| | |
| | | | | | | 5,251 | |
| | | | | | | | |
|
Life Sciences Tools & Services — 1.2% | |
| | |
Adaptive Biotechnologies Corp. * | | | 5 | | | | 308 | |
| | |
Berkeley Lights, Inc. * (b) | | | 7 | | | | 581 | |
| | |
Personalis, Inc. * | | | 28 | | | | 1,029 | |
| | |
Seer, Inc. * | | | 10 | | | | 570 | |
| | | | | | | | |
| | |
| | | | | | | 2,488 | |
| | | | | | | | |
|
Machinery — 1.7% | |
| | |
Albany International Corp., Class A | | | 1 | | | | 81 | |
| | |
Altra Industrial Motion Corp. | | | 4 | | | | 194 | |
| | |
Barnes Group, Inc. | | | 7 | | | | 340 | |
| | |
CIRCOR International, Inc. * | | | 2 | | | | 77 | |
| | |
Columbus McKinnon Corp. | | | 11 | | | | 404 | |
| | |
Gencor Industries, Inc. * | | | 3 | | | | 38 | |
| | |
Manitowoc Co., Inc. (The) * | | | 15 | | | | 203 | |
| | |
Meritor, Inc. * | | | 15 | | | | 410 | |
SEE NOTES TO FINANCIAL STATEMENTS.
| | | | | | | | | | |
| | | | | |
| DECEMBER 31, 2020 | | JPMORGAN INSURANCE TRUST | | | | | | | | 9 |
JPMorgan Insurance Trust Small Cap Core Portfolio
SCHEDULE OF PORTFOLIO INVESTMENTS
AS OF DECEMBER 31, 2020 (continued)
| | | | | | | | |
| INVESTMENTS | | SHARES
(000) | | | VALUE
($000) | |
Common Stocks — continued | | | | | | | | |
| | |
Machinery — continued | | | | | | | | |
| | |
Mueller Industries, Inc. | | | 4 | | | | 147 | |
| | |
Park-Ohio Holdings Corp. | | | 2 | | | | 68 | |
| | |
Terex Corp. | | | 37 | | | | 1,298 | |
| | |
Welbilt, Inc. * | | | 12 | | | | 154 | |
| | | | | | | | |
| | |
| | | | | | | 3,414 | |
| | | | | | | | |
|
Marine — 0.2% | |
| | |
Costamare, Inc. (Monaco) | | | 49 | | | | 403 | |
| | | | | | | | |
|
Media — 1.3% | |
| | |
Cardlytics, Inc. * (b) | | | 2 | | | | 328 | |
| | |
EW Scripps Co. (The), Class A | | | 27 | | | | 407 | |
| | |
Fluent, Inc. * | | | 39 | | | | 204 | |
| | |
Gray Television, Inc. * | | | 21 | | | | 372 | |
| | |
Meredith Corp. | | | 41 | | | | 778 | |
| | |
Sinclair Broadcast Group, Inc., Class A (b) | | | 16 | | | | 503 | |
| | | | | | | | |
| | |
| | | | | | | 2,592 | |
| | | | | | | | |
|
Metals & Mining — 1.9% | |
| | |
Alcoa Corp. * | | | 10 | | | | 240 | |
| | |
Allegheny Technologies, Inc. * | | | 22 | | | | 367 | |
| | |
Arconic Corp. * | | | 11 | | | | 331 | |
| | |
Carpenter Technology Corp. | | | 4 | | | | 108 | |
| | |
Cleveland-Cliffs, Inc. | | | 38 | | | | 559 | |
| | |
Commercial Metals Co. | | | 50 | | | | 1,019 | |
| | |
Kaiser Aluminum Corp. | | | 2 | | | | 207 | |
| | |
SunCoke Energy, Inc. | | | 68 | | | | 297 | |
| | |
Warrior Met Coal, Inc. | | | 25 | | | | 531 | |
| | |
Worthington Industries, Inc. | | | 3 | | | | 149 | |
| | | | | | | | |
| | |
| | | | | | | 3,808 | |
| | | | | | | | |
|
Mortgage Real Estate Investment Trusts (REITs) — 1.1% | |
| | |
Apollo Commercial Real Estate Finance, Inc. (b) | | | 11 | | | | 124 | |
| | |
Ares Commercial Real Estate Corp. | | | 10 | | | | 113 | |
| | |
Blackstone Mortgage Trust, Inc., Class A | | | 8 | | | | 215 | |
| | |
Colony Credit Real Estate, Inc. | | | 6 | | | | 45 | |
| | |
Ellington Financial, Inc. | | | 1 | | | | 16 | |
| | |
Granite Point Mortgage Trust, Inc. | | | 5 | | | | 46 | |
| | |
Great Ajax Corp. | | | 1 | | | | 15 | |
| | |
KKR Real Estate Finance Trust, Inc. | | | 3 | | | | 45 | |
| | |
Ladder Capital Corp. | | | 41 | | | | 402 | |
| | |
New York Mortgage Trust, Inc. (b) | | | 5 | | | | 20 | |
| | |
PennyMac Mortgage Investment Trust | | | 33 | | | | 573 | |
| | |
Redwood Trust, Inc. (b) | | | 39 | | | | 340 | |
| | |
TPG RE Finance Trust, Inc. (b) | | | 14 | | | | 153 | |
| | |
Two Harbors Investment Corp. (b) | | | 21 | | | | 134 | |
| | | | | | | | |
| | |
| | | | | | | 2,241 | |
| | | | | | | | |
| | | | | | | | |
| INVESTMENTS | | SHARES
(000) | | | VALUE
($000) | |
| | | | | | | | |
|
Multiline Retail — 0.4% | |
| | |
Big Lots, Inc. (b) | | | 8 | | | | 339 | |
| | |
Dillard��s, Inc., Class A (b) | | | 3 | | | | 189 | |
| | |
Macy’s, Inc. | | | 19 | | | | 210 | |
| | | | | | | | |
| | |
| | | | | | | 738 | |
| | | | | | | | |
|
Multi-Utilities — 0.1% | |
| | |
Black Hills Corp. | | | 4 | | | | 264 | |
| | | | | | | | |
|
Oil, Gas & Consumable Fuels — 2.1% | |
| | |
Arch Resources, Inc. * | | | 7 | | | | 293 | |
| | |
Berry Corp. | | | 43 | | | | 156 | |
| | |
Bonanza Creek Energy, Inc. * | | | 4 | | | | 83 | |
| | |
CNX Resources Corp. * | | | 13 | | | | 135 | |
| | |
CVR Energy, Inc. | | | 11 | | | | 165 | |
| | |
Dorian LPG Ltd. * | | | 21 | | | | 261 | |
| | |
Falcon Minerals Corp. | | | 42 | | | | 133 | |
| | |
Green Plains, Inc. * (b) | | | 9 | | | | 119 | |
| | |
Magnolia Oil & Gas Corp., Class A * (b) | | | 49 | | | | 346 | |
| | |
Matador Resources Co. * | | | 24 | | | | 294 | |
| | |
Par Pacific Holdings, Inc. * | | | 16 | | | | 227 | |
| | |
PDC Energy, Inc. * | | | 20 | | | | 413 | |
| | |
Renewable Energy Group, Inc. * | | | 22 | | | | 1,586 | |
| | |
REX American Resources Corp. * | | | 1 | | | | 73 | |
| | |
Talos Energy, Inc. * | | | 4 | | | | 30 | |
| | | | | | | | |
| | |
| | | | | | | 4,314 | |
| | | | | | | | |
|
Paper & Forest Products — 1.5% | |
| | |
Boise Cascade Co. | | | 9 | | | | 445 | |
| | |
Domtar Corp. | | | 10 | | | | 326 | |
| | |
Glatfelter Corp. | | | 3 | | | | 56 | |
| | |
Louisiana-Pacific Corp. | | | 17 | | | | 628 | |
| | |
Neenah, Inc. | | | 3 | | | | 188 | |
| | |
Schweitzer-Mauduit International, Inc. | | | 28 | | | | 1,130 | |
| | |
Verso Corp., Class A | | | 16 | | | | 192 | |
| | | | | | | | |
| | |
| | | | | | | 2,965 | |
| | | | | | | | |
|
Personal Products — 0.5% | |
| | |
Edgewell Personal Care Co. | | | 18 | | | | 615 | |
| | |
Medifast, Inc. | | | 2 | | | | 393 | |
| | | | | | | | |
| | |
| | | | | | | 1,008 | |
| | | | | | | | |
|
Pharmaceuticals — 2.8% | |
| | |
Arvinas, Inc. * (b) | | | — | (a) | | | 34 | |
| | |
Cara Therapeutics, Inc. * | | | 9 | | | | 132 | |
| | |
Endo International plc * | | | 148 | | | | 1,060 | |
| | |
Horizon Therapeutics plc * | | | 20 | | | | 1,470 | |
| | |
Intersect ENT, Inc. * | | | 29 | | | | 653 | |
| | |
Lannett Co., Inc. * (b) | | | 114 | | | | 745 | |
SEE NOTES TO FINANCIAL STATEMENTS.
| | | | | | | | | | |
| | | | | |
| 10 | | | | | | | | JPMORGAN INSURANCE TRUST | | DECEMBER 31, 2020 |
| | | | | | | | |
| INVESTMENTS | | SHARES
(000) | | | VALUE
($000) | |
Common Stocks — continued | | | | | | | | |
| | |
Pharmaceuticals — continued | | | | | | | | |
| | |
NGM Biopharmaceuticals, Inc. * | | | 20 | | | | 606 | |
| | |
Phibro Animal Health Corp., Class A | | | 5 | | | | 101 | |
| | |
Revance Therapeutics, Inc. * | | | 3 | | | | 77 | |
| | |
TherapeuticsMD, Inc. * (b) | | | 51 | | | | 61 | |
| | |
VYNE Therapeutics, Inc. * (b) | | | 27 | | | | 42 | |
| | |
WaVe Life Sciences Ltd. * | | | 49 | | | | 386 | |
| | |
Zogenix, Inc. * (b) | | | 12 | | | | 242 | |
| | |
Zynerba Pharmaceuticals, Inc. * (b) | | | 22 | | | | 71 | |
| | | | | | | | |
| | |
| | | | | | | 5,680 | |
| | | | | | | | |
|
Professional Services — 2.5% | |
| | |
Barrett Business Services, Inc. | | | 14 | | | | 955 | |
| | |
CBIZ, Inc. * | | | 11 | | | | 279 | |
| | |
Heidrick & Struggles International, Inc. | | | 13 | | | | 370 | |
| | |
Insperity, Inc. | | | 3 | | | | 261 | |
| | |
Kelly Services, Inc., Class A | | | 16 | | | | 319 | |
| | |
Kforce, Inc. | | | 9 | | | | 379 | |
| | |
Korn Ferry | | | 35 | | | | 1,522 | |
| | |
TriNet Group, Inc. * | | | 9 | | | | 685 | |
| | |
TrueBlue, Inc. * | | | 20 | | | | 372 | |
| | | | | | | | |
| | |
| | | | | | | 5,142 | |
| | | | | | | | |
|
Real Estate Management & Development — 0.5% | |
| | |
Jones Lang LaSalle, Inc. * | | | 1 | | | | 136 | |
| | |
Realogy Holdings Corp. * | | | 58 | | | | 762 | |
| | |
RMR Group, Inc. (The), Class A | | | 2 | | | | 74 | |
| | | | | | | | |
| | |
| | | | | | | 972 | |
| | | | | | | | |
|
Road & Rail — 0.9% | |
| | |
ArcBest Corp. | | | 43 | | | | 1,839 | |
| | | | | | | | |
|
Semiconductors & Semiconductor Equipment — 2.0% | |
| | |
Advanced Energy Industries, Inc. * | | | 5 | | | | 485 | |
| | |
Alpha & Omega Semiconductor Ltd. * | | | 26 | | | | 609 | |
| | |
Amkor Technology, Inc. | | | 27 | | | | 409 | |
| | |
GSI Technology, Inc. * | | | 25 | | | | 184 | |
| | |
Ichor Holdings Ltd. * | | | 11 | | | | 316 | |
| | |
NVE Corp. | | | 3 | | | | 152 | |
| | |
PDF Solutions, Inc. * | | | 8 | | | | 171 | |
| | |
Photronics, Inc. * | | | 64 | | | | 712 | |
| | |
Rambus, Inc. * | | | 6 | | | | 108 | |
| | |
SMART Global Holdings, Inc. * (b) | | | 17 | | | | 632 | |
| | |
Ultra Clean Holdings, Inc. * | | | 12 | | | | 377 | |
| | | | | | | | |
| | |
| | | | | | | 4,155 | |
| | | | | | | | |
|
Software — 5.0% | |
| | |
ACI Worldwide, Inc. * | | | 3 | | | | 100 | |
| | |
American Software, Inc., Class A | | | 15 | | | | 261 | |
| | | | | | | | |
| INVESTMENTS | | SHARES
(000) | | | VALUE
($000) | |
| | | | | | | | |
| | |
Software — continued | | | | | | | | |
| | |
Appian Corp. * (b) | | | 3 | | | | 470 | |
| | |
Asana, Inc., Class A * | | | 10 | | | | 301 | |
| | |
Avaya Holdings Corp. * | | | 38 | | | | 722 | |
| | |
Cerence, Inc. * | | | 5 | | | | 492 | |
| | |
Cornerstone OnDemand, Inc. * | | | 35 | | | | 1,541 | |
| | |
Digital Turbine, Inc. * | | | 10 | | | | 583 | |
| | |
eGain Corp. * | | | 77 | | | | 914 | |
| | |
Envestnet, Inc. * | | | 3 | | | | 222 | |
| | |
j2 Global, Inc. * (b) | | | 10 | | | | 977 | |
| | |
JFrog Ltd. (Israel) * | | | 3 | | | | 201 | |
| | |
MicroStrategy, Inc., Class A * (b) | | | 4 | | | | 1,632 | |
| | |
Model N, Inc. * (b) | | | 3 | | | | 104 | |
| | |
PubMatic, Inc., Class A * (b) | | | 10 | | | | 276 | |
| | |
Rimini Street, Inc. * | | | 34 | | | | 152 | |
| | |
Verint Systems, Inc. * | | | 12 | | | | 779 | |
| | |
Zuora, Inc., Class A * | | | 24 | | | | 336 | |
| | | | | | | | |
| | |
| | | | | | | 10,063 | |
| | | | | | | | |
|
Specialty Retail — 2.3% | |
| | |
Aaron’s Co., Inc. (The) * | | | 5 | | | | 90 | |
| | |
Bed Bath & Beyond, Inc. (b) | | | 10 | | | | 179 | |
| | |
Genesco, Inc. * | | | 10 | | | | 289 | |
| | |
Guess?, Inc. | | | 27 | | | | 599 | |
| | |
Hibbett Sports, Inc. * | | | 15 | | | | 707 | |
| | |
MarineMax, Inc. * | | | 9 | | | | 315 | |
| | |
ODP Corp. (The) * | | | 16 | | | | 456 | |
| | |
Rent-A-Center, Inc. | | | 30 | | | | 1,164 | |
| | |
Signet Jewelers Ltd. (b) | | | 18 | | | | 502 | |
| | |
Zumiez, Inc. * | | | 12 | | | | 430 | |
| | | | | | | | |
| | |
| | | | | | | 4,731 | |
| | | | | | | | |
|
Technology Hardware, Storage & Peripherals — 0.2% | |
| | |
Diebold Nixdorf, Inc. * | | | 39 | | | | 417 | |
| | | | | | | | |
|
Textiles, Apparel & Luxury Goods — 1.3% | |
| | |
Deckers Outdoor Corp. * | | | 8 | | | | 2,316 | |
| | |
Movado Group, Inc. * | | | 16 | | | | 271 | |
| | | | | | | | |
| | |
| | | | | | | 2,587 | |
| | | | | | | | |
|
Thrifts & Mortgage Finance — 3.4% | |
| | |
ESSA Bancorp, Inc. | | | 1 | | | | 19 | |
| | |
Essent Group Ltd. | | | 20 | | | | 860 | |
| | |
Flagstar Bancorp, Inc. | | | 25 | | | | 1,007 | |
| | |
FS Bancorp, Inc. | | | 1 | | | | 49 | |
| | |
HomeStreet, Inc. | | | 5 | | | | 176 | |
| | |
Kearny Financial Corp. | | | 18 | | | | 189 | |
| | |
Luther Burbank Corp. | | | 7 | | | | 66 | |
| | |
MGIC Investment Corp. | | | 30 | | | | 371 | |
SEE NOTES TO FINANCIAL STATEMENTS.
| | | | | | | | | | |
| | | | | |
| DECEMBER 31, 2020 | | JPMORGAN INSURANCE TRUST | | | | | | | | 11 |
JPMorgan Insurance Trust Small Cap Core Portfolio
SCHEDULE OF PORTFOLIO INVESTMENTS
AS OF DECEMBER 31, 2020 (continued)
| | | | | | | | |
| INVESTMENTS | | SHARES
(000) | | | VALUE
($000) | |
Common Stocks — continued | | | | | | | | |
|
Thrifts & Mortgage Finance — continued | |
| | |
MMA Capital Holdings, Inc. * | | | 1 | | | | 22 | |
| | |
Mr. Cooper Group, Inc. * | | | 23 | | | | 707 | |
| | |
NMI Holdings, Inc., Class A * | | | 7 | | | | 147 | |
| | |
OP Bancorp | | | 8 | | | | 58 | |
| | |
PennyMac Financial Services, Inc. | | | 8 | | | | 492 | |
| | |
Provident Bancorp, Inc. | | | 14 | | | | 169 | |
| | |
Provident Financial Services, Inc. | | | 43 | | | | 774 | |
| | |
Radian Group, Inc. | | | 34 | | | | 689 | |
| | |
Standard AVB Financial Corp. | | | 1 | | | | 33 | |
| | |
Walker & Dunlop, Inc. | | | 12 | | | | 1,141 | |
| | | | | | | | |
| | |
| | | | | | | 6,969 | |
| | | | | | | | |
|
Trading Companies & Distributors — 2.2% | |
| | |
Applied Industrial Technologies, Inc. | | | 6 | | | | 437 | |
| | |
Beacon Roofing Supply, Inc. * | | | 10 | | | | 386 | |
| | |
BMC Stock Holdings, Inc. * | | | 9 | | | | 494 | |
| | |
GMS, Inc. * | | | 23 | | | | 686 | |
| | |
NOW, Inc. * | | | 42 | | | | 301 | |
| | |
Veritiv Corp. * | | | 7 | | | | 143 | |
| | |
WESCO International, Inc. * | | | 26 | | | | 2,056 | |
| | | | | | | | |
| | |
| | | | | | | 4,503 | |
| | | | | | | | |
|
Water Utilities — 0.0% (c) | |
| | |
Consolidated Water Co. Ltd. (Cayman Islands) | | | 1 | | | | 14 | |
| | | | | | | | |
|
Wireless Telecommunication Services — 0.1% | |
| | |
Spok Holdings, Inc. | | | 26 | | | | 294 | |
| | | | | | | | |
| |
Total Common Stocks
(Cost $147,224) | | | | 200,437 | |
| | | | | |
| | |
| | | No. of
Rights
(000) | | | | |
Rights — 0.0% (c) | |
|
Biotechnology — 0.0% (c) | |
| | |
Contra Aduro Biotech I * ‡ (Cost $63) | | | 21 | | | | — | (a) |
| | | | | | | | |
| | |
| | | SHARES
(000) | | | | |
Short-Term Investments — 8.9% | | | | | | | | |
| | |
Investment Companies — 1.6% | | | | | | | | |
| | |
JPMorgan U.S. Government Money Market Fund Class Institutional Shares, 0.03% (d) (e) (Cost $3,240) | | | 3,240 | | | | 3,240 | |
| | | | | | | | |
| | | | | | | | |
| INVESTMENTS | | SHARES
(000) | | | VALUE
($000) | |
|
Investment of Cash Collateral from Securities Loaned — 7.3% | |
| | |
JPMorgan Securities Lending Money Market Fund Agency SL Class Shares, 0.15% (d) (e) | | | 8,497 | | | | 8,498 | |
| | |
JPMorgan U.S. Government Money Market Fund Class IM Shares, 0.03% (d) (e) | | | 6,291 | | | | 6,291 | |
| | | | | | | | |
| |
Total Investment of Cash Collateral from Securities Loaned
(Cost $14,790) | | | | 14,789 | |
| | | | | |
| |
Total Short-Term Investments
(Cost $18,030) | | | | 18,029 | |
| | | | | | | | |
Total Investments — 107.7%
(Cost $165,317) | | | | 218,466 | |
Liabilities in Excess of
Other Assets — (7.7)% | | | | (15,527 | ) |
| | | | | | | | |
NET ASSETS — 100.0% | | | | 202,939 | |
| | | | | | | | |
Percentages indicated are based on net assets.
| | |
| Abbreviations |
| REIT | | Real Estate Investment Trust |
| |
| (a) | | Amount rounds to less than one thousand. |
| (b) | | The security or a portion of this security is on loan at December 31, 2020. The total value of securities on loan at December 31, 2020 is approximately $14,230,000. |
| (c) | | Amount rounds to less than 0.1% of net assets. |
| (d) | | Investment in an affiliated fund, which is registered under the Investment Company Act of 1940, as amended, and is advised by J.P. Morgan Investment Management Inc. |
| (e) | | The rate shown is the current yield as of December 31, 2020. |
| * | | Non-income producing security. |
| ‡ | | Value determined using significant unobservable inputs. |
SEE NOTES TO FINANCIAL STATEMENTS.
| | | | | | | | | | |
| | | | | |
| 12 | | | | | | | | JPMORGAN INSURANCE TRUST | | DECEMBER 31, 2020 |
STATEMENT OF ASSETS AND LIABILITIES
AS OF DECEMBER 31, 2020
(Amounts in thousands, except per share amounts)
| | | | |
| | | JPMorgan
Insurance Trust
Small Cap Core
Portfolio | |
ASSETS: | | | | |
Investments in non-affiliates, at value | | $ | 200,437 | |
Investments in affiliates, at value | | | 3,240 | |
Investment of cash collateral received from securities loaned, at value (See Note 2.B.) | | | 14,789 | |
Cash | | | 2 | |
Deposits at broker for futures contracts | | | 156 | |
Receivables: | | | | |
Investment securities sold | | | 313 | |
Portfolio shares sold | | | 34 | |
Dividends from non-affiliates | | | 195 | |
Dividends from affiliates | | | — | (a) |
Securities lending income (See Note 2.B.) | | | 6 | |
| | | | |
Total Assets | | | 219,172 | |
| | | | |
| |
LIABILITIES: | | | | |
Payables: | | | | |
Investment securities purchased | | | 600 | |
Collateral received on securities loaned (See Note 2.B.) | | | 14,789 | |
Portfolio shares redeemed | | | 648 | |
Accrued liabilities: | | | | |
Investment advisory fees | | | 111 | |
Administration fees | | | 13 | |
Distribution fees | | | — | (a) |
Custodian and accounting fees | | | 10 | |
Trustees’ and Chief Compliance Officer’s fees | | | — | (a) |
Other | | | 62 | |
| | | | |
Total Liabilities | | | 16,233 | |
| | | | |
Net Assets | | $ | 202,939 | |
| | | | |
| |
NET ASSETS: | | | | |
Paid-in-Capital | | $ | 146,839 | |
Total distributable earnings (loss) | | | 56,100 | |
| | | | |
Total Net Assets | | $ | 202,939 | |
| | | | |
| |
Net Assets: | | | | |
Class 1 | | $ | 201,489 | |
Class 2 | | | 1,450 | |
| | | | |
Total | | $ | 202,939 | |
| | | | |
| |
Outstanding units of beneficial interest (shares) (unlimited number of shares authorized, no par value): | | | | |
Class 1 | | | 8,357 | |
Class 2 | | | 61 | |
| |
Net Asset Value (b): | | | | |
Class 1 — Offering and redemption price per share | | $ | 24.11 | |
Class 2 — Offering and redemption price per share | | | 23.85 | |
| | | | |
Cost of investments in non-affiliates | | $ | 147,287 | |
Cost of investments in affiliates | | | 3,240 | |
Investment securities on loan, at value (See Note 2.B.) | | | 14,230 | |
Cost of investment of cash collateral (See Note 2.B.) | | | 14,790 | |
| (a) | Amount rounds to less than one thousand. |
| (b) | Per share amounts may not recalculate due to rounding of net assets and/or shares outstanding. |
SEE NOTES TO FINANCIAL STATEMENTS.
| | | | | | | | | | |
| | | | | |
| DECEMBER 31, 2020 | | JPMORGAN INSURANCE TRUST | | | | | | | | 13 |
STATEMENT OF OPERATIONS
FOR THE YEAR ENDED DECEMBER 31, 2020
(Amounts in thousands)
| | | | |
| | | JPMorgan
Insurance Trust
Small Cap Core
Portfolio | |
INVESTMENT INCOME: | | | | |
Interest income from non-affiliates | | $ | 1 | |
Dividend income from non-affiliates | | | 2,539 | |
Dividend income from affiliates | | | 13 | |
Income from securities lending (net) (See Note 2.B.) | | | 135 | |
| | | | |
Total investment income | | | 2,688 | |
| | | | |
| |
EXPENSES: | | | | |
Investment advisory fees | | | 1,095 | |
Administration fees | | | 126 | |
Distribution fees: | | | | |
Class 2 | | | 3 | |
Custodian and accounting fees | | | 59 | |
Interest expense to affiliates | | | — | (a) |
Professional fees | | | 57 | |
Trustees’ and Chief Compliance Officer’s fees | | | 26 | |
Printing and mailing costs | | | 31 | |
Transfer agency fees (See Note 2.F.) | | | 5 | |
Other | | | 16 | |
| | | | |
Total expenses | | | 1,418 | |
| | | | |
Less fees waived | | | (7 | ) |
| | | | |
Net expenses | | | 1,411 | |
| | | | |
Net investment income (loss) | | | 1,277 | |
| | | | |
| |
REALIZED/UNREALIZED GAINS (LOSSES): | | | | |
Net realized gain (loss) on transactions from: | | | | |
Investments in non-affiliates | | | 2,454 | |
Futures contracts | | | 604 | |
| | | | |
Net realized gain (loss) | | | 3,058 | |
| | | | |
Change in net unrealized appreciation/depreciation on: | | | | |
Investments in non-affiliates | | | 19,708 | |
Investments in affiliates | | | (1 | ) |
Futures contracts | | | (55 | ) |
| | | | |
Change in net unrealized appreciation/depreciation | | | 19,652 | |
| | | | |
Net realized/unrealized gains (losses) | | | 22,710 | |
| | | | |
Change in net assets resulting from operations | | $ | 23,987 | |
| | | | |
| (a) | Amount rounds to less than one thousand. |
SEE NOTES TO FINANCIAL STATEMENTS.
| | | | | | | | | | |
| | | | | |
| 14 | | | | | | | | JPMORGAN INSURANCE TRUST | | DECEMBER 31, 2020 |
STATEMENTS OF CHANGES IN NET ASSETS
FOR THE PERIODS INDICATED
(Amounts in thousands)
| | | | | | | | |
| | | JPMorgan Insurance Trust Small
Cap Core Portfolio | |
| | | Year Ended
December 31, 2020 | | | Year Ended
December 31, 2019 | |
CHANGE IN NET ASSETS RESULTING FROM OPERATIONS: | | | | | | | | |
Net investment income (loss) | | $ | 1,277 | | | $ | 1,213 | |
Net realized gain (loss) | | | 3,058 | | | | 10,680 | |
Change in net unrealized appreciation/depreciation | | | 19,652 | | | | 26,485 | |
| | | | | | | | |
Change in net assets resulting from operations | | | 23,987 | | | | 38,378 | |
| | | | | | | | |
| | |
DISTRIBUTIONS TO SHAREHOLDERS: | | | | | | | | |
Class 1 | | | (12,432 | ) | | | (22,648 | ) |
Class 2 | | | (89 | ) | | | (169 | ) |
| | | | | | | | |
Total distributions to shareholders | | | (12,521 | ) | | | (22,817 | ) |
| | | | | | | | |
| | |
CAPITAL TRANSACTIONS: | | | | | | | | |
Change in net assets resulting from capital transactions | | | (8,855 | ) | | | 30,307 | |
| | | | | | | | |
| | |
NET ASSETS: | | | | | | | | |
Change in net assets | | | 2,611 | | | | 45,868 | |
Beginning of period | | | 200,328 | | | | 154,460 | |
| | | | | | | | |
End of period | | $ | 202,939 | | | $ | 200,328 | |
| | | | | | | | |
| | |
CAPITAL TRANSACTIONS: | | | | | | | | |
Class 1 | | | | | | | | |
Proceeds from shares issued | | $ | 20,155 | | | $ | 42,367 | |
Distributions reinvested | | | 12,432 | | | | 22,648 | |
Cost of shares redeemed | | | (41,101 | ) | | | (35,352 | ) |
| | | | | | | | |
Change in net assets resulting from Class 1 capital transactions | | | (8,514 | ) | | | 29,663 | |
| | | | | | | | |
Class 2 | | | | | | | | |
Proceeds from shares issued | | | 409 | | | | 625 | |
Distributions reinvested | | | 89 | | | | 169 | |
Cost of shares redeemed | | | (839 | ) | | | (150 | ) |
| | | | | | | | |
Change in net assets resulting from Class 2 capital transactions | | $ | (341 | ) | | $ | 644 | |
| | | | | | | | |
Total change in net assets resulting from capital transactions | | $ | (8,855 | ) | | $ | 30,307 | |
| | | | | | | | |
| | |
SHARE TRANSACTIONS: | | | | | | | | |
Class 1 | | | | | | | | |
Issued | | | 1,135 | | | | 1,809 | |
Reinvested | | | 735 | | | | 1,100 | |
Redeemed | | | (2,131 | ) | | | (1,561 | ) |
| | | | | | | | |
Change in Class 1 Shares | | | (261 | ) | | | 1,348 | |
| | | | | | | | |
Class 2 | | | | | | | | |
Issued | | | 25 | | | | 28 | |
Reinvested | | | 5 | | | | 8 | |
Redeemed | | | (47 | ) | | | (7 | ) |
| | | | | | | | |
Change in Class 2 Shares | | | (17 | ) | | | 29 | |
| | | | | | | | |
SEE NOTES TO FINANCIAL STATEMENTS.
| | | | | | | | | | |
| | | | | |
| DECEMBER 31, 2020 | | JPMORGAN INSURANCE TRUST | | | | | | | | 15 |
FINANCIAL HIGHLIGHTS
FOR THE PERIODS INDICATED
| | | | | | | | | | | | | | | | | | | | | | | | | | | | |
| | | Per share operating performance | |
| | | | | | Investment operations | | | Distributions | |
| | | Net asset
value,
beginning
of period | | |
Net
investment
income
(loss) (a) | | | Net realized
and unrealized
gains
(losses) on
investments | | | Total from
investment
operations | | | Net
investment
income | | | Net
realized
gain | | | Total
distributions | |
JPMorgan Insurance Trust Small Cap Core Portfolio | | | | | | | | | | | | | | | | | | | | | | | | | | | | |
Class 1 | | | | | | | | | | | | | | | | | | | | | | | | | | | | |
Year Ended December 31, 2020 | | $ | 23.04 | | | $ | 0.15 | | | $ | 2.38 | | | $ | 2.53 | | | $ | (0.19 | ) | | $ | (1.27 | ) | | $ | (1.46 | ) |
Year Ended December 31, 2019 | | | 21.10 | | | | 0.15 | | | | 4.69 | | | | 4.84 | | | | (0.10 | ) | | | (2.80 | ) | | | (2.90 | ) |
Year Ended December 31, 2018 | | | 25.64 | | | | 0.12 | | | | (2.85 | ) | | | (2.73 | ) | | | (0.10 | ) | | | (1.71 | ) | | | (1.81 | ) |
Year Ended December 31, 2017 | | | 22.49 | | | | 0.10 | | | | 3.30 | | | | 3.40 | | | | (0.08 | ) | | | (0.17 | ) | | | (0.25 | ) |
Year Ended December 31, 2016 | | | 20.56 | | | | 0.09 | | | | 3.65 | | | | 3.74 | | | | (0.11 | ) | | | (1.70 | ) | | | (1.81 | ) |
| | | | | | | |
Class 2 | | | | | | | | | | | | | | | | | | | | | | | | | | | | |
Year Ended December 31, 2020 | | | 22.79 | | | | 0.09 | | | | 2.37 | | | | 2.46 | | | | (0.13 | ) | | | (1.27 | ) | | | (1.40 | ) |
Year Ended December 31, 2019 | | | 20.91 | | | | 0.09 | | | | 4.63 | | | | 4.72 | | | | (0.04 | ) | | | (2.80 | ) | | | (2.84 | ) |
Year Ended December 31, 2018 | | | 25.41 | | | | 0.05 | | | | (2.82 | ) | | | (2.77 | ) | | | (0.02 | ) | | | (1.71 | ) | | | (1.73 | ) |
Year Ended December 31, 2017 | | | 22.30 | | | | 0.02 | | | | 3.29 | | | | 3.31 | | | | (0.03 | ) | | | (0.17 | ) | | | (0.20 | ) |
Year Ended December 31, 2016 | | | 20.38 | | | | 0.04 | | | | 3.62 | | | | 3.66 | | | | (0.04 | ) | | | (1.70 | ) | | | (1.74 | ) |
| (a) | Calculated based upon average shares outstanding. |
| (b) | Includes adjustments in accordance with accounting principles generally accepted in the United States of America and as such, the net asset values for financial reporting purposes and the returns based upon those net asset values may differ from the net asset values and returns for shareholder transactions. |
| (c) | Total returns do not include charges that will be imposed by variable insurance contracts or by Eligible Plans. If these charges were reflected, returns would be lower than those shown. |
| (d) | Includes earnings credits and interest expense, if applicable, each of which is less than 0.005% unless otherwise noted. |
SEE NOTES TO FINANCIAL STATEMENTS.
| | | | | | | | | | |
| | | | | |
| 16 | | | | | | | | JPMORGAN INSURANCE TRUST | | DECEMBER 31, 2020 |
| | | | | | | | | | | | | | | | | | | | | | | | | | |
| | | Ratios/Supplemental data | |
| | | | | | | | | | Ratios to average net assets | | | | |
Net asset
value,
end of
period | | | Total return (b)(c) | | | Net assets,
end of
period
(000’s) | | | Net
expenses (d) | | | Net
investment income
(loss) | | | Expenses
without waivers,
reimbursements and
earnings credits | | | Portfolio
turnover
rate | |
| | | | | | | | | | | | | | | | | | | | | | | | | | |
| | | | | | | | | | | | | | | | | | | | | | | | | | |
| $ | 24.11 | | | | 13.69 | % | | $ | 201,489 | | | | 0.84 | % | | | 0.76 | % | | | 0.84 | % | | | 95 | % |
| | 23.04 | | | | 24.58 | | | | 198,542 | | | | 0.83 | | | | 0.66 | | | | 0.84 | | | | 83 | |
| | 21.10 | | | | (11.93 | ) | | | 153,429 | | | | 0.82 | | | | 0.47 | | | | 0.83 | | | | 59 | |
| | 25.64 | | | | 15.23 | | | | 189,186 | | | | 0.83 | | | | 0.40 | | | | 0.83 | | | | 51 | |
| | 22.49 | | | | 20.21 | | | | 161,501 | | | | 0.87 | | | | 0.46 | | | | 0.87 | | | | 55 | |
| | | | | | |
| | | | | | | | | | | | | | | | | | | | | | | | | | |
| | 23.85 | | | | 13.38 | | | | 1,450 | | | | 1.12 | | | | 0.46 | | | | 1.12 | | | | 95 | |
| | 22.79 | | | | 24.20 | | | | 1,786 | | | | 1.11 | | | | 0.39 | | | | 1.11 | | | | 83 | |
| | 20.91 | | | | (12.15 | ) | | | 1,031 | | | | 1.09 | | | | 0.20 | | | | 1.10 | | | | 59 | |
| | 25.41 | | | | 14.93 | | | | 1,111 | | | | 1.09 | | | | 0.10 | | | | 1.10 | | | | 51 | |
| | 22.30 | | | | 19.88 | | | | 1,570 | | | | 1.12 | | | | 0.20 | | | | 1.13 | | | | 55 | |
SEE NOTES TO FINANCIAL STATEMENTS.
| | | | | | | | | | |
| | | | | |
| DECEMBER 31, 2020 | | JPMORGAN INSURANCE TRUST | | | | | | | | 17 |
NOTES TO FINANCIAL STATEMENTS
AS OF DECEMBER 31, 2020
1. Organization
JPMorgan Insurance Trust (the “Trust”) is registered under the Investment Company Act of 1940, as amended (the “1940 Act”), as an open-end management investment company and is a Massachusetts business trust.
The following is a separate portfolio of the Trust (the “Portfolio”) covered by this report:
| | | | |
| | | Classes Offered | | Diversification Classification |
| JPMorgan Insurance Trust Small Cap Core Portfolio | | Class 1 and Class 2 | | Diversified |
The investment objective of the Portfolio is to seek capital growth over the long term.
Portfolio shares are offered only to separate accounts of participating insurance companies and Eligible Plans. Individuals may not purchase shares directly from the Portfolio.
All classes of shares have equal rights as to earnings, assets and voting privileges, except that each class may bear different transfer agency fees and distribution fees and each class has exclusive voting rights with respect to its distribution plan and administrative services plan.
J.P. Morgan Investment Management Inc. (“JPMIM”), an indirect, wholly-owned subsidiary of JPMorgan Chase & Co. (“JPMorgan”), acts as Adviser (the “Adviser”) and Administrator (the “Administrator”) to the Portfolio.
2. Significant Accounting Policies
The following is a summary of significant accounting policies followed by the Portfolio in the preparation of its financial statements. The Portfolio is an investment company and, accordingly, follows the investment company accounting and reporting guidance of the Financial Accounting Standards Board (“FASB”) Accounting Standards Codification Topic 946 — Investment Companies, which is part of U.S. generally accepted accounting principles (“GAAP”). The preparation of financial statements in conformity with GAAP requires management to make estimates and assumptions that affect (i) the reported amounts of assets and liabilities, (ii) disclosure of contingent assets and liabilities at the date of the financial statements, and (iii) the reported amounts of increases and decreases in net assets from operations during the reporting period. Actual results could differ from those estimates.
A. Valuation of Investments — Investments are valued in accordance with GAAP and the Portfolio’s valuation policies set forth by, and under the supervision and responsibility of, the Board of Trustees of the Trust (the “Board”), which established the following approach to valuation, as described more fully below: (i) investments for which market quotations are readily available shall be valued at their market value and (ii) all other investments for which market quotations are not readily available shall be valued at their fair value as determined in good faith by the Board.
The Administrator has established the J.P. Morgan Asset Management Americas Valuation Committee (“AVC”) to assist the Board with the oversight and monitoring of the valuation of the Portfolio’s investments. The Administrator implements the valuation policies of the Portfolio’s investments, as directed by the Board. The AVC oversees and carries out the policies for the valuation of investments held in the Portfolio. This includes monitoring the appropriateness of fair values based on results of ongoing valuation oversight including, but not limited to, consideration of macro or security specific events, market events, and pricing vendor and broker due diligence. The Administrator is responsible for discussing and assessing the potential impacts to the fair values on an ongoing basis, and, at least on a quarterly basis, with the AVC and the Board.
A market-based approach is primarily used to value the Portfolio’s investments. Investments for which market quotations are not readily available are fair valued by approved affiliated and/or unaffiliated pricing vendors or third party broker-dealers (collectively referred to as “Pricing Services”) or may be internally fair valued using methods set forth by the valuation policies approved by the Board. This may include the use of related or comparable assets or liabilities, recent transactions, market multiples, book values and other relevant information for the investment. An income-based valuation approach may be used in which the anticipated future cash flows of the investment are discounted to calculate the fair value. Discounts may also be applied due to the nature or duration of any restrictions on the disposition of the investments. Valuations may be based upon current market prices of securities that are comparable in coupon, rating, maturity and industry. It is possible that the estimated values may differ significantly from the values that would have been used had a ready market for the investments existed, and such differences could be material.
Equities and other exchange-traded instruments are valued at the last sale price or official market closing price on the primary exchange on which the instrument is traded before the net asset values (“NAV”) of the Portfolio are calculated on a valuation date.
Investments in open-end investment companies (“Underlying Funds”) are valued at each Underlying Fund’s NAV per share as of the report date.
Futures contracts are generally valued on the basis of available market quotations.
Valuations reflected in this report are as of the report date. As a result, changes in valuation due to market events and/or issuer-related events after the report date and prior to issuance of the report are not reflected herein.
The various inputs that are used in determining the valuation of the Portfolio’s investments are summarized into the three broad levels listed below.
| • | | Level 1 — Unadjusted inputs using quoted prices in active markets for identical investments. |
| • | | Level 2 — Other significant observable inputs including, but not limited to, quoted prices for similar investments, inputs other than quoted prices that are observable for investments (such as interest rates, prepayment speeds, credit risk, etc.) or other market corroborated inputs. |
| | | | | | | | | | |
| | | | | |
| 18 | | | | | | | | JPMORGAN INSURANCE TRUST | | DECEMBER 31, 2020 |
| • | | Level 3 — Significant inputs based on the best information available in the circumstances, to the extent observable inputs are not available (including the Portfolio’s assumptions in determining the fair value of investments). |
A financial instrument’s level within the fair value hierarchy is based on the lowest level of any input, both individually and in the aggregate, that is significant to the fair value measurement. The inputs or methodology used for valuing instruments are not necessarily an indication of the risk associated with investing in those instruments.
The following table represents each valuation input as presented on the Schedule of Portfolio Investments (“SOI”) (amounts in thousands):
| | | | | | | | | | | | | | | | |
| | | Level 1
Quoted prices | | | Level 2
Other significant
observable inputs | | | Level 3
Significant unobservable inputs | | | Total | |
Investments in Securities | | | | | |
Common Stocks | | $ | 200,437 | | | $ | — | | | $ | — | | | $ | 200,437 | |
Rights | | | — | | | | — | | | | — | (a) | | | — | (a) |
Short-Term Investments | | | | | | | | | | | | | | | | |
Investment Companies | | | 3,240 | | | | — | | | | — | | | | 3,240 | |
Investment of cash collateral from securities loaned | | | 14,789 | | | | — | | | | — | | | | 14,789 | |
| | | | | | | | | | | | | | | | |
Total Short-Term Investments | | | 18,029 | | | | — | | | | — | | | | 18,029 | |
| | | | | | | | | | | | | | | | |
Total Investments in Securities | | $ | 218,466 | | | $ | — | | | $ | — | (a) | | $ | 218,466 | |
| | | | | | | | | | | | | | | | |
| (a) | Amount rounds to less than one thousand. |
B. Securities Lending — The Portfolio is authorized to engage in securities lending in order to generate additional income. The Portfolio is able to lend to approved borrowers. Citibank N.A. (“Citibank”) serves as lending agent for the Portfolio, pursuant to a Securities Lending Agency Agreement (the “Securities Lending Agency Agreement”). Securities loaned are collateralized by cash equal to at least 100% of the market value plus accrued interest on the securities lent, which is invested in the Class IM Shares of the JPMorgan U.S. Government Money Market Fund and the Agency SL Class Shares of the JPMorgan Securities Lending Money Market Fund. The Portfolio retains loan fees and the interest on cash collateral investments but is required to pay the borrower a rebate for the use of cash collateral. In cases where the lent security is of high value to borrowers, there may be a negative rebate (i.e., a net payment from the borrower to the Portfolio). Upon termination of a loan, the Portfolio is required to return to the borrower an amount equal to the cash collateral, plus any rebate owed to the borrowers. The remaining maturities of the securities lending transactions are considered overnight and continuous. Loans are subject to termination by the Portfolio or the borrower at any time.
The net income earned on the securities lending (after payment of rebates and Citibank’s fee) is included on the Statement of Operations as Income from securities lending (net). The Portfolio also receives payments from the borrower during the period of the loan, equivalent to dividends and interest earned on the securities loaned, which are recorded as Dividend or Interest income, respectively, on the Statement of Operations.
Under the Securities Lending Agency Agreement, Citibank marks to market the loaned securities on a daily basis. In the event the cash received from the borrower is less than 102% of the value of the loaned securities (105% for loans of non-U.S. securities), Citibank requests additional cash from the borrower so as to maintain a collateralization level of at least 102% of the value of the loaned securities plus accrued interest (105% for loans of non-U.S. securities), subject to certain de minimis amounts.
The value of securities out on loan is recorded as an asset on the Statement of Assets and Liabilities. The value of the cash collateral received is recorded as a liability on the Statement of Assets and Liabilities and details of collateral investments are disclosed on the SOI.
The Portfolio bears the risk of loss associated with the collateral investments and is not entitled to additional collateral from the borrower to cover any such losses. To the extent that the value of the collateral investments declines below the amount owed to a borrower, the Portfolio may incur losses that exceed the amount it earned on lending the security. Upon termination of a loan, the Portfolio may use leverage (borrow money) to repay the borrower for cash collateral posted if the Adviser does not believe that it is prudent to sell the collateral investments to fund the payment of this liability. Securities lending activity is subject to master netting arrangements.
The following table presents the Portfolio’s value of the securities on loan with Citibank, net of amounts available for offset under the master netting arrangements and any related collateral received or posted by the Portfolio as of December 31, 2020 (amounts in thousands).
| | | | | | | | | | | | |
| | | Investment Securities
on Loan, at value,
Presented on the
Statement of Assets
and Liabilities | | | Cash
Collateral
Posted by Borrower* | | | Net Amount Due
to Counterparty
(not less than zero) | |
| | $ | 14,230 | | | $ | (14,230 | ) | | $ | — | |
| * | Collateral posted reflects the value of securities on loan and does not include any additional amounts received from the borrower. |
| | | | | | | | | | |
| | | | | |
| DECEMBER 31, 2020 | | JPMORGAN INSURANCE TRUST | | | | | | | | 19 |
NOTES TO FINANCIAL STATEMENTS
AS OF DECEMBER 31, 2020 (continued)
Securities lending also involves counterparty risks, including the risk that the loaned securities may not be returned in a timely manner or at all. Subject to certain conditions, Citibank has agreed to indemnify the Portfolio from losses resulting from a borrower’s failure to return a loaned security.
JPMIM voluntarily waived investment advisory fees charged to the Portfolio to reduce the impact of the cash collateral investment in the JPMorgan U.S. Government Money Market Fund from 0.15% to 0.06%. For the year ended December 31, 2020, JPMIM waived fees associated with the Portfolio’s investment in the JPMorgan U.S. Government Money Market Fund as follows (amounts in thousands):
The above waiver is included in the determination of earnings on cash collateral investment and in the calculation of Citibank’s compensation and is included on the Statement of Operations as Income from securities lending (net).
C. Investment Transactions with Affiliates — The Portfolio invested in Underlying Funds which are advised by the Adviser. An issuer which is under common control with the Portfolio may be considered an affiliate. For the purposes of the financial statements, the Portfolio assumes the issuers listed in the table below to be affiliated issuers. Underlying Funds’ distributions may be reinvested into the Underlying Funds. Reinvestment amounts are included in the purchase cost amounts in the table below. Amounts in the table below are in thousands.
| | | | | | | | | | | | | | | | | | | | | | | | | | | | | | | | | | | | |
For the year ended December 31, 2020 | |
| Security Description | | Value at
December 31,
2019 | | | Purchases at
Cost | | | Proceeds
from
Sales | | | Net
Realized
Gain
(Loss) | | | Change in
Unrealized
Appreciation/
(Depreciation) | | | Value at
December 31,
2020 | | | Shares at
December 31,
2020 | | | Dividend
Income | | | Capital Gain
Distributions | |
JPMorgan Securities Lending Money Market Fund Agency SL Class Shares, 0.15% (a) (b) | | $ | 2,000 | | | $ | 22,000 | | | $ | 15,500 | | | $ | (1 | )* | | $ | (1 | ) | | $ | 8,498 | | | | 8,497 | | | $ | 25 | * | | $ | — | |
JPMorgan U.S. Government Money Market Fund Class IM Shares, 0.03% (a) (b) | | | 2,474 | | | | 75,713 | | | | 71,896 | | | | — | | | | — | | | | 6,291 | | | | 6,291 | | | | 17 | * | | | — | |
JPMorgan U.S. Government Money Market Fund Class Institutional Shares, 0.03% (a) (b) | | | 4,966 | | | | 65,236 | | | | 66,962 | | | | — | | | | — | | | | 3,240 | | | | 3,240 | | | | 13 | | | | — | |
| | | | | | | | | | | | | | | | | | | | | | | | | | | | | | | | | | | | |
Total | | $ | 9,440 | | | $ | 162,949 | | | $ | 154,358 | | | $ | (1 | ) | | $ | (1 | ) | | $ | 18,029 | | | | | | | $ | 55 | | | $ | — | |
| | | | | | | | | | | | | | | | | | | | | | | | | | | | | | | | | | | | |
| (a) | Investment in an affiliated fund, which is registered under the Investment Company Act of 1940, as amended, and is advised by J.P. Morgan Investment Management Inc. |
| (b) | The rate shown is the current yield as of December 31, 2020. |
| * | Amount is included on the Statement of Operations as Income from securities lending (net) (after payments of rebates and Citibank’s fee). |
D. Futures Contracts — The Portfolio used index futures contracts to gain or reduce exposure to the stock market, or maintain liquidity or minimize transaction costs. The Portfolio also purchased futures contracts to invest incoming cash in the market or sold futures in response to cash outflows, thereby simulating an invested position in the underlying index while maintaining a cash balance for liquidity.
Futures contracts provide for the delayed delivery of the underlying instrument at a fixed price or are settled for a cash amount based on the change in the value of the underlying instrument at a specific date in the future. Upon entering into a futures contract, the Portfolio is required to deposit with the broker, cash or securities in an amount equal to a certain percentage of the contract amount, which is referred to as the initial margin deposit. Subsequent payments, referred to as variation margin, are made or received by the Portfolio periodically and are based on changes in the market value of open futures contracts. Changes in the market value of open futures contracts are recorded as Change in net unrealized appreciation/depreciation on futures contracts on the Statement of Operations. Realized gains or losses, representing the difference between the value of the contract at the time it was opened and the value at the time it was closed, are reported on the Statement of Operations at the closing or expiration of the futures contract. Securities deposited as initial margin are designated on the SOI, while cash deposited, which is considered restricted, is recorded on the Statement of Assets and Liabilities. A receivable from and/or a payable to brokers for the daily variation margin is also recorded on the Statement of Assets and Liabilities.
The use of futures contracts exposes the Portfolio to equity price risk. The Portfolio may be subject to the risk that the change in the value of the futures contract may not correlate perfectly with the underlying instrument. Use of long futures contracts subjects the Portfolio to risk of loss in excess of the amounts shown on the Statement of Assets and Liabilities, up to the notional amount of the futures contracts. Use of short futures contracts subjects the Portfolio to unlimited risk of loss. The Portfolio may enter into futures contracts only on exchanges or boards of trade. The exchange or board of trade acts as the counterparty to each futures transaction; therefore, the Portfolio’s credit risk is limited to failure of the exchange or board of trade. Under some circumstances, futures exchanges may establish daily limits on the amount that the price of a futures contract can vary from the previous day’s settlement price, which could effectively prevent liquidation of positions.
| | | | | | | | | | |
| | | | | |
| 20 | | | | | | | | JPMORGAN INSURANCE TRUST | | DECEMBER 31, 2020 |
The Portfolio’s futures contracts are not subject to master netting arrangements (the right to close out all transactions traded with a counterparty and net amounts owed or due across transactions).
The table below discloses the volume of the Portfolio’s futures contracts activity during the year ended December 31, 2020 (amounts in thousands):
| | | | |
Futures Contracts — Equity: | | | | |
Average Notional Balance Long | | $ | 2,613 | |
E. Security Transactions and Investment Income — Investment transactions are accounted for on the trade date (the date the order to buy or sell is executed). Securities gains and losses are calculated on a specifically identified cost basis. Dividend income is recorded on the ex-dividend date or when the Portfolio first learns of the dividend.
To the extent such information is publicly available, the Portfolio records distributions received in excess of income earned from underlying investments as a reduction of cost of investments and/or realized gain. Such amounts are based on estimates if actual amounts are not available and actual amounts of income, realized gain and return of capital may differ from the estimated amounts. The Portfolio adjusts the estimated amounts of the components of distributions (and consequently its net investment income) as necessary, once the issuers provide information about the actual composition of the distributions.
F. Allocation of Income and Expenses — Expenses directly attributable to the Portfolio are charged directly to the Portfolio, while the expenses attributable to more than one portfolio of the Trust are allocated among the applicable portfolios. Investment income, realized and unrealized gains and losses and expenses, other than class-specific expenses, are allocated daily to each class of shares based upon the proportion of net assets of each class at the beginning of each day.
Transfer agency fees are class-specific expenses. The amount of the transfer agency fees charged to each share class of the Portfolio for the year ended December 31, 2020 are as follows (amounts in thousands):
| | | | | | | | | | | | |
| | | Class 1 | | | Class 2 | | | Total | |
Transfer agency fees | | $ | 4 | | | $ | 1 | | | $ | 5 | |
G. Federal Income Taxes — The Portfolio is treated as a separate taxable entity for Federal income tax purposes. The Portfolio’s policy is to comply with the provisions of the Internal Revenue Code (the “Code”) applicable to regulated investment companies and to distribute to shareholders all of its distributable net investment income and net realized capital gains on investments. Accordingly, no provision for Federal income tax is necessary. The Portfolio is also a segregated portfolio of assets for insurance purposes and intends to comply with the diversification requirements of Subchapter L of the Code. Management has reviewed the Portfolio’s tax positions for all open tax years and has determined that as of December 31, 2020, no liability for Federal income tax is required in the Portfolio’s financial statements for net unrecognized tax benefits. However, management’s conclusions may be subject to future review based on changes in, or the interpretation of, the accounting standards or tax laws and regulations. The Portfolio’s Federal tax returns for the prior three fiscal years remain subject to examination by the Internal Revenue Service.
H. Distributions to Shareholders — Distributions from net investment income, if any, are generally declared and paid at least annually and are declared separately for each class. No class has preferential dividend rights; differences in per share rates are due to differences in separate class expenses. Net realized capital gains, if any, are distributed at least annually. The amount of distributions from net investment income and net realized capital gains is determined in accordance with Federal income tax regulations, which may differ from GAAP. To the extent these “book/tax” differences are permanent in nature (i.e., that they result from other than timing of recognition — “temporary differences”), such amounts are reclassified within the capital accounts based on their Federal tax basis treatment.
The following amounts were reclassified within the capital accounts (amounts in thousands):
| | | | | | | | | | |
| | | Paid-in-Capital | | Accumulated
undistributed
(distributions in
excess of)
net investment
income | | | Accumulated
net realized
gains (losses) | |
| | $— | | $ | 629 | | | $ | (629 | ) |
The reclassifications for the Portfolio relate primarily to investments in passive foreign investment companies (“PFICs”).
I. Recent Accounting Pronouncement — In March 2020, the FASB issued Accounting Standards Update No. 2020-04 (“ASU 2020-04”), Reference Rate Reform (Topic 848) — Facilitation of the Effects of Reference Rate Reform on Financial Reporting. ASU 2020-04 provides optional temporary financial reporting relief from the effect of certain types of contract modifications due to the planned discontinuation of the London Interbank Offered Rate (“LIBOR”) and other interbank-offered based reference rates as of the end of 2021. ASU 2020-04 became effective upon the issuance and its optional relief can be applied through December 31, 2022. Management is currently evaluating the impact, if any, to the Portfolio’s financial statements of applying ASU 2020-04.
| | | | | | | | | | |
| | | | | |
| DECEMBER 31, 2020 | | JPMORGAN INSURANCE TRUST | | | | | | | | 21 |
NOTES TO FINANCIAL STATEMENTS
AS OF DECEMBER 31, 2020 (continued)
3. Fees and Other Transactions with Affiliates
A. Investment Advisory Fee — Pursuant to an Investment Advisory Agreement, the Adviser manages the investments of the Portfolio and for such services is paid a fee. The investment advisory fee is accrued daily and paid monthly at an annual rate of 0.65% of the Portfolio’s average daily net assets.
The Adviser waived investment advisory fees and/or reimbursed expenses as outlined in Note 3.E.
B. Administration Fee — Pursuant to an Administration Agreement, the Administrator provides certain administration services to the Portfolio. In consideration of these services, the Administrator receives a fee accrued daily and paid monthly at an annual rate of 0.075% of the first $10 billion of the Portfolio’s average daily net assets, plus 0.050% of the Portfolio’s average daily net assets between $10 billion and $20 billion, plus 0.025% of the Portfolio’s average daily net assets between $20 billion and $25 billion, plus 0.01% of the Portfolio’s average daily net assets in excess of $25 billion. For the year ended December 31, 2020, the effective rate was 0.075% of the Portfolio’s average daily net assets, notwithstanding any fee waivers and/or expense reimbursements.
The Administrator waived administration fees as outlined in Note 3.E.
JPMorgan Chase Bank, N.A. (“JPMCB”), a wholly-owned subsidiary of JPMorgan, serves as the Portfolio’s sub-administrator (the “Sub-administrator”). For its services as Sub-administrator, JPMCB receives a portion of the fees payable to the Administrator.
C. Distribution Fees — Pursuant to a Distribution Agreement, JPMorgan Distribution Services, Inc. (“JPMDS”), an indirect, wholly-owned subsidiary of JPMorgan, serves as the Portfolio’s principal underwriter and promotes and arranges for the sale of the Portfolio’s shares.
The Board has adopted a Distribution Plan (the “Distribution Plan”) for Class 2 Shares of the Portfolio pursuant to Rule 12b-1 under the 1940 Act. Class 1 Shares of the Portfolio do not charge a distribution fee. The Distribution Plan provides that the Portfolio shall pay, with respect to the applicable share classes, distribution fees, including payments to JPMDS, at an annual rate of 0.25% of the average daily net assets of Class 2 Shares.
D. Custodian and Accounting Fees — JPMCB provides portfolio custody and accounting services to the Portfolio. For performing these services, the Portfolio pays JPMCB transaction and asset-based fees that vary according to the number of transactions and positions, plus out-of-pocket expenses. The amounts paid directly to JPMCB by the Portfolio for custody and accounting services are included in Custodian and accounting fees on the Statement of Operations.
Interest income earned on cash balances at the custodian, if any, is included in Interest income from affiliates on the Statement of Operations.
Interest expense paid to the custodian related to cash overdrafts, if any, is included in Interest expense to affiliates on the Statement of Operations.
E. Waivers and Reimbursements — The Adviser (for all share classes), Administrator (for all share classes) and/or JPMDS (for Class 2 Shares) have contractually agreed to waive fees and/or reimburse the Portfolio to the extent that total annual operating expenses of the Portfolio (excluding acquired fund fees and expenses other than certain money market fund fees as described below, dividend and interest expenses related to short sales, interest, taxes, expenses related to litigation and potential litigation, expenses related to trustee elections and extraordinary expenses) exceed the percentages of the Portfolio’s respective average daily net assets as shown in the table below:
| | | | | | | | |
| | | Class 1 | | | Class 2 | |
| | | 1.03 | % | | | 1.28 | % |
The expense limitation agreement was in effect for the year ended December 31, 2020 and the contractual expense limitation percentages in the table above are in place until at least April 30, 2021.
For the year ended December 31, 2020, the Portfolio’s service providers did not waive fees and/or reimburse expenses for the Portfolio.
Additionally, the Portfolio may invest in one or more money market funds advised by the Adviser (affiliated money market funds). The Adviser, Administrator and/or JPMDS have contractually agreed to waive fees and/or reimburse expenses in an amount sufficient to offset the respective net fees each collects from the affiliated money market fund on the Portfolio’s investment in such affiliated money market fund, except for investments of securities lending cash collateral. None of these parties expect the Portfolio to repay any such waived fees and/or reimbursed expenses in future years.
The amount of these waivers resulting from investments in these money market funds for the year ended December 31, 2020 was approximately $7,000.
F. Other — Certain officers of the Trust are affiliated with the Adviser, the Administrator and JPMDS. Such officers, with the exception of the Chief Compliance Officer, receive no compensation from the Portfolio for serving in their respective roles.
The Board designated and appointed a Chief Compliance Officer to the Portfolio pursuant to Rule 38a-1 under the 1940 Act. The Portfolio, along with affiliated portfolios, makes reimbursement payments, on a pro-rata basis, to the Administrator for a portion of the fees associated with the office of the Chief Compliance Officer. Such fees are included in Trustees’ and Chief Compliance Officer’s fees on the Statement of Operations.
The Trust adopted a Trustee Deferred Compensation Plan (the “Plan”) which allows the independent Trustees to defer the receipt of all or a portion of compensation related to performance of their duties as Trustees. The deferred fees are invested in various J.P. Morgan Funds until distribution in accordance with the Plan.
| | | | | | | | | | |
| | | | | |
| 22 | | | | | | | | JPMORGAN INSURANCE TRUST | | DECEMBER 31, 2020 |
During the year ended December 31, 2020, the Portfolio purchased securities from an underwriting syndicate in which the principal underwriter or members of the syndicate were affiliated with the Adviser.
The Securities and Exchange Commission (“SEC”) has granted an exemptive order permitting the Portfolio to engage in principal transactions with J.P. Morgan Securities LLC, an affiliated broker, involving taxable money market instruments, subject to certain conditions.
4. Investment Transactions
During the year ended December 31, 2020, purchases and sales of investments (excluding short-term investments) were as follows (amounts in thousands):
| | | | | | | | |
| | | Purchases
(excluding U.S.
Government) | | | Sales
(excluding U.S.
Government) | |
| | $ | 157,507 | | | $ | 174,402 | |
During the year ended December 31, 2020, there were no purchases or sales of U.S. Government securities.
5. Federal Income Tax Matters
For Federal income tax purposes, the estimated cost and unrealized appreciation (depreciation) in value of investments held at December 31, 2020 were as follows (amounts in thousands):
| | | | | | | | | | | | | | | | |
| | | Aggregate
Cost | | | Gross
Unrealized
Appreciation | | | Gross
Unrealized
Depreciation | | | Net Unrealized
Appreciation
(Depreciation) | |
| | $ | 169,038 | | | $ | 55,495 | | | $ | 6,067 | | | $ | 49,428 | |
The difference between book and tax basis appreciation (depreciation) on investments is primarily attributed to wash sale loss deferrals.
The tax character of distributions paid during the year ended December 31, 2020 was as follows (amounts in thousands):
| | | | | | | | | | | | |
| | | Ordinary
Income* | | | Net
Long-Term
Capital Gains | | | Total
Distributions
Paid | |
| | $ | 1,647 | | | $ | 10,874 | | | $ | 12,521 | |
| * | Short-term gain distributions are treated as ordinary income for income tax purposes. |
The tax character of distributions paid during the year ended December 31, 2019 was as follows (amounts in thousands):
| | | | | | | | | | | | |
| | | Ordinary
Income* | | | Net
Long-Term
Capital Gains | | | Total
Distributions
Paid | |
| | $ | 2,769 | | | $ | 20,048 | | | $ | 22,817 | |
| * | Short-term gain distributions are treated as ordinary income for income tax purposes. |
As of December 31, 2020, the estimated components of net assets (excluding paid-in-capital) on a tax basis were as follows (amounts in thousands):
| | | | | | | | | | | | |
| | | Current
Distributable
Ordinary
Income | | | Current
Distributable
Long-Term
Capital Gain
(Tax Basis Capital
Loss Carryover) | | | Unrealized
Appreciation
(Depreciation) | |
| | $ | 2,219 | | | $ | 4,466 | | | $ | 49,428 | |
The cumulative timing differences primarily consist of wash sale loss deferrals.
As of December 31, 2020, the Portfolio did not have any net capital loss carryforwards.
6. Borrowings
The Portfolio relies upon an exemptive order granted by the SEC (the “Order”) permitting the establishment and operation of an Interfund Lending Facility (the “Facility”). The Facility allows the Portfolio to directly lend and borrow money to or from any other fund relying upon the Order at rates beneficial to both the borrowing and lending funds. Advances under the Facility are taken primarily for temporary or emergency purposes, including the meeting of redemption requests that otherwise might require the untimely disposition of securities, and are subject to the Portfolio’s borrowing restrictions. The Interfund loan rate is determined, as specified in the Order, by averaging the current repurchase agreement rate and the current bank loan rate. The Order was granted to the Trust and may be relied upon by the Portfolio because the Portfolio and the series of the Trust are all investment companies in the same “group of investment companies” (as defined in Section 12(d)(1)(G) of the 1940 Act).
| | | | | | | | | | |
| | | | | |
| DECEMBER 31, 2020 | | JPMORGAN INSURANCE TRUST | | | | | | | | 23 |
NOTES TO FINANCIAL STATEMENTS
AS OF DECEMBER 31, 2020 (continued)
The Portfolio had no borrowings outstanding from another fund during the year ended December 31, 2020.
The Trust and JPMCB have entered into a financing arrangement. Under this arrangement, JPMCB provides an unsecured, uncommitted credit facility in the aggregate amount of $100 million to certain of the J.P. Morgan Funds, including the Portfolio. Advances under the arrangement are taken primarily for temporary or emergency purposes, including the meeting of redemption requests that otherwise might require the untimely disposition of securities, and are subject to the Portfolio’s borrowing restrictions. Interest on borrowings is payable at a rate determined by JPMCB at the time of borrowing. This agreement has been extended until November 1, 2021.
The Portfolio had no borrowings outstanding from the unsecured, uncommitted credit facility during the year ended December 31, 2020.
The Trust, along with certain other trusts for J.P. Morgan Funds (“Borrowers”), has entered into a joint syndicated senior unsecured revolving credit facility totaling $1.5 billion (“Credit Facility”) with various lenders and The Bank of New York Mellon, as administrative agent for the lenders. This Credit Facility provides a source of funds to the Borrowers for temporary and emergency purposes, including the meeting of redemption requests that otherwise might require the untimely disposition of securities. Under the terms of the Credit Facility, a borrowing portfolio must have a minimum of $25,000,000 in adjusted net asset value and not exceed certain adjusted net asset coverage ratios prior to and during the time in which any borrowings are outstanding. If a portfolio does not comply with the aforementioned requirements, the portfolio must remediate within three business days with respect to the $25,000,000 minimum adjusted net asset value or within one business day with respect to certain asset coverage ratios or the administrative agent at the request of, or with the consent of, the lenders may terminate the Credit Facility and declare any outstanding borrowings to be due and payable immediately.
Interest associated with any borrowing under the Credit Facility is charged to the borrowing portfolio at a rate of interest equal to 1.00%, which has increased to 1.25% pursuant to the amendment referenced below, plus the greater of the federal funds effective rate or one month LIBOR. The annual commitment fee to maintain the Credit Facility is 0.15% and is incurred on the unused portion of the Credit Facility and is allocated to all participating portfolios pro rata based on their respective net assets. Effective August 11, 2020, this agreement has been amended and restated for a term of 364 days, unless extended, and to include the change to the interest rate charged for borrowing from the Credit Facility to 1.25%, as noted above, and an upfront fee of 0.075% of the Credit Facility to be charged and paid by all participating funds of the Credit Facility.
The Portfolio did not utilize the Credit Facility during the year ended December 31, 2020.
7. Risks, Concentrations and Indemnifications
In the normal course of business, the Portfolio enters into contracts that contain a variety of representations which provide general indemnifications. The Portfolio’s maximum exposure under these arrangements is unknown. The amount of exposure would depend on future claims that may be brought against the Portfolio. However, based on experience, the Portfolio expects the risk of loss to be remote.
As of December 31, 2020, the Portfolio had three individual shareholder and/or non-affiliated omnibus accounts, which owned 65.9% of the Portfolio’s outstanding shares.
Significant shareholder transactions by these shareholders may impact the Portfolio’s performance and liquidity.
Derivatives may be riskier than other types of investments because they may be more sensitive to changes in economic and market conditions and could result in losses that significantly exceed the Portfolio’s original investment. Many derivatives create leverage thereby causing the Portfolio to be more volatile than they would have been if they had not used derivatives. Derivatives also expose the Portfolio to counterparty risk (the risk that the derivative counterparty will not fulfill its contractual obligations), including credit risk of the derivative counterparty. The possible lack of a liquid secondary market for derivatives and the resulting inability of the Portfolio to sell or otherwise close a derivatives position could expose the Portfolio to losses.
The Portfolio invests in companies with relatively small market capitalizations. Investments in companies with relatively small market capitalizations may involve greater risk than is usually associated with stocks of larger companies. These securities may have limited marketability and may be subject to more abrupt or erratic movements in price than securities of companies with larger capitalizations.
LIBOR is intended to represent the rate at which contributing banks may obtain short-term borrowings from each other in the London interbank market. The regulatory authority that oversees financial services firms and financial markets in the U.K. has announced that, after the end of 2021, it would no longer persuade or compel contributing banks to make rate submissions for purposes of determining the LIBOR rate. As a result, it is possible that commencing in 2022, LIBOR may no longer be available or no longer deemed an appropriate reference rate upon which to determine the interest rate on or impacting certain loans, notes, derivatives and other instruments or investments comprising some or all of the Portfolio’s portfolio. In light of this eventuality, public and private sector industry initiatives are currently underway to identify new or alternative reference rates to be used in place of LIBOR. There is no assurance that the composition or characteristics of any such alternative reference rate will be similar to or produce the same value or economic equivalence as LIBOR or that it will have the same volume or liquidity as did LIBOR prior to its discontinuance or unavailability, which may affect the value or liquidity or return on certain investments of the Portfolio and result in costs incurred in connection with closing out positions and entering into new trades. These risks may also apply with respect to changes in connection with other interbank offering rates (e.g., Euribor) and a wide range of other index levels, rates and values that are treated as “benchmarks” and are the subject of recent regulatory reform.
| | | | | | | | | | |
| | | | | |
| 24 | | | | | | | | JPMORGAN INSURANCE TRUST | | DECEMBER 31, 2020 |
The Portfolio is subject to infectious disease epidemics/pandemics risk. The worldwide outbreak of COVID-19, a novel coronavirus disease, has negatively affected economies, markets and individual companies throughout the world. The effects of this COVID-19 pandemic to public health, and business and market conditions, including exchange trading suspensions and closures may continue to have a significant negative impact on the performance of the Portfolio’s investments, increase the Portfolio’s volatility, exacerbate other pre-existing political, social and economic risks to the Portfolio and negatively impact broad segments of businesses and populations. The Portfolio’s operations may be interrupted as a result, which may have a significant negative impact on investment performance. In addition, governments, their regulatory agencies, or self-regulatory organizations may take actions in response to the pandemic that affect the instruments in which the Portfolio invests, or the issuers of such instruments, in ways that could also have a significant negative impact on the Portfolio’s investment performance. The full impact of this COVID-19 pandemic, or other future epidemics/pandemics, is currently unknown.
8. Subsequent Event
On February 10, 2021, the contractual expense limitations for Class 1 Shares and Class 2 Shares were extended until at least April 30, 2022.
| | | | | | | | | | |
| | | | | |
| DECEMBER 31, 2020 | | JPMORGAN INSURANCE TRUST | | | | | | | | 25 |
REPORT OF INDEPENDENT REGISTERED PUBLIC ACCOUNTING FIRM
To the Board of Trustees of JPMorgan Insurance Trust and Shareholders of JPMorgan Insurance Trust Small Cap Core Portfolio
Opinion on the Financial Statements
We have audited the accompanying statement of assets and liabilities, including the schedule of portfolio investments, of JPMorgan Insurance Trust Small Cap Core Portfolio (one of the portfolios constituting JPMorgan Insurance Trust, referred to hereafter as the “Portfolio”) as of December 31, 2020, the related statement of operations for the year ended December 31, 2020, the statements of changes in net assets for each of the two years in the period ended December 31, 2020, including the related notes, and the financial highlights for each of the five years in the period ended December 31, 2020 (collectively referred to as the “financial statements”). In our opinion, the financial statements present fairly, in all material respects, the financial position of the Portfolio as of December 31, 2020, the results of its operations for the year then ended, the changes in its net assets for each of the two years in the period ended December 31, 2020 and the financial highlights for each of the five years in the period ended December 31, 2020 in conformity with accounting principles generally accepted in the United States of America.
Basis for Opinion
These financial statements are the responsibility of the Portfolio’s management. Our responsibility is to express an opinion on the Portfolio’s financial statements based on our audits. We are a public accounting firm registered with the Public Company Accounting Oversight Board (United States) (PCAOB) and are required to be independent with respect to the Portfolio in accordance with the U.S. federal securities laws and the applicable rules and regulations of the Securities and Exchange Commission and the PCAOB.
We conducted our audits of these financial statements in accordance with the standards of the PCAOB. Those standards require that we plan and perform the audit to obtain reasonable assurance about whether the financial statements are free of material misstatement, whether due to error or fraud.
Our audits included performing procedures to assess the risks of material misstatement of the financial statements, whether due to error or fraud, and performing procedures that respond to those risks. Such procedures included examining, on a test basis, evidence regarding the amounts and disclosures in the financial statements. Our audits also included evaluating the accounting principles used and significant estimates made by management, as well as evaluating the overall presentation of the financial statements. Our procedures included confirmation of securities owned as of December 31, 2020 by correspondence with the custodian, transfer agent and brokers; when replies were not received from brokers, we performed other auditing procedures. We believe that our audits provide a reasonable basis for our opinion.
/s/ PricewaterhouseCoopers LLP
New York, New York
February 12, 2021
We have served as the auditor of one or more investment companies in the JPMorgan Funds complex since 1993.
| | | | | | | | | | |
| | | | | |
| 26 | | | | | | | | JPMORGAN INSURANCE TRUST | | DECEMBER 31, 2020 |
TRUSTEES
(Unaudited)
The Portfolio’s Statement of Additional Information includes additional information about the Portfolio’s Trustees and is available, without charge, upon request by calling 1-800-480-4111 or on the J.P. Morgan Funds’ website at www.jpmorganfunds.com.
| | | | | | |
Name (Year of Birth); Positions With the Portfolio (1) | | Principal Occupation During Past 5 Years | | Number of
Portfolios in Fund
Complex Overseen
by Trustee (2) | | Other Directorships Held During the Past 5 Years |
Independent Trustees | | |
| | | |
| John F. Finn (1947); Chairman since 2020; Trustee of Trust since 2005; Trustee of heritage One Group Mutual Funds since 1998. | | Chairman, Gardner, Inc. (supply chain management company serving industrial and consumer markets) (serving in various roles 1974-present). | | 128 | | Director, Greif, Inc. (GEF) (industrial package products and services) (2007-present); Trustee, Columbus Association for the Performing Arts (1988-present); Director, Cardinal Health, Inc. (CAH) (1994-2014). |
| | | |
| Stephen P. Fisher (1959); Trustee of Trust since 2018. | | Retired; Chairman and Chief Executive Officer, NYLIFE Distributors LLC (registered broker-dealer) (serving in various roles 2008-2013); Chairman, NYLIM Service Company LLC (transfer agent) (2008-2017); New York Life Investment Management LLC (registered investment adviser) (serving in various roles 2005-2017); Chairman, IndexIQ Advisors LLC (registered investment adviser for ETFs) (2014-2017); President, MainStay VP Funds Trust (2007-2017), MainStay DefinedTerm Municipal Opportunities Fund (2011-2017) and MainStay Funds Trust (2007-2017) (registered investment companies). | | 128 | | Honors Program Advisory Board Member, The Zicklin School of Business, Baruch College, The City University of New York (2017-present). |
| | | |
| Kathleen M. Gallagher (1958); Trustee of Trust since 2018. | | Retired; Chief Investment Officer — Benefit Plans, Ford Motor Company (serving in various roles 1985-2016). | | 128 | | Non-Executive Director, Legal & General Investment Management (Holdings) (2018-present); Non-Executive Director, Legal & General Investment Management America (financial services and insurance) (2017-present); Advisory Board Member, Fiduciary Solutions, State Street Global Advisors (2017-present); Member, Client Advisory Council, Financial Engines, LLC (registered investment adviser) (2011-2016); Director, Ford Pension Funds Investment Management Ltd. (2007-2016). |
| | | |
| Dennis P. Harrington* (1950); Trustee of Trust since 2017. | | Retired; Partner, Deloitte LLP (accounting firm) (serving in various roles 1984-2012). | | 128 | | None |
| | | |
| Frankie D. Hughes (1952); Trustee of Trust since 2008. | | President, Ashland Hughes Properties (property management) (2014-present); President and Chief Investment Officer, Hughes Capital Management, Inc. (fixed income asset management) (1993-2014). | | 128 | | None |
| | | | | | | | | | |
| | | | | |
| DECEMBER 31, 2020 | | JPMORGAN INSURANCE TRUST | | | | | | | | 27 |
TRUSTEES
(Unaudited) (continued)
| | | | | | |
Name (Year of Birth); Positions With the Portfolio (1) | | Principal Occupation During Past 5 Years | | Number of
Portfolios in Fund
Complex Overseen
by Trustee (2) | | Other Directorships Held During the Past 5 Years |
Independent Trustees (continued) | | |
| | | |
Raymond Kanner** (1953); Trustee of Trust since 2017. | | Retired; Managing Director & Chief Investment Officer, IBM Retirement Funds (2007-2016). | | 128 | | Advisory Board Member, Penso Advisors LLC (2020-present); Advisory Board Member, Los Angeles Capital (2018-present); Advisory Board Member, State Street Global Advisors Fiduciary Solutions Board (2017-present); Acting Executive Director, Committee on Investment of Employee Benefit Assets (CIEBA) (2016-2017); Advisory Board Member, Betterment for Business (robo advisor) (2016-2017); Advisory Board Member, BlueStar Indexes (index creator) (2013-2017); Director, Emerging Markets Growth Fund (registered investment company) (1997-2016); Member, Russell Index Client Advisory Board (2001-2015). |
| | | |
| Peter C. Marshall (1942); Trustee of Trust since 2005; Trustee of heritage One Group Mutual Funds since 1985. (3) | | Self-employed business consultant
(2002-present). | | 128 | | None |
| | | |
| Mary E. Martinez (1960); Trustee of Trust since 2013. | | Associate, Special Properties, a Christie’s International Real Estate Affiliate (2010-present); Managing Director, Bank of America (Asset Management) (2007-2008); Chief Operating Officer, U.S. Trust Asset Management, U.S. Trust Company (asset management) (2003-2007); President, Excelsior Funds (registered investment companies) (2004-2005). | | 128 | | None |
| | | |
| Marilyn McCoy (1948); Trustee of Trust since 2005; Trustee of heritage One Group Mutual Funds since 1999. | | Vice President of Administration and Planning, Northwestern University (1985-present). | | 128 | | None |
| | | |
| Mitchell M. Merin (1953); Trustee of Trust since 2013. (4) | | Retired; President and Chief Operating Officer, Morgan Stanley Investment Management, Member, Morgan Stanley & Co. Management Committee (serving in various roles 1981-2006). | | 128 | | Director, Sun Life Financial (SLF) (financial services and insurance) (2007-2013). |
| | | |
| Dr. Robert A. Oden, Jr. (1946); Trustee of Trust since 2005; Trustee of heritage One Group Mutual Funds since 1997. | | Retired; President, Carleton College (2002-2010); President, Kenyon College (1995-2002). | | 128 | | Trustee and Vice Chair, Trout Unlimited (2017-present); Trustee, American Museum of Fly Fishing (2013-present); Vice Chair, Dartmouth-Hitchcock Medical Center (2011-present); Trustee, American University in Cairo (1999-2014). |
| | | |
| Marian U. Pardo*** (1946); Trustee of Trust since 2013. | | Managing Director and Founder, Virtual Capital Management LLC (investment consulting) (2007-present); Managing Director, Credit Suisse Asset Management (portfolio manager) (2003-2006). | | 128 | | President and Member, Board of Governors, Columbus Citizens Foundation (not-for-profit supporting philanthropic and cultural programs) (2006-present). |
| | | | | | | | | | |
| | | | | |
| 28 | | | | | | | | JPMORGAN INSURANCE TRUST | | DECEMBER 31, 2020 |
| (1) | The Trustees serve for an indefinite term, subject to the Trust’s current retirement policy, which is age 78 for all Trustees. |
| (2) | A Fund Complex means two or more registered investment companies that hold themselves out to investors as related companies for purposes of investment and investor services or have a common investment adviser or have an investment adviser that is an affiliated person of the investment adviser of any of the other registered investment companies. The J.P. Morgan Funds Complex for which the Board of Trustees serves currently includes ten registered investment companies (128 funds). |
| (3) | Mr. Marshall retired from the Board of Trustees effective the close of business on December 31, 2020. |
| (4) | Mr. Merin retired from the Board of Trustees effective the close of business on January 31, 2021. |
| * | Two family members of Mr. Harrington are partner and managing director, respectively, of the Portfolio’s independent registered public accounting firm. Such firm has represented to the Board that those family members are not involved in the audit of the Portfolio’s financial statements and do not provide other services to the Portfolio. The Board has concluded that such association does not interfere with Mr. Harrington’s exercise of independent judgment as an Independent Trustee. |
| ** | A family member of Mr. Kanner is employed by JPMorgan Chase Bank, which is affiliated with JPMIM and JPMDS. In that capacity, this employee provides services to various JPMorgan affiliates including JPMIM and JPMDS and for which JPMIM and JPMDS bear some portion of the expense thereof. |
| *** | In connection with prior employment with JPMorgan Chase, Ms. Pardo was the recipient of non-qualified pension plan payments from JPMorgan Chase in the amount of approximately $2,055 per month, which she irrevocably waived effective January 1, 2013, and deferred compensation payments from JPMorgan Chase in the amount of approximately $7,294 per year, which ended in January 2013. In addition, Ms. Pardo receives payments from a fully-funded qualified plan, which is not an obligation of JPMorgan Chase. |
The contact address for each of the Trustees is 277 Park Avenue, New York, NY 10172.
| | | | | | | | | | |
| | | | | |
| DECEMBER 31, 2020 | | JPMORGAN INSURANCE TRUST | | | | | | | | 29 |
OFFICERS
(Unaudited)
| | |
Name (Year of Birth), Positions Held with the Trust (Since) | | Principal Occupations During Past 5 Years |
| |
Brian S. Shlissel (1964),
President and Principal Executive Officer (2016)* | | Managing Director and Chief Administrative Officer for J.P. Morgan pooled vehicles, J.P. Morgan Investment Management Inc. (formerly JPMorgan Funds Management, Inc.) (from 2014 to present); Managing Director and Head of Mutual Fund Services, Allianz Global Investors; President and Chief Executive Officer, Allianz Global Investors Mutual Funds and PIMCO Closed-End Funds (from 1999 to 2014). |
| |
Timothy J. Clemens (1975), Treasurer and Principal Financial Officer (2018)** | | Executive Director, J.P. Morgan Investment Management Inc. (formerly JPMorgan Funds Management, Inc.) since February 2016; Vice President, JPMorgan Funds Management, Inc. from October 2013 to January 2016. |
| |
Gregory S. Samuels (1980),
Secretary (2019) (formerly Assistant Secretary since 2010)** | | Executive Director and Assistant General Counsel, JPMorgan Chase. Mr. Samuels has been with JPMorgan Chase since 2010. |
| |
Stephen M. Ungerman (1953),
Chief Compliance Officer (2005) | | Managing Director, JPMorgan Chase & Co.; Mr. Ungerman has been with JPMorgan Chase & Co. since 2000. |
| |
Elizabeth A. Davin (1964), Assistant Secretary (2005)*** | | Executive Director and Assistant General Counsel, JPMorgan Chase since February 2012; formerly Vice President and Assistant General Counsel, JPMorgan Chase from 2005 to February 2012; Senior Counsel, JPMorgan Chase (formerly Bank One Corporation) from 2004 to 2005. |
| |
Jessica K. Ditullio (1962),
Assistant Secretary (2005)*** | | Executive Director and Assistant General Counsel, JPMorgan Chase. Ms. Ditullio has been with JPMorgan Chase (formerly Bank One Corporation) since 1990. |
| |
Anthony Geron (1971),
Assistant Secretary (2018)** | | Vice President and Assistant General Counsel, JPMorgan Chase since September 2018; Lead Director and Counsel, AXA Equitable Life Insurance Company from 2015 to 2018 and Senior Director and Counsel, AXA Equitable Life Insurance Company from 2014 to 2015. |
| |
Carmine Lekstutis (1980),
Assistant Secretary (2011)** | | Executive Director and Assistant General Counsel, JPMorgan Chase. Mr. Lekstutis has been with JPMorgan Chase since 2011. |
| |
Zachary E. Vonnegut-Gabovitch (1986), Assistant Secretary (2017)** | | Vice President and Assistant General Counsel, JPMorgan Chase since September 2016; Associate, Morgan, Lewis & Bockius (law firm) from 2012 to 2016. |
| |
Michael M. D’Ambrosio (1969),
Assistant Treasurer (2012) | | Managing Director, J.P. Morgan Investment Management Inc. (formerly JPMorgan Funds Management, Inc.). Mr. D’Ambrosio has been with J.P. Morgan Investment Management Inc. since 2012. |
| |
Aleksandr Fleytekh (1972), Assistant Treasurer (2019)** | | Vice President, J.P. Morgan Investment Management Inc. (formerly JPMorgan Funds Management, Inc.) since February 2012. |
| |
Shannon Gaines (1977),
Assistant Treasurer (2018)*** | | Vice President, J.P. Morgan Investment Management Inc. (formerly JPMorgan Funds Management, Inc.) since January 2014. |
| |
Jeffrey D. House (1972), Assistant Treasurer (2017)*** | | Vice President, J.P. Morgan Investment Management Inc. (formerly JPMorgan Funds Management, Inc.) since July 2006. |
| |
Michael Mannarino (1985),
Assistant Treasurer (2020) | | Vice President, J.P. Morgan Investment Management Inc. (formerly JPMorgan Funds Management, Inc.) since 2014. |
| |
Joseph Parascondola (1963),
Assistant Treasurer (2011)* | | Executive Director, J.P. Morgan Investment Management, Inc. since February 2020, formerly Vice President, J.P. Morgan Investment Management Inc. (formerly JPMorgan Funds Management, Inc.) from August 2006 to January 2020. |
| |
Gillian I. Sands (1969),
Assistant Treasurer (2012)** | | Vice President, J.P. Morgan Investment Management Inc. (formerly JPMorgan Funds Management, Inc.) since September 2012. |
The contact address for each of the officers, unless otherwise noted, is 277 Park Avenue, New York, NY 10172.
| * | The contact address for the officer is 575 Washington Boulevard, Jersey City, NJ 07310. |
| ** | The contact address for the officer is 4 New York Plaza, New York, NY 10004. |
| *** | The contact address for the officer is 1111 Polaris Parkway, Columbus, OH 43240. |
| | | | | | | | | | |
| | | | | |
| 30 | | | | | | | | JPMORGAN INSURANCE TRUST | | DECEMBER 31, 2020 |
SCHEDULE OF SHAREHOLDER EXPENSES
(Unaudited)
Hypothetical $1,000 Investment
As a shareholder of the Portfolio, you incur ongoing costs, including investment advisory fees, administration fees, distribution fees (for Class 2 Shares) and other Portfolio expenses. Because the Portfolio is a funding vehicle for Policies and Eligible Plans, you may also incur sales charges and other fees relating to the Policies or Eligible Plans. The examples below are intended to help you understand your ongoing costs (in dollars) of investing in the Portfolio, but not the costs of the Policies or Eligible Plans, and to compare these ongoing costs with the ongoing costs of investing in other mutual funds. The examples assume that you had a $1,000 investment in each Class at the beginning of the reporting period, July 1, 2020, and continued to hold your shares at the end of the reporting period, December 31, 2020.
Actual Expenses
For each Class of the Portfolio in the table below, the first line provides information about actual account values and actual expenses. You may use the information in this line, together with the amount you invested, to estimate the expenses that you paid over the period. Simply divide your account value by $1,000 (for example, an $8,600 account value divided by $1,000 = 8.6), then multiply the result by the number in the first line of each Class under the heading titled “Expenses Paid During the Period” to estimate the expenses you paid on your account during this period.
Hypothetical Example for Comparison Purposes
The second line of each Class in the table below provides information about hypothetical account values and hypothetical expenses based on the Class’ actual expense ratio and an assumed rate of return of 5% per year before expenses, which is not the Class’ actual return. The hypothetical account values and expenses may not be used to estimate the actual ending account balance or expenses you paid for the period. You may use this information to compare the ongoing costs of investing in the Class of the Portfolio and other funds. To do so, compare this 5% hypothetical example with the 5% hypothetical examples that appear in the shareholder reports of the other funds. Please note that the expenses shown in the table are meant to highlight your ongoing costs only and do not reflect any transaction costs, such as sales charges (loads) or redemption fees or the costs associated with the Policies and Eligible Plans through which the Portfolio is held. Therefore, the second line for each Class in the table is useful in comparing ongoing costs only, and will not help you determine the relative total costs of owning different funds. In addition, if these transaction costs were included, your costs would have been higher. The examples also assume all dividends and distributions have been reinvested.
| | | | | | | | | | | | | | | | |
| | | Beginning
Account Value
July 1, 2020 | | | Ending
Account Value
December 31, 2020 | | | Expenses
Paid During
the Period* | | | Annualized
Expense
Ratio | |
JPMorgan Insurance Trust Small Cap Core Portfolio | | | | | | | | | | | | | | | | |
Class 1 | | | | | | | | | | | | | | | | |
Actual | | $ | 1,000.00 | | | $ | 1,383.20 | | | $ | 5.09 | | | | 0.85 | % |
Hypothetical | | | 1,000.00 | | | | 1,020.86 | | | | 4.32 | | | | 0.85 | |
Class 2 | | | | | | | | | | | | | | | | |
Actual | | | 1,000.00 | | | | 1,381.80 | | | | 6.89 | | | | 1.15 | |
Hypothetical | | | 1,000.00 | | | | 1,019.36 | | | | 5.84 | | | | 1.15 | |
| * | Expenses are equal to each Class’ respective annualized expense ratio, multiplied by the average account value over the period, multiplied by 184/366 (to reflect the one-half year period). |
| | | | | | | | | | |
| | | | | |
| DECEMBER 31, 2020 | | JPMORGAN INSURANCE TRUST | | | | | | | | 31 |
BOARD APPROVAL OF INVESTMENT ADVISORY AGREEMENT
(Unaudited)
The Board of Trustees has established various standing committees composed of Trustees with diverse backgrounds, to which the Board of Trustees has assigned specific subject matter responsibilities to further enhance the effectiveness of the Board’s oversight and decision making. The Board of Trustees and its investment committees (money market and alternative products, equity, and fixed income) meet regularly throughout the year and consider factors that are relevant to their annual consideration of investment advisory agreements at each meeting. They also meet for the specific purpose of considering investment advisory agreement annual renewals. The Board of Trustees held meetings in June and August 2020, at which the Trustees considered the continuation of the investment advisory agreement for the Portfolio whose annual report is contained herein (the “Advisory Agreement”). In accordance with SEC guidance, due to the COVID-19 pandemic, the meetings were conducted through video conference. At the June meeting, the Board’s investment committees met to review and consider performance, expense and related information for the J.P. Morgan Funds. Each investment committee reported to the full Board, which then considered the investment committee’s preliminary findings. At the August meeting, the Trustees continued their review and consideration. The Trustees, including a majority of the Trustees who are not parties to the Advisory Agreement or “interested persons” (as defined in the 1940 Act) of any party to the Advisory Agreement or any of their affiliates, approved the continuation of the Advisory Agreement on August 11, 2020.
As part of their review of the Advisory Agreement, the Trustees considered and reviewed performance and other information about the Portfolio received from the Adviser. This information includes the Portfolio’s performance as compared to the performance of its peers and benchmarks and analyses by the Adviser of the Portfolio’s performance. In addition, at each of their regular meetings throughout the year, the Trustees considered reports on the performance of certain J.P. Morgan Funds provided by an independent management consulting firm (“independent consultant”). In addition, in preparation for the June and August meetings, the Trustees requested, received and evaluated extensive materials from the Adviser, including performance and expense information compiled by Broadridge, using data from Lipper Inc. and/or Morningstar Inc., independent providers of investment company data (together, “Broadridge”). Before voting on the Advisory Agreement, the Trustees reviewed the Advisory Agreement with representatives of the Adviser, counsel to the Trust and independent legal counsel and received a memorandum from independent legal counsel to the Trustees discussing the legal standards for their consideration of the Advisory Agreement. The Trustees also discussed the Advisory Agreement in executive sessions with independent legal counsel at which no representatives of the Adviser were present.
A summary of the material factors evaluated by the Trustees in determining whether to approve the Advisory Agreement is provided below. Each Trustee attributed different weights to the various factors and no factor alone was considered determinative. The Trustees considered information provided with respect to the Portfolio throughout the year, including additional reporting and information provided in connection with the market volatility caused by the COVID-19 pandemic, as well as materials furnished specifically in connection with the annual review process. From year to year, the Trustees consider and place emphasis on relevant information in light of changing circumstances in market and economic conditions.
After considering and weighing the factors and information they had received, the Trustees found that the compensation to be received by the Adviser from the Portfolio under the Advisory Agreement was fair and reasonable under the circumstances and determined that the continuance of the Advisory Agreement was in the best interests of the Portfolio and its shareholders.
Nature, Extent and Quality of Services Provided by the Adviser
The Trustees received and considered information regarding the nature, extent and quality of services provided to the Portfolio under the Advisory Agreement. The Trustees took into account information furnished throughout the year at Trustee meetings, as well as the materials furnished specifically in connection with this annual review process. The Trustees considered the background and experience of the Adviser’s senior management, personnel changes, if any, and the expertise of, and the amount of attention given to the Portfolio by, investment personnel of the Adviser. In addition, the Trustees reviewed the qualifications, backgrounds and responsibilities of the portfolio management team primarily responsible for the day-to-day management of the Portfolio and the infrastructure supporting the team, including personnel changes, if any. In addition, the Board considered its discussions with the Adviser regarding the Adviser’s business continuity plan and steps the Adviser was taking to provide ongoing services to the Portfolio during the COVID-19 pandemic, and the Adviser’s success in continuing to provide services to the Portfolio and their shareholders throughout this period. The Trustees also considered information provided by the Adviser and JPMorgan Distribution Services, Inc. (“JPMDS”) about the structure and distribution strategy of the Portfolio. The Trustees reviewed information relating to the Adviser’s risk governance model and reports showing the Adviser’s compliance structure and ongoing compliance processes. The Trustees also considered the quality of the administration services provided by the Adviser in its role as administrator.
The Trustees also considered their knowledge of the nature and quality of services provided by the Adviser and its affiliates to the Portfolio gained from their experience as Trustees of the
| | | | | | | | | | |
| | | | | |
| 32 | | | | | | | | JPMORGAN INSURANCE TRUST | | DECEMBER 31, 2020 |
J.P. Morgan Funds. In addition, they considered the overall reputation and capabilities of the Adviser and its affiliates, the commitment of the Adviser to provide high quality service to the Portfolio, their overall confidence in the Adviser’s integrity and the Adviser’s responsiveness to questions or concerns raised by them, including the Adviser’s willingness to consider and implement organizational and operational changes designed to improve investment results and the services provided to the Portfolio.
Based upon these considerations and other factors, the Trustees concluded that they were satisfied with the nature, extent and quality of the investment advisory services provided to the Portfolio by the Adviser.
Costs of Services Provided and Profitability to the Adviser and its Affiliates
The Trustees received and considered information regarding the profitability to the Adviser and its affiliates in providing services to the Portfolio. The Trustees reviewed and discussed this information. The Trustees recognized that this information is not audited and represents the Adviser’s determination of its and its affiliates’ revenues from the contractual services provided to the Portfolio, less expenses of providing such services. Expenses include direct and indirect costs and are calculated using an allocation methodology developed by the Adviser. The Trustees also recognized that it is difficult to make comparisons of profitability from fund investment advisory contracts because comparative information is not generally publicly available and is affected by numerous factors, including the structure of the particular adviser, the types of funds it manages, its business mix, numerous assumptions regarding allocations and the fact that publicly-traded fund managers’ operating profits and net income are net of distribution and marketing expenses. Based upon their review, and taking into consideration the factors noted above, the Trustees concluded that the profitability to the Adviser under the Advisory Agreement was not unreasonable in light of the services and benefits provided to the Portfolio.
The Trustees also considered that the Adviser earns fees from the Portfolio for providing administration services. These fees were shown separately in the profitability analysis presented to the Trustees. The Trustees also considered the payments of Rule 12b-1 fees to JPMDS, an affiliate of the Adviser, which also acts as the Portfolio’s distributor and that these fees are in turn generally paid to financial intermediaries that sell the Portfolio, including financial intermediaries that are affiliates of the Adviser(although they are retained by JPMDS in certain instances). The Trustees also considered the fees paid to JPMorgan Chase Bank, N.A. (“JPMCB”) for custody and fund accounting and other related services.
Fall-Out Benefits
The Trustees reviewed information regarding potential “fall-out” or ancillary benefits received by the Adviser and its affiliates as a result of their relationship with the Portfolio. The Trustees considered that the J.P. Morgan Funds’ operating accounts are held at JPMCB, which, as a result, will receive float benefits for certain J.P. Morgan Funds, as applicable. The Trustees also noted that the Adviser supports a diverse set of products and services, which benefits the Adviser by allowing it to leverage its infrastructure to serve additional clients, including benefits that may be received by the Adviser and its affiliates in connection with the Portfolio’s potential investments in other funds advised by the Adviser. The Trustees also reviewed the Adviser’s allocation of fund brokerage for the J.P. Morgan Funds complex, including allocations to brokers who provide research to the Adviser.
Economies of Scale
The Trustees considered the extent to which the Portfolio may benefit from economies of scale. The Trustees considered that there may not be a direct relationship between economies of scale realized by the Portfolio and those realized by the Adviser as assets increase. The Trustees considered the extent to which the Portfolio was priced to scale and whether it would be appropriate to add advisory fee breakpoints. , but noted that the Portfolio has implemented fee waivers and contractual expense limitations (“Fee Caps”) which allow the Portfolio’s shareholders to share potential economies of scale from its inception and that the fees remain satisfactory relative to peer funds. The Trustees considered the benefits to the Portfolio of the use of an affiliated distributor and custodian, including the ability to rely on existing infrastructure supporting distribution, custodial and transfer agent services, and the ability to negotiate competitive fees for the Portfolio. The Trustees further considered the Adviser’s and JPMDS’s ongoing investments in their business in support of the Portfolio, including the Adviser’s and/or JPMDS’s investments in trading systems, technology (including improvements to the J.P. Morgan Funds’ website, and cybersecurity improvements), retention of key talent, and regulatory support enhancements. The Trustees concluded that the current fee structure for the Portfolio, including Fee Caps that the Adviser has in place that serve to limit the overall net expense ratios of the Portfolio at competitive levels, was reasonable. The Trustees concluded that the Portfolio’s shareholders received the benefits of potential economies of scale through the Fee Caps and the Adviser’s reinvestment in its operations to serve the Portfolio and its shareholders. The Trustees noted that the Adviser’s reinvestment ensures sufficient resources in terms of personnel and infrastructure to support the Portfolio.
| | | | | | | | | | |
| | | | | |
| DECEMBER 31, 2020 | | JPMORGAN INSURANCE TRUST | | | | | | | | 33 |
BOARD APPROVAL OF INVESTMENT ADVISORY AGREEMENT
(Unaudited) (continued)
Independent Written Evaluation of the Portfolio’s Chief Compliance Officer
The Trustees noted that, upon their direction, the Chief Compliance Officer for the Portfolio had prepared an independent written evaluation in order to assist the Trustees in determining the reasonableness of the proposed management fees. The Trustees considered the written evaluation in determining whether to continue the Advisory Agreement.
Fees Relative to Adviser’s Other Clients
The Trustees received and considered information about the nature and extent of investment advisory services and fee rates offered to other clients of the Adviser, including institutional separate accounts, collective investment trusts, ETFs and/or funds sub-advised by the Adviser, for investment management styles substantially similar to that of the Portfolio. The Trustees considered the complexity of investment management for registered mutual funds relative to the Adviser’s other clients and noted differences, as applicable, in the regulatory, legal and other risks and responsibilities of providing services to the different clients. The Trustees considered that serving as an adviser to a registered mutual fund involves greater responsibilities and risks than acting as a sub-adviser and observed that sub-advisory fees may be lower than those charged by the Adviser to the Portfolio. The Trustees also noted that the adviser, not the mutual fund, pays the sub-advisory fee and that many responsibilities related to the advisory function are retained by the primary adviser. The Trustees concluded that the fee rates charged to the Portfolio in comparison to those charged to the Adviser’s other clients were reasonable.
Investment Performance
The Trustees received and considered absolute and/or relative performance information for the Portfolio in a report prepared by Broadridge. The Trustees considered the total return performance information, which included the ranking of the Portfolio within a performance universe made up of funds with the same Broadridge investment classification and objective (the “Universe”), as well as a subset of funds within the Universe (the “Peer Group”), by total return for the applicable one-, three- and five-year periods. The Trustees reviewed a description of Broadridge’s methodology for selecting mutual funds in the Portfolio’s Universe and Peer Group and noted that Universe and Peer Group rankings were not calculated if the number of funds in the Universe and/or Peer Group did not meet a predetermined minimum. The Broadridge materials provided to the Trustees highlighted information with respect to a representative class to assist the Trustees in their review. As part of this review, the Trustees also reviewed the Portfolio’s
performance against its benchmark and considered the performance information provided for the Portfolio at regular Board meetings by the Adviser. The Trustees also engaged with the Adviser to consider what steps might be taken to improve performance, as applicable. The Broadridge performance data noted by the Trustees as part of their review and the determinations made by the Trustees with respect to the Portfolio’s performance are summarized below:
The Trustees noted that the Portfolio’s performance for Class 1 shares was in the second quintile, based upon the Peer Group, for each of the one-, three and five-year period ended December 2019, and in the third, second and third quintiles, based upon the Universe, for the one-, three- and five-year periods ended December 31, 2019, respectively. The Trustees discussed the performance and investment strategy of the Portfolio with the Adviser and based upon this discussion and various other factors, concluded that the Portfolio’s performance was satisfactory.
Advisory Fees and Expense Ratios
The Trustees considered the contractual advisory fee rate and administration fee rate paid by the Portfolio to the Adviser and compared the combined rate to the information prepared by Broadridge concerning management fee rates paid by other funds in the same Broadridge category as the Portfolio. The Trustees recognized that Broadridge reported the Portfolio’s management fee rate as the combined contractual advisory fee and administration fee rates. The Trustees also reviewed information about other expenses and the expense ratios for the Portfolio and noted that Universe and Peer Group rankings were not calculated if the number of funds in the Universe and/or Peer Groups did not meet a predetermined minimum. The Trustees considered the Fee Caps currently in place for the Portfolio, the net advisory fee rate after taking into account any waivers and/or reimbursements, and, where deemed appropriate by the Trustees, additional waivers and/or reimbursements. The Trustees recognized that it is difficult to make comparisons of advisory fees because there are variations in the services that are included in the fees paid by other funds. The Trustees’ determinations as a result of the review of the Portfolio’s advisory fees and expense ratios are summarized below:
The Trustees noted that the Portfolio’s net advisory fee and actual total expenses for Class 1 shares were both in the second quintile based upon both the Peer Group and Universe. After considering the factors identified above, in light of this information, the Trustees concluded that the advisory fee was satisfactory in light of the services provided to the Portfolio.
| | | | | | | | | | |
| | | | | |
| 34 | | | | | | | | JPMORGAN INSURANCE TRUST | | DECEMBER 31, 2020 |
TAX LETTER
(Unaudited)
Dividends Received Deduction (DRD)
The Portfolio had 100.00%, or maximum allowable percentage, of ordinary income distributions eligible for the dividends received deduction for corporate shareholders for the fiscal year ended December 31, 2020.
Long Term Capital Gain
The Portfolio distributed approximately $10,874,000, or maximum allowable amount, of long-term capital gain dividends for the fiscal year ended December 31, 2020.
| | | | | | | | | | |
| | | | | |
| DECEMBER 31, 2020 | | JPMORGAN INSURANCE TRUST | | | | | | | | 35 |
J.P. Morgan Funds are distributed by JPMorgan Distribution Services, Inc., which is an affiliate of JPMorgan Chase & Co. Affiliates of JPMorgan Chase & Co. receive fees for providing various services to the funds.
Contact JPMorgan Distribution Services, Inc. at 1-800-480-4111 for a portfolio prospectus. You can also visit us at www.jpmorganfunds.com. Investors should carefully consider the investment objectives and risk as well as charges and expenses of the mutual fund before investing. The prospectus contains this and other information about the mutual fund. Read the prospectus carefully before investing.
The Portfolio files a complete schedule of its portfolio holdings for the first and third quarters of its fiscal year with the SEC as an exhibit to its report on Form N-PORT. The Portfolio’s Form N-PORT reports are available on the SEC’s website at http://www.sec.gov. The Portfolio’s quarterly holdings can be found by visiting the J.P. Morgan Funds’ website at www.jpmorganfunds.com.
A description of the Portfolio’s policies and procedures with respect to the disclosure of the Portfolio’s holdings is available in the prospectuses and Statement of Additional Information.
A copy of proxy policies and procedures is available without charge upon request by calling 1-800-480-4111 and on the Portfolio’s website at www.jpmorganfunds.com. A description of such policies and procedures is on the SEC’s website at www.sec.gov. The Trustees have delegated the authority to vote proxies for securities owned by the Portfolio to the Adviser. A copy of the Portfolio’s voting record for the most recent 12-month period ended June 30 is available on the SEC’s website at www.sec.gov or at the Portfolio’s website at www.jpmorganfunds.com no later than August 31 of each year. The Portfolio’s proxy voting record will include, among other things, a brief description of the matter voted on for each portfolio security, and will state how each vote was cast, for example, for or against the proposal.

J.P. Morgan Asset Management is the brand name for the asset management business of JPMorgan Chase & Co. and its affiliates worldwide.
| | | | |
| | © JPMorgan Chase & Co., 2020. All rights reserved. December 2020. | | AN-JPMITSCCP-1220 |
Annual Report
JPMorgan Insurance Trust
December 31, 2020
JPMorgan Insurance Trust U.S. Equity Portfolio
| | | | |
NOT FDIC INSURED • NO BANK GUARANTEE • MAY LOSE VALUE
| | |  | |
CONTENTS
Investments in the Portfolio are not deposits or obligations of, or guaranteed or endorsed by, any bank and are not insured or guaranteed by the FDIC, the Federal Reserve Board or any other government agency. You could lose money if you sell when the Portfolio’s share price is lower than when you invested.
Past performance is no guarantee of future performance. The general market views expressed in this report are opinions based on market and other conditions through the end of the reporting period and are subject to change without notice. These views are not intended to predict the future performance of the Portfolio or the securities markets. References to specific securities and their issuers are for illustrative purposes only and are not intended to be, and should not be interpreted as, recommendations to purchase or sell such securities. Such views are not meant as investment advice and may not be relied on as an indication of trading intent on behalf of the Portfolio.
This Portfolio is intended to be a funding vehicle for variable annuity contracts and variable life insurance policies (collectively “Policies”) offered by the separate accounts of various insurance companies. Portfolio shares may also be offered to qualified pension and retirement plans and accounts permitting accumulation of assets on a tax-deferred basis (“Eligible Plans”). Individuals may not purchase shares directly from the Portfolio.
Prospective investors should refer to the Portfolio’s prospectuses for a discussion of the Portfolio’s investment objective, strategies and risks. Call J.P. Morgan Funds Service Center at 1-800-480-4111 for a prospectus containing more complete information about the Portfolio, including management fees and other expenses. Please read it carefully before investing.
| | | | | | | | | | |
| | | | | |
| DECEMBER 31, 2020 | | JPMORGAN INSURANCE TRUST | | | | | | | | 1 |
LETTER TO SHAREHOLDERS
February 4, 2021 (Unaudited)
Dear Shareholders,
The immense efforts of central banks, government and researchers in the public and private sectors appear to have shepherded the world through the most difficult days of a profound crisis caused by the pandemic. While the economic and health care challenges are not behind us, the uncertainty and turbulence of 2020 has abated.
| | |
 | | “We believe the clear lesson is that investors who remained fully invested over the past year, in the face of uncertainty over the direction of the pandemic and the unprecedented responses to it, were likely rewarded for their resolve.” — Andrea L. Lisher |
The development of multiple vaccines against Covid-19 toward the end of 2020 provided hope that the pandemic would be halted and that economic and social activity could begin to resume in the year ahead. That optimism spread to global financial markets. While leading equity indexes fell by 20% or more in the first quarter of 2020, financial markets stabilized and equity markets largely rebounded — slowly at first and then rapidly the second half of the year. At the end of 2020, the S&P 500 Index had generated a total return of 18.10% for the full 12 months and 22.16% for the final six months of the year.
We believe the clear lesson is that investors who remained fully invested over the past year, in the face of uncertainty over the
direction of the pandemic and the unprecedented responses to it, were likely rewarded for their resolve.
Certainly, enormous challenges remain in both the implementation of global vaccinations and in the rebuilding of economies at the local, national and international levels. However, the advances in the fight against Covid-19 provide policymakers and investors with the opportunity to plan for the future and meet those challenges. J.P. Morgan Asset Management has thrived amid the many challenges presented by the pandemic. Moreover, our deep experience in risk management enabled us to better navigate increased volatility in global financial markets. Throughout 2020, we continued to seek to operate under the same fundamental practices and principles that have driven our success for more than a century with an unwavering focus on putting our clients at the center of everything we do.
On behalf of J.P. Morgan Asset Management, thank you for entrusting us to manage your investment. Should you have any questions, please visit www.jpmorganfunds.com or contact the J.P. Morgan Funds Service Center at 1-800-480-4111.
Sincerely yours,

Andrea L. Lisher
Head of Americas, Client
J.P. Morgan Asset Management
JPMorgan Insurance Trust U.S. Equity Portfolio
PORTFOLIO COMMENTARY
TWELVE MONTHS ENDED DECEMBER 31, 2020 (Unaudited)
| | | | |
| REPORTING PERIOD RETURN: | |
| Portfolio (Class 1 Shares)* | | | 25.26% | |
| S&P 500 Index** | | | 18.40% | |
| |
| Net Assets as of 12/31/2020 (In Thousands) | | | $140,167 | |
INVESTMENT OBJECTIVE***
The JPMorgan Insurance Trust U.S. Equity Portfolio (the “Portfolio”) seeks to provide high total return from a portfolio of selected equity securities.
HOW DID THE MARKET PERFORM?
Global financial markets generally recovered from a sharp sell-off in the first quarter of 2020, led by a rally in equity markets in the second half of the year. Investor demand for equity was largely fueled by continued support from central banks, relief spending by governments across the globe and the development and approvals of the first vaccines against Covid-19.
In the first days of January 2020, financial markets largely shrugged off a brief flare-up in military tensions between the U.S. and Iran. However, the emergence and spread of Covid-19 fed increasing investor uncertainty and by early March, the novel coronavirus was declared a pandemic by the World Health Organization. The closure of large sectors of national economies on a global scale sparked a dramatic sell-off in financial markets. Yields on developed market sovereign bonds fell sharply and prices for commodity gold spiked. By the end of the first quarter of 2020, leading developed market equity indexes had lost 20% or more of their value from the start of the year. Corporate bond prices fell and the price of crude oil ended the first quarter down by 60%.
Leading central banks promptly responded with lower interest rates and/or asset purchasing programs, which helped to support asset price stability and head off a potential liquidity crunch in credit markets. Governments also responded with a range of fiscal stimulus or paycheck protection programs designed to cushion the economic impact of the pandemic. In the ensuing months, global equity markets staged a slow and uneven rebound, led by U.S. and emerging markets.
At the start of the second half of the year, U.S. equity led a broad rebound in both developed markets and emerging markets equity. Leading U.S. equity indexes rose in July and August 2020, punctuated by five consecutive record high closings for the S&P 500 in late August — a stretch not seen since 2017. Notably, Apple Inc. issued a 4-for-1 stock split in August and became the first publicly listed company with a valuation surpassing $2 trillion. The U.S. Federal Reserve (the “Fed”) signaled its continued support for asset purchases and low benchmark interest rates. While the spread of Covid-19 accelerated in the U.S., multiple candidate vaccines were being developed around the world and the number of hospitalizations
at the end of the summer was relatively small compared with what was to come at the end of the year.
Equity prices across the globe largely declined over September and October 2020. Re-closings across Asia and Europe in response to Covid-19 dented investor optimism. The inability of the U.S. Congress to adopt further spending for pandemic relief put acute pressure on the S&P 500 in the final week of October.
U.S. equity prices began to rebound in November and by mid-month the S&P 500 reached a closing high and crossed 3,600 points for the first time amid the U.S. Food and Drug Administration’s approval of the first Covid-19 vaccines. While the results of the U.S. presidential election were contested, President-elect Joe Biden’s early cabinet choices — including former Fed Chairwoman Janet Yellen — removed some investor uncertainty. The Fed kept interest rates and policies unchanged and Congressional negotiations over proposed relief and stimulus spending continued through the month.
Globally, equity markets maintained upward momentum through the end of December, largely driven by investor expectations that mass vaccinations and the re-opening of economies would unleash pent up demand from consumers, businesses and governments. Notably, emerging markets equity outperformed developed markets equity, including U.S. equity in the second half of 2020 as China, Taiwan and South Korea appeared to have greater success in containing the pandemic.
In the U.S., growth stocks continued to outperform value stocks but the difference narrowed somewhat during the period as share price valuations rose. Additionally, shares of select companies that had seen their stock prices plummet in the first half of 2020 benefitted from increased investor appetite for bargains in the second half of the year. At year’s end, the largest 10 companies in the S&P 500 made up 27.4% of the index’s value, compared with 22.7% at the end of 2019 and 21.0% at the end of 2018.
WHAT WERE THE MAIN DRIVERS OF THE PORTFOLIO’S PERFORMANCE?
The Portfolio’s Class 1 Shares outperformed the S&P 500 Index (the “Benchmark”) for the twelve months ended December 31, 2020. The Portfolio’s security selection and overweight position in the semiconductors & hardware sector and its underweight position and security selection in the big banks & brokers sector were leading contributors to performance relative to the Benchmark,
| | | | | | | | | | |
| | | | | |
| 2 | | | | | | | | JPMORGAN INSURANCE TRUST | | DECEMBER 31, 2020 |
while the Portfolio’s security selection in the consumer cyclical and retail sectors was a leading detractor from relative performance.
Leading individual contributors to relative performance included the Portfolio’s overweight positions in Tesla Inc. and Morgan Stanley, and its underweight position in Intel Corp. Shares of Tesla, a producer of electric vehicles and energy storage systems, rose after the company was added to the S&P 500 Index. Shares of Morgan Stanley, a financial services and investment company, rose after the company reported better-than-expected earnings and revenue for the third quarter of 2020. Shares of Intel, a semiconductor manufacturer not held in the Fund, fell after news reports that large technology companies would develop their own semiconductors rather than buy them from Intel and other sources.
Leading individual detractors from relative performance included the Portfolio’s overweight positions in Royal Caribbean Cruises Ltd., Boston Scientific Corp. and Analog Devices Inc. Shares of Royal Caribbean Cruises, a cruise ship operator, fell as its business shut down in response to the pandemic. Shares of Boston Scientific, a medical devices manufacturer, fell after the company reported lower-than-expected earnings for the first quarter of 2020 and reported consecutive quarters of lower-than-expected revenue. Shares of Analog Devices, a maker of specialty semiconductors and software, underperformed the broader market after a run-up in the stock price early in the period.
HOW WAS THE PORTFOLIO POSITIONED?
The portfolio managers employed a bottom-up fundamental approach to stock selection, researching companies to determine what the portfolio managers believed to each company’s underlying value and potential for future earnings growth. As a result of the Portfolio’s bottom-up fundamental approach to stock selection, the Portfolio’s largest overweight positions relative to the Benchmark were in the regional banks and media sectors and its largest underweight positions were in the big banks & brokers and the financial services sectors.
| | | | | | | | |
| TOP TEN EQUITY HOLDINGS OF THE PORTFOLIO**** | |
| | 1. | | | Microsoft Corp. | | | 6.5 | % |
| | 2. | | | Amazon.com, Inc. | | | 5.6 | |
| | 3. | | | Apple, Inc. | | | 5.3 | |
| | 4. | | | Mastercard, Inc., Class A | | | 3.8 | |
| | 5. | | | Alphabet, Inc., Class A | | | 2.9 | |
| | 6. | | | NextEra Energy, Inc. | | | 2.3 | |
| | 7. | | | Norfolk Southern Corp. | | | 2.2 | |
| | 8. | | | Eaton Corp. plc | | | 2.1 | |
| | 9. | | | Analog Devices, Inc. | | | 2.1 | |
| | 10. | | | Coca-Cola Co. (The) | | | 2.0 | |
| | | | |
PORTFOLIO COMPOSITION BY SECTOR**** | |
| Information Technology | | | 30.1 | % |
| Consumer Discretionary | | | 13.5 | |
| Health Care | | | 12.4 | |
| Financials | | | 9.5 | |
| Communication Services | | | 9.4 | |
| Industrials | | | 9.3 | |
| Consumer Staples | | | 5.0 | |
| Utilities | | | 4.1 | |
| Materials | | | 2.9 | |
| Real Estate | | | 2.4 | |
| Energy | | | 1.2 | |
| Short-Term Investments | | | 0.2 | |
| * | | The return shown is based on net asset values calculated for shareholder transactions and may differ from the return shown in the financial highlights, which reflects adjustments made to the net asset values in accordance with accounting principles generally accepted in the United States of America. |
| ** | | “S&P 500 Index” is a registered service mark of Standard & Poor’s Corporation, which does not sponsor, and is in no way affiliated with, the Portfolio. |
| *** | | The adviser seeks to achieve the Portfolio’s objective. There can be no guarantee it will be achieved. |
| **** | | Percentages indicated are based on total investments as of December 31, 2020. The Portfolio’s composition is subject to change. |
| | | | | | | | | | |
| | | | | |
| DECEMBER 31, 2020 | | JPMORGAN INSURANCE TRUST | | | | | | | | 3 |
JPMorgan Insurance Trust U.S. Equity Portfolio
PORTFOLIO COMMENTARY
TWELVE MONTHS ENDED DECEMBER 31, 2020 (Unaudited) (continued)
| | | | | | | | | | | | | | |
AVERAGE ANNUAL TOTAL RETURNS AS OF DECEMBER 31, 2020 | |
| | | | |
| | | INCEPTION DATE OF
CLASS | | 1 YEAR | | | 5 YEAR | | | 10 YEAR | |
CLASS 1 SHARES | | March 30, 1995 | | | 25.26 | % | | | 16.01 | % | | | 14.27 | % |
CLASS 2 SHARES | | August 16, 2006 | | | 24.95 | | | | 15.73 | | | | 13.99 | |
TEN YEAR PERFORMANCE (12/31/10 TO 12/31/20)
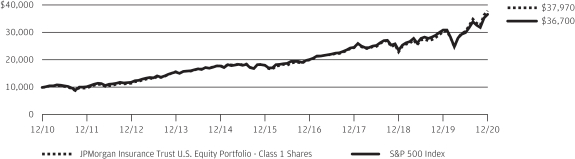
The performance quoted is past performance and is not a guarantee of future results. Mutual funds are subject to certain market risks. Investment returns and principal value of an investment will fluctuate so that an investor’s shares, when redeemed, may be worth more or less than their original cost. Current performance may be higher or lower than the performance data shown. For up-to-date month-end performance information please call 1-800-480-4111.
The graph illustrates comparative performance for $10,000 invested in Class 1 Shares of the JPMorgan Insurance Trust U.S. Equity Portfolio and the S&P 500 Index from December 31, 2010 to December 31, 2020. The performance of the Portfolio assumes reinvestment of all dividends and capital gain distributions, if any. The performance of the S&P 500 Index does not reflect the deduction of expenses associated with a mutual fund and has been adjusted to reflect reinvestment of all dividends and capital gain distributions of the securities
included in the benchmark, if applicable. The S&P 500 Index is an unmanaged index generally representative of the performance of large companies in the U.S. stock market. Investors cannot invest directly in an index.
Portfolio performance does not reflect any charges imposed by the Policies or Eligible Plans. If these charges were included, the returns would be lower than shown. Portfolio performance may reflect the waiver of the Portfolio’s fees and reimbursement of expenses for certain periods. Without these waivers and reimbursements, performance would have been lower.
The returns shown are based on net asset values calculated for shareholder transactions and may differ from the returns shown in the financial highlights, which reflect adjustments made to the net asset values in accordance with accounting principles generally accepted in the United States of America.
| | | | | | | | | | |
| | | | | |
| 4 | | | | | | | | JPMORGAN INSURANCE TRUST | | DECEMBER 31, 2020 |
JPMorgan Insurance Trust U.S. Equity Portfolio
SCHEDULE OF PORTFOLIO INVESTMENTS
AS OF DECEMBER 31, 2020
| | | | | | | | |
| INVESTMENTS | |
SHARES (000) | | | VALUE ($000) | |
Common Stocks — 99.1% | |
|
Aerospace & Defense — 1.5% | |
| | |
Northrop Grumman Corp. | | | 6 | | | | 1,699 | |
| | |
Raytheon Technologies Corp. | | | 6 | | | | 394 | |
| | | | | | | | |
| | |
| | | | | | | 2,093 | |
| | | | | | | | |
|
Air Freight & Logistics — 0.2% | |
| | |
FedEx Corp. | | | 1 | | | | 258 | |
| | | | | | | | |
|
Airlines — 0.1% | |
| | |
Delta Air Lines, Inc. | | | 3 | | | | 131 | |
| | | | | | | | |
|
Automobiles — 1.8% | |
| | |
Tesla, Inc. * | | | 3 | | | | 2,447 | |
| | | | | | | | |
|
Banks — 4.6% | |
| | |
Bank of America Corp. | | | 13 | | | | 380 | |
| | |
Huntington Bancshares, Inc. | | | 35 | | | | 438 | |
| | |
KeyCorp | | | 43 | | | | 698 | |
| | |
Regions Financial Corp. | | | 42 | | | | 671 | |
| | |
Truist Financial Corp. | | | 55 | | | | 2,635 | |
| | |
Wells Fargo & Co. | | | 52 | | | | 1,576 | |
| | | | | | | | |
| | |
| | | | | | | 6,398 | |
| | | | | | | | |
|
Beverages — 3.5% | |
| | |
Coca-Cola Co. (The) | | | 51 | | | | 2,793 | |
| | |
Constellation Brands, Inc., Class A | | | 9 | | | | 2,079 | |
| | | | | | | | |
| | |
| | | | | | | 4,872 | |
| | | | | | | | |
|
Biotechnology — 2.7% | |
| | |
AbbVie, Inc. | | | 25 | | | | 2,694 | |
| | |
Alexion Pharmaceuticals, Inc. * | | | 2 | | | | 330 | |
| | |
Biogen, Inc. * | | | 2 | | | | 395 | |
| | |
Regeneron Pharmaceuticals, Inc. * | | | — | (a) | | | 152 | |
| | |
Vertex Pharmaceuticals, Inc. * | | | 1 | | | | 233 | |
| | | | | | | | |
| | |
| | | | | | | 3,804 | |
| | | | | | | | |
|
Building Products — 0.5% | |
| | |
Trane Technologies plc | | | 5 | | | | 716 | |
| | | | | | | | |
|
Capital Markets — 2.6% | |
| | |
Ameriprise Financial, Inc. | | | 5 | | | | 994 | |
| | |
Intercontinental Exchange, Inc. | | | 2 | | | | 179 | |
| | |
Morgan Stanley | | | 33 | | | | 2,285 | |
| | |
State Street Corp. | | | 3 | | | | 224 | |
| | | | | | | | |
| | |
| | | | | | | 3,682 | |
| | | | | | | | |
|
Chemicals — 1.8% | |
| | |
DuPont de Nemours, Inc. | | | 3 | | | | 193 | |
| | |
Eastman Chemical Co. | | | 16 | | | | 1,648 | |
| | |
Linde plc (United Kingdom) | | | 2 | | | | 612 | |
| | |
PPG Industries, Inc. | | | 1 | | | | 119 | |
| | | | | | | | |
| | |
| | | | | | | 2,572 | |
| | | | | | | | |
| | | | | | | | |
| INVESTMENTS | |
SHARES (000) | | |
VALUE ($000) | |
| | | | | | | | |
|
Consumer Finance — 0.4% | |
| | |
Capital One Financial Corp. | | | 6 | | | | 599 | |
| | | | | | | | |
|
Containers & Packaging — 1.1% | |
| | |
Crown Holdings, Inc. * | | | 15 | | | | 1,506 | |
| | | | | | | | |
|
Diversified Financial Services — 0.1% | |
| | |
Voya Financial, Inc. | | | 2 | | | | 108 | |
| | | | | | | | |
|
Electric Utilities — 3.4% | |
| | |
NextEra Energy, Inc. | | | 41 | | | | 3,192 | |
| | |
Xcel Energy, Inc. | | | 24 | | | | 1,609 | |
| | | | | | | | |
| | |
| | | | | | | 4,801 | |
| | | | | | | | |
|
Electrical Equipment — 2.2% | |
| | |
AMETEK, Inc. | | | 1 | | | | 153 | |
| | |
Eaton Corp. plc | | | 25 | | | | 2,948 | |
| | | | | | | | |
| | |
| | | | | | | 3,101 | |
| | | | | | | | |
|
Entertainment — 1.6% | |
| | |
Netflix, Inc. * | | | 4 | | | | 2,304 | |
| | | | | | | | |
|
Equity Real Estate Investment Trusts (REITs) — 2.4% | |
| | |
Prologis, Inc. | | | 23 | | | | 2,329 | |
| | |
SBA Communications Corp. | | | 1 | | | | 257 | |
| | |
Sun Communities, Inc. | | | 2 | | | | 251 | |
| | |
Ventas, Inc. | | | 9 | | | | 453 | |
| | | | | | | | |
| | |
| | | | | | | 3,290 | |
| | | | | | | | |
|
Food Products — 0.1% | |
| | |
Mondelez International, Inc., Class A | | | 3 | | | | 202 | |
| | | | | | | | |
|
Health Care Equipment & Supplies — 2.6% | |
| | |
Boston Scientific Corp. * | | | 49 | | | | 1,763 | |
| | |
Intuitive Surgical, Inc. * | | | 1 | | | | 803 | |
| | |
Medtronic plc | | | 5 | | | | 536 | |
| | |
Zimmer Biomet Holdings, Inc. | | | 4 | | | | 581 | |
| | | | | | | | |
| | |
| | | | | | | 3,683 | |
| | | | | | | | |
|
Health Care Providers & Services — 2.8% | |
| | |
Cigna Corp. | | | 12 | | | | 2,425 | |
| | |
McKesson Corp. | | | 1 | | | | 143 | |
| | |
Quest Diagnostics, Inc. | | | 3 | | | | 414 | |
| | |
UnitedHealth Group, Inc. | | | 3 | | | | 925 | |
| | | | | | | | |
| | |
| | | | | | �� | 3,907 | |
| | | | | | | | |
|
Hotels, Restaurants & Leisure — 2.4% | |
| | |
Hilton Worldwide Holdings, Inc. | | | 1 | | | | 68 | |
| | |
McDonald’s Corp. | | | 7 | | | | 1,528 | |
| | |
Yum! Brands, Inc. | | | 16 | | | | 1,725 | |
| | | | | | | | |
| | |
| | | | | | | 3,321 | |
| | | | | | | | |
|
Household Durables — 0.1% | |
| | |
KB Home | | | 3 | | | | 93 | |
SEE NOTES TO FINANCIAL STATEMENTS.
| | | | | | | | | | |
| | | | | |
| DECEMBER 31, 2020 | | JPMORGAN INSURANCE TRUST | | | | | | | | 5 |
JPMorgan Insurance Trust U.S. Equity Portfolio
SCHEDULE OF PORTFOLIO INVESTMENTS
AS OF DECEMBER 31, 2020 (continued)
| | | | | | | | |
| INVESTMENTS | |
SHARES (000) | | | VALUE ($000) | |
Common Stocks — continued | |
|
Household Durables — continued | |
| | |
Toll Brothers, Inc. | | | 2 | | | | 95 | |
| | | | | | | | |
| | |
| | | | | | | 188 | |
| | | | | | | | |
|
Household Products — 0.8% | |
| | |
Procter & Gamble Co. (The) | | | 8 | | | | 1,051 | |
| | | | | | | | |
|
Industrial Conglomerates — 0.5% | |
| | |
Honeywell International, Inc. | | | 3 | | | | 713 | |
| | | | | | | | |
|
Insurance — 1.7% | |
| | |
Chubb Ltd. | | | 7 | | | | 1,045 | |
| | |
Hartford Financial Services Group, Inc. (The) | | | 5 | | | | 235 | |
| | |
Progressive Corp. (The) | | | 12 | | | | 1,157 | |
| | | | | | | | |
| | |
| | | | | | | 2,437 | |
| | | | | | | | |
|
Interactive Media & Services — 5.6% | |
| | |
Alphabet, Inc., Class A* | | | 2 | | | | 3,973 | |
| | |
Alphabet, Inc., Class C* | | | 1 | | | | 2,435 | |
| | |
Facebook, Inc., Class A* | | | 5 | | | | 1,470 | |
| | | | | | | | |
| | |
| | | | | | | 7,878 | |
| | | | | | | | |
|
Internet & Direct Marketing Retail — 5.8% | |
| | |
Amazon.com, Inc. * | | | 2 | | | | 7,810 | |
| | |
Booking Holdings, Inc. * | | | — | (a) | | | 334 | |
| | | | | | | | |
| | |
| | | | | | | 8,144 | |
| | | | | | | | |
|
IT Services — 7.5% | |
| | |
Booz Allen Hamilton Holding Corp. | | | 5 | | | | 463 | |
| | |
FleetCor Technologies, Inc. * | | | 6 | | | | 1,706 | |
| | |
Leidos Holdings, Inc. | | | 18 | | | | 1,931 | |
| | |
Mastercard, Inc., Class A | | | 15 | | | | 5,338 | |
| | |
Okta, Inc. * | | | 1 | | | | 147 | |
| | |
PayPal Holdings, Inc. * | | | 4 | | | | 868 | |
| | | | | | | | |
| | |
| | | | | | | 10,453 | |
| | | | | | | | |
|
Life Sciences Tools & Services — 0.5% | |
| | |
Thermo Fisher Scientific, Inc. | | | 2 | | | | 735 | |
| | | | | | | | |
|
Machinery — 1.4% | |
| | |
Deere & Co. | | | 2 | | | | 478 | |
| | |
Stanley Black & Decker, Inc. | | | 9 | | | | 1,544 | |
| | | | | | | | |
| | |
| | | | | | | 2,022 | |
| | | | | | | | |
|
Media — 1.6% | |
| | |
Charter Communications, Inc., Class A* | | | 2 | | | | 1,631 | |
| | |
Comcast Corp., Class A | | | 13 | | | | 659 | |
| | | | | | | | |
| | |
| | | | | | | 2,290 | |
| | | | | | | | |
|
Multi-Utilities — 0.6% | |
| | |
Ameren Corp. | | | 2 | | | | 159 | |
| | | | | | | | |
| INVESTMENTS | |
SHARES (000) | | |
VALUE ($000) | |
| | | | | | | | |
|
Multi-Utilities — continued | |
| | |
CMS Energy Corp. | | | 12 | | | | 703 | |
| | | | | | | | |
| | |
| | | | | | | 862 | |
| | | | | | | | |
|
Oil, Gas & Consumable Fuels — 1.2% | |
| | |
Chevron Corp. | | | 7 | | | | 624 | |
| | |
Diamondback Energy, Inc. | | | 7 | | | | 338 | |
| | |
Pioneer Natural Resources Co. | | | 6 | | | | 631 | |
| | |
Williams Cos., Inc. (The) | | | 6 | | | | 114 | |
| | | | | | | | |
| | |
| | | | | | | 1,707 | |
| | | | | | | | |
|
Personal Products — 0.3% | |
| | |
Estee Lauder Cos., Inc. (The), Class A | | | 1 | | | | 360 | |
| | | | | | | | |
|
Pharmaceuticals — 3.7% | |
| | |
Bristol-Myers Squibb Co. | | | 35 | | | | 2,142 | |
| | |
Elanco Animal Health, Inc. * | | | 6 | | | | 196 | |
| | |
Eli Lilly and Co. | | | 13 | | | | 2,184 | |
| | |
Johnson & Johnson | | | 2 | | | | 323 | |
| | |
Merck & Co., Inc. | | | 4 | | | | 340 | |
| | | | | | | | |
| | |
| | | | | | | 5,185 | |
| | | | | | | | |
|
Road & Rail — 2.8% | |
| | |
Lyft, Inc., Class A* | | | 8 | | | | 384 | |
| | |
Norfolk Southern Corp. | | | 13 | | | | 3,050 | |
| | |
Uber Technologies, Inc. * | | | 4 | | | | 198 | |
| | |
Union Pacific Corp. | | | 1 | | | | 296 | |
| | | | | | | | |
| | |
| | | | | | | 3,928 | |
| | | | | | | | |
|
Semiconductors & Semiconductor Equipment — 8.0% | |
| | |
Advanced Micro Devices, Inc. * | | | 21 | | | | 1,900 | |
| | |
Analog Devices, Inc. | | | 20 | | | | 2,902 | |
| | |
Applied Materials, Inc. | | | 6 | | | | 537 | |
| | |
ASML Holding NV (Registered), NYRS (Netherlands) | | | 2 | | | | 975 | |
| | |
Lam Research Corp. | | | 3 | | | | 1,273 | |
| | |
NVIDIA Corp. | | | 1 | | | | 409 | |
| | |
NXP Semiconductors NV (Netherlands) | | | 17 | | | | 2,627 | |
| | |
Taiwan Semiconductor Manufacturing Co. Ltd., ADR (Taiwan) | | | 5 | | | | 560 | |
| | | | | | | | |
| | |
| | | | | | | 11,183 | |
| | | | | | | | |
|
Software — 9.2% | |
| | |
Ceridian HCM Holding, Inc. * | | | 6 | | | | 662 | |
| | |
Coupa Software, Inc. * | | | 2 | | | | 578 | |
| | |
Intuit, Inc. | | | 1 | | | | 266 | |
| | |
Microsoft Corp. | | | 41 | | | | 9,071 | |
| | |
Paylocity Holding Corp. * | | | 1 | | | | 191 | |
| | |
salesforce.com, Inc. * | | | 6 | | | | 1,422 | |
SEE NOTES TO FINANCIAL STATEMENTS.
| | | | | | | | | | |
| | | | | |
| 6 | | | | | | | | JPMORGAN INSURANCE TRUST | | DECEMBER 31, 2020 |
| | | | | | | | |
| INVESTMENTS | |
SHARES (000) | | |
VALUE ($000) | |
Common Stocks — continued | |
|
Software — continued | |
| | |
Workday, Inc., Class A* | | | 3 | | | | 681 | |
| | | | | | | | |
| | |
| | | | | | | 12,871 | |
| | | | | | | | |
|
Specialty Retail — 3.1% | |
| | |
AutoZone, Inc. * | | | — | (a) | | | 305 | |
| | |
Best Buy Co., Inc. | | | 1 | | | | 89 | |
| | |
Lowe’s Cos., Inc. | | | 5 | | | | 868 | |
| | |
O’Reilly Automotive, Inc. * | | | 4 | | | | 1,788 | |
| | |
Ross Stores, Inc. | | | 7 | | | | 800 | |
| | |
TJX Cos., Inc. (The) | | | 6 | | | | 431 | |
| | | | | | | | |
| | |
| | | | | | | 4,281 | |
| | | | | | | | |
|
Technology Hardware, Storage & Peripherals — 5.3% | |
| | |
Apple, Inc. | | | 56 | | | | 7,426 | |
| | | | | | | | |
|
Textiles, Apparel & Luxury Goods — 0.3% | |
| | |
Carter’s, Inc. | | | 1 | | | | 68 | |
| | |
NIKE, Inc., Class B | | | 2 | | | | 324 | |
| | | | | | | | |
| | |
| | | | | | | 392 | |
| | | | | | | | |
|
Tobacco — 0.3% | |
| | |
Altria Group, Inc. | | | 8 | | | | 323 | |
| | |
Philip Morris International, Inc. | | | 1 | | | | 99 | |
| | | | | | | | |
| | |
| | | | | | | 422 | |
| | | | | | | | |
| | | | | | | | |
|
Wireless Telecommunication Services — 0.4% | |
| | |
T-Mobile US, Inc. * | | | 4 | | | | 541 | |
| | | | | | | | |
| | |
Total Common Stocks
(Cost $82,735) | | | | | | | 138,864 | |
| | | | | |
| | | | | | | | |
| INVESTMENTS | | NO. OF
RIGHTS (000) | | |
VALUE ($000) | |
Rights — 0.0% (b) | |
|
Pharmaceuticals — 0.0% (b) | |
| | |
Bristol-Myers Squibb Co., CVR,
expiring 3/31/2021 *
(Cost $5) | | | 2 | | | | 1 | |
| | | | | | | | |
| | |
| | | SHARES (000) | | | | |
Short-Term Investments — 0.2% | |
|
Investment Companies — 0.2% | |
| | |
JPMorgan U.S. Government Money Market Fund Class Institutional Shares, 0.03% (c) (d)
(Cost $338) | | | 338 | | | | 338 | |
| | | | | | | | |
Total Investments — 99.3%
(Cost $83,078) | | | | 139,203 | |
Other Assets Less Liabilities — 0.7% | | | | 964 | |
| | | | | |
NET ASSETS — 100.0% | | | | 140,167 | |
| | | | | |
Percentages indicated are based on net assets.
Abbreviations
| | |
| ADR | | American Depositary Receipt |
| CVR | | Contingent Value Rights |
| NYRS | | New York Registry Shares |
| |
| (a) | | Amount rounds to less than one thousand. |
| (b) | | Amount rounds to less than 0.1% of net assets. |
| (c) | | Investment in an affiliated fund, which is registered under the Investment Company Act of 1940, as amended, and is advised by J.P. Morgan Investment Management Inc. |
| (d) | | The rate shown is the current yield as of December 31, 2020. |
| * | | Non-income producing security. |
| | | | | | | | | | | | | | | | | | | | |
| Futures contracts outstanding as of December 31, 2020 (amounts in thousands, except number of contracts): | |
| DESCRIPTION | | NUMBER OF
CONTRACTS | | | EXPIRATION
DATE | | | TRADING
CURRENCY | | | NOTIONAL
AMOUNT ($) | | | VALUE AND
UNREALIZED
APPRECIATION
(DEPRECIATION) ($) | |
| | | | | |
Long Contracts | | | | | | | | | | | | | | | | | | | | |
| | | | | |
S&P 500 E-Mini Index | | | 2 | | | | 03/2021 | | | | USD | | | | 375 | | | | 2 | |
| | | | | | | | | | | | | | | | | | | | |
Abbreviations
SEE NOTES TO FINANCIAL STATEMENTS.
| | | | | | | | | | |
| | | | | |
| DECEMBER 31, 2020 | | JPMORGAN INSURANCE TRUST | | | | | | | | 7 |
STATEMENT OF ASSETS AND LIABILITIES
AS OF DECEMBER 31, 2020
(Amounts in thousands, except per share amounts)
| | | | |
| | | JPMorgan
Insurance
Trust U.S.
Equity
Portfolio | |
ASSETS: | |
Investments in non-affiliates, at value | | $ | 138,865 | |
Investments in affiliates, at value | | | 338 | |
Cash | | | 1 | |
Deposits at broker for futures contracts | | | 32 | |
Receivables: | | | | |
Investment securities sold | | | 1,311 | |
Portfolio shares sold | | | 4 | |
Dividends from non-affiliates | | | 93 | |
Dividends from affiliates | | | — | (a) |
Securities lending income (See Note 2.B.) | | | — | (a) |
Variation margin on futures contracts | | | 2 | |
| | | | |
Total Assets | | | 140,646 | |
| | | | |
|
LIABILITIES: | |
Payables: | | | | |
Investment securities purchased | | | 260 | |
Portfolio shares redeemed | | | 92 | |
Accrued liabilities: | | | | |
Investment advisory fees | | | 63 | |
Administration fees | | | 9 | |
Distribution fees | | | 4 | |
Custodian and accounting fees | | | 8 | |
Trustees’ and Chief Compliance Officer’s fees | | | — | (a) |
Other | | | 43 | |
| | | | |
Total Liabilities | | | 479 | |
| | | | |
Net Assets | | $ | 140,167 | |
| | | | |
| |
NET ASSETS: | | | | |
Paid-in-Capital | | $ | 78,347 | |
Total distributable earnings (loss) | | | 61,820 | |
| | | | |
Total Net Assets | | $ | 140,167 | |
| | | | |
| |
Net Assets: | | | | |
Class 1 | | $ | 121,611 | |
Class 2 | | | 18,556 | |
| | | | |
Total | | $ | 140,167 | |
| | | | |
| |
Outstanding units of beneficial interest (shares) | | | | |
(unlimited number of shares authorized, no par value): | | | | |
Class 1 | | | 3,252 | |
Class 2 | | | 503 | |
| |
Net Asset Value (b): | | | | |
Class 1 — Offering and redemption price per share | | $ | 37.40 | |
Class 2 — Offering and redemption price per share | | | 36.85 | |
| | | | |
| |
Cost of investments in non-affiliates | | $ | 82,740 | |
Cost of investments in affiliates | | | 338 | |
| (a) | Amount rounds to less than one thousand. |
| (b) | Per share amounts may not recalculate due to rounding of net assets and/or shares outstanding. |
SEE NOTES TO FINANCIAL STATEMENTS.
| | | | | | | | | | |
| | | | | |
| 8 | | | | | | | | JPMORGAN INSURANCE TRUST | | DECEMBER 31, 2020 |
STATEMENT OF OPERATIONS
FOR THE YEAR ENDED DECEMBER 31, 2020
(Amounts in thousands)
| | | | |
| | | JPMorgan
Insurance
Trust U.S.
Equity
Portfolio | |
INVESTMENT INCOME: | | | | |
Interest income from non-affiliates | | $ | — | (a) |
Dividend income from non-affiliates | | | 2,010 | |
Dividend income from affiliates | | | 5 | |
Income from securities lending (net) (See Note 2.B.) | | | 1 | |
| | | | |
Total investment income | | | 2,016 | |
| | | | |
| |
EXPENSES: | | | | |
Investment advisory fees | | | 653 | |
Administration fees | | | 89 | |
Distribution fees: | | | | |
Class 2 | | | 42 | |
Custodian and accounting fees | | | 41 | |
Professional fees | | | 56 | |
Trustees’ and Chief Compliance Officer’s fees | | | 26 | |
Printing and mailing costs | | | 29 | |
Transfer agency fees (See Note 2.F.) | | | 2 | |
Other | | | 11 | |
| | | | |
Total expenses | | | 949 | |
| | | | |
Less fees waived | | | (2 | ) |
| | | | |
Net expenses | | | 947 | |
| | | | |
Net investment income (loss) | | | 1,069 | |
| | | | |
| |
REALIZED/UNREALIZED GAINS (LOSSES): | | | | |
Net realized gain (loss) on transactions from: | | | | |
Investments in non-affiliates | | | 6,273 | |
Futures contracts | | | 12 | |
| | | | |
Net realized gain (loss) | | | 6,285 | |
| | | | |
Change in net unrealized appreciation/depreciation on: | | | | |
Investments in non-affiliates | | | 20,521 | |
Futures contracts | | | (17 | ) |
| | | | |
Change in net unrealized appreciation/depreciation | | | 20,504 | |
| | | | |
Net realized/unrealized gains (losses) | | | 26,789 | |
| | | | |
Change in net assets resulting from operations | | $ | 27,858 | |
| | | | |
| (a) | Amount rounds to less than one thousand. |
SEE NOTES TO FINANCIAL STATEMENTS.
| | | | | | | | | | |
| | | | | |
| DECEMBER 31, 2020 | | JPMORGAN INSURANCE TRUST | | | | | | | | 9 |
STATEMENTS OF CHANGES IN NET ASSETS
FOR THE PERIODS INDICATED
(Amounts in thousands)
| | | | | | | | |
| |
| | | JPMorgan Insurance Trust
U.S. Equity Portfolio | |
| | | Year Ended
December 31, 2020 | | | Year Ended
December 31, 2019 | |
CHANGE IN NET ASSETS RESULTING FROM OPERATIONS: | |
Net investment income (loss) | | $ | 1,069 | | | $ | 933 | |
Net realized gain (loss) | | | 6,285 | | | | 7,415 | |
Change in net unrealized appreciation/depreciation | | | 20,504 | | | | 21,530 | |
| | | | | | | | |
Change in net assets resulting from operations | | | 27,858 | | | | 29,878 | |
| | | | | | | | |
| | |
DISTRIBUTIONS TO SHAREHOLDERS: | | | | | | | | |
Class 1 | | | (7,167 | ) | | | (7,455 | ) |
Class 2 | | | (1,169 | ) | | | (1,192 | ) |
| | | | | | | | |
Total distributions to shareholders | | | (8,336 | ) | | | (8,647 | ) |
| | | | | | | | |
|
CAPITAL TRANSACTIONS: | |
Change in net assets resulting from capital transactions | | | 2,464 | | | | (875 | ) |
| | | | | | | | |
|
NET ASSETS: | |
Change in net assets | | | 21,986 | | | | 20,356 | |
Beginning of period | | | 118,181 | | | | 97,825 | |
| | | | | | | | |
End of period | | $ | 140,167 | | | $ | 118,181 | |
| | | | | | | | |
| | |
CAPITAL TRANSACTIONS: | | | | | | | | |
Class 1 | | | | | | | | |
Proceeds from shares issued | | $ | 11,890 | | | $ | 3,480 | |
Distributions reinvested | | | 7,167 | | | | 7,455 | |
Cost of shares redeemed | | | (15,387 | ) | | | (12,159 | ) |
| | | | | | | | |
Change in net assets resulting from Class 1 capital transactions | | $ | 3,670 | | | $ | (1,224 | ) |
| | | | | | | | |
Class 2 | | | | | | | | |
Proceeds from shares issued | | $ | 2,911 | | | $ | 2,559 | |
Distributions reinvested | | | 1,169 | | | | 1,192 | |
Cost of shares redeemed | | | (5,286 | ) | | | (3,402 | ) |
| | | | | | | | |
Change in net assets resulting from Class 2 capital transactions | | $ | (1,206 | ) | | $ | 349 | |
| | | | | | | | |
Total change in net assets resulting from capital transactions | | $ | 2,464 | | | $ | (875 | ) |
| | | | | | | | |
|
SHARE TRANSACTIONS: | |
Class 1 | |
Issued | | | 354 | | | | 118 | |
Reinvested | | | 250 | | | | 267 | |
Redeemed | | | (486 | ) | | | (410 | ) |
| | | | | | | | |
Change in Class 1 Shares | | | 118 | | | | (25 | ) |
| | | | | | | | |
Class 2 | |
Issued | | | 97 | | | | 87 | |
Reinvested | | | 41 | | | | 43 | |
Redeemed | | | (171 | ) | | | (115 | ) |
| | | | | | | | |
Change in Class 2 Shares | | | (33 | ) | | | 15 | |
| | | | | | | | |
SEE NOTES TO FINANCIAL STATEMENTS.
| | | | | | | | | | |
| | | | | |
| 10 | | | | | | | | JPMORGAN INSURANCE TRUST | | DECEMBER 31, 2020 |
THIS PAGE IS INTENTIONALLY LEFT BLANK
| | | | | | | | | | |
| | | | | |
| DECEMBER 31, 2020 | | JPMORGAN INSURANCE TRUST | | | | | | | | 11 |
FINANCIAL HIGHLIGHTS
FOR THE PERIODS INDICATED
| | | | | | | | | | | | | | | | | | | | | | | | | | | | |
| | | Per share operating performance | |
| | | | | | Investment operations | | | Distributions | |
| | | Net asset
value,
beginning
of period | | | Net
investment
income
(loss) (a) | | | Net realized
and unrealized
gains
(losses) on
investments | | | Total from
investment
operations | | | Net
investment
income | | | Net
realized
gain | | | Total
distributions | |
JPMorgan Insurance Trust U.S. Equity Portfolio | | | | | | | | | | | | | | | | | | | | | | | | | |
Class 1 | | | | | | | | | | | | | | | | | | | | | | | | | | | | |
Year Ended December 31, 2020 | | $ | 32.27 | | | $ | 0.30 | | | $ | 7.16 | | | $ | 7.46 | | | $ | (0.26 | ) | | $ | (2.07 | ) | | $ | (2.33 | ) |
Year Ended December 31, 2019 | | | 26.63 | | | | 0.26 | | | | 7.81 | | | | 8.07 | | | | (0.26 | ) | | | (2.17 | ) | | | (2.43 | ) |
Year Ended December 31, 2018 | | | 32.43 | | | | 0.27 | | | | (1.93 | ) | | | (1.66 | ) | | | (0.27 | ) | | | (3.87 | ) | | | (4.14 | ) |
Year Ended December 31, 2017 | | | 27.03 | | | | 0.26 | | | | 5.69 | | | | 5.95 | | | | (0.26 | ) | | | (0.29 | ) | | | (0.55 | ) |
Year Ended December 31, 2016 | | | 25.50 | | | | 0.26 | | | | 2.42 | | | | 2.68 | | | | (0.25 | ) | | | (0.90 | ) | | | (1.15 | ) |
| | | | | | | |
Class 2 | | | | | | | | | | | | | | | | | | | | | | | | | | | | |
Year Ended December 31, 2020 | | | 31.83 | | | | 0.22 | | | | 7.05 | | | | 7.27 | | | | (0.18 | ) | | | (2.07 | ) | | | (2.25 | ) |
Year Ended December 31, 2019 | | | 26.29 | | | | 0.19 | | | | 7.71 | | | | 7.90 | | | | (0.19 | ) | | | (2.17 | ) | | | (2.36 | ) |
Year Ended December 31, 2018 | | | 32.08 | | | | 0.20 | | | | (1.92 | ) | | | (1.72 | ) | | | (0.20 | ) | | | (3.87 | ) | | | (4.07 | ) |
Year Ended December 31, 2017 | | | 26.74 | | | | 0.19 | | | | 5.64 | | | | 5.83 | | | | (0.20 | ) | | | (0.29 | ) | | | (0.49 | ) |
Year Ended December 31, 2016 | | | 25.24 | | | | 0.18 | | | | 2.40 | | | | 2.58 | | | | (0.18 | ) | | | (0.90 | ) | | | (1.08 | ) |
| (a) | Calculated based upon average shares outstanding. |
| (b) | Includes adjustments in accordance with accounting principles generally accepted in the United States of America and as such, the net asset values for financial reporting purposes and the returns based upon those net asset values may differ from the net asset values and returns for shareholder transactions. |
| (c) | Total returns do not include charges that will be imposed by variable insurance contracts or by Eligible Plans. If these charges were reflected, returns would be lower than those shown. |
| (d) | Includes earnings credits and interest expense, if applicable, each of which is less than 0.005% unless otherwise noted. |
SEE NOTES TO FINANCIAL STATEMENTS.
| | | | | | | | | | |
| | | | | |
| 12 | | | | | | | | JPMORGAN INSURANCE TRUST | | DECEMBER 31, 2020 |
| | | | | | | | | | | | | | | | | | | | | | | | | | |
| | | | Ratios/Supplemental data | |
| | | | | | | Ratios to average net assets | |
Net asset
value,
end of
period | | | Total return (b)(c) | | | Net assets,
end of
period
(000’s) | | | Net
expenses (d) | | | Net
investment income
(loss) | | |
Expenses
without waivers,
reimbursements and
earnings credits | | | Portfolio
turnover
rate | |
| | | | | | | | | | | | | | | | | | | | | | | | | | |
| | | | | | | | | | | | | | | | | | | | | | | | | | |
| $ | 37.40 | | | | 25.26 | % | | $ | 121,611 | | | | 0.76 | % | | | 0.94 | % | | | 0.76 | % | | | 66 | % |
| | 32.27 | | | | 31.75 | | | | 101,127 | | | | 0.78 | | | | 0.88 | | | | 0.79 | | | | 69 | |
| | 26.63 | | | | (6.16 | ) | | | 84,126 | | | | 0.74 | | | | 0.89 | | | | 0.79 | | | | 95 | |
| | 32.43 | | | | 22.28 | | | | 97,287 | | | | 0.75 | | | | 0.89 | | | | 0.79 | | | | 91 | |
| | 27.03 | | | | 10.98 | | | | 87,878 | | | | 0.80 | | | | 0.98 | | | | 0.80 | | | | 61 | |
| | | | | | |
| | | | | | | | | | | | | | | | | | | | | | | | | | |
| | 36.85 | | | | 24.95 | | | | 18,556 | | | | 1.01 | | | | 0.69 | | | | 1.01 | | | | 66 | |
| | 31.83 | | | | 31.44 | | | | 17,054 | | | | 1.03 | | | | 0.64 | | | | 1.03 | | | | 69 | |
| | 26.29 | | | | (6.42 | ) | | | 13,699 | | | | 0.99 | | | | 0.65 | | | | 1.04 | | | | 95 | |
| | 32.08 | | | | 22.04 | | | | 14,274 | | | | 1.00 | | | | 0.65 | | | | 1.03 | | | | 91 | |
| | 26.74 | | | | 10.65 | | | | 12,079 | | | | 1.05 | | | | 0.73 | | | | 1.05 | | | | 61 | |
SEE NOTES TO FINANCIAL STATEMENTS.
| | | | | | | | | | |
| | | | | |
| DECEMBER 31, 2020 | | JPMORGAN INSURANCE TRUST | | | | | | | | 13 |
NOTES TO FINANCIAL STATEMENTS
AS OF DECEMBER 31, 2020
1. Organization
JPMorgan Insurance Trust (the “Trust”) is registered under the Investment Company Act of 1940, as amended (the “1940 Act”), as an open-end management investment company and is a Massachusetts business trust.
The following is a separate portfolio of the Trust (the “Portfolio”) covered by this report:
| | | | |
| | | Classes Offered | | Diversification Classification |
| JPMorgan Insurance Trust U.S. Equity Portfolio | | Class 1 and Class 2 | | Diversified |
The investment objective of the Portfolio is to seek to provide high total return from a portfolio of selected equity securities.
Portfolio shares are offered only to separate accounts of participating insurance companies and Eligible Plans. Individuals may not purchase shares directly from the Portfolio.
All classes of shares have equal rights as to earnings, assets and voting privileges, except that each class may bear different transfer agency fees and distribution fees and each class has exclusive voting rights with respect to its distribution plan and administrative services plan.
J.P. Morgan Investment Management Inc. (“JPMIM”), an indirect, wholly-owned subsidiary of JPMorgan Chase & Co. (“JPMorgan”), acts as Adviser (the “Adviser”) and Administrator (the “Administrator”) to the Portfolio.
2. Significant Accounting Policies
The following is a summary of significant accounting policies followed by the Portfolio in the preparation of its financial statements. The Portfolio is an investment company and, accordingly, follows the investment company accounting and reporting guidance of the Financial Accounting Standards Board (“FASB”) Accounting Standards Codification Topic 946 — Investment Companies, which is part of U.S. generally accepted accounting principles (“GAAP”). The preparation of financial statements in conformity with GAAP requires management to make estimates and assumptions that affect (i) the reported amounts of assets and liabilities, (ii) disclosure of contingent assets and liabilities at the date of the financial statements, and (iii) the reported amounts of increases and decreases in net assets from operations during the reporting period. Actual results could differ from those estimates.
A. Valuation of Investments — Investments are valued in accordance with GAAP and the Portfolio’s valuation policies set forth by, and under the supervision and responsibility of, the Board of Trustees of the Trust (the “Board”), which established the following approach to valuation, as described more fully below: (i) investments for which market quotations are readily available shall be valued at their market value and (ii) all other investments for which market quotations are not readily available shall be valued at their fair value as determined in good faith by the Board.
The Administrator has established the J.P. Morgan Asset Management Americas Valuation Committee (“AVC”) to assist the Board with the oversight and monitoring of the valuation of the Portfolio’s investments. The Administrator implements the valuation policies of the Portfolio’s investments, as directed by the Board. The AVC oversees and carries out the policies for the valuation of investments held in the Portfolio. This includes monitoring the appropriateness of fair values based on results of ongoing valuation oversight including, but not limited to, consideration of macro or security specific events, market events, and pricing vendor and broker due diligence. The Administrator is responsible for discussing and assessing the potential impacts to the fair values on an ongoing basis, and, at least on a quarterly basis, with the AVC and the Board.
Equities and other exchange-traded instruments are valued at the last sale price or official market closing price on the primary exchange on which the instrument is traded before the net asset values (“NAV”) of the Portfolio are calculated on a valuation date.
Investments in open-end investment companies (“Underlying Funds”) are valued at each Underlying Fund’s NAV per share as of the report date.
Futures contracts are generally valued on the basis of available market quotations.
Valuations reflected in this report are as of the report date. As a result, changes in valuation due to market events and/or issuer-related events after the report date and prior to issuance of the report are not reflected herein.
The various inputs that are used in determining the valuation of the Portfolio’s investments are summarized into the three broad levels listed below.
| • | | Level 1 — Unadjusted inputs using quoted prices in active markets for identical investments. |
| • | | Level 2 — Other significant observable inputs including, but not limited to, quoted prices for similar investments, inputs other than quoted prices that are observable for investments (such as interest rates, prepayment speeds, credit risk, etc.) or other market corroborated inputs. |
| • | | Level 3 — Significant inputs based on the best information available in the circumstances, to the extent observable inputs are not available (including the Portfolio’s assumptions in determining the fair value of investments). |
A financial instrument’s level within the fair value hierarchy is based on the lowest level of any input, both individually and in the aggregate, that is significant to the fair value measurement. The inputs or methodology used for valuing instruments are not necessarily an indication of the risk associated with investing in those instruments.
| | | | | | | | | | |
| | | | | |
| 14 | | | | | | | | JPMORGAN INSURANCE TRUST | | DECEMBER 31, 2020 |
The following table represents each valuation input as presented on the Schedule of Portfolio Investments (“SOI”) (amounts in thousands):
| | | | | | | | | | | | | | | | |
| | | Level 1
Quoted prices | | | Level 2
Other significant observable inputs | | | Level 3
Significant unobservable inputs | | | Total | |
Total Investments in Securities (a) | | $ | 139,203 | | | $ | — | | | $ | — | | | $ | 139,203 | |
| | | | | | | | | | | | | | | | |
Appreciation in Other Financial Instruments | | | | | | | | | | | | | | | | |
Futures Contracts (a) | | $ | 2 | | | $ | — | | | $ | — | | | $ | 2 | |
| | | | | | | | | | | | | | | | |
| (a) | Please refer to the SOI for specifics of portfolio holdings. |
B. Securities Lending — The Portfolio is authorized to engage in securities lending in order to generate additional income. The Portfolio is able to lend to approved borrowers. Citibank N.A. (“Citibank”) serves as lending agent for the Portfolio, pursuant to a Securities Lending Agency Agreement (the “Securities Lending Agency Agreement”). Securities loaned are collateralized by cash equal to at least 100% of the market value plus accrued interest on the securities lent, which is invested in the Class IM Shares of the JPMorgan U.S. Government Money Market Fund. The Portfolio retains loan fees and the interest on cash collateral investments but is required to pay the borrower a rebate for the use of cash collateral. In cases where the lent security is of high value to borrowers, there may be a negative rebate (i.e., a net payment from the borrower to the Portfolio). Upon termination of a loan, the Portfolio is required to return to the borrower an amount equal to the cash collateral, plus any rebate owed to the borrowers. The remaining maturities of the securities lending transactions are considered overnight and continuous. Loans are subject to termination by the Portfolio or the borrower at any time.
The net income earned on the securities lending (after payment of rebates and Citibank’s fee) is included on the Statement of Operations as Income from securities lending (net). The Portfolio also receives payments from the borrower during the period of the loan, equivalent to dividends and interest earned on the securities loaned, which are recorded as Dividend or Interest income, respectively, on the Statement of Operations.
Under the Securities Lending Agency Agreement, Citibank marks to market the loaned securities on a daily basis. In the event the cash received from the borrower is less than 102% of the value of the loaned securities (105% for loans of non-U.S. securities), Citibank requests additional cash from the borrower so as to maintain a collateralization level of at least 102% of the value of the loaned securities plus accrued interest (105% for loans of non-U.S. securities), subject to certain de minimis amounts.
The value of securities out on loan is recorded as an asset on the Statement of Assets and Liabilities. The value of the cash collateral received is recorded as a liability on the Statement of Assets and Liabilities and details of collateral investments are disclosed on the SOI.
The Portfolio bears the risk of loss associated with the collateral investments and is not entitled to additional collateral from the borrower to cover any such losses. To the extent that the value of the collateral investments declines below the amount owed to a borrower, the Portfolio may incur losses that exceed the amount it earned on lending the security. Upon termination of a loan, the Portfolio may use leverage (borrow money) to repay the borrower for cash collateral posted if the Adviser does not believe that it is prudent to sell the collateral investments to fund the payment of this liability. Securities lending activity is subject to master netting arrangements.
Securities lending also involves counterparty risks, including the risk that the loaned securities may not be returned in a timely manner or at all. Subject to certain conditions, Citibank has agreed to indemnify the Portfolio from losses resulting from a borrower’s failure to return a loaned security.
JPMIM voluntarily waived investment advisory fees charged to the Portfolio to reduce the impact of the cash collateral investment in the JPMorgan U.S. Government Money Market Fund from 0.15% to 0.06%. For the year ended December 31, 2020, JPMIM waived fees associated with the Portfolio’s investment in the JPMorgan U.S. Government Money Market Fund as follows (amounts in thousands):
| (a) | Amount rounds to less than one thousand. |
The above waiver is included in the determination of earnings on cash collateral investment and in the calculation of Citibank’s compensation and is included on the Statement of Operations as Income from securities lending (net).
The Portfolio did not have any securities out on loan at December 31, 2020.
C. Investment Transactions with Affiliates — The Portfolio invested in Underlying Funds which are advised by the Adviser. An issuer which is under common control with the Portfolio may be considered an affiliate. For the purposes of the financial statements, the Portfolio assumes the issuers listed in the table below to be affiliated issuers. Underlying Funds’ distributions may be reinvested into the Underlying Funds. Reinvestment amounts are included in the purchase cost amounts in the table below. Amounts in the table below are in thousands.
| | | | | | | | | | |
| | | | | |
| DECEMBER 31, 2020 | | JPMORGAN INSURANCE TRUST | | | | | | | | 15 |
NOTES TO FINANCIAL STATEMENTS
AS OF DECEMBER 31, 2020 (continued)
| | | | | | | | | | | | | | | | | | | | | | | | | | | | | | | | | | | | |
For the year ended December 31, 2020 | |
| Security Description | | Value at
December 31,
2019 | | | Purchases
at Cost | | | Proceeds
from Sales | | | Net
Realized
Gain (Loss) | | | Change in
Unrealized
Appreciation/
(Depreciation) | | | Value at
December 31,
2020 | | | Shares at
December 31,
2020 | | | Dividend
Income | | | Capital Gain
Distributions | |
JPMorgan U.S. Government Money Market Fund Class IM Shares(a) | | $ | 173 | | | $ | 9,065 | | | $ | 9,238 | | | $ | — | | | $ | — | | | $ | — | | | | — | | | $ | 1 | * | | $ | — | |
JPMorgan U.S. Government Money Market Fund Class Institutional Shares, 0.03% (a) (b) | | | 1,568 | | | | 22,610 | | | | 23,840 | | | | — | | | | — | | | | 338 | | | | 338 | | | | 5 | | | | — | |
| | | | | | | | | | | | | | | | | | | | | | | | | | | | | | | | | | | | |
Total | | $ | 1,741 | | | $ | 31,675 | | | $ | 33,078 | | | $ | — | | | $ | — | | | $ | 338 | | | | | | | $ | 6 | | | $ | — | |
| | | | | | | | | | | | | | | | | | | | | | | | | | | | | | | | | | | | |
| (a) | Investment in an affiliated fund, which is registered under the Investment Company Act of 1940, as amended, and is advised by J.P. Morgan Investment Management Inc. |
| (b) | The rate shown is the current yield as of December 31, 2020. |
| * | Amount is included on the Statement of Operations as Income from securities lending (net) (after payments of rebates and Citibank’s fee). |
D. Futures Contracts — The Portfolio used index futures contracts to gain or reduce exposure to the stock market, or maintain liquidity or minimize transaction costs. The Portfolio also purchased futures contracts to invest incoming cash in the market or sold futures in response to cash outflows, thereby simulating an invested position in the underlying index while maintaining a cash balance for liquidity.
Futures contracts provide for the delayed delivery of the underlying instrument at a fixed price or are settled for a cash amount based on the change in the value of the underlying instrument at a specific date in the future. Upon entering into a futures contract, the Portfolio is required to deposit with the broker, cash or securities in an amount equal to a certain percentage of the contract amount, which is referred to as the initial margin deposit. Subsequent payments, referred to as variation margin, are made or received by the Portfolio periodically and are based on changes in the market value of open futures contracts. Changes in the market value of open futures contracts are recorded as Change in net unrealized appreciation/depreciation on futures contracts on the Statement of Operations. Realized gains or losses, representing the difference between the value of the contract at the time it was opened and the value at the time it was closed, are reported on the Statement of Operations at the closing or expiration of the futures contract. Securities deposited as initial margin are designated on the SOI, while cash deposited, which is considered restricted, is recorded on the Statement of Assets and Liabilities. A receivable from and/or a payable to brokers for the daily variation margin is also recorded on the Statement of Assets and Liabilities.
The use of futures contracts exposes the Portfolio to equity price risk. The Portfolio may be subject to the risk that the change in the value of the futures contract may not correlate perfectly with the underlying instrument. Use of long futures contracts subjects the Portfolio to risk of loss in excess of the amounts shown on the Statement of Assets and Liabilities, up to the notional amount of the futures contracts. Use of short futures contracts subjects the Portfolio to unlimited risk of loss. The Portfolio may enter into futures contracts only on exchanges or boards of trade. The exchange or board of trade acts as the counterparty to each futures transaction; therefore, the Portfolio’s credit risk is limited to failure of the exchange or board of trade. Under some circumstances, futures exchanges may establish daily limits on the amount that the price of a futures contract can vary from the previous day’s settlement price, which could effectively prevent liquidation of positions.
The Portfolio’s futures contracts are not subject to master netting arrangements (the right to close out all transactions traded with a counterparty and net amounts owed or due across transactions).
The table below discloses the volume of the Portfolio’s futures contracts activity during the year ended December 31, 2020 (amounts in thousands):
| | | | |
Futures Contracts—Equity: | | | | |
Average Notional Balance Long | | $ | 630 | |
Ending Notional Balance Long | | | 375 | |
E. Security Transactions and Investment Income — Investment transactions are accounted for on the trade date (the date the order to buy or sell is executed). Securities gains and losses are calculated on a specifically identified cost basis. Dividend income is recorded on the ex-dividend date or when the Portfolio first learns of the dividend.
To the extent such information is publicly available, the Portfolio records distributions received in excess of income earned from underlying investments as a reduction of cost of investments and/or realized gain. Such amounts are based on estimates if actual amounts are not available and actual amounts of income, realized gain and return of capital may differ from the estimated amounts. The Portfolio adjusts the estimated amounts of the components of distributions (and consequently its net investment income) as necessary, once the issuers provide information about the actual composition of the distributions.
F. Allocation of Income and Expenses — Expenses directly attributable to the Portfolio are charged directly to the Portfolio, while the expenses attributable to more than one portfolio of the Trust are allocated among the applicable portfolios. Investment income, realized and unrealized gains and losses and expenses, other than class-specific expenses, are allocated daily to each class of shares based upon the proportion of net assets of each class at the beginning of each day.
| | | | | | | | | | |
| | | | | |
| 16 | | | | | | | | JPMORGAN INSURANCE TRUST | | DECEMBER 31, 2020 |
Transfer agency fees are class-specific expenses. The amount of the transfer agency fees charged to each share class of the Portfolio for the year ended December 31, 2020 are as follows (amounts in thousands):
| | | | | | | | | | | | |
| | Class 1 | | | Class 2 | | | Total | |
Transfer agency fees | | $ | 2 | | | $ | – | (a) | | $ | 2 | |
| (a) | Amount rounds to less than one thousand. |
G. Federal Income Taxes — The Portfolio is treated as a separate taxable entity for Federal income tax purposes. The Portfolio’s policy is to comply with the provisions of the Internal Revenue Code (the “Code”) applicable to regulated investment companies and to distribute to shareholders all of its distributable net investment income and net realized capital gains on investments. Accordingly, no provision for Federal income tax is necessary. The Portfolio is also a segregated portfolio of assets for insurance purposes and intends to comply with the diversification requirements of Subchapter L of the Code. Management has reviewed the Portfolio’s tax positions for all open tax years and has determined that as of December 31, 2020, no liability for Federal income tax is required in the Portfolio’s financial statements for net unrecognized tax benefits. However, management’s conclusions may be subject to future review based on changes in, or the interpretation of, the accounting standards or tax laws and regulations. The Portfolio’s Federal tax returns for the prior three fiscal years remain subject to examination by the Internal Revenue Service.
H. Distributions to Shareholders — Distributions from net investment income, if any, are generally declared and paid at least annually and are declared separately for each class. No class has preferential dividend rights; differences in per share rates are due to differences in separate class expenses. Net realized capital gains, if any, are distributed at least annually. The amount of distributions from net investment income and net realized capital gains is determined in accordance with Federal income tax regulations, which may differ from GAAP. To the extent these “book/tax” differences are permanent in nature (i.e., that they result from other than timing of recognition — “temporary differences”), such amounts are reclassified within the capital accounts based on their Federal tax basis treatment.
The following amounts were reclassified within the capital accounts (amounts in thousands):
| | | | | | | | | | | | |
| | | Paid-in-Capital | | | Accumulated
undistributed
(distributions in
excess of)
net investment
income | | | Accumulated
net realized
gains (losses) | |
| | $ | — | | | $ | (4 | ) | | $ | 4 | |
The reclassifications for the Portfolio relate primarily to investments in real estate investment trusts.
I. Recent Accounting Pronouncement — In March 2020, the FASB issued Accounting Standards Update No. 2020-04 (“ASU 2020-04”), Reference Rate Reform (Topic 848) — Facilitation of the Effects of Reference Rate Reform on Financial Reporting. ASU 2020-04 provides optional temporary financial reporting relief from the effect of certain types of contract modifications due to the planned discontinuation of the London Interbank Offered Rate (“LIBOR”) and other interbank-offered based reference rates as of the end of 2021. ASU 2020-04 became effective upon the issuance and its optional relief can be applied through December 31, 2022. Management is currently evaluating the impact, if any, to the Portfolio’s financial statements of applying ASU 2020-04.
3. Fees and Other Transactions with Affiliates
A. Investment Advisory Fee — Pursuant to an Investment Advisory Agreement, the Adviser manages the investments of the Portfolio and for such services is paid a fee. The investment advisory fee is accrued daily and paid monthly at an annual rate of 0.55% of the Portfolio’s average daily net assets.
The Adviser waived investment advisory fees and/or reimbursed expenses as outlined in Note 3.E.
B. Administration Fee — Pursuant to an Administration Agreement, the Administrator provides certain administration services to the Portfolio. In consideration of these services, the Administrator receives a fee accrued daily and paid monthly at an annual rate of 0.075% of the first $10 billion of the Portfolio’s average daily net assets, plus 0.050% of the Portfolio’s average daily net assets between $10 billion and $20 billion, plus 0.025% of the Portfolio’s average daily net assets between $20 billion and $25 billion, plus 0.01% of the Portfolio’s average daily net assets in excess of $25 billion. For the year ended December 31, 2020, the effective rate was 0.075% of the Portfolio’s average daily net assets, notwithstanding any fee waivers and/or expense reimbursements.
The Administrator waived administration fees as outlined in Note 3.E.
JPMorgan Chase Bank, N.A. (“JPMCB”), a wholly-owned subsidiary of JPMorgan, serves as the Portfolio’s sub-administrator (the “Sub-administrator”). For its services as Sub-administrator, JPMCB receives a portion of the fees payable to the Administrator.
C. Distribution Fees — Pursuant to a Distribution Agreement, JPMorgan Distribution Services, Inc. (“JPMDS”), an indirect, wholly-owned subsidiary of JPMorgan, serves as the Portfolio’s principal underwriter and promotes and arranges for the sale of the Portfolio’s shares.
The Board has adopted a Distribution Plan (the “Distribution Plan”) for Class 2 Shares of the Portfolio pursuant to Rule 12b-1 under the 1940 Act. Class 1 Shares of the Portfolio do not charge a distribution fee. The Distribution Plan provides that the Portfolio shall pay, with respect to the applicable share classes, distribution fees, including payments to JPMDS, at an annual rate of 0.25% of the average daily net assets of Class 2 Shares.
| | | | | | | | | | |
| | | | | |
| DECEMBER 31, 2020 | | JPMORGAN INSURANCE TRUST | | | | | | | | 17 |
NOTES TO FINANCIAL STATEMENTS
AS OF DECEMBER 31, 2020 (continued)
D. Custodian and Accounting Fees — JPMCB provides portfolio custody and accounting services to the Portfolio. For performing these services, the Portfolio pays JPMCB transaction and asset-based fees that vary according to the number of transactions and positions, plus out-of-pocket expenses. The amounts paid directly to JPMCB by the Portfolio for custody and accounting services are included in Custodian and accounting fees on the Statement of Operations.
Interest income earned on cash balances at the custodian, if any, is included in Interest income from affiliates on the Statement of Operations.
Interest expense paid to the custodian related to cash overdrafts, if any, is included in Interest expense to affiliates on the Statement of Operations.
E. Waivers and Reimbursements — The Adviser (for all share classes), Administrator (for all share classes) and/or JPMDS (for Class 2 Shares) have contractually agreed to waive fees and/or reimburse the Portfolio to the extent that total annual operating expenses of the Portfolio (excluding acquired fund fees and expenses other than certain money market fund fees as described below, dividend and interest expenses related to short sales, interest, taxes, expenses related to litigation and potential litigation, expenses related to trustee elections and extraordinary expenses) exceed the percentages of the Portfolio’s respective average daily net assets as shown in the table below:
| | | | | | |
| | | Class 1 | | Class 2 | |
| | 0.80% | | | 1.05 | % |
The expense limitation agreement was in effect for the year ended December 31, 2020 and the contractual expense limitation percentages in the table above are in place until at least April 30, 2021.
For the year ended December 31, 2020, the Portfolio’s service providers did not waive fees and/or reimburse expenses for the Portfolio.
Additionally, the Portfolio may invest in one or more money market funds advised by the Adviser (affiliated money market funds). The Adviser, Administrator and/or JPMDS have contractually agreed to waive fees and/or reimburse expenses in an amount sufficient to offset the respective net fees each collects from the affiliated money market fund on the Portfolio’s investment in such affiliated money market fund, except for investments of securities lending cash collateral. None of these parties expect the Portfolio to repay any such waived fees and/or reimbursed expenses in future years.
The amount of these waivers resulting from investments in these money market funds for the year ended December 31, 2020 was approximately $2,000.
F. Other — Certain officers of the Trust are affiliated with the Adviser, the Administrator and JPMDS. Such officers, with the exception of the Chief Compliance Officer, receive no compensation from the Portfolio for serving in their respective roles.
The Board designated and appointed a Chief Compliance Officer to the Portfolio pursuant to Rule 38a-1 under the 1940 Act. The Portfolio, along with affiliated portfolios, makes reimbursement payments, on a pro-rata basis, to the Administrator for a portion of the fees associated with the office of the Chief Compliance Officer. Such fees are included in Trustees’ and Chief Compliance Officer’s fees on the Statement of Operations.
The Trust adopted a Trustee Deferred Compensation Plan (the “Plan”) which allows the independent Trustees to defer the receipt of all or a portion of compensation related to performance of their duties as Trustees. The deferred fees are invested in various J.P. Morgan Funds until distribution in accordance with the Plan.
During the year ended December 31, 2020, the Portfolio purchased securities from an underwriting syndicate in which the principal underwriter or members of the syndicate were affiliated with the Adviser.
The Securities and Exchange Commission (“SEC”) has granted an exemptive order permitting the Portfolio to engage in principal transactions with J.P. Morgan Securities LLC, an affiliated broker, involving taxable money market instruments, subject to certain conditions.
4. Investment Transactions
During the year ended December 31, 2020, purchases and sales of investments (excluding short-term investments) were as follows (amounts in thousands):
| | | | | | | | |
| | | Purchases
(excluding U.S.
Government) | | | Sales
(excluding U.S.
Government) | |
| | $ | 77,236 | | | $ | 82,047 | |
During the year ended December 31, 2020, there were no purchases or sales of U.S. Government securities.
| | | | | | | | | | |
| | | | | |
| 18 | | | | | | | | JPMORGAN INSURANCE TRUST | | DECEMBER 31, 2020 |
5. Federal Income Tax Matters
For Federal income tax purposes, the estimated cost and unrealized appreciation (depreciation) in value of investments held at December 31, 2020 were as follows (amounts in thousands):
| | | | | | | | | | | | | | | | |
| | | Aggregate
Cost | | | Gross
Unrealized
Appreciation | | | Gross
Unrealized
Depreciation | | | Net
Unrealized
Appreciation
(Depreciation) | |
| | $ | 84,985 | | | $ | 54,501 | | | $ | 281 | | | $ | 54,220 | |
The difference between book and tax basis appreciation (depreciation) on investments is primarily attributed to non-taxable dividends and wash sale loss deferrals.
The tax character of distributions paid during the year ended December 31, 2020 was as follows (amounts in thousands):
| | | | | | | | | | | | |
| | | Ordinary
Income* | | | Net Long-Term Capital Gains | | | Total
Distributions
Paid | |
| | $ | 1,507 | | | $ | 6,829 | | | $ | 8,336 | |
| * | Short-term gain distributions are treated as ordinary income for income tax purposes. |
The tax character of distributions paid during the year ended December 31, 2019 was as follows (amounts in thousands):
| | | | | | | | | | | | |
| | | Ordinary
Income* | | | Net Long-Term
Capital Gains | | | Total
Distributions
Paid | |
| | $ | 2,476 | | | $ | 6,171 | | | $ | 8,647 | |
| * | Short-term gain distributions are treated as ordinary income for income tax purposes. |
As of December 31, 2020, the estimated components of net assets (excluding paid-in-capital) on a tax basis were as follows (amounts in thousands):
| | | | | | | | | | | | |
| | | Current
Distributable
Ordinary
Income | | | Current
Distributable
Long-Term
Capital Gain
(Tax Basis Capital
Loss Carryover) | | | Unrealized
Appreciation
(Depreciation) | |
| | $ | 3,506 | | | $ | 4,125 | | | $ | 54,220 | |
The cumulative timing differences primarily consist of non-taxable dividends and wash sale loss deferrals.
As of December 31, 2020, the Portfolio did not have any net capital loss carryforwards.
6. Borrowings
The Portfolio relies upon an exemptive order granted by the SEC (the “Order”) permitting the establishment and operation of an Interfund Lending Facility (the “Facility”). The Facility allows the Portfolio to directly lend and borrow money to or from any other fund relying upon the Order at rates beneficial to both the borrowing and lending funds. Advances under the Facility are taken primarily for temporary or emergency purposes, including the meeting of redemption requests that otherwise might require the untimely disposition of securities, and are subject to the Portfolio’s borrowing restrictions. The Interfund loan rate is determined, as specified in the Order, by averaging the current repurchase agreement rate and the current bank loan rate. The Order was granted to the Trust and may be relied upon by the Portfolio because the Portfolio and the series of the Trust are all investment companies in the same “group of investment companies” (as defined in Section 12(d)(1)(G) of the 1940 Act).
The Portfolio had no borrowings outstanding from another fund during the year ended December 31, 2020.
The Trust and JPMCB have entered into a financing arrangement. Under this arrangement, JPMCB provides an unsecured, uncommitted credit facility in the aggregate amount of $100 million to certain of the J.P. Morgan Funds, including the Portfolio. Advances under the arrangement are taken primarily for temporary or emergency purposes, including the meeting of redemption requests that otherwise might require the untimely disposition of securities, and are subject to the Portfolio’s borrowing restrictions. Interest on borrowings is payable at a rate determined by JPMCB at the time of borrowing. This agreement has been extended until November 1, 2021.
The Portfolio had no borrowings outstanding from the unsecured, uncommitted credit facility during the year ended December 31, 2020.
The Trust, along with certain other trusts for J.P. Morgan Funds (“Borrowers”), has entered into a joint syndicated senior unsecured revolving credit facility totaling $1.5 billion (“Credit Facility”) with various lenders and The Bank of New York Mellon, as administrative agent for the lenders. This Credit Facility provides a source of funds to the Borrowers for temporary and emergency purposes, including the meeting of redemption requests that otherwise might require the untimely disposition of securities. Under the terms of the Credit Facility, a borrowing portfolio must have a minimum of $25,000,000 in adjusted net asset value and not exceed certain adjusted net asset coverage ratios prior to and during the time in which any
| | | | | | | | | | |
| | | | | |
| DECEMBER 31, 2020 | | JPMORGAN INSURANCE TRUST | | | | | | | | 19 |
NOTES TO FINANCIAL STATEMENTS
AS OF DECEMBER 31, 2020 (continued)
borrowings are outstanding. If a portfolio does not comply with the aforementioned requirements, the portfolio must remediate within three business days with respect to the $25,000,000 minimum adjusted net asset value or within one business day with respect to certain asset coverage ratios or the administrative agent at the request of, or with the consent of, the lenders may terminate the Credit Facility and declare any outstanding borrowings to be due and payable immediately.
Interest associated with any borrowing under the Credit Facility is charged to the borrowing portfolio at a rate of interest equal to 1.00%, which has increased to 1.25% pursuant to the amendment referenced below, plus the greater of the federal funds effective rate or one month LIBOR. The annual commitment fee to maintain the Credit Facility is 0.15% and is incurred on the unused portion of the Credit Facility and is allocated to all participating portfolios pro rata based on their respective net assets. Effective August 11, 2020, this agreement has been amended and restated for a term of 364 days, unless extended, and to include the change to the interest rate charged for borrowing from the Credit Facility to 1.25%, as noted above, and an upfront fee of 0.075% of the Credit Facility to be charged and paid by all participating funds of the Credit Facility.
The Portfolio did not utilize the Credit Facility during the year ended December 31, 2020.
7. Risks, Concentrations and Indemnifications
In the normal course of business, the Portfolio enters into contracts that contain a variety of representations which provide general indemnifications. The Portfolio’s maximum exposure under these arrangements is unknown. The amount of exposure would depend on future claims that may be brought against the Portfolio. However, based on experience, the Portfolio expects the risk of loss to be remote.
As of December 31, 2020, the Portfolio had three individual shareholder and/or non-affiliated omnibus accounts, which owned 64.6% of the Portfolio’s outstanding shares.
Significant shareholder transactions by these shareholders may impact the Portfolio’s performance and liquidity.
Derivatives may be riskier than other types of investments because they may be more sensitive to changes in economic and market conditions and could result in losses that significantly exceed the Funds’ original investment. Many derivatives create leverage thereby causing the Portfolio to be more volatile than they would have been if they had not used derivatives. Certain derivatives also expose the Portfolio to counterparty risk (the risk that the derivative counterparty will not fulfill its contractual obligations), including credit risk of the derivative counterparty. The possible lack of a liquid secondary market for derivatives and the resulting inability of the Portfolio to sell or otherwise close a derivatives position could expose the Portfolio to losses.
LIBOR is intended to represent the rate at which contributing banks may obtain short-term borrowings from each other in the London interbank market. The regulatory authority that oversees financial services firms and financial markets in the U.K. has announced that, after the end of 2021, it would no longer persuade or compel contributing banks to make rate submissions for purposes of determining the LIBOR rate. As a result, it is possible that commencing in 2022, LIBOR may no longer be available or no longer deemed an appropriate reference rate upon which to determine the interest rate on or impacting certain loans, notes, derivatives and other instruments or investments comprising some or all of the Portfolio’s portfolio. In light of this eventuality, public and private sector industry initiatives are currently underway to identify new or alternative reference rates to be used in place of LIBOR. There is no assurance that the composition or characteristics of any such alternative reference rate will be similar to or produce the same value or economic equivalence as LIBOR or that it will have the same volume or liquidity as did LIBOR prior to its discontinuance or unavailability, which may affect the value or liquidity or return on certain investments of the Portfolio and result in costs incurred in connection with closing out positions and entering into new trades. These risks may also apply with respect to changes in connection with other interbank offering rates (e.g., Euribor) and a wide range of other index levels, rates and values that are treated as “benchmarks” and are the subject of recent regulatory reform.
The Portfolio is subject to infectious disease epidemics/pandemics risk. The worldwide outbreak of COVID-19, a novel coronavirus disease, has negatively affected economies, markets and individual companies throughout the world. The effects of this COVID-19 pandemic to public health, and business and market conditions, including exchange trading suspensions and closures may continue to have a significant negative impact on the performance of the Portfolio’s investments, increase the Portfolio’s volatility, exacerbate other pre-existing political, social and economic risks to the Portfolio and negatively impact broad segments of businesses and populations. The Portfolio’s operations may be interrupted as a result, which may have a significant negative impact on investment performance. In addition, governments, their regulatory agencies, or self-regulatory organizations may take actions in response to the pandemic that affect the instruments in which the Portfolio invests, or the issuers of such instruments, in ways that could also have a significant negative impact on the Portfolio’s investment performance. The full impact of this COVID-19 pandemic, or other future epidemics/pandemics, is currently unknown.
8. Subsequent Event
On February 10, 2021, the contractual expense limitations for Class 1 Shares and Class 2 Shares were extended until at least April 30, 2022.
| | | | | | | | | | |
| | | | | |
| 20 | | | | | | | | JPMORGAN INSURANCE TRUST | | DECEMBER 31, 2020 |
REPORT OF INDEPENDENT REGISTERED PUBLIC ACCOUNTING FIRM
To the Board of Trustees of JPMorgan Insurance Trust and Shareholders of JPMorgan Insurance Trust U.S. Equity Portfolio
Opinion on the Financial Statements
We have audited the accompanying statement of assets and liabilities, including the schedule of portfolio investments, of JPMorgan Insurance Trust U.S. Equity Portfolio (one of the portfolios constituting JPMorgan Insurance Trust, referred to hereafter as the “Portfolio”) as of December 31, 2020, the related statement of operations for the year ended December 31, 2020, the statements of changes in net assets for each of the two years in the period ended December 31, 2020, including the related notes, and the financial highlights for each of the five years in the period ended December 31, 2020 (collectively referred to as the “financial statements”). In our opinion, the financial statements present fairly, in all material respects, the financial position of the Portfolio as of December 31, 2020, the results of its operations for the year then ended, the changes in its net assets for each of the two years in the period ended December 31, 2020 and the financial highlights for each of the five years in the period ended December 31, 2020 in conformity with accounting principles generally accepted in the United States of America.
Basis for Opinion
These financial statements are the responsibility of the Portfolio’s management. Our responsibility is to express an opinion on the Portfolio’s financial statements based on our audits. We are a public accounting firm registered with the Public Company Accounting Oversight Board (United States) (PCAOB) and are required to be independent with respect to the Portfolio in accordance with the U.S. federal securities laws and the applicable rules and regulations of the Securities and Exchange Commission and the PCAOB.
We conducted our audits of these financial statements in accordance with the standards of the PCAOB. Those standards require that we plan and perform the audit to obtain reasonable assurance about whether the financial statements are free of material misstatement, whether due to error or fraud.
Our audits included performing procedures to assess the risks of material misstatement of the financial statements, whether due to error or fraud, and performing procedures that respond to those risks. Such procedures included examining, on a test basis, evidence regarding the amounts and disclosures in the financial statements. Our audits also included evaluating the accounting principles used and significant estimates made by management, as well as evaluating the overall presentation of the financial statements. Our procedures included confirmation of securities owned as of December 31, 2020 by correspondence with the custodian, transfer agent and brokers; when replies were not received from brokers, we performed other auditing procedures. We believe that our audits provide a reasonable basis for our opinion.
/s/ PricewaterhouseCoopers LLP
New York, New York
February 12, 2021
We have served as the auditor of one or more investment companies in the JPMorgan Funds complex since 1993.
| | | | | | | | | | |
| | | | | |
| DECEMBER 31, 2020 | | JPMORGAN INSURANCE TRUST | | | | | | | | 21 |
TRUSTEES
(Unaudited)
The Portfolio’s Statement of Additional Information includes additional information about the Portfolio’s Trustees and is available, without charge, upon request by calling 1-800-480-4111 or on the J.P. Morgan Funds’ website at www.jpmorganfunds.com.
| | | | | | |
Name (Year of Birth); Positions With the Portfolio (1) | | Principal Occupation During Past 5 Years | | Number of
Portfolios in Fund
Complex Overseen
by Trustee (2) | | Other Directorships Held During the Past 5 Years |
Independent Trustees | | |
| | | |
| John F. Finn (1947); Chairman since 2020; Trustee of Trust since 2005; Trustee of heritage One Group Mutual Funds since 1998. | | Chairman, Gardner, Inc. (supply chain management company serving industrial and consumer markets) (serving in various roles 1974-present). | | 128 | | Director, Greif, Inc. (GEF) (industrial package products and services) (2007-present); Trustee, Columbus Association for the Performing Arts (1988-present); Director, Cardinal Health, Inc. (CAH) (1994-2014). |
| | | |
| Stephen P. Fisher (1959); Trustee of Trust since 2018. | | Retired; Chairman and Chief Executive Officer, NYLIFE Distributors LLC (registered broker-dealer) (serving in various roles 2008-2013); Chairman, NYLIM Service Company LLC (transfer agent) (2008-2017); New York Life Investment Management LLC (registered investment adviser) (serving in various roles 2005-2017); Chairman, IndexIQ Advisors LLC (registered investment adviser for ETFs) (2014-2017); President, MainStay VP Funds Trust (2007-2017), MainStay DefinedTerm Municipal Opportunities Fund (2011-2017) and MainStay Funds Trust (2007-2017) (registered investment companies). | | 128 | | Honors Program Advisory Board Member, The Zicklin School of Business, Baruch College, The City University of New York (2017-present). |
| | | |
| Kathleen M. Gallagher (1958); Trustee of Trust since 2018. | | Retired; Chief Investment Officer — Benefit Plans, Ford Motor Company (serving in various roles 1985-2016). | | 128 | | Non-Executive Director, Legal & General Investment Management (Holdings) (2018-present); Non-Executive Director, Legal & General Investment Management America (financial services and insurance) (2017-present); Advisory Board Member, Fiduciary Solutions, State Street Global Advisors (2017-present); Member, Client Advisory Council, Financial Engines, LLC (registered investment adviser) (2011-2016); Director, Ford Pension Funds Investment Management Ltd. (2007-2016). |
| | | |
| Dennis P. Harrington* (1950); Trustee of Trust since 2017. | | Retired; Partner, Deloitte LLP (accounting firm) (serving in various roles 1984-2012). | | 128 | | None |
| | | |
| Frankie D. Hughes (1952); Trustee of Trust since 2008. | | President, Ashland Hughes Properties (property management) (2014-present); President and Chief Investment Officer, Hughes Capital Management, Inc. (fixed income asset management) (1993-2014). | | 128 | | None |
| | | | | | | | | | |
| | | | | |
| 22 | | | | | | | | JPMORGAN INSURANCE TRUST | | DECEMBER 31, 2020 |
| | | | | | |
Name (Year of Birth); Positions With the Portfolio (1) | | Principal Occupation During Past 5 Years | | Number of
Portfolios in Fund
Complex Overseen
by Trustee (2) | | Other Directorships Held During the Past 5 Years |
Independent Trustees (continued) | | |
| | | |
Raymond Kanner** (1953); Trustee of Trust since 2017. | | Retired; Managing Director & Chief Investment Officer, IBM Retirement Funds (2007-2016). | | 128 | | Advisory Board Member, Penso Advisors LLC (2020-present); Advisory Board Member, Los Angeles Capital (2018-present); Advisory Board Member, State Street Global Advisors Fiduciary Solutions Board (2017-present); Acting Executive Director, Committee on Investment of Employee Benefit Assets (CIEBA) (2016-2017); Advisory Board Member, Betterment for Business (robo advisor) (2016-2017); Advisory Board Member, BlueStar Indexes (index creator) (2013-2017); Director, Emerging Markets Growth Fund (registered investment company) (1997-2016); Member, Russell Index Client Advisory Board (2001-2015). |
| | | |
| Peter C. Marshall (1942); Trustee of Trust since 2005; Trustee of heritage One Group Mutual Funds since 1985. (3) | | Self-employed business consultant
(2002-present). | | 128 | | None |
| | | |
| Mary E. Martinez (1960); Trustee of Trust since 2013. | | Associate, Special Properties, a Christie’s International Real Estate Affiliate (2010-present); Managing Director, Bank of America (Asset Management) (2007-2008); Chief Operating Officer, U.S. Trust Asset Management, U.S. Trust Company (asset management) (2003-2007); President, Excelsior Funds (registered investment companies) (2004-2005). | | 128 | | None |
| | | |
| Marilyn McCoy (1948); Trustee of Trust since 2005; Trustee of heritage One Group Mutual Funds since 1999. | | Vice President of Administration and Planning, Northwestern University (1985-present). | | 128 | | None |
| | | |
| Mitchell M. Merin (1953); Trustee of Trust since 2013. (4) | | Retired; President and Chief Operating Officer, Morgan Stanley Investment Management, Member, Morgan Stanley & Co. Management Committee (serving in various roles 1981-2006). | | 128 | | Director, Sun Life Financial (SLF) (financial services and insurance) (2007-2013). |
| | | |
| Dr. Robert A. Oden, Jr. (1946); Trustee of Trust since 2005; Trustee of heritage One Group Mutual Funds since 1997. | | Retired; President, Carleton College (2002-2010); President, Kenyon College (1995-2002). | | 128 | | Trustee and Vice Chair, Trout Unlimited (2017-present); Trustee, American Museum of Fly Fishing (2013-present); Vice Chair, Dartmouth-Hitchcock Medical Center (2011-present); Trustee, American University in Cairo (1999-2014). |
| | | |
| Marian U. Pardo*** (1946); Trustee of Trust since 2013. | | Managing Director and Founder, Virtual Capital Management LLC (investment consulting) (2007-present); Managing Director, Credit Suisse Asset Management (portfolio manager) (2003-2006). | | 128 | | President and Member, Board of Governors, Columbus Citizens Foundation (not-for-profit supporting philanthropic and cultural programs) (2006-present). |
| | | | | | | | | | |
| | | | | |
| DECEMBER 31, 2020 | | JPMORGAN INSURANCE TRUST | | | | | | | | 23 |
TRUSTEES
(Unaudited) (continued)
| (1) | The Trustees serve for an indefinite term, subject to the Trust’s current retirement policy, which is age 78 for all Trustees. |
| (2) | A Fund Complex means two or more registered investment companies that hold themselves out to investors as related companies for purposes of investment and investor services or have a common investment adviser or have an investment adviser that is an affiliated person of the investment adviser of any of the other registered investment companies. The J.P. Morgan Funds Complex for which the Board of Trustees serves currently includes ten registered investment companies (128 funds). |
| (3) | Mr. Marshall retired from the Board of Trustees effective the close of business on December 31, 2020. |
| (4) | Mr. Merin retired from the Board of Trustees effective the close of business on January 31, 2021. |
| * | Two family members of Mr. Harrington are partner and managing director, respectively, of the Portfolio’s independent registered public accounting firm. Such firm has represented to the Board that those family members are not involved in the audit of the Portfolio’s financial statements and do not provide other services to the Portfolio. The Board has concluded that such association does not interfere with Mr. Harrington’s exercise of independent judgment as an Independent Trustee. |
| ** | A family member of Mr. Kanner is employed by JPMorgan Chase Bank, which is affiliated with JPMIM and JPMDS. In that capacity, this employee provides services to various JPMorgan affiliates including JPMIM and JPMDS and for which JPMIM and JPMDS bear some portion of the expense thereof. |
| *** | In connection with prior employment with JPMorgan Chase, Ms. Pardo was the recipient of non-qualified pension plan payments from JPMorgan Chase in the amount of approximately $2,055 per month, which she irrevocably waived effective January 1, 2013, and deferred compensation payments from JPMorgan Chase in the amount of approximately $7,294 per year, which ended in January 2013. In addition, Ms. Pardo receives payments from a fully-funded qualified plan, which is not an obligation of JPMorgan Chase. |
The contact address for each of the Trustees is 277 Park Avenue, New York, NY 10172.
| | | | | | | | | | |
| | | | | |
| 24 | | | | | | | | JPMORGAN INSURANCE TRUST | | DECEMBER 31, 2020 |
OFFICERS
(Unaudited)
| | |
Name (Year of Birth), Positions Held with the Trust (Since) | | Principal Occupations During Past 5 Years |
| |
Brian S. Shlissel (1964),
President and Principal Executive Officer (2016)* | | Managing Director and Chief Administrative Officer for J.P. Morgan pooled vehicles, J.P. Morgan Investment Management Inc. (formerly JPMorgan Funds Management, Inc.) (from 2014 to present); Managing Director and Head of Mutual Fund Services, Allianz Global Investors; President and Chief Executive Officer, Allianz Global Investors Mutual Funds and PIMCO Closed-End Funds (from 1999 to 2014). |
| |
Timothy J. Clemens (1975), Treasurer and Principal Financial Officer (2018)** | | Executive Director, J.P. Morgan Investment Management Inc. (formerly JPMorgan Funds Management, Inc.) since February 2016; Vice President, JPMorgan Funds Management, Inc. from October 2013 to January 2016. |
| |
Gregory S. Samuels (1980),
Secretary (2019) (formerly Assistant Secretary since 2010)** | | Executive Director and Assistant General Counsel, JPMorgan Chase. Mr. Samuels has been with JPMorgan Chase since 2010. |
| |
Stephen M. Ungerman (1953),
Chief Compliance Officer (2005) | | Managing Director, JPMorgan Chase & Co.; Mr. Ungerman has been with JPMorgan Chase & Co. since 2000. |
| |
Elizabeth A. Davin (1964), Assistant Secretary (2005)*** | | Executive Director and Assistant General Counsel, JPMorgan Chase since February 2012; formerly Vice President and Assistant General Counsel, JPMorgan Chase from 2005 to February 2012; Senior Counsel, JPMorgan Chase (formerly Bank One Corporation) from 2004 to 2005. |
| |
Jessica K. Ditullio (1962),
Assistant Secretary (2005)*** | | Executive Director and Assistant General Counsel, JPMorgan Chase. Ms. Ditullio has been with JPMorgan Chase (formerly Bank One Corporation) since 1990. |
| |
Anthony Geron (1971),
Assistant Secretary (2018)** | | Vice President and Assistant General Counsel, JPMorgan Chase since September 2018; Lead Director and Counsel, AXA Equitable Life Insurance Company from 2015 to 2018 and Senior Director and Counsel, AXA Equitable Life Insurance Company from 2014 to 2015. |
| |
Carmine Lekstutis (1980),
Assistant Secretary (2011)** | | Executive Director and Assistant General Counsel, JPMorgan Chase. Mr. Lekstutis has been with JPMorgan Chase since 2011. |
| |
Zachary E. Vonnegut-Gabovitch (1986), Assistant Secretary (2017)** | | Vice President and Assistant General Counsel, JPMorgan Chase since September 2016; Associate, Morgan, Lewis & Bockius (law firm) from 2012 to 2016. |
| |
Michael M. D’Ambrosio (1969),
Assistant Treasurer (2012) | | Managing Director, J.P. Morgan Investment Management Inc. (formerly JPMorgan Funds Management, Inc.). Mr. D’Ambrosio has been with J.P. Morgan Investment Management Inc. since 2012. |
| |
Aleksandr Fleytekh (1972), Assistant Treasurer (2019)** | | Vice President, J.P. Morgan Investment Management Inc. (formerly JPMorgan Funds Management, Inc.) since February 2012. |
| |
Shannon Gaines (1977),
Assistant Treasurer (2018)*** | | Vice President, J.P. Morgan Investment Management Inc. (formerly JPMorgan Funds Management, Inc.) since January 2014. |
| |
Jeffrey D. House (1972), Assistant Treasurer (2017)*** | | Vice President, J.P. Morgan Investment Management Inc. (formerly JPMorgan Funds Management, Inc.) since July 2006. |
| |
Michael Mannarino (1985),
Assistant Treasurer (2020) | | Vice President, J.P. Morgan Investment Management Inc. (formerly JPMorgan Funds Management, Inc.) since 2014. |
| |
Joseph Parascondola (1963),
Assistant Treasurer (2011)* | | Executive Director, J.P. Morgan Investment Management, Inc. since February 2020, formerly Vice President, J.P. Morgan Investment Management Inc. (formerly JPMorgan Funds Management, Inc.) from August 2006 to January 2020. |
| |
Gillian I. Sands (1969),
Assistant Treasurer (2012)** | | Vice President, J.P. Morgan Investment Management Inc. (formerly JPMorgan Funds Management, Inc.) since September 2012. |
The contact address for each of the officers, unless otherwise noted, is 277 Park Avenue, New York, NY 10172.
| * | The contact address for the officer is 575 Washington Boulevard, Jersey City, NJ 07310. |
| ** | The contact address for the officer is 4 New York Plaza, New York, NY 10004. |
| *** | The contact address for the officer is 1111 Polaris Parkway, Columbus, OH 43240. |
| | | | | | | | | | |
| | | | | |
| DECEMBER 31, 2020 | | JPMORGAN INSURANCE TRUST | | | | | | | | 25 |
SCHEDULE OF SHAREHOLDER EXPENSES
(Unaudited)
Hypothetical $1,000 Investment
As a shareholder of the Portfolio, you incur ongoing costs, including investment advisory fees, administration fees, distribution fees (for Class 2 Shares) and other Portfolio expenses. Because the Portfolio is a funding vehicle for Policies and Eligible Plans, you may also incur sales charges and other fees relating to the Policies or Eligible Plans. The examples below are intended to help you understand your ongoing costs (in dollars) of investing in the Portfolio, but not the costs of the Policies or Eligible Plans, and to compare these ongoing costs with the ongoing costs of investing in other mutual funds. The examples assume that you had a $1,000 investment in each Class at the beginning of the reporting period, July 1, 2020, and continued to hold your shares at the end of the reporting period, December 31, 2020.
Actual Expenses
For each Class of the Portfolio in the table below, the first line provides information about actual account values and actual expenses. You may use the information in this line, together with the amount you invested, to estimate the expenses that you paid over the period. Simply divide your account value by $1,000 (for example, an $8,600 account value divided by $1,000 = 8.6), then multiply the result by the number in the first line of each Class under the heading titled “Expenses Paid During the Period” to estimate the expenses you paid on your account during this period.
Hypothetical Example for Comparison Purposes
The second line of each Class in the table below provides information about hypothetical account values and hypothetical expenses based on the Class’ actual expense ratio and an assumed rate of return of 5% per year before expenses, which is not the Class’ actual return. The hypothetical account values and expenses may not be used to estimate the actual ending account balance or expenses you paid for the period. You may use this information to compare the ongoing costs of investing in the Class of the Portfolio and other funds. To do so, compare this 5% hypothetical example with the 5% hypothetical examples that appear in the shareholder reports of the other funds. Please note that the expenses shown in the table are meant to highlight your ongoing costs only and do not reflect any transaction costs, such as sales charges (loads) or redemption fees or the costs associated with the Policies and Eligible Plans through which the Portfolio is held. Therefore, the second line for each Class in the table is useful in comparing ongoing costs only, and will not help you determine the relative total costs of owning different funds. In addition, if these transaction costs were included, your costs would have been higher. The examples also assume all dividends and distributions have been reinvested.
| | | | | | | | | | | | | | | | |
| | | Beginning
Account Value
July 1, 2020 | | | Ending
Account Value
December 31, 2020 | | | Expenses
Paid During
the Period* | | | Annualized
Expense
Ratio | |
JPMorgan Insurance Trust U.S. Equity Portfolio | | | | | | | | | | | | | | | | |
Class 1 | | | | | | | | | | | | | | | | |
Actual | | $ | 1,000.00 | | | $ | 1,245.00 | | | $ | 4.35 | | | | 0.77 | % |
Hypothetical | | | 1,000.00 | | | | 1,021.27 | | | | 3.91 | | | | 0.77 | |
Class 2 | | | | | | | | | | | | | | | | |
Actual | | | 1,000.00 | | | | 1,243.70 | | | | 5.70 | | | | 1.01 | |
Hypothetical | | | 1,000.00 | | | | 1,020.06 | | | | 5.13 | | | | 1.01 | |
| * | Expenses are equal to each Class’ respective annualized expense ratio, multiplied by the average account value over the period, multiplied by 184/366 (to reflect the one-half year period). |
| | | | | | | | | | |
| | | | | |
| 26 | | | | | | | | JPMORGAN INSURANCE TRUST | | DECEMBER 31, 2020 |
BOARD APPROVAL OF INVESTMENT ADVISORY AGREEMENT
(Unaudited)
The Board of Trustees has established various standing committees composed of Trustees with diverse backgrounds, to which the Board of Trustees has assigned specific subject matter responsibilities to further enhance the effectiveness of the Board’s oversight and decision making. The Board of Trustees and its investment committees (money market and alternative products, equity, and fixed income) meet regularly throughout the year and consider factors that are relevant to their annual consideration of investment advisory agreements at each meeting. They also meet for the specific purpose of considering investment advisory agreement annual renewals. The Board of Trustees held meetings in June and August 2020, at which the Trustees considered the continuation of the investment advisory agreement for the Portfolio whose annual report is contained herein (the “Advisory Agreement”). In accordance with SEC guidance, due to the COVID-19 pandemic, the meetings were conducted through video conference. At the June meeting, the Board’s investment committees met to review and consider performance, expense and related information for the J.P. Morgan Funds. Each investment committee reported to the full Board, which then considered the investment committee’s preliminary findings. At the August meeting, the Trustees continued their review and consideration. The Trustees, including a majority of the Trustees who are not parties to the Advisory Agreement or “interested persons” (as defined in the 1940 Act) of any party to the Advisory Agreement or any of their affiliates, approved the continuation of the Advisory Agreement on August 11, 2020.
As part of their review of the Advisory Agreement, the Trustees considered and reviewed performance and other information about the Portfolio received from the Adviser. This information includes the Portfolio’s performance as compared to the performance of its peers and benchmarks and analyses by the Adviser of the Portfolio’s performance. In addition, at each of their regular meetings throughout the year, the Trustees considered reports on the performance of certain J.P. Morgan Funds provided by an independent management consulting firm (“independent consultant”). In addition, in preparation for the June and August meetings, the Trustees requested, received and evaluated extensive materials from the Adviser, including performance and expense information compiled by Broadridge, using data from Lipper Inc. and/or Morningstar Inc., independent providers of investment company data (together, “Broadridge”). Before voting on the Advisory Agreement, the Trustees reviewed the Advisory Agreement with representatives of the Adviser, counsel to the Trust and independent legal counsel and received a memorandum from independent legal counsel to the Trustees discussing the legal standards for their consideration of the Advisory Agreement. The Trustees also discussed the Advisory Agreement in executive sessions with independent legal counsel at which no representatives of the Adviser were present.
A summary of the material factors evaluated by the Trustees in determining whether to approve the Advisory Agreement is provided below. Each Trustee attributed different weights to the various factors and no factor alone was considered determinative. The Trustees considered information provided with respect to the Portfolio throughout the year, including additional reporting and information provided in connection with the market volatility caused by the COVID-19 pandemic, as well as materials furnished specifically in connection with the annual review process. From year to year, the Trustees consider and place emphasis on relevant information in light of changing circumstances in market and economic conditions.
After considering and weighing the factors and information they had received, the Trustees found that the compensation to be received by the Adviser from the Portfolio under the Advisory Agreement was fair and reasonable under the circumstances and determined that the continuance of the Advisory Agreement was in the best interests of the Portfolio and its shareholders.
Nature, Extent and Quality of Services Provided by the Adviser
The Trustees received and considered information regarding the nature, extent and quality of services provided to the Portfolio under the Advisory Agreement. The Trustees took into account information furnished throughout the year at Trustee meetings, as well as the materials furnished specifically in connection with this annual review process. The Trustees considered the background and experience of the Adviser’s senior management, personnel changes, if any, and the expertise of, and the amount of attention given to the Portfolio by, investment personnel of the Adviser. In addition, the Trustees reviewed the qualifications, backgrounds and responsibilities of the portfolio management team primarily responsible for the day-to-day management of the Portfolio and the infrastructure supporting the team, including personnel changes, if any. In addition, the Board considered its discussions with the Adviser regarding the Adviser’s business continuity plan and steps the Adviser was taking to provide ongoing services to the Portfolio during the COVID-19 pandemic, and the Adviser’s success in continuing to provide services to the Portfolio and their shareholders throughout this period. The Trustees also considered information provided by the Adviser and JPMorgan Distribution Services, Inc. (“JPMDS”) about the structure and distribution strategy of the Portfolio. The Trustees reviewed information relating to the Adviser’s risk governance model and reports showing the Adviser’s compliance structure and ongoing compliance processes. The Trustees also considered the quality of the administration services provided by the Adviser in its role as administrator.
The Trustees also considered their knowledge of the nature and quality of services provided by the Adviser and its affiliates to the Portfolio gained from their experience as Trustees of the
| | | | | | | | | | |
| | | | | |
| DECEMBER 31, 2020 | | JPMORGAN INSURANCE TRUST | | | | | | | | 27 |
J.P. Morgan Funds. In addition, they considered the overall reputation and capabilities of the Adviser and its affiliates, the commitment of the Adviser to provide high quality service to the Portfolio, their overall confidence in the Adviser’s integrity and the Adviser’s responsiveness to questions or concerns raised by them, including the Adviser’s willingness to consider and implement organizational and operational changes designed to improve investment results and the services provided to the Portfolio.
Based upon these considerations and other factors, the Trustees concluded that they were satisfied with the nature, extent and quality of the investment advisory services provided to the Portfolio by the Adviser.
Costs of Services Provided and Profitability to the Adviser and its Affiliates
The Trustees received and considered information regarding the profitability to the Adviser and its affiliates in providing services to the Portfolio. The Trustees reviewed and discussed this information. The Trustees recognized that this information is not audited and represents the Adviser’s determination of its and its affiliates’ revenues from the contractual services provided to the Portfolio, less expenses of providing such services. Expenses include direct and indirect costs and are calculated using an allocation methodology developed by the Adviser. The Trustees also recognized that it is difficult to make comparisons of profitability from fund investment advisory contracts because comparative information is not generally publicly available and is affected by numerous factors, including the structure of the particular adviser, the types of funds it manages, its business mix, numerous assumptions regarding allocations and the fact that publicly-traded fund managers’ operating profits and net income are net of distribution and marketing expenses. Based upon their review, and taking into consideration the factors noted above, the Trustees concluded that the profitability to the Adviser under the Advisory Agreement was not unreasonable in light of the services and benefits provided to the Portfolio.
The Trustees also considered that the Adviser earns fees from the Portfolio for providing administration services. These fees were shown separately in the profitability analysis presented to the Trustees. The Trustees also considered the payments of Rule 12b-1 fees to JPMDS, an affiliate of the Adviser, which also acts as the Portfolio’s distributor and that these fees are in turn generally paid to financial intermediaries that sell the Portfolio, including financial intermediaries that are affiliates of the Adviser (although they are retained by JPMDS in certain instances). The Trustees also considered the fees paid to JPMorgan Chase Bank, N.A. (“JPMCB”) for custody and fund accounting and other related services.
Fall-Out Benefits
The Trustees reviewed information regarding potential “fall-out” or ancillary benefits received by the Adviser and its affiliates as a result of their relationship with the Portfolio. The Trustees considered that the J.P. Morgan Funds’ operating accounts are held at JPMCB, which, as a result, will receive float benefits for certain J.P. Morgan Funds, as applicable. The Trustees also noted that the Adviser supports a diverse set of products and services, which benefits the Adviser by allowing it to leverage its infrastructure to serve additional clients, including benefits that may be received by the Adviser and its affiliates in connection with the Portfolio’s potential investments in other funds advised by the Adviser. The Trustees also reviewed the Adviser’s allocation of fund brokerage for the J.P. Morgan Funds complex, including allocations to brokers who provide research to the Adviser.
Economies of Scale
The Trustees considered the extent to which the Portfolio may benefit from economies of scale. The Trustees considered that there may not be a direct relationship between economies of scale realized by the Portfolio and those realized by the Adviser as assets increase. The Trustees considered the extent to which the Portfolio was priced to scale and whether it would be appropriate to add advisory fee breakpoints, but noted that the Portfolio has implemented fee waivers and contractual expense limitations (“Fee Caps”) which allow the Portfolio’s shareholders to share potential economies of scale from its inception and that the fees remain satisfactory relative to peer funds. The Trustees considered the benefits to the Portfolio of the use of an affiliated distributor and custodian, including the ability to rely on existing infrastructure supporting distribution, custodial and transfer agent services, and the ability to negotiate competitive fees for the Portfolio. The Trustees further considered the Adviser’s and JPMDS’s ongoing investments in their business in support of the Portfolio, including the Adviser’s and/or JPMDS’s investments in trading systems, technology (including improvements to the J.P. Morgan Funds’ website, and cybersecurity improvements), retention of key talent, and regulatory support enhancements. The Trustees concluded that the current fee structure for the Portfolio, including Fee Caps that the Adviser has in place that serve to limit the overall net expense ratios of the Portfolio at competitive levels, was reasonable. The Trustees concluded that the Portfolio’s shareholders received the benefits of potential economies of scale through the Fee Caps and the Adviser’s reinvestment in its operations to serve the Portfolio and its shareholders. The Trustees noted that the Adviser’s reinvestment ensures sufficient resources in terms of personnel and infrastructure to support the Portfolio.
| | | | | | | | | | |
| | | | | |
| 28 | | | | | | | | JPMORGAN INSURANCE TRUST | | DECEMBER 31, 2020 |
Independent Written Evaluation of the Portfolio’s Chief Compliance Officer
The Trustees noted that, upon their direction, the Chief Compliance Officer for the Portfolio had prepared an independent written evaluation in order to assist the Trustees in determining the reasonableness of the proposed management fees. The Trustees considered the written evaluation in determining whether to continue the Advisory Agreement.
Fees Relative to Adviser’s Other Clients
The Trustees received and considered information about the nature and extent of investment advisory services and fee rates offered to other clients of the Adviser, including institutional separate accounts, collective investment trusts, ETFs and/or funds sub-advised by the Adviser, for investment management styles substantially similar to that of the Portfolio. The Trustees considered the complexity of investment management for registered mutual funds relative to the Adviser’s other clients and noted differences, as applicable, in the regulatory, legal and other risks and responsibilities of providing services to the different clients. The Trustees considered that serving as an adviser to a registered mutual fund involves greater responsibilities and risks than acting as a sub-adviser and observed that sub-advisory fees may be lower than those charged by the Adviser to the Portfolio. The Trustees also noted that the adviser, not the mutual fund, pays the sub-advisory fee and that many responsibilities related to the advisory function are retained by the primary adviser. The Trustees concluded that the fee rates charged to the Portfolio in comparison to those charged to the Adviser’s other clients were reasonable.
Investment Performance
The Trustees received and considered absolute and/or relative performance information for the Portfolio in a report prepared by Broadridge. The Trustees considered the total return performance information, which included the ranking of the Portfolio within a performance universe made up of funds with the same Broadridge investment classification and objective (the “Universe”), as well as a subset of funds within the Universe (the “Peer Group”), by total return for the applicable one-, three- and five-year periods. The Trustees reviewed a description of Broadridge’s methodology for selecting mutual funds in the Portfolio’s Universe and Peer Group and noted that Universe and Peer Group rankings were not calculated if the number of funds in the Universe and/or Peer Group did not meet a predetermined minimum. The Broadridge materials provided to the Trustees highlighted information with respect to a representative class to assist the Trustees in their review. As part of this review, the Trustees also reviewed the Portfolio’s
performance against its benchmark and considered the performance information provided for the Portfolio at regular Board meetings by the Adviser. The Trustees also engaged with the Adviser to consider what steps might be taken to improve performance, as applicable. The Broadridge performance data noted by the Trustees as part of their review and the determinations made by the Trustees with respect to the Portfolio’s performance are summarized below:
The Trustees noted that the Portfolio’s performance for Class 1 shares was in the second quintile, based upon both the Peer Group and the Universe, for each of the one-, three- and five-year periods ended December 31, 2019. The Trustees discussed the performance and investment strategy of the Portfolio with the Adviser and based upon this discussion and various other factors, concluded that the Portfolio’s performance was satisfactory.
Advisory Fees and Expense Ratios
The Trustees considered the contractual advisory fee rate and administration fee rate paid by the Portfolio to the Adviser and compared the combined rate to the information prepared by Broadridge concerning management fee rates paid by other funds in the same Broadridge category as the Portfolio. The Trustees recognized that Broadridge reported the Portfolio’s management fee rate as the combined contractual advisory fee and administration fee rates. The Trustees also reviewed information about other expenses and the expense ratios for the Portfolio and noted that Universe and Peer Group rankings were not calculated if the number of funds in the Universe and/or Peer Groups did not meet a predetermined minimum. The Trustees considered the Fee Caps currently in place for the Portfolio, the net advisory fee rate after taking into account any waivers and/or reimbursements and, where deemed appropriate by the Trustees, additional waivers and/or reimbursements. The Trustees recognized that it is difficult to make comparisons of advisory fees because there are variations in the services that are included in the fees paid by other funds. The Trustees’ determinations as a result of the review of the Portfolio’s advisory fees and expense ratios are summarized below:
The Trustees noted that the Portfolio’s net advisory fee for Class 1 shares was in the third quintile based upon both the Peer Group and Universe, and that the actual total expenses for Class 1 shares were in the third and fourth quintiles based upon the Peer Group and Universe, respectively. After considering the factors identified above, in light of this information, the Trustees concluded that the advisory fee was satisfactory in light of the services provided to the Portfolio.
| | | | | | | | | | |
| | | | | |
| DECEMBER 31, 2020 | | JPMORGAN INSURANCE TRUST | | | | | | | | 29 |
TAX LETTER
(Unaudited)
Dividends Received Deduction (DRD)
The Portfolio had 100.00%, or maximum allowable percentage, of ordinary income distributions eligible for the dividends received deduction for corporate shareholders for the fiscal year ended December 31, 2020.
Long Term Capital Gain
The Portfolio distributed approximately $6,829,000 or maximum allowable amount, of long-term capital gain dividends for the fiscal year ended December 31, 2020.
| | | | | | | | | | |
| | | | | |
| 30 | | | | | | | | JPMORGAN INSURANCE TRUST | | DECEMBER 31, 2020 |
J.P. Morgan Funds are distributed by JPMorgan Distribution Services, Inc., which is an affiliate of JPMorgan Chase & Co. Affiliates of JPMorgan Chase & Co. receive fees for providing various services to the funds.
Contact JPMorgan Distribution Services, Inc. at 1-800-480-4111 for a portfolio prospectus. You can also visit us at www.jpmorganfunds.com. Investors should carefully consider the investment objectives and risk as well as charges and expenses of the mutual fund before investing. The prospectus contains this and other information about the mutual fund. Read the prospectus carefully before investing.
The Portfolio files a complete schedule of its portfolio holdings for the first and third quarters of its fiscal year with the SEC as an exhibit to its report on Form N-PORT. The Portfolio’s Form N-PORT reports are available on the SEC’s website at http://www.sec.gov. The Portfolio’s quarterly holdings can be found by visiting the J.P. Morgan Funds’ website at www.jpmorganfunds.com.
A description of the Portfolio’s policies and procedures with respect to the disclosure of the Portfolio’s holdings is available in the prospectuses and Statement of Additional Information.
A copy of proxy policies and procedures is available without charge upon request by calling 1-800-480-4111 and on the Portfolio’s website at www.jpmorganfunds.com. A description of such policies and procedures is on the SEC’s website at www.sec.gov. The Trustees have delegated the authority to vote proxies for securities owned by the Portfolio to the Adviser. A copy of the Portfolio’s voting record for the most recent 12-month period ended June 30 is available on the SEC’s website at www.sec.gov or at the Portfolio’s website at www.jpmorganfunds.com no later than August 31 of each year. The Portfolio’s proxy voting record will include, among other things, a brief description of the matter voted on for each portfolio security, and will state how each vote was cast, for example, for or against the proposal.

J.P. Morgan Asset Management is the brand name for the asset management business of JPMorgan Chase & Co. and its affiliates worldwide.
| | | | |
| | © JPMorgan Chase & Co., 2020. All rights reserved. December 2020. | | AN-JPMITUSEP-1220 |
Annual Report
JPMorgan Insurance Trust
December 31, 2020
JPMorgan Insurance Trust Income Builder Portfolio
| | | | |
NOT FDIC INSURED • NO BANK GUARANTEE • MAY LOSE VALUE
| | |  | |
CONTENTS
Investments in the Portfolio are not deposits or obligations of, or guaranteed or endorsed by, any bank and are not insured or guaranteed by the FDIC, the Federal Reserve Board or any other government agency. You could lose money if you sell when the Portfolio’s share price is lower than when you invested.
Past performance is no guarantee of future performance. The general market views expressed in this report are opinions based on market and other conditions through the end of the reporting period and are subject to change without notice. These views are not intended to predict the future performance of the Portfolio or the securities markets. References to specific securities and their issuers are for illustrative purposes only and are not intended to be, and should not be interpreted as, recommendations to purchase or sell such securities. Such views are not meant as investment advice and may not be relied on as an indication of trading intent on behalf of the Portfolio.
This Portfolio is intended to be a funding vehicle for variable annuity contracts and variable life insurance policies (collectively “Policies”) offered by the separate accounts of various insurance companies. Portfolio shares may also be offered to qualified pension and retirement plans and accounts permitting accumulation of assets on a tax-deferred basis (“Eligible Plans”). Individuals may not purchase shares directly from the Portfolio.
Prospective investors should refer to the Portfolio’s prospectuses for a discussion of the Portfolio’s investment objective, strategies and risks. Call
J.P. Morgan Funds Service Center at 1-800-480-4111 for a prospectus containing more complete information about the Portfolio, including management fees and other expenses. Please read it carefully before investing.
LETTER TO SHAREHOLDERS
February 4, 2021 (Unaudited)
Dear Shareholders,
The immense efforts of central banks, government and researchers in the public and private sectors appear to have shepherded the world through the most difficult days of a profound crisis caused by the pandemic. While the economic and health care challenges are not behind us, the uncertainty and turbulence of 2020 has abated.
| | |
 | | “We believe the clear lesson is that investors who remained fully invested over the past year, in the face of uncertainty over the direction of the pandemic and the unprecedented responses to it, were likely rewarded for their resolve.” — Andrea L. Lisher |
The development of multiple vaccines against Covid-19 toward the end of 2020 provided hope that the pandemic would be halted and that economic and social activity could begin to resume in the year ahead. That optimism spread to global financial markets. While leading equity indexes fell by 20% or more in the first quarter of 2020, financial markets stabilized and equity markets largely rebounded — slowly at first and then rapidly the second half of the year. At the end of 2020, the S&P 500 Index had generated a total return of 18.10% for the full 12 months and 22.16% for the final six months of the year.
We believe the clear lesson is that investors who remained fully invested over the past year, in the face of uncertainty over the
direction of the pandemic and the unprecedented responses to it, were likely rewarded for their resolve.
Certainly, enormous challenges remain in both the implementation of global vaccinations and in the rebuilding of economies at the local, national and international levels. However, the advances in the fight against Covid-19 provide policymakers and investors with the opportunity to plan for the future and meet those challenges. J.P. Morgan Asset Management has thrived amid the many challenges presented by the pandemic. Moreover, our deep experience in risk management enabled us to better navigate increased volatility in global financial markets. Throughout 2020, we continued to seek to operate under the same fundamental practices and principles that have driven our success for more than a century with an unwavering focus on putting our clients at the center of everything we do.
On behalf of J.P. Morgan Asset Management, thank you for entrusting us to manage your investment. Should you have any questions, please visit www.jpmorganfunds.com or contact the J.P. Morgan Funds Service Center at 1-800-480-4111.
Sincerely yours,

Andrea L. Lisher
Head of Americas, Client
J.P. Morgan Asset Management
| | | | | | | | |
| | | |
| DECEMBER 31, 2020 | | JPMORGAN INSURANCE TRUST | | | | | 1 | |
JPMorgan Insurance Trust Income Builder Portfolio
PORTFOLIO COMMENTARY
TWELVE MONTHS ENDED DECEMBER 31, 2020 (Unaudited)
| | | | |
| REPORTING PERIOD RETURN: | |
| Portfolio (Class 2 Shares)* | | | 5.21% | |
| MSCI World Index (net of foreign withholding taxes) | | | 15.90% | |
| Income Builder Composite Benchmark | | | 13.31% | |
| |
| Net Assets as of 12/31/2020 (In Thousands) | | | $99,860 | |
INVESTMENT OBJECTIVE**
The JPMorgan Insurance Trust Income Builder Portfolio (the “Portfolio”) seeks to maximize income while maintaining prospects for capital appreciation.
HOW DID THE MARKET PERFORM?
Global financial markets generally recovered from a sharp sell-off in the first quarter of 2020, led by a rally in equity markets in the second half of the year. Investor demand for equity was largely fueled by continued support from central banks, relief spending by governments across the globe and the development and approvals of the first vaccines against Covid-19.
In the first days of January 2020, financial markets largely shrugged off a brief flare-up in military tensions between the U.S. and Iran. However, the emergence and spread of Covid-19 fed increasing investor uncertainty and by early March, the novel coronavirus was declared a pandemic by the World Health Organization. The closure of large sectors of national economies on a global scale sparked a dramatic sell-off in financial markets. Yields on developed market sovereign bonds fell sharply and prices for commodity gold spiked. By the end of the first quarter of 2020, leading developed market equity indexes had lost 20% or more of their value from the start of the year. Corporate bond prices fell and the price of crude oil ended the first quarter down by 60%.
Leading central banks promptly responded with lower interest rates and/or asset purchasing programs, which helped to support asset price stability and head off a potential liquidity crunch in credit markets. Governments also responded with a range of fiscal stimulus or paycheck protection programs designed to cushion the economic impact of the pandemic. In the ensuing months, global equity markets staged a slow and uneven rebound, led by U.S. and emerging markets.
At the start of the second half of the year, U.S. equity led a broad rebound in both developed markets and emerging markets equity. Leading U.S. equity indexes rose in July and August 2020, punctuated by five consecutive record high closings for S&P 500 in late August — a stretch not seen since 2017. Notably, Apple Inc. issued a 4-for-1 stock split in August and became the first publicly listed company with a valuation surpassing $2 trillion. The U.S. Federal Reserve (the “Fed”) signaled its continued support for asset purchases and low benchmark interest
rates. While the spread of Covid-19 accelerated in the U.S., multiple candidate vaccines were being developed around the world and the number of hospitalizations at the end of the summer was relatively small compared with what was to come at the end of the year.
Equity prices across the globe largely declined over September and October 2020. Re-closings across Asia and Europe in response to Covid-19 dented investor optimism. The inability of the U.S. Congress to adopt further spending for pandemic relief put acute pressure on the S&P 500 in the final week of October.
U.S. equity prices began to rebound in November and by mid-month the S&P 500 reached a closing high and crossed 3,600 points for the first time amid the U.S. Food and Drug Administration’s approval of the first Covid-19 vaccines. While the results of the U.S. presidential election were contested, President-elect Joe Biden’s early cabinet choices — including former Fed Chairwoman Janet Yellen — removed some investor uncertainty. The Fed kept interest rates and policies unchanged and Congressional negotiations over proposed relief and stimulus spending continued through the month.
Globally, equity markets maintained upward momentum through the end of December, largely driven by investor expectations that mass vaccinations and the re-opening of economies would unleash pent up demand from consumers, businesses and governments. Notably, emerging markets equity outperformed developed markets equity, including U.S. equity in the second half of 2020 as China, Taiwan and South Korea appeared to have greater success in containing the pandemic.
In the U.S., growth stocks continued to outperform value stocks but the difference narrowed somewhat during the period as share price valuations rose. Additionally, shares of select companies that had seen their stock prices plummet in the first half of 2020 benefitted from increased investor appetite for bargains in the second half of the year. At year’s end, the largest 10 companies in the S&P 500 made up 27.4% of the index’s value, compared with 22.7% at the end of 2019 and 21.0% at the end of 2018.
WHAT WERE THE MAIN DRIVERS OF THE PORTFOLIO’S PERFORMANCE?
The Portfolio’s Class 2 Shares underperformed both the MSCI World Index (net of foreign withholding taxes) (the “Benchmark”)
| | | | | | |
| | | |
| 2 | | | | JPMORGAN INSURANCE TRUST | | DECEMBER 31, 2020 |
and the Income Builder Composite Benchmark (the “Composite”), which is made up of 60% MSCI World Index and 40% Bloomberg Barclays U.S. Aggregate Index, for the twelve months ended December 31, 2020.
The Portfolio’s allocation real estate investment trusts detracted from performance relative to the Benchmark. The Portfolio’s allocation to fixed income also detracted from performance relative to the Benchmark, which is an all-equity index.
Relative to the Composite, the Portfolio’s allocations to global equity and investment grade corporate bonds contributed to relative performance, as those asset classes performed strongly toward the end of the year following the approvals of the first vaccines against Covid-19 and continued fiscal support from governments.
HOW WAS THE PORTFOLIO POSITIONED?
During the reporting period, the Portfolio was positioned to tactically pursue income. During the first half of the reporting period, the Portfolio’s portfolio managers reduced the Portfolio’s overall equity allocation and increased the Portfolio’s overall duration through the use of government bond futures. Duration measures the price sensitivity of a bond or a portfolio of bonds to relative changes in interest rates. Generally, bonds with longer duration will experience a larger increase or decrease in price as interest rates fall or rise, respectively, versus bonds with shorter duration. Following supportive policy actions from leading central banks in 2020, the portfolio managers increased the Portfolio’s allocation to equity and maintained the Portfolio’s credit allocations. The portfolio managers also added equity-linked notes and increased the Portfolio’s allocation to investment grade corporate bonds.
| | | | | | | | |
| TOP TEN HOLDINGS OF THE PORTFOLIO*** | |
| | 1. | | | JPMorgan Equity Income Fund, Class R6 Shares | | | 3.6 | % |
| | 2. | | | Merrill Lynch International & Co., ELN, 6.83%, 3/3/2021 (linked to Russell 2000 Index) | | | 2.1 | |
| | 3. | | | JPMorgan Emerging Markets Strategic Debt Fund, Class R6 Shares | | | 2.0 | |
| | 4. | | | Barclays Bank plc, ELN, 6.50%, 3/24/2021, (linked to Russell 2000 Index) | | | 1.0 | |
| | 5. | | | JPMorgan Floating Rate Income Fund, Class R6 Shares | | | 0.9 | |
| | 6. | | | Samsung Electronics Co. Ltd. (South Korea) | | | 0.6 | |
| | 7. | | | U.S. Treasury Notes, 2.50%, 1/31/2021 | | | 0.6 | |
| | 8. | | | Prologis, Inc., REIT | | | 0.6 | |
| | 9. | | | Coca-Cola Co. (The) | | | 0.6 | |
| | 10. | | | Taiwan Semiconductor Manufacturing Co. Ltd. (Taiwan), ADR | | | 0.5 | |
| | | | |
PORTFOLIO COMPOSITION*** | |
| Corporate Bonds | | | 40.8 | % |
| Common Stocks | | | 34.9 | |
| Investment Companies | | | 6.7 | |
| Collateralized Mortgage Obligations | | | 3.6 | |
| Equity-Linked Notes | | | 3.1 | |
| Commercial Mortgage-Backed Securities | | | 2.9 | |
| Asset-Backed Securities | | | 1.6 | |
| Others (each less than 1.0%) | | | 2.2 | |
| Short-Term Investments | | | 4.2 | |
| * | | The return shown is based on net asset values calculated for shareholder transactions and may differ from the return shown in the financial highlights, which reflects adjustments made to the net asset values in accordance with accounting principles generally accepted in the United States of America. |
| ** | | The adviser seeks to achieve the Portfolio’s objective. There can be no guarantee it will be achieved. |
| *** | | Percentages indicated are based on total investments as of December 31, 2020. The Portfolio’s composition is subject to change. |
| | |
| ADR | | American Depositary Receipt |
| ELN | | Equity-Linked Note |
| REIT | | Real Estate Investment Trust |
| | | | | | | | |
| | | |
| DECEMBER 31, 2020 | | JPMORGAN INSURANCE TRUST | | | | | 3 | |
JPMorgan Insurance Trust Income Builder Portfolio
PORTFOLIO COMMENTARY
TWELVE MONTHS ENDED DECEMBER 31, 2020 (Unaudited) (continued)
| | | | | | | | | | | | | | |
AVERAGE ANNUAL TOTAL RETURNS AS OF DECEMBER 31, 2020 | |
| | | | |
| | | INCEPTION DATE OF
CLASS | | 1 YEAR | | | 5 YEAR | | | SINCE INCEPTION | |
CLASS 1 SHARES | | December 9, 2014 | | | 5.45 | % | | | 6.55 | % | | | 5.29 | % |
CLASS 2 SHARES | | December 9, 2014 | | | 5.21 | | | | 6.28 | | | | 5.04 | |
LIFE OF PORTFOLIO PERFORMANCE (12/9/14 TO 12/31/20)
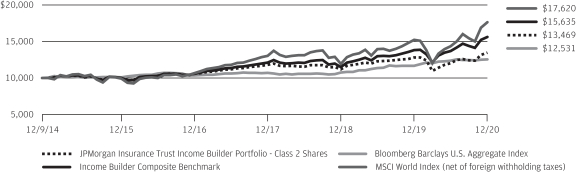
The performance quoted is past performance and is not a guarantee of future results. Mutual funds are subject to certain market risks. Investment returns and principal value of an investment will fluctuate so that an investor’s shares, when redeemed, may be worth more or less than their original cost. Current performance may be higher or lower than the performance data shown. For up-to-date month-end performance information please call 1-800-480-4111.
The Portfolio commenced operations on December 9, 2014.
The graph illustrates comparative performance for $10,000 invested in Class 2 Shares of the JPMorgan Insurance Trust Income Builder Portfolio, the MSCI World Index (net of foreign withholding taxes), the Bloomberg Barclays U.S. Aggregate Index and the Income Builder Composite Benchmark from December 9, 2014 to December 31, 2020. The performance of the Portfolio assumes reinvestment of all dividends and capital gain distributions, if any. The performance of the MSCI World Index (net of foreign withholding taxes), the Bloomberg Barclays U.S. Aggregate Index and the Income Builder Composite Benchmark do not reflect the deduction of expenses associated with a mutual fund and have been adjusted to reflect reinvestment of all dividends and capital gain distributions of the securities included in the benchmarks, if applicable. The MSCI World Index (net of foreign withholding taxes) is a free float-adjusted
market capitalization weighted index that is designed to measure the equity market performance of developed markets. The Bloomberg Barclays U.S. Aggregate Index is an unmanaged index that represents securities that are SEC-registered, taxable, and dollar denominated. The index covers the U.S. investment grade fixed rate bond market, with index components for government and corporate securities, mortgage pass-through securities, and asset-backed securities. The Income Builder Composite Benchmark is a composite benchmark comprised of unmanaged indices that includes the MSCI World Index (net of foreign withholding taxes) (60%) and the Bloomberg Barclays U.S. Aggregate Index (40%). Investors cannot invest directly in an index.
Portfolio performance does not reflect any charges imposed by the Policies or Eligible Plans. If these charges were included, the returns would be lower than shown. Portfolio performance may reflect the waiver of the Portfolio’s fees and reimbursement of expenses for certain periods since the inception date. Without these waivers and reimbursements, performance would have been lower. The returns shown are based on net asset values calculated for shareholder transactions and may differ from the returns shown in the financial highlights, which reflect adjustments made to the net asset values in accordance with accounting principles generally accepted in the United States of America.
| | | | | | |
| | | |
| 4 | | | | JPMORGAN INSURANCE TRUST | | DECEMBER 31, 2020 |
JPMorgan Insurance Trust Income Builder Portfolio
SCHEDULE OF PORTFOLIO INVESTMENTS
AS OF DECEMBER 31, 2020
(Amounts in thousands)
| | | | | | | | |
| INVESTMENTS | | PRINCIPAL
AMOUNT
($000) | | | VALUE
($000) | |
| | | | | | | | |
Corporate Bonds — 41.0% | | | | | | | | |
| | |
Australia — 0.3% | | | | | | | | |
| |
Australia & New Zealand Banking Group Ltd. | | | | | |
| | |
(USD ICE Swap Rate 5 Year + 5.17%), 6.75%, 6/15/2026 (a) (b) (c) (d) | | | 200 | | | | 233 | |
| | |
FMG Resources August 2006 Pty. Ltd. 4.75%, 5/15/2022 (c) | | | 21 | | | | 22 | |
| | |
5.13%, 5/15/2024 (c) | | | 12 | | | | 13 | |
| | |
Newcrest Finance Pty. Ltd.
3.25%, 5/13/2030 (c) | | | 10 | | | | 11 | |
| | |
4.20%, 5/13/2050 (c) | | | 5 | | | | 6 | |
| | | | | | | | |
| | |
| | | | | | | 285 | |
| | | | | | | | |
| | |
Belgium — 0.1% | | | | | | | | |
| | |
Anheuser-Busch Cos. LLC 4.90%, 2/1/2046 | | | 15 | | | | 20 | |
| | |
Anheuser-Busch InBev Worldwide, Inc. 4.38%, 4/15/2038 | | | 15 | | | | 18 | |
| | |
4.60%, 4/15/2048 | | | 30 | | | | 38 | |
| | |
5.55%, 1/23/2049 | | | 10 | | | | 14 | |
| | |
4.50%, 6/1/2050 | | | 30 | | | | 38 | |
| | | | | | | | |
| | |
| | | | | | | 128 | |
| | | | | | | | |
| | |
Canada — 1.7% | | | | | | | | |
| | |
1011778 BC ULC
4.25%, 5/15/2024 (c) | | | 87 | | | | 89 | |
| | |
3.88%, 1/15/2028 (c) | | | 17 | | | | 17 | |
| | |
Advanz Pharma Corp. Ltd. 8.00%, 9/6/2024 | | | 80 | | | | 81 | |
| | |
Alimentation Couche-Tard, Inc. 4.50%, 7/26/2047 (c) | | | 8 | | | | 10 | |
| | |
3.80%, 1/25/2050 (c) | | | 5 | | | | 6 | |
| | |
ATS Automation Tooling Systems, Inc. 6.50%, 6/15/2023 (c) | | | 20 | | | | 20 | |
| | |
Bank of Nova Scotia (The) | | | | | | | | |
| | |
(ICE LIBOR USD 3 Month + 2.65%), 4.65%, 10/12/2022 (a) (b) (d) | | | 13 | | | | 13 | |
| | |
(US Treasury Yield Curve Rate T Note Constant Maturity 5 Year + 4.55%), 4.90%, 6/4/2025 (a) (b) (d) | | | 15 | | | | 16 | |
| | |
Bell Canada 4.30%, 7/29/2049 | | | 30 | | | | 39 | |
| | |
Bombardier, Inc.
6.00%, 10/15/2022 (c) | | | 50 | | | | 49 | |
| | |
6.13%, 1/15/2023 (c) | | | 40 | | | | 39 | |
| | |
7.50%, 12/1/2024 (c) | | | 45 | | | | 43 | |
| | |
7.50%, 3/15/2025 (c) | | | 38 | | | | 36 | |
| | |
Cenovus Energy, Inc. 5.38%, 7/15/2025 (e) | | | 130 | | | | 147 | |
| | |
Emera, Inc. | | | | | | | | |
| | |
Series 16-A, (ICE LIBOR USD 3 Month + 5.44%), 6.75%, 6/15/2076 (b) | | | 185 | | | | 216 | |
| | | | | | | | |
| INVESTMENTS | | PRINCIPAL
AMOUNT
($000) | | | VALUE
($000) | |
| | | | | | | | |
| | | | | | | | |
| | |
Canada — continued | | | | | | | | |
| | |
Enbridge, Inc. | | | | | | | | |
| | |
4.50%, 6/10/2044 | | | 5 | | | | 6 | |
| | |
Series 16-A, (ICE LIBOR USD 3 Month + 3.89%), 6.00%, 1/15/2077 (b) | | | 10 | | | | 11 | |
| | |
(ICE LIBOR USD 3 Month + 3.64%),
6.25%, 3/1/2078 (b) | | | 45 | | | | 49 | |
| | |
Series 20-A, (US Treasury Yield Curve Rate T Note Constant Maturity 5 Year + 5.31%),
5.75%, 7/15/2080 (b) | | | 117 | | | | 131 | |
| | |
Gateway Casinos & Entertainment Ltd. 8.25%, 3/1/2024 (c) | | | 65 | | | | 61 | |
| | |
MEG Energy Corp. 6.50%, 1/15/2025 (c) | | | 45 | | | | 46 | |
| | |
NOVA Chemicals Corp.
5.00%, 5/1/2025 (c) | | | 34 | | | | 35 | |
| | |
5.25%, 6/1/2027 (c) | | | 26 | | | | 28 | |
| | |
Open Text Corp. 5.88%, 6/1/2026 (c) | | | 57 | | | | 59 | |
| | |
Precision Drilling Corp.
5.25%, 11/15/2024 | | | 3 | | | | 3 | |
| | |
7.13%, 1/15/2026 (c) | | | 23 | | | | 20 | |
| | |
Quebecor Media, Inc. 5.75%, 1/15/2023 | | | 130 | | | | 141 | |
| | |
Rogers Communications, Inc.
4.35%, 5/1/2049 | | | 25 | | | | 32 | |
| | |
3.70%, 11/15/2049 | | | 15 | | | | 18 | |
| | |
Stars Group Holdings BV 7.00%, 7/15/2026 (c) | | | 24 | | | | 25 | |
| | |
TransCanada PipeLines Ltd.
4.75%, 5/15/2038 | | | 10 | | | | 13 | |
| | |
5.10%, 3/15/2049 | | | 10 | | | | 13 | |
| | |
Transcanada Trust | | | | | | | | |
| | |
Series 16-A, (ICE LIBOR USD 3 Month + 4.64%), 5.87%, 8/15/2076 (b) | | | 33 | | | | 37 | |
| | |
(ICE LIBOR USD 3 Month + 4.15%), 5.50%, 9/15/2079 (b) | | | 72 | | | | 79 | |
| | |
Videotron Ltd. 5.00%, 7/15/2022 | | | 38 | | | | 40 | |
| | |
5.13%, 4/15/2027 (c) | | | 32 | | | | 34 | |
| | | | | | | | |
| | |
| | | | | | | 1,702 | |
| | | | | | | | |
| | |
Cayman Islands — 0.0% (f) | | | | | | | | |
| | |
Global Aircraft Leasing Co. Ltd. 13.75% (Blend (cash 6.50% + PIK 7.25%)), 9/15/2024 (c) (g) | | | 31 | | | | 27 | |
| | | | | | | | |
| | |
Finland — 0.1% | | | | | | | | |
| | |
Nokia OYJ
4.38%, 6/12/2027 | | | 12 | | | | 13 | |
| | |
6.63%, 5/15/2039 | | | 33 | | | | 42 | |
| | | | | | | | |
| | |
| | | | | | | 55 | |
| | | | | | | | |
SEE NOTES TO FINANCIAL STATEMENTS.
| | | | | | | | | | |
| | | | | |
| DECEMBER 31, 2020 | | JPMORGAN INSURANCE TRUST | | | | | | | | 5 |
JPMorgan Insurance Trust Income Builder Portfolio
SCHEDULE OF PORTFOLIO INVESTMENTS
AS OF DECEMBER 31, 2020 (continued)
(Amounts in thousands)
| | | | | | | | |
| INVESTMENTS | | PRINCIPAL
AMOUNT
($000) | | | VALUE
($000) | |
| | | | | | | | |
Corporate Bonds — continued | | | | | | | | |
|
France — 0.8% | |
| | |
Altice France SA | | | | | | | | |
| | |
8.13%, 2/1/2027 (c) | | | 200 | | | | 220 | |
| |
Credit Agricole SA | | | | | |
| | |
(USD Swap Semi 5 Year + 6.19%), 8.12%, 12/23/2025 (a) (b) (c) (d) | | | 200 | | | | 243 | |
| |
Societe Generale SA | | | | | |
| | |
(USD ICE Swap Rate 5 Year + 5.87%), 8.00%, 9/29/2025 (a) (b) (c) (d) | | | 200 | | | | 235 | |
| | |
Total Capital International SA | | | | | | | | |
| | |
2.99%, 6/29/2041 | | | 20 | | | | 22 | |
| | |
3.13%, 5/29/2050 | | | 25 | | | | 27 | |
| | |
3.39%, 6/29/2060 | | | 5 | | | | 6 | |
| | | | | | | | |
| | |
| | | | | | | 753 | |
| | | | | | | | |
Germany — 0.1% | |
| | |
Deutsche Telekom International Finance BV | | | | | | | | |
| | |
8.75%, 6/15/2030 (h) | | | 85 | | | | 134 | |
| | | | | | | | |
Ireland — 0.1% | |
| | |
Avolon Holdings Funding Ltd. | | | | | | | | |
| | |
5.50%, 1/15/2023 (c) | | | 9 | | | | 10 | |
| | |
5.13%, 10/1/2023 (c) | | | 33 | | | | 35 | |
| | |
5.25%, 5/15/2024 (c) | | | 21 | | | | 23 | |
| | |
Park Aerospace Holdings Ltd. | | | | | | | | |
| | |
4.50%, 3/15/2023 (c) | | | 16 | | | | 17 | |
| | |
5.50%, 2/15/2024 (c) | | | 37 | | | | 40 | |
| | | | | | | | |
| | |
| | | | | | | 125 | |
| | | | | | | | |
Italy — 0.1% | |
| | |
Telecom Italia Capital SA | | | | | | | | |
| | |
6.38%, 11/15/2033 | | | 20 | | | | 25 | |
| | |
6.00%, 9/30/2034 | | | 32 | | | | 39 | |
| | | | | | | | |
| | |
| | | | | | | 64 | |
| | | | | | | | |
Luxembourg — 0.2% | |
| | |
Intelsat Jackson Holdings SA | | | | | | | | |
| | |
5.50%, 8/1/2023 (i) | | | 100 | | | | 68 | |
| | |
8.00%, 2/15/2024 (c) (h) (i) | | | 77 | | | | 79 | |
| | |
8.50%, 10/15/2024 (c) (i) | | | 110 | | | | 78 | |
| | |
9.75%, 7/15/2025 (c) (i) | | | 35 | | | | 25 | |
| | | | | | | | |
| | |
| | | | | | | 250 | |
| | | | | | | | |
Mexico — 0.2% | |
| | |
Cemex SAB de CV | | | | | | | | |
| | |
5.70%, 1/11/2025 (c) (e) | | | 200 | | | | 204 | |
| | | | | | | | |
Netherlands — 0.1% | |
| | |
Shell International Finance BV | | | | | | | | |
| | |
4.00%, 5/10/2046 | | | 25 | | | | 32 | |
| | |
3.25%, 4/6/2050 | | | 40 | | | | 45 | |
| | | | | | | | |
| | |
| | | | | | | 77 | |
| | | | | | | | |
| | | | | | | | |
| INVESTMENTS | | PRINCIPAL
AMOUNT
($000) | | | VALUE
($000) | |
| | | | | | | | |
| | | | | | | | |
Norway — 0.0% (f) | |
| | |
Equinor ASA | | | | | | | | |
| | |
2.38%, 5/22/2030 | | | 20 | | | | 21 | |
| | | | | | | | |
Peru — 0.0% (f) | |
| | |
Hudbay Minerals, Inc. | | | | | | | | |
| | |
7.63%, 1/15/2025 (c) | | | 10 | | | | 10 | |
| | | | | | | | |
Switzerland — 0.7% | |
| |
Credit Suisse Group AG | | | | | |
| | |
(USD Swap Semi 5 Year + 5.11%), 7.13%, 7/29/2022 (a) (b) (d) (j) | | | 200 | | | | 211 | |
| | |
(USD Swap Semi 5 Year + 3.46%), 6.25%, 12/18/2024 (a) (b) (c) (d) | | | 200 | | | | 219 | |
| |
UBS Group AG | | | | | |
| | |
(USD Swap Semi 5 Year + 4.87%), 7.00%, 2/19/2025 (a) (b) (d) (j) | | | 200 | | | | 227 | |
| | | | | | | | |
| | |
| | | | | | | 657 | |
| | | | | | | | |
United Arab Emirates — 0.1% | |
| | |
DAE Funding LLC | | | | | | | | |
| | |
4.50%, 8/1/2022 (c) | | | 10 | | | | 10 | |
| | |
5.00%, 8/1/2024 (c) | | | 45 | | | | 46 | |
| | |
Shelf Drilling Holdings Ltd. | | | | | | | | |
| | |
8.25%, 2/15/2025 (c) | | | 69 | | | | 30 | |
| | | | | | | | |
| | |
| | | | | | | 86 | |
| | | | | | | | |
United Kingdom — 0.7% | |
| | |
AstraZeneca plc | | | | | | | | |
| | |
2.13%, 8/6/2050 | | | 65 | | | | 61 | |
| | |
BAT Capital Corp. | | | | | | | | |
| | |
4.39%, 8/15/2037 | | | 32 | | | | 36 | |
| | |
4.76%, 9/6/2049 | | | 45 | | | | 52 | |
| |
BP Capital Markets plc | | | | | |
| | |
(US Treasury Yield Curve Rate T Note Constant Maturity 5 Year + 4.04%), 4.38%, 6/22/2025 (a) (b) (d) | | | 26 | | | | 28 | |
| | |
(US Treasury Yield Curve Rate T Note Constant Maturity 5 Year + 4.40%), 4.88%, 3/22/2030 (a) (b) (d) | | | 121 | | | | 135 | |
| |
Natwest Group plc | | | | | |
| | |
(US Treasury Yield Curve Rate T Note Constant Maturity 5 Year + 5.63%), 6.00%, 12/29/2025 (a) (b) (d) | | | 200 | | | | 219 | |
| | |
Vodafone Group plc | | | | | | | | |
| | |
5.00%, 5/30/2038 | | | 15 | | | | 20 | |
| | |
5.25%, 5/30/2048 | | | 40 | | | | 55 | |
| | |
4.25%, 9/17/2050 | | | 30 | | | | 37 | |
| | |
(USD Swap Semi 5 Year + 4.87%), 7.00%, 4/4/2079 (b) | | | 57 | | | | 71 | |
| | | | | | | | |
| | |
| | | | | | | 714 | |
| | | | | | | | |
SEE NOTES TO FINANCIAL STATEMENTS.
| | | | | | | | | | |
| | | | | |
| 6 | | | | | | | | JPMORGAN INSURANCE TRUST | | DECEMBER 31, 2020 |
| | | | | | | | |
| INVESTMENTS | | PRINCIPAL
AMOUNT
($000) | | | VALUE
($000) | |
| | | | | | | | |
Corporate Bonds — continued | | | | | | | | |
|
United States — 35.7% | |
| | |
Abbott Laboratories | | | | | | | | |
| | |
4.75%, 11/30/2036 | | | 70 | | | | 96 | |
| | |
4.90%, 11/30/2046 | | | 25 | | | | 37 | |
| | |
AbbVie, Inc. | | | | | | | | |
| | |
4.05%, 11/21/2039 | | | 30 | | | | 36 | |
| | |
4.45%, 5/14/2046 | | | 25 | | | | 32 | |
| | |
4.25%, 11/21/2049 | | | 40 | | | | 50 | |
| | |
Acadia Healthcare Co., Inc. | | | | | | | | |
| | |
5.63%, 2/15/2023 | | | 20 | | | | 20 | |
| | |
6.50%, 3/1/2024 | | | 55 | | | | 56 | |
| | |
ACCO Brands Corp. | | | | | | | | |
| | |
5.25%, 12/15/2024 (c) | | | 12 | | | | 12 | |
| |
Adient US LLC | | | | | |
| | |
7.00%, 5/15/2026 (c) | | | 120 | | | | 131 | |
| |
ADT Security Corp. (The) | | | | | |
| | |
4.13%, 6/15/2023 | | | 95 | | | | 101 | |
| | |
4.88%, 7/15/2032 (c) | | | 45 | | | | 49 | |
| |
Advanced Drainage Systems, Inc. | | | | | |
| | |
5.00%, 9/30/2027 (c) | | | 10 | | | | 11 | |
| |
AECOM | | | | | |
| | |
5.88%, 10/15/2024 | | | 5 | | | | 6 | |
| | |
5.13%, 3/15/2027 | | | 53 | | | | 59 | |
| |
AEP Texas, Inc. | | | | | |
| | |
Series H, 3.45%, | | | | | | | | |
| | |
1/15/2050 | | | 10 | | | | 11 | |
| |
AEP Transmission Co. LLC | | | | | |
| | |
Series M, 3.65%, 4/1/2050 | | | 10 | | | | 12 | |
| |
Aetna, Inc. | | | | | |
| | |
4.75%, 3/15/2044 | | | 14 | | | | 18 | |
| | |
3.88%, 8/15/2047 | | | 25 | | | | 30 | |
| |
Air Lease Corp. | | | | | |
| | |
3.38%, 7/1/2025 | | | 10 | | | | 11 | |
| | |
3.75%, 6/1/2026 | | | 10 | | | | 11 | |
| |
Albertsons Cos., Inc. | | | | | |
| | |
5.75%, 3/15/2025 | | | 21 | | | | 22 | |
| | |
7.50%, 3/15/2026 (c) | | | 80 | | | | 90 | |
| | |
5.88%, 2/15/2028 (c) | | | 38 | | | | 41 | |
| |
Alcoa Nederland Holding BV | | | | | |
| | |
6.13%, 5/15/2028 (c) | | | 200 | | | | 218 | |
| |
Allegheny Technologies, Inc. | | | | | |
| | |
7.88%, 8/15/2023 (h) | | | 10 | | | | 11 | |
| |
Allied Universal Holdco LLC | | | | | |
| | |
6.63%, 7/15/2026 (c) | | | 13 | | | | 14 | |
| | |
9.75%, 7/15/2027 (c) | | | 13 | | | | 14 | |
| | | | | | | | |
| INVESTMENTS | | PRINCIPAL
AMOUNT
($000) | | | VALUE
($000) | |
| | | | | | | | |
| | | | | | | | |
| | |
United States — continued | | | | | | | | |
| |
Allison Transmission, Inc. | | | | | |
| | |
4.75%, 10/1/2027 (c) | | | 65 | | | | 68 | |
| | |
5.88%, 6/1/2029 (c) | | | 70 | | | | 78 | |
| |
Allstate Corp. (The) | | | | | |
| | |
Series B, (ICE LIBOR USD 3 Month + 2.94%), | | | | | | | | |
| | |
5.75%, 8/15/2053 (b) | | | 33 | | | | 35 | |
| |
Ally Financial, Inc. | | | | | |
| | |
5.75%, 11/20/2025 | | | 110 | | | | 128 | |
| | |
8.00%, 11/1/2031 | | | 39 | | | | 57 | |
| |
Alphabet, Inc. | | | | | |
| | |
2.05%, 8/15/2050 | | | 25 | | | | 24 | |
| | |
2.25%, 8/15/2060 | | | 15 | | | | 14 | |
| |
Altria Group, Inc. | | | | | |
| | |
3.88%, 9/16/2046 | | | 40 | | | | 42 | |
| | |
5.95%, 2/14/2049 | | | 10 | | | | 14 | |
| | |
4.45%, 5/6/2050 | | | 10 | | | | 12 | |
| |
Amazon.com, Inc. | | | | | |
| | |
4.95%, 12/5/2044 | | | 10 | | | | 15 | |
| | |
2.50%, 6/3/2050 | | | 10 | | | | 10 | |
| | |
2.70%, 6/3/2060 | | | 25 | | | | 27 | |
| |
AMC Entertainment Holdings, Inc. | | | | | |
| | |
10.50%, 4/24/2026 (c) (e) | | | 26 | | | | 18 | |
| | |
12.00% (PIK), 6/15/2026 (c) (g) | | | 76 | | | | 16 | |
| |
AMC Networks, Inc. | | | | | |
| | |
4.75%, 12/15/2022 | | | 27 | | | | 27 | |
| |
Ameren Corp. | | | | | |
| | |
3.50%, 1/15/2031 | | | 15 | | | | 17 | |
| |
American Airlines Group, Inc. | | | | | |
| | |
5.00%, 6/1/2022 (c) | | | 21 | | | | 19 | |
| |
American Axle & Manufacturing, Inc. | | | | | |
| | |
6.25%, 4/1/2025 | | | 87 | | | | 90 | |
| | |
6.25%, 3/15/2026 | | | 52 | | | | 54 | |
| | |
6.50%, 4/1/2027 | | | 53 | | | | 56 | |
| |
American Express Co. | | | | | |
| | |
Series B, (ICE LIBOR USD 3 Month + 3.43%), 3.65%, 2/15/2021 (a) (b) (d) | | | 18 | | | | 18 | |
| | |
Series C, (ICE LIBOR USD 3 Month + 3.29%),
3.50%, 3/15/2021 (a) (b) (d) | | | 21 | | | | 20 | |
| |
American International Group, Inc. | | | | | |
| | |
3.88%, 1/15/2035 | | | 23 | | | | 28 | |
| | |
Series A-9, (ICE LIBOR USD 3 Month + 2.87%), 5.75%, 4/1/2048 (b) | | | 29 | | | | 33 | |
SEE NOTES TO FINANCIAL STATEMENTS.
| | | | | | | | | | |
| | | | | |
| DECEMBER 31, 2020 | | JPMORGAN INSURANCE TRUST | | | | | | | | 7 |
JPMorgan Insurance Trust Income Builder Portfolio
SCHEDULE OF PORTFOLIO INVESTMENTS
AS OF DECEMBER 31, 2020 (continued)
(Amounts in thousands)
| | | | | | | | |
| INVESTMENTS | | PRINCIPAL
AMOUNT
($000) | | | VALUE
($000) | |
| | | | | | | | |
Corporate Bonds — continued | | | | | | | | |
United States — continued | | | | | | | | |
American Tower Corp. | | | | | | | | |
| | |
REIT, 3.70%, 10/15/2049 | | | 10 | | | | 11 | |
| | |
REIT, 3.10%, 6/15/2050 | | | 55 | | | | 57 | |
American Water Capital Corp. | | | | | | | | |
| | |
3.45%, 5/1/2050 | | | 10 | | | | 12 | |
AmeriGas Partners LP | | | | | | | | |
| | |
5.63%, 5/20/2024 | | | 25 | | | | 27 | |
| | |
5.75%, 5/20/2027 | | | 35 | | | | 40 | |
Amgen, Inc. | | | | | | | | |
| | |
3.15%, 2/21/2040 | | | 20 | | | | 22 | |
| | |
3.38%, 2/21/2050 | | | 35 | | | | 39 | |
Amkor Technology, Inc. | | | | | | | | |
| | |
6.63%, 9/15/2027 (c) (e) | | | 62 | | | | 67 | |
Amsted Industries, Inc. | | | | | | | | |
| | |
5.63%, 7/1/2027 (c) | | | 21 | | | | 22 | |
Antero Midstream Partners LP | | | | | | | | |
| | |
5.38%, 9/15/2024 | | | 10 | | | | 10 | |
Antero Resources Corp. | | | | | | | | |
| | |
5.13%, 12/1/2022 (e) | | | 11 | | | | 11 | |
| | |
5.63%, 6/1/2023 | | | 14 | | | | 14 | |
Anthem, Inc. | | | | | | | | |
| | |
3.13%, 5/15/2050 | | | 25 | | | | 27 | |
Apple, Inc. | | | | | | | | |
| | |
4.50%, 2/23/2036 | | | 35 | | | | 47 | |
| | |
3.85%, 5/4/2043 | | | 25 | | | | 32 | |
| | |
4.65%, 2/23/2046 | | | 5 | | | | 7 | |
| | |
2.65%, 5/11/2050 | | | 30 | | | | 32 | |
| | |
2.55%, 8/20/2060 | | | 5 | | | | 5 | |
Archrock Partners LP | | | | | | | | |
| | |
6.88%, 4/1/2027 (c) | | | 7 | | | | 8 | |
Arconic Corp. | | | | | | | | |
| | |
6.00%, 5/15/2025 (c) | | | 110 | | | | 117 | |
Ardagh Packaging Finance plc | | | | | | | | |
| | |
4.13%, 8/15/2026 (c) | | | 200 | | | | 209 | |
AT&T, Inc. | | | | | | | | |
| | |
3.50%, 6/1/2041 | | | 35 | | | | 38 | |
| | |
4.50%, 3/9/2048 | | | 26 | | | | 31 | |
| | |
3.65%, 6/1/2051 | | | 15 | | | | 15 | |
| | |
3.30%, 2/1/2052 | | | 10 | | | | 10 | |
| | |
3.50%, 9/15/2053 (c) | | | 12 | | | | 12 | |
| | |
3.55%, 9/15/2055 (c) | | | 15 | | | | 15 | |
| | |
3.65%, 9/15/2059 (c) | | | 4 | | | | 4 | |
| | |
3.85%, 6/1/2060 | | | 25 | | | | 26 | |
| | |
3.50%, 2/1/2061 | | | 15 | | | | 15 | |
| | | | | | | | |
| INVESTMENTS | | PRINCIPAL
AMOUNT
($000) | | | VALUE
($000) | |
| | | | | | | | |
| | | | | | | | |
| | |
United States — continued | | | | | | | | |
Avis Budget Car Rental LLC | | | | | | | | |
| | |
6.38%, 4/1/2024 (c) | | | 100 | | | | 102 | |
| | |
5.25%, 3/15/2025 (c) | | | 50 | | | | 50 | |
| | |
5.75%, 7/15/2027 (c) (e) | | | 24 | | | | 24 | |
B&G Foods, Inc. | | | | | | | | |
| | |
5.25%, 4/1/2025 | | | 146 | | | | 151 | |
Baker Hughes a GE Co. LLC | | | | | | | | |
| | |
4.08%, 12/15/2047 | | | 15 | | | | 17 | |
Baltimore Gas and Electric Co. | | | | | | | | |
| | |
2.90%, 6/15/2050 | | | 5 | | | | 5 | |
Bank of America Corp. | | | | | | | | |
| | |
Series U, (ICE LIBOR USD 3 Month + 3.14%), 5.20%, 6/1/2023 (a) (b) (d) | | | 56 | | | | 58 | |
| | |
Series JJ, (ICE LIBOR USD 3 Month + 3.29%), 5.13%, 6/20/2024 (a) (b) (d) | | | 24 | | | | 25 | |
| | |
Series X, (ICE LIBOR USD 3 Month + 3.71%), 6.25%, 9/5/2024 (a) (b) (d) | | | 146 | | | | 162 | |
| | |
Series Z, (ICE LIBOR USD 3 Month + 4.17%), 6.50%, 10/23/2024 (a) (b) (d) | | | 53 | | | | 61 | |
| | |
Series AA, (ICE LIBOR USD 3 Month + 3.90%), 6.10%, 3/17/2025 (a) (b) (d) | | | 33 | | | | 37 | |
| | |
Series AA, (ICE LIBOR USD 3 Month + 3.90%), 6.10%, 3/17/2025 (a) (b) (d) (e) | | | 20 | | | | 23 | |
| | |
Series DD, (ICE LIBOR USD 3 Month + 4.55%), 6.30%, 3/10/2026 (a) (b) (d) (e) | | | 120 | | | | 140 | |
| | |
Series FF, (ICE LIBOR USD 3 Month + 2.93%), 5.87%, 3/15/2028 (a) (b) (d) | | | 133 | | | | 150 | |
| | |
(SOFR + 1.93%), 2.68%, 6/19/2041 (b) | | | 75 | | | | 78 | |
| | |
(ICE LIBOR USD 3 Month + 3.15%), 4.08%, 3/20/2051 (b) | | | 40 | | | | 51 | |
Bank of New York Mellon Corp. (The) | | | | | | | | |
| | |
Series E, (ICE LIBOR USD 3 Month + 3.42%), 3.66%, 3/20/2021 (a) (b) (d) | | | 22 | | | | 22 | |
| | |
Series D, (ICE LIBOR USD 3 Month + 2.46%), 4.50%, 6/20/2023 (a) (b) (d) | | | 51 | | | | 52 | |
| | |
Series G, (US Treasury Yield Curve Rate T Note Constant Maturity 5 Year + 4.36%), 4.70%, 9/20/2025 (a) (b) (d) | | | 13 | | | | 14 | |
| | |
Series H, (US Treasury Yield Curve Rate T Note Constant Maturity 5 Year + 3.35%), 3.70%, 3/20/2026 (a) (b) (d) | | | 20 | | | | 21 | |
| | |
Series F, (ICE LIBOR USD 3 Month + 3.13%), 4.62%, 9/20/2026 (a) (b) (d) | | | 100 | | | | 106 | |
Bausch Health Americas, Inc. | | | | | | | | |
| | |
9.25%, 4/1/2026 (c) | | | 26 | | | | 29 | |
SEE NOTES TO FINANCIAL STATEMENTS.
| | | | | | | | | | |
| | | | | |
| 8 | | | | | | | | JPMORGAN INSURANCE TRUST | | DECEMBER 31, 2020 |
| | | | | | | | |
| INVESTMENTS | | PRINCIPAL
AMOUNT
($000) | | | VALUE
($000) | |
| | | | | | | | |
Corporate Bonds — continued | | | | | | | | |
United States — continued | | | | | | | | |
| | |
Bausch Health Cos., Inc. | | | | | | | | |
| | |
7.00%, 3/15/2024 (c) | | | 69 | | | | 71 | |
| | |
6.13%, 4/15/2025 (c) | | | 95 | | | | 98 | |
| | |
5.50%, 11/1/2025 (c) | | | 121 | | | | 125 | |
| | |
9.00%, 12/15/2025 (c) | | | 68 | | | | 75 | |
| | |
5.75%, 8/15/2027 (c) | | | 12 | | | | 13 | |
| | |
7.00%, 1/15/2028 (c) | | | 20 | | | | 22 | |
| | |
5.00%, 1/30/2028 (c) | | | 340 | | | | 350 | |
| | |
7.25%, 5/30/2029 (c) | | | 22 | | | | 25 | |
Baxter International, Inc. | | | | | | | | |
| | |
3.50%, 8/15/2046 | | | 15 | | | | 17 | |
Berkshire Hathaway Energy Co. | | | | | | | | |
| | |
4.25%, 10/15/2050 (c) | | | 15 | | | | 19 | |
| | |
2.85%, 5/15/2051 (c) | | | 20 | | | | 21 | |
Berkshire Hathaway Finance Corp. | | | | | | | | |
| | |
4.25%, 1/15/2049 | | | 10 | | | | 13 | |
| | |
2.85%, 10/15/2050 | | | 10 | | | | 11 | |
| | |
Berry Global, Inc. | | | | | | | | |
| | |
5.13%, 7/15/2023 (e) | | | 5 | | | | 5 | |
| | |
4.88%, 7/15/2026 (c) | | | 84 | | | | 90 | |
| | |
5.63%, 7/15/2027 (c) | | | 20 | | | | 22 | |
| | |
Biogen, Inc. | | | | | | | | |
| | |
3.15%, 5/1/2050 | | | 55 | | | | 57 | |
| | |
Boston Scientific Corp. | | | | | | | | |
| | |
4.00%, 3/1/2029 | | | 20 | | | | 23 | |
| | |
2.65%, 6/1/2030 | | | 55 | | | | 59 | |
| | |
4.55%, 3/1/2039 | | | 10 | | | | 13 | |
| | |
Boyd Gaming Corp. | | | | | | | | |
| | |
6.38%, 4/1/2026 | | | 4 | | | | 4 | |
| | |
6.00%, 8/15/2026 | | | 34 | | | | 35 | |
| | |
Boyne USA, Inc. | | | | | | | | |
| | |
7.25%, 5/1/2025 (c) | | | 41 | | | | 43 | |
| | |
BP Capital Markets America, Inc. | | | | | | | | |
| | |
3.00%, 2/24/2050 | | | 30 | | | | 31 | |
| | |
2.77%, 11/10/2050 | | | 30 | | | | 30 | |
| | |
2.94%, 6/4/2051 | | | 15 | | | | 15 | |
| | |
Brink’s Co. (The) | | | | | | | | |
| | |
4.63%, 10/15/2027 (c) | | | 75 | | | | 78 | |
| | |
Bristol-Myers Squibb Co. | | | | | | | | |
| | |
4.13%, 6/15/2039 | | | 30 | | | | 38 | |
| | |
2.35%, 11/13/2040 | | | 25 | | | | 26 | |
| | |
4.25%, 10/26/2049 | | | 15 | | | | 20 | |
| | |
2.55%, 11/13/2050 | | | 25 | | | | 26 | |
| | |
Broadcom, Inc. | | | | | | | | |
| | |
4.15%, 11/15/2030 | | | 15 | | | | 17 | |
| | |
4.30%, 11/15/2032 | | | 15 | | | | 18 | |
| | | | | | | | |
| INVESTMENTS | | PRINCIPAL
AMOUNT
($000) | | | VALUE
($000) | |
| | | | | | | | |
| | |
United States — continued | | | | | | | | |
| |
Brookfield Property REIT, Inc. | | | | | |
| | |
REIT, 5.75%, 5/15/2026 (c) | | | 59 | | | | 58 | |
| | |
Buckeye Partners LP | | | | | | | | |
| | |
3.95%, 12/1/2026 | | | 60 | | | | 61 | |
| | |
Burlington Northern Santa Fe LLC | | | | | | | | |
| | |
5.15%, 9/1/2043 | | | 5 | | | | 7 | |
| | |
3.05%, 2/15/2051 | | | 55 | | | | 62 | |
| | |
Callon Petroleum Co. | | | | | | | | |
| | |
6.25%, 4/15/2023 | | | 66 | | | | 42 | |
| | |
6.13%, 10/1/2024 | | | 8 | | | | 5 | |
| | |
6.38%, 7/1/2026 | | | 6 | | | | 3 | |
| | |
Calpine Corp. | | | | | | | | |
| | |
5.25%, 6/1/2026 (c) | | | 61 | | | | 63 | |
| | |
Cameron LNG LLC | | | | | | | | |
| | |
2.90%, 7/15/2031 (c) | | | 10 | | | | 11 | |
| | |
3.30%, 1/15/2035 (c) | | | 5 | | | | 6 | |
| | |
Capital One Financial Corp. | | | | | | | | |
| | |
Series E, (ICE LIBOR USD 3 Month + 3.80%), 4.03%, 3/1/2021 (a) (b) (d) | | | 30 | | | | 30 | |
| | |
Catalent Pharma Solutions, Inc. 4.88%, 1/15/2026 (c) | | | 44 | | | | 45 | |
| | |
5.00%, 7/15/2027 (c) | | | 29 | | | | 31 | |
| | |
CCO Holdings LLC 5.75%, 2/15/2026 (c) | | | 85 | | | | 88 | |
| | |
5.50%, 5/1/2026 (c) | | | 130 | | | | 135 | |
| | |
5.13%, 5/1/2027 (c) | | | 158 | | | | 168 | |
| | |
5.88%, 5/1/2027 (c) | | | 35 | | | | 36 | |
| | |
5.00%, 2/1/2028 (c) | | | 23 | | | | 24 | |
| | |
4.75%, 3/1/2030 (c) | | | 404 | | | | 436 | |
| | |
CDK Global, Inc. 5.25%, 5/15/2029 (c) | | | 99 | | | | 110 | |
| | |
CDW LLC 4.25%, 4/1/2028 | | | 40 | | | | 42 | |
| | |
Cedar Fair LP 5.38%, 4/15/2027 | | | 3 | | | | 3 | |
| | |
5.25%, 7/15/2029 | | | 6 | | | | 6 | |
| | |
Centene Corp. 4.75%, 1/15/2025 | | | 30 | | | | 31 | |
| | |
3.38%, 2/15/2030 | | | 330 | | | | 347 | |
| | |
CenterPoint Energy Houston Electric LLC 3.95%, 3/1/2048 (e) | | | 10 | | | | 13 | |
| | |
CenterPoint Energy, Inc. | | | | | | | | |
| | |
Series A, (ICE LIBOR USD 3 Month + 3.27%), 6.13%, 9/1/2023 (a) (b) (d) | | | 46 | | | | 48 | |
| | |
CenturyLink, Inc. | | | | | | | | |
| | |
Series T, 5.80%, 3/15/2022 | | | 30 | | | | 31 | |
| | |
Series W, 6.75%, 12/1/2023 | | | 28 | | | | 31 | |
| | |
Series Y, 7.50%, 4/1/2024 (e) | | | 2 | | | | 2 | |
| | |
5.63%, 4/1/2025 | | | 57 | | | | 62 | |
| | |
Series G, 6.88%, 1/15/2028 (e) | | | 160 | | | | 186 | |
SEE NOTES TO FINANCIAL STATEMENTS.
| | | | | | | | | | |
| | | | | |
| DECEMBER 31, 2020 | | JPMORGAN INSURANCE TRUST | | | | | | | | 9 |
JPMorgan Insurance Trust Income Builder Portfolio
SCHEDULE OF PORTFOLIO INVESTMENTS
AS OF DECEMBER 31, 2020 (continued)
| | | | | | | | |
| INVESTMENTS | | PRINCIPAL
AMOUNT
($000) | | | VALUE
($000) | |
| | | | | | | | |
Corporate Bonds — continued | | | | | | | | |
United States — continued | | | | | | | | |
| | |
Charles Schwab Corp. (The) | | | | | | | | |
| | |
Series G, (US Treasury Yield Curve Rate T Note Constant Maturity 5 Year + 4.97%), 5.38%, 6/1/2025 (a) (b) (d) (e) | | | 40 | | | | 44 | |
| | |
Series F, (ICE LIBOR USD 3 Month + 2.58%), 5.00%, 12/1/2027 (a) (b) (d) | | | 99 | | | | 106 | |
| | |
Series H, (US Treasury Yield Curve Rate T Note Constant Maturity 10 Year + 3.08%), 4.00%, 12/1/2030 (a) (b) (d) | | | 70 | | | | 74 | |
| | |
Chemours Co. (The) 7.00%, 5/15/2025 (e) | | | 82 | | | | 85 | |
| | |
5.38%, 5/15/2027 (e) | | | 55 | | | | 59 | |
| | |
Cheniere Energy Partners LP 5.25%, 10/1/2025 | | | 18 | | | | 18 | |
| | |
5.63%, 10/1/2026 | | | 14 | | | | 15 | |
| | |
4.50%, 10/1/2029 | | | 120 | | | | 127 | |
| | |
Chesapeake Energy Corp. | | | | | | | | |
| | |
11.50%, 1/1/2025 (c) (i) | | | 45 | | | | 8 | |
| | |
Chevron Corp. 2.98%, 5/11/2040 | | | 10 | | | | 11 | |
| | |
Chevron USA, Inc. 2.34%, 8/12/2050 | | | 5 | | | | 5 | |
| | |
Cincinnati Bell, Inc. 7.00%, 7/15/2024 (c) | | | 45 | | | | 47 | |
| | |
8.00%, 10/15/2025 (c) | | | 15 | | | | 16 | |
| | |
Cinemark USA, Inc. 4.88%, 6/1/2023 | | | 25 | | | | 24 | |
| | |
CIT Group, Inc. 4.75%, 2/16/2024 | | | 22 | | | | 24 | |
| | |
5.25%, 3/7/2025 | | | 45 | | | | 51 | |
| | |
6.13%, 3/9/2028 | | | 21 | | | | 26 | |
| | |
Citigroup, Inc. | | | | | | | | |
| | |
Series R, (ICE LIBOR USD 3 Month + 4.48%), 4.70%, 2/15/2021 (a) (b) (d) | | | 45 | | | | 45 | |
| | |
(ICE LIBOR USD 3 Month + 4.07%), 5.95%, 1/30/2023 (a) (b) (d) | | | 139 | | | | 146 | |
| | |
(ICE LIBOR USD 3 Month + 4.23%), 5.90%, 2/15/2023 (a) (b) (d) | | | 30 | | | | 32 | |
| | |
Series M, (ICE LIBOR USD 3 Month + 3.42%), 6.30%, 5/15/2024 (a) (b) (d) | | | 158 | | | | 171 | |
| | |
Series U, (SOFR + 3.81%), 5.00%, 9/12/2024 (a) (b) (d) | | | 141 | | | | 147 | |
| | |
Series V, (SOFR + 3.23%), 4.70%, 1/30/2025 (a) (b) (d) | | | 124 | | | | 127 | |
| | |
Series P, (ICE LIBOR USD 3 Month + 3.91%), 5.95%, 5/15/2025 (a) (b) (d) | | | 103 | | | | 113 | |
| | |
Series W, (US Treasury Yield Curve Rate T Note Constant Maturity 5 Year + 3.60%), 4.00%, 12/10/2025 (a) (b) (d) | | | 80 | | | | 82 | |
| | |
Series T, (ICE LIBOR USD 3 Month + 4.52%), 6.25%, 8/15/2026 (a) (b) (d) | | | 98 | | | | 112 | |
| | |
(SOFR + 2.11%), 2.57%, 6/3/2031 (b) | | | 25 | | | | 27 | |
| | |
(ICE LIBOR USD 3 Month + 1.17%), 3.88%, 1/24/2039 (b) | | | 10 | | | | 12 | |
| | | | | | | | |
| INVESTMENTS | | PRINCIPAL
AMOUNT
($000) | | | VALUE
($000) | |
| | | | | | | | |
| | | | | | | | |
| | |
United States — continued | | | | | | | | |
| | |
(SOFR + 4.55%), 5.32%, 3/26/2041 (b) | | | 35 | | | | 49 | |
| | |
(ICE LIBOR USD 3 Month + 1.84%), 4.28%, 4/24/2048 (b) | | | 21 | | | | 27 | |
| | |
Citizens Financial Group, Inc. | | | | | | | | |
| | |
Series A, (ICE LIBOR USD 3 Month + 3.96%), 4.19%, 4/6/2021 (a) (b) (d) | | | 27 | | | | 27 | |
| | |
Series B, (ICE LIBOR USD 3 Month + 3.00%), 6.00%, 7/6/2023 (a) (b) (d) | | | 23 | | | | 23 | |
| | |
Series C, (ICE LIBOR USD 3 Month + 3.16%), 6.37%, 4/6/2024 (a) (b) (d) | | | 35 | | | | 36 | |
| | |
Clear Channel Worldwide Holdings, Inc. | | | | | | | | |
| | |
9.25%, 2/15/2024 | | | 170 | | | | 172 | |
| | |
5.13%, 8/15/2027 (c) | | | 35 | | | | 35 | |
| | |
Clearway Energy Operating LLC 5.75%, 10/15/2025 | | | 20 | | | | 21 | |
| | |
Cleveland Electric Illuminating Co. (The) 4.55%, 11/15/2030 (c) | | | 15 | | | | 17 | |
| |
CMS Energy Corp. | | | | | |
| | |
(US Treasury Yield Curve Rate T Note Constant Maturity 5 Year + 4.12%), 4.75%, 6/1/2050 (b) | | | 20 | | | | 23 | |
| | |
Coca-Cola Co. (The) 2.60%, 6/1/2050 | | | 50 | | | | 53 | |
| | |
Colfax Corp. | | | | | | | | |
| | |
6.00%, 2/15/2024 (c) | | | 33 | | | | 34 | |
| | |
6.38%, 2/15/2026 (c) | | | 5 | | | | 6 | |
| | |
Comcast Corp. | | | | | | | | |
| | |
3.20%, 7/15/2036 | | | 20 | | | | 23 | |
| | |
3.75%, 4/1/2040 | | | 20 | | | | 24 | |
| | |
3.45%, 2/1/2050 | | | 25 | | | | 29 | |
| | |
4.05%, 11/1/2052 | | | 55 | | | | 70 | |
| | |
2.65%, 8/15/2062 | | | 15 | | | | 15 | |
| | |
Commercial Metals Co. | | | | | | | | |
| | |
4.88%, 5/15/2023 | | | 19 | | | | 20 | |
| | |
5.38%, 7/15/2027 | | | 61 | | | | 64 | |
| | |
CommScope Technologies LLC | | | | | | | | |
| | |
6.00%, 6/15/2025 (c) | | | 97 | | | | 99 | |
| | |
5.00%, 3/15/2027 (c) | | | 15 | | | | 15 | |
| | |
CommScope, Inc. | | | | | | | | |
| | |
5.50%, 3/1/2024 (c) | | | 31 | | | | 32 | |
| | |
6.00%, 3/1/2026 (c) | | | 35 | | | | 37 | |
| | |
8.25%, 3/1/2027 (c) (e) | | | 75 | | | | 80 | |
| | |
Community Health Systems, Inc. | | | | | | | | |
| | |
8.63%, 1/15/2024 (c) | | | 37 | | | | 38 | |
| | |
8.00%, 3/15/2026 (c) | | | 11 | | | | 12 | |
SEE NOTES TO FINANCIAL STATEMENTS.
| | | | | | | | | | |
| | | | | |
| 10 | | | | | | | | JPMORGAN INSURANCE TRUST | | DECEMBER 31, 2020 |
| | | | | | | | |
| INVESTMENTS | | PRINCIPAL
AMOUNT
($000) | | | VALUE
($000) | |
| | | | | | | | |
Corporate Bonds — continued | | | | | | | | |
United States — continued | | | | | | | | |
| | |
Constellation Brands, Inc. | | | | | | | | |
| | |
4.50%, 5/9/2047 | | | 20 | | | | 25 | |
| | |
5.25%, 11/15/2048 | | | 15 | | | | 21 | |
| | |
Constellation Merger Sub, Inc. 8.50%, 9/15/2025 (c) | | | 32 | | | | 30 | |
| | |
Corning, Inc. 5.35%, 11/15/2048 | | | 5 | | | | 7 | |
| | |
Covanta Holding Corp. 5.88%, 7/1/2025 | | | 19 | | | | 20 | |
| | |
Cox Communications, Inc. | | | | | | | | |
| | |
4.80%, 2/1/2035 (c) | | | 5 | | | | 7 | |
| | |
2.95%, 10/1/2050 (c) | | | 15 | | | | 15 | |
| | |
Crestwood Midstream Partners LP | | | | | | | | |
| | |
6.25%, 4/1/2023 (h) | | | 10 | | | | 10 | |
| | |
5.75%, 4/1/2025 | | | 29 | | | | 29 | |
| | |
5.63%, 5/1/2027 (c) | | | 10 | | | | 10 | |
| | |
Crown Americas LLC | | | | | | | | |
| | |
4.50%, 1/15/2023 | | | 27 | | | | 28 | |
| | |
4.75%, 2/1/2026 | | | 26 | | | | 27 | |
| |
Crown Castle International Corp. | | | | | |
| | |
REIT, 5.20%, 2/15/2049 | | | 5 | | | | 7 | |
| | |
REIT, 4.15%, 7/1/2050 | | | 28 | | | | 34 | |
| | |
REIT, 3.25%, 1/15/2051 | | | 15 | | | | 16 | |
| | |
CSC Holdings LLC | | | | | | | | |
| | |
6.75%, 11/15/2021 | | | 27 | | | | 28 | |
| | |
5.88%, 9/15/2022 | | | 15 | | | | 16 | |
| | |
5.25%, 6/1/2024 | | | 157 | | | | 170 | |
| | |
5.75%, 1/15/2030 (c) | | | 200 | | | | 219 | |
| | |
CSX Corp. 4.75%, 11/15/2048 | | | 29 | | | | 40 | |
| | |
Cummins, Inc. 2.60%, 9/1/2050 | | | 20 | | | | 20 | |
| | |
Curo Group Holdings Corp. 8.25%, 9/1/2025 (c) | | | 71 | | | | 67 | |
| | |
CVR Partners LP 9.25%, 6/15/2023 (c) | | | 164 | | | | 164 | |
| | |
CVS Health Corp. | | | | | | | | |
| | |
4.78%, 3/25/2038 | | | 15 | | | | 19 | |
| | |
4.13%, 4/1/2040 | | | 10 | | | | 12 | |
| | |
2.70%, 8/21/2040 | | | 20 | | | | 20 | |
| | |
5.30%, 12/5/2043 | | | 30 | | | | 41 | |
| | |
5.05%, 3/25/2048 | | | 10 | | | | 13 | |
| | |
Dana, Inc. 5.38%, 11/15/2027 | | | 115 | | | | 122 | |
| | |
Darling Ingredients, Inc. 5.25%, 4/15/2027 (c) | | | 12 | | | | 13 | |
| | |
DCP Midstream Operating LP | | | | | | | | |
| | |
4.95%, 4/1/2022 | | | 5 | | | | 5 | |
| | |
3.88%, 3/15/2023 | | | 38 | | | | 39 | |
| | |
5.38%, 7/15/2025 | | | 14 | | | | 15 | |
| | |
6.75%, 9/15/2037 (c) | | | 20 | | | | 22 | |
| | | | | | | | |
| INVESTMENTS | | PRINCIPAL
AMOUNT
($000) | | | VALUE
($000) | |
| | | | | | | | |
| | | | | | | | |
| | |
United States — continued | | | | | | | | |
| | |
Deere & Co. 3.75%, 4/15/2050 | | | 30 | | | | 39 | |
| | |
Delek Logistics Partners LP 6.75%, 5/15/2025 | | | 48 | | | | 47 | |
| | |
Dell International LLC | | | | | | | | |
| | |
7.13%, 6/15/2024 (c) | | | 65 | | | | 68 | |
| | |
6.02%, 6/15/2026 (c) | | | 10 | | | | 12 | |
| | |
4.90%, 10/1/2026 (c) | | | 5 | | | | 6 | |
| | |
DH Europe Finance II SARL 3.25%, 11/15/2039 | | | 20 | | | | 23 | |
| | |
Diamond Sports Group LLC 5.38%, 8/15/2026 (c) | | | 53 | | | | 43 | |
| | |
Discovery Communications LLC | | | | | | | | |
| | |
5.30%, 5/15/2049 | | | 20 | | | | 26 | |
| | |
4.65%, 5/15/2050 | | | 20 | | | | 25 | |
| | |
DISH DBS Corp. | | | | | | | | |
| | |
6.75%, 6/1/2021 | | | 105 | | | | 107 | |
| | |
5.88%, 7/15/2022 | | | 24 | | | | 25 | |
| | |
5.00%, 3/15/2023 | | | 223 | | | | 231 | |
| | |
5.88%, 11/15/2024 | | | 25 | | | | 26 | |
| | |
7.75%, 7/1/2026 | | | 125 | | | | 140 | |
| | |
Dole Food Co., Inc. 7.25%, 6/15/2025 (c) | | | 50 | | | | 51 | |
| |
Dominion Energy, Inc. | | | | | |
| | |
Series B, (US Treasury Yield Curve Rate T Note Constant Maturity 5 Year + 2.99%),
4.65%, 12/15/2024 (a) (b) (d) | | | 24 | | | | 25 | |
| | |
(ICE LIBOR USD 3 Month + 3.06%),
5.75%, 10/1/2054 (b) | | | 10 | | | | 11 | |
| | |
Downstream Development Authority of the Quapaw Tribe of Oklahoma
10.50%, 2/15/2023 (c) | | | 87 | | | | 88 | |
| | |
Duke Energy Corp. | | | | | | | | |
| | |
3.75%, 9/1/2046 | | | 15 | | | | 18 | |
| | |
3.95%, 8/15/2047 | | | 10 | | | | 12 | |
| | |
Duke Energy Progress LLC
4.10%, 3/15/2043 (e) | | | 20 | | | | 25 | |
| | |
Dun & Bradstreet Corp. (The)
6.88%, 8/15/2026 (c) | | | 27 | | | | 29 | |
| | |
Duquesne Light Holdings, Inc.
3.62%, 8/1/2027 (c) | | | 2 | | | | 2 | |
| | |
Eli Lilly and Co. 2.25%, 5/15/2050 | | | 66 | | | | 65 | |
| | |
Embarq Corp. 8.00%, 6/1/2036 | | | 124 | | | | 153 | |
| | |
EMC Corp. 3.38%, 6/1/2023 | | | 26 | | | | 27 | |
| |
Energy Transfer Operating LP | | | | | |
| | |
Series B, (ICE LIBOR USD 3 Month + 4.16%), 6.63%, 2/15/2028 (a) (b) (d) | | | 65 | | | | 55 | |
| | |
Series G, (US Treasury Yield Curve Rate T Note Constant Maturity 5 Year + 5.31%),
7.13%, 5/15/2030 (a) (b) (d) | | | 30 | | | | 28 | |
SEE NOTES TO FINANCIAL STATEMENTS.
| | | | | | | | | | |
| | | | | |
| DECEMBER 31, 2020 | | JPMORGAN INSURANCE TRUST | | | | | | | | 11 |
JPMorgan Insurance Trust Income Builder Portfolio
SCHEDULE OF PORTFOLIO INVESTMENTS
AS OF DECEMBER 31, 2020 (continued)
| | | | | | | | |
| INVESTMENTS | | PRINCIPAL
AMOUNT
($000) | | | VALUE
($000) | |
| | | | | | | | |
Corporate Bonds — continued | | | | | | | | |
United States — continued | | | | | | | | |
| |
EnLink Midstream Partners LP | | | | | |
| | |
Series C, (ICE LIBOR USD 3 Month + 4.11%), 6.00%, 12/15/2022 (a) (b) (d) | | | 30 | | | | 17 | |
| | |
4.40%, 4/1/2024 | | | 19 | | | | 19 | |
| | |
4.15%, 6/1/2025 | | | 23 | | | | 23 | |
| | |
4.85%, 7/15/2026 | | | 58 | | | | 56 | |
| | |
5.60%, 4/1/2044 | | | 5 | | | | 4 | |
| | |
Entegris, Inc. 4.63%, 2/10/2026 (c) | | | 49 | | | | 51 | |
| | |
Entercom Media Corp.
7.25%, 11/1/2024 (c) (e) | | | 35 | | | | 35 | |
| | |
6.50%, 5/1/2027 (c) | | | 41 | | | | 42 | |
| | |
Entergy Texas, Inc. 3.55%, 9/30/2049 | | | 15 | | | | 17 | |
| | |
Enterprise Development Authority (The) 12.00%, 7/15/2024 (c) | | | 82 | | | | 92 | |
| | |
Enterprise Products Operating LLC
4.80%, 2/1/2049 | | | 10 | | | | 13 | |
| | |
4.20%, 1/31/2050 | | | 25 | | | | 29 | |
| | |
3.70%, 1/31/2051 | | | 5 | | | | 6 | |
| | |
Series E, (ICE LIBOR USD 3 Month + 3.03%), 5.25%, 8/16/2077 (b) | | | 25 | | | | 25 | |
| | |
Envision Healthcare Corp. 8.75%, 10/15/2026 (c) | | | 20 | | | | 13 | |
| | |
EOG Resources, Inc. 5.10%, 1/15/2036 | | | 10 | | | | 12 | |
| | |
EQT Corp. 7.88%, 2/1/2025 (h) | | | 105 | | | | 120 | |
| |
Equitable Holdings, Inc. | | | | | |
| | |
Series B, (US Treasury Yield Curve Rate T Note Constant Maturity 5 Year + 4.74%), 4.95%, 9/15/2025 (a) (b) (d) | | | 5 | | | | 5 | |
| |
ESH Hospitality, Inc. | | | | | |
| | |
REIT, 5.25%, 5/1/2025 (c) | | | 30 | | | | 31 | |
| | |
REIT, 4.63%, 10/1/2027 (c) | | | 30 | | | | 30 | |
| | |
Essex Portfolio LP REIT, 2.65%, 9/1/2050 | | | 10 | | | | 10 | |
| | |
Evergy, Inc. 2.90%, 9/15/2029 | | | 20 | | | | 22 | |
| | |
Exela Intermediate LLC 10.00%, 7/15/2023 (c) | | | 94 | | | | 29 | |
| | |
Exxon Mobil Corp.
4.23%, 3/19/2040 | | | 10 | | | | 12 | |
| | |
4.33%, 3/19/2050 | | | 15 | | | | 20 | |
| | |
3.45%, 4/15/2051 | | | 35 | | | | 40 | |
| | |
FirstEnergy Transmission LLC 4.55%, 4/1/2049 (c) | | | 15 | | | | 17 | |
| | |
Florida Power & Light Co. 4.05%, 6/1/2042 | | | 15 | | | | 19 | |
| | |
Ford Motor Credit Co. LLC
4.39%, 1/8/2026 | | | 200 | | | | 210 | |
| | |
4.54%, 8/1/2026 | | | 200 | | | | 214 | |
| | |
5.11%, 5/3/2029 | | | 275 | | | | 306 | |
| | | | | | | | |
| INVESTMENTS | | PRINCIPAL
AMOUNT
($000) | | | VALUE
($000) | |
| | | | | | | | |
| | | | | | | | |
| | |
United States — continued | | | | | | | | |
| | |
Fox Corp. 5.58%, 1/25/2049 | | | 5 | | | | 7 | |
| | |
Freeport-McMoRan, Inc.
5.00%, 9/1/2027 | | | 140 | | | | 149 | |
| | |
5.45%, 3/15/2043 | | | 75 | | | | 93 | |
| | |
Frontier Communications Corp.
7.63%, 4/15/2024 (i) | | | 11 | | | | 5 | |
| | |
6.88%, 1/15/2025 (i) | | | 24 | | | | 12 | |
| | |
11.00%, 9/15/2025 (i) | | | 31 | | | | 16 | |
General Electric Co. | | | | | |
| | |
Series D, (ICE LIBOR USD 3 Month + 3.33%), 5.00%, 3/15/2021 (a) (b) (d) | | | 236 | | | | 219 | |
| | |
3.63%, 5/1/2030 | | | 20 | | | | 23 | |
| | |
Genesis Energy LP
6.50%, 10/1/2025 | | | 5 | | | | 5 | |
| | |
6.25%, 5/15/2026 | | | 15 | | | | 14 | |
| | |
Gilead Sciences, Inc.
2.60%, 10/1/2040 | | | 20 | | | | 20 | |
| | |
4.15%, 3/1/2047 (e) | | | 15 | | | | 18 | |
| | |
2.80%, 10/1/2050 | | | 35 | | | | 35 | |
| | |
Global Payments, Inc. 4.15%, 8/15/2049 | | | 5 | | | | 6 | |
| | |
Go Daddy Operating Co. LLC 5.25%, 12/1/2027 (c) | | | 50 | | | | 53 | |
| |
Goldman Sachs Capital II | | | | | |
| | |
(ICE LIBOR USD 3 Month + 0.77%, 4.00% Floor), 4.00%, 2/8/2021 (a) (b) (d) | | | 22 | | | | 22 | |
| |
Goldman Sachs Group, Inc. (The) | | | | | |
| | |
Series M, (ICE LIBOR USD 3 Month + 3.92%), 4.13%, 2/8/2021 (a) (b) (d) | | | 134 | | | | 134 | |
| | |
Series S, (US Treasury Yield Curve Rate T Note Constant Maturity 5 Year + 2.85%), 4.40%, 2/10/2025 (a) (b) (d) | | | 11 | | | | 11 | |
| | |
Series R, (US Treasury Yield Curve Rate T Note Constant Maturity 5 Year + 3.22%),
4.95%, 2/10/2025 (a) (b) (d) | | | 24 | | | | 25 | |
| | |
3.80%, 3/15/2030 | | | 25 | | | | 30 | |
| | |
(ICE LIBOR USD 3 Month + 1.37%), 4.02%, 10/31/2038 (b) | | | 15 | | | | 18 | |
| | |
4.80%, 7/8/2044 | | | 25 | | | | 35 | |
| | |
Goodyear Tire & Rubber Co. (The)
5.13%, 11/15/2023 | | | 28 | | | | 28 | |
| | |
5.00%, 5/31/2026 | | | 47 | | | | 48 | |
| | |
4.88%, 3/15/2027 | | | 10 | | | | 10 | |
| | |
Gray Television, Inc.
5.88%, 7/15/2026 (c) | | | 20 | | | | 21 | |
| | |
7.00%, 5/15/2027 (c) | | | 45 | | | | 49 | |
| | |
Greif, Inc. 6.50%, 3/1/2027 (c) | | | 36 | | | | 38 | |
SEE NOTES TO FINANCIAL STATEMENTS.
| | | | | | | | | | |
| | | | | |
| 12 | | | | | | | | JPMORGAN INSURANCE TRUST | | DECEMBER 31, 2020 |
| | | | | | | | |
| INVESTMENTS | | PRINCIPAL
AMOUNT
($000) | | | VALUE
($000) | |
| | | | | | | | |
Corporate Bonds — continued | | | | | | | | |
United States — continued | | | | | | | | |
| | |
Guardian Life Insurance Co. of America (The) 4.88%, 6/19/2064 (c) | | | 5 | | | | 7 | |
| | |
3.70%, 1/22/2070 (c) | | | 5 | | | | 5 | |
| | |
Hanesbrands, Inc. 4.88%, 5/15/2026 (c) | | | 60 | | | | 65 | |
| | |
Harsco Corp. 5.75%, 7/31/2027 (c) | | | 9 | | | | 10 | |
| | |
HAT Holdings I LLC REIT, 5.25%, 7/15/2024 (c) | | | 13 | | | | 14 | |
| | |
HCA, Inc.
5.38%, 2/1/2025 | | | 146 | | | | 164 | |
| | |
5.88%, 2/15/2026 | | | 285 | | | | 328 | |
| | |
5.63%, 9/1/2028 | | | 274 | | | | 324 | |
| |
Healthpeak Properties, Inc. | | | | | |
| | |
REIT, 3.00%, 1/15/2030 | | | 10 | | | | 11 | |
| | |
REIT, 2.88%, 1/15/2031 | | | 10 | | | | 11 | |
| | |
Herc Holdings, Inc. 5.50%, 7/15/2027 (c) | | | 28 | | | | 30 | |
| | |
Hertz Corp. (The)
7.63%, 6/1/2022 (c) (i) | | | 8 | | | | 8 | |
| | |
5.50%, 10/15/2024 (c) (i) | | | 70 | | | | 38 | |
| | |
7.13%, 8/1/2026 (c) (i) | | | 75 | | | | 40 | |
| | |
Hilcorp Energy I LP
5.00%, 12/1/2024 (c) | | | 90 | | | | 89 | |
| | |
5.75%, 10/1/2025 (c) | | | 4 | | | | 4 | |
| | |
6.25%, 11/1/2028 (c) | | | 39 | | | | 40 | |
| | |
Hill-Rom Holdings, Inc.
5.00%, 2/15/2025 (c) | | | 15 | | | | 16 | |
| | |
4.38%, 9/15/2027 (c) | | | 75 | | | | 79 | |
| | |
Hilton Domestic Operating Co., Inc.
5.13%, 5/1/2026 | | | 12 | | | | 13 | |
| | |
4.88%, 1/15/2030 | | | 24 | | | | 26 | |
| | |
Hilton Grand Vacations Borrower LLC 6.13%, 12/1/2024 | | | 28 | | | | 29 | |
| | |
Hilton Worldwide Finance LLC 4.88%, 4/1/2027 | | | 32 | | | | 34 | |
| | |
Hologic, Inc. 4.63%, 2/1/2028 (c) | | | 25 | | | | 27 | |
| | |
Home Depot, Inc. (The) 4.25%, 4/1/2046 | | | 15 | | | | 20 | |
| | |
Honeywell International, Inc. 2.80%, 6/1/2050 | | | 10 | | | | 11 | |
| | |
Howmet Aerospace, Inc.
5.13%, 10/1/2024 | | | 107 | | | | 118 | |
| | |
5.90%, 2/1/2027 | | | 8 | | | | 9 | |
| | |
5.95%, 2/1/2037 | | | 34 | | | | 41 | |
| | |
Hughes Satellite Systems Corp.
5.25%, 8/1/2026 | | | 125 | | | | 138 | |
| | |
6.63%, 8/1/2026 | | | 20 | | | | 23 | |
| |
Huntington Bancshares, Inc. | | | | | |
| | |
Series E, (ICE LIBOR USD 3 Month + 2.88%), 5.70%, 4/15/2023 (a) (b) (d) | | | 23 | | | | 23 | |
| | |
Icahn Enterprises LP
6.25%, 2/1/2022 | | | 43 | | | | 43 | |
| | |
4.75%, 9/15/2024 | | | 70 | | | | 73 | |
| | |
6.38%, 12/15/2025 | | | 22 | | | | 23 | |
| | |
iHeartCommunications, Inc.
6.38%, 5/1/2026 | | | 57 | | | | 61 | |
| | |
8.38%, 5/1/2027 | | | 98 | | | | 104 | |
| | | | | | | | |
| INVESTMENTS | | PRINCIPAL
AMOUNT
($000) | | | VALUE
($000) | |
| | | | | | | | |
| | |
United States — continued | | | | | | | | |
| | |
5.25%, 8/15/2027 (c) | | | 18 | | | | 19 | |
| |
ILFC E-Capital Trust I | | | | | |
| | |
(USD Constant Maturity 30 Year + 1.55%, 14.50% Cap), 3.23%, 12/21/2065 (b) (c) | | | 100 | | | | 67 | |
| | |
Intel Corp.
4.10%, 5/19/2046 | | | 35 | | | | 44 | |
| | |
3.10%, 2/15/2060 | | | 5 | | | | 6 | |
| | |
International Game Technology plc 6.50%, 2/15/2025 (c) | | | 200 | | | | 224 | |
| | |
IQVIA, Inc. 5.00%, 5/15/2027 (c) | | | 200 | | | | 213 | |
| | |
IRB Holding Corp. 6.75%, 2/15/2026 (c) | | | 56 | | | | 58 | |
| |
Iron Mountain, Inc. | | | | | |
| | |
REIT, 4.88%, 9/15/2027 (c) | | | 84 | | | | 88 | |
| | |
REIT, 5.25%, 3/15/2028 (c) | | | 48 | | | | 50 | |
| | |
ITC Holdings Corp. 2.95%, 5/14/2030 (c) | | | 10 | | | | 11 | |
| | |
JB Poindexter & Co., Inc. 7.13%, 4/15/2026 (c) | | | 31 | | | | 33 | |
| | |
JBS USA LUX SA
5.75%, 6/15/2025 (c) | | | 96 | | | | 99 | |
| | |
6.50%, 4/15/2029 (c) | | | 63 | | | | 74 | |
| | |
5.50%, 1/15/2030 (c) | | | 42 | | | | 48 | |
| | |
Johnson & Johnson 2.25%, 9/1/2050 | | | 15 | | | | 15 | |
| | |
Kaiser Aluminum Corp. 4.63%, 3/1/2028 (c) | | | 80 | | | | 83 | |
| | |
Kennedy-Wilson, Inc. 5.88%, 4/1/2024 | | | 11 | | | | 11 | |
| | |
Keurig Dr Pepper, Inc.
4.42%, 12/15/2046 | | | 30 | | | | 38 | |
| | |
3.80%, 5/1/2050 (e) | | | 25 | | | | 30 | |
| | |
Kinder Morgan Energy Partners LP 4.70%, 11/1/2042 | | | 10 | | | | 11 | |
| | |
Kinder Morgan, Inc. 3.25%, 8/1/2050 | | | 15 | | | | 15 | |
| | |
Kraft Heinz Foods Co. 4.63%, 1/30/2029 | | | 175 | | | | 200 | |
| | |
Kroger Co. (The) 3.88%, 10/15/2046 | | | 38 | | | | 44 | |
| | |
LABL Escrow Issuer LLC 6.75%, 7/15/2026 (c) | | | 100 | | | | 108 | |
| | |
Ladder Capital Finance Holdings LLLP REIT, 5.25%, 10/1/2025 (c) | | | 48 | | | | 48 | |
| | |
Lamar Media Corp. 5.75%, 2/1/2026 | | | 20 | | | | 21 | |
| | |
Lamb Weston Holdings, Inc.
4.88%, 11/1/2026 (c) | | | 89 | | | | 93 | |
| | |
Leidos, Inc. 4.38%, 5/15/2030 (c) | | | 10 | | | | 12 | |
| | |
Lennar Corp. | | | | | | | | |
| | |
4.50%, 4/30/2024 | | | 15 | | | | 16 | |
| | |
5.88%, 11/15/2024 | | | 45 | | | | 52 | |
| | |
4.75%, 5/30/2025 | | | 5 | | | | 6 | |
| | |
5.25%, 6/1/2026 | | | 14 | | | | 17 | |
| | |
5.00%, 6/15/2027 | | | 20 | | | | 23 | |
| | |
Level 3 Financing, Inc. | | | | | | | | |
| | |
5.38%, 1/15/2024 | | | 10 | | | | 10 | |
| | |
5.38%, 5/1/2025 | | | 91 | | | | 93 | |
| | |
5.25%, 3/15/2026 | | | 54 | | | | 56 | |
SEE NOTES TO FINANCIAL STATEMENTS.
| | | | | | | | | | |
| | | | | |
| DECEMBER 31, 2020 | | JPMORGAN INSURANCE TRUST | | | | | | | | 13 |
JPMorgan Insurance Trust Income Builder Portfolio
SCHEDULE OF PORTFOLIO INVESTMENTS
AS OF DECEMBER 31, 2020 (continued)
| | | | | | | | |
| INVESTMENTS | | PRINCIPAL
AMOUNT
($000) | | | VALUE
($000) | |
| | | | | | | | |
Corporate Bonds — continued | | | | | | | | |
United States — continued | | | | | | | | |
| | |
Liberty Interactive LLC 8.25%, 2/1/2030 | | | 35 | | | | 39 | |
| | |
Live Nation Entertainment, Inc. | | | | | | | | |
| | |
5.63%, 3/15/2026 (c) | | | 33 | | | | 34 | |
| | |
6.50%, 5/15/2027 (c) | | | 165 | | | | 184 | |
| | |
Lockheed Martin Corp. 2.80%, 6/15/2050 | | | 35 | | | | 38 | |
| | |
Lowe’s Cos., Inc. 3.70%, 4/15/2046 | | | 10 | | | | 12 | |
| | |
LPL Holdings, Inc. 5.75%, 9/15/2025 (c) | | | 50 | | | | 52 | |
| | |
Macy’s, Inc. 8.38%, 6/15/2025 (c) | | | 90 | | | | 100 | |
| | |
Marriott Ownership Resorts, Inc. 6.50%, 9/15/2026 | | | 50 | | | | 52 | |
| | |
Mastercard, Inc. 3.85%, 3/26/2050 | | | 15 | | | | 19 | |
| | |
Matador Resources Co. 5.88%, 9/15/2026 | | | 55 | | | | 54 | |
| | |
Mattel, Inc. | | | | | | | | |
| | |
3.15%, 3/15/2023 (e) | | | 37 | | | | 38 | |
| | |
6.75%, 12/31/2025 (c) | | | 150 | | | | 158 | |
| | |
Mauser Packaging Solutions Holding Co. 5.50%, 4/15/2024 (c) | | | 227 | | | | 231 | |
| | |
McDonald’s Corp. | | | | | | | | |
| | |
3.70%, 2/15/2042 | | | 10 | | | | 11 | |
| | |
3.63%, 9/1/2049 | | | 10 | | | | 12 | |
| |
Mellon Capital IV | | | | | |
| | |
Series 1, (ICE LIBOR USD 3 Month + 0.57%, 4.00% Floor), 4.00%, 2/8/2021 (a) (b) (d) | | | 8 | | | | 8 | |
| | |
Merck & Co., Inc. | | | | | | | | |
| | |
2.35%, 6/24/2040 | | | 5 | | | | 5 | |
| | |
4.00%, 3/7/2049 | | | 15 | | | | 20 | |
| | |
Meredith Corp. 6.88%, 2/1/2026 (e) | | | 185 | | | | 180 | |
| | |
MetLife Capital Trust IV 7.88%, 12/15/2037 (c) | | | 100 | | | | 141 | |
| |
MetLife, Inc. | | | | | |
| | |
Series C, (ICE LIBOR USD 3 Month + 3.58%), 3.79%, 2/8/2021 (a) (b) (d) | | | 23 | | | | 23 | |
| | |
Series G, (US Treasury Yield Curve Rate T Note Constant Maturity 5 Year + 3.58%), 3.85%, 9/15/2025 (a) (b) (d) | | | 70 | | | | 74 | |
| | |
Series D, (ICE LIBOR USD 3 Month + 2.96%), 5.87%, 3/15/2028 (a) (b) (d) | | | 82 | | | | 94 | |
| | |
6.40%, 12/15/2036 | | | 108 | | | | 139 | |
| | | | | | | | |
| INVESTMENTS | | PRINCIPAL
AMOUNT
($000) | | | VALUE
($000) | |
| | | | | | | | |
| | |
United States — continued | | | | | | | | |
| |
MGM Growth Properties Operating Partnership LP | | | | | |
| | |
REIT, 5.75%, 2/1/2027 | | | 23 | | | | 26 | |
| | |
MGM Resorts International 4.63%, 9/1/2026 | | | 200 | | | | 212 | |
| | |
Microsoft Corp. | | | | | | | | |
| | |
3.45%, 8/8/2036 | | | 50 | | | | 62 | |
| | |
4.10%, 2/6/2037 | | | 16 | | | | 21 | |
| | |
2.68%, 6/1/2060 | | | 15 | | | | 16 | |
| | |
MidAmerican Energy Co. 4.25%, 5/1/2046 | | | 15 | | | | 19 | |
| | |
Midcontinent Communications 5.38%, 8/15/2027 (c) | | | 17 | | | | 18 | |
| | |
Mississippi Power Co. Series 12-A, 4.25%, 3/15/2042 | | | 15 | | | | 18 | |
| | |
Moody’s Corp. 2.55%, 8/18/2060 | | | 20 | | | | 19 | |
| |
Morgan Stanley | | | | | |
| | |
Series H, (ICE LIBOR USD 3 Month + 3.61%), 3.85%, 4/15/2021 (a) (b) (d) | | | 249 | | | | 247 | |
| | |
Series J, (ICE LIBOR USD 3 Month + 3.81%), 4.05%, 4/15/2021 (a) (b) (d) (e) | | | 159 | | | | 158 | |
| | |
Series J, (ICE LIBOR USD 3 Month + 3.81%), 4.05%, 4/15/2021 (a) (b) (d) | | | 14 | | | | 14 | |
| | |
Series N, (ICE LIBOR USD 3 Month + 3.16%), 5.30%, 12/15/2025 (a) (b) (d) | | | 8 | | | | 8 | |
| | |
Series M, (ICE LIBOR USD 3 Month + 4.44%), 5.87%, 9/15/2026 (a) (b) (d) | | | 18 | | | | 20 | |
| | |
(ICE LIBOR USD 3 Month + 1.63%), 4.43%, 1/23/2030 (b) | | | 20 | | | | 24 | |
| | |
(SOFR + 1.14%), 2.70%, 1/22/2031 (b) | | | 25 | | | | 27 | |
| | |
(ICE LIBOR USD 3 Month + 1.43%), 4.46%, 4/22/2039 (b) | | | 25 | | | | 33 | |
| | |
MPLX LP | | | | | | | | |
| | |
2.65%, 8/15/2030 | | | 15 | | | | 15 | |
| | |
4.50%, 4/15/2038 | | | 5 | | | | 6 | |
| | |
MSCI, Inc. 5.38%, 5/15/2027 (c) | | | 69 | | | | 74 | |
| | |
MTS Systems Corp. 5.75%, 8/15/2027 (c) | | | 24 | | | | 26 | |
| | |
MYT Holding LLC 7.50% (PIK), 9/25/2025 (c) (g) | | | 10 | | | | 10 | |
| |
National Rural Utilities Cooperative Finance Corp. | | | | | |
| | |
(ICE LIBOR USD 3 Month + 3.63%), 5.25%, 4/20/2046 (b) | | | 20 | | | | 22 | |
SEE NOTES TO FINANCIAL STATEMENTS.
| | | | | | | | | | |
| | | | | |
| 14 | | | | | | | | JPMORGAN INSURANCE TRUST | | DECEMBER 31, 2020 |
| | | | | | | | |
| INVESTMENTS | | PRINCIPAL
AMOUNT
($000) | | | VALUE
($000) | |
| | | | | | | | |
Corporate Bonds — continued | | | | | | | | |
United States — continued | | | | | | | | |
| |
NCR Corp. | | | | | |
| | |
5.75%, 9/1/2027 (c) | | | 25 | | | | 26 | |
| | |
6.13%, 9/1/2029 (c) | | | 25 | | | | 28 | |
| | |
Netflix, Inc. | | | | | | | | |
| | |
5.88%, 2/15/2025 | | | 100 | | | | 115 | |
| | |
4.88%, 4/15/2028 | | | 15 | | | | 17 | |
| | |
5.88%, 11/15/2028 | | | 60 | | | | 72 | |
| | |
5.38%, 11/15/2029 (c) | | | 15 | | | | 18 | |
| | |
4.88%, 6/15/2030 (c) | | | 15 | | | | 17 | |
| | |
New Albertsons LP | | | | | | | | |
| | |
7.75%, 6/15/2026 | | | 5 | | | | 6 | |
| | |
6.63%, 6/1/2028 | | | 15 | | | | 17 | |
| | |
7.45%, 8/1/2029 | | | 21 | | | | 25 | |
| | |
8.00%, 5/1/2031 | | | 80 | | | | 100 | |
| | |
New York Life Insurance Co. 3.75%, 5/15/2050 (c) | | | 10 | | | | 12 | |
| | |
Newell Brands, Inc. | | | | | | | | |
| | |
4.70%, 4/1/2026 (h) | | | 150 | | | | 165 | |
| | |
Nexstar Broadcasting, Inc. 5.63%, 7/15/2027 (c) | | | 43 | | | | 46 | |
| | |
NextEra Energy Capital Holdings, Inc. | | | | | | | | |
| | |
2.75%, 11/1/2029 | | | 5 | | | | 6 | |
| | |
2.25%, 6/1/2030 | | | 50 | | | | 52 | |
| | |
(ICE LIBOR USD 3 Month + 2.07%), 2.29%, 10/1/2066 (b) | | | 39 | | | | 34 | |
| | |
(ICE LIBOR USD 3 Month + 2.13%), 2.34%, 6/15/2067 (b) | | | 22 | | | | 19 | |
| | |
(ICE LIBOR USD 3 Month + 3.16%), 5.65%, 5/1/2079 (b) | | | 28 | | | | 33 | |
| | |
NextEra Energy Operating Partners LP | | | | | | | | |
| | |
4.25%, 7/15/2024 (c) | | | 23 | | | | 25 | |
| | |
4.25%, 9/15/2024 (c) | | | 4 | | | | 4 | |
| | |
4.50%, 9/15/2027 (c) | | | 8 | | | | 9 | |
| | |
Nielsen Co. Luxembourg SARL (The) 5.00%, 2/1/2025 (c) | | | 10 | | | | 10 | |
| | |
Nielsen Finance LLC 5.00%, 4/15/2022 (c) | | | 39 | | | | 39 | |
| | |
NIKE, Inc. | | | | | | | | |
| | |
3.25%, 3/27/2040 | | | 5 | | | | 6 | |
| | |
3.88%, 11/1/2045 | | | 15 | | | | 19 | |
| | |
3.38%, 3/27/2050 | | | 5 | | | | 6 | |
| |
NiSource, Inc. | | | | | |
| | |
(US Treasury Yield Curve Rate T Note Constant Maturity 5 Year + 2.84%), 5.65%, 6/15/2023 (a) (b) (d) | | | 30 | | | | 31 | |
| | | | | | | | |
| INVESTMENTS | | PRINCIPAL
AMOUNT
($000) | | | VALUE
($000) | |
| | | | | | | | |
| | | | | | | | |
| | |
United States — continued | | | | | | | | |
| | |
4.80%, 2/15/2044 | | | 4 | | | | 5 | |
| | |
Norfolk Southern Corp. | | | | | | | | |
| | |
3.95%, 10/1/2042 | | | 10 | | | | 12 | |
| | |
3.05%, 5/15/2050 | | | 40 | | | | 44 | |
| | |
Northern States Power Co.
3.40%, 8/15/2042 | | | 20 | | | | 23 | |
| | |
Northrop Grumman Corp.
5.15%, 5/1/2040 | | | 20 | | | | 28 | |
| | |
3.85%, 4/15/2045 | | | 55 | | | | 67 | |
| | |
Northwestern Mutual Life Insurance Co. (The) 3.85%, 9/30/2047 (c) | | | 2 | | | | 2 | |
| | |
Novelis Corp.
5.88%, 9/30/2026 (c) | | | 25 | | | | 26 | |
| |
NRG Energy, Inc. | | | | | |
| | |
7.25%, 5/15/2026 | | | 40 | | | | 42 | |
| | |
6.63%, 1/15/2027 | | | 15 | | | | 16 | |
| | |
5.75%, 1/15/2028 | | | 12 | | | | 13 | |
| | |
5.25%, 6/15/2029 (c) | | | 26 | | | | 29 | |
| | |
Nuance Communications, Inc.
5.63%, 12/15/2026 | | | 59 | | | | 62 | |
| | |
NuStar Logistics LP | | | | | | | | |
| | |
6.00%, 6/1/2026 | | | 12 | | | | 13 | |
| | |
5.63%, 4/28/2027 | | | 30 | | | | 32 | |
| | |
Occidental Petroleum Corp. | | | | | | | | |
| | |
2.90%, 8/15/2024 | | | 205 | | | | 197 | |
| | |
8.88%, 7/15/2030 | | | 115 | | | | 135 | |
| | |
Oceaneering International, Inc.
6.00%, 2/1/2028 | | | 14 | | | | 13 | |
| | |
Oncor Electric Delivery Co. LLC
4.10%, 11/15/2048 | | | 10 | | | | 13 | |
| | |
OneMain Finance Corp.
7.75%, 10/1/2021 | | | 40 | | | | 42 | |
| | |
6.13%, 5/15/2022 | | | 5 | | | | 5 | |
| | |
5.63%, 3/15/2023 | | | 27 | | | | 29 | |
| | |
6.13%, 3/15/2024 | | | 20 | | | | 22 | |
| | |
6.88%, 3/15/2025 | | | 45 | | | | 52 | |
| | |
7.13%, 3/15/2026 | | | 52 | | | | 62 | |
| | |
6.63%, 1/15/2028 | | | 33 | | | | 39 | |
| | |
ONEOK, Inc.
3.40%, 9/1/2029 | | | 5 | | | | 5 | |
| | |
Oracle Corp.
3.90%, 5/15/2035 | | | 26 | | | | 32 | |
| | |
3.85%, 7/15/2036 | | | 4 | | | | 5 | |
| | |
3.60%, 4/1/2040 | | | 35 | | | | 41 | |
SEE NOTES TO FINANCIAL STATEMENTS.
| | | | | | | | | | |
| | | | | |
| DECEMBER 31, 2020 | | JPMORGAN INSURANCE TRUST | | | | | | | | 15 |
JPMorgan Insurance Trust Income Builder Portfolio
SCHEDULE OF PORTFOLIO INVESTMENTS
AS OF DECEMBER 31, 2020 (continued)
| | | | | | | | |
| INVESTMENTS | | PRINCIPAL
AMOUNT
($000) | | | VALUE
($000) | |
| | | | | | | | |
Corporate Bonds — continued | | | | | | | | |
United States — continued | | | | | | | | |
| | |
3.60%, 4/1/2050 | | | 55 | | | | 64 | |
| | |
Otis Worldwide Corp.
3.36%, 2/15/2050 | | | 5 | | | | 6 | |
| | |
Outfront Media Capital LLC
5.63%, 2/15/2024 | | | 25 | | | | 26 | |
| | |
5.00%, 8/15/2027 (c) | | | 15 | | | | 15 | |
| | |
Pacific Gas and Electric Co.
4.00%, 12/1/2046 | | | 30 | | | | 31 | |
| | |
PacifiCorp
4.10%, 2/1/2042 | | | 18 | | | | 22 | |
| | |
3.30%, 3/15/2051 | | | 17 | | | | 20 | |
| | |
Par Pharmaceutical, Inc. 7.50%, 4/1/2027 (c) | | | 12 | | | | 13 | |
| | |
PBF Holding Co. LLC 7.25%, 6/15/2025 | | | 25 | | | | 16 | |
| | |
PBF Logistics LP 6.88%, 5/15/2023 | | | 25 | | | | 24 | |
| | |
PECO Energy Co. 2.80%, 6/15/2050 | | | 3 | | | | 3 | |
| | |
Penske Automotive Group, Inc. 5.50%, 5/15/2026 | | | 75 | | | | 78 | |
| | |
PepsiCo, Inc. 3.50%, 3/19/2040 | | | 20 | | | | 24 | |
| | |
Performance Food Group, Inc. 5.50%, 10/15/2027 (c) | | | 20 | | | | 21 | |
| | |
PetSmart, Inc.
7.13%, 3/15/2023 (c) | | | 70 | | | | 70 | |
| | |
5.88%, 6/1/2025 (c) | | | 232 | | | | 238 | |
| | |
Pfizer, Inc.
2.55%, 5/28/2040 | | | 20 | | | | 21 | |
| | |
2.70%, 5/28/2050 (e) | | | 50 | | | | 54 | |
| |
Philip Morris International, Inc. | | | | | |
| | |
4.38%, 11/15/2041 | | | 25 | | | | 31 | |
| | |
4.13%, 3/4/2043 | | | 5 | | | | 6 | |
| | |
4.25%, 11/10/2044 | | | 20 | | | | 25 | |
| | |
Phillips 66 4.88%, 11/15/2044 | | | 15 | | | | 19 | |
| | |
Piedmont Natural Gas Co., Inc. 3.35%, 6/1/2050 | | | 15 | | | | 17 | |
| | |
Pilgrim’s Pride Corp. | | | | | | | | |
| | |
5.75%, 3/15/2025 (c) | | | 59 | | | | 61 | |
| | |
5.88%, 9/30/2027 (c) | | | 39 | | | | 42 | |
| | |
Plains All American Pipeline LP | | | | | | | | |
| | |
Series B, (ICE LIBOR USD 3 Month + 4.11%), 6.13%, 11/15/2022 (a) (b) (d) | | | 8 | | | | 7 | |
| | |
Plantronics, Inc. 5.50%, 5/31/2023 (c) | | | 61 | | | | 61 | |
| | |
PNC Financial Services Group, Inc. (The) | | | | | | | | |
| | |
Series O, (ICE LIBOR USD 3 Month + 3.68%), 6.75%, 8/1/2021 (a) (b) (d) | | | 68 | | | | 70 | |
| | |
Series R, (ICE LIBOR USD 3 Month + 3.04%), 4.85%, 6/1/2023 (a) (b) (d) | | | 64 | | | | 67 | |
| | |
Series S, (ICE LIBOR USD 3 Month + 3.30%), 5.00%, 11/1/2026 (a) (b) (d) | | | 39 | | | | 42 | |
| | | | | | | | |
| INVESTMENTS | | PRINCIPAL
AMOUNT
($000) | | | VALUE
($000) | |
| | | | | | | | |
| | | | | | | | |
| | |
United States — continued | | | | | | | | |
| | |
Post Holdings, Inc. 5.00%, 8/15/2026 (c) | | | 84 | | | | 87 | |
| | |
5.75%, 3/1/2027 (c) | | | 20 | | | | 21 | |
| | |
5.50%, 12/15/2029 (c) | | | 140 | | | | 153 | |
| | |
Prime Security Services Borrower LLC
5.25%, 4/15/2024 (c) | | | 31 | | | | 33 | |
| | |
5.75%, 4/15/2026 (c) | | | 50 | | | | 55 | |
| | |
Progressive Corp. (The) | | | | | | | | |
| | |
Series B, (ICE LIBOR USD 3 Month + 2.54%), 5.38%, 3/15/2023 (a) (b) (d) | | | 75 | | | | 78 | |
| | |
Prologis LP REIT, 2.13%, 10/15/2050 | | | 35 | | | | 32 | |
| | |
Prudential Financial, Inc. | | | | | | | | |
| | |
(ICE LIBOR USD 3 Month + 3.92%), 5.63%, 6/15/2043 (b) | | | 171 | | | | 183 | |
| | |
4.35%, 2/25/2050 | | | 10 | | | | 13 | |
| | |
Public Service Co. of Colorado | | | | | | | | |
| | |
Series 36, 2.70%, 1/15/2051 | | | 5 | | | | 5 | |
| | |
Public Service Electric and Gas Co. 2.70%, 5/1/2050 | | | 10 | | | | 11 | |
| | |
QEP Resources, Inc.
5.38%, 10/1/2022 | | | 8 | | | | 8 | |
| | |
5.25%, 5/1/2023 | | | 75 | | | | 79 | |
| | |
QUALCOMM, Inc. 3.25%, 5/20/2050 | | | 30 | | | | 35 | |
| | |
Quicken Loans LLC 5.25%, 1/15/2028 (c) | | | 20 | | | | 21 | |
| | |
Radian Group, Inc.
4.50%, 10/1/2024 | | | 40 | | | | 42 | |
| | |
4.88%, 3/15/2027 | | | 12 | | | | 13 | |
| | |
Raytheon Technologies Corp.
4.15%, 5/15/2045 | | | 40 | | | | 51 | |
| | |
3.13%, 7/1/2050 | | | 50 | | | | 55 | |
| | |
Refinitiv US Holdings, Inc.
6.25%, 5/15/2026 (c) | | | 35 | | | | 37 | |
| | |
8.25%, 11/15/2026 (c) | | | 29 | | | | 32 | |
| | |
Regeneron Pharmaceuticals, Inc. 2.80%, 9/15/2050 | | | 10 | | | | 10 | |
| | |
Reynolds Group Issuer, Inc. 5.13%, 7/15/2023 (c) | | | 2 | | | | 2 | |
| | |
4.00%, 10/15/2027 (c) | | | 200 | | | | 205 | |
| | |
RHP Hotel Properties LP | | | | | | | | |
| | |
REIT, 4.75%, 10/15/2027 | | | 18 | | | | 19 | |
| | |
Roper Technologies, Inc. 2.00%, 6/30/2030 | | | 10 | | | | 10 | |
| | |
S&P Global, Inc. 2.30%, 8/15/2060 | | | 35 | | | | 33 | |
| | |
SBA Communications Corp. | | | | | | | | |
| | |
REIT, 4.00%, 10/1/2022 | | | 23 | | | | 23 | |
| | |
Scientific Games International, Inc. 5.00%, 10/15/2025 (c) | | | 156 | | | | 161 | |
SEE NOTES TO FINANCIAL STATEMENTS.
| | | | | | | | | | |
| | | | | |
| 16 | | | | | | | | JPMORGAN INSURANCE TRUST | | DECEMBER 31, 2020 |
| | | | | | | | |
| INVESTMENTS | | PRINCIPAL
AMOUNT
($000) | | | VALUE
($000) | |
| | | | | | | | |
Corporate Bonds — continued | | | | | | | | |
United States — continued | | | | | | | | |
| | |
Scotts Miracle-Gro Co. (The) 5.25%, 12/15/2026 | | | 125 | | | | 132 | |
| | |
Sealed Air Corp. 5.13%, 12/1/2024 (c) | | | 20 | | | | 22 | |
| | |
Sempra Energy | | | | | | | | |
| | |
(US Treasury Yield Curve Rate T Note Constant Maturity 5 Year + 4.55%), 4.88%, 10/15/2025 (a) (b) (d) | | | 65 | | | | 69 | |
| | |
Sensata Technologies BV 4.88%, 10/15/2023 (c) | | | 15 | | | | 16 | |
| | |
5.63%, 11/1/2024 (c) | | | 125 | | | | 140 | |
| | |
5.00%, 10/1/2025 (c) | | | 30 | | | | 33 | |
| | |
Service Corp. International 4.63%, 12/15/2027 | | | 12 | | | | 13 | |
| | |
5.13%, 6/1/2029 | | | 5 | | | | 5 | |
| | |
Sherwin-Williams Co. (The) 4.55%, 8/1/2045 | | | 5 | | | | 6 | |
| | |
Sinclair Television Group, Inc. 5.88%, 3/15/2026 (c) | | | 50 | | | | 51 | |
| | |
Sirius XM Radio, Inc. 5.38%, 7/15/2026 (c) | | | 87 | | | | 91 | |
| | |
5.00%, 8/1/2027 (c) | | | 53 | | | | 56 | |
| | |
5.50%, 7/1/2029 (c) | | | 161 | | | | 177 | |
| | |
Six Flags Entertainment Corp. 4.88%, 7/31/2024 (c) | | | 12 | | | | 12 | |
| | |
5.50%, 4/15/2027 (c) (e) | | | 102 | | | | 105 | |
| | |
SM Energy Co. 6.75%, 9/15/2026 | | | 12 | | | | 9 | |
| | |
6.63%, 1/15/2027 | | | 16 | | | | 13 | |
| | |
Southern California Edison Co. | | | | | | | | |
| | |
Series E, (ICE LIBOR USD 3 Month + 4.20%), 6.25%, 2/1/2022 (a) (b) (d) | | | 12 | | | | 12 | |
| | |
Series C, 4.13%, 3/1/2048 | | | 5 | | | | 6 | |
| | |
3.65%, 2/1/2050 | | | 20 | | | | 23 | |
| | |
Southwestern Public Service Co. 3.40%, 8/15/2046 | | | 5 | | | | 6 | |
| | |
Spectrum Brands, Inc. 6.13%, 12/15/2024 | | | 18 | | | | 19 | |
| | |
5.75%, 7/15/2025 | | | 133 | | | | 137 | |
| | |
5.00%, 10/1/2029 (c) | | | 31 | | | | 33 | |
| | |
Sprint Capital Corp. 8.75%, 3/15/2032 | | | 197 | | | | 312 | |
| | |
Sprint Corp. 7.88%, 9/15/2023 | | | 227 | | | | 263 | |
| | |
7.13%, 6/15/2024 | | | 71 | | | | 83 | |
| | |
7.63%, 2/15/2025 | | | 194 | | | | 232 | |
| | |
7.63%, 3/1/2026 | | | 39 | | | | 48 | |
| | |
SS&C Technologies, Inc. 5.50%, 9/30/2027 (c) | | | 93 | | | | 99 | |
| | |
Standard Industries, Inc. 5.00%, 2/15/2027 (c) | | | 18 | | | | 19 | |
| | |
4.75%, 1/15/2028 (c) | | | 77 | | | | 81 | |
Stanley Black & Decker, Inc. | | | | | |
| | |
(US Treasury Yield Curve Rate T Note Constant Maturity 5 Year + 2.66%), 4.00%, 3/15/2060 (b) | | | 10 | | | | 11 | |
| | | | | | | | |
| INVESTMENTS | | PRINCIPAL
AMOUNT
($000) | | | VALUE
($000) | |
| | | | | | | | |
| | | | | | | | |
United States — continued | | | | | | | | |
| | |
Staples, Inc. 7.50%, 4/15/2026 (c) | | | 95 | | | | 99 | |
| | |
10.75%, 4/15/2027 (c) | | | 85 | | | | 85 | |
| | |
Starbucks Corp. 3.75%, 12/1/2047 | | | 10 | | | | 12 | |
| | |
4.45%, 8/15/2049 | | | 20 | | | | 26 | |
| | |
3.35%, 3/12/2050 | | | 10 | | | | 11 | |
State Street Corp. | | | | | |
| | |
Series F, (ICE LIBOR USD 3 Month + 3.60%), 3.81%, 3/15/2021 (a) (b) (d) | | | 73 | | | | 72 | |
| | |
Series H, (ICE LIBOR USD 3 Month + 2.54%), 5.63%, 12/15/2023 (a) (b) (d) | | | 71 | | | | 75 | |
| | |
(SOFR + 2.65%), 3.15%, 3/30/2031 (b) | | | 5 | | | | 6 | |
| | |
Station Casinos LLC 5.00%, 10/1/2025 (c) | | | 36 | | | | 36 | |
| | |
Steel Dynamics, Inc. 5.00%, 12/15/2026 | | | 15 | | | | 16 | |
| | |
Stryker Corp. 2.90%, 6/15/2050 | | | 15 | | | | 16 | |
| | |
Summit Materials LLC 5.13%, 6/1/2025 (c) | | | 35 | | | | 35 | |
| | |
6.50%, 3/15/2027 (c) | | | 45 | | | | 48 | |
| | |
Summit Midstream Holdings LLC 5.75%, 4/15/2025 | | | 35 | | | | 22 | |
| | |
Sunoco Logistics Partners Operations LP 4.00%, 10/1/2027 | | | 10 | | | | 11 | |
| | |
Sunoco LP 4.88%, 1/15/2023 | | | 23 | | | | 23 | |
| | |
5.50%, 2/15/2026 | | | 13 | | | | 14 | |
| | |
6.00%, 4/15/2027 | | | 36 | | | | 38 | |
| | |
5.88%, 3/15/2028 | | | 3 | | | | 3 | |
| | |
Sysco Corp. 3.30%, 2/15/2050 | | | 5 | | | | 5 | |
| | |
Tallgrass Energy Partners LP 5.50%, 9/15/2024 (c) | | | 25 | | | | 26 | |
| | |
5.50%, 1/15/2028 (c) | | | 5 | | | | 5 | |
| | |
Targa Resources Partners LP 4.25%, 11/15/2023 | | | 15 | | | | 15 | |
| | |
5.13%, 2/1/2025 | | | 50 | | | | 51 | |
| | |
5.88%, 4/15/2026 | | | 82 | | | | 87 | |
| | |
6.50%, 7/15/2027 | | | 106 | | | | 115 | |
| | |
Teachers Insurance & Annuity Association of America 3.30%, 5/15/2050 (c) | | | 55 | | | | 60 | |
| | |
Team Health Holdings, Inc.
6.38%, 2/1/2025 (c) | | | 85 | | | | 73 | |
| | |
TEGNA, Inc. 5.50%, 9/15/2024 (c) | | | 4 | | | | 4 | |
| | |
Tempur Sealy International, Inc. 5.63%, 10/15/2023 | | | 23 | | | | 23 | |
| | |
5.50%, 6/15/2026 | | | 64 | | | | 67 | |
| | |
Tenet Healthcare Corp. 4.63%, 7/15/2024 | | | 75 | | | | 77 | |
| | |
4.63%, 9/1/2024 (c) | | | 11 | | | | 11 | |
| | |
5.13%, 5/1/2025 | | | 57 | | | | 58 | |
| | |
4.88%, 1/1/2026 (c) | | | 78 | | | | 82 | |
| | |
6.25%, 2/1/2027 (c) | | | 30 | | | | 32 | |
| | |
5.13%, 11/1/2027 (c) | | | 189 | | | | 200 | |
SEE NOTES TO FINANCIAL STATEMENTS.
| | | | | | | | | | |
| | | | | |
| DECEMBER 31, 2020 | | JPMORGAN INSURANCE TRUST | | | | | | | | 17 |
JPMorgan Insurance Trust Income Builder Portfolio
SCHEDULE OF PORTFOLIO INVESTMENTS
AS OF DECEMBER 31, 2020 (continued)
| | | | | | | | |
| INVESTMENTS | | PRINCIPAL
AMOUNT
($000) | | | VALUE
($000) | |
| | | | | | | | |
Corporate Bonds — continued | | | | | | | | |
United States — continued | | | | | | | | |
| | |
Tennant Co. 5.63%, 5/1/2025 | | | 60 | | | | 62 | |
| | |
TerraForm Power Operating LLC 4.25%, 1/31/2023 (c) | | | 15 | | | | 15 | |
| | |
5.00%, 1/31/2028 (c) | | | 29 | | | | 33 | |
| | |
T-Mobile USA, Inc. 5.13%, 4/15/2025 | | | 10 | | | | 10 | |
| | |
4.50%, 2/1/2026 | | | 99 | | | | 101 | |
| | |
4.75%, 2/1/2028 | | | 93 | | | | 100 | |
| | |
2.25%, 11/15/2031 (c) | | | 10 | | | | 10 | |
| | |
4.38%, 4/15/2040 (c) | | | 45 | | | | 55 | |
| | |
3.00%, 2/15/2041 (c) | | | 10 | | | | 10 | |
| | |
4.50%, 4/15/2050 (c) | | | 30 | | | | 37 | |
| | |
3.30%, 2/15/2051 (c) | | | 15 | | | | 16 | |
| | |
Transcontinental Gas Pipe Line Co. LLC 3.95%, 5/15/2050 | | | 10 | | | | 11 | |
| | |
TransDigm, Inc. 6.25%, 3/15/2026 (c) | | | 59 | | | | 63 | |
| | |
Transocean Pontus Ltd. 6.13%, 8/1/2025 (c) | | | 37 | | | | 35 | |
| | |
Transocean Poseidon Ltd. 6.88%, 2/1/2027 (c) | | | 50 | | | | 46 | |
| | |
Transocean Proteus Ltd. 6.25%, 12/1/2024 (c) | | | 20 | | | | 19 | |
| | |
Travelers Cos., Inc. (The) 3.75%, 5/15/2046 | | | 10 | | | | 12 | |
| | |
2.55%, 4/27/2050 | | | 10 | | | | 11 | |
| | |
Trinseo Materials Operating SCA 5.38%, 9/1/2025 (c) | | | 52 | | | | 53 | |
| | |
Tronox, Inc. 6.50%, 4/15/2026 (c) | | | 32 | | | | 33 | |
Truist Financial Corp. | | | | | |
| | |
Series N, (US Treasury Yield Curve Rate T Note Constant Maturity 5 Year + 3.00%), 4.80%, 9/1/2024 (a) (b) (d) | | | 25 | | | | 26 | |
| | |
Series L, (ICE LIBOR USD 3 Month + 3.10%), 5.05%, 12/15/2024 (a) (b) (d) | | | 34 | | | | 35 | |
| | |
Series P, (US Treasury Yield Curve Rate T Note Constant Maturity 5 Year + 4.61%), 4.95%, 9/1/2025 (a) (b) (d) | | | 20 | | | | 22 | |
| | |
Series M, (ICE LIBOR USD 3 Month + 2.79%), 5.13%, 12/15/2027 (a) (b) (d) | | | 40 | | | | 43 | |
| | |
Series Q, (US Treasury Yield Curve Rate T Note Constant Maturity 10 Year + 4.35%), 5.10%, 3/1/2030 (a) (b) (d) | | | 101 | | | | 115 | |
| | |
Tucson Electric Power Co. 4.00%, 6/15/2050 | | | 13 | | | | 16 | |
| |
UDR, Inc. | | | | | |
| | |
REIT, 3.20%, 1/15/2030 | | | 5 | | | | 6 | |
| | |
REIT, 3.00%, 8/15/2031 | | | 10 | | | | 11 | |
| | |
Union Electric Co. 4.00%, 4/1/2048 | | | 13 | | | | 16 | |
| | |
Union Pacific Corp. 4.00%, 4/15/2047 | | | 11 | | | | 14 | |
| | |
3.25%, 2/5/2050 | | | 15 | | | | 17 | |
| | |
3.95%, 8/15/2059 | | | 10 | | | | 12 | |
| | |
United Airlines Holdings, Inc.
5.00%, 2/1/2024 (e) | | | 33 | | | | 33 | |
| | |
4.88%, 1/15/2025 (e) | | | 28 | | | | 27 | |
| | | | | | | | |
| INVESTMENTS | | PRINCIPAL
AMOUNT
($000) | | | VALUE
($000) | |
| | | | | | | | |
| | | | | | | | |
United States — continued | | | | | | | | |
United Rentals North America, Inc. 5.88%, 9/15/2026 | | | 32 | | | | 34 | |
| | |
5.50%, 5/15/2027 | | | 10 | | | | 11 | |
| | |
4.88%, 1/15/2028 | | | 100 | | | | 106 | |
| | |
UnitedHealth Group, Inc. 4.25%, 4/15/2047 | | | 10 | | | | 13 | |
| | |
3.13%, 5/15/2060 | | | 30 | | | | 35 | |
| |
US Bancorp | | | | | |
| | |
Series I, (ICE LIBOR USD 3 Month + 3.49%), 5.13%, 2/8/2021 (a) (b) (d) | | | 30 | | | | 30 | |
| | |
Series J, (ICE LIBOR USD 3 Month + 2.91%), 5.30%, 4/15/2027 (a) (b) (d) | | | 8 | | | | 9 | |
| | |
Verizon Communications, Inc. 4.40%, 11/1/2034 | | | 20 | | | | 25 | |
| | |
4.27%, 1/15/2036 | | | 25 | | | | 31 | |
| | |
3.85%, 11/1/2042 | | | 15 | | | | 18 | |
| | |
4.86%, 8/21/2046 | | | 40 | | | | 54 | |
| | |
4.52%, 9/15/2048 | | | 35 | | | | 45 | |
| | |
ViacomCBS, Inc. 5.90%, 10/15/2040 | | | 10 | | | | 13 | |
| | |
4.95%, 5/19/2050 | | | 45 | | | | 58 | |
| | |
(ICE LIBOR USD 3 Month + 3.90%), 5.87%, 2/28/2057 (b) | | | 39 | | | | 41 | |
| | |
(ICE LIBOR USD 3 Month + 3.90%), 6.25%, 2/28/2057 (b) | | | 86 | | | | 97 | |
| |
VICI Properties LP | | | | | |
| | |
REIT, 4.25%, 12/1/2026 (c) | | | 75 | | | | 78 | |
| | |
Virginia Electric and Power Co. 2.45%, 12/15/2050 | | | 5 | | | | 5 | |
| |
Visa, Inc. | | | | | |
| | |
2.00%, 8/15/2050 | | | 40 | | | | 38 | |
| | |
Vistra Operations Co. LLC 5.50%, 9/1/2026 (c) | | | 20 | | | | 21 | |
| | |
W&T Offshore, Inc. 9.75%, 11/1/2023 (c) | | | 55 | | | | 39 | |
| |
Wachovia Capital Trust III | | | | | |
| | |
(ICE LIBOR USD 3 Month + 0.93%, 5.57% Floor), 5.57%, 2/8/2021 (a) (b) (d) | | | 56 | | | | 57 | |
| | |
Walmart, Inc. 4.05%, 6/29/2048 | | | 20 | | | | 27 | |
| | |
2.95%, 9/24/2049 | | | 15 | | | | 17 | |
| |
Wells Fargo & Co. | | | | | |
| | |
Series S, (ICE LIBOR USD 3 Month + 3.11%), 5.90%, 6/15/2024 (a) (b) (d) | | | 43 | | | | 46 | |
| | |
Series U, (ICE LIBOR USD 3 Month + 3.99%), 5.87%, 6/15/2025 (a) (b) (d) | | | 18 | | | | 20 | |
| | |
(SOFR + 2.53%), 3.07%, 4/30/2041 (b) | | | 55 | | | | 60 | |
| | |
(ICE LIBOR USD 3 Month + 4.24%), 5.01%, 4/4/2051 (b) | | | 25 | | | | 35 | |
| |
Welltower, Inc. | | | | | |
| | |
REIT, 2.75%, 1/15/2031 | | | 20 | | | | 21 | |
| | |
WESCO Distribution, Inc. 5.38%, 6/15/2024 | | | 36 | | | | 37 | |
| | |
7.25%, 6/15/2028 (c) | | | 125 | | | | 142 | |
SEE NOTES TO FINANCIAL STATEMENTS.
| | | | | | | | | | |
| | | | | |
| 18 | | | | | | | | JPMORGAN INSURANCE TRUST | | DECEMBER 31, 2020 |
| | | | | | | | |
| INVESTMENTS | | PRINCIPAL
AMOUNT
($000) | | | VALUE
($000) | |
| | | | | | | | |
Corporate Bonds — continued | | | | | | | | |
United States — continued | | | | | | | | |
| | |
Western Digital Corp. 4.75%, 2/15/2026 | | | 74 | | | | 82 | |
| | |
William Carter Co. (The) 5.63%, 3/15/2027 (c) | | | 73 | | | | 77 | |
| | |
Wisconsin Power and Light Co. 3.65%, 4/1/2050 | | | 10 | | | | 12 | |
| | |
WMG Acquisition Corp. 5.50%, 4/15/2026 (c) | | | 57 | | | | 59 | |
| | |
WPX Energy, Inc. 5.75%, 6/1/2026 | | | 104 | | | | 109 | |
| | |
Wyndham Destinations, Inc. 4.25%, 3/1/2022 | | | 2 | | | | 2 | |
| | |
5.65%, 4/1/2024 (h) | | | 17 | | | | 18 | |
| | |
6.60%, 10/1/2025 (h) | | | 16 | | | | 18 | |
| | |
6.00%, 4/1/2027 (h) | | | 25 | | | | 28 | |
| | |
Wynn Las Vegas LLC 5.50%, 3/1/2025 (c) | | | 35 | | | | 37 | |
| | |
Wynn Resorts Finance LLC 5.13%, 10/1/2029 (c) | | | 224 | | | | 235 | |
| | |
Xcel Energy, Inc. 3.50%, 12/1/2049 | | | 10 | | | | 12 | |
| | |
Xerox Corp. 4.38%, 3/15/2023 (h) | | | 45 | | | | 47 | |
| | |
XPO Logistics, Inc. 6.13%, 9/1/2023 (c) | | | 40 | | | | 41 | |
| | |
6.75%, 8/15/2024 (c) | | | 65 | | | | 69 | |
| | |
Yum! Brands, Inc. 4.75%, 1/15/2030 (c) | | | 24 | | | | 26 | |
| | |
Zayo Group Holdings, Inc. 4.00%, 3/1/2027 (c) | | | 140 | | | | 140 | |
| | |
Zoetis, Inc. 4.45%, 8/20/2048 | | | 40 | | | | 54 | |
| | |
3.00%, 5/15/2050 | | | 25 | | | | 27 | |
| | | | | | | | |
| | |
| | | | | | | 35,634 | |
| | | | | | | | |
Total Corporate Bonds
(Cost $39,712) | | | | 40,926 | |
| | | | | |
| | | | | | | | |
| | | SHARES
(000) | | | | |
Common Stocks — 35.0% | |
|
Australia — 1.2% | |
| | |
Adbri Ltd. | | | 8 | | | | 21 | |
| | |
AGL Energy Ltd. | | | 7 | | | | 66 | |
| | |
Alumina Ltd. | | | 21 | | | | 30 | |
| | |
APA Group | | | 2 | | | | 17 | |
| | |
Atlas Arteria Ltd. | | | 2 | | | | 10 | |
| | |
AusNet Services | | | 7 | | | | 9 | |
| | |
Bendigo & Adelaide Bank Ltd. | | | 5 | | | | 37 | |
| | |
BHP Group plc | | | 4 | | | | 118 | |
| | |
Charter Hall Long Wale, REIT | | | 20 | | | | 72 | |
| | |
CSR Ltd. | | | 7 | | | | 28 | |
| | |
Dexus, REIT | | | 11 | | | | 82 | |
| | |
Goodman Group, REIT | | | 8 | | | | 122 | |
| | |
IOOF Holdings Ltd. | | | 8 | | | | 21 | |
| | |
Mirvac Group, REIT | | | 49 | | | | 100 | |
| | |
Rio Tinto plc | | | 4 | | | | 265 | |
| | |
Sonic Healthcare Ltd. | | | 1 | | | | 32 | |
| | | | | | | | |
| INVESTMENTS | | SHARES
(000) | | | VALUE
($000) | |
| | | | | | | | |
| | | | | | | | |
Australia — continued | |
| | |
Spark Infrastructure Group | | | 5 | | | | 9 | |
| | |
Sydney Airport * | | | 5 | | | | 23 | |
| | |
Transurban Group | | | 2 | | | | 23 | |
| | |
Wesfarmers Ltd. | | | 1 | | | | 51 | |
| | |
Woodside Petroleum Ltd. | | | 2 | | | | 30 | |
| | | | | | | | |
| | |
| | | | | | | 1,166 | |
| | | | | | | | |
|
Austria — 0.0% (f) | |
| | |
ANDRITZ AG | | | — | (k) | | | 6 | |
| | |
Erste Group Bank AG | | | — | (k) | | | 9 | |
| | |
OMV AG | | | — | (k) | | | 10 | |
| | |
Verbund AG | | | — | (k) | | | 13 | |
| | | | | | | | |
| | |
| | | | | | | 38 | |
| | | | | | | | |
|
Belgium — 0.2% | |
| | |
Ageas SA | | | — | (k) | | | 13 | |
| | |
KBC Group NV | | | — | (k) | | | 12 | |
| | |
Proximus SADP | | | 1 | | | | 21 | |
| | |
Shurgard Self Storage SA | | | 1 | | | | 55 | |
| | |
Solvay SA | | | — | (k) | | | 9 | |
| | |
Telenet Group Holding NV | | | — | (k) | | | 8 | |
| | |
Warehouses De Pauw CVA, REIT | | | 2 | | | | 78 | |
| | | | | | | | |
| | |
| | | | | | | 196 | |
| | | | | | | | |
|
Brazil — 0.2% | |
| | |
Ambev SA * | | | 23 | | | | 69 | |
| | |
BB Seguridade Participacoes SA | | | 7 | | | | 40 | |
| | |
Itau Unibanco Holding SA (Preference) | | | 13 | | | | 77 | |
| | |
Yara International ASA | | | — | (k) | | | 7 | |
| | | | | | | | |
| | |
| | | | | | | 193 | |
| | | | | | | | |
|
Canada — 1.3% | |
| | |
Algonquin Power & Utilities Corp. | | | 1 | | | | 24 | |
| | |
Allied Properties, REIT | | | 4 | | | | 128 | |
| | |
AltaGas Ltd. | | | 1 | | | | 16 | |
| | |
Atco Ltd., Class I | | | — | (k) | | | 7 | |
| | |
BCE, Inc. (e) | | | 1 | | | | 45 | |
| | |
Canadian Imperial Bank of Commerce | | | 1 | | | | 50 | |
| | |
Canadian Tire Corp. Ltd., Class A | | | — | (k) | | | 54 | |
| | |
Canadian Utilities Ltd., Class A | | | 2 | | | | 56 | |
| | |
Capital Power Corp. | | | — | (k) | | | 11 | |
| | |
Emera, Inc. | | | 1 | | | | 22 | |
| | |
Enbridge, Inc. | | | 1 | | | | 44 | |
| | |
Fortis, Inc. | | | 2 | | | | 69 | |
| | |
Great-West Lifeco, Inc. | | | 1 | | | | 19 | |
| | |
Hydro One Ltd. (j) | | | 3 | | | | 66 | |
SEE NOTES TO FINANCIAL STATEMENTS.
| | | | | | | | | | |
| | | | | |
| DECEMBER 31, 2020 | | JPMORGAN INSURANCE TRUST | | | | | | | | 19 |
JPMorgan Insurance Trust Income Builder Portfolio
SCHEDULE OF PORTFOLIO INVESTMENTS
AS OF DECEMBER 31, 2020 (continued)
| | | | | | | | |
| INVESTMENTS | | SHARES
(000) | | | VALUE
($000) | |
| | | | | | | | |
Common Stocks — continued | |
|
Canada — continued | |
| | |
IGM Financial, Inc. | | | 1 | | | | 32 | |
| | |
Magna International, Inc. | | | 1 | | | | 61 | |
| | |
Northland Power, Inc. | | | 1 | | | | 19 | |
| | |
Nutrien Ltd. | | | 1 | | | | 55 | |
| | |
Pembina Pipeline Corp. | | | 2 | | | | 41 | |
| | |
Power Corp. of Canada | | | 2 | | | | 52 | |
| | |
Restaurant Brands International, Inc. | | | 1 | | | | 44 | |
| | |
Rogers Communications, Inc., Class B (e) | | | 1 | | | | 34 | |
| | |
Shaw Communications, Inc., Class B | | | 3 | | | | 44 | |
| | |
Superior Plus Corp. | | | 1 | | | | 6 | |
| | |
TC Energy Corp. | | | 2 | | | | 95 | |
| | |
TELUS Corp. | | | 3 | | | | 51 | |
| | |
Thomson Reuters Corp. | | | 1 | | | | 48 | |
| | |
Toronto-Dominion Bank (The) | | | 2 | | | | 109 | |
| | | | | | | | |
| | |
| | | | | | | 1,302 | |
| | | | | | | | |
|
Chile — 0.0% (f) | |
| | |
Banco Santander Chile, ADR | | | 1 | | | | 19 | |
| | | | | | | | |
|
China — 1.9% | |
| | |
China Construction Bank Corp., Class H | | | 158 | | | | 119 | |
| | |
China Construction Bank Corp., Class H | | | 57 | | | | 43 | |
| | |
China Life Insurance Co. Ltd., Class H | | | 28 | | | | 62 | |
| | |
China Merchants Bank Co. Ltd., Class H | | | 25 | | | | 158 | |
| | |
China Pacific Insurance Group Co. Ltd., Class H | | | 42 | | | | 164 | |
| | |
China Petroleum & Chemical Corp., Class H | | | 114 | | | | 51 | |
| | |
China Resources Land Ltd. | | | 14 | | | | 58 | |
| | |
Fuyao Glass Industry Group Co. Ltd., Class A | | | 5 | | | | 38 | |
| | |
Guangdong Investment Ltd. | | | 34 | | | | 61 | |
| | |
Haier Smart Home Co. Ltd., Class H * | | | 22 | | | | 81 | |
| | |
Huayu Automotive Systems Co. Ltd., Class A | | | 8 | | | | 36 | |
| | |
Inner Mongolia Yili Industrial Group Co. Ltd., Class A | | | 27 | | | | 181 | |
| | |
Jiangsu Yanghe Brewery Joint-Stock Co. Ltd., Class A | | | 2 | | | | 80 | |
| | |
Joyoung Co. Ltd., Class A | | | 4 | | | | 18 | |
| | |
Midea Group Co. Ltd., Class A | | | 15 | | | | 221 | |
| | |
NetEase, Inc. | | | 3 | | | | 50 | |
| | |
Ping An Insurance Group Co. of China Ltd., Class H | | | 21 | | | | 256 | |
| | |
Postal Savings Bank of China Co. Ltd., Class H (j) | | | 145 | | | | 82 | |
| | |
Tingyi Cayman Islands Holding Corp. | | | 42 | | | | 72 | |
| | |
Topsports International Holdings Ltd. (j) | | | 23 | | | | 34 | |
| | |
Yum China Holdings, Inc. | | | 1 | | | | 49 | |
| | | | | | | | |
| | |
| | | | | | | 1,914 | |
| | | | | | | | |
|
Czech Republic — 0.0% (f) | |
| | |
Komercni banka A/S * | | | 1 | | | | 19 | |
| | | | | | | | |
| | | | | | | | |
| INVESTMENTS | | SHARES
(000) | | | VALUE
($000) | |
| | | | | | | | |
| | | | | | | | |
|
Denmark — 0.2% | |
| | |
Carlsberg A/S, Class B | | | 1 | | | | 159 | |
| | |
Tryg A/S | | | — | (k) | | | 6 | |
| | | | | | | | |
| | |
| | | | | | | 165 | |
| | | | | | | | |
|
Finland — 0.3% | |
| | |
Fortum OYJ | | | 3 | | | | 81 | |
| | |
Kone OYJ, Class B | | | — | (k) | | | 12 | |
| | |
Neste OYJ | | | — | (k) | | | 12 | |
| | |
Nordea Bank Abp | | | 5 | | | | 42 | |
| | |
Orion OYJ, Class B | | | 1 | | | | 45 | |
| | |
Sampo OYJ, Class A | | | — | (k) | | | 11 | |
| | |
Stora Enso OYJ, Class R | | | — | (k) | | | 8 | |
| | |
UPM-Kymmene OYJ | | | — | (k) | | | 10 | |
| | |
Wartsila OYJ Abp (e) | | | 5 | | | | 47 | |
| | | | | | | | |
| | |
| | | | | | | 268 | |
| | | | | | | | |
|
France — 1.1% | |
| | |
Aeroports de Paris | | | — | (k) | | | 8 | |
| | |
Amundi SA * (j) | | | — | (k) | | | 9 | |
| | |
Arkema SA | | | — | (k) | | | 7 | |
| | |
Atos SE * | | | 1 | | | | 49 | |
| | |
AXA SA | | | 1 | | | | 18 | |
| | |
BNP Paribas SA * | | | — | (k) | | | 21 | |
| | |
Bouygues SA | | | — | (k) | | | 11 | |
| | |
Casino Guichard Perrachon SA * (e) | | | — | (k) | | | 11 | |
| | |
Cie de Saint-Gobain | | | — | (k) | | | 12 | |
| | |
Cie Generale des Etablissements Michelin SCA | | | — | (k) | | | 12 | |
| | |
Covivio, REIT | | | 1 | | | | 100 | |
| | |
Credit Agricole SA * | | | 1 | | | | 13 | |
| | |
Electricite de France SA | | | 1 | | | | 24 | |
| | |
Engie SA * | | | 2 | | | | 32 | |
| | |
LVMH Moet Hennessy Louis Vuitton SE | | | — | (k) | | | 56 | |
| | |
Orange SA | | | 1 | | | | 12 | |
| | |
Peugeot SA * | | | 1 | | | | 14 | |
| | |
Publicis Groupe SA | | | — | (k) | | | 12 | |
| | |
Renault SA * (e) | | | 1 | | | | 27 | |
| | |
Rexel SA * | | | 1 | | | | 8 | |
| | |
Rubis SCA | | | — | (k) | | | 10 | |
| | |
Safran SA * | | | 1 | | | | 151 | |
| | |
Sanofi | | | 1 | | | | 72 | |
| | |
Schneider Electric SE | | | 1 | | | | 191 | |
| | |
Societe Generale SA * | | | — | (k) | | | 10 | |
| | |
Suez SA | | | 1 | | | | 26 | |
| | |
Thales SA | | | — | (k) | | | 7 | |
| | |
Total SE | | | 1 | | | | 28 | |
SEE NOTES TO FINANCIAL STATEMENTS.
| | | | | | | | | | |
| | | | | |
| 20 | | | | | | | | JPMORGAN INSURANCE TRUST | | DECEMBER 31, 2020 |
| | | | | | | | |
| INVESTMENTS | | SHARES
(000) | | | VALUE
($000) | |
| | | | | | | | |
Common Stocks — continued | |
|
France — continued | |
| | |
Veolia Environnement SA | | | 1 | | | | 31 | |
| | |
Vinci SA | | | 2 | | | | 157 | |
| | | | | | | | |
| | |
| | | | | | | 1,139 | |
| | | | | | | | |
|
Germany — 1.1% | |
| | |
adidas AG * | | | — | (k) | | | 143 | |
| | |
Allianz SE (Registered) | | | — | (k) | | | 32 | |
| | |
BASF SE | | | 1 | | | | 75 | |
| | |
Bayerische Motoren Werke AG | | | — | (k) | | | 17 | |
| | |
Continental AG | | | — | (k) | | | 9 | |
| | |
Covestro AG (j) | | | — | (k) | | | 9 | |
| | |
Daimler AG (Registered) | | | — | (k) | | | 22 | |
| | |
Deutsche Post AG (Registered) | | | 3 | | | | 131 | |
| | |
Deutsche Telekom AG (Registered) | | | 5 | | | | 96 | |
| | |
E.ON SE | | | 3 | | | | 32 | |
| | |
Evonik Industries AG | | | — | (k) | | | 9 | |
| | |
Hannover Rueck SE | | | — | (k) | | | 8 | |
| | |
HeidelbergCement AG | | | — | (k) | | | 10 | |
| | |
Muenchener Rueckversicherungs-Gesellschaft AG (Registered) | | | 1 | | | | 155 | |
| | |
ProSiebenSat.1 Media SE * | | | 1 | | | | 14 | |
| | |
Scout24 AG (e) (j) | | | — | (k) | | | 7 | |
| | |
Siemens AG (Registered) | | | — | (k) | | | 29 | |
| | |
Telefonica Deutschland Holding AG (e) | | | 15 | | | | 42 | |
| | |
Uniper SE (e) | | | — | (k) | | | 15 | |
| | |
Volkswagen AG (Preference) | | | — | (k) | | | 67 | |
| | |
Vonovia SE | | | 2 | | | | 155 | |
| | | | | | | | |
| | |
| | | | | | | 1,077 | |
| | | | | | | | |
|
Hong Kong — 0.6% | |
| | |
CK Asset Holdings Ltd. | | | 11 | | | | 54 | |
| | |
CK Infrastructure Holdings Ltd. | | | 3 | | | | 13 | |
| | |
CLP Holdings Ltd. | | | 3 | | | | 23 | |
| | |
Hang Seng Bank Ltd. | | | 5 | | | | 79 | |
| | |
HKT Trust & HKT Ltd. | | | 42 | | | | 55 | |
| | |
Hong Kong & China Gas Co. Ltd. | | | 15 | | | | 22 | |
| | |
Hong Kong Exchanges & Clearing Ltd. | | | 3 | | | | 148 | |
| | |
Power Assets Holdings Ltd. | | | 4 | | | | 19 | |
| | |
VTech Holdings Ltd. | | | 4 | | | | 28 | |
| | |
WH Group Ltd. (j) | | | 47 | | | | 39 | |
| | |
Wharf Real Estate Investment Co. Ltd. | | | 7 | | | | 36 | |
| | |
Xinyi Glass Holdings Ltd. | | | 14 | | | | 39 | |
| | |
Yue Yuen Industrial Holdings Ltd. | | | 19 | | | | 39 | |
| | | | | | | | |
| | |
| | | | | | | 594 | |
| | | | | | | | |
| | | | | | | | |
| INVESTMENTS | | SHARES
(000) | | | VALUE
($000) | |
| | | | | | | | |
| | | | | | | | |
|
India — 0.4% | |
| | |
Infosys Ltd., ADR | | | 25 | | | | 431 | |
| | | | | | | | |
|
Indonesia — 0.3% | |
| | |
Bank Rakyat Indonesia Persero Tbk. PT | | | 429 | | | | 127 | |
| | |
Telkom Indonesia Persero Tbk. PT, ADR | | | 7 | | | | 161 | |
| | | | | | | | |
| | |
| | | | | | | 288 | |
| | | | | | | | |
|
Ireland — 0.0% (f) | |
| | |
CRH plc | | | — | (k) | | | 18 | |
| | |
Smurfit Kappa Group plc | | | — | (k) | | | 11 | |
| | | | | | | | |
| | |
| | | | | | | 29 | |
| | | | | | | | |
|
Italy — 0.4% | |
| | |
A2A SpA | | | 33 | | | | 53 | |
| | |
Assicurazioni Generali SpA | | | 1 | | | | 9 | |
| | |
Atlantia SpA * | | | 1 | | | | 12 | |
| | |
Enel SpA | | | 14 | | | | 146 | |
| | |
Eni SpA | | | 1 | | | | 12 | |
| | |
ERG SpA | | | — | (k) | | | 7 | |
| | |
Hera SpA | | | 3 | | | | 12 | |
| | |
Intesa Sanpaolo SpA * | | | 24 | | | | 56 | |
| | |
Iren SpA | | | 2 | | | | 6 | |
| | |
Italgas SpA | | | 2 | | | | 16 | |
| | |
Mediobanca Banca di Credito Finanziario SpA * | | | 1 | | | | 9 | |
| | |
Poste Italiane SpA (j) | | | 1 | | | | 8 | |
| | |
Snam SpA | | | 6 | | | | 36 | |
| | |
Telecom Italia SpA | | | 17 | | | | 9 | |
| | |
Terna Rete Elettrica Nazionale SpA | | | 4 | | | | 33 | |
| | | | | | | | |
| | |
| | | | | | | 424 | |
| | | | | | | | |
|
Japan — 1.8% | |
| | |
Aozora Bank Ltd. | | | 3 | | | | 46 | |
| | |
Chubu Electric Power Co., Inc. | | | 2 | | | | 20 | |
| | |
Chugoku Electric Power Co., Inc. (The) | | | 1 | | | | 13 | |
| | |
Daiwa House REIT Investment Corp., REIT | | | — | (k) | | | 52 | |
| | |
Electric Power Development Co. Ltd. | | | 1 | | | | 12 | |
| | |
ENEOS Holdings, Inc. | | | 12 | | | | 45 | |
| | |
FANUC Corp. | | | — | (k) | | | 49 | |
| | |
H.U. Group Holdings, Inc. | | | — | (k) | | | 11 | |
| | |
Hokkaido Electric Power Co., Inc. | | | 1 | | | | 5 | |
| | |
Idemitsu Kosan Co. Ltd. | | | 2 | | | | 33 | |
| | |
Inpex Corp. | | | 3 | | | | 16 | |
| | |
Japan Hotel REIT Investment Corp., REIT | | | — | (k) | | | 68 | |
| | |
Japan Post Holdings Co. Ltd. | | | 3 | | | | 25 | |
| | |
Japan Retail Fund Investment Corp., REIT | | | — | (k) | | | 93 | |
| | |
Japan Tobacco, Inc. | | | 2 | | | | 43 | |
SEE NOTES TO FINANCIAL STATEMENTS.
| | | | | | | | | | |
| | | | | |
| DECEMBER 31, 2020 | | JPMORGAN INSURANCE TRUST | | | | | | | | 21 |
JPMorgan Insurance Trust Income Builder Portfolio
SCHEDULE OF PORTFOLIO INVESTMENTS
AS OF DECEMBER 31, 2020 (continued)
| | | | | | | | |
| INVESTMENTS | | SHARES
(000) | | | VALUE
($000) | |
| | | | | | | | |
Common Stocks — continued | |
|
Japan — continued | |
| | |
JFE Holdings, Inc. | | | 5 | | | | 46 | |
| | |
Kamigumi Co. Ltd. | | | 1 | | | | 9 | |
| | |
Kansai Electric Power Co., Inc. (The) | | | 7 | | | | 64 | |
| | |
KDDI Corp. | | | 2 | | | | 50 | |
| | |
Kenedix Office Investment Corp., REIT | | | — | (k) | | | 75 | |
| | |
Kenedix Retail REIT Corp., REIT | | | — | (k) | | | 78 | |
| | |
Konica Minolta, Inc. | | | 10 | | | | 38 | |
| | |
Kyushu Electric Power Co., Inc. | | | 2 | | | | 15 | |
| | |
Lawson, Inc. | | | 1 | | | | 28 | |
| | |
MCUBS MidCity Investment Corp., REIT | | | — | (k) | | | 40 | |
| | |
Mitsubishi Chemical Holdings Corp. | | | 5 | | | | 27 | |
| | |
Mitsubishi Logistics Corp. | | | — | (k) | | | 6 | |
| | |
Mitsui Fudosan Logistics Park, Inc., REIT | | | — | (k) | | | 66 | |
| | |
Nippon Accommodations Fund, Inc., REIT | | | — | (k) | | | 73 | |
| | |
Nippon Prologis REIT, Inc., REIT * | | | — | (k) | | | 91 | |
| | |
Osaka Gas Co. Ltd. | | | — | (k) | | | 4 | |
| | |
Otsuka Corp. | | | 1 | | | | 58 | |
| | |
Shikoku Electric Power Co., Inc. | | | 1 | | | | 5 | |
| | |
Takeda Pharmaceutical Co. Ltd. | | | 1 | | | | 33 | |
| | |
Tohoku Electric Power Co., Inc. | | | 4 | | | | 35 | |
| | |
Tokio Marine Holdings, Inc. | | | 3 | | | | 139 | |
| | |
Tokyo Electron Ltd. | | | — | (k) | | | 75 | |
| | |
Tokyo Gas Co. Ltd. | | | 1 | | | | 14 | |
| | |
Toyota Motor Corp. | | | 3 | | | | 247 | |
| | | | | | | | |
| | |
| | | | | | | 1,847 | |
| | | | | | | | |
|
Jordan — 0.0% (f) | |
| | |
Hikma Pharmaceuticals plc | | | — | (k) | | | 6 | |
| | | | | | | | |
|
Macau — 0.0% (f) | |
| | |
Sands China Ltd. | | | 2 | | | | 7 | |
| | | | | | | | |
|
Mexico — 0.3% | |
| | |
Bolsa Mexicana de Valores SAB de CV (e) | | | 8 | | | | 19 | |
| | | | | | | | |
| | |
Grupo Financiero Banorte SAB de CV, Class O * | | | 7 | | | | 41 | |
| | |
Kimberly-Clark de Mexico SAB de CV, Class A | | | 30 | | | | 51 | |
| | |
Wal-Mart de Mexico SAB de CV | | | 77 | | | | 216 | |
| | | | | | | | |
| | |
| | | | | | | 327 | |
| | | | | | | | |
|
Netherlands — 0.3% | |
| | |
Akzo Nobel NV | | | 1 | | | | 73 | |
| | |
Eurocommercial Properties NV, REIT, CVA * | | | 2 | | | | 38 | |
| | |
ING Groep NV | | | 7 | | | | 63 | |
| | |
Koninklijke Ahold Delhaize NV | | | — | (k) | | | 14 | |
| | |
Koninklijke KPN NV | | | 2 | | | | 7 | |
| | |
NN Group NV | | | — | (k) | | | 11 | |
| | | | | | | | |
| INVESTMENTS | | SHARES
(000) | | | VALUE
($000) | |
| | | | | | | | |
| |
|
Netherlands — continued | |
| | |
Randstad NV * | | | — | (k) | | | 10 | |
| | |
Royal Dutch Shell plc, Class B | | | 2 | | | | 34 | |
| | | | | | | | |
| | |
| | | | | | | 250 | |
| | | | | | | | |
|
New Zealand — 0.1% | |
| | |
Contact Energy Ltd. | | | 7 | | | | 43 | |
| | |
Spark New Zealand Ltd. | | | 15 | | | | 50 | |
| | | | | | | | |
| | |
| | | | | | | 93 | |
| | | | | | | | |
|
Norway — 0.1% | |
| | |
Aker BP ASA | | | 1 | | | | 18 | |
| | |
DNB ASA | | | 1 | | | | 13 | |
| | |
Equinor ASA | | | 1 | | | | 11 | |
| | |
Gjensidige Forsikring ASA | | | — | (k) | | | 9 | |
| | |
Orkla ASA | | | 1 | | | | 8 | |
| | |
Telenor ASA | | | 2 | | | | 39 | |
| | | | | | | | |
| | |
| | | | | | | 98 | |
| | | | | | | | |
|
Portugal — 0.0% (f) | |
| | |
EDP — Energias de Portugal SA | | | 6 | | | | 41 | |
| | | | | | | | |
|
Russia — 0.6% | |
| | |
Alrosa PJSC | | | 34 | | | | 45 | |
| | |
Evraz plc | | | 2 | | | | 11 | |
| | |
LUKOIL PJSC, ADR | | | 2 | | | | 107 | |
| | |
Moscow Exchange MICEX-RTS PJSC | | | 68 | | | | 147 | |
| | |
Sberbank of Russia PJSC | | | 52 | | | | 192 | |
| | |
Sberbank of Russia PJSC | | | 8 | | | | 30 | |
| | |
Severstal PAO, GDR (j) | | | 2 | | | | 36 | |
| | |
Severstal PAO, GDR (j) | | | 1 | | | | 19 | |
| | | | | | | | |
| | |
| | | | | | | 587 | |
| | | | | | | | |
|
Saudi Arabia — 0.1% | |
| | |
Al Rajhi Bank | | | 5 | | | | 108 | |
| | | | | | | | |
|
Singapore — 0.2% | |
| | |
Ascendas, REIT | | | 48 | | | | 108 | |
| | |
Mapletree Logistics Trust, REIT | | | 45 | | | | 68 | |
| | |
Mapletree Logistics Trust Management Ltd., REIT * | | | 1 | | | | 2 | |
| | |
SATS Ltd. * | | | 4 | | | | 13 | |
| | |
StarHub Ltd. | | | 15 | | | | 15 | |
| | | | | | | | |
| | |
| | | | | | | 206 | |
| | | | | | | | |
|
South Africa — 0.2% | |
| | |
Anglo American plc | | | 1 | | | | 19 | |
| | |
AVI Ltd. | | | 5 | | | | 24 | |
| | |
Bid Corp. Ltd. | | | 2 | | | | 39 | |
| | |
FirstRand Ltd. | | | 6 | | | | 22 | |
| | |
SPAR Group Ltd. (The) | | | 2 | | | | 25 | |
| | |
Vodacom Group Ltd. | | | 6 | | | | 52 | |
| | | | | | | | |
| | |
| | | | | | | 181 | |
| | | | | | | | |
SEE NOTES TO FINANCIAL STATEMENTS.
| | | | | | | | | | |
| | | | | |
| 22 | | | | | | | | JPMORGAN INSURANCE TRUST | | DECEMBER 31, 2020 |
| | | | | | | | |
| INVESTMENTS | | SHARES
(000) | | | VALUE
($000) | |
| | | | | | | | |
Common Stocks — continued | |
|
South Korea — 0.8% | |
| | |
ESR Kendall Square REIT Co. Ltd., REIT * | | | 7 | | | | 30 | |
| | |
KT&G Corp. | | | 1 | | | | 78 | |
| | |
Samsung Electronics Co. Ltd. | | | 8 | | | | 613 | |
| | |
SK Telecom Co. Ltd., ADR | | | 1 | | | | 33 | |
| | | | | | | | |
| | |
| | | | | | | 754 | |
| | | | | | | | |
|
Spain — 1.0% | |
| | |
Acciona SA | | | — | (k) | | | 8 | |
| | |
ACS Actividades de Construccion y Servicios SA | | | — | (k) | | | 10 | |
| | |
Aena SME SA * (j) | | | — | (k) | | | 24 | |
| | |
Atlantica Sustainable Infrastructure plc | | | — | (k) | | | 15 | |
| | |
Banco Bilbao Vizcaya Argentaria SA | | | 3 | | | | 16 | |
| | |
Bankinter SA | | | 1 | | | | 7 | |
| | |
CaixaBank SA | | | 4 | | | | 10 | |
| | |
Cellnex Telecom SA (j) | | | 1 | | | | 64 | |
| | |
Enagas SA | | | 1 | | | | 20 | |
| | |
Endesa SA | | | 1 | | | | 34 | |
| | |
Iberdrola SA | | | 25 | | | | 365 | |
| | |
Industria de Diseno Textil SA | | | 5 | | | | 150 | |
| | |
Inmobiliaria Colonial Socimi SA, REIT | | | 5 | | | | 46 | |
| | |
Naturgy Energy Group SA | | | 3 | | | | 72 | |
| | |
Red Electrica Corp. SA | | | 2 | | | | 34 | |
| | |
Repsol SA | | | 7 | | | | 66 | |
| | |
Telefonica SA | | | 13 | | | | 52 | |
| | |
Telefonica SA * | | | 1 | | | | 2 | |
| | | | | | | | |
| | |
| | | | | | | 995 | |
| | | | | | | | |
|
Sweden — 0.4% | |
| | |
Autoliv, Inc. | | | — | (k) | | | 27 | |
| | |
Boliden AB | | | — | (k) | | | 7 | |
| | |
Electrolux AB, Series B | | | — | (k) | | | 6 | |
| | |
Lundin Energy AB | | | — | (k) | | | 9 | |
| | |
Sandvik AB * | | | 1 | | | | 13 | |
| | |
Skandinaviska Enskilda Banken AB, Class A * | | | 1 | | | | 12 | |
| | |
SKF AB, Class B | | | 4 | | | | 107 | |
| | |
Svenska Handelsbanken AB, Class A * | | | 1 | | | | 11 | |
| | |
Swedish Match AB | | | — | (k) | | | 11 | |
| | |
Telia Co. AB | | | 11 | | | | 46 | |
| | |
Volvo AB, Class B * | | | 7 | | | | 176 | |
| | | | | | | | |
| | |
| | | | | | | 425 | |
| | | | | | | | |
|
Switzerland — 1.3% | |
| | |
ABB Ltd. (Registered) | | | 1 | | | | 20 | |
| | |
Adecco Group AG (Registered) | | | — | (k) | | | 9 | |
| | |
Baloise Holding AG (Registered) | | | — | (k) | | | 7 | |
| | | | | | | | |
| INVESTMENTS | | SHARES
(000) | | | VALUE
($000) | |
| | | | | | | | |
| |
|
Switzerland — continued | |
| | |
Credit Suisse Group AG (Registered) | | | 1 | | | | 12 | |
| | |
Flughafen Zurich AG (Registered) * | | | — | (k) | | | 6 | |
| | |
Julius Baer Group Ltd. | | | — | (k) | | | 10 | |
| | |
LafargeHolcim Ltd. (Registered) * | | | — | (k) | | | 14 | |
| | |
Nestle SA (Registered) | | | 2 | | | | 248 | |
| | |
Novartis AG (Registered) | | | 2 | | | | 174 | |
| | |
OC Oerlikon Corp. AG (Registered) | | | 4 | | | | 44 | |
| | |
Roche Holding AG | | | 1 | | | | 462 | |
| | |
Swiss Life Holding AG (Registered) * | | | — | (k) | | | 8 | |
| | |
Swisscom AG (Registered) | | | — | (k) | | | 8 | |
| | |
UBS Group AG (Registered) | | | 1 | | | | 19 | |
| | |
Zurich Insurance Group AG | | | 1 | | | | 268 | |
| | | | | | | | |
| | |
| | | | | | | 1,309 | |
| | | | | | | | |
|
Taiwan — 1.5% | |
| | |
Accton Technology Corp. | | | 8 | | | | 90 | |
| | |
Chicony Electronics Co. Ltd. | | | 2 | | | | 6 | |
| | |
Delta Electronics, Inc. | | | 16 | | | | 150 | |
| | |
MediaTek, Inc. | | | 5 | | | | 133 | |
| | |
Mega Financial Holding Co. Ltd. | | | 56 | | | | 60 | |
| | |
President Chain Store Corp. | | | 8 | | | | 76 | |
| | |
Quanta Computer, Inc. | | | 34 | | | | 98 | |
| | |
Taiwan Semiconductor Manufacturing Co. Ltd., ADR | | | 5 | | | | 494 | |
| | |
Taiwan Semiconductor Manufacturing Co. Ltd. | | | 16 | | | | 303 | |
| | |
Vanguard International Semiconductor Corp. | | | 23 | | | | 95 | |
| | | | | | | | |
| | |
| | | | | | | 1,505 | |
| | | | | | | | |
|
Thailand — 0.1% | |
| | |
Siam Cement PCL (The) (Registered) | | | 5 | | | | 64 | |
| | | | | | | | |
|
United Kingdom — 2.2% | |
| | |
3i Group plc | | | 1 | | | | 11 | |
| | |
Admiral Group plc | | | — | (k) | | | 9 | |
| | |
Ashtead Group plc | | | — | (k) | | | 13 | |
| | |
AstraZeneca plc | | | — | (k) | | | 34 | |
| | |
Avast plc (j) | | | 2 | | | | 15 | |
| | |
Aviva plc | | | 3 | | | | 13 | |
| | |
BAE Systems plc | | | 2 | | | | 11 | |
| | |
Barclays plc | | | 8 | | | | 15 | |
| | |
Barratt Developments plc | | | 6 | | | | 58 | |
| | |
Berkeley Group Holdings plc | | | 1 | | | | 69 | |
| | |
BP plc | | | 41 | | | | 142 | |
| | |
British American Tobacco plc | | | 1 | | | | 23 | |
| | |
BT Group plc * | | | 25 | | | | 44 | |
| | |
Centrica plc | | | 88 | | | | 56 | |
SEE NOTES TO FINANCIAL STATEMENTS.
| | | | | | | | | | |
| | | | | |
| DECEMBER 31, 2020 | | JPMORGAN INSURANCE TRUST | | | | | | | | 23 |
JPMorgan Insurance Trust Income Builder Portfolio
SCHEDULE OF PORTFOLIO INVESTMENTS
AS OF DECEMBER 31, 2020 (continued)
| | | | | | | | |
| INVESTMENTS | | SHARES
(000) | | | VALUE
($000) | |
| | | | | | | | |
Common Stocks — continued | |
|
United Kingdom — continued | |
| | |
DCC plc | | | — | (k) | | | 6 | |
| | |
Diageo plc | | | 4 | | | | 157 | |
| | |
Direct Line Insurance Group plc | | | 8 | | | | 37 | |
| | |
Drax Group plc | | | 1 | | | | 6 | |
| | |
easyJet plc | | | 5 | | | | 53 | |
| | |
GlaxoSmithKline plc | | | 4 | | | | 67 | |
| | |
HSBC Holdings plc | | | 6 | | | | 29 | |
| | |
Imperial Brands plc | | | 2 | | | | 49 | |
| | |
InterContinental Hotels Group plc | | | 1 | | | | 40 | |
| | |
J Sainsbury plc | | | 3 | | | | 8 | |
| | |
Linde plc | | | — | (k) | | | 51 | |
| | |
M&G plc | | | 4 | | | | 12 | |
| | |
Mondi plc | | | — | (k) | | | 9 | |
| | |
National Grid plc | | | 3 | | | | 37 | |
| | |
NewRiver REIT plc, REIT * | | | 37 | | | | 43 | |
| | |
Pearson plc | | | 1 | | | | 7 | |
| | |
Pennon Group plc | | | 1 | | | | 14 | |
| | |
Persimmon plc | | | 2 | | | | 72 | |
| | |
Safestore Holdings plc, REIT | | | 5 | | | | 58 | |
| | |
Sage Group plc (The) | | | 6 | | | | 44 | |
| | |
Schroders plc | | | — | (k) | | | 10 | |
| | |
Segro plc, REIT | | | 10 | | | | 136 | |
| | |
Severn Trent plc | | | 1 | | | | 30 | |
| | |
Signature Aviation plc * | | | 1 | | | | 7 | |
| | |
Smiths Group plc | | | 1 | | | | 10 | |
| | |
SSE plc | | | 4 | | | | 91 | |
| | |
St James’s Place plc | | | 1 | | | | 10 | |
| | |
Standard Chartered plc | | | 2 | | | | 10 | |
| | |
Standard Life Aberdeen plc | | | 2 | | | | 9 | |
| | |
Taylor Wimpey plc | | | 24 | | | | 55 | |
| | |
Tesco plc | | | 4 | | | | 14 | |
| | |
Unilever plc | | | 3 | | | | 205 | |
| | |
Unilever plc | | | — | (k) | | | 23 | |
| | |
UNITE Group plc (The), REIT | | | 6 | | | | 79 | |
| | |
United Utilities Group plc | | | 3 | | | | 31 | |
| | |
Vodafone Group plc | | | 29 | | | | 48 | |
| | |
Wm Morrison Supermarkets plc | | | 3 | | | | 8 | |
| | |
Workspace Group plc, REIT | | | 5 | | | | 55 | |
| | |
WPP plc | | | 4 | | | | 48 | |
| | | | | | | | |
| | |
| | | | | | | 2,191 | |
| | | | | | | | |
|
United States — 14.8% | |
| | |
3M Co. | | | — | (k) | | | 49 | |
| | |
AbbVie, Inc. | | | 4 | | | | 451 | |
| | | | | | | | |
| INVESTMENTS | | SHARES
(000) | | | VALUE
($000) | |
| | | | | | | | |
| |
|
United States — continued | |
| | |
AES Corp. (The) | | | 4 | | | | 85 | |
| | |
AGNC Investment Corp., REIT | | | 3 | | | | 46 | |
| | |
Air Products and Chemicals, Inc. | | | — | (k) | | | 41 | |
| | |
ALLETE, Inc. | | | — | (k) | | | 20 | |
| | |
Altria Group, Inc. | | | 3 | | | | 110 | |
| | |
Ameren Corp. | | | — | (k) | | | 22 | |
| | |
American Electric Power Co., Inc. | | | 1 | | | | 61 | |
| | |
American Tower Corp., REIT | | | — | (k) | | | 99 | |
| | |
Americold Realty Trust, REIT | | | 4 | | | | 161 | |
| | |
Amgen, Inc. | | | — | (k) | | | 46 | |
| | |
Analog Devices, Inc. | | | 2 | | | | 312 | |
| | |
Annaly Capital Management, Inc., REIT | | | 6 | | | | 48 | |
| | |
AT&T, Inc. | | | 2 | | | | 44 | |
| | |
AvalonBay Communities, Inc., REIT | | | 1 | | | | 193 | |
| | |
Avangrid, Inc. | | | 1 | | | | 63 | |
| | |
Avista Corp. | | | — | (k) | | | 19 | |
| | |
Black Hills Corp. | | | — | (k) | | | 20 | |
| | |
Brandywine Realty Trust, REIT | | | 11 | | | | 130 | |
| | |
Bristol-Myers Squibb Co. | | | 6 | | | | 364 | |
| | |
Brixmor Property Group, Inc., REIT | | | 5 | | | | 89 | |
| | |
Bunge Ltd. | | | 1 | | | | 57 | |
| | |
Camden Property Trust, REIT | | | 1 | | | | 119 | |
| | |
Cardinal Health, Inc. | | | 1 | | | | 46 | |
| | |
CenterPoint Energy, Inc. | | | 3 | | | | 68 | |
| | |
CenturyLink, Inc. | | | 4 | | | | 42 | |
| | |
CF Industries Holdings, Inc. | | | 1 | | | | 51 | |
| | |
Chubb Ltd. | | | 1 | | | | 132 | |
| | |
Clear Channel Outdoor Holdings, Inc. * | | | 5 | | | | 8 | |
| | |
Clearway Energy, Inc., Class C | | | 1 | | | | 17 | |
| | |
CME Group, Inc. | | | 1 | | | | 171 | |
| | |
CMS Energy Corp. | | | — | (k) | | | 20 | |
| | |
CNA Financial Corp. | | | 1 | | | | 47 | |
| | |
Coca-Cola Co. (The) | | | 10 | | | | 548 | |
| | |
Comcast Corp., Class A | | | 4 | | | | 226 | |
| | |
Comerica, Inc. | | | 1 | | | | 57 | |
| | |
ConocoPhillips | | | 1 | | | | 49 | |
| | |
Consolidated Edison, Inc. | | | 1 | | | | 66 | |
| | |
Dominion Energy, Inc. | | | 1 | | | | 62 | |
| | |
Douglas Emmett, Inc., REIT | | | 3 | | | | 102 | |
| | |
Dow, Inc. | | | 1 | | | | 52 | |
| | |
DTE Energy Co. | | | 1 | | | | 70 | |
| | |
Duke Energy Corp. | �� | | 1 | | | | 74 | |
| | |
DuPont de Nemours, Inc. | | | — | (k) | | | 23 | |
| | |
Eastman Chemical Co. | | | 2 | | | | 202 | |
| | |
Eaton Corp. plc | | | 2 | | | | 218 | |
SEE NOTES TO FINANCIAL STATEMENTS.
| | | | | | | | | | |
| | | | | |
| 24 | | | | | | | | JPMORGAN INSURANCE TRUST | | DECEMBER 31, 2020 |
| | | | | | | | |
| INVESTMENTS | | SHARES
(000) | | | VALUE
($000) | |
| | | | | | | | |
Common Stocks — continued | |
|
United States — continued | |
| | |
Edison International | | | 1 | | | | 70 | |
| | |
Eli Lilly and Co. | | | 1 | | | | 204 | |
| | |
Emerson Electric Co. | | | 1 | | | | 46 | |
| | |
Entergy Corp. | | | 1 | | | | 59 | |
| | |
EP Energy Corp. * | | | — | (k) | | | 15 | |
| | |
Equinix, Inc., REIT | | | — | (k) | | | 84 | |
| | |
Equity LifeStyle Properties, Inc., REIT | | | 3 | | | | 167 | |
| | |
Essex Property Trust, Inc., REIT | | | 1 | | | | 129 | |
| | |
Evergy, Inc. | | | — | (k) | | | 24 | |
| | |
Exelon Corp. | | | 2 | | | | 71 | |
| | |
Exxon Mobil Corp. | | | 1 | | | | 44 | |
| | |
Fastenal Co. | | | 1 | | | | 45 | |
| | |
Federal Realty Investment Trust, REIT | | | 1 | | | | 92 | |
| | |
Ferguson plc | | | — | (k) | | | 10 | |
| | |
FirstEnergy Corp. | | | 2 | | | | 71 | |
| | |
General Dynamics Corp. | | | — | (k) | | | 44 | |
| | |
General Mills, Inc. | | | 1 | | | | 42 | |
| | |
Genuine Parts Co. | | | — | (k) | | | 45 | |
| | |
Gilead Sciences, Inc. | | | 1 | | | | 42 | |
| | |
Hasbro, Inc. | | | 1 | | | | 48 | |
| | |
Hawaiian Electric Industries, Inc. | | | — | (k) | | | 17 | |
| | |
Healthcare Trust of America, Inc., Class A, REIT | | | 4 | | | | 97 | |
| | |
Healthpeak Properties, Inc., REIT | | | 6 | | | | 192 | |
| | |
Hewlett Packard Enterprise Co. | | | 4 | | | | 50 | |
| | |
Honeywell International, Inc. | | | 1 | | | | 140 | |
| | |
HP, Inc. | | | 2 | | | | 56 | |
| | |
IDACORP, Inc. | | | — | (k) | | | 21 | |
| | |
iHeartMedia, Inc., Class A * | | | — | (k) | | | 2 | |
| | |
Ingredion, Inc. | | | 1 | | | | 45 | |
| | |
International Business Machines Corp. | | | — | (k) | | | 44 | |
| | |
International Flavors & Fragrances, Inc. | | | — | (k) | | | 42 | |
| | |
International Paper Co. | | | 1 | | | | 51 | |
| | |
Interpublic Group of Cos., Inc. (The) | | | 2 | | | | 54 | |
| | |
Invitation Homes, Inc., REIT | | | 7 | | | | 211 | |
| | |
Iron Mountain, Inc., REIT | | | 4 | | | | 107 | |
| | |
JM Smucker Co. (The) | | | — | (k) | | | 31 | |
| | |
Johnson & Johnson | | | 2 | | | | 271 | |
| | |
Johnson Controls International plc | | | 1 | | | | 41 | |
| | |
Kellogg Co. | | | 1 | | | | 42 | |
| | |
Kimco Realty Corp., REIT | | | 2 | | | | 25 | |
| | |
Kinder Morgan, Inc. | | | 3 | | | | 41 | |
| | |
Kraft Heinz Co. (The) | | | 1 | | | | 48 | |
| | |
Las Vegas Sands Corp. | | | 1 | | | | 50 | |
| | | | | | | | |
| INVESTMENTS | | SHARES
(000) | | | VALUE
($000) | |
| | | | | | | | |
| |
|
United States — continued | |
| | |
Leidos Holdings, Inc. | | | 1 | | | | 66 | |
| | |
LyondellBasell Industries NV, Class A | | | 1 | | | | 57 | |
| | |
Macquarie Infrastructure Corp. | | | 1 | | | | 27 | |
| | |
Maxim Integrated Products, Inc. | | | — | (k) | | | 44 | |
| | |
MDU Resources Group, Inc. | | | 1 | | | | 21 | |
| | |
Medtronic plc | | | — | (k) | | | 47 | |
| | |
Merck & Co., Inc. | | | 5 | | | | 393 | |
| | |
Morgan Stanley | | | 1 | | | | 102 | |
| | |
National Fuel Gas Co. | | | 1 | | | | 21 | |
| | |
National Retail Properties, Inc., REIT | | | 3 | | | | 109 | |
| | |
NetApp, Inc. | | | 1 | | | | 63 | |
| | |
New Jersey Resources Corp. | | | 1 | | | | 19 | |
| | |
Newell Brands, Inc. | | | 3 | | | | 53 | |
| | |
NextEra Energy, Inc. | | | 2 | | | | 134 | |
| | |
Nielsen Holdings plc | | | 2 | | | | 34 | |
| | |
NiSource, Inc. | | | 3 | | | | 59 | |
| | |
NMG, Inc. * ‡ | | | — | (k) | | | — | (k) |
| | |
Norfolk Southern Corp. | | | 1 | | | | 131 | |
| | |
Northwest Natural Holding Co. | | | — | (k) | | | 8 | |
| | |
NorthWestern Corp. | | | — | (k) | | | 24 | |
| | |
NortonLifeLock, Inc. | | | 2 | | | | 40 | |
| | |
Nucor Corp. | | | 1 | | | | 45 | |
| | |
Oasis Petroleum, Inc. * | | | 1 | | | | 30 | |
| | |
Occidental Petroleum Corp. | | | 1 | | | | 17 | |
| | |
OGE Energy Corp. | | | 1 | | | | 23 | |
| | |
Omnicom Group, Inc. | | | 2 | | | | 139 | |
| | |
ONE Gas, Inc. | | | — | (k) | | | 16 | |
| | |
ONEOK, Inc. | | | 1 | | | | 57 | |
| | |
PACCAR, Inc. | | | 1 | | | | 43 | |
| | |
Packaging Corp. of America | | | — | (k) | | | 54 | |
| | |
Park Hotels & Resorts, Inc., REIT | | | 6 | | | | 99 | |
| | |
Philip Morris International, Inc. | | | 1 | | | | 123 | |
| | |
Pinnacle West Capital Corp. | | | 1 | | | | 67 | |
| | |
Portland General Electric Co. | | | 1 | | | | 24 | |
| | |
PPL Corp. | | | 3 | | | | 71 | |
| | |
Procter & Gamble Co. (The) | | | 1 | | | | 188 | |
| | |
Prologis, Inc., REIT | | | 6 | | | | 558 | |
| | |
Public Service Enterprise Group, Inc. | | | 1 | | | | 75 | |
| | |
Public Storage, REIT | | | 1 | | | | 249 | |
| | |
Quest Diagnostics, Inc. | | | — | (k) | | | 29 | |
| | |
Raytheon Technologies Corp. | | | 1 | | | | 45 | |
| | |
Rexford Industrial Realty, Inc., REIT | | | 2 | | | | 80 | |
| | |
Schlumberger NV | | | 2 | | | | 33 | |
| | |
Seagate Technology plc | | | 3 | | | | 185 | |
SEE NOTES TO FINANCIAL STATEMENTS.
| | | | | | | | | | |
| | | | | |
| DECEMBER 31, 2020 | | JPMORGAN INSURANCE TRUST | | | | | | | | 25 |
JPMorgan Insurance Trust Income Builder Portfolio
SCHEDULE OF PORTFOLIO INVESTMENTS
AS OF DECEMBER 31, 2020 (continued)
| | | | | | | | |
| INVESTMENTS | | SHARES (000) | | | VALUE ($000) | |
| | | | | | | | |
Common Stocks — continued | |
|
United States — continued | |
| | |
Simon Property Group, Inc., REIT | | | 1 | | | | 52 | |
| | |
South Jersey Industries, Inc. | | | 1 | | | | 17 | |
| | |
Southern Co. (The) | | | 1 | | | | 75 | |
| | |
Southwest Gas Holdings, Inc. | | | — | (k) | | | 18 | |
| | |
Spire, Inc. | | | — | (k) | | | 18 | |
| | |
Stanley Black & Decker, Inc. | | | 1 | | | | 108 | |
| | |
State Street Corp. | | | 1 | | | | 108 | |
| | |
Steel Dynamics, Inc. | | | 1 | | | | 53 | |
| | |
Sun Communities, Inc., REIT | | | — | (k) | | | 56 | |
| | |
Texas Instruments, Inc. | | | 2 | | | | 272 | |
| | |
Trane Technologies plc | | | 1 | | | | 96 | |
| | |
TransDigm Group, Inc. * | | | — | (k) | | | 47 | |
| | |
Truist Financial Corp. | | | 2 | | | | 107 | |
| | |
UGI Corp. | | | 1 | | | | 21 | |
| | |
United Parcel Service, Inc., Class B | | | — | (k) | | | 48 | |
| | |
UnitedHealth Group, Inc. | | | — | (k) | | | 97 | |
| | |
Valero Energy Corp. | | | 1 | | | | 46 | |
| | |
Ventas, Inc., REIT | | | 6 | | | | 272 | |
| | |
VEREIT, Inc., REIT | | | 3 | | | | 121 | |
| | |
Verizon Communications, Inc. | | | 4 | | | | 216 | |
| | |
VICI Properties, Inc., REIT | | | 6 | | | | 149 | |
| | |
Vornado Realty Trust, REIT | | | 2 | | | | 88 | |
| | |
Walgreens Boots Alliance, Inc. | | | 1 | | | | 43 | |
| | |
WEC Energy Group, Inc. | | | — | (k) | | | 21 | |
| | |
Weingarten Realty Investors, REIT | | | 5 | | | | 110 | |
| | |
Wells Fargo & Co. | | | 4 | | | | 110 | |
| | |
Western Union Co. (The) | | | 2 | | | | 46 | |
| | |
Whiting Petroleum Corp. * | | | 2 | | | | 48 | |
| | |
Williams Cos., Inc. (The) | | | 2 | | | | 44 | |
| | |
Xcel Energy, Inc. | | | 4 | | | | 241 | |
| | |
Yum! Brands, Inc. | | | 1 | | | | 162 | |
| | |
Zimmer Biomet Holdings, Inc. | | | 1 | | | | 102 | |
| | | | | | | | |
| | |
| | | | | | | 14,744 | |
| | | | | | | | |
| |
Total Common Stocks
(Cost $30,354) | | | | 35,000 | |
| | | | | |
Investment Companies — 6.7% | |
| | |
JPMorgan Emerging Markets Strategic Debt Fund Class R6 Shares (l) | | | 236 | | | | 1,953 | |
| | |
JPMorgan Equity Income Fund Class R6 Shares (l) | | | 181 | | | | 3,573 | |
| | |
JPMorgan Floating Rate Income Fund Class R6 Shares (l) | | | 105 | | | | 931 | |
| | |
JPMorgan Managed Income Fund Class L Shares (l) | | | 25 | | | | 249 | |
| | | | | | | | |
Total Investment Companies
(Cost $5,806) | | | | | | | 6,706 | |
| | | | | |
| | | | | | | | |
| INVESTMENTS | | PRINCIPAL
AMOUNT
($000) | | | VALUE ($000) | |
| | | | | | | | |
Collateralized Mortgage Obligations — 3.7% | |
United States — 3.7% | |
| |
American Home Mortgage Investment Trust | | | | | |
| | |
Series 2005-1, Class 6A, 2.25%, 6/25/2045 (m) | | | 20 | | | | 20 | |
| |
Banc of America Funding Trust | | | | | |
| | |
Series 2006-A, Class 1A1, 2.83%, 2/20/2036 (m) | | | 15 | | | | 14 | |
| |
Banc of America Mortgage Trust | | | | | |
| | |
Series 2005-A, Class 2A2, 3.67%, 2/25/2035 (m) | | | 9 | | | | 9 | |
| |
Bear Stearns ALT-A Trust | | | | | |
| | |
Series 2005-4, Class 23A2, 3.37%, 5/25/2035 (m) | | | 29 | | | | 29 | |
| |
Bear Stearns ARM Trust | | | | | |
| | |
Series 2004-9, Class 22A1, 3.13%, 11/25/2034 (m) | | | 62 | | | | 60 | |
| | |
Series 2006-1, Class A1, 2.37%, 2/25/2036 (m) | | | 11 | | | | 11 | |
| |
Citigroup Mortgage Loan Trust, Inc. | | | | | |
| | |
Series 2005-6, Class A1, 2.22%, 9/25/2035 (m) | | | 30 | | | | 31 | |
| |
Connecticut Avenue Securities Trust | | | | | |
| | |
Series 2019-R06, Class 2M2, 2.25%, 9/25/2039 ‡ (c) (m) | | | 116 | | | | 116 | |
| |
Deephaven Residential Mortgage Trust | | | | | |
| | |
Series 2019-4A, Class B1, 3.99%, 10/25/2059 ‡ (c) (m) | | | 250 | | | | 250 | |
| | |
Series 2020-1, Class A3, 2.65%, 1/25/2060 (c) (m) | | | 334 | | | | 337 | |
| |
FHLMC Structured Agency Credit Risk Debt Notes | | | | | |
| | |
Series 2018-HQA1, Class M2, 2.45%, 9/25/2030 (m) | | | 197 | | | | 197 | |
| |
FHLMC, REMIC | | | | | |
| | |
Series 4703, Class SA, IF, IO, 5.99%, 7/15/2047 (m) | | | 319 | | | | 65 | |
| | |
Series 4937, Class MS, IF, IO, 5.90%, 12/25/2049 (m) | | | 228 | | | | 43 | |
| | |
Series 4839, Class WS, IF, IO, 5.94%, 8/15/2056 (m) | | | 184 | | | | 39 | |
| |
FHLMC, STRIPS | | | | | |
| | |
Series 316, Class S7, IF, IO, 5.94%, 11/15/2043 (m) | | | 314 | | | | 54 | |
| | |
Series 356, Class S5, IF, IO, 5.84%, 9/15/2047 (m) | | | 370 | | | | 79 | |
| |
FNMA, Connecticut Avenue Securities | | | | | |
| | |
Series 2017-C07, Class 2M2, 2.65%, 5/25/2030 (m) | | | 122 | | | | 122 | |
SEE NOTES TO FINANCIAL STATEMENTS.
| | | | | | | | | | |
| | | | | |
| 26 | | | | | | | | JPMORGAN INSURANCE TRUST | | DECEMBER 31, 2020 |
| | | | | | | | |
| INVESTMENTS | | PRINCIPAL
AMOUNT
($000) | | | VALUE
($000) | |
| | | | | | | | |
|
Collateralized Mortgage Obligations — continued | |
| | |
United States — continued | | | | | | | | |
| | |
Series 2018-C02, Class 2M2, 2.35%, 8/25/2030 (m) | | | 196 | | | | 194 | |
| | |
Series 2018-C04, Class 2M2, 2.70%, 12/25/2030 (m) | | | 183 | | | | 184 | |
| |
FNMA, REMIC | | | | | |
| | |
Series 2012-75, Class DS, IF, IO, 5.80%, 7/25/2042 (m) | | | 268 | | | | 48 | |
| | |
Series 2016-1, Class SJ, IF, IO, 6.00%, 2/25/2046 (m) | | | 175 | | | | 32 | |
| | |
Series 2018-67, Class SN, IF, IO, 6.05%, 9/25/2048 (m) | | | 473 | | | | 95 | |
| | |
Series 2018-73, Class SC, IF, IO, 6.05%, 10/25/2048 (m) | | | 320 | | | | 64 | |
| |
GNMA | | | | | |
| | |
Series 2017-67, Class ST, IF, IO, 6.05%, 5/20/2047 (m) | | | 213 | | | | 46 | |
| | |
Series 2017-112, Class S, IF, IO, 6.05%, 7/20/2047 (m) | | | 221 | | | | 40 | |
| | |
Series 2018-36, Class SG, IF, IO, 6.05%, 3/20/2048 (m) | | | 105 | | | | 21 | |
| | |
Series 2019-22, Class SM, IF, IO, 5.90%, 2/20/2049 (m) | | | 298 | | | | 58 | |
| | |
Series 2019-42, Class SJ, IF, IO, 5.90%, 4/20/2049 (m) | | | 320 | | | | 48 | |
| |
GSR Mortgage Loan Trust | | | | | |
| | |
Series 2005-AR3, Class 1A1, 0.59%, 5/25/2035 (m) | | | 32 | | | | 31 | |
| |
Homeward Opportunities Fund I Trust | | | | | |
| | |
Series 2018-1, Class A1, 3.77%, 6/25/2048 (c) (m) | | | 74 | | | | 74 | |
| | |
Series 2019-1, Class M1, 3.95%,
1/25/2059 ‡ (c) (m) | | | 250 | | | | 255 | |
| |
Impac CMB Trust | | | | | |
| | |
Series 2004-6, Class 1A2, 0.93%, 10/25/2034 (m) | | | 31 | | | | 31 | |
| | |
Series 2004-7, Class 1A2, 1.07%, 11/25/2034 (m) | | | 59 | | | | 60 | |
| | |
Series 2005-4, Class 1A1A, 0.69%, 5/25/2035 (m) | | | 137 | | | | 138 | |
| | |
Series 2005-8, Class 1AM, 0.85%, 2/25/2036 (m) | | | 104 | | | | 101 | |
| |
Lehman Mortgage Trust | | | | | |
| | |
Series 2005-3, Class 2A3, 5.50%, 1/25/2036 | | | 7 | | | | 7 | |
| |
MASTR Adjustable Rate Mortgages Trust | | | | | |
| | |
Series 2004-13, Class 2A1, 3.11%, 4/21/2034 (m) | | | 13 | | | | 13 | |
| | | | | | | | |
| INVESTMENTS | | PRINCIPAL
AMOUNT
($000) | | | VALUE
($000) | |
| | | | | | | | |
| |
| | |
United States — continued | | | | | | | | |
| |
Merrill Lynch Mortgage Investors Trust | | | | | |
| | |
Series 2007-1, Class 4A3, 3.03%, 1/25/2037 (m) | | | 7 | | | | 7 | |
| |
Morgan Stanley Mortgage Loan Trust | | | | | |
| | |
Series 2004-5AR, Class 4A, 3.31%, 7/25/2034 (m) | | | 18 | | | | 18 | |
| |
New Residential Mortgage Loan Trust | | | | | |
| | |
Series 2019-NQM4, Class M1, 2.99%, 9/25/2059 ‡ (c) (m) | | | 239 | | | | 241 | |
| |
Opteum Mortgage Acceptance Corp. Asset-Backed Pass-Through Certificates | | | | | |
| | |
Series 2005-5, Class 1APT, 0.71%, 12/25/2035 (m) | | | 38 | | | | 38 | |
| |
RALI Trust | | | | | |
| | |
Series 2006-QA3, Class A1, 0.55%, 4/25/2036 (m) | | | 46 | | | | 48 | |
| |
Residential Asset Securitization Trust | | | | | |
| | |
Series 2004-A6, Class A1, 5.00%, 8/25/2019 | | | — | (k) | | | 1 | |
| |
Structured Adjustable Rate Mortgage Loan Trust | | | | | |
| | |
Series 2007-9, Class 1A1, 1.76%, 10/25/2037 (m) | | | 274 | | | | 260 | |
| |
WaMu Mortgage Pass-Through Certificates Trust | | | | | |
| | |
Series 2005-AR3, Class A1, 3.60%, 3/25/2035 (m) | | | 12 | | | | 12 | |
| | |
Series 2005-AR5, Class A6, 3.63%, 5/25/2035 (m) | | | 19 | | | | 19 | |
| | | | | | | | |
Total Collateralized Mortgage Obligations
(Cost $3,609) | | | | 3,660 | |
| | | | | |
|
Equity-Linked Notes — 3.1% | |
| | |
Barclays Bank plc, ELN, 6.50%, 3/24/2021, (linked to Russell 2000 Index)(c) | | | 1 | | | | 1,015 | |
| | |
Merrill Lynch International & Co., ELN, 6.83%, 3/3/2021 (linked to Russell 2000 Index) (j) | | | 1 | | | | 2,077 | |
| | | | | | | | |
Total Equity-Linked Notes
(Cost $3,038) | | | | 3,092 | |
| | | | | |
Commercial Mortgage-Backed Securities — 2.9% | |
|
Cayman Islands — 0.2% | |
| |
GPMT Ltd. | | | | | |
| | |
Series 2018-FL1, Class AS, 1.35%, 11/21/2035 ‡ (c) (m) | | | 250 | | | | 248 | |
| | | | | | | | |
|
United States — 2.7% | |
| |
BANK | | | | | |
| | |
Series 2017-BNK7, Class D, 2.71%, 9/15/2060 ‡ (c) | | | 100 | | | | 82 | |
SEE NOTES TO FINANCIAL STATEMENTS.
| | | | | | | | | | |
| | | | | |
| DECEMBER 31, 2020 | | JPMORGAN INSURANCE TRUST | | | | | | | | 27 |
JPMorgan Insurance Trust Income Builder Portfolio
SCHEDULE OF PORTFOLIO INVESTMENTS
AS OF DECEMBER 31, 2020 (continued)
| | | | | | | | |
| INVESTMENTS | | PRINCIPAL
AMOUNT
($000) | | | VALUE
($000) | |
| | | | | | | | |
Commercial Mortgage-Backed Securities — continued | |
| | |
United States — continued | | | | | | | | |
| |
Benchmark Mortgage Trust | | | | | |
| | |
Series 2019-B11, Class D,
3.00%, 5/15/2052 ‡ (c) | | | 100 | | | | 93 | |
| |
BX Commercial Mortgage Trust | | | | | |
| | |
Series 2020-VIV2, Class C, 3.54%, 3/9/2044 ‡ (c) (m) | | | 106 | | | | 110 | |
| |
Citigroup Commercial Mortgage Trust | | | | | |
| | |
Series 2012-GC8, Class D, 4.88%, 9/10/2045 ‡ (c) (m) | | | 100 | | | | 86 | |
| | |
Series 2016-P6, Class D, 3.25%, 12/10/2049 ‡ (c) | | | 20 | | | | 16 | |
| | |
Series 2017-P7, Class D, 3.25%, 4/14/2050 ‡ (c) | | | 23 | | | | 19 | |
| | |
Series 2017-P7, Class B, 4.14%, 4/14/2050 ‡ (m) | | | 10 | | | | 11 | |
| |
Commercial Mortgage Trust | | | | | |
| | |
Series 2016-CR28, Class C, 4.64%, 2/10/2049 ‡ (m) | | | 100 | | | | 104 | |
| |
CSAIL Commercial Mortgage Trust | | | | | |
| | |
Series 2019-C15, Class C, 4.98%, 3/15/2052 ‡ (m) | | | 100 | | | | 104 | |
| |
DBGS Mortgage Trust | | | | | |
| | |
Series 2018-5BP, Class B, 0.99%, 6/15/2033 ‡ (c) (m) | | | 100 | | | | 99 | |
| |
FHLMC Multiclass Certificates | | | | | |
| | |
Series 2020-RR05, Class X, IO, 2.01%, 1/27/2029 | | | 160 | | | | 23 | |
| |
FHLMC, Multi-Family Structured Pass-Through Certificates | | | | | |
| | |
Series K734, Class X3, IO, 2.17%, 7/25/2026 (m) | | | 120 | | | | 12 | |
| | |
Series Q012, Class X, IO, 4.23%, 9/25/2035 (m) | | | 497 | | | | 130 | |
| | |
Series K716, Class X3, IO, 1.79%, 8/25/2042 (m) | | | 106 | | | | 1 | |
| | |
Series K726, Class X3, IO, 2.13%, 7/25/2044 (m) | | | 151 | | | | 9 | |
| | |
Series K729, Class X3, IO, 1.97%, 11/25/2044 (m) | | | 1,212 | | | | 81 | |
| | |
Series K728, Class X3, IO, 1.95%, 11/25/2045 (m) | | | 100 | | | | 7 | |
| | |
Series K071, Class X3, IO, 2.01%, 11/25/2045 (m) | | | 700 | | | | 82 | |
| | |
Series K088, Class X3, IO, 2.35%, 2/25/2047 (m) | | | 555 | | | | 89 | |
| | |
Series K108, Class X3, IO, 3.49%, 4/25/2048 (m) | | | 400 | | | | 102 | |
| | | | | | | | |
| INVESTMENTS | | PRINCIPAL
AMOUNT
($000) | | | VALUE
($000) | |
| | | | | | | | |
| |
| | |
United States — continued | | | | | | | | |
| |
FREMF | | | | | |
| | |
Series 2018-KF46, Class B, 2.10%, 3/25/2028 (c) (m) | | | 6 | | | | 6 | |
| |
FREMF Mortgage Trust | | | | | |
| | |
Series 2015-KF09, Class B, 5.50%, 5/25/2022 (c) (m) | | | 2 | | | | 1 | |
| | |
Series 2015-KF10, Class B, 6.25%, 7/25/2022 (c) (m) | | | 3 | | | | 3 | |
| | |
Series 2017-KF31, Class B, 3.05%, 4/25/2024 (c) (m) | | | 4 | | | | 4 | |
| | |
Series 2017-KF32, Class B, 2.70%, 5/25/2024 (c) (m) | | | 30 | | | | 29 | |
| | |
Series 2018-KF45, Class B, 2.10%, 3/25/2025 (c) (m) | | | 10 | | | | 10 | |
| | |
Series 2018-KF47, Class B, 2.15%, 5/25/2025 (c) (m) | | | 41 | | | | 40 | |
| | |
Series 2018-KC02, Class B, 4.09%, 7/25/2025 (c) (m) | | | 25 | | | | 25 | |
| | |
Series 2018-KF53, Class B, 2.20%, 10/25/2025 (m) | | | 60 | | | | 58 | |
| | |
Series 2019-KC03, Class B, 4.37%, 1/25/2026 (c) (m) | | | 25 | | | | 26 | |
| | |
Series 2019-KF62, Class B, 2.20%, 4/25/2026 (c) (m) | | | 22 | | | | 21 | |
| | |
Series 2018-KF43, Class B, 2.30%, 1/25/2028 (c) (m) | | | 45 | | | | 44 | |
| | |
Series 2018-KF50, Class B, 2.05%, 7/25/2028 (c) (m) | | | 7 | | | | 7 | |
| | |
Series 2018-K82, Class B, 4.13%, 9/25/2028 (c) (m) | | | 50 | | | | 57 | |
| | |
Series 2019-KF63, Class B, 2.50%, 5/25/2029 (c) (m) | | | 19 | | | | 18 | |
| | |
Series 2012-K19, Class C, 4.02%, 5/25/2045 (c) (m) | | | 10 | | | | 10 | |
| | |
Series 2017-K67, Class C, 3.94%, 9/25/2049 (c) (m) | | | 5 | | | | 5 | |
| | |
Series 2017-K65, Class B, 4.07%, 7/25/2050 (c) (m) | | | 75 | | | | 84 | |
| | |
Series 2019-K87, Class C, 4.32%, 1/25/2051 (c) (m) | | | 100 | | | | 109 | |
| | |
Series 2018-K75, Class B, 3.97%, 4/25/2051 (c) (m) | | | 10 | | | | 11 | |
| | |
Series 2019-K103, Class C, 3.45%, 12/25/2051 (c) (m) | | | 25 | | | | 25 | |
| | |
Series 2020-K737, Class B, 3.30%, 1/25/2053 (c) (m) | | | 100 | | | | 109 | |
| | |
Series 2020-K737, Class C, 3.30%, 1/25/2053 (c) (m) | | | 145 | | | | 149 | |
SEE NOTES TO FINANCIAL STATEMENTS.
| | | | | | | | | | |
| | | | | |
| 28 | | | | | | | | JPMORGAN INSURANCE TRUST | | DECEMBER 31, 2020 |
| | | | | | | | |
| INVESTMENTS | | PRINCIPAL
AMOUNT
($000) | | | VALUE
($000) | |
Commercial Mortgage-Backed Securities — continued | |
| | |
United States — continued | | | | | | | | |
| |
GNMA | | | | | |
| | |
Series 2013-178, IO, 0.42%, 6/16/2055 (m) | | | 52 | | | | 1 | |
| | |
Series 2016-71, Class QI, IO, 0.92%, 11/16/2057 (m) | | | 235 | | | | 13 | |
| | |
Series 2020-28, IO, 0.86%, 11/16/2061 (m) | | | 147 | | | | 11 | |
| | |
Series 2020-14, IO, 0.75%, 2/16/2062 (m) | | | 923 | | | | 67 | |
| | |
Series 2020-23, IO, 0.76%, 4/16/2062 (m) | | | 227 | | | | 17 | |
| |
Jackson Park Trust | | | | | |
| | |
Series 2019-LIC, Class E, 3.24%, 10/14/2039 ‡ (c) (m) | | | 100 | | | | 91 | |
| | |
Series 2019-LIC, Class F, 3.24%, 10/14/2039 ‡ (c) (m) | | | 100 | | | | 87 | |
| |
JPMorgan Chase Commercial Mortgage Securities Trust | | | | | |
| | |
Series 2015-JP1, Class E, 4.22%, 1/15/2049 ‡ (c) (m) | | | 100 | | | | 79 | |
| |
LB-UBS Commercial Mortgage Trust | | | | | |
| | |
Series 2006-C6, Class AJ, 5.49%, 9/15/2039 ‡ (m) | | | 34 | | | | 20 | |
| |
Morgan Stanley Bank of America Merrill Lynch Trust | | | | | |
| | |
Series 2016-C31, Class B, 3.88%, 11/15/2049 (m) | | | 50 | | | | 51 | |
| |
Morgan Stanley Capital I Trust | | | | | |
| | |
Series 2018-MP, Class D, 4.28%, 7/11/2040 ‡ (c) (m) | | | 10 | | | | 9 | |
| | |
Series 2020-HR8, Class XA, IO, 1.85%, 7/15/2053 (m) | | | 999 | | | | 144 | |
| | | | | | | | |
| | |
| | | | | | | 2,701 | |
| | | | | | | | |
| |
Total Commercial Mortgage-Backed Securities
(Cost $2,974) | | | | 2,949 | |
| | | | | |
Asset-Backed Securities — 1.6% | | | | | | | | |
| |
United States — 1.6% | | | | | |
| |
ABFC Trust | | | | | |
| | |
Series 2003-OPT1, Class M1, 1.18%, 2/25/2033 ‡ (m) | | | 99 | | | | 98 | |
| | | | | | | | |
| |
ACE Securities Corp. Home Equity Loan Trust | | | | | |
| | |
Series 2003-HE1, Class M1, 1.12%, 11/25/2033 (m) | | | 82 | | | | 82 | |
| |
AMRESCO Residential Securities Corp. Mortgage Loan Trust | | | | | |
| | |
Series 1997-1, Class A7, 7.61%, 3/25/2027 ‡ | | | 4 | | | | 4 | |
| |
Asset-Backed Securities Corp. Home Equity Loan Trust | | | | | |
| | |
Series 2003-HE6, Class M2, 2.62%, 11/25/2033 ‡ (m) | | | 53 | | | | 53 | |
| |
Bear Stearns Asset-Backed Securities Trust | | | | | |
| | |
Series 2004-HE5, Class M2, 2.02%, 7/25/2034 ‡ (m) | | | 12 | | | | 12 | |
| | | | | | | | |
| INVESTMENTS | | PRINCIPAL
AMOUNT
($000) | | | VALUE
($000) | |
| |
| | |
United States — continued | | | | | | | | |
| |
Conn’s Receivables Funding LLC | | | | | |
| | |
Series 2019-A, Class B, 4.36%, 10/16/2023 ‡ (c) | | | 44 | | | | 44 | |
| |
Countrywide Asset-Backed Certificates | | | | | |
| | |
Series 2004-2, Class M1, 0.90%, 5/25/2034 ‡ (m) | | | 10 | | | | 10 | |
| |
CWABS, Inc. Asset-Backed Certificates Trust | | | | | |
| | |
Series 2004-5, Class M5, 2.47%, 5/25/2034 (m) | | | 9 | | | | 9 | |
| | |
Series 2004-5, Class M3, 1.87%, 7/25/2034 ‡ (m) | | | 54 | | | | 54 | |
| |
Exeter Automobile Receivables Trust | | | | | |
| | |
Series 2018-2A, Class E, 5.33%, 5/15/2025 (c) | | | 120 | | | | 125 | |
| | |
Series 2018-4A, Class E, 5.38%, 7/15/2025 (c) | | | 10 | | | | 11 | |
| |
Fremont Home Loan Trust | | | | | |
| | |
Series 2003-A, Class M1, 1.13%, 8/25/2033 ‡ (m) | | | 57 | | | | 55 | |
| |
GSAMP Trust | | | | | |
| | |
Series 2003-SEA, Class A1, 0.55%, 2/25/2033 ‡ (m) | | | 116 | | | | 110 | |
| |
Long Beach Mortgage Loan Trust | | | | | |
| | |
Series 2004-6, Class A3, 1.45%, 11/25/2034 ‡ (m) | | | 30 | | | | 30 | |
| |
MASTR Asset-Backed Securities Trust | | | | | |
| | |
Series 2004-OPT2, Class M1, 1.05%, 9/25/2034 ‡ (m) | | | 12 | | | | 12 | |
| |
Morgan Stanley ABS Capital I, Inc. Trust | | | | | |
| | |
Series 2003-SD1, Class M1, 2.40%, 3/25/2033 ‡ (m) | | | 145 | | | | 141 | |
| | |
Series 2003-NC10, Class M1, 1.17%, 10/25/2033 ‡ (m) | | | 19 | | | | 19 | |
| | |
Series 2004-HE3, Class M1, 1.00%, 3/25/2034 ‡ (m) | | | 51 | | | | 50 | |
| | |
Series 2004-NC7, Class M2, 1.08%, 7/25/2034 ‡ (m) | | | 15 | | | | 14 | |
| |
Prestige Auto Receivables Trust | | | | | |
| | |
Series 2018-1A, Class D, 4.14%, 10/15/2024 (c) | | | 10 | | | | 11 | |
| |
RAMP Trust | | | | | |
| | |
Series 2005-RS6, Class M4, 1.12%, 6/25/2035 (m) | | | 250 | | | | 250 | |
| | |
Series 2006-RZ3, Class M1, 0.50%, 8/25/2036 ‡ (m) | | | 189 | | | | 185 | |
| |
Securitized Asset-Backed Receivables LLC Trust | | | | | |
| | |
Series 2004-OP2, Class M3, 2.17%, 8/25/2034 ‡ (m) | | | 86 | | | | 86 | |
SEE NOTES TO FINANCIAL STATEMENTS.
| | | | | | | | | | |
| | | | | |
| DECEMBER 31, 2020 | | JPMORGAN INSURANCE TRUST | | | | | | | | 29 |
JPMorgan Insurance Trust Income Builder Portfolio
SCHEDULE OF PORTFOLIO INVESTMENTS
AS OF DECEMBER 31, 2020 (continued)
| | | | | | | | |
| INVESTMENTS | | PRINCIPAL
AMOUNT
($000) | | | VALUE
($000) | |
Asset-Backed Securities — continued | |
|
United States — continued | |
| |
Structured Asset Investment Loan Trust | | | | | |
| | |
Series 2003-BC11, Class M1, 1.12%, 10/25/2033 ‡ (m) | | | 7 | | | | 8 | |
| |
Structured Asset Securities Corp. Mortgage Loan Trust | | | | | |
| | |
Series 2006-BC6, Class A4, 0.32%, 1/25/2037 (m) | | | 65 | | | | 64 | |
| |
Wells Fargo Home Equity Asset-Backed Securities Trust | | | | | |
| | |
Series 2006-3, Class A2, 0.30%, 1/25/2037 ‡ (m) | | | 1 | | | | 1 | |
| |
Westlake Automobile Receivables Trust | | | | | |
| | |
Series 2019-1A, Class E, 4.49%, 7/15/2024 (c) | | | 50 | | | | 52 | |
| | | | | | | | |
| | |
Total Asset-Backed Securities
(Cost $1,552) | | | | | | | 1,590 | |
| | | | | |
U.S. Treasury Obligations — 0.6% | | | | | | | | |
| | |
U.S. Treasury Notes 2.50%, 1/31/2021 (n)
(Cost $604) | | | 603 | | | | 604 | |
| | | | | | | | |
| | | SHARES
(000) | | | | |
Preferred Stocks — 0.6% | | | | | | | | |
|
United States — 0.6% | |
| | |
Allstate Corp. (The), Series H, 5.10%, 10/15/2024 ($25 par value) (o) | | | — | (k) | | | 8 | |
| | |
Bank of America Corp., | | | | | | | | |
| | |
Series GG, 6.00%, 5/16/2023
($25 par value) (o) | | | 1 | | | | 20 | |
| | |
Series HH, 5.88%, 7/24/2023
($25 par value) (o) | | | 1 | | | | 19 | |
| | |
Series KK, 5.38%, 6/25/2024
($25 par value) (o) | | | — | (k) | | | 8 | |
| | |
Series LL, 5.00%, 9/17/2024
($25 par value) (o) | | | 1 | | | | 35 | |
| | |
Energy Transfer Operating LP, Series E, (ICE LIBOR USD 3 Month + 5.16%), 7.60%, 5/15/2024 ($25 par value) (b) (o) | | | 2 | | | | 37 | |
| | |
MetLife, Inc., Series F, 4.75%, 3/15/2025
($25 par value) (o) | | | 1 | | | | 17 | |
| | |
Morgan Stanley, Series K, (ICE LIBOR USD 3 Month + 3.49%), 5.85%, 4/15/2027 ($25 par value) (b) (o) | | | 2 | | | | 72 | |
| | |
MYT Holding LLC, Series A, 10.00%, 6/6/2029 ‡ | | | 8 | | | | 10 | |
| | |
NextEra Energy Capital Holdings, Inc., Series N, 5.65%, 3/1/2079 ($25 par value) | | | 1 | | | | 18 | |
| | |
Northern Trust Corp., Series E, 4.70%, 1/1/2025 ($25 par value) (o) | | | — | (k) | | | 12 | |
| | |
Public Storage, Series L, , REIT4.63%, 6/17/2025
($25 par value) (o) | | | 1 | | | | 14 | |
| | | | | | | | |
INVESTMENTS | | SHARES
(000) | | | VALUE
($000) | |
| |
| | |
United States — continued | | | | | | | | |
| | |
Regions Financial Corp., Series C, (ICE LIBOR USD 3 Month + 3.15%), 5.70%, 5/15/2029 ($25 par value) (b) (o) | | | — | (k) | | | 7 | |
| | |
SCE Trust II, 5.10%, 5/5/2020 ($25 par value) (o) | | | 1 | | | | 13 | |
| | |
SCE Trust VI, 5.00%, 6/26/2022
($25 par value) (o) | | | 2 | | | | 48 | |
| | |
Sempra Energy, 5.75%, 7/1/2079 ($25 par value) | | | — | (k) | | | 3 | |
| | |
Southern Co. (The), Series 2020, 4.95%, 1/30/2080 ($25 par value) | | | 1 | | | | 27 | |
| | |
State Street Corp., Series G, (ICE LIBOR USD 3 Month + 3.71%), 5.35%, 3/15/2026 ($25 par value) (b) (o) | | | — | (k) | | | 11 | |
| | |
Truist Financial Corp., Series R, 4.75%, 9/1/2025 ($25 par value) (o) | | | 1 | | | | 22 | |
| | |
US Bancorp, Series K, 5.50%, 10/15/2023 ($25 par value) (o) | | | 1 | | | | 18 | |
| | |
Wells Fargo & Co., | | | | | | | | |
| | |
Series Y, 5.63%, 6/15/2022
($25 par value) (o) | | | 1 | | | | 33 | |
| | |
Series Z, 4.75%, 3/15/2025
($25 par value) (o) | | | 5 | | | | 123 | |
| | | | | | | | |
| |
Total Preferred Stocks
(Cost $539) | | | | 575 | |
| | | | | |
| | | PRINCIPAL
AMOUNT
($000) | | | | |
Mortgage-Backed Securities — 0.5% | |
|
United States — 0.5% | |
| |
FNMA UMBS, 30 Year | | | | | |
| | |
Pool # MA4100, 2.00%, 8/1/2050 | | | 53 | | | | 56 | |
| | |
Pool # MA4119, 2.00%, 9/1/2050 | | | 20 | | | | 20 | |
| | |
Pool # MA4159, 2.50%, 10/1/2050 | | | 59 | | | | 62 | |
| | |
Pool # MA4208, 2.00%, 12/1/2050 | | | 269 | | | | 280 | |
| |
GNMA II, 30 Year | | | | | |
| | |
Pool # MA7052, 2.50%, 12/20/2050 | | | 60 | | | | 64 | |
| | | | | | | | |
| |
Total Mortgage-Backed Securities
(Cost $479) | | | | 482 | |
| | | | | |
Loan Assignments — 0.5% (p) | |
|
United States — 0.5% | |
| | |
American Axle & Manufacturing, Inc., 1st Lien Term Loan B (ICE LIBOR USD 1 Month + 2.25%), 3.00%, 4/6/2024 (b) (q) | | | 7 | | | | 7 | |
| | |
Axalta Coating Systems US Holdings, Inc., Term Loan B (ICE LIBOR USD 3 Month + 1.75%), 2.00%, 6/1/2024 (b) | | | 21 | | | | 21 | |
SEE NOTES TO FINANCIAL STATEMENTS.
| | | | | | | | | | |
| | | | | |
| 30 | | | | | | | | JPMORGAN INSURANCE TRUST | | DECEMBER 31, 2020 |
| | | | | | | | |
| INVESTMENTS | | PRINCIPAL
AMOUNT
($000) | | | VALUE
($000) | |
| | | | | | | | |
Loan Assignments — continued | |
United States — continued | | | | | | | | |
| | |
CenturyLink, Inc., 1st Lien Term Loan B (ICE LIBOR USD 1 Month + 2.25%), 2.40%, 3/15/2027 (b) | | | 8 | | | | 7 | |
| | |
Cincinnati Bell, Inc., Term Loan B (ICE LIBOR USD 1 Month + 3.25%), 4.25%, 10/2/2024 (b) | | | 25 | | | | 25 | |
| | |
Dole Food Co., 1st Lien Term Loan B (ICE LIBOR USD 1 Month + 2.75%), 3.75%, 4/6/2024 (b) | | | 20 | | | | 20 | |
| | |
Golden Nugget, Inc., 1st Lien Term Loan B (ICE LIBOR USD 1 Week + 2.50%; ICE LIBOR USD 2 Month + 2.50%), 3.37%, 10/4/2023 (b) | | | 49 | | | | 47 | |
| | |
JBS USA LUX SA, 1st Lien Term Loan B (ICE LIBOR USD 1 Month + 2.00%), 2.15%, 5/1/2026 (b) | | | 33 | | | | 33 | |
| | |
MultiPlan, Inc., 1st Lien Term Loan B (ICE LIBOR USD 3 Month + 2.75%), 3.75%, 6/7/2023 (b) | | | 85 | | | | 84 | |
| | |
Navistar, Inc., 1st Lien Term Loan B (ICE LIBOR USD 1 Month + 3.50%), 3.66%, 11/6/2024 (b) | | | 41 | | | | 41 | |
| | |
Nexstar Broadcasting, Inc., 1st Lien Term Loan B (ICE LIBOR USD 1 Month + 2.75%), 2.91%, 9/18/2026 (b) | | | 43 | | | | 43 | |
| | |
UFC Holdings LLC, 1st Lien Term Loan (ICE LIBOR USD 3 Month + 3.25%), 4.25%, 4/29/2026 (b) | | | 43 | | | | 43 | |
| | |
Valeant Pharmaceuticals International, Inc., 1st Lien Term Loan B (ICE LIBOR USD 1 Month + 3.00%), 3.15%, 6/2/2025 (b) | | | 79 | | | | 78 | |
| | |
WMG Acquisition Corp., 1st Lien Term Loan F (ICE LIBOR USD 1 Month + 2.13%), 2.27%, 11/1/2023 (b) | | | 31 | | | | 31 | |
| | | | | | | | |
| |
Total Loan Assignments
(Cost $482) | | | | 480 | |
| | | | | |
| | | NO. OF
WARRANTS
(000) | | | | |
Warrants — 0.0% (f) | | | | | | | | |
| | |
United States — 0.0% (f) | | | | | | | | |
| | |
iHeartMedia Capital I LLC expiring 5/2/2039, price 1.00 USD * ‡ | | | 1 | | | | 13 | |
| | |
Nmg Research Ltd. expiring 9/24/2027, price 1.00 USD * ‡ | | | — | (k) | | | — | (k) |
| | |
Windstream Holdings, Inc. expiring 12/31/2049, price 10.75 USD * ‡ | | | — | (k) | | | — | (k) |
| | | | | | | | |
| |
Total Warrants
(Cost $19) | | | | 13 | |
| | | | | |
| | | | | | | | |
| INVESTMENTS | | PRINCIPAL
AMOUNT
($000) | | | VALUE
($000) | |
Convertible Bonds — 0.0% (f) | | | | | | | | |
| | |
United States — 0.0% (f) | | | | | | | | |
| | |
Liberty Interactive LLC
4.00%, 11/15/2029 | | | 3 | | | | 2 | |
| | |
3.75%, 2/15/2030 | | | 2 | | | | 2 | |
| | | | | | | | |
| |
Total Convertible Bonds
(Cost $3) | | | | 4 | |
| | | | | |
| | | NO. OF
RIGHTS
(000) | | | | |
Rights — 0.0% (f) | | | | | | | | |
| | |
Spain — 0.0% (f) | | | | | | | | |
| | |
Repsol SA, expiring 1/8/2021 *
(Cost $2) | | | 5 | | | | 2 | |
| | | | | | | | |
| | | SHARES
(000) | | | | |
Short-Term Investments — 4.2% | | | | | | | | |
| | |
Investment Companies — 2.8% | | | | | | | | |
| | |
JPMorgan Prime Money Market Fund Class Institutional Shares, 0.09% (l) (r) | | | 2,629 | | | | 2,630 | |
| | |
JPMorgan Prime Money Market Fund Class IM Shares, 0.12% (l) (r) | | | 209 | | | | 209 | |
| | | | | | | | |
| |
Total Investment Companies
(Cost $2,838) | | | | 2,839 | |
| | | | | |
Investment of Cash Collateral from Securities Loaned — 1.4% | |
| | |
JPMorgan Securities Lending Money Market Fund Agency SL Class Shares, 0.15% (l) (r) | | | 700 | | | | 700 | |
| | |
JPMorgan U.S. Government Money Market Fund Class IM Shares, 0.03% (l) (r) | | | 667 | | | | 667 | |
| | | | | | | | |
Total Investment of Cash Collateral From Securities Loaned
(Cost $1,367) | | | | | | | 1,367 | |
| | | | | |
Total Short-Term Investments
(Cost $4,205) | | | | | | | 4,206 | |
| | | | | | | | |
Total Investments — 100.4%
(Cost $93,378) | | | | | | | 100,289 | |
Liabilities in Excess of
Other Assets — (0.4)% | | | | | | | (429 | ) |
| | | | | | | | |
NET ASSETS — 100.0% | | | | | | | 99,860 | |
| | | | | |
| | | | | |
Percentages indicated are based on net assets.
SEE NOTES TO FINANCIAL STATEMENTS.
| | | | | | | | | | |
| | | | | |
| DECEMBER 31, 2020 | | JPMORGAN INSURANCE TRUST | | | | | | | | 31 |
JPMorgan Insurance Trust Income Builder Portfolio
SCHEDULE OF PORTFOLIO INVESTMENTS
AS OF DECEMBER 31, 2020 (continued)
Summary of Investments by Industry, December 31, 2020
The following table represents the portfolio investments of the Portfolio by industry classifications as a percentage of total investments:
| | | | |
| PORTFOLIO COMPOSITION BY INDUSTRY | | PERCENTAGE | |
| |
Equity Real Estate Investment Trusts (REITs) | | | 6.5 | % |
| |
Banks | | | 6.0 | |
| |
Oil, Gas & Consumable Fuels | | | 4.5 | |
| |
Diversified Telecommunication Services | | | 4.2 | |
| |
Collateralized Mortgage Obligations | | | 3.6 | |
| |
Pharmaceuticals | | | 3.6 | |
| |
Electric Utilities | | | 3.6 | |
| |
U.S. Equity | | | 3.6 | |
| |
Media | | | 3.6 | |
| |
Capital Markets | | | 3.1 | |
| |
Fixed Income | | | 3.1 | |
| |
Convertible Bonds | | | 3.1 | |
| |
Commercial Mortgage-Backed Securities | | | 2.9 | |
| |
Insurance | | | 2.6 | |
| |
Health Care Providers & Services | | | 2.4 | |
| | | | |
| |
Hotels, Restaurants & Leisure | | | 2.3 | |
| |
Food Products | | | 2.0 | |
| |
Semiconductors & Semiconductor Equipment | | | 2.0 | |
| |
Wireless Telecommunication Services | | | 1.6 | |
| |
Asset-Backed Securities | | | 1.6 | |
| |
Metals & Mining | | | 1.6 | |
| |
Technology Hardware, Storage & Peripherals | | | 1.5 | |
| |
Consumer Finance | | | 1.4 | |
| |
Chemicals | | | 1.4 | |
| |
Beverages | | | 1.3 | |
| |
Multi-Utilities | | | 1.3 | |
| |
Containers & Packaging | | | 1.1 | |
| |
Auto Components | | | 1.0 | |
| |
Household Durables | | | 1.0 | |
| |
Others (each less than 1.0%) | | | 18.3 | |
| |
Short-Term Investments | | | 4.2 | |
Abbreviations
| | |
| ABS | | Asset-Backed Securities |
| ADR | | American Depositary Receipt |
| CVA | | Dutch Certification |
| ELN | | Equity-Linked Note |
| FHLMC | | Federal Home Loan Mortgage Corp. |
| FNMA | | Federal National Mortgage Association |
| GDR | | Global Depositary Receipt |
| GNMA | | Government National Mortgage Association |
| ICE | | Intercontinental Exchange |
| IF | | Inverse Floaters represent securities that pay interest at a rate that increases (decreases) with a decline (incline) in a specified index or have an interest rate that adjusts periodically based on changes in current interest rates and prepayments on the underlying pool of assets. The interest rate shown is the rate in effect as of December 31, 2020. The rate may be subject to a cap and floor. |
| IO | | Interest Only represents the right to receive the monthly interest payments on an underlying pool of mortgage loans. The principal amount shown represents the par value on the underlying pool. The yields on these securities are subject to accelerated principal paydowns as a result of prepayment or refinancing of the underlying pool of mortgage instruments. As a result, interest income may be reduced considerably. |
| | |
| LIBOR | | London Interbank Offered Rate |
| OYJ | | Public Limited Company |
| PJSC | | Public Joint Stock Company |
| Preference | | A special type of equity investment that shares in the earnings of the company, has limited voting rights, and may have a dividend preference. Preference shares may also have liquidation preference. |
| PT | | Limited liability company |
| REIT | | Real Estate Investment Trust |
| REMIC | | Real Estate Mortgage Investment Conduit |
| RTS | | Russian Trading System |
| SCA | | Limited partnership with share capital |
| SOFR | | Secured Overnight Financing Rate |
| STRIPS | | Separate Trading of Registered Interest and Principal of Securities. The STRIPS Program lets investors hold and trade individual interest and principal components of eligible notes and bonds as separate securities. |
| UMBS | | Uniform Mortgage-Backed Securities |
| USD | | United States Dollar |
SEE NOTES TO FINANCIAL STATEMENTS.
| | | | | | | | | | |
| | | | | |
| 32 | | | | | | | | JPMORGAN INSURANCE TRUST | | DECEMBER 31, 2020 |
| | |
| (a) | | Security is perpetual and thus, does not have a predetermined maturity date. The coupon rate for this security is fixed for a period of time and may be structured to adjust thereafter. The date shown, if applicable, reflects the next call date. The coupon rate shown is the rate in effect as of December 31, 2020. |
| (b) | | Variable or floating rate security, linked to the referenced benchmark. The interest rate shown is the current rate as of December 31, 2020. |
| (c) | | Securities exempt from registration under Rule 144A or section 4(a)(2), of the Securities Act of 1933, as amended. |
| (d) | | Security is an interest bearing note with preferred security characteristics. |
| (e) | | The security or a portion of this security is on loan at December 31, 2020. The total value of securities on loan at December 31, 2020 is approximately $1,313,000. |
| (f) | | Amount rounds to less than 0.1% of net assets. |
| (g) | | Security has the ability to pay in kind (“PIK”) or pay income in cash. When applicable, separate rates of such payments are disclosed. |
| (h) | | Step bond. Interest rate is a fixed rate for an initial period that either resets at a specific date or may reset in the future contingent upon a predetermined trigger. The interest rate shown is the current rate as of December 31, 2020. |
| (i) | | Defaulted security. |
| (j) | | Security exempt from registration pursuant to Regulation S under the Securities Act of 1933, as amended. Regulation S applies to securities offerings that are made outside of the United States and |
| | |
| | do not involve direct selling efforts in the United States and as such may have restrictions on resale. |
| (k) | | Amount rounds to less than one thousand. |
| (l) | | Investment in an affiliated fund, which is registered under the Investment Company Act of 1940, as amended, and is advised by J.P. Morgan Investment Management Inc. |
| (m) | | Variable or floating rate security, the interest rate of which adjusts periodically based on changes in current interest rates and prepayments on the underlying pool of assets. The interest rate shown is the current rate as of December 31, 2020. |
| (n) | | All or a portion of this security is deposited with the broker as initial margin for futures contracts. |
| (o) | | The date shown reflects the next call date on which the issuer may redeem the security at par value. The coupon rate for this security is based on par value and is in effect as of December 31, 2020. |
| (p) | | Loan assignments are presented by obligor. Each series or loan tranche underlying each obligor may have varying terms. |
| (q) | | All or a portion of this security is unsettled as of December 31, 2020. Unless otherwise indicated, the coupon rate is undetermined. The coupon rate shown may not be accrued for the entire position. |
| (r) | | The rate shown is the current yield as of December 31, 2020. |
| * | | Non-income producing security. |
| ‡ | | Value determined using significant unobservable inputs. |
|
| Detailed information about investment portfolios of the underlying funds can be found in shareholder reports filed with the Securities and Exchange Commission (SEC) by each such underlying fund semi-annually on Form N-CSR and in portfolio holdings filed quarterly on Form N-PORT, and are available for download from both the SEC’s as well as each respective underlying fund’s website. Detailed information about underlying J.P. Morgan Funds can also be found at www.jpmorganfunds.com or by calling 1-800-480-4111. |
| | | | | | | | | | | | | | | | | | | | |
| Futures contracts outstanding as of December 31, 2020 (amounts in thousands, except number of contracts): | |
| DESCRIPTION | | NUMBER OF
CONTRACTS | | | EXPIRATION
DATE | | | TRADING
CURRENCY | | | NOTIONAL
AMOUNT
($) | | | VALUE AND
UNREALIZED
APPRECIATION
(DEPRECIATION)
($) | |
| | | | | |
| Long Contracts | | | | | | | | | | | | | | | | | | | | |
| | | | | |
| EURO STOXX 50 Index | | | 9 | | | | 03/2021 | | | | EUR | | | | 390 | | | | 5 | |
| | | | | |
| U.S. Treasury 10 Year Note | | | 96 | | | | 03/2021 | | | | USD | | | | 13,251 | | | | 9 | |
| | | | | | | | | | | | | | | | | | | | |
| | | | | |
| | | | | | | | | | | | | | | | | | | 14 | |
| | | | | | | | | | | | | | | | | | | | |
| | | | | |
| Short Contracts | | | | | | | | | | | | | | | | | | | | |
| | | | | |
| Foreign Exchange GBP/USD | | | (16 | ) | | | 03/2021 | | | | USD | | | | (1,368 | ) | | | (38 | ) |
| | | | | |
| S&P 500 E-Mini Index | | | (10 | ) | | | 03/2021 | | | | USD | | | | (1,872 | ) | | | (30 | ) |
| | | | | | | | | | | | | | | | | | | | |
| | | | | |
| | | | | | | | | | | | | | | | | | | (68 | ) |
| | | | | | | | | | | | | | | | | | | | |
| | | | | |
| | | | | | | | | | | | | | | | | | | (54 | ) |
| | | | | | | | | | | | | | | | | | | | |
Abbreviations
| | |
| EUR | | Euro |
| GBP | | British Pound |
| USD | | United States Dollar |
SEE NOTES TO FINANCIAL STATEMENTS.
| | | | | | | | | | |
| | | | | |
| DECEMBER 31, 2020 | | JPMORGAN INSURANCE TRUST | | | | | | | | 33 |
STATEMENT OF ASSETS AND LIABILITIES
AS OF DECEMBER 31, 2020
(Amounts in thousands, except per share amounts)
| | | | |
| | | JPMorgan Insurance Trust Income Builder
Portfolio | |
ASSETS: | |
Investments in non-affiliates, at value | | $ | 89,377 | |
Investments in affiliates, at value | | | 9,545 | |
Investment of cash collateral received from securities loaned, at value (See Note 2.E.) | | | 1,367 | |
Cash | | | 76 | |
Foreign currency, at value | | | 132 | |
Deposits at broker for futures contracts | | | 12 | |
Receivables: | | | | |
Portfolio shares sold | | | 5 | |
Interest from non-affiliates | | | 574 | |
Dividends from non-affiliates | | | 84 | |
Dividends from affiliates | | | — | (a) |
Tax reclaims | | | 39 | |
Securities lending income (See Note 2.E.) | | | — | (a) |
Variation margin on futures contracts | | | 172 | |
Due from adviser | | | 5 | |
| | | | |
Total Assets | | | 101,388 | |
| | | | |
|
LIABILITIES: | |
Payables: | | | | |
Investment securities purchased | | | — | (a) |
Collateral received on securities loaned (See Note 2.E.) | | | 1,367 | |
Portfolio shares redeemed | | | 32 | |
Accrued liabilities: | | | | |
Distribution fees | | | 17 | |
Custodian and accounting fees | | | 36 | |
Trustees’ and Chief Compliance Officer’s fees | | | — | (a) |
Other | | | 76 | |
| | | | |
Total Liabilities | | | 1,528 | |
| | | | |
Net Assets | | $ | 99,860 | |
| | | | |
| (a) | Amount rounds to less than one thousand. |
SEE NOTES TO FINANCIAL STATEMENTS.
| | | | | | | | | | |
| | | | | |
| 34 | | | | | | | | JPMORGAN INSURANCE TRUST | | DECEMBER 31, 2020 |
| | | | |
| | | JPMorgan Insurance Trust Income Builder
Portfolio | |
NET ASSETS: | |
Paid-in-Capital | | $ | 90,612 | |
Total distributable earnings (loss) | | | 9,248 | |
| | | | |
Total Net Assets | | $ | 99,860 | |
| | | | |
Net Assets: | |
Class 1 | | $ | 19,684 | |
Class 2 | | | 80,176 | |
| | | | |
Total | | $ | 99,860 | |
| | | | |
Outstanding units of beneficial interest (shares) | |
(unlimited number of shares authorized, no par value): | | | | |
Class 1 | | | 1,738 | |
Class 2 | | | 7,105 | |
| |
Net Asset Value (b): | | | | |
Class 1 — Offering and redemption price per share | | $ | 11.33 | |
Class 2 — Offering and redemption price per share | | | 11.28 | |
| |
Cost of investments in non-affiliates | | $ | 83,367 | |
Cost of investments in affiliates | | | 8,644 | |
Cost of foreign currency | | | 124 | |
Investment securities on loan, at value (See Note 2.E.) | | | 1,313 | |
Cost of investment of cash collateral (See Note 2.E.) | | | 1,367 | |
| (b) | Per share amounts may not recalculate due to rounding of net assets and/or shares outstanding. |
SEE NOTES TO FINANCIAL STATEMENTS.
| | | | | | | | | | |
| | | | | |
| DECEMBER 31, 2020 | | JPMORGAN INSURANCE TRUST | | | | | | | | 35 |
STATEMENT OF OPERATIONS
FOR THE YEAR ENDED DECEMBER 31, 2020
(Amounts in thousands)
| | | | |
| | | JPMorgan Insurance Trust Income Builder Portfolio | |
INVESTMENT INCOME: | | | | |
Interest income from non-affiliates | | $ | 2,328 | |
Interest income from affiliates | | | — | (a) |
Dividend income from non-affiliates | | | 962 | |
Dividend income from affiliates | | | 261 | |
Income from securities lending (net) (See Note 2.E.) | | | 5 | |
Foreign taxes withheld (net) | | | (54 | ) |
| | | | |
Total investment income | | | 3,502 | |
| | | | |
| |
EXPENSES: | | | | |
Investment advisory fees | | | 376 | |
Administration fees | | | 67 | |
Distribution fees: | | | | |
Class 2 | | | 187 | |
Custodian and accounting fees | | | 215 | |
Interest expense to affiliates | | | — | (a) |
Professional fees | | | 111 | |
Trustees’ and Chief Compliance Officer’s fees | | | 25 | |
Printing and mailing costs | | | 30 | |
Transfer agency fees (See Note 2.L.) | | | 15 | |
Other | | | 11 | |
| | | | |
Total expenses | | | 1,037 | |
| | | | |
Less fees waived | | | (179 | ) |
Less expense reimbursements | | | (171 | ) |
| | | | |
Net expenses | | | 687 | |
| | | | |
Net investment income (loss) | | | 2,815 | |
| | | | |
| |
REALIZED/UNREALIZED GAINS (LOSSES): | | | | |
Net realized gain (loss) on transactions from: | | | | |
Investments in non-affiliates | | | (337 | ) |
Investments in affiliates | | | (356 | ) |
Futures contracts | | | 988 | |
Foreign currency transactions | | | (26 | ) |
| | | | |
Net realized gain (loss) | | | 269 | |
| | | | |
Distributions of capital gains received from investment company affiliates | | | — | (a) |
| | | | |
Change in net unrealized appreciation/depreciation on: | | | | |
Investments in non-affiliates | | | 1,589 | |
Investments in affiliates | | | (82 | ) |
Futures contracts | | | 11 | |
Foreign currency translations | | | 20 | |
| | | | |
Change in net unrealized appreciation/depreciation | | | 1,538 | |
| | | | |
Net realized/unrealized gains (losses) | | | 1,807 | |
| | | | |
Change in net assets resulting from operations | | $ | 4,622 | |
| | | | |
| (a) | Amount rounds to less than one thousand. |
SEE NOTES TO FINANCIAL STATEMENTS.
| | | | | | | | | | |
| | | | | |
| 36 | | | | | | | | JPMORGAN INSURANCE TRUST | | DECEMBER 31, 2020 |
STATEMENTS OF CHANGES IN NET ASSETS
FOR THE PERIODS INDICATED
(Amounts in thousands)
| | | | | | | | |
| | |
JPMorgan Insurance Trust Income Builder Portfolio | |
| | | Year Ended
December 31, 2020 | | | Year Ended
December 31, 2019 | |
CHANGE IN NET ASSETS RESULTING FROM OPERATIONS: | |
Net investment income (loss) | | $ | 2,815 | | | $ | 2,829 | |
Net realized gain (loss) | | | 269 | | | | (97 | ) |
Distributions of capital gains received from investment company affiliates | | | — | (a) | | | 60 | |
Change in net unrealized appreciation/depreciation | | | 1,538 | | | | 7,481 | |
| | | | | | | | |
Change in net assets resulting from operations | | | 4,622 | | | | 10,273 | |
| | | | | | | | |
| | |
DISTRIBUTIONS TO SHAREHOLDERS: | | | | | | | | |
Class 1 | | | (495 | ) | | | (499 | ) |
Class 2 | | | (2,485 | ) | | | (2,195 | ) |
| | | | | | | | |
Total distributions to shareholders | | | (2,980 | ) | | | (2,694 | ) |
| | | | | | | | |
|
CAPITAL TRANSACTIONS: | |
Change in net assets resulting from capital transactions | | | 7,628 | | | | 16,580 | |
| | | | | | | | |
|
NET ASSETS: | |
Change in net assets | | | 9,270 | | | | 24,159 | |
Beginning of period | | | 90,590 | | | | 66,431 | |
| | | | | | | | |
End of period | | $ | 99,860 | | | $ | 90,590 | |
| | | | | | | | |
| | |
CAPITAL TRANSACTIONS: | | | | | | | | |
Class 1 | | | | | | | | |
Proceeds from shares issued | | $ | 4,684 | | | $ | 4,351 | |
Distributions reinvested | | | 495 | | | | 499 | |
Cost of shares redeemed | | | (630 | ) | | | (2,506 | ) |
| | | | | | | | |
Change in net assets resulting from Class 1 capital transactions | | | 4,549 | | | | 2,344 | |
| | | | | | | | |
Class 2 | | | | | | | | |
Proceeds from shares issued | | | 13,471 | | | | 19,866 | |
Distributions reinvested | | | 2,485 | | | | 2,195 | |
Cost of shares redeemed | | | (12,877 | ) | | | (7,825 | ) |
| | | | | | | | |
Change in net assets resulting from Class 2 capital transactions | | | 3,079 | | | | 14,236 | |
| | | | | | | | |
Total change in net assets resulting from capital transactions | | $ | 7,628 | | | $ | 16,580 | |
| | | | | | | | |
|
SHARE TRANSACTIONS: | |
Class 1 | |
Issued | | | 436 | | | | 404 | |
Reinvested | | | 50 | | | | 48 | |
Redeemed | | | (57 | ) | | | (225 | ) |
| | | | | | | | |
Change in Class 1 Shares | | | 429 | | | | 227 | |
| | | | | | | | |
Class 2 | |
Issued | | | 1,275 | | | | 1,850 | |
Reinvested | | | 254 | | | | 210 | |
Redeemed | | | (1,258 | ) | | | (729 | ) |
| | | | | | | | |
Change in Class 2 Shares | | | 271 | | | | 1,331 | |
| | | | | | | | |
| (a) | Amount rounds to less than one thousand. |
SEE NOTES TO FINANCIAL STATEMENTS.
| | | | | | | | | | |
| | | | | |
| DECEMBER 31, 2020 | | JPMORGAN INSURANCE TRUST | | | | | | | | 37 |
FINANCIAL HIGHLIGHTS
FOR THE PERIODS INDICATED
| | | | | | | | | | | | | | | | | | | | | | | | | | | | | | | | | | | | |
| | | | | | Per share operating performance | | | | |
| | | | | | Investment operations | | | | | | Distributions | |
| | | Net asset
value,
beginning
of period | | | Net
investment
income
(loss) (a)(b) | | | Net realized
and unrealized
gains
(losses) on
investments | | | Total from
investment
operations | | | | | | Net
investment
income | | | Net
realized
gain | | | Return of
capital | | | Total
distributions | |
JPMorgan Insurance Trust Income Builder Portfolio | | | | | | | | | | | | | | | | | | | | | | | | | | | | | | | | | | | | |
Class 1 | | | | | | | | | | | | | | | | | | | | | | | | | | | | | | | | | | | | |
Year Ended December 31, 2020 | | $ | 11.16 | | | $ | 0.35 | | | $ | 0.20 | | | $ | 0.55 | | | | | | | $ | (0.38 | ) | | $ | — | | | $ | — | | | $ | (0.38 | ) |
Year Ended December 31, 2019 | | | 10.11 | | | | 0.40 | | | | 1.05 | | | | 1.45 | | | | | | | | (0.37 | ) | | | (0.03 | ) | | | — | | | | (0.40 | ) |
Year Ended December 31, 2018 | | | 10.62 | | | | 0.42 | | | | (0.91 | ) | | | (0.49 | ) | | | | | | | — | | | | (0.02 | ) | | | — | | | | (0.02 | ) |
Year Ended December 31, 2017 | | | 9.93 | | | | 0.37 | | | | 0.81 | | | | 1.18 | | | | | | | | (0.39 | ) | | | (0.10 | ) | | | — | | | | (0.49 | ) |
Year Ended December 31, 2016 | | | 9.63 | | | | 0.37 | | | | 0.26 | | | | 0.63 | | | | | | | | (0.32 | ) | | | — | | | | (0.01 | ) | | | (0.33 | ) |
| | | | | | | | | |
Class 2 | | | | | | | | | | | | | | | | | | | | | | | | | | | | | | | | | | | | |
Year Ended December 31, 2020 | | | 11.12 | | | | 0.33 | | | | 0.19 | | | | 0.52 | | | | | | | | (0.36 | ) | | | — | | | | — | | | | (0.36 | ) |
Year Ended December 31, 2019 | | | 10.08 | | | | 0.37 | | | | 1.04 | | | | 1.41 | | | | | | | | (0.34 | ) | | | (0.03 | ) | | | — | | | | (0.37 | ) |
Year Ended December 31, 2018 | | | 10.62 | | | | 0.39 | | | | (0.91 | ) | | | (0.52 | ) | | | | | | | — | | | | (0.02 | ) | | | — | | | | (0.02 | ) |
Year Ended December 31, 2017 | | | 9.92 | | | | 0.35 | | | | 0.81 | | | | 1.16 | | | | | | | | (0.36 | ) | | | (0.10 | ) | | | — | | | | (0.46 | ) |
Year Ended December 31, 2016 | | | 9.63 | | | | 0.35 | | | | 0.25 | | | | 0.60 | | | | | | | | (0.30 | ) | | | — | | | | (0.01 | ) | | | (0.31 | ) |
| (a) | Net investment income (loss) is affected by timing of distributions from Underlying Funds. |
| (b) | Calculated based upon average shares outstanding. |
| (c) | Includes adjustments in accordance with accounting principles generally accepted in the United States of America and as such, the net asset values for financial reporting purposes and the returns based upon those net asset values may differ from the net asset values and returns for shareholder transactions. |
| (d) | Total returns do not include charges that will be imposed by variable insurance contracts or by Eligible Plans. If these charges were reflected, returns would be lower than those shown. |
| (e) | Does not include expenses of Underlying Funds. |
| (f) | Includes earnings credits and interest expense, if applicable, each of which is less than 0.005% unless otherwise noted. |
SEE NOTES TO FINANCIAL STATEMENTS.
| | | | | | | | | | |
| | | | | |
| 38 | | | | | | | | JPMORGAN INSURANCE TRUST | | DECEMBER 31, 2020 |
| | | | | | | | | | | | | | | | | | | | | | | | | | |
| Ratios/Supplemental data | |
| | | | | | | Ratios to average net assets | |
Net asset
value,
end of
period | | | Total
return (c)(d) | | | Net assets,
end of
period
(000’s) | | | Net
expenses (e)(f) | | |
Net
investment
income
(loss) (a) | | | Expenses
without waivers,
reimbursements and
earnings credits (e) | | | Portfolio
turnover
rate | |
| | | | | | | | | | | | | | | | | | | | | | | | | | |
| | | | | | | | | | | | | | | | | | | | | | | | | | |
| $ | 11.33 | | | | 5.45 | % | | $ | 19,684 | | | | 0.56 | % | | | 3.33 | % | | | 0.94 | % | | | 66 | % |
| | 11.16 | | | | 14.56 | | | | 14,607 | | | | 0.60 | | | | 3.71 | | | | 0.95 | | | | 51 | |
| | 10.11 | | | | (4.63 | ) | | | 10,947 | | | | 0.59 | | | | 4.02 | | | | 1.14 | | | | 68 | |
| | 10.62 | | | | 11.89 | | | | 8,776 | | | | 0.59 | | | | 3.40 | | | | 1.26 | | | | 85 | |
| | 9.93 | | | | 6.53 | | | | 106 | | | | 0.60 | | | | 3.72 | | | | 1.27 | | | | 46 | |
| | | | | | |
| | | | | | | | | | | | | | | | | | | | | | | | | | |
| | 11.28 | | | | 5.12 | | | | 80,176 | | | | 0.81 | | | | 3.10 | | | | 1.20 | | | | 66 | |
| | 11.12 | �� | | | 14.27 | | | | 75,983 | | | | 0.85 | | | | 3.49 | | | | 1.21 | | | | 51 | |
| | 10.08 | | | | (4.92 | ) | | | 55,484 | | | | 0.84 | | | | 3.76 | | | | 1.39 | | | | 68 | |
| | 10.62 | | | | 11.70 | | | | 42,122 | | | | 0.84 | | | | 3.31 | | | | 1.40 | | | | 85 | |
| | 9.92 | | | | 6.21 | | | | 48,465 | | | | 0.85 | | | | 3.47 | | | | 1.49 | | | | 46 | |
SEE NOTES TO FINANCIAL STATEMENTS.
| | | | | | | | | | |
| | | | | |
| DECEMBER 31, 2020 | | JPMORGAN INSURANCE TRUST | | | | | | | | 39 |
NOTES TO FINANCIAL STATEMENTS
AS OF DECEMBER 31, 2020
1. Organization
JPMorgan Insurance Trust (the “Trust”) is registered under the Investment Company Act of 1940, as amended (the “1940 Act”), as an open-end management investment company and is a Massachusetts business trust.
The following is a separate portfolio of the Trust (the “Portfolio”) covered by this report:
| | | | |
| | | Classes Offered | | Diversification Classification |
| JPMorgan Insurance Trust Income Builder Portfolio | | Class 1 and Class 2 | | Diversified |
The investment objective of the Portfolio is to seek to maximize income while maintaining prospects for capital appreciation.
Portfolio shares are offered only to separate accounts of participating insurance companies and Eligible Plans. Individuals may not purchase shares directly from the Portfolio.
All classes of shares have equal rights as to earnings, assets and voting privileges, except that each class may bear different transfer agency fees and distribution fees and each class has exclusive voting rights with respect to its distribution plan and administrative services plan.
J.P. Morgan Investment Management Inc. (“JPMIM”), an indirect, wholly-owned subsidiary of JPMorgan Chase & Co. (“JPMorgan”), acts as Adviser (the “Adviser”) and Administrator (the “Administrator”) to the Portfolio.
2. Significant Accounting Policies
The following is a summary of significant accounting policies followed by the Portfolio in the preparation of its financial statements. The Portfolio is an investment company and, accordingly, follows the investment company accounting and reporting guidance of the Financial Accounting Standards Board (“FASB”) Accounting Standards Codification Topic 946 — Investment Companies, which is part of U.S. generally accepted accounting principles (“GAAP”). The preparation of financial statements in conformity with GAAP requires management to make estimates and assumptions that affect (i) the reported amounts of assets and liabilities, (ii) disclosure of contingent assets and liabilities at the date of the financial statements, and (iii) the reported amounts of increases and decreases in net assets from operations during the reporting period. Actual results could differ from those estimates.
A. Valuation of Investments — Investments are valued in accordance with GAAP and the Portfolio’s valuation policies set forth by, and under the supervision and responsibility of, the Board of Trustees of the Trust (the “Board”), which established the following approach to valuation, as described more fully below: (i) investments for which market quotations are readily available shall be valued at their market value and (ii) all other investments for which market quotations are not readily available shall be valued at their fair value as determined in good faith by the Board.
The Administrator has established the J.P. Morgan Asset Management Americas Valuation Committee (“AVC”) to assist the Board with the oversight and monitoring of the valuation of the Portfolio’s investments. The Administrator implements the valuation policies of the Portfolio’s investments, as directed by the Board. The AVC oversees and carries out the policies for the valuation of investments held in the Portfolio. This includes monitoring the appropriateness of fair values based on results of ongoing valuation oversight including, but not limited to, consideration of macro or security specific events, market events, and pricing vendor and broker due diligence. The Administrator is responsible for discussing and assessing the potential impacts to the fair values on an ongoing basis, and, at least on a quarterly basis, with the AVC and the Board.
A market-based approach is primarily used to value the Portfolio’s investments. Investments for which market quotations are not readily available are fair valued by approved affiliated and/or unaffiliated pricing vendors or third party broker-dealers (collectively referred to as “Pricing Services”) or may be internally fair valued using methods set forth by the valuation policies approved by the Board. This may include the use of related or comparable assets or liabilities, recent transactions, market multiples, book values and other relevant information for the investment. An income-based valuation approach may be used in which the anticipated future cash flows of the investment are discounted to calculate the fair value. Discounts may also be applied due to the nature or duration of any restrictions on the disposition of the investments. Valuations may be based upon current market prices of securities that are comparable in coupon, rating, maturity and industry. It is possible that the estimated values may differ significantly from the values that would have been used had a ready market for the investments existed, and such differences could be material.
Fixed income instruments are valued based on prices received from Pricing Services. The Pricing Services use multiple valuation techniques to determine the valuation of fixed income instruments. In instances where sufficient market activity exists, the Pricing Services may utilize a market-based approach through which trades or quotes from market makers are used to determine the valuation of these instruments. In instances where sufficient market activity may not exist, the Pricing Services also utilize proprietary valuation models which may consider market transactions in comparable securities and the various relationships between securities in determining fair value and/or market characteristics in order to estimate the relevant cash flows, which are then discounted to calculate the fair values.
Equities and other exchange-traded instruments are valued at the last sale price or official market closing price on the primary exchange on which the instrument is traded before the net asset values (“NAV”) of the Portfolio are calculated on a valuation date. Certain foreign equity instruments, as well as certain derivatives with foreign equity reference obligations, are valued by applying international fair value factors provided by approved Pricing Services. The factors seek to adjust the local closing price for movements of local markets post-closing, but prior to the time the NAVs are calculated.
Investments in open-end investment companies (“Underlying Funds”) are valued at each Underlying Fund’s NAV per share as of the report date.
| | | | | | | | | | |
| | | | | |
| 40 | | | | | | | | JPMORGAN INSURANCE TRUST | | DECEMBER 31, 2020 |
Futures contracts are generally valued on the basis of available market quotations.
See the table on “Quantitative Information about Level 3 Fair Value Measurements” for information on the valuation techniques and inputs used to value level 3 securities held by the Portfolio at December 31, 2020.
Valuations reflected in this report are as of the report date. As a result, changes in valuation due to market events and/or issuer-related events after the report date and prior to issuance of the report are not reflected herein.
The various inputs that are used in determining the valuation of the Portfolio’s investments are summarized into the three broad levels listed below.
| • | | Level 1 — Unadjusted inputs using quoted prices in active markets for identical investments. |
| • | | Level 2 — Other significant observable inputs including, but not limited to, quoted prices for similar investments, inputs other than quoted prices that are observable for investments (such as interest rates, prepayment speeds, credit risk, etc.) or other market corroborated inputs. |
| • | | Level 3 — Significant inputs based on the best information available in the circumstances, to the extent observable inputs are not available (including the Portfolio’s assumptions in determining the fair value of investments). |
A financial instrument’s level within the fair value hierarchy is based on the lowest level of any input, both individually and in the aggregate, that is significant to the fair value measurement. The inputs or methodology used for valuing instruments are not necessarily an indication of the risk associated with investing in those instruments.
The following table represents each valuation input as presented on the Schedule of Portfolio Investments (“SOI”) (amounts in thousands):
| | | | | | | | | | | | | | | | |
| | | Level 1
Quoted prices | | | Level 2
Other significant
observable inputs | | | Level 3
Significant
unobservable inputs | | | Total | |
Investments in Securities | |
Asset-Backed Securities | |
United States | | $ | — | | | $ | 604 | | | $ | 986 | | | $ | 1,590 | |
Collateralized Mortgage Obligations | |
United States | | | — | | | | 2,798 | | | | 862 | | | | 3,660 | |
Commercial Mortgage-Backed Securities | |
Cayman Islands | | | — | | | | — | | | | 248 | | | | 248 | |
United States | | | — | | | | 1,691 | | | | 1,010 | | | | 2,701 | |
| | | | | | | | | | | | | | | | |
Total Commercial Mortgage-Backed Securities | | | — | | | | 1,691 | | | | 1,258 | | | | 2,949 | |
| | | | | | | | | | | | | | | | |
Common Stocks | |
Australia | | | — | | | | 1,166 | | | | — | | | | 1,166 | |
Austria | | | — | | | | 38 | | | | — | | | | 38 | |
Belgium | | | — | | | | 196 | | | | — | | | | 196 | |
Brazil | | | 186 | | | | 7 | | | | — | | | | 193 | |
Canada | | | 1,302 | | | | — | | | | — | | | | 1,302 | |
Chile | | | 19 | | | | — | | | | — | | | | 19 | |
China | | | 81 | | | | 1,833 | | | | — | | | | 1,914 | |
Czech Republic | | | — | | | | 19 | | | | — | | | | 19 | |
Denmark | | | — | | | | 165 | | | | — | | | | 165 | |
Finland | | | — | | | | 268 | | | | — | | | | 268 | |
France | | | — | | | | 1,139 | | | | — | | | | 1,139 | |
Germany | | | — | | | | 1,077 | | | | — | | | | 1,077 | |
Hong Kong | | | — | | | | 594 | | | | — | | | | 594 | |
India | | | 431 | | | | — | | | | — | | | | 431 | |
Indonesia | | | 161 | | | | 127 | | | | — | | | | 288 | |
Ireland | | | 11 | | | | 18 | | | | — | | | | 29 | |
Italy | | | — | | | | 424 | | | | — | | | | 424 | |
Japan | | | — | | | | 1,847 | | | | — | | | | 1,847 | |
Jordan | | | — | | | | 6 | | | | — | | | | 6 | |
Macau | | | — | | | | 7 | | | | — | | | | 7 | |
Mexico | | | 327 | | | | — | | | | — | | | | 327 | |
Netherlands | | | — | | | | 250 | | | | — | | | | 250 | |
New Zealand | | | — | | | | 93 | | | | — | | | | 93 | |
Norway | | | — | | | | 98 | | | | — | | | | 98 | |
Portugal | | | — | | | | 41 | | | | — | | | | 41 | |
Russia | | | 222 | | | | 365 | | | | — | | | | 587 | |
| | | | | | | | | | |
| | | | | |
| DECEMBER 31, 2020 | | JPMORGAN INSURANCE TRUST | | | | | | | | 41 |
NOTES TO FINANCIAL STATEMENTS
AS OF DECEMBER 31, 2020 (continued)
| | | | | | | | | | | | | | | | |
| | | Level 1
Quoted prices | | | Level 2
Other significant
observable inputs | | | Level 3
Significant
unobservable inputs | | | Total | |
Saudi Arabia | | $ | 108 | | | $ | — | | | $ | — | | | $ | 108 | |
Singapore | | | 2 | | | | 204 | | | | — | | | | 206 | |
South Africa | | | 52 | | | | 129 | | | | — | | | | 181 | |
South Korea | | | 63 | | | | 691 | | | | — | | | | 754 | |
Spain | | | 17 | | | | 978 | | | | — | | | | 995 | |
Sweden | | | 27 | | | | 398 | | | | — | | | | 425 | |
Switzerland | | | — | | | | 1,309 | | | | — | | | | 1,309 | |
Taiwan | | | 494 | | | | 1,011 | | | | — | | | | 1,505 | |
Thailand | | | — | | | | 64 | | | | — | | | | 64 | |
United Kingdom | | | 172 | | | | 2,019 | | | | — | | | | 2,191 | |
United States | | | 14,719 | | | | 25 | | | | — | (a) | | | 14,744 | |
| | | | | | | | | | | | | | | | |
Total Common Stocks | | | 18,394 | | | | 16,606 | | | | — | (a) | | | 35,000 | |
| | | | | | | | | | | | | | | | |
Convertible Bonds | | | — | | | | 4 | | | | — | | | | 4 | |
Corporate Bonds | | | — | | | | 40,926 | | | | — | | | | 40,926 | |
Equity-Linked Notes | | | — | | | | 3,092 | | | | — | | | | 3,092 | |
Investment Companies | | | 6,706 | | | | — | | | | — | | | | 6,706 | |
Loan Assignments | | | — | | | | 480 | | | | — | | | | 480 | |
Mortgage-Backed Securities | | | — | | | | 482 | | | | — | | | | 482 | |
Preferred Stocks | |
United States | | | 565 | | | | — | | | | 10 | | | | 575 | |
Rights | | | 2 | | | | — | | | | — | | | | 2 | |
U.S. Treasury Obligations | | | — | | | | 604 | | | | — | | | | 604 | |
Warrants | | | — | | | | — | | | | 13 | | | | 13 | |
Short-Term Investments | |
Investment Companies | | | 2,839 | | | | — | | | | — | | | | 2,839 | |
Investment of cash collateral from securities loaned | | | 1,367 | | | | — | | | | — | | | | 1,367 | |
| | | | | | | | | | | | | | | | |
Total Short-Term Investments | | | 4,206 | | | | — | | | | — | | | | 4,206 | |
| | | | | | | | | | | | | | | | |
Total Investments in Securities | | $ | 29,873 | | | $ | 67,287 | | | $ | 3,129 | | | $ | 100,289 | |
| | | | | | | | | | | | | | | | |
Appreciation in Other Financial Instruments | |
Futures Contracts | | $ | 14 | | | $ | — | | | $ | — | | | $ | 14 | |
| | | | | | | | | | | | | | | | |
Depreciation in Other Financial Instruments | |
Futures Contracts | | $ | (68 | ) | | $ | — | | | $ | — | | | $ | (68 | ) |
| | | | | | | | | | | | | | | | |
| (a) | Amount rounds to less than one thousand. |
| | | | | | | | | | |
| | | | | |
| 42 | | | | | | | | JPMORGAN INSURANCE TRUST | | DECEMBER 31, 2020 |
The following is a summary of investments for which significant unobservable inputs (level 3) were used in determining fair value (amounts in thousands):
| | | | | | | | | | | | | | | | | | | | | | | | | | | | | | | | | | | | |
| | | Balance as of
December
31, 2019 | | | Realized
gain
(loss) | | | Change in net
unrealized
appreciation
(depreciation) | | | Net accretion
(amortization) | | | Purchases1 | | | Sales2 | | | Transfers
into
Level 3 | | | Transfers
out of
Level 3 | | | Balance as of
December 31,
2020 | |
Investments in Securities | | | | | | | | | | | | | | | | | | | | | | | | | | | | | | | | | | | | |
Asset-Backed Securities — United States | | $ | 1,852 | | | $ | (2 | ) | | $ | (19 | ) | | $ | 3 | | | $ | — | | | $ | (598 | ) | | $ | — | | | $ | (250 | ) | | $ | 986 | |
Collateralized Mortgage Obligations — United States | | | 979 | | | | — | | | | 6 | | | | — | (a) | | | — | | | | (123 | ) | | | — | | | | — | | | | 862 | |
Commercial Mortgage-Backed Securities — Cayman Islands | | | 249 | | | | — | | | | (1 | ) | | | — | | | | — | | | | — | | | | — | | | | — | | | | 248 | |
Commercial Mortgage-Backed Securities — United States | | | 1,150 | | | | (64 | ) | | | (55 | ) | | | 1 | | | | 281 | | | | (412 | ) | | | 109 | | | | — | | | | 1,010 | |
Common Stocks — United States | | | — | | | | — | | | | — | (a) | | | — | | | | — | (a) | | | — | | | | — | | | | — | | | | — | (a) |
Corporate Bonds — United States | | | — | (b) | | | 2 | | | | — | | | | — | | | | — | | | | (2 | ) | | | — | | | | — | | | | — | |
Preferred Stocks — United States | | | — | | | | — | | | | 2 | | | | — | | | | 8 | | | | — | | | | — | | | | — | | | | 10 | |
Warrants — United States | | | 17 | | | | — | | | | (4 | ) | | | — | | | | — | (a) | | | — | | | | — | | | | — | | | | 13 | |
| | | | | | | | | | | | | | | | | | | | | | | | | | | | | | | | | | | | |
Total | | $ | 4,247 | | | $ | (64 | ) | | $ | (71 | ) | | $ | 4 | | | $ | 289 | | | $ | (1,135 | ) | | $ | 109 | | | $ | (250 | ) | | $ | 3,129 | |
| | | | | | | | | | | | | | | | | | | | | | | | | | | | | | | | | | | | |
| 1 | Purchases include all purchases of securities and securities received in corporate actions. |
| 2 | Sales include all sales of securities, maturities, paydowns and securities tendered in corporate actions. |
| (a) | Amount rounds to less than one thousand. |
The changes in net unrealized appreciation (depreciation) attributable to securities owned at December 31, 2020, which were valued using significant unobservable inputs (level 3) amounted to approximately $(49,000). This amount is included in Change in net unrealized appreciation/depreciation on investments in non-affiliates on the Statement of Operations.
There were no significant transfers into or out of level 3 for the year ended December 31, 2020.
The significant unobservable inputs used in the fair value measurement of the Portfolio’s investments are listed below. Generally, a change in the assumptions used in any input in isolation may be accompanied by a change in another input. Significant changes in any of the unobservable inputs may significantly impact the fair value measurement. The impact is based on the relationship between each unobservable input and the fair value measurement. Significant increases (decreases) in enterprise multiples may increase (decrease) the fair value measurement. Significant increases (decreases) in the discount for lack of marketability, liquidity discount, probability of default, yield and default rate may decrease (increase) the fair value measurement. A significant change in the discount rate or prepayment rate (Constant Prepayment Rate or PSA Prepayment Model) may decrease or increase the fair value measurement.
Quantitative Information about Level 3 Fair Value Measurements #
(Amounts in thousands)
| | | | | | | | | | | | |
| | | Fair Value at
December 31,
2020 | | | Valuation Technique(s) | | Unobservable Input | | Range (Weighted Average) (a) | |
| | $ | 986 | | | Discounted Cash Flow | | Constant Prepayment Rate | | | 0.00% - 20.00% (5.89%) | |
| | | | | | | | Constant Default Rate | | | 0.00% - 5.80% (3.69%) | |
| | | | | | | | Yield (Discount Rate of Cash Flows) | | | 0.40% - 4.23% (2.54%) | |
| | | | | | | | | | | | |
| Asset-Backed Securities | | | 986 | | | | | | | | | |
| |
| | | 900 | | | Discounted Cash Flow | | Yield (Discount Rate of Cash Flows) | | | 1.53% - 199.00% (10.13%) | |
| | | | | | | | | | | | |
| Commercial Mortgage-Backed Securities | | | 900 | | | | | | | | | |
| |
| | | 862 | | | Discounted Cash Flow | | Constant Prepayment Rate | | | 10.00% - 25.00% (20.10%) | |
| | | | | | | | Constant Default Rate | | | 0.00% - 0.50% (0.15%) | |
| | | | | | | | Yield (Discount Rate of Cash Flows) | | | 2.32% - 4.01% (3.28%) | |
| | | | | | | | | | | | |
| Collateralized Mortgage Obligations | | | 862 | | | | | | | | | |
| |
| | | — | (b) | | Market Comparable Companies | | EBITDA Multiple (c) | | | 4.8x (4.8x) | |
| | | — | (b) | | Pending Distribution Amount | | Expected Recovery | | | 0.01 ($0.01) | |
| | | | | | | | | | | | |
| Warrants | | | — | (b) | | | | | | | | |
| |
| Total | | $ | 2,748 | | | | | | | | | |
| |
| | | | | | | | | | |
| | | | | |
| DECEMBER 31, 2020 | | JPMORGAN INSURANCE TRUST | | | | | | | | 43 |
NOTES TO FINANCIAL STATEMENTS
AS OF DECEMBER 31, 2020 (continued)
| # | The table above does not include certain Level 3 investments that are valued by brokers and Pricing Services. At December 31, 2020, the value of these investments was approximately $381,000. The inputs for these securities are not readily available or cannot be reasonably estimated and are generally those inputs described in Note 2.A. |
| (a) | Unobservable inputs were weighted by the relative fair value of the instruments. |
| (b) | Amount rounds to less than one thousand. |
| (c) | Represents amounts used when the reporting entity has determined that market participants would take into account such multiples when pricing the investments. |
B. Restricted Securities — Certain securities held by the Portfolio may be subject to legal or contractual restrictions on resale. Restricted securities generally are resold in transactions exempt from registration under the Securities Act of 1933, as amended (the “Securities Act”). Disposal of these securities may involve time-consuming negotiations and expense. Prompt sale at the current valuation may be difficult and could adversely affect the NAVs of the Portfolio.
As of December 31, 2020, the Portfolio had no investments in restricted securities other than securities sold to the Portfolio under Rule 144A and/or Regulation S under the Securities Act.
C. Loan Assignments — The Portfolio invested in debt instruments that are interests in amounts owed to lenders or lending syndicates (a “Lender”) by corporate, governmental or other borrowers (a “Borrower”). A loan is often administered by a bank or other financial institution (the “Agent”) that acts as Agent for all holders. The Agent administers the terms of the loan, as specified in the loan agreement. The Portfolio invests in loan assignments of all or a portion of the loans. When the Portfolio purchases a loan assignment, the Portfolio has direct rights against the Borrower on a loan, provided, however, the Portfolio’s rights may be more limited than the Lender from which it acquired the assignment and the Portfolio may be able to enforce its rights only through the Agent. As a result, the Portfolio assumes the credit risk of the Borrower as well as any other persons interpositioned between the Portfolio and the Borrower (“Intermediate Participants”). The Portfolio may incur certain costs and delays in realizing payment on a loan assignment or suffer a loss of principal and/or interest if assets or interests held by the Agent or other Intermediate Participants are determined to be subject to the claims of the Agent’s or other Intermediate Participant’s creditors. In addition, it is unclear whether loan assignments and other forms of direct indebtedness offer securities law protections against fraud and misrepresentation. Also, because JPMIM may wish to invest in publicly traded securities of a Borrower, it may not have access to material non-public information regarding the Borrower to which other investors have access. Although certain loan assignments are secured by collateral, the Portfolio could experience delays or limitations in realizing the value on such collateral or have its interest subordinated to other indebtedness of the Borrower.
Loan assignments are vulnerable to market conditions such that economic conditions or other events may reduce the demand for assignments and certain assignments which were liquid, when purchased, may become illiquid and they may be difficult to value. In addition, the settlement period for loans is uncertain as there is no standardized settlement schedule applicable to such investments. Therefore, the Portfolio may not receive the proceeds from a sale of such investments for a period after the sale.
Certain loan assignments are also subject to the risks associated with high yield securities described under Note 7.
D. When-Issued Securities, Delayed Delivery Securities and Forward Commitments — The Portfolio purchased when-issued securities, including To Be Announced (“TBA”) securities, and entered into contracts to purchase or sell securities for a fixed price that may be settled a month or more after the trade date, or purchased delayed delivery securities which generally settle seven days after the trade date. When-issued securities are securities that have been authorized, but not issued in the market. A forward commitment involves entering into a contract to purchase or sell securities for a fixed price at a future date that may be settled a month or more after the trade date. A delayed delivery security is agreed upon in advance between the buyer and the seller of the security and is generally delivered beyond seven days of the agreed upon date. The purchase of securities on a when-issued, delayed delivery or forward commitment basis involves the risk that the value of the security to be purchased declines before the settlement date. The sale of securities on a forward commitment basis involves the risk that the value of the securities sold may increase before the settlement date. The Portfolio may be exposed to credit risk if the counterparty fails to perform under the terms of the transaction. Interest income for securities purchased on a when-issued, delayed delivery or forward commitment basis is not accrued until the settlement date.
E. Securities Lending — The Portfolio is authorized to engage in securities lending in order to generate additional income. The Portfolio is able to lend to approved borrowers. Citibank N.A. (“Citibank”) serves as lending agent for the Portfolio, pursuant to a Securities Lending Agency Agreement (the “Securities Lending Agency Agreement”). Securities loaned are collateralized by cash equal to at least 100% of the market value plus accrued interest on the securities lent, which is invested in the Class IM Shares of the JPMorgan U.S. Government Money Market Fund and the Agency SL Class Shares of the JPMorgan Securities Lending Money Market Fund. The Portfolio retains loan fees and the interest on cash collateral investments but is required to pay the borrower a rebate for the use of cash collateral. In cases where the lent security is of high value to borrowers, there may be a negative rebate (i.e., a net payment from the borrower to the Portfolio). Upon termination of a loan, the Portfolio is required to return to the borrower an amount equal to the cash collateral, plus any rebate owed to the borrowers. The remaining maturities of the securities lending transactions are considered overnight and continuous. Loans are subject to termination by the Portfolio or the borrower at any time.
The net income earned on the securities lending (after payment of rebates and Citibank’s fee) is included on the Statement of Operations as Income from securities lending (net). The Portfolio also receives payments from the borrower during the period of the loan, equivalent to dividends and interest earned on the securities loaned, which are recorded as Dividend or Interest income, respectively, on the Statement of Operations.
| | | | | | | | | | |
| | | | | |
| 44 | | | | | | | | JPMORGAN INSURANCE TRUST | | DECEMBER 31, 2020 |
Under the Securities Lending Agency Agreement, Citibank marks to market the loaned securities on a daily basis. In the event the cash received from the borrower is less than 102% of the value of the loaned securities (105% for loans of non-U.S. securities), Citibank requests additional cash from the borrower so as to maintain a collateralization level of at least 102% of the value of the loaned securities plus accrued interest (105% for loans of non-U.S. securities), subject to certain de minimis amounts.
The value of securities out on loan is recorded as an asset on the Statement of Assets and Liabilities. The value of the cash collateral received is recorded as a liability on the Statement of Assets and Liabilities and details of collateral investments are disclosed on the SOI.
The Portfolio bears the risk of loss associated with the collateral investments and is not entitled to additional collateral from the borrower to cover any such losses. To the extent that the value of the collateral investments declines below the amount owed to a borrower, the Portfolio may incur losses that exceed the amount it earned on lending the security. Upon termination of a loan, the Portfolio may use leverage (borrow money) to repay the borrower for cash collateral posted if the Adviser does not believe that it is prudent to sell the collateral investments to fund the payment of this liability. Securities lending activity is subject to master netting arrangements.
The following table presents the Portfolio’s value of the securities on loan with Citibank, net of amounts available for offset under the master netting arrangements and any related collateral received or posted by the Portfolio as of December 31, 2020 (amounts in thousands).
| | | | | | | | | | | | |
| | | Investment Securities
on Loan, at value,
Presented on the
Statement of Assets
and Liabilities | | | Cash Collateral
Posted by Borrower* | | | Net Amount Due
to Counterparty
(not less than zero) | |
| | $ | 1,313 | | | $ | (1,313 | ) | | $ | — | |
| * | Collateral posted reflects the value of securities on loan and does not include any additional amounts received from the borrower. |
Securities lending also involves counterparty risks, including the risk that the loaned securities may not be returned in a timely manner or at all. Subject to certain conditions, Citibank has agreed to indemnify the Portfolio from losses resulting from a borrower’s failure to return a loaned security.
JPMIM voluntarily waived investment advisory fees charged to the Portfolio to reduce the impact of the cash collateral investment in the JPMorgan U.S. Government Money Market Fund from 0.15% to 0.06%. For the year ended December 31, 2020, JPMIM waived fees associated with the Portfolio’s investment in the JPMorgan U.S. Government Money Market Fund as follows (amounts in thousands):
| (a) | Amount rounds to less than one thousand. |
The above waiver is included in the determination of earnings on cash collateral investment and in the calculation of Citibank’s compensation and is included on the Statement of Operations as Income from securities lending (net).
| | | | | | | | | | |
| | | | | |
| DECEMBER 31, 2020 | | JPMORGAN INSURANCE TRUST | | | | | | | | 45 |
NOTES TO FINANCIAL STATEMENTS
AS OF DECEMBER 31, 2020 (continued)
F. Investment Transactions with Affiliates — The Portfolio invested in Underlying Funds which are advised by the Adviser. An issuer which is under common control with the Portfolio may be considered an affiliate. For the purposes of the financial statements, the Portfolio assumes the issuers listed in the table below to be affiliated issuers. Underlying Funds’ distributions may be reinvested into the Underlying Funds. Reinvestment amounts are included in the purchase cost amounts in the table below. Amounts in the table below are in thousands.
| | | | | | | | | | | | | | | | | | | | | | | | | | | | | | | | | | | | |
| For the year ended December 31, 2020 | |
| Security Description | | Value at
December 31,
2019 | | | Purchases
at Cost | | | Proceeds
from Sales | | | Net
Realized
Gain
(Loss) | | | Change in
Unrealized
Appreciation/
(Depreciation) | | | Value at
December 31,
2020 | | | Shares at
December 31,
2020 | | | Dividend
Income | | | Capital Gain
Distributions | |
JPMorgan Emerging Markets Strategic Debt Fund Class R6 Shares (a) | | $ | 2,556 | | | $ | 1,161 | | | $ | 1,494 | | | $ | (283 | ) | | $ | 13 | | | $ | 1,953 | | | | 236 | | | $ | 89 | | | $ | — | |
JPMorgan Equity Income Fund Class R6 Shares (a) | | | 5,485 | | | | 1,285 | | | | 3,049 | | | | (85 | ) | | | (63 | ) | | | 3,573 | | | | 181 | | | | 107 | | | | — | |
JPMorgan Floating Rate Income Fund Class R6 Shares (a) | | | 918 | | | | 37 | | | | — | | | | — | | | | (24 | ) | | | 931 | | | | 105 | | | | 36 | | | | — | |
JPMorgan Managed Income Fund Class L Shares (a) | | | 2,478 | | | | 7 | | | | 2,239 | | | | 12 | | | | (9 | ) | | | 249 | | | | 25 | | | | 8 | | | | — | (b) |
JPMorgan Prime Money Market Fund Class IM Shares, 0.12% (a)(c) | | | 331 | | | | 2,735 | | | | 2,857 | | | | — | (b) | | | — | (b) | | | 209 | | | | 209 | | | | 2 | | | | — | |
JPMorgan Prime Money Market Fund Class Institutional Shares, 0.09% (a)(c) | | | 2,270 | | | | 42,690 | | | | 42,331 | | | | — | (b) | | | 1 | | | | 2,630 | | | | 2,629 | | | | 19 | | | | — | |
JPMorgan Securities Lending Money Market Fund Agency SL Class Shares, 0.15% (a)(c) | | | — | | | | 700 | | | | — | | | | — | | | | — | (b) | | | 700 | | | | 700 | | | | 1 | * | | | — | |
JPMorgan U.S. Government Money Market Fund Class IM Shares, 0.03% (a)(c) | | | 286 | | | | 12,919 | | | | 12,538 | | | | — | | | | — | | | | 667 | | | | 667 | | | | 2 | * | | | — | |
| | | | | | | | | | | | | | | | | | | | | | | | | | | | | | | | | | | | |
Total | | $ | 14,324 | | | $ | 61,534 | | | $ | 64,508 | | | $ | (356 | ) | | $ | (82 | ) | | $ | 10,912 | | | | | | | $ | 264 | | | $ | — | (b) |
| | | | | | | | | | | | | | | | | | | | | | | | | | | | | | | | | | | | |
| (a) | Investment in an affiliated fund, which is registered under the Investment Company Act of 1940, as amended, and is advised by J.P.Morgan Investment Management Inc. |
| (b) | Amount rounds to less than one thousand. |
| (c) | The rate shown is the current yield as of December 31, 2020. |
| * | Amount is included on the Statement of Operations as Income from securities lending (net) (after payments of rebates and Citibank’s fee). |
G. Foreign Currency Translation — The books and records of the Portfolio are maintained in U.S. dollars. Foreign currency amounts are translated into U.S. dollars at the prevailing exchange rates of such currencies against the U.S. dollar. The market value of investment securities and other assets and liabilities are translated at the exchange rate as of the valuation date. Purchases and sales of investment securities, income and expenses are translated at the exchange rate prevailing on the respective dates of such transactions.
The Portfolio does not isolate the effect of changes in foreign exchange rates from changes in market prices on securities held. Accordingly, such changes are included within Change in net unrealized appreciation/depreciation on investments in non-affiliates on the Statement of Operations.
Reported realized foreign currency gains and losses arise from the disposition of foreign currency, currency gains or losses realized between the trade and settlement dates on securities transactions, and the difference between the amounts of dividends, interest and foreign withholding taxes recorded on the Portfolio’s books on the transaction date and the U.S. dollar equivalent of the amounts actually received or paid. These reported realized foreign currency gains and losses are included in Net realized gain (loss) on foreign currency transactions on the Statement of Operations. Unrealized foreign currency gains and losses arise from changes (due to changes in exchange rates) in the value of foreign currency and other assets and liabilities denominated in foreign currencies, which are held at period end and are included in Change in net unrealized appreciation/depreciation on foreign currency translations on the Statement of Operations.
H. Futures Contracts — The Portfolio used currency, index, treasury or other financial futures contracts to manage and hedge interest rate risk associated with portfolio investments and to gain or reduce exposure to particular countries or regions. The Portfolio also used futures contracts to lengthen or shorten the duration of the overall investment portfolio.
Futures contracts provide for the delayed delivery of the underlying instrument at a fixed price or are settled for a cash amount based on the change in the value of the underlying instrument at a specific date in the future. Upon entering into a futures contract, the Portfolio is required to deposit with the broker, cash or securities in an amount equal to a certain percentage of the contract amount, which is referred to as the initial margin deposit. Subsequent payments, referred to as variation margin, are made or received by the Portfolio periodically and are based on changes
| | | | | | | | | | |
| | | | | |
| 46 | | | | | | | | JPMORGAN INSURANCE TRUST | | DECEMBER 31, 2020 |
in the market value of open futures contracts. Changes in the market value of open futures contracts are recorded as Change in net unrealized appreciation/depreciation on futures contracts on the Statement of Operations. Realized gains or losses, representing the difference between the value of the contract at the time it was opened and the value at the time it was closed, are reported on the Statement of Operations at the closing or expiration of the futures contract. Securities deposited as initial margin are designated on the SOI, while cash deposited, which is considered restricted, is recorded on the Statement of Assets and Liabilities. A receivable from and/or a payable to brokers for the daily variation margin is also recorded on the Statement of Assets and Liabilities.
The use of futures contracts exposes the Portfolio to equity price, foreign exchange and interest rate risks. The Portfolio may be subject to the risk that the change in the value of the futures contract may not correlate perfectly with the underlying instrument. Use of long futures contracts subjects the Portfolio to risk of loss in excess of the amounts shown on the Statement of Assets and Liabilities, up to the notional amount of the futures contracts. Use of short futures contracts subjects the Portfolio to unlimited risk of loss. The Portfolio may enter into futures contracts only on exchanges or boards of trade. The exchange or board of trade acts as the counterparty to each futures transaction; therefore, the Portfolio’s credit risk is limited to failure of the exchange or board of trade. Under some circumstances, futures exchanges may establish daily limits on the amount that the price of a futures contract can vary from the previous day’s settlement price, which could effectively prevent liquidation of positions.
The Portfolio’s futures contracts are not subject to master netting arrangements (the right to close out all transactions traded with a counterparty and net amounts owed or due across transactions).
The table below discloses the volume of the Portfolio’s futures contracts activity during the year ended December 31, 2020 (amounts in thousands):
| | | | |
Futures Contracts — Equity: | | | | |
Average Notional Balance Long | | $ | 1,225 | |
Average Notional Balance Short | | | 962 | |
Ending Notional Balance Long | | | 390 | |
Ending Notional Balance Short | | | 1,872 | |
| |
Futures Contracts — Foreign Exchange: | | | | |
Average Notional Balance Long | | | 204 | |
Average Notional Balance Short | | | 1,296 | |
Ending Notional Balance Short | | | 1,368 | |
| |
Futures Contracts — Interest Rate: | | | | |
Average Notional Balance Long | | | 11,015 | |
Ending Notional Balance Long | | | 13,251 | |
I. Summary of Derivatives Information — The following table presents the value of derivatives held as of December 31, 2020 by their primary underlying risk exposure and respective location on the Statement of Assets and Liabilities (amounts in thousands):
| | | | | | |
| Derivative Contracts | | Statement of Assets and Liabilities Location | | | |
| Gross Assets: | | | | Futures Contracts (a) | |
Equity contracts | | Receivables, Net Assets — Unrealized Appreciation | | $ | 5 | |
Interest rate contracts | | Receivables, Net Assets — Unrealized Appreciation | | | 9 | |
| | | | | | |
| | | | $ | 14 | |
| | | | | | |
Gross Liabilities: | | | | | |
Equity contracts | | Payables, Net Assets — Unrealized Depreciation | | $ | (30 | ) |
Foreign exchange contracts | | Payables, Net Assets — Unrealized Depreciation | | | (38 | ) |
| | | | | | |
| | | | $ | (68 | ) |
| | | | | | |
| (a) | This amount represents the cumulative appreciation (depreciation) of futures contracts as reported on the SOI. The Statement of Assets and Liabilities only reflects the current day variation margin receivable/payable from/to brokers. |
The following table presents the effect of derivatives on the Statement of Operations for the year ended December 31, 2020, by primary underlying risk exposure (amounts in thousands):
| | | | |
| Amount of Realized Gain (Loss) on Derivatives Recognized on the Statement of Operations | |
| Derivative Contracts | | Futures Contracts | |
Equity contracts | | $ | 442 | |
Foreign exchange contracts | | | (10 | ) |
Interest rate contracts | | | 556 | |
| | | | |
Total | | $ | 988 | |
| | | | |
| | | | | | | | | | |
| | | | | |
| DECEMBER 31, 2020 | | JPMORGAN INSURANCE TRUST | | | | | | | | 47 |
NOTES TO FINANCIAL STATEMENTS
AS OF DECEMBER 31, 2020 (continued)
| | | | |
| Amount of Change in Unrealized Appreciation (Depreciation) on Derivatives Recognized on the Statement of Operations | |
| Derivative Contracts | | Futures Contracts | |
Equity contracts | | $ | (43 | ) |
Foreign exchange contracts | | | (33 | ) |
Interest rate contracts | | | 87 | |
| | | | |
Total | | $ | 11 | |
| | | | |
The Portfolio’s derivatives contracts held at December 31, 2020 are not accounted for as hedging instruments under GAAP.
J. Equity-Linked Notes — The Portfolio invested in Equity-Linked Notes (“ELNs”). These are hybrid instruments which combine both debt and equity characteristics into a single note form. ELNs’ values are linked to the performance of an underlying index. ELNs are unsecured debt obligations of an issuer and may not be publicly listed or traded on an exchange. ELNs are valued daily, under procedures adopted by the Board, based on values provided by an approved pricing source. These notes have a coupon which is accrued and recorded as interest income on the Statement of Operations. Changes in the market value of ELNs are recorded as Change in net unrealized appreciation or depreciation on the Statement of Operations. The Portfolio realizes a gain or loss when an ELN is sold or matures which is recorded as Net realized gain (loss) on transactions from investments in non-affiliates on the Statement of Operations.
As of December 31, 2020, the Portfolio had outstanding ELNs as listed on the SOI.
K. Security Transactions and Investment Income — Investment transactions are accounted for on the trade date (the date the order to buy or sell is executed). Securities gains and losses are calculated on a specifically identified cost basis. Interest income is determined on the basis of coupon interest accrued using the effective interest method, which adjusts for amortization of premiums and accretion of discounts. Dividend income, net of foreign taxes withheld, if any, and distributions of net investment income and realized capital gains from the Underlying Funds, if any, is recorded on the ex-dividend date or when the Portfolio first learns of the dividend. The Portfolio may receive other income from investment in loan assignments and/or unfunded commitments, including amendment fees, consent fees and commitment fees. These fees are recorded as income when received by the Portfolio. These amounts are included in Interest income from non-affiliates on the Statement of Operations.
To the extent such information is publicly available, the Portfolio records distributions received in excess of income earned from underlying investments as a reduction of cost of investments and/or realized gain. Such amounts are based on estimates if actual amounts are not available and actual amounts of income, realized gain and return of capital may differ from the estimated amounts. The Portfolio adjusts the estimated amounts of the components of distributions (and consequently its net investment income) as necessary, once the issuers provide information about the actual composition of the distributions.
L. Allocation of Income and Expenses — Expenses directly attributable to the Portfolio are charged directly to the Portfolio, while the expenses attributable to more than one portfolio of the Trust are allocated among the applicable portfolios. Investment income, realized and unrealized gains and losses and expenses, other than class-specific expenses, are allocated daily to each class of shares based upon the proportion of net assets of each class at the beginning of each day.
Transfer agency fees are class-specific expenses. The amount of the transfer agency fees charged to each share class of the Portfolio for the year ended December 31, 2020 are as follows (amounts in thousands):
| | | | | | | | | | |
| | | Class 1 | | Class 2 | | | Total | |
Transfer agency fees | | $—(a) | | $ | 15 | | | $ | 15 | |
| (a) | Amount rounds to less than one thousand. |
The Portfolio invests in Underlying Funds and, as a result, bear a portion of the expenses incurred by these Underlying Funds. These expenses are not reflected in the expenses shown on the Statement of Operations and are not included in the ratios to average net assets shown in the Financial Highlights. Certain expenses of affiliated Underlying Funds are waived as described in Note 3.E.
M. Federal Income Taxes — The Portfolio is treated as a separate taxable entity for Federal income tax purposes. The Portfolio’s policy is to comply with the provisions of the Internal Revenue Code (the “Code”) applicable to regulated investment companies and to distribute to shareholders all of its distributable net investment income and net realized capital gains on investments. Accordingly, no provision for Federal income tax is necessary. The Portfolio is also a segregated portfolio of assets for insurance purposes and intends to comply with the diversification requirements of Subchapter L of the Code. Management has reviewed the Portfolio’s tax positions for all open tax years and has determined that as of December 31, 2020, no liability for Federal income tax is required in the Portfolio’s financial statements for net unrecognized tax benefits. However, management’s conclusions may be subject to future review based on changes in, or the interpretation of, the accounting standards or tax laws and regulations. The Portfolio’s Federal tax returns for the prior three fiscal years remain subject to examination by the Internal Revenue Service.
N. Foreign Taxes — The Portfolio may be subject to foreign taxes on income, gains on investments or currency purchases/repatriation, a portion of which may be recoverable. The Portfolio will accrue such taxes and recoveries as applicable, based upon its current interpretation of tax rules and regulations that exist in the markets in which it invests. When a capital gains tax is determined to apply, the Portfolio records an estimated deferred tax liability in an amount that would be payable if the securities were disposed of on the valuation date.
| | | | | | | | | | |
| | | | | |
| 48 | | | | | | | | JPMORGAN INSURANCE TRUST | | DECEMBER 31, 2020 |
O. Distributions to Shareholders — Distributions from net investment income, if any, are generally declared and paid at least annually and are declared separately for each class. No class has preferential dividend rights; differences in per share rates are due to differences in separate class expenses. Net realized capital gains, if any, are distributed at least annually. The amount of distributions from net investment income and net realized capital gains is determined in accordance with Federal income tax regulations, which may differ from GAAP. To the extent these “book/tax” differences are permanent in nature (i.e., that they result from other than timing of recognition — “temporary differences”), such amounts are reclassified within the capital accounts based on their Federal tax basis treatment.
The following amounts were reclassified within the capital accounts (amounts in thousands):
| | | | | | | | | | | | |
| | | Paid-in-Capital | | | Accumulated
undistributed
(distributions in
excess of)
net investment
income | | | Accumulated
net realized
gains (losses) | |
| | $ | (38 | ) | | $ | 54 | | | $ | (16 | ) |
The reclassifications for the Portfolio relate primarily to investments in passive foreign investment companies (“PFICs”).
P. Recent Accounting Pronouncement — In March 2020, the FASB issued Accounting Standards Update No. 2020-04 (“ASU 2020-04”), Reference Rate Reform (Topic 848) – Facilitation of the Effects of Reference Rate Reform on Financial Reporting. ASU 2020-04 provides optional temporary financial reporting relief from the effect of certain types of contract modifications due to the planned discontinuation of the London Interbank Offered Rate (“LIBOR”) and other interbank-offered based reference rates as of the end of 2021. ASU 2020-04 became effective upon the issuance and its optional relief can be applied through December 31, 2022. Management is currently evaluating the impact, if any, to the Portfolio’s financial statements of applying ASU 2020-04.
3. Fees and Other Transactions with Affiliates
A. Investment Advisory Fee — Pursuant to an Investment Advisory Agreement, the Adviser manages the investments of the Portfolio and for such services is paid a fee. The investment advisory fee is accrued daily and paid monthly at an annual rate of 0.42% of the Portfolio’s average daily net assets.
The Adviser waived investment advisory fees and/or reimbursed expenses as outlined in Note 3.E.
B. Administration Fee — Pursuant to an Administration Agreement, the Administrator provides certain administration services to the Portfolio. In consideration of these services, the Administrator receives a fee accrued daily and paid monthly at an annual rate of 0.075% of the first $10 billion of the Portfolio’s average daily net assets, plus 0.050% of the Portfolio’s average daily net assets between $10 billion and $20 billion, plus 0.025% of the Portfolio’s average daily net assets between $20 billion and $25 billion, plus 0.01% of the Portfolio’s average daily net assets in excess of $25 billion. For the year ended December 31, 2020, the effective rate was 0.075% of the Portfolio’s average daily net assets, notwithstanding any fee waivers and/or expense reimbursements.
The Administrator waived administration fees as outlined in Note 3.E.
JPMorgan Chase Bank, N.A. (“JPMCB”), a wholly-owned subsidiary of JPMorgan, serves as the Portfolio’s sub-administrator (the “Sub-administrator”). For its services as Sub-administrator, JPMCB receives a portion of the fees payable to the Administrator.
C. Distribution Fees — Pursuant to a Distribution Agreement, JPMorgan Distribution Services, Inc. (“JPMDS”), an indirect, wholly-owned subsidiary of JPMorgan, serves as the Portfolio’s principal underwriter and promotes and arranges for the sale of the Portfolio’s shares.
The Board has adopted a Distribution Plan (the “Distribution Plan”) for Class 2 Shares of the Portfolio pursuant to Rule 12b-1 under the 1940 Act. Class 1 Shares of the Portfolio do not charge a distribution fee. The Distribution Plan provides that the Portfolio shall pay, with respect to the applicable share classes, distribution fees, including payments to JPMDS, at an annual rate of 0.25% of the average daily net assets of Class 2 Shares.
D. Custodian and Accounting Fees — JPMCB provides portfolio custody and accounting services to the Portfolio. For performing these services, the Portfolio pays JPMCB transaction and asset-based fees that vary according to the number of transactions and positions, plus out-of-pocket expenses. The amounts paid directly to JPMCB by the Portfolio for custody and accounting services are included in Custodian and accounting fees on the Statement of Operations.
Interest income earned on cash balances at the custodian, if any, is included in Interest income from affiliates on the Statement of Operations.
Interest expense paid to the custodian related to cash overdrafts, if any, is included in Interest expense to affiliates on the Statement of Operations.
E. Waivers and Reimbursements — The Adviser (for all share classes), Administrator (for all share classes) and/or JPMDS (for Class 2 Shares) have contractually agreed to waive fees and/or reimburse the Portfolio to the extent that total annual operating expenses of the Portfolio (excluding acquired fund fees and expenses other than certain money market fund fees as described below, dividend and interest expenses related to short
| | | | | | | | | | |
| | | | | |
| DECEMBER 31, 2020 | | JPMORGAN INSURANCE TRUST | | | | | | | | 49 |
NOTES TO FINANCIAL STATEMENTS
AS OF DECEMBER 31, 2020 (continued)
sales, interest, taxes, expenses related to litigation and potential litigation, expenses related to trustee elections and extraordinary expenses) exceed the percentages of the Portfolio’s respective average daily net assets as shown in the table below:
| | | | | | |
| | | Class 1 | | Class 2 | |
| | 0.60% | | | 0.85 | %�� |
The expense limitation agreement was in effect for the year ended December 31, 2020 and the contractual expense limitation percentages in the table above are in place until at least April 30, 2021.
The Underlying Funds may impose separate advisory fees. The Adviser has agreed to voluntarily waive the Portfolio’s investment advisory fees in the weighted average pro-rata amount of the advisory fees charged by the affiliated Underlying Funds. During the year ended December 31, 2020, the Adviser waived approximately $38,000. These waivers may be in addition to any waivers required to meet the Portfolio’s contractual expense limitations, but will not exceed the Portfolio’s advisory fee.
For the year ended December 31, 2020, the Portfolio’s service providers waived fees and/or reimbursed expenses for the Portfolio as follows (amounts in thousands). None of these parties expect the Portfolio to repay any such waived fees and/or reimbursed expenses in future years.
| | | | | | | | | | | | | | | | |
| | | Contractual Waivers | | | | |
| | | Investment
Advisory Fees | | | Administration
Fees | | | Total | | | Contractual Reimbursements | |
| | $ | 65 | | | $ | 67 | | | $ | 132 | | | $ | 171 | |
Additionally, the Portfolio may invest in one or more money market funds advised by the Adviser (affiliated money market funds). The Adviser, Administrator and/or JPMDS have contractually agreed to waive fees and/or reimburse expenses in an amount sufficient to offset the respective net fees each collects from the affiliated money market fund on the Portfolio’s investment in such affiliated money market fund, except for investments of securities lending cash collateral. None of these parties expect the Portfolio to repay any such waived fees and/or reimbursed expenses in future years.
The amount of these waivers resulting from investments in these money market funds for the year ended December 31, 2020 was approximately $9,000.
F. Other — Certain officers of the Trust are affiliated with the Adviser, the Administrator and JPMDS. Such officers, with the exception of the Chief Compliance Officer, receive no compensation from the Portfolio for serving in their respective roles.
The Board designated and appointed a Chief Compliance Officer to the Portfolio pursuant to Rule 38a-1 under the 1940 Act. The Portfolio, along with affiliated portfolios, makes reimbursement payments, on a pro-rata basis, to the Administrator for a portion of the fees associated with the office of the Chief Compliance Officer. Such fees are included in Trustees’ and Chief Compliance Officer’s fees on the Statement of Operations.
The Trust adopted a Trustee Deferred Compensation Plan (the “Plan”) which allows the independent Trustees to defer the receipt of all or a portion of compensation related to performance of their duties as Trustees. The deferred fees are invested in various J.P. Morgan Funds until distribution in accordance with the Plan.
During the year ended December 31, 2020, the Portfolio purchased securities from an underwriting syndicate in which the principal underwriter or members of the syndicate were affiliated with the Adviser.
The Securities and Exchange Commission (“SEC”) has granted an exemptive order permitting the Portfolio to engage in principal transactions with J.P. Morgan Securities LLC, an affiliated broker, involving taxable money market instruments, subject to certain conditions.
4. Investment Transactions
During the year ended December 31, 2020, purchases and sales of investments (excluding short-term investments) were as follows (amounts in thousands):
| | | | | | | | | | | | | | | | |
| | | Purchases
(excluding U.S.
Government) | | | Sales
(excluding U.S.
Government) | | | Purchases
of U.S.
Government | | | Sales
of U.S.
Government | |
| | $ | 62,952 | | | $ | 55,007 | | | $ | 376 | | | $ | 478 | |
5. Federal Income Tax Matters
For Federal income tax purposes, the estimated cost and unrealized appreciation (depreciation) in value of investments held at December 31, 2020 were as follows (amounts in thousands):
| | | | | | | | | | | | | | | | |
| | | Aggregate
Cost | | | Gross
Unrealized
Appreciation | | | Gross
Unrealized
Depreciation | | | Net Unrealized
Appreciation
(Depreciation) | |
| | $ | 94,073 | | | $ | 8,160 | | | $ | 1,998 | | | $ | 6,162 | |
The difference between book and tax basis appreciation (depreciation) on investments is primarily attributed to callable bonds, investments in perpetual bonds, mark to market of futures contracts, wash sale loss deferrals and investments in PFICs.
| | | | | | | | | | |
| | | | | |
| 50 | | | | | | | | JPMORGAN INSURANCE TRUST | | DECEMBER 31, 2020 |
The tax character of distributions paid during the year ended December 31, 2020 was as follows (amounts in thousands):
| | | | | | |
| | | Ordinary
Income* | | Total
Distributions
Paid | |
| | $2,980 | | $ | 2,980 | |
| * | Short-term gain distributions are treated as ordinary income for income tax purposes. |
The tax character of distributions paid during the year ended December 31, 2019 was as follows (amounts in thousands):
| | | | | | | | | | | | |
| | | Ordinary
Income* | | | Net
Long-Term
Capital Gains | | | Total
Distributions
Paid | |
| | $ | 2,487 | | | $ | 207 | | | $ | 2,694 | |
| * | Short-term gain distributions are treated as ordinary income for income tax purposes. |
As of December 31, 2020, the estimated components of net assets (excluding paid-in-capital) on a tax basis were as follows (amounts in thousands):
| | | | | | | | | | | | |
| | | Current
Distributable
Ordinary
Income | | | Current
Distributable
Long-Term
Capital Gain
(Tax Basis Capital
Loss Carryover) | | | Unrealized
Appreciation
(Depreciation) | |
| | $ | 2,908 | | | $ | 187 | | | $ | 6,180 | |
The cumulative timing differences primarily consist of investments in perpetual bonds, investments in PFICs, callable bonds, mark to market of futures contracts and wash sale loss deferrals.
During the year ended December 31, 2020, the Portfolio utilized capital loss carryforwards as follows (amounts in thousands):
| | | | | | | | |
| | | Capital Loss Utilized | |
| | | Short-Term | | | Long-Term | |
| | $ | 36 | | | $ | 159 | |
As of December 31, 2020, the Portfolio did not have any net capital loss carryforwards.
6. Borrowings
The Portfolio relies upon an exemptive order granted by the SEC (the “Order”) permitting the establishment and operation of an Interfund Lending Facility (the “Facility”). The Facility allows the Portfolio to directly lend and borrow money to or from any other fund relying upon the Order at rates beneficial to both the borrowing and lending funds. Advances under the Facility are taken primarily for temporary or emergency purposes, including the meeting of redemption requests that otherwise might require the untimely disposition of securities, and are subject to the Portfolio’s borrowing restrictions. The Interfund loan rate is determined, as specified in the Order, by averaging the current repurchase agreement rate and the current bank loan rate. The Order was granted to the Trust and may be relied upon by the Portfolio because the Portfolio and the series of the Trust are all investment companies in the same “group of investment companies” (as defined in Section 12(d)(1)(G) of the 1940 Act).
The Portfolio had no borrowings outstanding from another fund during the year ended December 31, 2020.
The Trust and JPMCB have entered into a financing arrangement. Under this arrangement, JPMCB provides an unsecured, uncommitted credit facility in the aggregate amount of $100 million to certain of the J.P. Morgan Funds, including the Portfolio. Advances under the arrangement are taken primarily for temporary or emergency purposes, including the meeting of redemption requests that otherwise might require the untimely disposition of securities, and are subject to the Portfolio’s borrowing restrictions. Interest on borrowings is payable at a rate determined by JPMCB at the time of borrowing. This agreement has been extended until November 1, 2021.
The Portfolio had no borrowings outstanding from the unsecured, uncommitted credit facility during the year ended December 31, 2020.
The Trust, along with certain other trusts for J.P. Morgan Funds (“Borrowers”), has entered into a joint syndicated senior unsecured revolving credit facility totaling $1.5 billion (“Credit Facility”) with various lenders and The Bank of New York Mellon, as administrative agent for the lenders. This Credit Facility provides a source of funds to the Borrowers for temporary and emergency purposes, including the meeting of redemption requests that otherwise might require the untimely disposition of securities. Under the terms of the Credit Facility, a borrowing portfolio must have a minimum of $25,000,000 in adjusted net asset value and not exceed certain adjusted net asset coverage ratios prior to and during the time in which any borrowings are outstanding. If a portfolio does not comply with the aforementioned requirements, the portfolio must remediate within three business days with respect to the $25,000,000 minimum adjusted net asset value or within one business day with respect to certain asset coverage ratios or the administrative agent at the request of, or with the consent of, the lenders may terminate the Credit Facility and declare any outstanding borrowings to be due and payable immediately.
| | | | | | | | | | |
| | | | | |
| DECEMBER 31, 2020 | | JPMORGAN INSURANCE TRUST | | | | | | | | 51 |
NOTES TO FINANCIAL STATEMENTS
AS OF DECEMBER 31, 2020 (continued)
Interest associated with any borrowing under the Credit Facility is charged to the borrowing portfolio at a rate of interest equal to 1.00%, which has increased to 1.25% pursuant to the amendment referenced below, plus the greater of the federal funds effective rate or one month LIBOR. The annual commitment fee to maintain the Credit Facility is 0.15% and is incurred on the unused portion of the Credit Facility and is allocated to all participating portfolios pro rata based on their respective net assets. Effective August 11, 2020, this agreement has been amended and restated for a term of 364 days, unless extended, and to include the change to the interest rate charged for borrowing from the Credit Facility to 1.25%, as noted above, and an upfront fee of 0.075% of the Credit Facility to be charged and paid by all participating funds of the Credit Facility.
The Portfolio did not utilize the Credit Facility during the year ended December 31, 2020.
7. Risks, Concentrations and Indemnifications
In the normal course of business, the Portfolio enters into contracts that contain a variety of representations which provide general indemnifications. The Portfolio’s maximum exposure under these arrangements is unknown. The amount of exposure would depend on future claims that may be brought against the Portfolio. However, based on experience, the Portfolio expects the risk of loss to be remote.
As of December 31, 2020, the Portfolio had four individual shareholder and/or non-affiliated omnibus accounts, which owned 79.5% of the Portfolio’s outstanding shares.
Significant shareholder transactions by these shareholders may impact the Portfolio’s performance and liquidity.
The Portfolio is subject to risks associated with securities with contractual cash flows including asset-backed and mortgage-related securities such as collateralized mortgage obligations, mortgage-pass-through securities and commercial mortgage-backed securities, including securities backed by sub-prime mortgage loans. The value, liquidity and related income of these securities are sensitive to changes in economic conditions, including real estate value, pre-payments, delinquencies and/or defaults, and may be adversely affected by shifts in the market’s perception of the issuers and changes in interest rates.
The Portfolio is subject to interest rate and credit risk. The value of debt securities may decline as interest rates increase. The Portfolio could lose money if the issuer of a fixed income security is unable to pay interest or repay principal when it is due. The Portfolio invests in floating rate loans and other floating rate debt securities. Although these investments are generally less sensitive to interest rate changes than other fixed rate instruments, the value of floating rate loans and other floating rate investments may decline if their interest rates do not rise as quickly, or as much, as general interest rates. Many factors can cause interest rates to rise. Some examples include central bank monetary policy, rising inflation rates and general economic conditions. The Portfolio may face a heightened level of interest rate risk due to certain changes in monetary policy. During periods when interest rates are low or there are negative interest rates, the Portfolio’s yield (and total return) also may be low or the Portfolio may be unable to maintain positive returns. The ability of the issuers of debt to meet their obligations may be affected by economic and political developments in a specific industry or region. The value of a Portfolio’s investments may be adversely affected if any of the issuers or counterparties it is invested in are subject to an actual or perceived deterioration in their credit quality.
Investing in securities of foreign countries may include certain risks and considerations not typically associated with investing in U.S. securities. These risks include revaluation of currencies, high rates of inflation, repatriation restrictions on income and currencies, and future and adverse political, social and economic developments.
Derivatives may be riskier than other types of investments because they may be more sensitive to changes in economic and market conditions and could result in losses that significantly exceed the Portfolio’s original investment. Many derivatives create leverage thereby causing the Portfolio to be more volatile than they would have been if they had not used derivatives. Derivatives also expose the Portfolio to counterparty risk (the risk that the derivative counterparty will not fulfill its contractual obligations), including credit risk of the derivative counterparty. The possible lack of a liquid secondary market for derivatives and the resulting inability of the Portfolio to sell or otherwise close a derivatives position could expose the Portfolio to losses.
Because of the Portfolio’s investments in the Underlying Funds, the Portfolio indirectly pays a portion of the expenses incurred by the Underlying Funds. As a result, the cost of investing in the Portfolio may be higher than the cost of investing in a mutual fund that invests directly in individual securities and financial instruments. The Portfolio is also subject to certain risks related to the Underlying Funds’ investments in securities and financial instruments such as fixed income securities including high yield, asset-backed and mortgage-related securities, equity securities, foreign and emerging markets securities, commodities and real estate securities. These securities are subject to risks specific to their structure, sector or market.
In addition, the Underlying Funds may use derivative instruments in connection with their individual investment strategies including futures contracts, forward foreign currency exchange contracts, options, swaps and other derivatives, which are also subject to specific risks related to their structure, sector or market and may be riskier than investments in other types of securities. Specific risks and concentrations present in the Underlying Funds are disclosed within their individual financial statements and registration statements, as appropriate.
The Portfolio invests in preferred securities. These securities are typically issued by corporations, generally in the form of interest bearing notes with preferred security characteristics and may include provisions that permit the issuer, in its discretion, to defer or omit distributions for a certain period of time.
LIBOR is intended to represent the rate at which contributing banks may obtain short-term borrowings from each other in the London interbank market. The regulatory authority that oversees financial services firms and financial markets in the U.K. has announced that, after the end of 2021, it would no longer persuade or compel contributing banks to make rate submissions for purposes of determining the LIBOR rate. As a result, it is
| | | | | | | | | | |
| | | | | |
| 52 | | | | | | | | JPMORGAN INSURANCE TRUST | | DECEMBER 31, 2020 |
possible that commencing in 2022, LIBOR may no longer be available or no longer deemed an appropriate reference rate upon which to determine the interest rate on or impacting certain loans, notes, derivatives and other instruments or investments comprising some or all of the Portfolio’s portfolio. In light of this eventuality, public and private sector industry initiatives are currently underway to identify new or alternative reference rates to be used in place of LIBOR. There is no assurance that the composition or characteristics of any such alternative reference rate will be similar to or produce the same value or economic equivalence as LIBOR or that it will have the same volume or liquidity as did LIBOR prior to its discontinuance or unavailability, which may affect the value or liquidity or return on certain investments of the Portfolio and result in costs incurred in connection with closing out positions and entering into new trades. These risks may also apply with respect to changes in connection with other interbank offering rates (e.g., Euribor) and a wide range of other index levels, rates and values that are treated as “benchmarks” and are the subject of recent regulatory reform.
The Portfolio is subject to infectious disease epidemics/pandemics risk. The worldwide outbreak of COVID-19, a novel coronavirus disease, has negatively affected economies, markets and individual companies throughout the world. The effects of this COVID-19 pandemic to public health, and business and market conditions, including exchange trading suspensions and closures may continue to have a significant negative impact on the performance of the Portfolio’s investments, increase the Portfolio’s volatility, exacerbate other pre-existing political, social and economic risks to the Portfolio and negatively impact broad segments of businesses and populations. The Portfolio’s operations may be interrupted as a result, which may have a significant negative impact on investment performance. In addition, governments, their regulatory agencies, or self-regulatory organizations may take actions in response to the pandemic that affect the instruments in which the Portfolio invests, or the issuers of such instruments, in ways that could also have a significant negative impact on the Portfolio’s investment performance. The full impact of this COVID-19 pandemic, or other future epidemics/pandemics, is currently unknown.
8. Subsequent Event
On February 10, 2021, the contractual expense limitations for Class 1 Shares and Class 2 Shares were extended until at least April 30, 2022.
| | | | | | | | | | |
| | | | | |
| DECEMBER 31, 2020 | | JPMORGAN INSURANCE TRUST | | | | | | | | 53 |
REPORT OF INDEPENDENT REGISTERED PUBLIC ACCOUNTING FIRM
To the Board of Trustees of JPMorgan Insurance Trust and Shareholders of JPMorgan Insurance Trust Income Builder Portfolio
Opinion on the Financial Statements
We have audited the accompanying statement of assets and liabilities, including the schedule of portfolio investments, of JPMorgan Insurance Trust Income Builder Portfolio (one of the portfolios constituting JPMorgan Insurance Trust, referred to hereafter as the “Portfolio”) as of December 31, 2020, the related statement of operations for the year ended December 31, 2020, the statements of changes in net assets for each of the two years in the period ended December 31, 2020, including the related notes, and the financial highlights for each of the five years in the period ended December 31, 2020 (collectively referred to as the “financial statements”). In our opinion, the financial statements present fairly, in all material respects, the financial position of the Portfolio as of December 31, 2020, the results of its operations for the year then ended, the changes in its net assets for each of the two years in the period ended December 31, 2020 and the financial highlights for each of the five years in the period ended December 31, 2020 in conformity with accounting principles generally accepted in the United States of America.
Basis for Opinion
These financial statements are the responsibility of the Portfolio’s management. Our responsibility is to express an opinion on the Portfolio’s financial statements based on our audits. We are a public accounting firm registered with the Public Company Accounting Oversight Board (United States) (PCAOB) and are required to be independent with respect to the Portfolio in accordance with the U.S. federal securities laws and the applicable rules and regulations of the Securities and Exchange Commission and the PCAOB.
We conducted our audits of these financial statements in accordance with the standards of the PCAOB. Those standards require that we plan and perform the audit to obtain reasonable assurance about whether the financial statements are free of material misstatement, whether due to error or fraud.
Our audits included performing procedures to assess the risks of material misstatement of the financial statements, whether due to error or fraud, and performing procedures that respond to those risks. Such procedures included examining, on a test basis, evidence regarding the amounts and disclosures in the financial statements. Our audits also included evaluating the accounting principles used and significant estimates made by management, as well as evaluating the overall presentation of the financial statements. Our procedures included confirmation of securities owned as of December 31, 2020 by correspondence with the custodian, transfer agent, agent banks and broker. We believe that our audits provide a reasonable basis for our opinion.
/s/ PricewaterhouseCoopers LLP
New York, New York
February 12, 2021
We have served as the auditor of one or more investment companies in the JPMorgan Funds complex since 1993.
| | | | | | | | | | |
| | | | | |
| 54 | | | | | | | | JPMORGAN INSURANCE TRUST | | DECEMBER 31, 2020 |
TRUSTEES
(Unaudited)
The Portfolio’s Statement of Additional Information includes additional information about the Portfolio’s Trustees and is available, without charge, upon request by calling 1-800-480-4111 or on the J.P. Morgan Funds’ website at www.jpmorganfunds.com.
| | | | | | |
Name (Year of Birth); Positions With the Portfolio (1) | | Principal Occupation During Past 5 Years | | Number of
Portfolios in Fund
Complex Overseen
by Trustee (2) | | Other Directorships Held During the Past 5 Years |
Independent Trustees | | |
| | | |
| John F. Finn (1947); Chairman since 2020; Trustee of Trust since 2005; Trustee of heritage One Group Mutual Funds since 1998. | | Chairman, Gardner, Inc. (supply chain management company serving industrial and consumer markets) (serving in various roles 1974-present). | | 128 | | Director, Greif, Inc. (GEF) (industrial package products and services) (2007-present); Trustee, Columbus Association for the Performing Arts (1988-present); Director, Cardinal Health, Inc. (CAH) (1994-2014). |
| | | |
| Stephen P. Fisher (1959); Trustee of Trust since 2018. | | Retired; Chairman and Chief Executive Officer, NYLIFE Distributors LLC (registered broker-dealer) (serving in various roles 2008-2013); Chairman, NYLIM Service Company LLC (transfer agent) (2008-2017); New York Life Investment Management LLC (registered investment adviser) (serving in various roles 2005-2017); Chairman, IndexIQ Advisors LLC (registered investment adviser for ETFs) (2014-2017); President, MainStay VP Funds Trust (2007-2017), MainStay DefinedTerm Municipal Opportunities Fund (2011-2017) and MainStay Funds Trust (2007-2017) (registered investment companies). | | 128 | | Honors Program Advisory Board Member, The Zicklin School of Business, Baruch College, The City University of New York (2017-present). |
| | | |
| Kathleen M. Gallagher (1958); Trustee of Trust since 2018. | | Retired; Chief Investment Officer — Benefit Plans, Ford Motor Company (serving in various roles 1985-2016). | | 128 | | Non-Executive Director, Legal & General Investment Management (Holdings) (2018-present); Non-Executive Director, Legal & General Investment Management America (financial services and insurance) (2017-present); Advisory Board Member, Fiduciary Solutions, State Street Global Advisors (2017-present); Member, Client Advisory Council, Financial Engines, LLC (registered investment adviser) (2011-2016); Director, Ford Pension Funds Investment Management Ltd. (2007-2016). |
| | | |
| Dennis P. Harrington* (1950); Trustee of Trust since 2017. | | Retired; Partner, Deloitte LLP (accounting firm) (serving in various roles 1984-2012). | | 128 | | None |
| | | |
| Frankie D. Hughes (1952); Trustee of Trust since 2008. | | President, Ashland Hughes Properties (property management) (2014-present); President and Chief Investment Officer, Hughes Capital Management, Inc. (fixed income asset management) (1993-2014). | | 128 | | None |
| | | | | | | | | | |
| | | | | |
| DECEMBER 31, 2020 | | JPMORGAN INSURANCE TRUST | | | | | | | | 55 |
TRUSTEES
(Unaudited) (continued)
| | | | | | |
Name (Year of Birth); Positions With the Portfolio (1) | | Principal Occupation During Past 5 Years | | Number of
Portfolios in Fund
Complex Overseen
by Trustee (2) | | Other Directorships Held During the Past 5 Years |
Independent Trustees (continued) | | |
| | | |
Raymond Kanner** (1953); Trustee of Trust since 2017. | | Retired; Managing Director & Chief Investment Officer, IBM Retirement Funds (2007-2016). | | 128 | | Advisory Board Member, Penso Advisors LLC (2020-present); Advisory Board Member, Los Angeles Capital (2018-present); Advisory Board Member, State Street Global Advisors Fiduciary Solutions Board (2017-present); Acting Executive Director, Committee on Investment of Employee Benefit Assets (CIEBA) (2016-2017); Advisory Board Member, Betterment for Business (robo advisor) (2016-2017); Advisory Board Member, BlueStar Indexes (index creator) (2013-2017); Director, Emerging Markets Growth Fund (registered investment company) (1997-2016); Member, Russell Index Client Advisory Board (2001-2015). |
| | | |
| Peter C. Marshall (1942); Trustee of Trust since 2005; Trustee of heritage One Group Mutual Funds since 1985. (3) | | Self-employed business consultant
(2002-present). | | 128 | | None |
| | | |
| Mary E. Martinez (1960); Trustee of Trust since 2013. | | Associate, Special Properties, a Christie’s International Real Estate Affiliate (2010-present); Managing Director, Bank of America (Asset Management) (2007-2008); Chief Operating Officer, U.S. Trust Asset Management, U.S. Trust Company (asset management) (2003-2007); President, Excelsior Funds (registered investment companies) (2004-2005). | | 128 | | None |
| | | |
| Marilyn McCoy (1948); Trustee of Trust since 2005; Trustee of heritage One Group Mutual Funds since 1999. | | Vice President of Administration and Planning, Northwestern University (1985-present). | | 128 | | None |
| | | |
| Mitchell M. Merin (1953); Trustee of Trust since 2013. (4) | | Retired; President and Chief Operating Officer, Morgan Stanley Investment Management, Member, Morgan Stanley & Co. Management Committee (serving in various roles 1981-2006). | | 128 | | Director, Sun Life Financial (SLF) (financial services and insurance) (2007-2013). |
| | | |
| Dr. Robert A. Oden, Jr. (1946); Trustee of Trust since 2005; Trustee of heritage One Group Mutual Funds since 1997. | | Retired; President, Carleton College (2002-2010); President, Kenyon College (1995-2002). | | 128 | | Trustee and Vice Chair, Trout Unlimited (2017-present); Trustee, American Museum of Fly Fishing (2013-present); Vice Chair, Dartmouth-Hitchcock Medical Center (2011-present); Trustee, American University in Cairo (1999-2014). |
| | | |
| Marian U. Pardo*** (1946); Trustee of Trust since 2013. | | Managing Director and Founder, Virtual Capital Management LLC (investment consulting) (2007-present); Managing Director, Credit Suisse Asset Management (portfolio manager) (2003-2006). | | 128 | | President and Member, Board of Governors, Columbus Citizens Foundation (not-for-profit supporting philanthropic and cultural programs) (2006-present). |
| | | | | | | | | | |
| | | | | |
| 56 | | | | | | | | JPMORGAN INSURANCE TRUST | | DECEMBER 31, 2020 |
| (1) | The Trustees serve for an indefinite term, subject to the Trust’s current retirement policy, which is age 78 for all Trustees. |
| (2) | A Fund Complex means two or more registered investment companies that hold themselves out to investors as related companies for purposes of investment and investor services or have a common investment adviser or have an investment adviser that is an affiliated person of the investment adviser of any of the other registered investment companies. The J.P. Morgan Funds Complex for which the Board of Trustees serves currently includes ten registered investment companies (128 funds). |
| (3) | Mr. Marshall retired from the Board of Trustees effective the close of business on December 31, 2020. |
| (4) | Mr. Merin retired from the Board of Trustees effective the close of business on January 31, 2021. |
| * | Two family members of Mr. Harrington are partner and managing director, respectively, of the Portfolio’s independent registered public accounting firm. Such firm has represented to the Board that those family members are not involved in the audit of the Portfolio’s financial statements and do not provide other services to the Portfolio. The Board has concluded that such association does not interfere with Mr. Harrington’s exercise of independent judgment as an Independent Trustee. |
| ** | A family member of Mr. Kanner is employed by JPMorgan Chase Bank, which is affiliated with JPMIM and JPMDS. In that capacity, this employee provides services to various JPMorgan affiliates including JPMIM and JPMDS and for which JPMIM and JPMDS bear some portion of the expense thereof. |
| *** | In connection with prior employment with JPMorgan Chase, Ms. Pardo was the recipient of non-qualified pension plan payments from JPMorgan Chase in the amount of approximately $2,055 per month, which she irrevocably waived effective January 1, 2013, and deferred compensation payments from JPMorgan Chase in the amount of approximately $7,294 per year, which ended in January 2013. In addition, Ms. Pardo receives payments from a fully-funded qualified plan, which is not an obligation of JPMorgan Chase. |
The contact address for each of the Trustees is 277 Park Avenue, New York, NY 10172.
| | | | | | | | | | |
| | | | | |
| DECEMBER 31, 2020 | | JPMORGAN INSURANCE TRUST | | | | | | | | 57 |
OFFICERS
(Unaudited)
| | |
Name (Year of Birth), Positions Held with the Trust (Since) | | Principal Occupations During Past 5 Years |
| |
Brian S. Shlissel (1964),
President and Principal Executive Officer (2016)* | | Managing Director and Chief Administrative Officer for J.P. Morgan pooled vehicles, J.P. Morgan Investment Management Inc. (formerly JPMorgan Funds Management, Inc.) (from 2014 to present); Managing Director and Head of Mutual Fund Services, Allianz Global Investors; President and Chief Executive Officer, Allianz Global Investors Mutual Funds and PIMCO Closed-End Funds (from 1999 to 2014). |
| |
Timothy J. Clemens (1975), Treasurer and Principal Financial Officer (2018)** | | Executive Director, J.P. Morgan Investment Management Inc. (formerly JPMorgan Funds Management, Inc.) since February 2016; Vice President, JPMorgan Funds Management, Inc. from October 2013 to January 2016. |
| |
Gregory S. Samuels (1980),
Secretary (2019) (formerly Assistant Secretary since 2010)** | | Executive Director and Assistant General Counsel, JPMorgan Chase. Mr. Samuels has been with JPMorgan Chase since 2010. |
| |
Stephen M. Ungerman (1953),
Chief Compliance Officer (2005) | | Managing Director, JPMorgan Chase & Co.; Mr. Ungerman has been with JPMorgan Chase & Co. since 2000. |
| |
Elizabeth A. Davin (1964), Assistant Secretary (2005)*** | | Executive Director and Assistant General Counsel, JPMorgan Chase since February 2012; formerly Vice President and Assistant General Counsel, JPMorgan Chase from 2005 to February 2012; Senior Counsel, JPMorgan Chase (formerly Bank One Corporation) from 2004 to 2005. |
| |
Jessica K. Ditullio (1962),
Assistant Secretary (2005)*** | | Executive Director and Assistant General Counsel, JPMorgan Chase. Ms. Ditullio has been with JPMorgan Chase (formerly Bank One Corporation) since 1990. |
| |
Anthony Geron (1971),
Assistant Secretary (2018)** | | Vice President and Assistant General Counsel, JPMorgan Chase since September 2018; Lead Director and Counsel, AXA Equitable Life Insurance Company from 2015 to 2018 and Senior Director and Counsel, AXA Equitable Life Insurance Company from 2014 to 2015. |
| |
Carmine Lekstutis (1980),
Assistant Secretary (2011)** | | Executive Director and Assistant General Counsel, JPMorgan Chase. Mr. Lekstutis has been with JPMorgan Chase since 2011. |
| |
Zachary E. Vonnegut-Gabovitch (1986), Assistant Secretary (2017)** | | Vice President and Assistant General Counsel, JPMorgan Chase since September 2016; Associate, Morgan, Lewis & Bockius (law firm) from 2012 to 2016. |
| |
Michael M. D’Ambrosio (1969),
Assistant Treasurer (2012) | | Managing Director, J.P. Morgan Investment Management Inc. (formerly JPMorgan Funds Management, Inc.). Mr. D’Ambrosio has been with J.P. Morgan Investment Management Inc. since 2012. |
| |
Aleksandr Fleytekh (1972), Assistant Treasurer (2019)** | | Vice President, J.P. Morgan Investment Management Inc. (formerly JPMorgan Funds Management, Inc.) since February 2012. |
| |
Shannon Gaines (1977),
Assistant Treasurer (2018)*** | | Vice President, J.P. Morgan Investment Management Inc. (formerly JPMorgan Funds Management, Inc.) since January 2014. |
| |
Jeffrey D. House (1972), Assistant Treasurer (2017)*** | | Vice President, J.P. Morgan Investment Management Inc. (formerly JPMorgan Funds Management, Inc.) since July 2006. |
| |
Michael Mannarino (1985),
Assistant Treasurer (2020) | | Vice President, J.P. Morgan Investment Management Inc. (formerly JPMorgan Funds Management, Inc.) since 2014. |
| |
Joseph Parascondola (1963),
Assistant Treasurer (2011)* | | Executive Director, J.P. Morgan Investment Management, Inc. since February 2020, formerly Vice President, J.P. Morgan Investment Management Inc. (formerly JPMorgan Funds Management, Inc.) from August 2006 to January 2020. |
| |
Gillian I. Sands (1969),
Assistant Treasurer (2012)** | | Vice President, J.P. Morgan Investment Management Inc. (formerly JPMorgan Funds Management, Inc.) since September 2012. |
The contact address for each of the officers, unless otherwise noted, is 277 Park Avenue, New York, NY 10172.
| * | The contact address for the officer is 575 Washington Boulevard, Jersey City, NJ 07310. |
| ** | The contact address for the officer is 4 New York Plaza, New York, NY 10004. |
| *** | The contact address for the officer is 1111 Polaris Parkway, Columbus, OH 43240. |
| | | | | | | | | | |
| | | | | |
| 58 | | | | | | | | JPMORGAN INSURANCE TRUST | | DECEMBER 31, 2020 |
SCHEDULE OF SHAREHOLDER EXPENSES
(Unaudited)
Hypothetical $1,000 Investment
As a shareholder of the Portfolio, you incur ongoing costs, including investment advisory fees, administration fees, distribution fees (for Class 2 Shares) and other Portfolio expenses. Because the Portfolio is a funding vehicle for Policies and Eligible Plans, you may also incur sales charges and other fees relating to the Policies or Eligible Plans. The examples below are intended to help you understand your ongoing costs (in dollars) of investing in the Portfolio, but not the costs of the Policies or Eligible Plans, and to compare these ongoing costs with the ongoing costs of investing in other mutual funds. The examples assume that you had a $1,000 investment in each Class at the beginning of the reporting period, July 1, 2020, and continued to hold your shares at the end of the reporting period, December 31, 2020.
Actual Expenses
For each Class of the Portfolio in the table below, the first line provides information about actual account values and actual expenses. You may use the information in this line, together with the amount you invested, to estimate the expenses that you paid over the period. Simply divide your account value by $1,000 (for example, an $8,600 account value divided by $1,000 = 8.6), then multiply the result by the number in the first line of each Class under the heading titled “Expenses Paid During the Period” to estimate the expenses you paid on your account during this period.
Hypothetical Example for Comparison Purposes
The second line of each Class in the table below provides information about hypothetical account values and hypothetical expenses based on the Class’ actual expense ratio and an assumed rate of return of 5% per year before expenses, which is not the Class’ actual return. The hypothetical account values and expenses may not be used to estimate the actual ending account balance or expenses you paid for the period. You may use this information to compare the ongoing costs of investing in the Class of the Portfolio and other funds. To do so, compare this 5% hypothetical example with the 5% hypothetical examples that appear in the shareholder reports of the other funds. Please note that the expenses shown in the table are meant to highlight your ongoing costs only and do not reflect any transaction costs, such as sales charges (loads) or redemption fees or the costs associated with the Policies and Eligible Plans through which the Portfolio is held. Therefore, the second line for each Class in the table is useful in comparing ongoing costs only, and will not help you determine the relative total costs of owning different funds. In addition, if these transaction costs were included, your costs would have been higher. The examples also assume all dividends and distributions have been reinvested.
| | | | | | | | | | | | | | | | |
| | | Beginning Account Value July 1, 2020 | | | Ending
Account Value
December 31, 2020 | | | Expenses
Paid During
the Period* | | | Annualized Expense
Ratio | |
JPMorgan Insurance Trust Income Builder Portfolio | | | | | | | | | | | | | | | | |
Class 1 | | | | | | | | | | | | | | | | |
Actual | | $ | 1,000.00 | | | $ | 1,124.00 | | | $ | 2.94 | | | | 0.55 | % |
Hypothetical | | | 1,000.00 | | | | 1,022.37 | | | | 2.80 | | | | 0.55 | |
Class 2 | | | | | | | | | | | | | | | | |
Actual | | | 1,000.00 | | | | 1,121.30 | | | | 4.27 | | | | 0.80 | |
Hypothetical | | | 1,000.00 | | | | 1,021.11 | | | | 4.06 | | | | 0.80 | |
| * | Expenses are equal to each Class’ respective annualized expense ratio, multiplied by the average account value over the period, multiplied by 184/366 (to reflect the one-half year period). |
| | | | | | | | | | |
| | | | | |
| DECEMBER 31, 2020 | | JPMORGAN INSURANCE TRUST | | | | | | | | 59 |
BOARD APPROVAL OF INVESTMENT ADVISORY AGREEMENT
(Unaudited)
The Board of Trustees has established various standing committees composed of Trustees with diverse backgrounds, to which the Board of Trustees has assigned specific subject matter responsibilities to further enhance the effectiveness of the Board’s oversight and decision making. The Board of Trustees and its investment committees (money market and alternative products, equity, and fixed income) meet regularly throughout the year and consider factors that are relevant to their annual consideration of investment advisory agreements at each meeting. They also meet for the specific purpose of considering investment advisory agreement annual renewals. The Board of Trustees held meetings in June and August 2020, at which the Trustees considered the continuation of the investment advisory agreement for the Portfolio whose annual report is contained herein (the “Advisory Agreement”). In accordance with SEC guidance, due to the COVID-19 pandemic, the meetings were conducted through video conference. At the June meeting, the Board’s investment committees met to review and consider performance, expense and related information for the Portfolio and the other J.P. Morgan Funds overseen by the Board in which the Portfolio may invest (“Underlying Funds”). Each investment committee reported to the full Board, which then considered the investment committee’s preliminary findings. At the August meeting, the Trustees continued their review and consideration. The Trustees, including a majority of the Trustees who are not parties to the Advisory Agreement or “interested persons” (as defined in the 1940 Act) of any party to the Advisory Agreement or any of their affiliates, approved the continuation of the Advisory Agreement on August 11, 2020.
As part of their review of the Advisory Agreement, the Trustees considered and reviewed performance and other information about the Portfolio and Underlying Funds received from the Adviser. This information includes the Portfolio’s and Underlying Funds’ performance as compared to the performance of the Portfolio’s and Underlying Funds’ peers and benchmarks and analyses by the Adviser of the Portfolio’s and Underlying Funds’ performance. In addition, at each of their regular meetings throughout the year, the Trustees considered reports on the performance of certain J.P. Morgan Funds provided by an independent management consulting firm (“independent consultant”). In addition, in preparation for the June and August meetings, the Trustees requested, received and evaluated extensive materials from the Adviser, including, with respect to the Portfolio and/or Underlying Funds, performance and expense information compiled by Broadridge, using data from Lipper Inc. and/or Morningstar Inc., independent providers of investment company data (together, “Broadridge/”). The independent consultant also provided additional analysis of the performance of certain Underlying Funds in connection with the Trustees’ review of the Advisory Agreement. Before voting on the Advisory Agreement, the Trustees reviewed the Advisory Agreement with representatives of the Adviser, counsel to the Trust and independent legal counsel and received a
memorandum from independent legal counsel to the Trustees discussing the legal standards for their consideration of the Advisory Agreement. The Trustees also discussed the Advisory Agreement in executive sessions with independent legal counsel at which no representatives of the Adviser were present.
A summary of the material factors evaluated by the Trustees in determining whether to approve the Advisory Agreement is provided below. Each Trustee attributed different weights to the various factors and no factor alone was considered determinative. The Trustees considered information provided with respect to the Portfolio and Underlying Funds throughout the year, including additional reporting and information provided in connection with the market volatility caused by the COVID-19 pandemic, as well as materials furnished specifically in connection with the annual review process. From year to year, the Trustees consider and place emphasis on relevant information in light of changing circumstances in market and economic conditions.
After considering and weighing the factors and information they had received, the Trustees found that the compensation to be received by the Adviser from the Portfolio under the Advisory Agreement was fair and reasonable under the circumstances and determined that the continuance of the Advisory Agreement was in the best interests of the Portfolio and its shareholders.
Nature, Extent and Quality of Services Provided by the Adviser
The Trustees received and considered information regarding the nature, extent and quality of services provided to the Portfolio under the Advisory Agreement. The Trustees took into account information furnished throughout the year at Trustee meetings, as well as the materials furnished specifically in connection with this annual review process. The Trustees considered the background and experience of the Adviser’s senior management, personnel changes, if any, and the expertise of, and the amount of attention given to the Portfolio by, investment personnel of the Adviser. In addition, the Trustees reviewed the qualifications, backgrounds and responsibilities of the portfolio management team primarily responsible for the day-to-day management of the Portfolio and the infrastructure supporting the team, including personnel changes, if any. In addition, the Board considered its discussions with the Adviser regarding the Adviser’s business continuity plan and steps the Adviser was taking to provide ongoing services to the Portfolio during the COVID-19 pandemic, and the Adviser’s success in continuing to provide services to the Portfolio and their shareholders throughout this period. The Trustees also considered information provided by the Adviser and JPMorgan Distribution Services, Inc. (“JPMDS”) about the structure and distribution strategy of the Portfolio. The Trustees reviewed information relating to the Adviser’s risk governance model and reports showing the Adviser’s compliance structure and ongoing compliance processes. The Trustees also considered the quality of the administration services provided by the Adviser in its role as administrator.
| | | | | | | | | | |
| | | | | |
| 60 | | | | | | | | JPMORGAN INSURANCE TRUST | | DECEMBER 31, 2020 |
The Trustees also considered their knowledge of the nature and quality of services provided by the Adviser and its affiliates to the Portfolio and Underlying Funds gained from their experience as Trustees of the J.P. Morgan Funds. In addition, they considered the overall reputation and capabilities of the Adviser and its affiliates, the commitment of the Adviser to provide high quality service to the Portfolio and Underlying Funds, their overall confidence in the Adviser’s integrity and the Adviser’s responsiveness to questions or concerns raised by them, including the Adviser’s willingness to consider and implement organizational and operational changes designed to improve investment results and the services provided to the Portfolio and Underlying Funds.
Based upon these considerations and other factors, the Trustees concluded that they were satisfied with the nature, extent and quality of the investment advisory services provided to the Portfolio by the Adviser.
Costs of Services Provided and Profitability to the Adviser and its Affiliates
The Trustees received and considered information regarding the profitability to the Adviser and its affiliates in providing services to the Portfolio and Underlying Funds. The Trustees reviewed and discussed this information. The Trustees recognized that this information is not audited and represents the Adviser’s determination of its and its affiliates’ revenues from the contractual services provided to the Portfolio, less expenses of providing such services. Expenses include direct and indirect costs and are calculated using an allocation methodology developed by the Adviser. The Trustees also recognized that it is difficult to make comparisons of profitability from fund investment advisory contracts because comparative information is not generally publicly available and is affected by numerous factors, including the structure of the particular adviser, the types of funds it manages, its business mix, numerous assumptions regarding allocations and the fact that publicly-traded fund managers’ operating profits and net income are net of distribution and marketing expenses. Based upon their review, and taking into consideration the factors noted above, the Trustees concluded that the profitability to the Adviser under the Advisory Agreement was not unreasonable in light of the services and benefits provided to the Portfolio.
The Trustees also considered that the Adviser earns fees from the Portfolio and Underlying Funds for providing administration services. These fees were shown separately in the profitability analysis presented to the Trustees. The Trustees also considered the payments of Rule 12b-1 fees to JPMDS, an affiliate of the Adviser, which also acts as the Portfolio’s distributor, and that these fees are in turn generally paid to financial intermediaries that sell the Portfolio, including financial intermediaries that are affiliates of the Adviser (although they are retained by JPMDS in certain instances). The Trustees also considered the fees paid to JPMorgan Chase Bank, N.A. (“JPMCB”) for custody and fund accounting and other related services for the Portfolio and/or Underlying Funds.
Fall-Out Benefits
The Trustees reviewed information regarding potential “fall-out” or ancillary benefits received by the Adviser and its affiliates as a result of their relationship with the Portfolio. The Trustees considered that the J.P. Morgan Funds’ operating accounts are held at JPMCB, which, as a result, will receive float benefits for certain J.P. Morgan Funds, as applicable. The Trustees also noted that the Adviser supports a diverse set of products and services, which benefits the Adviser by allowing it to leverage its infrastructure to serve additional clients, including the benefits received by the Adviser and its affiliates in connection with the Portfolio’s investments in the Underlying Funds. The Trustees also reviewed the Adviser’s allocation of fund brokerage for the J.P. Morgan Funds complex, including allocations to brokers who provide research to the Adviser.
Economies of Scale
The Trustees considered the extent to which the Portfolio may benefit from economies of scale. The Trustees considered that there may not be a direct relationship between economies of scale realized by the Portfolio and those realized by the Adviser as assets increase. The Trustees considered the extent to which the Portfolio was priced to scale and whether it would be appropriate to add advisory fee breakpoints, but noted that the Portfolio has implemented fee waivers and contractual expense limitations (“Fee Caps”) which allow the Portfolio’s shareholders to share potential economies of scale from its inception and that the fees remain satisfactory relative to peer funds. The Trustees considered the benefits to the Portfolio of the use of an affiliated distributor and custodian, including the ability to rely on existing infrastructure supporting distribution, custodial and transfer agent services, and the ability to negotiate competitive fees for the Portfolio. The Trustees further considered the Adviser’s and JPMDS’s ongoing investments in their business in support of the Portfolio, including the Adviser’s and/or JPMDS’s investments in trading systems, technology (including improvements to the J.P. Morgan Funds’ website, and cybersecurity improvements), retention of key talent, and regulatory support enhancements. The Trustees concluded that the current fee structure for the Portfolio, including Fee Caps that the Adviser has in place that serve to limit the overall net expense ratios of the Portfolio at competitive levels, was reasonable. The Trustees concluded that the Portfolio’s shareholders received the benefits of potential economies of scale through the Fee Caps and the Adviser’s reinvestment in its operations to serve the Portfolio and its shareholders. The Trustees noted that the Adviser’s reinvestment ensures sufficient resources in terms of personnel and infrastructure to support the Portfolio.
| | | | | | | | | | |
| | | | | |
| DECEMBER 31, 2020 | | JPMORGAN INSURANCE TRUST | | | | | | | | 61 |
BOARD APPROVAL OF INVESTMENT ADVISORY AGREEMENTS
(Unaudited) (continued)
Independent Written Evaluation of the Portfolio’s Chief Compliance Officer
The Trustees noted that, upon their direction, the Chief Compliance Officer for the Portfolio had prepared an independent written evaluation in order to assist the Trustees in determining the reasonableness of the proposed management fees. The Trustees considered the written evaluation in determining whether to continue the Advisory Agreement.
Fees Relative to Adviser’s Other Clients
The Trustees received and considered information about the nature and extent of investment advisory services and fee rates offered to other clients of the Adviser, including institutional separate accounts, collective investment trusts, ETFs and/or funds sub-advised by the Adviser, for investment management styles substantially similar to that of the Portfolio. The Trustees considered the complexity of investment management for registered mutual funds relative to the Adviser’s other clients and noted differences, as applicable, in the regulatory, legal and other risks and responsibilities of providing services to the different clients. The Trustees considered that serving as an adviser to a registered mutual fund involves greater responsibilities and risks than acting as a sub-adviser and observed that sub-advisory fees may be lower than those charged by the Adviser to the Portfolio. The Trustees also noted that the adviser, not the mutual fund, pays the sub-advisory fee and that many responsibilities related to the advisory function are retained by the primary adviser. The Trustees concluded that the fee rates charged to the Portfolio in comparison to those charged to the Adviser’s other clients were reasonable.
Investment Performance
The Trustees received and considered absolute and/or relative performance information for the Portfolio in a report prepared by Broadridge. The Trustees considered the total return performance information, which included the ranking of the Portfolio within a performance universe made up of funds with the same Broadridge investment classification and objective (the “Universe”), as well as a subset of funds within the Universe (the “Peer Group”), by total return for the applicable one-, three-and five-year periods. The Trustees reviewed a description of Broadridge’s methodology for selecting mutual funds in the Portfolio’s Universe and Peer Group and noted that Universe and Peer Group rankings were not calculated if the number of funds in the Universe and/or Peer Group did not meet a predetermined minimum. The Broadridge materials provided to the Trustees highlighted information with respect to a representative class to assist the Trustees in their review. As part of this review, the Trustees also reviewed the Portfolio’s performance against its benchmark and considered the performance information provided for the Portfolio at regular Board meetings by the Adviser. The Trustees also engaged with the Adviser to consider what steps might be taken to improve
performance, as applicable. The Broadridge performance data noted by the Trustees as part of their review and the determinations made by the Trustees with respect to the Portfolio’s performance are summarized below:
The Trustees noted that the Portfolio’s performance for Class 2 shares was in the fifth quintile based upon both the Peer Group and the Universe for each of the one-, three- and five-year periods ended December 31, 2019. The Trustees discussed the performance and investment strategy of the Portfolio with the Adviser and based upon this discussion and various other factors, concluded that the Portfolio’s performance was satisfactory under the circumstances. They requested however, that the Portfolio’s Adviser provide additional Portfolio performance information to be reviewed with the members of the Board’s money market and alternative products committee at each of its regularly scheduled meetings over the course of the next year.
Advisory Fees and Expense Ratios
The Trustees considered the contractual advisory fee rate and administration fee rate paid by the Portfolio to the Adviser and compared the combined rate to the information prepared by Broadridge concerning management fee rates paid by other funds in the same Broadridge category as the Portfolio. The Trustees recognized that Broadridge reported the Portfolio’s management fee rate as the combined contractual advisory fee and administration fee rates. The Trustees also reviewed information about other expenses and the expense ratios for the Portfolio and noted that Universe and Peer Group rankings were not calculated if the number of funds in the Universe and/or Peer Groups did not meet a predetermined minimum. The Trustees considered the Fee Caps currently in place for the Portfolio, the net advisory fee rate after taking into account any waivers and/or reimbursements, and, where deemed appropriate by the Trustees, additional waivers and/or reimbursements. The Trustees recognized that it is difficult to make comparisons of advisory fees because there are variations in the services that are included in the fees paid by other funds. The Trustees’ determinations as a result of the review of the Portfolio’s advisory fees and expense ratios are summarized below:
The Trustees noted that the Portfolio’s net advisory fee for Class 2 shares was in the first quintile based upon both the Peer Group and Universe, and that the actual total expenses for Class 2 shares were in the first and second quintiles based upon the Peer Group and Universe, respectively. After considering the factors identified above, in light of this information, the Trustees concluded that the advisory fee was satisfactory in light of the services provided to the Portfolio and that such fee would be for services provided in addition to, rather than duplicative of, services provided under the advisory agreements of the Underlying Funds in which the Portfolio invests.
| | | | | | | | | | |
| | | | | |
| 62 | | | | | | | | JPMORGAN INSURANCE TRUST | | DECEMBER 31, 2020 |
TAX LETTER
(Unaudited)
Dividends Received Deduction (DRD)
The Portfolio had 8.65%, or maximum allowable percentage, of ordinary income distributions eligible for the dividends received deduction for corporate shareholders for the fiscal year ended December 31, 2020.
| | | | | | | | | | |
| | | | | |
| DECEMBER 31, 2020 | | JPMORGAN INSURANCE TRUST | | | | | | | | 63 |
J.P. Morgan Funds are distributed by JPMorgan Distribution Services, Inc., which is an affiliate of JPMorgan Chase & Co. Affiliates of JPMorgan Chase & Co. receive fees for providing various services to the funds.
Contact JPMorgan Distribution Services, Inc. at 1-800-480-4111 for a portfolio prospectus. You can also visit us at www.jpmorganfunds.com. Investors should carefully consider the investment objectives and risk as well as charges and expenses of the mutual fund before investing. The prospectus contains this and other information about the mutual fund. Read the prospectus carefully before investing.
The Portfolio files a complete schedule of its portfolio holdings for the first and third quarters of its fiscal year with the SEC as an exhibit to its report on Form N-PORT. The Portfolio’s Form N-PORT reports are available on the SEC’s website at http://www.sec.gov. The Portfolio’s quarterly holdings can be found by visiting the J.P. Morgan Funds’ website at www.jpmorganfunds.com.
A description of the Portfolio’s policies and procedures with respect to the disclosure of the Portfolio’s holdings is available in the prospectuses and Statement of Additional Information.
A copy of proxy policies and procedures is available without charge upon request by calling 1-800-480-4111 and on the Portfolio’s website at www.jpmorganfunds.com. A description of such policies and procedures is on the SEC’s website at www.sec.gov. The Trustees have delegated the authority to vote proxies for securities owned by the Portfolio to the Adviser. A copy of the Portfolio’s voting record for the most recent 12-month period ended June 30 is available on the SEC’s website at www.sec.gov or at the Portfolio’s website at www.jpmorganfunds.com no later than August 31 of each year. The Portfolio’s proxy voting record will include, among other things, a brief description of the matter voted on for each portfolio security, and will state how each vote was cast, for example, for or against the proposal.

J.P. Morgan Asset Management is the brand name for the asset management business of JPMorgan Chase & Co. and its affiliates worldwide.
| | | | |
| | © JPMorgan Chase & Co., 2020. All rights reserved. December 2020. | | AN-JPMITIBP-1220 |
Annual Report
JPMorgan Insurance Trust
December 31, 2020
JPMorgan Insurance Trust Global Allocation Portfolio
| | | | |
NOT FDIC INSURED • NO BANK GUARANTEE • MAY LOSE VALUE
| | |  | |
CONTENTS
Investments in the Portfolio are not deposits or obligations of, or guaranteed or endorsed by, any bank and are not insured or guaranteed by the FDIC, the Federal Reserve Board or any other government agency. You could lose money if you sell when the Portfolio’s share price is lower than when you invested.
Past performance is no guarantee of future performance. The general market views expressed in this report are opinions based on market and other conditions through the end of the reporting period and are subject to change without notice. These views are not intended to predict the future performance of the Portfolio or the securities markets. References to specific securities and their issuers are for illustrative purposes only and are not intended to be, and should not be interpreted as, recommendations to purchase or sell such securities. Such views are not meant as investment advice and may not be relied on as an indication of trading intent on behalf of the Portfolio.
This Portfolio is intended to be a funding vehicle for variable annuity contracts and variable life insurance policies (collectively “Policies”) offered by the separate accounts of various insurance companies. Portfolio shares may also be offered to qualified pension and retirement plans and accounts permitting accumulation of assets on a tax-deferred basis (“Eligible Plans”). Individuals may not purchase shares directly from the Portfolio.
Prospective investors should refer to the Portfolio’s prospectuses for a discussion of the Portfolio’s investment objective, strategies and risks. Call J.P. Morgan Funds Service Center at 1-800-480-4111 for a prospectus containing more complete information about the Portfolio, including management fees and other expenses. Please read it carefully before investing.
LETTER TO SHAREHOLDERS
February 4, 2021 (Unaudited)
Dear Shareholders,
The immense efforts of central banks, government and researchers in the public and private sectors appear to have shepherded the world through the most difficult days of a profound crisis caused by the pandemic. While the economic and health care challenges are not behind us, the uncertainty and turbulence of 2020 has abated.
| | |
 | | “We believe the clear lesson is that investors who remained fully invested over the past year, in the face of uncertainty over the direction of the pandemic and the unprecedented responses to it, were likely rewarded for their resolve.” — Andrea L. Lisher |
The development of multiple vaccines against Covid-19 toward the end of 2020 provided hope that the pandemic would be halted and that economic and social activity could begin to resume in the year ahead. That optimism spread to global financial markets. While leading equity indexes fell by 20% or more in the first quarter of 2020, financial markets stabilized and equity markets largely rebounded — slowly at first and then rapidly the second half of the year. At the end of 2020, the S&P 500 Index had generated a total return of 18.10% for the full 12 months and 22.16% for the final six months of the year.
We believe the clear lesson is that investors who remained fully invested over the past year, in the face of uncertainty over the
direction of the pandemic and the unprecedented responses to it, were likely rewarded for their resolve.
Certainly, enormous challenges remain in both the implementation of global vaccinations and in the rebuilding of economies at the local, national and international levels. However, the advances in the fight against Covid-19 provide policymakers and investors with the opportunity to plan for the future and meet those challenges. J.P. Morgan Asset Management has thrived amid the many challenges presented by the pandemic. Moreover, our deep experience in risk management enabled us to better navigate increased volatility in global financial markets. Throughout 2020, we continued to seek to operate under the same fundamental practices and principles that have driven our success for more than a century with an unwavering focus on putting our clients at the center of everything we do.
On behalf of J.P. Morgan Asset Management, thank you for entrusting us to manage your investment. Should you have any questions, please visit www.jpmorganfunds.com or contact the J.P. Morgan Funds Service Center at 1-800-480-4111.
Sincerely yours,

Andrea L. Lisher
Head of Americas, Client
J.P. Morgan Asset Management
| | | | | | | | | | |
| | | | | |
| DECEMBER 31, 2020 | | JPMORGAN INSURANCE TRUST | | | | | | | | 1 |
JPMorgan Insurance Trust Global Allocation Portfolio
PORTFOLIO COMMENTARY
TWELVE MONTHS ENDED DECEMBER 31, 2020 (Unaudited)
| | | | |
| REPORTING PERIOD RETURN: | |
| Portfolio (Class 2 Shares)* | | | 15.40% | |
| MSCI All Country World Index USD (net for foreign withholding taxes)1 | | | 16.25% | |
| MSCI World Index (net of foreign withholding taxes) | | | 15.90% | |
| Global Allocation Composite Benchmark | | | 14.05% | |
| |
| Net Assets as of 12/31/2020 (In Thousands) | | $ | 120,070 | |
INVESTMENT OBJECTIVE**
The JPMorgan Insurance Trust Global Allocation Portfolio (the “Portfolio”) seeks to maximize long-term total return.
HOW DID THE MARKET PERFORM?
Global financial markets generally recovered from a sharp sell-off in the first quarter of 2020, led by a rally in equity markets in the second half of the year. Investor demand for equity was largely fueled by continued support from central banks, relief spending by governments across the globe and the development and approvals of the first vaccines against Covid-19.
In the first days of January 2020, financial markets largely shrugged off a brief flare-up in military tensions between the U.S. and Iran. However, the emergence and spread of Covid-19 fed increasing investor uncertainty and by early March, the novel coronavirus was declared a pandemic by the World Health Organization. The closure of large sectors of national economies on a global scale sparked a dramatic sell-off in financial markets across the globe. Yields on developed market sovereign bonds fell sharply and prices for commodity gold spiked. By the end of the first quarter of 2020, leading developed market equity indexes had lost 20% or more of their value from the start of the year. Corporate bond prices generally fell and the price of crude oil ended the first quarter down by 60%.
Leading central banks promptly responded with lower interest rates and/or asset purchasing programs, which helped to support asset price stability and head off a potential liquidity crunch in credit markets. Governments also responded with a range of fiscal stimulus or paycheck protection programs designed to cushion the economic impact of the pandemic. In the ensuing months, global equity markets staged a slow and uneven rebound, led by U.S. and emerging markets.
At the start of the second half of the year, U.S. equity led a broad rebound in both developed markets and emerging markets equity. Leading U.S. equity indexes rose in July and August 2020, punctuated by five consecutive record high closings for S&P 500 in late August — a stretch not seen since 2017. Notably, Apple Inc. issued a 4-for-1 stock split in August and became the first publicly listed company with a valuation surpassing
$2 trillion. The U.S. Federal Reserve (the “Fed”) signaled its continued support for asset purchases and low benchmark interest rates. While the spread of Covid-19 accelerated in the U.S., multiple candidate vaccines were being developed around the world and the number of hospitalizations at the end of the summer was relatively small compared with what was to come at the end of the year.
Equity prices across the globe largely declined over September and October 2020. Re-closings across Asia and Europe in response to Covid-19 dented investor optimism. The inability of the U.S. Congress to adopt further spending for pandemic relief put acute pressure on the S&P 500 in the final week of October.
U.S. equity prices began to rebound in November and by mid-month the S&P 500 reached a closing high and crossed 3,600 points for the first time amid the U.S. Food and Drug Administration’s approval of the first Covid-19 vaccines. While the results of the U.S. presidential election were contested, President-elect Joe Biden’s early cabinet choices — including former Fed Chairwoman Janet Yellen — removed some investor uncertainty. The Fed kept interest rates and policies unchanged and Congressional negotiations over proposed relief and stimulus spending continued through the month.
Globally, equity markets maintained upward momentum through the end of December, largely driven by investor expectations that mass vaccinations and the re-opening of economies would unleash pent up demand from consumers, businesses and governments. Notably, emerging markets equity outperformed developed markets equity, including U.S. equity in the second half of 2020 as China, Taiwan and South Korea appeared to have greater success in containing the pandemic.
In the U.S., growth stocks continued to outperform value stocks but the difference narrowed somewhat during the period as share price valuations rose. Additionally, shares of select companies that had seen their stock prices plummet in the first half of 2020 benefitted from increased investor appetite for bargains in the second half of the year. At year’s end, the largest 10 companies in the S&P 500 made up 27.4% of the index’s value, compared with 22.7% at the end of 2019 and 21.0% at the end of 2018.
| | | | | | | | | | |
| | | | | |
| 2 | | | | | | | | JPMORGAN INSURANCE TRUST | | DECEMBER 31, 2020 |
WHAT WERE THE MAIN DRIVERS OF THE PORTFOLIO’S PERFORMANCE?
The Portfolio’s Class 2 Shares underperformed the MSCI All Country World Index (net of foreign withholding taxes) (the “Benchmark”) and outperformed the Global Allocation Composite Benchmark (the “Composite”), which consists of 60% MSCI All Country World Index and 40% Bloomberg Barclays Global Aggregate Index, for the twelve months ended December 31, 2020.
The Portfolio’s allocation to fixed income securities, particularly global developed markets government bonds, detracted from performance relative to the Benchmark, which is an all-equity index.
Relative to the Composite, the Portfolio’s allocations to global equity and investment grade corporate bonds contributed to relative performance as both asset classes performed strongly toward the end of the year amid the approvals for the first Covid-19 vaccines and continued fiscal support from governments.
HOW WAS THE PORTFOLIO POSITIONED?
During the reporting period, the Portfolio was positioned to maximize total return while managing risk. Early in 2020, the portfolio managers sought to lower the risk profile of the Portfolio by increasing its overall government bond duration by one year and reducing allocations to both U.S. high yield bonds and overall equity. In the second half of March 2020, as the Fed took steps to support the corporate bond market, the portfolio managers added investment grade corporate bonds and increased the Portfolio’s allocation to U.S. high yield bonds. In the final months of the reporting period, the portfolio managers increased the Portfolio’s allocation to emerging markets equity and maintain their position in credit.
| | | | | | | | |
| TOP TEN LONG POSITIONS OF THE PORTFOLIO*** | |
| | 1. | | | JPMorgan High Yield Fund Class R6 Shares | | | 15.9 | % |
| | 2. | | | JPMorgan Emerging Markets Equity Fund Class R6 Shares | | | 10.7 | |
| | 3. | | | U.S. Treasury Notes, 2.50%, 1/31/2021 | | | 2.0 | |
| | 4. | | | JPMorgan Mortgage-Backed Securities Fund Class R6 Shares | | | 1.0 | |
| | 5. | | | Microsoft Corp. | | | 0.9 | |
| | 6. | | | Amazon.com, Inc. | | | 0.8 | |
| | 7. | | | Apple, Inc. | | | 0.8 | |
| | 8. | | | Alphabet, Inc., Class C | | | 0.6 | |
| | 9. | | | Samsung Electronics Co. Ltd. (South Korea) | | | 0.5 | |
| | 10. | | | Nestle SA (Registered) (Switzerland) | | | 0.5 | |
| | | | | | | | |
| TOP TEN SHORT POSITIONS OF THE PORTFOLIO**** | |
| | 1. | | | Acacia Communications, Inc. | | | 17.6 | % |
| | 2. | | | Varian Medical Systems, Inc. | | | 16.9 | |
| | 3. | | | Sirius XM Holdings, Inc. | | | 15.8 | |
| | 4. | | | Tiffany & Co. | | | 14.2 | |
| | 5. | | | National General Holdings Corp. | | | 13.9 | |
| | 6. | | | Intel Corp. | | | 5.5 | |
| | 7. | | | Beyond Meat, Inc. | | | 5.0 | |
| | 8. | | | Kroger Co. (The) | | | 3.8 | |
| | 9. | | | Navistar International Corp. | | | 2.9 | |
| | 10. | | | Pinnacle West Capital Corp. | | | 1.4 | |
| | | | |
LONG POSITION PORTFOLIO COMPOSITION*** | |
Common Stocks | | | 43.7 | % |
Investment Companies | | | 27.5 | |
Corporate Bonds | | | 8.0 | |
Foreign Government Securities | | | 5.9 | |
U.S. Treasury Obligations | | | 2.0 | |
Collateralized Mortgage Obligations | | | 1.9 | |
Commercial Mortgage-Backed Securities | | | 1.5 | |
Others (each less than 1.0%) | | | 0.8 | |
Short-Term Investments | | | 8.7 | |
| | | | |
SHORT POSITION PORTFOLIO COMPOSITION**** | |
Common Stocks | | | 100.0 | % |
| 1 | | On November 30, 2020, the Portfolio’s benchmark index was changed to the MSCI All Country World Index from the MSCI World Index to better reflect, for comparison purposes, how the Portfolio is managed. The Portfolio’s composite benchmark was also changed to include the MSCI All Country World Index and exclude the MSCI World Index. |
| * | | The return shown is based on net asset values calculated for shareholder transactions and may differ from the return shown in the financial highlights, which reflects adjustments made to the net asset values in accordance with accounting principles generally accepted in the United States of America. |
| ** | | The adviser seeks to achieve the Portfolio’s objective. There can be no guarantee it will be achieved. |
| *** | | Percentages indicated are based on total long investments as of December 31, 2020. The Portfolio’s composition is subject to change. |
| **** | | Percentages indicated are based on total short investments as of December 31, 2020. The Portfolio’s composition is subject to change. |
| | | | | | | | | | |
| | | | | |
| DECEMBER 31, 2020 | | JPMORGAN INSURANCE TRUST | | | | | | | | 3 |
JPMorgan Insurance Trust Global Allocation Portfolio
PORTFOLIO COMMENTARY
TWELVE MONTHS ENDED DECEMBER 31, 2020 (Unaudited) (continued)
| | | | | | | | | | | | | | |
AVERAGE ANNUAL TOTAL RETURNS AS OF DECEMBER 31, 2020 | |
| | | | |
| | | INCEPTION DATE OF
CLASS | | 1 YEAR | | | 5 YEAR | | | SINCE
INCEPTION | |
CLASS 1 SHARES | | December 9, 2014 | | | 15.69 | % | | | 9.56 | % | | | 7.59 | % |
CLASS 2 SHARES | | December 9, 2014 | | | 15.40 | | | | 9.28 | | | | 7.32 | |
LIFE OF PORTFOLIO PERFORMANCE (12/9/14 TO 12/31/20)
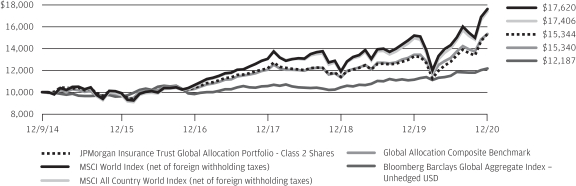
The performance quoted is past performance and is not a guarantee of future results. Mutual funds are subject to certain market risks. Investment returns and principal value of an investment will fluctuate so that an investor’s shares, when redeemed, may be worth more or less than their original cost. Current performance may be higher or lower than the performance data shown. For up-to-date month-end performance information please call 1-800-480-4111.
The Portfolio commenced operations on December 9, 2014.
The graph illustrates comparative performance for $10,000 invested in Class 2 Shares of the JPMorgan Insurance Trust Global Allocation Portfolio, the MSCI World Index (net of foreign withholding taxes), the MSCI All Country World Index (net of foreign withholding taxes), the Bloomberg Barclays Global Aggregate Index — Unhedged USD and the Global Allocation Composite Benchmark from December 9, 2014 to December 31, 2020. The performance of the Portfolio assumes reinvestment of all dividends and capital gain distributions, if any. The performance of the MSCI World Index (net of foreign withholding taxes), MSCI All Country World Index (net of foreign withholding taxes), Bloomberg Barclays Global Aggregate Index — Unhedged USD and Global Allocation Composite Benchmark do not reflect the deduction of expenses associated with a mutual fund and have been adjusted to reflect reinvestment of all dividends and capital gain distributions of the securities included in the benchmarks, if applicable. The MSCI World Index (net of foreign withholding taxes) is a free float-adjusted market capitalization weighted index that is designed to measure the equity market performance of developed markets. The MSCI All Country World Index (net of foreign withholding taxes) is a free float-adjusted market capitalization weighted index that is designed to measure the equity market performance of
developed and emerging markets. The Bloomberg Barclays Global Aggregate Index provides a broad-based measure of the global investment-grade fixed income markets. Since November 30, 2020, the Global Allocation Composite Benchmark is a composite benchmark comprised of unmanaged indices that includes the MSCI All Country World Index (net of foreign withholding taxes) (60%) and the Bloomberg Barclays Global Aggregate Bond Index (40%). Prior to November 30, 2020, the Global Allocation Composite Benchmark was a composite benchmark comprised of unmanaged indices that included the MSCI World Index (net of foreign withholding taxes) (60%) and the Bloomberg Barclays Global Aggregate Bond Index (40%). Investors cannot invest directly in an index.
Portfolio performance does not reflect any charges imposed by the Policies or Eligible Plans. If these charges were included, the returns would be lower than shown. Portfolio performance may reflect the waiver of the Portfolio’s fees and reimbursement of expenses for certain periods since the inception date. Without these waivers and reimbursements, performance would have been lower.
International investing involves a greater degree of risk and increased volatility. Changes in currency exchange rates and differences in accounting and taxation policies outside the United States can raise or lower returns. Also, some overseas markets may not be as politically and economically stable as the United States and other nations.
The returns shown are based on net asset values calculated for shareholder transactions and may differ from the returns shown in the financial highlights, which reflect adjustments made to the net asset values in accordance with accounting principles generally accepted in the United States of America.
| | | | | | | | | | |
| | | | | |
| 4 | | | | | | | | JPMORGAN INSURANCE TRUST | | DECEMBER 31, 2020 |
JPMorgan Insurance Trust Global Allocation Portfolio
SCHEDULE OF PORTFOLIO INVESTMENTS
AS OF DECEMBER 31, 2020
| | | | | | | | |
| INVESTMENTS | | SHARES
(000) | | |
VALUE
($000) | |
Long Positions — 100.4% | | | | | |
|
Common Stocks — 43.8% | |
|
Australia — 0.8% | |
| | |
AGL Energy Ltd. | | | — | (a) | | | 2 | |
| | |
Ampol Ltd. | | | — | (a) | | | 4 | |
| | |
APA Group | | | 1 | | | | 5 | |
| | |
Aristocrat Leisure Ltd. | | | — | (a) | | | 3 | |
| | |
Aurizon Holdings Ltd. | | | 1 | | | | 4 | |
| | |
Australia & New Zealand Banking Group Ltd. | | | 2 | | | | 28 | |
| | |
BHP Group Ltd. | | | 1 | | | | 46 | |
| | |
BHP Group plc | | | 9 | | | | 243 | |
| | |
Brambles Ltd. | | | 1 | | | | 6 | |
| | |
Cochlear Ltd. | | | — | (a) | | | 6 | |
| | |
Coles Group Ltd. | | | — | (a) | | | 7 | |
| | |
Commonwealth Bank of Australia | | | 1 | | | | 43 | |
| | |
Computershare Ltd. | | | — | (a) | | | 4 | |
| | |
CSL Ltd. | | | — | (a) | | | 43 | |
| | |
Fortescue Metals Group Ltd. | | | — | (a) | | | 6 | |
| | |
Goodman Group, REIT | | | 1 | | | | 14 | |
| | |
GPT Group (The), REIT | | | 3 | | | | 10 | |
| | |
Insurance Australia Group Ltd. | | | 1 | | | | 3 | |
| | |
LendLease Corp. Ltd. | | | — | (a) | | | 3 | |
| | |
Macquarie Group Ltd. | | | — | (a) | | | 16 | |
| | |
Mirvac Group, REIT | | | 6 | | | | 12 | |
| | |
National Australia Bank Ltd. | | | 1 | | | | 17 | |
| | |
Newcrest Mining Ltd. | | | — | (a) | | | 6 | |
| | |
Oil Search Ltd. | | | 1 | | | | 2 | |
| | |
Orica Ltd. | | | — | (a) | | | 3 | |
| | |
Origin Energy Ltd. | | | 1 | | | | 2 | |
| | |
QBE Insurance Group Ltd. | | | 1 | | | | 7 | |
| | |
Ramsay Health Care Ltd. | | | — | (a) | | | 4 | |
| | |
REA Group Ltd. | | | — | (a) | | | 6 | |
| | |
Rio Tinto Ltd. | | | — | (a) | | | 20 | |
| | |
Rio Tinto plc | | | 3 | | | | 228 | |
| | |
Santos Ltd. | | | 1 | | | | 3 | |
| | |
Sonic Healthcare Ltd. | | | — | (a) | | | 3 | |
| | |
South32 Ltd. | | | 3 | | | | 5 | |
| | |
Stockland, REIT | | | 1 | | | | 4 | |
| | |
Suncorp Group Ltd. | | | 1 | | | | 7 | |
| | |
Sydney Airport * | | | 1 | | | | 4 | |
| | |
Tabcorp Holdings Ltd. | | | 1 | | | | 3 | |
| | |
Telstra Corp. Ltd. | | | 1 | | | | 2 | |
| | |
TPG Telecom Ltd. * (b) | | | — | (a) | | | 2 | |
| | |
Transurban Group | | | 1 | | | | 11 | |
| | |
Treasury Wine Estates Ltd. | | | — | (a) | | | 2 | |
| | |
Wesfarmers Ltd. | | | — | (a) | | | 19 | |
| | |
Westpac Banking Corp. | | | 2 | | | | 25 | |
| | | | | | | | |
| INVESTMENTS | | SHARES
(000) | | |
VALUE
($000) | |
| | | | | | | | |
| | | | | | | | |
|
Australia — continued | |
| | |
Woodside Petroleum Ltd. | | | — | (a) | | | 6 | |
| | |
Woolworths Group Ltd. | | | 1 | | | | 20 | |
| | | | | | | | |
| | |
| | | | | | | 919 | |
| | | | | | | | |
|
Austria — 0.1% | |
| | |
Erste Group Bank AG | | | 6 | | | | 171 | |
| | | | | | | | |
| |
Belgium — 0.2% | | | | | |
| | |
Anheuser-Busch InBev SA/NV | | | — | (a) | | | 9 | |
| | |
KBC Group NV | | | 3 | | | | 203 | |
| | | | | | | | |
| | |
| | | | | | | 212 | |
| | | | | | | | |
|
Canada — 0.5% | |
| | |
Alimentation Couche-Tard, Inc., Class B | | | 4 | | | | 130 | |
| | |
Canadian National Railway Co. | | | 2 | | | | 194 | |
| | |
Canadian Pacific Railway Ltd. | | | — | (a) | | | 45 | |
| | |
Fairfax Financial Holdings Ltd. | | | — | (a) | | | 58 | |
| | |
Shopify, Inc., Class A * | | | — | (a) | | | 31 | |
| | |
Toronto-Dominion Bank (The) | | | 3 | | | | 178 | |
| | | | | | | | |
| | |
| | | | | | | 636 | |
| | | | | | | | |
|
China — 1.0% | |
| | |
Alibaba Group Holding Ltd. * | | | 10 | | | | 291 | |
| | |
Alibaba Group Holding Ltd., ADR * | | | — | (a) | | | 49 | |
| | |
BOC Hong Kong Holdings Ltd. | | | 3 | | | | 9 | |
| | |
Ping An Insurance Group Co. of China Ltd., Class H | | | 31 | | | | 371 | |
| | |
Prosus NV * | | | 1 | | | | 57 | |
| | |
Tencent Holdings Ltd. | | | 5 | | | | 367 | |
| | |
Wilmar International Ltd. | | | 1 | | | | 5 | |
| | | | | | | | |
| | |
| | | | | | | 1,149 | |
| | | | | | | | |
|
Denmark — 0.7% | |
| | |
Carlsberg A/S, Class B | | | 1 | | | | 206 | |
| | |
Novo Nordisk A/S, Class B | | | 6 | | | | 437 | |
| | |
Orsted A/S (c) | | | 1 | | | | 178 | |
| | | | | | | | |
| | |
| | | | | | | 821 | |
| | | | | | | | |
|
Finland — 0.2% | |
| | |
Elisa OYJ | | | — | (a) | | | 13 | |
| | |
Kone OYJ, Class B | | | 2 | | | | 140 | |
| | |
UPM-Kymmene OYJ | | | 1 | | | | 28 | |
| | | | | | | | |
| | |
| | | | | | | 181 | |
| | | | | | | | |
|
France — 2.5% | |
| | |
Accor SA * | | | 1 | | | | 23 | |
| | |
Air Liquide SA | | | — | (a) | | | 45 | |
| | |
Airbus SE * (b) | | | 2 | | | | 233 | |
| | |
Alstom SA * | | | 2 | | | | 137 | |
SEE NOTES TO FINANCIAL STATEMENTS.
| | | | | | | | | | |
| | | | | |
| DECEMBER 31, 2020 | | JPMORGAN INSURANCE TRUST | | | | | | | | 5 |
JPMorgan Insurance Trust Global Allocation Portfolio
SCHEDULE OF PORTFOLIO INVESTMENTS
AS OF DECEMBER 31, 2020 (continued)
| | | | | | | | |
| INVESTMENTS | | SHARES
(000) | | |
VALUE
($000) | |
Long Positions — continued | |
|
Common Stocks — continued | |
|
France — continued | |
| | |
Arkema SA | | | — | (a) | | | 24 | |
| | |
AXA SA | | | 2 | | | | 45 | |
| | |
BioMerieux | | | — | (a) | | | 17 | |
| | |
BNP Paribas SA * | | | 3 | | | | 163 | |
| | |
Capgemini SE | | | 2 | | | | 246 | |
| | |
Dassault Systemes SE | | | — | (a) | | | 39 | |
| | |
Eiffage SA * | | | — | (a) | | | 13 | |
| | |
EssilorLuxottica SA | | | — | (a) | | | 13 | |
| | |
Kering SA | | | — | (a) | | | 54 | |
| | |
L’Oreal SA | | | — | (a) | | | 54 | |
| | |
LVMH Moet Hennessy Louis Vuitton SE | | | 1 | | | | 575 | |
| | |
Orange SA | | | 1 | | | | 13 | |
| | |
Pernod Ricard SA | | | — | (a) | | | 11 | |
| | |
Peugeot SA * | | | 1 | | | | 29 | |
| | |
Safran SA * | | | 2 | | | | 262 | |
| | |
Sanofi | | | — | (a) | | | 44 | |
| | |
Schneider Electric SE | | | 3 | | | | 484 | |
| | |
Societe Generale SA * | | | 1 | | | | 11 | |
| | |
Thales SA | | | — | (a) | | | 20 | |
| | |
TOTAL SE (b) | | | 2 | | | | 75 | |
| | |
Veolia Environnement SA | | | 1 | | | | 34 | |
| | |
Vinci SA | | | 4 | | | | 394 | |
| | | | | | | | |
| | |
| | | | | | | 3,058 | |
| | | | | | | | |
| |
Germany — 1.6% | | | | | |
| | |
adidas AG * | | | 1 | | | | 301 | |
| | |
Allianz SE (Registered) | | | 2 | | | | 505 | |
| | |
BASF SE | | | — | (a) | | | 35 | |
| | |
Bayer AG (Registered) | | | — | (a) | | | 29 | |
| | |
Daimler AG (Registered) | | | — | (a) | | | 32 | |
| | |
Delivery Hero SE * (b) (c) | | | 1 | | | | 186 | |
| | |
Deutsche Boerse AG | | | — | (a) | | | 13 | |
| | |
Deutsche Post AG (Registered) | | | 1 | | | | 62 | |
| | |
Deutsche Telekom AG (Registered) | | | 4 | | | | 67 | |
| | |
Infineon Technologies AG | | | 1 | | | | 52 | |
| | |
Merck KGaA | | | — | (a) | | | 35 | |
| | |
Muenchener Rueckversicherungs-Gesellschaft AG (Registered) | | | — | (a) | | | 44 | |
| | |
RWE AG (b) | | | 3 | | | | 144 | |
| | |
SAP SE | | | 1 | | | | 75 | |
| | |
Siemens AG (Registered) | | | — | (a) | | | 46 | |
| | |
Volkswagen AG (Preference) | | | 1 | | | | 149 | |
| | |
Vonovia SE | | | 2 | | | | 162 | |
| | | | | | | | |
| | |
| | | | | | | 1,937 | |
| | | | | | | | |
| | | | | | | | |
| INVESTMENTS | | SHARES
(000) | | |
VALUE
($000) | |
| | | | | | | | |
| | | | | | | | |
| |
Hong Kong — 0.6% | | | | | |
| | |
AIA Group Ltd. | | | 34 | | | | 409 | |
| | |
ASM Pacific Technology Ltd. | | | — | (a) | | | 1 | |
| | |
CK Asset Holdings Ltd. | | | 1 | | | | 5 | |
| | |
CK Infrastructure Holdings Ltd. | | | 1 | | | | 3 | |
| | |
CLP Holdings Ltd. | | | 1 | | | | 5 | |
| | |
Hang Seng Bank Ltd. | | | — | (a) | | | 7 | |
| | |
Henderson Land Development Co. Ltd. | | | 1 | | | | 4 | |
| | |
HKT Trust & HKT Ltd. | | | 1 | | | | 1 | |
| | |
Hong Kong & China Gas Co. Ltd. | | | 4 | | | | 6 | |
| | |
Hong Kong Exchanges & Clearing Ltd. | | | 4 | | | | 208 | |
| | |
Hongkong Land Holdings Ltd. | | | 1 | | | | 3 | |
| | |
Jardine Matheson Holdings Ltd. | | | — | (a) | | | 6 | |
| | |
Link, REIT | | | 1 | | | | 6 | |
| | |
MTR Corp. Ltd. | | | 1 | | | | 3 | |
| | |
New World Development Co. Ltd. | | | 1 | | | | 2 | |
| | |
Power Assets Holdings Ltd. | | | 1 | | | | 3 | |
| | |
Sino Land Co. Ltd. | | | 2 | | | | 3 | |
| | |
Sun Hung Kai Properties Ltd. | | | 1 | | | | 6 | |
| | |
Swire Pacific Ltd., Class A | | | 1 | | | | 3 | |
| | |
Techtronic Industries Co. Ltd. | | | 1 | | | | 7 | |
| | |
WH Group Ltd. (c) | | | 2 | | | | 2 | |
| | |
Wharf Real Estate Investment Co. Ltd. | | | 1 | | | | 5 | |
| | | | | | | | |
| | |
| | | | | | | 698 | |
| | | | | | | | |
| |
India — 0.4% | | | | | |
| | |
HDFC Bank Ltd., ADR * | | | 6 | | | | 435 | |
| | | | | | | | |
| |
Indonesia — 0.1% | | | | | |
| | |
Bank Central Asia Tbk. PT | | | 61 | | | | 147 | |
| | | | | | | | |
| |
Ireland — 0.2% | | | | | |
| | |
CRH plc | | | 1 | | | | 45 | |
| | |
Kingspan Group plc | | | — | (a) | | | 12 | |
| | |
Kingspan Group plc | | | — | (a) | | | 5 | |
| | |
Ryanair Holdings plc, ADR * | | | 1 | | | | 118 | |
| | | | | | | | |
| | |
| | | | | | | 180 | |
| | | | | | | | |
| |
Italy — 0.2% | | | | | |
| | |
Davide Campari-Milano NV (b) | | | 1 | | | | 14 | |
| | |
Enel SpA | | | 3 | | | | 28 | |
| | |
Ferrari NV | | | — | (a) | | | 72 | |
| | |
FinecoBank Banca Fineco SpA * (b) | | | 2 | | | | 28 | |
| | |
Snam SpA | | | 7 | | | | 38 | |
| | |
UniCredit SpA * | | | 2 | | | | 22 | |
| | | | | | | | |
| | |
| | | | | | | 202 | |
| | | | | | | | |
SEE NOTES TO FINANCIAL STATEMENTS.
| | | | | | | | | | |
| | | | | |
| 6 | | | | | | | | JPMORGAN INSURANCE TRUST | | DECEMBER 31, 2020 |
| | | | | | | | |
| INVESTMENTS | |
SHARES
(000) | | | VALUE
($000) | |
Long Positions — continued | |
|
Common Stocks — continued | |
| |
Japan — 2.7% | | | | | |
| | |
Advantest Corp. | | | — | (a) | | | 15 | |
| | |
Aeon Co. Ltd. | | | — | (a) | | | 3 | |
| | |
Amada Co. Ltd. | | | 1 | | | | 9 | |
| | |
Asahi Group Holdings Ltd. | | | — | (a) | | | 16 | |
| | |
Asahi Intecc Co. Ltd. | | | — | (a) | | | 4 | |
| | |
Asahi Kasei Corp. | | | 2 | | | | 16 | |
| | |
Astellas Pharma, Inc. | | | 1 | | | | 8 | |
| | |
Bandai Namco Holdings, Inc. | | | — | (a) | | | 9 | |
| | |
Bridgestone Corp. | | | — | (a) | | | 10 | |
| | |
Canon, Inc. | | | — | (a) | | | 8 | |
| | |
Casio Computer Co. Ltd. | | | — | (a) | | | 4 | |
| | |
Central Japan Railway Co. | | | — | (a) | | | 14 | |
| | |
Chubu Electric Power Co., Inc. | | | 1 | | | | 8 | |
| | |
Chugai Pharmaceutical Co. Ltd. | | | — | (a) | | | 16 | |
| | |
Concordia Financial Group Ltd. | | | 2 | | | | 6 | |
| | |
CyberAgent, Inc. | | | — | (a) | | | 7 | |
| | |
Dai Nippon Printing Co. Ltd. | | | — | (a) | | | 2 | |
| | |
Dai-ichi Life Holdings, Inc. | | | — | (a) | | | 6 | |
| | |
Daiichi Sankyo Co. Ltd. | | | 1 | | | | 38 | |
| | |
Daikin Industries Ltd. | | | — | (a) | | | 44 | |
| | |
Daito Trust Construction Co. Ltd. | | | — | (a) | | | 9 | |
| | |
Daiwa House Industry Co. Ltd. | | | 1 | | | | 18 | |
| | |
Daiwa House REIT Investment Corp., REIT | | | — | (a) | | | 2 | |
| | |
Denso Corp. | | | — | (a) | | | 24 | |
| | |
Dentsu Group, Inc. | | | — | (a) | | | 6 | |
| | |
East Japan Railway Co. | | | — | (a) | | | 13 | |
| | |
Eisai Co. Ltd. | | | — | (a) | | | 7 | |
| | |
ENEOS Holdings, Inc. | | | 3 | | | | 11 | |
| | |
FANUC Corp. | | | — | (a) | | | 25 | |
| | |
Fast Retailing Co. Ltd. | | | — | (a) | | | 90 | |
| | |
FUJIFILM Holdings Corp. | | | — | (a) | | | 16 | |
| | |
Fujitsu Ltd. | | | — | (a) | | | 14 | |
| | |
Fukuoka Financial Group, Inc. | | | — | (a) | | | 7 | |
| | |
GLP J-REIT, REIT * | | | — | (a) | | | 2 | |
| | |
Hankyu Hanshin Holdings, Inc. | | | — | (a) | | | 3 | |
| | |
Hitachi Ltd. | | | 1 | | | | 35 | |
| | |
Honda Motor Co. Ltd. | | | 1 | | | | 28 | |
| | |
Hoya Corp. | | | — | (a) | | | 42 | |
| | |
Isuzu Motors Ltd. | | | 1 | | | | 7 | |
| | |
ITOCHU Corp. | | | 1 | | | | 32 | |
| | |
Japan Airlines Co. Ltd. | | | 4 | | | | 79 | |
| | |
Japan Exchange Group, Inc. | | | — | (a) | | | 10 | |
| | |
Japan Post Holdings Co. Ltd. | | | — | (a) | | | 2 | |
| | |
Japan Real Estate Investment Corp., REIT | | | — | (a) | | | 6 | |
| | | | | | | | |
| INVESTMENTS | | SHARES
(000) | | |
VALUE
($000) | |
| | | | | | | | |
| | | | | | | | |
| |
Japan — continued | | | | | |
| | |
Japan Retail Fund Investment Corp., REIT | | | — | (a) | | | 4 | |
| | |
Japan Tobacco, Inc. | | | 1 | | | | 14 | |
| | |
Kajima Corp. | | | 1 | | | | 9 | |
| | |
Kansai Electric Power Co., Inc. (The) | | | — | (a) | | | 4 | |
| | |
Kansai Paint Co. Ltd. | | | — | (a) | | | 3 | |
| | |
Kao Corp. | | | — | (a) | | | 31 | |
| | |
KDDI Corp. | | | 1 | | | | 30 | |
| | |
Keikyu Corp. | | | — | (a) | | | 2 | |
| | |
Keyence Corp. | | | — | (a) | | | 169 | |
| | |
Kikkoman Corp. | | | — | (a) | | | 7 | |
| | |
Kintetsu Group Holdings Co. Ltd. | | | — | (a) | | | 4 | |
| | |
Kirin Holdings Co. Ltd. | | | — | (a) | | | 9 | |
| | |
Komatsu Ltd. | | | — | (a) | | | 11 | |
| | |
Konami Holdings Corp. | | | — | (a) | | | 11 | |
| | |
Kubota Corp. | | | 1 | | | | 24 | |
| | |
Kuraray Co. Ltd. | | | 1 | | | | 7 | |
| | |
Kurita Water Industries Ltd. | | | — | (a) | | | 4 | |
| | |
Kyocera Corp. | | | — | (a) | | | 12 | |
| | |
Kyowa Kirin Co. Ltd. | | | — | (a) | | | 11 | |
| | |
Kyushu Electric Power Co., Inc. | | | — | (a) | | | 3 | |
| | |
Lawson, Inc. | | | — | (a) | | | 5 | |
| | |
Lion Corp. | | | — | (a) | | | 10 | |
| | |
M3, Inc. | | | — | (a) | | | 38 | |
| | |
Makita Corp. | | | — | (a) | | | 5 | |
| | |
Marui Group Co. Ltd. | | | — | (a) | | | 5 | |
| | |
MINEBEA MITSUMI, Inc. | | | — | (a) | | | 8 | |
| | |
MISUMI Group, Inc. | | | — | (a) | | | 10 | |
| | |
Mitsubishi Corp. | | | 1 | | | | 27 | |
| | |
Mitsubishi Electric Corp. | | | 1 | | | | 15 | |
| | |
Mitsubishi Estate Co. Ltd. | | | — | (a) | | | 6 | |
| | |
Mitsubishi Heavy Industries Ltd. | | | — | (a) | | | 3 | |
| | |
Mitsubishi UFJ Financial Group, Inc. | | | 8 | | | | 35 | |
| | |
Mitsui & Co. Ltd. | | | 1 | | | | 15 | |
| | |
Mitsui Chemicals, Inc. | | | — | (a) | | | 9 | |
| | |
Mitsui Fudosan Co. Ltd. | | | 4 | | | | 77 | |
| | |
Mizuho Financial Group, Inc. | | | 1 | | | | 10 | |
| | |
MS&AD Insurance Group Holdings, Inc. | | | — | (a) | | | 3 | |
| | |
Murata Manufacturing Co. Ltd. | | | — | (a) | | | 36 | |
| | |
Nabtesco Corp. | | | — | (a) | | | 13 | |
| | |
NEC Corp. | | | — | (a) | | | 5 | |
| | |
Nexon Co. Ltd. | | | — | (a) | | | 6 | |
| | |
NGK Spark Plug Co. Ltd. | | | — | (a) | | | 2 | |
| | |
NH Foods Ltd. | | | — | (a) | | | 9 | |
| | |
Nidec Corp. | | | — | (a) | | | 51 | |
SEE NOTES TO FINANCIAL STATEMENTS.
| | | | | | | | | | |
| | | | | |
| DECEMBER 31, 2020 | | JPMORGAN INSURANCE TRUST | | | | | | | | 7 |
JPMorgan Insurance Trust Global Allocation Portfolio
SCHEDULE OF PORTFOLIO INVESTMENTS
AS OF DECEMBER 31, 2020 (continued)
| | | | | | | | |
| INVESTMENTS | | SHARES
(000) | | |
VALUE
($000) | |
Long Positions — continued | |
|
Common Stocks — continued | |
| |
Japan — continued | | | | | |
| | |
Nihon M&A Center, Inc. | | | — | (a) | | | 7 | |
| | |
Nintendo Co. Ltd. | | | — | (a) | | | 64 | |
| | |
Nippon Building Fund, Inc., REIT | | | — | (a) | | | 6 | |
| | |
Nippon Express Co. Ltd. | | | — | (a) | | | 13 | |
| | |
Nippon Prologis REIT, Inc., REIT * | | | — | (a) | | | 3 | |
| | |
Nippon Steel Corp. * | | | 1 | | | | 9 | |
| | |
Nippon Telegraph & Telephone Corp. | | | 1 | | | | 28 | |
| | |
Nippon Yusen KK | | | — | (a) | | | 5 | |
| | |
Nissan Motor Co. Ltd. | | | 1 | | | | 6 | |
| | |
Nissin Foods Holdings Co. Ltd. | | | — | (a) | | | 9 | |
| | |
Nitori Holdings Co. Ltd. | | | — | (a) | | | 21 | |
| | |
Nomura Holdings, Inc. | | | 1 | | | | 4 | |
| | |
Nomura Real Estate Master Fund, Inc., REIT | | | — | (a) | | | 1 | |
| | |
Nomura Research Institute Ltd. | | | — | (a) | | | 14 | |
| | |
Odakyu Electric Railway Co. Ltd. | | | — | (a) | | | 6 | |
| | |
Olympus Corp. | | | — | (a) | | | 9 | |
| | |
Omron Corp. | | | — | (a) | | | 9 | |
| | |
Ono Pharmaceutical Co. Ltd. | | | — | (a) | | | 12 | |
| | |
Oriental Land Co. Ltd. | | | — | (a) | | | 16 | |
| | |
ORIX Corp. | | | 1 | | | | 17 | |
| | |
Orix JREIT, Inc., REIT | | | — | (a) | | | 2 | |
| | |
Otsuka Corp. | | | — | (a) | | | 11 | |
| | |
Otsuka Holdings Co. Ltd. | | | — | (a) | | | 9 | |
| | |
Pan Pacific International Holdings Corp. | | | — | (a) | | | 7 | |
| | |
Panasonic Corp. | | | 1 | | | | 8 | |
| | |
Rakuten, Inc. | | | 1 | | | | 9 | |
| | |
Recruit Holdings Co. Ltd. | | | 1 | | | | 38 | |
| | |
Resona Holdings, Inc. | | | 3 | | | | 9 | |
| | |
Rinnai Corp. | | | — | (a) | | | 12 | |
| | |
Rohm Co. Ltd. | | | — | (a) | | | 10 | |
| | |
Ryohin Keikaku Co. Ltd. | | | — | (a) | | | 8 | |
| | |
Santen Pharmaceutical Co. Ltd. | | | — | (a) | | | 2 | |
| | |
SBI Holdings, Inc. | | | — | (a) | | | 7 | |
| | |
Secom Co. Ltd. | | | — | (a) | | | 9 | |
| | |
Sekisui House Ltd. | | | 1 | | | | 10 | |
| | |
Seven & i Holdings Co. Ltd. | | | 1 | | | | 21 | |
| | |
Shimadzu Corp. | | | — | (a) | | | 12 | |
| | |
Shin-Etsu Chemical Co. Ltd. | | | — | (a) | | | 53 | |
| | |
Shionogi & Co. Ltd. | | | — | (a) | | | 16 | |
| | |
Shiseido Co. Ltd. | | | — | (a) | | | 14 | |
| | |
SMC Corp. | | | — | (a) | | | 122 | |
| | |
SoftBank Corp. | | | 1 | | | | 13 | |
| | |
SoftBank Group Corp. | | | 1 | | | | 62 | |
| | |
Sompo Holdings, Inc. | | | — | (a) | | | 8 | |
| | | | | | | | |
| INVESTMENTS | | SHARES
(000) | | |
VALUE
($000) | |
| | | | | | | | |
| | | | | | | | |
| |
Japan — continued | | | | | |
| | |
Sony Corp. | | | 4 | | | | 393 | |
| | |
Square Enix Holdings Co. Ltd. | | | — | (a) | | | 6 | |
| | |
Stanley Electric Co. Ltd. | | | — | (a) | | | 3 | |
| | |
Sumitomo Electric Industries Ltd. | | | — | (a) | | | 5 | |
| | |
Sumitomo Metal Mining Co. Ltd. | | | — | (a) | | | 13 | |
| | |
Sumitomo Mitsui Financial Group, Inc. | | | 1 | | | | 31 | |
| | |
Sumitomo Realty & Development Co. Ltd. | | | — | (a) | | | 3 | |
| | |
Sundrug Co. Ltd. | | | — | (a) | | | 8 | |
| | |
Suntory Beverage & Food Ltd. | | | — | (a) | | | 4 | |
| | |
Suzuki Motor Corp. | | | — | (a) | | | 14 | |
| | |
Sysmex Corp. | | | — | (a) | | | 24 | |
| | |
T&D Holdings, Inc. | | | 1 | | | | 11 | |
| | |
Taiheiyo Cement Corp. | | | — | (a) | | | 5 | |
| | |
Taisei Corp. | | | — | (a) | | | 10 | |
| | |
Takeda Pharmaceutical Co. Ltd. | | | 1 | | | | 33 | |
| | |
Terumo Corp. | | | — | (a) | | | 17 | |
| | |
Tohoku Electric Power Co., Inc. | | | — | (a) | | | 2 | |
| | |
Tokio Marine Holdings, Inc. | | | 1 | | | | 31 | |
| | |
Tokyo Electric Power Co. Holdings, Inc. * | | | — | (a) | | | 1 | |
| | |
Tokyo Electron Ltd. | | | — | (a) | | | 37 | |
| | |
Tokyo Gas Co. Ltd. | | | — | (a) | | | 9 | |
| | |
Tokyu Corp. | | | 1 | | | | 9 | |
| | |
Toppan Printing Co. Ltd. | | | — | (a) | | | 1 | |
| | |
Toshiba Corp. | | | — | (a) | | | 6 | |
| | |
Toyota Motor Corp. | | | 3 | | | | 255 | |
| | |
Toyota Tsusho Corp. | | | — | (a) | | | 4 | |
| | |
Unicharm Corp. | | | — | (a) | | | 5 | |
| | |
United Urban Investment Corp., REIT | | | — | (a) | | | 1 | |
| | |
Yamaha Corp. | | | — | (a) | | | 6 | |
| | |
Yamaha Motor Co. Ltd. | | | — | (a) | | | 4 | |
| | |
Yamato Holdings Co. Ltd. | | | — | (a) | | | 10 | |
| | |
Yaskawa Electric Corp. | | | — | (a) | | | 5 | |
| | |
Z Holdings Corp. | | | 1 | | | | 8 | |
| | | | | | | | |
| | |
| | | | | | | 3,208 | |
| | | | | | | | |
| |
Macau — 0.0% (d) | | | | | |
| | |
Galaxy Entertainment Group Ltd. | | | 1 | | | | 8 | |
| | |
Sands China Ltd. | | | 2 | | | | 7 | |
| | |
Wynn Macau Ltd. * | | | — | (a) | | | — | (a) |
| | | | | | | | |
| | |
| | | | | | | 15 | |
| | | | | | | | |
| |
Netherlands — 1.3% | | | | | |
| | |
Adyen NV * (b) (c) | | | — | (a) | | | 16 | |
| | |
Akzo Nobel NV | | | 2 | | | | 215 | |
| | |
ASML Holding NV | | | 1 | | | | 614 | |
SEE NOTES TO FINANCIAL STATEMENTS.
| | | | | | | | | | |
| | | | | |
| 8 | | | | | | | | JPMORGAN INSURANCE TRUST | | DECEMBER 31, 2020 |
| | | | | | | | |
| INVESTMENTS | | SHARES
(000) | | |
VALUE
($000) | |
Long Positions — continued | |
|
Common Stocks — continued | |
| |
Netherlands — continued | | | | | |
| | |
Heineken NV | | | — | (a) | | | 22 | |
| | |
ING Groep NV | | | 14 | | | | 129 | |
| | |
Koninklijke Ahold Delhaize NV | | | 1 | | | | 39 | |
| | |
Koninklijke DSM NV | | | — | (a) | | | 19 | |
| | |
Koninklijke KPN NV | | | 11 | | | | 32 | |
| | |
Koninklijke Philips NV * | | | — | (a) | | | 20 | |
| | |
NN Group NV | | | 1 | | | | 35 | |
| | |
NXP Semiconductors NV | | | 2 | | | | 385 | |
| | |
Randstad NV * | | | — | (a) | | | 16 | |
| | |
Royal Dutch Shell plc, Class A | | | 2 | | | | 28 | |
| | |
Royal Dutch Shell plc, Class B | | | 1 | | | | 22 | |
| | |
Wolters Kluwer NV | | | — | (a) | | | 26 | |
| | | | | | | | |
| | |
| | | | | | | 1,618 | |
| | | | | | | | |
| |
New Zealand — 0.0% (d) | | | | | |
| | |
Auckland International Airport Ltd. | | | 1 | | | | 4 | |
| | |
Ryman Healthcare Ltd. | | | — | (a) | | | 3 | |
| | |
Spark New Zealand Ltd. | | | 1 | | | | 4 | |
| | | | | | | | |
| | |
| | | | | | | 11 | |
| | | | | | | | |
| |
Norway — 0.0% (d) | | | | | |
| | |
Telenor ASA | | | 2 | | | | 30 | |
| | | | | | | | |
| |
Peru — 0.0% (d) | | | | | |
| | |
Credicorp Ltd. | | | — | (a) | | | 49 | |
| | | | | | | | |
| |
Portugal — 0.0% (d) | | | | | |
| | |
Galp Energia SGPS SA | | | — | (a) | | | 4 | |
| | | | | | | | |
| |
Singapore — 0.1% | | | | | |
| | |
Ascendas, REIT | | | 1 | | | | 2 | |
| | |
CapitaLand Integrated Commercial Trust, REIT | | | 1 | | | | 2 | |
| | |
CapitaLand Ltd. | | | 2 | | | | 5 | |
| | |
DBS Group Holdings Ltd. | | | 1 | | | | 23 | |
| | |
Genting Singapore Ltd. | | | 2 | | | | 1 | |
| | |
Keppel Corp. Ltd. | | | 1 | | | | 4 | |
| | |
Oversea-Chinese Banking Corp. Ltd. | | | 2 | | | | 18 | |
| | |
Singapore Telecommunications Ltd. | | | 6 | | | | 10 | |
| | |
United Overseas Bank Ltd. | | | — | (a) | | | 3 | |
| | | | | | | | |
| | |
| | | | | | | 68 | |
| | | | | | | | |
| |
South Africa — 0.1% | | | | | |
| | |
Anglo American plc | | | 4 | | | | 129 | |
| | | | | | | | |
| |
South Korea — 0.6% | | | | | |
| | |
LG Chem Ltd. * | | | — | (a) | | | 131 | |
| | |
Samsung Electronics Co. Ltd. | | | 9 | | | | 637 | |
| | | | | | | | |
| | |
| | | | | | | 768 | |
| | | | | | | | |
| | | | | | | | |
| INVESTMENTS | | SHARES
(000) | | |
VALUE
($000) | |
| | | | | | | | |
| | | | | | | | |
| |
Spain — 0.6% | | | | | |
| | |
Banco Bilbao Vizcaya Argentaria SA | | | 7 | | | | 32 | |
| | |
Banco Santander SA | | | 9 | | | | 29 | |
| | |
Cellnex Telecom SA (c) | | | 2 | | | | 119 | |
| | |
Endesa SA | | | 1 | | | | 16 | |
| | |
Grifols SA | | | 1 | | | | 22 | |
| | |
Iberdrola SA | | | 27 | | | | 382 | |
| | |
Industria de Diseno Textil SA | | | 5 | | | | 153 | |
| | | | | | | | |
| | |
| | | | | | | 753 | |
| | | | | | | | |
| |
Sweden — 0.7% | | | | | |
| | |
Alfa Laval AB * | | | 1 | | | | 15 | |
| | |
Atlas Copco AB, Class A | | | 4 | | | | 189 | |
| | |
Boliden AB | | | 1 | | | | 25 | |
| | |
Lundin Energy AB (b) | | | 1 | | | | 19 | |
| | |
Sandvik AB * | | | 1 | | | | 36 | |
| | |
SKF AB, Class B | | | 8 | | | | 208 | |
| | |
Svenska Handelsbanken AB, Class A * | | | 17 | | | | 171 | |
| | |
Volvo AB, Class B * | | | 9 | | | | 209 | |
| | | | | | | | |
| | |
| | | | | | | 872 | |
| | | | | | | | |
| |
Switzerland — 1.7% | | | | | |
| | |
ABB Ltd. (Registered) | | | 1 | | | | 19 | |
| | |
Adecco Group AG (Registered) | | | — | (a) | | | 19 | |
| | |
Cie Financiere Richemont SA (Registered) | | | — | (a) | | | 13 | |
| | |
Credit Suisse Group AG (Registered) | | | 3 | | | | 39 | |
| | |
Givaudan SA (Registered) | | | — | (a) | | | 9 | |
| | |
LafargeHolcim Ltd. (Registered) * | | | 4 | | | | 236 | |
| | |
Lonza Group AG (Registered) | | | — | (a) | | | 200 | |
| | |
Nestle SA (Registered) | | | 5 | | | | 615 | |
| | |
Novartis AG (Registered) | | | 2 | | | | 155 | |
| | |
Roche Holding AG | | | 1 | | | | 377 | |
| | |
Schindler Holding AG | | | — | (a) | | | 17 | |
| | |
SGS SA (Registered) | | | — | (a) | | | 169 | |
| | |
UBS Group AG (Registered) | | | 2 | | | | 22 | |
| | |
Zurich Insurance Group AG | | | — | (a) | | | 205 | |
| | | | | | | | |
| | |
| | | | | | | 2,095 | |
| | | | | | | | |
| |
Taiwan — 0.5% | | | | | |
| | |
Sea Ltd., ADR * | | | 1 | | | | 153 | |
| | |
Taiwan Semiconductor Manufacturing Co. Ltd., ADR | | | 4 | | | | 410 | |
| | | | | | | | |
| | |
| | | | | | | 563 | |
| | | | | | | | |
| |
United Kingdom — 2.8% | | | | | |
| | |
3i Group plc | | | 3 | | | | 41 | |
| | |
AstraZeneca plc | | | 1 | | | | 69 | |
| | |
BP plc | | | 68 | | | | 235 | |
SEE NOTES TO FINANCIAL STATEMENTS.
| | | | | | | | | | |
| | | | | |
| DECEMBER 31, 2020 | | JPMORGAN INSURANCE TRUST | | | | | | | | 9 |
JPMorgan Insurance Trust Global Allocation Portfolio
SCHEDULE OF PORTFOLIO INVESTMENTS
AS OF DECEMBER 31, 2020 (continued)
| | | | | | | | |
| INVESTMENTS | | SHARES
(000) | | |
VALUE
($000) | |
Long Positions — continued | |
|
Common Stocks — continued | |
| |
United Kingdom — continued | | | | | |
| | |
British American Tobacco plc | | | 2 | | | | 63 | |
| | |
CK Hutchison Holdings Ltd. | | | 2 | | | | 14 | |
| | |
Compass Group plc | | | 1 | | | | 11 | |
| | |
DCC plc | | | — | (a) | | | 23 | |
| | |
Diageo plc | | | 12 | | | | 487 | |
| | |
GlaxoSmithKline plc | | | 3 | | | | 50 | |
| | |
HSBC Holdings plc | | | 9 | | | | 48 | |
| | |
InterContinental Hotels Group plc | | | 3 | | | | 212 | |
| | |
Intertek Group plc | | | — | (a) | | | 30 | |
| | |
Legal & General Group plc | | | 46 | | | | 168 | |
| | |
Linde plc | | | 1 | | | | 147 | |
| | |
Linde plc | | | 1 | | | | 200 | |
| | |
Lloyds Banking Group plc | | | 85 | | | | 42 | |
| | |
London Stock Exchange Group plc | | | 1 | | | | 181 | |
| | |
National Grid plc | | | 1 | | | | 8 | |
| | |
Next plc * | | | — | (a) | | | 10 | |
| | |
Persimmon plc | | | 5 | | | | 186 | |
| | |
Prudential plc | | | 2 | | | | 31 | |
| | |
Reckitt Benckiser Group plc | | | 3 | | | | 252 | |
| | |
RELX plc | | | 7 | | | | 159 | |
| | |
RELX plc | | | 2 | | | | 61 | |
| | |
Standard Chartered plc | | | 5 | | | | 32 | |
| | |
Taylor Wimpey plc | | | 63 | | | | 143 | |
| | |
Tesco plc | | | 14 | | | | 43 | |
| | |
Unilever plc | | | 5 | | | | 329 | |
| | |
Unilever plc | | | 1 | | | | 56 | |
| | |
Vodafone Group plc | | | 8 | | | | 13 | |
| | | | | | | | |
| | |
| | | | | | | 3,344 | |
| | | | | | | | |
| |
United States — 23.6% | | | | | |
| | |
AbbVie, Inc. | | | 3 | | | | 371 | |
| | |
Advanced Micro Devices, Inc. * | | | 3 | | | | 240 | |
| | |
Airbnb, Inc., Class A * | | | — | (a) | | | 25 | |
| | |
Alexion Pharmaceuticals, Inc. * | | | 1 | | | | 137 | |
| | |
Alleghany Corp. | | | — | (a) | | | 59 | |
| | |
Alnylam Pharmaceuticals, Inc. * | | | — | (a) | | | 26 | |
| | |
Alphabet, Inc., Class A * | | | — | (a) | | | 2 | |
| | |
Alphabet, Inc., Class C * (e) | | | — | (a) | | | 732 | |
| | |
Altice USA, Inc., Class A * | | | 3 | | | | 102 | |
| | |
Amazon.com, Inc. * (e) | | | — | (a) | | | 1,016 | |
| | |
American Electric Power Co., Inc. | | | 1 | | | | 112 | |
| | |
American Express Co. | | | 1 | | | | 90 | |
| | |
American Homes 4 Rent, Class A, REIT | | | 2 | | | | 68 | |
| | |
American International Group, Inc. | | | 1 | | | | 57 | |
| | | | | | | | |
| INVESTMENTS | | SHARES
(000) | | |
VALUE
($000) | |
| | | | | | | | |
| | | | | | | | |
| |
United States — continued | | | | | |
| | |
AmerisourceBergen Corp. | | | 1 | | | | 63 | |
| | |
AMETEK, Inc. | | | — | (a) | | | 48 | |
| | |
Amgen, Inc. | | | 1 | | | | 119 | |
| | |
Amphenol Corp., Class A | | | — | (a) | | | 35 | |
| | |
Analog Devices, Inc. | | | 3 | | | | 371 | |
| | |
Apple, Inc. | | | 7 | | | | 923 | |
| | |
Applied Materials, Inc. | | | 2 | | | | 163 | |
| | |
Arrow Electronics, Inc. * | | | 1 | | | | 62 | |
| | |
AutoZone, Inc. * | | | — | (a) | | | 140 | |
| | |
Ball Corp. | | | 1 | | | | 58 | |
| | |
Bank of America Corp. | | | 12 | | | | 368 | |
| | |
Berkshire Hathaway, Inc., Class B * | | | 1 | | | | 239 | |
| | |
Best Buy Co., Inc. | | | 1 | | | | 129 | |
| | |
Biogen, Inc. * | | | — | (a) | | | 32 | |
| | |
BlackRock, Inc. | | | — | (a) | | | 52 | |
| | |
Blackstone Group, Inc. (The), Class A | | | 1 | | | | 47 | |
| | |
Booking Holdings, Inc. * | | | — | (a) | | | 303 | |
| | |
Booz Allen Hamilton Holding Corp. | | | 1 | | | | 57 | |
| | |
Boston Scientific Corp. * | | | 7 | | | | 261 | |
| | |
Bristol-Myers Squibb Co. | | | 6 | | | | 374 | |
| | |
Brixmor Property Group, Inc., REIT | | | 4 | | | | 61 | |
| | |
Cabot Oil & Gas Corp. | | | 2 | | | | 30 | |
| | |
Cadence Design Systems, Inc. * | | | — | (a) | | | 41 | |
| | |
Capital One Financial Corp. | | | 4 | | | | 373 | |
| | |
Carlisle Cos., Inc. (e) | | | — | (a) | | | 64 | |
| | |
CarMax, Inc. * | | | — | (a) | | | 39 | |
| | |
Catalent, Inc. * | | | 1 | | | | 59 | |
| | |
CBRE Group, Inc., Class A * | | | 1 | | | | 89 | |
| | |
Ceridian HCM Holding, Inc. * | | | 1 | | | | 60 | |
| | |
Charles Schwab Corp. (The) | | | 4 | | | | 200 | |
| | |
Charter Communications, Inc., Class A * | | | 1 | | | | 458 | |
| | |
Chevron Corp. | | | 2 | | | | 172 | |
| | |
Chubb Ltd. | | | 1 | | | | 220 | |
| | |
Cigna Corp. | | | 2 | | | | 330 | |
| | |
Cisco Systems, Inc. | | | 2 | | | | 68 | |
| | |
Citigroup, Inc. | | | 2 | | | | 102 | |
| | |
Citizens Financial Group, Inc. | | | 3 | | | | 115 | |
| | |
CNA Financial Corp. | | | 1 | | | | 26 | |
| | |
Coca-Cola Co. (The) | | | 7 | | | | 364 | |
| | |
Columbia Sportswear Co. | | | 1 | | | | 57 | |
| | |
Comcast Corp., Class A | | | 5 | | | | 283 | |
| | |
CommScope Holding Co., Inc. * | | | 5 | | | | 72 | |
| | |
ConocoPhillips | | | 3 | | | | 113 | |
| | |
Constellation Brands, Inc., Class A | | | 1 | | | | 181 | |
SEE NOTES TO FINANCIAL STATEMENTS.
| | | | | | | | | | |
| | | | | |
| 10 | | | | | | | | JPMORGAN INSURANCE TRUST | | DECEMBER 31, 2020 |
| | | | | | | | |
| INVESTMENTS | | SHARES
(000) | | |
VALUE
($000) | |
Long Positions — continued | |
|
Common Stocks — continued | |
| |
United States — continued | | | | | |
| | |
Copart, Inc. * | | | — | (a) | | | 49 | |
| | |
Coty, Inc., Class A | | | 4 | | | | 30 | |
| | |
Coupa Software, Inc. * | | | — | (a) | | | 70 | |
| | |
Crowdstrike Holdings, Inc., Class A * | | | — | (a) | | | 61 | |
| | |
CVS Health Corp. | | | 1 | | | | 48 | |
| | |
DexCom, Inc. * | | | — | (a) | | | 52 | |
| | |
Diamondback Energy, Inc. | | | 1 | | | | 31 | |
| | |
Discovery, Inc., Class A * | | | 3 | | | | 86 | |
| | |
Discovery, Inc., Class C * | | | 2 | | | | 64 | |
| | |
DISH Network Corp., Class A * | | | 2 | | | | 71 | |
| | |
Dover Corp. | | | 1 | | | | 131 | |
| | |
EastGroup Properties, Inc., REIT | | | — | (a) | | | 43 | |
| | |
Eastman Chemical Co. | | | 2 | | | | 191 | |
| | |
Edison International | | | 1 | | | | 51 | |
| | |
Eli Lilly and Co. | | | 1 | | | | 202 | |
| | |
Energizer Holdings, Inc. | | | 2 | | | | 72 | |
| | |
Enphase Energy, Inc. * | | | — | (a) | | | 73 | |
| | |
Entegris, Inc. | | | 1 | | | | 58 | |
| | |
Entergy Corp. | | | — | (a) | | | 47 | |
| | |
EQT Corp. | | | 3 | | | | 33 | |
| | |
Equitrans Midstream Corp. | | | 5 | | | | 41 | |
| | |
Estee Lauder Cos., Inc. (The), Class A | | | — | (a) | | | 67 | |
| | |
Exact Sciences Corp. * | | | — | (a) | | | 56 | |
| | |
Exelixis, Inc. * | | | 2 | | | | 32 | |
| | |
Facebook, Inc., Class A * | | | — | (a) | | | 79 | |
| | |
Federal Realty Investment Trust, REIT | | | 1 | | | | 49 | |
| | |
Ferguson plc | | | 2 | | | | 195 | |
| | |
Fifth Third Bancorp | | | 1 | | | | 25 | |
| | |
First Republic Bank | | | 1 | | | | 78 | |
| | |
Fiserv, Inc. * | | | 1 | | | | 152 | |
| | |
Five9, Inc. * | | | — | (a) | | | 29 | |
| | |
FleetCor Technologies, Inc. * | | | — | (a) | | | 119 | |
| | |
Fortune Brands Home & Security, Inc. | | | 1 | | | | 52 | |
| | |
Freeport-McMoRan, Inc. | | | 1 | | | | 33 | |
| | |
FTI Consulting, Inc. * | | | — | (a) | | | 37 | |
| | |
Gap, Inc. (The) | | | — | (a) | | | 8 | |
| | |
Garmin Ltd. | | | — | (a) | | | 58 | |
| | |
Generac Holdings, Inc. * | | | — | (a) | | | 69 | |
| | |
General Dynamics Corp. | | | — | (a) | | | 71 | |
| | |
Global Payments, Inc. | | | — | (a) | | | 82 | |
| | |
Graphic Packaging Holding Co. | | | 5 | | | | 76 | |
| | |
Hartford Financial Services Group, Inc. (The) | | | 2 | | | | 75 | |
| | |
HCA Healthcare, Inc. | | | — | (a) | | | 44 | |
| | |
Home Depot, Inc. (The) | | | 1 | | | | 156 | |
| | | | | | | | |
| INVESTMENTS | | SHARES
(000) | | |
VALUE
($000) | |
| | | | | | | | |
| | | | | | | | |
| |
United States — continued | | | | | |
| | |
Honeywell International, Inc. | | | 1 | | | | 235 | |
| | |
Horizon Therapeutics plc * | | | 1 | | | | 38 | |
| | |
HubSpot, Inc. * | | | — | (a) | | | 39 | |
| | |
IHS Markit Ltd. | | | — | (a) | | | 41 | |
| | |
Illinois Tool Works, Inc. | | | — | (a) | | | 44 | |
| | |
Ingersoll Rand, Inc. * | | | 1 | | | | 49 | |
| | |
Insulet Corp. * | | | — | (a) | | | 26 | |
| | |
Intuitive Surgical, Inc. * | | | — | (a) | | | 69 | |
| | |
Invesco Ltd. | | | 2 | | | | 33 | |
| | |
ITT, Inc. | | | 1 | | | | 67 | |
| | |
James Hardie Industries plc, CHDI * | | | — | (a) | | | 8 | |
| | |
Jazz Pharmaceuticals plc * | | | — | (a) | | | 41 | |
| | |
Johnson & Johnson | | | 1 | | | | 169 | |
| | |
KB Home | | | 1 | | | | 31 | |
| | |
Keurig Dr Pepper, Inc. | | | 2 | | | | 54 | |
| | |
Keysight Technologies, Inc. * | | | — | (a) | | | 58 | |
| | |
Kimco Realty Corp., REIT | | | 4 | | | | 63 | |
| | |
Kinder Morgan, Inc. | | | 6 | | | | 81 | |
| | |
Kohl’s Corp. | | | 1 | | | | 40 | |
| | |
Kraft Heinz Co. (The) | | | 1 | | | | 49 | |
| | |
Lam Research Corp. | | | — | (a) | | | 82 | |
| | |
Lamar Advertising Co., Class A, REIT | | | — | (a) | | | 16 | |
| | |
Las Vegas Sands Corp. | | | 2 | | | | 92 | |
| | |
Liberty Media Corp.-Liberty SiriusXM, Class A * | | | 1 | | | | 63 | |
| | |
Liberty Media Corp.-Liberty SiriusXM, Class C * | | | 3 | | | | 111 | |
| | |
Loews Corp. (e) | | | 5 | | | | 205 | |
| | |
Lowe’s Cos., Inc. | | | 1 | | | | 177 | |
| | |
Lyft, Inc., Class A * | | | 4 | | | | 205 | |
| | |
M&T Bank Corp. | | | 1 | | | | 121 | |
| | |
Marathon Petroleum Corp. | | | 2 | | | | 83 | |
| | |
Marsh & McLennan Cos., Inc. | | | — | (a) | | | 42 | |
| | |
Martin Marietta Materials, Inc. | | | — | (a) | | | 120 | |
| | |
Mastercard, Inc., Class A (e) | | | 1 | | | | 484 | |
| | |
McKesson Corp. | | | — | (a) | | | 41 | |
| | |
Medtronic plc | | | 1 | | | | 99 | |
| | |
Merck & Co., Inc. | | | 1 | | | | 64 | |
| | |
Mettler-Toledo International, Inc. * | | | — | (a) | | | 59 | |
| | |
Microchip Technology, Inc. | | | — | (a) | | | 44 | |
| | |
Microsoft Corp. (e) | | | 5 | | | | 1,135 | |
| | |
Mid-America Apartment Communities, Inc., REIT | | | 1 | | | | 82 | |
| | |
Middleby Corp. (The) * | | | — | (a) | | | 41 | |
| | |
Mohawk Industries, Inc. * | | | 1 | | | | 84 | |
| | |
MongoDB, Inc. * | | | — | (a) | | | 46 | |
| | |
Morgan Stanley | | | 5 | | | | 323 | |
SEE NOTES TO FINANCIAL STATEMENTS.
| | | | | | | | | | |
| | | | | |
| DECEMBER 31, 2020 | | JPMORGAN INSURANCE TRUST | | | | | | | | 11 |
JPMorgan Insurance Trust Global Allocation Portfolio
SCHEDULE OF PORTFOLIO INVESTMENTS
AS OF DECEMBER 31, 2020 (continued)
| | | | | | | | |
| INVESTMENTS | | SHARES
(000) | | |
VALUE
($000) | |
Long Positions — continued | |
|
Common Stocks — continued | |
| |
United States — continued | | | | | |
| | |
Murphy USA, Inc. | | | — | (a) | | | 59 | |
| | |
National Vision Holdings, Inc. * | | | 1 | | | | 23 | |
| | |
Netflix, Inc. * | | | 1 | | | | 300 | |
| | |
Newell Brands, Inc. | | | 3 | | | | 65 | |
| | |
Nexstar Media Group, Inc., Class A | | | 1 | | | | 83 | |
| | |
NextEra Energy, Inc. | | | 6 | | | | 440 | |
| | |
NIKE, Inc., Class B | | | 1 | | | | 91 | |
| | |
Nordstrom, Inc. | | | 1 | | | | 25 | |
| | |
Norfolk Southern Corp. | | | 1 | | | | 311 | |
| | |
Northern Trust Corp. | | | 1 | | | | 67 | |
| | |
Northrop Grumman Corp. | | | — | (a) | | | 42 | |
| | |
NVIDIA Corp. (e) | | | — | (a) | | | 239 | |
| | |
Old Dominion Freight Line, Inc. | | | — | (a) | | | 44 | |
| | |
O’Reilly Automotive, Inc. * | | | 1 | | | | 287 | |
| | |
Otis Worldwide Corp. | | | — | (a) | | | 25 | |
| | |
Outfront Media, Inc., REIT | | | 1 | | | | 26 | |
| | |
Packaging Corp. of America | | | 1 | | | | 89 | |
| | |
Paylocity Holding Corp. * | | | — | (a) | | | 37 | |
| | |
PayPal Holdings, Inc. * | | | 1 | | | | 324 | |
| | |
Pfizer, Inc. | | | 2 | | | | 68 | |
| | |
Phillips 66 | | | 1 | | | | 79 | |
| | |
Pioneer Natural Resources Co. | | | 1 | | | | 144 | |
| | |
PNC Financial Services Group, Inc. (The) | | | 1 | | | | 143 | |
| | |
Post Holdings, Inc. * | | | 1 | | | | 97 | |
| | |
Procter & Gamble Co. (The) | | | 1 | | | | 130 | |
| | |
Progressive Corp. (The) | | | 1 | | | | 61 | |
| | |
Prologis, Inc., REIT | | | 2 | | | | 161 | |
| | |
Prudential Financial, Inc. | | | — | (a) | | | 2 | |
| | |
Public Storage, REIT | | | — | (a) | | | 93 | |
| | |
QUALCOMM, Inc. | | | 1 | | | | 126 | |
| | |
Ralph Lauren Corp. | | | 1 | | | | 78 | |
| | |
Rayonier, Inc., REIT | | | 2 | | | | 71 | |
| | |
Raytheon Technologies Corp. | | | 2 | | | | 112 | |
| | |
Regeneron Pharmaceuticals, Inc. * | | | — | (a) | | | 119 | |
| | |
RingCentral, Inc., Class A * | | | — | (a) | | | 74 | |
| | |
Royalty Pharma plc, Class A | | | 1 | | | | 48 | |
| | |
S&P Global, Inc. | | | — | (a) | | | 42 | |
| | |
salesforce.com, Inc. * | | | 1 | | | | 118 | |
| | |
ServiceNow, Inc. * | | | — | (a) | | | 59 | |
| | |
Sherwin-Williams Co. (The) | | | — | (a) | | | 43 | |
| | |
Snowflake, Inc., Class A * (b) | | | — | (a) | | | 18 | |
| | |
SolarEdge Technologies, Inc. * | | | — | (a) | | | 57 | |
| | |
Spotify Technology SA * | | | — | (a) | | | 48 | |
| | |
Stanley Black & Decker, Inc. | | | 2 | | | | 278 | |
| | | | | | | | |
| INVESTMENTS | | SHARES
(000) | | |
VALUE
($000) | |
| |
|
| |
| |
United States — continued | | | | | |
| | |
State Street Corp. | | | 2 | | | | 122 | |
| | |
Sun Communities, Inc., REIT | | | — | (a) | | | 68 | |
| | |
Synopsys, Inc. * | | | — | (a) | | | 53 | |
| | |
Sysco Corp. | | | 1 | | | | 53 | |
| | |
T. Rowe Price Group, Inc. | | | — | (a) | | | 70 | |
| | |
Take-Two Interactive Software, Inc. * | | | — | (a) | | | 60 | |
| | |
Teladoc Health, Inc. * (b) | | | — | (a) | | | 35 | |
| | |
Teradyne, Inc. | | | — | (a) | | | 35 | |
| | |
Tesla, Inc. * | | | 1 | | | | 490 | |
| | |
Texas Instruments, Inc. (e) | | | 1 | | | | 127 | |
| | |
Thermo Fisher Scientific, Inc. | | | — | (a) | | | 216 | |
| | |
Thor Industries, Inc. | | | — | (a) | | | 28 | |
| | |
T-Mobile US, Inc. * | | | 1 | | | | 79 | |
| | |
Toll Brothers, Inc. | | | 1 | | | | 34 | |
| | |
Tractor Supply Co. | | | — | (a) | | | 65 | |
| | |
Trade Desk, Inc. (The), Class A * | | | — | (a) | | | 86 | |
| | |
Trane Technologies plc | | | 2 | | | | 301 | |
| | |
Travelers Cos., Inc. (The) | | | 1 | | | | 168 | |
| | |
Truist Financial Corp. | | | 5 | | | | 240 | |
| | |
Twilio, Inc., Class A * | | | — | (a) | | | 100 | |
| | |
Uber Technologies, Inc. * | | | 2 | | | | 121 | |
| | |
UnitedHealth Group, Inc. (e) | | | 2 | | | | 551 | |
| | |
US Bancorp | | | 2 | | | | 89 | |
| | |
Verizon Communications, Inc. | | | 3 | | | | 180 | |
| | |
Vertex Pharmaceuticals, Inc. * | | | — | (a) | | | 85 | |
| | |
ViacomCBS, Inc. | | | 1 | | | | 20 | |
| | |
Viatris, Inc. * | | | 2 | | | | 29 | |
| | |
Visa, Inc., Class A | | | — | (a) | | | 56 | |
| | |
Vornado Realty Trust, REIT | | | — | (a) | | | 2 | |
| | |
Wells Fargo & Co. | | | 10 | | | | 310 | |
| | |
WestRock Co. | | | 2 | | | | 68 | |
| | |
Weyerhaeuser Co., REIT | | | 2 | | | | 61 | |
| | |
Williams Cos., Inc. (The) | | | 3 | | | | 61 | |
| | |
Workday, Inc., Class A * | | | — | (a) | | | 105 | |
| | |
Xcel Energy, Inc. | | | 2 | | | | 103 | |
| | |
Yum! Brands, Inc. | | | 2 | | | | 168 | |
| | |
Zebra Technologies Corp., Class A * | | | — | (a) | | | 66 | |
| | |
Zillow Group, Inc., Class C * | | | — | (a) | | | 40 | |
| | |
Zimmer Biomet Holdings, Inc. | | | 1 | | | | 194 | |
| | |
Zscaler, Inc. * | | | 1 | | | | 118 | |
| | | | | | | | |
| | |
| | | | | | | 28,361 | |
| | | | | | | | |
| | |
Total Common Stocks
(Cost $36,745) | | | | | | | 52,634 | |
| | | | | | | | |
SEE NOTES TO FINANCIAL STATEMENTS.
| | | | | | | | | | |
| | | | | |
| 12 | | | | | | | | JPMORGAN INSURANCE TRUST | | DECEMBER 31, 2020 |
| | | | | | | | |
| INVESTMENTS | | SHARES
(000) | | |
VALUE
($000) | |
Long Positions — continued | |
|
Investment Companies — 27.6% | |
| | |
JPMorgan Emerging Markets Equity Fund Class R6 Shares (f) | | | 292 | | | | 12,847 | |
| | |
JPMorgan High Yield Fund Class R6 Shares (f) | | | 2,685 | | | | 19,120 | |
| | |
JPMorgan Mortgage-Backed Securities Fund Class R6 Shares (f) | | | 103 | | | | 1,187 | |
| | | | | | | | |
| | |
Total Investment Companies
(Cost $27,579) | | | | | | | 33,154 | |
| | | | | | | | |
| | |
| | | PRINCIPAL
AMOUNT
($000) | | | | |
Corporate Bonds — 8.1% | |
|
Australia — 0.1% | |
| | |
Glencore Funding LLC 2.50%, 9/1/2030 (g) | | | 22 | | | | 22 | |
| | |
Macquarie Bank Ltd. 0.44%, 12/16/2022 (g) | | | 20 | | | | 20 | |
| | |
Newcrest Finance Pty. Ltd. 5.75%, 11/15/2041 (g) | | | 15 | | | | 21 | |
| | |
Westpac Banking Corp. | | | | | | | | |
| | |
(US Treasury Yield Curve Rate T Note Constant Maturity 5 Year + 2.00%), 4.11%, 7/24/2034 (h) | | | 30 | | | | 34 | |
| | |
2.96%, 11/16/2040 | | | 10 | | | | 11 | |
| | | | | | | | |
| | |
| | | | | | | 108 | |
| | | | | | | | |
|
Belgium — 0.2% | |
| | |
Anheuser-Busch Cos. LLC 4.70%, 2/1/2036 | | | 5 | | | | 6 | |
| | |
Anheuser-Busch InBev Worldwide, Inc. | | | | | | | | |
| | |
4.38%, 4/15/2038 | | | 45 | | | | 56 | |
| | |
5.45%, 1/23/2039 | | | 15 | | | | 20 | |
| | |
4.60%, 4/15/2048 | | | 25 | | | | 32 | |
| | |
4.44%, 10/6/2048 | | | 25 | | | | 31 | |
| | |
4.50%, 6/1/2050 | | | 50 | | | | 63 | |
| | | | | | | | |
| | |
| | | | | | | 208 | |
| | | | | | | | |
|
Canada — 0.2% | |
| | |
Alimentation Couche-Tard, Inc. 3.80%, 1/25/2050 (g) | | | 15 | | | | 18 | |
| | |
Bell Canada 4.30%, 7/29/2049 | | | 15 | | | | 20 | |
| | |
Emera US Finance LP 4.75%, 6/15/2046 | | | 20 | | | | 25 | |
| | |
Enbridge, Inc. 4.50%, 6/10/2044 | | | 15 | | | | 17 | |
| | |
Nutrien Ltd. 4.13%, 3/15/2035 | | | 20 | | | | 24 | |
| | |
Rogers Communications, Inc. | | | | | | | | |
| | |
(ICE LIBOR USD 3 Month + 0.60%),
0.84%, 3/22/2022 (h) | | | 21 | | | | 21 | |
| | |
4.35%, 5/1/2049 | | | 10 | | | | 13 | |
| | |
3.70%, 11/15/2049 | | | 20 | | | | 24 | |
| | |
Royal Bank of Canada (SOFR + 0.45%), 0.54%, 10/26/2023 (h) | | | 21 | | | | 21 | |
| | | | | | | | |
| INVESTMENTS | | PRINCIPAL
AMOUNT
($000) | | |
VALUE
($000) | |
| | | | | | | | |
| | | | | | | | |
|
Canada — continued | |
| | |
Suncor Energy, Inc. | | | | | | | | |
| | |
6.80%, 5/15/2038 (b) | | | 15 | | | | 21 | |
| | |
6.50%, 6/15/2038 (b) | | | 15 | | | | 21 | |
| | |
TransCanada PipeLines Ltd. 5.60%, 3/31/2034 | | | 25 | | | | 33 | |
| | |
Transcanada Trust Series 16-A, (ICE LIBOR USD 3 Month + 4.64%), 5.87%, 8/15/2076 (h) | | | 10 | | | | 11 | |
| | | | | | | | |
| | |
| | | | | | | 269 | |
| | | | | | | | |
|
China — 0.2% | |
| | |
China Development Bank 0.88%, 1/24/2024 (c) | | EUR | 200 | | | | 247 | |
| | | | | | | | |
| |
France — 0.3% | | | | | |
| | |
Dexia Credit Local SA | | | | | | | | |
| | |
0.75%, 1/25/2023 (c) | | EUR | 100 | | | | 125 | |
| | |
1.63%, 12/8/2023 (c) | | GBP | 100 | | | | 143 | |
| | |
Total Capital International SA | | | | | | | | |
| | |
2.99%, 6/29/2041 | | | 15 | | | | 16 | |
| | |
3.13%, 5/29/2050 | | | 10 | | | | 11 | |
| | | | | | | | |
| | |
| | | | | | | 295 | |
| | | | | | | | |
|
Germany — 0.3% | |
| | |
BMW US Capital LLC 2.70%, 4/6/2022 (g) | | | 25 | | | | 26 | |
| | |
Daimler Finance North America LLC
(ICE LIBOR USD 3 Month + 0.45%), 0.66%, 2/22/2021 (g) (h) | | | 150 | | | | 150 | |
| | |
Deutsche Telekom International Finance BV 8.75%, 6/15/2030(i) | | | 25 | | | | 39 | |
| | |
Kreditanstalt fuer Wiederaufbau 0.00%, 12/15/2022 | | EUR | 80 | | | | 99 | |
| | | | | | | | |
| | |
| | | | | | | 314 | |
| | | | | | | | |
|
Japan — 0.0% (d) | |
| | |
Mitsubishi UFJ Financial Group, Inc. 3.54%, 7/26/2021 | | | 20 | | | | 20 | |
| | |
Sumitomo Mitsui Financial Group, Inc. 2.78%, 7/12/2022 | | | 25 | | | | 26 | |
| | | | | | | | |
| | |
| | | | | | | 46 | |
| | | | | | | | |
|
Netherlands — 0.1% | |
| | |
BNG Bank NV | | | | | | | | |
| | |
4.75%, 3/6/2023 (c) | | AUD | 15 | | | | 13 | |
| | |
1.90%, 11/26/2025 (c) | | AUD | 90 | | | | 73 | |
| | |
Shell International Finance BV | | | | | | | | |
| | |
3.13%, 11/7/2049 | | | 25 | | | | 27 | |
| | |
3.25%, 4/6/2050 | | | 20 | | | | 23 | |
| | | | | | | | |
| | |
| | | | | | | 136 | |
| | | | | | | | |
SEE NOTES TO FINANCIAL STATEMENTS.
| | | | | | | | | | |
| | | | | |
| DECEMBER 31, 2020 | | JPMORGAN INSURANCE TRUST | | | | | | | | 13 |
JPMorgan Insurance Trust Global Allocation Portfolio
SCHEDULE OF PORTFOLIO INVESTMENTS
AS OF DECEMBER 31, 2020 (continued)
| | | | | | | | |
| INVESTMENTS | | PRINCIPAL
AMOUNT
($000) | | |
VALUE
($000) | |
Long Positions — continued | |
|
Corporate Bonds — continued | |
|
Singapore — 0.2% | |
| | |
Temasek Financial I Ltd. 0.50%, 3/1/2022 (c) | | EUR | 150 | | | | 185 | |
| | | | | | | | |
| |
South Korea — 0.2% | | | | | |
| | |
Korea Development Bank (The) | | | | | | | | |
| | |
1.75%, 12/15/2022 (c) | | GBP | 100 | | | | 141 | |
| | |
0.63%, 7/17/2023 (c) | | EUR | 100 | | | | 125 | |
| | | | | | | | |
| | |
| | | | | | | 266 | |
| | | | | | | | |
|
Spain — 0.0% (d) | |
| | |
Telefonica Emisiones SA 7.05%, 6/20/2036 | | | 30 | | | | 45 | |
| | | | | | | | |
| |
Switzerland—0.0% (d) | | | | | |
| | |
Glencore Finance Canada Ltd. 5.55%, 10/25/2042 (g) (i) | | | 10 | | | | 12 | |
| | | | | | | | |
| |
United Kingdom — 0.3% | | | | | |
| | |
AstraZeneca plc 2.13%, 8/6/2050 | | | 35 | | | | 33 | |
| | |
BAT Capital Corp. | | | | | | | | |
| | |
4.91%, 4/2/2030 | | | 15 | | | | 18 | |
| | |
4.39%, 8/15/2037 | | | 35 | | | | 39 | |
| | |
4.54%, 8/15/2047 | | | 25 | | | | 28 | |
| | |
GlaxoSmithKline Capital, Inc. 6.38%, 5/15/2038 | | | 10 | | | | 16 | |
| | |
HSBC Holdings plc 6.80%, 6/1/2038 | | | 100 | | | | 151 | |
| | |
Vodafone Group plc | | | | | | | | |
| | |
5.00%, 5/30/2038 | | | 5 | | | | 6 | |
| | |
4.38%, 2/19/2043 | | | 5 | | | | 6 | |
| | |
4.25%, 9/17/2050 | | | 40 | | | | 50 | |
| | | | | | | | |
| | |
| | | | | | | 347 | |
| | | | | | | | |
| |
United States — 6.0% | | | | | |
| | |
Abbott Laboratories 4.90%, 11/30/2046 | | | 15 | | | | 22 | |
| | |
AbbVie, Inc. | | | | | | | | |
| | |
3.45%, 3/15/2022 | | | 15 | | | | 16 | |
| | |
4.50%, 5/14/2035 | | | 20 | | | | 25 | |
| | |
4.05%, 11/21/2039 | | | 35 | | | | 42 | |
| | |
4.45%, 5/14/2046 | | | 35 | | | | 44 | |
| | |
4.25%, 11/21/2049 | | | 20 | | | | 25 | |
| | |
AEP Transmission Co. LLC Series M, 3.65%, 4/1/2050 | | | 15 | | | | 18 | |
| | |
Aetna, Inc. | | | | | | | | |
| | |
4.13%, 11/15/2042 | | | 10 | | | | 12 | |
| | |
3.88%, 8/15/2047 | | | 25 | | | | 30 | |
| | |
Aflac, Inc. 4.00%, 10/15/2046 | | | 35 | | | | 42 | |
| | |
Air Products and Chemicals, Inc. 2.80%, 5/15/2050 | | | 10 | | | | 11 | |
| | |
Alabama Power Co. Series A, 4.30%, 7/15/2048 | | | 10 | | | | 13 | |
| | | | | | | | |
| INVESTMENTS | | PRINCIPAL
AMOUNT
($000) | | |
VALUE
($000) | |
| | | | | | | | |
| | | | | | | | |
| |
United States — continued | | | | | |
| | |
Alexandria Real Estate Equities, Inc. | | | | | | | | |
| | |
REIT, 4.90%, 12/15/2030 | | | 25 | | | | 32 | |
| | |
REIT, 1.88%, 2/1/2033 | | | 20 | | | | 20 | |
| | |
Alphabet, Inc. 2.25%, 8/15/2060 | | | 10 | | | | 10 | |
| | |
Altria Group, Inc. | | | | | | | | |
| | |
4.25%, 8/9/2042 | | | 5 | | | | 5 | |
| | |
4.50%, 5/2/2043 | | | 20 | | | | 23 | |
| | |
3.88%, 9/16/2046 | | | 35 | | | | 37 | |
| | |
Amazon.com, Inc. | | | | | | | | |
| | |
3.88%, 8/22/2037 | | | 40 | | | | 50 | |
| | |
2.70%, 6/3/2060 | | | 15 | | | | 16 | |
| | |
Ameren Corp. 3.50%, 1/15/2031 | | | 17 | | | | 20 | |
| | |
American Express Co. 4.05%, 12/3/2042 | | | 5 | | | | 6 | |
| | |
American Financial Group, Inc. 4.50%, 6/15/2047 | | | 5 | | | | 6 | |
| | |
American Honda Finance Corp. 0.40%, 10/21/2022 | | | 25 | | | | 25 | |
| | |
American International Group, Inc. 3.88%, 1/15/2035 | | | 65 | | | | 78 | |
| | |
American Tower Corp. | | | | | | | | |
| | |
REIT, 3.70%, 10/15/2049 | | | 20 | | | | 23 | |
| | |
REIT, 3.10%, 6/15/2050 | | | 10 | | | | 10 | |
| | |
American Water Capital Corp. 3.45%, 5/1/2050 | | | 30 | | | | 35 | |
| | |
Amgen, Inc. | | | | | | | | |
| | |
3.15%, 2/21/2040 | | | 20 | | | | 22 | |
| | |
3.38%, 2/21/2050 | | | 25 | | | | 28 | |
| | |
2.77%, 9/1/2053 (g) | | | 20 | | | | 20 | |
| | |
Anthem, Inc. | | | | | | | | |
| | |
4.63%, 5/15/2042 | | | 20 | | | | 26 | |
| | |
3.13%, 5/15/2050 | | | 10 | | | | 11 | |
| | |
Appalachian Power Co. Series Z, 3.70%, 5/1/2050 | | | 5 | | | | 6 | |
| | |
Apple, Inc. | | | | | | | | |
| | |
2.95%, 9/11/2049 | | | 45 | | | | 50 | |
| | |
2.65%, 5/11/2050 | | | 15 | | | | 16 | |
| | |
2.55%, 8/20/2060 | | | 15 | | | | 15 | |
| | |
AT&T, Inc. | | | | | | | | |
| | |
2.75%, 6/1/2031 | | | 20 | | | | 21 | |
| | |
2.25%, 2/1/2032 | | | 10 | | | | 10 | |
| | |
3.50%, 6/1/2041 | | | 40 | | | | 43 | |
| | |
3.10%, 2/1/2043 | | | 20 | | | | 20 | |
| | |
3.30%, 2/1/2052 | | | 15 | | | | 15 | |
| | |
3.55%, 9/15/2055 (g) | | | 75 | | | | 75 | |
| | |
3.65%, 9/15/2059 (g) | | | 69 | | | | 69 | |
SEE NOTES TO FINANCIAL STATEMENTS.
| | | | | | | | | | |
| | | | | |
| 14 | | | | | | | | JPMORGAN INSURANCE TRUST | | DECEMBER 31, 2020 |
| | | | | | | | |
| INVESTMENTS | | PRINCIPAL
AMOUNT
($000) | | |
VALUE
($000) | |
Long Positions — continued | |
|
Corporate Bonds — continued | |
|
United States — continued | |
| | |
Baltimore Gas and Electric Co. 2.90%, 6/15/2050 | | | 5 | | | | 5 | |
| | |
Bank of America Corp. | | | | | | | | |
| | |
(ICE LIBOR USD 3 Month + 0.37%), 2.74%, 1/23/2022 (h) | | | 15 | | | | 15 | |
| | |
(SOFR + 1.93%), 2.68%, 6/19/2041 (h) | | | 70 | | | | 73 | |
| | |
(SOFR + 1.88%), 2.83%, 10/24/2051 (h) | | | 55 | | | | 57 | |
| | |
Becton Dickinson and Co. | | | | | | | | |
| | |
4.69%, 12/15/2044 | | | 20 | | | | 26 | |
| | |
4.67%, 6/6/2047 | | | 5 | | | | 6 | |
| | |
3.79%, 5/20/2050 | | | 10 | | | | 12 | |
| | |
Berkshire Hathaway Energy Co. | | | | | | | | |
| | |
4.50%, 2/1/2045 | | | 10 | | | | 13 | |
| | |
2.85%, 5/15/2051 (g) | | | 10 | | | | 10 | |
| | |
Berkshire Hathaway Finance Corp. | | | | | | | | |
| | |
4.20%, 8/15/2048 | | | 35 | | | | 46 | |
| | |
2.85%, 10/15/2050 | | | 20 | | | | 22 | |
| | |
Biogen, Inc. 3.15%, 5/1/2050 | | | 30 | | | | 31 | |
| | |
Boeing Co. (The) | | | | | | | | |
| | |
5.04%, 5/1/2027 | | | 3 | | | | 3 | |
| | |
3.25%, 2/1/2028 | | | 10 | | | | 11 | |
| | |
3.63%, 2/1/2031 | | | 25 | | | | 27 | |
| | |
3.60%, 5/1/2034 | | | 10 | | | | 11 | |
| | |
3.25%, 2/1/2035 | | | 30 | | | | 31 | |
| | |
5.71%, 5/1/2040 | | | 35 | | | | 45 | |
| | |
Boston Scientific Corp. 4.55%, 3/1/2039 | | | 10 | | | | 13 | |
| | |
BP Capital Markets America, Inc. | | | | | | | | |
| | |
3.25%, 5/6/2022 | | | 17 | | | | 18 | |
| | |
3.00%, 2/24/2050 | | | 20 | | | | 20 | |
| | |
2.77%, 11/10/2050 | | | 10 | | | | 10 | |
| | |
2.94%, 6/4/2051 | | | 5 | | | | 5 | |
| | |
Bristol-Myers Squibb Co. | | | | | | | | |
| | |
2.35%, 11/13/2040 | | | 30 | | | | 31 | |
| | |
2.55%, 11/13/2050 | | | 35 | | | | 36 | |
| | |
Broadcom, Inc. 4.15%, 11/15/2030 | | | 30 | | | | 35 | |
| | |
Burlington Northern Santa Fe LLC | | | | | | | | |
| | |
4.95%, 9/15/2041 | | | 4 | | | | 5 | |
| | |
3.05%, 2/15/2051 | | | 35 | | | | 40 | |
| | |
Cameron LNG LLC 3.30%, 1/15/2035 (g) | | | 10 | | | | 11 | |
| | |
Capital One Financial Corp. 3.05%, 3/9/2022 (b) | | | 15 | | | | 15 | |
| | |
Carrier Global Corp. 3.38%, 4/5/2040 | | | 15 | | | | 16 | |
| | |
Caterpillar, Inc. | | | | | | | | |
| | |
3.25%, 9/19/2049 | | | 15 | | | | 17 | |
| | |
3.25%, 4/9/2050 | | | 5 | | | | 6 | |
| | | | | | | | |
| INVESTMENTS | | PRINCIPAL
AMOUNT
($000) | | |
VALUE
($000) | |
| | | | | | | | |
| | | | | | | | |
|
United States — continued | |
| | |
Charles Schwab Corp. (The) Series H, (US Treasury Yield Curve Rate T Note Constant Maturity 10 Year + 3.08%), 4.00%, 12/1/2030 (h) (j) (k) | | | 20 | | | | 21 | |
| | |
Charter Communications Operating LLC | | | | | | | | |
| | |
5.38%, 5/1/2047 | | | 15 | | | | 19 | |
| | |
5.13%, 7/1/2049 | | | 15 | | | | 18 | |
| | |
4.80%, 3/1/2050 | | | 50 | | | | 60 | |
| | |
3.70%, 4/1/2051 | | | 15 | | | | 15 | |
| | |
Chevron Corp. 2.98%, 5/11/2040 | | | 10 | | | | 11 | |
| | |
Cigna Corp. | | | | | | | | |
| | |
3.20%, 3/15/2040 | | | 20 | | | | 22 | |
| | |
3.40%, 3/15/2050 | | | 15 | | | | 17 | |
| | |
Citigroup, Inc. | | | | | | | | |
| | |
Series W, (US Treasury Yield Curve Rate T Note Constant Maturity 5 Year + 3.60%), 4.00%, 12/10/2025 (h) (j) (k) | | | 10 | | | | 10 | |
| | |
(SOFR + 4.55%), 5.32%, 3/26/2041 (h) | | | 40 | | | | 56 | |
| | |
4.65%, 7/30/2045 | | | 10 | | | | 14 | |
| | |
4.75%, 5/18/2046 | | | 15 | | | | 20 | |
| | |
4.65%, 7/23/2048 | | | 15 | | | | 21 | |
| | |
Coca-Cola Co. (The) 2.50%, 6/1/2040 | | | 15 | | | | 16 | |
| | |
Comcast Corp. | | | | | | | | |
| | |
3.20%, 7/15/2036 | | | 45 | | | | 51 | |
| | |
3.75%, 4/1/2040 | | | 60 | | | | 72 | |
| | |
2.45%, 8/15/2052 | | | 75 | | | | 73 | |
| | |
Commonwealth Edison Co. | | | | | | | | |
| | |
Series 123, 3.75%, 8/15/2047 | | | 10 | | | | 12 | |
| | |
3.00%, 3/1/2050 | | | 10 | | | | 11 | |
| | |
Conagra Brands, Inc. 5.30%, 11/1/2038 | | | 20 | | | | 27 | |
| | |
Concho Resources, Inc. 4.88%, 10/1/2047 | | | 20 | | | | 27 | |
| | |
Connecticut Light and Power Co. (The) 4.30%, 4/15/2044 | | | 20 | | | | 26 | |
| | |
Consolidated Edison Co. of New York, Inc. Series 12-A, 4.20%, 3/15/2042 | | | 20 | | | | 24 | |
| | |
Constellation Brands, Inc. | | | | | | | | |
| | |
4.50%, 5/9/2047 | | | 15 | | | | 19 | |
| | |
3.75%, 5/1/2050 | | | 15 | | | | 18 | |
| | |
Cox Communications, Inc. 4.80%, 2/1/2035 (g) | | | 25 | | | | 32 | |
| | |
Crown Castle International Corp. | | | | | | | | |
| | |
REIT, 4.15%, 7/1/2050 | | | 20 | | | | 24 | |
| | |
REIT, 3.25%, 1/15/2051 | | | 10 | | | | 11 | |
| | |
CSX Corp. | | | | | | | | |
| | |
4.10%, 3/15/2044 | | | 15 | | | | 19 | |
| | |
4.75%, 11/15/2048 | | | 15 | | | | 21 | |
| | |
3.80%, 4/15/2050 | | | 15 | | | | 18 | |
SEE NOTES TO FINANCIAL STATEMENTS.
| | | | | | | | | | |
| | | | | |
| DECEMBER 31, 2020 | | JPMORGAN INSURANCE TRUST | | | | | | | | 15 |
JPMorgan Insurance Trust Global Allocation Portfolio
SCHEDULE OF PORTFOLIO INVESTMENTS
AS OF DECEMBER 31, 2020 (continued)
| | | | | | | | |
| INVESTMENTS | | PRINCIPAL
AMOUNT
($000) | | |
VALUE
($000) | |
Long Positions — continued | |
|
Corporate Bonds — continued | |
|
United States — continued | |
| | |
Cummins, Inc. 2.60%, 9/1/2050 | | | 10 | | | | 10 | |
| | |
CVS Health Corp. | | | | | | | | |
| | |
2.70%, 8/21/2040 | | | 85 | | | | 86 | |
| | |
4.25%, 4/1/2050 | | | 20 | | | | 25 | |
| | |
Dell International LLC | | | | | | | | |
| | |
6.20%, 7/15/2030 (g) | | | 25 | | | | 32 | |
| | |
8.10%, 7/15/2036 (g) | | | 10 | | | | 15 | |
| | |
8.35%, 7/15/2046 (g) | | | 5 | | | | 8 | |
| | |
Discovery Communications LLC | | | | | | | | |
| | |
5.20%, 9/20/2047 | | | 20 | | | | 26 | |
| | |
4.00%, 9/15/2055 (g) | | | 25 | | | | 28 | |
| | |
Dow Chemical Co. (The) | | | | | | | | |
| | |
2.10%, 11/15/2030 | | | 25 | | | | 26 | |
| | |
4.25%, 10/1/2034 | | | 20 | | | | 24 | |
| | |
Duke Energy Indiana LLC 2.75%, 4/1/2050 | | | 30 | | | | 31 | |
| | |
Duke Energy Progress LLC | | | | | | | | |
| | |
4.20%, 8/15/2045 | | | 10 | | | | 13 | |
| | |
3.60%, 9/15/2047 | | | 10 | | | | 12 | |
| | |
2.50%, 8/15/2050 | | | 25 | | | | 25 | |
| | |
DuPont de Nemours, Inc. 5.32%, 11/15/2038 | | | 15 | | | | 20 | |
| | |
Eastern Energy Gas Holdings LLC 4.60%, 12/15/2044 | | | 10 | | | | 13 | |
| | |
Eli Lilly and Co. 2.25%, 5/15/2050 | | | 30 | | | | 29 | |
| | |
Energy Transfer Operating LP | | | | | | | | |
| | |
4.90%, 3/15/2035 | | | 20 | | | | 22 | |
| | |
5.15%, 2/1/2043 | | | 10 | | | | 11 | |
| | |
5.15%, 3/15/2045 | | | 15 | | | | 16 | |
| | |
Entergy Louisiana LLC 2.90%, 3/15/2051 | | | 20 | | | | 21 | |
| | |
Entergy Texas, Inc. 3.55%, 9/30/2049 | | | 20 | | | | 23 | |
| | |
Enterprise Products Operating LLC | | | | | | | | |
| | |
4.85%, 8/15/2042 | | | 10 | | | | 13 | |
| | |
4.45%, 2/15/2043 | | | 10 | | | | 12 | |
| | |
3.70%, 1/31/2051 | | | 30 | | | | 33 | |
| | |
3.20%, 2/15/2052 | | | 10 | | | | 10 | |
| | |
Equitable Financial Life Global Funding 0.50%, 11/17/2023 (g) | | | 6 | | | | 6 | |
| | |
Essex Portfolio LP REIT, 2.65%, 9/1/2050 | | | 20 | | | | 19 | |
| | |
Evergy Metro, Inc. 4.20%, 3/15/2048 | | | 15 | | | | 19 | |
| | |
Exelon Corp. 4.70%, 4/15/2050 | | | 15 | | | | 20 | |
| | |
Exxon Mobil Corp. | | | | | | | | |
| | |
3.00%, 8/16/2039 | | | 30 | | | | 32 | |
| | |
4.23%, 3/19/2040 | | | 10 | | | | 12 | |
| | |
3.10%, 8/16/2049 | | | 20 | | | | 22 | |
| | | | | | | | |
| INVESTMENTS | | PRINCIPAL
AMOUNT
($000) | | |
VALUE
($000) | |
| | | | | | | | |
| | | | | | | | |
|
United States — continued | |
| | |
FedEx Corp. 4.40%, 1/15/2047 | | | 15 | | | | 19 | |
| | |
Florida Power & Light Co. 3.80%, 12/15/2042 | | | 15 | | | | 19 | |
| | |
Fox Corp. 5.58%, 1/25/2049 | | | 10 | | | | 15 | |
| | |
General Electric Co. 4.13%, 10/9/2042 | | | 95 | | | | 111 | |
| | |
General Motors Co. 5.20%, 4/1/2045 | | | 30 | | | | 36 | |
| | |
Gilead Sciences, Inc. | | | | | | | | |
| | |
4.00%, 9/1/2036 | | | 35 | | | | 42 | |
| | |
2.60%, 10/1/2040 | | | 30 | | | | 30 | |
| | |
2.80%, 10/1/2050 | | | 20 | | | | 20 | |
| | |
Global Payments, Inc. 2.90%, 5/15/2030 | | | 15 | | | | 16 | |
| | |
Goldman Sachs Group, Inc. (The) | | | | | | | | |
| | |
(SOFR + 0.54%), 0.63%, 11/17/2023 (h) | | | 15 | | | | 15 | |
| | |
(ICE LIBOR USD 3 Month + 1.37%), 4.02%, 10/31/2038 (h) | | | 50 | | | | 61 | |
| | |
(ICE LIBOR USD 3 Month + 1.43%), 4.41%, 4/23/2039 (h) | | | 35 | | | | 45 | |
| | |
HCA, Inc. | | | | | | | | |
| | |
5.13%, 6/15/2039 | | | 10 | | | | 13 | |
| | |
5.50%, 6/15/2047 | | | 20 | | | | 27 | |
| | |
5.25%, 6/15/2049 | | | 5 | | | | 6 | |
| | |
Healthcare Trust of America Holdings LP REIT, 2.00%, 3/15/2031 | | | 20 | | | | 20 | |
| | |
Healthpeak Properties, Inc. REIT, 2.88%, 1/15/2031 | | | 20 | | | | 22 | |
| | |
Hershey Co. (The) 2.65%, 6/1/2050 | | | 10 | | | | 11 | |
| | |
Home Depot, Inc. (The) | | | | | | | | |
| | |
3.30%, 4/15/2040 | | | 30 | | | | 35 | |
| | |
4.40%, 3/15/2045 | | | 5 | | | | 6 | |
| | |
3.13%, 12/15/2049 | | | 5 | | | | 6 | |
| | |
3.35%, 4/15/2050 | | | 20 | | | | 24 | |
| | |
Hyundai Capital America 1.15%, 11/10/2022 (g) | | | 14 | | | | 14 | |
| | |
Intel Corp. 3.25%, 11/15/2049 | | | 30 | | | | 34 | |
| | |
International Business Machines Corp. 4.00%, 6/20/2042 | | | 30 | | | | 37 | |
| | |
Johnson & Johnson 3.40%, 1/15/2038 | | | 15 | | | | 18 | |
| | |
Keurig Dr Pepper, Inc. 4.42%, 12/15/2046 | | | 15 | | | | 19 | |
| | |
Kinder Morgan, Inc. | | | | | | | | |
| | |
2.00%, 2/15/2031 | | | 35 | | | | 35 | |
| | |
5.05%, 2/15/2046 | | | 20 | | | | 25 | |
| | |
3.25%, 8/1/2050 | | | 15 | | | | 15 | |
| | |
Kroger Co. (The) 3.88%, 10/15/2046 | | | 30 | | | | 35 | |
| | |
Leidos, Inc. | | | | | | | | |
| | |
4.38%, 5/15/2030 (g) | | | 5 | | | | 6 | |
| | |
2.30%, 2/15/2031 (g) | | | 15 | | | | 15 | |
SEE NOTES TO FINANCIAL STATEMENTS.
| | | | | | | | | | |
| | | | | |
| 16 | | | | | | | | JPMORGAN INSURANCE TRUST | | DECEMBER 31, 2020 |
| | | | | | | | |
| INVESTMENTS | | PRINCIPAL
AMOUNT
($000) | | |
VALUE
($000) | |
Long Positions — continued | |
|
Corporate Bonds — continued | |
|
United States — continued | |
| | |
Lockheed Martin Corp. | | | | | | | | |
| | |
4.07%, 12/15/2042 | | | 10 | | | | 13 | |
| | |
3.80%, 3/1/2045 | | | 25 | | | | 31 | |
| | |
2.80%, 6/15/2050 | | | 15 | | | | 16 | |
| | |
Lowe’s Cos., Inc. | | | | | | | | |
| | |
3.70%, 4/15/2046 | | | 40 | | | | 47 | |
| | |
3.00%, 10/15/2050 | | | 10 | | | | 11 | |
| | |
Marathon Petroleum Corp. | | | | | | | | |
| | |
4.75%, 9/15/2044 | | | 10 | | | | 12 | |
| | |
4.50%, 4/1/2048 | | | 10 | | | | 11 | |
| | |
McDonald’s Corp. | | | | | | | | |
| | |
3.63%, 9/1/2049 | | | 20 | | | | 24 | |
| | |
4.20%, 4/1/2050 | | | 25 | | | | 32 | |
| | |
Merck & Co., Inc. 2.35%, 6/24/2040 | | | 5 | | | | 5 | |
| | |
MetLife, Inc. 4.13%, 8/13/2042 | | | 20 | | | | 25 | |
| | |
Microsoft Corp. | | | | | | | | |
| | |
3.45%, 8/8/2036 | | | 30 | | | | 37 | |
| | |
3.70%, 8/8/2046 | | | 20 | | | | 25 | |
| | |
2.53%, 6/1/2050 | | | 10 | | | | 11 | |
| | |
2.68%, 6/1/2060 | | | 15 | | | | 16 | |
| | |
Molson Coors Beverage Co. 4.20%, 7/15/2046 | | | 15 | | | | 17 | |
| | |
Mondelez International, Inc. 0.63%, 7/1/2022 | | | 5 | | | | 5 | |
| | |
Morgan Stanley | | | | | | | | |
| | |
7.25%, 4/1/2032 | | | 30 | | | | 46 | |
| | |
(ICE LIBOR USD 3 Month + 1.46%), 3.97%, 7/22/2038 (h) | | | 35 | | | | 43 | |
| | |
6.38%, 7/24/2042 | | | 25 | | | | 41 | |
| | |
MPLX LP | | | | | | | | |
| | |
4.50%, 4/15/2038 | | | 25 | | | | 28 | |
| | |
4.70%, 4/15/2048 | | | 15 | | | | 18 | |
| | |
New York and Presbyterian Hospital (The) 2.26%, 8/1/2040 | | | 20 | | | | 20 | |
| | |
NIKE, Inc. | | | | | | | | |
| | |
3.25%, 3/27/2040 | | | 30 | | | | 35 | |
| | |
3.38%, 3/27/2050 | | | 5 | | | | 6 | |
| | |
NiSource, Inc. 5.25%, 2/15/2043 | | | 20 | | | | 27 | |
| | |
Noble Energy, Inc. | | | | | | | | |
| | |
5.05%, 11/15/2044 | | | 25 | | | | 35 | |
| | |
4.20%, 10/15/2049 | | | 5 | | | | 7 | |
| | |
Norfolk Southern Corp. 3.05%, 5/15/2050 | | | 47 | | | | 51 | |
| | |
Northrop Grumman Corp. | | | | | | | | |
| | |
3.85%, 4/15/2045 | | | 25 | | | | 30 | |
| | |
4.03%, 10/15/2047 | | | 15 | | | | 19 | |
| | | | | | | | |
| INVESTMENTS | | PRINCIPAL
AMOUNT
($000) | | |
VALUE
($000) | |
| |
|
| |
|
United States — continued | |
| | |
Nutrition & Biosciences, Inc. 3.47%, 12/1/2050 (g) | | | 10 | | | | 11 | |
| | |
NVIDIA Corp. 3.50%, 4/1/2050 | | | 10 | | | | 12 | |
| | |
Oncor Electric Delivery Co. LLC | | | | | | | | |
| | |
3.80%, 9/30/2047 | | | 5 | | | | 6 | |
| | |
3.70%, 5/15/2050 | | | 20 | | | | 25 | |
| | |
Oracle Corp. | | | | | | | | |
| | |
3.60%, 4/1/2040 | | | 70 | | | | 82 | |
| | |
3.60%, 4/1/2050 | | | 45 | | | | 52 | |
| | |
Otis Worldwide Corp. 3.11%, 2/15/2040 | | | 10 | | | | 11 | |
| | |
Pacific Gas and Electric Co. | | | | | | | | |
| | |
4.45%, 4/15/2042 | | | 30 | | | | 32 | |
| | |
4.60%, 6/15/2043 | | | 19 | | | | 21 | |
| | |
4.00%, 12/1/2046 | | | 14 | | | | 15 | |
| | |
PacifiCorp | | | | | | | | |
| | |
4.13%, 1/15/2049 | | | 20 | | | | 25 | |
| | |
3.30%, 3/15/2051 | | | 40 | | | | 46 | |
| | |
PECO Energy Co. 2.80%, 6/15/2050 | | | 8 | | | | 9 | |
| | |
Penske Truck Leasing Co. LP 3.38%, 2/1/2022 (g) | | | 10 | | | | 10 | |
| | |
PepsiCo, Inc. 3.50%, 3/19/2040 | | | 30 | | | | 36 | |
| | |
Pfizer, Inc. | | | | | | | | |
| | |
2.55%, 5/28/2040 | | | 35 | | | | 37 | |
| | |
4.20%, 9/15/2048 | | | 10 | | | | 14 | |
| | |
2.70%, 5/28/2050 | | | 10 | | | | 11 | |
| | |
Philip Morris International, Inc. | | | | | | | | |
| | |
4.50%, 3/20/2042 | | | 5 | | | | 6 | |
| | |
3.88%, 8/21/2042 | | | 20 | | | | 23 | |
| | |
4.25%, 11/10/2044 | | | 10 | | | | 13 | |
| | |
Phillips 66 2.15%, 12/15/2030 | | | 40 | | | | 41 | |
| | |
Piedmont Natural Gas Co., Inc. 3.35%, 6/1/2050 | | | 5 | | | | 6 | |
| | |
Pioneer Natural Resources Co. 1.90%, 8/15/2030 | | | 15 | | | | 15 | |
| | |
Plains All American Pipeline LP | | | | | | | | |
| | |
3.80%, 9/15/2030 | | | 15 | | | | 16 | |
| | |
5.15%, 6/1/2042 | | | 10 | | | | 11 | |
| | |
4.30%, 1/31/2043 | | | 15 | | | | 15 | |
| | |
PPL Electric Utilities Corp. (ICE LIBOR USD 3 Month + 0.25%), 0.50%, 9/28/2023 (h) | | | 22 | | | | 22 | |
| | |
Prologis LP REIT, 2.13%, 10/15/2050 | | | 20 | | | | 19 | |
| | |
Prudential Financial, Inc. | | | | | | | | |
| | |
3.00%, 3/10/2040 | | | 10 | | | | 11 | |
| | |
3.70%, 3/13/2051 | | | 15 | | | | 18 | |
SEE NOTES TO FINANCIAL STATEMENTS.
| | | | | | | | | | |
| | | | | |
| DECEMBER 31, 2020 | | JPMORGAN INSURANCE TRUST | | | | | | | | 17 |
JPMorgan Insurance Trust Global Allocation Portfolio
SCHEDULE OF PORTFOLIO INVESTMENTS
AS OF DECEMBER 31, 2020 (continued)
| | | | | | | | |
| INVESTMENTS | | PRINCIPAL
AMOUNT
($000) | | |
VALUE
($000) | |
Long Positions — continued | |
|
Corporate Bonds — continued | |
|
United States — continued | |
| | |
Public Service Co. of Colorado 4.05%, 9/15/2049 | | | 30 | | | | 39 | |
| | |
Public Service Electric and Gas Co. | | | | | | | | |
| | |
3.15%, 1/1/2050 | | | 15 | | | | 17 | |
| | |
2.70%, 5/1/2050 | | | 10 | | | | 11 | |
| | |
QUALCOMM, Inc. | | | | | | | | |
| | |
4.80%, 5/20/2045 | | | 10 | | | | 14 | |
| | |
3.25%, 5/20/2050 | | | 10 | | | | 12 | |
| | |
Raytheon Technologies Corp. | | | | | | | | |
| | |
4.45%, 11/16/2038 | | | 10 | | | | 13 | |
| | |
4.50%, 6/1/2042 | | | 30 | | | | 39 | |
| | |
4.63%, 11/16/2048 | | | 15 | | | | 20 | |
| | |
3.13%, 7/1/2050 | | | 15 | | | | 17 | |
| | |
Regeneron Pharmaceuticals, Inc. 2.80%, 9/15/2050 | | | 20 | | | | 19 | |
| | |
Reliance Standard Life Global Funding II 2.15%, 1/21/2023 (g) | | | 10 | | | | 10 | |
| | |
Republic Services, Inc. 3.05%, 3/1/2050 | | | 15 | | | | 16 | |
| | |
Royalty Pharma plc | | | | | | | | |
| | |
3.30%, 9/2/2040 (g) | | | 10 | | | | 10 | |
| | |
3.55%, 9/2/2050 (g) | | | 10 | | | | 11 | |
| | |
S&P Global, Inc. 2.30%, 8/15/2060 | | | 15 | | | | 14 | |
| | |
San Diego Gas & Electric Co. Series UUU, 3.32%, 4/15/2050 | | | 20 | | | | 23 | |
| | |
Sherwin-Williams Co. (The) 3.30%, 5/15/2050 | | | 23 | | | | 25 | |
| | |
Simon Property Group LP REIT, 3.25%, 9/13/2049 | | | 10 | | | | 10 | |
| | |
Southern California Edison Co. | | | | | | | | |
| | |
Series C, 4.13%, 3/1/2048 | | | 30 | | | | 36 | |
| | |
3.65%, 2/1/2050 | | | 20 | | | | 22 | |
| | |
Southern California Gas Co. Series VV, 4.30%, 1/15/2049 | | | 10 | | | | 13 | |
| | |
Southern Co. (The) | | | | | | | | |
| | |
2.35%, 7/1/2021 | | | 26 | | | | 26 | |
| | |
4.40%, 7/1/2046 | | | 15 | | | | 19 | |
| | |
Southwestern Public Service Co. 3.40%, 8/15/2046 | | | 15 | | | | 17 | |
| | |
Starbucks Corp. | | | | | | | | |
| | |
3.75%, 12/1/2047 | | | 20 | | | | 24 | |
| | |
3.35%, 3/12/2050 | | | 10 | | | | 11 | |
| | |
Sunoco Logistics Partners Operations LP 5.30%, 4/1/2044 | | | 10 | | | | 11 | |
| | |
Sysco Corp. 3.30%, 2/15/2050 | | | 40 | | | | 42 | |
| | |
Texas Eastern Transmission LP 4.15%, 1/15/2048 (g) | | | 10 | | | | 11 | |
| | | | | | | | |
| INVESTMENTS | | PRINCIPAL
AMOUNT
($000) | | |
VALUE
($000) | |
| |
|
| |
|
United States — continued | |
| | |
Time Warner Cable LLC | | | | | | | | |
| | |
7.30%, 7/1/2038 | | | 10 | | | | 15 | |
| | |
4.50%, 9/15/2042 | | | 25 | | | | 29 | |
| | |
T-Mobile USA, Inc. | | | | | | | | |
| | |
4.38%, 4/15/2040 (g) | | | 20 | | | | 24 | |
| | |
3.00%, 2/15/2041 (g) | | | 25 | | | | 26 | |
| | |
3.30%, 2/15/2051 (g) | | | 30 | | | | 31 | |
| | |
Travelers Cos., Inc. (The) 2.55%, 4/27/2050 | | | 20 | | | | 21 | |
| | |
Tucson Electric Power Co. 4.00%, 6/15/2050 | | | 20 | | | | 24 | |
| | |
Tyson Foods, Inc. 4.55%, 6/2/2047 | | | 5 | | | | 7 | |
| | |
Union Electric Co. 2.63%, 3/15/2051 | | | 10 | | | | 10 | |
| | |
Union Pacific Corp. | | | | | | | | |
| | |
4.38%, 9/10/2038 | | | 15 | | | | 19 | |
| | |
3.55%, 8/15/2039 | | | 45 | | | | 52 | |
| | |
3.84%, 3/20/2060 | | | 10 | | | | 12 | |
| | |
UnitedHealth Group, Inc. | | | | | | | | |
| | |
3.50%, 8/15/2039 | | | 15 | | | | 18 | |
| | |
2.75%, 5/15/2040 | | | 32 | | | | 35 | |
| | |
2.90%, 5/15/2050 | | | 30 | | | | 33 | |
| | |
Universal Health Services, Inc. 2.65%, 10/15/2030 (g) | | | 30 | | | | 31 | |
| | |
Verizon Communications, Inc. | | | | | | | | |
| | |
4.27%, 1/15/2036 | | | 45 | | | | 56 | |
| | |
2.65%, 11/20/2040 | | | 20 | | | | 20 | |
| | |
3.85%, 11/1/2042 | | | 30 | | | | 36 | |
| | |
4.86%, 8/21/2046 | | | 5 | | | | 7 | |
| | |
2.88%, 11/20/2050 | | | 20 | | | | 20 | |
| | |
2.99%, 10/30/2056 (g) | | | 30 | | | | 30 | |
| | |
ViacomCBS, Inc. | | | | | | | | |
| | |
4.20%, 5/19/2032 | | | 46 | | | | 55 | |
| | |
5.85%, 9/1/2043 | | | 10 | | | | 14 | |
| | |
4.60%, 1/15/2045 | | | 15 | | | | 18 | |
| | |
Viatris, Inc. | | | | | | | | |
| | |
3.85%, 6/22/2040 (g) | | | 10 | | | | 11 | |
| | |
4.00%, 6/22/2050 (g) | | | 10 | | | | 12 | |
| | |
Virginia Electric and Power Co. | | | | | | | | |
| | |
2.95%, 1/15/2022 | | | 13 | | | | 13 | |
| | |
Series B, 4.20%, 5/15/2045 | | | 15 | | | | 19 | |
| | |
2.45%, 12/15/2050 | | | 15 | | | | 15 | |
| | |
Visa, Inc. 2.70%, 4/15/2040 | | | 25 | | | | 27 | |
| | |
Walt Disney Co. (The) | | | | | | | | |
| | |
3.50%, 5/13/2040 | | | 40 | | | | 47 | |
| | |
2.75%, 9/1/2049 | | | 10 | | | | 11 | |
SEE NOTES TO FINANCIAL STATEMENTS.
| | | | | | | | | | |
| | | | | |
| 18 | | | | | | | | JPMORGAN INSURANCE TRUST | | DECEMBER 31, 2020 |
| | | | | | | | |
| INVESTMENTS | | PRINCIPAL
AMOUNT
($000) | | |
VALUE
($000) | |
Long Positions — continued | |
|
Corporate Bonds — continued | |
|
United States — continued | |
| | |
Wells Fargo & Co. | | | | | | | | |
| | |
(SOFR + 2.53%), 3.07%, 4/30/2041 (h) | | | 40 | | | | 43 | |
| | |
4.90%, 11/17/2045 | | | 20 | | | | 27 | |
| | |
4.40%, 6/14/2046 | | | 30 | | | | 38 | |
| | |
(ICE LIBOR USD 3 Month + 4.24%), 5.01%, 4/4/2051 (h) | | | 20 | | | | 28 | |
| | |
Welltower, Inc. REIT, 2.75%, 1/15/2031 | | | 25 | | | | 27 | |
| | |
West Virginia United Health System Obligated Group Series 2020, 3.13%, 6/1/2050 | | | 10 | | | | 10 | |
| | |
Whirlpool Corp. 4.60%, 5/15/2050 | | | 5 | | | | 6 | |
| | |
Williams Cos., Inc. (The) 5.75%, 6/24/2044 | | | 15 | | | | 19 | |
| | |
WP Carey, Inc. REIT, 2.40%, 2/1/2031 | | | 10 | | | | 10 | |
| | |
Zimmer Biomet Holdings, Inc. 4.45%, 8/15/2045 | | | 5 | | | | 6 | |
| | |
Zoetis, Inc. 3.00%, 5/15/2050 | | | 15 | | | | 17 | |
| | | | | | | | |
| | |
| | | | | | | 7,232 | |
| | | | | | | | |
| | |
Total Corporate Bonds
(Cost $9,330) | | | | | | | 9,710 | |
| | | | | | | | |
Foreign Government Securities — 6.0% | |
|
Australia — 0.2% | |
| | |
Commonwealth of Australia | | | | | | | | |
| | |
0.25%, 11/21/2025 (c) | | AUD | 43 | | | | 33 | |
| | |
1.00%, 12/21/2030 (c) | | AUD | 152 | | | | 118 | |
| | |
3.75%, 4/21/2037 (c) | | AUD | 36 | | | | 37 | |
| | |
2.75%, 5/21/2041 (c) | | AUD | 1 | | | | 1 | |
| | |
3.00%, 3/21/2047 (c) | | AUD | 14 | | | | 13 | |
| | | | | | | | |
| | |
| | | | | | | 202 | |
| | | | | | | | |
| |
Austria — 0.0% (d) | | | | | |
| | |
Republic of Austria 0.85%, 6/30/2120 (c) | | EUR | 12 | | | | 19 | |
| | | | | | | | |
| |
Belgium — 0.1% | | | | | |
| | |
Kingdom of Belgium | | | | | | | | |
| | |
3.00%, 6/22/2034 (c) | | EUR | 29 | | | | 51 | |
| | |
1.90%, 6/22/2038 (c) | | EUR | 49 | | | | 79 | |
| | |
1.60%, 6/22/2047 (c) | | EUR | 1 | | | | 2 | |
| | |
1.70%, 6/22/2050 (c) | | EUR | 10 | | | | 17 | |
| | |
2.15%, 6/22/2066 (c) | | EUR | 7 | | | | 14 | |
| | | | | | | | |
| | |
| | | | | | | 163 | |
| | | | | | | | |
| |
Canada — 0.1% | | | | | |
| | |
Canada Government Bond | | | | | | | | |
| | |
2.00%, 9/1/2023 | | CAD | 20 | | | | 16 | |
| | |
1.50%, 9/1/2024 | | CAD | 2 | | | | 2 | |
| | |
1.25%, 3/1/2025 | | CAD | 7 | | | | 6 | |
| | | | | | | | |
| INVESTMENTS | | PRINCIPAL
AMOUNT
($000) | | |
VALUE
($000) | |
| |
|
| |
| |
Canada — continued | | | | | |
| | |
0.50%, 9/1/2025 | | CAD | 27 | | | | 21 | |
| | |
1.00%, 6/1/2027 | | CAD | 17 | | | | 14 | |
| | |
2.25%, 6/1/2029 | | CAD | 59 | | | | 53 | |
| | |
5.00%, 6/1/2037 | | CAD | 10 | | | | 13 | |
| | |
3.50%, 12/1/2045 | | CAD | 9 | | | | 11 | |
| | |
2.75%, 12/1/2048 | | CAD | 20 | | | | 21 | |
| | |
2.75%, 12/1/2064 | | CAD | 3 | | | | 3 | |
| | | | | | | | |
| | |
| | | | | | | 160 | |
| | | | | | | | |
| |
China — 0.2% | | | | | |
| | |
Export-Import Bank of China(The) 0.75%, 5/28/2023 (c) | | EUR | 200 | | | | 248 | |
| | | | | | | | |
| |
Denmark — 0.1% | | | | | |
| | |
Kingdom of Denmark | | | | | | | | |
| | |
1.50%, 11/15/2023 | | DKK | 36 | | | | 6 | |
| | |
1.75%, 11/15/2025 | | DKK | 28 | | | | 5 | |
| | |
0.50%, 11/15/2027 | | DKK | 10 | | | | 2 | |
| | |
0.50%, 11/15/2029 (c) | | DKK | 86 | | | | 15 | |
| | |
4.50%, 11/15/2039 | | DKK | 78 | | | | 25 | |
| | | | | | | | |
| | |
| | | | | | | 53 | |
| | | | | | | | |
| |
France — 0.6% | | | | | |
| | |
French Republic | | | | | | | | |
| | |
1.75%, 11/25/2024 (c) | | EUR | 39 | | | | 51 | |
| | |
0.25%, 11/25/2026 (c) | | EUR | 93 | | | | 119 | |
| | |
0.50%, 5/25/2029 (c) | | EUR | 15 | | | | 19 | |
| | |
0.00%, 11/25/2029 (c) | | EUR | 191 | | | | 242 | |
| | |
1.25%, 5/25/2034 (c) | | EUR | 99 | | | | 144 | |
| | |
3.25%, 5/25/2045 (c) | | EUR | 34 | | | | 72 | |
| | |
2.00%, 5/25/2048 (c) | | EUR | 5 | | | | 9 | |
| | |
1.50%, 5/25/2050 (c) | | EUR | 1 | | | | 2 | |
| | |
0.75%, 5/25/2052 (c) | | EUR | 8 | | | | 11 | |
| | |
4.00%, 4/25/2055 (c) | | EUR | 12 | | | | 32 | |
| | |
4.00%, 4/25/2060 (c) | | EUR | 2 | | | | 6 | |
| | |
1.75%, 5/25/2066 (c) | | EUR | 13 | | | | 24 | |
| | | | | | | | |
| | |
| | | | | | | 731 | |
| | | | | | | | |
| |
Germany — 0.3% | | | | | |
| | |
Bundesobligation 0.00%, 10/10/2025 (c) | | EUR | 98 | | | | 124 | |
| | |
Bundesrepublik Deutschland | | | | | | | | |
| | |
0.00%, 8/15/2030 (c) | | EUR | 111 | | | | 143 | |
| | |
2.50%, 7/4/2044 (c) | | EUR | 14 | | | | 29 | |
| | |
0.00%, 8/15/2050 (c) | | EUR | 11 | | | | 14 | |
| | | | | | | | |
| | |
| | | | | | | 310 | |
| | | | | | | | |
SEE NOTES TO FINANCIAL STATEMENTS.
| | | | | | | | | | |
| | | | | |
| DECEMBER 31, 2020 | | JPMORGAN INSURANCE TRUST | | | | | | | | 19 |
JPMorgan Insurance Trust Global Allocation Portfolio
SCHEDULE OF PORTFOLIO INVESTMENTS
AS OF DECEMBER 31, 2020 (continued)
| | | | | | | | |
| INVESTMENTS | | PRINCIPAL
AMOUNT
($000) | | |
VALUE
($000) | |
Long Positions — continued | |
|
Foreign Government Securities — continued | |
| |
Italy — 1.1% | | | | | |
| | |
Buoni Poliennali del Tesoro | | | | | | | | |
| | |
1.35%, 4/15/2022 | | EUR | 13 | | | | 16 | |
| | |
1.45%, 9/15/2022 | | EUR | 41 | | | | 52 | |
| | |
0.05%, 1/15/2023 (c) | | EUR | 111 | | | | 137 | |
| | |
0.35%, 2/1/2025 (c) | | EUR | 145 | | | | 181 | |
| | |
1.45%, 5/15/2025 (c) | | EUR | 44 | | | | 57 | |
| | |
1.85%, 7/1/2025 (c) | | EUR | 92 | | | | 122 | |
| | |
0.50%, 2/1/2026 (c) | | EUR | 130 | | | | 163 | |
| | |
1.60%, 6/1/2026 | | EUR | 112 | | | | 149 | |
| | |
2.80%, 12/1/2028 (c) | | EUR | 4 | | | | 6 | |
| | |
3.00%, 8/1/2029 (c) | | EUR | 24 | | | | 36 | |
| | |
1.35%, 4/1/2030 (c) | | EUR | 110 | | | | 145 | |
| | |
1.65%, 3/1/2032 (c) | | EUR | 39 | | | | 53 | |
| | |
2.45%, 9/1/2033 (c) | | EUR | 11 | | | | 16 | |
| | |
2.25%, 9/1/2036 (c) | | EUR | 56 | | | | 81 | |
| | |
4.00%, 2/1/2037 (c) | | EUR | 19 | | | | 33 | |
| | |
4.75%, 9/1/2044 (c) | | EUR | 19 | | | | 40 | |
| | |
3.45%, 3/1/2048 (c) | | EUR | 25 | | | | 45 | |
| | |
3.85%, 9/1/2049 (c) | | EUR | 4 | | | | 8 | |
| | |
2.80%, 3/1/2067 (c) | | EUR | 8 | | | | 13 | |
| | | | | | | | |
| | |
| | | | | | | 1,353 | |
| | | | | | | | |
|
Japan — 1.9% | |
| | |
Japan Government Bond | | | | | | | | |
| | |
0.10%, 12/20/2022 | | JPY | 28,500 | | | | 277 | |
| | |
0.60%, 12/20/2023 | | JPY | 17,200 | | | | 170 | |
| | |
0.10%, 9/20/2024 | | JPY | 10,800 | | | | 106 | |
| | |
0.10%, 12/20/2024 | | JPY | 14,800 | | | | 145 | |
| | |
0.10%, 3/20/2025 | | JPY | 3,500 | | | | 34 | |
| | |
0.30%, 12/20/2025 | | JPY | 9,150 | | | | 90 | |
| | |
0.10%, 6/20/2029 | | JPY | 2,900 | | | | 28 | |
| | |
0.10%, 9/20/2029 | | JPY | 750 | | | | 7 | |
| | |
0.10%, 12/20/2029 | | JPY | 16,100 | | | | 158 | |
| | |
0.10%, 3/20/2030 | | JPY | 10,700 | | | | 105 | |
| | |
1.50%, 3/20/2034 | | JPY | 33,650 | | | | 382 | |
| | |
0.60%, 12/20/2037 | | JPY | 32,350 | | | | 328 | |
| | |
2.50%, 3/20/2038 | | JPY | 500 | | | | 7 | |
| | |
0.30%, 12/20/2039 | | JPY | 12,300 | | | | 117 | |
| | |
1.70%, 9/20/2044 | | JPY | 50 | | | | 1 | |
| | |
1.40%, 12/20/2045 | | JPY | 4,550 | | | | 53 | |
| | |
0.80%, 3/20/2047 | | JPY | 9,000 | | | | 92 | |
| | |
0.40%, 9/20/2049 | | JPY | 2,000 | | | | 18 | |
| | |
0.40%, 12/20/2049 | | JPY | 2,250 | | | | 21 | |
| | |
0.90%, 3/20/2057 | | JPY | 16,000 | | | | 166 | |
| | | | | | | | |
| | |
| | | | | | | 2,305 | |
| | | | | | | | |
| | | | | | | | |
| INVESTMENTS | | PRINCIPAL
AMOUNT
($000) | | |
VALUE
($000) | |
| | | | | | | | |
| | | | | | | | |
|
Netherlands — 0.1% | |
| | |
Kingdom of Netherlands | | | | | | | | |
| | |
0.25%, 7/15/2029 (c) | | EUR | 11 | | | | 14 | |
| | |
0.00%, 1/15/2052 (c) | | EUR | 35 | | | | 44 | |
| | | | | | | | |
| | |
| | | | | | | 58 | |
| | | | | | | | |
|
Qatar — 0.2% | |
| | |
State of Qatar 3.88%, 4/23/2023 (g) | | | 200 | | | | 215 | |
| | | | | | | | |
| |
South Korea — 0.1% | | | | | |
| | |
Export-Import Bank of Korea 0.38%, 3/26/2024 (c) | | EUR | 100 | | | | 124 | |
| | | | | | | | |
| |
Spain — 0.5% | | | | | |
| | |
Bonos and Obligaciones del Estado | | | | | | | | |
| | |
0.00%, 4/30/2023 | | EUR | 43 | | | | 53 | |
| | |
1.60%, 4/30/2025 (c) | | EUR | 92 | | | | 123 | |
| | |
1.40%, 7/30/2028 (c) | | EUR | 4 | | | | 6 | |
| | |
1.45%, 4/30/2029 (c) | | EUR | 35 | | | | 48 | |
| | |
0.60%, 10/31/2029 (c) | | EUR | 49 | | | | 64 | |
| | |
0.50%, 4/30/2030 (c) | | EUR | 44 | | | | 56 | |
| | |
1.95%, 7/30/2030 (c) | | EUR | 10 | | | | 15 | |
| | |
1.25%, 10/31/2030 (c) | | EUR | 14 | | | | 19 | |
| | |
2.35%, 7/30/2033 (c) | | EUR | 8 | | | | 12 | |
| | |
1.85%, 7/30/2035 (c) | | EUR | 9 | | | | 13 | |
| | |
4.20%, 1/31/2037 (c) | | EUR | 31 | | | | 60 | |
| | |
2.70%, 10/31/2048 (c) | | EUR | 30 | | | | 54 | |
| | |
3.45%, 7/30/2066 (c) | | EUR | 11 | | | | 24 | |
| | | | | | | | |
| | |
| | | | | | | 547 | |
| | | | | | | | |
|
Sweden — 0.0% (d) | |
| | |
Kingdom of Sweden | | | | | | | | |
| | |
3.50%, 6/1/2022 | | SEK | 35 | | | | 5 | |
| | |
2.50%, 5/12/2025 | | SEK | 90 | | | | 12 | |
| | |
0.75%, 11/12/2029 (c) | | SEK | 40 | | | | 5 | |
| | |
2.25%, 6/1/2032 (c) | | SEK | 15 | | | | 2 | |
| | |
3.50%, 3/30/2039 | | SEK | 45 | | | | 9 | |
| | | | | | | | |
| | |
| | | | | | | 33 | |
| | | | | | | | |
|
United Kingdom — 0.5% | |
| | |
United Kingdom of Great Britain and Northern Ireland | | | | | | | | |
| | |
0.63%, 6/7/2025 (c) | | GBP | 18 | | | | 25 | |
| | |
6.00%, 12/7/2028 (c) | | GBP | 36 | | | | 72 | |
| | |
4.75%, 12/7/2038 (c) | | GBP | 41 | | | | 96 | |
| | |
3.50%, 1/22/2045 (c) | | GBP | 14 | | | | 31 | |
| | |
4.25%, 12/7/2046 (c) | | GBP | 50 | | | | 125 | |
SEE NOTES TO FINANCIAL STATEMENTS.
| | | | | | | | | | |
| | | | | |
| 20 | | | | | | | | JPMORGAN INSURANCE TRUST | | DECEMBER 31, 2020 |
| | | | | | | | |
| INVESTMENTS | | PRINCIPAL
AMOUNT
($000) | | |
VALUE
($000) | |
Long Positions — continued | |
|
Foreign Government Securities — continued | |
|
United Kingdom — continued | |
| | |
1.75%, 1/22/2049 (c) | | GBP | 47 | | | | 80 | |
| | |
4.25%, 12/7/2055 (c) | | GBP | 15 | | | | 42 | |
| | |
2.50%, 7/22/2065 (c) | | GBP | 59 | | | | 138 | |
| | |
3.50%, 7/22/2068 (c) | | GBP | 8 | | | | 24 | |
| | | | | | | | |
| | |
| | | | | | | 633 | |
| | | | | | | | |
| | |
Total Foreign Government Securities
(Cost $6,515) | | | | | | | 7,154 | |
| | | | | | | | |
U.S. Treasury Obligations — 2.0% | |
| | |
U.S. Treasury Notes 2.50%, 1/31/2021 (l)
(Cost $2,401) | | | 2,398 | | | | 2,402 | |
| | | | | | | | |
Collateralized Mortgage Obligations — 1.9% | |
|
United States — 1.9% | |
| | |
American Home Mortgage Investment Trust Series 2005-1, Class 6A, 2.25%, 6/25/2045 (m) | | | 20 | | | | 20 | |
| | |
Banc of America Funding Trust Series 2006-A, Class 1A1, 2.83%, 2/20/2036 (m) | | | 15 | | | | 14 | |
| | |
Banc of America Mortgage Trust Series 2005-A, Class 2A2, 3.67%, 2/25/2035 (m) | | | 15 | | | | 16 | |
| | |
Bear Stearns ALT-A Trust Series 2005-4, Class 23A2, 3.37%, 5/25/2035 (m) | | | 29 | | | | 29 | |
| | |
Deephaven Residential Mortgage Trust | | | | | | | | |
| | |
Series 2019-2A, Class M1, 3.92%, 4/25/2059 ‡ (g) (m) | | | 175 | | | | 176 | |
| | |
Series 2019-4A, Class B1, 3.99%, 10/25/2059 ‡ (g) (m) | | | 140 | | | | 140 | |
| | |
Series 2020-1, Class A3, 2.65%,
1/25/2060 (g) (m) | | | 297 | | | | 300 | |
| | |
Deutsche Alt-A Securities Mortgage Loan Trust Series 2007-3, Class 2A1, 0.90%, 10/25/2047 (m) | | | 229 | | | | 209 | |
| | |
FNMA, Connecticut Avenue Securities Series 2014-C04, Class 2M2, 5.15%, 11/25/2024 (m) | | | 36 | | | | 37 | |
| | |
GCAT Trust Series 2019-NQM2, Class A3, 3.16%, 9/25/2059 (g) (i) | | | 246 | | | | 249 | |
| | |
GSR Mortgage Loan Trust Series 2005-AR3, Class 1A1, 0.59%, 5/25/2035 (m) | | | 54 | | | | 51 | |
| | |
Homeward Opportunities Fund I Trust Series 2019-1, Class M1, 3.95%, 1/25/2059 ‡ (g) (m) | | | 250 | | | | 255 | |
| | |
Impac CMB Trust Series 2004-7, Class 1A2, 1.07%, 11/25/2034 (m) | | | 59 | | | | 60 | |
| | |
JPMorgan Mortgage Trust Series 2005-A3, Class 4A1, 3.07%, 6/25/2035 (m) | | | 6 | | | | 6 | |
| | | | | | | | |
| INVESTMENTS | | PRINCIPAL
AMOUNT
($000) | | |
VALUE
($000) | |
| |
|
| |
|
United States — continued | |
| | |
Lehman Mortgage Trust Series 2005-3, Class 2A3, 5.50%, 1/25/2036 | | | 7 | | | | 7 | |
| | |
Merrill Lynch Mortgage Investors Trust Series 2007-1, Class 4A3, 3.03%, 1/25/2037 (m) | | | 12 | | | | 12 | |
| | |
Morgan Stanley Mortgage Loan Trust Series 2004-5AR, Class 4A, 3.31%, 7/25/2034 (m) | | | 13 | | | | 13 | |
| | |
New Residential Mortgage Loan Trust Series 2019-NQM4, Class M1, 2.99%, 9/25/2059 ‡ (g) (m) | | | 300 | | | | 302 | |
| | |
Opteum Mortgage Acceptance Corp. Asset-Backed Pass-Through Certificates Series 2005-5, Class 1APT, 0.71%, 12/25/2035 (m) | | | 38 | | | | 38 | |
| | |
Residential Asset Securitization Trust Series 2004-A6, Class A1, 5.00%, 8/25/2019 | | | 1 | | | | 1 | |
| | |
Structured Adjustable Rate Mortgage Loan Trust Series 2007-9, Class 1A1, 1.76%, 10/25/2037 (m) | | | 274 | | | | 260 | |
| | |
WaMu Mortgage Pass-Through Certificates Trust | | | | | | | | |
| | |
Series 2005-AR3, Class A1, 3.60%, 3/25/2035 (m) | | | 12 | | | | 12 | |
| | |
Series 2005-AR5, Class A6, 3.63%, 5/25/2035 (m) | | | 19 | | | | 19 | |
| | |
Series 2005-AR10, Class 1A3, 3.05%, 9/25/2035 (m) | | | 20 | | | | 20 | |
| | | | | | | | |
| | |
Total Collateralized Mortgage Obligations
(Cost $2,228) | | | | | | | 2,246 | |
| | | | | | | | |
Commercial Mortgage-Backed Securities — 1.5% | |
|
United States — 1.5% | |
| | |
BANK Series 2017-BNK7, Class B, 3.95%, 9/15/2060 | | | 25 | | | | 28 | |
| | |
BX Commercial Mortgage Trust Series 2020-BXLP, Class F, 2.16%, 12/15/2036 ‡ (g) (m) | | | 100 | | | | 98 | |
| | |
CAMB Commercial Mortgage Trust | | | | | | | | |
| | |
Series 2019-LIFE, Class E, 2.31%, 12/15/2037 ‡ (g) (m) | | | 100 | | | | 100 | |
| | |
Series 2019-LIFE, Class G, 3.41%, 12/15/2037 ‡ (g) (m) | | | 100 | | | | 96 | |
| | |
Citigroup Commercial Mortgage Trust | | | | | | | | |
| | |
Series 2019-SMRT, Class D, 4.74%, 1/10/2036 ‡ (g) (m) | | | 100 | | | | 103 | |
| | |
Series 2012-GC8, Class D, 4.88%, 9/10/2045 ‡ (g) (m) | | | 100 | | | | 86 | |
| | |
Series 2016-P6, Class D, 3.25%, 12/10/2049 ‡ (g) | | | 20 | | | | 16 | |
| | |
Series 2017-P7, Class D, 3.25%, 4/14/2050 ‡ (g) | | | 23 | | | | 19 | |
SEE NOTES TO FINANCIAL STATEMENTS.
| | | | | | | | | | |
| | | | | |
| DECEMBER 31, 2020 | | JPMORGAN INSURANCE TRUST | | | | | | | | 21 |
JPMorgan Insurance Trust Global Allocation Portfolio
SCHEDULE OF PORTFOLIO INVESTMENTS
AS OF DECEMBER 31, 2020 (continued)
| | | | | | | | |
| INVESTMENTS | | PRINCIPAL
AMOUNT
($000) | | |
VALUE
($000) | |
Long Positions — continued | |
|
Commercial Mortgage-Backed Securities — continued | |
| | |
United States — continued | | | | | | | | |
| | |
Series 2017-P7, Class B, 4.14%, 4/14/2050 ‡ (m) | | | 15 | | | | 17 | |
| | |
Commercial Mortgage Trust Series 2016-CR28, Class C, 4.64%, 2/10/2049 ‡ (m) | | | 100 | | | | 104 | |
| | |
DBGS Mortgage Trust Series 2018-5BP, Class B, 0.99%, 6/15/2033 ‡ (g) (m) | | | 100 | | | | 99 | |
| | |
FHLMC, Multi-Family Structured Pass-Through Certificates | | | | | | | | |
| | |
Series K734, Class X3, IO, 2.17%, 7/25/2026 (m) | | | 180 | | | | 18 | |
| | |
Series K083, Class X1, IO, 0.03%, 9/25/2028 (m) | | | 14,567 | | | | 85 | |
| | |
Series K094, Class X1, IO, 0.88%, 6/25/2029 (m) | | | 1,274 | | | | 84 | |
| | |
Series K723, Class X3, IO, 1.92%, 10/25/2034 (m) | | | 119 | | | | 6 | |
| | |
Series K153, Class X3, IO, 3.77%, 4/25/2035 (m) | | | 100 | | | | 30 | |
| | |
Series K716, Class X3, IO, 1.79%, 8/25/2042 (m) | | | 317 | | | | 2 | |
| | |
Series K726, Class X3, IO, 2.13%, 7/25/2044 (m) | | | 302 | | | | 19 | |
| | |
Series K728, Class X3, IO, 1.95%, 11/25/2045 (m) | | | 151 | | | | 10 | |
| | |
Series K071, Class X3, IO, 2.01%, 11/25/2045 (m) | | | 700 | | | | 82 | |
| | |
Series K092, Class X3, IO, 2.25%, 5/25/2047 (m) | | | 100 | | | | 15 | |
| | |
Series K094, Class X3, IO, 2.12%, 7/25/2047 (m) | | | 588 | | | | 88 | |
| | |
FREMF Series 2018-KF46, Class B, 2.10%,
3/25/2028 (g) (m) | | | 6 | | | | 6 | |
| | |
FREMF Mortgage Trust | | | | | | | | |
| | |
Series 2015-KF09, Class B, 5.50%, 5/25/2022 (g) (m) | | | 2 | | | | 2 | |
| | |
Series 2015-KF10, Class B, 6.25%, 7/25/2022 (g) (m) | | | 7 | | | | 7 | |
| | |
Series 2017-KF32, Class B, 2.70%, 5/25/2024 (g) (m) | | | 6 | | | | 6 | |
| | |
Series 2017-KF38, Class B, 2.65%, 9/25/2024 (g) (m) | | | 7 | | | | 7 | |
| | |
Series 2018-KF42, Class B, 2.35%, 12/25/2024 (g) (m) | | | 7 | | | | 6 | |
| | |
Series 2018-KF45, Class B, 2.10%, 3/25/2025 (g) (m) | | | 15 | | | | 14 | |
| | |
Series 2018-KF49, Class B, 2.05%, 6/25/2025 (g) (m) | | | 4 | | | | 4 | |
| | | | | | | | |
| INVESTMENTS | | PRINCIPAL
AMOUNT
($000) | | |
VALUE
($000) | |
| |
|
| |
|
United States — continued | |
| | |
Series 2018-KC02, Class B, 4.09%, 7/25/2025 (g) (m) | | | 35 | | | | 36 | |
| | |
Series 2018-KF53, Class B, 2.20%, 10/25/2025 (m) | | | 60 | | | | 58 | |
| | |
Series 2019-KC03, Class B, 4.37%, 1/25/2026 (g) (m) | | | 30 | | | | 31 | |
| | |
Series 2019-KF62, Class B, 2.20%, 4/25/2026 (g) (m) | | | 22 | | | | 21 | |
| | |
Series 2018-KF50, Class B, 2.05%, 7/25/2028 (g) (m) | | | 7 | | | | 7 | |
| | |
Series 2019-KF63, Class B, 2.50%, 5/25/2029 (g) (m) | | | 57 | | | | 54 | |
| | |
Series 2012-K19, Class C, 4.02%, 5/25/2045 (g) (m) | | | 10 | | | | 10 | |
| | |
Series 2017-K67, Class C, 3.94%, 9/25/2049 (g) (m) | | | 15 | | | | 16 | |
| | |
Series 2019-K103, Class C, 3.45%, 12/25/2051 (g) (m) | | | 25 | | | | 25 | |
| | |
Series 2020-K737, Class B, 3.30%, 1/25/2053 (g) (m) | | | 100 | | | | 109 | |
| | |
Series 2019-K96, Class B, 3.81%, 8/25/2056 (g) (m) | | | 30 | | | | 34 | |
| | |
GNMA | | | | | | | | |
| | |
Series 2013-178, IO, 0.42%, 6/16/2055 (m) | | | 67 | | | | 1 | |
| | |
Series 2015-172, IO, 0.74%, 3/16/2057 (m) | | | 121 | | | | 5 | |
| | |
Series 2016-40, IO, 0.67%, 7/16/2057 (m) | | | 415 | | | | 16 | |
| | |
Series 2017-69, IO, 0.78%, 7/16/2059 (m) | | | 344 | | | | 19 | |
| | |
Series 2018-119, IO, 0.70%, 5/16/2060 (m) | | | 283 | | | | 19 | |
| | |
Series 2020-28, IO, 0.86%, 11/16/2061 (m) | | | 235 | | | | 17 | |
| | |
LB Commercial Mortgage Trust Series 2007-C3, Class AJ, 5.91%, 7/15/2044 (m) | | | 4 | | | | 4 | |
| | |
LB-UBS Commercial Mortgage Trust Series 2006-C6, Class AJ, 5.49%, 9/15/2039 ‡ (m) | | | 54 | | | | 31 | |
| | |
Morgan Stanley Capital I Trust Series 2018-MP, Class D, 4.28%, 7/11/2040 ‡ (g) (m) | | | 15 | | | | 13 | |
| | | | | | | | |
| | |
Total Commercial Mortgage-Backed Securities
(Cost $1,828) | | | | | | | 1,783 | |
| | | | | | | | |
Asset-Backed Securities — 0.5% | |
|
United States — 0.5% | |
| | |
AMRESCO Residential Securities Corp. Mortgage Loan Trust Series 1997-1, Class A7, 7.61%, 3/25/2027 ‡ | | | 6 | | | | 6 | |
| | |
Asset-Backed Securities Corp. Home Equity Loan Trust | | | | | | | | |
| | |
Series 2003-HE6, Class M2, 2.62%, 11/25/2033 ‡ (m) | | | 50 | | | | 51 | |
SEE NOTES TO FINANCIAL STATEMENTS.
| | | | | | | | | | |
| | | | | |
| 22 | | | | | | | | JPMORGAN INSURANCE TRUST | | DECEMBER 31, 2020 |
| | | | | | | | |
| INVESTMENTS | | PRINCIPAL
AMOUNT
($000) | | |
VALUE
($000) | |
Long Positions — continued | |
|
Asset-Backed Securities — continued | |
|
United States — continued | |
| | |
Series 2004-HE3, Class M2, 1.83%, 6/25/2034 ‡ (m) | | | 60 | | | | 60 | |
| | |
Bear Stearns Asset-Backed Securities Trust | | | | | | | | |
| | |
Series 2004-HE5, Class M2, 2.02%, 7/25/2034 ‡ (m) | | | 12 | | | | 12 | |
| | |
Series 2003-2, Class M1, 1.95%, 3/25/2043 ‡ (m) | | | 29 | | | | 29 | |
| | |
Countrywide Asset-Backed Certificates Series 2004-2, Class M1, 0.90%, 5/25/2034 ‡ (m) | | | 16 | | | | 16 | |
| | |
CWABS, Inc. Asset-Backed Certificates Series 2004-1, Class M2, 0.97%, 3/25/2034 ‡ (m) | | | 39 | | | | 39 | |
| | |
CWABS, Inc. Asset-Backed Certificates Trust | | | | | | | | |
| | |
Series 2004-5, Class M5, 2.47%, 5/25/2034 (m) | | | 9 | | | | 9 | |
| | |
Series 2004-5, Class M3, 1.87%, 7/25/2034 ‡ (m) | | | 54 | | | | 54 | |
| | |
Exeter Automobile Receivables Trust Series 2018-4A, Class E, 5.38%, 7/15/2025 (g) | | | 20 | | | | 21 | |
| | |
First Franklin Mortgage Loan Trust
Series 2004-FFH3, Class M1, 1.02%, 10/25/2034 ‡ (m) | | | 11 | | | | 11 | |
| | |
Long Beach Mortgage Loan Trust | | | | | | | | |
| | |
Series 2004-4, Class M1, 1.05%, 10/25/2034 ‡ (m) | | | 61 | | | | 60 | |
| | |
Series 2004-6, Class A3, 1.45%, 11/25/2034 ‡ (m) | | | 11 | | | | 11 | |
| | |
Morgan Stanley ABS Capital I, Inc. Trust Series 2003-NC10, Class M1, 1.17%, 10/25/2033 ‡ (m) | | | 31 | | | | 31 | |
| | |
Saxon Asset Securities Trust Series 2003-3, Class M1, 1.12%, 12/25/2033 ‡ (m) | | | 36 | | | | 35 | |
| | |
Structured Asset Investment Loan Trust Series 2003-BC11, Class M1, 1.12%, 10/25/2033 ‡ (m) | | | 10 | | | | 10 | |
| | |
Structured Asset Securities Corp. Mortgage Loan Trust | | | | | | | | |
| | |
Series 2006-BC6, Class A4, 0.32%, 1/25/2037 (m) | | | 65 | | | | 64 | |
| | |
Series 2007-WF2, Class A1, 1.15%, 8/25/2037 ‡ (m) | | | 31 | | | | 31 | |
| | |
Wells Fargo Home Equity Asset-Backed Securities Trust Series 2006-3, Class A2, 0.30%, 1/25/2037 ‡ (m) | | | 1 | | | | 2 | |
| | | | | | | | |
| | |
Total Asset-Backed Securities
(Cost $518) | | | | | | | 552 | |
| | | | | | | | |
| | | | | | | | |
| INVESTMENTS | | NO. OF
CONTRACTS | | |
VALUE
($000) | |
Options Purchased — 0.2% | |
|
Call Options Purchased — 0.2% | |
| | |
United States — 0.2% | | | | | | | | |
| | |
iShares Russell 2000 ETF 3/19/2021 at USD 200.00, American Style Notional Amount: USD 6,764 Exchange-Traded *
(Cost $345) | | | 345 | | | | 269 | |
| | | | | | | | |
| | |
| | | PRINCIPAL
AMOUNT
($000) | | | | |
Supranational — 0.1% | |
| | |
European Investment Bank | | | | | | | | |
| | |
2.80%, 1/15/2021 | | AUD | 33 | | | | 26 | |
| | |
0.50%, 6/21/2023 | | AUD | 30 | | | | 23 | |
| | |
Inter-American Development Bank | | | | | | | | |
| | |
0.50%, 5/23/2023 | | CAD | 63 | | | | 49 | |
| | |
4.40%, 1/26/2026 | | CAD | 16 | | | | 15 | |
| | | | | | | | |
| | |
Total Supranational
(Cost $107) | | | | | | | 113 | |
| | | | | | | | |
| | |
| | | NO. OF
RIGHTS
(000) | | | | |
Rights — 0.0% | | | | | |
| |
United States — 0.0% | | | | | |
| | |
Media General, Inc., CVR * ‡
(Cost $—) | | | 1 | | | | — | |
| | | | | | | | |
| | |
| | | PRINCIPAL
AMOUNT
($000) | | | | |
Short-Term Investments — 8.7% | |
| |
Foreign Government Treasury Bills — 2.6% | | | | | |
| | |
Canadian Treasury Bills | | | | | | | | |
| | |
0.31%, 3/4/2021 (n) | | CAD | 1,360 | | | | 1,068 | |
| | |
0.32%, 4/1/2021 (n) | | CAD | 1,360 | | | | 1,068 | |
| | |
0.34%, 4/29/2021 (n) | | CAD | 1,361 | | | | 1,069 | |
| | | | | | | | |
| | |
Total Foreign Government Treasury Bills
(Cost $2,946) | | | | | | | 3,205 | |
| | | | | | | | |
| | |
| | | SHARES
(000) | | | | |
| |
Investment Companies — 5.4% | | | | | |
| | |
JPMorgan Prime Money Market Fund
Class Institutional Shares,
0.09% (f) (o)
(Cost $6,487) | | | 6,486 | | | | 6,489 | |
| | | | | | | | |
|
Investment of Cash Collateral from Securities Loaned — 0.6% | |
| | |
JPMorgan Securities Lending Money
Market Fund Agency SL Class Shares,
0.15% (f) (o) | | | 600 | | | | 600 | |
SEE NOTES TO FINANCIAL STATEMENTS.
| | | | | | | | | | |
| | | | | |
| DECEMBER 31, 2020 | | JPMORGAN INSURANCE TRUST | | | | | | | | 23 |
JPMorgan Insurance Trust Global Allocation Portfolio
SCHEDULE OF PORTFOLIO INVESTMENTS
AS OF DECEMBER 31, 2020 (continued)
| | | | | | | | |
| INVESTMENTS | | SHARES
(000) | | |
VALUE
($000) | |
Short-Term Investments — continued | |
|
Investment of Cash Collateral from Securities Loaned — continued | |
| | |
JPMorgan U.S. Government Money Market Fund Class IM Shares, 0.03% (f) (o) | | | 133 | | | | 133 | |
| | | | | | | | |
| |
Total Investment of Cash Collateral from Securities Loaned
(Cost $733) | | | | 733 | |
| | | | | | | | |
| | |
| | | PRINCIPAL
AMOUNT
($000) | | | | |
|
U.S. Treasury Obligations — 0.1% | |
| | |
U.S. Treasury Bills 0.10%, 3/11/2021 (l) (n)
(Cost $87) | | | 87 | | | | 87 | |
| | | | | | | | |
| | |
Total Short-Term Investments
(Cost $10,253) | | | | | | | 10,514 | |
| | | | | | | | |
| | |
Total Long Positions
(Cost $97,849) | | | | | | | 120,531 | |
| | | | | | | | |
| | |
| | | SHARES
(000) | | | | |
Short Positions — (0.6)% | |
|
Common Stocks — (0.6)% | |
| | |
United States — (0.6)% | | | | | | | | |
| | |
Acacia Communications, Inc. * | | | (2 | ) | | | (129 | ) |
| | |
Beyond Meat, Inc. * | | | — | (a) | | | (37 | ) |
| | |
Intel Corp. | | | (1 | ) | | | (41 | ) |
| | |
Kroger Co. (The) | | | (1 | ) | | | (28 | ) |
| | |
National General Holdings Corp. | | | (3 | ) | | | (102 | ) |
| | |
Navistar International Corp. * | | | — | (a) | | | (21 | ) |
| | |
Pinnacle West Capital Corp. | | | — | (a) | | | (11 | ) |
| | |
Sirius XM Holdings, Inc. | | | (18 | ) | | | (116 | ) |
| | |
Tiffany & Co. | | | (1 | ) | | | (105 | ) |
| | |
Varian Medical Systems, Inc. * | | | (1 | ) | | | (124 | ) |
| | |
Walgreens Boots Alliance, Inc. | | | — | (a) | | | (11 | ) |
| | |
Walmart, Inc. | | | — | (a) | | | (10 | ) |
| | | | | | | | |
| | |
Total Common Stocks
(Proceeds $(713)) | | | | | | | (735 | ) |
| | | | | | | | |
| | |
Total Short Positions
(Proceeds $(713)) | | | | | | | (735 | ) |
| | | | | | | | |
Total Investments — 99.8%
(Cost $97,136) | | | | | | | 119,796 | |
Other Assets Less Liabilities — 0.2% | | | | | | | 274 | |
| | | | | | | | |
NET ASSETS — 100.0% | | | | | | | 120,070 | |
| | | | | | | | |
Percentages indicated are based on net assets.
Summary of Investments by Industry, December 31, 2020
The following table represents the portfolio investments of the Portfolio by industry classifications as a percentage of total investments:
| | | | |
| LONG PORTFOLIO COMPOSITION BY INDUSTRY | | PERCENTAGE | |
| |
Fixed Income | | | 16.8 | % |
| |
International Equity | | | 10.7 | |
| |
Foreign Government Securities | | | 5.9 | |
| |
Banks | | | 4.4 | |
| |
Semiconductors & Semiconductor Equipment | | | 2.7 | |
| |
Foreign Government Treasury Bills | | | 2.7 | |
| |
Insurance | | | 2.6 | |
| |
Pharmaceuticals | | | 2.3 | |
| |
Software | | | 2.0 | |
| |
U.S. Treasury Notes | | | 2.0 | |
| |
Collateralized Mortgage Obligations | | | 1.9 | |
| |
Electric Utilities | | | 1.8 | |
| |
Oil, Gas & Consumable Fuels | | | 1.7 | |
| |
Capital Markets | | | 1.7 | |
| |
Internet & Direct Marketing Retail | | | 1.6 | |
| |
Media | | | 1.6 | |
| |
Machinery | | | 1.6 | |
| |
IT Services | | | 1.5 | |
| |
Commercial Mortgage-Backed Securities | | | 1.5 | |
| |
Technology Hardware, Storage & Peripherals | | | 1.4 | |
| |
Beverages | | | 1.4 | |
| |
Health Care Providers & Services | | | 1.3 | |
| |
Specialty Retail | | | 1.2 | |
| |
Biotechnology | | | 1.2 | |
| |
Automobiles | | | 1.1 | |
| |
Chemicals | | | 1.1 | |
| |
Interactive Media & Services | | | 1.0 | |
| |
Road & Rail | | | 1.0 | |
| |
Textiles, Apparel & Luxury Goods | | | 1.0 | |
| |
Equity Real Estate Investment Trusts (REITs) | | | 1.0 | |
| |
Others (each less than 1.0%) | | | 14.3 | |
| |
Short-Term Investments | | | 6.0 | |
| | | | |
| SHORT PORTFOLIO COMPOSITION BY INDUSTRY | | PERCENTAGE | |
Communications Equipment | | | 17.6 | % |
| |
Health Care Equipment & Supplies | | | 16.9 | |
| |
Media | | | 15.9 | |
| |
Specialty Retail | | | 14.2 | |
| |
Insurance | | | 13.9 | |
| |
Food & Staples Retailing | | | 6.6 | |
| |
Semiconductors & Semiconductor Equipment | | | 5.5 | |
| |
Food Products | | | 5.0 | |
| |
Machinery | | | 2.9 | |
| |
Electric Utilities | | | 1.5 | |
SEE NOTES TO FINANCIAL STATEMENTS.
| | | | | | | | | | |
| | | | | |
| 24 | | | | | | | | JPMORGAN INSURANCE TRUST | | DECEMBER 31, 2020 |
| | |
Abbreviations |
| ABS | | Asset-backed securities |
| ADR | | American Depositary Receipt |
| AUD | | Australian Dollar |
| CAD | | Canadian Dollar |
| CHDI | | Clearing House Electronic Subregister System (CHESS) Depository Interest |
| CVR | | Contingent Value Rights |
| DKK | | Danish Krone |
| ETF | | Exchange-Traded Fund |
| EUR | | Euro |
| FHLMC | | Federal Home Loan Mortgage Corp. |
| FNMA | | Federal National Mortgage Association |
| GBP | | British Pound |
| GNMA | | Government National Mortgage Association |
| ICE | | Intercontinental Exchange |
| IO | | Interest Only represents the right to receive the monthly interest payments on an underlying pool of mortgage loans. The principal amount shown represents the par value on the underlying pool. The yields on these securities are subject to accelerated principal paydowns as a result of prepayment or refinancing of the underlying pool of mortgage instruments. As a result, interest income may be reduced considerably. |
| JPY | | Japanese Yen |
| LIBOR | | London Interbank Offered Rate |
| OYJ | | Public Limited Company |
| Preference | | A special type of equity investment that shares in the earnings of the company, has limited voting rights, and may have a dividend preference. Preference shares may also have liquidation preference. |
| PT | | Limited liability company |
| REIT | | Real Estate Investment Trust |
| SGPS | | Holding company |
| SOFR | | Secured Overnight Financing Rate |
| USD | | United States Dollar |
| |
| (a) | | Amount rounds to less than one thousand. |
| (b) | | The security or a portion of this security is on loan at December 31, 2020. The total value of securities on loan at December 31, 2020 is approximately $693,000. |
| (c) | | Security exempt from registration pursuant to Regulation S under the Securities Act of 1933, as amended. Regulation S applies to securities offerings that are made outside of the United States and do not involve direct selling efforts in the United States and as such may have restrictions on resale. |
| | |
| (d) | | Amount rounds to less than 0.1% of net assets. |
| (e) | | All or a portion of this security is segregated as collateral for short sales. The total value of securities and cash segregated as collateral is approximately $1,791,000 and $728,000, respectively. |
| (f) | | Investment in an affiliated fund, which is registered under the Investment Company Act of 1940, as amended, and is advised by J.P. Morgan Investment Management Inc. |
| (g) | | Securities exempt from registration under Rule 144A or section 4(a)(2), of the Securities Act of 1933, as amended. |
| (h) | | Variable or floating rate security, linked to the referenced benchmark. The interest rate shown is the current rate as of December 31, 2020. |
| (i) | | Step bond. Interest rate is a fixed rate for an initial period that either resets at a specific date or may reset in the future contingent upon a predetermined trigger. The interest rate shown is the current rate as of December 31, 2020. |
| (j) | | Security is perpetual and thus, does not have a predetermined maturity date. The coupon rate for this security is fixed for a period of time and may be structured to adjust thereafter. The date shown, if applicable, reflects the next call date. The coupon rate shown is the rate in effect as of December 31, 2020. |
| (k) | | Security is an interest bearing note with preferred security characteristics. |
| (l) | | All or a portion of this security is deposited with the broker as initial margin for futures contracts. |
| (m) | | Variable or floating rate security, the interest rate of which adjusts periodically based on changes in current interest rates and prepayments on the underlying pool of assets. The interest rate shown is the current rate as of December 31, 2020. |
| (n) | | The rate shown is the effective yield as of December 31, 2020. |
| (o) | | The rate shown is the current yield as of December 31, 2020. |
| * | | Non-income producing security. |
| ‡ | | Value determined using significant unobservable inputs. |
Detailed information about investment portfolios of the underlying funds can be found in shareholder reports filed with the Securities and Exchange Commission (SEC) by each such underlying fund semi-annually on Form N-CSR and in portfolio holdings filed quarterly on Form N-PORT, and are available for download from both the SEC’s as well as each respective underlying fund’s website. Detailed information about underlying J.P. Morgan Funds can also be found at www.jpmorganfunds.com or by calling 1-800-480-4111.
SEE NOTES TO FINANCIAL STATEMENTS.
| | | | | | | | | | |
| | | | | |
| DECEMBER 31, 2020 | | JPMORGAN INSURANCE TRUST | | | | | | | | 25 |
JPMorgan Insurance Trust Global Allocation Portfolio
SCHEDULE OF PORTFOLIO INVESTMENTS
AS OF DECEMBER 31, 2020 (continued)
| | | | | | | | | | | | | | | | | | | | |
| Futures contracts outstanding as of December 31, 2020 (amounts in thousands, except number of contracts): | |
| DESCRIPTION | | NUMBER OF
CONTRACTS | | | EXPIRATION
DATE | | | TRADING
CURRENCY | | | NOTIONAL
AMOUNT
($) | | | VALUE AND
UNREALIZED
APPRECIATION
(DEPRECIATION)
($) | |
Long Contracts | | | | | | | | | | | | | | | | | | | | |
| | | | | |
EURO STOXX 50 Index | | | 6 | | | | 03/2021 | | | | EUR | | | | 260 | | | | 1 | |
| | | | | |
Euro-Bund | | | 1 | | | | 03/2021 | | | | EUR | | | | 217 | | | | 1 | |
| | | | | |
Foreign Exchange AUD/USD | | | 15 | | | | 03/2021 | | | | USD | | | | 1,157 | | | | 33 | |
| | | | | |
Foreign Exchange CAD/USD | | | 35 | | | | 03/2021 | | | | USD | | | | 2,751 | | | | 10 | |
Foreign Exchange EUR/USD | | | 51 | | | | 03/2021 | | | | USD | | | | 7,800 | | | | 75 | |
Foreign Exchange GBP/USD | | | 10 | | | | 03/2021 | | | | USD | | | | 855 | | | | 22 | |
Foreign Exchange JPY/USD | | | 50 | | | | 03/2021 | | | | USD | | | | 6,058 | | | | 71 | |
FTSE 100 Index | | | 1 | | | | 03/2021 | | | | GBP | | | | 88 | | | | (1 | ) |
Japan 10 Year Bond Mini | | | 3 | | | | 03/2021 | | | | JPY | | | | 441 | | | | (1 | ) |
Long Gilt | | | 1 | | | | 03/2021 | | | | GBP | | | | 185 | | | | 2 | |
MSCI EAFE E-Mini Index | | | 4 | | | | 03/2021 | | | | USD | | | | 427 | | | | 5 | |
Russell 2000 E-Mini Index | | | 30 | | | | 03/2021 | | | | USD | | | | 2,967 | | | | 101 | |
S&P 500 E-Mini Index | | | 33 | | | | 03/2021 | | | | USD | | | | 6,180 | | | | 149 | |
SPI 200 Index | | | 2 | | | | 03/2021 | | | | AUD | | | | 252 | | | | (1 | ) |
U.S. Treasury 10 Year Note | | | 110 | | | | 03/2021 | | | | USD | | | | 15,183 | | | | 7 | |
U.S. Treasury Long Bond | | | 5 | | | | 03/2021 | | | | USD | | | | 865 | | | | (9 | ) |
| | | | | | | | | | | | | | | | | | | | |
| | | | | |
| | | | | | | | | | | | | | | | | | | 465 | |
| | | | | | | | | | | | | | | | | | | | |
| | | | | |
Short Contracts | | | | | | | | | | | | | | | | | | | | |
Euro-Bobl | | | (1 | ) | | | 03/2021 | | | | EUR | | | | (165 | ) | | | — | (a) |
Euro-Schatz | | | (7 | ) | | | 03/2021 | | | | EUR | | | | (960 | ) | | | — | (a) |
MSCI Emerging Markets E-Mini Index | | | (36 | ) | | | 03/2021 | | | | USD | | | | (2,318 | ) | | | (61 | ) |
U.S. Treasury 2 Year Note | | | (1 | ) | | | 03/2021 | | | | USD | | | | (221 | ) | | | — | (a) |
U.S. Treasury 10 Year Ultra Note | | | (2 | ) | | | 03/2021 | | | | USD | | | | (312 | ) | | | 2 | |
U.S. Treasury Long Bond | | | (22 | ) | | | 03/2021 | | | | USD | | | | (3,805 | ) | | | 45 | |
U.S. Treasury Ultra Bond | | | (1 | ) | | | 03/2021 | | | | USD | | | | (213 | ) | | | 3 | |
| | | | | | | | | | | | | | | | | | | | |
| | | | | |
| | | | | | | | | | | | | | | | | | | (11 | ) |
| | | | | | | | | | | | | | | | | | | | |
| | | | | |
| | | | | | | | | | | | | | | | | | | 454 | |
| | | | | | | | | | | | | | | | | | | | |
| | |
Abbreviations |
| AUD | | Australian Dollar |
| CAD | | Canadian Dollar |
| EAFE | | Europe, Australasia and Far East |
| EUR | | Euro |
| FTSE | | Financial Times and the London Stock Exchange |
| | |
| | |
| GBP | | British Pound |
| JPY | | Japanese Yen |
| MSCI | | Morgan Stanley Capital International |
| SPI | | Australian Securities Exchange |
| USD | | United States Dollar |
(a) Amount rounds to less than one thousand.
SEE NOTES TO FINANCIAL STATEMENTS.
| | | | | | | | | | |
| | | | | |
| 26 | | | | | | | | JPMORGAN INSURANCE TRUST | | DECEMBER 31, 2020 |
| | | | | | | | | | | | | | | | | | | | | | |
| Forward foreign currency exchange contracts outstanding as of December 31, 2020 (amounts in thousands): | |
| CURRENCY PURCHASED | | | CURRENCY SOLD | | | COUNTERPARTY | | SETTLEMENT
DATE | | | Unrealized
Appreciation
(Depreciation)
($) | |
| CAD | | | 49 | | | | USD | | | | 38 | | | State Street Corp. | | | 1/5/2021 | | | | 1 | |
| EUR | | | 118 | | | | USD | | | | 141 | | | TD Bank Financial Group | | | 1/5/2021 | | | | 3 | |
| GBP | | | 14 | | | | USD | | | | 18 | | | HSBC Bank, NA | | | 1/5/2021 | | | | — | (a) |
| GBP | | | 10 | | | | USD | | | | 14 | | | State Street Corp. | | | 1/5/2021 | | | | — | (a) |
| GBP | | | 10 | | | | USD | | | | 13 | | | TD Bank Financial Group | | | 1/5/2021 | | | | — | (a) |
| JPY | | | 10,850 | | | | USD | | | | 105 | | | TD Bank Financial Group | | | 1/5/2021 | | | | — | (a) |
| GBP | | | 43 | | | | USD | | | | 57 | | | State Street Corp. | | | 1/29/2021 | | | | 1 | |
| EUR | | | 13 | | | | USD | | | | 15 | | | Merrill Lynch International | | | 2/3/2021 | | | | — | (a) |
| GBP | | | 13 | | | | USD | | | | 18 | | | TD Bank Financial Group | | | 2/3/2021 | | | | — | (a) |
| USD | | | 341 | | | | AUD | | | | 441 | | | Merrill Lynch International | | | 2/3/2021 | | | | 1 | |
| USD | | | 56 | | | | DKK | | | | 338 | | | BNP Paribas | | | 2/3/2021 | | | | — | (a) |
| USD | | | 4,448 | | | | EUR | | | | 3,625 | | | Goldman Sachs International | | | 2/3/2021 | | | | 17 | |
| USD | | | 13 | | | | EUR | | | | 11 | | | TD Bank Financial Group | | | 2/3/2021 | | | | — | (a) |
| USD | | | 2,329 | | | | JPY | | | | 239,925 | | | Merrill Lynch International | | | 2/3/2021 | | | | 4 | |
| USD | | | 42 | | | | SEK | | | | 344 | | | Merrill Lynch International | | | 2/3/2021 | | | | — | (a) |
| | | | | | | | | | | | | | | | | | | | | | |
Total unrealized appreciation | | | | | | | 27 | |
| | | | | | | | | | | | | | | | | | | | | | |
| USD | | | 22 | | | | AUD | | | | 29 | | | Standard Chartered Bank | | | 1/5/2021 | | | | — | (a) |
| USD | | | 304 | | | | AUD | | | | 412 | | | State Street Corp. | | | 1/5/2021 | | | | (14 | ) |
| USD | | | 243 | | | | CAD | | | | 316 | | | BNP Paribas | | | 1/5/2021 | | | | (5 | ) |
| USD | | | 13 | | | | CAD | | | | 16 | | | State Street Corp. | | | 1/5/2021 | | | | — | (a) |
| USD | | | 55 | | | | DKK | | | | 338 | | | TD Bank Financial Group | | | 1/5/2021 | | | | (1 | ) |
| USD | | | 4,357 | | | | EUR | | | | 3,631 | | | Barclays Bank plc | | | 1/5/2021 | | | | (79 | ) |
| USD | | | 58 | | | | EUR | | | | 47 | | | Citibank, NA | | | 1/5/2021 | | | | — | (a) |
| USD | | | 14 | | | | EUR | | | | 11 | | | Merrill Lynch International | | | 1/5/2021 | | | | — | (a) |
| USD | | | 64 | | | | EUR | | | | 53 | | | State Street Corp. | | | 1/5/2021 | | | | — | (a) |
| USD | | | 14 | | | | GBP | | | | 10 | | | Barclays Bank plc | | | 1/5/2021 | | | | — | (a) |
| USD | | | 910 | | | | GBP | | | | 683 | | | Merrill Lynch International | | | 1/5/2021 | | | | (23 | ) |
| USD | | | 33 | | | | GBP | | | | 25 | | | State Street Corp. | | | 1/5/2021 | | | | (1 | ) |
| USD | | | 2,413 | | | | JPY | | | | 250,776 | | | BNP Paribas | | | 1/5/2021 | | | | (16 | ) |
| USD | | | 41 | | | | SEK | | | | 344 | | | State Street Corp. | | | 1/5/2021 | | | | (1 | ) |
| USD | | | 3,085 | | | | CAD | | | | 4,052 | | | HSBC Bank, NA | | | 1/19/2021 | | | | (99 | ) |
| AUD | | | 567 | | | | GBP | | | | 323 | | | State Street Corp. | | | 1/29/2021 | | | | (5 | ) |
| JPY | | | 35,366 | | | | GBP | | | | 257 | | | State Street Corp. | | | 1/29/2021 | | | | (9 | ) |
| USD | | | 57 | | | | JPY | | | | 5,911 | | | BNP Paribas | | | 1/29/2021 | | | | — | (a) |
| USD | | | 222 | | | | CAD | | | | 283 | | | Merrill Lynch International | | | 2/3/2021 | | | | — | (a) |
| USD | | | 15 | | | | GBP | | | | 11 | | | Barclays Bank plc | | | 2/3/2021 | | | | — | (a) |
| USD | | | 934 | | | | GBP | | | | 684 | | | State Street Corp. | | | 2/3/2021 | | | | (2 | ) |
| | | | | | | | | | | | | | | | | | | | | | |
Total unrealized depreciation | | | | (255 | ) |
| | | | | | | | | | | | | | | | | | | | | | |
Net unrealized depreciation | | | | (228 | ) |
| | | | | | | | | | | | | | | | | | | | | | |
| | |
Abbreviations |
| AUD | | Australian Dollar |
| CAD | | Canadian Dollar |
| DKK | | Danish Krone |
| EUR | | Euro |
| | |
| | |
| GBP | | British Pound |
| JPY | | Japanese Yen |
| SEK | | Swedish Krona |
| USD | | United States Dollar |
(a) Amount rounds to less than one thousand.
SEE NOTES TO FINANCIAL STATEMENTS.
| | | | | | | | | | |
| | | | | |
| DECEMBER 31, 2020 | | JPMORGAN INSURANCE TRUST | | | | | | | | 27 |
STATEMENT OF ASSETS AND LIABILITIES
AS OF DECEMBER 31, 2020
(Amounts in thousands, except per share amounts)
| | | | |
| |
| | | JPMorgan
Insurance Trust
Global Allocation
Portfolio | |
ASSETS: | |
Investments in non-affiliates, at value | | $ | 79,886 | |
Investments in affiliates, at value | | | 39,643 | |
Investment of cash collateral received from securities loaned, at value (See Note 2.C.) | | | 733 | |
Options purchased, at value | | | 269 | |
Cash | | | 209 | |
Foreign currency, at value | | | 92 | |
Deposits at broker for futures contracts | | | 121 | |
Deposits at broker for securities sold short | | | 728 | |
Receivables: | | | | |
Investment securities sold | | | 161 | |
Portfolio shares sold | | | — | (a) |
Interest from non-affiliates | | | 135 | |
Dividends from non-affiliates | | | 31 | |
Dividends from affiliates | | | 1 | |
Tax reclaims | | | 48 | |
Securities lending income (See Note 2.C.) | | | — | (a) |
Variation margin on futures contracts | | | 7 | |
Unrealized appreciation on forward foreign currency exchange contracts | | | 27 | |
| | | | |
Total Assets | | | 122,091 | |
| | | | |
|
LIABILITIES: | |
Payables: | | | | |
Securities sold short, at value | | | 735 | |
Dividend expense to non-affiliates on securities sold short | | | — | (a) |
Investment securities purchased | | | 133 | |
Interest expense to non-affiliates on securities sold short | | | — | (a) |
Collateral received on securities loaned (See Note 2.C.) | | | 733 | |
Portfolio shares redeemed | | | 28 | |
Unrealized depreciation on forward foreign currency exchange contracts | | | 255 | |
Accrued liabilities: | | | | |
Investment advisory fees | | | 9 | |
Distribution fees | | | 14 | |
Custodian and accounting fees | | | 38 | |
Trustees’ and Chief Compliance Officer’s fees | | | — | (a) |
Other | | | 76 | |
| | | | |
Total Liabilities | | | 2,021 | |
| | | | |
Net Assets | | $ | 120,070 | |
| | | | |
| (a) | Amount rounds to less than one thousand. |
SEE NOTES TO FINANCIAL STATEMENTS.
| | | | | | | | | | |
| | | | | |
| 28 | | | | | | | | JPMORGAN INSURANCE TRUST | | DECEMBER 31, 2020 |
| | | | |
| |
| | | JPMorgan
Insurance Trust
Global Allocation
Portfolio | |
NET ASSETS: | |
Paid-in-Capital | | $ | 94,374 | |
Total distributable earnings (loss) | | | 25,696 | |
| | | | |
Total Net Assets | | $ | 120,070 | |
| | | | |
| |
Net Assets: | | | | |
Class 1 | | $ | 55,575 | |
Class 2 | | | 64,495 | |
| | | | |
Total | | $ | 120,070 | |
| | | | |
| |
Outstanding units of beneficial interest (shares) (unlimited number of shares authorized, no par value): | | | | |
Class 1 | | | 2,806 | |
Class 2 | | | 3,268 | |
| |
Net Asset Value (a): | | | | |
Class 1 — Offering and redemption price per share | | $ | 19.81 | |
Class 2 — Offering and redemption price per share | | | 19.73 | |
| |
Cost of investments in non-affiliates | | $ | 62,705 | |
Cost of investments in affiliates | | | 34,066 | |
Cost of options purchased | | | 345 | |
Cost of foreign currency | | | 91 | |
Investment securities on loan, at value (See Note 2.C.) | | | 693 | |
Cost of investment of cash collateral (See Note 2.C.) | | | 733 | |
Proceeds from securities sold short | | | 713 | |
| (a) | Per share amounts may not recalculate due to rounding of net assets and/or shares outstanding. |
SEE NOTES TO FINANCIAL STATEMENTS.
| | | | | | | | | | |
| | | | | |
| DECEMBER 31, 2020 | | JPMORGAN INSURANCE TRUST | | | | | | | | 29 |
STATEMENT OF OPERATIONS
FOR THE YEAR ENDED DECEMBER 31, 2020
(Amounts in thousands)
| | | | |
| |
| | | JPMorgan
Insurance Trust
Global Allocation
Portfolio | |
INVESTMENT INCOME: | |
Interest income from non-affiliates | | $ | 700 | |
Interest income from affiliates | | | — | (a) |
Dividend income from non-affiliates | | | 895 | |
Dividend income from affiliates | | | 618 | |
Income from securities lending (net) (See Note 2.C.) | | | 3 | |
Foreign taxes withheld (net) | | | (40 | ) |
| | | | |
Total investment income | | | 2,176 | |
| | | | |
|
EXPENSES: | |
Investment advisory fees | | | 558 | |
Administration fees | | | 76 | |
Distribution fees: | | | | |
Class 2 | | | 142 | |
Custodian and accounting fees | | | 181 | |
Interest expense to affiliates | | | — | (a) |
Professional fees | | | 107 | |
Trustees’ and Chief Compliance Officer’s fees | | | 25 | |
Printing and mailing costs | | | 27 | |
Transfer agency fees (See Note 2.I.) | | | 12 | |
Dividend expense to non-affiliates on securities sold short | | | 8 | |
Interest expense to non-affiliates on securities sold short | | | 1 | |
Other | | | 11 | |
| | | | |
Total expenses | | | 1,148 | |
| | | | |
Less fees waived | | | (204 | ) |
Less expense reimbursements | | | (102 | ) |
| | | | |
Net expenses | | | 842 | |
| | | | |
Net investment income (loss) | | | 1,334 | |
| | | | |
| |
REALIZED/UNREALIZED GAINS (LOSSES): | | | | |
Net realized gain (loss) on transactions from: | |
Investments in non-affiliates | | | 673 | |
Investments in affiliates | | | (43 | ) |
Options purchased | | | (981 | ) |
Futures contracts | | | 4,710 | |
Securities sold short | | | (106 | ) |
Foreign currency transactions | | | (47 | ) |
Forward foreign currency exchange contracts | | | (437 | ) |
Options written | | | 4 | |
| | | | |
Net realized gain (loss) | | | 3,773 | |
| | | | |
Distributions of capital gains received from investment company affiliates | | | 10 | |
Change in net unrealized appreciation/depreciation on: | |
Investments in non-affiliates | | | 7,665 | |
Investments in affiliates | | | 3,818 | |
Options purchased | | | (183 | ) |
Futures contracts | | | 172 | |
Securities sold short | | | (16 | ) |
Foreign currency translations | | | (45 | ) |
Forward foreign currency exchange contracts | | | 9 | |
| | | | |
Change in net unrealized appreciation/depreciation | | | 11,420 | |
| | | | |
Net realized/unrealized gains (losses) | | | 15,203 | |
| | | | |
Change in net assets resulting from operations | | $ | 16,537 | |
| | | | |
| (a) | Amount rounds to less than one thousand. |
SEE NOTES TO FINANCIAL STATEMENTS.
| | | | | | | | | | |
| | | | | |
| 30 | | | | | | | | JPMORGAN INSURANCE TRUST | | DECEMBER 31, 2020 |
STATEMENTS OF CHANGES IN NET ASSETS
FOR THE PERIODS INDICATED
(Amounts in thousands)
| | | | | | | | |
| | | JPMorgan Insurance Trust Global
Allocation Portfolio | |
| | | Year Ended
December 31, 2020 | | | Year Ended
December 31, 2019 | |
CHANGE IN NET ASSETS RESULTING FROM OPERATIONS: | |
Net investment income (loss) | | $ | 1,334 | | | $ | 1,617 | |
Net realized gain (loss) | | | 3,773 | | | | 1,181 | |
Distributions of capital gains received from investment company affiliates | | | 10 | | | | — | (a) |
Change in net unrealized appreciation/depreciation | | | 11,420 | | | | 10,731 | |
| | | | | | | | |
Change in net assets resulting from operations | | | 16,537 | | | | 13,529 | |
| | | | | | | | |
| | |
DISTRIBUTIONS TO SHAREHOLDERS: | | | | | | | | |
Class 1 | | | (1,226 | ) | | | (810 | ) |
Class 2 | | | (1,437 | ) | | | (1,095 | ) |
| | | | | | | | |
Total distributions to shareholders | | | (2,663 | ) | | | (1,905 | ) |
| | | | | | | | |
|
CAPITAL TRANSACTIONS: | |
Change in net assets resulting from capital transactions | | | 7,095 | | | | 8,282 | |
| | | | | | | | |
| | |
NET ASSETS: | | | | | | | | |
Change in net assets | | | 20,969 | | | | 19,906 | |
Beginning of period | | | 99,101 | | | | 79,195 | |
| | | | | | | | |
End of period | | $ | 120,070 | | | $ | 99,101 | |
| | | | | | | | |
| | |
CAPITAL TRANSACTIONS: | | | | | | | | |
Class 1 | | | | | | | | |
Proceeds from shares issued | | $ | 8,707 | | | $ | 8,716 | |
Distributions reinvested | | | 1,226 | | | | 810 | |
Cost of shares redeemed | | | (2,183 | ) | | | (3,254 | ) |
| | | | | | | | |
Change in net assets resulting from Class 1 capital transactions | | | 7,750 | | | | 6,272 | |
| | | | | | | | |
Class 2 | | | | | | | | |
Proceeds from shares issued | | | 8,940 | | | | 12,007 | |
Distributions reinvested | | | 1,437 | | | | 1,095 | |
Cost of shares redeemed | | | (11,032 | ) | | | (11,092 | ) |
| | | | | | | | |
Change in net assets resulting from Class 2 capital transactions | | | (655 | ) | | | 2,010 | |
| | | | | | | | |
Total change in net assets resulting from capital transactions | | $ | 7,095 | | | $ | 8,282 | |
| | | | | | | | |
|
SHARE TRANSACTIONS: | |
Class 1 | |
Issued | | | 512 | | | | 525 | |
Reinvested | | | 78 | | | | 50 | |
Redeemed | | | (125 | ) | | | (197 | ) |
| | | | | | | | |
Change in Class 1 Shares | | | 465 | | | | 378 | |
| | | | | | | | |
Class 2 | |
Issued | | | 536 | | | | 721 | |
Reinvested | | | 91 | | | | 68 | |
Redeemed | | | (646 | ) | | | (671 | ) |
| | | | | | | | |
Change in Class 2 Shares | | | (19 | ) | | | 118 | |
| | | | | | | | |
| (a) | Amount rounds to less than one thousand. |
SEE NOTES TO FINANCIAL STATEMENTS.
| | | | | | | | | | |
| | | | | |
| DECEMBER 31, 2020 | | JPMORGAN INSURANCE TRUST | | | | | | | | 31 |
FINANCIAL HIGHLIGHTS
FOR THE PERIODS INDICATED
| | | | | | | | | | | | | | | | | | | | | | | | | | | | |
| | | Per share operating performance | |
| | | | | | Investment operations | | | Distributions | |
| | | Net asset
value,
beginning
of period | | | Net
investment
income
(loss) (a)(b) | | |
Net realized
and unrealized
gains
(losses) on
investments | | | Total from
investment
operations | | | Net
investment
income | | | Net
realized
gain | | | Total
distributions | |
JPMorgan Insurance Trust Global Allocation Portfolio | |
Class 1 | |
Year Ended December 31, 2020 | | $ | 17.65 | | | $ | 0.25 | | | $ | 2.40 | | | $ | 2.65 | | | $ | (0.33 | ) | | $ | (0.16 | ) | | $ | (0.49 | ) |
Year Ended December 31, 2019 | | | 15.47 | | | | 0.33 | | | | 2.24 | | | | 2.57 | | | | (0.39 | ) | | | — | | | | (0.39 | ) |
Year Ended December 31, 2018 | | | 16.57 | | | | 0.29 | | | | (1.29 | ) | | | (1.00 | ) | | | — | | | | (0.10 | ) | | | (0.10 | ) |
Year Ended December 31, 2017 | | | 14.89 | | | | 0.29 | | | | 2.25 | | | | 2.54 | | | | (0.20 | ) | | | (0.66 | ) | | | (0.86 | ) |
Year Ended December 31, 2016 | | | 14.46 | | | | 0.35 | | | | 0.54 | | | | 0.89 | | | | (0.46 | ) | | | — | (i) | | | (0.46 | ) |
|
Class 2 | |
Year Ended December 31, 2020 | | | 17.58 | | | | 0.21 | | | | 2.39 | | | | 2.60 | | | | (0.29 | ) | | | (0.16 | ) | | | (0.45 | ) |
Year Ended December 31, 2019 | | | 15.41 | | | | 0.29 | | | | 2.23 | | | | 2.52 | | | | (0.35 | ) | | | — | | | | (0.35 | ) |
Year Ended December 31, 2018 | | | 16.55 | | | | 0.25 | | | | (1.29 | ) | | | (1.04 | ) | | | — | | | | (0.10 | ) | | | (0.10 | ) |
Year Ended December 31, 2017 | | | 14.87 | | | | 0.26 | | | | 2.24 | | | | 2.50 | | | | (0.16 | ) | | | (0.66 | ) | | | (0.82 | ) |
Year Ended December 31, 2016 | | | 14.45 | | | | 0.30 | | | | 0.54 | | | | 0.84 | | | | (0.42 | ) | | | — | (i) | | | (0.42 | ) |
| (a) | Net investment income (loss) is affected by timing of distributions from Underlying Funds. |
| (b) | Calculated based upon average shares outstanding. |
| (c) | Includes adjustments in accordance with accounting principles generally accepted in the United States of America and as such, the net asset values for financial reporting purposes and the returns based upon those net asset values may differ from the net asset values and returns for shareholder transactions. |
| (d) | Total returns do not include charges that will be imposed by variable insurance contracts or by Eligible Plans. If these charges were reflected, returns would be lower than those shown. |
| (e) | Does not include expenses of Underlying Funds. |
| (f) | Includes earnings credits and interest expense, if applicable, each of which is less than 0.005% unless otherwise noted. |
| (g) | The Portfolio presents portfolio turnover in two ways, one including securities sold short and the other excluding securities sold short. |
| (h) | The net expenses and expenses without waivers, reimbursements and earnings credits (excluding dividend and interest expense for securities sold short) for Class 1 are 0.68% and 0.97% for the year ended December 31, 2020, 0.77% and 1.03% for the year ended December 31, 2019, 0.77% and 1.10% for the year ended December 31, 2018 and 0.76% and 1.11% for the year ended December 31, 2017; for Class 2 are 0.93% and 1.24% for the year ended December 31, 2020, 1.02% and 1.28% for the year ended December 31, 2019, 1.02% and 1.34% for the year ended December 31, 2018 and 1.01% and 1.32% for the year ended December 31, 2017, respectively. |
| (i) | Amount rounds to less than $0.005. |
| (j) | Dividend expense on securities sold short is less than 0.005%. |
SEE NOTES TO FINANCIAL STATEMENTS.
| | | | | | | | | | |
| | | | | |
| 32 | | | | | | | | JPMORGAN INSURANCE TRUST | | DECEMBER 31, 2020 |
| | | | | | | | | | | | | | | | | | | | | | | | | | | | | | |
| | | Ratios/Supplemental data | |
| | | | | | | | | | Ratios to average net assets | |
Net asset
value,
end of
period | | | Total
return (c)(d) | | | Net assets,
end of
period
(000’s) | | | Net expenses
(including
dividend and
interest
expense for
securities sold
short) (e)(f) | | | Net
investment
income
(loss) (a) | | | Expenses
without waivers,
reimbursements and
earnings credits
(including dividend
and interest expense
for securities sold
short) (e) | | | Portfolio
turnover rate
(excluding
securities sold
short) (g) | | | Portfolio
turnover rate
(including
securities sold
short) (g) | |
| | |
| | |
| $ | 19.81 | | | | 15.69 | % | | $ | 55,575 | | | | 0.69 | %(h) | | | 1.45 | % | | | 0.98 | %(h) | | | 113 | % | | | 123 | % |
| | 17.65 | | | | 16.87 | | | | 41,311 | | | | 0.79 | (h) | | | 1.99 | | | | 1.05 | (h) | | | 98 | | | | 116 | |
| | 15.47 | | | | (6.06 | ) | | | 30,366 | | | | 0.81 | (h) | | | 1.79 | | | | 1.14 | (h) | | | 110 | | | | 141 | |
| | 16.57 | | | | 17.11 | | | | 14,308 | | | | 0.79 | (h) | | | 1.76 | | | | 1.14 | (h) | | | 80 | | | | 92 | |
| | 14.89 | | | | 6.13 | | | | 4,664 | | | | 0.77 | (j) | | | 2.34 | | | | 1.20 | (j) | | | 60 | | | | 61 | |
|
| | |
| | 19.73 | | | | 15.40 | | | | 64,495 | | | | 0.94 | (h) | | | 1.21 | | | | 1.25 | (h) | | | 113 | | | | 123 | |
| | 17.58 | | | | 16.58 | | | | 57,790 | | | | 1.04 | (h) | | | 1.73 | | | | 1.30 | (h) | | | 98 | | | | 116 | |
| | 15.41 | | | | (6.31 | ) | | | 48,829 | | | | 1.06 | (h) | | | 1.52 | | | | 1.38 | (h) | | | 110 | | | | 141 | |
| | 16.55 | | | | 16.85 | | | | 48,470 | | | | 1.04 | (h) | | | 1.59 | | | | 1.35 | (h) | | | 80 | | | | 92 | |
| | 14.87 | | | | 5.84 | | | | 49,869 | | | | 1.02 | (j) | | | 2.04 | | | | 1.45 | (j) | | | 60 | | | | 61 | |
SEE NOTES TO FINANCIAL STATEMENTS.
| | | | | | | | | | |
| | | | | |
| DECEMBER 31, 2020 | | JPMORGAN INSURANCE TRUST | | | | | | | | 33 |
NOTES TO FINANCIAL STATEMENTS
AS OF DECEMBER 31, 2020
1. Organization
JPMorgan Insurance Trust (the “Trust”) is registered under the Investment Company Act of 1940, as amended (the “1940 Act”), as an open-end management investment company and is a Massachusetts business trust.
The following is a separate portfolio of the Trust (the “Portfolio”) covered by this report:
| | | | |
| | | Classes Offered | | Diversification Classification |
| JPMorgan Insurance Trust Global Allocation Portfolio | | Class 1 and Class 2 | | Diversified |
The investment objective of the Portfolio is to seek to maximize long-term total return.
Portfolio shares are offered only to separate accounts of participating insurance companies and Eligible Plans. Individuals may not purchase shares directly from the Portfolio.
All classes of shares have equal rights as to earnings, assets and voting privileges, except that each class may bear different transfer agency fees and distribution fees and each class has exclusive voting rights with respect to its distribution plan and administrative services plan.
J.P. Morgan Investment Management Inc. (“JPMIM”), an indirect, wholly-owned subsidiary of JPMorgan Chase & Co. (“JPMorgan”), acts as Adviser (the “Adviser”) and Administrator (the “Administrator”) to the Portfolio.
2. Significant Accounting Policies
The following is a summary of significant accounting policies followed by the Portfolio in the preparation of its financial statements. The Portfolio is an investment company and, accordingly, follows the investment company accounting and reporting guidance of the Financial Accounting Standards Board (“FASB”) Accounting Standards Codification Topic 946 — Investment Companies, which is part of U.S. generally accepted accounting principles (“GAAP”). The preparation of financial statements in conformity with GAAP requires management to make estimates and assumptions that affect (i) the reported amounts of assets and liabilities, (ii) disclosure of contingent assets and liabilities at the date of the financial statements, and (iii) the reported amounts of increases and decreases in net assets from operations during the reporting period. Actual results could differ from those estimates.
A. Valuation of Investments — Investments are valued in accordance with GAAP and the Portfolio’s valuation policies set forth by, and under the supervision and responsibility of, the Board of Trustees of the Trust (the “Board”), which established the following approach to valuation, as described more fully below: (i) investments for which market quotations are readily available shall be valued at their market value and (ii) all other investments for which market quotations are not readily available shall be valued at their fair value as determined in good faith by the Board.
The Administrator has established the J.P. Morgan Asset Management Americas Valuation Committee (“AVC”) to assist the Board with the oversight and monitoring of the valuation of the Portfolio’s investments. The Administrator implements the valuation policies of the Portfolio’s investments, as directed by the Board. The AVC oversees and carries out the policies for the valuation of investments held in the Portfolio. This includes monitoring the appropriateness of fair values based on results of ongoing valuation oversight including, but not limited to, consideration of macro or security specific events, market events, and pricing vendor and broker due diligence. The Administrator is responsible for discussing and assessing the potential impacts to the fair values on an ongoing basis, and, at least on a quarterly basis, with the AVC and the Board.
A market-based approach is primarily used to value the Portfolio’s investments. Investments for which market quotations are not readily available are fair valued by approved affiliated and/or unaffiliated pricing vendors or third party broker-dealers (collectively referred to as “Pricing Services”) or may be internally fair valued using methods set forth by the valuation policies approved by the Board. This may include the use of related or comparable assets or liabilities, recent transactions, market multiples, book values and other relevant information for the investment. An income-based valuation approach may be used in which the anticipated future cash flows of the investment are discounted to calculate the fair value. Discounts may also be applied due to the nature or duration of any restrictions on the disposition of the investments. Valuations may be based upon current market prices of securities that are comparable in coupon, rating, maturity and industry. It is possible that the estimated values may differ significantly from the values that would have been used had a ready market for the investments existed, and such differences could be material.
Fixed income instruments are valued based on prices received from Pricing Services. The Pricing Services use multiple valuation techniques to determine the valuation of fixed income instruments. In instances where sufficient market activity exists, the Pricing Services may utilize a market-based approach through which trades or quotes from market makers are used to determine the valuation of these instruments. In instances where sufficient market activity may not exist, the Pricing Services also utilize proprietary valuation models which may consider market transactions in comparable securities and the various relationships between securities in determining fair value and/or market characteristics in order to estimate the relevant cash flows, which are then discounted to calculate the fair values.
Equities and other exchange-traded instruments are valued at the last sale price or official market closing price on the primary exchange on which the instrument is traded before the net asset values (“NAV”) of the Portfolio are calculated on a valuation date. Certain foreign equity instruments, as well as certain derivatives with foreign equity reference obligations, are valued by applying international fair value factors provided by approved Pricing Services. The factors seek to adjust the local closing price for movements of local markets post-closing, but prior to the time the NAVs are calculated.
| | | | | | | | | | |
| | | | | |
| 34 | | | | | | | | JPMORGAN INSURANCE TRUST | | DECEMBER 31, 2020 |
Investments in open-end investment companies (“Underlying Funds”) are valued at each Underlying Fund’s NAV per share as of the report date.
Futures contracts and options are generally valued on the basis of available market quotations. Forward foreign currency exchange contracts are valued utilizing market quotations from approved Pricing Services.
See the table on “Quantitative Information about Level 3 Fair Value Measurements” for information on the valuation techniques and inputs used to value level 3 securities held by the Portfolio at December 31, 2020.
Valuations reflected in this report are as of the report date. As a result, changes in valuation due to market events and/or issuer-related events after the report date and prior to issuance of the report are not reflected herein.
The various inputs that are used in determining the valuation of the Portfolio’s investments are summarized into the three broad levels listed below.
| • | | Level 1 — Unadjusted inputs using quoted prices in active markets for identical investments. |
| • | | Level 2 — Other significant observable inputs including, but not limited to, quoted prices for similar investments, inputs other than quoted prices that are observable for investments (such as interest rates, prepayment speeds, credit risk, etc.) or other market corroborated inputs. |
| • | | Level 3 — Significant inputs based on the best information available in the circumstances, to the extent observable inputs are not available (including the Portfolio’s assumptions in determining the fair value of investments). |
A financial instrument’s level within the fair value hierarchy is based on the lowest level of any input, both individually and in the aggregate, that is significant to the fair value measurement. The inputs or methodology used for valuing instruments are not necessarily an indication of the risk associated with investing in those instruments.
The following table represents each valuation input as presented on the Schedule of Portfolio Investments (“SOI”) (amounts in thousands):
| | | | | | | | | | | | | | | | |
| | | Level 1
Quoted prices | | | Level 2
Other significant
observable inputs | | | Level 3
Significant unobservable inputs | | | Total | |
Investments in Securities | |
Asset-Backed Securities | |
United States | | $ | — | | | $ | 94 | | | $ | 458 | | | $ | 552 | |
Collateralized Mortgage Obligations | |
United States | | | — | | | | 1,373 | | | | 873 | | | | 2,246 | |
Commercial Mortgage-Backed Securities | |
United States | | | — | | | | 1,001 | | | | 782 | | | | 1,783 | |
Common Stocks | |
Australia | | | — | | | | 919 | | | | — | | | | 919 | |
Austria | | | — | | | | 171 | | | | — | | | | 171 | |
Belgium | | | — | | | | 212 | | | | — | | | | 212 | |
Canada | | | 636 | | | | — | | | | — | | | | 636 | |
China | | | 49 | | | | 1,100 | | | | — | | | | 1,149 | |
Denmark | | | — | | | | 821 | | | | — | | | | 821 | |
Finland | | | — | | | | 181 | | | | — | | | | 181 | |
France | | | — | | | | 3,058 | | | | — | | | | 3,058 | |
Germany | | | — | | | | 1,937 | | | | — | | | | 1,937 | |
Hong Kong | | | — | | | | 698 | | | | — | | | | 698 | |
India | | | 435 | | | | — | | | | — | | | | 435 | |
Indonesia | | | — | | | | 147 | | | | — | | | | 147 | |
Ireland | | | 130 | | | | 50 | | | | — | | | | 180 | |
Italy | | | 72 | | | | 130 | | | | — | | | | 202 | |
Japan | | | — | | | | 3,208 | | | | — | | | | 3,208 | |
Macau | | | — | | | | 15 | | | | — | | | | 15 | |
Netherlands | | | 433 | | | | 1,185 | | | | — | | | | 1,618 | |
New Zealand | | | — | | | | 11 | | | | — | | | | 11 | |
Norway | | | — | | | | 30 | | | | — | | | | 30 | |
Peru | | | 49 | | | | — | | | | — | | | | 49 | |
Portugal | | | — | | | | 4 | | | | — | | | | 4 | |
Singapore | | | — | | | | 68 | | | | — | | | | 68 | |
South Africa | | | — | | | | 129 | | | | — | | | | 129 | |
South Korea | | | — | | | | 768 | | | | — | | | | 768 | |
Spain | | | — | | | | 753 | | | | — | | | | 753 | |
Sweden | | | — | | | | 872 | | | | — | | | | 872 | |
| | | | | | | | | | |
| | | | | |
| DECEMBER 31, 2020 | | JPMORGAN INSURANCE TRUST | | | | | | | | 35 |
NOTES TO FINANCIAL STATEMENTS
AS OF DECEMBER 31, 2020 (continued)
| | | | | | | | | | | | | | | | |
| | | Level 1
Quoted prices | | | Level 2
Other significant
observable inputs | | | Level 3
Significant unobservable inputs | | | Total | |
Switzerland | | $ | — | | | $ | 2,095 | | | $ | — | | | $ | 2,095 | |
Taiwan | | | 563 | | | | — | | | | — | | | | 563 | |
United Kingdom | | | 476 | | | | 2,868 | | | | — | | | | 3,344 | |
United States | | | 28,158 | | | | 203 | | | | — | | | | 28,361 | |
| | | | | | | | | | | | | | | | |
Total Common Stocks | | | 31,001 | | | | 21,633 | | | | — | | | | 52,634 | |
| | | | | | | | | | | | | | | | |
Corporate Bonds | | | — | | | | 9,710 | | | | — | | | | 9,710 | |
Foreign Government Securities | | | — | | | | 7,154 | | | | — | | | | 7,154 | |
Investment Companies | | | 33,154 | | | | — | | | | — | | | | 33,154 | |
Options Purchased | |
Call Options Purchased | | | 269 | | | | — | | | | — | | | | 269 | |
Rights | | | — | | | | — | | | | — | (a) | | | — | (a) |
Supranational | | | — | | | | 113 | | | | — | | | | 113 | |
U.S. Treasury Obligations | | | — | | | | 2,402 | | | | — | | | | 2,402 | |
Short-Term Investments | |
Foreign Government Treasury Bills | | | — | | | | 3,205 | | | | — | | | | 3,205 | |
Investment Companies | | | 6,489 | | | | — | | | | — | | | | 6,489 | |
Investment of cash collateral from securities loaned | | | 733 | | | | — | | | | — | | | | 733 | |
U.S. Treasury Obligations | | | — | | | | 87 | | | | — | | | | 87 | |
| | | | | | | | | | | | | | | | |
Total Short-Term Investments | | | 7,222 | | | | 3,292 | | | | — | | | | 10,514 | |
| | | | | | | | | | | | | | | | |
Total Investments in Securities | | $ | 71,646 | | | $ | 46,772 | | | $ | 2,113 | | | $ | 120,531 | |
| | | | | | | | | | | | | | | | |
Liabilities | |
Common Stocks | | $ | (735 | ) | | $ | — | | | $ | — | | | $ | (735 | ) |
| | | | | | | | | | | | | | | | |
Total Liabilities in Securities Sold Short | | $ | (735 | ) | | $ | — | | | $ | — | | | $ | (735 | ) |
| | | | | | | | | | | | | | | | |
Appreciation in Other Financial Instruments | |
Forward Foreign Currency Exchange Contracts | | $ | — | | | $ | 27 | | | $ | — | | | $ | 27 | |
Futures Contracts | | | 527 | | | | — | | | | — | | | | 527 | |
| | | | | | | | | | | | | | | | |
Total Appreciation in Other Financial Instruments | | $ | 527 | | | $ | 27 | | | $ | — | | | $ | 554 | |
| | | | | | | | | | | | | | | | |
Depreciation in Other Financial Instruments | |
Forward Foreign Currency Exchange Contracts | | $ | — | | | $ | (255 | ) | | $ | — | | | $ | (255 | ) |
Futures Contracts | | | (73 | ) | | | — | | | | — | | | | (73 | ) |
| | | | | | | | | | | | | | | | |
Total Depreciation in Other Financial Instruments | | $ | (73 | ) | | $ | (255 | ) | | $ | — | | | $ | (328 | ) |
| | | | | | | | | | | | | | | | |
The following is a summary of investments for which significant unobservable inputs (level 3) were used in determining fair value (amounts in thousands):
| | | | | | | | | | | | | | | | | | | | | | | | | | | | | | | | | | | | |
| | | Balance as of
December 31,
2019 | | | Realized
gain (loss) | | | Change in net
unrealized
appreciation
(depreciation) | | | Net
accretion
(amortization) | | | Purchases1 | | | Sales2 | | | Transfers
into Level 3 | | | Transfers
out
of Level 3 | | | Balance as of
December 31,
2020 | |
Investments in Securities | | | | | | | | | | | | | | | | | | | | | | | | | | | | | |
Asset-Backed Securities — United States | | $ | 1,407 | | | $ | (12 | ) | | $ | (14 | ) | | $ | 2 | | | $ | — | | | $ | (925 | ) | | $ | — | | | $ | — | | | $ | 458 | |
Collateralized Mortgage Obligations — United States | | | 1,106 | | | | (3 | ) | | | 7 | | | | — | (a) | | | — | | | | (237 | ) | | | — | | | | — | | | | 873 | |
Commercial Mortgage-Backed Securities — United States | | | 1,980 | | | | (211 | ) | | | (74 | ) | | | 1 | | | | 100 | | | | (1,034 | ) | | | 20 | | | | — | | | | 782 | |
Rights — United States | | | — | (b) | | | — | | | | — | | | | — | | | | — | | | | — | | | | — | | | | — | | | | — | (b) |
| | | | | | | | | | | | | | | | | | | | | | | | | | | | | | | | | | | | |
Total | | $ | 4,493 | | | $ | (226 | ) | | $ | (81 | ) | | $ | 3 | | | $ | 100 | | | $ | (2,196 | ) | | $ | 20 | | | $ | — | | | $ | 2,113 | |
| | | | | | | | | | | | | | | | | | | | | | | | | | | | | | | | | | | | |
| 1 | Purchases include all purchases of securities and securities received in corporate actions. |
| 2 | Sales include all sales of securities, maturities, paydowns and securities tendered in corporate actions. |
| (a) | Amount rounds to less than one thousand. |
| | | | | | | | | | |
| | | | | |
| 36 | | | | | | | | JPMORGAN INSURANCE TRUST | | DECEMBER 31, 2020 |
The changes in net unrealized appreciation (depreciation) attributable to securities owned at December 31, 2020, which were valued using significant unobservable inputs (level 3) amounted to approximately $(29,000). This amount is included in Change in net unrealized appreciation/depreciation on investments in non-affiliates on the Statement of Operations.
There were no significant transfers into or out of level 3 for the year ended December 31, 2020.
The significant unobservable inputs used in the fair value measurement of the Portfolio’s investments are listed below. Generally, a change in the assumptions used in any input in isolation may be accompanied by a change in another input. Significant changes in any of the unobservable inputs may significantly impact the fair value measurement. The impact is based on the relationship between each unobservable input and the fair value measurement. Significant increases (decreases) in enterprise multiples may increase (decrease) the fair value measurement. Significant increases (decreases) in the discount for lack of marketability, liquidity discount, probability of default, yield and default rate may decrease (increase) the fair value measurement. A significant change in the discount rate or prepayment rate (Constant Prepayment Rate or PSA Prepayment Model) may decrease or increase the fair value measurement.
Quantitative Information about Level 3 Fair Value Measurements
(Amounts in thousands)
| | | | | | | | | | | | |
| | | Fair Value at
December 31,
2020 | | | Valuation Technique(s) | | Unobservable Input | | Range (Weighted Average) (a) | |
| | $ | 458 | | | Discounted Cash Flow | | Constant Prepayment Rate | | | 0.00% - 9.63% (5.45%) | |
| | | | | | | | Constant Default Rate | | | 2.04% - 5.80% (3.72%) | |
| | | | | | | | Yield (Discount Rate of Cash Flows) | | | 0.40% - 4.23% (2.01%) | |
| | | | | | | | | | | | |
| Asset-Backed Securities | | | 458 | | | | | | | | | |
| |
| | | 782 | | | Discounted Cash Flow | | Yield (Discount Rate of Cash Flows) | | | 1.53% -199.00% (12.65%) | |
| | | | | | | | | | | | |
| Commercial Mortgage-Backed Securities | | | 782 | | | | | | | | | |
| |
| | | 873 | | | Discounted Cash Flow | | Constant Prepayment Rate | | | 20.00% -30.00% (22.82%) | |
| | | | | | | | Constant Default Rate | | | 0.00% - 0.50% (0.17%) | |
| | | | | | | | Yield (Discount Rate of Cash Flows) | | | 2.75% - 4.01% (3.35%) | |
| | | | | | | | | | | | |
| Collateralized Mortgage Obligations | | | 873 | | | | | | | | | |
| |
| | | — | (b) | | Pending Distribution Amount | | Expected Recovery | | | 0.00% (0.00%) | |
| | | | | | | | | | | | |
| Rights | | | — | (b) | | | | | | | | |
| |
| Total | | $ | 2,113 | | | | | | | | | |
| |
| (a) | Unobservable inputs were weighted by the relative fair value of the instruments. |
B. Restricted Securities — Certain securities held by the Portfolio may be subject to legal or contractual restrictions on resale. Restricted securities generally are resold in transactions exempt from registration under the Securities Act of 1933, as amended (the “Securities Act”). Disposal of these securities may involve time-consuming negotiations and expense. Prompt sale at the current valuation may be difficult and could adversely affect the NAVs of the Portfolio.
As of December 31, 2020, the Portfolio had no investments in restricted securities other than securities sold to the Portfolio under Rule 144A and/or Regulation S under the Securities Act.
C. Securities Lending — The Portfolio is authorized to engage in securities lending in order to generate additional income. The Portfolio is able to lend to approved borrowers. Citibank N.A. (“Citibank”) serves as lending agent for the Portfolio, pursuant to a Securities Lending Agency Agreement (the “Securities Lending Agency Agreement”). Securities loaned are collateralized by cash equal to at least 100% of the market value plus accrued interest on the securities lent, which is invested in the Class IM Shares of the JPMorgan U.S. Government Money Market Fund and the Agency SL Class Shares of the JPMorgan Securities Lending Money Market Fund. The Portfolio retains loan fees and the interest on cash collateral investments but is required to pay the borrower a rebate for the use of cash collateral. In cases where the lent security is of high value to borrowers, there may be a negative rebate (i.e., a net payment from the borrower to the Portfolio). Upon termination of a loan, the Portfolio is required to return to the borrower an amount equal to the cash collateral, plus any rebate owed to the borrowers. The remaining maturities of the securities lending transactions are considered overnight and continuous. Loans are subject to termination by the Portfolio or the borrower at any time.
The net income earned on the securities lending (after payment of rebates and Citibank’s fee) is included on the Statement of Operations as Income from securities lending (net). The Portfolio also receives payments from the borrower during the period of the loan, equivalent to dividends and interest earned on the securities loaned, which are recorded as Dividend or Interest income, respectively, on the Statement of Operations.
| | | | | | | | | | |
| | | | | |
| DECEMBER 31, 2020 | | JPMORGAN INSURANCE TRUST | | | | | | | | 37 |
NOTES TO FINANCIAL STATEMENTS
AS OF DECEMBER 31, 2020 (continued)
Under the Securities Lending Agency Agreement, Citibank marks to market the loaned securities on a daily basis. In the event the cash received from the borrower is less than 102% of the value of the loaned securities (105% for loans of non-U.S. securities), Citibank requests additional cash from the borrower so as to maintain a collateralization level of at least 102% of the value of the loaned securities plus accrued interest (105% for loans of non-U.S. securities), subject to certain de minimis amounts.
The value of securities out on loan is recorded as an asset on the Statement of Assets and Liabilities. The value of the cash collateral received is recorded as a liability on the Statement of Assets and Liabilities and details of collateral investments are disclosed on the SOI.
The Portfolio bears the risk of loss associated with the collateral investments and is not entitled to additional collateral from the borrower to cover any such losses. To the extent that the value of the collateral investments declines below the amount owed to a borrower, the Portfolio may incur losses that exceed the amount it earned on lending the security. Upon termination of a loan, the Portfolio may use leverage (borrow money) to repay the borrower for cash collateral posted if the Adviser does not believe that it is prudent to sell the collateral investments to fund the payment of this liability. Securities lending activity is subject to master netting arrangements.
The following table presents the Portfolio’s value of the securities on loan with Citibank, net of amounts available for offset under the master netting arrangements and any related collateral received or posted by the Portfolio as of December 31, 2020 (amounts in thousands).
| | | | | | | | | | | | |
| | | Investment Securities
on Loan, at value,
Presented on the
Statement of Assets
and Liabilities | | | Cash Collateral
Posted by Borrower* | | | Net Amount Due
to Counterparty
(not less than zero) | |
| | $ | 693 | | | $ | (693 | ) | | $ | — | |
| * | Collateral posted reflects the value of securities on loan and does not include any additional amounts received from the borrower. |
Securities lending also involves counterparty risks, including the risk that the loaned securities may not be returned in a timely manner or at all. Subject to certain conditions, Citibank has agreed to indemnify the Portfolio from losses resulting from a borrower’s failure to return a loaned security.
JPMIM voluntarily waived investment advisory fees charged to the Portfolio to reduce the impact of the cash collateral investment in the JPMorgan U.S. Government Money Market Fund from 0.15% to 0.06%. For the year ended December 31, 2020, JPMIM waived fees associated with the Portfolio’s investment in the JPMorgan U.S. Government Money Market Fund as follows (amounts in thousands):
| (a) | Amount rounds to less than one thousand. |
The above waiver is included in the determination of earnings on cash collateral investment and in the calculation of Citibank’s compensation and is included on the Statement of Operations as Income from securities lending (net).
D. Investment Transactions with Affiliates — The Portfolio invested in Underlying Funds which are advised by the Adviser. An issuer which is under common control with the Portfolio may be considered an affiliate. For the purposes of the financial statements, the Portfolio assumes the issuers listed in the table below to be affiliated issuers. Underlying Funds’ distributions may be reinvested into the Underlying Funds. Reinvestment amounts are included in the purchase cost amounts in the table below. Amounts in the table below are in thousands.
| | | | | | | | | | | | | | | | | | | | | | | | | | | | | | | | | | | | |
For the year ended December 31, 2020 | |
| Security Description | | Value at
December 31,
2019 | | | Purchases
at Cost | | | Proceeds
from Sales | | | Net
Realized
Gain (Loss) | | | Change in
Unrealized
Appreciation/
(Depreciation) | | | Value at
December 31,
2020 | | | Shares at
December 31,
2020 | | | Dividend
Income | | | Capital Gain
Distributions | |
JPMorgan Corporate Bond Fund Class R6 Shares (a) | | $ | — | | | $ | 10,446 | | | $ | 10,700 | | | $ | 254 | | | $ | — | | | $ | — | | | | — | | | $ | — | | | $ | — | |
JPMorgan Emerging Markets Equity Fund Class R6 Shares (a) | | | 6,639 | | | | 3,432 | | | | 212 | | | | 30 | | | | 2,958 | | | | 12,847 | | | | 292 | | | | 24 | | | | — | |
JPMorgan Emerging Markets Strategic Debt Fund Class R6 Shares (a) | | | 1,962 | | | | 21 | | | | 1,682 | | | | (308 | ) | | | 7 | | | | — | | | | — | | | | 22 | | | | — | |
JPMorgan High Yield Fund Class R6 Shares (a) | | | 9,769 | | | | 17,909 | | | | 9,401 | | | | (18 | ) | | | 861 | | | | 19,120 | | | | 2,685 | | | | 526 | | | | — | |
JPMorgan Mortgage-Backed Securities Fund Class R6 Shares (a) | | | — | | | | 1,196 | | | | — | | | | — | | | | (9 | ) | | | 1,187 | | | | 103 | | | | 2 | | | | 10 | |
JPMorgan Prime Money Market Fund Class Institutional Shares, 0.09% (a) (b) | | | 7,420 | | | | 59,651 | | | | 60,582 | | | | (1 | ) | | | 1 | | | | 6,489 | | | | 6,486 | | | | 44 | | | | — | |
JPMorgan Securities Lending Money Market Fund Agency SL Class Shares, 0.15% (a) (b) | | | — | | | | 1,100 | | | | 500 | | | | — | *(c) | | | — | (c) | | | 600 | | | | 600 | | | | 1 | * | | | — | |
| | | | | | | | | | |
| | | | | |
| 38 | | | | | | | | JPMORGAN INSURANCE TRUST | | DECEMBER 31, 2020 |
| | | | | | | | | | | | | | | | | | | | | | | | | | | | | | | | | | | | |
For the year ended December 31, 2020 | |
| Security Description | | Value at
December 31,
2019 | | | Purchases
at Cost | | | Proceeds
from Sales | | | Net
Realized
Gain (Loss) | | | Change in
Unrealized
Appreciation/
(Depreciation) | | | Value at
December 31,
2020 | | | Shares at
December 31,
2020 | | | Dividend
Income | | | Capital Gain
Distributions | |
JPMorgan U.S. Government Money Market Fund Class IM Shares, 0.03% (a) (b) | | $ | 23 | | | $ | 11,059 | | | $ | 10,949 | | | $ | — | | | $ | — | | | $ | 133 | | | | 133 | | | $ | 1 | * | | $ | — | |
| | | | | | | | | | | | | | | | | | | | | | | | | | | | | | | | | | | | |
Total | | $ | 25,813 | | | $ | 104,814 | | | $ | 94,026 | | | $ | (43 | ) | | $ | 3,818 | | | $ | 40,376 | | | | | | | $ | 620 | | | $ | 10 | |
| | | | | | | | | | | | | | | | | | | | | | | | | | | | | | | | | | | | |
| (a) | Investment in an affiliated fund, which is registered under the Investment Company Act of 1940, as amended, and is advised by J.P. Morgan Investment Management Inc. |
| (b) | The rate shown is the current yield as of December 31, 2020. |
| (c) | Amount rounds to less than one thousand. |
| * | Amount is included on the Statement of Operations as Income from securities lending (net) (after payments of rebates and Citibank’s fee). |
E. Foreign Currency Translation — The books and records of the Portfolio are maintained in U.S. dollars. Foreign currency amounts are translated into U.S. dollars at the prevailing exchange rates of such currencies against the U.S. dollar. The market value of investment securities and other assets and liabilities are translated at the exchange rate as of the valuation date. Purchases and sales of investment securities, income and expenses are translated at the exchange rate prevailing on the respective dates of such transactions.
The Portfolio does not isolate the effect of changes in foreign exchange rates from changes in market prices on securities held. Accordingly, such changes are included within Change in net unrealized appreciation/depreciation on investments in non-affiliates on the Statement of Operations.
Reported realized foreign currency gains and losses arise from the disposition of foreign currency, currency gains or losses realized between the trade and settlement dates on securities transactions, and the difference between the amounts of dividends, interest and foreign withholding taxes recorded on the Portfolio’s books on the transaction date and the U.S. dollar equivalent of the amounts actually received or paid. These reported realized foreign currency gains and losses are included in Net realized gain (loss) on foreign currency transactions on the Statement of Operations. Unrealized foreign currency gains and losses arise from changes (due to changes in exchange rates) in the value of foreign currency and other assets and liabilities denominated in foreign currencies, which are held at period end and are included in Change in net unrealized appreciation/depreciation on foreign currency translations on the Statement of Operations.
F. Derivatives — The Portfolio used derivative instruments including options, futures contracts and forward foreign currency exchange contracts in connection with its investment strategy. Derivative instruments may be used as substitutes for securities in which the Portfolio can invest, to hedge portfolio investments or to generate income or gains to the Portfolio. Derivatives may also be used to manage duration, sector and yield curve exposures and credit and spread volatility.
The Portfolio may be subject to various risks from the use of derivatives, including the risk that changes in the value of a derivative may not correlate perfectly with the underlying asset, rate or index; counterparty credit risk related to derivatives counterparties’ failure to perform under contract terms; liquidity risk related to the potential lack of a liquid market for these contracts allowing the Portfolio to close out its position(s); and documentation risk relating to disagreement over contract terms. Investing in certain derivatives also results in a form of leverage and as such, the Portfolio’s risk of loss associated with these instruments may exceed its value, as recorded on the Statement of Assets and Liabilities.
The Portfolio is party to various derivative contracts governed by International Swaps and Derivatives Association master agreements (“ISDA agreements”). The Portfolio’s ISDA agreements, which are separately negotiated with each dealer counterparty, may contain provisions allowing, absent other considerations, a counterparty to exercise rights, to the extent not otherwise waived, against the Portfolio in the event the Portfolio’s net assets decline over time by a pre-determined percentage or fall below a pre-determined floor. The ISDA agreements may also contain provisions allowing, absent other conditions, the Portfolio to exercise rights, to the extent not otherwise waived, against a counterparty (e.g., decline in a counterparty’s credit rating below a specified level). Such rights for both a counterparty and the Portfolio often include the ability to terminate (i.e., close out) open contracts at prices which may favor a counterparty, which could have an adverse effect on the Portfolio. The ISDA agreements give the Portfolio and a counterparty the right, upon an event of default, to close out all transactions traded under such agreements and to net amounts owed or due across all transactions and offset such net payable or receivable against collateral posted to a segregated account by one party for the benefit of the other.
Counterparty credit risk may be mitigated to the extent a counterparty posts additional collateral for mark to market gains to the Portfolio.
Notes F(1) — F(3) below describe the various derivatives used by the Portfolio.
(1). Options — The Portfolio purchased and/or sold (“wrote”) put and call options on various instruments including currencies, futures, securities and interest rate swaps (“swaptions”) to manage and hedge interest rate risks within its portfolio and also to gain long or short exposure to the underlying instrument, index, currency or rate. A purchaser of a put option has the right, but not the obligation, to sell the underlying instrument at an agreed upon price (“strike price”) to the option seller. A purchaser of a call option has the right, but not the obligation, to purchase the underlying instrument at the strike price from the option seller. Swaptions and Eurodollar options are settled for cash.
| | | | | | | | | | |
| | | | | |
| DECEMBER 31, 2020 | | JPMORGAN INSURANCE TRUST | | | | | | | | 39 |
NOTES TO FINANCIAL STATEMENTS
AS OF DECEMBER 31, 2020 (continued)
Options Purchased — Premiums paid by the Portfolio for options purchased are included on the Statement of Assets and Liabilities as Options purchased. The option is adjusted daily to reflect the current market value of the option and the change is recorded as Change in net unrealized appreciation/depreciation on options purchased on the Statement of Operations. If the option is allowed to expire, the Portfolio will lose the entire premium it paid and record a realized loss for the premium amount. Premiums paid for options purchased which are exercised or closed are added to the amounts paid or offset against the proceeds on the underlying investment transaction to determine the realized gain (loss) or cost basis of the underlying investment.
Options Written — Premiums received by the Portfolio for options written are included on the Statement of Assets and Liabilities as a liability. The amount of the liability is adjusted daily to reflect the current market value of the option written and the change is recorded as Change in net unrealized appreciation/depreciation on options written on the Statement of Operations. Premiums received from options written that expire are treated as realized gains. If a written option is closed, the Portfolio records a realized gain or loss on options written based on whether the cost of the closing transaction exceeds the premium received. If a call option is exercised by the option buyer, the premium received by the Portfolio is added to the proceeds from the sale of the underlying security to the option buyer and compared to the cost of the closing transaction to determine whether there has been a realized gain or loss. If a put option is exercised by an option buyer, the premium received by the option seller reduces the cost basis of the purchased security.
Written uncovered call options subject the Portfolio to unlimited risk of loss. Written covered call options limit the upside potential of a security above the strike price. Written put options subject the Portfolio to risk of loss if the value of the security declines below the exercise price minus the put premium.
The Portfolio is not subject to credit risk on options written as the counterparty has already performed its obligation by paying the premium at the inception of the contract.
The Portfolio’s exchange-traded option contracts are not subject to master netting arrangements (the right to close out all transactions traded with a counterparty and net amounts owed or due across transactions).
(2). Futures Contracts — The Portfolio used index, treasury or other financial futures contracts to manage and hedge interest rate risk associated with portfolio investments and to gain or reduce exposure to the stock and bond markets. The Portfolio also used futures contracts to lengthen or shorten the duration of the overall investment portfolio.
Futures contracts provide for the delayed delivery of the underlying instrument at a fixed price or are settled for a cash amount based on the change in the value of the underlying instrument at a specific date in the future. Upon entering into a futures contract, the Portfolio is required to deposit with the broker, cash or securities in an amount equal to a certain percentage of the contract amount, which is referred to as the initial margin deposit. Subsequent payments, referred to as variation margin, are made or received by the Portfolio periodically and are based on changes in the market value of open futures contracts. Changes in the market value of open futures contracts are recorded as Change in net unrealized appreciation/depreciation on futures contracts on the Statement of Operations. Realized gains or losses, representing the difference between the value of the contract at the time it was opened and the value at the time it was closed, are reported on the Statement of Operations at the closing or expiration of the futures contract. Securities deposited as initial margin are designated on the SOI, while cash deposited, which is considered restricted, is recorded on the Statement of Assets and Liabilities. A receivable from and/or a payable to brokers for the daily variation margin is also recorded on the Statement of Assets and Liabilities.
The use of futures contracts exposes the Portfolio to equity price, foreign exchange and interest rate risks. The Portfolio may be subject to the risk that the change in the value of the futures contract may not correlate perfectly with the underlying instrument. Use of long futures contracts subjects the Portfolio to risk of loss in excess of the amounts shown on the Statement of Assets and Liabilities, up to the notional amount of the futures contracts. Use of short futures contracts subjects the Portfolio to unlimited risk of loss. The Portfolio may enter into futures contracts only on exchanges or boards of trade. The exchange or board of trade acts as the counterparty to each futures transaction; therefore, the Portfolio’s credit risk is limited to failure of the exchange or board of trade. Under some circumstances, futures exchanges may establish daily limits on the amount that the price of a futures contract can vary from the previous day’s settlement price, which could effectively prevent liquidation of positions.
The Portfolio’s futures contracts are not subject to master netting arrangements (the right to close out all transactions traded with a counterparty and net amounts owed or due across transactions).
(3). Forward Foreign Currency Exchange Contracts — The Portfolio is exposed to foreign currency risks associated with some or all of the portfolio investments and used forward foreign currency exchange contracts to hedge or manage certain of these exposures as part of the investment strategy. The Portfolio also bought forward foreign currency exchange contracts to gain exposure to currencies. Forward foreign currency exchange contracts represent obligations to purchase or sell foreign currency on a specified future date at a price fixed at the time the contracts are entered into. Non-deliverable forward foreign currency exchange contracts are settled with the counterparty in U.S. dollars without the delivery of the foreign currency.
The values of the forward foreign currency exchange contracts are adjusted daily based on the applicable exchange rate of the underlying currency. Changes in the value of these contracts are recorded as unrealized appreciation or depreciation until the contract settlement date. When the forward foreign currency exchange contract is closed, the Portfolio records a realized gain or loss equal to the difference between the value at the time the contract was opened and the value at the time it was closed. The Portfolio also records a realized gain or loss, upon settlement, when a forward foreign currency exchange contract offsets another forward foreign currency exchange contract with the same counterparty.
| | | | | | | | | | |
| | | | | |
| 40 | | | | | | | | JPMORGAN INSURANCE TRUST | | DECEMBER 31, 2020 |
The Portfolio’s forward foreign currency exchange contracts are subject to master netting arrangements (the right to close out all transactions with a counterparty and net amounts owed or due across transactions).
The Portfolio may be required to post or receive collateral for non-deliverable forward foreign currency exchange contracts.
(4). Summary of Derivatives Information — The following table presents the value of derivatives held as of December 31, 2020 by their primary underlying risk exposure and respective location on the Statement of Assets and Liabilities (amounts in thousands):
| | | | | | | | | | | | | | | | | | |
| Derivative Contracts | | Statement of Assets and Liabilities Location | |
| Gross Assets: | | | | Options (a) | | | Futures
Contracts (b) | | | Forward Foreign
Currency Exchange
Contracts | | | Total | |
Equity contracts | | Receivables, Net Assets — Unrealized Appreciation | | $ | 269 | | | $ | 256 | | | $ | — | | | $ | 525 | |
Foreign exchange contracts | | Receivables, Net Assets — Unrealized Appreciation | | | — | | | | 211 | | | | 27 | | | | 238 | |
Interest rate contracts | | Receivables, Net Assets — Unrealized Appreciation | | | — | | | | 60 | | | | — | | | | 60 | |
| | | | | | | | | | | | | | | | | | |
Total | | | | $ | 269 | | | $ | 527 | | | $ | 27 | | | $ | 823 | |
| | | | | | | | | | | | | | | | | | |
Gross Liabilities: | | | | | | | | | | | | | | | | | | |
Equity contracts | | Payables, Net Assets — Unrealized Depreciation | | $ | — | | | $ | (63) | | | $ | — | | | $ | (63 | ) |
Foreign exchange contracts | | Payables | | | — | | | | — | | | | (255 | ) | | | (255 | ) |
Interest rate contracts | | Payables, Net Assets — Unrealized Depreciation | | | — | | | | (10 | ) | | | — | | | | (10 | ) |
| | | | | | | | | | | | | | | | | | |
Total | | | | $ | — | | | $ | (73 | ) | | $ | (255 | ) | | $ | (328 | ) |
| | | | | | | | | | | | | | | | | | |
| (a) | The value of options is included on the Statement of Assets and Liabilities as Options purchased, at value. |
| (b) | This amount represents the cumulative appreciation (depreciation) of futures contracts as reported on the SOI. The Statement of Assets and Liabilities only reflects the current day variation margin receivable/payable from/to brokers. |
The following table presents the effect of derivatives on the Statement of Operations for the year ended December 31, 2020, by primary underlying risk exposure (amounts in thousands):
| | | | | | | | | | | | | | | | |
| Amount of Realized Gain (Loss) on Derivatives Recognized on the Statement of Operations | |
| Derivative Contracts | | Options | | | Futures
Contracts | | | Forward Foreign
Currency Exchange
Contracts | | | Total | |
Equity contracts | | $ | (977 | ) | | $ | 3,679 | | | $ | — | | | $ | 2,702 | |
Foreign exchange contracts | | | — | | | | 459 | | | | (437 | ) | | | 22 | |
Interest rate contracts | | | — | | | | 572 | | | | — | | | | 572 | |
| | | | | | | | | | | | | | | | |
Total | | $ | (977 | ) | | $ | 4,710 | | | $ | (437 | ) | | $ | 3,296 | |
| | | | | | | | | | | | | | | | |
| | | | | | | | | | | | | | | | |
| Amount of Change in Unrealized Appreciation (Depreciation) on Derivatives Recognized on the Statement of Operations | |
| Derivative Contracts | | Options | | | Futures
Contracts | | | Forward Foreign
Currency Exchange
Contracts | | | Total | |
Equity contracts | | $ | (183 | ) | | $ | (104 | ) | | $ | — | | | $ | (287 | ) |
Foreign exchange contracts | | | — | | | | 182 | | | | 9 | | | | 191 | |
Interest rate contracts | | | — | | | | 94 | | | | — | | | | 94 | |
| | | | | | | | | | | | | | | | |
Total | | $ | (183 | ) | | $ | 172 | | | $ | 9 | | | $ | (2 | ) |
| | | | | | | | | | | | | | | | |
| | | | | | | | | | |
| | | | | |
| DECEMBER 31, 2020 | | JPMORGAN INSURANCE TRUST | | | | | | | | 41 |
NOTES TO FINANCIAL STATEMENTS
AS OF DECEMBER 31, 2020 (continued)
Derivatives Volume
The table below discloses the volume of the Portfolio’s options, futures contracts and forward foreign currency exchange contracts activity during the year ended December 31, 2020. Please refer to the table in the Summary of Derivatives Information for derivative-related gains and losses associated with volume activity (amounts in thousands):
| | | | |
Futures Contracts — Equity: | | | | |
Average Notional Balance Long | | $ | 15,919 | |
Average Notional Balance Short | | | 1,953 | |
Ending Notional Balance Long | | | 10,174 | |
Ending Notional Balance Short | | | 2,318 | |
| |
Futures Contracts — Foreign Exchange: | | | | |
Average Notional Balance Long | | | 12,140 | |
Ending Notional Balance Long | | | 18,621 | |
| |
Futures Contracts — Interest Rate: | | | | |
Average Notional Balance Long | | | 13,470 | |
Average Notional Balance Short | | | 6,071 | |
Ending Notional Balance Long | | | 16,891 | |
Ending Notional Balance Short | | | 5,676 | |
| |
Forward Foreign Currency Exchange Contracts: | | | | |
Average Settlement Value Purchased | | | 3,616 | |
Average Settlement Value Sold | | | 18,056 | |
Ending Settlement Value Purchased | | | 1,214 | |
Ending Settlement Value Sold | | | 20,083 | |
| |
Exchange-Traded Options: | | | | |
Average Number of Contracts Purchased | | | 559 | |
Ending Number of Contracts Purchased | | | 345 | |
The Portfolio’s derivatives contracts held at December 31, 2020 are not accounted for as hedging instruments under GAAP.
G. Short Sales — The Portfolio engaged in short sales as part of its normal investment activities. In a short sale, the Portfolio sells securities it does not own in anticipation of a decline in the market value of those securities. In order to deliver securities to the purchaser, the Portfolio borrows securities from a broker. To close out a short position, the Portfolio delivers the same securities to the broker.
The Portfolio is required to pledge cash or securities to the broker as collateral for the securities sold short. Collateral requirements are calculated daily based on the current market value of the short positions. Cash collateral deposited with the broker is recorded as Deposits at broker for securities sold short, while cash collateral deposited at the Portfolio’s custodian for the benefit of the broker is recorded as Restricted cash for securities sold short on the Statement of Assets and Liabilities. Securities segregated as collateral are denoted on the SOI. The Portfolio may receive or pay the net of the following amounts: (i) a portion of the income from the investment of cash collateral; (ii) the broker’s fee on the borrowed securities (calculated daily based upon the market value of each borrowed security and a variable rate that is dependent on availability of the security); and (iii) a financing charge for the difference between the market value of the short position and cash collateral deposited with the broker. The net amounts of income or fees are included as interest income or interest expense on securities sold short on the Statement of Operations.
The Portfolio is obligated to pay the broker dividends declared on short positions when a position is open on the record date. Dividends on short positions are reported on ex-dividend date on the Statement of Operations as Dividend expense on securities sold short. Liabilities for securities sold short are reported at market value on the Statement of Assets and Liabilities and the change in market value is recorded as Change in net unrealized appreciation/depreciation on the Statement of Operations. Short sale transactions may result in unlimited losses as the security’s price increases and the short position loses value. There is no upward limit on the price a borrowed security could attain. The Portfolio is also subject to risk of loss if the broker were to fail to perform its obligations under the contractual terms.
The Portfolio will record a realized loss if the price of the borrowed security increases between the date of the short sale and the date on which the Portfolio replaces the borrowed security. The Portfolio will record a realized gain if the price of the borrowed security declines between those dates.
As of December 31, 2020, the Portfolio had outstanding short sales as listed on the SOI.
H. Security Transactions and Investment Income — Investment transactions are accounted for on the trade date (the date the order to buy or sell is executed). Securities gains and losses are calculated on a specifically identified cost basis. Interest income is determined on the basis of coupon interest accrued using the effective interest method, which adjusts for amortization of premiums and accretion of discounts. Dividend income, net of foreign taxes withheld, if any, dividend expense on securities sold short and distributions of net investment income and realized capital gains from the Underlying Funds, if any, are recorded on the ex-dividend date or when the Portfolio first learns of the dividend.
| | | | | | | | | | |
| | | | | |
| 42 | | | | | | | | JPMORGAN INSURANCE TRUST | | DECEMBER 31, 2020 |
I. Allocation of Income and Expenses — Expenses directly attributable to the Portfolio are charged directly to the Portfolio, while the expenses attributable to more than one portfolio of the Trust are allocated among the applicable portfolios. Investment income, realized and unrealized gains and losses and expenses, other than class-specific expenses, are allocated daily to each class of shares based upon the proportion of net assets of each class at the beginning of each day.
Transfer agency fees are class-specific expenses. The amount of the transfer agency fees charged to each share class of the Portfolio for the year ended December 31, 2020 are as follows (amounts in thousands):
| | | | | | | | | | | | |
| | | Class 1 | | | Class 2 | | | Total | |
Transfer agency fees | | $ | 1 | | | $ | 11 | | | $ | 12 | |
The Portfolio invests in Underlying Funds and, as a result, bear a portion of the expenses incurred by these Underlying Funds. These expenses are not reflected in the expenses shown on the Statement of Operations and are not included in the ratios to average net assets shown in the Financial Highlights. Certain expenses of affiliated Underlying Funds are waived as described in Note 3.E.
J. Federal Income Taxes — The Portfolio is treated as a separate taxable entity for Federal income tax purposes. The Portfolio’s policy is to comply with the provisions of the Internal Revenue Code (the “Code”) applicable to regulated investment companies and to distribute to shareholders all of its distributable net investment income and net realized capital gains on investments. Accordingly, no provision for Federal income tax is necessary. The Portfolio is also a segregated portfolio of assets for insurance purposes and intends to comply with the diversification requirements of Subchapter L of the Code. Management has reviewed the Portfolio’s tax positions for all open tax years and has determined that as of December 31, 2020, no liability for Federal income tax is required in the Portfolio’s financial statements for net unrecognized tax benefits. However, management’s conclusions may be subject to future review based on changes in, or the interpretation of, the accounting standards or tax laws and regulations. The Portfolio’s Federal tax returns for the prior three fiscal years remain subject to examination by the Internal Revenue Service.
K. Foreign Taxes — The Portfolio may be subject to foreign taxes on income, gains on investments or currency purchases/repatriation, a portion of which may be recoverable. The Portfolio will accrue such taxes and recoveries as applicable, based upon its current interpretation of tax rules and regulations that exist in the markets in which it invests. When a capital gains tax is determined to apply, the Portfolio records an estimated deferred tax liability in an amount that would be payable if the securities were disposed of on the valuation date.
L. Distributions to Shareholders — Distributions from net investment income, if any, are generally declared and paid at least annually and are declared separately for each class. No class has preferential dividend rights; differences in per share rates are due to differences in separate class expenses. Net realized capital gains, if any, are distributed at least annually. The amount of distributions from net investment income and net realized capital gains is determined in accordance with Federal income tax regulations, which may differ from GAAP. To the extent these “book/tax” differences are permanent in nature (i.e., that they result from other than timing of recognition — “temporary differences”), such amounts are reclassified within the capital accounts based on their Federal tax basis treatment.
The following amounts were reclassified within the capital accounts (amounts in thousands):
| | | | | | | | | | | | |
| | | Paid-in-Capital | | | Accumulated
undistributed
(distributions in excess of)
net investment
income | | | Accumulated
net realized
gains (losses) | |
| | $ | (1 | ) | | $ | (804 | ) | | $ | 805 | |
The reclassifications for the Portfolio relate primarily to foreign currency gains or losses.
M. Recent Accounting Pronouncement — In March 2020, the FASB issued Accounting Standards Update No. 2020-04 (“ASU 2020-04”), Reference Rate Reform (Topic 848) – Facilitation of the Effects of Reference Rate Reform on Financial Reporting. ASU 2020-04 provides optional temporary financial reporting relief from the effect of certain types of contract modifications due to the planned discontinuation of the London Interbank Offered Rate (“LIBOR”) and other interbank-offered based reference rates as of the end of 2021. ASU 2020-04 became effective upon the issuance and its optional relief can be applied through December 31, 2022. Management is currently evaluating the impact, if any, to the Portfolio’s financial statements of applying ASU 2020-04.
3. Fees and Other Transactions with Affiliates
A. Investment Advisory Fee — Pursuant to an Investment Advisory Agreement, the Adviser manages the investments of the Portfolio and for such services is paid a fee. The investment advisory fee is accrued daily and paid monthly at an annual rate of 0.55% of the Portfolio’s average daily net assets.
The Adviser waived investment advisory fees and/or reimbursed expenses as outlined in Note 3.E.
B. Administration Fee — Pursuant to an Administration Agreement, the Administrator provides certain administration services to the Portfolio. In consideration of these services, the Administrator receives a fee accrued daily and paid monthly at an annual rate of 0.075% of the first $10 billion of the Portfolio’s average daily net assets, plus 0.050% of the Portfolio’s average daily net assets between $10 billion and $20 billion, plus 0.025%
| | | | | | | | | | |
| | | | | |
| DECEMBER 31, 2020 | | JPMORGAN INSURANCE TRUST | | | | | | | | 43 |
NOTES TO FINANCIAL STATEMENTS
AS OF DECEMBER 31, 2020 (continued)
of the Portfolio’s average daily net assets between $20 billion and $25 billion, plus 0.01% of the Portfolio’s average daily net assets in excess of $25 billion. For the year ended December 31, 2020, the effective rate was 0.075% of the Portfolio’s average daily net assets, notwithstanding any fee waivers and/or expense reimbursements.
The Administrator waived administration fees as outlined in Note 3.E.
JPMorgan Chase Bank, N.A. (“JPMCB”), a wholly-owned subsidiary of JPMorgan, serves as the Portfolio’s sub-administrator (the “Sub-administrator”). For its services as Sub-administrator, JPMCB receives a portion of the fees payable to the Administrator.
C. Distribution Fees — Pursuant to a Distribution Agreement, JPMorgan Distribution Services, Inc. (“JPMDS”), an indirect, wholly-owned subsidiary of JPMorgan, serves as the Portfolio’s principal underwriter and promotes and arranges for the sale of the Portfolio’s shares.
The Board has adopted a Distribution Plan (the “Distribution Plan”) for Class 2 Shares of the Portfolio pursuant to Rule 12b-1 under the 1940 Act. Class 1 Shares of the Portfolio do not charge a distribution fee. The Distribution Plan provides that the Portfolio shall pay, with respect to the applicable share classes, distribution fees, including payments to JPMDS, at an annual rate of 0.25% of the average daily net assets of Class 2 Shares.
D. Custodian and Accounting Fees — JPMCB provides portfolio custody and accounting services to the Portfolio. For performing these services, the Portfolio pays JPMCB transaction and asset-based fees that vary according to the number of transactions and positions, plus out-of-pocket expenses. The amounts paid directly to JPMCB by the Portfolio for custody and accounting services are included in Custodian and accounting fees on the Statement of Operations.
Interest income earned on cash balances at the custodian, if any, is included in Interest income from affiliates on the Statement of Operations.
Interest expense paid to the custodian related to cash overdrafts, if any, is included in Interest expense to affiliates on the Statement of Operations.
E. Waivers and Reimbursements — The Adviser (for all share classes), Administrator (for all share classes) and/or JPMDS (for Class 2 Shares) have contractually agreed to waive fees and/or reimburse the Portfolio to the extent that total annual operating expenses of the Portfolio (excluding acquired fund fees and expenses other than certain money market fund fees as described below, dividend and interest expenses related to short sales, interest, taxes, expenses related to litigation and potential litigation, expenses related to trustee elections and extraordinary expenses) exceed the percentages of the Portfolio’s respective average daily net assets as shown in the table below:
| | | | | | | | |
| | | Class 1 | | | Class 2 | |
| | | 0.78 | %�� | | | 1.03 | % |
The expense limitation agreement was in effect for the year ended December 31, 2020 and the contractual expense limitation percentages in the table above are in place until at least April 30, 2021.
The Underlying Funds may impose separate advisory fees. The Adviser has agreed to voluntarily waive the Portfolio’s investment advisory fees in the weighted average pro-rata amount of the advisory fees charged by the affiliated Underlying Funds. During the year ended December 31, 2020, the Adviser waived approximately $106,000. These waivers may be in addition to any waivers required to meet the Portfolio’s contractual expense limitations, but will not exceed the Portfolio’s advisory fee.
For the year ended December 31, 2020, the Portfolio’s service providers waived fees and/or reimbursed expenses for the Portfolio as follows (amounts in thousands). None of these parties expect the Portfolio to repay any such waived fees and/or reimbursed expenses in future years.
| | | | | | | | | | | | | | |
| | | Contractual Waivers | | | | |
| | | Investment
Advisory Fees | | Administration Fees | | | Total | | | Contractual
Reimbursements | |
| | $9 | | $ | 76 | | | $ | 85 | | | $ | 102 | |
Additionally, the Portfolio may invest in one or more money market funds advised by the Adviser (affiliated money market funds). The Adviser, Administrator and/or JPMDS have contractually agreed to waive fees and/or reimburse expenses in an amount sufficient to offset the respective net fees each collects from the affiliated money market fund on the Portfolio’s investment in such affiliated money market fund, except for investments of securities lending cash collateral. None of these parties expect the Portfolio to repay any such waived fees and/or reimbursed expenses in future years.
The amount of these waivers resulting from investments in these money market funds for the year ended December 31, 2020 was approximately $13,000.
F. Other — Certain officers of the Trust are affiliated with the Adviser, the Administrator and JPMDS. Such officers, with the exception of the Chief Compliance Officer, receive no compensation from the Portfolio for serving in their respective roles.
The Board designated and appointed a Chief Compliance Officer to the Portfolio pursuant to Rule 38a-1 under the 1940 Act. The Portfolio, along with affiliated portfolios, makes reimbursement payments, on a pro-rata basis, to the Administrator for a portion of the fees associated with the office of the Chief Compliance Officer. Such fees are included in Trustees’ and Chief Compliance Officer’s fees on the Statement of Operations.
| | | | | | | | | | |
| | | | | |
| 44 | | | | | | | | JPMORGAN INSURANCE TRUST | | DECEMBER 31, 2020 |
The Trust adopted a Trustee Deferred Compensation Plan (the “Plan”) which allows the independent Trustees to defer the receipt of all or a portion of compensation related to performance of their duties as Trustees. The deferred fees are invested in various J.P. Morgan Funds until distribution in accordance with the Plan.
During the year ended December 31, 2020, the Portfolio purchased securities from an underwriting syndicate in which the principal underwriter or members of the syndicate were affiliated with the Adviser.
The Securities and Exchange Commission (“SEC”) has granted an exemptive order permitting the Portfolio to engage in principal transactions with J.P. Morgan Securities LLC, an affiliated broker, involving taxable money market instruments, subject to certain conditions.
4. Investment Transactions
During the year ended December 31, 2020, purchases and sales of investments (excluding short-term investments) were as follows (amounts in thousands):
| | | | | | | | | | | | | | | | | | | | | | | | |
| | | Purchases
(excluding
U.S. Government) | | | Sales
(excluding
U.S. Government) | | | Purchases
of U.S.
Government | | | Sales
of U.S.
Government | | | Securities
Sold Short | | | Covers on
Securities
Sold Short | |
| | $ | 110,184 | | | $ | 98,423 | | | $ | 1,985 | | | $ | 2,522 | | | $ | 9,600 | | | $ | 9,185 | |
5. Federal Income Tax Matters
For Federal income tax purposes, the estimated cost and unrealized appreciation (depreciation) in value of investments held at December 31, 2020 were as follows (amounts in thousands):
| | | | | | | | | | | | | | | | |
| | | Aggregate
Cost | | | Gross
Unrealized
Appreciation | | | Gross
Unrealized
Depreciation | | | Net Unrealized
Appreciation
(Depreciation) | |
| | $ | 98,586 | | | $ | 22,317 | | | $ | 881 | | | $ | 21,436 | |
| * | The tax cost includes the proceeds from short sales which may result in a net negative cost. |
The difference between book and tax basis appreciation (depreciation) on investments is primarily attributed to mark to market of forward foreign currency contracts, mark to market of futures contracts and wash sale loss deferrals.
The tax character of distributions paid during the year ended December 31, 2020 was as follows (amounts in thousands):
| | | | | | | | | | | | |
| | | Ordinary
Income* | | | Net
Long-Term
Capital Gains | | | Total
Distributions
Paid | |
| | $ | 2,144 | | | $ | 519 | | | $ | 2,663 | |
| * | Short-term gain distributions are treated as ordinary income for income tax purposes. |
The tax character of distributions paid during the year ended December 31, 2019 was as follows (amounts in thousands):
| | | | | | | | |
| | | Ordinary
Income* | | | Total
Distributions Paid | |
| | $ | 1,905 | | | $ | 1,905 | |
| * | Short-term gain distributions are treated as ordinary income for income tax purposes. |
As of December 31, 2020, the estimated components of net assets (excluding paid-in-capital) on a tax basis were as follows (amounts in thousands):
| | | | | | | | | | | | |
| | | Current
Distributable
Ordinary
Income | | | Current
Distributable
Long-Term
Capital Gain
(Tax Basis Capital
Loss Carryover) | | | Unrealized
Appreciation
(Depreciation) | |
| | $ | 3,943 | | | $ | 2,263 | | | $ | 19,515 | |
The cumulative timing differences primarily consist of mark to market of forward foreign currency contracts, mark to market of futures contracts, straddle loss deferrals and wash sale loss deferrals.
As of December 31, 2020, the Portfolio did not have any net capital loss carryforwards.
| | | | | | | | | | |
| | | | | |
| DECEMBER 31, 2020 | | JPMORGAN INSURANCE TRUST | | | | | | | | 45 |
NOTES TO FINANCIAL STATEMENTS
AS OF DECEMBER 31, 2020 (continued)
6. Borrowings
The Portfolio relies upon an exemptive order granted by the SEC (the “Order”) permitting the establishment and operation of an Interfund Lending Facility (the “Facility”). The Facility allows the Portfolio to directly lend and borrow money to or from any other fund relying upon the Order at rates beneficial to both the borrowing and lending funds. Advances under the Facility are taken primarily for temporary or emergency purposes, including the meeting of redemption requests that otherwise might require the untimely disposition of securities, and are subject to the Portfolio’s borrowing restrictions. The Interfund loan rate is determined, as specified in the Order, by averaging the current repurchase agreement rate and the current bank loan rate. The Order was granted to the Trust and may be relied upon by the Portfolio because the Portfolio and the series of the Trust are all investment companies in the same “group of investment companies” (as defined in Section 12(d)(1)(G) of the 1940 Act).
The Portfolio had no borrowings outstanding from another fund during the year ended December 31, 2020.
The Trust and JPMCB have entered into a financing arrangement. Under this arrangement, JPMCB provides an unsecured, uncommitted credit facility in the aggregate amount of $100 million to certain of the J.P. Morgan Funds, including the Portfolio. Advances under the arrangement are taken primarily for temporary or emergency purposes, including the meeting of redemption requests that otherwise might require the untimely disposition of securities, and are subject to the Portfolio’s borrowing restrictions. Interest on borrowings is payable at a rate determined by JPMCB at the time of borrowing. This agreement has been extended until November 1, 2021.
The Portfolio had no borrowings outstanding from the unsecured, uncommitted credit facility during the year ended December 31, 2020.
The Trust, along with certain other trusts for J.P. Morgan Funds (“Borrowers”), has entered into a joint syndicated senior unsecured revolving credit facility totaling $1.5 billion (“Credit Facility”) with various lenders and The Bank of New York Mellon, as administrative agent for the lenders. This Credit Facility provides a source of funds to the Borrowers for temporary and emergency purposes, including the meeting of redemption requests that otherwise might require the untimely disposition of securities. Under the terms of the Credit Facility, a borrowing portfolio must have a minimum of $25,000,000 in adjusted net asset value and not exceed certain adjusted net asset coverage ratios prior to and during the time in which any borrowings are outstanding. If a portfolio does not comply with the aforementioned requirements, the portfolio must remediate within three business days with respect to the $25,000,000 minimum adjusted net asset value or within one business day with respect to certain asset coverage ratios or the administrative agent at the request of, or with the consent of, the lenders may terminate the Credit Facility and declare any outstanding borrowings to be due and payable immediately.
Interest associated with any borrowing under the Credit Facility is charged to the borrowing portfolio at a rate of interest equal to 1.00%, which has increased to 1.25% pursuant to the amendment referenced below, plus the greater of the federal funds effective rate or one month LIBOR. The annual commitment fee to maintain the Credit Facility is 0.15% and is incurred on the unused portion of the Credit Facility and is allocated to all participating portfolios pro rata based on their respective net assets. Effective August 11, 2020, this agreement has been amended and restated for a term of 364 days, unless extended, and to include the change to the interest rate charged for borrowing from the Credit Facility to 1.25%, as noted above, and an upfront fee of 0.075% of the Credit Facility to be charged and paid by all participating funds of the Credit Facility.
The Portfolio did not utilize the Credit Facility during the year ended December 31, 2020.
7. Risks, Concentrations and Indemnifications
In the normal course of business, the Portfolio enters into contracts that contain a variety of representations which provide general indemnifications. The Portfolio’s maximum exposure under these arrangements is unknown. The amount of exposure would depend on future claims that may be brought against the Portfolio. However, based on experience, the Portfolio expects the risk of loss to be remote.
As of December 31, 2020, the Portfolio had four individual shareholder and/or non-affiliated omnibus accounts, which owned 90.7% of the Portfolio’s outstanding shares.
Significant shareholder transactions by these shareholders may impact the Portfolio’s performance and liquidity.
The Portfolio is subject to risks associated with securities with contractual cash flows including asset-backed and mortgage-related securities such as collateralized mortgage obligations, mortgage-pass-through securities and commercial mortgage-backed securities, including securities backed by sub-prime mortgage loans. The value, liquidity and related income of these securities are sensitive to changes in economic conditions, including real estate value, pre-payments, delinquencies and/or defaults, and may be adversely affected by shifts in the market’s perception of the issuers and changes in interest rates.
The Portfolio is subject to interest rate and credit risk. The value of debt securities may decline as interest rates increase. The Portfolio could lose money if the issuer of a fixed income security is unable to pay interest or repay principal when it is due. The Portfolio invests in floating rate loans and other floating rate debt securities. Although these investments are generally less sensitive to interest rate changes than other fixed rate instruments, the value of floating rate loans and other floating rate investments may decline if their interest rates do not rise as quickly, or as much, as general interest rates. Many factors can cause interest rates to rise. Some examples include central bank monetary policy, rising inflation rates and general economic conditions. The Portfolio may face a heightened level of interest rate risk due to certain changes in monetary policy. During periods when interest rates are low or there are negative interest rates, the Portfolio’s yield (and total return) also may be low or the Portfolio may be unable to maintain positive returns. The ability of the issuers of debt to meet their obligations may be affected by economic and political developments in a specific industry or region. The value of a Portfolio’s investments may be adversely affected if any of the issuers or counterparties it is invested in are subject to an actual or perceived deterioration in their credit quality.
| | | | | | | | | | |
| | | | | |
| 46 | | | | | | | | JPMORGAN INSURANCE TRUST | | DECEMBER 31, 2020 |
Investing in securities of foreign countries may include certain risks and considerations not typically associated with investing in U.S. securities. These risks include revaluation of currencies, high rates of inflation, repatriation restrictions on income and currencies, and future and adverse political, social and economic developments.
As of December 31, 2020, a significant portion of the Portfolio’s investments consisted of securities that were denominated in foreign currencies. Changes in currency exchange rates will affect the value of, and investment income from, such securities.
Derivatives may be riskier than other types of investments because they may be more sensitive to changes in economic and market conditions and could result in losses that significantly exceed the Portfolio’s original investment. Many derivatives create leverage thereby causing the Portfolio to be more volatile than they would have been if they had not used derivatives. Derivatives also expose the Portfolio to counterparty risk (the risk that the derivative counterparty will not fulfill its contractual obligations), including credit risk of the derivative counterparty. The possible lack of a liquid secondary market for derivatives and the resulting inability of the Portfolio to sell or otherwise close a derivatives position could expose the Portfolio to losses.
The Portfolio is also subject to counterparty credit risk, which is the risk that a counterparty fails to perform on agreements with the Portfolio such as option contracts and forward foreign currency exchange contracts.
Because of the Portfolio’s investments in the Underlying Funds, the Portfolio indirectly pays a portion of the expenses incurred by the Underlying Funds. As a result, the cost of investing in the Portfolio may be higher than the cost of investing in a mutual fund that invests directly in individual securities and financial instruments. The Portfolio is also subject to certain risks related to the Underlying Funds’ investments in securities and financial instruments such as fixed income securities including high yield, asset-backed and mortgage-related securities, equity securities, foreign and emerging markets securities, commodities and real estate securities. These securities are subject to risks specific to their structure, sector or market.
In addition, the Underlying Funds may use derivative instruments in connection with their individual investment strategies including futures contracts, forward foreign currency exchange contracts, options, swaps and other derivatives, which are also subject to specific risks related to their structure, sector or market and may be riskier than investments in other types of securities. Specific risks and concentrations present in the Underlying Funds are disclosed within their individual financial statements and registration statements, as appropriate.
LIBOR is intended to represent the rate at which contributing banks may obtain short-term borrowings from each other in the London interbank market. The regulatory authority that oversees financial services firms and financial markets in the U.K. has announced that, after the end of 2021, it would no longer persuade or compel contributing banks to make rate submissions for purposes of determining the LIBOR rate. As a result, it is possible that commencing in 2022, LIBOR may no longer be available or no longer deemed an appropriate reference rate upon which to determine the interest rate on or impacting certain loans, notes, derivatives and other instruments or investments comprising some or all of the Portfolio’s portfolio. In light of this eventuality, public and private sector industry initiatives are currently underway to identify new or alternative reference rates to be used in place of LIBOR. There is no assurance that the composition or characteristics of any such alternative reference rate will be similar to or produce the same value or economic equivalence as LIBOR or that it will have the same volume or liquidity as did LIBOR prior to its discontinuance or unavailability, which may affect the value or liquidity or return on certain investments of the Portfolio and result in costs incurred in connection with closing out positions and entering into new trades. These risks may also apply with respect to changes in connection with other interbank offering rates (e.g., Euribor) and a wide range of other index levels, rates and values that are treated as “benchmarks” and are the subject of recent regulatory reform.
The Portfolio is subject to infectious disease epidemics/pandemics risk. The worldwide outbreak of COVID-19, a novel coronavirus disease, has negatively affected economies, markets and individual companies throughout the world. The effects of this COVID-19 pandemic to public health, and business and market conditions, including exchange trading suspensions and closures may continue to have a significant negative impact on the performance of the Portfolio’s investments, increase the Portfolio’s volatility, exacerbate other pre-existing political, social and economic risks to the Portfolio and negatively impact broad segments of businesses and populations. The Portfolio’s operations may be interrupted as a result, which may have a significant negative impact on investment performance. In addition, governments, their regulatory agencies, or self-regulatory organizations may take actions in response to the pandemic that affect the instruments in which the Portfolio invests, or the issuers of such instruments, in ways that could also have a significant negative impact on the Portfolio’s investment performance. The full impact of this COVID-19 pandemic, or other future epidemics/pandemics, is currently unknown.
8. Subsequent Event
On February 10, 2021, the contractual expense limitations for Class 1 Shares and Class 2 Shares were extended until at least April 30, 2022.
| | | | | | | | | | |
| | | | | |
| DECEMBER 31, 2020 | | JPMORGAN INSURANCE TRUST | | | | | | | | 47 |
REPORT OF INDEPENDENT REGISTERED PUBLIC ACCOUNTING FIRM
To the Board of Trustees of JPMorgan Insurance Trust and Shareholders of JPMorgan Insurance Trust Global Allocation Portfolio
Opinion on the Financial Statements
We have audited the accompanying statement of assets and liabilities, including the schedule of portfolio investments, of JPMorgan Insurance Trust Global Allocation Portfolio (one of the portfolios constituting JPMorgan Insurance Trust, referred to hereafter as the “Portfolio”) as of December 31, 2020, the related statement of operations for the year ended December 31, 2020, the statements of changes in net assets for each of the two years in the period ended December 31, 2020, including the related notes, and the financial highlights for each of the five years in the period ended December 31, 2020 (collectively referred to as the “financial statements”). In our opinion, the financial statements present fairly, in all material respects, the financial position of the Portfolio as of December 31, 2020, the results of its operations for the year then ended, the changes in its net assets for each of the two years in the period ended December 31, 2020 and the financial highlights for each of the five years in the period ended December 31, 2020 in conformity with accounting principles generally accepted in the United States of America.
Basis for Opinion
These financial statements are the responsibility of the Portfolio’s management. Our responsibility is to express an opinion on the Portfolio’s financial statements based on our audits. We are a public accounting firm registered with the Public Company Accounting Oversight Board (United States) (PCAOB) and are required to be independent with respect to the Portfolio in accordance with the U.S. federal securities laws and the applicable rules and regulations of the Securities and Exchange Commission and the PCAOB.
We conducted our audits of these financial statements in accordance with the standards of the PCAOB. Those standards require that we plan and perform the audit to obtain reasonable assurance about whether the financial statements are free of material misstatement, whether due to error or fraud.
Our audits included performing procedures to assess the risks of material misstatement of the financial statements, whether due to error or fraud, and performing procedures that respond to those risks. Such procedures included examining, on a test basis, evidence regarding the amounts and disclosures in the financial statements. Our audits also included evaluating the accounting principles used and significant estimates made by management, as well as evaluating the overall presentation of the financial statements. Our procedures included confirmation of securities owned as of December 31, 2020 by correspondence with the custodian, transfer agent and brokers; when replies were not received from brokers, we performed other auditing procedures. We believe that our audits provide a reasonable basis for our opinion.
/s/ PricewaterhouseCoopers LLP
New York, New York
February 12, 2021
We have served as the auditor of one or more investment companies in the JPMorgan Funds complex since 1993.
| | | | | | | | | | |
| | | | | |
| 48 | | | | | | | | JPMORGAN INSURANCE TRUST | | DECEMBER 31, 2020 |
TRUSTEES
(Unaudited)
The Portfolio’s Statement of Additional Information includes additional information about the Portfolio’s Trustees and is available, without charge, upon request by calling 1-800-480-4111 or on the J.P. Morgan Funds’ website at www.jpmorganfunds.com.
| | | | | | |
Name (Year of Birth); Positions With the Portfolio (1) | | Principal Occupation During Past 5 Years | | Number of
Portfolios in Fund
Complex Overseen
by Trustee (2) | | Other Directorships Held During the Past 5 Years |
Independent Trustees | | |
| | | |
| John F. Finn (1947); Chairman since 2020; Trustee of Trust since 2005; Trustee of heritage One Group Mutual Funds since 1998. | | Chairman, Gardner, Inc. (supply chain management company serving industrial and consumer markets) (serving in various roles 1974-present). | | 128 | | Director, Greif, Inc. (GEF) (industrial package products and services) (2007-present); Trustee, Columbus Association for the Performing Arts (1988-present); Director, Cardinal Health, Inc. (CAH) (1994-2014). |
| | | |
| Stephen P. Fisher (1959); Trustee of Trust since 2018. | | Retired; Chairman and Chief Executive Officer, NYLIFE Distributors LLC (registered broker-dealer) (serving in various roles 2008-2013); Chairman, NYLIM Service Company LLC (transfer agent) (2008-2017); New York Life Investment Management LLC (registered investment adviser) (serving in various roles 2005-2017); Chairman, IndexIQ Advisors LLC (registered investment adviser for ETFs) (2014-2017); President, MainStay VP Funds Trust (2007-2017), MainStay DefinedTerm Municipal Opportunities Fund (2011-2017) and MainStay Funds Trust (2007-2017) (registered investment companies). | | 128 | | Honors Program Advisory Board Member, The Zicklin School of Business, Baruch College, The City University of New York (2017-present). |
| | | |
| Kathleen M. Gallagher (1958); Trustee of Trust since 2018. | | Retired; Chief Investment Officer — Benefit Plans, Ford Motor Company (serving in various roles 1985-2016). | | 128 | | Non-Executive Director, Legal & General Investment Management (Holdings) (2018-present); Non-Executive Director, Legal & General Investment Management America (financial services and insurance) (2017-present); Advisory Board Member, Fiduciary Solutions, State Street Global Advisors (2017-present); Member, Client Advisory Council, Financial Engines, LLC (registered investment adviser) (2011-2016); Director, Ford Pension Funds Investment Management Ltd. (2007-2016). |
| | | |
| Dennis P. Harrington* (1950); Trustee of Trust since 2017. | | Retired; Partner, Deloitte LLP (accounting firm) (serving in various roles 1984-2012). | | 128 | | None |
| | | |
| Frankie D. Hughes (1952); Trustee of Trust since 2008. | | President, Ashland Hughes Properties (property management) (2014-present); President and Chief Investment Officer, Hughes Capital Management, Inc. (fixed income asset management) (1993-2014). | | 128 | | None |
| | | | | | | | | | |
| | | | | |
| DECEMBER 31, 2020 | | JPMORGAN INSURANCE TRUST | | | | | | | | 49 |
TRUSTEES
(Unaudited) (continued)
| | | | | | |
Name (Year of Birth); Positions With the Portfolio (1) | | Principal Occupation During Past 5 Years | | Number of
Portfolios in Fund
Complex Overseen
by Trustee (2) | | Other Directorships Held During the Past 5 Years |
Independent Trustees (continued) | | |
| | | |
Raymond Kanner** (1953); Trustee of Trust since 2017. | | Retired; Managing Director & Chief Investment Officer, IBM Retirement Funds (2007-2016). | | 128 | | Advisory Board Member, Penso Advisors LLC (2020-present); Advisory Board Member, Los Angeles Capital (2018-present); Advisory Board Member, State Street Global Advisors Fiduciary Solutions Board (2017-present); Acting Executive Director, Committee on Investment of Employee Benefit Assets (CIEBA) (2016-2017); Advisory Board Member, Betterment for Business (robo advisor) (2016-2017); Advisory Board Member, BlueStar Indexes (index creator) (2013-2017); Director, Emerging Markets Growth Fund (registered investment company) (1997-2016); Member, Russell Index Client Advisory Board (2001-2015). |
| | | |
| Peter C. Marshall (1942); Trustee of Trust since 2005; Trustee of heritage One Group Mutual Funds since 1985. (3) | | Self-employed business consultant
(2002-present). | | 128 | | None |
| | | |
| Mary E. Martinez (1960); Trustee of Trust since 2013. | | Associate, Special Properties, a Christie’s International Real Estate Affiliate (2010-present); Managing Director, Bank of America (Asset Management) (2007-2008); Chief Operating Officer, U.S. Trust Asset Management, U.S. Trust Company (asset management) (2003-2007); President, Excelsior Funds (registered investment companies) (2004-2005). | | 128 | | None |
| | | |
| Marilyn McCoy (1948); Trustee of Trust since 2005; Trustee of heritage One Group Mutual Funds since 1999. | | Vice President of Administration and Planning, Northwestern University (1985-present). | | 128 | | None |
| | | |
| Mitchell M. Merin (1953); Trustee of Trust since 2013. (4) | | Retired; President and Chief Operating Officer, Morgan Stanley Investment Management, Member, Morgan Stanley & Co. Management Committee (serving in various roles 1981-2006). | | 128 | | Director, Sun Life Financial (SLF) (financial services and insurance) (2007-2013). |
| | | |
| Dr. Robert A. Oden, Jr. (1946); Trustee of Trust since 2005; Trustee of heritage One Group Mutual Funds since 1997. | | Retired; President, Carleton College (2002-2010); President, Kenyon College (1995-2002). | | 128 | | Trustee and Vice Chair, Trout Unlimited (2017-present); Trustee, American Museum of Fly Fishing (2013-present); Vice Chair, Dartmouth-Hitchcock Medical Center (2011-present); Trustee, American University in Cairo (1999-2014). |
| | | |
| Marian U. Pardo*** (1946); Trustee of Trust since 2013. | | Managing Director and Founder, Virtual Capital Management LLC (investment consulting) (2007-present); Managing Director, Credit Suisse Asset Management (portfolio manager) (2003-2006). | | 128 | | President and Member, Board of Governors, Columbus Citizens Foundation (not-for-profit supporting philanthropic and cultural programs) (2006-present). |
| | | | | | | | | | |
| | | | | |
| 50 | | | | | | | | JPMORGAN INSURANCE TRUST | | DECEMBER 31, 2020 |
| (1) | The Trustees serve for an indefinite term, subject to the Trust’s current retirement policy, which is age 78 for all Trustees. |
| (2) | A Fund Complex means two or more registered investment companies that hold themselves out to investors as related companies for purposes of investment and investor services or have a common investment adviser or have an investment adviser that is an affiliated person of the investment adviser of any of the other registered investment companies. The J.P. Morgan Funds Complex for which the Board of Trustees serves currently includes ten registered investment companies (128 funds). |
| (3) | Mr. Marshall retired from the Board of Trustees effective the close of business on December 31, 2020. |
| (4) | Mr. Merin retired from the Board of Trustees effective the close of business on January 31, 2021. |
| * | Two family members of Mr. Harrington are partner and managing director, respectively, of the Portfolio’s independent registered public accounting firm. Such firm has represented to the Board that those family members are not involved in the audit of the Portfolio’s financial statements and do not provide other services to the Portfolio. The Board has concluded that such association does not interfere with Mr. Harrington’s exercise of independent judgment as an Independent Trustee. |
| ** | A family member of Mr. Kanner is employed by JPMorgan Chase Bank, which is affiliated with JPMIM and JPMDS. In that capacity, this employee provides services to various JPMorgan affiliates including JPMIM and JPMDS and for which JPMIM and JPMDS bear some portion of the expense thereof. |
| *** | In connection with prior employment with JPMorgan Chase, Ms. Pardo was the recipient of non-qualified pension plan payments from JPMorgan Chase in the amount of approximately $2,055 per month, which she irrevocably waived effective January 1, 2013, and deferred compensation payments from JPMorgan Chase in the amount of approximately $7,294 per year, which ended in January 2013. In addition, Ms. Pardo receives payments from a fully-funded qualified plan, which is not an obligation of JPMorgan Chase. |
The contact address for each of the Trustees is 277 Park Avenue, New York, NY 10172.
| | | | | | | | | | |
| | | | | |
| DECEMBER 31, 2020 | | JPMORGAN INSURANCE TRUST | | | | | | | | 51 |
OFFICERS
(Unaudited)
| | |
Name (Year of Birth), Positions Held with the Trust (Since) | | Principal Occupations During Past 5 Years |
| |
Brian S. Shlissel (1964),
President and Principal Executive Officer (2016)* | | Managing Director and Chief Administrative Officer for J.P. Morgan pooled vehicles, J.P. Morgan Investment Management Inc. (formerly JPMorgan Funds Management, Inc.) (from 2014 to present); Managing Director and Head of Mutual Fund Services, Allianz Global Investors; President and Chief Executive Officer, Allianz Global Investors Mutual Funds and PIMCO Closed-End Funds (from 1999 to 2014). |
| |
Timothy J. Clemens (1975), Treasurer and Principal Financial Officer (2018)** | | Executive Director, J.P. Morgan Investment Management Inc. (formerly JPMorgan Funds Management, Inc.) since February 2016; Vice President, JPMorgan Funds Management, Inc. from October 2013 to January 2016. |
| |
Gregory S. Samuels (1980),
Secretary (2019) (formerly Assistant Secretary since 2010)** | | Executive Director and Assistant General Counsel, JPMorgan Chase. Mr. Samuels has been with JPMorgan Chase since 2010. |
| |
Stephen M. Ungerman (1953),
Chief Compliance Officer (2005) | | Managing Director, JPMorgan Chase & Co.; Mr. Ungerman has been with JPMorgan Chase & Co. since 2000. |
| |
Elizabeth A. Davin (1964), Assistant Secretary (2005)*** | | Executive Director and Assistant General Counsel, JPMorgan Chase since February 2012; formerly Vice President and Assistant General Counsel, JPMorgan Chase from 2005 to February 2012; Senior Counsel, JPMorgan Chase (formerly Bank One Corporation) from 2004 to 2005. |
| |
Jessica K. Ditullio (1962),
Assistant Secretary (2005)*** | | Executive Director and Assistant General Counsel, JPMorgan Chase. Ms. Ditullio has been with JPMorgan Chase (formerly Bank One Corporation) since 1990. |
| |
Anthony Geron (1971),
Assistant Secretary (2018)** | | Vice President and Assistant General Counsel, JPMorgan Chase since September 2018; Lead Director and Counsel, AXA Equitable Life Insurance Company from 2015 to 2018 and Senior Director and Counsel, AXA Equitable Life Insurance Company from 2014 to 2015. |
| |
Carmine Lekstutis (1980),
Assistant Secretary (2011)** | | Executive Director and Assistant General Counsel, JPMorgan Chase. Mr. Lekstutis has been with JPMorgan Chase since 2011. |
| |
Zachary E. Vonnegut-Gabovitch (1986), Assistant Secretary (2017)** | | Vice President and Assistant General Counsel, JPMorgan Chase since September 2016; Associate, Morgan, Lewis & Bockius (law firm) from 2012 to 2016. |
| |
Michael M. D’Ambrosio (1969),
Assistant Treasurer (2012) | | Managing Director, J.P. Morgan Investment Management Inc. (formerly JPMorgan Funds Management, Inc.). Mr. D’Ambrosio has been with J.P. Morgan Investment Management Inc. since 2012. |
| |
Aleksandr Fleytekh (1972), Assistant Treasurer (2019)** | | Vice President, J.P. Morgan Investment Management Inc. (formerly JPMorgan Funds Management, Inc.) since February 2012. |
| |
Shannon Gaines (1977),
Assistant Treasurer (2018)*** | | Vice President, J.P. Morgan Investment Management Inc. (formerly JPMorgan Funds Management, Inc.) since January 2014. |
| |
Jeffrey D. House (1972), Assistant Treasurer (2017)*** | | Vice President, J.P. Morgan Investment Management Inc. (formerly JPMorgan Funds Management, Inc.) since July 2006. |
| |
Michael Mannarino (1985),
Assistant Treasurer (2020) | | Vice President, J.P. Morgan Investment Management Inc. (formerly JPMorgan Funds Management, Inc.) since 2014. |
| |
Joseph Parascondola (1963),
Assistant Treasurer (2011)* | | Executive Director, J.P. Morgan Investment Management, Inc. since February 2020, formerly Vice President, J.P. Morgan Investment Management Inc. (formerly JPMorgan Funds Management, Inc.) from August 2006 to January 2020. |
| |
Gillian I. Sands (1969),
Assistant Treasurer (2012)** | | Vice President, J.P. Morgan Investment Management Inc. (formerly JPMorgan Funds Management, Inc.) since September 2012. |
The contact address for each of the officers, unless otherwise noted, is 277 Park Avenue, New York, NY 10172.
| * | The contact address for the officer is 575 Washington Boulevard, Jersey City, NJ 07310. |
| ** | The contact address for the officer is 4 New York Plaza, New York, NY 10004. |
| *** | The contact address for the officer is 1111 Polaris Parkway, Columbus, OH 43240. |
| | | | | | | | | | |
| | | | | |
| 52 | | | | | | | | JPMORGAN INSURANCE TRUST | | DECEMBER 31, 2020 |
SCHEDULE OF SHAREHOLDER EXPENSES
(Unaudited)
Hypothetical $1,000 Investment
As a shareholder of the Portfolio, you incur ongoing costs, including investment advisory fees, administration fees, distribution fees (for Class 2 Shares) and other Portfolio expenses. Because the Portfolio is a funding vehicle for Policies and Eligible Plans, you may also incur sales charges and other fees relating to the Policies or Eligible Plans. The examples below are intended to help you understand your ongoing costs (in dollars) of investing in the Portfolio, but not the costs of the Policies or Eligible Plans, and to compare these ongoing costs with the ongoing costs of investing in other mutual funds. The examples assume that you had a $1,000 investment in each Class at the beginning of the reporting period, July 1, 2020, and continued to hold your shares at the end of the reporting period, December 31, 2020.
Actual Expenses
For each Class of the Portfolio in the table below, the first line provides information about actual account values and actual expenses. You may use the information in this line, together with the amount you invested, to estimate the expenses that you paid over the period. Simply divide your account value by $1,000 (for example, an $8,600 account value divided by $1,000 = 8.6), then multiply the result by the number in the first line of each Class under the heading titled “Expenses Paid During the Period” to estimate the expenses you paid on your account during this period.
Hypothetical Example for Comparison Purposes
The second line of each Class in the table below provides information about hypothetical account values and hypothetical expenses based on the Class’ actual expense ratio and an assumed rate of return of 5% per year before expenses, which is not the Class’ actual return. The hypothetical account values and expenses may not be used to estimate the actual ending account balance or expenses you paid for the period. You may use this information to compare the ongoing costs of investing in the Class of the Portfolio and other funds. To do so, compare this 5% hypothetical example with the 5% hypothetical examples that appear in the shareholder reports of the other funds. Please note that the expenses shown in the table are meant to highlight your ongoing costs only and do not reflect any transaction costs, such as sales charges (loads) or redemption fees or the costs associated with the Policies and Eligible Plans through which the Portfolio is held. Therefore, the second line for each Class in the table is useful in comparing ongoing costs only, and will not help you determine the relative total costs of owning different funds. In addition, if these transaction costs were included, your costs would have been higher. The examples also assume all dividends and distributions have been reinvested.
| | | | | | | | | | | | | | | | |
| | | Beginning
Account Value
July 1, 2020 | | | Ending
Account Value
December 31, 2020 | | | Expenses
Paid During
the Period* | | | Annualized Expense Ratio | |
JPMorgan Insurance Trust Global Allocation Portfolio | | | | | | | | | | | | | | | | |
Class 1 | | | | | | | | | | | | | | | | |
Actual | | $ | 1,000.00 | | | $ | 1,202.10 | | | $ | 3.72 | | | | 0.67 | % |
Hypothetical | | | 1,000.00 | | | | 1,021.76 | | | | 3.42 | | | | 0.67 | |
Class 2 | | | | | | | | | | | | | | | | |
Actual | | | 1,000.00 | | | | 1,200.10 | | | | 5.04 | | | | 0.91 | |
Hypothetical | | | 1,000.00 | | | | 1,020.55 | | | | 4.63 | | | | 0.91 | |
| * | Expenses are equal to each Class’ respective annualized expense ratio, multiplied by the average account value over the period, multiplied by 184/366 ( to reflect the one-half year period). |
| | | | | | | | | | |
| | | | | |
| DECEMBER 31, 2020 | | JPMORGAN INSURANCE TRUST | | | | | | | | 53 |
BOARD APPROVAL OF INVESTMENT ADVISORY AGREEMENT
(Unaudited)
The Board of Trustees has established various standing committees composed of Trustees with diverse backgrounds, to which the Board of Trustees has assigned specific subject matter responsibilities to further enhance the effectiveness of the Board’s oversight and decision making. The Board of Trustees and its investment committees (money market and alternative products, equity, and fixed income) meet regularly throughout the year and consider factors that are relevant to their annual consideration of investment advisory agreements at each meeting. They also meet for the specific purpose of considering investment advisory agreement annual renewals. The Board of Trustees held meetings in June and August 2020, at which the Trustees considered the continuation of the investment advisory agreement for the Portfolio whose annual report is contained herein (the “Advisory Agreement”). In accordance with SEC guidance, due to the COVID-19 pandemic, the meetings were conducted through video conference. At the June meeting, the Board’s investment committees met to review and consider performance, expense and related information for the Portfolio and the other J.P. Morgan Funds overseen by the Board in which the Portfolio may invest (“Underlying Funds”). Each investment committee reported to the full Board, which then considered the investment committee’s preliminary findings. At the August meeting, the Trustees continued their review and consideration. The Trustees, including a majority of the Trustees who are not parties to the Advisory Agreement or “interested persons” (as defined in the 1940 Act) of any party to the Advisory Agreement or any of their affiliates, approved the continuation of the Advisory Agreement on August 11, 2020.
As part of their review of the Advisory Agreement, the Trustees considered and reviewed performance and other information about the Portfolio and Underlying Funds received from the Adviser. This information includes the Portfolio’s and Underlying Funds’ performance as compared to the performance of the Portfolio’s and Underlying Funds’ peers and benchmarks and analyses by the Adviser of the Portfolio’s and Underlying Funds’ performance. In addition, at each of their regular meetings throughout the year, the Trustees considered reports on the performance of certain J.P. Morgan Funds provided by an independent management consulting firm (“independent consultant”). In addition, in preparation for the June and August meetings, the Trustees requested, received and evaluated extensive materials from the Adviser, including, with respect to the Portfolio and/or Underlying Funds, performance and expense information compiled by Broadridge, using data from Lipper Inc. and/or Morningstar Inc., independent providers of investment company data (together, “Broadridge”). The independent consultant also provided additional analysis of the performance of certain Underlying Funds in connection with the Trustees’ review of the Advisory Agreement. Before voting on the Advisory Agreement, the Trustees reviewed the Advisory Agreement with representatives of the Adviser, counsel to the Trust and independent legal counsel and received a
memorandum from independent legal counsel to the Trustees discussing the legal standards for their consideration of the Advisory Agreement. The Trustees also discussed the Advisory Agreement in executive sessions with independent legal counsel at which no representatives of the Adviser were present.
A summary of the material factors evaluated by the Trustees in determining whether to approve the Advisory Agreement is provided below. Each Trustee attributed different weights to the various factors and no factor alone was considered determinative. The Trustees considered information provided with respect to the Portfolio and Underlying Funds throughout the year, including additional reporting and information provided in connection with the market volatility caused by the COVID-19 pandemic, as well as materials furnished specifically in connection with the annual review process. From year to year, the Trustees consider and place emphasis on relevant information in light of changing circumstances in market and economic conditions.
After considering and weighing the factors and information they had received, the Trustees found that the compensation to be received by the Adviser from the Portfolio under the Advisory Agreement was fair and reasonable under the circumstances and determined that the continuance of the Advisory Agreement was in the best interests of the Portfolio and its shareholders.
Nature, Extent and Quality of Services Provided by the Adviser
The Trustees received and considered information regarding the nature, extent and quality of services provided to the Portfolio under the Advisory Agreement. The Trustees took into account information furnished throughout the year at Trustee meetings, as well as the materials furnished specifically in connection with this annual review process. The Trustees considered the background and experience of the Adviser’s senior management, personnel changes, if any, and the expertise of, and the amount of attention given to the Portfolio by, investment personnel of the Adviser. In addition, the Trustees reviewed the qualifications, backgrounds and responsibilities of the portfolio management team primarily responsible for the day-to-day management of the Portfolio and the infrastructure supporting the team, including personnel changes, if any. In addition, the Board considered its discussions with the Adviser regarding the Adviser��s business continuity plan and steps the Adviser was taking to provide ongoing services to the Portfolio during the COVID-19 pandemic, and the Adviser’s success in continuing to provide services to the Portfolio and their shareholders throughout this period. The Trustees also considered information provided by the Adviser and JPMorgan Distribution Services, Inc. (“JPMDS”) about the structure and distribution strategy of the Portfolio. The Trustees reviewed information relating to the Adviser’s risk governance model and reports showing the Adviser’s compliance structure and ongoing compliance processes. The Trustees also considered the quality of
| | | | | | | | | | |
| | | | | |
| 54 | | | | | | | | JPMORGAN INSURANCE TRUST | | DECEMBER 31, 2020 |
the administration services provided by the Adviser in its role as administrator.
The Trustees also considered their knowledge of the nature and quality of services provided by the Adviser and its affiliates to the Portfolio and Underlying Funds gained from their experience as Trustees of the J.P. Morgan Funds. In addition, they considered the overall reputation and capabilities of the Adviser and its affiliates, the commitment of the Adviser to provide high quality service to the Portfolio and Underlying Funds, their overall confidence in the Adviser’s integrity and the Adviser’s responsiveness to questions or concerns raised by them, including the Adviser’s willingness to consider and implement organizational and operational changes designed to improve investment results and the services provided to the Portfolio and Underlying Funds.
Based upon these considerations and other factors, the Trustees concluded that they were satisfied with the nature, extent and quality of the investment advisory services provided to the Portfolio by the Adviser.
Costs of Services Provided and Profitability to the Adviser and its Affiliates
The Trustees received and considered information regarding the profitability to the Adviser and its affiliates in providing services to the Portfolio and Underlying Funds. The Trustees reviewed and discussed this information. The Trustees recognized that this information is not audited and represents the Adviser’s determination of its and its affiliates’ revenues from the contractual services provided to the Portfolio, less expenses of providing such services. Expenses include direct and indirect costs and are calculated using an allocation methodology developed by the Adviser. The Trustees also recognized that it is difficult to make comparisons of profitability from fund investment advisory contracts because comparative information is not generally publicly available and is affected by numerous factors, including the structure of the particular adviser, the types of funds it manages, its business mix, numerous assumptions regarding allocations and the fact that publicly-traded fund managers’ operating profits and net income are net of distribution and marketing expenses. Based upon their review, and taking into consideration the factors noted above, the Trustees concluded that the profitability to the Adviser under the Advisory Agreement was not unreasonable in light of the services and benefits provided to the Portfolio.
The Trustees also considered that the Adviser earns fees from the Portfolio and Underlying Funds for providing administration services. These fees were shown separately in the profitability analysis presented to the Trustees. The Trustees also considered the payments of Rule 12b-1 fees to JPMDS, an affiliate of the Adviser, which also acts as the Portfolio’s distributor, and that these fees are in turn generally paid to financial intermediaries that sell the Portfolio, including financial intermediaries that are
affiliates of the Adviser (although they are retained by JPMDS in certain instances). The Trustees also considered the fees paid to JPMorgan Chase Bank, N.A. (“JPMCB”) for custody and fund accounting and other related services for the Portfolio and/or Underlying Funds.
Fall-Out Benefits
The Trustees reviewed information regarding potential “fall-out” or ancillary benefits received by the Adviser and its affiliates as a result of their relationship with the Portfolio. The Trustees considered that the J.P. Morgan Funds’ operating accounts are held at JPMCB, which, as a result, will receive float benefits for certain J.P. Morgan Funds, as applicable. The Trustees also noted that the Adviser supports a diverse set of products and services, which benefits the Adviser by allowing it to leverage its infrastructure to serve additional clients, including the benefits received by the Adviser and its affiliates in connection with the Portfolio’s investments in the Underlying Funds. The Trustees also reviewed the Adviser’s allocation of fund brokerage for the J.P. Morgan Funds complex, including allocations to brokers who provide research to the Adviser.
Economies of Scale
The Trustees considered the extent to which the Portfolio may benefit from economies of scale. The Trustees considered that there may not be a direct relationship between economies of scale realized by the Portfolio and those realized by the Adviser as assets increase. The Trustees considered the extent to which the Portfolio was priced to scale and whether it would be appropriate to add advisory fee breakpoints, but noted that the Portfolio has implemented fee waivers and contractual expense limitations (“Fee Caps”) which allows the Portfolio’s shareholders to share potential economies of scale from its inception and that the fees remain satisfactory relative to peer funds. The Trustees considered the benefits to the Portfolio of the use of an affiliated distributor and custodian, including the ability to rely on existing infrastructure supporting distribution, custodial and transfer agent services, and the ability to negotiate competitive fees for the Portfolio. The Trustees further considered the Adviser’s and JPMDS’s ongoing investments in their business in support of the Portfolio, including the Adviser’s and/or JPMDS’s investments in trading systems, technology (including improvements to the J.P. Morgan Funds’ website, and cybersecurity improvements), retention of key talent, and regulatory support enhancements. The Trustees concluded that the current fee structure for the Portfolio, including Fee Caps that the Adviser has in place that serve to limit the overall net expense ratios of the Portfolio at competitive levels, was reasonable. The Trustees concluded that the Portfolio’s shareholders received the benefits of potential economies of scale through the Fee Caps and the Adviser’s reinvestment in its operations to serve the Portfolio and its shareholders. The Trustees noted that the Adviser’s reinvestment ensures sufficient resources in terms of personnel and infrastructure to support the Portfolio.
| | | | | | | | | | |
| | | | | |
| DECEMBER 31, 2020 | | JPMORGAN INSURANCE TRUST | | | | | | | | 55 |
BOARD APPROVAL OF INVESTMENT ADVISORY AGREEMENT
(Unaudited) (continued)
Independent Written Evaluation of the Portfolio’s Chief Compliance Officer
The Trustees noted that, upon their direction, the Chief Compliance Officer for the Portfolio had prepared an independent written evaluation in order to assist the Trustees in determining the reasonableness of the proposed management fees. The Trustees considered the written evaluation in determining whether to continue the Advisory Agreement.
Fees Relative to Adviser’s Other Clients
The Trustees received and considered information about the nature and extent of investment advisory services and fee rates offered to other clients of the Adviser, including institutional separate accounts, collective investment trusts, ETFs and/or funds sub-advised by the Adviser, for investment management styles substantially similar to that of the Portfolio. The Trustees considered the complexity of investment management for registered mutual funds relative to the Adviser’s other clients and noted differences, as applicable, in the regulatory, legal and other risks and responsibilities of providing services to the different clients. The Trustees considered that serving as an adviser to a registered mutual fund involves greater responsibilities and risks than acting as a sub-adviser and observed that sub-advisory fees may be lower than those charged by the Adviser to the Portfolio. The Trustees also noted that the adviser, not the mutual fund, pays the sub-advisory fee and that many responsibilities related to the advisory function are retained by the primary adviser. The Trustees concluded that the fee rates charged to the Portfolio in comparison to those charged to the Adviser’s other clients were reasonable.
Investment Performance
The Trustees received and considered absolute and/or relative performance information for the Portfolio in a report prepared by Broadridge. The Trustees considered the total return performance information, which included the ranking of the Portfolio within a performance universe made up of funds with the same Broadridge investment classification and objective (the “Universe”), as well as a subset of funds within the Universe (the “Peer Group”), by total return for the applicable one-, three-and five-year periods. The Trustees reviewed a description of Broadridge’s methodology for selecting mutual funds in the Portfolio’s Universe and Peer Group and noted that Universe and Peer Group rankings were not calculated if the number of funds in the Universe and/or Peer Group did not meet a predetermined minimum. The Broadridge materials provided to the Trustees highlighted information with respect to a representative class to assist the Trustees in their review. As part of this review, the Trustees also reviewed the Portfolio’s performance against its benchmark and considered the performance information provided for the Portfolio at regular Board meetings by the Adviser. The Trustees also engaged with the Adviser to consider what steps might be taken to improve
performance, as applicable. The Broadridge performance data noted by the Trustees as part of their review and the determinations made by the Trustees with respect to the Portfolio’s performance are summarized below:
The Trustees noted that the Portfolio’s performance for Class 2 shares was in the fifth, second and first quintiles, based upon the Peer Group, and in the fourth, third and second quintiles, based upon the Universe, for the one-,three- and five year periods ended December 31, 2019, respectively. The Trustees discussed the performance and investment strategy of the Portfolio with the Adviser and based upon this discussion and various other factors, concluded that the Portfolio’s performance was satisfactory under the circumstances. They requested however, that the Portfolio’s Adviser provide additional Portfolio performance information to be reviewed with the members of the Board’s money market and alternative products committee at each of its regularly scheduled meetings over the course of the next year.
Advisory Fees and Expense Ratios
The Trustees considered the contractual advisory fee rate and administration fee rate paid by the Portfolio to the Adviser and compared the combined rate to the information prepared by Broadridge concerning management fee rates paid by other funds in the same Broadridge category as the Portfolio. The Trustees recognized that Broadridge reported the Portfolio’s management fee rate as the combined contractual advisory fee and administration fee rates. The Trustees also reviewed information about other expenses and the expense ratios for the Portfolio and noted that Universe and Peer Group rankings were not calculated if the number of funds in the Universe and/or Peer Groups did not meet a predetermined minimum. The Trustees considered the Fee Caps currently in place, for the Portfolio, the net advisory fee rate after taking into account any waivers and/or reimbursements, and, where deemed appropriate by the Trustees, additional waivers and/or reimbursements. The Trustees recognized that it is difficult to make comparisons of advisory fees because there are variations in the services that are included in the fees paid by other funds. The Trustees’ determinations as a result of the review of the Portfolio’s advisory fees and expense ratios are summarized below:
The Trustees noted that the Portfolio’s net advisory fee for Class 2 shares was in the second quintile based upon both the Peer Group and Universe, and that the actual total expenses for Class 2 shares were in the fourth and fifth quintiles based upon the Peer Group and Universe, respectively. After considering the factors identified above, in light of this information, the Trustees concluded that the advisory fee was satisfactory in light of the services provided to the Portfolio and that such fee would be for services provided in addition to, rather than duplicative of, services provided under the advisory agreements of the Underlying Funds in which the Portfolio invests.
| | | | | | | | | | |
| | | | | |
| 56 | | | | | | | | JPMORGAN INSURANCE TRUST | | DECEMBER 31, 2020 |
TAX LETTER
(Unaudited)
Dividends Received Deduction (DRD)
The Portfolio had 14.00%, or maximum allowable percentage, of ordinary income distributions eligible for the dividends received deduction for corporate shareholders for the fiscal year ended December 31, 2020.
Long Term Capital Gain
The Portfolio distributed approximately $519,000, or maximum allowable amount, of long-term capital gain dividends for the fiscal year ended December 31, 2020.
| | | | | | | | | | |
| | | | | |
| DECEMBER 31, 2020 | | JPMORGAN INSURANCE TRUST | | | | | | | | 57 |
J.P. Morgan Funds are distributed by JPMorgan Distribution Services, Inc., which is an affiliate of JPMorgan Chase & Co. Affiliates of JPMorgan Chase & Co. receive fees for providing various services to the funds.
Contact JPMorgan Distribution Services, Inc. at 1-800-480-4111 for a portfolio prospectus. You can also visit us at www.jpmorganfunds.com. Investors should carefully consider the investment objectives and risk as well as charges and expenses of the mutual fund before investing. The prospectus contains this and other information about the mutual fund. Read the prospectus carefully before investing.
The Portfolio files a complete schedule of its portfolio holdings for the first and third quarters of its fiscal year with the SEC as an exhibit to its report on Form N-PORT. The Portfolio’s Form N-PORT reports are available on the SEC’s website at http://www.sec.gov. The Portfolio’s quarterly holdings can be found by visiting the J.P. Morgan Funds’ website at www.jpmorganfunds.com.
A description of the Portfolio’s policies and procedures with respect to the disclosure of the Portfolio’s holdings is available in the prospectuses and Statement of Additional Information.
A copy of proxy policies and procedures is available without charge upon request by calling 1-800-480-4111 and on the Portfolio’s website at www.jpmorganfunds.com. A description of such policies and procedures is on the SEC’s website at www.sec.gov. The Trustees have delegated the authority to vote proxies for securities owned by the Portfolio to the Adviser. A copy of the Portfolio’s voting record for the most recent 12-month period ended June 30 is available on the SEC’s website at www.sec.gov or at the Portfolio’s website at www.jpmorganfunds.com no later than August 31 of each year. The Portfolio’s proxy voting record will include, among other things, a brief description of the matter voted on for each portfolio security, and will state how each vote was cast, for example, for or against the proposal.

J.P. Morgan Asset Management is the brand name for the asset management business of JPMorgan Chase & Co. and its affiliates worldwide.
| | | | |
| | © JPMorgan Chase & Co., 2020. All rights reserved. December 2020. | | AN-JPMITGAP-1220 |
ITEM 2. CODE OF ETHICS.
Disclose whether, as of the end of the period covered by the report, the registrant has adopted a code of ethics that applies to the registrant’s principal executive officer, principal financial officer, principal accounting officer or controller, or persons performing similar functions, regardless of whether these individuals are employed by the registrant or a third party. If the registrant has not adopted such a code of ethics, explain why it has not done so.
The registrant must briefly describe the nature of any amendment, during the period covered by the report, to a provision of its code of ethics that applies to the registrant’s principal executive officer, principal financial officer, principal accounting officer or controller, or persons performing similar functions, regardless of whether these individuals are employed by the registrant or a third party, and that relates to any element of the code of ethics definition enumerated in paragraph (b) of this Item. The registrant must file a copy of any such amendment as an exhibit pursuant to Item 13(a)(1), unless the registrant has elected to satisfy paragraph (f) of this Item by positing its code of ethics on its website pursuant to paragraph (f)(2) of this Item, or by undertaking to provide its code of ethics to any person without charge, upon request, pursuant to paragraph (f)(3) of this Item.
If the registrant has, during the period covered by the report, granted a waiver, including an implicit waiver, from a provision of the code of ethics that applies to the registrant’s principal executive officer, principal financial officer, principal accounting officer or controller, or persons performing similar functions, regardless of whether these individuals are employed by the registrant or third party, that relates to one or more items set forth in paragraph (b) of this Item, the registrant must briefly describe the nature of the waiver, the name of the person to whom the waiver was granted, and the date of the waiver.
The Registrant has adopted a code of ethics that applies to the Registrant’s principal executive officer and principal financial officer. There were no amendments to the code of ethics or waivers granted with respect to the code of ethics in the period covered by the report.
ITEM 3. AUDIT COMMITTEE FINANCIAL EXPERT.
(a) (1) Disclose that the registrant’s board of directors has determined that the registrant either:
(i) Has at least one audit committee financial expert serving on its audit committee; or
(ii) Does not have an audit committee financial expert serving on its audit committee.
The Registrant’s Board of Trustees has determined that the Registrant has at least one audit committee financial expert serving on its audit committee. The Securities and Exchange Commission has stated that the designation or identification of a person as an audit committee financial expert pursuant to this Item 3 of Form N-CSR does not impose on such person any duties, obligations or liabilities that are greater than the duties, obligations and liabilities imposed on such person as a member of the Audit Committee and the Board of Trustees in the absence of such designation or identification.
(2) If the registrant provides the disclosure required by paragraph (a)(1)(i) of this Item, it must disclose the name of the audit committee financial expert and whether that person is “independent.” In order to be considered “independent” for purposes of this Item, a member of an audit committee may not, other than in his or her capacity as a member of the audit committee, the board of directors, or any other board committee:
(i) Accept directly or indirectly any consulting, advisory, or other compensatory fee from the issuer; or
(ii) Be an “interested person” of the investment company as defined in Section 2(a)(19) of the Act (15 U.S.C. 80a-2(a)(19)).
The audit committee financial expert is Dennis P. Harrington. He is not an “interested person” of the Registrant and is also “independent” as defined by the U.S. Securities and Exchange Commission for purposes of audit committee financial expert determinations.
(3) If the registrant provides the disclosure required by paragraph (a)(1)(ii) of this Item, it must explain why it does not have an audit committee financial expert.
Not applicable.
ITEM 4. PRINCIPAL ACCOUNTANT FEES AND SERVICES.
(a) Disclose, under the caption Audit Fees, the aggregate fees billed for each of the last two fiscal years for professional services rendered by the principal accountant for the audit of the registrant’s annual financial statements or services that are normally provided by the accountant in connection with statutory and regulatory filings or engagements for those fiscal years.
AUDIT FEES
2020 – $333,907
2019 – $345,852
(b) Disclose, under the caption Audit-Related Fees, the aggregate fees billed in each of the last two fiscal years for assurance and related services by the principal accountant that are reasonably related to the performance of the audit of the registrant’s financial statements and are not reported under paragraph (a) of this Item. Registrants shall describe the nature of the services comprising the fees disclosed under this category.
AUDIT-RELATED FEES
2020 – $47,963
2019 – $51,850
Audit-related fees consists of semi-annual financial statement reviews and security count procedures performed as required under Rule 17f-2 of the Investment Company Act of 1940 during the Registrant’s fiscal year.
(c) Disclose, under the caption Tax Fees, the aggregate fees billed in each of the last two fiscal years for professional services rendered by the principal accountant for tax compliance, tax advice, and tax planning. Registrants shall describe the nature of the services comprising the fees disclosed under this category.
TAX FEES
2020 – $58,848
2019 – $63,495
The tax fees consist of fees billed in connection with preparing the federal regulated investment company income tax returns for the Registrant for the tax years ended December 31, 2020 and 2019, respectively.
For the last fiscal year, no tax fees were required to be approved pursuant to paragraph (c)(7)(ii) of Rule 2-01 of Regulation S-X.
(d) Disclose, under the caption All Other Fees, the aggregate fees billed in each of the last two fiscal years for products and services provided by the principal accountant, other than the services reported in paragraphs (a) through (c) of this Item. Registrants shall describe the nature of the services comprising the fees disclosed under this category.
ALL OTHER FEES
2020 – Not applicable
2019 – Not applicable
(e) (1) Disclose the audit committee’s pre-approval policies and procedures described in paragraph (c)(7) of Rule 2-01 of Regulation S-X.
Pursuant to the Registrant’s Audit Committee Charter and written policies and procedures for the pre-approval of audit and non-audit services (the “Pre-approval Policy”), the Audit Committee pre-approves all audit and non-audit services performed by the Registrant’s independent public registered accounting firm for the Registrant. In addition, the Audit Committee pre-approves the auditor’s engagement for non-audit services with the Registrant’s investment adviser (not including a sub-adviser whose role is primarily portfolio management and is sub-contracted or overseen by another investment adviser) and any Service Affiliate in accordance with paragraph (c)(7)(ii) of Rule 2-01 of Regulation S-X, if the engagement relates directly to the operations and financial reporting of the Registrant. Proposed services may be pre-approved either 1) without consideration of specific case-by-case services or 2) require the specific pre-approval of the Audit Committee. Therefore, initially the Pre-approval Policy listed a number of audit and non-audit services that have been approved by the Audit Committee, or which were not subject to pre-approval under the transition provisions of Sarbanes-Oxley Act of 2002 (the
“Pre-approval List”). The Audit Committee annually reviews and pre-approves the services included on the Pre-approval List that may be provided by the independent public registered accounting firm without obtaining additional specific pre-approval of individual services from the Audit Committee. The Audit Committee adds to, or subtracts from, the list of general pre-approved services from time to time, based on subsequent determinations. All other audit and non-audit services not on the Pre-approval List must be specifically pre-approved by the Audit Committee.
One or more members of the Audit Committee may be appointed as the Committee’s delegate for the purposes of considering whether to approve such services. Any pre-approvals granted by the delegate will be reported, for informational purposes only, to the Audit Committee at its next scheduled meeting. The Audit Committee’s responsibilities to pre-approve services performed by the independent public registered accounting firm are not delegated to management.
(2) Disclose the percentage of services described in each of paragraphs (b) through (d) of this Item that were approved by the audit committee pursuant to paragraph (c)(7)(i)(C) of Rule 2-01 of Regulation S-X.
2020 – 0.0%
2019 – 0.0%
(f) If greater than 50 percent, disclose the percentage of hours expended on the principal accountant’s engagement to audit the registrant’s financial statements for the most recent fiscal year that were attributed to work performed by persons other than the principal accountant’s full-time, permanent employees.
Not applicable - Less than 50%.
(g) Disclose the aggregate non-audit fees billed by the registrant’s accountant for services rendered to the registrant, and rendered to the registrant’s investment adviser (not including any sub-adviser whose role is primarily portfolio management and is subcontracted with or overseen by another investment adviser), and any entity controlling, controlled by, or under common control with the adviser that provides ongoing services to the registrant for each of the last two fiscal years of the registrant.
The aggregate non-audit fees billed by the independent registered public accounting firm for services rendered to the Registrant, and rendered to Service Affiliates, for the last two calendar year ends were:
2020 - $28.0 million
2019 - $30.6 million
(h) Disclose whether the registrant’s audit committee of the board of directors has considered whether the provision of non-audit services that were rendered to the registrant’s investment adviser (not including any subadviser whose role is primarily portfolio management and is subcontracted with or overseen by another investment adviser), and any entity controlling, controlled by, or under common control with the investment adviser that provides ongoing services to the registrant that were not pre-approved pursuant to paragraph (c)(7)(ii) of Rule 2-01 of Regulation S-X is compatible with maintaining the principal accountant’s independence.
The Registrant’s Audit Committee has considered whether the provision of the non-audit services that were rendered to Service Affiliates that were not pre-approved (not requiring pre-approval) is compatible with maintaining the independent public registered accounting firm’s independence. All services provided by the independent public registered accounting firm to the Registrant or to Service Affiliates that were required to be pre-approved were pre-approved as required.
ITEM 5. AUDIT COMMITTEE OF LISTED REGISTRANTS.
(a) If the registrant is a listed issuer as defined in Rule 10A-3 under the Exchange Act (17CFR 240.10A-3), state whether or not the registrant has a separately-designated standing audit committee established in accordance with Section 3(a)(58)(A) of the Exchange Act (15 U.S.C. 78c(a)(58)(A)). If the registrant has such a committee, however designated, identify each committee member. If the entire board of directors is acting as the registrant’s audit committee as specified in Section 3(a)(58)(B) of the Exchange Act (15 U.S.C. 78c(a)(58)(B)), so state.
(b) If applicable, provide the disclosure required by Rule 10A-3(d) under the Exchange Act (17CFR 240.10A-3(d)) regarding an exemption from the listing standards for all audit committees.
Not applicable.
ITEM 6. INVESTMENTS.
File Schedule I – Investments in securities of unaffiliated issuers as of the close of the reporting period as set forth in Section 210.12-12 of Regulation S-X, unless the schedule is included as part of the report to shareholders filed under Item 1 of this Form.
Included in Item 1.
ITEM 7. DISCLOSURE OF PROXY VOTING POLICIES AND PROCEDURES FOR CLOSED-END MANAGEMENT INVESTMENT COMPANIES.
Not applicable.
ITEM 8. PORTFOLIO MANAGERS OF CLOSED-END MANAGEMENT INVESTMENT COMPANIES.
Not applicable.
ITEM 9. PURCHASE OF EQUITY SECURITIES BY CLOSED-END MANAGEMENT INVESTMENT COMPANY AND AFFILIATED PURCHASERS.
Not applicable.
ITEM 10. SUBMISSION OF MATTERS TO A VOTE OF SECURITY HOLDERS.
Describe any material changes to the procedures by which shareholders may recommend nominees to the registrant’s board of directors, where those changes were implemented after the registrant last provided disclosure in response to the requirements of Item 7(d)(2)(ii)(G) of Schedule 14A (17 CFR 240.14a-101), or this Item.
No material changes to report.
ITEM 11. CONTROLS AND PROCEDURES.
(a) Disclose the conclusions of the registrant’s principal executive and principal financial officers, or persons performing similar functions, regarding the effectiveness of the registrant’s disclosure controls and procedures (as defined in Rule 30a-3(c) under the Act (17 CFR 270.30a-3(c))) as of a date within 90 days of the filing date of the report that includes the disclosure required by this paragraph, based on the evaluation of these controls and procedures required by Rule 30a-3(b) under the Act (17 CFR 270.30a-3(b)) and Rules 13a-15(b) or 15d-15(b) under the Exchange Act (17 CFR 240.13a-15(b) or 240.15d-15(b)).
The Registrant’s principal executive and principal financial officers have concluded, based on their evaluation of the Registrant’s disclosure controls and procedures as of a date within 90 days of the filing date of this report, that the Registrant’s disclosure controls and procedures are reasonably designed to ensure that information required to be disclosed by the Registrant on Form N-CSR is recorded, processed, summarized and reported within the required time periods and that information required to be disclosed by the Registrant in the reports that it files or submits on Form N-CSR is accumulated and communicated to the Registrant’s management, including its principal executive and principal financial officers, as appropriate to allow timely decisions regarding required disclosure.
(b) Disclose any change in the registrant’s internal control over financial reporting (as defined in Rule 30a-3(d) under the Act (17 CFR 270.30a-3(d)) that occurred during the registrant’s second fiscal quarter of the period covered by this report that has materially affected, or is reasonably likely to materially affect, the registrant’s internal control over financial reporting.
There were no changes in the Registrant’s internal control over financial reporting that occurred during the last fiscal quarter covered by this report that have materially affected, or are reasonably likely to materially affect, the Registrant’s internal control over financial reporting.
ITEM 12. DISCLOSURE OF SECURITIES LENDING ACTIVITIES FOR CLOSED-END MANAGEMENT INVESTMENT COMPANIES.
Not applicable.
ITEM 13. EXHIBITS.
| | (a) | File the exhibits listed below as part of this Form. Letter or number the exhibits in the sequence indicated. |
(1) Any code of ethics, or amendment thereto, that is the subject of the disclosure required by Item 2, to the extent that the registrant intends to satisfy the Item 2 requirements through filing of an exhibit.
Code of Ethics applicable to its Principal Executive and Principal Financial Officers pursuant to Section 406 of the Sarbanes-Oxley Act of 2002 attached hereto.
(2) A separate certification for each principal executive officer and principal financial officer of the registrant as required by Rule 30a-2(a) under the Act (17 CFR 270.30a-2).
Certifications pursuant to Rule 30a-2(a) under the Investment Company Act of 1940 are attached hereto.
(3) Any written solicitation to purchase securities under Rule 23c-1 under the Act (17 CFR 270.23c-1) sent or given during the period covered by the report by or on behalf of the registrant to 10 or more persons.
Not applicable.
| | (b) | A separate or combined certification for each principal executive officer and principal officer of the registrant as required by Rule 30a-2(b) under the Act of 1940. |
Certifications pursuant to Rule 30a-2(b) under the Investment Company Act of 1940 are attached hereto.
SIGNATURES
Pursuant to the requirements of the Securities Exchange Act of 1934 and the Investment Company Act of 1940, the registrant has duly caused this report to be signed on its behalf by the undersigned, thereunto duly authorized.
| | |
| JPMorgan Insurance Trust |
| |
| By: | | /s/ Brian S. Shlissel |
| | Brian S. Shlissel |
| | President and Principal Executive Officer |
| | February 19, 2021 |
| | |
| Pursuant to the requirements of the Securities Exchange Act of 1934 and the Investment Company Act of 1940, this report has been signed below by the following persons on behalf of the registrant and in the capacities and on the dates indicated. |
| | |
| By: | | /s/ Brian S. Shlissel |
| | Brian S. Shlissel |
| | President and Principal Executive Officer |
| | February 19, 2021 |
| |
| By: | | /s/ Timothy J. Clemens |
| | Timothy J. Clemens |
| | Treasurer and Principal Financial Officer |
| | February 19, 2021 |