UNITED STATES
SECURITIES AND EXCHANGE COMMISSION
Washington, D.C. 20549
FORM N-CSR
CERTIFIED SHAREHOLDER REPORT OF REGISTERED
MANAGEMENT INVESTMENT COMPANIES
| | |
| Investment Company Act file number | | 811-07890 |
|
AIM Tax-Exempt Funds (Invesco Tax-Exempt Funds) |
| (Exact name of registrant as specified in charter) |
|
11 Greenway Plaza, Suite 1000 Houston, Texas 77046 |
| (Address of principal executive offices) (Zip code) |
|
Sheri Morris 11 Greenway Plaza, Suite 1000 Houston, Texas 77046 |
| (Name and address of agent for service) |
|
Registrant’s telephone number, including area code: (713) 626-1919 |
|
Date of fiscal year end: 2/28 |
|
Date of reporting period: 2/28/23 |
| ITEM 1. | REPORTS TO STOCKHOLDERS. |
(a) The Registrant’s annual report transmitted to shareholders pursuant to Rule 30e-1 under the Investment Company Act of 1940 is as follows:
(b) Not applicable.

| | |
| | |
| Annual Report to Shareholders | | February 28, 2023 |
Invesco AMT-Free Municipal Income Fund
Nasdaq:
A: OPTAX ∎ C: OMFCX ∎ Y: OMFYX ∎ R6: IORAX
Management’s Discussion of Fund Performance
| | | | |
| |
Performance summary | |
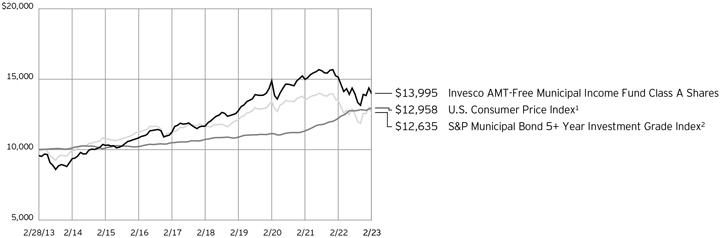
For the fiscal year ended February 28, 2023, Class A shares of Invesco AMT-Free Municipal Income Fund (the Fund), at net asset value (NAV), underperformed the S&P Municipal Bond 5+ Year Investment Grade Index. Your Fund’s long-term performance appears later in this report. | |
Fund vs. Indexes | |
Total returns, 2/28/22 to 2/28/23, at net asset value (NAV). Performance shown does not include applicable contingent deferred sales charges (CDSC) or front-end sales charges, which would have reduced performance. | |
| |
Class A Shares | | | -7.51 | % |
Class C Shares | | | -8.19 | |
Class Y Shares | | | -7.33 | |
Class R6 Shares | | | -7.22 | |
S&P Municipal Bond 5+ Year Investment Grade Index▼ | | | -6.31 | |
U.S. Consumer Price Index∎ | | | 6.04 | |
| |
Source(s): ▼RIMES Technologies Corp.; ∎Bloomberg LP | | | | |
Market conditions and your Fund
At the beginning of the fiscal year, investors were hopeful in anticipation of a return to normalcy as COVID-19 cases declined and pandemic-related restrictions were reduced or lifted. This allowed policymakers to turn their attention to the high inflation levels; however, on February 24, 2022, Russia began a full-scale invasion of Ukraine, which exacerbated inflationary pressures by driving up commodity prices. Against this backdrop, the fiscal year was plagued by volatility and uncertainty. The municipal market set multiple record lows in 2022, making it one of the most challenging years in history for municipal markets.
Investment grade municipal bonds returned -5.10%, high yield municipal bonds returned -9.35% and taxable municipal bonds returned -12.96% during the fiscal year.1
While municipal funds had experienced record inflows of $101.7 billion in 2021, flows quickly turned negative in the first quarter of 2022, perpetuating the Bloomberg Municipal Bond Index’s worst quarterly return in 40 years. Municipal bonds enjoyed a short respite in late May and early June 2022 with increased demand from crossover buyers like hedge funds, banks and insurance companies; however, the May 2022 Consumer Price Index report quoted inflation rising to a 40-year high. This sent the 10-year Treasury yield to a new 52-week high of nearly 3.50%, pushing municipal mutual fund flows back into negative territory.2 According to Lipper, net outflows from municipal bond funds totaled over -$110 billion for the fiscal year.3
On March 16, 2022, the US Federal Reserve (the Fed) raised the federal funds target rate 0.25% for the first time in more than three years in hopes of containing inflation.4 This was the first of eight consecutive increases during the fiscal year as the Fed announced its plan for a quantitative tightening campaign in an attempt to rein in inflation without harming employment or the overall
economy. Rate increases as high as 0.75% followed, the Fed’s most aggressive monetary policy since the 1980s, bringing the target rate to 4.75% as of the end of the fiscal year.4
The AAA municipal yield curve made history after the Fed’s December 2022 meeting when the curve inverted between one- and 10-year maturities. Any inversion is noteworthy, but this was a first for municipal bonds. On January 31, 2023, policymakers indicated that future rate increases were likely to be “appropriate,” suggesting they were not yet convinced inflation was contained, which increased uncertainty about when the current tightening cycle might end.4 The fiscal year ended with an increase of 0.25% on February 1, 2023. We expect additional rate hikes in 2023, although not with the same pace or vigor as in 2022.
New municipal issuance for the fiscal year totaled $354 billion, down 27% from the previous fiscal year’s $484 billion.5 Issuers, with cash on their balance sheets, have been reluctant to issue at higher interest rates. While taxable issuance continued to account for a significant portion of new issuance, at 14% of the total, this figure is down from 18% from the previous fiscal year because of higher interest rates.5
Puerto Rico continued to make developments in its ongoing debt restructuring throughout the fiscal year. The territory restructured its outstanding general obligation and other government-guaranteed debt in March 2022 and began paying bondholders on the new restructured bonds. Puerto Rico’s weight in the Bloomberg High Yield Municipal Bond Index increased from 13% to 20% as the new bonds were included.1 The Financial Oversight and Management Board for Puerto Rico, the Puerto Rican government, bond-holders and other interested parties continued to negotiate the restructuring of bonds issued by the Puerto Rico Electric Power Authority, the territory’s largest remaining unresolved debt, as the fiscal year closed.
Municipal credits have a long history of low defaults as many provide essential services to all Americans. This continues to be the case as evidenced by S&P rating changes – upgrades exceeded downgrades by a ratio of 2.5:1 through December 2022.6 This positive dynamic, which we believe will continue, likely stems from benefits of the various federal stimulus measures including the American Rescue Plan Act, the Infrastructure Investment and Jobs Act and the Inflation Reduction Act, as well as higher revenues collected by state and local governments.
We believe the valuable benefits of municipal bonds will prevail over current market volatility and economic uncertainty. We continue to rely on our experienced portfolio managers and credit analysts to weather the challenges while identifying marketplace opportunities to add long-term value for shareholders.
During the fiscal year, underweight exposure to local general obligation bonds contributed to the Fund’s performance relative to its benchmark. Additionally, an underweight exposure in lower coupon bonds (3.99% and lower) contributed to the Fund’s relative return. On a state level, underweight exposure to California domiciled bonds also added to the Fund’s relative performance.
Conversely, overweight exposure in bonds A-rated† and below detracted from the Fund’s performance relative to its benchmark during the fiscal year. Overweight exposure in the dedicated tax sector also detracted from the Fund’s relative performance. On a state level, overweight exposure to Puerto Rico holdings was a detractor from the Fund’s relative results.
During the fiscal year, leverage contributed to the Fund’s performance relative to its benchmark. The Fund achieved a leveraged position through the use of inverse floating rate securities or tender option bonds. The Fund uses leverage because we believe that, over time, leveraging provides opportunities for additional income and total return for shareholders. However, the use of leverage also can expose shareholders to additional volatility. For more information about the Fund’s use of leverage, see the Notes to Financial Statements later in this report.
We wish to remind you that the Fund is subject to interest rate risk, meaning when interest rates rise, the value of fixed income securities tends to fall. The degree to which the value of fixed income securities may decline due to rising interest rates may vary depending on the speed and magnitude of the increase in interest rates, as well as individual security characteristics, such as price, maturity, duration and coupon and market forces, such as supply and demand for similar securities. We are monitoring interest rates, as well as the market, economic and geopolitical factors that may impact the direction, speed and magnitude of changes to interest rates across the maturity spectrum, including the potential
| | |
| 2 | | Invesco AMT-Free Municipal Income Fund |
impact of monetary policy changes by the Fed and certain foreign central banks. If interest rates rise or fall faster than expected, markets may experience increased volatility, which may affect the value and/or liquidity of certain of the Fund’s investments.
Thank you for investing in Invesco AMT-Free Municipal Income Fund and for sharing our long-term investment horizon.
| 4 | Source: US Federal Reserve |
| 6 | Source: Standard & Poor’s |
† Sources: A credit rating is an assessment provided by a NRSRO of the creditworthiness of an issuer with respect to debt obligations, including specific securities, money market instruments or other debts. Ratings are measured on a scale that generally ranges from AAA (highest) to D (lowest); ratings are subject to change without notice. For more information on rating methodology, please visit www.spglobal.com and select “Understanding Credit Ratings” under About Ratings on the homepage; www.fitchratings.com and select “Understanding Credit Ratings” from the drop-down menu on the homepage; and www.moodys.com and select “Methodology,” then “Rating Methodologies” under Research Type on the left-hand side.
Portfolio manager(s):
Josh Cooney
Elizabeth Mossow
Tim O’Reilly
Mark Paris
Julius Williams
The views and opinions expressed in management’s discussion of Fund performance are those of Invesco Advisers, Inc. and its affiliates. These views and opinions are subject to change at any time based on factors such as market and economic conditions. These views and opinions may not be relied upon as investment advice or recommendations, or as an offer for a particular security. The information is not a complete analysis of every aspect of any market, country, industry, security or the Fund. Statements of fact are from sources considered reliable, but Invesco Advisers, Inc. makes no representation or warranty as to their completeness or accuracy. Although historical performance is no guarantee of future results, these insights may help you understand our investment management philosophy.
See important Fund and, if applicable, index disclosures later in this report.
| | |
| 3 | | Invesco AMT-Free Municipal Income Fund |
Your Fund’s Long-Term Performance
Results of a $10,000 Investment – Oldest Share Class(es)
Fund and index data from 2/28/13
| 2 | Source: RIMES Technologies Corp. |
Past performance cannot guarantee future results.
The data shown in the chart include reinvested distributions, applicable sales charges and Fund expenses including management
fees. Index results include reinvested dividends, but they do not reflect sales charges. Performance of the peer group, if applicable, reflects Fund expenses and management fees; performance of a market index does
not. Performance shown in the chart does not reflect deduction of taxes a shareholder would pay on Fund distributions or sale of Fund shares.
| | |
| 4 | | Invesco AMT-Free Municipal Income Fund |
| | | | |
| |
Average Annual Total Returns | |
As of 2/28/23, including maximum applicable sales charges | |
Class A Shares | | | | |
Inception (10/27/76) | | | 5.39 | % |
10 Years | | | 3.42 | |
5 Years | | | 2.82 | |
1 Year | | | -11.47 | |
| |
Class C Shares | | | | |
Inception (8/29/95) | | | 3.96 | % |
10 Years | | | 3.25 | |
5 Years | | | 2.90 | |
1 Year | | | -9.08 | |
| |
Class Y Shares | | | | |
Inception (11/29/10) | | | 6.00 | % |
10 Years | | | 4.12 | |
5 Years | | | 3.94 | |
1 Year | | | -7.33 | |
| |
Class R6 Shares | | | | |
10 Years | | | 3.99 | % |
5 Years | | | 3.96 | |
1 Year | | | -7.22 | |
Effective May 24, 2019, Class A, Class C and Class Y shares of the Oppenheimer Rochester AMT-Free Municipal Fund, (the predecessor fund), were reorganized into Class A, Class C and Class Y shares, respectively, of the Invesco Oppenheimer Rochester® AMT-Free Municipal Fund. The Fund was subsequently renamed the Invesco AMT-Free Municipal Income Fund (the Fund). Returns shown above, for periods ending on or prior to May 24, 2019, for Class A, Class C and Class Y shares are those for Class A, Class C and Class Y shares of the predecessor fund. Share class returns will differ from the predecessor fund because of different expenses.
Class R6 shares incepted on May 24, 2019. Performance shown on and prior to that date is that of the predecessor fund’s Class A shares at net asset value and includes the 12b-1 fees applicable to Class A shares.
The performance data quoted represent past performance and cannot guarantee future results; current performance may be lower or higher. Please visit invesco.com/ performance for the most recent month-end performance. Performance figures reflect reinvested distributions, changes in net asset value and the effect of the maximum sales charge unless otherwise stated. Performance figures do not reflect deduction of taxes a shareholder would pay on Fund distributions or sale of Fund shares. Investment return and principal value will fluctuate so that you may have a gain or loss when you sell shares.
Class A share performance reflects the maximum 4.25% sales charge, and Class C share performance reflects the applicable contingent deferred sales charge (CDSC) for the period involved. The CDSC on
Class C shares is 1% for the first year after purchase. Class Y and Class R6 shares do not have a front-end sales charge or a CDSC; therefore, performance is at net asset value.
The performance of the Fund’s share classes will differ primarily due to different sales charge structures and class expenses.
Fund performance reflects any applicable fee waivers and/or expense reimbursements. Had the adviser not waived fees and/or reimbursed expenses currently or in the past, returns would have been lower. See current prospectus for more information.
| | |
| 5 | | Invesco AMT-Free Municipal Income Fund |
Supplemental Information
Invesco AMT-Free Municipal Income Fund’s investment objective is to seek tax-free income.
| ∎ | Unless otherwise stated, information presented in this report is as of February 28, 2023, and is based on total net assets. |
| ∎ | Unless otherwise noted, all data is provided by Invesco. |
| ∎ | To access your Fund’s reports/prospectus, visit invesco.com/fundreports. |
About indexes used in this report
| ∎ | The S&P Municipal Bond 5+ Year Investment Grade Index seeks to measure the performance of investment-grade US municipal bonds with maturities equal to or greater than five years. |
| ∎ | The U.S. Consumer Price Index is a measure of change in consumer prices as determined by the US Bureau of Labor Statistics. |
| ∎ | The Fund is not managed to track the performance of any particular index, including the index(es) described here, and consequently, the performance of the Fund may deviate significantly from the performance of the index(es). |
| ∎ | A direct investment cannot be made in an index. Unless otherwise indicated, index results include reinvested dividends, and they do not reflect sales charges. Performance of the peer group, if applicable, reflects fund expenses; performance of a market index does not. |
| | |
This report must be accompanied or preceded by a currently effective Fund prospectus, which contains more complete information, including sales charges and expenses. Investors should read it carefully before investing. | | |
| |
NOT FDIC INSURED | MAY LOSE VALUE | NO BANK GUARANTEE | | |
| | |
| 6 | | Invesco AMT-Free Municipal Income Fund |
Fund Information
Portfolio Composition
| | | | |
| By credit sector | | % of total investments | |
| |
Revenue Bonds | | | 80.29% | |
| |
General Obligation Bonds | | | 14.31 | |
| |
Pre-Refunded Bonds | | | 2.77 | |
| |
Other | | | 2.63 | |
| |
| Top Five Debt Holdings | | | | |
| | | % of total net assets | |
| |
1. Los Angeles Department of Water & Power Water System Revenue, Series 2022, RB | | | 1.19% | |
| |
2. Buckeye Tobacco Settlement Financing Authority, Series 2020 B-2, Ref. RB | | | 1.08 | |
| |
3. Washington (State of) Metropolitan Area Transit Authority, Series 2020 A, RB | | | 1.04 | |
| |
4. Illinois (State of) Toll Highway Authority, Series 2020 A, RB | | | 0.96 | |
| |
5. California (State of) County Tobacco Securitization Agency, Series 2006 B, RB | | | 0.92 | |
The Fund’s holdings are subject to change, and there is no assurance that the Fund will continue to hold any particular security.
Data presented here are as of February 28, 2023.
| | |
| 7 | | Invesco AMT-Free Municipal Income Fund |
Schedule of Investments
February 28, 2023
| | | | | | | | | | | | | | | | |
| | | Interest
Rate | | | Maturity
Date | | | Principal
Amount
(000) | | | Value | |
Municipal Obligations–101.19% | | | | | | | | | | | | | | | | |
Alabama–5.12% | | | | | | | | | | | | | | | | |
Birmingham (City of) & Jefferson (County of), AL Civic Center Authority; Series 2018 A, RB | | | 5.00% | | | | 07/01/2048 | | | $ | 2,500 | | | $ | 2,579,162 | |
Birmingham (City of), AL Private Educational Building Authority (Birmingham-Southern College); Series 1996, RB | | | 6.13% | | | | 12/01/2025 | | | | 290 | | | | 254,836 | |
Birmingham (City of), AL Water Works Board; Series 2016 B, Ref. RB(a)(b) | | | 5.00% | | | | 01/01/2027 | | | | 16,150 | | | | 17,446,367 | |
Fort Deposit (Town of), AL Cooperative District; Series 2003, RB | | | 6.00% | | | | 02/01/2036 | | | | 165 | | | | 156,383 | |
Homewood (City of), AL Educational Building Authority (Samford University); Series 2017 A, Ref. RB | | | 5.00% | | | | 12/01/2047 | | | | 4,500 | | | | 4,586,248 | |
Jefferson (County of), AL; | | | | | | | | | | | | | | | | |
Series 2013 C, Revenue Wts. (INS - AGM)(c)(d) | | | 6.90% | | | | 10/01/2050 | | | | 8,750 | | | | 8,924,464 | |
Series 2013 D, Revenue Wts. | | | 6.00% | | | | 10/01/2042 | | | | 8,000 | | | | 8,492,672 | |
Series 2013 D, Revenue Wts. | | | 7.00% | | | | 10/01/2051 | | | | 4,000 | | | | 4,267,322 | |
Series 2013 D, Revenue Wts. | | | 6.50% | | | | 10/01/2053 | | | | 7,500 | | | | 7,977,745 | |
Series 2013 F, Revenue Wts.(c) | | | 7.75% | | | | 10/01/2046 | | | | 20,185 | | | | 20,716,758 | |
Series 2013 F, Revenue Wts.(c) | | | 7.90% | | | | 10/01/2050 | | | | 20,000 | | | | 20,514,886 | |
Series 2017, Ref. Revenue Wts. | | | 5.00% | | | | 09/15/2035 | | | | 4,500 | | | | 4,750,132 | |
Lower Alabama Gas District (The); Series 2016 A, RB | | | 5.00% | | | | 09/01/2046 | | | | 4,000 | | | | 3,976,037 | |
Mobile (City of), AL Downtown Redevelopment Authority (Austal USA, LLC); Series 2011 A, VRD RB (LOC - Bank Of America N.A.)(e)(f)(g) | | | 2.74% | | | | 05/01/2041 | | | | 10,000 | | | | 10,000,000 | |
Mobile (City of), AL Improvement District (McGowin Park); Series 2016 A, RB | | | 5.25% | | | | 08/01/2030 | | | | 200 | | | | 190,146 | |
Southeast Energy Authority A Cooperative District (No. 3); Series 2022 A-1, RB(b) | | | 5.50% | | | | 12/01/2029 | | | | 4,105 | | | | 4,401,915 | |
| | | | | | | | | | | | | | | | 119,235,073 | |
| | | | |
Alaska–0.00% | | | | | | | | | | | | | | | | |
Alaska (State of) Industrial Development & Export Authority (Boys & Girls Home & Family Services, Inc.); Series 2007 C, RB(h) | | | 5.88% | | | | 12/01/2027 | | | | 600 | | | | 1,560 | |
| | | | |
Arizona–1.36% | | | | | | | | | | | | | | | | |
Arizona (State of) Industrial Development Authority (Academies of Math & Science); | | | | | | | | | | | | | | | | |
Series 2017 A, Ref. RB | | | 5.00% | | | | 07/01/2042 | | | | 675 | | | | 682,837 | |
Series 2017 A, Ref. RB | | | 5.00% | | | | 07/01/2047 | | | | 925 | | | | 930,751 | |
Series 2017 A, Ref. RB | | | 5.00% | | | | 07/01/2051 | | | | 1,000 | | | | 1,003,760 | |
Series 2018 A, Ref. RB | | | 5.00% | | | | 07/01/2038 | | | | 500 | | | | 511,138 | |
Series 2018 A, Ref. RB | | | 5.00% | | | | 07/01/2048 | | | | 1,800 | | | | 1,809,291 | |
Series 2018 A, Ref. RB | | | 5.00% | | | | 07/01/2052 | | | | 2,125 | | | | 2,132,629 | |
Arizona (State of) Industrial Development Authority (Provident Group - Eastern Michigan University Parking); | | | | | | | | | | | | | | | | |
Series 2018, RB | | | 5.00% | | | | 05/01/2048 | | | | 1,100 | | | | 719,860 | |
Series 2018, RB | | | 5.00% | | | | 05/01/2051 | | | | 1,000 | | | | 644,095 | |
Arizona (State of) Industrial Development Authority (Provident Group-NCCU Properties LLC); Series 2019 A, RB (INS - BAM)(d) | | | 5.00% | | | | 06/01/2058 | | | | 570 | | | | 604,796 | |
Arizona (State of) Industrial Development Authority (Social Bonds); Series 2020 A, RB | | | 4.00% | | | | 11/01/2050 | | | | 2,100 | | | | 1,804,867 | |
Festival Ranch Community Facilities District (Assessment Districts Nos. 4 & 5); Series 2007, RB | | | 5.75% | | | | 07/01/2032 | | | | 273 | | | | 260,097 | |
Maricopa (County of), AZ Industrial Development Authority (GreatHearts Arizona); | | | | | | | | | | | | | | | | |
Series 2017 C, RB | | | 5.00% | | | | 07/01/2037 | | | | 80 | | | | 82,826 | |
Series 2017 C, RB | | | 5.00% | | | | 07/01/2048 | | | | 145 | | | | 147,432 | |
Maricopa (County of), AZ Industrial Development Authority (Legacy Traditional Schools); | | | | | | | | | | | | | | | | |
Series 2019, Ref. RB(e) | | | 5.00% | | | | 07/01/2049 | | | | 800 | | | | 724,059 | |
Series 2019, Ref. RB(e) | | | 5.00% | | | | 07/01/2054 | | | | 600 | | | | 533,356 | |
Merrill Ranch Community Facilities District No. 1 (Assessment Area One); Series 2006, RB | | | 5.30% | | | | 07/01/2030 | | | | 174 | | | | 173,999 | |
Phoenix (City of), AZ Industrial Development Authority (Espiritu Community Development Corp. Charter School); Series 2006 A, RB | | | 6.25% | | | | 07/01/2036 | | | | 405 | | | | 381,909 | |
Phoenix (City of), AZ Industrial Development Authority (Great Hearts Academies); Series 2016 A, Ref. RB | | | 5.00% | | | | 07/01/2041 | | | | 1,200 | | | | 1,209,699 | |
Phoenix Civic Improvement Corp.; | | | | | | | | | | | | | | | | |
Series 2019 A, RB | | | 4.00% | | | | 07/01/2045 | | | | 2,765 | | | | 2,529,352 | |
Series 2019, RB | | | 4.00% | | | | 07/01/2044 | | | | 6,855 | | | | 6,495,353 | |
See accompanying Notes to Financial Statements which are an integral part of the financial statements.
| | |
| 8 | | Invesco AMT-Free Municipal Income Fund |
| | | | | | | | | | | | | | |
| | | Interest Rate | | | Maturity Date | | | Principal Amount (000) | | | Value |
Arizona–(continued) | | | | | | | | | | | | | | |
Pima (County of), AZ Industrial Development Authority (Arizona Charter Schools Ref.); Series 2013 Q, Ref. RB | | | 5.38% | | | | 07/01/2031 | | | $ | 1,715 | | | $ 1,678,296 |
Pima (County of), AZ Industrial Development Authority (Christian Care Tuscon, Inc.); Series 2017 A, Ref. RB(a)(b) | | | 5.00% | | | | 06/15/2025 | | | | 550 | | | 574,225 |
Series 2017 C, RB(a)(b) | | | 5.00% | | | | 06/15/2025 | | | | 1,010 | | | 1,054,487 |
Pima (County of), AZ Industrial Development Authority (Excalibur Charter School (The)); Series 2016, Ref. RB(e) | | | 5.50% | | | | 09/01/2046 | | | | 900 | | | 812,320 |
Pima (County of), AZ Industrial Development Authority (Paideia Academies (The)); | | | | | | | | | | | | | | |
Series 2019, RB | | | 5.13% | | | | 07/01/2039 | | | | 195 | | | 181,991 |
Series 2019, RB | | | 5.25% | | | | 07/01/2049 | | | | 240 | | | 213,984 |
Pima (County of), AZ Industrial Development Authority (Tuscon Country Day School); Series 2007, Ref. RB | | | 5.00% | | | | 06/01/2037 | | | | 760 | | | 656,314 |
Salt Verde Financial Corp.; | | | | | | | | | | | | | | |
Series 2007, RB | | | 5.50% | | | | 12/01/2029 | | | | 100 | | | 106,550 |
Series 2007, RB | | | 5.00% | | | | 12/01/2032 | | | | 3,000 | | | 3,141,680 |
| | | | | | | | | | | | | | | 31,801,953 |
| | | | |
Arkansas–0.15% | | | | | | | | | | | | | | |
Arkansas (State of) Development Finance Authority (Baptist Memorial Health); Series 2020, Ref. RB | | | 5.00% | | | | 09/01/2044 | | | | 2,000 | | | 1,997,209 |
Cave Springs Municipal Property Owners’ Improvement District No. 3;
Series 2007, GO Bonds(i) | | | 6.25% | | | | 02/01/2038 | | | | 1,480 | | | 1,480,000 |
| | | | | | | | | | | | | | | 3,477,209 |
| | | | |
California–9.89% | | | | | | | | | | | | | | |
Bay Area Toll Authority (San Francisco Bay Area); Series 2019 S-8, Ref. RB(a)(b) | | | 5.00% | | | | 10/01/2029 | | | | 5,000 | | | 5,731,120 |
California (State of); | | | | | | | | | | | | | | |
Series 2016, Ref. GO Bonds | | | 5.00% | | | | 09/01/2037 | | | | 10,085 | | | 10,684,470 |
Series 2018, GO Bonds | | | 5.00% | | | | 10/01/2047 | | | | 13,500 | | | 14,015,141 |
Series 2020, GO Bonds | | | 3.00% | | | | 03/01/2050 | | | | 1,500 | | | 1,140,234 |
Series 2020, GO Bonds | | | 4.00% | | | | 03/01/2050 | | | | 2,600 | | | 2,511,319 |
Series 2021, Ref. GO Bonds | | | 5.00% | | | | 10/01/2041 | | | | 1,500 | | | 1,657,442 |
Series 2022, GO Bonds | | | 4.00% | | | | 04/01/2049 | | | | 1,325 | | | 1,283,663 |
California (State of) Community Choice Financing Authority (Green Bonds); | | | | | | | | | | | | | | |
Series 2021 B-1, RB(b) | | | 4.00% | | | | 08/01/2031 | | | | 9,280 | | | 9,231,225 |
Series 2023 C, RB(b) | | | 5.25% | | | | 10/01/2031 | | | | 3,250 | | | 3,384,037 |
Series 2023, RB(b) | | | 5.00% | | | | 08/01/2029 | | | | 5,000 | | | 5,247,510 |
California (State of) County Tobacco Securitization Agency; Series 2006 B, RB(j) | | | 0.00% | | | | 06/01/2050 | | | | 129,820 | | | 21,382,834 |
California (State of) County Tobacco Securitization Agency (Alameda County Tobacco Asset Securitization Corp.); Series 2002, RB | | | 5.88% | | | | 06/01/2035 | | | | 25 | | | 25,414 |
California (State of) County Tobacco Securitization Agency (Fresno County Tobacco Funding Corp.); | | | | | | | | | | | | | | |
Series 2006 A, RB(j) | | | 0.00% | | | | 06/01/2046 | | | | 7,000 | | | 1,582,890 |
Series 2006 B, RB(j) | | | 0.00% | | | | 06/01/2046 | | | | 6,000 | | | 1,311,335 |
California (State of) County Tobacco Securitization Agency (Stanislaus County Tobacco Funding Corp.); Series 2002 A, RB | | | 5.88% | | | | 06/01/2043 | | | | 3,100 | | | 3,100,086 |
California (State of) Health Facilities Financing Authority (Commonspirit Health);
Series 2020 A, Ref. RB | | | 4.00% | | | | 04/01/2049 | | | | 1,500 | | | 1,326,257 |
California (State of) Health Facilities Financing Authority (Sutter Health); | | | | | | | | | | | | | | |
Series 2016 B, Ref. RB(a)(b) | | | 5.00% | | | | 11/15/2026 | | | | 4,080 | | | 4,369,396 |
Series 2016 B, Ref. RB | | | 5.00% | | | | 11/15/2046 | | | | 5,920 | | | 6,034,944 |
California (State of) Housing Finance Agency; | | | | | | | | | | | | | | |
Series 2019 A-1, RB | | | 4.25% | | | | 01/15/2035 | | | | 166 | | | 165,208 |
Series 2019 A-2, RB | | | 4.00% | | | | 03/20/2033 | | | | 7,131 | | | 7,048,032 |
California (State of) Municipal Finance Authority (CHF-Davis I, LLC - West Village Student Housing); Series 2018, RB (INS - BAM)(d) | | | 5.00% | | | | 05/15/2043 | | | | 4,250 | | | 4,406,676 |
California (State of) Statewide Communities Development Authority (Community Facilities District No. 2007-01); Series 2015, Ref. RB | | | 5.00% | | | | 09/01/2030 | | | | 850 | | | 876,322 |
Cathedral (City of), CA Redevelopment Agency Successor Agency (Merged Redevelopment); | | | | | | | | | | | | | | |
Series 2014 A, Ref. RB (INS - AGM)(d) | | | 5.00% | | | | 08/01/2032 | | | | 1,450 | | | 1,497,913 |
Series 2014 A, Ref. RB (INS - AGM)(d) | | | 5.00% | | | | 08/01/2033 | | | | 885 | | | 914,306 |
Golden State Tobacco Securitization Corp.; Series 2017 A-1, Ref. RB(a)(b) | | | 5.00% | | | | 06/01/2027 | | | | 170 | | | 185,540 |
Inland Empire Tobacco Securitization Corp.; Series 2007 F, RB(e)(j) | | | 0.00% | | | | 06/01/2057 | | | | 345,750 | | | 16,574,529 |
Lammersville Joint Unified School District; Series 2013, RB | | | 6.00% | | | | 09/01/2043 | | | | 2,750 | | | 2,771,080 |
See accompanying Notes to Financial Statements which are an integral part of the financial statements.
| | |
| 9 | | Invesco AMT-Free Municipal Income Fund |
| | | | | | | | | | | | | | |
| | | Interest Rate | | | Maturity Date | | | Principal Amount (000) | | | Value |
California–(continued) | | | | | | | | | | | | | | |
Local Public Schools Funding Authority (School Facilities Improvement District No. 2016-1 - Election of 2016); Series 2017 A, GO Bonds (INS - BAM)(d) | | | 4.00% | | | | 08/01/2042 | | | $ | 3,500 | | | $ 3,393,189 |
Long Beach (City of), CA Bond Finance Authority; Series 2007 A, RB | | | 5.50% | | | | 11/15/2037 | | | | 2,000 | | | 2,176,538 |
Los Angeles (City of), CA Department of Airports (Green Bonds); Series 2022 I, RB | | | 5.00% | | | | 05/15/2048 | | | | 3,000 | | | 3,267,452 |
Los Angeles (City of), CA Department of Water & Power; Series 2017 A, RB | | | 5.00% | | | | 07/01/2042 | | | | 5,000 | | | 5,261,148 |
Los Angeles Department of Water & Power Water System Revenue; Series 2022, RB(k) | | | 5.00% | | | | 07/01/2042 | | | | 25,000 | | | 27,748,308 |
Los Angeles Unified School District; Series 2022, GO Bonds | | | 5.25% | | | | 07/01/2047 | | | | 5,000 | | | 5,617,165 |
M-S-R Energy Authority; Series 2009 B, RB | | | 7.00% | | | | 11/01/2034 | | | | 10,000 | | | 12,412,923 |
Oak Grove School District (Election of 2008); Series 2018 E, Ref. GO Bonds(c) | | | 5.00% | | | | 08/01/2042 | | | | 4,500 | | | 2,467,409 |
Oxnard (City of), CA Financing Authority; | | | | | | | | | | | | | | |
Series 2014, Ref. RB (INS - AGM)(d) | | | 5.00% | | | | 06/01/2032 | | | | 1,250 | | | 1,275,593 |
Series 2014, Ref. RB (INS - AGM)(d) | | | 5.00% | | | | 06/01/2033 | | | | 1,500 | | | 1,529,788 |
Series 2014, Ref. RB (INS -AGM)(d) | | | 5.00% | | | | 06/01/2034 | | | | 850 | | | 866,044 |
Paramount Unified School District (Election of 2016); Series 2017 A, GO Bonds (INS - AGM)(d) | | | 5.25% | | | | 08/01/2046 | | | | 2,575 | | | 2,741,066 |
Poway Unified School District Public Financing Authority;
Series 2015 B, Ref. RB (INS - BAM)(d) | | | 5.00% | | | | 09/01/2033 | | | | 1,725 | | | 1,816,646 |
Series 2015 B, Ref. RB (INS - BAM)(d) | | | 5.00% | | | | 09/01/2034 | | | | 3,075 | | | 3,227,845 |
San Diego (County of), CA Regional Airport Authority; | | | | | | | | | | | | | | |
Series 2019 A, Ref. RB | | | 5.00% | | | | 07/01/2044 | | | | 5,000 | | | 5,245,365 |
Series 2021 A, RB (INS - AGM)(d) | | | 5.00% | | | | 07/01/2051 | | | | 15,000 | | | 15,942,841 |
Santa Cruz (County of), CA Redevelopment Successor Agency; Series 2015 A, Ref. RB (INS - AGM)(d) | | | 5.00% | | | | 09/01/2035 | | | | 1,880 | | | 1,968,231 |
Transbay Joint Powers Authority (Green Bonds); Series 2020 A, RB | | | 5.00% | | | | 10/01/2049 | | | | 2,000 | | | 2,029,496 |
Twin Rivers Unified School District; Series 2020, GO Bonds (INS - AGM)(d)(j) | | | 0.00% | | | | 08/01/2044 | | | | 8,990 | | | 3,168,834 |
| | | | | | | | | | | | | | | 230,614,804 |
| | | | |
Colorado–4.76% | | | | | | | | | | | | | | |
Aurora (City of), CO (Pipeline/Interceptor); Series 2023, RB | | | 4.00% | | | | 08/01/2053 | | | | 13,285 | | | 12,212,891 |
Berthoud-Heritage Metropolitan District No. 1; Series 2019, RB | | | 5.63% | | | | 12/01/2048 | | | | 2,000 | | | 1,896,602 |
BNC Metropolitan District No. 1; Series 2017 A, Ref. GO Bonds (INS - BAM)(d) | | | 5.00% | | | | 12/01/2037 | | | | 550 | | | 587,502 |
Colorado (State of) Educational & Cultural Facilities Authority (Stargate Charter School); Series 2018 A, Ref. RB | | | 5.00% | | | | 12/01/2038 | | | | 1,000 | | | 1,028,545 |
Colorado (State of) Health Facilities Authority (Adventhealth Obligated Group); Series 2019, Ref. RB | | | 4.00% | | | | 11/15/2043 | | | | 2,000 | | | 1,896,174 |
Series 2021 A, Ref. RB | | | 4.00% | | | | 11/15/2050 | | | | 5,000 | | | 4,549,678 |
Colorado (State of) Health Facilities Authority (Christian Living Neighborhoods); Series 2016, Ref. RB | | | 5.00% | | | | 01/01/2031 | | | | 1,400 | | | 1,330,195 |
Colorado (State of) Health Facilities Authority (CommonSpirit Health);
Series 2019 A-2, Ref. RB | | | 5.00% | | | | 08/01/2044 | | | | 6,515 | | | 6,636,090 |
Series 2022, RB | | | 5.25% | | | | 11/01/2052 | | | | 7,500 | | | 7,726,424 |
Denver (City & County of), CO; | | | | | | | | | | | | | | |
Series 2018 B, Ref. RB | | | 5.00% | | | | 12/01/2048 | | | | 12,500 | | | 12,929,504 |
Series 2022 B, RB | | | 5.00% | | | | 11/15/2047 | | | | 6,250 | | | 6,775,679 |
Series 2022 B, RB | | | 5.25% | | | | 11/15/2053 | | | | 8,000 | | | 8,770,970 |
Series 2022 C, Ref. RB | | | 5.25% | | | | 11/15/2053 | | | | 6,120 | | | 6,709,792 |
E-470 Public Highway Authority; Series 1997 B, RB (INS - NATL)(d)(j) | | | 0.00% | | | | 09/01/2025 | | | | 125 | | | 114,472 |
Ebert Metropolitan District; | | | | | | | | | | | | | | |
Series 2018 A-1, GO Bonds (INS - BAM)(d) | | | 5.00% | | | | 12/01/2043 | | | | 7,000 | | | 7,402,335 |
Series 2018 A-2, GO Bonds (INS - BAM)(d) | | | 5.00% | | | | 12/01/2043 | | | | 1,605 | | | 1,697,250 |
Hunters Overlook Metropolitan District No. 5; | | | | | | | | | | | | | | |
Series 2019 A, GO Bonds | | | 5.00% | | | | 12/01/2039 | | | | 887 | | | 838,588 |
Series 2019 A, GO Bonds | | | 5.00% | | | | 12/01/2049 | | | | 1,360 | | | 1,216,698 |
Hunting Hill Metropolitan District; Series 2018, Ref. GO Bonds | | | 5.63% | | | | 12/01/2048 | | | | 2,075 | | | 1,998,963 |
Powhaton Road Metropolitan District No. 2; Series 2019 A, GO Bonds(a)(b) | | | 5.63% | | | | 12/01/2023 | | | | 710 | | | 741,763 |
Public Authority for Colorado Energy; | | | | | | | | | | | | | | |
Series 2008, RB | | | 6.25% | | | | 11/15/2028 | | | | 1,495 | | | 1,607,543 |
Series 2008, RB | | | 6.50% | | | | 11/15/2038 | | | | 11,740 | | | 13,993,823 |
Rampart Range Metropolitan District No. 1; Series 2017, Ref. RB (INS - AGM)(d) | | | 5.00% | | | | 12/01/2047 | | | | 6,165 | | | 6,477,735 |
Tallyn’s Reach Metropolitan District No. 3; | | | | | | | | | | | | | | |
Series 2013, Ref. GO Bonds(a)(b)(e) | | | 5.00% | | | | 12/01/2023 | | | | 103 | | | 104,279 |
Series 2013, Ref. GO Bonds(a)(b)(e) | | | 5.13% | | | | 12/01/2023 | | | | 250 | | | 253,056 |
See accompanying Notes to Financial Statements which are an integral part of the financial statements.
| | |
| 10 | | Invesco AMT-Free Municipal Income Fund |
| | | | | | | | | | | | | | |
| | | Interest Rate | | | Maturity Date | | | Principal Amount (000) | | | Value |
Colorado–(continued) | | | | | | | | | | | | | | |
Vauxmont Metropolitan District; Series 2020, Ref. GO Bonds (INS - AGM)(d) | | | 5.00% | | | | 12/01/2050 | | | $ | 1,500 | | | $ 1,533,790 |
| | | | | | | | | | | | | | | 111,030,341 |
| | | | |
Connecticut–0.91% | | | | | | | | | | | | | | |
Connecticut (State of); Series 2020 A, RB | | | 4.00% | | | | 05/01/2039 | | | | 1,000 | | | 1,002,520 |
Connecticut (State of) Health & Educational Facilities Authority; Series 2020 G-1, Ref. RB(e) | | | 5.00% | | | | 07/01/2050 | | | | 1,100 | | | 997,873 |
Connecticut (State of) Health & Educational Facilities Authority (Fairfield University); Series 2017 R, Ref. RB | | | 4.00% | | | | 07/01/2047 | | | | 6,125 | | | 5,494,583 |
Connecticut (State of) Health & Educational Facilities Authority (Nuvance Health); Series 2019 A, Ref. RB | | | 4.00% | | | | 07/01/2049 | | | | 12,430 | | | 10,378,759 |
Georgetown (City of), CT Special Taxing District; Series 2006 A, GO Bonds(h)(i) | | | 5.13% | | | | 10/01/2036 | | | | 500 | | | 60,000 |
Hamden (Town of), CT; Series 2018 A, Ref. GO Bonds (INS - BAM)(d) | | | 5.00% | | | | 08/15/2030 | | | | 625 | | | 677,592 |
Mashantucket Western Pequot Tribe; Series 2013, RB(h) | | | 6.05% | | | | 07/01/2031 | | | | 11,260 | | | 2,505,364 |
| | | | | | | | | | | | | | | 21,116,691 |
| | | | |
District of Columbia–2.40% | | | | | | | | | | | | | | |
District of Columbia; | | | | | | | | | | | | | | |
Series 2006 B-1, RB (INS - NATL)(d) | | | 5.00% | | | | 02/01/2031 | | | | 15 | | | 15,014 |
Series 2020 A, RB | | | 4.00% | | | | 03/01/2045 | | | | 4,335 | | | 4,182,443 |
District of Columbia Tobacco Settlement Financing Corp.; | | | | | | | | | | | | | | |
Series 2001, RB | | | 6.50% | | | | 05/15/2033 | | | | 340 | | | 347,811 |
Series 2001, RB | | | 6.75% | | | | 05/15/2040 | | | | 4,385 | | | 4,514,269 |
Series 2006 B, RB(j) | | | 0.00% | | | | 06/15/2046 | | | | 72,125 | | | 13,552,302 |
Metropolitan Washington Airports Authority (Dulles Metrorail and Capital Improvement); Series 2019 B, Ref. RB | | | 4.00% | | | | 10/01/2049 | | | | 10,000 | | | 8,969,296 |
Washington (State of) Metropolitan Area Transit Authority; Series 2020 A, RB | | | 4.00% | | | | 07/15/2045 | | | | 25,600 | | | 24,280,092 |
| | | | | | | | | | | | | | | 55,861,227 |
| | | | |
Florida–5.94% | | | | | | | | | | | | | | |
Alachua (County of), FL Health Facilities Authority (Shands Teaching Hospital & Clinics, Inc.); Series 2019, Ref. RB | | | 5.00% | | | | 12/01/2037 | | | | 2,580 | | | 2,673,062 |
Amelia Concourse Community Development District; Series 2007, RB(h)(i) | | | 5.75% | | | | 05/01/2038 | | | | 1,510 | | | 1,464,700 |
Arlington Ridge Community Development District; Series 2006 A, RB | | | 5.50% | | | | 05/01/2036 | | | | 140 | | | 140,021 |
Broward (County of), FL (Convention Center Expansion); Series 2021, RB | | | 4.00% | | | | 09/01/2047 | | | | 17,250 | | | 15,489,819 |
Broward (County of), FL School Board; Series 2022, GO Bonds | | | 5.00% | | | | 07/01/2051 | | | | 10,000 | | | 10,722,829 |
Canaveral Port Authority; Series 2018 B, RB | | | 5.00% | | | | 06/01/2048 | | | | 5,000 | | | 5,130,107 |
Capital Trust Agency, Inc. (Advantage Academy of Hillsborough); | | | | | | | | | | | | | | |
Series 2019 A, RB | | | 5.00% | | | | 12/15/2049 | | | | 455 | | | 455,353 |
Series 2019 A, RB | | | 5.00% | | | | 12/15/2054 | | | | 320 | | | 318,018 |
Capital Trust Agency, Inc. (Florida Charter Educational Foundation, Inc.); | | | | | | | | | | | | | | |
Series 2018 A, RB(e) | | | 5.38% | | | | 06/15/2038 | | | | 255 | | | 246,343 |
Series 2018 A, RB(e) | | | 5.38% | | | | 06/15/2048 | | | | 480 | | | 437,687 |
Chapel Creek Community Development District; Series 2006 A, RB(h)(i) | | | 5.50% | | | | 05/01/2038 | | | | 1,990 | | | 1,333,300 |
Clearwater Cay Community Development District; Series 2006 A, RB(h)(i) | | | 5.50% | | | | 05/01/2037 | | | | 826 | | | 470,787 |
Creekside Community Development District; Series 2006, RB(h)(i) | | | 5.20% | | | | 05/01/2038 | | | | 2,280 | | | 1,026,000 |
East Homestead Community Development District; Series 2013, RB | | | 5.00% | | | | 11/01/2033 | | | | 350 | | | 350,169 |
Greater Orlando Aviation Authority; Series 2015 XF2019, Revenue Ctfs.(k) | | | 5.00% | | | | 10/01/2032 | | | | 9,385 | | | 9,398,487 |
Heritage Isles Community Development District; Series 1999, RB(h) | | | 7.10% | | | | 10/01/2023 | | | | 195 | | | 27,300 |
Highland Meadows Community Development District; Series 2006 A, RB | | | 5.50% | | | | 05/01/2036 | | | | 85 | | | 85,013 |
Indigo Community Development District; Series 2005, RB(i) | | | 5.75% | | | | 05/01/2036 | | | | 375 | | | 251,250 |
Jacksonville (City of), FL (Brooks Rehabilitation); Series 2020, Ref. RB | | | 5.00% | | | | 11/01/2050 | | | | 5,000 | | | 5,042,928 |
Jacksonville (City of), FL Health Facilities Authority; Series 1997 B, RB(a) | | | 5.25% | | | | 08/15/2027 | | | | 20 | | | 20,297 |
Lake (County of), FL (Imagine South Lake Charter School Program); Series 2019, RB(e) | | | 5.00% | | | | 01/15/2054 | | | | 190 | | | 167,526 |
Lake Helen (City of), FL (Ivy Hawn Charter School of the Arts); | | | | | | | | | | | | | | |
Series 2018 A, RB(e) | | | 5.50% | | | | 07/15/2048 | | | | 565 | | | 502,538 |
Series 2018 A, RB(e) | | | 5.75% | | | | 07/15/2053 | | | | 600 | | | 560,895 |
Lakeland (City of), FL (Lakeland Regional Health); Series 2015, RB | | | 5.00% | | | | 11/15/2040 | | | | 3,000 | | | 3,027,782 |
Lee Memorial Health System; Series 2019 A-1, Ref. RB | | | 4.00% | | | | 04/01/2037 | | | | 4,000 | | | 3,930,343 |
Lucaya Community Development District; Series 2005, RB | | | 5.38% | | | | 05/01/2035 | | | | 1,090 | | | 1,090,303 |
Magnolia Creek Community Development District; Series 2007 A, RB(h)(i) | | | 5.90% | | | | 05/01/2039 | | | | 195 | | | 107,250 |
See accompanying Notes to Financial Statements which are an integral part of the financial statements.
| | |
| 11 | | Invesco AMT-Free Municipal Income Fund |
| | | | | | | | | | | | | | | | |
| | | Interest Rate | | | Maturity Date | | | Principal Amount (000) | | | Value | |
Florida–(continued) | | | | | | | | | | | | | | | | |
Magnolia West Community Development District; Series 2017, RB | | | 5.35% | | | | 05/01/2037 | | | $ | 75 | | | $ | 75,482 | |
Miami-Dade (County of), FL; | | | | | | | | | | | | | | | | |
Series 2009, RB (INS - BAM)(d)(j) | | | 0.00% | | | | 10/01/2042 | | | | 6,925 | | | | 2,897,905 | |
Series 2013 A, RB(a)(b) | | | 5.50% | | | | 10/01/2023 | | | | 3,000 | | | | 3,041,125 | |
Series 2019 B, RB (INS - BAM)(d) | | | 4.00% | | | | 10/01/2049 | | | | 17,745 | | | | 16,426,027 | |
Series 2021, RB (INS - BAM)(d) | | | 4.00% | | | | 10/01/2051 | | | | 5,000 | | | | 4,600,575 | |
Miami-Dade (County of), FL Transit System; | | | | | | | | | | | | | | | | |
Series 2020 A, RB | | | 4.00% | | | | 07/01/2048 | | | | 12,185 | | | | 11,346,086 | |
Series 2020 A, RB | | | 4.00% | | | | 07/01/2050 | | | | 5,000 | | | | 4,610,366 | |
Miromar Lakes Community Development District; Series 2015, Ref. RB | | | 5.00% | | | | 05/01/2035 | | | | 1,195 | | | | 1,193,106 | |
Naturewalk Community Development District; Series 2007 A, RB(h)(i) | | | 5.50% | | | | 05/01/2038 | | | | 335 | | | | 107,200 | |
Orange (County of), FL Health Facilities Authority (Orlando Health Obligated Group); Series 2022, RB | | | 4.00% | | | | 10/01/2052 | | | | 5,000 | | | | 4,477,390 | |
Orlando (City of), FL; Series 2008, RB (INS - AGC)(d) | | | 5.50% | | | | 11/01/2038 | | | | 130 | | | | 130,196 | |
Orlando (City of), FL Utilities Commission; Series 2018 A, RB | | | 5.00% | | | | 10/01/2038 | | | | 3,000 | | | | 3,204,481 | |
Osceola (County of), FL; Series 2020 A-1, Ref. RB | | | 5.00% | | | | 10/01/2049 | | | | 2,055 | | | | 2,061,771 | |
Palace Coral Gables Community Development District; | | | | | | | | | | | | | | | | |
Series 2011, RB | | | 5.00% | | | | 05/01/2032 | | | | 415 | | | | 415,322 | |
Series 2011, RB | | | 5.63% | | | | 05/01/2042 | | | | 1,000 | | | | 1,000,791 | |
Polk (County of), FL Industrial Development Authority (Carpenter’s Home Estates); Series 2019, Ref. IDR | | | 5.00% | | | | 01/01/2049 | | | | 750 | | | | 647,689 | |
Reunion East Community Development District; | | | | | | | | | | | | | | | | |
Series 2002 A-2, RB(h)(i) | | | 7.38% | | | | 05/01/2033 | | | | 860 | | | | 9 | |
Series 2005, RB(h)(i) | | | 5.80% | | | | 05/01/2036 | | | | 810 | | | | 8 | |
Ridgewood Trails Community Development District; Series 2007 A, RB | | | 5.65% | | | | 05/01/2038 | | | | 15 | | | | 15,004 | |
South Bay Community Development District; | | | | | | | | | | | | | | | | |
Series 2005 A, RB(h)(i) | | | 5.95% | | | | 05/01/2036 | | | | 1,645 | | | | 16 | |
Series 2005 A-1, Ref. RB | | | 5.95% | | | | 05/01/2036 | | | | 1,700 | | | | 1,677,671 | |
Series 2005 A-2, Ref. RB(h)(i) | | | 6.60% | | | | 05/01/2036 | | | | 1,095 | | | | 547,500 | |
Series 2005 B-2, Ref. RB(h)(i) | | | 6.60% | | | | 05/01/2025 | | | | 935 | | | | 467,501 | |
Tampa (City of), FL; | | | | | | | | | | | | | | | | |
Series 2020 A, RB(j) | | | 0.00% | | | | 09/01/2033 | | | | 210 | | | | 138,812 | |
Series 2020 A, RB(j) | | | 0.00% | | | | 09/01/2034 | | | | 880 | | | | 553,638 | |
Series 2020 A, RB(j) | | | 0.00% | | | | 09/01/2035 | | | | 750 | | | | 445,903 | |
Series 2020 A, RB(j) | | | 0.00% | | | | 09/01/2036 | | | | 850 | | | | 476,829 | |
Series 2020 A, RB(j) | | | 0.00% | | | | 09/01/2037 | | | | 825 | | | | 438,331 | |
Series 2020 A, RB(j) | | | 0.00% | | | | 09/01/2038 | | | | 1,050 | | | | 527,594 | |
Series 2020 A, RB(j) | | | 0.00% | | | | 09/01/2039 | | | | 1,000 | | | | 471,952 | |
Villages of Avignon Community Development District (The); Series 2007 A, RB(h)(i) | | | 5.40% | | | | 05/01/2037 | | | | 250 | | | | 12,500 | |
Vista Community Development District; Series 2006 A, RB | | | 5.38% | | | | 05/01/2037 | | | | 3,560 | | | | 3,560,252 | |
Waterford Estates Community Development District; Series 2006 A, RB | | | 5.50% | | | | 05/01/2037 | | | | 1,665 | | | | 1,665,269 | |
Waterstone Community Development District; | | | | | | | | | | | | | | | | |
Series 2007 A, RB(c)(i) | | | 6.88% | | | | 05/01/2037 | | | | 146 | | | | 93,826 | |
Series 2007 B, RB(i)(j) | | | 0.00% | | | | 11/01/2028 | | | | 888 | | | | 533,755 | |
West Villages Improvement District; | | | | | | | | | | | | | | | | |
Series 2005 A-1, RB | | | 5.75% | | | | 05/01/2036 | | | | 3,045 | | | | 3,046,632 | |
Series 2005 A-2, RB(h)(i) | | | 5.75% | | | | 05/01/2036 | | | | 2,925 | | | | 1,696,500 | |
Westridge Community Development District; Series 2005, RB | | | 5.80% | | | | 05/01/2037 | | | | 415 | | | | 415,062 | |
Westside Community Development District; Series 2019 2, RB(h) | | | 5.65% | | | | 05/01/2037 | | | | 525 | | | | 351,236 | |
Zephyr Ridge Community Development District; Series 2006 A, RB(h)(i) | | | 5.63% | | | | 05/01/2037 | | | | 979 | | | | 489,330 | |
| | | | | | | | | | | | | | | | 138,330,749 | |
| | | | |
Georgia–1.83% | | | | | | | | | | | | | | | | |
Atlanta (City of), GA Urban Residential Finance Authority (Trestletree Village Apartments); Series 2013 A, RB | | | 5.00% | | | | 11/01/2048 | | | | 565 | | | | 439,448 | |
Brookhaven (City of), GA Urban Redevelopment Agency; Series 2023 A, RB | | | 4.00% | | | | 07/01/2053 | | | | 5,000 | | | | 4,772,393 | |
See accompanying Notes to Financial Statements which are an integral part of the financial statements.
| | |
| 12 | | Invesco AMT-Free Municipal Income Fund |
| | | | | | | | | | | | | | |
| | | Interest Rate | | | Maturity Date | | | Principal Amount (000) | | | Value |
Georgia–(continued) | | | | | | | | | | | | | | |
Floyd (County of), GA Development Authority (The Spires at Berry College); | | | | | | | | | | | | | | |
Series 2018 A, RB | | | 5.75% | | | | 12/01/2033 | | | $ | 1,155 | | | $ 1,110,162 |
Series 2018 A, RB | | | 6.00% | | | | 12/01/2038 | | | | 2,260 | | | 2,173,026 |
Series 2018 A, RB | | | 6.25% | | | | 12/01/2048 | | | | 5,565 | | | 5,285,113 |
Series 2018 A, RB | | | 6.50% | | | | 12/01/2053 | | | | 3,205 | | | 3,097,260 |
Fulton (County of), GA Development Authority (Piedmont Healthcare, Inc.); | | | | | | | | | | | | | | |
Series 2016 A, Ref. RB | | | 5.00% | | | | 07/01/2046 | | | | 3,000 | | | 3,043,526 |
Series 2019, RB | | | 4.00% | | | | 07/01/2049 | | | | 11,150 | | | 9,959,523 |
George L Smith II Congress Center Authority (Convention Center Hotel); Series 2021, RB | | | 4.00% | | | | 01/01/2054 | | | | 2,200 | | | 1,745,707 |
Main Street Natural Gas, Inc.; | | | | | | | | | | | | | | |
Series 2019 A, RB | | | 5.00% | | | | 05/15/2043 | | | | 1,040 | | | 1,038,127 |
Series 2022 C, RB(b)(e) | | | 4.00% | | | | 11/01/2027 | | | | 7,000 | | | 6,657,328 |
Oconee (County of), GA Industrial Development Authority (Presbyterian Village Athens); | | | | | | | | | | | | | | |
Series 2018 A-1, RB | | | 6.13% | | | | 12/01/2038 | | | | 880 | | | 800,868 |
Series 2018 A-1, RB | | | 6.25% | | | | 12/01/2048 | | | | 1,230 | | | 1,053,145 |
Series 2018 A-1, RB | | | 6.38% | | | | 12/01/2053 | | | | 1,030 | | | 879,510 |
Series 2018 A-2, RB(b) | | | 5.50% | | | | 12/01/2028 | | | | 700 | | | 633,686 |
| | | | | | | | | | | | | | | 42,688,822 |
| | | | |
Guam–0.17% | | | | | | | | | | | | | | |
Guam (Territory of); Series 2015 D, Ref. RB | | | 5.00% | | | | 11/15/2039 | | | | 2,500 | | | 2,511,491 |
Guam (Territory of) Waterworks Authority; Series 2020 A, RB | | | 5.00% | | | | 01/01/2050 | | | | 1,500 | | | 1,505,695 |
| | | | | | | | | | | | | | | 4,017,186 |
| | | | |
Illinois–7.31% | | | | | | | | | | | | | | |
Chicago (City of), IL; Series 2012, RB (INS - BAM)(d) | | | 4.00% | | | | 01/01/2042 | | | | 6,000 | | | 5,805,395 |
Chicago (City of), IL (O’Hare International Airport); | | | | | | | | | | | | | | |
Series 2015 B, Ref. RB | | | 5.00% | | | | 01/01/2034 | | | | 2,500 | | | 2,572,393 |
Series 2016 B, Ref. RB | | | 5.00% | | | | 01/01/2041 | | | | 3,000 | | | 3,072,328 |
Series 2017 D, RB | | | 5.00% | | | | 01/01/2052 | | | | 3,000 | | | 3,065,396 |
Series 2018 B, RB | | | 5.00% | | | | 01/01/2048 | | | | 10,000 | | | 10,348,069 |
Series 2020 A, Ref. RB | | | 4.00% | | | | 01/01/2036 | | | | 5,000 | | | 5,028,285 |
Chicago (City of), IL Board of Education; | | | | | | | | | | | | | | |
Series 1998 B-1, GO Bonds (INS - NATL)(d)(j) | | | 0.00% | | | | 12/01/2024 | | | | 915 | | | 851,829 |
Series 1999 A, GO Bonds (INS - NATL)(d)(j) | | | 0.00% | | | | 12/01/2024 | | | | 1,405 | | | 1,307,999 |
Series 2016, RB | | | 6.00% | | | | 04/01/2046 | | | | 4,300 | | | 4,440,882 |
Series 2018 A, Ref. GO Bonds (INS - AGM)(d) | | | 5.00% | | | | 12/01/2026 | | | | 775 | | | 805,675 |
Series 2018 A, Ref. GO Bonds (INS - AGM)(d) | | | 5.00% | | | | 12/01/2028 | | | | 2,250 | | | 2,387,364 |
Series 2018 A, Ref. GO Bonds (INS - AGM)(d) | | | 5.00% | | | | 12/01/2031 | | | | 1,000 | | | 1,050,751 |
Series 2018 A, Ref. GO Bonds (INS - AGM)(d) | | | 5.00% | | | | 12/01/2034 | | | | 1,205 | | | 1,255,544 |
Series 2022 A, GO Bonds | | | 5.00% | | | | 12/01/2047 | | | | 3,200 | | | 3,039,708 |
Chicago (City of), IL Transit Authority; | | | | | | | | | | | | | | |
Series 2020 A, Ref. RB | | | 5.00% | | | | 12/01/2045 | | | | 20 | | | 20,625 |
Series 2020 A, Ref. RB | | | 5.00% | | | | 12/01/2055 | | | | 2,140 | | | 2,180,465 |
Cook (County of), IL; Series 2021 A, Ref. RB | | | 4.00% | | | | 11/15/2041 | | | | 3,500 | | | 3,231,358 |
Cook County Community School District No. 147; Series 2004 A, Ref. GO Bonds (INS - ACA)(d) | | | 7.13% | | | | 06/01/2024 | | | | 1,105 | | | 1,124,681 |
Du Page (County of), IL Special Service Area No. 31 (Monarch Landing, Inc.); Series 2006, RB | | | 5.63% | | | | 03/01/2036 | | | | 287 | | | 280,781 |
Gilberts (Village of), IL; Series 2014, Ref. RB (INS - AGM)(d) | | | 5.00% | | | | 03/01/2035 | | | | 2,000 | | | 2,018,940 |
Gilberts (Village of), IL Special Service Area No. 24 (The Conservancy); Subseries 2014 A, RB | | | 5.38% | | | | 03/01/2034 | | | | 690 | | | 615,499 |
Harvey (City of), IL; | | | | | | | | | | | | | | |
Series 2007 A, Ref. GO Bonds (Acquired 09/02/2009; Cost $ 1,773,512)(h)(l) | | | 5.50% | | | | 12/01/2027 | | | | 2,225 | | | 2,038,656 |
Series 2007 A, Ref. GO Bonds (Acquired 09/03/2009; Cost $ 758,969)(h)(l) | | | 5.63% | | | | 12/01/2032 | | | | 1,000 | | | 916,250 |
Series 2008, RB | | | 6.88% | | | | 08/01/2028 | | | | 2,685 | | | 2,446,629 |
See accompanying Notes to Financial Statements which are an integral part of the financial statements.
| | |
| 13 | | Invesco AMT-Free Municipal Income Fund |
| | | | | | | | | | | | | | |
| | | Interest Rate | | | Maturity Date | | | Principal Amount (000) | | | Value |
Illinois–(continued) | | | | | | | | | | | | | | |
Illinois (State of); | | | | | | | | | | | | | | |
Series 2014, GO Bonds | | | 5.00% | | | | 04/01/2025 | | | $ | 2,000 | | | $ 2,023,356 |
Series 2014, GO Bonds | | | 5.00% | | | | 02/01/2039 | | | | 1,525 | | | 1,531,747 |
Series 2016, GO Bonds (INS - BAM)(d) | | | 4.00% | | | | 06/01/2041 | | | | 5,000 | | | 4,642,798 |
Series 2017 C, GO Bonds | | | 5.00% | | | | 11/01/2029 | | | | 3,000 | | | 3,137,484 |
Series 2018 A, GO Bonds | | | 5.00% | | | | 05/01/2036 | | | | 2,610 | | | 2,691,616 |
Series 2018 A, Ref. GO Bonds | | | 5.00% | | | | 10/01/2029 | | | | 6,500 | | | 6,851,855 |
Series 2018 A, Ref. GO Bonds | | | 5.00% | | | | 10/01/2032 | | | | 3,000 | | | 3,135,600 |
Series 2018 A, Ref. GO Bonds | | | 5.00% | | | | 10/01/2033 | | | | 750 | | | 781,602 |
Series 2018 B, Ref. GO Bonds | | | 5.00% | | | | 10/01/2029 | | | | 5,000 | | | 5,270,658 |
Series 2020, GO Bonds | | | 5.50% | | | | 05/01/2039 | | | | 3,750 | | | 3,986,576 |
Illinois (State of) Finance Authority (University of Illinois Health Services); Series 2020, RB | | | 4.00% | | | | 10/01/2040 | | | | 3,950 | | | 3,478,145 |
Illinois (State of) Metropolitan Pier & Exposition Authority (McCormick Place Expansion); Series 1998 A, RB (INS - AGM)(d) | | | 5.50% | | | | 12/15/2023 | | | | 360 | | | 363,447 |
Illinois (State of) Regional Transportation Authority; | | | | | | | | | | | | | | |
Series 2018 B, RB | | | 4.00% | | | | 06/01/2043 | | | | 1,365 | | | 1,310,943 |
Series 2018 XF2618, Revenue Ctfs.(k) | | | 4.00% | | | | 06/01/2043 | | | | 18,000 | | | 17,287,159 |
Illinois (State of) Sports Facilities Authority; | | | | | | | | | | | | | | |
Series 2014, Ref. RB (INS - AGM)(d) | | | 5.25% | | | | 06/15/2032 | | | | 2,000 | | | 2,028,590 |
Series 2019, Ref. RB (INS - BAM)(d) | | | 5.00% | | | | 06/15/2028 | | | | 2,520 | | | 2,634,283 |
Series 2019, Ref. RB (INS - BAM)(d) | | | 5.00% | | | | 06/15/2029 | | | | 1,455 | | | 1,536,334 |
Series 2019, Ref. RB (INS - BAM)(d) | | | 5.00% | | | | 06/15/2030 | | | | 245 | | | 259,018 |
Illinois (State of) Toll Highway Authority; | | | | | | | | | | | | | | |
Series 2020 A, RB | | | 5.00% | | | | 01/01/2045 | | | | 21,090 | | | 22,381,471 |
Series 2021 A, RB | | | 4.00% | | | | 01/01/2046 | | | | 7,785 | | | 7,340,059 |
Jefferson County Township High School District No. 201; | | | | | | | | | | | | | | |
Series 2012 A, GO Bonds | | | 6.50% | | | | 12/30/2027 | | | | 895 | | | 1,025,123 |
Series 2012 A, GO Bonds | | | 6.50% | | | | 12/30/2028 | | | | 955 | | | 1,121,255 |
Series 2012 A, GO Bonds | | | 6.50% | | | | 12/30/2031 | | | | 1,160 | | | 1,438,884 |
Lincolnshire (Village of), IL (Sedgewick); Series 2004, RB | | | 6.25% | | | | 03/01/2034 | | | | 1,859 | | | 1,860,240 |
Markham (City of), IL; Series 2008 B, GO Bonds | | | 5.75% | | | | 02/01/2028 | | | | 410 | | | 378,321 |
Northern Illinois Municipal Power Agency; Series 2016 A, Ref. RB | | | 4.00% | | | | 12/01/2041 | | | | 1,050 | | | 981,006 |
Plano (City of), IL Special Service Area No. 5 (Lakewood Springs Club); Series 2006, RB | | | 6.00% | | | | 03/01/2036 | | | | 365 | | | 352,388 |
Sales Tax Securitization Corp.; Series 2018 C, Ref. RB (INS - BAM)(d) | | | 5.25% | | | | 01/01/2048 | | | | 5,000 | | | 5,224,744 |
Southwestern Illinois Development Authority; Series 2006, RB(h) | | | 5.63% | | | | 11/01/2026 | | | | 890 | | | 534,000 |
Stephenson County School District No. 145 Freeport; | | | | | | | | | | | | | | |
Series 2018 A, GO Bonds(a)(b) | | | 5.00% | | | | 02/01/2028 | | | | 210 | | | 230,918 |
Series 2018 A, GO Bonds(a)(b) | | | 5.00% | | | | 02/01/2028 | | | | 135 | | | 148,447 |
Series 2018 A, GO Bonds(a)(b) | | | 5.00% | | | | 02/01/2028 | | | | 160 | | | 175,937 |
Series 2018 A, GO Bonds (INS - AGM)(d) | | | 5.00% | | | | 02/01/2032 | | | | 945 | | | 1,049,676 |
Series 2018 A, GO Bonds (INS - AGM)(d) | | | 5.00% | | | | 02/01/2033 | | | | 690 | | | 765,886 |
Series 2018 A, GO Bonds (INS - AGM)(d) | | | 5.00% | | | | 02/01/2034 | | | | 615 | | | 680,917 |
Yorkville (United City of), IL (United City Special Services Area); Series 2013, Ref. RB | | | 5.00% | | | | 03/01/2033 | | | | 1,848 | | | 1,745,875 |
| | | | | | | | | | | | | | | 170,291,860 |
| | | | |
Indiana–0.53% | | | | | | | | | | | | | | |
Columbus (City of), IN (Vivera Senior Living); Series 2019, RB | | | 5.63% | | | | 05/01/2039 | | | | 3,575 | | | 2,970,249 |
Indiana (State of) Finance Authority (Good Samaritan Hospital); Series 2016 A, RB | | | 5.50% | | | | 04/01/2026 | | | | 1,620 | | | 1,691,641 |
Indiana (State of) Municipal Power Agency; Series 2016 A, Ref. RB | | | 5.00% | | | | 01/01/2037 | | | | 7,500 | | | 7,751,397 |
| | | | | | | | | | | | | | | 12,413,287 |
| | | | |
Iowa–0.75% | | | | | | | | | | | | | | |
Iowa (State of) Finance Authority; Series 2007, RB(h) | | | 5.90% | | | | 12/01/2028 | | | | 400 | | | 1,040 |
Iowa (State of) Finance Authority (Iowa Fertilizer Co.); Series 2022, Ref. RB(b) | | | 5.00% | | | | 12/01/2042 | | | | 7,785 | | | 7,814,218 |
Iowa (State of) Finance Authority (Mercy Medical Center); Series 2012, RB | | | 5.00% | | | | 08/15/2028 | | | | 1,685 | | | 1,685,892 |
Iowa (State of) Finance Authority (Unitypoint Health); Series 2018 B, Ref. RB | | | 5.00% | | | | 02/15/2048 | | | | 1,300 | | | 1,331,049 |
Iowa (State of) Finance Authority (Wedum Walnut Ridge LLC); Series 2007 B, RB | | | 5.38% | | | | 06/01/2025 | | | | 120 | | | 117,577 |
PEFA, Inc.; Series 2019, RB(b) | | | 5.00% | | | | 09/01/2026 | | | | 5,190 | | | 5,342,175 |
See accompanying Notes to Financial Statements which are an integral part of the financial statements.
| | |
| 14 | | Invesco AMT-Free Municipal Income Fund |
| | | | | | | | | | | | | | |
| | | Interest Rate | | | Maturity Date | | | Principal Amount (000) | | | Value |
Iowa–(continued) | | | | | | | | | | | | | | |
Xenia (City of), IA Rural Water District; Series 2016, Ref. RB(a)(b) | | | 5.00% | | | | 12/01/2026 | | | $ | 1,000 | | | $ 1,076,825 |
| | | | | | | | | | | | | | | 17,368,776 |
| | | | |
Kansas–0.01% | | | | | | | | | | | | | | |
Pittsburgh (City of), KS; Series 2006, RB | | | 4.90% | | | | 04/01/2024 | | | | 275 | | | 275,363 |
| | | | |
Kentucky–2.60% | | | | | | | | | | | | | | |
Kentucky (Commonwealth of) Municipal Power Agency (Prairie State); | | | | | | | | | | | | | | |
Series 2016 A, Ref. RB (INS - NATL)(d) | | | 5.00% | | | | 09/01/2032 | | | | 5,480 | | | 5,719,276 |
Series 2016 A, Ref. RB (INS - NATL)(d) | | | 5.00% | | | | 09/01/2033 | | | | 11,525 | | | 12,008,999 |
Series 2016 A, Ref. RB (INS - NATL)(d) | | | 5.00% | | | | 09/01/2034 | | | | 5,000 | | | 5,193,346 |
Kentucky (Commonwealth of) Property & Building Commission (No. 115); | | | | | | | | | | | | | | |
Series 2017, RB | | | 5.00% | | | | 04/01/2037 | | | | 2,500 | | | 2,641,916 |
Series 2017, RB (INS - BAM)(d) | | | 5.00% | | | | 04/01/2038 | | | | 2,500 | | | 2,639,369 |
Kentucky (Commonwealth of) Property & Building Commission (No. 119); | | | | | | | | | | | | | | |
Series 2018, RB | | | 5.00% | | | | 05/01/2035 | | | | 1,500 | | | 1,614,600 |
Series 2018, RB | | | 5.00% | | | | 05/01/2036 | | | | 1,170 | | | 1,248,468 |
Series 2018, RB | | | 5.00% | | | | 05/01/2037 | | | | 4,605 | | | 4,877,257 |
Kentucky (Commonwealth of) Public Energy Authority; Series 2022 A-1, RB(b) | | | 4.00% | | | | 08/01/2030 | | | | 15,000 | | | 14,684,748 |
Louisville (City of) & Jefferson (County of), KY Metropolitan Government (Norton Healthcare, Inc.); Series 2013 A, RB | | | 5.75% | | | | 10/01/2042 | | | | 10,000 | | | 10,080,464 |
Springfield (City of), KY (St. Catharine College); Series 2004, Ref. RB(h)(i) | | | 5.75% | | | | 10/01/2035 | | | | 15 | | | 37 |
| | | | | | | | | | | | | | | 60,708,480 |
| | | | |
Louisiana–1.16% | | | | | | | | | | | | | | |
Denham Springs (City of) & Livingston (Parish of), LA Housing & Mortgage Finance Authority; Series 2007, RB (CEP - GNMA) | | | 5.00% | | | | 11/01/2040 | | | | 3 | | | 3,308 |
Louisiana (State of) Public Facilities Authority (19th Judicial District Court Building); Series 2015, Ref. RB(a)(b) | | | 5.00% | | | | 06/01/2025 | | | | 2,500 | | | 2,601,520 |
Louisiana (State of) Public Facilities Authority (Archdiocese of New Orleans); | | | | | | | | | | | | | | |
Series 2017, Ref. RB | | | 5.00% | | | | 07/01/2032 | | | | 395 | | | 335,750 |
Series 2017, Ref. RB | | | 5.00% | | | | 07/01/2033 | | | | 300 | | | 255,000 |
Series 2017, Ref. RB | | | 5.00% | | | | 07/01/2037 | | | | 345 | | | 293,250 |
Louisiana (State of) Public Facilities Authority (CHRISTUS Health); Series 2009 B-2, Ref. VRD RB (LOC - Bank of New York Mellon)(f)(g) | | | 2.93% | | | | 07/01/2047 | | | | 4,375 | | | 4,375,000 |
Louisiana (State of) Public Facilities Authority (Ochsner Clinic Foundation); Series 2017, Ref. RB | | | 5.00% | | | | 05/15/2046 | | | | 7,500 | | | 7,586,154 |
Louisiana (State of) Public Facilities Authority (Provident Group-Flagship Properties LLC- Louisiana State University Nicholson Gateway); Series 2017, RB | | | 5.00% | | | | 07/01/2057 | | | | 1,300 | | | 1,312,562 |
Louisiana (State of) Stadium & Exposition District; Series 2013 A, Ref. RB | | | 5.00% | | | | 07/01/2028 | | | | 50 | | | 50,156 |
Louisiana State University & Agricultural & Mechanical College Board of Supervisors; Series 2016 A, Ref. RB(a)(b) | | | 5.00% | | | | 07/01/2026 | | | | 4,035 | | | 4,300,032 |
New Orleans (City of), LA Aviation Board (Parking Facilities Corp. Consolidated Garage System); | | | | | | | | | | | | | | |
Series 2018 A, RB (INS - AGM)(d) | | | 5.00% | | | | 10/01/2043 | | | | 700 | | | 732,053 |
Series 2018 A, RB (INS - AGM)(d) | | | 5.00% | | | | 10/01/2048 | | | | 1,280 | | | 1,329,319 |
St. John the Baptist (Parish of), LA (Marathon Oil Corp.); | | | | | | | | | | | | | | |
Series 2017, Ref. RB(b) | | | 2.13% | | | | 07/01/2024 | | | | 2,000 | | | 1,944,526 |
Subseries 2017 A-3, Ref. RB(b) | | | 2.20% | | | | 07/01/2026 | | | | 2,000 | | | 1,862,654 |
| | | | | | | | | | | | | | | 26,981,284 |
| | | | |
Maryland–0.84% | | | | | | | | | | | | | | |
Baltimore (City of), MD (Water); Series 2020 A, RB | | | 4.00% | | | | 07/01/2045 | | | | 2,000 | | | 1,928,881 |
Baltimore (County of), MD (Riderwood Village, Inc.); | | | | | | | | | | | | | | |
Series 2020, Ref. RB | | | 4.00% | | | | 01/01/2045 | | | | 5,250 | | | 4,552,067 |
Series 2020, Ref. RB | | | 4.00% | | | | 01/01/2050 | | | | 6,000 | | | 5,035,596 |
Gaithersburg (City of), MD (Asbury Maryland Obligated Group); Series 2018 A, Ref. RB | | | 5.00% | | | | 01/01/2036 | | | | 1,500 | | | 1,485,896 |
Maryland (State of) Health & Higher Educational Facilities Authority; | | | | | | | | | | | | | | |
Series 2001, RB (INS - AMBAC)(d) | | | 5.00% | | | | 07/01/2034 | | | | 5 | | | 5,037 |
Series 2016, Ref. RB | | | 5.00% | | | | 06/01/2036 | | | | 400 | | | 411,996 |
Maryland Economic Development Corp. (University of Maryland College Park); Series 2016, Ref. RB (INS - AGM)(d) | | | 5.00% | | | | 06/01/2035 | | | | 4,530 | | | 4,720,086 |
See accompanying Notes to Financial Statements which are an integral part of the financial statements.
| | |
| 15 | | Invesco AMT-Free Municipal Income Fund |
| | | | | | | | | | | | | | |
| | | Interest Rate | | | Maturity Date | | | Principal Amount (000) | | | Value |
Maryland–(continued) | | | | | | | | | | | | | | |
Prince George’s (County of), MD (Victoria Falls); Series 2005, RB | | | 5.25% | | | | 07/01/2035 | | | $ | 1,531 | | | $ 1,534,387 |
| | | | | | | | | | | | | | | 19,673,946 |
| | | | |
Massachusetts–1.66% | | | | | | | | | | | | | | |
Massachusetts (Commonwealth of); Series 2016-XF0530, Ctfs. Of Obligation(k) | | | 5.00% | | | | 12/01/2035 | | | | 20,000 | | | 21,230,520 |
Massachusetts (Commonwealth of) Development Finance Agency; | | | | | | | | | | | | | | |
Series 2016 I, Ref. RB | | | 5.00% | | | | 07/01/2036 | | | | 2,000 | | | 2,062,164 |
Series 2019 A, Ref. RB | | | 4.00% | | | | 07/01/2044 | | | | 3,000 | | | 2,453,700 |
Massachusetts (Commonwealth of) Development Finance Agency (SpringField College); | | | | | | | | | | | | | | |
Series 2021 B, Ref. RB | | | 4.00% | | | | 06/01/2041 | | | | 2,535 | | | 2,217,926 |
Series 2021 B, Ref. RB | | | 4.00% | | | | 06/01/2050 | | | | 1,700 | | | 1,379,692 |
Massachusetts (Commonwealth of) Transportation Fund (Rail Enhancement Program); Series 2021 A, RB(k) | | | 4.00% | | | | 06/01/2050 | | | | 10,000 | | | 9,433,996 |
| | | | | | | | | | | | | | | 38,777,998 |
| | | | |
Michigan–3.32% | | | | | | | | | | | | | | |
Detroit (City of), MI; Series 2003 B-R, RB (INS - AGM)(d) | | | 7.50% | | | | 07/01/2033 | | | | 60 | | | 60,194 |
Detroit (City of), MI Downtown Development Authority (Catalyst Development); | | | | | | | | | | | | | | |
Series 2018 A, Ref. RB (INS - AGM)(d) | | | 5.00% | | | | 07/01/2043 | | | | 150 | | | 146,552 |
Series 2018 A, Ref. RB (INS - AGM)(d) | | | 5.00% | | | | 07/01/2048 | | | | 1,350 | | | 1,316,359 |
Michigan (State of); | | | | | | | | | | | | | | |
Series 2020 B, RB | | | 4.00% | | | | 11/15/2045 | | | | 10,000 | | | 9,659,464 |
Series 2021, RB | | | 4.00% | | | | 11/15/2046 | | | | 6,000 | | | 5,775,024 |
Michigan (State of) Finance Authority; | | | | | | | | | | | | | | |
Series 2005 A, RB | | | 6.00% | | | | 12/01/2035 | | | | 1,155 | | | 1,090,053 |
Series 2008 C, RB(j) | | | 0.00% | | | | 06/01/2058 | | | | 289,275 | | | 11,470,101 |
Series 2014, Ref. RB (Acquired 03/01/2019; Cost $ 1,954,606)(a)(b)(e)(l) | | | 6.75% | | | | 07/01/2024 | | | | 1,945 | | | 2,019,957 |
Series 2014, Ref. RB (Acquired 03/01/2019; Cost $ 4,075,026)(e)(l) | | | 6.75% | | | | 07/01/2044 | | | | 4,055 | | | 3,904,004 |
Michigan (State of) Finance Authority (CHE Trinity Health Credit Group); Series 2013 MI-4, Ref. RB | | | 5.00% | | | | 12/01/2039 | | | | 5,000 | | | 5,267,499 |
Michigan (State of) Finance Authority (Detroit Water & Sewerage Department); | | | | | | | | | | | | | | |
Series 2014 C-6, Ref. RB | | | 5.00% | | | | 07/01/2033 | | | | 1,000 | | | 1,016,048 |
Series 2014 D-4, Ref. RB | | | 5.00% | | | | 07/01/2032 | | | | 2,450 | | | 2,490,914 |
Series 2014 D-4, Ref. RB | | | 5.00% | | | | 07/01/2034 | | | | 1,000 | | | 1,014,358 |
Series 2014 D-6, Ref. RB (INS - NATL)(d) | | | 5.00% | | | | 07/01/2025 | | | | 1,000 | | | 1,019,441 |
Series 2014 D-6, Ref. RB (INS - NATL)(d) | | | 5.00% | | | | 07/01/2026 | | | | 895 | | | 913,572 |
Series 2014 D-6, Ref. RB (INS - NATL)(d) | | | 5.00% | | | | 07/01/2027 | | | | 930 | | | 949,542 |
Series 2015 C, RB | | | 5.00% | | | | 07/01/2034 | | | | 2,200 | | | 2,251,328 |
Michigan (State of) Finance Authority (Henry Ford Health System); Series 2016, Ref. RB | | | 5.00% | | | | 11/15/2041 | | | | 6,300 | | | 6,400,071 |
Michigan (State of) Finance Authority (Old Redforf Academy); Series 2010 A, RB | | | 5.90% | | | | 12/01/2030 | | | | 505 | | | 493,614 |
Michigan (State of) Finance Authority (Universal Learning Academy); Series 2018, Ref. RB | | | 5.75% | | | | 11/01/2040 | | | | 635 | | | 635,550 |
Michigan (State of) Strategic Fund (Wolverine Human Services); Series 2007, RB(h) | | | 5.85% | | | | 08/31/2027 | | | | 6,074 | | | 5,467,503 |
Michigan State University Board of Trustees; Series 2019 B, RB | | | 5.00% | | | | 02/15/2044 | | | | 1,180 | | | 1,254,740 |
Plymouth Educational Center Charter School; | | | | | | | | | | | | | | |
Series 2005, Ref. RB(i) | | | 5.38% | | | | 11/01/2030 | | | | 400 | | | 244,000 |
Series 2005, Ref. RB(i) | | | 5.63% | | | | 11/01/2035 | | | | 1,325 | | | 808,250 |
Renaissance Public School Academy; Series 2012 A, RB | | | 6.00% | | | | 05/01/2037 | | | | 500 | | | 500,050 |
Walled Lake Consolidated School District; | | | | | | | | | | | | | | |
Series 2019, GO Bonds | | | 4.00% | | | | 05/01/2039 | | | | 600 | | | 606,721 |
Series 2019, GO Bonds | | | 4.00% | | | | 05/01/2040 | | | | 1,220 | | | 1,230,216 |
Series 2019, GO Bonds | | | 4.00% | | | | 05/01/2041 | | | | 2,485 | | | 2,510,995 |
Series 2019, GO Bonds | | | 5.00% | | | | 05/01/2044 | | | | 6,385 | | | 6,852,750 |
| | | | | | | | | | | | | | | 77,368,870 |
| | | | |
Minnesota–0.19% | | | | | | | | | | | | | | |
Bethel (City of), MN (Benedictine Health System - St. Peter Communities); Series 2018 A, Ref. RB | | | 5.50% | | | | 12/01/2048 | | | | 1,050 | | | 848,313 |
Duluth (City of), MN Economic Development Authority (Essentia Health Obligated Group); Series 2018 A, Ref. RB | | | 5.00% | | | | 02/15/2043 | | | | 2,300 | | | 2,345,005 |
Minnesota (State of) Higher Education Facilities Authority (Trustees of the Hamline University of Minnesota); Series 2017, Ref. RB | | | 5.00% | | | | 10/01/2047 | | | | 900 | | | 902,962 |
See accompanying Notes to Financial Statements which are an integral part of the financial statements.
| | |
| 16 | | Invesco AMT-Free Municipal Income Fund |
| | | | | | | | | | | | | | |
| | | Interest Rate | | | Maturity Date | | | Principal Amount (000) | | | Value |
Minnesota–(continued) | | | | | | | | | | | | | | |
Mound (City of), MN Housing & Redevelopment Authority; Series 2006, Ref. RB | | | 5.00% | | | | 02/15/2027 | | | $ | 352 | | | $ 339,644 |
| | | | | | | | | | | | | | | 4,435,924 |
| | | | |
Mississippi–0.50% | | | | | | | | | | | | | | |
Mississippi (State of) Development Bank; Series 2016, RB (CEP - Colorado Higher Education Intercept Program) | | | 5.00% | | | | 12/01/2046 | | | | 10,000 | | | 10,402,890 |
Mississippi Business Finance Corp. (System Energy Resources, Inc.); Series 2021, RB | | | 2.38% | | | | 06/01/2044 | | | | 1,795 | | | 1,187,836 |
| | | | | | | | | | | | | | | 11,590,726 |
| | | | |
Missouri–0.83% | | | | | | | | | | | | | | |
Branson (City of), MO Industrial Development Authority (Branson Hills Redevelopment); | | | | | | | | | | | | | | |
Series 2005 A, RB(i) | | | 7.05% | | | | 05/01/2027 | | | | 70 | | | 59,490 |
Series 2007 A, RB(i) | | | 5.75% | | | | 05/01/2026 | | | | 715 | | | 614,904 |
Broadway-Fairview Transportation Development District; Series 2006 A, RB(i) | | | 5.88% | | | | 12/01/2031 | | | | 675 | | | 423,563 |
Chillicothe (City of), MO (South U.S. 65); Series 2006, RB(i) | | | 5.63% | | | | 04/01/2027 | | | | 400 | | | 335,834 |
Columbia (City of), MO Housing Authority (Stuart Park/Paquin Tower Apartments); | | | | | | | | | | | | | | |
Series 2015, RB | | | 5.00% | | | | 12/15/2040 | | | | 580 | | | 534,935 |
Series 2015, RB | | | 5.13% | | | | 12/15/2050 | | | | 1,330 | | | 1,173,443 |
Grindstone Plaza Transportation Development District; Series 2006 A, RB | | | 5.50% | | | | 10/01/2031 | | | | 355 | | | 351,163 |
Hollister (City of), MO; Series 2019, RB(e) | | | 5.63% | | | | 10/01/2039 | | | | 4,700 | | | 4,233,018 |
Kansas City (City of), MO Industrial Development Authority (Ward Parkway Center Community Improvement District); Series 2016 A, Ref. RB(e) | | | 5.00% | | | | 04/01/2046 | | | | 295 | | | 254,098 |
Lee’s Summit (City of), MO Industrial Development Authority; Series 2007, RB(h)(i) | | | 5.75% | | | | 03/01/2029 | | | | 250 | | | 145,000 |
Maplewood (City of), MO (Maplewood South Redevelopment Area); Series 2005, Ref. RB | | | 5.75% | | | | 11/01/2026 | | | | 1,335 | | | 1,291,738 |
Missouri (State of) Health & Educational Facilities Authority (Washington University); Series 2000 B, VRD RB(f) | | | 1.85% | | | | 03/01/2040 | | | | 2,600 | | | 2,600,000 |
Northwoods Transportation Development District; Series 2006 A, RB | | | 5.85% | | | | 02/01/2031 | | | | 50 | | | 43,601 |
St. Charles (County of), MO Industrial Development Authority (Suemandy/Mid-Rivers Community Improvement District); Series 2016, RB(e) | | | 5.00% | | | | 10/01/2046 | | | | 1,025 | | | 834,395 |
St. Louis (City of), MO (Abbey Condominiums); | | | | | | | | | | | | | | |
Series 2006 A, RB(i)(m) | | | 6.00% | | | | 08/04/2025 | | | | 481 | | | 52,910 |
Series 2007, RB(i) | | | 5.50% | | | | 05/29/2028 | | | | 661 | | | 279,504 |
St. Louis (City of), MO Land Clearance for Redevelopment Authority (Scottrade Center); Series 2018 A, RB | | | 5.00% | | | | 04/01/2048 | | | | 3,250 | | | 3,323,556 |
St. Louis (County of), MO; Series 2007 A, RB(i) | | | 5.50% | | | | 09/02/2028 | | | | 373 | | | 108,170 |
St. Louis (County of), MO (Ludwig Lofts); Series 2008, RB(i)(m) | | | 6.69% | | | | 04/21/2029 | | | | 1,080 | | | 183,600 |
St. Louis (County of), MO (Printers Lofts Tax Increment Financing); Series 2006, RB(i)(m) | | | 6.00% | | | | 08/21/2026 | | | | 545 | | | 87,200 |
St. Louis (County of), MO (Washington Park Redevelopment); | | | | | | | | | | | | | | |
Series 2006, RB(i)(m) | | | 6.00% | | | | 08/21/2026 | | | | 846 | | | 186,120 |
Series 2006, RB(i) | | | 5.50% | | | | 03/09/2027 | | | | 1,879 | | | 507,330 |
Series 2007 A, RB(i) | | | 5.50% | | | | 01/20/2028 | | | | 728 | | | 305,760 |
Series 2007 B, RB(i)(m) | | | 5.50% | | | | 01/20/2028 | | | | 466 | | | 23,300 |
Series 2008 A, RB(i) | | | 6.60% | | | | 01/21/2028 | | | | 3,255 | | | 1,367,100 |
Stone Canyon Community Improvement District; Series 2007, RB(h)(i) | | | 5.75% | | | | 04/01/2027 | | | | 320 | | | 83,200 |
| | | | | | | | | | | | | | | 19,402,932 |
| | | | |
Montana–0.09% | | | | | | | | | | | | | | |
Hardin (City of), MT; Series 2006, RB(i)(m) | | | 6.25% | | | | 09/01/2031 | | | | 11,710 | | | 2,107,800 |
| | | | |
Nebraska–0.52% | | | | | | | | | | | | | | |
Central Plains Energy Project (No. 3); Series 2017 A, Ref. RB | | | 5.00% | | | | 09/01/2035 | | | | 6,150 | | | 6,432,925 |
Omaha (City of), NE Public Power District; Series 2021 A, RB (INS - AGM)(d) | | | 4.00% | | | | 02/01/2051 | | | | 6,000 | | | 5,628,095 |
| | | | | | | | | | | | | | | 12,061,020 |
| | | | |
Nevada–0.82% | | | | | | | | | | | | | | |
Clark (County of), NV (Special Improvement District No. 128); | | | | | | | | | | | | | | |
Series 2007 A, RB | | | 5.00% | | | | 02/01/2026 | | | | 190 | | | 190,552 |
Series 2007 A, RB | | | 5.05% | | | | 02/01/2031 | | | | 245 | | | 245,443 |
Clark (County of), NV (Stadium Improvement Bonds); Series 2018 A, GO Bonds | | | 5.00% | | | | 05/01/2048 | | | | 2,500 | | | 2,627,126 |
Clark County School District; Series 2018 B, GO Bonds (INS - BAM)(d) | | | 5.00% | | | | 06/15/2036 | | | | 5,280 | | | 5,723,534 |
See accompanying Notes to Financial Statements which are an integral part of the financial statements.
| | |
| 17 | | Invesco AMT-Free Municipal Income Fund |
| | | | | | | | | | | | | | | | |
| | | Interest Rate | | | Maturity Date | | �� | Principal Amount (000) | | | Value | |
Nevada–(continued) | | | | | | | | | | | | | | | | |
Las Vegas (City of), NV Convention & Visitors Authority; Series 2018 B, RB | | | 5.00% | | | | 07/01/2043 | | | $ | 10,000 | | | $ | 10,342,387 | |
| | | | | | | | | | | | | | | | 19,129,042 | |
| | | | |
New Hampshire–0.57% | | | | | | | | | | | | | | | | |
Manchester Housing & Redevelopment Authority, Inc.; Series 2000 B, RB (INS - ACA)(d)(j) | | | 0.00% | | | | 01/01/2029 | | | | 305 | | | | 227,019 | |
New Hampshire (State of) Business Finance Authority; Series 2020-1A, RB | | | 4.13% | | | | 01/20/2034 | | | | 7,360 | | | | 7,246,136 | |
New Hampshire (State of) Business Finance Authority (Social Bonds); Series 2022-2A, RB | | | 4.00% | | | | 10/20/2036 | | | | 5,060 | | | | 4,725,617 | |
New Hampshire (State of) Business Finance Authority (Vista (The)); | | | | | | | | | | | | | | | | |
Series 2019 A, RB(e) | | | 5.25% | | | | 07/01/2039 | | | | 410 | | | | 375,040 | |
Series 2019 A, RB(e) | | | 5.63% | | | | 07/01/2046 | | | | 230 | | | | 210,608 | |
Series 2019 A, RB(e) | | | 5.75% | | | | 07/01/2054 | | | | 570 | | | | 519,382 | |
| | | | | | | | | | | | | | | | 13,303,802 | |
| | | | |
New Jersey–8.11% | | | | | | | | | | | | | | | | |
Atlantic City (City of), NJ; | | | | | | | | | | | | | | | | |
Series 2017 A, Ref. GO Bonds (INS - BAM)(d) | | | 5.00% | | | | 03/01/2032 | | | | 250 | | | | 267,863 | |
Series 2017 A, Ref. GO Bonds (INS - BAM)(d) | | | 5.00% | | | | 03/01/2037 | | | | 500 | | | | 523,960 | |
Series 2017 B, GO Bonds (INS - AGM)(d) | | | 4.00% | | | | 03/01/2042 | | | | 3,510 | | | | 3,388,316 | |
Casino Reinvestment Development Authority, Inc.; | | | | | | | | | | | | | | | | |
Series 2014, Ref. RB (INS - AGM)(d) | | | 5.00% | | | | 11/01/2030 | | | | 2,000 | | | | 2,055,520 | |
Series 2014, Ref. RB (INS - AGM)(d) | | | 5.00% | | | | 11/01/2032 | | | | 2,000 | | | | 2,048,744 | |
Hudson County Improvement Authority (Hudson County Courthouse); Series 2020, RB | | | 4.00% | | | | 10/01/2046 | | | | 10,000 | | | | 9,224,399 | |
New Jersey (State of); Series 2020 A, GO Bonds | | | 4.00% | | | | 06/01/2032 | | | | 6,380 | | | | 6,881,270 | |
New Jersey (State of) Economic Development Authority; | | | | | | | | | | | | | | | | |
Series 2016 AAA, RB(a)(b) | | | 5.00% | | | | 12/15/2026 | | | | 3,000 | | | | 3,216,012 | |
Series 2017 DDD, RB | | | 5.00% | | | | 06/15/2028 | | | | 1,930 | | | | 2,061,045 | |
Series 2017 DDD, RB | | | 5.00% | | | | 06/15/2029 | | | | 3,500 | | | | 3,736,571 | |
Series 2018 A, RB | | | 5.00% | | | | 06/15/2042 | | | | 3,500 | | | | 3,589,679 | |
Series 2018 A, RB | | | 5.00% | | | | 06/15/2047 | | | | 735 | | | | 750,699 | |
Series 2018 C, RB | | | 5.00% | | | | 06/15/2031 | | | | 4,855 | | | | 5,207,842 | |
Series 2019, RB | | | 4.00% | | | | 06/15/2044 | | | | 3,000 | | | | 2,794,695 | |
Series 2020, RB | | | 4.00% | | | | 11/01/2038 | | | | 1,750 | | | | 1,706,002 | |
New Jersey (State of) Economic Development Authority (Golden Door Charter School); Series 2018 A, RB(e) | | | 6.50% | | | | 11/01/2052 | | | | 220 | | | | 229,801 | |
New Jersey (State of) Economic Development Authority (Newark Downtown District Management Corp.); Series 2019, Ref. RB | | | 5.13% | | | | 06/15/2037 | | | | 904 | | | | 964,390 | |
New Jersey (State of) Economic Development Authority (Provident Group - Montclair Properties L.L.C. - Montclair University Student Housing); Series 2017, Ref. RB (INS - AGM)(d) | | | 5.00% | | | | 06/01/2037 | | | | 1,000 | | | | 1,031,752 | |
New Jersey (State of) Health Care Facilities Financing Authority; Series 2015 A, RB (INS - AGM)(d) | | | 5.00% | | | | 07/01/2029 | | | | 2,100 | | | | 2,161,066 | |
New Jersey (State of) Transportation Trust Fund Authority; | | | | | | | | | | | | | | | | |
Series 2004 A, RB (INS - NATL)(d) | | | 5.75% | | | | 06/15/2024 | | | | 11,570 | | | | 11,875,895 | |
Series 2008 A, RB(j) | | | 0.00% | | | | 12/15/2038 | | | | 5,680 | | | | 2,706,851 | |
Series 2009 D, RB | | | 5.00% | | | | 06/15/2032 | | | | 5,015 | | | | 5,109,793 | |
Series 2016, RN | | | 5.00% | | | | 06/15/2030 | | | | 6,000 | | | | 6,312,645 | |
Series 2018 A, Ref. RN | | | 5.00% | | | | 06/15/2029 | | | | 6,660 | | | | 7,010,627 | |
Series 2018 A, Ref. RN | | | 5.00% | | | | 06/15/2030 | | | | 945 | | | | 994,242 | |
Series 2018 A, Ref. RN | | | 5.00% | | | | 06/15/2031 | | | | 880 | | | | 924,138 | |
Series 2019 BB, RB | | | 4.00% | | | | 06/15/2050 | | | | 7,125 | | | | 6,457,228 | |
Series 2020 AA, RB | | | 4.00% | | | | 06/15/2050 | | | | 10,200 | | | | 9,244,031 | |
Series 2020 AA, RB | | | 5.00% | | | | 06/15/2050 | | | | 1,230 | | | | 1,267,775 | |
New Jersey (State of) Turnpike Authority; | | | | | | | | | | | | | | | | |
Series 2015 E, RB | | | 5.00% | | | | 01/01/2034 | | | | 7,000 | | | | 7,234,213 | |
Series 2019 A, RB | | | 5.00% | | | | 01/01/2048 | | | | 3,000 | | | | 3,151,745 | |
Series 2021 A, RB | | | 4.00% | | | | 01/01/2042 | | | | 2,000 | | | | 1,945,247 | |
Series 2021 A, RB | | | 4.00% | | | | 01/01/2051 | | | | 10,000 | | | | 9,367,650 | |
See accompanying Notes to Financial Statements which are an integral part of the financial statements.
| | |
| 18 | | Invesco AMT-Free Municipal Income Fund |
| | | | | | | | | | | | | | |
| | | Interest Rate | | | Maturity Date | | | Principal Amount (000) | | | Value |
New Jersey–(continued) | | | | | | | | | | | | | | |
Tobacco Settlement Financing Corp.; | | | | | | | | | | | | | | |
Series 2018 A, Ref. RB | | | 5.00% | | | | 06/01/2028 | | | $ | 3,500 | | | $ 3,761,294 |
Series 2018 A, Ref. RB | | | 5.00% | | | | 06/01/2030 | | | | 5,000 | | | 5,376,146 |
Series 2018 A, Ref. RB | | | 5.00% | | | | 06/01/2031 | | | | 11,600 | | | 12,459,102 |
Series 2018 A, Ref. RB | | | 5.00% | | | | 06/01/2032 | | | | 12,980 | | | 13,919,161 |
Series 2018 A, Ref. RB | | | 5.00% | | | | 06/01/2033 | | | | 5,005 | | | 5,349,390 |
Series 2018 A, Ref. RB | | | 5.00% | | | | 06/01/2037 | | | | 3,000 | | | 3,133,405 |
Series 2018 A, Ref. RB | | | 5.00% | | | | 06/01/2046 | | | | 6,000 | | | 6,119,868 |
Series 2018 B, Ref. RB | | | 5.00% | | | | 06/01/2046 | | | | 13,700 | | | 13,563,303 |
| | | | | | | | | | | | | | | 189,123,375 |
| | | | |
New Mexico–0.09% | | | | | | | | | | | | | | |
Boulders Public Improvement District; Series 2015, RB | | | 5.75% | | | | 10/01/2044 | | | | 230 | | | 208,639 |
Trails Public Improvement District; Series 2008, RB | | | 7.75% | | | | 10/01/2038 | | | | 1,775 | | | 1,774,879 |
| | | | | | | | | | | | | | | 1,983,518 |
| | | | |
New York–11.39% | | | | | | | | | | | | | | |
Hudson Yards Infrastructure Corp.; | | | | | | | | | | | | | | |
Series 2017 XF0549, Revenue Ctfs.(k) | | | 5.00% | | | | 02/15/2037 | | | | 8,500 | | | 8,955,306 |
Series 2017 XF0549, Revenue Ctfs.(k) | | | 5.00% | | | | 02/15/2039 | | | | 7,500 | | | 7,845,871 |
Metropolitan Transportation Authority; Series 2016 C-1, RB | | | 5.25% | | | | 11/15/2056 | | | | 5,000 | | | 4,993,674 |
Metropolitan Transportation Authority (Green Bonds); | | | | | | | | | | | | | | |
Series 2016 A-1, RB | | | 5.25% | | | | 11/15/2056 | | | | 14,375 | | | 14,357,602 |
Series 2017 A-1, RB | | | 5.25% | | | | 11/15/2057 | | | | 3,500 | | | 3,495,378 |
Series 2019 A, RB | | | 5.00% | | | | 11/15/2045 | | | | 10,065 | | | 10,129,855 |
MTA Hudson Rail Yards Trust Obligations; Series 2016 A, RB | | | 5.00% | | | | 11/15/2056 | | | | 13,150 | | | 12,920,076 |
New York & New Jersey (States of) Port Authority; One Hundred Ninety Fourth Series 2015, Ref. RB | | | 5.25% | | | | 10/15/2055 | | | | 10,000 | | | 10,231,153 |
New York (City of), NY; | | | | | | | | | | | | | | |
Series 2022 A, GO Bonds | | | 5.25% | | | | 09/01/2043 | | | | 10,000 | | | 11,118,556 |
Subseries 2014 I-2, VRD GO Bonds(f) | | | 1.85% | | | | 03/01/2040 | | | | 1,160 | | | 1,160,000 |
New York (City of), NY Municipal Water Finance Authority; Series 2018 EE, Ref. RB | | | 5.00% | | | | 06/15/2040 | | | | 10,160 | | | 10,841,700 |
New York (City of), NY Transitional Finance Authority; | | | | | | | | | | | | | | |
Series 2018 S-3, RB | | | 5.00% | | | | 07/15/2043 | | | | 14,000 | | | 14,784,990 |
Series 2019 A-3, RB | | | 4.00% | | | | 05/01/2041 | | | | 10,000 | | | 9,775,496 |
Series 2022 C-1, RB | | | 4.00% | | | | 02/01/2051 | | | | 4,000 | | | 3,774,346 |
Series 2022, RB | | | 4.00% | | | | 02/01/2043 | | | | 5,000 | | | 4,850,246 |
New York (State of) Dormitory Authority; | | | | | | | | | | | | | | |
Series 2015 B, RB | | | 5.00% | | | | 03/15/2033 | | | | 10,000 | | | 10,457,886 |
Series 2015 B, Ref. RB(a)(b) | | | 5.00% | | | | 07/01/2025 | | | | 2,650 | | | 2,765,295 |
Series 2016 A, RB | | | 5.00% | | | | 03/15/2035 | | | | 5,000 | | | 5,301,271 |
Series 2020 D, Ref. RB | | | 4.00% | | | | 02/15/2047 | | | | 14,300 | | | 13,524,139 |
Series 2021 A, Ref. RB | | | 5.00% | | | | 03/15/2049 | | | | 5,000 | | | 5,325,943 |
New York (State of) Dormitory Authority (Columbia University); Series 2017 A, RB | | | 5.00% | | | | 10/01/2047 | | | | 10,990 | | | 12,370,412 |
New York (State of) Power Authority (Green Bonds); | | | | | | | | | | | | | | |
Series 2020 A, Ref. RB | | | 4.00% | | | | 11/15/2045 | | | | 7,000 | | | 6,778,341 |
Series 2020 A, Ref. RB | | | 4.00% | | | | 11/15/2050 | | | | 5,000 | | | 4,776,558 |
New York (State of) Thruway Authority; Series 2019 B, RB | | | 4.00% | | | | 01/01/2050 | | | | 10,015 | | | 9,169,269 |
New York (State of) Thruway Authority (Group 2); Series 2021 O, Ref. RB | | | 4.00% | | | | 01/01/2046 | | | | 5,000 | | | 4,695,814 |
New York Counties Tobacco Trust II; Series 2001, RB | | | 5.75% | | | | 06/01/2043 | | | | 65 | | | 66,299 |
New York Counties Tobacco Trust VI; Series 2016 A-1, Ref. RB | | | 5.75% | | | | 06/01/2043 | | | | 285 | | | 295,080 |
New York Liberty Development Corp. (Goldman Sachs Headquarters); Series 2005, Ref. RB | | | 5.25% | | | | 10/01/2035 | | | | 6,075 | | | 6,821,837 |
New York State Urban Development Corp.; | | | | | | | | | | | | | | |
Series 2020 A, RB | | | 5.00% | | | | 03/15/2041 | | | | 1,800 | | | 1,945,609 |
Series 2020 A, RB | | | 5.00% | | | | 03/15/2042 | | | | 515 | | | 554,151 |
Series 2020 A, RB | | | 4.00% | | | | 03/15/2045 | | | | 14,130 | | | 13,399,189 |
Series 2020 A, RB | | | 4.00% | | | | 03/15/2049 | | | | 10,000 | | | 9,293,206 |
Series 2020 C, Ref. RB | | | 5.00% | | | | 03/15/2050 | | | | 7,000 | | | 7,439,048 |
See accompanying Notes to Financial Statements which are an integral part of the financial statements.
| | |
| 19 | | Invesco AMT-Free Municipal Income Fund |
| | | | | | | | | | | | | | |
| | | Interest Rate | | | Maturity Date | | | Principal Amount (000) | | | Value |
New York–(continued) | | | | | | | | | | | | | | |
New York Transportation Development Corp. (Terminal 4 JFK International Airport); | | | | | | | | | | | | | | |
Series 2020, Ref. RB | | | 5.00% | | | | 12/01/2035 | | | $ | 2,305 | | | $ 2,466,364 |
Series 2020, Ref. RB | | | 5.00% | | | | 12/01/2036 | | | | 2,205 | | | 2,342,308 |
Triborough Bridge & Tunnel Authority; Series 2021 A-1, Ref. RB | | | 5.00% | | | | 05/15/2051 | | | | 3,260 | | | 3,480,976 |
Triborough Bridge & Tunnel Authority (MTA Bridges & Tunnels); Series 2022 A, RB | | | 5.25% | | | | 05/15/2052 | | | | 5,000 | | | 5,479,670 |
TSASC, Inc.; | | | | | | | | | | | | | | |
Series 2016 B, Ref. RB | | | 5.00% | | | | 06/01/2045 | | | | 5,450 | | | 5,056,101 |
Series 2017 A, Ref. RB | | | 5.00% | | | | 06/01/2036 | | | | 2,455 | | | 2,529,508 |
| | | | | | | | | | | | | | | 265,568,523 |
| | | | |
North Carolina–1.17% | | | | | | | | | | | | | | |
Charlotte (City of), NC (Charlotte Douglas International Airport); Series 2022, RB | | | 4.00% | | | | 07/01/2047 | | | | 8,370 | | | 7,863,755 |
Charlotte-Mecklenburg Hospital Authority (The) (Carolinas Health Care Systems); Series 2007 C, Ref. VRD RB(f) | | | 1.40% | | | | 01/15/2037 | | | | 4,115 | | | 4,115,000 |
North Carolina (State of) Turnpike Authority; Series 2018, Ref. RB (INS - AGM)(d) | | | 5.00% | | | | 01/01/2038 | | | | 5,000 | | | 5,233,480 |
Raleigh & Durham (Cities of), NC Airport Authority; Series 2008 C, Ref. VRD RB (LOC - TD Bank N.A.)(f)(g) | | | 2.77% | | | | 05/01/2036 | | | | 10,000 | | | 10,000,000 |
| | | | | | | | | | | | | | | 27,212,235 |
| | | | |
Ohio–3.32% | | | | | | | | | | | | | | |
Buckeye Tobacco Settlement Financing Authority; | | | | | | | | | | | | | | |
Series 2020 B-2, Ref. RB | | | 5.00% | | | | 06/01/2055 | | | | 27,705 | | | 25,195,991 |
Series 2020 B-3, Ref. RB(j) | | | 0.00% | | | | 06/01/2057 | | | | 49,575 | | | 5,769,816 |
Cleveland (City of) & Cuyahoga (County of), OH Port Authority (Flats East Bank); Series 2010, RB | | | 6.00% | | | | 11/15/2035 | | | | 3,445 | | | 3,452,067 |
Cuyahoga (County of), OH (MetroHealth System); | | | | | | | | | | | | | | |
Series 2017, Ref. RB | | | 5.50% | | | | 02/15/2052 | | | | 2,475 | | | 2,530,920 |
Series 2017, Ref. RB | | | 5.50% | | | | 02/15/2057 | | | | 1,050 | | | 1,071,651 |
Franklin (County of), OH (Nationwide Children’s Hospital); Series 2017 B, Ref. VRD RB(f) | | | 2.70% | | | | 11/01/2052 | | | | 9,630 | | | 9,630,000 |
Greater Cincinnati (Port of), OH Development Authority; | | | | | | | | | | | | | | |
Series 2004, RB | | | 6.30% | | | | 02/15/2024 | | | | 280 | | | 279,342 |
Series 2004, RB | | | 6.40% | | | | 02/15/2034 | | | | 5,860 | | | 5,676,359 |
Greene (County of), OH (Marauder Development LLC at Central State University); Series 2002 A, RB (INS - ACA)(d) | | | 5.50% | | | | 09/01/2027 | | | | 820 | | | 820,011 |
Montgomery (County of), OH (Dayton Children’s Hospital); Series 2021, Ref. RB | | | 4.00% | | | | 08/01/2046 | | | | 5,000 | | | 4,586,688 |
Ohio (State of); | | | | | | | | | | | | | | |
Series 2017 A, GO Bonds | | | 5.00% | | | | 03/15/2036 | | | | 5,000 | | | 5,078,785 |
Series 2020 A, Ref. RB | | | 5.00% | | | | 01/15/2050 | | | | 3,905 | | | 3,985,171 |
Ohio (State of) (Cleveland Clinic Health System Obligated Group); Series 2019, VRD RB(f) | | | 2.78% | | | | 01/01/2052 | | | | 7,165 | | | 7,165,000 |
Ohio (State of) Higher Educational Facility Commission; Series 2018, Ref. RB | | | 5.25% | | | | 01/01/2038 | | | | 1,350 | | | 1,165,364 |
Ohio (State of) Higher Educational Facility Commission (University of Findlay); Series 2019, Ref. RB | | | 5.00% | | | | 03/01/2039 | | | | 1,000 | | | 994,151 |
| | | | | | | | | | | | | | | 77,401,316 |
| | | | |
Oklahoma–0.14% | | | | | | | | | | | | | | |
Carter (County of), OK Public Facilities Authority; Series 2018, RB | | | 5.00% | | | | 09/01/2032 | | | | 3,070 | | | 3,270,944 |
| | | | |
Oregon–0.09% | | | | | | | | | | | | | | |
Yamhill (County of), OR Hospital Authority (Friendsview); | | | | | | | | | | | | | | |
Series 2021 A, Ref. RB | | | 5.00% | | | | 11/15/2046 | | | | 1,540 | | | 1,196,273 |
Series 2021 A, Ref. RB | | | 5.00% | | | | 11/15/2051 | | | | 1,100 | | | 827,047 |
| | | | | | | | | | | | | | | 2,023,320 |
| | | | |
Pennsylvania–6.88% | | | | | | | | | | | | | | |
Allegheny (County of), PA Hospital Development Authority (Allegheny Health Network Obligated Group Issue); Series 2018 A, Ref. RB | | | 5.00% | | | | 04/01/2036 | | | | 2,825 | | | 2,972,594 |
Bethlehem Area School District; Series 2015 A, GO Bonds (INS - BAM)(d) | | | 5.00% | | | | 08/01/2033 | | | | 5,000 | | | 5,195,866 |
Chester (County of), PA Industrial Development Authority (Longwood Gardens); | | | | | | | | | | | | | | |
Series 2019, RB | | | 5.00% | | | | 12/01/2044 | | | | 1,840 | | | 1,982,798 |
Series 2019, RB | | | 4.00% | | | | 12/01/2049 | | | | 1,350 | | | 1,207,733 |
See accompanying Notes to Financial Statements which are an integral part of the financial statements.
| | |
| 20 | | Invesco AMT-Free Municipal Income Fund |
| | | | | | | | | | | | | | |
| | | Interest Rate | | | Maturity Date | | | Principal Amount (000) | | | Value |
Pennsylvania–(continued) | | | | | | | | | | | | | | |
Commonwealth Financing Authority; | | | | | | | | | | | | | | |
Series 2018, RB | | | 5.00% | | | | 06/01/2030 | | | $ | 1,250 | | | $ 1,345,809 |
Series 2018, RB | | | 5.00% | | | | 06/01/2032 | | | | 3,000 | | | 3,219,775 |
Series 2018, RB | | | 5.00% | | | | 06/01/2033 | | | | 2,000 | | | 2,143,782 |
Series 2018, RB | | | 5.00% | | | | 06/01/2034 | | | | 1,760 | | | 1,878,267 |
Delaware (County of), PA Authority (Neumann University); | | | | | | | | | | | | | | |
Series 2016, Ref. RB | | | 5.00% | | | | 10/01/2031 | | | | 1,425 | | | 1,446,688 |
Series 2016, Ref. RB | | | 5.00% | | | | 10/01/2035 | | | | 2,305 | | | 2,325,614 |
Geisinger Authority (Geisinger Health System); Series 2017 A-1, Ref. RB | | | 5.00% | | | | 02/15/2045 | | | | 6,335 | | | 6,448,900 |
Montgomery (County of), PA Higher Education & Health Authority (Thomas Jefferson University); Series 2019, Ref. RB | | | 4.00% | | | | 09/01/2049 | | | | 5,250 | | | 4,695,232 |
Pennsylvania (Commonwealth of); | | | | | | | | | | | | | | |
First Series 2013 1, GO Bonds | | | 4.00% | | | | 04/01/2032 | | | | 5,000 | | | 5,003,965 |
First Series 2018 1, GO Bonds | | | 5.00% | | | | 03/01/2032 | | | | 10,000 | | | 10,972,262 |
First Series 2018 1, GO Bonds | | | 4.00% | | | | 03/01/2035 | | | | 12,500 | | | 12,874,949 |
First Series 2018-1, GO Bonds (INS - BAM)(d) | | | 4.00% | | | | 03/01/2036 | | | | 4,175 | | | 4,265,337 |
Pennsylvania (Commonwealth of) Public School Building Authority (Philadelphia School District); | | | | | | | | | | | | | | |
Series 2016 A, Ref. RB (INS - AGM)(d) | | | 5.00% | | | | 06/01/2032 | | | | 5,000 | | | 5,228,103 |
Series 2016 A, Ref. RB (INS - AGM)(d) | | | 5.00% | | | | 06/01/2033 | | | | 5,000 | | | 5,217,420 |
Pennsylvania (Commonwealth of) Turnpike Commission; | | | | | | | | | | | | | | |
Series 2009 E, RB | | | 6.38% | | | | 12/01/2038 | | | | 1,500 | | | 1,690,470 |
Series 2014 A-3, RB(j) | | | 0.00% | | | | 12/01/2041 | | | | 3,450 | | | 1,452,740 |
Series 2016, Ref. RB | | | 5.00% | | | | 06/01/2030 | | | | 5,000 | | | 5,262,673 |
Series 2017 3, Ref. RB | | | 5.00% | | | | 12/01/2040 | | | | 5,125 | | | 5,340,832 |
Series 2019 A, RB | | | 5.00% | | | | 12/01/2044 | | | | 7,750 | | | 8,087,057 |
Series 2020 B, RB | | | 5.00% | | | | 12/01/2045 | | | | 5,000 | | | 5,266,011 |
Series 2021 A, RB | | | 4.00% | | | | 12/01/2050 | | | | 2,000 | | | 1,815,819 |
Series 2021 B, RB | | | 4.00% | | | | 12/01/2051 | | | | 8,500 | | | 7,765,616 |
Series 2021 B, Ref. RB | | | 5.00% | | | | 12/01/2051 | | | | 7,000 | | | 7,311,622 |
Philadelphia (City of), PA; | | | | | | | | | | | | | | |
Series 2017 15, Ref. RB | | | 5.00% | | | | 08/01/2036 | | | | 1,000 | | | 1,055,768 |
Series 2017 A, RB | | | 5.00% | | | | 10/01/2047 | | | | 10,000 | | | 10,352,026 |
Series 2019 B, RB | | | 5.00% | | | | 11/01/2049 | | | | 1,000 | | | 1,044,158 |
Series 2021 C, RB | | | 5.00% | | | | 10/01/2046 | | | | 5,000 | | | 5,287,814 |
Philadelphia (City of), PA Authority for Industrial Development (Architecture & Design Charter High School); Series 2013, RB(a)(b) | | | 6.13% | | | | 03/15/2023 | | | | 685 | | | 685,697 |
Philadelphia (City of), PA Authority for Industrial Development (St. Joseph’s University); Series 2022, RB | | | 5.25% | | | | 11/01/2052 | | | | 5,000 | | | 5,285,324 |
Philadelphia School District (The); Series 2016 F, Ref. GO Bonds | | | 5.00% | | | | 09/01/2032 | | | | 1,000 | | | 1,041,996 |
Pottsville (City of), PA Hospital Authority (Lehigh Valley); Series 2016 B, Ref. RB | | | 5.00% | | | | 07/01/2041 | | | | 4,000 | | | 4,085,323 |
Reading School District; | | | | | | | | | | | | | | |
Series 2017, Ref. GO Bonds (INS - AGM)(d) | | | 5.00% | | | | 03/01/2035 | | | | 280 | | | 298,234 |
Series 2017, Ref. GO Bonds (INS - AGM)(d) | | | 5.00% | | | | 03/01/2036 | | | | 255 | | | 270,142 |
Scranton School District; | | | | | | | | | | | | | | |
Series 2017 E, Ref. GO Bonds (INS - BAM)(d) | | | 5.00% | | | | 12/01/2029 | | | | 1,000 | | | 1,090,264 |
Series 2017 E, Ref. GO Bonds (INS - BAM)(d) | | | 5.00% | | | | 12/01/2030 | | | | 1,305 | | | 1,423,311 |
Series 2017 E, Ref. GO Bonds (INS - BAM)(d) | | | 5.00% | | | | 12/01/2032 | | | | 890 | | | 969,484 |
Series 2017 E, Ref. GO Bonds (INS - BAM)(d) | | | 5.00% | | | | 12/01/2033 | | | | 710 | | | 771,769 |
Tender Option Bond Trust Receipts/Certificates; Series 2022, VRD RB(e)(f) | | | 3.10% | | | | 12/01/2066 | | | | 4,160 | | | 4,160,000 |
| | | | | | | | | | | | | | | 160,239,244 |
| | | | |
Puerto Rico–4.42% | | | | | | | | | | | | | | |
Corp. Para El Financiamiento Publico de Puerto Rico; Series 2011, RB | | | 5.50% | | | | 08/01/2031 | | | | 5,615 | | | 147,394 |
PRHTA Custodial Trust; Series 2022 I, RB(i) | | | 5.00% | | | | 12/06/2049 | | | | 15 | | | 4,228 |
PRIFA Custodial Trust; | | | | | | | | | | | | | | |
Series 2005 A, RB | | | 0.00% | | | | 03/15/2049 | | | | 731 | | | 446,661 |
Series 2005 A, RB | | | 0.00% | | | | 03/15/2049 | | | | 645 | | | 394,333 |
Series 2022, RB | | | 0.00% | | | | 03/15/2049 | | | | 6,997 | | | 2,860,198 |
Series 2022, RB | | | 0.00% | | | | 03/15/2049 | | | | 6,362 | | | 2,791,324 |
See accompanying Notes to Financial Statements which are an integral part of the financial statements.
| | |
| 21 | | Invesco AMT-Free Municipal Income Fund |
| | | | | | | | | | | | | | |
| | | Interest Rate | | | Maturity Date | | | Principal Amount (000) | | | Value |
Puerto Rico–(continued) | | | | | | | | | | | | | | |
Puerto Rico (Commonwealth of); | | | | | | | | | | | | | | |
Series 2021 A, GO Bonds(j) | | | 0.00% | | | | 07/01/2024 | | | $ | 1,221 | | | $ 1,145,661 |
Series 2021 A, GO Bonds(j) | | | 0.00% | | | | 07/01/2033 | | | | 4,698 | | | 2,676,772 |
Series 2021 A-1, GO Bonds | | | 5.25% | | | | 07/01/2023 | | | | 2,038 | | | 2,044,453 |
Series 2021 A-1, GO Bonds | | | 5.38% | | | | 07/01/2025 | | | | 4,066 | | | 4,128,073 |
Series 2021 A-1, GO Bonds | | | 5.63% | | | | 07/01/2027 | | | | 4,029 | | | 4,161,978 |
Series 2021 A-1, GO Bonds | | | 5.63% | | | | 07/01/2029 | | | | 3,964 | | | 4,135,578 |
Series 2021 A-1, GO Bonds | | | 5.75% | | | | 07/01/2031 | | | | 3,850 | | | 4,052,279 |
Series 2021 A-1, GO Bonds | | | 4.00% | | | | 07/01/2033 | | | | 3,651 | | | 3,271,177 |
Series 2021 A-1, GO Bonds | | | 4.00% | | | | 07/01/2035 | | | | 3,281 | | | 2,874,188 |
Series 2021 A-1, GO Bonds | | | 4.00% | | | | 07/01/2037 | | | | 2,816 | | | 2,408,548 |
Series 2021 A-1, GO Bonds | | | 4.00% | | | | 07/01/2046 | | | | 7,929 | | | 6,314,070 |
Subseries 2022, RN | | | 0.00% | | | | 11/01/2043 | | | | 18,308 | | | 7,895,372 |
Subseries 2022, RN | | | 0.00% | | | | 11/01/2051 | | | | 45 | | | 15,593 |
Subseries 2022, RN | | | 0.00% | | | | 11/01/2051 | | | | 2,090 | | | 914,241 |
Puerto Rico (Commonwealth of) Electric Power Authority; | | | | | | | | | | | | | | |
Series 2003 NN, RB(h) | | | 5.50% | | | | 12/01/2049 | | | | 295 | | | 202,813 |
Series 2005 RR, RB (INS - NATL)(d) | | | 5.00% | | | | 07/01/2023 | | | | 30 | | | 30,000 |
Series 2005 RR, RB (INS - NATL)(d) | | | 5.00% | | | | 07/01/2024 | | | | 260 | | | 260,245 |
Series 2005 SS, Ref. RB (INS - NATL)(d) | | | 5.00% | | | | 07/01/2025 | | | | 4,000 | | | 4,003,776 |
Series 2007 VV, Ref. RB (INS - NATL)(d) | | | 5.25% | | | | 07/01/2025 | | | | 1,690 | | | 1,695,306 |
Series 2008 WW, RB(h) | | | 5.38% | | | | 07/01/2023 | | | | 2,750 | | | 1,918,125 |
Series 2008 WW, RB(h) | | | 5.25% | | | | 07/01/2025 | | | | 1,985 | | | 1,382,056 |
Series 2010 AAA, RB(h) | | | 5.25% | | | | 07/01/2028 | | | | 2,830 | | | 1,973,925 |
Series 2010 CCC, RB(h) | | | 5.00% | | | | 07/01/2028 | | | | 2,500 | | | 1,737,500 |
Series 2010 XX, RB(h) | | | 5.25% | | | | 07/01/2040 | | | | 1,670 | | | 1,173,175 |
Series 2010 ZZ, Ref. RB(h) | | | 5.25% | | | | 07/01/2025 | | | | 405 | | | 281,981 |
Puerto Rico (Commonwealth of) Highway & Transportation Authority; | | | | | | | | | | | | | | |
Series 2022 A, RB | | | 5.00% | | | | 07/01/2062 | | | | 329 | | | 305,010 |
Series 2022 B, RB(j) | | | 0.00% | | | | 07/01/2032 | | | | 214 | | | 133,568 |
Series 2022 C, RB(c) | | | 5.00% | | | | 07/01/2053 | | | | 366 | | | 202,953 |
Puerto Rico Sales Tax Financing Corp.; | | | | | | | | | | | | | | |
Series 2018 A-1, RB(j) | | | 0.00% | | | | 07/01/2046 | | | | 34,472 | | | 8,834,484 |
Series 2018 A-1, RB(j) | | | 0.00% | | | | 07/01/2051 | | | | 31,582 | | | 5,958,892 |
Series 2018 A-1, RB | | | 4.75% | | | | 07/01/2053 | | | | 9,853 | | | 8,832,053 |
Series 2018 A-1, RB | | | 5.00% | | | | 07/01/2058 | | | | 4,400 | | | 4,082,320 |
Series 2019 A-2, RB | | | 4.54% | | | | 07/01/2053 | | | | 387 | | | 334,674 |
Series 2019 A-2, RB | | | 4.78% | | | | 07/01/2058 | | | | 5,172 | | | 4,623,062 |
University of Puerto Rico; | | | | | | | | | | | | | | |
Series 2006 P, Ref. RB | | | 5.00% | | | | 06/01/2026 | | | | 1,305 | | | 1,283,847 |
Series 2006 P, Ref. RB | | | 5.00% | | | | 06/01/2030 | | | | 900 | | | 874,355 |
Series 2006 Q, RB | | | 5.00% | | | | 06/01/2036 | | | | 150 | | | 144,500 |
| | | | | | | | | | | | | | | 102,950,741 |
| | | | |
Rhode Island–0.24% | | | | | | | | | | | | | | |
Central Falls Detention Facility Corp.; Series 2005, Ref. RB (Acquired 06/23/2005; Cost $4,862,486)(h)(l) | | | 7.25% | | | | 07/15/2035 | | | | 4,915 | | | 884,700 |
Rhode Island Housing and Mortgage Finance Corp.; Series 1992 10-A, RB | | | 6.50% | | | | 04/01/2027 | | | | 20 | | | 20,043 |
Tobacco Settlement Financing Corp.; Series 2015 A, Ref. RB | | | 5.00% | | | | 06/01/2040 | | | | 4,695 | | | 4,728,401 |
| | | | | | | | | | | | | | | 5,633,144 |
| | | | |
South Carolina–0.10% | | | | | | | | | | | | | | |
South Carolina (State of) Public Service Authority; Series 2020 A, Ref. RB | | | 5.00% | | | | 12/01/2043 | | | | 2,200 | | | 2,259,006 |
| | | | |
South Dakota–0.07% | | | | | | | | | | | | | | |
Educational Enhancement Funding Corp.; Series 2013 B, RB(a)(b) | | | 5.00% | | | | 06/01/2023 | | | | 1,500 | | | 1,506,504 |
See accompanying Notes to Financial Statements which are an integral part of the financial statements.
| | |
| 22 | | Invesco AMT-Free Municipal Income Fund |
| | | | | | | | | | | | | | | | |
| | | Interest
Rate | | | Maturity
Date | | | Principal
Amount
(000) | | | Value | |
Tennessee–1.08% | | | | | | | | | | | | | | | | |
Chattanooga (City of), TN Health, Educational & Housing Facility Board (CommonSpirit Health); | | | | | | | | | | | | | | | | |
Series 2019 A-1, Ref. RB | | | 4.00% | | | | 08/01/2038 | | | $ | 225 | | | $ | 212,569 | |
Series 2019 A-1, Ref. RB | | | 4.00% | | | | 08/01/2044 | | | | 455 | | | | 409,395 | |
Series 2019 A-2, Ref. RB | | | 5.00% | | | | 08/01/2044 | | | | 340 | | | | 345,377 | |
Series 2019 A-2, Ref. RB | | | 5.00% | | | | 08/01/2049 | | | | 455 | | | | 458,166 | |
Greeneville (Town of), TN Health & Educational Facilities Board (Ballad Health Obligated Group); | | | | | | | | | | | | | | | | |
Series 2018 A, Ref. RB | | | 5.00% | | | | 07/01/2035 | | | | 2,000 | | | | 2,112,807 | |
Series 2018 A, Ref. RB | | | 5.00% | | | | 07/01/2036 | | | | 3,000 | | | | 3,145,175 | |
Series 2018 A, Ref. RB | | | 5.00% | | | | 07/01/2037 | | | | 3,000 | | | | 3,127,957 | |
Metropolitan Development and Housing Agency (Fifth + Broadway Development); Series 2018, RB(e) | | | 5.13% | | | | 06/01/2036 | | | | 200 | | | | 202,045 | |
Metropolitan Nashville Airport Authority (The); Series 2019 A, RB | | | 4.00% | | | | 07/01/2049 | | | | 2,500 | | | | 2,314,852 | |
Nashville (City of) & Davidson (County of), TN Metropolitan Government Health & Educational Facilities Board (The) (Vanderbilt University Medical Center); Series 2016 A, RB | | | 5.00% | | | | 07/01/2046 | | | | 7,000 | | | | 7,084,293 | |
Tennessee Energy Acquisition Corp.; Series 2006 C, RB | | | 5.00% | | | | 02/01/2027 | | | | 5,665 | | | | 5,715,351 | |
| | | | | | | | | | | | | | | | 25,127,987 | |
| | | | |
Texas–7.37% | | | | | | | | | | | | | | | | |
Alamo Community College District; Series 2007, GO Bonds (INS - NATL)(d) | | | 4.50% | | | | 08/15/2033 | | | | 5 | | | | 5,005 | |
Aldine Independent School District; Series 2017, Ref. GO Bonds (CEP - Texas Permanent School Fund) | | | 5.00% | | | | 02/15/2042 | | | | 10,700 | | | | 11,231,494 | |
Arlington Higher Education Finance Corp. (UME Preparatory Academy); Series 2017 A, RB | | | 5.00% | | | | 08/15/2038 | | | | 885 | | | | 838,426 | |
Arlington Higher Education Finance Corp. (Winfree Academy Charter School); Series 2019, Ref. RB | | | 5.75% | | | | 08/15/2043 | | | | 1,400 | | | | 1,376,825 | |
Aubrey Independent School District; Series 2022, GO Bonds (CEP - Texas Permanent School Fund) | | | 4.00% | | | | 02/15/2052 | | | | 5,000 | | | | 4,634,783 | |
Birdville Independent School District; Series 2023, GO Bonds | | | 4.00% | | | | 02/15/2048 | | | | 5,000 | | | | 4,581,262 | |
Dallas & Fort Worth (Cities of), TX (Dallas/Fort Worth International Airport); Series 2021 B, Ref. RB | | | 4.00% | | | | 11/01/2045 | | | | 5,000 | | | | 4,716,251 | |
Dallas (County of), TX Flood Control District No. 1; Series 2015, Ref. GO Bonds(e) | | | 5.00% | | | | 04/01/2032 | | | | 1,100 | | | | 1,100,135 | |
El Paso (City of), TX; Series 2022 A, RB | | | 4.00% | | | | 03/01/2048 | | | | 11,500 | | | | 10,712,289 | |
Forney Independent School District; Series 2022 B, GO Bonds (CEP - Texas Permanent School Fund) | | | 4.00% | | | | 08/15/2047 | | | | 5,665 | | | | 5,421,182 | |
Grand Parkway Transportation Corp.; Series 2020, Ref. RB | | | 4.00% | | | | 10/01/2045 | | | | 15,000 | | | | 13,927,743 | |
Harris (County of), TX Hospital District; Series 2010, Ref. VRD RB (LOC - JPMorgan Chase Bank N.A.)(f)(g) | | | 2.82% | | | | 02/15/2042 | | | | 3,970 | | | | 3,970,000 | |
Harris (County of), TX Port Authority of Houston; Series 2021, RB | | | 4.00% | | | | 10/01/2046 | | | | 5,365 | | | | 5,071,632 | |
Houston (City of), TX; Series 2020 C, Ref. RB | | | 4.00% | | | | 11/15/2043 | | | | 10,000 | | | | 9,655,022 | |
Humble Independent School District; Series 2022, GO Bonds (CEP - Texas Permanent School Fund) | | | 4.00% | | | | 02/15/2052 | | | | 10,750 | | | | 10,177,722 | |
Lamar Consolidated Independent School District; Series 2023, GO Bonds | | | 4.00% | | | | 02/15/2053 | | | | 7,500 | | | | 7,029,100 | |
Lower Colorado River Authority (LCRA Transmission Services Corp.); Series 2022, Ref. RB | | | 6.00% | | | | 05/15/2052 | | | | 3,235 | | | | 3,711,635 | |
Montgomery (County of), TX Toll Road Authority; | | | | | | | | | | | | | | | | |
Series 2018, RB | | | 5.00% | | | | 09/15/2043 | | | | 2,000 | | | | 1,991,395 | |
Series 2018, RB | | | 5.00% | | | | 09/15/2048 | | | | 2,500 | | | | 2,434,128 | |
New Hope Cultural Education Facilities Finance Corp. (Beta Academy); | | | | | | | | | | | | | | | | |
Series 2019, RB(e) | | | 5.00% | | | | 08/15/2039 | | | | 425 | | | | 408,399 | |
Series 2019, RB(e) | | | 5.00% | | | | 08/15/2049 | | | | 150 | | | | 135,362 | |
New Hope Cultural Education Facilities Finance Corp. (Cardinal Bay, Inc. - Village on the Park/Carriage Inn); Series 2016 A-1, RB | | | 5.00% | | | | 07/01/2031 | | | | 140 | | | | 93,450 | |
New Hope Cultural Education Facilities Finance Corp. (Cardinal Bay, Inc.); | | | | | | | | | | | | | | | | |
Series 2016, RB | | | 5.00% | | | | 07/02/2046 | | | | 700 | | | | 467,250 | |
Series 2016, RB | | | 5.00% | | | | 07/03/2051 | | | | 600 | | | | 400,500 | |
New Hope Cultural Education Facilities Finance Corp. (CHF - Collegiate Housing Corpus Christi II, LLC - Texas A&M University-Corpus Christi); Series 2016 A, RB(a)(b) | | | 5.00% | | | | 04/01/2026 | | | | 355 | | | | 374,345 | |
New Hope Cultural Education Facilities Finance Corp. (CHF - Collegiate Housing Denton, LLC - Texas Woman’s University); | | | | | | | | | | | | | | | | |
Series 2018 A-1, RB (INS - AGM)(d) | | | 5.00% | | | | 07/01/2048 | | | | 250 | | | | 251,363 | |
Series 2018 A-1, RB (INS - AGM)(d) | | | 5.00% | | | | 07/01/2058 | | | | 850 | | | | 852,933 | |
New Hope Cultural Education Facilities Finance Corp. (CHF - Collegiate Housing San Antonio I, LLC - Texas A&M University); Series 2016 A, RB(a)(b) | | | 5.00% | | | | 04/01/2026 | | | | 1,000 | | | | 1,052,990 | |
New Hope Cultural Education Facilities Finance Corp. (CHF - Stephenville, LLC - Tarleton State University); | | | | | | | | | | | | | | | | |
Series 2013 A, RB(a)(b) | | | 5.88% | | | | 04/01/2023 | | | | 555 | | | | 556,120 | |
Series 2013 A, RB(a)(b) | | | 6.00% | | | | 04/01/2023 | | | | 780 | | | | 781,639 | |
See accompanying Notes to Financial Statements which are an integral part of the financial statements.
| | |
| 23 | | Invesco AMT-Free Municipal Income Fund |
| | | | | | | | | | | | | | | | |
| | | Interest
Rate | | | Maturity
Date | | | Principal
Amount
(000) | | | Value | |
Texas–(continued) | | | | | | | | | | | | | | | | |
North Texas Tollway Authority; Series 2017 B, Ref. RB (INS - BAM)(d) | | | 5.00% | | | | 01/01/2043 | | | $ | 10,000 | | | $ | 10,396,861 | |
Northwest Independent School District; Series 2015, GO Bonds(a)(b) | | | 5.00% | | | | 02/15/2025 | | | | 10,000 | | | | 10,347,570 | |
Spring Independent School District; Series 2023, GO Bonds | | | 4.00% | | | | 08/15/2052 | | | | 7,500 | | | | 7,018,759 | |
Tender Option Bond Trust Receipts/Certificates; Series 2021, VRD RB (LOC - Morgan Stanley Mun Fdg)(e)(f)(g) | | | 3.10% | | | | 06/15/2056 | | | | 5,000 | | | | 5,000,000 | |
Texas (State of) Water Development Board; Series 2022, RB | | | 5.00% | | | | 10/15/2047 | | | | 16,350 | | | | 17,702,063 | |
Texas Municipal Gas Acquisition & Supply Corp. III; Series 2021, Ref. RB | | | 5.00% | | | | 12/15/2032 | | | | 7,500 | | | | 7,854,954 | |
Texas Private Activity Bond Surface Transportation Corp. (NTE Mobility Partners LLC - North Tarrant Express Managed Lanes); Series 2019 A, Ref. RB | | | 4.00% | | | | 12/31/2038 | | | | 6,135 | | | | 5,587,998 | |
| | | | | | | | | | | | | | | | 171,868,585 | |
| | | | |
Utah–0.07% | | | | | | | | | | | | | | | | |
Utah (State of) Charter School Finance Authority; Series 2018, RB | | | 5.00% | | | | 10/15/2038 | | | | 720 | | | | 742,077 | |
Utah (State of) Charter School Finance Authority (Merit Preparatory Academy); Series 2019 A, RB(e) | | | 5.38% | | | | 06/15/2049 | | | | 1,110 | | | | 995,819 | |
| | | | | | | | | | | | | | | | 1,737,896 | |
| | | | |
Virgin Islands–0.06% | | | | | | | | | | | | | | | | |
Virgin Islands (Government of) Public Finance Authority (Virgin Islands Gross Receipts Taxes Loan Note); Series 2012 A, Ref. RB (INS - AGM)(d) | | | 5.00% | | | | 10/01/2032 | | | | 1,480 | | | | 1,480,936 | |
| | | | |
Virginia–0.43% | | | | | | | | | | | | | | | | |
Celebrate North Community Development Authority; Series 2003 B, RB(h)(i) | | | 6.75% | | | | 03/01/2034 | | | | 302 | | | | 196,300 | |
Chesapeake Bay Bridge & Tunnel District; Series 2016, RB (INS - AGM)(d) | | | 5.00% | | | | 07/01/2041 | | | | 8,950 | | | | 9,084,432 | |
Virginia Beach Development Authority (Westminster-Canterbury on Chesapeake Bay); Series 2018, Ref. RB | | | 5.00% | | | | 09/01/2036 | | | | 715 | | | | 695,847 | |
| | | | | | | | | | | | | | | | 9,976,579 | |
| | | | |
Washington–0.36% | | | | | | | | | | | | | | | | |
Cowlitz County School District No. 458 Kelso; Series 2019, GO Bonds (CEP - Oregon School Bond Guaranty) | | | 4.00% | | | | 12/01/2038 | | | | 1,680 | | | | 1,689,304 | |
Kelso (City of), WA Housing Authority (Chinook & Columbia Apartments); Series 1998, RB | | | 5.60% | | | | 03/01/2028 | | | | 45 | | | | 44,995 | |
Tacoma (City of), WA Consolidated Local Improvement Districts; Series 2013, RB | | | 5.75% | | | | 04/01/2043 | | | | 1,461 | | | | 1,392,508 | |
Washington (State of); Series 2021 A, Ref. GO Bonds | | | 5.00% | | | | 06/01/2039 | | | | 2,750 | | | | 3,002,003 | |
Washington (State of) Health Care Facilities Authority (Virginia Mason Medical Center); Series 2017, Ref. RB | | | 5.00% | | | | 08/15/2031 | | | | 2,250 | | | | 2,351,530 | |
| | | | | | | | | | | | | | | | 8,480,340 | |
| | | | |
Wisconsin–1.57% | | | | | | | | | | | | | | | | |
Wisconsin (State of) Center District; Series 2020 D, RB (INS - AGM)(d)(j) | | | 0.00% | | | | 12/15/2055 | | | | 23,575 | | | | 4,481,006 | |
Wisconsin (State of) Health & Educational Facilities Authority; Series 2018 XF2541, Revenue Ctfs.(k) | | | 4.00% | | | | 11/15/2034 | | | | 20,000 | | | | 20,127,304 | |
Wisconsin (State of) Health & Educational Facilities Authority (Froedtert Health); Series 2022 A, Ref. RB | | | 4.00% | | | | 04/01/2042 | | | | 7,160 | | | | 6,565,337 | |
Wisconsin (State of) Public Finance Authority (Beyond Boone, LLC - Appalachian State University); | | | | | | | | | | | | | | | | |
Series 2019 A, RB (INS - AGM)(d) | | | 5.00% | | | | 07/01/2036 | | | | 900 | | | | 940,035 | |
Series 2019 A, RB (INS - AGM)(d) | | | 5.00% | | | | 07/01/2054 | | | | 1,275 | | | | 1,289,245 | |
Series 2019 A, RB (INS - AGM)(d) | | | 5.00% | | | | 07/01/2058 | | | | 1,400 | | | | 1,415,642 | |
Wisconsin (State of) Public Finance Authority (Explore Knowledge Foundation); | | | | | | | | | | | | | | | | |
Series 2012 A, RB | | | 5.75% | | | | 07/15/2032 | | | | 345 | | | | 345,204 | |
Series 2012 A, RB | | | 6.00% | | | | 07/15/2042 | | | | 350 | | | | 350,172 | |
Wisconsin (State of) Public Finance Authority (North Carolina Leadership Academy); Series 2019, RB(e) | | | 5.00% | | | | 06/15/2039 | | | | 310 | | | | 291,216 | |
See accompanying Notes to Financial Statements which are an integral part of the financial statements.
| | |
| 24 | | Invesco AMT-Free Municipal Income Fund |
| | | | | | | | | | | | | | | | |
| | | Interest
Rate | | | Maturity
Date | | | Principal
Amount
(000) | | | Value | |
Wisconsin–(continued) | | | | | | | | | | | | | | | | |
Wisconsin (State of) Public Finance Authority (Traders Point Christian Schools); | | | | | | | | | | | | | | | | |
Series 2019 A, RB(e) | | | 5.38% | | | | 06/01/2044 | | | $ | 435 | | | $ | 387,251 | |
Series 2019 A, RB(e) | | | 5.50% | | | | 06/01/2054 | | | | 540 | | | | 470,053 | |
|
| |
| | | | | | | | | | | | | | | 36,662,465 | |
|
| |
TOTAL INVESTMENTS IN SECURITIES(n)-101.19% (Cost $2,446,305,370) | | | | | | | | | | | | | | | 2,358,573,383 | |
|
| |
FLOATING RATE NOTE OBLIGATIONS-(2.95)% | | | | | | | | | | | | | | | | |
Notes with interest and fee rates ranging from 3.97% to 4.02% at 02/28/2023 and contractual maturities of collateral ranging from 10/01/2032 to 06/01/2043 (See Note 1K)(o) | | | | | | | | | | | | | | | (68,795,000 | ) |
|
| |
OTHER ASSETS LESS LIABILITIES-1.76% | | | | | | | | | | | | | | | 41,050,289 | |
|
| |
NET ASSETS-100.00% | | | | | | | | | | | | | | $ | 2,330,828,672 | |
|
| |
Investment Abbreviations:
| | |
| ACA | | - ACA Financial Guaranty Corp. |
| AGC | | - Assured Guaranty Corp. |
| AGM | | - Assured Guaranty Municipal Corp. |
| AMBAC | | - American Municipal Bond Assurance Corp. |
| BAM | | - Build America Mutual Assurance Co. |
| CEP | | - Credit Enhancement Provider |
| CHF | | - Swiss Franc |
| Ctfs. | | - Certificates |
| GNMA | | - Government National Mortgage Association |
| GO | | - General Obligation |
| IDR | | - Industrial Development Revenue Bonds |
| INS | | - Insurer |
| LOC | | - Letter of Credit |
| NATL | | - National Public Finance Guarantee Corp. |
| RB | | - Revenue Bonds |
| Ref. | | - Refunding |
| RN | | - Revenue Notes |
| VRD | | - Variable Rate Demand |
| Wts. | | - Warrants |
Notes to Schedule of Investments:
| (a) | Advance refunded; secured by an escrow fund of U.S. Government obligations or other highly rated collateral. |
| (b) | Security has an irrevocable call by the issuer or mandatory put by the holder. Maturity date reflects such call or put. |
| (c) | Convertible capital appreciation bond. The interest rate shown represents the coupon rate at which the bond will accrue at a specified future date. |
| (d) | Principal and/or interest payments are secured by the bond insurance company listed. |
| (e) | Security purchased or received in a transaction exempt from registration under the Securities Act of 1933, as amended (the “1933 Act”). The security may be resold pursuant to an exemption from registration under the 1933 Act, typically to qualified institutional buyers. The aggregate value of these securities at February 28, 2023 was $64,302,372, which represented 2.76% of the Fund’s Net Assets. |
| (f) | Demand security payable upon demand by the Fund at specified time intervals no greater than thirteen months. Interest rate is redetermined periodically by the issuer or agent based on current market conditions. Rate shown is the rate in effect on February 28, 2023. |
| (g) | Principal and interest payments are fully enhanced by a letter of credit from the bank listed or a predecessor bank, branch or subsidiary. |
| (h) | Defaulted security. Currently, the issuer is in default with respect to principal and/or interest payments. The aggregate value of these securities at February 28, 2023 was $29,604,322, which represented 1.27% of the Fund’s Net Assets. |
| (i) | Security valued using significant unobservable inputs (Level 3). See Note 3. |
| (j) | Zero coupon bond issued at a discount. |
| (k) | Underlying security related to TOB Trusts entered into by the Fund. See Note 1K. |
| (l) | Restricted security. The aggregate value of these securities at February 28, 2023 was $9,763,567, which represented less than 1% of the Fund’s Net Assets. |
| (m) | The issuer is paying less than stated interest, but is not in default on principal because scheduled principal payments have not yet begun. |
| (n) | This table provides a listing of those entities that have either issued, guaranteed, backed or otherwise enhanced the credit quality of more than 5% of the securities held in the portfolio. In instances where the entity has guaranteed, backed or otherwise enhanced the credit quality of a security, it is not primarily responsible for the issuer’s obligations but may be called upon to satisfy the issuer’s obligations. |
| | | | |
| Entity | | Percent | |
Assured Guaranty Municipal Corp. | | | 5.08% | |
| (o) | Floating rate note obligations related to securities held. The interest and fee rates shown reflect the rates in effect at February 28, 2023. At February 28, 2023, the Fund’s investments with a value of $122,026,951 are held by TOB Trusts and serve as collateral for the $68,795,000 in the floating rate note obligations outstanding at that date. |
See accompanying Notes to Financial Statements which are an integral part of the financial statements.
| | |
| 25 | | Invesco AMT-Free Municipal Income Fund |
Statement of Assets and Liabilities
February 28, 2023
| | |
Assets: | | |
Investments in unaffiliated securities, at value (Cost $2,446,305,370) | | $2,358,573,383 |
Cash | | 19,531,189 |
Receivable for: | | |
Investments sold | | 9,614,482 |
Fund shares sold | | 1,247,453 |
Interest | | 27,192,949 |
Investments matured, at value
(Cost $10,050,210) | | 5,023,351 |
Investment for trustee deferred compensation and retirement plans | | 123,653 |
Other assets | | 818,146 |
Total assets | | 2,422,124,606 |
| |
Liabilities: | | |
Floating rate note obligations | | 68,795,000 |
Payable for: | | |
Investments purchased | | 16,450,184 |
Dividends | | 3,199,299 |
Fund shares reacquired | | 1,574,002 |
Due to broker | | 89,313 |
Accrued fees to affiliates | | 871,245 |
Accrued interest expense | | 29,479 |
Accrued trustees’ and officers’ fees and benefits | | 73,485 |
Accrued other operating expenses | | 90,274 |
Trustee deferred compensation and retirement plans | | 123,653 |
Total liabilities | | 91,295,934 |
Net assets applicable to shares outstanding | | $2,330,828,672 |
| | | | |
Net assets consist of: | | | | |
Shares of beneficial interest | | $ | 2,804,256,575 | |
| |
Distributable earnings (loss) | | | (473,427,903 | ) |
| |
| | $ | 2,330,828,672 | |
|
| |
| |
Net Assets: | | | | |
Class A | | $ | 1,328,471,170 | |
|
| |
Class C | | $ | 98,529,851 | |
|
| |
Class Y | | $ | 898,453,828 | |
|
| |
Class R6 | | $ | 5,373,823 | |
|
| |
|
Shares outstanding, no par value, with an unlimited number of shares authorized: | |
Class A | | | 195,443,862 | |
|
| |
Class C | | | 14,614,180 | |
|
| |
Class Y | | | 132,648,175 | |
|
| |
Class R6 | | | 790,201 | |
|
| |
Class A: | | | | |
Net asset value per share | | $ | 6.80 | |
|
| |
Maximum offering price per share
(Net asset value of $6.80 ÷ 95.75%) | | $ | 7.10 | |
|
| |
Class C: | | | | |
Net asset value and offering price per share | | $ | 6.74 | |
|
| |
Class Y: | | | | |
Net asset value and offering price per share | | $ | 6.77 | |
|
| |
Class R6: | | | | |
Net asset value and offering price per share | | $ | 6.80 | |
|
| |
See accompanying Notes to Financial Statements which are an integral part of the financial statements.
| | |
| 26 | | Invesco AMT-Free Municipal Income Fund |
Statement of Operations
For the year ended February 28, 2023
| | | | |
Investment income: | | | | |
Interest | | $ | 103,803,141 | |
|
| |
| |
Expenses: | | | | |
Advisory fees | | | 9,467,799 | |
| |
Administrative services fees | | | 348,060 | |
| |
Custodian fees | | | 20,012 | |
| |
Distribution fees: | | | | |
Class A | | | 3,457,569 | |
| |
Class C | | | 1,190,591 | |
| |
Interest, facilities and maintenance fees | | | 3,091,111 | |
| |
Transfer agent fees – A, C and Y | | | 2,047,814 | |
| |
Transfer agent fees – R6 | | | 869 | |
| |
Trustees’ and officers’ fees and benefits | | | 41,319 | |
| |
Registration and filing fees | | | 155,210 | |
| |
Reports to shareholders | | | 41,829 | |
| |
Professional services fees | | | 194,233 | |
| |
Other | | | 34,499 | |
|
| |
Total expenses | | | 20,090,915 | |
| |
Less: Expense offset arrangement(s) | | | (3,536 | ) |
| |
Net expenses | | | 20,087,379 | |
| |
Net investment income | | | 83,715,762 | |
|
| |
| |
Realized and unrealized gain (loss) from: | | | | |
Net realized gain (loss) from: | | | | |
Unaffiliated investment securities (includes net gains (losses) from securities sold to affiliates of $(6,307,900)) | | | (157,066,290 | ) |
| |
Futures contracts | | | 8,880,044 | |
| |
| | | (148,186,246 | ) |
| |
Change in net unrealized appreciation (depreciation) of unaffiliated investment securities | | | (147,301,707 | ) |
| |
Net realized and unrealized gain (loss) | | | (295,487,953 | ) |
| |
Net increase (decrease) in net assets resulting from operations | | $ | (211,772,191 | ) |
|
| |
See accompanying Notes to Financial Statements which are an integral part of the financial statements.
| | |
| 27 | | Invesco AMT-Free Municipal Income Fund |
Statement of Changes in Net Assets
For the years ended February 28, 2023 and 2022
| | | | | | | | |
| | | 2023 | | | 2022 | |
|
| |
Operations: | | | | | | | | |
Net investment income | | $ | 83,715,762 | | | $ | 71,313,120 | |
| |
Net realized gain (loss) | | | (148,186,246 | ) | | | (15,499,698 | ) |
| |
Change in net unrealized appreciation (depreciation) | | | (147,301,707 | ) | | | (33,172,643 | ) |
| |
Net increase (decrease) in net assets resulting from operations | | | (211,772,191 | ) | | | 22,640,779 | |
|
| |
| | |
Distributions to shareholders from distributable earnings: | | | | | | | | |
Class A | | | (48,573,310 | ) | | | (59,093,969 | ) |
| |
Class C | | | (3,138,905 | ) | | | (4,228,732 | ) |
| |
Class Y | | | (31,797,566 | ) | | | (35,143,795 | ) |
| |
Class R6 | | | (212,856 | ) | | | (259,537 | ) |
| |
Total distributions from distributable earnings | | | (83,722,637 | ) | | | (98,726,033 | ) |
|
| |
| | |
Share transactions–net: | | | | | | | | |
Class A | | | (182,415,286 | ) | | | 68,730,627 | |
| |
Class C | | | (40,496,004 | ) | | | 6,925,905 | |
| |
Class Y | | | 19,405,212 | | | | 176,609,675 | |
| |
Class R6 | | | (640,381 | ) | | | 23,696 | |
| |
Net increase (decrease) in net assets resulting from share transactions | | | (204,146,459 | ) | | | 252,289,903 | |
| |
Net increase (decrease) in net assets | | | (499,641,287 | ) | | | 176,204,649 | |
|
| |
| | |
Net assets: | | | | | | | | |
Beginning of year | | | 2,830,469,959 | | | | 2,654,265,310 | |
| |
End of year | | $ | 2,330,828,672 | | | $ | 2,830,469,959 | |
|
| |
See accompanying Notes to Financial Statements which are an integral part of the financial statements.
| | |
| 28 | | Invesco AMT-Free Municipal Income Fund |
Financial Highlights
The following schedule presents financial highlights for a share of the Fund outstanding throughout the periods indicated.
| | | | | | | | | | | | | | | | | | | | | | | | | | | | | | | | | | | | | | | | | | | | | | | | | | | | | | | | | | | | | | | | | |
| | | Net asset value, beginning of period | | Net investment income(a) | | Net gains (losses) on securities (both realized and unrealized) | | Total from investment operations | | Dividends from net investment income | | Net asset value, end of period | | Total return(b) | | Net assets, end of period (000’s omitted) | | Ratio of expenses to average net assets with fee waivers and/or expenses absorbed | | Ratio of expenses to average net assets without fee waivers and/or expenses absorbed | | Supplemental ratio of expenses to average net assets with fee waivers (excluding interest, facilities and maintenance fees) | | Ratio of net investment income to average net assets | | Portfolio turnover (c) |
Class A | | | | | | | | | | | | | | | | | | | | | | | | | | | | | | | | | | | | | | | | | | | | | | | | | | | | | | | | | | | | | | | | | |
Year ended 02/28/23 | | | | $7.61 | | | | | $0.24 | | | | | $(0.81 | ) | | | | $(0.57 | ) | | | | $(0.24 | ) | | | | $6.80 | | | | | (7.51 | )%(d) | | | | $1,328,471 | | | | | 0.88 | %(d) | | | | 0.88 | %(d) | | | | 0.75 | %(d) | | | | 3.42 | %(d) | | | | 53 | % |
Year ended 02/28/22 | | | | 7.79 | | | | | 0.19 | | | | | (0.10 | ) | | | | 0.09 | | | | | (0.27 | ) | | | | 7.61 | | | | | 1.03 | (d) | | | | 1,685,219 | | | | | 0.80 | (d) | | | | 0.80 | (d) | | | | 0.74 | (d) | | | | 2.42 | (d) | | | | 10 | |
Year ended 02/28/21 | | | | 8.04 | | | | | 0.22 | | | | | (0.17 | ) | | | | 0.05 | | | | | (0.30 | ) | | | | 7.79 | | | | | 0.70 | (d) | | | | 1,659,677 | | | | | 0.84 | (d) | | | | 0.84 | (d) | | | | 0.76 | (d) | | | | 2.86 | (d) | | | | 20 | |
Seven months ended 02/29/20 | | | | 7.50 | | | | | 0.15 | | | | | 0.55 | | | | | 0.70 | | | | | (0.16 | ) | | | | 8.04 | | | | | 9.44 | | | | | 1,551,474 | | | | | 0.86 | (e) | | | | 0.86 | (e) | | | | 0.74 | (e) | | | | 3.33 | (e) | | | | 8 | |
Year ended 07/31/19 | | | | 7.12 | | | | | 0.28 | | | | | 0.36 | | | | | 0.64 | | | | | (0.26 | ) | | | | 7.50 | | | | | 9.22 | | | | | 1,378,279 | | | | | 1.02 | | | | | 1.02 | | | | | 0.80 | | | | | 3.86 | | | | | 27 | |
Year ended 07/31/18 | | | | 7.05 | | | | | 0.29 | | | | | 0.07 | | | | | 0.36 | | | | | (0.29 | ) | | | | 7.12 | | | | | 5.24 | | | | | 1,144,325 | | | | | 1.03 | | | | | 1.03 | | | | | 0.87 | | | | | 4.15 | | | | | 20 | |
Class C | | | | | | | | | | | | | | | | | | | | | | | | | | | | | | | | | | | | | | | | | | | | | | | | | | | | | | | | | | | | | | | | | |
Year ended 02/28/23 | | | | 7.54 | | | | | 0.18 | | | | | (0.80 | ) | | | | (0.62 | ) | | | | (0.18 | ) | | | | 6.74 | | | | | (8.19 | ) | | | | 98,530 | | | | | 1.64 | | | | | 1.64 | | | | | 1.51 | | | | | 2.66 | | | | | 53 | |
Year ended 02/28/22 | | | | 7.72 | | | | | 0.13 | | | | | (0.11 | ) | | | | 0.02 | | | | | (0.20 | ) | | | | 7.54 | | | | | 0.24 | | | | | 154,706 | | | | | 1.56 | | | | | 1.56 | | | | | 1.50 | | | | | 1.66 | | | | | 10 | |
Year ended 02/28/21 | | | | 7.97 | | | | | 0.16 | | | | | (0.18 | ) | | | | (0.02 | ) | | | | (0.23 | ) | | | | 7.72 | | | | | (0.14 | ) | | | | 151,779 | | | | | 1.60 | | | | | 1.60 | | | | | 1.52 | | | | | 2.10 | | | | | 20 | |
Seven months ended 02/29/20 | | | | 7.43 | | | | | 0.11 | | | | | 0.56 | | | | | 0.67 | | | | | (0.13 | ) | | | | 7.97 | | | | | 9.05 | | | | | 230,719 | | | | | 1.63 | (e) | | | | 1.63 | (e) | | | | 1.51 | (e) | | | | 2.57 | (e) | | | | 8 | |
Year ended 07/31/19 | | | | 7.06 | | | | | 0.22 | | | | | 0.36 | | | | | 0.58 | | | | | (0.21 | ) | | | | 7.43 | | | | | 8.34 | | | | | 258,540 | | | | | 1.78 | | | | | 1.78 | | | | | 1.56 | | | | | 3.10 | | | | | 27 | |
Year ended 07/31/18 | | | | 6.99 | | | | | 0.23 | | | | | 0.07 | | | | | 0.30 | | | | | (0.23 | ) | | | | 7.06 | | | | | 4.49 | | | | | 345,676 | | | | | 1.80 | | | | | 1.80 | | | | | 1.64 | | | | | 3.38 | | | | | 20 | |
Class Y | | | | | | | | | | | | | | | | | | | | | | | | | | | | | | | | | | | | | | | | | | | | | | | | | | | | | | | | | | | | | | | | | |
Year ended 02/28/23 | | | | 7.58 | | | | | 0.25 | | | | | (0.81 | ) | | | | (0.56 | ) | | | | (0.25 | ) | | | | 6.77 | | | | | (7.33 | ) | | | | 898,454 | | | | | 0.64 | | | | | 0.64 | | | | | 0.51 | | | | | 3.66 | | | | | 53 | |
Year ended 02/28/22 | | | | 7.76 | | | | | 0.21 | | | | | (0.11 | ) | | | | 0.10 | | | | | (0.28 | ) | | | | 7.58 | | | | | 1.26 | | | | | 983,831 | | | | | 0.56 | | | | | 0.56 | | | | | 0.50 | | | | | 2.66 | | | | | 10 | |
Year ended 02/28/21 | | | | 8.02 | | | | | 0.24 | | | | | (0.18 | ) | | | | 0.06 | | | | | (0.32 | ) | | | | 7.76 | | | | | 0.82 | | | | | 835,955 | | | | | 0.60 | | | | | 0.60 | | | | | 0.52 | | | | | 3.10 | | | | | 20 | |
Seven months ended 02/29/20 | | | | 7.47 | | | | | 0.16 | | | | | 0.56 | | | | | 0.72 | | | | | (0.17 | ) | | | | 8.02 | | | | | 9.77 | | | | | 578,082 | | | | | 0.62 | (e) | | | | 0.62 | (e) | | | | 0.50 | (e) | | | | 3.57 | (e) | | | | 8 | |
Year ended 07/31/19 | | | | 7.09 | | | | | 0.29 | | | | | 0.37 | | | | | 0.66 | | | | | (0.28 | ) | | | | 7.47 | | | | | 9.52 | | | | | 502,457 | | | | | 0.78 | | | | | 0.78 | | | | | 0.56 | | | | | 4.10 | | | | | 27 | |
Year ended 07/31/18 | | | | 7.03 | | | | | 0.30 | | | | | 0.06 | | | | | 0.36 | | | | | (0.30 | ) | | | | 7.09 | | | | | 5.36 | | | | | 428,027 | | | | | 0.79 | | | | | 0.79 | | | | | 0.63 | | | | | 4.39 | | | | | 20 | |
Class R6 | | | | | | | | | | | | | | | | | | | | | | | | | | | | | | | | | | | | | | | | | | | | | | | | | | | | | | | | | | | | | | | | | |
Year ended 02/28/23 | | | | 7.61 | | | | | 0.26 | | | | | (0.81 | ) | | | | (0.55 | ) | | | | (0.26 | ) | | | | 6.80 | | | | | (7.22 | ) | | | | 5,374 | | | | | 0.57 | | | | | 0.57 | | | | | 0.44 | | | | | 3.73 | | | | | 53 | |
Year ended 02/28/22 | | | | 7.79 | | | | | 0.22 | | | | | (0.11 | ) | | | | 0.11 | | | | | (0.29 | ) | | | | 7.61 | | | | | 1.35 | | | | | 6,714 | | | | | 0.49 | | | | | 0.49 | | | | | 0.43 | | | | | 2.73 | | | | | 10 | |
Year ended 02/28/21 | | | | 8.05 | | | | | 0.25 | | | | | (0.18 | ) | | | | 0.07 | | | | | (0.33 | ) | | | | 7.79 | | | | | 0.92 | | | | | 6,855 | | | | | 0.52 | | | | | 0.52 | | | | | 0.44 | | | | | 3.18 | | | | | 20 | |
Seven months ended 02/29/20 | | | | 7.50 | | | | | 0.16 | | | | | 0.56 | | | | | 0.72 | | | | | (0.17 | ) | | | | 8.05 | | | | | 9.74 | | | | | 5,675 | | | | | 0.59 | (e) | | | | 0.59 | (e) | | | | 0.47 | (e) | | | | 3.60 | (e) | | | | 8 | |
Period ended 07/31/19(f) | | | | 7.42 | | | | | 0.06 | | | | | 0.07 | | | | | 0.13 | | | | | (0.05 | ) | | | | 7.50 | | | | | 1.80 | | | | | 10 | | | | | 0.72 | (e) | | | | 0.72 | (e) | | | | 0.50 | (e) | | | | 4.16 | (e) | | | | 27 | |
| (a) | Calculated using average shares outstanding. |
| (b) | Includes adjustments in accordance with accounting principles generally accepted in the United States of America and as such, the net asset value for financial reporting purposes and the returns based upon those net asset values may differ from the net asset value and returns for shareholder transactions. Does not include sales charges and is not annualized for periods less than one year, if applicable. |
| (c) | Portfolio turnover is calculated at the fund level and is not annualized for periods less than one year, if applicable. |
| (d) | The total return, ratio of expenses to average net assets and ratio of net investment income to average net assets reflect actual 12b-1 fees of 0.24% for the years ended February 28, 2023, 2022 and 2021, respectively. |
| (f) | Commencement date after the close of business on May 24, 2019. |
See accompanying Notes to Financial Statements which are an integral part of the financial statements.
| | |
| 29 | | Invesco AMT-Free Municipal Income Fund |
Notes to Financial Statements
February 28, 2023
NOTE 1–Significant Accounting Policies
Invesco AMT-Free Municipal Income Fund (the “Fund”) is a series portfolio of AIM Tax-Exempt Funds (Invesco Tax-Exempt Funds) (the “Trust”). The Trust is a Delaware statutory trust registered under the Investment Company Act of 1940, as amended (the “1940 Act”), as an open-end series management investment company authorized to issue an unlimited number of shares of beneficial interest. Information presented in these financial statements pertains only to the Fund. Matters affecting the Fund or each class will be voted on exclusively by the shareholders of the Fund or each class.
The Fund’s investment objective is to seek tax-free income.
The Fund currently consists of four different classes of shares: Class A, Class C, Class Y and Class R6. Class Y shares are available only to certain investors. Class A shares are sold with a front-end sales charge unless certain waiver criteria are met. Under certain circumstances, load waived shares may be subject to contingent deferred sales charges (“CDSC”). Class C shares are sold with a CDSC. Class Y and Class R6 shares are sold at net asset value. Class C shares held for eight years after purchase are eligible for automatic conversion into Class A shares of the same Fund (the “Conversion Feature”). The automatic conversion pursuant to the Conversion Feature will generally occur at the end of the month following the eighth anniversary after a purchase of Class C shares.
The Fund is an investment company and accordingly follows the investment company accounting and reporting guidance in accordance with Financial Accounting Standards Board Accounting Standards Codification Topic 946, Financial Services – Investment Companies.
The following is a summary of the significant accounting policies followed by the Fund in the preparation of its financial statements.
| A. | Security Valuations – Securities, including restricted securities, are valued according to the following policy. |
Securities generally normally are valued on the basis of prices provided by independent pricing services. Prices provided by the pricing service may be determined without exclusive reliance on quoted prices, and may reflect appropriate factors such as institution-size trading in similar groups of securities, developments related to specific securities, dividend rate (for unlisted equities), yield (for debt obligations), quality, type of issue, coupon rate (for debt obligations), maturity (for debt obligations), individual trading characteristics and other market data. Pricing services generally value debt obligations assuming orderly transactions of institutional round lot size, but a fund may hold or transact in the same securities in smaller, odd lot sizes. Odd lots often trade at lower prices than institutional round lots, and their value may be adjusted accordingly. Debt obligations are subject to interest rate and credit risks. In addition, all debt obligations involve some risk of default with respect to interest and/or principal payments.
A security listed or traded on an exchange is generally valued at its trade price or official closing price that day as of the close of the exchange where the security is principally traded, or lacking any sales or official closing price on a particular day, the security may be valued at the closing bid price on that day. Securities traded in the over-the-counter market are valued based on prices furnished by independent pricing services or market makers. When such securities are valued using prices provided by an independent pricing service they may be considered fair valued. Futures contracts are valued at the daily settlement price set by an exchange on which they are principally traded. U.S. exchange-traded options are valued at the mean between the last bid and asked prices from the exchange on which they are principally traded. Non-U.S. exchange-traded options are valued at the final settlement price set by the exchange on which they trade. Options not listed on an exchange and swaps generally are valued using pricing provided from independent pricing services.
Securities for which market quotations are not readily available are fair valued by Invesco Advisers, Inc. (the “Adviser” or “Invesco”) in accordance with Board-approved policies and related Adviser procedures (“Valuation Procedures”). If a fair value price provided by a pricing service is not representative of market value in the Adviser’s judgment (“unreliable”), the Adviser will fair value the security using the Valuation Procedures. Issuer specific events, market trends, bid/asked quotes of brokers and information providers and other market data may be reviewed in the course of making a good faith determination of a security’s fair value.
The Fund may invest in securities that are subject to interest rate risk, meaning the risk that the prices will generally fall as interest rates rise and, conversely, the prices will generally rise as interest rates fall. Specific securities differ in their sensitivity to changes in interest rates depending on their individual characteristics. Changes in interest rates may result in increased market volatility, which may affect the value and/or liquidity of certain Fund investments.
Valuations change in response to many factors including the historical and prospective earnings of the issuer, the value of the issuer’s assets, general market conditions which are not specifically related to the particular issuer, such as real or perceived adverse economic conditions, changes in the general outlook for revenues or corporate earnings, changes in interest or currency rates, regional or global instability, natural or environmental disasters, widespread disease or other public health issues, war, acts of terrorism, significant governmental actions or adverse investor sentiment generally and market liquidity. Because of the inherent uncertainties of valuation, the values reflected in the financial statements may materially differ from the value received upon actual sale of those investments.
The price the Fund could receive upon the sale of any investment may differ from the Adviser’s valuation of the investment, particularly for securities that are valued using a fair valuation technique. When fair valuation techniques are applied, the Adviser uses available information, including both observable and unobservable inputs and assumptions, to determine a methodology that will result in a valuation that the Adviser believes approximates market value. Fund securities that are fair valued may be subject to greater fluctuation in their value from one day to the next than would be the case if market quotations were used. Because of the inherent uncertainties of valuation, and the degree of subjectivity in such decisions, the Fund could realize a greater or lesser than expected gain or loss upon the sale of the investment.
| B. | Securities Transactions and Investment Income – Securities transactions are accounted for on a trade date basis. Realized gains or losses on sales are computed on the basis of specific identification of the securities sold. Interest income (net of withholding tax, if any) is recorded on an accrual basis from settlement date and includes coupon interest and amortization of premium and accretion of discount on debt securities as applicable. Pay-in-kind interest income and non-cash dividend income received in the form of securities in-lieu of cash are recorded at the fair value of the securities received. Dividend income (net of withholding tax, if any) is recorded on the ex-dividend date. |
The Fund may periodically participate in litigation related to Fund investments. As such, the Fund may receive proceeds from litigation settlements.Any proceeds received are included in the Statement of Operations as realized gain (loss) for investments no longer held and as unrealized gain (loss) for investments still held.
Brokerage commissions and mark ups are considered transaction costs and are recorded as an increase to the cost basis of securities purchased and/or a reduction of proceeds on a sale of securities. Such transaction costs are included in the determination of net realized and unrealized gain (loss) from investment securities reported in the Statement of Operations and the Statement of Changes in Net Assets and the net realized and unrealized gains (losses) on securities per share in the Financial Highlights. Transaction costs are included in the calculation of the Fund’s net asset value and, accordingly, they reduce the Fund’s total returns. These transaction costs are not considered operating expenses and are not reflected in net investment income reported in the Statement of Operations and the Statement of Changes in Net Assets, or the net investment income per share and the ratios of expenses and net investment income reported in the Financial Highlights, nor are they limited by any expense limitation arrangements between the Fund and the investment adviser.
The Fund allocates realized and unrealized capital gains and losses to a class based on the relative net assets of each class. The Fund allocates income to a class based on the relative value of the settled shares of each class.
| C. | Country Determination �� For the purposes of making investment selection decisions and presentation in the Schedule of Investments, the investment adviser may determine the country in which an issuer is located and/or credit risk exposure based on various factors. These factors include the laws of the country under |
| | |
| 30 | | Invesco AMT-Free Municipal Income Fund |
which the issuer is organized, where the issuer maintains a principal office, the country in which the issuer derives 50% or more of its total revenues, the country that has the primary market for the issuer’s securities and its “country of risk” as determined by a third party service provider, as well as other criteria. Among the other criteria that may be evaluated for making this determination are the country in which the issuer maintains 50% or more of its assets, the type of security, financial guarantees and enhancements, the nature of the collateral and the sponsor organization. Country of issuer and/or credit risk exposure has been determined to be the United States of America, unless otherwise noted.
| D. | Distributions – Distributions from net investment income, if any, are declared daily and paid monthly. Distributions from net realized capital gain, if any, are generally declared and paid annually and recorded on the ex-dividend date. The Fund may elect to treat a portion of the proceeds from redemptions as distributions for federal income tax purposes. |
| E. | Federal Income Taxes – The Fund intends to comply with the requirements of Subchapter M of the Internal Revenue Code of 1986, as amended (the “Internal Revenue Code”), necessary to qualify as a regulated investment company and to distribute substantially all of the Fund’s taxable and tax-exempt earnings to shareholders. As such, the Fund will not be subject to federal income taxes on otherwise taxable income (including net realized capital gain) that is distributed to shareholders. Therefore, no provision for federal income taxes is recorded in the financial statements. |
The Fund recognizes the tax benefits of uncertain tax positions only when the position is more likely than not to be sustained. Management has analyzed the Fund’s uncertain tax positions and concluded that no liability for unrecognized tax benefits should be recorded related to uncertain tax positions. Management is not aware of any tax positions for which it is reasonably possible that the total amounts of unrecognized tax benefits will change materially in the next 12 months.
In addition, the Fund intends to invest in such municipal securities to allow it to qualify to pay shareholders “exempt-interest dividends”, as defined in the Internal Revenue Code.
The Fund files tax returns in the U.S. Federal jurisdiction and certain other jurisdictions. Generally, the Fund is subject to examinations by such taxing authorities for up to three years after the filing of the return for the tax period.
| F. | Expenses – Fees provided for under the Rule 12b-1 plan of a particular class of the Fund are charged to the operations of such class. Transfer agency fees and expenses and other shareholder recordkeeping fees and expenses attributable to Class R6 are charged to such class. Transfer agency fees and expenses and other shareholder recordkeeping fees and expenses relating to all other classes are allocated among those classes based on relative net assets. All other expenses are allocated among the classes based on relative net assets. |
| G. | Interest, Facilities and Maintenance Fees – Interest, Facilities and Maintenance Fees include interest and related borrowing costs such as commitment fees, administrative expenses and other expenses associated with establishing and maintaining the line of credit. In addition, interest and administrative expenses related to establishing and maintaining floating rate note obligations, if any, are included. |
| H. | Accounting Estimates – The preparation of financial statements in conformity with accounting principles generally accepted in the United States of America (“GAAP”) requires management to make estimates and assumptions that affect the reported amounts of assets and liabilities at the date of the financial statements and the reported amounts of revenues and expenses during the reporting period including estimates and assumptions related to taxation. Actual results could differ from those estimates by a significant amount. In addition, the Fund monitors for material events or transactions that may occur or become known after the period-end date and before the date the financial statements are released to print. |
| I. | Indemnifications – Under the Trust’s organizational documents, each Trustee, officer, employee or other agent of the Trust is indemnified against certain liabilities that may arise out of the performance of their duties to the Fund. Additionally, in the normal course of business, the Fund enters into contracts, including the Fund’s servicing agreements, that contain a variety of indemnification clauses. The Fund’s maximum exposure under these arrangements is unknown as this would involve future claims that may be made against the Fund that have not yet occurred. The risk of material loss as a result of such indemnification claims is considered remote. |
| J. | Securities Purchased on a When-Issued and Delayed Delivery Basis – The Fund may purchase and sell interests in corporate loans and corporate debt securities and other portfolio securities on a when-issued and delayed delivery basis, with payment and delivery scheduled for a future date. No income accrues to the Fund on such interests or securities in connection with such transactions prior to the date the Fund actually takes delivery of such interests or securities. These transactions are subject to market fluctuations and are subject to the risk that the value at delivery may be more or less than the trade date purchase price. Although the Fund will generally purchase these securities with the intention of acquiring such securities, they may sell such securities prior to the settlement date. |
| K. | Floating Rate Note Obligations – The Fund invests in inverse floating rate securities, such as Tender Option Bonds (“TOBs”), for investment purposes and to enhance the yield of the Fund. Such securities may be purchased in the secondary market without first owning an underlying bond but generally are created through the sale of fixed rate bonds by the Fund to special purpose trusts established by a broker dealer or by the Fund (“TOB Trusts”) in exchange for cash and residual interests in the TOB Trusts’ assets and cash flows, which are in the form of inverse floating rate securities. The TOB Trusts finance the purchases of the fixed rate bonds by issuing floating rate notes to third parties and allowing the Fund to retain residual interests in the bonds. The floating rate notes issued by the TOB Trusts have interest rates that reset weekly and the floating rate note holders have the option to tender their notes to the TOB Trusts for redemption at par at each reset date. The residual interests held by the Fund (inverse floating rate securities) include the right of the Fund (1) to cause the holders of the floating rate notes to tender their notes at par at the next interest rate reset date, and (2) to transfer the municipal bond from the TOB Trust to the Fund, thereby collapsing the TOB Trust. Inverse floating rate securities tend to underperform the market for fixed rate bonds in a rising interest rate environment, but tend to outperform the market for fixed rate bonds when interest rates decline or remain relatively stable. |
The Fund generally invests in inverse floating rate securities that include embedded leverage, thus exposing the Fund to greater risks and increased costs. The primary risks associated with inverse floating rate securities are varying degrees of liquidity and decreases in the value of such securities in response to changes in interest rates to a greater extent than fixed rate securities having similar credit quality, redemption provisions and maturity, which may cause the Fund’s net asset value to be more volatile than if it had not invested in inverse floating rate securities. In certain instances, the short-term floating rate notes created by the TOB Trust may not be able to be sold to third parties or, in the case of holders tendering (or putting) such notes for repayment of principal, may not be able to be remarketed to third parties. In such cases, the TOB Trust holding the fixed rate bonds may be collapsed with the entity that contributed the fixed rate bonds to the TOB Trust. In the case where a TOB Trust is collapsed with the Fund, the Fund will be required to repay the principal amount of the tendered securities, which may require the Fund to sell other portfolio holdings to raise cash to meet that obligation. The Fund could therefore be required to sell other portfolio holdings at a disadvantageous time or price to raise cash to meet this obligation, which risk will be heightened during times of market volatility, illiquidity or uncertainty. The embedded leverage in the TOB Trust could cause the Fund to lose more money than the value of the asset it has contributed to the TOB Trust and greater levels of leverage create the potential for greater losses. In addition, a Fund may enter into reimbursement agreements with the liquidity provider of certain TOB transactions in connection with certain residuals held by the Fund. These agreements commit a Fund to reimburse the liquidity provider to the extent that the liquidity provider must provide cash to a TOB Trust, including following the termination of a TOB Trust resulting from a mandatory tender event (“liquidity shortfall”). The reimbursement agreement will effectively make the Fund liable for the amount of the negative difference, if any, between the liquidation value of the underlying security and the purchase price of the floating rate notes issued by the TOB Trust.
The Fund accounts for the transfer of fixed rate bonds to the TOB Trusts as secured borrowings, with the securities transferred remaining in the Fund’s investment assets, and the related floating rate notes reflected as Fund liabilities under the caption Floating rate note obligations on the Statement of Assets and Liabilities. The carrying amount of the Fund’s floating rate note obligations as reported on the Statement of Assets and Liabilities approximates its fair value. The Fund records the interest income from the fixed rate bonds under the caption Interest and records the expenses related to floating rate obligations and any administrative expenses of the TOB Trusts as a component of Interest, facilities and maintenance fees on the Statement of Operations.
| | |
| 31 | | Invesco AMT-Free Municipal Income Fund |
Final rules implementing section 619 of the Dodd-Frank Wall Street Reform and Consumer Protection Act (the “Volcker Rule”) prohibit banking entities from engaging in proprietary trading of certain instruments and limit such entities’ investments in, and relationships with, “covered funds”, as defined in the rules. These rules preclude banking entities and their affiliates from sponsoring and/or providing services for existing TOB Trusts. A new TOB structure is being utilized by the Fund wherein the Fund, as holder of the residuals, will perform certain duties previously performed by banking entities as “sponsors” of TOB Trusts. These duties may be performed by a third-party service provider. The Fund’s expanded role under the new TOB structure may increase its operational and regulatory risk. The new structure is substantially similar to the previous structure; however, pursuant to the Volcker Rule, the remarketing agent would not be able to repurchase tendered floaters for its own account upon a failed remarketing. In the event of a failed remarketing, a banking entity serving as liquidity provider may loan the necessary funds to the TOB Trust to purchase the tendered floaters. The TOB Trust, not the Fund, would be the borrower and the loan from the liquidity provider will be secured by the purchased floaters now held by the TOB Trust. However, as previously described, the Fund would bear the risk of loss with respect to any liquidity shortfall to the extent it entered into a reimbursement agreement with the liquidity provider.
Further, the SEC and various banking agencies have adopted rules implementing credit risk retention requirements for asset-backed securities (the “Risk Retention Rules”). The Risk Retention Rules require the sponsor of a TOB Trust to retain at least 5% of the credit risk of the underlying assets supporting the TOB Trust’s municipal bonds. The Fund has adopted policies intended to comply with the Risk Retention Rules. The Risk Retention Rules may adversely affect the Fund’s ability to engage in TOB Trust transactions or increase the costs of such transactions in certain circumstances.
There can be no assurances that the new TOB structure will continue to be a viable form of leverage. Further, there can be no assurances that alternative forms of leverage will be available to the Fund in order to maintain current levels of leverage. Any alternative forms of leverage may be less advantageous to the Fund, and may adversely affect the Fund’s net asset value, distribution rate and ability to achieve its investment objective.
TOBs are presently classified as private placement securities. Private placement securities are subject to restrictions on resale because they have not been registered under the Securities Act of 1933, as amended (the “1933 Act”), or are otherwise not readily marketable. As a result of the absence of a public trading market for these securities, they may be less liquid than publicly traded securities. Although atypical, these securities may be resold in privately negotiated transactions, the prices realized from these sales could be less than those originally paid by the Fund or less than what may be considered the fair value of such securities.
| L. | Futures Contracts – The Fund may enter into futures contracts to manage exposure to interest rate, equity and market price movements and/or currency risks. A futures contract is an agreement between two parties (“Counterparties”) to purchase or sell a specified underlying security, currency or commodity (or delivery of a cash settlement price, in the case of an index future) for a fixed price at a future date. The Fund currently invests only in exchange-traded futures and they are standardized as to maturity date and underlying financial instrument. Initial margin deposits required upon entering into futures contracts are satisfied by the segregation of specific securities or cash as collateral at the futures commission merchant (broker). During the period the futures contracts are open, changes in the value of the contracts are recognized as unrealized gains or losses by recalculating the value of the contracts on a daily basis. Subsequent or variation margin payments are received or made depending upon whether unrealized gains or losses are incurred. These amounts are reflected as receivables or payables on the Statement of Assets and Liabilities. When the contracts are closed or expire, the Fund recognizes a realized gain or loss equal to the difference between the proceeds from, or cost of, the closing transaction and the Fund’s basis in the contract. The net realized gain (loss) and the change in unrealized gain (loss) on futures contracts held during the period is included on the Statement of Operations. The primary risks associated with futures contracts are market risk and the absence of a liquid secondary market. If the Fund were unable to liquidate a futures contract and/or enter into an offsetting closing transaction, the Fund would continue to be subject to market risk with respect to the value of the contracts and continue to be required to maintain the margin deposits on the futures contracts. Futures contracts have minimal Counterparty risk since the exchange’s clearinghouse, as Counterparty to all exchange-traded futures, guarantees the futures against default. Risks may exceed amounts recognized in the Statement of Assets and Liabilities. |
| M. | Other Risks - Increases in the federal funds and equivalent foreign rates or other changes to monetary policy or regulatory actions may expose fixed income markets to heightened volatility and reduced liquidity for certain fixed income investments, particularly those with longer maturities. It is difficult to predict the impact of interest rate changes on various markets. In addition, decreases in fixed income dealer market-making capacity may also potentially lead to heightened volatility and reduced liquidity in the fixed income markets. As a result, the value of the Fund’s investments and share price may decline. Changes in central bank policies could also result in higher than normal redemptions by shareholders, which could potentially increase the Fund’s portfolio turnover rate and transaction costs. |
Policy changes by the U.S. government or its regulatory agencies and political events within the U.S. and abroad may, among other things, affect investor and consumer confidence and increase volatility in the financial markets, perhaps suddenly and to a significant degree, which may adversely impact the Fund’s operations, universe of potential investment options, and return potential.
The Fund may invest in lower-quality debt securities, i.e., “junk bonds”. Investments in lower-rated securities or unrated securities of comparable quality tend to be more sensitive to economic conditions than higher rated securities. Junk bonds involve a greater risk of default by the issuer because such securities are generally unsecured and are often subordinated to other creditors’ claims. Junk bonds are less liquid than investment grade debt securities and their prices tend to be more volatile.
The municipal issuers in which the Fund invests may be located in the same geographic area or may pay their interest obligations from revenue of similar projects, such as hospitals, airports, utility systems and housing finance agencies. This may make the Fund’s investments more susceptible to similar social, economic, political or regulatory occurrences, making the Fund more susceptible to experience a drop in its share price than if the Fund had been more diversified across issuers that did not have similar characteristics.
The risk of a municipal obligation generally depends on the financial and credit status of the issuer. Constitutional amendments, legislative enactments, executive orders, administrative regulations, voter initiatives, and the issuer’s regional economic conditions may affect the municipal security’s value, interest payments, repayment of principal and the Fund’s ability to sell the security. Failure of a municipal security issuer to comply with applicable tax requirements may make income paid thereon taxable, resulting in a decline in the security’s value. In addition, there could be changes in applicable tax laws or tax treatments that reduce or eliminate the current federal income tax exemption on municipal securities or otherwise adversely affect the current federal or state tax status of municipal securities.
| N. | COVID-19 Risk - The COVID-19 strain of coronavirus has resulted in instances of market closures and dislocations, extreme volatility, liquidity constraints and increased trading costs. Efforts to contain its spread have resulted in travel restrictions, disruptions of healthcare systems, business operations (including business closures) and supply chains, layoffs, lower consumer demand and employee availability, and defaults and credit downgrades, among other significant economic impacts that have disrupted global economic activity across many industries. Such economic impacts may exacerbate other pre-existing political, social and economic risks locally or globally and cause general concern and uncertainty. The full economic impact and ongoing effects of COVID-19 (or other future epidemics or pandemics) at the macro-level and on individual businesses are unpredictable and may result in significant and prolonged effects on the Fund’s performance. |
| | |
| 32 | | Invesco AMT-Free Municipal Income Fund |
NOTE 2–Advisory Fees and Other Fees Paid to Affiliates
The Trust has entered into a master investment advisory agreement with the Adviser. Under the terms of the investment advisory agreement, the Fund accrues daily and pays monthly an advisory fee to the Adviser based on the annual rate of the Fund’s average daily net assets as follows:
| | | | |
| Average Daily Net Assets | | Rate* | |
|
| |
First $200 million | | | 0.600% | |
|
| |
Next $100 million | | | 0.550% | |
|
| |
Next $200 million | | | 0.500% | |
|
| |
Next $250 million | | | 0.450% | |
|
| |
Next $250 million | | | 0.400% | |
|
| |
Next $4 billion | | | 0.350% | |
|
| |
Over $5 billion | | | 0.330% | |
|
| |
| * | The advisory fee paid by the Fund shall be reduced by any amounts paid by the Fund under the administrative services agreement with the Adviser. |
For the year ended February 28, 2023, the effective advisory fee rate incurred by the Fund was 0.39%.
Under the terms of a master sub-advisory agreement between the Adviser and each of Invesco Asset Management Deutschland GmbH, Invesco Asset Management Limited, Invesco Asset Management (Japan) Limited, Invesco Hong Kong Limited, Invesco Senior Secured Management, Inc. and Invesco Canada Ltd. and separate sub-advisory agreements with Invesco Capital Management LLC and Invesco Asset Management (India) Private Limited (collectively, the “Affiliated Sub-Advisers”) the Adviser, not the Fund, will pay 40% of the fees paid to the Adviser to any such Affiliated Sub-Adviser(s) that provide(s) discretionary investment management services to the Fund based on the percentage of assets allocated to such Affiliated Sub-Adviser(s). Invesco has also entered into a sub-advisory agreement with OppenheimerFunds, Inc. to provide discretionary management services to the Fund.
The Adviser has contractually agreed, though at least June 30, 2023, to waive advisory fees and/or reimburse expenses of all shares to the extent necessary to limit total annual fund operating expenses after fee waiver and/or expense reimbursement (excluding certain items discussed below) of Class A, Class C, Class Y and Class R6 shares to 1.50%, 2.25%, 1.25% and 1.25%, respectively, of the Fund’s average daily net assets (the “expense limits”). In determining the Adviser’s obligation to waive advisory fees and/or reimburse expenses, the following expenses are not taken into account, and could cause the total annual fund operating expenses after fee waiver and/or expense reimbursement to exceed the numbers reflected above: (1) interest, facilities and maintenance fees; (2) taxes; (3) dividend expense on short sales; (4) extraordinary or non-routine items, including litigation expenses; and (5) expenses that the Fund has incurred but did not actually pay because of an expense offset arrangement. Unless Invesco continues the fee waiver agreement, it will terminate on June 30, 2023. During its term, the fee waiver agreement cannot be terminated or amended to increase the expense limits or reduce the advisory fee waiver without approval of the Board of Trustees. The Adviser did not waive fees and/or reimburse expenses during the period under these expense limits.
The Trust has entered into a master administrative services agreement with Invesco pursuant to which the Fund has agreed to pay Invesco for certain administrative costs incurred in providing accounting services to the Fund. For the year ended February 28, 2023, expenses incurred under the agreement are shown in the Statement of Operations as Administrative services fees. Invesco has entered into a sub-administration agreement whereby State Street Bank and Trust Company (“SSB”) serves as fund accountant and provides certain administrative services to the Fund. Pursuant to a custody agreement with the Trust on behalf of the Fund, SSB also serves as the Fund’s custodian.
The Trust has entered into a transfer agency and service agreement with Invesco Investment Services, Inc. (“IIS”) pursuant to which the Fund has agreed to pay IIS a fee for providing transfer agency and shareholder services to the Fund and reimburse IIS for certain expenses incurred by IIS in the course of providing such services. IIS may make payments to intermediaries that provide omnibus account services, sub-accounting services and/or networking services. All fees payable by IIS to intermediaries that provide omnibus account services or sub-accounting services are charged back to the Fund, subject to certain limitations approved by the Trust’s Board of Trustees. For the year ended February 28, 2023, expenses incurred under the agreement are shown in the Statement of Operations as Transfer agent fees.
The Trust has entered into master distribution agreements with Invesco Distributors, Inc. (“IDI”) to serve as the distributor for the Class A, Class C, Class Y and Class R6 shares of the Fund. The Trust has adopted plans pursuant to Rule 12b-1 under the 1940 Act with respect to the Fund’s Class A and Class C shares (collectively, the “Plans”). The Fund, pursuant to the Class A Plan, reimburses IDI for its allocated share of expenses incurred for the period, up to a maximum annual rate of 0.25% of the average daily net assets of Class A shares. The Fund pursuant to the Class C Plan, pays IDI compensation at the annual rate of 1.00% of the average daily net assets of Class C shares. The fees are accrued daily and paid monthly. Of the Plan payments, up to 0.25% of the average daily net assets of each class of shares may be paid to furnish continuing personal shareholder services to customers who purchase and own shares of such classes. Any amounts not paid as a service fee under the Plans would constitute an asset-based sales charge. Rules of the Financial Industry Regulatory Authority (“FINRA”) impose a cap on the total sales charges, including asset-based sales charges, that may be paid by any class of shares of the Fund. For the year ended February 28, 2023, expenses incurred under the Plans are shown in the Statement of Operations as Distribution fees.
Front-end sales commissions and CDSC (collectively, the “sales charges”) are not recorded as expenses of the Fund. Front-end sales commissions are deducted from proceeds from the sales of Fund shares prior to investment in Class A shares of the Fund. CDSC are deducted from redemption proceeds prior to remittance to the shareholder. During the year ended February 28, 2023, IDI advised the Fund that IDI retained $40,228 in front-end sales commissions from the sale of Class A shares and $95,440 and $29,409 from Class A and Class C shares, respectively, for CDSC imposed upon redemptions by shareholders.
Certain officers and trustees of the Trust are officers and directors of the Adviser, IIS and/or IDI.
NOTE 3–Additional Valuation Information
GAAP defines fair value as the price that would be received to sell an asset or paid to transfer a liability in an orderly transaction between market participants at the measurement date, under current market conditions. GAAP establishes a hierarchy that prioritizes the inputs to valuation methods, giving the highest priority to readily available unadjusted quoted prices in an active market for identical assets (Level 1) and the lowest priority to significant unobservable inputs (Level 3), generally when market prices are not readily available or are unreliable. Based on the valuation inputs, the securities or other investments are tiered into one of three levels. Changes in valuation methods may result in transfers in or out of an investment’s assigned level:
Level 1 – Prices are determined using quoted prices in an active market for identical assets.
Level 2 – Prices are determined using other significant observable inputs. Observable inputs are inputs that other market participants may use in pricing a security. These may include quoted prices for similar securities, interest rates, prepayment speeds, credit risk, yield curves, loss severities, default rates, discount rates, volatilities and others.
Level 3 – Prices are determined using significant unobservable inputs. In situations where quoted prices or observable inputs are unavailable (for example, when there is little or no market activity for an investment at the end of the period), unobservable inputs may be used. Unobservable inputs reflect the Adviser’s assumptions about the factors market participants would use in determining fair value of the securities or instruments and would be based on the best available information.
| | |
| 33 | | Invesco AMT-Free Municipal Income Fund |
The following is a summary of the tiered valuation input levels, as of February 28, 2023. The level assigned to the securities valuations may not be an indication of the risk or liquidity associated with investing in those securities. Because of the inherent uncertainties of valuation, the values reflected in the financial statements may materially differ from the value received upon actual sale of those investments.
| | | | | | | | | | | | | | | | |
| | | Level 1 | | | Level 2 | | | Level 3 | | | Total | |
Investments in Securities | | | | | | | | | | | | | | | | |
Municipal Obligations | | | $– | | | $ | 2,340,308,351 | | | $ | 18,265,032 | | | $ | 2,358,573,383 | |
| | | | |
Other Investments - Assets | | | | | | | | | | | | | | | | |
Investments Matured | | | – | | | | 4,024,400 | | | | 998,951 | | | | 5,023,351 | |
Total Investments | | | $– | | | $ | 2,344,332,751 | | | $ | 19,263,983 | | | $ | 2,363,596,734 | |
NOTE 4–Derivative Investments
The Fund may enter into an International Swaps and Derivatives Association Master Agreement (“ISDA Master Agreement”) under which a fund may trade OTC derivatives. An OTC transaction entered into under an ISDA Master Agreement typically involves a collateral posting arrangement, payment netting provisions and close-out netting provisions. These netting provisions allow for reduction of credit risk through netting of contractual obligations. The enforceability of the netting provisions of the ISDA Master Agreement depends on the governing law of the ISDA Master Agreement, among other factors.
For financial reporting purposes, the Fund does not offset OTC derivative assets or liabilities that are subject to ISDA Master Agreements in the Statement of Assets and Liabilities.
Effect of Derivative Investments for the year ended February 28, 2023
The table below summarizes the gains (losses) on derivative investments, detailed by primary risk exposure, recognized in earnings during the period:
| | | | |
| | | Location of Gain on
Statement of Operations Interest Rate Risk | |
Realized Gain: | | | | |
Futures contracts | | | $8,880,044 | |
| |
The table below summarizes the average notional value of derivatives held during the period. | | | | |
| | | Futures Contracts | |
Average notional value | | | $123,061,788 | |
NOTE 5–Security Transactions with Affiliated Funds
The Fund is permitted to purchase securities from or sell securities to certain other affiliated funds under specified conditions outlined in procedures adopted by the Board of Trustees of the Trust. The procedures have been designed to ensure that any purchase or sale of securities by the Fund from or to another fund that is or could be considered an “affiliated person” by virtue of having a common investment adviser (or affiliated investment advisers), common Trustees and/or common officers is made in reliance on Rule 17a-7 of the 1940 Act and, to the extent applicable, related SEC staff positions. Each such transaction is effected at the security’s “current market price”, as provided for in these procedures and Rule 17a-7. Pursuant to these procedures, for the year ended February 28, 2023, the Fund engaged in securities purchases of $269,837,376 and securities sales of $219,241,169, which resulted in net realized gains (losses) of $(6,307,900).
NOTE 6–Expense Offset Arrangement(s)
The expense offset arrangement is comprised of transfer agency credits which result from balances in demand deposit accounts used by the transfer agent for clearing shareholder transactions. For the year ended February 28, 2023, the Fund received credits from this arrangement, which resulted in the reduction of the Fund’s total expenses of $3,536.
NOTE 7–Trustees’ and Officers’ Fees and Benefits
Trustees’ and Officers’ Fees and Benefits include amounts accrued by the Fund to pay remuneration to certain Trustees and Officers of the Fund. Trustees have the option to defer compensation payable by the Fund, and Trustees’ and Officers’ Fees and Benefits also include amounts accrued by the Fund to fund such deferred compensation amounts. Those Trustees who defer compensation have the option to select various Invesco Funds in which their deferral accounts shall be deemed to be invested. Finally, certain current Trustees were eligible to participate in a retirement plan that provided for benefits to be paid upon retirement to Trustees over a period of time based on the number of years of service. The Fund may have certain former Trustees who also participate in a retirement plan and receive benefits under such plan. Trustees’ and Officers’ Fees and Benefits include amounts accrued by the Fund to fund such retirement benefits. Obligations under the deferred compensation and retirement plans represent unsecured claims against the general assets of the Fund.
NOTE 8–Cash Balances and Borrowings
The Fund has entered into a revolving credit and security agreement, which enables the Fund to participate with certain other Invesco Funds in a committed secured borrowing facility that permits borrowings up to $2.5 billion, collectively by certain Invesco Funds, and which will expire on February 22, 2024. The revolving credit and security agreement is secured by the assets of the Fund. The Fund is subject to certain covenants relating to the revolving credit and security agreement. Failure to comply with these restrictions could cause the acceleration of the repayment of the amount outstanding under the revolving credit and security agreement.
During the year ended February 28, 2023, the average daily balance of borrowing under the revolving credit and security agreement was $16,986 with an average interest rate of 4.32%. The carrying amount of the Fund’s payable for borrowings as reported on the Statement of Assets and Liabilities approximates its fair value. Expenses under the revolving credit and security agreement are shown in the Statement of Operations as Interest, facilities and maintenance fees.
Additionally, the Fund is permitted to temporarily carry a negative or overdrawn balance in its account with SSB, the custodian bank. Such balances, if any at period-end, are shown in the Statement of Assets and Liabilities under the payable caption Amount due custodian. To compensate the custodian bank for such overdrafts, the overdrawn Fund may either (1) leave funds as a compensating balance in the account so the custodian bank can be compensated by earning the
| | |
| 34 | | Invesco AMT-Free Municipal Income Fund |
additional interest; or (2) compensate by paying the custodian bank at a rate agreed upon by the custodian bank and Invesco, not to exceed the contractually agreed upon rate. The Fund may not purchase additional securities when any borrowings from banks or broker-dealers exceed 5% of the Fund’s total assets, or when any borrowings from an Invesco Fund are outstanding.
Inverse floating rate obligations resulting from the transfer of bonds to TOB Trusts are accounted for as secured borrowings. The average floating rate notes outstanding and average annual interest and fee rate related to inverse floating rate note obligations during the year ended February 28, 2023 were $61,671,538 and 3.17%, respectively.
NOTE 9–Distributions to Shareholders and Tax Components of Net Assets
Tax Character of Distributions to Shareholders Paid During the Fiscal Years Ended February 28, 2023 and 2022:
| | | | | | | | |
| | | 2023 | | | 2022 | |
Ordinary income* | | $ | 5,112,367 | | | $ | 639,879 | |
Ordinary income-tax-exempt | | | 78,610,270 | | | | 98,086,154 | |
Total distributions | | $ | 83,722,637 | | | $ | 98,726,033 | |
| * | Includes short-term capital gain distributions, if any. |
| | | | |
Tax Components of Net Assets at Period-End: | | | |
| | | 2023 | |
|
| |
Undistributed tax-exempt income | | $ | 26,154,122 | |
|
| |
Net unrealized appreciation (depreciation) – investments | | | (103,355,888 | ) |
|
| |
Temporary book/tax differences | | | (190,082 | ) |
|
| |
Capital loss carryforward | | | (396,036,055 | ) |
|
| |
Shares of beneficial interest | | | 2,804,256,575 | |
|
| |
Total net assets | | $ | 2,330,828,672 | |
|
| |
The difference between book-basis and tax-basis unrealized appreciation (depreciation) is due to differences in the timing of recognition of gains and losses on investments for tax and book purposes. The Fund’s net unrealized appreciation (depreciation) difference is attributable primarily to wash sales, defaulted bonds, payment-in-kind securities, amortization and accretion on debt securities.
The temporary book/tax differences are a result of timing differences between book and tax recognition of income and/or expenses. The Fund’s temporary book/tax differences are the result of the trustee deferral of compensation and retirement plan benefits.
Capital loss carryforward is calculated and reported as of a specific date. Results of transactions and other activity after that date may affect the amount of capital loss carryforward actually available for the Fund to utilize. The ability to utilize capital loss carryforward in the future may be limited under the Internal Revenue Code and related regulations based on the results of future transactions.
The Fund has a capital loss carryforward as of February 28, 2023, as follows:
| | | | | | | | | | | | | | |
| Capital Loss Carryforward* | |
|
| |
| Expiration | | | | Short-Term | | | Long-Term | | | Total | |
|
| |
Not subject to expiration | | | | $ | 77,688,739 | | | $ | 318,347,316 | | | $ | 396,036,055 | |
|
| |
| * | Capital loss carryforward is reduced for limitations, if any, to the extent required by the Internal Revenue Code and may be further limited depending upon a variety of factors, including the realization of net unrealized gains or losses as of the date of any reorganization. |
NOTE 10–Investment Transactions
The aggregate amount of investment securities (other than short-term securities, U.S. Government obligations and money market funds, if any) purchased and sold by the Fund during the year ended February 28, 2023 was $1,218,380,454 and $1,356,794,641, respectively. Cost of investments, including any derivatives, on a tax basis includes the adjustments for financial reporting purposes as of the most recently completed federal income tax reporting period-end.
| | | | |
Unrealized Appreciation (Depreciation) of Investments on a Tax Basis | |
Aggregate unrealized appreciation of investments | | $ | 38,010,019 | |
|
| |
Aggregate unrealized (depreciation) of investments | | | (141,365,907 | ) |
|
| |
Net unrealized appreciation (depreciation) of investments | | $ | (103,355,888 | ) |
|
| |
Cost of investments for tax purposes is $2,466,952,622.
NOTE 11–Reclassification of Permanent Differences
Primarily as a result of differing book/tax treatment of market discounts, defaulted bonds, dirt bonds, amortization and accretion on debt securities, on February 28, 2023, undistributed net investment income was increased by $19,443,586, undistributed net realized gain (loss) was decreased by $21,155,183 and shares of beneficial interest was increased by $1,711,597. This reclassification had no effect on the net assets of the Fund.
| | |
| 35 | | Invesco AMT-Free Municipal Income Fund |
NOTE 12—Share Information
| | | | | | | | | | | | | | | | |
| | | Summary of Share Activity | |
|
| |
| | | Year ended | | | Year ended | |
| | | February 28, 2023(a) | | | February 28, 2022 | |
| | | Shares | | | Amount | | | Shares | | | Amount | |
|
| |
Sold: | | | | | | | | | | | | | | | | |
Class A | | | 35,263,932 | | | $ | 243,796,401 | | | | 40,929,248 | | | $ | 323,702,366 | |
|
| |
Class C | | | 2,358,822 | | | | 16,125,434 | | | | 5,132,645 | | | | 40,337,762 | |
|
| |
Class Y | | | 109,683,613 | | | | 753,231,357 | | | | 58,934,495 | | | | 463,949,523 | |
|
| |
Class R6 | | | 7,353 | | | | 53,104 | | | | 32,224 | | | | 257,888 | |
|
| |
| | | | |
Issued as reinvestment of dividends: | | | | | | | | | | | | | | | | |
Class A | | | 3,802,814 | | | | 26,256,480 | | | | 4,096,556 | | | | 32,283,791 | |
|
| |
Class C | | | 272,476 | | | | 1,868,513 | | | | 329,023 | | | | 2,571,362 | |
|
| |
Class Y | | | 2,370,299 | | | | 16,291,832 | | | | 2,259,125 | | | | 17,736,520 | |
|
| |
Class R6 | | | 29,472 | | | | 203,602 | | | | 31,310 | | | | 246,912 | |
|
| |
| | | | |
Automatic conversion of Class C shares to Class A shares: | | | | | | | | | | | | | | | | |
Class A | | | 1,900,088 | | | | 13,147,340 | | | | 1,738,193 | | | | 13,708,896 | |
|
| |
Class C | | | (1,915,369 | ) | | | (13,147,340 | ) | | | (1,753,000 | ) | | | (13,708,896 | ) |
|
| |
| | | | |
Reacquired: | | | | | | | | | | | | | | | | |
Class A | | | (67,078,663 | ) | | | (465,615,507 | ) | | | (38,307,486 | ) | | | (300,964,426 | ) |
|
| |
Class C | | | (6,610,056 | ) | | | (45,342,611 | ) | | | (2,851,864 | ) | | | (22,274,323 | ) |
|
| |
Class Y | | | (109,205,826 | ) | | | (750,117,977 | ) | | | (39,110,746 | ) | | | (305,076,368 | ) |
|
| |
Class R6 | | | (128,805 | ) | | | (897,087 | ) | | | (61,039 | ) | | | (481,104 | ) |
|
| |
Net increase (decrease) in share activity | | | (29,249,850 | ) | | $ | (204,146,459 | ) | | | 31,398,684 | | | $ | 252,289,903 | |
|
| |
| (a) | There are entities that are record owners of more than 5% of the outstanding shares of the Fund and in the aggregate own 63% of the outstanding shares of the Fund. IDI has an agreement with these entities to sell Fund shares. The Fund, Invesco and/or Invesco affiliates may make payments to these entities, which are considered to be related to the Fund, for providing services to the Fund, Invesco and/or Invesco affiliates including but not limited to services such as securities brokerage, distribution, third party record keeping and account servicing. The Fund has no knowledge as to whether all or any portion of the shares owned of record by these entities are also owned beneficially. |
| | |
| 36 | | Invesco AMT-Free Municipal Income Fund |
Report of Independent Registered Public Accounting Firm
To the Board of Trustees of AIM Tax-Exempt Funds (Invesco Tax-Exempt Funds) and Shareholders of Invesco AMT-Free Municipal Income Fund
Opinion on the Financial Statements
We have audited the accompanying statement of assets and liabilities, including the schedule of investments, of Invesco AMT-Free Municipal Income Fund (one of the funds constituting AIM Tax-Exempt Funds (Invesco Tax-Exempt Funds), referred to hereafter as the “Fund”) as of February 28, 2023, the related statement of operations for the year ended February 28, 2023, the statement of changes in net assets for each of the two years in the period ended February 28, 2023, including the related notes, and the financial highlights for each of the periods indicated in the table below (collectively referred to as the “financial statements”). In our opinion, the financial statements present fairly, in all material respects, the financial position of the Fund as of February 28, 2023, the results of its operations for the year then ended, the changes in its net assets for each of the two years in the period ended February 28, 2023 and the financial highlights for each of the periods indicated in the table below, in conformity with accounting principles generally accepted in the United States of America.
|
| Financial Highlights |
| For each of the three years in the period ended February 28, 2023, the seven months ended February 29, 2020 and the year ended July 31, 2019 for Class A, Class C and Class Y. |
| For each of the three years in the period ended February 28, 2023, the seven months ended February 29, 2020 and the period May 24, 2019 (commencement date) through July 31, 2019 for Class R6. |
The financial statements of Oppenheimer Rochester® AMT-Free Municipal Fund (subsequently renamed Invesco AMT-Free Municipal Income Fund) as of and for the year ended July 31, 2018 and the financial highlights for the year ended July 31, 2018 (not presented herein, other than the financial highlights) were audited by other auditors whose report dated September 27, 2018 expressed an unqualified opinion on those financial statements and financial highlights.
Basis for Opinion
These financial statements are the responsibility of the Fund’s management. Our responsibility is to express an opinion on the Fund’s financial statements based on our audits. We are a public accounting firm registered with the Public Company Accounting Oversight Board (United States) (PCAOB) and are required to be independent with respect to the Fund in accordance with the U.S. federal securities laws and the applicable rules and regulations of the Securities and Exchange Commission and the PCAOB.
We conducted our audits of these financial statements in accordance with the standards of the PCAOB. Those standards require that we plan and perform the audit to obtain reasonable assurance about whether the financial statements are free of material misstatement, whether due to error or fraud.
Our audits included performing procedures to assess the risks of material misstatement of the financial statements, whether due to error or fraud, and performing procedures that respond to those risks. Such procedures included examining, on a test basis, evidence regarding the amounts and disclosures in the financial statements. Our audits also included evaluating the accounting principles used and significant estimates made by management, as well as evaluating the overall presentation of the financial statements. Our procedures included confirmation of securities owned as of February 28, 2023 by correspondence with the custodian and brokers; when replies were not received from brokers, we performed other auditing procedures. We believe that our audits provide a reasonable basis for our opinion.
/s/PricewaterhouseCoopers LLP
Houston, Texas
April 21, 2023
We have served as the auditor of one or more of the investment companies in the Invesco group of investment companies since at least 1995. We have not been able to determine the specific year we began serving as auditor.
| | |
| 37 | | Invesco AMT-Free Municipal Income Fund |
Calculating your ongoing Fund expenses
Example
As a shareholder of the Fund, you incur two types of costs: (1) transaction costs, which may include sales charges (loads) on purchase payments or contingent deferred sales charges on redemptions, if any; and (2) ongoing costs, including management fees, distribution and/or service (12b-1) fees, and other Fund expenses. This example is intended to help you understand your ongoing costs (in dollars) of investing in the Fund and to compare these costs with ongoing costs of investing in other mutual funds. The example is based on an investment of $1,000 invested at the beginning of the period and held for the entire period September 1, 2022 through February 28, 2023.
Actual expenses
The table below provides information about actual account values and actual expenses. You may use the information in this table, together with the amount you invested, to estimate the expenses that you paid over the period. Simply divide your account value by $1,000 (for example, an $8,600 account value divided by $1,000 = 8.6), then multiply the result by the number in the table under the heading entitled “Actual Expenses Paid During Period” to estimate the expenses you paid on your account during this period.
Hypothetical example for comparison purposes
The table below also provides information about hypothetical account values and hypothetical expenses based on the Fund’s actual expense ratio and an assumed rate of return of 5% per year before expenses, which is not the Fund’s actual return.
The hypothetical account values and expenses may not be used to estimate the actual ending account balance or expenses you paid for the period. You may use this information to compare the ongoing costs of investing in the Fund and other funds. To do so, compare this 5% hypothetical example with the 5% hypothetical examples that appear in the shareholder reports of the other funds.
Please note that the expenses shown in the table are meant to highlight your ongoing costs only and do not reflect any transaction costs, such as sales charges (loads) on purchase payments or contingent deferred sales charges on redemptions, if any. Therefore, the hypothetical information is useful in comparing ongoing costs only, and will not help you determine the relative total costs of owning different funds. In addition, if these transaction costs were included, your costs would have been higher.
| | | | | | | | | | | | |
| | | | | ACTUAL | | HYPOTHETICAL (5% annual return before expenses) | | |
| | | Beginning
Account Value
(09/01/22) | | Ending
Account Value
(02/28/23)1 | | Expenses
Paid During
Period2 | | Ending
Account Value
(02/28/23) | | Expenses
Paid During
Period2 | | Annualized
Expense Ratio |
Class A | | $1,000.00 | | $1,003.20 | | $4.67 | | $1,020.13 | | $4.71 | | 0.94% |
Class C | | 1,000.00 | | 999.30 | | 8.43 | | 1,016.36 | | 8.50 | | 1.70 |
Class Y | | 1,000.00 | | 1,004.40 | | 3.48 | | 1,021.32 | | 3.51 | | 0.70 |
Class R6 | | 1,000.00 | | 1,004.80 | | 3.13 | | 1,021.67 | | 3.16 | | 0.63 |
| 1 | The actual ending account value is based on the actual total return of the Fund for the period September 1, 2022 through February 28, 2023, after actual expenses and will differ from the hypothetical ending account value which is based on the Fund’s expense ratio and a hypothetical annual return of 5% before expenses. |
| 2 | Expenses are equal to the Fund’s annualized expense ratio as indicated above multiplied by the average account value over the period, multiplied by 181/365 to reflect the most recent fiscal half year. |
| | |
| 38 | | Invesco AMT-Free Municipal Income Fund |
Tax Information
Form 1099-DIV, Form 1042-S and other year–end tax information provide shareholders with actual calendar year amounts that should be included in their tax returns. Shareholders should consult their tax advisers.
The following distribution information is being provided as required by the Internal Revenue Code or to meet a specific state’s requirement.
The Fund designates the following amounts or, if subsequently determined to be different, the maximum amount allowable for its fiscal year ended February 28, 2023:
| | | | | | |
| | | | | | |
Federal and State Income Tax | | | | |
Qualified Dividend Income* | | | 0.00 | % |
Corporate Dividends Received Deduction* | | | 0.00 | % |
U.S. Treasury Obligations* | | | 0.00 | % |
Qualified Business Income* | | | 0.00 | % |
Business Interest Income* | | | 0.00 | % |
Tax-Exempt Interest Dividends* | | | 93.89 | % |
| | * | | The above percentages are based on ordinary income dividends paid to shareholders during the Fund’s fiscal year. |
| | |
| 39 | | Invesco AMT-Free Municipal Income Fund |
Trustees and Officers
The address of each trustee and officer is AIM Tax-Exempt Funds (Invesco Tax-Exempt Funds) (the “Trust”), 11 Greenway Plaza, Suite 1000, Houston, Texas 77046-1173. The trustees serve for the life of the Trust, subject to their earlier death, incapacitation, resignation, retirement or removal as more specifically provided in the Trust’s organizational documents. Each officer serves for a one year term or until their successors are elected and qualified. Column two below includes length of time served with predecessor entities, if any.
| | | | | | | | |
Name, Year of Birth and Position(s) Held with the Trust | | Trustee and/or Officer Since | | Principal Occupation(s) During Past 5 Years | | Number of Funds in Fund Complex Overseen by Trustee | | Other Directorship(s) Held by Trustee During Past 5 Years |
| Interested Trustee | | | | | | | | |
| Martin L. Flanagan1 – 1960 Trustee and Vice Chair | | 2007 | | Executive Director, Chief Executive Officer and President, Invesco Ltd. (ultimate parent of Invesco and a global investment management firm); Trustee and Vice Chair, The Invesco Funds; Vice Chair, Investment Company Institute; and Member of Executive Board, SMU Cox School of Business Formerly: Advisor to the Board, Invesco Advisers, Inc. (formerly known as Invesco Institutional (N.A.), Inc.); Chairman and Chief Executive Officer, Invesco Advisers, Inc. (registered investment adviser); Director, Chairman, Chief Executive Officer and President, Invesco Holding Company (US), Inc. (formerly IVZ Inc.) (holding company), Invesco Group Services, Inc. (service provider) and Invesco North American Holdings, Inc. (holding company); Director, Chief Executive Officer and President, Invesco Holding Company Limited (parent of Invesco and a global investment management firm); Director, Invesco Ltd.; Chairman, Investment Company Institute and President, Co-Chief Executive Officer, Co-President, Chief Operating Officer and Chief Financial Officer, Franklin Resources, Inc. (global investment management organization) | | 175 | | None |
| 1 | Mr. Flanagan is considered an interested person (within the meaning of Section 2(a)(19) of the 1940 Act) of the Trust because he is an officer of the Adviser to the Trust, and an officer and a director of Invesco Ltd., ultimate parent of the Adviser. |
| | |
| T-1 | | Invesco AMT-Free Municipal Income Fund |
Trustees and Officers–(continued)
| | | | | | | | |
Name, Year of Birth and Position(s) Held with the Trust | | Trustee and/or Officer Since | | Principal Occupation(s) During Past 5 Years | | Number of Funds in Fund Complex Overseen by Trustee | | Other Directorship(s) Held by Trustee During Past 5 Years |
| Independent Trustees |
Beth Ann Brown – 1968
Trustee (2019) and Chair (August 2022) | | 2019 | | Independent Consultant Formerly: Head of Intermediary Distribution, Managing Director, Strategic Relations, Managing Director, Head of National Accounts, Senior Vice President, National Account Manager and Senior Vice President, Key Account Manager, Columbia Management Investment Advisers LLC; Vice President, Key Account Manager, Liberty Funds Distributor, Inc.; and Trustee of certain Oppenheimer Funds | | 175 | | Director, Board of Directors of Caron Engineering Inc.; Advisor, Board of Advisors of Caron Engineering Inc.; President and Director, Acton Shapleigh Youth Conservation Corps (non-profit) Formerly: President and Director Director of Grahamtastic Connection (non-profit) |
Cynthia Hostetler – 1962
Trustee | | 2017 | | Non-Executive Director and Trustee of a number of public and private business corporations Formerly: Director, Aberdeen Investment Funds (4 portfolios); Director, Artio Global Investment LLC (mutual fund complex); Director, Edgen Group, Inc. (specialized energy and infrastructure products distributor); Director, Genesee & Wyoming, Inc. (railroads); Head of Investment Funds and Private Equity, Overseas Private Investment Corporation; President, First Manhattan Bancorporation, Inc.; and Attorney, Simpson Thacher & Bartlett LLP | | 175 | | Resideo Technologies, Inc. (smart home technology); Vulcan Materials Company (construction materials company); Trilinc Global Impact Fund; Textainer Group Holdings, (shipping container leasing company); Investment Company Institute (professional organization); and Independent Directors Council (professional organization) |
Eli Jones – 1961 Trustee | | 2016 | | Professor and Dean Emeritus, Mays Business School - Texas A&M University Formerly: Dean of Mays Business School-Texas A&M University; Professor and Dean, Walton College of Business, University of Arkansas and E.J. Ourso College of Business, Louisiana State University; and Director, Arvest Bank | | 175 | | Insperity, Inc. (formerly known as Administaff) (human resources provider); Board Member of the regional board, First Financial Bank Texas; and Boad Member, First Financial Bankshares, Inc. Texas (FFIN) |
Elizabeth Krentzman – 1959 Trustee | | 2019 | | Formerly: Principal and Chief Regulatory Advisor for Asset Management Services and U.S. Mutual Fund Leader of Deloitte & Touche LLP; General Counsel of the Investment Company Institute (trade association); National Director of the Investment Management Regulatory Consulting Practice, Principal, Director and Senior Manager of Deloitte & Touche LLP; Assistant Director of the Division of Investment Management - Office of Disclosure and Investment Adviser Regulation of the U.S. Securities and Exchange Commission and various positions with the Division of Investment Management – Office of Regulatory Policy of the U.S. Securities and Exchange Commission; Associate at Ropes & Gray LLP; and Trustee of certain Oppenheimer Funds | | 175 | | Formerly: Member of the Cartica Funds Board of Directors (private investment fund); Trustee of the University of Florida National Board Foundation; and Member of the University of Florida Law Center Association, Inc. Board of Trustees, Audit Committee and Membership Committee |
| Anthony J. LaCava, Jr. – 1956 Trustee | | 2019 | | Formerly: Director and Member of the Audit Committee, Blue Hills Bank (publicly traded financial institution) and Managing Partner, KPMG LLP | | 175 | | Blue Hills Bank; Member and Chairman, Bentley University, Business School Advisory Council; and Nominating Committee, KPMG LLP |
| Prema Mathai-Davis – 1950 Trustee | | 1998 | | Retired Formerly: Co-Founder & Partner of Quantalytics Research, LLC, (a FinTech Investment Research Platform for the Self-Directed Investor); Trustee of YWCA Retirement Fund; CEO of YWCA of the USA; Board member of the NY Metropolitan Transportation Authority; Commissioner of the NYC Department of Aging; and Board member of Johns Hopkins Bioethics Institute | | 175 | | Member of Board of Positive Planet US (non-profit) and HealthCare Chaplaincy Network (non-profit) |
| | |
| T-2 | | Invesco AMT-Free Municipal Income Fund |
Trustees and Officers–(continued)
| | | | | | | | |
Name, Year of Birth and Position(s) Held with the Trust | | Trustee and/or Officer Since | | Principal Occupation(s) During Past 5 Years | | Number of Funds in Fund Complex Overseen by Trustee | | Other Directorship(s) Held by Trustee During Past 5 Years |
| Independent Trustees–(continued) |
Joel W. Motley – 1952 Trustee | | 2019 | | Director of Office of Finance, Federal Home Loan Bank System; Managing Director of Carmona Motley Inc. (privately held financial advisor); Member of the Council on Foreign Relations and its Finance and Budget Committee; Chairman Emeritus of Board of Human Rights Watch and Member of its Investment Committee; and Member of Investment Committee Board of Historic Hudson Valley (non-profit cultural organization); Member of the Board, Blue Ocean Acquisition Corp.; and Member of the Vestry and the Investment Committee of Trinity Church Wall Street. Formerly: Managing Director of Public Capital Advisors, LLC (privately held financial advisor); Managing Director of Carmona Motley Hoffman, Inc. (privately held financial advisor); Trustee of certain Oppenheimer Funds; and Director of Columbia Equity Financial Corp. (privately held financial advisor) | | 175 | | Member of Board of Trust for Mutual Understanding (non-profit promoting the arts and environment); Member of Board of Greenwall Foundation (bioethics research foundation) and its Investment Committee; Member of Board of Friends of the LRC (non- profit legal advocacy); and Board Member and Investment Committee Member of Pulitzer Center for Crisis Reporting (non-profit journalism) |
| Teresa M. Ressel – 1962 Trustee | | 2017 | | Non-executive director and trustee of a number of public and private business corporations Formerly: Chief Executive Officer, UBS Securities LLC (investment banking); Chief Operating Officer, UBS AG Americas (investment banking); Sr. Management Team Olayan America, The Olayan Group (international investor/commercial/industrial); and Assistant Secretary for Management & Budget and Designated Chief Financial Officer, U.S. Department of Treasury | | 175 | | None |
| Robert C. Troccoli – 1949 Trustee | | 2016 | | Retired Formerly: Adjunct Professor, University of Denver - Daniels College of Business; and Managing Partner, KPMG LLP | | 175 | | None |
| Daniel S. Vandivort –1954 Trustee | | 2019 | | President, Flyway Advisory Services LLC (consulting and property management) Formerly: President and Chief Investment Officer, previously Head of Fixed Income, Weiss Peck and Greer/Robeco Investment Management; Trustee and Chair, Weiss Peck and Greer Funds Board; and various capacities at CS First Boston including Head of Fixed Income at First Boston Asset Management. | | 175 | | Formerly: Trustee and Governance Chair, Oppenheimer Funds; Treasurer, Chairman of the Audit and Finance Committee, Huntington Disease Foundation of America |
| | |
| T-3 | | Invesco AMT-Free Municipal Income Fund |
Trustees and Officers–(continued)
| | | | | | | | |
Name, Year of Birth and Position(s) Held with the Trust | | Trustee and/or Officer Since | | Principal Occupation(s) During Past 5 Years | | Number of Funds in Fund Complex Overseen by Trustee | | Other Directorship(s) Held by Trustee During Past 5 Years |
| Officers | | | | | | | | |
Sheri Morris – 1964 President and Principal Executive Officer | | 1999 | | Director, Invesco Trust Company; Head of Global Fund Services, Invesco Ltd.; President and Principal Executive Officer, The Invesco Funds; Vice President, Invesco Exchange-Traded Fund Trust, Invesco Exchange-Traded Fund Trust II, Invesco India Exchange-Traded Fund Trust, Invesco Actively Managed Exchange-Traded Fund Trust, Invesco Actively Managed Exchange-Traded Commodity Fund Trust and Invesco Exchange-Traded Self-Indexed Fund Trust; and Vice President, OppenheimerFunds, Inc. Formerly: Vice President, Treasurer and Principal Financial Officer, The Invesco Funds; Vice President, Invesco AIM Advisers, Inc., Invesco AIM Capital Management, Inc. and Invesco AIM Private Asset Management, Inc.; Assistant Vice President and Assistant Treasurer, The Invesco Funds; Vice President and Assistant Vice President, Invesco Advisers, Inc.; Assistant Vice President, Invesco AIM Capital Management, Inc. and Invesco AIM Private Asset Management, Inc.; Treasurer, Invesco Exchange-Traded Fund Trust, Invesco Exchange-Traded Fund Trust II, Invesco India Exchange-Traded Fund Trust and Invesco Actively Managed Exchange-Traded Fund Trust; and Senior Vice President, Invesco Advisers, Inc. (formerly known as Invesco Institutional (N.A.), Inc.) (registered investment adviser) | | N/A | | N/A |
Melanie Ringold – 1975 Senior Vice President, Chief Legal Officer and Secretary | | 2023 | | Head of Legal of the Americas, Invesco Ltd.; Senior Vice President and Secretary, Invesco Advisers, Inc. (formerly known as Invesco Institutional (N.A.), Inc.) (registered investment adviser); Secretary, Invesco Distributors, Inc. (formerly known as Invesco AIM Distributors, Inc.); Secretary, Invesco Investment Services, Inc. (formerly known as Invesco AIM Investment Services, Inc.); Senior Vice President, Chief Legal Officer and Secretary, The Invesco Funds; Secretary, Invesco Investment Advisers LLC, Invesco Capital Markets, Inc.; Chief Legal Officer, Invesco Exchange-Traded Fund Trust, Invesco Exchange-Traded Fund Trust II, Invesco India Exchange-Traded Fund Trust, Invesco Actively Managed Exchange-Traded Fund Trust, Invesco Actively Managed Exchange-Traded Commodity Fund Trust and Invesco Exchange-Traded Self-Indexed Fund Trust;Secretary and Vice President, Harbourview Asset Management Corporation; Secretary and Senior Vice President, OppenheimerFunds, Inc. and Invesco Managed Accounts, LLC; Secretary and Senior Vice President, OFI SteelPath, Inc.; Secretary and Senior Vice President, Oppenheimer Acquisition Corp.; Secretary, SteelPath Funds Remediation LLC; and Secretary and Senior Vice President, Trinity Investment Management Corporation Formerly: Assistant Secretary, Invesco Distributors, Inc.; Invesco Advisers, Inc. Invesco Investment Services, Inc., Invesco Capital Markets, Inc., Invesco Capital Management LLC and Invesco Investment Advisers LLC; and Assistant Secretary and Investment Vice President, Invesco Funds | | N/A | | N/A |
Andrew R. Schlossberg – 1974 Senior Vice President | | 2019 | | Senior Vice President, Invesco Group Services, Inc.; Head of the Americas and Senior Managing Director, Invesco Ltd.; Director and Senior Vice President, Invesco Advisers, Inc. (formerly known as Invesco Institutional (N.A.), Inc.) (registered investment adviser); Director and Chairman, Invesco Investment Services, Inc. (formerly known as Invesco AIM Investment Services, Inc.) (registered transfer agent); Senior Vice President, The Invesco Funds; and Director, Invesco Investment Advisers LLC (formerly known as Van Kampen Asset Management) Formerly: Director, President and Chairman, Invesco Insurance Agency, Inc.; Director, Invesco UK Limited; Director and Chief Executive, Invesco Asset Management Limited and Invesco Fund Managers Limited; Assistant Vice President, The Invesco Funds; Senior Vice President, Invesco Advisers, Inc. (formerly known as Invesco Institutional (N.A.), Inc.) (registered investment adviser); Director and Chief Executive, Invesco Administration Services Limited and Invesco Global Investment Funds Limited; Director, Invesco Distributors, Inc.; Head of EMEA, Invesco Ltd.; President, Invesco Actively Managed Exchange-Traded Commodity Fund Trust, Invesco Actively Managed Exchange-Traded Fund Trust, Invesco Exchange-Traded Fund Trust, Invesco Exchange-Traded Fund Trust II and Invesco India Exchange-Traded Fund Trust; and Managing Director and Principal Executive Officer, Invesco Capital Management LLC | | N/A | | N/A |
| | |
| T-4 | | Invesco AMT-Free Municipal Income Fund |
Trustees and Officers–(continued)
| | | | | | | | |
Name, Year of Birth and Position(s) Held with the Trust | | Trustee and/or Officer Since | | Principal Occupation(s) During Past 5 Years | | Number of Funds in Fund Complex Overseen by Trustee | | Other Directorship(s) Held by Trustee During Past 5 Years |
| Officers–(continued) | | | | | | | | |
John M. Zerr – 1962 Senior Vice President | | 2006 | | Chief Operating Officer of the Americas; Senior Vice President, Invesco Advisers, Inc. (formerly known as Invesco Institutional (N.A.), Inc.) (registered investment adviser); Senior Vice President, Invesco Distributors, Inc. (formerly known as Invesco AIM Distributors, Inc.); Director and Vice President, Invesco Investment Services, Inc. (formerly known as Invesco AIM Investment Services, Inc.) Senior Vice President, The Invesco Funds; Managing Director, Invesco Capital Management LLC; Director, Invesco Investment Advisers LLC (formerly known as Van Kampen Asset Management); Senior Vice President, Invesco Capital Markets, Inc. (formerly known as Van Kampen Funds Inc.); Manager, Invesco Indexing LLC; Manager, Invesco Specialized Products, LLC; Member, Invesco Canada Funds Advisory Board; Director, President and Chief Executive Officer, Invesco Corporate Class Inc. (corporate mutual fund company); and Director, Chairman, President and Chief Executive Officer, Invesco Canada Ltd. (formerly known as Invesco Trimark Ltd./Invesco Trimark Ltèe) (registered investment adviser and registered transfer agent); President, Invesco, Inc.; President, Invesco Global Direct Real Estate Feeder GP Ltd.; President, Invesco IP Holdings (Canada) Ltd; President, Invesco Global Direct Real Estate GP Ltd.; President, Invesco Financial Services Ltd. / Services Financiers Invesco Ltée; and Director and Chairman, Invesco Trust Company Formerly: President, Trimark Investments Ltd/Services Financiers Invesco Ltee; Director and Senior Vice President, Invesco Insurance Agency, Inc.; Director and Senior Vice President, Invesco Management Group, Inc. (formerly known as Invesco AIM Management Group, Inc.); Secretary and General Counsel, Invesco Management Group, Inc. (formerly known as Invesco AIM Management Group, Inc.); Secretary, Invesco Investment Services, Inc. (formerly known as Invesco AIM Investment Services, Inc.); Chief Legal Officer and Secretary, The Invesco Funds; Secretary and General Counsel, Invesco Investment Advisers LLC (formerly known as Van Kampen Asset Management); Secretary and General Counsel, Invesco Capital Markets, Inc. (formerly known as Van Kampen Funds Inc.); Chief Legal Officer, Invesco Exchange-Traded Fund Trust, Invesco Exchange-Traded Fund Trust II, Invesco India Exchange-Traded Fund Trust, Invesco Actively Managed Exchange-Traded Fund Trust, Invesco Actively Managed Exchange-Traded Commodity Fund Trust and Invesco Exchange-Traded Self-Indexed Fund Trust; Secretary, Invesco Indexing LLC; Director, Secretary, General Counsel and Senior Vice President, Van Kampen Exchange Corp.; Director, Vice President and Secretary, IVZ Distributors, Inc. (formerly known as INVESCO Distributors, Inc.); Director and Vice President, INVESCO Funds Group, Inc.; Director and Vice President, Van Kampen Advisors Inc.; Director, Vice President, Secretary and General Counsel, Van Kampen Investor Services Inc.;Director and Secretary, Invesco Distributors, Inc. (formerly known as Invesco AIM Distributors, Inc.); Director, Senior Vice President, General Counsel and Secretary, Invesco AIM Advisers, Inc. and Van Kampen Investments Inc.; Director, Vice President and Secretary, Fund Management Company; Director, Senior Vice President, Secretary, General Counsel and Vice President, Invesco AIM Capital Management, Inc.; and Chief Operating Officer and General Counsel, Liberty Ridge Capital, Inc. (an investment adviser) | | N/A | | N/A |
Gregory G. McGreevey – 1962 Senior Vice President | | 2012 | | Senior Managing Director, Invesco Ltd.; Director, Chairman, President, and Chief Executive Officer, Invesco Advisers, Inc. (formerly known as Invesco Institutional (N.A.), Inc.) (registered investment adviser); Director, Invesco Mortgage Capital, Inc. and Invesco Senior Secured Management, Inc.; Senior Vice President, The Invesco Funds; President, SNW Asset Management Corporation and Invesco Managed Accounts, LLC; Chairman and Director, Invesco Private Capital, Inc.; Chairman and Director, INVESCO Private Capital Investments, Inc.; Chairman and Director, INVESCO Realty, Inc.; and Senior Vice President, Invesco Group Services, Inc. Formerly: Senior Vice President, Invesco Management Group, Inc. and Invesco Advisers, Inc.; Assistant Vice President, The Invesco Funds | | N/A | | N/A |
| Adrien Deberghes – 1967 Principal Financial Officer, Treasurer and Vice President | | 2020 | | Head of the Fund Office of the CFO and Fund Administration; Vice President, Invesco Advisers, Inc.; Principal Financial Officer, Treasurer and Vice President, The Invesco Funds; Vice President, Invesco Exchange-Traded Fund Trust, Invesco Exchange-Traded Fund Trust II, Invesco India Exchange-Traded Fund Trust, Invesco Actively Managed Exchange-Traded Fund Trust, Invesco Actively Managed Exchange-Traded Commodity Fund Trust and Invesco Exchange-Traded Self-Indexed Fund Trust Formerly: Senior Vice President and Treasurer, Fidelity Investments | | N/A | | N/A |
Crissie M. Wisdom – 1969 Anti-Money Laundering Compliance Officer | | 2013 | | Anti-Money Laundering and OFAC Compliance Officer for Invesco U.S. entities including: Invesco Advisers, Inc. and its affiliates, Invesco Capital Markets, Inc., Invesco Distributors, Inc., Invesco Investment Services, Inc., The Invesco Funds, Invesco Capital Management, LLC, Invesco Trust Company; and Fraud Prevention Manager for Invesco Investment Services, Inc. | | N/A | | N/A |
| | |
| T-5 | | Invesco AMT-Free Municipal Income Fund |
Trustees and Officers–(continued)
| | | | | | | | |
Name, Year of Birth and Position(s) Held with the Trust | | Trustee and/or Officer Since | | Principal Occupation(s) During Past 5 Years | | Number of Funds in Fund Complex Overseen by Trustee | | Other Directorship(s) Held by Trustee During Past 5 Years |
| Officers–(continued) | | | | | | | | |
Todd F. Kuehl – 1969 Chief Compliance Officer and Senior Vice President | | 2020 | | Chief Compliance Officer, Invesco Advisers, Inc. (registered investment adviser); and Chief Compliance Officer and Senior Vice President, The Invesco Funds Formerly: Managing Director and Chief Compliance Officer, Legg Mason (Mutual Funds); Chief Compliance Officer, Legg Mason Private Portfolio Group (registered investment adviser) | | N/A | | N/A |
James Bordewick, Jr. – 1959 Senior Vice President and Senior Officer | | 2022 | | Senior Vice President and Senior Officer, The Invesco Funds Formerly: Chief Legal Officer, KingsCrowd, Inc. (research and analytical platform for investment in private capital markets); Chief Operating Officer and Head of Legal and Regulatory, Netcapital (private capital investment platform); Managing Director, General Counsel of asset management and Chief Compliance Officer for asset management and private banking, Bank of America Corporation; Chief Legal Officer, Columbia Funds and BofA Funds; Senior Vice President and Associate General Counsel, MFS Investment Management; Chief Legal Officer, MFS Funds; Associate, Ropes & Gray; and Associate, Gaston Snow & Ely Bartlett | | N/A | | N/A |
The Statement of Additional Information of the Trust includes additional information about the Fund’s Trustees and is available upon request, without charge, by calling 1.800.959.4246. Please refer to the Fund’s Statement of Additional Information for information on the Fund’s sub-advisers.
| | | | | | |
Office of the Fund 11 Greenway Plaza, Suite 1000 Houston, TX 77046-1173 | | Investment Adviser Invesco Advisers, Inc. 1331 Spring Street, NW, Suite 2500 Atlanta, GA 30309 | | Distributor Invesco Distributors, Inc. 11 Greenway Plaza, Suite 1000 Houston, TX 77046-1173 | | Auditors PricewaterhouseCoopers LLP 1000 Louisiana Street, Suite 5800 Houston, TX 77002-5021 |
| | | |
Counsel to the Fund Stradley Ronon Stevens & Young, LLP 2005 Market Street, Suite 2600 Philadelphia, PA 19103-7018 | | Counsel to the Independent Trustees Sidley Austin LLP 787 Seventh Avenue New York, NY 10019 | | Transfer Agent Invesco Investment Services, Inc. 11 Greenway Plaza, Suite 1000 Houston, TX 77046-1173 | | Custodian State Street Bank and Trust Company 225 Franklin Street Boston, MA 02110-2801 |
| | |
| T-6 | | Invesco AMT-Free Municipal Income Fund |
(This page intentionally left blank)
(This page intentionally left blank)

Go paperless with eDelivery
Visit invesco.com/edelivery to enjoy the convenience and security of anytime electronic access to your investment documents.
With eDelivery, you can elect to have any or all of the following materials delivered straight to your inbox to download, save and print from your own computer:
∎ Fund reports and prospectuses
∎ Quarterly statements
∎ Daily confirmations
∎ Tax forms
Invesco mailing information
Send general correspondence to Invesco Investment Services, Inc., P.O. Box 219078, Kansas City, MO 64121-9078.
Important notice regarding delivery of security holder documents
To reduce Fund expenses, only one copy of most shareholder documents may be mailed to shareholders with multiple accounts at the same address (Householding). Mailing of your shareholder documents may be householded indefinitely unless you instruct us otherwise. If you do not want the mailing of these documents to be combined with those for other members of your household, please contact Invesco Investment Services, Inc. at 800 959 4246 or contact your financial institution. We will begin sending you individual copies for each account within 30 days after receiving your request.
Fund holdings and proxy voting information
The Fund provides a complete list of its portfolio holdings four times each year, at the end of each fiscal quarter. For the second and fourth quarters, the list appears, respectively, in the Fund’s semiannual and annual reports to shareholders. For the first and third quarters, the Fund files the list with the Securities and Exchange Commission (SEC) as an exhibit to its reports on Form N-PORT. The most recent list of portfolio holdings is available at invesco.com/completeqtrholdings. Shareholders can also look up the Fund’s Form N-PORT filings on the SEC website, sec.gov. The SEC file numbers for the Fund are shown below.
A description of the policies and procedures that the Fund uses to determine how to vote proxies relating to portfolio securities is available without charge, upon request, from our Client Services department at 800 959 4246, or at invesco.com/ corporate/about-us/esg. The information is also available on the SEC website, sec.gov.
Information regarding how the Fund voted proxies related to its portfolio securities during the most recent 12-month period ended June 30 is available at invesco.com/proxysearch. This information is also available on the SEC website, sec.gov.
Invesco Advisers, Inc. is an investment adviser; it provides investment advisory services to individual and institutional clients and does not sell securities. Invesco Distributors, Inc. is the US distributor for Invesco Ltd.’s retail mutual funds, exchange-traded funds and institutional money market funds. Both are wholly owned, indirect subsidiaries of Invesco Ltd.

| | | | |
| SEC file number(s): 811-07890 and 033-66242 | | Invesco Distributors, Inc. | | O-ROAFM-AR-1 |

| | |
| | |
| Annual Report to Shareholders | | February 28, 2023 |
Invesco California Municipal Fund
Nasdaq:
A: OPCAX ∎ C: OCACX ∎ Y: OCAYX ∎ R6: IORCX
Management’s Discussion of Fund Performance
| | | | |
| |
Performance summary | |
For the fiscal year ended February 28, 2023, Class A shares of Invesco California Municipal Fund (the Fund), at net asset value (NAV), underperformed the S&P Municipal Bond California 5+ Year Investment Grade Index. | | | | |
Your Fund’s long-term performance appears later in this report. | |
| |
Fund vs. Indexes | |
Total returns, 2/28/22 to 2/28/23, at net asset value (NAV). Performance shown does not include applicable contingent deferred sales charges (CDSC) or front-end sales charges, which would have reduced performance. | |
Class A Shares | | | -7.75 | % |
Class C Shares | | | -8.41 | |
Class Y Shares | | | -7.52 | |
Class R6 Shares | | | -7.55 | |
S&P Municipal Bond California 5+ Year Investment Grade Index▼ | | | -6.04 | |
U.S. Consumer Price Index∎ | | | 6.04 | |
Source(s): ▼RIMES Technologies Corp.; ∎Bloomberg LP | | | | |
Market conditions and your Fund
The State of California’s ability to maintain robust levels of general fund cash reserves has provided a cushion during periods of revenue volatility. At the close of the state’s fiscal year in June 2022, the state had reserves totaling over $76.2 billion, or 34% of fiscal year 2022 expenditures.1 We believe these reserves should help mitigate the impact of an expected 5.7% decline in state tax revenues in fiscal year 2023. Despite the estimated decline in revenues, reserves at the close of fiscal year 2023 are expected to exceed $47 billion, or 20% of expenditures.1
The Golden State’s liquidity remains robust. The California State Controller reported that the state had cash and internal borrowable resources of over $93.4 billion, as of February 28, 2023.2 We believe that the state will continue to maintain a prudent approach to budgeting in response to potential revenue declines. The governor’s proposed fiscal year 2024 budget would cut expenditures by nearly 7%.1 While some reserves would be used to balance the budget, the state’s Rainy Day Fund would not be utilized. Based on the governor’s proposal, budget reserves would still exceed $35 billion, or nearly 16% of estimated expenditures at the close of fiscal year 2024.1
The state’s revenue growth has been driven by its economy’s size and diversity. California has the largest state population, representing approximately 12% of the US population and nearly 15% of the nation’s Gross Domestic Product.3 Unemployment rates continue to decline from pandemic highs, falling to 3.7% at the end of 2022.4 State tax revenues continued to grow even as unemployment rates increased after the onset of the pandemic. The impact on employment levels for high-wage earners was less severe, and high-income taxpayers benefited as the financial markets rebounded from the initial pandemic impacts. California’s fiscal condition has benefited from conserva-
tive budgeting, a result of the state’s recognition that its tax structure is highly sensitive to economic cycles due to its heavy reliance on top earners. The state has limited its expenditure growth and worked to maintain fiscal flexibility by increasing one-time expenditures, including extra pension payments, instead of increasing ongoing program expenditures. As the state moves into budget negotiations for fiscal year 2024, its ability to continue its fiscal discipline will be crucial for financial performance and retention of reserves to mitigate the impact of future economic downturns or fiscal emergencies. This discipline, as well as federal stimulus, has helped the state maintain rating stability through the pandemic. All three of the major credit rating agencies, Moody’s, Standard & Poor’s and Fitch have maintained their respective Aa2, AA- and AA rating† on the state’s general obligation bonds. In March 2023, Standard & Poor’s affirmed its positive outlook on the state’s general obligation debt while both Moody’s and Fitch affirmed stable outlooks on their respective ratings.
At the beginning of the fiscal year, investors were hopeful in anticipation of a return to normalcy as COVID-19 cases declined and pandemic-related restrictions were reduced or lifted. This allowed policymakers to turn their attention to the high inflation levels; however, on February 24, 2022, Russia began a full-scale invasion of Ukraine, which exacerbated inflationary pressures by driving up commodity prices. Against this backdrop, the fiscal year was plagued by volatility and uncertainty. The municipal market set multiple record lows in 2022, making it one of the most challenging years in history for municipal markets.
Investment grade municipal bonds returned -5.10%, high yield municipal bonds returned -9.35% and taxable municipal bonds returned -12.96% during the fiscal year.5
While municipal funds had experienced record inflows of $101.7 billion in 2021, flows quickly turned negative in the first quarter of
2022, perpetuating the Bloomberg Municipal Bond Index’s worst quarterly return in 40 years. Municipal bonds enjoyed a short respite in late May and early June 2022 with increased demand from crossover buyers like hedge funds, banks and insurance companies; however, the May 2022 Consumer Price Index report quoted inflation rising to a 40-year high. This sent the 10-year Treasury yield to a new 52-week high of nearly 3.50%, pushing municipal mutual fund flows back into negative territory.6 According to Lipper, net outflows from municipal bond funds totaled over -$110 billion for the fiscal year.7
On March 16, 2022, the US Federal Reserve (the Fed) raised the federal funds target rate 0.25% for the first time in more than three years in hopes of containing inflation.8 This was the first of eight consecutive increases during the fiscal year as the Fed announced its plan for a quantitative tightening campaign in an attempt to rein in inflation without harming employment or the overall economy. Rate increases as high as 0.75% followed, the Fed’s most aggressive monetary policy since the 1980s, bringing the target rate to 4.75% as of the end of the fiscal year.8
The AAA municipal yield curve made history after the Fed’s December 2022 meeting when the curve inverted between one- and 10-year maturities. Any inversion is noteworthy, but this was a first for municipal bonds. On January 31, 2023, policymakers indicated that future rate increases were likely to be “appropriate,” suggesting they were not yet convinced inflation was contained, which increased uncertainty about when the current tightening cycle might end.8 The fiscal year ended with an increase of 0.25% on February 1, 2023. We expect additional rate hikes in 2023, although not with the same pace or vigor as in 2022.
New municipal issuance for the fiscal year totaled $354 billion, down 27% from the previous fiscal year’s $484 billion.9 Issuers, with cash on their balance sheets, have been reluctant to issue at higher interest rates. While taxable issuance continued to account for a significant portion of new issuance, at 14% of the total, this figure is down from 18% from the previous fiscal year because of higher interest rates.9
Puerto Rico continued to make developments in its ongoing debt restructuring throughout the fiscal year. The territory restructured its outstanding general obligation and other government-guaranteed debt in March 2022 and began paying bondholders on the new restructured bonds. Puerto Rico’s weight in the Bloomberg High Yield Municipal Bond Index increased from 13% to 20% as the new bonds were included.5 The Financial Oversight and Management Board for Puerto Rico, the Puerto Rican government, bond-holders and other interested parties continued to negotiate the restructuring of bonds
| | |
| 2 | | Invesco California Municipal Fund |
issued by the Puerto Rico Electric Power Authority, the territory’s largest remaining unresolved debt, as the fiscal year closed.
Municipal credits have a long history of low defaults as many provide essential services to all Americans. This continues to be the case as evidenced by S&P rating changes – upgrades exceeded downgrades by a ratio of 2.5:1 for calendar year 2022.10 This positive dynamic, which we believe will continue, likely stems from benefits of the various federal stimulus measures including the American Rescue Plan Act, the Infrastructure Investment and Jobs Act and the Inflation Reduction Act, as well as higher revenues collected by state and local governments.
We believe the valuable benefits of municipal bonds will prevail over current market volatility and economic uncertainty. We continue to rely on our experienced portfolio managers and credit analysts to weather the challenges while identifying marketplace opportunities to add long-term value for shareholders.
During the fiscal year, underweight exposures to and sector allocation among general obligation and local obligation bonds contributed to the Fund’s relative return. Security selection within credits rated AAA† also added to relative performance. Security selection among and an overweight allocation to bonds with a duration of 15.00- 19.99 years contributed to relative performance as well.
An overweight allocation to the dedicated tax sector detracted from the Fund’s relative performance over the fiscal year, as did an overweight to airport bonds. Overweight exposure to non-rated credits† also detracted from relative performance. Overweight exposure to bonds with durations of 10.00- 14.99 years detracted from relative performance.
During the fiscal year, leverage contributed to the Fund’s performance relative to its benchmark. The Fund achieved a leveraged position through the use of inverse floating rate securities or tender option bonds. The Fund uses leverage because we believe that, over time, leveraging provides opportunities for additional income and total return for shareholders. However, the use of leverage also can expose shareholders to additional volatility. For more information about the Fund’s use of leverage, see the Notes to Financial Statements later in this report.
We wish to remind you that the Fund is subject to interest rate risk, meaning when interest rates rise, the value of fixed income securities tends to fall. The degree to which the value of fixed income securities may decline due to rising interest rates may vary depending on the speed and magnitude of the increase in interest rates, as well as individual security characteristics, such as price, maturity, duration and coupon and market forces, such as supply and demand for similar securities. We are monitoring interest rates, as well as the market, economic and geopolitical factors that may impact the direction, speed and magnitude of changes to interest rates across
the maturity spectrum, including the potential impact of monetary policy changes by the Fed and certain foreign central banks. If interest rates rise or fall faster than expected, markets may experience increased volatility, which may affect the value and/or liquidity of certain of the Fund’s investments.
Thank you for investing in Invesco California Municipal Fund and for sharing our long-term investment horizon.
| 1 | Source: State of California, Governor’s Budget Summary 2023-24, January 10, 2023 |
| 2 | Source: California State Controller’s Statement of General Fund Cash Receipts and Disbursements, March 10, 2023 |
| 3 | Source: State of California General Obligation Bonds, Preliminary Official Statement, March 1, 2022 |
| 4 | Source: U.S. Bureau of Labor Statistics, as of December 31, 2022 (Not Seasonally Adjusted) |
| 8 | Source: US Federal Reserve |
10 Source: Standard & Poor’s
† Sources: A credit rating is an assessment provided by a nationally recognized statistical rating organization (NRSRO) of the creditworthiness of an issuer with respect to debt obligations, including specific securities, money market instruments or other debts. Ratings are measured on a scale that generally ranges from AAA (highest) to D (lowest); ratings are subject to change without notice. For more information on rating methodology, please visit www.spglobal.com and select “Understanding Credit Ratings” under About Ratings on the homepage; www.fitchratings.com and select “Understanding Credit Ratings” from the drop-down menu on the homepage; and www.moodys.com and select “Methodology,” then “Rating Methodologies” under Research Type on the left-hand side.
Portfolio manager(s):
Michael Camarella
Scott Cottier
Mark DeMitry
Tim O’Reilly
Mark Paris
Julius Williams
The views and opinions expressed in management’s discussion of Fund performance are those of Invesco Advisers, Inc. and its affiliates. These views and opinions are subject to change at any time based on factors such as market and economic conditions. These views and opinions may not be relied upon as investment advice or recommendations, or as an offer for a particular security. The information is not a complete analysis of every aspect of any market, country, industry, security or the Fund. Statements of fact are from sources considered reliable, but Invesco Advisers, Inc. makes no representation or warranty as to their completeness or accuracy. Although historical performance is no guarantee of future results, these insights may help you understand our investment management philosophy.
See important Fund and, if applicable, index disclosures later in this report.
| | |
| 3 | | Invesco California Municipal Fund |
Your Fund’s Long-Term Performance
Results of a $10,000 Investment – Oldest Share Class(es)
Fund and index data from 2/28/13
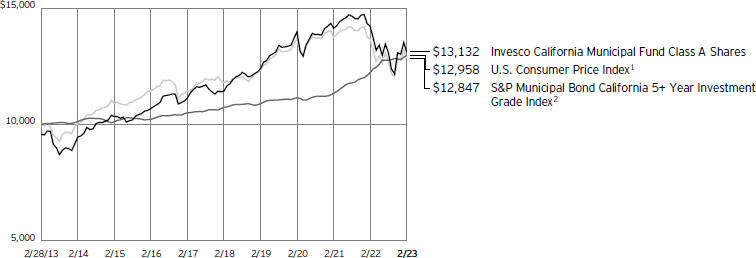
1 Source: Bloomberg LP
2 Source: RIMES Technologies Corp.
Past performance cannot guarantee future results.
The data shown in the chart include reinvested distributions, applicable sales charges and Fund expenses including management
fees. Index results include reinvested dividends, but they do not reflect sales charges. Performance of the peer group, if applicable, reflects Fund expenses and management fees; performance of a market index does
not. Performance shown in the chart does not reflect deduction of taxes a shareholder would pay on Fund distributions or sale of Fund shares.
| | |
| 4 | | Invesco California Municipal Fund |
| | | | |
| |
Average Annual Total Returns | |
As of 2/28/23, including maximum applicable sales charges | |
Class A Shares | | | | |
Inception (11/3/88) | | | 4.96 | % |
10 Years | | | 2.76 | |
5 Years | | | 1.93 | |
1 Year | | | -11.63 | |
| |
Class C Shares | | | | |
Inception (11/1/95) | | | 4.06 | % |
10 Years | | | 2.58 | |
5 Years | | | 2.05 | |
1 Year | | | -9.30 | |
| | | | |
| |
Class Y Shares | | | | |
Inception (11/29/10) | | | 5.24 | % |
10 Years | | | 3.45 | |
5 Years | | | 3.07 | |
1 Year | | | -7.52 | |
| |
Class R6 Shares | | | | |
10 Years | | | 3.34 | % |
5 Years | | | 3.10 | |
1 Year | | | -7.55 | |
Effective May 24, 2019, Class A, Class C and Class Y shares of the Oppenheimer Rochester California Municipal Fund, (the predecessor fund), were reorganized into Class A, Class C and Class Y shares, respectively, of the Invesco Oppenheimer Rochester® California Municipal Fund. The Fund was subsequently renamed the In-vesco California Municipal Fund (the Fund). Returns shown above, for periods ending on or prior to May 24, 2019, for Class A, Class C, and Class Y shares are those for Class A, Class C and Class Y shares of the predecessor fund. Share class returns will differ from the predecessor fund because of different expenses.
Class R6 shares incepted on May 24, 2019. Performance shown on and prior to that date is that of the predecessor fund’s Class A shares at net asset value and includes the 12b-1 fees applicable to Class A shares.
The performance data quoted represent past performance and cannot guarantee future results; current performance may be lower or higher. Please visit invesco.com/ performance for the most recent month-end performance. Performance figures reflect reinvested distributions, changes in net asset value and the effect of the maximum sales charge unless otherwise stated. Performance figures do not reflect deduction of taxes a shareholder would pay on Fund distributions or sale of Fund shares. Investment return and principal value will fluctuate so that you may have a gain or loss when you sell shares.
Class A share performance reflects the maximum 4.25% sales charge, and Class C share performance reflects the applicable contingent deferred sales charge (CDSC) for the period involved. The CDSC on
Class C shares is 1% for the first year after purchase. Class Y and Class R6 shares do not have a front-end sales charge or a CDSC; therefore, performance is at net asset value.
The performance of the Fund’s share classes will differ primarily due to different sales charge structures and class expenses.
Fund performance reflects any applicable fee waivers and/or expense reimbursements. Had the adviser not waived fees and/or reimbursed expenses currently or in the past, returns would have been lower. See current prospectus for more information.
| | |
| 5 | | Invesco California Municipal Fund |
Supplemental Information
Invesco California Municipal Fund’s investment objective is to seek tax-free income.
| ∎ | Unless otherwise stated, information presented in this report is as of February 28, 2023, and is based on total net assets. |
| ∎ | Unless otherwise noted, all data is provided by Invesco. |
| ∎ | To access your Fund’s reports/prospectus, visit invesco.com/fundreports. |
About indexes used in this report
| ∎ | The S&P Municipal Bond California 5+ Year Investment Grade Index tracks the performance of investment-grade, California-issued US municipal bonds with maturities equal to or greater than five years. |
| ∎ | The U.S. Consumer Price Index is a measure of change in consumer prices as determined by the US Bureau of Labor Statistics. |
| ∎ | The Fund is not managed to track the performance of any particular index, including the index(es) described here, and consequently, the performance of the Fund may deviate significantly from the performance of the index(es). |
| ∎ | A direct investment cannot be made in an index. Unless otherwise indicated, index results include reinvested dividends, and they do not reflect sales charges. Performance of the peer group, if applicable, reflects fund expenses; performance of a market index does not. |
|
|
This report must be accompanied or preceded by a currently effective Fund prospectus, which contains more complete information, including sales charges and expenses. Investors should read it carefully before investing. |
|
| NOT FDIC INSURED | MAY LOSE VALUE | NO BANK GUARANTEE |
| | |
| 6 | | Invesco California Municipal Fund |
Fund Information
Portfolio Composition
| | | | | |
| By credit sector | | % of total investments |
| |
Revenue Bonds | | | | 82.36 | % |
| |
General Obligation Bonds | | | | 15.37 | |
| |
Pre-Refunded Bonds | | | | 1.23 | |
| |
Other | | | | 1.04 | |
Top Five Debt Holdings
| | | | | | | |
| | | | | % of total net assets |
| | |
1. | | San Francisco (City & County of), CA Airport Commission (San Francisco International Airport), Series 2019 E, RB | | | | 1.65 | % |
| | |
2. | | California (State of) County Tobacco Securitization Agency (Alameda County Tobacco Asset Securitization Corp.), Series 2006 C, RB | | | | 1.51 | |
| | |
3. | | California (State of) County Tobacco Securitization Agency (Fresno County Tobacco Funding Corp.), Series 2006 D, RB | | | | 1.37 | |
| | |
4. | | Los Angeles (City of), CA Department of Airports (Los Angeles International Airport), Series 2019, RB | | | | 1.30 | |
| | |
5. | | California (State of) Health Facilities Financing Authority (Cedars-Sinai Medical Center), Series 2021 A, Ref. RB | | | | 1.19 | |
The Fund’s holdings are subject to change, and there is no assurance that the Fund will continue to hold any particular security.
Data presented here are as of February 28, 2023.
| | |
| 7 | | Invesco California Municipal Fund |
Schedule of Investments
February 28, 2023
| | | | | | | | | | | | | | |
| | | Interest
Rate | | | Maturity
Date | | | Principal
Amount
(000) | | | Value |
Municipal Obligations-106.92% | | | | | | | | | | | | | | |
California-101.73% | | | | | | | | | | | | | | |
ABAG Finance Authority for Nonprofit Corps. (Sharp Healthcare); Series 2014 A, RB | | | 5.00% | | | | 08/01/2043 | | | $ | 500 | | | $ 501,195 |
Adelanto (City of), CA Improvement Agency; Series 1993 B, Ref. RB (INS - FGIC)(a) | | | 5.50% | | | | 12/01/2023 | | | | 5 | | | 5,016 |
Adelanto Community Facilities District No. 2006-2 (Improvement Area No. 2); Series 2015 A, RB | | | 5.00% | | | | 09/01/2045 | | | | 1,000 | | | 1,007,979 |
Adelanto Public Utility Authority (Utility System); | | | | | | | | | | | | | | |
Series 2014 A, RB | | | 5.00% | | | | 07/01/2024 | | | | 480 | | | 480,393 |
Series 2014 A, RB | | | 5.00% | | | | 07/01/2039 | | | | 5,710 | | | 5,712,243 |
Series 2017 A, Ref. RB (INS - AGM)(a) | | | 5.00% | | | | 07/01/2039 | | | | 2,000 | | | 2,132,429 |
Alameda (City of), CA Corridor Transportation Authority; Series 2022 C, RB (INS - AGM)(a) | | | 5.00% | | | | 10/01/2052 | | | | 7,000 | | | 7,509,685 |
Anaheim (City of), CA Public Financing Authority (Anaheim Convention Center Expansion); Series 2014 A, Ref. RB(b)(c) | | | 5.00% | | | | 05/01/2024 | | | | 1,350 | | | 1,380,370 |
Atwater (City of), CA; | | | | | | | | | | | | | | |
Series 2017 A, Ref. RB (INS - AGM)(a) | | | 5.00% | | | | 05/01/2040 | | | | 1,250 | | | 1,317,280 |
Series 2017 A, Ref. RB (INS - AGM)(a) | | | 5.00% | | | | 05/01/2043 | | | | 1,300 | | | 1,362,876 |
Bakersfield (City of), CA (Assessment District No. 07-2); Series 2008, RB | | | 7.38% | | | | 09/02/2028 | | | | 785 | | | 794,045 |
Bay Area Toll Authority (San Francisco Bay Area); | | | | | | | | | | | | | | |
Series 2017 F-1, RB(b)(d)(e) | | | 5.00% | | | | 04/01/2027 | | | | 3,465 | | | 3,781,903 |
Series 2017, Ref. RB | | | 4.00% | | | | 04/01/2049 | | | | 630 | | | 598,834 |
Beaumont (City of), CA (Community Facilities District No. 2016-1); | | | | | | | | | | | | | | |
Series 2019, RB | | | 5.00% | | | | 09/01/2030 | | | | 125 | | | 132,170 |
Series 2019, RB | | | 5.00% | | | | 09/01/2031 | | | | 140 | | | 147,870 |
Series 2019, RB | | | 5.00% | | | | 09/01/2049 | | | | 775 | | | 781,606 |
Beaumont (City of), CA Financing Authority (Improvement Area No. 17A); Series 2013 B, RB(b)(c) | | | 5.00% | | | | 09/01/2023 | | | | 635 | | | 640,831 |
Beaumont (City of), CA Financing Authority (Improvement Area No. 19A); Series 2015 B, Ref. RB | | | 5.00% | | | | 09/01/2025 | | | | 1,560 | | | 1,589,788 |
Beaumont (City of), CA Financing Authority (Improvement Area No. 19C); Series 2013 A, RB(b)(c) | | | 5.00% | | | | 09/01/2023 | | | | 745 | | | 751,841 |
Beverly Hills Unified School District (Election of 2008); | | | | | | | | | | | | | | |
Series 2009, GO Bonds(f) | | | 0.00% | | | | 08/01/2026 | | | | 1,465 | | | 1,314,302 |
Series 2009, GO Bonds(f) | | | 0.00% | | | | 08/01/2032 | | | | 3,045 | | | 2,218,978 |
Blythe (City of), CA Community Facilities District No. 2004-1; Series 2005, RB | | | 5.30% | | | | 09/01/2035 | | | | 500 | | | 503,476 |
Blythe (City of), CA Redevelopment Agency Successor Agency (Project No. 1); | | | | | | | | | | | | | | |
Series 2011 A, RB | | | 9.75% | | | | 05/01/2038 | | | | 1,960 | | | 1,968,429 |
Series 2015, Ref. RB | | | 5.00% | | | | 05/01/2038 | | | | 1,000 | | | 1,017,873 |
Calexico (City of), CA Community Facilities District No. 2005-1; | | | | | | | | | | | | | | |
Series 2006, RB(g) | | | 5.50% | | | | 09/01/2036 | | | | 2,500 | | | 825,000 |
Series 2006, RB(g) | | | 5.55% | | | | 09/01/2036 | | | | 2,325 | | | 767,250 |
California (State of); | | | | | | | | | | | | | | |
Series 2000, GO Bonds | | | 5.75% | | | | 05/01/2030 | | | | 5 | | | 5,010 |
Series 2015, GO Bonds | | | 5.00% | | | | 08/01/2045 | | | | 1,000 | | | 1,034,689 |
Series 2016, GO Bonds(e) | | | 5.00% | | | | 09/01/2045 | | | | 3,400 | | | 3,551,947 |
Series 2020, Ref. GO Bonds | | | 3.00% | | | | 11/01/2040 | | | | 3,500 | | | 2,974,738 |
Series 2022 CU, GO Bonds | | | 4.85% | | | | 12/01/2046 | | | | 1,700 | | | 1,809,055 |
Series 2022, GO Bonds(e) | | | 5.00% | | | | 11/01/2042 | | | | 11,370 | | | 12,729,034 |
Series 2022, GO Bonds | | | 5.25% | | | | 09/01/2047 | | | | 6,000 | | | 6,735,261 |
Series 2022, GO Bonds | | | 4.00% | | | | 04/01/2049 | | | | 3,500 | | | 3,390,809 |
Series 2022, GO Bonds(e) | | | 5.00% | | | | 09/01/2052 | | | | 10,000 | | | 10,920,848 |
California (State of) Community Choice Financing Authority (Green Bonds); | | | | | | | | | | | | | | |
Series 2023 C, RB(c) | | | 5.25% | | | | 10/01/2031 | | | | 5,000 | | | 5,206,210 |
Series 2023, RB(c) | | | 5.00% | | | | 08/01/2029 | | | | 3,600 | | | 3,787,452 |
California (State of) Community College Financing Authority (NCCD - Orange Coast Properties LLC - Orange Coast College); | | | | | | | | | | | | | | |
Series 2018, RB | | | 5.25% | | | | 05/01/2048 | | | | 665 | | | 672,739 |
Series 2018, RB | | | 5.25% | | | | 05/01/2053 | | | | 2,500 | | | 2,520,006 |
California (State of) Community Housing Agency (Annadel Apartments); Series 2019 A, RB(h) | | | 5.00% | | | | 04/01/2049 | | | | 4,555 | | | 3,941,945 |
California (State of) Community Housing Agency (Serenity at Larkspur); Series 2020 A, RB(h) | | | 5.00% | | | | 02/01/2050 | | | | 4,500 | | | 3,918,721 |
California (State of) Community Housing Agency (Stonridge Apartments); Series 2021 A, RB(h) | | | 4.00% | | | | 02/01/2056 | | | | 3,000 | | | 2,248,061 |
California (State of) Community Housing Agency (Verdant at Green Valley); Series 2019 A, RB(h) | | | 5.00% | | | | 08/01/2049 | | | | 5,360 | | | 5,141,520 |
See accompanying Notes to Financial Statements which are an integral part of the financial statements.
| | |
| 8 | | Invesco California Municipal Fund |
| | | | | | | | | | | | | | | | |
| | | Interest Rate | | | Maturity Date | | | Principal Amount (000) | | | Value | |
California-(continued) | | | | | | | | | | | | | | | | |
California (State of) County Tobacco Securitization Agency; | | | | | | | | | | | | | | | | |
Series 2007 B, RB | | | 5.10% | | | | 06/01/2028 | | | $ | 240 | | | $ | 239,326 | |
Series 2007 D, RB(f)(h) | | | 0.00% | | | | 06/01/2057 | | | | 45,600 | | | | 3,210,559 | |
Series 2007 E, RB(f)(h) | | | 0.00% | | | | 06/01/2057 | | | | 51,500 | | | | 3,075,868 | |
Series 2007 F, RB(f)(h) | | | 0.00% | | | | 06/01/2057 | | | | 55,250 | | | | 3,179,566 | |
Series 2014, Ref. RB | | | 4.00% | | | | 06/01/2029 | | | | 1,720 | | | | 1,721,804 | |
Series 2020 A, Ref. RB | | | 4.00% | | | | 06/01/2037 | | | | 550 | | | | 532,529 | |
Series 2020 A, Ref. RB | | | 4.00% | | | | 06/01/2039 | | | | 1,200 | | | | 1,141,951 | |
California (State of) County Tobacco Securitization Agency (Alameda County Tobacco Asset Securitization Corp.); | | | | | | | | | | | | | | | | |
Series 2002, RB | | | 5.88% | | | | 06/01/2035 | | | | 5,980 | | | | 6,078,916 | |
Series 2002, RB | | | 6.00% | | | | 06/01/2042 | | | | 18,700 | | | | 19,009,319 | |
Series 2006 C, RB(f) | | | 0.00% | | | | 06/01/2055 | | | | 332,360 | | | | 29,527,307 | |
California (State of) County Tobacco Securitization Agency (Fresno County Tobacco Funding Corp.); | | | | | | | | | | | | | | | | |
Series 2002, RB | | | 6.00% | | | | 06/01/2035 | | | | 6,210 | | | | 6,214,560 | |
Series 2002, RB | | | 6.13% | | | | 06/01/2038 | | | | 9,700 | | | | 9,706,078 | |
Series 2006 A, RB(f) | | | 0.00% | | | | 06/01/2046 | | | | 62,110 | | | | 14,044,754 | |
Series 2006 C, RB(f) | | | 0.00% | | | | 06/01/2055 | | | | 71,700 | | | | 7,235,914 | |
Series 2006 D, RB(f) | | | 0.00% | | | | 06/01/2055 | | | | 309,500 | | | | 26,655,997 | |
California (State of) County Tobacco Securitization Agency (Los Angeles County Securitization Corp.); | | | | | | | | | | | | | | | | |
Series 2020 A, Ref. RB | | | 4.00% | | | | 06/01/2049 | | | | 2,000 | | | | 1,765,251 | |
Series 2020 A, Ref. RB | | | 4.00% | | | | 06/01/2049 | | | | 710 | | | | 626,664 | |
Series 2020 B-1, Ref. RB | | | 5.00% | | | | 06/01/2049 | | | | 895 | | | | 903,055 | |
Series 2020 B-2, Ref. RB(f) | | | 0.00% | | | | 06/01/2055 | | | | 22,000 | | | | 3,671,527 | |
California (State of) County Tobacco Securitization Agency (Merced County Tobacco Funding Corp.); Series 2020, Ref. RB | | | 5.00% | | | | 06/01/2050 | | | | 1,750 | | | | 1,750,978 | |
California (State of) County Tobacco Securitization Agency (Sonoma County Securitization Corp.); | | | | | | | | | | | | | | | | |
Series 2020, Ref. RB | | | 4.00% | | | | 06/01/2049 | | | | 1,380 | | | | 1,218,023 | |
Series 2020, Ref. RB(f) | | | 0.00% | | | | 06/01/2055 | | | | 7,050 | | | | 1,438,553 | |
California (State of) County Tobacco Securitization Agency (Stanislaus County Tobacco Funding Corp.); Series 2002 A, RB | | | 5.88% | | | | 06/01/2043 | | | | 1,315 | | | | 1,315,036 | |
California (State of) Educational Facilities Authority (Loma Linda University); | | | | | | | | | | | | | | | | |
Series 2017 A, Ref. RB | | | 5.00% | | | | 04/01/2042 | | | | 1,715 | | | | 1,758,857 | |
Series 2017 A, Ref. RB | | | 5.00% | | | | 04/01/2047 | | | | 1,000 | | | | 1,020,004 | |
California (State of) Educational Facilities Authority (Stanford University); Series 2010, RB(e) | | | 5.25% | | | | 04/01/2040 | | | | 4,520 | | | | 5,391,299 | |
California (State of) Educational Facilities Authority (University of Redlands); Series 2022 A, RB | | | 5.00% | | | | 10/01/2052 | | | | 3,600 | | | | 3,500,180 | |
California (State of) Educational Facilities Authority (University of San Francisco); Series 2018 A, RB | | | 5.00% | | | | 10/01/2043 | | | | 2,730 | | | | 2,856,394 | |
California (State of) Health Facilities Financing Authority (Cedars-Sinai Medical Center); | | | | | | | | | | | | | | | | |
Series 2015, Ref. RB | | | 5.00% | | | | 11/15/2031 | | | | 1,300 | | | | 1,376,655 | |
Series 2015, Ref. RB | | | 5.00% | | | | 11/15/2032 | | | | 1,250 | | | | 1,322,142 | |
Series 2015, Ref. RB | | | 5.00% | | | | 11/15/2033 | | | | 1,000 | | | | 1,056,425 | |
Series 2021 A, Ref. RB | | | 4.00% | | | | 08/15/2048 | | | | 24,375 | | | | 23,260,053 | |
California (State of) Health Facilities Financing Authority (Children’s Hospital Los Angeles); Series 2017 A, Ref. RB | | | 5.00% | | | | 08/15/2047 | | | | 1,715 | | | | 1,734,905 | |
California (State of) Health Facilities Financing Authority (Commonspirit Health); Series 2020 A, Ref. RB | | | 4.00% | | | | 04/01/2049 | | | | 12,060 | | | | 10,663,106 | |
California (State of) Health Facilities Financing Authority (Community Program for Persons with Developmental Disabilities); Series 2011 A, RB (INS - Cal-Mortgage)(a) | | | 6.25% | | | | 02/01/2026 | | | | 1,105 | | | | 1,108,017 | |
California (State of) Health Facilities Financing Authority (Lucile Salter Packard Children’s Hospital at Stanford); Series 2017, RB | | | 4.00% | | | | 11/15/2047 | | | | 560 | | | | 529,064 | |
California (State of) Health Facilities Financing Authority (On Lok Senior Health Services) (Social Bonds); | | | | | | | | | | | | | | | | |
Series 2020, Ref. RB | | | 5.00% | | | | 08/01/2040 | | | | 700 | | | | 729,656 | |
Series 2020, Ref. RB | | | 5.00% | | | | 08/01/2050 | | | | 1,000 | | | | 1,021,915 | |
California (State of) Health Facilities Financing Authority (St. Joseph Health System); Series 2013 A, RB(b)(c) | | | 5.00% | | | | 07/01/2023 | | | | 1,000 | | | | 1,006,058 | |
California (State of) Health Facilities Financing Authority (Stanford Health Care); Series 2020 A, Ref. RB | | | 4.00% | | | | 08/15/2050 | | | | 15,000 | | | | 14,286,754 | |
See accompanying Notes to Financial Statements which are an integral part of the financial statements.
| | |
| 9 | | Invesco California Municipal Fund |
| | | | | | | | | | | | | | | | |
| | | Interest
Rate | | | Maturity
Date | | | Principal
Amount
(000) | | | Value | |
California-(continued) | | | | | | | | | | | | | | | | |
California (State of) Health Facilities Financing Authority (Sutter Health); | | | | | | | | | | | | | | | | |
Series 2017 A, Ref. RB | | | 5.00% | | | | 11/15/2048 | | | $ | 10,000 | | | $ | 10,210,338 | |
Series 2018 A, RB | | | 5.00% | | | | 11/15/2048 | | | | 3,000 | | | | 3,063,101 | |
California (State of) Housing Finance Agency; | | | | | | | | | | | | | | | | |
Series 2019 A-1, RB | | | 4.25% | | | | 01/15/2035 | | | | 6,343 | | | | 6,320,368 | |
Series 2019 A-2, RB | | | 4.00% | | | | 03/20/2033 | | | | 8,503 | | | | 8,404,145 | |
Series 2021-1A, Revenue Ctfs. | | | 3.50% | | | | 11/20/2035 | | | | 3,921 | | | | 3,693,220 | |
California (State of) Housing Finance Agency (Social Certificates); Series 2021 A, RB | | | 3.25% | | | | 08/20/2036 | | | | 9,811 | | | | 9,061,771 | |
California (State of) Infrastructure & Economic Development Bank (Academy Motion Picture Arts & Sciences Obligated Group); | | | | | | | | | | | | | | | | |
Series 2015 A, Ref. RB | | | 5.00% | | | | 11/01/2041 | | | | 6,265 | | | | 6,305,479 | |
Series 2015, Ref. RB | | | 5.00% | | | | 11/01/2035 | | | | 1,000 | | | | 1,009,543 | |
California (State of) Infrastructure & Economic Development Bank (WFCS Portfolio Program); Series 2021 A-1, RB(h) | | | 5.00% | | | | 01/01/2056 | | | | 2,450 | | | | 1,868,278 | |
California (State of) Municipal Finance Authority; | | | | | | | | | | | | | | | | |
Series 2021 B, RB | | | 4.00% | | | | 09/01/2041 | | | | 915 | | | | 822,050 | |
Series 2021 B, RB | | | 4.00% | | | | 09/01/2046 | | | | 830 | | | | 720,802 | |
Series 2021 B, RB | | | 3.38% | | | | 09/01/2051 | | | | 580 | | | | 385,514 | |
Series 2021 B, RB | | | 4.00% | | | | 09/01/2051 | | | | 775 | | | | 651,648 | |
California (State of) Municipal Finance Authority (American Heritage Education Foundation); Series 2016 A, Ref. RB | | | 5.00% | | | | 06/01/2046 | | | | 2,515 | | | | 2,519,001 | |
California (State of) Municipal Finance Authority (Bella Mente Montessori Academy); | | | | | | | | | | | | | | | | |
Series 2018 A, RB(h) | | | 5.00% | | | | 06/01/2038 | | | | 280 | | | | 264,546 | |
Series 2018 A, RB(h) | | | 5.00% | | | | 06/01/2048 | | | | 705 | | | | 628,944 | |
California (State of) Municipal Finance Authority (Bold Program); | | | | | | | | | | | | | | | | |
Series 2020 B, RB | | | 4.00% | | | | 09/01/2043 | | | | 755 | | | | 674,608 | |
Series 2020 B, RB | | | 4.00% | | | | 09/01/2050 | | | | 1,095 | | | | 938,667 | |
Series 2021 A, RB | | | 4.00% | | | | 09/01/2041 | | | | 655 | | | | 588,462 | |
Series 2021 A, RB | | | 4.00% | | | | 09/01/2051 | | | | 1,500 | | | | 1,255,307 | |
Series 2022 B, Ref. RB | | | 6.00% | | | | 09/01/2052 | | | | 2,160 | | | | 2,201,623 | |
Series 2022 B, Ref. RB | | | 6.30% | | | | 09/01/2052 | | | | 870 | | | | 902,451 | |
Series 2022 C, RB | | | 6.25% | | | | 09/01/2052 | | | | 1,900 | | | | 1,911,610 | |
California (State of) Municipal Finance Authority (California Baptist University); Series 2016 A, RB(h) | | | 5.00% | | | | 11/01/2046 | | | | 1,000 | | | | 955,845 | |
California (State of) Municipal Finance Authority (Caritas Affordable Housing, Inc.); | | | | | | | | | | | | | | | | |
Series 2014 A, RB | | | 5.25% | | | | 08/15/2039 | | | | 2,665 | | | | 2,704,590 | |
Series 2014 A, RB | | | 5.25% | | | | 08/15/2049 | | | | 1,420 | | | | 1,436,941 | |
Series 2014 B, RB | | | 5.88% | | | | 08/15/2049 | | | | 705 | | | | 708,815 | |
California (State of) Municipal Finance Authority (Caritas); | | | | | | | | | | | | | | | | |
Series 2017 A, Ref. RB | | | 4.00% | | | | 08/15/2037 | | | | 1,055 | | | | 1,026,990 | |
Series 2021 B, Ref. RB | | | 4.00% | | | | 08/15/2041 | | | | 295 | | | | 265,406 | |
Series 2021 B, Ref. RB | | | 4.00% | | | | 08/15/2051 | | | | 435 | | | | 369,287 | |
California (State of) Municipal Finance Authority (CHF-Davis I, LLC - West Village Student Housing); Series 2018, RB | | | 5.00% | | | | 05/15/2043 | | | | 5,900 | | | | 5,951,450 | |
California (State of) Municipal Finance Authority (CHF-Riverside I, LLC - UCR Dundee-Glasgow Student Housing); Series 2018, RB | | | 5.00% | | | | 05/15/2043 | | | | 3,000 | | | | 3,016,033 | |
California (State of) Municipal Finance Authority (CHF-Riverside II, LLC - UCR North District Phase I Student Housing); Series 2019, RB (INS - BAM)(a) | | | 5.00% | | | | 05/15/2049 | | | | 2,660 | | | | 2,743,564 | |
California (State of) Municipal Finance Authority (Community Medical Centers); | | | | | | | | | | | | | | | | |
Series 2017 A, Ref. RB | | | 5.00% | | | | 02/01/2034 | | | | 3,750 | | | | 3,945,792 | |
Series 2017 A, Ref. RB | | | 5.00% | | | | 02/01/2035 | | | | 4,000 | | | | 4,187,786 | |
Series 2017 A, Ref. RB | | | 5.00% | | | | 02/01/2036 | | | | 2,000 | | | | 2,080,801 | |
Series 2017 A, Ref. RB | | | 5.00% | | | | 02/01/2037 | | | | 1,000 | | | | 1,035,453 | |
Series 2017 A, Ref. RB | | | 5.00% | | | | 02/01/2042 | | | | 625 | | | | 641,060 | |
Series 2017 A, Ref. RB | | | 5.00% | | | | 02/01/2047 | | | | 1,380 | | | | 1,413,537 | |
California (State of) Municipal Finance Authority (Eisenhower Medical Centers); Series 2017 A, Ref. RB | | | 5.00% | | | | 07/01/2047 | | | | 1,000 | | | | 1,010,107 | |
California (State of) Municipal Finance Authority (Goodwill Industries of Sacramento & Nevada); | | | | | | | | | | | | | | | | |
Series 2012, RB(h) | | | 6.63% | | | | 01/01/2032 | | | | 930 | | | | 922,558 | |
Series 2012, RB(h) | | | 6.88% | | | | 01/01/2042 | | | | 2,080 | | | | 1,994,589 | |
See accompanying Notes to Financial Statements which are an integral part of the financial statements.
| | |
| 10 | | Invesco California Municipal Fund |
| | | | | | | | | | | | | | | | |
| | | Interest
Rate | | | Maturity
Date | | | Principal
Amount
(000) | | | Value | |
California-(continued) | | | | | | | | | | | | | | | | |
California (State of) Municipal Finance Authority (Green Bonds); Series 2021, RB (INS - BAM)(a) | | | 4.00% | | | | 05/15/2046 | | | $ | 2,000 | | | $ | 1,839,536 | |
California (State of) Municipal Finance Authority (Humangood Obligation Group); Series 2019 A, Ref. RB | | | 5.00% | | | | 10/01/2044 | | | | 1,695 | | | | 1,731,069 | |
California (State of) Municipal Finance Authority (Humangood); Series 2021, RB | | | 4.00% | | | | 10/01/2049 | | | | 4,000 | | | | 3,621,591 | |
California (State of) Municipal Finance Authority (Linxs APM); | | | | | | | | | | | | | | | | |
Series 2018 A, RB(i) | | | 5.00% | | | | 12/31/2043 | | | | 10,005 | | | | 10,035,065 | |
Series 2018 A, RB(i) | | | 5.00% | | | | 12/31/2047 | | | | 18,610 | | | | 18,432,591 | |
California (State of) Municipal Finance Authority (Mt. San Antonio Gardens); Series 2019, Ref. RB | | | 5.00% | | | | 11/15/2049 | | | | 2,825 | | | | 2,481,608 | |
California (State of) Municipal Finance Authority (OCEAA); Series 2008 A, RB | | | 7.00% | | | | 10/01/2039 | | | | 1,500 | | | | 1,501,040 | |
California (State of) Municipal Finance Authority (Palmdale Aerospace Academy (The)); Series 2018 A, RB(h) | | | 5.00% | | | | 07/01/2049 | | | | 600 | | | | 532,607 | |
California (State of) Municipal Finance Authority (Palomar Health); Series 2022 A, Ref. COP (INS - AGM)(a) | | | 5.25% | | | | 11/01/2052 | | | | 5,400 | | | | 5,690,841 | |
California (State of) Municipal Finance Authority (Samuel Merritt University); Series 2022, RB | | | 5.25% | | | | 06/01/2053 | | | | 11,500 | | | | 12,324,902 | |
California (State of) Municipal Finance Authority (Santa Rosa Academy); Series 2022, Ref. RB | | | 5.00% | | | | 07/01/2052 | | | | 2,050 | | | | 1,865,458 | |
California (State of) Municipal Finance Authority (Social Bonds); | | | | | | | | | | | | | | | | |
Series 2019 A, Ref. RB(h) | | | 5.00% | | | | 11/01/2029 | | | | 990 | | | | 1,020,134 | |
Series 2019 A, Ref. RB(h) | | | 5.00% | | | | 11/01/2039 | | | | 1,475 | | | | 1,443,288 | |
Series 2019 A, Ref. RB(h) | | | 5.00% | | | | 11/01/2049 | | | | 1,700 | | | | 1,608,585 | |
California (State of) Municipal Finance Authority (Touro College and University System); Series 2014 A, RB(b)(c) | | | 5.25% | | | | 07/01/2024 | | | | 620 | | | | 637,641 | |
California (State of) Municipal Finance Authority (Town and Country Manor); Series 2019, Ref. RB (INS - Cal-Mortgage)(a) | | | 5.00% | | | | 07/01/2049 | | | | 5,885 | | | | 6,271,378 | |
California (State of) Municipal Finance Authority (UCR North District Phase 1 Student Housing); Series 2019, RB (INS - BAM)(a) | | | 5.00% | | | | 05/15/2052 | | | | 5,875 | | | | 6,041,590 | |
California (State of) Municipal Finance Authority (United Airlines, Inc.); Series 2019, RB(i) | | | 4.00% | | | | 07/15/2029 | | | | 16,780 | | | | 16,076,487 | |
California (State of) Municipal Finance Authority (University of La Verne); Series 2017 A, Ref. RB | | | 5.00% | | | | 06/01/2043 | | | | 600 | | | | 620,492 | |
California (State of) Municipal Finance Authority (Waste Management, Inc.); Series 2019 A, RB(c)(i) | | | 2.40% | | | | 10/01/2029 | | | | 8,000 | | | | 7,209,467 | |
California (State of) Municipal Finance Authority (William Jessup University); Series 2019, Ref. RB(h) | | | 5.00% | | | | 08/01/2039 | | | | 1,500 | | | | 1,402,599 | |
California (State of) Pollution Control Financing Authority; | | | | | | | | | | | | | | | | |
Series 2012, RB(h)(i) | | | 5.00% | | | | 07/01/2037 | | | | 3,000 | | | | 3,007,674 | |
Series 2012, RB(h)(i) | | | 5.00% | | | | 11/21/2045 | | | | 1,000 | | | | 1,001,176 | |
California (State of) Pollution Control Financing Authority (Aemerge Redpak Services Southern California LLC); | | | | | | | | | | | | | | | | |
Series 2016, RB (Acquired 01/21/2016; Cost $3,500,000)(h)(i)(j)(k) | | | 7.00% | | | | 12/01/2027 | | | | 3,500 | | | | 350,000 | |
Series 2017, RB(h)(i)(j) | | | 8.00% | | | | 12/01/2027 | | | | 2,000 | | | | 120,000 | |
California (State of) Pollution Control Financing Authority (CalPlant I) (Green Bonds); | | | | | | | | | | | | | | | | |
Series 2017, RB(h)(i)(j) | | | 7.50% | | | | 07/01/2032 | | | | 1,425 | | | | 71,250 | |
Series 2017, RB(h)(i)(j) | | | 8.00% | | | | 07/01/2039 | | | | 1,900 | | | | 95,000 | |
Series 2020, RB (Acquired 10/06/2020; Cost $401,185)(h)(i)(j)(k) | | | 7.50% | | | | 07/01/2032 | | | | 420 | | | | 54,600 | |
California (State of) Pollution Control Financing Authority (Poseidon Resources L.P.); Series 2023, RB(h)(i) | | | 5.00% | | | | 11/21/2045 | | | | 1,000 | | | | 1,011,988 | |
California (State of) Pollution Control Financing Authority (San Diego County Water Authority); Series 2019, Ref. RB(h) | | | 5.00% | | | | 11/21/2045 | | | | 3,500 | | | | 3,526,153 | |
California (State of) Pollution Control Financing Authority (Waste Management, Inc.); Series 2015 B-1, Ref. RB(i) | | | 3.00% | | | | 11/01/2025 | | | | 1,500 | | | | 1,470,568 | |
California (State of) Public Finance Authority (California Crosspoint Academy); Series 2020 A, RB(h) | | | 5.13% | | | | 07/01/2055 | | | | 5,000 | | | | 4,007,876 | |
California (State of) Public Finance Authority (Crossroads Christian Schools); Series 2020, RB(h) | | | 5.00% | | | | 01/01/2056 | | | | 1,000 | | | | 782,943 | |
California (State of) Public Finance Authority (Enso Village) (Green Bonds); | | | | | | | | | | | | | | | | |
Series 2021 B-3, RB(h) | | | 2.13% | | | | 11/15/2027 | | | | 2,000 | | | | 1,868,420 | |
Series 2021, RB(h) | | | 2.38% | | | | 11/15/2028 | | | | 2,000 | | | | 1,852,130 | |
Series 2021, RB(h) | | | 5.00% | | | | 11/15/2046 | | | | 1,000 | | | | 858,520 | |
Series 2021, RB(h) | | | 5.00% | | | | 11/15/2051 | | | | 500 | | | | 420,539 | |
California (State of) Public Finance Authority (Henry Mayo Newhall Hospital); | | | | | | | | | | | | | | | | |
Series 2017, Ref. RB | | | 5.00% | | | | 10/15/2037 | | | | 1,000 | | | | 1,018,892 | |
Series 2017, Ref. RB | | | 5.00% | | | | 10/15/2047 | | | | 1,000 | | | | 986,367 | |
California (State of) Public Finance Authority (Kendal at Ventura); Series 2023 A-C, RB(h) | | | 10.00% | | | | 05/15/2028 | | | | 2,900 | | | | 2,878,443 | |
California (State of) Public Finance Authority (LaVerne Elementary Preparatory Academy); | | | | | | | | | | | | | | | | |
Series 2019 A, RB(h) | | | 5.00% | | | | 06/15/2049 | | | | 1,400 | | | | 1,248,010 | |
See accompanying Notes to Financial Statements which are an integral part of the financial statements.
| | |
| 11 | | Invesco California Municipal Fund |
| | | | | | | | | | | | | | | | |
| | | Interest
Rate | | | Maturity
Date | | | Principal
Amount
(000) | | | Value | |
California-(continued) | | | | | | | | | | | | | | | | |
California (State of) Public Finance Authority (Trinity Classical Academy); | | | | | | | | | | | | | | | | |
Series 2019 A, RB(h) | | | 5.00% | | | | 07/01/2036 | | | $ | 400 | | | $ | 384,903 | |
Series 2019 A, RB(h) | | | 5.00% | | | | 07/01/2044 | | | | 630 | | | | 565,876 | |
Series 2019 A, RB(h) | | | 5.00% | | | | 07/01/2054 | | | | 1,600 | | | | 1,371,345 | |
California (State of) Public Works Board (Various Capital); Series 2021 B, RB | | | 4.00% | | | | 05/01/2046 | | | | 3,000 | | | | 2,903,437 | |
California (State of) Public Works Board (Various Correctional Facilities); Series 2014 A, RB | | | 5.00% | | | | 09/01/2039 | | | | 3,000 | | | | 3,064,573 | |
California (State of) School Finance Authority (Alliance for College-Ready Public Schools); | | | | | | | | | | | | | | | | |
Series 2013 A, RB | | | 6.30% | | | | 07/01/2043 | | | | 840 | | | | 844,033 | |
Series 2015, RB(h) | | | 5.00% | | | | 07/01/2045 | | | | 1,265 | | | | 1,269,941 | |
California (State of) School Finance Authority (Aspen Public Sschools Obligated Group); | | | | | | | | | | | | | | | | |
Series 2022 A, RB(h) | | | 6.13% | | | | 07/01/2052 | | | | 3,745 | | | | 3,737,016 | |
Series 2022 A, RB(h) | | | 6.25% | | | | 07/01/2062 | | | | 4,655 | | | | 4,627,485 | |
California (State of) School Finance Authority (Aspire Public School); | | | | | | | | | | | | | | | | |
Series 2015 A, Ref. RB(h) | | | 5.00% | | | | 08/01/2045 | | | | 1,000 | | | | 1,000,456 | |
Series 2016, Ref. RB(b)(c)(h) | | | 5.00% | | | | 08/01/2025 | | | | 65 | | | | 67,900 | |
Series 2016, Ref. RB(h) | | | 5.00% | | | | 08/01/2046 | | | | 685 | | | | 684,614 | |
California (State of) School Finance Authority (Escuela Popular); Series 2017, RB(h) | | | 6.25% | | | | 07/01/2037 | | | | 1,250 | | | | 1,257,854 | |
California (State of) School Finance Authority (Granada Hills Charter Obligated Group); Series 2019, RB(h) | | | 5.00% | | | | 07/01/2043 | | | | 2,000 | | | | 2,014,266 | |
California (State of) School Finance Authority (Green Dot Public Schools); | | | | | | | | | | | | | | | | |
Series 2015 A, RB(h) | | | 5.00% | | | | 08/01/2045 | | | | 1,500 | | | | 1,496,371 | |
Series 2018 A, RB(h) | | | 5.00% | | | | 08/01/2038 | | | | 1,000 | | | | 1,016,035 | |
California (State of) School Finance Authority (Grimmway Schools Obligated Group); Series 2016 A, RB(h) | | | 4.25% | | | | 07/01/2028 | | | | 1,000 | | | | 987,796 | |
California (State of) School Finance Authority (Hawking Steam Charter School); | | | | | | | | | | | | | | | | |
Series 2022, RB(h) | | | 5.38% | | | | 07/01/2056 | | | | 995 | | | | 959,830 | |
Series 2022, RB(h) | | | 5.50% | | | | 07/01/2062 | | | | 1,000 | | | | 974,793 | |
California (State of) School Finance Authority (KIPP LA); | | | | | | | | | | | | | | | | |
Series 2015 A, RB(h) | | | 5.00% | | | | 07/01/2045 | | | | 500 | | | | 502,281 | |
Series 2017 A, RB(h) | | | 5.00% | | | | 07/01/2037 | | | | 590 | | | | 603,787 | |
Series 2017 A, RB(h) | | | 5.00% | | | | 07/01/2047 | | | | 1,240 | | | | 1,248,191 | |
California (State of) School Finance Authority (KIPP SoCal Public Schools); Series 2019 A, RB(h) | | | 5.00% | | | | 07/01/2049 | | | | 1,700 | | | | 1,713,496 | |
California (State of) School Finance Authority (New Designs Charter School); Series 2012 A, RB | | | 5.25% | | | | 06/01/2032 | | | | 1,550 | | | | 1,550,708 | |
California (State of) School Finance Authority (Sonoma County Junior College); Series 2021, RB(h) | | | 4.00% | | | | 11/01/2051 | | | | 2,700 | | | | 2,033,779 | |
California (State of) Statewide Communities Development Authority; | | | | | | | | | | | | | | | | |
Series 2017, RB | | | 5.00% | | | | 09/02/2037 | | | | 1,135 | | | | 1,169,978 | |
Series 2017, RB | | | 5.00% | | | | 09/02/2046 | | | | 1,265 | | | | 1,280,550 | |
Series 2020 B, RB | | | 4.00% | | | | 09/02/2050 | | | | 445 | | | | 370,056 | |
Series 2020, RB | | | 4.00% | | | | 09/01/2040 | | | | 400 | | | | 361,288 | |
Series 2020, RB | | | 4.00% | | | | 09/01/2050 | | | | 2,340 | | | | 1,987,239 | |
Series 2021 A, RB | | | 4.00% | | | | 09/02/2051 | | | | 1,990 | | | | 1,567,485 | |
California (State of) Statewide Communities Development Authority (Adventist Health System); | | | | | | | | | | | | | | | | |
Series 2015, Ref. RB | | | 5.00% | | | | 03/01/2033 | | | | 775 | | | | 805,510 | |
Series 2015, Ref. RB | | | 5.00% | | | | 03/01/2045 | | | | 2,315 | | | | 2,340,792 | |
Series 2018, Ref. RB | | | 5.00% | | | | 03/01/2042 | | | | 1,185 | | | | 1,213,972 | |
California (State of) Statewide Communities Development Authority (Alliance for College-Ready Public Schools - 47th and Main); | | | | | | | | | | | | | | | | |
Series 2012 A, RB | | | 6.38% | | | | 07/01/2047 | | | | 2,000 | | | | 2,002,326 | |
Series 2012, RB | | | 6.10% | | | | 07/01/2032 | | | | 820 | | | | 821,402 | |
California (State of) Statewide Communities Development Authority (California Baptist University); | | | | | | | | | | | | | | | | |
Series 2014 A, RB(h) | | | 5.13% | | | | 11/01/2023 | | | | 175 | | | | 175,446 | |
Series 2017 A, Ref. RB(h) | | | 5.00% | | | | 11/01/2041 | | | | 875 | | | | 858,286 | |
California (State of) Statewide Communities Development Authority (Community Facilities District No. 2007-01); Series 2015, Ref. RB | | | 5.00% | | | | 09/01/2037 | | | | 1,650 | | | | 1,680,193 | |
California (State of) Statewide Communities Development Authority (Community Facilities District No. 2015-1); | | | | | | | | | | | | | | | | |
Series 2020, RB | | | 4.00% | | | | 09/01/2050 | | | | 1,500 | | | | 1,273,871 | |
Series 2020, RB | | | 4.00% | | | | 09/01/2050 | | | | 1,415 | | | | 1,190,538 | |
California (State of) Statewide Communities Development Authority (Community Facilities District No. 2016-02); Series 2020, RB | | | 4.00% | | | | 09/01/2050 | | | | 2,465 | | | | 2,090,141 | |
See accompanying Notes to Financial Statements which are an integral part of the financial statements.
| | |
| 12 | | Invesco California Municipal Fund |
| | | | | | | | | | | | | | |
| | | Interest
Rate | | | Maturity
Date | | | Principal
Amount
(000) | | | Value |
California-(continued) | | | | | | | | | | | | | | |
California (State of) Statewide Communities Development Authority (Community Facilities District No. 2018-02); Series 2020, RB(h) | | | 7.25% | | | | 09/01/2050 | | | $ | 4,255 | | | $ 4,095,335 |
California (State of) Statewide Communities Development Authority (Community Facilities District No. 2020-02); Series 2022, RB | | | 5.25% | | | | 09/01/2052 | | | | 1,650 | | | 1,644,104 |
California (State of) Statewide Communities Development Authority (Delta Coves); Series 2022, RB | | | 5.50% | | | | 09/01/2052 | | | | 3,070 | | | 3,096,201 |
California (State of) Statewide Communities Development Authority (Enloe Medical Center); | | | | | | | | | | | | | | |
Series 2022 A, RB (INS - AGM)(a) | | | 5.25% | | | | 08/15/2052 | | | | 2,000 | | | 2,116,939 |
Series 2022 A, RB (INS - AGM)(a) | | | 5.38% | | | | 08/15/2057 | | | | 2,320 | | | 2,467,714 |
California (State of) Statewide Communities Development Authority (Front Porch Communities & Services); Series 2017, Ref. RB | | | 5.00% | | | | 04/01/2047 | | | | 3,390 | | | 3,447,692 |
California (State of) Statewide Communities Development Authority (Henry Mayo Newhall Memorial Hospital); Series 2014 A, RB(b)(c) | | | 5.25% | | | | 10/01/2024 | | | | 600 | | | 620,454 |
California (State of) Statewide Communities Development Authority (Heritage Park at Cathedral City Apartments); Series 2002 NN-1, RB (INS - AMBAC)(a)(i) | | | 5.20% | | | | 06/01/2036 | | | | 2,345 | | | 2,347,454 |
California (State of) Statewide Communities Development Authority (Huntington Memorial Hospital); Series 2014 B, Ref. RB(b)(c) | | | 5.00% | | | | 07/01/2024 | | | | 750 | | | 769,409 |
California (State of) Statewide Communities Development Authority (Improvement Area No. 1); | | | | | | | | | | | | | | |
Series 2021, RB | | | 4.00% | | | | 09/01/2041 | | | | 690 | | | 617,568 |
Series 2021, RB | | | 4.00% | | | | 09/01/2051 | | | | 1,170 | | | 974,531 |
California (State of) Statewide Communities Development Authority (John Muir Health); Series 2016 A, Ref. RB | | | 5.00% | | | | 08/15/2051 | | | | 3,000 | | | 3,063,676 |
California (State of) Statewide Communities Development Authority (Lancer Educational Student Housing); | | | | | | | | | | | | | | |
Series 2016, Ref. RB(h) | | | 5.00% | | | | 06/01/2046 | | | | 1,000 | | | 932,277 |
Series 2019, RB(h) | | | 5.00% | | | | 06/01/2034 | | | | 375 | | | 369,584 |
Series 2019, RB(h) | | | 5.00% | | | | 06/01/2039 | | | | 100 | | | 96,751 |
Series 2019, RB(h) | | | 5.00% | | | | 06/01/2051 | | | | 295 | | | 270,788 |
California (State of) Statewide Communities Development Authority (Loma Linda University Medical Center); | | | | | | | | | | | | | | |
Series 2014, RB | | | 5.50% | | | | 12/01/2054 | | | | 1,500 | | | 1,486,772 |
Series 2016 A, RB(h) | | | 5.25% | | | | 12/01/2056 | | | | 830 | | | 782,647 |
Series 2018 A, RB(h) | | | 5.50% | | | | 12/01/2058 | | | | 5,000 | | | 4,915,951 |
California (State of) Statewide Communities Development Authority (Methodist Hospital of Southern California); | | | | | | | | | | | | | | |
Series 2018, RB | | | 5.00% | | | | 01/01/2043 | | | | 1,000 | | | 1,022,141 |
Series 2018; RB | | | 5.00% | | | | 01/01/2048 | | | | 1,995 | | | 2,028,468 |
California (State of) Statewide Communities Development Authority (NCCD-Hooper Street LLC- California College of the Arts); | | | | | | | | | | | | | | |
Series 2019, RB(h) | | | 5.25% | | | | 07/01/2039 | | | | 1,640 | | | 1,520,979 |
Series 2019, RB(h) | | | 5.25% | | | | 07/01/2049 | | | | 3,375 | | | 2,969,085 |
California (State of) Statewide Communities Development Authority (San Francisco Campus for Jewish Living); | | | | | | | | | | | | | | |
Series 2021, RB (INS - Cal-Mortgage)(a) | | | 4.00% | | | | 11/01/2041 | | | | 1,745 | | | 1,712,318 |
Series 2021, RB (INS - Cal-Mortgage)(a) | | | 4.00% | | | | 11/01/2051 | | | | 3,425 | | | 3,150,339 |
California (State of) Statewide Communities Development Authority (Sand Creek); | | | | | | | | | | | | | | |
Series 2021, RB | | | 4.00% | | | | 09/01/2041 | | | | 550 | | | 490,409 |
Series 2021, RB | | | 4.00% | | | | 09/01/2051 | | | | 1,125 | | | 937,050 |
California (State of) Statewide Communities Development Authority (Statewide Community Infrastructure Program); | | | | | | | | | | | | | | |
Series 2019 B, RB | | | 5.00% | | | | 09/02/2049 | | | | 1,500 | | | 1,456,772 |
Series 2019 C, RB | | | 5.00% | | | | 09/02/2049 | | | | 700 | | | 706,898 |
Series 2021 C-1, RB | | | 4.00% | | | | 09/02/2041 | | | | 2,185 | | | 1,938,473 |
Series 2021 C-1, RB | | | 4.00% | | | | 09/02/2051 | | | | 2,505 | | | 2,079,942 |
Series 2022, RB | | | 5.38% | | | | 09/02/2052 | | | | 1,000 | | | 975,589 |
California (State of) Statewide Communities Development Authority (University of California - Irvine East Campus Apartments - CHF-Irvine, LLC); Series 2016, Ref. RB | | | 5.00% | | | | 05/15/2040 | | | | 1,200 | | | 1,213,698 |
California (State of) Statewide Communities Development Authority (Yucaipa Valley Water Reservoir); Series 2014, RB | | | 6.00% | | | | 09/02/2044 | | | | 2,700 | | | 2,725,338 |
See accompanying Notes to Financial Statements which are an integral part of the financial statements.
| | |
| 13 | | Invesco California Municipal Fund |
| | | | | | | | | | | | | | | | |
| | | Interest
Rate | | | Maturity
Date | | | Principal
Amount
(000) | | | Value | |
California-(continued) | | | | | | | | | | | | | | | | |
California (State of) Statewide Financing Authority (Pooled Tobacco Securitization Program); | | | | | | | | | | | | | | | | |
Series 2002 A, RB | | | 6.00% | | | | 05/01/2037 | | | $ | 6,910 | | | $ | 7,030,437 | |
Series 2002 B, RB | | | 6.00% | | | | 05/01/2037 | | | | 835 | | | | 849,554 | |
Series 2002 B, RB | | | 6.00% | | | | 05/01/2043 | | | | 705 | | | | 717,301 | |
Series 2002, RB | | | 6.00% | | | | 05/01/2043 | | | | 45 | | | | 45,785 | |
Series 2006 A, RB(f) | | | 0.00% | | | | 06/01/2046 | | | | 8,000 | | | | 1,913,045 | |
Calimesa (City of), CA Community Facilities District No. 2018-1 (Summerwind Trails); | | | | | | | | | | | | | | | | |
Series 2020, RB | | | 4.00% | | | | 09/01/2045 | | | | 605 | | | | 526,959 | |
Series 2020, RB | | | 4.00% | | | | 09/01/2050 | | | | 575 | | | | 486,045 | |
Cambrian School District; Series 2022, GO Bonds | | | 5.00% | | | | 08/01/2048 | | | | 7,505 | | | | 8,058,233 | |
Carlsbad (City of), CA (Assessment District No. 96-1); Series 1998, RB | | | 5.50% | | | | 09/02/2028 | | | | 10 | | | | 10,108 | |
Carson (City of), CA Public Financing Authority; Series 2019, RB | | | 5.00% | | | | 09/02/2030 | | | | 545 | | | | 590,275 | |
Cerritos Community College District (Election of 2012); Series 2018 B, GO Bonds | | | 4.00% | | | | 08/01/2043 | | | | 1,870 | | | | 1,845,862 | |
Chino (City of), CA Community Facilities District; | | | | | | | | | | | | | | | | |
Series 2020, RB | | | 4.00% | | | | 09/01/2040 | | | | 170 | | | | 154,297 | |
Series 2020, RB | | | 4.00% | | | | 09/01/2051 | | | | 705 | | | | 589,994 | |
Chino (City of), CA Public Financing Authority; | | | | | | | | | | | | | | | | |
Series 2015 A, Ref. RB (INS - AGM)(a) | | | 5.00% | | | | 09/01/2034 | | | | 1,100 | | | | 1,160,113 | |
Series 2015 A, Ref. RB (INS - AGM)(a) | | | 5.00% | | | | 09/01/2035 | | | | 865 | | | | 909,430 | |
Chino Valley Unified School District; | | | | | | | | | | | | | | | | |
Series 2020 B, GO Bonds | | | 4.00% | | | | 08/01/2045 | | | | 3,000 | | | | 2,941,323 | |
Series 2020 B, GO Bonds | | | 5.00% | | | | 08/01/2055 | | | | 10,995 | | | | 11,796,974 | |
Chula Vista (City of), CA Community Facilities District No. 16-1 (Improvement Area No. 2); | | | | | | | | | | | | | | | | |
Series 2021, RB | | | 4.00% | | | | 09/01/2041 | | | | 250 | | | | 222,910 | |
Series 2021, RB | | | 4.00% | | | | 09/01/2051 | | | | 1,775 | | | | 1,504,320 | |
Clovis (City of), CA; | | | | | | | | | | | | | | | | |
Series 2015, Ref. RB (INS - AGM)(a) | | | 5.25% | | | | 08/01/2030 | | | | 1,060 | | | | 1,127,310 | |
Series 2015, Ref. RB (INS - AGM)(a) | | | 5.25% | | | | 08/01/2031 | | | | 500 | | | | 531,697 | |
Clovis (City of), CA Public Financing Authority; Series 2008 A, RB (INS - NATL)(a) | | | 4.63% | | | | 08/01/2029 | | | | 35 | | | | 35,051 | |
Clovis Unified School District (Election of 2004); Series 2004 A, GO Bonds (INS - NATL)(a)(f) | | | 0.00% | | | | 08/01/2029 | | | | 735 | | | | 590,714 | |
Coachella (City of), CA (Community Facilities District No. 2018-1); | | | | | | | | | | | | | | | | |
Series 2018, RB(h) | | | 5.00% | | | | 09/01/2030 | | | | 515 | | | | 544,667 | |
Series 2018, RB(h) | | | 5.00% | | | | 09/01/2038 | | | | 1,090 | | | | 1,127,510 | |
Series 2018, RB(h) | | | 5.00% | | | | 09/01/2048 | | | | 2,015 | | | | 2,041,337 | |
Series 2018, RB(h) | | | 5.00% | | | | 09/01/2053 | | | | 1,525 | | | | 1,536,007 | |
Compton (City of), CA Public Finance Authority (Various Capital); Series 2008, Ref. RB (INS - AMBAC)(a) | | | 5.25% | | | | 09/01/2027 | | | | 1,000 | | | | 1,000,531 | |
Compton Unified School District; | | | | | | | | | | | | | | | | |
Series 2019 B, GO Bonds (INS - BAM)(a)(f) | | | 0.00% | | | | 06/01/2035 | | | | 1,300 | | | | 763,583 | |
Series 2019 B, GO Bonds (INS - BAM)(a)(f) | | | 0.00% | | | | 06/01/2041 | | | | 6,250 | | | | 2,518,609 | |
Series 2019 B, GO Bonds (INS - BAM)(a)(f) | | | 0.00% | | | | 06/01/2042 | | | | 4,335 | | | | 1,657,358 | |
Series 2019 B, GO Bonds (INS - BAM)(a) | | | 4.00% | | | | 06/01/2049 | | | | 14,140 | | | | 13,431,932 | |
Corona Community Facilities District (Bedford Improvement Area No. 1); | | | | | | | | | | | | | | | | |
Series 2020, RB | | | 4.00% | | | | 09/01/2040 | | | | 285 | | | | 252,475 | |
Series 2020, RB | | | 4.00% | | | | 09/01/2045 | | | | 460 | | | | 394,718 | |
Series 2020, RB | | | 4.00% | | | | 09/01/2050 | | | | 1,035 | | | | 870,942 | |
Corona-Norco Unified School District (Community Facilities District No. 17-1); Series 2020, RB | | | 4.00% | | | | 09/01/2050 | | | | 350 | | | | 296,027 | |
CSCDA Community Improvement Authority (Oceanaire-Long Beach Social Bonds); Series 2021 A-2, RB(h) | | | 4.00% | | | | 09/01/2056 | | | | 2,500 | | | | 1,928,883 | |
CSCDA Community Improvement Authority (Parallel-Anaheim Social Bonds); Series 2021, RB(h) | | | 4.00% | | | | 08/01/2056 | | | | 1,000 | | | | 814,770 | |
CSCDA Community Improvement Authority (Renaissance at City Center); Series 2020 A, RB(h) | | | 5.00% | | | | 07/01/2051 | | | | 3,250 | | | | 3,031,040 | |
Daly (City of), CA Housing Development Finance Agency (Franciscan Mobile Home Park Acquisition); | | | | | | | | | | | | | | | | |
Series 2007 A, Ref. RB | | | 5.00% | | | | 12/15/2037 | | | | 50 | | | | 50,021 | |
Series 2007 C, Ref. RB | | | 6.50% | | | | 12/15/2047 | | | | 865 | | | | 858,575 | |
Dehesa School District (Election of 2012); Series 2014 A, GO Bonds(b)(c) | | | 5.50% | | | | 08/01/2023 | | | | 1,220 | | | | 1,232,027 | |
Dixon (City of), CA Improvement Area No. 1 (Community Facilities District No. 2019-1); | | | | | | | | | | | | | | | | |
Series 2020, RB | | | 4.00% | | | | 09/01/2036 | | | | 200 | | | | 190,567 | |
Series 2020, RB | | | 4.00% | | | | 09/01/2040 | | | | 400 | | | | 364,826 | |
Series 2020, RB | | | 4.00% | | | | 09/01/2050 | | | | 1,000 | | | | 849,248 | |
See accompanying Notes to Financial Statements which are an integral part of the financial statements.
| | |
| 14 | | Invesco California Municipal Fund |
| | | | | | | | | | | | | | | | |
| | | Interest
Rate | | | Maturity
Date | | | Principal
Amount
(000) | | | Value | |
California-(continued) | | | | | | | | | | | | | | | | |
Dublin (City of), CA Community Facilities District No. 2015-1 (Improvement Area No. 3); | | | | | | | | | | | | | | | | |
Series 2021, RB | | | 4.00% | | | | 09/01/2045 | | | $ | 850 | | | $ | 727,975 | |
Series 2021, RB | | | 4.00% | | | | 09/01/2051 | | | | 865 | | | | 714,860 | |
Eastern Municipal Water District (Community Facilities District No. 2016-75); | | | | | | | | | | | | | | | | |
Series 2021, RB | | | 4.00% | | | | 09/01/2030 | | | | 75 | | | | 74,949 | |
Series 2021, RB | | | 4.00% | | | | 09/01/2050 | | | | 385 | | | | 327,470 | |
El Dorado Irrigation District; Series 2020 A, COP | | | 4.00% | | | | 03/01/2050 | | | | 15,330 | | | | 14,546,269 | |
El Segundo Unified School District (Election of 2008); Series 2009 A, GO Bonds(f) | | | 0.00% | | | | 08/01/2033 | | | | 4,430 | | | | 3,049,637 | |
Elsinore Valley Municipal Water District; Series 2021 A, RB(h) | | | 4.50% | | | | 09/01/2051 | | | | 2,680 | | | | 2,252,366 | |
Emeryville (City of), CA Public Financing Authority (Alameda County); | | | | | | | | | | | | | | | | |
Series 2014 A, Ref. RB (INS - AGM)(a) | | | 5.00% | | | | 09/01/2032 | | | | 445 | | | | 460,556 | |
Series 2014 A, Ref. RB (INS - AGM)(a) | | | 5.00% | | | | 09/01/2033 | | | | 385 | | | | 398,466 | |
Series 2014 A, Ref. RB (INS - AGM)(a) | | | 5.00% | | | | 09/01/2034 | | | | 500 | | | | 517,573 | |
Escondido Union School District (Election of 2014); Series 2018 B, GO Bonds | | | 4.00% | | | | 08/01/2047 | | | | 1,690 | | | | 1,611,729 | |
Etiwanda School District Community Facilities District No. 2018-1 (Day Creek Square Public Facilities); | | | | | | | | | | | | | | | | |
Series 2020, RB | | | 4.00% | | | | 09/01/2045 | | | | 510 | | | | 429,438 | |
Series 2020, RB | | | 4.00% | | | | 09/01/2050 | | | | 705 | | | | 578,464 | |
Fairfield (City of), CA Community Facilities District No. 2007-1 (Fairfield Commons); Series 2008, RB | | | 6.88% | | | | 09/01/2038 | | | | 865 | | | | 880,797 | |
Fairfield (City of), CA Community Facilities District No. 2019-1 (One Lake); Series 2021 A, RB | | | 4.00% | | | | 09/01/2051 | | | | 5,290 | | | | 4,469,139 | |
Folsom Ranch Financing Authority Community Facilities District no. 23 (Improvement Area No. 1); Series 2022, RB | | | 5.00% | | | | 09/01/2042 | | | | 3,290 | | | | 3,312,527 | |
Fontana (City of), CA (Community Facilities District No. 80); Series 2017, RB | | | 5.00% | | | | 09/01/2046 | | | | 1,000 | | | | 1,012,688 | |
Fontana (City of), CA (El Paseo Community Facilities District 87); | | | | | | | | | | | | | | | | |
Series 2021, RB | | | 4.00% | | | | 09/01/2027 | | | | 120 | | | | 120,034 | |
Series 2021, RB | | | 4.00% | | | | 09/01/2028 | | | | 125 | | | | 125,409 | |
Series 2021, RB | | | 4.00% | | | | 09/01/2029 | | | | 110 | | | | 110,491 | |
Series 2021, RB | | | 4.00% | | | | 09/01/2032 | | | | 100 | | | | 99,265 | |
Series 2021, RB | | | 4.00% | | | | 09/01/2041 | | | | 200 | | | | 179,457 | |
Series 2021, RB | | | 4.00% | | | | 09/01/2046 | | | | 325 | | | | 278,207 | |
Series 2021, RB | | | 4.00% | | | | 09/01/2051 | | | | 400 | | | | 332,129 | |
Fontana (City of), CA (Summit at Rosena Phase One); Series 2021, RB | | | 4.00% | | | | 09/01/2051 | | | | 525 | | | | 440,743 | |
Fontana (City of), CA (The Meadows); | | | | | | | | | | | | | | | | |
Series 2020, RB | | | 4.00% | | | | 09/01/2045 | | | | 530 | | | | 462,284 | |
Series 2020, RB | | | 4.00% | | | | 09/01/2050 | | | | 635 | | | | 536,763 | |
Foothill-Eastern Transportation Corridor Agency; | | | | | | | | | | | | | | | | |
Series 2015, Ref. RB (INS - AGM)(a)(f) | | | 0.00% | | | | 01/15/2035 | | | | 2,745 | | | | 1,721,980 | |
Series 2021 A, RB | | | 4.00% | | | | 01/15/2046 | | | | 7,840 | | | | 7,112,583 | |
Series 2021 A, Ref. RB | | | 4.00% | | | | 01/15/2046 | | | | 8,125 | | | | 7,371,140 | |
Fremont Community Facilities District No. 1 (Pacific Commons); Series 2015, Ref. RB | | | 5.00% | | | | 09/01/2035 | | | | 815 | | | | 834,492 | |
Gilroy Unified School District (Election of 2008); | | | | | | | | | | | | | | | | |
Series 2009 A, GO Bonds(b)(f) | | | 0.00% | | | | 08/01/2029 | | | | 615 | | | | 513,151 | |
Series 2009 A, GO Bonds (INS - AGC)(a)(f) | | | 0.00% | | | | 08/01/2029 | | | | 4,735 | | | | 3,822,323 | |
Series 2009 A, GO Bonds(b)(f) | | | 0.00% | | | | 08/01/2031 | | | | 2,235 | | | | 1,762,132 | |
Series 2009 A, GO Bonds (INS - AGC)(a)(f) | | | 0.00% | | | | 08/01/2031 | | | | 1,415 | | | | 1,062,108 | |
Glendora (City of), CA Public Finance Authority (No. 1); Series 2003 A, RB (INS - NATL)(a) | | | 5.00% | | | | 09/01/2024 | | | | 940 | | | | 941,215 | |
Golden State Tobacco Securitization Corp.; Series 2021 B-2, Ref. RB(f) | | | 0.00% | | | | 06/01/2066 | | | | 21,000 | | | | 2,087,427 | |
Golden Valley Unified School District Financing Authority; | | | | | | | | | | | | | | | | |
Series 2021 A, RB | | | 4.00% | | | | 09/01/2046 | | | | 250 | | | | 213,392 | |
Series 2021 A, RB | | | 4.00% | | | | 09/01/2051 | | | | 500 | | | | 413,214 | |
Hayward Unified School District (Election of 2018); | | | | | | | | | | | | | | | | |
Series 2019 A, GO Bonds (INS - BAM)(a) | | | 4.00% | | | | 08/01/2048 | | | | 6,900 | | | | 6,636,252 | |
Series 2022, GO Bonds (INS - BAM)(a) | | | 4.00% | | | | 08/01/2050 | | | | 10,875 | | | | 10,404,285 | |
Hollister (City of), CA Redevelopment Agency Successor Agency (Hollister Community Development); | | | | | | | | | | | | | | | | |
Series 2014, Ref. RB (INS - BAM)(a) | | | 5.00% | | | | 10/01/2030 | | | | 1,600 | | | | 1,658,045 | |
Series 2014, Ref. RB (INS - BAM)(a) | | | 5.00% | | | | 10/01/2032 | | | | 1,305 | | | | 1,353,052 | |
Hollister Joint Powers Financing Authority; Series 2016, Ref. RB (INS - AGM)(a) | | | 5.00% | | | | 06/01/2036 | | | | 1,270 | | | | 1,357,976 | |
Hollister School District (Election of 2016); Series 2019 B, GO Bonds | | | 4.00% | | | | 09/01/2046 | | | | 3,675 | | | | 3,519,729 | |
See accompanying Notes to Financial Statements which are an integral part of the financial statements.
| | |
| 15 | | Invesco California Municipal Fund |
| | | | | | | | | | | | | | |
| | | Interest
Rate | | | Maturity
Date | | | Principal
Amount
(000) | | | Value |
California-(continued) | | | | | | | | | | | | | | |
Imperial (County of), CA (Community Facilities District No. 2004-2 - Improvement Area No. 1); Series 2007, RB | | | 5.90% | | | | 09/01/2037 | | | $ | 1,430 | | | $ 1,442,466 |
Independent Cities Finance Authority (Hacienda Valley Estates); Series 2014, Ref. RB | | | 5.00% | | | | 11/15/2034 | | | | 885 | | | 902,366 |
Independent Cities Finance Authority (Union City Tropics); Series 2019, Ref. RB | | | 5.00% | | | | 05/15/2048 | | | | 1,000 | | | 1,029,615 |
Inglewood (City of), CA Redevelopment Agency (Merged Redevelopment); Series 1998 A, Ref. RB (INS - AMBAC)(a) | | | 5.25% | | | | 05/01/2023 | | | | 40 | | | 40,081 |
Inglewood Unified School District; | | | | | | | | | | | | | | |
Series 2019 C, GO Bonds (INS - BAM)(a) | | | 4.00% | | | | 08/01/2038 | | | | 550 | | | 547,373 |
Series 2019 C, GO Bonds (INS - BAM)(a) | | | 4.00% | | | | 08/01/2039 | | | | 690 | | | 681,482 |
Series 2021 A, GO Bonds (INS - AGM)(a) | | | 4.00% | | | | 08/01/2051 | | | | 9,100 | | | 8,464,593 |
Inland Empire Tobacco Securitization Corp.; | | | | | | | | | | | | | | |
Series 2007 C-1, RB(f) | | | 0.00% | | | | 06/01/2036 | | | | 8,000 | | | 3,374,134 |
Series 2007 C-2, RB(f) | | | 0.00% | | | | 06/01/2047 | | | | 14,000 | | | 2,799,605 |
Irvine (City of), CA Community Facilities District No. 2013-3 (Great Park Improvement Area No. 1); | | | | | | | | | | | | | | |
Series 2014, RB | | | 5.00% | | | | 09/01/2044 | | | | 445 | | | 447,670 |
Series 2014, RB | | | 5.00% | | | | 09/01/2049 | | | | 445 | | | 446,961 |
Irvine Ranch Water District; Series 2016, RB(d)(e) | | | 5.25% | | | | 02/01/2046 | | | | 4,305 | | | 4,540,513 |
Irvine Unified School District (Community Facilities District No. 01-1); Series 2015, Ref. RB (INS - BAM)(a) | | | 5.00% | | | | 09/01/2038 | | | | 3,500 | | | 3,625,033 |
Irvine Unified School District (Community Facilities District No. 09-1); | | | | | | | | | | | | | | |
Series 2017 B, RB | | | 5.00% | | | | 09/01/2047 | | | | 495 | | | 500,409 |
Series 2018 A, Ref. RB | | | 5.00% | | | | 09/01/2045 | | | | 995 | | | 1,007,465 |
Series 2019 A, RB (INS - BAM)(a) | | | 4.00% | | | | 09/01/2044 | | | | 3,585 | | | 3,444,079 |
Jurupa Community Services District; Series 2021 A, RB | | | 4.00% | | | | 09/01/2045 | | | | 710 | | | 614,941 |
Lake Elsinore (City of), CA; | | | | | | | | | | | | | | |
Series 2021, RB | | | 4.00% | | | | 09/01/2041 | | | | 350 | | | 311,158 |
Series 2021, RB | | | 4.00% | | | | 09/01/2046 | | | | 450 | | | 387,136 |
Series 2021, RB | | | 4.00% | | | | 09/01/2051 | | | | 700 | | | 587,284 |
Lake Elsinore Unified School District Community Facilities District; Series 2021, RB | | | 4.00% | | | | 09/01/2045 | | | | 380 | | | 328,145 |
Lake Elsinore Unified School District Community Facilities District No. 2006-2 (Improvement Area No. C); Series 2020, RB | | | 4.00% | | | | 09/01/2050 | | | | 4,015 | | | 3,372,868 |
Lake Elsniore (City of), CA Community Facilities District No. 2006-1; | | | | | | | | | | | | | | |
Series 2019, RB | | | 5.00% | | | | 09/01/2050 | | | | 1,000 | | | 1,010,131 |
Series 2021, RB | | | 4.00% | | | | 09/01/2046 | | | | 290 | | | 251,846 |
Series 2021, RB | | | 4.00% | | | | 09/01/2051 | | | | 310 | | | 261,897 |
Lake Elsniore (City of), CA Community Facilities District No. 2006-1 (Improvement Area II); | | | | | | | | | | | | | | |
Series 2020, RB | | | 4.00% | | | | 09/01/2040 | | | | 760 | | | 681,000 |
Series 2020, RB | | | 4.00% | | | | 09/01/2045 | | | | 835 | | | 734,513 |
Lammersville Joint Unified School District; | | | | | | | | | | | | | | |
Series 2020, RB | | | 4.00% | | | | 09/01/2039 | | | | 250 | | | 227,662 |
Series 2020, RB | | | 4.00% | | | | 09/01/2045 | | | | 310 | | | 268,549 |
Series 2020, RB | | | 4.00% | | | | 09/01/2045 | | | | 500 | | | 429,721 |
Series 2020, RB | | | 4.00% | | | | 09/01/2049 | | | | 730 | | | 618,333 |
Series 2020, RB | | | 4.00% | | | | 09/01/2050 | | | | 1,000 | | | 838,642 |
Series 2022, RB | | | 4.00% | | | | 09/01/2052 | | | | 4,000 | | | 3,362,552 |
Lathrop (City of), CA (Community Facilities District No. 03-2); Series 2003, RB | | | 7.00% | | | | 09/01/2033 | | | | 3,130 | | | 3,138,430 |
Lennox School District; Series 2014, COP (INS - BAM)(a) | | | 5.00% | | | | 10/01/2034 | | | | 1,000 | | | 1,000,574 |
Lincoln (City of), CA Community Facilities District No. 2006-1 (Improvement Area No. 1); | | | | | | | | | | | | | | |
Series 2021, Ref. RB | | | 4.00% | | | | 09/01/2030 | | | | 155 | | | 155,794 |
Series 2021, Ref. RB | | | 4.00% | | | | 09/01/2034 | | | | 210 | | | 208,061 |
Series 2021, Ref. RB | | | 4.00% | | | | 09/01/2038 | | | | 270 | | | 253,026 |
Series 2021, Ref. RB | | | 4.00% | | | | 09/01/2043 | | | | 320 | | | 287,469 |
Long Beach (City of), CA; | | | | | | | | | | | | | | |
Series 2017 A, RB(i) | | | 5.00% | | | | 05/15/2037 | | | | 1,300 | | | 1,353,735 |
Series 2017 A, RB(i) | | | 5.00% | | | | 05/15/2040 | | | | 14,670 | | | 15,040,024 |
Long Beach (City of), CA (Alamitos Bay Marina); Series 2015, RB | | | 5.00% | | | | 05/15/2045 | | | | 2,370 | | | 2,394,540 |
Long Beach (City of), CA (Green Bonds); Series 2017 B, RB(i) | | | 5.00% | | | | 05/15/2043 | | | | 8,210 | | | 8,379,651 |
See accompanying Notes to Financial Statements which are an integral part of the financial statements.
| | |
| 16 | | Invesco California Municipal Fund |
| | | | | | | | | | | | | | |
| | | Interest
Rate | | | Maturity
Date | | | Principal
Amount
(000) | | | Value |
California-(continued) | | | | | | | | | | | | | | |
Long Beach (City of), CA Bond Finance Authority; | | | | | | | | | | | | | | |
Series 2007 A, RB | | | 5.50% | | | | 11/15/2028 | | | $ | 50 | | | $ 53,474 |
Series 2007 A, RB | | | 5.50% | | | | 11/15/2032 | | | | 2,665 | | | 2,948,103 |
Series 2007 A, RB | | | 5.50% | | | | 11/15/2037 | | | | 1,000 | | | 1,088,269 |
Los Alamitos Unified School District; Series 2013, GO Bonds(l) | | | 6.01% | | | | 08/01/2040 | | | | 1,660 | | | 1,575,474 |
Los Alamitos Unified School District (Capital); Series 2012, COP(l) | | | 5.95% | | | | 08/01/2034 | | | | 1,200 | | | 1,273,450 |
Los Angeles (City of), CA Community Facilities District No. 4 (Playa Vista - Phase 1); Series 2014, Ref. RB | | | 5.00% | | | | 09/01/2031 | | | | 590 | | | 612,543 |
Los Angeles (City of), CA Department of Airports; | | | | | | | | | | | | | | |
Series 2015 A, RB(i) | | | 5.00% | | | | 05/15/2034 | | | | 45 | | | 46,236 |
Series 2018, RB(e)(i) | | | 5.00% | | | | 05/15/2035 | | | | 11,410 | | | 12,165,846 |
Series 2018, RB(e)(i) | | | 5.00% | | | | 05/15/2036 | | | | 10,640 | | | 11,260,972 |
Series 2019 A, Ref. RB(i) | | | 5.00% | | | | 05/15/2049 | | | | 16,710 | | | 17,127,994 |
Series 2020 C, RB(i) | | | 4.00% | | | | 05/15/2050 | | | | 3,600 | | | 3,336,857 |
Series 2021, Ref. RB(i) | | | 5.00% | | | | 05/15/2035 | | | | 3,500 | | | 3,795,868 |
Series 2022 A, RB(i) | | | 5.00% | | | | 05/15/2045 | | | | 12,875 | | | 13,426,090 |
Series 2022 A, RB(i) | | | 4.00% | | | | 05/15/2049 | | | | 6,400 | | | 5,880,920 |
Los Angeles (City of), CA Department of Airports (Los Angeles International Airport); | | | | | | | | | | | | | | |
Series 2013, RB(i) | | | 5.00% | | | | 05/15/2043 | | | | 3,000 | | | 3,001,793 |
Series 2015 A, RB(i) | | | 5.00% | | | | 05/15/2045 | | | | 5,000 | | | 5,042,378 |
Series 2018 A, RB(i) | | | 5.25% | | | | 05/15/2048 | | | | 5,000 | | | 5,179,579 |
Series 2018, Ref. RB(i) | | | 5.00% | | | | 05/15/2048 | | | | 4,395 | | | 4,508,385 |
Series 2019, RB(i) | | | 5.00% | | | | 05/15/2049 | | | | 24,745 | | | 25,320,099 |
Series 2022, RB(i) | | | 4.00% | | | | 05/15/2047 | | | | 10,000 | | | 9,298,316 |
Los Angeles (City of), CA Department of Water & Power; | | | | | | | | | | | | | | |
Series 2017 A, Ref. RB | | | 5.00% | | | | 07/01/2044 | | | | 8,250 | | | 8,668,284 |
Series 2017 C, RB | | | 5.00% | | | | 07/01/2042 | | | | 5,525 | | | 5,848,495 |
Series 2017, RB(e) | | | 5.00% | | | | 07/01/2047 | | | | 21,000 | | | 21,967,619 |
Series 2020 B, Ref. RB | | | 5.00% | | | | 07/01/2050 | | | | 8,000 | | | 8,573,606 |
Series 2022 B, RB | | | 5.00% | | | | 07/01/2052 | | | | 6,500 | | | 7,052,285 |
Series 2022 D, Ref. RB | | | 5.00% | | | | 07/01/2047 | | | | 17,555 | | | 19,272,098 |
Los Angeles (County of), CA Community Facilities District No. 2021-01 (Valencia Facilities); Series 2022, RB | | | 5.00% | | | | 09/01/2052 | | | | 2,000 | | | 1,980,500 |
Los Angeles (County of), CA Metropolitan Transportation Authority (Prop C); Series 2021 A, RB | | | 5.00% | | | | 07/01/2042 | | | | 6,055 | | | 6,711,230 |
Los Angeles (Port of), CA; Series 2014 A, Ref. RB(i) | | | 5.00% | | | | 08/01/2036 | | | | 1,000 | | | 1,017,430 |
Los Angeles County Schools Regionalized Business Services Corp. (Los Angeles County Schools Pooled Financing Program); Series 1999 A, COP (INS - AMBAC)(a)(f) | | | 0.00% | | | | 08/01/2024 | | | | 1,265 | | | 1,195,314 |
Lynwood (City of), CA Public Financing Authority (Measure M); Series 2019 A, RB (INS - AGM)(a) | | | 5.25% | | | | 06/01/2048 | | | | 3,185 | | | 3,407,770 |
Madera (County of), CA (Valley Children’s Hospital); Series 1995, COP (INS - NATL)(a) | | | 5.75% | | | | 03/15/2028 | | | | 85 | | | 87,545 |
Madera (County of), CA Community Facilities District No. 2017-1 (Tesoro Viejo); | | | | | | | | | | | | | | |
Series 2020, RB | | | 4.00% | | | | 09/01/2045 | | | | 2,060 | | | 1,762,075 |
Series 2020, RB | | | 4.00% | | | | 09/01/2051 | | | | 3,560 | | | 2,941,207 |
Manhattan Beach Unified School District (Measure C); Series 2020 B, GO Bonds | | | 4.00% | | | | 09/01/2045 | | | | 10 | | | 9,728 |
Marina (City of), CA Redevelopment Agency Successor Agency; | | | | | | | | | | | | | | |
Series 2018 B, RB | | | 5.00% | | | | 09/01/2038 | | | | 250 | | | 258,727 |
Series 2020 A, RB | | | 4.00% | | | | 09/01/2040 | | | | 700 | | | 629,037 |
Series 2020 B, RB | | | 4.00% | | | | 09/01/2040 | | | | 700 | | | 620,998 |
McFarland Unified School District (Election of 2012); Series 2014 A, GO Bonds(b)(c) | | | 5.50% | | | | 11/01/2024 | | | | 1,750 | | | 1,821,431 |
Menifee (City of), CA (Meadow Run); Series 2022, RB | | | 4.00% | | | | 09/01/2051 | | | | 570 | | | 485,378 |
Menifee (City of), CA Community Facilities District No. 2020-1 (McCall Mesa); Series 2022 A, RB | | | 4.00% | | | | 09/01/2051 | | | | 1,430 | | | 1,208,104 |
Menifee Union School District; | | | | | | | | | | | | | | |
Series 2020 C, GO Bonds (INS - AGM)(a) | | | 3.00% | | | | 08/01/2040 | | | | 1,500 | | | 1,242,155 |
Series 2020 C, GO Bonds (INS - AGM)(a) | | | 3.00% | | | | 08/01/2045 | | | | 2,200 | | | 1,693,290 |
Series 2021, RB | | | 4.00% | | | | 09/01/2044 | | | | 560 | | | 494,108 |
Series 2021, RB | | | 4.00% | | | | 09/01/2051 | | | | 675 | | | 570,259 |
Menifee Union School District (Community Facilities District No. 2006-2); Series 2020, Ref. RB | | | 4.00% | | | | 09/01/2045 | | | | 705 | | | 619,281 |
See accompanying Notes to Financial Statements which are an integral part of the financial statements.
| | |
| 17 | | Invesco California Municipal Fund |
| | | | | | | | | | | | | | |
| | | Interest
Rate | | | Maturity
Date | | | Principal
Amount
(000) | | | Value |
California-(continued) | | | | | | | | | | | | | | |
Menifee Union School District (Community Facilities District No. 2011-1 - Improvement Area No. 3); | | | | | | | | | | | | | | |
Series 2018, RB | | | 5.00% | | | | 09/01/2043 | | | $ | 1,000 | | | $ 1,016,627 |
Series 2018, RB | | | 5.00% | | | | 09/01/2048 | | | | 1,500 | | | 1,515,268 |
Series 2021, RB | | | 4.00% | | | | 09/01/2051 | | | | 1,825 | | | 1,536,948 |
Menifee Union School District (Community Facilities District No. 2011-1 - Improvement Area No. 5); Series 2021, RB | | | 4.00% | | | | 09/01/2045 | | | | 975 | | | 852,832 |
Menifee Union School District (Community Facilities District No. 2014-3); Series 2019, RB | | | 5.00% | | | | 09/01/2044 | | | | 1,500 | | | 1,518,188 |
Menifee Union School District (Election of 2008); Series 2009 C, GO Bonds (INS - AGC)(a)(f) | | | 0.00% | | | | 08/01/2035 | | | | 940 | | | 578,989 |
Menifee Union School District Public Financing Authority; Series 2017 A, RB (INS - NATL)(a) | | | 5.00% | | | | 09/01/2033 | | | | 1,000 | | | 1,063,096 |
Merced City School District (Election of 2014); | | | | | | | | | | | | | | |
Series 2018, GO Bonds | | | 5.00% | | | | 08/01/2048 | | | | 3,020 | | | 3,220,511 |
Series 2022, GO Bonds (INS - AGM)(a) | | | 4.00% | | | | 08/01/2046 | | | | 3,500 | | | 3,353,367 |
Mizuho Floater/Residual Trust; Series 2022, VRD RB (LOC - Mizuho Capital Mkts LLC)(h)(m)(n) | | | 3.05% | | | | 06/01/2050 | | | | 14,645 | | | 14,645,000 |
Moorpark Unified School District (Election of 2008); Series 2009 A, GO Bonds (INS - AGC)(a)(f) | | | 0.00% | | | | 08/01/2031 | | | | 840 | | | 621,195 |
Moreno Valley Unified School District (Community Facilities District No. 2004-4); Series 2015, RB | | | 5.00% | | | | 09/01/2045 | | | | 2,050 | | | 2,066,357 |
Moreno Valley Unified School District (Community Facilities District No. 2015-2); | | | | | | | | | | | | | | |
Series 2019, RB | | | 5.00% | | | | 09/01/2044 | | | | 435 | | | 442,507 |
Series 2019, RB | | | 5.00% | | | | 09/01/2048 | | | | 485 | | | 491,339 |
Mountain House Public Financing Authority (Green Bonds); | | | | | | | | | | | | | | |
Series 2020 A, RB (INS - BAM)(a) | | | 4.00% | | | | 12/01/2045 | | | | 1,045 | | | 1,001,783 |
Series 2020 A, RB (INS - BAM)(a) | | | 4.00% | | | | 12/01/2050 | | | | 17,030 | | | 16,062,366 |
Mountain View Shoreline Regional Park Community; Series 2018 A, RB (INS - AGM)(a) | | | 5.00% | | | | 08/01/2048 | | | | 2,000 | | | 2,112,652 |
Mt. San Antonio Community College District (Election of 2008); Series 2013 A, GO Bonds(l) | | | 6.25% | | | | 08/01/2043 | | | | 2,035 | | | 1,822,403 |
Mt. San Antonio Community College District (Election of 2018); Series 2019 A, GO Bonds | | | 5.00% | | | | 08/01/2044 | | | | 8,000 | | | 8,612,071 |
Murrieta (City of), CA (Community Facilities District No. 2005-5); Series 2017, RB | | | 5.00% | | | | 09/01/2042 | | | | 655 | | | 666,628 |
Norco (City of), CA Community Redevelopment Agency Successor Agency (Project Area No. 1); Series 2014, Ref. RB (INS - BAM)(a) | | | 5.00% | | | | 03/01/2030 | | | | 1,500 | | | 1,534,562 |
North Orange (County of), CA Community College District; Series 2022 C, GO Bonds(d)(e) | | | 4.00% | | | | 08/01/2047 | | | | 22,000 | | | 21,177,141 |
Northern California Energy Authority; Series 2018 A, RB(c) | | | 4.00% | | | | 07/01/2024 | | | | 10,000 | | | 10,009,633 |
Northern California Tobacco Securitization Authority; | | | | | | | | | | | | | | |
Series 2021 A, Ref. RB | | | 4.00% | | | | 06/01/2049 | | | | 1,615 | | | 1,452,183 |
Series 2021 B-1, Ref. RB | | | 4.00% | | | | 06/01/2049 | | | | 1,655 | | | 1,572,246 |
Oak Grove School District (Election of 2008); | | | | | | | | | | | | | | |
Series 2018 E, Ref. GO Bonds(l) | | | 5.00% | | | | 08/01/2038 | | | | 8,680 | | | 4,823,176 |
Series 2018 E, Ref. GO Bonds(l) | | | 5.00% | | | | 08/01/2042 | | | | 5,755 | | | 3,155,541 |
Oakland Unified School District (County of Alameda); Series 2021 A, GO Bonds (INS - BAM)(a) | | | 4.00% | | | | 08/01/2046 | | | | 9,000 | | | 8,661,608 |
Oceanside Unified School District (Election of 2008); Series 2019 E, GO Bonds | | | 4.00% | | | | 08/01/2048 | | | | 2,500 | | | 2,374,588 |
Ontario (City of), CA; Series 2021, RB | | | 4.00% | | | | 09/01/2051 | | | | 500 | | | 419,095 |
Ontario (City of), CA Community Facilities District No. 25 (Park Place Facilities Phase II); Series 2019, RB | | | 5.00% | | | | 09/01/2049 | | | | 1,000 | | | 1,012,857 |
Ontario (City of), CA Community Facilities District No. 40 (Emerald Park Facilities); Series 2020, RB | | | 4.00% | | | | 09/01/2050 | | | | 780 | | | 651,209 |
Ontario (City of), CA Community Facilities District No. 43 (Park Place Facilities Phase IV); Series 2020, RB | | | 4.00% | | | | 09/01/2050 | | | | 1,000 | | | 846,610 |
Ontario (City of), CA Community Facilities District No. 45; | | | | | | | | | | | | | | |
Series 2020, RB | | | 4.00% | | | | 09/01/2043 | | | | 280 | | | 244,910 |
Series 2020, RB | | | 4.00% | | | | 09/01/2051 | | | | 1,110 | | | 924,909 |
Orange (County of), CA Community Facilities District (Village of Esencia); Series 2020, RB | | | 4.00% | | | | 08/15/2045 | | | | 845 | | | 733,002 |
Orange (County of), CA Community Facilities District No. 2015-1 (Esencia Village); | | | | | | | | | | | | | | |
Series 2015 A, RB | | | 5.00% | | | | 08/15/2035 | | | | 125 | | | 128,191 |
Series 2015 A, RB | | | 5.25% | | | | 08/15/2045 | | | | 1,810 | | | 1,838,722 |
Orange (County of), CA Community Facilities District No. 2016-1 (Village of Esencia); Series 2016 A, RB | | | 5.00% | | | | 08/15/2031 | | | | 1,350 | | | 1,409,662 |
Orange (County of), CA Community Facilities District No. 2021-1 (Ladera Ranch); Series 2022 A, RB | | | 5.00% | | | | 08/15/2052 | | | | 2,000 | | | 2,011,326 |
Oxnard (City of), CA Financing Authority; | | | | | | | | | | | | | | |
Series 2014, Ref. RB (INS - AGM)(a) | | | 5.00% | | | | 06/01/2032 | | | | 1,250 | | | 1,275,593 |
Series 2014, Ref. RB (INS - AGM)(a) | | | 5.00% | | | | 06/01/2033 | | | | 1,500 | | | 1,529,788 |
Series 2014, Ref. RB (INS - AGM)(a) | | | 5.00% | | | | 06/01/2034 | | | | 850 | | | 866,044 |
See accompanying Notes to Financial Statements which are an integral part of the financial statements.
| | |
| 18 | | Invesco California Municipal Fund |
| | | | | | | | | | | | | | |
| | | Interest
Rate | | | Maturity
Date | | | Principal
Amount
(000) | | | Value |
California-(continued) | | | | | | | | | | | | | | |
Palm Desert (City of), CA; | | | | | | | | | | | | | | |
Series 2021 A, Ref. RB | | | 4.00% | | | | 09/01/2026 | | | $ | 300 | | | $ 299,143 |
Series 2021 A, Ref. RB | | | 4.00% | | | | 09/01/2027 | | | | 315 | | | 314,446 |
Series 2021 A, Ref. RB | | | 4.00% | | | | 09/01/2030 | | | | 250 | | | 249,351 |
Series 2021 A, Ref. RB | | | 4.00% | | | | 09/01/2033 | | | | 275 | | | 271,912 |
Series 2021 A, Ref. RB | | | 4.00% | | | | 09/01/2036 | | | | 300 | | | 285,266 |
Palm Desert (City of), CA Financing Authority (Project Area No. 2); Series 2003, RB (INS - NATL)(a) | | | 5.00% | | | | 08/01/2033 | | | | 40 | | | 40,403 |
Palm Springs (City of), CA Community Redevelopment Agency Successor Agency; Series 2014, Ref. RB (INS - AGM)(a) | | | 5.00% | | | | 09/01/2032 | | | | 445 | | | 460,556 |
Palomar Community College District (Election of 2006); Series 2010, GO Bonds(l) | | | 6.38% | | | | 08/01/2045 | | | | 3,330 | | | 2,844,754 |
Palomar Health; | | | | | | | | | | | | | | |
Series 2017, COP | | | 4.00% | | | | 11/01/2047 | | | | 3,185 | | | 2,753,549 |
Series 2017, Ref. RB | | | 5.00% | | | | 11/01/2042 | | | | 4,835 | | | 4,860,841 |
Paradise Unified School District; | | | | | | | | | | | | | | |
Series 2023 C, GO Bonds | | | 5.00% | | | | 08/01/2047 | | | | 2,310 | | | 2,412,648 |
Series 2023 C, GO Bonds | | | 5.00% | | | | 08/01/2052 | | | | 3,605 | | | 3,754,872 |
Perris (City of), CA Joint Powers Authority (Green Valley West Elementary); | | | | | | | | | | | | | | |
Series 2021, RB | | | 4.00% | | | | 09/01/2044 | | | | 1,060 | | | 932,704 |
Series 2021, RB | | | 4.00% | | | | 09/01/2051 | | | | 1,225 | | | 1,033,280 |
Perris Elementary School District (Election of 2014); | | | | | | | | | | | | | | |
Series 2014 A, GO Bonds (INS - BAM)(a) | | | 6.00% | | | | 08/01/2029 | | | | 235 | | | 243,687 |
Series 2014 A, GO Bonds (INS - BAM)(a) | | | 6.00% | | | | 08/01/2030 | | | | 290 | | | 300,557 |
Perris Union High School District; Series 2019, Ref. COP (INS - BAM)(a) | | | 5.00% | | | | 10/01/2048 | | | | 3,000 | | | 3,213,693 |
Piedmont Unified School District; Series 2019, GO Bonds | | | 3.00% | | | | 08/01/2045 | | | | 4,375 | | | 3,466,808 |
Pittsburg Unified School District Financing Authority (Pittsburg Unified School District Bond Program); Series 2019, RB (INS - AGM)(a) | | | 5.00% | | | | 09/01/2047 | | | | 7,000 | | | 7,364,454 |
Pixley Union School District (Election of 2014); Series 2014 A, GO Bonds(b)(c) | | | 5.25% | | | | 08/01/2024 | | | | 1,000 | | | 1,029,631 |
Poway Unified School District (Del Sur East II); Series 2020, RB (INS - AGM)(a) | | | 4.00% | | | | 09/01/2050 | | | | 4,255 | | | 4,052,576 |
Poway Unified School District Public Financing Authority; Series 2015 B, Ref. RB (INS - BAM)(a) | | | 5.00% | | | | 09/01/2035 | | | | 1,940 | | | 2,027,715 |
Rancho Cordova (City of), CA (Community Facilities District No. 2014-1); | | | | | | | | | | | | | | |
Series 2021, RB | | | 4.00% | | | | 09/01/2041 | | | | 390 | | | 352,154 |
Series 2021, RB | | | 4.00% | | | | 09/01/2046 | | | | 585 | | | 508,035 |
Series 2021, RB | | | 4.00% | | | | 09/01/2050 | | | | 500 | | | 422,648 |
Rancho Cordova (City of), CA (Community Facilities District No. 2018-1); | | | | | | | | | | | | | | |
Series 2021, RB | | | 4.00% | | | | 09/01/2046 | | | | 225 | | | 197,100 |
Series 2021, RB | | | 4.00% | | | | 09/01/2050 | | | | 200 | | | 171,446 |
Rancho Mirage Community Facilities District (Del Webb); | | | | | | | | | | | | | | |
Series 2021, RB | | | 4.00% | | | | 09/01/2046 | | | | 380 | | | 331,919 |
Series 2021, RB | | | 4.00% | | | | 09/01/2051 | | | | 325 | | | 276,313 |
Ravenswood School District; | | | | | | | | | | | | | | |
Series 2018, GO Bonds | | | 5.00% | | | | 08/01/2031 | | | | 500 | | | 538,518 |
Series 2018, GO Bonds | | | 5.00% | | | | 08/01/2033 | | | | 500 | | | 537,797 |
Series 2018, GO Bonds | | | 5.00% | | | | 08/01/2035 | | | | 750 | | | 801,282 |
Redding (City of), CA Redevelopment Agency (Canby-Hilltop-Cypress Redevelopment); Series 2003 A, RB (INS - NATL)(a) | | | 5.00% | | | | 09/01/2023 | | | | 1,400 | | | 1,401,519 |
Regents of the University of California Medical Center; | | | | | | | | | | | | | | |
Series 2013 K, VRD RB(m) | | | 1.00% | | | | 05/15/2047 | | | | 7,000 | | | 7,000,000 |
Series 2022 P, RB(d)(e) | | | 5.00% | | | | 05/15/2047 | | | | 10,000 | | | 10,805,070 |
Series 2022 P, RB(d) | | | 4.00% | | | | 05/15/2053 | | | | 15,000 | | | 13,839,760 |
Series 2022 P, RB(d)(e) | | | 4.00% | | | | 05/15/2053 | | | | 15,000 | | | 13,839,761 |
Rialto Unified School District; | | | | | | | | | | | | | | |
Series 2019 A, GO Bonds (INS - BAM)(a)(f) | | | 0.00% | | | | 08/01/2042 | | | | 8,125 | | | 3,350,951 |
Series 2019 A, GO Bonds (INS - BAM)(a)(f) | | | 0.00% | | | | 08/01/2043 | | | | 4,500 | | | 1,760,000 |
Rio Hondo Community College District (Election of 2004); Series 2010 C, GO Bonds(l) | | | 6.63% | | | | 08/01/2042 | | | | 10,530 | | | 12,040,434 |
River Islands Public Financing Authority; | | | | | | | | | | | | | | |
Series 2022 A-1, Ref. RB (INS - AGM)(a) | | | 5.25% | | | | 09/01/2052 | | | | 3,600 | | | 3,990,561 |
Series 2022, RB (INS - AGM)(a) | | | 5.25% | | | | 09/01/2052 | | | | 2,000 | | | 2,215,749 |
Riverbank (City of), CA Redevelopment Agency; Series 2007 B, RB(g) | | | 5.00% | | | | 08/01/2032 | | | | 35 | | | 34,125 |
Riverside (City of), CA (Community Facilities District No. 92-1); Series 2005 A, RB | | | 5.30% | | | | 09/01/2034 | | | | 1,050 | | | 1,057,830 |
See accompanying Notes to Financial Statements which are an integral part of the financial statements.
| | |
| 19 | | Invesco California Municipal Fund |
| | | | | | | | | | | | | | |
| | | Interest
Rate | | | Maturity
Date | | | Principal
Amount
(000) | | | Value |
California-(continued) | | | | | | | | | | | | | | |
Riverside (County of), CA Community Facilities District No. 07-2 (Clinton Keith); | | | | | | | | | | | | | | |
Series 2015, RB | | | 5.00% | | | | 09/01/2044 | | | $ | 1,000 | | | $ 1,007,911 |
Series 2017, RB | | | 5.00% | | | | 09/01/2045 | | | | 535 | | | 542,351 |
Riverside (County of), CA Public Financing Authority (Desert Communities and Interstate 215 Corridor); | | | | | | | | | | | | | | |
Series 2017 A, Ref. RB (INS - BAM)(a) | | | 5.00% | | | | 10/01/2034 | | | | 1,000 | | | 1,088,052 |
Series 2017 A, Ref. RB (INS - BAM)(a) | | | 4.00% | | | | 10/01/2040 | | | | 500 | | | 494,330 |
Riverside (County of), CA Redevelopment Successor Agency (Jurupa Valley Redevelopment); | | | | | | | | | | | | | | |
Series 2011, RB(b)(c) | | | 7.75% | | | | 10/01/2024 | | | | 1,000 | | | 1,070,774 |
Series 2011, RB(b)(c) | | | 8.00% | | | | 10/01/2024 | | | | 1,000 | | | 1,073,795 |
Riverside (County of), CA Transportation Commission; Series 2021 B-1, Ref. RB | | | 4.00% | | | | 06/01/2046 | | | | 16,545 | | | 15,283,111 |
Riverside Unified School District (Community Facilities District No. 32); | | | | | | | | | | | | | | |
Series 2020, RB | | | 4.00% | | | | 09/01/2045 | | | | 290 | | | 253,305 |
Series 2020, RB | | | 4.00% | | | | 09/01/2050 | | | | 610 | | | 516,432 |
Riverside Unified School District (Community Facilities District No. 33); | | | | | | | | | | | | | | |
Series 2021, RB | | | 4.00% | | | | 09/01/2041 | | | | 275 | | | 243,052 |
Series 2021, RB | | | 4.00% | | | | 09/01/2050 | | | | 600 | | | 500,639 |
Riverside Unified School District (Election of 2016); | | | | | | | | | | | | | | |
Series 2019 B, GO Bonds | | | 3.00% | | | | 08/01/2038 | | | | 1,740 | | | 1,504,889 |
Series 2019 B, GO Bonds | | | 3.00% | | | | 08/01/2039 | | | | 4,250 | | | 3,612,191 |
Series 2019 B, GO Bonds | | | 3.00% | | | | 08/01/2040 | | | | 2,770 | | | 2,297,424 |
Romoland School District Community Facilities No. 2004-1; Series 2015, Ref. RB | | | 5.00% | | | | 09/01/2038 | | | | 1,000 | | | 1,013,085 |
Root Creek Water District Community Facilities District No. 2016-1 Improvement Area No. 1; | | | | | | | | | | | | | | |
Series 2021, RB | | | 4.00% | | | | 09/01/2041 | | | | 430 | | | 385,832 |
Series 2021, RB | | | 4.00% | | | | 09/01/2050 | | | | 570 | | | 482,568 |
Root Creek Water District Community Facilities District No. 2016-1 Improvement Area No. 2; Series 2021, RB | | | 4.00% | | | | 09/01/2050 | | | | 930 | | | 787,347 |
Roseville (City of), CA (Villages at Sierra Vista Community Facilities District No. 1 - Public Facilities); | | | | | | | | | | | | | | |
Series 2020, RB | | | 4.00% | | | | 09/01/2039 | | | | 375 | | | 348,210 |
Series 2020, RB | | | 4.00% | | | | 09/01/2045 | | | | 350 | | | 308,752 |
Series 2020, RB | | | 4.00% | | | | 09/01/2050 | | | | 475 | | | 408,459 |
Roseville (City of), CA (Westpark-Federico Community Facilities District); | | | | | | | | | | | | | | |
Series 2022, RB | | | 5.00% | | | | 09/01/2043 | | | | 1,830 | | | 1,855,742 |
Series 2022, RB | | | 5.00% | | | | 09/01/2052 | | | | 2,760 | | | 2,758,300 |
Sacramento (City of), CA (Convention Center Complex); Series 2018 A, RB | | | 5.00% | | | | 06/01/2043 | | | | 2,000 | | | 2,092,379 |
Sacramento (City of), CA (North Natomas Community Facilities District No. 4); | | | | | | | | | | | | | | |
Series 2015, Ref. RB | | | 5.00% | | | | 09/01/2032 | | | | 1,290 | | | 1,334,506 |
Series 2015, Ref. RB | | | 5.00% | | | | 09/01/2033 | | | | 1,200 | | | 1,239,405 |
Sacramento (City of), CA Municipal Utility District (Green Bonds); Series 2020 H, RB | | | 4.00% | | | | 08/15/2045 | | | | 5,000 | | | 4,858,367 |
Sacramento (County of), CA; | | | | | | | | | | | | | | |
Series 2018 C, Ref. RB(i) | | | 5.00% | | | | 07/01/2038 | | | | 2,200 | | | 2,287,351 |
Series 2018 C, Ref. RB(i) | | | 5.00% | | | | 07/01/2039 | | | | 9,495 | | | 9,829,231 |
Sacramento (County of), CA (Community Facilities District No. 2014-2); Series 2021, RB | | | 4.00% | | | | 09/01/2046 | | | | 650 | | | 566,935 |
Sacramento (County of), CA Housing Authority; Series 2002 C, RB (INS - AMBAC)(a)(i) | | | 5.25% | | | | 06/01/2027 | | | | 650 | | | 639,043 |
San Bernardino (City of), CA; | | | | | | | | | | | | | | |
Series 2022, RB | | | 5.13% | | | | 09/01/2047 | | | | 555 | | | 555,726 |
Series 2022, RB | | | 5.25% | | | | 09/01/2052 | | | | 680 | | | 681,814 |
San Bernardino (City of), CA Joint Powers Financing Authority; Series 1999, Ref. COP (INS - NATL)(a) | | | 5.50% | | | | 09/01/2024 | | | | 5 | | | 5,009 |
San Bernardino Mountains Community Hospital District; | | | | | | | | | | | | | | |
Series 2007 A, COP | | | 5.00% | | | | 02/01/2027 | | | | 650 | | | 650,080 |
Series 2007 A, COP | | | 5.00% | | | | 02/01/2037 | | | | 3,235 | | | 3,234,910 |
San Diego (City of), CA Housing Authority (Sorrento Tower Apartments); Series 2011 B, RB | | | 5.00% | | | | 05/01/2029 | | | | 2,975 | | | 2,979,468 |
San Diego (County of), CA Redevelopment Agency (Gillespie Field); Series 2005 A, Ref. RB(i) | | | 5.75% | | | | 12/01/2032 | | | | 3,925 | | | 3,931,446 |
See accompanying Notes to Financial Statements which are an integral part of the financial statements.
| | |
| 20 | | Invesco California Municipal Fund |
| | | | | | | | | | | | | | |
| | | Interest
Rate | | | Maturity
Date | | | Principal
Amount
(000) | | | Value |
California-(continued) | | | | | | | | | | | | | | |
San Diego (County of), CA Regional Airport Authority; | | | | | | | | | | | | | | |
Series 2017 B, RB(i) | | | 5.00% | | | | 07/01/2037 | | | $ | 1,000 | | | $ 1,032,923 |
Series 2019 B, Ref. RB(i) | | | 4.00% | | | | 07/01/2044 | | | | 1,000 | | | 923,997 |
Series 2019 B, Ref. RB(i) | | | 5.00% | | | | 07/01/2049 | | | | 12,840 | | | 13,067,965 |
Series 2021 A, RB | | | 5.00% | | | | 07/01/2056 | | | | 8,880 | | | 9,317,955 |
Series 2021 B, RB(i) | | | 4.00% | | | | 07/01/2046 | | | | 15,040 | | | 13,708,626 |
Series 2021 B, RB(i) | | | 4.00% | | | | 07/01/2051 | | | | 2,000 | | | 1,778,800 |
Series 2021 B, RB(i) | | | 5.00% | | | | 07/01/2056 | | | | 9,400 | | | 9,618,744 |
San Diego (County of), CA Regional Transportation Commission; Series 2014 A, RB(b)(c)(e) | | | 5.00% | | | | 04/01/2024 | | | | 2,980 | | | 3,040,491 |
San Diego Unified School District; Series 2022, GO Bonds(e) | | | 4.25% | | | | 07/01/2052 | | | | 17,500 | | | 17,330,269 |
San Diego Unified School District (Election of 2012); Series 2017 I, GO Bonds | | | 4.00% | | | | 07/01/2047 | | | | 14,155 | | | 13,628,149 |
San Diego Unified School District (Green Bonds); Series 2021 N-2, GO Bonds | | | 4.00% | | | | 07/01/2046 | | | | 12,500 | | | 12,052,445 |
San Francisco (City & County of), CA Airport Commission (San Francisco International Airport); | | | | | | | | | | | | | | |
Second Series 2018 D, RB(i) | | | 5.00% | | | | 05/01/2048 | | | | 11,290 | | | 11,475,486 |
Second Series 2022 B, Ref. RB | | | 4.00% | | | | 05/01/2052 | | | | 10,225 | | | 9,565,751 |
Series 2017 A, RB(i) | | | 5.00% | | | | 05/01/2042 | | | | 1,930 | | | 1,969,906 |
Series 2018 D, RB(i) | | | 5.25% | | | | 05/01/2048 | | | | 6,200 | | | 6,372,299 |
Series 2019 A, RB(i) | | | 5.00% | | | | 05/01/2049 | | | | 8,055 | | | 8,203,389 |
Series 2019 E, RB(i) | | | 5.00% | | | | 05/01/2050 | | | | 31,575 | | | 32,131,410 |
San Francisco (City & County of), CA Community Facilities District No. 2016-1; | | | | | | | | | | | | | | |
Series 2020, RB | | | 4.00% | | | | 09/01/2042 | | | | 550 | | | 491,545 |
Series 2020, RB | | | 4.00% | | | | 09/01/2050 | | | | 1,025 | | | 869,125 |
San Francisco (City & County of), CA Community Facilities District No. 2016-1 (Treasure Island); Series 2022, RB(h) | | | 4.00% | | | | 09/01/2052 | | | | 2,000 | | | 1,662,563 |
San Francisco (City & County of), CA Infrastructure & Revitalization Financing District No. 1; | | | | | | | | | | | | | | |
Series 2022 A, RB(h) | | | 5.00% | | | | 09/01/2037 | | | | 385 | | | 389,347 |
Series 2022 A, RB(h) | | | 5.00% | | | | 09/01/2052 | | | | 2,000 | | | 1,892,755 |
Series 2022 B, RB(h) | | | 5.00% | | | | 09/01/2052 | | | | 1,000 | | | 946,378 |
San Francisco (City & County of), CA Public Utilities Commission; Series 2018 B, RB | | | 5.00% | | | | 10/01/2043 | | | | 7,250 | | | 7,761,126 |
San Francisco (City & County of), CA Public Utilities Commission (Green Bonds); | | | | | | | | | | | | | | |
Series 2021 A, RB | | | 4.00% | | | | 10/01/2048 | | | | 10,000 | | | 9,780,410 |
Series 2021 A, RB | | | 4.00% | | | | 10/01/2051 | | | | 5,000 | | | 4,844,981 |
San Francisco (City & County of), CA Successor Agency to the Redevelopment Agency (Hunters Point Shipyard Phase One Improvements); Series 2014, Ref. RB | | | 5.00% | | | | 08/01/2044 | | | | 2,775 | | | 2,790,268 |
San Francisco (City & County of), CA Successor Agency to the Redevelopment Agency (Mission Bay South Redevelopment); Series 2014 A, RB | | | 5.00% | | | | 08/01/2043 | | | | 1,060 | | | 1,088,309 |
San Francisco (City & County of), CA Successor Agency to the Redevelopment Agency Community Facilities District No. 6 (Mission Bay South Public Improvements); | | | | | | | | | | | | | | |
Series 2013 A, Ref. RB | | | 5.00% | | | | 08/01/2033 | | | | 500 | | | 504,142 |
Series 2013 B, RB | | | 5.00% | | | | 08/01/2031 | | | | 500 | | | 504,684 |
San Gorgonio Memorial Health Care District; Series 2014, Ref. GO Bonds | | | 5.00% | | | | 08/01/2032 | | | | 500 | | | 496,541 |
San Jacinto Unified School District (Community Facilities District No. 2020-1); Series 2022, RB | | | 4.00% | | | | 09/01/2052 | | | | 760 | | | 629,763 |
San Jacinto Unified School District Financing Authority; Series 2017, Ref. RB | | | 5.00% | | | | 09/01/2043 | | | | 250 | | | 254,288 |
San Joaquin Hills Transportation Corridor Agency; | | | | | | | | | | | | | | |
Series 2014 B, Ref. RB | | | 5.25% | | | | 01/15/2044 | | | | 2,000 | | | 2,009,025 |
Series 2021 A, Ref. RB | | | 4.00% | | | | 01/15/2044 | | | | 1,705 | | | 1,598,971 |
San Jose (City of), CA; Series 2017 A, Ref. RB(i) | | | 5.00% | | | | 03/01/2047 | | | | 8,600 | | | 8,721,970 |
San Jose (City of), CA (El Parador Apartments); Series 2000 A, RB(i) | | | 6.20% | | | | 01/01/2041 | | | | 3,150 | | | 3,127,117 |
San Jose (City of), CA (Fallen Leaves Apartments); Series 2002 J-1, RB (INS - AMBAC)(a)(i) | | | 5.10% | | | | 12/01/2032 | | | | 4,025 | | | 4,024,747 |
San Jose (City of), CA (Orvieto Family Apartments); Series 2010 B-1, RB | | | 4.75% | | | | 08/01/2029 | | | | 5,020 | | | 5,026,683 |
San Jose Evergreen Community College District (Election of 2004); Series 2008 B, GO Bonds (INS - AGM)(a)(f) | | | 0.00% | | | | 09/01/2031 | | | | 3,110 | | | 2,345,793 |
San Leandro Unified School District (Election of 2016); Series 2019 B, GO Bonds (INS - BAM)(a) | | | 4.00% | | | | 08/01/2043 | | | | 5,000 | | | 4,856,500 |
San Luis Obispo (County of), CA Financing Authority (Lopez Dam Improvement); Series 2011 A, Ref. RB (INS - AGM)(a) | | | 5.00% | | | | 08/01/2030 | | | | 1,500 | | | 1,502,247 |
San Marcos Unified School District (Community Facilities District No. 7); Series 2019, RB | | | 5.00% | | | | 09/01/2048 | | | | 750 | | | 759,803 |
San Mateo (County of), CA Joint Powers Financing Authority; Series 2018 A, RB(e) | | | 5.00% | | | | 07/15/2043 | | | | 18,075 | | | 19,405,911 |
San Mateo Foster City School District; Series 2010, GO Bonds(l) | | | 6.63% | | | | 08/01/2042 | | | | 1,010 | | | 976,624 |
San Rafael City Elementary School District; Series 2019 C, GO Bonds | | | 4.00% | | | | 08/01/2047 | | | | 2,950 | | | 2,813,373 |
See accompanying Notes to Financial Statements which are an integral part of the financial statements.
| | |
| 21 | | Invesco California Municipal Fund |
| | | | | | | | | | | | | | |
| | | Interest
Rate | | | Maturity
Date | | | Principal
Amount
(000) | | | Value |
California-(continued) | | | | | | | | | | | | | | |
Santa Barbara (County of), CA; | | | | | | | | | | | | | | |
Series 2018 B, COP(i) | | | 5.00% | | | | 12/01/2037 | | | $ | 12,695 | | | $ 13,376,526 |
Series 2018 B, COP(i) | | | 5.00% | | | | 12/01/2038 | | | | 5,000 | | | 5,225,269 |
Santa Clara (County of), CA Housing Authority; | | | | | | | | | | | | | | |
Series 2001 A, RB(i) | | | 5.85% | | | | 08/01/2031 | | | | 885 | | | 886,890 |
Series 2001 A, RB(i) | | | 6.00% | | | | 08/01/2041 | | | | 2,070 | | | 2,114,675 |
Series 2010 A-1, RB (CEP - FHLMC) | | | 4.75% | | | | 11/01/2027 | | | | 4,010 | | | 4,011,729 |
Santa Clarita Community College District; Series 2019, GO Bonds | | | 3.00% | | | | 08/01/2044 | | | | 1,410 | | | 1,098,528 |
Santa Margarita Water District (Community Facilities District No. 2013-1); | | | | | | | | | | | | | | |
Series 2013, RB | | | 5.63% | | | | 09/01/2036 | | | | 960 | | | 967,559 |
Series 2013, RB | | | 5.63% | | | | 09/01/2043 | | | | 960 | | | 965,044 |
Santa Monica (City of), CA Redevelopment Agency; | | | | | | | | | | | | | | |
Series 2011, RB | | | 5.88% | | | | 07/01/2036 | | | | 1,750 | | | 1,756,061 |
Series 2011, RB | | | 5.88% | | | | 07/01/2042 | | | | 2,600 | | | 2,608,475 |
Saugus Union School District Financing Authority; Series 2021 A, RB (INS - BAM)(a) | | | 4.00% | | | | 09/01/2049 | | | | 1,250 | | | 1,186,379 |
Sebastopol Union School District; Series 2020 A, GO Bonds | | | 4.00% | | | | 08/01/2041 | | | | 500 | | | 491,066 |
Signal Hill (City of), CA Redevelopment Agency Successor Agency (Signal Hill Redevelopment Project No. 1); Series 2011, RB | | | 7.00% | | | | 10/01/2026 | | | | 1,385 | | | 1,388,779 |
Silicon Valley Tobacco Securitization Authority (Santa Clara); | | | | | | | | | | | | | | |
Series 2007 A, RB(f) | | | 0.00% | | | | 06/01/2036 | | | | 22,420 | | | 10,754,459 |
Series 2007 A, RB(f) | | | 0.00% | | | | 06/01/2041 | | | | 10,000 | | | 3,529,214 |
Series 2007 B, RB(f) | | | 0.00% | | | | 06/01/2047 | | | | 12,650 | | | 3,125,552 |
Series 2007 C, RB(f) | | | 0.00% | | | | 06/01/2056 | | | | 65,815 | | | 5,952,559 |
Simi Valley Unified School District (Election of 2004); | | | | | | | | | | | | | | |
Series 2007 C, GO Bonds (INS - AGM)(a)(f) | | | 0.00% | | | | 08/01/2028 | | | | 3,480 | | | 2,946,099 |
Series 2007 C, GO Bonds (INS - AGM)(a)(f) | | | 0.00% | | | | 08/01/2030 | | | | 2,765 | | | 2,183,915 |
South El Monte (City of), CA Improvement District Successor Agency; Series 2015 A, Ref. RB (INS - AGM)(a) | | | 5.00% | | | | 08/01/2035 | | | | 4,150 | | | 4,339,622 |
South Orange (County of), CA Public Financing Authority (County of Orange Sheriff-Coroner); Series 2022, RB | | | 5.00% | | | | 06/01/2052 | | | | 10,000 | | | 10,714,894 |
South Orange (County of), CA Public Financing Authority (Ladera Ranch); Series 2014 A, Ref. RB | | | 5.00% | | | | 08/15/2034 | | | | 895 | | | 901,246 |
South San Francisco (City of), CA (Community Facilities District No. 2021-01); Series 2022, RB | | | 5.00% | | | | 09/01/2052 | | | | 2,500 | | | 2,516,156 |
Southern California Public Power Authority (No.1); | | | | | | | | | | | | | | |
Series 2007 A, RB | | | 5.25% | | | | 11/01/2023 | | | | 50 | | | 50,381 |
Series 2007 A, RB | | | 5.25% | | | | 11/01/2026 | | | | 250 | | | 260,867 |
Series 2007 A, RB | | | 5.25% | | | | 11/01/2027 | | | | 2,255 | | | 2,381,801 |
Series 2007 A, RB | | | 5.00% | | | | 11/01/2028 | | | | 205 | | | 216,437 |
Series 2007 A, RB | | | 5.00% | | | | 11/01/2029 | | | | 165 | | | 175,266 |
Series 2007 A, RB | | | 5.00% | | | | 11/01/2033 | | | | 2,085 | | | 2,237,641 |
Series 2014 A, RB | | | 5.00% | | | | 07/01/2035 | | | | 13,000 | | | 13,281,685 |
Southern California Tobacco Securitization Authority (San Diego County Asset Securitization Corp.); | | | | | | | | | | | | | | |
Series 2006, RB(f) | | | 0.00% | | | | 06/01/2046 | | | | 3,000 | | | 478,955 |
Series 2019, Ref. RB | | | 5.00% | | | | 06/01/2039 | | | | 750 | | | 791,658 |
Series 2019, Ref. RB(f) | | | 0.00% | | | | 06/01/2054 | | | | 20,000 | | | 3,638,512 |
Stockton (City of), CA Community Facilities District (Westlake Villages II); Series 2022, RB | | | 5.13% | | | | 09/01/2052 | | | | 1,800 | | | 1,754,837 |
Stockton (City of), CA Redevelopment Agency Successor Agency; Series 2016 A, Ref. RB (INS - AGM)(a) | | | 5.00% | | | | 09/01/2034 | | | | 1,000 | | | 1,068,623 |
Sulphur Springs Union School District; Series 2020, RB | | | 4.00% | | | | 09/01/2050 | | | | 1,225 | | | 1,040,328 |
Susanville (City of), CA (Natural Gas Enterprise Ref.); Series 2019, Ref. RB (INS - AGM)(a) | | | 4.00% | | | | 06/01/2045 | | | | 3,325 | | | 3,188,071 |
Tahoe-Truckee Unified School District; | | | | | | | | | | | | | | |
Series 2016 B, GO Bonds | | | 5.00% | | | | 08/01/2039 | | | | 3,000 | | | 3,164,916 |
Series 2016 B, GO Bonds | | | 5.00% | | | | 08/01/2041 | | | | 950 | | | 999,602 |
Tejon Ranch Public Facilities Finance Authority (Community Facilities District No. 2008-1 - Tejon Industrial Complex Public Improvements); Series 2020, RB | | | 4.00% | | | | 09/01/2050 | | | | 4,750 | | | 4,110,267 |
Tender Option Bond Trust Receipts/Certificates; Series 2023, RB(e) | | | 5.00% | | | | 07/01/2051 | | | | 14,000 | | | 15,105,475 |
Three Rivers Levee Improvement Authority (Community Facilities District No. 2006-1); | | | | | | | | | | | | | | |
Series 2021, Ref. RB | | | 4.00% | | | | 09/01/2036 | | | | 1,075 | | | 1,002,548 |
Series 2021, Ref. RB | | | 4.00% | | | | 09/01/2041 | | | | 2,840 | | | 2,457,321 |
Series 2021, Ref. RB | | | 4.00% | | | | 09/01/2046 | | | | 2,700 | | | 2,202,071 |
See accompanying Notes to Financial Statements which are an integral part of the financial statements.
| | |
| 22 | | Invesco California Municipal Fund |
| | | | | | | | | | | | | | |
| | | Interest Rate | | | Maturity Date | | | Principal Amount (000) | | | Value |
California-(continued) | | | | | | | | | | | | | | |
Torrance Unified School District (Election of 2008-Measure Z); Series 2009, GO Bonds(f) | | | 0.00% | | | | 08/01/2034 | | | $ | 3,600 | | | $ 2,076,327 |
Tracy (City of), CA Community Facilities District; | | | | | | | | | | | | | | |
Series 2022, RB | | | 5.00% | | | | 09/01/2042 | | | | 1,905 | | | 1,944,143 |
Series 2022, RB | | | 5.00% | | | | 09/01/2052 | | | | 2,400 | | | 2,410,084 |
Transbay Joint Powers Authority (Green Bonds); | | | | | | | | | | | | | | |
Series 2020 A, RB | | | 5.00% | | | | 10/01/2045 | | | | 2,190 | | | 2,242,641 |
Series 2020 A, RB | | | 5.00% | | | | 10/01/2049 | | | | 2,100 | | | 2,130,970 |
Series 2020 B, RB | | | 5.00% | | | | 10/01/2035 | | | | 250 | | | 261,248 |
Series 2020 B, RB | | | 5.00% | | | | 10/01/2038 | | | | 300 | | | 310,643 |
Tustin Unified School District (Community Facilities District No. 97-1); Series 2015, Ref. RB (INS - BAM)(a) | | | 5.00% | | | | 09/01/2038 | | | | 2,000 | | | 2,062,893 |
University of California; | | | | | | | | | | | | | | |
Series 2017, RB(e) | | | 5.00% | | | | 05/15/2047 | | | | 15,000 | | | 15,807,065 |
Series 2017, RB(d)(e) | | | 5.00% | | | | 05/15/2048 | | | | 16,000 | | | 16,961,982 |
Series 2018 AZ, Ref. RB | | | 4.00% | | | | 05/15/2048 | | | | 2,000 | | | 1,918,877 |
Series 2018 AZ, Ref. RB(d) | | | 5.00% | | | | 05/15/2048 | | | | 4,000 | | | 4,240,496 |
Series 2020 BE, Ref. RB | | | 4.00% | | | | 05/15/2050 | | | | 12,000 | | | 11,469,964 |
Series 2021 Q, Ref. RB (INS - BAM)(a) | | | 4.00% | | | | 05/15/2051 | | | | 5,040 | | | 4,800,869 |
University of California (Limited); | | | | | | | | | | | | | | |
Series 2017 M, RB | | | 4.00% | | | | 05/15/2047 | | | | 10,160 | | | 9,712,791 |
Series 2018 O, Ref. RB | | | 5.00% | | | | 05/15/2048 | | | | 3,000 | | | 3,174,551 |
Upland (City of), CA Community Facilities District No. 2003-2 (Improvement Area No. 2); | | | | | | | | | | | | | | |
Series 2015, Ref. RB | | | 5.00% | | | | 09/01/2029 | | | | 1,030 | | | 1,052,625 |
Series 2015, Ref. RB | | | 5.00% | | | | 09/01/2030 | | | | 1,080 | | | 1,101,049 |
Upland (City of), CA Community Facilities District No. 2015-1 (Improvement Area No. 1); | | | | | | | | | | | | | | |
Series 2019 A, RB | | | 4.00% | | | | 09/01/2049 | | | | 750 | | | 651,283 |
Upland (City of), CA Community Facilities District No. 2016-1 (Improvement Area No. 2); | | | | | | | | | | | | | | |
Series 2021 A, RB | | | 4.00% | | | | 09/01/2040 | | | | 260 | | | 233,308 |
Series 2021 A, RB | | | 4.00% | | | | 09/01/2045 | | | | 165 | | | 143,165 |
Series 2021 A, RB | | | 4.00% | | | | 09/01/2051 | | | | 260 | | | 218,509 |
Valley (City of), CA Sanitary District; Series 2005, RB | | | 5.20% | | | | 09/02/2030 | | | | 1,320 | | | 1,330,436 |
Victorville (City of), CA (Community Facilities District No. 07-01); Series 2012 A, RB | | | 5.35% | | | | 09/01/2042 | | | | 485 | | | 486,982 |
Vista Unified School District; Series 2019 A, GO Bonds | | | 4.00% | | | | 08/01/2044 | | | | 1,000 | | | 963,896 |
West Contra Costa Unified School District; | | | | | | | | | | | | | | |
Series 2005, GO Bonds (INS - NATL)(a)(f) | | | 0.00% | | | | 08/01/2025 | | | | 2,500 | | | 2,291,784 |
Series 2020 E, GO Bonds (INS - AGM)(a) | | | 3.00% | | | | 08/01/2045 | | | | 6,465 | | | 4,975,963 |
West Covina (City of), CA Public Financing Authority; Series 2018 A, Ref. RB | | | 5.00% | | | | 05/01/2031 | | | | 445 | | | 482,372 |
West Patterson Financing Authority (Community Facilities District No. 2005-1); | | | | | | | | | | | | | | |
Series 2021, RB | | | 4.00% | | | | 09/01/2043 | | | | 600 | | | 524,004 |
Series 2021, RB | | | 4.00% | | | | 09/01/2046 | | | | 745 | | | 636,807 |
Series 2021, RB | | | 4.00% | | | | 09/01/2049 | | | | 1,775 | | | 1,495,935 |
West Patterson Financing Authority (Community Facilities District No. 2015-1); | | | | | | | | | | | | | | |
Series 2015, RB | | | 5.25% | | | | 09/01/2035 | | | | 610 | | | 627,741 |
Series 2015, RB | | | 5.25% | | | | 09/01/2045 | | | | 1,550 | | | 1,571,404 |
West Sacramento (City of), CA (Community Facilities District No. 29); Series 2019, RB | | | 5.00% | | | | 09/01/2044 | | | | 1,065 | | | 1,086,254 |
West Sacramento (City of), CA (Port Towne Infrasctructure); Series 2019, RB | | | 5.00% | | | | 09/01/2037 | | | | 860 | | | 896,770 |
Whittier (City of), CA (Presbyterian Intercommunity Hospital, Inc.); Series 2014, RB | | | 5.00% | | | | 06/01/2044 | | | | 1,500 | | | 1,509,425 |
Woodland (City of), CA Community Facilities District 2004-1; Series 2019, RB | | | 5.00% | | | | 09/01/2044 | | | | 2,140 | | | 2,177,972 |
Yosemite Community College District (Election of 2004); Series 2008 C, GO Bonds (INS - AGM)(a)(f) | | | 0.00% | | | | 08/01/2024 | | | | 4,685 | | | 4,469,520 |
| | | | | | | | | | | | | | | 1,983,415,269 |
| | | | |
Guam-0.74% | | | | | | | | | | | | | | |
Guam (Territory of); Series 2021 F, Ref. RB | | | 4.00% | | | | 01/01/2042 | | | | 1,120 | | | 999,579 |
Guam (Territory of) Department of Education (John F. Kennedy); Series 2020, Ref. COP | | | 5.00% | | | | 02/01/2040 | | | | 2,750 | | | 2,726,541 |
See accompanying Notes to Financial Statements which are an integral part of the financial statements.
| | |
| 23 | | Invesco California Municipal Fund |
| | | | | | | | | | | | | | |
| | | Interest Rate | | | Maturity Date | | | Principal Amount (000) | | | Value |
Guam-(continued) | | | | | | | | | | | | | | |
Guam (Territory of) International Airport Authority; | | | | | | | | | | | | | | |
Series 2013 C, RB(b)(c)(i) | | | 6.00% | | | | 10/01/2023 | | | $ | 715 | | | $ 724,894 |
Series 2013 C, RB(b)(c)(i) | | | 6.13% | | | | 10/01/2023 | | | | 2,055 | | | 2,084,898 |
Series 2013 C, RB(b)(c)(i) | | | 6.25% | | | | 10/01/2023 | | | | 395 | | | 401,028 |
Series 2013 C, RB(b)(i) | | | 6.00% | | | | 10/01/2034 | | | | 285 | | | 288,944 |
Series 2013 C, RB(b)(i) | | | 6.25% | | | | 10/01/2034 | | | | 605 | | | 614,232 |
Series 2013 C, RB(b)(i) | | | 6.13% | | | | 10/01/2043 | | | | 445 | | | 451,474 |
Guam (Territory of) Port Authority; Series 2018 A, RB | | | 5.00% | | | | 07/01/2048 | | | | 1,825 | | | 1,854,978 |
Guam (Territory of) Waterworks Authority; | | | | | | | | | | | | | | |
Series 2014 A, Ref. RB | | | 5.00% | | | | 07/01/2035 | | | | 765 | | | 770,927 |
Series 2020 A, RB | | | 5.00% | | | | 01/01/2050 | | | | 3,460 | | | 3,473,135 |
| | | | | | | | | | | | | | | 14,390,630 |
| | | | |
Northern Mariana Islands-0.10% | | | | | | | | | | | | | | |
Northern Mariana Islands (Commonwealth of) Ports Authority; | | | | | | | | | | | | | | |
Series 1998 A, RB(i) | | | 6.25% | | | | 03/15/2028 | | | | 675 | | | 648,644 |
Series 2005 A, RB(i) | | | 5.50% | | | | 03/15/2031 | | | | 1,415 | | | 1,302,498 |
| | | | | | | | | | | | | | | 1,951,142 |
| | | | |
Puerto Rico-4.15% | | | | | | | | | | | | | | |
Children’s Trust Fund; | | | | | | | | | | | | | | |
Series 2002, RB | | | 5.38% | | | | 05/15/2033 | | | | 125 | | | 125,042 |
Series 2002, RB | | | 5.50% | | | | 05/15/2039 | | | | 9,635 | | | 9,635,560 |
Series 2002, RB | | | 5.63% | | | | 05/15/2043 | | | | 7,770 | | | 7,848,116 |
PRIFA Custodial Trust; Series 2005, RB | | | 0.00% | | | | 03/15/2049 | | | | 86 | | | 26,858 |
Puerto Rico (Commonwealth of); | | | | | | | | | | | | | | |
Series 2021 A, GO Bonds(f) | | | 0.00% | | | | 07/01/2024 | | | | 278 | | | 260,721 |
Series 2021 A, GO Bonds(f) | | | 0.00% | | | | 07/01/2033 | | | | 1,069 | | | 609,160 |
Series 2021 A-1, GO Bonds | | | 5.25% | | | | 07/01/2023 | | | | 464 | | | 465,262 |
Series 2021 A-1, GO Bonds | | | 5.38% | | | | 07/01/2025 | | | | 925 | | | 939,436 |
Series 2021 A-1, GO Bonds | | | 5.63% | | | | 07/01/2027 | | | | 917 | | | 947,153 |
Series 2021 A-1, GO Bonds | | | 5.63% | | | | 07/01/2029 | | | | 902 | | | 941,145 |
Series 2021 A-1, GO Bonds | | | 5.75% | | | | 07/01/2031 | | | | 876 | | | 922,190 |
Series 2021 A-1, GO Bonds | | | 4.00% | | | | 07/01/2033 | | | | 1,731 | | | 1,550,891 |
Series 2021 A-1, GO Bonds | | | 4.00% | | | | 07/01/2035 | | | | 747 | | | 654,087 |
Series 2021 A-1, GO Bonds | | | 4.00% | | | | 07/01/2037 | | | | 641 | | | 548,119 |
Series 2021 A-1, GO Bonds | | | 4.00% | | | | 07/01/2041 | | | | 871 | | | 719,834 |
Series 2021 A-1, GO Bonds | | | 4.00% | | | | 07/01/2046 | | | | 0 | | | 3 |
Subseries 2022, RN | | | 0.00% | | | | 11/01/2043 | | | | 4,245 | | | 1,830,748 |
Subseries 2022, RN | | | 0.00% | | | | 11/01/2051 | | | | 182 | | | 175,864 |
Puerto Rico (Commonwealth of) Aqueduct & Sewer Authority; | | | | | | | | | | | | | | |
Series 2008 A, RB | | | 6.13% | | | | 07/01/2024 | | | | 1,100 | | | 1,117,647 |
Series 2022 A, Ref. RB(h) | | | 5.00% | | | | 07/01/2037 | | | | 1,500 | | | 1,474,304 |
Puerto Rico (Commonwealth of) Electric Power Authority; | | | | | | | | | | | | | | |
Series 2012 A, RB(j) | | | 5.00% | | | | 07/01/2042 | | | | 4,000 | | | 2,790,000 |
Series 2012 A, RB(j) | | | 5.05% | | | | 07/01/2042 | | | | 1,000 | | | 697,500 |
Series 2013 A, RB(j) | | | 6.75% | | | | 07/01/2036 | | | | 7,350 | | | 5,292,000 |
Puerto Rico (Commonwealth of) Highway & Transportation Authority; | | | | | | | | | | | | | | |
Series 2022 A, RB | | | 5.00% | | | | 07/01/2062 | | | | 957 | | | 887,475 |
Series 2022 B, RB(f) | | | 0.00% | | | | 07/01/2032 | | | | 622 | | | 388,638 |
Series 2022 C, RB(l) | | | 5.00% | | | | 07/01/2053 | | | | 1,064 | | | 590,524 |
Puerto Rico (Commonwealth of) Industrial, Tourist, Educational, Medical & Environmental Control Facilities Financing Authority; Series 2000, RB(i) | | | 6.63% | | | | 06/01/2026 | | | | 5,450 | | | 5,535,151 |
See accompanying Notes to Financial Statements which are an integral part of the financial statements.
| | |
| 24 | | Invesco California Municipal Fund |
| | | | | | | | | | | | | | | | |
| | | Interest Rate | | | Maturity Date | | | Principal Amount (000) | | | Value | |
Puerto Rico-(continued) | | | | | | | | | | | | | | | | |
Puerto Rico Sales Tax Financing Corp.; | | | | | | | | | | | | | | | | |
Series 2018 A-1, RB(f) | | | 0.00% | | | | 07/01/2024 | | | $ | 147 | | | $ | 138,580 | |
|
| |
Series 2018 A-1, RB(f) | | | 0.00% | | | | 07/01/2027 | | | | 1,524 | | | | 1,249,250 | |
|
| |
Series 2018 A-1, RB(f) | | | 0.00 | % | | | 07/01/2031 | | | | 1,616 | | | | 1,077,063 | |
|
| |
Series 2018 A-1, RB(f) | | | 0.00 | % | | | 07/01/2033 | | | | 11,974 | | | | 7,152,931 | |
|
| |
Series 2018 A-1, RB | | | 4.50 | % | | | 07/01/2034 | | | | 419 | | | | 415,459 | |
|
| |
Series 2018 A-1, RB | | | 4.55 | % | | | 07/01/2040 | | | | 342 | | | | 319,384 | |
|
| |
Series 2018 A-1, RB(f) | | | 0.00 | % | | | 07/01/2046 | | | | 8,788 | | | | 2,252,189 | |
|
| |
Series 2018 A-1, RB(f) | | | 0.00 | % | | | 07/01/2051 | | | | 13,879 | | | | 2,618,690 | |
|
| |
Series 2018 A-1, RB | | | 4.75 | % | | | 07/01/2053 | | | | 2,510 | | | | 2,249,919 | |
|
| |
Series 2018 A-1, RB | | | 5.00 | % | | | 07/01/2058 | | | | 11,595 | | | | 10,757,841 | |
|
| |
Series 2019 A-2, RB | | | 4.33 | % | | | 07/01/2040 | | | | 2,154 | | | | 1,957,345 | |
|
| |
Series 2019 A-2, RB | | | 4.54 | % | | | 07/01/2053 | | | | 65 | | | | 56,211 | |
|
| |
Series 2019 A-2, RB | | | 4.78 | % | | | 07/01/2058 | | | | 865 | | | | 773,192 | |
|
| |
Series 2019 A-2B, RB | | | 4.55 | % | | | 07/01/2040 | | | | 926 | | | | 864,765 | |
|
| |
University of Puerto Rico; Series 2006 P, Ref. RB | | | 5.00% | | | | 06/01/2030 | | | | 2,190 | | | | 2,127,598 | |
|
| |
| | | | | | | | | | | | | | | 80,983,845 | |
|
| |
| | | | |
Virgin Islands-0.20% | | | | | | | | | | | | | | | | |
Virgin Islands (Government of) Port Authority; | | | | | | | | | | | | | | | | |
Series 2014 A, Ref. RB(i) | | | 5.00% | | | | 09/01/2029 | | | | 1,645 | | | | 1,570,143 | |
|
| |
Series 2014 A, Ref. RB(i) | | | 5.00% | | | | 09/01/2033 | | | | 1,500 | | | | 1,378,699 | |
|
| |
Virgin Islands (Government of) Public Finance Authority (Garvee); Series 2015, RB(h) | | | 5.00% | | | | 09/01/2030 | | | | 1,000 | | | | 1,018,292 | |
|
| |
| | | | | | | | | | | | | | | 3,967,134 | |
|
| |
Total Municipal Obligations (Cost $2,176,923,401) | | | | | | | | | | | | | | | 2,084,708,020 | |
|
| |
| | | | |
U.S. Dollar Denominated Bonds & Notes-0.10% | | | | | | | | | | | | | | | | |
California-0.10% | | | | | | | | | | | | | | | | |
CalPlant I LLC; | | | | | | | | | | | | | | | | |
Series 21A(h)(o) | | | 9.50 | % | | | 06/05/2023 | | | | 160 | | | | 160,000 | |
|
| |
Series 21B(h)(o) | | | 9.50 | % | | | 06/05/2023 | | | | 605 | | | | 605,000 | |
|
| |
Series 22A(h)(o) | | | 9.50 | % | | | 06/05/2023 | | | | 330 | | | | 330,000 | |
|
| |
Series 22B(h)(o) | | | 9.50 | % | | | 06/05/2023 | | | | 30 | | | | 30,000 | |
|
| |
Series 22C(h)(o) | | | 9.50 | % | | | 06/05/2023 | | | | 220 | | | | 220,000 | |
|
| |
Series 22X(h) | | | 9.50 | % | | | 03/31/2023 | | | | 325 | | | | 326,758 | |
|
| |
Series 23A(h)(o) | | | 9.50 | % | | | 03/31/2023 | | | | 115 | | | | 115,000 | |
|
| |
Series 23B(h) | | | 9.50 | % | | | 03/31/2023 | | | | 100 | | | | 100,000 | |
|
| |
Total U.S. Dollar Denominated Bonds & Notes (Cost $1,885,000) | | | | | | | | | | | | | | | 1,886,758 | |
|
| |
TOTAL INVESTMENTS IN SECURITIES-107.02% (Cost $2,178,808,401) | | | | | | | | | | | | | | | 2,086,594,778 | |
|
| |
FLOATING RATE NOTE OBLIGATIONS-(7.83)% | | | | | | | | | | | | | | | | |
Notes with interest and fee rates ranging from 3.95% to 3.99% at 02/28/2023 and contractual maturities of collateral ranging from 05/15/2035 to 04/01/2056 (See Note 1K)(p) | | | | | | | | | | | | | | | (152,730,000 | ) |
|
| |
BORROWINGS-(0.16)% | | | | | | | | | | | | | | | (3,200,000 | ) |
|
| |
OTHER ASSETS LESS LIABILITIES-0.97% | | | | | | | | | | | | | | | 19,041,632 | |
|
| |
NET ASSETS-100.00% | | | | | | | | | | | | | | $ | 1,949,706,410 | |
|
| |
See accompanying Notes to Financial Statements which are an integral part of the financial statements.
| | |
| 25 | | Invesco California Municipal Fund |
Investment Abbreviations:
| | |
| AGC | | - Assured Guaranty Corp. |
| AGM | | - Assured Guaranty Municipal Corp. |
| AMBAC | | - American Municipal Bond Assurance Corp. |
| BAM | | - Build America Mutual Assurance Co. |
| CEP | | - Credit Enhancement Provider |
| COP | | - Certificates of Participation |
| Ctfs. | | - Certificates |
| FGIC | | - Financial Guaranty Insurance Company |
| FHLMC | | - Federal Home Loan Mortgage Corp. |
| GO | | - General Obligation |
| INS | | - Insurer |
| LOC | | - Letter of Credit |
| NATL | | - National Public Finance Guarantee Corp. |
| RB | | - Revenue Bonds |
| Ref. | | - Refunding |
| RN | | - Revenue Notes |
| VRD | | - Variable Rate Demand |
Notes to Schedule of Investments:
| (a) | Principal and/or interest payments are secured by the bond insurance company listed. |
| (b) | Advance refunded; secured by an escrow fund of U.S. Government obligations or other highly rated collateral. |
| (c) | Security has an irrevocable call by the issuer or mandatory put by the holder. Maturity date reflects such call or put. |
| (d) | Security is subject to a reimbursement agreement which may require the Fund to pay amounts to a counterparty in the event of a significant decline in the market value of the security underlying the TOB Trusts. In case of a shortfall, the maximum potential amount of payments the Fund could ultimately be required to make under the agreement is $50,605,000. However, such shortfall payment would be reduced by the proceeds from the sale of the security underlying the TOB Trusts. |
| (e) | Underlying security related to TOB Trusts entered into by the Fund. See Note 1K. |
| (f) | Zero coupon bond issued at a discount. |
| (g) | The issuer is paying less than stated interest, but is not in default on principal because scheduled principal payments have not yet begun. |
| (h) | Security purchased or received in a transaction exempt from registration under the Securities Act of 1933, as amended (the “1933 Act”). The security may be resold pursuant to an exemption from registration under the 1933 Act, typically to qualified institutional buyers. The aggregate value of these securities at February 28, 2023 was $143,210,056, which represented 7.35% of the Fund’s Net Assets. |
| (i) | Security subject to the alternative minimum tax. |
| (j) | Defaulted security. Currently, the issuer is in default with respect to principal and/or interest payments. The aggregate value of these securities at February 28, 2023 was $9,470,350, which represented less than 1% of the Fund’s Net Assets. |
| (k) | Restricted security. The aggregate value of these securities at February 28, 2023 was $404,600, which represented less than 1% of the Fund’s Net Assets. |
| (l) | Convertible capital appreciation bond. The interest rate shown represents the coupon rate at which the bond will accrue at a specified future date. |
| (m) | Demand security payable upon demand by the Fund at specified time intervals no greater than thirteen months. Interest rate is redetermined periodically by the issuer or agent based on current market conditions. Rate shown is the rate in effect on February 28, 2023. |
| (n) | Principal and interest payments are fully enhanced by a letter of credit from the bank listed or a predecessor bank, branch or subsidiary. |
| (o) | Security valued using significant unobservable inputs (Level 3). See Note 1. |
| (p) | Floating rate note obligations related to securities held. The interest and fee rates shown reflect the rates in effect at February 28, 2023. At February 28, 2023, the Fund’s investments with a value of $219,783,146 are held by TOB Trusts and serve as collateral for the $152,730,000 in the floating rate note obligations outstanding at that date. |
See accompanying Notes to Financial Statements which are an integral part of the financial statements.
| | |
| 26 | | Invesco California Municipal Fund |
Statement of Assets and Liabilities
February 28, 2023
| | | | |
Assets: | | | | |
| |
Investments in unaffiliated securities, at value (Cost $2,178,808,401) | | $ | 2,086,594,778 | |
|
| |
Cash | | | 262,631 | |
|
| |
Receivable for: | | | | |
Investments sold | | | 3,073,181 | |
|
| |
Fund shares sold | | | 2,518,723 | |
|
| |
Interest | | | 22,491,598 | |
|
| |
Investments matured, at value
(Cost $2,161,645) | | | 1,569,895 | |
|
| |
Investment for trustee deferred compensation and retirement plans | | | 130,995 | |
|
| |
Other assets | | | 632,154 | |
|
| |
Total assets | | | 2,117,273,955 | |
|
| |
| |
Liabilities: | | | | |
Floating rate note obligations | | | 152,730,000 | |
|
| |
Payable for: | | | | |
Borrowings | | | 3,200,000 | |
|
| |
Investments purchased | | | 6,278,662 | |
|
| |
Dividends | | | 2,787,283 | |
|
| |
Fund shares reacquired | | | 1,513,617 | |
|
| |
Accrued fees to affiliates | | | 713,025 | |
|
| |
Accrued interest expense | | | 25,564 | |
|
| |
Accrued trustees’ and officers’ fees and benefits | | | 60,802 | |
|
| |
Accrued other operating expenses | | | 75,996 | |
|
| |
Trustee deferred compensation and retirement plans | | | 182,596 | |
|
| |
Total liabilities | | | 167,567,545 | |
|
| |
Net assets applicable to shares outstanding | | $ | 1,949,706,410 | |
|
| |
| | | | |
Net assets consist of: | | | | |
| |
Shares of beneficial interest | | $ | 2,360,161,223 | |
|
| |
Distributable earnings (loss) | | | (410,454,813 | ) |
|
| |
| | $ | 1,949,706,410 | |
|
| |
| |
Net Assets: | | | | |
Class A | | $ | 1,203,777,567 | |
|
| |
Class C | | $ | 109,955,090 | |
|
| |
Class Y | | $ | 634,952,261 | |
|
| |
Class R6 | | $ | 1,021,492 | |
|
| |
|
Shares outstanding, no par value, with an unlimited number of shares authorized: | |
Class A | | | 152,242,700 | |
|
| |
Class C | | | 13,973,506 | |
|
| |
Class Y | | | 80,285,851 | |
|
| |
Class R6 | | | 128,756 | |
|
| |
Class A: | | | | |
Net asset value per share | | $ | 7.91 | |
|
| |
Maximum offering price per share
(Net asset value of $7.91 ÷ 95.75%) | | $ | 8.26 | |
|
| |
Class C: | | | | |
Net asset value and offering price per share | | $ | 7.87 | |
|
| |
Class Y: | | | | |
Net asset value and offering price per share | | $ | 7.91 | |
|
| |
Class R6: | | | | |
Net asset value and offering price per share | | $ | 7.93 | |
|
| |
See accompanying Notes to Financial Statements which are an integral part of the financial statements.
| | |
| 27 | | Invesco California Municipal Fund |
Statement of Operations
For the year ended February 28, 2023
| | | | |
Investment income: | | | | |
| |
Interest | | $ | 89,622,845 | |
|
| |
| |
Expenses: | | | | |
Advisory fees | | | 7,823,273 | |
|
| |
Administrative services fees | | | 279,069 | |
|
| |
Custodian fees | | | 18,255 | |
|
| |
Distribution fees: | | | | |
Class A | | | 3,059,672 | |
|
| |
Class C | | | 1,151,134 | |
|
| |
Interest, facilities and maintenance fees | | | 7,411,387 | |
|
| |
Transfer agent fees – A, C and Y | | | 1,401,608 | |
|
| |
Transfer agent fees – R6 | | | 190 | |
|
| |
Trustees’ and officers’ fees and benefits | | | 37,995 | |
|
| |
Registration and filing fees | | | 66,466 | |
|
| |
Reports to shareholders | | | 17,767 | |
|
| |
Professional services fees | | | 119,261 | |
|
| |
Other | | | 28,195 | |
|
| |
Total expenses | | | 21,414,272 | |
|
| |
Less: Expense offset arrangement(s) | | | (2,036 | ) |
|
| |
Net expenses | | | 21,412,236 | |
|
| |
Net investment income | | | 68,210,609 | |
|
| |
| |
Realized and unrealized gain (loss) from: | | | | |
| |
Net realized gain (loss) from unaffiliated investment securities | | | (60,894,990 | ) |
|
| |
Change in net unrealized appreciation (depreciation) of unaffiliated investment securities | | | (183,201,616 | ) |
|
| |
Net realized and unrealized gain (loss) | | | (244,096,606 | ) |
|
| |
Net increase (decrease) in net assets resulting from operations | | $ | (175,885,997 | ) |
|
| |
See accompanying Notes to Financial Statements which are an integral part of the financial statements.
| | |
| 28 | | Invesco California Municipal Fund |
Statement of Changes in Net Assets
For the years ended February 28, 2023 and 2022
| | | | | | | | |
| | | 2023 | | | 2022 | |
|
| |
Operations: | | | | | | | | |
Net investment income | | $ | 68,210,609 | | | $ | 64,003,959 | |
|
| |
Net realized gain (loss) | | | (60,894,990 | ) | | | 1,420,277 | |
|
| |
Change in net unrealized appreciation (depreciation) | | | (183,201,616 | ) | | | (53,632,776 | ) |
|
| |
Net increase (decrease) in net assets resulting from operations | | | (175,885,997 | ) | | | 11,791,460 | |
|
| |
| | |
Distributions to shareholders from distributable earnings: | | | | | | | | |
Class A | | | (42,985,623 | ) | | | (44,892,395 | ) |
|
| |
Class C | | | (3,103,810 | ) | | | (3,545,904 | ) |
|
| |
Class Y | | | (21,568,810 | ) | | | (20,984,896 | ) |
|
| |
Class R6 | | | (42,853 | ) | | | (20,209 | ) |
|
| |
Total distributions from distributable earnings | | | (67,701,096 | ) | | | (69,443,404 | ) |
|
| |
| | |
Share transactions–net: | | | | | | | | |
Class A | | | (91,353,476 | ) | | | 41,301,146 | |
|
| |
Class C | | | (18,974,367 | ) | | | (5,933,605 | ) |
|
| |
Class Y | | | 54,380,018 | | | | 122,195,805 | |
|
| |
Class R6 | | | 346,893 | | | | (2,630,248 | ) |
|
| |
Net increase (decrease) in net assets resulting from share transactions | | | (55,600,932 | ) | | | 154,933,098 | |
|
| |
Net increase (decrease) in net assets | | | (299,188,025 | ) | | | 97,281,154 | |
|
| |
| | |
Net assets: | | | | | | | | |
Beginning of year | | | 2,248,894,435 | | | | 2,151,613,281 | |
|
| |
End of year | | $ | 1,949,706,410 | | | $ | 2,248,894,435 | |
|
| |
See accompanying Notes to Financial Statements which are an integral part of the financial statements.
| | |
| 29 | | Invesco California Municipal Fund |
Financial Highlights
The following schedule presents financial highlights for a share of the Fund outstanding throughout the periods indicated.
| | | | | | | | | | | | | | | | | | | | | | | | | | | | | | | | | | | | | | | | | | | | | | | | | | | | |
| | | Net asset value, beginning of period | | Net investment income(a) | | Net gains (losses) on securities (both realized and unrealized) | | Total from investment operations | | Dividends from net investment income | | Net asset value, end of period | | Total return(b) | | Net assets, end of period (000’s omitted) | | Ratio of expenses to average net assets with fee waivers and/or expenses absorbed | | Ratio of expenses to average net assets without fee waivers and/or expenses absorbed | | Supplemental ratio of expenses to average net assets with fee waivers (excluding interest, facilities and maintenance fees) | | Ratio of net investment income to average net assets | | Portfolio turnover (c) |
Class A | | | | | | | | | | | | | | | | | | | | | | | | | | | | | | | | | | | | | | | | | | | | | | | | | | | | |
Year ended 02/28/23 | | | $8.88 | | | | $0.28 | | | | $(0.97 | ) | | | $(0.69 | ) | | | $(0.28 | ) | | | $7.91 | | | | (7.75 | )% | | | $1,203,778 | | | | 1.14 | % | | | 1.14 | % | | | 0.75 | % | | | 3.50 | % | | | 41 | % |
Year ended 02/28/22 | | | 9.09 | | | | 0.26 | | | | (0.19 | ) | | | 0.07 | | | | (0.28 | ) | | | 8.88 | | | | 0.69 | | | | 1,449,851 | | | | 0.84 | | | | 0.84 | | | | 0.75 | | | | 2.78 | | | | 11 | |
Year ended 02/28/21 | | | 9.28 | | | | 0.28 | | | | (0.18 | ) | | | 0.10 | | | | (0.29 | ) | | | 9.09 | | | | 1.11 | | | | 1,443,969 | | | | 0.86 | | | | 0.86 | | | | 0.76 | | | | 3.15 | | | | 28 | |
Seven months ended 02/29/20 | | | 8.87 | | | | 0.17 | | | | 0.41 | | | | 0.58 | | | | (0.17 | ) | | | 9.28 | | | | 6.63 | | | | 1,061,154 | | | | 0.93 | (d) | | | 0.93 | (d) | | | 0.76 | (d) | | | 3.18 | (d) | | | 11 | |
Year ended 07/31/19 | | | 8.49 | | | | 0.37 | | | | 0.32 | | | | 0.69 | | | | (0.31 | ) | | | 8.87 | | | | 8.35 | | | | 960,939 | | | | 1.13 | | | | 1.13 | | | | 0.81 | | | | 4.36 | | | | 37 | |
Year ended 07/31/18 | | | 8.49 | | | | 0.36 | | | | (0.04 | ) | | | 0.32 | | | | (0.32 | ) | | | 8.49 | | | | 3.95 | | | | 789,596 | | | | 1.06 | | | | 1.06 | | | | 0.85 | | | | 4.26 | | | | 22 | |
Class C | | | | | | | | | | | | | | | | | | | | | | | | | | | | | | | | | | | | | | | | | | | | | | | | | | | | |
Year ended 02/28/23 | | | 8.83 | | | | 0.22 | | | | (0.96 | ) | | | (0.74 | ) | | | (0.22 | ) | | | 7.87 | | | | (8.41 | ) | | | 109,955 | | | | 1.89 | | | | 1.89 | | | | 1.50 | | | | 2.75 | | | | 41 | |
Year ended 02/28/22 | | | 9.04 | | | | 0.19 | | | | (0.19 | ) | | | 0.00 | | | | (0.21 | ) | | | 8.83 | | | | (0.08 | ) | | | 144,067 | | | | 1.59 | | | | 1.59 | | | | 1.50 | | | | 2.03 | | | | 11 | |
Year ended 02/28/21 | | | 9.23 | | | | 0.21 | | | | (0.18 | ) | | | 0.03 | | | | (0.22 | ) | | | 9.04 | | | | 0.36 | | | | 153,595 | | | | 1.61 | | | | 1.61 | | | | 1.51 | | | | 2.40 | | | | 28 | |
Seven months ended 02/29/20 | | | 8.83 | | | | 0.13 | | | | 0.40 | | | | 0.53 | | | | (0.13 | ) | | | 9.23 | | | | 6.08 | | | | 193,922 | | | | 1.69 | (d) | | | 1.69 | (d) | | | 1.52 | (d) | | | 2.42 | (d) | | | 11 | |
Year ended 07/31/19 | | | 8.45 | | | | 0.31 | | | | 0.32 | | | | 0.63 | | | | (0.25 | ) | | | 8.83 | | | | 7.58 | | | | 178,207 | | | | 1.89 | | | | 1.89 | | | | 1.57 | | | | 3.60 | | | | 37 | |
Year ended 07/31/18 | | | 8.45 | | | | 0.29 | | | | (0.03 | ) | | | 0.26 | | | | (0.26 | ) | | | 8.45 | | | | 3.18 | | | | 206,268 | | | | 1.82 | | | | 1.82 | | | | 1.61 | | | | 3.50 | | | | 22 | |
Class Y | | | | | | | | | | | | | | | | | | | | | | | | | | | | | | | | | | | | | | | | | | | | | | | | | | | | |
Year ended 02/28/23 | | | 8.88 | | | | 0.30 | | | | (0.97 | ) | | | (0.67 | ) | | | (0.30 | ) | | | 7.91 | | | | (7.52 | ) | | | 634,952 | | | | 0.89 | | | | 0.89 | | | | 0.50 | | | | 3.75 | | | | 41 | |
Year ended 02/28/22 | | | 9.09 | | | | 0.28 | | | | (0.19 | ) | | | 0.09 | | | | (0.30 | ) | | | 8.88 | | | | 0.94 | | | | 654,169 | | | | 0.59 | | | | 0.59 | | | | 0.50 | | | | 3.03 | | | | 11 | |
Year ended 02/28/21 | | | 9.28 | | | | 0.31 | | | | (0.19 | ) | | | 0.12 | | | | (0.31 | ) | | | 9.09 | | | | 1.36 | | | | 550,591 | | | | 0.61 | | | | 0.61 | | | | 0.51 | | | | 3.40 | | | | 28 | |
Seven months ended 02/29/20 | | | 8.87 | | | | 0.18 | | | | 0.41 | | | | 0.59 | | | | (0.18 | ) | | | 9.28 | | | | 6.78 | | | | 476,142 | | | | 0.69 | (d) | | | 0.69 | (d) | | | 0.52 | (d) | | | 3.42 | (d) | | | 11 | |
Year ended 07/31/19 | | | 8.49 | | | | 0.40 | | | | 0.31 | | | | 0.71 | | | | (0.33 | ) | | | 8.87 | | | | 8.61 | | | | 397 | | | | 0.88 | | | | 0.88 | | | | 0.56 | | | | 4.60 | | | | 37 | |
Year ended 07/31/18 | | | 8.49 | | | | 0.38 | | | | (0.04 | ) | | | 0.34 | | | | (0.34 | ) | | | 8.49 | | | | 4.20 | | | | 227,535 | | | | 0.82 | | | | 0.82 | | | | 0.61 | | | | 4.50 | | | | 22 | |
Class R6 | | | | | | | | | | | | | | | | | | | | | | | | | | | | | | | | | | | | | | | | | | | | | | | | | | | | |
Year ended 02/28/23 | | | 8.91 | | | | 0.31 | | | | (0.98 | ) | | | (0.67 | ) | | | (0.31 | ) | | | 7.93 | | | | (7.55 | ) | | | 1,021 | | | | 0.84 | | | | 0.84 | | | | 0.45 | | | | 3.80 | | | | 41 | |
Year ended 02/28/22 | | | 9.10 | | | | 0.30 | | | | (0.18 | ) | | | 0.12 | | | | (0.31 | ) | | | 8.91 | | | | 1.22 | | | | 807 | | | | 0.42 | | | | 0.42 | | | | 0.33 | | | | 3.20 | | | | 11 | |
Year ended 02/28/21 | | | 9.29 | | | | 0.31 | | | | (0.19 | ) | | | 0.12 | | | | (0.31 | ) | | | 9.10 | | | | 1.38 | | | | 3,457 | | | | 0.58 | | | | 0.58 | | | | 0.48 | | | | 3.43 | | | | 28 | |
Seven months ended 02/29/20 | | | 8.88 | | | | 0.18 | | | | 0.42 | | | | 0.60 | | | | (0.19 | ) | | | 9.29 | | | | 6.83 | | | | 933 | | | | 0.71 | (d) | | | 0.71 | (d) | | | 0.54 | (d) | | | 3.40 | (d) | | | 11 | |
Period ended 07/31/19(e) | | | 8.80 | | | | 0.08 | | | | 0.06 | | | | 0.14 | | | | (0.06 | ) | | | 8.88 | | | | 1.62 | | | | 10 | | | | 0.84 | (d) | | | 0.84 | (d) | | | 0.52 | (d) | | | 4.64 | (d) | | | 37 | |
| (a) | Calculated using average shares outstanding. |
| (b) | Includes adjustments in accordance with accounting principles generally accepted in the United States of America and as such, the net asset value for financial reporting purposes and the returns based upon those net asset values may differ from the net asset value and returns for shareholder transactions. Does not include sales charges and is not annualized for periods less than one year, if applicable. |
| (c) | Portfolio turnover is calculated at the fund level and is not annualized for periods less than one year, if applicable. For the year ended February 28, 2021, the portfolio turnover calculation excludes the value of securities purchased of $367,457,266 in connection with the acquisition of Invesco California Tax-Free Income Fund into the Fund. |
| (e) | Commencement date after the close of business on May 24, 2019. |
See accompanying Notes to Financial Statements which are an integral part of the financial statements.
| | |
| 30 | | Invesco California Municipal Fund |
Notes to Financial Statements
February 28, 2023
NOTE 1–Significant Accounting Policies
Invesco California Municipal Fund (the “Fund”) is a series portfolio of AIM Tax-Exempt Funds (Invesco Tax-Exempt Funds) (the “Trust”). The Trust is a Delaware statutory trust registered under the Investment Company Act of 1940, as amended (the “1940 Act”), as an open-end series management investment company authorized to issue an unlimited number of shares of beneficial interest. Information presented in these financial statements pertains only to the Fund. Matters affecting the Fund or each class will be voted on exclusively by the shareholders of the Fund or each class.
The Fund’s investment objective is to seek tax-free income.
The Fund currently consists of four different classes of shares: Class A, Class C, Class Y and Class R6. Class Y shares are available only to certain investors. Class A shares are sold with a front-end sales charge unless certain waiver criteria are met. Under certain circumstances, load waived shares may be subject to contingent deferred sales charges (“CDSC”). Class C shares are sold with a CDSC. Class Y and Class R6 shares are sold at net asset value. Class C shares held for eight years after purchase are eligible for automatic conversion into Class A shares of the same Fund (the “Conversion Feature”). The automatic conversion pursuant to the Conversion Feature will generally occur at the end of the month following the eighth anniversary after a purchase of Class C shares.
The Fund is an investment company and accordingly follows the investment company accounting and reporting guidance in accordance with Financial Accounting Standards Board Accounting Standards Codification Topic 946, Financial Services – Investment Companies.
The following is a summary of the significant accounting policies followed by the Fund in the preparation of its financial statements.
| A. | Security Valuations - Securities, including restricted securities, are valued according to the following policy. |
Securities generally normally are valued on the basis of prices provided by independent pricing services. Prices provided by the pricing service may be determined without exclusive reliance on quoted prices, and may reflect appropriate factors such as institution-size trading in similar groups of securities, developments related to specific securities, dividend rate (for unlisted equities), yield (for debt obligations), quality, type of issue, coupon rate (for debt obligations), maturity (for debt obligations), individual trading characteristics and other market data. Pricing services generally value debt obligations assuming orderly transactions of institutional round lot size, but a fund may hold or transact in the same securities in smaller, odd lot sizes. Odd lots often trade at lower prices than institutional round lots, and their value may be adjusted accordingly. Debt obligations are subject to interest rate and credit risks. In addition, all debt obligations involve some risk of default with respect to interest and/or principal payments.
A security listed or traded on an exchange is generally valued at its trade price or official closing price that day as of the close of the exchange where the security is principally traded, or lacking any sales or official closing price on a particular day, the security may be valued at the closing bid price on that day. Securities traded in the over-the-counter market are valued based on prices furnished by independent pricing services or market makers. When such securities are valued using prices provided by an independent pricing service they may be considered fair valued. Futures contracts are valued at the daily settlement price set by an exchange on which they are principally traded. U.S. exchange-traded options are valued at the mean between the last bid and asked prices from the exchange on which they are principally traded. Non-U.S. exchange-traded options are valued at the final settlement price set by the exchange on which they trade. Options not listed on an exchange and swaps generally are valued using pricing provided from independent pricing services.
Securities for which market quotations are not readily available are fair valued by Invesco Advisers, Inc. (the “Adviser” or “Invesco”) in accordance with Board-approved policies and related Adviser procedures (“Valuation Procedures”). If a fair value price provided by a pricing service is not representative of market value in the Adviser’s judgment (“unreliable”), the Adviser will fair value the security using the Valuation Procedures. Issuer specific events, market trends, bid/asked quotes of brokers and information providers and other market data may be reviewed in the course of making a good faith determination of a security’s fair value.
The Fund may invest in securities that are subject to interest rate risk, meaning the risk that the prices will generally fall as interest rates rise and, conversely, the prices will generally rise as interest rates fall. Specific securities differ in their sensitivity to changes in interest rates depending on their individual characteristics. Changes in interest rates may result in increased market volatility, which may affect the value and/or liquidity of certain Fund investments.
Valuations change in response to many factors including the historical and prospective earnings of the issuer, the value of the issuer’s assets, general market conditions which are not specifically related to the particular issuer, such as real or perceived adverse economic conditions, changes in the general outlook for revenues or corporate earnings, changes in interest or currency rates, regional or global instability, natural or environmental disasters, widespread disease or other public health issues, war, acts of terrorism, significant governmental actions or adverse investor sentiment generally and market liquidity. Because of the inherent uncertainties of valuation, the values reflected in the financial statements may materially differ from the value received upon actual sale of those investments.
The price the Fund could receive upon the sale of any investment may differ from the Adviser’s valuation of the investment, particularly for securities that are valued using a fair valuation technique. When fair valuation techniques are applied, the Adviser uses available information, including both observable and unobservable inputs and assumptions, to determine a methodology that will result in a valuation that the Adviser believes approximates market value. Fund securities that are fair valued may be subject to greater fluctuation in their value from one day to the next than would be the case if market quotations were used. Because of the inherent uncertainties of valuation, and the degree of subjectivity in such decisions, the Fund could realize a greater or lesser than expected gain or loss upon the sale of the investment.
| B. | Securities Transactions and Investment Income - Securities transactions are accounted for on a trade date basis. Realized gains or losses on sales are computed on the basis of specific identification of the securities sold. Interest income (net of withholding tax, if any) is recorded on an accrual basis from settlement date and includes coupon interest and amortization of premium and accretion of discount on debt securities as applicable. Pay-in-kind interest income and non-cash dividend income received in the form of securities in-lieu of cash are recorded at the fair value of the securities received. Dividend income (net of withholding tax, if any) is recorded on the ex-dividend date. |
The Fund may periodically participate in litigation related to Fund investments. As such, the Fund may receive proceeds from litigation settlements. Any proceeds received are included in the Statement of Operations as realized gain (loss) for investments no longer held and as unrealized gain (loss) for investments still held.
Brokerage commissions and mark ups are considered transaction costs and are recorded as an increase to the cost basis of securities purchased and/or a reduction of proceeds on a sale of securities. Such transaction costs are included in the determination of net realized and unrealized gain (loss) from investment securities reported in the Statement of Operations and the Statement of Changes in Net Assets and the net realized and unrealized gains (losses) on securities per share in the Financial Highlights. Transaction costs are included in the calculation of the Fund’s net asset value and, accordingly, they reduce the Fund’s total returns. These transaction costs are not considered operating expenses and are not reflected in net investment income reported in the Statement of Operations and the Statement of Changes in Net Assets, or the net investment income per share and the ratios of expenses and net investment income reported in the Financial Highlights, nor are they limited by any expense limitation arrangements between the Fund and the investment adviser.
The Fund allocates realized and unrealized capital gains and losses to a class based on the relative net assets of each class. The Fund allocates income to a class based on the relative value of the settled shares of each class.
| C. | Country Determination - For the purposes of making investment selection decisions and presentation in the Schedule of Investments, the investment adviser may determine the country in which an issuer is located and/or credit risk exposure based on various factors. These factors include the laws of the country under |
| | |
| 31 | | Invesco California Municipal Fund |
which the issuer is organized, where the issuer maintains a principal office, the country in which the issuer derives 50% or more of its total revenues, the country that has the primary market for the issuer’s securities and its “country of risk” as determined by a third party service provider, as well as other criteria. Among the other criteria that may be evaluated for making this determination are the country in which the issuer maintains 50% or more of its assets, the type of security, financial guarantees and enhancements, the nature of the collateral and the sponsor organization. Country of issuer and/or credit risk exposure has been determined to be the United States of America, unless otherwise noted.
| D. | Distributions - Distributions from net investment income, if any, are declared daily and paid monthly. Distributions from net realized capital gain, if any, are generally declared and paid annually and recorded on the ex-dividend date. The Fund may elect to treat a portion of the proceeds from redemptions as distributions for federal income tax purposes. |
| E. | Federal Income Taxes - The Fund intends to comply with the requirements of Subchapter M of the Internal Revenue Code of 1986, as amended (the “Internal Revenue Code”), necessary to qualify as a regulated investment company and to distribute substantially all of the Fund’s taxable and tax-exempt earnings to shareholders. As such, the Fund will not be subject to federal income taxes on otherwise taxable income (including net realized capital gain) that is distributed to shareholders. Therefore, no provision for federal income taxes is recorded in the financial statements. |
The Fund recognizes the tax benefits of uncertain tax positions only when the position is more likely than not to be sustained. Management has analyzed the Fund’s uncertain tax positions and concluded that no liability for unrecognized tax benefits should be recorded related to uncertain tax positions. Management is not aware of any tax positions for which it is reasonably possible that the total amounts of unrecognized tax benefits will change materially in the next 12 months.
In addition, the Fund intends to invest in such municipal securities to allow it to qualify to pay shareholders “exempt-interest dividends”, as defined in the Internal Revenue Code.
The Fund files tax returns in the U.S. Federal jurisdiction and certain other jurisdictions. Generally, the Fund is subject to examinations by such taxing authorities for up to three years after the filing of the return for the tax period.
| F. | Expenses - Fees provided for under the Rule 12b-1 plan of a particular class of the Fund are charged to the operations of such class. Transfer agency fees and expenses and other shareholder recordkeeping fees and expenses attributable to Class R6 are charged to such class. Transfer agency fees and expenses and other shareholder recordkeeping fees and expenses relating to all other classes are allocated among those classes based on relative net assets. All other expenses are allocated among the classes based on relative net assets. |
| G. | Interest, Facilities and Maintenance Fees - Interest, Facilities and Maintenance Fees include interest and related borrowing costs such as commitment fees, administrative expenses and other expenses associated with establishing and maintaining the line of credit. In addition, interest and administrative expenses related to establishing and maintaining floating rate note obligations, if any, are included. |
| H. | Accounting Estimates - The preparation of financial statements in conformity with accounting principles generally accepted in the United States of America (“GAAP”) requires management to make estimates and assumptions that affect the reported amounts of assets and liabilities at the date of the financial statements and the reported amounts of revenues and expenses during the reporting period including estimates and assumptions related to taxation. Actual results could differ from those estimates by a significant amount. In addition, the Fund monitors for material events or transactions that may occur or become known after the period-end date and before the date the financial statements are released to print. |
| I. | Indemnifications - Under the Trust’s organizational documents, each Trustee, officer, employee or other agent of the Trust is indemnified against certain liabilities that may arise out of the performance of their duties to the Fund. Additionally, in the normal course of business, the Fund enters into contracts, including the Fund’s servicing agreements, that contain a variety of indemnification clauses. The Fund’s maximum exposure under these arrangements is unknown as this would involve future claims that may be made against the Fund that have not yet occurred. The risk of material loss as a result of such indemnification claims is considered remote. |
| J. | Securities Purchased on a When-Issued and Delayed Delivery Basis - The Fund may purchase and sell interests in corporate loans and corporate debt securities and other portfolio securities on a when-issued and delayed delivery basis, with payment and delivery scheduled for a future date. No income accrues to the Fund on such interests or securities in connection with such transactions prior to the date the Fund actually takes delivery of such interests or securities. These transactions are subject to market fluctuations and are subject to the risk that the value at delivery may be more or less than the trade date purchase price. Although the Fund will generally purchase these securities with the intention of acquiring such securities, they may sell such securities prior to the settlement date. |
| K. | Floating Rate Note Obligations - The Fund invests in inverse floating rate securities, such as Tender Option Bonds (“TOBs”), for investment purposes and to enhance the yield of the Fund. Such securities may be purchased in the secondary market without first owning an underlying bond but generally are created through the sale of fixed rate bonds by the Fund to special purpose trusts established by a broker dealer or by the Fund (“TOB Trusts”) in exchange for cash and residual interests in the TOB Trusts’ assets and cash flows, which are in the form of inverse floating rate securities. The TOB Trusts finance the purchases of the fixed rate bonds by issuing floating rate notes to third parties and allowing the Fund to retain residual interests in the bonds. The floating rate notes issued by the TOB Trusts have interest rates that reset weekly and the floating rate note holders have the option to tender their notes to the TOB Trusts for redemption at par at each reset date. The residual interests held by the Fund (inverse floating rate securities) include the right of the Fund (1) to cause the holders of the floating rate notes to tender their notes at par at the next interest rate reset date, and (2) to transfer the municipal bond from the TOB Trust to the Fund, thereby collapsing the TOB Trust. Inverse floating rate securities tend to underperform the market for fixed rate bonds in a rising interest rate environment, but tend to outperform the market for fixed rate bonds when interest rates decline or remain relatively stable. |
The Fund generally invests in inverse floating rate securities that include embedded leverage, thus exposing the Fund to greater risks and increased costs. The primary risks associated with inverse floating rate securities are varying degrees of liquidity and decreases in the value of such securities in response to changes in interest rates to a greater extent than fixed rate securities having similar credit quality, redemption provisions and maturity, which may cause the Fund’s net asset value to be more volatile than if it had not invested in inverse floating rate securities. In certain instances, the short-term floating rate notes created by the TOB Trust may not be able to be sold to third parties or, in the case of holders tendering (or putting) such notes for repayment of principal, may not be able to be remarketed to third parties. In such cases, the TOB Trust holding the fixed rate bonds may be collapsed with the entity that contributed the fixed rate bonds to the TOB Trust. In the case where a TOB Trust is collapsed with the Fund, the Fund will be required to repay the principal amount of the tendered securities, which may require the Fund to sell other portfolio holdings to raise cash to meet that obligation. The Fund could therefore be required to sell other portfolio holdings at a disadvantageous time or price to raise cash to meet this obligation, which risk will be heightened during times of market volatility, illiquidity or uncertainty. The embedded leverage in the TOB Trust could cause the Fund to lose more money than the value of the asset it has contributed to the TOB Trust and greater levels of leverage create the potential for greater losses. In addition, a Fund may enter into reimbursement agreements with the liquidity provider of certain TOB transactions in connection with certain residuals held by the Fund. These agreements commit a Fund to reimburse the liquidity provider to the extent that the liquidity provider must provide cash to a TOB Trust, including following the termination of a TOB Trust resulting from a mandatory tender event (“liquidity shortfall”). The reimbursement agreement will effectively make the Fund liable for the amount of the negative difference, if any, between the liquidation value of the underlying security and the purchase price of the floating rate notes issued by the TOB Trust.
The Fund accounts for the transfer of fixed rate bonds to the TOB Trusts as secured borrowings, with the securities transferred remaining in the Fund’s investment assets, and the related floating rate notes reflected as Fund liabilities under the caption Floating rate note obligations on the Statement of Assets and Liabilities. The carrying amount of the Fund’s floating rate note obligations as reported on the Statement of Assets and Liabilities approximates its fair value. The Fund records the interest income from the fixed rate bonds under the caption Interest and records the expenses related to floating rate obligations and any administrative expenses of the TOB Trusts as a component of Interest, facilities and maintenance fees on the Statement of Operations.
| | |
| 32 | | Invesco California Municipal Fund |
Final rules implementing section 619 of the Dodd-Frank Wall Street Reform and Consumer Protection Act (the “Volcker Rule”) prohibit banking entities from engaging in proprietary trading of certain instruments and limit such entities’ investments in, and relationships with, “covered funds”, as defined in the rules. These rules preclude banking entities and their affiliates from sponsoring and/or providing services for existing TOB Trusts. A new TOB structure is being utilized by the Fund wherein the Fund, as holder of the residuals, will perform certain duties previously performed by banking entities as “sponsors” of TOB Trusts. These duties may be performed by a third-party service provider. The Fund’s expanded role under the new TOB structure may increase its operational and regulatory risk. The new structure is substantially similar to the previous structure; however, pursuant to the Volcker Rule, the remarketing agent would not be able to repurchase tendered floaters for its own account upon a failed remarketing. In the event of a failed remarketing, a banking entity serving as liquidity provider may loan the necessary funds to the TOB Trust to purchase the tendered floaters. The TOB Trust, not the Fund, would be the borrower and the loan from the liquidity provider will be secured by the purchased floaters now held by the TOB Trust. However, as previously described, the Fund would bear the risk of loss with respect to any liquidity shortfall to the extent it entered into a reimbursement agreement with the liquidity provider.
Further, the SEC and various banking agencies have adopted rules implementing credit risk retention requirements for asset-backed securities (the “Risk Retention Rules”). The Risk Retention Rules require the sponsor of a TOB Trust to retain at least 5% of the credit risk of the underlying assets supporting the TOB Trust’s municipal bonds. The Fund has adopted policies intended to comply with the Risk Retention Rules. The Risk Retention Rules may adversely affect the Fund’s ability to engage in TOB Trust transactions or increase the costs of such transactions in certain circumstances.
There can be no assurances that the new TOB structure will continue to be a viable form of leverage. Further, there can be no assurances that alternative forms of leverage will be available to the Fund in order to maintain current levels of leverage. Any alternative forms of leverage may be less advantageous to the Fund, and may adversely affect the Fund’s net asset value, distribution rate and ability to achieve its investment objective.
TOBs are presently classified as private placement securities. Private placement securities are subject to restrictions on resale because they have not been registered under the Securities Act of 1933, as amended (the “1933 Act”), or are otherwise not readily marketable. As a result of the absence of a public trading market for these securities, they may be less liquid than publicly traded securities. Although atypical, these securities may be resold in privately negotiated transactions, the prices realized from these sales could be less than those originally paid by the Fund or less than what may be considered the fair value of such securities.
| L. | Other Risks - The value of, payment of interest on, repayment of principal for and the ability to sell a municipal security may be affected by constitutional amendments, legislative enactments, executive orders, administrative regulations, voter initiatives and the economics of the regions in which the issuers are located. Since many municipal securities are issued to finance similar projects, especially those relating to education, health care, transportation and utilities, conditions in those sectors can affect the overall municipal securities market and the Fund’s investments in municipal securities. There is some risk that a portion or all of the interest received from certain tax-free municipal securities could become taxable as a result of determinations by the Internal Revenue Service. |
The Fund may invest in lower-quality debt securities, i.e., “junk bonds”. Investments in lower-rated securities or unrated securities of comparable quality tend to be more sensitive to economic conditions than higher rated securities. Junk bonds involve a greater risk of default by the issuer because such securities are generally unsecured and are often subordinated to other creditors’ claims. Junk bonds are less liquid than investment grade debt securities and their prices tend to be more volatile.
Increases in the federal funds and equivalent foreign rates or other changes to monetary policy or regulatory actions may expose fixed income markets to heightened volatility and reduced liquidity for certain fixed income investments, particularly those with longer maturities. It is difficult to predict the impact of interest rate changes on various markets. In addition, decreases in fixed income dealer market-making capacity may also potentially lead to heightened volatility and reduced liquidity in the fixed income markets. As a result, the value of the Fund’s investments and share price may decline. Changes in central bank policies could also result in higher than normal redemptions by shareholders, which could potentially increase the Fund’s portfolio turnover rate and transaction costs.
Policy changes by the U.S. government or its regulatory agencies and political events within the U.S. and abroad may, among other things, affect investor and consumer confidence and increase volatility in the financial markets, perhaps suddenly and to a significant degree, which may adversely impact the Fund’s operations, universe of potential investment options, and return potential.
| M. | COVID-19 Risk - The COVID-19 strain of coronavirus has resulted in instances of market closures and dislocations, extreme volatility, liquidity constraints and increased trading costs. Efforts to contain its spread have resulted in travel restrictions, disruptions of healthcare systems, business operations (including business closures) and supply chains, layoffs, lower consumer demand and employee availability, and defaults and credit downgrades, among other significant economic impacts that have disrupted global economic activity across many industries. Such economic impacts may exacerbate other pre-existing political, social and economic risks locally or globally and cause general concern and uncertainty. The full economic impact and ongoing effects of COVID-19 (or other future epidemics or pandemics) at the macro-level and on individual businesses are unpredictable and may result in significant and prolonged effects on the Fund’s performance. |
NOTE 2–Advisory Fees and Other Fees Paid to Affiliates
The Trust has entered into a master investment advisory agreement with the Adviser. Under the terms of the investment advisory agreement, the Fund accrues daily and pays monthly an advisory fee to the Adviser based on the annual rate of the Fund’s average daily net assets as follows:
| | |
| Average Daily Net Assets | | Rate* |
First $ 500 million | | 0.480% |
Next $250 million | | 0.455% |
Next $250 million | | 0.425% |
Next $500 million | | 0.380% |
Next $500 million | | 0.370% |
Next $500 million | | 0.355% |
Next $1.5 billion | | 0.350% |
Over $4 billion | | 0.330% |
| * | The advisory fee paid by the Fund shall be reduced by any amounts paid by the Fund under the administrative services agreement with the Adviser. |
For the year ended February 28, 2023, the effective advisory fee rate incurred by the Fund was 0.40%.
Under the terms of a master sub-advisory agreement between the Adviser and each of Invesco Asset Management Deutschland GmbH, Invesco Asset Management Limited, Invesco Asset Management (Japan) Limited, Invesco Hong Kong Limited, Invesco Senior Secured Management, Inc. and Invesco Canada Ltd. and separate sub-advisory agreements with Invesco Capital Management LLC and Invesco Asset Management (India) Private Limited (collectively, the “Affiliated Sub-Advisers”) the Adviser, not the Fund, will pay 40% of the fees paid to the Adviser to any such Affiliated Sub-Adviser(s) that provide(s) discretionary investment management services to the Fund based on the percentage of assets allocated to such Affiliated Sub-Adviser(s). Invesco has also entered into a sub-advisory agreement with OppenheimerFunds, Inc. to provide discretionary management services to the Fund.
| | |
| 33 | | Invesco California Municipal Fund |
The Adviser has contractually agreed, through at least June 30, 2023, to waive advisory fees and/or reimburse expenses of all shares to the extent necessary to limit total annual fund operating expenses after fee waiver and/or expense reimbursement (excluding certain items discussed below) of Class A, Class C, Class Y and Class R6 shares to 1.50%, 2.25%, 1.25% and 1.25%, respectively, of the Fund’s average daily net assets (the “expense limits”). In determining the Adviser’s obligation to waive advisory fees and/or reimburse expenses, the following expenses are not taken into account, and could cause the total annual fund operating expenses after fee waiver and/or expense reimbursement to exceed the numbers reflected above: (1) interest, facilities and maintenance fees; (2) taxes; (3) dividend expense on short sales; (4) extraordinary or non-routine items, including litigation expenses; and (5) expenses that the Fund has incurred but did not actually pay because of an expense offset arrangement. Unless Invesco continues the fee waiver agreement, it will terminate on June 30, 2023. During its term, the fee waiver agreement cannot be terminated or amended to increase the expense limits or reduce the advisory fee waiver without approval of the Board of Trustees. The Adviser did not waive fees and/or reimburse expenses during the period under these expense limits.
The Trust has entered into a master administrative services agreement with Invesco pursuant to which the Fund has agreed to pay Invesco for certain administrative costs incurred in providing accounting services to the Fund. For the year ended February 28, 2023, expenses incurred under the agreement are shown in the Statement of Operations as Administrative services fees. Invesco has entered into a sub-administration agreement whereby State Street Bank and Trust Company (“SSB”) serves as fund accountant and provides certain administrative services to the Fund. Pursuant to a custody agreement with the Trust on behalf of the Fund, SSB also serves as the Fund’s custodian.
The Trust has entered into a transfer agency and service agreement with Invesco Investment Services, Inc. (“IIS”) pursuant to which the Fund has agreed to pay IIS a fee for providing transfer agency and shareholder services to the Fund and reimburse IIS for certain expenses incurred by IIS in the course of providing such services. IIS may make payments to intermediaries that provide omnibus account services, sub-accounting services and/or networking services. All fees payable by IIS to intermediaries that provide omnibus account services or sub-accounting services are charged back to the Fund, subject to certain limitations approved by the Trust’s Board of Trustees. For the year ended February 28, 2023, expenses incurred under the agreement are shown in the Statement of Operations as Transfer agent fees.
The Trust has entered into master distribution agreements with Invesco Distributors, Inc. (“IDI”) to serve as the distributor for the Class A, Class C, Class Y and Class R6 shares of the Fund. The Trust has adopted plans pursuant to Rule 12b-1 under the 1940 Act with respect to the Fund’s Class A and Class C shares (collectively, the “Plans”). The Fund, pursuant to the Class A Plan, reimburses IDI for its allocated share of expenses incurred for the period, up to a maximum annual rate of 0.25% of the average daily net assets of Class A shares. The Fund pursuant to the Class C Plan, pays IDI compensation at the annual rate of 1.00% of the average daily net assets of Class C shares. The fees are accrued daily and paid monthly. Of the Plan payments, up to 0.25% of the average daily net assets of each class of shares may be paid to furnish continuing personal shareholder services to customers who purchase and own shares of such classes. Any amounts not paid as a service fee under the Plans would constitute an asset-based sales charge. Rules of the Financial Industry Regulatory Authority (“FINRA”) impose a cap on the total sales charges, including asset-based sales charges, that may be paid by any class of shares of the Fund. For the year ended February 28, 2023, expenses incurred under the Plans are shown in the Statement of Operations as Distribution fees.
Front-end sales commissions and CDSC (collectively, the “sales charges”) are not recorded as expenses of the Fund. Front-end sales commissions are deducted from proceeds from the sales of Fund shares prior to investment in Class A shares of the Fund. CDSC are deducted from redemption proceeds prior to remittance to the shareholder. During the year ended February 28, 2023, IDI advised the Fund that IDI retained $50,847 in front-end sales commissions from the sale of Class A shares and $69,118 and $12,799 from Class A and Class C shares, respectively, for CDSC imposed upon redemptions by shareholders.
Certain officers and trustees of the Trust are officers and directors of the Adviser, IIS and/or IDI.
NOTE 3–Additional Valuation Information
GAAP defines fair value as the price that would be received to sell an asset or paid to transfer a liability in an orderly transaction between market participants at the measurement date, under current market conditions. GAAP establishes a hierarchy that prioritizes the inputs to valuation methods, giving the highest priority to readily available unadjusted quoted prices in an active market for identical assets (Level 1) and the lowest priority to significant unobservable inputs (Level 3), generally when market prices are not readily available. Based on the valuation inputs, the securities or other investments are tiered into one of three levels. Changes in valuation methods may result in transfers in or out of an investment’s assigned level:
| | |
| Level 1 - | | Prices are determined using quoted prices in an active market for identical assets. |
| Level 2 - | | Prices are determined using other significant observable inputs. Observable inputs are inputs that other market participants may use in pricing a security. These may include quoted prices for similar securities, interest rates, prepayment speeds, credit risk, yield curves, loss severities, default rates, discount rates, volatilities and others. |
| Level 3 - | | Prices are determined using significant unobservable inputs. In situations where quoted prices or observable inputs are unavailable (for example, when there is little or no market activity for an investment at the end of the period), unobservable inputs may be used. Unobservable inputs reflect the Adviser’s assumptions about the factors market participants would use in determining fair value of the securities or instruments and would be based on the best available information. |
The following is a summary of the tiered valuation input levels, as of February 28, 2023. The level assigned to the securities valuations may not be an indication of the risk or liquidity associated with investing in those securities. Because of the inherent uncertainties of valuation, the values reflected in the financial statements may materially differ from the value received upon actual sale of those investments.
| | | | | | | | | | | | | | | | | | | | | | | | |
| | | Level 1 | | | | | | Level 2 | | | | | | Level 3 | | | Total | |
|
| |
Investments in Securities | | | | | | | | | | | | | | | | | | | | | | | | |
|
| |
Municipal Obligations | | | $– | | | | | | | $ | 2,084,708,020 | | | | | | | $ | – | | | $ | 2,084,708,020 | |
|
| |
U.S. Dollar Denominated Bonds & Notes | | | – | | | | | | | | 426,758 | | | | | | | | 1,460,000 | | | | 1,886,758 | |
|
| |
Total Investments in Securities | | | – | | | | | | | | 2,085,134,778 | | | | | | | | 1,460,000 | | | | 2,086,594,778 | |
|
| |
| | | | | | |
Other Investments - Assets | | | | | | | | | | | | | | | | | | | | | | | | |
|
| |
Investments Matured | | | – | | | | | | | | 1,569,895 | | | | | | | | – | | | | 1,569,895 | |
|
| |
Total Investments | | | $– | | | | | | | $ | 2,086,704,673 | | | | | | | $ | 1,460,000 | | | $ | 2,088,164,673 | |
|
| |
NOTE 4–Expense Offset Arrangement(s)
The expense offset arrangement is comprised of transfer agency credits which result from balances in demand deposit accounts used by the transfer agent for clearing shareholder transactions. For the year ended February 28, 2023, the Fund received credits from this arrangement, which resulted in the reduction of the Fund’s total expenses of $2,036.
| | |
| 34 | | Invesco California Municipal Fund |
NOTE 5–Trustees’ and Officers’ Fees and Benefits
Trustees’ and Officers’ Fees and Benefits include amounts accrued by the Fund to pay remuneration to certain Trustees and Officers of the Fund. Trustees have the option to defer compensation payable by the Fund, and Trustees’ and Officers’ Fees and Benefits also include amounts accrued by the Fund to fund such deferred compensation amounts. Those Trustees who defer compensation have the option to select various Invesco Funds in which their deferral accounts shall be deemed to be invested. Finally, certain current Trustees were eligible to participate in a retirement plan that provided for benefits to be paid upon retirement to Trustees over a period of time based on the number of years of service. The Fund may have certain former Trustees who also participate in a retirement plan and receive benefits under such plan. Trustees’ and Officers’ Fees and Benefits include amounts accrued by the Fund to fund such retirement benefits. Obligations under the deferred compensation and retirement plans represent unsecured claims against the general assets of the Fund.
NOTE 6–Cash Balances and Borrowings
The Fund has entered into a revolving credit and security agreement, which enables the Fund to participate with certain other Invesco Funds in a committed secured borrowing facility that permits borrowings up to $2.5 billion, collectively by certain Invesco Funds, and which will expire on February 22, 2024. The revolving credit and security agreement is secured by the assets of the Fund. The Fund is subject to certain covenants relating to the revolving credit and security agreement. Failure to comply with these restrictions could cause the acceleration of the repayment of the amount outstanding under the revolving credit and security agreement.
During the year ended February 28, 2023, the average daily balance of borrowing under the revolving credit and security agreement was $13,797,260 with an average interest rate of 2.25%. The carrying amount of the Fund’s payable for borrowings as reported on the Statement of Assets and Liabilities approximates its fair value. Expenses under the revolving credit and security agreement are shown in the Statement of Operations as Interest, facilities and maintenance fees.
Additionally, the Fund is permitted to temporarily carry a negative or overdrawn balance in its account with SSB, the custodian bank. Such balances, if any at period-end, are shown in the Statement of Assets and Liabilities under the payable caption Amount due custodian. To compensate the custodian bank for such overdrafts, the overdrawn Fund may either (1) leave funds as a compensating balance in the account so the custodian bank can be compensated by earning the additional interest; or (2) compensate by paying the custodian bank at a rate agreed upon by the custodian bank and Invesco, not to exceed the contractually agreed upon rate. The Fund may not purchase additional securities when any borrowings from banks or broker-dealers exceed 5% of the Fund’s total assets, or when any borrowings from an Invesco Fund are outstanding.
Inverse floating rate obligations resulting from the transfer of bonds to TOB Trusts are accounted for as secured borrowings. The average floating rate notes outstanding and average annual interest and fee rate related to inverse floating rate note obligations during the year ended February 28, 2023 were $152,408,077 and 4.05%, respectively.
NOTE 7–Distributions to Shareholders and Tax Components of Net Assets
Tax Character of Distributions to Shareholders Paid During the Fiscal Years Ended February 28, 2023 and 2022:
| | | | | | | | |
| | | 2023 | | | 2022 | |
|
| |
Ordinary income* | | $ | 689,456 | | | $ | 94,011 | |
|
| |
Ordinary income-tax-exempt | | | 67,011,640 | | | | 69,349,393 | |
|
| |
Total distributions | | $ | 67,701,096 | | | $ | 69,443,404 | |
|
| |
| * | Includes short-term capital gain distributions, if any. |
Tax Components of Net Assets at Period-End:
| | | | |
| | | 2023 | |
|
| |
Undistributed tax-exempt income | | $ | 12,631,761 | |
|
| |
Net unrealized appreciation (depreciation) – investments | | | (87,506,248 | ) |
|
| |
Temporary book/tax differences | | | (224,874 | ) |
|
| |
Capital loss carryforward | | | (335,355,452 | ) |
|
| |
Shares of beneficial interest | | | 2,360,161,223 | |
|
| |
Total net assets | | $ | 1,949,706,410 | |
|
| |
The difference between book-basis and tax-basis unrealized appreciation (depreciation) is due to differences in the timing of recognition of gains and losses on investments for tax and book purposes. The Fund’s net unrealized appreciation (depreciation) difference is attributable primarily to wash sales, defaulted bonds, inverse floaters, amortization and accretion on debt securities.
The temporary book/tax differences are a result of timing differences between book and tax recognition of income and/or expenses. The Fund’s temporary book/tax differences are the result of the trustee deferral of compensation and retirement plan benefits.
Capital loss carryforward is calculated and reported as of a specific date. Results of transactions and other activity after that date may affect the amount of capital loss carryforward actually available for the Fund to utilize. The ability to utilize capital loss carryforward in the future may be limited under the Internal Revenue Code and related regulations based on the results of future transactions.
The Fund has a capital loss carryforward as of February 28, 2023, as follows:
| | | | | | | | | | | | | | |
Capital Loss Carryforward* |
| Expiration | | Short-Term | | | | | Long-Term | | | | | Total |
|
|
Not subject to expiration | | $95,701,967 | | | | | | $239,653,485 | | | | | | $335,355,452 |
|
|
| * | Capital loss carryforward is reduced for limitations, if any, to the extent required by the Internal Revenue Code and may be further limited depending upon a variety of factors, including the realization of net unrealized gains or losses as of the date of any reorganization. |
| | |
| 35 | | Invesco California Municipal Fund |
NOTE 8–Investment Transactions
The aggregate amount of investment securities (other than short-term securities, U.S. Government obligations and money market funds, if any) purchased and sold by the Fund during the year ended February 28, 2023 was $842,977,561 and $920,255,938, respectively. Cost of investments, including any derivatives, on a tax basis includes the adjustments for financial reporting purposes as of the most recently completed federal income tax reporting period-end.
| | | | |
Unrealized Appreciation (Depreciation) of Investments on a Tax Basis | |
Aggregate unrealized appreciation of investments | | $ | 42,473,972 | |
|
| |
Aggregate unrealized (depreciation) of investments | | | (129,980,220 | ) |
|
| |
Net unrealized appreciation (depreciation) of investments | | $ | (87,506,248 | ) |
|
| |
Cost of investments for tax purposes is $2,175,670,921.
NOTE 9–Reclassification of Permanent Differences
Primarily as a result of differing book/tax treatment of defaulted bonds, on February 28, 2023, undistributed net investment income was increased by $7,044,958, undistributed net realized gain (loss) was decreased by $7,039,801 and shares of beneficial interest was decreased by $5,157. Further, as a result of tax deferrals acquired in the reorganization of Invesco California Tax Free Income Fund into the Fund, and . These reclassifications had no effect on the net assets of the Fund.
NOTE 10–Share Information
| | | | | | | | | | | | | | | | | | | | | | | | | | | | |
| | | Summary of Share Activity | |
|
| |
| | | Year ended
February 28, 2023(a) | | | | | | Year ended
February 28, 2022 | |
| | | Shares | | | | | | Amount | | | | | | Shares | | | | | | Amount | |
|
| |
Sold: | | | | | | | | | | | | | | | | | | | | | | | | | | | | |
Class A | | | 24,900,060 | | | | | | | $ | 200,588,212 | | | | | | | | 24,642,948 | | | | | | | $ | 226,477,500 | |
|
| |
Class C | | | 3,007,789 | | | | | | | | 24,025,621 | | | | | | | | 3,377,950 | | | | | | | | 30,990,566 | |
|
| |
Class Y | | | 59,470,494 | | | | | | | | 479,972,817 | | | | | | | | 33,910,841 | | | | | | | | 312,365,642 | |
|
| |
Class R6 | | | 124,837 | | | | | | | | 1,053,180 | | | | | | | | 55,464 | | | | | | | | 511,796 | |
|
| |
| | | | | | |
Issued as reinvestment of dividends: | | | | | | | | | | | | | | | | | | | | | | | | | |
Class A | | | 2,786,096 | | | | | | | | 22,316,112 | | | | | | | | 2,637,873 | | | | | | | | 24,220,617 | |
|
| |
Class C | | | 238,655 | | | | | | | | 1,902,545 | | | | | | | | 232,762 | | | | | | | | 2,126,358 | |
|
| |
Class Y | | | 1,348,570 | | | | | | | | 10,797,332 | | | | | | | | 1,162,044 | | | | | | | | 10,668,110 | |
|
| |
Class R6 | | | 2,863 | | | | | | | | 23,014 | | | | | | | | 435 | | | | | | | | 3,977 | |
|
| |
| | | | | | |
Automatic conversion of Class C shares to Class A shares: | | | | | | | | | | | | | | | | | | | | | | | | | |
Class A | | | 1,322,854 | | | | | | | | 10,678,105 | | | | | | | | 931,662 | | | | | | | | 8,535,143 | |
|
| |
Class C | | | (1,329,355 | ) | | | | | | | (10,678,105 | ) | | | | | | | (936,162 | ) | | | | | | | (8,535,143 | ) |
|
| |
Reacquired: | | | | | | | | | | | | | | | | | | | | | | | | | | | | |
Class A | | | (40,090,157 | ) | | | | | | | (324,935,905 | ) | | | | | | | (23,791,544 | ) | | | | | | | (217,932,114 | ) |
|
| |
Class C | | | (4,253,359 | ) | | | | | | | (34,224,428 | ) | | | | | | | (3,351,695 | ) | | | | | | | (30,515,386 | ) |
|
| |
Class Y | | | (54,207,858 | ) | | | | | | | (436,390,131 | ) | | | | | | | (21,976,178 | ) | | | | | | | (200,837,947 | ) |
|
| |
Class R6 | | | (89,498 | ) | | | | | | | (729,301 | ) | | | | | | | (345,311 | ) | | | | | | | (3,146,021 | ) |
|
| |
Net increase (decrease) in share activity | | | (6,768,009 | ) | | | | | | $ | (55,600,932 | ) | | | | | | | 16,551,089 | | | | | | | $ | 154,933,098 | |
|
| |
| (a) | There are entities that are record owners of more than 5% of the outstanding shares of the Fund and in the aggregate own 59% of the outstanding shares of the Fund. IDI has an agreement with these entities to sell Fund shares. The Fund, Invesco and/or Invesco affiliates may make payments to these entities, which are considered to be related to the Fund, for providing services to the Fund, Invesco and/or Invesco affiliates including but not limited to services such as securities brokerage, distribution, third party record keeping and account servicing. The Fund has no knowledge as to whether all or any portion of the shares owned of record by these entities are also owned beneficially. |
| | |
| 36 | | Invesco California Municipal Fund |
Report of Independent Registered Public Accounting Firm
To the Board of Trustees of AIM Tax-Exempt Funds (Invesco Tax-Exempt Funds) and Shareholders of Invesco California Municipal Fund
Opinion on the Financial Statements
We have audited the accompanying statement of assets and liabilities, including the schedule of investments, of Invesco California Municipal Fund (one of the funds constituting AIM Tax-Exempt Funds (Invesco Tax-Exempt Funds), referred to hereafter as the “Fund”) as of February 28, 2023, the related statement of operations for the year ended February 28, 2023, the statement of changes in net assets for each of the two years in the period ended February 28, 2023, including the related notes, and the financial highlights for each of the periods indicated in the table below (collectively referred to as the “financial statements”). In our opinion, the financial statements present fairly, in all material respects, the financial position of the Fund as of February 28, 2023, the results of its operations for the year then ended, the changes in its net assets for each of the two years in the period ended February 28, 2023 and the financial highlights for each of the periods indicated in the table below, in conformity with accounting principles generally accepted in the United States of America.
|
| |
Financial Highlights |
| |
For each of the three years in the period ended February 28, 2023, the seven months ended February 29, 2020 and the year ended July 31, 2019 for Class A, Class C and Class Y. |
| |
For each of the three years in the period ended February 28, 2023, the seven months ended February 29, 2020 and the period May 24, 2019 (commencement date) through July 31, 2019 for Class R6. |
The financial statements of Oppenheimer Rochester® California Municipal Fund (subsequently renamed Invesco California Municipal Fund) as of and for the year ended July 31, 2018 and the financial highlights for the year ended July 31, 2018 (not presented herein, other than the financial highlights) were audited by other auditors whose report dated September 27, 2018 expressed an unqualified opinion on those financial statements and financial highlights.
Basis for Opinion
These financial statements are the responsibility of the Fund’s management. Our responsibility is to express an opinion on the Fund’s financial statements based on our audits. We are a public accounting firm registered with the Public Company Accounting Oversight Board (United States) (PCAOB) and are required to be independent with respect to the Fund in accordance with the U.S. federal securities laws and the applicable rules and regulations of the Securities and Exchange Commission and the PCAOB.
We conducted our audits of these financial statements in accordance with the standards of the PCAOB. Those standards require that we plan and perform the audit to obtain reasonable assurance about whether the financial statements are free of material misstatement, whether due to error or fraud.
Our audits included performing procedures to assess the risks of material misstatement of the financial statements, whether due to error or fraud, and performing procedures that respond to those risks. Such procedures included examining, on a test basis, evidence regarding the amounts and disclosures in the financial statements. Our audits also included evaluating the accounting principles used and significant estimates made by management, as well as evaluating the overall presentation of the financial statements. Our procedures included confirmation of securities owned as of February 28, 2023 by correspondence with the custodian and brokers. We believe that our audits provide a reasonable basis for our opinion.
/s/PricewaterhouseCoopers LLP
Houston, Texas
April 21, 2023
We have served as the auditor of one or more of the investment companies in the Invesco group of investment companies since at least 1995. We have not been able to determine the specific year we began serving as auditor.
| | |
| 37 | | Invesco California Municipal Fund |
Calculating your ongoing Fund expenses
Example
As a shareholder of the Fund, you incur two types of costs: (1) transaction costs, which may include sales charges (loads) on purchase payments or contingent deferred sales charges on redemptions, if any; and (2) ongoing costs, including management fees, distribution and/or service (12b-1) fees, and other Fund expenses. This example is intended to help you understand your ongoing costs (in dollars) of investing in the Fund and to compare these costs with ongoing costs of investing in other mutual funds. The example is based on an investment of $1,000 invested at the beginning of the period and held for the entire period September 1, 2022 through February 28, 2023.
Actual expenses
The table below provides information about actual account values and actual expenses. You may use the information in this table, together with the amount you invested, to estimate the expenses that you paid over the period. Simply divide your account value by $1,000 (for example, an $8,600 account value divided by $1,000 = 8.6), then multiply the result by the number in the table under the heading entitled “Actual Expenses Paid During Period” to estimate the expenses you paid on your account during this period.
Hypothetical example for comparison purposes
The table below also provides information about hypothetical account values and hypothetical expenses based on the Fund’s actual expense ratio and an assumed rate of return of 5% per year before expenses, which is not the Fund’s actual return.
The hypothetical account values and expenses may not be used to estimate the actual ending account balance or expenses you paid for the period. You may use this information to compare the ongoing costs of investing in the Fund and other funds. To do so, compare this 5% hypothetical example with the 5% hypothetical examples that appear in the shareholder reports of the other funds.
Please note that the expenses shown in the table are meant to highlight your ongoing costs only and do not reflect any transaction costs, such as sales charges (loads) on purchase payments or contingent deferred sales charges on redemptions, if any. Therefore, the hypothetical information is useful in comparing ongoing costs only, and will not help you determine the relative total costs of owning different funds. In addition, if these transaction costs were included, your costs would have been higher.
| | | | | | | | | | | | |
| | | | | ACTUAL | | HYPOTHETICAL (5% annual return before
expenses) | | |
| | | Beginning Account Value
(09/01/22) | | Ending
Account Value
(02/28/23)1 | | Expenses
Paid During
Period2 | | Ending Account Value
(02/28/23) | | Expenses
Paid During
Period2 | | Annualized
Expense Ratio |
Class A | | $1,000.00 | | $1,004.50 | | $6.21 | | $1,018.60 | | $6.26 | | 1.25% |
Class C | | 1,000.00 | | 1,000.60 | | 9.92 | | 1,014.88 | | 9.99 | | 2.00 |
Class Y | | 1,000.00 | | 1,005.70 | | 4.97 | | 1,019.84 | | 5.01 | | 1.00 |
Class R6 | | 1,000.00 | | 1,004.80 | | 4.72 | | 1,020.08 | | 4.76 | | 0.95 |
| 1 | The actual ending account value is based on the actual total return of the Fund for the period September 1, 2022 through February 28, 2023, after actual expenses and will differ from the hypothetical ending account value which is based on the Fund’s expense ratio and a hypothetical annual return of 5% before expenses. |
| 2 | Expenses are equal to the Fund’s annualized expense ratio as indicated above multiplied by the average account value over the period, multiplied by 181/365 to reflect the most recent fiscal half year. |
| | |
| 38 | | Invesco California Municipal Fund |
Tax Information
Form 1099-DIV, Form 1042-S and other year–end tax information provide shareholders with actual calendar year amounts that should be included in their tax returns. Shareholders should consult their tax advisers.
The following distribution information is being provided as required by the Internal Revenue Code or to meet a specific state’s requirement.
The Fund designates the following amounts or, if subsequently determined to be different, the maximum amount allowable for its fiscal year ended February 28, 2023:
| | | | | | | | |
Federal and State Income Tax | | | | | | |
Qualified Dividend Income* | | | 0.00 | % | | | | |
Corporate Dividends Received Deduction* | | | 0.00 | % | | | | |
U.S. Treasury Obligations* | | | 0.00 | % | | | | |
Qualified Business Income* | | | 0.00 | % | | | | |
Business Interest Income* | | | 0.00 | % | | | | |
Tax-Exempt Interest Dividends* | | | 98.98 | % | | | | |
|
| * The above percentages are based on ordinary income dividends paid to shareholders during the Fund’s fiscal year. | |
| | |
| 39 | | Invesco California Municipal Fund |
Trustees and Officers
The address of each trustee and officer is AIM Tax-Exempt Funds (Invesco Tax-Exempt Funds) (the “Trust”), 11 Greenway Plaza, Suite 1000, Houston, Texas 77046-1173. The trustees serve for the life of the Trust, subject to their earlier death, incapacitation, resignation, retirement or removal as more specifically provided in the Trust’s organizational documents. Each officer serves for a one year term or until their successors are elected and qualified. Column two below includes length of time served with predecessor entities, if any.
| | | | | | | | |
Name, Year of Birth and Position(s) Held with the Trust | | Trustee and/or Officer Since | | Principal Occupation(s) During Past 5 Years | | Number of Funds in Fund Complex Overseen by Trustee | | Other Directorship(s) Held by Trustee During Past 5 Years |
| Interested Trustee | | | | | | | | |
Martin L. Flanagan1 – 1960 Trustee and Vice Chair | | 2007 | | Executive Director, Chief Executive Officer and President, Invesco Ltd. (ultimate parent of Invesco and a global investment management firm); Trustee and Vice Chair, The Invesco Funds; Vice Chair, Investment Company Institute; and Member of Executive Board, SMU Cox School of Business Formerly: Advisor to the Board, Invesco Advisers, Inc. (formerly known as Invesco Institutional (N.A.), Inc.); Chairman and Chief Executive Officer, Invesco Advisers, Inc. (registered investment adviser); Director, Chairman, Chief Executive Officer and President, Invesco Holding Company (US), Inc. (formerly IVZ Inc.) (holding company), Invesco Group Services, Inc. (service provider) and Invesco North American Holdings, Inc. (holding company); Director, Chief Executive Officer and President, Invesco Holding Company Limited (parent of Invesco and a global investment management firm); Director, Invesco Ltd.; Chairman, Investment Company Institute and President, Co-Chief Executive Officer, Co-President, Chief Operating Officer and Chief Financial Officer, Franklin Resources, Inc. (global investment management organization) | | 175 | | None |
| 1 | Mr. Flanagan is considered an interested person (within the meaning of Section 2(a)(19) of the 1940 Act) of the Trust because he is an officer of the Adviser to the Trust, and an officer and a director of Invesco Ltd., ultimate parent of the Adviser. |
| | |
| T-1 | | Invesco California Municipal Fund |
Trustees and Officers–(continued)
| | | | | | | | |
Name, Year of Birth and
Position(s) Held with the Trust | | Trustee and/or Officer Since | | Principal Occupation(s) During Past 5 Years | | Number of Funds in Fund Complex
Overseen by
Trustee | | Other Directorship(s) Held by Trustee During Past 5 Years |
Independent Trustees | | | | | | | | |
Beth Ann Brown – 1968 Trustee (2019) and Chair (August 2022) | | 2019 | | Independent Consultant Formerly: Head of Intermediary Distribution, Managing Director, Strategic Relations, Managing Director, Head of National Accounts, Senior Vice President, National Account Manager and Senior Vice President, Key Account Manager, Columbia Management Investment Advisers LLC; Vice President, Key Account Manager, Liberty Funds Distributor, Inc.; and Trustee of certain Oppenheimer Funds | | 175 | | Director, Board of Directors of Caron Engineering Inc.; Advisor, Board of Advisors of Caron Engineering Inc.; President and Director, Acton Shapleigh Youth Conservation Corps (non-profit) Formerly: President and Director Director of Grahamtastic Connection (non-profit) |
Cynthia Hostetler – 1962 Trustee | | 2017 | | Non-Executive Director and Trustee of a number of public and private business corporations Formerly: Director, Aberdeen Investment Funds (4 portfolios); Director, Artio Global Investment LLC (mutual fund complex); Director, Edgen Group, Inc. (specialized energy and infrastructure products distributor); Director, Genesee & Wyoming, Inc. (railroads); Head of Investment Funds and Private Equity, Overseas Private Investment Corporation; President, First Manhattan Bancorporation, Inc.; and Attorney, Simpson Thacher & Bartlett LLP | | 175 | | Resideo Technologies, Inc. (smart home technology); Vulcan Materials Company (construction materials company); Trilinc Global Impact Fund; Textainer Group Holdings, (shipping container leasing company); Investment Company Institute (professional organization); and Independent Directors Council (professional organization) |
Eli Jones – 1961 Trustee | | 2016 | | Professor and Dean Emeritus, Mays Business School—Texas A&M University Formerly: Dean of Mays Business School-Texas A&M University; Professor and Dean, Walton College of Business, University of Arkansas and E.J. Ourso College of Business, Louisiana State University; and Director, Arvest Bank | | 175 | | Insperity, Inc. (formerly known as Administaff) (human resources provider); Board Member of the regional board, First Financial Bank Texas; and Boad Member, First Financial Bankshares, Inc. Texas (FFIN) |
Elizabeth Krentzman – 1959 Trustee | | 2019 | | Formerly: Principal and Chief Regulatory Advisor for Asset Management Services and U.S. Mutual Fund Leader of Deloitte & Touche LLP; General Counsel of the Investment Company Institute (trade association); National Director of the Investment Management Regulatory Consulting Practice, Principal, Director and Senior Manager of Deloitte & Touche LLP; Assistant Director of the Division of Investment Management - Office of Disclosure and Investment Adviser Regulation of the U.S. Securities and Exchange Commission and various positions with the Division of Investment Management – Office of Regulatory Policy of the U.S. Securities and Exchange Commission; Associate at Ropes & Gray LLP; and Trustee of certain Oppenheimer Funds | | 175 | | Formerly: Member of the Cartica Funds Board of Directors (private investment fund); Trustee of the University of Florida National Board Foundation; and Member of the University of Florida Law Center Association, Inc. Board of Trustees, Audit Committee and Membership Committee |
Anthony J. LaCava, Jr. – 1956 Trustee | | 2019 | | Formerly: Director and Member of the Audit Committee, Blue Hills Bank (publicly traded financial institution) and Managing Partner, KPMG LLP | | 175 | | Blue Hills Bank; Member and Chairman, Bentley University, Business School Advisory Council; and Nominating Committee, KPMG LLP |
Prema Mathai-Davis – 1950 Trustee | | 1998 | | Retired Formerly: Co-Founder & Partner of Quantalytics Research, LLC, (a FinTech Investment Research Platform for the Self-Directed Investor); Trustee of YWCA Retirement Fund; CEO of YWCA of the USA; Board member of the NY Metropolitan Transportation Authority; Commissioner of the NYC Department of Aging; and Board member of Johns Hopkins Bioethics Institute | | 175 | | Member of Board of Positive Planet US (non-profit) and HealthCare Chaplaincy Network (non-profit) |
| | |
| T-2 | | Invesco California Municipal Fund |
Trustees and Officers–(continued)
| | | | | | | | |
Name, Year of Birth and
Position(s) Held with the Trust | | Trustee and/or Officer Since | | Principal Occupation(s) During Past 5 Years | | Number of Funds in Fund Complex
Overseen by
Trustee | | Other Directorship(s) Held by Trustee During Past 5 Years |
Independent Trustees–(continued) | | | | | | |
Joel W. Motley – 1952 Trustee | | 2019 | | Director of Office of Finance, Federal Home Loan Bank System; Managing Director of Carmona Motley Inc. (privately held financial advisor); Member of the Council on Foreign Relations and its Finance and Budget Committee; Chairman Emeritus of Board of Human Rights Watch and Member of its Investment Committee; and Member of Investment Committee Board of Historic Hudson Valley (non-profit cultural organization); Member of the Board, Blue Ocean Acquisition Corp.; and Member of the Vestry and the Investment Committee of Trinity Church Wall Street. Formerly: Managing Director of Public Capital Advisors, LLC (privately held financial advisor); Managing Director of Carmona Motley Hoffman, Inc. (privately held financial advisor); Trustee of certain Oppenheimer Funds; and Director of Columbia Equity Financial Corp. (privately held financial advisor) | | 175 | | Member of Board of Trust for Mutual Understanding (non-profit promoting the arts and environment); Member of Board of Greenwall Foundation (bioethics research foundation) and its Investment Committee; Member of Board of Friends of the LRC (non- profit legal advocacy); and Board Member and Investment Committee Member of Pulitzer Center for Crisis Reporting (non-profit journalism) |
Teresa M. Ressel – 1962 Trustee | | 2017 | | Non-executive director and trustee of a number of public and private business corporations Formerly: Chief Executive Officer, UBS Securities LLC (investment banking); Chief Operating Officer, UBS AG Americas (investment banking); Sr. Management Team Olayan America, The Olayan Group (international investor/commercial/industrial); and Assistant Secretary for Management & Budget and Designated Chief Financial Officer, U.S. Department of Treasury | | 175 | | None |
Robert C. Troccoli – 1949 Trustee | | 2016 | | Retired Formerly: Adjunct Professor, University of Denver – Daniels College of Business; and Managing Partner, KPMG LLP | | 175 | | None |
Daniel S. Vandivort – 1954 Trustee | | 2019 | | President, Flyway Advisory Services LLC (consulting and property management) Formerly: President and Chief Investment Officer, previously Head of Fixed Income, Weiss Peck and Greer/Robeco Investment Management; Trustee and Chair, Weiss Peck and Greer Funds Board; and various capacities at CS First Boston including Head of Fixed Income at First Boston Asset Management. | | 175 | | Formerly: Trustee and Governance Chair, Oppenheimer Funds; Treasurer, Chairman of the Audit and Finance Committee, Huntington Disease Foundation of America |
| | |
| T-3 | | Invesco California Municipal Fund |
Trustees and Officers–(continued)
| | | | | | | | |
Name, Year of Birth and
Position(s) Held with the Trust | | Trustee and/or Officer Since | | Principal Occupation(s) During Past 5 Years | | Number of Funds in
Fund Complex
Overseen by
Trustee | | Other Directorship(s) Held by Trustee During Past 5 Years |
| Officers | | | | | | |
Sheri Morris – 1964 President and Principal Executive Officer | | 1999 | | Director, Invesco Trust Company; Head of Global Fund Services, Invesco Ltd.; President and Principal Executive Officer, The Invesco Funds; Vice President, Invesco Exchange-Traded Fund Trust, Invesco Exchange-Traded Fund Trust II, Invesco India Exchange-Traded Fund Trust, Invesco Actively Managed Exchange-Traded Fund Trust, Invesco Actively Managed Exchange-Traded Commodity Fund Trust and Invesco Exchange-Traded Self-Indexed Fund Trust; and Vice President, OppenheimerFunds, Inc. Formerly: Vice President, Treasurer and Principal Financial Officer, The Invesco Funds; Vice President, Invesco AIM Advisers, Inc., Invesco AIM Capital Management, Inc. and Invesco AIM Private Asset Management, Inc.; Assistant Vice President and Assistant Treasurer, The Invesco Funds; Vice President and Assistant Vice President, Invesco Advisers, Inc.; Assistant Vice President, Invesco AIM Capital Management, Inc. and Invesco AIM Private Asset Management, Inc.; Treasurer, Invesco Exchange-Traded Fund Trust, Invesco Exchange-Traded Fund Trust II, Invesco India Exchange-Traded Fund Trust and Invesco Actively Managed Exchange-Traded Fund Trust; and Senior Vice President, Invesco Advisers, Inc. (formerly known as Invesco Institutional (N.A.), Inc.) (registered investment adviser) | | N/A | | N/A |
Melanie Ringold – 1975 Senior Vice President, Chief Legal Officer and Secretary | | 2023 | | Head of Legal of the Americas, Invesco Ltd.; Senior Vice President and Secretary, Invesco Advisers, Inc. (formerly known as Invesco Institutional (N.A.), Inc.) (registered investment adviser); Secretary, Invesco Distributors, Inc. (formerly known as Invesco AIM Distributors, Inc.); Secretary, Invesco Investment Services, Inc. (formerly known as Invesco AIM Investment Services, Inc.); Senior Vice President, Chief Legal Officer and Secretary, The Invesco Funds; Secretary, Invesco Investment Advisers LLC, Invesco Capital Markets, Inc.; Chief Legal Officer, Invesco Exchange-Traded Fund Trust, Invesco Exchange-Traded Fund Trust II, Invesco India Exchange-Traded Fund Trust, Invesco Actively Managed Exchange-Traded Fund Trust, Invesco Actively Managed Exchange-Traded Commodity Fund Trust and Invesco Exchange-Traded Self-Indexed Fund Trust;Secretary and Vice President, Harbourview Asset Management Corporation; Secretary and Senior Vice President, OppenheimerFunds, Inc. and Invesco Managed Accounts, LLC; Secretary and Senior Vice President, OFI SteelPath, Inc.; Secretary and Senior Vice President, Oppenheimer Acquisition Corp.; Secretary, SteelPath Funds Remediation LLC; and Secretary and Senior Vice President, Trinity Investment Management Corporation Formerly: Assistant Secretary, Invesco Distributors, Inc.; Invesco Advisers, Inc. Invesco Investment Services, Inc., Invesco Capital Markets, Inc., Invesco Capital Management LLC and Invesco Investment Advisers LLC; and Assistant Secretary and Investment Vice President, Invesco Funds | | N/A | | N/A |
Andrew R. Schlossberg – 1974 Senior Vice President | | 2019 | | Senior Vice President, Invesco Group Services, Inc.; Head of the Americas and Senior Managing Director, Invesco Ltd.; Director and Senior Vice President, Invesco Advisers, Inc. (formerly known as Invesco Institutional (N.A.), Inc.) (registered investment adviser); Director and Chairman, Invesco Investment Services, Inc. (formerly known as Invesco AIM Investment Services, Inc.) (registered transfer agent); Senior Vice President, The Invesco Funds; and Director, Invesco Investment Advisers LLC (formerly known as Van Kampen Asset Management) Formerly: Director, President and Chairman, Invesco Insurance Agency, Inc.; Director, Invesco UK Limited; Director and Chief Executive, Invesco Asset Management Limited and Invesco Fund Managers Limited; Assistant Vice President, The Invesco Funds; Senior Vice President, Invesco Advisers, Inc. (formerly known as Invesco Institutional (N.A.), Inc.) (registered investment adviser); Director and Chief Executive, Invesco Administration Services Limited and Invesco Global Investment Funds Limited; Director, Invesco Distributors, Inc.; Head of EMEA, Invesco Ltd.; President, Invesco Actively Managed Exchange-Traded Commodity Fund Trust, Invesco Actively Managed Exchange-Traded Fund Trust, Invesco Exchange-Traded Fund Trust, Invesco Exchange-Traded Fund Trust II and Invesco India Exchange-Traded Fund Trust; and Managing Director and Principal Executive Officer, Invesco Capital Management LLC | | N/A | | N/A |
| | |
T-4 | | Invesco California Municipal Fund |
Trustees and Officers–(continued)
| | | | | | | | |
Name, Year of Birth and
Position(s) Held with the Trust | | Trustee and/or Officer Since | | Principal Occupation(s) During Past 5 Years | | Number of Funds in
Fund Complex
Overseen by
Trustee | | Other Directorship(s) Held by Trustee During Past 5 Years |
| Officers–(continued) | | | | | | |
John M. Zerr – 1962 Senior Vice President | | 2006 | | Chief Operating Officer of the Americas; Senior Vice President, Invesco Advisers, Inc. (formerly known as Invesco Institutional (N.A.), Inc.) (registered investment adviser); Senior Vice President, Invesco Distributors, Inc. (formerly known as Invesco AIM Distributors, Inc.); Director and Vice President, Invesco Investment Services, Inc. (formerly known as Invesco AIM Investment Services, Inc.) Senior Vice President, The Invesco Funds; Managing Director, Invesco Capital Management LLC; Director, Invesco Investment Advisers LLC (formerly known as Van Kampen Asset Management); Senior Vice President, Invesco Capital Markets, Inc. (formerly known as Van Kampen Funds Inc.); Manager, Invesco Indexing LLC; Manager, Invesco Specialized Products, LLC; Member, Invesco Canada Funds Advisory Board; Director, President and Chief Executive Officer, Invesco Corporate Class Inc. (corporate mutual fund company); and Director, Chairman, President and Chief Executive Officer, Invesco Canada Ltd. (formerly known as Invesco Trimark Ltd./Invesco Trimark Ltèe) (registered investment adviser and registered transfer agent); President, Invesco, Inc.; President, Invesco Global Direct Real Estate Feeder GP Ltd.; President, Invesco IP Holdings (Canada) Ltd; President, Invesco Global Direct Real Estate GP Ltd.; President, Invesco Financial Services Ltd. / Services Financiers Invesco Ltée; and Director and Chairman, Invesco Trust Company Formerly: President, Trimark Investments Ltd/Services Financiers Invesco Ltee; Director and Senior Vice President, Invesco Insurance Agency, Inc.; Director and Senior Vice President, Invesco Management Group, Inc. (formerly known as Invesco AIM Management Group, Inc.); Secretary and General Counsel, Invesco Management Group, Inc. (formerly known as Invesco AIM Management Group, Inc.); Secretary, Invesco Investment Services, Inc. (formerly known as Invesco AIM Investment Services, Inc.); Chief Legal Officer and Secretary, The Invesco Funds; Secretary and General Counsel, Invesco Investment Advisers LLC (formerly known as Van Kampen Asset Management); Secretary and General Counsel, Invesco Capital Markets, Inc. (formerly known as Van Kampen Funds Inc.); Chief Legal Officer, Invesco Exchange-Traded Fund Trust, Invesco Exchange-Traded Fund Trust II, Invesco India Exchange-Traded Fund Trust, Invesco Actively Managed Exchange-Traded Fund Trust, Invesco Actively Managed Exchange-Traded Commodity Fund Trust and Invesco Exchange-Traded Self-Indexed Fund Trust; Secretary, Invesco Indexing LLC; Director, Secretary, General Counsel and Senior Vice President, Van Kampen Exchange Corp.; Director, Vice President and Secretary, IVZ Distributors, Inc. (formerly known as INVESCO Distributors, Inc.); Director and Vice President, INVESCO Funds Group, Inc.; Director and Vice President, Van Kampen Advisors Inc.; Director, Vice President, Secretary and General Counsel, Van Kampen Investor Services Inc.;Director and Secretary, Invesco Distributors, Inc. (formerly known as Invesco AIM Distributors, Inc.); Director, Senior Vice President, General Counsel and Secretary, Invesco AIM Advisers, Inc. and Van Kampen Investments Inc.; Director, Vice President and Secretary, Fund Management Company; Director, Senior Vice President, Secretary, General Counsel and Vice President, Invesco AIM Capital Management, Inc.; and Chief Operating Officer and General Counsel, Liberty Ridge Capital, Inc. (an investment adviser) | | N/A | | N/A |
Gregory G. McGreevey – 1962 Senior Vice President | | 2012 | | Senior Managing Director, Invesco Ltd.; Director, Chairman, President, and Chief Executive Officer, Invesco Advisers, Inc. (formerly known as Invesco Institutional (N.A.), Inc.) (registered investment adviser); Director, Invesco Mortgage Capital, Inc. and Invesco Senior Secured Management, Inc.; Senior Vice President, The Invesco Funds; President, SNW Asset Management Corporation and Invesco Managed Accounts, LLC; Chairman and Director, Invesco Private Capital, Inc.; Chairman and Director, INVESCO Private Capital Investments, Inc.; Chairman and Director, INVESCO Realty, Inc.; and Senior Vice President, Invesco Group Services, Inc. Formerly: Senior Vice President, Invesco Management Group, Inc. and Invesco Advisers, Inc.; Assistant Vice President, The Invesco Funds | | N/A | | N/A |
Adrien Deberghes –1967 Principal Financial Officer, Treasurer and Vice President | | 2020 | | Head of the Fund Office of the CFO and Fund Administration; Vice President, Invesco Advisers, Inc.; Principal Financial Officer, Treasurer and Vice President, The Invesco Funds; Vice President, Invesco Exchange-Traded Fund Trust, Invesco Exchange-Traded Fund Trust II, Invesco India Exchange-Traded Fund Trust, Invesco Actively Managed Exchange-Traded Fund Trust, Invesco Actively Managed Exchange-Traded Commodity Fund Trust and Invesco Exchange-Traded Self-Indexed Fund Trust Formerly: Senior Vice President and Treasurer, Fidelity Investments | | N/A | | N/A |
Crissie M. Wisdom – 1969 Anti-Money Laundering Compliance Officer | | 2013 | | Anti-Money Laundering and OFAC Compliance Officer for Invesco U.S. entities including: Invesco Advisers, Inc. and its affiliates, Invesco Capital Markets, Inc., Invesco Distributors, Inc., Invesco Investment Services, Inc., The Invesco Funds, Invesco Capital Management, LLC, Invesco Trust Company; and Fraud Prevention Manager for Invesco Investment Services, Inc. | | N/A | | N/A |
| | |
| T-5 | | Invesco California Municipal Fund |
Trustees and Officers–(continued)
| | | | | | | | |
Name, Year of Birth and
Position(s) Held with the Trust | | Trustee and/or Officer Since | | Principal Occupation(s) During Past 5 Years | | Number of Funds in
Fund Complex
Overseen by
Trustee | | Other Directorship(s) Held by Trustee During Past 5 Years |
| Officers–(continued) | | | | | | |
Todd F. Kuehl - 1969 Chief Compliance Officer and Senior Vice President | | 2020 | | Chief Compliance Officer, Invesco Advisers, Inc. (registered investment adviser); and Chief Compliance Officer and Senior Vice President, The Invesco Funds Formerly: Managing Director and Chief Compliance Officer, Legg Mason (Mutual Funds); Chief Compliance Officer, Legg Mason Private Portfolio Group (registered investment adviser) | | N/A | | N/A |
James Bordewick, Jr. – 1959 Senior Vice President and Senior Officer | | 2022 | | Senior Vice President and Senior Officer, The Invesco Funds Formerly: Chief Legal Officer, KingsCrowd, Inc. (research and analytical platform for investment in private capital markets); Chief Operating Officer and Head of Legal and Regulatory, Netcapital (private capital investment platform); Managing Director, General Counsel of asset management and Chief Compliance Officer for asset management and private banking, Bank of America Corporation; Chief Legal Officer, Columbia Funds and BofA Funds; Senior Vice President and Associate General Counsel, MFS Investment Management; Chief Legal Officer, MFS Funds; Associate, Ropes & Gray; and Associate, Gaston Snow & Ely Bartlett | | N/A | | N/A |
The Statement of Additional Information of the Trust includes additional information about the Fund’s Trustees and is available upon request, without charge, by calling 1.800.959.4246. Please refer to the Fund’s Statement of Additional Information for information on the Fund’s sub-advisers.
| | | | | | |
| Office of the Fund | | Investment Adviser | | Distributor | | Auditors |
| 11 Greenway Plaza, Suite 1000 | | Invesco Advisers, Inc. | | Invesco Distributors, Inc. | | PricewaterhouseCoopers LLP |
| Houston, TX 77046-1173 | | 1331 Spring Street, NW, Suite 2500 | | 11 Greenway Plaza, Suite 1000 | | 1000 Louisiana Street, Suite 5800 |
| | Atlanta, GA 30309 | | Houston, TX 77046-1173 | | Houston, TX 77002-5021 |
| | | |
| Counsel to the Fund | | Counsel to the Independent Trustees | | Transfer Agent | | Custodian |
| Stradley Ronon Stevens & Young, LLP | | Sidley Austin LLP | | Invesco Investment Services, Inc. | | State Street Bank and Trust Company |
| 2005 Market Street, Suite 2600 | | 787 Seventh Avenue | | 11 Greenway Plaza, Suite 1000 | | 225 Franklin Street |
| Philadelphia, PA 19103-7018 | | New York, NY 10019 | | Houston, TX 77046-1173 | | Boston, MA 02110-2801 |
| | |
| T-6 | | Invesco California Municipal Fund |
(This page intentionally left blank)
(This page intentionally left blank)

Go paperless with eDelivery
Visit invesco.com/edelivery to enjoy the convenience and security of anytime electronic access to your investment documents.
With eDelivery, you can elect to have any or all of the following materials delivered straight to your inbox to download, save and print from your own computer:
∎ Fund reports and prospectuses
∎ Quarterly statements
∎ Daily confirmations
∎ Tax forms
Invesco mailing information
Send general correspondence to Invesco Investment Services, Inc., P.O. Box 219078, Kansas City, MO 64121-9078.
Important notice regarding delivery of security holder documents
To reduce Fund expenses, only one copy of most shareholder documents may be mailed to shareholders with multiple accounts at the same address (Householding). Mailing of your shareholder documents may be householded indefinitely unless you instruct us otherwise. If you do not want the mailing of these documents to be combined with those for other members of your household, please contact Invesco Investment Services, Inc. at 800 959 4246 or contact your financial institution. We will begin sending you individual copies for each account within 30 days after receiving your request.
Fund holdings and proxy voting information
The Fund provides a complete list of its portfolio holdings four times each year, at the end of each fiscal quarter. For the second and fourth quarters, the list appears, respectively, in the Fund’s semiannual and annual reports to shareholders. For the first and third quarters, the Fund files the list with the Securities and Exchange Commission (SEC) as an exhibit to its reports on Form N-PORT. The most recent list of portfolio holdings is available at invesco.com/completeqtrholdings. Shareholders can also look up the Fund’s Form N-PORT filings on the SEC website, sec.gov. The SEC file numbers for the Fund are shown below.
A description of the policies and procedures that the Fund uses to determine how to vote proxies relating to portfolio securities is available without charge, upon request, from our Client Services department at 800 959 4246, or at invesco.com/ corporate/about-us/esg. The information is also available on the SEC website, sec.gov.
Information regarding how the Fund voted proxies related to its portfolio securities during the most recent 12-month period ended June 30 is available at invesco.com/proxysearch. This information is also available on the SEC website, sec.gov.
Invesco Advisers, Inc. is an investment adviser; it provides investment advisory services to individual and institutional clients and does not sell securities. Invesco Distributors, Inc. is the US distributor for Invesco Ltd.’s retail mutual funds, exchange-traded funds and institutional money market funds. Both are wholly owned, indirect subsidiaries of Invesco Ltd.
| | | | |
| SEC file number(s): 811-07890 and 033-66242 | | Invesco Distributors, Inc. | | O-ROCAM-AR-1 |

| | |
| | |
| Annual Report to Shareholders | | February 28, 2023 |
Invesco Environmental Focus Municipal Fund
Nasdaq:
A: OPAMX ∎ C: OPCMX ∎ Y: OPYMX ∎ R6: IOMUX
Management’s Discussion of Fund Performance
| | | | |
| |
Performance summary | |
For the fiscal year ended February 28, 2023, Class A shares of Invesco Environmental Focus Municipal Fund (the Fund), at net asset value (NAV), underper-formed the S&P Municipal Bond 5+ Year Investment Grade Index, the Fund’s style-specific benchmark. | |
Your Fund’s long-term performance appears later in this report. | |
| |
Fund vs. Indexes | |
Total returns, 2/28/22 to 2/28/23, at net asset value (NAV). Performance shown does not include applicable contingent deferred sales charges (CDSC) or front-end sales charges, which would have reduced performance. | |
Class A Shares | | | -9.23 | % |
Class C Shares | | | -9.85 | |
Class Y Shares | | | -9.00 | |
Class R6 Shares | | | -8.91 | |
S&P Municipal Bond Index▼ (Broad Market Index) | | | -4.91 | |
S&P Municipal Bond 5+ Year Investment Grade Index▼ (Style-Specific Index) | | | -6.31 | |
| |
Source(s): ▼RIMES Technologies Corp. | | | | |
Market conditions and your Fund
At the beginning of the fiscal year, investors were hopeful in anticipation of a return to normalcy as COVID-19 cases declined and pandemic-related restrictions were reduced or lifted. This allowed policymakers to turn their attention to the high inflation levels; however, on February 24, 2022, Russia began a full-scale invasion of Ukraine, which exacerbated inflationary pressures by driving up commodity prices. Against this backdrop, the fiscal year was plagued by volatility and uncertainty. The municipal market set multiple record lows in 2022, making it one of the most challenging years in history for municipal markets.
Investment grade municipal bonds returned -5.10%, high yield municipal bonds returned -9.35% and taxable municipal bonds returned -12.96% during the fiscal year.1
While municipal funds had experienced record inflows of $101.7 billion in 2021, flows quickly turned negative in the first quarter of 2022, perpetuating the Bloomberg Municipal Bond Index’s worst quarterly return in 40 years. Municipal bonds enjoyed a short respite in late May and early June 2022 with increased demand from crossover buyers like hedge funds, banks and insurance companies; however, the May 2022 Consumer Price Index report quoted inflation rising to a 40-year high. This sent the 10-year Treasury yield to a new 52-week high of nearly 3.50%, pushing municipal mutual fund flows back into negative territory.2 According to Lipper, net outflows from municipal bond funds totaled over -$110 billion for the fiscal year.3
On March 16, 2022, the US Federal Reserve (the Fed) raised the federal funds target rate 0.25% for the first time in more than three years in hopes of containing inflation.4 This was the first of eight consecutive increases during the fiscal year as the Fed announced its plan for a quantitative tightening campaign in an attempt to rein in inflation
without harming employment or the overall economy. Rate increases as high as 0.75% followed, the Fed’s most aggressive monetary policy since the 1980s, bringing the target rate to 4.75% as of the end of the fiscal year.4
The AAA municipal yield curve made history after the Fed’s December 2022 meeting when the curve inverted between one- and 10-year maturities. Any inversion is noteworthy, but this was a first for municipal bonds. On January 31, 2023, policymakers indicated that future rate increases were likely to be “appropriate,” suggesting they were not yet convinced inflation was contained, which increased uncertainty about when the current tightening cycle might end.4 The fiscal year ended with an increase of 0.25% on February 1, 2023. We expect additional rate hikes in 2023, although not with the same pace or vigor as in 2022.
New municipal issuance for the fiscal year totaled $354 billion, down 27% from the previous fiscal year’s $484 billion.5 Issuers, with cash on their balance sheets, have been reluctant to issue at higher interest rates. While taxable issuance continued to account for a significant portion of new issuance, at 14% of the total, this figure is down from 18% from the previous fiscal year because of higher interest rates.5
Puerto Rico continued to make developments in its ongoing debt restructuring throughout the fiscal year. The territory restructured its outstanding general obligation and other government-guaranteed debt in March 2022 and began paying bondholders on the new restructured bonds. Puerto Rico’s weight in the Bloomberg High Yield Municipal Bond Index increased from 13% to 20% as the new bonds were included.1 The Financial Oversight and Management Board for Puerto Rico, the Puerto Rican government, bond-holders and other interested parties continued to negotiate the restructuring of bonds issued by the Puerto Rico Electric Power Au-
thority, the territory’s largest remaining unresolved debt, as the fiscal year closed.
Municipal credits have a long history of low defaults as many provide essential services to all Americans. This continues to be the case as evidenced by S&P rating changes – upgrades exceeded downgrades by a ratio of
2.5:1 through December 2022.6 This positive dynamic, which we believe will continue, likely stems from benefits of the various federal stimulus measures including the American Rescue Plan Act, the Infrastructure Investment and Jobs Act and the Inflation Reduction Act, as well as higher revenues collected by state and local governments.
We believe the valuable benefits of municipal bonds will prevail over current market volatility and economic uncertainty. We continue to rely on our experienced portfolio managers and credit analysts to weather the challenges while identifying marketplace opportunities to add long-term value for shareholders.
During the fiscal year, an underweight allocation to AAA-rated† bonds contributed to the Fund’s performance relative to its style-specific benchmark. At the sector level, security selection and an underweight exposure to the dedicated tax sector contributed to the Fund’s relative performance. On a state level, underweight exposure to Texas domiciled issues contributed to the Fund’s relative performance.
An overweight exposure to intermediate duration bonds (10.00 - 14.99 years specifically) detracted from the Fund’s performance relative to its style-specific benchmark. An overweight allocation to multi-family housing bonds detracted from the Fund’s performance relative to the style-specific benchmark during the year. On a state level, overweight exposure to New York holdings were a detractor from the Fund’s relative results.
During the fiscal year, leverage contributed to the Fund’s performance relative to its style-specific benchmark. The Fund achieved a leveraged position through the use of inverse floating rate securities or tender option bonds. The Fund uses leverage because we believe that, over time, leveraging provides opportunities for additional income and total return for shareholders. However, the use of leverage also can expose shareholders to additional volatility. For more information about the Fund’s use of leverage, see the Notes to Financial Statements later in this report.
We wish to remind you that the Fund is subject to interest rate risk, meaning when interest rates rise, the value of fixed income securities tends to fall. The degree to which the value of fixed income securities may decline due to rising interest rates may vary depending on the speed and magnitude of the increase in interest rates, as well as individual security characteristics, such as price, maturity, duration and coupon and market forces, such as supply and demand for similar securities. We are monitoring interest rates, as well
| | |
| 2 | | Invesco Environmental Focus Municipal Fund |
as the market, economic and geopolitical factors that may impact the direction, speed and magnitude of changes to interest rates across the maturity spectrum, including the potential impact of monetary policy changes by the Fed and certain foreign central banks. If interest rates rise or fall faster than expected, markets may experience increased volatility, which may affect the value and/or liquidity of certain of the Fund’s investments.
Thank you for investing in Invesco Environmental Focus Municipal Fund and for sharing our long-term investment horizon.
1 Source: Bloomberg LP
2 Source: Refinitiv TM3
3 Source: Lipper Inc.
4 Source: US Federal Reserve
5 Source: JP Morgan
6 Source: Standard & Poor’s
† Sources: A credit rating is an assessment provided by a NRSRO of the creditworthiness of an issuer with respect to debt obligations, including specific securities, money market instruments or other debts. Ratings are measured on a scale that generally ranges from AAA (highest) to D (lowest); ratings are subject to change without notice. For more information on rating methodology, please visit www.spglobal.com and select “Understanding Credit Ratings” under About Ratings on the homepage; www.fitchratings.com and select “Understanding Credit Ratings” from the drop-down menu on the homepage; and www.moodys.com and select “Methodology,” then “Rating Methodologies” under Research Type on the left-hand side.
Portfolio manager(s):
Tim Benzel
Eddie Bernhardt
Joshua Cooney
Tim O’Reilly
Mark Paris
Galen True
Julius Williams
The views and opinions expressed in management’s discussion of Fund performance are those of Invesco Advisers, Inc. and its affiliates. These views and opinions are subject to change at any time based on factors such as market and economic conditions. These views and opinions may not be relied upon as investment advice or recommendations, or as an offer for a particular security. The information is not a complete analysis of every aspect of any market, country, industry, security or the Fund. Statements of fact are from sources considered reliable, but Invesco Advisers, Inc. makes no representation or warranty as to their completeness or accuracy. Although historical performance is no guarantee of future results, these insights may help you understand our investment management philosophy.
| | |
| 3 | | Invesco Environmental Focus Municipal Fund |
Your Fund’s Long-Term Performance
Results of a $10,000 Investment – Oldest Share Class(es)
Fund and index data from 2/28/13
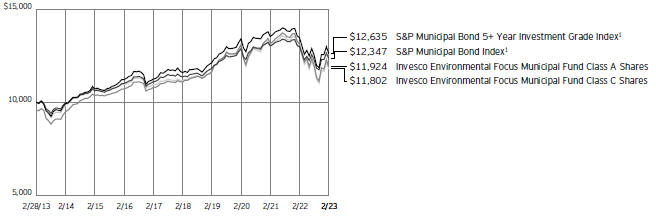
1 Source: RIMES Technologies Corp.
Past performance cannot guarantee future results.
The data shown in the chart include reinvested distributions, applicable sales charges and Fund expenses including management
fees. Index results include reinvested dividends, but they do not reflect sales charges. Performance of the peer group, if applicable, reflects Fund expenses and management fees; performance of a market index does
not. Performance shown in the chart does not reflect deduction of taxes a shareholder would pay on Fund distributions or sale of Fund shares.
| | |
| 4 | | Invesco Environmental Focus Municipal Fund |
| | | | |
| |
Average Annual Total Returns | |
As of 2/28/23, including maximum applicable sales charges | |
| |
Class A Shares | | | | |
Inception (11/7/06) | | | 2.91 | % |
10 Years | | | 1.78 | |
5 Years | | | 0.59 | |
1 Year | | | -13.10 | |
| |
Class C Shares | | | | |
Inception (11/7/06) | | | 2.79 | % |
10 Years | | | 1.67 | |
5 Years | | | 0.83 | |
1 Year | | | -10.73 | |
| |
Class Y Shares | | | | |
Inception (7/29/11) | | | 3.60 | % |
10 Years | | | 2.37 | |
5 Years | | | 1.70 | |
1 Year | | | -9.00 | |
| |
Class R6 Shares | | | | |
10 Years | | | 2.35 | % |
5 Years | | | 1.72 | |
1 Year | | | -8.91 | |
Effective May 24, 2019, Class A, Class C and Class Y shares of the Oppenheimer Municipal Fund, (the predecessor fund), were reorganized into Class A, Class C and Class Y shares, respectively, of the Invesco Oppenheimer Municipal Fund. The Fund was subsequently renamed the Invesco Environmental Focus Municipal Fund (the Fund). Returns shown above, for periods ending on or prior to May 24, 2019, for Class A, Class C and Class Y shares are those for Class A, Class C and Class Y shares of the predecessor fund. Share class returns will differ from the predecessor fund because of different expenses.
Class R6 shares incepted on May 24, 2019. Performance shown on and prior to that date is that of the predecessor fund’s Class A shares at net asset value and includes the 12b-1 fees applicable to Class A shares.
The performance data quoted represent past performance and cannot guarantee future results; current performance may be lower or higher. Please visit invesco.com/ performance for the most recent month-end performance. Performance figures reflect reinvested distributions, changes in net asset value and the effect of the maximum sales charge unless otherwise stated. Performance figures do not reflect deduction of taxes a shareholder would pay on Fund distributions or sale of Fund shares. Investment return and principal value will fluctuate so that you may have a gain or loss when you sell shares.
Class A share performance reflects the maximum 4.25% sales charge, and Class C share performance reflects the applicable contingent deferred sales charge (CDSC) for the period involved. The CDSC on Class C shares is 1% for the first year after
purchase. Class Y and Class R6 shares do not have a front-end sales charge or a CDSC; therefore, performance is at net asset value.
The performance of the Fund’s share classes will differ primarily due to different sales charge structures and class expenses.
Fund performance reflects any applicable fee waivers and/or expense reimbursements. Had the adviser not waived fees and/or reimbursed expenses currently or in the past, returns would have been lower. See current prospectus for more information.
| | |
| 5 | | Invesco Environmental Focus Municipal Fund |
Supplemental Information
Invesco Environmental Focus Municipal Fund’s investment objective is to seek to provide investors with a high level of current income exempt from federal income tax, consistent with preservation of capital.
| ∎ | Unless otherwise stated, information presented in this report is as of February 28, 2023, and is based on total net assets. |
| ∎ | Unless otherwise noted, all data is provided by Invesco. |
| ∎ | To access your Fund’s reports/prospectus, visit invesco.com/fundreports. |
About indexes used in this report
| ∎ | The S&P Municipal Bond Index is a broad, market value-weighted index that seeks to measure the performance of the US municipal bond market. |
| ∎ | The S&P Municipal Bond 5+ Year Investment Grade Index seeks to measure the performance of investment-grade US municipal bonds with maturities equal to or greater than five years. |
| ∎ | The Fund is not managed to track the performance of any particular index, including the index(es) described here, and consequently, the performance of the Fund may deviate significantly from the performance of the index(es). |
| ∎ | A direct investment cannot be made in an index. Unless otherwise indicated, index results include reinvested dividends, and they do not reflect sales charges. Performance of the peer group, if applicable, reflects fund expenses; performance of a market index does not. |
|
|
This report must be accompanied or preceded by a currently effective Fund
prospectus, which contains more complete information, including sales
charges and expenses. Investors should read it carefully before investing. |
|
| NOT FDIC INSURED | MAY LOSE VALUE | NO BANK GUARANTEE |
| | |
| 6 | | Invesco Environmental Focus Municipal Fund |
Fund Information
Portfolio Composition
| | | | | |
| By credit sector | | % of total investments |
| |
Revenue Bonds | | | | 91.57 | % |
| |
General Obligation Bonds | | | | 8.43 | |
Top Five Debt Holdings
| | | | | | | |
| | | | | % of total net assets |
| | |
| 1. | | New Jersey (State of) Educational Facilities Authority (Stevens Institute of Technology) (Green Bonds),
Series 2020 A, RB | | | | 3.54 | % |
| | |
| 2. | | Washington (State of) Health Care Facilities Authority (Virginia Mason Medical Center), Series 2017, Ref. RB | | | | 3.23 | |
| | |
| 3. | | District of Columbia (Green Bonds),
Series 2022 A, RB | | | | 3.15 | |
| | |
| 4. | | Geisinger Authority (Geisinger Health System), Series 2020, Ref. RB | | | | 2.46 | |
| | |
5. | | New York (City of), NY,
Series 2021 F-1, GO Bonds | | | | 2.45 | |
The Fund’s holdings are subject to change, and there is no assurance that the Fund will continue to hold any particular security.
Data presented here are as of February 28, 2023.
| | |
| 7 | | Invesco Environmental Focus Municipal Fund |
Schedule of Investments
February 28, 2023
| | | | | | | | | | | | | | | | |
| | | Interest
Rate | | | Maturity
Date | | | Principal
Amount
(000) | | | Value | |
|
| |
Municipal Obligations-99.40% | | | | | | | | | | | | | | | | |
Arizona-2.19% | | | | | | | | | | | | | | | | |
Arizona (State of) Industrial Development Authority (Mater Academy of Nevada Mountain Vista Campus Project); Series 2018 A, RB(a) | | | 5.25 | % | | | 12/15/2038 | | | $ | 100 | | | $ | 100,400 | |
|
| |
Maricopa (County of), AZ Industrial Development Authority (Benjamin Franklin Charter School); Series 2018, RB(a) | | | 6.00 | % | | | 07/01/2052 | | | | 1,000 | | | | 1,025,523 | |
|
| |
Maricopa County Pollution Control Corp. (Southern California Edison); Series 2000, Ref. RB | | | 2.40 | % | | | 06/01/2035 | | | | 1,000 | | | | 769,659 | |
|
| |
| | | | | | | | | | | | | | | 1,895,582 | |
|
| |
| | | | |
Arkansas-1.71% | | | | | | | | | | | | | | | | |
Arkansas (State of) Development Finance Authority (Green Bonds); Series 2022,
RB(a)(b) | | | 5.45 | % | | | 09/01/2052 | | | | 1,500 | | | | 1,478,346 | |
|
| |
| | | | |
California-12.64% | | | | | | | | | | | | | | | | |
California (State of) Community Choice Financing Authority (Green Bonds);
Series 2021 B-1, RB(c) | | | 4.00 | % | | | 08/01/2031 | | | | 1,750 | | | | 1,740,802 | |
|
| |
Series 2023, RB(c) | | | 5.00 | % | | | 08/01/2029 | | | | 1,500 | | | | 1,574,253 | |
|
| |
California (State of) Educational Facilities Authority (University of Redlands); Series 2022 A, RB | | | 5.00 | % | | | 10/01/2052 | | | | 1,000 | | | | 972,272 | |
|
| |
California (State of) Health Facilities Financing Authority (Commonspirit Health); Series 2020 A, Ref. RB | | | 4.00 | % | | | 04/01/2049 | | | | 1,000 | | | | 884,172 | |
|
| |
California (State of) Municipal Finance Authority (Sustainability Bonds); Series 2021, RB(a) | | | 4.00 | % | | | 11/01/2036 | | | | 1,625 | | | | 1,469,575 | |
|
| |
California (State of) Pollution Control Financing Authority (Poseidon Resources L.P.); Series 2023, RB(a)(b) | | | 5.00 | % | | | 07/01/2038 | | | | 500 | | | | 516,242 | |
|
| |
California (State of) Pollution Control Financing Authority (San Diego County Water Authority); Series 2019, Ref. RB(a) | | | 5.00 | % | | | 11/21/2045 | | | | 1,650 | | | | 1,662,329 | |
|
| |
California (State of) Public Finance Authority (Enso Village) (Green Bonds); Series 2021, RB(a) | | | 5.00 | % | | | 11/15/2051 | | | | 1,250 | | | | 1,051,347 | |
|
| |
Los Angeles (City of), CA Department of Airports (Green Bonds); Series 2022 G, RB(b) | | | 5.25 | % | | | 05/15/2047 | | | | 1,000 | | | | 1,063,264 | |
|
| |
| | | | | | | | | | | | | | | 10,934,256 | |
|
| |
| | | | |
Colorado-3.21% | | | | | | | | | | | | | | | | |
Colorado (State of) Health Facilities Authority (CommonSpirit Health); Series 2022, RB | | | 5.25 | % | | | 11/01/2052 | | | | 1,500 | | | | 1,545,285 | |
|
| |
Colorado (State of) Regional Transportation District (Denver Transit Partners Eagle P3); Series 2020 A, Ref. RB | | | 4.00 | % | | | 07/15/2035 | | | | 1,250 | | | | 1,230,123 | |
|
| |
| | | | | | | | | | | | | | | 2,775,408 | |
|
| |
| | | | |
District of Columbia-3.15% | | | | | | | | | | | | | | | | |
District of Columbia (Green Bonds); Series 2022 A, RB(b) | | | 5.50 | % | | | 08/31/2034 | | | | 2,500 | | | | 2,729,176 | |
|
| |
| | | | |
Florida-5.99% | | | | | | | | | | | | | | | | |
Broward (County of), FL; Series 2022 A, RB | | | 4.00 | % | | | 10/01/2045 | | | | 1,000 | | | | 954,425 | |
|
| |
Capital Trust Agency, Inc. (Sustainability Bonds); Series 2021, RB(a) | | | 4.00 | % | | | 06/15/2051 | | | | 2,000 | | | | 1,460,561 | |
|
| |
Florida Development Finance Corp. (Green Bonds); Series 2019 B, RB(a)(b) | | | 7.38 | % | | | 01/01/2049 | | | | 900 | | | | 814,995 | |
|
| |
Lake Helen (City of), FL (Ivy Hawn Charter School of the Arts); Series 2018 A, RB(a) | | | 5.75 | % | | | 07/15/2053 | | | | 100 | | | | 93,483 | |
|
| |
Miami-Dade (County of), FL; Series 2021, RB | | | 4.00 | % | | | 10/01/2046 | | | | 2,000 | | | | 1,857,355 | |
|
| |
| | | | | | | | | | | | | | | 5,180,819 | |
|
| |
| | | | |
Georgia-1.90% | | | | | | | | | | | | | | | | |
Atlanta (City of), GA (Beltline); Series 2016 A, Ref. RB | | | 5.00 | % | | | 01/01/2026 | | | | 1,275 | | | | 1,276,646 | |
|
| |
Oconee (County of), GA Industrial Development Authority (Presbyterian Village Athens); Series 2018 A-1, RB | | | 6.38 | % | | | 12/01/2053 | | | | 250 | | | | 213,473 | |
|
| |
Series 2018 A-2, RB(c) | | | 5.50 | % | | | 12/01/2028 | | | | 175 | | | | 158,422 | |
|
| |
| | | | | | | | | | | | | | | 1,648,541 | |
|
| |
| | | | |
Illinois-3.55% | | | | | | | | | | | | | | | | |
Chicago (City of), IL; Series 2021 A, Ref. GO Bonds | | | 5.00 | % | | | 01/01/2033 | | | | 1,000 | | | | 1,037,309 | |
|
| |
Chicago (City of), IL (Chicago Works); Series 2023 A, GO Bonds | | | 5.50 | % | | | 01/01/2039 | | | | 1,000 | | | | 1,062,405 | |
|
| |
Chicago (City of), IL Park District; Series 2020 D, GO Bonds (INS - BAM)(d) | | | 4.00 | % | | | 01/01/2038 | | | | 1,000 | | | | 969,380 | |
|
| |
| | | | | | | | | | | | | | | 3,069,094 | |
|
| |
| | | | |
Indiana-1.12% | | | | | | | | | | | | | | | | |
Indiana (State of) Finance Authority (Ohio Valley Electrical Corp.); Series 2012 A, RB | | | 4.25 | % | | | 11/01/2030 | | | | 1,000 | | | | 970,673 | |
|
| |
See accompanying Notes to Financial Statements which are an integral part of the financial statements.
| | |
| 8 | | Invesco Environmental Focus Municipal Fund |
| | | | | | | | | | | | | | | | |
| | | Interest
Rate | | | Maturity
Date | | | Principal
Amount
(000) | | | Value | |
Iowa-0.10% | | | | | | | | | | | | | | | | |
Clear Lake (City of), IA (Timbercrest Apartments, LLC); Series 2018, RB | | | 6.00 | % | | | 10/01/2048 | | | $ | 100 | | | $ | 88,922 | |
|
| |
| | | | |
Kentucky-1.10% | | | | | | | | | | | | | | | | |
Henderson (City of), KY (Pratt Paper LLC); Series 2022 B, RB(a)(b) | | | 4.45 | % | | | 01/01/2042 | | | | 1,000 | | | | 953,294 | |
|
| |
| | | | |
Louisiana-3.21% | | | | | | | | | | | | | | | | |
Louisiana (State of) Local Government Environmental Facilities & Community Development Authority (Entergy Louisiana LLC); Series 2021 B, Ref. RB | | | 2.50 | % | | | 04/01/2036 | | | | 2,000 | | | | 1,615,146 | |
|
| |
New Orleans (City of), LA; Series 2020 B, RB | | | 4.00 | % | | | 06/01/2050 | | | | 1,300 | | | | 1,160,865 | |
|
| |
| | | | | | | | | | | | | | | 2,776,011 | |
|
| |
| | | | |
Maryland-3.50% | | | | | | | | | | | | | | | | |
Maryland Economic Development Corp. (Green Bonds); Series 2022, RB(b) | | | 5.25 | % | | | 06/30/2052 | | | | 2,000 | | | | 2,008,045 | |
|
| |
Maryland Economic Development Corp. (Purple Line) (Green Bonds); Series 2022 A, RB(b) | | | 5.00 | % | | | 11/12/2028 | | | | 1,000 | | | | 1,020,397 | |
|
| |
| | | | | | | | | | | | | | | 3,028,442 | |
|
| |
| | | | |
Massachusetts-2.62% | | | | | | | | | | | | | | | | |
Massachusetts (Commonwealth of) Development Finance Agency (Green Bonds); Series 2015, RB | | | 5.00 | % | | | 07/01/2044 | | | | 1,000 | | | | 1,008,447 | |
|
| |
Massachusetts (Commonwealth of) Housing Finance Agency (Sustainability Bonds); Series 2020 D-1, RB | | | 2.65 | % | | | 12/01/2055 | | | | 2,000 | | | | 1,260,618 | |
|
| |
| | | | | | | | | | | | | | | 2,269,065 | |
|
| |
| | | | |
Minnesota-10.10% | | | | | | | | | | | | | | | | |
Anoka (County of), MN Housing & Redevelopment Authority (Woodland Park Apartments); Series 2011 A, RB | | | 5.00 | % | | | 04/01/2027 | | | | 1,000 | | | | 1,001,243 | |
|
| |
Chisago (City of), MN (CDL Homes LLC); Series 2013 B, RB | | | 6.00 | % | | | 08/01/2043 | | | | 1,000 | | | | 1,000,321 | |
|
| |
Cokato (City of), MN (Cokato Charitable Trust); Series 2006 A, Ref. RB | | | 5.25 | % | | | 12/01/2026 | | | | 125 | | | | 119,664 | |
|
| |
Dakota (County of), MN Community Development Agency (Sanctuary at West St. Paul); Series 2015, RB (Acquired 08/06/2015-01/18/2019; Cost $2,301,190)(e) | | | 6.00 | % | | | 08/01/2035 | | | | 2,300 | | | | 1,757,787 | |
|
| |
Hayward (City of), MN (St. John’s Lutheran Home of Albert Lea); Series 2014, Ref. RB | | | 5.38 | % | | | 10/01/2044 | | | | 500 | | | | 328,470 | |
|
| |
International Falls (City of), MN (Boise Cascade Corp.); Series 1999, Ref. RB(b) | | | 6.85 | % | | | 12/01/2029 | | | | 115 | | | | 115,263 | |
|
| |
Little Canada (City of), MN (PHS/Mayfield LLC); Series 2010, Ref. RB | | | 6.00 | % | | | 12/01/2030 | | | | 250 | | | | 236,353 | |
|
| |
Maplewood (City of), MN (VOA Care Centers); Series 2005 A, Ref. RB | | | 5.38 | % | | | 10/01/2024 | | | | 275 | | | | 264,615 | |
|
| |
Minneapolis & St. Paul (Cities of), MN Housing Finance Board; Series 2007 A-2, RB (CEP - GNMA)(b) | | | 5.52 | % | | | 03/01/2041 | | | | 5 | | | | 4,998 | |
|
| |
Minnesota (State of) Housing Finance Agency; Series 2013 B-1, RB | | | 5.30 | % | | | 08/01/2044 | | | | 1,050 | | | | 1,055,304 | |
|
| |
St. Paul (City of), MN Housing & Redevelopment Authority; Series 2004, RB | | | 6.25 | % | | | 03/01/2029 | | | | 218 | | | | 195,236 | |
|
| |
St. Paul (City of), MN Port Authority; Series 2007 1, RB | | | 5.00 | % | | | 08/01/2036 | | | | 1,310 | | | | 1,310,255 | |
|
| |
Stillwater (City of), MN (Orleans Homes); | | | | | | | | | | | | | | | | |
Series 2007, RB(b) | | | 5.38 | % | | | 02/01/2032 | | | | 900 | | | | 876,667 | |
|
| |
Series 2007, RB(b) | | | 5.50 | % | | | 02/01/2042 | | | | 510 | | | | 477,534 | |
|
| |
| | | | | | | | | | | | | | | 8,743,710 | |
|
| |
| | | | |
New Hampshire-1.26% | | | | | | | | | | | | | | | | |
New Hampshire (State of) Business Finance Authority (Covanta Green Bonds); Series 2020 B, Ref. RB(a)(b)(c) | | | 3.75 | % | | | 07/02/2040 | | | | 1,420 | | | | 1,092,616 | |
|
| |
| | | | |
New Jersey-4.96% | | | | | | | | | | | | | | | | |
New Jersey (State of) Economic Development Authority (Golden Door Charter School); Series 2018 A, RB(a) | | | 6.50 | % | | | 11/01/2052 | | | | 100 | | | | 104,455 | |
|
| |
New Jersey (State of) Economic Development Authority (Newark Downtown District Management Corp.); Series 2019, Ref. RB | | | 5.13 | % | | | 06/15/2037 | | | | 83 | | | | 88,545 | |
|
| |
New Jersey (State of) Economic Development Authority (Portal North Bridge); Series 2022 A, RB | | | 5.00 | % | | | 11/01/2052 | | | | 1,000 | | | | 1,034,493 | |
|
| |
New Jersey (State of) Educational Facilities Authority (Stevens Institute of Technology) (Green Bonds); Series 2020 A, RB | | | 5.00 | % | | | 07/01/2045 | | | | 3,000 | | | | 3,061,083 | |
|
| |
| | | | | | | | | | | | | | | 4,288,576 | |
|
| |
| | | | |
New Mexico-1.87% | | | | | | | | | | | | | | | | |
Farmington (City of), NM (San Juan and Four Corners); Series 2016 B, Ref. RB | | | 2.15 | % | | | 04/01/2033 | | | | 2,000 | | | | 1,619,922 | |
|
| |
| | | | |
New York-18.28% | | | | | | | | | | | | | | | | |
Metropolitan Transportation Authority (Green Bonds); | | | | | | | | | | | | | | | | |
Series 2020 C-1, RB | | | 5.00 | % | | | 11/15/2050 | | | | 1,000 | | | | 1,006,538 | |
|
| |
Series 2020 C-1, RB | | | 5.25 | % | | | 11/15/2055 | | | | 2,000 | | | | 2,048,851 | |
|
| |
See accompanying Notes to Financial Statements which are an integral part of the financial statements.
| | |
| 9 | | Invesco Environmental Focus Municipal Fund |
| | | | | | | | | | | | | | | | |
| | | Interest
Rate | | | Maturity
Date | | | Principal
Amount
(000) | | | Value | |
New York-(continued) | | | | | | | | | | | | | | | | |
New York (City of), NY; | | | | | | | | | | | | | | | | |
Series 2018 E-1, GO Bonds | | | 4.00 | % | | | 03/01/2042 | | | $ | 1,000 | | | $ | 964,069 | |
|
| |
Series 2021 F-1, GO Bonds | | | 4.00 | % | | | 03/01/2047 | | | | 2,240 | | | | 2,117,703 | |
|
| |
Subseries 2022 B-1, GO Bonds | | | 5.25 | % | | | 10/01/2047 | | | | 1,000 | | | | 1,100,528 | |
|
| |
New York (State of) Dormitory Authority; Series 2020 A, RB | | | 4.00 | % | | | 07/01/2053 | | | | 1,000 | | | | 901,018 | |
|
| |
New York (State of) Dormitory Authority (Montefiore Obligated Group); Series 2020 A, Ref. RB | | | 4.00 | % | | | 09/01/2045 | | | | 1,500 | | | | 1,263,054 | |
|
| |
New York (State of) Housing Finance Agency (Sustainability Bonds); Series 2019 P, RB | | | 3.05 | % | | | 11/01/2049 | | | | 1,000 | | | | 722,504 | |
|
| |
New York (State of) Thruway Authority (Bidding Group 1); Series 2022 C, RB | | | 5.00 | % | | | 03/15/2055 | | | | 1,000 | | | | 1,072,160 | |
|
| |
New York City Housing Development Corp. (Sustainable Development); Series 2020 A-1-C, RB | | | 2.80 | % | | | 11/01/2045 | | | | 1,000 | | | | 722,413 | |
|
| |
New York Liberty Development Corp. (Green Bonds); | | | | | | | | | | | | | | | | |
Series 2021 A, Ref. RB (INS - AGM)(d) | | | 2.75 | % | | | 11/15/2041 | | | | 1,000 | | | | 749,491 | |
|
| |
Series 2021 A, Ref. RB | | | 2.88 | % | | | 11/15/2046 | | | | 1,000 | | | | 700,045 | |
|
| |
Triborough Bridge & Tunnel Authority; Series 2021 C-3, RB | | | 4.00 | % | | | 05/15/2051 | | | | 1,500 | | | | 1,373,853 | |
|
| |
Triborough Bridge & Tunnel Authority (MTA Bridges & Tunnels); Series 2022 C, RB | | | 5.00 | % | | | 05/15/2047 | | | | 1,000 | | | | 1,078,105 | |
|
| |
| | | | | | | | | | | | | | | 15,820,332 | |
|
| |
| | | | |
Oregon-1.59% | | | | | | | | | | | | | | | | |
Multnomah (County of), OR Hospital Facilities Authority (Terwilliger Plaza, Inc.); Series 2021, Ref. RB | | | 4.00 | % | | | 12/01/2051 | | | | 2,000 | | | | 1,380,398 | |
|
| |
| | | | |
Pennsylvania-4.02% | | | | | | | | | | | | | | | | |
Chester (County of), PA Industrial Development Authority (Sustainability Bonds); Series 2021, RB | | | 4.00 | % | | | 12/01/2051 | | | | 1,500 | | | | 1,349,665 | |
|
| |
Geisinger Authority (Geisinger Health System); Series 2020, Ref. RB | | | 4.00 | % | | | 04/01/2050 | | | | 2,415 | | | | 2,126,608 | |
|
| |
| | | | | | | | | | | | | | | 3,476,273 | |
|
| |
| | | | |
Tennessee-0.12% | | | | | | | | | | | | | | | | |
Metropolitan Development and Housing Agency (Fifth + Broadway Development); Series 2018, RB(a) | | | 5.13 | % | | | 06/01/2036 | | | | 100 | | | | 101,022 | |
|
| |
| | | | |
Texas-1.53% | | | | | | | | | | | | | | | | |
San Antonio (City of), TX; Series 2020, RB | | | 5.00 | % | | | 02/01/2049 | | | | 1,260 | | | | 1,320,545 | |
|
| |
| | | | |
Washington-5.47% | | | | | | | | | | | | | | | | |
Washington (State of) Economic Development Finance Authority (Green Bonds); Series 2020 A, RB(a)(b) | | | 5.63 | % | | | 12/01/2040 | | | | 2,000 | | | | 1,944,073 | |
|
| |
Washington (State of) Health Care Facilities Authority (Virginia Mason Medical Center); Series 2017, Ref. RB | | | 5.00 | % | | | 08/15/2035 | | | | 2,745 | | | | 2,793,350 | |
|
| |
| | | | | | | | | | | | | | | 4,737,423 | |
|
| |
| | | | |
Wisconsin-4.21% | | | | | | | | | | | | | | | | |
Somers (Village of), WI; Series 2018 B, Ref. RB | | | 4.85 | % | | | 06/01/2036 | | | | 1,235 | | | | 1,251,599 | |
|
| |
Wisconsin (State of) Public Finance Authority (Beyond Boone, LLC - Appalachian State University); Series 2019 A, RB (INS - AGM)(d) | | | 5.00 | % | | | 07/01/2058 | | | | 100 | | | | 101,117 | |
|
| |
Wisconsin (State of) Public Finance Authority (Green Bonds); Series 2021, RB(b) | | | 4.00 | % | | | 09/30/2051 | | | | 2,540 | | | | 2,018,535 | |
|
| |
Wisconsin (State of) Public Finance Authority (North Carolina Leadership Academy); Series 2019, RB(a) | | | 5.00 | % | | | 06/15/2039 | | | | 100 | | | | 93,941 | |
|
| |
Wisconsin (State of) Public Finance Authority (Traders Point Christian Schools); | | | | | | | | | | | | | | | | |
Series 2019 A, RB(a) | | | 5.38 | % | | | 06/01/2044 | | | | 100 | | | | 89,023 | |
|
| |
Series 2019 A, RB(a) | | | 5.50 | % | | | 06/01/2054 | | | | 100 | | | | 87,047 | |
|
| |
| | | | | | | | | | | | | | | 3,641,262 | |
|
| |
TOTAL INVESTMENTS IN SECURITIES(f) -99.40% (Cost $89,679,689) | | | | | | | | | | | | | | | 86,019,708 | |
|
| |
OTHER ASSETS LESS LIABILITIES-0.60% | | | | | | | | | | | | | | | 515,048 | |
|
| |
NET ASSETS-100.00% | | | | | | | | | | | | | | $ | 86,534,756 | |
|
| |
| | |
Investment Abbreviations: |
| AGM | | - Assured Guaranty Municipal Corp. |
| BAM | | - Build America Mutual Assurance Co. |
| CEP | | - Credit Enhancement Provider |
| GNMA | | - Government National Mortgage Association |
| GO | | - General Obligation |
| INS | | - Insurer |
| MTA | | - Moving Treasury Average |
| RB | | - Revenue Bonds |
| Ref. | | - Refunding |
See accompanying Notes to Financial Statements which are an integral part of the financial statements.
| | |
| 10 | | Invesco Environmental Focus Municipal Fund |
Notes to Schedule of Investments:
| (a) | Security purchased or received in a transaction exempt from registration under the Securities Act of 1933, as amended (the “1933 Act”). The security may be resold pursuant to an exemption from registration under the 1933 Act, typically to qualified institutional buyers. The aggregate value of these securities at February 28, 2023 was $14,138,272, which represented 16.34% of the Fund’s Net Assets. |
| (b) | Security subject to the alternative minimum tax. |
| (c) | Security has an irrevocable call by the issuer or mandatory put by the holder. Maturity date reflects such call or put. |
| (d) | Principal and/or interest payments are secured by the bond insurance company listed. |
| (e) | Restricted security. The value of this security at February 28, 2023 represented 2.03% of the Fund’s Net Assets. |
| (f) | Entities may either issue, guarantee, back or otherwise enhance the credit quality of a security. The entities are not primarily responsible for the issuer’s obligations but may be called upon to satisfy issuer’s obligations. No concentration of any single entity was greater than 5% each. |
See accompanying Notes to Financial Statements which are an integral part of the financial statements.
| | |
| 11 | | Invesco Environmental Focus Municipal Fund |
Statement of Assets and Liabilities
February 28, 2023
| | | | |
Assets: | | | | |
| |
Investments in unaffiliated securities, at value
(Cost $89,679,689) | | $ | 86,019,708 | |
|
| |
Cash | | | 151,494 | |
|
| |
Receivable for: | | | | |
Investments sold | | | 15,000 | |
|
| |
Fund shares sold | | | 24,826 | |
|
| |
Interest | | | 1,032,373 | |
|
| |
Investment for trustee deferred compensation and retirement plans | | | 18,136 | |
|
| |
Other assets | | | 41,144 | |
|
| |
Total assets | | | 87,302,681 | |
|
| |
| |
Liabilities: | | | | |
Payable for: | | | | |
Investments purchased | | | 519,155 | |
|
| |
Dividends | | | 101,707 | |
|
| |
Fund shares reacquired | | | 19,006 | |
|
| |
Accrued fees to affiliates | | | 36,194 | |
|
| |
Accrued interest expense | | | 4,189 | |
|
| |
Accrued trustees’ and officers’ fees and benefits | | | 1,905 | |
|
| |
Accrued other operating expenses | | | 67,633 | |
|
| |
Trustee deferred compensation and retirement plans | | | 18,136 | |
|
| |
Total liabilities | | | 767,925 | |
|
| |
Net assets applicable to shares outstanding | | $ | 86,534,756 | |
|
| |
| | | | |
Net assets consist of: | | | | |
Shares of beneficial interest | | $ | 100,877,098 | |
|
| |
Distributable earnings (loss) | | | (14,342,342 | ) |
|
| |
| | $ | 86,534,756 | |
|
| |
| |
Net Assets: | | | | |
Class A | | $ | 57,366,266 | |
|
| |
Class C | | $ | 5,423,388 | |
|
| |
Class Y | | $ | 21,616,421 | |
|
| |
Class R6 | | $ | 2,128,681 | |
|
| |
|
Shares outstanding, no par value, with an unlimited number of shares authorized: | |
Class A | | | 5,083,673 | |
|
| |
Class C | | | 480,977 | |
|
| |
Class Y | | | 1,916,306 | |
|
| |
Class R6 | | | 188,625 | |
|
| |
Class A: | | | | |
Net asset value per share | | $ | 11.28 | |
|
| |
Maximum offering price per share
(Net asset value of $11.28 ÷ 95.75%) | | $ | 11.78 | |
|
| |
Class C: | | | | |
Net asset value and offering price per share | | $ | 11.28 | |
|
| |
Class Y: | | | | |
Net asset value and offering price per share | | $ | 11.28 | |
|
| |
Class R6: | | | | |
Net asset value and offering price per share | | $ | 11.29 | |
|
| |
See accompanying Notes to Financial Statements which are an integral part of the financial statements.
| | |
| 12 | | Invesco Environmental Focus Municipal Fund |
Statement of Operations
For the year ended February 28, 2023
| | | | |
Investment income: | | | | |
Interest | | $ | 4,380,215 | |
|
| |
| |
Expenses: | | | | |
Advisory fees | | | 399,089 | |
|
| |
Administrative services fees | | | 14,916 | |
|
| |
Custodian fees | | | 4,485 | |
|
| |
Distribution fees: | | | | |
Class A | | | 162,832 | |
|
| |
Class C | | | 68,722 | |
|
| |
Interest, facilities and maintenance fees | | | 101,325 | |
|
| |
Transfer agent fees – A, C and Y | | | 88,370 | |
|
| |
Transfer agent fees – R6 | | | 274 | |
|
| |
Trustees’ and officers’ fees and benefits | | | 16,366 | |
|
| |
Registration and filing fees | | | 57,971 | |
|
| |
Reports to shareholders | | | 7,072 | |
|
| |
Professional services fees | | | 67,526 | |
|
| |
Other | | | 10,890 | |
|
| |
Total expenses | | | 999,838 | |
|
| |
Less: Fees waived, expenses reimbursed and/or expense offset arrangement(s) | | | (200,645 | ) |
|
| |
Net expenses | | | 799,193 | |
|
| |
Net investment income | | | 3,581,022 | |
|
| |
| |
Realized and unrealized gain (loss) from: | | | | |
Net realized gain (loss) from: | | | | |
Unaffiliated investment securities (includes net gains (losses) from securities sold to affiliates of $(1,866,221)) | | | (11,815,594 | ) |
|
| |
Futures contracts | | | 580,905 | |
|
| |
| | | (11,234,689 | ) |
|
| |
Change in net unrealized appreciation (depreciation) of: | | | | |
Unaffiliated investment securities | | | (3,943,628 | ) |
|
| |
Futures contracts | | | 3,125 | |
|
| |
| | | (3,940,503 | ) |
|
| |
Net realized and unrealized gain (loss) | | | (15,175,192 | ) |
|
| |
Net increase (decrease) in net assets resulting from operations | | $ | (11,594,170 | ) |
|
| |
See accompanying Notes to Financial Statements which are an integral part of the financial statements.
| | |
| 13 | | Invesco Environmental Focus Municipal Fund |
Statement of Changes in Net Assets
For the years ended February 28, 2023 and 2022
| | | | | | | | |
| | |
| | | 2023 | | | 2022 | |
|
| |
Operations: | | | | | | | | |
Net investment income | | $ | 3,581,022 | | | $ | 3,106,311 | |
|
| |
Net realized gain (loss) | | | (11,234,689 | ) | | | 612,818 | |
|
| |
Change in net unrealized appreciation (depreciation) | | | (3,940,503 | ) | | | (3,615,839 | ) |
|
| |
Net increase (decrease) in net assets resulting from operations | | | (11,594,170 | ) | | | 103,290 | |
|
| |
| | |
Distributions to shareholders from distributable earnings: | | | | | | | | |
Class A | | | (1,941,556 | ) | | | (4,937,949 | ) |
|
| |
Class C | | | (149,753 | ) | | | (569,669 | ) |
|
| |
Class Y | | | (940,908 | ) | | | (2,591,963 | ) |
|
| |
Class R6 | | | (60,634 | ) | | | (3,704 | ) |
|
| |
Total distributions from distributable earnings | | | (3,092,851 | ) | | | (8,103,285 | ) |
|
| |
| | |
Share transactions–net: | | | | | | | | |
Class A | | | (15,128,675 | ) | | | (2,446,422 | ) |
|
| |
Class C | | | (3,208,279 | ) | | | (3,729,052 | ) |
|
| |
Class Y | | | (13,589,402 | ) | | | (976,542 | ) |
|
| |
Class R6 | | | 1,470,304 | | | | 834,197 | |
|
| |
Net increase (decrease) in net assets resulting from share transactions | | | (30,456,052 | ) | | | (6,317,819 | ) |
|
| |
Net increase (decrease) in net assets | | | (45,143,073 | ) | | | (14,317,814 | ) |
|
| |
| | |
Net assets: | | | | | | | | |
Beginning of year | | | 131,677,829 | | | | 145,995,643 | |
|
| |
End of year | | $ | 86,534,756 | | | $ | 131,677,829 | |
|
| |
See accompanying Notes to Financial Statements which are an integral part of the financial statements.
| | |
| 14 | | Invesco Environmental Focus Municipal Fund |
Financial Highlights
The following schedule presents financial highlights for a share of the Fund outstanding throughout the periods indicated.
| | | | | | | | | | | | | | | | | | | | | | | | | | | | | | | | | | | | | | | | | | | | | | | | | | | | | | | | | | | | |
| | | Net asset
value,
beginning
of period | | | Net
investment
income(a) | | | Net gains
(losses)
on securities
(both
realized and
unrealized) | | | Total from
investment
operations | | | Dividends
from net
investment
income | | | Distributions
from net
realized
gains | | | Total
distributions | | | Net asset
value, end
of period | | | Total return(b) | | | Net assets,
end of period
(000’s omitted) | | | Ratio of
expenses
to average
net assets
with fee
waivers
and/or
expenses
absorbed | | | Ratio of
expenses
to average
net assets
without
fee waivers
and/or
expenses
absorbed | | | Supplemental
ratio of
expenses
to average
net assets
with fee waivers
(excluding
interest,
facilities and
maintenance
fees) | | | Ratio of net
investment
income
to average
net assets | | | Portfolio turnover (c) | |
Class A | | | | | | | | | | | | | | | | | | | | | | | | | | | | | | | | | | | | | | | | | | | | | | | | | | | | | | | | | | | | |
Year ended 02/28/23 | | $ | 12.81 | | | $ | 0.40 | | | $ | (1.58 | ) | | $ | (1.18 | ) | | $ | (0.35 | ) | | $ | – | | | $ | (0.35 | ) | | $ | 11.28 | | | | (9.23 | )% | | $ | 57,366 | | | | 0.79 | % | | | 0.99 | % | | | 0.70 | % | | | 3.44 | % | | | 101 | % |
Year ended 02/28/22 | | | 13.56 | | | | 0.29 | | | | (0.28 | ) | | | 0.01 | | | | (0.30 | ) | | | (0.46 | ) | | | (0.76 | ) | | | 12.81 | | | | (0.14 | ) | | | 81,812 | | | | 0.74 | | | | 0.90 | | | | 0.70 | | | | 2.11 | | | | 46 | |
Year ended 02/28/21 | | | 13.87 | | | | 0.36 | | | | (0.30 | ) | | | 0.06 | | | | (0.37 | ) | | | – | | | | (0.37 | ) | | | 13.56 | | | | 0.46 | | | | 89,194 | | | | 0.75 | | | | 0.95 | | | | 0.70 | | | | 2.69 | | | | 63 | |
Eleven months ended 02/29/20 | | | 13.09 | | | | 0.33 | | | | 0.88 | | | | 1.21 | | | | (0.43 | ) | | | – | | | | (0.43 | ) | | | 13.87 | | | | 9.36 | | | | 81,165 | | | | 0.86 | (d) | | | 0.92 | (d) | | | 0.76 | (d) | | | 2.65 | (d) | | | 14 | |
Year ended 03/31/19 | | | 12.68 | | | | 0.48 | | | | 0.40 | | | | 0.88 | | | | (0.47 | ) | | | – | | | | (0.47 | ) | | | 13.09 | | | | 7.12 | | | | 54,800 | | | | 0.99 | | | | 1.19 | | | | 0.95 | | | | 3.76 | | | | 79 | |
Year ended 03/31/18 | | | 12.71 | | | | 0.45 | | | | (0.01 | ) | | | 0.44 | | | | (0.47 | ) | | | – | | | | (0.47 | ) | | | 12.68 | | | | 3.49 | | | | 60,899 | | | | 0.98 | | | | 1.13 | | | | 0.95 | | | | 3.49 | | | | 9 | |
Class C | | | | | | | | | | | | | | | | | | | | | | | | | | | | | | | | | | | | | | | | | | | | | | | | | | | | | | | | | | | | |
Year ended 02/28/23 | | | 12.80 | | | | 0.31 | | | | (1.57 | ) | | | (1.26 | ) | | | (0.26 | ) | | | – | | | | (0.26 | ) | | | 11.28 | | | | (9.85 | ) | | | 5,423 | | | | 1.54 | | | | 1.74 | | | | 1.45 | | | | 2.69 | | | | 101 | |
Year ended 02/28/22 | | | 13.56 | | | | 0.20 | | | | (0.29 | ) | | | (0.09 | ) | | | (0.21 | ) | | | (0.46 | ) | | | (0.67 | ) | | | 12.80 | | | | (0.87 | ) | | | 9,678 | | | | 1.42 | | | | 1.65 | | | | 1.38 | | | | 1.43 | | | | 46 | |
Year ended 02/28/21 | | | 13.86 | | | | 0.28 | | | | (0.29 | ) | | | (0.01 | ) | | | (0.29 | ) | | | – | | | | (0.29 | ) | | | 13.56 | | | | (0.01 | ) | | | 13,982 | | | | 1.30 | | | | 1.70 | | | | 1.25 | | | | 2.14 | | | | 63 | |
Eleven months ended 02/29/20 | | | 13.08 | | | | 0.26 | | | | 0.87 | | | | 1.13 | | | | (0.35 | ) | | | – | | | | (0.35 | ) | | | 13.86 | | | | 8.77 | | | | 26,381 | | | | 1.62 | (d) | | | 1.68 | (d) | | | 1.31 | (d) | | | 2.10 | (d) | | | 14 | |
Year ended 03/31/19 | | | 12.66 | | | | 0.39 | | | | 0.41 | | | | 0.80 | | | | (0.38 | ) | | | – | | | | (0.38 | ) | | | 13.08 | | | | 6.47 | | | | 25,961 | | | | 1.75 | | | | 1.95 | | | | 1.62 | | | | 3.10 | | | | 79 | |
Year ended 03/31/18 | | | 12.70 | | | | 0.35 | | | | (0.02 | ) | | | 0.33 | | | | (0.37 | ) | | | – | | | | (0.37 | ) | | | 12.66 | | | | 2.65 | | | | 29,457 | | | | 1.73 | | | | 1.88 | | | | 1.70 | | | | 2.73 | | | | 9 | |
Class Y | | | | | | | | | | | | | | | | | | | | | | | | | | | | | | | | | | | | | | | | | | | | | | | | | | | | | | | | | | | | |
Year ended 02/28/23 | | | 12.80 | | | | 0.43 | | | | (1.57 | ) | | | (1.14 | ) | | | (0.38 | ) | | | – | | | | (0.38 | ) | | | 11.28 | | | | (8.93 | ) | | | 21,616 | | | | 0.54 | | | | 0.74 | | | | 0.45 | | | | 3.69 | | | | 101 | |
Year ended 02/28/22 | | | 13.56 | | | | 0.32 | | | | (0.29 | ) | | | 0.03 | | | | (0.33 | ) | | | (0.46 | ) | | | (0.79 | ) | | | 12.80 | | | | 0.03 | | | | 39,370 | | | | 0.49 | | | | 0.65 | | | | 0.45 | | | | 2.36 | | | | 46 | |
Year ended 02/28/21 | | | 13.86 | | | | 0.39 | | | | (0.29 | ) | | | 0.10 | | | | (0.40 | ) | | | – | | | | (0.40 | ) | | | 13.56 | | | | 0.78 | | | | 42,810 | | | | 0.50 | | | | 0.70 | | | | 0.45 | | | | 2.94 | | | | 63 | |
Eleven months ended 02/29/20 | | | 13.09 | | | | 0.36 | | | | 0.87 | | | | 1.23 | | | | (0.46 | ) | | | – | | | | (0.46 | ) | | | 13.86 | | | | 9.54 | | | | 46,639 | | | | 0.62 | (d) | | | 0.68 | (d) | | | 0.51 | (d) | | | 2.91 | (d) | | | 14 | |
Year ended 03/31/19 | | | 12.68 | | | | 0.49 | | | | 0.41 | | | | 0.90 | | | | (0.49 | ) | | | – | | | | (0.49 | ) | | | 13.09 | | | | 7.26 | | | | 26,214 | | | | 0.74 | | | | 0.94 | | | | 0.82 | | | | 3.89 | | | | 79 | |
Year ended 03/31/18 | | | 12.71 | | | | 0.45 | | | | (0.00 | ) | | | 0.45 | | | | (0.48 | ) | | | – | | | | (0.48 | ) | | | 12.68 | | | | 3.57 | | | | 27,590 | | | | 0.72 | | | | 0.87 | | | | 0.87 | | | | 3.55 | | | | 9 | |
Class R6 | | | | | | | | | | | | | | | | | | | | | | | | | | | | | | | | | | | | | | | | | | | | | | | | | | | | | | | | | | | | |
Year ended 02/28/23 | | | 12.81 | | | | 0.42 | | | | (1.56 | ) | | | (1.14 | ) | | | (0.38 | ) | | | – | | | | (0.38 | ) | | | 11.29 | | | | (8.91 | ) | | | 2,129 | | | | 0.54 | | | | 0.67 | | | | 0.45 | | | | 3.69 | | | | 101 | |
Year ended 02/28/22 | | | 13.57 | | | | 0.30 | | | | (0.26 | ) | | | 0.04 | | | | (0.34 | ) | | | (0.46 | ) | | | (0.80 | ) | | | 12.81 | | | | 0.09 | | | | 817 | | | | 0.49 | | | | 0.57 | | | | 0.45 | | | | 2.36 | | | | 46 | |
Year ended 02/28/21 | | | 13.87 | | | | 0.41 | | | | (0.30 | ) | | | 0.11 | | | | (0.41 | ) | | | – | | | | (0.41 | ) | | | 13.57 | | | | 0.88 | | | | 10 | | | | 0.40 | | | | 0.71 | | | | 0.35 | | | | 3.04 | | | | 63 | |
Period ended 02/29/20(e) | | | 13.29 | | | | 0.31 | | | | 0.66 | | | | 0.97 | | | | (0.39 | ) | | | – | | | | (0.39 | ) | | | 13.87 | | | | 7.42 | | | | 10 | | | | 0.57 | (d) | | | 0.63 | (d) | | | 0.41 | (d) | | | 3.00 | (d) | | | 14 | |
| (a) | Calculated using average shares outstanding. |
| (b) | Includes adjustments in accordance with accounting principles generally accepted in the United States of America and as such, the net asset value for financial reporting purposes and the returns based upon those net asset values may differ from the net asset value and returns for shareholder transactions. Does not include sales charges and is not annualized for periods less than one year, if applicable. |
| (c) | Portfolio turnover is calculated at the fund level and is not annualized for periods less than one year, if applicable. |
| (e) | Commencement date after the close of business on May 24, 2019. |
See accompanying Notes to Financial Statements which are an integral part of the financial statements.
| | |
| 15 | | Invesco Environmental Focus Municipal Fund |
Notes to Financial Statements
February 28, 2023
NOTE 1–Significant Accounting Policies
Invesco Environmental Focus Municipal Fund (the “Fund”) is a series portfolio of AIM Tax-Exempt Funds (Invesco Tax-Exempt Funds) (the “Trust”). The Trust is a Delaware statutory trust registered under the Investment Company Act of 1940, as amended (the “1940 Act”), as an open-end series management investment company authorized to issue an unlimited number of shares of beneficial interest. Information presented in these financial statements pertains only to the Fund. Matters affecting the Fund or each class will be voted on exclusively by the shareholders of the Fund or each class.
The Fund’s investment objective is to seek to provide investors with a high level of current income exempt from federal income tax, consistent with preservation of capital.
The Fund currently consists of four different classes of shares: Class A, Class C, Class Y and Class R6. Class Y shares are available only to certain investors. Class A shares are sold with a front-end sales charge unless certain waiver criteria are met. Under certain circumstances, load waived shares may be subject to contingent deferred sales charges (“CDSC”). Class C shares are sold with a CDSC. Class Y and Class R6 shares are sold at net asset value. Class C shares held for eight years after purchase are eligible for automatic conversion into Class A shares of the same Fund (the “Conversion Feature”). The automatic conversion pursuant to the Conversion Feature will generally occur at the end of the month following the eighth anniversary after a purchase of Class C shares.
The Fund is an investment company and accordingly follows the investment company accounting and reporting guidance in accordance with Financial Accounting Standards Board Accounting Standards Codification Topic 946, Financial Services - Investment Companies.
The following is a summary of the significant accounting policies followed by the Fund in the preparation of its financial statements.
| A. | Security Valuations - Securities, including restricted securities, are valued according to the following policy. |
Securities generally are valued on the basis of prices provided by independent pricing services. Prices provided by the pricing service may be determined without exclusive reliance on quoted prices, and may reflect appropriate factors such as institution-size trading in similar groups of securities, developments related to specific securities, dividend rate (for unlisted equities), yield (for debt obligations), quality, type of issue, coupon rate (for debt obligations), maturity (for debt obligations), individual trading characteristics and other market data. Pricing services generally value debt obligations assuming orderly transactions of institutional round lot size, but a fund may hold or transact in the same securities in smaller, odd lot sizes. Odd lots often trade at lower prices than institutional round lots, and their value may be adjusted accordingly. Debt obligations are subject to interest rate and credit risks. In addition, all debt obligations involve some risk of default with respect to interest and/or principal payments.
Securities for which market quotations are not readily available are fair valued by Invesco Advisers, Inc. (the “Adviser” or “Invesco”) in accordance with Board-approved policies and related Adviser procedures (“Valuation Procedures”). If a fair value price provided by a pricing service is not representative of market value in the Adviser’s judgment (“unreliable”), the Adviser will fair value the security using the Valuation Procedures. Some of the factors which may be considered in determining fair value are fundamental analytical data relating to the investment; the nature and duration of any restrictions on transferability or disposition; trading in similar securities by the same issuer or comparable companies; relevant political, economic or issuer specific news; and other relevant factors under the circumstances.
The Fund may invest in securities that are subject to interest rate risk, meaning the risk that the prices will generally fall as interest rates rise and, conversely, the prices will generally rise as interest rates fall. Specific securities differ in their sensitivity to changes in interest rates depending on their individual characteristics. Changes in interest rates may result in increased market volatility, which may affect the value and/or liquidity of certain Fund investments.
Valuations change in response to many factors including the historical and prospective earnings of the issuer, the value of the issuer’s assets, general market conditions which are not specifically related to the particular issuer, such as real or perceived adverse economic conditions, changes in the general outlook for revenues or corporate earnings, changes in interest or currency rates, regional or global instability, natural or environmental disasters, widespread disease or other public health issues, war, acts of terrorism, significant governmental actions or adverse investor sentiment generally and market liquidity. Because of the inherent uncertainties of valuation, the values reflected in the financial statements may materially differ from the value received upon actual sale of those investments.
The price the Fund could receive upon the sale of any investment may differ from the Adviser’s valuation of the investment, particularly for securities that are valued using a fair valuation technique. When fair valuation techniques are applied, the Adviser uses available information, including both observable and unobservable inputs and assumptions, to determine a methodology that will result in a valuation that the Adviser believes approximates market value. Fund securities that are fair valued may be subject to greater fluctuation in their value from one day to the next than would be the case if market quotations were used. Because of the inherent uncertainties of valuation, and the degree of subjectivity in such decisions, the Fund could realize a greater or lesser than expected gain or loss upon the sale of the investment.
| B. | Securities Transactions and Investment Income - Securities transactions are accounted for on a trade date basis. Realized gains or losses on sales are computed on the basis of specific identification of the securities sold. Interest income (net of withholding tax, if any) is recorded on an accrual basis from settlement date and includes coupon interest and amortization of premium and accretion of discount on debt securities as applicable. Pay-in-kind interest income and non-cash dividend income received in the form of securities in-lieu of cash are recorded at the fair value of the securities received. Dividend income (net of withholding tax, if any) is recorded on the ex-dividend date. |
The Fund may periodically participate in litigation related to Fund investments. As such, the Fund may receive proceeds from litigation settlements.Any proceeds received are included in the Statement of Operations as realized gain (loss) for investments no longer held and as unrealized gain (loss) for investments still held.
Brokerage commissions and mark ups are considered transaction costs and are recorded as an increase to the cost basis of securities purchased and/or a reduction of proceeds on a sale of securities. Such transaction costs are included in the determination of net realized and unrealized gain (loss) from investment securities reported in the Statement of Operations and the Statement of Changes in Net Assets and the net realized and unrealized gains (losses) on securities per share in the Financial Highlights. Transaction costs are included in the calculation of the Fund’s net asset value and, accordingly, they reduce the Fund’s total returns. These transaction costs are not considered operating expenses and are not reflected in net investment income reported in the Statement of Operations and the Statement of Changes in Net Assets, or the net investment income per share and the ratios of expenses and net investment income reported in the Financial Highlights, nor are they limited by any expense limitation arrangements between the Fund and the investment adviser.
The Fund allocates realized and unrealized capital gains and losses to a class based on the relative net assets of each class. The Fund allocates income to a class based on the relative value of the settled shares of each class.
| C. | Country Determination - For the purposes of making investment selection decisions and presentation in the Schedule of Investments, the investment adviser may determine the country in which an issuer is located and/or credit risk exposure based on various factors. These factors include the laws of the country under which the issuer is organized, where the issuer maintains a principal office, the country in which the issuer derives 50% or more of its total revenues, the country that has the primary market for the issuer’s securities and its “country of risk” as determined by a third party service provider, as well as other criteria. Among the other criteria that may be evaluated for making this determination are the country in which the issuer maintains 50% or more of its assets, the type of security, financial guarantees and enhancements, the nature of the collateral and the sponsor organization. Country of issuer and/or credit risk exposure has been determined to be the United States of America, unless otherwise noted. |
| | |
| 16 | | Invesco Environmental Focus Municipal Fund |
| D. | Distributions - Distributions from net investment income, if any, are declared daily and paid monthly. Distributions from net realized capital gain, if any, are generally declared and paid annually and recorded on the ex-dividend date. The Fund may elect to treat a portion of the proceeds from redemptions as distributions for federal income tax purposes. |
| E. | Federal Income Taxes - The Fund intends to comply with the requirements of Subchapter M of the Internal Revenue Code of 1986, as amended (the “Internal Revenue Code”), necessary to qualify as a regulated investment company and to distribute substantially all of the Fund’s taxable and tax-exempt earnings to shareholders. As such, the Fund will not be subject to federal income taxes on otherwise taxable income (including net realized capital gain) that is distributed to shareholders. Therefore, no provision for federal income taxes is recorded in the financial statements. |
The Fund recognizes the tax benefits of uncertain tax positions only when the position is more likely than not to be sustained. Management has analyzed the Fund’s uncertain tax positions and concluded that no liability for unrecognized tax benefits should be recorded related to uncertain tax positions. Management is not aware of any tax positions for which it is reasonably possible that the total amounts of unrecognized tax benefits will change materially in the next 12 months.
In addition, the Fund intends to invest in such municipal securities to allow it to qualify to pay shareholders “exempt-interest dividends”, as defined in the Internal Revenue Code.
The Fund files tax returns in the U.S. Federal jurisdiction and certain other jurisdictions. Generally, the Fund is subject to examinations by such taxing authorities for up to three years after the filing of the return for the tax period.
| F. | Expenses - Fees provided for under the Rule 12b-1 plan of a particular class of the Fund are charged to the operations of such class. Transfer agency fees and expenses and other shareholder recordkeeping fees and expenses attributable to Class R6 are charged to such class. Transfer agency fees and expenses and other shareholder recordkeeping fees and expenses relating to all other classes are allocated among those classes based on relative net assets. All other expenses are allocated among the classes based on relative net assets. |
| G. | Interest, Facilities and Maintenance Fees - Interest, Facilities and Maintenance Fees include interest and related borrowing costs such as commitment fees, administrative expenses and other expenses associated with establishing and maintaining the line of credit. |
| H. | Accounting Estimates - The preparation of financial statements in conformity with accounting principles generally accepted in the United States of America (“GAAP”) requires management to make estimates and assumptions that affect the reported amounts of assets and liabilities at the date of the financial statements and the reported amounts of revenues and expenses during the reporting period including estimates and assumptions related to taxation. Actual results could differ from those estimates by a significant amount. In addition, the Fund monitors for material events or transactions that may occur or become known after the period-end date and before the date the financial statements are released to print. |
| I. | Indemnifications - Under the Trust’s organizational documents, each Trustee, officer, employee or other agent of the Trust is indemnified against certain liabilities that may arise out of the performance of their duties to the Fund. Additionally, in the normal course of business, the Fund enters into contracts, including the Fund’s servicing agreements, that contain a variety of indemnification clauses. The Fund’s maximum exposure under these arrangements is unknown as this would involve future claims that may be made against the Fund that have not yet occurred. The risk of material loss as a result of such indemnification claims is considered remote. |
| J. | Securities Purchased on a When-Issued and Delayed Delivery Basis - The Fund may purchase and sell interests in corporate loans and corporate debt securities and other portfolio securities on a when-issued and delayed delivery basis, with payment and delivery scheduled for a future date. No income accrues to the Fund on such interests or securities in connection with such transactions prior to the date the Fund actually takes delivery of such interests or securities. These transactions are subject to market fluctuations and are subject to the risk that the value at delivery may be more or less than the trade date purchase price. Although the Fund will generally purchase these securities with the intention of acquiring such securities, they may sell such securities prior to the settlement date. |
| K. | Floating Rate Note Obligations - The Fund invests in inverse floating rate securities, such as Tender Option Bonds (“TOBs”), for investment purposes and to enhance the yield of the Fund. Such securities may be purchased in the secondary market without first owning an underlying bond but generally are created through the sale of fixed rate bonds by the Fund to special purpose trusts established by a broker dealer or by the Fund (“TOB Trusts”) in exchange for cash and residual interests in the TOB Trusts’ assets and cash flows, which are in the form of inverse floating rate securities. The TOB Trusts finance the purchases of the fixed rate bonds by issuing floating rate notes to third parties and allowing the Fund to retain residual interests in the bonds. The floating rate notes issued by the TOB Trusts have interest rates that reset weekly and the floating rate note holders have the option to tender their notes to the TOB Trusts for redemption at par at each reset date. The residual interests held by the Fund (inverse floating rate securities) include the right of the Fund (1) to cause the holders of the floating rate notes to tender their notes at par at the next interest rate reset date, and (2) to transfer the municipal bond from the TOB Trust to the Fund, thereby collapsing the TOB Trust. Inverse floating rate securities tend to underperform the market for fixed rate bonds in a rising interest rate environment, but tend to outperform the market for fixed rate bonds when interest rates decline or remain relatively stable. |
The Fund generally invests in inverse floating rate securities that include embedded leverage, thus exposing the Fund to greater risks and increased costs. The primary risks associated with inverse floating rate securities are varying degrees of liquidity and decreases in the value of such securities in response to changes in interest rates to a greater extent than fixed rate securities having similar credit quality, redemption provisions and maturity, which may cause the Fund’s net asset value to be more volatile than if it had not invested in inverse floating rate securities. In certain instances, the short-term floating rate notes created by the TOB Trust may not be able to be sold to third parties or, in the case of holders tendering (or putting) such notes for repayment of principal, may not be able to be remarketed to third parties. In such cases, the TOB Trust holding the fixed rate bonds may be collapsed with the entity that contributed the fixed rate bonds to the TOB Trust. In the case where a TOB Trust is collapsed with the Fund, the Fund will be required to repay the principal amount of the tendered securities, which may require the Fund to sell other portfolio holdings to raise cash to meet that obligation. The Fund could therefore be required to sell other portfolio holdings at a disadvantageous time or price to raise cash to meet this obligation, which risk will be heightened during times of market volatility, illiquidity or uncertainty. The embedded leverage in the TOB Trust could cause the Fund to lose more money than the value of the asset it has contributed to the TOB Trust and greater levels of leverage create the potential for greater losses. In addition, a Fund may enter into reimbursement agreements with the liquidity provider of certain TOB transactions in connection with certain residuals held by the Fund. These agreements commit a Fund to reimburse the liquidity provider to the extent that the liquidity provider must provide cash to a TOB Trust, including following the termination of a TOB Trust resulting from a mandatory tender event (“liquidity shortfall”). The reimbursement agreement will effectively make the Fund liable for the amount of the negative difference, if any, between the liquidation value of the underlying security and the purchase price of the floating rate notes issued by the TOB Trust.
The Fund accounts for the transfer of fixed rate bonds to the TOB Trusts as secured borrowings, with the securities transferred remaining in the Fund’s investment assets, and the related floating rate notes reflected as Fund liabilities under the caption Floating rate note obligations on the Statement of Assets and Liabilities. The carrying amount of the Fund’s floating rate note obligations as reported on the Statement of Assets and Liabilities approximates its fair value. The Fund records the interest income from the fixed rate bonds under the caption Interest and records the expenses related to floating rate obligations and any administrative expenses of the TOB Trusts as a component of Interest, facilities and maintenance fees on the Statement of Operations.
Final rules implementing section 619 of the Dodd-Frank Wall Street Reform and Consumer Protection Act (the “Volcker Rule”) prohibit banking entities from engaging in proprietary trading of certain instruments and limit such entities’ investments in, and relationships with, “covered funds”, as defined in the rules. These rules preclude banking entities and their affiliates from sponsoring and/or providing services for existing TOB Trusts. A new TOB structure is being utilized by the Fund wherein the Fund, as holder of the residuals, will perform certain duties previously performed by banking entities as “sponsors” of TOB Trusts. These duties may be performed by a third-party service provider. The Fund’s expanded role under the new TOB structure may increase its operational and regulatory risk. The new structure is substantially similar to the previous structure; however, pursuant to the Volcker Rule, the remarketing agent would not be able to repurchase
| | |
| 17 | | Invesco Environmental Focus Municipal Fund |
tendered floaters for its own account upon a failed remarketing. In the event of a failed remarketing, a banking entity serving as liquidity provider may loan the necessary funds to the TOB Trust to purchase the tendered floaters. The TOB Trust, not the Fund, would be the borrower and the loan from the liquidity provider will be secured by the purchased floaters now held by the TOB Trust. However, as previously described, the Fund would bear the risk of loss with respect to any liquidity shortfall to the extent it entered into a reimbursement agreement with the liquidity provider.
Further, the SEC and various banking agencies have adopted rules implementing credit risk retention requirements for asset-backed securities (the “Risk Retention Rules”). The Risk Retention Rules require the sponsor of a TOB Trust to retain at least 5% of the credit risk of the underlying assets supporting the TOB Trust’s municipal bonds. The Fund has adopted policies intended to comply with the Risk Retention Rules. The Risk Retention Rules may adversely affect the Fund’s ability to engage in TOB Trust transactions or increase the costs of such transactions in certain circumstances.
There can be no assurances that the new TOB structure will continue to be a viable form of leverage. Further, there can be no assurances that alternative forms of leverage will be available to the Fund in order to maintain current levels of leverage. Any alternative forms of leverage may be less advantageous to the Fund, and may adversely affect the Fund’s net asset value, distribution rate and ability to achieve its investment objective.
TOBs are presently classified as private placement securities. Private placement securities are subject to restrictions on resale because they have not been registered under the Securities Act of 1933, as amended (the “1933 Act”), or are otherwise not readily marketable. As a result of the absence of a public trading market for these securities, they may be less liquid than publicly traded securities. Although atypical, these securities may be resold in privately negotiated transactions, the prices realized from these sales could be less than those originally paid by the Fund or less than what may be considered the fair value of such securities.
| L. | Futures Contracts - The Fund may enter into futures contracts to manage exposure to interest rate, equity and market price movements and/or currency risks. A futures contract is an agreement between two parties (“Counterparties”) to purchase or sell a specified underlying security, currency or commodity (or delivery of a cash settlement price, in the case of an index future) for a fixed price at a future date. The Fund currently invests only in exchange-traded futures and they are standardized as to maturity date and underlying financial instrument. Initial margin deposits required upon entering into futures contracts are satisfied by the segregation of specific securities or cash as collateral at the futures commission merchant (broker). During the period the futures contracts are open, changes in the value of the contracts are recognized as unrealized gains or losses by recalculating the value of the contracts on a daily basis. Subsequent or variation margin payments are received or made depending upon whether unrealized gains or losses are incurred. These amounts are reflected as receivables or payables on the Statement of Assets and Liabilities. When the contracts are closed or expire, the Fund recognizes a realized gain or loss equal to the difference between the proceeds from, or cost of, the closing transaction and the Fund’s basis in the contract. The net realized gain (loss) and the change in unrealized gain (loss) on futures contracts held during the period is included on the Statement of Operations. The primary risks associated with futures contracts are market risk and the absence of a liquid secondary market. If the Fund were unable to liquidate a futures contract and/or enter into an offsetting closing transaction, the Fund would continue to be subject to market risk with respect to the value of the contracts and continue to be required to maintain the margin deposits on the futures contracts. Futures contracts have minimal Counterparty risk since the exchange’s clearinghouse, as Counterparty to all exchange-traded futures, guarantees the futures against default. Risks may exceed amounts recognized in the Statement of Assets and Liabilities. |
| M. | Other Risks - Increases in the federal funds and equivalent foreign rates or other changes to monetary policy or regulatory actions may expose fixed income markets to heightened volatility and reduced liquidity for certain fixed income investments, particularly those with longer maturities. It is difficult to predict the impact of interest rate changes on various markets. In addition, decreases in fixed income dealer market-making capacity may also potentially lead to heightened volatility and reduced liquidity in the fixed income markets. As a result, the value of the Fund’s investments and share price may decline. Changes in central bank policies could also result in higher than normal redemptions by shareholders, which could potentially increase the Fund’s portfolio turnover rate and transaction costs. |
Policy changes by the U.S. government or its regulatory agencies and political events within the U.S. and abroad may, among other things, affect investor and consumer confidence and increase volatility in the financial markets, perhaps suddenly and to a significant degree, which may adversely impact the Fund’s operations, universe of potential investment options, and return potential.
The Fund may invest in lower-quality debt securities, i.e., “junk bonds”. Investments in lower-rated securities or unrated securities of comparable quality tend to be more sensitive to economic conditions than higher rated securities. Junk bonds involve a greater risk of default by the issuer because such securities are generally unsecured and are often subordinated to other creditors’ claims. Junk bonds are less liquid than investment grade debt securities and their prices tend to be more volatile.
The municipal issuers in which the Fund invests may be located in the same geographic area or may pay their interest obligations from revenue of similar projects, such as hospitals, airports, utility systems and housing finance agencies. This may make the Fund’s investments more susceptible to similar social, economic, political or regulatory occurrences, making the Fund more susceptible to experience a drop in its share price than if the Fund had been more diversified across issuers that did not have similar characteristics.
The risk of a municipal obligation generally depends on the financial and credit status of the issuer. Constitutional amendments, legislative enactments, executive orders, administrative regulations, voter initiatives, and the issuer’s regional economic conditions may affect the municipal security’s value, interest payments, repayment of principal and the Fund’s ability to sell the security. Failure of a municipal security issuer to comply with applicable tax requirements may make income paid thereon taxable, resulting in a decline in the security’s value. In addition, there could be changes in applicable tax laws or tax treatments that reduce or eliminate the current federal income tax exemption on municipal securities or otherwise adversely affect the current federal or state tax status of municipal securities.
Because the Fund evaluates environmental focus factors to assess and exclude certain investments for non-financial reasons, it may forego some market opportunities available to funds that do not use these factors. The issuers that are deemed appropriate to meet the Fund’s standards for high potential positive environmental impact based on the Adviser’s proprietary process to evaluate municipal securities in different sectors based on pre-determined environmental and sustainability factors may underperform similar issuers that do not meet the Fund’s standards or may underperform the stock market as a whole. As a result, the Fund may underperform funds that do not focus on investing in issuers with high potential for positive environmental impact or funds that use a different environmental focus investment process or methodology. Information used by the Fund to evaluate environmental factors may not be readily available, complete or accurate, which could negatively impact the Fund’s ability to apply its investment process, which in turn could negatively impact the Fund’s performance. In addition, the Fund’s assessment of an issuer’s high potential positive environmental impact may differ from that of other funds or an investor. As a result, the issuers deemed eligible for inclusion in the Fund’s portfolio may not reflect the beliefs or values of any particular investor and may not be deemed to exhibit positive or favorable environmental focus characteristics if different metrics were used to evaluate them.
Active trading of portfolio securities may result in added expenses, a lower return and increased tax liability.
| N. | COVID-19 Risk - The COVID-19 strain of coronavirus has resulted in instances of market closures and dislocations, extreme volatility, liquidity constraints and increased trading costs. Efforts to contain its spread have resulted in travel restrictions, disruptions of healthcare systems, business operations (including business closures) and supply chains, layoffs, lower consumer demand and employee availability, and defaults and credit downgrades, among other significant economic impacts that have disrupted global economic activity across many industries. Such economic impacts may exacerbate other pre-existing political, social and economic risks locally or globally and cause general concern and uncertainty. The full economic impact and ongoing effects of COVID-19 (or other future epidemics or pandemics) at the macro-level and on individual businesses are unpredictable and may result in significant and prolonged effects on the Fund’s performance. |
| | |
| 18 | | Invesco Environmental Focus Municipal Fund |
NOTE 2–Advisory Fees and Other Fees Paid to Affiliates
The Trust has entered into a master investment advisory agreement with the Adviser. Under the terms of the investment advisory agreement, the Fund accrues daily and pays monthly an advisory fee to the Adviser based on the annual rate of the Fund’s average daily net assets as follows:
| | | | |
| Average Daily Net Assets | | Rate* | |
|
| |
First $ 500 million | | | 0.400 | % |
|
| |
Next $ 500 million | | | 0.350 | % |
|
| |
Next $ 500 million | | | 0.300 | % |
|
| |
Over $1.5 billion | | | 0.280 | % |
|
| |
| * | The advisory fee paid by the Fund shall be reduced by any amounts paid by the Fund under the administrative services agreement with the Adviser. |
For the year ended February 28, 2023, the effective advisory fee rate incurred by the Fund was 0.39%.
Under the terms of a master sub-advisory agreement between the Adviser and each of Invesco Asset Management Deutschland GmbH, Invesco Asset Management Limited, Invesco Asset Management (Japan) Limited, Invesco Hong Kong Limited, Invesco Senior Secured Management, Inc. and Invesco Canada Ltd. and separate sub-advisory agreements with Invesco Capital Management LLC and Invesco Asset Management (India) Private Limited (collectively, the “Affiliated Sub-Advisers”) the Adviser, not the Fund, will pay 40% of the fees paid to the Adviser to any such Affiliated Sub-Adviser(s) that provide(s) discretionary investment management services to the Fund based on the percentage of assets allocated to such Affiliated Sub-Adviser(s). Invesco has also entered into a sub-advisory agreement with OppenheimerFunds, Inc. to provide discretionary management services to the Fund.
The Adviser has contractually agreed, through at least June 30, 2023, to waive advisory fees and/or reimburse expenses of all shares to the extent necessary to limit total annual fund operating expenses after fee waiver and/or expense reimbursement (excluding certain items discussed below) of Class A, Class C, Class Y and Class R6 shares to 0.70%, 1.45%, 0.45% and 0.45%, respectively, of the Fund’s average daily net assets (the “expense limits”). In determining the Adviser’s obligation to waive advisory fees and/or reimburse expenses, the following expenses are not taken into account, and could cause the total annual fund operating expenses after fee waiver and/or expense reimbursement to exceed the numbers reflected above: (1) interest, facilities and maintenance fees; (2) taxes; (3) dividend expense on short sales; (4) extraordinary or non-routine items, including litigation expenses; and (5) expenses that the Fund has incurred but did not actually pay because of an expense offset arrangement. Unless Invesco continues the fee waiver agreement, it will terminate on June 30, 2023. During its term, the fee waiver agreement cannot be terminated or amended to increase the expense limits or reduce the advisory fee waiver without approval of the Board of Trustees.
For the year ended February 28, 2023, the Adviser waived advisory fees of $111,708 and reimbursed class level expenses of $56,809, $5,969, $25,592 and $274 of Class A, Class C, Class Y and Class R6 shares, respectively.
The Trust has entered into a master administrative services agreement with Invesco pursuant to which the Fund has agreed to pay Invesco for certain administrative costs incurred in providing accounting services to the Fund. For the year ended February 28, 2023, expenses incurred under the agreement are shown in the Statement of Operations as Administrative services fees. Invesco has entered into a sub-administration agreement whereby State Street Bank and Trust Company (“SSB”) serves as fund accountant and provides certain administrative services to the Fund. Pursuant to a custody agreement with the Trust on behalf of the Fund, SSB also serves as the Fund’s custodian.
The Trust has entered into a transfer agency and service agreement with Invesco Investment Services, Inc. (“IIS”) pursuant to which the Fund has agreed to pay IIS a fee for providing transfer agency and shareholder services to the Fund and reimburse IIS for certain expenses incurred by IIS in the course of providing such services. IIS may make payments to intermediaries that provide omnibus account services, sub-accounting services and/or networking services. All fees payable by IIS to intermediaries that provide omnibus account services or sub-accounting services are charged back to the Fund, subject to certain limitations approved by the Trust’s Board of Trustees. For the year ended February 28, 2023, expenses incurred under the agreement are shown in the Statement of Operations as Transfer agent fees.
The Trust has entered into master distribution agreements with Invesco Distributors, Inc. (“IDI”) to serve as the distributor for the Class A, Class C, Class Y and Class R6 shares of the Fund. The Trust has adopted plans pursuant to Rule 12b-1 under the 1940 Act with respect to the Fund’s Class A and Class C shares (collectively, the “Plans”). The Fund, pursuant to the Class A Plan, reimburses IDI for its allocated share of expenses incurred for the period, up to a maximum annual rate of 0.25% of the average daily net assets of Class A shares. The Fund pursuant to the Class C Plan, pays IDI compensation at the annual rate of 1.00% of the average daily net assets of Class C shares. The fees are accrued daily and paid monthly. Of the Plan payments, up to 0.25% of the average daily net assets of each class of shares may be paid to furnish continuing personal shareholder services to customers who purchase and own shares of such classes. Any amounts not paid as a service fee under the Plans would constitute an asset-based sales charge. Rules of the Financial Industry Regulatory Authority (“FINRA”) impose a cap on the total sales charges, including asset-based sales charges, that may be paid by any class of shares of the Fund. For the year ended February 28, 2023, expenses incurred under the Plans are shown in the Statement of Operations as Distribution fees.
Front-end sales commissions and CDSC (collectively, the “sales charges”) are not recorded as expenses of the Fund. Front-end sales commissions are deducted from proceeds from the sales of Fund shares prior to investment in Class A shares of the Fund. CDSC are deducted from redemption proceeds prior to remittance to the shareholder. During the year ended February 28, 2023, IDI advised the Fund that IDI retained $234 in front-end sales commissions from the sale of Class A shares and $2,390 and $840 from Class A and Class C shares, respectively, for CDSC imposed upon redemptions by shareholders.
Certain officers and trustees of the Trust are officers and directors of the Adviser, IIS and/or IDI.
NOTE 3–Additional Valuation Information
GAAP defines fair value as the price that would be received to sell an asset or paid to transfer a liability in an orderly transaction between market participants at the measurement date, under current market conditions. GAAP establishes a hierarchy that prioritizes the inputs to valuation methods, giving the highest priority to readily available unadjusted quoted prices in an active market for identical assets (Level 1) and the lowest priority to significant unobservable inputs (Level 3), generally when market prices are not readily available. Based on the valuation inputs, the securities or other investments are tiered into one of three levels. Changes in valuation methods may result in transfers in or out of an investment’s assigned level:
| | |
| Level 1 - | | Prices are determined using quoted prices in an active market for identical assets. |
| Level 2 - | | Prices are determined using other significant observable inputs. Observable inputs are inputs that other market participants may use in pricing a security. These may include quoted prices for similar securities, interest rates, prepayment speeds, credit risk, yield curves, loss severities, default rates, discount rates, volatilities and others. |
| Level 3 - | | Prices are determined using significant unobservable inputs. In situations where quoted prices or observable inputs are unavailable (for example, when there is little or no market activity for an investment at the end of the period), unobservable inputs may be used. Unobservable inputs reflect the Adviser’s assumptions about the factors market participants would use in determining fair value of the securities or instruments and would be based on the best available information. |
| | |
| 19 | | Invesco Environmental Focus Municipal Fund |
As of February 28, 2023, all of the securities in this Fund were valued based on Level 2 inputs (see the Schedule of Investments for security categories). The level assigned to the securities valuations may not be an indication of the risk or liquidity associated with investing in those securities. Because of the inherent uncertainties of valuation, the values reflected in the financial statements may materially differ from the value received upon actual sale of those investments.
NOTE 4–Derivative Investments
The Fund may enter into an International Swaps and Derivatives Association Master Agreement (“ISDA Master Agreement”) under which a fund may trade OTC derivatives. An OTC transaction entered into under an ISDA Master Agreement typically involves a collateral posting arrangement, payment netting provisions and close-out netting provisions. These netting provisions allow for reduction of credit risk through netting of contractual obligations. The enforceability of the netting provisions of the ISDA Master Agreement depends on the governing law of the ISDA Master Agreement, among other factors.
For financial reporting purposes, the Fund does not offset OTC derivative assets or liabilities that are subject to ISDA Master Agreements in the Statement of Assets and Liabilities.
Effect of Derivative Investments for the year ended February 28, 2023
The table below summarizes the gains (losses) on derivative investments, detailed by primary risk exposure, recognized in earnings during the period:
| | | | |
| | | Location of Gain on
Statement of Operations | |
| | | Interest Rate Risk | |
Realized Gain: | | | | |
Futures contracts | | | $580,905 | |
| |
Change in Net Unrealized Appreciation: | | | | |
Futures contracts | | | 3,125 | |
| |
Total | | | $584,030 | |
|
| |
| | | | |
|
The table below summarizes the average notional value of derivatives held during the period. | |
| | | Futures Contracts | |
|
| |
Average notional value | | | $5,086,753 | |
| |
NOTE 5–Security Transactions with Affiliated Funds
The Fund is permitted to purchase securities from or sell securities to certain other affiliated funds under specified conditions outlined in procedures adopted by the Board of Trustees of the Trust. The procedures have been designed to ensure that any purchase or sale of securities by the Fund from or to another fund that is or could be considered an “affiliated person” by virtue of having a common investment adviser (or affiliated investment advisers), common Trustees and/or common officers is made in reliance on Rule 17a-7 of the 1940 Act and, to the extent applicable, related SEC staff positions. Each such transaction is effected at the security’s “current market price”, as provided for in these procedures and Rule 17a-7. Pursuant to these procedures, for the year ended February 28, 2023, the Fund engaged in securities purchases of $30,700,441 and securities sales of $49,235,407, which resulted in net realized gains (losses) of $(1,866,221).
NOTE 6–Expense Offset Arrangement(s)
The expense offset arrangement is comprised of transfer agency credits which result from balances in demand deposit accounts used by the transfer agent for clearing shareholder transactions. For the year ended February 28, 2023, the Fund received credits from this arrangement, which resulted in the reduction of the Fund’s total expenses of $293.
NOTE 7–Trustees’ and Officers’ Fees and Benefits
Trustees’ and Officers’ Fees and Benefits include amounts accrued by the Fund to pay remuneration to certain Trustees and Officers of the Fund. Trustees have the option to defer compensation payable by the Fund, and Trustees’ and Officers’ Fees and Benefits also include amounts accrued by the Fund to fund such deferred compensation amounts. Those Trustees who defer compensation have the option to select various Invesco Funds in which their deferral accounts shall be deemed to be invested. Finally, certain current Trustees were eligible to participate in a retirement plan that provided for benefits to be paid upon retirement to Trustees over a period of time based on the number of years of service. The Fund may have certain former Trustees who also participate in a retirement plan and receive benefits under such plan. Trustees’ and Officers’ Fees and Benefits include amounts accrued by the Fund to fund such retirement benefits. Obligations under the deferred compensation and retirement plans represent unsecured claims against the general assets of the Fund.
NOTE 8–Cash Balances and Borrowings
The Fund has entered into a revolving credit and security agreement, which enables the Fund to participate with certain other Invesco Funds in a committed secured borrowing facility that permits borrowings up to $2.5 billion, collectively by certain Invesco Funds, and which will expire on February 22, 2024. The revolving credit and security agreement is secured by the assets of the Fund. The Fund is subject to certain covenants relating to the revolving credit and security agreement. Failure to comply with these restrictions could cause the acceleration of the repayment of the amount outstanding under the revolving credit and security agreement.
During the year ended February 28, 2023, the average daily balance of borrowing under the revolving credit and security agreement was $1,129,041 with an average interest rate of 4.08%. The carrying amount of the Fund’s payable for borrowings as reported on the Statement of Assets and Liabilities approximates its fair value. Expenses under the revolving credit and security agreement are shown in the Statement of Operations as Interest, facilities and maintenance fees.
Additionally, the Fund is permitted to temporarily carry a negative or overdrawn balance in its account with SSB, the custodian bank. Such balances, if any at period-end, are shown in the Statement of Assets and Liabilities under the payable caption Amount due custodian. To compensate the custodian bank for such overdrafts, the overdrawn Fund may either (1) leave funds as a compensating balance in the account so the custodian bank can be compensated by earning the additional interest; or (2) compensate by paying the custodian bank at a rate agreed upon by the custodian bank and Invesco, not to exceed the contractually agreed upon rate. The Fund may not purchase additional securities when any borrowings from banks or broker-dealers exceed 5% of the Fund’s total assets, or when any borrowings from an Invesco Fund are outstanding.
| | |
| 20 | | Invesco Environmental Focus Municipal Fund |
Inverse floating rate obligations resulting from the transfer of bonds to TOB Trusts are accounted for as secured borrowings. The average floating rate notes outstanding and average annual interest and fee rate related to inverse floating rate note obligations during the year ended February 28, 2023 were $115,385 and 1.95%, respectively.
NOTE 9–Distributions to Shareholders and Tax Components of Net Assets
Tax Character of Distributions to Shareholders Paid During the Fiscal Years Ended February 28, 2023 and 2022:
| | | | | | | | | | | | |
| | | 2023 | | | | | | 2022 | |
|
| |
Ordinary income* | | $ | 61,567 | | | | | | | $ | 113,948 | |
|
| |
Long-term capital gain | | | – | | | | | | | | 4,930,123 | |
|
| |
Ordinary income-tax-exempt | | | 3,031,284 | | | | | | | | 3,059,214 | |
|
| |
Total distributions | | $ | 3,092,851 | | | | | | | $ | 8,103,285 | |
|
| |
| * | Includes short-term capital gain distributions, if any. |
Tax Components of Net Assets at Period-End:
| | | | |
| | | 2023 | |
|
| |
Undistributed tax-exempt income | | $ | 467,113 | |
|
| |
Net unrealized appreciation (depreciation) – investments | | | (3,344,292 | ) |
|
| |
Temporary book/tax differences | | | (16,646 | ) |
|
| |
Capital loss carryforward | | | (11,448,517 | ) |
|
| |
Shares of beneficial interest | | | 100,877,098 | |
|
| |
Total net assets | | $ | 86,534,756 | |
|
| |
The difference between book-basis and tax-basis unrealized appreciation (depreciation) is due to differences in the timing of recognition of gains and losses on investments for tax and book purposes. The Fund’s net unrealized appreciation (depreciation) difference is attributable primarily to amortization and accretion on debt securities.
The temporary book/tax differences are a result of timing differences between book and tax recognition of income and/or expenses. The Fund’s temporary book/tax differences are the result of the trustee deferral of compensation and retirement plan benefits.
Capital loss carryforward is calculated and reported as of a specific date. Results of transactions and other activity after that date may affect the amount of capital loss carryforward actually available for the Fund to utilize. The ability to utilize capital loss carryforward in the future may be limited under the Internal Revenue Code and related regulations based on the results of future transactions.
The Fund does not have a capital loss carryforward as of February 28, 2023.
| | | | | | | | | | | | |
| Capital Loss Carryforward* | |
|
| |
| Expiration | | Short-Term | | | Long-Term | | | Total | |
|
| |
Not subject to expiration | | $ | 6,430,258 | | | $ | 5,018,259 | | | $ | 11,448,517 | |
|
| |
| * | Capital loss carryforward is reduced for limitations, if any, to the extent required by the Internal Revenue Code and may be further limited depending upon a variety of factors, including the realization of net unrealized gains or losses as of the date of any reorganization. |
NOTE 10–Investment Transactions
The aggregate amount of investment securities (other than short-term securities, U.S. Government obligations and money market funds, if any) purchased and sold by the Fund during the year ended February 28, 2023 was $97,686,416 and $120,242,564, respectively. Cost of investments, including any derivatives, on a tax basis includes the adjustments for financial reporting purposes as of the most recently completed federal income tax reporting period-end.
| | | | |
Unrealized Appreciation (Depreciation) of Investments on a Tax Basis | |
Aggregate unrealized appreciation of investments | | | $1,394,159 | |
|
| |
Aggregate unrealized (depreciation) of investments | | | (4,738,451 | ) |
|
| |
Net unrealized appreciation (depreciation) of investments | | | $(3,344,292) | |
|
| |
Cost of investments for tax purposes is $89,364,000.
NOTE 11–Reclassification of Permanent Differences
Primarily as a result of differing book/tax treatment of market discounts, distributions and amortization and accretion on debt securities, on February 28, 2023, undistributed net investment income was increased by $16,716, undistributed net realized gain (loss) was increased by $32,259 and shares of beneficial interest was decreased by $48,975. This reclassification had no effect on the net assets of the Fund.
| | |
| 21 | | Invesco Environmental Focus Municipal Fund |
NOTE 12–Share Information
| | | | | | | | | | | | | | | | |
| | | Summary of Share Activity | |
|
| |
| | |
| | | Year ended | | | Year ended | |
| | | February 28, 2023(a) | | | February 28, 2022 | |
| | | Shares | | | Amount | | | Shares | | | Amount | |
|
| |
Sold: | | | | | | | | | | | | | | | | |
Class A | | | 979,815 | | | $ | 11,327,270 | | | | 811,975 | | | $ | 11,138,286 | |
|
| |
Class C | | | 17,487 | | | | 202,245 | | | | 46,272 | | | | 638,621 | |
|
| |
Class Y | | | 1,315,819 | | | | 15,133,276 | | | | 680,339 | | | | 9,297,103 | |
|
| |
Class R6 | | | 170,376 | | | | 1,984,804 | | | | 62,839 | | | | 831,506 | |
|
| |
| | | | |
Issued as reinvestment of dividends: | | | | | | | | | | | | | | | | |
Class A | | | 107,015 | | | | 1,228,877 | | | | 271,319 | | | | 3,655,261 | |
|
| |
Class C | | | 9,984 | | | | 114,592 | | | | 35,889 | | | | 483,120 | |
|
| |
Class Y | | | 45,997 | | | | 528,134 | | | | 127,516 | | | | 1,718,444 | |
|
| |
Class R6 | | | 4,660 | | | | 53,203 | | | | 237 | | | | 3,080 | |
|
| |
| | | | |
Automatic conversion of Class C shares to Class A shares: | | | | | | | | | | | | | | | | |
Class A | | | 133,485 | | | | 1,553,612 | | | | 185,528 | | | | 2,523,247 | |
|
| |
Class C | | | (133,581 | ) | | | (1,553,612 | ) | | | (185,674 | ) | | | (2,523,247 | ) |
|
| |
| | | | |
Reacquired: | | | | | | | | | | | | | | | | |
Class A | | | (2,524,129 | ) | | | (29,238,434 | ) | | | (1,456,709 | ) | | | (19,763,216 | ) |
|
| |
Class C | | | (169,172 | ) | | | (1,971,504 | ) | | | (171,508 | ) | | | (2,327,546 | ) |
|
| |
Class Y | | | (2,520,150 | ) | | | (29,250,812 | ) | | | (889,909 | ) | | | (11,992,089 | ) |
|
| |
Class R6 | | | (50,208 | ) | | | (567,703 | ) | | | (31 | ) | | | (389 | ) |
|
| |
Net increase (decrease) in share activity | | | (2,612,602 | ) | | $ | (30,456,052 | ) | | | (481,917 | ) | | $ | (6,317,819 | ) |
|
| |
| (a) | There are entities that are record owners of more than 5% of the outstanding shares of the Fund and in the aggregate own 61% of the outstanding shares of the Fund. IDI has an agreement with these entities to sell Fund shares. The Fund, Invesco and/or Invesco affiliates may make payments to these entities, which are considered to be related to the Fund, for providing services to the Fund, Invesco and/or Invesco affiliates including but not limited to services such as securities brokerage, distribution, third party record keeping and account servicing. The Fund has no knowledge as to whether all or any portion of the shares owned of record by these entities are also owned beneficially. |
| | |
| 22 | | Invesco Environmental Focus Municipal Fund |
Report of Independent Registered Public Accounting Firm
To the Board of Trustees of AIM Tax-Exempt Funds (Invesco Tax-Exempt Funds) and Shareholders of Invesco Environmental Focus Municipal Fund
Opinion on the Financial Statements
We have audited the accompanying statement of assets and liabilities, including the schedule of investments, of Invesco Environmental Focus Municipal Fund (one of the funds constituting AIM Tax-Exempt Funds (Invesco Tax-Exempt Funds), referred to hereafter as the “Fund”) as of February 28, 2023, the related statement of operations for the year ended February 28, 2023, the statement of changes in net assets for each of the two years in the period ended February 28, 2023, including the related notes, and the financial highlights for each of the periods indicated in the table below (collectively referred to as the “financial statements”). In our opinion, the financial statements present fairly, in all material respects, the financial position of the Fund as of February 28, 2023, the results of its operations for the year then ended, the changes in its net assets for each of the two years in the period ended February 28, 2023 and the financial highlights for each of the periods indicated in the table below, in conformity with accounting principles generally accepted in the United States of America.
|
| |
Financial Highlights |
| |
For each of the three years in the period ended February 28, 2023 and the eleven months ended February 29, 2020 for Class A, Class C and Class Y. |
For each of the three years in the period ended February 28, 2023 and the period May 24, 2019 (commencement date) through February 29, 2020 for Class R6. |
The financial statements of Oppenheimer Municipal Fund (subsequently renamed Invesco Environmental Focus Municipal Fund) as of and for the year ended March 31, 2019 and the financial highlights for each of the periods ended on or prior to March 31, 2019 (not presented herein, other than the financial highlights) were audited by other auditors whose report dated May 15, 2019 expressed an unqualified opinion on those financial statements and financial highlights.
Basis for Opinion
These financial statements are the responsibility of the Fund’s management. Our responsibility is to express an opinion on the Fund’s financial statements based on our audits. We are a public accounting firm registered with the Public Company Accounting Oversight Board (United States) (PCAOB) and are required to be independent with respect to the Fund in accordance with the U.S. federal securities laws and the applicable rules and regulations of the Securities and Exchange Commission and the PCAOB.
We conducted our audits of these financial statements in accordance with the standards of the PCAOB. Those standards require that we plan and perform the audit to obtain reasonable assurance about whether the financial statements are free of material misstatement, whether due to error or fraud.
Our audits included performing procedures to assess the risks of material misstatement of the financial statements, whether due to error or fraud, and performing procedures that respond to those risks. Such procedures included examining, on a test basis, evidence regarding the amounts and disclosures in the financial statements. Our audits also included evaluating the accounting principles used and significant estimates made by management, as well as evaluating the overall presentation of the financial statements. Our procedures included confirmation of securities owned as of February 28, 2023 by correspondence with the custodian and brokers; when replies were not received from brokers, we performed other auditing procedures. We believe that our audits provide a reasonable basis for our opinion.
/s/PricewaterhouseCoopers LLP
Houston, Texas
April 21, 2023
We have served as the auditor of one or more of the investment companies in the Invesco group of investment companies since at least 1995. We have not been able to determine the specific year we began serving as auditor.
| | |
| 23 | | Invesco Environmental Focus Municipal Fund |
Calculating your ongoing Fund expenses
Example
As a shareholder of the Fund, you incur two types of costs: (1) transaction costs, which may include sales charges (loads) on purchase payments or contingent deferred sales charges on redemptions, if any; and (2) ongoing costs, including management fees, distribution and/or service (12b-1) fees, and other Fund expenses. This example is intended to help you understand your ongoing costs (in dollars) of investing in the Fund and to compare these costs with ongoing costs of investing in other mutual funds. The example is based on an investment of $1,000 invested at the beginning of the period and held for the entire period September 1, 2022 through February 28, 2023.
Actual expenses
The table below provides information about actual account values and actual expenses. You may use the information in this table, together with the amount you invested, to estimate the expenses that you paid over the period. Simply divide your account value by $1,000 (for example, an $8,600 account value divided by $1,000 = 8.6), then multiply the result by the number in the table under the heading entitled “Actual Expenses Paid During Period” to estimate the expenses you paid on your account during this period.
Hypothetical example for comparison purposes
The table below also provides information about hypothetical account values and hypothetical expenses based on the Fund’s actual expense ratio and an assumed rate of return of 5% per year before expenses, which is not the Fund’s actual return.
The hypothetical account values and expenses may not be used to estimate the actual ending account balance or expenses you paid for the period. You may use this information to compare the ongoing costs of investing in the Fund and other funds. To do so, compare this 5% hypothetical example with the 5% hypothetical examples that appear in the shareholder reports of the other funds.
Please note that the expenses shown in the table are meant to highlight your ongoing costs only and do not reflect any transaction costs, such as sales charges (loads) on purchase payments or contingent deferred sales charges on redemptions, if any. Therefore, the hypothetical information is useful in comparing ongoing costs only, and will not help you determine the relative total costs of owning different funds. In addition, if these transaction costs were included, your costs would have been higher.
| | | | | | | | | | | | |
| | | | | ACTUAL | | HYPOTHETICAL (5% annual return before expenses) | | |
| | | Beginning Account Value (09/01/22) | | Ending Account Value (02/28/23)1 | | Expenses Paid During Period2 | | Ending Account Value (02/28/23) | | Expenses Paid During Period2 | | Annualized Expense Ratio |
Class A | | $1,000.00 | | $995.40 | | $4.25 | | $1,020.53 | | $4.31 | | 0.86% |
Class C | | 1,000.00 | | 992.50 | | 7.95 | | 1,016.81 | | 8.05 | | 1.61 |
Class Y | | 1,000.00 | | 997.60 | | 3.02 | | 1,021.77 | | 3.06 | | 0.61 |
Class R6 | | 1,000.00 | | 997.60 | | 3.02 | | 1,021.77 | | 3.06 | | 0.61 |
| 1 | The actual ending account value is based on the actual total return of the Fund for the period September 1, 2022 through February 28, 2023, after actual expenses and will differ from the hypothetical ending account value which is based on the Fund’s expense ratio and a hypothetical annual return of 5% before expenses. |
| 2 | Expenses are equal to the Fund’s annualized expense ratio as indicated above multiplied by the average account value over the period, multiplied by 181/365 to reflect the most recent fiscal half year. |
| | |
| 24 | | Invesco Environmental Focus Municipal Fund |
Tax Information
Form 1099-DIV, Form 1042-S and other year–end tax information provide shareholders with actual calendar year amounts that should be included in their tax returns. Shareholders should consult their tax advisers.
The following distribution information is being provided as required by the Internal Revenue Code or to meet a specific state’s requirement.
The Fund designates the following amounts or, if subsequently determined to be different, the maximum amount allowable for its fiscal year ended February 28, 2023:
| | | | | | | | |
Federal and State Income Tax | | | | | | |
Qualified Dividend Income* | | | 0.00 | % | | | | |
Corporate Dividends Received Deduction* | | | 0.00 | % | | | | |
U.S. Treasury Obligations* | | | 0.00 | % | | | | |
Qualified Business Income* | | | 0.00 | % | | | | |
Business Interest Income* | | | 0.00 | % | | | | |
Tax-Exempt Interest Dividends* | | | 98.01 | % | | | | |
|
| * The above percentages are based on ordinary income dividends paid to shareholders during the Fund’s fiscal year. | |
| | |
| 25 | | Invesco Environmental Focus Municipal Fund |
Trustees and Officers
The address of each trustee and officer is AIM Tax-Exempt Funds (Invesco Tax-Exempt Funds) (the “Trust”), 11 Greenway Plaza, Suite 1000, Houston, Texas 77046-1173. The trustees serve for the life of the Trust, subject to their earlier death, incapacitation, resignation, retirement or removal as more specifically provided in the Trust’s organizational documents. Each officer serves for a one year term or until their successors are elected and qualified. Column two below includes length of time served with predecessor entities, if any.
| | | | | | | | |
Name, Year of Birth and Position(s) Held with the Trust | | Trustee and/or Officer Since | | Principal Occupation(s) During Past 5 Years | | Number of Funds in Fund Complex Overseen by
Trustee | | Other Directorship(s) Held by Trustee During Past 5 Years |
| Interested Trustee | | | | | | | | |
Martin L. Flanagan1 – 1960 Trustee and Vice Chair | | 2007 | | Executive Director, Chief Executive Officer and President, Invesco Ltd. (ultimate parent of Invesco and a global investment management firm); Trustee and Vice Chair, The Invesco Funds; Vice Chair, Investment Company Institute; and Member of Executive Board, SMU Cox School of Business Formerly: Advisor to the Board, Invesco Advisers, Inc. (formerly known as Invesco Institutional (N.A.), Inc.); Chairman and Chief Executive Officer, Invesco Advisers, Inc. (registered investment adviser); Director, Chairman, Chief Executive Officer and President, Invesco Holding Company (US), Inc. (formerly IVZ Inc.) (holding company), Invesco Group Services, Inc. (service provider) and Invesco North American Holdings, Inc. (holding company); Director, Chief Executive Officer and President, Invesco Holding Company Limited (parent of Invesco and a global investment management firm); Director, Invesco Ltd.; Chairman, Investment Company Institute and President, Co-Chief Executive Officer, Co-President, Chief Operating Officer and Chief Financial Officer, Franklin Resources, Inc. (global investment management organization) | | 175 | | None |
| 1 | Mr. Flanagan is considered an interested person (within the meaning of Section 2(a)(19) of the 1940 Act) of the Trust because he is an officer of the Adviser to the Trust, and an officer and a director of Invesco Ltd., ultimate parent of the Adviser. |
| | |
| T-1 | | Invesco Environmental Focus Municipal Fund |
Trustees and Officers–(continued)
| | | | | | | | |
Name, Year of Birth and Position(s) Held with the Trust | | Trustee and/or Officer Since | | Principal Occupation(s) During Past 5 Years | | Number of Funds in Fund Complex Overseen by Trustee | | Other Directorship(s) Held by Trustee During Past 5 Years |
| Independent Trustees | | | | | | | | |
Beth Ann Brown – 1968 Trustee (2019) and Chair (August 2022) | | 2019 | | Independent Consultant Formerly: Head of Intermediary Distribution, Managing Director, Strategic Relations, Managing Director, Head of National Accounts, Senior Vice President, National Account Manager and Senior Vice President, Key Account Manager, Columbia Management Investment Advisers LLC; Vice President, Key Account Manager, Liberty Funds Distributor, Inc.; and Trustee of certain Oppenheimer Funds | | 175 | | Director, Board of Directors of Caron Engineering Inc.; Advisor, Board of Advisors of Caron Engineering Inc.; President and Director, Acton Shapleigh Youth Conservation Corps (non-profit) Formerly: President and Director Director of Grahamtastic Connection (non-profit) |
Cynthia Hostetler – 1962 Trustee | | 2017 | | Non-Executive Director and Trustee of a number of public and private business corporations Formerly: Director, Aberdeen Investment Funds (4 portfolios); Director, Artio Global Investment LLC (mutual fund complex); Director, Edgen Group, Inc. (specialized energy and infrastructure products distributor); Director, Genesee & Wyoming, Inc. (railroads); Head of Investment Funds and Private Equity, Overseas Private Investment Corporation; President, First Manhattan Bancorporation, Inc.; and Attorney, Simpson Thacher & Bartlett LLP | | 175 | | Resideo Technologies, Inc. (smart home technology); Vulcan Materials Company (construction materials company); Trilinc Global Impact Fund; Textainer Group Holdings, (shipping container leasing company); Investment Company Institute (professional organization); and Independent Directors Council (professional organization) |
Eli Jones – 1961 Trustee | | 2016 | | Professor and Dean Emeritus, Mays Business School - Texas A&M University Formerly: Dean of Mays Business School-Texas A&M University; Professor and Dean, Walton College of Business, University of Arkansas and E.J. Ourso College of Business, Louisiana State University; and Director, Arvest Bank | | 175 | | Insperity, Inc. (formerly known as Administaff) (human resources provider); Board Member of the regional board, First Financial Bank Texas; and Board Member, First Financial Bankshares, Inc. Texas (FFIN) |
Elizabeth Krentzman – 1959 Trustee | | 2019 | | Formerly: Principal and Chief Regulatory Advisor for Asset Management Services and U.S. Mutual Fund Leader of Deloitte & Touche LLP; General Counsel of the Investment Company Institute (trade association); National Director of the Investment Management Regulatory Consulting Practice, Principal, Director and Senior Manager of Deloitte & Touche LLP; Assistant Director of the Division of Investment Management - Office of Disclosure and Investment Adviser Regulation of the U.S. Securities and Exchange Commission and various positions with the Division of Investment Management - Office of Regulatory Policy of the U.S. Securities and Exchange Commission; Associate at Ropes & Gray LLP; and Trustee of certain Oppenheimer Funds | | 175 | | Formerly: Member of the Cartica Funds Board of Directors (private investment fund); Trustee of the University of Florida National Board Foundation; and Member of the University of Florida Law Center Association, Inc. Board of Trustees, Audit Committee and Membership Committee |
Anthony J. LaCava, Jr. – 1956 Trustee | | 2019 | | Formerly: Director and Member of the Audit Committee, Blue Hills Bank (publicly traded financial institution) and Managing Partner, KPMG LLP | | 175 | | Blue Hills Bank; Member and Chairman, Bentley University, Business School Advisory Council; and Nominating Committee, KPMG LLP |
Prema Mathai-Davis – 1950 Trustee | | 1998 | | Retired Formerly: Co-Founder & Partner of Quantalytics Research, LLC, (a FinTech Investment Research Platform for the Self-Directed Investor); Trustee of YWCA Retirement Fund; CEO of YWCA of the USA; Board member of the NY Metropolitan Transportation Authority; Commissioner of the NYC Department of Aging; and Board member of Johns Hopkins Bioethics Institute | | 175 | | Member of Board of Positive Planet US (non-profit) and HealthCare Chaplaincy Network (non-profit) |
| | |
| T-2 | | Invesco Environmental Focus Municipal Fund |
Trustees and Officers–(continued)
| | | | | | | | |
Name, Year of Birth and Position(s) Held with the Trust | | Trustee and/or Officer Since | | Principal Occupation(s) During Past 5 Years | | Number of Funds in Fund Complex Overseen by Trustee | | Other Directorship(s) Held by Trustee During Past 5 Years |
| Independent Trustees–(continued) | | | | | | |
Joel W. Motley – 1952 Trustee | | 2019 | | Director of Office of Finance, Federal Home Loan Bank System; Managing Director of Carmona Motley Inc. (privately held financial advisor); Member of the Council on Foreign Relations and its Finance and Budget Committee; Chairman Emeritus of Board of Human Rights Watch and Member of its Investment Committee; and Member of Investment Committee Board of Historic Hudson Valley (non-profit cultural organization); Member of the Board, Blue Ocean Acquisition Corp.; and Member of the Vestry and the Investment Committee of Trinity Church Wall Street. Formerly: Managing Director of Public Capital Advisors, LLC (privately held financial advisor); Managing Director of Carmona Motley Hoffman, Inc. (privately held financial advisor); Trustee of certain Oppenheimer Funds; and Director of Columbia Equity Financial Corp. (privately held financial advisor) | | 175 | | Member of Board of Trust for Mutual Understanding (non-profit promoting the arts and environment); Member of Board of Greenwall Foundation (bioethics research foundation) and its Investment Committee; Member of Board of Friends of the LRC (non- profit legal advocacy); and Board Member and Investment Committee Member of Pulitzer Center for Crisis Reporting (non-profit journalism) |
Teresa M. Ressel – 1962 Trustee | | 2017 | | Non-executive director and trustee of a number of public and private business corporations Formerly: Chief Executive Officer, UBS Securities LLC (investment banking); Chief Operating Officer, UBS AG Americas (investment banking); Sr. Management Team Olayan America, The Olayan Group (international investor/commercial/industrial); and Assistant Secretary for Management & Budget and Designated Chief Financial Officer, U.S. Department of Treasury | | 175 | | None |
Robert C. Troccoli – 1949 Trustee | | 2016 | | Retired Formerly: Adjunct Professor, University of Denver - Daniels College of Business; and Managing Partner, KPMG LLP | | 175 | | None |
Daniel S. Vandivort – 1954 Trustee | | 2019 | | President, Flyway Advisory Services LLC (consulting and property management) Formerly: President and Chief Investment Officer, previously Head of Fixed Income, Weiss Peck and Greer/Robeco Investment Management; Trustee and Chair, Weiss Peck and Greer Funds Board; and various capacities at CS First Boston including Head of Fixed Income at First Boston Asset Management. | | 175 | | Formerly: Trustee and Governance Chair, Oppenheimer Funds; Treasurer, Chairman of the Audit and Finance Committee, Huntington Disease Foundation of America |
| | |
| T-3 | | Invesco Environmental Focus Municipal Fund |
Trustees and Officers–(continued)
| | | | | | | | |
Name, Year of Birth and Position(s) Held with the Trust | | Trustee and/or Officer Since | | Principal Occupation(s) During Past 5 Years | | Number of Funds in Fund Complex Overseen by Trustee | | Other Directorship(s) Held by Trustee During Past 5 Years |
| Officers | | | | | | | | |
Sheri Morris – 1964 President and Principal Executive Officer | | 1999 | | Director, Invesco Trust Company; Head of Global Fund Services, Invesco Ltd.; President and Principal Executive Officer, The Invesco Funds; Vice President, Invesco Exchange-Traded Fund Trust, Invesco Exchange-Traded Fund Trust II, Invesco India Exchange-Traded Fund Trust, Invesco Actively Managed Exchange-Traded Fund Trust, Invesco Actively Managed Exchange-Traded Commodity Fund Trust and Invesco Exchange-Traded Self-Indexed Fund Trust; and Vice President, OppenheimerFunds, Inc. Formerly: Vice President, Treasurer and Principal Financial Officer, The Invesco Funds; Vice President, Invesco AIM Advisers, Inc., Invesco AIM Capital Management, Inc. and Invesco AIM Private Asset Management, Inc.; Assistant Vice President and Assistant Treasurer, The Invesco Funds; Vice President and Assistant Vice President, Invesco Advisers, Inc.; Assistant Vice President, Invesco AIM Capital Management, Inc. and Invesco AIM Private Asset Management, Inc.; Treasurer, Invesco Exchange-Traded Fund Trust, Invesco Exchange-Traded Fund Trust II, Invesco India Exchange-Traded Fund Trust and Invesco Actively Managed Exchange-Traded Fund Trust; and Senior Vice President, Invesco Advisers, Inc. (formerly known as Invesco Institutional (N.A.), Inc.) (registered investment adviser) | | N/A | | N/A |
Melanie Ringold – 1975 Senior Vice President, Chief Legal Officer and Secretary | | 2023 | | Head of Legal of the Americas, Invesco Ltd.; Senior Vice President and Secretary, Invesco Advisers, Inc. (formerly known as Invesco Institutional (N.A.), Inc.) (registered investment adviser); Secretary, Invesco Distributors, Inc. (formerly known as Invesco AIM Distributors, Inc.); Secretary, Invesco Investment Services, Inc. (formerly known as Invesco AIM Investment Services, Inc.); Senior Vice President, Chief Legal Officer and Secretary, The Invesco Funds; Secretary, Invesco Investment Advisers LLC, Invesco Capital Markets, Inc.; Chief Legal Officer, Invesco Exchange-Traded Fund Trust, Invesco Exchange-Traded Fund Trust II, Invesco India Exchange-Traded Fund Trust, Invesco Actively Managed Exchange-Traded Fund Trust, Invesco Actively Managed Exchange-Traded Commodity Fund Trust and Invesco Exchange-Traded Self-Indexed Fund Trust;Secretary and Vice President, Harbourview Asset Management Corporation; Secretary and Senior Vice President, OppenheimerFunds, Inc. and Invesco Managed Accounts, LLC; Secretary and Senior Vice President, OFI SteelPath, Inc.; Secretary and Senior Vice President, Oppenheimer Acquisition Corp.; Secretary, SteelPath Funds Remediation LLC; and Secretary and Senior Vice President, Trinity Investment Management Corporation Formerly: Assistant Secretary, Invesco Distributors, Inc.; Invesco Advisers, Inc. Invesco Investment Services, Inc., Invesco Capital Markets, Inc., Invesco Capital Management LLC and Invesco Investment Advisers LLC; and Assistant Secretary and Investment Vice President, Invesco Funds | | N/A | | N/A |
| Andrew R. Schlossberg – 1974 Senior Vice President | | 2019 | | Senior Vice President, Invesco Group Services, Inc.; Head of the Americas and Senior Managing Director, Invesco Ltd.; Director and Senior Vice President, Invesco Advisers, Inc. (formerly known as Invesco Institutional (N.A.), Inc.) (registered investment adviser); Director and Chairman, Invesco Investment Services, Inc. (formerly known as Invesco AIM Investment Services, Inc.) (registered transfer agent); Senior Vice President, The Invesco Funds; and Director, Invesco Investment Advisers LLC (formerly known as Van Kampen Asset Management) Formerly: Director, President and Chairman, Invesco Insurance Agency, Inc.; Director, Invesco UK Limited; Director and Chief Executive, Invesco Asset Management Limited and Invesco Fund Managers Limited; Assistant Vice President, The Invesco Funds; Senior Vice President, Invesco Advisers, Inc. (formerly known as Invesco Institutional (N.A.), Inc.) (registered investment adviser); Director and Chief Executive, Invesco Administration Services Limited and Invesco Global Investment Funds Limited; Director, Invesco Distributors, Inc.; Head of EMEA, Invesco Ltd.; President, Invesco Actively Managed Exchange-Traded Commodity Fund Trust, Invesco Actively Managed Exchange-Traded Fund Trust, Invesco Exchange-Traded Fund Trust, Invesco Exchange-Traded Fund Trust II and Invesco India Exchange-Traded Fund Trust; and Managing Director and Principal Executive Officer, Invesco Capital Management LLC | | N/A | | N/A |
| | |
| T-4 | | Invesco Environmental Focus Municipal Fund |
Trustees and Officers–(continued)
| | | | | | | | |
Name, Year of Birth and Position(s) Held with the Trust | | Trustee and/or Officer Since | | Principal Occupation(s) During Past 5 Years | | Number of Funds in Fund Complex Overseen by Trustee | | Other Directorship(s) Held by Trustee During Past 5 Years |
| Officers–(continued) | | | | | | | | |
John M. Zerr – 1962 Senior Vice President | | 2006 | | Chief Operating Officer of the Americas; Senior Vice President, Invesco Advisers, Inc. (formerly known as Invesco Institutional (N.A.), Inc.) (registered investment adviser); Senior Vice President, Invesco Distributors, Inc. (formerly known as Invesco AIM Distributors, Inc.); Director and Vice President, Invesco Investment Services, Inc. (formerly known as Invesco AIM Investment Services, Inc.) Senior Vice President, The Invesco Funds; Managing Director, Invesco Capital Management LLC; Director, Invesco Investment Advisers LLC (formerly known as Van Kampen Asset Management); Senior Vice President, Invesco Capital Markets, Inc. (formerly known as Van Kampen Funds Inc.); Manager, Invesco Indexing LLC; Manager, Invesco Specialized Products, LLC; Member, Invesco Canada Funds Advisory Board; Director, President and Chief Executive Officer, Invesco Corporate Class Inc. (corporate mutual fund company); and Director, Chairman, President and Chief Executive Officer, Invesco Canada Ltd. (formerly known as Invesco Trimark Ltd./Invesco Trimark Ltèe) (registered investment adviser and registered transfer agent); President, Invesco, Inc.; President, Invesco Global Direct Real Estate Feeder GP Ltd.; President, Invesco IP Holdings (Canada) Ltd; President, Invesco Global Direct Real Estate GP Ltd.; President, Invesco Financial Services Ltd. / Services Financiers Invesco Ltée; and Director and Chairman, Invesco Trust Company Formerly: President, Trimark Investments Ltd/Services Financiers Invesco Ltee; Director and Senior Vice President, Invesco Insurance Agency, Inc.; Director and Senior Vice President, Invesco Management Group, Inc. (formerly known as Invesco AIM Management Group, Inc.); Secretary and General Counsel, Invesco Management Group, Inc. (formerly known as Invesco AIM Management Group, Inc.); Secretary, Invesco Investment Services, Inc. (formerly known as Invesco AIM Investment Services, Inc.); Chief Legal Officer and Secretary, The Invesco Funds; Secretary and General Counsel, Invesco Investment Advisers LLC (formerly known as Van Kampen Asset Management); Secretary and General Counsel, Invesco Capital Markets, Inc. (formerly known as Van Kampen Funds Inc.); Chief Legal Officer, Invesco Exchange-Traded Fund Trust, Invesco Exchange-Traded Fund Trust II, Invesco India Exchange-Traded Fund Trust, Invesco Actively Managed Exchange-Traded Fund Trust, Invesco Actively Managed Exchange-Traded Commodity Fund Trust and Invesco Exchange-Traded Self-Indexed Fund Trust; Secretary, Invesco Indexing LLC; Director, Secretary, General Counsel and Senior Vice President, Van Kampen Exchange Corp.; Director, Vice President and Secretary, IVZ Distributors, Inc. (formerly known as INVESCO Distributors, Inc.); Director and Vice President, INVESCO Funds Group, Inc.; Director and Vice President, Van Kampen Advisors Inc.; Director, Vice President, Secretary and General Counsel, Van Kampen Investor Services Inc.; Director and Secretary, Invesco Distributors, Inc. (formerly known as Invesco AIM Distributors, Inc.); Director, Senior Vice President, General Counsel and Secretary, Invesco AIM Advisers, Inc. and Van Kampen Investments Inc.; Director, Vice President and Secretary, Fund Management Company; Director, Senior Vice President, Secretary, General Counsel and Vice President, Invesco AIM Capital Management, Inc.; and Chief Operating Officer and General Counsel, Liberty Ridge Capital, Inc. (an investment adviser) | | N/A | | N/A |
Gregory G. McGreevey – 1962 Senior Vice President | | 2012 | | Senior Managing Director, Invesco Ltd.; Director, Chairman, President, and Chief Executive Officer, Invesco Advisers, Inc. (formerly known as Invesco Institutional (N.A.), Inc.) (registered investment adviser); Director, Invesco Mortgage Capital, Inc. and Invesco Senior Secured Management, Inc.; Senior Vice President, The Invesco Funds; President, SNW Asset Management Corporation and Invesco Managed Accounts, LLC; Chairman and Director, Invesco Private Capital, Inc.; Chairman and Director, INVESCO Private Capital Investments, Inc.; Chairman and Director, INVESCO Realty, Inc.; and Senior Vice President, Invesco Group Services, Inc. Formerly: Senior Vice President, Invesco Management Group, Inc. and Invesco Advisers, Inc.; Assistant Vice President, The Invesco Funds | | N/A | | N/A |
Adrien Deberghes – 1967 Principal Financial Officer,
Treasurer and Vice President | | 2020 | | Head of the Fund Office of the CFO and Fund Administration; Vice President, Invesco Advisers, Inc.; Principal Financial Officer, Treasurer and Vice President, The Invesco Funds; Vice President, Invesco Exchange-Traded Fund Trust, Invesco Exchange-Traded Fund Trust II, Invesco India Exchange-Traded Fund Trust, Invesco Actively Managed Exchange-Traded Fund Trust, Invesco Actively Managed Exchange-Traded Commodity Fund Trust and Invesco Exchange-Traded Self-Indexed Fund Trust Formerly: Senior Vice President and Treasurer, Fidelity Investments | | N/A | | N/A |
Crissie M. Wisdom – 1969 Anti-Money Laundering
Compliance Officer | | 2013 | | Anti-Money Laundering and OFAC Compliance Officer for Invesco U.S. entities including: Invesco Advisers, Inc. and its affiliates, Invesco Capital Markets, Inc., Invesco Distributors, Inc., Invesco Investment Services, Inc., The Invesco Funds, Invesco Capital Management, LLC, Invesco Trust Company; and Fraud Prevention Manager for Invesco Investment Services, Inc. | | N/A | | N/A |
| | |
| T-5 | | Invesco Environmental Focus Municipal Fund |
Trustees and Officers–(continued)
| | | | | | | | |
Name, Year of Birth and Position(s) Held with the Trust | | Trustee and/or Officer Since | | Principal Occupation(s) During Past 5 Years | | Number of Funds in Fund Complex Overseen by Trustee | | Other Directorship(s) Held by Trustee During Past 5 Years |
| Officers–(continued) | | | | | | | | |
Todd F. Kuehl – 1969 Chief Compliance Officer and
Senior Vice President | | 2020 | | Chief Compliance Officer, Invesco Advisers, Inc. (registered investment adviser); and Chief Compliance Officer and Senior Vice President, The Invesco Funds Formerly: Managing Director and Chief Compliance Officer, Legg Mason (Mutual Funds); Chief Compliance Officer, Legg Mason Private Portfolio Group (registered investment adviser) | | N/A | | N/A |
James Bordewick, Jr. – 1959 Senior Vice President and
Senior Officer | | 2022 | | Senior Vice President and Senior Officer, The Invesco Funds Formerly: Chief Legal Officer, KingsCrowd, Inc. (research and analytical platform for investment in private capital markets); Chief Operating Officer and Head of Legal and Regulatory, Netcapital (private capital investment platform); Managing Director, General Counsel of asset management and Chief Compliance Officer for asset management and private banking, Bank of America Corporation; Chief Legal Officer, Columbia Funds and BofA Funds; Senior Vice President and Associate General Counsel, MFS Investment Management; Chief Legal Officer, MFS Funds; Associate, Ropes & Gray; and Associate, Gaston Snow & Ely Bartlett | | N/A | | N/A |
The Statement of Additional Information of the Trust includes additional information about the Fund’s Trustees and is available upon request, without charge, by calling 1.800.959.4246. Please refer to the Fund’s Statement of Additional Information for information on the Fund’s sub-advisers.
| | | | | | |
| Office of the Fund | | Investment Adviser | | Distributor | | Auditors |
| 11 Greenway Plaza, Suite 1000 | | Invesco Advisers, Inc. | | Invesco Distributors, Inc. | | PricewaterhouseCoopers LLP |
| Houston, TX 77046-1173 | | 1331 Spring Street, NW, Suite 2500 | | 11 Greenway Plaza, Suite 1000 | | 1000 Louisiana Street, Suite 5800 |
| | Atlanta, GA 30309 | | Houston, TX 77046-1173 | | Houston, TX 77002-5021 |
| | | |
| Counsel to the Fund | | Counsel to the Independent Trustees | | Transfer Agent | | Custodian |
| Stradley Ronon Stevens & Young, LLP | | Sidley Austin LLP | | Invesco Investment Services, Inc. | | State Street Bank and Trust Company |
| 2005 Market Street, Suite 2600 | | 787 Seventh Avenue | | 11 Greenway Plaza, Suite 1000 | | 225 Franklin Street |
| Philadelphia, PA 19103-7018 | | New York, NY 10019 | | Houston, TX 77046-1173 | | Boston, MA 02110-2801 |
| | |
| T-6 | | Invesco Environmental Focus Municipal Fund |

Go paperless with eDelivery
Visit invesco.com/edelivery to enjoy the convenience and security of anytime electronic access to your investment documents.
With eDelivery, you can elect to have any or all of the following materials delivered straight to your inbox to download, save and print from your own computer:
∎Fund reports and prospectuses
∎ Quarterly statements
∎ Daily confirmations
∎ Tax forms
Invesco mailing information
Send general correspondence to Invesco Investment Services, Inc., P.O. Box 219078, Kansas City, MO 64121-9078.
Important notice regarding delivery of security holder documents
To reduce Fund expenses, only one copy of most shareholder documents may be mailed to shareholders with multiple accounts at the same address (Householding). Mailing of your shareholder documents may be householded indefinitely unless you instruct us otherwise. If you do not want the mailing of these documents to be combined with those for other members of your household, please contact Invesco Investment Services, Inc. at 800 959 4246 or contact your financial institution. We will begin sending you individual copies for each account within 30 days after receiving your request.
Fund holdings and proxy voting information
The Fund provides a complete list of its portfolio holdings four times each year, at the end of each fiscal quarter. For the second and fourth quarters, the list appears, respectively, in the Fund’s semiannual and annual reports to shareholders. For the first and third quarters, the Fund files the list with the Securities and Exchange Commission (SEC) as an exhibit to its reports on Form N-PORT. The most recent list of portfolio holdings is available at invesco.com/completeqtrholdings. Shareholders can also look up the Fund’s Form N-PORT filings on the SEC website, sec.gov. The SEC file numbers for the Fund are shown below.
A description of the policies and procedures that the Fund uses to determine how to vote proxies relating to portfolio securities is available without charge, upon request, from our Client Services department at 800 959 4246, or at invesco.com/ corporate/about-us/esg. The information is also available on the SEC website, sec.gov.
Information regarding how the Fund voted proxies related to its portfolio securities during the most recent 12-month period ended June 30 is available at invesco.com/proxysearch. This information is also available on the SEC website, sec.gov.
Invesco Advisers, Inc. is an investment adviser; it provides investment advisory services to individual and institutional clients and does not sell securities. Invesco Distributors, Inc. is the US distributor for Invesco Ltd.’s retail mutual funds, exchange-traded funds and institutional money market funds. Both are wholly owned, indirect subsidiaries of Invesco Ltd.

| | | | |
| SEC file number(s): 811-07890 and 033-66242 | | Invesco Distributors, Inc. | | O-MUNI-AR-1 |

| | |
| | |
| Annual Report to Shareholders | | February 28, 2023 |
Invesco High Yield Municipal Fund
Nasdaq:
A: ACTHX ∎ C: ACTFX ∎ Y: ACTDX ∎ R5: ACTNX ∎ R6: ACTSX
Management’s Discussion of Fund Performance
| | | | |
| |
Performance summary | |
For the fiscal year ended February 28, 2023, Class A shares of Invesco High Yield Municipal Fund (the Fund), at net asset value (NAV), underperformed the Custom Invesco High Yield Municipal Index, the Fund’s style-specific benchmark. Your Fund’s long-term performance appears later in this report. | |
Fund vs. Indexes | |
Total returns, 2/28/22 to 2/28/23, at net asset value (NAV). Performance shown does not include applicable contingent deferred sales charges (CDSC) or front-end sales charges, which would have reduced performance. | |
| |
Class A Shares | | | -9.91 | % |
Class C Shares | | | -10.60 | |
Class Y Shares | | | -9.75 | |
Class R5 Shares | | | -9.72 | |
Class R6 Shares | | | -9.65 | |
S&P Municipal Bond High Yield Index▼ (Broad Market Index) | | | -8.57 | |
Custom Invesco High Yield Municipal Index∎ (Style-Specific Index) | | | -7.78 | |
Lipper High Yield Municipal Debt Funds Index◆ (Peer Group Index) | | | -9.48 | |
| |
Source(s): ▼RIMES Technologies Corp.; ∎ Invesco, RIMES Technologies Corp.; ◆Lipper Inc. | | | | |
Market conditions and your Fund
At the beginning of the fiscal year, investors were hopeful in anticipation of a return to normalcy as COVID-19 cases declined and pandemic-related restrictions were reduced or lifted. This allowed policymakers to turn their attention to the high inflation levels; however, on February 24, 2022, Russia began a full-scale invasion of Ukraine, which exacerbated inflationary pressures by driving up commodity prices. Against this backdrop, the fiscal year was plagued by volatility and uncertainty. The municipal market set multiple record lows in 2022, making it one of the most challenging years in history for municipal markets.
Investment grade municipal bonds returned -5.10%, high yield municipal bonds returned -9.35% and taxable municipal bonds returned -12.96% during the fiscal year.1
While municipal funds had experienced record inflows of $101.7 billion in 2021, flows quickly turned negative in the first quarter of 2022, perpetuating the Bloomberg Municipal Bond Index’s worst quarterly return in 40 years. Municipal bonds enjoyed a short respite in late May and early June 2022 with increased demand from crossover buyers like hedge funds, banks and insurance companies; however, the May 2022 Consumer Price Index report quoted inflation rising to a 40-year high. This sent the 10-year Treasury yield to a new 52-week high of nearly 3.50%, pushing municipal mutual fund flows back into negative territory.2 According to Lipper, net outflows from municipal bond funds totaled over -$110 billion for the fiscal year.3
On March 16, 2022, the US Federal Reserve (the Fed) raised the federal funds target rate 0.25% for the first time in more than three years in hopes of containing inflation.4 This was the first of eight consecutive increases during the fiscal year as the Fed announced its plan for a quantitative tightening
campaign in an attempt to rein in inflation without harming employment or the overall economy. Rate increases as high as 0.75% followed, the Fed’s most aggressive monetary policy since the 1980s, bringing the target rate to 4.75% as of the end of the fiscal year.4
The AAA municipal yield curve made history after the Fed’s December 2022 meeting when the curve inverted between one- and 10-year maturities. Any inversion is noteworthy, but this was a first for municipal bonds. On January 31, 2023, policymakers indicated that future rate increases were likely to be “appropriate,” suggesting they were not yet convinced inflation was contained, which increased uncertainty about when the current tightening cycle might end.4 The fiscal year ended with an increase of 0.25% on February 1, 2023. We expect additional rate hikes in 2023, although not with the same pace or vigor as in 2022.
New municipal issuance for the fiscal year totaled $354 billion, down 27% from the previous fiscal year’s $484 billion.5 Issuers, with cash on their balance sheets, have been reluctant to issue at higher interest rates. While taxable issuance continued to account for a significant portion of new issuance, at 14% of the total, this figure is down from 18% from the previous fiscal year because of higher interest rates.5
Puerto Rico continued to make developments in its ongoing debt restructuring throughout the fiscal year. The territory restructured its outstanding general obligation and other government-guaranteed debt in March 2022 and began paying bondholders on the new restructured bonds. Puerto Rico’s weight in the Bloomberg High Yield Municipal Bond Index increased from 13% to 20% as the new bonds were included.1 The Financial Oversight and Management Board for Puerto Rico, the Puerto Rican government, bond-holders and other interested parties continued
to negotiate the restructuring of bonds issued by the Puerto Rico Electric Power Authority, the territory’s largest remaining unresolved debt, as the fiscal year closed.
Municipal credits have a long history of low defaults as many provide essential services to all Americans. This continues to be the case as evidenced by S&P rating changes – upgrades exceeded downgrades by a ratio of 2.5:1 through December 2022.6 This positive dynamic, which we believe will continue, likely stems from benefits of the various federal stimulus measures including the American Rescue Plan Act, the Infrastructure Investment and Jobs Act and the Inflation Reduction Act, as well as higher revenues collected by state and local governments.
We believe the valuable benefits of municipal bonds will prevail over current market volatility and economic uncertainty. We continue to rely on our experienced portfolio managers and credit analysts to weather the challenges while identifying marketplace opportunities to add long-term value for shareholders.
During the fiscal year, underweight allocations to multifamily housing and state general obligation bonds contributed to the Fund’s relative return. Security selection in non-rated† credits also added to relative performance. On a regional level, underweight exposure to credits domiciled in Pennsylvania contributed to relative performance.
An overweight allocation to the public power sector detracted from the Fund’s relative performance over the fiscal year. Overweight exposure to longer duration bonds also detracted from relative performance. On a regional level, underweight exposure to bonds domiciled in Puerto Rico detracted from relative performance.
During the fiscal year, leverage contributed to the Fund’s performance relative to its style-specific benchmark. The Fund achieved a leveraged position through the use of inverse floating rate securities or tender option bonds. The Fund uses leverage because we believe that, over time, leveraging provides opportunities for additional income and total return for shareholders. However, the use of leverage also can expose shareholders to additional volatility. For more information about the Fund’s use of leverage, see the Notes to Financial Statements later in this report.
We wish to remind you that the Fund is subject to interest rate risk, meaning when interest rates rise, the value of fixed income securities tends to fall. The degree to which the value of fixed income securities may decline due to rising interest rates may vary depending on the speed and magnitude of the increase in interest rates, as well as individual security characteristics, such as price, maturity, duration and coupon and market forces, such as supply and demand for similar securities. We are monitoring interest rates, as well as the market, economic and geopolitical factors that may impact the direction, speed and
| | |
| 2 | | Invesco High Yield Municipal Fund |
magnitude of changes to interest rates across the maturity spectrum, including the potential impact of monetary policy changes by the Fed and certain foreign central banks. If interest rates rise or fall faster than expected, markets may experience increased volatility, which may affect the value and/or liquidity of certain of the Fund’s investments.
Thank you for investing in Invesco High Yield Municipal Fund and for sharing our long-term investment horizon.
| 4 | Source: US Federal Reserve |
| 6 | Source: Standard & Poor’s |
† Sources: A credit rating is an assessment provided by a nationally recognized statistical rating organization (NRSRO) of the creditworthiness of an issuer with respect to debt obligations, including specific securities, money market instruments or other debts. Ratings are measured on a scale that generally ranges from AAA (highest) to D (lowest); ratings are subject to change without notice. For more information on rating methodology, please visit www.spglobal.com and select “Understanding Credit Ratings” under About Ratings on the homepage; www.fitchratings.com and select “Understanding Credit Ratings” from the drop-down menu on the homepage; and www.moodys.com and select “Methodology,” then “Rating Methodologies” under Research Type on the left-hand side.
Portfolio manager(s):
Jack Connelly
Tim O’Reilly
Mark Paris
James Phillips
John Schorle
Julius Williams
The views and opinions expressed in management’s discussion of Fund performance are those of Invesco Advisers, Inc. and its affiliates. These views and opinions are subject to change at any time based on factors such as market and economic conditions. These views and opinions may not be relied upon as investment advice or recommendations, or as an offer for a particular security. The information is not a complete analysis of every aspect of any market, country, industry, security or the Fund. Statements of fact are from sources considered reliable, but Invesco Advisers, Inc. makes no representation or warranty as to their completeness or accuracy. Although historical performance is no guarantee of future results, these insights may help you understand our investment management philosophy.
| | |
| 3 | | Invesco High Yield Municipal Fund |
Your Fund’s Long-Term Performance
Results of a $10,000 Investment – Oldest Share Class(es)
Fund and index data from 2/28/13
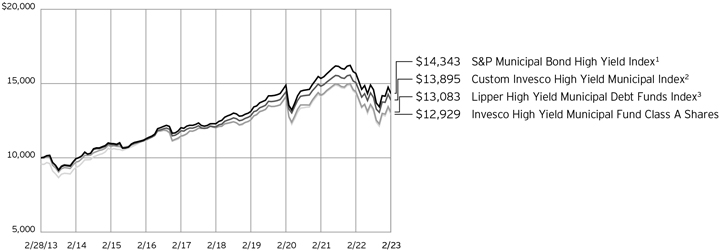
| 1 | Source: RIMES Technologies Corp. |
| 2 | Source: Invesco, RIMES Technologies Corp. |
Past performance cannot guarantee future results.
The data shown in the chart include reinvested distributions, applicable sales charges and Fund expenses including management
fees. Index results include reinvested dividends, but they do not reflect sales charges. Performance of the peer group, if applicable, reflects Fund expenses and management fees; performance of a market index does
not. Performance shown in the chart does not reflect deduction of taxes a shareholder would pay on Fund distributions or sale of Fund shares.
| | |
| 4 | | Invesco High Yield Municipal Fund |
| | | | |
| |
Average Annual Total Returns | |
As of 2/28/23, including maximum applicable sales charges | |
Class A Shares | | | | |
Inception (1/2/86) | | | 5.28 | % |
10 Years | | | 2.60 | |
5 Years | | | 0.54 | |
1 Year | | | -13.72 | |
| |
Class C Shares | | | | |
Inception (12/10/93) | | | 4.57 | % |
10 Years | | | 2.44 | |
5 Years | | | 0.69 | |
1 Year | | | -11.46 | |
| |
Class Y Shares | | | | |
Inception (3/1/06) | | | 4.07 | % |
10 Years | | | 3.30 | |
5 Years | | | 1.68 | |
1 Year | | | -9.75 | |
| |
Class R5 Shares | | | | |
Inception (4/30/12) | | | 3.85 | % |
10 Years | | | 3.27 | |
5 Years | | | 1.66 | |
1 Year | | | -9.72 | |
| |
Class R6 Shares | | | | |
10 Years | | | 3.23 | % |
5 Years | | | 1.75 | |
1 Year | | | -9.65 | |
Effective June 1, 2010, Class A, Class C and Class I shares of the predecessor fund, Van Kampen High Yield Municipal Fund, advised by Van Kampen Asset Management were reorganized into Class A, Class C and Class Y shares, respectively, of Invesco Van Kampen High Yield Municipal Fund (renamed Invesco High Yield Municipal Fund). Returns shown above, prior to June 1, 2010, for Class A, Class C and Class Y are those for Class A, Class C and Class I shares of the predecessor fund. Share class returns will differ from the predecessor fund because of different expenses.
Class R6 shares incepted on April 4, 2017. Performance shown prior to that date is that of the Fund’s Class A shares at net asset value and includes the 12b-1 fees applicable to Class A shares.
The performance data quoted represent past performance and cannot guarantee future results; current performance may be lower or higher. Please visit invesco.com/performance for the most recent month-end performance. Performance figures reflect reinvested distributions, changes in net asset value and the effect of the maximum sales charge unless otherwise stated. Performance figures do not reflect deduction of taxes a shareholder would pay on Fund distributions or sale of Fund shares. Investment return and principal value will fluctuate so that you may have a gain or loss when you sell shares.
Class A share performance reflects the maximum 4.25% sales charge, and Class C share performance reflects the applicable
contingent deferred sales charge (CDSC) for the period involved. The CDSC on Class C shares is 1% for the first year after purchase. Class Y, Class R5 and Class R6 shares do not have a front-end sales charge or a CDSC; therefore, performance is at net asset value.
The performance of the Fund’s share classes will differ primarily due to different sales charge structures and class expenses.
Fund performance reflects any applicable fee waivers and/or expense reimbursements. Had fees not been waived and/or expenses reimbursed currently or in the past, returns would have been lower. See current prospectus for more information.
| | |
| 5 | | Invesco High Yield Municipal Fund |
Supplemental Information
Invesco High Yield Municipal Fund’s investment objective is to seek federal tax-exempt current income and taxable capital appreciation.
| ∎ | Unless otherwise stated, information presented in this report is as of February 28, 2023, and is based on total net assets. |
| ∎ | Unless otherwise noted, all data is provided by Invesco. |
| ∎ | To access your Fund’s reports/prospectus, visit invesco.com/fundreports. |
About indexes used in this report
| ∎ | The S&P Municipal Bond High Yield Index is an unmanaged index considered representative of municipal bonds that are not rated or are rated below investment grade. |
| ∎ | The Custom Invesco High Yield Municipal Index is composed of 80% S&P Municipal Bond High Yield Index and 20% S&P Municipal Bond Investment Grade Index. The S&P Municipal Bond Investment Grade Index is considered representative of investment-grade US municipal bonds. |
| ∎ | The Lipper High Yield Municipal Debt Funds Index is an unmanaged index considered representative of high-yield municipal debt funds tracked by Lipper. |
| ∎ | The Fund is not managed to track the performance of any particular index, including the index(es) described here, and consequently, the performance of the Fund may deviate significantly from the performance of the index(es). |
| ∎ | A direct investment cannot be made in an index. Unless otherwise indicated, index results include reinvested dividends, and they do not reflect sales charges. Performance of the peer group, if applicable, reflects fund expenses; performance of a market index does not. |
| | |
This report must be accompanied or preceded by a currently effective Fund prospectus, which contains more complete information, including sales charges and expenses. Investors should read it carefully before investing. | | |
| |
NOT FDIC INSURED | MAY LOSE VALUE | NO BANK GUARANTEE | | |
| | |
| 6 | | Invesco High Yield Municipal Fund |
Fund Information
Portfolio Composition
| | | | | |
| By credit sector | | % of total investments |
| |
Revenue Bonds | | | | 82.16 | % |
| |
General Obligation Bonds | | | | 15.38 | |
| |
Pre-Refunded Bonds | | | | 1.39 | |
| |
Other | | | | 1.07 | |
| |
| Top Five Debt Holdings | | | | | |
| | | % of total net assets |
| |
1. Jefferson (County of), AL, Series 2013 F, Revenue Wts. | | | | 1.24 | % |
| |
2. Children’s Trust Fund, Series 2005 A, RB | | | | 1.05 | |
| |
3. Buckeye Tobacco Settlement Financing Authority, Series 2020 B-2, Ref. RB | | | | 0.99 | |
| |
4. Inland Empire Tobacco Securitization Corp., Series 2007 C-1, RB | | | | 0.93 | |
| |
5. New York (City of), NY Municipal Water Finance Authority, Series 2023 CC, VRD RB | | | | 0.86 | |
The Fund’s holdings are subject to change, and there is no assurance that the Fund will continue to hold any particular security.
Data presented here are as of February 28, 2023.
| | |
| 7 | | Invesco High Yield Municipal Fund |
Schedule of Investments
February 28, 2023
| | | | | | | | | | | | | | |
| | | Interest Rate | | | Maturity Date | | | Principal Amount (000) | | | Value |
Municipal Obligations–113.44%(a) | | | | | | | | | | | | | | |
Alabama–3.64% | | | | | | | | | | | | | | |
Birmingham (City of), AL Special Care Facilities Financing Authority (Methodist Home for the Aging); Series 2016, RB | | | 6.00% | | | | 06/01/2050 | | | $ | 8,650 | | | $ 7,612,209 |
Black Belt Energy Gas District (The); Series 2022 F, RB(b) | | | 5.50% | | | | 12/01/2028 | | | | 4,000 | | | 4,225,814 |
Hoover (City of), AL Industrial Development Board (United States Steel Corp.); Series 2019, RB(c) | | | 5.75% | | | | 10/01/2049 | | | | 8,500 | | | 8,800,371 |
Huntsville (City of), AL Special Care Facilities Financing Authority (Redstone Village); | | | | | | | | | | | | | | |
Series 2007, RB (Acquired 03/25/2020; Cost $945,200)(d)(e) | | | 5.50% | | | | 01/01/2028 | | | | 1,390 | | | 861,800 |
Series 2007, RB (Acquired 04/27/2007-03/25/2019; Cost $18,675,698)(d)(e) | | | 5.50% | | | | 01/01/2043 | | | | 21,290 | | | 13,199,800 |
Series 2008 A, RB (Acquired 06/30/2008-11/12/2009; Cost $4,404,879)(d)(e) | | | 6.88% | | | | 01/01/2043 | | | | 4,470 | | | 2,771,400 |
Series 2011 A, RB (Acquired 09/20/2011; Cost $2,561,987)(d)(e) | | | 7.50% | | | | 01/01/2047 | | | | 2,600 | | | 1,612,000 |
Series 2012 A, RB (Acquired 11/07/2012; Cost $6,575,000)(d)(e) | | | 5.63% | | | | 01/01/2042 | | | | 6,575 | | | 4,076,500 |
Jefferson (County of), AL; | | | | | | | | | | | | | | |
Series 2013 C, Revenue Wts. (INS - AGM)(f)(g) | | | 6.50% | | | | 10/01/2038 | | | | 7,000 | | | 7,159,672 |
Series 2013 C, Revenue Wts. (INS - AGM)(f)(g) | | | 6.60% | | | | 10/01/2042 | | | | 11,700 | | | 11,946,650 |
Series 2013 F, Revenue Wts.(f) | | | 7.50% | | | | 10/01/2039 | | | | 27,640 | | | 28,405,352 |
Series 2013 F, Revenue Wts.(f) | | | 7.75% | | | | 10/01/2046 | | | | 95,055 | | | 97,559,226 |
Series 2013 F, Revenue Wts.(f) | | | 7.90% | | | | 10/01/2050 | | | | 64,150 | | | 65,801,497 |
Southeast Energy Authority A Cooperative District (No. 3); Series 2022 A-1, RB(b) | | | 5.50% | | | | 12/01/2029 | | | | 3,800 | | | 4,074,854 |
Tuscaloosa (County of), AL Industrial Development Authority (Hunt Refining); Series 2019 A, Ref. IDR(h) | | | 5.25% | | | | 05/01/2044 | | | | 34,100 | | | 29,584,799 |
| | | | | | | | | | | | | | | 287,691,944 |
| | | | |
Alaska–0.05% | | | | | | | | | | | | | | |
Alaska (State of) Municipal Bond Bank Authority (Master Resolution); Series 2017 A, RB | | | 5.50% | | | | 10/01/2046 | | | | 505 | | | 526,407 |
Northern Tobacco Securitization Corp.; Series 2021 B-2, Ref. RB(i) | | | 0.00% | | | | 06/01/2066 | | | | 29,999 | | | 3,562,410 |
| | | | | | | | | | | | | | | 4,088,817 |
| | | | |
American Samoa–0.19% | | | | | | | | | | | | | | |
American Samoa (Territory of) Economic Development Authority; Series 2015 A, Ref. RB | | | 6.63% | | | | 09/01/2035 | | | | 14,345 | | | 14,968,629 |
| | | | |
Arizona–2.54% | | | | | | | | | | | | | | |
Arizona (State of) Industrial Development Authority (Academies of Math & Science); | | | | | | | | | | | | | | |
Series 2019, RB(h) | | | 5.00% | | | | 07/01/2039 | | | | 1,000 | | | 972,737 |
Series 2019, RB(h) | | | 5.00% | | | | 07/01/2049 | | | | 1,000 | | | 913,959 |
Series 2022, RB(h) | | | 5.25% | | | | 07/01/2052 | | | | 500 | | | 469,429 |
Arizona (State of) Industrial Development Authority (American Charter Schools Foundation); | | | | | | | | | | | | | | |
Series 2017, Ref. RB(h) | | | 6.00% | | | | 07/01/2037 | | | | 13,845 | | | 14,241,388 |
Series 2017, Ref. RB(h) | | | 6.00% | | | | 07/01/2047 | | | | 19,660 | | | 19,948,990 |
Arizona (State of) Industrial Development Authority (Basis Schools); | | | | | | | | | | | | | | |
Series 2017 A, Ref. RB(h) | | | 5.13% | | | | 07/01/2037 | | | | 1,180 | | | 1,166,356 |
Series 2017 A, Ref. RB(h) | | | 5.38% | | | | 07/01/2050 | | | | 6,000 | | | 5,699,205 |
Series 2017 D, Ref. RB(h) | | | 5.00% | | | | 07/01/2051 | | | | 3,300 | | | 2,955,685 |
Series 2017 G, Ref. RB(h) | | | 5.00% | | | | 07/01/2037 | | | | 1,105 | | | 1,078,426 |
Series 2017 G, Ref. RB(h) | | | 5.00% | | | | 07/01/2051 | | | | 1,000 | | | 895,662 |
Arizona (State of) Industrial Development Authority (Benjamin Franklin Charter School); | | | | | | | | | | | | | | |
Series 2023, RB(h) | | | 5.00% | | | | 07/01/2043 | | | | 1,000 | | | 949,741 |
Series 2023, RB(h) | | | 5.25% | | | | 07/01/2053 | | | | 1,000 | | | 940,808 |
Arizona (State of) Industrial Development Authority (Doral Academy of Nevada - Fire Mesa & Red Rock Campus); Series 2019 A, IDR(h) | | | 5.00% | | | | 07/15/2039 | | | | 2,650 | | | 2,512,578 |
Arizona (State of) Industrial Development Authority (Kaizen Education Foundation); | | | | | | | | | | | | | | |
Series 2016, RB(h) | | | 5.70% | | | | 07/01/2047 | | | | 9,730 | | | 9,808,235 |
Series 2016, RB(h) | | | 5.80% | | | | 07/01/2052 | | | | 4,920 | | | 4,965,421 |
Arizona (State of) Industrial Development Authority (Leman Academy– Parker Colorado); Series 2019, RB(h) | | | 5.00% | | | | 07/01/2054 | | | | 6,210 | | | 5,336,871 |
Arizona (State of) Industrial Development Authority (Linder Village); Series 2020, RB(h) | | | 5.00% | | | | 06/01/2031 | | | | 6,000 | | | 5,961,454 |
See accompanying Notes to Financial Statements which are an integral part of the financial statements.
| | |
| 8 | | Invesco High Yield Municipal Fund |
| | | | | | | | | | | | | | |
| | | Interest Rate | | | Maturity Date | | | Principal Amount (000) | | | Value |
Arizona–(continued) | | | | | | | | | | | | | | |
Arizona (State of) Industrial Development Authority (Mater Academy of Nevada Mountain Vista Campus Project); | | | | | | | | | | | | | | |
Series 2018 A, RB(h) | | | 5.25% | | | | 12/15/2038 | | | $ | 1,015 | | | $ 1,019,061 |
Series 2018 A, RB(h) | | | 5.50% | | | | 12/15/2048 | | | | 2,265 | | | 2,252,434 |
Arizona (State of) Industrial Development Authority (Phoenix Children’s Hospital); Series 2020 A, RB(j) | | | 4.00% | | | | 02/01/2050 | | | | 15,285 | | | 13,723,854 |
Arizona (State of) Industrial Development Authority (Somerset Academy of Las Vegas - Lone Mountain Campus); Series 2019 A, IDR(h) | | | 5.00% | | | | 12/15/2049 | | | | 500 | | | 451,546 |
Glendale (City of), AZ Industrial Development Authority (Sun Health Services); Series 2019 A, Ref. RB | | | 5.00% | | | | 11/15/2054 | | | | 12,000 | | | 10,695,106 |
Glendale (City of), AZ Industrial Development Authority (Terraces of Phoenix); Series 2018 A, Ref. RB | | | 5.00% | | | | 07/01/2048 | | | | 1,500 | | | 1,209,556 |
Glendale (City of), AZ Industrial Development Authority (The Beatitudes Campus); | | | | | | | | | | | | | | |
Series 2017, Ref. RB | | | 4.00% | | | | 11/15/2027 | | | | 1,935 | | | 1,816,025 |
Series 2017, Ref. RB | | | 5.00% | | | | 11/15/2040 | | | | 1,485 | | | 1,289,204 |
Series 2017, Ref. RB | | | 5.00% | | | | 11/15/2045 | | | | 9,390 | | | 7,748,636 |
Series 2018, RB | | | 5.00% | | | | 11/15/2053 | | | | 5,970 | | | 4,719,254 |
Maricopa (County of), AZ Industrial Development Authority (Legacy Traditional Schools); Series 2019, Ref. RB(h) | | | 5.00% | | | | 07/01/2054 | | | | 950 | | | 844,481 |
Maricopa (County of), AZ Industrial Development Authority (Paradise Schools); | | | | | | | | | | | | | | |
Series 2016, Ref. RB(h) | | | 5.00% | | | | 07/01/2036 | | | | 2,475 | | | 2,474,829 |
Series 2016, Ref. RB(h) | | | 5.00% | | | | 07/01/2047 | | | | 1,525 | | | 1,427,157 |
Peoria (City of), AZ Industrial Development Authority (Sierra Winds Life Care Community); | | | | | | | | | | | | | | |
Series 2014, Ref. RB (Acquired 11/06/2014; Cost $ 3,668,697)(e) | | | 5.50% | | | | 11/15/2034 | | | | 3,695 | | | 2,921,363 |
Series 2014, Ref. RB (Acquired 11/06/2014; Cost $ 6,015,000)(e) | | | 5.75% | | | | 11/15/2040 | | | | 6,015 | | | 4,544,129 |
Phoenix (City of), AZ Industrial Development Authority (Basis Schools); | | | | | | | | | | | | | | |
Series 2015, Ref. RB(h) | | | 5.00% | | | | 07/01/2045 | | | | 3,515 | | | 3,235,239 |
Series 2016 A, Ref. RB(h) | | | 5.00% | | | | 07/01/2046 | | | | 2,125 | | | 1,944,427 |
Series 2016 A, Ref. RB(h) | | | 5.00% | | | | 07/01/2046 | | | | 1,650 | | | 1,509,790 |
Phoenix (City of), AZ Industrial Development Authority (Legacy Traditional Schools); | | | | | | | | | | | | | | |
Series 2014 A, RB(h) | | | 6.75% | | | | 07/01/2044 | | | | 5,250 | | | 5,354,166 |
Series 2015, Ref. RB(h) | | | 5.00% | | | | 07/01/2045 | | | | 1,845 | | | 1,700,355 |
Phoenix (City of), AZ Industrial Development Authority (The) (Overland Crossing); Series 2022, RB(h) | | | 9.50% | | | | 04/01/2052 | | | | 7,900 | | | 7,103,058 |
Pima (County of), AZ Industrial Development Authority (Acclaim Charter School); | | | | | | | | | | | | | | |
Series 2006, RB | | | 5.70% | | | | 12/01/2026 | | | | 1,030 | | | 997,891 |
Series 2006, RB | | | 5.80% | | | | 12/01/2036 | | | | 4,385 | | | 3,885,727 |
Pima (County of), AZ Industrial Development Authority (American Leadership Academy); | | | | | | | | | | | | | | |
Series 2015, Ref. RB(h) | | | 5.38% | | | | 06/15/2035 | | | | 2,370 | | | 2,387,766 |
Series 2015, Ref. RB(h) | | | 5.63% | | | | 06/15/2045 | | | | 3,500 | | | 3,503,006 |
Series 2019, Ref. RB(h) | | | 5.00% | | | | 06/15/2052 | | | | 6,050 | | | 5,394,718 |
Series 2022, Ref. RB(h) | | | 4.00% | | | | 06/15/2051 | | | | 8,800 | | | 6,454,991 |
Pima (County of), AZ Industrial Development Authority (Career Success Schools); | | | | | | | | | | | | | | |
Series 2020, Ref. RB(h) | | | 5.50% | | | | 05/01/2040 | | | | 1,125 | | | 1,050,293 |
Series 2020, Ref. RB(h) | | | 5.75% | | | | 05/01/2050 | | | | 5,000 | | | 4,643,954 |
Pima (County of), AZ Industrial Development Authority (Desert Heights Charter School); Series 2014, Ref. RB | | | 7.25% | | | | 05/01/2044 | | | | 3,000 | | | 3,058,090 |
Pima (County of), AZ Industrial Development Authority (Imagine East Mesa Charter Schools); Series 2019, RB(h) | | | 5.00% | | | | 07/01/2049 | | | | 1,500 | | | 1,350,080 |
Pima (County of), AZ Industrial Development Authority (Premier Charter High School); | | | | | | | | | | | | | | |
Series 2016 A, Ref. RB(h) | | | 7.00% | | | | 07/01/2045 | | | | 3,152 | | | 2,972,384 |
Series 2016 B, Ref. RB(k) | | | 2.07% | | | | 07/01/2045 | | | | 1,735 | | | 433,839 |
Series 2016 C, Ref. RB(k) | | | 2.07% | | | | 07/01/2045 | | | | 1,036 | | | 10,355 |
Pima (County of), AZ Industrial Development Authority (Riverbend Prep); Series 2010, RB(h) | | | 7.00% | | | | 09/01/2037 | | | | 3,227 | | | 3,227,161 |
Sundance Community Facilities District (Assessment District No. 2); Series 2003, RB(h) | | | 7.13% | | | | 07/01/2027 | | | | 335 | | | 329,412 |
Sundance Community Facilities District (Assessment District No. 3); Series 2004, RB | | | 6.50% | | | | 07/01/2029 | | | | 91 | | | 88,343 |
Tempe (City of), AZ Industrial Development Authority (Mirabella at ASU); | | | | | | | | | | | | | | |
Series 2017 A, RB(h) | | | 6.13% | | | | 10/01/2047 | | | | 2,800 | | | 2,170,212 |
Series 2017 A, RB(h) | | | 6.13% | | | | 10/01/2052 | | | | 2,800 | | | 2,124,881 |
| | | | | | | | | | | | | | | 200,883,718 |
See accompanying Notes to Financial Statements which are an integral part of the financial statements.
| | |
| 9 | | Invesco High Yield Municipal Fund |
| | | | | | | | | | | | | | |
| | | Interest Rate | | | Maturity Date | | | Principal Amount (000) | | | Value |
Arkansas–0.38% | | | | | | | | | | | | | | |
Arkansas (State of) Development Finance Authority (Big River Steel); Series 2019, RB(c)(h) | | | 4.50% | | | | 09/01/2049 | | | $ | 16,750 | | | $ 14,897,492 |
Arkansas (State of) Development Finance Authority (Green Bonds); Series 2022, RB(c)(h) | | | 5.45% | | | | 09/01/2052 | | | | 15,500 | | | 15,276,247 |
| | | | | | | | | | | | | | | 30,173,739 |
| | | | |
California–10.60% | | | | | | | | | | | | | | |
Antelope Valley Community College District; Series 2022, GO Bonds (INS - AGM)(g)(j)(l) | | | 3.00% | | | | 08/01/2050 | | | | 10,000 | | | 7,353,404 |
Bay Area Toll Authority (San Francisco Bay Area); Series 2017 F-1, RB(b)(j)(l)(m) | | | 5.00% | | | | 04/01/2027 | | �� | | 21,000 | | | 22,920,624 |
Brentwood Union School District (Election of 2016); Series 2022, GO Bonds | | | | | | | | | | | | | | |
California (State of); | | | 5.25% | | | | 08/01/2052 | | | | 4,250 | | | 4,711,027 |
Series 2020, GO Bonds (INS - BAM)(g) | | | 3.00% | | | | 03/01/2046 | | | | 8,195 | | | 6,512,662 |
Series 2020, GO Bonds (INS - BAM)(g) | | | 3.00% | | | | 03/01/2050 | | | | 4,000 | | | 3,069,484 |
California (State of) Community Choice Financing Authority (Green Bonds); Series 2023 C, RB(b) | | | 5.25% | | | | 10/01/2031 | | | | 3,500 | | | 3,644,347 |
California (State of) County Tobacco Securitization Agency (Los Angeles County Securitization Corp.); | | | | | | | | | | | | | | |
Series 2020 A, Ref. RB | | | 4.00% | | | | 06/01/2049 | | | | 1,000 | | | 882,626 |
Series 2020 B-2, Ref. RB(i) | | | 0.00% | | | | 06/01/2055 | | | | 12,780 | | | 2,132,824 |
California (State of) County Tobacco Securitization Agency (Stanislaus County Tobacco Funding Corp.); Series 2006 A, RB(i) | | | 0.00% | | | | 06/01/2046 | | | | 25,000 | | | 6,073,575 |
California (State of) Educational Facilities Authority (Stanford University); | | | | | | | | | | | | | | |
Series 2010, RB(j) | | | 5.25% | | | | 04/01/2040 | | | | 8,745 | | | 10,430,732 |
Series 2013, RB(j) | | | 5.00% | | | | 10/01/2032 | | | | 6,255 | | | 7,570,625 |
Series 2014 U-6, RB(j) | | | 5.00% | | | | 05/01/2045 | | | | 15,000 | | | 17,340,579 |
California (State of) Health Facilities Financing Authority (Cedars Sinai Health System); Series 2021, Ref. RB | | | 3.00% | | | | 08/15/2051 | | | | 10,000 | | | 7,160,220 |
California (State of) Health Facilities Financing Authority (Kaiser Permanente); Subseries 2017 A-2, RB(j) | | | 5.00% | | | | 11/01/2047 | | | | 10,000 | | | 11,341,727 |
California (State of) Municipal Finance Authority (American Heritage Education Foundation); Series 2016 A, Ref. RB | | | 5.00% | | | | 06/01/2046 | | | | 1,500 | | | 1,502,386 |
California (State of) Municipal Finance Authority (California Baptist University); | | | | | | | | | | | | | | |
Series 2016 A, RB(h) | | | 5.00% | | | | 11/01/2036 | | | | 1,500 | | | 1,512,378 |
Series 2016 A, RB(h) | | | 5.00% | | | | 11/01/2046 | | | | 1,500 | | | 1,433,768 |
California (State of) Municipal Finance Authority (Eisenhower Medical Centers); Series 2017 A, Ref. RB | | | 5.00% | | | | 07/01/2047 | | | | 9,635 | | | 9,732,385 |
California (State of) Municipal Finance Authority (Goodwill Industries of Sacramento & Nevada); | | | | | | | | | | | | | | |
Series 2012, RB(h) | | | 6.63% | | | | 01/01/2032 | | | | 865 | | | 858,078 |
Series 2012, RB(h) | | | 6.88% | | | | 01/01/2042 | | | | 1,465 | | | 1,404,843 |
California (State of) Municipal Finance Authority (Palomar Health); Series 2022 A, Ref. COP (INS - AGM)(g) | | | 5.25% | | | | 11/01/2052 | | | | 3,000 | | | 3,161,578 |
California (State of) Municipal Finance Authority (UCR North District Phase 1 Student Housing); Series 2019, RB (INS - BAM)(g) | | | 5.00% | | | | 05/15/2052 | | | | 1,375 | | | 1,413,989 |
California (State of) Municipal Finance Authority (United Airlines, Inc.); Series 2019, RB(c) | | | 4.00% | | | | 07/15/2029 | | | | 10,960 | | | 10,500,494 |
California (State of) Pollution Control Financing Authority; | | | | | | | | | | | | | | |
Series 2012, RB(c)(h) | | | 5.00% | | | | 07/01/2037 | | | | 13,500 | | | 13,534,534 |
Series 2012, RB(c)(h) | | | 5.00% | | | | 11/21/2045 | | | | 20,710 | | | 20,734,345 |
California (State of) Pollution Control Financing Authority (Aemerge Redpak Services Southern California LLC); Series 2016, RB (Acquired 01/22/2016-09/26/2017; Cost $9,847,500)(c)(d)(e)(h) | | | 7.00% | | | | 12/01/2027 | | | | 9,925 | | | 992,500 |
California (State of) Public Finance Authority (Enso Village) (Green Bonds); | | | | | | | | | | | | | | |
Series 2021, RB(h) | | | 5.00% | | | | 11/15/2036 | | | | 1,000 | | | 937,580 |
Series 2021, RB(h) | | | 5.00% | | | | 11/15/2046 | | | | 2,000 | | | 1,717,039 |
Series 2021, RB(h) | | | 5.00% | | | | 11/15/2051 | | | | 1,735 | | | 1,459,270 |
Series 2021, RB(h) | | | 5.00% | | | | 11/15/2056 | | | | 915 | | | 753,813 |
California (State of) Public Finance Authority (Excelsior Charter Schools); | | | | | | | | | | | | | | |
Series 2020 A, RB(h) | | | 5.00% | | | | 06/15/2050 | | | | 1,540 | | | 1,387,625 |
Series 2020 A, RB(h) | | | 5.00% | | | | 06/15/2055 | | | | 1,030 | | | 914,364 |
California (State of) Public Finance Authority (Henry Mayo Newhall Hospital); Series 2017, Ref. RB | | | 5.00% | | | | 10/15/2037 | | | | 3,430 | | | 3,494,800 |
California (State of) School Finance Authority (Alliance for College-Ready Public Schools); Series 2013 A, RB | | | 6.40% | | | | 07/01/2048 | | | | 3,000 | | | 3,014,940 |
California (State of) School Finance Authority (Aspire Public School); Series 2016, Ref. RB(h) | | | 5.00% | | | | 08/01/2046 | | | | 2,285 | | | 2,283,712 |
See accompanying Notes to Financial Statements which are an integral part of the financial statements.
| | |
| 10 | | Invesco High Yield Municipal Fund |
| | | | | | | | | | | | | | |
| | | Interest
Rate | | | Maturity
Date | | | Principal
Amount
(000) | | | Value |
California–(continued) | | | | | | | | | | | | | | |
California (State of) School Finance Authority (Aspire Public Schools Obligated Group); | | | | | | | | | | | | | | |
Series 2020 A, RB(h) | | | 5.00% | | | | 08/01/2050 | | | $ | 1,200 | | | $ 1,189,944 |
Series 2022, RB(h) | | | 5.00% | | | | 08/01/2052 | | | | 1,000 | | | 985,704 |
California (State of) School Finance Authority (Green Dot Public Schools); | | | | | | | | | | | | | | |
Series 2022, Ref. RB(h) | | | 5.00% | | | | 08/01/2032 | | | | 700 | | | 730,258 |
Series 2022, Ref. RB(h) | | | 5.38% | | | | 08/01/2042 | | | | 1,150 | | | 1,189,092 |
Series 2022, Ref. RB(h) | | | 5.75% | | | | 08/01/2052 | | | | 1,160 | | | 1,211,876 |
California (State of) School Finance Authority (New Designs Charter School); | | | | | | | | | | | | | | |
Series 2012, RB | | | 5.50% | | | | 06/01/2042 | | | | 5,000 | | | 5,001,502 |
Series 2019 A, RB(h) | | | 5.00% | | | | 06/01/2040 | | | | 750 | | | 722,246 |
Series 2019 A, RB(h) | | | 5.00% | | | | 06/01/2050 | | | | 1,060 | | | 981,299 |
California (State of) School Finance Authority (TEACH Public Schools); Series 2019 A, RB(h) | | | 5.00% | | | | 06/01/2058 | | | | 500 | | | 456,885 |
California (State of) Statewide Communities Development Authority; Series 2022, RB (INS - AGM)(g)(j) | | | 5.38% | | | | 08/15/2057 | | | | 10,000 | | | 10,636,699 |
California (State of) Statewide Communities Development Authority (California Baptist University); Series 2014 A, RB(h) | | | 6.13% | | | | 11/01/2033 | | | | 1,560 | | | 1,579,146 |
California (State of) Statewide Communities Development Authority (Creative Child Care & Team Charter); Series 2015, RB(h) | | | 6.75% | | | | 06/01/2045 | | | | 6,635 | | | 6,441,082 |
California (State of) Statewide Communities Development Authority (Enloe Medical Center); Series 2022 A, RB (INS - AGM)(g) | | | 5.25% | | | | 08/15/2052 | | | | 2,000 | | | 2,116,939 |
California (State of) Statewide Communities Development Authority (Eskaton Properties, Inc.); Series 2012, RB | | | 5.25% | | | | 11/15/2034 | | | | 4,350 | | | 4,349,766 |
California (State of) Statewide Communities Development Authority (Loma Linda University Medical Center); | | | | | | | | | | | | | | |
Series 2014, RB | | | 5.25% | | | | 12/01/2044 | | | | 3,000 | | | 2,919,861 |
Series 2016 A, RB(h) | | | 5.25% | | | | 12/01/2056 | | | | 6,605 | | | 6,228,172 |
Series 2018 A, RB(h) | | | 5.50% | | | | 12/01/2058 | | | | 49,340 | | | 48,510,609 |
California (State of) Statewide Communities Development Authority (NCCD-Hooper Street LLC-California College of the Arts); Series 2019, RB(h) | | | 5.25% | | | | 07/01/2052 | | | | 1,450 | | | 1,261,251 |
California (State of) Statewide Financing Authority (Pooled Tobacco Securitization Program); | | | | | | | | | | | | | | |
Series 2002, RB | | | 6.00% | | | | 05/01/2043 | | | | 15,000 | | | 15,261,687 |
Series 2006 A, RB(i) | | | 0.00% | | | | 06/01/2046 | | | | 181,950 | | | 43,509,813 |
Series 2006 C, RB(h)(i) | | | 0.00% | | | | 06/01/2055 | | | | 91,150 | | | 4,843,483 |
California School Facilities Financing Authority; Series 2010, RB (INS - AGM)(g)(i) | | | 0.00% | | | | 08/01/2049 | | | | 29,405 | | | 7,402,585 |
Fairfield (City of), CA Community Facilities District No. 2007-1 (Fairfield Commons); | | | | | | | | | | | | | | |
Series 2008, RB | | | 6.50% | | | | 09/01/2023 | | | | 330 | | | 335,355 |
Series 2008, RB | | | 6.75% | | | | 09/01/2028 | | | | 2,550 | | | 2,595,519 |
Series 2008, RB | | | 6.88% | | | | 09/01/2038 | | | | 4,440 | | | 4,521,087 |
Foothill-Eastern Transportation Corridor Agency; | | | | | | | | | | | | | | |
Series 2014 A, Ref. RB(b)(m) | | | 6.00% | | | | 01/15/2024 | | | | 20,000 | | | 20,500,396 |
Series 2014 A, Ref. RB (INS - AGM)(g)(i) | | | 0.00% | | | | 01/15/2036 | | | | 61,010 | | | 35,988,512 |
Series 2014 A, Ref. RB (INS - AGM)(g)(i) | | | 0.00% | | | | 01/15/2037 | | | | 20,000 | | | 11,085,422 |
Series 2014 A, Ref. RB(f) | | | 6.85% | | | | 01/15/2042 | | | | 5,000 | | | 5,353,016 |
Series 2014 C, Ref. RB(b)(m) | | | 6.50% | | | | 01/15/2024 | | | | 10,750 | | | 11,053,446 |
Golden State Tobacco Securitization Corp.; Series 2021 B-2, Ref. RB(i) | | | 0.00% | | | | 06/01/2066 | | | | 585,053 | | | 58,155,029 |
Inland Empire Tobacco Securitization Corp.; | | | | | | | | | | | | | | |
Series 2007 C-1, RB(i) | | | 0.00% | | | | 06/01/2036 | | | | 173,915 | | | 73,351,573 |
Series 2007 D, RB(i) | | | 0.00% | | | | 06/01/2057 | | | | 46,635 | | | 3,209,640 |
Series 2007 F, RB(h)(i) | | | 0.00% | | | | 06/01/2057 | | | | 99,650 | | | 4,777,012 |
Long Beach (City of), CA; Series 2022 C, RB (INS - AGM)(c)(g) | | | 5.25% | | | | 06/01/2047 | | | | 1,750 | | | 1,848,618 |
Long Beach Community College District (Election of 2008); Series 2012 B, GO Bonds(f) | | | 4.75% | | | | 08/01/2049 | | | | 12,000 | | | 7,941,007 |
Los Angeles (City of), CA Department of Airports; Series 2021 A, Ref. RB(c)(j)(l) | | | 5.00% | | | | 05/15/2051 | | | | 5,000 | | | 5,162,355 |
Los Angeles (City of), CA Department of Airports (Green Bonds); Series 2022 G, RB(c) | | | 4.00% | | | | 05/15/2047 | | | | 3,000 | | | 2,789,495 |
Oak Grove School District (Election of 2008); Series 2023 A-2, GO Bonds | | | 4.00% | | | | 08/01/2049 | | | | 5,000 | | | 4,746,828 |
Oakland Unified School District (County of Alameda); Series 2021 A, GO Bonds (INS - BAM)(g) | | | 4.00% | | | | 08/01/2046 | | | | 9,940 | | | 9,566,265 |
Sacramento (County of), CA (Metro Air Park Community); Series 2022, Ref. RB | | | 5.00% | | | | 09/01/2042 | | | | 1,000 | | | 992,750 |
See accompanying Notes to Financial Statements which are an integral part of the financial statements.
| | |
| 11 | | Invesco High Yield Municipal Fund |
| | | | | | | | | | | | | | |
| | | Interest Rate | | | Maturity Date | | | Principal Amount (000) | | | Value |
California–(continued) | | | | | | | | | | | | | | |
San Bernardino City Unified School District; | | | | | | | | | | | | | | |
Series 2011 D, GO Bonds (INS - AGM)(g)(i) | | | 0.00% | | | | 08/01/2036 | | | $ | 7,650 | | | $ 4,409,254 |
Series 2011 D, GO Bonds (INS - AGM)(g)(i) | | | 0.00% | | | | 08/01/2037 | | | | 13,130 | | | 7,127,804 |
Series 2011 D, GO Bonds (INS - AGM)(g)(i) | | | 0.00% | | | | 08/01/2038 | | | | 13,515 | | | 6,917,397 |
Series 2011 D, GO Bonds (INS - AGM)(g)(i) | | | 0.00% | | | | 08/01/2039 | | | | 13,895 | | | 6,735,089 |
Series 2011 D, GO Bonds (INS - AGM)(g)(i) | | | 0.00% | | | | 08/01/2040 | | | | 14,280 | | | 6,533,833 |
Series 2011 D, GO Bonds (INS - AGM)(g)(i) | | | 0.00% | | | | 08/01/2041 | | | | 14,080 | | | 6,136,551 |
San Diego (County of), CA Regional Airport Authority; | | | | | | | | | | | | | | |
Series 2021 B, RB(c) | | | 4.00% | | | | 07/01/2056 | | | | 2,660 | | | 2,332,203 |
Series 2021 B, RB(c)(j) | | | 5.00% | | | | 07/01/2056 | | | | 13,970 | | | 14,295,090 |
San Diego Unified School District (Election of 2008); Series 2012 E, GO Bonds(f) | | | 5.25% | | | | 07/01/2042 | | | | 10,000 | | | 7,201,549 |
San Francisco (City & County of), CA Airport Commission (San Francisco International Airport); | | | | | | | | | | | | | | |
Second Series 2022 A, Ref. RB(c) | | | 5.00% | | | | 05/01/2052 | | | | 1,435 | | | 1,473,764 |
Series 2019 E, RB(c) | | | 5.00% | | | | 05/01/2050 | | | | 13,040 | | | 13,269,790 |
San Francisco (City & County of), CA Community Facilities District No. 2014-1 (Transbay Transit Center); Series 2022 A, RB | | | 5.00% | | | | 09/01/2052 | | | | 1,025 | | | 1,071,996 |
San Francisco (City & County of), CA Successor Agency to the Redevelopment Agency Community Facilities District No. 6 (Mission Bay South Public Improvements); | | | | | | | | | | | | | | |
Series 2013 C, RB(i) | | | 0.00% | | | | 08/01/2036 | | | | 5,710 | | | 2,672,045 |
Series 2013 C, RB(i) | | | 0.00% | | | | 08/01/2038 | | | | 2,000 | | | 820,518 |
Series 2013 C, RB(i) | | | 0.00% | | | | 08/01/2043 | | | | 17,000 | | | 5,168,250 |
San Francisco (City of), CA Bay Area Rapid Transit District; Series 2022, GO Bonds (INS - AGM)(g)(j)(l) | | | 3.00% | | | | 08/01/2050 | | | | 16,770 | | | 12,714,477 |
San Francisco Community College District (Election of 2020); Series 2020 A, GO Bonds (INS - BAM)(g) | | | 3.00% | | | | 06/15/2045 | | | | 8,225 | | | 6,168,108 |
San Jose (City of), CA; | | | | | | | | | | | | | | |
Series 2017 A, RB(c)(j)(l) | | | 5.00% | | | | 03/01/2041 | | | | 10,000 | | | 10,218,747 |
Series 2017 A, RB(c)(j)(l) | | | 5.00% | | | | 03/01/2047 | | | | 20,000 | | | 20,283,652 |
San Jose (City of), CA (Helzer Courts Apartments); Series 1999 A, RB(c) | | | 6.40% | | | | 12/01/2041 | | | | 13,093 | | | 12,811,989 |
San Luis Coastal Unified School District (Election of 2022); Series 2023 A, GO Bonds | | | 4.00% | | | | 08/01/2049 | | | | 10,000 | | | 9,773,588 |
Santee School District (Election of 2006); Series 2006 D, GO Bonds
(INS - AGC)(g)(i) | | | 0.00% | | | | 08/01/2038 | | | | 4,355 | | | 2,304,269 |
Savanna School District (Election of 2008); Series 2012 B, GO Bonds
(INS - AGM)(f)(g) | | | 6.75% | | | | 02/01/2052 | | | | 7,500 | | | 5,408,204 |
Silicon Valley Tobacco Securitization Authority (Santa Clara); | | | | | | | | | | | | | | |
Series 2007 A, RB(i) | | | 0.00% | | | | 06/01/2036 | | | | 10,000 | | | 4,796,815 |
Series 2007 A, RB(i) | | | 0.00% | | | | 06/01/2047 | | | | 20,000 | | | 4,906,456 |
Southern California Logistics Airport Authority; | | | | | | | | | | | | | | |
Series 2007, RB | | | 6.15% | | | | 12/01/2043 | | | | 4,400 | | | 4,399,569 |
Series 2008 A, RB | | | 6.00% | | | | 12/01/2033 | | | | 1,475 | | | 1,474,380 |
Series 2008 A, RB(i) | | | 0.00% | | | | 12/01/2045 | | | | 18,085 | | | 3,669,390 |
Series 2008 A, RB(i) | | | 0.00% | | | | 12/01/2046 | | | | 18,085 | | | 3,411,198 |
Series 2008 A, RB(i) | | | 0.00% | | | | 12/01/2047 | | | | 18,085 | | | 3,167,872 |
Series 2008 A, RB(i) | | | 0.00% | | | | 12/01/2048 | | | | 18,085 | | | 2,940,717 |
Series 2008 A, RB(i) | | | 0.00% | | | | 12/01/2049 | | | | 18,085 | | | 2,728,639 |
Series 2008 A, RB(i) | | | 0.00% | | | | 12/01/2050 | | | | 18,085 | | | 2,530,970 |
Southern California Tobacco Securitization Authority (San Diego County Asset Securitization Corp.); | | | | | | | | | | | | | | |
Series 2006, RB(i) | | | 0.00% | | | | 06/01/2046 | | | | 31,025 | | | 5,736,758 |
Series 2019, Ref. RB(i) | | | 0.00% | | | | 06/01/2054 | | | | 19,300 | | | 3,511,164 |
Vallejo (City of), CA Public Financing Authority (Hiddenbrooke Improvement District); Series 2004 A, RB | | | 5.80% | | | | 09/01/2031 | | | | 3,165 | | | 3,197,802 |
| | | | | | | | | | | | | | | 837,711,998 |
| | | | |
Colorado–12.07% | | | | | | | | | | | | | | |
3rd and Havana Metropolitan District; | | | | | | | | | | | | | | |
Series 2020 A, GO Bonds | | | 5.25% | | | | 12/01/2049 | | | | 3,200 | | | 2,667,333 |
Series 2020 B, GO Bonds | | | 7.75% | | | | 12/15/2049 | | | | 1,925 | | | 1,724,363 |
64th Ave ARI Authority; Series 2020, RB | | | 6.50% | | | | 12/01/2043 | | | | 14,000 | | | 13,250,034 |
Aberdeen Metropolitan District No. 2; Series 2021, Ref. GO Bonds(f) | | | 5.75% | | | | 12/01/2051 | | | | 6,055 | | | 3,762,478 |
Amber Creek Metropolitan District; Series 2017 B, GO Bonds | | | 7.75% | | | | 12/15/2047 | | | | 463 | | | 425,465 |
Aurora Crossroads Metropolitan District No. 2; Series 2020 B, GO Bonds | | | 7.75% | | | | 12/15/2050 | | | | 3,500 | | | 3,197,987 |
See accompanying Notes to Financial Statements which are an integral part of the financial statements.
| | |
| 12 | | Invesco High Yield Municipal Fund |
| | | | | | | | | | | | | | |
| | | Interest Rate | | | Maturity Date | | | Principal Amount (000) | | | Value |
Colorado–(continued) | | | | | | | | | | | | | | |
Aurora Highlands Community Authority Board; Series 2021 A, Ref. RB | | | 5.75% | | | | 12/01/2051 | | | $ | 40,000 | | | $ 35,655,012 |
Banning Lewis Ranch Metropolitan District No. 4; | | | | | | | | | | | | | | |
Series 2018 A, GO Bonds | | | 5.75% | | | | 12/01/2048 | | | | 4,998 | | | 4,964,286 |
Series 2018 B, GO Bonds | | | 8.00% | | | | 12/15/2048 | | | | 2,063 | | | 1,946,756 |
Series 2018 C, GO Bonds | | | 8.00% | | | | 12/15/2051 | | | | 4,134 | | | 3,380,014 |
Banning Lewis Ranch Metropolitan District No. 5; | | | | | | | | | | | | | | |
Series 2018 A, GO Bonds | | | 5.75% | | | | 12/01/2048 | | | | 2,195 | | | 2,179,822 |
Series 2018 B, GO Bonds | | | 8.00% | | | | 12/15/2048 | | | | 511 | | | 482,207 |
Series 2018 C, GO Bonds | | | 8.00% | | | | 12/15/2051 | | | | 1,942 | | | 1,586,937 |
Banning Lewis Ranch Metropolitan District No. 8; Series 2021, GO Bonds(h) | | | 4.88% | | | | 12/01/2051 | | | | 4,500 | | | 3,455,676 |
Banning Lewis Ranch Regional Metropolitan District No. 1; | | | | | | | | | | | | | | |
Series 2018 A, GO Bonds | | | 5.38% | | | | 12/01/2048 | | | | 2,500 | | | 2,377,405 |
Series 2018 B, GO Bonds | | | 7.75% | | | | 12/15/2041 | | | | 630 | | | 600,059 |
Series 2018 C, GO Bonds | | | 8.00% | | | | 12/15/2041 | | | | 1,801 | | | 1,505,280 |
Banning Lewis Ranch Regional Metropolitan District No. 2; Series 2021, GO Bonds | | | 5.75% | | | | 12/01/2051 | | | | 5,190 | | | 4,488,001 |
Base Village Metropolitan District No. 2; Series 2016 B, Ref. GO Bonds | | | 6.50% | | | | 12/15/2048 | | | | 2,830 | | | 1,893,421 |
Baseline Metropolitan District No. 1; | | | | | | | | | | | | | | |
Seires 2018 A-2, RB | | | 5.50% | | | | 12/01/2034 | | | | 8,340 | | | 8,474,554 |
Seires 2018 A-2, RB | | | 5.85% | | | | 12/01/2048 | | | | 9,000 | | | 9,074,204 |
Series 2018 A-1, RB | | | 5.38% | | | | 12/01/2034 | | | | 5,650 | | | 5,717,274 |
Series 2018 A-1, RB | | | 5.75% | | | | 12/01/2048 | | | | 3,850 | | | 3,868,825 |
Series 2021 A, GO Bonds | | | 5.00% | | | | 12/01/2051 | | | | 1,000 | | | 849,248 |
Series 2021 B, GO Bonds | | | 7.50% | | | | 12/15/2051 | | | | 2,195 | | | 1,943,415 |
Belford North Metropolitan District; Series 2020 B, GO Bonds | | | 8.50% | | | | 12/15/2050 | | | | 6,500 | | | 6,018,376 |
Bella Mesa Metropolitan District; Series 2020 A, GO Bonds(f)(h) | | | 6.75% | | | | 12/01/2049 | | | | 3,785 | | | 3,147,985 |
Bennett Ranch Metropolitan District No. 1; Series 2021 B, GO Bonds | | | 7.50% | | | | 12/15/2051 | | | | 1,221 | | | 1,088,089 |
Berthoud-Heritage Metropolitan District No. 1; Series 2019, RB | | | 5.63% | | | | 12/01/2048 | | | | 10,000 | | | 9,483,012 |
Berthoud-Heritage Metropolitan District No. 10; Series 2022 B, GO Bonds | | | 8.00% | | | | 12/15/2052 | | | | 6,840 | | | 6,271,398 |
Brighton Crossing Metropolitan District No. 4; Series 2017 B, GO Bonds | | | 7.00% | | | | 12/15/2047 | | | | 670 | | | 612,345 |
Broadway Station Metropolitan District No. 2; Series 2019 B, GO Bonds(f) | | | 7.50% | | | | 12/01/2048 | | | | 7,075 | | | 4,974,226 |
Broadway Station Metropolitan District No. 3; Series 2019 B, GO Bonds(f) | | | 7.50% | | | | 12/01/2049 | | | | 30,465 | | | 19,036,424 |
Bromley Park Metropolitan District No. 2; Series 2018 C, Ref. GO Bonds | | | 7.85% | | | | 12/15/2047 | | | | 6,297 | | | 6,071,933 |
Buffalo Highlands Metropolitan District; | | | | | | | | | | | | | | |
Series 2018 A, GO Bonds | | | 5.25% | | | | 12/01/2038 | | | | 1,000 | | | 968,019 |
Series 2018 A, GO Bonds | | | 5.38% | | | | 12/01/2048 | | | | 1,750 | | | 1,634,499 |
Series 2018 B, GO Bonds | | | 7.63% | | | | 12/15/2046 | | | | 1,226 | | | 1,131,818 |
Buffalo Ridge Metropolitan District; Series 2018 B, GO Bonds | | | 7.38% | | | | 12/15/2047 | | | | 3,184 | | | 3,026,059 |
Canyon Pines Metropolitan District; | | | | | | | | | | | | | | |
Series 2021 A-1, GO Bonds | | | 5.25% | | | | 12/01/2023 | | | | 5 | | | 4,946 |
Series 2021 A-1, GO Bonds | | | 5.25% | | | | 12/01/2051 | | | | 6,995 | | | 5,924,280 |
Canyons Metropolitan District No. 5; | | | | | | | | | | | | | | |
Series 2016, GO Bonds | | | 7.00% | | | | 12/15/2057 | | | | 10,116 | | | 6,864,683 |
Series 2017 A, Ref. GO Bonds | | | 6.00% | | | | 12/01/2037 | | | | 1,750 | | | 1,696,585 |
Series 2017 A, Ref. GO Bonds | | | 6.13% | | | | 12/01/2047 | | | | 4,735 | | | 4,573,768 |
Series 2017 B, GO Bonds | | | 8.00% | | | | 12/15/2047 | | | | 3,500 | | | 3,242,140 |
Cascade Ridge Metropolitan District; Series 2021, GO Bonds | | | 5.00% | | | | 12/01/2051 | | | | 3,000 | | | 2,463,925 |
Centerra Metropolitan District No. 1 (In the City of Loveland); | | | | | | | | | | | | | | |
Series 2017, RB(h) | | | 5.00% | | | | 12/01/2047 | | | | 500 | | | 447,142 |
Series 2018, RB | | | 5.25% | | | | 12/01/2048 | | | | 5,550 | | | 5,123,072 |
Series 2020 A, Ref. GO Bonds | | | 5.00% | | | | 12/01/2051 | | | | 6,375 | | | 5,467,044 |
Chambers Highpoint Metropolitan District No. 2; | | | | | | | | | | | | | | |
Series 2021, GO Bonds | | | 5.00% | | | | 12/01/2041 | | | | 520 | | | 469,388 |
Series 2021, GO Bonds | | | 5.00% | | | | 12/01/2051 | | | | 835 | | | 712,063 |
Citadel on Colfax Business Improvement District; | | | | | | | | | | | | | | |
Series 2020 A, RB | | | 5.35% | | | | 12/01/2050 | | | | 2,900 | | | 2,585,684 |
Series 2020 B, RB | | | 7.88% | | | | 12/15/2050 | | | | 465 | | | 422,487 |
City Center West Commercial Metropolitan District; | | | | | | | | | | | | | | |
Series 2020 A, Ref. GO Bonds | | | 7.00% | | | | 12/01/2049 | | | | 4,000 | | | 3,937,653 |
Series 2020 B, GO Bonds | | | 9.00% | | | | 12/15/2049 | | | | 581 | | | 572,574 |
See accompanying Notes to Financial Statements which are an integral part of the financial statements.
| | |
| 13 | | Invesco High Yield Municipal Fund |
| | | | | | | | | | | | | | |
| | | Interest
Rate | | | Maturity
Date | | | Principal
Amount
(000) | | | Value |
Colorado–(continued) | | | | | | | | | | | | | | |
City Center West Residential Metropolitan District No. 2; Series 2019 B, GO Bonds | | | 7.75% | | | | 12/15/2049 | | | $ | 1,425 | | | $ 1,295,970 |
Clear Creek Station Metropolitan District No. 2; Series 2017 B, GO Bonds | | | 7.38% | | | | 12/15/2047 | | | | 500 | | | 464,990 |
Clear Creek Transit Metropolitan District No. 2; Series 2021 B, GO Bonds | | | 7.90% | | | | 12/15/2050 | | | | 1,160 | | | 1,037,974 |
Colliers Hill Metropolitan District No. 1; | | | | | | | | | | | | | | |
Series 2019 B, Ref. GO Bonds | | | 8.00% | | | | 12/15/2048 | | | | 2,500 | | | 2,308,955 |
Series 2021 C, GO Bonds | | | 7.25% | | | | 12/15/2049 | | | | 2,350 | | | 2,064,212 |
Colliers Hill Metropolitan District No. 2; | | | | | | | | | | | | | | |
Series 2022 B-2, GO Bonds | | | 7.63% | | | | 12/15/2042 | | | | 5,782 | | | 5,234,010 |
Series 2022, Ref. GO Bonds | | | 5.75% | | | | 12/15/2047 | | | | 2,995 | | | 2,800,755 |
Colorado (State of) Educational & Cultural Facilities Authority (Community Leadership Academy); | | | | | | | | | | | | | | |
Series 2008, RB | | | 6.25% | | | | 07/01/2028 | | | | 1,200 | | | 1,201,879 |
Series 2008, RB | | | 6.50% | | | | 07/01/2038 | | | | 1,000 | | | 1,001,433 |
Series 2013, RB | | | 7.45% | | | | 08/01/2048 | | | | 2,245 | | | 2,269,790 |
Colorado (State of) Health Facilities Authority (Aberdeen Ridge); Series 2021 A, RB | | | 5.00% | | | | 05/15/2044 | | | | 3,750 | | | 3,047,961 |
Colorado (State of) Health Facilities Authority (CommonSpirit Health); | | | | | | | | | | | | | | |
Series 2022, RB | | | 5.50% | | | | 11/01/2047 | | | | 7,250 | | | 7,639,727 |
Series 2022, RB | | | 5.25% | | | | 11/01/2052 | | | | 7,500 | | | 7,726,424 |
Colorado (State of) Health Facilities Authority (Frasier Meadows Retirement Community); Series 2017 B, RB(b)(m) | | | 5.00% | | | | 05/15/2023 | | | | 1,500 | | | 1,504,862 |
Colorado (State of) Health Facilities Authority (Sunny Vista Living Center); | | | | | | | | | | | | | | |
Series 2015 A, Ref. RB(h) | | | 5.75% | | | | 12/01/2035 | | | | 1,650 | | | 1,224,695 |
Series 2015 A, Ref. RB(h) | | | 6.13% | | | | 12/01/2045 | | | | 2,300 | | | 1,581,565 |
Series 2015 A, Ref. RB(h) | | | 6.25% | | | | 12/01/2050 | | | | 4,070 | | | 2,764,214 |
Colorado (State of) Health Facilities Authority (Volunteers of America Care); | | | | | | | | | | | | | | |
Series 2007 A, RB | | | 5.25% | | | | 07/01/2027 | | | | 3,260 | | | 3,027,849 |
Series 2007 A, RB | | | 5.30% | | | | 07/01/2037 | | | | 2,895 | | | 2,297,929 |
Colorado (State of) International Center Metropolitan District No. 14; | | | | | | | | | | | | | | |
Series 2018, GO Bonds | | | 5.88% | | | | 12/01/2046 | | | | 13,500 | | | 13,029,926 |
Series 2022, GO Bonds | | | 7.50% | | | | 12/15/2051 | | | | 15,000 | | | 13,620,305 |
Colorado (State of) International Center Metropolitan District No. 4; | | | | | | | | | | | | | | |
Series 2019 A, Ref. GO Bonds(f) | | | 6.00% | | | | 12/01/2047 | | | | 30,920 | | | 25,733,179 |
Series 2019 A-2, GO Bonds(f) | | | 6.25% | | | | 12/01/2048 | | | | 15,075 | | | 13,620,664 |
Series 2019 B-2, GO Bonds | | | 8.75% | | | | 12/15/2048 | | | | 1,997 | | | 1,896,933 |
Colorado (State of) Regional Transportation District (Denver Transit Partners Eagle P3); | | | | | | | | | | | | | | |
Series 2020 A, Ref. RB | | | 4.00% | | | | 07/15/2038 | | | | 350 | | | 332,565 |
Series 2020 A, Ref. RB | | | 4.00% | | | | 07/15/2039 | | | | 1,325 | | | 1,246,764 |
Colorado Crossing Metropolitan District No. 2; | | | | | | | | | | | | | | |
Series 2020 A-1, Ref. GO Bonds | | | 5.00% | | | | 12/01/2047 | | | | 14,614 | | | 12,763,010 |
Series 2020 A-2, GO Bonds | | | 5.00% | | | | 12/01/2050 | | | | 5,000 | | | 4,291,821 |
Series 2020 B, GO Bonds(h) | | | 7.50% | | | | 12/15/2050 | | | | 3,495 | | | 3,101,261 |
Conestoga Metropolitan District No. 2; Series 2021 A, GO Bonds | | | 5.25% | | | | 12/01/2051 | | | | 1,625 | | | 1,411,371 |
Copperleaf Metropolitan District No. 6; Series 2018 B, GO Bonds(b)(m) | | | 7.50% | | | | 12/15/2023 | | | | 820 | | | 870,396 |
Cottonwood Highlands Metropolitan District No. 1; Series 2019 B, GO Bonds | | | 8.75% | | | | 12/15/2049 | | | | 2,095 | | | 2,004,861 |
Cottonwood Hollow Residential Metropolitan District; Series 2021, GO Bonds | | | 5.00% | | | | 12/01/2051 | | | | 15,824 | | | 12,627,921 |
Creekside Village Metropolitan District; Series 2019, GO Bonds | | | 7.75% | | | | 12/15/2049 | | | | 569 | | | 516,392 |
Crossroads Metropolitan District No. 1; Series 2022, GO Bonds | | | 6.50% | | | | 12/01/2051 | | | | 9,000 | | | 8,535,146 |
Crowfoot Valley Ranch Metropolitan District No. 2; | | | | | | | | | | | | | | |
Series 2018 A, GO Bonds | | | 5.63% | | | | 12/01/2038 | | | | 3,555 | | | 3,545,188 |
Series 2018 A, GO Bonds | | | 5.75% | | | | 12/01/2048 | | | | 10,415 | | | 10,102,568 |
Series 2018 B, GO Bonds | | | 8.00% | | | | 12/15/2048 | | | | 1,630 | | | 1,505,438 |
Dacono Urban Renewal Authority; Series 2020, RB | | | 6.25% | | | | 12/01/2039 | | | | 1,976 | | | 1,851,816 |
Deer Creek Villas Metropolitan District; Series 2022 B, GO Bonds | | | 7.75% | | | | 12/15/2055 | | | | 650 | | | 587,120 |
Denver (City & County of), CO; | | | | | | | | | | | | | | |
Series 2018 A, RB(c)(j) | | | 5.25% | | | | 12/01/2043 | | | | 17,500 | | | 18,135,689 |
Series 2021 A, RB(j) | | | 4.00% | | | | 08/01/2051 | | | | 17,350 | | | 15,916,177 |
Series 2022 A, RB(c) | | | 5.00% | | | | 11/15/2047 | | | | 12,550 | | | 13,040,714 |
Series 2022 A, RB(c) | | | 4.13% | | | | 11/15/2053 | | | | 5,000 | | | 4,581,381 |
Series 2022, RB(c)(j)(l) | | | 5.00% | | | | 11/15/2042 | | | | 4,000 | | | 4,204,112 |
Series 2022, RB(c)(j)(l) | | | 5.75% | | | | 11/15/2045 | | | | 8,000 | | | 8,913,273 |
See accompanying Notes to Financial Statements which are an integral part of the financial statements.
| | |
| 14 | | Invesco High Yield Municipal Fund |
| | | | | | | | | | | | | | |
| | | Interest
Rate | | | Maturity
Date | | | Principal
Amount
(000) | | | Value |
Colorado–(continued) | | | | | | | | | | | | | | |
Denver (City & County of), CO (United Airlines, Inc.); Series 2017, Ref. RB(c) | | | 5.00% | | | | 10/01/2032 | | | $ | 30,840 | | | $ 30,144,120 |
Denver (City & County of), CO Airport System; Series 2022 D, RB(c)(j)(l) | | | 5.00% | | | | 11/15/2053 | | | | 26,000 | | | 26,704,803 |
Denver (City & County of), CO Convention Center Hotel Authority; | | | | | | | | | | | | | | |
Series 2016, Ref. RB | | | 5.00% | | | | 12/01/2032 | | | | 1,000 | | | 1,023,640 |
Series 2016, Ref. RB | | | 5.00% | | | | 12/01/2040 | | | | 250 | | | 244,646 |
Denver Gateway Center Metropolitan District; | | | | | | | | | | | | | | |
Series 2018 A, GO Bonds | | | 5.63% | | | | 12/01/2048 | | | | 2,130 | | | 2,023,036 |
Series 2018 B, GO Bonds | | | 7.88% | | | | 12/15/2048 | | | | 1,855 | | | 1,741,642 |
Denver International Business Center Metropolitan District No. 1; Series 2019 B, GO Bonds | | | 6.00% | | | | 12/01/2048 | | | | 2,300 | | | 2,259,406 |
Elbert & Highway 86 Commercial Metropolitan District; Series 2021 B, GO Bonds(h) | | | 8.00% | | | | 12/15/2051 | | | | 1,905 | | | 1,690,647 |
Elevation Park Metropolitan District; Series 2021, GO Bonds | | | 4.25% | | | | 12/01/2051 | | | | 2,455 | | | 1,771,121 |
Erie Commons Metropolitan District No. 2; Series 2019 B, Ref. GO Bonds | | | 6.95% | | | | 12/15/2054 | | | | 3,100 | | | 2,818,382 |
Erie Highlands Metropolitan District No. 2; Series 2018 C, GO Bonds | | | 8.00% | | | | 12/15/2052 | | | | 3,600 | | | 2,938,752 |
Evan’s Place Metropolitan District; | | | | | | | | | | | | | | |
Series 2020 A, GO Bonds | | | 5.00% | | | | 12/01/2040 | | | | 550 | | | 510,811 |
Series 2020 A, GO Bonds | | | 5.00% | | | | 12/01/2050 | | | | 1,585 | | | 1,357,676 |
Flying Horse Metropolitan District No. 3; Series 2019, Ref. GO Bonds(h) | | | 6.00% | | | | 12/01/2049 | | | | 2,970 | | | 2,787,098 |
Forest Trace Metropolitan District No. 3; Series 2020 B, GO Bonds | | | 7.88% | | | | 12/15/2049 | | | | 933 | | | 906,568 |
Fourth North Business Improvement District; Series 2022 B, RB | | | 8.13% | | | | 12/15/2052 | | | | 4,525 | | | 4,469,287 |
Gardens at East Iliff Metropolitan District; Series 2019 B, GO Bonds | | | 8.50% | | | | 12/15/2049 | | | | 680 | | | 632,104 |
Gardens on Havana Metropolitan District No. 3 (The); | | | | | | | | | | | | | | |
Series 2017 A, RB | | | 5.13% | | | | 12/01/2037 | | | | 1,070 | | | 1,034,298 |
Series 2017 A, RB | | | 5.25% | | | | 12/01/2047 | | | | 1,015 | | | 947,023 |
Series 2017 B, RB | | | 7.75% | | | | 12/15/2047 | | | | 1,000 | | | 940,381 |
Granby Ranch Metropolitan District; Series 2018, Ref. GO Bonds(h) | | | 5.50% | | | | 12/01/2052 | | | | 5,490 | | | 5,046,847 |
Hance Ranch Metropolitan District; | | | | | | | | | | | | | | |
Series 2020, GO Bonds | | | 5.00% | | | | 12/01/2040 | | | | 565 | | | 510,913 |
Series 2020, GO Bonds | | | 5.13% | | | | 12/01/2050 | | | | 1,810 | | | 1,558,322 |
Haskins Station Metropolitan District; Series 2019 B, GO Bonds | | | 8.75% | | | | 12/15/2049 | | | | 1,328 | | | 1,217,399 |
Hess Ranch Metropolitan District No. 6; | | | | | | | | | | | | | | |
Series 2020 A-2, GO Bonds(f) | | | 5.75% | | | | 12/01/2049 | | | | 9,000 | | | 6,291,981 |
Series 2020 B, GO Bonds | | | 8.00% | | | | 12/15/2049 | | | | 4,683 | | | 4,209,943 |
Series 2022 C, GO Bonds(h) | | | 8.25% | | | | 12/15/2052 | | | | 15,569 | | | 13,758,025 |
Highlands Metropolitan District No. 1; Series 2021, GO Bonds | | | 5.00% | | | | 12/01/2051 | | | | 575 | | | 479,002 |
HM Metropolitan District No. 2; Series 2021, GO Bonds(f) | | | 5.75% | | | | 12/01/2051 | | | | 15,000 | | | 7,255,487 |
Home Place Metropolitan District; Series 2020 B, GO Bonds | | | 8.25% | | | | 12/15/2050 | | | | 834 | | | 772,717 |
Homestead Hills Metropolitan District; Series 2020 B, GO Bonds | | | 8.00% | | | | 12/15/2050 | | | | 722 | | | 675,604 |
Independence Metropolitan District No. 3; | | | | | | | | | | | | | | |
Series 2019 A, GO Bonds | | | 6.25% | | | | 12/01/2049 | | | | 8,095 | | | 7,290,720 |
Series 2019 B, GO Bonds | | | 9.00% | | | | 12/15/2049 | | | | 4,230 | | | 3,958,719 |
Series 2021, GO Bonds | | | 9.00% | | | | 12/15/2049 | | | | 8,405 | | | 7,865,965 |
Independence Water & Sanitation District; Series 2019, RB | | | 7.25% | | | | 12/01/2038 | | | | 4,404 | | | 4,422,222 |
Jefferson (County of), CO Center Metropolitan District No. 1; Series 2020 B, Ref. RB | | | 5.75% | | | | 12/15/2050 | | | | 6,909 | | | 6,583,583 |
Johnstown Farms East Metropolitan District; Series 2021, GO Bonds | | | 5.00% | | | | 12/01/2051 | | | | 2,562 | | | 2,115,161 |
Johnstown Plaza Metropolitan District; Series 2022, Ref. GO Bonds | | | 4.25% | | | | 12/01/2046 | | | | 12,200 | | | 9,716,185 |
Johnstown Village Metropolitan District No. 2; | | | | | | | | | | | | | | |
Series 2020 A, GO Bonds | | | 5.00% | | | | 12/01/2050 | | | | 2,000 | | | 1,726,302 |
Series 2020 B, GO Bonds(h) | | | 7.75% | | | | 12/15/2050 | | | | 711 | | | 647,447 |
Jones District Community Authority Board; Series 2020 A, RB(f) | | | 5.75% | | | | 12/01/2050 | | | | 6,815 | | | 5,588,022 |
Kinston Metropolitan District No. 5; | | | | | | | | | | | | | | |
Series 2020 A, GO Bonds | | | 5.13% | | | | 12/01/2050 | | | | 850 | | | 670,636 |
Series 2020 B, GO Bonds | | | 7.50% | | | | 12/15/2052 | | | | 3,800 | | | 3,367,782 |
Lake Bluff Metropolitan District No. 2; Series 2021, Ref. GO Bonds | | | 5.25% | | | | 12/01/2051 | | | | 12,186 | | | 10,046,346 |
Lakes at Centerra Metropolitan District No. 2; | | | | | | | | | | | | | | |
Series 2018 A, GO Bonds | | | 5.13% | | | | 12/01/2037 | | | | 2,700 | | | 2,577,382 |
Series 2018 A, GO Bonds | | | 5.25% | | | | 12/01/2047 | | | | 4,970 | | | 4,503,968 |
Series 2018 B, GO Bonds | | | 7.63% | | | | 12/15/2047 | | | | 1,795 | | | 1,654,364 |
Lanterns Rock Creek Metropolitan District; Series 2020, GO Bonds | | | 6.25% | | | | 08/01/2045 | | | | 1,495 | | | 1,371,223 |
Mayberry Springs Community Authority; Series 2021 B, RB | | | 8.00% | | | | 04/15/2051 | | | | 3,351 | | | 3,001,155 |
See accompanying Notes to Financial Statements which are an integral part of the financial statements.
| | |
| 15 | | Invesco High Yield Municipal Fund |
| | | | | | | | | | | | | | |
| | | Interest Rate | | | Maturity Date | | | Principal Amount (000) | | | Value |
Colorado–(continued) | | | | | | | | | | | | | | |
Mayfield Metropolitan District; | | | | | | | | | | | | | | |
Series 2020 A, GO Bonds | | | 5.75% | | | | 12/01/2050 | | | $ | 1,190 | | | $ 1,145,555 |
Series 2020 B, GO Bonds | | | 8.25% | | | | 12/15/2050 | | | | 622 | | | 589,554 |
Series 2020 C, GO Bonds | | | 3.00% | | | | 12/15/2050 | | | | 767 | | | 264,383 |
Meadowbrook Crossing Metropolitan District; | | | | | | | | | | | | | | |
Series 2020 A, Ref. GO Bonds | | | 5.25% | | | | 12/01/2049 | | | | 3,355 | | | 3,079,949 |
Series 2020 B, Ref. GO Bonds(h) | | | 7.75% | | | | 12/15/2049 | | | | 494 | | | 450,078 |
Meadowlark Metropolitan District; Series 2020 B, GO Bonds | | | 7.63% | | | | 12/15/2050 | | | | 607 | | | 551,860 |
Mirabelle Metropolitan District No. 2; Series 2020 B, GO Bonds | | | 7.38% | | | | 12/15/2049 | | | | 1,473 | | | 1,325,542 |
Montrose (County of), CO (The Homestead at Montrose, Inc.); | | | | | | | | | | | | | | |
Series 2003 A, RB | | | 7.00% | | | | 02/01/2025 | | | | 550 | | | 544,268 |
Series 2003 A, RB | | | 7.00% | | | | 02/01/2038 | | | | 6,200 | | | 5,700,268 |
Morgan Hill Metropolitan District No. 3; Series 2021 B, GO Bonds | | | 6.38% | | | | 12/15/2051 | | | | 1,460 | | | 1,322,073 |
Murphy Creek Metropolitan District No. 5; | | | | | | | | | | | | | | |
Series 2022 A, GO Bonds | | | 6.00% | | | | 12/01/2052 | | | | 3,000 | | | 2,875,485 |
Series 2022 B, GO Bonds | | | 9.25% | | | | 12/15/2052 | | | | 3,532 | | | 3,442,808 |
Neu Town Metropolitan District; Series 2018 B, Ref. GO Bonds | | | 7.75% | | | | 12/15/2046 | | | | 2,285 | | | 2,117,644 |
Nexus North at DIA Metropolitan District; Series 2021, GO Bonds | | | 5.00% | | | | 12/01/2041 | | | | 520 | | | 469,388 |
North Holly Metropolitan District; | | | | | | | | | | | | | | |
Series 2018 A, GO Bonds | | | 5.50% | | | | 12/01/2048 | | | | 1,260 | | | 1,197,538 |
Series 2018 B, GO Bonds | | | 7.88% | | | | 12/15/2048 | | | | 1,015 | | | 950,649 |
Series 2018 C, GO Bonds | | | 8.00% | | | | 12/15/2050 | | | | 1,614 | | | 1,308,377 |
North Range Metropolitan District No. 2; | | | | | | | | | | | | | | |
Series 2017 A, Ref. GO Bonds | | | 5.63% | | | | 12/01/2037 | | | | 3,270 | | | 3,299,033 |
Series 2017 A, Ref. GO Bonds | | | 5.75% | | | | 12/01/2047 | | | | 4,885 | | | 4,908,483 |
Series 2017 B, GO Bonds | | | 7.75% | | | | 12/15/2047 | | | | 2,816 | | | 2,791,808 |
North Range Metropolitan District No. 3; Series 2020 A, GO Bonds | | | 5.25% | | | | 12/01/2050 | | | | 7,320 | | | 6,581,720 |
Painted Prairie Metropolitain District No. 2; Series 2018, GO Bonds | | | 5.25% | | | | 12/01/2048 | | | | 3,000 | | | 2,758,014 |
Palisade Metropolitan District No. 2; Series 2019, GO Bonds | | | 7.25% | | | | 12/15/2049 | | | | 3,712 | | | 3,367,038 |
Palisade Park North Metropolitan District No. 1; Series 2021 B, GO Bonds | | | 5.25% | | | | 12/15/2051 | | | | 2,912 | | | 2,394,201 |
Peak Metropolitan District No. 1; | | | | | | | | | | | | | | |
Series 2021 A, GO Bonds(h) | | | 5.00% | | | | 12/01/2051 | | | | 1,725 | | | 1,475,349 |
Series 2021 B, GO Bonds(h) | | | 7.63% | | | | 12/15/2051 | | | | 1,652 | | | 1,474,921 |
Promontory Metropolitan District No. 3; Series 2020 A, GO Bonds | | | 6.25% | | | | 12/01/2050 | | | | 1,021 | | | 922,590 |
Pronghorn Valley Metropolitan District; Series 2021 B, GO Bonds | | | 7.25% | | | | 12/15/2051 | | | | 500 | | | 439,951 |
Pueblo Urban Renewal Authority (Evraz); Series 2021, RB(h) | | | 4.75% | | | | 12/01/2045 | | | | 3,930 | | | 1,773,390 |
Raindance Metropolitan District No. 2; Series 2019 B, GO Bonds | | | 7.50% | | | | 12/15/2049 | | | | 2,290 | | | 2,065,112 |
Reata Ridge Village Metropolitan District No. 2; Series 2019 B-3, GO Bonds | | | 8.00% | | | | 12/15/2049 | | | | 615 | | | 571,066 |
Remuda Ranch Metropolitan District; Series 2020 B, GO Bonds | | | 7.63% | | | | 12/15/2050 | | | | 574 | | | 518,510 |
Riverdale Peaks II Metropolitan District; Series 2005, GO Bonds(k) | | | 6.50% | | | | 12/01/2035 | | | | 1,000 | | | 500,000 |
Riverwalk Metropolitan District No. 2; Series 2022 B, RB | | | 7.75% | | | | 12/15/2052 | | | | 5,902 | | | 5,370,703 |
RM Mead Metropolitan District; | | | | | | | | | | | | | | |
Series 2020 A, GO Bonds | | | 5.25% | | | | 12/01/2050 | | | | 4,370 | | | 3,881,991 |
Series 2020 B, GO Bonds | | | 8.00% | | | | 12/15/2050 | | | | 610 | | | 558,942 |
Rock Canyon Metropolitan District; | | | | | | | | | | | | | | |
Series 2020 A, GO Bonds | | | 5.00% | | | | 12/01/2049 | | | | 1,637 | | | 1,458,704 |
Series 2020 B, GO Bonds | | | 8.75% | | | | 12/15/2049 | | | | 398 | | | 368,362 |
Rocky Mountain Rail Park Metropolitan District; | | | | | | | | | | | | | | |
Series 2021 A, GO Bonds(h) | | | 5.00% | | | | 12/01/2041 | | | | 5,645 | | | 4,832,648 |
Series 2021 B, GO Bonds(h) | | | 8.25% | | | | 12/15/2051 | | | | 7,200 | | | 6,680,377 |
Rudolph Farms Metropolitan District No. 6; Series 2022 A, GO Bonds | | | 6.50% | | | | 06/01/2052 | | | | 13,000 | | | 12,505,836 |
Settler’s Crossing Metropolitan District No. 1; | | | | | | | | | | | | | | |
Series 2020 B, GO Bonds | | | 7.63% | | | | 12/15/2050 | | | | 598 | | | 543,678 |
Series 2021 C, GO Bonds | | | 7.63% | | | | 12/15/2052 | | | | 4,560 | | | 4,040,184 |
Severance Shores Metropolitan District No. 4; Series 2020 B, GO Bonds | | | 8.25% | | | | 12/15/2049 | | | | 805 | | | 743,739 |
Silver Peaks Metropolitan District No. 3; | | | | | | | | | | | | | | |
Series 2020 A, GO Bonds | | | 5.00% | | | | 12/01/2050 | | | | 565 | | | 483,922 |
Series 2020 B, GO Bonds | | | 7.00% | | | | 12/15/2050 | | | | 500 | | | 440,656 |
South Aurora Regional Improvement Authority; Series 2018, RB | | | 6.25% | | | | 12/01/2057 | | | | 2,815 | | | 2,634,036 |
See accompanying Notes to Financial Statements which are an integral part of the financial statements.
| | |
| 16 | | Invesco High Yield Municipal Fund |
| | | | | | | | | | | | | | |
| | | Interest Rate | | | Maturity Date | | | Principal Amount (000) | | | Value |
Colorado–(continued) | | | | | | | | | | | | | | |
Spring Valley Metropolitan District No. 3; Series 2020 B, GO Bonds | | | 8.50% | | | | 12/15/2049 | | | $ | 656 | | | $ 605,568 |
St. Vrain Lakes Metropolitan District No. 2; Series 2017 B, GO Bonds | | | 7.63% | | | | 12/15/2047 | | | | 1,080 | | | 1,058,328 |
STC Metropolitan District No. 2; Series 2019 B, GO Bonds | | | 8.00% | | | | 12/15/2049 | | | | 3,954 | | | 3,633,956 |
Sterling Ranch Community Authority Board; Series 2020 B, RB | | | 7.13% | | | | 12/15/2050 | | | | 716 | | | 677,568 |
Tailholt Metropolitan District No. 3; | | | | | | | | | | | | | | |
Series 2018 A, GO Bonds | | | 6.00% | | | | 12/01/2048 | | | | 7,545 | | | 7,248,319 |
Series 2018 B, GO Bonds | | | 8.13% | | | | 12/15/2048 | | | | 1,647 | | | 1,553,073 |
Talon Pointe Metropolitan District; | | | | | | | | | | | | | | |
Series 2019 A, Ref. GO Bonds | | | 5.25% | | | | 12/01/2039 | | | | 3,260 | | | 2,781,221 |
Series 2019 A, Ref. GO Bonds | | | 5.25% | | | | 12/01/2051 | | | | 5,345 | | | 4,145,457 |
Series 2019 B, Ref. GO Bonds | | | 8.00% | | | | 12/15/2051 | | | | 2,595 | | | 2,151,568 |
Three Springs Metropolitan District No. 1; Series 2020 B, Ref. GO Bonds | | | 7.13% | | | | 12/15/2050 | | | | 1,695 | | | 1,507,453 |
Timberleaf Metropolitan District; Series 2020 B, GO Bonds | | | 8.25% | | | | 12/15/2050 | | | | 777 | | | 719,906 |
Trails at Crowfoot Metropolitan District No. 3; | | | | | | | | | | | | | | |
Series 2019 A, GO Bonds | | | 5.00% | | | | 12/01/2039 | | | | 1,000 | | | 945,648 |
Series 2019, GO Bonds | | | 9.00% | | | | 12/15/2049 | | | | 3,140 | | | 2,928,894 |
Transport Metropolitan District No. 3; Series 2021 A-2, GO Bonds(f) | | | 5.50% | | | | 12/01/2051 | | | | 3,000 | | | 2,195,392 |
Tuscan Foothills Village Metropolitan District; Series 2019 A, GO Bonds | | | 6.25% | | | | 12/01/2049 | | | | 1,240 | | | 1,171,099 |
USAFA Visitor’s Center Business Improvement District; Series 2022 C, RB(h) | | | 7.75% | | | | 12/15/2052 | | | | 24,275 | | | 22,044,484 |
Velocity Metropolitan District No. 5; | | | | | | | | | | | | | | |
Series 2020 A-2, GO Bonds(f) | | | 6.00% | | | | 12/01/2050 | | | | 13,100 | | | 8,776,716 |
Series 2022 B, GO Bonds | | | 8.00% | | | | 12/15/2039 | | | | 14,197 | | | 12,940,964 |
Verve Metropolitan District No. 1; Series 2023, GO Bonds | | | 6.75% | | | | 12/01/2052 | | | | 4,385 | | | 3,980,482 |
Villages at Castle Rock Metropolitan District No. 6; Series 2021 B, Ref. GO Bonds(h) | | | 5.70% | | | | 12/01/2051 | | | | 27,543 | | | 24,280,309 |
Villages at Johnstown Metropolitan District No. 3; | | | | | | | | | | | | | | |
Series 2020 A, GO Bonds | | | 5.00% | | | | 12/01/2050 | | | | 1,020 | | | 873,978 |
Series 2020 B, GO Bonds | | | 7.50% | | | | 12/15/2050 | | | | 843 | | | 756,113 |
Wagons West Metropolitan District; Series 2020 B-3, GO Bonds | | | 8.50% | | | | 12/15/2049 | | | | 553 | | | 506,464 |
Waters’ Edge Metropolitan District No. 2; Series 2021, GO Bonds | | | 5.00% | | | | 12/01/2051 | | | | 4,445 | | | 3,640,118 |
Waterstone Metropolitan District No. 1; Series 2020 A, GO Bonds | | | 6.00% | | | | 12/01/2049 | | | | 15,680 | | | 15,553,169 |
Waterview II Metropolitan District; Series 2022 B, GO Bonds | | | 8.00% | | | | 12/15/2051 | | | | 2,915 | | | 2,674,423 |
Westerly Metropolitan District No. 4; | | | | | | | | | | | | | | |
Series 2021 A-2, GO Bonds(f) | | | 5.20% | | | | 12/01/2050 | | | | 1,000 | | | 653,771 |
Series 2021 B, GO Bonds | | | 8.00% | | | | 12/15/2050 | | | | 4,238 | | | 3,720,164 |
Wild Plum Metropolitan District; Series 2019 B, GO Bonds(b)(h)(m) | | | 7.75% | | | | 12/01/2024 | | | | 505 | | | 554,668 |
Willow Springs Metropolitan District; Series 2019 B, GO Bonds | | | 7.75% | | | | 12/15/2049 | | | | 650 | | | 588,115 |
Windler Public Improvement Authority; | | | | | | | | | | | | | | |
Series 2021 A-1, RB | | | 4.13% | | | | 12/01/2051 | | | | 9,000 | | | 6,150,656 |
Series 2021 A-2, RB(f) | | | 4.63% | | | | 12/01/2051 | | | | 40,060 | | | 21,227,674 |
Winsome Metropolitan District No. 3; Series 2021 A, GO Bonds(h) | | | 5.13% | | | | 12/01/2050 | | | | 2,700 | | | 2,200,394 |
| | | | | | | | | | | | | | | 953,918,216 |
| | | | |
Connecticut–0.27% | | | | | | | | | | | | | | |
Connecticut (State of) Health & Educational Facilities Authority; Series 2020 G-1, Ref. RB(h) | | | 5.00% | | | | 07/01/2039 | | | | 1,100 | | | 1,038,607 |
Connecticut (State of) Health & Educational Facilities Authority (Nuvance Health); Series 2019 A, Ref. RB | | | 4.00% | | | | 07/01/2041 | | | | 5,670 | | | 5,033,583 |
Connecticut (State of) Health & Educational Facilities Authority (Stamford Hospital); Series 2022, Ref. RB | | | 4.00% | | | | 07/01/2041 | | | | 1,725 | | | 1,546,781 |
Georgetown (City of), CT Special Taxing District; Series 2006 A, GO Bonds(d)(k) | | | 5.13% | | | | 10/01/2036 | | | | 7,935 | | | 952,200 |
Hamden (Town of), CT (Whitney Center); | | | | | | | | | | | | | | |
Series 2019, Ref. RB | | | 5.00% | | | | 01/01/2050 | | | | 10,280 | | | 8,490,502 |
Series 2022 A, RB | | | 7.00% | | | | 01/01/2053 | | | | 4,000 | | | 4,110,965 |
| | | | | | | | | | | | | | 21,172,638 |
| | | | | |
Delaware–0.17% | | | | | | | | | | | | | | |
Delaware (State of) Economic Development Authority (Aspira of Delaware Charter Operations, Inc.); Series 2016 A, RB | | | 5.00% | | | | 06/01/2051 | | | | 2,200 | | | 2,034,126 |
See accompanying Notes to Financial Statements which are an integral part of the financial statements.
| | |
| 17 | | Invesco High Yield Municipal Fund |
| | | | | | | | | | | | | | | | |
| | | Interest Rate | | | Maturity Date | | | Principal Amount (000) | | | Value | |
Delaware–(continued) | | | | | | | | | | | | | | | | |
Millsboro (Town of), DE (Plantation Lakes Special Development District); | | | | | | | | | | | | | | | | |
Series 2018, Ref. RB(h) | | | 5.13% | | | | 07/01/2038 | | | $ | 7,992 | | | $ | 7,782,905 | |
Series 2018, Ref. RB(h) | | | 5.25% | | | | 07/01/2048 | | | | 4,098 | | | | 3,883,782 | |
| | | | | | | | | | | | | | | | 13,700,813 | |
District of Columbia–0.80% | | | | | | | | | | | | | | | | |
District of Columbia (Ingleside at Rock Creek); | | | | | | | | | | | | | | | | |
Series 2017 A, RB | | | 5.00% | | | | 07/01/2032 | | | | 500 | | | | 490,113 | |
Series 2017 A, RB | | | 5.00% | | | | 07/01/2037 | | | | 2,650 | | | | 2,489,562 | |
Series 2017 A, RB | | | 5.00% | | | | 07/01/2052 | | | | 9,485 | | | | 8,010,682 | |
District of Columbia (Provident Group – Howard Properties LLC); Series 2013, RB | | | 5.00% | | | | 10/01/2045 | | | | 7,750 | | | | 7,377,051 | |
District of Columbia Tobacco Settlement Financing Corp.; | | | | | | | | | | | | | | | | |
Series 2006 A, RB(i) | | | 0.00% | | | | 06/15/2046 | | | | 100,920 | | | | 22,704,235 | |
Series 2006 C, RB(i) | | | 0.00% | | | | 06/15/2055 | | | | 60,320 | | | | 5,613,180 | |
Metropolitan Washington Airports Authority; | | | | | | | | | | | | | | | | |
Series 2021 A, Ref. RB(c) | | | 5.00% | | | | 10/01/2046 | | | | 5,000 | | | | 5,185,590 | |
Series 2022, Ref. RB (INS - AGM)(g) | | | 4.00% | | | | 10/01/2052 | | | | 5,000 | | | | 4,553,486 | |
Metropolitan Washington Airports Authority (Dulles Metrorail and Capital Improvement); Series 2019 B, Ref. RB | | | 4.00% | | | | 10/01/2049 | | | | 7,500 | | | | 6,726,972 | |
| | | | | | | | | | | | | | | | 63,150,871 | |
Florida–7.56% | | | | | | | | | | | | | | | | |
Alachua (County of), FL Health Facilities Authority (East Ridge Retirement Village, Inc.); | | | | | | | | | | | | | | | | |
Series 2014, RB (Acquired 09/15/2020; Cost $2,192,702)(e) | | | 5.00% | | | | 11/15/2024 | | | | 2,320 | | | | 2,186,177 | |
Series 2014, RB (Acquired 09/15/2020; Cost $886,944)(e) | | | 5.63% | | | | 11/15/2029 | | | | 1,000 | | | | 844,455 | |
Series 2014, RB (Acquired 06/03/2020-06/04/2020; Cost $3,437,500)(e) | | | 6.00% | | | | 11/15/2029 | | | | 4,000 | | | | 3,398,427 | |
Series 2014, RB (Acquired 03/31/2020-10/04/2021; Cost $2,771,510)(e) | | | 6.00% | | | | 11/15/2034 | | | | 3,305 | | | | 2,551,766 | |
Series 2014, RB (Acquired 02/26/2014-12/04/2020; Cost $20,042,466)(e) | | | 6.25% | | | | 11/15/2044 | | | | 22,145 | | | | 15,877,440 | |
Series 2014, RB (Acquired 02/26/2014-09/15/2020; Cost $4,770,787)(e) | | | 6.38% | | | | 11/15/2049 | | | | 5,130 | | | | 3,618,183 | |
Alachua (County of), FL Health Facilities Authority (Shands Teaching Hospital & Clinics, Inc.); Series 2022, RB(j)(l) | | | 4.00% | | | | 12/01/2049 | | | | 11,450 | | | | 10,044,940 | |
Alachua (County of), FL Health Facilities Authority (Terraces at Bonita Springs); | | | | | | | | | | | | | | | | |
Series 2022 A, Ref. RB(h) | | | 5.00% | | | | 11/15/2061 | | | | 40,750 | | | | 27,294,774 | |
Series 2022 B, RB(h) | | | 6.50% | | | | 11/15/2033 | | | | 3,325 | | | | 2,900,508 | |
Atlantic Beach (City of), FL (Fleet Landing); | | | | | | | | | | | | | | | | |
Series 2018 A, RB | | | 5.00% | | | | 11/15/2043 | | | | 1,100 | | | | 971,672 | |
Series 2018 A, RB | | | 5.00% | | | | 11/15/2048 | | | | 5,000 | | | | 4,290,346 | |
Brevard (County of), FL Health Facilities Authority; Series 2022, RB(j)(l) | | | 5.00% | | | | 04/01/2052 | | | | 10,000 | | | | 10,320,789 | |
Broward (County of), FL Airport System; Series 2017, RB(c)(j)(l) | | | 5.00% | | | | 10/01/2042 | | | | 12,045 | | | | 12,266,935 | |
Buckeye Park Community Development District; Series 2008 A, RB | | | 7.88% | | | | 05/01/2038 | | | | 765 | | | | 760,651 | |
Cape Coral (City of), FL Health Facilities Authority (Gulf Care, Inc.); | | | | | | | | | | | | | | | | |
Series 2015, Ref. RB(h) | | | 5.88% | | | | 07/01/2040 | | | | 1,165 | | | | 1,055,034 | |
Series 2015, Ref. RB(h) | | | 6.00% | | | | 07/01/2045 | | | | 7,500 | | | | 6,712,495 | |
Series 2015, Ref. RB(h) | | | 6.00% | | | | 07/01/2050 | | | | 3,860 | | | | 3,396,466 | |
Capital Trust Agency, Inc. (Franklin Academy); | | | | | | | | | | | | | | | | |
Series 2020, RB(h) | | | 5.00% | | | | 12/15/2050 | | | | 1,955 | | | | 1,664,056 | |
Series 2020, RB(h) | | | 5.00% | | | | 12/15/2055 | | | | 2,845 | | | | 2,378,821 | |
Capital Trust Agency, Inc. (H-Bay Ministries, Inc.- Superior Residences); | | | | | | | | | | | | | | | | |
Series 2018 A-1, RB(d) | | | 4.00% | | | | 07/01/2038 | | | | 2,750 | | | | 1,072,500 | |
Series 2018 A-1, RB(d) | | | 4.00% | | | | 07/01/2043 | | | | 1,000 | | | | 390,000 | |
Series 2018 A-1, RB(d) | | | 5.00% | | | | 07/01/2048 | | | | 5,660 | | | | 2,207,400 | |
Series 2018 A-1, RB(d) | | | 4.13% | | | | 07/01/2053 | | | | 2,000 | | | | 780,000 | |
Series 2018 B, RB(d) | | | 5.00% | | | | 07/01/2043 | | | | 500 | | | | 50,000 | |
Series 2018 B, RB(d) | | | 5.00% | | | | 07/01/2053 | | �� | | 1,100 | | | | 110,000 | |
Capital Trust Agency, Inc. (Imagine School at North Manatee); | | | | | | | | | | | | | | | | |
Series 2021 C, RB(h) | | | 5.00% | | | | 06/01/2056 | | | | 520 | | | | 433,787 | |
Series 2021, RB(h) | | | 5.00% | | | | 06/01/2056 | | | | 900 | | | | 750,785 | |
Capital Trust Agency, Inc. (New Springs, Inc.); Series 2021, RB | | | 4.75% | | | | 06/01/2056 | | | | 2,825 | | | | 2,056,640 | |
See accompanying Notes to Financial Statements which are an integral part of the financial statements.
| | |
| 18 | | Invesco High Yield Municipal Fund |
| | | | | | | | | | | | | | |
| | | Interest Rate | | | Maturity Date | | | Principal Amount (000) | | | Value |
Florida–(continued) | | | | | | | | | | | | | | |
Capital Trust Agency, Inc. (Sarasota-Manatee Jewish Housing Council, Inc.); | | | | | | | | | | | | | | |
Series 2017, Ref. RB(h) | | | 5.00% | | | | 07/01/2037 | | | $ | 1,000 | | | $ 844,037 |
Series 2017, Ref. RB(h) | | | 5.00% | | | | 07/01/2046 | | | | 600 | | | 462,378 |
Capital Trust Agency, Inc. (Sustainability Bonds); Series 2021, RB(h) | | | 4.00% | | | | 06/15/2051 | | | | 2,220 | | | 1,621,223 |
Capital Trust Agency, Inc. (Tallahassee Tapestry); | | | | | | | | | | | | | | |
Series 2015, RB (Acquired 12/02/2015; Cost $5,348,646)(d)(e)(h) | | | 6.75% | | | | 12/03/2035 | | | | 5,405 | | | 1,770,138 |
Series 2015, RB (Acquired 12/02/2015; Cost $1,976,520)(d)(e)(h) | | | 7.00% | | | | 12/01/2045 | | | | 2,000 | | | 655,000 |
Series 2015, RB (Acquired 12/02/2015; Cost $989,541)(d)(e)(h) | | | 7.13% | | | | 12/01/2050 | | | | 1,000 | | | 327,500 |
Capital Trust Agency, Inc. (University Bridge LLC Student Housing); | | | | | | | | | | | | | | |
Series 2018 A, RB(h) | | | 5.25% | | | | 12/01/2043 | | | | 15,850 | | | 14,968,721 |
Series 2018 A, RB(h) | | | 5.25% | | | | 12/01/2058 | | | | 16,600 | | | 14,956,952 |
Capital Trust Agency, Inc. (WFCS Portfolio); Series 2021 A, RB(h) | | | 5.00% | | | | 01/01/2056 | | | | 1,000 | | | 750,131 |
Charlotte (County of), FL Industrial Development Authority (Town & Country Utilities); | | | | | | | | | | | | | | |
Series 2019, RB(c)(h) | | | 5.00% | | | | 10/01/2049 | | | | 2,420 | | | 2,280,347 |
Series 2021, RB(c)(h) | | | 4.00% | | | | 10/01/2051 | | | | 2,000 | | | 1,497,915 |
Collier (County of), FL Industrial Development Authority (The Arlington of Naples); | | | | | | | | | | | | | | |
Series 2014 A, RB (Acquired 12/16/2013-09/18/2020; Cost $6,344,740)(d)(e)(h) | | | 8.13% | | | | 05/15/2044 | | | | 6,670 | | | 3,868,600 |
Series 2014 A, RB (Acquired 12/16/2013-12/19/2013; Cost $43,950,403)(d)(e)(h) | | | 8.25% | | | | 05/15/2049 | | | | 44,570 | | | 25,850,600 |
Series 2015 A, RB (Acquired 06/30/2015; Cost $345,000)(d)(e)(h) | | | 5.50% | | | | 05/15/2025 | | | | 345 | | | 200,100 |
Series 2015 A, RB (Acquired 06/30/2015; Cost $875,000)(d)(e)(h) | | | 6.25% | | | | 05/15/2035 | | | | 875 | | | 507,500 |
Series 2015 A, RB (Acquired 06/30/2015; Cost $3,000,000)(d)(e)(h) | | | 6.50% | | | | 05/15/2049 | | | | 3,000 | | | 1,740,000 |
East Homestead Community Development District; Series 2013, RB | | | 5.63% | | | | 11/01/2043 | | | | 2,000 | | | 2,001,890 |
Escambia (County of), FL Health Facilities Authority; Series 2020, Ref. RB | | | 4.00% | | | | 08/15/2045 | | | | 2,655 | | | 2,396,204 |
Florida (State of), FL Department of Transportation (Turnpike); Series 2022 C, RB(j) | | | 5.00% | | | | 07/01/2052 | | | | 10,000 | | | 10,776,656 |
Florida Development Finance Corp. (Brightline Fllorida Passenger Rail Expansion); Series 2022 A, Ref. RB(b)(c)(h) | | | 7.25% | | | | 10/03/2023 | | | | 27,000 | | | 27,086,305 |
Florida Development Finance Corp. (Central Charter School); | | | | | | | | | | | | | | |
Series 2022, Ref. RB(h) | | | 5.63% | | | | 08/15/2042 | | | | 1,515 | | | 1,404,388 |
Series 2022, Ref. RB(h) | | | 5.88% | | | | 08/15/2052 | | | | 5,000 | | | 4,604,335 |
Series 2022, Ref. RB(h) | | | 6.00% | | | | 08/15/2057 | | | | 5,500 | | | 5,067,074 |
Florida Development Finance Corp. (Global Outreach Charter Academy); | | | | | | | | | | | | | | |
Series 2021 A, Ref. RB(h) | | | 4.00% | | | | 06/30/2046 | | | | 925 | | | 698,993 |
Series 2021 A, Ref. RB(h) | | | 4.00% | | | | 06/30/2056 | | | | 1,390 | | | 975,974 |
Florida Development Finance Corp. (Green Bonds); Series 2019 B, RB(c)(h) | | | 7.38% | | | | 01/01/2049 | | | | 30,740 | | | 27,836,601 |
Florida Development Finance Corp. (Mater Academy); Series 2022 A, RB | | | 5.00% | | | | 06/15/2056 | | | | 3,815 | | | 3,482,262 |
Florida Development Finance Corp. (Palm Bay Academy, Inc.); | | | | | | | | | | | | | | |
Series 2017, Ref. RB(h)(k) | | | 0.00% | | | | 05/15/2037 | | | | 970 | | | 10 |
Series 2017, Ref. RB(h) | | | 6.38% | | | | 05/15/2037 | | | | 2,705 | | | 2,300,864 |
Series 2017, Ref. RB(h)(k) | | | 6.38% | | | | 05/15/2037 | | | | 1,265 | | | 253,000 |
Florida Development Finance Corp. (Renaissance Charter School, Inc.); Series 2015, RB(h) | | | 6.13% | | | | 06/15/2046 | | | | 14,035 | | | 14,070,409 |
Florida Development Finance Corp. (Virgin Trains USA Passenger Rail); | | | | | | | | | | | | | | |
Series 2019 A, Ref. RB(b)(c)(h) | | | 6.25% | | | | 01/01/2024 | | | | 14,410 | | | 14,014,356 |
Series 2019 A, Ref. RB(b)(c)(h) | | | 6.38% | | | | 01/01/2026 | | | | 43,480 | | | 40,390,794 |
Series 2019 A, Ref. RB(b)(c)(h) | | | 6.50% | | | | 01/01/2029 | | | | 6,310 | | | 5,800,632 |
Gramercy Farms Community Development District; | | | | | | | | | | | | | | |
Series 2007 A-1, RB(d) | | | 5.25% | | | | 05/01/2039 | | | | 1,335 | | | 214 |
Series 2007 A-2, RB(d) | | | 5.25% | | | | 05/01/2039 | | | | 1,700 | | | 272 |
Series 2011, Ref. RB(k) | | | 0.00% | | | | 05/01/2039 | | | | 14,435 | | | 7,506,200 |
Highlands (County of), FL Health Facilities Authority (Trousdale Foundation Properties); Series 2018 A, RB (Acquired 08/29/2018-12/30/2020; Cost $12,283,078)(e) | | | 6.25% | | | | 04/01/2049 | | | | 13,980 | | | 4,893,000 |
Kendall Breeze West Community Development District; Series 2004, RB | | | 5.88% | | | | 05/01/2034 | | | | 905 | | | 905,479 |
Lake (County of), FL (Lakeside at Waterman Village); | | | | | | | | | | | | | | |
Series 2020 A, Ref. RB | | | 5.75% | | | | 08/15/2050 | | | | 9,000 | | | 7,762,087 |
Series 2020 A, Ref. RB | | | 5.75% | | | | 08/15/2055 | | | | 6,000 | | | 5,063,205 |
Lake Helen (City of), FL (Ivy Hawn Charter School of the Arts); | | | | | | | | | | | | | | |
Series 2018 A, RB(h) | | | 5.50% | | | | 07/15/2048 | | | | 2,250 | | | 2,001,259 |
Series 2018 A, RB(h) | | | 5.75% | | | | 07/15/2053 | | | | 2,030 | | | 1,897,695 |
See accompanying Notes to Financial Statements which are an integral part of the financial statements.
| | |
| 19 | | Invesco High Yield Municipal Fund |
| | | | | | | | | | | | | | | | |
| | | Interest Rate | | | Maturity Date | | | Principal Amount (000) | | | Value | |
Florida–(continued) | | | | | | | | | | | | | | | | |
Lee (County of), FL Industrial Development Authority (Lee County Community Charter Schools, LLC); | | | | | | | | | | | | | | | | |
Series 2012, IDR(h) | | | 5.50% | | | | 06/15/2032 | | | $ | 1,880 | | | $ | 1,823,319 | |
Series 2012, IDR(h) | | | 5.75% | | | | 06/15/2042 | | | | 3,210 | | | | 3,075,385 | |
Miami Beach (City of), FL Health Facilities Authority (Mt. Sinai Medical Center); Series 2021, RB | | | 4.00% | | | | 11/15/2051 | | | | 7,000 | | | | 6,023,846 | |
Miami-Dade (County of), FL; | | | | | | | | | | | | | | | | |
Series 2009, RB(i) | | | 0.00% | | | | 10/01/2035 | | | | 12,000 | | | | 7,151,522 | |
Series 2009, RB(i) | | | 0.00% | | | | 10/01/2042 | | | | 42,215 | | | | 16,712,057 | |
Series 2021, RB (INS - AGM)(g) | | | 3.00% | | | | 10/01/2043 | | | | 5,065 | | | | 3,947,643 | |
Series 2021, RB (INS - AGM)(g)(j)(l) | | | 3.00% | | | | 10/01/2051 | | | | 12,000 | | | | 8,551,897 | |
Series 2022 A(j) | | | 5.00% | | | | 04/01/2052 | | | | 15,720 | | | | 16,901,646 | |
Series 2022 A, Ref. RB(c) | | | 5.25% | | | | 10/01/2052 | | | | 9,250 | | | | 9,657,325 | |
Series 2022, RB(j) | | | 5.00% | | | | 07/01/2052 | | | | 10,000 | | | | 10,688,213 | |
Series 2023 A, Ref. RB(c) | | | 5.00% | | | | 10/01/2047 | | | | 10,000 | | | | 10,300,950 | |
Subseries 2021 A-1, Ref. RB (INS - AGM)(c)(g) | | | 4.00% | | | | 10/01/2045 | | | | 9,000 | | | | 8,293,451 | |
Orange (County of), FL Health Facilities Authority (Orlando Health Obligated Group); Series 2022, RB(j) | | | 4.00% | | | | 10/01/2052 | | | | 17,245 | | | | 15,442,520 | |
Orange (County of), FL Housing Finance Authority (Alhambra Trace Apartments); Series 1998 C, RB | | | 7.00% | | | | 04/01/2028 | | | | 820 | | | | 820,243 | |
Orange (County of), FL Housing Finance Authority (Governors Manor Apartments); Series 2001 F-4, RB | | | 7.25% | | | | 10/01/2031 | | | | 2,360 | | | | 2,362,008 | |
Orange (County of), FL Housing Finance Authority (Lake Davis Apartments); Series 2001 F-1, RB | | | 7.25% | | | | 10/01/2031 | | | | 490 | | | | 490,417 | |
Orange (County of), FL Housing Finance Authority (Lake Jennie Phase I); Series 2001 F-2, RB | | | 7.25% | | | | 10/01/2031 | | | | 115 | | | | 115,098 | |
Orange (County of), FL Housing Finance Authority (Lake Jennie Phase II); Series 2001 F-3, RB | | | 7.25% | | | | 10/01/2031 | | | | 490 | | | | 490,417 | |
Orange (County of), FL Housing Finance Authority (Mellonville Trace Apartments); Series 2001 F-5, RB | | | 7.25% | | | | 10/01/2031 | | | | 200 | | | | 200,170 | |
Palm Beach (County of), FL Health Facilities Authority (Toby & Leon Cooperman Sinai Residences of Boca Raton Expanison); Series 2022, Ref. RB | | | 4.00% | | | | 06/01/2041 | | | | 2,100 | | | | 1,679,752 | |
Polk (County of), FL Industrial Development Authority (Mineral Development LLC); Series 2020, RB(c)(h) | | | 5.88% | | | | 01/01/2033 | | | | 7,000 | | | | 7,027,855 | |
Reunion East Community Development District; | | | | | | | | | | | | | | | | |
Series 2002 A-2, RB(d)(k) | | | 7.38% | | | | 05/01/2033 | | | | 145 | | | | 1 | |
Series 2005, RB(d)(k) | | | 5.80% | | | | 05/01/2036 | | | | 1,716 | | | | 17 | |
Sarasota (County of), FL Public Hospital District (Sarasota Memorial Hospital); | | | | | | | | | | | | | | | | |
Series 2018, RB(j) | | | 4.00% | | | | 07/01/2048 | | | | 36,680 | | | | 33,368,900 | |
Series 2022, RB | | | 4.00% | | | | 07/01/2052 | | | | 2,000 | | | | 1,788,808 | |
Seminole (County of), FL; Series 2022, RB(j) | | | 5.00% | | | | 10/01/2052 | | | | 10,000 | | | | 10,509,289 | |
St. Johns (County of), FL; Series 2022, RB(j) | | | 5.00% | | | | 06/01/2052 | | | | 15,145 | | | | 16,581,994 | |
Sterling Hill Community Development District; Series 2003 A, RB(k)(n) | | | 6.20% | | | | 05/01/2035 | | | | 1,375 | | | | 742,325 | |
Tampa Bay (City of), FL Water; Series 2001 A, RB (INS - NATL)(g)(j) | | | 6.00% | | | | 10/01/2029 | | | | 13,440 | | | | 16,093,258 | |
Treeline Preserve Community Development District; Series 2007 A, RB(d)(k) | | | 6.80% | | | | 05/01/2039 | | | | 4,895 | | | | 685,300 | |
| | | | | | | | | | | | | | | | 597,401,973 | |
| | | | |
Georgia–0.85% | | | | | | | | | | | | | | | | |
Atlanta (City of), GA Department of Aviation; Series 2022 B, RB(c) | | | 5.00% | | | | 07/01/2052 | | | | 2,100 | | | | 2,157,555 | |
Brookhaven (City of), GA Development Authority (Children’s Healthcare of Atlanta, Inc.); Series 2019 A, RB(j)(l) | | | 4.00% | | | | 07/01/2049 | | | | 10,150 | | | | 9,405,254 | |
Brookhaven (City of), GA Urban Redevelopment Agency; Series 2023 A, RB | | | 4.00% | | | | 07/01/2053 | | | | 10,355 | | | | 9,883,627 | |
Fulton (County of), GA Development Authority (Piedmont Healthcare, Inc.); Series 2019, RB(j) | | | 4.00% | | | | 07/01/2049 | | | | 15,000 | | | | 13,398,462 | |
Gainesville (City of) & Hall (County of), GA Hospital Authority (Northeast Georgia Health System, Inc.); | | | | | | | | | | | | | | | | |
Series 2021 A, RB | | | 4.00% | | | | 02/15/2051 | | | | 6,130 | | | | 5,413,203 | |
Series 2021, RB | | | 4.00% | | | | 02/15/2046 | | | | 6,200 | | | | 5,656,374 | |
George L Smith II Congress Center Authority (Convention Center Hotel); | | | | | | | | | | | | | | | | |
Series 2021, RB(h) | | | 5.00% | | | | 01/01/2036 | | | | 2,000 | | | | 1,813,605 | |
Series 2021, RB(h) | | | 5.00% | | | | 01/01/2054 | | | | 6,000 | | | | 4,709,602 | |
Main Street Natural Gas, Inc.; Series 2019 A, RB | | | 5.00% | | | | 05/15/2049 | | | | 5,000 | | | | 4,962,366 | |
See accompanying Notes to Financial Statements which are an integral part of the financial statements.
| | |
| 20 | | Invesco High Yield Municipal Fund |
| | | | | | | | | | | | | | | | |
| | | Interest Rate | | | Maturity Date | | | Principal Amount (000) | | | Value | |
Georgia–(continued) | | | | | | | | | | | | | | | | |
Marietta (City of), GA Developing Authority (Life University, Inc.); | | | | | | | | | | | | | | | | |
Series 2017 A, Ref. RB(h) | | | 5.00% | | | | 11/01/2037 | | | $ | 6,000 | | | $ | 5,793,932 | |
Series 2017 A, Ref. RB(h) | | | 5.00% | | | | 11/01/2047 | | | | 4,480 | | | | 4,111,389 | |
| | | | | | | | | | | | | | | | 67,305,369 | |
| | | | |
Hawaii–0.13% | | | | | | | | | | | | | | | | |
Hawaii (State of) Airport System; Series 2022 A(c)(j) | | | 5.00% | | | | 07/01/2047 | | | | 10,000 | | | | 10,294,391 | |
| | | | |
Idaho–0.34% | | | | | | | | | | | | | | | | |
Gooding Industrial Development Corp. (Intrepid Technology & Resources); Series 2006, RB (Acquired 11/03/2006; Cost $7,640,000)(c)(d)(e)(k) | | | 7.50% | | | | 11/01/2024 | | | | 7,640 | | | | 0 | |
Idaho (State of) Health Facilities Authority (Terraces of Boise); | | | | | | | | | | | | | | | | |
Series 2014, RB | | | 3.80% | | | | 10/01/2031 | | | | 550 | | | | 465,161 | |
Series 2014, RB | | | 4.00% | | | | 10/01/2033 | | | | 1,000 | | | | 821,645 | |
Series 2014, RB | | | 4.50% | | | | 10/01/2050 | | | | 17,030 | | | | 12,116,799 | |
Series 2014, RB | | | 4.55% | | | | 10/01/2056 | | | | 13,000 | | | | 9,039,696 | |
Series 2021, Ref. RB | | | 8.00% | | | | 10/01/2028 | | | | 3,450 | | | | 3,187,423 | |
Idaho (State of) Housing & Finance Association (North Star Charter School); Series 2014 B, Ref. RB(h)(i) | | | 0.00% | | | | 07/01/2049 | | | | 9,112 | | | | 1,523,316 | |
| | | | | | | | | | | | | | | | 27,154,040 | |
| | | | |
Illinois–9.39% | | | | | | | | | | | | | | | | |
Bolingbrook (Village of), IL; | | | | | | | | | | | | | | | | |
Series 2005, RB | | | 6.25% | | | | 01/01/2024 | | | | 1,776 | | | | 1,726,705 | |
Series 2005, RB | | | 6.00% | | | | 01/01/2026 | | | | 4,500 | | | | 4,135,035 | |
Bolingbrook (Village of), IL Special Service Area No. 2005-1; Series 2019, Ref. RB | | | 5.25% | | | | 03/01/2041 | | | | 4,000 | | | | 3,657,201 | |
Burbank (City of), IL (Intercultural Montessori Language School); Series 2015, RB(h) | | | 6.25% | | | | 09/01/2045 | | | | 4,000 | | | | 3,966,613 | |
Chicago (City of), IL; | | | | | | | | | | | | | | | | |
Series 2002 B, GO Bonds | | | 5.50% | | | | 01/01/2034 | | | | 3,145 | | | | 3,198,461 | |
Series 2003 B, Ref. GO Bonds | | | 5.50% | | | | 01/01/2032 | | | | 2,150 | | | | 2,188,954 | |
Series 2003 B, Ref. GO Bonds | | | 5.50% | | | | 01/01/2033 | | | | 3,000 | | | | 3,053,706 | |
Series 2003 B, Ref. GO Bonds | | | 5.50% | | | | 01/01/2034 | | | | 2,160 | | | | 2,196,717 | |
Series 2005 D, Ref. GO Bonds | | | 5.50% | | | | 01/01/2037 | | | | 6,075 | | | | 6,156,646 | |
Series 2007 E, Ref. GO Bonds | | | 5.50% | | | | 01/01/2035 | | | | 2,500 | | | | 2,537,739 | |
Series 2007 F, Ref. GO Bonds(j)(l) | | | 5.50% | | | | 01/01/2035 | | | | 10,640 | | | | 10,800,616 | |
Series 2007 G, Ref. GO Bonds | | | 5.50% | | | | 01/01/2035 | | | | 375 | | | | 380,661 | |
Series 2007 G, Ref. GO Bonds | | | 5.50% | | | | 01/01/2042 | | | | 400 | | | | 403,710 | |
Series 2014 A, Ref. GO Bonds | | | 5.25% | | | | 01/01/2033 | | | | 3,250 | | | | 3,271,791 | |
Series 2014, RB(j) | | | 5.00% | | | | 01/01/2044 | | | | 16,755 | | | | 16,760,501 | |
Series 2015 A, GO Bonds | | | 5.50% | | | | 01/01/2034 | | | | 4,440 | | | | 4,515,475 | |
Series 2015 A, GO Bonds | | | 5.50% | | | | 01/01/2035 | | | | 2,000 | | | | 2,030,191 | |
Series 2017 A, Ref. GO Bonds(j)(l) | | | 6.00% | | | | 01/01/2038 | | | | 64,150 | | | | 67,335,471 | |
Chicago (City of), IL (Chicago Works); | | | | | | | | | | | | | | | | |
Series 2023 A, GO Bonds | | | 4.00% | | | | 01/01/2035 | | | | 8,500 | | | | 8,030,084 | |
Series 2023 A, GO Bonds | | | 5.50% | | | | 01/01/2039 | | | | 6,000 | | | | 6,374,431 | |
Series 2023 A, GO Bonds | | | 5.50% | | | | 01/01/2040 | | | | 6,500 | | | | 6,881,475 | |
Chicago (City of), IL (Diversey/Narragansett); Series 2006, COP(k) | | | 7.46% | | | | 02/15/2026 | | | | 1,678 | | | | 1,392,862 | |
Chicago (City of), IL (O’Hare International Airport); | | | | | | | | | | | | | | | | |
Series 2017 D, RB(c)(j) | | | 5.00% | | | | 01/01/2047 | | | | 27,500 | | | | 27,786,850 | |
Series 2017 D, RB(c)(j) | | | 5.00% | | | | 01/01/2052 | | | | 9,960 | | | | 10,037,296 | |
Series 2018 A, Ref. RB(c) | | | 5.00% | | | | 01/01/2053 | | | | 5,000 | | | | 5,065,527 | |
Series 2022 A(c)(j)(l) | | | 5.00% | | | | 01/01/2048 | | | | 14,000 | | | | 14,363,748 | |
Series 2022 A(c)(j) | | | 4.63% | | | | 01/01/2053 | | | | 15,000 | | | | 14,426,783 | |
Series 2022 A (INS - AGM)(c)(g)(j) | | | 5.50% | | | | 01/01/2053 | | | | 15,000 | | | | 15,899,696 | |
Series 2022 A, RB(c) | | | 5.50% | | | | 01/01/2055 | | | | 3,495 | | | | 3,710,813 | |
See accompanying Notes to Financial Statements which are an integral part of the financial statements.
| | |
| 21 | | Invesco High Yield Municipal Fund |
| | | | | | | | | | | | | | |
| | | Interest Rate | | | Maturity Date | | | Principal Amount (000) | | | Value |
Illinois–(continued) | | | | | | | | | | | | | | |
Chicago (City of), IL Board of Education; | | | | | | | | | | | | | | |
Series 2012 A, GO Bonds | | | 5.00% | | | | 12/01/2042 | | | $ | 12,280 | | | $ 11,601,485 |
Series 2015 C, GO Bonds | | | 5.25% | | | | 12/01/2039 | | | | 23,310 | | | 22,576,334 |
Series 2017 H, GO Bonds | | | 5.00% | | | | 12/01/2046 | | | | 5,000 | | | 4,798,097 |
Series 2018 D, GO Bonds | | | 5.00% | | | | 12/01/2046 | | | | 4,000 | | | 3,807,516 |
Series 2018 D, GO Bonds | | | 5.00% | | | | 12/01/2046 | | | | 19,170 | | | 17,954,327 |
Chicago (City of), IL Metropolitan Water Reclamation District; Series 2016 C, GO Bonds(j)(l) | | | 5.00% | | | | 12/01/2045 | | | | 19,750 | | | 20,323,196 |
Chicago (City of), IL Transit Authority; Series 2014, RB(j) | | | 5.25% | | | | 12/01/2049 | | | | 27,000 | | | 27,302,254 |
East Dundee (Village of), IL (Route 25 South Redevelopment); Series 2012, RB | | | 5.63% | | | | 12/01/2031 | | | | 1,530 | | | 1,440,211 |
Evanston (City of), IL (Roycemore School); Series 2021, RB(h) | | | 4.63% | | | | 04/01/2051 | | | | 1,250 | | | 885,499 |
Gilberts (Village of), IL Special Service Area No. 24 (The Conservancy); Subseries 2014 A, RB | | | 5.38% | | | | 03/01/2034 | | | | 1,380 | | | 1,230,998 |
Gilberts (Village of), IL Special Service Area No. 25 (The Conservancy); Series 2018 A, RB(f) | | | 6.00% | | | | 03/01/2048 | | | | 12,967 | | | 11,941,240 |
Illinois (State of); | | | | | | | | | | | | | | |
Series 2013, GO Bonds | | | 5.50% | | | | 07/01/2038 | | | | 9,000 | | | 9,035,155 |
Series 2016, Ref. GO Bonds | | | 5.00% | | | | 02/01/2026 | | | | 4,775 | | | 4,922,290 |
Series 2017 C, GO Bonds | | | 5.00% | | | | 11/01/2029 | | | | 10,350 | | | 10,824,319 |
Series 2017 D, GO Bonds | | | 5.00% | | | | 11/01/2025 | | | | 21,000 | | | 21,592,332 |
Series 2020, GO Bonds | | | 5.75% | | | | 05/01/2045 | | | | 8,750 | | | 9,279,518 |
Illinois (State of) Development Finance Authority (CITGO Petroleum Corp.); Series 2002, RB(c) | | | 8.00% | | | | 06/01/2032 | | | | 4,020 | | | 4,023,363 |
Illinois (State of) Finance Authority; Series 2018 B, Ref. RB(h) | | | 6.00% | | | | 04/01/2038 | | | | 2,100 | | | 2,061,116 |
Illinois (State of) Finance Authority (DePaul College Prep Foundation); Series 2023, Ref. RB(h) | | | 5.63% | | | | 08/01/2053 | | | | 250 | | | 243,768 |
Illinois (State of) Finance Authority (Intrinsic Schools - Belmont School); Series 2015, RB(h) | | | 6.00% | | | | 12/01/2045 | | | | 3,715 | | | 3,814,675 |
Illinois (State of) Finance Authority (Lutheran Communities Obligated Group); | | | | | | | | | | | | | | |
Series 2019 A, Ref. RB | | | 5.00% | | | | 11/01/2035 | | | | 3,000 | | | 2,706,615 |
Series 2019 A, Ref. RB | | | 5.00% | | | | 11/01/2040 | | | | 20,210 | | | 17,412,849 |
Series 2019 A, Ref. RB | | | 5.00% | | | | 11/01/2049 | | | | 26,085 | | | 21,212,935 |
Illinois (State of) Finance Authority (Montgomery Place); | | | | | | | | | | | | | | |
Series 2017, Ref. RB (Acquired 04/12/2017; Cost $6,795,000)(e) | | | 5.25% | | | | 05/15/2037 | | | | 6,795 | | | 5,724,039 |
Series 2017, Ref. RB (Acquired 04/12/2017-09/08/2020; Cost $12,534,469)(e) | | | 5.25% | | | | 05/15/2048 | | | | 12,770 | | | 9,747,231 |
Illinois (State of) Finance Authority (Northshore Edward Elmhurst Health Credit Group); | | | | | | | | | | | | | | |
Series 2020 D, Ref. VRD RB(o) | | | 1.80% | | | | 08/15/2057 | | | | 6,100 | | | 6,100,000 |
Series 2022, RB(j)(l) | | | 5.00% | | | | 08/15/2051 | | | | 25,000 | | | 26,226,535 |
Illinois (State of) Finance Authority (Northshore University Health); Series 2020 B, VRD RB(o) | | | 1.80% | | | | 08/15/2049 | | | | 5,300 | | | 5,300,000 |
Illinois (State of) Finance Authority (Park Place of Elmhurst); Series 2016, RB | | | 5.13% | | | | 05/15/2060 | | | | 65,871 | | | 38,282,522 |
Illinois (State of) Finance Authority (Peace Village); Series 2013, RB(b)(m) | | | 7.00% | | | | 08/15/2023 | | | | 12,210 | | | 12,389,139 |
Illinois (State of) Finance Authority (Plymouth Place); | | | | | | | | | | | | | | |
Series 2015, Ref. RB(b)(m) | | | 5.25% | | | | 05/15/2025 | | | | 4,810 | | | 5,025,656 |
Series 2015, Ref. RB(b)(m) | | | 5.25% | | | | 05/15/2025 | | | | 1,850 | | | 1,932,945 |
Illinois (State of) Finance Authority (Rogers Park Montessori School); | | | | | | | | | | | | | | |
Series 2014, Ref. RB | | | 6.00% | | | | 02/01/2034 | | | | 750 | | | 755,048 |
Series 2014, Ref. RB | | | 6.13% | | | | 02/01/2045 | | | | 1,500 | | | 1,506,964 |
Illinois (State of) Finance Authority (Roosevelt University); | | | | | | | | | | | | | | |
Series 2007, RB | | | 5.50% | | | | 04/01/2037 | | | | 9,170 | | | 8,523,564 |
Series 2018 B, Ref. RB(h) | | | 6.13% | | | | 04/01/2058 | | | | 6,000 | | | 5,729,678 |
Series 2019 A, RB(h) | | | 6.13% | | | | 04/01/2049 | | | | 1,000 | | | 971,343 |
Series 2019 A, RB(h) | | | 6.13% | | | | 04/01/2058 | | | | 23,840 | | | 22,766,110 |
Illinois (State of) Finance Authority (Social Bonds); | | | | | | | | | | | | | | |
Series 2021, Ref. RB | | | 4.00% | | | | 11/01/2041 | | | | 725 | | | 644,343 |
Series 2021, Ref. RB | | | 4.00% | | | | 11/01/2051 | | | | 1,100 | | | 912,810 |
Series 2021, Ref. RB | | | 4.00% | | | | 11/01/2056 | | | | 350 | | | 282,199 |
Illinois (State of) Finance Authority (Three Crowns Park); | | | | | | | | | | | | | | |
Series 2017, Ref. RB | | | 5.00% | | | | 02/15/2032 | | | | 985 | | | 985,324 |
Series 2017, Ref. RB | | | 5.25% | | | | 02/15/2037 | | | | 2,365 | | | 2,366,601 |
Series 2017, Ref. RB | | | 5.25% | | | | 02/15/2047 | | | | 2,500 | | | 2,366,393 |
Illinois (State of) Finance Authority (Villa St. Benedict); | | | | | | | | | | | | | | |
Series 2015, Ref. RB | | | 6.13% | | | | 11/15/2035 | | | | 8,405 | | | 8,509,211 |
Series 2015, Ref. RB | | | 6.38% | | | | 11/15/2043 | | | | 10,700 | | | 10,826,743 |
Illinois (State of) Housing Development Authority (Stonebridge of Gurnee); Series 2016 A, RB(h) | | | 5.45% | | | | 01/01/2046 | | | | 5,000 | | | 3,610,324 |
See accompanying Notes to Financial Statements which are an integral part of the financial statements.
| | |
| 22 | | Invesco High Yield Municipal Fund |
| | | | | | | | | | | | | | |
| | | Interest Rate | | | Maturity Date | | | Principal Amount (000) | | | Value |
Illinois–(continued) | | | | | | | | | | | | | | |
Illinois (State of) Metropolitan Pier & Exposition Authority (McCormick Place Expansion); | | | | | | | | | | | | | | |
Series 2002 A, RB (INS - NATL)(g)(i) | | | 0.00% | | | | 12/15/2038 | | | $ | 29,950 | | | $ 14,185,165 |
Series 2012 B, RB(i) | | | 0.00% | | | | 12/15/2051 | | | | 13,165 | | | 2,699,496 |
Series 2012, RB(i) | | | 0.00% | | | | 12/15/2050 | | | | 35,755 | | | 7,776,466 |
Series 2015 A, RB | | | 5.00% | | | | 06/15/2053 | | | | 4,000 | | | 3,890,227 |
Series 2015, RB(i) | | | 0.00% | | | | 12/15/2052 | | | | 46,000 | | | 8,893,148 |
Series 2017 B, Ref. RB(f) | | | 4.95% | | | | 12/15/2047 | | | | 3,000 | | | 1,739,916 |
Series 2017 B, Ref. RB(i) | | | 0.00% | | | | 12/15/2054 | | | | 5,000 | | | 861,703 |
Series 2017, RB | | | 5.00% | | | | 06/15/2057 | | | | 11,000 | | | 10,665,949 |
Series 2020, Ref. RB | | | 5.00% | | | | 06/15/2050 | | | | 15,700 | | | 15,333,198 |
Malta (Village of), IL (Prairie Springs); Series 2006, RB(k) | | | 5.75% | | | | 12/30/2025 | | | | 1,800 | | | 450,000 |
Matteson (Village of), IL; Series 2015, RB | | | 6.50% | | | | 12/01/2035 | | | | 1,205 | | | 1,237,796 |
Morton Grove (Village of), IL (Sawmill Station Redevelopment); Series 2019, RB | | | 5.00% | | | | 01/01/2039 | | | | 2,000 | | | 1,810,540 |
Plano (City of), IL Special Service Area No. 10 (Lakewood Springs Club); Series 2007, RB(d)(k) | | | 5.80% | | | | 03/01/2037 | | | | 5,615 | | | 617,650 |
Southwestern Illinois Development Authority (US Steel Corp.); Series 2012, RB(c) | | | 5.75% | | | | 08/01/2042 | | | | 1,945 | | | 1,948,368 |
St. Charles (City of), IL Special Service Area No. 21; Series 1998, RB | | | 6.63% | | | | 03/01/2028 | | | | 345 | | | 340,903 |
Villa Park (Village of), IL (Garden Station Redevelopment); Series 2021, RB | | | 4.50% | | | | 12/31/2038 | | | | 1,915 | | | 1,402,415 |
Volo (Village of), IL Special Service Area No. 17; Series 2017, Ref. RB | | | 5.50% | | | | 03/01/2047 | | | | 1,189 | | | 1,171,395 |
Yorkville (United City of), IL (Cannonball/Beecher Road); Series 2007, RB | | | 5.75% | | | | 03/01/2028 | | | | 2,460 | | | 2,458,406 |
| | | | | | | | | | | | | | | 742,243,313 |
| | | | |
Indiana–0.63% | | | | | | | | | | | | | | |
Indiana (State of) Finance Authority (Good Samaritan Hospital); Series 2016 A, RB | | | 5.50% | | | | 04/01/2046 | | | | 5,785 | | | 5,877,294 |
Indiana (State of) Finance Authority (Indiana University Health); Series 2019 A, RB(j)(l) | | | 4.00% | | | | 12/01/2049 | | | | 13,000 | | | 11,808,438 |
Indiana (State of) Finance Authority (Irvington Community School); | | | | | | | | | | | | | | |
Series 2018 A, Ref. RB(h) | | | 5.90% | | | | 07/01/2038 | | | | 1,000 | | | 988,983 |
Series 2018 A, Ref. RB(h) | | | 6.00% | | | | 07/01/2048 | | | | 2,750 | | | 2,662,856 |
Indiana (State of) Finance Authority (University of Evansville); Series 2022 A, Ref. RB | | | 5.25% | | | | 09/01/2044 | | | | 6,465 | | | 6,254,224 |
Valparaiso (City of), IN (Pratt Paper, LLC); | | | | | | | | | | | | | | |
Series 2013, RB(c) | | | 6.75% | | | | 01/01/2034 | | | | 10,785 | | | 11,034,816 |
Series 2013, RB(c) | | | 7.00% | | | | 01/01/2044 | | | | 11,000 | | | 11,277,032 |
| | | | | | | | | | | | | | | 49,903,643 |
| | | | |
Iowa–0.69% | | | | | | | | | | | | | | |
Iowa (State of) Finance Authority (Iowa Fertilizer Co.); | | | | | | | | | | | | | | |
Series 2022, Ref. RB(b) | | | 5.00% | | | | 12/01/2042 | | | | 7,200 | | | 7,227,022 |
Series 2022, Ref. RB | | | 5.00% | | | | 12/01/2050 | | | | 8,450 | | | 8,263,247 |
Iowa (State of) Tobacco Settlement Authority; Series 2021 B-2, Ref. RB(i) | | | 0.00% | | | | 06/01/2065 | | | | 360,375 | | | 38,886,733 |
| | | | | | | | | | | | | | | 54,377,002 |
| | | | |
Kansas–0.44% | | | | | | | | | | | | | | |
Olathe (City of), KS (West Village Center); Series 2007, RB | | | 5.50% | | | | 09/01/2026 | | | | 2,475 | | | 2,278,912 |
Roeland Park (City of), KS (TDD No. 1); | | | | | | | | | | | | | | |
Series 2005, RB(k)(n) | | | 5.75% | | | | 12/01/2025 | | | | 314 | | | 245,304 |
Series 2006 A, RB(k)(n) | | | 5.88% | | | | 12/01/2025 | | | | 590 | | | 460,450 |
Roeland Park (City of), KS (TDD No. 2); Series 2006 B, RB(k)(n) | | | 5.88% | | | | 12/01/2025 | | | | 661 | | | 660,498 |
Wichita (City of), KS (Larksfield Place); | | | | | | | | | | | | | | |
Series 2013 III, Ref. RB(b)(m) | | | 7.13% | | | | 12/15/2023 | | | | 1,000 | | | 1,029,004 |
Series 2013 III, Ref. RB(b)(m) | | | 7.38% | | | | 12/15/2023 | | | | 5,000 | | | 5,154,626 |
Wichita (City of), KS (Presbyterian Manors, Inc.); | | | | | | | | | | | | | | |
Series 2013 IV-A, RB | | | 6.38% | | | | 05/15/2043 | | | | 5,000 | | | 5,005,070 |
Series 2013 IV-A, RB | | | 6.50% | | | | 05/15/2048 | | | | 11,000 | | | 11,011,163 |
Series 2014 IV-A, RB | | | 5.63% | | | | 05/15/2044 | | | | 1,850 | | | 1,748,146 |
Series 2014 IV-A, RB | | | 5.63% | | | | 05/15/2049 | | | | 2,750 | | | 2,566,348 |
Series 2019, Ref. RB | | | 5.00% | | | | 05/15/2034 | | | | 1,000 | | | 926,119 |
Series 2019, Ref. RB | | | 5.00% | | | | 05/15/2050 | | | | 2,115 | | | 1,723,888 |
Wyandotte (County of), KS Unified Government (Legends Apartments Garage & West Lawn); Series 2018, RB | | | 4.50% | | | | 06/01/2040 | | | | 1,765 | | | 1,602,814 |
| | | | | | | | | | | | | | | 34,412,342 |
See accompanying Notes to Financial Statements which are an integral part of the financial statements.
| | |
| 23 | | Invesco High Yield Municipal Fund |
| | | | | | | | | | | | | | |
| | | Interest Rate | | | Maturity Date | | | Principal Amount (000) | | | Value |
Kentucky–0.74% | | | | | | | | | | | | | | |
Christian (County of), KY (Jennie Stuart Medical Center, Inc.); | | | | | | | | | | | | | | |
Series 2016, Ref. RB | | | 5.38% | | | | 02/01/2036 | | | $ | 11,895 | | | $ 12,225,953 |
Series 2016, Ref. RB | | | 5.50% | | | | 02/01/2044 | | | | 8,500 | | | 8,638,683 |
Kentucky (Commonwealth of) Economic Development Finance Authority (Christian Care Communities); Series 2021, Ref. RB | | | 5.13% | | | | 07/01/2055 | | | | 2,000 | | | 1,559,598 |
Kentucky (Commonwealth of) Economic Development Finance Authority (Masonic Homes of Kentucky, Inc.); Series 2012, Ref. RB | | | 5.38% | | | | 11/15/2032 | | | | 1,600 | | | 1,462,091 |
Kentucky (Commonwealth of) Economic Development Finance Authority (Owensboro Health, Inc.); Series 2017 A, Ref. RB | | | 5.00% | | | | 06/01/2041 | | | | 4,000 | | | 4,015,290 |
Kentucky (Commonwealth of) Economic Development Finance Authority (Rosedale Green); | | | | | | | | | | | | | | |
Series 2015, Ref. RB | | | 5.50% | | | | 11/15/2035 | | | | 1,200 | | | 1,080,688 |
Series 2015, Ref. RB | | | 5.75% | | | | 11/15/2045 | | | | 2,350 | | | 2,027,605 |
Series 2015, Ref. RB | | | 5.75% | | | | 11/15/2050 | | | | 4,650 | | | 3,922,708 |
Kentucky (Commonwealth of) Public Transportation Infrastructure Authority (Downtown Crossing); | | | | | | | | | | | | | | |
Series 2013 C, RB(f) | | | 6.60% | | | | 07/01/2039 | | | | 9,000 | | | 10,082,005 |
Series 2013 C, RB(f) | | | 6.75% | | | | 07/01/2043 | | | | 5,000 | | | 5,593,172 |
Series 2013 C, RB(f) | | | 6.88% | | | | 07/01/2046 | | | | 7,000 | | | 7,843,121 |
| | | | | | | | | | | | | | | 58,450,914 |
| | | | |
Louisiana–0.90% | | | | | | | | | | | | | | |
Lafayette (Parish of), LA School Board; | | | | | | | | | | | | | | |
Series 2023, RB(j) | | | 4.00% | | | | 04/01/2048 | | | | 8,500 | | | 8,139,479 |
Series 2023, RB(j) | | | 4.00% | | | | 04/01/2053 | | | | 4,550 | | | 4,284,964 |
Louisiana (State of) Local Government Environmental Facilities & Community Development Authority; | | | | | | | | | | | | | | |
Series 2015 A, Ref. RB | | | 6.00% | | | | 11/15/2030 | | | | 2,250 | | | 2,252,532 |
Series 2015 A, Ref. RB | | | 6.00% | | | | 11/15/2035 | | | | 4,135 | | | 4,027,180 |
Series 2015 A, Ref. RB | | | 6.25% | | | | 11/15/2045 | | | | 8,985 | | | 8,495,606 |
Louisiana (State of) Local Government Environmental Facilities & Community Development Authority (Assumption (Parish of), LA Gomesa); Series 2021, RB(h) | | | 3.88% | | | | 11/01/2045 | | | | 5,875 | | | 4,928,163 |
Louisiana (State of) Local Government Environmental Facilities & Community Development Authority (Cameron (Parish of), LA Gomesa) (Green Bonds); Series 2018, RB(h) | | | 5.65% | | | | 11/01/2037 | | | | 3,850 | | | 4,061,066 |
Louisiana (State of) Local Government Environmental Facilities & Community Development Authority (Lafourche (Parish of), LA Gomesa); Series 2019, RB(h) | | | 3.95% | | | | 11/01/2043 | | | | 4,317 | | | 3,751,813 |
Louisiana (State of) Local Government Environmental Facilities & Community Development Authority (Livingston (Parish of), LA Gomesha) (Green Bonds); Series 2018, RB(h) | | | 5.38% | | | | 11/01/2038 | | | | 575 | | | 597,251 |
Louisiana (State of) Local Government Environmental Facilities & Community Development Authority (St. Mary (Parish of), LA Gomesa); Series 2019, RB(h) | | | 4.40% | | | | 11/01/2044 | | | | 3,680 | | | 3,435,845 |
Louisiana (State of) Local Government Environmental Facilities & Community Development Authority (Terrebonne (Parish of), LA Gomesa); Series 2018 A, RB(h) | | | 5.50% | | | | 11/01/2039 | | | | 2,235 | | | 2,329,622 |
Louisiana (State of) Local Government Environmental Facilities & Community Development Authority (Vermilion (Parish of), LA Gomesha) (Green Bonds); Series 2019, RB(h) | | | 4.63% | | | | 11/01/2038 | | | | 1,825 | | | 1,828,048 |
Louisiana (State of) Public Facilities Authority (Encore Academy); Series 2021, RB(h) | | | 5.00% | | | | 06/01/2051 | | | | 3,055 | | | 2,091,983 |
New Orleans (City of), LA Aviation Board (North Terminal); Series 2017 B, RB(c)(j)(l) | | | 5.00% | | | | 01/01/2048 | | | | 17,750 | | | 17,922,897 |
St. James (Parish of), LA (Nustar Logistics, L.P.); Series 2010, RB(h) | | | 6.35% | | | | 07/01/2040 | | | | 3,000 | | | 3,237,731 |
| | | | | | | | | | | | | | | 71,384,180 |
| | | | |
Maine–0.13% | | | | | | | | | | | | | | |
Maine (State of) Health & Higher Educational Facilities Authority (Eastern Maine Healthcare System); | | | | | | | | | | | | | | |
Series 2016 A, RB | | | 5.00% | | | | 07/01/2041 | | | | 6,800 | | | 6,572,021 |
Series 2016 A, RB | | | 5.00% | | | | 07/01/2046 | | | | 3,705 | | | 3,339,756 |
| | | | | | | | | | | | | | | 9,911,777 |
| | | | |
Maryland–0.29% | | | | | | | | | | | | | | |
Anne Arundel (County of), MD (The Villages at Two Rivers); Series 2014, RB | | | 5.25% | | | | 07/01/2044 | | | | 2,145 | | | 2,124,120 |
Baltimore (City of), MD (Convention Center Hotel); Series 2017, Ref. RB | | | 5.00% | | | | 09/01/2032 | | | | 3,135 | | | 3,167,138 |
Baltimore (City of), MD (Harbor Point); Series 2022, RB | | | 5.00% | | | | 06/01/2051 | | | | 1,000 | | | 941,046 |
Howard (County of), MD (Annapolis Junction Town Center); | | | | | | | | | | | | | | |
Series 2014, RB | | | 5.80% | | | | 02/15/2034 | | | | 720 | | | 701,779 |
Series 2014, RB | | | 6.10% | | | | 02/15/2044 | | | | 1,420 | | | 1,369,577 |
See accompanying Notes to Financial Statements which are an integral part of the financial statements.
| | |
| 24 | | Invesco High Yield Municipal Fund |
| | | | | | | | | | | | | | |
| | | Interest Rate | | | Maturity Date | | | Principal Amount (000) | | | Value |
Maryland–(continued) | | | | | | | | | | | | | | |
Howard (County of), MD (Vantage House Facility); Series 2016, Ref. RB | | | 5.00% | | | | 04/01/2046 | | | $ | 2,710 | | | $ 2,227,347 |
Maryland Economic Development Corp. (Port Covington); Series 2020, RB | | | 4.00% | | | | 09/01/2050 | | | | 4,000 | | | 3,222,084 |
Prince George’s (County of), MD (Westphalia Town Center); | | | | | | | | | | | | | | |
Series 2018, RB(h) | | | 5.13% | | | | 07/01/2039 | | | | 1,300 | | | 1,269,696 |
Series 2018, RB(h) | | | 5.25% | | | | 07/01/2048 | | | | 2,100 | | | 2,034,942 |
Rockville (City of), MD (Ingleside at King Farm); | | | | | | | | | | | | | | |
Series 2017 A-1, Ref. RB | | | 5.00% | | | | 11/01/2037 | | | | 1,250 | | | 1,148,563 |
Series 2017 B, RB | | | 5.00% | | | | 11/01/2042 | | | | 4,600 | | | 4,072,702 |
Series 2017 B, RB | | | 5.00% | | | | 11/01/2047 | | | | 500 | | | 430,278 |
| | | | | | | | | | | | | | | 22,709,272 |
| | | | |
Massachusetts–1.14% | | | | | | | | | | | | | | |
Collegiate Charter School of Lowell; | | | | | | | | | | | | | | |
Series 2019, RB | | | 5.00% | | | | 06/15/2049 | | | | 1,750 | | | 1,606,255 |
Series 2019, RB | | | 5.00% | | | | 06/15/2054 | | | | 1,620 | | | 1,459,543 |
Massachusetts (Commonwealth of); Series 2004 A, Ref. GO Bonds (INS - AMBAC)(g)(j) | | | 5.50% | | | | 08/01/2030 | | | | 32,040 | | | 37,606,713 |
Massachusetts (Commonwealth of) Development Finance Agency; Series 2019 A, Ref. RB | | | 4.00% | | | | 07/01/2044 | | | | 13,400 | | | 10,959,859 |
Massachusetts (Commonwealth of) Development Finance Agency (Massachusetts Institute of Technology); Series 2002 K, RB(j) | | | 5.50% | | | | 07/01/2032 | | | | 5,015 | | | 6,235,675 |
Massachusetts (Commonwealth of) Transportation Fund; | | | | | | | | | | | | | | |
Series 2022 A, RB(j) | | | 5.00% | | | | 06/01/2050 | | | | 15,000 | | | 16,146,069 |
Series 2022 B, RB(j) | | | 5.00% | | | | 06/01/2052 | | | | 15,000 | | | 16,228,614 |
| | | | | | | | | | | | | | | 90,242,728 |
| | | | |
Michigan–0.92% | | | | | | | | | | | | | | |
Advanced Technology Academy; Series 2019, Ref. RB | | | 5.00% | | | | 11/01/2044 | | | | 900 | | | 810,739 |
Charyl Stockwell Academy; | | | | | | | | | | | | | | |
Series 2015, Ref. RB | | | 5.50% | | | | 10/01/2035 | | | | 2,740 | | | 2,615,398 |
Series 2015, Ref. RB | | | 5.75% | | | | 10/01/2045 | | | | 3,500 | | | 3,253,646 |
Grand Blanc Academy; Series 2000, COP | | | 7.75% | | | | 02/01/2030 | | | | 1,330 | | | 1,190,509 |
Kalamazoo Economic Development Corp. (Friendship Village of Kalamazoo); | | | | | | | | | | | | | | |
Series 2021, Ref. RB(h) | | | 5.00% | | | | 08/15/2041 | | | | 1,235 | | | 1,038,672 |
Series 2021, Ref. RB(h) | | | 5.00% | | | | 08/15/2051 | | | | 1,510 | | | 1,195,137 |
Michigan (State of) Finance Authority; Series 2020 B-2, Ref. RB(i) | | | 0.00% | | | | 06/01/2065 | | | | 101,350 | | | 9,510,350 |
Michigan (State of) Finance Authority (Madison Academy); Series 2021, Ref. RB | | | 5.00% | | | | 12/01/2046 | | | | 1,295 | | | 1,040,202 |
Michigan (State of) Finance Authority (McLaren Health Care); Series 2019 A, RB(j) | | | 4.00% | | | | 02/15/2050 | | | | 14,975 | | | 13,347,309 |
Michigan (State of) Housing Development Authority; | | | | | | | | | | | | | | |
Series 2022, RB(j)(l) | | | 5.10% | | | | 12/01/2037 | | | | 10,000 | | | 10,558,300 |
Series 2022, RB(j)(l) | | | 5.20% | | | | 12/01/2040 | | | | 4,425 | | | 4,638,360 |
Michigan (State of) Strategic Fund (Canterbury Health Care, Inc.); | | | | | | | | | | | | | | |
Series 2016, RB(h) | | | 5.00% | | | | 07/01/2036 | | | | 1,970 | | | 1,404,866 |
Series 2016, RB(h) | | | 5.00% | | | | 07/01/2046 | | | | 2,000 | | | 1,219,547 |
Series 2016, RB(h) | | | 5.00% | | | | 07/01/2051 | | | | 3,080 | | | 1,805,465 |
Michigan (State of) Strategic Fund (Evangelical Homes); Series 2013, Ref. RB | | | 5.50% | | | | 06/01/2047 | | | | 6,350 | | | 5,415,170 |
Saline Economic Development Corp. (Evangelical Homes of Michigan); Series 2013, Ref. RB | | | 5.50% | | | | 06/01/2047 | | | | 6,735 | | | 5,743,491 |
Waterford Township Economic Development Corp. (Canterbury Health Care, Inc.); | | | | | | | | | | | | | | |
Series 2016 A, Ref. RB(h) | | | 5.00% | | | | 07/01/2036 | | | | 4,550 | | | 3,244,740 |
Series 2016 A, Ref. RB(h) | | | 5.00% | | | | 07/01/2046 | | | | 4,895 | | | 2,984,842 |
Series 2016 A, Ref. RB(h) | | | 5.00% | | | | 07/01/2051 | | | | 2,795 | | | 1,638,400 |
| | | | | | | | | | | | | | | 72,655,143 |
| | | | |
Minnesota–1.32% | | | | | | | | | | | | | | |
Anoka (City of), MN (The Homestead at Anoka, Inc.); Series 2017, Ref. RB | | | 5.50% | | | | 11/01/2046 | | | | 3,700 | | | 3,388,969 |
Bethel (City of), MN (Spectrum High School); Series 2017 A, Ref. RB | | | 4.00% | | | | 07/01/2037 | | | | 375 | | | 313,442 |
Brooklyn Park (City of), MN (Athlos Leadership Academy); | | | | | | | | | | | | | | |
Series 2015, RB | | | 5.50% | | | | 07/01/2035 | | | | 1,490 | | | 1,373,101 |
Series 2015, RB | | | 5.50% | | | | 07/01/2040 | | | | 2,250 | | | 1,977,491 |
Series 2015, RB | | | 5.75% | | | | 07/01/2046 | | | | 2,800 | | | 2,431,800 |
Carlton (City of), MN (Inter-Faith Care Center); Series 2006, Ref. RB(d) | | | 5.70% | | | | 04/01/2036 | | | | 2,000 | | | 1,200,000 |
Dakota (County of), MN Community Development Agency (Quill); Series 2021, RB(h) | | | 3.55% | | | | 04/01/2039 | | | | 5,000 | | | 3,614,094 |
See accompanying Notes to Financial Statements which are an integral part of the financial statements.
| | |
| 25 | | Invesco High Yield Municipal Fund |
| | | | | | | | | | | | | | |
| | | Interest Rate | | | Maturity Date | | | Principal Amount (000) | | | Value |
Minnesota–(continued) | | | | | | | | | | | | | | |
Deephaven (City of), MN (Seven Hills Preparatory Academy); Series 2017, RB | | | 5.00% | | | | 10/01/2049 | | | $ | 1,200 | | | $ 1,010,770 |
Minneapolis (City of), MN (Riverton Community Housing); | | | | | | | | | | | | | | |
Series 2014, Ref. RB | | | 5.50% | | | | 08/01/2049 | | | | 6,500 | | | 6,518,031 |
Series 2018, RB(h) | | | 4.75% | | | | 08/01/2043 | | | | 600 | | | 553,840 |
Minnesota (State of) Higher Education Facilities Authority (St. Olaf college); Series 2021, RB | | | 4.00% | | | | 10/01/2050 | | | | 1,600 | | | 1,471,919 |
Rochester (City of), MN (Homestead at Rochester, Inc.); Series 2013 A, RB | | | 6.88% | | | | 12/01/2048 | | | | 6,000 | | | 6,016,198 |
Sartell (City of), MN (Country Manor Campus LLC); Series 2013, RB | | | 5.38% | | | | 09/01/2043 | | | | 5,000 | | | 4,466,461 |
St. Louis Park (City of), MN (Place Via Sol Project); Series 2018, RB (Acquired 12/26/2018; Cost $26,750,000)(b)(d)(e)(h) | | | 6.00% | | | | 07/01/2027 | | | | 26,750 | | | 24,075,000 |
St. Paul (City of), MN Housing & Redevelopment Authority (Emerald Gardens); Series 2010, Ref. RB | | | 6.50% | | | | 03/01/2029 | | | | 625 | | | 625,127 |
St. Paul (City of), MN Housing & Redevelopment Authority (High School for Recording Arts); | | | | | | | | | | | | | | |
Series 2015, RB | | | 6.00% | | | | 10/01/2035 | | | | 2,695 | | | 2,611,676 |
Series 2015, RB | | | 6.25% | | | | 10/01/2045 | | | | 4,275 | | | 4,085,861 |
St. Paul (City of), MN Housing & Redevelopment Authority (Higher Ground Academy); | | | | | | | | | | | | | | |
Series 2018, RB | | | 5.00% | | | | 12/01/2043 | | | | 4,170 | | | 3,958,035 |
Series 2018, RB | | | 5.13% | | | | 12/01/2049 | | | | 7,560 | | | 7,184,938 |
St. Paul (City of), MN Housing & Redevelopment Authority (Hmong College Prep Academy); | | | | | | | | | | | | | | |
Series 2016, Ref. RB | | | 5.75% | | | | 09/01/2046 | | | | 1,000 | | | 1,001,629 |
Series 2016, Ref. RB | | | 6.00% | | | | 09/01/2051 | | | | 3,550 | | | 3,576,634 |
St. Paul (City of), MN Housing & Redevelopment Authority (Hope Community Academy); Series 2020, RB | | | 5.00% | | | | 12/01/2055 | | | | 4,000 | | | 3,282,484 |
St. Paul (City of), MN Housing & Redevelopment Authority (Marian Center); Series 2007 A, Ref. RB | | | 5.38% | | | | 05/01/2043 | | | | 5,000 | | | 4,147,435 |
St. Paul (City of), MN Housing & Redevelopment Authority (Rossy & Richard Shaller Family Sholom East Campus); | | | | | | | | | | | | | | |
Series 2018, Ref. RB | | | 4.35% | | | | 10/01/2038 | | | | 1,185 | | | 946,612 |
Series 2018, Ref. RB | | | 5.00% | | | | 10/01/2043 | | | | 1,000 | | | 825,134 |
Series 2018, Ref. RB | | | 4.65% | | | | 10/01/2048 | | | | 1,500 | | | 1,133,427 |
St. Paul Park (City of), MN (Presbyterian Homes Bloomington); Series 2017, Ref. RB | | | 5.00% | | | | 09/01/2042 | | | | 500 | | | 482,493 |
Vadnais Heights (City of), MN (Agriculture & Food Sciences Academy); | | | | | | | | | | | | | | |
Series 2018 A, Ref. RB | | | 5.50% | | | | 12/01/2038 | | | | 3,255 | | | 3,068,210 |
Series 2018 A, Ref. RB | | | 5.88% | | | | 12/01/2048 | | | | 4,500 | | | 4,251,926 |
Series 2018 A, Ref. RB | | | 6.50% | | | | 12/01/2053 | | | | 4,315 | | | 4,343,156 |
Series 2018 B, Ref. RB | | | 6.75% | | | | 12/01/2025 | | | | 330 | | | 315,645 |
West St. Paul (City of), MN (Walker Westwood Ridge Campus); Series 2017, Ref. RB | | | 4.75% | | | | 11/01/2052 | | | | 375 | | | 316,282 |
| | | | | | | | | | | | | | | 104,567,820 |
| | | | |
Mississippi–0.09% | | | | | | | | | | | | | | |
Mississippi (State of) Development Bank (Hancock County Gomesa) (Green Bonds); Series 2019, RB(h) | | | 4.55% | | | | 11/01/2039 | | | | 2,100 | | | 2,078,113 |
Mississippi (State of) Development Bank (Jackson County Gomesa); Series 2021, RB(h) | | | 3.63% | | | | 11/01/2036 | | | | 1,000 | | | 898,086 |
Tunica (County of), MS; Series 2019, Ref. RB | | | 6.00% | | | | 10/01/2040 | | | | 4,870 | | | 4,290,271 |
| | | | | | | | | | | | | | | 7,266,470 |
| | | | |
Missouri–1.96% | | | | | | | | | | | | | | |
Branson Hills Infrastructure Facilities Community Improvement District; Series 2007 A, RB(k) | | | 5.50% | | | | 04/01/2027 | | | | 6,055 | | | 1,453,200 |
Dardenne Town Square Transportation Development District; Series 2006 A, RB(k)(n) | | | 5.00% | | | | 05/01/2036 | | | | 5,190 | | | 2,387,400 |
Grandview (City of), MO Industrial Development Authority (Grandview Crossing); Series 2006, RB(k)(n) | | | 5.75% | | | | 12/01/2028 | | | | 1,250 | | | 275,000 |
I-470 Western Gateway Transportation Development District; | | | | | | | | | | | | | | |
Series 2019 A, RB(h) | | | 5.25% | | | | 12/01/2048 | | | | 6,415 | | | 6,351,881 |
Series 2019 B, RB(h) | | | 7.75% | | | | 12/15/2048 | | | | 3,853 | | | 3,639,975 |
Kansas City (City of), MO Industrial Development Authority (Kansas City International Airport); | | | | | | | | | | | | | | |
Series 2019 B, RB(c)(j) | | | 5.00% | | | | 03/01/2054 | | | | 20,000 | | | 20,217,904 |
Series 2020 A, RB (INS - AGM)(c)(g)(j) | | | 5.00% | | | | 03/01/2057 | | | | 40,000 | | | 40,759,100 |
Series 2020, RB(c) | | | 4.00% | | | | 03/01/2045 | | | | 6,040 | | | 5,465,899 |
Series 2020, RB (INS - AGM)(c)(g) | | | 4.00% | | | | 03/01/2057 | | | | 750 | | | 668,440 |
Kansas City (City of), MO Industrial Development Authority (Northwoods Apartments); Series 2004 A, RB(c) | | | 6.45% | | | | 05/01/2040 | | | | 1,751 | | | 1,740,036 |
Kansas City (City of), MO Land Clearance for Redevelopment Authority (Convention Center Hotel); Series 2018 B, RB(h) | | | 5.00% | | | | 02/01/2050 | | | | 2,550 | | | 1,832,920 |
See accompanying Notes to Financial Statements which are an integral part of the financial statements.
| | |
| 26 | | Invesco High Yield Municipal Fund |
| | | | | | | | | | | | | | |
| | | Interest Rate | | | Maturity Date | | | Principal Amount (000) | | | Value |
Missouri–(continued) | | | | | | | | | | | | | | |
Kirkwood (City of), MO Industrial Development Authority (Aberdeen Heights); | | | | | | | | | | | | | | |
Series 2017 A, Ref. RB | | | 5.25% | | | | 05/15/2050 | | | $ | 12,750 | | | $ 10,503,565 |
Series 2017, Ref. RB | | | 5.25% | | | | 05/15/2037 | | | | 3,285 | | | 2,952,649 |
Series 2017, Ref. RB | | | 5.25% | | | | 05/15/2042 | | | | 1,000 | | | 864,880 |
Lee’s Summit (City of), MO Industrial Development Authority (John Knox Village Obligated Group); | | | | | | | | | | | | | | |
Series 2014 A, RB | | | 5.25% | | | | 08/15/2039 | | | | 3,000 | | | 2,749,070 |
Series 2018, Ref. RB | | | 5.00% | | | | 08/15/2032 | | | | 1,020 | | | 961,228 |
| | | | |
Liberty (City of), MO (Liberty Commons); Series 2015 A, RB(h) | | | 6.00% | | | �� | 06/01/2046 | | | | 6,170 | | | 5,576,786 |
| | | | |
Maplewood (City of), MO (Maplewood South Redevelopment Area); Series 2005, Ref. RB | | | 5.75% | | | | 11/01/2026 | | | | 865 | | | 836,969 |
| | | | |
Missouri (State of) Development Finance Board (St. Louis Zoo); Series 2022, RB(j) | | | 5.13% | | | | 05/01/2052 | | | | 10,005 | | | 10,628,811 |
| | | | |
Missouri (State of) Health & Educational Facilities Authority (Truman Medical Center, Inc.); Series 2017 B, RB(h) | | | 4.25% | | | | 12/01/2042 | | | | 7,460 | | | 7,021,420 |
| | | | |
St. Louis (City of), MO Industrial Development Authority (Ballpark Village Development); Series 2017 A, Ref. RB | | | 4.75% | | | | 11/15/2047 | | | | 1,500 | | | 1,113,865 |
| | | | |
St. Louis (City of), MO Industrial Development Authority (Grand Center Redevelopment); Series 2011, RB | | | 6.38% | | | | 12/01/2025 | | | | 950 | | | 950,026 |
St. Louis (County of), MO Industrial Development Authority (Friendship Village West County); | | | | | | | | | | | | | | |
Series 2018 A, RB | | | 5.00% | | | | 09/01/2038 | | | | 5,500 | | | 5,188,283 |
Series 2018 A, RB | | | 5.13% | | | | 09/01/2048 | | | | 12,345 | | | 10,928,775 |
Series 2018 A, RB | | | 5.13% | | | | 09/01/2049 | | | | 6,475 | | | 5,712,296 |
Series 2018 A, RB | | | 5.25% | | | | 09/01/2053 | | | | 4,900 | | | 4,332,592 |
| | | | | | | | | | | | | | | 155,112,970 |
| | | | |
Montana–0.04% | | | | | | | | | | | | | | |
Kalispell (City of), MT (Immanuel Lutheran Corp.); | | | | | | | | | | | | | | |
Series 2017, Ref. RB | | | 5.25% | | | | 05/15/2037 | | | | 1,000 | | | 894,513 |
Series 2017, Ref. RB | | | 5.25% | | | | 05/15/2052 | | | | 2,320 | | | 1,841,489 |
| | | | | | | | | | | | | | | 2,736,002 |
| | | | |
Nevada–0.21% | | | | | | | | | | | | | | |
| | | | |
Clark (County of), NV (Homestead Boulder City); Series 1997, RB | | | 6.50% | | | | 12/01/2027 | | | | 1,050 | | | 1,021,141 |
| | | | |
Las Vegas (City of), NV; Series 2016, RB(h) | | | 4.38% | | | | 06/15/2035 | | | | 4,000 | | | 3,576,050 |
| | | | |
Nevada (State of) Department of Business & Industry (Fulcrum Sierra Biofuels, LLC) (Green Bonds); Series 2017, RB(c)(h) | | | 6.25% | | | | 12/15/2037 | | | | 1,000 | | | 895,874 |
Nevada (State of) Department of Business & Industry (Somerset Academy); | | | | | | | | | | | | | | |
Series 2018 A, RB(h) | | | 5.00% | | | | 12/15/2038 | | | | 1,000 | | | 962,927 |
Series 2018 A, RB(h) | | | 5.00% | | | | 12/15/2048 | | | | 3,000 | | | 2,721,560 |
North Las Vegas (City of), NV Special Improvement District No. 66 (Villages at Tule Springs Village 1); | | | | | | | | | | | | | | |
Series 2022, RB(h) | | | 5.75% | | | | 06/01/2042 | | | | 350 | | | 347,150 |
Series 2022, RB(h) | | | 6.00% | | | | 06/01/2052 | | | | 1,800 | | | 1,794,875 |
Reno (City of), NV (ReTRAC - Reno Transportation Rail Access Corridor); | | | | | | | | | | | | | | |
Series 2018 C, Ref. RB(h)(i) | | | 0.00% | | | | 07/01/2058 | | | | 32,000 | | | 3,970,669 |
Series 2018 D, Ref. RB(h)(i) | | | 0.00% | | | | 07/01/2058 | | | | 13,000 | | | 1,280,636 |
| | | | | | | | | | | | | | | 16,570,882 |
| | | | |
New Hampshire–0.27% | | | | | | | | | | | | | | |
| | | | |
New Hampshire (State of) Business Finance Authority (Covanta); Series 2018 C, Ref. RB(c)(h) | | | 4.88% | | | | 11/01/2042 | | | | 7,500 | | | 6,619,708 |
| | | | |
New Hampshire (State of) Business Finance Authority (Social Bonds); Series 2022-2A, RB | | | 4.00% | | | | 10/20/2036 | | | | 14,925 | | | 13,939,874 |
| | | | |
New Hampshire (State of) Health and Education Facilities Authority; Series 2005 A2, VRD RB(o) | | | 0.02% | | | | 07/01/2035 | | | | 400 | | | 400,000 |
| | | | | | | | | | | | | | | 20,959,582 |
| | | | |
New Jersey–3.13% | | | | | | | | | | | | | | |
Camden (County of), NJ Improvement Authority (The) (KIPP Cooper Norcross Academy) (Social Bonds); | | | | | | | | | | | | | | |
Series 2022, RB | | | 6.00% | | | | 06/15/2047 | | | | 1,425 | | | 1,504,807 |
Series 2022, RB | | | 6.00% | | | | 06/15/2062 | | | | 4,300 | | | 4,478,785 |
New Jersey (State of) Economic Development Authority (Beloved Community Charter School, Inc.); | | | | | | | | | | | | | | |
Series 2019 A, RB(h) | | | 5.00% | | | | 06/15/2049 | | | | 1,110 | | | 1,017,400 |
Series 2019 A, RB(h) | | | 5.00% | | | | 06/15/2054 | | | | 725 | | | 655,144 |
See accompanying Notes to Financial Statements which are an integral part of the financial statements.
| | |
| 27 | | Invesco High Yield Municipal Fund |
| | | | | | | | | | | | | | | | |
| | | Interest Rate | | | Maturity Date | | | Principal Amount (000) | | | Value | |
New Jersey–(continued) | | | | | | | | | | | | | | | | |
New Jersey (State of) Economic Development Authority (Continental Airlines, Inc.); | | | | | | | | | | | | | | | | |
Series 1999, RB(c) | | | 5.25% | | | | 09/15/2029 | | | $ | 47,065 | | | $ | 46,837,017 | |
Series 2000 A, RB(c) | | | 5.63% | | | | 11/15/2030 | | | | 20,000 | | | | 20,133,686 | |
Series 2012, RB(c) | | | 5.75% | | | | 09/15/2027 | | | | 34,325 | | | | 34,322,769 | |
New Jersey (State of) Economic Development Authority (Paterson Charter School for Science and Technology, Inc.); | | | | | | | | | | | | | | | | |
Series 2012 A, RB | | | 6.00% | | | | 07/01/2032 | | | | 1,800 | | | | 1,801,470 | |
Series 2012 A, RB | | | 6.10% | | | | 07/01/2044 | | | | 4,025 | | | | 4,027,344 | |
Series 2012 C, RB | | | 5.00% | | | | 07/01/2032 | | | | 1,370 | | | | 1,353,831 | |
Series 2012 C, RB | | | 5.30% | | | | 07/01/2044 | | | | 4,500 | | | | 4,365,459 | |
New Jersey (State of) Economic Development Authority (The Goethals Bridge Replacement); | | | | | | | | | | | | | | | | |
Series 2013, RB(c) | | | 5.38% | | | | 01/01/2043 | | | | 13,855 | | | | 13,928,224 | |
Series 2013, RB(c) | | | 5.63% | | | | 01/01/2052 | | | | 22,695 | | | | 22,829,447 | |
New Jersey (State of) Transportation Trust Fund Authority; | | | | | | | | | | | | | | | | |
Series 2009 A, RB(i) | | | 0.00% | | | | 12/15/2038 | | | | 63,105 | | | | 30,073,211 | |
Series 2010 A, RB(i) | | | 0.00% | | | | 12/15/2031 | | | | 7,540 | | | | 5,295,628 | |
Series 2010 A, RB(i) | | | 0.00% | | | | 12/15/2036 | | | | 45,555 | | | | 24,406,447 | |
Series 2010 A, RB(i) | | | 0.00% | | | | 12/15/2037 | | | | 10,000 | | | | 5,047,209 | |
Series 2013 AA, RB | | | 5.00% | | | | 06/15/2044 | | | | 3,645 | | | | 3,649,333 | |
Series 2018 A, Ref. RB | | | 5.00% | | | | 12/15/2036 | | | | 1,200 | | | | 1,264,000 | |
Series 2019 BB, RB | | | 5.00% | | | | 06/15/2044 | | | | 2,500 | | | | 2,566,647 | |
Series 2019, RB | | | 5.25% | | | | 06/15/2043 | | | | 10,000 | | | | 10,432,642 | |
Series 2019, Ref. RB | | | 5.00% | | | | 12/15/2039 | | | | 6,300 | | | | 6,577,987 | |
Series 2020 AA, RB | | | 5.00% | | | | 06/15/2035 | | | | 1,000 | | | | 1,082,752 | |
| | | | | | | | | | | | | | | | 247,651,239 | |
| | | | |
New Mexico–0.24% | | | | | | | | | | | | | | | | |
New Mexico (State of) Hospital Equipment Loan Council (La Vida Expansion); | | | | | | | | | | | | | | | | |
Series 2019 A, RB | | | 5.00% | | | | 07/01/2039 | | | | 1,225 | | | | 1,048,269 | |
Series 2019 A, RB | | | 5.00% | | | | 07/01/2049 | | | | 10,525 | | | | 8,153,470 | |
| | | | |
New Mexico (State of) Hospital Equipment Loan Council (Presbyterian Healthcare); Series 2008 B, VRD RB(o) | | | 1.85% | | | | 08/01/2034 | | | | 4,600 | | | | 4,600,000 | |
| | | | |
Winrock Town Center Tax Increment Development District No. 1; Series 2020, RB(h) | | | 8.00% | | | | 05/01/2040 | | | | 5,510 | | | | 4,900,215 | |
| | | | | | | | | | | | | | | | 18,701,954 | |
| | | | |
New York–12.16% | | | | | | | | | | | | | | | | |
| | | | |
Amherst (Town of), NY Industrial Development Agency (Shaary Zedek); Series 2006 A, Ref. RB | | | 7.00% | | | | 06/15/2036 | | | | 1,660 | | | | 1,660,548 | |
Brooklyn Arena Local Development Corp. (Barclays Center); | | | | | | | | | | | | | | | | |
Series 2009, RB(i) | | | 0.00% | | | | 07/15/2034 | | | | 14,345 | | | | 8,601,086 | |
Series 2009, RB(i) | | | 0.00% | | | | 07/15/2044 | | | | 23,805 | | | | 7,964,286 | |
| | | | |
Broome County Local Development Corp. (Good Shepherd Village at Endwell); Series 2021, Ref. RB | | | 4.00% | | | | 01/01/2047 | | | | 1,160 | | | | 843,797 | |
Buffalo & Erie County Industrial Land Development Corp. (Tapestry Charter School); | | | | | | | | | | | | | | | | |
Series 2017 A, RB | | | 5.00% | | | | 08/01/2037 | | | | 1,325 | | | | 1,282,631 | |
Series 2017 A, RB | | | 5.00% | | | | 08/01/2047 | | | | 3,790 | | | | 3,479,752 | |
Series 2017 A, RB | | | 5.00% | | | | 08/01/2052 | | | | 790 | | | | 714,636 | |
| | | | |
Build NYC Resource Corp. (Brooklyn Navy Yard); Series 2019, Ref. RB(c)(h) | | | 5.50% | | | | 12/31/2040 | | | | 13,140 | | | | 11,376,847 | |
Build NYC Resource Corp. (NY Preparatory Charter School); | | | | | | | | | | | | | | | | |
Series 2021 A, RB | | | 4.00% | | | | 06/15/2041 | | | | 785 | | | | 643,921 | |
Series 2021 A, RB | | | 4.00% | | | | 06/15/2056 | | | | 450 | | | | 326,995 | |
| | | | |
Erie Tobacco Asset Securitization Corp.; Series 2005 A, RB | | | 5.00% | | | | 06/01/2045 | | | | 10,000 | | | | 9,394,654 | |
Metropolitan Transportation Authority (Green Bonds); | | | | | | | | | | | | | | | | |
Series 2019 C, RB (INS - AGM)(g)(j)(l) | | | 4.00% | | | | 11/15/2046 | | | | 22,245 | | | | 20,756,638 | |
Series 2019 C, RB (INS - AGM)(g)(j)(l) | | | 4.00% | | | | 11/15/2049 | | | | 14,615 | | | | 13,559,930 | |
Series 2020 C-1, RB | | | 5.00% | | | | 11/15/2050 | | | | 14,000 | | | | 14,091,533 | |
Series 2020 C-1, RB | | | 5.25% | | | | 11/15/2055 | | | | 10,500 | | | | 10,756,469 | |
Series 2020 D-1, RB | | | 5.00% | | | | 11/15/2045 | | | | 10,000 | | | | 10,133,237 | |
Subseries 2020 A-1, RB (INS - AGM)(g)(j)(l) | | | 4.00% | | | | 11/15/2043 | | | | 16,025 | | | | 15,084,113 | |
Subseries 2020 A-1, RB(j)(l) | | | 4.00% | | | | 11/15/2053 | | | | 27,500 | | | | 22,887,849 | |
See accompanying Notes to Financial Statements which are an integral part of the financial statements.
| | |
| 28 | | Invesco High Yield Municipal Fund |
| | | | | | | | | | | | | | |
| | | Interest Rate | | Maturity Date | | | Principal Amount (000) | | | Value | |
New York–(continued) | | | | | | | | | | | | | | |
Monroe County Industrial Development Corp. (St. Ann’s Community); | | | | | | | | | | | | | | |
Series 2019, Ref. RB | | 5.00% | | | 01/01/2040 | | | $ | 8,500 | | | $ | 7,276,059 | |
Series 2019, Ref. RB | | 5.00% | | | 01/01/2050 | | | | 6,750 | | | | 5,342,964 | |
Nassau (County of), NY Industrial Development Agency (Amsterdam at Harborside); | | | | | | | | | | | | | | |
Series 2021, RB (Acquired 12/13/2007-02/28/2018; Cost $32,429,978)(e) | | 5.00% | | | 01/01/2058 | | | | 30,886 | | | | 14,883,777 | |
Series 2021, Ref. RB (Acquired 09/07/2021; Cost $14,980,000)(e)(h) | | 9.00% | | | 01/01/2041 | | | | 14,980 | | | | 12,383,689 | |
Nassau County Tobacco Settlement Corp.; | | | | | | | | | | | | | | |
Series 2006 A-3, RB | | 5.00% | | | 06/01/2035 | | | | 10,290 | | | | 9,582,961 | |
Series 2006 A-3, RB | | 5.13% | | | 06/01/2046 | | | | 64,730 | | | | 59,805,685 | |
Series 2006 B, RB(i) | | 0.00% | | | 06/01/2046 | | | | 105,990 | | | | 28,056,041 | |
| | | | |
New York & New Jersey (States of) Port Authority; Series 2020 221, RB(c) | | 4.00% | | | 07/15/2055 | | | | 500 | | | | 443,780 | |
| | | | |
New York (City of), NY; Subseries 2023 B-1, GO Bonds(j) | | 5.25% | | | 10/01/2047 | | | | 10,000 | | | | 11,005,274 | |
New York (City of), NY Municipal Water Finance Authority; | | | | | | | | | | | | | | |
Series 2014 BB, RB | | 5.00% | | | 06/15/2046 | | | | 50 | | | | 50,137 | |
Series 2023 CC, VRD RB(o) | | 1.85% | | | 06/15/2053 | | | | 67,700 | | | | 67,700,000 | |
Subseries 2022 CC-1, RB(j) | | 5.00% | | | 06/15/2052 | | | | 21,210 | | | | 22,630,955 | |
Subseries 2023 AA-3, RB(j) | | 5.00% | | | 06/15/2047 | | | | 10,000 | | | | 10,796,421 | |
New York (City of), NY Transitional Finance Authority; | | | | | | | | | | | | | | |
Series 2022 C-1, RB | | 4.00% | | | 02/01/2051 | | | | 3,270 | | | | 3,085,528 | |
Series 2022, RB(j) | | 5.25% | | | 11/01/2048 | | | | 12,500 | | | | 13,765,540 | |
Subseries 2019 S1B, RB | | 3.00% | | | 07/15/2049 | | | | 5,000 | | | | 3,734,621 | |
Subseries 2022 C-1, RB(j) | | 4.00% | | | 02/01/2047 | | | | 11,000 | | | | 10,466,374 | |
New York (State of) Dormitory Authority; | | | | | | | | | | | | | | |
Series 2014 C, RB(j) | | 5.00% | | | 03/15/2041 | | | | 26,940 | | | | 27,254,729 | |
Series 2015 C, RB(b)(m) | | 5.00% | | | 09/15/2025 | | | | 40 | | | | 41,865 | |
Series 2018 E, RB(j) | | 5.00% | | | 03/15/2045 | | | | 35,050 | | | | 37,225,494 | |
Series 2022 A, RB (INS - AGM)(g)(j) | | 4.25% | | | 05/01/2052 | | | | 15,000 | | | | 14,478,551 | |
| | | | |
New York (State of) Dormitory Authority (Montefiore Medical Center); Series 2020 A, RB (INS - AGM)(g)(j)(l) | | 3.00% | | | 09/01/2050 | | | | 14,775 | | | | 10,906,787 | |
New York (State of) Thruway Authority; | | | | | | | | | | | | | | |
Series 2019 B, RB(j) | | 4.00% | | | 01/01/2053 | | | | 15,000 | | | | 13,647,489 | |
Series 2021 A-1(j) | | 4.00% | | | 03/15/2054 | | | | 10,000 | | | | 9,280,244 | |
Series 2021 A-1(j) | | 4.00% | | | 03/15/2059 | | | | 30,000 | | | | 27,442,368 | |
New York (State of) Thruway Authority (Green Bonds); | | | | | | | | | | | | | | |
Series 2022 C, RB(j) | | 4.13% | | | 03/15/2056 | | | | 5,000 | | | | 4,721,053 | |
Series 2022 C, RB(j) | | 4.13% | | | 03/15/2057 | | | | 15,000 | | | | 14,127,123 | |
New York City Housing Development Corp. (Sustainable development Bonds); | | | | | | | | | | | | | | |
Series 2022 F-1, RB | | 4.60% | | | 11/01/2042 | | | | 2,000 | | | | 2,010,294 | |
Series 2022 F-1, RB | | 4.75% | | | 11/01/2047 | | | | 1,000 | | | | 993,125 | |
Series 2022 F-1, RB | | 4.85% | | | 11/01/2052 | | | | 3,000 | | | | 2,956,159 | |
Series 2022 F-1, RB | | 4.90% | | | 11/01/2057 | | | | 3,000 | | | | 2,970,734 | |
| | | | |
New York Convention Center Development Corp. (Hotel Unit Fee Secured); Series 2016, RB(i) | | 0.00% | | | 11/15/2049 | | | | 13,390 | | | | 3,533,692 | |
| | | | |
New York Counties Tobacco Trust IV; Series 2005 F, RB(i) | | 0.00% | | | 06/01/2060 | | | | 50,000 | | | | 2,597,350 | |
New York Counties Tobacco Trust V; | | | | | | | | | | | | | | |
Series 2005 S-1, RB(i) | | 0.00% | | | 06/01/2038 | | | | 65,990 | | | | 26,288,925 | |
Series 2005 S-2, RB(i) | | 0.00% | | | 06/01/2050 | | | | 45,500 | | | | 6,187,258 | |
Series 2005 S-3, RB(i) | | 0.00% | | | 06/01/2055 | | | | 268,000 | | | | 19,766,688 | |
New York Liberty Development Corp. (3 World Trade Center); | | | | | | | | | | | | | | |
Series 2014, Class 2, Ref. RB(h) | | 5.38% | | | 11/15/2040 | | | | 2,500 | | | | 2,434,377 | |
Series 2014, Class 3, Ref. RB(h) | | 7.25% | | | 11/15/2044 | | | | 49,000 | | | | 49,506,013 | |
| | | | |
New York Liberty Development Corp. (Green Bonds); Series 2021 A, Ref. RB (INS - AGM)(g)(j)(l) | | 3.00% | | | 11/15/2051 | | | | 10,000 | | | | 7,080,029 | |
New York Transportation Development Corp. (American Airlines, Inc. John F. Kennedy International Airport); | | | | | | | | | | | | | | |
Series 2020, Ref. RB(c) | | 5.25% | | | 08/01/2031 | | | | 8,320 | | | | 8,472,950 | |
Series 2020, Ref. RB(c) | | 5.38% | | | 08/01/2036 | | | | 11,505 | | | | 11,625,681 | |
New York Transportation Development Corp. (American Airlines, Inc.); | | | | | | | | | | | | | | |
Series 2016, Ref. RB(c) | | 5.00% | | | 08/01/2026 | | | | 3,725 | | | | 3,726,629 | |
Series 2016, Ref. RB(c) | | 5.00% | | | 08/01/2031 | | | | 3,775 | | | | 3,778,459 | |
Series 2021, Ref. RB(c) | | 3.00% | | | 08/01/2031 | | | | 3,500 | | | | 3,124,171 | |
See accompanying Notes to Financial Statements which are an integral part of the financial statements.
| | |
| 29 | | Invesco High Yield Municipal Fund |
| | | | | | | | | | | | | | | | |
| | | Interest Rate | | | Maturity Date | | | Principal Amount (000) | | | Value | |
New York–(continued) | | | | | | | | | | | | | | | | |
New York Transportation Development Corp. (Delta Air Lines, Inc. LaGuardia Airport Terminals C&D Redevelopment); | | | | | | | | | | | | | | | | |
Series 2018, RB(c) | | | 5.00% | | | | 01/01/2028 | | | $ | 10,650 | | | $ | 11,037,686 | |
Series 2018, RB(c) | | | 5.00% | | | | 01/01/2034 | | | | 4,905 | | | | 5,045,461 | |
Series 2020, RB(c) | | | 5.00% | | | | 10/01/2040 | | | | 16,450 | | | | 16,430,234 | |
Series 2020, RB(c) | | | 4.38% | | | | 10/01/2045 | | | | 750 | | | | 682,233 | |
New York Transportation Development Corp. (LaGuardia Airport Terminal B Redevelopment); | | | | | | | | | | | | | | | | |
Series 2016 A, RB(c) | | | 5.00% | | | | 07/01/2046 | | | | 5,420 | | | | 5,336,141 | |
Series 2016 A, RB(c) | | | 5.25% | | | | 01/01/2050 | | | | 10,995 | | | | 10,968,211 | |
New York Transportation Development Corp. (Terminal 4 John F. Kennedy International Airport); Series 2022, RB (INS - AGM)(c)(g) | | | 4.00% | | | | 12/01/2042 | | | | 5,000 | | | | 4,559,248 | |
Niagara Area Development Corp. (Covanta); Series 2018 A, Ref. RB(c)(h) | | | 4.75% | | | | 11/01/2042 | | | | 2,390 | | | | 2,074,961 | |
Rockland Tobacco Asset Securitization Corp.; Series 2005 C, RB(h)(i) | | | 0.00% | | | | 08/15/2060 | | | | 368,350 | | | | 22,338,107 | |
Tompkins County Development Corp. (Tompkins Cortland Community College Foundation, Inc.); | | | | | | | | | | | | | | | | |
Series 2013 A, RB(d) | | | 5.00% | | | | 07/01/2027 | | | | 1,985 | | | | 982,575 | |
Series 2013 A, RB(d) | | | 5.00% | | | | 07/01/2038 | | | | 5,700 | | | | 2,821,500 | |
Triborough Bridge & Tunnel Authority; Series 2019 C, RB (INS - AGM)(g)(j)(l) | | | 3.00% | | | | 11/15/2047 | | | | 12,665 | | | | 9,624,568 | |
Triborough Bridge & Tunnel Authority (MTA Bridges & Tunnels); | | | | | | | | | | | | | | | | |
Series 2012 1-A, RB(j) | | | 4.00% | | | | 11/15/2056 | | | | 10,000 | | | | 9,236,009 | |
Series 2022 A(j) | | | 5.00% | | | | 05/15/2057 | | | | 11,490 | | | | 12,258,327 | |
TSASC, Inc.; | | | | | | | | | | | | | | | | |
Series 2016 B, Ref. RB | | | 5.00% | | | | 06/01/2045 | | | | 8,325 | | | | 7,723,311 | |
Series 2016 B, Ref. RB | | | 5.00% | | | | 06/01/2048 | | | | 26,205 | | | | 23,959,292 | |
Westchester (County of), NY Industrial Development Agency (Million Air Two LLC General Aviation Facilities); Series 2017 A, RB(c)(h) | | | 7.00% | | | | 06/01/2046 | | | | 58,890 | | | | 51,626,242 | |
Westchester County Healthcare Corp.; Series 2014 A, RB | | | 5.00% | | | | 11/01/2044 | | | | 4,131 | | | | 4,137,043 | |
Westchester Tobacco Asset Securitization Corp.; Series 2016 C, Ref. RB | | | 5.13% | | | | 06/01/2051 | | | | 9,405 | | | | 9,524,080 | |
| | | | | | | | | | | | | | | | 961,112,194 | |
| | | | |
North Carolina–0.31% | | | | | | | | | | | | | | | | |
Charlotte-Mecklenburg Hospital Authority (The) (Atrium Health); Series 2018 H, VRD RB(o) | | | 1.40% | | | | 01/15/2048 | | | | 1,945 | | | | 1,945,000 | |
Charlotte-Mecklenburg Hospital Authority (The) (Carolinas Health Care Systems); Series 2007 B, Ref. VRD RB(o) | | | 1.85% | | | | 01/15/2038 | | | | 1,695 | | | | 1,695,000 | |
Clayton (Town of), NC; Series 2022, RB | | | 4.00% | | | | 08/01/2047 | | | | 3,720 | | | | 3,505,261 | |
North Carolina (State of) Department of Transportation (I-77 HOT Lanes); Series 2015, RB(c) | | | 5.00% | | | | 06/30/2054 | | | | 1,000 | | | | 939,976 | |
North Carolina (State of) Medical Care Commission (Aldersgate); Series 2013, Ref. RB(b)(m) | | | 6.25% | | | | 07/01/2023 | | | | 3,750 | | | | 3,786,220 | |
North Carolina (State of) Medical Care Commission (Salemtowne Project); | | | | | | | | | | | | | | | | |
Series 2018 A, RB | | | 5.00% | | | | 10/01/2038 | | | | 1,185 | | | | 1,090,844 | |
Series 2018 A, RB | | | 5.00% | | | | 10/01/2048 | | | | 13,080 | | | | 11,303,434 | |
| | | | | | | | | | | | | | | | 24,265,735 | |
| | | | |
North Dakota–0.03% | | | | | | | | | | | | | | | | |
Burleigh (County of), ND (University of Mary); | | | | | | | | | | | | | | | | |
Series 2016, RB | | | 5.10% | | | | 04/15/2036 | | | | 1,500 | | | | 1,445,708 | |
Series 2016, RB | | | 5.20% | | | | 04/15/2046 | | | | 1,125 | | | | 1,022,296 | |
| | | | | | | | | | | | | | | | 2,468,004 | |
| | | | |
Ohio–5.21% | | | | | | | | | | | | | | | | |
Akron, Bath & Copley Joint Township Hospital District (Summa Health Obligated Group); Series 2016, Ref. RB | | | 5.25% | | | | 11/15/2041 | | | | 3,800 | | | | 3,854,881 | |
Buckeye Tobacco Settlement Financing Authority; | | | | | | | | | | | | | | | | |
Series 2020 B-2, Ref. RB | | | 5.00% | | | | 06/01/2055 | | | | 86,395 | | | | 78,571,052 | |
Series 2020 B-3, Ref. RB(i) | | | 0.00% | | | | 06/01/2057 | | | | 418,785 | | | | 48,740,543 | |
Cleveland (City of) & Cuyahoga (County of), OH Port Authority (Constellation Schools); Series 2014 A, Ref. RB(h) | | | 6.75% | | | | 01/01/2044 | | | | 13,900 | | | | 13,985,055 | |
Cleveland (City of), OH (Continental Airlines, Inc.); Series 1998, RB(c) | | | 5.38% | | | | 09/15/2027 | | | | 4,190 | | | | 4,189,728 | |
Columbus (City of) & Franklin (County of), OH Finance Authority (Easton); Series 2020, RB(h) | | | 5.00% | | | | 06/01/2028 | | | | 3,435 | | | | 3,420,274 | |
See accompanying Notes to Financial Statements which are an integral part of the financial statements.
| | |
| 30 | | Invesco High Yield Municipal Fund |
| | | | | | | | | | | | | | | | |
| | | Interest Rate | | | Maturity Date | | | Principal Amount (000) | | | Value | |
Ohio–(continued) | | | | | | | | | | | | | | | | |
Cuyahoga (County of), OH (MetroHealth System); | | | | | | | | | | | | | | | | |
Series 2017, RB(j)(l) | | | 5.25% | | | | 02/15/2047 | | | $ | 26,990 | | | $ | 27,395,287 | |
Series 2017, RB(j)(l) | | | 5.50% | | | | 02/15/2052 | | | | 19,495 | | | | 19,935,466 | |
Series 2017, RB(j)(l) | | | 5.50% | | | | 02/15/2057 | | | | 30,650 | | | | 31,282,006 | |
Series 2017, Ref. RB | | | 5.00% | | | | 02/15/2057 | | | | 10,000 | | | | 9,825,157 | |
Darke (County of), OH (Wayne Healthcare); Series 2019 A, RB | | | 5.00% | | | | 09/01/2049 | | | | 2,000 | | | | 1,804,334 | |
Franklin (County of), OH (Nationwide Children’s Hospital); Series 2022 B, Ref. VRD RB(o) | | | 1.85% | | | | 11/01/2042 | | | | 4,300 | | | | 4,300,000 | |
Franklin (County of), OH (Wesley Communities); | | | | | | | | | | | | | | | | |
Series 2020, Ref. RB | | | 5.25% | | | | 11/15/2040 | | | | 1,000 | | | | 915,741 | |
Series 2020, Ref. RB | | | 5.25% | | | | 11/15/2055 | | | | 6,300 | | | | 5,402,879 | |
Franklin (County of), OH Convention Facilities Authority (Greater Columbus Convention Center); | | | | | | | | | | | | | | | | |
Series 2019, RB | | | 5.00% | | | | 12/01/2039 | | | | 715 | | | | 680,366 | |
Series 2019, RB | | | 5.00% | | | | 12/01/2051 | | | | 2,500 | | | | 2,306,477 | |
Hamilton (County of), OH (Life Enriching Communities); Series 2012, RB | | | 5.00% | | | | 01/01/2032 | | | | 2,075 | | | | 2,074,876 | |
Hamilton (County of), OH (UC Health); Series 2020, RB(j)(l) | | | 4.00% | | | | 09/15/2050 | | | | 15,000 | | | | 12,937,553 | |
Hickory Chase Community Authority (Senior Bonds); Series 2019, Ref. RB(h) | | | 5.00% | | | | 12/01/2040 | | | | 1,355 | | | | 1,216,869 | |
Marion (County of), OH (United Church Homes, Inc.); | | | | | | | | | | | | | | | | |
Series 2019, Ref. RB | | | 5.00% | | | | 12/01/2039 | | | | 1,150 | | | | 1,035,061 | |
Series 2019, Ref. RB | | | 5.13% | | | | 12/01/2049 | | | | 3,545 | | | | 3,046,019 | |
Montgomery (County of), OH (Premier Health Partners Obligated Group); | | | | | | | | | | | | | | | | |
Series 2019 A, RB(j) | | | 4.00% | | | | 11/15/2045 | | | | 11,825 | | | | 10,262,255 | |
Series 2019 A, Ref. RB | | | 4.00% | | | | 11/15/2042 | | | | 4,955 | | | | 4,430,554 | |
Series 2019 A, Ref. RB(l) | | | 4.00% | | | | 11/15/2045 | | | | 2,420 | | | | 2,100,182 | |
Montgomery (County of), OH (Trousdale Foundation Properties); | | | | | | | | | | | | | | | | |
Series 2018 A, RB (Acquired 08/29/2018-09/14/2020; Cost $5,915,050)(e)(h) | | | 6.00% | | | | 04/01/2038 | | | | 7,270 | | | | 2,544,500 | |
Series 2018 A, RB (Acquired 04/01/2020-09/14/2020; Cost $1,179,430)(e)(h) | | | 6.25% | | | | 04/01/2049 | | | | 2,115 | | | | 740,250 | |
Muskingum (County of), OH (Genesis Healthcare System); | | | | | | | | | | | | | | | | |
Series 2013, RB | | | 5.00% | | | | 02/15/2044 | | | | 23,810 | | | | 21,419,740 | |
Series 2013, RB | | | 5.00% | | | | 02/15/2048 | | | | 16,370 | | | | 14,086,830 | |
Ohio (State of) Air Quality Development Authority (AMG Vanadium Project); Series 2019, RB(c)(h) | | | 5.00% | | | | 07/01/2049 | | | | 22,500 | | | | 19,619,134 | |
Ohio (State of) Air Quality Development Authority (Pratt Paper LLC); Series 2017, RB(c)(h) | | | 4.50% | | | | 01/15/2048 | | | | 500 | | | | 466,637 | |
Ohio State University (The) (Green Bonds); Series 2021 A, GO Bonds (INS - AGM)(g)(j) | | | 5.50% | | | | 11/01/2059 | | | | 10,000 | | | | 10,885,553 | |
Ohio State University (The) (Multiyear Debt Issuance Program II) (Green Bonds); Series 2021 A, RB(j) | | | 4.00% | | | | 12/01/2048 | | | | 10,000 | | | | 9,509,389 | |
Southeastern Ohio (State of) Port Authority (Memorial Health Systems); | | | | | | | | | | | | | | | | |
Series 2015, Ref. RB | | | 5.00% | | | | 12/01/2035 | | | | 1,750 | | | | 1,706,134 | |
Series 2015, Ref. RB | | | 5.00% | | | | 12/01/2043 | | | | 6,695 | | | | 6,095,284 | |
Series 2015, Ref. RB | | | 5.50% | | | | 12/01/2043 | | | | 3,875 | | | | 3,880,788 | |
Southern Ohio Port Authority (Purecycle); | | | | | | | | | | | | | | | | |
Series 2020 A, RB(c)(h) | | | 6.25% | | | | 12/01/2025 | | | | 6,000 | | | | 5,401,438 | |
Series 2020 A, RB(c)(h) | | | 7.00% | | | | 12/01/2042 | | | | 23,000 | | | | 16,377,686 | |
Tuscarawas (County of), OH Economic Development and Finance Alliance (Ashland University); Series 2015, Ref. RB | | | 6.00% | | | | 03/01/2045 | | | | 5,000 | | | | 4,987,882 | |
| | | | | | | | | | | | | | | | 411,433,860 | |
| | | | |
Oklahoma–1.77% | | | | | | | | | | | | | | | | |
Atoka (County of), OK Health Care Authority (Atoka Memorial Hospital); Series 2007, RB (Acquired 08/30/2007; Cost $3,040,000)(e) | | | 6.63% | | | | 10/01/2037 | | | | 3,040 | | | | 2,730,915 | |
Oklahoma (State of) Development Finance Authority (OU Medicine); | | | | | | | | | | | | | | | | |
Series 2018 B, RB(j)(l) | | | 5.50% | | | | 08/15/2052 | | | | 15,210 | | | | 13,922,192 | |
Series 2018 B, RB(l) | | | 5.50% | | | | 08/15/2057 | | | | 11,180 | | | | 10,114,641 | |
Series 2018 B, RB(j) | | | 5.50% | | | | 08/15/2057 | | | | 23,320 | | | | 21,097,802 | |
Oklahoma (State of) Development Finance Authority (Provident Oklahoma Education Resources, Inc.-Cross Village Student Housing); | | | | | | | | | | | | | | | | |
Series 2017, RB(d) | | | 5.00% | | | | 08/01/2047 | | | | 10,500 | | | | 10,500 | |
Series 2017, RB(d) | | | 5.00% | | | | 08/01/2052 | | | | 20,000 | | | | 20,000 | |
Series 2017, RB(d) | | | 5.25% | | | | 08/01/2057 | | | | 2,190 | | | | 2,190 | |
Oklahoma (State of) Development Finance Authority (Sommerset); Series 2015, RB | | | 5.00% | | | | 07/01/2035 | | | | 1,300 | | | | 1,173,027 | |
See accompanying Notes to Financial Statements which are an integral part of the financial statements.
| | |
| 31 | | Invesco High Yield Municipal Fund |
| | | | | | | | | | | | | | | | |
| | | Interest Rate | | | Maturity Date | | | Principal Amount (000) | | | Value | |
Oklahoma–(continued) | | | | | | | | | | | | | | | | |
Payne (County of), OK Economic Development Authority (Epworth Living at the Ranch); | | | | | | | | | | | | | | | | |
Series 2016 A, RB(d) | | | 6.88% | | | | 11/01/2046 | | | $ | 2,469 | | | $ | 6,172 | |
Series 2016 A, RB(d) | | | 6.63% | | | | 11/30/2049 | | | | 1,164 | | | | 2,911 | |
Series 2016 A, RB(d) | | | 7.00% | | | | 11/01/2051 | | | | 2,429 | | | | 6,072 | |
Series 2016 B-1, RB(d) | | | 5.25% | | | | 11/30/2049 | | | | 1,664 | | | | 4,159 | |
Tulsa (City of), OK Airports Improvement Trust; | | | | | | | | | | | | | | | | |
Series 2000 A, Ref. RB(c) | | | 5.50% | | | | 06/01/2035 | | | | 18,625 | | | | 18,646,450 | |
Series 2001 B, Ref. RB(c) | | | 5.50% | | | | 12/01/2035 | | | | 15,000 | | | | 15,017,276 | |
Series 2001 C, Ref. RB(c) | | | 5.50% | | | | 12/01/2035 | | | | 47,625 | | | | 47,679,850 | |
Tulsa (City of), OK Airports Improvement Trust (American Airlines Group, Inc.); Series 2015, Ref. RB(b)(c) | | | 5.00% | | | | 06/01/2025 | | | | 6,500 | | | | 6,507,705 | |
Tulsa (City of), OK Authority for Economic Opportunity (Santa Fe Square); Series 2021, RB(h) | | | 4.38% | | | | 12/01/2041 | | | | 3,955 | | | | 3,221,738 | |
| | | | | | | | | | | | | | | | 140,163,600 | |
| | | | |
Oregon–0.27% | | | | | | | | | | | | | | | | |
Clackamas (County of), OR Hospital Facility Authority (Willamette View); | | | | | | | | | | | | | | | | |
Series 2017 A, Ref. RB | | | 5.00% | | | | 11/15/2032 | | | | 500 | | | | 492,417 | |
Series 2017 A, Ref. RB | | | 5.00% | | | | 11/15/2037 | | | | 500 | | | | 479,843 | |
Series 2017 A, Ref. RB | | | 5.00% | | | | 11/15/2052 | | | | 2,750 | | | | 2,468,440 | |
Oregon (State of) Facilities Authority (Legacy Health); Series 2016 A, RB(j) | | | 4.00% | | | | 06/01/2046 | | | | 16,025 | | | | 14,414,395 | |
Yamhill (County of), OR Hospital Authority (Friendsview Retirement Community); Series 2016 A, Ref. RB | | | 5.00% | | | | 11/15/2046 | | | | 1,835 | | | | 1,425,429 | |
Yamhill (County of), OR Hospital Authority (Friendsview); | | | | | | | | | | | | | | | | |
Series 2021 A, Ref. RB | | | 5.00% | | | | 11/15/2046 | | | | 2,500 | | | | 1,942,002 | |
Series 2021 A, Ref. RB | | | 5.00% | | | | 11/15/2051 | | | | 500 | | | | 375,930 | |
| | | | | | | | | | | | | | | | 21,598,456 | |
| | | | |
Pennsylvania–2.05% | | | | | | | | | | | | | | | | |
Allegheny (County of), PA Airport Authority; Series 2021 A, RB(c) | | | 5.00% | | | | 01/01/2051 | | | | 10,000 | | | | 10,186,900 | |
Allegheny (County of), PA Sanitary Authority; Series 2022, RB | | | 5.00% | | | | 06/01/2053 | | | | 3,000 | | | | 3,170,654 | |
Allentown (City of), PA Neighborhood Improvement Zone Development Authority (615 Waterfront); Series 2021, RB(h) | | | 6.00% | | | | 05/01/2042 | | | | 5,075 | | | | 5,139,790 | |
Allentown (City of), PA Neighborhood Improvement Zone Development Authority (City Center); Series 2022, RB(h) | | | 5.25% | | | | 05/01/2042 | | | | 3,750 | | | | 3,648,167 | |
Franklin (County of), PA Industrial Development Authority (Menno-Haven, Inc.); | | | | | | | | | | | | | | | | |
Series 2018, Ref. RB | | | 5.00% | | | | 12/01/2038 | | | | 1,750 | | | | 1,502,744 | |
Series 2018, Ref. RB | | | 5.00% | | | | 12/01/2043 | | | | 2,500 | | | | 2,063,494 | |
Series 2018, Ref. RB | | | 5.00% | | | | 12/01/2048 | | | | 2,500 | | | | 2,015,428 | |
Series 2019, RB | | | 5.00% | | | | 12/01/2054 | | | | 2,000 | | | | 1,557,107 | |
Lehigh (County of), PA General Purpose Authority (Kidspeace Obligation Group); | | | | | | | | | | | | | | | | |
Series 2014 A, RB | | | 7.50% | | | | 02/01/2044 | | | | 4,864 | | | | 4,367,365 | |
Series 2014 B, RB(f) | | | 7.50% | | | | 02/01/2044 | | | | 1,379 | | | | 714,415 | |
Series 2014 C, RB(d) | | | 0.00% | | | | 02/01/2044 | | | | 4,122 | | | | 21,541 | |
Montgomery (County of), PA Higher Education & Health Authority (Philadelphia Presbytery Homes, Inc.); Series 2017, Ref. RB | | | 4.00% | | | | 12/01/2048 | | | | 3,000 | | | | 2,298,874 | |
Pennsylvania (Commonwealth of); First Series 2014, GO Bonds(j) | | | 5.00% | | | | 06/15/2034 | | | | 15,450 | | | | 15,755,290 | |
Pennsylvania (Commonwealth of) Economic Development Financing Authority (National Gypson Co.); Series 2014, Ref. RB(c) | | | 5.50% | | | | 11/01/2044 | | | | 4,000 | | | | 4,017,317 | |
Pennsylvania (Commonwealth of) Economic Development Financing Authority (Penndot Major Bridges); | | | | | | | | | | | | | | | | |
Series 2022, RB(c) | | | 5.25% | | | | 06/30/2053 | | | | 11,000 | | | | 11,211,750 | |
Series 2022, RB (INS - AGM)(c)(g) | | | 5.00% | | | | 12/31/2057 | | | | 16,000 | | | | 16,184,832 | |
Series 2022, RB(c) | | | 6.00% | | | | 06/30/2061 | | | | 18,500 | | | | 20,133,167 | |
Series 2022, RB (INS - AGM)(c)(g) | | | 5.75% | | | | 12/31/2062 | | | | 10,000 | | | | 10,697,327 | |
Pennsylvania (Commonwealth of) Turnpike Commission; Series 2013 B-2, RB(f) | | | 6.00% | | | | 12/01/2037 | | | | 7,000 | | | | 6,125,941 | |
Philadelphia (City of), PA Authority for Industrial Development (Alliance for Progress Charter School, Inc.); Series 2019 A, RB | | | 5.00% | | | | 06/15/2049 | | | | 2,775 | | | | 2,456,731 | |
Philadelphia (City of), PA Authority for Industrial Development (First Philadelphia Preparatory Charter School); Series 2014 A, RB | | | 7.25% | | | | 06/15/2043 | | | | 5,500 | | | | 5,694,102 | |
See accompanying Notes to Financial Statements which are an integral part of the financial statements.
| | |
| 32 | | Invesco High Yield Municipal Fund |
| | | | | | | | | | | | | | | | |
| | | Interest Rate | | | Maturity Date | | | Principal Amount (000) | | | Value | |
Pennsylvania–(continued) | | | | | | | | | | | | | | | | |
Philadelphia (City of), PA Authority for Industrial Development (MaST I Charter School); | | | | | | | | | | | | | | | | |
Series 2016 A, Ref. RB | | | 5.25% | | | | 08/01/2046 | | | $ | 2,560 | | | $ | 2,592,247 | |
Series 2016 A, Ref. RB | | | 5.38% | | | | 08/01/2051 | | | | 3,950 | | | | 4,006,805 | |
Philadelphia (City of), PA Authority for Industrial Development (MaST II Charter School); Series 2016 B, RB | | | 5.63 | % | | | 08/01/2036 | | | | 30 | | | | 30,788 | |
Philadelphia (City of), PA Authority for Industrial Development (St. Joseph’s University); Series 2022, RB | | | 5.50 | % | | | 11/01/2060 | | | | 18,625 | | | | 19,936,481 | |
Philadelphia (City of), PA Authority for Industrial Development (Wesley Enhanced Living Obligated Group); | | | | | | | | | | | | | | | | |
Series 2017, Ref. RB | | | 5.00% | | | | 07/01/2037 | | | | 4,575 | | | | 4,023,741 | |
Series 2017, Ref. RB | | | 5.00% | | | | 07/01/2049 | | | | 2,930 | | | | 2,371,099 | |
| | | | | | | | | | | | | | | | 161,924,097 | |
| | | | |
Puerto Rico–9.70% | | | | | | | | | | | | | | | | |
Children’s Trust Fund; | | | | | | | | | | | | | | | | |
Series 2002, RB | | | 5.38% | | | | 05/15/2033 | | | | 395 | | | | 395,132 | |
Series 2002, RB | | | 5.50% | | | | 05/15/2039 | | | | 27,590 | | | | 27,591,603 | |
Series 2002, RB | | | 5.63% | | | | 05/15/2043 | | | | 5,415 | | | | 5,469,440 | |
Series 2005 A, RB(i) | | | 0.00% | | | | 05/15/2050 | | | | 473,480 | | | | 83,090,910 | |
Series 2008 B, RB(i) | | | 0.00% | | | | 05/15/2057 | | | | 784,260 | | | | 42,536,537 | |
Puerto Rico (Commonwealth of); | | | | | | | | | | | | | | | | |
Series 2021 A, GO Bonds(i) | | | 0.00% | | | | 07/01/2024 | | | | 2,469 | | | | 2,317,377 | |
Series 2021 A, GO Bonds(i) | | | 0.00% | | | | 07/01/2033 | | | | 9,503 | | | | 5,414,415 | |
Series 2021 A-1, GO Bonds | | | 4.00% | | | | 07/01/2033 | | | | 10,000 | | | | 8,960,656 | |
Series 2021 A-1, GO Bonds | | | 4.00% | | | | 07/01/2041 | | | | 23,758 | | | | 19,625,676 | |
Subseries 2022, RN | | | 0.00% | | | | 11/01/2043 | | | | 38,871 | | | | 16,763,081 | |
Subseries 2022, RN | | | 0.00% | | | | 11/01/2051 | | | | 62,766 | | | | 27,460,241 | |
Puerto Rico (Commonwealth of) Aqueduct & Sewer Authority; | | | | | | | | | | | | | | | | |
Series 2008 A, RB | | | 6.13% | | | | 07/01/2024 | | | | 7,162 | | | | 7,276,897 | |
Series 2020 A, Ref. RB(h) | | | 5.00% | | | | 07/01/2035 | | | | 8,000 | | | | 7,984,867 | |
Series 2020 A, Ref. RB(h) | | | 5.00% | | | | 07/01/2047 | | | | 4,060 | | | | 3,921,164 | |
Series 2021 B, RB(h) | | | 5.00% | | | | 07/01/2037 | | | | 5,456 | | | | 5,362,535 | |
Series 2021 B, RB(h) | | | 4.00% | | | | 07/01/2042 | | | | 40,000 | | | | 34,320,236 | |
Series 2022 A, Ref. RB(h) | | | 5.00% | | | | 07/01/2037 | | | | 10,000 | | | | 9,828,694 | |
Puerto Rico (Commonwealth of) Electric Power Authority; | | | | | | | | | | | | | | | | |
Series 2003 NN, RB(d) | | | 5.50% | | | | 12/01/2049 | | | | 50 | | | | 34,375 | |
Series 2004 PP, Ref. RB (INS - NATL)(g) | | | 5.00% | | | | 07/01/2023 | | | | 755 | | | | 755,000 | |
Series 2007 TT, RB(d) | | | 5.00% | | | | 07/01/2023 | | | | 515 | | | | 357,281 | |
Series 2007 TT, RB(d) | | | 5.00% | | | | 07/01/2026 | | | | 6,685 | | | | 4,646,075 | |
Series 2007 TT, RB(d) | | | 5.00% | | | | 07/01/2027 | | | | 2,350 | | | | 1,633,250 | |
Series 2007 TT, RB(d) | | | 5.00% | | | | 07/01/2032 | | | | 16,805 | | | | 11,721,487 | |
Series 2007 TT, RB(d) | | | 5.00% | | | | 12/01/2049 | | | | 80 | | | | 54,500 | |
Series 2007 TT, RB(d) | | | 5.00% | | | | 12/01/2049 | | | | 1,510 | | | | 1,028,688 | |
Series 2007 UU, Ref. RB (3 mo. USD LIBOR + 0.68%)(d)(p) | | | 3.20% | | | | 07/01/2025 | | | | 4,250 | | | | 2,895,313 | |
Series 2007 UU, Ref. RB (3 mo. USD LIBOR + 0.70%)(d)(p) | | | 3.22% | | | | 07/01/2031 | | | | 2,050 | | | | 1,396,563 | |
Series 2007 UU, Ref. RB(d) | | | 1.00% | | | | 12/01/2049 | | | | 6,350 | | | | 4,278,313 | |
Series 2007 VV, Ref. RB (INS - NATL)(g) | | | 5.25% | | | | 07/01/2024 | | | | 4,560 | | | | 4,567,097 | |
Series 2007 VV, Ref. RB (INS - NATL)(g) | | | 5.25% | | | | 07/01/2030 | | | | 9,275 | | | | 9,308,438 | |
Series 2007 VV, Ref. RB (INS - AGM)(g) | | | 5.25% | | | | 07/01/2031 | | | | 20,000 | | | | 20,146,080 | |
Series 2007 VV, Ref. RB (INS - NATL)(g) | | | 5.25% | | | | 07/01/2032 | | | | 6,275 | | | | 6,291,279 | |
Series 2008 WW, RB(d) | | | 5.38% | | | | 07/01/2023 | | | | 825 | | | | 575,438 | |
Series 2008 WW, RB(d) | | | 5.00% | | | | 07/01/2028 | | | | 13,620 | | | | 9,465,900 | |
Series 2008 WW, RB(d) | | | 5.25% | | | | 07/01/2033 | | | | 2,200 | | | | 1,545,500 | |
Series 2008 WW, RB(d) | | | 5.50% | | | | 07/01/2038 | | | | 19,685 | | | | 13,927,137 | |
Series 2010 AAA, RB(d) | | | 5.25% | | | | 07/01/2025 | | | | 840 | | | | 584,850 | |
Series 2010 AAA, RB(d) | | | 5.25% | | | | 07/01/2031 | | | | 1,350 | | | | 945,000 | |
Series 2010 AAA, RB(d) | | | 5.25% | | | | 12/01/2049 | | | | 2,355 | | | | 1,610,231 | |
Series 2010 CCC, RB(d) | | | 5.00% | | | | 07/01/2025 | | | | 325 | | | | 225,469 | |
Series 2010 CCC, RB(d) | | | 5.25% | | | | 07/01/2026 | | | | 14,455 | | | | 10,082,362 | |
See accompanying Notes to Financial Statements which are an integral part of the financial statements.
| | |
| 33 | | Invesco High Yield Municipal Fund |
| | | | | | | | | | | | | | | | |
| | | Interest Rate | | | Maturity Date | | | Principal Amount (000) | | | Value | |
Puerto Rico–(continued) | | | | | | | | | | | | | | | | |
Series 2010 CCC, RB(d) | | | 5.00% | | | | 07/01/2028 | | | $ | 960 | | | $ | 667,200 | |
Series 2010 CCC, RB(d) | | | 5.25% | | | | 07/01/2028 | | | | 7,600 | | | | 5,301,000 | |
Series 2010 DDD, Ref. RB(d) | | | 5.00% | | | | 07/03/2023 | | | | 1,150 | | | | 797,813 | |
Series 2010 EEE, RB(d) | | | 6.05% | | | | 07/01/2032 | | | | 895 | | | | 606,363 | |
Series 2010 XX, RB(d) | | | 4.63% | | | | 07/01/2025 | | | | 620 | | | | 428,575 | |
Series 2010 XX, RB(d) | | | 5.25% | | | | 07/01/2026 | | | | 385 | | | | 268,538 | |
Series 2010 XX, RB(d) | | | 5.25% | | | | 07/01/2035 | | | | 6,799 | | | | 4,776,297 | |
Series 2010 XX, RB(d) | | | 5.25% | | | | 07/01/2040 | | | | 13,940 | | | | 9,792,850 | |
Series 2010 YY, RB(d) | | | 6.13% | | | | 07/01/2040 | | | | 1,200 | | | | 813,000 | |
Series 2010 ZZ, Ref. RB(d) | | | 4.50% | | | | 07/01/2023 | | | | 475 | | | | 330,125 | |
Series 2010 ZZ, Ref. RB(d) | | | 5.00% | | | | 07/01/2024 | | | | 340 | | | | 235,875 | |
Series 2010 ZZ, Ref. RB(d) | | | 5.25% | | | | 07/01/2024 | | | | 65 | | | | 45,256 | |
Series 2010 ZZ, Ref. RB(d) | | | 4.63% | | | | 07/01/2025 | | | | 640 | | | | 442,400 | |
Series 2010 ZZ, Ref. RB(d) | | | 5.00% | | | | 07/01/2026 | | | | 435 | | | | 302,325 | |
Series 2010 ZZ, Ref. RB(d) | | | 5.25% | | | | 07/01/2026 | | | | 875 | | | | 610,313 | |
Series 2010 ZZ, Ref. RB(d) | | | 5.00% | | | | 07/01/2028 | | | | 310 | | | | 215,450 | |
Series 2010 ZZ, Ref. RB(d) | | | 4.10% | | | | 12/01/2049 | | | | 2,475 | | | | 1,667,531 | |
Series 2010 ZZ, Ref. RB(d) | | | 5.00% | | | | 12/01/2049 | | | | 10,000 | | | | 6,812,500 | |
Series 2010 ZZ, Ref. RB(d) | | | 5.00% | | | | 12/01/2049 | | | | 550 | | | | 374,688 | |
Series 2012 A, RB(d) | | | 4.80% | | | | 07/01/2029 | | | | 2,260 | | | | 1,565,050 | |
Series 2012 A, RB(d) | | | 5.00% | | | | 07/02/2029 | | | | 3,535 | | | | 2,456,825 | |
Series 2012 A, RB(d) | | | 5.00% | | | | 07/01/2042 | | | | 25,280 | | | | 17,632,800 | |
Series 2012 A, RB(d) | | | 5.05% | | | | 07/01/2042 | | | | 3,095 | | | | 2,158,763 | |
Series 2013 A, RB(d) | | | 7.25% | | | | 07/01/2030 | | | | 2,120 | | | | 1,526,400 | |
Series 2013 A, RB(d) | | | 7.00% | | | | 07/01/2033 | | | | 6,030 | | | | 4,341,600 | |
Series 2013 A, RB(d) | | | 6.75% | | | | 07/01/2036 | | | | 15,090 | | | | 10,864,800 | |
Series 2013 A, RB(d) | | | 7.00% | | | | 07/01/2040 | | | | 2,675 | | | | 1,932,688 | |
Series 2013 A, RB(d) | | | 7.00% | | | | 07/01/2043 | | | | 20,415 | | | | 14,749,837 | |
Puerto Rico (Commonwealth of) Highway & Transportation Authority; | | | | | | | | | | | | | | | | |
Series 2022 A, RB | | | 5.00% | | | | 07/01/2062 | | | | 9,878 | | | | 9,161,884 | |
Series 2022 B, RB(i) | | | 0.00% | | | | 07/01/2032 | | | | 6,419 | | | | 4,012,118 | |
Series 2022 C, RB(f) | | | 5.00% | | | | 07/01/2053 | | | | 10,981 | | | | 6,096,302 | |
Puerto Rico (Commonwealth of) Industrial, Tourist, Educational, Medical & Environmental Control Facilities Financing Authority; Series 2000, RB(c) | | | 6.63% | | | | 06/01/2026 | | | | 19,130 | | | | 19,428,889 | |
Puerto Rico Sales Tax Financing Corp.; | | | | | | | | | | | | | | | | |
Series 2018 A-1, RB(i) | | | 0.00% | | | | 07/01/2029 | | | | 1,927 | | | | 1,429,200 | |
Series 2018 A-1, RB(i) | | | 0.00% | | | | 07/01/2031 | | | | 2,484 | | | | 1,655,584 | |
Series 2018 A-1, RB(i) | | | 0.00% | | | | 07/01/2033 | | | | 10,296 | | | | 6,150,541 | |
Series 2018 A-1, RB | | | 4.50% | | | | 07/01/2034 | | | | 6,168 | | | | 6,115,877 | |
Series 2018 A-1, RB | | | 4.55% | | | | 07/01/2040 | | | | 4,089 | | | | 3,818,601 | |
Series 2018 A-1, RB(i) | | | 0.00% | | | | 07/01/2046 | | | | 25,889 | | | | 6,634,749 | |
Series 2018 A-1, RB(i) | | | 0.00% | | | | 07/01/2051 | | | | 244,981 | | | | 46,223,015 | |
Series 2018 A-1, RB | | | 4.75% | | | | 07/01/2053 | | | | 31,979 | | | | 28,665,315 | |
Series 2018 A-1, RB | | | 5.00% | | | | 07/01/2058 | | | | 45,864 | | | | 42,552,667 | |
Series 2019 A-2, RB | | | 4.33% | | | | 07/01/2040 | | | | 59,409 | | | | 53,985,095 | |
Series 2019 A-2, RB | | | 4.54% | | | | 07/01/2053 | | | | 314 | | | | 271,544 | |
Series 2019 A-2, RB | | | 4.78% | | | | 07/01/2058 | | | | 25,223 | | | | 22,545,917 | |
| | | | | | | | | | | | | | | | 766,859,247 | |
| | | | |
Rhode Island–0.00% | | | | | | | | | | | | | | | | |
Tobacco Settlement Financing Corp.; Series 2015 B, Ref. RB | | | 5.00% | | | | 06/01/2050 | | | | 30 | | | | 29,218 | |
| | | | |
South Carolina–0.13% | | | | | | | | | | | | | | | | |
South Carolina (State of) Jobs-Economic Development Authority (High Point Academy Project); Series 2018 A, RB(h) | | | 5.75% | | | | 06/15/2049 | | | | 2,000 | | | | 2,014,655 | |
South Carolina (State of) Jobs-Economic Development Authority (Kiawah Life Plan Village, Inc.); Series 2021, RB(h) | | | 8.75% | | | | 07/01/2025 | | | | 3,000 | | | | 3,177,062 | |
See accompanying Notes to Financial Statements which are an integral part of the financial statements.
| | |
| 34 | | Invesco High Yield Municipal Fund |
| | | | | | | | | | | | | | | | |
| | | Interest Rate | | | Maturity Date | | | Principal Amount (000) | | | Value | |
South Carolina–(continued) | | | | | | | | | | | | | | | | |
South Carolina (State of) Jobs-Economic Development Authority (Lutheran Homes); | | | | | | | | | | | | | | | | |
Series 2013, RB | | | 5.00% | | | | 05/01/2043 | | | $ | 1,000 | | | $ | 821,013 | |
Series 2013, RB | | | 5.13% | | | | 05/01/2048 | | | | 2,000 | | | | 1,615,079 | |
Series 2017, Ref. RB | | | 5.00% | | | | 05/01/2042 | | | | 250 | | | | 207,070 | |
South Carolina (State of) Jobs-Economic Development Authority (South Carolina Episcopal Home at Still Hopes); Series 2018 A, Ref. RB | | | 5.00% | | | | 04/01/2048 | | | | 1,085 | | | | 921,572 | |
South Carolina (State of) Jobs-Economic Development Authority (Virtus Academy); Series 2021 A, RB(h) | | | 5.00% | | | | 06/15/2051 | | | | 1,330 | | | | 1,095,364 | |
| | | | | | | | | | | | | | | | 9,851,815 | |
| | | | |
Tennessee–1.17% | | | | | | | | | | | | | | | | |
Bristol (City of), TN Industrial Development Board (Pinnacle); Series 2016, RB | | | 5.63% | | | | 06/01/2035 | | | | 13,000 | | | | 11,721,852 | |
Memphis (City of) & Shelby (County of), TN Economic Development Growth Engine Industrial Development Board (Graceland); | | | | | | | | | | | | | | | | |
Series 2017 A, Ref. RB | | | 5.50% | | | | 07/01/2037 | | | | 250 | | | | 182,538 | |
Series 2017 A, Ref. RB | | | 5.63% | | | | 01/01/2046 | | | | 750 | | | | 464,120 | |
Metropolitan Nashville Airport Authority (The); Series 2022 B, RB(c) | | | 5.50% | | | | 07/01/2052 | | | | 1,000 | | | | 1,070,407 | |
Nashville (City of) & Davidson (County of), TN Metropolitan Government Health & Educational Facilities Board (The) (Trousdale Foundation Properties); | | | | | | | | | | | | | | | | |
Series 2018 A, RB (Acquired 08/29/2018; Cost $14,581,018)(e)(h) | | | 6.00% | | | | 04/01/2038 | | | | 14,875 | | | | 5,206,250 | |
Series 2018 A, RB (Acquired 08/29/2018-09/14/2020; Cost $12,784,437)(e)(h) | | | 6.25% | | | | 04/01/2049 | | | | 19,400 | | | | 6,790,000 | |
New Memphis Arena Public Building Authority (City of Memphis); | | | | | | | | | | | | | | | | |
Series 2021, RB(i) | | | 0.00% | | | | 04/01/2036 | | | | 1,300 | | | | 732,215 | |
Series 2021, RB(i) | | | 0.00% | | | | 04/01/2037 | | | | 1,475 | | | | 781,284 | |
Series 2021, RB(i) | | | 0.00% | | | | 04/01/2039 | | | | 1,250 | | | | 588,152 | |
Series 2021, RB(i) | | | 0.00% | | | | 04/01/2040 | | | | 1,375 | | | | 610,004 | |
Series 2021, RB(i) | | | 0.00% | | | | 04/01/2042 | | | | 1,300 | | | | 512,446 | |
Series 2021, RB(i) | | | 0.00% | | | | 04/01/2043 | | | | 1,350 | | | | 504,360 | |
Shelby (County of), TN Health, Educational & Housing Facilities Board (Kirby Pines); Series 1997 A, RB | | | 6.38% | | | | 11/15/2025 | | | | 1,105 | | | | 1,088,643 | |
Shelby (County of), TN Health, Educational & Housing Facilities Board (Trezevant Manor); | | | | | | | | | | | | | | | | |
Series 2013 A, Ref. RB | | | 5.50% | | | | 09/01/2047 | | | | 16,300 | | | | 13,561,589 | |
Series 2016 A, Ref. RB(h) | | | 5.00% | | | | 09/01/2031 | | | | 750 | | | | 675,961 | |
Series 2016 A, Ref. RB(h) | | | 5.00% | | | | 09/01/2037 | | | | 1,145 | | | | 964,101 | |
Tennessee (State of) School Bond Authority; Series 2022, RB (CEP - Colorado Higher Education Intercept Program)(j) | | | 5.00% | | | | 11/01/2047 | | | | 42,835 | | | | 47,149,371 | |
| | | | | | | | | | | | | | | | 92,603,293 | |
| | | | |
Texas–9.88% | | | | | | | | | | | | | | | | |
Arlington Higher Education Finance Corp. (Legacy Traditional Schools); | | | | | | | | | | | | | | | | |
Series 2021, Ref. RB | | | 4.38% | | | | 02/15/2051 | | | | 7,500 | | | | 5,302,351 | |
Series 2021, Ref. RB | | | 4.50% | | | | 02/15/2056 | | | | 3,000 | | | | 2,088,401 | |
Series 2022, RB(h) | | | 6.38% | | | | 02/15/2052 | | | | 4,000 | | | | 3,819,868 | |
Series 2022, RB(h) | | | 6.50% | | | | 02/15/2057 | | | | 6,000 | | | | 5,739,468 | |
Arlington Higher Education Finance Corp. (Newman International Academy); Series 2021, RB | | | 5.00% | | | | 08/15/2051 | | | | 3,500 | | | | 3,033,455 | |
Arlington Higher Education Finance Corp. (Universal Academy); Series 2014 A, RB | | | 7.13% | | | | 03/01/2044 | | | | 2,000 | | | | 2,032,091 | |
Aubrey Independent School District; Series 2022, GO Bonds (CEP - Texas Permanent School Fund) | | | 4.00% | | | | 02/15/2047 | | | | 10,000 | | | | 9,461,121 | |
Bexar (County of), TX; Series 2021, Ctfs. of Obligation (INS - BAM)(g) | | | 3.00% | | | | 06/15/2047 | | | | 5,000 | | | | 3,982,816 | |
Birdville Independent School District; Series 2023, GO Bonds | | | 4.00% | | | | 02/15/2048 | | | | 12,640 | | | | 11,581,430 | |
Brazoria County Industrial Development Corp. (Gladieux Metals Recycling LLC); | | | | | | | | | | | | | | | | |
Series 2019 A, RB(c)(h) | | | 9.00% | | | | 03/01/2039 | | | | 1,895 | | | | 1,998,377 | |
Series 2019, RB(c) | | | 7.00% | | | | 03/01/2039 | | | | 10,700 | | | | 9,897,696 | |
Series 2019, RB(c)(h) | | | 9.00% | | | | 03/01/2039 | | | | 3,280 | | | | 3,458,933 | |
Bridge City Independent School District; | | | | | | | | | | | | | | | | |
Series 2022, GO Bonds (CEP - Texas Permanent School Fund)(j) | | | 4.13% | | | | 02/15/2043 | | | | 3,440 | | | | 3,399,497 | |
Series 2022, GO Bonds (CEP - Texas Permanent School Fund)(j) | | | 4.13% | | | | 02/15/2045 | | | | 7,320 | | | | 7,181,247 | |
Calhoun (County of), TX Navigation Industrial Development Authority (Max Midstream Texas LLC); Series 2021, RN(c)(h) | | | 3.63% | | | | 07/01/2026 | | | | 7,000 | | | | 6,337,290 | |
See accompanying Notes to Financial Statements which are an integral part of the financial statements.
| | |
| 35 | | Invesco High Yield Municipal Fund |
| | | | | | | | | | | | | | | | |
| | | Interest Rate | | | Maturity Date | | | Principal Amount (000) | | | Value | |
Texas–(continued) | | | | | | | | | | | | | | | | |
Clifton Higher Education Finance Corp. (International Leadership of Texas); | | | | | | | | | | | | | | | | |
Series 2015, RB | | | 5.75% | | | | 08/15/2038 | | | $ | 1,000 | | | $ | 1,004,267 | |
Series 2015, RB | | | 5.75% | | | | 08/15/2045 | | | | 8,000 | | | | 7,861,211 | |
Series 2018 D, RB | | | 5.75% | | | | 08/15/2033 | | | | 6,190 | | | | 6,295,738 | |
Series 2018 D, RB | | | 6.00% | | | | 08/15/2038 | | | | 14,250 | | | | 14,423,943 | |
Series 2018 D, RB | | | 6.13% | | | | 08/15/2048 | | | | 29,450 | | | | 29,618,142 | |
Community Independent School District; | | | | | | | | | | | | | | | | |
Series 2022 B, GO Bonds (CEP - Texas Permanent School Fund) | | | 4.00% | | | | 02/15/2046 | | | | 4,600 | | | | 4,380,932 | |
Series 2022 B, GO Bonds (CEP - Texas Permanent School Fund) | | | 4.00% | | | | 02/15/2050 | | | | 2,000 | | | | 1,868,456 | |
Corpus Christi Independent School District; | | | | | | | | | | | | | | | | |
Series 2022, GO Bonds (CEP - Texas Permanent School Fund) | | | 4.00% | | | | 08/15/2040 | | | | 1,120 | | | | 1,081,965 | |
Series 2022, GO Bonds (CEP - Texas Permanent School Fund) | | | 4.00% | | | | 08/15/2041 | | | | 1,165 | | | | 1,123,158 | |
Series 2022, GO Bonds (CEP - Texas Permanent School Fund) | | | 4.00% | | | | 08/15/2042 | | | | 700 | | | | 675,076 | |
Series 2022, GO Bonds (CEP - Texas Permanent School Fund) | | | 4.00% | | | | 08/15/2047 | | | | 6,400 | | | | 6,050,289 | |
Cypress-Fairbanks Independent School District; Series 2022, GO Bonds (CEP - Texas Permanent School Fund)(j) | | | 4.50% | | | | 02/15/2047 | | | | 15,550 | | | | 15,839,678 | |
Dallas (City of), TX; Series 2023 A, Ref. RB | | | 4.00% | | | | 10/01/2052 | | | | 7,230 | | | | 6,818,379 | |
Deer Park Independent School District; | | | | | | | | | | | | | | | | |
Series 2018, GO Bonds (CEP - Texas Permanent School Fund) | | | 5.00% | | | | 10/01/2040 | | | | 2,515 | | | | 2,831,678 | |
Series 2018, GO Bonds (CEP - Texas Permanent School Fund) | | | 4.25% | | | | 10/01/2041 | | | | 1,415 | | | | 1,437,559 | |
Series 2018, GO Bonds (CEP - Texas Permanent School Fund) | | | 4.25% | | | | 10/01/2042 | | | | 1,795 | | | | 1,814,838 | |
Del Valle Independent School District; Series 2022, GO Bonds (CEP - Texas Permanent School Fund) | | | 4.00% | | | | 06/15/2047 | | | | 10,000 | | | | 9,605,363 | |
El Paso (City of), TX; | | | | | | | | | | | | | | | | |
Series 2021 B, GO Bonds | | | 4.00% | | | | 08/15/2047 | | | | 1,250 | | | | 1,166,387 | |
Series 2022, RB(j) | | | 4.00% | | | | 03/01/2048 | | | | 9,950 | | | | 9,268,459 | |
Forney Independent School District; Series 2022 B, GO Bonds (CEP - Texas Permanent School Fund)(j) | | | 4.00% | | | | 08/15/2047 | | | | 16,625 | | | | 15,909,470 | |
Goose Creek Consolidated Independent School District; | | | | | | | | | | | | | | | | |
Series 2019 B, GO Bonds (CEP - Texas Permanent School Fund) | | | 5.00% | | | | 10/01/2041 | | | | 1,450 | | | | 1,613,565 | |
Series 2019 B, GO Bonds (CEP - Texas Permanent School Fund)(j) | | | 4.50% | | | | 10/01/2049 | | | | 10,000 | | | | 10,161,974 | |
Grand Parkway Transportation Corp.; Series 2013 B, RB(f) | | | 5.85% | | | | 10/01/2048 | | | | 17,000 | | | | 17,934,657 | |
Guadalupe (County of) & Seguin (City of), TX Hospital Board of Managers; | | | | | | | | | | | | | | | | |
Series 2015, Ref. RB | | | 5.00% | | | | 12/01/2040 | | | | 5,350 | | | | 4,982,678 | |
Series 2015, Ref. RB | | | 5.00% | | | | 12/01/2045 | | | | 9,230 | | | | 8,315,998 | |
Harris (County of), TX; Series 2021, Ref. RB | | | 4.00% | | | | 10/01/2036 | | | | 10 | | | | 10,271 | |
Harris (County of), TX Toll Road Authority (The); Series 2021, Ref. RB | | | 4.00% | | | | 08/15/2045 | | | | 10,000 | | | | 9,562,375 | |
Houston (City of), TX Airport System (Continental Airlines, Inc.); Series 2011 A, Ref. RB(c) | | | 6.63% | | | | 07/15/2038 | | | | 16,000 | | | | 16,001,264 | |
Houston (City of), TX Airport System (United Airlines, Inc. Terminal E); Series 2014, Ref. RB(c) | | | 5.00% | | | | 07/01/2029 | | | | 32,705 | | | | 32,234,414 | |
Houston (City of), TX Airport System (United Airlines, Inc.); | | | | | | | | | | | | | | | | |
Series 2020 C, Ref. RB(c) | | | 5.00% | | | | 07/15/2027 | | | | 1,325 | | | | 1,324,653 | |
Series 2021 B-1, RB(c) | | | 4.00% | | | | 07/15/2041 | | | | 13,745 | | | | 11,847,962 | |
Houston Higher Education Finance Corp. (Houston Baptist University); Series 2021, RB | | | 4.00% | | | | 10/01/2051 | | | | 1,350 | | | | 1,079,471 | |
Ingram Independent School District; Series 2022, GO Bonds (CEP - Texas Permanent School Fund) | | | 4.00% | | | | 08/15/2047 | | | | 3,500 | | | | 3,313,792 | |
Katy Independent School District; Series 2021, GO Bonds (INS - BAM)(g) | | | 3.00% | | | | 02/15/2046 | | | | 5,000 | | | | 3,982,062 | |
La Vernia Higher Education Finance Corp. (Meridian World School); Series 2015, RB(b)(h)(m) | | | 5.60% | | | | 08/15/2024 | | | | 4,420 | | | | 4,559,797 | |
Lake Travis Independent School District; Series 2023, Ref. GO Bonds | | | 4.00% | | | | 02/15/2048 | | | | 13,875 | | | | 12,905,519 | |
Lamar Consolidated Independent School District; | | | | | | | | | | | | | | | | |
Series 2021, GO Bonds (INS - BAM)(g) | | | 3.00% | | | | 02/15/2051 | | | | 5,000 | | | | 3,781,088 | |
Series 2023, GO Bonds | | | 4.00% | | | | 02/15/2048 | | | | 25,000 | | | | 23,822,870 | |
Liberty Hill Independent School District; Series 2022, GO Bonds (CEP - Texas Permanent School Fund) | | | 3.00% | | | | 02/01/2051 | | | | 5,000 | | | | 3,761,811 | |
Little Elm Independent School District; Series 2023, GO Bonds | | | 4.00% | | | | 08/15/2048 | | | | 3,865 | | | | 3,652,316 | |
Magnolia Independent School District; Series 2023, GO Bonds | | | 4.00% | | | | 08/15/2047 | | | | 12,000 | | | | 11,184,628 | |
Mission Economic Development Corp. (Natgasoline); Series 2018, Ref.
RB(c)(h) | | | 4.63% | | | | 10/01/2031 | | | | 21,150 | | | | 20,673,349 | |
New Hope Cultural Education Facilities Finance Corp. (4-K Housing, Inc.-Stoney Brook); Series 2017 C, RB(d) | | | 5.00% | | | | 07/01/2037 | | | | 1,610 | | | | 563,500 | |
See accompanying Notes to Financial Statements which are an integral part of the financial statements.
| | |
| 36 | | Invesco High Yield Municipal Fund |
| | | | | | | | | | | | | | | | |
| | | Interest Rate | | | Maturity Date | | | Principal Amount (000) | | | Value | |
Texas–(continued) | | | | | | | | | | | | | | | | |
New Hope Cultural Education Facilities Finance Corp. (Buckingham Senior Living Community); | | | | | | | | | | | | | | | | |
Series 2021 A-1, RB | | | 7.50% | | | | 11/15/2037 | | | $ | 285 | | | $ | 226,603 | |
Series 2021 A-2, RB | | | 7.50% | | | | 11/15/2036 | | | | 2,390 | | | | 2,004,315 | |
Series 2021, RB | | | 2.00% | | | | 11/15/2061 | | | | 7,389 | | | | 3,216,109 | |
New Hope Cultural Education Facilities Finance Corp. (Carillon Lifecare Community); Series 2016, Ref. RB | | | 5.00% | | | | 07/01/2046 | | | | 18,395 | | | | 13,409,663 | |
New Hope Cultural Education Facilities Finance Corp. (Legacy Midtown Park); Series 2018 A, RB | | | 5.50% | | | | 07/01/2054 | | | | 8,750 | | | | 6,767,459 | |
New Hope Cultural Education Facilities Finance Corp. (Longhorn Village); Series 2017, Ref. RB | | | 5.00% | | | | 01/01/2047 | | | | 6,790 | | | | 6,060,542 | |
New Hope Cultural Education Facilities Finance Corp. (MRC Senior Living-The Langford); | | | | | | | | | | | | | | | | |
Series 2016 A, RB | | | 5.38% | | | | 11/15/2036 | | | | 1,365 | | | | 1,208,807 | |
Series 2016 A, RB | | | 5.50% | | | | 11/15/2046 | | | | 4,475 | | | | 3,721,235 | |
Series 2016 A, RB | | | 5.50% | | | | 11/15/2052 | | | | 850 | | | | 688,671 | |
New Hope Cultural Education Facilities Finance Corp. (Presbyterian Village North); | | | | | | | | | | | | | | | | |
Series 2018, Ref. RB | | | 5.25% | | | | 10/01/2049 | | | | 9,040 | | | | 7,578,690 | |
Series 2020, RB | | | 5.25% | | | | 10/01/2055 | | | | 1,900 | | | | 1,553,794 | |
Newark High Education Finance Corp. (A+ Charter Schools, Inc.); | | | | | | | | | | | | | | | | |
Series 2015 A, RB(h) | | | 5.50% | | | | 08/15/2035 | | | | 845 | | | | 871,168 | |
Series 2015 A, RB(h) | | | 5.75% | | | | 08/15/2045 | | | | 2,015 | | | | 2,063,996 | |
Newark High Education Finance Corp. (Hughen Center, Inc.); | | | | | | | | | | | | | | | | |
Series 2022 A, RB (CEP - Texas Permanent School Fund) | | | 5.00% | | | | 08/15/2042 | | | | 600 | | | | 642,005 | |
Series 2022 A, RB (CEP - Texas Permanent School Fund) | | | 5.00% | | | | 08/15/2047 | | | | 1,000 | | | | 1,058,071 | |
Series 2022 A, RB (CEP - Texas Permanent School Fund) | | | 5.00% | | | | 08/15/2052 | | | | 500 | | | | 525,988 | |
North Texas Tollway Authority; Series 2011 B, RB(b)(i)(m) | | | 0.00% | | | | 09/01/2031 | | | | 15,500 | | | | 7,627,051 | |
Port Beaumont Navigation District (Jefferson Gulf Coast Energy); | | | | | | | | | | | | | | | | |
Series 2020, Ref. RB(c)(h) | | | 4.00% | | | | 01/01/2050 | | | | 6,125 | | | | 4,520,446 | |
Series 2021, RB(c)(h) | | | 2.75% | | | | 01/01/2036 | | | | 1,750 | | | | 1,268,972 | |
Prosper Independent School District; | | | | | | | | | | | | | | | | |
Series 2022, GO Bonds (CEP - Texas Permanent School Fund) | | | 4.00% | | | | 02/15/2047 | | | | 5,000 | | | | 4,872,980 | |
Series 2023, GO Bonds (CEP - Texas Permanent School Fund) | | | 4.00% | | | | 02/15/2048 | | | | 10,000 | | | | 9,711,734 | |
Red River Health Facilities Development Corp. (MRC Crossing); | | | | | | | | | | | | | | | | |
Series 2014 A, RB(b)(m) | | | 7.50% | | | | 11/15/2024 | | | | 2,350 | | | | 2,510,952 | |
Series 2014 A, RB(b)(m) | | | 7.75% | | | | 11/15/2024 | | | | 5,100 | | | | 5,470,225 | |
Series 2014 A, RB(b)(m) | | | 8.00% | | | | 11/15/2024 | | | | 6,000 | | | | 6,454,998 | |
San Antonio (City of), TX River Authority; Series 2021, RB (INS - BAM)(g) | | | 3.00% | | | | 01/01/2046 | | | | 3,725 | | | | 2,813,418 | |
Sanger Independent School District; Series 2022, GO Bonds (CEP - Texas Permanent School Fund) | | | 4.00% | | | | 08/15/2047 | | | | 7,380 | | | | 6,966,135 | |
Sanger Industrial Development Corp. (Texas Pellets); Series 2012 B, RB (Acquired 09/04/2012; Cost $37,110,000)(c)(d)(e)(k) | | | 8.00% | | | | 07/01/2038 | | | | 37,110 | | | | 9,277,500 | |
Sheldon Independent School District; | | | | | | | | | | | | | | | | |
Series 2023, GO Bonds (INS - BAM)(g) | | | 4.00% | | | | 02/15/2048 | | | | 4,950 | | | | 4,637,813 | |
Series 2023, GO Bonds (INS - BAM)(g) | | | 4.00% | | | | 02/15/2050 | | | | 10,220 | | | | 9,544,550 | |
Splendora Independent School District; Series 2023, GO Bonds (CEP - Texas Permanent School Fund) | | | 4.10% | | | | 02/15/2048 | | | | 3,085 | | | | 3,020,453 | |
Spring Branch Independent School District; Series 2022, GO Bonds (CEP - Texas Permanent School Fund)(j) | | | 4.50% | | | | 02/01/2047 | | | | 10,000 | | | | 10,222,756 | |
Spring Independent School District; Series 2023, GO Bonds | | | 4.00% | | | | 08/15/2052 | | | | 12,500 | | | | 11,697,933 | |
Tarrant County Cultural Education Facilities Finance Corp. (Baylor Scott & White Health); Series 2022, RB(j) | | | 5.00% | | | | 11/15/2051 | | | | 15,000 | | | | 15,763,098 | |
Tarrant County Cultural Education Facilities Finance Corp. (Air Force Village Obligated Group); Series 2016, Ref. RB | | | 5.00% | | | | 05/15/2045 | | | | 3,000 | | | | 2,530,535 | |
Tarrant County Cultural Education Facilities Finance Corp. (Buckner Senior Living - Ventana); | | | | | | | | | | | | | | | | |
Series 2017, RB | | | 6.00% | | | | 11/15/2027 | | | | 3,250 | | | | 3,271,254 | |
Series 2017, RB | | | 6.75% | | | | 11/15/2047 | | | | 13,125 | | | | 13,194,507 | |
Series 2017, RB | | | 6.75% | | | | 11/15/2052 | | | | 965 | | | | 967,311 | |
See accompanying Notes to Financial Statements which are an integral part of the financial statements.
| | |
| 37 | | Invesco High Yield Municipal Fund |
| | | | | | | | | | | | | | | | |
| | | Interest Rate | | | Maturity Date | | | Principal Amount (000) | | | Value | |
Texas–(continued) | | | | | | | | | | | | | | | | |
Tarrant County Cultural Education Facilities Finance Corp. (C.C. Young Memorial Home); | | | | | | | | | | | | | | | | |
Series 2007, RB (Acquired 07/18/2007; Cost $1,015,000)(d)(e) | | | 5.75% | | | | 02/15/2025 | | | $ | 1,015 | | | $ | 558,250 | |
Series 2007, RB (Acquired 07/18/2007; Cost $1,600,000)(d)(e) | | | 5.75% | | | | 02/15/2029 | | | | 1,600 | | | | 880,000 | |
Series 2009 A, RB (Acquired 12/10/2009-10/01/2020; Cost $12,866,093)(d)(e) | | | 8.00% | | | | 02/15/2038 | | | | 13,350 | | | | 7,342,500 | |
Series 2017 A, RB (Acquired 12/15/2016-09/17/2020; Cost $26,170,658)(d)(e) | | | 6.38% | | | | 02/15/2048 | | | | 26,895 | | | | 14,792,250 | |
Series 2017 A, RB (Acquired 12/15/2016-04/28/2020; Cost $24,814,254)(d)(e) | | | 6.38% | | | | 02/15/2052 | | | | 25,055 | | | | 13,780,250 | |
Series 2017, RB (Acquired 11/05/2019; Cost $9,547,686)(d)(e) | | | 6.38% | | | | 02/15/2041 | | | | 8,755 | | | | 4,815,250 | |
Tarrant County Cultural Education Facilities Finance Corp. (Christus Health); Series 2022 A, RB | | | 4.00% | | | | 07/01/2053 | | | | 4,345 | | | | 3,882,339 | |
Tarrant County Cultural Education Facilities Finance Corp. (MRC Stevenson Oaks); | | | | | | | | | | | | | | | | |
Series 2020, Ref. RB | | | 6.63% | | | | 11/15/2041 | | | | 1,000 | | | | 948,138 | |
Series 2020, Ref. RB | | | 6.75% | | | | 11/15/2051 | | | | 4,000 | | | | 3,674,014 | |
Series 2020, Ref. RB | | | 6.88% | | | | 11/15/2055 | | | | 4,000 | | | | 3,705,166 | |
Tarrant County Cultural Education Facilities Finance Corp. (Stayton at Museum Way); Series 2020, RB | | | 5.75% | | | | 12/01/2054 | | | | 18,637 | | | | 12,113,954 | |
Texas (State of) Transportation Commission; | | | | | | | | | | | | | | | | |
Series 2019, RB(i) | | | 0.00% | | | | 08/01/2051 | | | | 6,000 | | | | 1,218,174 | |
Series 2019, RB(i) | | | 0.00% | | | | 08/01/2052 | | | | 6,000 | | | | 1,147,366 | |
Series 2019, RB(i) | | | 0.00% | | | | 08/01/2053 | | | | 1,000 | | | | 180,513 | |
Texas (State of) Water Development Board; | | | | | | | | | | | | | | | | |
Series 2022, RB(j) | | | 4.80% | | | | 10/15/2052 | | | | 33,000 | | | | 34,568,140 | |
Series 2022, RB(j) | | | 5.00% | | | | 10/15/2057 | | | | 3,500 | | | | 3,765,808 | |
Texas Private Activity Bond Surface Transportation Corp. (NTE Mobility Partners Segments 3 LLC Segments 3A and 3B Facility); | | | | | | | | | | | | | | | | |
Series 2013, RB(c) | | | 7.00% | | | | 12/31/2038 | | | | 4,000 | | | | 4,054,731 | |
Series 2013, RB(c) | | | 6.75% | | | | 06/30/2043 | | | | 17,450 | | | | 17,654,619 | |
Texas Private Activity Bond Surface Transportation Corp. (NTE Mobility Partners Segments 3 LLC Segments 3C); Series 2019, RB(c) | | | 5.00% | | | | 06/30/2058 | | | | 17,135 | | | | 16,854,512 | |
Thrall Independent School District; Series 2022, GO Bonds (CEP - Texas Permanent School Fund) | | | 4.00% | | | | 02/15/2052 | | | | 10,000 | | | | 9,267,719 | |
Travis County Cultural Education Facilities Finance Corp. (Wayside Schools); Series 2012 A, RB | | | 5.25% | | | | 08/15/2042 | | | | 55 | | | | 53,368 | |
Waco (City of), TX; Series 2023 A, Ctfs. Of Obligation | | | 4.00% | | | | 02/01/2053 | | | | 8,660 | | | | 7,913,946 | |
Waco Independent School District; Series 2022, GO Bonds (CEP - Texas Permanent School Fund) | | | 3.00% | | | | 08/15/2052 | | | | 5,000 | | | | 3,723,695 | |
| | | | | | | | | | | | | | | | 780,495,482 | |
| | | | |
Utah–1.04% | | | | | | | | | | | | | | | | |
Black Desert Public Infrastructure District; | | | | | | | | | | | | | | | | |
Series 2021 A, GO Bonds(h) | | | 4.00% | | | | 03/01/2051 | | | | 8,525 | | | | 6,346,757 | |
Series 2021 B, GO Bonds(h) | | | 7.38% | | | | 09/15/2051 | | | | 5,500 | | | | 4,473,129 | |
Downtown East Streetcar Sewer Public Infrastructure District; Series 2022 B, GO Bonds(h) | | | 9.00% | | | | 03/15/2053 | | | | 1,239 | | | | 1,226,357 | |
Jepson Canyon Public Infrastructure District No. 1; | | | | | | | | | | | | | | | | |
Series 2022 A, GO Bonds(h) | | | 5.13% | | | | 03/01/2051 | | | | 3,280 | | | | 2,519,618 | |
Series 2022 B, GO Bonds(h) | | | 8.00% | | | | 03/15/2051 | | | | 579 | | | | 478,448 | |
Mida Mountain Village Public Infrastructure District; | | | | | | | | | | | | | | | | |
Series 2020 A, RB(h) | | | 4.50% | | | | 08/01/2040 | | | | 1,205 | | | | 1,082,942 | |
Series 2020 A, RB(h) | | | 5.00% | | | | 08/01/2050 | | | | 6,500 | | | | 5,784,260 | |
Murray (City of), UT (IHC Health Services, Inc.); Series 2005 A, VRD RB(o) | | | 0.02% | | | | 05/15/2037 | | | | 3,935 | | | | 3,935,000 | |
Red Bridge Public Infrastructure District No. 1; | | | | | | | | | | | | | | | | |
Series 2021 A, GO Bonds(h) | | | 3.63% | | | | 02/01/2035 | | | | 600 | | | | 480,911 | |
Series 2021 A, GO Bonds(h) | | | 4.13% | | | | 02/01/2041 | | | | 500 | | | | 385,076 | |
Series 2021 A, GO Bonds(h) | | | 4.38% | | | | 02/01/2051 | | | | 1,100 | | | | 814,143 | |
Series 2021 B, GO Bonds(h) | | | 7.38% | | | | 08/15/2051 | | | | 600 | | | | 481,260 | |
Salt Lake City (City of), UT; | | | | | | | | | | | | | | | | |
Series 2018 A, RB(c)(j) | | | 5.00% | | | | 07/01/2043 | | | | 14,750 | | | | 15,043,562 | |
Series 2018 A, RB(c)(j) | | | 5.00% | | | | 07/01/2048 | | | | 11,250 | | | | 11,397,690 | |
Salt Lake City (City of), UT (Salt Lake City International Airport); Series 2021 A, RB(c)(j)(l) | | | 5.00% | | | | 07/01/2051 | | | | 11,675 | | | | 11,904,660 | |
University of Utah (The) (Green Bonds); Series 2022 A, RB | | | 4.00% | | | | 08/01/2051 | | | | 4,000 | | | | 3,645,402 | |
Utah (State of) Charter School Finance Authority (Ascent Academies of Utah); Series 2022, RB(h) | | | 5.00% | | | | 06/15/2052 | | | | 9,640 | | | | 7,788,153 | |
Utah (State of) Charter School Finance Authority (Leadership Learning Academy); Series 2019 A, RB(h) | | | 5.00% | | | | 06/15/2050 | | | | 2,000 | | | | 1,759,618 | |
Utah (State of) Charter School Finance Authority (Navigator Pointe Academy); Series 2010 A, RB | | | 5.38% | | | | 07/15/2030 | | | | 925 | | | | 926,121 | |
See accompanying Notes to Financial Statements which are an integral part of the financial statements.
| | |
| 38 | | Invesco High Yield Municipal Fund |
| | | | | | | | | | | | | | | | |
| | | Interest Rate | | | Maturity Date | | | Principal Amount (000) | | | Value | |
Utah–(continued) | | | | | | | | | | | | | | | | |
Utah (State of) Charter School Finance Authority (Renaissance Academy); Series 2020, Ref. RB(h) | | | 5.00% | | | | 06/15/2055 | | | $ | 2,080 | | | $ | 1,888,690 | |
| | | | | | | | | | | | | | | | 82,361,797 | |
| | | | |
Virginia–0.72% | | | | | | | | | | | | | | | | |
Ballston Quarter Community Development Authority; | | | | | | | | | | | | | | | | |
Series 2016 A, RB | | | 5.38% | | | | 03/01/2036 | | | | 1,545 | | | | 1,191,775 | |
Series 2016 A, RB | | | 5.50% | | | | 03/01/2046 | | | | 9,590 | | | | 6,699,062 | |
Norfolk (City of), VA Redevelopment & Housing Authority (Fort Norfolk Retirement Community, Inc. - Harbor’s Edge); Series 2019 A, RB | | | 5.00% | | | | 01/01/2049 | | | | 7,265 | | | | 5,764,419 | |
Roanoke (City of), VA Economic Development Authority (Richfield Living); | | | | | | | | | | | | | | | | |
Series 2020, RB (Acquired 01/23/2020; Cost $ 1,669,102)(e) | | | 5.00% | | | | 09/01/2040 | | | | 1,645 | | | | 1,118,680 | |
Series 2020, RB (Acquired 01/23/2020; Cost $ 1,210,000)(e) | | | 5.13% | | | | 09/01/2055 | | | | 1,210 | | | | 765,264 | |
Tobacco Settlement Financing Corp.; | | | | | | | | | | | | | | | | |
Series 2007 B-1, RB | | | 5.00% | | | | 06/01/2047 | | | | 21,035 | | | | 19,634,037 | |
Series 2007 B-2, RB | | | 5.20% | | | | 06/01/2046 | | | | 3,000 | | | | 2,928,585 | |
Virginia (Commonwealth of) Small Business Financing Authority (95 Express Lanes LLC); Series 2022, Ref. RB(c) | | | 4.00% | | | | 01/01/2040 | | | | 500 | | | | 449,576 | |
Virginia (Commonwealth of) Small Business Financing Authority (Transform 66 P3); | | | | | | | | | | | | | | | | |
Series 2017, RB(c) | | | 5.00% | | | | 12/31/2049 | | | | 7,350 | | | | 7,338,710 | |
Series 2017, RB(c) | | | 5.00% | | | | 12/31/2052 | | | | 2,150 | | | | 2,143,237 | |
Series 2017, RB(c) | | | 5.00% | | | | 12/31/2056 | | | | 7,235 | | | | 7,199,384 | |
Virginia Beach Development Authority (Westminster-Canterbury on Chesapeake Bay); Series 2018, Ref. RB | | | 5.00% | | | | 09/01/2040 | | | | 1,750 | | | | 1,652,473 | |
| | | | | | | | | | | | | | | | 56,885,202 | |
| | | | |
Washington–1.47% | | | | | | | | | | | | | | | | |
Central Puget Sound Regional Transit Authority (Green Bonds); Series 2021 S-1, Ref. RB(j) | | | 4.00% | | | | 11/01/2046 | | | | 16,255 | | | | 14,980,367 | |
King (County of), WA Public Hospital District No. 4; | | | | | | | | | | | | | | | | |
Series 2015 A, RB | | | 5.75% | | | | 12/01/2030 | | | | 3,000 | | | | 3,069,269 | |
Series 2015 A, RB | | | 6.00% | | | | 12/01/2035 | | | | 2,685 | | | | 2,752,074 | |
Series 2015 A, RB | | | 6.25% | | | | 12/01/2045 | | | | 6,465 | | | | 6,618,170 | |
Port of Seattle Industrial Development Corp. (Delta Airlines); Series 2012, Ref. RB(c) | | | 5.00% | | | | 04/01/2030 | | | | 19,500 | | | | 19,510,345 | |
University of Washington; Series 2020 A, RB | | | 4.00% | | | | 04/01/2045 | | | | 5,900 | | | | 5,642,785 | |
Washington (State of) Convention Center Public Facilities District; Series 2018, RB(j)(l) | | | 5.00% | | | | 07/01/2058 | | | | 29,500 | | | | 28,096,440 | |
Washington (State of) Economic Development Finance Authority (Green Bonds); Series 2020 A, RB(c)(h) | �� | | 5.63% | | | | 12/01/2040 | | | | 9,000 | | | | 8,748,329 | |
Washington (State of) Housing Finance Commission (Bayview Manor Homes); | | | | | | | | | | | | | | | | |
Series 2016 A, Ref. RB(h) | | | 5.00% | | | | 07/01/2036 | | | | 1,460 | | | | 1,286,775 | |
Series 2016 A, Ref. RB(h) | | | 5.00% | | | | 07/01/2046 | | | | 1,700 | | | | 1,352,758 | |
Series 2016 A, Ref. RB(h) | | | 5.00% | | | | 07/01/2051 | | | | 9,650 | | | | 7,459,075 | |
Washington (State of) Housing Finance Commission (Heron’s Key Senior Living); | | | | | | | | | | | | | | | | |
Series 2015 A, RB(b)(h)(m) | | | 7.00% | | | | 07/01/2025 | | | | 2,150 | | | | 2,301,417 | |
Series 2015 A, RB(b)(h)(m) | | | 7.00% | | | | 07/01/2025 | | | | 1,500 | | | | 1,605,640 | |
Washington (State of) Housing Finance Commission (Presbyterian Retirement Co.); | | | | | | | | | | | | | | | | |
Series 2016 A, Ref. RB(h) | | | 5.00% | | | | 01/01/2031 | | | | 1,500 | | | | 1,346,433 | |
Series 2016 A, Ref. RB(h) | | | 5.00% | | | | 01/01/2046 | | | | 8,700 | | | | 6,738,353 | |
Washington (State of) Housing Finance Commission (Spokane International Academy); Series 2021 A, RB(h) | | | 5.00% | | | | 07/01/2050 | | | | 2,000 | | | | 1,825,635 | |
Washington (State of) Housing Finance Commission (Transforming Age); Series 2019 A, RB(h) | | | 5.00% | | | | 01/01/2055 | | | | 4,000 | | | | 2,952,788 | |
| | | | | | | | | | | | | | | | 116,286,653 | |
| | | | |
West Virginia–0.75% | | | | | | | | | | | | | | | | |
Harrison (County of), WV Commission (Charles Pointe No. 2); | | | | | | | | | | | | | | | | |
Series 2008 A, Ref. RB | | | 7.00% | | | | 06/01/2035 | | | | 3,340 | | | | 3,342,008 | |
Series 2013, Ref. RB(d)(h) | | | 7.00% | | | | 06/01/2035 | | | | 1,000 | | | | 500,000 | |
Harrison (County of), WV County Commission (Charles Pointe Economic Opportunity Development District); | | | | | | | | | | | | | | | | |
Series 2019 A, RB(h) | | | 5.75% | | | | 06/01/2042 | | | | 15,000 | | | | 10,946,502 | |
Series 2019 B, Ref. RB(h) | | | 7.50% | | | | 06/01/2042 | | | | 6,140 | | | | 4,792,249 | |
Kanawha (County of), WV (The West Virginia State University Foundation); Series 2013, RB(b)(h)(m) | | | 6.75% | | | | 07/01/2023 | | | | 5,650 | | | | 5,712,815 | |
See accompanying Notes to Financial Statements which are an integral part of the financial statements.
| | |
| 39 | | Invesco High Yield Municipal Fund |
| | | | | | | | | | | | | | | | |
| | | Interest Rate | | | Maturity Date | | | Principal Amount (000) | | | Value | |
West Virginia–(continued) | | | | | | | | | | | | | | | | |
Monongalia (County of), WV Commission Special District (University Town Centre Economic Opportunity Development District); | | | | | | | | | | | | | | | | |
Series 2017 A, Ref. RB(h) | | | 5.75% | | | | 06/01/2043 | | | $ | 6,000 | | | $ | 6,080,456 | |
Series 2020, Ref. RB(h) | | | 7.50% | | | | 06/01/2043 | | | | 13,205 | | | | 13,782,636 | |
Series 2021 A, Ref. RB(h) | | | 4.13% | | | | 06/01/2043 | | | | 3,000 | | | | 2,671,476 | |
West Virginia (State of) Economic Development Authority (Entsorga West Virginia LLC); | | | | | | | | | | | | | | | | |
Series 2016, RB(c)(h) | | | 7.25% | | | | 02/01/2036 | | | | 10,965 | | | | 7,675,500 | |
Series 2018, RB(c)(h) | | | 8.75% | | | | 02/01/2036 | | | | 4,500 | | | | 3,600,000 | |
| | | | | | | | | | | | | | | | 59,103,642 | |
| | | | |
Wisconsin–4.66% | | | | | | | | | | | | | | | | |
Wisconsin (State of) Center District; | | | | | | | | | | | | | | | | |
Series 2020 C, RB (INS - AGM)(g)(i) | | | 0.00% | | | | 12/15/2055 | | | | 24,900 | | | | 4,732,855 | |
Series 2020 D, RB (INS - AGM)(g)(i) | | | 0.00% | | | | 12/15/2060 | | | | 86,500 | | | | 12,530,675 | |
Wisconsin (State of) Health & Educational Facilities Authority (American Baptist Homes of the Midwest Obligated Group); | | | | | | | | | | | | | | | | |
Series 2017, Ref. RB | | | 5.00% | | | | 08/01/2027 | | | | 1,800 | | | | 1,699,037 | |
Series 2017, Ref. RB | | | 5.00% | | | | 08/01/2037 | | | | 5,820 | | | | 4,880,844 | |
Series 2017, Ref. RB | | | 5.00% | | | | 08/01/2039 | | | | 2,355 | | | | 1,933,416 | |
Wisconsin (State of) Health & Educational Facilities Authority (Camillus Health System); | | | | | | | | | | | | | | | | |
Series 2019, Ref. RB | | | 5.00% | | | | 11/01/2039 | | | | 2,950 | | | | 2,538,435 | |
Series 2019, Ref. RB | | | 5.00% | | | | 11/01/2046 | | | | 10,050 | | | | 8,136,826 | |
Wisconsin (State of) Health & Educational Facilities Authority (Mile Bluff Medical Center, Inc.); Series 2014, RB | | | 5.75% | | | | 05/01/2039 | | | | 4,260 | | | | 4,064,074 | |
Wisconsin (State of) Public Finance Authority (Alabama Proton Therapy Center); | | | | | | | | | | | | | | | | |
Series 2017 A, RB(h) | | | 6.25% | | | | 10/01/2031 | | | | 3,475 | | | | 2,952,601 | |
Series 2017 A, RB(h) | | | 6.85% | | | | 10/01/2047 | | | | 25,735 | | | | 19,532,736 | |
Series 2017 A, RB(h) | | | 7.00% | | | | 10/01/2047 | | | | 1,250 | | | | 952,450 | |
Wisconsin (State of) Public Finance Authority (American Dream at Meadowlands); | | | | | | | | | | | | | | | | |
Series 2017, RB(d)(h) | | | 6.25% | | | | 08/01/2027 | | | | 1,550 | | | | 1,162,500 | |
Series 2017, RB(d)(h) | | | 6.75% | | | | 08/01/2031 | | | | 15,590 | | | | 8,574,500 | |
Series 2017, RB(h) | | | 6.50% | | | | 12/01/2037 | | | | 25,000 | | | | 21,552,330 | |
Series 2017, RB(h) | | | 6.75% | | | | 12/01/2042 | | | | 12,270 | | | | 10,575,098 | |
Series 2017, RB(h) | | | 7.00% | | | | 12/01/2050 | | | | 8,900 | | | | 7,684,484 | |
Wisconsin (State of) Public Finance Authority (Ascend Leadership Academy); Series 2021 A, RB(h) | | | 5.00% | | | | 06/15/2051 | | | | 2,000 | | | | 1,577,323 | |
Wisconsin (State of) Public Finance Authority (Bancroft Neurohealth); Series 2016 A, RB(h) | | | 5.13% | | | | 06/01/2048 | | | | 10,500 | | | | 9,387,014 | |
Wisconsin (State of) Public Finance Authority (Coral Academy of Science Reno); Series 2019, Ref. RB(h) | | | 5.00% | | | | 06/01/2050 | | | | 1,250 | | | | 1,075,702 | |
Wisconsin (State of) Public Finance Authority (Cross Creek Public Improvement District); Series 2019, RB(h) | | | 5.75% | | | | 10/01/2053 | | | | 4,880 | | | | 4,885,020 | |
Wisconsin (State of) Public Finance Authority (Delray Beach Radiation Therapy Center); | | | | | | | | | | | | | | | | |
Series 2017 A, RB (Acquired 04/03/2017; Cost $1,440,000)(d)(e)(h) | | | 5.75% | | | | 11/01/2024 | | | | 1,440 | | | | 864,000 | |
Series 2017 A, RB (Acquired 04/03/2017; Cost $2,525,000)(d)(e)(h) | | | 6.25% | | | | 11/01/2028 | | | | 2,525 | | | | 1,515,000 | |
Series 2017 A, RB (Acquired 04/03/2017-01/13/2021; Cost $34,467,094)(d)(e)(h) | | | 6.85% | | | | 11/01/2046 | | | | 34,350 | | | | 20,610,000 | |
Series 2017 B, RB (Acquired 01/23/2018; Cost $8,349,668)(d)(e)(h) | | | 8.50% | | | | 11/01/2046 | | | | 8,000 | | | | 3,600,000 | |
Wisconsin (State of) Public Finance Authority (Explore Academy); | | | | | | | | | | | | | | | | |
Series 2018 A, RB(h) | | | 6.13% | | | | 02/01/2048 | | | | 5,535 | | | | 4,827,073 | |
Series 2020 A, RB(h) | | | 6.13% | | | | 02/01/2050 | | | | 3,305 | | | | 2,870,817 | |
Series 2022 A, RB(h) | | | 6.13% | | | | 02/01/2050 | | | | 3,580 | | | | 3,109,690 | |
Wisconsin (State of) Public Finance Authority (Goodwill Industries of Southern Nevada, Inc.); | | | | | | | | | | | | | | | | |
Series 2019 A, RB | | | 5.50% | | | | 12/01/2038 | | | | 4,117 | | | | 3,753,092 | |
Series 2019 A, RB | | | 5.75% | | | | 12/01/2048 | | | | 6,863 | | | | 6,030,447 | |
Wisconsin (State of) Public Finance Authority (Grand Hyatt San Antonio); | | | | | | | | | | | | | | | | |
Series 2022 B, RB(h) | | | 5.63% | | | | 02/01/2046 | | | | 3,500 | | | | 3,390,894 | |
Series 2022 B, RB(h) | | | 6.00% | | | | 02/01/2062 | | | | 6,500 | | | | 6,471,604 | |
Wisconsin (State of) Public Finance Authority (Kipp Charlotte, Inc.); Series 2020 A, RB(h) | | | 5.00% | | | | 10/15/2055 | | | | 350 | | | | 317,698 | |
Wisconsin (State of) Public Finance Authority (KU Campus Development Corp. -Central District Development); Series 2016, RB(l) | | | 5.00% | | | | 03/01/2041 | | | | 15,000 | | | | 15,407,805 | |
Wisconsin (State of) Public Finance Authority (Mallard Creek Stem Academy); Series 2019 A, RB(h) | | | 5.25% | | | | 06/15/2049 | | | | 5,775 | | | | 5,407,711 | |
See accompanying Notes to Financial Statements which are an integral part of the financial statements.
| | |
| 40 | | Invesco High Yield Municipal Fund |
| | | | | | | | | | | | | | | | |
| | | Interest Rate | | | Maturity Date | | | Principal Amount (000) | | | Value | |
Wisconsin–(continued) | | | | | | | | | | | | | | | | |
Wisconsin (State of) Public Finance Authority (Maryland Proton Treatment Center); | | | | | | | | | | | | | | | | |
Series 2018 A-1, RB(h) | | | 6.25% | | | | 01/01/2038 | | | $ | 11,000 | | | $ | 6,765,000 | |
Series 2018 A-1, RB(h) | | | 6.38% | | | | 01/01/2048 | | | | 16,520 | | | | 10,159,800 | |
Wisconsin (State of) Public Finance Authority (Mary’s Woods at Marylhurst); | | | | | | | | | | | | | | | | |
Series 2017 A, Ref. RB(h) | | | 5.25% | | | | 05/15/2037 | | | | 1,000 | | | | 958,377 | |
Series 2017 A, Ref. RB(h) | | | 5.25% | | | | 05/15/2047 | | | | 2,240 | | | | 2,005,756 | |
Series 2017 A, Ref. RB(h) | | | 5.25% | | | | 05/15/2052 | | | | 3,300 | | | | 2,891,055 | |
Wisconsin (State of) Public Finance Authority (Million Air Two LLC General Aviation Facilities); | | | | | | | | | | | | | | | | |
Series 2017 A, RB(c) | | | 7.25% | | | | 06/01/2035 | | | | 10,940 | | | | 10,397,188 | |
Series 2017, Ref. RB(c)(h) | | | 7.13% | | | | 06/01/2041 | | | | 15,375 | | | | 13,705,987 | |
Wisconsin (State of) Public Finance Authority (Minnesota College of Osteopathic Medicine); Series 2019 A-1, RB(d)(h) | | | 5.50% | | | | 12/01/2048 | | | | 76 | | | | 23,584 | |
Wisconsin (State of) Public Finance Authority (New Plan Learning, Inc.); | | | | | | | | | | | | | | | | |
Series 2021 A, Ref. RB | | | 3.75% | | | | 07/01/2031 | | | | 4,165 | | | | 3,599,444 | |
Series 2021 A, Ref. RB | | | 5.00% | | | | 07/01/2041 | | | | 7,415 | | | | 6,382,315 | |
Wisconsin (State of) Public Finance Authority (Penick Village Obligated Group); Series 2019, Ref. RB(h) | | | 5.00% | | | | 09/01/2049 | | | | 1,450 | | | | 1,121,220 | |
Wisconsin (State of) Public Finance Authority (Prime Healthcare Foundation, Inc.); | | | | | | | | | | | | | | | | |
Series 2018 A, RB | | | 5.20% | | | | 12/01/2037 | | | | 17,025 | | | | 17,291,220 | |
Series 2018 A, RB | | | 5.35% | | | | 12/01/2045 | | | | 24,750 | | | | 24,402,644 | |
Wisconsin (State of) Public Finance Authority (Proton International); | | | | | | | | | | | | | | | | |
Series 2021 A, RB(h) | | | 6.50% | | | | 01/01/2041 | | | | 10,000 | | | | 7,978,972 | |
Series 2021 A, RB(h) | | | 6.85% | | | | 01/01/2051 | | | | 11,110 | | | | 8,371,657 | |
Wisconsin (State of) Public Finance Authority (Rose Villa); Series 2014 A, RB(b)(h)(m) | | | 6.00% | | | | 11/15/2024 | | | | 2,500 | | | | 2,597,454 | |
Wisconsin (State of) Public Finance Authority (Roseman University of Health Sciences); Series 2015, Ref. RB | | | 5.88% | | | | 04/01/2045 | | | | 6,400 | | | | 6,461,240 | |
Wisconsin (State of) Public Finance Authority (Searstone CCRC); Series 2021 A, Ref. RB(h) | | | 4.00% | | | | 06/01/2036 | | | | 1,000 | | | | 824,535 | |
Wisconsin (State of) Public Finance Authority (Southminster); | | | | | | | | | | | | | | | | |
Series 2018, RB(h) | | | 5.00% | | | | 10/01/2043 | | | | 500 | | | | 428,669 | |
Series 2018, RB(h) | | | 5.00% | | | | 10/01/2053 | | | | 9,600 | | | | 7,794,462 | |
Wisconsin (State of) Public Finance Authority (Uwharrie Charter Academy); Series 2022 A, RB(h) | | | 5.00% | | | | 06/15/2052 | | | | 1,000 | | | | 871,406 | |
Wisconsin (State of) Public Finance Authority (Wakemed Hospital); Series 2019 A, Ref. RB | | | 4.00% | | | | 10/01/2049 | | | | 1,250 | | | | 1,100,773 | |
Wisconsin (State of) Public Finance Authority (WFCS Portfolio); Series 2021 A-1, RB(h) | | | 5.00% | | | | 01/01/2056 | | | | 1,150 | | | | 862,639 | |
Wisconsin (State of) Public Finance Authority (WhiteStone); | | | | | | | | | | | | | | | | |
Series 2017, Ref. RB(h) | | | 5.00% | | | | 03/01/2052 | | | | 2,300 | | | | 1,911,891 | |
Series 2020 A, RB(h) | | | 5.25% | | | | 03/01/2045 | | | | 5,000 | | | | 4,433,843 | |
Wisconsin (State of) Public Finance Authority (Wittenberg University); | | | | | | | | | | | | | | | | |
Series 2016, RB(h) | | | 5.00% | | | | 12/01/2031 | | | | 7,330 | | | | 6,950,731 | |
Series 2016, RB(h) | | | 5.25% | | | | 12/01/2039 | | | | 10,685 | | | | 9,303,451 | |
| | | | | | | | | | | | | | | | 368,199,064 | |
Total Municipal Obligations (Cost $9,522,278,797) | | | | | | | | | | | | | | | 8,965,115,748 | |
|
| |
| | | | |
U.S. Dollar Denominated Bonds & Notes–0.28% | | | | | | | | | | | | | | | | |
Louisiana–0.19% | | | | | | | | | | | | | | | | |
Nola Oil Terminal LLC; Series 2021(h) | | | 12.00 | % | | | 03/15/2023 | | | | 15,000 | | | | 14,996,250 | |
|
| |
| | | | |
West Virginia–0.09% | | | | | | | | | | | | | | | | |
Empire South Terminal of West Virginia LLC(h) | | | 14.00 | % | | | 11/01/2023 | | | | 6,850 | | | | 7,209,008 | |
|
| |
Total U.S. Dollar Denominated Bonds & Notes (Cost $21,850,000) | | | | | | | | | | | | | | | 22,205,258 | |
|
| |
TOTAL INVESTMENTS IN SECURITIES(q) –113.72% (Cost $9,544,128,797) | | | | | | | | | | | | | | | 8,987,321,006 | |
|
| |
FLOATING RATE NOTE OBLIGATIONS–(15.31)% | | | | | | | | | | | | | | | | |
Notes with interest and fee rates ranging from 3.95% to 4.24% at 02/28/2023 and contractual maturities of collateral ranging from 10/01/2029 to 11/01/2059 (See Note 1K)(r) | | | | | | | | | | | | | | | (1,210,095,000 | ) |
|
| |
OTHER ASSETS LESS LIABILITIES–1.59% | | | | | | | | | | | | | | | 125,976,242 | |
|
| |
NET ASSETS–100.00% | | | | | | | | | | | | | | $ | 7,903,202,248 | |
|
| |
See accompanying Notes to Financial Statements which are an integral part of the financial statements.
| | |
| 41 | | Invesco High Yield Municipal Fund |
Investment Abbreviations:
| | |
| AGC | | - Assured Guaranty Corp. |
| AGM | | - Assured Guaranty Municipal Corp. |
| AMBAC | | - American Municipal Bond Assurance Corp. |
| BAM | | - Build America Mutual Assurance Co. |
| CEP | | - Credit Enhancement Provider |
| COP | | - Certificates of Participation |
| Ctfs. | | - Certificates |
| GO | | - General Obligation |
| IDR | | - Industrial Development Revenue Bonds |
| INS | | - Insurer |
| LIBOR | | - London Interbank Offered Rate |
| NATL | | - National Public Finance Guarantee Corp. |
| RB | | - Revenue Bonds |
| Ref. | | - Refunding |
| RN | | - Revenue Notes |
| USD | | - U.S. Dollar |
| VRD | | - Variable Rate Demand |
| Wts. | | - Warrants |
Notes to Schedule of Investments:
| (a) | Calculated as a percentage of net assets. Amounts in excess of 100% are due to the Fund’s use of leverage. |
| (b) | Security has an irrevocable call by the issuer or mandatory put by the holder. Maturity date reflects such call or put. |
| (c) | Security subject to the alternative minimum tax. |
| (d) | Defaulted security. Currently, the issuer is in default with respect to principal and/or interest payments. The aggregate value of these securities at February 28, 2023 was $342,035,290, which represented 4.33% of the Fund’s Net Assets. |
| (e) | Restricted security. The aggregate value of these securities at February 28, 2023 was $264,012,973, which represented 3.34% of the Fund’s Net Assets. |
| (f) | Convertible capital appreciation bond. The interest rate shown represents the coupon rate at which the bond will accrue at a specified future date. |
| (g) | Principal and/or interest payments are secured by the bond insurance company listed. |
| (h) | Security purchased or received in a transaction exempt from registration under the Securities Act of 1933, as amended (the “1933 Act”). The security may be resold pursuant to an exemption from registration under the 1933 Act, typically to qualified institutional buyers. The aggregate value of these securities at February 28, 2023 was $1,672,133,901, which represented 21.16% of the Fund’s Net Assets. |
| (i) | Zero coupon bond issued at a discount. |
| (j) | Underlying security related to TOB Trusts entered into by the Fund. See Note 1K. |
| (k) | Security valued using significant unobservable inputs (Level 3). See Note 3. |
| (l) | Security is subject to a reimbursement agreement which may require the Fund to pay amounts to a counterparty in the event of a significant decline in the market value of the security underlying the TOB Trusts. In case of a shortfall, the maximum potential amount of payments the Fund could ultimately be required to make under the agreement is $474,265,000. However, such shortfall payment would be reduced by the proceeds from the sale of the security underlying the TOB Trusts. |
| (m) | Advance refunded; secured by an escrow fund of U.S. Government obligations or other highly rated collateral. |
| (n) | The issuer is paying less than stated interest, but is not in default on principal because scheduled principal payments have not yet begun. |
| (o) | Demand security payable upon demand by the Fund at specified time intervals no greater than thirteen months. Interest rate is redetermined periodically by the issuer or agent based on current market conditions. Rate shown is the rate in effect on February 28, 2023. |
| (p) | Interest or dividend rate is redetermined periodically. Rate shown is the rate in effect on February 28, 2023. |
| (q) | Entities may either issue, guarantee, back or otherwise enhance the credit quality of a security. The entities are not primarily responsible for the issuer’s obligations but may be called upon to satisfy issuer’s obligations. No concentration of any single entity was greater than 5% each. |
| (r) | Floating rate note obligations related to securities held. The interest and fee rates shown reflect the rates in effect at February 28, 2023. At February 28, 2023, the Fund’s investments with a value of $1,692,582,612 are held by TOB Trusts and serve as collateral for the $1,210,095,000 in the floating rate note obligations outstanding at that date. |
See accompanying Notes to Financial Statements which are an integral part of the financial statements.
| | |
| 42 | | Invesco High Yield Municipal Fund |
Statement of Assets and Liabilities
February 28, 2023
| | | | |
Assets: | | | | |
Investments in unaffiliated securities, at value
(Cost $9,544,128,797) | | $ | 8,987,321,006 | |
Receivable for: | | | | |
Investments sold | | | 64,057,707 | |
Fund shares sold | | | 11,737,580 | |
Interest | | | 155,428,789 | |
Investments matured, at value
(Cost $88,094,835) | | | 70,871,193 | |
Investment for trustee deferred compensation and retirement plans | | | 519,060 | |
Other assets | | | 3,396,531 | |
Total assets | | | 9,293,331,866 | |
| |
Liabilities: | | | | |
Floating rate note obligations | | | 1,210,095,000 | |
Payable for: | | | | |
Investments purchased | | | 137,970,002 | |
Dividends | | | 14,451,996 | |
Fund shares reacquired | | | 10,207,882 | |
Amount due custodian | | | 13,433,288 | |
Accrued fees to affiliates | | | 2,883,114 | |
Accrued interest expense | | | 107,330 | |
Accrued trustees’ and officers’ fees and benefits | | | 8,150 | |
Accrued other operating expenses | | | 382,042 | |
Trustee deferred compensation and retirement plans | | | 590,814 | |
Total liabilities | | | 1,390,129,618 | |
Net assets applicable to shares outstanding | | $ | 7,903,202,248 | |
| |
Net assets consist of: | | | | |
Shares of beneficial interest | | $ | 9,406,658,152 | |
Distributable earnings (loss) | | | (1,503,455,904 | ) |
| |
| | $ | 7,903,202,248 | |
|
| |
| | | | |
Net Assets: | | | | |
Class A | | $ | 4,873,987,480 | |
|
| |
Class C | | $ | 346,859,350 | |
|
| |
Class Y | | $ | 2,023,123,972 | |
|
| |
Class R5 | | $ | 45,893 | |
|
| |
Class R6 | | $ | 659,185,553 | |
|
| |
|
Shares outstanding, no par value, with an unlimited number of shares authorized: | |
Class A | | | 570,012,925 | |
|
| |
Class C | | | 40,705,470 | |
|
| |
Class Y | | | 236,253,529 | |
|
| |
Class R5 | | | 5,370 | |
|
| |
Class R6 | | | 77,197,460 | |
|
| |
Class A: | | | | |
Net asset value per share | | $ | 8.55 | |
|
| |
Maximum offering price per share (Net asset value of $8.55 ÷ 95.75%) | | $ | 8.93 | |
|
| |
Class C: | | | | |
Net asset value and offering price per share | | $ | 8.52 | |
|
| |
Class Y: | | | | |
Net asset value and offering price per share | | $ | 8.56 | |
|
| |
Class R5: | | | | |
Net asset value and offering price per share | | $ | 8.55 | |
|
| |
Class R6: | | | | |
Net asset value and offering price per share | | $ | 8.54 | |
|
| |
See accompanying Notes to Financial Statements which are an integral part of the financial statements.
| | |
| 43 | | Invesco High Yield Municipal Fund |
Statement of Operations
For the year ended February 28, 2023
| | | | |
Investment income: | | | | |
Interest | | $ | 514,932,434 | |
|
| |
| |
Expenses: | | | | |
Advisory fees | | | 43,188,668 | |
| |
Administrative services fees | | | 1,235,983 | |
| |
Custodian fees | | | 48,908 | |
| |
Distribution fees: | | | | |
Class A | | | 13,160,529 | |
| |
Class C | | | 4,006,747 | |
| |
Interest, facilities and maintenance fees | | | 45,479,807 | |
| |
Transfer agent fees – A, C and Y | | | 5,378,319 | |
| |
Transfer agent fees – R5 | | | 124 | |
| |
Transfer agent fees – R6 | | | 109,732 | |
| |
Trustees’ and officers’ fees and benefits | | | 74,004 | |
| |
Registration and filing fees | | | 302,302 | |
| |
Reports to shareholders | | | 198,492 | |
| |
Professional services fees | | | 760,178 | |
| |
Other | | | 294,277 | |
|
| |
Total expenses | | | 114,238,070 | |
| |
Less: Expense offset arrangement(s) | | | (3,187 | ) |
| |
Net expenses | | | 114,234,883 | |
| |
Net investment income | | | 400,697,551 | |
|
| |
| |
Realized and unrealized gain (loss) from: | | | | |
Net realized gain (loss) from: | | | | |
Unaffiliated investment securities (includes net gains (losses) from securities sold to affiliates of $(1,279,342)) | | | (308,206,743 | ) |
| |
Futures contracts | | | 46,277,150 | |
| |
| | | (261,929,593 | ) |
| |
Change in net unrealized appreciation (depreciation) of: | | | | |
Unaffiliated investment securities | | | (1,137,439,991 | ) |
| |
Futures contracts | | | 250,000 | |
| |
| | | (1,137,189,991 | ) |
| |
Net realized and unrealized gain (loss) | | | (1,399,119,584 | ) |
| |
Net increase (decrease) in net assets resulting from operations | | $ | (998,422,033 | ) |
|
| |
See accompanying Notes to Financial Statements which are an integral part of the financial statements.
| | |
| 44 | | Invesco High Yield Municipal Fund |
Statement of Changes in Net Assets
For the years ended February 28, 2023 and 2022
| | | | | | | | |
| | | 2023 | | | 2022 | |
|
| |
Operations: | | | | | | | | |
Net investment income | | $ | 400,697,551 | | | $ | 418,523,480 | |
| |
Net realized gain (loss) | | | (261,929,593 | ) | | | 43,674,375 | |
| |
Change in net unrealized appreciation (depreciation) | | | (1,137,189,991 | ) | | | (300,915,371 | ) |
| |
Net increase (decrease) in net assets resulting from operations | | | (998,422,033 | ) | | | 161,282,484 | |
|
| |
| | |
Distributions to shareholders from distributable earnings: | | | | | | | | |
Class A | | | (241,232,400 | ) | | | (259,211,014 | ) |
| |
Class C | | | (15,619,181 | ) | | | (18,774,894 | ) |
| |
Class Y | | | (106,353,416 | ) | | | (123,351,862 | ) |
| |
Class R5 | | | (5,839 | ) | | | (6,774 | ) |
| |
Class R6 | | | (32,985,545 | ) | | | (33,850,863 | ) |
| |
Total distributions from distributable earnings | | | (396,196,381 | ) | | | (435,195,407 | ) |
|
| |
| | |
Share transactions–net: | | | | | | | | |
Class A | | | (532,392,868 | ) | | | 89,215,608 | |
| |
Class C | | | (114,720,165 | ) | | | (62,913,536 | ) |
| |
Class Y | | | (386,703,990 | ) | | | 174,949,804 | |
| |
Class R5 | | | (91,765 | ) | | | 1,240 | |
| |
Class R6 | | | (32,858,865 | ) | | | 125,135,956 | |
| |
Net increase (decrease) in net assets resulting from share transactions | | | (1,066,767,653 | ) | | | 326,389,072 | |
|
| |
Net increase (decrease) in net assets | | | (2,461,386,067 | ) | | | 52,476,149 | |
|
| |
| | |
Net assets: | | | | | | | | |
Beginning of year | | | 10,364,588,315 | | | | 10,312,112,166 | |
| |
End of year | | $ | 7,903,202,248 | | | $ | 10,364,588,315 | |
|
| |
See accompanying Notes to Financial Statements which are an integral part of the financial statements.
| | |
| 45 | | Invesco High Yield Municipal Fund |
Statement of Cash Flows
For the year ended February 28, 2023
| | | | |
Cash provided by operating activities: | | | | |
Net increase (decrease) in net assets resulting from operations | | $ | (998,422,033 | ) |
|
| |
| |
Adjustments to reconcile the change in net assets from operations to net cash provided by operating activities: | | | | |
Purchases of investments | | | (2,440,683,977 | ) |
| |
Proceeds from sales of investments | | | 3,453,278,268 | |
| |
Proceeds from sales of short-term investments, net | | | 45,888,989 | |
| |
Amortization of premium on investment securities | | | 26,095,658 | |
| |
Accretion of discount on investment securities | | | (90,694,379 | ) |
| |
Increase in variation margin - futures contracts | | | (2,810,010 | ) |
| |
Net realized loss from investment securities | | | 308,206,743 | |
| |
Net change in unrealized depreciation on investment securities | | | 1,137,439,991 | |
| |
Change in operating assets and liabilities: | | | | |
| |
Increase in receivables and other assets | | | (3,377,559 | ) |
| |
Decrease in accrued expenses and other payables | | | (583,768 | ) |
|
| |
Net cash provided by operating activities | | | 1,434,337,923 | |
|
| |
Cash provided by (used in) financing activities: | | | | |
Dividends paid to shareholders from distributable earnings | | | (180,202,170 | ) |
| |
Decrease in payable for amount due custodian | | | (3,526,263 | ) |
| |
Proceeds from shares of beneficial interest sold | | | 3,362,446,950 | |
| |
Proceeds of TOB Trusts | | | 881,090,000 | |
| |
Repayments of TOB Trusts | | | (812,705,000 | ) |
| |
Repayment of borrowings | | | (32,500,000 | ) |
| |
Disbursements from shares of beneficial interest reacquired | | | (4,651,501,440 | ) |
|
| |
Net cash provided by (used in) financing activities | | | (1,436,897,923 | ) |
|
| |
Net decrease in cash and cash equivalents | | | (2,560,000 | ) |
|
| |
Cash and cash equivalents at beginning of period | | | 2,560,000 | |
|
| |
Cash and cash equivalents at end of period | | $ | – | |
|
| |
| |
Non-cash financing activities: | | | | |
Value of shares of beneficial interest issued in reinvestment of dividends paid to shareholders | | $ | 216,932,890 | |
|
| |
| |
Supplemental disclosure of cash flow information: | | | | |
| |
Cash paid during the period for interest, facilities and maintenance fees | | $ | 45,471,248 | |
|
| |
See accompanying Notes to Financial Statements which are an integral part of the financial statements.
| | |
| 46 | | Invesco High Yield Municipal Fund |
Financial Highlights
The following schedule presents financial highlights for a share of the Fund outstanding throughout the periods indicated.
| | | | | | | | | | | | | | | | | | | | | | | | | | | | | | | | | | | | | | | | | | | | | | | | | | | | | | | | | | | | | | | | | |
| | | Net asset value, beginning of period | | Net investment income(a) | | Net gains (losses) on securities (both realized and unrealized) | | Total from investment operations | | Dividends from net investment income | | Net asset value, end of period | | Total return (b) | | Net assets, end of period (000’s omitted) | | Ratio of expenses to average net assets with fee
waivers and/or expenses absorbed | | Ratio of expenses to average net assets without fee waivers and/or expenses absorbed | | Supplemental ratio of expenses to average net assets with fee waivers (excluding interest, facilities and maintenance fees) | | Ratio of net investment income to average net assets | | Portfolio turnover (c) |
Class A | | | | | | | | | | | | | | | | | | | | | | | | | | | | | | | | | | | | | | | | | | | | | | | | | | | | | | | | | | | | | | | | | |
Year ended 02/28/23 | | | | $ 9.94 | | | | | $0.41 | | | | | $(1.39) | | | | | $(0.98) | | | | | $(0.41) | | | | | $ 8.55 | | | | | (9.91) | % | | | | $4,873,987 | | | | | 1.39 | % | | | | 1.39 | % | | | | 0.86 | % | | | | 4.63 | % | | | | 27 | % |
Year ended 02/28/22 | | | | 10.19 | | | | | 0.39 | | | | | (0.23) | | | | | 0.16 | | | | | (0.41) | | | | | 9.94 | | | | | 1.44 | | | | | 6,253,279 | | | | | 0.98 | | | | | 0.98 | | | | | 0.86 | | | | | 3.76 | | | | | 17 | |
Year ended 02/28/21 | | | | 10.68 | | | | | 0.42 | | | | | (0.47) | | | | | (0.05) | | | | | (0.44) | | | | | 10.19 | | | | | (0.25) | | | | | 6,323,866 | | | | | 1.03 | | | | | 1.03 | | | | | 0.86 | | | | | 4.28 | | | | | 26 | |
Year ended 02/29/20 | | | | 9.87 | | | | | 0.43 | | | | | 0.83 | | | | | 1.26 | | | | | (0.45) | | | | | 10.68 | | | | | 13.00 | | | | | 6,659,123 | | | | | 1.13 | | | | | 1.13 | | | | | 0.86 | | | | | 4.19 | | | | | 10 | |
Year ended 02/28/19 | | | | 9.93 | | | | | 0.43 | | | | | (0.02) | | | | | 0.41 | | | | | (0.47) | | | | | 9.87 | | | | | 4.17 | | | | | 5,561,342 | | | | | 1.22 | | | | | 1.22 | | | | | 0.86 | | | | | 4.37 | | | | | 24 | |
Class C | | | | | | | | | | | | | | | | | | | | | | | | | | | | | | | | | | | | | | | | | | | | | | | | | | | | | | | | | | | | | | | | | |
Year ended 02/28/23 | | | | 9.91 | | | | | 0.35 | | | | | (1.40) | | | | | (1.05) | | | | | (0.34) | | | | | 8.52 | | | | | (10.60) | (d) | | | | 346,859 | | | | | 2.13 | (d) | | | | 2.13 | (d) | | | | 1.59 | (d) | | | | 3.89 | (d) | | | | 27 | |
Year ended 02/28/22 | | | | 10.15 | | | | | 0.31 | | | | | (0.22) | | | | | 0.09 | | | | | (0.33) | | | | | 9.91 | | | | | 0.78 | (d) | | | | 530,125 | | | | | 1.71 | (d) | | | | 1.71 | (d) | | | | 1.59 | (d) | | | | 3.03 | (d) | | | | 17 | |
Year ended 02/28/21 | | | | 10.64 | | | | | 0.35 | | | | | (0.48) | | | | | (0.13) | | | | | (0.36) | | | | | 10.15 | | | | | (0.99) | (d) | | | | 605,479 | | | | | 1.77 | (d) | | | | 1.77 | (d) | | | | 1.60 | (d) | | | | 3.54 | (d) | | | | 26 | |
Year ended 02/29/20 | | | | 9.84 | | | | | 0.35 | | | | | 0.82 | | | | | 1.17 | | | | | (0.37) | | | | | 10.64 | | | | | 12.09 | | | | | 948,191 | | | | | 1.88 | | | | | 1.88 | | | | | 1.61 | | | | | 3.44 | | | | | 10 | |
Year ended 02/28/19 | | | | 9.89 | | | | | 0.36 | | | | | (0.02) | | | | | 0.34 | | | | | (0.39) | | | | | 9.84 | | | | | 3.52 | | | | | 860,988 | | | | | 1.97 | | | | | 1.97 | | | | | 1.61 | | | | | 3.62 | | | | | 24 | |
Class Y | | | | | | | | | | | | | | | | | | | | | | | | | | | | | | | | | | | | | | | | | | | | | | | | | | | | | | | | | | | | | | | | | |
Year ended 02/28/23 | | | | 9.96 | | | | | 0.44 | | | | | (1.41) | | | | | (0.97) | | | | | (0.43) | | | | | 8.56 | | | | | (9.75) | | | | | 2,023,124 | | | | | 1.14 | | | | | 1.14 | | | | | 0.61 | | | | | 4.88 | | | | | 27 | |
Year ended 02/28/22 | | | | 10.21 | | | | | 0.42 | | | | | (0.24) | | | | | 0.18 | | | | | (0.43) | | | | | 9.96 | | | | | 1.70 | | | | | 2,780,042 | | | | | 0.73 | | | | | 0.73 | | | | | 0.61 | | | | | 4.01 | | | | | 17 | |
Year ended 02/28/21 | | | | 10.70 | | | | | 0.45 | | | | | (0.48) | | | | | (0.03) | | | | | (0.46) | | | | | 10.21 | | | | | 0.01 | | | | | 2,684,515 | | | | | 0.78 | | | | | 0.78 | | | | | 0.61 | | | | | 4.53 | | | | | 26 | |
Year ended 02/29/20 | | | | 9.89 | | | | | 0.46 | | | | | 0.82 | | | | | 1.28 | | | | | (0.47) | | | | | 10.70 | | | | | 13.25 | | | | | 3,291,052 | | | | | 0.88 | | | | | 0.88 | | | | | 0.61 | | | | | 4.44 | | | | | 10 | |
Year ended 02/28/19 | | | | 9.94 | | | | | 0.46 | | | | | (0.02) | | | | | 0.44 | | | | | (0.49) | | | | | 9.89 | | | | | 4.54 | | | | | 2,557,003 | | | | | 0.97 | | | | | 0.97 | | | | | 0.61 | | | | | 4.62 | | | | | 24 | |
Class R5 | | | | | | | | | | | | | | | | | | | | | | | | | | | | | | | | | | | | | | | | | | | | | | | | | | | | | | | | | | | | | | | | | |
Year ended 02/28/23 | | | | 9.93 | | | | | 0.44 | | | | | (1.39) | | | | | (0.95) | | | | | (0.43) | | | | | 8.55 | | | | | (9.61) | | | | | 46 | | | | | 1.17 | | | | | 1.17 | | | | | 0.63 | | | | | 4.85 | | | | | 27 | |
Year ended 02/28/22 | | | | 10.18 | | | | | 0.41 | | | | | (0.23) | | | | | 0.18 | | | | | (0.43) | | | | | 9.93 | | | | | 1.67 | | | | | 158 | | | | | 0.76 | | | | | 0.76 | | | | | 0.64 | | | | | 3.98 | | | | | 17 | |
Year ended 02/28/21 | | | | 10.67 | | | | | 0.44 | | | | | (0.47) | | | | | (0.03) | | | | | (0.46) | | | | | 10.18 | | | | | (0.02) | | | | | 160 | | | | | 0.79 | | | | | 0.79 | | | | | 0.62 | | | | | 4.52 | | | | | 26 | |
Year ended 02/29/20 | | | | 9.87 | | | | | 0.46 | | | | | 0.81 | | | | | 1.27 | | | | | (0.47) | | | | | 10.67 | | | | | 13.20 | | | | | 189 | | | | | 0.86 | | | | | 0.86 | | | | | 0.59 | | | | | 4.46 | | | | | 10 | |
Year ended 02/28/19 | | | | 9.92 | | | | | 0.46 | | | | | (0.02) | | | | | 0.44 | | | | | (0.49) | | | | | 9.87 | | | | | 4.51 | | | | | 215 | | | | | 0.99 | | | | | 0.99 | | | | | 0.63 | | | | | 4.60 | | | | | 24 | |
Class R6 | | | | | | | | | | | | | | | | | | | | | | | | | | | | | | | | | | | | | | | | | | | | | | | | | | | | | | | | | | | | | | | | | |
Year ended 02/28/23 | | | | 9.93 | | | | | 0.44 | | | | | (1.39) | | | | | (0.95) | | | | | (0.44) | | | | | 8.54 | | | | | (9.65) | | | | | 659,186 | | | | | 1.09 | | | | | 1.09 | | | | | 0.56 | | | | | 4.93 | | | | | 27 | |
Year ended 02/28/22 | | | | 10.18 | | | | | 0.42 | | | | | (0.23) | | | | | 0.19 | | | | | (0.44) | | | | | 9.93 | | | | | 1.75 | | | | | 800,984 | | | | | 0.68 | | | | | 0.68 | | | | | 0.56 | | | | | 4.06 | | | | | 17 | |
Year ended 02/28/21 | | | | 10.66 | | | | | 0.45 | | | | | (0.46) | | | | | (0.01) | | | | | (0.47) | | | | | 10.18 | | | | | 0.14 | | | | | 698,091 | | | | | 0.72 | | | | | 0.72 | | | | | 0.56 | | | | | 4.59 | | | | | 26 | |
Year ended 02/29/20 | | | | 9.86 | | | | | 0.46 | | | | | 0.82 | | | | | 1.28 | | | | | (0.48) | | | | | 10.66 | | | | | 13.25 | | | | | 649,785 | | | | | 0.81 | | | | | 0.81 | | | | | 0.54 | | | | | 4.51 | | | | | 10 | |
Year ended 02/28/19 | | | | 9.91 | | | | | 0.46 | | | | | (0.01) | | | | | 0.45 | | | | | (0.50) | | | | | 9.86 | | | | | 4.59 | | | | | 388,029 | | | | | 0.92 | | | | | 0.92 | | | | | 0.56 | | | | | 4.67 | | | | | 24 | |
| (a) | Calculated using average shares outstanding. |
| (b) | Includes adjustments in accordance with accounting principles generally accepted in the United States of America and as such, the net asset value for financial reporting purposes and the returns based upon those net asset values may differ from the net asset value and returns for shareholder transactions. Does not include sales charges and is not annualized for periods less than one year, if applicable. |
| (c) | Portfolio turnover is calculated at the fund level and is not annualized for periods less than one year, if applicable. |
| (d) | The total return, ratio of expenses to average net assets and ratio of net investment income to average net assets reflect actual 12b-1 fees of 0.99%, 0.98% and 0.99% for the years ended February 28, 2023, 2022 and 2021, respectively. |
See accompanying Notes to Financial Statements which are an integral part of the financial statements.
| | |
| 47 | | Invesco High Yield Municipal Fund |
Notes to Financial Statements
February 28, 2023
NOTE 1���Significant Accounting Policies
Invesco High Yield Municipal Fund (the “Fund”) is a series portfolio of AIM Tax-Exempt Funds (Invesco Tax-Exempt Funds) (the “Trust”). The Trust is a Delaware statutory trust registered under the Investment Company Act of 1940, as amended (the “1940 Act”), as an open-end series management investment company authorized to issue an unlimited number of shares of beneficial interest. Information presented in these financial statements pertains only to the Fund. Matters affecting the Fund or each class will be voted on exclusively by the shareholders of the Fund or each class.
The Fund’s investment objective is to seek federal tax-exempt current income and taxable capital appreciation.
The Fund currently consists of five different classes of shares: Class A, Class C, Class Y, Class R5 and Class R6. Class Y shares are available only to certain investors. Class A shares are sold with a front-end sales charge unless certain waiver criteria are met. Under certain circumstances, load waived shares may be subject to contingent deferred sales charges (“CDSC”). Class C shares are sold with a CDSC. Class Y, Class R5 and Class R6 shares are sold at net asset value. Class C shares held for eight years after purchase are eligible for automatic conversion into Class A shares of the same Fund (the “Conversion Feature”). The automatic conversion pursuant to the Conversion Feature will generally occur at the end of the month following the eighth anniversary after a purchase of Class C shares.
Effective as of the open of business June 28, 2022, the Fund reopened to all investors.
The Fund is an investment company and accordingly follows the investment company accounting and reporting guidance in accordance with Financial Accounting Standards Board Accounting Standards Codification Topic 946, Financial Services - Investment Companies.
The following is a summary of the significant accounting policies followed by the Fund in the preparation of its financial statements.
| A. | Security Valuations - Securities, including restricted securities, are valued according to the following policy. |
Securities generally normally are valued on the basis of prices provided by independent pricing services. Prices provided by the pricing service may be determined without exclusive reliance on quoted prices, and may reflect appropriate factors such as institution-size trading in similar groups of securities, developments related to specific securities, dividend rate (for unlisted equities), yield (for debt obligations), quality, type of issue, coupon rate (for debt obligations), maturity (for debt obligations), individual trading characteristics and other market data. Pricing services generally value debt obligations assuming orderly transactions of institutional round lot size, but a fund may hold or transact in the same securities in smaller, odd lot sizes. Odd lots often trade at lower prices than institutional round lots, and their value may be adjusted accordingly. Debt obligations are subject to interest rate and credit risks. In addition, all debt obligations involve some risk of default with respect to interest and/or principal payments.
A security listed or traded on an exchange is generally valued at its trade price or official closing price that day as of the close of the exchange where the security is principally traded, or lacking any sales or official closing price on a particular day, the security may be valued at the closing bid price on that day. Securities traded in the over-the-counter market are valued based on prices furnished by independent pricing services or market makers. When such securities are valued using prices provided by an independent pricing service they may be considered fair valued. Futures contracts are valued at the daily settlement price set by an exchange on which they are principally traded. U.S. exchange-traded options are valued at the mean between the last bid and asked prices from the exchange on which they are principally traded. Non-U.S. exchange-traded options are valued at the final settlement price set by the exchange on which they trade. Options not listed on an exchange and swaps generally are valued using pricing provided from independent pricing services.
Securities for which market quotations are not readily available are fair valued by Invesco Advisers, Inc. (the “Adviser” or “Invesco”) in accordance with Board-approved policies and related Adviser procedures (“Valuation Procedures”). If a fair value price provided by a pricing service is not representative of market value in the Adviser’s judgment (“unreliable”), the Adviser will fair value the security using the Valuation Procedures. Issuer specific events, market trends, bid/asked quotes of brokers and information providers and other market data may be reviewed in the course of making a good faith determination of a security’s fair value.
The Fund may invest in securities that are subject to interest rate risk, meaning the risk that the prices will generally fall as interest rates rise and, conversely, the prices will generally rise as interest rates fall. Specific securities differ in their sensitivity to changes in interest rates depending on their individual characteristics. Changes in interest rates may result in increased market volatility, which may affect the value and/or liquidity of certain Fund investments.
Valuations change in response to many factors including the historical and prospective earnings of the issuer, the value of the issuer’s assets, general market conditions which are not specifically related to the particular issuer, such as real or perceived adverse economic conditions, changes in the general outlook for revenues or corporate earnings, changes in interest or currency rates, regional or global instability, natural or environmental disasters, widespread disease or other public health issues, war, acts of terrorism, significant governmental actions or adverse investor sentiment generally and market liquidity. Because of the inherent uncertainties of valuation, the values reflected in the financial statements may materially differ from the value received upon actual sale of those investments.
The price the Fund could receive upon the sale of any investment may differ from the Adviser’s valuation of the investment, particularly for securities that are valued using a fair valuation technique. When fair valuation techniques are applied, the Adviser uses available information, including both observable and unobservable inputs and assumptions, to determine a methodology that will result in a valuation that the Adviser believes approximates market value. Fund securities that are fair valued may be subject to greater fluctuation in their value from one day to the next than would be the case if market quotations were used. Because of the inherent uncertainties of valuation, and the degree of subjectivity in such decisions, the Fund could realize a greater or lesser than expected gain or loss upon the sale of the investment.
| B. | Securities Transactions and Investment Income - Securities transactions are accounted for on a trade date basis. Realized gains or losses on sales are computed on the basis of specific identification of the securities sold. Interest income (net of withholding tax, if any) is recorded on an accrual basis from settlement date and includes coupon interest and amortization of premium and accretion of discount on debt securities as applicable. Pay-in-kind interest income and non-cash dividend income received in the form of securities in-lieu of cash are recorded at the fair value of the securities received. Paydown gains and losses on mortgage and asset-backed securities are recorded as adjustments to interest income. Dividend income (net of withholding tax, if any) is recorded on the ex-dividend date. |
The Fund may periodically participate in litigation related to Fund investments. As such, the Fund may receive proceeds from litigation settlements.Any proceeds received are included in the Statement of Operations as realized gain (loss) for investments no longer held and as unrealized gain (loss) for investments still held.
Brokerage commissions and mark ups are considered transaction costs and are recorded as an increase to the cost basis of securities purchased and/or a reduction of proceeds on a sale of securities. Such transaction costs are included in the determination of net realized and unrealized gain (loss) from investment securities reported in the Statement of Operations and the Statement of Changes in Net Assets and the net realized and unrealized gains (losses) on securities per share in the Financial Highlights. Transaction costs are included in the calculation of the Fund’s net asset value and, accordingly, they reduce the Fund’s total returns. These transaction costs are not considered operating expenses and are not reflected in net investment income reported in the Statement of Operations and the Statement of Changes in Net Assets, or the net investment income per share and the ratios of expenses and net investment income reported in the Financial Highlights, nor are they limited by any expense limitation arrangements between the Fund and the investment adviser.
The Fund allocates realized and unrealized capital gains and losses to a class based on the relative net assets of each class. The Fund allocates income to a class based on the relative value of the settled shares of each class.
| | |
| 48 | | Invesco High Yield Municipal Fund |
| C. | Country Determination - For the purposes of making investment selection decisions and presentation in the Schedule of Investments, the investment adviser may determine the country in which an issuer is located and/or credit risk exposure based on various factors. These factors include the laws of the country under which the issuer is organized, where the issuer maintains a principal office, the country in which the issuer derives 50% or more of its total revenues, the country that has the primary market for the issuer’s securities and its “country of risk” as determined by a third party service provider, as well as other criteria. Among the other criteria that may be evaluated for making this determination are the country in which the issuer maintains 50% or more of its assets, the type of security, financial guarantees and enhancements, the nature of the collateral and the sponsor organization. Country of issuer and/or credit risk exposure has been determined to be the United States of America, unless otherwise noted. |
| D. | Distributions - Distributions from net investment income, if any, are declared daily and paid monthly. Distributions from net realized capital gain, if any, are generally declared and paid annually and recorded on the ex-dividend date. The Fund may elect to treat a portion of the proceeds from redemptions as distributions for federal income tax purposes. |
| E. | Federal Income Taxes - The Fund intends to comply with the requirements of Subchapter M of the Internal Revenue Code of 1986, as amended (the “Internal Revenue Code”), necessary to qualify as a regulated investment company and to distribute substantially all of the Fund’s taxable and tax-exempt earnings to shareholders. As such, the Fund will not be subject to federal income taxes on otherwise taxable income (including net realized capital gain) that is distributed to shareholders. Therefore, no provision for federal income taxes is recorded in the financial statements. |
The Fund recognizes the tax benefits of uncertain tax positions only when the position is more likely than not to be sustained. Management has analyzed the Fund’s uncertain tax positions and concluded that no liability for unrecognized tax benefits should be recorded related to uncertain tax positions. Management is not aware of any tax positions for which it is reasonably possible that the total amounts of unrecognized tax benefits will change materially in the next 12 months.
In addition, the Fund intends to invest in such municipal securities to allow it to qualify to pay shareholders “exempt-interest dividends”, as defined in the Internal Revenue Code.
The Fund files tax returns in the U.S. Federal jurisdiction and certain other jurisdictions. Generally, the Fund is subject to examinations by such taxing authorities for up to three years after the filing of the return for the tax period.
| F. | Expenses - Fees provided for under the Rule 12b-1 plan of a particular class of the Fund are charged to the operations of such class. Transfer agency fees and expenses and other shareholder recordkeeping fees and expenses attributable to Class R5 and Class R6 are allocated based on relative net assets of Class R5 and Class R6. Sub-accounting fees attributable to Class R5 are charged to the operations of the class. Transfer agency fees and expenses and other shareholder recordkeeping fees and expenses relating to all other classes are allocated among those classes based on relative net assets. All other expenses are allocated among the classes based on relative net assets. |
| G. | Interest, Facilities and Maintenance Fees - Interest, Facilities and Maintenance Fees include interest and related borrowing costs such as commitment fees, administrative expenses and other expenses associated with establishing and maintaining the line of credit. In addition, interest and administrative expenses related to establishing and maintaining floating rate note obligations, if any, are included. |
| H. | Accounting Estimates - The preparation of financial statements in conformity with accounting principles generally accepted in the United States of America (“GAAP”) requires management to make estimates and assumptions that affect the reported amounts of assets and liabilities at the date of the financial statements and the reported amounts of revenues and expenses during the reporting period including estimates and assumptions related to taxation. Actual results could differ from those estimates by a significant amount. In addition, the Fund monitors for material events or transactions that may occur or become known after the period-end date and before the date the financial statements are released to print. |
| I. | Indemnifications - Under the Trust’s organizational documents, each Trustee, officer, employee or other agent of the Trust is indemnified against certain liabilities that may arise out of the performance of their duties to the Fund. Additionally, in the normal course of business, the Fund enters into contracts, including the Fund’s servicing agreements, that contain a variety of indemnification clauses. The Fund’s maximum exposure under these arrangements is unknown as this would involve future claims that may be made against the Fund that have not yet occurred. The risk of material loss as a result of such indemnification claims is considered remote. |
| J. | Cash and Cash Equivalents - For the purposes of the Statement of Cash Flows, the Fund defines Cash and Cash Equivalents as cash (including foreign currency), money market funds, cash pledged as collateral and other investments held in lieu of cash and excludes investments made with cash collateral received. The cash pledged as collateral included in Cash and Cash Equivalents is restricted cash. |
| K. | Floating Rate Note Obligations - The Fund invests in inverse floating rate securities, such as Tender Option Bonds (“TOBs”), for investment purposes and to enhance the yield of the Fund. Such securities may be purchased in the secondary market without first owning an underlying bond but generally are created through the sale of fixed rate bonds by the Fund to special purpose trusts established by a broker dealer or by the Fund (“TOB Trusts”) in exchange for cash and residual interests in the TOB Trusts’ assets and cash flows, which are in the form of inverse floating rate securities. The TOB Trusts finance the purchases of the fixed rate bonds by issuing floating rate notes to third parties and allowing the Fund to retain residual interests in the bonds. The floating rate notes issued by the TOB Trusts have interest rates that reset weekly and the floating rate note holders have the option to tender their notes to the TOB Trusts for redemption at par at each reset date. The residual interests held by the Fund (inverse floating rate securities) include the right of the Fund (1) to cause the holders of the floating rate notes to tender their notes at par at the next interest rate reset date, and (2) to transfer the municipal bond from the TOB Trust to the Fund, thereby collapsing the TOB Trust. Inverse floating rate securities tend to underperform the market for fixed rate bonds in a rising interest rate environment, but tend to outperform the market for fixed rate bonds when interest rates decline or remain relatively stable. |
The Fund generally invests in inverse floating rate securities that include embedded leverage, thus exposing the Fund to greater risks and increased costs. The primary risks associated with inverse floating rate securities are varying degrees of liquidity and decreases in the value of such securities in response to changes in interest rates to a greater extent than fixed rate securities having similar credit quality, redemption provisions and maturity, which may cause the Fund’s net asset value to be more volatile than if it had not invested in inverse floating rate securities. In certain instances, the short-term floating rate notes created by the TOB Trust may not be able to be sold to third parties or, in the case of holders tendering (or putting) such notes for repayment of principal, may not be able to be remarketed to third parties. In such cases, the TOB Trust holding the fixed rate bonds may be collapsed with the entity that contributed the fixed rate bonds to the TOB Trust. In the case where a TOB Trust is collapsed with the Fund, the Fund will be required to repay the principal amount of the tendered securities, which may require the Fund to sell other portfolio holdings to raise cash to meet that obligation. The Fund could therefore be required to sell other portfolio holdings at a disadvantageous time or price to raise cash to meet this obligation, which risk will be heightened during times of market volatility, illiquidity or uncertainty. The embedded leverage in the TOB Trust could cause the Fund to lose more money than the value of the asset it has contributed to the TOB Trust and greater levels of leverage create the potential for greater losses. In addition, a Fund may enter into reimbursement agreements with the liquidity provider of certain TOB transactions in connection with certain residuals held by the Fund. These agreements commit a Fund to reimburse the liquidity provider to the extent that the liquidity provider must provide cash to a TOB Trust, including following the termination of a TOB Trust resulting from a mandatory tender event (“liquidity shortfall”). The reimbursement agreement will effectively make the Fund liable for the amount of the negative difference, if any, between the liquidation value of the underlying security and the purchase price of the floating rate notes issued by the TOB Trust.
The Fund accounts for the transfer of fixed rate bonds to the TOB Trusts as secured borrowings, with the securities transferred remaining in the Fund’s investment assets, and the related floating rate notes reflected as Fund liabilities under the caption Floating rate note obligations on the Statement of Assets and Liabilities. The carrying amount of the Fund’s floating rate note obligations as reported on the Statement of Assets and Liabilities approximates its fair value. The Fund records the interest income from the fixed rate bonds under the caption Interest and records the expenses related to floating rate obligations and any administrative expenses of the TOB Trusts as a component of Interest, facilities and maintenance fees on the Statement of Operations.
| | |
| 49 | | Invesco High Yield Municipal Fund |
Final rules implementing section 619 of the Dodd-Frank Wall Street Reform and Consumer Protection Act (the “Volcker Rule”) prohibit banking entities from engaging in proprietary trading of certain instruments and limit such entities’ investments in, and relationships with, “covered funds”, as defined in the rules. These rules preclude banking entities and their affiliates from sponsoring and/or providing services for existing TOB Trusts. A new TOB structure is being utilized by the Fund wherein the Fund, as holder of the residuals, will perform certain duties previously performed by banking entities as “sponsors” of TOB Trusts. These duties may be performed by a third-party service provider. The Fund’s expanded role under the new TOB structure may increase its operational and regulatory risk. The new structure is substantially similar to the previous structure; however, pursuant to the Volcker Rule, the remarketing agent would not be able to repurchase tendered floaters for its own account upon a failed remarketing. In the event of a failed remarketing, a banking entity serving as liquidity provider may loan the necessary funds to the TOB Trust to purchase the tendered floaters. The TOB Trust, not the Fund, would be the borrower and the loan from the liquidity provider will be secured by the purchased floaters now held by the TOB Trust. However, as previously described, the Fund would bear the risk of loss with respect to any liquidity shortfall to the extent it entered into a reimbursement agreement with the liquidity provider.
Further, the SEC and various banking agencies have adopted rules implementing credit risk retention requirements for asset-backed securities (the “Risk Retention Rules”). The Risk Retention Rules require the sponsor of a TOB Trust to retain at least 5% of the credit risk of the underlying assets supporting the TOB Trust’s municipal bonds. The Fund has adopted policies intended to comply with the Risk Retention Rules. The Risk Retention Rules may adversely affect the Fund’s ability to engage in TOB Trust transactions or increase the costs of such transactions in certain circumstances.
There can be no assurances that the new TOB structure will continue to be a viable form of leverage. Further, there can be no assurances that alternative forms of leverage will be available to the Fund in order to maintain current levels of leverage. Any alternative forms of leverage may be less advantageous to the Fund, and may adversely affect the Fund’s net asset value, distribution rate and ability to achieve its investment objective.
TOBs are presently classified as private placement securities. Private placement securities are subject to restrictions on resale because they have not been registered under the Securities Act of 1933, as amended (the “1933 Act”), or are otherwise not readily marketable. As a result of the absence of a public trading market for these securities, they may be less liquid than publicly traded securities. Although atypical, these securities may be resold in privately negotiated transactions, the prices realized from these sales could be less than those originally paid by the Fund or less than what may be considered the fair value of such securities.
| L. | Futures Contracts - The Fund may enter into futures contracts to manage exposure to interest rate, equity and market price movements and/or currency risks. A futures contract is an agreement between two parties (“Counterparties”) to purchase or sell a specified underlying security, currency or commodity (or delivery of a cash settlement price, in the case of an index future) for a fixed price at a future date. The Fund currently invests only in exchange-traded futures and they are standardized as to maturity date and underlying instrument or asset. Initial margin deposits required upon entering into futures contracts are satisfied by the segregation of specific securities or cash as collateral at the futures commission merchant (broker). During the period the futures contracts are open, changes in the value of the contracts are recognized as unrealized gains or losses by recalculating the value of the contracts on a daily basis. Subsequent or variation margin payments are received or made depending upon whether unrealized gains or losses are incurred. These amounts are reflected as receivables or payables on the Statement of Assets and Liabilities. When the contracts are closed or expire, the Fund recognizes a realized gain or loss equal to the difference between the proceeds from, or cost of, the closing transaction and the Fund’s basis in the contract. The net realized gain (loss) and the change in unrealized gain (loss) on futures contracts held during the period is included on the Statement of Operations. The primary risks associated with futures contracts are market risk and the absence of a liquid secondary market. If the Fund were unable to liquidate a futures contract and/or enter into an offsetting closing transaction, the Fund would continue to be subject to market risk with respect to the value of the contracts and continue to be required to maintain the margin deposits on the futures contracts. Futures contracts have minimal Counterparty risk since the exchange’s clearinghouse, as Counterparty to all exchange-traded futures, guarantees the futures against default. Risks may exceed amounts recognized in the Statement of Assets and Liabilities. |
| M. | Leverage Risk - Leverage exists when the Fund can lose more than it originally invests because it purchases or sells an instrument or enters into a transaction without investing an amount equal to the full economic exposure of the instrument or transaction. |
| N. | Other Risks - The Fund may invest in lower-quality debt securities, i.e., “junk bonds.” Investments in lower-rated securities or unrated securities of comparable quality tend to be more sensitive to economic conditions than higher-rated securities. Junk bonds involve a greater risk of default by the issuer because such securities are generally unsecured and are often subordinated to other creditors’ claims. |
The value of, payment of interest on, repayment of principal for and the ability to sell a municipal security may be affected by constitutional amendments, legislative enactments, executive orders, administrative regulations, voter initiatives and the economics of the regions in which the issuers are located.
Since many municipal securities are issued to finance similar projects, especially those relating to education, health care, transportation and utilities, conditions in those sectors can affect the overall municipal securities market and the Fund’s investments in municipal securities.
There is some risk that a portion or all of the interest received from certain tax-free municipal securities could become taxable as a result of determinations by the Internal Revenue Service.
Increases in the federal funds and equivalent foreign rates or other changes to monetary policy or regulatory actions may expose fixed income markets to heightened volatility and reduced liquidity for certain fixed income investments, particularly those with longer maturities. It is difficult to predict the impact of interest rate changes on various markets. In addition, decreases in fixed income dealer market-making capacity may also potentially lead to heightened volatility and reduced liquidity in the fixed income markets. As a result, the value of the Fund’s investments and share price may decline. Changes in central bank policies could also result in higher than normal redemptions by shareholders, which could potentially increase the Fund’s portfolio turnover rate and transaction costs.
Policy changes by the U.S. government or its regulatory agencies and political events within the U.S. and abroad may, among other things, affect investor and consumer confidence and increase volatility in the financial markets, perhaps suddenly and to a significant degree, which may adversely impact the Fund’s operations, universe of potential investment options, and return potential.
| O. | COVID-19 Risk - The COVID-19 strain of coronavirus has resulted in instances of market closures and dislocations, extreme volatility, liquidity constraints and increased trading costs. Efforts to contain its spread have resulted in travel restrictions, disruptions of healthcare systems, business operations (including business closures) and supply chains, layoffs, lower consumer demand and employee availability, and defaults and credit downgrades, among other significant economic impacts that have disrupted global economic activity across many industries. Such economic impacts may exacerbate other pre-existing political, social and economic risks locally or globally and cause general concern and uncertainty. The full economic impact and ongoing effects of COVID-19 (or other future epidemics or pandemics) at the macro-level and on individual businesses are unpredictable and may result in significant and prolonged effects on the Fund’s performance. |
NOTE 2–Advisory Fees and Other Fees Paid to Affiliates
The Trust has entered into a master investment advisory agreement with the Adviser. Under the terms of the investment advisory agreement, the Fund accrues daily and pays monthly an advisory fee to the Adviser based on the annual rate of the Fund’s average daily net assets as follows:
| | | | |
| Average Daily Net Assets | | Rate | |
|
| |
First $300 million | | | 0.600% | |
|
| |
Next $300 million | | | 0.550% | |
|
| |
Over $600 million | | | 0.500% | |
|
| |
| | |
| 50 | | Invesco High Yield Municipal Fund |
For the year ended February 28, 2023, the effective advisory fee rate incurred by the Fund was 0.51%.
Under the terms of a master sub-advisory agreement between the Adviser and each of Invesco Asset Management Deutschland GmbH, Invesco Asset Management Limited, Invesco Asset Management (Japan) Limited, Invesco Hong Kong Limited, Invesco Senior Secured Management, Inc. and Invesco Canada Ltd. and separate sub-advisory agreements with Invesco Capital Management LLC and Invesco Asset Management (India) Private Limited (collectively, the “Affiliated Sub-Advisers”) the Adviser, not the Fund, will pay 40% of the fees paid to the Adviser to any such Affiliated Sub-Adviser(s) that provide(s) discretionary investment management services to the Fund based on the percentage of assets allocated to such Affiliated Sub-Adviser(s).
The Adviser has contractually agreed, through at least June 30, 2023, to waive advisory fees and/or reimburse expenses of all shares to the extent necessary to limit total annual fund operating expenses after fee waiver and/or expense reimbursement (excluding certain items discussed below) of Class A, Class C, Class Y, Class R5 and Class R6 shares to 1.50%, 2.25%, 1.25%, 1.25% and 1.25%, respectively, of the Fund’s average daily net assets (the “expense limits”). In determining the Adviser’s obligation to waive advisory fees and/or reimburse expenses, the following expenses are not taken into account, and could cause the total annual fund operating expenses after fee waiver and/or expense reimbursement to exceed the numbers reflected above: (1) interest, facilities and maintenance fees; (2) taxes; (3) dividend expense on short sales; (4) extraordinary or non-routine items, including litigation expenses; and (5) expenses that the Fund has incurred but did not actually pay because of an expense offset arrangement. Unless Invesco continues the fee waiver agreement, it will terminate on June 30, 2023. During its term, the fee waiver agreement cannot be terminated or amended to increase the expense limits or reduce the advisory fee waiver without approval of the Board of Trustees. The Adviser did not waive fees and/or reimburse expenses during the period under this expense limit.
The Trust has entered into a master administrative services agreement with Invesco pursuant to which the Fund has agreed to pay Invesco for certain administrative costs incurred in providing accounting services to the Fund. For the year ended February 28, 2023, expenses incurred under the agreement are shown in the Statement of Operations as Administrative services fees. Invesco has entered into a sub-administration agreement whereby State Street Bank and Trust Company (“SSB”) serves as fund accountant and provides certain administrative services to the Fund. Pursuant to a custody agreement with the Trust on behalf of the Fund, SSB also serves as the Fund’s custodian.
The Trust has entered into a transfer agency and service agreement with Invesco Investment Services, Inc. (“IIS”) pursuant to which the Fund has agreed to pay IIS a fee for providing transfer agency and shareholder services to the Fund and reimburse IIS for certain expenses incurred by IIS in the course of providing such services. IIS may make payments to intermediaries that provide omnibus account services, sub-accounting services and/or networking services. All fees payable by IIS to intermediaries that provide omnibus account services or sub-accounting services are charged back to the Fund, subject to certain limitations approved by the Trust’s Board of Trustees. For the year ended February 28, 2023, expenses incurred under the agreement are shown in the Statement of Operations as Transfer agent fees.
The Trust has entered into master distribution agreements with Invesco Distributors, Inc. (“IDI”) to serve as the distributor for the Class A, Class C, Class Y, Class R5 and Class R6 shares of the Fund. The Trust has adopted distribution and service plan pursuant to Rule 12b-1 under the 1940 Act with respect to the Fund’s Class A and Class C shares (collectively, the “Plan”). The Fund, pursuant to the Plan, reimburses IDI for its allocated share of expenses incurred for the period, up to a maximum annual rate of 0.25% of the average daily net assets of Class A shares and up to 1.00% of the average daily net assets of Class C shares. The fees are accrued daily and paid monthly. Of the Plan payments, up to 0.25% of the average daily net assets of each class of shares may be paid to furnish continuing personal shareholder services to customers who purchase and own shares of such classes. Any amounts not paid as a service fee under the Plans would constitute an asset-based sales charge. Rules of the Financial Industry Regulatory Authority (“FINRA”) impose a cap on the total sales charges, including asset-based sales charges,that may be paid by any class of shares of the Fund. For the year ended February 28, 2023, expenses incurred under the Plans are shown in the Statement of Operations as Distribution fees.
Front-end sales commissions and CDSC (collectively, the “sales charges”) are not recorded as expenses of the Fund. Front-end sales commissions are deducted from proceeds from the sales of Fund shares prior to investment in Class A shares of the Fund. CDSC are deducted from redemption proceeds prior to remittance to the shareholder. During the year ended February 28, 2023, IDI advised the Fund that IDI retained $269,883 in front-end sales commissions from the sale of Class A shares and $277,091 and $20,853 from Class A and Class C shares, respectively, for CDSC imposed upon redemptions by shareholders.
Certain officers and trustees of the Trust are officers and directors of the Adviser, IIS and/or IDI.
NOTE–3 Additional Valuation Information
GAAP defines fair value as the price that would be received to sell an asset or paid to transfer a liability in an orderly transaction between market participants at the measurement date, under current market conditions. GAAP establishes a hierarchy that prioritizes the inputs to valuation methods, giving the highest priority to readily available unadjusted quoted prices in an active market for identical assets (Level 1) and the lowest priority to significant unobservable inputs (Level 3), generally when market prices are not readily available. Based on the valuation inputs, the securities or other investments are tiered into one of three levels. Changes in valuation methods may result in transfers in or out of an investment’s assigned level:
| | |
| Level 1 - | | Prices are determined using quoted prices in an active market for identical assets. |
| Level 2 - | | Prices are determined using other significant observable inputs. Observable inputs are inputs that other market participants may use in pricing a security. These may include quoted prices for similar securities, interest rates, prepayment speeds, credit risk, yield curves, loss severities, default rates, discount rates, volatilities and others. |
| Level 3 - | | Prices are determined using significant unobservable inputs. In situations where quoted prices or observable inputs are unavailable (for example, when there is little or no market activity for an investment at the end of the period), unobservable inputs may be used. Unobservable inputs reflect the Adviser’s assumptions about the factors market participants would use in determining fair value of the securities or instruments and would be based on the best available information. |
The following is a summary of the tiered valuation input levels, as of February 28, 2023. The level assigned to the securities valuations may not be an indication of the risk or liquidity associated with investing in those securities. Because of the inherent uncertainties of valuation, the values reflected in the financial statements may materially differ from the value received upon actual sale of those investments.
| | | | | | | | | | | | | | | | |
| | | Level 1 | | | Level 2 | | | Level 3 | | | Total | |
Investments in Securities | | | | | | | | | | | | | | | | |
Municipal Obligations | | | $– | | | | $8,936,812,637 | | | | $28,303,111 | | | | $8,965,115,748 | |
U.S. Dollar Denominated Bonds & Notes | | | – | | | | 22,205,258 | | | | – | | | | 22,205,258 | |
Total Investments in Securities | | | – | | | | 8,959,017,895 | | | | 28,303,111 | | | | 8,987,321,006 | |
Other Investments - Assets | | | | | | | | | | | | | | | | |
Investments Matured | | | – | | | | 57,276,166 | | | | 13,595,027 | | | | 70,871,193 | |
Total Investments | | | $– | | | | $9,016,294,061 | | | | $41,898,138 | | | | $9,058,192,199 | |
| | |
| 51 | | Invesco High Yield Municipal Fund |
NOTE 4–Derivative Investments
The Fund may enter into an International Swaps and Derivatives Association Master Agreement (“ISDA Master Agreement”) under which a fund may trade OTC derivatives. An OTC transaction entered into under an ISDA Master Agreement typically involves a collateral posting arrangement, payment netting provisions and close-out netting provisions. These netting provisions allow for reduction of credit risk through netting of contractual obligations. The enforceability of the netting provisions of the ISDA Master Agreement depends on the governing law of the ISDA Master Agreement, among other factors.
For financial reporting purposes, the Fund does not offset OTC derivative assets or liabilities that are subject to ISDA Master Agreements in the Statement of Assets and Liabilities.
Effect of Derivative Investments for the year ended February 28, 2023
The table below summarizes the gains on derivative investments, detailed by primary risk exposure, recognized in earnings during the period:
| | | | |
| | | Location of Gain on
Statement of Operations | |
| | | Interest Rate Risk | |
Realized Gain: | | | | |
Futures contracts | | | $46,277,150 | |
Change in Net Unrealized Appreciation: | | | | |
Futures contracts | | | 250,000 | |
Total | | | $46,527,150 | |
The table below summarizes the average notional value of derivatives held during the period.
| | | | |
| | | Futures
Contracts | |
Average notional value | | $ | 584,308,439 | |
NOTE 5–Security Transactions with Affiliated Funds
The Fund is permitted to purchase securities from or sell securities to certain other affiliated funds under specified conditions outlined in procedures adopted by the Board of Trustees of the Trust. The procedures have been designed to ensure that any purchase or sale of securities by the Fund from or to another fund that is or could be considered an “affiliated person” by virtue of having a common investment adviser (or affiliated investment advisers), common Trustees and/or common officers is made in reliance on Rule 17a-7 of the 1940 Act and, to the extent applicable, related SEC staff positions. Each such transaction is effected at the security’s “current market price”, as provided for in these procedures and Rule 17a-7. Pursuant to these procedures, for the year ended February 28, 2023, the Fund engaged in securities purchases of $57,464,169 and securities sales of $195,496,103, which resulted in net realized gains (losses) of $(1,279,342).
NOTE 6–Expense Offset Arrangement(s)
The expense offset arrangement is comprised of transfer agency credits which result from balances in demand deposit accounts used by the transfer agent for clearing shareholder transactions. For the year ended February 28, 2023, the Fund received credits from this arrangement, which resulted in the reduction of the Fund’s total expenses of $3,187.
NOTE 7–Trustees’ and Officers’ Fees and Benefits
Trustees’ and Officers’ Fees and Benefits include amounts accrued by the Fund to pay remuneration to certain Trustees and Officers of the Fund. Trustees have the option to defer compensation payable by the Fund, and Trustees’ and Officers’ Fees and Benefits also include amounts accrued by the Fund to fund such deferred compensation amounts. Those Trustees who defer compensation have the option to select various Invesco Funds in which their deferral accounts shall be deemed to be invested. Finally, certain current Trustees were eligible to participate in a retirement plan that provided for benefits to be paid upon retirement to Trustees over a period of time based on the number of years of service. The Fund may have certain former Trustees who also participate in a retirement plan and receive benefits under such plan. Trustees’ and Officers’ Fees and Benefits include amounts accrued by the Fund to fund such retirement benefits. Obligations under the deferred compensation and retirement plans represent unsecured claims against the general assets of the Fund.
NOTE 8–Cash Balances and Borrowings
The Fund has entered into a revolving credit and security agreement, which enables the Fund to participate with certain other Invesco Funds in a committed secured borrowing facility that permits borrowings up to $2.5 billion, collectively by certain Invesco Funds, and which will expire on February 22, 2024. The revolving credit and security agreement is secured by the assets of the Fund. The Fund is subject to certain covenants relating to the revolving credit and security agreement. Failure to comply with these restrictions could cause the acceleration of the repayment of the amount outstanding under the revolving credit and security agreement.
During the year ended February 28, 2023, the average daily balance of borrowing under the revolving credit and security agreement was $45,009,041 with an average interest rate of 3.07%. The carrying amount of the Fund’s payable for borrowings as reported on the Statement of Assets and Liabilities approximates its fair value. Expenses under the revolving credit and security agreement are shown in the Statement of Operations as Interest, facilities and maintenance fees.
Additionally, the Fund is permitted to temporarily carry a negative or overdrawn balance in its account with SSB, the custodian bank. Such balances, if any at period-end, are shown in the Statement of Assets and Liabilities under the payable caption Amount due custodian. To compensate the custodian bank for such overdrafts, the overdrawn Fund may either (1) leave funds as a compensating balance in the account so the custodian bank can be compensated by earning the additional interest; or (2) compensate by paying the custodian bank at a rate agreed upon by the custodian bank and Invesco, not to exceed the contractually agreed upon rate. The Fund may not purchase additional securities when any borrowings from banks or broker-dealers exceed 5% of the Fund’s total assets, or when any borrowings from an Invesco Fund are outstanding.
Inverse floating rate obligations resulting from the transfer of bonds to TOB Trusts are accounted for as secured borrowings. The average floating rate notes outstanding and average annual interest and fee rate related to inverse floating rate note obligations during the year ended February 28, 2023 were $1,157,609,642 and 3.36%, respectively.
| | |
| 52 | | Invesco High Yield Municipal Fund |
NOTE 9–Distributions to Shareholders and Tax Components of Net Assets
Tax Character of Distributions to Shareholders Paid During the Fiscal Years Ended February 28, 2023 and 2022:
| | | | | | | | |
| | | 2023 | | | 2022 | |
Ordinary income* | | $ | 13,648,668 | | | $ | – | |
Ordinary income-tax-exempt | | | 382,547,713 | | | | 435,195,407 | |
Total distributions | | $ | 396,196,381 | | | $ | 435,195,407 | |
| * | Includes short-term capital gain distributions, if any. |
| | | | |
Tax Components of Net Assets at Period-End: | | | |
| | | 2023 | |
|
| |
Undistributed tax-exempt income | | $ | 71,925,420 | |
|
| |
Net unrealized appreciation (depreciation) – investments | | | (638,056,243 | ) |
|
| |
Temporary book/tax differences | | | (410,044 | ) |
|
| |
Capital loss carryforward | | | (936,915,037 | ) |
|
| |
Shares of beneficial interest | | | 9,406,658,152 | |
|
| |
Total net assets | | $ | 7,903,202,248 | |
|
| |
The difference between book-basis and tax-basis unrealized appreciation (depreciation) is due to differences in the timing of recognition of gains and losses on investments for tax and book purposes. The Fund’s net unrealized appreciation (depreciation) difference is attributable primarily to wash sales, defaulted bonds and amortization and accretion on debt securities.
The temporary book/tax differences are a result of timing differences between book and tax recognition of income and/or expenses. The Fund’s temporary book/tax differences are the result of the trustee deferral of compensation and retirement plan benefits.
Capital loss carryforward is calculated and reported as of a specific date. Results of transactions and other activity after that date may affect the amount of capital loss carryforward actually available for the Fund to utilize. The ability to utilize capital loss carryforward in the future may be limited under the Internal Revenue Code and related regulations based on the results of future transactions.
The Fund has a capital loss carryforward as of February 28, 2023, as follows:
| | | | | | | | | | | | | | |
| | | Capital Loss Carryforward* | | | | | | | | | |
|
| |
| Expiration | | | | Short-Term | | | Long-Term | | | Total | |
|
| |
Not subject to expiration | | | | $ | 485,204,573 | | | $ | 451,710,464 | | | $ | 936,915,037 | |
|
| |
| * | Capital loss carryforward is reduced for limitations, if any, to the extent required by the Internal Revenue Code and may be further limited depending upon a variety of factors, including the realization of net unrealized gains or losses as of the date of any reorganization. |
NOTE 10–Investment Transactions
The aggregate amount of investment securities (other than short-term securities, U.S. Government obligations and money market funds, if any) purchased and sold by the Fund during the year ended February 28, 2023 was $2,483,366,478 and $3,480,037,465, respectively. Cost of investments, including any derivatives, on a tax basis includes the adjustments for financial reporting purposes as of the most recently completed federal income tax reporting period-end.
| | | | |
Unrealized Appreciation (Depreciation) of Investments on a Tax Basis | |
Aggregate unrealized appreciation of investments | | $ | 272,428,639 | |
|
| |
Aggregate unrealized (depreciation) of investments | | | (910,484,882 | ) |
|
| |
Net unrealized appreciation (depreciation) of investments | | $ | (638,056,243 | ) |
|
| |
Cost of investments for tax purposes is $9,696,248,442.
NOTE 11–Reclassification of Permanent Differences
Primarily as a result of differing book/tax treatment of market discounts, defaulted bonds and amortization and accretion on debt securities, on February 28, 2023, undistributed net investment income was increased by $65,130,460, undistributed net realized gain (loss) was decreased by $64,738,891 and shares of beneficial interest was decreased by $391,569. This reclassification had no effect on the net assets of the Fund.
NOTE 12–Share Information
| | | | | | | | | | | | | | | | |
| | | Summary of Share Activity | |
|
| |
| | | Year ended | | | Year ended | |
| | | February 28, 2023(a) | | | February 28, 2022 | |
| | | Shares | | | Amount | | | Shares | | | Amount | |
|
| |
Sold: | | | | | | | | | | | | | | | | |
Class A | | | 158,867,815 | | | $ | 1,399,191,601 | | | | 78,726,847 | | | $ | 814,171,948 | |
|
| |
Class C | | | 5,330,317 | | | | 46,572,086 | | | | 3,700,257 | | | | 38,195,218 | |
|
| |
Class Y | | | 178,575,581 | | | | 1,576,940,241 | | | | 99,433,377 | | | | 1,031,956,209 | |
|
| |
Class R6 | | | 39,152,521 | | | | 345,712,205 | | | | 38,817,697 | | | | 402,547,569 | |
|
| |
| | |
| 53 | | Invesco High Yield Municipal Fund |
| | | | | | | | | | | | | | | | |
| | | Summary of Share Activity | |
|
| |
| | | Year ended | | | Year ended | |
| | | February 28, 2023(a) | | | February 28, 2022 | |
| | | Shares | | | Amount | | | Shares | | | Amount | |
|
| |
| | | | |
Issued as reinvestment of dividends: | | | | | | | | | | | | | | | | |
Class A | | | 14,615,642 | | | $ | 129,069,386 | | | | 13,327,131 | | | $ | 137,730,919 | |
|
| |
Class C | | | 1,196,108 | | | | 10,542,703 | | | | 1,234,645 | | | | 12,716,823 | |
|
| |
Class Y | | | 5,973,158 | | | | 52,854,268 | | | | 6,304,682 | | | | 65,291,247 | |
|
| |
Class R5 | | | 155 | | | | 1,365 | | | | 130 | | | | 1,343 | |
|
| |
Class R6 | | | 2,774,249 | | | | 24,465,168 | | | | 2,321,895 | | | | 23,948,570 | |
|
| |
| | | | |
Automatic conversion of Class C shares to Class A shares: | | | | | | | | | | | | | | | | |
Class A | | | 4,244,484 | | | | 38,323,712 | | | | 3,569,960 | | | | 36,895,640 | |
|
| |
Class C | | | (4,257,829 | ) | | | (38,323,712 | ) | | | (3,581,930 | ) | | | (36,895,640 | ) |
|
| |
| | | | |
Reacquired: | | | | | | | | | | | | | | | | |
Class A | | | (236,885,295 | ) | | | (2,098,977,567 | ) | | | (87,041,079 | ) | | | (899,582,899 | ) |
|
| |
Class C | | | (15,077,267 | ) | | | (133,511,242 | ) | | | (7,468,080 | ) | | | (76,929,937 | ) |
|
| |
Class Y | | | (227,548,344 | ) | | | (2,016,498,499 | ) | | | (89,472,817 | ) | | | (922,297,652 | ) |
|
| |
Class R5 | | | (10,668 | ) | | | (93,130 | ) | | | (10 | ) | | | (103 | ) |
|
| |
Class R6 | | | (45,431,004 | ) | | | (403,036,238 | ) | | | (29,042,329 | ) | | | (301,360,183 | ) |
|
| |
Net increase (decrease) in share activity | | | (118,480,377 | ) | | $ | (1,066,767,653 | ) | | | 30,830,376 | | | $ | 326,389,072 | |
|
| |
| (a) | There are entities that are record owners of more than 5% of the outstanding shares of the Fund and in the aggregate own 61% of the outstanding shares of the Fund. IDI has an agreement with these entities to sell Fund shares. The Fund, Invesco and/or Invesco affiliates may make payments to these entities, which are considered to be related to the Fund, for providing services to the Fund, Invesco and/or Invesco affiliates including but not limited to services such as securities brokerage, distribution, third party record keeping and account servicing. The Fund has no knowledge as to whether all or any portion of the shares owned of record by these entities are also owned beneficially. |
| | |
| 54 | | Invesco High Yield Municipal Fund |
Report of Independent Registered Public Accounting Firm
To the Board of Trustees of AIM Tax-Exempt Funds (Invesco Tax-Exempt Funds) and Shareholders of Invesco High Yield Municipal Fund
Opinion on the Financial Statements
We have audited the accompanying statement of assets and liabilities, including the schedule of investments, of Invesco High Yield Municipal Fund (one of the funds constituting AIM Tax-Exempt Funds (Invesco Tax-Exempt Funds), referred to hereafter as the “Fund”) as of February 28, 2023, the related statements of operations and cash flows for the year ended February 28, 2023, the statement of changes in net assets for each of the two years in the period ended February 28, 2023, including the related notes, and the financial highlights for each of the five years in the period ended February 28, 2023 (collectively referred to as the “financial statements”). In our opinion, the financial statements present fairly, in all material respects, the financial position of the Fund as of February 28, 2023, the results of its operations and its cash flows for the year then ended, the changes in its net assets for each of the two years in the period ended February 28, 2023 and the financial highlights for each of the five years in the period ended February 28, 2023 in conformity with accounting principles generally accepted in the United States of America.
Basis for Opinion
These financial statements are the responsibility of the Fund’s management. Our responsibility is to express an opinion on the Fund’s financial statements based on our audits. We are a public accounting firm registered with the Public Company Accounting Oversight Board (United States) (PCAOB) and are required to be independent with respect to the Fund in accordance with the U.S. federal securities laws and the applicable rules and regulations of the Securities and Exchange Commission and the PCAOB.
We conducted our audits of these financial statements in accordance with the standards of the PCAOB. Those standards require that we plan and perform the audit to obtain reasonable assurance about whether the financial statements are free of material misstatement, whether due to error or fraud.
Our audits included performing procedures to assess the risks of material misstatement of the financial statements, whether due to error or fraud, and performing procedures that respond to those risks. Such procedures included examining, on a test basis, evidence regarding the amounts and disclosures in the financial statements. Our audits also included evaluating the accounting principles used and significant estimates made by management, as well as evaluating the overall presentation of the financial statements. Our procedures included confirmation of securities owned as of February 28, 2023 by correspondence with the custodian and brokers. We believe that our audits provide a reasonable basis for our opinion.
/s/PricewaterhouseCoopers LLP
Houston, Texas
April 21, 2023
We have served as the auditor of one or more of the investment companies in the Invesco group of investment companies since at least 1995. We have not been able to determine the specific year we began serving as auditor.
| | |
| 55 | | Invesco High Yield Municipal Fund |
Calculating your ongoing Fund expenses
Example
As a shareholder of the Fund, you incur two types of costs: (1) transaction costs, which may include sales charges (loads) on purchase payments or contingent deferred sales charges on redemptions, if any; and (2) ongoing costs, including management fees, distribution and/or service (12b-1) fees, and other Fund expenses. This example is intended to help you understand your ongoing costs (in dollars) of investing in the Fund and to compare these costs with ongoing costs of investing in other mutual funds. The example is based on an investment of $1,000 invested at the beginning of the period and held for the entire period September 1, 2022 through February 28, 2023.
Actual expenses
The table below provides information about actual account values and actual expenses. You may use the information in this table, together with the amount you invested, to estimate the expenses that you paid over the period. Simply divide your account value by $1,000 (for example, an $8,600 account value divided by $1,000 = 8.6), then multiply the result by the number in the table under the heading entitled “Actual Expenses Paid During Period” to estimate the expenses you paid on your account during this period.
Hypothetical example for comparison purposes
The table below also provides information about hypothetical account values and hypothetical expenses based on the Fund’s actual expense ratio and an assumed rate of return of 5% per year before expenses, which is not the Fund’s actual return.
The hypothetical account values and expenses may not be used to estimate the actual ending account balance or expenses you paid for the period. You may use this information to compare the ongoing costs of investing in the Fund and other funds. To do so, compare this 5% hypothetical example with the 5% hypothetical examples that appear in the shareholder reports of the other funds.
Please note that the expenses shown in the table are meant to highlight your ongoing costs only and do not reflect any transaction costs, such as sales charges (loads) on purchase payments or contingent deferred sales charges on redemptions, if any. Therefore, the hypothetical information is useful in comparing ongoing costs only, and will not help you determine the relative total costs of owning different funds. In addition, if these transaction costs were included, your costs would have been higher.
| | | | | | | | | | | | |
| | | | | ACTUAL | | HYPOTHETICAL (5% annual return before expenses) | | |
| | | Beginning Account Value
(09/01/22) | | Ending Account Value
(02/28/23)1 | | Expenses Paid During
Period2 | | Ending Account Value
(02/28/23) | | Expenses Paid During
Period2 | | Annualized Expense Ratio |
Class A | | $1,000.00 | | $981.30 | | $8.06 | | $1,016.66 | | $8.20 | | 1.64% |
Class C | | 1,000.00 | | 977.60 | | 12.21 | | 1,012.45 | | 12.42 | | 2.49 |
Class Y | | 1,000.00 | | 981.50 | | 6.88 | | 1,017.85 | | 7.00 | | 1.40 |
Class R5 | | 1,000.00 | | 982.40 | | 7.37 | | 1,017.36 | | 7.50 | | 1.50 |
Class R6 | | 1,000.00 | | 982.70 | | 6.54 | | 1,018.20 | | 6.66 | | 1.33 |
| 1 | The actual ending account value is based on the actual total return of the Fund for the period September 1, 2022 through February 28, 2023, after actual expenses and will differ from the hypothetical ending account value which is based on the Fund’s expense ratio and a hypothetical annual return of 5% before expenses. |
| 2 | Expenses are equal to the Fund’s annualized expense ratio as indicated above multiplied by the average account value over the period, multiplied by 181/365 to reflect the most recent fiscal half year. |
| | |
| 56 | | Invesco High Yield Municipal Fund |
Tax Information
Form 1099-DIV, Form 1042-S and other year–end tax information provide shareholders with actual calendar year amounts that should be included in their tax returns. Shareholders should consult their tax advisers.
The following distribution information is being provided as required by the Internal Revenue Code or to meet a specific state’s requirement.
The Fund designates the following amounts or, if subsequently determined to be different, the maximum amount allowable for its fiscal year ended February 28, 2023:
| | | | | | |
| | | | | | |
Federal and State Income Tax | | | | |
Qualified Dividend Income* | | | 0.00 | % |
Corporate Dividends Received Deduction* | | | 0.00 | % |
U.S. Treasury Obligations* | | | 0.00 | % |
Qualified Business Income* | | | 0.00 | % |
Business Interest Income* | | | 0.00 | % |
Tax-Exempt Interest Dividends* | | | 96.56 | % |
| | * | | The above percentages are based on ordinary income dividends paid to shareholders during the Fund’s fiscal year. |
| | |
| 57 | | Invesco High Yield Municipal Fund |
Trustees and Officers
The address of each trustee and officer is AIM Tax-Exempt Funds (Invesco Tax-Exempt Funds) (the “Trust”), 11 Greenway Plaza, Suite 1000, Houston, Texas 77046-1173. The trustees serve for the life of the Trust, subject to their earlier death, incapacitation, resignation, retirement or removal as more specifically provided in the Trust’s organizational documents. Each officer serves for a one year term or until their successors are elected and qualified. Column two below includes length of time served with predecessor entities, if any.
| | | | | | | | |
Name, Year of Birth and Position(s) Held with the Trust | | Trustee and/or Officer Since | | Principal Occupation(s) During Past 5 Years | | Number of Funds in Fund Complex Overseen by Trustee | | Other
Directorship(s) Held by Trustee During Past 5 Years |
| Interested Trustee | | | | | | | | |
| Martin L. Flanagan1 – 1960 Trustee and Vice Chair | | 2007 | | Executive Director, Chief Executive Officer and President, Invesco Ltd. (ultimate parent of Invesco and a global investment management firm); Trustee and Vice Chair, The Invesco Funds; Vice Chair, Investment Company Institute; and Member of Executive Board, SMU Cox School of Business Formerly: Advisor to the Board, Invesco Advisers, Inc. (formerly known as Invesco Institutional (N.A.), Inc.); Chairman and Chief Executive Officer, Invesco Advisers, Inc. (registered investment adviser); Director, Chairman, Chief Executive Officer and President, Invesco Holding Company (US), Inc. (formerly IVZ Inc.) (holding company), Invesco Group Services, Inc. (service provider) and Invesco North American Holdings, Inc. (holding company); Director, Chief Executive Officer and President, Invesco Holding Company Limited (parent of Invesco and a global investment management firm); Director, Invesco Ltd.; Chairman, Investment Company Institute and President, Co-Chief Executive Officer, Co-President, Chief Operating Officer and Chief Financial Officer, Franklin Resources, Inc. (global investment management organization) | | 175 | | None |
| 1 | Mr. Flanagan is considered an interested person (within the meaning of Section 2(a)(19) of the 1940 Act) of the Trust because he is an officer of the Adviser to the Trust, and an officer and a director of Invesco Ltd., ultimate parent of the Adviser. |
| | |
| T-1 | | Invesco High Yield Municipal Fund |
Trustees and Officers–(continued)
| | | | | | | | |
Name, Year of Birth and Position(s) Held with the Trust | | Trustee and/or Officer Since | | Principal Occupation(s) During Past 5 Years | | Number of Funds in Fund Complex Overseen by Trustee | | Other Directorship(s) Held by Trustee During Past 5 Years |
| Independent Trustees |
Beth Ann Brown – 1968 Trustee (2019) and Chair (August 2022) | | 2019 | | Independent Consultant Formerly: Head of Intermediary Distribution, Managing Director, Strategic Relations, Managing Director, Head of National Accounts, Senior Vice President, National Account Manager and Senior Vice President, Key Account Manager, Columbia Management Investment Advisers LLC; Vice President, Key Account Manager, Liberty Funds Distributor, Inc.; and Trustee of certain Oppenheimer Funds | | 175 | | Director, Board of Directors of Caron Engineering Inc.; Advisor, Board of Advisors of Caron Engineering Inc.; President and Director, Acton Shapleigh Youth Conservation Corps (non-profit) Formerly: President and Director Director of Grahamtastic Connection (non-profit) |
Cynthia Hostetler –1962 Trustee | | 2017 | | Non-Executive Director and Trustee of a number of public and private business corporations Formerly: Director, Aberdeen Investment Funds (4 portfolios); Director, Artio Global Investment LLC (mutual fund complex); Director, Edgen Group, Inc. (specialized energy and infrastructure products distributor); Director, Genesee & Wyoming, Inc. (railroads); Head of Investment Funds and Private Equity, Overseas Private Investment Corporation; President, First Manhattan Bancorporation, Inc.; and Attorney, Simpson Thacher & Bartlett LLP | | 175 | | Resideo Technologies, Inc. (smart home technology); Vulcan Materials Company (construction materials company); Trilinc Global Impact Fund; Textainer Group Holdings, (shipping container leasing company); Investment Company Institute (professional organization); and Independent Directors Council (professional organization) |
Eli Jones – 1961 Trustee | | 2016 | | Professor and Dean Emeritus, Mays Business School - Texas A&M University Formerly: Dean of Mays Business School -Texas A&M University; Professor and Dean, Walton College of Business, University of Arkansas and E.J. Ourso College of Business, Louisiana State University; and Director, Arvest Bank | | 175 | | Insperity, Inc. (formerly known as Administaff) (human resources provider); Board Member of the regional board, First Financial Bank Texas; and Boad Member, First Financial Bankshares, Inc. Texas (FFIN) |
| Elizabeth Krentzman – 1959 Trustee | | 2019 | | Formerly: Principal and Chief Regulatory Advisor for Asset Management Services and U.S. Mutual Fund Leader of Deloitte & Touche LLP; General Counsel of the Investment Company Institute (trade association); National Director of the Investment Management Regulatory Consulting Practice, Principal, Director and Senior Manager of Deloitte & Touche LLP; Assistant Director of the Division of Investment Management - Office of Disclosure and Investment Adviser Regulation of the U.S. Securities and Exchange Commission and various positions with the Division of Investment Management - Office of Regulatory Policy of the U.S. Securities and Exchange Commission; Associate at Ropes & Gray LLP; and Trustee of certain Oppenheimer Funds | | 175 | | Formerly: Member of the Cartica Funds Board of Directors (private investment fund); Trustee of the University of Florida National Board Foundation; and Member of the University of Florida Law Center Association, Inc. Board of Trustees, Audit Committee and Membership Committee |
| Anthony J. LaCava, Jr. – 1956 Trustee | | 2019 | | Formerly: Director and Member of the Audit Committee, Blue Hills Bank (publicly traded financial institution) and Managing Partner, KPMG LLP | | 175 | | Blue Hills Bank; Member and Chairman, Bentley University, Business School Advisory Council; and Nominating Committee, KPMG LLP |
| Prema Mathai-Davis – 1950 Trustee | | 1998 | | Retired Formerly: Co-Founder & Partner of Quantalytics Research, LLC, (a FinTech Investment Research Platform for the Self-Directed Investor); Trustee of YWCA Retirement Fund; CEO of YWCA of the USA; Board member of the NY Metropolitan Transportation Authority; Commissioner of the NYC Department of Aging; and Board member of Johns Hopkins Bioethics Institute | | 175 | | Member of Board of Positive Planet US (non-profit) and HealthCare Chaplaincy Network (non-profit) |
| | |
| T-2 | | Invesco High Yield Municipal Fund |
Trustees and Officers–(continued)
| | | | | | | | |
Name, Year of Birth and Position(s) Held with the Trust | | Trustee and/or Officer Since | | Principal Occupation(s) During Past 5 Years | | Number of
Funds in
Fund Complex Overseen by Trustee | | Other Directorship(s) Held by Trustee During Past 5
Years |
| Independent Trustees–(continued) |
Joel W. Motley – 1952 Trustee | | 2019 | | Director of Office of Finance, Federal Home Loan Bank System; Managing Director of Carmona Motley Inc. (privately held financial advisor); Member of the Council on Foreign Relations and its Finance and Budget Committee; Chairman Emeritus of Board of Human Rights Watch and Member of its Investment Committee; and Member of Investment Committee Board of Historic Hudson Valley (non-profit cultural organization); Member of the Board, Blue Ocean Acquisition Corp.; and Member of the Vestry and the Investment Committee of Trinity Church Wall Street. Formerly: Managing Director of Public Capital Advisors, LLC (privately held financial advisor); Managing Director of Carmona Motley Hoffman, Inc. (privately held financial advisor); Trustee of certain Oppenheimer Funds; and Director of Columbia Equity Financial Corp. (privately held financial advisor) | | 175 | | Member of Board of Trust for Mutual Understanding (non-profit promoting the arts and environment); Member of Board of Greenwall Foundation (bioethics research foundation) and its Investment Committee; Member of Board of Friends of the LRC (non- profit legal advocacy); and Board Member and Investment Committee Member of Pulitzer Center for Crisis Reporting (non-profit journalism) |
| Teresa M. Ressel – 1962 Trustee | | 2017 | | Non-executive director and trustee of a number of public and private business corporations Formerly: Chief Executive Officer, UBS Securities LLC (investment banking); Chief Operating Officer, UBS AG Americas (investment banking); Sr. Management Team Olayan America, The Olayan Group (international investor/commercial/industrial); and Assistant Secretary for Management & Budget and Designated Chief Financial Officer, U.S. Department of Treasury | | 175 | | None |
| Robert C. Troccoli – 1949 Trustee | | 2016 | | Retired Formerly: Adjunct Professor, University of Denver – Daniels College of Business; and Managing Partner, KPMG LLP | | 175 | | None |
| Daniel S. Vandivort –1954 Trustee | | 2019 | | President, Flyway Advisory Services LLC (consulting and property management) Formerly: President and Chief Investment Officer, previously Head of Fixed Income, Weiss Peck and Greer/Robeco Investment Management; Trustee and Chair, Weiss Peck and Greer Funds Board; and various capacities at CS First Boston including Head of Fixed Income at First Boston Asset Management. | | 175 | | Formerly: Trustee and Governance Chair, Oppenheimer Funds; Treasurer, Chairman of the Audit and Finance Committee, Huntington Disease Foundation of America |
| | |
| T-3 | | Invesco High Yield Municipal Fund |
Trustees and Officers–(continued)
| | | | | | | | |
Name, Year of Birth and Position(s) Held with the Trust | | Trustee and/or Officer Since | | Principal Occupation(s) During Past 5 Years | | Number of
Funds in
Fund Complex
Overseen by
Trustee | | Other
Directorship(s)
Held by Trustee
During Past 5
Years |
| Officers |
Sheri Morris – 1964 President and Principal Executive Officer | | 1999 | | Director, Invesco Trust Company; Head of Global Fund Services, Invesco Ltd.; President and Principal Executive Officer, The Invesco Funds; Vice President, Invesco Exchange-Traded Fund Trust, Invesco Exchange-Traded Fund Trust II, Invesco India Exchange-Traded Fund Trust, Invesco Actively Managed Exchange-Traded Fund Trust, Invesco Actively Managed Exchange-Traded Commodity Fund Trust and Invesco Exchange-Traded Self-Indexed Fund Trust; and Vice President, OppenheimerFunds, Inc. Formerly: Vice President, Treasurer and Principal Financial Officer, The Invesco Funds; Vice President, Invesco AIM Advisers, Inc., Invesco AIM Capital Management, Inc. and Invesco AIM Private Asset Management, Inc.; Assistant Vice President and Assistant Treasurer, The Invesco Funds; Vice President and Assistant Vice President, Invesco Advisers, Inc.; Assistant Vice President, Invesco AIM Capital Management, Inc. and Invesco AIM Private Asset Management, Inc.; Treasurer, Invesco Exchange-Traded Fund Trust, Invesco Exchange-Traded Fund Trust II, Invesco India Exchange-Traded Fund Trust and Invesco Actively Managed Exchange-Traded Fund Trust; and Senior Vice President, Invesco Advisers, Inc. (formerly known as Invesco Institutional (N.A.), Inc.) (registered investment adviser) | | N/A | | N/A |
Melanie Ringold – 1975 Senior Vice President, Chief Legal Officer and Secretary | | 2023 | | Head of Legal of the Americas, Invesco Ltd.; Senior Vice President and Secretary, Invesco Advisers, Inc. (formerly known as Invesco Institutional (N.A.), Inc.) (registered investment adviser); Secretary, Invesco Distributors, Inc. (formerly known as Invesco AIM Distributors, Inc.); Secretary, Invesco Investment Services, Inc. (formerly known as Invesco AIM Investment Services, Inc.); Senior Vice President, Chief Legal Officer and Secretary, The Invesco Funds; Secretary, Invesco Investment Advisers LLC, Invesco Capital Markets, Inc.; Chief Legal Officer, Invesco Exchange-Traded Fund Trust, Invesco Exchange-Traded Fund Trust II, Invesco India Exchange-Traded Fund Trust, Invesco Actively Managed Exchange-Traded Fund Trust, Invesco Actively Managed Exchange-Traded Commodity Fund Trust and Invesco Exchange-Traded Self-Indexed Fund Trust;Secretary and Vice President, Harbourview Asset Management Corporation; Secretary and Senior Vice President, OppenheimerFunds, Inc. and Invesco Managed Accounts, LLC; Secretary and Senior Vice President, OFI SteelPath, Inc.; Secretary and Senior Vice President, Oppenheimer Acquisition Corp.; Secretary, SteelPath Funds Remediation LLC; and Secretary and Senior Vice President, Trinity Investment Management Corporation Formerly: Assistant Secretary, Invesco Distributors, Inc.; Invesco Advisers, Inc. Invesco Investment Services, Inc., Invesco Capital Markets, Inc., Invesco Capital Management LLC and Invesco Investment Advisers LLC; and Assistant Secretary and Investment Vice President, Invesco Funds | | N/A | | N/A |
Andrew R. Schlossberg – 1974 Senior Vice President | | 2019 | | Senior Vice President, Invesco Group Services, Inc.; Head of the Americas and Senior Managing Director, Invesco Ltd.; Director and Senior Vice President, Invesco Advisers, Inc. (formerly known as Invesco Institutional (N.A.), Inc.) (registered investment adviser); Director and Chairman, Invesco Investment Services, Inc. (formerly known as Invesco AIM Investment Services, Inc.) (registered transfer agent); Senior Vice President, The Invesco Funds; and Director, Invesco Investment Advisers LLC (formerly known as Van Kampen Asset Management) Formerly: Director, President and Chairman, Invesco Insurance Agency, Inc.; Director, Invesco UK Limited; Director and Chief Executive, Invesco Asset Management Limited and Invesco Fund Managers Limited; Assistant Vice President, The Invesco Funds; Senior Vice President, Invesco Advisers, Inc. (formerly known as Invesco Institutional (N.A.), Inc.) (registered investment adviser); Director and Chief Executive, Invesco Administration Services Limited and Invesco Global Investment Funds Limited; Director, Invesco Distributors, Inc.; Head of EMEA, Invesco Ltd.; President, Invesco Actively Managed Exchange-Traded Commodity Fund Trust, Invesco Actively Managed Exchange-Traded Fund Trust, Invesco Exchange-Traded Fund Trust, Invesco Exchange-Traded Fund Trust II and Invesco India Exchange-Traded Fund Trust; and Managing Director and Principal Executive Officer, Invesco Capital Management LLC | | N/A | | N/A |
| | |
| T-4 | | Invesco High Yield Municipal Fund |
Trustees and Officers–(continued)
| | | | | | | | |
Name, Year of Birth and Position(s) Held with the Trust | | Trustee and/or Officer Since | | Principal Occupation(s) During Past 5 Years | | Number of
Funds in
Fund Complex
Overseen by
Trustee | | Other
Directorship(s)
Held by Trustee
During Past 5
Years |
| Officers–(continued) |
John M. Zerr – 1962 Senior Vice President | | 2006 | | Chief Operating Officer of the Americas; Senior Vice President, Invesco Advisers, Inc. (formerly known as Invesco Institutional (N.A.), Inc.) (registered investment adviser); Senior Vice President, Invesco Distributors, Inc. (formerly known as Invesco AIM Distributors, Inc.); Director and Vice President, Invesco Investment Services, Inc. (formerly known as Invesco AIM Investment Services, Inc.) Senior Vice President, The Invesco Funds; Managing Director, Invesco Capital Management LLC; Director, Invesco Investment Advisers LLC (formerly known as Van Kampen Asset Management); Senior Vice President, Invesco Capital Markets, Inc. (formerly known as Van Kampen Funds Inc.); Manager, Invesco Indexing LLC; Manager, Invesco Specialized Products, LLC; Member, Invesco Canada Funds Advisory Board; Director, President and Chief Executive Officer, Invesco Corporate Class Inc. (corporate mutual fund company); and Director, Chairman, President and Chief Executive Officer, Invesco Canada Ltd. (formerly known as Invesco Trimark Ltd./Invesco Trimark Ltèe) (registered investment adviser and registered transfer agent); President, Invesco, Inc.; President, Invesco Global Direct Real Estate Feeder GP Ltd.; President, Invesco IP Holdings (Canada) Ltd; President, Invesco Global Direct Real Estate GP Ltd.; President, Invesco Financial Services Ltd. / Services Financiers Invesco Ltée; and Director and Chairman, Invesco Trust Company Formerly: President, Trimark Investments Ltd/Services Financiers Invesco Ltee; Director and Senior Vice President, Invesco Insurance Agency, Inc.; Director and Senior Vice President, Invesco Management Group, Inc. (formerly known as Invesco AIM Management Group, Inc.); Secretary and General Counsel, Invesco Management Group, Inc. (formerly known as Invesco AIM Management Group, Inc.); Secretary, Invesco Investment Services, Inc. (formerly known as Invesco AIM Investment Services, Inc.); Chief Legal Officer and Secretary, The Invesco Funds; Secretary and General Counsel, Invesco Investment Advisers LLC (formerly known as Van Kampen Asset Management); Secretary and General Counsel, Invesco Capital Markets, Inc. (formerly known as Van Kampen Funds Inc.); Chief Legal Officer, Invesco Exchange-Traded Fund Trust, Invesco Exchange-Traded Fund Trust II, Invesco India Exchange-Traded Fund Trust, Invesco Actively Managed Exchange-Traded Fund Trust, Invesco Actively Managed Exchange-Traded Commodity Fund Trust and Invesco Exchange-Traded Self-Indexed Fund Trust; Secretary, Invesco Indexing LLC; Director, Secretary, General Counsel and Senior Vice President, Van Kampen Exchange Corp.; Director, Vice President and Secretary, IVZ Distributors, Inc. (formerly known as INVESCO Distributors, Inc.); Director and Vice President, INVESCO Funds Group, Inc.; Director and Vice President, Van Kampen Advisors Inc.; Director, Vice President, Secretary and General Counsel, Van Kampen Investor Services Inc.;Director and Secretary, Invesco Distributors, Inc. (formerly known as Invesco AIM Distributors, Inc.); Director, Senior Vice President, General Counsel and Secretary, Invesco AIM Advisers, Inc. and Van Kampen Investments Inc.; Director, Vice President and Secretary, Fund Management Company; Director, Senior Vice President, Secretary, General Counsel and Vice President, Invesco AIM Capital Management, Inc.; and Chief Operating Officer and General Counsel, Liberty Ridge Capital, Inc. (an investment adviser) | | N/A | | N/A |
Gregory G. McGreevey – 1962 Senior Vice President | | 2012 | | Senior Managing Director, Invesco Ltd.; Director, Chairman, President, and Chief Executive Officer, Invesco Advisers, Inc. (formerly known as Invesco Institutional (N.A.), Inc.) (registered investment adviser); Director, Invesco Mortgage Capital, Inc. and Invesco Senior Secured Management, Inc.; Senior Vice President, The Invesco Funds; President, SNW Asset Management Corporation and Invesco Managed Accounts, LLC; Chairman and Director, Invesco Private Capital, Inc.; Chairman and Director, INVESCO Private Capital Investments, Inc.; Chairman and Director, INVESCO Realty, Inc.; and Senior Vice President, Invesco Group Services, Inc. Formerly: Senior Vice President, Invesco Management Group, Inc. and Invesco Advisers, Inc.; Assistant Vice President, The Invesco Funds | | N/A | | N/A |
Adrien Deberghes – 1967 Principal Financial Officer, Treasurer and Vice President | | 2020 | | Head of the Fund Office of the CFO and Fund Administration; Vice President, Invesco Advisers, Inc.; Principal Financial Officer, Treasurer and Vice President, The Invesco Funds; Vice President, Invesco Exchange-Traded Fund Trust, Invesco Exchange-Traded Fund Trust II, Invesco India Exchange-Traded Fund Trust, Invesco Actively Managed Exchange-Traded Fund Trust, Invesco Actively Managed Exchange-Traded Commodity Fund Trust and Invesco Exchange-Traded Self-Indexed Fund Trust Formerly: Senior Vice President and Treasurer, Fidelity Investments | | N/A | | N/A |
Crissie M. Wisdom – 1969 Anti-Money Laundering Compliance Officer | | 2013 | | Anti-Money Laundering and OFAC Compliance Officer for Invesco U.S. entities including: Invesco Advisers, Inc. and its affiliates, Invesco Capital Markets, Inc., Invesco Distributors, Inc., Invesco Investment Services, Inc., The Invesco Funds, Invesco Capital Management, LLC, Invesco Trust Company; and Fraud Prevention Manager for Invesco Investment Services, Inc. | | N/A | | N/A |
| | |
| T-5 | | Invesco High Yield Municipal Fund |
Trustees and Officers–(continued)
| | | | | | | | |
Name, Year of Birth and Position(s) Held with the Trust | | Trustee and/or Officer Since | | Principal Occupation(s) During Past 5 Years | | Number of
Funds in
Fund Complex
Overseen by
Trustee | | Other
Directorship(s)
Held by Trustee
During Past 5
Years |
| Officers–(continued) | | | | | | | | |
Todd F. Kuehl – 1969 Chief Compliance Officer and Senior Vice President | | 2020 | | Chief Compliance Officer, Invesco Advisers, Inc. (registered investment adviser); and Chief Compliance Officer and Senior Vice President, The Invesco Funds Formerly: Managing Director and Chief Compliance Officer, Legg Mason (Mutual Funds); Chief Compliance Officer, Legg Mason Private Portfolio Group (registered investment adviser) | | N/A | | N/A |
James Bordewick, Jr. – 1959 Senior Vice President and Senior Officer | | 2022 | | Senior Vice President and Senior Officer, The Invesco Funds Formerly: Chief Legal Officer, KingsCrowd, Inc. (research and analytical platform for investment in private capital markets); Chief Operating Officer and Head of Legal and Regulatory, Netcapital (private capital investment platform); Managing Director, General Counsel of asset management and Chief Compliance Officer for asset management and private banking, Bank of America Corporation; Chief Legal Officer, Columbia Funds and BofA Funds; Senior Vice President and Associate General Counsel, MFS Investment Management; Chief Legal Officer, MFS Funds; Associate, Ropes & Gray; and Associate, Gaston Snow & Ely Bartlett | | N/A | | N/A |
The Statement of Additional Information of the Trust includes additional information about the Fund’s Trustees and is available upon request, without charge, by calling 1.800.959.4246. Please refer to the Fund’s Statement of Additional Information for information on the Fund’s sub-advisers.
| | | | | | |
Office of the Fund 11 Greenway Plaza, Suite 1000 Houston, TX 77046-1173 | | Investment Adviser Invesco Advisers, Inc. 1331 Spring Street, NW, Suite 2500 Atlanta, GA 30309 | | Distributor Invesco Distributors, Inc. 11 Greenway Plaza, Suite 1000 Houston, TX 77046-1173 | | Auditors PricewaterhouseCoopers LLP 1000 Louisiana Street, Suite 5800 Houston, TX 77002-5021 |
| | | |
Counsel to the Fund Stradley Ronon Stevens & Young, LLP 2005 Market Street, Suite 2600 Philadelphia, PA 19103-7018 | | Counsel to the Independent Trustees Sidley Austin LLP 787 Seventh Avenue New York, NY 10019 | | Transfer Agent Invesco Investment Services, Inc. 11 Greenway Plaza, Suite 1000 Houston, TX 77046-1173 | | Custodian State Street Bank and Trust Company 225 Franklin Street Boston, MA 02110-2801 |
| | |
| T-6 | | Invesco High Yield Municipal Fund |

Go paperless with eDelivery
Visit invesco.com/edelivery to enjoy the convenience and security of anytime electronic access to your investment documents.
With eDelivery, you can elect to have any or all of the following materials delivered straight to your inbox to download, save and print from your own computer:
∎ Fund reports and prospectuses
∎ Quarterly statements
∎ Daily confirmations
∎ Tax forms
Invesco mailing information
Send general correspondence to Invesco Investment Services, Inc., P.O. Box 219078, Kansas City, MO 64121-9078.
Important notice regarding delivery of security holder documents
To reduce Fund expenses, only one copy of most shareholder documents may be mailed to shareholders with multiple accounts at the same address (Householding). Mailing of your shareholder documents may be householded indefinitely unless you instruct us otherwise. If you do not want the mailing of these documents to be combined with those for other members of your household, please contact Invesco Investment Services, Inc. at 800 959 4246 or contact your financial institution. We will begin sending you individual copies for each account within 30 days after receiving your request.
Fund holdings and proxy voting information
The Fund provides a complete list of its portfolio holdings four times each year, at the end of each fiscal quarter. For the second and fourth quarters, the list appears, respectively, in the Fund’s semiannual and annual reports to shareholders. For the first and third quarters, the Fund files the list with the Securities and Exchange Commission (SEC) as an exhibit to its reports on Form N-PORT. The most recent list of portfolio holdings is available at invesco.com/completeqtrholdings. Shareholders can also look up the Fund’s Form N-PORT filings on the SEC website, sec.gov. The SEC file numbers for the Fund are shown below.
A description of the policies and procedures that the Fund uses to determine how to vote proxies relating to portfolio securities is available without charge, upon request, from our Client Services department at 800 959 4246, or at invesco.com/ corporate/about-us/esg. The information is also available on the SEC website, sec.gov.
Information regarding how the Fund voted proxies related to its portfolio securities during the most recent 12-month period ended June 30 is available at invesco.com/proxysearch. This information is also available on the SEC website, sec.gov.
Invesco Advisers, Inc. is an investment adviser; it provides investment advisory services to individual and institutional clients and does not sell securities. Invesco Distributors, Inc. is the US distributor for Invesco Ltd.’s retail mutual funds, exchange-traded funds and institutional money market funds. Both are wholly owned, indirect subsidiaries of Invesco Ltd.

| | | | |
| SEC file number(s): 811-07890 and 033-66242 | | Invesco Distributors, Inc. | | VK-HYM-AR-1 |

| | |
| | |
| Annual Report to Shareholders | | February 28, 2023 |
Invesco Intermediate Term Municipal Income Fund
Nasdaq:
A: VKLMX ∎ C: VKLCX ∎ Y: VKLIX ∎ R6: VKLSX
Management’s Discussion of Fund Performance
| | | | |
| |
Performance summary | |
For the fiscal year ended February 28, 2023, Class A shares of Invesco Intermediate Term Municipal Income Fund (the Fund), at net asset value (NAV), underperformed the S&P Municipal Bond 2-17 Years Investment Grade Index, the Fund’s style-specific benchmark. | |
Your Fund’s long-term performance appears later in this report. | |
| |
Fund vs. Indexes | |
Total returns, 2/28/22 to 2/28/23, at net asset value (NAV). Performance shown does not include applicable contingent deferred sales charges (CDSC) or front-end sales charges, which would have reduced performance. | |
Class A Shares | | | -5.37 | % |
Class C Shares | | | -6.11 | |
Class Y Shares | | | -5.14 | |
Class R6 Shares | | | -5.07 | |
S&P Municipal Bond Index▼ (Broad Market Index) | | | -4.91 | |
S&P Municipal Bond 2-17 Years Investment Grade Index▼ (Style-Specific Index) | | | -3.39 | |
Lipper Intermediate Municipal Debt Funds Index∎ (Peer Group Index) | | | -4.13 | |
| |
Source(s): ▼RIMES Technologies Corp.; ∎Lipper Inc. | | | | |
Market conditions and your Fund
At the beginning of the fiscal year, investors were hopeful in anticipation of a return to normalcy as COVID-19 cases declined and pandemic-related restrictions were reduced or lifted. This allowed policymakers to turn their attention to the high inflation levels; however, on February 24, 2022, Russia began a full-scale invasion of Ukraine, which exacerbated inflationary pressures by driving up commodity prices. Against this backdrop, the fiscal year was plagued by volatility and uncertainty. The municipal market set multiple record lows in 2022, making it one of the most challenging years in history for municipal markets.
Investment grade municipal bonds returned -5.10%, high yield municipal bonds returned -9.35% and taxable municipal bonds returned -12.96% during the fiscal year.1
While municipal funds had experienced record inflows of $101.7 billion in 2021, flows quickly turned negative in the first quarter of 2022, perpetuating the Bloomberg Municipal Bond Index’s worst quarterly return in 40 years. Municipal bonds enjoyed a short respite in late May and early June 2022 with increased demand from crossover buyers like hedge funds, banks and insurance companies; however, the May 2022 Consumer Price Index report quoted inflation rising to a 40-year high. This sent the 10-year Treasury yield to a new 52-week high of nearly 3.50%, pushing municipal mutual fund flows back into negative territory.2 According to Lipper, net outflows from municipal bond funds totaled over -$110 billion for the fiscal year.3
On March 16, 2022, the US Federal Reserve (the Fed) raised the federal funds target rate 0.25% for the first time in more than three years in hopes of containing inflation.4 This was the first of eight consecutive increases during the fiscal year as the Fed announced its plan for a quantitative tightening
campaign in an attempt to rein in inflation without harming employment or the overall economy. Rate increases as high as 0.75% followed, the Fed’s most aggressive monetary policy since the 1980s, bringing the target rate to 4.75% as of the end of the fiscal year.4
The AAA municipal yield curve made history after the Fed’s December 2022 meeting when the curve inverted between one- and 10-year maturities. Any inversion is noteworthy, but this was a first for municipal bonds. On January 31, 2023, policymakers indicated that future rate increases were likely to be “appropriate,” suggesting they were not yet convinced inflation was contained, which increased uncertainty about when the current tightening cycle might end.4 The fiscal year ended with an increase of 0.25% on February 1, 2023. We expect additional rate hikes in 2023, although not with the same pace or vigor as in 2022.
New municipal issuance for the fiscal year totaled $354 billion, down 27% from the previous fiscal year’s $484 billion.5 Issuers, with cash on their balance sheets, have been reluctant to issue at higher interest rates. While taxable issuance continued to account for a significant portion of new issuance, at 14% of the total, this figure is down from 18% from the previous fiscal year because of higher interest rates.5
Puerto Rico continued to make developments in its ongoing debt restructuring throughout the fiscal year. The territory restructured its outstanding general obligation and other government-guaranteed debt in March 2022 and began paying bondholders on the new restructured bonds. Puerto Rico’s weight in the Bloomberg High Yield Municipal Bond Index increased from 13% to 20% as the new bonds were included.1 The Financial Oversight and Management Board for Puerto Rico, the Puerto Rican government, bondholders and other interested parties continued
to negotiate the restructuring of bonds issued by the Puerto Rico Electric Power Authority, the territory’s largest remaining unresolved debt, as the fiscal year closed.
Municipal credits have a long history of low defaults as many provide essential services to all Americans. This continues to be the case as evidenced by S&P rating changes - upgrades exceeded downgrades by a ratio of 2.5:1 through December 2022.6 This positive dynamic, which we believe will continue, likely stems from benefits of the various federal stimulus measures including the American Rescue Plan Act, the Infrastructure Investment and Jobs Act and the Inflation Reduction Act, as well as higher revenues collected by state and local governments.
We believe the valuable benefits of municipal bonds will prevail over current market volatility and economic uncertainty. We continue to rely on our experienced portfolio managers and credit analysts to weather the challenges while identifying marketplace opportunities to add long-term value for shareholders.
During the fiscal year, an underweight allocation to local general obligation bonds contributed to the Fund’s relative return. An overweight allocation to AAA and AA-rated† credits also added to relative performance. On a state level, underweight allocations to and security selection among bonds domiciled in Texas contributed to relative performance.
Overweight allocations to life care and dedicated tax sectors detracted from the Fund’s relative performance over the fiscal year. Overweight exposure to intermediate duration bonds (10.00 - 14.99 years) also detracted from relative performance. On a regional level, overweight exposure to bonds domiciled Pennsylvania detracted from relative performance.
During the fiscal year, leverage contributed to the Fund’s performance relative to its style-specific benchmark. The Fund achieved a leveraged position through the use of inverse floating rate securities or tender option bonds. The Fund uses leverage because we believe that, over time, leveraging provides opportunities for additional income and total return for shareholders. However, the use of leverage also can expose shareholders to additional volatility. For more information about the Fund’s use of leverage, see the Notes to Financial Statements later in this report.
We wish to remind you that the Fund is subject to interest rate risk, meaning when interest rates rise, the value of fixed income securities tends to fall. The degree to which the value of fixed income securities may decline due to rising interest rates may vary depending on the speed and magnitude of the increase in interest rates, as well as individual security characteristics, such as price, maturity, duration and coupon and market forces, such as supply and demand for similar securities. We are monitoring interest rates, as well
| | |
| 2 | | Invesco Intermediate Term Municipal Income Fund |
as the market, economic and geopolitical factors that may impact the direction, speed and magnitude of changes to interest rates across the maturity spectrum, including the potential impact of monetary policy changes by the Fed and certain foreign central banks. If interest rates rise or fall faster than expected, markets may experience increased volatility, which may affect the value and/or liquidity of certain of the Fund’s investments.
Thank you for investing in Invesco Intermediate Term Municipal Income Fund and for sharing our long-term investment horizon.
1 Source: Bloomberg LP
2 Source: Refinitiv TM3
3 Source: Lipper Inc.
4 Source: US Federal Reserve
5 Source: JP Morgan
6 Source: Standard & Poor’s
† Sources: A credit rating is an assessment provided by a NRSRO of the creditworthiness of an issuer with respect to debt obligations, including specific securities, money market instruments or other debts. Ratings are measured on a scale that generally ranges from AAA (highest) to D (lowest); ratings are subject to change without notice. For more information on rating methodology, please visit www.spglobal.com and select “Understanding Credit Ratings” under About Ratings on the homepage; www.fitchratings.com and select “Understanding Credit Ratings” from the drop-down menu on the homepage; and www.moodys.com and select “Methodology,” then “Rating Methodologies” under Research Type on the left-hand side.
Portfolio manager(s):
Jack Connelly
Josh Cooney
Elizabeth Mossow
Tim O’Reilly
Mark Paris
James Phillips
John Schorle
Rebecca Setcavage
Julius Williams
The views and opinions expressed in management’s discussion of Fund performance are those of Invesco Advisers, Inc. and its affiliates. These views and opinions are subject to change at any time based on factors such as market and economic conditions. These views and opinions may not be relied upon as investment advice or recommendations, or as an offer for a particular security. The information is not a complete analysis of every aspect of any market, country, industry, security or the Fund. Statements of fact are from sources considered reliable, but Invesco Advisers, Inc. makes no representation or warranty as to their completeness or accuracy. Although historical performance is no guarantee of future results, these insights may help you understand our investment management philosophy.
See important Fund and, if applicable, index disclosures later in this report.
| | |
| 3 | | Invesco Intermediate Term Municipal Income Fund |
Your Fund’s Long-Term Performance
Results of a $10,000 Investment – Oldest Share Class(es)
Fund and index data from 2/28/13
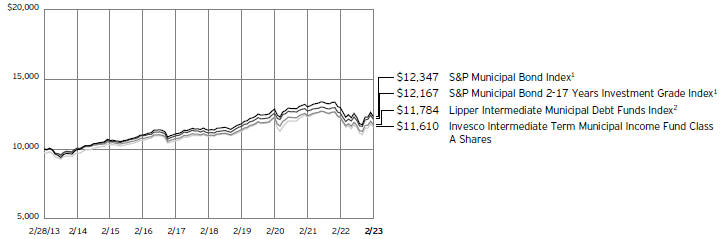
1 Source: RIMES Technologies Corp.
2 Source: Lipper Inc.
Past performance cannot guarantee future results.
The data shown in the chart include reinvested distributions, applicable sales charges and Fund expenses including management
fees. Index results include reinvested dividends, but they do not reflect sales charges. Performance of the peer group, if applicable, reflects Fund expenses and management fees; performance of a market index does
not. Performance shown in the chart does not reflect deduction of taxes a shareholder would pay on Fund distributions or sale of Fund shares.
| | |
| 4 | | Invesco Intermediate Term Municipal Income Fund |
| | | | |
| |
Average Annual Total Returns | |
As of 2/28/23, including maximum applicable sales charges | |
Class A Shares | | | | |
Inception (5/28/93) | | | 3.91 | % |
10 Years | | | 1.50 | |
5 Years | | | 0.71 | |
1 Year | | | -7.77 | |
| |
Class C Shares | | | | |
Inception (10/19/93) | | | 3.59 | % |
10 Years | | | 1.16 | |
5 Years | | | 0.46 | |
1 Year | | | -7.03 | |
| |
Class Y Shares | | | | |
Inception (8/12/05) | | | 3.27 | % |
10 Years | | | 2.01 | |
5 Years | | | 1.47 | |
1 Year | | | -5.14 | |
| |
Class R6 Shares | | | | |
10 Years | | | 1.93 | % |
5 Years | | | 1.54 | |
1 Year | | | -5.07 | |
Effective June 1, 2010, Class A, Class C and Class I shares of the predecessor fund, Van Kampen Intermediate Term Municipal Income Fund, advised by Van Kampen Asset Management were reorganized into Class A, Class C and Class Y shares, respectively, of Invesco Van Kampen Intermediate Term Municipal Income Fund (renamed Invesco Intermediate Term Municipal Income Fund). Returns shown above, prior to June 1, 2010, for Class A, Class C and Class Y shares are those for Class A, Class C and Class I shares of the predecessor fund. Share class returns will differ from the predecessor fund because of different expenses.
Class R6 shares incepted on April 4, 2017. Performance shown prior to that date is that of the Fund’s Class A shares at net asset value and includes the 12b-1 fees applicable to Class A shares.
The performance data quoted represent past performance and cannot guarantee future results; current performance may be lower or higher. Please visit invesco.com/performance for the most recent month-end performance. Performance figures reflect reinvested distributions, changes in net asset value and the effect of the maximum sales charge unless otherwise stated. Performance figures do not reflect deduction of taxes a shareholder would pay on Fund distributions or sale of Fund shares. Investment return and principal value will fluctuate so that you may have a gain or loss when you sell shares.
Class A share performance reflects the maximum 2.50% sales charge, and Class C share performance reflects the applicable contingent deferred sales charge (CDSC) for the period involved. The CDSC on Class C shares is 1% for the first year after
purchase. Class Y and Class R6 shares do not have a front-end sales charge or a CDSC; therefore, performance is at net asset value.
The performance of the Fund’s share classes will differ primarily due to different sales charge structures and class expenses.
Fund performance reflects any applicable fee waivers and/or expense reimbursements. Had the adviser not waived fees and/or reimbursed expenses currently or in the past, returns would have been lower. See current prospectus for more information.
| | |
| 5 | | Invesco Intermediate Term Municipal Income Fund |
Supplemental Information
Invesco Intermediate Term Municipal Income Fund’s investment objective is to provide investors with a high level of current income exempt from federal income tax, consistent with preservation of capital.
| ∎ | Unless otherwise stated, information presented in this report is as of February 28, 2023, and is based on total net assets. |
| ∎ | Unless otherwise noted, all data is provided by Invesco. |
| ∎ | To access your Fund’s reports/prospectus, visit invesco.com/fundreports. |
About indexes used in this report
| ∎ | The S&P Municipal Bond Index is a broad, market value-weighted index that seeks to measure the performance of the US municipal bond market. |
| ∎ | The S&P Municipal Bond 2-17 Years Investment Grade Index seeks to measure the performance of investment-grade US municipals with maturities between two and 17 years. |
| ∎ | The Lipper Intermediate Municipal Debt Funds Index is an unmanaged index considered representative of intermediate municipal debt funds tracked by Lipper. |
| ∎ | The Fund is not managed to track the performance of any particular index, including the index(es) described here, and consequently, the performance of the Fund may deviate significantly from the performance of the index(es). |
| ∎ | A direct investment cannot be made in an index. Unless otherwise indicated, index results include reinvested dividends, and they do not reflect sales charges. Performance of the peer group, if applicable, reflects fund expenses; performance of a market index does not. |
|
|
This report must be accompanied or preceded by a currently effective Fund prospectus, which contains more complete information, including sales charges and expenses. Investors should read it carefully before investing. |
|
| NOT FDIC INSURED | MAY LOSE VALUE | NO BANK GUARANTEE |
| | |
| 6 | | Invesco Intermediate Term Municipal Income Fund |
Fund Information
Portfolio Composition
| | | | | |
| By credit sector | | % of total investments |
| |
Revenue Bonds | | | | 87.19 | % |
| |
General Obligation Bonds | | | | 11.06 | |
| |
Pre-Refunded Bonds | | | | 1.75 | |
Top Five Debt Holdings
| | | | | | | |
| | | | | % of total net assets |
| | |
| 1. | | New York Transportation Development Corp. (American Airlines, Inc.), Series 2016, Ref. RB | | | | 1.34 | % |
| | |
| 2. | | Puerto Rico Sales Tax Financing Corp., Series 2018 A-1, RB | | | | 0.80 | |
| | |
| 3. | | Miami-Dade (County of), FL, Series 2017 B, Ref. RB | | | | 0.79 | |
| | |
| 4. | | New Jersey (State of) Economic Development Authority (Continental Airlines, Inc.), Series 2012, RB | | | | 0.72 | |
| | |
| 5. | | Broward (County of), FL (Convention Center Expansion), Series 2021, RB | | | | 0.69 | |
The Fund’s holdings are subject to change, and there is no assurance that the Fund will continue to hold any particular security.
Data presented here are as of February 28, 2023.
| | |
| 7 | | Invesco Intermediate Term Municipal Income Fund |
Schedule of Investments
February 28, 2023
| | | | | | | | | | | | | | |
| | | Interest Rate | | | Maturity Date | | | Principal Amount (000) | | | Value |
Municipal Obligations-100.19% | | | | | | | | | | | | | | |
Alabama-1.14% | | | | | | | | | | | | | | |
Alabama (State of) Port Authority; Series 2017 A, Ref. RB (INS - AGM)(a)(b) | | | 5.00% | | | | 10/01/2033 | | | $ | 3,500 | | | $ 3,660,261 |
Alabaster (City of), AL Board of Education; Series 2014 A, GO Wts. (INS - AGM)(b) | | | 5.00% | | | | 09/01/2025 | | | | 1,500 | | | 1,538,184 |
Birmingham (City of) & Jefferson (County of), AL Civic Center Authority; Series 2018 B, RB | | | 5.00% | | | | 07/01/2035 | | | | 2,345 | | | 2,493,547 |
Birmingham (City of), AL Special Care Facilities Financing Authority (Methodist Home for the Aging); | | | | | | | | | | | | | | |
Series 2016, RB | | | 5.25% | | | | 06/01/2025 | | | | 55 | | | 54,038 |
Series 2016, RB | | | 5.50% | | | | 06/01/2030 | | | | 2,000 | | | 1,886,738 |
Lee (County of), AL Public Building Authority (DHR Building); Series 2006, Revenue Wts. (INS - SGI)(b) | | | 4.38% | | | | 09/01/2025 | | | | 10 | | | 10,007 |
Lower Alabama Gas District (The); Series 2016 A, RB | | | 5.00% | | | | 09/01/2034 | | | | 5,000 | | | 5,276,970 |
Selma (City of), AL Industrial Development Board (International Paper Co.); Series 2019, Ref. RB(c) | | | 2.00% | | | | 10/01/2024 | | | | 1,500 | | | 1,438,752 |
Southeast Energy Authority A Cooperative District (No. 3); Series 2022 A-1, RB(c) | | | 5.50% | | | | 12/01/2029 | | | | 2,000 | | | 2,144,660 |
Tuscaloosa (County of), AL Industrial Development Authority (Hunt Refining); Series 2019 A, Ref. IDR(d) | | | 4.50% | | | | 05/01/2032 | | | | 2,991 | | | 2,687,572 |
UAB Medicine Finance Authority; Series 2019, RB | | | 5.00% | | | | 09/01/2031 | | | | 550 | | | 608,787 |
| | | | | | | | | | | | | | | 21,799,516 |
| | | | |
Arizona-2.35% | | | | | | | | | | | | | | |
Arizona (State of) Health Facilities Authority (Scottsdale Lincoln Hospital); Series 2014, Ref. RB | | | 5.00% | | | | 12/01/2032 | | | | 3,400 | | | 3,503,135 |
Arizona (State of) Industrial Development Authority; Series 2019-2A, Revenue Ctfs. | | | 3.63% | | | | 05/20/2033 | | | | 3,058 | | | 2,840,421 |
Arizona (State of) Industrial Development Authority (Academies of Math & Science); Series 2019, RB(d) | | | 5.00% | | | | 07/01/2039 | | | | 1,000 | | | 972,737 |
Arizona (State of) Industrial Development Authority (Basis Schools); Series 2017 D, Ref. RB(d) | | | 5.00% | | | | 07/01/2037 | | | | 630 | | | 614,849 |
Arizona (State of) Industrial Development Authority (Pinecrest Academy of Nevada-Horizon, Inspirada and St. Rose Campus Projects); Series 2018 A, RB(d) | | | 5.75% | | | | 07/15/2038 | | | | 1,810 | | | 1,862,227 |
Glendale (City of), AZ; Series 2015, Ref. RB (INS - AGM)(b) | | | 5.00% | | | | 07/01/2029 | | | | 1,000 | | | 1,040,530 |
Glendale (City of), AZ Industrial Development Authority (The Beatitudes Campus); Series 2017, Ref. RB | | | 5.00% | | | | 11/15/2028 | | | | 2,105 | | | 2,048,887 |
La Paz (County of), AZ Industrial Development Authority (Charter School Solutions- Harmony Public Schools); Series 2018 A, RB | | | 5.00% | | | | 02/15/2038 | | | | 1,200 | | | 1,206,731 |
Maricopa (County of), AZ Industrial Development Authority (Commercial Metals Co.); Series 2022, RB(a)(d) | | | 4.00% | | | | 10/15/2047 | | | | 2,000 | | | 1,659,078 |
Maricopa (County of), AZ Industrial Development Authority (GreatHearts Arizona); Series 2017 C, RB | | | 5.00% | | | | 07/01/2037 | | | | 315 | | | 326,128 |
Maricopa (County of), AZ Industrial Development Authority (Legacy Traditional Schools); Series 2021, RB(d) | | | 4.00% | | | | 07/01/2041 | | | | 1,275 | | | 1,049,380 |
Maricopa County Pollution Control Corp. (Southern California Edison); Series 2000, Ref. RB | | | 2.40% | | | | 06/01/2035 | | | | 4,000 | | | 3,078,635 |
Navajo (Nation of); Series 2015 A, Ref. RB(d) | | | 5.50% | | | | 12/01/2030 | | | | 725 | | | 753,376 |
Northern Arizona University; Series 2015, Ref. RB (INS - BAM)(b) | | | 5.00% | | | | 06/01/2032 | | | | 250 | | | 257,026 |
Peoria (City of), AZ Industrial Development Authority (Sierra Winds Life Care Community); | | | | | | | | | | | | | | |
Series 2014, Ref. RB (Acquired 11/06/2014; Cost $ 1,273,117)(e) | | | 5.00% | | | | 11/15/2024 | | | | 1,270 | | | 1,151,638 |
Series 2014, Ref. RB (Acquired 11/06/2014; Cost $ 2,105,000)(e) | | | 5.25% | | | | 11/15/2029 | | | | 2,105 | | | 1,805,678 |
Phoenix (City of), AZ Industrial Development Authority (Great Hearts Academies); Series 2016, Ref. RB | | | 5.00% | | | | 07/01/2036 | | | | 1,000 | | | 1,015,035 |
Phoenix (City of), AZ Industrial Development Authority (Legacy Traditional Schools); Series 2014 A, RB(d) | | | 5.75% | | | | 07/01/2024 | | | | 440 | | | 442,916 |
Phoenix Civic Improvement Corp.; Series 2019 A, RB | | | 5.00% | | | | 07/01/2033 | | | | 3,500 | | | 3,811,645 |
Pima (County of), AZ Industrial Development Authority (American Leadership Academy); | | | | | | | | | | | | | | |
Series 2015, Ref. RB(d) | | | 5.38% | | | | 06/15/2035 | | | | 1,360 | | | 1,370,195 |
Series 2021, RB(d) | | | 4.00% | | | | 06/15/2041 | | | | 740 | | | 600,400 |
Pima (County of), AZ Industrial Development Authority (Desert Heights Charter School); Series 2014, Ref. RB | | | 6.00% | | | | 05/01/2024 | | | | 175 | | | 176,703 |
Pima (County of), AZ Industrial Development Authority (Excalibur Charter School (The)); Series 2016, Ref. RB(d) | | | 5.00% | | | | 09/01/2026 | | | | 35 | | | 34,757 |
Pima (County of), AZ Industrial Development Authority (Grande Innovations Academy); Series 2018, RB(d) | | | 5.00% | | | | 07/01/2033 | | | | 2,245 | | | 2,158,969 |
Salt River Project Agricultural Improvement & Power District; Series 2016 A, Ref. RB | | | 5.00% | | | | 01/01/2034 | | | | 5,500 | | | 5,898,011 |
Tempe (City of), AZ Industrial Development Authority (Mirabella at ASU); Series 2017 A, RB(d) | | | 5.50% | | | | 10/01/2027 | | | | 1,245 | | | 1,171,410 |
University of Arizona Board of Regents (Arizona Biomedical Research Collaborative Building); Series 2006, COP (INS - AMBAC)(b) | | | 4.50% | | | | 06/01/2031 | | | | 20 | | | 20,016 |
See accompanying Notes to Financial Statements which are an integral part of the financial statements.
| | |
| 8 | | Invesco Intermediate Term Municipal Income Fund |
| | | | | | | | | | | | | | |
| | | Interest Rate | | | Maturity Date | | | Principal Amount (000) | | | Value |
Arizona-(continued) | | | | | �� | | | | | | | | | |
Verrado Community Facilities District No. 1; Series 2013 A, Ref. GO Bonds(d) | | | 5.00% | | | | 07/15/2023 | | | $ | 825 | | | $ 824,661 |
Westpark Community Facility District; Series 2016, Ref. GO Bonds | | | 5.00% | | | | 07/15/2032 | | | | 2,000 | | | 2,053,345 |
Yuma (City of), AZ Industrial Development Authority (Regional Medical Center); Series 2014 A, RB | | | 5.00% | | | | 08/01/2025 | | | | 1,000 | | | 1,019,971 |
| | | | | | | | | | | | | | | 44,768,490 |
| | | | |
Arkansas-0.07% | | | | | | | | | | | | | | |
Pulaski (County of), AR Public Facilities Board; Series 2014, RB | | | 5.00% | | | | 12/01/2024 | | | | 1,345 | | | 1,380,304 |
| | | | |
California-9.73% | | | | | | | | | | | | | | |
Adelanto Public Utility Authority (Utility System); | | | | | | | | | | | | | | |
Series 2017 A, Ref. RB (INS - AGM)(b) | | | 5.00% | | | | 07/01/2027 | | | | 175 | | | 190,082 |
Series 2017 A, Ref. RB (INS - AGM)(b) | | | 5.00% | | | | 07/01/2028 | | | | 315 | | | 343,946 |
Series 2017 A, Ref. RB (INS - AGM)(b) | | | 5.00% | | | | 07/01/2029 | | | | 300 | | | 328,214 |
Series 2017 A, Ref. RB (INS - AGM)(b) | | | 5.00% | | | | 07/01/2030 | | | | 325 | | | 355,046 |
Series 2017 A, Ref. RB (INS - AGM)(b) | | | 5.00% | | | | 07/01/2031 | | | | 310 | | | 338,496 |
Series 2017 A, Ref. RB (INS - AGM)(b) | | | 5.00% | | | | 07/01/2032 | | | | 310 | | | 337,733 |
Atwater (City of), CA; Series 2017 A, Ref. RB (INS - AGM)(b) | | | 5.00% | | | | 05/01/2033 | | | | 100 | | | 108,126 |
Beaumont (City of), CA Financing Authority (Improvement Area No. 17A); Series 2013 B, RB(c)(f) | | | 5.00% | | | | 09/01/2023 | | | | 1,000 | | | 1,009,183 |
California (State of); | | | | | | | | | | | | | | |
Series 2020, Ref. GO Bonds | | | 4.00% | | | | 03/01/2036 | | | | 9,385 | | | 9,636,511 |
Series 2022, GO Bonds | | | 5.00% | | | | 09/01/2039 | | | | 3,000 | | | 3,396,244 |
California (State of) (Bid Group B); Series 2020, GO Bonds | | | 5.00% | | | | 11/01/2036 | | | | 10,000 | | | 11,253,472 |
California (State of) Community Choice Financing Authority (Green Bonds); Series 2023 C, RB(c) | | | 5.25% | | | | 10/01/2031 | | | | 3,250 | | | 3,384,036 |
California (State of) County Tobacco Securitization Agency; | | | | | | | | | | | | | | |
Series 2014, Ref. RB | | | 4.00% | | | | 06/01/2029 | | | | 765 | | | 765,802 |
Series 2020 A, Ref. RB | | | 5.00% | | | | 06/01/2032 | | | | 385 | | | 413,753 |
Series 2020 A, Ref. RB | | | 5.00% | | | | 06/01/2033 | | | | 600 | | | 642,848 |
California (State of) County Tobacco Securitization Agency (Alameda County Tobacco Asset Securitization Corp.); Series 2002, RB | | | 6.00% | | | | 06/01/2042 | | | | 2,250 | | | 2,287,217 |
California (State of) Enterprise Development Authority (Academy for Academic Excellence); Series 2020 A, RB(d) | | | 5.00% | | | | 07/01/2040 | | | | 1,000 | | | 963,990 |
California (State of) Housing Finance Agency; | | | | | | | | | | | | | | |
Series 2019 A-1, RB | | | 4.25% | | | | 01/15/2035 | | | | 1,895 | | | 1,888,086 |
Series 2019 A-2, RB | | | 4.00% | | | | 03/20/2033 | | | | 12,629 | | | 12,481,868 |
Series 2021-1A, Revenue Ctfs. | | | 3.50% | | | | 11/20/2035 | | | | 4,859 | | | 4,576,481 |
California (State of) Municipal Finance Authority (American Heritage Education Foundation); Series 2016 A, Ref. RB | | | 5.00% | | | | 06/01/2046 | | | | 875 | | | 876,392 |
California (State of) Municipal Finance Authority (CHF-Davis I, LLC - West Village Student Housing); Series 2018, RB | | | 5.00% | | | | 05/15/2035 | | | | 5,000 | | | 5,169,919 |
California (State of) Municipal Finance Authority (Emerson College); Series 2011, RB | | | 5.00% | | | | 01/01/2028 | | | | 270 | | | 270,284 |
California (State of) Municipal Finance Authority (Harbor Regional Center); Series 2015, Ref. RB | | | 5.00% | | | | 11/01/2032 | | | | 1,000 | | | 1,060,108 |
California (State of) Municipal Finance Authority (Mt. San Antonio Gardens); Series 2022, RB | | | 2.75% | | | | 11/15/2027 | | | | 525 | | | 474,989 |
California (State of) Pollution Control Financing Authority; Series 2012, RB(a)(d) | | | 5.00% | | | | 07/01/2027 | | | | 5,590 | | | 5,617,229 |
California (State of) Public Finance Authority (Enso Village) (Green Bonds); | | | | | | | | | | | | | | |
Series 2021 B-3, RB(d) | | | 2.13% | | | | 11/15/2027 | | | | 2,140 | | | 1,999,209 |
Series 2021, RB(d) | | | 2.38% | | | | 11/15/2028 | | | | 1,050 | | | 972,368 |
Series 2021, RB(d) | | | 3.13% | | | | 05/15/2029 | | | | 4,140 | | | 3,650,918 |
Series 2021, RB(d) | | | 5.00% | | | | 11/15/2036 | | | | 1,160 | | | 1,087,593 |
California (State of) Public Finance Authority (Henry Mayo Newhall Hospital); | | | | | | | | | | | | | | |
Series 2017, Ref. RB | | | 5.00% | | | | 10/15/2031 | | | | 1,070 | | | 1,116,335 |
Series 2017, Ref. RB | | | 5.00% | | | | 10/15/2033 | | | | 1,000 | | | 1,037,081 |
California (State of) Public Works Board (Various Capital); Series 2021 B, RB | | | 4.00% | | | | 05/01/2038 | | | | 2,125 | | | 2,141,339 |
California (State of) School Finance Authority (Alliance for College-Ready Public Schools); Series 2013 A, RB | | | 5.25% | | | | 07/01/2023 | | | | 230 | | | 230,857 |
California (State of) School Finance Authority (KIPP LA); Series 2014 A, RB(d) | | | 4.13% | | | | 07/01/2024 | | | | 270 | | | 270,113 |
California (State of) Statewide Communities Development Authority (California Baptist University); Series 2017 A, Ref. RB(d) | | | 5.00% | | | | 11/01/2032 | | | | 1,135 | | | 1,153,316 |
See accompanying Notes to Financial Statements which are an integral part of the financial statements.
| | |
| 9 | | Invesco Intermediate Term Municipal Income Fund |
| | | | | | | | | | | | | | |
| | | Interest Rate | | | Maturity Date | | | Principal Amount (000) | | | Value |
California-(continued) | | | | | | | | | | | | | | |
California (State of) Statewide Communities Development Authority (Loma Linda University Medical Center); | | | | | | | | | | | | | | |
Series 2014, RB | | | 5.25% | | | | 12/01/2029 | | | $ | 4,300 | | | $ 4,397,778 |
Series 2018 A, RB(d) | | | 5.25% | | | | 12/01/2038 | | | | 1,000 | | | 1,012,686 |
California (State of) Statewide Communities Development Authority (University of California - Irvine East Campus Apartments - CHF-Irvine, LLC); Series 2016, Ref. RB | | | 5.00% | | | | 05/15/2032 | | | | 1,250 | | | 1,283,339 |
Chula Vista (City of), CA Municipal Financing Authority; Series 2015 B, Ref. RB | | | 5.00% | | | | 09/01/2026 | | | | 1,500 | | | 1,575,780 |
Corona-Norco Unified School District (Community Facilities District No. 98-1); Series 2013, Ref. RB(f) | | | 5.00% | | | | 09/01/2023 | | | | 1,000 | | | 1,009,678 |
El Centro (City of), CA Financing Authority (El Centro California Redevelopment); Series 2011, RB | | | 6.63% | | | | 11/01/2025 | | | | 75 | | | 75,220 |
El Dorado (County of), CA (Community Facilities District No. 1992-1 - El Dorado Hills Development); Series 2012, Ref. RB | | | 5.00% | | | | 09/01/2024 | | | | 495 | | | 495,741 |
Golden State Tobacco Securitization Corp.; | | | | | | | | | | | | | | |
Series 2005 A, RB(f)(g) | | | 0.00% | | | | 06/01/2028 | | | | 55 | | | 47,434 |
Series 2017 A-1, Ref. RB(f) | | | 5.00% | | | | 06/01/2027 | | | | 4,000 | | | 4,365,647 |
Series 2018 A-1, Ref. RB(c)(f) | | | 5.00% | | | | 06/01/2028 | | | | 4,000 | | | 4,472,004 |
Imperial (County of), CA Local Transportation Authority; | | | | | | | | | | | | | | |
Series 2022 A, Ref. RB (INS - AGM)(b) | | | 5.00% | | | | 06/01/2032 | | | | 3,800 | | | 4,118,768 |
Series 2022 B, Ref. RB (INS - AGM)(b) | | | 5.00% | | | | 06/01/2032 | | | | 5,000 | | | 5,419,226 |
Series 2022 C, Ref. RB (INS - AGM)(b) | | | 5.00% | | | | 06/01/2032 | | | | 1,100 | | | 1,192,320 |
Series 2022 D, Ref. RB (INS - AGM)(b) | | | 5.00% | | | | 06/01/2032 | | | | 2,880 | | | 3,121,474 |
Indio (City of), CA Community Facilities District No. 2004-3 (Improvement Area No. 1); Series 2015, Ref. RB | | | 5.00% | | | | 09/01/2035 | | | | 910 | | | 931,981 |
Inglewood Unified School District; Series 2019 C, GO Bonds (INS - BAM)(b) | | | 4.00% | | | | 08/01/2039 | | | | 1,000 | | | 987,656 |
Irvine (City of), CA (Reassessment District No. 13-1); Series 2013, RB | | | 5.00% | | | | 09/02/2023 | | | | 500 | | | 504,072 |
Lake Elsinore Public Financing Authority; Series 2015, Ref. RB | | | 5.00% | | | | 09/01/2028 | | | | 2,115 | | | 2,197,771 |
Lancaster (City of), CA Redevelopment Agency Successor Agency (Redevelopment Areas); Series 2017, Ref. RB (INS - AGM)(b) | | | 4.00% | | | | 08/01/2039 | | | | 3,400 | | | 3,370,059 |
Los Angeles (City of), CA Department of Airports; Series 2020 C, RB(a) | | | 5.00% | | | | 05/15/2039 | | | | 1,160 | | | 1,227,905 |
Los Angeles (City of), CA Department of Airports (Los Angeles International Airport); | | | | | | | | | | | | | | |
Series 2018 A, RB(a) | | | 5.00% | | | | 05/15/2044 | | | | 7,005 | | | 7,181,509 |
Series 2018 B, Ref. RB(a) | | | 5.00% | | | | 05/15/2029 | | | | 2,000 | | | 2,147,747 |
Series 2018 D, Ref. RB(a) | | | 5.00% | | | | 05/15/2031 | | | | 3,000 | | | 3,245,074 |
Los Angeles Unified School District; Series 2020 RYQ, GO Bonds | | | 4.00% | | | | 07/01/2036 | | | | 5,000 | | | 5,123,132 |
Modesto (City of), CA Irrigation District; Series 2015 B, Ref. RB | | | 5.00% | | | | 10/01/2028 | | | | 1,595 | | | 1,687,557 |
M-S-R Energy Authority; Series 2009 B, RB | | | 7.00% | | | | 11/01/2034 | | | | 3,500 | | | 4,344,523 |
Northern California Tobacco Securitization Authority; | | | | | | | | | | | | | | |
Series 2021 A, Ref. RB | | | 4.00% | | | | 06/01/2049 | | | | 3,390 | | | 3,048,236 |
Series 2021 B-1, Ref. RB | | | 4.00% | | | | 06/01/2049 | | | | 3,790 | | | 3,600,491 |
Oakland Unified School District (County of Alameda); | | | | | | | | | | | | | | |
Series 2015 A, GO Bonds | | | 5.00% | | | | 08/01/2028 | | | | 1,000 | | | 1,051,009 |
Series 2015 A, GO Bonds | | | 5.00% | | | | 08/01/2029 | | | | 1,160 | | | 1,221,560 |
Oroville (City of), CA (Oroville Hospital); Series 2019, RB | | | 5.25% | | | | 04/01/2034 | | | | 2,000 | | | 2,062,480 |
Palomar Health; Series 2016, Ref. RB | | | 5.00% | | | | 11/01/2031 | | | | 500 | | | 520,143 |
Redwood City (City of), CA (Redwood Shores Community Facilities District No. 99-1 - Shores Transportation Improvement); Series 2012, Ref. RB | | | 5.00% | | | | 09/01/2026 | | | | 495 | | | 495,556 |
Riverside (City of), CA (Riverwalk Assessment District); Series 2011, Ref. RB | | | 5.25% | | | | 09/02/2026 | | | | 400 | | | 403,543 |
Riverside (County of), CA Community Facilities District No. 04-2 (Lake Hills Crest); Series 2012, Ref. RB | | | 5.00% | | | | 09/01/2028 | | | | 500 | | | 503,952 |
Riverside (County of), CA Public Financing Authority (Desert Communities and Interstate 215 Corridor - Project Area No. 1); Series 2015 A, RB (INS - AGM)(b) | | | 5.00% | | | | 10/01/2029 | | | | 1,375 | | | 1,449,415 |
San Diego (City of), CA Community Facilities District No. 3; Series 2013, Ref. RB | | | 5.00% | | | | 09/01/2024 | | | | 520 | | | 523,142 |
San Diego (County of), CA Regional Airport Authority; Series 2021 B, RB(a) | | | 4.00% | | | | 07/01/2040 | | | | 3,000 | | | 2,822,270 |
San Francisco (City & County of), CA Airport Commission (San Francisco International Airport); | | | | | | | | | | | | | | |
Series 2019 A, Ref. RB(a) | | | 5.00% | | | | 01/01/2033 | | | | 1,000 | | | 1,069,221 |
Series 2019 A, Ref. RB(a) | | | 5.00% | | | | 01/01/2034 | | | | 1,335 | | | 1,423,531 |
Series 2019 D, Ref. RB | | | 5.00% | | | | 05/01/2030 | | | | 1,800 | | | 2,036,568 |
San Francisco (City & County of), CA Successor Agency to the Redevelopment Agency Community Facilities District No. 6 (Mission Bay South Public Improvements); | | | | | | | | | | | | | | |
Series 2013 A, Ref. RB | | | 5.00% | | | | 08/01/2027 | | | | 750 | | | 757,255 |
Series 2013 B, RB | | | 5.00% | | | | 08/01/2027 | | | | 405 | | | 408,941 |
See accompanying Notes to Financial Statements which are an integral part of the financial statements.
| | |
| 10 | | Invesco Intermediate Term Municipal Income Fund |
| | | | | | | | | | | | | | |
| | | Interest Rate | | | Maturity Date | | | Principal Amount (000) | | | Value |
California-(continued) | | | | | | | | | | | | | | |
San Francisco Bay Area Rapid Transit District (Green Bonds) (Election of 2016); Series 2019 B1, GO Bonds | | | 4.00% | | | | 08/01/2037 | | | $ | 5,000 | | | $ 5,155,435 |
San Luis Obispo (County of), CA Financing Authority (Lopez Dam Improvement); Series 2011 A, Ref. RB (INS - AGM)(b) | | | 5.50% | | | | 08/01/2026 | | | | 3,195 | | | 3,201,052 |
Santa Margarita Water District (Community Facilities District No. 2013-1); | | | | | | | | | | | | | | |
Series 2013, RB | | | 5.00% | | | | 09/01/2026 | | | | 990 | | | 997,116 |
Series 2013, RB | | | 5.13% | | | | 09/01/2027 | | | | 1,150 | | | 1,159,566 |
South Tahoe Joint Powers Financing Authority (South Tahoe Redevelopment Project Area No. 1); Series 2015 A, Ref. RB (INS - NATL)(b) | | | 5.00% | | | | 10/01/2028 | | | | 2,080 | | | 2,151,219 |
West Contra Costa Unified School District (Election of 2005); Series 2008 B, GO Bonds | | | 6.00% | | | | 08/01/2023 | | | | 1,000 | | | 1,011,938 |
William S. Hart Union High School District (Community Facilities District No. 2005-1); Series 2015, Ref. RB | | | 5.00% | | | | 09/01/2032 | | | | 1,045 | | | 1,070,029 |
| | | | | | | | | | | | | | | 185,508,933 |
| | | | |
Colorado-2.58% | | | | | | | | | | | | | | |
Arkansas River Power Authority; Series 2018 A, Ref. RB | | | 5.00% | | | | 10/01/2032 | | | | 2,645 | | | 2,732,527 |
Aurora Crossroads Metropolitan District No. 2; Series 2020 A, GO Bonds | | | 5.00% | | | | 12/01/2040 | | | | 1,480 | | | 1,365,772 |
BNC Metropolitan District No. 1; Series 2017 A, Ref. GO Bonds (INS - BAM)(b) | | | 5.00% | | | | 12/01/2032 | | | | 360 | | | 387,325 |
Brighton Crossing Metropolitan District No. 4; Series 2017 A, GO Bonds | | | 5.00% | | | | 12/01/2037 | | | | 1,050 | | | 1,020,890 |
Broadway Park North Metropolitan District No. 2; Series 2020, GO Bonds(d) | | | 5.00% | | | | 12/01/2040 | | | | 1,325 | | | 1,251,814 |
Centerra Metropolitan District No. 1 (In the City of Loveland); Series 2017, RB(d) | | | 5.00% | | | | 12/01/2029 | | | | 4,000 | | | 3,947,236 |
Clear Creek Transit Metropolitan District No. 2; Series 2021 A, GO Bonds | | | 4.00% | | | | 12/01/2031 | | | | 525 | | | 466,861 |
Colorado (State of) Health Facilities Authority (Aberdeen Ridge); Series 2021 B, RB | | | 2.63% | | | | 05/15/2029 | | | | 1,125 | | | 1,006,799 |
Colorado (State of) Health Facilities Authority (Children’s Hospital); Series 2013 A, RB | | | 5.00% | | | | 12/01/2036 | | | | 200 | | | 198,330 |
Colorado (State of) Health Facilities Authority (Christian Living Neighborhoods); Series 2016, Ref. RB | | | 5.00% | | | | 01/01/2031 | | | | 2,475 | | | 2,351,595 |
Colorado (State of) Health Facilities Authority (CommonSpirit Health); Series 2019 A, Ref. RB | | | 4.00% | | | | 08/01/2037 | | | | 4,730 | | | 4,507,570 |
Colorado (State of) Health Facilities Authority (Sunny Vista Living Center); | | | | | | | | | | | | | | |
Series 2015 A, Ref. RB(d) | | | 5.00% | | | | 12/01/2025 | | | | 375 | | | 339,869 |
Series 2015 A, Ref. RB(d) | | | 5.50% | | | | 12/01/2030 | | | | 750 | | | 602,840 |
Dacono Urban Renewal Authority; Series 2020, RB | | | 6.25% | | | | 12/01/2039 | | | | 656 | | | 614,773 |
Denver (City & County of), CO; | | | | | | | | | | | | | | |
Series 2018 A, Ref. RB(a) | | | 5.00% | | | | 12/01/2028 | | | | 1,510 | | | 1,614,247 |
Series 2018 A, Ref. RB(a) | | | 5.00% | | | | 12/01/2030 | | | | 1,000 | | | 1,089,703 |
Series 2018 A-2, RB(g) | | | 0.00% | | | | 08/01/2030 | | | | 800 | | | 603,870 |
Series 2018 A-2, RB(g) | | | 0.00% | | | | 08/01/2031 | | | | 1,000 | | | 721,495 |
Series 2022 A, RB(a) | | | 5.00% | | | | 11/15/2034 | | | | 8,750 | | | 9,635,580 |
Series 2022 D, Ref. RB(a) | | | 5.50% | | | | 11/15/2032 | | | | 2,250 | | | 2,627,986 |
Denver (City & County of), CO (United Airlines, Inc.); Series 2017, Ref. RB(a) | | | 5.00% | | | | 10/01/2032 | | | | 5,000 | | | 4,887,179 |
Denver (City & County of), CO Health & Hospital Authority; Series 2019 A, Ref. RB | | | 4.00% | | | | 12/01/2038 | | | | 2,500 | | | 2,233,801 |
Evan’s Place Metropolitan District; Series 2020 A, GO Bonds | | | 5.00% | | | | 12/01/2040 | | | | 1,050 | | | 975,184 |
Interquest South Business Improvement District; Series 2017, GO Bonds | | | 4.50% | | | | 12/01/2030 | | | | 180 | | | 167,893 |
Jefferson (County of), CO Center Metropolitan District No. 1; Series 2020 A-2, RB | | | 4.13% | | | | 12/01/2040 | | | | 575 | | | 477,262 |
Pueblo Urban Renewal Authority (Evraz); Series 2021 B, RB(d)(g) | | | 0.00% | | | | 12/01/2025 | | | | 250 | | | 185,870 |
Transport Metropolitan District No. 3; Series 2021 A-1, GO Bonds | | | 4.13% | | | | 12/01/2031 | | | | 805 | | | 723,705 |
Vauxmont Metropolitan District; | | | | | | | | | | | | | | |
Series 2019, Ref. GO Bonds (INS - AGM)(b) | | | 5.00% | | | | 12/15/2031 | | | | 135 | | | 143,988 |
Series 2019, Ref. GO Bonds (INS - AGM)(b) | | | 5.00% | | | | 12/15/2032 | | | | 160 | | | 170,604 |
Series 2020, Ref. GO Bonds (INS - AGM)(b) | | | 5.00% | | | | 12/01/2031 | | | | 230 | | | 254,470 |
Series 2020, Ref. GO Bonds (INS - AGM)(b) | | | 5.00% | | | | 12/01/2032 | | | | 250 | | | 276,333 |
Series 2020, Ref. GO Bonds (INS - AGM)(b) | | | 5.00% | | | | 12/01/2033 | | | | 255 | | | 281,048 |
Series 2020, Ref. GO Bonds (INS - AGM)(b) | | | 5.00% | | | | 12/01/2034 | | | | 285 | | | 312,265 |
Series 2020, Ref. GO Bonds (INS - AGM)(b) | | | 5.00% | | | | 12/01/2035 | | | | 100 | | | 108,679 |
Windler Public Improvement Authority; Series 2021 A-1, RB | | | 4.00% | | | | 12/01/2031 | | | | 1,065 | | | 926,865 |
| | | | | | | | | | | | | | | 49,212,228 |
See accompanying Notes to Financial Statements which are an integral part of the financial statements.
| | |
| 11 | | Invesco Intermediate Term Municipal Income Fund |
| | | | | | | | | | | | | | |
| | | Interest Rate | | | Maturity Date | | | Principal Amount (000) | | | Value |
Connecticut-1.36% | | | | | | | | | | | | | | |
Connecticut (State of); | | | | | | | | | | | | | | |
Series 2018 C, GO Bonds | | | 5.00% | | | | 06/15/2027 | | | $ | 3,000 | | | $ 3,254,306 |
Series 2018, RB | | | 5.00% | | | | 01/01/2030 | | | | 5,000 | | | 5,496,866 |
Series 2019 A, GO Bonds | | | 5.00% | | | | 04/15/2034 | | | | 4,150 | | | 4,581,865 |
Connecticut (State of) Health & Educational Facilities Authority; | | | | | | | | | | | | | | |
Series 2020 G-1, Ref. RB(d) | | | 5.00% | | | | 07/01/2030 | | | | 285 | | | 287,110 |
Series 2020 G-1, Ref. RB(d) | | | 5.00% | | | | 07/01/2031 | | | | 540 | | | 542,470 |
Series 2020 G-1, Ref. RB(d) | | | 5.00% | | | | 07/01/2033 | | | | 600 | | | 596,956 |
Hamden (Town of), CT (Whitney Center); Series 2019, Ref. RB | | | 5.00% | | | | 01/01/2030 | | | | 2,685 | | | 2,607,719 |
University of Connecticut; | | | | | | | | | | | | | | |
Series 2016 A, RB | | | 5.00% | | | | 03/15/2032 | | | | 2,940 | | | 3,092,446 |
Series 2017 A, RB | | | 5.00% | | | | 01/15/2030 | | | | 5,000 | | | 5,391,905 |
| | | | | | | | | | | | | | | 25,851,643 |
| | | | |
District of Columbia-1.40% | | | | | | | | | | | | | | |
District of Columbia (Provident Group - Howard Properties LLC); Series 2013, RB | | | 5.00% | | | | 10/01/2030 | | | | 2,550 | | | 2,549,997 |
Metropolitan Washington Airports Authority; | | | | | | | | | | | | | | |
Series 2016 A, Ref. RB(a) | | | 5.00% | | | | 10/01/2034 | | | | 2,215 | | | 2,303,796 |
Series 2019 A, Ref. RB(a) | | | 5.00% | | | | 10/01/2031 | | | | 5,000 | | | 5,413,321 |
Series 2019 A, Ref. RB(a) | | | 5.00% | | | | 10/01/2032 | | | | 1,435 | | | 1,552,134 |
Series 2019 A, Ref. RB(a) | | | 5.00% | | | | 10/01/2039 | | | | 3,775 | | | 3,957,171 |
Series 2019 A, Ref. RB(a) | | | 5.00% | | | | 10/01/2040 | | | | 1,635 | | | 1,707,046 |
Series 2021 A, Ref. RB(a) | | | 5.00% | | | | 10/01/2033 | | | | 6,000 | | | 6,597,511 |
Metropolitan Washington Airports Authority (Dulles Metrorail and Capital Improvement); | | | | | | | | | | | | | | |
Series 2010 A, RB(g) | | | 0.00% | | | | 10/01/2037 | | | | 5,000 | | | 2,519,619 |
Series 2010 A, RB (INS - AGM)(b)(g) | | | 0.00% | | | | 10/01/2037 | | | | 40 | | | 20,562 |
| | | | | | | | | | | | | | | 26,621,157 |
| | | | |
Florida-6.80% | | | | | | | | | | | | | | |
Alachua (County of), FL Health Facilities Authority (Shands Teaching Hospital & Clinics, Inc.); | | | | | | | | | | | | | | |
Series 2014 A, RB | | | 5.00% | | | | 12/01/2044 | | | | 5,000 | | | 5,023,631 |
Series 2019, Ref. RB | | | 5.00% | | | | 12/01/2037 | | | | 2,570 | | | 2,662,702 |
Atlantic Beach (City of), FL (Fleet Landing); | | | | | | | | | | | | | | |
Series 2013 A, Ref. RB | | | 5.00% | | | | 11/15/2023 | | | | 565 | | | 565,848 |
Series 2018 A, RB | | | 5.00% | | | | 11/15/2038 | | | | 1,100 | | | 1,011,067 |
Broward (County of), FL (Convention Center Expansion); Series 2021, RB | | | 4.00% | | | | 09/01/2037 | | | | 13,000 | | | 13,101,326 |
Capital Trust Agency, Inc. (Franklin Academy); Series 2020, RB(d) | | | 5.00% | | | | 12/15/2040 | | | | 4,860 | | | 4,391,697 |
Capital Trust Agency, Inc. (H-Bay Ministries, Inc.- Superior Residences); Series 2018 B, RB(h) | | | 4.50% | | | | 07/01/2038 | | | | 500 | | | 50,000 |
Capital Trust Agency, Inc. (Sarasota-Manatee Jewish Housing Council, Inc.); Series 2017, Ref. RB(d) | | | 5.00% | | | | 07/01/2032 | | | | 2,645 | | | 2,365,300 |
Capital Trust Agency, Inc. (Viera Charter Schools, Inc.); Series 2017 A, RB(d) | | | 5.00% | | | | 10/15/2037 | | | | 510 | | | 491,023 |
Collier (County of), FL Industrial Development Authority (The Arlington of Naples); Series 2014 A, RB (Acquired 12/16/2013; Cost $1,215,000)(d)(e)(h) | | | 7.25% | | | | 05/15/2026 | | | | 1,215 | | | 704,700 |
Florida (State of) Higher Educational Facilities Financial Authority (Florida Institute of Technology); Series 2019, RB | | | 5.00% | | | | 10/01/2032 | | | | 2,590 | | | 2,719,284 |
Florida (State of) North Broward Hospital District; Series 2017 B, Ref. RB | | | 5.00% | | | | 01/01/2034 | | | | 5,000 | | | 5,218,900 |
Florida Development Finance Corp. (Green Bonds); Series 2019 B, RB(a)(d) | | | 7.38% | | | | 01/01/2049 | | | | 10,000 | | | 9,055,498 |
Florida Development Finance Corp. (Renaissance Charter School, Inc.); | | | | | | | | | | | | | | |
Series 2015, RB(d) | | | 6.00% | | | | 06/15/2035 | | | | 1,265 | | | 1,277,479 |
Series 2020 C, Ref. RB(d) | | | 4.00% | | | | 09/15/2030 | | | | 470 | | | 420,524 |
Florida Housing Finance Corp.; Series 2015 A, RB (CEP - GNMA) | | | 3.65% | | | | 07/01/2041 | | | | 240 | | | 237,484 |
Greater Orlando Aviation Authority; | | | | | | | | | | | | | | |
Series 2019 A, RB(a) | | | 5.00% | | | | 10/01/2032 | | | | 7,025 | | | 7,598,423 |
Series 2019 A, RB(a) | | | 5.00% | | | | 10/01/2034 | | | | 5,000 | | | 5,367,014 |
Greater Orlando Aviation Authority (Jetblue Airway); Series 2013, Ref. RB(a) | | | 5.00% | | | | 11/15/2026 | | | | 3,500 | | | 3,502,760 |
Halifax Hospital Medical Center; Series 2015, Ref. RB(c)(f) | | | 5.00% | | | | 06/01/2025 | | | | 325 | | | 338,557 |
Highlands (County of), FL Health Facilities Authority (Trousdale Foundation Properties); Series 2018 A, RB (Acquired 08/29/2018; Cost $2,494,063)(e) | | | 5.25% | | | | 04/03/2028 | | | | 2,500 | | | 875,000 |
Lake Helen (City of), FL (Ivy Hawn Charter School of the Arts); Series 2018 A, RB(d) | | | 5.00% | | | | 07/15/2028 | | | | 485 | | | 473,935 |
Lee (County of), FL; Series 2021 B, RB(a) | | | 5.00% | | | | 10/01/2035 | | | | 5,000 | | | 5,353,692 |
Lee (County of), FL Industrial Development Authority (Preserve (The)); Series 2017 A, RB(d) | | | 5.38% | | | | 12/01/2032 | | | | 1,000 | | | 820,951 |
See accompanying Notes to Financial Statements which are an integral part of the financial statements.
| | |
| 12 | | Invesco Intermediate Term Municipal Income Fund |
| | | | | | | | | | | | | | |
| | | Interest Rate | | | Maturity Date | | | Principal Amount (000) | | | Value |
Florida-(continued) | | | | | | | | | | | | | | |
Manatee (County of), FL School District; | | | | | | | | | | | | | | |
Series 2017, RB (INS - AGM)(b) | | | 5.00% | | | | 10/01/2029 | | | $ | 1,000 | | | $ 1,075,449 |
Series 2017, RB (INS - AGM)(b) | | | 5.00% | | | | 10/01/2031 | | | | 3,000 | | | 3,224,166 |
Series 2017, RB (INS - AGM)(b) | | | 5.00% | | | | 10/01/2032 | | | | 1,250 | | | 1,342,556 |
Miami (City of) & Dade (County of), FL School Board; Series 2015 A, Ref. COP | | | 5.00% | | | | 05/01/2032 | | | | 1,900 | | | 1,962,193 |
Miami (City of), FL; Series 2012, Ref. RB(d) | | | 5.00% | | | | 03/01/2030 | | | | 100 | | | 100,000 |
Miami-Dade (County of), FL; | | | | | | | | | | | | | | |
Series 2017 B, Ref. RB | | | 4.00% | | | | 10/01/2036 | | | | 15,000 | | | 15,062,007 |
Series 2021, RB | | | 4.00% | | | | 10/01/2042 | | | | 3,000 | | | 2,877,257 |
Series 2023 A, Ref. RB(a) | | | 5.00% | | | | 10/01/2033 | | | | 3,865 | | | 4,251,374 |
Subseries 2021 A-1, Ref. RB (INS - AGM)(a)(b) | | | 4.00% | | | | 10/01/2039 | | | | 3,500 | | | 3,442,618 |
Subseries 2021 A-1, Ref. RB (INS - AGM)(a)(b) | | | 4.00% | | | | 10/01/2040 | | | | 3,000 | | | 2,903,768 |
Subseries 2021 A-1, Ref. RB (INS - AGM)(a)(b) | | | 4.00% | | | | 10/01/2041 | | | | 2,385 | | | 2,274,520 |
Miami-Dade (County of), FL (Jackson Health System); Series 2015 A, Ref. RB | | | 5.00% | | | | 06/01/2033 | | | | 1,000 | | | 1,036,310 |
Miami-Dade (County of), FL Expressway Authority; Series 2016 A, Ref. RB | | | 5.00% | | | | 07/01/2028 | | | | 1,625 | | | 1,697,024 |
Miami-Dade (County of), FL Transit System; Series 2022, RB | | | 5.00% | | | | 07/01/2043 | | | | 5,000 | | | 5,453,563 |
Mirabella Community Development District; Series 2013, RB | | | 6.00% | | | | 11/01/2026 | | | | 85 | | | 86,589 |
Orlando (City of), FL Community Redevelopment Agency (Conroy Road District); Series 2012, Ref. RB | | | 5.00% | | | | 04/01/2023 | | | | 500 | | | 500,363 |
Osceola (County of), FL; | | | | | | | | | | | | | | |
Series 2020 A-1, Ref. RB | | | 5.00% | | | | 10/01/2033 | | | | 350 | | | 357,578 |
Series 2020 A-1, Ref. RB | | | 5.00% | | | | 10/01/2034 | | | | 300 | | | 305,212 |
Series 2020 A-1, Ref. RB | | | 5.00% | | | | 10/01/2035 | | | | 500 | | | 507,915 |
Palm Beach (County of), FL Health Facilities Authority (ACTS Retirement-Life Communities, Inc.); | | | | | | | | | | | | | | |
Series 2016, Ref. RB | | | 5.00% | | | | 11/15/2032 | | | | 3,500 | | | 3,550,498 |
Series 2020 B, RB | | | 4.00% | | | | 11/15/2041 | | | | 250 | | | 209,877 |
Pompano Beach (City of), FL (John Knox Village); | | | | | | | | | | | | | | |
Series 2021 B-1, RB | | | 2.00% | | | | 01/01/2029 | | | | 1,150 | | | 964,835 |
Series 2021 B-2, RB | | | 1.45% | | | | 01/01/2027 | | | | 560 | | | 491,639 |
Tampa (City of), FL; | | | | | | | | | | | | | | |
Series 2020 A, RB(g) | | | 0.00% | | | | 09/01/2041 | | | | 3,030 | | | 1,251,645 |
Series 2020 A, RB(g) | | | 0.00% | | | | 09/01/2049 | | | | 3,795 | | | 1,001,439 |
| | | | | | | | | | | | | | | 129,557,190 |
| | | | |
Georgia-1.34% | | | | | | | | | | | | | | |
Atlanta (City of), GA; Series 2019, RB(a) | | | 4.00% | | | | 07/01/2038 | | | | 1,540 | | | 1,493,402 |
Brookhaven (City of), GA Development Authority (Children’s Healthcare of Atlanta, Inc.); Series 2019 A, RB | | | 5.00% | | | | 07/01/2031 | | | | 330 | | | 369,727 |
Burke (County of), GA Development Authority (Georgia Power Co. Plant Vogtle); Series 1995, RB | | | 2.20% | | | | 10/01/2032 | | | | 2,000 | | | 1,636,138 |
College Park (City of), GA (Atlanta International Airport); Series 2006 B, RB (INS - NATL)(b) | | | 4.50% | | | | 01/01/2031 | | | | 15 | | | 15,012 |
Floyd (County of), GA Development Authority (The Spires at Berry College); | | | | | | | | | | | | | | |
Series 2018 A, RB | | | 5.50% | | | | 12/01/2028 | | | | 940 | | | 920,461 |
Series 2018 A, RB | | | 5.75% | | | | 12/01/2033 | | | | 1,500 | | | 1,441,768 |
Fulton (County of), GA Development Authority (Robert W. Woodruff Arts Center); Series 2019, Ref. RB | | | 4.00% | | | | 03/15/2044 | | | | 830 | | | 778,157 |
Fulton (County of), GA Development Authority (Wellstar Health System, Inc.); Series 2017, RAC | | | 5.00% | | | | 04/01/2033 | | | | 1,870 | | | 1,972,284 |
George L Smith II Congress Center Authority (Convention Center Hotel); | | | | | | | | | | | | | | |
Series 2021, RB | | | 2.38% | | | | 01/01/2031 | | | | 525 | | | 455,890 |
Series 2021, RB | | | 4.00% | | | | 01/01/2036 | | | | 1,100 | | | 1,010,992 |
Georgia (State of) Municipal Electric Authority; Series 2019 A, Ref. RB | | | 5.00% | | | | 01/01/2033 | | | | 1,200 | | | 1,300,755 |
Georgia (State of) Municipal Electric Authority (Project One); Series 2015 A, Ref. RB | | | 5.00% | | | | 01/01/2032 | | | | 875 | | | 900,182 |
Georgia (State of) Municipal Electric Authority of Georgia (Plant Vogtle Units 3 & 4); | | | | | | | | | �� | | | | | |
Series 2021 A, Ref. RB | | | 4.00% | | | | 01/01/2041 | | | | 480 | | | 420,935 |
Series 2021 A, Ref. RB (INS - AGM)(b) | | | 4.00% | | | | 01/01/2041 | | | | 485 | | | 457,466 |
Series 2021 A, Ref. RB (INS - AGM)(b) | | | 4.00% | | | | 01/01/2046 | | | | 1,295 | | | 1,171,574 |
Georgia Municipal Association, Inc.; Series 1998, COP (INS - AGM)(b) | | | 5.00% | | | | 12/01/2023 | | | | 15 | | | 15,024 |
Houston (County of), GA Hospital Authority (Houston Hospitals, Inc.); Series 2016 A, Ref. RB(c)(f) | | | 5.00% | | | | 04/01/2024 | | | | 730 | | | 738,831 |
Macon-Bibb (County of), GA Urban Development Authority (Academy for Classical Education, Inc.); Series 2017 A, RB(d) | | | 5.75% | | | | 06/15/2037 | | | | 1,540 | | | 1,560,823 |
See accompanying Notes to Financial Statements which are an integral part of the financial statements.
| | |
| 13 | | Invesco Intermediate Term Municipal Income Fund |
| | | | | | | | | | | | | | |
| | | Interest Rate | | | Maturity Date | | | Principal Amount (000) | | | Value |
Georgia-(continued) | | | | | | | | | | | | | | |
Main Street Natural Gas, Inc.; | | | | | | | | | | | | | | |
Series 2022 B, RB(c) | | | 5.00% | | | | 06/01/2029 | | | $ | 5,000 | | | $ 5,196,859 |
Series 2022 C, RB(d) | | | 4.00% | | | | 11/01/2027 | | | | 3,810 | | | 3,633,544 |
| | | | | | | | | | | | | | | 25,489,824 |
| | | | |
Guam-0.27% | | | | | | | | | | | | | | |
Guam (Territory of); | | | | | | | | | | | | | | |
Series 2021 A, Ref. RB | | | 5.00% | | | | 11/01/2040 | | | | 4,000 | | | 4,106,163 |
Series 2021 F, Ref. RB | | | 5.00% | | | | 01/01/2029 | | | | 1,000 | | | 1,053,065 |
| | | | | | | | | | | | | | | 5,159,228 |
| | | | |
Hawaii-0.46% | | | | | | | | | | | | | | |
Hawaii (State of) Department of Budget & Finance; Series 2019, Ref. RB | | | 3.20% | | | | 07/01/2039 | | | | 1,655 | | | 1,366,811 |
Hawaii (State of) Department of Transportation (Airports Division); Series 2013, COP(a) | | | 5.00% | | | | 08/01/2023 | | | | 1,250 | | | 1,255,293 |
Honolulu (City & County of), HI; Series 2015 A, RB(i) | | | 5.00% | | | | 07/01/2031 | | | | 6,000 | | | 6,225,373 |
| | | | | | | | | | | | | | | 8,847,477 |
| | | | |
Idaho-0.11% | | | | | | | | | | | | | | |
Idaho (State of) Housing & Finance Association; Series 2019, Ref. RB | | | 5.00% | | | | 07/15/2035 | | | | 1,900 | | | 2,085,784 |
| | | | |
Illinois-10.13% | | | | | | | | | | | | | | |
Bartlett (Village of), IL (Quarry Redevelopment); Series 2016, Ref. RB | | | 4.00% | | | | 01/01/2024 | | | | 1,275 | | | 1,265,108 |
Bolingbrook (Village of), IL Special Service Area No. 2005-1; Series 2019, Ref. RB | | | 5.00% | | | | 03/01/2033 | | | | 1,645 | | | 1,570,129 |
Chicago (City of), IL; | | | | | | | | | | | | | | |
Series 2003 B, Ref. GO Bonds | | | 5.00% | | | | 01/01/2024 | | | | 1,795 | | | 1,808,251 |
Series 2004, RB | | | 5.00% | | | | 11/01/2028 | | | | 3,000 | | | 3,115,463 |
Series 2008 C, Ref. RB | | | 5.00% | | | | 01/01/2029 | | | | 2,500 | | | 2,542,223 |
Series 2008 C, Ref. RB | | | 5.00% | | | | 01/01/2030 | | | | 1,500 | | | 1,528,902 |
Series 2015 A, GO Bonds | | | 5.38% | | | | 01/01/2029 | | | | 5,000 | | | 5,092,931 |
Series 2017 A, Ref. GO Bonds | | | 5.75% | | | | 01/01/2034 | | | | 2,500 | | | 2,613,839 |
Series 2017 B, Ref. RB | | | 5.00% | | | | 01/01/2033 | | | | 3,000 | | | 3,095,778 |
Series 2019 A, GO Bonds | | | 5.50% | | | | 01/01/2035 | | | | 3,000 | | | 3,142,455 |
Series 2021 A, Ref. GO Bonds | | | 5.00% | | | | 01/01/2033 | | | | 9,000 | | | 9,335,780 |
Chicago (City of), IL (83rd/Stewart Redevelopment); Series 2013, COP(d) | | | 7.00% | | | | 01/15/2029 | | | | 823 | | | 823,119 |
Chicago (City of), IL (O’Hare International Airport); | | | | | | | | | | | | | | |
Series 2015 A, Ref. RB(a) | | | 5.00% | | | | 01/01/2029 | | | | 6,000 | | | 6,109,832 |
Series 2015 B, Ref. RB | | | 5.00% | | | | 01/01/2031 | | | | 3,000 | | | 3,091,443 |
Series 2017 D, RB(a) | | | 5.00% | | | | 01/01/2031 | | | | 1,000 | | | 1,043,497 |
Series 2017 D, RB(a) | | | 5.00% | | | | 01/01/2032 | | | | 1,000 | | | 1,042,965 |
Series 2017 D, RB(a) | | | 5.00% | | | | 01/01/2033 | | | | 2,000 | | | 2,084,742 |
Series 2020 A, Ref. RB (INS - AGM)(b) | | | 4.00% | | | | 01/01/2037 | | | | 2,250 | | | 2,242,137 |
Chicago (City of), IL Board of Education; | | | | | | | | | | | | | | |
Series 2017 C, Ref. GO Bonds | | | 5.00% | | | | 12/01/2030 | | | | 2,000 | | | 2,057,184 |
Series 2017, RB | | | 5.75% | | | | 04/01/2035 | | | | 1,000 | | | 1,044,585 |
Series 2018 A, Ref. GO Bonds (INS - AGM)(b) | | | 5.00% | | | | 12/01/2027 | | | | 1,500 | | | 1,577,422 |
Series 2018 A, Ref. GO Bonds (INS - AGM)(b) | | | 5.00% | | | | 12/01/2030 | | | | 1,000 | | | 1,054,564 |
Series 2018 A, Ref. GO Bonds (INS - AGM)(b) | | | 5.00% | | | | 12/01/2031 | | | | 1,250 | | | 1,313,439 |
Series 2018 C, Ref. GO Bonds | | | 5.00% | | | | 12/01/2025 | | | | 1,000 | | | 1,020,786 |
Series 2021 A, GO Bonds | | | 5.00% | | | | 12/01/2035 | | | | 20 | | | 20,174 |
Series 2021 A, GO Bonds | | | 5.00% | | | | 12/01/2038 | | | | 1,240 | | | 1,229,152 |
Chicago (City of), IL Metropolitan Water Reclamation District; Series 2015 C, GO Bonds(i) | | | 5.00% | | | | 12/01/2027 | | | | 7,000 | | | 7,226,998 |
Chicago (City of), IL Midway International Airport; | | | | | | | | | | | | | | |
Series 2013 A, Ref. RB(a) | | | 5.50% | | | | 01/01/2027 | | | | 1,000 | | | 1,000,912 |
Series 2013 A, Ref. RB(a) | | | 5.38% | | | | 01/01/2033 | | | | 6,500 | | | 6,505,907 |
Series 2013 B, Ref. RB | | | 5.00% | | | | 01/01/2025 | | | | 1,000 | | | 1,001,106 |
Cook (County of), IL; Series 2018, Ref. RB | | | 5.25% | | | | 11/15/2035 | | | | 2,000 | | | 2,132,977 |
Cook County Community College District No. 508 (City Colleges of Chicago); Series 2013, GO Bonds | | | 5.25% | | | | 12/01/2026 | | | | 500 | | | 502,780 |
See accompanying Notes to Financial Statements which are an integral part of the financial statements.
| | |
| 14 | | Invesco Intermediate Term Municipal Income Fund |
| | | | | | | | | | | | | | |
| | | Interest Rate | | | Maturity Date | | | Principal Amount (000) | | | Value |
Illinois-(continued) | | | | | | | | | | | | | | |
Illinois (State of); | | | | | | | | | | | | | | |
Series 2013, GO Bonds | | | 5.50% | | | | 07/01/2027 | | | $ | 2,295 | | | $ 2,307,777 |
Series 2013, GO Bonds | | | 5.50% | | | | 07/01/2038 | | | | 2,500 | | | 2,509,765 |
Series 2016, GO Bonds | | | 5.00% | | | | 11/01/2025 | | | | 2,135 | | | 2,195,220 |
Series 2016, GO Bonds | | | 5.00% | | | | 11/01/2030 | | | | 1,040 | | | 1,076,148 |
Series 2016, GO Bonds | | | 4.00% | | | | 06/01/2032 | | | | 3,155 | | | 3,139,108 |
Series 2017 C, GO Bonds | | | 5.00% | | | | 11/01/2029 | | | | 2,000 | | | 2,091,656 |
Series 2018 A, Ref. GO Bonds | | | 5.00% | | | | 10/01/2028 | | | | 8,375 | | | 8,843,789 |
Series 2018 B, Ref. GO Bonds | | | 5.00% | | | | 10/01/2027 | | | | 1,405 | | | 1,471,565 |
Series 2020 B, GO Bonds | | | 4.00% | | | | 10/01/2035 | | | | 3,000 | | | 2,888,977 |
Series 2020, GO Bonds | | | 5.50% | | | | 05/01/2024 | | | | 1,000 | | | 1,018,223 |
Series 2020, GO Bonds | | | 5.50% | | | | 05/01/2030 | | | | 3,000 | | | 3,289,500 |
Series 2020, GO Bonds | | | 5.50% | | | | 05/01/2039 | | | | 2,455 | | | 2,609,878 |
Illinois (State of) (Rebuild Illinois Program); Series 2019 B, GO Bonds | | | 4.00% | | | | 11/01/2035 | | | | 4,450 | | | 4,281,979 |
Illinois (State of) Development Finance Authority (CITGO Petroleum Corp.); Series 2002, RB(a) | | | 8.00% | | | | 06/01/2032 | | | | 710 | | | 710,594 |
Illinois (State of) Finance Authority (Advocate Health Care Network); Series 2008 A, Ref. RB | | | 5.00% | | | | 11/01/2030 | | | | 2,000 | | | 2,103,641 |
Illinois (State of) Finance Authority (Benedictine University); Series 2021, Ref. RB | | | 5.00% | | | | 10/01/2030 | | | | 1,300 | | | 1,324,583 |
Illinois (State of) Finance Authority (Centegra Health System); | | | | | | | | | | | | | | |
Series 2014 A, RB(c)(f) | | | 5.00% | | | | 09/01/2024 | | | | 1,000 | | | 1,026,825 |
Series 2014 A, RB(c)(f) | | | 5.00% | | | | 09/01/2024 | | | | 1,250 | | | 1,283,531 |
Illinois (State of) Finance Authority (DePaul College Prep Foundation); Series 2023, Ref. RB(d) | | | 4.50% | | | | 08/01/2033 | | | | 1,275 | | | 1,256,205 |
Illinois (State of) Finance Authority (Park Place of Elmhurst); Series 2016, RB | | | 5.13% | | | | 05/15/2060 | | | | 1,043 | | | 606,524 |
Illinois (State of) Finance Authority (Peace Village); Series 2013, RB(c)(f) | | | 6.25% | | | | 08/15/2023 | | | | 1,505 | | | 1,522,607 |
Illinois (State of) Finance Authority (Rogers Park Montessori School); Series 2014, Ref. RB | | | 5.00% | | | | 02/01/2024 | | | | 100 | | | 100,084 |
Illinois (State of) Finance Authority (Rush University Medical Center); Series 2015 A, Ref. RB | | | 5.00% | | | | 11/15/2034 | | | | 4,500 | | | 4,608,462 |
Illinois (State of) Finance Authority (The University of Chicago); Series 2021 A, Ref. RB | | | 5.00% | | | | 10/01/2036 | | | | 1,600 | | | 1,890,433 |
Illinois (State of) Finance Authority (University of Illinois Health Services); | | | | | | | | | | | | | | |
Series 2020, RB | | | 5.00% | | | | 10/01/2030 | | | | 750 | | | 807,240 |
Series 2020, RB | | | 5.00% | | | | 10/01/2031 | | | | 750 | | | 796,666 |
Series 2020, RB | | | 5.00% | | | | 10/01/2032 | | | | 750 | | | 795,809 |
Series 2020, RB | | | 5.00% | | | | 10/01/2033 | | | | 750 | | | 793,675 |
Series 2020, RB | | | 5.00% | | | | 10/01/2034 | | | | 750 | | | 791,517 |
Series 2020, RB | | | 5.00% | | | | 10/01/2035 | | | | 750 | | | 784,779 |
Illinois (State of) Metropolitan Pier & Exposition Authority (McCormick Place Expansion); | | | | | | | | | | | | | | |
Series 1998 A, Ref. RB (INS - NATL)(b) | | | 5.50% | | | | 06/15/2029 | | | | 2,000 | | | 2,100,095 |
Series 2002 A, Ref. RB (INS - NATL)(b) | | | 5.70% | | | | 06/15/2023 | | | | 1,295 | | | 1,301,265 |
Series 2002, RB (INS - AGM)(b)(g) | | | 0.00% | | | | 12/15/2029 | | | | 2,550 | | | 1,959,838 |
Series 2002, RB (INS - NATL)(b)(g) | | | 0.00% | | | | 12/15/2032 | | | | 13,490 | | | 8,897,070 |
Series 2002, RB (INS - NATL)(b)(g) | | | 0.00% | | | | 12/15/2034 | | | | 5,000 | | | 2,974,642 |
Illinois (State of) Regional Transportation Authority; | | | | | | | | | | | | | | |
Series 2002 A, RB (INS - AGM)(b) | | | 6.00% | | | | 07/01/2027 | | | | 2,700 | | | 3,039,557 |
Series 2018 B, RB(i) | | | 5.00% | | | | 06/01/2031 | | | | 3,800 | | | 4,208,644 |
Series 2018 B, RB(i) | | | 5.00% | | | | 06/01/2032 | | | | 3,995 | | | 4,408,618 |
Illinois (State of) Sports Facilities Authority; | | | | | | | | | | | | | | |
Series 2019, Ref. RB (INS - BAM)(b) | | | 5.00% | | | | 06/15/2028 | | | | 2,100 | | | 2,195,236 |
Series 2019, Ref. RB (INS - BAM)(b) | | | 5.00% | | | | 06/15/2029 | | | | 1,000 | | | 1,055,900 |
Series 2019, Ref. RB (INS - BAM)(b) | | | 5.00% | | | | 06/15/2030 | | | | 1,200 | | | 1,268,658 |
Illinois (State of) Toll Highway Authority; Series 2013 A, RB | | | 5.00% | | | | 01/01/2038 | | | | 2,000 | | | 2,001,684 |
Kane County School District No. 131 Aurora East Side; Series 2020 A, GO Bonds (INS - AGM)(b) | | | 4.00% | | | | 12/01/2036 | | | | 745 | | | 756,764 |
Manhattan (Village of), IL Special Service Area No. 2004-1 (Brookstone Springs); Series 2015, Ref. RB | | | 4.25% | | | | 03/01/2024 | | | | 214 | | | 213,039 |
Railsplitter Tobacco Settlement Authority; | | | | | | | | | | | | | | |
Series 2017, RB | | | 5.00% | | | | 06/01/2027 | | | | 4,000 | | | 4,220,688 |
Series 2017, RB | | | 5.00% | | | | 06/01/2028 | | | | 2,000 | | | 2,115,151 |
Sales Tax Securitization Corp.; | | | | | | | | | | | | | | |
Series 2017 A, Ref. RB | | | 5.00% | | | | 01/01/2029 | | | | 1,000 | | | 1,075,733 |
Series 2017 A, Ref. RB | | | 5.00% | | | | 01/01/2030 | | | | 1,000 | | | 1,073,621 |
Series 2018 A, Ref. RB | | | 5.00% | | | | 01/01/2031 | | | | 3,000 | | | 3,215,011 |
See accompanying Notes to Financial Statements which are an integral part of the financial statements.
| | |
| 15 | | Invesco Intermediate Term Municipal Income Fund |
| | | | | | | | | | | | | | |
| | | Interest Rate | | | Maturity Date | | | Principal Amount (000) | | | Value |
Illinois-(continued) | | | | | | | | | | | | | | |
Springfield (City of), IL; | | | | | | | | | | | | | | |
Series 2015, Ref. RB | | | 5.00% | | | | 03/01/2032 | | | $ | 2,000 | | | $ 2,038,363 |
Series 2015, Ref. RB | | | 5.00% | | | | 03/01/2033 | | | | 3,500 | | | 3,563,096 |
Stephenson County School District No. 145 Freeport; | | | | | | | | | | | | | | |
Series 2018 A, GO Bonds(c)(f) | | | 5.00% | | | | 02/01/2028 | | | | 205 | | | 225,420 |
Series 2018 A, GO Bonds (INS - AGM)(b) | | | 5.00% | | | | 02/01/2031 | | | | 895 | | | 994,868 |
| | | | | | | | | | | | | | | 193,066,301 |
| | | | |
Indiana-0.67% | | | | | | | | | | | | | | |
Allen (County of), IN (Evergreen Village Fort Wayne); Series 2019, RB | | | 6.00% | | | | 02/01/2039 | | | | 570 | | | 518,313 |
Indiana (State of) Finance Authority (CWA Authority); Series 2021, Ref. RB | | | 4.00% | | | | 10/01/2039 | | | | 5,075 | | | 4,873,884 |
Indiana (State of) Finance Authority (KIPP Indianapolis, Inc.); Series 2020 A, RB | | | 4.00% | | | | 07/01/2030 | | | | 215 | | | 202,306 |
Indiana (State of) Finance Authority (United States Steel Corp.); Series 2021 A, Ref. RB | | | 4.13% | | | | 12/01/2026 | | | | 1,000 | | | 982,750 |
Jeffersonville (City of), IN (Vivera Senior Living); | | | | | | | | | | | | | | |
Series 2020 A, RB(d) | | | 4.75% | | | | 11/01/2030 | | | | 575 | | | 501,689 |
Series 2020 A, RB(d) | | | 5.25% | | | | 11/01/2040 | | | | 4,560 | | | 3,632,189 |
Northern Indiana Commuter Transportation District; Series 2016, RB | | | 5.00% | | | | 07/01/2028 | | | | 1,250 | | | 1,317,864 |
Terre Haute (City of), IN (Silver Birch of Terre Haute); Series 2017, RB | | | 5.10% | | | | 01/01/2032 | | | | 610 | | | 528,371 |
Valparaiso (City of), IN (Pratt Paper, LLC); Series 2013, RB(a) | | | 5.88% | | | | 01/01/2024 | | | | 220 | | | 223,262 |
| | | | | | | | | | | | | | | 12,780,628 |
| | | | |
Iowa-0.78% | | | | | | | | | | | | | | |
Iowa (State of) Finance Authority (Iowa Fertilizer Co.); Series 2022, Ref. RB(c) | | | 4.00% | | | | 12/01/2032 | | | | 5,350 | | | 5,252,261 |
Iowa (State of) Finance Authority (Lifespace Communities, Inc.); Series 2021 A, Ref. RB | | | 4.00% | | | | 05/15/2046 | | | | 3,500 | | | 2,345,623 |
Iowa (State of) Finance Authority (Mercy Medical Center); Series 2012, RB | | | 4.00% | | | | 08/15/2023 | | | | 1,200 | | | 1,201,020 |
Iowa (State of) Finance Authority (PHS Council Bluffs, Inc.); Series 2018, RB | | | 4.45% | | | | 08/01/2028 | | | | 125 | | | 115,117 |
Iowa (State of) Tobacco Settlement Authority; Series 2021 A-2, Ref. RB | | | 5.00% | | | | 06/01/2028 | | | | 2,100 | | | 2,232,091 |
PEFA, Inc.; Series 2019, RB(c) | | | 5.00% | | | | 09/01/2026 | | | | 3,635 | | | 3,741,582 |
| | | | | | | | | | | | | | | 14,887,694 |
| | | | |
Kansas-0.69% | | | | | | | | | | | | | | |
Derby (City of), KS (Derby Star Bond); Series 2020, RB | | | 3.90% | | | | 03/01/2037 | | | | 600 | | | 596,159 |
Kansas (State of) Municipal Energy Agency (Jameson Energy Center); Series 2013, RB(c)(f) | | | 5.00% | | | | 07/01/2023 | | | | 1,140 | | | 1,146,831 |
Lenexa (City of), KS (Lakeview Village, Inc.); | | | | | | | | | | | | | | |
Series 2018 A, Ref. RB | | | 5.00% | | | | 05/15/2029 | | | | 1,210 | | | 1,208,633 |
Series 2018 A, Ref. RB | | | 5.00% | | | | 05/15/2031 | | | | 1,335 | | | 1,322,516 |
Manhattan (City of), KS (Meadowlark Hills); | | | | | | | | | | | | | | |
Series 2021 A, Ref. RB | | | 4.00% | | | | 06/01/2036 | | | | 1,000 | | | 825,342 |
Series 2021 A, Ref. RB | | | 4.00% | | | | 06/01/2046 | | | | 1,150 | | | 843,937 |
Wichita (City of), KS (Kansas Masonic Home); Series 2016 II-A, RB (Acquired 05/25/2017-05/30/2019; Cost $1,539,894)(e) | | | 5.25% | | | | 12/01/2036 | | | | 1,500 | | | 345,000 |
Wichita (City of), KS (Presbyterian Manors, Inc.); | | | | | | | | | | | | | | |
Series 2018 I, Ref. RB | | | 5.00% | | | | 05/15/2033 | | | | 1,140 | | | 1,069,570 |
Series 2019, Ref. RB | | | 5.00% | | | | 05/15/2029 | | | | 1,280 | | | 1,232,331 |
Series 2019, Ref. RB | | | 5.00% | | | | 05/15/2034 | | | | 2,950 | | | 2,732,050 |
Wyandotte (County of), KS Unified Government; Series 2014 A, Ref. RB | | | 5.00% | | | | 09/01/2044 | | | | 1,740 | | | 1,756,684 |
| | | | | | | | | | | | | | | 13,079,053 |
| | | | |
Kentucky-2.12% | | | | | | | | | | | | | | |
Ashland (City of), KY (King’s Daughters Medical Center); | | | | | | | | | | | | | | |
Series 2019, Ref. RB | | | 5.00% | | | | 02/01/2030 | | | | 370 | | | 398,983 |
Series 2019, Ref. RB | | | 5.00% | | | | 02/01/2031 | | | | 460 | | | 485,823 |
Series 2019, Ref. RB | | | 5.00% | | | | 02/01/2032 | | | | 450 | | | 474,430 |
Fayette County School District Finance Corp.; Series 2015 D, RB (CEP - Colorado Higher Education Intercept Program) | | | 5.00% | | | | 08/01/2031 | | | | 1,000 | | | 1,035,408 |
Kentucky (Commonwealth of) Economic Development Finance Authority (Catholic Health Initiatives); Series 2011 B, RB (SIFMA Municipal Swap Index + 1.40%)(c)(j) | | | 4.20% | | | | 02/01/2025 | | | | 1,430 | | | 1,432,481 |
Kentucky (Commonwealth of) Economic Development Finance Authority (Masonic Home Independent Living II, Inc.); Series 2016 A, Ref. RB | | | 5.00% | | | | 05/15/2036 | | | | 2,000 | | | 1,706,488 |
See accompanying Notes to Financial Statements which are an integral part of the financial statements.
| | |
| 16 | | Invesco Intermediate Term Municipal Income Fund |
| | | | | | | | | | | | | | |
| | | Interest Rate | | | Maturity Date | | | Principal Amount (000) | | | Value |
Kentucky-(continued) | | | | | | | | | | | | | | |
Kentucky (Commonwealth of) Economic Development Finance Authority (Next Generation Kentucky Information Highway); | | | | | | | | | | | | | | |
Series 2015 A, RB | | | 5.00% | | | | 07/01/2028 | | | $ | 1,500 | | | $ 1,520,991 |
Series 2015 A, RB | | | 5.00% | | | | 07/01/2030 | | | | 3,000 | | | 3,045,521 |
Kentucky (Commonwealth of) Economic Development Finance Authority (Owensboro Health, Inc.); Series 2017 A, Ref. RB | | | 5.00% | | | | 06/01/2032 | | | | 1,435 | | | 1,499,571 |
Kentucky (Commonwealth of) Economic Development Finance Authority (Rosedale Green); Series 2015, Ref. RB | | | 5.50% | | | | 11/15/2035 | | | | 3,100 | | | 2,792,181 |
Kentucky (Commonwealth of) Municipal Power Agency; | | | | | | | | | | | | | | |
Series 2015 A, Ref. RB (INS - NATL)(b) | | | 5.00% | | | | 09/01/2026 | | | | 1,000 | | | 1,031,597 |
Series 2015 A, Ref. RB (INS - NATL)(b) | | | 5.00% | | | | 09/01/2027 | | | | 1,620 | | | 1,671,578 |
Series 2015 A, Ref. RB (INS - NATL)(b) | | | 5.00% | | | | 09/01/2028 | | | | 1,260 | | | 1,300,116 |
Kentucky (Commonwealth of) Municipal Power Agency (Prairie State); | | | | | | | | | | | | | | |
Series 2016, Ref. RB (INS - NATL)(b) | | | 5.00% | | | | 09/01/2031 | | | | 5,000 | | | 5,225,001 |
Series 2019 A, Ref. RB | | | 5.00% | | | | 09/01/2031 | | | | 1,500 | | | 1,617,318 |
Series 2019 A, Ref. RB | | | 5.00% | | | | 09/01/2032 | | | | 1,600 | | | 1,722,875 |
Series 2019 A, Ref. RB | | | 5.00% | | | | 09/01/2033 | | | | 1,000 | | | 1,074,787 |
Kentucky (Commonwealth of) Property & Building Commission (No. 108); Series 2015 A, RB | | | 5.00% | | | | 08/01/2029 | | | | 1,000 | | | 1,038,230 |
Kentucky (Commonwealth of) Property & Building Commission (No. 119); | | | | | | | | | | | | | | |
Series 2018, RB (INS - BAM)(b) | | | 5.00% | | | | 05/01/2031 | | | | 100 | | | 109,896 |
Series 2018, RB (INS - BAM)(b) | | | 5.00% | | | | 05/01/2032 | | | | 100 | | | 109,353 |
Series 2018, RB (INS - BAM)(b) | | | 5.00% | | | | 05/01/2033 | | | | 100 | | | 109,384 |
Series 2018, RB (INS - BAM)(b) | | | 5.00% | | | | 05/01/2034 | | | | 100 | | | 108,734 |
Kentucky (Commonwealth of) Public Energy Authority; | | | | | | | | | | | | | | |
Series 2018 B, RB(c) | | | 4.00% | | | | 01/01/2025 | | | | 2,000 | | | 1,991,133 |
Series 2019 C, RB(c) | | | 4.00% | | | | 02/01/2028 | | | | 5,000 | | | 4,982,973 |
Louisville (City of) & Jefferson (County of), KY Metropolitan Government (Norton Healthcare, Inc.); | | | | | | | | | | | | | | |
Series 2016 A, Ref. RB | | | 5.00% | | | | 10/01/2033 | | | | 2,450 | | | 2,552,648 |
Series 2020 A, RB | | | 4.00% | | | | 10/01/2040 | | | | 1,500 | | | 1,367,106 |
| | | | | | | | | | | | | | | 40,404,606 |
| | | | |
Louisiana-1.09% | | | | | | | | | | | | | | |
Louisiana (State of) Public Facilities Authority (19th Judicial District Court Building); Series 2015, Ref. RB(c)(f) | | | 5.00% | | | | 06/01/2025 | | | | 1,405 | | | 1,462,055 |
Louisiana (State of) Public Facilities Authority (Archdiocese of New Orleans); | | | | | | | | | | | | | | |
Series 2017, Ref. RB | | | 5.00% | | | | 07/03/2028 | | | | 250 | | | 212,500 |
Series 2017, Ref. RB | | | 5.00% | | | | 07/02/2029 | | | | 400 | | | 340,000 |
Series 2017, Ref. RB | | | 5.00% | | | | 07/01/2030 | | | | 500 | | | 425,000 |
Louisiana (State of) Public Facilities Authority (Ochsner Clinic Foundation); Series 2016, Ref. RB | | | 5.00% | | | | 05/15/2034 | | | | 2,545 | | | 2,656,623 |
New Orleans (City of), LA; Series 2014, Ref. RB | | | 5.00% | | | | 12/01/2026 | | | | 1,250 | | | 1,280,022 |
New Orleans (City of), LA Aviation Board; | | | | | | | | | | | | | | |
Series 2015 B, RB(a) | | | 5.00% | | | | 01/01/2027 | | | | 1,750 | | | 1,781,566 |
Series 2015 B, RB(a) | | | 5.00% | | | | 01/01/2029 | | | | 1,805 | | | 1,838,041 |
New Orleans (City of), LA Aviation Board (Parking Facilities Corp. Consolidated Garage System); | | | | | | | | | | | | | | |
Series 2018 A, RB (INS - AGM)(b) | | | 5.00% | | | | 10/01/2034 | | | | 100 | | | 108,168 |
Series 2018 A, RB (INS - AGM)(b) | | | 5.00% | | | | 10/01/2036 | | | | 220 | | | 234,437 |
Series 2018 A, RB (INS - AGM)(b) | | | 5.00% | | | | 10/01/2037 | | | | 145 | | | 153,931 |
Series 2018 A, RB (INS - AGM)(b) | | | 5.00% | | | | 10/01/2038 | | | | 100 | | | 106,029 |
Series 2018 B, Ref. RB (INS - AGM)(b) | | | 5.00% | | | | 10/01/2030 | | | | 350 | | | 385,337 |
Series 2018 B, Ref. RB (INS - AGM)(b) | | | 5.00% | | | | 10/01/2032 | | | | 200 | | | 218,843 |
Series 2018 B, Ref. RB (INS - AGM)(b) | | | 5.00% | | | | 10/01/2033 | | | | 135 | | | 147,052 |
Series 2018 B, Ref. RB (INS - AGM)(b) | | | 5.00% | | | | 10/01/2034 | | | | 100 | | | 108,168 |
St. James (Parish of), LA (Nustar Logistics, L.P.); Series 2008, RB(c)(d) | | | 6.10% | | | | 06/01/2030 | | | | 2,700 | | | 2,907,274 |
St. John the Baptist (Parish of), LA (Marathon Oil Corp.); | | | | | | | | | | | | | | |
Series 2017, Ref. RB(c) | | | 2.10% | | | | 07/01/2024 | | | | 1,000 | | | 971,943 |
Subseries 2017 A-3, Ref. RB(c) | | | 2.20% | | | | 07/01/2026 | | | | 2,000 | | | 1,862,654 |
St. Tammany (Parish of), LA Public Trust Financing Authority (Christwood); | | | | | | | | | | | | | | |
Series 2015, Ref. RB | | | 5.00% | | | | 11/15/2024 | | | | 800 | | | 801,052 |
Series 2015, Ref. RB | | | 5.25% | | | | 11/15/2029 | | | | 2,800 | | | 2,785,723 |
| | | | | | | | | | | | | | | 20,786,418 |
See accompanying Notes to Financial Statements which are an integral part of the financial statements.
| | |
| 17 | | Invesco Intermediate Term Municipal Income Fund |
| | | | | | | | | | | | | | |
| | | Interest Rate | | | Maturity Date | | | Principal Amount (000) | | | Value |
Maryland-0.74% | | | | | | | | | | | | | | |
Baltimore (City of), MD (Convention Center Hotel); Series 2017, Ref. RB | | | 5.00% | | | | 09/01/2033 | | | $ | 1,105 | | | $ 1,114,602 |
Baltimore (City of), MD (Water); Series 2017 A, RB | | | 5.00% | | | | 07/01/2033 | | | | 2,500 | | | 2,677,427 |
Gaithersburg (City of), MD (Asbury Maryland Obligated Group); Series 2018 A, Ref. RB | | | 5.00% | | | | 01/01/2033 | | | | 2,000 | | | 2,003,262 |
Howard (County of), MD (Downtown Columbia); Series 2017 A, RB(d) | | | 4.13% | | | | 02/15/2034 | | | | 1,000 | | | 927,666 |
Maryland (State of) Department of Transportation; Series 2012, RB | | | 2.25% | | | | 10/01/2025 | | | | 100 | | | 97,082 |
Maryland (State of) Health & Higher Educational Facilities Authority (Stevenson University); | | | | | | | | | | | | | | |
Series 2021, Ref. RB | | | 5.00% | | | | 06/01/2028 | | | | 250 | | | 265,477 |
Series 2021, Ref. RB | | | 5.00% | | | | 06/01/2030 | | | | 350 | | | 378,395 |
Series 2021, Ref. RB | | | 5.00% | | | | 06/01/2032 | | | | 400 | | | 434,274 |
Series 2021, Ref. RB | | | 4.00% | | | | 06/01/2034 | | | | 350 | | | 348,018 |
Series 2021, Ref. RB | | | 4.00% | | | | 06/01/2036 | | | | 450 | | | 435,394 |
Maryland Economic Development Corp. (AFCO Cargo BWI II, LLC); Series 2017, Ref. RB(a)(d) | | | 4.00% | | | | 07/01/2024 | | | | 855 | | | 846,258 |
Maryland Economic Development Corp. (CNX Marine Terminal, Inc. - Port of Baltimore Facility); Series 2010, Ref. RB | | | 5.75% | | | | 09/01/2025 | | | | 1,500 | | | 1,514,074 |
Maryland Economic Development Corp. (Port Covington); | | | | | | | | | | | | | | |
Series 2020, RB | | | 3.25% | | | | 09/01/2030 | | | | 1,000 | | | 911,398 |
Series 2020, RB | | | 4.00% | | | | 09/01/2040 | | | | 2,500 | | | 2,173,677 |
| | | | | | | | | | | | | | | 14,127,004 |
| | | | |
Massachusetts-1.85% | | | | | | | | | | | | | | |
Massachusetts (Commonwealth of); | | | | | | | | | | | | | | |
Series 2005, Ref. RB (INS - NATL)(b) | | | 5.50% | | | | 01/01/2034 | | | | 3,000 | | | 3,550,022 |
Series 2016 G, GO Bonds | | | 4.00% | | | | 09/01/2037 | | | | 3,000 | | | 3,018,476 |
Massachusetts (Commonwealth of) Department of Transportation (Contract Assistance); Series 2018 A, Ref. RB | | | 5.00% | | | | 01/01/2029 | | | | 495 | | | 556,577 |
Massachusetts (Commonwealth of) Development Finance Agency; | | | | | | | | | | | | | | |
Series 2019 A, Ref. RB | | | 5.00% | | | | 07/01/2031 | | | | 1,530 | | | 1,584,323 |
Series 2019 A, Ref. RB | | | 5.00% | | | | 07/01/2032 | | | | 2,115 | | | 2,188,143 |
Series 2021 G, Ref. RB | | | 5.00% | | | | 07/01/2038 | | | | 300 | | | 315,187 |
Series 2021 G, Ref. RB | | | 5.00% | | | | 07/01/2039 | | | | 350 | | | 365,642 |
Series 2021 G, Ref. RB | | | 4.00% | | | | 07/01/2046 | | | | 1,000 | | | 872,642 |
Massachusetts (Commonwealth of) Development Finance Agency (Ascentria Care Alliance); Series 2021, Ref. RB(d) | | | 5.00% | | | | 07/01/2041 | | | | 2,050 | | | 1,754,542 |
Massachusetts (Commonwealth of) Development Finance Agency (Emerson College); Series 2017 A, Ref. RB | | | 5.00% | | | | 01/01/2026 | | | | 1,600 | | | 1,644,355 |
Massachusetts (Commonwealth of) Development Finance Agency (Newbridge Charles, Inc.); Series 2017, Ref. RB(d) | | | 5.00% | | | | 10/01/2037 | | | | 1,500 | | | 1,515,830 |
Massachusetts (Commonwealth of) Development Finance Agency (Seven Hills Foundation); | | | | | | | | | | | | | | |
Series 2021, Ref. RB | | | 4.00% | | | | 09/01/2041 | | | | 1,300 | | | 1,134,309 |
Series 2021, Ref. RB | | | 4.00% | | | | 09/01/2048 | | | | 1,380 | | | 1,135,717 |
Massachusetts (Commonwealth of) Development Finance Agency (SpringField College); Series 2021 B, Ref. RB | | | 4.00% | | | | 06/01/2035 | | | | 2,000 | | | 1,889,031 |
Massachusetts (Commonwealth of) Development Finance Agency (Suffolk University); Series 2017, Ref. RB | | | 5.00% | | | | 07/01/2034 | | | | 1,000 | | | 1,043,702 |
Massachusetts (Commonwealth of) School Building Authority; | | | | | | | | | | | | | | |
Series 2018 B, RB | | | 4.00% | | | | 02/15/2039 | | | | 10,735 | | | 10,667,534 |
Series 2018 B, RB | | | 4.00% | | | | 02/15/2041 | | | | 1,685 | | | 1,643,353 |
Massachusetts (Commonwealth of) Water Resources Authority; Series 2007 B, Ref. RB (INS - AGM)(b) | | | 5.25% | | | | 08/01/2025 | | | | 300 | | | 316,191 |
| | | | | | | | | | | | | | | 35,195,576 |
| | | | |
Michigan-2.39% | | | | | | | | | | | | | | |
Charyl Stockwell Academy; Series 2015, Ref. RB | | | 4.88% | | | | 10/01/2023 | | | | 85 | | | 84,644 |
Detroit (City of), MI Downtown Development Authority (Catalyst Development); | | | | | | | | | | | | | | |
Series 2018 A, Ref. RB (INS - AGM)(b) | | | 5.00% | | | | 07/01/2030 | | | | 700 | | | 712,146 |
Series 2018 A, Ref. RB (INS - AGM)(b) | | | 5.00% | | | | 07/01/2032 | | | | 2,000 | | | 2,031,055 |
Great Lakes Water Authority; Series 2018 B, Ref. RB | | | 5.00% | | | | 07/01/2029 | | | | 3,000 | | | 3,386,987 |
Kalamazoo Economic Development Corp. (Heritage Community of Kalamazoo); | | | | | | | | | | | | | | |
Series 2019, Ref. RB | | | 5.00% | | | | 05/15/2032 | | | | 870 | | | 814,923 |
Series 2019, Ref. RB | | | 5.00% | | | | 05/15/2042 | | | | 2,010 | | | 1,727,096 |
Series 2020, RB | | | 2.88% | | | | 05/15/2026 | | | | 1,520 | | | 1,427,197 |
See accompanying Notes to Financial Statements which are an integral part of the financial statements.
| | |
| 18 | | Invesco Intermediate Term Municipal Income Fund |
| | | | | | | | | | | | | | |
| | | Interest Rate | | | Maturity Date | | | Principal Amount (000) | | | Value |
Michigan-(continued) | | | | | | | | | | | | | | |
Kentwood Economic Development Corp. (Holland Home Obligated Group); | | | | | | | | | | | | | | |
Series 2019, Ref. RB | | | 5.00% | | | | 11/15/2032 | | | $ | 2,100 | | | $ 2,126,082 |
Series 2022, Ref. RB | | | 4.00% | | | | 11/15/2031 | | | | 1,000 | | | 929,401 |
Michigan (State of) Building Authority (Facilities Program); | | | | | | | | | | | | | | |
Series 2015 I, Ref. RB(c)(f) | | | 5.00% | | | | 10/15/2025 | | | | 615 | | | 645,561 |
Series 2015 I, Ref. RB | | | 5.00% | | | | 04/15/2031 | | | | 4,385 | | | 4,617,805 |
Michigan (State of) Finance Authority; Series 2020 B-1, Ref. RB | | | 5.00% | | | | 06/01/2049 | | | | 810 | | | 818,751 |
Michigan (State of) Finance Authority (Detroit Water & Sewerage Department); | | | | | | | | | | | | | | |
Series 2014 C-7, Ref. RB (INS - NATL)(b) | | | 5.00% | | | | 07/01/2026 | | | | 1,000 | | | 1,018,787 |
Series 2014 C-7, Ref. RB (INS - NATL)(b) | | | 5.00% | | | | 07/01/2027 | | | | 1,000 | | | 1,021,012 |
Series 2014 D-4, Ref. RB | | | 5.00% | | | | 07/01/2029 | | | | 5,000 | | | 5,087,409 |
Series 2015 D-1, Ref. RB | | | 5.00% | | | | 07/01/2029 | | | | 750 | | | 774,933 |
Michigan (State of) Finance Authority (Henry Ford Health System); Series 2016, Ref. RB | | | 5.00% | | | | 11/15/2028 | | | | 2,000 | | | 2,116,856 |
Michigan (State of) Finance Authority (Local Government Loan Program); Series 2014 F, Ref. RB | | | 4.50% | | | | 10/01/2029 | | | | 5,590 | | | 5,603,325 |
Michigan (State of) Finance Authority (Sparrow Obligated Group); Series 2015, Ref. RB | | | 5.00% | | | | 11/15/2032 | | | | 245 | | | 251,469 |
Michigan (State of) Finance Authority (Wayne (County of) Criminal Justice Center); Series 2018, RB | | | 5.00% | | | | 11/01/2029 | | | | 1,500 | | | 1,652,771 |
Michigan (State of) Strategic Fund (Canterbury Health Care, Inc.); Series 2016, RB(d) | | | 5.00% | | | | 07/01/2031 | | | | 1,530 | | | 1,214,723 |
Michigan (State of) Strategic Fund (Green Bonds); Series 2021, RB(a)(c) | | | 4.00% | | | | 10/01/2026 | | | | 1,230 | | | 1,213,828 |
Michigan (State of) Strategic Fund (Holland Home Obligated Group); Series 2019, Ref. RB | | | 5.00% | | | | 11/15/2034 | | | | 1,810 | | | 1,822,159 |
Romulus (City of), MI Tax Increment Finance Authority; Series 2016, Ref. RB (INS - BAM)(b) | | | 5.00% | | | | 11/01/2026 | | | | 1,805 | | | 1,903,355 |
Wayne (County of), MI Airport Authority (Detroit Metropolitan Airport); Series 2012 D, Ref. RB(a) | | | 5.00% | | | | 12/01/2028 | | | | 2,500 | | | 2,501,827 |
| | | | | | | | | | | | | | | 45,504,102 |
| | | | |
Minnesota-0.39% | | | | | | | | | | | | | | |
Dakota (County of), MN Community Development Agency (Sanctuary at West St. Paul); Series 2015, RB (Acquired 08/06/2015; Cost $335,222)(e) | | | 5.75% | | | | 08/01/2030 | | | | 335 | | | 269,273 |
Duluth (City of), MN Housing & Redevelopment Authority (Duluth Public Schools Academy); | | | | | | | | | | | | | | |
Series 2018 A, Ref. RB | | | 4.25% | | | | 11/01/2028 | | | | 320 | | | 305,836 |
Series 2018 A, Ref. RB | | | 5.00% | | | | 11/01/2033 | | | | 205 | | | 197,919 |
Maple Grove (City of), MN (Maple Grove Hospital Corp.); | | | | | | | | | | | | | | |
Series 2017, Ref. RB | | | 5.00% | | | | 05/01/2031 | | | | 500 | | | 522,867 |
Series 2017, Ref. RB | | | 5.00% | | | | 05/01/2032 | | | | 1,600 | | | 1,665,783 |
Minnesota (State of) Higher Education Facilities Authority (Bethel University); Series 2017, Ref. RB | | | 5.00% | | | | 05/01/2032 | | | | 1,750 | | | 1,734,670 |
St. Louis Park (City of), MN (Place Via Sol Project); Series 2018, RB (Acquired 12/26/2018; Cost $1,250,000)(c)(d)(e)(h) | | | 6.00% | | | | 07/01/2027 | | | | 1,250 | | | 1,125,000 |
St. Paul (City of), MN Housing & Redevelopment Authority (High School for Recording Arts); Series 2015, RB | | | 5.13% | | | | 10/01/2023 | | | | 70 | | | 69,849 |
Woodbury (City of), MN Housing & Redevelopment Authority (St. Therese of Woodbury); | | | | | | | | | | | | | | |
Series 2014, RB | | | 4.00% | | | | 12/01/2023 | | | | 300 | | | 297,181 |
Series 2014, RB | | | 4.00% | | | | 12/01/2024 | | | | 175 | | | 171,182 |
Series 2014, RB | | | 5.00% | | | | 12/01/2029 | | | | 1,000 | | | 969,856 |
| | | | | | | | | | | | | | | 7,329,416 |
| | | | |
Mississippi-0.31% | | | | | | | | | | | | | | |
Mississippi (State of) Hospital Equipment & Facilities Authority (Forrest Co. General Hospital); | | | | | | | | | | | | | | |
Series 2019 B, Ref. RB | | | 5.00% | | | | 01/01/2029 | | | | 1,000 | | | 1,074,055 |
Series 2019 B, Ref. RB | | | 5.00% | | | | 01/01/2030 | | | | 1,000 | | | 1,080,531 |
Mississippi (State of) Hospital Equipment & Facilities Authority (North Mississippi Health Services); | | | | | | | | | | | | | | |
Series 2020, Ref. RB | | | 5.00% | | | | 10/01/2033 | | | | 650 | | | 698,228 |
Series 2020, Ref. RB | | | 5.00% | | | | 10/01/2034 | | | | 725 | | | 772,554 |
Series 2020, Ref. RB | | | 5.00% | | | | 10/01/2035 | | | | 600 | | | 632,734 |
Series 2020, Ref. RB | | | 5.00% | | | | 10/01/2036 | | | | 650 | | | 679,319 |
Mississippi Business Finance Corp. (System Energy Resources, Inc.); Series 2021, RB | | | 2.38% | | | | 06/01/2044 | | | | 1,390 | | | 919,828 |
| | | | | | | | | | | | | | | 5,857,249 |
| | | | |
Missouri-1.13% | | | | | | | | | | | | | | |
Arnold Retail Corridor Transportation Development District; Series 2019, Ref. RB | | | 3.00% | | | | 11/01/2028 | | | | 30 | | | 27,956 |
Cape Girardeau (County of), MO Industrial Development Authority (South Eastern Health); | | | | | | | | | | | | | | |
Series 2017 A, Ref. RB | | | 5.00% | | | | 03/01/2036 | | | | 3,000 | | | 3,067,676 |
Series 2017, Ref. RB | | | 5.00% | | | | 03/01/2029 | | | | 100 | | | 103,737 |
See accompanying Notes to Financial Statements which are an integral part of the financial statements.
| | |
| 19 | | Invesco Intermediate Term Municipal Income Fund |
| | | | | | | | | | | | | | |
| | | Interest Rate | | | Maturity Date | | | Principal Amount (000) | | | Value |
Missouri-(continued) | | | | | | | | | | | | | | |
Kansas City (City of), MO; Series 2017 C, Ref. RB | | | 5.00% | | | | 09/01/2032 | | | $ | 1,850 | | | $ 2,005,864 |
Kansas City (City of), MO Industrial Development Authority (Downtown Redevelopment District); Series 2011 A, Ref. RB | | | 5.50% | | | | 09/01/2028 | | | | 2,000 | | | 2,004,168 |
Kansas City (City of), MO Industrial Development Authority (Kansas City International Airport); Series 2019 B, RB(a) | | | 5.00% | | | | 03/01/2035 | | | | 1,000 | | | 1,053,969 |
Kansas City (City of), MO Industrial Development Authority (Ward Parkway Center Community Improvement District); Series 2016 A, Ref. RB(d) | | | 4.25% | | | | 04/01/2026 | | | | 15 | | | 14,491 |
Kirkwood (City of), MO Industrial Development Authority (Aberdeen Heights); Series 2017, Ref. RB | | | 5.25% | | | | 05/15/2032 | | | | 2,685 | | | 2,511,459 |
Missouri (State of) Health & Educational Facilities Authority (Lutheran Senior Services); | | | | | | | | | | | | | | |
Series 2016 B, Ref. RB | | | 5.00% | | | | 02/01/2032 | | | | 1,000 | | | 996,402 |
Series 2016, Ref. RB | | | 5.00% | | | | 02/01/2033 | | | | 1,305 | | | 1,294,885 |
Series 2019 A, RB | | | 5.00% | | | | 02/01/2029 | | | | 1,100 | | | 1,108,844 |
Missouri (State of) Joint Municipal Electric Utility Commission (Iatan 2); Series 2014 A, Ref. RB | | | 5.00% | | | | 01/01/2029 | | | | 2,000 | | | 2,019,715 |
Missouri (State of) Joint Municipal Electric Utility Commission (Prairie State); | | | | | | | | | | | | | | |
Series 2015 A, Ref. RB | | | 5.00% | | | | 06/01/2027 | | | | 1,500 | | | 1,550,019 |
Series 2015 A, Ref. RB | | | 5.00% | | | | 12/01/2027 | | | | 640 | | | 661,201 |
St. Charles (County of), MO Industrial Development Authority (Suemandy/Mid-Rivers Community Improvement District); Series 2016, RB(d) | | | 4.00% | | | | 10/01/2028 | | | | 250 | | | 228,684 |
St. Louis (County of), MO Industrial Development Authority (Friendship Village of Sunset Hills); | | | | | | | | | | | | | | |
Series 2012, RB | | | 4.50% | | | | 09/01/2023 | | | | 340 | | | 339,355 |
Series 2012, RB | | | 5.00% | | | | 09/01/2032 | | | | 1,490 | | | 1,485,543 |
St. Louis Municipal Finance Corp.; Series 2015, Ref. RB (INS - AGM)(b) | | | 5.00% | | | | 07/15/2030 | | | | 1,000 | | | 1,020,193 |
| | | | | | | | | | | | | | | 21,494,161 |
| | | | |
Nebraska-0.27% | | | | | | | | | | | | | | |
Public Power Generation Agency (Whelan Energy Center Unit 2); Series 2016 A, Ref. RB | | | 5.00% | | | | 01/01/2034 | | | | 5,000 | | | 5,228,012 |
| | | | |
Nevada-0.27% | | | | | | | | | | | | | | |
Clark (County of), NV (Special Improvement District No. 159); | | | | | | | | | | | | | | |
Series 2015, RB | | | 5.00% | | | | 08/01/2026 | | | | 130 | | | 132,061 |
Series 2015, RB | | | 5.00% | | | | 08/01/2029 | | | | 1,180 | | | 1,191,576 |
Series 2015, RB | | | 5.00% | | | | 08/01/2031 | | | | 1,295 | | | 1,304,917 |
Series 2015, RB | | | 5.00% | | | | 08/01/2032 | | | | 315 | | | 317,693 |
Las Vegas (City of), NV Special Improvement District No. 607; Series 2013, Ref. RB | | | 5.00% | | | | 06/01/2024 | | | | 20 | | | 20,248 |
Las Vegas (City of), NV Special Improvement District No. 815; | | | | | | | | | | | | | | |
Series 2020, RB | | | 3.25% | | | | 12/01/2025 | | | | 235 | | | 226,842 |
Series 2020, RB | | | 4.00% | | | | 12/01/2030 | | | | 240 | | | 227,873 |
Sparks (City of), NV (Tourism Improvement District No. 1); Series 2019 A, Ref. RB(d) | | | 2.75% | | | | 06/15/2028 | | | | 2,000 | | | 1,797,011 |
| | | | | | | | | | | | | | | 5,218,221 |
| | | | |
New Hampshire-0.60% | | | | | | | | | | | | | | |
New Hampshire (State of) Business Finance Authority; Series 2020-1A, RB | | | 4.13% | | | | 01/20/2034 | | | | 6,691 | | | 6,587,579 |
New Hampshire (State of) Business Finance Authority (Covanta Green Bonds); Series 2020 B, Ref. RB(a)(c)(d) | | | 3.75% | | | | 07/02/2040 | | | | 605 | | | 465,516 |
New Hampshire (State of) Business Finance Authority (Covanta); Series 2020 A, Ref. RB(c)(d) | | | 3.63% | | | | 07/02/2040 | | | | 370 | | | 283,069 |
New Hampshire (State of) Business Finance Authority (New York State Electric & Gas Corp.); Series 2022 A, Ref. RB(a) | | | 4.00% | | | | 12/01/2028 | | | | 2,300 | | | 2,321,531 |
New Hampshire (State of) Business Finance Authority (Social Bonds); Series 2022-2A, RB | | | 4.00% | | | | 10/20/2036 | | | | 1,990 | | | 1,858,650 |
| | | | | | | | | | | | | | | 11,516,345 |
| | | | |
New Jersey-6.52% | | | | | | | | | | | | | | |
Atlantic City (City of), NJ; Series 2017 A, Ref. GO Bonds (INS - BAM)(b) | | | 5.00% | | | | 03/01/2032 | | | | 250 | | | 267,863 |
Casino Reinvestment Development Authority, Inc.; Series 2014, Ref. RB (INS - AGM)(b) | | | 5.00% | | | | 11/01/2027 | | | | 1,000 | | | 1,029,427 |
Garden State Preservation Trust; Series 2005 A, RB (INS - AGM)(b) | | | 5.75% | | | | 11/01/2028 | | | | 2,000 | | | 2,187,461 |
Gloucester (County of), NJ Industrial Pollution Control Financing Authority (Logan); Series 2014 A, Ref. PCR(a)(f) | | | 5.00% | | | | 12/01/2024 | | | | 1,670 | | | 1,685,961 |
New Jersey (State of); Series 2020 A, GO Bonds | | | 4.00% | | | | 06/01/2032 | | | | 3,000 | | | 3,235,707 |
See accompanying Notes to Financial Statements which are an integral part of the financial statements.
| | |
| 20 | | Invesco Intermediate Term Municipal Income Fund |
| | | | | | | | | | | | | | |
| | | Interest Rate | | | Maturity Date | | | Principal Amount (000) | | | Value |
New Jersey-(continued) | | | | | | | | | | | | | | |
New Jersey (State of) Economic Development Authority; | | | | | | | | | | | | | | |
Series 2013 NN, Ref. RB | | | 5.00% | | | | 03/01/2026 | | | $ | 305 | | | $ 305,239 |
Series 2015 XX, Ref. RB | | | 5.00% | | | | 06/15/2025 | | | | 2,000 | | | 2,061,420 |
Series 2017 A, Ref. RB (INS - BAM)(b) | | | 5.00% | | | | 07/01/2028 | | | | 5,035 | | | 5,380,792 |
Series 2017 DDD, RB(c)(f) | | | 5.00% | | | | 06/15/2027 | | | | 3,670 | | | 3,989,775 |
New Jersey (State of) Economic Development Authority (American Water Co., Inc.); Series 2019, Ref. RB(a)(c) | | | 2.20% | | | | 12/03/2029 | | | | 2,500 | | | 2,144,168 |
New Jersey (State of) Economic Development Authority (Continental Airlines, Inc.); | | | | | | | | | | | | | | |
Series 1999, RB(a) | | | 5.13% | | | | 09/15/2023 | | | | 1,770 | | | 1,769,335 |
Series 2012, RB(a) | | | 5.75% | | | | 09/15/2027 | | | | 13,725 | | | 13,724,108 |
New Jersey (State of) Economic Development Authority (Leap Academy University Charter School, Inc.); Series 2014 A, RB(d) | | | 6.20% | | | | 10/01/2044 | | | | 200 | | | 201,120 |
New Jersey (State of) Economic Development Authority (Newark Downtown District Management Corp.); Series 2019, Ref. RB | | | 5.13% | | | | 06/15/2037 | | | | 107 | | | 114,148 |
New Jersey (State of) Economic Development Authority (Paterson Charter School for Science and Technology, Inc.); Series 2012 C, RB | | | 5.00% | | | | 07/01/2032 | | | | 475 | | | 469,394 |
New Jersey (State of) Economic Development Authority (Port Newark Container Terminal LLC); Series 2017, Ref. RB(a) | | | 5.00% | | | | 10/01/2047 | | | | 1,000 | | | 983,284 |
New Jersey (State of) Economic Development Authority (Provident Group - Rowan Properties LLC - Rowan University Student Housing); Series 2015 A, RB | | | 5.00% | | | | 01/01/2030 | | | | 250 | | | 247,987 |
New Jersey (State of) Economic Development Authority (Social Bonds); | | | | | | | | | | | | | | |
Series 2021 QQQ, RB | | | 4.00% | | | | 06/15/2039 | | | | 1,000 | | | 966,925 |
Series 2021, RB | | | 4.00% | | | | 06/15/2038 | | | | 1,000 | | | 975,286 |
New Jersey (State of) Economic Development Authority (The Goethals Bridge Replacement); | | | | | | | | | | | | | | |
Series 2013, RB(a) | | | 5.50% | | | | 01/01/2026 | | | | 1,390 | | | 1,410,070 |
Series 2013, RB(a) | | | 5.50% | | | | 01/01/2027 | | | | 2,130 | | | 2,159,738 |
Series 2013, RB(a) | | | 5.00% | | | | 01/01/2028 | | | | 1,000 | | | 1,009,807 |
New Jersey (State of) Educational Facilities Authority (Higher Education Facilities Trust Fund); Series 2014, RB | | | 5.00% | | | | 06/15/2026 | | | | 1,000 | | | 1,014,627 |
New Jersey (State of) Educational Facilities Authority (Rider University); | | | | | | | | | | | | | | |
Series 2017 F, RB | | | 5.00% | | | | 07/01/2032 | | | | 395 | | | 382,104 |
Series 2017 F, RB | | | 5.00% | | | | 07/01/2033 | | | | 415 | | | 397,834 |
Series 2017 F, RB | | | 5.00% | | | | 07/01/2035 | | | | 1,000 | | | 945,302 |
New Jersey (State of) Health Care Facilities Financing Authority (Princeton HealthCare System); | | | | | | | | | | | | | | |
Series 2016, Ref. RB | | | 5.00% | | | | 07/01/2030 | | | | 1,200 | | | 1,274,249 |
Series 2016, Ref. RB | | | 5.00% | | | | 07/01/2031 | | | | 1,000 | | | 1,061,799 |
New Jersey (State of) Higher Education Student Assistance Authority; | | | | | | | | | | | | | | |
Series 2013 1B, RB(a) | | | 4.75% | | | | 12/01/2043 | | | | 5,000 | | | 4,799,640 |
Series 2018 B, Ref. RB(a) | | | 5.00% | | | | 12/01/2025 | | | | 2,250 | | | 2,326,454 |
Series 2021 B, RB(a) | | | 2.50% | | | | 12/01/2040 | | | | 2,000 | | | 1,652,856 |
New Jersey (State of) Transportation Trust Fund Authority; | | | | | | | | | | | | | | |
Series 2006 C, RB (INS - AMBAC)(b)(g) | | | 0.00% | | | | 12/15/2026 | | | | 3,500 | | | 3,049,811 |
Series 2008 A, RB(g) | | | 0.00% | | | | 12/15/2028 | | | | 255 | | | 205,285 |
Series 2009 C, RB | | | 5.25% | | | | 06/15/2032 | | | | 250 | | | 255,793 |
Series 2010 D, RB | | | 5.25% | | | | 12/15/2023 | | | | 1,500 | | | 1,520,019 |
Series 2013 AA, RB | | | 5.25% | | | | 06/15/2030 | | | | 710 | | | 713,805 |
Series 2013 AA, RB (INS - BAM)(b) | | | 5.25% | | | | 06/15/2033 | | | | 2,000 | | | 2,009,921 |
Series 2015 AA, RB | | | 5.00% | | | | 06/15/2023 | | | | 2,000 | | | 2,008,333 |
Series 2018 A, Ref. RB | | | 5.00% | | | | 12/15/2028 | | | | 5,000 | | | 5,456,976 |
Series 2018 A, Ref. RB | | | 5.00% | | | | 12/15/2032 | | | | 5,000 | | | 5,417,077 |
Series 2018 A, Ref. RN | | | 5.00% | | | | 06/15/2023 | | | | 2,500 | | | 2,511,495 |
Series 2018 A, RN(i)(k) | | | 5.00% | | | | 06/15/2029 | | | | 4,500 | | | 4,736,910 |
Series 2018 A, RN(i)(k) | | | 5.00% | | | | 06/15/2030 | | | | 2,000 | | | 2,104,215 |
Series 2019, Ref. RB | | | 5.00% | | | | 12/15/2024 | | | | 2,500 | | | 2,558,904 |
Series 2020 AA, RB | | | 4.00% | | | | 06/15/2037 | | | | 2,000 | | | 1,966,260 |
Series 2021 A, Ref. RB | | | 4.00% | | | | 06/15/2034 | | | | 1,485 | | | 1,515,682 |
Series 2021 A, Ref. RB | | | 4.00% | | | | 06/15/2035 | | | | 10,245 | | | 10,350,385 |
Series 2021 A, Ref. RB | | | 4.00% | | | | 06/15/2036 | | | | 2,000 | | | 2,000,171 |
Salem (County of), NJ Pollution Control Financing Authority (Chambers); Series 2014 A, PCR(a)(f) | | | 5.00% | | | | 12/01/2023 | | | | 1,895 | | | 1,910,718 |
South Jersey Transportation Authority; Series 2014 A, Ref. RB | | | 5.00% | | | | 11/01/2028 | | | | 500 | | | 509,708 |
See accompanying Notes to Financial Statements which are an integral part of the financial statements.
| | |
| 21 | | Invesco Intermediate Term Municipal Income Fund |
| | | | | | | | | | | | | | |
| | | Interest Rate | | | Maturity Date | | | Principal Amount (000) | | | Value |
New Jersey-(continued) | | | | | | | | | | | | | | |
Tobacco Settlement Financing Corp.; | | | | | | | | | | | | | | |
Series 2018 A, Ref. RB | | | 5.00% | | | | 06/01/2031 | | | $ | 2,500 | | | $ 2,685,151 |
Series 2018 A, Ref. RB | | | 5.00% | | | | 06/01/2032 | | | | 4,965 | | | 5,324,240 |
Series 2018 A, Ref. RB | | | 5.00% | | | | 06/01/2033 | | | | 5,000 | | | 5,344,046 |
Series 2018 B, Ref. RB | | | 3.20% | | | | 06/01/2027 | | | | 10 | | | 9,993 |
| | | | | | | | | | | | | | | 124,338,778 |
| | | | |
New Mexico-0.06% | | | | | | | | | | | | | | |
Santa Fe (City of), NM (El Castillo Retirement); | | | | | | | | | | | | | | |
Series 2019 A, RB | | | 5.00% | | | | 05/15/2034 | | | | 725 | | | 692,586 |
Series 2019 A, RB | | | 5.00% | | | | 05/15/2039 | | | | 500 | | | 449,556 |
| | | | | | | | | | | | | | | 1,142,142 |
| | | | |
New York-11.47% | | | | | | | | | | | | | | |
Buffalo & Erie County Industrial Land Development Corp. (Medaille College); Series 2018, Ref. RB(d) | | | 5.00% | | | | 10/01/2038 | | | | 500 | | | 449,348 |
Build NYC Resource Corp. (Brooklyn Navy Yard); Series 2019, Ref. RB(a)(d) | | | 5.25% | | | | 12/31/2033 | | | | 1,500 | | | 1,376,456 |
Build NYC Resource Corp. (Pratt Paper, Inc.); Series 2014, Ref. RB(a)(d) | | | 4.50% | | | | 01/01/2025 | | | | 635 | | | 639,148 |
Build NYC Resource Corp. (Shefa School); Series 2021 A, RB(d) | | | 2.50% | | | | 06/15/2031 | | | | 375 | | | 312,472 |
Erie Tobacco Asset Securitization Corp.; Series 2005 A, RB | | | 5.00% | | | | 06/01/2045 | | | | 1,000 | | | 939,465 |
Long Island (City of), NY Power Authority; | | | | | | | | | | | | | | |
Series 2014 A, Ref. RB | | | 5.00% | | | | 09/01/2034 | | | | 4,000 | | | 4,073,213 |
Series 2018, RB | | | 5.00% | | | | 09/01/2029 | | | | 1,000 | | | 1,116,689 |
Metropolitan Transportation Authority; | | | | | | | | | | | | | | |
Series 2015 A-2, RB(c) | | | 5.00% | | | | 05/15/2030 | | | | 3,000 | | | 3,181,736 |
Subseries 2015 C-1, Ref. RB | | | 5.00% | | | | 11/15/2031 | | | | 1,875 | | | 1,899,326 |
Subseries 2015 C-1, Ref. RB | | | 5.25% | | | | 11/15/2031 | | | | 2,500 | | | 2,548,171 |
Metropolitan Transportation Authority (Green Bonds); | | | | | | | | | | | | | | |
Series 2016 A-2, Ref. RB | | | 5.00% | | | | 11/15/2024 | | | | 1,360 | | | 1,392,461 |
Series 2017 C-2, Ref. RB(g) | | | 0.00% | | | | 11/15/2029 | | | | 1,000 | | | 765,432 |
Monroe County Industrial Development Corp. (St. Ann’s Community); Series 2019, Ref. RB | | | 4.00% | | | | 01/01/2030 | | | | 1,640 | | | 1,462,520 |
Monroe County Industrial Development Corp. (University of Rochester); Series 2017 D, Ref. RB | | | 4.00% | | | | 07/01/2036 | | | | 1,000 | | | 1,000,848 |
Nassau County Tobacco Settlement Corp.; Series 2006 A-2, RB | | | 5.25% | | | | 06/01/2026 | | | | 452 | | | 443,940 |
New Rochelle (City of), NY (Iona College); Series 2015 A, Ref. RB | | | 5.00% | | | | 07/01/2035 | | | | 350 | | | 359,270 |
New York & New Jersey (States of) Port Authority; | | | | | | | | | | | | | | |
Series 2014, RB(a) | | | 4.00% | | | | 09/01/2034 | | | | 10,000 | | | 10,006,969 |
Series 2020, RB(a) | | | 5.00% | | | | 07/15/2031 | | | | 4,525 | | | 5,004,292 |
Two Hundred Second Series 2017, Ref. RB(a) | | | 5.00% | | | | 10/15/2035 | | | | 3,000 | | | 3,136,798 |
Two Hundred Seventh Series 2018, Ref. RB(a)(i)(k) | | | 5.00% | | | | 09/15/2028 | | | | 9,000 | | | 9,571,097 |
Two Hundred Thirty Third Series 2021, Ref. RB(a) | | | 4.00% | | | | 07/15/2036 | | | | 1,625 | | | 1,620,542 |
New York (City of), NY; | | | | | | | | | | | | | | |
Series 2015 C, Ref. GO Bonds | | | 5.00% | | | | 08/01/2029 | | | | 1,000 | | | 1,033,885 |
Series 2020 C, GO Bonds | | | 4.00% | | | | 08/01/2039 | | | | 5,000 | | | 4,926,528 |
Series 2020 C, GO Bonds | | | 4.00% | | | | 08/01/2040 | | | | 5,000 | | | 4,887,893 |
New York (City of), NY Transitional Finance Authority; | | | | | | | | | | | | | | |
Series 2018 S-2A, Ref. RB | | | 5.00% | | | | 07/15/2034 | | | | 5,000 | | | 5,500,964 |
Series 2021 B-1, RB | | | 4.00% | | | | 08/01/2036 | | | | 8,000 | | | 8,096,414 |
Series 2021 E-1, RB | | | 4.00% | | | | 02/01/2038 | | | | 5,390 | | | 5,371,500 |
Series 2021, Ref. RB | | | 4.00% | | | | 11/01/2036 | | | | 2,825 | | | 2,853,150 |
New York (State of) Dormitory Authority; | | | | | | | | | | | | | | |
Series 2015 B, RB | | | 5.00% | | | | 02/15/2032 | | | | 2,055 | | | 2,125,032 |
Series 2019 A, Ref. RB | | | 5.00% | | | | 03/15/2037 | | | | 3,000 | | | 3,257,899 |
Series 2022 A, Ref. RB | | | 4.00% | | | | 03/15/2040 | | | | 10,620 | | | 10,419,854 |
New York (State of) Dormitory Authority (Bidding Group 2); Series 2020 A, Ref. RB | | | 4.00% | | | | 03/15/2036 | | | | 5,000 | | | 5,073,884 |
New York (State of) Dormitory Authority (Master Boces Program); Series 2020, RB | | | 4.00% | | | | 08/15/2041 | | | | 2,000 | | | 1,939,643 |
New York (State of) Dormitory Authority (Montefiore Obligated Group); | | | | | | | | | | | | | | |
Series 2018 A, Ref. RB | | | 5.00% | | | | 08/01/2028 | | | | 2,300 | | | 2,365,878 |
Series 2018 A, Ref. RB | | | 5.00% | | | | 08/01/2031 | | | | 3,195 | | | 3,276,226 |
See accompanying Notes to Financial Statements which are an integral part of the financial statements.
| | |
| 22 | | Invesco Intermediate Term Municipal Income Fund |
| | | | | | | | | | | | | | |
| | | Interest Rate | | | Maturity Date | | | Principal Amount (000) | | | Value |
New York-(continued) | | | | | | | | | | | | | | |
New York (State of) Dormitory Authority (Orange Regional Medical Center); | | | | | | | | | | | | | | |
Series 2015, Ref. RB(d) | | | 5.00% | | | | 12/01/2024 | | | $ | 300 | | | $ 301,188 |
Series 2017, Ref. RB(d) | | | 5.00% | | | | 12/01/2033 | | | | 2,000 | | | 2,006,816 |
Series 2017, Ref. RB(d) | | | 5.00% | | | | 12/01/2034 | | | | 1,000 | | | 999,008 |
New York (State of) Dormitory Authority (Ozanam Hall of Queens Nursing Home, Inc.); Series 2006, RB (LOC - Allied Irish Banks PLC)(l) | | | 5.00% | | | | 11/01/2026 | | | | 30 | | | 30,406 |
New York (State of) Thruway Authority; | | | | | | | | | | | | | | |
Series 2018 L, Ref. RB | | | 5.00% | | | | 01/01/2030 | | | | 500 | | | 549,687 |
Series 2018 L, Ref. RB | | | 5.00% | | | | 01/01/2031 | | | | 1,000 | | | 1,098,790 |
Series 2019 B, RB | | | 4.00% | | | | 01/01/2037 | | | | 1,490 | | | 1,477,396 |
New York (State of) Thruway Authority (Bidding Group 3); Series 2022, Ref. RB | | | 4.00% | | | | 03/15/2043 | | | | 10,000 | | | 9,607,862 |
New York City Housing Development Corp. (Sustainable Development); Series 2022 A, RB | | | 2.70% | | | | 08/01/2037 | | | | 2,150 | | | 1,771,990 |
New York Counties Tobacco Trust IV; Series 2005 A, RB | | | 5.00% | | | | 06/01/2042 | | | | 4,520 | | | 4,202,600 |
New York Counties Tobacco Trust VI; | | | | | | | | | | | | | | |
Series 2016 B, Ref. RB | | | 5.00% | | | | 06/01/2027 | | | | 280 | | | 288,051 |
Series 2016 B, Ref. RB | | | 5.00% | | | | 06/01/2030 | | | | 270 | | | 277,429 |
Series 2016 B, Ref. RB | | | 5.00% | | | | 06/01/2031 | | | | 465 | | | 476,941 |
New York Liberty Development Corp. (Goldman Sachs Headquarters); Series 2007, RB | | | 5.50% | | | | 10/01/2037 | | | | 2,660 | | | 3,019,953 |
New York Liberty Development Corp. (Green Bonds); Series 2021 A, Ref. RB (INS - AGM)(b) | | | 2.75% | | | | 11/15/2041 | | | | 9,000 | | | 6,745,422 |
New York Transportation Development Corp. (American Airlines, Inc. John F. Kennedy International Airport); | | | | | | | | | | | | | | |
Series 2020, Ref. RB(a) | | | 5.25% | | | | 08/01/2031 | | | | 1,615 | | | 1,644,689 |
Series 2020, Ref. RB(a) | | | 5.38% | | | | 08/01/2036 | | | | 1,000 | | | 1,010,489 |
New York Transportation Development Corp. (American Airlines, Inc.); | | | | | | | | | | | | | | |
Series 2016, Ref. RB(a) | | | 5.00% | | | | 08/01/2026 | | | | 1,500 | | | 1,500,656 |
Series 2016, Ref. RB(a) | | | 5.00% | | | | 08/01/2031 | | | | 25,500 | | | 25,523,374 |
New York Transportation Development Corp. (Delta Air Lines, Inc. LaGuardia Airport Terminals C&D Redevelopment); | | | | | | | | | | | | | | |
Series 2018, RB(a) | | | 5.00% | | | | 01/01/2026 | | | | 10,000 | | | 10,193,486 |
Series 2018, RB(a) | | | 5.00% | | | | 01/01/2034 | | | | 3,090 | | | 3,178,486 |
Series 2018, RB(a) | | | 5.00% | | | | 01/01/2036 | | | | 960 | | | 975,735 |
Series 2020, RB(a) | | | 4.00% | | | | 10/01/2030 | | | | 3,000 | | | 2,923,789 |
Series 2020, RB(a) | | | 5.00% | | | | 10/01/2035 | | | | 2,000 | | | 2,053,213 |
New York Transportation Development Corp. (LaGuardia Airport Terminal B Redevelopment); Series 2016 A, RB (INS - AGM)(a)(b) | | | 4.00% | | | | 07/01/2041 | | | | 1,000 | | | 927,680 |
New York Transportation Development Corp. (Terminal 4 JFK International Airport); | | | | | | | | | | | | | | |
Series 2020 A, Ref. RB(a) | | | 5.00% | | | | 12/01/2030 | | | | 1,000 | | | 1,072,956 |
Series 2020 A, Ref. RB(a) | | | 5.00% | | | | 12/01/2032 | | | | 1,250 | | | 1,338,673 |
Series 2020, Ref. RB | | | 5.00% | | | | 12/01/2033 | | | | 1,600 | | | 1,740,239 |
Series 2022, RB(a) | | | 5.00% | | | | 12/01/2026 | | | | 1,000 | | | 1,038,873 |
Series 2022, RB(a) | | | 5.00% | | | | 12/01/2028 | | | | 2,145 | | | 2,265,746 |
Series 2022, RB(a) | | | 5.00% | | | | 12/01/2029 | | | | 3,000 | | | 3,192,571 |
Oneida County Local Development Corp. (Mohawk Valley Health System); Series 2019, Ref. RB (INS - AGM)(b) | | | 5.00% | | | | 12/01/2031 | | | | 1,000 | | | 1,107,671 |
Otsego County Capital Resource Corp. (Hartwick College); Series 2015 A, Ref. RB | | | 5.00% | | | | 10/01/2030 | | | | 500 | | | 465,549 |
Rockland Tobacco Asset Securitization Corp.; Series 2001, RB | | | 5.63% | | | | 08/15/2035 | | | | 1,355 | | | 1,377,413 |
Triborough Bridge & Tunnel Authority; Series 2013 A, Ref. RB(c)(f) | | | 5.00% | | | | 05/15/2023 | | | | 75 | | | 75,266 |
TSASC, Inc.; | | | | | | | | | | | | | | |
Series 2017 A, Ref. RB | | | 5.00% | | | | 06/01/2032 | | | | 2,000 | | | 2,091,603 |
Series 2017 A, Ref. RB | | | 5.00% | | | | 06/01/2033 | | | | 1,500 | | | 1,564,972 |
Series 2017 A, Ref. RB | | | 5.00% | | | | 06/01/2034 | | | | 1,000 | | | 1,040,234 |
Westchester County Local Development Corp.; Series 2014 A, RB | | | 5.00% | | | | 05/01/2034 | | | | 5,000 | | | 5,041,686 |
| | | | | | | | | | | | | | | 218,627,531 |
| | | | |
North Carolina-1.57% | | | | | | | | | | | | | | |
Charlotte (City of), NC (Charlotte Douglas International Airport); | | | | | | | | | | | | | | |
Series 2017 A, RB | | | 5.00% | | | | 07/01/2034 | | | | 750 | | | 809,123 |
Series 2017 A, RB | | | 5.00% | | | | 07/01/2035 | | | | 1,000 | | | 1,073,490 |
Columbus (County of), NC Industrial Facilities & Pollution Control Financing Authority (International Paper Co.); Series 2019, Ref. RB(c) | | | 2.00% | | | | 10/01/2024 | | | | 1,500 | | | 1,438,752 |
See accompanying Notes to Financial Statements which are an integral part of the financial statements.
| | |
| 23 | | Invesco Intermediate Term Municipal Income Fund |
| | | | | | | | | | | | | | |
| | | Interest Rate | | | Maturity Date | | | Principal Amount (000) | | | Value |
North Carolina-(continued) | | | | | | | | | | | | | | |
New Hanover (County of), NC (New Hanover Regional Medical Center); Series 2017, Ref. RB(c)(f) | | | 5.00% | | | | 10/01/2027 | | | $ | 1,000 | | | $ 1,089,652 |
North Carolina (State of) Department of Transportation (I-77 HOT Lanes); | | | | | | | | | | | | | | |
Series 2015, RB(a) | | | 5.00% | | | | 06/30/2026 | | | | 1,700 | | | 1,710,825 |
Series 2015, RB(a) | | | 5.00% | | | | 06/30/2027 | | | | 1,215 | | | 1,225,043 |
Series 2015, RB(a) | | | 5.00% | | | | 06/30/2029 | | | | 1,340 | | | 1,354,739 |
Series 2015, RB(a) | | | 5.00% | | | | 06/30/2030 | | | | 1,405 | | | 1,420,537 |
North Carolina (State of) Medical Care Commission (Forest at Duke (The)); Series 2021, RB | | | 4.00% | | | | 09/01/2041 | | | | 2,255 | | | 1,900,265 |
North Carolina (State of) Medical Care Commission (Lutheran Services for the Aging); | | | | | | | | | | | | | | |
Series 2021, RB | | | 4.00% | | | | 03/01/2029 | | | | 275 | | | 256,166 |
Series 2021, RB | | | 4.00% | | | | 03/01/2030 | | | | 285 | | | 261,691 |
Series 2021, RB | | | 4.00% | | | | 03/01/2031 | | | | 290 | | | 261,808 |
Series 2021, RB | | | 4.00% | | | | 03/01/2036 | | | | 900 | | | 749,178 |
Series 2021, RB | | | 4.00% | | | | 03/01/2041 | | | | 1,050 | | | 815,923 |
North Carolina (State of) Medical Care Commission (Pennybyrn at Maryfield); Series 2020, RB | | | 2.88% | | | | 10/01/2026 | | | | 610 | | | 573,881 |
North Carolina (State of) Medical Care Commission (Rex Healthcare); Series 2020 A, RB | | | 5.00% | | | | 07/01/2033 | | | | 1,250 | | | 1,374,714 |
North Carolina (State of) Medical Care Commission (Vidant Health); Series 2015, Ref. RB | | | 5.00% | | | | 06/01/2040 | | | | 5,000 | | | 5,036,010 |
North Carolina (State of) Municipal Power Agency No. 1 (Catawba); Series 2015 A, Ref. RB | | | 5.00% | | | | 01/01/2028 | | | | 5,000 | | | 5,273,070 |
North Carolina (State of) Turnpike Authority; Series 2017, Ref. RB (INS - AGM)(b) | | | 5.00% | | | | 01/01/2031 | | | | 1,250 | | | 1,329,600 |
Raleigh & Durham (Cities of), NC Airport Authority; Series 2020 A, Ref. RB(a) | | | 5.00% | | | | 05/01/2031 | | | | 1,750 | | | 1,906,795 |
| | | | | | | | | | | | | | | 29,861,262 |
| | | | |
North Dakota-0.17% | | | | | | | | | | | | | | |
Burleigh (County of), ND (University of Mary); | | | | | | | | | | | | | | |
Series 2016, RB | | | 4.38% | | | | 04/15/2026 | | | | 475 | | | 464,625 |
Series 2016, RB | | | 5.10% | | | | 04/15/2036 | | | | 2,815 | | | 2,713,112 |
| | | | | | | | | | | | | | | 3,177,737 |
| | | | |
Ohio-2.58% | | | | | | | | | | | | | | |
American Municipal Power, Inc. (Combined Hydroelectric); Series 2016 A, Ref. RB | | | 4.00% | | | | 02/15/2035 | | | | 3,000 | | | 3,018,482 |
Buckeye Tobacco Settlement Financing Authority; Series 2020 A-2, Ref. RB | | | 4.00% | | | | 06/01/2038 | | | | 8,310 | | | 8,040,782 |
Centerville (City of), OH (Graceworks Lutheran Services); Series 2017, Ref. RB | | | 5.25% | | | | 11/01/2037 | | | | 1,195 | | | 1,118,255 |
Cleveland (City of) & Cuyahoga (County of), OH Port Authority (Constellation Schools); Series 2014 A, Ref. RB(d) | | | 5.75% | | | | 01/01/2024 | | | | 180 | | | 180,097 |
Cleveland (City of) & Cuyahoga (County of), OH Port Authority (Euclid Avenue Development Corp.); Series 2014, Ref. RB | | | 5.00% | | | | 08/01/2027 | | | | 1,000 | | | 1,023,118 |
Cleveland (City of) & Cuyahoga (County of), OH Port Authority (Playhouse Square Foundation); Series 2018, Ref. RB | | | 5.00% | | | | 12/01/2033 | | | | 2,460 | | | 2,480,587 |
Columbus (City of) & Franklin (County of), OH Finance Authority (Easton); Series 2020, RB(d) | | | 5.00% | | | | 06/01/2028 | | | | 4,295 | | | 4,276,587 |
Cuyahoga (County of), OH (MetroHealth System); | | | | | | | | | | | | | | |
Series 2017, Ref. RB | | | 5.00% | | | | 02/15/2031 | | | | 1,750 | | | 1,818,698 |
Series 2017, Ref. RB | | | 5.00% | | | | 02/15/2032 | | | | 3,980 | | | 4,130,675 |
Hamilton (County of), OH (Life Enriching Communities); Series 2012, RB | | | 5.00% | | | | 01/01/2032 | | | | 690 | | | 689,959 |
Hamilton (County of), OH (UC Health); Series 2020, RB | | | 5.00% | | | | 09/15/2037 | | | | 2,000 | | | 2,086,317 |
Montgomery (County of), OH (Premier Health Partners Obligated Group); Series 2019 A, Ref. RB | | | 5.00% | | | | 11/15/2034 | | | | 1,500 | | | 1,549,407 |
Muskingum (County of), OH (Genesis Healthcare System); Series 2013, RB | | | 5.00% | | | | 02/15/2033 | | | | 1,240 | | | 1,240,239 |
Ohio (State of); | | | | | | | | | | | | | | |
Series 2020 A, Ref. RB | | | 5.00% | | | | 01/15/2033 | | | | 600 | | | 649,552 |
Series 2020 A, Ref. RB | | | 5.00% | | | | 01/15/2034 | | | | 1,000 | | | 1,082,868 |
Series 2020 A, Ref. RB | | | 5.00% | | | | 01/15/2035 | | | | 900 | | | 967,837 |
Ohio (State of) (Portsmouth Bypass); Series 2015, RB(a) | | | 5.00% | | | | 12/31/2025 | | | | 1,300 | | | 1,336,127 |
Ohio (State of) Air Quality Development Authority (Ohio Valley Electric Corp.); Series 2014, RB(a)(c) | | | 2.60% | | | | 10/01/2029 | | | | 9,000 | | | 7,921,789 |
Ohio (State of) Air Quality Development Authority (Pratt Paper LLC); Series 2017, RB(a)(d) | | | 3.75% | | | | 01/15/2028 | | | | 5,265 | | | 5,216,281 |
Southeastern Ohio (State of) Port Authority (Memorial Health Systems); Series 2015, Ref. RB | | | 5.50% | | | | 12/01/2029 | | | | 350 | | | 354,807 |
| | | | | | | | | | | | | | | 49,182,464 |
| | | | |
Oklahoma-0.63% | | | | | | | | | | | | | | |
Comanche (County of), OK Hospital Authority; Series 2015, Ref. RB | | | 5.00% | | | | 07/01/2023 | | | | 2,815 | | | 2,814,225 |
Oklahoma (State of) Development Finance Authority (OU Medicine); Series 2018 B, RB | | | 5.00% | | | | 08/15/2033 | | | | 1,000 | | | 962,134 |
Payne (County of), OK Economic Development Authority (Epworth Living at the Ranch); Series 2016 B-2, RB(h) | | | 4.75% | | | | 11/01/2023 | | | | 852 | | | 2,129 |
See accompanying Notes to Financial Statements which are an integral part of the financial statements.
| | |
| 24 | | Invesco Intermediate Term Municipal Income Fund |
| | | | | | | | | | | | | | |
| | | Interest Rate | | | Maturity Date | | | Principal Amount (000) | | | Value |
Oklahoma-(continued) | | | | | | | | | | | | | | |
Tulsa (City of), OK Airports Improvement Trust; Series 2001 B, Ref. RB(a) | | | 5.50% | | | | 12/01/2035 | | | $ | 3,250 | | | $ 3,253,743 |
Tulsa (City of), OK Airports Improvement Trust (American Airlines Group, Inc.); Series 2015, Ref. RB(a)(c) | | | 5.00% | | | | 06/01/2025 | | | | 5,000 | | | 5,005,927 |
| | | | | | | | | | | | | | | 12,038,158 |
| | | | |
Oregon-1.12% | | | | | | | | | | | | | | |
Forest Grove (City of), OR (Pacific University); Series 2015 A, Ref. RB | | | 5.00% | | | | 05/01/2036 | | | | 250 | | | 254,261 |
Medford (City of), OR Hospital Facilities Authority (Asante); Series 2020 A, Ref. RB | | | 4.00% | | | | 08/15/2039 | | | | 1,100 | | | 1,076,116 |
Multnomah (County of), OR Hospital Facilities Authority (Terwilliger Plaza, Inc.); | | | | | | | | | | | | | | |
Series 2016, Ref. RB | | | 5.00% | | | | 12/01/2025 | | | | 295 | | | 295,202 |
Series 2016, Ref. RB | | | 5.00% | | | | 12/01/2030 | | | | 1,305 | | | 1,287,608 |
Oregon (State of) Tri-County Metropolitan Transportation District; Series 2018 A, RB | | | 4.00% | | | | 09/01/2048 | | | | 7,465 | | | 7,045,951 |
Portland (Port of), OR; | | | | | | | | | | | | | | |
Series 2017, RB(a) | | | 5.00% | | | | 07/01/2036 | | | | 4,000 | | | 4,137,338 |
Series 2022 28, RB(a) | | | 5.00% | | | | 07/01/2027 | | | | 2,785 | | | 2,926,408 |
Salem-Keizer School District No. 24J; Series 2020 A, GO Bonds (CEP - Oregon School Bond Guaranty)(g) | | | 0.00% | | | | 06/15/2040 | | | | 4,415 | | | 2,036,983 |
Yamhill (County of), OR Hospital Authority (Friendsview); | | | | | | | | | | | | | | |
Series 2021 B-1, RB | | | 2.50% | | | | 11/15/2028 | | | | 2,000 | | | 1,756,299 |
Series 2021 B-2, RB | | | 2.13% | | | | 11/15/2027 | | | | 500 | | | 443,689 |
| | | | | | | | | | | | | | | 21,259,855 |
| | | | |
Pennsylvania-6.03% | | | | | | | | | | | | | | |
Allegheny (County of), PA Hospital Development Authority (Allegheny Health Network Obligated Group Issue); Series 2018 A, Ref. RB | | | 5.00% | | | | 04/01/2032 | | | | 2,000 | | | 2,137,752 |
Allegheny (County of), PA Industrial Development Authority (United States Steel Corp.); Series 2019, Ref. RB | | | 4.88% | | | | 11/01/2024 | | | | 2,000 | | | 2,010,820 |
Allentown (City of), PA Neighborhood Improvement Zone Development Authority; Series 2022, Ref. RB | | | 5.00% | | | | 05/01/2036 | | | | 1,500 | | | 1,532,486 |
Allentown (City of), PA Neighborhood Improvement Zone Development Authority (City Center); Series 2018, RB(d) | | | 5.00% | | | | 05/01/2033 | | | | 3,795 | | | 3,846,334 |
Chester (County of), PA Health & Education Facilities Authority (Simpson Senior Services); | | | | | | | | | | | | | | |
Series 2015 A, Ref. RB | | | 5.00% | | | | 12/01/2030 | | | | 1,000 | | | 944,586 |
Series 2015 A, Ref. RB | | | 5.25% | | | | 12/01/2045 | | | | 1,400 | | | 1,238,833 |
Coatesville Area School District Building Authority; | | | | | | | | | | | | | | |
Series 2018, RB (INS - BAM)(b) | | | 5.00% | | | | 12/01/2025 | | | | 385 | | | 386,314 |
Series 2018, RB (INS - BAM)(b) | | | 5.00% | | | | 12/01/2026 | | | | 335 | | | 336,094 |
Series 2018, RB (INS - BAM)(b) | | | 5.00% | | | | 12/01/2027 | | | | 360 | | | 361,113 |
Coatesville School District; Series 2020 A, GO Bonds (INS - BAM)(b)(g) | | | 0.00% | | | | 10/01/2036 | | | | 1,300 | | | 692,555 |
Commonwealth Financing Authority; | | | | | | | | | | | | | | |
Series 2018, RB | | | 5.00% | | | | 06/01/2030 | | | | 5,500 | | | 5,921,558 |
Series 2018, RB | | | 5.00% | | | | 06/01/2033 | | | | 4,000 | | | 4,287,564 |
East Hempfield (Township of), PA Industrial Development Authority (Student Services, Inc. Student Housing at Millersville University of Pennsylvania); Series 2015, RB(f) | | | 5.00% | | | | 07/01/2025 | | | | 230 | | | 235,353 |
Franklin (County of), PA Industrial Development Authority (Menno-Haven, Inc.); | | | | | | | | | | | | | | |
Series 2018, Ref. RB | | | 5.00% | | | | 12/01/2029 | | | | 1,000 | | | 929,336 |
Series 2018, Ref. RB | | | 5.00% | | | | 12/01/2031 | | | | 1,005 | | | 915,536 |
Series 2018, Ref. RB | | | 5.00% | | | | 12/01/2033 | | | | 750 | | | 669,226 |
Lancaster (County of), PA Hospital Authority (Masonic Villages); Series 2015, Ref. RB | | | 5.00% | | | | 11/01/2029 | | | | 1,500 | | | 1,532,629 |
Lancaster (County of), PA Hospital Authority (Moravian Manors, Inc.); Series 2019 A, RB | | | 5.00% | | | | 06/15/2038 | | | | 1,110 | | | 1,025,987 |
Luzerne (County of), PA; Series 2015 A, Ref. GO Bonds (INS - AGM)(b) | | | 5.00% | | | | 11/15/2029 | | | | 500 | | | 520,568 |
Montgomery (County of), PA Higher Education & Health Authority (Thomas Jefferson University); | | | | | | | | | | | | | | |
Series 2018 A, Ref. RB | | | 5.00% | | | | 09/01/2030 | | | | 3,500 | | | 3,773,089 |
Series 2019, Ref. RB | | | 5.00% | | | | 09/01/2031 | | | | 545 | | | 591,255 |
Pennsylvania (Commonwealth of); | | | | | | | | | | | | | | |
First Series 2015 1, GO Bonds | | | 5.00% | | | | 03/15/2031 | | | | 1,500 | | | 1,555,949 |
First Series 2017, Ref. GO Bonds | | | 5.00% | | | | 01/01/2026 | | | | 5,400 | | | 5,700,836 |
Series 2018 A, Ref. COP | | | 5.00% | | | | 07/01/2029 | | | | 300 | | | 328,146 |
Series 2018 A, Ref. COP | | | 5.00% | | | | 07/01/2030 | | | | 375 | | | 411,309 |
Series 2018 A, Ref. COP | | | 5.00% | | | | 07/01/2031 | | | | 425 | | | 466,921 |
See accompanying Notes to Financial Statements which are an integral part of the financial statements.
| | |
| 25 | | Invesco Intermediate Term Municipal Income Fund |
| | | | | | | | | | | | | | |
| | | Interest Rate | | | Maturity Date | | | Principal Amount (000) | | | Value |
Pennsylvania-(continued) | | | | | | | | | | | | | | |
Pennsylvania (Commonwealth of) Economic Development Financing Authority (PA Bridges Finco L.P.); | | | | | | | | | | | | | | |
Series 2015, RB(a) | | | 5.00% | | | | 12/31/2027 | | | $ | 5,965 | | | $ 6,081,263 |
Series 2015, RB(a) | | | 5.00% | | | | 12/31/2034 | | | | 2,630 | | | 2,656,293 |
Pennsylvania (Commonwealth of) Economic Development Financing Authority (Presbyterian Senior Living); Series 2021, Ref. RB | | | 4.00% | | | | 07/01/2030 | | | | 1,600 | | | 1,533,037 |
Pennsylvania (Commonwealth of) Economic Development Financing Authority (UPMC); | | | | | | | | | | | | | | |
Series 2021 A, Ref. RB | | | 4.00% | | | | 10/15/2039 | | | | 1,325 | | | 1,272,950 |
Series 2021 A, Ref. RB | | | 4.00% | | | | 10/15/2040 | | | | 1,200 | | | 1,146,449 |
Pennsylvania (Commonwealth of) Public School Building Authority (Philadelphia School District); | | | | | | | | | | | | | | |
Series 2016 A, Ref. RB (INS - AGM)(b) | | | 5.00% | | | | 06/01/2030 | | | | 3,000 | | | 3,141,144 |
Series 2016 A, Ref. RB (INS - AGM)(b) | | | 5.00% | | | | 06/01/2031 | | | | 120 | | | 125,603 |
Pennsylvania (Commonwealth of) Turnpike Commission; | | | | | | | | | | | | | | |
Second Series 2017, Ref. RB | | | 5.00% | | | | 12/01/2031 | | | | 4,075 | | | 4,380,319 |
Series 2015 A-1, Ref. RB | | | 5.00% | | | | 12/01/2028 | | | | 1,055 | | | 1,102,204 |
Series 2015 A-1, Ref. RB | | | 5.25% | | | | 12/01/2034 | | | | 250 | | | 264,171 |
Series 2016 A-1, RB | | | 5.00% | | | | 12/01/2041 | | | | 1,000 | | | 1,023,691 |
Series 2017 3, Ref. RB | | | 5.00% | | | | 12/01/2034 | | | | 3,000 | | | 3,235,882 |
Series 2019 A, RB | | | 5.00% | | | | 12/01/2031 | | | | 1,860 | | | 2,049,593 |
Series 2019 A, RB | | | 5.00% | | | | 12/01/2033 | | | | 1,240 | | | 1,382,540 |
Series 2021 A, RB | | | 3.00% | | | | 12/01/2042 | | | | 6,500 | | | 5,082,336 |
Series 2021 B, RB | | | 4.00% | | | | 12/01/2040 | | | | 1,500 | | | 1,461,672 |
Series 2021 B, RB | | | 4.00% | | | | 12/01/2041 | | | | 1,750 | | | 1,689,976 |
Philadelphia (City of), PA; | | | | | | | | | | | | | | |
Series 2015, Ref. RB | | | 5.00% | | | | 08/01/2031 | | | | 1,000 | | | 1,033,063 |
Series 2015, Ref. RB | | | 5.00% | | | | 08/01/2032 | | | | 1,000 | | | 1,031,192 |
Series 2019 B, GO Bonds | | | 5.00% | | | | 02/01/2033 | | | | 1,200 | | | 1,311,163 |
Series 2020 A, Ref. RB | | | 4.00% | | | | 07/01/2039 | | | | 5,000 | | | 4,909,278 |
Philadelphia (City of), PA Authority for Industrial Development; | | | | | | | | | | | | | | |
Series 2017, RB | | | 5.00% | | | | 12/01/2035 | | | | 1,000 | | | 1,050,940 |
Series 2017, RB | | | 5.00% | | | | 12/01/2037 | | | | 1,310 | | | 1,366,572 |
Philadelphia (City of), PA Authority for Industrial Development (Kipp Philadelphia Charter School); Series 2016 A, RB | | | 5.00% | | | | 04/01/2036 | | | | 1,500 | | | 1,448,256 |
Philadelphia (City of), PA Authority for Industrial Development (La Salle University); | | | | | | | | | | | | | | |
Series 2017, Ref. RB | | | 5.00% | | | | 05/01/2034 | | | | 1,000 | | | 942,689 |
Series 2017, Ref. RB | | | 5.00% | | | | 05/01/2036 | | | | 1,000 | | | 920,050 |
Philadelphia (City of), PA Authority for Industrial Development (Thomas Jefferson University); Series 2017 A, Ref. RB | | | 5.00% | | | | 09/01/2035 | | | | 3,000 | | | 3,132,986 |
Philadelphia (City of), PA Authority for Industrial Development (University Square Apartments); Series 2017, RB | | | 4.00% | | | | 12/01/2047 | | | | 2,000 | | | 1,778,266 |
Philadelphia (City of), PA Authority for Industrial Development (Wesley Enhanced Living Obligated Group); Series 2017, Ref. RB | | | 5.00% | | | | 07/01/2042 | | | | 4,355 | | | 3,666,039 |
Philadelphia (City of), PA Hospitals & Higher Education Facilities Authority (Temple University Health System); | | | | | | | | | | | | | | |
Series 2017, Ref. RB | | | 5.00% | | | | 07/01/2027 | | | | 3,480 | | | 3,614,341 |
Series 2017, Ref. RB | | | 5.00% | | | | 07/01/2029 | | | | 2,295 | | | 2,377,527 |
Philadelphia School District (The); | | | | | | | | | | | | | | |
Series 2007 A, Ref. GO Bonds (INS - NATL)(b) | | | 5.00% | | | | 06/01/2025 | | | | 2,400 | | | 2,476,878 |
Series 2018 A, GO Bonds | | | 5.00% | | | | 09/01/2025 | | | | 745 | | | 773,954 |
Series 2018 A, GO Bonds | | | 5.00% | | | | 09/01/2032 | | | | 510 | | | 555,024 |
Series 2019 A, GO Bonds | | | 5.00% | | | | 09/01/2031 | | | | 1,000 | | | 1,103,797 |
Reading School District; | | | | | | | | | | | | | | |
Series 2017, Ref. GO Bonds (INS - AGM)(b) | | | 5.00% | | | | 03/01/2035 | | | | 30 | | | 31,954 |
Series 2017, Ref. GO Bonds (INS - AGM)(b) | | | 5.00% | | | | 03/01/2036 | | | | 25 | | | 26,484 |
Scranton School District; | | | | | | | | | | | | | | |
Series 2017 E, Ref. GO Bonds (INS - BAM)(b) | | | 5.00% | | | | 12/01/2032 | | | | 110 | | | 119,824 |
Series 2017 E, Ref. GO Bonds (INS - BAM)(b) | | | 5.00% | | | | 12/01/2033 | | | | 90 | | | 97,830 |
Washington (County of), PA Redevelopment Authority (Victory Centre); Series 2018, Ref. RB | | | 5.00% | | | | 07/01/2028 | | | | 225 | | | 224,049 |
West Shore Area Authority (Messiah Village); Series 2015 A, Ref. RB | | | 5.00% | | | | 07/01/2030 | | | | 500 | | | 496,637 |
Wilkes-Barre Area School District; Series 2016 B, GO Bonds (INS - BAM)(b) | | | 5.00% | | | | 08/01/2028 | | | | 500 | | | 539,556 |
| | | | | | | | | | | | | | | 115,009,621 |
See accompanying Notes to Financial Statements which are an integral part of the financial statements.
| | |
| 26 | | Invesco Intermediate Term Municipal Income Fund |
| | | | | | | | | | | | | | |
| | | Interest Rate | | | Maturity Date | | | Principal Amount (000) | | | Value |
Puerto Rico-3.74% | | | | | | | | | | | | | | |
Children’s Trust Fund; | | | | | | | | | | | | | | |
Series 2002, RB | | | 5.38% | | | | 05/15/2033 | | | $ | 55 | | | $ 55,018 |
Series 2002, RB | | | 5.50% | | | | 05/15/2039 | | | | 850 | | | 850,049 |
Series 2002, RB | | | 5.63% | | | | 05/15/2043 | | | | 4,215 | | | 4,257,376 |
Puerto Rico (Commonwealth of); | | | | | | | | | | | | | | |
Series 2021 A, GO Bonds(g) | | | 0.00% | | | | 07/01/2024 | | | | 462 | | | 433,653 |
Series 2021 A, GO Bonds(g) | | | 0.00% | | | | 07/01/2033 | | | | 2,100 | | | 1,196,521 |
Series 2021 A-1, GO Bonds | | | 5.25% | | | | 07/01/2023 | | | | 3,230 | | | 3,239,179 |
Series 2021 A-1, GO Bonds | | | 5.38% | | | | 07/01/2025 | | | | 6,456 | | | 6,554,647 |
Series 2021 A-1, GO Bonds | | | 5.63% | | | | 07/01/2027 | | | | 1,443 | | | 1,490,141 |
Series 2021 A-1, GO Bonds | | | 5.63% | | | | 07/01/2029 | | | | 1,419 | | | 1,480,689 |
Series 2021 A-1, GO Bonds | | | 5.75% | | | | 07/01/2031 | | | | 6,378 | | | 6,713,869 |
Series 2021 A-1, GO Bonds | | | 4.00% | | | | 07/01/2033 | | | | 6,307 | | | 5,651,530 |
Series 2021 A-1, GO Bonds | | | 4.00% | | | | 07/01/2035 | | | | 1,175 | | | 1,029,065 |
Series 2021 A-1, GO Bonds | | | 4.00% | | | | 07/01/2037 | | | | 1,008 | | | 862,349 |
Series 2021 A-1, GO Bonds | | | 4.00% | | | | 07/01/2041 | | | | 1,371 | | | 1,132,503 |
Series 2021 A-1, GO Bonds | | | 4.00% | | | | 07/01/2046 | | | | 1,426 | | | 1,135,354 |
Subseries 2022, RN | | | 0.00% | | | | 11/01/2043 | | | | 6,163 | | | 2,657,870 |
Puerto Rico (Commonwealth of) Aqueduct & Sewer Authority; Series 2021 B, RB(d) | | | 5.00% | | | | 07/01/2033 | | | | 4,365 | | | 4,376,498 |
Puerto Rico (Commonwealth of) Electric Power Authority; Series 2008 WW, RB(h) | | | 5.50% | | | | 07/01/2038 | | | | 3,500 | | | 2,476,250 |
Puerto Rico (Commonwealth of) Industrial, Tourist, Educational, Medical & Environmental Control Facilities Financing Authority (Hospital Auxilio Mutuo); | | | | | | | | | | | | | | |
Series 2021, Ref. RB | | | 5.00% | | | | 07/01/2031 | | | | 425 | | | 468,641 |
Series 2021, Ref. RB | | | 5.00% | | | | 07/01/2032 | | | | 450 | | | 492,551 |
Series 2021, Ref. RB | | | 5.00% | | | | 07/01/2033 | | | | 425 | | | 464,508 |
Puerto Rico (Commonwealth of) Industrial, Tourist, Educational, Medical & Environmental Control Facilities Financing Authority (University Plaza); Series 2000 A, RB (INS - NATL)(b) | | | 5.00% | | | | 07/01/2033 | | | | 1,340 | | | 1,324,590 |
Puerto Rico Sales Tax Financing Corp.; | | | | | | | | | | | | | | |
Series 2018 A-1, RB(g) | | | 0.00% | | | | 07/01/2029 | | | | 20,432 | | | 15,153,824 |
Series 2018 A-1, RB | | | 4.50% | | | | 07/01/2034 | | | | 3,468 | | | 3,438,694 |
Series 2018 A-1, RB(g) | | | 0.00% | | | | 07/01/2046 | | | | 17,000 | | | 4,356,760 |
| | | | | | | | | | | | | | | 71,292,129 |
| | | | |
Rhode Island-1.08% | | | | | | | | | | | | | | |
Providence (City of), RI Public Building Authority (Various Capital); Series 2011 A, RB (INS - AGM)(b) | | | 5.88% | | | | 06/15/2026 | | | | 410 | | | 410,885 |
Tobacco Settlement Financing Corp.; | | | | | | | | | | | | | | |
Series 2015 A, Ref. RB | | | 5.00% | | | | 06/01/2026 | | | | 1,375 | | | 1,405,656 |
Series 2015 A, Ref. RB | | | 5.00% | | | | 06/01/2027 | | | | 900 | | | 920,702 |
Series 2015 A, Ref. RB | | | 5.00% | | | | 06/01/2028 | | | | 1,080 | | | 1,106,520 |
Series 2015 A, Ref. RB | | | 5.00% | | | | 06/01/2035 | | | | 12,500 | | | 12,704,485 |
Series 2015 A, Ref. RB | | | 5.00% | | | | 06/01/2040 | | | | 4,000 | | | 4,028,457 |
| | | | | | | | | | | | | | | 20,576,705 |
| | | | |
South Carolina-0.28% | | | | | | | | | | | | | | |
Piedmont Municipal Power Agency; Series 2015 A, RB | | | 5.00% | | | | 01/01/2030 | | | | 2,000 | | | 2,061,404 |
South Carolina (State of) Jobs-Economic Development Authority (Lutheran Homes); | | | | | | | | | | | | | | |
Series 2013, RB | | | 5.00% | | | | 05/01/2023 | | | | 1,000 | | | 999,021 |
Series 2013, RB | | | 5.00% | | | | 05/01/2028 | | | | 1,250 | | | 1,202,591 |
South Carolina (State of) Jobs-Economic Development Authority (Prisma Health Obligated Group); Series 2018 A, Ref. RB | | | 5.00% | | | | 05/01/2048 | | | | 200 | | | 203,746 |
South Carolina (State of) Public Service Authority; Series 2020 A, Ref. RB | | | 4.00% | | | | 12/01/2037 | | | | 1,000 | | | 948,967 |
| | | | | | | | | | | | | | | 5,415,729 |
| | | | |
South Dakota-0.03% | | | | | | | | | | | | | | |
Educational Enhancement Funding Corp.; Series 2013 B, RB(c)(f) | | | 5.00% | | | | 06/01/2023 | | | | 550 | | | 552,385 |
| | | | |
Tennessee-1.36% | | | | | | | | | | | | | | |
Chattanooga (City of) & Hamilton (County of), TN Hospital Authority (Erlanger Health System); Series 2014 A, Ref. RB | | | 5.00% | | | | 10/01/2039 | | | | 1,505 | | | 1,511,657 |
See accompanying Notes to Financial Statements which are an integral part of the financial statements.
| | |
| 27 | | Invesco Intermediate Term Municipal Income Fund |
| | | | | | | | | | | | | | |
| | | Interest Rate | | | Maturity Date | | | Principal Amount (000) | | | Value |
Tennessee-(continued) | | | | | | | | | | | | | | |
Greeneville (Town of), TN Health & Educational Facilities Board (Ballad Health Obligated Group); | | | | | | | | | | | | | | |
Series 2018 A, Ref. RB | | | 5.00% | | | | 07/01/2032 | | | $ | 370 | | | $ 370,871 |
Series 2018 A, Ref. RB | | | 5.00% | | | | 07/01/2034 | | | | 3,000 | | | 3,005,284 |
Series 2018 A, Ref. RB | | | 5.00% | | | | 07/01/2035 | | | | 2,500 | | | 2,641,009 |
Knox (County of), TN Health, Educational & Housing Facility Board (Covenant Health); Series 2012 A, Ref. RB | | | 5.00% | | | | 01/01/2025 | | | | 500 | | | 500,315 |
Metropolitan Development and Housing Agency (Fifth + Broadway Development); Series 2018, RB(d) | | | 4.50% | | | | 06/01/2028 | | | | 765 | | | 766,268 |
Nashville (City of) & Davidson (County of), TN Metropolitan Government Health & Educational Facilities Board (The) (Lipscomb University); Series 2019 A, Ref. RB | | | 5.00% | | | | 10/01/2035 | | | | 1,115 | | | 1,123,860 |
Nashville (City of) & Davidson (County of), TN Metropolitan Government Health & Educational Facilities Board (The) (Vanderbilt University Medical Center); | | | | | | | | | | | | | | |
Series 2016 A, RB | | | 5.00% | | | | 07/01/2031 | | | | 1,000 | | | 1,055,300 |
Series 2016 A, RB | | | 5.00% | | | | 07/01/2035 | | | | 2,000 | | | 2,072,454 |
New Memphis Arena Public Building Authority (City of Memphis); | | | | | | | | | | | | | | |
Series 2021, RB(g) | | | 0.00% | | | | 04/01/2036 | | | | 1,200 | | | 675,890 |
Series 2021, RB(g) | | | 0.00% | | | | 04/01/2037 | | | | 1,375 | | | 728,315 |
Shelby (County of), TN Health, Educational & Housing Facilities Board (Methodist Le Bonheur Healthcare); Series 2017 A, RB | | | 5.00% | | | | 05/01/2031 | | | | 1,185 | | | 1,261,266 |
Shelby (County of), TN Health, Educational & Housing Facilities Board (The Village at Germantown, Inc.); Series 2014, RB | | | 5.00% | | | | 12/01/2029 | | | | 650 | | | 648,478 |
Shelby (County of), TN Health, Educational & Housing Facilities Board (Trezevant Manor); Series 2016 A, Ref. RB(d) | | | 5.00% | | | | 09/01/2037 | | | | 750 | | | 631,507 |
Tennergy Corp.; Series 2022 A, RB(c) | | | 5.50% | | | | 12/01/2030 | | | | 3,300 | | | 3,508,416 |
Tennessee Energy Acquisition Corp.; | | | | | | | | | | | | | | |
Series 2006 C, RB | | | 5.00% | | | | 02/01/2024 | | | | 3,225 | | | 3,230,625 |
Series 2006 C, RB | | | 5.00% | | | | 02/01/2027 | | | | 150 | | | 151,333 |
Series 2018, RB(c) | | | 4.00% | | | | 11/01/2025 | | | | 2,000 | | | 1,998,831 |
| | | | | | | | | | | | | | | 25,881,679 |
| | | | |
Texas-6.70% | | | | | | | | | | | | | | |
Arlington Higher Education Finance Corp. (Harmony Public Schools); Series 2015, Ref. RB (CEP - Texas Permanent School Fund) | | | 5.00% | | | | 02/15/2032 | | | | 1,500 | | | 1,541,079 |
Arlington Higher Education Finance Corp. (UME Preparatory Academy); | | | | | | | | | | | | | | |
Series 2017 A, RB | | | 4.55% | | | | 08/15/2028 | | | | 120 | | | 116,296 |
Series 2017 A, RB | | | 5.00% | | | | 08/15/2038 | | | | 115 | | | 108,948 |
Arlington Higher Education Finance Corp. (Universal Academy); | | | | | | | | | | | | | | |
Series 2014 A, RB | | | 5.88% | | | | 03/01/2024 | | | | 70 | | | 70,400 |
Series 2014 A, RB | | | 6.63% | | | | 03/01/2029 | | | | 1,000 | | | 1,016,005 |
Austin Convention Enterprises, Inc.; | | | | | | | | | | | | | | |
Series 2017, Ref. RB | | | 5.00% | | | | 01/01/2032 | | | | 1,075 | | | 1,074,691 |
Series 2017, Ref. RB | | | 5.00% | | | | 01/01/2033 | | | | 1,200 | | | 1,228,051 |
Central Texas Regional Mobility Authority; | | | | | | | | | | | | | | |
Series 2021 B, RB | | | 5.00% | | | | 01/01/2035 | | | | 600 | | | 661,581 |
Series 2021 B, RB | | | 5.00% | | | | 01/01/2036 | | | | 600 | | | 655,386 |
Clifton Higher Education Finance Corp. (Idea Public Schools); | | | | | | | | | | | | | | |
Series 2013, RB | | | 6.00% | | | | 08/15/2033 | | | | 1,250 | | | 1,265,399 |
Series 2022 A, RB | | | 4.00% | | | | 08/15/2033 | | | | 535 | | | 534,977 |
Series 2022 A, RB | | | 4.00% | | | | 08/15/2034 | | | | 555 | | | 552,641 |
Series 2022 A, RB | | | 4.00% | | | | 08/15/2035 | | | | 410 | | | 402,968 |
Clifton Higher Education Finance Corp. (International Leadership of Texas); | | | | | | | | | | | | | | |
Series 2015 A, RB | | | 4.88% | | | | 08/15/2027 | | | | 500 | | | 495,556 |
Series 2015 A, RB | | | 5.13% | | | | 08/15/2030 | | | | 3,000 | | | 2,998,998 |
Series 2018 D, RB | | | 5.75% | | | | 08/15/2033 | | | | 5,000 | | | 5,085,411 |
Dallas & Fort Worth (Cities of), TX (Dallas/Fort Worth International Airport); Series 2014 A, Ref. RB(a) | | | 5.25% | | | | 11/01/2026 | | | | 2,000 | | | 2,016,995 |
Dallas (City of), TX Area Rapid Transit; Series 2016 B, Ref. RB | | | 4.00% | | | | 12/01/2038 | | | | 5,250 | | | 5,251,445 |
Dallas (County of), TX Flood Control District No. 1; Series 2015, Ref. GO Bonds(d) | | | 5.00% | | | | 04/01/2028 | | | | 1,000 | | | 1,000,070 |
Decatur (City of), TX Hospital Authority (Wise Regional Health System); | | | | | | | | | | | | | | |
Series 2014 A, Ref. RB | | | 5.00% | | | | 09/01/2023 | | | | 150 | | | 150,150 |
Series 2014 A, Ref. RB | | | 5.00% | | | | 09/01/2024 | | | | 265 | | | 265,940 |
Series 2014 A, Ref. RB | | | 5.25% | | | | 09/01/2029 | | | | 1,000 | | | 1,009,566 |
See accompanying Notes to Financial Statements which are an integral part of the financial statements.
| | |
| 28 | | Invesco Intermediate Term Municipal Income Fund |
| | | | | | | | | | | | | | |
| | | Interest Rate | | | Maturity Date | | | Principal Amount (000) | | | Value |
Texas-(continued) | | | | | | | | | | | | | | |
Dickinson Independent School District; Series 2000, Ref. GO Bonds (CEP - Texas Permanent School Fund) | | | 6.00% | | | | 02/15/2028 | | | $ | 1,515 | | | $ 1,658,091 |
Grand Parkway Transportation Corp.; | | | | | | | | | | | | | | |
Series 2020 C, Ref. RB | | | 4.00% | | | | 10/01/2036 | | | | 250 | | | 252,201 |
Series 2020, Ref. RB | | | 4.00% | | | | 10/01/2037 | | | | 1,000 | | | 1,001,855 |
Series 2020, Ref. RB | | | 4.00% | | | | 10/01/2038 | | | | 2,250 | | | 2,244,779 |
Grand Parkway Transportation Corp. (TELA Supported); Series 2018 A, RB | | | 5.00% | | | | 10/01/2038 | | | | 2,000 | | | 2,121,205 |
Gulf Coast Authority (Waste Management of Texas); Series 2003 B, RB(a) | | | 1.50% | | | | 05/01/2028 | | | | 1,750 | | | 1,511,913 |
Harris (County of) & Houston (City of), TX Sports Authority; Series 2014 A, Ref. RB | | | 5.00% | | | | 11/15/2030 | | | | 1,000 | | | 1,023,382 |
Harris County Cultural Education Facilities Finance Corp. (Brazos Presbyterian Homes, Inc.); Series 2013 A, RB | | | 5.00% | | | | 01/01/2033 | | | | 1,090 | | | 1,014,439 |
Harris County Cultural Education Facilities Finance Corp. (YMCA of the Greater Houston Area); Series 2013 A, Ref. RB | | | 5.00% | | | | 06/01/2028 | | | | 1,500 | | | 1,473,445 |
Houston (City of), TX Airport System (United Airlines, Inc. Terminal E); | | | | | | | | | | | | | | |
Series 2014, Ref. RB(a) | | | 4.75% | | | | 07/01/2024 | | | | 2,465 | | | 2,462,960 |
Series 2020 A, Ref. RB(a) | | | 5.00% | | | | 07/01/2027 | | | | 500 | | | 499,807 |
Series 2021 A, RB(a) | | | 4.00% | | | | 07/01/2041 | | | | 4,500 | | | 3,879,683 |
Houston (City of), TX Airport System (United Airlines, Inc.); | | | | | | | | | | | | | | |
Series 2020 B-2, Ref. RB(a) | | | 5.00% | | | | 07/15/2027 | | | | 3,350 | | | 3,348,501 |
Series 2021 B-1, RB(a) | | | 4.00% | | | | 07/15/2041 | | | | 4,000 | | | 3,447,934 |
Houston Higher Education Finance Corp. (KIPP, Inc.); Series 2015, Ref. RB (CEP - Texas Permanent School Fund) | | | 5.00% | | | | 08/15/2029 | | | | 250 | | | 259,267 |
Lower Colorado River Authority (LCRA Transmission Services Corp.); Series 2019, Ref. RB | | | 5.00% | | | | 05/15/2030 | | | | 1,200 | | | 1,333,266 |
Mesquite Health Facilities Development Corp. (Christian Care Centers, Inc.); Series 2014, Ref. RB (Acquired 08/27/2014; Cost $217,124)(e)(h) | | | 5.00% | | | | 02/15/2024 | | | | 215 | | | 152,650 |
Mission Economic Development Corp. (Natgasoline); Series 2018, Ref. RB(a)(d) | | | 4.63% | | | | 10/01/2031 | | | | 5,000 | | | 4,887,317 |
New Hope Cultural Education Facilities Finance Corp. (Carillon Lifecare Community); | | | | | | | | | | | | | | |
Series 2016, Ref. RB | | | 4.00% | | | | 07/01/2028 | | | | 2,620 | | | 2,298,465 |
Series 2016, Ref. RB | | | 5.00% | | | | 07/01/2036 | | | | 2,750 | | | 2,242,860 |
New Hope Cultural Education Facilities Finance Corp. (CHF-Collegiate Housing Corpus Christi II, LLC - Texas A&M University-Corpus Christi); Series 2016 A, RB(c)(f) | | | 5.00% | | | | 04/01/2026 | | | | 670 | | | 706,511 |
New Hope Cultural Education Facilities Finance Corp. (Collegiate Housing Stephenville II, LLC - Tarleton State University); Series 2014 A, RB(f) | | | 5.00% | | | | 04/01/2023 | | | | 785 | | | 785,911 |
New Hope Cultural Education Facilities Finance Corp. (Jubilee Academic Center); Series 2021, Ref. RB(d) | | | 4.00% | | | | 08/15/2036 | | | | 2,000 | | | 1,736,124 |
New Hope Cultural Education Facilities Finance Corp. (Longhorn Village); | | | | | | | | | | | | | | |
Series 2017, Ref. RB | | | 5.00% | | | | 01/01/2027 | | | | 1,090 | | | 1,085,051 |
Series 2017, Ref. RB | | | 5.00% | | | | 01/01/2029 | | | | 1,205 | | | 1,193,521 |
Series 2017, Ref. RB | | | 5.00% | | | | 01/01/2037 | | | | 2,000 | | | 1,894,605 |
New Hope Cultural Education Facilities Finance Corp. (MRC Senior Living-The Langford); Series 2016 A, RB | | | 5.00% | | | | 11/15/2026 | | | | 320 | | | 308,665 |
New Hope Cultural Education Facilities Finance Corp. (Presbyterian Village North); | | | | | | | | | | | | | | |
Series 2018, Ref. RB | | | 5.00% | | | | 10/01/2029 | | | | 2,105 | | | 2,020,521 |
Series 2018, Ref. RB | | | 5.00% | | | | 10/01/2030 | | | | 2,210 | | | 2,103,983 |
New Hope Cultural Education Facilities Finance Corp. (Tarleton State University); Series 2014 A, RB(c)(f) | | | 5.00% | | | | 04/01/2024 | | | | 620 | | | 630,862 |
New Hope Cultural Education Facilities Finance Corp. (Wesleyan Homes, Inc.); | | | | | | | | | | | | | | |
Series 2014, RB | | | 5.25% | | | | 01/01/2029 | | | | 1,500 | | | 1,443,531 |
Series 2014, RB | | | 5.50% | | | | 01/01/2035 | | | | 1,400 | | | 1,278,019 |
Newark High Education Finance Corp. (A+ Charter Schools, Inc.); Series 2015 A, RB(d) | | | 4.63% | | | | 08/15/2025 | | | | 485 | | | 487,444 |
North Texas Tollway Authority; Series 2017 B, Ref. RB (INS - AGM)(b) | | | 4.00% | | | | 01/01/2034 | | | | 750 | | | 764,926 |
Port Beaumont Navigation District (Jefferson Gulf Coast Energy); | | | | | | | | | | | | | | |
Series 2021, RB(a)(d) | | | 2.13% | | | | 01/01/2028 | | | | 575 | | | 493,851 |
Series 2021, RB(a)(d) | | | 2.25% | | | | 01/01/2029 | | | | 800 | | | 667,503 |
Pottsboro Higher Education Finance Corp. (Imagine International Academy of North Texas LLC); Series 2016 A, RB | | | 5.00% | | | | 08/15/2036 | | | | 1,960 | | | 1,873,019 |
SA Energy Acquisition Public Facility Corp.; Series 2007, RB | | | 5.50% | | | | 08/01/2025 | | | | 2,000 | | | 2,048,990 |
San Antonio (City of), TX; Series 2019 A, Ref. RB(a) | | | 5.00% | | | | 07/01/2032 | | | | 2,380 | | | 2,555,652 |
Tarrant County Cultural Education Facilities Finance Corp.; Series 2014, Ref. RB | | | 5.00% | | | | 10/01/2049 | | | | 5,125 | | | 4,836,133 |
See accompanying Notes to Financial Statements which are an integral part of the financial statements.
| | |
| 29 | | Invesco Intermediate Term Municipal Income Fund |
| | | | | | | | | | | | | | |
| | | Interest Rate | | | Maturity Date | | | Principal Amount (000) | | | Value |
Texas-(continued) | | | | | | | | | | | | | | |
Tarrant County Cultural Education Facilities Finance Corp. (MRC Stevenson Oaks); | | | | | | | | | | | | | | |
Series 2020 B-2, Ref. RB | | | 3.00% | | | | 11/15/2026 | | | $ | 895 | | | $ 854,937 |
Series 2020, Ref. RB | | | 4.00% | | | | 11/15/2027 | | | | 3,100 | | | 2,931,512 |
Temple (City of), TX; Series 2018 A, RB | | | 5.00% | | | | 08/01/2038 | | | | 5,000 | | | 5,038,120 |
Texas (State of) Transportation Commission; | | | | | | | | | | | | | | |
Series 2019, RB(g) | | | 0.00% | | | | 08/01/2034 | | | | 1,400 | | | 817,265 |
Series 2019, RB(g) | | | 0.00% | | | | 08/01/2035 | | | | 2,050 | | | 1,121,028 |
Series 2019, RB(g) | | | 0.00% | | | | 08/01/2036 | | | | 1,500 | | | 766,259 |
Texas (State of) Transportation Commission (Central Texas Turnpike System); | | | | | | | | | | | | | | |
Series 2015 B, Ref. RB(g) | | | 0.00% | | | | 08/15/2036 | | | | 5,000 | | | 2,667,696 |
Series 2015 C, Ref. RB | | | 5.00% | | | | 08/15/2033 | | | | 5,000 | | | 5,088,161 |
Texas Municipal Gas Acquisition & Supply Corp. I; Series 2008 D, RB | | | 6.25% | | | | 12/15/2026 | | | | 3,820 | | | 3,987,399 |
Texas Municipal Gas Acquisition & Supply Corp. III; Series 2021, Ref. RB | | | 5.00% | | | | 12/15/2032 | | | | 3,250 | | | 3,403,813 |
Texas Private Activity Bond Surface Transportation Corp. (NTE Mobility Partners LLC - North Tarrant Express Managed Lanes); | | | | | | | | | | | | | | |
Series 2019 A, Ref. RB | | | 5.00% | | | | 12/31/2030 | | | | 3,000 | | | 3,174,214 |
Series 2019 A, Ref. RB | | | 5.00% | | | | 12/31/2032 | | | | 1,000 | | | 1,056,172 |
Viridian Municipal Management District; | | | | | | | | | | | | | | |
Series 2015, Ref. GO Bonds (INS - BAM)(b) | | | 6.00% | | | | 12/01/2029 | | | | 665 | | | 697,661 |
Series 2015, Ref. GO Bonds (INS - BAM)(b) | | | 6.00% | | | | 12/01/2029 | | | | 1,005 | | | 1,054,360 |
Series 2015, Ref. GO Bonds (INS - BAM)(b) | | | 6.00% | | | | 12/01/2030 | | | | 920 | | | 965,322 |
Series 2015, Ref. GO Bonds (INS - BAM)(b) | | | 6.00% | | | | 12/01/2030 | | | | 500 | | | 524,632 |
| | | | | | | | | | | | | | | 127,679,946 |
| | | | |
Utah-0.79% | | | | | | | | | | | | | | |
Black Desert Public Infrastructure District; Series 2021 A, GO Bonds(d) | | | 3.50% | | | | 03/01/2036 | | | | 2,000 | | | 1,657,147 |
Mida Mountain Village Public Infrastructure District (Assessment Area No. 2); | | | | | | | | | | | | | | |
Series 2021, RB(d) | | | 4.00% | | | | 08/01/2025 | | | | 1,205 | | | 1,180,053 |
Series 2021, RB(d) | | | 4.00% | | | | 08/01/2027 | | | | 1,000 | | | 961,448 |
Series 2021, RB(d) | | | 4.00% | | | | 08/01/2030 | | | | 1,000 | | | 924,796 |
Military Installation Development Authority; | | | | | | | | | | | | | | |
Series 2021 A-1, RB | | | 4.00% | | | | 06/01/2036 | | | | 500 | | | 415,793 |
Series 2021 A-1, RB | | | 4.00% | | | | 06/01/2041 | | | | 1,000 | | | 782,707 |
Series 2021 A-2, RB | | | 4.00% | | | | 06/01/2036 | | | | 5,250 | | | 4,365,397 |
Salt Lake City (City of), UT; | | | | | | | | | | | | | | |
Series 2018 A, RB(a) | | | 5.00% | | | | 07/01/2033 | | | | 3,500 | | | 3,696,822 |
Series 2018 B, RB | | | 5.00% | | | | 07/01/2038 | | | | 1,000 | | | 1,052,893 |
| | | | | | | | | | | | | | | 15,037,056 |
| | | | |
Vermont-0.21% | | | | | | | | | | | | | | |
Burlington (City of), VT; Series 2014 A, Ref. RB (INS - AGM)(b) | | | 5.00% | | | | 07/01/2030 | | | | 1,000 | | | 1,024,913 |
University of Vermont and State Agricultural College; | | | | | | | | | | | | | | |
Series 2019 B, Ref. RB | | | 5.00% | | | | 10/01/2035 | | | | 1,220 | | | 1,414,790 |
Series 2019 B, Ref. RB | | | 5.00% | | | | 10/01/2036 | | | | 1,375 | | | 1,588,716 |
| | | | | | | | | | | | | | | 4,028,419 |
| | | | |
Virginia-0.77% | | | | | | | | | | | | | | |
Dulles Town Center Community Development Authority (Dulles Town Center); Series 2012, Ref. RB | | | 4.25% | | | | 03/01/2026 | | | | 700 | | | 676,308 |
Farmville (Town of), VA Industrial Development Authority (Longwood University Student Housing); Series 2018 A, Ref. RB | | | 5.00% | | | | 01/01/2038 | | | | 1,000 | | | 1,007,472 |
Virginia (Commonwealth of) Small Business Financing Authority (95 Express Lanes LLC); Series 2022, Ref. RB(a) | | | 5.00% | | | | 07/01/2033 | | | | 3,235 | | | 3,467,834 |
Virginia (Commonwealth of) Small Business Financing Authority (I-495 Hot Lanes); | | | | | | | | | | | | | | |
Series 2022, Ref. RB(a) | | | 5.00% | | | | 06/30/2042 | | | | 2,395 | | | 2,447,311 |
Series 2022, Ref. RB(a) | | | 5.00% | | | | 12/31/2042 | | | | 2,000 | | | 2,043,683 |
Virginia (State of) Small Business Financing Authority (95 Express Lanes LLC); Series 2022, Ref. RB(a) | | | 5.00% | | | | 01/01/2035 | | | | 4,105 | | | 4,338,766 |
Virginia Beach Development Authority (Westminster-Canterbury on Chesapeake Bay); | | | | | | | | | | | | | | |
Series 2018, Ref. RB | | | 5.00% | | | | 09/01/2028 | | | | 150 | | | 152,303 |
Series 2018, Ref. RB | | | 5.00% | | | | 09/01/2030 | | | | 455 | | | 459,789 |
| | | | | | | | | | | | | | | 14,593,466 |
See accompanying Notes to Financial Statements which are an integral part of the financial statements.
| | |
| 30 | | Invesco Intermediate Term Municipal Income Fund |
| | | | | | | | | | | | | | |
| | | Interest Rate | | | Maturity Date | | | Principal Amount (000) | | | Value |
Washington-1.77% | | | | | | | | | | | | | | |
Kalispel Tribe of Indians; | | | | | | | | | | | | | | |
Series 2018 A, RB(d) | | | 5.00% | | | | 01/01/2032 | | | $ | 70 | | | $ 72,277 |
Series 2018 B, RB(d) | | | 5.00% | | | | 01/01/2032 | | | | 100 | | | 103,252 |
Kelso (City of), WA Housing Authority (Chinook & Columbia Apartments); Series 1998, RB | | | 5.60% | | | | 03/01/2028 | | | | 15 | | | 14,998 |
Seattle (Port of), WA; | | | | | | | | | | | | | | |
Series 2016 B, Ref. RB(a) | | | 5.00% | | | | 10/01/2028 | | | | 3,730 | | | 3,867,676 |
Series 2019, RB(a) | | | 5.00% | | | | 04/01/2032 | | | | 2,000 | | | 2,164,402 |
Series 2022 B, Ref. RB(a) | | | 5.00% | | | | 08/01/2038 | | | | 3,000 | | | 3,223,422 |
Seattle (Port of), WA (SEATAC Fuel Facilities LLC); Series 2013, Ref. RB(a) | | | 5.00% | | | | 06/01/2024 | | | | 1,560 | | | 1,564,376 |
Washington (State of); | | | | | | | | | | | | | | |
Series 2021 A, Ref. GO Bonds | | | 5.00% | | | | 06/01/2034 | | | | 1,000 | | | 1,136,845 |
Series 2021 A, Ref. GO Bonds | | | 5.00% | | | | 06/01/2035 | | | | 1,500 | | | 1,687,078 |
Washington (State of) Convention Center Public Facilities District (Green Notes); | | | | | | | | | | | | | | |
Series 2021 B, RB | | | 5.00% | | | | 07/01/2031 | | | | 2,365 | | | 2,452,275 |
Series 2021, RB | | | 4.00% | | | | 07/01/2031 | | | | 1,250 | | | 1,157,245 |
Washington (State of) Health Care Facilities Authority (Catholic Health Initiatives); Series 2013, RB (SIFMA Municipal Swap Index + 1.40%)(c)(j) | | | 4.20% | | | | 01/01/2025 | | | | 3,350 | | | 3,360,119 |
Washington (State of) Health Care Facilities Authority (Central Washington Health Services Association); Series 2015, Ref. RB | | | 5.00% | | | | 07/01/2030 | | | | 500 | | | 515,473 |
Washington (State of) Health Care Facilities Authority (PeaceHealth); Series 2014 A, Ref. RB(c)(f) | | | 5.00% | | | | 05/15/2024 | | | | 500 | | | 510,008 |
Washington (State of) Health Care Facilities Authority (Virginia Mason Medical Center); | | | | | | | | | | | | | | |
Series 2017, Ref. RB | | | 5.00% | | | | 08/15/2032 | | | | 1,500 | | | 1,560,383 |
Series 2017, Ref. RB | | | 5.00% | | | | 08/15/2037 | | | | 1,360 | | | 1,367,099 |
Washington (State of) Housing Finance Commission (Bayview Manor Homes); | | | | | | | | | | | | | | |
Series 2016 A, Ref. RB(d) | | | 5.00% | | | | 07/01/2031 | | | | 1,350 | | | 1,257,356 |
Series 2016 A, Ref. RB(d) | | | 5.00% | | | | 07/01/2036 | | | | 1,450 | | | 1,277,961 |
Washington (State of) Housing Finance Commission (Eliseo); Series 2021 B-2, Ref. RB(d) | | | 2.13% | | | | 07/01/2027 | | | | 2,750 | | | 2,467,345 |
Washington (State of) Housing Finance Commission (Heron’s Key Senior Living); Series 2015 A, RB(d)(f) | | | 6.00% | | | | 07/01/2025 | | | | 335 | | | 344,346 |
Washington (State of) Housing Finance Commission (The Hearthstone); Series 2018 A, Ref. RB(d) | | | 5.00% | | | | 07/01/2038 | | | | 830 | | | 678,071 |
Washington (State of) Housing Finance Commission (Transforming Age); | | | | | | | | | | | | | | |
Series 2019 A, RB(d) | | | 5.00% | | | | 01/01/2034 | | | | 745 | | | 645,892 |
Series 2019 A, RB(d) | | | 5.00% | | | | 01/01/2039 | | | | 2,895 | | | 2,379,629 |
| | | | | | | | | | | | | | | 33,807,528 |
| | | | |
West Virginia-0.26% | | | | | | | | | | | | | | |
Monongalia (County of), WV Commission Special District (University Town Centre Economic Opportunity Development District); Series 2017 A, Ref. RB(d) | | | 5.50% | | | | 06/01/2037 | | | | 2,000 | | | 2,023,187 |
West Virginia (State of) Economic Development Authority; Series 2020, RB(a)(c) | | | 5.00% | | | | 07/01/2025 | | | | 1,000 | | | 999,496 |
West Virginia (State of) Economic Development Authority (Entsorga West Virginia LLC); | | | | | | | | | | | | | | |
Series 2016, RB(a)(d) | | | 6.75% | | | | 02/01/2026 | | | | 2,000 | | | 1,400,000 |
Series 2018, RB(a)(d) | | | 8.75% | | | | 02/01/2036 | | | | 640 | | | 512,000 |
| | | | | | | | | | | | | | | 4,934,683 |
| | | | |
Wisconsin-1.93% | | | | | | | | | | | | | | |
Wisconsin (State of) Health & Educational Facilities Authority (American Baptist Homes of the Midwest Obligated Group); Series 2017, Ref. RB | | | 5.00% | | | | 08/01/2032 | | | | 5,100 | | | 4,563,979 |
Wisconsin (State of) Health & Educational Facilities Authority (Ascension Senior Credit Group); Series 2016 A, Ref. RB | | | 4.00% | | | | 11/15/2036 | | | | 2,000 | | | 1,991,514 |
Wisconsin (State of) Health & Educational Facilities Authority (Benevolent Corp. Cedar Community); | | | | | | | | | | | | | | |
Series 2017, Ref. RB | | | 5.00% | | | | 06/01/2030 | | | | 1,560 | | | 1,520,119 |
Series 2017, Ref. RB | | | 5.00% | | | | 06/01/2032 | | | | 1,720 | | | 1,648,543 |
Wisconsin (State of) Health & Educational Facilities Authority (Camillus Health System); Series 2019 B-2, Ref. RB | | | 2.55% | | | | 11/01/2027 | | | | 1,155 | | | 1,081,539 |
Wisconsin (State of) Health & Educational Facilities Authority (Mercy Alliance); | | | | | | | | | | | | | | |
Series 2012, RB | | | 5.00% | | | | 06/01/2025 | | | | 2,450 | | | 2,460,067 |
Series 2012, RB | | | 5.00% | | | | 06/01/2026 | | | | 1,000 | | | 1,000,816 |
Wisconsin (State of) Public Finance Authority; | | | | | | | | | | | | | | |
Series 2012 B, Ref. RB(a) | | | 5.00% | | | | 07/01/2042 | | | | 1,000 | | | 979,436 |
Series 2012 C, Ref. RB(a) | | | 5.00% | | | | 07/01/2042 | | | | 1,000 | | | 979,436 |
Wisconsin (State of) Public Finance Authority (21st Century Public Academy); Series 2020 A, RB(d) | | | 3.75% | | | | 06/01/2030 | | | | 350 | | | 311,837 |
See accompanying Notes to Financial Statements which are an integral part of the financial statements.
| | |
| 31 | | Invesco Intermediate Term Municipal Income Fund |
| | | | | | | | | | | | | | | | |
| | | Interest Rate | | | Maturity Date | | | Principal Amount (000) | | | Value | |
|
| |
Wisconsin-(continued) | | | | | | | | | | | | | | | | |
Wisconsin (State of) Public Finance Authority (ACTS Retirement-Life Community); Series 2020 A, RB | | | 4.00% | | | | 11/15/2037 | | | $ | 600 | | | $ | 529,422 | |
|
| |
Wisconsin (State of) Public Finance Authority (Bancroft Neurohealth); | | | | | | | | | | | | | | | | |
Series 2016 A, RB(d) | | | 5.00% | | | | 06/01/2025 | | | | 1,000 | | | | 992,182 | |
|
| |
Series 2016 A, RB(d) | | | 4.63% | | | | 06/01/2036 | | | | 125 | | | | 112,612 | |
|
| |
Wisconsin (State of) Public Finance Authority (Beyond Boone, LLC - Appalachian State University); Series 2019 A, RB (INS - AGM)(b) | | | 5.00% | | | | 07/01/2034 | | | | 800 | | | | 845,798 | |
|
| |
Wisconsin (State of) Public Finance Authority (City of Boynton Beach, Florida Municipal Improvements); Series 2018, RB | | | 5.00% | | | | 07/01/2035 | | | | 2,000 | | | | 2,143,697 | |
|
| |
Wisconsin (State of) Public Finance Authority (Community School of Davidson); Series 2018, RB | | | 5.00% | | | | 10/01/2033 | | | | 390 | | | | 386,197 | |
|
| |
Wisconsin (State of) Public Finance Authority (Explore Academy); | | | | | | | | | | | | | | | | |
Series 2020 A, RB(d) | | | 6.13% | | | | 02/01/2039 | | | | 500 | | | | 449,966 | |
|
| |
Series 2022 A, RB(d) | | | 6.13% | | | | 02/01/2039 | | | | 485 | | | | 436,467 | |
|
| |
Wisconsin (State of) Public Finance Authority (Goodwill Industries of Southern Nevada, Inc.); Series 2019 A, RB | | | 5.50% | | | | 12/01/2038 | | | | 1,930 | | | | 1,759,261 | |
|
| |
Wisconsin (State of) Public Finance Authority (Mallard Creek Stem Academy); Series 2019 A, RB(d) | | | 4.38% | | | | 06/15/2029 | | | | 1,745 | | | | 1,674,848 | |
|
| |
Wisconsin (State of) Public Finance Authority (Maryland Proton Treatment Center); Series 2018 A-1, RB(d) | | | 6.25% | | | | 01/01/2038 | | | | 3,250 | | | | 1,998,750 | |
|
| |
Wisconsin (State of) Public Finance Authority (Prime Healthcare Foundation, Inc.); Series 2018 A, RB | | | 5.20% | | | | 12/01/2037 | | | | 4,000 | | | | 4,062,548 | |
|
| |
Wisconsin (State of) Public Finance Authority (Roseman University of Health Sciences); Series 2015, Ref. RB | | | 5.00% | | | | 04/01/2025 | | | | 645 | | | | 645,726 | |
|
| |
Wisconsin (State of) Public Finance Authority (Southminster); Series 2018, RB(d) | | | 5.00% | | | | 10/01/2043 | | | | 500 | | | | 428,669 | |
|
| |
Wisconsin (State of) Public Finance Authority (Wingate University); Series 2018 A, Ref. RB | | | 5.25% | | | | 10/01/2038 | | | | 1,000 | | | | 1,003,281 | |
|
| |
Wisconsin (State of) Public Finance Authority (Wittenberg University); Series 2016, RB(d) | | | 4.13% | | | | 12/01/2024 | | | | 2,900 | | | | 2,826,715 | |
|
| |
| | | | | | | | | | | | | | | 36,833,425 | |
|
| |
| | | | |
Wyoming-0.08% | | | | | | | | | | | | | | | | |
Wyoming (State of) Municipal Power Agency; Series 2017 A, Ref. RB(c)(f) | | | 5.00% | | | | 01/01/2027 | | | | 1,500 | | | | 1,609,673 | |
|
| |
TOTAL INVESTMENTS IN SECURITIES(m)-100.19% (Cost $1,977,418,676) | | | | | | | | | | | | | | | 1,909,636,931 | |
|
| |
FLOATING RATE NOTE OBLIGATIONS-(1.30)% | | | | | | | | | | | | | | | | |
Notes with interest and fee rates ranging from 3.97% to 4.01% at 02/28/2023 and contractual maturities of collateral ranging from 01/09/2022 to 01/06/2032 (See Note 1)(n) | | | | | | | | | | | | | | | (24,775,000 | ) |
|
| |
OTHER ASSETS LESS LIABILITIES-1.11% | | | | | | | | | | | | | | | 21,153,724 | |
|
| |
NET ASSETS-100.00% | | | | | | | | | | | | | | $ | 1,906,015,655 | |
|
| |
| | |
| Investment Abbreviations: |
| |
| AGM | | - Assured Guaranty Municipal Corp. |
| AMBAC | | - American Municipal Bond Assurance Corp. |
| BAM | | - Build America Mutual Assurance Co. |
| CEP | | - Credit Enhancement Provider |
| COP | | - Certificates of Participation |
| Ctfs. | | - Certificates |
| GNMA | | - Government National Mortgage Association |
| GO | | - General Obligation |
| IDR | | - Industrial Development Revenue Bonds |
| INS | | - Insurer |
| LOC | | - Letter of Credit |
| NATL | | - National Public Finance Guarantee Corp. |
| PCR | | - Pollution Control Revenue Bonds |
| RAC | | - Revenue Anticipation Certificates |
| RB | | - Revenue Bonds |
| Ref. | | - Refunding |
| RN | | - Revenue Notes |
| SGI | | - Syncora Guarantee, Inc. |
| SIFMA | | - Securities Industry and Financial Markets Association |
| Wts. | | - Warrants |
See accompanying Notes to Financial Statements which are an integral part of the financial statements.
| | |
| 32 | | Invesco Intermediate Term Municipal Income Fund |
Notes to Schedule of Investments:
| (a) | Security subject to the alternative minimum tax. |
| (b) | Principal and/or interest payments are secured by the bond insurance company listed. |
| (c) | Security has an irrevocable call by the issuer or mandatory put by the holder. Maturity date reflects such call or put. |
| (d) | Security purchased or received in a transaction exempt from registration under the Securities Act of 1933, as amended (the “1933 Act”). The security may be resold pursuant to an exemption from registration under the 1933 Act, typically to qualified institutional buyers. The aggregate value of these securities at February 28, 2023 was $147,241,097, which represented 7.73% of the Fund’s Net Assets. |
| (e) | Restricted security. The aggregate value of these securities at February 28, 2023 was $6,428,939, which represented less than 1% of the Fund’s Net Assets. |
| (f) | Advance refunded; secured by an escrow fund of U.S. Government obligations or other highly rated collateral. |
| (g) | Zero coupon bond issued at a discount. |
| (h) | Defaulted security. Currently, the issuer is in default with respect to principal and/or interest payments. The aggregate value of these securities at February 28, 2023 was $4,510,729, which represented less than 1% of the Fund’s Net Assets. |
| (i) | Underlying security related to TOB Trusts entered into by the Fund. See Note 1J. |
| (j) | Interest or dividend rate is redetermined periodically. Rate shown is the rate in effect on February 28, 2023. |
| (k) | Security is subject to a reimbursement agreement which may require the Fund to pay amounts to a counterparty in the event of a significant decline in the market value of the security underlying the TOB Trusts. In case of a shortfall, the maximum potential amount of payments the Fund could ultimately be required to make under the agreement is $10,330,000. However, such shortfall payment would be reduced by the proceeds from the sale of the security underlying the TOB Trusts. |
| (l) | Principal and interest payments are fully enhanced by a letter of credit from the bank listed or a predecessor bank, branch or subsidiary. |
| (m) | Entities may either issue, guarantee, back or otherwise enhance the credit quality of a security. The entities are not primarily responsible for the issuer’s obligations but may be called upon to satisfy issuer’s obligations. No concentration of any single entity was greater than 5% each. |
| (n) | Floating rate note obligations related to securities held. The interest and fee rates shown reflect the rates in effect at February 28, 2023. At February 28, 2023, the Fund’s investments with a value of $38,481,855 are held by TOB Trusts and serve as collateral for the $24,775,000 in the floating rate note obligations outstanding at that date. |
See accompanying Notes to Financial Statements which are an integral part of the financial statements.
| | |
| 33 | | Invesco Intermediate Term Municipal Income Fund |
Statement of Assets and Liabilities
February 28, 2023
| | | | |
Assets: | | | | |
| |
Investments in unaffiliated securities, at value
(Cost $1,977,418,676) | | $ | 1,909,636,931 | |
|
| |
Cash | | | 1,104,059 | |
|
| |
Receivable for: | | | | |
Investments sold | | | 1,224,391 | |
|
| |
Fund shares sold | | | 2,117,218 | |
|
| |
Interest | | | 22,463,147 | |
|
| |
Investment for trustee deferred compensation and retirement plans | | | 80,976 | |
|
| |
Other assets | | | 619,230 | |
|
| |
Total assets | | | 1,937,245,952 | |
|
| |
| |
Liabilities: | | | | |
| |
Floating rate note obligations | | | 24,775,000 | |
|
| |
Payable for: | | | | |
Dividends | | | 1,465,512 | |
|
| |
Fund shares reacquired | | | 4,051,792 | |
|
| |
Accrued fees to affiliates | | | 705,472 | |
|
| |
Accrued interest expense | | | 21,220 | |
|
| |
Accrued trustees’ and officers’ fees and benefits | | | 2,840 | |
|
| |
Accrued other operating expenses | | | 114,371 | |
|
| |
Trustee deferred compensation and retirement plans | | | 94,090 | |
|
| |
Total liabilities | | | 31,230,297 | |
|
| |
Net assets applicable to shares outstanding | | $ | 1,906,015,655 | |
|
| |
| | | | |
Net assets consist of: | | | | |
| |
Shares of beneficial interest | | $ | 2,082,572,782 | |
|
| |
Distributable earnings (loss) | | | (176,557,127 | ) |
|
| |
| | $ | 1,906,015,655 | |
|
| |
| |
Net Assets: | | | | |
| |
Class A | | $ | 1,313,245,969 | |
|
| |
Class C | | $ | 63,377,506 | |
|
| |
Class Y | | $ | 528,911,433 | |
|
| |
Class R6 | | $ | 480,747 | |
|
| |
|
Shares outstanding, no par value, with an unlimited number of shares authorized: | |
| |
Class A | | | 128,144,327 | |
|
| |
Class C | | | 6,199,072 | |
|
| |
Class Y | | | 51,642,418 | |
|
| |
Class R6 | | | 46,964 | |
|
| |
Class A: | | | | |
Net asset value per share | | $ | 10.25 | |
|
| |
Maximum offering price per share
(Net asset value of $10.25 ÷ 97.50%) | | $ | 10.51 | |
|
| |
Class C: | | | | |
Net asset value and offering price per share | | $ | 10.22 | |
|
| |
Class Y: | | | | |
Net asset value and offering price per share | | $ | 10.24 | |
|
| |
Class R6: | | | | |
Net asset value and offering price per share | | $ | 10.24 | |
|
| |
See accompanying Notes to Financial Statements which are an integral part of the financial statements.
| | |
| 34 | | Invesco Intermediate Term Municipal Income Fund |
Statement of Operations
For the year ended February 28, 2023
| | | | |
Investment income: | | | | |
| |
Interest | | $ | 75,239,730 | |
|
| |
| |
Expenses: | | | | |
| |
Advisory fees | | | 8,138,335 | |
|
| |
Administrative services fees | | | 299,064 | |
|
| |
Custodian fees | | | 14,443 | |
|
| |
Distribution fees: | | | | |
Class A | | | 3,470,510 | |
|
| |
Class C | | | 738,398 | |
|
| |
Interest, facilities and maintenance fees | | | 1,435,396 | |
|
| |
Transfer agent fees – A, C and Y | | | 1,582,355 | |
|
| |
Transfer agent fees – R6 | | | 75 | |
|
| |
Trustees’ and officers’ fees and benefits | | | 29,724 | |
|
| |
Registration and filing fees | | | 199,301 | |
|
| |
Reports to shareholders | | | 48,617 | |
|
| |
Professional services fees | | | 109,246 | |
|
| |
Other | | | 34,046 | |
|
| |
Total expenses | | | 16,099,510 | |
|
| |
Less: Expense offset arrangement(s) | | | (977 | ) |
|
| |
Net expenses | | | 16,098,533 | |
|
| |
Net investment income | | | 59,141,197 | |
|
| |
| |
Realized and unrealized gain (loss) from: | | | | |
| |
Net realized gain (loss) from: | | | | |
Unaffiliated investment securities (includes net gains (losses) from securities sold to affiliates of $(2,258,596)) | | | (67,635,321 | ) |
|
| |
Futures contracts | | | 5,782,940 | |
|
| |
| | | (61,852,381 | ) |
|
| |
Change in net unrealized appreciation (depreciation) of unaffiliated investment securities | | | (125,342,440 | ) |
|
| |
Net realized and unrealized gain (loss) | | | (187,194,821 | ) |
|
| |
Net increase (decrease) in net assets resulting from operations | | $ | (128,053,624 | ) |
|
| |
See accompanying Notes to Financial Statements which are an integral part of the financial statements.
| | |
| 35 | | Invesco Intermediate Term Municipal Income Fund |
Statement of Changes in Net Assets
For the years ended February 28, 2023 and 2022
| | | | | | | | | | |
| | | 2023 | | | | | 2022 | |
|
| |
Operations: | | | | | | | | | | |
| | | |
Net investment income | | $ | 59,141,197 | | | | | $ | 51,662,534 | |
|
| |
Net realized gain (loss) | | | (61,852,381 | ) | | | | | (3,658,650 | ) |
|
| |
Change in net unrealized appreciation (depreciation) | | | (125,342,440 | ) | | | | | (61,500,228 | ) |
|
| |
Net increase (decrease) in net assets resulting from operations | | | (128,053,624 | ) | | | | | (13,496,344 | ) |
|
| |
| | | |
Distributions to shareholders from distributable earnings: | | | | | | | | | | |
| | | |
Class A | | | (36,139,563 | ) | | | | | (34,656,995 | ) |
|
| |
Class C | | | (1,353,317 | ) | | | | | (1,581,852 | ) |
|
| |
Class Y | | | (16,364,876 | ) | | | | | (16,132,588 | ) |
|
| |
Class R6 | | | (18,717 | ) | | | | | (113,885 | ) |
|
| |
Total distributions from distributable earnings | | | (53,876,473 | ) | | | | | (52,485,320 | ) |
|
| |
| | | |
Share transactions-net: | | | | | | | | | | |
| | | |
Class A | | | (152,597,556 | ) | | | | | 221,659,532 | |
|
| |
Class C | | | (20,457,744 | ) | | | | | (22,934,407 | ) |
|
| |
Class Y | | | (96,150,845 | ) | | | | | 127,601,982 | |
|
| |
Class R6 | | | (3,497,421 | ) | | | | | (503,442 | ) |
|
| |
Net increase (decrease) in net assets resulting from share transactions | | | (272,703,566 | ) | | | | | 325,823,665 | |
|
| |
Net increase (decrease) in net assets | | | (454,633,663 | ) | | | | | 259,842,001 | |
|
| |
| | | |
Net assets: | | | | | | | | | | |
| | | |
Beginning of year | | | 2,360,649,318 | | | | | | 2,100,807,317 | |
|
| |
End of year | | $ | 1,906,015,655 | | | | | $ | 2,360,649,318 | |
|
| |
See accompanying Notes to Financial Statements which are an integral part of the financial statements.
| | |
| 36 | | Invesco Intermediate Term Municipal Income Fund |
Financial Highlights
The following schedule presents financial highlights for a share of the Fund outstanding throughout the periods indicated.
| | | | | | | | | | | | | | | | | | | | | | | | | | | | | | | | | | | | | | | | | | | | | | | | | | | | |
| | | Net asset value, beginning of period | | Net investment income(a) | | Net gains (losses) on securities (both realized and unrealized) | | Total from investment operations | | Dividends from net investment income | | Net asset value, end of period | | Total return (b) | | Net assets, end of period (000’s omitted) | | Ratio of expenses to average net assets with fee waivers and/or expenses absorbed | | Ratio of expenses to average net assets without fee waivers and/or expenses absorbed | | Supplemental ratio of expenses to average net assets with fee waivers (excluding interest, facilities and maintenance fees) | | Ratio of net investment income to average net assets | | Portfolio turnover (c) |
Class A | | | | | | | | | | | | | | | | | | | | | | | | | | | | | | | | | | | | | | | | | | | | | | | | | | | | |
Year ended 02/28/23 | | | $11.12 | | | | $0.30 | | | | $(0.90 | ) | | | $(0.60 | ) | | | $(0.27 | ) | | | $10.25 | | | | (5.37 | )% | | | $1,313,246 | | | | 0.83 | % | | | 0.83 | % | | | 0.76 | % | | | 2.86 | % | | | 37 | % |
Year ended 02/28/22 | | | 11.41 | | | | 0.25 | | | | (0.28 | ) | | | (0.03 | ) | | | (0.26 | ) | | | 11.12 | | | | (0.33 | ) | | | 1,588,653 | | | | 0.79 | | | | 0.79 | | | | 0.74 | | | | 2.21 | | | | 11 | |
Year ended 02/28/21 | | | 11.66 | | | | 0.29 | | | | (0.25 | ) | | | 0.04 | | | | (0.29 | ) | | | 11.41 | | | | 0.39 | | | | 1,411,258 | | | | 0.82 | | | | 0.82 | | | | 0.79 | | | | 2.62 | | | | 26 | |
Year ended 02/29/20 | | | 11.02 | | | | 0.29 | | | | 0.66 | | | | 0.95 | | | | (0.31 | ) | | | 11.66 | | | | 8.75 | | | | 1,114,423 | | | | 0.89 | | | | 0.89 | | | | 0.84 | | | | 2.56 | | | | 11 | |
Year ended 02/28/19 | | | 10.99 | | | | 0.31 | | | | 0.03 | | | | 0.34 | | | | (0.31 | ) | | | 11.02 | | | | 3.19 | | | | 848,116 | | | | 0.88 | | | | 0.91 | | | | 0.84 | | | | 2.85 | | | | 27 | |
Class C | | | | | | | | | | | | | | | | | | | | | | | | | | | | | | | | | | | | | | | | | | | | | | | | | | | | |
Year ended 02/28/23 | | | 11.09 | | | | 0.22 | | | | (0.90 | ) | | | (0.68 | ) | | | (0.19 | ) | | | 10.22 | | | | (6.11 | ) | | | 63,378 | | | | 1.58 | | | | 1.58 | | | | 1.51 | | | | 2.11 | | | | 37 | |
Year ended 02/28/22 | | | 11.38 | | | | 0.17 | | | | (0.29 | ) | | | (0.12 | ) | | | (0.17 | ) | | | 11.09 | | | | (1.08 | ) | | | 90,660 | | | | 1.54 | | | | 1.54 | | | | 1.49 | | | | 1.46 | | | | 11 | |
Year ended 02/28/21 | | | 11.62 | | | | 0.21 | | | | (0.25 | ) | | | (0.04 | ) | | | (0.20 | ) | | | 11.38 | | | | (0.27 | ) | | | 115,826 | | | | 1.57 | | | | 1.57 | | | | 1.54 | | | | 1.87 | | | | 26 | |
Year ended 02/29/20 | | | 10.99 | | | | 0.20 | | | | 0.66 | | | | 0.86 | | | | (0.23 | ) | | | 11.62 | | | | 7.87 | | | | 145,443 | | | | 1.64 | | | | 1.64 | | | | 1.59 | | | | 1.81 | | | | 11 | |
Year ended 02/28/19 | | | 10.96 | | | | 0.23 | | | | 0.03 | | | | 0.26 | | | | (0.23 | ) | | | 10.99 | | | | 2.42 | | | | 106,166 | | | | 1.63 | | | | 1.66 | | | | 1.59 | | | | 2.10 | | | | 27 | |
Class Y | | | | | | | | | | | | | | | | | | | | | | | | | | | | | | | | | | | | | | | | | | | | | | | | | | | | |
Year ended 02/28/23 | | | 11.11 | | | | 0.32 | | | | (0.89 | ) | | | (0.57 | ) | | | (0.30 | ) | | | 10.24 | | | | (5.14 | ) | | | 528,911 | | | | 0.58 | | | | 0.58 | | | | 0.51 | | | | 3.11 | | | | 37 | |
Year ended 02/28/22 | | | 11.40 | | | | 0.28 | | | | (0.28 | ) | | | 0.00 | | | | (0.29 | ) | | | 11.11 | | | | (0.08 | ) | | | 677,149 | | | | 0.54 | | | | 0.54 | | | | 0.49 | | | | 2.46 | | | | 11 | |
Year ended 02/28/21 | | | 11.65 | | | | 0.32 | | | | (0.25 | ) | | | 0.07 | | | | (0.32 | ) | | | 11.40 | | | | 0.64 | | | | 568,900 | | | | 0.57 | | | | 0.57 | | | | 0.54 | | | | 2.87 | | | | 26 | |
Year ended 02/29/20 | | | 11.02 | | | | 0.32 | | | | 0.65 | | | | 0.97 | | | | (0.34 | ) | | | 11.65 | | | | 8.93 | | | | 492,202 | | | | 0.64 | | | | 0.64 | | | | 0.59 | | | | 2.81 | | | | 11 | |
Year ended 02/28/19 | | | 10.98 | | | | 0.34 | | | | 0.04 | | | | 0.38 | | | | (0.34 | ) | | | 11.02 | | | | 3.54 | | | | 413,274 | | | | 0.63 | | | | 0.66 | | | | 0.59 | | | | 3.10 | | | | 27 | |
Class R6 | | | | | | | | | | | | | | | | | | | | | | | | | | | | | | | | | | | | | | | | | | | | | | | | | | | | |
Year ended 02/28/23 | | | 11.11 | | | | 0.35 | | | | (0.92 | ) | | | (0.57 | ) | | | (0.30 | ) | | | 10.24 | | | | (5.07 | ) | | | 481 | | | | 0.51 | | | | 0.51 | | | | 0.44 | | | | 3.18 | | | | 37 | |
Year ended 02/28/22 | | | 11.40 | | | | 0.29 | | | | (0.29 | ) | | | 0.00 | | | | (0.29 | ) | | | 11.11 | | | | (0.01 | ) | | | 4,187 | | | | 0.47 | | | | 0.47 | | | | 0.42 | | | | 2.53 | | | | 11 | |
Year ended 02/28/21 | | | 11.65 | | | | 0.33 | | | | (0.26 | ) | | | 0.07 | | | | (0.32 | ) | | | 11.40 | | | | 0.72 | | | | 4,823 | | | | 0.49 | | | | 0.49 | | | | 0.46 | | | | 2.95 | | | | 26 | |
Year ended 02/29/20 | | | 11.01 | | | | 0.32 | | | | 0.66 | | | | 0.98 | | | | (0.34 | ) | | | 11.65 | | | | 9.03 | | | | 4,268 | | | | 0.64 | | | | 0.64 | | | | 0.59 | | | | 2.81 | | | | 11 | |
Year ended 02/28/19 | | | 10.97 | | | | 0.34 | | | | 0.04 | | | | 0.38 | | | | (0.34 | ) | | | 11.01 | | | | 3.54 | | | | 10 | | | | 0.63 | | | | 0.67 | | | | 0.59 | | | | 3.10 | | | | 27 | |
| (a) | Calculated using average shares outstanding. |
| (b) | Includes adjustments in accordance with accounting principles generally accepted in the United States of America and as such, the net asset value for financial reporting purposes and the returns based upon those net asset values may differ from the net asset value and returns for shareholder transactions. Does not include sales charges and is not annualized for periods less than one year, if applicable. |
| (c) | Portfolio turnover is calculated at the fund level and is not annualized for periods less than one year, if applicable. For the year ended February 28, 2021, the portfolio turnover calculation excludes the value of securities purchased of $201,465,106 in connection with the acquisition of Invesco Oppenheimer Intermediate Term Municipal Fund into the Fund. |
See accompanying Notes to Financial Statements which are an integral part of the financial statements.
| | |
| 37 | | Invesco Intermediate Term Municipal Income Fund |
Notes to Financial Statements
February 28, 2023
NOTE 1–Significant Accounting Policies
Invesco Intermediate Term Municipal Income Fund (the “Fund”) is a series portfolio of AIM Tax-Exempt Funds (Invesco Tax-Exempt Funds) (the “Trust”). The Trust is a Delaware statutory trust registered under the Investment Company Act of 1940, as amended (the “1940 Act”), as an open-end series management investment company authorized to issue an unlimited number of shares of beneficial interest. Information presented in these financial statements pertains only to the Fund. Matters affecting the Fund or each class will be voted on exclusively by the shareholders of the Fund or each class.
The Fund’s investment objective is to provide investors with a high level of current income exempt from federal income tax, consistent with preservation of capital.
The Fund currently consists of four different classes of shares: Class A, Class C, Class Y and Class R6. Class Y shares are available only to certain investors. Class A shares are sold with a front-end sales charge unless certain waiver criteria are met. Under certain circumstances, load waived shares may be subject to contingent deferred sales charges (“CDSC”). Class C shares are sold with a CDSC. Class Y and Class R6 shares are sold at net asset value. Class C shares held for eight years after purchase are eligible for automatic conversion into Class A shares of the same Fund (the “Conversion Feature”). The automatic conversion pursuant to the Conversion Feature will generally occur at the end of the month following the eighth anniversary after a purchase of Class C shares.
The Fund is an investment company and accordingly follows the investment company accounting and reporting guidance in accordance with Financial Accounting Standards Board Accounting Standards Codification Topic 946, Financial Services - Investment Companies.
The following is a summary of the significant accounting policies followed by the Fund in the preparation of its financial statements.
| A. | Security Valuations - Securities, including restricted securities, are valued according to the following policy. |
Securities generally normally are valued on the basis of prices provided by independent pricing services. Prices provided by the pricing service may be determined without exclusive reliance on quoted prices, and may reflect appropriate factors such as institution-size trading in similar groups of securities, developments related to specific securities, dividend rate (for unlisted equities), yield (for debt obligations), quality, type of issue, coupon rate (for debt obligations), maturity (for debt obligations), individual trading characteristics and other market data. Pricing services generally value debt obligations assuming orderly transactions of institutional round lot size, but a fund may hold or transact in the same securities in smaller, odd lot sizes. Odd lots often trade at lower prices than institutional round lots, and their value may be adjusted accordingly. Debt obligations are subject to interest rate and credit risks. In addition, all debt obligations involve some risk of default with respect to interest and/or principal payments.
A security listed or traded on an exchange is generally valued at its trade price or official closing price that day as of the close of the exchange where the security is principally traded, or lacking any sales or official closing price on a particular day, the security may be valued at the closing bid price on that day. Securities traded in the over-the-counter market are valued based on prices furnished by independent pricing services or market makers. When such securities are valued using prices provided by an independent pricing service they may be considered fair valued. Futures contracts are valued at the daily settlement price set by an exchange on which they are principally traded. U.S. exchange-traded options are valued at the mean between the last bid and asked prices from the exchange on which they are principally traded. Non-U.S. exchange-traded options are valued at the final settlement price set by the exchange on which they trade. Options not listed on an exchange and swaps generally are valued using pricing provided from independent pricing services.
Securities for which market quotations are not readily available are fair valued by Invesco Advisers, Inc. (the “Adviser” or “Invesco”) in accordance with Board-approved policies and related Adviser procedures (“Valuation Procedures”). If a fair value price provided by a pricing service is not representative of market value in the Adviser’s judgment (“unreliable”), the Adviser will fair value the security using the Valuation Procedures. Issuer specific events, market trends, bid/asked quotes of brokers and information providers and other market data may be reviewed in the course of making a good faith determination of a security’s fair value.
The Fund may invest in securities that are subject to interest rate risk, meaning the risk that the prices will generally fall as interest rates rise and, conversely, the prices will generally rise as interest rates fall. Specific securities differ in their sensitivity to changes in interest rates depending on their individual characteristics. Changes in interest rates may result in increased market volatility, which may affect the value and/or liquidity of certain Fund investments.
Valuations change in response to many factors including the historical and prospective earnings of the issuer, the value of the issuer’s assets, general market conditions which are not specifically related to the particular issuer, such as real or perceived adverse economic conditions, changes in the general outlook for revenues or corporate earnings, changes in interest or currency rates, regional or global instability, natural or environmental disasters, widespread disease or other public health issues, war, acts of terrorism, significant governmental actions or adverse investor sentiment generally and market liquidity. Because of the inherent uncertainties of valuation, the values reflected in the financial statements may materially differ from the value received upon actual sale of those investments.
The price the Fund could receive upon the sale of any investment may differ from the Adviser’s valuation of the investment, particularly for securities that are valued using a fair valuation technique. When fair valuation techniques are applied, the Adviser uses available information, including both observable and unobservable inputs and assumptions, to determine a methodology that will result in a valuation that the Adviser believes approximates market value. Fund securities that are fair valued may be subject to greater fluctuation in their value from one day to the next than would be the case if market quotations were used. Because of the inherent uncertainties of valuation, and the degree of subjectivity in such decisions, the Fund could realize a greater or lesser than expected gain or loss upon the sale of the investment.
| B. | Securities Transactions and Investment Income - Securities transactions are accounted for on a trade date basis. Realized gains or losses on sales are computed on the basis of specific identification of the securities sold. Interest income (net of withholding tax, if any) is recorded on an accrual basis from settlement date and includes coupon interest and amortization of premium and accretion of discount on debt securities as applicable. Pay-in-kind interest income and non-cash dividend income received in the form of securities in-lieu of cash are recorded at the fair value of the securities received. Dividend income (net of withholding tax, if any) is recorded on the ex-dividend date. |
The Fund may periodically participate in litigation related to Fund investments. As such, the Fund may receive proceeds from litigation settlements. Any proceeds received are included in the Statement of Operations as realized gain (loss) for investments no longer held and as unrealized gain (loss) for investments still held.
Brokerage commissions and mark ups are considered transaction costs and are recorded as an increase to the cost basis of securities purchased and/or a reduction of proceeds on a sale of securities. Such transaction costs are included in the determination of net realized and unrealized gain (loss) from investment securities reported in the Statement of Operations and the Statement of Changes in Net Assets and the net realized and unrealized gains (losses) on securities per share in the Financial Highlights. Transaction costs are included in the calculation of the Fund’s net asset value and, accordingly, they reduce the Fund’s total returns. These transaction costs are not considered operating expenses and are not reflected in net investment income reported in the Statement of Operations and the Statement of Changes in Net Assets, or the net investment income per share and the ratios of expenses and net investment income reported in the Financial Highlights, nor are they limited by any expense limitation arrangements between the Fund and the investment adviser.
The Fund allocates realized and unrealized capital gains and losses to a class based on the relative net assets of each class. The Fund allocates income to a class based on the relative value of the settled shares of each class.
| C. | Country Determination - For the purposes of making investment selection decisions and presentation in the Schedule of Investments, the investment adviser may determine the country in which an issuer is located and/or credit risk exposure based on various factors. These factors include the laws of the country under |
| | |
| 38 | | Invesco Intermediate Term Municipal Income Fund |
| | which the issuer is organized, where the issuer maintains a principal office, the country in which the issuer derives 50% or more of its total revenues, the country that has the primary market for the issuer’s securities and its “country of risk” as determined by a third party service provider, as well as other criteria. Among the other criteria that may be evaluated for making this determination are the country in which the issuer maintains 50% or more of its assets, the type of security, financial guarantees and enhancements, the nature of the collateral and the sponsor organization. Country of issuer and/or credit risk exposure has been determined to be the United States of America, unless otherwise noted. |
| D. | Distributions - Distributions from net investment income, if any, are declared daily and paid monthly. Distributions from net realized capital gain, if any, are generally declared and paid annually and recorded on the ex-dividend date. The Fund may elect to treat a portion of the proceeds from redemptions as distributions for federal income tax purposes. |
| E. | Federal Income Taxes - The Fund intends to comply with the requirements of Subchapter M of the Internal Revenue Code of 1986, as amended (the “Internal Revenue Code”), necessary to qualify as a regulated investment company and to distribute substantially all of the Fund’s taxable and tax-exempt earnings to shareholders. As such, the Fund will not be subject to federal income taxes on otherwise taxable income (including net realized capital gain) that is distributed to shareholders. Therefore, no provision for federal income taxes is recorded in the financial statements. |
The Fund recognizes the tax benefits of uncertain tax positions only when the position is more likely than not to be sustained. Management has analyzed the Fund’s uncertain tax positions and concluded that no liability for unrecognized tax benefits should be recorded related to uncertain tax positions. Management is not aware of any tax positions for which it is reasonably possible that the total amounts of unrecognized tax benefits will change materially in the next 12 months.
In addition, the Fund intends to invest in such municipal securities to allow it to qualify to pay shareholders “exempt-interest dividends”, as defined in the Internal Revenue Code.
The Fund files tax returns in the U.S. Federal jurisdiction and certain other jurisdictions. Generally, the Fund is subject to examinations by such taxing authorities for up to three years after the filing of the return for the tax period.
| F. | Expenses - Fees provided for under the Rule 12b-1 plan of a particular class of the Fund are charged to the operations of such class. Transfer agency fees and expenses and other shareholder recordkeeping fees and expenses attributable to Class R6 are charged to such class. Transfer agency fees and expenses and other shareholder recordkeeping fees and expenses relating to all other classes are allocated among those classes based on relative net assets. All other expenses are allocated among the classes based on relative net assets. |
| G. | Interest, Facilities and Maintenance Fees - Interest, Facilities and Maintenance Fees include interest and related borrowing costs such as commitment fees, administrative expenses and other expenses associated with establishing and maintaining the line of credit. In addition, interest and administrative expenses related to establishing and maintaining floating rate note obligations, if any, are included. |
| H. | Accounting Estimates - The preparation of financial statements in conformity with accounting principles generally accepted in the United States of America (“GAAP”) requires management to make estimates and assumptions that affect the reported amounts of assets and liabilities at the date of the financial statements and the reported amounts of revenues and expenses during the reporting period including estimates and assumptions related to taxation. Actual results could differ from those estimates by a significant amount. In addition, the Fund monitors for material events or transactions that may occur or become known after the period-end date and before the date the financial statements are released to print. |
| I. | Indemnifications - Under the Trust’s organizational documents, each Trustee, officer, employee or other agent of the Trust is indemnified against certain liabilities that may arise out of the performance of their duties to the Fund. Additionally, in the normal course of business, the Fund enters into contracts, including the Fund’s servicing agreements, that contain a variety of indemnification clauses. The Fund’s maximum exposure under these arrangements is unknown as this would involve future claims that may be made against the Fund that have not yet occurred. The risk of material loss as a result of such indemnification claims is considered remote. |
| J. | Floating Rate Note Obligations - The Fund invests in inverse floating rate securities, such as Tender Option Bonds (“TOBs”), for investment purposes and to enhance the yield of the Fund. Such securities may be purchased in the secondary market without first owning an underlying bond but generally are created through the sale of fixed rate bonds by the Fund to special purpose trusts established by a broker dealer or by the Fund (“TOB Trusts”) in exchange for cash and residual interests in the TOB Trusts’ assets and cash flows, which are in the form of inverse floating rate securities. The TOB Trusts finance the purchases of the fixed rate bonds by issuing floating rate notes to third parties and allowing the Fund to retain residual interests in the bonds. The floating rate notes issued by the TOB Trusts have interest rates that reset weekly and the floating rate note holders have the option to tender their notes to the TOB Trusts for redemption at par at each reset date. The residual interests held by the Fund (inverse floating rate securities) include the right of the Fund (1) to cause the holders of the floating rate notes to tender their notes at par at the next interest rate reset date, and (2) to transfer the municipal bond from the TOB Trust to the Fund, thereby collapsing the TOB Trust. Inverse floating rate securities tend to underperform the market for fixed rate bonds in a rising interest rate environment, but tend to outperform the market for fixed rate bonds when interest rates decline or remain relatively stable. |
The Fund generally invests in inverse floating rate securities that include embedded leverage, thus exposing the Fund to greater risks and increased costs. The primary risks associated with inverse floating rate securities are varying degrees of liquidity and decreases in the value of such securities in response to changes in interest rates to a greater extent than fixed rate securities having similar credit quality, redemption provisions and maturity, which may cause the Fund’s net asset value to be more volatile than if it had not invested in inverse floating rate securities. In certain instances, the short-term floating rate notes created by the TOB Trust may not be able to be sold to third parties or, in the case of holders tendering (or putting) such notes for repayment of principal, may not be able to be remarketed to third parties. In such cases, the TOB Trust holding the fixed rate bonds may be collapsed with the entity that contributed the fixed rate bonds to the TOB Trust. In the case where a TOB Trust is collapsed with the Fund, the Fund will be required to repay the principal amount of the tendered securities, which may require the Fund to sell other portfolio holdings to raise cash to meet that obligation. The Fund could therefore be required to sell other portfolio holdings at a disadvantageous time or price to raise cash to meet this obligation, which risk will be heightened during times of market volatility, illiquidity or uncertainty. The embedded leverage in the TOB Trust could cause the Fund to lose more money than the value of the asset it has contributed to the TOB Trust and greater levels of leverage create the potential for greater losses. In addition, a Fund may enter into reimbursement agreements with the liquidity provider of certain TOB transactions in connection with certain residuals held by the Fund. These agreements commit a Fund to reimburse the liquidity provider to the extent that the liquidity provider must provide cash to a TOB Trust, including following the termination of a TOB Trust resulting from a mandatory tender event (“liquidity shortfall”). The reimbursement agreement will effectively make the Fund liable for the amount of the negative difference, if any, between the liquidation value of the underlying security and the purchase price of the floating rate notes issued by the TOB Trust.
The Fund accounts for the transfer of fixed rate bonds to the TOB Trusts as secured borrowings, with the securities transferred remaining in the Fund’s investment assets, and the related floating rate notes reflected as Fund liabilities under the caption Floating rate note obligations on the Statement of Assets and Liabilities. The carrying amount of the Fund’s floating rate note obligations as reported on the Statement of Assets and Liabilities approximates its fair value. The Fund records the interest income from the fixed rate bonds under the caption Interest and records the expenses related to floating rate obligations and any administrative expenses of the TOB Trusts as a component of Interest, facilities and maintenance fees on the Statement of Operations.
Final rules implementing section 619 of the Dodd-Frank Wall Street Reform and Consumer Protection Act (the “Volcker Rule”) prohibit banking entities from engaging in proprietary trading of certain instruments and limit such entities’ investments in, and relationships with, “covered funds”, as defined in the rules. These rules preclude banking entities and their affiliates from sponsoring and/or providing services for existing TOB Trusts. A new TOB structure is being utilized by the Fund wherein the Fund, as holder of the residuals, will perform certain duties previously performed by banking entities as “sponsors” of TOB Trusts. These duties may be performed by a third-party service provider. The Fund’s expanded role under the new TOB structure may increase its operational and regulatory risk. The new structure is substantially similar to the previous structure; however, pursuant to the Volcker Rule, the remarketing agent would not be able to repurchase
| | |
| 39 | | Invesco Intermediate Term Municipal Income Fund |
tendered floaters for its own account upon a failed remarketing. In the event of a failed remarketing, a banking entity serving as liquidity provider may loan the necessary funds to the TOB Trust to purchase the tendered floaters. The TOB Trust, not the Fund, would be the borrower and the loan from the liquidity provider will be secured by the purchased floaters now held by the TOB Trust. However, as previously described, the Fund would bear the risk of loss with respect to any liquidity shortfall to the extent it entered into a reimbursement agreement with the liquidity provider.
Further, the SEC and various banking agencies have adopted rules implementing credit risk retention requirements for asset-backed securities (the “Risk Retention Rules”). The Risk Retention Rules require the sponsor of a TOB Trust to retain at least 5% of the credit risk of the underlying assets supporting the TOB Trust’s municipal bonds. The Fund has adopted policies intended to comply with the Risk Retention Rules. The Risk Retention Rules may adversely affect the Fund’s ability to engage in TOB Trust transactions or increase the costs of such transactions in certain circumstances.
There can be no assurances that the new TOB structure will continue to be a viable form of leverage. Further, there can be no assurances that alternative forms of leverage will be available to the Fund in order to maintain current levels of leverage. Any alternative forms of leverage may be less advantageous to the Fund, and may adversely affect the Fund’s net asset value, distribution rate and ability to achieve its investment objective.
TOBs are presently classified as private placement securities. Private placement securities are subject to restrictions on resale because they have not been registered under the Securities Act of 1933, as amended (the “1933 Act”), or are otherwise not readily marketable. As a result of the absence of a public trading market for these securities, they may be less liquid than publicly traded securities. Although atypical, these securities may be resold in privately negotiated transactions, the prices realized from these sales could be less than those originally paid by the Fund or less than what may be considered the fair value of such securities.
| K. | Futures Contracts - The Fund may enter into futures contracts to manage exposure to interest rate, equity and market price movements and/or currency risks. A futures contract is an agreement between two parties (“Counterparties”) to purchase or sell a specified underlying security, currency or commodity (or delivery of a cash settlement price, in the case of an index future) for a fixed price at a future date. The Fund currently invests only in exchange-traded futures and they are standardized as to maturity date and underlying financial instrument. Initial margin deposits required upon entering into futures contracts are satisfied by the segregation of specific securities or cash as collateral at the futures commission merchant (broker). During the period the futures contracts are open, changes in the value of the contracts are recognized as unrealized gains or losses by recalculating the value of the contracts on a daily basis. Subsequent or variation margin payments are received or made depending upon whether unrealized gains or losses are incurred. These amounts are reflected as receivables or payables on the Statement of Assets and Liabilities. When the contracts are closed or expire, the Fund recognizes a realized gain or loss equal to the difference between the proceeds from, or cost of, the closing transaction and the Fund’s basis in the contract. The net realized gain (loss) and the change in unrealized gain (loss) on futures contracts held during the period is included on the Statement of Operations. The primary risks associated with futures contracts are market risk and the absence of a liquid secondary market. If the Fund were unable to liquidate a futures contract and/or enter into an offsetting closing transaction, the Fund would continue to be subject to market risk with respect to the value of the contracts and continue to be required to maintain the margin deposits on the futures contracts. Futures contracts have minimal Counterparty risk since the exchange’s clearinghouse, as Counterparty to all exchange-traded futures, guarantees the futures against default. Risks may exceed amounts recognized in the Statement of Assets and Liabilities. |
| L. | Other Risks - The value of, payment of interest on, repayment of principal for and the ability to sell a municipal security may be affected by constitutional amendments, legislative enactments, executive orders, administrative regulations, voter initiatives and the economics of the regions in which the issuers are located. Since many municipal securities are issued to finance similar projects, especially those relating to education, health care, transportation and utilities, conditions in those sectors can affect the overall municipal securities market and the Fund’s investments in municipal securities. There is some risk that a portion or all of the interest received from certain tax-free municipal securities could become taxable as a result of determinations by the Internal Revenue Service. |
Increases in the federal funds and equivalent foreign rates or other changes to monetary policy or regulatory actions may expose fixed income markets to heightened volatility and reduced liquidity for certain fixed income investments, particularly those with longer maturities. It is difficult to predict the impact of interest rate changes on various markets. In addition, decreases in fixed income dealer market-making capacity may also potentially lead to heightened volatility and reduced liquidity in the fixed income markets. As a result, the value of the Fund’s investments and share price may decline. Changes in central bank policies could also result in higher than normal redemptions by shareholders, which could potentially increase the Fund’s portfolio turnover rate and transaction costs.
Policy changes by the U.S. government or its regulatory agencies and political events within the U.S. and abroad may, among other things, affect investor and consumer confidence and increase volatility in the financial markets, perhaps suddenly and to a significant degree, which may adversely impact the Fund’s operations, universe of potential investment options, and return potential.
| M. | COVID-19 Risk - The COVID-19 strain of coronavirus has resulted in instances of market closures and dislocations, extreme volatility, liquidity constraints and increased trading costs. Efforts to contain its spread have resulted in travel restrictions, disruptions of healthcare systems, business operations (including business closures) and supply chains, layoffs, lower consumer demand and employee availability, and defaults and credit downgrades, among other significant economic impacts that have disrupted global economic activity across many industries. Such economic impacts may exacerbate other pre-existing political, social and economic risks locally or globally and cause general concern and uncertainty. The full economic impact and ongoing effects of COVID-19 (or other future epidemics or pandemics) at the macro-level and on individual businesses are unpredictable and may result in significant and prolonged effects on the Fund’s performance. |
NOTE 2–Advisory Fees and Other Fees Paid to Affiliates
The Trust has entered into a master investment advisory agreement with the Adviser. Under the terms of the investment advisory agreement, the Fund accrues daily and pays monthly an advisory fee to the Adviser based on the annual rate of the Fund’s average daily net assets as follows:
| | | | |
| Average Daily Net Assets | | Rate | |
|
| |
First $500 million | | | 0.500% | |
|
| |
Next $250 million | | | 0.450% | |
|
| |
Next $250 million | | | 0.425% | |
|
| |
Over $1 billion | | | 0.333% | |
|
| |
For the year ended February 28, 2023, the effective advisory fee rate incurred by the Fund was 0.40%.
Under the terms of a master sub-advisory agreement between the Adviser and each of Invesco Asset Management Deutschland GmbH, Invesco Asset Management Limited, Invesco Asset Management (Japan) Limited, Invesco Hong Kong Limited, Invesco Senior Secured Management, Inc. and Invesco Canada Ltd. and separate sub-advisory agreements with Invesco Capital Management LLC and Invesco Asset Management (India) Private Limited (collectively, the “Affiliated Sub-Advisers”) the Adviser, not the Fund, will pay 40% of the fees paid to the Adviser to any such Affiliated Sub-Adviser(s) that provide(s) discretionary investment management services to the Fund based on the percentage of assets allocated to such Affiliated Sub-Adviser(s).
The Adviser has contractually agreed, through at least June 30, 2023, to waive advisory fees and/or reimburse expenses of all shares to the extent necessary to limit total annual fund operating expenses after fee waiver and/or expense reimbursement (excluding certain items discussed below) of Class A, Class C, Class Y and Class R6 shares to 1.50%, 2.25%, 1.25% and 1.25%, respectively, of the Fund’s average daily net assets (the “expense limits”). In determining the Adviser’s obligation to waive advisory fees and/or reimburse expenses, the following expenses are not taken into account, and could cause the total annual fund operating
| | |
| 40 | | Invesco Intermediate Term Municipal Income Fund |
expenses after fee waiver and/or expense reimbursement to exceed the numbers reflected above: (1) interest, facilities and maintenance fees; (2) taxes; (3) dividend expense on short sales; (4) extraordinary or non-routine items, including litigation expenses; and (5) expenses that the Fund has incurred but did not actually pay because of an expense offset arrangement. Unless Invesco continues the fee waiver agreement, it will terminate on June 30, 2023. During its term, the fee waiver agreement cannot be terminated or amended to increase the expense limits or reduce the advisory fee waiver without approval of the Board of Trustees. The Adviser did not waive fees and/or reimburse expenses during the period under these expense limits.
The Trust has entered into a master administrative services agreement with Invesco pursuant to which the Fund has agreed to pay Invesco for certain administrative costs incurred in providing accounting services to the Fund. For the year ended February 28, 2023, expenses incurred under the agreement are shown in the Statement of Operations as Administrative services fees. Invesco has entered into a sub-administration agreement whereby State Street Bank and Trust Company (“SSB”) serves as fund accountant and provides certain administrative services to the Fund. Pursuant to a custody agreement with the Trust on behalf of the Fund, SSB also serves as the Fund’s custodian.
The Trust has entered into a transfer agency and service agreement with Invesco Investment Services, Inc. (“IIS”) pursuant to which the Fund has agreed to pay IIS a fee for providing transfer agency and shareholder services to the Fund and reimburse IIS for certain expenses incurred by IIS in the course of providing such services. IIS may make payments to intermediaries that provide omnibus account services, sub-accounting services and/or networking services. All fees payable by IIS to intermediaries that provide omnibus account services or sub-accounting services are charged back to the Fund, subject to certain limitations approved by the Trust’s Board of Trustees. For the year ended February 28, 2023, expenses incurred under the agreement are shown in the Statement of Operations as Transfer agent fees.
The Trust has entered into master distribution agreements with Invesco Distributors, Inc. (“IDI”) to serve as the distributor for the Class A, Class C, Class Y and Class R6 shares of the Fund. The Trust has adopted plans pursuant to Rule 12b-1 under the 1940 Act with respect to the Fund’s Class A and Class C shares (collectively, the “Plans”). The Fund, pursuant to the Plans, reimburses IDI for its allocated share of expenses incurred for the period, up to a maximum annual rate of 0.25% of the average daily net assets of Class A shares and up to a maximum annual rate of 1.00% of the average daily net assets of Class C shares. The fees are accrued daily and paid monthly. Of the Plan payments, up to 0.25% of the average daily net assets of each class of shares may be paid to furnish continuing personal shareholder services to customers who purchase and own shares of such classes. Any amounts not paid as a service fee under the Plans would constitute an asset-based sales charge. Rules of the Financial Industry Regulatory Authority (“FINRA”) impose a cap on the total sales charges, including asset-based sales charges, that may be paid by any class of shares of the Fund. For the year ended February 28, 2023, expenses incurred under the Plans are shown in the Statement of Operations as Distribution fees.
Front-end sales commissions and CDSC (collectively, the “sales charges”) are not recorded as expenses of the Fund. Front-end sales commissions are deducted from proceeds from the sales of Fund shares prior to investment in Class A shares of the Fund. CDSC are deducted from redemption proceeds prior to remittance to the shareholder. During the year ended February 28, 2023, IDI advised the Fund that IDI retained $25,687 in front-end sales commissions from the sale of Class A shares and $298,907 and $2,381 from Class A and Class C shares, respectively, for CDSC imposed upon redemptions by shareholders.
Certain officers and trustees of the Trust are officers and directors of the Adviser, IIS and/or IDI.
NOTE 3–Additional Valuation Information
GAAP defines fair value as the price that would be received to sell an asset or paid to transfer a liability in an orderly transaction between market participants at the measurement date, under current market conditions. GAAP establishes a hierarchy that prioritizes the inputs to valuation methods, giving the highest priority to readily available unadjusted quoted prices in an active market for identical assets (Level 1) and the lowest priority to significant unobservable inputs (Level 3), generally when market prices are not readily available. Based on the valuation inputs, the securities or other investments are tiered into one of three levels. Changes in valuation methods may result in transfers in or out of an investment’s assigned level:
| | |
| Level 1 - | | Prices are determined using quoted prices in an active market for identical assets. |
| Level 2 - | | Prices are determined using other significant observable inputs. Observable inputs are inputs that other market participants may use in pricing a security. These may include quoted prices for similar securities, interest rates, prepayment speeds, credit risk, yield curves, loss severities, default rates, discount rates, volatilities and others. |
| Level 3 - | | Prices are determined using significant unobservable inputs. In situations where quoted prices or observable inputs are unavailable (for example, when there is little or no market activity for an investment at the end of the period), unobservable inputs may be used. Unobservable inputs reflect the Adviser’s assumptions about the factors market participants would use in determining fair value of the securities or instruments and would be based on the best available information. |
As of February 28, 2023, all of the securities in this Fund were valued based on Level 2 inputs (see the Schedule of Investments for security categories). The level assigned to the securities valuations may not be an indication of the risk or liquidity associated with investing in those securities. Because of the inherent uncertainties of valuation, the values reflected in the financial statements may materially differ from the value received upon actual sale of those investments.
NOTE 4–Derivative Investments
The Fund may enter into an International Swaps and Derivatives Association Master Agreement (“ISDA Master Agreement”) under which a fund may trade OTC derivatives. An OTC transaction entered into under an ISDA Master Agreement typically involves a collateral posting arrangement, payment netting provisions and close-out netting provisions. These netting provisions allow for reduction of credit risk through netting of contractual obligations. The enforceability of the netting provisions of the ISDA Master Agreement depends on the governing law of the ISDA Master Agreement, among other factors.
For financial reporting purposes, the Fund does not offset OTC derivative assets or liabilities that are subject to ISDA Master Agreements in the Statement of Assets and Liabilities.
Effect of Derivative Investments for the year ended February 28, 2023
The table below summarizes the gains (losses) on derivative investments, detailed by primary risk exposure, recognized in earnings during the period:
| | | | |
| | | Location of Gain on
Statement of Operations | |
| | | Interest Rate Risk | |
|
| |
Realized Gain: | | | | |
Futures contracts | | | $5,782,940 | |
|
| |
| | |
| 41 | | Invesco Intermediate Term Municipal Income Fund |
The table below summarizes the average notional value of derivatives held during the period.
| | |
| | | Futures Contracts |
|
|
Average notional value | | $132,583,511 |
|
|
NOTE 5–Security Transactions with Affiliated Funds
The Fund is permitted to purchase securities from or sell securities to certain other affiliated funds under specified conditions outlined in procedures adopted by the Board of Trustees of the Trust. The procedures have been designed to ensure that any purchase or sale of securities by the Fund from or to another fund that is or could be considered an “affiliated person” by virtue of having a common investment adviser (or affiliated investment advisers), common Trustees and/or common officers is made in reliance on Rule 17a-7 of the 1940 Act and, to the extent applicable, related SEC staff positions. Each such transaction is effected at the security’s “current market price”, as provided for in these procedures and Rule 17a-7. Pursuant to these procedures, for the year ended February 28, 2023, the Fund engaged in securities purchases of $19,671,782 and securities sales of $66,611,372, which resulted in net realized gains (losses) of $(2,258,596).
NOTE 6–Expense Offset Arrangement(s)
The expense offset arrangement is comprised of transfer agency credits which result from balances in demand deposit accounts used by the transfer agent for clearing shareholder transactions. For the year ended February 28, 2023, the Fund received credits from this arrangement, which resulted in the reduction of the Fund’s total expenses of $977.
NOTE 7–Trustees’ and Officers’ Fees and Benefits
Trustees’ and Officers’ Fees and Benefits include amounts accrued by the Fund to pay remuneration to certain Trustees and Officers of the Fund. Trustees have the option to defer compensation payable by the Fund, and Trustees’ and Officers’ Fees and Benefits also include amounts accrued by the Fund to fund such deferred compensation amounts. Those Trustees who defer compensation have the option to select various Invesco Funds in which their deferral accounts shall be deemed to be invested. Finally, certain current Trustees were eligible to participate in a retirement plan that provided for benefits to be paid upon retirement to Trustees over a period of time based on the number of years of service. The Fund may have certain former Trustees who also participate in a retirement plan and receive benefits under such plan. Trustees’ and Officers’ Fees and Benefits include amounts accrued by the Fund to fund such retirement benefits. Obligations under the deferred compensation and retirement plans represent unsecured claims against the general assets of the Fund.
NOTE 8–Cash Balances and Borrowings
The Fund has entered into a revolving credit and security agreement, which enables the Fund to participate with certain other Invesco Funds in a committed secured borrowing facility that permits borrowings up to $2.5 billion, collectively by certain Invesco Funds, and which will expire on February 22, 2024. The revolving credit and security agreement is secured by the assets of the Fund. The Fund is subject to certain covenants relating to the revolving credit and security agreement. Failure to comply with these restrictions could cause the acceleration of the repayment of the amount outstanding under the revolving credit and security agreement.
During the year ended February 28, 2023, the average daily balance of borrowing under the revolving credit and security agreement was $829,041 with an average interest rate of 4.32%. The carrying amount of the Fund’s payable for borrowings as reported on the Statement of Assets and Liabilities approximates its fair value. Expenses under the revolving credit and security agreement are shown in the Statement of Operations as Interest, facilities and maintenance fees. At February 28, 2023, the Fund had no borrowings outstanding under this agreement.
Additionally, the Fund is permitted to temporarily carry a negative or overdrawn balance in its account with SSB, the custodian bank. Such balances, if any at period-end, are shown in the Statement of Assets and Liabilities under the payable caption Amount due custodian. To compensate the custodian bank for such overdrafts, the overdrawn Fund may either (1) leave funds as a compensating balance in the account so the custodian bank can be compensated by earning the additional interest; or (2) compensate by paying the custodian bank at a rate agreed upon by the custodian bank and Invesco, not to exceed the contractually agreed upon rate. The Fund may not purchase additional securities when any borrowings from banks or broker-dealers exceed 5% of the Fund’s total assets, or when any borrowings from an Invesco Fund are outstanding.
Inverse floating rate obligations resulting from the transfer of bonds to TOB Trusts are accounted for as secured borrowings. The average floating rate notes outstanding and average annual interest and fee rate related to inverse floating rate note obligations during the year ended February 28, 2023 were $27,720,385 and 2.15%, respectively.
NOTE 9–Distributions to Shareholders and Tax Components of Net Assets
Tax Character of Distributions to Shareholders Paid During the Fiscal Years Ended February 28, 2023 and 2022:
| | | | | | | | | | | | |
| | | |
| | | 2023 | | | | | | 2022 | |
|
| |
Ordinary income* | | $ | 323,669 | | | | | | | $ | – | |
|
| |
Ordinary income-tax-exempt | | | 53,552,804 | | | | | | | | 52,485,320 | |
|
| |
Total distributions | | $ | 53,876,473 | | | | | | | $ | 52,485,320 | |
|
| |
| * | Includes short-term capital gain distributions, if any. |
| | | | |
Tax Components of Net Assets at Period-End: | | | |
| |
| | | 2023 | |
|
| |
Undistributed tax-exempt income | | $ | 5,964,059 | |
|
| |
Net unrealized appreciation (depreciation) – investments | | | (68,766,259 | ) |
|
| |
Temporary book/tax differences | | | (73,013 | ) |
|
| |
Capital loss carryforward | | | (113,681,914 | ) |
|
| |
Shares of beneficial interest | | | 2,082,572,782 | |
|
| |
Total net assets | | $ | 1,906,015,655 | |
|
| |
| | |
| 42 | | Invesco Intermediate Term Municipal Income Fund |
The difference between book-basis and tax-basis unrealized appreciation (depreciation) is due to differences in the timing of recognition of gains and losses on investments for tax and book purposes. The Fund’s net unrealized appreciation (depreciation) difference is attributable primarily to wash sales, amortization and accretion on debt securities and defaulted bonds.
The temporary book/tax differences are a result of timing differences between book and tax recognition of income and/or expenses. The Fund’s temporary book/tax differences are the result of the trustee deferral of compensation and retirement plan benefits.
Capital loss carryforward is calculated and reported as of a specific date. Results of transactions and other activity after that date may affect the amount of capital loss carryforward actually available for the Fund to utilize. The ability to utilize capital loss carryforward in the future may be limited under the Internal Revenue Code and related regulations based on the results of future transactions.
The Fund has a capital loss carryforward as of February 28, 2023, as follows:
| | | | | | | | | | | | | | | | | | | | |
Capital Loss Carryforward* | |
| Expiration | | Short-Term | | | | | | Long-Term | | | | | | Total | |
|
| |
Not subject to expiration | | $ | 74,055,797 | | | | | | | $ | 39,626,117 | | | | | | | $ | 113,681,914 | |
|
| |
| * | Capital loss carryforward is reduced for limitations, if any, to the extent required by the Internal Revenue Code and may be further limited depending upon a variety of factors, including the realization of net unrealized gains or losses as of the date of any reorganization. |
NOTE 10–Investment Transactions
The aggregate amount of investment securities (other than short-term securities, U.S. Government obligations and money market funds, if any) purchased and sold by the Fund during the year ended February 28, 2023 was $742,111,112 and $878,759,666, respectively. Cost of investments, including any derivatives, on a tax basis includes the adjustments for financial reporting purposes as of the most recently completed federal income tax reporting period-end.
| | | | |
Unrealized Appreciation (Depreciation) of Investments on a Tax Basis | |
Aggregate unrealized appreciation of investments | | | $ 15,890,791 | |
|
| |
Aggregate unrealized (depreciation) of investments | | | (84,657,050 | ) |
|
| |
Net unrealized appreciation (depreciation) of investments | | | $(68,766,259 | ) |
|
| |
Cost of investments for tax purposes is $1,978,403,190.
NOTE 11–Reclassification of Permanent Differences
Primarily as a result of differing book/tax treatment of market discounts and defaulted bonds, amortization and accretion on debt securities, on February 28, 2023, undistributed net investment income was increased by $588,004, undistributed net realized gain (loss) was decreased by $586,706 and shares of beneficial interest was decreased by $1,298. This reclassification had no effect on the net assets of the Fund.
NOTE 12–Share Information
| | | | | | | | | | | | | | | | | | | | | | | | | | | | |
| | | Summary of Share Activity | |
|
| |
| | | Year ended
February 28, 2023(a) | | | | | | Year ended
February 28, 2022 | |
| | | Shares | | | | | | Amount | | | | | | Shares | | | | | | Amount | |
|
| |
Sold: | | | | | | | | | | | | | | | | | | | | | | | | | | | | |
| | | | | | | |
Class A | | | 50,598,567 | | | | | | | $ | 522,602,710 | | | | | | | | 42,081,018 | | | | | | | $ | 484,099,533 | |
|
| |
Class C | | | 1,502,189 | | | | | | | | 15,508,447 | | | | | | | | 434,459 | | | | | | | | 4,984,581 | |
|
| |
Class Y | | | 39,930,571 | | | | | | | | 412,323,242 | | | | | | | | 25,034,327 | | | | | | | | 287,358,796 | |
|
| |
Class R6 | | | 45,071 | | | | | | | | 470,218 | | | | | | | | 136,712 | | | | | | | | 1,580,301 | |
|
| |
| | | | | | | |
Issued as reinvestment of dividends: | | | | | | | | | | | | | | | | | | | | | | | | | | | | |
| | | | | | | |
Class A | | | 2,454,413 | | | | | | | | 25,324,509 | | | | | | | | 2,155,588 | | | | | | | | 24,736,226 | |
|
| |
Class C | | | 107,048 | | | | | | | | 1,101,526 | | | | | | | | 114,687 | | | | | | | | 1,314,115 | |
|
| |
Class Y | | | 1,034,903 | | | | | | | | 10,674,768 | | | | | | | | 913,609 | | | | | | | | 10,474,495 | |
|
| |
Class R6 | | | 1,436 | | | | | | | | 15,206 | | | | | | | | 8,606 | | | | | | | | 98,668 | |
|
| |
| | | | | | | |
Automatic conversion of Class C shares to Class A shares: | | | | | | | | | | | | | | | | | | | | | | | | | | | | |
| | | | | | | |
Class A | | | 278,480 | | | | | | | | 2,884,779 | | | | | | | | 437,292 | | | | | | | | 5,014,316 | |
|
| |
Class C | | | (279,154 | ) | | | | | | | (2,884,779 | ) | | | | | | | (438,434 | ) | | | | | | | (5,014,316 | ) |
|
| |
| | | | | | | |
Reacquired: | | | | | | | | | | | | | | | | | | | | | | | | | | | | |
| | | | | | | |
Class A | | | (68,054,120 | ) | | | | | | | (703,409,554 | ) | | | | | | | (25,474,170 | ) | | | | | | | (292,190,543 | ) |
|
| |
Class C | | | (3,304,730 | ) | | | | | | | (34,182,938 | ) | | | | | | | (2,113,484 | ) | | | | | | | (24,218,787 | ) |
|
| |
Class Y | | | (50,258,713 | ) | | | | | | | (519,148,855 | ) | | | | | | | (14,897,899 | ) | | | | | | | (170,231,309 | ) |
|
| |
Class R6 | | | (376,412 | ) | | | | | | | (3,982,845 | ) | | | | | | | (191,489 | ) | | | | | | | (2,182,411 | ) |
|
| |
Net increase (decrease) in share activity | | | (26,320,451 | ) | | | | | | $ | (272,703,566 | ) | | | | | | | 28,200,822 | | | | | | | $ | 325,823,665 | |
|
| |
| (a) | There are entities that are record owners of more than 5% of the outstanding shares of the Fund and in the aggregate own 68% of the outstanding shares of the Fund. IDI has an agreement with these entities to sell Fund shares. The Fund, Invesco and/or Invesco affiliates may make payments to these entities, which are considered to be related to the Fund, for providing services to the Fund, Invesco and/or Invesco affiliates including but not limited to services such as securities brokerage, distribution, third party record keeping and account servicing. The Fund has no knowledge as to whether all or any portion of the shares owned of record by these entities are also owned beneficially. |
| | |
| 43 | | Invesco Intermediate Term Municipal Income Fund |
Report of Independent Registered Public Accounting Firm
To the Board of Trustees of AIM Tax-Exempt Funds (Invesco Tax-Exempt Funds) and Shareholders of Invesco Intermediate Term Municipal Income Fund
Opinion on the Financial Statements
We have audited the accompanying statement of assets and liabilities, including the schedule of investments, of Invesco Intermediate Term Municipal Income Fund (one of the funds constituting AIM Tax-Exempt Funds (Invesco Tax-Exempt Funds), referred to hereafter as the “Fund”) as of February 28, 2023, the related statement of operations for the year ended February 28, 2023, the statement of changes in net assets for each of the two years in the period ended February 28, 2023, including the related notes, and the financial highlights for each of the five years in the period ended February 28, 2023 (collectively referred to as the “financial statements”). In our opinion, the financial statements present fairly, in all material respects, the financial position of the Fund as of February 28, 2023, the results of its operations for the year then ended, the changes in its net assets for each of the two years in the period ended February 28, 2023 and the financial highlights for each of the five years in the period ended February 28, 2023 in conformity with accounting principles generally accepted in the United States of America.
Basis for Opinion
These financial statements are the responsibility of the Fund’s management. Our responsibility is to express an opinion on the Fund’s financial statements based on our audits. We are a public accounting firm registered with the Public Company Accounting Oversight Board (United States) (PCAOB) and are required to be independent with respect to the Fund in accordance with the U.S. federal securities laws and the applicable rules and regulations of the Securities and Exchange Commission and the PCAOB.
We conducted our audits of these financial statements in accordance with the standards of the PCAOB. Those standards require that we plan and perform the audit to obtain reasonable assurance about whether the financial statements are free of material misstatement, whether due to error or fraud.
Our audits included performing procedures to assess the risks of material misstatement of the financial statements, whether due to error or fraud, and performing procedures that respond to those risks. Such procedures included examining, on a test basis, evidence regarding the amounts and disclosures in the financial statements. Our audits also included evaluating the accounting principles used and significant estimates made by management, as well as evaluating the overall presentation of the financial statements. Our procedures included confirmation of securities owned as of February 28, 2023 by correspondence with the custodian and brokers; when replies were not received from brokers, we performed other auditing procedures. We believe that our audits provide a reasonable basis for our opinion.
/s/PricewaterhouseCoopers LLP
Houston, Texas
April 21, 2023
We have served as the auditor of one or more of the investment companies in the Invesco group of investment companies since at least 1995. We have not been able to determine the specific year we began serving as auditor.
| | |
| 44 | | Invesco Intermediate Term Municipal Income Fund |
Calculating your ongoing Fund expenses
Example
As a shareholder of the Fund, you incur two types of costs: (1) transaction costs, which may include sales charges (loads) on purchase payments or contingent deferred sales charges on redemptions, if any; and (2) ongoing costs, including management fees, distribution and/or service (12b-1) fees, and other Fund expenses. This example is intended to help you understand your ongoing costs (in dollars) of investing in the Fund and to compare these costs with ongoing costs of investing in other mutual funds. The example is based on an investment of $1,000 invested at the beginning of the period and held for the entire period September 1, 2022 through February 28, 2023.
Actual expenses
The table below provides information about actual account values and actual expenses. You may use the information in this table, together with the amount you invested, to estimate the expenses that you paid over the period. Simply divide your account value by $1,000 (for example, an $8,600 account value divided by $1,000 = 8.6), then multiply the result by the number in the table under the heading entitled “Actual Expenses Paid During Period” to estimate the expenses you paid on your account during this period.
Hypothetical example for comparison purposes
The table below also provides information about hypothetical account values and hypothetical expenses based on the Fund’s actual expense ratio and an assumed rate of return of 5% per year before expenses, which is not the Fund’s actual return.
The hypothetical account values and expenses may not be used to estimate the actual ending account balance or expenses you paid for the period. You may use this information to compare the ongoing costs of investing in the Fund and other funds. To do so, compare this 5% hypothetical example with the 5% hypothetical examples that appear in the shareholder reports of the other funds.
Please note that the expenses shown in the table are meant to highlight your ongoing costs only and do not reflect any transaction costs, such as sales charges (loads) on purchase payments or contingent deferred sales charges on redemptions, if any. Therefore, the hypothetical information is useful in comparing ongoing costs only, and will not help you determine the relative total costs of owning different funds. In addition, if these transaction costs were included, your costs would have been higher.
| | | | | | | | | | | | |
| | | | | ACTUAL | | HYPOTHETICAL (5% annual return before expenses) | | |
| | | Beginning Account Value (09/01/22) | | Ending Account Value (02/28/23)1 | | Expenses Paid During Period2 | | Ending Account Value (02/28/23) | | Expenses Paid During Period2 | | Annualized Expense Ratio |
Class A | | $1,000.00 | | $1,005.00 | | $4.28 | | $1,020.53 | | $4.31 | | 0.86% |
Class C | | 1,000.00 | | 1,001.20 | | 7.99 | | 1,016.81 | | 8.05 | | 1.61 |
Class Y | | 1,000.00 | | 1,006.20 | | 3.03 | | 1,021.77 | | 3.06 | | 0.61 |
Class R6 | | 1,000.00 | | 1,006.60 | | 2.69 | | 1,022.12 | | 2.71 | | 0.54 |
| 1 | The actual ending account value is based on the actual total return of the Fund for the period September 1, 2022 through February 28, 2023, after actual expenses and will differ from the hypothetical ending account value which is based on the Fund’s expense ratio and a hypothetical annual return of 5% before expenses. |
| 2 | Expenses are equal to the Fund’s annualized expense ratio as indicated above multiplied by the average account value over the period, multiplied by 181/365 to reflect the most recent fiscal half year. |
| | |
| 45 | | Invesco Intermediate Term Municipal Income Fund |
Tax Information
Form 1099-DIV, Form 1042-S and other year-end tax information provide shareholders with actual calendar year amounts that should be included in their tax returns. Shareholders should consult their tax advisers.
The following distribution information is being provided as required by the Internal Revenue Code or to meet a specific state’s requirement.
The Fund designates the following amounts or, if subsequently determined to be different, the maximum amount allowable for its fiscal year ended February 28, 2023:
| | | | | | | | |
Federal and State Income Tax | | | | | | |
Qualified Dividend Income* | | | 0.00 | % | | | | |
Corporate Dividends Received Deduction* | | | 0.00 | % | | | | |
U.S. Treasury Obligations* | | | 0.00 | % | | | | |
Qualified Business Income* | | | 0.00 | % | | | | |
Business Interest Income* | | | 11.65 | % | | | | |
Tax-Exempt Interest Dividends* | | | 99.40 | % | | | | |
|
| * The above percentages are based on ordinary income dividends paid to shareholders during the Fund’s fiscal year. | |
| | |
| 46 | | Invesco Intermediate Term Municipal Income Fund |
Trustees and Officers
The address of each trustee and officer is AIM Tax-Exempt Funds (Invesco Tax-Exempt Funds) (the “Trust”), 11 Greenway Plaza, Suite 1000, Houston, Texas 77046-1173. The trustees serve for the life of the Trust, subject to their earlier death, incapacitation, resignation, retirement or removal as more specifically provided in the Trust’s organizational documents. Each officer serves for a one year term or until their successors are elected and qualified. Column two below includes length of time served with predecessor entities, if any.
| | | | | | | | |
Name, Year of Birth and Position(s) Held with the Trust | | Trustee and/or Officer Since | | Principal Occupation(s) During Past 5 Years | | Number of Funds in Fund Complex Overseen by Trustee | | Other Directorship(s) Held by Trustee During Past 5 Years |
| Interested Trustee | | | | | | | | |
Martin L. Flanagan1 - 1960 Trustee and Vice Chair | | 2007 | | Executive Director, Chief Executive Officer and President, Invesco Ltd. (ultimate parent of Invesco and a global investment management firm); Trustee and Vice Chair, The Invesco Funds; Vice Chair, Investment Company Institute; and Member of Executive Board, SMU Cox School of Business Formerly: Advisor to the Board, Invesco Advisers, Inc. (formerly known as Invesco Institutional (N.A.), Inc.); Chairman and Chief Executive Officer, Invesco Advisers, Inc. (registered investment adviser); Director, Chairman, Chief Executive Officer and President, Invesco Holding Company (US), Inc. (formerly IVZ Inc.) (holding company), Invesco Group Services, Inc. (service provider) and Invesco North American Holdings, Inc. (holding company); Director, Chief Executive Officer and President, Invesco Holding Company Limited (parent of Invesco and a global investment management firm); Director, Invesco Ltd.; Chairman, Investment Company Institute and President, Co-Chief Executive Officer, Co-President, Chief Operating Officer and Chief Financial Officer, Franklin Resources, Inc. (global investment management organization) | | 175 | | None |
| 1 | Mr. Flanagan is considered an interested person (within the meaning of Section 2(a)(19) of the 1940 Act) of the Trust because he is an officer of the Adviser to the Trust, and an officer and a director of Invesco Ltd., ultimate parent of the Adviser. |
| | |
| T-1 | | Invesco Intermediate Term Municipal Income Fund |
Trustees and Officers–(continued)
| | | | | | | | |
Name, Year of Birth and Position(s) Held with the Trust | | Trustee and/or Officer Since | | Principal Occupation(s) During Past 5 Years | | Number of Funds in Fund Complex Overseen by Trustee | | Other Directorship(s) Held by Trustee During Past 5 Years |
| Independent Trustees | | | | | | | | |
Beth Ann Brown - 1968 Trustee (2019) and Chair (August 2022) | | 2019 | | Independent Consultant Formerly: Head of Intermediary Distribution, Managing Director, Strategic Relations, Managing Director, Head of National Accounts, Senior Vice President, National Account Manager and Senior Vice President, Key Account Manager, Columbia Management Investment Advisers LLC; Vice President, Key Account Manager, Liberty Funds Distributor, Inc.; and Trustee of certain Oppenheimer Funds | | 175 | | Director, Board of Directors of Caron Engineering Inc.; Advisor, Board of Advisors of Caron Engineering Inc.; President and Director, Acton Shapleigh Youth Conservation Corps (non-profit) Formerly: President and Director Director of Grahamtastic Connection (non-profit) |
Cynthia Hostetler - 1962 Trustee | | 2017 | | Non-Executive Director and Trustee of a number of public and private business corporations Formerly: Director, Aberdeen Investment Funds (4 portfolios); Director, Artio Global Investment LLC (mutual fund complex); Director, Edgen Group, Inc. (specialized energy and infrastructure products distributor); Director, Genesee & Wyoming, Inc. (railroads); Head of Investment Funds and Private Equity, Overseas Private Investment Corporation; President, First Manhattan Bancorporation, Inc.; and Attorney, Simpson Thacher & Bartlett LLP | | 175 | | Resideo Technologies, Inc. (smart home technology); Vulcan Materials Company (construction materials company); Trilinc Global Impact Fund; Textainer Group Holdings, (shipping container leasing company); Investment Company Institute (professional organization); and Independent Directors Council (professional organization) |
Eli Jones - 1961 Trustee | | 2016 | | Professor and Dean Emeritus, Mays Business School - Texas A&M University Formerly: Dean of Mays Business School-Texas A&M University; Professor and Dean, Walton College of Business, University of Arkansas and E.J. Ourso College of Business, Louisiana State University; and Director, Arvest Bank | | 175 | | Insperity, Inc. (formerly known as Administaff) (human resources provider); Board Member of the regional board, First Financial Bank Texas; and Boad Member, First Financial Bankshares, Inc. Texas (FFIN) |
Elizabeth Krentzman - 1959 Trustee | | 2019 | | Formerly: Principal and Chief Regulatory Advisor for Asset Management Services and U.S. Mutual Fund Leader of Deloitte & Touche LLP; General Counsel of the Investment Company Institute (trade association); National Director of the Investment Management Regulatory Consulting Practice, Principal, Director and Senior Manager of Deloitte & Touche LLP; Assistant Director of the Division of Investment Management - Office of Disclosure and Investment Adviser Regulation of the U.S. Securities and Exchange Commission and various positions with the Division of Investment Management - Office of Regulatory Policy of the U.S. Securities and Exchange Commission; Associate at Ropes & Gray LLP; and Trustee of certain Oppenheimer Funds | | 175 | | Formerly: Member of the Cartica Funds Board of Directors (private investment fund); Trustee of the University of Florida National Board Foundation; and Member of the University of Florida Law Center Association, Inc. Board of Trustees, Audit Committee and Membership Committee |
Anthony J. LaCava, Jr. - 1956 Trustee | | 2019 | | Formerly: Director and Member of the Audit Committee, Blue Hills Bank (publicly traded financial institution) and Managing Partner, KPMG LLP | | 175 | | Blue Hills Bank; Member and Chairman, Bentley University, Business School Advisory Council; and Nominating Committee, KPMG LLP |
Prema Mathai-Davis - 1950 Trustee | | 1998 | | Retired Formerly: Co-Founder & Partner of Quantalytics Research, LLC, (a FinTech Investment Research Platform for the Self-Directed Investor); Trustee of YWCA Retirement Fund; CEO of YWCA of the USA; Board member of the NY Metropolitan Transportation Authority; Commissioner of the NYC Department of Aging; and Board member of Johns Hopkins Bioethics Institute | | 175 | | Member of Board of Positive Planet US (non-profit) and HealthCare Chaplaincy Network (non-profit) |
| | |
| T-2 | | Invesco Intermediate Term Municipal Income Fund |
Trustees and Officers–(continued)
| | | | | | | | |
Name, Year of Birth and Position(s) Held with the Trust | | Trustee and/or Officer Since | | Principal Occupation(s) During Past 5 Years | | Number of Funds in Fund Complex Overseen by Trustee | | Other Directorship(s) Held by Trustee During Past 5 Years |
| Independent Trustees–(continued) | | | | | | |
Joel W. Motley - 1952 Trustee | | 2019 | | Director of Office of Finance, Federal Home Loan Bank System; Managing Director of Carmona Motley Inc. (privately held financial advisor); Member of the Council on Foreign Relations and its Finance and Budget Committee; Chairman Emeritus of Board of Human Rights Watch and Member of its Investment Committee; and Member of Investment Committee Board of Historic Hudson Valley (non-profit cultural organization); Member of the Board, Blue Ocean Acquisition Corp.; and Member of the Vestry and the Investment Committee of Trinity Church Wall Street. Formerly: Managing Director of Public Capital Advisors, LLC (privately held financial advisor); Managing Director of Carmona Motley Hoffman, Inc. (privately held financial advisor); Trustee of certain Oppenheimer Funds; and Director of Columbia Equity Financial Corp. (privately held financial advisor) | | 175 | | Member of Board of Trust for Mutual Understanding (non-profit promoting the arts and environment); Member of Board of Greenwall Foundation (bioethics research foundation) and its Investment Committee; Member of Board of Friends of the LRC (non-profit legal advocacy); and Board Member and Investment Committee Member of Pulitzer Center for Crisis Reporting (non-profit journalism) |
Teresa M. Ressel - 1962 Trustee | | 2017 | | Non-executive director and trustee of a number of public and private business corporations Formerly: Chief Executive Officer, UBS Securities LLC (investment banking); Chief Operating Officer, UBS AG Americas (investment banking); Sr. Management Team Olayan America, The Olayan Group (international investor/commercial/industrial); and Assistant Secretary for Management & Budget and Designated Chief Financial Officer, U.S. Department of Treasury | | 175 | | None |
Robert C. Troccoli - 1949 Trustee | | 2016 | | Retired Formerly: Adjunct Professor, University of Denver - Daniels College of Business; and Managing Partner, KPMG LLP | | 175 | | None |
Daniel S. Vandivort - 1954 Trustee | | 2019 | | President, Flyway Advisory Services LLC (consulting and property management) Formerly: President and Chief Investment Officer, previously Head of Fixed Income, Weiss Peck and Greer/Robeco Investment Management; Trustee and Chair, Weiss Peck and Greer Funds Board; and various capacities at CS First Boston including Head of Fixed Income at First Boston Asset Management. | | 175 | | Formerly: Trustee and Governance Chair, Oppenheimer Funds; Treasurer, Chairman of the Audit and Finance Committee, Huntington Disease Foundation of America |
| | |
| T-3 | | Invesco Intermediate Term Municipal Income Fund |
Trustees and Officers–(continued)
| | | | | | | | |
Name, Year of Birth and Position(s) Held with the Trust | | Trustee and/or Officer Since | | Principal Occupation(s) During Past 5 Years | | Number of Funds in Fund Complex Overseen by Trustee | | Other Directorship(s) Held by Trustee During Past 5 Years |
| Officers | | | | | | | | |
Sheri Morris - 1964 President and Principal Executive Officer | | 1999 | | Director, Invesco Trust Company; Head of Global Fund Services, Invesco Ltd.; President and Principal Executive Officer, The Invesco Funds; Vice President, Invesco Exchange-Traded Fund Trust, Invesco Exchange-Traded Fund Trust II, Invesco India Exchange-Traded Fund Trust, Invesco Actively Managed Exchange-Traded Fund Trust, Invesco Actively Managed Exchange-Traded Commodity Fund Trust and Invesco Exchange-Traded Self-Indexed Fund Trust; and Vice President, OppenheimerFunds, Inc. Formerly: Vice President, Treasurer and Principal Financial Officer, The Invesco Funds; Vice President, Invesco AIM Advisers, Inc., Invesco AIM Capital Management, Inc. and Invesco AIM Private Asset Management, Inc.; Assistant Vice President and Assistant Treasurer, The Invesco Funds; Vice President and Assistant Vice President, Invesco Advisers, Inc.; Assistant Vice President, Invesco AIM Capital Management, Inc. and Invesco AIM Private Asset Management, Inc.; Treasurer, Invesco Exchange-Traded Fund Trust, Invesco Exchange-Traded Fund Trust II, Invesco India Exchange-Traded Fund Trust and Invesco Actively Managed Exchange-Traded Fund Trust; and Senior Vice President, Invesco Advisers, Inc. (formerly known as Invesco Institutional (N.A.), Inc.) (registered investment adviser) | | N/A | | N/A |
Melanie Ringold - 1975 Senior Vice President, Chief Legal Officer and Secretary | | 2023 | | Head of Legal of the Americas, Invesco Ltd.; Senior Vice President and Secretary, Invesco Advisers, Inc. (formerly known as Invesco Institutional (N.A.), Inc.) (registered investment adviser); Secretary, Invesco Distributors, Inc. (formerly known as Invesco AIM Distributors, Inc.); Secretary, Invesco Investment Services, Inc. (formerly known as Invesco AIM Investment Services, Inc.); Senior Vice President, Chief Legal Officer and Secretary, The Invesco Funds; Secretary, Invesco Investment Advisers LLC, Invesco Capital Markets, Inc.; Chief Legal Officer, Invesco Exchange-Traded Fund Trust, Invesco Exchange-Traded Fund Trust II, Invesco India Exchange-Traded Fund Trust, Invesco Actively Managed Exchange-Traded Fund Trust, Invesco Actively Managed Exchange-Traded Commodity Fund Trust and Invesco Exchange-Traded Self-Indexed Fund Trust; Secretary and Vice President, Harbourview Asset Management Corporation; Secretary and Senior Vice President, OppenheimerFunds, Inc. and Invesco Managed Accounts, LLC; Secretary and Senior Vice President, OFI SteelPath, Inc.; Secretary and Senior Vice President, Oppenheimer Acquisition Corp.; Secretary, SteelPath Funds Remediation LLC; and Secretary and Senior Vice President, Trinity Investment Management Corporation Formerly: Assistant Secretary, Invesco Distributors, Inc.; Invesco Advisers, Inc. Invesco Investment Services, Inc., Invesco Capital Markets, Inc., Invesco Capital Management LLC and Invesco Investment Advisers LLC; and Assistant Secretary and Investment Vice President, Invesco Funds | | N/A | | N/A |
Andrew R. Schlossberg - 1974 Senior Vice President | | 2019 | | Senior Vice President, Invesco Group Services, Inc.; Head of the Americas and Senior Managing Director, Invesco Ltd.; Director and Senior Vice President, Invesco Advisers, Inc. (formerly known as Invesco Institutional (N.A.), Inc.) (registered investment adviser); Director and Chairman, Invesco Investment Services, Inc. (formerly known as Invesco AIM Investment Services, Inc.) (registered transfer agent); Senior Vice President, The Invesco Funds; and Director, Invesco Investment Advisers LLC (formerly known as Van Kampen Asset Management) Formerly: Director, President and Chairman, Invesco Insurance Agency, Inc.; Director, Invesco UK Limited; Director and Chief Executive, Invesco Asset Management Limited and Invesco Fund Managers Limited; Assistant Vice President, The Invesco Funds; Senior Vice President, Invesco Advisers, Inc. (formerly known as Invesco Institutional (N.A.), Inc.) (registered investment adviser); Director and Chief Executive, Invesco Administration Services Limited and Invesco Global Investment Funds Limited; Director, Invesco Distributors, Inc.; Head of EMEA, Invesco Ltd.; President, Invesco Actively Managed Exchange-Traded Commodity Fund Trust, Invesco Actively Managed Exchange-Traded Fund Trust, Invesco Exchange-Traded Fund Trust, Invesco Exchange-Traded Fund Trust II and Invesco India Exchange-Traded Fund Trust; and Managing Director and Principal Executive Officer, Invesco Capital Management LLC | | N/A | | N/A |
| | |
| T-4 | | Invesco Intermediate Term Municipal Income Fund |
Trustees and Officers–(continued)
| | | | | | | | |
Name, Year of Birth and Position(s) Held with the Trust | | Trustee and/or Officer Since | | Principal Occupation(s) During Past 5 Years | | Number of Funds in Fund Complex Overseen by Trustee | | Other Directorship(s) Held by Trustee During Past 5 Years |
| Officers–(continued) | | | | | | | | |
John M. Zerr - 1962 Senior Vice President | | 2006 | | Chief Operating Officer of the Americas; Senior Vice President, Invesco Advisers, Inc. (formerly known as Invesco Institutional (N.A.), Inc.) (registered investment adviser); Senior Vice President, Invesco Distributors, Inc. (formerly known as Invesco AIM Distributors, Inc.); Director and Vice President, Invesco Investment Services, Inc. (formerly known as Invesco AIM Investment Services, Inc.) Senior Vice President, The Invesco Funds; Managing Director, Invesco Capital Management LLC; Director, Invesco Investment Advisers LLC (formerly known as Van Kampen Asset Management); Senior Vice President, Invesco Capital Markets, Inc. (formerly known as Van Kampen Funds Inc.); Manager, Invesco Indexing LLC; Manager, Invesco Specialized Products, LLC; Member, Invesco Canada Funds Advisory Board; Director, President and Chief Executive Officer, Invesco Corporate Class Inc. (corporate mutual fund company); and Director, Chairman, President and Chief Executive Officer, Invesco Canada Ltd. (formerly known as Invesco Trimark Ltd./Invesco Trimark Ltèe) (registered investment adviser and registered transfer agent); President, Invesco, Inc.; President, Invesco Global Direct Real Estate Feeder GP Ltd.; President, Invesco IP Holdings (Canada) Ltd; President, Invesco Global Direct Real Estate GP Ltd.; President, Invesco Financial Services Ltd. / Services Financiers Invesco Ltée; and Director and Chairman, Invesco Trust Company Formerly: President, Trimark Investments Ltd/Services Financiers Invesco Ltee; Director and Senior Vice President, Invesco Insurance Agency, Inc.; Director and Senior Vice President, Invesco Management Group, Inc. (formerly known as Invesco AIM Management Group, Inc.); Secretary and General Counsel, Invesco Management Group, Inc. (formerly known as Invesco AIM Management Group, Inc.); Secretary, Invesco Investment Services, Inc. (formerly known as Invesco AIM Investment Services, Inc.); Chief Legal Officer and Secretary, The Invesco Funds; Secretary and General Counsel, Invesco Investment Advisers LLC (formerly known as Van Kampen Asset Management); Secretary and General Counsel, Invesco Capital Markets, Inc. (formerly known as Van Kampen Funds Inc.); Chief Legal Officer, Invesco Exchange-Traded Fund Trust, Invesco Exchange-Traded Fund Trust II, Invesco India Exchange-Traded Fund Trust, Invesco Actively Managed Exchange-Traded Fund Trust, Invesco Actively Managed Exchange-Traded Commodity Fund Trust and Invesco Exchange-Traded Self-Indexed Fund Trust; Secretary, Invesco Indexing LLC; Director, Secretary, General Counsel and Senior Vice President, Van Kampen Exchange Corp.; Director, Vice President and Secretary, IVZ Distributors, Inc. (formerly known as INVESCO Distributors, Inc.); Director and Vice President, INVESCO Funds Group, Inc.; Director and Vice President, Van Kampen Advisors Inc.; Director, Vice President, Secretary and General Counsel, Van Kampen Investor Services Inc.; Director and Secretary, Invesco Distributors, Inc. (formerly known as Invesco AIM Distributors, Inc.); Director, Senior Vice President, General Counsel and Secretary, Invesco AIM Advisers, Inc. and Van Kampen Investments Inc.; Director, Vice President and Secretary, Fund Management Company; Director, Senior Vice President, Secretary, General Counsel and Vice President, Invesco AIM Capital Management, Inc.; and Chief Operating Officer and General Counsel, Liberty Ridge Capital, Inc. (an investment adviser) | | N/A | | N/A |
Gregory G. McGreevey - 1962 Senior Vice President | | 2012 | | Senior Managing Director, Invesco Ltd.; Director, Chairman, President, and Chief Executive Officer, Invesco Advisers, Inc. (formerly known as Invesco Institutional (N.A.), Inc.) (registered investment adviser); Director, Invesco Mortgage Capital, Inc. and Invesco Senior Secured Management, Inc.; Senior Vice President, The Invesco Funds; President, SNW Asset Management Corporation and Invesco Managed Accounts, LLC; Chairman and Director, Invesco Private Capital, Inc.; Chairman and Director, INVESCO Private Capital Investments, Inc.; Chairman and Director, INVESCO Realty, Inc.; and Senior Vice President, Invesco Group Services, Inc. Formerly: Senior Vice President, Invesco Management Group, Inc. and Invesco Advisers, Inc.; Assistant Vice President, The Invesco Funds | | N/A | | N/A |
Adrien Deberghes - 1967 Principal Financial Officer, Treasurer and Vice President | | 2020 | | Head of the Fund Office of the CFO and Fund Administration; Vice President, Invesco Advisers, Inc.; Principal Financial Officer, Treasurer and Vice President, The Invesco Funds; Vice President, Invesco Exchange-Traded Fund Trust, Invesco Exchange-Traded Fund Trust II, Invesco India Exchange-Traded Fund Trust, Invesco Actively Managed Exchange-Traded Fund Trust, Invesco Actively Managed Exchange-Traded Commodity Fund Trust and Invesco Exchange-Traded Self-Indexed Fund Trust Formerly: Senior Vice President and Treasurer, Fidelity Investments | | N/A | | N/A |
Crissie M. Wisdom - 1969 Anti-Money Laundering Compliance Officer | | 2013 | | Anti-Money Laundering and OFAC Compliance Officer for Invesco U.S. entities including: Invesco Advisers, Inc. and its affiliates, Invesco Capital Markets, Inc., Invesco Distributors, Inc., Invesco Investment Services, Inc., The Invesco Funds, Invesco Capital Management, LLC, Invesco Trust Company; and Fraud Prevention Manager for Invesco Investment Services, Inc. | | N/A | | N/A |
| | |
| T-5 | | Invesco Intermediate Term Municipal Income Fund |
Trustees and Officers–(continued)
| | | | | | | | |
Name, Year of Birth and Position(s) Held with the Trust | | Trustee and/or Officer Since | | Principal Occupation(s) During Past 5 Years | | Number of Funds in Fund Complex Overseen by Trustee | | Other Directorship(s) Held by Trustee During Past 5 Years |
| Officers–(continued) | | | | | | | | |
Todd F. Kuehl - 1969 Chief Compliance Officer and Senior Vice President | | 2020 | | Chief Compliance Officer, Invesco Advisers, Inc. (registered investment adviser); and Chief Compliance Officer and Senior Vice President, The Invesco Funds Formerly: Managing Director and Chief Compliance Officer, Legg Mason (Mutual Funds); Chief Compliance Officer, Legg Mason Private Portfolio Group (registered investment adviser) | | N/A | | N/A |
James Bordewick, Jr. - 1959 Senior Vice President and Senior Officer | | 2022 | | Senior Vice President and Senior Officer, The Invesco Funds Formerly: Chief Legal Officer, KingsCrowd, Inc. (research and analytical platform for investment in private capital markets); Chief Operating Officer and Head of Legal and Regulatory, Netcapital (private capital investment platform); Managing Director, General Counsel of asset management and Chief Compliance Officer for asset management and private banking, Bank of America Corporation; Chief Legal Officer, Columbia Funds and BofA Funds; Senior Vice President and Associate General Counsel, MFS Investment Management; Chief Legal Officer, MFS Funds; Associate, Ropes & Gray; and Associate, Gaston Snow & Ely Bartlett | | N/A | | N/A |
The Statement of Additional Information of the Trust includes additional information about the Fund’s Trustees and is available upon request, without charge, by calling 1.800.959.4246. Please refer to the Fund’s Statement of Additional Information for information on the Fund’s sub-advisers.
| | | | | | |
| Office of the Fund | | Investment Adviser | | Distributor | | Auditors |
| 11 Greenway Plaza, Suite 1000 | | Invesco Advisers, Inc. | | Invesco Distributors, Inc. | | PricewaterhouseCoopers LLP |
| Houston, TX 77046-1173 | | 1331 Spring Street, NW, Suite 2500 | | 11 Greenway Plaza, Suite 1000 | | 1000 Louisiana Street, Suite 5800 |
| | Atlanta, GA 30309 | | Houston, TX 77046-1173 | | Houston, TX 77002-5021 |
| | | |
| Counsel to the Fund | | Counsel to the Independent Trustees | | Transfer Agent | | Custodian |
| Stradley Ronon Stevens & Young, LLP | | Sidley Austin LLP | | Invesco Investment Services, Inc. | | State Street Bank and Trust Company |
| 2005 Market Street, Suite 2600 | | 787 Seventh Avenue | | 11 Greenway Plaza, Suite 1000 | | 225 Franklin Street |
| Philadelphia, PA 19103-7018 | | New York, NY 10019 | | Houston, TX 77046-1173 | | Boston, MA 02110-2801 |
| | |
| T-6 | | Invesco Intermediate Term Municipal Income Fund |
(This page intentionally left blank)
(This page intentionally left blank)
(This page intentionally left blank)

Go paperless with eDelivery
Visit invesco.com/edelivery to enjoy the convenience and security of anytime electronic access to your investment documents.
With eDelivery, you can elect to have any or all of the following materials delivered straight to your inbox to download, save and print from your own computer:
∎ Fund reports and prospectuses
∎ Quarterly statements
∎ Daily confirmations
∎ Tax forms
Invesco mailing information
Send general correspondence to Invesco Investment Services, Inc., P.O. Box 219078, Kansas City, MO 64121-9078.
Important notice regarding delivery of security holder documents
To reduce Fund expenses, only one copy of most shareholder documents may be mailed to shareholders with multiple accounts at the same address (Householding). Mailing of your shareholder documents may be householded indefinitely unless you instruct us otherwise. If you do not want the mailing of these documents to be combined with those for other members of your household, please contact Invesco Investment Services, Inc. at 800 959 4246 or contact your financial institution. We will begin sending you individual copies for each account within 30 days after receiving your request.
Fund holdings and proxy voting information
The Fund provides a complete list of its portfolio holdings four times each year, at the end of each fiscal quarter. For the second and fourth quarters, the list appears, respectively, in the Fund’s semiannual and annual reports to shareholders. For the first and third quarters, the Fund files the list with the Securities and Exchange Commission (SEC) as an exhibit to its reports on Form N-PORT. The most recent list of portfolio holdings is available at invesco.com/completeqtrholdings. Shareholders can also look up the Fund’s Form N-PORT filings on the SEC website, sec.gov. The SEC file numbers for the Fund are shown below.
A description of the policies and procedures that the Fund uses to determine how to vote proxies relating to portfolio securities is available without charge, upon request, from our Client Services department at 800 959 4246, or at invesco.com/corporate/about-us/esg. The information is also available on the SEC website, sec.gov.
Information regarding how the Fund voted proxies related to its portfolio securities during the most recent 12-month period ended June 30 is available at invesco.com/proxysearch. This information is also available on the SEC website, sec.gov.
Invesco Advisers, Inc. is an investment adviser; it provides investment advisory services to individual and institutional clients and does not sell securities. Invesco Distributors, Inc. is the US distributor for Invesco Ltd.’s retail mutual funds, exchange-traded funds and institutional money market funds. Both are wholly owned, indirect subsidiaries of Invesco Ltd.

| | | | |
| SEC file number(s): 811-07890 and 033-66242 | | Invesco Distributors, Inc. | | VK-ITMI-AR-1 |

| | |
| Annual Report to Shareholders | | February 28, 2023 |
Invesco Limited Term California Municipal Fund
Nasdaq:
A: OLCAX ∎ C: OLCCX ∎ Y: OLCYX ∎ R6: IORLX
Management’s Discussion of Fund Performance
|
| |
Performance summary For the fiscal year ended February 28, 2023, Class A shares of Invesco Limited Term California Municipal Fund (the Fund), at net asset value (NAV), underper-formed the S&P Municipal California Investment Grade 4-7 Years Bond Index. Your Fund’s long-term performance appears later in this report. |
| | | | |
| | |
Fund vs. Indexes | | | | |
Total returns, 2/28/22 to 2/28/23, at net asset value (NAV). Performance shown does not include applicable contingent deferred sales charges (CDSC) or front-end sales charges, which would have reduced performance. | |
Class A Shares | | | -3.52 | % |
Class C Shares | | | -3.96 | |
Class Y Shares | | | -3.24 | |
Class R6 Shares | | | -3.21 | |
S&P Municipal Bond 2-17 Years Investment Grade Index ▼ | | | -3.39 | |
S&P Municipal California Investment Grade 4-7 Years Bond Index▼ | | | -2.25 | |
Source(s): ▼RIMES Technologies Corp. | | | | |
Market conditions and your Fund
The State of California’s ability to maintain robust levels of general fund cash reserves has provided a cushion during periods of revenue volatility. At the close of the state’s fiscal year in June 2022, the state had reserves totaling over $76.2 billion, or 34% of fiscal year 2022 expenditures.1 We believe these reserves should help mitigate the impact of an expected 5.7% decline in state tax revenues in fiscal year 2023. Despite the estimated decline in revenues, reserves at the close of fiscal year 2023 are expected to exceed $47 billion, or 20% of expenditures.1
The Golden State’s liquidity remains robust. The California State Controller reported that the state had cash and internal borrowable resources of over $93.4 billion, as of February 28, 2023.2 We believe that the state will continue to maintain a prudent approach to budgeting in response to potential revenue declines. The governor’s proposed fiscal year 2024 budget would cut expenditures by nearly 7%.1 While some reserves would be used to balance the budget, the state’s Rainy Day Fund would not be utilized. Based on the governor’s proposal, budget reserves would still exceed $35 billion, or nearly 16% of estimated expenditures at the close of fiscal year 2024.1
The state’s revenue growth has been driven by its economy’s size and diversity. California has the largest state population, representing approximately 12% of the US population and nearly 15% of the nation’s Gross Domestic Product.3 Unemployment rates continue to decline from pandemic highs, falling to 3.7% at the end of 2022.4 State tax revenues continued to grow even as unemployment rates increased after the onset of the pandemic. The impact on employment levels for high-wage earners was less severe, and high-income taxpayers benefited as the financial markets rebounded from the initial pandemic impacts. California’s fiscal condition has benefited from conserva-
tive budgeting, a result of the state’s recognition that its tax structure is highly sensitive to economic cycles due to its heavy reliance on top earners. The state has limited its expenditure growth and worked to maintain fiscal flexibility by increasing one-time expenditures, including extra pension payments, instead of increasing ongoing program expenditures. As the state moves into budget negotiations for fiscal year 2024, its ability to continue its fiscal discipline will be crucial for financial performance and retention of reserves to mitigate the impact of future economic downturns or fiscal emergencies. This discipline, as well as federal stimulus, has helped the state maintain rating stability through the pandemic. All three of the major credit rating agencies, Moody’s, Standard & Poor’s and Fitch have maintained their respective Aa2, AA- and AA rating† on the state’s general obligation bonds. In March 2023, Standard & Poor’s affirmed its positive outlook on the state’s general obligation debt while both Moody’s and Fitch affirmed stable outlooks on their respective ratings.
At the beginning of the fiscal year, investors were hopeful in anticipation of a return to normalcy as COVID-19 cases declined and pandemic-related restrictions were reduced or lifted. This allowed policymakers to turn their attention to the high inflation levels; however, on February 24, 2022, Russia began a full-scale invasion of Ukraine, which exacerbated inflationary pressures by driving up commodity prices. Against this backdrop, the fiscal year was plagued by volatility and uncertainty. The municipal market set multiple record lows in 2022, making it one of the most challenging years in history for municipal markets.
Investment grade municipal bonds returned -5.10%, high yield municipal bonds returned -9.35% and taxable municipal bonds returned -12.96% during the fiscal year.5
While municipal funds had experienced record inflows of $101.7 billion in 2021, flows quickly turned negative in the first quarter of
2022, perpetuating the Bloomberg Municipal Bond Index’s worst quarterly return in 40 years. Municipal bonds enjoyed a short respite in late May and early June 2022 with increased demand from crossover buyers like hedge funds, banks and insurance companies; however, the May 2022 Consumer Price Index report quoted inflation rising to a 40-year high. This sent the 10-year Treasury yield to a new 52-week high of nearly 3.50%, pushing municipal mutual fund flows back into negative territory.6 According to Lipper, net outflows from municipal bond funds totaled over -$110 billion for the fiscal year.7
On March 16, 2022, the US Federal Reserve (the Fed) raised the federal funds target rate 0.25% for the first time in more than three years in hopes of containing inflation.8 This was the first of eight consecutive increases during the fiscal year as the Fed announced its plan for a quantitative tightening campaign in an attempt to rein in inflation without harming employment or the overall economy. Rate increases as high as 0.75% followed, the Fed’s most aggressive monetary policy since the 1980s, bringing the target rate to 4.75% as of the end of the fiscal year.8
The AAA municipal yield curve made history after the Fed’s December 2022 meeting when the curve inverted between one- and 10-year maturities. Any inversion is noteworthy, but this was a first for municipal bonds. On January 31, 2023, policymakers indicated that future rate increases were likely to be “appropriate,” suggesting they were not yet convinced inflation was contained, which increased uncertainty about when the current tightening cycle might end.8 The fiscal year ended with an increase of 0.25% on February 1, 2023. We expect additional rate hikes in 2023, although not with the same pace or vigor as in 2022.
New municipal issuance for the fiscal year totaled $354 billion, down 27% from the previous fiscal year’s $484 billion.9 Issuers, with cash on their balance sheets, have been reluctant to issue at higher interest rates. While taxable issuance continued to account for a significant portion of new issuance, at 14% of the total, this figure is down from 18% from the previous fiscal year because of higher interest rates.9
Puerto Rico continued to make developments in its ongoing debt restructuring throughout the fiscal year. The territory restructured its outstanding general obligation and other government-guaranteed debt in March 2022 and began paying bondholders on the new restructured bonds. Puerto Rico’s weight in the Bloomberg High Yield Municipal Bond Index increased from 13% to 20% as the new bonds were included.5 The Financial Oversight and Management Board for Puerto Rico, the Puerto Rican government, bond-holders and other interested parties continued to negotiate the restructuring of bonds
2 Invesco Limited Term California Municipal Fund
issued by the Puerto Rico Electric Power Authority, the territory’s largest remaining unresolved debt, as the fiscal year closed.
Municipal credits have a long history of low defaults as many provide essential services to all Americans. This continues to be the case as evidenced by S&P rating changes – upgrades exceeded downgrades by a ratio of 2.5:1 for calendar year 2022.10 This positive dynamic, which we believe will continue, likely stems from benefits of the various federal stimulus measures including the American Rescue Plan Act, the Infrastructure Investment and Jobs Act and the Inflation Reduction Act, as well as higher revenues collected by state and local governments.
We believe the valuable benefits of municipal bonds will prevail over current market volatility and economic uncertainty. We continue to rely on our experienced portfolio managers and credit analysts to weather the challenges while identifying marketplace opportunities to add long-term value for shareholders.
During the Fund’s fiscal year, security selection and an underweight exposure in lower duration bonds (5.99 years and lower) contributed to the Fund’s performance relative to its benchmark. An overweight allocation and security selection among 5.00% and greater coupon bonds was also a positive for performance. At the sector level, an underweight exposure in appropriation bonds contributed to the Fund’s relative performance.
An overweight exposure among 4.00 - 4.49% coupon bonds detracted from the Fund’s performance relative to its benchmark over the fiscal year. An overweight exposure among bonds 6.00 years and longer in duration was also detractive from relative return. An overweight allocation to the airport detracted from the Fund’s performance relative to the benchmark during the fiscal year.
We wish to remind you that the Fund is subject to interest rate risk, meaning when interest rates rise, the value of fixed income securities tends to fall. The degree to which the value of fixed income securities may decline due to rising interest rates may vary depending on the speed and magnitude of the increase in interest rates, as well as individual security characteristics, such as price, maturity, duration and coupon and market forces, such as supply and demand for similar securities. We are monitoring interest rates, as well as the market, economic and geopolitical factors that may impact the direction, speed and magnitude of changes to interest rates across the maturity spectrum, including the potential impact of monetary policy changes by the Fed and certain foreign central banks. If interest rates rise or fall faster than expected, markets may experience increased volatility, which may affect the value and/or liquidity of certain of the Fund’s investments.
Thank you for investing in Invesco Limited Term California Municipal Fund and for sharing our long-term investment horizon.
| 1 | Source: State of California, Governor’s Budget Summary 2023-24, January 10, 2023 |
| 2 | Source: California State Controller’s Statement of General Fund Cash Receipts and Disbursements, March 10, 2023 |
| 3 | Source: State of California General Obligation Bonds, Preliminary Official Statement, March 1, 2022 |
| 4 | Source: U.S. Bureau of Labor Statistics, as of December 31, 2022 (Not Seasonally Adjusted) |
| 8 | Source: US Federal Reserve |
| 10 | Source: Standard & Poor’s |
† Sources: A credit rating is an assessment provided by a nationally recognized statistical rating organization (NRSRO) of the creditworthiness of an issuer with respect to debt obligations, including specific securities, money market instruments or other debts. Ratings are measured on a scale that generally ranges from AAA (highest) to D (lowest); ratings are subject to change without notice. For more information on rating methodology, please visit www.spglobal.com and select “Understanding Credit Ratings” under About Ratings on the homepage; www.fitchratings.com and select “Understanding Credit Ratings” from the drop-down menu on the homepage; and www.moodys.com and select “Methodology,” then “Rating Methodologies” under Research Type on the left-hand side.
Portfolio manager(s):
Michael Camarella
Scott Cottier
Mark DeMitry
Tim O’Reilly
Mark Paris
Julius Williams
The views and opinions expressed in management’s discussion of Fund performance are those of Invesco Advisers, Inc. and its affiliates. These views and opinions are subject to change at any time based on factors such as market and economic conditions. These views and opinions may not be relied upon as investment advice or recommendations, or as an offer for a particular security. The information is not a complete analysis of every aspect of any market, country, industry, security or the Fund. Statements of fact are from sources considered reliable, but Invesco Advisers, Inc. makes no representation or warranty as to their completeness or accuracy. Although historical performance is no guarantee of future results, these insights may help you understand our investment management philosophy.
See important Fund and, if applicable, index disclosures later in this report.
3 Invesco Limited Term California Municipal Fund
Your Fund’s Long-Term Performance
Results of a $10,000 Investment – Oldest Share Class(es)
Fund and index data from 2/28/13
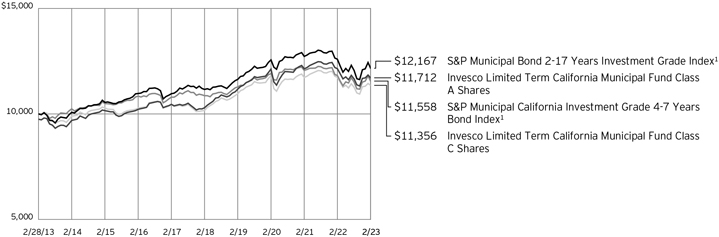
1 Source: RIMES Technologies Corp.
Past performance cannot guarantee future results.
The data shown in the chart include reinvested distributions, applicable sales charges and Fund expenses including management
fees. Index results include reinvested dividends, but they do not reflect sales charges. Performance of the peer group, if applicable, reflects Fund expenses and management fees; performance of a market index does
not. Performance shown in the chart does not reflect deduction of taxes a shareholder would pay on Fund distributions or sale of Fund shares.
4 Invesco Limited Term California Municipal Fund
| | | | |
Average Annual Total Returns | |
| As of 2/28/23, including maximum applicable sales charges | |
| |
Class A Shares | | | | |
Inception (2/25/04) | | | 3.17 | % |
10 Years | | | 1.59 | |
5 Years | | | 2.09 | |
1 Year | | | -5.82 | |
| |
Class C Shares | | | | |
Inception (2/25/04) | | | 2.97 | % |
10 Years | | | 1.28 | |
5 Years | | | 1.93 | |
1 Year | | | -4.90 | |
| |
Class Y Shares | | | | |
Inception (11/29/10) | | | 2.92 | % |
10 Years | | | 2.13 | |
5 Years | | | 2.88 | |
1 Year | | | -3.24 | |
| |
Class R6 Shares | | | | |
10 Years | | | 1.97 | % |
5 Years | | | 2.86 | |
1 Year | | | -3.21 | |
Effective May 24, 2019, Class A, Class C and Class Y shares of the Oppenheimer Rochester Limited Term California Municipal Fund, (the predecessor fund), were reorganized into Class A, Class C and Class Y shares, respectively, of the Invesco Oppen-heimer Rochester® Limited Term California Municipal Fund. The Fund was subsequently renamed the Invesco Limited Term California Municipal Fund (the Fund). Returns shown above, for periods ending on or prior to May 24, 2019, for Class A, Class C and Class Y shares are those for Class A, Class C and Class Y shares of the predecessor fund. Share class returns will differ from the predecessor fund because of different expenses.
Class R6 shares incepted on May 24, 2019. Performance shown on and prior to that date is that of the predecessor fund’s Class A shares at net asset value and includes the 12b-1 fees applicable to Class A shares.
The performance data quoted represent past performance and cannot guarantee future results; current performance may be lower or higher. Please visit invesco.com/ performance for the most recent month-end performance. Performance figures reflect reinvested distributions, changes in net asset value and the effect of the maximum sales charge unless otherwise stated. Performance figures do not reflect deduction of taxes a shareholder would pay on Fund distributions or sale of Fund shares. Investment return and principal value will fluctuate so that you may have a gain or loss when you sell shares.
Class A share performance reflects the maximum 2.50% sales charge, and Class C share performance reflects the applicable contingent deferred sales charge (CDSC)
for the period involved. The CDSC on Class C shares is 1% for the first year after purchase. Class Y and Class R6 shares do not have a front-end sales charge or a CDSC; therefore, performance is at net asset value.
The performance of the Fund’s share classes will differ primarily due to different sales charge structures and class expenses.
Fund performance reflects any applicable fee waivers and/or expense reimbursements. Had the adviser not waived fees and/or reimbursed expenses currently or in the past, returns would have been lower. See current prospectus for more information.
5 Invesco Limited Term California Municipal Fund
Supplemental Information
Invesco Limited Term California Municipal Fund’s investment objective is to seek tax-free income.
| ∎ | | Unless otherwise stated, information presented in this report is as of February 28, 2023, and is based on total net assets. |
| ∎ | | Unless otherwise noted, all data is provided by Invesco. |
| ∎ | | To access your Fund’s reports/prospectus, visit invesco.com/fundreports. |
About indexes used in this report
| ∎ | | The S&P Municipal Bond 2-17 Years Investment Grade Index seeks to measure the performance of investment-grade US municipals with maturities between two and 17 years. |
| ∎ | | The S&P Municipal California Investment Grade 4-7 Years Bond Index consists of bonds issued within California with maturities between four and seven years that are rated at least BBB- by S&P Global Ratings, Baa3 by Moody’s or BBB- by Fitch Ratings. Bonds that are pre-refunded or escrowed to maturity are included in this index. |
| ∎ | | The Fund is not managed to track the performance of any particular index, including the index(es) described here, and consequently, the performance of the Fund may deviate significantly from the performance of the index(es). |
| ∎ | | A direct investment cannot be made in an index. Unless otherwise indicated, index results include reinvested dividends, and they do not reflect sales charges. Performance of the peer group, if applicable, reflects fund expenses; performance of a market index does not. |
| | |
| This report must be accompanied or preceded by a currently effective Fund prospectus, which contains more complete information, including sales charges and expenses. Investors should read it carefully before investing. | | |
| | | |
| NOT FDIC INSURED | MAY LOSE VALUE | NO BANK GUARANTEE | | |
6 Invesco Limited Term California Municipal Fund
Fund Information
| | | | |
| Portfolio Composition | | |
| |
| By credit sector | | % of total investments |
Revenue Bonds | | 83.66% |
General Obligation Bonds | | 10.19 |
Pre-Refunded Bonds | | 6.15 |
| |
| Top Five Debt Holdings | | |
| | |
| | | | | % of total net assets |
| 1. | | Los Angeles (City of), CA Department of Airports (Los Angeles International Airport), Series 2013 A, RB | | 2.81% |
| 2. | | University of California, Series 2013 AI, RB | | 1.93 |
| 3. | | California (State of) Health Facilities Financing Authority (City of Hope), Series 2012 A, RB | | 1.70 |
| 4. | | California (State of), Series 2013, GO Bonds | | 1.53 |
| 5. | | California (State of) Pollution Control Financing Authority, Series 2012, RB | | 1.42 |
The Fund’s holdings are subject to change, and there is no assurance that the Fund will continue to hold any particular security.
Data presented here are as of February 28, 2023.
7 Invesco Limited Term California Municipal Fund
Schedule of Investments
February 28, 2023
| | | | | | | | | | | | | | | | |
| | | Interest
Rate | | | Maturity
Date | | | Principal
Amount
(000) | | | Value | |
Municipal Obligations–100.12% | | | | | | | | | | | | | | | | |
California–94.04% | | | | | | | | | | | | | | | | |
ABAG Finance Authority for Nonprofit Corps. (Sharp Healthcare); Series 2014 A, RB | | | 5.00 | % | | | 08/01/2043 | | | $ | 7,630 | | | $ | 7,648,231 | |
Adelanto (City of), CA Improvement Agency; Series 1993 B, Ref. RB (INS - FGIC)(a) | | | 5.50 | % | | | 12/01/2023 | | | | 90 | | | | 90,288 | |
Adelanto (City of), CA Public Financing Authority; Series 1996 B, RB | | | 6.30 | % | | | 09/01/2028 | | | | 535 | | | | 543,371 | |
Adelanto Public Utility Authority (Utility System); Series 2014 A, RB | | | 5.00 | % | | | 07/01/2024 | | | | 1,555 | | | | 1,556,274 | |
Alameda (County of), CA Joint Powers Authority (Multiple Capital); Series 2013 A, RB | | | 5.25 | % | | | 12/01/2025 | | | | 1,000 | | | | 1,017,305 | |
Alameda (County of), CA Redevelopment Successor Agency (Eden Area Redevelopment); Series 2006 A, RB (INS - NATL)(a) | | | 4.38 | % | | | 08/01/2030 | | | | 10 | | | | 10,010 | |
Association of Bay Area Governments (California Redevelopment Agency Pool);
Series 1994 A, RB (INS - AGM)(a) | | | 6.00 | % | | | 12/15/2024 | | | | 70 | | | | 70,533 | |
Beaumont (City of), CA Financing Authority (Improvement Area No. 19A); Series 2015 B, Ref. RB | | | 5.00 | % | | | 09/01/2025 | | | | 740 | | | | 754,130 | |
Beaumont (City of), CA Financing Authority (Improvement Area No. 19C); Series 2013 A, RB(b)(c) | | | 5.00 | % | | | 09/01/2023 | | | | 655 | | | | 661,015 | |
Bell (City of), CA Community Redevelopment Agency; Series 2003, Ref. RB (INS - AGC)(a) | | | 5.63 | % | | | 10/01/2033 | | | | 25 | | | | 25,086 | |
Blythe (City of), CA Financing Authority (City Hall & County Courthouse); Series 1997, RB (INS - NATL)(a) | | | 5.50 | % | | | 09/01/2027 | | | | 65 | | | | 65,131 | |
California (State of); | | | | | | | | | | | | | | | | |
Series 1993, GO Bonds (INS - NATL)(a) | | | 5.90 | % | | | 04/01/2023 | | | | 55 | | | | 55,121 | |
Series 1993, GO Bonds | | | 5.90 | % | | | 04/01/2023 | | | | 365 | | | | 365,801 | |
Series 1994, GO Bonds | | | 5.75 | % | | | 03/01/2023 | | | | 25 | | | | 25,000 | |
Series 1994, GO Bonds | | | 6.00 | % | | | 03/01/2024 | | | | 45 | | | | 45,639 | |
Series 1994, GO Bonds (INS - NATL)(a) | | | 6.00 | % | | | 08/01/2024 | | | | 45 | | | | 45,538 | |
Series 1995, GO Bonds (INS - AMBAC)(a) | | | 5.90 | % | | | 03/01/2025 | | | | 25 | | | | 25,355 | |
Series 1996, GO Bonds (INS - FGIC)(a) | | | 5.38 | % | | | 06/01/2026 | | | | 90 | | | | 90,560 | |
Series 1996, GO Bonds (INS - NATL)(a) | | | 5.38 | % | | | 06/01/2026 | | | | 10 | | | | 10,062 | |
Series 1996, Ref. GO Bonds | | | 5.63 | % | | | 09/01/2024 | | | | 5 | | | | 5,063 | |
Series 1997, GO Bonds (INS - NATL)(a) | | | 5.00 | % | | | 10/01/2023 | | | | 5 | | | | 5,007 | |
Series 1997, GO Bonds | | | 5.00 | % | | | 10/01/2023 | | | | 5 | | | | 5,007 | |
Series 1997, GO Bonds (INS - NATL)(a) | | | 5.63 | % | | | 10/01/2023 | | | | 120 | | | | 120,237 | |
Series 1997, GO Bonds (INS - NATL)(a) | | | 5.63 | % | | | 10/01/2026 | | | | 10 | | | | 10,022 | |
Series 1997, GO Bonds | | | 5.13 | % | | | 10/01/2027 | | | | 20 | | | | 20,038 | |
Series 2000, GO Bonds | | | 5.63 | % | | | 05/01/2026 | | | | 40 | | | | 40,088 | |
Series 2001, GO Bonds | | | 5.20 | % | | | 11/01/2031 | | | | 5 | | | | 5,008 | |
Series 2002, GO Bonds (INS - SGI)(a) | | | 5.00 | % | | | 10/01/2028 | | | | 5 | | | | 5,008 | |
Series 2013, GO Bonds | | | 5.00 | % | | | 04/01/2037 | | | | 4,825 | | | | 4,830,285 | |
Series 2013, GO Bonds | | | 5.00 | % | | | 04/01/2043 | | | | 10,770 | | | | 10,780,912 | |
Series 2013, GO Bonds | | | 5.00 | % | | | 11/01/2043 | | | | 1,700 | | | | 1,714,659 | |
Series 2015 C, Ref. GO Bonds | | | 5.00 | % | | | 08/01/2031 | | | | 815 | | | | 849,324 | |
California (State of) Community Choice Financing Authority (Green Bonds); Series 2023 C, RB(c) | | | 5.25 | % | | | 10/01/2031 | | | | 5,000 | | | | 5,206,210 | |
California (State of) Community College Financing Authority (Grossmont-Cuyamaca Community College District, Palomar Community College District & Shasta-Tehama-Trinity Joint Community College District); Series 2001 A, RB (INS - NATL)(a) | | | 5.63 | % | | | 04/01/2026 | | | | 430 | | | | 430,843 | |
California (State of) Community College Financing Authority (NCCD - Orange Coast Properties LLC - Orange Coast College); Series 2018, RB | | | 5.00 | % | | | 05/01/2033 | | | | 600 | | | | 623,171 | |
California (State of) County Tobacco Securitization Agency; | | | | | | | | | | | | | | | | |
Series 2007 A, RB | | | 5.00 | % | | | 06/01/2036 | | | | 4,375 | | | | 4,246,794 | |
Series 2007 B, RB | | | 5.10 | % | | | 06/01/2028 | | | | 145 | | | | 144,593 | |
Series 2014, Ref. RB | | | 4.00 | % | | | 06/01/2029 | | | | 1,795 | | | | 1,796,883 | |
Series 2020 B-1, Ref. RB | | | 4.00 | % | | | 06/01/2049 | | | | 375 | | | | 370,998 | |
California (State of) County Tobacco Securitization Agency (Alameda County Tobacco Asset Securitization Corp.); | | | | | | | | | | | | | | | | |
Series 2002, RB | | | 5.88 | % | | | 06/01/2035 | | | | 325 | | | | 330,376 | |
Series 2002, RB | | | 6.00 | % | | | 06/01/2042 | | | | 4,735 | | | | 4,813,322 | |
California (State of) County Tobacco Securitization Agency (Fresno County Tobacco Funding Corp.); Series 2002, RB | | | 6.00 | % | | | 06/01/2035 | | | | 3,000 | | | | 3,002,203 | |
California (State of) County Tobacco Securitization Agency (Los Angeles County Securitization Corp.); Series 2020 B-1, Ref. RB | | | 5.00 | % | | | 06/01/2049 | | | | 7,940 | | | | 8,011,456 | |
California (State of) County Tobacco Securitization Agency (Sonoma County Securitization Corp.); Series 2020, Ref. RB | | | 5.00 | % | | | 06/01/2049 | | | | 975 | | | | 984,279 | |
See accompanying Notes to Financial Statements which are an integral part of the financial statements.
8 Invesco Limited Term California Municipal Fund
| | | | | | | | | | | | | | | | |
| | | Interest
Rate | | | Maturity
Date | | | Principal
Amount
(000) | | | Value | |
California–(continued) | | | | | | | | | | | | | | | | |
California (State of) County Tobacco Securitization Agency (Stanislaus County Tobacco Funding Corp.); Series 2002 A, RB | | | 5.88 | % | | | 06/01/2043 | | | $ | 185 | | | $ | 185,005 | |
California (State of) Educational Facilities Authority (Loma Linda University); Series 2017 A, Ref. RB | | | 5.00 | % | | | 04/01/2030 | | | | 710 | | | | 752,284 | |
California (State of) Educational Facilities Authority (Santa Clara University); Series 2015, Ref. RB | | | 5.00 | % | | | 04/01/2039 | | | | 6,035 | | | | 6,220,622 | |
California (State of) Educational Facilities Authority (Southwestern University); Series 2003, Ref. RB | | | 5.00 | % | | | 11/01/2023 | | | | 30 | | | | 30,014 | |
California (State of) Health Facilities Financing Authority (Cedars-Sinai Medical Center); Series 2015, Ref. RB | | | 5.00 | % | | | 11/15/2032 | | | | 1,750 | | | | 1,850,998 | |
California (State of) Health Facilities Financing Authority (City of Hope); | | | | | | | | | | | | | | | | |
Series 2012 A, RB | | | 5.00 | % | | | 11/15/2032 | | | | 4,275 | | | | 4,243,089 | |
Series 2012 A, RB | | | 5.00 | % | | | 11/15/2035 | | | | 12,280 | | | | 11,990,991 | |
Series 2012 A, RB | | | 5.00 | % | | | 11/15/2039 | | | | 4,905 | | | | 4,610,471 | |
California (State of) Health Facilities Financing Authority (Commonspirit Health); Series 2020 A, Ref. RB | | | 4.00 | % | | | 04/01/2040 | | | | 2,500 | | | | 2,367,661 | |
California (State of) Health Facilities Financing Authority (El Camino Hospital); | | | | | | | | | | | | | | | | |
Series 2015 A, Ref. RB | | | 5.00 | % | | | 02/01/2032 | | | | 1,750 | | | | 1,811,455 | |
Series 2015 A, Ref. RB | | | 5.00 | % | | | 02/01/2033 | | | | 3,000 | | | | 3,103,305 | |
California (State of) Health Facilities Financing Authority (Gateways Hospital and Mental Health Center); | | | | | | | | | | | | | | | | |
Series 2011 B, RB (INS - Cal-Mortgage)(a) | | | 4.30 | % | | | 12/01/2023 | | | | 15 | | | | 15,012 | |
Series 2011 B, RB (INS - Cal-Mortgage)(a) | | | 4.45 | % | | | 12/01/2024 | | | | 10 | | | | 10,009 | |
California (State of) Health Facilities Financing Authority (Providence Health & Services); | | | | | | | | | | | | | | | | |
Series 2014 A, RB | | | 5.00 | % | | | 10/01/2029 | | | | 500 | | | | 515,859 | |
Series 2014 A, RB | | | 5.00 | % | | | 10/01/2038 | | | | 3,420 | | | | 3,465,451 | |
California (State of) Health Facilities Financing Authority (San Fernando Valley Community Mental Health Center, Inc.); Series 1998 A, RB (INS - NATL)(a) | | | 5.25 | % | | | 06/01/2023 | | | | 5 | | | | 5,001 | |
California (State of) Health Facilities Financing Authority (St. Joseph Health System); Series 2013 A, RB(b)(c) | | | 5.00 | % | | | 07/01/2023 | | | | 500 | | | | 503,029 | |
California (State of) Health Facilities Financing Authority (Stanford Health Care); Series 2017 A, Ref. RB | | | 4.00 | % | | | 11/15/2040 | | | | 3,000 | | | | 2,964,085 | |
California (State of) Health Facilities Financing Authority (Sutter Health); | | | | | | | | | | | | | | | | |
Series 2017 A, Ref. RB | | | 5.00 | % | | | 11/15/2032 | | | | 1,800 | | | | 1,956,934 | |
Series 2017 A, Ref. RB | | | 5.00 | % | | | 11/15/2033 | | | | 3,000 | | | | 3,250,852 | |
Series 2017 A, Ref. RB | | | 5.00 | % | | | 11/15/2035 | | | | 1,500 | | | | 1,606,423 | |
Series 2017 A, Ref. RB | | | 5.00 | % | | | 11/15/2037 | | | | 4,490 | | | | 4,752,893 | |
California (State of) Housing Finance Agency; Series 2019 A-1, RB | | | 4.25 | % | | | 01/15/2035 | | | | 4,737 | | | | 4,720,215 | |
California (State of) Infrastructure & Economic Development Bank; Series 2020,
RB(c)(d)(e) | | | 3.65 | % | | | 01/31/2024 | | | | 2,000 | | | | 1,992,677 | |
California (State of) Infrastructure & Economic Development Bank (Academy Motion Picture Arts & Sciences Obligated Group); Series 2015 A, Ref. RB | | | 5.00 | % | | | 11/01/2041 | | | | 6,100 | | | | 6,139,413 | |
California (State of) Infrastructure & Economic Development Bank (California Science Center Phase II); | | | | | | | | | | | | | | | | |
Series 2016 A, Ref. RB | | | 5.00 | % | | | 05/01/2027 | | | | 1,505 | | | | 1,605,743 | |
Series 2016 A, Ref. RB | | | 5.00 | % | | | 05/01/2028 | | | | 775 | | | | 829,875 | |
Series 2016 A, Ref. RB | | | 5.00 | % | | | 05/01/2029 | | | | 910 | | | | 976,040 | |
Series 2016 A, Ref. RB | | | 5.00 | % | | | 05/01/2030 | | | | 740 | | | | 794,618 | |
Series 2016 A, Ref. RB | | | 5.00 | % | | | 05/01/2031 | | | | 910 | | | | 978,539 | |
California (State of) Infrastructure & Economic Development Bank (Segerstrom Center for the Arts); Series 2016, Ref. RB | | | 5.00 | % | | | 07/01/2026 | | | | 5,000 | | | | 5,247,267 | |
California (State of) Municipal Finance Authority (American Heritage Education Foundation); Series 2016 A, Ref. RB | | | 5.00 | % | | | 06/01/2036 | | | | 1,000 | | | | 1,017,181 | |
California (State of) Municipal Finance Authority (Biola University); | | | | | | | | | | | | | | | | |
Series 2013, RB(b)(c) | | | 5.00 | % | | | 10/01/2023 | | | | 465 | | | | 469,699 | |
Series 2013, RB(b)(c) | | | 5.00 | % | | | 10/01/2023 | | | | 335 | | | | 338,385 | |
California (State of) Municipal Finance Authority (CHF-Davis I, LLC - West Village Student Housing); | | | | | | | | | | | | | | | | |
Series 2018, RB (INS - BAM)(a) | | | 5.00 | % | | | 05/15/2033 | | | | 6,385 | | | | 6,874,176 | |
Series 2018, RB | | | 5.00 | % | | | 05/15/2037 | | | | 2,500 | | | | 2,564,622 | |
California (State of) Municipal Finance Authority (CHF-Riverside I, LLC - UCR Dundee-Glasgow Student Housing); | | | | | | | | | | | | | | | | |
Series 2018, RB (INS - BAM)(a) | | | 5.00 | % | | | 05/15/2032 | | | | 2,120 | | | | 2,287,610 | |
Series 2018, RB (INS - BAM)(a) | | | 5.00 | % | | | 05/15/2033 | | | | 2,000 | | | | 2,151,085 | |
Series 2018, RB (INS - BAM)(a) | | | 5.00 | % | | | 05/15/2034 | | | | 1,260 | | | | 1,350,300 | |
Series 2018, RB (INS - BAM)(a) | | | 5.00 | % | | | 05/15/2036 | | | | 1,900 | | | | 2,009,864 | |
California (State of) Municipal Finance Authority (CHF-Riverside II, LLC - UCR North District Phase I Student Housing); Series 2019, RB (INS - BAM)(a) | | | 5.00 | % | | | 05/15/2040 | | | | 3,080 | | | | 3,221,481 | |
See accompanying Notes to Financial Statements which are an integral part of the financial statements.
9 Invesco Limited Term California Municipal Fund
| | | | | | | | | | | | | | |
| | | Interest
Rate | | Maturity
Date | | | Principal
Amount
(000) | | | Value | |
California–(continued) | | | | | | | | | | | | | | |
California (State of) Municipal Finance Authority (Community Medical Centers); | | | | | | | | | | | | | | |
Series 2017 A, Ref. RB | | 5.00% | | | 02/01/2028 | | | $ | 3,000 | | | $ | 3,169,386 | |
Series 2017 A, Ref. RB | | 5.00% | | | 02/01/2029 | | | | 3,400 | | | | 3,600,915 | |
Series 2017 A, Ref. RB | | 5.00% | | | 02/01/2030 | | | | 3,500 | | | | 3,709,456 | |
Series 2017 A, Ref. RB | | 5.00% | | | 02/01/2031 | | | | 2,000 | | | | 2,117,949 | |
Series 2017 A, Ref. RB | | 5.00% | | | 02/01/2032 | | | | 1,500 | | | | 1,585,826 | |
California (State of) Municipal Finance Authority (Eisenhower Medical Centers); Series 2017 A, Ref. RB | | 5.00% | | | 07/01/2030 | | | | 2,155 | | | | 2,269,439 | |
California (State of) Municipal Finance Authority (Emerson College);
Series 2011, RB | | 5.00% | | | 01/01/2028 | | | | 40 | | | | 40,042 | |
California (State of) Municipal Finance Authority (Linxs APM); | | | | | | | | | | | | | | |
Series 2018 A, RB(e) | | 5.00% | | | 12/31/2033 | | | | 8,385 | | | | 8,781,992 | |
Series 2018 A, RB(e) | | 5.00% | | | 12/31/2034 | | | | 6,500 | | | | 6,758,140 | |
Series 2018, RB(e) | | 5.00% | | | 12/31/2035 | | | | 2,700 | | | | 2,781,965 | |
California (State of) Municipal Finance Authority (NorthBay Healthcare Group); | | | | | | | | | | | | | | |
Series 2015, RB | | 5.00% | | | 11/01/2030 | | | | 440 | | | | 446,995 | |
Series 2015, RB | | 5.00% | | | 11/01/2035 | | | | 1,100 | | | | 1,112,011 | |
Series 2017 A, RB | | 5.00% | | | 11/01/2028 | | | | 1,000 | | | | 1,036,757 | |
Series 2017 A, RB | | 5.25% | | | 11/01/2029 | | | | 750 | | | | 783,987 | |
California (State of) Municipal Finance Authority (San Bernardino Municipal Water Department Water Facilities); | | | | | | | | | | | | | | |
Series 2016, Ref. RB (INS - BAM)(a) | | 5.00% | | | 08/01/2033 | | | | 1,580 | | | | 1,685,592 | |
Series 2016, Ref. RB (INS - BAM)(a) | | 5.00% | | | 08/01/2035 | | | | 1,715 | | | | 1,817,354 | |
California (State of) Municipal Finance Authority (United Airlines, Inc.); Series 2019, RB(e) | | 4.00% | | | 07/15/2029 | | | | 1,100 | | | | 1,053,882 | |
California (State of) Pollution Control Financing Authority; | | | | | | | | | | | | | | |
Series 2012, RB(d)(e) | | 5.00% | | | 07/01/2030 | | | | 5,000 | | | | 5,021,872 | |
Series 2012, RB(d)(e) | | 5.00% | | | 11/21/2045 | | | | 10,000 | | | | 10,011,755 | |
California (State of) Pollution Control Financing Authority (CalPlant I) (Green Bonds); Series 2017, RB(d)(e)(f) | | 7.50% | | | 07/01/2032 | | | | 4,000 | | | | 200,000 | |
Series 2020, RB (Acquired 10/06/2020; Cost $601,778)(d)(e)(f)(g) | | 7.50% | | | 07/01/2032 | | | | 630 | | | | 81,900 | |
California (State of) Pollution Control Financing Authority (San Diego County Water Authority); Series 2019, Ref. RB(d) | | 5.00% | | | 07/01/2039 | | | | 1,500 | | | | 1,526,448 | |
California (State of) Pollution Control Financing Authority (Southern California Water Co.); Series 1996 A, RB (INS - NATL)(a)(e) | | 5.50% | | | 12/01/2026 | | | | 1,030 | | | | 1,054,911 | |
California (State of) Public Finance Authority (California Crosspoint Academy); Series 2020 A, RB(d) | | 4.25% | | | 07/01/2030 | | | | 1,415 | | | | 1,281,495 | |
California (State of) Public Finance Authority (California University of Science and Medicine); Series 2019 A, RB(d) | | 6.25% | | | 07/01/2054 | | | | 7,000 | | | | 7,428,970 | |
California (State of) Public Finance Authority (Enso Village) (Green Bonds); | | | | | | | | | | | | | | |
Series 2021 B-3, RB(d) | | 2.13% | | | 11/15/2027 | | | | 1,000 | | | | 934,210 | |
Series 2021, RB(d) | | 3.13% | | | 05/15/2029 | | | | 1,000 | | | | 881,864 | |
Series 2021, RB(d) | | 5.00% | | | 11/15/2036 | | | | 500 | | | | 468,790 | |
California (State of) Public Finance Authority (Trinity Classical Academy); Series 2019 A, RB(d) | | 5.00% | | | 07/01/2036 | | | | 600 | | | | 577,355 | |
California (State of) Public Works Board (California Community Colleges);
Series 2004 B, RB | | 5.13% | | | 06/01/2025 | | | | 15 | | | | 15,026 | |
Series 2004 B, RB | | 5.13% | | | 06/01/2029 | | | | 45 | | | | 45,074 | |
Series 2005 E, RB (INS - BHAC)(a) | | 5.00% | | | 10/01/2024 | | | | 50 | | | | 50,078 | |
Series 2007 B, RB (INS - NATL)(a) | | 4.25% | | | 03/01/2026 | | | | 5 | | | | 5,005 | |
Series 2007 B, RB (INS - NATL)(a) | | 5.00% | | | 03/01/2027 | | | | 50 | | | | 50,085 | |
California (State of) Public Works Board (Coalinga State); Series 2013 E, RB | | 5.00% | | | 06/01/2029 | | | | 700 | | | | 703,350 | |
California (State of) Public Works Board (Department of Mental Health); Series 2003 B, RB | | 5.25% | | | 04/01/2023 | | | | 5 | | | | 5,008 | |
California (State of) Public Works Board (Green Bonds); Series 2021, RB | | 4.00% | | | 11/01/2041 | | | | 2,115 | | | | 2,088,932 | |
California (State of) Public Works Board (Judicial Council of California); Series 2013 A, RB | | 5.00% | | | 03/01/2026 | | | | 875 | | | | 876,454 | |
California (State of) Public Works Board (Various Capital); Series 2013 I, RB | | 5.00% | | | 11/01/2029 | | | | 100 | | | | 101,290 | |
California (State of) School Finance Authority (Escuela Popular); Series 2017, RB(d) | | 5.50% | | | 07/01/2027 | | | | 920 | | | | 909,828 | |
California (State of) School Finance Authority (HTH Learning); Series 2017 A, Ref. RB(d) | | 5.00% | | | 07/01/2032 | | | | 1,705 | | | | 1,678,683 | |
California (State of) Statewide Communities Development Authority; | | | | | | | | | | | | | | |
Series 2020 B, RB | | 4.00% | | | 09/02/2023 | | | | 105 | | | | 104,813 | |
Series 2020 B, RB | | 4.00% | | | 09/02/2024 | | | | 110 | | | | 109,272 | |
Series 2020 B, RB | | 4.00% | | | 09/02/2025 | | | | 115 | | | | 114,047 | |
Series 2020 B, RB | | 4.00% | | | 09/02/2026 | | | | 115 | | | | 114,119 | |
California (State of) Statewide Communities Development Authority (Enloe Medical Center); Series 2015, Ref. RB(b)(c) | | 5.00% | | | 02/15/2026 | | | | 2,875 | | | | 3,045,448 | |
See accompanying Notes to Financial Statements which are an integral part of the financial statements.
10 Invesco Limited Term California Municipal Fund
| | | | | | | | | | | | | | |
| | | Interest
Rate | | Maturity
Date | | | Principal
Amount
(000) | | | Value | |
California–(continued) | | | | | | | | | | | | | | |
California (State of) Statewide Communities Development Authority (Eskaton Properties, Inc.); Series 2012, RB | | 5.25% | | | 11/15/2034 | | | $ | 1,000 | | | $ | 999,946 | |
California (State of) Statewide Communities Development Authority (Front Porch Communities & Services); Series 2017 A, Ref. RB | | 5.00% | | | 04/01/2031 | | | | 175 | | | | 182,936 | |
California (State of) Statewide Communities Development Authority (Heritage Park at Cathedral City Apartments); Series 2002 NN-1, RB (INS - AMBAC)(a)(e) | | 5.20% | | | 06/01/2036 | | | | 795 | | | | 795,832 | |
California (State of) Statewide Communities Development Authority (Loma Linda University Medical Center); Series 2014, RB | | 5.25% | | | 12/01/2034 | | | | 3,000 | | | | 3,054,339 | |
California (State of) Statewide Communities Development Authority (NCCD-Hooper Street LLC-California College of the Arts); Series 2019, RB(d) | | 5.00% | | | 07/01/2029 | | | | 900 | | | | 874,743 | |
California (State of) Statewide Communities Development Authority (Statewide Community Infrastructure Program);
Series 2015, Ref. RB | | 5.00% | | | 09/02/2035 | | | | 3,515 | | | | 3,599,090 | |
Series 2021 C1, RB | | 2.25% | | | 09/02/2026 | | | | 1,575 | | | | 1,392,036 | |
California (State of) Statewide Communities Development Authority (University of California - Irvine East Campus Apartments - CHF-Irvine, LLC); Series 2016, Ref. RB | | 5.00% | | | 05/15/2030 | | | | 1,500 | | | | 1,548,649 | |
California (State of) Statewide Financing Authority (Pooled Tobacco Securitization Program); Series 2002 A, RB | | 6.00% | | | 05/01/2037 | | | | 2,720 | | | | 2,767,408 | |
California State University;
Series 2015 A, Ref. RB | | 5.00% | | | 11/01/2043 | | | | 1,700 | | | | 1,766,716 | |
Series 2019 A, RB | | 4.00% | | | 11/01/2041 | | | | 3,480 | | | | 3,428,171 | |
Calimesa (City of), CA Community Facilities District No. 2018-1 (Summerwind Trails); Series 2020, RB | | 4.00% | | | 09/01/2037 | | | | 415 | | | | 391,378 | |
Carlsbad (City of), CA Housing & Redevelopment Commission; Series 1993, RB (INS - NATL)(a) | | 5.30% | | | 09/01/2023 | | | | 5 | | | | 5,037 | |
Cathedral (City of), CA Redevelopment Agency Successor Agency (Merged Redevelopment);
Series 2021 A, Ref. RB (INS - BAM)(a) | | 4.00% | | | 08/01/2034 | | | | 1,000 | | | | 1,018,514 | |
Series 2021 A, Ref. RB (INS - BAM)(a) | | 4.00% | | | 08/01/2035 | | | | 200 | | | | 203,858 | |
Cerritos (City of), CA Public Financing Authority; Series 2002 A, RB (INS - AMBAC)(a) | | 4.55% | | | 11/01/2024 | | | | 5 | | | | 5,003 | |
Cerritos Community College District; Series 2014 A, GO Bonds | | 4.00% | | | 08/01/2044 | | | | 5,850 | | | | 5,645,007 | |
Chino (City of), CA Public Financing Authority; | | | | | | | | | | | | | | |
Series 2015 A, Ref. RB (INS - AGM)(a) | | 5.00% | | | 09/01/2028 | | | | 1,230 | | | | 1,298,998 | |
Series 2015 A, Ref. RB (INS - AGM)(a) | | 5.00% | | | 09/01/2029 | | | | 1,280 | | | | 1,355,358 | |
Series 2015 A, Ref. RB (INS - AGM)(a) | | 5.00% | | | 09/01/2030 | | | | 900 | | | | 955,029 | |
Series 2015 A, Ref. RB (INS - AGM)(a) | | 5.00% | | | 09/01/2031 | | | | 950 | | | | 1,004,148 | |
Colton (City of), CA Public Financing Authority; Series 2007 A, RB (INS - AMBAC)(a) | | 4.70% | | | 04/01/2032 | | | | 15 | | | | 15,021 | |
Compton (City of), CA; Series 1998, Ref. RB (INS - NATL)(a) | | 5.38% | | | 09/01/2023 | | | | 60 | | | | 60,045 | |
Dixon (City of), CA Improvement Area No. 1 (Community Facilities District No. 2013-1); Series 2019, RB | | 5.00% | | | 09/01/2044 | | | | 2,645 | | | | 2,696,299 | |
Downey (City of), CA Community Development Commission; Series 1997, Ref. RB (INS - NATL)(a) | | 5.13% | | | 08/01/2028 | | | | 40 | | | | 40,250 | |
El Dorado (County of), CA (Community Facilities District No. 1992-1 - El Dorado Hills Development);
Series 2012, Ref. RB | | 5.00% | | | 09/01/2026 | | | | 620 | | | | 620,913 | |
Series 2012, Ref. RB | | 5.00% | | | 09/01/2027 | | | | 790 | | | | 791,164 | |
El Monte Union High School District; Series 2019 A, GO Bonds | | 4.00% | | | 06/01/2037 | | | | 1,440 | | | | 1,457,609 | |
Fontana (City of), CA (Community Facilities District No. 80); | | | | | | | | | | | | | | |
Series 2017, RB | | 5.00% | | | 09/01/2026 | | | | 290 | | | | 303,341 | |
Series 2017, RB | | 5.00% | | | 09/01/2029 | | | | 175 | | | | 185,675 | |
Fresno (City of), CA; Series 2013 B, Ref. RB(e) | | 5.00% | | | 07/01/2023 | | | | 690 | | | | 692,763 | |
Fresno (City of), CA Joint Powers Financing Authority (Master Lease); | | | | | | | | | | | | | | |
Series 2017 A, Ref. RB (INS - AGM)(a) | | 5.00% | | | 04/01/2030 | | | | 675 | | | | 736,691 | |
Series 2017 A, Ref. RB (INS - AGM)(a) | | 5.00% | | | 04/01/2031 | | | | 1,000 | | | | 1,089,528 | |
Series 2017 A, Ref. RB (INS - AGM)(a) | | 5.00% | | | 04/01/2032 | | | | 500 | | | | 544,394 | |
Glendale (City of), CA; Series 2013, RB | | 5.00% | | | 02/01/2039 | | | | 4,000 | | | | 4,019,238 | |
Golden State Tobacco Securitization Corp.; | | | | | | | | | | | | | | |
Series 2017 A-1, Ref. RB(b)(c) | | 5.00% | | | 06/01/2027 | | | | 6,560 | | | | 7,159,661 | |
Series 2017 A-1, Ref. RB(b)(c) | | 5.00% | | | 06/01/2027 | | | | 2,090 | | | | 2,281,050 | |
Series 2017 A-1, Ref. RB(b) | | 5.00% | | | 06/01/2027 | | | | 1,850 | | | | 2,019,112 | |
Hawthorne (City of), CA Community Redevelopment Agency Successor Agency (Community Facilities District No. 1999-1); Series 2010, Ref. RB | | 6.13% | | | 10/01/2025 | | | | 2,040 | | | | 2,043,882 | |
See accompanying Notes to Financial Statements which are an integral part of the financial statements.
11 Invesco Limited Term California Municipal Fund
| | | | | | | | | | | | | | | | |
| | | Interest
Rate | | | Maturity
Date | | | Principal
Amount
(000) | | | Value | |
California–(continued) | | | | | | | | | | | | | | | | |
Hemet Unified School District; | | | | | | | | | | | | | | | | |
Series 2021, Ref. RB | | | 4.00 | % | | | 09/01/2026 | | | $ | 225 | | | $ | 224,357 | |
Series 2021, Ref. RB | | | 4.00 | % | | | 09/01/2028 | | | | 255 | | | | 255,584 | |
Series 2021, Ref. RB | | | 4.00 | % | | | 09/01/2032 | | | | 335 | | | | 333,320 | |
Series 2021, Ref. RB | | | 4.00 | % | | | 09/01/2035 | | | | 400 | | | | 387,577 | |
Series 2021, Ref. RB | | | 4.00 | % | | | 09/01/2036 | | | | 200 | | | | 190,958 | |
Hollister (City of), CA Redevelopment Agency Successor Agency (Hollister Community Development); Series 2014, Ref. RB (INS - BAM)(a) | | | 5.00 | % | | | 10/01/2031 | | | | 1,675 | | | | 1,737,391 | |
Huntington Beach (City of), CA (Community Facilities District No. 2002-1 - Improvement Area A - McDonnell Centre Business Park); Series 2002 A, RB | | | 6.25 | % | | | 09/01/2027 | | | | 20 | | | | 20,278 | |
Huntington Beach (City of), CA (Community Facilities District No. 2003-1 - Huntington Center); | | | | | | | | | | | | | | | | |
Series 2013, Ref. RB | | | 5.25 | % | | | 09/01/2025 | | | | 1,055 | | | | 1,056,353 | |
Series 2013, Ref. RB | | | 5.25 | % | | | 09/01/2026 | | | | 1,115 | | | | 1,116,546 | |
Series 2013, Ref. RB | | | 5.38 | % | | | 09/01/2033 | | | | 1,200 | | | | 1,209,911 | |
Huntington Beach (City of), CA Redevelopment Agency; Series 1999, Ref. RB (INS - AGM)(a) | | | 5.00 | % | | | 08/01/2024 | | | | 5 | | | | 5,009 | |
Imperial (City of), CA Public Financing Authority (Water Facility); Series 2012, RB | | | 5.00 | % | | | 10/15/2026 | | | | 2,735 | | | | 2,739,029 | |
Imperial Irrigation District; Series 2017, Ref. RB | | | 4.00 | % | | | 11/01/2037 | | | | 6,070 | | | | 6,118,433 | |
Inland Empire Tobacco Securitization Corp.; Series 2019, Ref. RB | | | 3.68 | % | | | 06/01/2038 | | | | 7,435 | | | | 6,887,809 | |
Inland Valley Development Agency; Series 2014 A, Ref. RB (INS - AGM)(a) | | | 5.00 | % | | | 09/01/2044 | | | | 5,000 | | | | 5,049,343 | |
Irvine (City of), CA (Reassessment District No. 13-1); Series 2013, RB | | | 5.00 | % | | | 09/02/2025 | | | | 710 | | | | 716,700 | |
Irvine (City of), CA Community Facilities District No. 2013-3 (Great Park Improvement Area No. 1); | | | | | | | | | | | | | | | | |
Series 2014, RB | | | 5.00 | % | | | 09/01/2039 | | | | 2,000 | | | | 2,019,404 | |
Series 2014, RB | | | 5.00 | % | | | 09/01/2044 | | | | 500 | | | | 503,000 | |
Jurupa (City of), CA Public Financing Authority; Series 2014 A, Ref. RB | | | 5.00 | % | | | 09/01/2042 | | | | 1,000 | | | | 1,017,427 | |
Jurupa Community Services District; | | | | | | | | | | | | | | | | |
Series 2021 A, RB | | | 4.00 | % | | | 09/01/2031 | | | | 100 | | | | 99,594 | |
Series 2021 A, RB | | | 4.00 | % | | | 09/01/2033 | | | | 100 | | | | 98,961 | |
Series 2021 A, RB | | | 4.00 | % | | | 09/01/2034 | | | | 165 | | | | 162,140 | |
Series 2021 A, RB | | | 4.00 | % | | | 09/01/2036 | | | | 180 | | | | 170,809 | |
Series 2021 A, RB | | | 4.00 | % | | | 09/01/2038 | | | | 385 | | | | 355,948 | |
Series 2021 A, RB | | | 4.00 | % | | | 09/01/2039 | | | | 135 | | | | 123,746 | |
Series 2021 A, RB | | | 4.00 | % | | | 09/01/2040 | | | | 140 | | | | 126,451 | |
La Mesa (City of), CA (Assessment District No. 98-1); Series 1998, RB | | | 5.75 | % | | | 09/02/2023 | | | | 10 | | | | 10,092 | |
Long Beach (City of), CA; Series 2015, RB | | | 5.00 | % | | | 05/15/2027 | | | | 850 | | | | 872,215 | |
Long Beach (City of), CA (Community Facilities District No. 6); Series 2002, RB | | | 6.25 | % | | | 10/01/2026 | | | | 25 | | | | 25,050 | |
Long Beach (City of), CA Bond Finance Authority;
Series 2007 A, RB | | | 5.25 | % | | | 11/15/2023 | | | | 1,435 | | | | 1,444,578 | |
Series 2007 A, RB | | | 5.50 | % | | | 11/15/2037 | | | | 100 | | | | 108,827 | |
Long Beach Unified School District (Election of 2008); Series 2009, GO Bonds | | | 5.75 | % | | | 08/01/2033 | | | | 30 | | | | 30,060 | |
Los Angeles (City of), CA Department of Airports; | | | | | | | | | | | | | | | | |
Series 2015 A, RB(e) | | | 4.75 | % | | | 05/15/2040 | | | | 8,500 | | | | 8,569,214 | |
Series 2015 C, Ref. RB | | | 5.00 | % | | | 05/15/2038 | | | | 4,240 | | | | 4,375,254 | |
Series 2018 B, Ref. RB(e) | | | 5.00 | % | | | 05/15/2034 | | | | 1,000 | | | | 1,066,434 | |
Los Angeles (City of), CA Department of Airports (Los Angeles International Airport); | | | | | | | | | | | | | | | | |
Series 2013 A, RB(e) | | | 5.00 | % | | | 05/15/2038 | | | | 19,750 | | | | 19,777,652 | |
Series 2018 A, RB(e) | | | 5.25 | % | | | 05/15/2038 | | | | 3,565 | | | | 3,765,271 | |
Series 2018 D, Ref. RB(e) | | | 5.00 | % | | | 05/15/2030 | | | | 9,000 | | | | 9,740,004 | |
Los Angeles (City of), CA Department of Water & Power; Series 2017 A, RB | | | 5.00 | % | | | 07/01/2042 | | | | 5,000 | | | | 5,261,148 | |
Los Angeles (County of), CA Metropolitan Transportation Authority; Series 2013 B, RB | | | 4.38 | % | | | 07/01/2037 | | | | 500 | | | | 501,553 | |
Los Angeles (County of), CA Metropolitan Transportation Authority (Green Bonds); Series 2020 A, RB | | | 4.00 | % | | | 06/01/2035 | | | | 1,000 | | | | 1,051,931 | |
Los Angeles (Port of), CA; | | | | | | | | | | | | | | | | |
Series 2014 A, Ref. RB(e) | | | 5.00 | % | | | 08/01/2030 | | | | 2,000 | | | | 2,051,811 | |
Series 2014 A, Ref. RB(e) | | | 5.00 | % | | | 08/01/2031 | | | | 1,250 | | | | 1,281,956 | |
Series 2014 A, Ref. RB(e) | | | 5.00 | % | | | 08/01/2032 | | | | 1,745 | | | | 1,788,697 | |
Series 2014 A, Ref. RB(e) | | | 5.00 | % | | | 08/01/2033 | | | | 1,895 | | | | 1,940,998 | |
Series 2014 A, Ref. RB(e) | | | 5.00 | % | | | 08/01/2034 | | | | 2,470 | | | | 2,526,030 | |
Madera (County of), CA (Valley Children’s Hospital); | | | | | | | | | | | | | | | | |
Series 1995, COP (INS - NATL)(a) | | | 5.75 | % | | | 03/15/2028 | | | | 455 | | | | 468,624 | |
Series 1998, COP (INS - NATL)(a) | | | 5.00 | % | | | 03/15/2023 | | | | 225 | | | | 225,149 | |
See accompanying Notes to Financial Statements which are an integral part of the financial statements.
12 Invesco Limited Term California Municipal Fund
| | | | | | | | | | | | | | | | | | | | |
| | | Interest
Rate | | Maturity
Date | | Principal
Amount
(000) | | Value |
California–(continued) Manteca Unified School District (Community Facilities District No. 1989-2); Series 2013 F, RB (INS - AGM)(a) | | | | 5.00 | % | | | | 09/01/2027 | | | | | $ 1,285 | | | | | $ 1,296,419 | |
Marina (City of), CA Redevelopment Agency Successor Agency; | | | | | | | | | | | | | | | | | | | | |
Series 2018 A, RB | | | | 5.00 | % | | | | 09/01/2033 | | | | | 340 | | | | | 359,229 | |
Series 2018 B, RB | | | | 5.00 | % | | | | 09/01/2033 | | | | | 250 | | | | | 264,201 | |
Modesto (City of), CA (Golf Course); Series 1993 B, COP (INS - NATL)(a) | | | | 5.00 | % | | | | 11/01/2023 | | | | | 65 | | | | | 64,613 | |
Mountain House Public Financing Authority (Green Bonds); | | | | | | | | | | | | | | | | | | | | |
Series 2020 A, RB (INS - BAM)(a) | | | | 4.00 | % | | | | 12/01/2036 | | | | | 310 | | | | | 313,405 | |
Series 2020 A, RB (INS - BAM)(a) | | | | 4.00 | % | | | | 12/01/2037 | | | | | 495 | | | | | 497,594 | |
Series 2020 A, RB (INS - BAM)(a) | | | | 4.00 | % | | | | 12/01/2038 | | | | | 555 | | | | | 556,591 | |
Series 2020 A, RB (INS - BAM)(a) | | | | 4.00 | % | | | | 12/01/2039 | | | | | 470 | | | | | 464,832 | |
Series 2020 A, RB (INS - BAM)(a) | | | | 4.00 | % | | | | 12/01/2040 | | | | | 600 | | | | | 593,247 | |
Series 2020 B, RB (INS - BAM)(a) | | | | 4.00 | % | | | | 12/01/2035 | | | | | 1,000 | | | | | 1,020,889 | |
Mountain View (City of), CA; Series 2004 A, RB (INS - NATL)(a) | | | | 4.50 | % | | | | 06/01/2026 | | | | | 10 | | | | | 10,014 | |
Mt. San Jacinto Community College District (Election of 2014); Series 2018 B, GO Bonds | | | | 4.00 | % | | | | 08/01/2043 | | | | | 5,000 | | | | | 4,935,460 | |
Napa Valley Unified School District; Series 2016 C, Ref. GO Bonds | | | | 5.00 | % | | | | 08/01/2041 | | | | | 300 | | | | | 314,775 | |
Natomas Unified School District; | | | | | | | | | | | | | | | | | | | | |
Series 2014, Ref. GO Bonds (INS - BAM)(a) | | | | 5.00 | % | | | | 08/01/2026 | | | | | 760 | | | | | 765,347 | |
Series 2020 A, GO Bonds (INS - AGM)(a) | | | | 4.00 | % | | | | 08/01/2045 | | | | | 4,000 | | | | | 3,848,144 | |
Northern California Energy Authority; Series 2018 A, RB(c) | | | | 4.00 | % | | | | 07/01/2024 | | | | | 5,000 | | | | | 5,004,816 | |
Northern California Tobacco Securitization Authority; Series 2021 B-1, Ref. RB | | | | 4.00 | % | | | | 06/01/2049 | | | | | 1,410 | | | | | 1,339,497 | |
Oakland Unified School District (County of Alameda); Series 2016, Ref. GO Bonds (INS - BAM)(a) | | | | 5.00 | % | | | | 08/01/2030 | | | | | 5,000 | | | | | 5,380,830 | |
Oceanside (City of), CA (Community Facilities District No. 200-1 - Ocean Ranch Corporate Centre); | | | | | | | | | | | | | | | | | | | | |
Series 2013 A, Ref. RB | | | | 5.00 | % | | | | 09/01/2026 | | | | | 685 | | | | | 689,958 | |
Series 2013 A, Ref. RB | | | | 5.00 | % | | | | 09/01/2027 | | | | | 745 | | | | | 750,522 | |
Series 2013 A, Ref. RB | | | | 5.00 | % | | | | 09/01/2028 | | | | | 805 | | | | | 811,045 | |
Oxnard (City of), CA Financing Authority; Series 2014, Ref. RB (INS - AGM)(a) | | | | 5.00 | % | | | | 06/01/2029 | | | | | 2,000 | | | | | 2,042,427 | |
Palm Desert (City of), CA; | | | | | | | | | | | | | | | | | | | | |
Series 2021 A, Ref. RB | | | | 3.00 | % | | | | 09/01/2023 | | | | | 270 | | | | | 267,673 | |
Series 2021 A, Ref. RB | | | | 3.00 | % | | | | 09/01/2024 | | | | | 280 | | | | | 272,807 | |
Series 2021 A, Ref. RB | | | | 4.00 | % | | | | 09/01/2025 | | | | | 290 | | | | | 288,812 | |
Palm Springs Unified School District; | | | | | | | | | | | | | | | | | | | | |
Series 2014, Ref. GO Bonds | | | | 4.00 | % | | | | 08/01/2033 | | | | | 1,155 | | | | | 1,161,890 | |
Series 2014, Ref. GO Bonds | | | | 4.00 | % | | | | 08/01/2035 | | | | | 1,095 | | | | | 1,099,530 | |
Palo Alto (City of), CA; Series 1999 A, Ref. RB (INS - AMBAC)(a) | | | | 5.25 | % | | | | 06/01/2024 | | | | | 10 | | | | | 10,076 | |
Palomar Health; | | | | | | | | | | | | | | | | | | | | |
Series 2016, Ref. RB | | | | 5.00 | % | | | | 11/01/2031 | | | | | 1,625 | | | | | 1,690,464 | |
Series 2016, Ref. RB | | | | 5.00 | % | | | | 11/01/2036 | | | | | 1,845 | | | | | 1,880,350 | |
Series 2016, Ref. RB | | | | 5.00 | % | | | | 11/01/2039 | | | | | 6,320 | | | | | 6,386,179 | |
Perris Elementary School District (Election of 2014); | | | | | | | | | | | | | | | | | | | | |
Series 2014 A, GO Bonds (INS - BAM)(a) | | | | 6.00 | % | | | | 08/01/2027 | | | | | 185 | | | | | 191,839 | |
Series 2014 A, GO Bonds (INS - BAM)(a) | | | | 6.00 | % | | | | 08/01/2028 | | | | | 205 | | | | | 212,578 | |
Perris Union High School District; Series 2019 A, GO Bonds (INS - AGM)(a) | | | | 4.00 | % | | | | 09/01/2040 | | | | | 2,000 | | | | | 1,982,201 | |
Poway Unified School District Public Financing Authority; | | | | | | | | | | | | | | | | | | | | |
Series 2013, RB(b)(c) | | | | 5.00 | % | | | | 09/15/2023 | | | | | 845 | | | | | 853,578 | |
Series 2013, RB(b)(c) | | | | 5.00 | % | | | | 09/15/2023 | | | | | 1,175 | | | | | 1,186,927 | |
Rancho Cucamonga (City of), CA (Community Facilities District No. 2003-01 - Improvement Area No. 1); Series 2013, Ref. RB | | | | 5.75 | % | | | | 09/01/2028 | | | | | 1,800 | | | | | 1,803,483 | |
Rancho Mirage (City of), CA (Reassessment District No. R22-85); Series 2002, Ref. RB | | | | 5.75 | % | | | | 09/02/2026 | | | | | 20 | | | | | 20,206 | |
Rancho Mirage (City of), CA (Reassessment District No. R25-90); Series 1998, Ref. RB | | | | 5.50 | % | | | | 09/02/2024 | | | | | 5 | | | | | 5,033 | |
Redlands (City of), CA (Community Facilities District No. 2003-1 - Redlands Business Center); Series 2004, RB | | | | 5.85 | % | | | | 09/01/2033 | | | | | 10 | | | | | 10,106 | |
Redwood City (City of), CA (Community Facilities District No. 99-1);
Series 2012, Ref. RB | | | | 5.00 | % | | | | 09/01/2029 | | | | | 690 | | | | | 690,898 | |
Regents of the University of California Medical Center; Series 2013 J, RB(b)(c) | | | | 5.00 | % | | | | 05/15/2023 | | | | | 6,050 | | | | | 6,072,339 | |
Richmond (City of), CA Joint Powers Financing Authority; Series 2016, RB | | | | 5.50 | % | | | | 11/01/2029 | | | | | 5,385 | | | | | 5,670,583 | |
Riverside (City of), CA (Community Facilities District No. 2006-1); Series 2013, RB | | | | 5.25 | % | | | | 09/01/2043 | | | | | 500 | | | | | 501,838 | |
Riverside (City of), CA (Riverwalk Auto Center Assessment District); | | | | | | | | | | | | | | | | | | | | |
Series 2012, Ref. RB | | | | 5.00 | % | | | | 09/02/2023 | | | | | 315 | | | | | 316,802 | |
Series 2012, Ref. RB | | | | 5.00 | % | | | | 09/02/2024 | | | | | 335 | | | | | 337,020 | |
See accompanying Notes to Financial Statements which are an integral part of the financial statements.
13 Invesco Limited Term California Municipal Fund
| | | | | | | | | | | | | | | | | | | | |
| | | Interest
Rate | | Maturity
Date | | Principal
Amount
(000) | | Value |
California–(continued) | | | | | | | | | | | | | | | | | | | | |
Riverside (City of), CA (Riverwalk Business Center Assessment District); Series 2004, RB | | | | 6.25 | % | | | | 09/02/2029 | | | | $ | 200 | | | | $ | 203,011 | |
Riverside (City of), CA Public Financing Authority; | | | | | | | | | | | | | | | | | | | | |
Series 2012 A, Ref. RB | | | | 5.00 | % | | | | 11/01/2027 | | | | | 1,640 | | | | | 1,644,993 | |
Series 2012 A, Ref. RB | | | | 5.00 | % | | | | 11/01/2028 | | | | | 1,155 | | | | | 1,158,497 | |
Riverside (County of), CA Community Facilities District No. 04-2 (Lake Hills Crest); Series 2012, Ref. RB | | | | 5.00 | % | | | | 09/01/2028 | | | | | 450 | | | | | 453,557 | |
Riverside (County of), CA Community Facilities District No. 05-8 (Scott Road); Series 2013, RB | | | | 5.00 | % | | | | 09/01/2042 | | | | | 3,000 | | | | | 3,000,955 | |
Riverside Unified School District (Community Facilities District No. 32); | | | | | | | | | | | | | | | | | | | | |
Series 2020, RB | | | | 4.00 | % | | | | 09/01/2034 | | | | | 500 | | | | | 490,439 | |
Series 2020, RB | | | | 4.00 | % | | | | 09/01/2037 | | | | | 500 | | | | | 470,018 | |
Series 2020, RB | | | | 4.00 | % | | | | 09/01/2040 | | | | | 350 | | | | | 317,284 | |
Riverside Unified School District (Community Facilities District No. 33); | | | | | | | | | | | | | | | | | | | | |
Series 2021, RB | | | | 4.00 | % | | | | 09/01/2035 | | | | | 295 | | | | | 282,535 | |
Series 2021, RB | | | | 4.00 | % | | | | 09/01/2036 | | | | | 305 | | | | | 288,638 | |
Series 2021, RB | | | | 4.00 | % | | | | 09/01/2037 | | | | | 320 | | | | | 298,105 | |
Series 2021, RB | | | | 4.00 | % | | | | 09/01/2038 | | | | | 330 | | | | | 303,651 | |
Series 2021, RB | | | | 4.00 | % | | | | 09/01/2039 | | | | | 345 | | | | | 313,735 | |
Series 2021, RB | | | | 4.00 | % | | | | 09/01/2040 | | | | | 190 | | | | | 170,250 | |
Romoland School District Community Facilities No. 2004-1; | | | | | | | | | | | | | | | | | | | | |
Series 2013, RB | | | | 5.00 | % | | | | 09/01/2025 | | | | | 365 | | | | | 367,093 | |
Series 2013, RB | | | | 5.00 | % | | | | 09/01/2026 | | | | | 440 | | | | | 442,816 | |
Series 2013, RB | | | | 5.00 | % | | | | 09/01/2027 | | | | | 405 | | | | | 407,683 | |
Series 2013, RB | | | | 5.00 | % | | | | 09/01/2028 | | | | | 500 | | | | | 503,386 | |
Roseville (City of), CA (Villages at Sierra Vista Community Facilities District No. 1 - Public Facilities); | | | | | | | | | | | | | | | | | | | | |
Series 2020, RB | | | | 4.00 | % | | | | 09/01/2033 | | | | | 235 | | | | | 233,746 | |
Series 2020, RB | | | | 4.00 | % | | | | 09/01/2035 | | | | | 275 | | | | | 267,755 | |
Series 2020, RB | | | | 4.00 | % | | | | 09/01/2037 | | | | | 320 | | | | | 302,763 | |
Roseville (City of), CA Natural Gas Financing Authority; | | | | | | | | | | | | | | | | | | | | |
Series 2007, RB | | | | 5.00 | % | | | | 02/15/2024 | | | | | 265 | | | | | 266,536 | |
Series 2007, RB | | | | 5.00 | % | | | | 02/15/2025 | | | | | 100 | | | | | 101,192 | |
Sacramento (City of), CA (2019 Sacramento Tourism Infrastructure District - Convention Center Ballroom); | | | | | | | | | | | | | | | | | | | | |
Series 2019, RB | | | | 4.00 | % | | | | 06/01/2034 | | | | | 1,265 | | | | | 1,295,978 | |
Series 2019, RB | | | | 4.00 | % | | | | 06/01/2037 | | | | | 1,760 | | | | | 1,757,552 | |
Sacramento (City of), CA Area Flood Control Agency; Series 2014, RB (INS - BAM)(a) | | | | 5.00 | % | | | | 10/01/2039 | | | | | 1,900 | | | | | 1,925,463 | |
Sacramento (City of), CA Financing Authority (Westlake and Regency Park); | | | | | | | | | | | | | | | | | | | | |
Series 2013 A, Ref. RB | | | | 5.00 | % | | | | 09/01/2024 | | | | | 1,840 | | | | | 1,841,466 | |
Series 2013 A, Ref. RB | | | | 5.00 | % | | | | 09/01/2025 | | | | | 850 | | | | | 850,640 | |
Series 2013 A, Ref. RB (INS - AGM)(a) | | | | 5.00 | % | | | | 09/01/2026 | | | | | 785 | | | | | 785,608 | |
Series 2013 A, Ref. RB | | | | 5.00 | % | | | | 09/01/2027 | | | | | 455 | | | | | 455,343 | |
Sacramento (City of), CA Municipal Utility District; Series 2015, Ref. RB | | | | 5.00 | % | | | | 07/01/2030 | | | | | 1,235 | | | | | 1,306,985 | |
Sacramento (County of), CA; | | | | | | | | | | | | | | | | | | | | |
Series 1991 A, RB(b)(e) | | | | 7.25 | % | | | | 10/01/2023 | | | | | 255 | | | | | 257,437 | |
Series 2018 C, Ref. RB(e) | | | | 5.00 | % | | | | 07/01/2037 | | | | | 6,000 | | | | | 6,250,080 | |
Sacramento (County of), CA (Juvenile Courthouse); Series 2003, COP (INS - AMBAC)(a) | | | | 5.00 | % | | | | 12/01/2023 | | | | | 430 | | | | | 430,572 | |
Sacramento (County of), CA Housing Authority; Series 2002 C, RB (INS - AMBAC)(a)(e) | | | | 5.25 | % | | | | 06/01/2027 | | | | | 215 | | | | | 211,376 | |
Sacramento (County of), CA Public Financing Authority; Series 2003 A, RB (INS - NATL)(a) | | | | 5.13 | % | | | | 12/01/2028 | | | | | 15 | | | | | 15,027 | |
Salinas (City of), CA Redevelopment Agency; Series 1996 A, RB (INS - AGM)(a) | | | | 5.50 | % | | | | 11/01/2023 | | | | | 45 | | | | | 45,078 | |
San Bernardino (City of), CA Joint Powers Financing Authority; | | | | | | | | | | | | | | | | | | | | |
Series 1999, Ref. COP (INS - NATL)(a) | | | | 5.50 | % | | | | 09/01/2024 | | | | | 130 | | | | | 130,234 | |
Series 2005 A, Ref. RB (INS - AGM)(a) | | | | 5.75 | % | | | | 10/01/2023 | | | | | 180 | | | | | 182,412 | |
Series 2005 B, Ref. RB (INS - AGM)(a) | | | | 5.75 | % | | | | 10/01/2023 | | | | | 70 | | | | | 70,938 | |
San Bernardino (City of), CA Redevelopment Agency Successor Agency; Series 1995, RB(e) | | | | 7.88 | % | | | | 07/01/2025 | | | | | 10 | | | | | 10,056 | |
San Bernardino (County of), CA Redevelopment Agency Successor Agency (San Sevaine Redevelopment); Series 2016 B, Ref. RB (INS - AGM)(a) | | | | 5.00 | % | | | | 09/01/2028 | | | | | 285 | | | | | 299,647 | |
San Bernardino County Transportation Authority; Series 2014 A, RB | | | | 5.25 | % | | | | 03/01/2040 | | | | | 9,045 | | | | | 9,225,421 | |
San Carlos School District (Election of 2012); Series 2013, GO Bonds | | | | 5.00 | % | | | | 10/01/2028 | | | | | 120 | | | | | 121,261 | |
See accompanying Notes to Financial Statements which are an integral part of the financial statements.
14 Invesco Limited Term California Municipal Fund
| | | | | | | | | | | | | | | | | | | | |
| | | Interest
Rate | | Maturity
Date | | Principal
Amount
(000) | | Value |
California–(continued) | | | | | | | | | | | | | | | | | | | | |
San Clemente (City of), CA; | | | | | | | | | | | | | | | | | | | | |
Series 2021, Ref. RB | | | | 4.00 | % | | | | 09/01/2026 | | | | $ | 100 | | | | $ | 99,843 | |
Series 2021, Ref. RB | | | | 4.00 | % | | | | 09/01/2027 | | | | | 100 | | | | | 100,151 | |
Series 2021, Ref. RB | | | | 4.00 | % | | | | 09/01/2028 | | | | | 100 | | | | | 100,475 | |
Series 2021, Ref. RB | | | | 4.00 | % | | | | 09/01/2029 | | | | | 100 | | | | | 100,389 | |
Series 2021, Ref. RB | | | | 4.00 | % | | | | 09/01/2030 | | | | | 100 | | | | | 99,676 | |
San Diego (City of), CA (Assessment District No. 4096); | | | | | | | | | | | | | | | | | | | | |
Series 2013, Ref. RB | | | | 5.00 | % | | | | 09/02/2023 | | | | | 175 | | | | | 175,872 | |
Series 2013, Ref. RB | | | | 5.00 | % | | | | 09/02/2024 | | | | | 185 | | | | | 185,979 | |
Series 2013, Ref. RB | | | | 5.00 | % | | | | 09/02/2025 | | | | | 190 | | | | | 191,115 | |
Series 2013, Ref. RB | | | | 5.13 | % | | | | 09/02/2026 | | | | | 205 | | | | | 206,487 | |
Series 2013, Ref. RB | | | | 5.13 | % | | | | 09/02/2027 | | | | | 215 | | | | | 216,661 | |
Series 2013, Ref. RB | | | | 5.25 | % | | | | 09/02/2028 | | | | | 225 | | | | | 226,965 | |
Series 2013, Ref. RB | | | | 5.38 | % | | | | 09/02/2029 | | | | | 240 | | | | | 242,293 | |
Series 2013, Ref. RB | | | | 5.38 | % | | | | 09/02/2030 | | | | | 250 | | | | | 252,105 | |
Series 2013, Ref. RB | | | | 5.50 | % | | | | 09/02/2031 | | | | | 260 | | | | | 262,353 | |
Series 2013, Ref. RB | | | | 5.50 | % | | | | 09/02/2032 | | | | | 280 | | | | | 282,496 | |
San Diego (City of), CA Community Facilities District No. 3; | | | | | | | | | | | | | | | | | | | | |
Series 2013, Ref. RB | | | | 5.00 | % | | | | 09/01/2025 | | | | | 545 | | | | | 548,634 | |
Series 2013, Ref. RB | | | | 5.00 | % | | | | 09/01/2027 | | | | | 610 | | | | | 614,641 | |
Series 2013, Ref. RB | | | | 5.00 | % | | | | 09/01/2028 | | | | | 640 | | | | | 644,964 | |
Series 2013, Ref. RB | | | | 5.00 | % | | | | 09/01/2030 | | | | | 720 | | | | | 724,920 | |
San Diego (City of), CA Public Facilities Financing Authority (Capital Improvement); | | | | | | | | | | | | | | | | | | | | |
Series 2015 A, RB | | | | 5.00 | % | | | | 10/15/2033 | | | | | 1,250 | | | | | 1,310,862 | |
Series 2015 A, RB | | | | 5.00 | % | | | | 10/15/2034 | | | | | 1,000 | | | | | 1,048,810 | |
San Diego (City of), CA Redevelopment Agency (Centre City Redevelopment); Series 2003 B, RB | | | | 5.25 | % | | | | 09/01/2026 | | | | | 75 | | | | | 75,127 | |
San Diego (County of), CA Regional Airport Authority; | | | | | | | | | | | | | | | | | | | | |
Series 2013 B, RB(b)(c)(e) | | | | 5.00 | % | | | | 07/01/2023 | | | | | 1,520 | | | | | 1,527,696 | |
Series 2017 B, RB(e) | | | | 5.00 | % | | | | 07/01/2037 | | | | | 1,000 | | | | | 1,032,923 | |
Series 2020, Ref. RB | | | | 5.00 | % | | | | 07/01/2040 | | | | | 2,000 | | | | | 2,140,921 | |
San Diego (County of), CA Water Authority; Series 1998 A, COP (INS - NATL)(a) | | | | 4.75 | % | | | | 05/01/2028 | | | | | 95 | | | | | 95,152 | |
San Francisco (City & County of), CA; | | | | | | | | | | | | | | | | | | | | |
Series 2015 A, COP | | | | 5.00 | % | | | | 04/01/2029 | | | | | 700 | | | | | 701,353 | |
Series 2015 R-1, Ref. COP | | | | 4.00 | % | | | | 09/01/2032 | | | | | 2,105 | | | | | 2,117,445 | |
Series 2015 R-1, Ref. COP | | | | 4.00 | % | | | | 09/01/2035 | | | | | 4,090 | | | | | 4,104,515 | |
Series 2015 R1, Ref. GO Bonds | | | | 4.00 | % | | | | 06/15/2030 | | | | | 100 | | | | | 100,402 | |
San Francisco (City & County of), CA (Bayshore Hester Assessment District No. 95-1); Series 1996, RB | | | | 6.85 | % | | | | 09/02/2026 | | | | | 15 | | | | | 15,678 | |
San Francisco (City & County of), CA (Moscone Convention Center Expansion); Series 2017 B, COP | | | | 4.00 | % | | | | 04/01/2042 | | | | | 2,250 | | | | | 2,191,584 | |
San Francisco (City & County of), CA Airport Commission (San Francisco International Airport); | | | | | | | | | | | | | | | | | | | | |
Series 2014 A, RB(e) | | | | 5.00 | % | | | | 05/01/2039 | | | | | 4,500 | | | | | 4,514,641 | |
Series 2014 A, RB(e) | | | | 5.00 | % | | | | 05/01/2040 | | | | | 575 | | | | | 576,408 | |
Series 2014 A, RB(e) | | | | 5.00 | % | | | | 05/01/2044 | | | | | 10,000 | | | | | 10,003,720 | |
Series 2016 B, RB(e) | | | | 5.00 | % | | | | 05/01/2041 | | | | | 5,000 | | | | | 5,089,298 | |
Series 2018 D, RB(e) | | | | 5.00 | % | | | | 05/01/2043 | | | | | 8,000 | | | | | 8,191,746 | |
Series 2019 A, RB(e) | | | | 5.00 | % | | | | 05/01/2037 | | | | | 8,000 | | | | | 8,383,964 | |
San Francisco (City & County of), CA Infrastructure & Revitalization Financing District No. 1; | | | | | | | | | | | | | | | | | | | | |
Series 2022 A, RB(d) | | | | 5.00 | % | | | | 09/01/2027 | | | | | 360 | | | | | 371,049 | |
Series 2022 A, RB(d) | | | | 5.00 | % | | | | 09/01/2032 | | | | | 400 | | | | | 424,716 | |
Series 2022 B, RB(d) | | | | 5.00 | % | | | | 09/01/2032 | | | | | 480 | | | | | 508,116 | |
San Francisco (City & County of), CA Public Utilities Commission; | | | | | | | | | | | | | | | | | | | | |
Series 2021 B, RB | | | | 4.00 | % | | | | 11/01/2043 | | | | | 1,355 | | | | | 1,341,717 | |
Series 2021 B, RB | | | | 4.00 | % | | | | 11/01/2044 | | | | | 1,465 | | | | | 1,448,658 | |
San Francisco (City & County of), CA Successor Agency to the Redevelopment Agency Community Facilities District No. 6 (Mission Bay South Public Improvements); | | | | | | | | | | | | | | | | | | | | |
Series 2013 A, Ref. RB | | | | 5.00 | % | | | | 08/01/2023 | | | | | 500 | | | | | 500,547 | |
Series 2013 A, Ref. RB | | | | 5.00 | % | | | | 08/01/2033 | | | | | 500 | | | | | 504,142 | |
Series 2013 C, RB(h) | | | | 0.00 | % | | | | 08/01/2036 | | | | | 1,245 | | | | | 582,609 | |
San Francisco Bay Area Rapid Transit District; Series 2019 A, RB | | | | 4.00 | % | | | | 07/01/2039 | | | | | 2,075 | | | | | 2,091,032 | |
San Jacinto (City of), CA Community Facilities District No. 2002-1; Series 2016, Ref. RB | | | | 5.00 | % | | | | 09/01/2026 | | | | | 925 | | | | | 967,554 | |
See accompanying Notes to Financial Statements which are an integral part of the financial statements.
15 Invesco Limited Term California Municipal Fund
| | | | | | | | | | | | | | | | | | | | |
| | | Interest
Rate | | Maturity
Date | | Principal
Amount
(000) | | Value |
California–(continued) | | | | | | | | | | | | | | | | | | | | |
San Jose (City of), CA; | | | | | | | | | | | | | | | | | | | | |
Series 2017 A, Ref. RB(e) | | | | 5.00 | % | | | | 03/01/2035 | | | | $ | 500 | | | | $ | 520,371 | |
Series 2017 A, Ref. RB(e) | | | | 5.00 | % | | | | 03/01/2036 | | | | | 1,000 | | | | | 1,035,159 | |
Series 2017 A, Ref. RB(e) | | | | 5.00 | % | | | | 03/01/2037 | | | | | 1,250 | | | | | 1,289,262 | |
San Jose (City of), CA (El Parador Apartments); Series 2000 A, RB(e) | | | | 6.10 | % | | | | 01/01/2031 | | | | | 25 | | | | | 25,003 | |
San Jose (City of), CA (Orvieto Family Apartments); Series 2010 B-1, RB | | | | 4.75 | % | | | | 08/01/2029 | | | | | 1,810 | | | | | 1,812,410 | |
San Luis Obispo (County of), CA (Paso Robles Courthouse); Series 2007, COP (INS - AGM)(a) | | | | 4.25 | % | | | | 10/15/2026 | | | | | 10 | | | | | 10,011 | |
Santa Clara (County of), CA Financing Authority; Series 2018 A, RB | | | | 4.00 | % | | | | 04/01/2043 | | | | | 3,670 | | | | | 3,583,801 | |
Santa Clara (County of), CA Housing Authority; | | | | | | | | | | | | | | | | | | | | |
Series 2001 A, RB(e) | | | | 5.85 | % | | | | 08/01/2031 | | | | | 1,515 | | | | | 1,518,874 | |
Series 2010 A-1, RB (CEP - FHLMC) | | | | 4.75 | % | | | | 11/01/2027 | | | | | 1,430 | | | | | 1,430,616 | |
Santa Clarita (City of), CA Community Facilities District No. 2002-1 (Valencia Town Center); | | | | | | | | | | | | | | | | | | | | |
Series 2012, Ref. RB | | | | 5.00 | % | | | | 11/15/2023 | | | | | 635 | | | | | 635,500 | |
Series 2012, Ref. RB | | | | 5.00 | % | | | | 11/15/2024 | | | | | 325 | | | | | 325,300 | |
Series 2012, Ref. RB | | | | 5.00 | % | | | | 11/15/2025 | | | | | 925 | | | | | 925,960 | |
Series 2012, Ref. RB | | | | 5.00 | % | | | | 11/15/2027 | | | | | 785 | | | | | 785,884 | |
Series 2012, Ref. RB | | | | 5.00 | % | | | | 11/15/2028 | | | | | 1,170 | | | | | 1,171,390 | |
Santa Margarita Water District (Community Facilities District No. 2013-1); Series 2013, RB | | | | 5.63 | % | | | | 09/01/2043 | | | | | 120 | | | | | 120,631 | |
Santa Nella (County of), CA Water District; Series 1998, Ref. RB | | | | 6.25 | % | | | | 09/02/2028 | | | | | 15 | | | | | 13,830 | |
Saugus Union School District (Community Facilities District No .2020-1); | | | | | | | | | | | | | | | | | | | | |
Series 2013, Ref. RB | | | | 5.00 | % | | | | 09/01/2025 | | | | | 710 | | | | | 714,664 | |
Series 2013, Ref. RB | | | | 5.00 | % | | | | 09/01/2026 | | | | | 770 | | | | | 775,611 | |
Series 2013, Ref. RB | | | | 5.00 | % | | | | 09/01/2027 | | | | | 830 | | | | | 836,438 | |
Series 2013, Ref. RB | | | | 5.00 | % | | | | 09/01/2028 | | | | | 895 | | | | | 902,206 | |
Saugus Union School District Financing Authority; | | | | | | | | | | | | | | | | | | | | |
Series 2021 A, RB (INS - BAM)(a) | | | | 4.00 | % | | | | 09/01/2038 | | | | | 650 | | | | | 650,958 | |
Series 2021 A, RB (INS - BAM)(a) | | | | 4.00 | % | | | | 09/01/2041 | | | | | 260 | | | | | 256,060 | |
Selma (City of), CA Redevelopment Agency; Series 2010 A, RB | | | | 5.75 | % | | | | 09/01/2024 | | | | | 735 | | | | | 735,842 | |
Simi Valley (City of), CA Community Development Agency (Merged Tapo Canyon & West End Community Development); Series 2003, Ref. RB (INS - NATL)(a) | | | | 5.00 | % | | | | 09/01/2030 | | | | | 25 | | | | | 25,055 | |
Sonora Union High School District (Election of 2012); Series 2013 A, GO Bonds (INS - | | | | 5.63 | % | | | | 08/01/2029 | | | | | 1,020 | | | | | 1,029,898 | |
South Pasadena (City of), CA; Series 2016, Ref. RB (INS - BAM)(a) | | | | 5.00 | % | | | | 10/01/2036 | | | | | 1,115 | | | | | 1,186,731 | |
South San Francisco (City of) CA Public Facilities Financing Authority; Series 2021 A, RB | | | | 4.00 | % | | | | 06/01/2040 | | | | | 3,305 | | | | | 3,270,160 | |
South Tahoe Joint Powers Financing Authority (South Tahoe Redevelopment Project Area No. 1); Series 2014, Ref. RB (INS - AGM)(a) | | | | 4.00 | % | | | | 10/01/2034 | | | | | 500 | | | | | 503,215 | |
Southern California Tobacco Securitization Authority (San Diego County Asset Securitization Corp.); | | | | | | | | | | | | | | | | | | | | |
Series 2019, Ref. RB | | | | 5.00 | % | | | | 06/01/2037 | | | | | 1,170 | | | | | 1,242,770 | |
Series 2019, Ref. RB | | | | 5.00 | % | | | | 06/01/2038 | | | | | 2,000 | | | | | 2,119,043 | |
Series 2019, Ref. RB | | | | 5.00 | % | | | | 06/01/2039 | | | | | 1,810 | | | | | 1,910,534 | |
Series 2019, Ref. RB | | | | 5.00 | % | | | | 06/01/2048 | | | | | 6,575 | | | | | 6,664,676 | |
Series 2012, Ref. GO Bonds (INS - AGM)(a) | | | | | | | | | | | | | | | | | | | | |
Stockton Unified School District; | | | | 5.00 | % | | | | 07/01/2025 | | | | | 1,620 | | | | | 1,622,054 | |
Series 2012, Ref. GO Bonds (INS - AGM)(a) | | | | 5.00 | % | | | | 07/01/2026 | | | | | 1,115 | | | | | 1,116,404 | |
Sutter & Butte (Counties of), CA Flood Agency; | | | | | | | | | | | | | | | | | | | | |
Series 2013, RB | | | | 5.00 | % | | | | 10/01/2025 | | | | | 300 | | | | | 302,980 | |
Series 2013, RB | | | | 5.00 | % | | | | 10/01/2026 | | | | | 415 | | | | | 419,002 | |
Series 2013, RB | | | | 5.00 | % | | | | 10/01/2027 | | | | | 700 | | | | | 706,590 | |
Series 2013, RB | | | | 5.00 | % | | | | 10/01/2028 | | | | | 1,465 | | | | | 1,478,454 | |
Series 2013, RB | | | | 5.00 | % | | | | 10/01/2029 | | | | | 1,490 | | | | | 1,502,654 | |
Tejon Ranch Public Facilities Finance Authority (Community Facilities District No. 2008-1); | | | | | | | | | | | | | | | | | | | | |
Series 2012 A, Ref. RB | | | | 5.00 | % | | | | 09/01/2032 | | | | | 1,500 | | | | | 1,502,860 | |
Series 2012 B, RB | | | | 5.00 | % | | | | 09/01/2032 | | | | | 1,500 | | | | | 1,502,860 | |
Three Rivers Levee Improvement Authority (Community Facilities District No. 2006-1); | | | | | | | | | | | | | | | | | | | | |
Series 2021, Ref. RB | | | | 4.00 | % | | | | 09/01/2026 | | | | | 220 | | | | | 219,300 | |
Series 2021, Ref. RB | | | | 4.00 | % | | | | 09/01/2028 | | | | | 260 | | | | | 260,596 | |
Series 2021, Ref. RB | | | | 4.00 | % | | | | 09/01/2030 | | | | | 300 | | | | | 298,262 | |
Series 2021, Ref. RB | | | | 4.00 | % | | | | 09/01/2032 | | | | | 100 | | | | | 98,492 | |
See accompanying Notes to Financial Statements which are an integral part of the financial statements.
16 Invesco Limited Term California Municipal Fund
| | | | | | | | | | | | | | |
| | | Interest
Rate | | Maturity
Date | | | Principal
Amount
(000) | | | Value | |
California–(continued) | | | | | | | | | | | | | | |
Tracy (City of), CA Community Facilities District No. 93-1 (I-205 Parcel GL-17); | | | | | | | | | | | | | | |
Series 1996 A, RB | | 6.30% | | | 09/01/2026 | | | $ | 20 | | | $ | 20,264 | |
Series 2002, RB | | 6.25% | | | 09/01/2032 | | | | 25 | | | | 25,053 | |
Transbay Joint Powers Authority (Green Bonds); Series 2020 B, RB | | 2.40% | | | 10/01/2049 | | | | 865 | | | | 819,711 | |
Truckee (Town of), CA Donner Public Utility District (Community Facilities District No. 04-1); Series 2004, RB | | 5.80% | | | 09/01/2035 | | | | 30 | | | | 27,762 | |
Tustin (City of), CA Community Facilities District (Tustin Legacy/John Laing Homes); | | | | | | | | | | | | | | |
Series 2013, Ref. RB | | 5.00% | | | 09/01/2024 | | | | 420 | | | | 423,178 | |
Series 2013, Ref. RB | | 5.00% | | | 09/01/2025 | | | | 445 | | | | 448,581 | |
Series 2013, Ref. RB | | 5.00% | | | 09/01/2026 | | | | 470 | | | | 474,004 | |
Series 2013, Ref. RB | | 5.00% | | | 09/01/2027 | | | | 490 | | | | 494,381 | |
Series 2013, Ref. RB | | 5.00% | | | 09/01/2028 | | | | 515 | | | | 519,782 | |
Tustin Unified School District (Community Facilities District No. 97-1); Series 2015, Ref. RB (INS - BAM)(a) | | 5.00% | | | 09/01/2038 | | | | 4,155 | | | | 4,285,659 | |
University of California; | | | | | | | | | | | | | | |
Series 2013 AF, RB(b)(c) | | 5.00% | | | 05/15/2023 | | | | 880 | | | | 883,430 | |
Series 2013 AI, RB(b)(c) | | 5.00% | | | 05/15/2023 | | | | 2,700 | | | | 2,709,969 | |
Series 2013 AI, RB(b)(c) | | 5.00% | | | 05/15/2023 | | | | 13,500 | | | | 13,549,847 | |
Vacaville (City of), CA Redevelopment Agency Successor Agency; Series 2000 A, Ref. RB | | 6.00% | | | 11/01/2024 | | | | 65 | | | | 65,339 | |
Vallejo (City of), CA; | | | | | | | | | | | | | | |
Series 2003 A, RB | | 6.00% | | | 09/01/2026 | | | | 25 | | | | 25,222 | |
Series 2003 A, RB | | 6.13% | | | 09/01/2034 | | | | 30 | | | | 30,313 | |
Victor Elementary School District; Series 2015 B, GO Bonds | | 5.00% | | | 08/01/2042 | | | | 2,925 | | | | 2,974,557 | |
Victorville (City of), CA Redevelopment Agency; Series 2002 A, RB (INS - AGM)(a) | | 5.13% | | | 12/01/2031 | | | | 20 | | | | 20,044 | |
Wasco (City of), CA Public Financing Authority; Series 1994, RB | | 7.50% | | | 09/15/2023 | | | | 5 | | | | 5,012 | |
Western Riverside (County of), CA Water & Wastewater Financing Authority; Series 2013 A-1, Ref. RB | | 5.00% | | | 09/01/2025 | | | | 2,335 | | | | 2,355,520 | |
Whittier (City of), CA (Presbyterian Intercommunity Hospital, Inc.); Series 2014, RB | | 5.00% | | | 06/01/2044 | | | | 6,250 | | | | 6,289,271 | |
William S. Hart Union High School District (Community Facilities District No. 2005-1); Series 2013, Ref. RB | | 5.00% | | | 09/01/2025 | | | | 835 | | | | 840,485 | |
| | | | | | | | | | | | | | 661,710,135 | |
| | | | |
Puerto Rico–5.65% | | | | | | | | | | | | | | |
Children’s Trust Fund; | | | | | | | | | | | | | | |
Series 2002, RB | | 5.38% | | | 05/15/2033 | | | | 324 | | | | 324,108 | |
Series 2002, RB | | 5.50% | | | 05/15/2039 | | | | 4,275 | | | | 4,275,248 | |
Corp. Para El Financiamiento Publico de Puerto Rico; | | | | | | | | | | | | | | |
Series 2011, RB | | 6.00% | | | 08/01/2024 | | | | 600 | | | | 15,750 | |
Series 2011, RB | | 6.00% | | | 08/01/2025 | | | | 1,400 | | | | 36,750 | |
Series 2011, RB | | 6.00% | | | 08/01/2026 | | | | 3,300 | | | | 86,625 | |
Series 2011, RB | | 5.50% | | | 08/01/2031 | | | | 1,750 | | | | 45,938 | |
PR Custodial Trust; Series 2003 A, RB | | 0.00% | | | 03/15/2049 | | | | 144 | | | | 5,112 | |
PRHTA Custodial Trust; | | | | | | | | | | | | | | |
Series 2022 G, RB(i) | | 5.00% | | | 12/06/2049 | | | | 25 | | | | 9,318 | |
Series 2022 L, RB(i) | | 5.25% | | | 12/06/2049 | | | | 362 | | | | 122,895 | |
Puerto Rico (Commonwealth of); | | | | | | | | | | | | | | |
Series 2021 A, GO Bonds(h) | | 0.00% | | | 07/01/2024 | | | | 56 | | | | 52,403 | |
Series 2021 A, GO Bonds(h) | | 0.00% | | | 07/01/2033 | | | | 215 | | | | 122,438 | |
Series 2021 A-1, GO Bonds | | 5.25% | | | 07/01/2023 | | | | 7,433 | | | | 7,454,547 | |
Series 2021 A-1, GO Bonds | | 5.38% | | | 07/01/2025 | | | | 8,856 | | | | 8,991,714 | |
Series 2021 A-1, GO Bonds | | 5.63% | | | 07/01/2027 | | | | 184 | | | | 190,372 | |
Series 2021 A-1, GO Bonds | | 5.63% | | | 07/01/2029 | | | | 181 | | | | 189,163 | |
Series 2021 A-1, GO Bonds | | 5.75% | | | 07/01/2031 | | | | 176 | | | | 185,354 | |
Series 2021 A-1, GO Bonds | | 4.00% | | | 07/01/2033 | | | | 347 | | | | 310,918 | |
Series 2021 A-1, GO Bonds | | 4.00% | | | 07/01/2035 | | | | 150 | | | | 131,467 | |
Series 2021 A-1, GO Bonds | | 4.00% | | | 07/01/2037 | | | | 129 | | | | 110,168 | |
Series 2021 A-1, GO Bonds | | 4.00% | | | 07/01/2041 | | | | 175 | | | | 144,681 | |
Subseries 2022, RN(h) | | 0.00% | | | 11/01/2043 | | | | 787 | | | | 339,339 | |
Puerto Rico (Commonwealth of) Aqueduct & Sewer Authority; | | | | | | | | | | | | | | |
Series 2008 A, RB (INS - AGC)(a) | | 6.13% | | | 07/01/2024 | | | | 20 | | | | 20,228 | |
Series 2021 B, RB(d) | | 5.00% | | | 07/01/2025 | | | | 4,060 | | | | 4,129,357 | |
See accompanying Notes to Financial Statements which are an integral part of the financial statements.
17 Invesco Limited Term California Municipal Fund
| | | | | | | | | | | | | | | | |
| | | Interest
Rate | | | Maturity
Date | | | Principal
Amount
(000) | | | Value | |
| |
Puerto Rico–(continued) | | | | | | | | | | | | | | | | |
Puerto Rico (Commonwealth of) Electric Power Authority; | | | | | | | | | | | | | | | | |
Series 2004 PP, Ref. RB (INS - NATL)(a) | | | 5.00% | | | | 07/01/2025 | | | $ | 470 | | | $ | 470,444 | |
| |
Series 2005 RR, RB (INS - NATL)(a) | | | 5.00% | | | | 07/01/2023 | | | | 3,690 | | | | 3,689,998 | |
| |
Series 2005 RR, RB (INS - NATL)(a) | | | 5.00% | | | | 07/01/2024 | | | | 520 | | | | 520,491 | |
| |
Series 2005 SS, Ref. RB (INS - NATL)(a) | | | 5.00% | | | | 07/01/2024 | | | | 100 | | | | 100,094 | |
| |
Series 2005 SS, Ref. RB (INS - NATL)(a) | | | 5.00% | | | | 07/01/2025 | | | | 25 | | | | 25,024 | |
| |
Series 2007 UU, Ref. RB (INS - AGM)(a) | | | 5.00% | | | | 07/01/2024 | | | | 455 | | | | 458,075 | |
| |
Puerto Rico (Commonwealth of) Industrial, Tourist, Educational, Medical & Environmental Control Facilities Financing Authority; Series 2000, RB(e) | | | 6.63% | | | | 06/01/2026 | | | | 2,130 | | | | 2,163,279 | |
| |
Puerto Rico Sales Tax Financing Corp.; | | | | | | | | | | | | | | | | |
Series 2018 A-1, RB | | | 4.50% | | | | 07/01/2034 | | | | 4,057 | | | | 4,022,716 | |
| |
Series 2018 A-1, RB | | | 4.55% | | | | 07/01/2040 | | | | 4 | | | | 3,735 | |
| |
Series 2018 A-1, RB(h) | | | 0.00% | | | | 07/01/2046 | | | | 5 | | | | 1,281 | |
| |
Series 2018 A-1, RB(h) | | | 0.00% | | | | 07/01/2051 | | | | 5 | | | | 943 | |
| |
Series 2018 A-1, RB | | | 4.75% | | | | 07/01/2053 | | | | 4 | | | | 3,586 | |
| |
Series 2018 A-1, RB | | | 5.00% | | | | 07/01/2058 | | | | 5 | | | | 4,639 | |
| |
Series 2019 A-2, RB | | | 4.54% | | | | 07/01/2053 | | | | 46 | | | | 39,780 | |
| |
Series 2019 A-2, RB | | | 4.78% | | | | 07/01/2058 | | | | 620 | | | | 554,195 | |
| |
University of Puerto Rico; | | | | | | | | | | | | | | | | |
Series 2006 P, Ref. RB (INS - NATL)(a) | | | 5.00% | | | | 06/01/2024 | | | | 100 | | | | 100,115 | |
| |
Series 2006 P, Ref. RB | | | 5.00% | | | | 06/01/2024 | | | | 315 | | | | 312,810 | |
| |
| | | | | | | | | | | | | | | 39,765,098 | |
| |
| | | | |
Northern Mariana Islands–0.17% | | | | | | | | | | | | | | | | |
Northern Mariana Islands (Commonwealth of); Series 2007 A, Ref. GO Bonds(d) | | | 5.00% | | | | 06/01/2030 | | | | 1,285 | | | | 1,164,738 | |
| |
| | | | |
Guam–0.16% | | | | | | | | | | | | | | | | |
Guam (Territory of); Series 2021 F, Ref. RB | | | 4.00% | | | | 01/01/2036 | | | | 1,160 | | | | 1,114,367 | |
| |
| | | | |
Virgin Islands–0.10% | | | | | | | | | | | | | | | | |
Virgin Islands (Government of) Public Finance Authority (Virgin Islands Gross Receipts Taxes Loan Note); | | | | | | | | | | | | | | | | |
Series 2006, RB (INS - NATL)(a) | | | 5.00% | | | | 10/01/2023 | | | | 300 | | | | 303,312 | |
| |
Series 2006, RB (INS - NATL)(a) | | | 5.00% | | | | 10/01/2024 | | | | 90 | | | | 91,002 | |
| |
Series 2006, RB (INS - NATL)(a) | | | 5.00% | | | | 10/01/2025 | | | | 170 | | | | 171,910 | |
| |
Series 2006, RB (INS - NATL)(a) | | | 5.00% | | | | 10/01/2026 | | | | 125 | | | | 126,418 | |
| |
| | | | | | | | | | | | | | | 692,642 | |
| |
Total Municipal Obligations (Cost $722,622,529) | | | | | | | | | | | | 704,446,980 | |
| |
| | | |
U.S. Dollar Denominated Bonds & Notes–0.40% | | | | | | | | | | | | | |
California–0.40% | | | | | | | | | | | | | | | | |
CalPlant I LLC; | | | | | | | | | | | | | | | | |
Series 21A(d)(i) | | | 9.50% | | | | 06/05/2023 | | | | 240 | | | | 240,000 | |
| |
Series 21B(d)(i) | | | 9.50% | | | | 06/05/2023 | | | | 905 | | | | 905,000 | |
| |
Series 22A(d)(i) | | | 9.50% | | | | 06/05/2023 | | | | 500 | | | | 500,000 | |
| |
Series 22B(d)(i) | | | 9.50% | | | | 06/05/2023 | | | | 45 | | | | 45,000 | |
| |
Series 22C(d)(i) | | | 9.50% | | | | 06/05/2023 | | | | 325 | | | | 325,000 | |
| |
Series 22X(d) | | | 9.50% | | | | 03/31/2023 | | | | 490 | | | | 492,651 | |
| |
Series 23A(d)(i) | | | 9.50% | | | | 03/31/2023 | | | | 175 | | | | 175,000 | |
| |
Series 23B(d) | | | 9.50% | | | | 03/31/2023 | | | | 155 | | | | 155,000 | |
| |
Total U.S. Dollar Denominated Bonds & Notes (Cost $2,835,000) | | | | | | | | | | | | | | | 2,837,651 | |
| |
TOTAL INVESTMENTS IN SECURITIES(j) –100.52% (Cost $725,457,529) | | | | | | | | | | | | | | | 707,284,631 | |
| |
BORROWINGS–(1.73)% | | | | | | | | | | | | | | | (12,200,000 | ) |
| |
OTHER ASSETS LESS LIABILITIES–1.21% | | | | | | | | | | | | | | | 8,529,111 | |
| |
NET ASSETS–100.00% | | | | | | | | | | | | | | $ | 703,613,742 | |
| |
See accompanying Notes to Financial Statements which are an integral part of the financial statements.
18 Invesco Limited Term California Municipal Fund
| | |
Investment Abbreviations: |
| AGC | | – Assured Guaranty Corp. |
| AGM | | – Assured Guaranty Municipal Corp. |
| AMBAC | | – American Municipal Bond Assurance Corp. |
| BAM | | – Build America Mutual Assurance Co. |
| BHAC | | – Berkshire Hathaway Assurance Corp. |
| CEP | | – Credit Enhancement Provider |
| COP | | – Certificates of Participation |
| FGIC | | – Financial Guaranty Insurance Company |
| FHLMC | | – Federal Home Loan Mortgage Corp. |
| GO | | – General Obligation |
| INS | | – Insurer |
| NATL | | – National Public Finance Guarantee Corp. |
| RB | | – Revenue Bonds |
| Ref. | | – Refunding |
| RN | | – Revenue Notes |
| SGI | | – Syncora Guarantee, Inc. |
Notes to Schedule of Investments:
| (a) | Principal and/or interest payments are secured by the bond insurance company listed. |
| (b) | Advance refunded; secured by an escrow fund of U.S. Government obligations or other highly rated collateral. |
| (c) | Security has an irrevocable call by the issuer or mandatory put by the holder. Maturity date reflects such call or put. |
| (d) | Security purchased or received in a transaction exempt from registration under the Securities Act of 1933, as amended (the “1933 Act”). The security may be resold pursuant to an exemption from registration under the 1933 Act, typically to qualified institutional buyers. The aggregate value of these securities at February 28, 2023 was $43,306,217, which represented 6.15% of the Fund’s Net Assets. |
| (e) | Security subject to the alternative minimum tax. |
| (f) | Defaulted security. Currently, the issuer is in default with respect to principal and/or interest payments. The aggregate value of these securities at February 28, 2023 was $281,900, which represented less than 1% of the Fund’s Net Assets. |
| (g) | Restricted security. The aggregate value of these securities at February 28, 2023 was $81,900, which represented less than 1% of the Fund’s Net Assets. |
| (h) | Zero coupon bond issued at a discount. |
| (i) | Security valued using significant unobservable inputs (Level 3). See Note 3. |
| (j) | This table provides a listing of those entities that have either issued, guaranteed, backed or otherwise enhanced the credit quality of more than 5% of the securities held in the portfolio. In instances where the entity has guaranteed, backed or otherwise enhanced the credit quality of a security, it is not primarily responsible for the issuer’s obligations but may be called upon to satisfy the issuer’s obligations. |
| | | | |
| Entity | | Percent | |
Build America Mutual Assurance Co. | | | 6.03% | |
See accompanying Notes to Financial Statements which are an integral part of the financial statements.
19 Invesco Limited Term California Municipal Fund
Statement of Assets and Liabilities
February 28, 2023
| | | | |
Assets: | | | | |
| |
Investments in unaffiliated securities, at value (Cost $725,457,529) | | $ | 707,284,631 | |
| |
| |
Cash | | | 83,219 | |
| |
| |
Receivable for: | | | | |
Investments sold | | | 686,200 | |
| |
Fund shares sold | | | 403,597 | |
| |
Interest | | | 9,917,392 | |
| |
Investments matured, at value
(Cost $1,017,842) | | | 50,000 | |
| |
Investment for trustee deferred compensation and retirement plans | | | 36,489 | |
| |
| |
Other assets | | | 157,399 | |
| |
Total assets | | | 718,618,927 | |
| |
| |
Liabilities: | | | | |
| |
Payable for: | | | | |
Borrowings | | | 12,200,000 | |
| |
Investments purchased | | | 1,129,244 | |
| |
Dividends | | | 608,030 | |
| |
Fund shares reacquired | | | 702,467 | |
| |
Accrued fees to affiliates | | | 204,358 | |
| |
Accrued interest expense | | | 41,342 | |
| |
Accrued trustees’ and officers’ fees and benefits | | | 9,206 | |
| |
Accrued other operating expenses | | | 74,049 | |
| |
| |
Trustee deferred compensation and retirement plans | | | 36,489 | |
| |
Total liabilities | | | 15,005,185 | |
| |
| |
Net assets applicable to shares outstanding | | $ | 703,613,742 | |
| |
| | | | |
Net assets consist of: | | | | |
| |
Shares of beneficial interest | | $ | 802,270,242 | |
| |
| |
Distributable earnings (loss) | | | (98,656,500 | ) |
| |
| |
| | $ | 703,613,742 | |
| |
Net Assets: | | | | |
| |
Class A | | $ | 290,093,304 | |
| |
| |
Class C | | $ | 26,082,437 | |
| |
| |
Class Y | | $ | 382,868,235 | |
| |
| |
Class R6 | | $ | 4,569,766 | |
| |
|
Shares outstanding, no par value, with an unlimited number of shares authorized: | |
| |
Class A | | | 93,768,106 | |
| |
Class C | | | 8,473,317 | |
| |
Class Y | | | 123,431,651 | |
| |
Class R6 | | | 1,479,267 | |
| |
Class A: | | | | |
Net asset value per share | | $ | 3.09 | |
| |
Maximum offering price per share
(Net asset value of $3.09 ÷ 97.50%) | | $ | 3.17 | |
| |
Class C: | | | | |
Net asset value and offering price per share | | $ | 3.08 | |
| |
Class Y: | | | | |
Net asset value and offering price per share | | $ | 3.10 | |
| |
Class R6: | | | | |
Net asset value and offering price per share | | $ | 3.09 | |
| |
See accompanying Notes to Financial Statements which are an integral part of the financial statements.
20 Invesco Limited Term California Municipal Fund
Statement of Operations
For the year ended February 28, 2023
| | | | |
Investment income: | | | | |
Interest | | $ | 22,654,236 | |
| |
| |
Expenses: | | | | |
Advisory fees | | | 2,967,315 | |
| |
Administrative services fees | | | 104,594 | |
| |
Custodian fees | | | 8,868 | |
| |
Distribution fees: | | | | |
Class A | | | 760,492 | |
| |
Class C | | | 291,442 | |
| |
Interest, facilities and maintenance fees | | | 435,206 | |
| |
Transfer agent fees – A, C and Y | | | 495,473 | |
| |
Transfer agent fees – R6 | | | 439 | |
| |
Trustees’ and officers’ fees and benefits | | | 21,687 | |
| |
Registration and filing fees | | | 61,690 | |
| |
Professional services fees | | | 79,894 | |
| |
Other | | | 14,572 | |
| |
Total expenses | | | 5,241,672 | |
| |
Less: Expense offset arrangement(s) | | | (530 | ) |
| |
Net expenses | | | 5,241,142 | |
| |
Net investment income | | | 17,413,094 | |
| |
| |
Realized and unrealized gain (loss) from: | | | | |
Net realized gain (loss) from unaffiliated investment securities | | | (22,575,767 | ) |
| |
Change in net unrealized appreciation (depreciation) of unaffiliated investment securities | | | (21,799,054 | ) |
| |
Net realized and unrealized gain (loss) | | | (44,374,821 | ) |
| |
Net increase (decrease) in net assets resulting from operations | | | $(26,961,727 | ) |
| |
See accompanying Notes to Financial Statements which are an integral part of the financial statements.
21 Invesco Limited Term California Municipal Fund
Statement of Changes in Net Assets
For the years ended February 28, 2023 and 2022
| | | | | | | | |
| | | 2023 | | | 2022 | |
| |
| | |
Operations: | | | | | | | | |
Net investment income | | $ | 17,413,094 | | | $ | 13,833,683 | |
| |
Net realized gain (loss) | | | (22,575,767 | ) | | | (1,703,658 | ) |
| |
Change in net unrealized appreciation (depreciation) | | | (21,799,054 | ) | | | (12,973,733 | ) |
| |
Net increase (decrease) in net assets resulting from operations | | | (26,961,727 | ) | | | (843,708 | ) |
| |
| | |
Distributions to shareholders from distributable earnings: | | | | | | | | |
Class A | | | (6,304,884 | ) | | | (7,442,945 | ) |
| |
Class C | | | (383,945 | ) | | | (604,644 | ) |
| |
Class Y | | | (9,038,338 | ) | | | (9,547,678 | ) |
| |
Class R6 | | | (116,698 | ) | | | (214,370 | ) |
| |
Total distributions from distributable earnings | | | (15,843,865 | ) | | | (17,809,637 | ) |
| |
| | |
Share transactions–net: | | | | | | | | |
Class A | | | (36,328,493 | ) | | | 34,757,274 | |
| |
Class C | | | (7,739,299 | ) | | | (10,358,126 | ) |
| |
Class Y | | | (7,181,503 | ) | | | 81,690,816 | |
| |
Class R6 | | | (1,645,880 | ) | | | (4,210,637 | ) |
| |
Net increase (decrease) in net assets resulting from share transactions | | | (52,895,175 | ) | | | 101,879,327 | |
| |
Net increase (decrease) in net assets | | | (95,700,767 | ) | | | 83,225,982 | |
| |
| | |
Net assets: | | | | | | | | |
Beginning of year | | | 799,314,509 | | | | 716,088,527 | |
| |
End of year | | $ | 703,613,742 | | | $ | 799,314,509 | |
| |
See accompanying Notes to Financial Statements which are an integral part of the financial statements.
22 Invesco Limited Term California Municipal Fund
Financial Highlights
The following schedule presents financial highlights for a share of the Fund outstanding throughout the periods indicated.
| | | | | | | | | | | | | | | | | | | | | | | | | | | | | | | | | | | | | | | | | | | | | | | | | | | | | | | | | | | | | | | | | |
| | | Net asset
value,
beginning
of period | | Net investment income(a) | | Net gains
(losses) on securities
(both
realized and unrealized) | | Total from investment operations | | Dividends from net investment income | | Net asset
value, end
of period | | Total
return(b) | | Net assets,
end of period (000’s omitted) | | Ratio of
expenses
to average
net assets
with fee waivers
and/or
expenses absorbed | | Ratio of
expenses
to average net
assets without fee waivers and/or
expenses
absorbed | | Supplemental
ratio of
expenses to average net assets
with fee waivers
(excluding
interest,
facilities and
maintenance
fees) | | Ratio of net
investment
income to average
net assets | | Portfolio turnover (c) |
Class A | | | | | | | | | | | | | | | | | | | | | | | | | | | | | | | | | | | | | | | | | | | | | | | | | | | | | | | | | | | | | | | | | |
Year ended 02/28/23 | | | $ | 3.27 | | | | $ | 0.07 | | | | $ | (0.19 | ) | | | $ | (0.12 | ) | | | $ | (0.06 | ) | | | $ | 3.09 | | | | | (3.52 | )% | | | $ | 290,093 | | | | | 0.83 | % | | | | 0.83 | % | | | | 0.77 | % | | | | 2.30 | % | | | | 59 | % |
Year ended 02/28/22 | | | | 3.34 | | | | | 0.06 | | | | | (0.06 | ) | | | | 0.00 | | | | | (0.07 | ) | | | | 3.27 | | | | | 0.04 | | | | | 344,777 | | | | | 0.80 | | | | | 0.80 | | | | | 0.76 | | | | | 1.66 | | | | | 29 | |
Year ended 02/28/21 | | | | 3.42 | | | | | 0.08 | | | | | (0.08 | ) | | | | 0.00 | | | | | (0.08 | ) | | | | 3.34 | | | | | 0.09 | | | | | 317,908 | | | | | 0.85 | | | | | 0.85 | | | | | 0.79 | | | | | 2.35 | | | | | 27 | |
Seven months ended 02/29/20 | | | | 3.32 | | | | | 0.05 | | | | | 0.10 | | | | | 0.15 | | | | | (0.05 | ) | | | | 3.42 | | | | | 4.51 | | | | | 255,461 | | | | | 0.84 | (d) | | | | 0.84 | (d) | | | | 0.78 | (d) | | | | 2.60 | (d) | | | | 13 | |
Year ended 07/31/19 | | | | 3.16 | | | | | 0.09 | | | | | 0.15 | | | | | 0.24 | | | | | (0.08 | ) | | | | 3.32 | | | | | 7.69 | | | | | 220,719 | | | | | 0.94 | | | | | 0.95 | | | | | 0.82 | | | | | 2.75 | | | | | 36 | |
Year ended 07/31/18 | | | | 3.15 | | | | | 0.09 | | | | | 0.01 | | | | | 0.10 | | | | | (0.09 | ) | | | | 3.16 | | | | | 3.19 | | | | | 182,533 | | | | | 0.98 | | | | | 0.98 | | | | | 0.85 | | | | | 2.79 | | | | | 20 | |
Class C | | | | | | | | | | | | | | | | | | | | | | | | | | | | | | | | | | | | | | | | | | | | | | | | | | | | | | | | | | | | | | | | | |
Year ended 02/28/23 | | | | 3.25 | | | | | 0.05 | | | | | (0.18 | ) | | | | (0.13 | ) | | | | (0.04 | ) | | | | 3.08 | | | | | (3.96 | ) | | | | 26,082 | | | | | 1.58 | | | | | 1.58 | | | | | 1.52 | | | | | 1.55 | | | | | 59 | |
Year ended 02/28/22 | | | | 3.32 | | | | | 0.03 | | | | | (0.05 | ) | | | | (0.02 | ) | | | | (0.05 | ) | | | | 3.25 | | | | | (0.71 | ) | | | | 35,663 | | | | | 1.55 | | | | | 1.55 | | | | | 1.51 | | | | | 0.91 | | | | | 29 | |
Year ended 02/28/21 | | | | 3.40 | | | | | 0.05 | | | | | (0.07 | ) | | | | (0.02 | ) | | | | (0.06 | ) | | | | 3.32 | | | | | (0.65 | ) | | | | 46,761 | | | | | 1.60 | | | | | 1.60 | | | | | 1.54 | | | | | 1.60 | | | | | 27 | |
Seven months ended 02/29/20 | | | | 3.31 | | | | | 0.04 | | | | | 0.08 | | | | | 0.12 | | | | | (0.03 | ) | | | | 3.40 | | | | | 3.76 | | | | | 74,037 | | | | | 1.59 | (d) | | | | 1.59 | (d) | | | | 1.53 | (d) | | | | 1.84 | (d) | | | | 13 | |
Year ended 07/31/19 | | | | 3.15 | | | | | 0.06 | | | | | 0.16 | | | | | 0.22 | | | | | (0.06 | ) | | | | 3.31 | | | | | 6.91 | | | | | 76,761 | | | | | 1.70 | | | | | 1.71 | | | | | 1.58 | | | | | 1.99 | | | | | 36 | |
Year ended 07/31/18 | | | | 3.14 | | | | | 0.06 | | | | | 0.01 | | | | | 0.07 | | | | | (0.06 | ) | | | | 3.15 | | | | | 2.43 | | | | | 94,579 | | | | | 1.73 | | | | | 1.73 | | | | | 1.60 | | | | | 2.03 | | | | | 20 | |
Class Y | | | | | | | | | | | | | | | | | | | | | | | | | | | | | | | | | | | | | | | | | | | | | | | | | | | | | | | | | | | | | | | | | |
Year ended 02/28/23 | | | | 3.28 | | | | | 0.08 | | | | | (0.19 | ) | | | | (0.11 | ) | | | | (0.07 | ) | | | | 3.10 | | | | | (3.24 | ) | | | | 382,868 | | | | | 0.58 | | | | | 0.58 | | | | | 0.52 | | | | | 2.55 | | | | | 59 | |
Year ended 02/28/22 | | | | 3.35 | | | | | 0.06 | | | | | (0.05 | ) | | | | 0.01 | | | | | (0.08 | ) | | | | 3.28 | | | | | 0.30 | | | | | 412,391 | | | | | 0.55 | | | | | 0.55 | | | | | 0.51 | | | | | 1.91 | | | | | 29 | |
Year ended 02/28/21 | | | | 3.43 | | | | | 0.09 | | | | | (0.08 | ) | | | | 0.01 | | | | | (0.09 | ) | | | | 3.35 | | | | | 0.35 | | | | | 340,628 | | | | | 0.60 | | | | | 0.60 | | | | | 0.54 | | | | | 2.60 | | | | | 27 | |
Seven months ended 02/29/20 | | | | 3.33 | | | | | 0.06 | | | | | 0.09 | | | | | 0.15 | | | | | (0.05 | ) | | | | 3.43 | | | | | 4.64 | | | | | 298,245 | | | | | 0.59 | (d) | | | | 0.59 | (d) | | | | 0.53 | (d) | | | | 2.84 | (d) | | | | 13 | |
Year ended 07/31/19 | | | | 3.17 | | | | | 0.10 | | | | | 0.15 | | | | | 0.25 | | | | | (0.09 | ) | | | | 3.33 | | | | | 7.93 | | | | | 251,897 | | | | | 0.70 | | | | | 0.71 | | | | | 0.58 | | | | | 2.99 | | | | | 36 | |
Year ended 07/31/18 | | | | 3.16 | | | | | 0.09 | | | | | 0.02 | | | | | 0.11 | | | | | (0.10 | ) | | | | 3.17 | | | | | 3.43 | | | | | 180,248 | | | | | 0.73 | | | | | 0.73 | | | | | 0.60 | | | | | 3.03 | | | | | 20 | |
Class R6 | | | | | | | | | | | | | | | | | | | | | | | | | | | | | | | | | | | | | | | | | | | | | | | | | | | | | | | | | | | | | | | | | |
Year ended 02/28/23 | | | | 3.27 | | | | | 0.08 | | | | | (0.19 | ) | | | | (0.11 | ) | | | | (0.07 | ) | | | | 3.09 | | | | | (3.21 | ) | | | | 4,570 | | | | | 0.52 | | | | | 0.52 | | | | | 0.46 | | | | | 2.61 | | | | | 59 | |
Year ended 02/28/22 | | | | 3.34 | | | | | 0.07 | | | | | (0.06 | ) | | | | 0.01 | | | | | (0.08 | ) | | | | 3.27 | | | | | 0.37 | | | | | 6,483 | | | | | 0.49 | | | | | 0.49 | | | | | 0.45 | | | | | 1.97 | | | | | 29 | |
Year ended 02/28/21 | | | | 3.41 | | | | | 0.09 | | | | | (0.07 | ) | | | | 0.02 | | | | | (0.09 | ) | | | | 3.34 | | | | | 0.70 | | | | | 10,792 | | | | | 0.53 | | | | | 0.54 | | | | | 0.47 | | | | | 2.67 | | | | | 27 | |
Seven months ended 02/29/20 | | | | 3.32 | | | | | 0.05 | | | | | 0.09 | | | | | 0.14 | | | | | (0.05 | ) | | | | 3.41 | | | | | 4.38 | | | | | 9,052 | | | | | 0.50 | (d) | | | | 0.56 | (d) | | | | 0.50 | (d) | | | | 2.94 | (d) | | | | 13 | |
Period ended 07/31/19(e) | | | | 3.29 | | | | | 0.02 | | | | | 0.03 | | | | | 0.05 | | | | | (0.02 | ) | | | | 3.32 | | | | | 1.44 | | | | | 166 | | | | | 0.60 | (d) | | | | 0.65 | (d) | | | | 0.52 | (d) | | | | 3.09 | (d) | | | | 36 | |
| (a) | Calculated using average shares outstanding. |
| (b) | Includes adjustments in accordance with accounting principles generally accepted in the United States of America and as such, the net asset value for financial reporting purposes and the returns based upon those net asset values may differ from the net asset value and returns for shareholder transactions. Does not include sales charges and is not annualized for periods less than one year, if applicable. |
| (c) | Portfolio turnover is calculated at the fund level and is not annualized for periods less than one year, if applicable. |
| (e) | Commencement date after the close of business on May 24, 2019. |
See accompanying Notes to Financial Statements which are an integral part of the financial statements.
23 Invesco Limited Term California Municipal Fund
Notes to Financial Statements
February 28, 2023
NOTE 1–Significant Accounting Policies
Invesco Limited Term California Municipal Fund (the “Fund”) is a series portfolio of AIM Tax-Exempt Funds (Invesco Tax-Exempt Funds) (the “Trust”). The Trust is a Delaware statutory trust registered under the Investment Company Act of 1940, as amended (the “1940 Act”), as an open-end series management investment company authorized to issue an unlimited number of shares of beneficial interest. Information presented in these financial statements pertains only to the Fund. Matters affecting the Fund or each class will be voted on exclusively by the shareholders of the Fund or each class.
The Fund’s investment objective is to seek tax-free income.
The Fund currently consists of four different classes of shares: Class A, Class C, Class Y and Class R6. Class Y shares are available only to certain investors. Class A shares are sold with a front-end sales charge unless certain waiver criteria are met. Under certain circumstances, load waived shares may be subject to contingent deferred sales charges (“CDSC”). Class C shares are sold with a CDSC. Class Y and Class R6 shares are sold at net asset value. Class C shares held for eight years after purchase are eligible for automatic conversion into Class A shares of the same Fund (the “Conversion Feature”). The automatic conversion pursuant to the Conversion Feature will generally occur at the end of the month following the eighth anniversary after a purchase of Class C shares.
The Fund is an investment company and accordingly follows the investment company accounting and reporting guidance in accordance with Financial Accounting Standards Board Accounting Standards Codification Topic 946, Financial Services – Investment Companies.
The following is a summary of the significant accounting policies followed by the Fund in the preparation of its financial statements.
| A. | Security Valuations – Securities, including restricted securities, are valued according to the following policy. |
Securities generally are valued on the basis of prices provided by independent pricing services. Prices provided by the pricing service may be determined without exclusive reliance on quoted prices, and may reflect appropriate factors such as institution-size trading in similar groups of securities, developments related to specific securities, dividend rate (for unlisted equities), yield (for debt obligations), quality, type of issue, coupon rate (for debt obligations), maturity (for debt obligations), individual trading characteristics and other market data. Pricing services generally value debt obligations assuming orderly transactions of institutional round lot size, but a fund may hold or transact in the same securities in smaller, odd lot sizes. Odd lots often trade at lower prices than institutional round lots, and their value may be adjusted accordingly. Debt obligations are subject to interest rate and credit risks. In addition, all debt obligations involve some risk of default with respect to interest and/or principal payments.
Securities for which market quotations are not readily available are fair valued by Invesco Advisers, Inc. (the “Adviser” or “Invesco”) in accordance with Board-approved policies and related Adviser procedures (“Valuation Procedures”). If a fair value price provided by a pricing service is not representative of market value in the Adviser’s judgment (“unreliable”), the Adviser will fair value the security using the Valuation Procedures. Some of the factors which may be considered in determining fair value are fundamental analytical data relating to the investment; the nature and duration of any restrictions on transferability or disposition; trading in similar securities by the same issuer or comparable companies; relevant political, economic or issuer specific news; and other relevant factors under the circumstances.
The Fund may invest in securities that are subject to interest rate risk, meaning the risk that the prices will generally fall as interest rates rise and, conversely, the prices will generally rise as interest rates fall. Specific securities differ in their sensitivity to changes in interest rates depending on their individual characteristics. Changes in interest rates may result in increased market volatility, which may affect the value and/or liquidity of certain Fund investments.
Valuations change in response to many factors including the historical and prospective earnings of the issuer, the value of the issuer’s assets, general market conditions which are not specifically related to the particular issuer, such as real or perceived adverse economic conditions, changes in the general outlook for revenues or corporate earnings, changes in interest or currency rates, regional or global instability, natural or environmental disasters, widespread disease or other public health issues, war, acts of terrorism, significant governmental actions or adverse investor sentiment generally and market liquidity. Because of the inherent uncertainties of valuation, the values reflected in the financial statements may materially differ from the value received upon actual sale of those investments.
The price the Fund could receive upon the sale of any investment may differ from the Adviser’s valuation of the investment, particularly for securities that are valued using a fair valuation technique. When fair valuation techniques are applied, the Adviser uses available information, including both observable and unobservable inputs and assumptions, to determine a methodology that will result in a valuation that the Adviser believes approximates market value. Fund securities that are fair valued may be subject to greater fluctuation in their value from one day to the next than would be the case if market quotations were used. Because of the inherent uncertainties of valuation, and the degree of subjectivity in such decisions, the Fund could realize a greater or lesser than expected gain or loss upon the sale of the investment.
| B. | Securities Transactions and Investment Income – Securities transactions are accounted for on a trade date basis. Realized gains or losses on sales are computed on the basis of specific identification of the securities sold. Interest income (net of withholding tax, if any) is recorded on an accrual basis from settlement date and includes coupon interest and amortization of premium and accretion of discount on debt securities as applicable. Pay-in-kind interest income and non-cash dividend income received in the form of securities in-lieu of cash are recorded at the fair value of the securities received. Dividend income (net of withholding tax, if any) is recorded on the ex-dividend date. |
The Fund may periodically participate in litigation related to Fund investments. As such, the Fund may receive proceeds from litigation settlements.Any proceeds received are included in the Statement of Operations as realized gain (loss) for investments no longer held and as unrealized gain (loss) for investments still held.
Brokerage commissions and mark ups are considered transaction costs and are recorded as an increase to the cost basis of securities purchased and/or a reduction of proceeds on a sale of securities. Such transaction costs are included in the determination of net realized and unrealized gain (loss) from investment securities reported in the Statement of Operations and the Statement of Changes in Net Assets and the net realized and unrealized gains (losses) on securities per share in the Financial Highlights. Transaction costs are included in the calculation of the Fund’s net asset value and, accordingly, they reduce the Fund’s total returns. These transaction costs are not considered operating expenses and are not reflected in net investment income reported in the Statement of Operations and the Statement of Changes in Net Assets, or the net investment income per share and the ratios of expenses and net investment income reported in the Financial Highlights, nor are they limited by any expense limitation arrangements between the Fund and the investment adviser.
The Fund allocates realized and unrealized capital gains and losses to a class based on the relative net assets of each class. The Fund allocates income to a class based on the relative value of the settled shares of each class.
| C. | Country Determination – For the purposes of making investment selection decisions and presentation in the Schedule of Investments, the investment adviser may determine the country in which an issuer is located and/or credit risk exposure based on various factors. These factors include the laws of the country under which the issuer is organized, where the issuer maintains a principal office, the country in which the issuer derives 50% or more of its total revenues, the country that has the primary market for the issuer’s securities and its “country of risk” as determined by a third party service provider, as well as other criteria. Among the other criteria that may be evaluated for making this determination are the country in which the issuer maintains 50% or more of its assets, the type of security, financial guarantees and enhancements, the nature of the collateral and the sponsor organization. Country of issuer and/or credit risk exposure has been determined to be the United States of America, unless otherwise noted. |
| D. | Distributions – Distributions from net investment income, if any, are declared daily and paid monthly. Distributions from net realized capital gain, if any, are |
24 Invesco Limited Term California Municipal Fund
| | generally declared and paid annually and recorded on the ex-dividend date. The Fund may elect to treat a portion of the proceeds from redemptions as distributions for federal income tax purposes. |
| E. | Federal Income Taxes – The Fund intends to comply with the requirements of Subchapter M of the Internal Revenue Code of 1986, as amended (the “Internal Revenue Code”), necessary to qualify as a regulated investment company and to distribute substantially all of the Fund’s taxable and tax-exempt earnings to shareholders. As such, the Fund will not be subject to federal income taxes on otherwise taxable income (including net realized capital gain) that is distributed to shareholders. Therefore, no provision for federal income taxes is recorded in the financial statements. |
The Fund recognizes the tax benefits of uncertain tax positions only when the position is more likely than not to be sustained. Management has analyzed the Fund’s uncertain tax positions and concluded that no liability for unrecognized tax benefits should be recorded related to uncertain tax positions. Management is not aware of any tax positions for which it is reasonably possible that the total amounts of unrecognized tax benefits will change materially in the next 12 months.
In addition, the Fund intends to invest in such municipal securities to allow it to qualify to pay shareholders “exempt-interest dividends”, as defined in the Internal Revenue Code.
The Fund files tax returns in the U.S. Federal jurisdiction and certain other jurisdictions. Generally, the Fund is subject to examinations by such taxing authorities for up to three years after the filing of the return for the tax period.
| F. | Expenses – Fees provided for under the Rule 12b-1 plan of a particular class of the Fund are charged to the operations of such class. Transfer agency fees and expenses and other shareholder recordkeeping fees and expenses attributable to Class R6 are charged to such class. Transfer agency fees and expenses and other shareholder recordkeeping fees and expenses relating to all other classes are allocated among those classes based on relative net assets. All other expenses are allocated among the classes based on relative net assets. |
| G. | Interest, Facilities and Maintenance Fees – Interest, Facilities and Maintenance Fees include interest and related borrowing costs such as commitment fees, administrative expenses and other expenses associated with establishing and maintaining the line of credit. In addition, interest and administrative expenses related to establishing and maintaining floating rate note obligations, if any, are included. |
| H. | Accounting Estimates – The preparation of financial statements in conformity with accounting principles generally accepted in the United States of America (“GAAP”) requires management to make estimates and assumptions that affect the reported amounts of assets and liabilities at the date of the financial statements and the reported amounts of revenues and expenses during the reporting period including estimates and assumptions related to taxation. Actual results could differ from those estimates by a significant amount. In addition, the Fund monitors for material events or transactions that may occur or become known after the period-end date and before the date the financial statements are released to print. |
| I. | Indemnifications – Under the Trust’s organizational documents, each Trustee, officer, employee or other agent of the Trust is indemnified against certain liabilities that may arise out of the performance of their duties to the Fund. Additionally, in the normal course of business, the Fund enters into contracts, including the Fund’s servicing agreements, that contain a variety of indemnification clauses. The Fund’s maximum exposure under these arrangements is unknown as this would involve future claims that may be made against the Fund that have not yet occurred. The risk of material loss as a result of such indemnification claims is considered remote. |
| J. | Securities Purchased on a When-Issued and Delayed Delivery Basis – The Fund may purchase and sell interests in corporate loans and corporate debt securities and other portfolio securities on a when-issued and delayed delivery basis, with payment and delivery scheduled for a future date. No income accrues to the Fund on such interests or securities in connection with such transactions prior to the date the Fund actually takes delivery of such interests or securities. These transactions are subject to market fluctuations and are subject to the risk that the value at delivery may be more or less than the trade date purchase price. Although the Fund will generally purchase these securities with the intention of acquiring such securities, they may sell such securities prior to the settlement date. |
| K. | Other Risks - The value of, payment of interest on, repayment of principal for and the ability to sell a municipal security may be affected by constitutional amendments, legislative enactments, executive orders, administrative regulations, voter initiatives and the economics of the regions in which the issuers are located. Since many municipal securities are issued to finance similar projects, especially those relating to education, health care, transportation and utilities, conditions in those sectors can affect the overall municipal securities market and the Fund’s investments in municipal securities. There is some risk that a portion or all of the interest received from certain tax-free municipal securities could become taxable as a result of determinations by the Internal Revenue Service. |
Increases in the federal funds and equivalent foreign rates or other changes to monetary policy or regulatory actions may expose fixed income markets to heightened volatility and reduced liquidity for certain fixed income investments, particularly those with longer maturities. It is difficult to predict the impact of interest rate changes on various markets. In addition, decreases in fixed income dealer market-making capacity may also potentially lead to heightened volatility and reduced liquidity in the fixed income markets. As a result, the value of the Fund’s investments and share price may decline. Changes in central bank policies could also result in higher than normal redemptions by shareholders, which could potentially increase the Fund’s portfolio turnover rate and transaction costs.
Policy changes by the U.S. government or its regulatory agencies and political events within the U.S. and abroad may, among other things, affect investor and consumer confidence and increase volatility in the financial markets, perhaps suddenly and to a significant degree, which may adversely impact the Fund’s operations, universe of potential investment options, and return potential.
There is a possibility that the credit rating of a municipal security may be downgraded after purchase, which may occur quickly and without advanced warning following sudden market downturns or unexpected developments involving an issuer, and which may adversely affect the liquidity and value of the security.
The municipal issuers in which the Fund invests may be located in the same geographic area or may pay their interest obligations from revenue of similar projects, such as hospitals, airports, utility systems and housing finance agencies. This may make the Fund’s investments more susceptible to similar social, economic, political or regulatory occurrences, making the Fund more susceptible to experience a drop in its share price than if the Fund had been more diversified across issuers that did not have similar characteristics.
| L. | COVID-19 Risk - The COVID-19 strain of coronavirus has resulted in instances of market closures and dislocations, extreme volatility, liquidity constraints and increased trading costs. Efforts to contain its spread have resulted in travel restrictions, disruptions of healthcare systems, business operations (including business closures) and supply chains, layoffs, lower consumer demand and employee availability, and defaults and credit downgrades, among other significant economic impacts that have disrupted global economic activity across many industries. Such economic impacts may exacerbate other pre-existing political, social and economic risks locally or globally and cause general concern and uncertainty. The full economic impact and ongoing effects of COVID-19 (or other future epidemics or pandemics) at the macro-level and on individual businesses are unpredictable and may result in significant and prolonged effects on the Fund’s performance. |
25 Invesco Limited Term California Municipal Fund
NOTE 2–Advisory Fees and Other Fees Paid to Affiliates
The Trust has entered into a master investment advisory agreement with the Adviser. Under the terms of the investment advisory agreement, the Fund accrues daily and pays monthly an advisory fee to the Adviser based on the annual rate of the Fund’s average daily net assets as follows:
| | |
| Average Daily Net Assets | | Rate* |
|
First $ 100 million | | 0.500% |
|
Next $150 million | | 0.450% |
|
Next $1.75 billion | | 0.400% |
|
Over $2 billion | | 0.390% |
|
| * | The advisory fee paid by the Fund shall be reduced by any amounts paid by the Fund under the administrative services agreement with the Adviser. |
For the year ended February 28, 2023, the effective advisory fee rate incurred by the Fund was 0.41%.
Under the terms of a master sub-advisory agreement between the Adviser and each of Invesco Asset Management Deutschland GmbH, Invesco Asset Management Limited, Invesco Asset Management (Japan) Limited, Invesco Hong Kong Limited, Invesco Senior Secured Management, Inc. and Invesco Canada Ltd. and separate sub-advisory agreements with Invesco Capital Management LLC and Invesco Asset Management (India) Private Limited (collectively, the “Affiliated Sub-Advisers”) the Adviser, not the Fund, will pay 40% of the fees paid to the Adviser to any such Affiliated Sub-Adviser(s) that provide(s) discretionary investment management services to the Fund based on the percentage of assets allocated to such Affiliated Sub-Adviser(s). Invesco has also entered into a sub-advisory agreement with OppenheimerFunds, Inc. to provide discretionary management services to the Fund.
The Adviser has contractually agreed, through at least June 30, 2023, to waive advisory fees and/or reimburse expenses of all shares to the extent necessary to limit total annual fund operating expenses after fee waiver and/or expense reimbursement (excluding certain items discussed below) of Class A, Class C, Class Y and Class R6 shares to 1.50%, 2.25%, 1.25% and 1.25%, respectively, of the Fund’s average daily net assets (the “expense limits”). In determining the Adviser’s obligation to waive advisory fees and/or reimburse expenses, the following expenses are not taken into account, and could cause the total annual fund operating expenses after fee waiver and/or expense reimbursement to exceed the numbers reflected above: (1) interest, facilities and maintenance fees; (2) taxes; (3) dividend expense on short sales; (4) extraordinary or non-routine items, including litigation expenses; and (5) expenses that the Fund has incurred but did not actually pay because of an expense offset arrangement. Unless Invesco continues the fee waiver agreement, it will terminate on June 30, 2023. During its term, the fee waiver agreement cannot be terminated or amended to increase the expense limits or reduce the advisory fee waiver without approval of the Board of Trustees. The Adviser did not waive fees and/or reimburse expenses during the period under these expense limits.
The Trust has entered into a master administrative services agreement with Invesco pursuant to which the Fund has agreed to pay Invesco for certain administrative costs incurred in providing accounting services to the Fund. For the year ended February 28, 2023, expenses incurred under the agreement are shown in the Statement of Operations as Administrative services fees. Invesco has entered into a sub-administration agreement whereby State Street Bank and Trust Company (“SSB”) serves as fund accountant and provides certain administrative services to the Fund. Pursuant to a custody agreement with the Trust on behalf of the Fund, SSB also serves as the Fund’s custodian.
The Trust has entered into a transfer agency and service agreement with Invesco Investment Services, Inc. (“IIS”) pursuant to which the Fund has agreed to pay IIS a fee for providing transfer agency and shareholder services to the Fund and reimburse IIS for certain expenses incurred by IIS in the course of providing such services. IIS may make payments to intermediaries that provide omnibus account services, sub-accounting services and/or networking services. All fees payable by IIS to intermediaries that provide omnibus account services or sub-accounting services are charged back to the Fund, subject to certain limitations approved by the Trust’s Board of Trustees. For the year ended February 28, 2023, expenses incurred under the agreement are shown in the Statement of Operations as Transfer agent fees.
The Trust has entered into master distribution agreements with Invesco Distributors, Inc. (“IDI”) to serve as the distributor for the Class A, Class C, Class Y and Class R6 shares of the Fund. The Trust has adopted plans pursuant to Rule 12b-1 under the 1940 Act with respect to the Fund’s Class A and Class C shares (collectively, the “Plans”). The Fund, pursuant to the Class A Plan, reimburses IDI for its allocated share of expenses incurred for the period, up to a maximum annual rate of 0.25% of the average daily net assets of Class A shares. The Fund pursuant to the Class C Plan, pays IDI compensation at the annual rate of 1.00% of the average daily net assets of Class C shares. The fees are accrued daily and paid monthly. Of the Plan payments, up to 0.25% of the average daily net assets of each class of shares may be paid to furnish continuing personal shareholder services to customers who purchase and own shares of such classes. Any amounts not paid as a service fee under the Plans would constitute an asset-based sales charge. Rules of the Financial Industry Regulatory Authority (“FINRA”) impose a cap on the total sales charges, including asset-based sales charges, that may be paid by any class of shares of the Fund. For the year ended February 28, 2023, expenses incurred under the Plans are shown in the Statement of Operations as Distribution fees.
Front-end sales commissions and CDSC (collectively, the “sales charges”) are not recorded as expenses of the Fund. Front-end sales commissions are deducted from proceeds from the sales of Fund shares prior to investment in Class A shares of the Fund. CDSC are deducted from redemption proceeds prior to remittance to the shareholder. During the year ended February 28, 2023, IDI advised the Fund that IDI retained $3,574 in front-end sales commissions from the sale of Class A shares and $74,047 and $1,455 from Class A and Class C shares, respectively, for CDSC imposed upon redemptions by shareholders.
Certain officers and trustees of the Trust are officers and directors of the Adviser, IIS and/or IDI.
NOTE 3–Additional Valuation Information
GAAP defines fair value as the price that would be received to sell an asset or paid to transfer a liability in an orderly transaction between market participants at the measurement date, under current market conditions. GAAP establishes a hierarchy that prioritizes the inputs to valuation methods, giving the highest priority to readily available unadjusted quoted prices in an active market for identical assets (Level 1) and the lowest priority to significant unobservable inputs (Level 3), generally when market prices are not readily available. Based on the valuation inputs, the securities or other investments are tiered into one of three levels. Changes in valuation methods may result in transfers in or out of an investment’s assigned level:
| | | | |
| | Level 1 – | | Prices are determined using quoted prices in an active market for identical assets. |
| | Level 2 – | | Prices are determined using other significant observable inputs. Observable inputs are inputs that other market participants may use in pricing a security. These may include quoted prices for similar securities, interest rates, prepayment speeds, credit risk, yield curves, loss severities, default rates, discount rates, volatilities and others. |
| | Level 3 – | | Prices are determined using significant unobservable inputs. In situations where quoted prices or observable inputs are unavailable (for example, when there is little or no market activity for an investment at the end of the period), unobservable inputs may be used. Unobservable inputs reflect the Adviser’s assumptions about the factors market participants would use in determining fair value of the securities or instruments and would be based on the best available information. |
The following is a summary of the tiered valuation input levels, as of February 28, 2023. The level assigned to the securities valuations may not be an indication of the risk or liquidity associated with investing in those securities. Because of the inherent uncertainties of valuation, the values reflected in the financial statements may materially differ from the value received upon actual sale of those investments.
26 Invesco Limited Term California Municipal Fund
| | | | | | | | | | | | | | |
| | | Level 1 | | Level 2 | | | Level 3 | | | Total | |
| |
Investments in Securities | | | | | | | | | | | | | | |
| |
Municipal Obligations | | $– | | $ | 704,314,767 | | | $ | 132,213 | | | $ | 704,446,980 | |
| |
U.S. Dollar Denominated Bonds & Notes | | – | | | 647,651 | | | | 2,190,000 | | | | 2,837,651 | |
| |
Total Investments in Securities | | – | | | 704,962,418 | | | | 2,322,213 | | | | 707,284,631 | |
| |
Other Investments - Assets | | | | | | | | | | | | | | |
| |
Investments Matured | | – | | | 50,000 | | | | – | | | | 50,000 | |
| |
Total Investments | | $– | | $ | 705,012,418 | | | $ | 2,322,213 | | | $ | 707,334,631 | |
| |
NOTE 4–Security Transactions with Affiliated Funds
The Fund is permitted to purchase securities from or sell securities to certain other affiliated funds under specified conditions outlined in procedures adopted by the Board of Trustees of the Trust. The procedures have been designed to ensure that any purchase or sale of securities by the Fund from or to another fund that is or could be considered an “affiliated person” by virtue of having a common investment adviser (or affiliated investment advisers), common Trustees and/or common officers is made in reliance on Rule 17a-7 of the 1940 Act and, to the extent applicable, related SEC staff positions. Each such transaction is effected at the security’s “current market price”, as provided for in these procedures and Rule 17a-7. Pursuant to these procedures, for the year ended February 28, 2023, the Fund engaged in securities purchases of $7,120,384.
NOTE 5–Expense Offset Arrangement(s)
The expense offset arrangement is comprised of transfer agency credits which result from balances in demand deposit accounts used by the transfer agent for clearing shareholder transactions. For the year ended February 28, 2023, the Fund received credits from this arrangement, which resulted in the reduction of the Fund’s total expenses of $530.
NOTE 6–Trustees’ and Officers’ Fees and Benefits
Trustees’ and Officers’ Fees and Benefits include amounts accrued by the Fund to pay remuneration to certain Trustees and Officers of the Fund. Trustees have the option to defer compensation payable by the Fund, and Trustees’ and Officers’ Fees and Benefits also include amounts accrued by the Fund to fund such deferred compensation amounts. Those Trustees who defer compensation have the option to select various Invesco Funds in which their deferral accounts shall be deemed to be invested. Finally, certain current Trustees were eligible to participate in a retirement plan that provided for benefits to be paid upon retirement to Trustees over a period of time based on the number of years of service. The Fund may have certain former Trustees who also participate in a retirement plan and receive benefits under such plan. Trustees’ and Officers’ Fees and Benefits include amounts accrued by the Fund to fund such retirement benefits. Obligations under the deferred compensation and retirement plans represent unsecured claims against the general assets of the Fund.
NOTE 7–Cash Balances and Borrowings
The Fund has entered into a revolving credit and security agreement, which enables the Fund to participate with certain other Invesco Funds in a committed secured borrowing facility that permits borrowings up to $2.5 billion, collectively by certain Invesco Funds, and which will expire on February 22, 2024. The revolving credit and security agreement is secured by the assets of the Fund. The Fund is subject to certain covenants relating to the revolving credit and security agreement. Failure to comply with these restrictions could cause the acceleration of the repayment of the amount outstanding under the revolving credit and security agreement.
During the year ended February 28, 2023, the average daily balance of borrowing under the revolving credit and security agreement was $7,145,753 with an average interest rate of 2.62%. The carrying amount of the Fund’s payable for borrowings as reported on the Statement of Assets and Liabilities approximates its fair value. Expenses under the revolving credit and security agreement are shown in the Statement of Operations as Interest, facilities and maintenance fees.
Additionally, the Fund is permitted to temporarily carry a negative or overdrawn balance in its account with SSB, the custodian bank. Such balances, if any at period-end, are shown in the Statement of Assets and Liabilities under the payable caption Amount due custodian. To compensate the custodian bank for such overdrafts, the overdrawn Fund may either (1) leave funds as a compensating balance in the account so the custodian bank can be compensated by earning the additional interest; or (2) compensate by paying the custodian bank at a rate agreed upon by the custodian bank and Invesco, not to exceed the contractually agreed upon rate. The Fund may not purchase additional securities when any borrowings from banks or broker-dealers exceed 5% of the Fund’s total assets, or when any borrowings from an Invesco Fund are outstanding.
NOTE 8–Distributions to Shareholders and Tax Components of Net Assets
Tax Character of Distributions to Shareholders Paid During the Fiscal Years Ended February 28, 2023 and 2022:
| | | | | | | | |
| | | 2023 | | | 2022 | |
Ordinary income* | | $ | 519,541 | | | $ | 484,565 | |
Ordinary income-tax-exempt | | | 15,324,324 | | | | 17,325,072 | |
Total distributions | | $ | 15,843,865 | | | $ | 17,809,637 | |
| * | Includes short-term capital gain distributions, if any. |
Tax Components of Net Assets at Period-End:
| | | | |
| | | 2023 | |
| |
Undistributed tax-exempt income | | $ | 2,603,430 | |
| |
Net unrealized appreciation (depreciation) – investments | | | (18,973,788 | ) |
| |
Temporary book/tax differences | | | (41,362 | ) |
| |
Capital loss carryforward | | | (82,244,780 | ) |
| |
Shares of beneficial interest | | | 802,270,242 | |
| |
Total net assets | | $ | 703,613,742 | |
| |
27 Invesco Limited Term California Municipal Fund
The difference between book-basis and tax-basis unrealized appreciation (depreciation) is due to differences in the timing of recognition of gains and losses on investments for tax and book purposes. The Fund’s net unrealized appreciation (depreciation) difference is attributable primarily to wash sales, defaulted bonds and amortization and accretion on debt securities.
The temporary book/tax differences are a result of timing differences between book and tax recognition of income and/or expenses. The Fund’s temporary book/tax differences are the result of the trustee deferral of compensation and retirement plan benefits.
Capital loss carryforward is calculated and reported as of a specific date. Results of transactions and other activity after that date may affect the amount of capital loss carryforward actually available for the Fund to utilize. The ability to utilize capital loss carryforward in the future may be limited under the Internal Revenue Code and related regulations based on the results of future transactions.
The Fund has a capital loss carryforward as of February 28, 2023, as follows:
| | | | | | | | | | | | |
| Capital Loss Carryforward* | |
| Expiration | | Short-Term | | | Long-Term | | | Total | |
Not subject to expiration | | $ | 22,377,594 | | | $ | 59,867,186 | | | $ | 82,244,780 | |
| * | Capital loss carryforward is reduced for limitations, if any, to the extent required by the Internal Revenue Code and may be further limited depending upon a variety of factors, including the realization of net unrealized gains or losses as of the date of any reorganization. |
NOTE 9–Investment Transactions
The aggregate amount of investment securities (other than short-term securities, U.S. Government obligations and money market funds, if any) purchased and sold by the Fund during the year ended February 28, 2023 was $426,490,331 and $474,940,267, respectively. Cost of investments, including any derivatives, on a tax basis includes the adjustments for financial reporting purposes as of the most recently completed federal income tax reporting period-end.
| | | | |
| Unrealized Appreciation (Depreciation) of Investments on a Tax Basis | | | |
| |
Aggregate unrealized appreciation of investments | | $ | 3,197,537 | |
| |
Aggregate unrealized (depreciation) of investments | | | (22,171,325 | ) |
| |
Net unrealized appreciation (depreciation) of investments | | $ | (18,973,788 | ) |
| |
Cost of investments for tax purposes is $726,308,419.
NOTE 10–Reclassification of Permanent Differences
Primarily as a result of differing book/tax treatment of defaulted securities, defaulted bonds and market discounts , on February 28, 2023, undistributed net investment income was increased by $1,267,006, undistributed net realized gain (loss) was decreased by $962,954 and shares of beneficial interest was decreased by $304,052. This reclassification had no effect on the net assets of the Fund.
NOTE 11–Share Information
| | | | | | | | | | | | | | | | |
| | | Summary of Share Activity | |
| |
| | | Year ended
February 28, 2023(a) | | | Year ended
February 28, 2022 | |
| | | Shares | | | Amount | | | Shares | | | Amount | |
| |
Sold: | | | | | | | | | | | | | | | | |
Class A | | | 32,781,609 | | | $ | 102,249,252 | | | | 25,435,717 | | | $ | 85,685,874 | |
| |
Class C | | | 1,922,795 | | | | 5,951,041 | | | | 1,490,504 | | | | 4,989,797 | |
| |
Class Y | | | 105,744,848 | | | | 330,647,420 | | | | 62,398,635 | | | | 210,489,933 | |
| |
Class R6 | | | 695,749 | | | | 2,140,841 | | | | 167,359 | | | | 564,318 | |
| |
| | | | |
Issued as reinvestment of dividends: | | | | | | | | | | | | | | | | |
Class A | | | 1,230,812 | | | | 3,825,625 | | | | 1,278,414 | | | | 4,292,257 | |
| |
Class C | | | 81,330 | | | | 251,596 | | | | 120,234 | | | | 401,900 | |
| |
Class Y | | | 1,656,660 | | | | 5,161,109 | | | | 1,672,097 | | | | 5,630,630 | |
| |
Class R6 | | | 27,680 | | | | 86,029 | | | | 55,430 | | | | 186,206 | |
| |
| | | | |
Automatic conversion of Class C shares to Class A shares: | | | | | | | | | | | | | | | | |
Class A | | | 1,396,371 | | | | 4,357,552 | | | | 2,109,779 | | | | 7,093,628 | |
| |
Class C | | | (1,402,472 | ) | | | (4,357,552 | ) | | | (2,121,283 | ) | | | (7,093,628 | ) |
| |
| | | | |
Reacquired: | | | | | | | | | | | | | | | | |
Class A | | | (47,055,768 | ) | | | (146,760,922 | ) | | | (18,573,867 | ) | | | (62,314,485 | ) |
| |
Class C | | | (3,086,171 | ) | | | (9,584,384 | ) | | | (2,599,011 | ) | | | (8,656,195 | ) |
| |
Class Y | | | (109,695,018 | ) | | | (342,990,032 | ) | | | (40,011,057 | ) | | | (134,429,747 | ) |
| |
Class R6 | | | (1,229,377 | ) | | | (3,872,750 | ) | | | (1,471,711 | ) | | | (4,961,161 | ) |
| |
Net increase (decrease) in share activity | | | (16,930,952 | ) | | | $ (52,895,175 | ) | | | 29,951,240 | | | $ | 101,879,327 | |
| |
| (a) | There are entities that are record owners of more than 5% of the outstanding shares of the Fund and in the aggregate own 57% of the outstanding shares of the Fund. IDI has an agreement with these entities to sell Fund shares. The Fund, Invesco and/or Invesco affiliates may make payments to these entities, which are considered to be related to the Fund, for providing services to the Fund, Invesco and/or Invesco affiliates including but not limited to services such as securities brokerage, distribution, third party record keeping and account servicing. The Fund has no knowledge as to whether all or any portion of the shares owned of record by these entities are also owned beneficially. |
28 Invesco Limited Term California Municipal Fund
Report of Independent Registered Public Accounting Firm
To the Board of Trustees of AIM Tax-Exempt Funds (Invesco Tax-Exempt Funds) and Shareholders of Invesco Limited Term California Municipal Fund
Opinion on the Financial Statements
We have audited the accompanying statement of assets and liabilities, including the schedule of investments, of Invesco Limited Term California Municipal Fund (one of the funds constituting AIM Tax-Exempt Funds (Invesco Tax-Exempt Funds), referred to hereafter as the “Fund”) as of February 28, 2023, the related statement of operations for the year ended February 28, 2023, the statement of changes in net assets for each of the two years in the period ended February 28, 2023, including the related notes, and the financial highlights for each of the periods indicated in the table below (collectively referred to as the “financial statements”). In our opinion, the financial statements present fairly, in all material respects, the financial position of the Fund as of February 28, 2023, the results of its operations for the year then ended, the changes in its net assets for each of the two years in the period ended February 28, 2023 and the financial highlights for each of the periods indicated in the table below, in conformity with accounting principles generally accepted in the United States of America.
|
| |
| Financial Highlights |
| |
| For each of the three years in the period ended February 28, 2023, the seven months ended February 29, 2020 and the year ended July 31, 2019 for Class A, Class C and Class Y. |
| |
| For each of the three years in the period ended February 28, 2023, the seven months ended February 29, 2020 and the period May 24, 2019 (commencement date) through July 31, 2019 for Class R6. |
The financial statements of Oppenheimer Rochester® Limited Term California Municipal Fund (subsequently renamed Invesco Limited Term California Municipal Fund) as of and for the year ended July 31, 2018 and the financial highlights for the year ended July 31, 2018 (not presented herein, other than the financial highlights) were audited by other auditors whose report dated September 27, 2018 expressed an unqualified opinion on those financial statements and financial highlights.
Basis for Opinion
These financial statements are the responsibility of the Fund’s management. Our responsibility is to express an opinion on the Fund’s financial statements based on our audits. We are a public accounting firm registered with the Public Company Accounting Oversight Board (United States) (PCAOB) and are required to be independent with respect to the Fund in accordance with the U.S. federal securities laws and the applicable rules and regulations of the Securities and Exchange Commission and the PCAOB.
We conducted our audits of these financial statements in accordance with the standards of the PCAOB. Those standards require that we plan and perform the audit to obtain reasonable assurance about whether the financial statements are free of material misstatement, whether due to error or fraud.
Our audits included performing procedures to assess the risks of material misstatement of the financial statements, whether due to error or fraud, and performing procedures that respond to those risks. Such procedures included examining, on a test basis, evidence regarding the amounts and disclosures in the financial statements. Our audits also included evaluating the accounting principles used and significant estimates made by management, as well as evaluating the overall presentation of the financial statements. Our procedures included confirmation of securities owned as of February 28, 2023 by correspondence with the custodian and broker. We believe that our audits provide a reasonable basis for our opinion.
/s/PricewaterhouseCoopers LLP
Houston, Texas
April 21, 2023
We have served as the auditor of one or more of the investment companies in the Invesco group of investment companies since at least 1995. We have not been able to determine the specific year we began serving as auditor.
29 Invesco Limited Term California Municipal Fund
Calculating your ongoing Fund expenses
Example
As a shareholder of the Fund, you incur two types of costs: (1) transaction costs, which may include sales charges (loads) on purchase payments or contingent deferred sales charges on redemptions, if any; and (2) ongoing costs, including management fees, distribution and/or service (12b-1) fees, and other Fund expenses. This example is intended to help you understand your ongoing costs (in dollars) of investing in the Fund and to compare these costs with ongoing costs of investing in other mutual funds. The example is based on an investment of $1,000 invested at the beginning of the period and held for the entire period September 1, 2022 through February 28, 2023.
Actual expenses
The table below provides information about actual account values and actual expenses. You may use the information in this table, together with the amount you invested, to estimate the expenses that you paid over the period. Simply divide your account value by $1,000 (for example, an $8,600 account value divided by $1,000 = 8.6), then multiply the result by the number in the table under the heading entitled “Actual Expenses Paid During Period” to estimate the expenses you paid on your account during this period.
Hypothetical example for comparison purposes
The table below also provides information about hypothetical account values and hypothetical expenses based on the Fund’s actual expense ratio and an assumed rate of return of 5% per year before expenses, which is not the Fund’s actual return.
The hypothetical account values and expenses may not be used to estimate the actual ending account balance or expenses you paid for the period. You may use this information to compare the ongoing costs of investing in the Fund and other funds. To do so, compare this 5% hypothetical example with the 5% hypothetical examples that appear in the shareholder reports of the other funds.
Please note that the expenses shown in the table are meant to highlight your ongoing costs only and do not reflect any transaction costs, such as sales charges (loads) on purchase payments or contingent deferred sales charges on redemptions, if any. Therefore, the hypothetical information is useful in comparing ongoing costs only, and will not help you determine the relative total costs of owning different funds. In addition, if these transaction costs were included, your costs would have been higher.
| | | | | | | | | | | | |
| | | | | ACTUAL | | HYPOTHETICAL (5% annual return before expenses) | | |
| | Beginning
Account Value
(09/01/22) | | Ending
Account Value
(02/28/23)1 | | Expenses
Paid During
Period2 | | Ending
Account Value
(02/28/23) | | Expenses
Paid During
Period2 | | Annualized
Expense Ratio |
Class A | | $1,000.00 | | $1,004.90 | | $4.23 | | $1,020.58 | | $4.26 | | 0.85% |
Class C | | 1,000.00 | | 1,001.10 | | 7.99 | | 1,016.81 | | 8.05 | | 1.61 |
Class Y | | 1,000.00 | | 1,006.20 | | 3.03 | | 1,021.77 | | 3.06 | | 0.61 |
Class R6 | | 1,000.00 | | 1,006.40 | | 2.74 | | 1,022.07 | | 2.76 | | 0.55 |
| 1 | The actual ending account value is based on the actual total return of the Fund for the period September 1, 2022 through February 28, 2023, after actual expenses and will differ from the hypothetical ending account value which is based on the Fund’s expense ratio and a hypothetical annual return of 5% before expenses. |
| 2 | Expenses are equal to the Fund’s annualized expense ratio as indicated above multiplied by the average account value over the period, multiplied by 181/365 to reflect the most recent fiscal half year. |
30 Invesco Limited Term California Municipal Fund
Tax Information
Form 1099-DIV, Form 1042-S and other year–end tax information provide shareholders with actual calendar year amounts that should be included in their tax returns. Shareholders should consult their tax advisers.
The following distribution information is being provided as required by the Internal Revenue Code or to meet a specific state’s requirement.
The Fund designates the following amounts or, if subsequently determined to be different, the maximum amount allowable for its fiscal year ended February 28, 2023:
| | | | | | |
| | Federal and State Income Tax | | | | |
| | Qualified Dividend Income* | | | 0.00 | % |
| | Corporate Dividends Received Deduction* | | | 0.00 | % |
| | U.S. Treasury Obligations* | | | 0.00 | % |
| | Qualified Business Income* | | | 0.00 | % |
| | Business Interest Income* | | | 0.00 | % |
| | Tax-Exempt Interest Dividends* | | | 96.72 | % |
* The above percentages are based on ordinary income dividends paid to shareholders during the Fund’s fiscal year.
31 Invesco Limited Term California Municipal Fund
Trustees and Officers
The address of each trustee and officer is AIM Tax-Exempt Funds (Invesco Tax-Exempt Funds) (the “Trust”), 11 Greenway Plaza, Suite 1000, Houston, Texas 77046-1173. The trustees serve for the life of the Trust, subject to their earlier death, incapacitation, resignation, retirement or removal as more specifically provided in the Trust’s organizational documents. Each officer serves for a one year term or until their successors are elected and qualified. Column two below includes length of time served with predecessor entities, if any.
| | | | | | | | |
Name, Year of Birth and
Position(s) Held with the Trust | | Trustee and/or Officer Since | | Principal Occupation(s) During Past 5 Years | | Number of
Funds in
Fund Complex
Overseen by
Trustee | | Other Directorship(s) Held by Trustee
During Past 5 Years |
| Interested Trustee | | | | | | | | |
| Martin L. Flanagan1 – 1960 Trustee and Vice Chair | | 2007 | | Executive Director, Chief Executive Officer and President, Invesco Ltd. (ultimate parent of Invesco and a global investment management firm); Trustee and Vice Chair, The Invesco Funds; Vice Chair, Investment Company Institute; and Member of Executive Board, SMU Cox School of Business Formerly: Advisor to the Board, Invesco Advisers, Inc. (formerly known as Invesco Institutional (N.A.), Inc.); Chairman and Chief Executive Officer, Invesco Advisers, Inc. (registered investment adviser); Director, Chairman, Chief Executive Officer and President, Invesco Holding Company (US), Inc. (formerly IVZ Inc.) (holding company), Invesco Group Services, Inc. (service provider) and Invesco North American Holdings, Inc. (holding company); Director, Chief Executive Officer and President, Invesco Holding Company Limited (parent of Invesco and a global investment management firm); Director, Invesco Ltd.; Chairman, Investment Company Institute and President, Co-Chief Executive Officer, Co-President, Chief Operating Officer and Chief Financial Officer, Franklin Resources, Inc. (global investment management organization) | | 175 | | None |
| 1 | Mr. Flanagan is considered an interested person (within the meaning of Section 2(a)(19) of the 1940 Act) of the Trust because he is an officer of the Adviser to the Trust, and an officer and a director of Invesco Ltd., ultimate parent of the Adviser. |
T-1 Invesco Limited Term California Municipal Fund
Trustees and Officers–(continued)
| | | | | | | | |
Name, Year of Birth and
Position(s) Held with the Trust | | Trustee and/or Officer Since | | Principal Occupation(s) During Past 5 Years | | Number of
Funds in Fund Complex
Overseen by
Trustee | | Other Directorship(s) Held by Trustee
During Past 5 Years |
| Independent Trustees | | | | | | | | |
| Beth Ann Brown – 1968 Trustee (2019) and Chair (August 2022) | | 2019 | | Independent Consultant Formerly: Head of Intermediary Distribution, Managing Director, Strategic Relations, Managing Director, Head of National Accounts, Senior Vice President, National Account Manager and Senior Vice President, Key Account Manager, Columbia Management Investment Advisers LLC; Vice President, Key Account Manager, Liberty Funds Distributor, Inc.; and Trustee of certain Oppenheimer Funds | | 175 | | Director, Board of Directors of Caron Engineering Inc.; Advisor, Board of Advisors of Caron Engineering Inc.; President and Director, Acton Shapleigh Youth Conservation Corps (non-profit) Formerly: President and Director Director of Grahamtastic Connection (non-profit) |
| Cynthia Hostetler – 1962 Trustee | | 2017 | | Non-Executive Director and Trustee of a number of public and private business corporations Formerly: Director, Aberdeen Investment Funds (4 portfolios); Director, Artio Global Investment LLC (mutual fund complex); Director, Edgen Group, Inc. (specialized energy and infrastructure products distributor); Director, Genesee & Wyoming, Inc. (railroads); Head of Investment Funds and Private Equity, Overseas Private Investment Corporation; President, First Manhattan Bancorporation, Inc.; and Attorney, Simpson Thacher & Bartlett LLP | | 175 | | Resideo Technologies, Inc. (smart home technology); Vulcan Materials Company (construction materials company); Trilinc Global Impact Fund; Textainer Group Holdings, (shipping container leasing company); Investment Company Institute (professional organization); and Independent Directors Council (professional organization) |
Eli Jones – 1961 Trustee | | 2016 | | Professor and Dean Emeritus, Mays Business School – Texas A&M University Formerly: Dean of Mays Business School-Texas A&M University; Professor and Dean, Walton College of Business, University of Arkansas and E.J. Ourso College of Business, Louisiana State University; and Director, Arvest Bank | | 175 | | Insperity, Inc. (formerly known as Administaff) (human resources provider); Board Member of the regional board, First Financial Bank Texas; and Boad Member, First Financial Bankshares, Inc. Texas (FFIN) |
| Elizabeth Krentzman – 1959 Trustee | | 2019 | | Formerly: Principal and Chief Regulatory Advisor for Asset Management Services and U.S. Mutual Fund Leader of Deloitte & Touche LLP; General Counsel of the Investment Company Institute (trade association); National Director of the Investment Management Regulatory Consulting Practice, Principal, Director and Senior Manager of Deloitte & Touche LLP; Assistant Director of the Division of Investment Management – Office of Disclosure and Investment Adviser Regulation of the U.S. Securities and Exchange Commission and various positions with the Division of Investment Management – Office of Regulatory Policy of the U.S. Securities and Exchange Commission; Associate at Ropes & Gray LLP; and Trustee of certain Oppenheimer Funds | | 175 | | Formerly: Member of the Cartica Funds Board of Directors (private investment fund); Trustee of the University of Florida National Board Foundation; and Member of the University of Florida Law Center Association, Inc. Board of Trustees, Audit Committee and Membership Committee |
| Anthony J. LaCava, Jr. – 1956 Trustee | | 2019 | | Formerly: Director and Member of the Audit Committee, Blue Hills Bank (publicly traded financial institution) and Managing Partner, KPMG LLP | | 175 | | Blue Hills Bank; Member and Chairman, Bentley University, Business School Advisory Council; and Nominating Committee, KPMG LLP |
| Prema Mathai-Davis – 1950 Trustee | | 1998 | | Retired Formerly: Co-Founder & Partner of Quantalytics Research, LLC, (a FinTech Investment Research Platform for the Self-Directed Investor); Trustee of YWCA Retirement Fund; CEO of YWCA of the USA; Board member of the NY Metropolitan Transportation Authority; Commissioner of the NYC Department of Aging; and Board member of Johns Hopkins Bioethics Institute | | 175 | | Member of Board of Positive Planet US (non-profit) and HealthCare Chaplaincy Network (non-profit) |
T-2 Invesco Limited Term California Municipal Fund
Trustees and Officers–(continued)
| | | | | | | | |
Name, Year of Birth and
Position(s) Held with the Trust | | Trustee and/or Officer Since | | Principal Occupation(s) During Past 5 Years | | Number of
Funds in Fund Complex
Overseen by
Trustee | | Other Directorship(s) Held by Trustee
During Past 5 Years |
| Independent Trustees–(continued) | | | | | | |
| Joel W. Motley – 1952 Trustee | | 2019 | | Director of Office of Finance, Federal Home Loan Bank System; Managing Director of Carmona Motley Inc. (privately held financial advisor); Member of the Council on Foreign Relations and its Finance and Budget Committee; Chairman Emeritus of Board of Human Rights Watch and Member of its Investment Committee; and Member of Investment Committee Board of Historic Hudson Valley (non-profit cultural organization); Member of the Board, Blue Ocean Acquisition Corp.; and Member of the Vestry and the Investment Committee of Trinity Church Wall Street. Formerly: Managing Director of Public Capital Advisors, LLC (privately held financial advisor); Managing Director of Carmona Motley Hoffman, Inc. (privately held financial advisor); Trustee of certain Oppenheimer Funds; and Director of Columbia Equity Financial Corp. (privately held financial advisor) | | 175 | | Member of Board of Trust for Mutual Understanding (non-profit promoting the arts and environment); Member of Board of Greenwall Foundation (bioethics research foundation) and its Investment Committee; Member of Board of Friends of the LRC (non- profit legal advocacy); and Board Member and Investment Committee Member of Pulitzer Center for Crisis Reporting (non-profit journalism) |
| Teresa M. Ressel – 1962 Trustee | | 2017 | | Non-executive director and trustee of a number of public and private business corporations Formerly: Chief Executive Officer, UBS Securities LLC (investment banking); Chief Operating Officer, UBS AG Americas (investment banking); Sr. Management Team Olayan America, The Olayan Group (international investor/commercial/industrial); and Assistant Secretary for Management & Budget and Designated Chief Financial Officer, U.S. Department of Treasury | | 175 | | None |
| Robert C. Troccoli – 1949 Trustee | | 2016 | | Retired Formerly: Adjunct Professor, University of Denver – Daniels College of Business; and Managing Partner, KPMG LLP | | 175 | | None |
| Daniel S. Vandivort –1954 Trustee | | 2019 | | President, Flyway Advisory Services LLC (consulting and property management) Formerly: President and Chief Investment Officer, previously Head of Fixed Income, Weiss Peck and Greer/Robeco Investment Management; Trustee and Chair, Weiss Peck and Greer Funds Board; and various capacities at CS First Boston including Head of Fixed Income at First Boston Asset Management. | | 175 | | Formerly: Trustee and Governance Chair, Oppenheimer Funds; Treasurer, Chairman of the Audit and Finance Committee, Huntington Disease Foundation of America |
T-3 Invesco Limited Term California Municipal Fund
Trustees and Officers–(continued)
| | | | | | | | |
Name, Year of Birth and
Position(s) Held with the Trust | | Trustee and/or Officer Since | | Principal Occupation(s) During Past 5 Years | | Number of
Funds in
Fund Complex
Overseen by Trustee | | Other Directorship(s)
Held by Trustee
During Past 5 Years |
| Officers | | | | | | | | |
Sheri Morris – 1964
President and Principal Executive Officer | | 1999 | | Director, Invesco Trust Company; Head of Global Fund Services, Invesco Ltd.; President and Principal Executive Officer, The Invesco Funds; Vice President, Invesco Exchange-Traded Fund Trust, Invesco Exchange-Traded Fund Trust II, Invesco India Exchange-Traded Fund Trust, Invesco Actively Managed Exchange-Traded Fund Trust, Invesco Actively Managed Exchange-Traded Commodity Fund Trust and Invesco Exchange-Traded Self-Indexed Fund Trust; and Vice President, OppenheimerFunds, Inc. Formerly: Vice President, Treasurer and Principal Financial Officer, The Invesco Funds; Vice President, Invesco AIM Advisers, Inc., Invesco AIM Capital Management, Inc. and Invesco AIM Private Asset Management, Inc.; Assistant Vice President and Assistant Treasurer, The Invesco Funds; Vice President and Assistant Vice President, Invesco Advisers, Inc.; Assistant Vice President, Invesco AIM Capital Management, Inc. and Invesco AIM Private Asset Management, Inc.; Treasurer, Invesco Exchange-Traded Fund Trust, Invesco Exchange-Traded Fund Trust II, Invesco India Exchange-Traded Fund Trust and Invesco Actively Managed Exchange-Traded Fund Trust; and Senior Vice President, Invesco Advisers, Inc. (formerly known as Invesco Institutional (N.A.), Inc.) (registered investment adviser) | | N/A | | N/A |
| Melanie Ringold – 1975 Senior Vice President, Chief Legal Officer and Secretary | | 2023 | | Head of Legal of the Americas, Invesco Ltd.; Senior Vice President and Secretary, Invesco Advisers, Inc. (formerly known as Invesco Institutional (N.A.), Inc.) (registered investment adviser); Secretary, Invesco Distributors, Inc. (formerly known as Invesco AIM Distributors, Inc.); Secretary, Invesco Investment Services, Inc. (formerly known as Invesco AIM Investment Services, Inc.); Senior Vice President, Chief Legal Officer and Secretary, The Invesco Funds; Secretary, Invesco Investment Advisers LLC, Invesco Capital Markets, Inc.; Chief Legal Officer, Invesco Exchange-Traded Fund Trust, Invesco Exchange-Traded Fund Trust II, Invesco India Exchange-Traded Fund Trust, Invesco Actively Managed Exchange-Traded Fund Trust, Invesco Actively Managed Exchange-Traded Commodity Fund Trust and Invesco Exchange-Traded Self-Indexed Fund Trust;Secretary and Vice President, Harbourview Asset Management Corporation; Secretary and Senior Vice President, OppenheimerFunds, Inc. and Invesco Managed Accounts, LLC; Secretary and Senior Vice President, OFI SteelPath, Inc.; Secretary and Senior Vice President, Oppenheimer Acquisition Corp.; Secretary, SteelPath Funds Remediation LLC; and Secretary and Senior Vice President, Trinity Investment Management Corporation Formerly: Assistant Secretary, Invesco Distributors, Inc.; Invesco Advisers, Inc. Invesco Investment Services, Inc., Invesco Capital Markets, Inc., Invesco Capital Management LLC and Invesco Investment Advisers LLC; and Assistant Secretary and Investment Vice President, Invesco Funds | | N/A | | N/A |
Andrew R. Schlossberg – 1974 Senior Vice President | | 2019 | | Senior Vice President, Invesco Group Services, Inc.; Head of the Americas and Senior Managing Director, Invesco Ltd.; Director and Senior Vice President, Invesco Advisers, Inc. (formerly known as Invesco Institutional (N.A.), Inc.) (registered investment adviser); Director and Chairman, Invesco Investment Services, Inc. (formerly known as Invesco AIM Investment Services, Inc.) (registered transfer agent); Senior Vice President, The Invesco Funds; and Director, Invesco Investment Advisers LLC (formerly known as Van Kampen Asset Management) Formerly: Director, President and Chairman, Invesco Insurance Agency, Inc.; Director, Invesco UK Limited; Director and Chief Executive, Invesco Asset Management Limited and Invesco Fund Managers Limited; Assistant Vice President, The Invesco Funds; Senior Vice President, Invesco Advisers, Inc. (formerly known as Invesco Institutional (N.A.), Inc.) (registered investment adviser); Director and Chief Executive, Invesco Administration Services Limited and Invesco Global Investment Funds Limited; Director, Invesco Distributors, Inc.; Head of EMEA, Invesco Ltd.; President, Invesco Actively Managed Exchange-Traded Commodity Fund Trust, Invesco Actively Managed Exchange-Traded Fund Trust, Invesco Exchange-Traded Fund Trust, Invesco Exchange-Traded Fund Trust II and Invesco India Exchange-Traded Fund Trust; and Managing Director and Principal Executive Officer, Invesco Capital Management LLC | | N/A | | N/A |
T-4 Invesco Limited Term California Municipal Fund
Trustees and Officers–(continued)
| | | | | | | | |
Name, Year of Birth and
Position(s) Held with the Trust | | Trustee and/or Officer Since | | Principal Occupation(s) During Past 5 Years | | Number of
Funds in
Fund Complex
Overseen by
Trustee | | Other
Directorship(s)
Held by Trustee
During Past 5
Years |
| Officers–(continued) | | | | | | | | |
| John M. Zerr - 1962 Senior Vice President | | 2006 | | Chief Operating Officer of the Americas; Senior Vice President, Invesco Advisers, Inc. (formerly known as Invesco Institutional (N.A.), Inc.) (registered investment adviser); Senior Vice President, Invesco Distributors, Inc. (formerly known as Invesco AIM Distributors, Inc.); Director and Vice President, Invesco Investment Services, Inc. (formerly known as Invesco AIM Investment Services, Inc.) Senior Vice President, The Invesco Funds; Managing Director, Invesco Capital Management LLC; Director, Invesco Investment Advisers LLC (formerly known as Van Kampen Asset Management); Senior Vice President, Invesco Capital Markets, Inc. (formerly known as Van Kampen Funds Inc.); Manager, Invesco Indexing LLC; Manager, Invesco Specialized Products, LLC; Member, Invesco Canada Funds Advisory Board; Director, President and Chief Executive Officer, Invesco Corporate Class Inc. (corporate mutual fund company); and Director, Chairman, President and Chief Executive Officer, Invesco Canada Ltd. (formerly known as Invesco Trimark Ltd./Invesco Trimark Ltèe) (registered investment adviser and registered transfer agent); President, Invesco, Inc.; President, Invesco Global Direct Real Estate Feeder GP Ltd.; President, Invesco IP Holdings (Canada) Ltd; President, Invesco Global Direct Real Estate GP Ltd.; President, Invesco Financial Services Ltd. / Services Financiers Invesco Ltée; and Director and Chairman, Invesco Trust Company Formerly: President, Trimark Investments Ltd/Services Financiers Invesco Ltee; Director and Senior Vice President, Invesco Insurance Agency, Inc.; Director and Senior Vice President, Invesco Management Group, Inc. (formerly known as Invesco AIM Management Group, Inc.); Secretary and General Counsel, Invesco Management Group, Inc. (formerly known as Invesco AIM Management Group, Inc.); Secretary, Invesco Investment Services, Inc. (formerly known as Invesco AIM Investment Services, Inc.); Chief Legal Officer and Secretary, The Invesco Funds; Secretary and General Counsel, Invesco Investment Advisers LLC (formerly known as Van Kampen Asset Management); Secretary and General Counsel, Invesco Capital Markets, Inc. (formerly known as Van Kampen Funds Inc.); Chief Legal Officer, Invesco Exchange-Traded Fund Trust, Invesco Exchange-Traded Fund Trust II, Invesco India Exchange-Traded Fund Trust, Invesco Actively Managed Exchange-Traded Fund Trust, Invesco Actively Managed Exchange-Traded Commodity Fund Trust and Invesco Exchange-Traded Self-Indexed Fund Trust; Secretary, Invesco Indexing LLC; Director, Secretary, General Counsel and Senior Vice President, Van Kampen Exchange Corp.; Director, Vice President and Secretary, IVZ Distributors, Inc. (formerly known as INVESCO Distributors, Inc.); Director and Vice President, INVESCO Funds Group, Inc.; Director and Vice President, Van Kampen Advisors Inc.; Director, Vice President, Secretary and General Counsel, Van Kampen Investor Services Inc.;Director and Secretary, Invesco Distributors, Inc. (formerly known as Invesco AIM Distributors, Inc.); Director, Senior Vice President, General Counsel and Secretary, Invesco AIM Advisers, Inc. and Van Kampen Investments Inc.; Director, Vice President and Secretary, Fund Management Company; Director, Senior Vice President, Secretary, General Counsel and Vice President, Invesco AIM Capital Management, Inc.; and Chief Operating Officer and General Counsel, Liberty Ridge Capital, Inc. (an investment adviser) | | N/A | | N/A |
Gregory G. McGreevey - 1962 Senior Vice President | | 2012 | | Senior Managing Director, Invesco Ltd.; Director, Chairman, President, and Chief Executive Officer, Invesco Advisers, Inc. (formerly known as Invesco Institutional (N.A.), Inc.) (registered investment adviser); Director, Invesco Mortgage Capital, Inc. and Invesco Senior Secured Management, Inc.; Senior Vice President, The Invesco Funds; President, SNW Asset Management Corporation and Invesco Managed Accounts, LLC; Chairman and Director, Invesco Private Capital, Inc.; Chairman and Director, INVESCO Private Capital Investments, Inc.; Chairman and Director, INVESCO Realty, Inc.; and Senior Vice President, Invesco Group Services, Inc. Formerly: Senior Vice President, Invesco Management Group, Inc. and Invesco Advisers, Inc.; Assistant Vice President, The Invesco Funds | | N/A | | N/A |
| Adrien Deberghes - 1967 Principal Financial Officer, Treasurer and Vice President | | 2020 | | Head of the Fund Office of the CFO and Fund Administration; Vice President, Invesco Advisers, Inc.; Principal Financial Officer, Treasurer and Vice President, The Invesco Funds; Vice President, Invesco Exchange-Traded Fund Trust, Invesco Exchange-Traded Fund Trust II, Invesco India Exchange-Traded Fund Trust, Invesco Actively Managed Exchange-Traded Fund Trust, Invesco Actively Managed Exchange-Traded Commodity Fund Trust and Invesco Exchange-Traded Self-Indexed Fund Trust Formerly: Senior Vice President and Treasurer, Fidelity Investments | | N/A | | N/A |
| Crissie M. Wisdom - 1969 Anti-Money Laundering Compliance Officer | | 2013 | | Anti-Money Laundering and OFAC Compliance Officer for Invesco U.S. entities including: Invesco Advisers, Inc. and its affiliates, Invesco Capital Markets, Inc., Invesco Distributors, Inc., Invesco Investment Services, Inc., The Invesco Funds, Invesco Capital Management, LLC, Invesco Trust Company; and Fraud Prevention Manager for Invesco Investment Services, Inc. | | N/A | | N/A |
T-5 Invesco Limited Term California Municipal Fund
Trustees and Officers–(continued)
| | | | | | | | |
Name, Year of Birth and Position(s) Held with the Trust | | Trustee and/or Officer Since | | Principal Occupation(s) During Past 5 Years | | Number of
Funds in
Fund Complex
Overseen by Trustee | | Other Directorship(s)
Held by Trustee
During Past 5
Years |
| Officers–(continued) | | | | | | | | |
Todd F. Kuehl - 1969
Chief Compliance Officer and Senior Vice President | | 2020 | | Chief Compliance Officer, Invesco Advisers, Inc. (registered investment adviser); and Chief Compliance Officer and Senior Vice President, The Invesco Funds Formerly: Managing Director and Chief Compliance Officer, Legg Mason (Mutual Funds); Chief Compliance Officer, Legg Mason Private Portfolio Group (registered investment adviser) | | N/A | | N/A |
James Bordewick, Jr. - 1959 Senior Vice President and Senior Officer | | 2022 | | Senior Vice President and Senior Officer, The Invesco Funds Formerly: Chief Legal Officer, KingsCrowd, Inc. (research and analytical platform for investment in private capital markets); Chief Operating Officer and Head of Legal and Regulatory, Netcapital (private capital investment platform); Managing Director, General Counsel of asset management and Chief Compliance Officer for asset management and private banking, Bank of America Corporation; Chief Legal Officer, Columbia Funds and BofA Funds; Senior Vice President and Associate General Counsel, MFS Investment Management; Chief Legal Officer, MFS Funds; Associate, Ropes & Gray; and Associate, Gaston Snow & Ely Bartlett | | N/A | | N/A |
The Statement of Additional Information of the Trust includes additional information about the Fund’s Trustees and is available upon request, without charge, by calling 1.800.959.4246. Please refer to the Fund’s Statement of Additional Information for information on the Fund’s sub-advisers.
| | | | | | |
| Office of the Fund | | Investment Adviser | | Distributor | | Auditors |
| 11 Greenway Plaza, Suite 1000 | | Invesco Advisers, Inc. | | Invesco Distributors, Inc. | | PricewaterhouseCoopers LLP |
| Houston, TX 77046-1173 | | 1331 Spring Street, NW, Suite 2500 | | 11 Greenway Plaza, Suite 1000 | | 1000 Louisiana Street, Suite 5800 |
| | Atlanta, GA 30309 | | Houston, TX 77046-1173 | | Houston, TX 77002-5021 |
| | | |
| Counsel to the Fund | | Counsel to the Independent Trustees | | Transfer Agent | | Custodian |
| Stradley Ronon Stevens & Young, LLP | | Sidley Austin LLP | | Invesco Investment Services, Inc. | | State Street Bank and Trust Company |
| 2005 Market Street, Suite 2600 | | 787 Seventh Avenue | | 11 Greenway Plaza, Suite 1000 | | 225 Franklin Street |
| Philadelphia, PA 19103-7018 | | New York, NY 10019 | | Houston, TX 77046-1173 | | Boston, MA 02110-2801 |
T-6 Invesco Limited Term California Municipal Fund
(This page intentionally left blank)
(This page intentionally left blank)

Go paperless with eDelivery
Visit invesco.com/edelivery to enjoy the convenience and security of anytime electronic access to your investment documents.
With eDelivery, you can elect to have any or all of the following materials delivered straight to your inbox to download, save and print from your own computer:
| ∎ | | Fund reports and prospectuses |
Invesco mailing information
Send general correspondence to Invesco Investment Services, Inc., P.O. Box 219078, Kansas City, MO 64121-9078.
Important notice regarding delivery of security holder documents
To reduce Fund expenses, only one copy of most shareholder documents may be mailed to shareholders with multiple accounts at the same address (Householding). Mailing of your shareholder documents may be householded indefinitely unless you instruct us otherwise. If you do not want the mailing of these documents to be combined with those for other members of your household, please contact Invesco Investment Services, Inc. at 800 959 4246 or contact your financial institution. We will begin sending you individual copies for each account within 30 days after receiving your request.
Fund holdings and proxy voting information
The Fund provides a complete list of its portfolio holdings four times each year, at the end of each fiscal quarter. For the second and fourth quarters, the list appears, respectively, in the Fund’s semiannual and annual reports to shareholders. For the first and third quarters, the Fund files the list with the Securities and Exchange Commission (SEC) as an exhibit to its reports on Form N-PORT. The most recent list of portfolio holdings is available at invesco.com/completeqtrholdings. Shareholders can also look up the Fund’s Form N-PORT filings on the SEC website, sec.gov. The SEC file numbers for the Fund are shown below.
A description of the policies and procedures that the Fund uses to determine how to vote proxies relating to portfolio securities is available without charge, upon request, from our Client Services department at 800 959 4246, or at invesco.com/ corporate/about-us/esg. The information is also available on the SEC website, sec.gov.
Information regarding how the Fund voted proxies related to its portfolio securities during the most recent 12-month period ended June 30 is available at invesco.com/proxysearch. This information is also available on the SEC website, sec.gov.
Invesco Advisers, Inc. is an investment adviser; it provides investment advisory services to individual and institutional clients and does not sell securities. Invesco Distributors, Inc. is the US distributor for Invesco Ltd.’s retail mutual funds, exchange-traded funds and institutional money market funds. Both are wholly owned, indirect subsidiaries of Invesco Ltd.
| | | | | | |
| SEC file number(s): 811-07890 and 033-66242 | | Invesco Distributors, Inc. | | O-ROLTCAM-AR-1 | | |

| | |
| | |
| Annual Report to Shareholders | | February 28, 2023 |
Invesco Limited Term Municipal Income Fund
Nasdaq:
A: ATFAX ∎ A2: AITFX ∎ C: ATFCX ∎ Y: ATFYX ∎ R5: ATFIX ∎ R6: ATFSX
Management’s Discussion of Fund Performance
| | |
Performance summary |
For the fiscal year ended February 28, 2023, Class A shares of Invesco Limited Term Municipal Income Fund (the Fund), at net asset value (NAV), outperformed the S&P Municipal Bond Investment Grade Short Intermediate Index, the Fund’s style-specific benchmark. |
Your Fund’s long-term performance appears later in this report. |
| | |
Fund vs. Indexes | | |
Total returns, 2/28/22 to 2/28/23, at net asset value (NAV). Performance shown does not include applicable contingent deferred sales charges (CDSC) or front-end sales charges, which would have reduced performance. | | |
| |
Class A Shares | | -1.21% |
Class A2 Shares | | -0.87 |
Class C Shares | | -1.86 |
Class Y Shares | | -0.87 |
Class R5 Shares | | -0.96 |
Class R6 Shares | | -0.81 |
S&P Municipal Bond Indexq (Broad Market Index) | | -4.91 |
S&P Municipal Bond Investment Grade Short Intermediate Indexq (Style-Specific Index) | | -1.88 |
Lipper Short-Intermediate Municipal Debt Funds Index∎ (Peer Group Index) | | -2.17 |
| |
Source(s): qRIMES Technologies Corp.; ∎Lipper Inc. | | |
Market conditions and your Fund
At the beginning of the fiscal year, investors were hopeful in anticipation of a return to normalcy as COVID-19 cases declined and pandemic-related restrictions were reduced or lifted. This allowed policymakers to turn their attention to the high inflation levels; however, on February 24, 2022, Russia began a full-scale invasion of Ukraine, which exacerbated inflationary pressures by driving up commodity prices. Against this backdrop, the fiscal year was plagued by volatility and uncertainty. The municipal market set multiple record lows in 2022, making it one of the most challenging years in history for municipal markets.
Investment grade municipal bonds returned -5.10%, high yield municipal bonds returned -9.35% and taxable municipal bonds returned -12.96% during the fiscal year.1
While municipal funds had experienced record inflows of $101.7 billion in 2021, flows quickly turned negative in the first quarter of 2022, perpetuating the Bloomberg Municipal Bond Index’s worst quarterly return in 40 years. Municipal bonds enjoyed a short respite in late May and early June 2022 with increased demand from crossover buyers like hedge funds, banks and insurance companies; however, the May 2022 Consumer Price Index report quoted inflation rising to a 40-year high. This sent the 10-year Treasury yield to a new 52-week high of nearly 3.50%, pushing municipal mutual fund flows back into negative territory.2 According to Lipper, net outflows from municipal bond funds totaled over -$110 billion for the fiscal year.3
On March 16, 2022, the US Federal Reserve (the Fed) raised the federal funds target rate 0.25% for the first time in more than three years in hopes of containing inflation.4
This was the first of eight consecutive increases during the fiscal year as the Fed announced its plan for a quantitative tightening campaign in an attempt to rein in inflation without harming employment or the overall economy. Rate increases as high as 0.75% followed, the Fed’s most aggressive monetary policy since the 1980s, bringing the target rate to 4.75% as of the end of the fiscal year.4
The AAA municipal yield curve made history after the Fed’s December 2022 meeting when the curve inverted between one- and 10-year maturities. Any inversion is noteworthy, but this was a first for municipal bonds. On January 31, 2023, policymakers indicated that future rate increases were likely to be “appropriate,” suggesting they were not yet convinced inflation was contained, which increased uncertainty about when the current tightening cycle might end.4 The fiscal year ended with an increase of 0.25% on February 1, 2023. We expect additional rate hikes in 2023, although not with the same pace or vigor as in 2022.
New municipal issuance for the fiscal year totaled $354 billion, down 27% from the previous fiscal year’s $484 billion.5 Issuers, with cash on their balance sheets, have been reluctant to issue at higher interest rates. While taxable issuance continued to account for a significant portion of new issuance, at 14% of the total, this figure is down from 18% from the previous fiscal year because of higher interest rates.5
Puerto Rico continued to make developments in its ongoing debt restructuring throughout the fiscal year. The territory restructured its outstanding general obligation and other government-guaranteed debt in March 2022 and began paying bondholders on the new restructured bonds. Puerto Rico’s
weight in the Bloomberg High Yield Municipal Bond Index increased from 13% to 20% as the new bonds were included.1 The Financial Oversight and Management Board for Puerto Rico, the Puerto Rican government, bondholders and other interested parties continued to negotiate the restructuring of bonds issued by the Puerto Rico Electric Power Authority, the territory’s largest remaining unresolved debt, as the fiscal year closed.
Municipal credits have a long history of low defaults as many provide essential services to all Americans. This continues to be the case as evidenced by S&P rating changes – upgrades exceeded downgrades by a ratio of 2.5:1 through December 2022.6 This positive dynamic, which we believe will continue, likely stems from benefits of the various federal stimulus measures including the American Rescue Plan Act, the Infrastructure Investment and Jobs Act and the Inflation Reduction Act, as well as higher revenues collected by state and local governments.
We believe the valuable benefits of municipal bonds will prevail over current market volatility and economic uncertainty. We continue to rely on our experienced portfolio managers and credit analysts to weather the challenges while identifying marketplace opportunities to add long-term value for shareholders.
During the fiscal year, underweight exposures to local general obligation bonds contributed to relative return. Underweight allocations to bonds rated AA† and greater, also added to relative performance. On a state level, underweight exposure to bonds domiciled in California and Texas contributed to relative performance.
Overweight allocations to the multifamily housing and industrial development revenue/ pollution control revenue sectors detracted from relative performance over the fiscal year. An overweight exposure to BBB-rated† bonds also detracted from relative performance. On a state level, overweight exposure to bonds domiciled in Arizona and New Jersey detracted from relative performance.
We wish to remind you that the Fund is subject to interest rate risk, meaning when interest rates rise, the value of fixed income securities tends to fall. The degree to which the value of fixed income securities may decline due to rising interest rates may vary depending on the speed and magnitude of the increase in interest rates, as well as individual security characteristics, such as price, maturity, duration and coupon and market forces, such as supply and demand for similar securities. We are monitoring interest rates, as well as the market, economic and geopolitical factors that may impact the direction, speed and magnitude of changes to interest rates across the maturity spectrum, including the potential impact of monetary policy changes by the Fed and certain foreign central banks. If interest rates rise or fall faster than expected, markets may experience increased volatility,
2 Invesco Limited Term Municipal Income Fund
which may affect the value and/or liquidity of certain of the Fund’s investments.
Thank you for investing in Invesco Limited Term Municipal Income Fund and for sharing our long-term investment horizon.
| 4 | Source: US Federal Reserve |
| 6 | Source: Standard & Poor’s |
† Sources: A credit rating is an assessment provided by a NRSRO of the creditworthiness of an issuer with respect to debt obligations, including specific securities, money market instruments or other debts. Ratings are measured on a scale that generally ranges from AAA (highest) to D (lowest); ratings are subject to change without notice. For more information on rating methodology, please visit www.spglobal.com and select “Understanding Credit Ratings” under About Ratings on the homepage; www.fitchratings.com and select “Understanding Credit Ratings” from the drop-down menu on the homepage; and www.moodys.com and select “Methodology,” then “Rating Methodologies” under Research Type on the left-hand side.
Portfolio manager(s):
Jack Connelly
Josh Cooney
Michael Magee
Tim O’Reilly
Mark Paris
James Phillips
John Schorle
Rebecca Setcavage
Julius Williams
The views and opinions expressed in management’s discussion of Fund performance are those of Invesco Advisers, Inc. and its affiliates. These views and opinions are subject to change at any time based on factors such as market and economic conditions. These views and opinions may not be relied upon as investment advice or recommendations, or as an offer for a particular security. The information is not a complete analysis of every aspect of any market, country, industry, security or the Fund. Statements of fact are from sources considered reliable, but Invesco Advisers, Inc. makes no representation or warranty as to their completeness or accuracy. Although historical performance is no guarantee of future results, these insights may help you understand our investment management philosophy.
See important Fund and, if applicable, index disclosures later in this report.
3 Invesco Limited Term Municipal Income Fund
Your Fund’s Long-Term Performance
Results of a $10,000 Investment – Oldest Share Class(es)
Fund and index data from 2/28/13
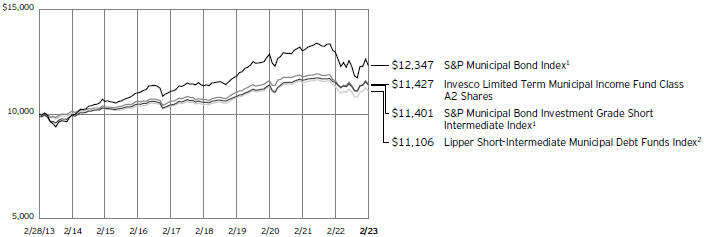
1 Source: RIMES Technologies Corp.
2 Source: Lipper Inc.
Past performance cannot guarantee future results.
The data shown in the chart include reinvested distributions, applicable sales charges and Fund expenses including management
fees. Index results include reinvested dividends, but they do not reflect sales charges. Performance of the peer group, if applicable, reflects Fund expenses and management fees; performance of a market index does
not. Performance shown in the chart does not reflect deduction of taxes a shareholder would pay on Fund distributions or sale of Fund shares.
4 Invesco Limited Term Municipal Income Fund
| | | | |
Average Annual Total Returns | |
As of 2/28/23, including maximum applicable sales charges | |
| Class A Shares | | | |
Inception (10/31/02) | | | 2.54 | % |
10 Years | | | 0.92 | |
5 Years | | | 0.78 | |
1 Year | | | -3.68 | |
| Class A2 Shares | | | |
Inception (5/11/87) | | | 4.29 | % |
10 Years | | | 1.34 | |
5 Years | | | 1.37 | |
1 Year | | | -1.83 | |
| Class C Shares | | | |
10 Years | | | 0.54 | % |
5 Years | | | 0.55 | |
1 Year | | | -2.83 | |
| Class Y Shares | | | |
Inception (10/3/08) | | | 3.04 | % |
10 Years | | | 1.44 | |
5 Years | | | 1.57 | |
1 Year | | | -0.87 | |
| Class R5 Shares | | | |
Inception (7/30/04) | | | 2.92 | % |
10 Years | | | 1.46 | |
5 Years | | | 1.59 | |
1 Year | | | -0.96 | |
| Class R6 Shares | | | |
10 Years | | | 1.38 | % |
5 Years | | | 1.63 | |
1 Year | | | -0.81 | |
Class C shares incepted on June 28, 2013. Performance shown prior to that date is that of Class A2 shares at net asset value, restated to reflect the higher 12b-1 fees applicable to Class C shares.
Class R6 shares incepted on April 4, 2017. Performance shown prior to that date is that of Class A shares at net asset value and includes the 12b-1 fees applicable to Class A shares.
The performance data quoted represent past performance and cannot guarantee future results; current performance may be lower or higher. Please visit invesco.com/performance for the most recent month-end performance. Performance figures reflect reinvested distributions, changes in net asset value and the effect of the maximum applicable sales charge unless otherwise stated. Performance figures do not reflect deduction of taxes a shareholder would pay on Fund distributions or sale of Fund shares. Investment return and principal value will fluctuate so that you may have a gain or loss when you sell shares.
Class A share performance reflects the maximum 2.50% sales charge. Class A2 share performance reflects the maximum 1% sales charge. The CDSC on Class C shares is 1% for the first year after purchase. Class Y, Class R5 and Class R6 shares do not have a front-end sales charge
or a CDSC; therefore, performance is at net asset value.
The performance of the Fund’s share classes will differ primarily due to different sales charge structures and class expenses.
Fund performance reflects any applicable fee waivers and/or expense reimbursements. Had the adviser not waived fees and/or reimbursed expenses currently or in the past, returns would have been lower. See current prospectus for more information.
5 Invesco Limited Term Municipal Income Fund
Supplemental Information
Invesco Limited Term Municipal Income Fund’s objective is federal tax-exempt current income.
| ∎ | | Unless otherwise stated, information presented in this report is as of February 28, 2023, and is based on total net assets. |
| ∎ | | Unless otherwise noted, all data is provided by Invesco. |
| ∎ | | To access your Fund’s reports/prospectus, visit invesco.com/fundreports. |
About indexes used in this report
| ∎ | | The S&P Municipal Bond Index is a broad, market value-weighted index that seeks to measure the performance of the US municipal bond market. |
| ∎ | | The S&P Municipal Bond Investment Grade Short Intermediate Index is an unmanaged index considered representative of investment-grade US municipal bonds with maturities between one and eight years. |
| ∎ | | The Lipper Short-Intermediate Municipal Debt Funds Index is an unmanaged index considered representative of short-intermediate municipal debt funds tracked by Lipper. |
| ∎ | | The Fund is not managed to track the performance of any particular index, including the index(es) described here, and consequently, the performance of the Fund may deviate significantly from the performance of the index(es). |
| ∎ | | A direct investment cannot be made in an index. Unless otherwise indicated, index results include reinvested dividends, and they do not reflect sales charges. Performance of the peer group, if applicable, reflects fund expenses; performance of a market index does not. |
|
This report must be accompanied or preceded by a currently effective Fund prospectus, which contains more complete information, including sales charges and expenses. Investors should read it carefully before investing. |
| | |
| | |
| NOT FDIC INSURED | MAY LOSE VALUE | NO BANK GUARANTEE | | |
6 Invesco Limited Term Municipal Income Fund
Fund Information
Portfolio Composition
| | | | | | | |
| By credit sector | | % of total investments |
| |
Revenue Bonds | | | | 73.11 | % |
General Obligation Bonds | | | | 15.62 | |
Other | | | | 8.17 | |
Pre-Refunded Bonds | | | | 3.10 | |
| |
| Top Five Debt Holdings | | | | | |
| | | | | % of total net assets |
| | |
1. | | Black Belt Energy Gas District (The) (No. 4), Series 2019 A-1, RB | | | | 1.61 | % |
| | |
2. | | Permanent University Fund - University of Texas System, Series 2014, RB | | | | 1.49 | |
| | |
3. | | Houston (City of), TX, Series 2015 A, Ref. RB | | | | 1.28 | |
| | |
4. | | Tennessee Energy Acquisition Corp., Series 2006 A, RB | | | | 1.19 | |
| | |
5. | | Rib Floater Trust, Series 2022-047, VRD RB | | | | 0.90 | |
The Fund’s holdings are subject to change, and there is no assurance that the Fund will continue to hold any particular security.
Data presented here are as of February 28, 2023.
7 Invesco Limited Term Municipal Income Fund
Schedule of Investments
February 28, 2023
| | | | | | | | | | | | | | |
| | | Interest
Rate | | | Maturity
Date | | | Principal
Amount
(000) | | | Value |
Municipal Obligations–98.13% | | | | | | | | | | | | | | |
Alabama–2.81% | | | | | | | | | | | | | | |
Alabama (State of) Federal Aid Highway Finance Authority (Garvee); Series 2017 B, Ref. RB(a) | | | 5.00% | | | | 09/01/2024 | | | $ | 3,580 | | | $ 3,681,328 |
Black Belt Energy Gas District (The) (No. 4); Series 2019 A-1, RB(b) | | | 4.00% | | | | 12/01/2025 | | | | 54,105 | | | 54,155,918 |
Black Belt Energy Gas District (The) (No. 6); Series 2021 B, RB(b) | | | 4.00% | | | | 12/01/2026 | | | | 4,000 | | | 3,979,992 |
Black Belt Energy Gas District (The) (No. 7); Series 2021, RB(b) | | | 4.00% | | | | 12/01/2026 | | | | 15,000 | | | 14,924,968 |
Huntsville (City of), AL; Series 2015 A, GO Bonds | | | 5.00% | | | | 05/01/2035 | | | | 3,000 | | | 3,121,195 |
Southeast Alabama Gas Supply District (The) (No. 1); | | | | | | | | | | | | | | |
Series 2018 B, RB (67% of 1 mo. USD LIBOR + 0.90%)(b)(c) | | | 4.02% | | | | 04/01/2024 | | | | 8,625 | | | 8,650,658 |
Series 2018 C, RB (SIFMA Municipal Swap Index + 0.65%)(b)(c) | | | 3.45% | | | | 04/01/2024 | | | | 2,875 | | | 2,868,736 |
Southeast Energy Authority A Cooperative District (No. 3); Series 2022 A-1, RB(b) | | | 5.50% | | | | 12/01/2029 | | | | 3,000 | | | 3,216,990 |
| | | | | | | | | | | | | | | 94,599,785 |
| | | | |
Alaska–0.31% | | | | | | | | | | | | | | |
Alaska (State of) Municipal Bond Bank Authority; Series 2016-3, Ref. RB | | | 5.00% | | | | 12/01/2025 | | | | 4,635 | | | 4,841,844 |
Anchorage (Municipality of), AK; Series 2022 A, GO Bonds | | | 5.00% | | | | 09/01/2024 | | | | 1,000 | | | 1,027,416 |
Northern Tobacco Securitization Corp.; Series 2021 B-1, Ref. RB | | | 4.00% | | | | 06/01/2050 | | | | 4,670 | | | 4,461,057 |
| | | | | | | | | | | | | | | 10,330,317 |
| | | | |
Arizona–1.78% | | | | | | | | | | | | | | |
Arizona (State of) Industrial Development Authority; Series 2019-2A, Revenue Ctfs. | | | 3.63% | | | | 05/20/2033 | | | | 15,056 | | | 13,983,608 |
Arizona (State of) Industrial Development Authority (Pinecrest Academy of Northern Nevada); Series 2022 A, RB(d) | | | 4.50% | | | | 07/15/2029 | | | | 1,250 | | | 1,197,768 |
Arizona State University; | | | | | | | | | | | | | | |
Series 2014, RB | | | 5.00% | | | | 08/01/2033 | | | | 2,200 | | | 2,228,970 |
Series 2014, RB | | | 5.00% | | | | 08/01/2034 | | | | 3,320 | | | 3,363,718 |
Series 2014, RB | | | 5.00% | | | | 08/01/2044 | | | | 4,145 | | | 4,181,408 |
Glendale Municipal Property Corp.; Series 2012 C, Ref. RB | | | 4.00% | | | | 07/01/2038 | | | | 100 | | | 99,535 |
La Paz (County of), AZ Industrial Development Authority (Charter School Solutions- Harmony Public Schools); Series 2016 A, RB(d) | | | 5.00% | | | | 02/15/2026 | | | | 755 | | | 762,324 |
Marana (Town of), AZ; Series 2013, Ref. RB | | | 5.00% | | | | 07/01/2033 | | | | 1,400 | | | 1,405,837 |
Maricopa (County of), AZ Industrial Development Authority (Banner Health Obligated Group); | | | | | | | | | | | | | | |
Series 2016, Ref. RB | | | 5.00% | | | | 01/01/2034 | | | | 1,010 | | | 1,077,893 |
Series 2016, Ref. RB | | | 5.00% | | | | 01/01/2035 | | | | 5,000 | | | 5,312,541 |
Series 2017 C, RB(b) | | | 5.00% | | | | 10/18/2024 | | | | 5,000 | | | 5,124,774 |
Maricopa (County of), AZ Industrial Development Authority (Honorhealth); Series 2019 B, RB(b) | | | 5.00% | | | | 09/01/2024 | | | | 14,500 | | | 14,784,480 |
Maricopa (County of), AZ Industrial Development Authority (Legacy Traditional Schools); Series 2021, RB(d) | | | 3.00% | | | | 07/01/2031 | | | | 625 | | | 542,596 |
Maricopa (County of), AZ Special Health Care District; Series 2018 C, GO Bonds | | | 5.00% | | | | 07/01/2024 | | | | 2,000 | | | 2,045,700 |
Phoenix Civic Improvement Corp.; | | | | | | | | | | | | | | |
Series 2022, RB | | | 5.00% | | | | 07/01/2034 | | | | 1,600 | | | 1,872,562 |
Series 2022, RB | | | 5.00% | | | | 07/01/2036 | | | | 1,000 | | | 1,139,638 |
Pima (County of), AZ Industrial Development Authority (Tuscon Country Day School); Series 2007, Ref. RB | | | 5.00% | | | | 06/01/2037 | | | | 750 | | | 647,678 |
| | | | | | | | | | | | | | | 59,771,030 |
| | | | |
Arkansas–0.08% | | | | | | | | | | | | | | |
Rogers School District No. 30; Series 2019, GO Bonds | | | 5.00% | | | | 02/01/2024 | | | | 2,750 | | | 2,796,951 |
| | | | |
California–4.82% | | | | | | | | | | | | | | |
California (State of); | | | | | | | | | | | | | | |
Series 2022, Ref. GO Bonds | | | 5.00% | | | | 09/01/2035 | | | | 5,500 | | | 6,406,028 |
Series 2022, Ref. GO Bonds | | | 5.00% | | | | 09/01/2036 | | | | 7,780 | | | 8,967,907 |
California (State of) Health Facilities Financing Authority (Adventist Health System); Series 2013 A, RB | | | 4.00% | | | | 03/01/2033 | | | | 240 | | | 240,037 |
California (State of) Health Facilities Financing Authority (Providence St. Joseph Health); Series 2016 B-2, Ref. RB(b) | | | 4.00% | | | | 10/01/2024 | | | | 5,000 | | | 5,046,958 |
California (State of) Health Facilities Financing Authority (Sutter Health); Series 2018 A, RB | | | 5.00% | | | | 11/15/2048 | | | | 10,000 | | | 10,210,338 |
California (State of) Housing Finance Agency; Series 2019 A-2, RB | | | 4.00% | | | | 03/20/2033 | | | | 6,000 | | | 5,930,769 |
See accompanying Notes to Financial Statements which are an integral part of the financial statements.
8 Invesco Limited Term Municipal Income Fund
| | | | | | | | | | | | | | |
| | | Interest
Rate | | | Maturity
Date | | | Principal
Amount
(000) | | | Value |
California–(continued) | | | | | | | | | | | | | | |
California (State of) Housing Finance Agency (Social Certificates); | | | | | | | | | | | | | | |
Series 2021 A, RB | | | 3.25% | | | | 08/20/2036 | | | $ | 5 | | | $ 4,531 |
Series 2021-2A, Revenue Ctfs. (CEP - FHLMC) | | | 3.75% | | | | 03/25/2035 | | | | 5,897 | | | 5,754,959 |
California (State of) Municipal Finance Authority (American Heritage Education Foundation); Series 2016 A, Ref. RB | | | 4.00% | | | | 06/01/2026 | | | | 1,190 | | | 1,175,918 |
California (State of) Public Finance Authority (Enso Village) (Green Bonds); | | | | | | | | | | | | | | |
Series 2021 B-3, RB(d) | | | 2.13% | | | | 11/15/2027 | | | | 1,000 | | | 934,210 |
Series 2021, RB(d) | | | 2.38% | | | | 11/15/2028 | | | | 1,500 | | | 1,389,097 |
Golden State Tobacco Securitization Corp.; | | | | | | | | | | | | | | |
Series 2017 A-1, Ref. RB(a) | | | 5.00% | | | | 06/01/2025 | | | | 10,000 | | | 10,432,649 |
Series 2017 A-1, Ref. RB(a)(b) | | | 5.00% | | | | 06/01/2027 | | | | 11,765 | | | 12,840,459 |
Grossmont-Cuyamaca Community College District (Election of 2002); Series 2008 C, GO Bonds (INS - AGC)(e)(f) | | | 0.00% | | | | 08/01/2025 | | | | 3,000 | | | 2,764,530 |
Los Angeles (City of), CA Department of Airports (Green Bonds); | | | | | | | | | | | | | | |
Series 2022 I, RB | | | 5.00% | | | | 05/15/2035 | | | | 1,355 | | | 1,571,233 |
Series 2022 I, RB | | | 5.00% | | | | 05/15/2036 | | | | 750 | | | 857,961 |
Series 2022 I, RB | | | 5.00% | | | | 05/15/2037 | | | | 1,130 | | | 1,279,526 |
Los Angeles (City of), CA Department of Airports (Los Angeles International Airport); Series 2022 B, RB | | | 5.00% | | | | 05/15/2038 | | | | 4,740 | | | 5,358,526 |
Los Angeles (City of), CA Department of Water & Power; | | | | | | | | | | | | | | |
Series 2014 D, RB | | | 5.00% | | | | 07/01/2027 | | | | 2,000 | | | 2,057,045 |
Series 2014 D, RB | | | 5.00% | | | | 07/01/2028 | | | | 2,550 | | | 2,620,707 |
Los Angeles (County of), CA Metropolitan Transportation Authority (Prop C); Series 2013 B, RB | | | 5.00% | | | | 07/01/2033 | | | | 8,880 | | | 8,929,965 |
Los Angeles (County of), CA Public Works Financing Authority; Series 2015 A, RB | | | 5.00% | | | | 12/01/2044 | | | | 14,095 | | | 14,273,462 |
Madera Unified School District; Series 2018, COP (INS - BAM)(e) | | | 5.00% | | | | 09/01/2034 | | | | 500 | | | 512,284 |
Northern California Tobacco Securitization Authority; Series 2021 B-1, Ref. RB | | | 4.00% | | | | 06/01/2049 | | | | 805 | | | 764,748 |
Rowland Unified School District (Election of 2006); Series 2009 B, GO Bonds(f) | | | 0.00% | | | | 08/01/2023 | | | | 1,300 | | | 1,281,750 |
San Diego (City of), CA Association of Governments (Mid Coast Corridor; Green Bonds); Series 2019, RB | | | 1.80% | | | | 11/15/2027 | | | | 9,465 | | | 8,735,230 |
San Diego (City of), CA Public Facilities Financing Authority; Series 2016 B, Ref. RB | | | 5.00% | | | | 08/01/2038 | | | | 8,735 | | | 9,291,637 |
San Francisco (City & County of), CA Public Utilities Commission; Series 2013 B, RB | | | 4.00% | | | | 10/01/2039 | | | | 150 | | | 150,001 |
San Francisco (City of), CA Public Utilities Commission; Series 2015, Ref. RB | | | 5.00% | | | | 11/01/2036 | | | | 1,230 | | | 1,284,120 |
Southern California Tobacco Securitization Authority (San Diego County Asset Securitization Corp.); | | | | | | | | | | | | | | |
Series 2019, Ref. RB | | | 5.00% | | | | 06/01/2027 | | | | 1,500 | | | 1,596,473 |
Series 2019, Ref. RB | | | 5.00% | | | | 06/01/2028 | | | | 1,500 | | | 1,620,274 |
Series 2019, Ref. RB | | | 5.00% | | | | 06/01/2038 | | | | 2,000 | | | 2,119,043 |
Tender Option Bond Trust Receipts/Certificates; Series 2021, VRD RB(d)(g) | | | 3.00% | | | | 10/01/2049 | | | | 2,600 | | | 2,600,000 |
Torrance Unified School District (Election of 2008-Measure Z); Series 2009 B-1, GO Bonds(f) | | | 0.00% | | | | 08/01/2023 | | | | 2,000 | | | 1,971,279 |
Tustin Unified School District (Community Facilities District No. 88-1); Series 2015, Ref. RB (INS - BAM)(e) | | | 5.00% | | | | 09/01/2023 | | | | 1,000 | | | 1,008,591 |
Tustin Unified School District (Community Facilities District No. 97-1); | | | | | | | | | | | | | | |
Series 2015 A, Ref. RB | | | 5.00% | | | | 09/01/2023 | | | | 650 | | | 654,943 |
Series 2015 A, Ref. RB | | | 5.00% | | | | 09/01/2024 | | | | 1,500 | | | 1,533,608 |
University of California; | | | | | | | | | | | | | | |
Series 2013 AF, RB(a)(b) | | | 5.00% | | | | 05/15/2023 | | | | 4,450 | | | 4,467,344 |
Series 2013 AI, RB(a)(b) | | | 5.00% | | | | 05/15/2023 | | | | 2,400 | | | 2,408,862 |
Series 2023 BM, Ref. RB | | | 5.00% | | | | 05/15/2034 | | | | 1,500 | | | 1,795,806 |
Series 2023 BM, Ref. RB | | | 5.00% | | | | 05/15/2035 | | | | 2,500 | | | 2,963,010 |
Series 2023 BM, Ref. RB | | | 5.00% | | | | 05/15/2036 | | | | 2,500 | | | 2,915,133 |
Series 2023 BM, Ref. RB | | | 5.00% | | | | 05/15/2037 | | | | 2,000 | | | 2,295,758 |
West Contra Costa Unified School District (Election of 2005); Series 2008 B, GO Bonds | | | 6.00% | | | | 08/01/2027 | | | | 1,000 | | | 1,127,064 |
| | | | | | | | | | | | | | | 162,143,773 |
| | | | |
Colorado–2.74% | | | | | | | | | | | | | | |
Arkansas River Power Authority; Series 2006, RB(a) | | | 5.88% | | | | 10/01/2026 | | | | 2,880 | | | 3,018,252 |
Colorado (State of) Health Facilities Authority (Aberdeen Ridge); Series 2021 B, RB | | | 2.13% | | | | 05/15/2028 | | | | 1,000 | | | 910,040 |
Colorado (State of) Health Facilities Authority (Adventist Health System/Sunbelt Obligated Group); Series 2018 B, RB(b) | | | 5.00% | | | | 11/20/2025 | | | | 10,425 | | | 10,837,284 |
Colorado (State of) Health Facilities Authority (Children’s Hospital); Series 2013 A, RB | | | 5.00% | | | | 12/01/2036 | | | | 21,235 | | | 21,057,660 |
Colorado (State of) Health Facilities Authority (CommonSpirit Health); Series 2019 B-2, RB(b) | | | 5.00% | | | | 08/01/2026 | | | | 2,000 | | | 2,068,880 |
See accompanying Notes to Financial Statements which are an integral part of the financial statements.
9 Invesco Limited Term Municipal Income Fund
| | | | | | | | | | | | | | |
| | | Interest
Rate | | | Maturity
Date | | | Principal
Amount
(000) | | | Value |
Colorado–(continued) | | | | | | | | | | | | | | |
Colorado (State of) Health Facilities Authority (SCL Health System); | | | | | | | | | | | | | | |
Series 2013 A, RB(a)(b) | | | 5.00% | | | | 01/01/2024 | | | $ | 12,545 | | | $ 12,718,070 |
Series 2013 A, RB(a)(b) | | | 5.50% | | | | 01/01/2024 | | | | 1,820 | | | 1,852,496 |
Colorado (State of) Health Facilities Authority (Vail Valley Medical Center); Series 2015, RB | | | 5.00% | | | | 01/15/2035 | | | | 2,000 | | | 2,063,219 |
Colorado Springs (City of), CO; | | | | | | | | | | | | | | |
Series 2013 B-1, RB | | | 5.00% | | | | 11/15/2038 | | | | 4,000 | | | 4,034,802 |
Series 2013 B-2, RB | | | 5.00% | | | | 11/15/2038 | | | | 4,500 | | | 4,539,152 |
Denver (City & County of), CO; | | | | | | | | | | | | | | |
Series 2012 B, RB | | | 4.00% | | | | 11/15/2031 | | | | 1,125 | | | 1,125,738 |
Series 2012 B, RB | | | 5.00% | | | | 11/15/2043 | | | | 2,590 | | | 2,592,067 |
Series 2022 B, RB | | | 5.00% | | | | 11/15/2033 | | | | 1,125 | | | 1,325,009 |
Series 2022 B, RB | | | 5.00% | | | | 11/15/2035 | | | | 1,050 | | | 1,208,853 |
El Paso (County of), CO School District No. 20; Series 2017, GO Bonds | | | 5.00% | | | | 12/15/2033 | | | | 2,900 | | | 3,085,692 |
Elbert & Highway 86 Commercial Metropolitan District; Series 2021 A, Ref. GO Bonds(d) | | | 3.75% | | | | 12/01/2029 | | | | 500 | | | 447,181 |
Mulberry Metropolitan District No. 2; Series 2022, RB | | | 7.00% | | | | 12/01/2034 | | | | 1,500 | | | 1,520,527 |
Prairie Center Metropolitan District No. 7; Series 2020, GO Bonds | | | 4.13% | | | | 12/15/2036 | | | | 390 | | | 340,061 |
Public Authority for Colorado Energy; | | | | | | | | | | | | | | |
Series 2008, RB | | | 6.13% | | | | 11/15/2023 | | | | 370 | | | 375,018 |
Series 2008, RB | | | 6.25% | | | | 11/15/2028 | | | | 2,000 | | | 2,150,559 |
Regional Transportation District (Fastracks); Series 2017 A, RB | | | 5.00% | | | | 11/01/2033 | | | | 1,000 | | | 1,066,287 |
Tender Option Bond Trust Receipts/Certificates; | | | | | | | | | | | | | | |
Series 2022, VRD RB(d)(g) | | | 3.67% | | | | 05/01/2038 | | | | 5,000 | | | 5,000,000 |
Series 2022, VRD RB(d)(g) | | | 3.67% | | | | 05/01/2046 | | | | 6,000 | | | 6,000,000 |
Vauxmont Metropolitan District; | | | | | | | | | | | | | | |
Series 2019, Ref. GO Bonds (INS - AGM)(e) | | | 5.00% | | | | 12/15/2027 | | | | 130 | | | 138,432 |
Series 2019, Ref. GO Bonds (INS - AGM)(e) | | | 5.00% | | | | 12/15/2028 | | | | 125 | | | 133,274 |
Series 2019, Ref. GO Bonds (INS - AGM)(e) | | | 5.00% | | | | 12/15/2029 | | | | 125 | | | 133,335 |
Series 2019, Ref. GO Bonds (INS - AGM)(e) | | | 5.00% | | | | 12/15/2030 | | | | 125 | | | 133,353 |
Series 2020, Ref. GO Bonds (INS - AGM)(e) | | | 5.00% | | | | 12/01/2026 | | | | 385 | | | 408,937 |
Series 2020, Ref. GO Bonds (INS - AGM)(e) | | | 5.00% | | | | 12/01/2027 | | | | 400 | | | 431,822 |
Series 2020, Ref. GO Bonds (INS - AGM)(e) | | | 5.00% | | | | 12/01/2028 | | | | 415 | | | 454,913 |
Series 2020, Ref. GO Bonds (INS - AGM)(e) | | | 5.00% | | | | 12/01/2029 | | | | 420 | | | 466,137 |
Series 2020, Ref. GO Bonds (INS - AGM)(e) | | | 5.00% | | | | 12/01/2030 | | | | 435 | | | 481,631 |
| | | | | | | | | | | | | | | 92,118,681 |
| | | | |
Connecticut–1.55% | | | | | | | | | | | | | | |
Connecticut (State of); | | | | | | | | | | | | | | |
Series 2018 C, GO Bonds | | | 4.00% | | | | 06/15/2024 | | | | 7,035 | | | 7,116,414 |
Series 2020 A, RB | | | 5.00% | | | | 05/01/2034 | | | | 5,000 | | | 5,659,749 |
Series 2021 A, RB | | | 5.00% | | | | 05/01/2035 | | | | 8,000 | | | 9,092,025 |
Series 2021 D, RB | | | 5.00% | | | | 11/01/2035 | | | | 3,430 | | | 3,902,366 |
Connecticut (State of) (Transportation Infrastructure); | | | | | | | | | | | | | | |
Series 2016 A, RB | | | 5.00% | | | | 09/01/2030 | | | | 1,965 | | | 2,098,565 |
Series 2016 A, RB | | | 5.00% | | | | 09/01/2036 | | | | 4,000 | | | 4,216,221 |
Series 2018, RB | | | 5.00% | | | | 01/01/2027 | | | | 3,000 | | | 3,224,978 |
Connecticut (State of) Health & Educational Facilities Authority (New Haven Hospital); Series 2014 A, RB | | | 5.00% | | | | 07/01/2033 | | | | 4,710 | | | 4,817,961 |
Connecticut (State of) Housing Finance Authority (Social Bonds); Series 2022, RB (CEP - GNMA) | | | 5.50% | | | | 11/15/2052 | | | | 6,500 | | | 6,912,777 |
New Haven (City of), CT; Series 2018 A, GO Bonds | | | 5.00% | | | | 08/01/2025 | | | | 1,160 | | | 1,198,897 |
Tender Option Bond Trust Receipts/Certificates; Series 2022, VRD GO Bonds
(INS - AGM)(d)(e)(g) | | | 2.83% | | | | 10/15/2027 | | | | 4,005 | | | 4,005,000 |
| | | | | | | | | | | | | | | 52,244,953 |
| | | | |
District of Columbia–0.78% | | | | | | | | | | | | | | |
District of Columbia; | | | | | | | | | | | | | | |
Series 2014 C, GO Bonds | | | 5.00% | | | | 06/01/2033 | | | | 6,690 | | | 6,836,866 |
Series 2014 C, GO Bonds | | | 5.00% | | | | 06/01/2034 | | | | 5,000 | | | 5,104,218 |
Series 2017 A, Ref. GO Bonds | | | 5.00% | | | | 06/01/2032 | | | | 1,000 | | | 1,087,053 |
Series 2020, RB | | | 5.00% | | | | 12/01/2033 | | | | 1,635 | | | 1,844,166 |
Series 2022 A, RB | | | 5.00% | | | | 07/01/2036 | | | | 7,500 | | | 8,599,292 |
See accompanying Notes to Financial Statements which are an integral part of the financial statements.
10 Invesco Limited Term Municipal Income Fund
| | | | | | | | | | | | | | |
| | | Interest
Rate | | | Maturity
Date | | | Principal
Amount
(000) | | | Value |
District of Columbia–(continued) | | | | | | | | | | | | | | |
District of Columbia Tobacco Settlement Financing Corp.; Series 2001, RB | | | 6.75% | | | | 05/15/2040 | | | $ | 70 | | | $ 72,064 |
District of Columbia Water & Sewer Authority; Series 1998, RB (INS - AGM)(e) | | | 5.50% | | | | 10/01/2023 | | | | 1,060 | | | 1,074,531 |
Washington Metropolitan Area Transit Authority; Series 2017 B, RB | | | 5.00% | | | | 07/01/2035 | | | | 1,400 | | | 1,500,543 |
| | | | | | | | | | | | | | | 26,118,733 |
| | | | |
Florida–5.51% | | | | | | | | | | | | | | |
Alachua (County of), FL Health Facilities Authority (Shands Teaching Hospital & Clinics, Inc.); Series 2014 B, RB | | | 5.00% | | | | 12/01/2034 | | | | 3,815 | | | 3,879,796 |
Broward (County of), FL School Board; Series 2017 C, Ref. COP | | | 5.00% | | | | 07/01/2025 | | | | 5,000 | | | 5,193,511 |
Cape Coral (City of) FL; Series 2017, Ref. RB | | | 5.00% | | | | 10/01/2033 | | | | 1,740 | | | 1,875,647 |
Central Florida Expressway Authority; Series 2016 B, Ref. RB | | | 5.00% | | | | 07/01/2033 | | | | 3,005 | | | 3,153,607 |
Citizens Property Insurance, Inc.; Series 2015 A-1, RB | | | 5.00% | | | | 06/01/2025 | | | | 6,000 | | | 6,143,080 |
Clearwater (City of), FL; Series 2017, Ref. RB | | | 5.00% | | | | 12/01/2035 | | | | 4,475 | | | 4,722,467 |
Florida (State of); | | | | | | | | | | | | | | |
Series 2016 A, Ref. GO Bonds | | | 5.00% | | | | 07/01/2025 | | | | 2,610 | | | 2,729,552 |
Series 2022 C, Ref. GO Bonds | | | 5.00% | | | | 06/01/2024 | | | | 4,110 | | | 4,208,860 |
Florida (State of) Higher Educational Facilities Financial Authority (Florida Institute of Technology); | | | | | | | | | | | | | | |
Series 2019, RB | | | 5.00% | | | | 10/01/2024 | | | | 350 | | | 354,263 |
Series 2019, RB | | | 5.00% | | | | 10/01/2025 | | | | 475 | | | 484,284 |
Florida (State of) Mid-Bay Bridge Authority; Series 2015 A, Ref. RB | | | 5.00% | | | | 10/01/2023 | | | | 1,000 | | | 1,007,114 |
Florida (State of) Municipal Power Agency (All-Requirements Power Supply); Series 2017 A, Ref. RB | | | 5.00% | | | | 10/01/2026 | | | | 4,000 | | | 4,248,578 |
Florida Development Finance Corp. (IPS Florida LLC-Idea); Series 2022, RB(d) | | | 5.25% | | | | 06/15/2029 | | | | 1,200 | | | 1,189,151 |
Florida Development Finance Corp. (Mayflower Retirement Community); Series 2021, Ref. RB(d) | | | 2.38% | | | | 06/01/2027 | | | | 835 | | | 745,218 |
Florida Housing Finance Corp. (Social Bonds); Series 2022 3, RB (CEP - GNMA) | | | 5.50% | | | | 01/01/2054 | | | | 5,600 | | | 5,941,926 |
Hialeah (City of), FL Utility System; | | | | | | | | | | | | | | |
Series 2022, Ref. RB | | | 5.00% | | | | 10/01/2035 | | | | 2,170 | | | 2,424,197 |
Series 2022, Ref. RB | | | 5.00% | | | | 10/01/2036 | | | | 2,275 | | | 2,504,438 |
Series 2022, Ref. RB | | | 5.00% | | | | 10/01/2037 | | | | 2,390 | | | 2,587,418 |
Series 2022, Ref. RB | | | 5.00% | | | | 10/01/2038 | | | | 2,510 | | | 2,691,403 |
Hillsborough (County of), FL Aviation Authority (Tampa International Airport); | | | | | | | | | | | | | | |
Series 2015 A, RB | | | 5.00% | | | | 10/01/2044 | | | | 10,000 | | | 10,096,268 |
Series 2018 F, RB | | | 5.00% | | | | 10/01/2023 | | | | 1,250 | | | 1,262,344 |
Jacksonville (City of), FL; Series 2021 A, RB | | | 5.00% | | | | 10/01/2034 | | | | 1,680 | | | 1,925,491 |
JEA Electric System; Series 2008 3C-1, VRD RB(g) | | | 2.75% | | | | 10/01/2034 | | | | 12,090 | | | 12,090,000 |
JEA Water & Sewer System; | | | | | | | | | | | | | | |
Series 2008 B, VRD RB(g) | | | 2.72% | | | | 10/01/2041 | | | | 750 | | | 750,000 |
Series 2017 A, Ref. RB | | | 5.00% | | | | 10/01/2025 | | | | 4,500 | | | 4,718,176 |
Lee (County of), FL Industrial Development Authority (Cypress Cove at Healthpark); Series 2022 B-2, RB | | | 3.25% | | | | 10/01/2026 | | | | 3,450 | | | 3,302,156 |
Miami (City of) & Dade (County of), FL School Board; | | | | | | | | | | | | | | |
Series 2015 A, Ref. COP | | | 5.00% | | | | 05/01/2032 | | | | 1,690 | | | 1,745,319 |
Series 2015 D, Ref. COP | | | 5.00% | | | | 02/01/2034 | | | | 1,000 | | | 1,031,650 |
Series 2016 C, Ref. COP | | | 3.25% | | | | 02/01/2033 | | | | 540 | | | 531,187 |
Series 2022 A, GO Bonds (INS - BAM)(e) | | | 5.00% | | | | 03/15/2036 | | | | 7,730 | | | 8,786,519 |
Series 2022 A, GO Bonds (INS - BAM)(e) | | | 5.00% | | | | 03/15/2041 | | | | 1,865 | | | 2,059,219 |
Miami-Dade (County of), FL; | | | | | | | | | | | | | | |
Series 2014 B, Ref. RB | | | 5.00% | | | | 10/01/2037 | | | | 5,000 | | | 5,086,018 |
Series 2016 A, Ref. GO Bonds | | | 5.00% | | | | 07/01/2037 | | | | 1,660 | | | 1,724,581 |
Series 2017 A, RB | | | 5.00% | | | | 10/01/2034 | | | | 5,110 | | | 5,270,449 |
Series 2023 B, Ref. RB | | | 5.00% | | | | 10/01/2037 | | | | 4,500 | | | 4,931,876 |
Miami-Dade (County of), FL Expressway Authority; | | | | | | | | | | | | | | |
Series 2014 A, RB | | | 5.00% | | | | 07/01/2039 | | | | 22,025 | | | 22,221,514 |
Series 2016 A, Ref. RB | | | 5.00% | | | | 07/01/2032 | | | | 2,000 | | | 2,085,451 |
North Sumter (County of), FL Utility Dependent District; Series 2020, Ref. RB | | | 5.00% | | | | 10/01/2024 | | | | 3,450 | | | 3,537,726 |
See accompanying Notes to Financial Statements which are an integral part of the financial statements.
11 Invesco Limited Term Municipal Income Fund
| | | | | | | | | | | | | | |
| | | Interest
Rate | | | Maturity
Date | | | Principal
Amount
(000) | | | Value |
Florida–(continued) | | | | | | | | | | | | | | |
Orange (County of), FL Health Facilities Authority (Orlando Health Obligated Group); | | | | | | | | | | | | | | |
Series 2016 A, Ref. RB | | | 5.00% | | | | 10/01/2033 | | | $ | 2,535 | | | $ 2,684,799 |
Series 2016 A, Ref. RB | | | 5.00% | | | | 10/01/2035 | | | | 1,210 | | | 1,271,932 |
Series 2016 A, Ref. RB | | | 5.00% | | | | 10/01/2036 | | | | 6,210 | | | 6,502,093 |
Series 2023 A, RB | | | 5.00% | | | | 10/01/2037 | | | | 1,000 | | | 1,094,830 |
Series 2023 A, RB | | | 5.00% | | | | 10/01/2038 | | | | 1,000 | | | 1,090,009 |
Pinellas (County of), FL Housing Finance Authority (Social Bonds); Series 2021 A, RB (CEP - GNMA) | | | 3.00% | | | | 03/01/2052 | | | | 2,595 | | | 2,497,483 |
Pompano Beach (City of), FL (John Knox Village); | | | | | | | | | | | | | | |
Series 2021 B-1, RB | | | 2.00% | | | | 01/01/2029 | | | | 1,605 | | | 1,346,574 |
Series 2021 B-2, RB | | | 1.45% | | | | 01/01/2027 | | | | 1,440 | | | 1,264,214 |
Reedy Creek Improvement District; Series 2016, GO Bonds | | | 5.00% | | | | 06/01/2035 | | | | 6,150 | | | 6,370,585 |
Seminole County School Board; Series 2016 C, COP | | | 5.00% | | | | 07/01/2036 | | | | 1,000 | | | 1,039,540 |
St. Johns (County of), FL Industrial Development Authority (Vicar’s Landing); | | | | | | | | | | | | | | |
Series 2021, Ref. RB | | | 4.00% | | | | 12/15/2024 | | | | 145 | | | 142,349 |
Series 2021, Ref. RB | | | 4.00% | | | | 12/15/2025 | | | | 180 | | | 174,770 |
Series 2021, Ref. RB | | | 4.00% | | | | 12/15/2026 | | | | 185 | | | 177,263 |
Series 2021, Ref. RB | | | 4.00% | | | | 12/15/2027 | | | | 215 | | | 203,480 |
Series 2021, Ref. RB | | | 4.00% | | | | 12/15/2028 | | | | 200 | | | 187,271 |
Series 2021, Ref. RB | | | 4.00% | | | | 12/15/2029 | | | | 220 | | | 203,861 |
Series 2021, Ref. RB | | | 4.00% | | | | 12/15/2030 | | | | 200 | | | 183,455 |
Series 2021, Ref. RB | | | 4.00% | | | | 12/15/2031 | | | | 205 | | | 185,921 |
St. Johns (County of), MO; Series 2016, Ref. RB | | | 5.00% | | | | 06/01/2036 | | | | 1,100 | | | 1,153,165 |
Tender Option Bond Trust Receipts/Certificates; Series 2022, VRD RB(d)(g) | | | 2.90% | | | | 01/01/2045 | | | | 6,000 | | | 6,000,000 |
USF Financing Corp.; Series 2012 A, Ref. COP | | | 5.00% | | | | 07/01/2031 | | | | 2,000 | | | 2,094,658 |
| | | | | | | | | | | | | | | 185,108,706 |
| | | | |
Georgia–1.98% | | | | | | | | | | | | | | |
Atlanta (City of), GA; Series 2009 B, RB (INS - AGM)(e) | | | 5.25% | | | | 11/01/2027 | | | | 2,000 | | | 2,167,757 |
Burke (County of), GA Development Authority (Georgia Power Co. Plant Vogtle); Series 1994, RB(b) | | | 2.25% | | | | 05/25/2023 | | | | 3,000 | | | 2,990,372 |
Dalton (City of), GA Downtown Development Authority (Hamilton Health Care System); Series 1996, Revenue Ctfs. (INS - NATL)(e) | | | 5.50% | | | | 08/15/2026 | | | | 2,145 | | | 2,214,893 |
George L Smith II Congress Center Authority (Convention Center Hotel); Series 2021, RB | | | 2.38% | | | | 01/01/2031 | | | | 725 | | | 629,562 |
Georgia (State of) Municipal Electric Authority of Georgia (Plant Vogtle Units 3 & 4); Series 2019, RB | | | 5.00% | | | | 01/01/2026 | | | | 300 | | | 311,905 |
Main Street Natural Gas, Inc.; | | | | | | | | | | | | | | |
Series 2018 A, RB(b) | | | 4.00% | | | | 09/01/2023 | | | | 4,430 | | | 4,439,359 |
Series 2021 A, RB(b) | | | 4.00% | | | | 09/01/2027 | | | | 17,500 | | | 17,497,121 |
Series 2021 C, RB(b) | | | 4.00% | | | | 12/01/2028 | | | | 5,000 | | | 4,935,583 |
Series 2022 C, RB(b)(d) | | | 4.00% | | | | 11/01/2027 | | | | 20,000 | | | 19,020,936 |
Subseries 2018 C, RB(b) | | | 4.00% | | | | 12/01/2023 | | | | 3,000 | | | 3,008,037 |
Subseries 2018 D, RB (1 mo. USD LIBOR + 0.83%)(b)(c) | | | 3.95% | | | | 12/01/2023 | | | | 8,700 | | | 8,722,161 |
Savannah (City of), GA Hospital Authority (St. Joseph’s/Candler Health system, Inc.); Series 2013 A, RB | | | 5.50% | | | | 07/01/2027 | | | | 500 | | | 502,764 |
| | | | | | | | | | | | | | | 66,440,450 |
| | | | |
Hawaii–0.00% | | | | | | | | | | | | | | |
Honolulu (City & County of), HI; Series 2012 A, GO Bonds | | | 4.00% | | | | 11/01/2036 | | | | 100 | | | 100,024 |
| | | | |
Idaho–0.19% | | | | | | | | | | | | | | |
Canyon County School District No. 139 Vallivue; | | | | | | | | | | | | | | |
Series 2015 A, GO Bonds(a) | | | 5.00% | | | | 09/15/2034 | | | | 625 | | | 653,363 |
Series 2015 A, GO Bonds | | | 5.00% | | | | 09/15/2034 | | | | 775 | | | 806,064 |
Idaho (State of) Health Facilities Authority (St. Luke’s Health System); | | | | | | | | | | | | | | |
Series 2014 A, RB | | | 5.00% | | | | 03/01/2039 | | | | 2,760 | | | 2,782,852 |
Series 2018 A, Ref. RB | | | 5.00% | | | | 03/01/2023 | | | | 2,000 | | | 2,000,000 |
| | | | | | | | | | | | | | | 6,242,279 |
| | | | |
Illinois–6.92% | | | | | | | | | | | | | | |
Bartlett (Village of), IL (Quarry Redevelopment); Series 2016, Ref. RB | | | 4.00% | | | | 01/01/2024 | | | | 850 | | | 843,405 |
See accompanying Notes to Financial Statements which are an integral part of the financial statements.
12 Invesco Limited Term Municipal Income Fund
| | | | | | | | | | | | | | |
| | | Interest
Rate | | | Maturity
Date | | | Principal
Amount
(000) | | | Value |
Illinois–(continued) | | | | | | | | | | | | | | |
Chicago (City of), IL; | | | | | | | | | | | | | | |
Series 2003 B, Ref. GO Bonds | | | 5.00% | | | | 01/01/2024 | | | $ | 3,205 | | | $ 3,228,660 |
Series 2004, Ref. RB | | | 5.00% | | | | 11/01/2023 | | | | 2,475 | | | 2,498,618 |
Series 2004, Ref. RB | | | 5.00% | | | | 11/01/2024 | | | | 14,440 | | | 14,794,724 |
Series 2008 C, Ref. RB | | | 5.00% | | | | 01/01/2035 | | | | 1,000 | | | 1,014,073 |
Series 2012, RB | | | 5.00% | | | | 01/01/2027 | | | | 1,000 | | | 1,003,693 |
Series 2012, RB | | | 5.00% | | | | 11/01/2032 | | | | 3,000 | | | 3,002,707 |
Series 2012, RB (INS - AGM)(e) | | | 5.00% | | | | 01/01/2037 | | | | 1,275 | | | 1,282,791 |
Series 2012, RB | | | 5.00% | | | | 11/01/2042 | | | | 2,500 | | | 2,362,531 |
Chicago (City of), IL (O’Hare International Airport); | | | | | | | | | | | | | | |
Series 2016 B, Ref. RB | | | 5.00% | | | | 01/01/2035 | | | | 2,500 | | | 2,599,419 |
Series 2016 B, Ref. RB | | | 5.00% | | | | 01/01/2041 | | | | 3,800 | | | 3,891,615 |
Series 2016 C, Ref. RB | | | 5.00% | | | | 01/01/2034 | | | | 1,500 | | | 1,566,520 |
Series 2017 D, RB | | | 5.25% | | | | 01/01/2029 | | | | 1,665 | | | 1,805,793 |
Series 2017 D, RB | | | 5.25% | | | | 01/01/2036 | | | | 5,000 | | | 5,282,562 |
Series 2022, Ref. RB | | | 5.00% | | | | 01/01/2034 | | | | 1,000 | | | 1,141,338 |
Series 2022, Ref. RB | | | 5.00% | | | | 01/01/2035 | | | | 2,330 | | | 2,629,276 |
Series 2022, Ref. RB (INS - AGM)(e) | | | 5.00% | | | | 01/01/2038 | | | | 4,750 | | | 5,196,120 |
Chicago (City of), IL Board of Education; Series 1998 B-1, GO Bonds (INS - NATL)(e)(f) | | | 0.00% | | | | 12/01/2025 | | | | 735 | | | 657,880 |
Chicago (City of), IL Metropolitan Water Reclamation District (Green Bonds); Series 2015 C, GO Bonds | | | 5.00% | | | | 12/01/2028 | | | | 3,040 | | | 3,129,157 |
Chicago (City of), IL Midway International Airport; Series 2014 B, Ref. RB | | | 5.00% | | | | 01/01/2035 | | | | 3,000 | | | 3,031,212 |
Chicago (City of), IL Transit Authority (FTA Section 5307 Urbanized Area Formula Funds); Series 2017, Ref. RB | | | 5.00% | | | | 06/01/2025 | | | | 4,000 | | | 4,104,590 |
Cook (County of), IL; Series 2018, Ref. GO Bonds | | | 5.00% | | | | 11/15/2034 | | | | 1,000 | | | 1,028,217 |
Cook County Community College District No. 508 (City Colleges of Chicago); Series 2013, GO Bonds (INS - BAM)(e) | | | 5.50% | | | | 12/01/2038 | | | | 6,500 | | | 6,600,919 |
Cook County Township High School District No. 220 Reavis; Series 2012, GO Bonds | | | 3.00% | | | | 12/01/2024 | | | | 1,035 | | | 1,021,292 |
Glen Ellyn (Village of), IL Park District; | | | | | | | | | | | | | | |
Series 2023 A, GO Bonds | | | 5.00% | | | | 12/15/2023 | | | | 505 | | | 512,029 |
Series 2023 A, GO Bonds | | | 5.00% | | | | 12/15/2024 | | | | 410 | | | 421,883 |
Illinois (State of); | | | | | | | | | | | | | | |
Series 2013, GO Bonds | | | 5.50% | | | | 07/01/2026 | | | | 2,000 | | | 2,011,102 |
Series 2013, RB | | | 5.00% | | | | 06/15/2026 | | | | 500 | | | 501,838 |
Series 2014, GO Bonds | | | 5.00% | | | | 02/01/2025 | | | | 4,695 | | | 4,741,448 |
Series 2017 D, GO Bonds | | | 5.00% | | | | 11/01/2024 | | | | 3,480 | | | 3,541,922 |
Series 2017 D, GO Bonds | | | 5.00% | | | | 11/01/2027 | | | | 1,065 | | | 1,116,258 |
Series 2020, GO Bonds | | | 5.50% | | | | 05/01/2024 | | | | 3,500 | | | 3,563,780 |
Series 2020, GO Bonds | | | 5.50% | | | | 05/01/2025 | | | | 5,000 | | | 5,166,127 |
Series 2020, GO Bonds | | | 5.50% | | | | 05/01/2026 | | | | 6,750 | | | 7,075,066 |
Illinois (State of) Finance Authority; | | | | | | | | | | | | | | |
Series 2008, Ref. VRD RB(g) | | | 2.75% | | | | 07/01/2038 | | | | 10,300 | | | 10,300,000 |
Series 2015 A, Ref. RB | | | 5.00% | | | | 11/15/2034 | | | | 1,650 | | | 1,701,357 |
Series 2016 A, Ref. RB | | | 5.00% | | | | 10/01/2035 | | | | 3,750 | | | 3,921,352 |
Illinois (State of) Finance Authority (Advocate Health Care Network); Series 2008 A, Ref. RB | | | 5.00% | | | | 11/01/2030 | | | | 3,000 | | | 3,155,462 |
Illinois (State of) Finance Authority (Ascension Health); Series 2016 C, Ref. RB | | | 5.00% | | | | 02/15/2036 | | | | 2,500 | | | 2,638,894 |
Illinois (State of) Finance Authority (DePaul College Prep Foundation); | | | | | | | | | | | | | | |
Series 2023, Ref. RB(d) | | | 4.30% | | | | 08/01/2028 | | | | 1,220 | | | 1,210,661 |
Series 2023, Ref. RB(d) | | | 5.25% | | | | 08/01/2038 | | | | 1,300 | | | 1,277,042 |
Illinois (State of) Finance Authority (Uchicago Medicine); Series 2022 B-2, RB(b) | | | 5.00% | | | | 08/15/2027 | | | | 9,500 | | | 10,143,851 |
Illinois (State of) Housing Development Authority; Series 2019 C, RB (CEP - GNMA) | | | 4.00% | | | | 10/01/2049 | | | | 4,940 | | | 4,910,933 |
Illinois (State of) Metropolitan Pier & Exposition Authority (McCormick Place Expansion); Series 2002, RB (INS - NATL)(e)(f) | | | 0.00% | | | | 12/15/2032 | | | | 25,000 | | | 16,488,270 |
Illinois (State of) Municipal Electric Agency; Series 2015 A, Ref. RB | | | 4.00% | | | | 02/01/2035 | | | | 7,430 | | | 7,496,019 |
Illinois (State of) Regional Transportation Authority; Series 1997, Ref. RB (INS - NATL)(e)
| | | 6.00% | | | | 06/01/2023 | | | | 355 | | | 357,288 |
See accompanying Notes to Financial Statements which are an integral part of the financial statements.
13 Invesco Limited Term Municipal Income Fund
| | | | | | | | | | | | | | |
| | | Interest
Rate | | | Maturity
Date | | | Principal
Amount
(000) | | | Value |
Illinois–(continued) | | | | | | | | | | | | | | |
Illinois (State of) Toll Highway Authority; | | | | | | | | | | | | | | |
Series 2013 A, RB | | | 5.00% | | | | 01/01/2038 | | | $ | 20,815 | | | $ 20,832,522 |
Series 2014 C, RB | | | 5.00% | | | | 01/01/2036 | | | | 8,170 | | | 8,377,174 |
Series 2014 C, RB | | | 5.00% | | | | 01/01/2038 | | | | 1,585 | | | 1,616,258 |
Series 2015 A, RB | | | 5.00% | | | | 01/01/2037 | | | | 1,500 | | | 1,539,950 |
Series 2015 B, RB | | | 5.00% | | | | 01/01/2036 | | | | 10,000 | | | 10,468,025 |
Kane and DeKalb (Counties of), IL Community Unit School District No. 301; Series 2017, GO Bonds | | | 5.00% | | | | 01/01/2033 | | | | 1,235 | | | 1,320,033 |
Long Grove (Village of), IL (Sunset Grove); | | | | | | | | | | | | | | |
Series 2020, Ref. RB | | | 3.00% | | | | 01/01/2026 | | | | 280 | | | 271,822 |
Series 2020, Ref. RB | | | 3.10% | | | | 01/01/2027 | | | | 290 | | | 278,085 |
Series 2020, Ref. RB | | | 3.25% | | | | 01/01/2028 | | | | 305 | | | 294,631 |
Series 2020, Ref. RB | | | 3.35% | | | | 01/01/2029 | | | | 320 | | | 310,973 |
Series 2020, Ref. RB | | | 3.50% | | | | 01/01/2030 | | | | 330 | | | 319,260 |
Series 2020, Ref. RB | | | 3.60% | | | | 01/01/2031 | | | | 345 | | | 334,918 |
Series 2020, Ref. RB | | | 3.70% | | | | 01/01/2032 | | | | 490 | | | 479,833 |
Railsplitter Tobacco Settlement Authority; Series 2017, RB | | | 5.00% | | | | 06/01/2025 | | | | 7,000 | | | 7,222,697 |
Rosemont (Village of), IL; Series 2017 A, GO Bonds (INS - AGM)(e) | | | 5.00% | | | | 12/01/2046 | | | | 4,000 | | | 4,154,076 |
Sales Tax Securitization Corp.; Series 2017 A, Ref. RB | | | 5.00% | | | | 01/01/2026 | | | | 6,525 | | | 6,805,410 |
Springfield (City of), IL; Series 2015, Ref. RB | | | 5.00% | | | | 03/01/2023 | | | | 2,000 | | | 2,000,000 |
| | | | | | | | | | | | | | | 232,595,361 |
| | | | |
Indiana–2.12% | | | | | | | | | | | | | | |
Columbus (City of), IN; Series 2016, Ref. RB (INS - BAM)(e) | | | 1.99% | | | | 02/15/2027 | | | | 8,045 | | | 7,567,483 |
Indiana (State of) Finance Authority; | | | | | | | | | | | | | | |
Series 2015, RB | | | 5.00% | | | | 03/01/2036 | | | | 2,480 | | | 2,541,585 |
Series 2016 C, Ref. RB | | | 5.00% | | | | 12/01/2025 | | | | 7,000 | | | 7,368,900 |
Indiana (State of) Finance Authority (CWA Authority); Series 2014 A, RB | | | 5.00% | | | | 10/01/2034 | | | | 1,400 | | | 1,434,512 |
Indiana (State of) Finance Authority (Green Bonds); Series 2016 A, RB | | | 5.00% | | | | 10/01/2035 | | | | 2,235 | | | 2,351,434 |
Indiana (State of) Finance Authority (Ohio Valley Electrical Corp.); | | | | | | | | | | | | | | |
Series 2010 A, RB | | | 3.00% | | | | 11/01/2030 | | | | 4,350 | | | 3,876,064 |
Series 2012 A, RB | | | 4.25% | | | | 11/01/2030 | | | | 3,335 | | | 3,237,195 |
Series 2012 B, RB | | | 3.00% | | | | 11/01/2030 | | | | 2,000 | | | 1,782,099 |
Indiana (State of) Finance Authority (Sisters of St. Francis Health Services, Inc. Obligated Group); | | | | | | | | | | | | | | |
Series 2008 I, Ref. VRD RB (LOC - Barclays Bank PLC)(g)(h) | | | 1.85% | | | | 11/01/2037 | | | | 8,285 | | | 8,285,000 |
Series 2008 J, Ref. VRD RB (LOC - Barclays Bank PLC)(g)(h) | | | 1.85% | | | | 11/01/2037 | | | | 9,925 | | | 9,925,000 |
Indiana (State of) Finance Authority (United States Steel Corp.); Series 2021 A, Ref. RB | | | 4.13% | | | | 12/01/2026 | | | | 3,500 | | | 3,439,624 |
Indiana (State of) Housing & Community Development Authority (Social Bonds); Series 2023 A-1, RB (CEP - GNMA) | | | 5.75% | | | | 07/01/2053 | | | | 3,000 | | | 3,229,174 |
Indiana (State of) Municipal Power Agency; Series 2016 A, Ref. RB | | | 5.00% | | | | 01/01/2042 | | | | 13,450 | | | 13,828,866 |
Indianapolis (City of), IN Department of Public Utilities; Series 2018 A, Ref. RB | | | 5.00% | | | | 10/01/2025 | | | | 1,350 | | | 1,412,715 |
Northern Indiana Commuter Transportation District; Series 2016, RB | | | 5.00% | | | | 07/01/2041 | | | | 1,140 | | | 1,174,978 |
| | | | | | | | | | | | | | | 71,454,629 |
| | | | |
Iowa–1.42% | | | | | | | | | | | | | | |
Iowa (State of) Board of Regents (University of Iowa Hospital & Clinics); Series 2022 C, RB | | | 5.00% | | | | 09/01/2036 | | | | 4,380 | | | 4,852,816 |
Iowa (State of) Finance Authority (Iowa Fertilizer Co.); Series 2022, Ref. RB(b) | | | 4.00% | | | | 12/01/2032 | | | | 10,000 | | | 9,817,311 |
Iowa (State of) Finance Authority (Iowa Health System); Series 2018, Ref. RB (SIFMA Municipal Swap Index + 0.58%)(b)(c)(d) | | | 3.38% | | | | 01/04/2024 | | | | 13,190 | | | 13,165,279 |
PEFA, Inc.; Series 2019, RB(b) | | | 5.00% | | | | 09/01/2026 | | | | 19,250 | | | 19,814,427 |
| | | | | | | | | | | | | | | 47,649,833 |
| | | | |
Kansas–0.74% | | | | | | | | | | | | | | |
Kansas (State of) Development Finance Authority; Series 2021, Ref. RB(b) | | | 5.00% | | | | 11/15/2031 | | | | 17,450 | | | 19,452,642 |
University of Kansas Hospital Authority (KU Health System); Series 2015, Ref. RB | | | 5.00% | | | | 09/01/2045 | | | | 5,245 | | | 5,307,798 |
| | | | | | | | | | | | | | | 24,760,440 |
| | | | |
Kentucky–1.68% | | | | | | | | | | | | | | |
Christian (County of), KY (Jennie Stuart Medical Center, Inc.); Series 2016, Ref. RB | | | 5.00% | | | | 02/01/2026 | | | | 1,230 | | | 1,258,348 |
Kentucky (Commonwealth of) Economic Development Finance Authority (Catholic Health Initiatives); Series 2011 B, RB (SIFMA Municipal Swap Index + 1.40%)(b)(c) | | | 4.20% | | | | 02/01/2025 | | | | 2,340 | | | 2,344,060 |
See accompanying Notes to Financial Statements which are an integral part of the financial statements.
14 Invesco Limited Term Municipal Income Fund
| | | | | | | | | | | | | | |
| | | Interest
Rate | | | Maturity
Date | | | Principal
Amount
(000) | | | Value |
Kentucky–(continued) | | | | | | | | | | | | | | |
Kentucky (Commonwealth of) Economic Development Finance Authority (Next Generation Kentucky Information Highway); Series 2015 A, RB | | | 5.00% | | | | 07/01/2037 | | | $ | 4,400 | | | $ 4,414,399 |
Kentucky (Commonwealth of) Municipal Power Agency; | | | | | | | | | | | | | | |
Series 2015 A, Ref. RB (INS - NATL)(e) | | | 5.00% | | | | 09/01/2026 | | | | 2,000 | | | 2,063,194 |
Series 2015 A, Ref. RB (INS - NATL)(e) | | | 5.00% | | | | 09/01/2027 | | | | 3,380 | | | 3,487,614 |
Series 2015 A, Ref. RB (INS - NATL)(e) | | | 5.00% | | | | 09/01/2028 | | | | 2,870 | | | 2,961,376 |
Kentucky (Commonwealth of) Property & Building Commission (No. 112); Series 2016 B, Ref. RB | | | 5.00% | | | | 11/01/2026 | | | | 13,290 | | | 14,180,457 |
Kentucky (Commonwealth of) Property & Building Commission (No. 115); Series 2017, RB | | | 5.00% | | | | 04/01/2028 | | | | 1,000 | | | 1,072,214 |
Kentucky (Commonwealth of) Public Energy Authority; | | | | | | | | | | | | | | |
Series 2018 A, RB(b) | | | 4.00% | | | | 04/01/2024 | | | | 5,000 | | | 5,003,683 |
Series 2018 B, RB(b) | | | 4.00% | | | | 01/01/2025 | | | | 5,000 | | | 4,977,832 |
Kentucky (Commonwealth of) Turnpike Authority (Revitalization); Series 2017 B, Ref. RB | | | 4.00% | | | | 07/01/2026 | | | | 3,750 | | | 3,816,777 |
Louisville (City of) & Jefferson (County of), KY Metropolitan Government (Norton Healthcare, Inc.); | | | | | | | | | | | | | | |
Series 2013 A, RB | | | 5.75% | | | | 10/01/2038 | | | | 100 | | | 100,954 |
Series 2013 A, RB | | | 5.75% | | | | 10/01/2042 | | | | 105 | | | 105,845 |
Series 2016 A, Ref. RB | | | 5.00% | | | | 10/01/2033 | | | | 1,740 | | | 1,812,901 |
Louisville (City of) & Jefferson (County of), KY Sewer District; Series 2017 A, RB | | | 5.00% | | | | 05/15/2025 | | | | 4,025 | | | 4,189,114 |
Trimble (County of), KY (Louisville Gas & Electric); Series 2002 A, Ref. RB | | | 0.63% | | | | 09/01/2026 | | | | 3,375 | | | 2,989,648 |
Western Kentucky University; Series 2012 A, RB (CEP - Colorado Higher Education Intercept Program) | | | 5.00% | | | | 05/01/2032 | | | | 1,625 | | | 1,627,358 |
| | | | | | | | | | | | | | | 56,405,774 |
| | | | |
Louisiana–1.50% | | | | | | | | | | | | | | |
Louisiana (State of); | | | | | | | | | | | | | | |
Series 2014 C, Ref. GO Bonds | | | 5.00% | | | | 08/01/2025 | | | | 2,400 | | | 2,463,216 |
Series 2015, RB | | | 5.00% | | | | 09/01/2026 | | | | 2,000 | | | 2,087,487 |
Series 2016 B, Ref. GO Bonds | | | 5.00% | | | | 08/01/2025 | | | | 10,000 | | | 10,453,282 |
Series 2022 A, Ref. RB (SOFR + 0.50%)(b)(c) | | | 3.69% | | | | 05/01/2026 | | | | 3,525 | | | 3,442,718 |
Louisiana (State of) Energy & Power Authority (LEPA Unit No. 1); | | | | | | | | | | | | | | |
Series 2013 A, RB(a)(b) | | | 5.25% | | | | 06/01/2023 | | | | 2,000 | | | 2,010,139 |
Series 2013 A, RB(a)(b) | | | 5.25% | | | | 06/01/2023 | | | | 2,000 | | | 2,010,139 |
Louisiana (State of) Public Facilities Authority (Franciscan Missionaries); Series 2015, Ref. RB | | | 5.00% | | | | 07/01/2039 | | | | 7,395 | | | 7,520,716 |
Louisiana (State of) Public Facilities Authority (Tulane University); | | | | | | | | | | | | | | |
Series 2023 A, Ref. RB | | | 5.00% | | | | 10/15/2036 | | | | 1,000 | | | 1,117,975 |
Series 2023 A, Ref. RB | | | 5.00% | | | | 10/15/2037 | | | | 1,100 | | | 1,217,833 |
Louisiana Housing Corp. (Home Ownership Program); Series 2022 B, RB (CEP - GNMA) | | | 6.00% | | | | 12/01/2052 | | | | 4,185 | | | 4,575,756 |
Louisiana State University & Agricultural & Mechanical College Board of Supervisors; Series 2016 A, Ref. RB | | | 5.00% | | | | 07/01/2023 | | | | 3,250 | | | 3,266,778 |
New Orleans (City of), LA; | | | | | | | | | | | | | | |
Series 2015, RB | | | 5.00% | | | | 06/01/2023 | | | | 700 | | | 702,826 |
Series 2015, RB | | | 5.00% | | | | 12/01/2023 | | | | 600 | | | 607,230 |
Series 2015, RB | | | 5.00% | | | | 06/01/2024 | | | | 400 | | | 408,239 |
Series 2015, RB | | | 5.00% | | | | 12/01/2024 | | | | 750 | | | 769,167 |
Series 2015, RB | | | 5.00% | | | | 06/01/2025 | | | | 500 | | | 517,002 |
Series 2015, RB | | | 5.00% | | | | 12/01/2025 | | | | 825 | | | 858,290 |
Series 2015, RB | | | 5.00% | | | | 06/01/2026 | | | | 250 | | | 259,986 |
Series 2015, RB | | | 5.00% | | | | 12/01/2026 | | | | 500 | | | 519,643 |
Series 2015, RB | | | 5.00% | | | | 06/01/2027 | | | | 350 | | | 363,672 |
Series 2015, RB | | | 5.00% | | | | 12/01/2027 | | | | 750 | | | 778,866 |
Series 2015, Ref. GO Bonds | | | 5.00% | | | | 12/01/2023 | | | | 500 | | | 506,136 |
Series 2015, Ref. GO Bonds | | | 5.00% | | | | 12/01/2024 | | | | 1,000 | | | 1,028,469 |
New Orleans (City of), LA Aviation Board (Parking Facilities Corp. Consolidated Garage System); Series 2018 B, Ref. RB (INS - AGM)(e) | | | 5.00% | | | | 10/01/2026 | | | | 200 | | | 212,848 |
St. John the Baptist (Parish of), LA (Marathon Oil Corp.); Series 2017, Ref. RB(b) | | | 2.10% | | | | 07/01/2024 | | | | 3,000 | | | 2,915,829 |
| | | | | | | | | | | | | | | 50,614,242 |
| | | | |
Maine–0.21% | | | | | | | | | | | | | | |
Lewiston (City of), ME (UBS Financial Services, Inc.); Series 2008 B, GO Bonds (INS - AGM)(e) | | | 5.50% | | | | 12/15/2023 | | | | 950 | | | 951,780 |
Maine (State of) Health & Higher Educational Facilities Authority; Series 2013, RB | | | 5.00% | | | | 07/01/2043 | | | | 2,930 | | | 2,902,606 |
See accompanying Notes to Financial Statements which are an integral part of the financial statements.
15 Invesco Limited Term Municipal Income Fund
| | | | | | | | | | | | | | |
| | | Interest
Rate | | | Maturity
Date | | | Principal
Amount
(000) | | | Value |
Maine–(continued) | | | | | | | | | | | | | | |
Maine (State of) State housing Authority (Social Bonds); Series 2023 B, RB(b) | | | 3.13% | | | | 05/01/2024 | | | $ | 3,300 | | | $ 3,279,034 |
| | | | | | | | | | | | | | | 7,133,420 |
| | | | |
Maryland–0.81% | | | | | | | | | | | | | | |
Baltimore (City of), MD (Water); Series 2014 A, RB | | | 5.00% | | | | 07/01/2034 | | | | 3,635 | | | 3,753,403 |
Howard (County of), MD Housing Commission (Social Bonds); | | | | | | | | | | | | | | |
Series 2021 A, Ref. RB | | | 1.20% | | | | 06/01/2027 | | | | 3,000 | | | 2,743,658 |
Series 2021 A, Ref. RB | | | 1.60% | | | | 06/01/2029 | | | | 2,000 | | | 1,805,680 |
Maryland (State of) Health & Higher Educational Facilities Authority; Series 2013 A, RB | | | 5.00% | | | | 08/15/2027 | | | | 2,000 | | | 2,010,391 |
Maryland Economic Development Corp. (CNX Marine Terminal, Inc. - Port of Baltimore Facility); Series 2010, Ref. RB | | | 5.75% | | | | 09/01/2025 | | | | 11,920 | | | 12,031,838 |
Washington (State of) Suburban Sanitary Commission; Series 2016 A-3, VRD RB(g) | | | 2.74% | | | | 06/01/2023 | | | | 4,800 | | | 4,800,000 |
| | | | | | | | | | | | | | | 27,144,970 |
| | | | |
Massachusetts–2.17% | | | | | | | | | | | | | | |
Massachusetts (Commonwealth of); | | | | | | | | | | | | | | |
Series 2015 A, Ref. GO Bonds | | | 5.00% | | | | 07/01/2035 | | | | 10,000 | | | 10,355,273 |
Series 2016 A, GO Bonds | | | 5.00% | | | | 03/01/2037 | | | | 5,000 | | | 5,067,997 |
Series 2017 A, GO Bonds | | | 5.00% | | | | 04/01/2035 | | | | 7,000 | | | 7,535,996 |
Massachusetts (Commonwealth of) Clean Water Trust (The) (Green Bonds); | | | | | | | | | | | | | | |
Series 2022, RB | | | 5.00% | | | | 02/01/2035 | | | | 875 | | | 1,020,674 |
Series 2022, RB | | | 5.00% | | | | 02/01/2036 | | | | 1,240 | | | 1,430,945 |
Massachusetts (Commonwealth of) Clean Water Trust (The) (Sustainable Development Bonds); | | | | | | | | | | | | | | |
Series 2022, RB | | | 5.00% | | | | 02/01/2035 | | | | 1,500 | | | 1,749,727 |
Series 2022, RB | | | 5.00% | | | | 02/01/2036 | | | | 2,000 | | | 2,307,976 |
Massachusetts (Commonwealth of) Development Finance Agency; | | | | | | | | | | | | | | |
Series 2015, Ref. RB | | | 5.00% | | | | 08/15/2034 | | | | 1,750 | | | 1,820,498 |
Series 2019 A, Ref. RB | | | 5.00% | | | | 07/01/2025 | | | | 845 | | | 864,525 |
Series 2019 A, Ref. RB | | | 5.00% | | | | 07/01/2027 | | | | 2,300 | | | 2,398,077 |
Massachusetts (Commonwealth of) Development Finance Agency (Harvard University); Series 2016 A, Ref. RB | | | 4.00% | | | | 07/15/2036 | | | | 10,395 | | | 10,569,636 |
Massachusetts (Commonwealth of) Development Finance Agency (International Charter School); Series 2015, Ref. RB | | | 5.00% | | | | 04/15/2025 | | | | 1,100 | | | 1,103,937 |
Massachusetts (Commonwealth of) Development Finance Agency (Suffolk University); Series 2017, Ref. RB | | | 5.00% | | | | 07/01/2024 | | | | 1,000 | | | 1,014,487 |
Massachusetts (Commonwealth of) Federal Highway; Series 2017 A, Ref. RB | | | 5.00% | | | | 06/15/2027 | | | | 2,000 | | | 2,135,690 |
Massachusetts (Commonwealth of) School Building Authority; | | | | | | | | | | | | | | |
Series 2015 C, Ref. RB | | | 5.00% | | | | 08/15/2037 | | | | 1,500 | | | 1,559,673 |
Series 2015 D, Ref. RB | | | 5.00% | | | | 08/15/2037 | | | | 15,000 | | | 15,596,728 |
Series 2016 C, Ref. RB | | | 5.00% | | | | 11/15/2034 | | | | 5,000 | | | 5,350,380 |
University of Massachusetts Building Authority; Series 2015-2, Ref. RB | | | 5.00% | | | | 11/01/2023 | | | | 975 | | | 986,423 |
| | | | | | | | | | | | | | | 72,868,642 |
| | | | |
Michigan–3.08% | | | | | | | | | | | | | | |
Great Lakes Water Authority; Series 2016 C, Ref. RB | | | 5.00% | | | | 07/01/2036 | | | | 3,560 | | | 3,718,094 |
Michigan (State of) Building Authority; Series 2016 I, Ref. RB | | | 5.00% | | | | 04/15/2024 | | | | 1,510 | | | 1,539,449 |
Michigan (State of) Building Authority (Facilities Program); | | | | | | | | | | | | | | |
Series 2016 I, Ref. RB | | | 5.00% | | | | 04/15/2041 | | | | 3,450 | | | 3,591,321 |
Series 2020, Ref. VRD RB(g) | | | 2.86% | | | | 10/15/2042 | | | | 2,000 | | | 2,000,000 |
Michigan (State of) Finance Authority (Beaumont Health Credit Group); Series 2016, RB | | | 5.00% | | | | 11/01/2044 | | | | 11,325 | | | 11,461,949 |
Michigan (State of) Finance Authority (Detroit Water & Sewerage Department); Series 2015, RB | | | 5.00% | | | | 07/01/2035 | | | | 7,830 | | | 7,991,673 |
Michigan (State of) Finance Authority (Henry Ford Health System); | | | | | | | | | | | | | | |
Series 2016, Ref. RB | | | 5.00% | | | | 11/15/2032 | | | | 2,725 | | | 2,874,631 |
Series 2016, Ref. RB | | | 5.00% | | | | 11/15/2037 | | | | 4,235 | | | 4,361,068 |
Michigan (State of) Finance Authority (Local Government Loan Program); Series 2014, Ref. RB | | | 3.88% | | | | 10/01/2023 | | | | 2,000 | | | 1,992,922 |
Michigan (State of) Finance Authority (McLaren Health Care); Series 2015, Ref. RB | | | 5.00% | | | | 05/15/2038 | | | | 5,000 | | | 5,091,385 |
Michigan (State of) Finance Authority (Trinity Health Credit Group); Series 2017, Ref. RB | | | 5.00% | | | | 12/01/2035 | | | | 1,785 | | | 1,913,051 |
Oakland University Board of Trustees; Series 2014, Ref. RB | | | 5.00% | | | | 03/01/2039 | | | | 2,000 | | | 2,013,297 |
Portage Public Schools; Series 2016, Ref. GO Bonds | | | 5.00% | | | | 11/01/2035 | | | | 1,300 | | | 1,354,241 |
Rib Floater Trust; Series 2022-047, VRD RB(d)(g) | | | 1.87% | | | | 12/01/2045 | | | | 30,390 | | | 30,390,000 |
See accompanying Notes to Financial Statements which are an integral part of the financial statements.
16 Invesco Limited Term Municipal Income Fund
| | | | | | | | | | | | | | |
| | | Interest
Rate | | | Maturity
Date | | | Principal
Amount
(000) | | | Value |
Michigan–(continued) | | | | | | | | | | | | | | |
Rochester Community School District; Series 2016 I, GO Bonds | | | 5.00% | | | | 05/01/2035 | | | $ | 2,350 | | | $ 2,443,055 |
Wayne (County of), MI Airport Authority; | | | | | | | | | | | | | | |
Series 2021 A, RB | | | 5.00% | | | | 12/01/2034 | | | | 1,650 | | | 1,868,182 |
Series 2021 A, RB | | | 5.00% | | | | 12/01/2036 | | | | 1,685 | | | 1,866,665 |
Series 2021 A, RB | | | 5.00% | | | | 12/01/2038 | | | | 2,000 | | | 2,202,003 |
Series 2021 A, RB | | | 5.00% | | | | 12/01/2039 | | | | 1,855 | | | 2,033,162 |
Wayne (County of), MI Airport Authority (Detroit Metropolitan Airport); | | | | | | | | | | | | | | |
Series 2012 A, RB | | | 5.00% | | | | 12/01/2037 | | | | 830 | | | 830,695 |
Series 2012 A, RB | | | 5.00% | | | | 12/01/2042 | | | | 5,220 | | | 5,223,203 |
Wayne (County of), MI Airport Authority (Detroit Michigan Wayne County Airport); Series 2015 D, RB | | | 5.00% | | | | 12/01/2040 | | | | 2,890 | | | 2,962,389 |
Wayne State University; | | | | | | | | | | | | | | |
Series 2015 A, Ref. RB | | | 5.00% | | | | 11/15/2033 | | | | 1,500 | | | 1,526,328 |
Series 2018 A, RB | | | 5.00% | | | | 11/15/2038 | | | | 2,220 | | | 2,289,288 |
| | | | | | | | | | | | | | | 103,538,051 |
| | | | |
Minnesota–0.09% | | | | | | | | | | | | | | |
Maple Grove (City of), MN (Maple Grove Hospital Corp.); | | | | | | | | | | | | | | |
Series 2017, Ref. RB | | | 5.00% | | | | 05/01/2023 | | | | 500 | | | 500,933 |
Series 2017, Ref. RB | | | 5.00% | | | | 05/01/2025 | | | | 800 | | | 819,628 |
Minnesota (State of) Higher Education Facilities Authority (Concordia University, St. Paul); Series 2007 Six-Q, VRD RB (LOC - U.S. Bank N.A.)(g)(h) | | | 2.04% | | | | 04/01/2037 | | | | 1,800 | | | 1,800,000 |
| | | | | | | | | | | | | | | 3,120,561 |
| | | | |
Mississippi–0.22% | | | | | | | | | | | | | | |
Mississippi (State of) Hospital Equipment & Facilities Authority (Baptist Memorial Health Care); Series 2016, RB | | | 5.00% | | | | 09/01/2036 | | | | 7,000 | | | 7,105,498 |
Mississippi (State of) Hospital Equipment & Facilities Authority (Forrest Co. General Hospital); Series 2019 B, Ref. RB | | | 5.00% | | | | 01/01/2024 | | | | 400 | | | 404,532 |
| | | | | | | | | | | | | | | 7,510,030 |
| | | | |
Missouri–1.71% | | | | | | | | | | | | | | |
Kansas City (City of), MO; | | | | | | | | | | | | | | |
Series 2017 C, Ref. RB | | | 5.00% | | | | 09/01/2023 | | | | 1,500 | | | 1,512,886 |
Series 2017 C, Ref. RB | | | 5.00% | | | | 09/01/2024 | | | | 2,675 | | | 2,744,781 |
Missouri (State of) Health & Educational Facilities Authority; Series 2014 G, VRD RB(g) | | | 2.92% | | | | 06/01/2044 | | | | 7,000 | | | 7,000,000 |
Missouri (State of) Health & Educational Facilities Authority (Coxhealth); | | | | | | | | | | | | | | |
Series 2015 A, Ref. RB | | | 5.00% | | | | 11/15/2033 | | | | 7,535 | | | 7,757,800 |
Series 2015 A, Ref. RB | | | 5.00% | | | | 11/15/2039 | | | | 3,200 | | | 3,234,905 |
Missouri (State of) Health & Educational Facilities Authority (Mercy Health); | | | | | | | | | | | | | | |
Series 2012, RB | | | 4.00% | | | | 11/15/2042 | | | | 690 | | | 654,814 |
Series 2018 A, Ref. RB | | | 5.00% | | | | 06/01/2026 | | | | 120 | | | 126,215 |
Missouri (State of) Health & Educational Facilities Authority (St. Luke’s Health System, Inc.); Series 2016, Ref. RB | | | 5.00% | | | | 11/15/2031 | | | | 2,740 | | | 2,864,144 |
Missouri (State of) Housing Development Commission (First Place Homeownership Loan); Series 2023, RB (CEP - GNMA) | | | 5.75% | | | | 05/01/2053 | | | | 4,200 | | | 4,515,299 |
Missouri (State of) Joint Municipal Electric Utility Commission (Iatan 2); | | | | | | | | | | | | | | |
Series 2014 A, Ref. RB | | | 5.00% | | | | 01/01/2032 | | | | 1,470 | | | 1,484,129 |
Series 2014 A, Ref. RB | | | 5.00% | | | | 01/01/2033 | | | | 2,500 | | | 2,523,826 |
Series 2014 A, Ref. RB | | | 5.00% | | | | 01/01/2034 | | | | 2,000 | | | 2,018,243 |
Missouri (State of) Joint Municipal Electric Utility Commission (Prairie State); | | | | | | | | | | | | | | |
Series 2015 A, Ref. RB | | | 5.00% | | | | 06/01/2027 | | | | 2,600 | | | 2,686,700 |
Series 2015 A, Ref. RB | | | 5.00% | | | | 12/01/2027 | | | | 1,140 | | | 1,177,765 |
North Kansas City School District No. 74 (Missouri Direct Deposit Program); Series 2022, GO Bonds | | | 5.25% | | | | 03/01/2038 | | | | 2,500 | | | 2,874,605 |
Pattonville R-3 School District; Series 2018 A, GO Bonds | | | 5.00% | | | | 03/01/2037 | | | | 2,095 | | | 2,174,130 |
St. Louis (County of), MO Industrial Development Authority (Friendship Village of Sunset Hills); | | | | | | | | | | | | | | |
Series 2012, RB | | | 5.00% | | | | 09/01/2032 | | | | 1,020 | | | 1,016,949 |
Series 2013 A, RB | | | 5.00% | | | | 09/01/2023 | | | | 305 | | | 305,162 |
Tender Option Bond Trust Receipts/Certificates; Series 2018, VRD RB(d)(g) | | | 2.93% | | | | 05/15/2041 | | | | 10,895 | | | 10,895,000 |
| | | | | | | | | | | | | | | 57,567,353 |
See accompanying Notes to Financial Statements which are an integral part of the financial statements.
17 Invesco Limited Term Municipal Income Fund
| | | | | | | | | | | | | | |
| | | Interest
Rate | | | Maturity
Date | | | Principal
Amount
(000) | | | Value |
Nebraska–1.19% | | | | | | | | | | | | | | |
Douglas (County of), NE (Creighton University); Series 2021, Ref. RB (SIFMA Municipal Swap Index + 0.53%)(b)(c) | | | 3.33% | | | | 09/01/2026 | | | $ | 7,930 | | | $ 7,835,915 |
Nebraska (State of) Public Power District; Series 2016 B, Ref. RB | | | 5.00% | | | | 01/01/2036 | | | | 3,500 | | | 3,613,132 |
Omaha (City of), NE; Series 2014, RB | | | 5.00% | | | | 11/15/2034 | | | | 85 | | | 87,212 |
Omaha (City of), NE Public Power District; Series 2015 A, RB | | | 5.00% | | | | 02/01/2040 | | | | 16,000 | | | 16,243,717 |
Public Power Generation Agency (Whelan Energy Center Unit 2); | | | | | | | | | | | | | | |
Series 2015, Ref. RB | | | 5.00% | | | | 01/01/2031 | | | | 6,385 | | | 6,533,897 |
Series 2016 A, Ref. RB | | | 5.00% | | | | 01/01/2034 | | | | 3,250 | | | 3,398,208 |
University of Nebraska Facilities Corp. (The); Series 2019 B, Ref. RB | | | 5.00% | | | | 10/01/2024 | | | | 2,125 | | | 2,180,355 |
| | | | | | | | | | | | | | | 39,892,436 |
| | | | |
Nevada–0.94% | | | | | | | | | | | | | | |
Clark County School District; | | | | | | | | | | | | | | |
Series 2015 C, Ref. GO Bonds (INS - BAM)(e) | | | 5.00% | | | | 06/15/2027 | | | | 4,000 | | | 4,206,680 |
Series 2022 A, GO Bonds | | | 5.25% | | | | 06/15/2035 | | | | 11,200 | | | 12,911,601 |
Las Vegas Valley Water District; | | | | | | | | | | | | | | |
Series 2015, Ref. GO Bonds | | | 5.00% | | | | 06/01/2039 | | | | 5,000 | | | 5,103,900 |
Series 2016 B, Ref. GO Bonds | | | 5.00% | | | | 06/01/2036 | | | | 3,750 | | | 3,921,841 |
Series 2022 D, GO Bonds | | | 5.00% | | | | 06/01/2036 | | | | 1,855 | | | 2,103,854 |
Sparks (City of), NV (Tourism Improvement District No. 1); | | | | | | | | | | | | | | |
Series 2019 A, Ref. RB(d) | | | 2.50% | | | | 06/15/2024 | | | | 315 | | | 306,628 |
Series 2019 A, Ref. RB(d) | | | 2.75% | | | | 06/15/2028 | | | | 3,235 | | | 2,906,666 |
| | | | | | | | | | | | | | | 31,461,170 |
| | | | |
New Hampshire–0.59% | | | | | | | | | | | | | | |
New Hampshire (State of) Business Finance Authority; Series 2020-1A, RB | | | 4.13% | | | | 01/20/2034 | | | | 1,813 | | | 1,784,614 |
New Hampshire (State of) Business Finance Authority (Social Bonds); | | | | | | | | | | | | | | |
Series 2022-1A, RB | | | 4.38% | | | | 09/20/2036 | | | | 8,430 | | | 8,157,142 |
Series 2022-2A, RB | | | 4.00% | | | | 10/20/2036 | | | | 6,840 | | | 6,389,109 |
New Hampshire (State of) Health and Education Facilities Authority; Series 2016, Ref. RB | | | 5.50% | | | | 06/01/2036 | | | | 3,250 | | | 3,364,413 |
| | | | | | | | | | | | | | | 19,695,278 |
| | | | |
New Jersey–4.73% | | | | | | | | | | | | | | |
Dover (Town of), NJ; Series 2023, GO Notes | | | 5.00% | | | | 01/24/2024 | | | | 14,925 | | | 15,151,784 |
New Jersey (State of) Economic Development Authority; | | | | | | | | | | | | | | |
Series 2016 AAA, RB | | | 5.00% | | | | 06/15/2035 | | | | 1,450 | | | 1,512,656 |
Series 2017 A, Ref. RB (INS - BAM)(e) | | | 5.00% | | | | 07/01/2027 | | | | 13,205 | | | 14,071,294 |
New Jersey (State of) Educational Facilities Authority; | | | | | | | | | | | | | | |
Series 2014 A, RB | | | 5.00% | | | | 07/01/2032 | | | | 1,010 | | | 1,032,239 |
Series 2015 D, Ref. RB | | | 5.00% | | | | 07/01/2034 | | | | 2,090 | | | 2,158,423 |
New Jersey (State of) Health Care Facilities Financing Authority (Inspira Health Obligated Group); Series 2016, Ref. RB | | | 5.00% | | | | 07/01/2033 | | | | 1,000 | | | 1,044,712 |
New Jersey (State of) Health Care Facilities Financing Authority (RWJ Barnabas Health Obligated Group); | | | | | | | | | | | | | | |
Series 2016 A, Ref. RB | | | 5.00% | | | | 07/01/2031 | | | | 5,195 | | | 5,531,321 |
Series 2019 B-1, Ref. RB(b) | | | 5.00% | | | | 07/01/2024 | | | | 5,340 | | | 5,434,745 |
New Jersey (State of) Housing & Mortgage Finance Agency (Social Bonds); Series 2022 I, RB | | | 5.00% | | | | 10/01/2053 | | | | 12,000 | | | 12,473,556 |
New Jersey (State of) Transportation Trust Fund Authority; | | | | | | | | | | | | | | |
Series 2005 B, RB (INS - AMBAC)(e) | | | 5.25% | | | | 12/15/2023 | | | | 505 | | | 511,740 |
Series 2010 D, RB | | | 5.25% | | | | 12/15/2023 | | | | 3,305 | | | 3,349,108 |
Series 2013 AA, RB | | | 5.00% | | | | 06/15/2036 | | | | 3,140 | | | 3,147,350 |
Series 2016 A-1, RN | | | 5.00% | | | | 06/15/2024 | | | | 4,500 | | | 4,590,060 |
Series 2016 A-1, RN | | | 5.00% | | | | 06/15/2028 | | | | 1,140 | | | 1,199,198 |
Series 2016, RN | | | 5.00% | | | | 06/15/2030 | | | | 2,025 | | | 2,130,518 |
Series 2018 A, Ref. RB | | | 5.00% | | | | 12/15/2025 | | | | 5,000 | | | 5,195,880 |
Series 2018 A, Ref. RB | | | 5.00% | | | | 12/15/2027 | | | | 2,500 | | | 2,696,222 |
Series 2018 A, Ref. RN | | | 5.00% | | | | 06/15/2023 | | | | 8,500 | | | 8,539,082 |
Series 2018 A, Ref. RN | | | 5.00% | | | | 06/15/2024 | | | | 8,750 | | | 8,932,883 |
Series 2018 A, Ref. RN | | | 5.00% | | | | 06/15/2029 | | | | 5,000 | | | 5,263,234 |
Series 2019, Ref. RB | | | 5.00% | | | | 12/15/2027 | | | | 10,250 | | | 11,054,508 |
See accompanying Notes to Financial Statements which are an integral part of the financial statements.
18 Invesco Limited Term Municipal Income Fund
| | | | | | | | | | | | | | |
| | | Interest
Rate | | | Maturity
Date | | | Principal
Amount
(000) | | | Value |
New Jersey–(continued) | | | | | | | | | | | | | | |
New Jersey (State of) Turnpike Authority; | | | | | | | | | | | | | | |
Series 2005 D-4, RB (INS - AGM)(e) | | | 5.25% | | | | 01/01/2026 | | | $ | 5,000 | | | $ 5,281,099 |
Series 2014 A, RB | | | 5.00% | | | | 01/01/2034 | | | | 13,215 | | | 13,505,686 |
Series 2015 E, RB | | | 5.00% | | | | 01/01/2032 | | | | 3,310 | | | 3,425,543 |
Series 2017 A-1, RB | | | 5.00% | | | | 01/01/2034 | | | | 10,000 | | | 10,698,334 |
Tender Option Bond Trust Receipts/Certificates; Series 2022, VRD RB(d)(g) | | | 2.86% | | | | 01/01/2052 | | | | 3,040 | | | 3,040,000 |
Tobacco Settlement Financing Corp.; | | | | | | | | | | | | | | |
Series 2018 A, Ref. RB | | | 5.00% | | | | 06/01/2025 | | | | 1,000 | | | 1,029,911 |
Series 2018 A, Ref. RB | | | 5.00% | | | | 06/01/2033 | | | | 6,500 | | | 6,947,260 |
| | | | | | | | | | | | | | | 158,948,346 |
| | | | |
New Mexico–0.42% | | | | | | | | | | | | | | |
Albuquerque Municipal School District No. 12; Series 2017, GO Bonds | | | 5.00% | | | | 08/01/2030 | | | | 1,250 | | | 1,327,313 |
Farmington (City of), NM (San Juan and Four Corners); Series 2010 D, Ref. RB(b) | | | 1.10% | | | | 06/01/2023 | | | | 6,000 | | | 5,949,182 |
Farmington (City of), NM (Southern California Edison); Series 2005 B, Ref. RB | | | 1.80% | | | | 04/01/2029 | | | | 8,000 | | | 6,804,955 |
| | | | | | | | | | | | | | | 14,081,450 |
| | | | |
New York–9.57% | | | | | | | | | | | | | | |
Hempstead (Town of), NY; Series 2019 B, Ref. GO Bonds | | | 5.00% | | | | 08/01/2024 | | | | 1,215 | | | 1,246,493 |
Jefferson Civic Facility Development Corp. (Samaritan Medical Center); | | | | | | | | | | | | | | |
Series 2017 A, Ref. RB | | | 5.00% | | | | 11/01/2023 | | | | 1,185 | | | 1,190,645 |
Series 2017 A, Ref. RB | | | 5.00% | | | | 11/01/2024 | | | | 1,245 | | | 1,258,281 |
Long Island (City of), NY Power Authority; | | | | | | | | | | | | | | |
Series 2014, Ref. RB (1 mo. USD LIBOR + 0.75%)(b)(c) | | | 4.01% | | | | 10/01/2023 | | | | 4,125 | | | 4,126,907 |
Series 2016 B, Ref. RB | | | 5.00% | | | | 09/01/2024 | | | | 2,485 | | | 2,553,497 |
Series 2017, RB | | | 5.00% | | | | 09/01/2025 | | | | 1,000 | | | 1,047,422 |
Metropolitan Transportation Authority; | | | | | | | | | | | | | | |
Series 2014 C, RB | | | 5.00% | | | | 11/15/2023 | | | | 5,000 | | | 5,043,510 |
Series 2016 A, Ref. RB | | | 5.25% | | | | 11/15/2034 | | | | 5,600 | | | 5,974,305 |
Series 2016 C-1, RB | | | 5.00% | | | | 11/15/2025 | | | | 2,125 | | | 2,198,512 |
Subseries 2012 G-1, VRD RB (LOC - Barclays Bank PLC)(g)(h) | | | 1.35% | | | | 11/01/2032 | | | | 13,950 | | | 13,950,000 |
Subseries 2012 G2, Ref. VRD RB (LOC - Td Bank N.A.)(g)(h) | | | 2.75% | | | | 11/01/2032 | | | | 4,855 | | | 4,855,000 |
Subseries 2015 E-1, VRD RB (LOC - Barclays Bank PLC)(g)(h) | | | 1.85% | | | | 11/15/2050 | | | | 14,250 | | | 14,250,000 |
Metropolitan Transportation Authority (Green Bonds); | | | | | | | | | | | | | | |
Series 2016 A2, Ref. RB | | | 5.00% | | | | 11/15/2027 | | | | 9,000 | | | 9,265,030 |
Series 2016 A-2, Ref. RB | | | 5.00% | | | | 11/15/2023 | | | | 1,000 | | | 1,008,702 |
Series 2017 B, Ref. RB | | | 5.00% | | | | 11/15/2024 | | | | 8,905 | | | 9,118,138 |
Series 2017 C-1, Ref. RB | | | 5.00% | | | | 11/15/2023 | | | | 3,000 | | | 3,026,106 |
Series 2020 E, Ref. RB | | | 5.00% | | | | 11/15/2027 | | | | 3,750 | | | 3,947,527 |
Series 2020 E, Ref. RB | | | 5.00% | | | | 11/15/2028 | | | | 4,000 | | | 4,232,829 |
Monroe County Industrial Development Corp. (St. Ann’s Community); Series 2019, Ref. RB | | | 5.00% | | | | 01/01/2040 | | | | 1,500 | | | 1,284,011 |
Nassau (County of), NY; Series 2016 C, GO Bonds | | | 5.00% | | | | 04/01/2033 | | | | 5,030 | | | 5,252,917 |
New York & New Jersey (States of) Port Authority; One Hudred Eighty Four Series 2014, RB | | | 5.00% | | | | 09/01/2039 | | | | 5,000 | | | 5,074,025 |
New York (City of), NY; | | | | | | | | | | | | | | |
Subseries 2015 F-5, VRD GO Bonds(g) | | | 1.85% | | | | 06/01/2044 | | | | 4,655 | | | 4,655,000 |
Subseries 2016 A-1, GO Bonds | | | 5.00% | | | | 08/01/2034 | | | | 3,855 | | | 4,047,452 |
Subseries 2022 B-1, GO Bonds | | | 5.00% | | | | 10/01/2036 | | | | 1,495 | | | 1,692,085 |
Subseries 2022 B-1, GO Bonds | | | 5.25% | | | | 10/01/2040 | | | | 4,500 | | | 5,071,615 |
New York (City of), NY Industrial Development Agency (Yankee Stadium); | | | | | | | | | | | | | | |
Series 2006, RB (CPI Rate + 0.87%) (INS - FGIC)(c)(e) | | | 7.28% | | | | 03/01/2025 | | | | 1,025 | | | 1,032,480 |
Series 2006, RB (CPI Rate + 0.88%) (INS - FGIC)(c)(e) | | | 7.29% | | | | 03/01/2026 | | | | 2,725 | | | 2,763,165 |
Series 2006, RB (CPI Rate + 0.89%) (INS - FGIC)(c)(e) | | | 7.30% | | | | 03/01/2027 | | | | 5,500 | | | 5,613,226 |
New York (City of), NY Municipal Water Finance Authority; | | | | | | | | | | | | | | |
Series 2014 BB, RB | | | 5.00% | | | | 06/15/2046 | | | | 10,120 | | | 10,147,638 |
Series 2014 DD, Ref. RB | | | 5.00% | | | | 06/15/2036 | | | | 10,000 | | | 10,172,309 |
Series 2016 CC, Ref. RB | | | 5.00% | | | | 06/15/2046 | | | | 4,000 | | | 4,124,392 |
Series 2018 BB, VRD RB(g) | | | 2.75% | | | | 06/15/2051 | | | | 2,000 | | | 2,000,000 |
See accompanying Notes to Financial Statements which are an integral part of the financial statements.
19 Invesco Limited Term Municipal Income Fund
| | | | | | | | | | | | | | |
| | | Interest
Rate | | | Maturity
Date | | | Principal
Amount
(000) | | | Value |
New York–(continued) | | | | | | | | | | | | | | |
New York (City of), NY Transitional Finance Authority; | | | | | | | | | | | | | | |
Series 2014 B-1, RB | | | 5.00% | | | | 08/01/2033 | | | $ | 5,000 | | | $ 5,119,130 |
Series 2014 D1, RB | | | 5.00% | | | | 02/01/2039 | | | | 10,000 | | | 10,113,835 |
Series 2015, RB | | | 5.00% | | | | 07/15/2037 | | | | 1,055 | | | 1,077,127 |
Series 2016 B-1, RB | | | 5.00% | | | | 08/01/2036 | | | | 10,000 | | | 10,525,592 |
Series 2022 A-1, RB | | | 5.00% | | | | 08/01/2035 | | | | 3,500 | | | 4,017,139 |
Series 2022 A-1, RB | | | 5.00% | | | | 08/01/2036 | | | | 4,000 | | | 4,546,060 |
Series 2022 B, Ref. RB | | | 5.25% | | | | 11/01/2035 | | | | 15,000 | | | 17,552,791 |
Subseries 2015 B-1, RB | | | 5.00% | | | | 11/01/2037 | | | | 2,825 | | | 2,920,932 |
New York (State of) Dormitory Authority; | | | | | | | | | | | | | | |
Series 2014 C, RB | | | 5.00% | | | | 03/15/2039 | | | | 2,270 | | | 2,298,827 |
Series 2015 B, RB | | | 5.00% | | | | 02/15/2032 | | | | 1,115 | | | 1,152,998 |
Series 2015 B-B, RB | | | 5.00% | | | | 03/15/2035 | | | | 6,965 | | | 7,257,972 |
New York (State of) Dormitory Authority (Memorial Sloan Kettering Cancer); Series 1998, RB (INS - NATL)(e) | | | 5.50% | | | | 07/01/2023 | | | | 1,765 | | | 1,778,095 |
New York (State of) Dormitory Authority (Montefiore Obligated Group); | | | | | | | | | | | | | | |
Series 2018 A, Ref. RB | | | 5.00% | | | | 08/01/2024 | | | | 1,250 | | | 1,254,344 |
Series 2018 A, Ref. RB | | | 5.00% | | | | 08/01/2025 | | | | 3,000 | | | 3,038,136 |
New York (State of) Dormitory Authority (New York University); Series 1998 A, RB (INS - NATL)(e) | | | 5.75% | | | | 07/01/2027 | | | | 1,505 | | | 1,587,899 |
New York (State of) Dormitory Authority (North Shore-Long Island Jewish Obligated Group); Series 2015 A, Ref. RB | | | 5.00% | | | | 05/01/2037 | | | | 1,000 | | | 1,022,571 |
New York (State of) Dormitory Authority (Northwell Health Obligated Group); Series 2019 B-2, RB(b) | | | 5.00% | | | | 05/01/2024 | | | | 4,000 | | | 4,036,856 |
New York (State of) Mortgage Agency (Social Bonds); Series 2021, RB | | | 3.25% | | | | 10/01/2051 | | | | 3,995 | | | 3,871,731 |
New York (State of) Thruway Authority; | | | | | | | | | | | | | | |
Series 2018 L, Ref. RB | | | 5.00% | | | | 01/01/2025 | | | | 780 | | | 806,731 |
Series 2018 L, Ref. RB | | | 5.00% | | | | 01/01/2026 | | | | 1,000 | | | 1,055,710 |
New York (State of) Utility Debt Securitization Authority; | | | | | | | | | | | | | | |
Series 2016 A, Ref. RB | | | 5.00% | | | | 12/15/2033 | | | | 4,000 | | | 4,226,662 |
Series 2016 A, Ref. RB | | | 5.00% | | | | 12/15/2035 | | | | 7,000 | | | 7,351,976 |
New York City Housing Development Corp. (Sustainability Bonds); Series 2020 I-2, RB (CEP - Federal Housing Administration)(b) | | | 0.70% | | | | 05/01/2025 | | | | 5,000 | | | 4,629,300 |
New York City Housing Development Corp. (Sustainable development Bonds); Series 2022 2B, RB(b) | | | 3.40% | | | | 12/22/2026 | | | | 18,655 | | | 18,391,366 |
New York City Housing Development Corp. (Sustainable Development); Series 2021 F-2, RB (CEP - Federal Housing Administration)(b) | | | 0.60% | | | | 07/01/2025 | | | | 2,000 | | | 1,833,378 |
New York Liberty Development Corp. (Green Bonds) (4 World Trade Center); | | | | | | | | | | | | | | |
Series 2021 A, Ref. RB | | | 0.95% | | | | 11/15/2027 | | | | 3,000 | | | 2,508,717 |
Series 2021 A, Ref. RB | | | 1.20% | | | | 11/15/2028 | | | | 1,000 | | | 821,491 |
Series 2021 A, Ref. RB | | | 1.45% | | | | 11/15/2029 | | | | 2,370 | | | 1,923,156 |
Series 2021 A, Ref. RB | | | 1.70% | | | | 11/15/2030 | | | | 2,200 | | | 1,768,674 |
Series 2021 A, Ref. RB | | | 1.90% | | | | 11/15/2031 | | | | 1,000 | | | 798,074 |
New York State Environmental Facilities Corp.; Series 2015 A, Ref. RB | | | 5.00% | | | | 06/15/2034 | | | | 6,675 | | | 6,921,626 |
New York State Urban Development Corp.; Series 2017 C-2, Ref. RB | | | 5.00% | | | | 03/15/2032 | | | | 1,000 | | | 1,093,684 |
Suffolk Tobacco Asset Securitization Corp.; | | | | | | | | | | | | | | |
Series 2021, Ref. RB | | | 0.45% | | | | 06/01/2031 | | | | 350 | | | 346,296 |
Series 2021, Ref. RB | | | 4.00% | | | | 06/01/2050 | | | | 5,220 | | | 5,067,762 |
Triborough Bridge & Tunnel Authority (MTA Bridges & Tunnels); Series 2005 A, VRD RB (LOC - Barclays Bank PLC)(g)(h) | | | 2.75% | | | | 11/01/2041 | | | | 15,250 | | | 15,250,000 |
TSASC, Inc.; | | | | | | | | | | | | | | |
Series 2017 A, Ref. RB | | | 5.00% | | | | 06/01/2024 | | | | 4,500 | | | 4,570,371 |
Series 2017 A, Ref. RB | | | 5.00% | | | | 06/01/2025 | | | | 5,000 | | | 5,127,645 |
Westchester County Local Development Corp.; Series 2021, Ref. RB(d) | | | 2.88% | | | | 07/01/2026 | | | | 3,070 | | | 2,931,202 |
| | | | | | | | | | | | | | | 321,819,075 |
| | | | |
North Carolina–1.56% | | | | | | | | | | | | | | |
Charlotte-Mecklenburg Hospital Authority (The) (Carolinas Health Care Systems); Series 2013 A, Ref. RB | | | 5.00% | | | | 01/15/2039 | | | | 9,540 | | | 9,231,123 |
Columbus (County of), NC Industrial Facilities & Pollution Control Financing Authority (International Paper Co.); Series 2019, Ref. RB(b) | | | 2.00% | | | | 10/01/2024 | | | | 850 | | | 815,293 |
See accompanying Notes to Financial Statements which are an integral part of the financial statements.
20 Invesco Limited Term Municipal Income Fund
| | | | | | | | | | | | | | |
| | | Interest
Rate | | | Maturity
Date | | | Principal
Amount
(000) | | | Value |
North Carolina–(continued) | | | | | | | | | | | | | | |
North Carolina (State of) Medical Care Commission (Novant Health Obligated Group); | | | | | | | | | | | | | | |
Series 2004 A, VRD RB(g) | | | 2.70% | | | | 11/01/2034 | | | $ | 17,000 | | | $ 17,000,000 |
Series 2013, Ref. RB | | | 5.00% | | | | 11/01/2046 | | | | 4,260 | | | 4,261,206 |
North Carolina (State of) Medical Care Commission (Wake Forest Baptist Obligated Group); Series 2012 A, RB | | | 4.00% | | | | 12/01/2045 | | | | 230 | | | 222,055 |
North Carolina (State of) Municipal Power Agency No. 1 (Catawba); Series 2015 A, Ref. RB | | | 5.00% | | | | 01/01/2028 | | | | 1,615 | | | 1,703,202 |
North Carolina (State of) Turnpike Authority; | | | | | | | | | | | | | | |
Series 2017, Ref. RB (INS - AGM)(e) | | | 5.00% | | | | 01/01/2026 | | | | 1,350 | | | 1,412,476 |
Series 2020 B, RB(a) | | | 5.00% | | | | 02/01/2024 | | | | 17,645 | | | 17,896,746 |
| | | | | | | | | | | | | | | 52,542,101 |
| | | | |
Ohio–2.49% | | | | | | | | | | | | | | |
Akron, Bath & Copley Joint Township Hospital District (Children’s Hospital Medical Center); Series 2013, RB(a)(b) | | | 5.00% | | | | 05/15/2023 | | | | 5,695 | | | 5,714,625 |
American Municipal Power, Inc. (Prairie State Energy); | | | | | | | | | | | | | | |
Series 2015 A, Ref. RB | | | 5.00% | | | | 02/15/2029 | | | | 2,500 | | | 2,536,210 |
Series 2015 A, Ref. RB | | | 5.00% | | | | 02/15/2039 | | | | 4,000 | | | 4,028,015 |
Cleveland (City of) & Cuyahoga (County of), OH Port Authority (Euclid Avenue Development Corp.); Series 2014, Ref. RB | | | 5.00% | | | | 08/01/2039 | | | | 3,010 | | | 3,044,933 |
Franklin (County of), OH (CHE Trinity Health Credit Group); Series 2013, VRD RB(g) | | | 2.50% | | | | 12/01/2046 | | | | 10,000 | | | 9,986,626 |
Franklin (County of), OH (Nationwide Children’s Hospital); Series 2016, Ref. RB | | | 5.00% | | | | 11/01/2033 | | | | 2,610 | | | 2,807,173 |
Franklin (County of), OH (OhioHealth Corp.); Series 2011 B, Ref. RB(b) | | | 5.00% | | | | 05/15/2023 | | | | 4,685 | | | 4,698,549 |
Greater Cincinnati (Port of), OH Development Authority (IPS Cincinnati LLC); Series 2021, RB(b) | | | 4.38% | | | | 06/15/2026 | | | | 1,500 | | | 1,435,465 |
Miami University (A State University of Ohio); | | | | | | | | | | | | | | |
Series 2014, Ref. RB | | | 5.00% | | | | 09/01/2023 | | | | 1,465 | | | 1,477,730 |
Series 2017, Ref. RB | | | 5.00% | | | | 09/01/2023 | | | | 1,995 | | | 2,012,335 |
Ohio (State of); | | | | | | | | | | | | | | |
Series 2017 A, GO Bonds | | | 5.00% | | | | 09/01/2036 | | | | 5,000 | | | 5,073,777 |
Series 2019 A, GO Bonds | | | 5.00% | | | | 05/01/2036 | | | | 6,000 | | | 6,383,012 |
Ohio (State of) (Cleveland Clinic Health System Obligated Group); Series 2017, Ref. RB | | | 5.00% | | | | 01/01/2026 | | | | 1,205 | | | 1,267,102 |
Ohio (State of) (University Hospitals Health System, Inc.); Series 2016, Ref. RB | | | 5.00% | | | | 01/15/2036 | | | | 2,500 | | | 2,573,164 |
Ohio (State of) Air Quality Development Authority (Duke Energy Corp.); Series 2020 B, Ref. RB(b) | | | 4.00% | | | | 06/01/2027 | | | | 10,000 | | | 9,923,909 |
Ohio (State of) Air Quality Development Authority (Ohio Valley Electric Corp.); | | | | | | | | | | | | | | |
Series 2014, RB(b) | | | 2.40% | | | | 10/01/2029 | | | | 4,500 | | | 3,922,173 |
Series 2019 A, Ref. PCR | | | 3.25% | | | | 09/01/2029 | | | | 7,500 | | | 6,817,859 |
Ohio (State of) Higher Educational Facility Commission; | | | | | | | | | | | | | | |
Series 2015, Ref. RB | | | 5.00% | | | | 07/01/2041 | | | | 2,500 | | | 2,550,656 |
Series 2017, RB | | | 5.00% | | | | 07/01/2042 | | | | 1,505 | | | 1,560,042 |
Ohio (State of) Higher Educational Facility Commission (University of Dayton); | | | | | | | | | | | | | | |
Series 2015 A, Ref. RB | | | 5.00% | | | | 12/01/2036 | | | | 2,135 | | | 2,205,651 |
Series 2022 B, Ref. RB | | | 5.00% | | | | 02/01/2024 | | | | 1,425 | | | 1,445,974 |
Ohio (State of) Housing Finance Agency; | | | | | | | | | | | | | | |
Series 2017 A, RB (CEP - GNMA) | | | 4.10% | | | | 03/01/2042 | | | | 540 | | | 526,796 |
Series 2018 A, RB (CEP - GNMA) | | | 4.00% | | | | 09/01/2048 | | | | 785 | | | 769,215 |
Warren (County of), OH Port Authority (Corridor 75 Park); Series 2022 B, RB | | | 4.75% | | | | 12/01/2034 | | | | 1,095 | | | 1,099,519 |
| | | | | | | | | | | | | | | 83,860,510 |
| | | | |
Oklahoma–0.03% | | | | | | | | | | | | | | |
Oklahoma (State of) Turnpike Authority; Second Series 2017 C, RB | | | 5.00% | | | | 01/01/2035 | | | | 1,000 | | | 1,071,449 |
| | | | |
Oregon–1.06% | | | | | | | | | | | | | | |
Multnomah (County of), OR; Series 2017, GO Bonds | | | 5.00% | | | | 06/01/2023 | | | | 6,960 | | | 6,991,918 |
Multnomah (County of), OR Hospital Facilities Authority (Green Bonds); | | | | | | | | | | | | | | |
Series 2021 B, Ref. RB | | | 1.20% | | | | 06/01/2028 | | | | 1,100 | | | 928,756 |
Series 2021 B2, Ref. RB | | | 0.95% | | | | 06/01/2027 | | | | 2,835 | | | 2,462,810 |
Oregon (State of) Department of Transportation; | | | | | | | | | | | | | | |
Series 2017 C, Ref. RB | | | 5.00% | | | | 11/15/2025 | | | | 3,525 | | | 3,711,975 |
Series 2017 C, Ref. RB | | | 5.00% | | | | 11/15/2026 | | | | 2,000 | | | 2,150,892 |
Oregon (State of) Lottery; | | | | | | | | | | | | | | |
Series 2022 A, RB | | | 5.00% | | | | 04/01/2035 | | | | 2,815 | | | 3,261,491 |
Series 2022 A, RB | | | 5.00% | | | | 04/01/2036 | | | | 4,800 | | | 5,501,716 |
See accompanying Notes to Financial Statements which are an integral part of the financial statements.
21 Invesco Limited Term Municipal Income Fund
| | | | | | | | | | | | |
| | | Interest
Rate | | Maturity
Date | | | Principal
Amount
(000) | | | Value |
Oregon–(continued) | | | | | | | | | | | | |
Oregon Health & Science University; Series 2016 B, Ref. RB | | 5.00% | | | 07/01/2036 | | | $ | 3,270 | | | $ 3,381,675 |
Portland (City of), OR; Series 2020 A, Ref. RB | | 5.00% | | | 05/01/2035 | | | | 1,740 | | | 1,948,214 |
Salem-Keizer School District No. 24J; Series 2009 B, GO Bonds (CEP - Oregon School Bond Guaranty)(f) | | 0.00% | | | 06/15/2023 | | | | 2,500 | | | 2,476,463 |
Washington & Multnomah Counties School District No. 48J Beaverton; Series 2017 D, GO Bonds (CEP - Oregon School Bond Guaranty) | | 5.00% | | | 06/15/2035 | | | | 2,170 | | | 2,308,864 |
Yamhill (County of), OR Hospital Authority (Friendsview); Series 2021 B-2, RB | | 2.13% | | | 11/15/2027 | | | | 500 | | | 443,689 |
| | | | | | | | | | | | | 35,568,463 |
| | | | |
Pennsylvania–4.15% | | | | | | | | | | | | |
Allegheny (County of), PA; Series 2000 C51, VRD GO Bonds (LOC - PNC Bank
N.A.)(g)(h) | | 2.80% | | | 05/01/2027 | | | | 755 | | | 755,000 |
Allegheny (County of), PA Higher Education Building Authority (Carnegie Mellon University); Series 2022, Ref. RB (SOFR + 0.29%)(b)(c) | | 3.48% | | | 02/01/2033 | | | | 1,000 | | | 967,303 |
Allegheny (County of), PA Hospital Development Authority (Allegheny Health Network Obligated Group Issue); Series 2018, Ref. RB | | 5.00% | | | 04/01/2033 | | | | 3,800 | | | 4,058,064 |
Canon Mcmillan School District; Series 2014 D, GO Bonds (INS - BAM)(e) | | 5.00% | | | 12/15/2037 | | | | 3,000 | | | 3,054,018 |
Commonwealth Financing Authority; | | | | | | | | | | | | |
Series 2015 A, RB | | 5.00% | | | 06/01/2034 | | | | 6,000 | | | 6,168,628 |
Series 2018, RB | | 5.00% | | | 06/01/2025 | | | | 5,500 | | | 5,668,967 |
Series 2018, RB | | 5.00% | | | 06/01/2026 | | | | 2,000 | | | 2,094,781 |
Delaware (State of) River Port Authority; | | | | | | | | | | | | |
Series 2013, RB | | 5.00% | | | 01/01/2037 | | | | 3,500 | | | 3,547,538 |
Series 2013, RB | | 5.00% | | | 01/01/2040 | | | | 25,750 | | | 26,054,769 |
Lancaster (County of), PA Hospital Authority (Masonic Villages); Series 2008 D, VRD RB (LOC - JP Morgan Chase Bank N.A.)(g)(h) | | 2.05% | | | 07/01/2034 | | | | 4,380 | | | 4,380,000 |
Lancaster (County of), PA Hospital Authority (University of Pennsylvania); Series 2016 A, Ref. RB | | 5.00% | | | 08/15/2042 | | | | 4,775 | | | 4,907,476 |
Montgomery (County of), PA Higher Education & Health Authority (Thomas Jefferson University); | | | | | | | | | | | | |
Series 2018 A, Ref. RB | | 5.00% | | | 09/01/2023 | | | | 1,050 | | | 1,057,209 |
Series 2018 A, Ref. RB | | 5.00% | | | 09/01/2024 | | | | 1,000 | | | 1,019,180 |
Pennsylvania (Commonwealth of); | | | | | | | | | | | | |
First Series 2016, Ref. GO Bonds | | 5.00% | | | 09/15/2026 | | | | 5,000 | | | 5,358,356 |
Series 2018 A, Ref. COP | | 5.00% | | | 07/01/2023 | | | | 500 | | | 502,664 |
Series 2018 A, Ref. COP | | 5.00% | | | 07/01/2025 | | | | 500 | | | 520,722 |
Pennsylvania (Commonwealth of) Economic Development Financing Authority; Series 2013, RB | | 5.00% | | | 07/01/2033 | | | | 1,405 | | | 1,408,030 |
Pennsylvania (Commonwealth of) Higher Educational Facilities Authority (Thomas Jefferson University); Series 2015, Ref. RB | | 5.00% | | | 09/01/2039 | | | | 5,000 | | | 5,084,131 |
Pennsylvania (Commonwealth of) Housing Finance Agency (Social Bonds); Series 2021, Ref. RB | | 3.00% | | | 10/01/2051 | | | | 9,544 | | | 9,248,896 |
Pennsylvania (Commonwealth of) Public School Building Authority (Delaware County Community college); Series 2023, RB (INS - BAM)(e) | | 4.13% | | | 10/01/2048 | | | | 5,005 | | | 4,680,080 |
Pennsylvania (Commonwealth of) Turnpike Commission; | | | | | | | | | | | | |
Series 2011 A, RB | | 5.00% | | | 12/01/2023 | | | | 1,500 | | | 1,518,075 |
Series 2016 B, Ref. RB | | 5.00% | | | 06/01/2033 | | | | 1,345 | | | 1,410,660 |
Series 2016, Ref. RB | | 5.00% | | | 12/01/2033 | | | | 2,000 | | | 2,144,489 |
Series 2016, Ref. RB | | 5.00% | | | 12/01/2034 | | | | 2,525 | | | 2,686,895 |
Series 2019 A, RB | | 5.00% | | | 12/01/2029 | | | | 2,000 | | | 2,239,033 |
Series 2019, Ref. VRD RB (LOC - Td Bank N.A.)(g)(h) | | 2.78% | | | 12/01/2038 | | | | 5,000 | | | 5,000,000 |
Series 2020, Ref. VRD RB (LOC - TD Bank, N.A.)(g)(h) | | 2.78% | | | 12/01/2039 | | | | 11,275 | | | 11,275,000 |
Series 2022 A, Ref. RB | | 5.00% | | | 12/01/2035 | | | | 1,500 | | | 1,696,077 |
Series 2022 A, Ref. RB | | 5.00% | | | 12/01/2036 | | | | 1,455 | | | 1,626,921 |
Pennsylvania State University (The); Series 2015 B, Ref. RB | | 5.00% | | | 09/01/2034 | | | | 1,000 | | | 1,039,838 |
Philadelphia (City of), PA; Series 2015, Ref. RB | | 5.00% | | | 08/01/2023 | | | | 4,000 | | | 4,023,519 |
Pocono Mountains Industrial Park Authority (St. Luke’s Hospital-Monroe); Series 2015, RB | | 5.00% | | | 08/15/2040 | | | | 11,875 | | | 11,987,778 |
Tender Option Bond Trust Receipts/Certificates; Series 2022, VRD RB(d)(g) | | 2.83% | | | 06/01/2044 | | | | 2,500 | | | 2,500,000 |
| | | | | | | | | | | | | 139,684,097 |
| | | | |
Puerto Rico–1.65% | | | | | | | | | | | | |
Children’s Trust Fund; | | | | | | | | | | | | |
Series 2002, RB | | 5.38% | | | 05/15/2033 | | | | 60 | | | 60,020 |
Series 2002, RB | | 5.50% | | | 05/15/2039 | | | | 7,000 | | | 7,000,407 |
Series 2002, RB | | 5.63% | | | 05/15/2043 | | | | 900 | | | 909,048 |
See accompanying Notes to Financial Statements which are an integral part of the financial statements.
22 Invesco Limited Term Municipal Income Fund
| | | | | | | | | | | | |
| | | Interest
Rate | | Maturity
Date | | | Principal
Amount
(000) | | | Value |
Puerto Rico–(continued) | | | | | | | | | | | | |
Puerto Rico (Commonwealth of); | | | | | | | | | | | | |
Series 2021 A-1, GO Bonds | | 5.25% | | | 07/01/2023 | | | $ | 12,497 | | | $ 12,532,908 |
Series 2021 A-1, GO Bonds | | 5.38% | | | 07/01/2025 | | | | 10,233 | | | 10,390,154 |
Puerto Rico (Commonwealth of) Aqueduct & Sewer Authority; Series 2020 A, Ref. RB(d) | | 4.00% | | | 07/01/2023 | | | | 1,800 | | | 1,799,723 |
Puerto Rico (Commonwealth of) Electric Power Authority; | | | | | | | | | | | | |
Series 2004 PP, Ref. RB (INS - NATL)(e) | | 5.00% | | | 07/01/2025 | | | | 300 | | | 300,283 |
Series 2005 RR, RB (INS - SGI)(e) | | 5.00% | | | 07/01/2026 | | | | 4,000 | | | 4,015,480 |
Series 2005 SS, Ref. RB (INS - NATL)(e) | | 5.00% | | | 07/01/2024 | | | | 5,645 | | | 5,650,329 |
Series 2005 SS, Ref. RB (INS - NATL)(e) | | 5.00% | | | 07/01/2025 | | | | 355 | | | 355,335 |
Series 2007 TT, RB (INS - NATL)(e) | | 5.00% | | | 07/01/2023 | | | | 225 | | | 225,000 |
Series 2007 TT, RB (INS - NATL)(e) | | 5.00% | | | 07/01/2026 | | | | 270 | | | 270,255 |
Puerto Rico Sales Tax Financing Corp.; | | | | | | | | | | | | |
Series 2018 A-1, RB(f) | | 0.00% | | | 07/01/2024 | | | | 7,603 | | | 7,167,489 |
Series 2018 A-1, RB(f) | | 0.00% | | | 07/01/2027 | | | | 5,752 | | | 4,715,019 |
| | | | | | | | | | | | | 55,391,450 |
| | | | |
Rhode Island–0.62% | | | | | | | | | | | | |
Rhode Island Health and Educational Building Corp. (University of Rhode Island - Auxiliary Enterprise); Series 2009 B, RB (INS - AGC)(e) | | 5.25% | | | 09/15/2029 | | | | 1,100 | | | 1,100,745 |
Tobacco Settlement Financing Corp.; | | | | | | | | | | | | |
Series 2015 A, Ref. RB | | 5.00% | | | 06/01/2026 | | | | 1,145 | | | 1,170,528 |
Series 2015 A, Ref. RB | | 5.00% | | | 06/01/2027 | | | | 6,810 | | | 6,966,647 |
Series 2015 B, Ref. RB | | 4.50% | | | 06/01/2045 | | | | 11,835 | | | 11,609,941 |
| | | | | | | | | | | | | 20,847,861 |
| | | | |
South Carolina–0.90% | | | | | | | | | | | | |
Coastal Carolina University; Series 2014, RB | | 5.00% | | | 06/01/2034 | | | | 1,355 | | | 1,386,318 |
Patriots Energy Group Financing Agency; Series 2018 A, RB(b) | | 4.00% | | | 02/01/2024 | | | | 8,750 | | | 8,774,931 |
SCAGO Educational Facilities Corp. for Pickens School District; Series 2015, Ref. RB | | 5.00% | | | 12/01/2026 | | | | 2,250 | | | 2,342,313 |
South Carolina (State of) Jobs-Economic Development Authority; Series 2020, RB(b) | | 5.00% | | | 10/01/2025 | | | | 5,000 | | | 5,161,972 |
South Carolina (State of) Jobs-Economic Development Authority (AnMed Health); Series 2018 A, Ref. RB | | 5.00% | | | 05/01/2025 | | | | 1,500 | | | 1,544,040 |
South Carolina (State of) Jobs-Economic Development Authority (Prisma Health Obligated Group); | | | | | | | | | | | | |
Series 2018 A, Ref. RB | | 5.00% | | | 05/01/2024 | | | | 1,000 | | | 1,015,942 |
Series 2018 C, VRD RB(g) | | 3.39% | | | 05/01/2048 | | | | 10,000 | | | 10,000,000 |
| | | | | | | | | | | | | 30,225,516 |
| | | | |
South Dakota–0.18% | | | | | | | | | | | | |
South Dakota Conservancy District; | | | | | | | | | | | | |
Series 2014, RB | | 5.00% | | | 08/01/2031 | | | | 3,020 | | | 3,094,904 |
Series 2014, RB | | 5.00% | | | 08/01/2032 | | | | 2,765 | | | 2,832,422 |
| | | | | | | | | | | | | 5,927,326 |
| | | | |
Tennessee–2.81% | | | | | | | | | | | | |
Greeneville (Town of), TN Health & Educational Facilities Board (Ballad Health Obligated Group); | | | | | | | | | | | | |
Series 2018 A, Ref. RB | | 5.00% | | | 07/01/2023 | | | | 1,800 | | | 1,806,732 |
Series 2018 A, Ref. RB | | 5.00% | | | 07/01/2034 | | | | 3,695 | | | 3,701,508 |
Metropolitan Nashville Airport Authority (The); Series 2015 A, RB | | 5.00% | | | 07/01/2045 | | | | 4,000 | | | 4,094,415 |
Nashville (City of) & Davidson (County of), TN Metropolitan Government Health & Educational Facilities Board (The) (Vanderbilt University Medical Center); Series 2016 A, RB | | 5.00% | | | 07/01/2035 | | | | 20,330 | | | 21,066,493 |
Shelby (County of), TN Health, Educational & Housing Facilities Board (Methodist Le Bonheur Healthcare); Series 2017 A, RB | | 5.00% | | | 05/01/2024 | | | | 1,840 | | | 1,873,341 |
Tennessee Energy Acquisition Corp.; | | | | | | | | | | | | |
Series 2006 A, RB | | 5.25% | | | 09/01/2023 | | | | 39,950 | | | 40,116,280 |
Series 2017 A, RB(a)(b) | | 4.00% | | | 05/15/2023 | | | | 13,215 | | | 13,230,715 |
Series 2018, RB(b) | | 4.00% | | | 11/01/2025 | | | | 3,420 | | | 3,418,001 |
Tennessee Housing Development Agency (Social Bonds); Series 2022, RB | | 5.50% | | | 01/01/2053 | | | | 4,750 | | | 5,041,471 |
| | | | | | | | | | | | | 94,348,956 |
| | | | |
Texas–13.01% | | | | | | | | | | | | |
Arlington Higher Education Finance Corp. (Basis Texas Charter School); Series 2021, RB(b)(d) | | 4.50% | | | 06/15/2026 | | | | 1,400 | | | 1,340,097 |
See accompanying Notes to Financial Statements which are an integral part of the financial statements.
23 Invesco Limited Term Municipal Income Fund
| | | | | | | | | | | | |
| | | Interest
Rate | | Maturity
Date | | | Principal
Amount
(000) | | | Value |
Texas–(continued) | | | | | | | | | | | | |
Aubrey Independent School District; | | | | | | | | | | | | |
Series 2022, GO Bonds (CEP - Texas Permanent School Fund) | | 5.00% | | | 02/15/2035 | | | $ | 1,600 | | | $ 1,839,432 |
Series 2022, GO Bonds (CEP - Texas Permanent School Fund) | | 5.00% | | | 02/15/2036 | | | | 2,250 | | | 2,553,178 |
Series 2022, GO Bonds (CEP - Texas Permanent School Fund) | | 5.00% | | | 02/15/2037 | | | | 2,550 | | | 2,863,537 |
Austin (City of), TX; | | | | | | | | | | | | |
Series 2012, RB | | 4.00% | | | 11/15/2037 | | | | 300 | | | 299,988 |
Series 2017, Ref. RB | | 5.00% | | | 11/15/2031 | | | | 1,000 | | | 1,065,549 |
Series 2022, Ref. RB | | 5.00% | | | 11/15/2034 | | | | 825 | | | 960,287 |
Series 2022, Ref. RB | | 5.00% | | | 11/15/2035 | | | | 1,250 | | | 1,436,858 |
Series 2022, Ref. RB | | 5.00% | | | 11/15/2036 | | | | 1,500 | | | 1,708,819 |
Series 2022, Ref. RB | | 5.00% | | | 11/15/2037 | | | | 1,250 | | | 1,413,717 |
Series 2022, Ref. RB | | 5.00% | | | 11/15/2038 | | | | 1,750 | | | 1,971,878 |
Austin Convention Enterprises, Inc.; | | | | | | | | | | | | |
Series 2017, Ref. RB | | 5.00% | | | 01/01/2025 | | | | 500 | | | 503,020 |
Series 2017, Ref. RB | | 5.00% | | | 01/01/2025 | | | | 400 | | | 397,503 |
Austin Independent School District; | | | | | | | | | | | | |
Series 2022 B, Ref. GO Bonds (CEP - Texas Permanent School Fund) | | 5.00% | | | 08/01/2032 | | | | 2,080 | | | 2,440,814 |
Series 2023, GO Bonds | | 5.00% | | | 08/01/2037 | | | | 2,250 | | | 2,557,857 |
Series 2023, GO Bonds | | 5.00% | | | 08/01/2038 | | | | 2,000 | | | 2,261,843 |
Bridge City Independent School District; | | | | | | | | | | | | |
Series 2022, GO Bonds (CEP - Texas Permanent School Fund) | | 5.00% | | | 02/15/2035 | | | | 2,385 | | | 2,730,222 |
Series 2022, GO Bonds (CEP - Texas Permanent School Fund) | | 5.00% | | | 02/15/2036 | | | | 1,610 | | | 1,821,356 |
Central Texas Regional Mobility Authority; Series 2021 B, RB | | 5.00% | | | 01/01/2033 | | | | 1,225 | | | 1,364,091 |
Clifton Higher Education Finance Corp. (Idea Public Schools); Series 2013, RB | | 5.00% | | | 08/15/2023 | | | | 200 | | | 201,021 |
Crockett County Consolidated Common School District No. 1; Series 2023, GO Bonds (INS - AGM)(e) | | 5.00% | | | 08/15/2037 | | | | 1,695 | | | 1,720,039 |
Dallas & Fort Worth (Cities of), TX (Dallas/Fort Worth International Airport); | | | | | | | | | | | | |
Series 2013 D, Ref. RB | | 5.00% | | | 11/01/2033 | | | | 1,000 | | | 1,010,744 |
Series 2022 B, Ref. RB | | 5.00% | | | 11/01/2035 | | | | 1,000 | | | 1,132,636 |
Series 2022 B, Ref. RB | | 5.00% | | | 11/01/2038 | | | | 4,500 | | | 4,994,405 |
Denton (City of), TX; Series 2017, RB | | 5.00% | | | 12/01/2035 | | | | 3,240 | | | 3,401,953 |
Dickinson Independent School District; Series 2000, Ref. GO Bonds (CEP - Texas Permanent School Fund) | | 6.00% | | | 02/15/2028 | | | | 8,590 | | | 9,401,319 |
El Paso (City of), TX; Series 2019 B, Ref. RB | | 5.00% | | | 03/01/2024 | | | | 1,205 | | | 1,227,293 |
Forney Independent School District; | | | | | | | | | | | | |
Series 2022 B, GO Bonds (CEP - Texas Permanent School Fund) | | 5.00% | | | 08/15/2036 | | | | 2,000 | | | 2,263,987 |
Series 2022 B, GO Bonds (CEP - Texas Permanent School Fund) | | 5.00% | | | 08/15/2037 | | | | 2,000 | | | 2,250,938 |
Frisco (City of), TX; Series 2018, GO Bonds | | 5.00% | | | 02/15/2024 | | | | 1,800 | | | 1,832,350 |
Frisco Independent School District; Series 2016 A, Ref. GO Bonds (CEP - Texas Permanent School Fund) | | 5.00% | | | 08/15/2025 | | | | 2,500 | | | 2,616,689 |
Galveston Independent School District; Series 2022, GO Bonds (CEP - Texas Permanent School Fund) | | 5.00% | | | 02/01/2037 | | | | 1,750 | | | 1,935,804 |
Garland (City of), TX; Series 2016 B, RB | | 5.00% | | | 03/01/2034 | | | | 1,000 | | | 1,056,220 |
Grand Parkway Transportation Corp. (TELA Supported); Series 2018 B, RB(b) | | 5.00% | | | 10/01/2023 | | | | 5,000 | | | 5,042,176 |
Harris (County of), TX; | | | | | | | | | | | | |
Series 2015 A, Ref. GO Bonds | | 5.00% | | | 10/01/2031 | | | | 4,555 | | | 4,766,605 |
Series 2015 A, Ref. GO Bonds | | 5.00% | | | 10/01/2036 | | | | 3,855 | | | 3,984,684 |
Series 2016 A, Ref. RB | | 5.00% | | | 08/15/2034 | | | | 1,685 | | | 1,779,829 |
Harris (County of), TX Metropolitan Transit Authority; Series 2017 B, Ref. RB | | 5.00% | | | 11/01/2025 | | | | 3,040 | | | 3,196,124 |
Harris County Cultural Education Facilities Finance Corp.; | | | | | | | | | | | | |
Series 2017, Ref. RB | | 5.00% | | | 11/15/2033 | | | | 3,675 | | | 3,987,324 |
Series 2019 A, Ref. RB (1 mo. USD LIBOR + 0.65%)(b)(c) | | 3.91% | | | 07/01/2024 | | | | 8,000 | | | 8,018,949 |
Harris County Flood Control District; | | | | | | | | | | | | |
Series 2022 A, GO Bonds | | 5.00% | | | 10/01/2034 | | | | 3,000 | | | 3,501,448 |
Series 2022 A, GO Bonds | | 5.00% | | | 10/01/2035 | | | | 2,600 | | | 2,991,172 |
Series 2022 A, GO Bonds | | 5.25% | | | 10/01/2036 | | | | 2,100 | | | 2,428,813 |
Series 2022 A, GO Bonds | | 5.25% | | | 10/01/2037 | | | | 2,500 | | | 2,869,816 |
Hays Consolidated Independent School District; Series 2022, GO Bonds (CEP - Texas Permanent School Fund) | | 4.00% | | | 02/15/2037 | | | | 1,000 | | | 1,006,132 |
See accompanying Notes to Financial Statements which are an integral part of the financial statements.
24 Invesco Limited Term Municipal Income Fund
| | | | | | | | | | | | |
| | | Interest
Rate | | Maturity
Date | | | Principal
Amount
(000) | | | Value |
Texas–(continued) | | | | | | | | | | | | |
Houston (City of), TX; | | | | | | | | | | | | |
Series 2004 B-6, Ref. VRD RB (LOC - Sumitomo Mitsui Banking)(g)(h) | | 2.82% | | | 05/15/2034 | | | $ | 150 | | | $ 150,000 |
Series 2015 A, Ref. RB | | 5.00% | | | 11/15/2036 | | | | 41,290 | | | 43,034,280 |
Series 2017 A, Ref. GO Bonds | | 5.00% | | | 03/01/2029 | | | | 6,000 | | | 6,493,650 |
Houston Independent School District; Series 2016 A, Ref. GO Bonds (CEP - Texas Permanent School Fund) | | 5.00% | | | 02/15/2025 | | | | 3,750 | | | 3,886,449 |
Lamar Consolidated Independent School District; | | | | | | | | | | | | |
Series 2023, GO Bonds | | 5.00% | | | 02/15/2036 | | | | 3,000 | | | 3,415,200 |
Series 2023, GO Bonds | | 5.00% | | | 02/15/2037 | | | | 2,000 | | | 2,238,566 |
Series 2023, GO Bonds | | 5.00% | | | 02/15/2038 | | | | 1,750 | | | 1,939,393 |
Leander Independent School District; Series 2014 D, Ref. GO Bonds(a)(f) | | 0.00% | | | 08/15/2027 | | | | 5,675 | | | 4,857,668 |
Lower Colorado River Authority; | | | | | | | | | | | | |
Series 2013, Ref. RB | | 5.00% | | | 05/15/2039 | | | | 5,000 | | | 5,005,664 |
Series 2015, Ref. RB | | 5.00% | | | 05/15/2040 | | | | 3,770 | | | 3,838,525 |
New Hope Cultural Education Facilities Finance Corp. (Jubilee Academic Center); | | | | | | | | | | | | |
Series 2021, Ref. RB(d) | | 4.00% | | | 08/15/2026 | | | | 660 | | | 638,886 |
Series 2021, Ref. RB(d) | | 4.00% | | | 08/15/2027 | | | | 520 | | | 500,060 |
Series 2021, Ref. RB(d) | | 4.00% | | | 08/15/2028 | | | | 540 | | | 515,982 |
Series 2021, Ref. RB(d) | | 4.00% | | | 08/15/2030 | | | | 1,405 | | | 1,325,972 |
New Hope Cultural Education Facilities Finance Corp. (Outlook at Windhaven (The)); Series 2022 B3, RB | | 4.25% | | | 10/01/2026 | | | | 3,500 | | | 3,464,414 |
North East Texas Regional Mobility Authority; Series 2016, RB | | 5.00% | | | 01/01/2026 | | | | 1,870 | | | 1,895,810 |
North Texas Tollway Authority; | | | | | | | | | | | | |
Series 2015 A, Ref. RB | | 5.00% | | | 01/01/2035 | | | | 7,000 | | | 7,227,037 |
Series 2019 B, Ref. RB | | 5.00% | | | 01/01/2024 | | | | 2,000 | | | 2,028,086 |
Pasadena Independent School District; Series 2018, GO Bonds (CEP - Texas Permanent School Fund) | | 5.00% | | | 02/15/2039 | | | | 1,075 | | | 1,150,058 |
Pearland (City of), TX; | | | | | | | | | | | | |
Series 2020, Ref. GO Bonds | | 5.00% | | | 03/01/2024 | | | | 1,010 | | | 1,027,688 |
Series 2022 B, GO Bonds | | 5.00% | | | 03/01/2030 | | | | 1,970 | | | 2,089,480 |
Permanent University Fund - University of Texas System; Series 2014, RB | | 5.00% | | | 07/01/2041 | | | | 50,000 | | | 50,167,175 |
Plano Independent School District; | | | | | | | | | | | | |
Series 2023, GO Bonds | | 5.00% | | | 02/15/2036 | | | | 1,650 | | | 1,887,288 |
Series 2023, GO Bonds | | 5.00% | | | 02/15/2037 | | | | 3,300 | | | 3,745,004 |
Series 2023, GO Bonds | | 5.00% | | | 02/15/2038 | | | | 2,850 | | | 3,218,272 |
Port Arthur (Port of), TX Navigation District; Series 2010, VRD RB(g) | | 3.67% | | | 11/01/2040 | | | | 11,825 | | | 11,825,000 |
Pottsboro Independent School District; Series 2022, GO Bonds (CEP - Texas Permanent School Fund) | | 5.00% | | | 02/15/2040 | | | | 1,200 | | | 1,334,831 |
San Antonio (City of), TX; | | | | | | | | | | | | |
Series 2014, RB | | 5.00% | | | 02/01/2031 | | | | 2,550 | | | 2,587,533 |
Series 2017, RB | | 5.00% | | | 02/01/2033 | | | | 1,000 | | | 1,084,631 |
San Antonio Independent School District; | | | | | | | | | | | | |
Series 2022, GO Bonds (CEP - Texas Permanent School Fund) | | 5.00% | | | 08/15/2034 | | | | 1,400 | | | 1,631,892 |
Series 2022, GO Bonds (CEP - Texas Permanent School Fund) | | 5.00% | | | 08/15/2036 | | | | 2,750 | | | 3,128,190 |
Sienna Management District; | | | | | | | | | | | | |
Series 2021, GO Bonds (INS - BAM)(e) | | 2.00% | | | 10/15/2029 | | | | 535 | | | 478,685 |
Series 2021, GO Bonds (INS - BAM)(e) | | 2.00% | | | 10/15/2030 | | | | 555 | | | 487,742 |
Series 2021, GO Bonds (INS - BAM)(e) | | 2.00% | | | 10/15/2031 | | | | 575 | | | 495,219 |
Series 2021, GO Bonds (INS - BAM)(e) | | 2.00% | | | 10/15/2032 | | | | 595 | | | 501,511 |
Spring Branch Independent School District; | | | | | | | | | | | | |
Series 2022, GO Bonds (CEP - Texas Permanent School Fund) | | 5.00% | | | 02/01/2035 | | | | 2,000 | | | 2,285,618 |
Series 2022, GO Bonds (CEP - Texas Permanent School Fund) | | 5.00% | | | 02/01/2036 | | | | 2,565 | | | 2,900,021 |
Series 2022, GO Bonds (CEP - Texas Permanent School Fund) | | 5.00% | | | 02/01/2037 | | | | 2,000 | | | 2,244,045 |
Series 2022, GO Bonds (CEP - Texas Permanent School Fund) | | 5.00% | | | 02/01/2038 | | | | 2,250 | | | 2,511,829 |
Spring Independent School District; | | | | | | | | | | | | |
Series 2023, GO Bonds | | 5.00% | | | 08/15/2036 | | | | 3,070 | | | 3,515,090 |
Series 2023, GO Bonds | | 5.00% | | | 08/15/2037 | | | | 3,100 | | | 3,516,422 |
Series 2023, GO Bonds | | 5.00% | | | 08/15/2038 | | | | 6,310 | | | 7,120,369 |
Tarrant County Cultural Education Facilities Finance Corp. (Christus Health); Series 2018 A, Ref. RB | | 5.00% | | | 07/01/2024 | | | | 1,850 | | | 1,885,966 |
Tarrant County Cultural Education Facilities Finance Corp. (Texas Health Resources System); | | | | | | | | | | | | |
Series 2012 B, VRD RB(g) | | 2.80% | | | 11/15/2047 | | | | 16,615 | | | 16,615,000 |
Series 2016 A, Ref. RB | | 5.00% | | | 02/15/2041 | | | | 19,835 | | | 20,347,852 |
See accompanying Notes to Financial Statements which are an integral part of the financial statements.
25 Invesco Limited Term Municipal Income Fund
| | | | | | | | | | | | |
| | | Interest
Rate | | Maturity
Date | | | Principal
Amount
(000) | | | Value |
Texas–(continued) | | | | | | | | | | | | |
Texas (State of); | | | | | | | | | | | | |
Series 2015 B, Ref. GO Bonds | | 5.00% | | | 10/01/2036 | | | $ | 25,000 | | | $ 26,022,590 |
Series 2018 A, Ref. GO Bonds | | 5.00% | | | 10/01/2023 | | | | 5,000 | | | 5,051,970 |
Series 2022 B, Ref. GO Bonds | | 5.00% | | | 08/01/2038 | | | | 3,100 | | | 3,205,401 |
Texas (State of) (Water Financial Assistance); | | | | | | | | | | | | |
Series 2022 B, Ref. GO Bonds | | 5.00% | | | 08/01/2039 | | | | 7,680 | | | 7,924,941 |
Series 2022 B, Ref. GO Bonds | | 5.00% | | | 08/01/2041 | | | | 2,700 | | | 2,775,406 |
Texas (State of) Transportation Commission (Central Texas Turnpike System); | | | | | | | | | | | | |
Series 2012 A, Ref. RB | | 4.00% | | | 08/15/2038 | | | | 350 | | | 330,634 |
Series 2015 C, Ref. RB | | 5.00% | | | 08/15/2031 | | | | 14,275 | | | 14,541,741 |
Series 2015 C, Ref. RB | | 5.00% | | | 08/15/2033 | | | | 5,000 | | | 5,088,162 |
Texas (State of) Water Development Board (State Water Implementation Fund); Series 2015, RB | | 5.00% | | | 10/15/2031 | | | | 2,875 | | | 3,007,234 |
Texas Municipal Gas Acquisition & Supply Corp. I; Series 2008 D, RB | | 6.25% | | | 12/15/2026 | | | | 12,075 | | | 12,604,147 |
Texas State University Board of Regents; Series 2017 A, Ref. RB | | 5.00% | | | 03/15/2023 | | | | 2,150 | | | 2,151,424 |
Trinity River Authority; Series 2017, Ref. RB | | 5.00% | | | 08/01/2034 | | | | 1,200 | | | 1,287,615 |
West Travis County Public Utility Agency; Series 2017, Ref. RB (INS - BAM)(e) | | 5.00% | | | 08/15/2030 | | | | 1,000 | | | 1,085,778 |
| | | | | | | | | | | | | 437,463,612 |
| | | | |
Utah–0.38% | | | | | | | | | | | | |
Grand (County of), UT School District Local Building Authority; Series 2019, RB (INS - AGM)(e) | | 5.00% | | | 12/15/2038 | | | | 2,040 | | | 2,103,496 |
Salt Lake City (City of), UT; Series 2017 B, RB | | 5.00% | | | 07/01/2042 | | | | 1,100 | | | 1,136,699 |
Utah (State of) Building Ownership Authority (Master Lease Program); Series 2022, RB | | 5.00% | | | 05/15/2036 | | | | 2,735 | | | 3,136,483 |
Utah Telecommunication Open Infrastructure Agency; | | | | | | | | | | | | |
Series 2022, Ref. RB | | 5.25% | | | 06/01/2033 | | | | 1,000 | | | 1,161,384 |
Series 2022, Ref. RB | | 5.25% | | | 06/01/2034 | | | | 1,000 | | | 1,154,898 |
Series 2022, Ref. RB | | 5.25% | | | 06/01/2035 | | | | 1,000 | | | 1,144,240 |
Series 2022, Ref. RB | | 5.25% | | | 06/01/2037 | | | | 2,770 | | | 3,116,251 |
| | | | | | | | | | | | | 12,953,451 |
| | | | |
Vermont–0.03% | | | | | | | | | | | | |
Vermont (State of) Educational & Health Buildings Financing Agency (University of Vermont Medical Center (The)); Series 2016 A, Ref. RB | | 5.00% | | | 12/01/2032 | | | | 1,120 | | | 1,174,310 |
| | | | |
Virgin Islands–0.15% | | | | | | | | | | | | |
Virgin Islands (Government of) Public Finance Authority (Garvee); | | | | | | | | | | | | |
Series 2015, RB(d) | | 5.00% | | | 09/01/2023 | | | | 1,750 | | | 1,757,722 |
Series 2015, RB(d) | | 5.00% | | | 09/01/2024 | | | | 1,650 | | | 1,672,510 |
Series 2015, RB(d) | | 5.00% | | | 09/01/2025 | | | | 1,500 | | | 1,509,982 |
| | | | | | | | | | | | | 4,940,214 |
| | | | |
Virginia–0.67% | | | | | | | | | | | | |
Chesapeake Bay Bridge & Tunnel District; Series 2019, RAN | | 5.00% | | | 11/01/2023 | | | | 6,360 | | | 6,420,690 |
Fairfax (County of), VA Industrial Development Authority (Inova Health System); Series 2018 B-2, Ref. RB(b) | | 5.00% | | | 05/15/2023 | | | | 3,825 | | | 3,836,375 |
Hampton (City of), VA Roads Transportation Accountability Commission; Series 2021 A, RB | | 5.00% | | | 07/01/2026 | | | | 5,000 | | | 5,313,698 |
Stafford (County of) & Staunton (City of), VA Industrial Development Authority; Series 2008 B, RB | | 6.50% | | | 08/01/2028 | | | | 930 | | | 931,654 |
Virginia (Commonwealth of) Housing Development Authority; Subseries 2012 C-2, RB | | 3.45% | | | 04/01/2038 | | | | 4,255 | | | 4,033,212 |
York (County of), VA Economic Development Authority (Virginia Electic & Power Co.); Series 2009 A, PCR(b) | | 1.90% | | | 06/01/2023 | | | | 2,000 | | | 1,988,539 |
| | | | | | | | | | | | | 22,524,168 |
| | | | |
Washington–4.61% | | | | | | | | | | | | |
Chelan County Public Utility District No. 1; Series 2008 B, Ref. VRD RB(g) | | 2.75% | | | 07/01/2032 | | | | 135 | | | 135,000 |
Energy Northwest (Columbia Generating Station); | | | | | | | | | | | | |
Series 2014, Ref. RB | | 5.00% | | | 07/01/2031 | | | | 8,150 | | | 8,354,461 |
Series 2022, Ref. RB | | 5.00% | | | 07/01/2033 | | | | 16,300 | | | 19,178,029 |
King County School District No. 401 Highline; Series 2022 B, Ref. GO Bonds (CEP - Oregon School Bond Guaranty) | | 5.00% | | | 12/01/2025 | | | | 5,400 | | | 5,684,580 |
Seattle (Port of), WA; Series 2017, GO Bonds | | 5.00% | | | 01/01/2036 | | | | 4,000 | | | 4,229,994 |
See accompanying Notes to Financial Statements which are an integral part of the financial statements.
26 Invesco Limited Term Municipal Income Fund
| | | | | | | | | | | | |
| | | Interest
Rate | | Maturity
Date | | | Principal
Amount
(000) | | | Value |
Washington–(continued) | | | | | | | | | | | | |
Washington (State of); | | | | | | | | | | | | |
Series 1998 C, GO Bonds | | 5.50% | | | 07/01/2023 | | | $ | 985 | | | $ 992,734 |
Series 2013 A, GO Bonds | | 5.00% | | | 08/01/2035 | | | | 3,265 | | | 3,286,351 |
Series 2013 A, GO Bonds | | 5.00% | | | 08/01/2036 | | | | 2,750 | | | 2,765,830 |
Series 2013 B, GO Bonds | | 5.00% | | | 08/01/2033 | | | | 2,005 | | | 2,020,348 |
Series 2015 B, GO Bonds | | 5.00% | | | 02/01/2039 | | | | 1,575 | | | 1,610,984 |
Series 2016 C, GO Bonds | | 5.00% | | | 02/01/2035 | | | | 4,000 | | | 4,174,846 |
Series 2016 C, GO Bonds | | 5.00% | | | 02/01/2036 | | | | 1,425 | | | 1,482,067 |
Series 2017 A, COP | | 5.00% | | | 07/01/2033 | | | | 2,100 | | | 2,260,581 |
Series 2019 C, GO Bonds | | 5.00% | | | 02/01/2024 | | | | 3,760 | | | 3,824,536 |
Washington (State of) (Bid Group 2); Series 2022 A-2, GO Bonds | | 5.00% | | | 08/01/2039 | | | | 10,000 | | | 11,148,283 |
Washington (State of) Health Care Facilities Authority; | | | | | | | | | | | | |
Series 2015 A, RB | | 5.00% | | | 08/15/2034 | | | | 2,170 | | | 2,223,921 |
Series 2015, Ref. RB | | 5.00% | | | 10/01/2038 | | | | 10,790 | | | 11,078,850 |
Washington (State of) Health Care Facilities Authority (Catholic Health Initiatives); Series 2013, RB (SIFMA Municipal Swap Index + 1.40%)(b)(c) | | 4.20% | | | 01/01/2025 | | | | 5,650 | | | 5,667,066 |
Washington (State of) Health Care Facilities Authority (Commonspirit Health); | | | | | | | | | | | | |
Series 2019 B-1, Ref. RB(b) | | 5.00% | | | 08/01/2024 | | | | 11,685 | | | 11,851,713 |
Series 2019 B-3, Ref. RB(b) | | 5.00% | | | 08/01/2026 | | | | 1,010 | | | 1,044,785 |
Washington (State of) Health Care Facilities Authority (Providence Health & Services); | | | | | | | | | | | | |
Series 2012 A, RB | | 5.00% | | | 10/01/2032 | | | | 1,940 | | | 1,949,144 |
Series 2012 A, RB | | 4.00% | | | 10/01/2034 | | | | 17,500 | | | 17,321,719 |
Series 2012 A, RB | | 4.25% | | | 10/01/2040 | | | | 2,450 | | | 2,436,313 |
Series 2012 A, RB | | 5.00% | | | 10/01/2042 | | | | 26,650 | | | 25,591,294 |
Washington (State of) Housing Finance Commission (Social Certificates); Series 2021-1A, Revenue Ctfs. | | 3.50% | | | 12/20/2035 | | | | 2,372 | | | 2,172,100 |
Washington (State of) Tobacco Settlement Authority; Series 2018, Ref. RB | | 5.00% | | | 06/01/2023 | | | | 2,500 | | | 2,512,530 |
| | | | | | | | | | | | | 154,998,059 |
| | | | |
West Virginia–0.05% | | | | | | | | | | | | |
West Virginia (State of) State School Building Authority; Series 2016 A, RB | | 5.00% | | | 07/01/2027 | | | | 1,595 | | | 1,663,297 |
| | | | |
Wisconsin–1.12% | | | | | | | | | | | | |
Southern Door County School District; Series 2023 A, GO Bonds | | 5.00% | | | 03/01/2024 | | | | 1,405 | | | 1,428,635 |
Wisconsin (State of); Series 2017 B, Ref. RB(a)(b) | | 5.00% | | | 05/01/2026 | | | | 5,000 | | | 5,302,376 |
Wisconsin (State of) Department of Transportation; Series 2017-1, Ref. RB | | 5.00% | | | 07/01/2025 | | | | 3,790 | | | 3,954,024 |
Wisconsin (State of) Health & Educational Facilities Authority (Advocate Aurora Health Credit Group); Series 2018 B-3, Ref. RB(b) | | 5.00% | | | 01/31/2024 | | | | 2,495 | | | 2,530,597 |
Wisconsin (State of) Health & Educational Facilities Authority (Ascension Health Credit Group); Series 2016 A, Ref. RB | | 5.00% | | | 11/15/2039 | | | | 3,745 | | | 3,854,754 |
Wisconsin (State of) Health & Educational Facilities Authority (Ascension Senior Credit Group); Series 2016, Ref. RB | | 5.00% | | | 11/15/2036 | | | | 5,000 | | | 5,169,874 |
Wisconsin (State of) Health & Educational Facilities Authority (Mercy Alliance); Series 2012, RB | | 5.00% | | | 06/01/2032 | | | | 1,000 | | | 1,000,201 |
Wisconsin (State of) Health & Educational Facilities Authority (Prohealth Care Obligated Group); Series 2015, Ref. RB | | 5.00% | | | 08/15/2039 | | | | 1,535 | | | 1,547,924 |
Wisconsin (State of) Health & Educational Facilities Authority (Thedacare, Inc.); Series 2015, Ref. RB | | 5.00% | | | 12/15/2034 | | | | 8,600 | | | 8,808,258 |
Wisconsin (State of) Public Finance Authority (Barton College); Series 2018 A, RB | | 5.00% | | | 03/01/2028 | | | | 1,335 | | | 1,330,494 |
Wisconsin Rapids School District; Series 2020, Ref. GO Bonds | | 5.00% | | | 04/01/2024 | | | | 1,640 | | | 1,671,359 |
WPPI Energy; Series 2014 A, Ref. RB | | 5.00% | | | 07/01/2031 | | | | 1,000 | | | 1,016,178 |
| | | | | | | | | | | | | 37,614,674 |
TOTAL INVESTMENTS IN SECURITIES(i)–98.13% (Cost $3,310,987,272) | | | | | | | | | | | | 3,299,076,257 |
OTHER ASSETS LESS LIABILITIES–1.87% | | | | | | | | | | | | 62,784,278 |
NET ASSETS–100.00% | | | | | | | | | | | | $3,361,860,535 |
See accompanying Notes to Financial Statements which are an integral part of the financial statements.
27 Invesco Limited Term Municipal Income Fund
Investment Abbreviations:
| | |
| AGC | | – Assured Guaranty Corp. |
| AGM | | – Assured Guaranty Municipal Corp. |
| AMBAC | | – American Municipal Bond Assurance Corp. |
| BAM | | – Build America Mutual Assurance Co. |
| CEP | | – Credit Enhancement Provider |
| COP | | – Certificates of Participation |
| CPI | | – Consumer Price Index |
| Ctfs. | | – Certificates |
| FGIC | | – Financial Guaranty Insurance Company |
| FHLMC | | – Federal Home Loan Mortgage Corp. |
| GNMA | | – Government National Mortgage Association |
| GO | | – General Obligation |
| INS | | – Insurer |
| LIBOR | | – London Interbank Offered Rate |
| LOC | | – Letter of Credit |
| NATL | | – National Public Finance Guarantee Corp. |
| PCR | | – Pollution Control Revenue Bonds |
| RAN | | – Revenue Anticipation Notes |
| RB | | – Revenue Bonds |
| Ref. | | – Refunding |
| RN | | – Revenue Notes |
| SGI | | – Syncora Guarantee, Inc. |
| SIFMA | | – Securities Industry and Financial Markets Association |
| SOFR | | – Secured Overnight Financing Rate |
| USD | | – U.S. Dollar |
| VRD | | – Variable Rate Demand |
Notes to Schedule of Investments:
| (a) | Advance refunded; secured by an escrow fund of U.S. Government obligations or other highly rated collateral. |
| (b) | Security has an irrevocable call by the issuer or mandatory put by the holder. Maturity date reflects such call or put. |
| (c) | Interest or dividend rate is redetermined periodically. Rate shown is the rate in effect on February 28, 2023. |
| (d) | Security purchased or received in a transaction exempt from registration under the Securities Act of 1933, as amended (the “1933 Act”). The security may be resold pursuant to an exemption from registration under the 1933 Act, typically to qualified institutional buyers. The aggregate value of these securities at February 28, 2023 was $129,516,893, which represented 3.85% of the Fund’s Net Assets. |
| (e) | Principal and/or interest payments are secured by the bond insurance company listed. |
| (f) | Zero coupon bond issued at a discount. |
| (g) | Demand security payable upon demand by the Fund at specified time intervals no greater than thirteen months. Interest rate is redetermined periodically by the issuer or agent based on current market conditions. Rate shown is the rate in effect on February 28, 2023. |
| (h) | Principal and interest payments are fully enhanced by a letter of credit from the bank listed or a predecessor bank, branch or subsidiary. |
| (i) | Entities may either issue, guarantee, back or otherwise enhance the credit quality of a security. The entities are not primarily responsible for the issuer’s obligations but may be called upon to satisfy issuer’s obligations. No concentration of any single entity was greater than 5% each. |
See accompanying Notes to Financial Statements which are an integral part of the financial statements.
28 Invesco Limited Term Municipal Income Fund
Statement of Assets and Liabilities
February 28, 2023
| | | | |
Assets: | | | | |
Investments in unaffiliated securities, at value (Cost $3,310,987,272) | | $ | 3,299,076,257 | |
| |
Cash | | | 53,813,139 | |
| |
Receivable for: | | | | |
Investments sold | | | 4,596,774 | |
| |
Fund shares sold | | | 3,205,008 | |
| |
Interest | | | 34,699,669 | |
| |
Investment for trustee deferred compensation and retirement plans | | | 160,916 | |
| |
Other assets | | | 172,359 | |
| |
Total assets | | | 3,395,724,122 | |
| |
| |
Liabilities: | | | | |
Payable for: | | | | |
Investments purchased | | | 25,847,638 | |
| |
Dividends | | | 2,535,566 | |
| |
Fund shares reacquired | | | 4,306,599 | |
| |
Accrued fees to affiliates | | | 873,233 | |
| |
Accrued trustees’ and officers’ fees and benefits | | | 3,623 | |
| |
Accrued other operating expenses | | | 114,276 | |
| |
Trustee deferred compensation and retirement plans | | | 182,652 | |
| |
Total liabilities | | | 33,863,587 | |
| |
Net assets applicable to shares outstanding | | $ | 3,361,860,535 | |
| |
| |
Net assets consist of: | | | | |
Shares of beneficial interest | | $ | 3,483,064,636 | |
| |
Distributable earnings (loss) | | | (121,204,101 | ) |
| |
| | $ | 3,361,860,535 | |
| |
| | | | |
Net Assets: | | | | |
Class A | | $ | 1,370,337,015 | |
| |
Class A2 | | $ | 31,001,090 | |
| |
Class C | | $ | 59,566,599 | |
| |
Class Y | | $ | 1,272,666,562 | |
| |
Class R5 | | $ | 773,661 | |
| |
Class R6 | | $ | 627,515,608 | |
| |
|
Shares outstanding, no par value, with an unlimited number of shares authorized: | |
Class A | | | 125,239,407 | |
| |
Class A2 | | | 2,831,746 | |
| |
Class C | | | 5,445,941 | |
| |
Class Y | | | 116,369,742 | |
| |
Class R5 | | | 70,707 | |
| |
Class R6 | | | 57,383,953 | |
| |
Class A: | | | | |
Net asset value per share | | $ | 10.94 | |
| |
Maximum offering price per share
(Net asset value of $10.94 ÷ 97.50%) | | $ | 11.22 | |
| |
Class A2: | | | | |
Net asset value per share | | $ | 10.95 | |
| |
Maximum offering price per share
(Net asset value of $10.95 ÷ 99.00%) | | $ | 11.06 | |
| |
Class C: | | | | |
Net asset value and offering price per share | | $ | 10.94 | |
| |
Class Y: | | | | |
Net asset value and offering price per share | | $ | 10.94 | |
| |
Class R5: | | | | |
Net asset value and offering price per share | | $ | 10.94 | |
| |
Class R6: | | | | |
Net asset value and offering price per share | | $ | 10.94 | |
| |
See accompanying Notes to Financial Statements which are an integral part of the financial statements.
29 Invesco Limited Term Municipal Income Fund
Statement of Operations
For the year ended February 28, 2023
| | | | |
Investment income: | | | | |
Interest | | $ | 90,863,311 | |
| |
| |
Expenses: | | | | |
Advisory fees | | | 7,491,964 | |
| |
Administrative services fees | | | 489,456 | |
| |
Custodian fees | | | 22,623 | |
| |
Distribution fees: | | | | |
Class A | | | 3,577,792 | |
| |
Class C | | | 658,535 | |
| |
Transfer agent fees – A, A2, C and Y | | | 2,183,801 | |
| |
Transfer agent fees – R5 | | | 833 | |
| |
Transfer agent fees – R6 | | | 91,699 | |
| |
Trustees’ and officers’ fees and benefits | | | 37,518 | |
| |
Registration and filing fees | | | 297,803 | |
| |
Reports to shareholders | | | 133,612 | |
| |
Professional services fees | | | 92,290 | |
| |
Other | | | 21,335 | |
| |
Total expenses | | | 15,099,261 | |
| |
Less: Expense offset arrangement(s) | | | (776 | ) |
| |
Net expenses | | | 15,098,485 | |
| |
Net investment income | | | 75,764,826 | |
| |
| |
Realized and unrealized gain (loss) from: | | | | |
Net realized gain (loss) from: | | | | |
Unaffiliated investment securities (includes net gains (losses) from securities sold to affiliates of $(1,552,529)) | | | (73,874,545 | ) |
| |
Futures contracts | | | 3,128,237 | |
| |
| | | (70,746,308 | ) |
| |
Change in net unrealized appreciation (depreciation) of unaffiliated investment securities | | | (36,854,818 | ) |
| |
Net realized and unrealized gain (loss) | | | (107,601,126 | ) |
| |
Net increase (decrease) in net assets resulting from operations | | $ | (31,836,300 | ) |
| |
See accompanying Notes to Financial Statements which are an integral part of the financial statements.
30 Invesco Limited Term Municipal Income Fund
Statement of Changes in Net Assets
For the years ended February 28, 2023 and 2022
| | | | | | | | |
| | | 2023 | | | 2022 | |
| |
Operations: | |
Net investment income | | $ | 75,764,826 | | | $ | 37,689,408 | |
| |
Net realized gain (loss) | | | (70,746,308 | ) | | | (4,033,534 | ) |
| |
Change in net unrealized appreciation (depreciation) | | | (36,854,818 | ) | | | (67,865,454 | ) |
| |
Net increase (decrease) in net assets resulting from operations | | | (31,836,300 | ) | | | (34,209,580 | ) |
| |
|
Distributions to shareholders from distributable earnings: | |
Class A | | | (26,214,372 | ) | | | (16,576,712 | ) |
| |
Class A2 | | | (700,506 | ) | | | (437,466 | ) |
| |
Class C | | | (694,440 | ) | | | (301,546 | ) |
| |
Class Y | | | (26,580,592 | ) | | | (14,825,059 | ) |
| |
Class R5 | | | (20,966 | ) | | | (26,808 | ) |
| |
Class R6 | | | (12,822,128 | ) | | | (6,208,921 | ) |
| |
Total distributions from distributable earnings | | | (67,033,004 | ) | | | (38,376,512 | ) |
| |
|
Share transactions–net: | |
Class A | | | (91,063,894 | ) | | | 124,652,584 | |
| |
Class A2 | | | (883,564 | ) | | | 800,326 | |
| |
Class C | | | (13,982,439 | ) | | | (18,463,222 | ) |
| |
Class Y | | | 145,027,863 | | | | 197,231,452 | |
| |
Class R5 | | | (1,016,059 | ) | | | (290,816 | ) |
| |
Class R6 | | | 123,914,625 | | | | 183,378,997 | |
| |
Net increase in net assets resulting from share transactions | | | 161,996,532 | | | | 487,309,321 | |
| |
Net increase in net assets | | | 63,127,228 | | | | 414,723,229 | |
| |
|
Net assets: | |
Beginning of year | | | 3,298,733,307 | | | | 2,884,010,078 | |
| |
End of year | | $ | 3,361,860,535 | | | $ | 3,298,733,307 | |
| |
See accompanying Notes to Financial Statements which are an integral part of the financial statements.
31 Invesco Limited Term Municipal Income Fund
Financial Highlights
The following schedule presents financial highlights for a share of the Fund outstanding throughout the periods indicated.
| | | | | | | | | | | | | | | | | | | | | | | | | | | | | | | | | | | | | | | | | | | | | | | | | | | | | | | | | | | | | | | | | |
| | | | | | | | | | | | | | | | | | | | | | | Supplemental | | | | |
| | | | | | | | | | | | | | | | | | | | | | | ratio of | | | | |
| | | | | | | | | | | | | | | | | | | | | | | expenses | | | | |
| | | | | | | | | | | | | | | | | | | Ratio of | | Ratio of | | to average | | | | |
| | | | | | | | | | | | | | | | | | | expenses | | expenses | | net assets | | | | |
| | | | | | | Net gains | | | | | | | | | | | | to average | | to average net | | with fee waivers | | | | |
| | | | | | | (losses) | | | | | | | | | | | | net assets | | assets without | | (excluding | | Ratio of net | | |
| | | Net asset | | | | on securities | | | | Dividends | | | | | | | | with fee waivers | | fee waivers | | interest, | | investment | | |
| | | value, | | Net | | (both | | Total from | | from net | | Net asset | | | | Net assets, | | and/or | | and/or | | facilities and | | income | | |
| | | beginning | | investment | | realized and | | investment | | investment | | value, end | | | | end of period | | expenses | | expenses | | maintenance | | to average | | Portfolio |
| | | of period | | income(a) | | unrealized) | | operations | | income | | of period | | Total return (b) | | (000’s omitted) | | absorbed | | absorbed | | fees) | | net assets | | turnover (c) |
Class A | | | | | | | | | | | | | | | | | | | | | | | | | | | | | | | | | | | | | | | | | | | | | | | | | | | | | | | | | | | | | | | | | |
Year ended 02/28/23 | | | $ | 11.28 | | | | $ | 0.23 | | | | $ | (0.37 | ) | | | $ | (0.14 | ) | | | $ | (0.20 | ) | | | $ | 10.94 | | | | | (1.21 | )% | | | $ | 1,370,337 | | | | | 0.58 | % | | | | 0.58 | % | | | | – | % | | | | 2.12 | % | | | | 96 | % |
Year ended 02/28/22 | | | | 11.52 | | | | | 0.12 | | | | | (0.23 | ) | | | | (0.11 | ) | | | | (0.13 | ) | | | | 11.28 | | | | | (1.00 | ) | | | | 1,505,388 | | | | | 0.62 | | | | | 0.62 | | | | | 0.58 | | | | | 1.05 | | | | | 23 | |
Year ended 02/28/21 | | | | 11.52 | | | | | 0.19 | | | | | 0.01 | | | | | 0.20 | | | | | (0.20 | ) | | | | 11.52 | | | | | 1.75 | | | | | 1,414,161 | | | | | 0.62 | | | | | 0.62 | | | | | 0.61 | | | | | 1.65 | | | | | 19 | |
Year ended 02/29/20 | | | | 11.25 | | | | | 0.22 | | | | | 0.30 | | | | | 0.52 | | | | | (0.25 | ) | | | | 11.52 | | | | | 4.68 | | | | | 1,115,905 | | | | | 0.61 | | | | | 0.61 | | | | | – | | | | | 1.98 | | | | | 26 | |
Year ended 02/28/19 | | | | 11.22 | | | | | 0.24 | | | | | 0.02 | | | | | 0.26 | | | | | (0.23 | ) | | | | 11.25 | | | | | 2.38 | | | | | 1,033,140 | | | | | 0.63 | | | | | 0.63 | | | | | – | | | | | 2.17 | | | | | 45 | |
Class A2 | | | | | | | | | | | | | | | | | | | | | | | | | | | | | | | | | | | | | | | | | | | | | | | | | | | | | | | | | | | | | | | | | |
Year ended 02/28/23 | | | | 11.28 | | | | | 0.26 | | | | | (0.36 | ) | | | | (0.10 | ) | | | | (0.23 | ) | | | | 10.95 | | | | | (0.87 | ) | | | | 31,001 | | | | | 0.33 | | | | | 0.33 | | | | | – | | | | | 2.37 | | | | | 96 | |
Year ended 02/28/22 | | | | 11.53 | | | | | 0.15 | | | | | (0.25 | ) | | | | (0.10 | ) | | | | (0.15 | ) | | | | 11.28 | | | | | (0.84 | ) | | | | 32,980 | | | | | 0.37 | | | | | 0.37 | | | | | 0.33 | | | | | 1.30 | | | | | 23 | |
Year ended 02/28/21 | | | | 11.53 | | | | | 0.22 | | | | | 0.01 | | | | | 0.23 | | | | | (0.23 | ) | | | | 11.53 | | | | | 2.00 | | | | | 32,880 | | | | | 0.37 | | | | | 0.37 | | | | | 0.36 | | | | | 1.90 | | | | | 19 | |
Year ended 02/29/20 | | | | 11.25 | | | | | 0.25 | | | | | 0.31 | | | | | 0.56 | | | | | (0.28 | ) | | | | 11.53 | | | | | 5.02 | | | | | 47,719 | | | | | 0.36 | | | | | 0.36 | | | | | – | | | | | 2.23 | | | | | 26 | |
Year ended 02/28/19 | | | | 11.22 | | | | | 0.27 | | | | | 0.02 | | | | | 0.29 | | | | | (0.26 | ) | | | | 11.25 | | | | | 2.64 | | | | | 52,007 | | | | | 0.38 | | | | | 0.38 | | | | | – | | | | | 2.42 | | | | | 45 | |
Class C | | | | | | | | | | | | | | | | | | | | | | | | | | | | | | | | | | | | | | | | | | | | | | | | | | | | | | | | | | | | | | | | | |
Year ended 02/28/23 | | | | 11.27 | | | | | 0.15 | | | | | (0.36 | ) | | | | (0.21 | ) | | | | (0.12 | ) | | | | 10.94 | | | | | (1.86 | ) | | | | 59,567 | | | | | 1.33 | | | | | 1.33 | | | | | – | | | | | 1.37 | | | | | 96 | |
Year ended 02/28/22 | | | | 11.52 | | | | | 0.04 | | | | | (0.25 | ) | | | | (0.21 | ) | | | | (0.04 | ) | | | | 11.27 | | | | | (1.84 | ) | | | | 75,669 | | | | | 1.37 | | | | | 1.37 | | | | | 1.33 | | | | | 0.30 | | | | | 23 | |
Year ended 02/28/21 | | | | 11.52 | | | | | 0.10 | | | | | 0.01 | | | | | 0.11 | | | | | (0.11 | ) | | | | 11.52 | | | | | 0.99 | | | | | 95,786 | | | | | 1.37 | | | | | 1.37 | | | | | 1.36 | | | | | 0.90 | | | | | 19 | |
Year ended 02/29/20 | | | | 11.24 | | | | | 0.14 | | | | | 0.31 | | | | | 0.45 | | | | | (0.17 | ) | | | | 11.52 | | | | | 3.99 | | | | | 108,818 | | | | | 1.36 | | | | | 1.36 | | | | | – | | | | | 1.23 | | | | | 26 | |
Year ended 02/28/19 | | | | 11.21 | | | | | 0.16 | | | | | 0.02 | | | | | 0.18 | | | | | (0.15 | ) | | | | 11.24 | | | | | 1.61 | | | | | 95,674 | | | | | 1.38 | | | | | 1.38 | | | | | – | | | | | 1.42 | | | | | 45 | |
Class Y | | | | | | | | | | | | | | | | | | | | | | | | | | | | | | | | | | | | | | | | | | | | | | | | | | | | | | | | | | | | | | | | | |
Year ended 02/28/23 | | | | 11.27 | | | | | 0.26 | | | | | (0.36 | ) | | | | (0.10 | ) | | | | (0.23 | ) | | | | 10.94 | | | | | (0.87 | ) | | | | 1,272,667 | | | | | 0.33 | | | | | 0.33 | | | | | – | | | | | 2.37 | | | | | 96 | |
Year ended 02/28/22 | | | | 11.52 | | | | | 0.15 | | | | | (0.25 | ) | | | | (0.10 | ) | | | | (0.15 | ) | | | | 11.27 | | | | | (0.85 | ) | | | | 1,162,937 | | | | | 0.37 | | | | | 0.37 | | | | | 0.33 | | | | | 1.30 | | | | | 23 | |
Year ended 02/28/21 | | | | 11.52 | | | | | 0.22 | | | | | 0.01 | | | | | 0.23 | | | | | (0.23 | ) | | | | 11.52 | | | | | 2.00 | | | | | 991,334 | | | | | 0.37 | | | | | 0.37 | | | | | 0.36 | | | | | 1.90 | | | | | 19 | |
Year ended 02/29/20 | | | | 11.24 | | | | | 0.25 | | | | | 0.31 | | | | | 0.56 | | | | | (0.28 | ) | | | | 11.52 | | | | | 5.02 | | | | | 721,346 | | | | | 0.36 | | | | | 0.36 | | | | | – | | | | | 2.23 | | | | | 26 | |
Year ended 02/28/19 | | | | 11.21 | | | | | 0.27 | | | | | 0.02 | | | | | 0.29 | | | | | (0.26 | ) | | | | 11.24 | | | | | 2.64 | | | | | 677,051 | | | | | 0.38 | | | | | 0.38 | | | | | – | | | | | 2.42 | | | | | 45 | |
Class R5 | | | | | | | | | | | | | | | | | | | | | | | | | | | | | | | | | | | | | | | | | | | | | | | | | | | | | | | | | | | | | | | | | |
Year ended 02/28/23 | | | | 11.28 | | | | | 0.26 | | | | | (0.37 | ) | | | | (0.11 | ) | | | | (0.23 | ) | | | | 10.94 | | | | | (0.96 | ) | | | | 774 | | | | | 0.33 | | | | | 0.33 | | | | | – | | | | | 2.37 | | | | | 96 | |
Year ended 02/28/22 | | | | 11.52 | | | | | 0.15 | | | | | (0.24 | ) | | | | (0.09 | ) | | | | (0.15 | ) | | | | 11.28 | | | | | (0.75 | ) | | | | 1,836 | | | | | 0.36 | | | | | 0.36 | | | | | 0.32 | | | | | 1.31 | | | | | 23 | |
Year ended 02/28/21 | | | | 11.51 | | | | | 0.23 | | | | | 0.01 | | | | | 0.24 | | | | | (0.23 | ) | | | | 11.52 | | | | | 2.14 | | | | | 2,165 | | | | | 0.25 | | | | | 0.25 | | | | | 0.23 | | | | | 2.02 | | | | | 19 | |
Year ended 02/29/20 | | | | 11.23 | | | | | 0.26 | | | | | 0.31 | | | | | 0.57 | | | | | (0.29 | ) | | | | 11.51 | | | | | 5.10 | | | | | 2,377 | | | | | 0.29 | | | | | 0.29 | | | | | – | | | | | 2.30 | | | | | 26 | |
Year ended 02/28/19 | | | | 11.21 | | | | | 0.27 | | | | | 0.01 | | | | | 0.28 | | | | | (0.26 | ) | | | | 11.23 | | | | | 2.54 | | | | | 2,812 | | | | | 0.38 | | | | | 0.38 | | | | | – | | | | | 2.42 | | | | | 45 | |
Class R6 | | | | | | | | | | | | | | | | | | | | | | | | | | | | | | | | | | | | | | | | | | | | | | | | | | | | | | | | | | | | | | | | | |
Year ended 02/28/23 | | | | 11.27 | | | | | 0.27 | | | | | (0.36 | ) | | | | (0.09 | ) | | | | (0.24 | ) | | | | 10.94 | | | | | (0.81 | ) | | | | 627,516 | | | | | 0.27 | | | | | 0.27 | | | | | – | | | | | 2.43 | | | | | 96 | |
Year ended 02/28/22 | | | | 11.51 | | | | | 0.16 | | | | | (0.24 | ) | | | | (0.08 | ) | | | | (0.16 | ) | | | | 11.27 | | | | | (0.70 | ) | | | | 519,924 | | | | | 0.31 | | | | | 0.31 | | | | | 0.27 | | | | | 1.36 | | | | | 23 | |
Year ended 02/28/21 | | | | 11.51 | | | | | 0.23 | | | | | 0.01 | | | | | 0.24 | | | | | (0.24 | ) | | | | 11.51 | | | | | 2.08 | | | | | 347,684 | | | | | 0.30 | | | | | 0.30 | | | | | 0.28 | | | | | 1.97 | | | | | 19 | |
Year ended 02/29/20 | | | | 11.24 | | | | | 0.26 | | | | | 0.30 | | | | | 0.56 | | | | | (0.29 | ) | | | | 11.51 | | | | | 5.01 | | | | | 266,014 | | | | | 0.28 | | | | | 0.28 | | | | | – | | | | | 2.31 | | | | | 26 | |
Year ended 02/28/19 | | | | 11.21 | | | | | 0.28 | | | | | 0.02 | | | | | 0.30 | | | | | (0.27 | ) | | | | 11.24 | | | | | 2.71 | | | | | 211,774 | | | | | 0.30 | | | | | 0.30 | | | | | – | | | | | 2.50 | | | | | 45 | |
| (a) | Calculated using average shares outstanding. |
| (b) | Includes adjustments in accordance with accounting principles generally accepted in the United States of America and as such, the net asset value for financial reporting purposes and the returns based upon those net asset values may differ from the net asset value and returns for shareholder transactions. Does not include sales charges and is not annualized for periods less than one year, if applicable. |
| (c) | Portfolio turnover is calculated at the fund level and is not annualized for periods less than one year, if applicable. |
See accompanying Notes to Financial Statements which are an integral part of the financial statements.
32 Invesco Limited Term Municipal Income Fund
Notes to Financial Statements
February 28, 2023
NOTE 1–Significant Accounting Policies
Invesco Limited Term Municipal Income Fund (the “Fund”) is a series portfolio of AIM Tax-Exempt Funds (Invesco Tax-Exempt Funds) (the “Trust”). The Trust is a Delaware statutory trust registered under the Investment Company Act of 1940, as amended (the “1940 Act”), as an open-end series management investment company authorized to issue an unlimited number of shares of beneficial interest. Information presented in these financial statements pertains only to the Fund. Matters affecting the Fund or each class will be voted on exclusively by the shareholders of the Fund or each class.
The Fund’s investment objective is federal tax-exempt current income.
The Fund currently consists of six different classes of shares: Class A, Class A2, Class C, Class Y, Class R5 and Class R6. Class Y shares are available only to certain investors. Class A and Class A2 shares are sold with a front-end sales charge unless certain waiver criteria are met and under certain circumstances, load waived shares may be subject to contingent deferred sales charges (“CDSC”). Class C shares are sold with a CDSC. Class Y, Class R5 and Class R6 shares are sold at net asset value. Class C shares held for eight years after purchase are eligible for automatic conversion into Class A shares of the same Fund (the “Conversion Feature”). The automatic conversion pursuant to the Conversion Feature will generally occur at the end of the month following the eighth anniversary after a purchase of Class C shares.
As of the close of business on October 30, 2002, Class A2 shares are closed to new investors.
The Fund is an investment company and accordingly follows the investment company accounting and reporting guidance in accordance with Financial Accounting Standards Board Accounting Standards Codification Topic 946, Financial Services – Investment Companies.
The following is a summary of the significant accounting policies followed by the Fund in the preparation of its financial statements.
| A. | Security Valuations – Securities, including restricted securities, are valued according to the following policy. |
Securities generally are valued on the basis of prices provided by independent pricing services. Prices provided by the pricing service may be determined without exclusive reliance on quoted prices, and may reflect appropriate factors such as institution-size trading in similar groups of securities, developments related to specific securities, dividend rate (for unlisted equities), yield (for debt obligations), quality, type of issue, coupon rate (for debt obligations), maturity (for debt obligations), individual trading characteristics and other market data. Pricing services generally value debt obligations assuming orderly transactions of institutional round lot size, but a fund may hold or transact in the same securities in smaller, odd lot sizes. Odd lots often trade at lower prices than institutional round lots, and their value may be adjusted accordingly. Debt obligations are subject to interest rate and credit risks. In addition, all debt obligations involve some risk of default with respect to interest and/or principal payments.
Securities for which market quotations are not readily available are fair valued by Invesco Advisers, Inc. (the “Adviser” or “Invesco”) in accordance with Board-approved policies and related Adviser procedures (“Valuation Procedures”). If a fair value price provided by a pricing service is not representative of market value in the Adviser’s judgment (“unreliable”), the Adviser will fair value the security using the Valuation Procedures. Some of the factors which may be considered in determining fair value are fundamental analytical data relating to the investment; the nature and duration of any restrictions on transferability or disposition; trading in similar securities by the same issuer or comparable companies; relevant political, economic or issuer specific news; and other relevant factors under the circumstances.
The Fund may invest in securities that are subject to interest rate risk, meaning the risk that the prices will generally fall as interest rates rise and, conversely, the prices will generally rise as interest rates fall. Specific securities differ in their sensitivity to changes in interest rates depending on their individual characteristics. Changes in interest rates may result in increased market volatility, which may affect the value and/or liquidity of certain Fund investments.
Valuations change in response to many factors including the historical and prospective earnings of the issuer, the value of the issuer’s assets, general market conditions which are not specifically related to the particular issuer, such as real or perceived adverse economic conditions, changes in the general outlook for revenues or corporate earnings, changes in interest or currency rates, regional or global instability, natural or environmental disasters, widespread disease or other public health issues, war, acts of terrorism, significant governmental actions or adverse investor sentiment generally and market liquidity. Because of the inherent uncertainties of valuation, the values reflected in the financial statements may materially differ from the value received upon actual sale of those investments.
The price the Fund could receive upon the sale of any investment may differ from the Adviser’s valuation of the investment, particularly for securities that are valued using a fair valuation technique. When fair valuation techniques are applied, the Adviser uses available information, including both observable and unobservable inputs and assumptions, to determine a methodology that will result in a valuation that the Adviser believes approximates market value. Fund securities that are fair valued may be subject to greater fluctuation in their value from one day to the next than would be the case if market quotations were used. Because of the inherent uncertainties of valuation, and the degree of subjectivity in such decisions, the Fund could realize a greater or lesser than expected gain or loss upon the sale of the investment.
| B. | Securities Transactions and Investment Income – Securities transactions are accounted for on a trade date basis. Realized gains or losses on sales are computed on the basis of specific identification of the securities sold. Interest income (net of withholding tax, if any) is recorded on an accrual basis from settlement date and includes coupon interest and amortization of premium and accretion of discount on debt securities as applicable. Pay-in-kind interest income and non-cash dividend income received in the form of securities in-lieu of cash are recorded at the fair value of the securities received. Dividend income (net of withholding tax, if any) is recorded on the ex-dividend date. |
The Fund may periodically participate in litigation related to Fund investments. As such, the Fund may receive proceeds from litigation settlements.Any proceeds received are included in the Statement of Operations as realized gain (loss) for investments no longer held and as unrealized gain (loss) for investments still held.
Brokerage commissions and mark ups are considered transaction costs and are recorded as an increase to the cost basis of securities purchased and/or a reduction of proceeds on a sale of securities. Such transaction costs are included in the determination of net realized and unrealized gain (loss) from investment securities reported in the Statement of Operations and the Statement of Changes in Net Assets and the net realized and unrealized gains (losses) on securities per share in the Financial Highlights. Transaction costs are included in the calculation of the Fund’s net asset value and, accordingly, they reduce the Fund’s total returns. These transaction costs are not considered operating expenses and are not reflected in net investment income reported in the Statement of Operations and the Statement of Changes in Net Assets, or the net investment income per share and the ratios of expenses and net investment income reported in the Financial Highlights, nor are they limited by any expense limitation arrangements between the Fund and the investment adviser.
The Fund allocates realized and unrealized capital gains and losses to a class based on the relative net assets of each class. The Fund allocates income to a class based on the relative value of the settled shares of each class.
| C. | Country Determination – For the purposes of making investment selection decisions and presentation in the Schedule of Investments, the investment adviser may determine the country in which an issuer is located and/or credit risk exposure based on various factors. These factors include the laws of the country under which the issuer is organized, where the issuer maintains a principal office, the country in which the issuer derives 50% or more of its total revenues, the country that has the primary market for the issuer’s securities and its “country of risk” as determined by a third party service provider, as well as other criteria. Among the other criteria that may be evaluated for making this determination are the country in which the issuer maintains 50% or more of its assets, the type of security, financial guarantees and enhancements, the nature of the collateral and the sponsor organization. Country of issuer and/or credit risk exposure has been determined to be the United States of America, unless otherwise noted. |
33 Invesco Limited Term Municipal Income Fund
| D. | Distributions – Distributions from net investment income, if any, are declared daily and paid monthly. Distributions from net realized capital gain, if any, are generally declared and paid annually and recorded on the ex-dividend date. The Fund may elect to treat a portion of the proceeds from redemptions as distributions for federal income tax purposes. |
| E. | Federal Income Taxes – The Fund intends to comply with the requirements of Subchapter M of the Internal Revenue Code of 1986, as amended (the “Internal Revenue Code”), necessary to qualify as a regulated investment company and to distribute substantially all of the Fund’s taxable and tax-exempt earnings to shareholders. As such, the Fund will not be subject to federal income taxes on otherwise taxable income (including net realized capital gain) that is distributed to shareholders. Therefore, no provision for federal income taxes is recorded in the financial statements. |
The Fund recognizes the tax benefits of uncertain tax positions only when the position is more likely than not to be sustained. Management has analyzed the Fund’s uncertain tax positions and concluded that no liability for unrecognized tax benefits should be recorded related to uncertain tax positions. Management is not aware of any tax positions for which it is reasonably possible that the total amounts of unrecognized tax benefits will change materially in the next 12 months.
In addition, the Fund intends to invest in such municipal securities to allow it to qualify to pay shareholders “exempt-interest dividends”, as defined in the Internal Revenue Code.
The Fund files tax returns in the U.S. Federal jurisdiction and certain other jurisdictions. Generally, the Fund is subject to examinations by such taxing authorities for up to three years after the filing of the return for the tax period.
| F. | Expenses – Fees provided for under the Rule 12b-1 plan of a particular class of the Fund are charged to the operations of such class. Transfer agency fees and expenses and other shareholder recordkeeping fees and expenses attributable to Class R5 and Class R6 are allocated based on relative net assets of Class R5 and Class R6. Sub-accounting fees attributable to Class R5 are charged to the operations of the class. Transfer agency fees and expenses and other shareholder recordkeeping fees and expenses relating to all other classes are allocated among those classes based on relative net assets. All other expenses are allocated among the classes based on relative net assets. |
| G. | Interest, Facilities and Maintenance Fees — Interest, Facilities and Maintenance Fees include interest and related borrowing costs such as commitment fees, administrative expenses and other expenses associated with establishing and maintaining the line of credit. |
| H. | Accounting Estimates – The preparation of financial statements in conformity with accounting principles generally accepted in the United States of America (“GAAP”) requires management to make estimates and assumptions that affect the reported amounts of assets and liabilities at the date of the financial statements and the reported amounts of revenues and expenses during the reporting period including estimates and assumptions related to taxation. Actual results could differ from those estimates by a significant amount. In addition, the Fund monitors for material events or transactions that may occur or become known after the period-end date and before the date the financial statements are released to print. |
| I. | Indemnifications – Under the Trust’s organizational documents, each Trustee, officer, employee or other agent of the Trust is indemnified against certain liabilities that may arise out of the performance of their duties to the Fund. Additionally, in the normal course of business, the Fund enters into contracts, including the Fund’s servicing agreements, that contain a variety of indemnification clauses. The Fund’s maximum exposure under these arrangements is unknown as this would involve future claims that may be made against the Fund that have not yet occurred. The risk of material loss as a result of such indemnification claims is considered remote. |
| J. | Other Risks – The value of, payment of interest on, repayment of principal for and the ability to sell a municipal security may be affected by constitutional amendments, legislative enactments, executive orders, administrative regulations, voter initiatives and the economics of the regions in which the issuers are located. Since many municipal securities are issued to finance similar projects, especially those relating to education, health care, transportation and utilities, conditions in those sectors can affect the overall municipal securities market and the Fund’s investments in municipal securities. There is some risk that a portion or all of the interest received from certain tax-free municipal securities could become taxable as a result of determinations by the Internal Revenue Service. |
Increases in the federal funds and equivalent foreign rates or other changes to monetary policy or regulatory actions may expose fixed income markets to heightened volatility and reduced liquidity for certain fixed income investments, particularly those with longer maturities. It is difficult to predict the impact of interest rate changes on various markets. In addition, decreases in fixed income dealer market-making capacity may also potentially lead to heightened volatility and reduced liquidity in the fixed income markets. As a result, the value of the Fund’s investments and share price may decline. Changes in central bank policies could also result in higher than normal redemptions by shareholders, which could potentially increase the Fund’s portfolio turnover rate and transaction costs.
Policy changes by the U.S. government or its regulatory agencies and political events within the U.S. and abroad may, among other things, affect investor and consumer confidence and increase volatility in the financial markets, perhaps suddenly and to a significant degree, which may adversely impact the Fund’s operations, universe of potential investment options, and return potential.
| K. | COVID-19 Risk – The COVID-19 strain of coronavirus has resulted in instances of market closures and dislocations, extreme volatility, liquidity constraints and increased trading costs. Efforts to contain its spread have resulted in travel restrictions, disruptions of healthcare systems, business operations (including business closures) and supply chains, layoffs, lower consumer demand and employee availability, and defaults and credit downgrades, among other significant economic impacts that have disrupted global economic activity across many industries. Such economic impacts may exacerbate other pre-existing political, social and economic risks locally or globally and cause general concern and uncertainty. The full economic impact and ongoing effects of COVID-19 (or other future epidemics or pandemics) at the macro-level and on individual businesses are unpredictable and may result in significant and prolonged effects on the Fund’s performance. |
NOTE 2–Advisory Fees and Other Fees Paid to Affiliates
The Trust has entered into a master investment advisory agreement with the Adviser. Under the terms of the investment advisory agreement, the Fund accrues daily and pays monthly an advisory fee to the Adviser based on the annual rate of the Fund’s average daily net assets as follows:
| | | | |
| Average Daily Net Assets | | Rate | |
| |
First $500 million | | | 0.300% | |
| |
Over $500 million up to and including $1 billion | | | 0.250% | |
| |
Over $1 billion | | | 0.200% | |
| |
For the year ended February 28, 2023, the effective advisory fee rate incurred by the Fund was 0.22%.
Under the terms of a master sub-advisory agreement between the Adviser and each of Invesco Asset Management Deutschland GmbH, Invesco Asset Management Limited, Invesco Asset Management (Japan) Limited, Invesco Hong Kong Limited, Invesco Senior Secured Management, Inc. and Invesco Canada Ltd. and separate sub-advisory agreements with Invesco Capital Management LLC and Invesco Asset Management (India) Private Limited (collectively, the “Affiliated Sub-Advisers”) the Adviser, not the Fund, will pay 40% of the fees paid to the Adviser to any such Affiliated Sub-Adviser(s) that provide(s) discretionary investment management services to the Fund based on the percentage of assets allocated to such Affiliated Sub-Adviser(s).
The Adviser has contractually agreed, through at least June 30, 2023, to waive advisory fees and/or reimburse expenses of all shares to the extent necessary to limit total annual fund operating expenses after fee waiver and/or expense reimbursement (excluding certain items discussed below) of Class A, Class A2, Class C, Class Y, Class R5 and Class R6 shares to 1.50%, 1.25%, 2.25%, 1.25%, 1.25% and 1.25%, respectively, of the Fund’s average daily net assets (the “expense limits”). In determining the Adviser’s obligation to waive advisory fees and/or reimburse expenses, the following expenses are not taken into account, and could cause
34 Invesco Limited Term Municipal Income Fund
the total annual fund operating expenses after fee waiver and/or expense reimbursement to exceed the numbers reflected above: (1) interest; (2) taxes; (3) dividend expense on short sales; (4) extraordinary or non-routine items, including litigation expenses; and (5) expenses that the Fund has incurred but did not actually pay because of an expense offset arrangement. Unless Invesco continues the fee waiver agreement, it will terminate on June 30, 2023. During its term, the fee waiver agreement cannot be terminated or amended to increase the expense limits or reduce the advisory fee waiver without approval of the Board of Trustees. The Adviser did not waive fees and/or reimburse expenses during the period under these expense limits.
The Trust has entered into a master administrative services agreement with Invesco pursuant to which the Fund has agreed to pay Invesco for certain administrative costs incurred in providing accounting services to the Fund. For the year ended February 28, 2023, expenses incurred under the agreement are shown in the Statement of Operations as Administrative services fees. Invesco has entered into a sub-administration agreement whereby State Street Bank and Trust Company (“SSB”) serves as fund accountant and provides certain administrative services to the Fund. Pursuant to a custody agreement with the Trust on behalf of the Fund, SSB also serves as the Fund’s custodian.
The Trust has entered into a transfer agency and service agreement with Invesco Investment Services, Inc. (“IIS”) pursuant to which the Fund has agreed to pay IIS a fee for providing transfer agency and shareholder services to the Fund and reimburse IIS for certain expenses incurred by IIS in the course of providing such services. IIS may make payments to intermediaries that provide omnibus account services, sub-accounting services and/or networking services. All fees payable by IIS to intermediaries that provide omnibus account services or sub-accounting services are charged back to the Fund, subject to certain limitations approved by the Trust’s Board of Trustees. For the year ended February 28, 2023, expenses incurred under the agreement are shown in the Statement of Operations as Transfer agent fees.
The Trust has entered into master distribution agreements with Invesco Distributors, Inc. (“IDI”) to serve as the distributor for the Class A, Class A2, Class C, Class Y, Class R5 and Class R6 shares of the Fund. The Trust has adopted plans pursuant to Rule 12b-1 under the 1940 Act with respect to the Fund’s Class A and Class C shares (collectively, the “Plans”). The Fund, pursuant to the Plan, pays IDI compensation at the annual rate of 0.25% of the Fund’s average daily net assets of Class A shares and 1.00% of the average daily net assets of Class C shares. The fees are accrued daily and paid monthly. Of the Rule 12b-1 payment, up to 0.25% of the average daily net assets of the Class A and Class C shares may be paid to furnish continuing personal shareholder services to customers who purchase and own Class A and Class C shares of the Fund. Any amounts not paid as a service fee under the Plan would constitute an asset-based sales charge. Rules of the Financial Industry Regulatory Authority (“FINRA”) also impose a cap on the total sales charges, including asset-based sales charges, that may be paid by any class of shares of the Fund. For the year ended February 28, 2023, expenses incurred under the Plans are shown in the Statement of Operations as Distribution fees.
Front-end sales commissions and CDSC (collectively, the “sales charges”) are not recorded as expenses of the Fund. Front-end sales commissions are deducted from proceeds from the sales of Fund shares prior to investment in Class A and Class A2 shares of the Fund. CDSC are deducted from redemption proceeds prior to remittance to the shareholder. During the year ended February 28, 2023, IDI advised the Fund that IDI retained $72,383 and $116 in front-end sales commissions from the sale of Class A and Class A2 shares, respectively, and $343,677, $0 and $5,414 from Class A, Class A2 and Class C shares, respectively, for CDSC imposed upon redemptions by shareholders.
Certain officers and trustees of the Trust are officers and directors of the Adviser, IIS and/or IDI.
NOTE 3–Additional Valuation Information
GAAP defines fair value as the price that would be received to sell an asset or paid to transfer a liability in an orderly transaction between market participants at the measurement date, under current market conditions. GAAP establishes a hierarchy that prioritizes the inputs to valuation methods, giving the highest priority to readily available unadjusted quoted prices in an active market for identical assets (Level 1) and the lowest priority to significant unobservable inputs (Level 3), generally when market prices are not readily available. Based on the valuation inputs, the securities or other investments are tiered into one of three levels. Changes in valuation methods may result in transfers in or out of an investment’s assigned level:
| | |
| Level 1 - | | Prices are determined using quoted prices in an active market for identical assets. |
| Level 2 - | | Prices are determined using other significant observable inputs. Observable inputs are inputs that other market participants may use in pricing a security. These may include quoted prices for similar securities, interest rates, prepayment speeds, credit risk, yield curves, loss severities, default rates, discount rates, volatilities and others. |
| Level 3 - | | Prices are determined using significant unobservable inputs. In situations where quoted prices or observable inputs are unavailable (for example, when there is little or no market activity for an investment at the end of the period), unobservable inputs may be used. Unobservable inputs reflect the Adviser’s assumptions about the factors market participants would use in determining fair value of the securities or instruments and would be based on the best available information. |
As of February 28, 2023, all of the securities in this Fund were valued based on Level 2 inputs (see the Schedule of Investments for security categories). The level assigned to the securities valuations may not be an indication of the risk or liquidity associated with investing in those securities. Because of the inherent uncertainties of valuation, the values reflected in the financial statements may materially differ from the value received upon actual sale of those investments.
NOTE 4–Derivative Investments
The Fund may enter into an International Swaps and Derivatives Association Master Agreement (“ISDA Master Agreement”) under which a fund may trade OTC derivatives. An OTC transaction entered into under an ISDA Master Agreement typically involves a collateral posting arrangement, payment netting provisions and close-out netting provisions. These netting provisions allow for reduction of credit risk through netting of contractual obligations. The enforceability of the netting provisions of the ISDA Master Agreement depends on the governing law of the ISDA Master Agreement, among other factors.
For financial reporting purposes, the Fund does not offset OTC derivative assets or liabilities that are subject to ISDA Master Agreements in the Statement of Assets and Liabilities.
Effect of Derivative Investments for the year ended February 28, 2023
The table below summarizes the gains (losses) on derivative investments, detailed by primary risk exposure, recognized in earnings during the period:
| | | | |
| | | Location of Gain on | |
| | | Statement of Operations | |
| | | Interest | |
| | | Rate Risk | |
| |
Realized Gain: | | | | |
Futures contracts | | | $3,128,237 | |
| |
35 Invesco Limited Term Municipal Income Fund
The table below summarizes the average notional value of derivatives held during the period.
| | | | |
| | | Futures | |
| | | Contracts | |
| |
Average notional value | | $ | 131,387,344 | |
| |
NOTE 5–Security Transactions with Affiliated Funds
The Fund is permitted to purchase securities from or sell securities to certain other affiliated funds under specified conditions outlined in procedures adopted by the Board of Trustees of the Trust. The procedures have been designed to ensure that any purchase or sale of securities by the Fund from or to another fund that is or could be considered an “affiliated person” by virtue of having a common investment adviser (or affiliated investment advisers), common Trustees and/or common officers is made in reliance on Rule 17a-7 of the 1940 Act and, to the extent applicable, related SEC staff positions. Each such transaction is effected at the security’s “current market price”, as provided for in these procedures and Rule 17a-7. Pursuant to these procedures, for the year ended February 28, 2023, the Fund engaged in securities purchases of $501,459,419 and securities sales of $685,695,368, which resulted in net realized gains (losses) of $(1,552,529).
NOTE 6–Expense Offset Arrangement(s)
The expense offset arrangement is comprised of transfer agency credits which result from balances in demand deposit accounts used by the transfer agent for clearing shareholder transactions. For the year ended February 28, 2023, the Fund received credits from this arrangement, which resulted in the reduction of the Fund’s total expenses of $776.
NOTE 7–Trustees’ and Officers’ Fees and Benefits
Trustees’ and Officers’ Fees and Benefits include amounts accrued by the Fund to pay remuneration to certain Trustees and Officers of the Fund. Trustees have the option to defer compensation payable by the Fund, and Trustees’ and Officers’ Fees and Benefits also include amounts accrued by the Fund to fund such deferred compensation amounts. Those Trustees who defer compensation have the option to select various Invesco Funds in which their deferral accounts shall be deemed to be invested. Finally, certain current Trustees were eligible to participate in a retirement plan that provided for benefits to be paid upon retirement to Trustees over a period of time based on the number of years of service. The Fund may have certain former Trustees who also participate in a retirement plan and receive benefits under such plan. Trustees’ and Officers’ Fees and Benefits include amounts accrued by the Fund to fund such retirement benefits. Obligations under the deferred compensation and retirement plans represent unsecured claims against the general assets of the Fund.
NOTE 8–Cash Balances
The Fund is permitted to temporarily carry a negative or overdrawn balance in its account with SSB, the custodian bank. Such balances, if any at period-end, are shown in the Statement of Assets and Liabilities under the payable caption Amount due custodian. To compensate the custodian bank for such overdrafts, the overdrawn Fund may either (1) leave funds as a compensating balance in the account so the custodian bank can be compensated by earning the additional interest; or (2) compensate by paying the custodian bank at a rate agreed upon by the custodian bank and Invesco, not to exceed the contractually agreed upon rate. The Fund may not purchase additional securities when any borrowings from banks or broker-dealers exceed 5% of the Fund’s total assets, or when any borrowings from an Invesco Fund are outstanding.
NOTE 9–Distributions to Shareholders and Tax Components of Net Assets
Tax Character of Distributions to Shareholders Paid During the Fiscal Years Ended February 28, 2023 and 2022:
| | | | | | | |
| | | 2023 | | 2022 |
Ordinary income* | | | | $ 52,159 | | | $ – |
Ordinary income-tax-exempt | | | | 66,980,845 | | | 38,376,512 |
Total distributions | | | | $67,033,004 | | | $38,376,512 |
| * | Includes short-term capital gain distributions, if any. |
Tax Components of Net Assets at Period-End:
| | | | |
| | | 2023 | |
| |
Undistributed tax-exempt income | | $ | 9,508,518 | |
| |
Net unrealized appreciation (depreciation) – investments | | | (13,637,362 | ) |
| |
Temporary book/tax differences | | | (127,329 | ) |
| |
Capital loss carryforward | | | (116,947,928 | ) |
| |
Shares of beneficial interest | | | 3,483,064,636 | |
| |
Total net assets | | $ | 3,361,860,535 | |
| |
The difference between book-basis and tax-basis unrealized appreciation (depreciation) is due to differences in the timing of recognition of gains and losses on investments for tax and book purposes. The Fund’s net unrealized appreciation (depreciation) difference is attributable primarily to amortization and accretion on debt securities and wash sales.
The temporary book/tax differences are a result of timing differences between book and tax recognition of income and/or expenses. The Fund’s temporary book/tax differences are the result of the trustee deferral of compensation and retirement plan benefits.
Capital loss carryforward is calculated and reported as of a specific date. Results of transactions and other activity after that date may affect the amount of capital loss carryforward actually available for the Fund to utilize. The ability to utilize capital loss carryforward in the future may be limited under the Internal Revenue Code and related regulations based on the results of future transactions.
36 Invesco Limited Term Municipal Income Fund
The Fund has a capital loss carryforward as of February 28, 2023, as follows:
| | | | | | |
| Capital Loss Carryforward* |
| Expiration | | Short-Term | | Long-Term | | Total |
Not subject to expiration | | $82,360,560 | | $34,587,368 | | $116,947,928 |
| * | Capital loss carryforward is reduced for limitations, if any, to the extent required by the Internal Revenue Code and may be further limited depending upon a variety of factors, including the realization of net unrealized gains or losses as of the date of any reorganization. |
NOTE 10–Investment Transactions
The aggregate amount of investment securities (other than short-term securities, U.S. Government obligations and money market funds, if any) purchased and sold by the Fund during the year ended February 28, 2023 was $3,153,380,392 and $2,441,017,093, respectively. Cost of investments, including any derivatives, on a tax basis includes the adjustments for financial reporting purposes as of the most recently completed federal income tax reporting period-end.
| | | | |
| Unrealized Appreciation (Depreciation) of Investments on a Tax Basis | |
| |
Aggregate unrealized appreciation of investments | | $ | 23,724,560 | |
| |
Aggregate unrealized (depreciation) of investments | | | (37,361,922 | ) |
| |
Net unrealized appreciation (depreciation) of investments | | $ | (13,637,362 | ) |
| |
Cost of investments for tax purposes is $3,312,713,619.
NOTE 11–Reclassification of Permanent Differences
Primarily as a result of differing book/tax treatment of amortization and accretion on debt securities, on February 28, 2023, undistributed net investment income was increased by $1,268,434 and undistributed net realized gain (loss) was decreased by $1,268,434. This reclassification had no effect on the net assets or the distributable earnings (loss) of the Fund.
NOTE 12–Share Information
| | | | | | | | | | | | | | | | |
| | | Summary of Share Activity | |
| |
| | | Year ended
February 28, 2023(a) | | | Year ended
February 28, 2022 | |
| | | Shares | | | Amount | | | Shares | | | Amount | |
| |
Sold: | | | | | | | | | | | | | | | | |
Class A | | | 53,928,796 | | | $ | 592,560,210 | | | | 45,543,523 | | | $ | 524,110,173 | |
| |
Class A2 | | | 918,802 | | | | 10,200,143 | | | | 207,060 | | | | 2,362,903 | |
| |
Class C | | | 1,197,551 | | | | 13,109,628 | | | | 628,384 | | | | 7,212,615 | |
| |
Class Y | | | 118,437,816 | | | | 1,301,424,121 | | | | 57,394,916 | | | | 659,121,798 | |
| |
Class R5 | | | 21,359 | | | | 237,251 | | | | 16,494 | | | | 187,636 | |
| |
Class R6 | | | 41,220,339 | | | | 453,037,462 | | | | 23,617,717 | | | | 271,336,076 | |
| |
| | | | |
Issued as reinvestment of dividends: | | | | | | | | | | | | | | | | |
Class A | | | 1,781,577 | | | | 19,542,829 | | | | 1,107,594 | | | | 12,731,882 | |
| |
Class A2 | | | 32,172 | | | | 353,151 | | | | 25,179 | | | | 289,584 | |
| |
Class C | | | 51,483 | | | | 563,936 | | | | 21,649 | | | | 249,462 | |
| |
Class Y | | | 1,378,819 | | | | 15,115,506 | | | | 732,152 | | | | 8,409,528 | |
| |
Class R5 | | | 613 | | | | 6,719 | | | | 630 | | | | 7,240 | |
| |
Class R6 | | | 974,181 | | | | 10,680,857 | | | | 462,738 | | | | 5,311,496 | |
| |
| | | | |
Automatic conversion of Class C shares to Class A shares: | | | | | | | | | | | | | | | | |
Class A | | | 212,588 | | | | 2,340,417 | | | | 260,616 | | | | 2,996,710 | |
| |
Class C | | | (212,673 | ) | | | (2,340,417 | ) | | | (260,757 | ) | | | (2,996,710 | ) |
| |
| | | | |
Reacquired: | | | | | | | | | | | | | | | | |
Class A | | | (64,169,619 | ) | | | (705,507,350 | ) | | | (36,164,994 | ) | | | (415,186,181 | ) |
| |
Class A2 | | | (1,041,976 | ) | | | (11,436,858 | ) | | | (161,549 | ) | | | (1,852,161 | ) |
| |
Class C | | | (2,302,767 | ) | | | (25,315,586 | ) | | | (1,994,109 | ) | | | (22,928,589 | ) |
| |
Class Y | | | (106,613,091 | ) | | | (1,171,511,764 | ) | | | (41,041,140 | ) | | | (470,299,874 | ) |
| |
Class R5 | | | (114,071 | ) | | | (1,260,029 | ) | | | (42,231 | ) | | | (485,692 | ) |
| |
Class R6 | | | (30,943,791 | ) | | | (339,803,694 | ) | | | (8,144,268 | ) | | | (93,268,575 | ) |
| |
Net increase in share activity | | | 14,758,108 | | | $ | 161,996,532 | | | | 42,209,604 | | | $ | 487,309,321 | |
| |
| (a) | There are entities that are record owners of more than 5% of the outstanding shares of the Fund and in the aggregate own 73% of the outstanding shares of the Fund. IDI has an agreement with these entities to sell Fund shares. The Fund, Invesco and/or Invesco affiliates may make payments to these entities, which are considered to be related to the Fund, for providing services to the Fund, Invesco and/or Invesco affiliates including but not limited to services such as securities brokerage, distribution, third party record keeping and account servicing. The Fund has no knowledge as to whether all or any portion of the shares owned of record by these entities are also owned beneficially. |
37 Invesco Limited Term Municipal Income Fund
Report of Independent Registered Public Accounting Firm
To the Board of Trustees of AIM Tax-Exempt Funds (Invesco Tax-Exempt Funds) and Shareholders of Invesco Limited Term Municipal Income Fund
Opinion on the Financial Statements
We have audited the accompanying statement of assets and liabilities, including the schedule of investments, of Invesco Limited Term Municipal Income Fund (one of the funds constituting AIM Tax-Exempt Funds (Invesco Tax-Exempt Funds), referred to hereafter as the “Fund”) as of February 28, 2023, the related statement of operations for the year ended February 28, 2023, the statement of changes in net assets for each of the two years in the period ended February 28, 2023, including the related notes, and the financial highlights for each of the five years in the period ended February 28, 2023 (collectively referred to as the “financial statements”). In our opinion, the financial statements present fairly, in all material respects, the financial position of the Fund as of February 28, 2023, the results of its operations for the year then ended, the changes in its net assets for each of the two years in the period ended February 28, 2023 and the financial highlights for each of the five years in the period ended February 28, 2023 in conformity with accounting principles generally accepted in the United States of America.
Basis for Opinion
These financial statements are the responsibility of the Fund’s management. Our responsibility is to express an opinion on the Fund’s financial statements based on our audits. We are a public accounting firm registered with the Public Company Accounting Oversight Board (United States) (PCAOB) and are required to be independent with respect to the Fund in accordance with the U.S. federal securities laws and the applicable rules and regulations of the Securities and Exchange Commission and the PCAOB.
We conducted our audits of these financial statements in accordance with the standards of the PCAOB. Those standards require that we plan and perform the audit to obtain reasonable assurance about whether the financial statements are free of material misstatement, whether due to error or fraud.
Our audits included performing procedures to assess the risks of material misstatement of the financial statements, whether due to error or fraud, and performing procedures that respond to those risks. Such procedures included examining, on a test basis, evidence regarding the amounts and disclosures in the financial statements. Our audits also included evaluating the accounting principles used and significant estimates made by management, as well as evaluating the overall presentation of the financial statements. Our procedures included confirmation of securities owned as of February 28, 2023 by correspondence with the custodian and broker. We believe that our audits provide a reasonable basis for our opinion.
/s/PricewaterhouseCoopers LLP
Houston, Texas
April 21, 2023
We have served as the auditor of one or more of the investment companies in the Invesco group of investment companies since at least 1995. We have not been able to determine the specific year we began serving as auditor.
38 Invesco Limited Term Municipal Income Fund
Calculating your ongoing Fund expenses
Example
As a shareholder of the Fund, you incur two types of costs: (1) transaction costs, which may include sales charges (loads) on purchase payments or contingent deferred sales charges on redemptions, if any; and (2) ongoing costs, including management fees, distribution and/or service (12b-1) fees, and other Fund expenses. This example is intended to help you understand your ongoing costs (in dollars) of investing in the Fund and to compare these costs with ongoing costs of investing in other mutual funds. The example is based on an investment of $1,000 invested at the beginning of the period and held for the entire period September 1, 2022 through February 28, 2023.
Actual expenses
The table below provides information about actual account values and actual expenses. You may use the information in this table, together with the amount you invested, to estimate the expenses that you paid over the period. Simply divide your account value by $1,000 (for example, an $8,600 account value divided by $1,000 = 8.6), then multiply the result by the number in the table under the heading entitled “Actual Expenses Paid During Period” to estimate the expenses you paid on your account during this period.
Hypothetical example for comparison purposes
The table below also provides information about hypothetical account values and hypothetical expenses based on the Fund’s actual expense ratio and an assumed rate of return of 5% per year before expenses, which is not the Fund’s actual return.
The hypothetical account values and expenses may not be used to estimate the actual ending account balance or expenses you paid for the period. You may use this information to compare the ongoing costs of investing in the Fund and other funds. To do so, compare this 5% hypothetical example with the 5% hypothetical examples that appear in the shareholder reports of the other funds.
Please note that the expenses shown in the table are meant to highlight your ongoing costs only and do not reflect any transaction costs, such as sales charges (loads) on purchase payments or contingent deferred sales charges on redemptions, if any. Therefore, the hypothetical information is useful in comparing ongoing costs only, and will not help you determine the relative total costs of owning different funds. In addition, if these transaction costs were included, your costs would have been higher.
| | | | | | | | | | | | |
| | | Beginning
Account Value
(09/01/22) | | ACTUAL | | HYPOTHETICAL (5% annual return before expenses) | | Annualized
Expense Ratio |
| | | Ending
Account Value
(02/28/23)1 | | Expenses
Paid During
Period2 | | Ending
Account Value
(02/28/23) | | Expenses
Paid During
Period2 |
Class A | | $1,000.00 | | $1,006.60 | | $2.94 | | $1,021.87 | | $2.96 | | 0.59% |
Class A2 | | 1,000.00 | | 1,008.80 | | 1.69 | | 1,023.11 | | 1.71 | | 0.34 |
Class C | | 1,000.00 | | 1,003.80 | | 6.66 | | 1,018.15 | | 6.71 | | 1.34 |
Class Y | | 1,000.00 | | 1,008.80 | | 1.69 | | 1,023.11 | | 1.71 | | 0.34 |
Class R5 | | 1,000.00 | | 1,007.80 | | 1.69 | | 1,023.11 | | 1.71 | | 0.34 |
Class R6 | | 1,000.00 | | 1,009.10 | | 1.34 | | 1,023.46 | | 1.35 | | 0.27 |
| 1 | The actual ending account value is based on the actual total return of the Fund for the period September 1, 2022 through February 28, 2023, after actual expenses and will differ from the hypothetical ending account value which is based on the Fund’s expense ratio and a hypothetical annual return of 5% before expenses. |
| 2 | Expenses are equal to the Fund’s annualized expense ratio as indicated above multiplied by the average account value over the period, multiplied by 181/365 to reflect the most recent fiscal half year. |
39 Invesco Limited Term Municipal Income Fund
Tax Information
Form 1099-DIV, Form 1042-S and other year–end tax information provide shareholders with actual calendar year amounts that should be included in their tax returns. Shareholders should consult their tax advisers.
The following distribution information is being provided as required by the Internal Revenue Code or to meet a specific state’s requirement.
The Fund designates the following amounts or, if subsequently determined to be different, the maximum amount allowable for its fiscal year ended February 28, 2023:
| | | | | | |
| | | | | |
| | Federal and State Income Tax | | | | |
| | Qualified Dividend Income* | | | 0.00 | % |
| | Corporate Dividends Received Deduction* | | | 0.00 | % |
| | U.S. Treasury Obligations* | | | 0.00 | % |
| | Qualified Business Income* | | | 0.00 | % |
| | Business Interest Income* | | | 0.00 | % |
| | Tax-Exempt Interest Dividends* | | | 99.92 | % |
* The above percentages are based on ordinary income dividends paid to shareholders during the Fund’s fiscal year.
40 Invesco Limited Term Municipal Income Fund
Trustees and Officers
The address of each trustee and officer is AIM Tax-Exempt Funds (Invesco Tax-Exempt Funds) (the “Trust”), 11 Greenway Plaza, Suite 1000, Houston, Texas 77046-1173. The trustees serve for the life of the Trust, subject to their earlier death, incapacitation, resignation, retirement or removal as more specifically provided in the Trust’s organizational documents. Each officer serves for a one year term or until their successors are elected and qualified. Column two below includes length of time served with predecessor entities, if any.
| | | | | | | | |
Name, Year of Birth and Position(s) Held with the Trust | | Trustee and/or Officer Since | | Principal Occupation(s) During Past 5 Years | | Number of Funds in Fund Complex Overseen by Trustee | | Other Directorship(s) Held by Trustee During Past 5 Years |
| Interested Trustee | | | | | | | | |
| Martin L. Flanagan1 - 1960 Trustee and Vice Chair | | 2007 | | Executive Director, Chief Executive Officer and President, Invesco Ltd. (ultimate parent of Invesco and a global investment management firm); Trustee and Vice Chair, The Invesco Funds; Vice Chair, Investment Company Institute; and Member of Executive Board, SMU Cox School of Business Formerly: Advisor to the Board, Invesco Advisers, Inc. (formerly known as Invesco Institutional (N.A.), Inc.); Chairman and Chief Executive Officer, Invesco Advisers, Inc. (registered investment adviser); Director, Chairman, Chief Executive Officer and President, Invesco Holding Company (US), Inc. (formerly IVZ Inc.) (holding company), Invesco Group Services, Inc. (service provider) and Invesco North American Holdings, Inc. (holding company); Director, Chief Executive Officer and President, Invesco Holding Company Limited (parent of Invesco and a global investment management firm); Director, Invesco Ltd.; Chairman, Investment Company Institute and President, Co-Chief Executive Officer, Co-President, Chief Operating Officer and Chief Financial Officer, Franklin Resources, Inc. (global investment management organization) | | 175 | | None |
| 1 | Mr. Flanagan is considered an interested person (within the meaning of Section 2(a)(19) of the 1940 Act) of the Trust because he is an officer of the Adviser to the Trust, and an officer and a director of Invesco Ltd., ultimate parent of the Adviser. |
T-1 Invesco Limited Term Municipal Income Fund
Trustees and Officers–(continued)
| | | | | | | | |
Name, Year of Birth and Position(s) Held with the Trust | | Trustee and/or Officer Since | | Principal Occupation(s) During Past 5 Years | | Number of Funds in Fund Complex Overseen by Trustee | | Other Directorship(s) Held by Trustee During Past 5 Years |
| Independent Trustees | | | | | | | | |
Beth Ann Brown - 1968 Trustee (2019) and Chair (August 2022) | | 2019 | | Independent Consultant Formerly: Head of Intermediary Distribution, Managing Director, Strategic Relations, Managing Director, Head of National Accounts, Senior Vice President, National Account Manager and Senior Vice President, Key Account Manager, Columbia Management Investment Advisers LLC; Vice President, Key Account Manager, Liberty Funds Distributor, Inc.; and Trustee of certain Oppenheimer Funds | | 175 | | Director, Board of Directors of Caron Engineering Inc.; Advisor, Board of Advisors of Caron Engineering Inc.; President and Director, Acton Shapleigh Youth Conservation Corps (non-profit) Formerly: President and Director Director of Grahamtastic Connection (non-profit) |
Cynthia Hostetler - 1962 Trustee | | 2017 | | Non-Executive Director and Trustee of a number of public and private business corporations Formerly: Director, Aberdeen Investment Funds (4 portfolios); Director, Artio Global Investment LLC (mutual fund complex); Director, Edgen Group, Inc. (specialized energy and infrastructure products distributor); Director, Genesee & Wyoming, Inc. (railroads); Head of Investment Funds and Private Equity, Overseas Private Investment Corporation; President, First Manhattan Bancorporation, Inc.; and Attorney, Simpson Thacher & Bartlett LLP | | 175 | | Resideo Technologies, Inc. (smart home technology); Vulcan Materials Company (construction materials company); Trilinc Global Impact Fund; Textainer Group Holdings, (shipping container leasing company); Investment Company Institute (professional organization); and Independent Directors Council (professional organization) |
Eli Jones - 1961 Trustee | | 2016 | | Professor and Dean Emeritus, Mays Business School - Texas A&M University Formerly: Dean of Mays Business School-Texas A&M University; Professor and Dean, Walton College of Business, University of Arkansas and E.J. Ourso College of Business, Louisiana State University; and Director, Arvest Bank | | 175 | | Insperity, Inc. (formerly known as Administaff) (human resources provider); Board Member of the regional board, First Financial Bank Texas; and Boad Member, First Financial Bankshares, Inc. Texas (FFIN) |
Elizabeth Krentzman - 1959 Trustee | | 2019 | | Formerly: Principal and Chief Regulatory Advisor for Asset Management Services and U.S. Mutual Fund Leader of Deloitte & Touche LLP; General Counsel of the Investment Company Institute (trade association); National Director of the Investment Management Regulatory Consulting Practice, Principal, Director and Senior Manager of Deloitte & Touche LLP; Assistant Director of the Division of Investment Management - Office of Disclosure and Investment Adviser Regulation of the U.S. Securities and Exchange Commission and various positions with the Division of Investment Management – Office of Regulatory Policy of the U.S. Securities and Exchange Commission; Associate at Ropes & Gray LLP; and Trustee of certain Oppenheimer Funds | | 175 | | Formerly: Member of the Cartica Funds Board of Directors (private investment fund); Trustee of the University of Florida National Board Foundation; and Member of the University of Florida Law Center Association, Inc. Board of Trustees, Audit Committee and Membership Committee |
Anthony J. LaCava, Jr. - 1956 Trustee | | 2019 | | Formerly: Director and Member of the Audit Committee, Blue Hills Bank (publicly traded financial institution) and Managing Partner, KPMG LLP | | 175 | | Blue Hills Bank; Member and Chairman, Bentley University, Business School Advisory Council; and Nominating Committee, KPMG LLP |
Prema Mathai-Davis - 1950 Trustee | | 1998 | | Retired Formerly: Co-Founder & Partner of Quantalytics Research, LLC, (a FinTech Investment Research Platform for the Self-Directed Investor); Trustee of YWCA Retirement Fund; CEO of YWCA of the USA; Board member of the NY Metropolitan Transportation Authority; Commissioner of the NYC Department of Aging; and Board member of Johns Hopkins Bioethics Institute | | 175 | | Member of Board of Positive Planet US (non-profit) and HealthCare Chaplaincy Network (non-profit) |
T-2 Invesco Limited Term Municipal Income Fund
Trustees and Officers–(continued)
| | | | | | | | |
Name, Year of Birth and Position(s) Held with the Trust | | Trustee and/or Officer Since | | Principal Occupation(s) During Past 5 Years | | Number of Funds in Fund Complex Overseen by Trustee | | Other Directorship(s) Held by Trustee During Past 5 Years |
| Independent Trustees–(continued) | | | | | | |
Joel W. Motley - 1952 Trustee | | 2019 | | Director of Office of Finance, Federal Home Loan Bank System; Managing Director of Carmona Motley Inc. (privately held financial advisor); Member of the Council on Foreign Relations and its Finance and Budget Committee; Chairman Emeritus of Board of Human Rights Watch and Member of its Investment Committee; and Member of Investment Committee Board of Historic Hudson Valley (non-profit cultural organization); Member of the Board, Blue Ocean Acquisition Corp.; and Member of the Vestry and the Investment Committee of Trinity Church Wall Street. Formerly: Managing Director of Public Capital Advisors, LLC (privately held financial advisor); Managing Director of Carmona Motley Hoffman, Inc. (privately held financial advisor); Trustee of certain Oppenheimer Funds; and Director of Columbia Equity Financial Corp. (privately held financial advisor) | | 175 | | Member of Board of Trust for Mutual Understanding (non-profit promoting the arts and environment); Member of Board of Greenwall Foundation (bioethics research foundation) and its Investment Committee; Member of Board of Friends of the LRC (non- profit legal advocacy); and Board Member and Investment Committee Member of Pulitzer Center for Crisis Reporting (non-profit journalism) |
Teresa M. Ressel - 1962 Trustee | | 2017 | | Non-executive director and trustee of a number of public and private business corporations Formerly: Chief Executive Officer, UBS Securities LLC (investment banking); Chief Operating Officer, UBS AG Americas (investment banking); Sr. Management Team Olayan America, The Olayan Group (international investor/commercial/industrial); and Assistant Secretary for Management & Budget and Designated Chief Financial Officer, U.S. Department of Treasury | | 175 | | None |
Robert C. Troccoli - 1949 Trustee | | 2016 | | Retired Formerly: Adjunct Professor, University of Denver – Daniels College of Business; and Managing Partner, KPMG LLP | | 175 | | None |
Daniel S. Vandivort - 1954 Trustee | | 2019 | | President, Flyway Advisory Services LLC (consulting and property management) Formerly: President and Chief Investment Officer, previously Head of Fixed Income, Weiss Peck and Greer/Robeco Investment Management; Trustee and Chair, Weiss Peck and Greer Funds Board; and various capacities at CS First Boston including Head of Fixed Income at First Boston Asset Management. | | 175 | | Formerly: Trustee and Governance Chair, Oppenheimer Funds; Treasurer, Chairman of the Audit and Finance Committee, Huntington Disease Foundation of America |
T-3 Invesco Limited Term Municipal Income Fund
Trustees and Officers–(continued)
| | | | | | | | |
Name, Year of Birth and Position(s) Held with the Trust | | Trustee and/or Officer Since | | Principal Occupation(s) During Past 5 Years | | Number of Funds in Fund Complex Overseen by Trustee | | Other Directorship(s) Held by Trustee During Past 5 Years |
| Officers | | | | | | |
Sheri Morris - 1964 President and Principal Executive Officer | | 1999 | | Director, Invesco Trust Company; Head of Global Fund Services, Invesco Ltd.; President and Principal Executive Officer, The Invesco Funds; Vice President, Invesco Exchange-Traded Fund Trust, Invesco Exchange-Traded Fund Trust II, Invesco India Exchange-Traded Fund Trust, Invesco Actively Managed Exchange-Traded Fund Trust, Invesco Actively Managed Exchange-Traded Commodity Fund Trust and Invesco Exchange-Traded Self-Indexed Fund Trust; and Vice President, OppenheimerFunds, Inc. Formerly: Vice President, Treasurer and Principal Financial Officer, The Invesco Funds; Vice President, Invesco AIM Advisers, Inc., Invesco AIM Capital Management, Inc. and Invesco AIM Private Asset Management, Inc.; Assistant Vice President and Assistant Treasurer, The Invesco Funds; Vice President and Assistant Vice President, Invesco Advisers, Inc.; Assistant Vice President, Invesco AIM Capital Management, Inc. and Invesco AIM Private Asset Management, Inc.; Treasurer, Invesco Exchange-Traded Fund Trust, Invesco Exchange-Traded Fund Trust II, Invesco India Exchange-Traded Fund Trust and Invesco Actively Managed Exchange-Traded Fund Trust; and Senior Vice President, Invesco Advisers, Inc. (formerly known as Invesco Institutional (N.A.), Inc.) (registered investment adviser) | | N/A | | N/A |
Melanie Ringold - 1975 Senior Vice President, Chief Legal Officer and Secretary | | 2023 | | Head of Legal of the Americas, Invesco Ltd.; Senior Vice President and Secretary, Invesco Advisers, Inc. (formerly known as Invesco Institutional (N.A.), Inc.) (registered investment adviser); Secretary, Invesco Distributors, Inc. (formerly known as Invesco AIM Distributors, Inc.); Secretary, Invesco Investment Services, Inc. (formerly known as Invesco AIM Investment Services, Inc.); Senior Vice President, Chief Legal Officer and Secretary, The Invesco Funds; Secretary, Invesco Investment Advisers LLC, Invesco Capital Markets, Inc.; Chief Legal Officer, Invesco Exchange-Traded Fund Trust, Invesco Exchange-Traded Fund Trust II, Invesco India Exchange-Traded Fund Trust, Invesco Actively Managed Exchange-Traded Fund Trust, Invesco Actively Managed Exchange-Traded Commodity Fund Trust and Invesco Exchange-Traded Self-Indexed Fund Trust;Secretary and Vice President, Harbourview Asset Management Corporation; Secretary and Senior Vice President, OppenheimerFunds, Inc. and Invesco Managed Accounts, LLC; Secretary and Senior Vice President, OFI SteelPath, Inc.; Secretary and Senior Vice President, Oppenheimer Acquisition Corp.; Secretary, SteelPath Funds Remediation LLC; and Secretary and Senior Vice President, Trinity Investment Management Corporation Formerly: Assistant Secretary, Invesco Distributors, Inc.; Invesco Advisers, Inc. Invesco Investment Services, Inc., Invesco Capital Markets, Inc., Invesco Capital Management LLC and Invesco Investment Advisers LLC; and Assistant Secretary and Investment Vice President, Invesco Funds | | N/A | | N/A |
| Andrew R. Schlossberg - 1974 Senior Vice President | | 2019 | | Senior Vice President, Invesco Group Services, Inc.; Head of the Americas and Senior Managing Director, Invesco Ltd.; Director and Senior Vice President, Invesco Advisers, Inc. (formerly known as Invesco Institutional (N.A.), Inc.) (registered investment adviser); Director and Chairman, Invesco Investment Services, Inc. (formerly known as Invesco AIM Investment Services, Inc.) (registered transfer agent); Senior Vice President, The Invesco Funds; and Director, Invesco Investment Advisers LLC (formerly known as Van Kampen Asset Management) Formerly: Director, President and Chairman, Invesco Insurance Agency, Inc.; Director, Invesco UK Limited; Director and Chief Executive, Invesco Asset Management Limited and Invesco Fund Managers Limited; Assistant Vice President, The Invesco Funds; Senior Vice President, Invesco Advisers, Inc. (formerly known as Invesco Institutional (N.A.), Inc.) (registered investment adviser); Director and Chief Executive, Invesco Administration Services Limited and Invesco Global Investment Funds Limited; Director, Invesco Distributors, Inc.; Head of EMEA, Invesco Ltd.; President, Invesco Actively Managed Exchange-Traded Commodity Fund Trust, Invesco Actively Managed Exchange-Traded Fund Trust, Invesco Exchange-Traded Fund Trust, Invesco Exchange-Traded Fund Trust II and Invesco India Exchange-Traded Fund Trust; and Managing Director and Principal Executive Officer, Invesco Capital Management LLC | | N/A | | N/A |
T-4 Invesco Limited Term Municipal Income Fund
Trustees and Officers–(continued)
| | | | | | | | |
Name, Year of Birth and Position(s) Held with the Trust | | Trustee and/or Officer Since | | Principal Occupation(s) During Past 5 Years | | Number of Funds in Fund Complex Overseen by Trustee | | Other Directorship(s) Held by Trustee During Past 5 Years |
| Officers–(continued) | | | | | | |
John M. Zerr - 1962 Senior Vice President | | 2006 | | Chief Operating Officer of the Americas; Senior Vice President, Invesco Advisers, Inc. (formerly known as Invesco Institutional (N.A.), Inc.) (registered investment adviser); Senior Vice President, Invesco Distributors, Inc. (formerly known as Invesco AIM Distributors, Inc.); Director and Vice President, Invesco Investment Services, Inc. (formerly known as Invesco AIM Investment Services, Inc.) Senior Vice President, The Invesco Funds; Managing Director, Invesco Capital Management LLC; Director, Invesco Investment Advisers LLC (formerly known as Van Kampen Asset Management); Senior Vice President, Invesco Capital Markets, Inc. (formerly known as Van Kampen Funds Inc.); Manager, Invesco Indexing LLC; Manager, Invesco Specialized Products, LLC; Member, Invesco Canada Funds Advisory Board; Director, President and Chief Executive Officer, Invesco Corporate Class Inc. (corporate mutual fund company); and Director, Chairman, President and Chief Executive Officer, Invesco Canada Ltd. (formerly known as Invesco Trimark Ltd./Invesco Trimark Ltèe) (registered investment adviser and registered transfer agent); President, Invesco, Inc.; President, Invesco Global Direct Real Estate Feeder GP Ltd.; President, Invesco IP Holdings (Canada) Ltd; President, Invesco Global Direct Real Estate GP Ltd.; President, Invesco Financial Services Ltd. / Services Financiers Invesco Ltée; and Director and Chairman, Invesco Trust Company Formerly: President, Trimark Investments Ltd/Services Financiers Invesco Ltee; Director and Senior Vice President, Invesco Insurance Agency, Inc.; Director and Senior Vice President, Invesco Management Group, Inc. (formerly known as Invesco AIM Management Group, Inc.); Secretary and General Counsel, Invesco Management Group, Inc. (formerly known as Invesco AIM Management Group, Inc.); Secretary, Invesco Investment Services, Inc. (formerly known as Invesco AIM Investment Services, Inc.); Chief Legal Officer and Secretary, The Invesco Funds; Secretary and General Counsel, Invesco Investment Advisers LLC (formerly known as Van Kampen Asset Management); Secretary and General Counsel, Invesco Capital Markets, Inc. (formerly known as Van Kampen Funds Inc.); Chief Legal Officer, Invesco Exchange-Traded Fund Trust, Invesco Exchange-Traded Fund Trust II, Invesco India Exchange-Traded Fund Trust, Invesco Actively Managed Exchange-Traded Fund Trust, Invesco Actively Managed Exchange-Traded Commodity Fund Trust and Invesco Exchange-Traded Self-Indexed Fund Trust; Secretary, Invesco Indexing LLC; Director, Secretary, General Counsel and Senior Vice President, Van Kampen Exchange Corp.; Director, Vice President and Secretary, IVZ Distributors, Inc. (formerly known as INVESCO Distributors, Inc.); Director and Vice President, INVESCO Funds Group, Inc.; Director and Vice President, Van Kampen Advisors Inc.; Director, Vice President, Secretary and General Counsel, Van Kampen Investor Services Inc.;Director and Secretary, Invesco Distributors, Inc. (formerly known as Invesco AIM Distributors, Inc.); Director, Senior Vice President, General Counsel and Secretary, Invesco AIM Advisers, Inc. and Van Kampen Investments Inc.; Director, Vice President and Secretary, Fund Management Company; Director, Senior Vice President, Secretary, General Counsel and Vice President, Invesco AIM Capital Management, Inc.; and Chief Operating Officer and General Counsel, Liberty Ridge Capital, Inc. (an investment adviser) | | N/A | | N/A |
Gregory G. McGreevey - 1962 Senior Vice President | | 2012 | | Senior Managing Director, Invesco Ltd.; Director, Chairman, President, and Chief Executive Officer, Invesco Advisers, Inc. (formerly known as Invesco Institutional (N.A.), Inc.) (registered investment adviser); Director, Invesco Mortgage Capital, Inc. and Invesco Senior Secured Management, Inc.; Senior Vice President, The Invesco Funds; President, SNW Asset Management Corporation and Invesco Managed Accounts, LLC; Chairman and Director, Invesco Private Capital, Inc.; Chairman and Director, INVESCO Private Capital Investments, Inc.; Chairman and Director, INVESCO Realty, Inc.; and Senior Vice President, Invesco Group Services, Inc. Formerly: Senior Vice President, Invesco Management Group, Inc. and Invesco Advisers, Inc.; Assistant Vice President, The Invesco Funds | | N/A | | N/A |
Adrien Deberghes - 1967 Principal Financial Officer, Treasurer and Vice President | | 2020 | | Head of the Fund Office of the CFO and Fund Administration; Vice President, Invesco Advisers, Inc.; Principal Financial Officer, Treasurer and Vice President, The Invesco Funds; Vice President, Invesco Exchange-Traded Fund Trust, Invesco Exchange-Traded Fund Trust II, Invesco India Exchange-Traded Fund Trust, Invesco Actively Managed Exchange-Traded Fund Trust, Invesco Actively Managed Exchange-Traded Commodity Fund Trust and Invesco Exchange-Traded Self-Indexed Fund Trust Formerly: Senior Vice President and Treasurer, Fidelity Investments | | N/A | | N/A |
Crissie M. Wisdom - 1969 Anti-Money Laundering Compliance Officer | | 2013 | | Anti-Money Laundering and OFAC Compliance Officer for Invesco U.S. entities including: Invesco Advisers, Inc. and its affiliates, Invesco Capital Markets, Inc., Invesco Distributors, Inc., Invesco Investment Services, Inc., The Invesco Funds, Invesco Capital Management, LLC, Invesco Trust Company; and Fraud Prevention Manager for Invesco Investment Services, Inc. | | N/A | | N/A |
T-5 Invesco Limited Term Municipal Income Fund
Trustees and Officers–(continued)
| | | | | | | | |
Name, Year of Birth and Position(s) Held with the Trust | | Trustee and/or Officer Since | | Principal Occupation(s) During Past 5 Years | | Number of Funds in Fund Complex Overseen by Trustee | | Other Directorship(s) Held by Trustee During Past 5 Years |
| Officers–(continued) | | | | | | |
Todd F. Kuehl - 1969 Chief Compliance Officer and Senior Vice President | | 2020 | | Chief Compliance Officer, Invesco Advisers, Inc. (registered investment adviser); and Chief Compliance Officer and Senior Vice President, The Invesco Funds Formerly: Managing Director and Chief Compliance Officer, Legg Mason (Mutual Funds); Chief Compliance Officer, Legg Mason Private Portfolio Group (registered investment adviser) | | N/A | | N/A |
James Bordewick, Jr. - 1959 Senior Vice President and Senior Officer | | 2022 | | Senior Vice President and Senior Officer, The Invesco Funds Formerly: Chief Legal Officer, KingsCrowd, Inc. (research and analytical platform for investment in private capital markets); Chief Operating Officer and Head of Legal and Regulatory, Netcapital (private capital investment platform); Managing Director, General Counsel of asset management and Chief Compliance Officer for asset management and private banking, Bank of America Corporation; Chief Legal Officer, Columbia Funds and BofA Funds; Senior Vice President and Associate General Counsel, MFS Investment Management; Chief Legal Officer, MFS Funds; Associate, Ropes & Gray; and Associate, Gaston Snow & Ely Bartlett | | N/A | | N/A |
The Statement of Additional Information of the Trust includes additional information about the Fund’s Trustees and is available upon request, without charge, by calling 1.800.959.4246. Please refer to the Fund’s Statement of Additional Information for information on the Fund’s sub-advisers.
| | | | | | |
| Office of the Fund | | Investment Adviser | | Distributor | | Auditors |
| 11 Greenway Plaza, Suite 1000 | | Invesco Advisers, Inc. | | Invesco Distributors, Inc. | | PricewaterhouseCoopers LLP |
| Houston, TX 77046-1173 | | 1331 Spring Street, NW, Suite 2500 | | 11 Greenway Plaza, Suite 1000 | | 1000 Louisiana Street, Suite 5800 |
| | Atlanta, GA 30309 | | Houston, TX 77046-1173 | | Houston, TX 77002-5021 |
| | | |
| Counsel to the Fund | | Counsel to the Independent Trustees | | Transfer Agent | | Custodian |
| Stradley Ronon Stevens & Young, LLP | | Sidley Austin LLP | | Invesco Investment Services, Inc. | | State Street Bank and Trust Company |
| 2005 Market Street, Suite 2600 | | 787 Seventh Avenue | | 11 Greenway Plaza, Suite 1000 | | 225 Franklin Street |
| Philadelphia, PA 19103-7018 | | New York, NY 10019 | | Houston, TX 77046-1173 | | Boston, MA 02110-2801 |
T-6 Invesco Limited Term Municipal Income Fund
(This page intentionally left blank)

Go paperless with eDelivery
Visit invesco.com/edelivery to enjoy the convenience and security of anytime electronic access to your investment documents.
With eDelivery, you can elect to have any or all of the following materials delivered straight to your inbox to download, save and print from your own computer:
∎ Fund reports and prospectuses
∎ Quarterly statements
∎ Daily confirmations
∎ Tax forms
Invesco mailing information
Send general correspondence to Invesco Investment Services, Inc., P.O. Box 219078, Kansas City, MO 64121-9078.
Important notice regarding delivery of security holder documents
To reduce Fund expenses, only one copy of most shareholder documents may be mailed to shareholders with multiple accounts at the same address (Householding). Mailing of your shareholder documents may be householded indefinitely unless you instruct us otherwise. If you do not want the mailing of these documents to be combined with those for other members of your household, please contact Invesco Investment Services, Inc. at 800 959 4246 or contact your financial institution. We will begin sending you individual copies for each account within 30 days after receiving your request.
Fund holdings and proxy voting information
The Fund provides a complete list of its portfolio holdings four times each year, at the end of each fiscal quarter. For the second and fourth quarters, the list appears, respectively, in the Fund’s semiannual and annual reports to shareholders. For the first and third quarters, the Fund files the list with the Securities and Exchange Commission (SEC) as an exhibit to its reports on Form N-PORT. The most recent list of portfolio holdings is available at invesco.com/completeqtrholdings. Shareholders can also look up the Fund’s Form N-PORT filings on the SEC website, sec.gov. The SEC file numbers for the Fund are shown below.
A description of the policies and procedures that the Fund uses to determine how to vote proxies relating to portfolio securities is available without charge, upon request, from our Client Services department at 800 959 4246, or at invesco.com/corporate/about-us/esg. The information is also available on the SEC website, sec.gov.
Information regarding how the Fund voted proxies related to its portfolio securities during the most recent 12-month period ended June 30 is available at invesco.com/proxysearch. This information is also available on the SEC website, sec.gov.
Invesco Advisers, Inc. is an investment adviser; it provides investment advisory services to individual and institutional clients and does not sell securities. Invesco Distributors, Inc. is the US distributor for Invesco Ltd.’s retail mutual funds, exchange-traded funds and institutional money market funds. Both are wholly owned, indirect subsidiaries of Invesco Ltd.
| | | | |
| SEC file number(s): 811-07890 and 033-66242 | | Invesco Distributors, Inc. | | LTMI-AR-1 |

| | |
| | |
| Annual Report to Shareholders | | February 28, 2023 |
Invesco Municipal Income Fund
Nasdaq:
A: VKMMX ∎ C: VMICX ∎ Y: VMIIX ∎ Investor: VMINX ∎ R6: VKMSX
Management’s Discussion of Fund Performance
| | | | |
| |
Performance summary | |
For the fiscal year ended February 28, 2023, Class A shares of Invesco Municipal Income Fund (the Fund), at net asset value (NAV), underperformed the S&P Municipal Bond 5+ Year Investment Grade Index, the Fund’s style-specific benchmark. | |
Your Fund’s long-term performance appears later in this report. | |
| |
Fund vs. Indexes | |
Total returns, 2/28/22 to 2/28/23, at net asset value (NAV). Performance shown does not include applicable contingent deferred sales charges (CDSC) or front-end sales charges, which would have reduced performance. | |
Class A Shares | | | -8.39 | % |
Class C Shares | | | -9.05 | |
Class Y Shares | | | -8.15 | |
Investor Class Shares | | | -8.28 | |
Class R6 Shares | | | -8.11 | |
S&P Municipal Bond Index▼ (Broad Market Index) | | | -4.91 | |
S&P Municipal Bond 5+ Year Investment Grade Index▼ (Style-Specific Index) | | | -6.31 | |
Lipper General Municipal Debt Funds Index∎ (Peer Group Index) | | | -6.86 | |
| |
Source(s): ▼RIMES Technologies Corp.; ∎Lipper Inc. | | | | |
Market conditions and your Fund
At the beginning of the fiscal year, investors were hopeful in anticipation of a return to normalcy as COVID-19 cases declined and pandemic-related restrictions were reduced or lifted. This allowed policymakers to turn their attention to the high inflation levels; however, on February 24, 2022, Russia began a full-scale invasion of Ukraine, which exacerbated inflationary pressures by driving up commodity prices. Against this backdrop, the fiscal year was plagued by volatility and uncertainty. The municipal market set multiple record lows in 2022, making it one of the most challenging years in history for municipal markets.
Investment grade municipal bonds returned -5.10%, high yield municipal bonds returned -9.35% and taxable municipal bonds returned -12.96% during the fiscal year.1
While municipal funds had experienced record inflows of $101.7 billion in 2021, flows quickly turned negative in the first quarter of 2022, perpetuating the Bloomberg Municipal Bond Index’s worst quarterly return in 40 years. Municipal bonds enjoyed a short respite in late May and early June 2022 with increased demand from crossover buyers like hedge funds, banks and insurance companies; however, the May 2022 Consumer Price Index report quoted inflation rising to a 40-year high. This sent the 10-year Treasury yield to a new 52-week high of nearly 3.50%, pushing municipal mutual fund flows back into negative territory.2 According to Lipper, net outflows from municipal bond funds totaled over -$110 billion for the fiscal year.3
On March 16, 2022, the US Federal Reserve (the Fed) raised the federal funds target rate 0.25% for the first time in more than three years in hopes of containing inflation.4 This was the first of eight consecutive increases during the fiscal year as the Fed announced its plan for a quantitative tightening
campaign in an attempt to rein in inflation without harming employment or the overall economy. Rate increases as high as 0.75% followed, the Fed’s most aggressive monetary policy since the 1980s, bringing the target rate to 4.75% as of the end of the fiscal year.4
The AAA municipal yield curve made history after the Fed’s December 2022 meeting when the curve inverted between one- and 10-year maturities. Any inversion is noteworthy, but this was a first for municipal bonds. On January 31, 2023, policymakers indicated that future rate increases were likely to be “appropriate,” suggesting they were not yet convinced inflation was contained, which increased uncertainty about when the current tightening cycle might end.4 The fiscal year ended with an increase of 0.25% on February 1, 2023. We expect additional rate hikes in 2023, although not with the same pace or vigor as in 2022.
New municipal issuance for the fiscal year totaled $354 billion, down 27% from the previous fiscal year’s $484 billion.5 Issuers, with cash on their balance sheets, have been reluctant to issue at higher interest rates. While taxable issuance continued to account for a significant portion of new issuance, at 14% of the total, this figure is down from 18% from the previous fiscal year because of higher interest rates.5
Puerto Rico continued to make developments in its ongoing debt restructuring throughout the fiscal year. The territory restructured its outstanding general obligation and other government-guaranteed debt in March 2022 and began paying bondholders on the new restructured bonds. Puerto Rico’s weight in the Bloomberg High Yield Municipal Bond Index increased from 13% to 20% as the new bonds were included.1 The Financial Oversight and Management Board for Puerto Rico, the Puerto Rican government, bondholders and other interested parties continued
to negotiate the restructuring of bonds issued by the Puerto Rico Electric Power Authority, the territory’s largest remaining unresolved debt, as the fiscal year closed.
Municipal credits have a long history of low defaults as many provide essential services to all Americans. This continues to be the case as evidenced by S&P rating changes - upgrades exceeded downgrades by a ratio of
2.5:1 through December 2022.6 This positive dynamic, which we believe will continue, likely stems from benefits of the various federal stimulus measures including the American Rescue Plan Act, the Infrastructure Investment and Jobs Act and the Inflation Reduction Act, as well as higher revenues collected by state and local governments.
We believe the valuable benefits of municipal bonds will prevail over current market volatility and economic uncertainty. We continue to rely on our experienced portfolio managers and credit analysts to weather the challenges while identifying marketplace opportunities to add long-term value for shareholders.
During the fiscal year, underweight exposure to local general obligation bonds contributed to relative return. An underweight allocation to bonds AAA and AA-rated† also added to relative performance. On a state level, security selection among and underweight allocations to bonds domiciled in New York contributed to relative performance.
An overweight allocation to the healthcare sector detracted from relative performance over the fiscal year, as did an overweight to airport and industrial development revenue/ pollution control revenue bonds. Overweight exposure to bonds A-rated† and below also detracted from relative performance. On a state level, overweight exposure to bonds domiciled in Florida detracted from relative performance.
During the fiscal year, leverage contributed to the Fund’s performance relative to its style-specific benchmark. The Fund achieved a leveraged position through the use of inverse floating rate securities or tender option bonds. The Fund uses leverage because we believe that, over time, leveraging provides opportunities for additional income and total return for shareholders. However, the use of leverage also can expose shareholders to additional volatility. For more information about the Fund’s use of leverage, see the Notes to Financial Statements later in this report.
We wish to remind you that the Fund is subject to interest rate risk, meaning when interest rates rise, the value of fixed income securities tends to fall. The degree to which the value of fixed income securities may decline due to rising interest rates may vary depending on the speed and magnitude of the increase in interest rates, as well as individual security characteristics, such as price, maturity, duration and coupon and market forces, such as supply and demand for similar securities. We are monitoring interest rates, as well
| | |
| 2 | | Invesco Municipal Income Fund |
as the market, economic and geopolitical factors that may impact the direction, speed and magnitude of changes to interest rates across the maturity spectrum, including the potential impact of monetary policy changes by the Fed and certain foreign central banks. If interest rates rise or fall faster than expected, markets may experience increased volatility, which may affect the value and/or liquidity of certain of the Fund’s investments.
Thank you for investing in Invesco Municipal Income Fund and for sharing our long-term investment horizon.
1 Source: Bloomberg LP
2 Source: Refinitiv TM3
3 Source: Lipper Inc.
4 Source: US Federal Reserve
5 Source: JP Morgan
6 Source: Standard & Poor’s
† Sources: A credit rating is an assessment provided by a NRSRO of the creditworthiness of an issuer with respect to debt obligations, including specific securities, money market instruments or other debts. Ratings are measured on a scale that generally ranges from AAA (highest) to D (lowest); ratings are subject to change without notice. For more information on rating methodology, please visit www.spglobal.com and select “Understanding Credit Ratings” under About Ratings on the homepage; www.fitchratings.com and select “Understanding Credit Ratings” from the drop-down menu on the homepage; and www.moodys.com and select “Methodology,” then “Rating Methodologies” under Research Type on the left-hand side.
Portfolio manager(s):
Jack Connelly
Josh Cooney
Elizabeth S. Mossow
Tim O’Reilly
Mark Paris
Jim Phillips
John Schorle
Julius Williams
The views and opinions expressed in management’s discussion of Fund performance are those of Invesco Advisers, Inc. and its affiliates. These views and opinions are subject to change at any time based on factors such as market and economic conditions. These views and opinions may not be relied upon as investment advice or recommendations, or as an offer for a particular security. The information is not a complete analysis of every aspect of any market, country, industry, security or the Fund. Statements of fact are from sources considered reliable, but Invesco Advisers, Inc. makes no representation or warranty as to their completeness or accuracy. Although historical performance is no guarantee of future results, these insights may help you understand our investment management philosophy.
See important Fund and, if applicable, index disclosures later in this report.
| | |
| 3 | | Invesco Municipal Income Fund |
Your Fund’s Long-Term Performance
Results of a $10,000 Investment – Oldest Share Class(es)
Fund and index data from 2/28/13
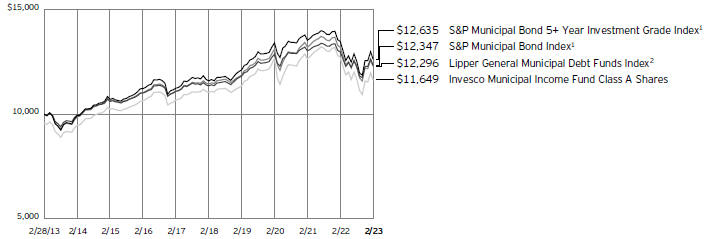
1 Source: RIMES Technologies Corp.
2 Source: Lipper Inc.
Past performance cannot guarantee future results.
The data shown in the chart include reinvested distributions, applicable sales charges and Fund expenses including management
fees. Index results include reinvested dividends, but they do not reflect sales charges. Performance of the peer group, if applicable, reflects Fund expenses and management fees; performance of a market index does
not. Performance shown in the chart does not reflect deduction of taxes a shareholder would pay on Fund distributions or sale of Fund shares.
| | |
| 4 | | Invesco Municipal Income Fund |
| | | | |
| |
Average Annual Total Returns | |
As of 2/28/23, including maximum applicable sales charges | |
Class A Shares | | | | |
Inception (8/1/90) | | | 4.23 | % |
10 Years | | | 1.54 | |
5 Years | | | 0.18 | |
1 Year | | | -12.29 | |
| |
Class C Shares | | | | |
Inception (8/13/93) | | | 3.44 | % |
10 Years | | | 1.36 | |
5 Years | | | 0.35 | |
1 Year | | | -9.94 | |
| |
Class Y Shares | | | | |
Inception (8/12/05) | | | 3.22 | % |
10 Years | | | 2.24 | |
5 Years | | | 1.33 | |
1 Year | | | -8.15 | |
| |
Investor Class Shares | | | | |
10 Years | | | 2.08 | % |
5 Years | | | 1.16 | |
1 Year | | | -8.28 | |
| |
Class R6 Shares | | | | |
10 Years | | | 2.16 | % |
5 Years | | | 1.39 | |
1 Year | | | -8.11 | |
Effective June 1, 2010, Class A, Class C and Class I shares of the predecessor fund, Van Kampen Municipal Income Fund, advised by Van Kampen Asset Management were reorganized into Class A, Class C and Class Y shares, respectively, of Invesco Van Kampen Municipal Income Fund (renamed Invesco Municipal Income Fund). Returns shown above, prior to June 1, 2010, for Class A, Class C and Class Y are those for Class A, Class C and Class I shares of the predecessor fund. Share class returns will differ from the predecessor fund because of different expenses.
Investor Class shares incepted on July 15, 2013. Performance shown prior to that date is that of Class A shares at net asset value and includes the 12b-1 fees applicable to Class A shares.
Class R6 shares incepted on April 4, 2017. Performance shown prior to that date is that of the Fund’s Class A shares at net asset value and includes the 12b-1 fees applicable to Class A shares.
The performance data quoted represent past performance and cannot guarantee future results; current performance may be lower or higher. Please visit invesco.com/performance for the most recent month-end performance. Performance figures reflect reinvested distributions, changes in net asset value and the effect of the maximum sales charge unless otherwise stated. Performance figures do not reflect deduction of taxes a shareholder would pay on Fund distributions or sale of Fund shares. Investment return and principal value will
fluctuate so that you may have a gain or loss when you sell shares.
Class A share performance reflects the maximum 4.25% sales charge, and Class C share performance reflects the applicable contingent deferred sales charge (CDSC) for the period involved. The CDSC on Class C shares is 1% for the first year after purchase. Class Y, Investor Class and Class R6 shares do not have a front-end sales charge or a CDSC; therefore, performance is at net asset value.
The performance of the Fund’s share classes will differ primarily due to different sales charge structures and class expenses.
Fund performance reflects any applicable fee waivers and/or expense reimbursements. Had the adviser not waived fees and/or reimbursed expenses currently or in the past, returns would have been lower. See current prospectus for more information.
| | |
| 5 | | Invesco Municipal Income Fund |
Supplemental Information
Invesco Municipal Income Fund’s investment objective is to provide investors with a high level of current income exempt from federal income tax, consistent with preservation of capital.
| ∎ | Unless otherwise stated, information presented in this report is as of February 28, 2023, and is based on total net assets. |
| ∎ | Unless otherwise noted, all data is provided by Invesco. |
| ∎ | To access your Fund’s reports/prospectus, visit invesco.com/fundreports. |
About indexes used in this report
| ∎ | The S&P Municipal Bond Index is a broad, market value-weighted index that seeks to measure the performance of the US municipal bond market. |
| ∎ | The S&P Municipal Bond 5+ Year Investment Grade Index seeks to measure the performance of investment-grade US municipal bonds with maturities equal to or greater than five years. |
| ∎ | The Lipper General Municipal Debt Funds Index is an unmanaged index considered representative of general municipal debt funds tracked by Lipper. |
| ∎ | The Fund is not managed to track the performance of any particular index, including the index(es) described here, and consequently, the performance of the Fund may deviate significantly from the performance of the index(es). |
| ∎ | A direct investment cannot be made in an index. Unless otherwise indicated, index results include reinvested dividends, and they do not reflect sales charges. Performance of the peer group, if applicable, reflects fund expenses; performance of a market index does not. |
|
|
This report must be accompanied or preceded by a currently effective Fund prospectus, which contains more complete information, including sales charges and expenses. Investors should read it carefully before investing. |
|
| |
| NOT FDIC INSURED | MAY LOSE VALUE | NO BANK GUARANTEE |
| | |
| 6 | | Invesco Municipal Income Fund |
Fund Information
Portfolio Composition
| | | | | |
| By credit sector | | % of total investments |
| |
Revenue Bonds | | | | 84.02 | % |
| |
General Obligation Bonds | | | | 8.94 | |
| |
Pre-Refunded Bonds | | | | 4.41 | |
| |
Other | | | | 2.63 | |
Top Five Debt Holdings
| | | | | | | |
| | | | | % of total net assets |
| | |
| 1. | | Public Authority for Colorado Energy, Series 2008, RB | | | | 1.23 | % |
| | |
| 2. | | Miami-Dade (County of), FL, Subseries 2021 A-1, Ref. RB | | | | 0.84 | |
| | |
| 3. | | Metropolitan Washington Airports Authority (Dulles Metrorail and Capital Improvement), Series 2019 B, Ref. RB | | | | 0.76 | |
| | |
| 4. | | Seattle (Port of), WA, Series 2018 A, RB | | | | 0.69 | |
| | |
| 5. | | Buckeye Tobacco Settlement Financing Authority, Series 2020 B-2, Ref. RB | | | | 0.68 | |
The Fund’s holdings are subject to change, and there is no assurance that the Fund will continue to hold any particular security.
Data presented here are as of February 28, 2023.
| | |
| 7 | | Invesco Municipal Income Fund |
Schedule of Investments
February 28, 2023
| | | | | | | | | | | | | | |
| | | Interest Rate | | | Maturity Date | | | Principal Amount (000) | | | Value |
Municipal Obligations-105.04% | | | | | | | | | | | | | | |
Alabama-2.33% | | | | | | | | | | | | | | |
Birmingham (City of), AL Special Care Facilities Financing Authority (Methodist Home for the Aging); Series 2016, RB | | | 5.75% | | | | 06/01/2035 | | | $ | 4,200 | | | $ 3,886,119 |
Black Belt Energy Gas District (The) (No. 4); Series 2019 A-1, RB(a) | | | 4.00% | | | | 12/01/2025 | | | | 15,000 | | | 15,014,116 |
Hoover (City of), AL Industrial Development Board (United States Steel Corp.); Series 2019, RB(b) | | | 5.75% | | | | 10/01/2049 | | | | 5,000 | | | 5,176,689 |
Huntsville (City of), AL Special Care Facilities Financing Authority (Redstone Village); Series 2007, RB (Acquired 12/17/2007; Cost $784,728)(c)(d) | | | 5.50% | | | | 01/01/2043 | | | | 900 | | | 558,000 |
Lower Alabama Gas District (The); Series 2016 A, RB | | | 5.00% | | | | 09/01/2046 | | | | 21,000 | | | 20,874,193 |
Mobile (City of), AL Downtown Redevelopment Authority (Austal USA, LLC); Series 2011 A, VRD RB (LOC - Bank Of America N.A.)(e)(f)(g) | | | 2.74% | | | | 05/01/2041 | | | | 5,940 | | | 5,940,000 |
Southeast Alabama Gas Supply District (The) (No. 1); Series 2018 A, RB(a) | | | 4.00% | | | | 04/01/2024 | | | | 5,370 | | | 5,368,078 |
Southeast Energy Authority A Cooperative District (No. 3); Series 2022 A-1, RB(a) | | | 5.50% | | | | 12/01/2029 | | | | 5,445 | | | 5,838,837 |
Tender Option Bond Trust Receipts/Certificates; Series 2022, VRD RB(a)(e)(f) | | | 2.15% | | | | 07/01/2025 | | | | 5,000 | | | 5,000,000 |
Tuscaloosa (County of), AL Industrial Development Authority (Hunt Refining); Series 2019 A, Ref. IDR(e) | | | 5.25% | | | | 05/01/2044 | | | | 5,000 | | | 4,337,947 |
| | | | | | | | | | | | | | | 71,993,979 |
| | | | |
Alaska-0.31% | | | | | | | | | | | | | | |
Alaska (State of) Municipal Bond Bank Authority; Series 2017 A, RB(h) | | | 5.50% | | | | 10/01/2042 | | | | 9,000 | | | 9,457,557 |
| | | | |
Arizona-1.57% | | | | | | | | | | | | | | |
Arizona (State of) Industrial Development Authority (Basis Schools); Series 2017 A, Ref. RB(e) | | | 5.25% | | | | 07/01/2047 | | | | 4,500 | | | 4,244,351 |
Arizona (State of) Industrial Development Authority (Kaizen Education Foundation); Series 2016, RB(e) | | | 5.50% | | | | 07/01/2036 | | | | 5,840 | | | 5,937,079 |
Arizona (State of) Industrial Development Authority (Pinecrest Academy of Nevada-Horizon, Inspirada and St. Rose Campus Projects); Series 2018 A, RB(e) | | | 5.75% | | | | 07/15/2048 | | | | 3,150 | | | 3,191,055 |
Arizona (State of) Industrial Development Authority (Social Bonds); Series 2020 A, RB | | | 4.00% | | | | 11/01/2045 | | | | 2,500 | | | 2,213,463 |
Glendale (City of), AZ Industrial Development Authority (The Beatitudes Campus); | | | | | | | | | | | | | | |
Series 2017, Ref. RB | | | 5.00% | | | | 11/15/2031 | | | | 2,440 | | | 2,323,878 |
Series 2017, Ref. RB | | | 5.00% | | | | 11/15/2036 | | | | 2,200 | | | 1,984,799 |
Maricopa (County of), AZ Industrial Development Authority (Paradise Schools); Series 2016, Ref. RB(e) | | | 5.00% | | | | 07/01/2036 | | | | 2,500 | | | 2,499,827 |
Phoenix (City of), AZ Industrial Development Authority (Legacy Traditional Schools); Series 2014 A, RB(e) | | | 6.50% | | | | 07/01/2034 | | | | 1,095 | | | 1,122,749 |
Phoenix Civic Improvement Corp.; | | | | | | | | | | | | | | |
Series 2019 A, RB | | | 4.00% | | | | 07/01/2045 | | | | 4,235 | | | 3,874,070 |
Series 2019, RB | | | 5.00% | | | | 07/01/2049 | | | | 11,425 | | | 12,004,548 |
Pima (County of), AZ Industrial Development Authority (Desert Heights Charter School); Series 2014, Ref. RB | | | 7.00% | | | | 05/01/2034 | | | | 1,000 | | | 1,019,411 |
Pima (County of), AZ Industrial Development Authority (Grande Innovations Academy); Series 2018, RB(e) | | | 5.25% | | | | 07/01/2048 | | | | 5,000 | | | 4,538,489 |
Verrado Community Facilities District No. 1; | | | | | | | | | | | | | | |
Series 2013 A, Ref. GO Bonds(e) | | | 6.00% | | | | 07/15/2027 | | | | 2,000 | | | 2,004,772 |
Series 2013 B, GO Bonds(e) | | | 5.70% | | | | 07/15/2029 | | | | 775 | | | 775,899 |
Series 2013 B, GO Bonds(e) | | | 6.00% | | | | 07/15/2033 | | | | 710 | | | 710,630 |
| | | | | | | | | | | | | | | 48,445,020 |
| | | | |
Arkansas-0.43% | | | | | | | | | | | | | | |
Arkansas (State of) Development Finance Authority (Baptist Memorial Health); Series 2020, Ref. RB | | | 5.00% | | | | 09/01/2044 | | | | 2,750 | | | 2,746,162 |
Arkansas (State of) Development Finance Authority (Green Bonds); Series 2022, RB(b)(e) | | | 5.45% | | | | 09/01/2052 | | | | 5,000 | | | 4,927,822 |
Pulaski (County of), AR Public Facilities Board; Series 2014, RB | | | 5.00% | | | | 12/01/2042 | | | | 5,530 | | | 5,595,154 |
| | | | | | | | | | | | | | | 13,269,138 |
| | | | |
California-10.70% | | | | | | | | | | | | | | |
Bay Area Toll Authority (San Francisco Bay Area); | | | | | | | | | | | | | | |
Series 2017 F-1, RB(a)(h)(i)(j) | | | 5.00% | | | | 04/01/2027 | | | | 12,000 | | | 13,097,500 |
Series 2019 S-8, Ref. RB(a)(i) | | | 5.00% | | | | 10/01/2029 | | | | 5,000 | | | 5,731,120 |
Beverly Hills Unified School District (Election of 2008); Series 2009, GO Bonds(k) | | | 0.00% | | | | 08/01/2031 | | | | 40 | | | 30,299 |
See accompanying Notes to Financial Statements which are an integral part of the financial statements.
| | |
| 8 | | Invesco Municipal Income Fund |
| | | | | | | | | | | | | | |
| | | Interest Rate | | | Maturity Date | | | Principal Amount (000) | | | Value |
California-(continued) | | | | | | | | | | | | | | |
California (State of); | | | | | | | | | | | | | | |
Series 2020, GO Bonds | | | 3.00% | | | | 03/01/2050 | | | $ | 2,500 | | | $ 1,900,390 |
Series 2020, GO Bonds | | | 4.00% | | | | 03/01/2050 | | | | 4,400 | | | 4,249,925 |
Series 2020, Ref. GO Bonds | | | 4.00% | | | | 03/01/2040 | | | | 5,000 | | | 5,013,334 |
Series 2021, Ref. GO Bonds | | | 5.00% | | | | 10/01/2041 | | | | 2,500 | | | 2,762,403 |
Series 2022, GO Bonds | | | 4.00% | | | | 04/01/2049 | | | | 2,190 | | | 2,121,678 |
California (State of) Community Choice Financing Authority (Green Bonds); | | | | | | | | | | | | | | |
Series 2021 B-1, RB(a) | | | 4.00% | | | | 08/01/2031 | | | | 7,500 | | | 7,460,581 |
Series 2023, RB(a) | | | 5.00% | | | | 08/01/2029 | | | | 5,000 | | | 5,247,510 |
California (State of) County Tobacco Securitization Agency (Los Angeles County Securitization Corp.); | | | | | | | | | | | | | | |
Series 2020 A, Ref. RB | | | 4.00% | | | | 06/01/2049 | | | | 1,500 | | | 1,323,939 |
Series 2020 B-1, Ref. RB | | | 5.00% | | | | 06/01/2049 | | | | 510 | | | 514,590 |
Series 2020 B-2, Ref. RB(k) | | | 0.00% | | | | 06/01/2055 | | | | 10,000 | | | 1,668,876 |
California (State of) County Tobacco Securitization Agency (Stanislaus County Tobacco Funding Corp.); Series 2006 A, RB(k) | | | 0.00% | | | | 06/01/2046 | | | | 20,000 | | | 4,858,860 |
California (State of) Educational Facilities Authority (Stanford University); Series 2019 V-1, RB(h) | | | 5.00% | | | | 05/01/2049 | | | | 15,000 | | | 17,360,876 |
California (State of) Health Facilities Financing Authority (Lucile Salter Packard Children’s Hospital at Stanford); Series 2017, RB | | | 5.00% | | | | 11/15/2056 | | | | 3,000 | | | 3,074,393 |
California (State of) Housing Finance Agency; | | | | | | | | | | | | | | |
Series 2019 A-1, RB | | | 4.25% | | | | 01/15/2035 | | | | 3,553 | | | 3,540,161 |
Series 2019 A-2, RB | | | 4.00% | | | | 03/20/2033 | | | | 9,685 | | | 9,572,560 |
California (State of) Municipal Finance Authority (Emerson College); Series 2011, RB | | | 5.00% | | | | 01/01/2028 | | | | 275 | | | 275,290 |
California (State of) Municipal Finance Authority (Linxs APM); Series 2018 A, RB(b) | | | 5.00% | | | | 12/31/2043 | | | | 12,550 | | | 12,587,713 |
California (State of) Pollution Control Financing Authority; | | | | | | | | | | | | | | |
Series 2012, RB(b)(e) | | | 5.00% | | | | 07/01/2030 | | | | 3,160 | | | 3,173,823 |
Series 2012, RB(b)(e) | | | 5.00% | | | | 07/01/2037 | | | | 6,955 | | | 6,972,792 |
California (State of) Pollution Control Financing Authority (San Diego County Water Authority); Series 2019, Ref. RB(e) | | | 5.00% | | | | 11/21/2045 | | | | 5,250 | | | 5,289,229 |
California (State of) Public Works Board (Various Correctional Facilities); Series 2014 A, RB | | | 5.00% | | | | 09/01/2039 | | | | 2,500 | | | 2,553,811 |
California (State of) School Finance Authority (New Designs Charter School); Series 2012, RB | | | 5.50% | | | | 06/01/2042 | | | | 2,000 | | | 2,000,601 |
California (State of) Statewide Communities Development Authority (Lancer Educational Student Housing); Series 2016, Ref. RB(e) | | | 5.00% | | | | 06/01/2046 | | | | 3,000 | | | 2,796,831 |
California (State of) Statewide Communities Development Authority (Loma Linda University Medical Center); | | | | | | | | | | | | | | |
Series 2016 A, RB(e) | | | 5.00% | | | | 12/01/2041 | | | | 6,475 | | | 6,202,955 |
Series 2016 A, RB(e) | | | 5.25% | | | | 12/01/2056 | | | | 6,150 | | | 5,799,131 |
California (State of) Statewide Communities Development Authority (Pooled Financing Program); Series 2004 A, RB (INS - AGM)(l) | | | 5.25% | | | | 10/01/2024 | | | | 115 | | | 115,219 |
California (State of) Statewide Financing Authority (Pooled Tobacco Securitization Program); Series 2006 C, RB(e)(k) | | | 0.00% | | | | 06/01/2055 | | | | 45,000 | | | 2,391,188 |
Clovis Unified School District (Election of 2004); Series 2004 A, GO Bonds (INS - NATL)(k)(l) | | | 0.00% | | | | 08/01/2029 | | | | 1,585 | | | 1,273,853 |
Clovis Unified School District (Election of 2012); Series 2015 D, GO Bonds(a)(i)(k) | | | 0.00% | | | | 08/01/2025 | | | | 3,270 | | | 2,103,603 |
Corona-Norco Unified School District (Election of 2006); Series 2009 C, GO Bonds (INS - AGM)(k)(l) | | | 0.00% | | | | 08/01/2039 | | | | 1,000 | | | 474,204 |
El Segundo Unified School District (Election of 2008); | | | | | | | | | | | | | | |
Series 2009 A, GO Bonds(k) | | | 0.00% | | | | 08/01/2032 | | | | 5,030 | | | 3,618,322 |
Series 2009 A, GO Bonds(k) | | | 0.00% | | | | 08/01/2033 | | | | 4,185 | | | 2,880,977 |
Golden State Tobacco Securitization Corp.; Series 2021 B-2, Ref. RB(k) | | | 0.00% | | | | 06/01/2066 | | | | 30,000 | | | 2,982,039 |
Hacienda La Puente Unified School District Facilities Financing Authority (Unified School District GO Bond Program); Series 2007, RB (INS - AGM)(l) | | | 5.00% | | | | 08/01/2026 | | | | 2,000 | | | 2,138,438 |
Hayward Unified School District (Election of 2008); Series 2010 A, GO Bonds (INS - AGM)(k)(l) | | | 0.00% | | | | 08/01/2034 | | | | 1,500 | | | 984,220 |
Inland Empire Tobacco Securitization Corp.; Series 2007 C-1, RB(k) | | | 0.00% | | | | 06/01/2036 | | | | 25,000 | | | 10,544,170 |
Long Beach Unified School District (Election of 2008); Series 2009, GO Bonds | | | 5.75% | | | | 08/01/2033 | | | | 305 | | | 305,608 |
Los Angeles (City of), CA Department of Airports (Green Bonds); | | | | | | | | | | | | | | |
Series 2022 G, RB(b) | | | 5.50% | | | | 05/15/2038 | | | | 1,000 | | | 1,117,792 |
Series 2022 G, RB(b) | | | 5.50% | | | | 05/15/2039 | | | | 10,000 | | | 11,128,613 |
Series 2022 G, RB(b) | | | 5.50% | | | | 05/15/2040 | | | | 5,000 | | | 5,536,507 |
Series 2022 G, RB(b) | | | 5.25% | | | | 05/15/2047 | | | | 4,500 | | | 4,784,688 |
See accompanying Notes to Financial Statements which are an integral part of the financial statements.
| | |
| 9 | | Invesco Municipal Income Fund |
| | | | | | | | | | | | | | |
| | | Interest Rate | | | Maturity Date | | | Principal Amount (000) | | | Value |
California-(continued) | | | | | | | | | | | | | | |
Los Angeles (City of), CA Department of Airports (Los Angeles International Airport); | | | | | | | | | | | | | | |
Series 2018 A, RB(b) | | | 5.00% | | | | 05/15/2044 | | | $ | 5,515 | | | $ 5,653,965 |
Series 2018 A, RB(b)(h)(j) | | | 5.25% | | | | 05/15/2048 | | | | 12,000 | | | 12,430,990 |
Los Angeles Unified School District; Series 2022, GO Bonds | | | 5.25% | | | | 07/01/2047 | | | | 5,000 | | | 5,617,165 |
Menifee Union School District (Election of 2008); Series 2009 C, GO Bonds (INS - AGC)(k)(l) | | | 0.00% | | | | 08/01/2035 | | | | 3,260 | | | 2,007,983 |
Morongo Band of Mission Indians (The); Series 2018 A, RB(e) | | | 5.00% | | | | 10/01/2042 | | | | 4,800 | | | 4,764,864 |
Mt. San Antonio Community College District (Election of 2008); Series 2013 A, GO Bonds(m) | | | 6.25% | | | | 08/01/2043 | | | | 6,965 | | | 6,237,364 |
Patterson Joint Unified School District (Election of 2008); | | | | | | | | | | | | | | |
Series 2009 B, GO Bonds (INS - AGM)(k)(l) | | | 0.00% | | | | 08/01/2037 | | | | 1,170 | | | 630,686 |
Series 2009 B, GO Bonds (INS - AGM)(k)(l) | | | 0.00% | | | | 08/01/2038 | | | | 4,770 | | | 2,423,094 |
Series 2009 B, GO Bonds (INS - AGM)(k)(l) | | | 0.00% | | | | 08/01/2039 | | | | 5,010 | | | 2,405,134 |
Series 2009 B, GO Bonds (INS - AGM)(k)(l) | | | 0.00% | | | | 08/01/2040 | | | | 5,260 | | | 2,386,319 |
Series 2009 B, GO Bonds (INS - AGM)(k)(l) | | | 0.00% | | | | 08/01/2041 | | | | 5,520 | | | 2,362,892 |
Placentia-Yorba Linda Unified School District (Election of 2008); Series 2011 D, GO Bonds(k) | | | 0.00% | | | | 08/01/2035 | | | | 1,500 | | | 934,100 |
Riverside (County of), CA Transportation Commission; Series 2013 A, RB(a)(i) | | | 5.75% | | | | 06/01/2023 | | | | 2,500 | | | 2,516,468 |
San Diego (County of), CA Regional Airport Authority; | | | | | | | | | | | | | | |
Series 2021 A, RB (INS - AGM)(l) | | | 5.00% | | | | 07/01/2051 | | | | 3,035 | | | 3,225,768 |
Series 2021 B, RB(b) | | | 5.00% | | | | 07/01/2046 | | | | 15,000 | | | 15,448,288 |
San Francisco (City & County of), CA Airport Commission (San Francisco International Airport); | | | | | | | | | | | | | | |
Series 2017 A, RB(b) | | | 5.25% | | | | 05/01/2042 | | | | 12,500 | | | 12,876,016 |
Series 2019 E, RB(b) | | | 5.00% | | | | 05/01/2050 | | | | 15,000 | | | 15,264,328 |
San Joaquin Hills Transportation Corridor Agency; Series 2014 B, Ref. RB | | | 5.25% | | | | 01/15/2044 | | | | 5,000 | | | 5,022,561 |
San Mateo Foster City School District; Series 2010, GO Bonds(m) | | | 6.63% | | | | 08/01/2042 | | | | 4,915 | | | 4,752,579 |
Santa Margarita Water District (Community Facilities District No. 2013-1); Series 2013, RB | | | 5.38% | | | | 09/01/2029 | | | | 2,430 | | | 2,454,643 |
Silicon Valley Tobacco Securitization Authority (Santa Clara); | | | | | | | | | | | | | | |
Series 2007 A, RB(k) | | | 0.00% | | | | 06/01/2036 | | | | 22,000 | | | 10,552,993 |
Series 2007 A, RB(k) | | | 0.00% | | | | 06/01/2041 | | | | 5,000 | | | 1,764,607 |
Southern California Tobacco Securitization Authority (San Diego County Asset Securitization Corp.); Series 2019, Ref. RB | | | 5.00% | | | | 06/01/2048 | | | | 4,825 | | | 4,890,808 |
Torrance Unified School District (Election of 2008-Measure Z); Series 2009 B-1, GO Bonds(k) | | | 0.00% | | | | 08/01/2026 | | | | 1,250 | | | 1,110,552 |
Transbay Joint Powers Authority (Green Bonds); Series 2020 A, RB | | | 5.00% | | | | 10/01/2049 | | | | 1,200 | | | 1,217,697 |
University of California; Series 2023 BP-2, Ref. VRD RB(a)(f) | | | 1.00% | | | | 05/15/2048 | | | | 1,500 | | | 1,500,000 |
West Contra Costa Unified School District; Series 2005, GO Bonds
(INS - NATL)(k)(l) | | | 0.00% | | | | 08/01/2027 | | | | 7,865 | | | 6,726,503 |
Yosemite Community College District (Election of 2004); Series 2008 C, GO Bonds (INS - AGM)(k)(l) | | | 0.00% | | | | 08/01/2024 | | | | 3,570 | | | 3,405,803 |
| | | | | | | | | | | | | | | 330,144,782 |
| | | | |
Colorado-4.64% | | | | | | | | | | | | | | |
Amber Creek Metropolitan District; Series 2017 A, Ref. GO Bonds | | | 5.13% | | | | 12/01/2047 | | | | 1,029 | | | 914,796 |
Broadway Park North Metropolitan District No. 2; Series 2020, GO Bonds(e) | | | 5.00% | | | | 12/01/2049 | | | | 1,600 | | | 1,454,378 |
Centerra Metropolitan District No. 1 (In the City of Loveland); Series 2017, RB(e) | | | 5.00% | | | | 12/01/2037 | | | | 3,500 | | | 3,284,085 |
Colorado (State of) Health Facilities Authority (Adventist Health System/Sunbelt Obligated Group); Series 2018 A, RB | | | 5.00% | | | | 11/15/2048 | | | | 5,000 | | | 5,180,831 |
Colorado (State of) Health Facilities Authority (CommonSpirit Health); Series 2019 A-2, Ref. RB | | | 4.00% | | | | 08/01/2049 | | | | 15,000 | | | 13,008,204 |
Colorado (State of) Health Facilities Authority (Evangelical Lutheran Good Samaritan Society (The)); | | | | | | | | | | | | | | |
Series 2013, RB(a)(i) | | | 5.63% | | | | 06/01/2023 | | | | 2,500 | | | 2,513,392 |
Series 2017, Ref. RB(a)(i) | | | 5.00% | | | | 06/01/2027 | | | | 3,500 | | | 3,780,503 |
Colorado (State of) High Performance Transportation Enterprise (C-470 Express Lanes); Series 2017, RB | | | 5.00% | | | | 12/31/2051 | | | | 6,220 | | | 5,883,979 |
Denver (City & County of), CO; | | | | | | | | | | | | | | |
Series 2018 A, RB(b)(h) | | | 5.25% | | | | 12/01/2043 | | | | 15,000 | | | 15,544,877 |
Series 2018 A, Ref. RB(b) | | | 5.00% | | | | 12/01/2048 | | | | 15,800 | | | 16,021,516 |
Series 2021 A, RB | | | 4.00% | | | | 08/01/2051 | | | | 9,000 | | | 8,256,230 |
Series 2022 A, RB(b) | | | 5.50% | | | | 11/15/2042 | | | | 7,500 | | | 8,239,246 |
Series 2022 A, RB(b) | | | 5.50% | | | | 11/15/2053 | | | | 6,755 | | | 7,287,035 |
Denver (City & County of), CO (United Airlines, Inc.); Series 2017, Ref. RB(b) | | | 5.00% | | | | 10/01/2032 | | | | 5,000 | | | 4,887,179 |
Denver (City & County of), CO Convention Center Hotel Authority; Series 2016, Ref. RB | | | 5.00% | | | | 12/01/2035 | | | | 2,500 | | | 2,520,046 |
Denver (City & County of), CO Health & Hospital Authority; | | | | | | | | | | | | | | |
Series 2019 A, Ref. RB | | | 4.00% | | | | 12/01/2039 | | | | 1,000 | | | 887,232 |
Series 2019 A, Ref. RB | | | 4.00% | | | | 12/01/2040 | | | | 1,000 | | | 881,222 |
See accompanying Notes to Financial Statements which are an integral part of the financial statements.
| | |
| 10 | | Invesco Municipal Income Fund |
| | | | | | | | | | | | | | |
| | | Interest Rate | | | Maturity Date | | | Principal Amount (000) | | | Value |
Colorado-(continued) | | | | | | | | | | | | | | |
Neu Town Metropolitan District; Series 2018 A, Ref. GO Bonds | | | 5.38% | | | | 12/01/2046 | | | $ | 3,000 | | | $ 2,818,534 |
Public Authority for Colorado Energy; Series 2008, RB | | | 6.50% | | | | 11/15/2038 | | | | 31,840 | | | 37,952,583 |
Sterling Ranch Community Authority Board; Series 2020 A, Ref. RB | | | 4.25% | | | | 12/01/2050 | | | | 2,250 | | | 1,738,349 |
| | | | | | | | | | | | | | | 143,054,217 |
| | | | |
Connecticut-0.82% | | | | | | | | | | | | | | |
Connecticut (State of); | | | | | | | | | | | | | | |
Series 2019 A, GO Bonds | | | 5.00% | | | | 04/15/2034 | | | | 2,000 | | | 2,208,127 |
Series 2019 A, GO Bonds | | | 5.00% | | | | 04/15/2036 | | | | 2,600 | | | 2,830,801 |
Series 2019 A, GO Bonds | | | 5.00% | | | | 04/15/2039 | | | | 1,600 | | | 1,721,643 |
Connecticut (State of) Health & Educational Facilities Authority (Church Home of Hartford, Inc.); Series 2016 A, RB(e) | | | 5.00% | | | | 09/01/2046 | | | | 3,990 | | | 3,541,213 |
Connecticut (State of) Health & Educational Facilities Authority (Duncaster, Inc.); | | | | | | | | | | | | | | |
Series 2014 A, RB | | | 5.00% | | | | 08/01/2035 | | | | 1,000 | | | 1,001,713 |
Series 2014 A, RB | | | 5.00% | | | | 08/01/2044 | | | | 5,000 | | | 4,909,524 |
Connecticut (State of) Health & Educational Facilities Authority (The Griffin Hospital); Series 2020 G-1, Ref. RB(e) | | | 5.00% | | | | 07/01/2044 | | | | 3,850 | | | 3,564,463 |
Hamden (Town of), CT (Whitney Center); Series 2019, Ref. RB | | | 5.00% | | | | 01/01/2040 | | | | 6,190 | | | 5,503,160 |
| | | | | | | | | | | | | | | 25,280,644 |
| | | | |
District of Columbia-2.16% | | | | | | | | | | | | | | |
District of Columbia; | | | | | | | | | | | | | | |
Series 2006 B-1, RB (INS - NATL)(l) | | | 5.00% | | | | 02/01/2031 | | | | 945 | | | 945,919 |
Series 2020 A, RB | | | 4.00% | | | | 03/01/2045 | | | | 6,665 | | | 6,430,446 |
District of Columbia (Georgetown University); | | | | | | | | | | | | | | |
Series 2017, Ref. RB(a)(i) | | | 5.00% | | | | 04/01/2027 | | | | 1,180 | | | 1,277,457 |
Series 2017, Ref. RB(a)(i) | | | 5.00% | | | | 04/01/2027 | | | | 7,125 | | | 7,713,455 |
District of Columbia (Ingleside at Rock Creek); Series 2017 A, RB | | | 5.00% | | | | 07/01/2052 | | | | 2,250 | | | 1,900,267 |
District of Columbia Tobacco Settlement Financing Corp.; Series 2006 A, RB(k) | | | 0.00% | | | | 06/15/2046 | | | | 25,000 | | | 5,624,315 |
Metropolitan Washington Airports Authority; Series 2016 A, Ref. RB(b) | | | 5.00% | | | | 10/01/2034 | | | | 5,295 | | | 5,507,269 |
Metropolitan Washington Airports Authority (Dulles Metrorail and Capital Improvement); | | | | | | | | | | | | | | |
Series 2010 A, RB (INS - AGM)(k)(l) | | | 0.00% | | | | 10/01/2037 | | | | 17,565 | | | 9,029,483 |
Series 2019 B, Ref. RB | | | 4.00% | | | | 10/01/2049 | | | | 26,045 | | | 23,360,531 |
Washington (State of) Metropolitan Area Transit Authority; Series 2020 A, RB | | | 4.00% | | | | 07/15/2045 | | | | 5,000 | | | 4,742,206 |
| | | | | | | | | | | | | | | 66,531,348 |
| | | | |
Florida-6.88% | | | | | | | | | | | | | | |
Broward (County of), FL; Series 2019 A, RB(b) | | | 4.00% | | | | 10/01/2049 | | | | 5,530 | | | 4,991,172 |
Broward (County of), FL (Convention Center Expansion); Series 2021, RB | | | 4.00% | | | | 09/01/2047 | | | | 15,000 | | | 13,469,408 |
Capital Trust Agency, Inc. (Franklin Academy); Series 2020, RB(e) | | | 5.00% | | | | 12/15/2050 | | | | 2,000 | | | 1,702,359 |
Capital Trust Agency, Inc. (Sarasota-Manatee Jewish Housing Council, Inc.); Series 2017, Ref. RB(e) | | | 5.00% | | | | 07/01/2046 | | | | 2,500 | | | 1,926,576 |
Collier (County of), FL Industrial Development Authority (The Arlington of Naples); | | | | | | | | | | | | | | |
Series 2014 A, RB (Acquired 12/16/2013; Cost $1,000,000)(c)(d)(e) | | | 7.25% | | | | 05/15/2026 | | | | 1,000 | | | 580,000 |
Series 2014 A, RB (Acquired 12/16/2013; Cost $2,442,456)(c)(d)(e) | | | 7.75% | | | | 05/15/2035 | | | | 2,500 | | | 1,450,000 |
Davie (Town of), FL (Nova Southeastern University); | | | | | | | | | | | | | | |
Series 2013 A, RB(a)(i) | | | 6.00% | | | | 04/01/2023 | | | | 3,250 | | | 3,257,338 |
Series 2018, Ref. RB | | | 5.00% | | | | 04/01/2048 | | | | 7,605 | | | 7,755,915 |
Florida (State of) North Broward Hospital District; Series 2017 B, Ref. RB | | | 5.00% | | | | 01/01/2048 | | | | 5,000 | | | 4,924,709 |
Florida Development Finance Corp. (Brightline Fllorida Passenger Rail Expansion); Series 2022 A, Ref. RB(a)(b)(e) | | | 7.25% | | | | 10/03/2023 | | | | 5,000 | | | 5,015,983 |
Florida Development Finance Corp. (Green Bonds); Series 2019 B, RB(b)(e) | | | 7.38% | | | | 01/01/2049 | | | | 14,860 | | | 13,456,470 |
Florida Development Finance Corp. (Renaissance Charter School, Inc.); | | | | | | | | | | | | | | |
Series 2015, RB(e) | | | 6.00% | | | | 06/15/2035 | | | | 2,935 | | | 2,963,952 |
Series 2020 C, Ref. RB(e) | | | 5.00% | | | | 09/15/2050 | | | | 2,200 | | | 1,751,155 |
Greater Orlando Aviation Authority; Series 2019 A, RB(b) | | | 4.00% | | | | 10/01/2044 | | | | 10,000 | | | 9,313,000 |
Highlands (County of), FL Health Facilities Authority (Trousdale Foundation Properties); Series 2018 A, RB (Acquired 08/29/2018-12/26/2018; Cost $5,886,218)(d) | | | 6.00% | | | | 04/01/2038 | | | | 6,000 | | | 2,100,000 |
Hillsborough (County of), FL Aviation Authority (Tampa International Airport); Series 2018 E, RB(b)(h) | | | 5.00% | | | | 10/01/2048 | | | | 15,000 | | | 15,264,327 |
See accompanying Notes to Financial Statements which are an integral part of the financial statements.
| | |
| 11 | | Invesco Municipal Income Fund |
| | | | | | | | | | | | | | |
| | | Interest Rate | | | Maturity Date | | | Principal Amount (000) | | | Value |
Florida-(continued) | | | | | | | | | | | | | | |
Lake (County of), FL (Lakeside at Waterman Village); | | | | | | | | | | | | | | |
Series 2020 A, Ref. RB | | | 5.50% | | | | 08/15/2030 | | | $ | 4,025 | | | $ 3,893,620 |
Series 2020 A, Ref. RB | | | 5.50% | | | | 08/15/2040 | | | | 4,000 | | | 3,547,830 |
Series 2020 A, Ref. RB | | | 5.75% | | | | 08/15/2050 | | | | 3,000 | | | 2,587,362 |
Series 2020 A, Ref. RB | | | 5.75% | | | | 08/15/2055 | | | | 1,500 | | | 1,265,801 |
Miami Beach (City of), FL Health Facilities Authority (Mt. Sinai Medical Center); | | | | | | | | | | | | | | |
Series 2014, Ref. RB | | | 5.00% | | | | 11/15/2039 | | | | 1,010 | | | 1,013,951 |
Series 2014, Ref. RB | | | 5.00% | | | | 11/15/2044 | | | | 1,045 | | | 1,047,615 |
Miami-Dade (County of), FL; | | | | | | | | | | | | | | |
Series 2017 B, Ref. RB(b) | | | 5.00% | | | | 10/01/2040 | | | | 6,000 | | | 6,141,326 |
Series 2019 B, RB (INS - BAM)(l) | | | 4.00% | | | | 10/01/2049 | | | | 15,000 | | | 13,885,060 |
Series 2021, RB (INS - BAM)(l) | | | 4.00% | | | | 10/01/2051 | | | | 5,000 | | | 4,600,576 |
Subseries 2021 A-1, Ref. RB (INS - AGM)(b)(l) | | | 4.00% | | | | 10/01/2045 | | | | 28,000 | | | 25,801,849 |
Subseries 2021 A-2, Ref. RB (INS - AGM)(l) | | | 4.00% | | | | 10/01/2049 | | | | 8,000 | | | 7,137,672 |
Miami-Dade (County of), FL Expressway Authority; Series 2010 A, RB
(INS - AGM)(l) | | | 5.00% | | | | 07/01/2035 | | | | 3,350 | | | 3,384,976 |
Miami-Dade (County of), FL Transit System; Series 2020 A, RB | | | 4.00% | | | | 07/01/2050 | | | | 5,000 | | | 4,610,367 |
Orange (County of), FL Health Facilities Authority (Orlando Health Obligated Group); Series 2019 A, RB | | | 5.00% | | | | 10/01/2047 | | | | 10,000 | | | 10,372,108 |
Osceola (County of), FL; Series 2020 A-1, Ref. RB | | | 5.00% | | | | 10/01/2049 | | | | 2,080 | | | 2,086,853 |
Pinellas (County of), FL Industrial Development Authority (2017 Foundation for Global Understanding); Series 2019, RB | | | 5.00% | | | | 07/01/2039 | | | | 2,000 | | | 1,933,958 |
Putnam (County of), FL Development Authority (Seminole Electric Cooperative); | | | | | | | | | | | | | | |
Series 2018 A, Ref. RB | | | 5.00% | | | | 03/15/2042 | | | | 12,125 | | | 12,559,657 |
Series 2018 B, Ref. PCR | | | 5.00% | | | | 03/15/2042 | | | | 4,920 | | | 5,133,486 |
Reunion East Community Development District; Series 2005, RB(c)(n) | | | 5.80% | | | | 05/01/2036 | | | | 197 | | | 2 |
Tallahassee (City of), FL (Tallahassee Memorial Health Care, Inc.); Series 2016, RB | | | 5.00% | | | | 12/01/2055 | | | | 4,500 | | | 4,478,938 |
Tampa (City of), FL; | | | | | | | | | | | | | | |
Series 2020 A, RB(k) | | | 0.00% | | | | 09/01/2040 | | | | 1,000 | | | 441,672 |
Series 2020 A, RB(k) | | | 0.00% | | | | 09/01/2041 | | | | 1,000 | | | 413,084 |
Series 2020 A, RB(k) | | | 0.00% | | | | 09/01/2042 | | | | 1,025 | | | 398,938 |
Series 2020 A, RB(k) | | | 0.00% | | | | 09/01/2045 | | | | 1,950 | | | 640,884 |
Series 2020 A, RB(k) | | | 0.00% | | | | 09/01/2049 | | | | 2,600 | | | 686,098 |
Series 2020 A, RB(k) | | | 0.00% | | | | 09/01/2053 | | | | 2,600 | | | 545,118 |
Tampa Bay (City of), FL Water; Series 2001 A, Ref. RB (INS - NATL)(l) | | | 6.00% | | | | 10/01/2029 | | | | 3,000 | | | 3,592,245 |
| | | | | | | | | | | | | | | 212,123,410 |
| | | | |
Georgia-1.22% | | | | | | | | | | | | | | |
George L Smith II Congress Center Authority (Convention Center Hotel); Series 2021, RB | | | 4.00% | | | | 01/01/2054 | | | | 3,000 | | | 2,380,510 |
Georgia (State of) Municipal Electric Authority of Georgia (Plant Vogtle Units 3 & 4); Series 2019, RB | | | 5.00% | | | | 01/01/2048 | | | | 9,595 | | | 9,371,334 |
Glynn (County of) & Brunswick (City of), GA Memorial Hospital Authority (Southeast Georgia Health System); Series 2017, RAC | | | 5.00% | | | | 08/01/2047 | | | | 7,750 | | | 7,771,739 |
Macon-Bibb (County of), GA Urban Development Authority (Academy for Classical Education, Inc.); | | | | | | | | | | | | | | |
Series 2017 A, RB(e) | | | 5.88% | | | | 06/15/2047 | | | | 1,680 | | | 1,683,918 |
Series 2017 A, RB(e) | | | 6.00% | | | | 06/15/2052 | | | | 1,530 | | | 1,537,049 |
Main Street Natural Gas, Inc.; Series 2019 A, RB | | | 5.00% | | | | 05/15/2043 | | | | 3,000 | | | 2,994,597 |
Marietta (City of), GA Developing Authority (Life University, Inc.); Series 2017 A, Ref. RB(e) | | | 5.00% | | | | 11/01/2037 | | | | 5,250 | | | 5,069,690 |
Rockdale (County of), GA Development Authority (Pratt Paper (GA), LLC); Series 2018, Ref. RB(b)(e) | | | 4.00% | | | | 01/01/2038 | | | | 7,210 | | | 6,740,900 |
| | | | | | | | | | | | | | | 37,549,737 |
| | | | |
Guam-0.07% | | | | | | | | | | | | | | |
Guam (Territory of) Waterworks Authority; Series 2020 A, RB | | | 5.00% | | | | 01/01/2050 | | | | 2,000 | | | 2,007,593 |
| | | | |
Hawaii-0.31% | | | | | | | | | | | | | | |
Hawaii (State of) Department of Budget & Finance (Hawaiian Electric Co., Inc.); Series 2015, Ref. RB(b) | | | 3.25% | | | | 01/01/2025 | | | | 4,500 | | | 4,419,955 |
Hawaii (State of) Department of Transportation (Airports Division); Series 2015 A, RB(b) | | | 5.00% | | | | 07/01/2045 | | | | 5,030 | | | 5,068,386 |
| | | | | | | | | | | | | | | 9,488,341 |
See accompanying Notes to Financial Statements which are an integral part of the financial statements.
| | |
| 12 | | Invesco Municipal Income Fund |
| | | | | | | | | | | | | | |
| | | Interest Rate | | | Maturity Date | | | Principal Amount (000) | | | Value |
Illinois-8.74% | | | | | | | | | | | | | | |
Bolingbrook (Village of), IL; Series 2005, RB | | | 6.25% | | | | 01/01/2024 | | | $ | 446 | | | $ 433,405 |
Chicago (City of), IL; | | | | | | | | | | | | | | |
Series 2002 B, GO Bonds | | | 5.50% | | | | 01/01/2032 | | | | 3,300 | | | 3,359,790 |
Series 2007 E, Ref. GO Bonds | | | 5.50% | | | | 01/01/2035 | | | | 1,500 | | | 1,522,643 |
Series 2008 C, Ref. RB | | | 5.00% | | | | 01/01/2039 | | | | 5,000 | | | 5,017,539 |
Series 2014, RB | | | 5.00% | | | | 11/01/2044 | | | | 1,905 | | | 1,910,879 |
Series 2015 A, GO Bonds | | | 5.50% | | | | 01/01/2034 | | | | 4,440 | | | 4,515,475 |
Series 2015 A, GO Bonds | | | 5.50% | | | | 01/01/2035 | | | | 2,000 | | | 2,030,191 |
Series 2017 A, RB (INS - AGM)(l) | | | 5.25% | | | | 01/01/2042 | | | | 2,000 | | | 2,055,731 |
Series 2017 A, Ref. GO Bonds | | | 6.00% | | | | 01/01/2038 | | | | 8,500 | | | 8,922,081 |
Series 2019 A, GO Bonds | | | 5.50% | | | | 01/01/2049 | | | | 8,000 | | | 8,194,950 |
Chicago (City of), IL (83rd/Stewart Redevelopment); Series 2013, COP(e) | | | 7.00% | | | | 01/15/2029 | | | | 2,209 | | | 2,209,801 |
Chicago (City of), IL (Cottage View Terrace Apartments); Series 2000 A, RB (CEP - GNMA)(b) | | | 6.13% | | | | 02/20/2042 | | | | 1,200 | | | 1,200,684 |
Chicago (City of), IL (Diversey/Narragansett); Series 2006, COP(n) | | | 7.46% | | | | 02/15/2026 | | | | 280 | | | 232,144 |
Chicago (City of), IL (O’Hare International Airport); | | | | | | | | | | | | | | |
Series 2016 C, Ref. RB | | | 5.00% | | | | 01/01/2037 | | | | 2,500 | | | 2,578,795 |
Series 2017 D, RB | | | 5.25% | | | | 01/01/2036 | | | | 4,600 | | | 4,859,957 |
Series 2018 A, Ref. RB(b) | | | 5.00% | | | | 01/01/2048 | | | | 6,300 | | | 6,415,207 |
Series 2022 A, RB(b)(h)(j) | | | 5.25% | | | | 01/01/2053 | | | | 15,000 | | | 15,495,747 |
Chicago (City of), IL Board of Education; | | | | | | | | | | | | | | |
Series 2017 H, GO Bonds | | | 5.00% | | | | 12/01/2036 | | | | 5,750 | | | 5,767,984 |
Series 2018 C, Ref. GO Bonds | | | 5.00% | | | | 12/01/2023 | | | | 3,000 | | | 3,021,242 |
Series 2018 D, GO Bonds | | | 5.00% | | | | 12/01/2046 | | | | 3,000 | | | 2,855,637 |
Series 2022 A, GO Bonds | | | 5.00% | | | | 12/01/2047 | | | | 4,300 | | | 4,084,608 |
Chicago (City of), IL Metropolitan Water Reclamation District; | | | | | | | | | | | | | | |
Series 2007 B, Ref. GO Bonds | | | 5.25% | | | | 12/01/2034 | | | | 5,000 | | | 6,123,107 |
Series 2015 C, GO Bonds(h) | | | 5.00% | | | | 12/01/2027 | | | | 6,805 | | | 7,025,675 |
Series 2015 C, GO Bonds(h) | | | 5.00% | | | | 12/01/2028 | | | | 4,000 | | | 4,117,312 |
Chicago (City of), IL Midway International Airport; | | | | | | | | | | | | | | |
Series 2013 A, Ref. RB(b) | | | 5.50% | | | | 01/01/2032 | | | | 5,000 | | | 5,005,105 |
Series 2014 A, Ref. RB(b) | | | 5.00% | | | | 01/01/2041 | | | | 10,225 | | | 10,266,646 |
Chicago (City of), IL Transit Authority; Series 2014, RB | | | 5.00% | | | | 12/01/2044 | | | | 8,195 | | | 8,273,433 |
Gilberts (Village of), IL Special Service Area No. 24 (The Conservancy); Subseries 2014 A, RB | | | 5.38% | | | | 03/01/2034 | | | | 552 | | | 492,399 |
Illinois (State of); | | | | | | | | | | | | | | |
Series 2013, GO Bonds | | | 5.25% | | | | 07/01/2031 | | | | 4,000 | | | 4,017,040 |
Series 2014, GO Bonds | | | 5.25% | | | | 02/01/2033 | | | | 2,650 | | | 2,681,115 |
Series 2014, GO Bonds | | | 5.00% | | | | 05/01/2039 | | | | 4,710 | | | 4,736,637 |
Series 2017 C, GO Bonds | | | 5.00% | | | | 11/01/2029 | | | | 5,000 | | | 5,229,140 |
Series 2018 A, GO Bonds | | | 6.00% | | | | 05/01/2028 | | | | 10,235 | | | 11,247,956 |
Series 2018 A, GO Bonds | | | 5.00% | | | | 05/01/2030 | | | | 2,775 | | | 2,911,106 |
Series 2020 B, GO Bonds | | | 4.00% | | | | 10/01/2034 | | | | 2,900 | | | 2,824,245 |
Series 2020, GO Bonds | | | 5.50% | | | | 05/01/2039 | | | | 6,250 | | | 6,644,293 |
Illinois (State of) (Rebuild Illinois Program); Series 2019 B, GO Bonds | | | 4.00% | | | | 11/01/2035 | | | | 4,450 | | | 4,281,979 |
Illinois (State of) Development Finance Authority (CITGO Petroleum Corp.); Series 2002, RB(b) | | | 8.00% | | | | 06/01/2032 | | | | 1,270 | | | 1,271,062 |
Illinois (State of) Finance Authority; Series 2016 C, Ref. RB | | | 5.00% | | | | 02/15/2041 | | | | 10,000 | | | 10,329,848 |
Illinois (State of) Finance Authority (Centegra Health System); | | | | | | | | | | | | | | |
Series 2014 A, RB(a)(i) | | | 5.00% | | | | 09/01/2024 | | | | 1,865 | | | 1,915,028 |
Series 2014 A, RB(a)(i) | | | 5.00% | | | | 09/01/2024 | | | | 1,290 | | | 1,324,604 |
Illinois (State of) Finance Authority (Lutheran Communities Obligated Group); | | | | | | | | | | | | | | |
Series 2019 A, Ref. RB | | | 5.00% | | | | 11/01/2035 | | | | 3,430 | | | 3,094,563 |
Series 2019 A, Ref. RB | | | 5.00% | | | | 11/01/2040 | | | | 2,245 | | | 1,934,282 |
Illinois (State of) Finance Authority (Northshore Edward); Series 2022 F, Ref. VRD RB(a)(f) | | | 1.80% | | | | 08/15/2057 | | | | 3,850 | | | 3,850,000 |
Illinois (State of) Finance Authority (Park Place of Elmhurst); Series 2016, RB | | | 5.13% | | | | 05/15/2060 | | | | 783 | �� | | 455,312 |
Illinois (State of) Finance Authority (Peace Village); Series 2013, RB(a)(i) | | | 6.75% | | | | 08/15/2023 | | | | 2,000 | | | 2,027,392 |
Illinois (State of) Finance Authority (Plymouth Place); | | | | | | | | | | | | | | |
Series 2015, Ref. RB(a)(i) | | | 5.00% | | | | 05/15/2025 | | | | 1,050 | | | 1,091,533 |
Series 2015, Ref. RB(a)(i) | | | 5.25% | | | | 05/15/2025 | | | | 2,355 | | | 2,460,586 |
See accompanying Notes to Financial Statements which are an integral part of the financial statements.
| | |
| 13 | | Invesco Municipal Income Fund |
| | | | | | | | | | | | | | |
| | | Interest Rate | | | Maturity Date | | | Principal Amount (000) | | | Value |
Illinois-(continued) | | | | | | | | | | | | | | |
Illinois (State of) Finance Authority (Rosalind Franklin University); | | | | | | | | | | | | | | |
Series 2017, RB | | | 5.00% | | | | 08/01/2049 | | | $ | 2,450 | | | $ 2,389,696 |
Series 2017, Ref. RB | | | 5.00% | | | | 08/01/2047 | | | | 1,025 | | | 1,004,088 |
Illinois (State of) Finance Authority (Rush University Medical Center); Series 2015 A, Ref. RB | | | 5.00% | | | | 11/15/2038 | | | | 6,750 | | | 6,819,495 |
Illinois (State of) Finance Authority (The University of Chicago); Series 2015 A, RB(h) | | | 5.00% | | | | 10/01/2040 | | | | 10,000 | | | 10,264,397 |
Illinois (State of) Metropolitan Pier & Exposition Authority (McCormick Place Expansion); Series 2020, Ref. RB | | | 4.00% | | | | 06/15/2050 | | | | 6,645 | | | 5,392,916 |
Illinois (State of) Sports Facilities Authority; | | | | | | | | | | | | | | |
Series 2014, Ref. RB (INS - AGM)(l) | | | 5.25% | | | | 06/15/2031 | | | | 2,630 | | | 2,668,917 |
Series 2014, Ref. RB (INS - AGM)(l) | | | 5.25% | | | | 06/15/2032 | | | | 2,395 | | | 2,429,237 |
Illinois (State of) Toll Highway Authority; | | | | | | | | | | | | | | |
Series 2013 A, RB(h) | | | 5.00% | | | | 01/01/2038 | | | | 8,000 | | | 8,006,734 |
Series 2015 A, RB(h) | | | 5.00% | | | | 01/01/2040 | | | | 14,190 | | | 14,503,476 |
Plano (City of), IL Special Service Area No. 10 (Lakewood Springs Club); Series 2007, RB(c)(n) | | | 5.80% | | | | 03/01/2037 | | | | 1,500 | | | 165,000 |
Railsplitter Tobacco Settlement Authority; Series 2017, RB | | | 5.00% | | | | 06/01/2026 | | | | 8,000 | | | 8,409,286 |
Sales Tax Securitization Corp.; Series 2018 C, Ref. RB | | | 5.25% | | | | 01/01/2043 | | | | 5,000 | | | 5,262,459 |
| | | | | | | | | | | | | | | 269,631,589 |
| | | | |
Indiana-0.81% | | | | | | | | | | | | | | |
Indiana (State of) Finance Authority (CWA Authority) (Green Bonds); Series 2016 A, RB (INS - NATL)(l) | | | 5.00% | | | | 10/01/2046 | | | | 15,000 | | | 15,500,221 |
Indiana (State of) Finance Authority (Good Samaritan Hospital); Series 2016 A, RB | | | 5.50% | | | | 04/01/2041 | | | | 4,555 | | | 4,640,245 |
Northern Indiana Commuter Transportation District; | | | | | | | | | | | | | | |
Series 2016, RB | | | 5.00% | | | | 07/01/2035 | | | | 1,700 | | | 1,770,465 |
Series 2016, RB | | | 5.00% | | | | 07/01/2041 | | | | 1,500 | | | 1,546,024 |
Valparaiso (City of), IN (Pratt Paper, LLC); Series 2013, RB(b) | | | 6.75% | | | | 01/01/2034 | | | | 1,500 | | | 1,534,745 |
| | | | | | | | | | | | | | | 24,991,700 |
| | | | |
Iowa-0.56% | | | | | | | | | | | | | | |
Iowa (State of) Finance Authority (Iowa Fertilizer Co.); Series 2022, Ref. RB(a) | | | 5.00% | | | | 12/01/2042 | | | | 10,215 | | | 10,253,338 |
Iowa (State of) Tobacco Settlement Authority; | | | | | | | | | | | | | | |
Series 2021 A-2, Ref. RB | | | 4.00% | | | | 06/01/2036 | | | | 1,000 | | | 972,762 |
Series 2021 A-2, Ref. RB | | | 4.00% | | | | 06/01/2049 | | | | 1,800 | | | 1,571,690 |
Series 2021 B-1, Ref. RB | | | 4.00% | | | | 06/01/2049 | | | | 2,765 | | | 2,707,155 |
Series 2021 B-2, Ref. RB(k) | | | 0.00% | | | | 06/01/2065 | | | | 17,350 | | | 1,872,174 |
| | | | | | | | | | | | | | | 17,377,119 |
| | | | |
Kansas-0.25% | | | | | | | | | | | | | | |
Kansas (State of) Municipal Energy Agency (Jameson Energy Center); Series 2013, RB(a)(i) | | | 5.25% | | | | 07/01/2023 | | | | 2,000 | | | 2,013,610 |
Lenexa (City of), KS (Lakeview Village, Inc.); Series 2018 A, Ref. RB | | | 5.00% | | | | 05/15/2039 | | | | 1,500 | | | 1,434,069 |
Wichita (City of), KS (Kansas Masonic Home); Series 2016 II-A, RB (Acquired 06/24/2016-05/30/2019; Cost $7,083,007)(d) | | | 5.38% | | | | 12/01/2046 | | | | 6,960 | | | 1,600,800 |
Wichita (City of), KS (Presbyterian Manors, Inc.); Series 2013 IV-A, RB | | | 6.38% | | | | 05/15/2043 | | | | 1,500 | | | 1,501,521 |
Wyandotte (County of), KS Unified Government; Series 2014 A, Ref. RB | | | 5.00% | | | | 09/01/2044 | | | | 1,180 | | | 1,191,314 |
| | | | | | | | | | | | | | | 7,741,314 |
| | | | |
Kentucky-2.64% | | | | | | | | | | | | | | |
Ashland (City of), KY (King’s Daughters Medical Center); | | | | | | | | | | | | | | |
Series 2019, Ref. RB | | | 4.00% | | | | 02/01/2035 | | | | 465 | | | 453,372 |
Series 2019, Ref. RB | | | 4.00% | | | | 02/01/2036 | | | | 380 | | | 356,711 |
Series 2019, Ref. RB | | | 4.00% | | | | 02/01/2037 | | | | 375 | | | 345,436 |
Series 2019, Ref. RB | | | 4.00% | | | | 02/01/2038 | | | | 375 | | | 342,021 |
Christian (County of), KY (Jennie Stuart Medical Center, Inc.); | | | | | | | | | | | | | | |
Series 2016, Ref. RB | | | 5.38% | | | | 02/01/2036 | | | | 3,000 | | | 3,083,469 |
Series 2016, Ref. RB | | | 5.50% | | | | 02/01/2044 | | | | 5,000 | | | 5,081,578 |
Kentucky (Commonwealth of) Economic Development Finance Authority (Baptist Healthcare System); Series 2017 B, RB | | | 5.00% | | | | 08/15/2046 | | | | 5,000 | | | 5,050,755 |
Kentucky (Commonwealth of) Economic Development Finance Authority (Louisville Arena Authority, Inc.); Series 2017 A, Ref. RB (INS - AGM)(l) | | | 5.00% | | | | 12/01/2045 | | | | 15,300 | | | 15,513,115 |
See accompanying Notes to Financial Statements which are an integral part of the financial statements.
| | |
| 14 | | Invesco Municipal Income Fund |
| | | | | | | | | | | | | | |
| | | Interest Rate | | | Maturity Date | | | Principal Amount (000) | | | Value |
Kentucky-(continued) | | | | | | | | | | | | | | |
Kentucky (Commonwealth of) Economic Development Finance Authority (Next Generation Kentucky Information Highway); | | | | | | | | | | | | | | |
Series 2015 A, RB | | | 5.00% | | | | 07/01/2037 | | | $ | 1,700 | | | $ 1,705,563 |
Series 2015 A, RB | | | 5.00% | | | | 07/01/2040 | | | | 12,705 | | | 12,653,066 |
Series 2015 A, RB | | | 5.00% | | | | 01/01/2045 | | | | 4,175 | | | 4,030,408 |
Kentucky (Commonwealth of) Economic Development Finance Authority (Owensboro Health, Inc.); Series 2017 A, Ref. RB | | | 5.00% | | | | 06/01/2045 | | | | 8,950 | | | 8,970,425 |
Kentucky (Commonwealth of) Municipal Power Agency (Prairie State); Series 2019 A, Ref. RB | | | 4.00% | | | | 09/01/2045 | | | | 13,555 | | | 12,011,014 |
Kentucky (Commonwealth of) Public Energy Authority; Series 2020 A, RB(a) | | | 4.00% | | | | 06/01/2026 | | | | 6,000 | | | 5,944,498 |
Louisville (City of) & Jefferson (County of), KY Metropolitan Government (Norton Healthcare, Inc.); Series 2013 A, RB | | | 5.75% | | | | 10/01/2042 | | | | 5,870 | | | 5,917,232 |
| | | | | | | | | | | | | | | 81,458,663 |
| | | | |
Louisiana-1.63% | | | | | | | | | | | | | | |
Jefferson (Parish of), LA Sales Tax District; Series 2019 B, RB (INS - AGM)(l) | | | 4.00% | | | | 12/01/2038 | | | | 6,000 | | | 5,907,645 |
Louisiana (State of) Public Facilities Authority (Ochsner Clinic Foundation); Series 2002 B, RB(a)(i) | | | 5.50% | | | | 05/15/2026 | | | | 1,010 | | | 1,085,505 |
Louisiana (State of) Public Facilities Authority (Provident Group-Flagship Properties LLC- Louisiana State University Nicholson Gateway); Series 2016, RB | | | 5.00% | | | | 07/01/2051 | | | | 12,400 | | | 12,512,340 |
New Orleans (City of), LA; | | | | | | | | | | | | | | |
Series 2014, Ref. RB(a)(i) | | | 5.00% | | | | 06/01/2024 | | | | 605 | | | 618,356 |
Series 2015, RB(a)(i) | | | 5.00% | | | | 12/01/2025 | | | | 3,000 | | | 3,150,001 |
Series 2015, RB(a)(i) | | | 5.00% | | | | 12/01/2025 | | | | 5,500 | | | 5,775,002 |
New Orleans (City of), LA Aviation Board (Parking Facilities Corp. Consolidated Garage System); Series 2018 A, RB (INS - AGM)(l) | | | 5.00% | | | | 10/01/2048 | | | | 5,000 | | | 5,192,654 |
St. John the Baptist (Parish of), LA (Marathon Oil Corp.); | | | | | | | | | | | | | | |
Series 2017, Ref. RB(a) | | | 2.13% | | | | 07/01/2024 | | | | 4,000 | | | 3,889,051 |
Subseries 2017 A-3, Ref. RB(a) | | | 2.20% | | | | 07/01/2026 | | | | 4,000 | | | 3,725,308 |
Tobacco Settlement Financing Corp.; Series 2013 A, Ref. RB | | | 5.25% | | | | 05/15/2035 | | | | 8,500 | | | 8,527,621 |
| | | | | | | | | | | | | | | 50,383,483 |
| | | | |
Maine-0.19% | | | | | | | | | | | | | | |
Maine (State of) Health & Higher Educational Facilities Authority (Eastern Maine Medical Center Obligated Group); Series 2013, RB(a)(i) | | | 5.00% | | | | 07/01/2023 | | | | 5,700 | | | 5,731,316 |
| | | | |
Maryland-1.24% | | | | | | | | | | | | | | |
Baltimore (City of), MD (Convention Center Hotel); Series 2017, Ref. RB | | | 5.00% | | | | 09/01/2039 | | | | 7,100 | | | 6,872,410 |
Baltimore (City of), MD (East Baltimore Research Park); Series 2017, Ref. RB | | | 5.00% | | | | 09/01/2038 | | | | 1,650 | | | 1,655,189 |
Baltimore (County of), MD (Oak Crest Village, Inc.); | | | | | | | | | | | | | | |
Series 2020, Ref. RB | | | 4.00% | | | | 01/01/2045 | | | | 1,750 | | | 1,525,779 |
Series 2020, Ref. RB | | | 4.00% | | | | 01/01/2050 | | | | 2,500 | | | 2,117,552 |
Maryland (State of) Health & Higher Educational Facilities Authority (Green Street Academy); | | | | | | | | | | | | | | |
Series 2017 A, RB(e) | | | 5.13% | | | | 07/01/2037 | | | | 1,265 | | | 1,206,226 |
Series 2017 A, RB(e) | | | 5.25% | | | | 07/01/2047 | | | | 4,295 | | | 3,926,100 |
Series 2017 A, RB(e) | | | 5.38% | | | | 07/01/2052 | | | | 1,530 | | | 1,404,535 |
Maryland (State of) Health & Higher Educational Facilities Authority (LifeBridge Health); Series 2016, Ref. RB | | | 5.00% | | | | 07/01/2047 | | | | 5,000 | | | 5,090,551 |
Maryland (State of) Health & Higher Educational Facilities Authority (MedStar Health); Series 2017 A, RB | | | 5.00% | | | | 05/15/2042 | | | | 5,000 | | | 5,127,359 |
Montgomery (County of), MD; Series 2017 E, VRD GO Bonds(f) | | | 1.80% | | | | 11/01/2037 | | | | 900 | | | 900,000 |
Prince George’s (County of), MD (Collington Episcopal Life Care Community, Inc.); | | | | | | | | | | | | | | |
Series 2017, Ref. RB | | | 5.25% | | | | 04/01/2037 | | | | 2,000 | | | 1,824,906 |
Series 2017, Ref. RB | | | 5.25% | | | | 04/01/2047 | | | | 4,035 | | | 3,403,566 |
Rockville (City of), MD (Ingleside at King Farm); Series 2017 B, RB | | | 5.00% | | | | 11/01/2042 | | | | 3,500 | | | 3,098,795 |
| | | | | | | | | | | | | | | 38,152,968 |
| | | | |
Massachusetts-1.80% | | | | | | | | | | | | | | |
Massachusetts (Commonwealth of) Bay Transportation Authority; Series 2016 A, Ref. RB(k) | | | 0.00% | | | | 07/01/2031 | | | | 13,000 | | | 9,474,418 |
Massachusetts (Commonwealth of) Development Finance Agency; Series 2019 A, Ref. RB | | | 5.00% | | | | 07/01/2044 | | | | 4,000 | | | 3,807,896 |
See accompanying Notes to Financial Statements which are an integral part of the financial statements.
| | |
| 15 | | Invesco Municipal Income Fund |
| | | | | | | | | | | | | | |
| | | Interest Rate | | | Maturity Date | | | Principal Amount (000) | | | Value |
Massachusetts-(continued) | | | | | | | | | | | | | | |
Massachusetts (Commonwealth of) Development Finance Agency (Caregroup); | | | | | | | | | | | | | | |
Series 2016 I, Ref. RB | | | 5.00% | | | | 07/01/2036 | | | $ | 3,000 | | | $ 3,116,969 |
Series 2016 I, Ref. RB | | | 5.00% | | | | 07/01/2038 | | | | 2,045 | | | 2,111,894 |
Series 2018 J-2, RB | | | 5.00% | | | | 07/01/2043 | | | | 4,100 | | | 4,230,515 |
Series 2018 J-2, RB | | | 5.00% | | | | 07/01/2048 | | | | 5,000 | | | 5,108,172 |
Massachusetts (Commonwealth of) Development Finance Agency (Emerson College); Series 2016 A, RB | | | 5.00% | | | | 01/01/2047 | | | | 5,000 | | | 5,026,048 |
Massachusetts (Commonwealth of) Development Finance Agency (International Charter School); Series 2015, Ref. RB | | | 5.00% | | | | 04/15/2040 | | | | 2,000 | | | 2,000,868 |
Massachusetts (Commonwealth of) Development Finance Agency (Lawrence General Hospital); | | | | | | | | | | | | | | |
Series 2017, Ref. RB | | | 5.00% | | | | 07/01/2042 | | | | 1,000 | | | 825,630 |
Series 2017, Ref. RB | | | 5.00% | | | | 07/01/2047 | | | | 3,000 | | | 2,395,902 |
Massachusetts (Commonwealth of) Port Authority; Series 2019 A, Ref. RB(b) | | | 5.00% | | | | 07/01/2040 | | | | 1,000 | | | 1,044,839 |
Massachusetts (Commonwealth of) Port Authority (Bosfuel); Series 2019 A, Ref. RB(b) | | | 4.00% | | | | 07/01/2044 | | | | 7,500 | | | 6,862,878 |
Massachusetts (Commonwealth of) Transportation Fund (Rail Enhancement Program); Series 2021 A, RB(h) | | | 4.00% | | | | 06/01/2050 | | | | 10,000 | | | 9,433,996 |
| | | | | | | | | | | | | | | 55,440,025 |
| | | | |
Michigan-2.12% | | | | | | | | | | | | | | |
Kalamazoo Economic Development Corp. (Heritage Community of Kalamazoo); | | | | | | | | | | | | | | |
Series 2019, Ref. RB | | | 5.00% | | | | 05/15/2037 | | | | 2,450 | | | 2,191,870 |
Series 2019, Ref. RB | | | 5.00% | | | | 05/15/2042 | | | | 3,310 | | | 2,844,124 |
Michigan (State of); Series 2021, RB | | | 4.00% | | | | 11/15/2046 | | | | 15,000 | | | 14,437,560 |
Michigan (State of) Building Authority (Facilities Program); Series 2021 I, RB | | | 4.00% | | | | 10/15/2046 | | | | 7,000 | | | 6,669,986 |
Michigan (State of) Finance Authority; Series 2020 B-1, Ref. RB | | | 5.00% | | | | 06/01/2049 | | | | 1,615 | | | 1,632,449 |
Michigan (State of) Finance Authority (Beaumont Health Credit Group); Series 2016, RB | | | 5.00% | | | | 11/01/2044 | | | | 9,000 | | | 9,108,833 |
Michigan (State of) Finance Authority (Charter County of Wayne Criminal Justice Center); Series 2018, RB | | | 5.00% | | | | 11/01/2043 | | | | 2,500 | | | 2,619,810 |
Michigan (State of) Finance Authority (Detroit Water & Sewerage Department); | | | | | | | | | | | | | | |
Series 2014 C-6, Ref. RB | | | 5.00% | | | | 07/01/2033 | | | | 1,355 | | | 1,376,745 |
Series 2014 D-1, Ref. RB (INS - AGM)(l) | | | 5.00% | | | | 07/01/2037 | | | | 2,000 | | | 2,026,898 |
Series 2014 D-2, Ref. RB (INS - AGM)(l) | | | 5.00% | | | | 07/01/2027 | | | | 4,000 | | | 4,080,905 |
Series 2014 D-4, Ref. RB | | | 5.00% | | | | 07/01/2029 | | | | 1,355 | | | 1,378,688 |
Michigan (State of) Finance Authority (Local Government Loan Program); Series 2014 F, Ref. RB | | | 4.50% | | | | 10/01/2029 | | | | 4,000 | | | 4,009,535 |
Oakland University Board of Trustees; Series 2016, RB | | | 5.00% | | | | 03/01/2047 | | | | 7,500 | | | 7,617,085 |
Wayne (County of), MI Airport Authority (Detroit Metropolitan Airport); | | | | | | | | | | | | | | |
Series 2012 B, RB(b) | | | 5.00% | | | | 12/01/2032 | | | | 1,500 | | | 1,500,921 |
Series 2012 B, RB(b) | | | 5.00% | | | | 12/01/2037 | | | | 1,500 | | | 1,500,764 |
Series 2012 D, Ref. RB(b) | | | 5.00% | | | | 12/01/2028 | | | | 2,500 | | | 2,501,826 |
| | | | | | | | | | | | | | | 65,497,999 |
| | | | |
Minnesota-0.28% | | | | | | | | | | | | | | |
Minnesota (State of) Higher Education Facilities Authority (Bethel University); Series 2017, Ref. RB | | | 5.00% | | | | 05/01/2047 | | | | 7,615 | | | 6,684,546 |
St. Paul (City of), MN Housing & Redevelopment Authority (Hmong College Prep Academy); Series 2016, Ref. RB | | | 5.75% | | | | 09/01/2046 | | | | 2,000 | | | 2,003,258 |
| | | | | | | | | | | | | | | 8,687,804 |
| | | | |
Mississippi-0.14% | | | | | | | | | | | | | | |
West Rankin Utility Authority; Series 2018, RB(a)(i) | | | 5.00% | | | | 01/01/2028 | | | | 4,050 | | | 4,464,735 |
| | | | |
Missouri-1.69% | | | | | | | | | | | | | | |
Kansas City (City of), MO Industrial Development Authority (Kansas City International Airport); Series 2019 B, RB (INS - AGM)(b)(l) | | | 5.00% | | | | 03/01/2049 | | | | 11,975 | | | 12,191,148 |
Kansas City (City of), MO Industrial Development Authority (Ward Parkway Center Community Improvement District); Series 2016 A, Ref. RB(e) | | | 5.00% | | | | 04/01/2046 | | | | 1,150 | | | 990,551 |
Kansas City (City of), MO Land Clearance for Redevelopment Authority (Convention Center Hotel); Series 2018 B, RB(e) | | | 5.00% | | | | 02/01/2040 | | | | 1,500 | | | 1,172,736 |
Kirkwood (City of), MO Industrial Development Authority (Aberdeen Heights); | | | | | | | | | | | | | | |
Series 2017 A, Ref. RB | | | 5.25% | | | | 05/15/2050 | | | | 2,900 | | | 2,389,046 |
Series 2017, Ref. RB | | | 5.25% | | | | 05/15/2042 | | | | 1,675 | | | 1,448,673 |
See accompanying Notes to Financial Statements which are an integral part of the financial statements.
| | |
| 16 | | Invesco Municipal Income Fund |
| | | | | | | | | | | | | | |
| | | Interest Rate | | | Maturity Date | | | Principal Amount (000) | | | Value |
Missouri-(continued) | | | | | | | | | | | | | | |
Missouri (State of) Health & Educational Facilities Authority (Lutheran Senior Services); | | | | | | | | | | | | | | |
Series 2016 B, Ref. RB | | | 5.00% | | | | 02/01/2046 | | | $ | 4,000 | | | $ 3,682,448 |
Series 2019 A, RB | | | 5.00% | | | | 02/01/2042 | | | | 3,000 | | | 2,811,458 |
Missouri (State of) Health & Educational Facilities Authority (Medical Research Lutheran Services); Series 2016 A, RB | | | 5.00% | | | | 02/01/2036 | | | | 3,200 | | | 3,110,895 |
Missouri (State of) Health & Educational Facilities Authority (Mercy Health); Series 2017 C, Ref. RB(h) | | | 5.00% | | | | 11/15/2047 | | | | 15,540 | | | 15,840,324 |
St. Louis (County of), MO Industrial Development Authority (Friendship Village of Sunset Hills); Series 2013 A, RB | | | 5.88% | | | | 09/01/2043 | | | | 1,750 | | | 1,753,169 |
St. Louis (County of), MO Industrial Development Authority (Friendship Village West County); Series 2018 A, RB | | | 5.13% | | | | 09/01/2048 | | | | 7,500 | | | 6,639,596 |
| | | | | | | | | | | | | | | 52,030,044 |
| | | | |
Montana-0.07% | | | | | | | | | | | | | | |
Kalispell (City of), MT (Immanuel Lutheran Corp.); Series 2017, Ref. RB | | | 5.25% | | | | 05/15/2047 | | | | 2,645 | | | 2,158,632 |
| | | | |
Nebraska-0.60% | | | | | | | | | | | | | | |
Central Plains Energy Project (No. 3); Series 2017 A, Ref. RB | | | 5.00% | | | | 09/01/2035 | | | | 8,140 | | | 8,514,473 |
Omaha (City of), NE Public Power District; Series 2021 A, RB (INS - AGM)(l) | | | 4.00% | | | | 02/01/2051 | | | | 5,000 | | | 4,690,079 |
Public Power Generation Agency (Whelan Energy Center Unit 2); Series 2016 A, Ref. RB | | | 5.00% | | | | 01/01/2037 | | | | 5,000 | | | 5,185,000 |
| | | | | | | | | | | | | | | 18,389,552 |
| | | | |
Nevada-0.50% | | | | | | | | | | | | | | |
Las Vegas (City of), NV Convention & Visitors Authority; Series 2018 B, RB | | | 5.00% | | | | 07/01/2043 | | | | 12,320 | | | 12,741,821 |
Nevada (State of) Department of Business & Industry (Doral Academy of Nevada); Series 2017 A, RB(e) | | | 5.00% | | | | 07/15/2047 | | | | 2,900 | | | 2,688,119 |
| | | | | | | | | | | | | | | 15,429,940 |
| | | | |
New Hampshire-0.60% | | | | | | | | | | | | | | |
New Hampshire (State of) Business Finance Authority; Series 2020-1A, RB | | | 4.13% | | | | 01/20/2034 | | | | 10,992 | | | 10,821,451 |
New Hampshire (State of) Business Finance Authority (Covanta Green Bonds); Series 2020 B, Ref. RB(a)(b)(e) | | | 3.75% | | | | 07/02/2040 | | | | 1,205 | | | 927,185 |
New Hampshire (State of) Business Finance Authority (Covanta); Series 2020 A, Ref. RB(a)(e) | | | 3.63% | | | | 07/02/2040 | | | | 740 | | | 566,139 |
New Hampshire (State of) Business Finance Authority (Social Bonds); Series 2022-2A, RB | | | 4.00% | | | | 10/20/2036 | | | | 6,681 | | | 6,240,417 |
| | | | | | | | | | | | | | | 18,555,192 |
| | | | |
New Jersey-5.81% | | | | | | | | | | | | | | |
Garden State Preservation Trust; Series 2005 A, RB (INS - AGM)(l) | | | 5.75% | | | | 11/01/2028 | | | | 6,000 | | | 6,562,384 |
Gloucester (County of), NJ Industrial Pollution Control Financing Authority (Logan); Series 2014 A, Ref. PCR(b)(i) | | | 5.00% | | | | 12/01/2024 | | | | 1,665 | | | 1,680,914 |
Hudson County Improvement Authority (Hudson County Courthouse); Series 2020, RB | | | 4.00% | | | | 10/01/2046 | | | | 10,000 | | | 9,224,399 |
New Jersey (State of); Series 2020 A, GO Bonds | | | 4.00% | | | | 06/01/2032 | | | | 9,120 | | | 9,836,548 |
New Jersey (State of) Economic Development Authority; | | | | | | | | | | | | | | |
Series 2005 N-1, Ref. RB (INS - AMBAC)(l) | | | 5.50% | | | | 09/01/2024 | | | | 3,885 | | | 3,991,564 |
Series 2012 II, Ref. RB | | | 5.00% | | | | 03/01/2023 | | | | 2,150 | | | 2,150,000 |
Series 2017 A, Ref. RB | | | 5.00% | | | | 07/01/2033 | | | | 2,800 | | | 2,968,115 |
New Jersey (State of) Economic Development Authority (Paterson Charter School for Science and Technology, Inc.); | | | | | | | | | | | | | | |
Series 2012 C, RB | | | 5.00% | | | | 07/01/2032 | | | | 675 | | | 667,033 |
Series 2012 C, RB | | | 5.30% | | | | 07/01/2044 | | | | 2,380 | | | 2,308,843 |
New Jersey (State of) Economic Development Authority (The Goethals Bridge Replacement); Series 2013, RB(b) | | | 5.38% | | | | 01/01/2043 | | | | 1,500 | | | 1,507,927 |
New Jersey (State of) Health Care Facilities Financing Authority (Hackensack Meridian Health Obligated Group); Series 2017 A, Ref. RB | | | 5.25% | | | | 07/01/2057 | | | | 6,375 | | | 6,566,178 |
New Jersey (State of) Health Care Facilities Financing Authority (Princeton HealthCare System); Series 2016 A, Ref. RB | | | 5.00% | | | | 07/01/2039 | | | | 7,000 | | | 7,265,937 |
See accompanying Notes to Financial Statements which are an integral part of the financial statements.
| | |
| 17 | | Invesco Municipal Income Fund |
| | | | | | | | | | | | | | |
| | | Interest Rate | | | Maturity Date | | | Principal Amount (000) | | | Value |
New Jersey-(continued) | | | | | | | | | | | | | | |
New Jersey (State of) Transportation Trust Fund Authority; | | | | | | | | | | | | | | |
Series 2006 C, RB (INS - AGC)(k)(l) | | | 0.00% | | | | 12/15/2026 | | | $ | 10,000 | | | $ 8,733,210 |
Series 2006 C, RB (INS - NATL)(k)(l) | | | 0.00% | | | | 12/15/2031 | | | | 7,410 | | | 5,249,345 |
Series 2010 D, RB | | | 5.25% | | | | 12/15/2023 | | | | 2,000 | | | 2,026,692 |
Series 2014, RB | | | 5.00% | | | | 06/15/2032 | | | | 3,000 | | | 3,251,553 |
Series 2015 AA, RB | | | 5.25% | | | | 06/15/2041 | | | | 2,500 | | | 2,550,624 |
Series 2015 AA, RB | | | 5.00% | | | | 06/15/2045 | | | | 3,420 | | | 3,458,913 |
Series 2016 A-1, RN | | | 5.00% | | | | 06/15/2027 | | | | 10,000 | | | 10,492,277 |
Series 2018 A, Ref. RB | | | 5.00% | | | | 12/15/2035 | | | | 7,030 | | | 7,449,974 |
Series 2018 A, RN(h)(j) | | | 5.00% | | | | 06/15/2030 | | | | 5,000 | | | 5,260,538 |
Series 2018 A, RN(h)(j) | | | 5.00% | | | | 06/15/2031 | | | | 7,500 | | | 7,876,181 |
Series 2019 BB, RB | | | 5.00% | | | | 06/15/2044 | | | | 5,000 | | | 5,133,293 |
Series 2019 BB, RB | | | 4.00% | | | | 06/15/2050 | | | | 6,930 | | | 6,280,504 |
Series 2020 AA, RB | | | 4.00% | | | | 06/15/2050 | | | | 11,760 | | | 10,657,825 |
Series 2022, RB | | | 5.50% | | | | 06/15/2050 | | | | 5,000 | | | 5,372,839 |
New Jersey (State of) Turnpike Authority; | | | | | | | | | | | | | | |
Series 2016 A, Ref. RB | | | 5.00% | | | | 01/01/2034 | | | | 5,000 | | | 5,254,892 |
Series 2021 A, RB | | | 4.00% | | | | 01/01/2042 | | | | 2,750 | | | 2,674,715 |
Series 2021 A, RB | | | 4.00% | | | | 01/01/2051 | | | | 10,000 | | | 9,367,650 |
Series 2022 B, RB | | | 5.25% | | | | 01/01/2052 | | | | 12,000 | | | 13,051,920 |
Tobacco Settlement Financing Corp.; Series 2018 A, Ref. RB | | | 5.00% | | | | 06/01/2046 | | | | 10,000 | | | 10,199,780 |
| | | | | | | | | | | | | | | 179,072,567 |
| | | | |
New Mexico-0.03% | | | | | | | | | | | | | | |
New Mexico (State of) Hospital Equipment Loan Council (La Vida Expansion); Series 2019 A, RB | | | 5.00% | | | | 07/01/2049 | | | | 1,250 | | | 968,346 |
| | | | |
New York-12.00% | | | | | | | | | | | | | | |
Brooklyn Arena Local Development Corp. (Barclays Center); Series 2009, RB(k) | | | 0.00% | | | | 07/15/2035 | | | | 5,000 | | | 2,828,183 |
Erie Tobacco Asset Securitization Corp.; Series 2005 A, RB | | | 5.00% | | | | 06/01/2045 | | | | 5,850 | | | 5,495,873 |
Hudson Yards Infrastructure Corp.; Series 2017 A, Ref. RB | | | 4.00% | | | | 02/15/2044 | | | | 5,000 | | | 4,675,458 |
Metropolitan Transportation Authority; | | | | | | | | | | | | | | |
Series 2013 A, RB | | | 5.00% | | | | 11/15/2038 | | | | 3,025 | | | 3,016,348 |
Subseries 2012 G-4, Ref. VRD RB (LOC - Bank Of Montreal)(a)(f)(g) | | | 2.00% | | | | 11/01/2030 | | | | 5,000 | | | 5,000,000 |
Metropolitan Transportation Authority (Green Bonds); | | | | | | | | | | | | | | |
Series 2017 A-1, RB | | | 5.25% | | | | 11/15/2057 | | | | 2,280 | | | 2,276,989 |
Series 2017 C-1, Ref. RB | | | 5.00% | | | | 11/15/2024 | | | | 3,670 | | | 3,757,719 |
Series 2019 C, RB (INS - AGM)(l) | | | 4.00% | | | | 11/15/2045 | | | | 10,000 | | | 9,346,289 |
Series 2020 C-1, RB | | | 5.00% | | | | 11/15/2050 | | | | 4,000 | | | 4,026,152 |
Series 2020 D-3, RB | | | 4.00% | | | | 11/15/2050 | | | | 10,000 | | | 8,521,899 |
Series 2020 E, Ref. RB | | | 4.00% | | | | 11/15/2045 | | | | 5,000 | | | 4,374,893 |
Monroe County Industrial Development Corp. (St. Ann’s Community); | | | | | | | | | | | | | | |
Series 2019, Ref. RB | | | 5.00% | | | | 01/01/2040 | | | | 4,985 | | | 4,267,195 |
Series 2019, Ref. RB | | | 5.00% | | | | 01/01/2050 | | | | 2,015 | | | 1,594,974 |
New York & New Jersey (States of) Port Authority; | | | | | | | | | | | | | | |
Ninety-Third Series 1994, RB | | | 6.13% | | | | 06/01/2094 | | | | 5,250 | | | 5,376,513 |
Series 2019, RB(b) | | | 5.00% | | | | 11/01/2049 | | | | 6,500 | | | 6,722,152 |
New York (City of), NY; | | | | | | | | | | | | | | |
Series 2018 E-1, GO Bonds | | | 5.00% | | | | 03/01/2041 | | | | 2,695 | | | 2,853,860 |
Series 2021 A-1, GO Bonds | | | 5.00% | | | | 08/01/2047 | | | | 10,000 | | | 10,673,225 |
Series 2022 A, GO Bonds | | | 5.25% | | | | 09/01/2043 | | | | 7,500 | | | 8,338,917 |
Subseries 2019 A-1, GO Bonds | | | 4.00% | | | | 08/01/2042 | | | | 11,930 | | | 11,489,355 |
New York (City of), NY Municipal Water Finance Authority; | | | | | | | | | | | | | | |
Series 2011 FF-2, VRD RB(f) | | | 0.02% | | | | 06/15/2044 | | | | 10,000 | | | 10,000,000 |
Series 2013 AA1, VRD RB(f) | | | 1.85% | | | | 06/15/2050 | | | | 7,265 | | | 7,265,000 |
See accompanying Notes to Financial Statements which are an integral part of the financial statements.
| | |
| 18 | | Invesco Municipal Income Fund |
| | | | | | | | | | | | | | |
| | | Interest Rate | | | Maturity Date | | | Principal Amount (000) | | | Value |
New York-(continued) | | | | | | | | | | | | | | |
New York (City of), NY Transitional Finance Authority; | | | | | | | | | | | | | | |
Series 2015 A4, VRD RB(f) | | | 1.85% | | | | 08/01/2041 | | | $ | 1,000 | | | $ 1,000,000 |
Series 2015 E3, VRD RB(f) | | | 1.85% | | | | 02/01/2045 | | | | 20,000 | | | 20,000,000 |
Series 2016 E4, VRD RB(f) | | | 1.85% | | | | 02/01/2045 | | | | 4,000 | | | 4,000,000 |
Series 2018 B4, VRD RB(f) | | | 1.85% | | | | 08/01/2042 | | | | 3,000 | | | 3,000,000 |
Series 2019, RB | | | 4.00% | | | | 11/01/2042 | | | | 10,000 | | | 9,722,005 |
Series 2022 C-1, RB | | | 4.00% | | | | 02/01/2051 | | | | 6,000 | | | 5,661,520 |
Subseries 2013, RB(h) | | | 5.00% | | | | 11/01/2038 | | | | 5,465 | | | 5,496,739 |
Subseries 2013, RB(h) | | | 5.00% | | | | 11/01/2042 | | | | 12,625 | | | 12,685,964 |
New York (State of) Dormitory Authority; Series 2021 A, Ref. RB | | | 5.00% | | | | 03/15/2049 | | | | 3,360 | | | 3,579,034 |
New York (State of) Dormitory Authority (Bidding Group 3); Series 2021 E, Ref. RB | | | 4.00% | | | | 03/15/2040 | | | | 10,855 | | | 10,650,426 |
New York (State of) Dormitory Authority (General Purpose); Series 2014 C, RB(h) | | | 5.00% | | | | 03/15/2040 | | | | 12,030 | | | 12,176,652 |
New York (State of) Housing Finance Agency (160 Madison Avenue); Series 2014 A, VRD RB (LOC - Landesbank Hessen-Thueringen
Girozentrale)(f)(g) | | | 1.77% | | | | 11/01/2046 | | | | 3,515 | | | 3,515,000 |
New York (State of) Power Authority (Green Bonds); | | | | | | | | | | | | | | |
Series 2020 A, Ref. RB | | | 4.00% | | | | 11/15/2045 | | | | 7,000 | | | 6,778,341 |
Series 2020 A, Ref. RB | | | 4.00% | | | | 11/15/2050 | | | | 5,000 | | | 4,776,557 |
New York (State of) Thruway Authority; Series 2019 B, RB | | | 4.00% | | | | 01/01/2050 | | | | 10,000 | | | 9,155,536 |
New York Counties Tobacco Trust VI; Series 2016 A-1, Ref. RB | | | 5.75% | | | | 06/01/2043 | | | | 10,000 | | | 10,353,681 |
New York Liberty Development Corp. (3 World Trade Center); Series 2014, Class 1, Ref. RB(e) | | | 5.00% | | | | 11/15/2044 | | | | 10,905 | | | 10,498,831 |
New York Liberty Development Corp. (Goldman Sachs Headquarters); Series 2005, Ref. RB | | | 5.25% | | | | 10/01/2035 | | | | 6,000 | | | 6,737,617 |
New York State Urban Development Corp.; | | | | | | | | | | | | | | |
Series 2020 A, RB | | | 5.00% | | | | 03/15/2042 | | | | 800 | | | 860,817 |
Series 2020 A, RB | | | 4.00% | | | | 03/15/2049 | | | | 10,045 | | | 9,335,025 |
New York State Urban Development Corp. (Bidding Group 3); Series 2021 A, Ref. RB | | | 4.00% | | | | 03/15/2045 | | | | 10,000 | | | 9,550,999 |
New York Transportation Development Corp. (American Airlines, Inc.); Series 2016, Ref. RB(b) | | | 5.00% | | | | 08/01/2026 | | | | 17,190 | | | 17,197,515 |
New York Transportation Development Corp. (Delta Air Lines, Inc. LaGuardia Airport Terminals C&D Redevelopment); | | | | | | | | | | | | | | |
Series 2018, RB(b) | | | 5.00% | | | | 01/01/2034 | | | | 6,970 | | | 7,169,595 |
Series 2018, RB(b) | | | 5.00% | | | | 01/01/2036 | | | | 1,235 | | | 1,255,242 |
New York Transportation Development Corp. (LaGuardia Airport Terminal B Redevelopment); Series 2016 A, RB(b) | | | 5.25% | | | | 01/01/2050 | | | | 14,815 | | | 14,778,903 |
New York Transportation Development Corp. (Terminal 4 JFK International Airport); | | | | | | | | | | | | | | |
Series 2020 A, Ref. RB(b) | | | 4.00% | | | | 12/01/2041 | | | | 1,300 | | | 1,147,678 |
Series 2020, Ref. RB | | | 5.00% | | | | 12/01/2038 | | | | 2,000 | | | 2,112,799 |
Series 2022, RB(b) | | | 5.00% | | | | 12/01/2037 | | | | 2,700 | | | 2,804,172 |
Series 2022, RB(b) | | | 5.00% | | | | 12/01/2041 | | | | 7,875 | | | 8,034,483 |
Rockland Tobacco Asset Securitization Corp.; | | | | | | | | | | | | | | |
Series 2001, RB | | | 5.63% | | | | 08/15/2035 | | | | 1,535 | | | 1,560,391 |
Series 2005 A, RB(e)(k) | | | 0.00% | | | | 08/15/2045 | | | | 55,385 | | | 15,090,563 |
Triborough Bridge & Tunnel Authority (MTA Bridges & Tunnels); | | | | | | | | | | | | | | |
Series 2021 C-1A, RB | | | 5.00% | | | | 05/15/2051 | | | | 4,115 | | | 4,408,179 |
Series 2022 A, RB | | | 5.25% | | | | 05/15/2052 | | | | 5,000 | | | 5,479,670 |
TSASC, Inc.; Series 2016 B, Ref. RB | | | 5.00% | | | | 06/01/2045 | | | | 8,265 | | | 7,667,647 |
| | | | | | | | | | | | | | | 370,142,575 |
| | | | |
North Carolina-0.51% | | | | | | | | | | | | | | |
North Carolina (State of) Department of Transportation (I-77 HOT Lanes); Series 2015, RB(b) | | | 5.00% | | | | 06/30/2054 | | | | 5,475 | | | 5,146,367 |
North Carolina (State of) Medical Care Commission (Pennybyrn at Maryfield); | | | | | | | | | | | | | | |
Series 2020, RB | | | 5.00% | | | | 10/01/2040 | | | | 1,050 | | | 992,401 |
Series 2020, RB | | | 5.00% | | | | 10/01/2045 | | | | 1,000 | | | 916,411 |
Series 2020, RB | | | 5.00% | | | | 10/01/2050 | | | | 1,500 | | | 1,343,344 |
North Carolina (State of) Turnpike Authority; Series 2018, Ref. RB | | | 5.00% | | | | 01/01/2040 | | | | 7,000 | | | 7,244,320 |
| | | | | | | | | | | | | | | 15,642,843 |
| | | | |
North Dakota-0.36% | | | | | | | | | | | | | | |
Burleigh (County of), ND (University of Mary); Series 2016, RB | | | 5.20% | | | | 04/15/2046 | | | | 1,520 | | | 1,381,236 |
Ward (County of), ND (Trinity Obligated Group); Series 2017 C, RB | | | 5.00% | | | | 06/01/2048 | | | | 11,065 | | | 9,821,660 |
| | | | | | | | | | | | | | | 11,202,896 |
See accompanying Notes to Financial Statements which are an integral part of the financial statements.
| | |
| 19 | | Invesco Municipal Income Fund |
| | | | | | | | | | | | | | |
| | | Interest Rate | | | Maturity Date | | | Principal Amount (000) | | | Value |
Ohio-4.38% | | | | | | | | | | | | | | |
Akron, Bath & Copley Joint Township Hospital District (Summa Health Obligated Group); Series 2016, Ref. RB | | | 5.25% | | | | 11/15/2046 | | | $ | 5,000 | | | $ 5,049,159 |
American Municipal Power, Inc. (Greenup Hydroelectric); Series 2016 A, RB | | | 5.00% | | | | 02/15/2046 | | | | 10,000 | | | 10,146,612 |
Buckeye Tobacco Settlement Financing Authority; | | | | | | | | | | | | | | |
Series 2020 B-2, Ref. RB | | | 5.00% | | | | 06/01/2055 | | | | 23,205 | | | 21,103,551 |
Series 2020 B-3, Ref. RB(k) | | | 0.00% | | | | 06/01/2057 | | | | 21,475 | | | 2,499,381 |
Centerville (City of), OH (Graceworks Lutheran Services); Series 2017, Ref. RB | | | 5.25% | | | | 11/01/2047 | | | | 5,400 | | | 4,755,632 |
Chillicothe (City of), OH (Adena Health System Obligated Group); Series 2017, Ref. RB | | | 5.00% | | | | 12/01/2037 | | | | 5,000 | | | 5,136,494 |
Cleveland (City of) & Cuyahoga (County of), OH Port Authority (Constellation Schools); | | | | | | | | | | | | | | |
Series 2014 A, Ref. RB(e) | | | 5.75% | | | | 01/01/2024 | | | | 135 | | | 135,073 |
Series 2014 A, Ref. RB(e) | | | 6.50% | | | | 01/01/2034 | | | | 2,450 | | | 2,467,606 |
Cleveland (City of), OH; Series 2008 B-2, RB (INS - NATL)(k)(l) | | | 0.00% | | | | 11/15/2025 | | | | 2,895 | | | 2,635,690 |
Cuyahoga (County of), OH (MetroHealth System); | | | | | | | | | | | | | | |
Series 2017, Ref. RB | | | 5.00% | | | | 02/15/2052 | | | | 5,000 | | | 4,929,101 |
Series 2017, Ref. RB | | | 5.50% | | | | 02/15/2052 | | | | 7,000 | | | 7,158,157 |
Series 2017, Ref. RB | | | 5.00% | | | | 02/15/2057 | | | | 2,150 | | | 2,112,409 |
Franklin (County of), OH (Nationwide Children’s Hospital); Series 2017 B, Ref. VRD RB(f) | | | 2.70% | | | | 11/01/2052 | | | | 5,000 | | | 5,000,000 |
Hamilton (County of), OH (Cincinnati Children’s Hospital); Series 2019 CC, RB | | | 5.00% | | | | 11/15/2049 | | | | 15,050 | | | 15,845,994 |
Hamilton (County of), OH (Life Enriching Communities); | | | | | | | | | | | | | | |
Series 2016, Ref. RB | | | 5.00% | | | | 01/01/2046 | | | | 6,505 | | | 5,842,883 |
Series 2016, Ref. RB | | | 5.00% | | | | 01/01/2051 | | | | 1,695 | | | 1,487,561 |
Hamilton (County of), OH (UC Health); Series 2020, RB | | | 5.00% | | | | 09/15/2050 | | | | 12,040 | | | 12,098,927 |
Lucas (County of), OH (ProMedica Healthcare System); Series 2018 A, Ref. RB | | | 5.25% | | | | 11/15/2048 | | | | 3,500 | | | 3,121,813 |
Montgomery (County of), OH (Dayton Children’s Hospital); Series 2021, Ref. RB | | | 4.00% | | | | 08/01/2046 | | | | 2,500 | | | 2,293,344 |
Muskingum (County of), OH (Genesis Healthcare System); Series 2013, RB | | | 5.00% | | | | 02/15/2044 | | | | 7,740 | | | 6,962,990 |
Ohio (State of) (Portsmouth Bypass); Series 2015, RB(b) | | | 5.00% | | | | 12/31/2025 | | | | 2,000 | | | 2,055,580 |
Ohio (State of) Housing Finance Agency (Covenant House Apartments); Series 2008 C, RB (CEP - GNMA)(b) | | | 6.10% | | | | 09/20/2049 | | | | 2,845 | | | 2,846,887 |
Ohio (State of) Water Development Authority Water Pollution Control Loan Fund (Green Bonds); Series 2021 A, RB | | | 4.00% | | | | 12/01/2046 | | | | 6,540 | | | 6,302,548 |
Tuscarawas (County of), OH Economic Development and Finance Alliance (Ashland University); Series 2015, Ref. RB | | | 6.00% | | | | 03/01/2045 | | | | 3,000 | | | 2,992,730 |
| | | | | | | | | | | | | | | 134,980,122 |
| | | | |
Oklahoma-0.83% | | | | | | | | | | | | | | |
Oklahoma (State of) Development Finance Authority (OU Medicine); | | | | | | | | | | | | | | |
Series 2018 B, RB | | | 5.25% | | | | 08/15/2043 | | | | 8,500 | | | 7,676,824 |
Series 2018 B, RB(h)(j) | | | 5.50% | | | | 08/15/2052 | | | | 6,000 | | | 5,491,989 |
Oklahoma (State of) Development Finance Authority (Provident Oklahoma Education Resources, Inc.-Cross Village Student Housing); | | | | | | | | | | | | | | |
Series 2017, RB(c) | | | 5.00% | | | | 08/01/2052 | | | | 2,000 | | | 2,000 |
Series 2017, RB(c) | | | 5.25% | | | | 08/01/2057 | | | | 2,610 | | | 2,610 |
Tulsa (City of), OK Airports Improvement Trust; Series 2001 C, Ref. RB(b) | | | 5.50% | | | | 12/01/2035 | | | | 7,500 | | | 7,508,638 |
Tulsa (City of), OK Airports Improvement Trust (American Airlines Group, Inc.); Series 2015, Ref. RB(a)(b) | | | 5.00% | | | | 06/01/2025 | | | | 5,000 | | | 5,005,927 |
| | | | | | | | | | | | | | | 25,687,988 |
| | | | |
Oregon-0.86% | | | | | | | | | | | | | | |
Clackamas (County of), OR Hospital Facility Authority (Mary’s Woods at Marylhurst, Inc.); | | | | | | | | | | | | | | |
Series 2018 A, RB | | | 5.00% | | | | 05/15/2048 | | | | 1,090 | | | 924,212 |
Series 2018 A, RB | | | 5.00% | | | | 05/15/2052 | | | | 500 | | | 415,370 |
Clackamas (County of), OR Hospital Facility Authority (Rose Villa); | | | | | | | | | | | | | | |
Series 2020 A, Ref. RB | | | 5.13% | | | | 11/15/2040 | | | | 1,000 | | | 925,828 |
Series 2020 A, Ref. RB | | | 5.25% | | | | 11/15/2050 | | | | 1,250 | | | 1,108,667 |
Clackamas (County of), OR Hospital Facility Authority (Willamette View); | | | | | | | | | | | | | | |
Series 2017 A, Ref. RB | | | 5.00% | | | | 11/15/2047 | | | | 2,415 | | | 2,201,136 |
Series 2017 A, Ref. RB | | | 5.00% | | | | 11/15/2052 | | | | 2,960 | | | 2,656,939 |
See accompanying Notes to Financial Statements which are an integral part of the financial statements.
| | |
| 20 | | Invesco Municipal Income Fund |
| | | | | | | | | | | | | | |
| | | Interest Rate | | | Maturity Date | | | Principal Amount (000) | | | Value |
Oregon-(continued) | | | | | | | | | | | | | | |
Portland (Port of), OR (Portland International Airport); | | | | | | | | | | | | | | |
Series 2017 24 B, RB(b) | | | 5.00% | | | | 07/01/2047 | | | $ | 3,000 | | | $ 3,041,789 |
Series 2019 25 B, RB(b) | | | 5.00% | | | | 07/01/2049 | | | | 5,000 | | | 5,110,764 |
Series 2022 28, RB(b) | | | 5.00% | | | | 07/01/2052 | | | | 10,000 | | | 10,274,073 |
| | | | | | | | | | | | | | | 26,658,778 |
| | | | |
Pennsylvania-3.91% | | | | | | | | | | | | | | |
Allegheny (County of), PA Hospital Development Authority (Allegheny Health Network Obligated Group Issue); Series 2018 A, Ref. RB | | | 5.00% | | | | 04/01/2047 | | | | 15,410 | | | 15,624,939 |
Montgomery (County of), PA Higher Education & Health Authority (Thomas Jefferson University); Series 2019, Ref. RB | | | 4.00% | | | | 09/01/2049 | | | | 5,535 | | | 4,950,116 |
Pennsylvania (Commonwealth of) Economic Development Financing Authority (National Gypson Co.); Series 2014, Ref. RB(b) | | | 5.50% | | | | 11/01/2044 | | | | 3,300 | | | 3,314,287 |
Pennsylvania (Commonwealth of) Economic Development Financing Authority (Penndot Major Bridges); Series 2022, RB(b) | | | 5.25% | | | | 06/30/2053 | | | | 12,000 | | | 12,231,000 |
Pennsylvania (Commonwealth of) Turnpike Commission; | | | | | | | | | | | | | | |
Series 2014 A-2, RB(m) | | | 5.13% | | | | 12/01/2040 | | | | 5,500 | | | 5,396,805 |
Series 2017 A, RB | | | 5.50% | | | | 12/01/2046 | | | | 10,000 | | | 10,412,698 |
Series 2017 A-1, RB | | | 5.00% | | | | 12/01/2042 | | | | 2,500 | | | 2,618,101 |
Series 2017 B-1, RB | | | 5.25% | | | | 06/01/2047 | | | | 9,875 | | | 10,255,392 |
Series 2020 B, RB | | | 5.00% | | | | 12/01/2045 | | | | 2,000 | | | 2,106,405 |
Series 2021 A, RB | | | 4.00% | | | | 12/01/2046 | | | | 1,000 | | | 924,578 |
Series 2021 A, Ref. RB | | | 4.00% | | | | 12/01/2051 | | | | 8,500 | | | 7,729,118 |
Philadelphia (City of), PA; | | | | | | | | | | | | | | |
Series 2017 B, Ref. RB(b) | | | 5.00% | | | | 07/01/2047 | | | | 7,500 | | | 7,587,512 |
Series 2021, Ref. RB(b) | | | 5.00% | | | | 07/01/2051 | | | | 15,000 | | | 15,295,066 |
Philadelphia (City of), PA Authority for Industrial Development (St. Joseph’s University); Series 2022, RB | | | 5.25% | | | | 11/01/2047 | | | | 8,000 | | | 8,505,886 |
Philadelphia (City of), PA Authority for Industrial Development (Thomas Jefferson University); Series 2017 A, Ref. RB | | | 5.00% | | | | 09/01/2047 | | | | 3,500 | | | 3,540,726 |
Philadelphia (City of), PA Authority for Industrial Development (Wesley Enhanced Living Obligated Group); Series 2017, Ref. RB | | | 5.00% | | | | 07/01/2042 | | | | 3,000 | | | 2,525,400 |
Philadelphia School District (The); Series 2007 A, Ref. GO Bonds (INS - NATL)(l) | | | 5.00% | | | | 06/01/2026 | | | | 2,360 | | | 2,472,581 |
Tender Option Bond Trust Receipts/Certificates; Series 2022, VRD RB(a)(e)(f) | | | 3.10% | | | | 12/01/2066 | | | | 5,000 | | | 5,000,000 |
| | | | | | | | | | | | | | | 120,490,610 |
| | | | |
Puerto Rico-1.41% | | | | | | | | | | | | | | |
Children’s Trust Fund; | | | | | | | | | | | | | | |
Series 2002, RB | | | 5.50% | | | | 05/15/2039 | | | | 6,450 | | | 6,450,375 |
Series 2002, RB | | | 5.63% | | | | 05/15/2043 | | | | 1,250 | | | 1,262,567 |
Series 2008 B, RB(k) | | | 0.00% | | | | 05/15/2057 | | | | 260,000 | | | 14,101,828 |
Puerto Rico (Commonwealth of) Electric Power Authority; | | | | | | | | | | | | | | |
Series 2007 VV, Ref. RB (INS - NATL)(l) | | | 5.25% | | | | 07/01/2030 | | | | 2,700 | | | 2,709,734 |
Series 2012 A, RB(c) | | | 5.00% | | | | 07/01/2042 | | | | 5,525 | | | 3,853,687 |
Puerto Rico Sales Tax Financing Corp.; | | | | | | | | | | | | | | |
Series 2018 A-1, RB | | | 4.50% | | | | 07/01/2034 | | | | 1,400 | | | 1,388,169 |
Series 2018 A-1, RB | | | 4.55% | | | | 07/01/2040 | | | | 1,583 | | | 1,478,011 |
Series 2018 A-1, RB(k) | | | 0.00% | | | | 07/01/2046 | | | | 31,000 | | | 7,944,680 |
Series 2018 A-1, RB | | | 5.00% | | | | 07/01/2058 | | | | 4,500 | | | 4,175,100 |
| | | | | | | | | | | | | | | 43,364,151 |
| | | | |
South Carolina-1.28% | | | | | | | | | | | | | | |
Patriots Energy Group Financing Agency; Series 2018 A, RB(a) | | | 4.00% | | | | 02/01/2024 | | | | 5,000 | | | 5,014,246 |
South Carolina (State of) Jobs-Economic Development Authority (Lutheran Homes); | | | | | | | | | | | | | | |
Series 2013, RB | | | 5.00% | | | | 05/01/2028 | | | | 2,000 | | | 1,924,146 |
Series 2017, Ref. RB | | | 5.00% | | | | 05/01/2037 | | | | 2,860 | | | 2,512,296 |
South Carolina (State of) Jobs-Economic Development Authority (Palmetto Health Alliance); Series 2013 A, Ref. RB(a)(i) | | | 5.25% | | | | 08/01/2023 | | | | 3,850 | | | 3,882,915 |
South Carolina (State of) Ports Authority; Series 2015, RB(a)(b)(i) | | | 5.00% | | | | 07/01/2025 | | | | 10,000 | | | 10,321,118 |
See accompanying Notes to Financial Statements which are an integral part of the financial statements.
| | |
| 21 | | Invesco Municipal Income Fund |
| | | | | | | | | | | | | | |
| | | Interest Rate | | | Maturity Date | | | Principal Amount (000) | | | Value |
South Carolina-(continued) | | | | | | | | | | | | | | |
South Carolina (State of) Public Service Authority; | | | | | | | | | | | | | | |
Series 2013 E, RB | | | 5.50% | | | | 12/01/2053 | | | $ | 5,000 | | | $ 5,027,218 |
Series 2015 E, RB | | | 5.25% | | | | 12/01/2055 | | | | 7,365 | | | 7,413,225 |
Series 2020 A, Ref. RB | | | 5.00% | | | | 12/01/2043 | | | | 3,300 | | | 3,388,510 |
| | | | | | | | | | | | | | | 39,483,674 |
| | | | |
Tennessee-1.66% | | | | | | | | | | | | | | |
Knox (County of), TN Health, Educational & Housing Facility Board (Covenant Health); Series 2016 A, Ref. RB | | | 5.00% | | | | 01/01/2042 | | | | 14,000 | | | 14,223,765 |
Metropolitan Nashville Airport Authority (The); Series 2019 B, RB(b) | | | 5.00% | | | | 07/01/2044 | | | | 5,000 | | | 5,135,263 |
Nashville (City of) & Davidson (County of), TN Metropolitan Government Health & Educational Facilities Board (The) (Vanderbilt University Medical Center); | | | | | | | | | | | | | | |
Series 2016 A, RB | | | 5.00% | | | | 07/01/2046 | | | | 8,015 | | | 8,111,516 |
Series 2017 A, RB | | | 5.00% | | | | 07/01/2048 | | | | 1,500 | | | 1,510,504 |
Shelby (County of), TN Health, Educational & Housing Facilities Board (The Village at Germantown, Inc.); | | | | | | | | | | | | | | |
Series 2014, RB | | | 5.00% | | | | 12/01/2034 | | | | 1,000 | | | 974,785 |
Series 2014, RB | | | 5.25% | | | | 12/01/2044 | | | | 1,165 | | | 1,116,814 |
Tennessee Energy Acquisition Corp.; Series 2017 A, RB(a)(i) | | | 4.00% | | | | 05/15/2023 | | | | 20,000 | | | 20,023,784 |
| | | | | | | | | | | | | | | 51,096,431 |
| | | | |
Texas-9.11% | | | | | | | | | | | | | | |
Aldine Independent School District; Series 2017 A, Ref. GO Bonds (CEP - Texas Permanent School Fund)(h) | | | 5.00% | | | | 02/15/2045 | | | | 15,000 | | | 15,689,478 |
Arlington Higher Education Finance Corp. (Universal Academy); Series 2014 A, RB | | | 7.00% | | | | 03/01/2034 | | | | 1,000 | | | 1,017,175 |
Aubrey Independent School District; Series 2022, GO Bonds (CEP - Texas Permanent School Fund) | | | 4.00% | | | | 02/15/2052 | | | | 5,000 | | | 4,634,783 |
Austin (City of), TX; Series 2022, RB(b) | | | 5.25% | | | | 11/15/2047 | | | | 8,500 | | | 8,922,883 |
Clifton Higher Education Finance Corp. (Idea Public Schools); Series 2013, RB | | | 6.00% | | | | 08/15/2043 | | | | 2,000 | | | 2,018,375 |
Clifton Higher Education Finance Corp. (International Leadership of Texas); | | | | | | | | | | | | | | |
Series 2015 A, RB | | | 5.13% | | | | 08/15/2030 | | | | 2,000 | | | 1,999,332 |
Series 2018 D, RB | | | 6.00% | | | | 08/15/2038 | | | | 5,000 | | | 5,061,032 |
Dallas & Fort Worth (Cities of), TX (Dallas/Fort Worth International Airport); Series 2022 B, Ref. RB | | | 4.00% | | | | 11/01/2045 | | | | 10,000 | | | 9,432,503 |
Decatur (City of), TX Hospital Authority (Wise Regional Health System); | | | | | | | | | | | | | | |
Series 2014 A, Ref. RB | | | 5.00% | | | | 09/01/2034 | | | | 1,250 | | | 1,194,929 |
Series 2014 A, Ref. RB | | | 5.25% | | | | 09/01/2044 | | | | 1,500 | | | 1,449,264 |
El Paso (City of), TX; Series 2022 A, RB | | | 4.00% | | | | 03/01/2048 | | | | 10,000 | | | 9,315,034 |
Forney Independent School District; Series 2022 B, GO Bonds (CEP - Texas Permanent School Fund) | | | 4.00% | | | | 08/15/2047 | | | | 7,460 | | | 7,138,926 |
Galena Park Independent School District; Series 1996, Ref. GO Bonds (CEP - Texas Permanent School Fund)(k) | | | 0.00% | | | | 08/15/2023 | | | | 2,000 | | | 1,970,613 |
Galveston Independent School District; Series 2022, GO Bonds (CEP - Texas Permanent School Fund) | | | 4.00% | | | | 02/01/2047 | | | | 6,500 | | | 6,156,763 |
Grand Parkway Transportation Corp.; | | | | | | | | | | | | | | |
Series 2013 B, RB(a)(i) | | | 5.25% | | | | 10/01/2023 | | | | 14,360 | | | 14,533,048 |
Series 2020, Ref. RB | | | 4.00% | | | | 10/01/2049 | | | | 15,300 | | | 13,921,132 |
Harris (County of), TX; Series 2007 C, Ref. GO Bonds (INS - AGM)(l) | | | 5.25% | | | | 08/15/2031 | | | | 6,665 | | | 7,899,604 |
Harris (County of), TX Port Authority of Houston; Series 2021, RB | | | 4.00% | | | | 10/01/2046 | | | | 7,065 | | | 6,678,672 |
Harris County Cultural Education Facilities Finance Corp. (Texas Children’s Hospital); Series 2021 C, Ref. VRD RB(f) | | | 1.80% | | | | 10/01/2041 | | | | 3,350 | | | 3,350,000 |
Houston (City of), TX Airport System (United Airlines, Inc.); | | | | | | | | | | | | | | |
Series 2020 B-2, Ref. RB(b) | | | 5.00% | | | | 07/15/2027 | | | | 1,500 | | | 1,499,329 |
Series 2020 C, Ref. RB(b) | | | 5.00% | | | | 07/15/2027 | | | | 3,875 | | | 3,873,986 |
Houston (City of), TX Convention & Entertainment Facilities Department; | | | | | | | | | | | | | | |
Series 2001 B, RB (INS - AGM)(k)(l) | | | 0.00% | | | | 09/01/2026 | | | | 8,750 | | | 7,684,258 |
Series 2001 B, RB (INS - AGM)(k)(l) | | | 0.00% | | | | 09/01/2027 | | | | 3,600 | | | 3,052,376 |
Lamar Consolidated Independent School District; Series 2023, GO Bonds | | | 4.00% | | | | 02/15/2053 | | | | 5,000 | | | 4,686,067 |
Love Field Airport Modernization Corp. (Southwest Airlines Co.); Series 2012, RB(b) | | | 5.00% | | | | 11/01/2028 | | | | 2,000 | | | 2,002,801 |
Lower Colorado River Authority (LCRA Transmission Services Corp.); | | | | | | | | | | | | | | |
Series 2019, Ref. RB | | | 5.00% | | | | 05/15/2044 | | | | 3,395 | | | 3,511,571 |
Series 2022, Ref. RB | | | 6.00% | | | | 05/15/2052 | | | | 4,265 | | | 4,893,392 |
See accompanying Notes to Financial Statements which are an integral part of the financial statements.
| | |
| 22 | | Invesco Municipal Income Fund |
| | | | | | | | | | | | | | |
| | | Interest Rate | | | Maturity Date | | | Principal Amount (000) | | | Value |
Texas-(continued) | | | | | | | | | | | | | | |
Mesquite Health Facilities Development Corp. (Christian Care Centers, Inc.); | | | | | | | | | | | | | | |
Series 2014, Ref. RB (Acquired 08/27/2014; Cost $1,770,403)(c)(d) | | | 5.13% | | | | 02/15/2030 | | | $ | 1,750 | | | $ 1,242,500 |
Series 2014, Ref. RB (Acquired 08/27/2014-05/08/2018; Cost $2,136,775)(c)(d) | | | 5.13% | | | | 02/15/2042 | | | | 2,135 | | | 1,515,850 |
Series 2016, Ref. RB (Acquired 05/08/2018; Cost $289,538)(c)(d) | | | 5.00% | | | | 02/15/2030 | | | | 280 | | | 198,800 |
Mission Economic Development Corp. (Natgasoline); Series 2018, Ref. RB(b)(e) | | | 4.63% | | | | 10/01/2031 | | | | 4,320 | | | 4,222,641 |
New Hope Cultural Education Facilities Finance Corp. (Buckingham Senior Living Community); | | | | | | | | | | | | | | |
Series 2021 A-1, RB | | | 7.50% | | | | 11/15/2037 | | | | 15 | | | 11,926 |
Series 2021, RB | | | 2.00% | | | | 11/15/2061 | | | | 351 | | | 153,042 |
New Hope Cultural Education Facilities Finance Corp. (Longhorn Village); Series 2017, Ref. RB | | | 5.00% | | | | 01/01/2047 | | | | 3,000 | | | 2,677,706 |
New Hope Cultural Education Facilities Finance Corp. (MRC Senior Living-The Langford); | | | | | | | | | | | | | | |
Series 2016 A, RB | | | 5.00% | | | | 11/15/2026 | | | | 1,145 | | | 1,104,442 |
Series 2016 A, RB | | | 5.38% | | | | 11/15/2036 | | | | 865 | | | 766,021 |
Series 2016 A, RB | | | 5.50% | | | | 11/15/2046 | | | | 1,250 | | | 1,039,451 |
New Hope Cultural Education Facilities Finance Corp. (Presbyterian Village North); | | | | | | | | | | | | | | |
Series 2018, Ref. RB | | | 5.00% | | | | 10/01/2035 | | | | 1,820 | | | 1,647,307 |
Series 2018, Ref. RB | | | 5.00% | | | | 10/01/2039 | | | | 3,260 | | | 2,815,591 |
Series 2020, RB | | | 5.25% | | | | 10/01/2055 | | | | 5,000 | | | 4,088,933 |
New Hope Cultural Education Facilities Finance Corp. (Tarleton State University); Series 2014 A, RB(a)(i) | | | 5.00% | | | | 04/01/2024 | | | | 3,000 | | | 3,052,556 |
North East Texas Regional Mobility Authority; | | | | | | | | | | | | | | |
Series 2016 A, RB | | | 5.00% | | | | 01/01/2041 | | | | 6,750 | | | 6,760,606 |
Series 2016, RB | | | 5.00% | | | | 01/01/2036 | | | | 3,400 | | | 3,440,523 |
North Texas Tollway Authority; | | | | | | | | | | | | | | |
Series 2008 D, Ref. RB (INS - AGC)(k)(l) | | | 0.00% | | | | 01/01/2028 | | | | 12,800 | | | 10,844,111 |
Series 2008 D, Ref. RB (INS - AGC)(k)(l) | | | 0.00% | | | | 01/01/2029 | | | | 2,165 | | | 1,774,518 |
Series 2008 D, Ref. RB (INS - AGC)(k)(l) | | | 0.00% | | | | 01/01/2031 | | | | 4,710 | | | 3,609,244 |
Pottsboro Higher Education Finance Corp. (Imagine International Academy of North Texas LLC); Series 2016 A, RB | | | 5.00% | | | | 08/15/2046 | | | | 3,000 | | | 2,726,491 |
Red River Health Facilities Development Corp. (MRC Crossing); Series 2014 A, RB(i) | | | 6.75% | | �� | | 11/15/2024 | | | | 410 | | | 422,024 |
Rowlett (City of), TX (Bayside Public Improvement District North Improvement Area); | | | | | | | | | | | | | | |
Series 2016, RB | | | 5.38% | | | | 09/15/2030 | | | | 395 | | | 391,594 |
Series 2016, RB | | | 5.75% | | | | 09/15/2036 | | | | 145 | | | 142,651 |
San Jacinto River Authority (Groundwater Reduction Plan Division); | | | | | | | | | | | | | | |
Series 2011, RB (INS - AGM)(l) | | | 5.00% | | | | 10/01/2032 | | | | 1,250 | | | 1,250,262 |
Series 2011, RB (INS - AGM)(l) | | | 5.00% | | | | 10/01/2037 | | | | 1,000 | | | 1,000,127 |
Spring Independent School District; Series 2023, GO Bonds | | | 4.00% | | | | 08/15/2052 | | | | 5,000 | | | 4,679,173 |
Tarrant County Cultural Education Facilities Finance Corp. (C.C. Young Memorial Home); | | | | | | | | | | | | | | |
Series 2007, RB (Acquired 07/18/2007; Cost $1,485,000)(c)(d) | | | 5.75% | | | | 02/15/2025 | | | | 1,485 | | | 816,750 |
Series 2007, RB (Acquired 07/18/2007; Cost $1,500,000)(c)(d) | | | 5.75% | | | | 02/15/2029 | | | | 1,500 | | | 825,000 |
Series 2017 A, RB (Acquired 03/27/2020; Cost $1,010,412)(c)(d) | | | 6.38% | | | | 02/15/2048 | | | | 1,000 | | | 550,000 |
Series 2017 A, RB (Acquired 12/15/2016; Cost $5,023,907)(c)(d) | | | 6.38% | | | | 02/15/2052 | | | | 5,000 | | | 2,750,000 |
Tarrant County Cultural Education Facilities Finance Corp. (Christus Health); Series 2018 B, RB | | | 5.00% | | | | 07/01/2043 | | | | 4,080 | | | 4,220,630 |
Tarrant County Cultural Education Facilities Finance Corp. (MRC Stevenson Oaks); | | | | | | | | | | | | | | |
Series 2020, Ref. RB | | | 6.63% | | | | 11/15/2041 | | | | 500 | | | 474,069 |
Series 2020, Ref. RB | | | 6.75% | | | | 11/15/2051 | | | | 500 | | | 459,252 |
Series 2020, Ref. RB | | | 6.88% | | | | 11/15/2055 | | | | 500 | | | 463,146 |
Texas (State of) Transportation Commission; | | | | | | | | | | | | | | |
Series 2019, RB(k) | | | 0.00% | | | | 08/01/2045 | | | | 4,000 | | | 1,163,037 |
Series 2019, RB(k) | | | 0.00% | | | | 08/01/2046 | | | | 3,180 | | | 869,865 |
Texas (State of) Transportation Commission (Central Texas Turnpike System); | | | | | | | | | | | | | | |
Series 2002 A, RB (INS - BHAC)(k)(l) | | | 0.00% | | | | 08/15/2027 | | | | 970 | | | 837,089 |
Series 2002, RB(i)(k) | | | 0.00% | | | | 08/15/2027 | | | | 30 | | | 26,079 |
Series 2015 B, Ref. RB(k) | | | 0.00% | | | | 08/15/2036 | | | | 7,670 | | | 4,092,246 |
Series 2015 B, Ref. RB(k) | | | 0.00% | | | | 08/15/2037 | | | | 9,995 | | | 5,051,655 |
Texas (State of) Water Development Board; Series 2022, RB | | | 5.00% | | | | 10/15/2047 | | | | 16,380 | | | 17,734,544 |
Texas Municipal Gas Acquisition & Supply Corp. III; Series 2021, Ref. RB | | | 5.00% | | | | 12/15/2032 | | | | 5,000 | | | 5,236,636 |
Texas Private Activity Bond Surface Transportation Corp. (Blueridge Transportation Group, LLC SH 288 Toll Lanes); | | | | | | | | | | | | | | |
Series 2016, RB(b) | | | 5.00% | | | | 12/31/2045 | | | | 10,400 | | | 10,360,324 |
Series 2016, RB(b) | | | 5.00% | | | | 12/31/2050 | | | | 4,095 | | | 3,953,623 |
See accompanying Notes to Financial Statements which are an integral part of the financial statements.
| | |
| 23 | | Invesco Municipal Income Fund |
| | | | | | | | | | | | | | |
| | | Interest Rate | | | Maturity Date | | | Principal Amount (000) | | | Value |
Texas-(continued) | | | | | | | | | | | | | | |
Texas Private Activity Bond Surface Transportation Corp. (NTE Mobility Partners LLC - North Tarrant Express Managed Lanes); Series 2019 A, Ref. RB | | | 4.00% | | | | 12/31/2038 | | | $ | 2,000 | | | $ 1,821,678 |
Texas Private Activity Bond Surface Transportation Corp. (NTE Mobility Partners Segments 3 LLC Segments 3A and 3B Facility); Series 2013, RB(b) | | | 7.00% | | | | 12/31/2038 | | | | 3,475 | | | 3,522,548 |
Ysleta Independent School District Public Facility Corp.; Series 2001, Ref. RB (INS - AMBAC)(l) | | | 5.38% | | | | 11/15/2024 | | | | 685 | | | 687,339 |
| | | | | | | | | | | | | | | 281,080,926 |
| | | | |
Utah-0.86% | | | | | | | | | | | | | | |
Mida Mountain Village Public Infrastructure District (Assessment Area No. 2); Series 2021, RB(e) | | | 4.00% | | | | 08/01/2050 | | | | 3,000 | | | 2,098,630 |
Salt Lake City (City of), UT; Series 2021 A, RB(b) | | | 5.00% | | | | 07/01/2046 | | | | 10,000 | | | 10,257,027 |
Salt Lake City Corp.; Series 2017 A, RB(b)(h) | | | 5.00% | | | | 07/01/2042 | | | | 14,000 | | | 14,244,833 |
| | | | | | | | | | | | | | | 26,600,490 |
| | | | |
Virginia-0.63% | | | | | | | | | | | | | | |
Ballston Quarter Community Development Authority; Series 2016 A, RB | | | 5.50% | | | | 03/01/2046 | | | | 2,400 | | | 1,676,512 |
Hanover (County of), VA Economic Development Authority (Covenant Woods); | | | | | | | | | | | | | | |
Series 2018, Ref. RB | | | 5.00% | | | | 07/01/2048 | | | | 700 | | | 632,084 |
Series 2018, Ref. RB | | | 5.00% | | | | 07/01/2051 | | | | 1,000 | | | 894,382 |
Tobacco Settlement Financing Corp.; Series 2007 B-2, RB | | | 5.20% | | | | 06/01/2046 | | | | 4,000 | | | 3,904,780 |
Virginia (Commonwealth of) Small Business Financing Authority (95 Express Lanes LLC); Series 2022, Ref. RB(b) | | | 4.00% | | | | 07/01/2039 | | | | 5,250 | | | 4,770,370 |
Virginia (Commonwealth of) Small Business Financing Authority (Transform 66 P3); Series 2017, RB(b) | | | 5.00% | | | | 12/31/2056 | | | | 7,500 | | | 7,463,079 |
| | | | | | | | | | | | | | | 19,341,207 |
| | | | |
Washington-2.69% | | | | | | | | | | | | | | |
King (County of), WA; Series 2019 A, Ref. VRD GO Bonds(f) | | | 1.80% | | | | 01/01/2046 | | | | 695 | | | 695,000 |
Seattle (Port of), WA; | | | | | | | | | | | | | | |
Series 2018 A, RB(b)(h) | | | 5.00% | | | | 05/01/2043 | | | | 21,000 | | | 21,294,823 |
Series 2021 C, Ref. RB(b) | | | 5.00% | | | | 08/01/2046 | | | | 10,000 | | | 10,400,774 |
Series 2022 B, Ref. RB(b) | | | 5.50% | | | | 08/01/2047 | | | | 1,500 | | | 1,614,327 |
Washington (State of); Series 2021 A, Ref. GO Bonds | | | 5.00% | | | | 06/01/2040 | | | | 2,750 | | | 2,988,888 |
Washington (State of) Convention Center Public Facilities District; | | | | | | | | | | | | | | |
Series 2018, RB | | | 5.00% | | | | 07/01/2048 | | | | 20,000 | | | 18,725,338 |
Series 2018, RB(h)(j) | | | 5.00% | | | | 07/01/2058 | | | | 16,500 | | | 15,714,958 |
Washington (State of) Housing Finance Commission (Bayview Manor Homes); Series 2016 A, Ref. RB(e) | | | 5.00% | | | | 07/01/2046 | | | | 7,255 | | | 5,773,095 |
Washington (State of) Housing Finance Commission (Heron’s Key Senior Living); | | | | | | | | | | | | | | |
Series 2015 A, RB(a)(e)(i) | | | 6.50% | | | | 07/01/2025 | | | | 800 | | | 848,056 |
Series 2015 A, RB(a)(e)(i) | | | 6.75% | | | | 07/01/2025 | | | | 820 | | | 873,788 |
Washington (State of) Housing Finance Commission (Presbyterian Retirement Co.); Series 2016, Ref. RB(e) | | | 5.00% | | | | 01/01/2036 | | | | 1,875 | | | 1,591,814 |
Washington (State of) Housing Finance Commission (The Hearthstone); | | | | | | | | | | | | | | |
Series 2018 A, Ref. RB(e) | | | 5.00% | | | | 07/01/2048 | | | | 2,000 | | | 1,477,633 |
Series 2018 A, Ref. RB(e) | | | 5.00% | | | | 07/01/2053 | | | | 1,500 | | | 1,078,152 |
| | | | | | | | | | | | | | | 83,076,646 |
| | | | |
West Virginia-0.21% | | | | | | | | | | | | | | |
Monongalia (County of), WV Commission Special District (University Town Centre Economic Opportunity Development District); Series 2017 A, Ref. RB(e) | | | 5.50% | | | | 06/01/2037 | | | | 2,500 | | | 2,528,983 |
West Virginia (State of) Economic Development Authority (Entsorga West Virginia LLC); | | | | | | | | | | | | | | |
Series 2016, RB(b)(e) | | | 6.75% | | | | 02/01/2026 | | | | 4,035 | | | 2,824,500 |
Series 2018, RB(b)(e) | | | 8.75% | | | | 02/01/2036 | | | | 1,300 | | | 1,040,000 |
| | | | | | | | | | | | | | | 6,393,483 |
| | | | |
Wisconsin-2.96% | | | | | | | | | | | | | | |
Wisconsin (State of) Center District; Series 2020 D, RB (INS - AGM)(k)(l) | | | 0.00% | | | | 12/15/2055 | | | | 11,870 | | | 2,256,184 |
Wisconsin (State of) Health & Educational Facilities Authority (American Baptist Homes of the Midwest Obligated Group); Series 2017, Ref. RB | | | 5.00% | | | | 08/01/2039 | | | | 3,500 | | | 2,873,442 |
Wisconsin (State of) Health & Educational Facilities Authority (Aspirus, Inc. Obligated Group); Series 2021, RB | | | 4.00% | | | | 08/15/2046 | | | | 10,170 | | | 9,084,392 |
See accompanying Notes to Financial Statements which are an integral part of the financial statements.
| | |
| 24 | | Invesco Municipal Income Fund |
| | | | | | | | | | | | | | | | |
| | | Interest Rate | | | Maturity Date | | | Principal Amount (000) | | | Value | |
|
| |
Wisconsin-(continued) | | | | | | | | | | | | | | | | |
Wisconsin (State of) Health & Educational Facilities Authority (Froedtert Health); Series 2022 A, Ref. RB | | | 4.00% | | | | 04/01/2042 | | | $ | 9,460 | | | $ | 8,674,314 | |
|
| |
Wisconsin (State of) Health & Educational Facilities Authority (St. John’s Communities, Inc.); | | | | | | | | | | | | | | | | |
Series 2018 A, RB(a)(i) | | | 5.00% | | | | 09/15/2023 | | | | 1,000 | | | | 1,009,245 | |
|
| |
Series 2018 A, RB(a)(i) | | | 5.00% | | | | 09/15/2023 | | | | 5,000 | | | | 5,046,225 | |
|
| |
Wisconsin (State of) Public Finance Authority (American Dream at Meadowlands); | | | | | | | | | | | | | | | | |
Series 2017, RB(c)(e) | | | 6.75% | | | | 08/01/2031 | | | | 3,000 | | | | 1,650,000 | |
|
| |
Series 2017, RB(e) | | | 7.00% | | | | 12/01/2050 | | | | 6,100 | | | | 5,266,894 | |
|
| |
Wisconsin (State of) Public Finance Authority (Explore Academy); | | | | | | | | | | | | | | | | |
Series 2020 A, RB(e) | | | 6.13% | | | | 02/01/2050 | | | | 2,500 | | | | 2,171,571 | |
|
| |
Series 2022 A, RB(e) | | | 6.13% | | | | 02/01/2050 | | | | 2,705 | | | | 2,349,640 | |
|
| |
Wisconsin (State of) Public Finance Authority (Green Bonds); Series 2021, RB(b) | | | 4.00% | | | | 03/31/2056 | | | | 5,500 | | | | 4,263,611 | |
|
| |
Wisconsin (State of) Public Finance Authority (KU Campus Development Corp. -Central District Development); | | | | | | | | | | | | | | | | |
Series 2016, RB | | | 5.00% | | | | 03/01/2036 | | | | 4,500 | | | | 4,668,675 | |
|
| |
Series 2016, RB | | | 5.00% | | | | 03/01/2041 | | | | 6,000 | | | | 6,163,122 | |
|
| |
Wisconsin (State of) Public Finance Authority (Maryland Proton Treatment Center); Series 2018 A-1, RB(e) | | | 6.25% | | | | 01/01/2038 | | | | 5,250 | | | | 3,228,750 | |
|
| |
Wisconsin (State of) Public Finance Authority (Prime Healthcare Foundation, Inc.); | | | | | | | | | | | | | | | | |
Series 2018 A, RB | | | 5.20% | | | | 12/01/2037 | | | | 5,000 | | | | 5,078,185 | |
|
| |
Series 2018 A, RB | | | 5.35% | | | | 12/01/2045 | | | | 4,000 | | | | 3,943,862 | |
|
| |
Wisconsin (State of) Public Finance Authority (Renown Regional Medical Center); | | | | | | | | | | | | | | | | |
Series 2016 A, Ref. RB | | | 5.00% | | | | 06/01/2032 | | | | 2,000 | | | | 2,087,464 | |
|
| |
Series 2016 A, Ref. RB | | | 5.00% | | | | 06/01/2034 | | | | 7,180 | | | | 7,457,674 | |
|
| |
Wisconsin (State of) Public Finance Authority (Roseman University of Health Sciences); Series 2015, Ref. RB | | | 5.75% | | | | 04/01/2035 | | | | 1,955 | | | | 1,989,335 | |
|
| |
Wisconsin (State of) Public Finance Authority (The Evergreens Obligated Group); Series 2019 A, Ref. RB | | | 5.00% | | | | 11/15/2044 | | | | 4,975 | | | | 4,746,480 | |
|
| |
Wisconsin (State of) Public Finance Authority (WhiteStone); Series 2017, Ref. RB(e) | | | 5.00% | | | | 03/01/2052 | | | | 1,075 | | | | 893,601 | |
|
| |
Wisconsin (State of) Public Finance Authority (Wittenberg University); Series 2016, RB(e) | | | 5.25% | | | | 12/01/2039 | | | | 7,285 | | | | 6,343,064 | |
|
| |
| | | | | | | | | | | | | | | 91,245,730 | |
|
| |
| | | | |
Wyoming-0.24% | | | | | | | | | | | | | | | | |
Wyoming (State of) Municipal Power Agency; Series 2017 A, Ref. RB(a)(h)(i)(l) | | | 5.00% | | | | 01/01/2027 | | | | 7,000 | | | | 7,511,809 | |
|
| |
TOTAL INVESTMENTS IN SECURITIES(o)-105.04% (Cost $3,329,313,857) | | | | | | | | | | | | | | | 3,239,509,113 | |
|
| |
FLOATING RATE NOTE OBLIGATIONS-(6.21)% | | | | | | | | | | | | | | | | |
Notes with interest and fee rates ranging from 3.94% to 4.14% at 02/28/2023 and contractual maturities of collateral ranging from 12/01/2027 to 07/01/2058 (See Note 1J)(p) | | | | | | | | | | | | | | | (191,580,000 | ) |
|
| |
OTHER ASSETS LESS LIABILITIES-1.17% | | | | | | | | | | | | | | | 36,098,994 | |
|
| |
NET ASSETS-100.00% | | | | | | | | | | | | | | $ | 3,084,028,107 | |
|
| |
| | |
| Investment Abbreviations: |
| |
| AGC | | - Assured Guaranty Corp. |
| AGM | | - Assured Guaranty Municipal Corp. |
| AMBAC | | - American Municipal Bond Assurance Corp. |
| BAM | | - Build America Mutual Assurance Co. |
| BHAC | | - Berkshire Hathaway Assurance Corp. |
| CEP | | - Credit Enhancement Provider |
| COP | | - Certificates of Participation |
| GNMA | | - Government National Mortgage Association |
| GO | | - General Obligation |
| IDR | | - Industrial Development Revenue Bonds |
| INS | | - Insurer |
| LOC | | - Letter of Credit |
| NATL | | - National Public Finance Guarantee Corp. |
| PCR | | - Pollution Control Revenue Bonds |
| RAC | | - Revenue Anticipation Certificates |
| RB | | - Revenue Bonds |
| Ref. | | - Refunding |
| RN | | - Revenue Notes |
| VRD | | - Variable Rate Demand |
See accompanying Notes to Financial Statements which are an integral part of the financial statements.
| | |
| 25 | | Invesco Municipal Income Fund |
Notes to Schedule of Investments:
| (a) | Security has an irrevocable call by the issuer or mandatory put by the holder. Maturity date reflects such call or put. |
| (b) | Security subject to the alternative minimum tax. |
| (c) | Defaulted security. Currently, the issuer is in default with respect to principal and/or interest payments. The aggregate value of these securities at February 28, 2023 was $16,160,199, which represented less than 1% of the Fund’s Net Assets. |
| (d) | Restricted security. The aggregate value of these securities at February 28, 2023 was $14,187,700, which represented less than 1% of the Fund’s Net Assets. |
| (e) | Security purchased or received in a transaction exempt from registration under the Securities Act of 1933, as amended (the “1933 Act”). The security may be resold pursuant to an exemption from registration under the 1933 Act, typically to qualified institutional buyers. The aggregate value of these securities at February 28, 2023 was $232,887,901, which represented 7.55% of the Fund’s Net Assets. |
| (f) | Demand security payable upon demand by the Fund at specified time intervals no greater than thirteen months. Interest rate is redetermined periodically by the issuer or agent based on current market conditions. Rate shown is the rate in effect on February 28, 2023. |
| (g) | Principal and interest payments are fully enhanced by a letter of credit from the bank listed or a predecessor bank, branch or subsidiary. |
| (h) | Underlying security related to TOB Trusts entered into by the Fund. See Note 1J. |
| (i) | Advance refunded; secured by an escrow fund of U.S. Government obligations or other highly rated collateral. |
| (j) | Security is subject to a reimbursement agreement which may require the Fund to pay amounts to a counterparty in the event of a significant decline in the market value of the security underlying the TOB Trusts. In case of a shortfall, the maximum potential amount of payments the Fund could ultimately be required to make under the agreement is $50,175,000. However, such shortfall payment would be reduced by the proceeds from the sale of the security underlying the TOB Trusts. |
| (k) | Zero coupon bond issued at a discount. |
| (l) | Principal and/or interest payments are secured by the bond insurance company listed. |
| (m) | Convertible capital appreciation bond. The interest rate shown represents the coupon rate at which the bond will accrue at a specified future date. |
| (n) | Security valued using significant unobservable inputs (Level 3). See Note 3. |
| (o) | Entities may either issue, guarantee, back or otherwise enhance the credit quality of a security. The entities are not primarily responsible for the issuer’s obligations but may be called upon to satisfy issuer’s obligations. No concentration of any single entity was greater than 5% each. |
| (p) | Floating rate note obligations related to securities held. The interest and fee rates shown reflect the rates in effect at February 28, 2023. At February 28, 2023, the Fund’s investments with a value of $291,287,752 are held by TOB Trusts and serve as collateral for the $191,580,000 in the floating rate note obligations outstanding at that date. |
See accompanying Notes to Financial Statements which are an integral part of the financial statements.
| | |
| 26 | | Invesco Municipal Income Fund |
Statement of Assets and Liabilities
February 28, 2023
| | | | |
Assets: | | | | |
| |
Investments in unaffiliated securities, at value
(Cost $3,329,313,857) | | $ | 3,239,509,113 | |
|
| |
Cash | | | 8,730,698 | |
|
| |
Receivable for: | | | | |
Investments sold | | | 4,829,208 | |
|
| |
Fund shares sold | | | 3,614,369 | |
|
| |
Interest | | | 37,207,442 | |
|
| |
Investment for trustee deferred compensation and retirement plans | | | 238,634 | |
|
| |
Other assets | | | 1,101,526 | |
|
| |
Total assets | | | 3,295,230,990 | |
|
| |
| |
Liabilities: | | | | |
| |
Floating rate note obligations | | | 191,580,000 | |
|
| |
Payable for: | | | | |
Investments purchased | | | 10,948,854 | |
|
| |
Dividends | | | 3,508,946 | |
|
| |
Fund shares reacquired | | | 3,542,430 | |
|
| |
Accrued fees to affiliates | | | 1,090,824 | |
|
| |
Accrued interest expense | | | 95,064 | |
|
| |
Accrued trustees’ and officers’ fees and benefits | | | 3,757 | |
|
| |
Accrued other operating expenses | | | 122,325 | |
|
| |
Trustee deferred compensation and retirement plans | | | 310,683 | |
|
| |
Total liabilities | | | 211,202,883 | |
|
| |
Net assets applicable to shares outstanding | | $ | 3,084,028,107 | |
|
| |
| |
Net assets consist of: | | | | |
| |
Shares of beneficial interest | | $ | 3,462,143,313 | |
|
| |
Distributable earnings (loss) | | | (378,115,206 | ) |
|
| |
| | $ | 3,084,028,107 | |
|
| |
| | | | |
Net Assets: | | | | |
| |
Class A | | $ | 2,162,851,619 | |
|
| |
Class C | | $ | 125,623,516 | |
|
| |
Class Y | | $ | 368,000,046 | |
|
| |
Investor Class | | $ | 74,358,057 | |
|
| |
Class R6 | | $ | 353,194,869 | |
|
| |
|
Shares outstanding, no par value, with an unlimited number of shares authorized: | |
| |
Class A | | | 184,007,308 | |
|
| |
Class C | | | 10,729,721 | |
|
| |
Class Y | | | 31,314,753 | |
|
| |
Investor Class | | | 6,320,370 | |
|
| |
Class R6 | | | 30,052,479 | |
|
| |
Class A: | | | | |
Net asset value per share | | $ | 11.75 | |
|
| |
Maximum offering price per share
(Net asset value of $11.75 ÷ 95.75%) | | $ | 12.27 | |
|
| |
Class C: | | | | |
Net asset value and offering price per share | | $ | 11.71 | |
|
| |
Class Y: | | | | |
Net asset value and offering price per share | | $ | 11.75 | |
|
| |
Investor Class: | | | | |
Net asset value and offering price per share | | $ | 11.76 | |
|
| |
Class R6: | | | | |
Net asset value and offering price per share | | $ | 11.75 | |
|
| |
See accompanying Notes to Financial Statements which are an integral part of the financial statements.
| | |
| 27 | | Invesco Municipal Income Fund |
Statement of Operations
For the year ended February 28, 2023
| | | | |
Investment income: | | | | |
| |
Interest | | $ | 142,269,107 | |
|
| |
| |
Expenses: | | | | |
| |
Advisory fees | | | 14,576,718 | |
|
| |
Administrative services fees | | | 460,161 | |
|
| |
Custodian fees | | | 17,834 | |
|
| |
Distribution fees: | | | | |
Class A | | | 5,613,683 | |
|
| |
Class C | | | 1,421,408 | |
|
| |
Investor Class | | | 114,477 | |
|
| |
Interest, facilities and maintenance fees | | | 6,931,506 | |
|
| |
Transfer agent fees – A, C, Y and Investor | | | 1,974,337 | |
|
| |
Transfer agent fees – R6 | | | 52,300 | |
|
| |
Trustees’ and officers’ fees and benefits | | | 40,470 | |
|
| |
Registration and filing fees | | | 206,937 | |
|
| |
Reports to shareholders | | | 81,017 | |
|
| |
Professional services fees | | | 115,353 | |
|
| |
Other | | | 73,202 | |
|
| |
Total expenses | | | 31,679,403 | |
|
| |
Less: Expense offset arrangement(s) | | | (4,773 | ) |
|
| |
Net expenses | | | 31,674,630 | |
|
| |
Net investment income | | | 110,594,477 | |
|
| |
| |
Realized and unrealized gain (loss) from: | | | | |
| |
Net realized gain (loss) from: | | | | |
Unaffiliated investment securities (includes net gains (losses) from securities sold to affiliates of $(5,371,250)) | | | (145,434,256 | ) |
|
| |
Futures contracts | | | 16,006,919 | |
|
| |
| | | (129,427,337 | ) |
|
| |
Change in net unrealized appreciation (depreciation) of: | | | | |
Unaffiliated investment securities | | | (282,997,365 | ) |
|
| |
Futures contracts | | | 85,938 | |
|
| |
| | | (282,911,427 | ) |
|
| |
Net realized and unrealized gain (loss) | | | (412,338,764 | ) |
|
| |
Net increase (decrease) in net assets resulting from operations | | $ | (301,744,287 | ) |
|
| |
See accompanying Notes to Financial Statements which are an integral part of the financial statements.
| | |
| 28 | | Invesco Municipal Income Fund |
Statement of Changes in Net Assets
For the years ended February 28, 2023 and 2022
| | | | | | | | | | |
| | | 2023 | | | | | 2022 | |
|
| |
Operations: | | | | | | | | | | |
| | | |
Net investment income | | $ | 110,594,477 | | | | | $ | 109,430,179 | |
|
| |
Net realized gain (loss) | | | (129,427,337 | ) | | | | | (1,741,055 | ) |
|
| |
Change in net unrealized appreciation (depreciation) | | | (282,911,427 | ) | | | | | (91,506,049 | ) |
|
| |
Net increase (decrease) in net assets resulting from operations | | | (301,744,287 | ) | | | | | 16,183,075 | |
|
| |
| | | |
Distributions to shareholders from distributable earnings: | | | | | | | | | | |
| | | |
Class A | | | (75,879,793 | ) | | | | | (79,768,354 | ) |
|
| |
Class C | | | (3,700,621 | ) | | | | | (4,674,760 | ) |
|
| |
Class Y | | | (14,093,930 | ) | | | | | (15,800,117 | ) |
|
| |
Investor Class | | | (2,766,717 | ) | | | | | (3,070,454 | ) |
|
| |
Class R6 | | | (12,121,899 | ) | | | | | (11,041,199 | ) |
|
| |
Total distributions from distributable earnings | | | (108,562,960 | ) | | | | | (114,354,884 | ) |
|
| |
| | | |
Share transactions-net: | | | | | | | | | | |
| | | |
Class A | | | (106,342,774 | ) | | | | | 80,335,462 | |
|
| |
Class C | | | (35,167,756 | ) | | | | | (36,392,251 | ) |
|
| |
Class Y | | | (38,174,816 | ) | | | | | 706,591 | |
|
| |
Investor Class | | | (6,199,325 | ) | | | | | (4,544,409 | ) |
|
| |
Class R6 | | | 30,910,854 | | | | | | 104,188,107 | |
|
| |
Net increase (decrease) in net assets resulting from share transactions | | | (154,973,817 | ) | | | | | 144,293,500 | |
|
| |
Net increase (decrease) in net assets | | | (565,281,064 | ) | | | | | 46,121,691 | |
|
| |
| | | |
Net assets: | | | | | | | | | | |
| | | |
Beginning of year | | | 3,649,309,171 | | | | | | 3,603,187,480 | |
|
| |
End of year | | $ | 3,084,028,107 | | | | | $ | 3,649,309,171 | |
|
| |
See accompanying Notes to Financial Statements which are an integral part of the financial statements.
| | |
| 29 | | Invesco Municipal Income Fund |
Financial Highlights
The following schedule presents financial highlights for a share of the Fund outstanding throughout the periods indicated.
| | | | | | | | | | | | | | | | | | | | | | | | | | | | | | | | | | | | | | | | | | | | | | | | | | | | |
| | | Net asset value, beginning of period | | Net investment income(a) | | Net gains (losses) on securities (both realized and unrealized) | | Total from investment operations | | Dividends from net investment income | | Net asset value, end of period | | Total return (b) | | Net assets, end of period (000’s omitted) | | Ratio of expenses to average net assets with fee waivers and/or expenses absorbed | | Ratio of expenses to average net assets without fee waivers and/or expenses absorbed | | Supplemental ratio of expenses to average net assets with fee waivers (excluding interest, facilities and maintenance fees) | | Ratio of net investment income to average net assets | | Portfolio turnover (c) |
Class A | | | | | | | | | | | | | | | | | | | | | | | | | | | | | | | | | | | | | | | | | | | | | | | | | | | | |
Year ended 02/28/23 | | | $13.27 | | | | $0.42 | | | | $(1.53 | ) | | | $(1.11 | ) | | | $(0.41 | ) | | | $11.75 | | | | (8.39 | )% | | | $2,162,852 | | | | 1.03 | % | | | 1.03 | % | | | 0.81 | % | | | 3.44 | % | | | 39 | % |
Year ended 02/28/22 | | | 13.61 | | | | 0.40 | | | | (0.32 | ) | | | 0.08 | | | | (0.42 | ) | | | 13.27 | | | | 0.52 | | | | 2,557,469 | | | | 0.90 | | | | 0.90 | | | | 0.80 | | | | 2.91 | | | | 11 | |
Year ended 02/28/21 | | | 14.04 | | | | 0.43 | | | | (0.46 | ) | | | (0.03 | ) | | | (0.40 | ) | | | 13.61 | | | | (0.14 | ) | | | 2,545,279 | | | | 0.92 | | | | 0.92 | | | | 0.81 | | | | 3.25 | | | | 23 | |
Year ended 02/29/20 | | | 13.02 | | | | 0.45 | | | | 1.03 | | | | 1.48 | | | | (0.46 | ) | | | 14.04 | | | | 11.56 | | | | 2,525,163 | | | | 1.05 | | | | 1.05 | | | | 0.82 | | | | 3.35 | | | | 9 | |
Year ended 02/28/19 | | | 13.19 | | | | 0.50 | | | | (0.14 | ) | | | 0.36 | | | | (0.53 | ) | | | 13.02 | | | | 2.78 | | | | 1,982,214 | | | | 1.01 | | | | 1.01 | | | | 0.85 | | | | 3.85 | | | | 27 | |
Class C | | | | | | | | | | | | | | | | | | | | | | | | | | | | | | | | | | | | | | | | | | | | | | | | | | | | |
Year ended 02/28/23 | | | 13.22 | | | | 0.32 | | | | (1.51 | ) | | | (1.19 | ) | | | (0.32 | ) | | | 11.71 | | | | (9.05 | ) | | | 125,624 | | | | 1.78 | | | | 1.78 | | | | 1.56 | | | | 2.69 | | | | 39 | |
Year ended 02/28/22 | | | 13.55 | | | | 0.30 | | | | (0.32 | ) | | | (0.02 | ) | | | (0.31 | ) | | | 13.22 | | | | (0.18 | ) | | | 180,005 | | | | 1.65 | | | | 1.65 | | | | 1.55 | | | | 2.16 | | | | 11 | |
Year ended 02/28/21 | | | 13.97 | | | | 0.33 | | | | (0.45 | ) | | | (0.12 | ) | | | (0.30 | ) | | | 13.55 | | | | (0.83 | ) | | | 220,569 | | | | 1.67 | | | | 1.67 | | | | 1.56 | | | | 2.50 | | | | 23 | |
Year ended 02/29/20 | | | 12.96 | | | | 0.35 | | | | 1.02 | | | | 1.37 | | | | (0.36 | ) | | | 13.97 | | | | 10.69 | | | | 298,433 | | | | 1.80 | | | | 1.80 | | | | 1.57 | | | | 2.60 | | | | 9 | |
Year ended 02/28/19 | | | 13.12 | | | | 0.40 | | | | (0.13 | ) | | | 0.27 | | | | (0.43 | ) | | | 12.96 | | | | 2.08 | | | | 133,292 | | | | 1.76 | | | | 1.76 | | | | 1.60 | | | | 3.10 | | | | 27 | |
Class Y | | | | | | | | | | | | | | | | | | | | | | | | | | | | | | | | | | | | | | | | | | | | | | | | | | | | |
Year ended 02/28/23 | | | 13.27 | | | | 0.45 | | | | (1.53 | ) | | | (1.08 | ) | | | (0.44 | ) | | | 11.75 | | | | (8.15 | ) | | | 368,000 | | | | 0.78 | | | | 0.78 | | | | 0.56 | | | | 3.69 | | | | 39 | |
Year ended 02/28/22 | | | 13.61 | | | | 0.44 | | | | (0.33 | ) | | | 0.11 | | | | (0.45 | ) | | | 13.27 | | | | 0.77 | | | | 457,194 | | | | 0.65 | | | | 0.65 | | | | 0.55 | | | | 3.16 | | | | 11 | |
Year ended 02/28/21 | | | 14.04 | | | | 0.47 | | | | (0.47 | ) | | | 0.00 | | | | (0.43 | ) | | | 13.61 | | | | 0.11 | | | | 468,937 | | | | 0.67 | | | | 0.67 | | | | 0.56 | | | | 3.50 | | | | 23 | |
Year ended 02/29/20 | | | 13.02 | | | | 0.48 | | | | 1.03 | | | | 1.51 | | | | (0.49 | ) | | | 14.04 | | | | 11.83 | | | | 500,893 | | | | 0.80 | | | | 0.80 | | | | 0.57 | | | | 3.60 | | | | 9 | |
Year ended 02/28/19 | | | 13.18 | | | | 0.54 | | | | (0.14 | ) | | | 0.40 | | | | (0.56 | ) | | | 13.02 | | | | 3.11 | | | | 406,923 | | | | 0.76 | | | | 0.76 | | | | 0.60 | | | | 4.10 | | | | 27 | |
Investor Class | | | | | | | | | | | | | | | | | | | | | | | | | | | | | | | | | | | | | | | | | | | | | | | | | | | | |
Year ended 02/28/23 | | | 13.28 | | | | 0.43 | | | | (1.53 | ) | | | (1.10 | ) | | | (0.42 | ) | | | 11.76 | | | | (8.28 | )(d) | | | 74,358 | | | | 0.92 | (d) | | | 0.92 | (d) | | | 0.70 | (d) | | | 3.55 | (d) | | | 39 | |
Year ended 02/28/22 | | | 13.63 | | | | 0.41 | | | | (0.33 | ) | | | 0.08 | | | | (0.43 | ) | | | 13.28 | | | | 0.53 | (d) | | | 90,711 | | | | 0.81 | (d) | | | 0.81 | (d) | | | 0.71 | (d) | | | 3.00 | (d) | | | 11 | |
Year ended 02/28/21 | | | 14.05 | | | | 0.45 | | | | (0.46 | ) | | | (0.01 | ) | | | (0.41 | ) | | | 13.63 | | | | 0.03 | (d) | | | 97,587 | | | | 0.81 | (d) | | | 0.81 | (d) | | | 0.70 | (d) | | | 3.36 | (d) | | | 23 | |
Year ended 02/29/20 | | | 13.03 | | | | 0.46 | | | | 1.03 | | | | 1.49 | | | | (0.47 | ) | | | 14.05 | | | | 11.65 | (d) | | | 102,850 | | | | 0.98 | (d) | | | 0.98 | (d) | | | 0.75 | (d) | | | 3.42 | (d) | | | 9 | |
Year ended 02/28/19 | | | 13.19 | | | | 0.52 | | | | (0.14 | ) | | | 0.38 | | | | (0.54 | ) | | | 13.03 | | | | 2.96 | (d) | | | 99,887 | | | | 0.88 | (d) | | | 0.88 | (d) | | | 0.72 | (d) | | | 3.98 | (d) | | | 27 | |
Class R6 | | | | | | | | | | | | | | | | | | | | | | | | | | | | | | | | | | | | | | | | | | | | | | | | | | | | |
Year ended 02/28/23 | | | 13.27 | | | | 0.45 | | | | (1.53 | ) | | | (1.08 | ) | | | (0.44 | ) | | | 11.75 | | | | (8.11 | ) | | | 353,195 | | | | 0.73 | | | | 0.73 | | | | 0.51 | | | | 3.74 | | | | 39 | |
Year ended 02/28/22 | | | 13.61 | | | | 0.44 | | | | (0.32 | ) | | | 0.12 | | | | (0.46 | ) | | | 13.27 | | | | 0.82 | | | | 363,930 | | | | 0.60 | | | | 0.60 | | | | 0.50 | | | | 3.21 | | | | 11 | |
Year ended 02/28/21 | | | 14.04 | | | | 0.48 | | | | (0.47 | ) | | | 0.01 | | | | (0.44 | ) | | | 13.61 | | | | 0.17 | | | | 270,815 | | | | 0.61 | | | | 0.61 | | | | 0.50 | | | | 3.56 | | | | 23 | |
Year ended 02/29/20 | | | 13.02 | | | | 0.49 | | | | 1.03 | | | | 1.52 | | | | (0.50 | ) | | | 14.04 | | | | 11.90 | | | | 243,417 | | | | 0.74 | | | | 0.74 | | | | 0.51 | | | | 3.66 | | | | 9 | |
Year ended 02/28/19 | | | 13.18 | | | | 0.54 | | | | (0.13 | ) | | | 0.41 | | | | (0.57 | ) | | | 13.02 | | | | 3.18 | | | | 152,478 | | | | 0.69 | | | | 0.69 | | | | 0.53 | | | | 4.17 | | | | 27 | |
| (a) | Calculated using average shares outstanding. |
| (b) | Includes adjustments in accordance with accounting principles generally accepted in the United States of America and as such, the net asset value for financial reporting purposes and the returns based upon those net asset values may differ from the net asset value and returns for shareholder transactions. Does not include sales charges and is not annualized for periods less than one year, if applicable. |
| (c) | Portfolio turnover is calculated at the fund level and is not annualized for periods less than one year, if applicable. |
| (d) | The total return, ratio of expenses to average net assets and ratio of net investment income to average net assets reflect actual 12b-1 fees of 0.14%, 0.16%, 0.14%, 0.17% and 0.13% for the years ended February 28, 2023, February 28, 2022, February 28, 2021, February 29, 2020, and February 28, 2019, respectively. |
See accompanying Notes to Financial Statements which are an integral part of the financial statements.
| | |
| 30 | | Invesco Municipal Income Fund |
Notes to Financial Statements
February 28, 2023
NOTE 1–Significant Accounting Policies
Invesco Municipal Income Fund (the “Fund”) is a series portfolio of AIM Tax-Exempt Funds (Invesco Tax-Exempt Funds) (the “Trust”). The Trust is a Delaware statutory trust registered under the Investment Company Act of 1940, as amended (the “1940 Act”), as an open-end series management investment company authorized to issue an unlimited number of shares of beneficial interest. Information presented in these financial statements pertains only to the Fund. Matters affecting the Fund or each class will be voted on exclusively by the shareholders of the Fund or each class.
The Fund’s investment objective is to provide investors with a high level of current income exempt from federal income tax, consistent with preservation of capital.
The Fund currently consists of five different classes of shares: Class A, Class C, Class Y, Investor Class and Class R6. Class Y and Investor Class shares are available only to certain investors. Class A shares are sold with a front-end sales charge unless certain waiver criteria are met. Under certain circumstances, load waived shares may be subject to contingent deferred sales charges (“CDSC”). Class C shares are sold with a CDSC. Class Y, Investor Class and Class R6 shares are sold at net asset value. Class C shares held for eight years after purchase are eligible for automatic conversion into Class A shares of the same Fund (the “Conversion Feature”). The automatic conversion pursuant to the Conversion Feature will generally occur at the end of the month following the eighth anniversary after a purchase of Class C shares.
The Fund is an investment company and accordingly follows the investment company accounting and reporting guidance in accordance with Financial Accounting Standards Board Accounting Standards Codification Topic 946, Financial Services - Investment Companies.
The following is a summary of the significant accounting policies followed by the Fund in the preparation of its financial statements.
| A. | Security Valuations - Securities, including restricted securities, are valued according to the following policy. |
Securities generally normally are valued on the basis of prices provided by independent pricing services. Prices provided by the pricing service may be determined without exclusive reliance on quoted prices, and may reflect appropriate factors such as institution-size trading in similar groups of securities, developments related to specific securities, dividend rate (for unlisted equities), yield (for debt obligations), quality, type of issue, coupon rate (for debt obligations), maturity (for debt obligations), individual trading characteristics and other market data. Pricing services generally value debt obligations assuming orderly transactions of institutional round lot size, but a fund may hold or transact in the same securities in smaller, odd lot sizes. Odd lots often trade at lower prices than institutional round lots, and their value may be adjusted accordingly. Debt obligations are subject to interest rate and credit risks. In addition, all debt obligations involve some risk of default with respect to interest and/or principal payments.
A security listed or traded on an exchange is generally valued at its trade price or official closing price that day as of the close of the exchange where the security is principally traded, or lacking any sales or official closing price on a particular day, the security may be valued at the closing bid price on that day. Securities traded in the over-the-counter market are valued based on prices furnished by independent pricing services or market makers. When such securities are valued using prices provided by an independent pricing service they may be considered fair valued. Futures contracts are valued at the daily settlement price set by an exchange on which they are principally traded. U.S. exchange-traded options are valued at the mean between the last bid and asked prices from the exchange on which they are principally traded. Non-U.S. exchange-traded options are valued at the final settlement price set by the exchange on which they trade. Options not listed on an exchange and swaps generally are valued using pricing provided from independent pricing services.
Securities for which market quotations are not readily available are fair valued by Invesco Advisers, Inc. (the “Adviser” or “Invesco”) in accordance with Board-approved policies and related Adviser procedures (“Valuation Procedures”). If a fair value price provided by a pricing service is not representative of market value in the Adviser’s judgment (“unreliable”), the Adviser will fair value the security using the Valuation Procedures. Issuer specific events, market trends, bid/asked quotes of brokers and information providers and other market data may be reviewed in the course of making a good faith determination of a security’s fair value.
The Fund may invest in securities that are subject to interest rate risk, meaning the risk that the prices will generally fall as interest rates rise and, conversely, the prices will generally rise as interest rates fall. Specific securities differ in their sensitivity to changes in interest rates depending on their individual characteristics. Changes in interest rates may result in increased market volatility, which may affect the value and/or liquidity of certain Fund investments.
Valuations change in response to many factors including the historical and prospective earnings of the issuer, the value of the issuer’s assets, general market conditions which are not specifically related to the particular issuer, such as real or perceived adverse economic conditions, changes in the general outlook for revenues or corporate earnings, changes in interest or currency rates, regional or global instability, natural or environmental disasters, widespread disease or other public health issues, war, acts of terrorism, significant governmental actions or adverse investor sentiment generally and market liquidity. Because of the inherent uncertainties of valuation, the values reflected in the financial statements may materially differ from the value received upon actual sale of those investments.
The price the Fund could receive upon the sale of any investment may differ from the Adviser’s valuation of the investment, particularly for securities that are valued using a fair valuation technique. When fair valuation techniques are applied, the Adviser uses available information, including both observable and unobservable inputs and assumptions, to determine a methodology that will result in a valuation that the Adviser believes approximates market value. Fund securities that are fair valued may be subject to greater fluctuation in their value from one day to the next than would be the case if market quotations were used. Because of the inherent uncertainties of valuation, and the degree of subjectivity in such decisions, the Fund could realize a greater or lesser than expected gain or loss upon the sale of the investment.
| B. | Securities Transactions and Investment Income - Securities transactions are accounted for on a trade date basis. Realized gains or losses on sales are computed on the basis of specific identification of the securities sold. Interest income (net of withholding tax, if any) is recorded on an accrual basis from settlement date and includes coupon interest and amortization of premium and accretion of discount on debt securities as applicable. Pay-in-kind interest income and non-cash dividend income received in the form of securities in-lieu of cash are recorded at the fair value of the securities received. Dividend income (net of withholding tax, if any) is recorded on the ex-dividend date. |
The Fund may periodically participate in litigation related to Fund investments. As such, the Fund may receive proceeds from litigation settlements. Any proceeds received are included in the Statement of Operations as realized gain (loss) for investments no longer held and as unrealized gain (loss) for investments still held.
Brokerage commissions and mark ups are considered transaction costs and are recorded as an increase to the cost basis of securities purchased and/or a reduction of proceeds on a sale of securities. Such transaction costs are included in the determination of net realized and unrealized gain (loss) from investment securities reported in the Statement of Operations and the Statement of Changes in Net Assets and the net realized and unrealized gains (losses) on securities per share in the Financial Highlights. Transaction costs are included in the calculation of the Fund’s net asset value and, accordingly, they reduce the Fund’s total returns. These transaction costs are not considered operating expenses and are not reflected in net investment income reported in the Statement of Operations and the Statement of Changes in Net Assets, or the net investment income per share and the ratios of expenses and net investment income reported in the Financial Highlights, nor are they limited by any expense limitation arrangements between the Fund and the investment adviser.
The Fund allocates realized and unrealized capital gains and losses to a class based on the relative net assets of each class. The Fund allocates income to a class based on the relative value of the settled shares of each class.
| C. | Country Determination - For the purposes of making investment selection decisions and presentation in the Schedule of Investments, the investment adviser |
| | |
| 31 | | Invesco Municipal Income Fund |
| | may determine the country in which an issuer is located and/or credit risk exposure based on various factors. These factors include the laws of the country under which the issuer is organized, where the issuer maintains a principal office, the country in which the issuer derives 50% or more of its total revenues, the country that has the primary market for the issuer’s securities and its “country of risk” as determined by a third party service provider, as well as other criteria. Among the other criteria that may be evaluated for making this determination are the country in which the issuer maintains 50% or more of its assets, the type of security, financial guarantees and enhancements, the nature of the collateral and the sponsor organization. Country of issuer and/or credit risk exposure has been determined to be the United States of America, unless otherwise noted. |
| D. | Distributions - Distributions from net investment income, if any, are declared daily and paid monthly. Distributions from net realized capital gain, if any, are generally declared and paid annually and recorded on the ex-dividend date. The Fund may elect to treat a portion of the proceeds from redemptions as distributions for federal income tax purposes. |
| E. | Federal Income Taxes - The Fund intends to comply with the requirements of Subchapter M of the Internal Revenue Code of 1986, as amended (the “Internal Revenue Code”), necessary to qualify as a regulated investment company and to distribute substantially all of the Fund’s taxable and tax-exempt earnings to shareholders. As such, the Fund will not be subject to federal income taxes on otherwise taxable income (including net realized capital gain) that is distributed to shareholders. Therefore, no provision for federal income taxes is recorded in the financial statements. |
The Fund recognizes the tax benefits of uncertain tax positions only when the position is more likely than not to be sustained. Management has analyzed the Fund’s uncertain tax positions and concluded that no liability for unrecognized tax benefits should be recorded related to uncertain tax positions. Management is not aware of any tax positions for which it is reasonably possible that the total amounts of unrecognized tax benefits will change materially in the next 12 months.
In addition, the Fund intends to invest in such municipal securities to allow it to qualify to pay shareholders “exempt-interest dividends”, as defined in the Internal Revenue Code.
The Fund files tax returns in the U.S. Federal jurisdiction and certain other jurisdictions. Generally, the Fund is subject to examinations by such taxing authorities for up to three years after the filing of the return for the tax period.
| F. | Expenses - Fees provided for under the Rule 12b-1 plan of a particular class of the Fund are charged to the operations of such class. Transfer agency fees and expenses and other shareholder recordkeeping fees and expenses attributable to Class R6 are charged to such class. Transfer agency fees and expenses and other shareholder recordkeeping fees and expenses relating to all other classes are allocated among those classes based on relative net assets. All other expenses are allocated among the classes based on relative net assets. |
| G. | Interest, Facilities and Maintenance Fees - Interest, Facilities and Maintenance Fees include interest and related borrowing costs such as commitment fees, administrative expenses and other expenses associated with establishing and maintaining the line of credit. In addition, interest and administrative expenses related to establishing and maintaining floating rate note obligations, if any, are included. |
| H. | Accounting Estimates - The preparation of financial statements in conformity with accounting principles generally accepted in the United States of America (“GAAP”) requires management to make estimates and assumptions that affect the reported amounts of assets and liabilities at the date of the financial statements and the reported amounts of revenues and expenses during the reporting period including estimates and assumptions related to taxation. Actual results could differ from those estimates by a significant amount. In addition, the Fund monitors for material events or transactions that may occur or become known after the period-end date and before the date the financial statements are released to print. |
| I. | Indemnifications - Under the Trust’s organizational documents, each Trustee, officer, employee or other agent of the Trust is indemnified against certain liabilities that may arise out of the performance of their duties to the Fund. Additionally, in the normal course of business, the Fund enters into contracts, including the Fund’s servicing agreements, that contain a variety of indemnification clauses. The Fund’s maximum exposure under these arrangements is unknown as this would involve future claims that may be made against the Fund that have not yet occurred. The risk of material loss as a result of such indemnification claims is considered remote. |
| J. | Floating Rate Note Obligations - The Fund invests in inverse floating rate securities, such as Tender Option Bonds (“TOBs”), for investment purposes and to enhance the yield of the Fund. Such securities may be purchased in the secondary market without first owning an underlying bond but generally are created through the sale of fixed rate bonds by the Fund to special purpose trusts established by a broker dealer or by the Fund (“TOB Trusts”) in exchange for cash and residual interests in the TOB Trusts’ assets and cash flows, which are in the form of inverse floating rate securities. The TOB Trusts finance the purchases of the fixed rate bonds by issuing floating rate notes to third parties and allowing the Fund to retain residual interests in the bonds. The floating rate notes issued by the TOB Trusts have interest rates that reset weekly and the floating rate note holders have the option to tender their notes to the TOB Trusts for redemption at par at each reset date. The residual interests held by the Fund (inverse floating rate securities) include the right of the Fund (1) to cause the holders of the floating rate notes to tender their notes at par at the next interest rate reset date, and (2) to transfer the municipal bond from the TOB Trust to the Fund, thereby collapsing the TOB Trust. Inverse floating rate securities tend to underperform the market for fixed rate bonds in a rising interest rate environment, but tend to outperform the market for fixed rate bonds when interest rates decline or remain relatively stable. |
The Fund generally invests in inverse floating rate securities that include embedded leverage, thus exposing the Fund to greater risks and increased costs. The primary risks associated with inverse floating rate securities are varying degrees of liquidity and decreases in the value of such securities in response to changes in interest rates to a greater extent than fixed rate securities having similar credit quality, redemption provisions and maturity, which may cause the Fund’s net asset value to be more volatile than if it had not invested in inverse floating rate securities. In certain instances, the short-term floating rate notes created by the TOB Trust may not be able to be sold to third parties or, in the case of holders tendering (or putting) such notes for repayment of principal, may not be able to be remarketed to third parties. In such cases, the TOB Trust holding the fixed rate bonds may be collapsed with the entity that contributed the fixed rate bonds to the TOB Trust. In the case where a TOB Trust is collapsed with the Fund, the Fund will be required to repay the principal amount of the tendered securities, which may require the Fund to sell other portfolio holdings to raise cash to meet that obligation. The Fund could therefore be required to sell other portfolio holdings at a disadvantageous time or price to raise cash to meet this obligation, which risk will be heightened during times of market volatility, illiquidity or uncertainty. The embedded leverage in the TOB Trust could cause the Fund to lose more money than the value of the asset it has contributed to the TOB Trust and greater levels of leverage create the potential for greater losses. In addition, a Fund may enter into reimbursement agreements with the liquidity provider of certain TOB transactions in connection with certain residuals held by the Fund. These agreements commit a Fund to reimburse the liquidity provider to the extent that the liquidity provider must provide cash to a TOB Trust, including following the termination of a TOB Trust resulting from a mandatory tender event (“liquidity shortfall”). The reimbursement agreement will effectively make the Fund liable for the amount of the negative difference, if any, between the liquidation value of the underlying security and the purchase price of the floating rate notes issued by the TOB Trust.
The Fund accounts for the transfer of fixed rate bonds to the TOB Trusts as secured borrowings, with the securities transferred remaining in the Fund’s investment assets, and the related floating rate notes reflected as Fund liabilities under the caption Floating rate note obligations on the Statement of Assets and Liabilities. The carrying amount of the Fund’s floating rate note obligations as reported on the Statement of Assets and Liabilities approximates its fair value. The Fund records the interest income from the fixed rate bonds under the caption Interest and records the expenses related to floating rate obligations and any administrative expenses of the TOB Trusts as a component of Interest, facilities and maintenance fees on the Statement of Operations.
Final rules implementing section 619 of the Dodd-Frank Wall Street Reform and Consumer Protection Act (the “Volcker Rule”) prohibit banking entities from engaging in proprietary trading of certain instruments and limit such entities’ investments in, and relationships with, “covered funds”, as defined in the rules. These rules preclude banking entities and their affiliates from sponsoring and/or providing services for existing TOB Trusts. A new TOB structure is being utilized by the Fund wherein the Fund, as holder of the residuals, will perform certain duties previously performed by banking entities as “sponsors” of TOB Trusts. These duties may be performed by a third-party service provider. The Fund’s expanded role under the new TOB structure may increase its operational and regulatory risk.
| | |
| 32 | | Invesco Municipal Income Fund |
The new structure is substantially similar to the previous structure; however, pursuant to the Volcker Rule, the remarketing agent would not be able to repurchase tendered floaters for its own account upon a failed remarketing. In the event of a failed remarketing, a banking entity serving as liquidity provider may loan the necessary funds to the TOB Trust to purchase the tendered floaters. The TOB Trust, not the Fund, would be the borrower and the loan from the liquidity provider will be secured by the purchased floaters now held by the TOB Trust. However, as previously described, the Fund would bear the risk of loss with respect to any liquidity shortfall to the extent it entered into a reimbursement agreement with the liquidity provider.
Further, the SEC and various banking agencies have adopted rules implementing credit risk retention requirements for asset-backed securities (the “Risk Retention Rules”). The Risk Retention Rules require the sponsor of a TOB Trust to retain at least 5% of the credit risk of the underlying assets supporting the TOB Trust’s municipal bonds. The Fund has adopted policies intended to comply with the Risk Retention Rules. The Risk Retention Rules may adversely affect the Fund’s ability to engage in TOB Trust transactions or increase the costs of such transactions in certain circumstances.
There can be no assurances that the new TOB structure will continue to be a viable form of leverage. Further, there can be no assurances that alternative forms of leverage will be available to the Fund in order to maintain current levels of leverage. Any alternative forms of leverage may be less advantageous to the Fund, and may adversely affect the Fund’s net asset value, distribution rate and ability to achieve its investment objective.
TOBs are presently classified as private placement securities. Private placement securities are subject to restrictions on resale because they have not been registered under the Securities Act of 1933, as amended (the “1933 Act”), or are otherwise not readily marketable. As a result of the absence of a public trading market for these securities, they may be less liquid than publicly traded securities. Although atypical, these securities may be resold in privately negotiated transactions, the prices realized from these sales could be less than those originally paid by the Fund or less than what may be considered the fair value of such securities.
| K. | Futures Contracts - The Fund may enter into futures contracts to manage exposure to interest rate, equity and market price movements and/or currency risks. A futures contract is an agreement between two parties (“Counterparties”) to purchase or sell a specified underlying security, currency or commodity (or delivery of a cash settlement price, in the case of an index future) for a fixed price at a future date. The Fund currently invests only in exchange-traded futures and they are standardized as to maturity date and underlying financial instrument. Initial margin deposits required upon entering into futures contracts are satisfied by the segregation of specific securities or cash as collateral at the futures commission merchant (broker). During the period the futures contracts are open, changes in the value of the contracts are recognized as unrealized gains or losses by recalculating the value of the contracts on a daily basis. Subsequent or variation margin payments are received or made depending upon whether unrealized gains or losses are incurred. These amounts are reflected as receivables or payables on the Statement of Assets and Liabilities. When the contracts are closed or expire, the Fund recognizes a realized gain or loss equal to the difference between the proceeds from, or cost of, the closing transaction and the Fund’s basis in the contract. The net realized gain (loss) and the change in unrealized gain (loss) on futures contracts held during the period is included on the Statement of Operations. The primary risks associated with futures contracts are market risk and the absence of a liquid secondary market. If the Fund were unable to liquidate a futures contract and/or enter into an offsetting closing transaction, the Fund would continue to be subject to market risk with respect to the value of the contracts and continue to be required to maintain the margin deposits on the futures contracts. Futures contracts have minimal Counterparty risk since the exchange’s clearinghouse, as Counterparty to all exchange-traded futures, guarantees the futures against default. Risks may exceed amounts recognized in the Statement of Assets and Liabilities. |
| L. | Collateral - To the extent the Fund has designated or segregated a security as collateral and that security is subsequently sold, it is the Fund’s practice to replace such collateral no later than the next business day. |
| M. | Other Risks - The value of, payment of interest on, repayment of principal for and the ability to sell a municipal security may be affected by constitutional amendments, legislative enactments, executive orders, administrative regulations, voter initiatives and the economics of the regions in which the issuers are located. Since many municipal securities are issued to finance similar projects, especially those relating to education, health care, transportation and utilities, conditions in those sectors can affect the overall municipal securities market and the Fund’s investments in municipal securities. There is some risk that a portion or all of the interest received from certain tax-free municipal securities could become taxable as a result of determinations by the Internal Revenue Service. |
Increases in the federal funds and equivalent foreign rates or other changes to monetary policy or regulatory actions may expose fixed income markets to heightened volatility and reduced liquidity for certain fixed income investments, particularly those with longer maturities. It is difficult to predict the impact of interest rate changes on various markets. In addition, decreases in fixed income dealer market-making capacity may also potentially lead to heightened volatility and reduced liquidity in the fixed income markets. As a result, the value of the Fund’s investments and share price may decline. Changes in central bank policies could also result in higher than normal redemptions by shareholders, which could potentially increase the Fund’s portfolio turnover rate and transaction costs.
Policy changes by the U.S. government or its regulatory agencies and political events within the U.S. and abroad may, among other things, affect investor and consumer confidence and increase volatility in the financial markets, perhaps suddenly and to a significant degree, which may adversely impact the Fund’s operations, universe of potential investment options, and return potential.
| N. | COVID-19 Risk - The COVID-19 strain of coronavirus has resulted in instances of market closures and dislocations, extreme volatility, liquidity constraints and increased trading costs. Efforts to contain its spread have resulted in travel restrictions, disruptions of healthcare systems, business operations (including business closures) and supply chains, layoffs, lower consumer demand and employee availability, and defaults and credit downgrades, among other significant economic impacts that have disrupted global economic activity across many industries. Such economic impacts may exacerbate other pre-existing political, social and economic risks locally or globally and cause general concern and uncertainty. The full economic impact and ongoing effects of COVID-19 (or other future epidemics or pandemics) at the macro-level and on individual businesses are unpredictable and may result in significant and prolonged effects on the Fund’s performance. |
NOTE 2–Advisory Fees and Other Fees Paid to Affiliates
The Trust has entered into a master investment advisory agreement with the Adviser. Under the terms of the investment advisory agreement, the Fund accrues daily and pays monthly an advisory fee to the Adviser based on the annual rate of the Fund’s average daily net assets as follows:
| | | | |
| Average Daily Net Assets | | Rate | |
|
| |
First $500 million | | | 0.500% | |
|
| |
Over $500 million | | | 0.450% | |
|
| |
For the year ended February 28, 2023, the effective advisory fee rate incurred by the Fund was 0.46%.
Under the terms of a master sub-advisory agreement between the Adviser and each of Invesco Asset Management Deutschland GmbH, Invesco Asset Management Limited, Invesco Asset Management (Japan) Limited, Invesco Hong Kong Limited, Invesco Senior Secured Management, Inc. and Invesco Canada Ltd. and separate sub-advisory agreements with Invesco Capital Management LLC and Invesco Asset Management (India) Private Limited (collectively, the “Affiliated Sub-Advisers”) the Adviser, not the Fund, will pay 40% of the fees paid to the Adviser to any such Affiliated Sub-Adviser(s) that provide(s) discretionary investment management services to the Fund based on the percentage of assets allocated to such Affiliated Sub-Adviser(s).
The Adviser has contractually agreed, through at least June 30, 2023, to waive advisory fees and/or reimburse expenses of all shares to the extent necessary to limit total annual fund operating expenses after fee waiver and/or expense reimbursement (excluding certain items discussed below) of Class A, Class C, Class Y, Investor Class and Class R6 shares to 1.50%, 2.25%, 1.25%, 1.50% and 1.25%, respectively, of the Fund’s average daily net assets (the “expense limits”). In determining the Adviser’s obligation to waive advisory fees and/or reimburse expenses, the following expenses are not taken into account, and could cause the total
| | |
| 33 | | Invesco Municipal Income Fund |
annual fund operating expenses after fee waiver and/or expense reimbursement to exceed the numbers reflected above: (1) interest, facilities and maintenance fees; (2) taxes; (3) dividend expense on short sales; (4) extraordinary or non-routine items, including litigation expenses; and (5) expenses that the Fund has incurred but did not actually pay because of an expense offset arrangement. Unless Invesco continues the fee waiver agreement, it will terminate on June 30, 2023. During its term, the fee waiver agreement cannot be terminated or amended to increase the expense limits or reduce the advisory fee waiver without approval of the Board of Trustees. The Adviser did not waive fees and/or reimburse expenses during the period under these expense limits.
The Trust has entered into a master administrative services agreement with Invesco pursuant to which the Fund has agreed to pay Invesco for certain administrative costs incurred in providing accounting services to the Fund. For the year ended February 28, 2023, expenses incurred under the agreement are shown in the Statement of Operations as Administrative services fees. Invesco has entered into a sub-administration agreement whereby State Street Bank and Trust Company (“SSB”) serves as fund accountant and provides certain administrative services to the Fund. Pursuant to a custody agreement with the Trust on behalf of the Fund, SSB also serves as the Fund’s custodian.
The Trust has entered into a transfer agency and service agreement with Invesco Investment Services, Inc. (“IIS”) pursuant to which the Fund has agreed to pay IIS a fee for providing transfer agency and shareholder services to the Fund and reimburse IIS for certain expenses incurred by IIS in the course of providing such services. IIS may make payments to intermediaries that provide omnibus account services, sub-accounting services and/or networking services. All fees payable by IIS to intermediaries that provide omnibus account services or sub-accounting services are charged back to the Fund, subject to certain limitations approved by the Trust’s Board of Trustees. For the year ended February 28, 2023, expenses incurred under the agreement are shown in the Statement of Operations as Transfer agent fees.
The Trust has entered into master distribution agreements with Invesco Distributors, Inc. (“IDI”) to serve as the distributor for the Class A, Class C, Class Y, Investor Class and Class R6 shares of the Fund. The Trust has adopted plans pursuant to Rule 12b-1 under the 1940 Act with respect to the Fund’s Class A, Class C and Investor Class shares (collectively, the “Plans”). The Fund, pursuant to the Plans, reimburses IDI for its allocated share of expenses incurred for the period, up to a maximum annual rate of 0.25% of the average daily net assets of Class A shares, up to 1.00% of the average daily net assets of Class C shares, and up to 0.25% of the average daily net assets of Investor Class shares. The fees are accrued daily and paid monthly. Of the Plan payments, up to 0.25% of the average daily net assets of each class of shares may be paid to furnish continuing personal shareholder services to customers who purchase and own shares of such classes. Any amounts not paid as a service fee under the Plans would constitute an asset-based sales charge. Rules of the Financial Industry Regulatory Authority (“FINRA”) impose a cap on the total sales charges, including asset-based sales charges, that may be paid by any class of shares of the Fund. For the year ended February 28, 2023, expenses incurred under the Plans are shown in the Statement of Operations as Distribution fees.
Front-end sales commissions and CDSC (collectively, the “sales charges”) are not recorded as expenses of the Fund. Front-end sales commissions are deducted from proceeds from the sales of Fund shares prior to investment in Class A shares of the Fund. CDSC are deducted from redemption proceeds prior to remittance to the shareholder. During the year ended February 28, 2023, IDI advised the Fund that IDI retained $142,848 in front-end sales commissions from the sale of Class A shares and $101,123 and $4,441 from Class A and Class C shares, respectively, for CDSC imposed upon redemptions by shareholders.
Certain officers and trustees of the Trust are officers and directors of the Adviser, IIS and/or IDI.
NOTE 3–Additional Valuation Information
GAAP defines fair value as the price that would be received to sell an asset or paid to transfer a liability in an orderly transaction between market participants at the measurement date, under current market conditions. GAAP establishes a hierarchy that prioritizes the inputs to valuation methods, giving the highest priority to readily available unadjusted quoted prices in an active market for identical assets (Level 1) and the lowest priority to significant unobservable inputs (Level 3), generally when market prices are not readily available. Based on the valuation inputs, the securities or other investments are tiered into one of three levels. Changes in valuation methods may result in transfers in or out of an investment’s assigned level:
| | |
| Level 1 - | | Prices are determined using quoted prices in an active market for identical assets. |
| Level 2 - | | Prices are determined using other significant observable inputs. Observable inputs are inputs that other market participants may use in pricing a security. These may include quoted prices for similar securities, interest rates, prepayment speeds, credit risk, yield curves, loss severities, default rates, discount rates, volatilities and others. |
| Level 3 - | | Prices are determined using significant unobservable inputs. In situations where quoted prices or observable inputs are unavailable (for example, when there is little or no market activity for an investment at the end of the period), unobservable inputs may be used. Unobservable inputs reflect the Adviser’s assumptions about the factors market participants would use in determining fair value of the securities or instruments and would be based on the best available information. |
The following is a summary of the tiered valuation input levels, as of February 28, 2023. The level assigned to the securities valuations may not be an indication of the risk or liquidity associated with investing in those securities. Because of the inherent uncertainties of valuation, the values reflected in the financial statements may materially differ from the value received upon actual sale of those investments.
| | | | | | | | | | | | | | | | |
| | | Level 1 | | | Level 2 | | | Level 3 | | | Total | |
|
| |
Investments in Securities | | | | | | | | | | | | | | | | |
|
| |
Municipal Obligations | | | $– | | | | $3,239,111,967 | | | | $397,146 | | | | $3,239,509,113 | |
|
| |
NOTE 4–Derivative Investments
The Fund may enter into an International Swaps and Derivatives Association Master Agreement (“ISDA Master Agreement”) under which a fund may trade OTC derivatives. An OTC transaction entered into under an ISDA Master Agreement typically involves a collateral posting arrangement, payment netting provisions and close-out netting provisions. These netting provisions allow for reduction of credit risk through netting of contractual obligations. The enforceability of the netting provisions of the ISDA Master Agreement depends on the governing law of the ISDA Master Agreement, among other factors.
For financial reporting purposes, the Fund does not offset OTC derivative assets or liabilities that are subject to ISDA Master Agreements in the Statement of Assets and Liabilities.
Effect of Derivative Investments for the year ended February 28, 2023
The table below summarizes the gains (losses) on derivative investments, detailed by primary risk exposure, recognized in earnings during the period:
| | | | |
| | | Location of Gain on
Statement of Operations | |
| | | Interest Rate Risk | |
|
| |
Realized Gain: | | | | |
Futures contracts | | | $16,006,919 | |
|
| |
| | |
| 34 | | Invesco Municipal Income Fund |
| | | | |
| | | Location of Gain on
Statement of Operations | |
| | | Interest Rate Risk | |
|
| |
Change in Net Unrealized Appreciation: | | | | |
Futures contracts | | | $ 85,938 | |
|
| |
Total | | | $16,092,857 | |
|
| |
The table below summarizes the average notional value of derivatives held during the period.
| | |
| | | Futures Contracts |
|
|
Average notional value | | $191,657,545 |
|
|
NOTE 5–Security Transactions with Affiliated Funds
The Fund is permitted to purchase securities from or sell securities to certain other affiliated funds under specified conditions outlined in procedures adopted by the Board of Trustees of the Trust. The procedures have been designed to ensure that any purchase or sale of securities by the Fund from or to another fund that is or could be considered an “affiliated person” by virtue of having a common investment adviser (or affiliated investment advisers), common Trustees and/or common officers is made in reliance on Rule 17a-7 of the 1940 Act and, to the extent applicable, related SEC staff positions. Each such transaction is effected at the security’s “current market price”, as provided for in these procedures and Rule 17a-7. Pursuant to these procedures, for the year ended February 28, 2023, the Fund engaged in securities purchases of $293,459,412 and securities sales of $176,424,217, which resulted in net realized gains (losses) of $(5,371,250).
NOTE 6–Expense Offset Arrangement(s)
The expense offset arrangement is comprised of transfer agency credits which result from balances in demand deposit accounts used by the transfer agent for clearing shareholder transactions. For the year ended February 28, 2023, the Fund received credits from this arrangement, which resulted in the reduction of the Fund’s total expenses of $4,773.
NOTE 7–Trustees’ and Officers’ Fees and Benefits
Trustees’ and Officers’ Fees and Benefits include amounts accrued by the Fund to pay remuneration to certain Trustees and Officers of the Fund. Trustees have the option to defer compensation payable by the Fund, and Trustees’ and Officers’ Fees and Benefits also include amounts accrued by the Fund to fund such deferred compensation amounts. Those Trustees who defer compensation have the option to select various Invesco Funds in which their deferral accounts shall be deemed to be invested. Finally, certain current Trustees were eligible to participate in a retirement plan that provided for benefits to be paid upon retirement to Trustees over a period of time based on the number of years of service. The Fund may have certain former Trustees who also participate in a retirement plan and receive benefits under such plan. Trustees’ and Officers’ Fees and Benefits include amounts accrued by the Fund to fund such retirement benefits. Obligations under the deferred compensation and retirement plans represent unsecured claims against the general assets of the Fund.
NOTE 8–Cash Balances and Borrowings
The Fund has entered into a revolving credit and security agreement, which enables the Fund to participate with certain other Invesco Funds in a committed secured borrowing facility that permits borrowings up to $2.5 billion, collectively by certain Invesco Funds, and which will expire on February 22, 2024. The revolving credit and security agreement is secured by the assets of the Fund. The Fund is subject to certain covenants relating to the revolving credit and security agreement. Failure to comply with these restrictions could cause the acceleration of the repayment of the amount outstanding under the revolving credit and security agreement. During the year ended February 28, 2023, the Fund did not borrow under this agreement.
Additionally, the Fund is permitted to temporarily carry a negative or overdrawn balance in its account with SSB, the custodian bank. Such balances, if any at period-end, are shown in the Statement of Assets and Liabilities under the payable caption Amount due custodian. To compensate the custodian bank for such overdrafts, the overdrawn Fund may either (1) leave funds as a compensating balance in the account so the custodian bank can be compensated by earning the additional interest; or (2) compensate by paying the custodian bank at a rate agreed upon by the custodian bank and Invesco, not to exceed the contractually agreed upon rate. The Fund may not purchase additional securities when any borrowings from banks or broker-dealers exceed 5% of the Fund’s total assets, or when any borrowings from an Invesco Fund are outstanding.
Inverse floating rate obligations resulting from the transfer of bonds to TOB Trusts are accounted for as secured borrowings. The average floating rate notes outstanding and average annual interest and fee rate related to inverse floating rate note obligations during the year ended February 28, 2023 were $233,822,308 and 2.32%, respectively.
NOTE 9–Distributions to Shareholders and Tax Components of Net Assets
Tax Character of Distributions to Shareholders Paid During the Fiscal Years Ended February 28, 2023 and 2022:
| | | | | | | | | | | | |
| | | |
| | | 2023 | | | | | | 2022 | |
|
| |
Ordinary income* | | $ | 3,049,101 | | | | | | | $ | – | |
|
| |
Ordinary income-tax-exempt | | | 105,513,859 | | | | | | | | 114,354,884 | |
|
| |
Total distributions | | $ | 108,562,960 | | | | | | | $ | 114,354,884 | |
|
| |
| * | Includes short-term capital gain distributions, if any. |
| | |
| 35 | | Invesco Municipal Income Fund |
| | | | |
Tax Components of Net Assets at Period-End: | | | |
| |
| | | 2023 | |
|
| |
Undistributed tax-exempt income | | $ | 8,825,252 | |
|
| |
Net unrealized appreciation (depreciation) – investments | | | (90,087,477 | ) |
|
| |
Temporary book/tax differences | | | (224,300 | ) |
|
| |
Capital loss carryforward | | | (296,628,681 | ) |
|
| |
Shares of beneficial interest | | | 3,462,143,313 | |
|
| |
Total net assets | | $ | 3,084,028,107 | |
|
| |
The difference between book-basis and tax-basis unrealized appreciation (depreciation) is due to differences in the timing of recognition of gains and losses on investments for tax and book purposes. The Fund’s net unrealized appreciation (depreciation) difference is attributable primarily to wash sales, inverse floaters, defaulted bonds, amortization and accretion on debt securities.
The temporary book/tax differences are a result of timing differences between book and tax recognition of income and/or expenses. The Fund’s temporary book/tax differences are the result of the trustee deferral of compensation and retirement plan benefits.
Capital loss carryforward is calculated and reported as of a specific date. Results of transactions and other activity after that date may affect the amount of capital loss carryforward actually available for the Fund to utilize. The ability to utilize capital loss carryforward in the future may be limited under the Internal Revenue Code and related regulations based on the results of future transactions.
The Fund has a capital loss carryforward as of February 28, 2023, as follows:
| | | | | | | | | | | | | | | | | | | | |
Capital Loss Carryforward* | |
| Expiration | | Short-Term | | | | | | Long-Term | | | | | | Total | |
|
| |
Not subject to expiration | | $ | 166,178,070 | | | | | | | $ | 130,450,611 | | | | | | | $ | 296,628,681 | |
|
| |
| * | Capital loss carryforward is reduced for limitations, if any, to the extent required by the Internal Revenue Code and may be further limited depending upon a variety of factors, including the realization of net unrealized gains or losses as of the date of any reorganization. |
NOTE 10–Investment Transactions
The aggregate amount of investment securities (other than short-term securities, U.S. Government obligations and money market funds, if any) purchased and sold by the Fund during the year ended February 28, 2023 was $1,255,731,979 and $1,370,851,258, respectively. Cost of investments, including any derivatives, on a tax basis includes the adjustments for financial reporting purposes as of the most recently completed federal income tax reporting period-end.
| | | | |
Unrealized Appreciation (Depreciation) of Investments on a Tax Basis | |
Aggregate unrealized appreciation of investments | | | $ 55,408,420 | |
|
| |
Aggregate unrealized (depreciation) of investments | | | (145,495,897 | ) |
|
| |
Net unrealized appreciation (depreciation) of investments | | | $ (90,087,477 | ) |
|
| |
Cost of investments for tax purposes is $3,329,596,590.
NOTE 11–Reclassification of Permanent Differences
Primarily as a result of differing book/tax treatment of market discounts, defaulted bonds, amortization and accretion on debt securities, on February 28, 2023, undistributed net investment income was increased by $1,022,184, undistributed net realized gain (loss) was decreased by $985,439 and shares of beneficial interest was decreased by $36,745. This reclassification had no effect on the net assets of the Fund.
NOTE 12–Share Information
| | | | | | | | | | | | | | | | | | | | | | | | | | | | |
| | | Summary of Share Activity | |
|
| |
| | | Year ended
February 28, 2023(a) | | | | | | Year ended
February 28, 2022 | |
| | | Shares | | | | | | Amount | | | | | | Shares | | | | | | Amount | |
|
| |
Sold: | | | | | | | | | | | | | | | | | | | | | | | | | | | | |
| | | | | | | |
Class A | | | 51,939,998 | | | | | | | $ | 622,005,075 | | | | | | | | 23,445,616 | | | | | | | $ | 323,770,134 | |
|
| |
Class C | | | 2,086,245 | | | | | | | | 24,691,610 | | | | | | | | 456,867 | | | | | | | | 6,275,162 | |
|
| |
Class Y | | | 14,023,508 | | | | | | | | 168,550,621 | | | | | | | | 5,332,654 | | | | | | | | 73,600,065 | |
|
| |
Investor Class | | | 129,085 | | | | | | | | 1,553,791 | | | | | | | | 570,656 | | | | | | | | 7,835,950 | |
|
| |
Class R6 | | | 19,086,248 | | | | | | | | 228,925,511 | | | | | | | | 10,560,172 | | | | | | | | 145,643,669 | |
|
| |
| | | | | | | |
Issued as reinvestment of dividends: | | | | | | | | | | | | | | | | | | | | | | | | | | | | |
| | | | | | | |
Class A | | | 3,915,578 | | | | | | | | 46,894,527 | | | | | | | | 3,643,290 | | | | | | | | 50,150,469 | |
|
| |
Class C | | | 235,311 | | | | | | | | 2,809,733 | | | | | | | | 268,064 | | | | | | | | 3,676,714 | |
|
| |
Class Y | | | 603,890 | | | | | | | | 7,233,773 | | | | | | | | 608,723 | | | | | | | | 8,378,322 | |
|
| |
Investor Class | | | 166,270 | | | | | | | | 1,993,122 | | | | | | | | 160,127 | | | | | | | | 2,206,562 | |
|
| |
Class R6 | | | 776,676 | | | | | | | | 9,299,042 | | | | | | | | 628,928 | | | | | | | | 8,649,963 | |
|
| |
| | | | | | | |
Automatic conversion of Class C shares to Class A shares: | | | | | | | | | | | | | | | | | | | | | | | | | | | | |
| | | | | | | |
Class A | | | 315,953 | | | | | | | | 3,793,670 | | | | | | | | 243,007 | | | | | | | | 3,345,896 | |
|
| |
Class C | | | (317,247 | ) | | | | | | | (3,793,670 | ) | | | | | | | (244,051 | ) | | | | | | | (3,345,896 | ) |
|
| |
| | |
| 36 | | Invesco Municipal Income Fund |
| | | | | | | | | | | | | | | | | | | | | | | | | | | | |
| | | Summary of Share Activity | |
|
| |
| | | Year ended
February 28, 2023(a) | | | | | | Year ended
February 28, 2022 | |
| | | Shares | | | | | | Amount | | | | | | Shares | | | | | | Amount | |
|
| |
| | | | | | | |
Reacquired: | | | | | | | | | | | | | | | | | | | | | | | | | | | | |
| | | | | | | |
Class A | | | (64,878,292 | ) | | | | | | $ | (779,036,046 | ) | | | | | | | (21,583,687 | ) | | | | | | $ | (296,931,037 | ) |
|
| |
Class C | | | (4,895,438 | ) | | | | | | | (58,875,429 | ) | | | | | | | (3,132,999 | ) | | | | | | | (42,998,231 | ) |
|
| |
Class Y | | | (17,770,229 | ) | | | | | | | (213,959,210 | ) | | | | | | | (5,936,028 | ) | | | | | | | (81,271,796 | ) |
|
| |
Investor Class | | | (804,121 | ) | | | | | | | (9,746,238 | ) | | | | | | | (1,063,264 | ) | | | | | | | (14,586,921 | ) |
|
| |
Class R6 | | | (17,237,266 | ) | | | | | | | (207,313,699 | ) | | | | | | | (3,657,047 | ) | | | | | | | (50,105,525 | ) |
|
| |
Net increase (decrease) in share activity | | | (12,623,831 | ) | | | | | | $ | (154,973,817 | ) | | | | | | | 10,301,028 | | | | | | | $ | 144,293,500 | |
|
| |
| (a) | There are entities that are record owners of more than 5% of the outstanding shares of the Fund and in the aggregate own 68% of the outstanding shares of the Fund. IDI has an agreement with these entities to sell Fund shares. The Fund, Invesco and/or Invesco affiliates may make payments to these entities, which are considered to be related to the Fund, for providing services to the Fund, Invesco and/or Invesco affiliates including but not limited to services such as securities brokerage, distribution, third party record keeping and account servicing. The Fund has no knowledge as to whether all or any portion of the shares owned of record by these entities are also owned beneficially. |
| | |
| 37 | | Invesco Municipal Income Fund |
Report of Independent Registered Public Accounting Firm
To the Board of Trustees of AIM Tax-Exempt Funds (Invesco Tax-Exempt Funds) and Shareholders of Invesco Municipal Income Fund
Opinion on the Financial Statements
We have audited the accompanying statement of assets and liabilities, including the schedule of investments, of Invesco Municipal Income Fund (one of the funds constituting AIM Tax-Exempt Funds (Invesco Tax-Exempt Funds), referred to hereafter as the “Fund”) as of February 28, 2023, the related statement of operations for the year ended February 28, 2023, the statement of changes in net assets for each of the two years in the period ended February 28, 2023, including the related notes, and the financial highlights for each of the five years in the period ended February 28, 2023 (collectively referred to as the “financial statements”). In our opinion, the financial statements present fairly, in all material respects, the financial position of the Fund as of February 28, 2023, the results of its operations for the year then ended, the changes in its net assets for each of the two years in the period ended February 28, 2023 and the financial highlights for each of the five years in the period ended February 28, 2023 in conformity with accounting principles generally accepted in the United States of America.
Basis for Opinion
These financial statements are the responsibility of the Fund’s management. Our responsibility is to express an opinion on the Fund’s financial statements based on our audits. We are a public accounting firm registered with the Public Company Accounting Oversight Board (United States) (PCAOB) and are required to be independent with respect to the Fund in accordance with the U.S. federal securities laws and the applicable rules and regulations of the Securities and Exchange Commission and the PCAOB.
We conducted our audits of these financial statements in accordance with the standards of the PCAOB. Those standards require that we plan and perform the audit to obtain reasonable assurance about whether the financial statements are free of material misstatement, whether due to error or fraud.
Our audits included performing procedures to assess the risks of material misstatement of the financial statements, whether due to error or fraud, and performing procedures that respond to those risks. Such procedures included examining, on a test basis, evidence regarding the amounts and disclosures in the financial statements. Our audits also included evaluating the accounting principles used and significant estimates made by management, as well as evaluating the overall presentation of the financial statements. Our procedures included confirmation of securities owned as of February 28, 2023 by correspondence with the custodian and brokers; when replies were not received from brokers, we performed other auditing procedures. We believe that our audits provide a reasonable basis for our opinion.
/s/PricewaterhouseCoopers LLP
Houston, Texas
April 21, 2023
We have served as the auditor of one or more of the investment companies in the Invesco group of investment companies since at least 1995. We have not been able to determine the specific year we began serving as auditor.
| | |
| 38 | | Invesco Municipal Income Fund |
Calculating your ongoing Fund expenses
Example
As a shareholder of the Fund, you incur two types of costs: (1) transaction costs, which may include sales charges (loads) on purchase payments or contingent deferred sales charges on redemptions, if any; and (2) ongoing costs, including management fees, distribution and/or service (12b-1) fees, and other Fund expenses. This example is intended to help you understand your ongoing costs (in dollars) of investing in the Fund and to compare these costs with ongoing costs of investing in other mutual funds. The example is based on an investment of $1,000 invested at the beginning of the period and held for the entire period September 1, 2022 through February 28, 2023.
Actual expenses
The table below provides information about actual account values and actual expenses. You may use the information in this table, together with the amount you invested, to estimate the expenses that you paid over the period. Simply divide your account value by $1,000 (for example, an $8,600 account value divided by $1,000 = 8.6), then multiply the result by the number in the table under the heading entitled “Actual Expenses Paid During Period” to estimate the expenses you paid on your account during this period.
Hypothetical example for comparison purposes
The table below also provides information about hypothetical account values and hypothetical expenses based on the Fund’s actual expense ratio and an assumed rate of return of 5% per year before expenses, which is not the Fund’s actual return.
The hypothetical account values and expenses may not be used to estimate the actual ending account balance or expenses you paid for the period. You may use this information to compare the ongoing costs of investing in the Fund and other funds. To do so, compare this 5% hypothetical example with the 5% hypothetical examples that appear in the shareholder reports of the other funds.
Please note that the expenses shown in the table are meant to highlight your ongoing costs only and do not reflect any transaction costs, such as sales charges (loads) on purchase payments or contingent deferred sales charges on redemptions, if any. Therefore, the hypothetical information is useful in comparing ongoing costs only, and will not help you determine the relative total costs of owning different funds. In addition, if these transaction costs were included, your costs would have been higher.
| | | | | | | | | | | | |
| | | | | ACTUAL | | HYPOTHETICAL (5% annual return before expenses) | | |
| | | Beginning Account Value (09/01/22) | | Ending Account Value (02/28/23)1 | | Expenses Paid During Period2 | | Ending Account Value (02/28/23) | | Expenses Paid During Period2 | | Annualized Expense Ratio |
Class A | | $1,000.00 | | $997.90 | | $5.40 | | $1,019.39 | | $5.46 | | 1.09% |
Class C | | 1,000.00 | | 994.10 | | 9.10 | | 1,015.67 | | 9.20 | | 1.84 |
Class Y | | 1,000.00 | | 999.10 | | 4.16 | | 1,020.63 | | 4.21 | | 0.84 |
Investor Class | | 1,000.00 | | 997.60 | | 4.90 | | 1,019.89 | | 4.96 | | 0.99 |
Class R6 | | 1,000.00 | | 999.40 | | 3.87 | | 1,020.93 | | 3.91 | | 0.78 |
| 1 | The actual ending account value is based on the actual total return of the Fund for the period September 1, 2022 through February 28, 2023, after actual expenses and will differ from the hypothetical ending account value which is based on the Fund’s expense ratio and a hypothetical annual return of 5% before expenses. |
| 2 | Expenses are equal to the Fund’s annualized expense ratio as indicated above multiplied by the average account value over the period, multiplied by 181/365 to reflect the most recent fiscal half year. |
| | |
| 39 | | Invesco Municipal Income Fund |
Tax Information
Form 1099-DIV, Form 1042-S and other year-end tax information provide shareholders with actual calendar year amounts that should be included in their tax returns. Shareholders should consult their tax advisers.
The following distribution information is being provided as required by the Internal Revenue Code or to meet a specific state’s requirement.
The Fund designates the following amounts or, if subsequently determined to be different, the maximum amount allowable for its fiscal year ended February 28, 2023:
| | | | | | | | |
Federal and State Income Tax | | | | | | |
Qualified Dividend Income* | | | 0.00 | % | | | | |
Corporate Dividends Received Deduction* | | | 0.00 | % | | | | |
U.S. Treasury Obligations* | | | 0.00 | % | | | | |
Qualified Business Income* | | | 0.00 | % | | | | |
Business Interest Income* | | | 0.00 | % | | | | |
Tax-Exempt Interest Dividends* | | | 97.19 | % | | | | |
|
| * The above percentages are based on ordinary income dividends paid to shareholders during the Fund’s fiscal year. | |
| | |
| 40 | | Invesco Municipal Income Fund |
Trustees and Officers
The address of each trustee and officer is AIM Tax-Exempt Funds (Invesco Tax-Exempt Funds) (the “Trust”), 11 Greenway Plaza, Suite 1000, Houston, Texas 77046-1173. The trustees serve for the life of the Trust, subject to their earlier death, incapacitation, resignation, retirement or removal as more specifically provided in the Trust’s organizational documents. Each officer serves for a one year term or until their successors are elected and qualified. Column two below includes length of time served with predecessor entities, if any.
| | | | | | | | |
Name, Year of Birth and Position(s) Held with the Trust | | Trustee and/or Officer Since | | Principal Occupation(s) During Past 5 Years | | Number of Funds in Fund Complex Overseen by Trustee | | Other Directorship(s) Held by Trustee During Past 5 Years |
| Interested Trustee | | | | | | | | |
Martin L. Flanagan1 - 1960 Trustee and Vice Chair | | 2007 | | Executive Director, Chief Executive Officer and President, Invesco Ltd. (ultimate parent of Invesco and a global investment management firm); Trustee and Vice Chair, The Invesco Funds; Vice Chair, Investment Company Institute; and Member of Executive Board, SMU Cox School of Business Formerly: Advisor to the Board, Invesco Advisers, Inc. (formerly known as Invesco Institutional (N.A.), Inc.); Chairman and Chief Executive Officer, Invesco Advisers, Inc. (registered investment adviser); Director, Chairman, Chief Executive Officer and President, Invesco Holding Company (US), Inc. (formerly IVZ Inc.) (holding company), Invesco Group Services, Inc. (service provider) and Invesco North American Holdings, Inc. (holding company); Director, Chief Executive Officer and President, Invesco Holding Company Limited (parent of Invesco and a global investment management firm); Director, Invesco Ltd.; Chairman, Investment Company Institute and President, Co-Chief Executive Officer, Co-President, Chief Operating Officer and Chief Financial Officer, Franklin Resources, Inc. (global investment management organization) | | 175 | | None |
| 1 | Mr. Flanagan is considered an interested person (within the meaning of Section 2(a)(19) of the 1940 Act) of the Trust because he is an officer of the Adviser to the Trust, and an officer and a director of Invesco Ltd., ultimate parent of the Adviser. |
| | |
| T-1 | | Invesco Municipal Income Fund |
Trustees and Officers–(continued)
| | | | | | | | |
Name, Year of Birth and Position(s) Held with the Trust | | Trustee and/or Officer Since | | Principal Occupation(s) During Past 5 Years | | Number of Funds in Fund Complex Overseen by Trustee | | Other Directorship(s) Held by Trustee During Past 5 Years |
| Independent Trustees | | | | | | | | |
Beth Ann Brown - 1968 Trustee (2019) and Chair (August 2022) | | 2019 | | Independent Consultant Formerly: Head of Intermediary Distribution, Managing Director, Strategic Relations, Managing Director, Head of National Accounts, Senior Vice President, National Account Manager and Senior Vice President, Key Account Manager, Columbia Management Investment Advisers LLC; Vice President, Key Account Manager, Liberty Funds Distributor, Inc.; and Trustee of certain Oppenheimer Funds | | 175 | | Director, Board of Directors of Caron Engineering Inc.; Advisor, Board of Advisors of Caron Engineering Inc.; President and Director, Acton Shapleigh Youth Conservation Corps (non-profit) Formerly: President and Director Director of Grahamtastic Connection (non-profit) |
Cynthia Hostetler - 1962 Trustee | | 2017 | | Non-Executive Director and Trustee of a number of public and private business corporations Formerly: Director, Aberdeen Investment Funds (4 portfolios); Director, Artio Global Investment LLC (mutual fund complex); Director, Edgen Group, Inc. (specialized energy and infrastructure products distributor); Director, Genesee & Wyoming, Inc. (railroads); Head of Investment Funds and Private Equity, Overseas Private Investment Corporation; President, First Manhattan Bancorporation, Inc.; and Attorney, Simpson Thacher & Bartlett LLP | | 175 | | Resideo Technologies, Inc. (smart home technology); Vulcan Materials Company (construction materials company); Trilinc Global Impact Fund; Textainer Group Holdings, (shipping container leasing company); Investment Company Institute (professional organization); and Independent Directors Council (professional organization) |
Eli Jones - 1961 Trustee | | 2016 | | Professor and Dean Emeritus, Mays Business School - Texas A&M University Formerly: Dean of Mays Business School-Texas A&M University; Professor and Dean, Walton College of Business, University of Arkansas and E.J. Ourso College of Business, Louisiana State University; and Director, Arvest Bank | | 175 | | Insperity, Inc. (formerly known as Administaff) (human resources provider); Board Member of the regional board, First Financial Bank Texas; and Boad Member, First Financial Bankshares, Inc. Texas (FFIN) |
Elizabeth Krentzman - 1959 Trustee | | 2019 | | Formerly: Principal and Chief Regulatory Advisor for Asset Management Services and U.S. Mutual Fund Leader of Deloitte & Touche LLP; General Counsel of the Investment Company Institute (trade association); National Director of the Investment Management Regulatory Consulting Practice, Principal, Director and Senior Manager of Deloitte & Touche LLP; Assistant Director of the Division of Investment Management - Office of Disclosure and Investment Adviser Regulation of the U.S. Securities and Exchange Commission and various positions with the Division of Investment Management - Office of Regulatory Policy of the U.S. Securities and Exchange Commission; Associate at Ropes & Gray LLP; and Trustee of certain Oppenheimer Funds | | 175 | | Formerly: Member of the Cartica Funds Board of Directors (private investment fund); Trustee of the University of Florida National Board Foundation; and Member of the University of Florida Law Center Association, Inc. Board of Trustees, Audit Committee and Membership Committee |
Anthony J. LaCava, Jr. - 1956 Trustee | | 2019 | | Formerly: Director and Member of the Audit Committee, Blue Hills Bank (publicly traded financial institution) and Managing Partner, KPMG LLP | | 175 | | Blue Hills Bank; Member and Chairman, Bentley University, Business School Advisory Council; and Nominating Committee, KPMG LLP |
Prema Mathai-Davis - 1950 Trustee | | 1998 | | Retired Formerly: Co-Founder & Partner of Quantalytics Research, LLC, (a FinTech Investment Research Platform for the Self-Directed Investor); Trustee of YWCA Retirement Fund; CEO of YWCA of the USA; Board member of the NY Metropolitan Transportation Authority; Commissioner of the NYC Department of Aging; and Board member of Johns Hopkins Bioethics Institute | | 175 | | Member of Board of Positive Planet US (non-profit) and HealthCare Chaplaincy Network (non-profit) |
| | |
| T-2 | | Invesco Municipal Income Fund |
Trustees and Officers–(continued)
| | | | | | | | |
Name, Year of Birth and Position(s) Held with the Trust | | Trustee and/or Officer Since | | Principal Occupation(s) During Past 5 Years | | Number of Funds in Fund Complex Overseen by Trustee | | Other Directorship(s) Held by Trustee During Past 5 Years |
| Independent Trustees–(continued) | | | | | | |
Joel W. Motley - 1952 Trustee | | 2019 | | Director of Office of Finance, Federal Home Loan Bank System; Managing Director of Carmona Motley Inc. (privately held financial advisor); Member of the Council on Foreign Relations and its Finance and Budget Committee; Chairman Emeritus of Board of Human Rights Watch and Member of its Investment Committee; and Member of Investment Committee Board of Historic Hudson Valley (non-profit cultural organization); Member of the Board, Blue Ocean Acquisition Corp.; and Member of the Vestry and the Investment Committee of Trinity Church Wall Street. Formerly: Managing Director of Public Capital Advisors, LLC (privately held financial advisor); Managing Director of Carmona Motley Hoffman, Inc. (privately held financial advisor); Trustee of certain Oppenheimer Funds; and Director of Columbia Equity Financial Corp. (privately held financial advisor) | | 175 | | Member of Board of Trust for Mutual Understanding (non-profit promoting the arts and environment); Member of Board of Greenwall Foundation (bioethics research foundation) and its Investment Committee; Member of Board of Friends of the LRC (non-profit legal advocacy); and Board Member and Investment Committee Member of Pulitzer Center for Crisis Reporting (non-profit journalism) |
Teresa M. Ressel - 1962 Trustee | | 2017 | | Non-executive director and trustee of a number of public and private business corporations Formerly: Chief Executive Officer, UBS Securities LLC (investment banking); Chief Operating Officer, UBS AG Americas (investment banking); Sr. Management Team Olayan America, The Olayan Group (international investor/commercial/industrial); and Assistant Secretary for Management & Budget and Designated Chief Financial Officer, U.S. Department of Treasury | | 175 | | None |
Robert C. Troccoli - 1949 Trustee | | 2016 | | Retired Formerly: Adjunct Professor, University of Denver - Daniels College of Business; and Managing Partner, KPMG LLP | | 175 | | None |
Daniel S. Vandivort - 1954 Trustee | | 2019 | | President, Flyway Advisory Services LLC (consulting and property management) Formerly: President and Chief Investment Officer, previously Head of Fixed Income, Weiss Peck and Greer/Robeco Investment Management; Trustee and Chair, Weiss Peck and Greer Funds Board; and various capacities at CS First Boston including Head of Fixed Income at First Boston Asset Management. | | 175 | | Formerly: Trustee and Governance Chair, Oppenheimer Funds; Treasurer, Chairman of the Audit and Finance Committee, Huntington Disease Foundation of America |
| | |
| T-3 | | Invesco Municipal Income Fund |
Trustees and Officers–(continued)
| | | | | | | | |
Name, Year of Birth and Position(s) Held with the Trust | | Trustee and/or Officer Since | | Principal Occupation(s) During Past 5 Years | | Number of Funds in Fund Complex Overseen by Trustee | | Other Directorship(s) Held by Trustee During Past 5 Years |
| Officers | | | | | | | | |
Sheri Morris - 1964 President and Principal Executive Officer | | 1999 | | Director, Invesco Trust Company; Head of Global Fund Services, Invesco Ltd.; President and Principal Executive Officer, The Invesco Funds; Vice President, Invesco Exchange-Traded Fund Trust, Invesco Exchange-Traded Fund Trust II, Invesco India Exchange-Traded Fund Trust, Invesco Actively Managed Exchange-Traded Fund Trust, Invesco Actively Managed Exchange-Traded Commodity Fund Trust and Invesco Exchange-Traded Self-Indexed Fund Trust; and Vice President, OppenheimerFunds, Inc. Formerly: Vice President, Treasurer and Principal Financial Officer, The Invesco Funds; Vice President, Invesco AIM Advisers, Inc., Invesco AIM Capital Management, Inc. and Invesco AIM Private Asset Management, Inc.; Assistant Vice President and Assistant Treasurer, The Invesco Funds; Vice President and Assistant Vice President, Invesco Advisers, Inc.; Assistant Vice President, Invesco AIM Capital Management, Inc. and Invesco AIM Private Asset Management, Inc.; Treasurer, Invesco Exchange-Traded Fund Trust, Invesco Exchange-Traded Fund Trust II, Invesco India Exchange-Traded Fund Trust and Invesco Actively Managed Exchange-Traded Fund Trust; and Senior Vice President, Invesco Advisers, Inc. (formerly known as Invesco Institutional (N.A.), Inc.) (registered investment adviser) | | N/A | | N/A |
Melanie Ringold - 1975 Senior Vice President, Chief Legal Officer and Secretary | | 2023 | | Head of Legal of the Americas, Invesco Ltd.; Senior Vice President and Secretary, Invesco Advisers, Inc. (formerly known as Invesco Institutional (N.A.), Inc.) (registered investment adviser); Secretary, Invesco Distributors, Inc. (formerly known as Invesco AIM Distributors, Inc.); Secretary, Invesco Investment Services, Inc. (formerly known as Invesco AIM Investment Services, Inc.); Senior Vice President, Chief Legal Officer and Secretary, The Invesco Funds; Secretary, Invesco Investment Advisers LLC, Invesco Capital Markets, Inc.; Chief Legal Officer, Invesco Exchange-Traded Fund Trust, Invesco Exchange-Traded Fund Trust II, Invesco India Exchange-Traded Fund Trust, Invesco Actively Managed Exchange-Traded Fund Trust, Invesco Actively Managed Exchange-Traded Commodity Fund Trust and Invesco Exchange-Traded Self-Indexed Fund Trust; Secretary and Vice President, Harbourview Asset Management Corporation; Secretary and Senior Vice President, OppenheimerFunds, Inc. and Invesco Managed Accounts, LLC; Secretary and Senior Vice President, OFI SteelPath, Inc.; Secretary and Senior Vice President, Oppenheimer Acquisition Corp.; Secretary, SteelPath Funds Remediation LLC; and Secretary and Senior Vice President, Trinity Investment Management Corporation Formerly: Assistant Secretary, Invesco Distributors, Inc.; Invesco Advisers, Inc. Invesco Investment Services, Inc., Invesco Capital Markets, Inc., Invesco Capital Management LLC and Invesco Investment Advisers LLC; and Assistant Secretary and Investment Vice President, Invesco Funds | | N/A | | N/A |
Andrew R. Schlossberg - 1974 Senior Vice President | | 2019 | | Senior Vice President, Invesco Group Services, Inc.; Head of the Americas and Senior Managing Director, Invesco Ltd.; Director and Senior Vice President, Invesco Advisers, Inc. (formerly known as Invesco Institutional (N.A.), Inc.) (registered investment adviser); Director and Chairman, Invesco Investment Services, Inc. (formerly known as Invesco AIM Investment Services, Inc.) (registered transfer agent); Senior Vice President, The Invesco Funds; and Director, Invesco Investment Advisers LLC (formerly known as Van Kampen Asset Management) Formerly: Director, President and Chairman, Invesco Insurance Agency, Inc.; Director, Invesco UK Limited; Director and Chief Executive, Invesco Asset Management Limited and Invesco Fund Managers Limited; Assistant Vice President, The Invesco Funds; Senior Vice President, Invesco Advisers, Inc. (formerly known as Invesco Institutional (N.A.), Inc.) (registered investment adviser); Director and Chief Executive, Invesco Administration Services Limited and Invesco Global Investment Funds Limited; Director, Invesco Distributors, Inc.; Head of EMEA, Invesco Ltd.; President, Invesco Actively Managed Exchange-Traded Commodity Fund Trust, Invesco Actively Managed Exchange-Traded Fund Trust, Invesco Exchange-Traded Fund Trust, Invesco Exchange-Traded Fund Trust II and Invesco India Exchange-Traded Fund Trust; and Managing Director and Principal Executive Officer, Invesco Capital Management LLC | | N/A | | N/A |
| | |
| T-4 | | Invesco Municipal Income Fund |
Trustees and Officers–(continued)
| | | | | | | | |
Name, Year of Birth and Position(s) Held with the Trust | | Trustee and/or Officer Since | | Principal Occupation(s) During Past 5 Years | | Number of Funds in Fund Complex Overseen by Trustee | | Other Directorship(s) Held by Trustee During Past 5 Years |
| Officers–(continued) | | | | | | | | |
John M. Zerr - 1962 Senior Vice President | | 2006 | | Chief Operating Officer of the Americas; Senior Vice President, Invesco Advisers, Inc. (formerly known as Invesco Institutional (N.A.), Inc.) (registered investment adviser); Senior Vice President, Invesco Distributors, Inc. (formerly known as Invesco AIM Distributors, Inc.); Director and Vice President, Invesco Investment Services, Inc. (formerly known as Invesco AIM Investment Services, Inc.) Senior Vice President, The Invesco Funds; Managing Director, Invesco Capital Management LLC; Director, Invesco Investment Advisers LLC (formerly known as Van Kampen Asset Management); Senior Vice President, Invesco Capital Markets, Inc. (formerly known as Van Kampen Funds Inc.); Manager, Invesco Indexing LLC; Manager, Invesco Specialized Products, LLC; Member, Invesco Canada Funds Advisory Board; Director, President and Chief Executive Officer, Invesco Corporate Class Inc. (corporate mutual fund company); and Director, Chairman, President and Chief Executive Officer, Invesco Canada Ltd. (formerly known as Invesco Trimark Ltd./Invesco Trimark Ltèe) (registered investment adviser and registered transfer agent); President, Invesco, Inc.; President, Invesco Global Direct Real Estate Feeder GP Ltd.; President, Invesco IP Holdings (Canada) Ltd; President, Invesco Global Direct Real Estate GP Ltd.; President, Invesco Financial Services Ltd. / Services Financiers Invesco Ltée; and Director and Chairman, Invesco Trust Company Formerly: President, Trimark Investments Ltd/Services Financiers Invesco Ltee; Director and Senior Vice President, Invesco Insurance Agency, Inc.; Director and Senior Vice President, Invesco Management Group, Inc. (formerly known as Invesco AIM Management Group, Inc.); Secretary and General Counsel, Invesco Management Group, Inc. (formerly known as Invesco AIM Management Group, Inc.); Secretary, Invesco Investment Services, Inc. (formerly known as Invesco AIM Investment Services, Inc.); Chief Legal Officer and Secretary, The Invesco Funds; Secretary and General Counsel, Invesco Investment Advisers LLC (formerly known as Van Kampen Asset Management); Secretary and General Counsel, Invesco Capital Markets, Inc. (formerly known as Van Kampen Funds Inc.); Chief Legal Officer, Invesco Exchange-Traded Fund Trust, Invesco Exchange-Traded Fund Trust II, Invesco India Exchange-Traded Fund Trust, Invesco Actively Managed Exchange-Traded Fund Trust, Invesco Actively Managed Exchange-Traded Commodity Fund Trust and Invesco Exchange-Traded Self-Indexed Fund Trust; Secretary, Invesco Indexing LLC; Director, Secretary, General Counsel and Senior Vice President, Van Kampen Exchange Corp.; Director, Vice President and Secretary, IVZ Distributors, Inc. (formerly known as INVESCO Distributors, Inc.); Director and Vice President, INVESCO Funds Group, Inc.; Director and Vice President, Van Kampen Advisors Inc.; Director, Vice President, Secretary and General Counsel, Van Kampen Investor Services Inc.; Director and Secretary, Invesco Distributors, Inc. (formerly known as Invesco AIM Distributors, Inc.); Director, Senior Vice President, General Counsel and Secretary, Invesco AIM Advisers, Inc. and Van Kampen Investments Inc.; Director, Vice President and Secretary, Fund Management Company; Director, Senior Vice President, Secretary, General Counsel and Vice President, Invesco AIM Capital Management, Inc.; and Chief Operating Officer and General Counsel, Liberty Ridge Capital, Inc. (an investment adviser) | | N/A | | N/A |
Gregory G. McGreevey - 1962 Senior Vice President | | 2012 | | Senior Managing Director, Invesco Ltd.; Director, Chairman, President, and Chief Executive Officer, Invesco Advisers, Inc. (formerly known as Invesco Institutional (N.A.), Inc.) (registered investment adviser); Director, Invesco Mortgage Capital, Inc. and Invesco Senior Secured Management, Inc.; Senior Vice President, The Invesco Funds; President, SNW Asset Management Corporation and Invesco Managed Accounts, LLC; Chairman and Director, Invesco Private Capital, Inc.; Chairman and Director, INVESCO Private Capital Investments, Inc.; Chairman and Director, INVESCO Realty, Inc.; and Senior Vice President, Invesco Group Services, Inc. Formerly: Senior Vice President, Invesco Management Group, Inc. and Invesco Advisers, Inc.; Assistant Vice President, The Invesco Funds | | N/A | | N/A |
Adrien Deberghes - 1967 Principal Financial Officer, Treasurer and Vice President | | 2020 | | Head of the Fund Office of the CFO and Fund Administration; Vice President, Invesco Advisers, Inc.; Principal Financial Officer, Treasurer and Vice President, The Invesco Funds; Vice President, Invesco Exchange-Traded Fund Trust, Invesco Exchange-Traded Fund Trust II, Invesco India Exchange-Traded Fund Trust, Invesco Actively Managed Exchange-Traded Fund Trust, Invesco Actively Managed Exchange-Traded Commodity Fund Trust and Invesco Exchange-Traded Self-Indexed Fund Trust Formerly: Senior Vice President and Treasurer, Fidelity Investments | | N/A | | N/A |
Crissie M. Wisdom - 1969 Anti-Money Laundering Compliance Officer | | 2013 | | Anti-Money Laundering and OFAC Compliance Officer for Invesco U.S. entities including: Invesco Advisers, Inc. and its affiliates, Invesco Capital Markets, Inc., Invesco Distributors, Inc., Invesco Investment Services, Inc., The Invesco Funds, Invesco Capital Management, LLC, Invesco Trust Company; and Fraud Prevention Manager for Invesco Investment Services, Inc. | | N/A | | N/A |
| | |
| T-5 | | Invesco Municipal Income Fund |
Trustees and Officers–(continued)
| | | | | | | | |
Name, Year of Birth and Position(s) Held with the Trust | | Trustee and/or Officer Since | | Principal Occupation(s) During Past 5 Years | | Number of Funds in Fund Complex Overseen by Trustee | | Other Directorship(s) Held by Trustee During Past 5 Years |
| Officers–(continued) | | | | | | | | |
Todd F. Kuehl - 1969 Chief Compliance Officer and Senior Vice President | | 2020 | | Chief Compliance Officer, Invesco Advisers, Inc. (registered investment adviser); and Chief Compliance Officer and Senior Vice President, The Invesco Funds Formerly: Managing Director and Chief Compliance Officer, Legg Mason (Mutual Funds); Chief Compliance Officer, Legg Mason Private Portfolio Group (registered investment adviser) | | N/A | | N/A |
James Bordewick, Jr. - 1959 Senior Vice President and Senior Officer | | 2022 | | Senior Vice President and Senior Officer, The Invesco Funds Formerly: Chief Legal Officer, KingsCrowd, Inc. (research and analytical platform for investment in private capital markets); Chief Operating Officer and Head of Legal and Regulatory, Netcapital (private capital investment platform); Managing Director, General Counsel of asset management and Chief Compliance Officer for asset management and private banking, Bank of America Corporation; Chief Legal Officer, Columbia Funds and BofA Funds; Senior Vice President and Associate General Counsel, MFS Investment Management; Chief Legal Officer, MFS Funds; Associate, Ropes & Gray; and Associate, Gaston Snow & Ely Bartlett | | N/A | | N/A |
The Statement of Additional Information of the Trust includes additional information about the Fund’s Trustees and is available upon request, without charge, by calling 1.800.959.4246. Please refer to the Fund’s Statement of Additional Information for information on the Fund’s sub-advisers.
| | | | | | |
| Office of the Fund | | Investment Adviser | | Distributor | | Auditors |
| 11 Greenway Plaza, Suite 1000 | | Invesco Advisers, Inc. | | Invesco Distributors, Inc. | | PricewaterhouseCoopers LLP |
| Houston, TX 77046-1173 | | 1331 Spring Street, NW, Suite 2500 | | 11 Greenway Plaza, Suite 1000 | | 1000 Louisiana Street, Suite 5800 |
| | Atlanta, GA 30309 | | Houston, TX 77046-1173 | | Houston, TX 77002-5021 |
| | | |
| Counsel to the Fund | | Counsel to the Independent Trustees | | Transfer Agent | | Custodian |
| Stradley Ronon Stevens & Young, LLP | | Sidley Austin LLP | | Invesco Investment Services, Inc. | | State Street Bank and Trust Company |
| 2005 Market Street, Suite 2600 | | 787 Seventh Avenue | | 11 Greenway Plaza, Suite 1000 | | 225 Franklin Street |
| Philadelphia, PA 19103-7018 | | New York, NY 10019 | | Houston, TX 77046-1173 | | Boston, MA 02110-2801 |
| | |
| T-6 | | Invesco Municipal Income Fund |
(This page intentionally left blank)

Go paperless with eDelivery
Visit invesco.com/edelivery to enjoy the convenience and security of anytime electronic access to your investment documents.
With eDelivery, you can elect to have any or all of the following materials delivered straight to your inbox to download, save and print from your own computer:
∎ Fund reports and prospectuses
∎ Quarterly statements
∎ Daily confirmations
∎ Tax forms
Invesco mailing information
Send general correspondence to Invesco Investment Services, Inc., P.O. Box 219078, Kansas City, MO 64121-9078.
Important notice regarding delivery of security holder documents
To reduce Fund expenses, only one copy of most shareholder documents may be mailed to shareholders with multiple accounts at the same address (Householding). Mailing of your shareholder documents may be householded indefinitely unless you instruct us otherwise. If you do not want the mailing of these documents to be combined with those for other members of your household, please contact Invesco Investment Services, Inc. at 800 959 4246 or contact your financial institution. We will begin sending you individual copies for each account within 30 days after receiving your request.
Fund holdings and proxy voting information
The Fund provides a complete list of its portfolio holdings four times each year, at the end of each fiscal quarter. For the second and fourth quarters, the list appears, respectively, in the Fund’s semiannual and annual reports to shareholders. For the first and third quarters, the Fund files the list with the Securities and Exchange Commission (SEC) as an exhibit to its reports on Form N-PORT. The most recent list of portfolio holdings is available at invesco.com/completeqtrholdings. Shareholders can also look up the Fund’s Form N-PORT filings on the SEC website, sec.gov. The SEC file numbers for the Fund are shown below.
A description of the policies and procedures that the Fund uses to determine how to vote proxies relating to portfolio securities is available without charge, upon request, from our Client Services department at 800 959 4246, or at invesco.com/corporate/about-us/esg. The information is also available on the SEC website, sec.gov.
Information regarding how the Fund voted proxies related to its portfolio securities during the most recent 12-month period ended June 30 is available at invesco.com/proxysearch. This information is also available on the SEC website, sec.gov.
Invesco Advisers, Inc. is an investment adviser; it provides investment advisory services to individual and institutional clients and does not sell securities. Invesco Distributors, Inc. is the US distributor for Invesco Ltd.’s retail mutual funds, exchange-traded funds and institutional money market funds. Both are wholly owned, indirect subsidiaries of Invesco Ltd.

| | | | |
| SEC file number(s): 811-07890 and 033-66242 | | Invesco Distributors, Inc. | | VK-MINC-AR-1 |

| | |
| Annual Report to Shareholders | | February 28, 2023 |
Invesco New Jersey Municipal Fund
|
| Nasdaq: |
| A: ONJAX ∎ C: ONJCX ∎ Y: ONJYX ∎ R6: IORJX |
Management’s Discussion of Fund Performance
| | | | |
| |
Performance summary | |
For the fiscal year ended February 28, 2023, Class A shares of Invesco New Jersey Municipal Fund (the Fund), at net asset value (NAV), underperformed the S&P Municipal Bond New Jersey Index. | |
Your Fund’s long-term performance appears later in this report. | |
| |
Fund vs. Indexes | |
Total returns, 2/28/22 to 2/28/23, at net asset value (NAV). Performance shown does not include applicable contingent deferred sales charges (CDSC) or front-end sales charges, which would have reduced performance. | |
Class A Shares | | | -5.96 | % |
Class C Shares | | | -6.67 | |
Class Y Shares | | | -5.72 | |
Class R6 Shares | | | -5.76 | |
S&P Municipal Bond New Jersey Index ▼ | | | -3.70 | |
U.S. Consumer Price Index▼ | | | 6.04 | |
Source(s): ▼Bloomberg LP | | | | |
Market conditions and your Fund
The New Jersey State economy continued to demonstrate near-term positive momentum following the COVID-19 pandemic. Revenue growth has been strong in recent years on steady increases in gross income taxes, sales taxes and a new pass-through business alternative income tax that was initiated in fiscal year 2021. This trend has helped to sustain general fund balances that remain well above what New Jersey has reported historically, noting that pandemic-related government stimulus along with a large COVID-19 Emergency General Obligation issuance also contributed to accumulating these healthy reserves.
As a credit positive, the state has used this opportunity to begin proactively addressing its large liability burden, including its second year of making the full actuarial contribution to its pension plans. Coupled with the trend of building a notably improved general fund balance, the enhanced financial flexibility of the state has garnered positive outlooks from all three major credit rating agencies. New Jersey also benefits from a large economy with high wealth levels, as illustrated by an average personal income that is 118% of the national average.1 Its proximity to the New York City metro area further provides for access to a diverse set of employment opportunities but with a cost of living that is lower than residing in Manhattan itself. For these reasons, the Invesco municipal investment team believes debt issued by the state of New Jersey has continued to offer opportunity for municipal investors at the right levels.
Despite the recent progress made by the Garden State, New Jersey does face longer-term challenges given its exposure to debt and retirement liabilities that are among the largest in the country. In addition, now that the bulk of one-time COVID-19 federal stimulus has largely come to an end, these challenges have the potential to become more pronounced as reserve balances are con-
sumed. As such, we believe the state’s credit trajectory will hinge on its demonstrated ability to achieve a balanced budget solely with tax collections and other recurring revenues, while ensuring policies are in place to sustain its debt management program moving forward. Absent these controls and policy measures, New Jersey could face the politically unpopular decision to either cut appropriations or incur additional deficit financing. We believe either outcome would be a negative for the credit, especially following a period where the governor has expanded the budget to cover increased levels of educational spending and pension contributions. Additionally, New Jersey’s already high tax rates restrict the state’s ability to further increase revenues absent a continued rebound in post-pandemic economic activity. Ultimately, the direction of future credit ratings will largely depend on New Jersey’s ability to address these fiscal concerns in a timely and sustainable fashion.
At the beginning of the fiscal year, investors were hopeful in anticipation of a return to normalcy as COVID-19 cases declined and pandemic-related restrictions were reduced or lifted. This allowed policymakers to turn their attention to the high inflation levels; however, on February 24, 2022, Russia began a full-scale invasion of Ukraine, which exacerbated inflationary pressures by driving up commodity prices. Against this backdrop, the fiscal year was plagued by volatility and uncertainty. The municipal market set multiple record lows in 2022, making it one of the most challenging years in history for municipal markets.
Investment grade municipal bonds returned -5.10%, high yield municipal bonds returned -9.35% and taxable municipal bonds returned -12.96% during the fiscal year.2
While municipal funds had experienced record inflows of $101.7 billion in 2021, flows quickly turned negative in the first quarter of 2022, perpetuating the Bloomberg Municipal Bond Index’s worst quarterly return in
40 years. Municipal bonds enjoyed a short respite in late May and early June 2022 with increased demand from crossover buyers like hedge funds, banks and insurance companies; however, the May 2022 Consumer Price Index report quoted inflation rising to a 40-year high. This sent the 10-year Treasury yield to a new 52-week high of nearly 3.50%, pushing municipal mutual fund flows back into negative territory.3 According to Lipper, net outflows from municipal bond funds totaled over -$110 billion for the fiscal year.4
On March 16, 2022, the US Federal Reserve (the Fed) raised the federal funds target rate 0.25% for the first time in more than three years in hopes of containing inflation.5 This was the first of eight consecutive increases during the fiscal year as the Fed announced its plan for a quantitative tightening campaign in an attempt to rein in inflation without harming employment or the overall economy. Rate increases as high as 0.75% followed, the Fed’s most aggressive monetary policy since the 1980s, bringing the target rate to 4.75% as of the end of the fiscal year.5
The AAA municipal yield curve made history after the Fed’s December 2022 meeting when the curve inverted between one- and10-year maturities. Any inversion is noteworthy, but this was a first for municipal bonds. On January 31, 2023, policymakers indicated that future rate increases were likely to be “appropriate,” suggesting they were not yet convinced inflation was contained, which increased uncertainty about when the current tightening cycle might end. The fiscal year ended with an increase of 0.25% on February 1, 2023. We expect additional rate hikes in 2023, although not with the same pace or vigor as in 2022.
New municipal issuance for the fiscal year totaled $354 billion, down 27% from the previous fiscal year’s $484 billion.6 Issuers, with cash on their balance sheets, have been reluctant to issue at higher interest rates. While taxable issuance continued to account for a significant portion of new issuance, at 14% of the total, this figure is down from 18% from the previous fiscal year because of higher interest rates.6
Puerto Rico continued to make developments in its ongoing debt restructuring throughout the fiscal year. The territory restructured its outstanding general obligation and other government-guaranteed debt in March 2022 and began paying bondholders on the new restructured bonds. Puerto Rico’s weight in the Bloomberg High Yield Municipal Bond Index increased from 13% to 20% as the new bonds were included.2 The Financial Oversight and Management Board for Puerto Rico, the Puerto Rican government, bond-holders and other interested parties continued to negotiate the restructuring of bonds issued by the Puerto Rico Electric Power Authority, the territory’s largest remaining unresolved debt, as the fiscal year closed.
| | |
| 2 | | Invesco New Jersey Municipal Fund |
Municipal credits have a long history of low defaults as many provide essential services to all Americans. This continues to be the case as evidenced by S&P rating changes – upgrades exceeded downgrades by a ratio of 2.5:1 for calendar year 2022.7 This positive dynamic, which we believe will continue, likely stems from benefits of the various federal stimulus measures including the American Rescue Plan Act, the Infrastructure Investment and Jobs Act and the Inflation Reduction Act, as well as higher revenues collected by state and local governments.
We believe the valuable benefits of municipal bonds will prevail over current market volatility and economic uncertainty. We continue to rely on our experienced portfolio managers and credit analysts to weather the challenges while identifying marketplace opportunities to add long-term value for shareholders.
During the fiscal year, security selection and an overweight allocation to non-rated bonds contributed to the Fund’s performance relative to its benchmark. At the sector level, sector allocation to and overweight exposure among the appropriation sector contributed to the Fund’s relative performance.
An underweight allocation to AA-rated† bonds detracted from the Fund’s performance relative to its benchmark during the fiscal year. An overweight exposure to 4.00-4.49% coupon bonds was also detractive from relative return. An overweight allocation to the education sector detracted from the Fund’s performance relative to its benchmark during the fiscal year.
During the fiscal year, leverage contributed to the Fund’s performance relative to its benchmark. The Fund achieved a leveraged position through the use of inverse floating rate securities or tender option bonds. The Fund uses leverage because we believe that, over time, leveraging provides opportunities for additional income and total return for shareholders. However, the use of leverage also can expose shareholders to additional volatility. For more information about the Fund’s use of leverage, see the Notes to Financial Statements later in this report.
We wish to remind you that the Fund is subject to interest rate risk, meaning when interest rates rise, the value of fixed income securities tends to fall. The degree to which the value of fixed income securities may decline due to rising interest rates may vary depending on the speed and magnitude of the increase in interest rates, as well as individual security characteristics, such as price, maturity, duration and coupon and market forces, such as supply and demand for similar securities. We are monitoring interest rates, as well as the market, economic and geopolitical factors that may impact the direction, speed and magnitude of changes to interest rates across the maturity spectrum, including the potential impact of monetary policy changes by the Fed and certain foreign central banks. If interest rates rise or fall faster than expected, markets may experience increased volatility,
which may affect the value and/or liquidity of certain of the Fund’s investments.
Thank you for investing in Invesco New Jersey Municipal Fund and for sharing our long-term investment horizon.
1 Source: Bureau of Economic Analysis
2 Source: Bloomberg LP
3 Source: Refinitiv TM3
4 Source: Lipper Inc.
5 Source: US Federal Reserve
6 Source: JP Morgan
7 Source: Standard & Poor’s
† Sources: A credit rating is an assessment provided by a nationally recognized statistical rating organization (NRSRO) of the creditworthiness of an issuer with respect to debt obligations, including specific securities, money market instruments or other debts. Ratings are measured on a scale that generally ranges from AAA (highest) to D (lowest); ratings are subject to change without notice. For more information on rating methodology, please visit www.spglobal.com and select “Understanding Credit Ratings” under About Ratings on the homepage; www.fitchratings.com and select “Understanding Credit Ratings” from the drop-down menu on the homepage; and www.moodys.com and select “Methodology,” then “Rating Methodologies” under Research Type on the left-hand side
Portfolio manager(s):
Josh Cooney
Elizabeth Mossow
Tim O’Reilly
Mark Paris
Julius Williams
The views and opinions expressed in management’s discussion of Fund performance are those of Invesco Advisers, Inc. and its affiliates. These views and opinions are subject to change at any time based on factors such as market and economic conditions. These views and opinions may not be relied upon as investment advice or recommendations, or as an offer for a particular security. The information is not a complete analysis of every aspect of any market, country, industry, security or the Fund. Statements of fact are from sources considered reliable, but Invesco Advisers, Inc. makes no representation or warranty as to their completeness or accuracy. Although historical performance is no guarantee of future results, these insights may help you understand our investment management philosophy.
See important Fund and, if applicable, index disclosures later in this report.
| | |
| 3 | | Invesco New Jersey Municipal Fund |
Your Fund’s Long-Term Performance
Results of a $10,000 Investment — Oldest Share Class(es)
Fund and index data from 2/28/13
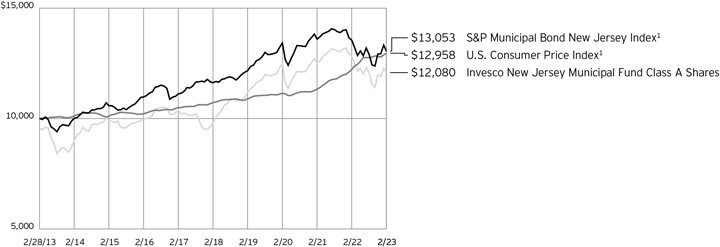
1 Source: Bloomberg LP
Past performance cannot guarantee future results.
The data shown in the chart include reinvested distributions, applicable sales charges and Fund expenses including management
fees. Index results include reinvested dividends, but they do not reflect sales charges. Performance of the peer group, if applicable, reflects Fund expenses and management fees; performance of a market index does
not. Performance shown in the chart does not reflect deduction of taxes a shareholder would pay on Fund distributions or sale of Fund shares.
| | |
| 4 | | Invesco New Jersey Municipal Fund |
| | | | |
| |
Average Annual Total Returns | |
As of 2/28/23, including maximum applicable sales charges | |
| |
Class A Shares | | | | |
Inception (3/1/94) | | | 4.06 | % |
10 Years | | | 1.91 | |
5 Years | | | 3.37 | |
1 Year | | | -9.94 | |
| |
Class C Shares | | | | |
Inception (8/29/95) | | | 4.05 | % |
10 Years | | | 1.77 | |
5 Years | | | 3.60 | |
1 Year | | | -7.57 | |
| |
Class Y Shares | | | | |
Inception (11/29/10) | | | 3.83 | % |
10 Years | | | 2.57 | |
5 Years | | | 4.53 | |
1 Year | | | -5.72 | |
| |
Class R6 Shares | | | | |
10 Years | | | 2.47 | % |
5 Years | | | 4.53 | |
1 Year | | | -5.76 | |
Effective May 24, 2019, Class A, Class C and Class Y shares of the Oppenheimer Rochester New Jersey Municipal Fund (the predecessor fund), were reorganized into Class A, Class C and Class Y shares, respectively, of the Invesco Oppenheimer Rochester® New Jersey Municipal Fund. The Fund was subsequently renamed the Invesco New Jersey Municipal Fund (the Fund). Returns shown above, for periods ending on or prior to May 24, 2019, for Class A, Class C and Class Y shares are those for Class A, Class C and Class Y shares of the predecessor fund. Share class returns will differ from the predecessor fund because of different expenses.
Class R6 shares incepted on May 24, 2019. Performance shown on and prior to that date is that of the predecessor fund’s Class A shares at net asset value and includes the 12b-1 fees applicable to Class A shares.
The performance data quoted represent past performance and cannot guarantee future results; current performance may be lower or higher. Please visit invesco.com/ performance for the most recent month-end performance. Performance figures reflect reinvested distributions, changes in net asset value and the effect of the maximum sales charge unless otherwise stated. Performance figures do not reflect deduction of taxes a shareholder would pay on Fund distributions or sale of Fund shares. Investment return and principal value will fluctuate so that you may have a gain or loss when you sell shares.
Class A share performance reflects the maximum 4.25% sales charge, and Class C share performance reflects the applicable contingent deferred sales charge (CDSC) for the period involved. The CDSC on
Class C shares is 1% for the first year after purchase. Class Y and Class R6 shares do not have a front-end sales charge or a CDSC; therefore, performance is at net asset value.
The performance of the Fund’s share classes will differ primarily due to different sales charge structures and class expenses.
Fund performance reflects any applicable fee waivers and/or expense reimbursements. Had the adviser not waived fees and/or reimbursed expenses currently or in the past, returns would have been lower. See current prospectus for more information.
| | |
| 5 | | Invesco New Jersey Municipal Fund |
Supplemental Information
Invesco New Jersey Municipal Fund’s investment objective is to seek tax-free income.
| ∎ | Unless otherwise stated, information presented in this report is as of February 28, 2023, and is based on total net assets. |
| ∎ | Unless otherwise noted, all data is provided by Invesco. |
| ∎ | To access your Fund’s reports/prospectus, visit invesco.com/fundreports. |
About indexes used in this report
| ∎ | The S&P Municipal Bond New Jersey Index is a broad, market value-weighted index that seeks to measure the performance of bonds issued within New Jersey. |
| ∎ | The U.S. Consumer Price Index is a measure of change in consumer prices as determined by the US Bureau of Labor Statistics. |
| ∎ | The Fund is not managed to track the performance of any particular index, including the index(es) described here, and consequently, the performance of the Fund may deviate significantly from the performance of the index(es). |
| ∎ | A direct investment cannot be made in an index. Unless otherwise indicated, index results include reinvested dividends, and they do not reflect sales charges. Performance of the peer group, if applicable, reflects fund expenses; performance of a market index does not. |
|
|
This report must be accompanied or preceded by a currently effective Fund prospectus, which contains more complete information, including sales charges and expenses. Investors should read it carefully before investing. |
|
| NOT FDIC INSURED | MAY LOSE VALUE | NO BANK GUARANTEE |
| | |
| 6 | | Invesco New Jersey Municipal Fund |
Fund Information
Portfolio Composition
| | | | | |
| By credit sector | | % of total investments |
Revenue Bonds | | | | 81.49 | % |
Pre-Refunded Bonds | | | | 8.96 | |
General Obligation Bonds | | | | 6.34 | |
Other | | | | 3.21 | |
Top Five Debt Holdings
| | | | | | | |
| | | | | % of total net assets |
| 1. | | Children’s Trust Fund, Series 2002, RB | | 5.44% |
| 2. | | New Jersey (State of) Health Care Facilities Financing Authority (AHS Hospital Corp.), Series 2008 B, VRD RB | | 3.21 |
| 3. | | New Jersey (State of) Economic Development Authority (The Goethals Bridge Replacement), Series 2013, RB | | 3.13 |
| 4. | | New Jersey (State of) Transportation Trust Fund Authority, Series 2018 A, Ref. RB | | 2.79 |
| 5. | | Rutgers The State University of New Jersey, Series 2013 L, Ref. RB | | 2.28 |
The Fund’s holdings are subject to change, and there is no assurance that the Fund will continue to hold any particular security.
Data presented here are as of February 28, 2023.
| | |
| 7 | | Invesco New Jersey Municipal Fund |
Schedule of Investments
February 28, 2023
| | | | | | | | | | | | | | | | |
| | | Interest
Rate | | | Maturity
Date | | | Principal
Amount
(000) | | | Value | |
|
| |
Municipal Obligations–100.06% | | | | | | | | | | | | | | | | |
New Jersey–86.23% | | | | | | | | | | | | | | | | |
| | | | |
Atlantic City (City of), NJ; Series 2017 A, Ref. GO Bonds (INS - BAM)(a) | | | 5.00 | % | | | 03/01/2042 | | | $ | 1,250 | | | $ | 1,293,003 | |
|
| |
| | | | |
Camden (County of), NJ Improvement Authority (The) (KIPP Cooper Norcross Academy) (Social Bonds); Series 2022, RB | | | 6.00 | % | | | 06/15/2052 | | | | 1,325 | | | | 1,392,558 | |
|
| |
Casino Reinvestment Development Authority, Inc.; | | | | | | | | | | | | | | | | |
Series 2004, RB (INS - AMBAC)(a) | | | 5.25 | % | | | 01/01/2024 | | | | 1,665 | | | | 1,666,571 | |
|
| |
Series 2004, RB (INS - AMBAC)(a) | | | 5.00 | % | | | 01/01/2025 | | | | 220 | | | | 220,180 | |
|
| |
Series 2014, Ref. RB (INS - AGM)(a) | | | 5.00 | % | | | 11/01/2028 | | | | 1,000 | | | | 1,029,853 | |
|
| |
Series 2014, Ref. RB (INS - AGM)(a) | | | 5.00 | % | | | 11/01/2031 | | | | 2,000 | | | | 2,051,904 | |
|
| |
Series 2014, Ref. RB | | | 5.25 | % | | | 11/01/2039 | | | | 3,000 | | | | 3,047,342 | |
|
| |
Series 2014, Ref. RB | | | 5.25 | % | | | 11/01/2044 | | | | 4,990 | | | | 5,058,574 | |
|
| |
| | | | |
Essex (County of), NJ Improvement Authority (559 Broad/Hazelwood); Series 2020 A, RB(b) | | | 4.00 | % | | | 08/01/2060 | | | | 1,500 | | | | 1,192,376 | |
|
| |
| | | | |
Essex (County of), NJ Improvement Authority (CHF-Newark LLC-NJIT Student Housing); Series 2021 A, RB (INS - BAM)(a) | | | 4.00 | % | | | 08/01/2051 | | | | 1,040 | | | | 954,677 | |
|
| |
| | | | |
Garden State Preservation Trust; | | | | | | | | | | | | | | | | |
Series 2003 B, RB (INS - AGM)(a)(c) | | | 0.00 | % | | | 11/01/2026 | | | | 140 | | | | 123,857 | |
|
| |
Series 2005 A, RB (INS - AGM)(a) | | | 5.75 | % | | | 11/01/2028 | | | | 2,140 | | | | 2,340,583 | |
|
| |
| | | | |
Hudson County Improvement Authority (Hudson County Courthouse);
Series 2020, RB | | | 4.00 | % | | | 10/01/2046 | | | | 1,600 | | | | 1,475,904 | |
|
| |
| | | | |
Jersey City (City of), NJ Redevelopment Agency (Bayfront Redevelopment);
Series 2022, RB | | | 4.00 | % | | | 12/15/2031 | | | | 2,000 | | | | 2,112,948 | |
|
| |
| | | | |
Lavallette School District; Series 2005, GO Bonds (INS - SGI)(a) | | | 4.20 | % | | | 02/01/2025 | | | | 10 | | | | 10,007 | |
|
| |
| | | | |
Middlesex (County of), NJ Improvement Authority; Series 2000, RB
(INS - AMBAC)(a)(d) | | | 5.50 | % | | | 09/01/2030 | | | | 20 | | | | 20,041 | |
|
| |
New Brunswick (City of), NJ Parking Authority; | | | | | | | | | | | | | | | | |
Series 2012, Ref. RB | | | 5.00 | % | | | 09/01/2027 | | | | 445 | | | | 445,655 | |
|
| |
Series 2012, Ref. RB | | | 5.00 | % | | | 09/01/2029 | | | | 605 | | | | 605,852 | |
|
| |
New Jersey (State of); | | | | | | | | | | | | | | | | |
Series 2016, GO Bonds(e) | | | 5.00 | % | | | 06/01/2028 | | | | 5,000 | | | | 5,426,900 | |
|
| |
Series 2020 A, GO Bonds | | | 4.00 | % | | | 06/01/2032 | | | | 4,540 | | | | 4,896,703 | |
|
| |
New Jersey (State of) Building Authority; | | | | | | | | | | | | | | | | |
Series 2016 A, Ref. RB(f)(g) | | | 5.00 | % | | | 06/15/2026 | | | | 300 | | | | 319,373 | |
|
| |
Series 2016 A, Ref. RB (INS - BAM)(a) | | | 5.00 | % | | | 06/15/2028 | | | | 600 | | | | 635,572 | |
|
| |
New Jersey (State of) Economic Development Authority; | | | | | | | | | | | | | | | | |
Series 1998 B, RB(d) | | | 6.50 | % | | | 04/01/2031 | | | | 90 | | | | 90,062 | |
|
| |
Series 1999 A, RB | | | 6.25 | % | | | 07/01/2024 | | | | 5 | | | | 5,009 | |
|
| |
Series 2005 N-1, Ref. RB (INS - NATL)(a) | | | 5.50 | % | | | 09/01/2023 | | | | 100 | | | | 100,975 | |
|
| |
Series 2015 WW, RB(f)(g) | | | 5.00 | % | | | 06/15/2025 | | | | 3,000 | | | | 3,120,495 | |
|
| |
Series 2015 WW, RB(f)(g) | | | 5.00 | % | | | 06/15/2025 | | | | 3,000 | | | | 3,120,495 | |
|
| |
Series 2017 A, Ref. RB (INS - BAM)(a) | | | 5.00 | % | | | 07/01/2033 | | | | 3,000 | | | | 3,176,411 | |
|
| |
Series 2018 A, RB | | | 5.00 | % | | | 06/15/2047 | | | | 3,000 | | | | 3,064,076 | |
|
| |
Series 2020, RB | | | 4.00 | % | | | 11/01/2038 | | | | 2,000 | | | | 1,949,717 | |
|
| |
| | | | |
New Jersey (State of) Economic Development Authority (Black Horse EHT Urban Renewal LLC); Series 2019 A, RB(b) | | | 5.00 | % | | | 10/01/2039 | | | | 2,000 | | | | 1,492,867 | |
|
| |
New Jersey (State of) Economic Development Authority (Continental Airlines, Inc.); | | | | | | | | | | | | | | | | |
Series 1999, RB(d) | | | 5.25 | % | | | 09/15/2029 | | | | 2,350 | | | | 2,338,617 | |
|
| |
Series 2012, RB(d) | | | 5.75 | % | | | 09/15/2027 | | | | 1,000 | | | | 999,935 | |
|
| |
| | | | |
New Jersey (State of) Economic Development Authority (Elite Pharmaceuticals, Inc. - 2005); Series 2005 A, RB(d) | | | 6.50 | % | | | 09/01/2030 | | | | 25 | | | | 21,683 | |
|
| |
New Jersey (State of) Economic Development Authority (Foundation Academy Charter School); | | | | | | | | | | | | | | | | |
Series 2018 A, RB | | | 5.00 | % | | | 07/01/2038 | | | | 350 | | | | 352,055 | |
|
| |
Series 2018 A, RB | | | 5.00 | % | | | 07/01/2050 | | | | 1,000 | | | | 961,543 | |
|
| |
New Jersey (State of) Economic Development Authority (Golden Door Charter School); | | | | | | | | | | | | | | | | |
Series 2018 A, RB(b) | | | 6.25 | % | | | 11/01/2038 | | | | 525 | | | | 548,040 | |
|
| |
Series 2018 A, RB(b) | | | 6.50 | % | | | 11/01/2052 | | | | 2,500 | | | | 2,611,374 | |
|
| |
New Jersey (State of) Economic Development Authority (Leap Academy University Charter School, Inc.); | | | | | | | | | | | | | | | | |
Series 2013, RB | | | 6.00 | % | | | 10/01/2043 | | | | 3,200 | | | | 3,235,988 | |
|
| |
Series 2014 A, RB(b) | | | 6.00 | % | | | 10/01/2034 | | | | 515 | | | | 518,974 | |
|
| |
| | | | |
New Jersey (State of) Economic Development Authority (Lions Gate); Series 2014, RB | | | 5.25 | % | | | 01/01/2044 | | | | 4,500 | | | | 3,946,162 | |
|
| |
See accompanying Notes to Financial Statements which are an integral part of the financial statements.
| | |
| 8 | | Invesco New Jersey Municipal Fund |
| | | | | | | | | | | | | | | | |
| | | Interest
Rate | | | Maturity
Date | | | Principal
Amount
(000) | | | Value | |
New Jersey–(continued) | | | | | | | | | | | | | | | | |
New Jersey (State of) Economic Development Authority (Marion P. Thomas Charter School); | | | | | | | | | | | | | | | | |
Series 2018 A, RB(b) | | | 5.00 | % | | | 10/01/2033 | | | $ | 1,000 | | | $ | 955,613 | |
Series 2018 A, RB(b) | | | 5.25 | % | | | 10/01/2038 | | | | 2,500 | | | | 2,357,632 | |
| | | | |
New Jersey (State of) Economic Development Authority (Middlesex Water Co.);
Series 2019, RB(d) | | | 4.00 | % | | | 08/01/2059 | | | | 4,275 | | | | 3,424,517 | |
| | | | |
New Jersey (State of) Economic Development Authority (Newark Downtown District Management Corp.); Series 2019, Ref. RB | | | 5.13 | % | | | 06/15/2037 | | | | 2,239 | | | | 2,388,571 | |
| | | | |
New Jersey (State of) Economic Development Authority (North Star Academy Charter School of Newark, Inc.); Series 2017, RB | | | 5.00 | % | | | 07/15/2047 | | | | 1,000 | | | | 1,001,207 | |
| | | | |
New Jersey (State of) Economic Development Authority (Port Newark Container Terminal LLC); Series 2017, Ref. RB(d) | | | 5.00 | % | | | 10/01/2047 | | | | 2,000 | | | | 1,966,568 | |
| | | | |
New Jersey (State of) Economic Development Authority (Portal North Bridge);
Series 2022 A, RB | | | 5.00 | % | | | 11/01/2052 | | | | 2,000 | | | | 2,068,986 | |
| | | | |
New Jersey (State of) Economic Development Authority (Provident Group - Rowan Properties LLC - Rowan University Student Housing); Series 2015 A, RB | | | 5.00 | % | | | 01/01/2030 | | | | 50 | | | | 49,597 | |
| | | | |
New Jersey (State of) Economic Development Authority (Social Bonds); Series 2021 QQQ, RB | | | 4.00 | % | | | 06/15/2046 | | | | 3,465 | | | | 3,158,050 | |
| | | | |
New Jersey (State of) Economic Development Authority (Team Academy Charter School); Series 2018 A, RB | | | 5.00 | % | | | 12/01/2048 | | | | 3,000 | | | | 3,022,533 | |
| | | | |
New Jersey (State of) Economic Development Authority (The Goethals Bridge Replacement); Series 2013, RB(d) | | | 5.38 | % | | | 01/01/2043 | | | | 8,650 | | | | 8,695,715 | |
New Jersey (State of) Economic Development Authority (UMM Energy Partners, LLC); | | | | | | | | | | | | | | | | |
Series 2012 A, RB(d) | | | 5.00 | % | | | 06/15/2037 | | | | 1,515 | | | | 1,515,223 | |
Series 2012 A, RB(d) | | | 5.13 | % | | | 06/15/2043 | | | | 3,250 | | | | 3,250,249 | |
New Jersey (State of) Economic Development Authority (University Heights Charter School); | | | | | | | | | | | | | | | | |
Series 2018 A, RB(b)(h) | | | 5.38 | % | | | 09/01/2033 | | | | 264 | | | | 241,160 | |
Series 2018 A, RB(b)(h) | | | 5.63 | % | | | 09/01/2038 | | | | 733 | | | | 670,865 | |
New Jersey (State of) Educational Facilities Authority (Georgian Court University); | | | | | | | | | | | | | | | | |
Series 2017 G, Ref. RB | | | 5.00 | % | | | 07/01/2030 | | | | 1,395 | | | | 1,359,837 | |
Series 2017 G, Ref. RB | | | 5.00 | % | | | 07/01/2033 | | | | 1,590 | | | | 1,521,818 | |
Series 2017 G, Ref. RB | | | 5.00 | % | | | 07/01/2035 | | | | 1,485 | | | | 1,391,210 | |
Series 2017 G, Ref. RB | | | 5.00 | % | | | 07/01/2036 | | | | 1,640 | | | | 1,513,487 | |
| | | | |
New Jersey (State of) Educational Facilities Authority (New Jersey City University); Series 2021, Ref. RB (INS - AGM)(a) | | | 4.00 | % | | | 07/01/2036 | | | | 765 | | | | 757,766 | |
| | | | |
New Jersey (State of) Educational Facilities Authority (Princeton University); Series 2022 A, RB | | | 5.00 | % | | | 03/01/2032 | | | | 2,500 | | | | 2,979,433 | |
New Jersey (State of) Educational Facilities Authority (Rider University); | | | | | | | | | | | | | | | | |
Series 2017 F, RB | | | 5.00 | % | | | 07/01/2035 | | | | 185 | | | | 174,881 | |
Series 2017 F, RB | | | 5.00 | % | | | 07/01/2036 | | | | 400 | | | | 375,847 | |
Series 2017 F, RB | | | 5.00 | % | | | 07/01/2047 | | | | 3,250 | | | | 2,839,873 | |
| | | | |
New Jersey (State of) Educational Facilities Authority (Stevens Institute of Technology) (Green Bonds); Series 2020 A, RB | | | 4.00 | % | | | 07/01/2050 | | | | 3,000 | | | | 2,609,201 | |
| | | | |
New Jersey (State of) Educational Facilities Authority (William Paterson University of New Jersey (The)); Series 2017 B, RB (INS - AGM)(a) | | | 5.00 | % | | | 07/01/2047 | | | | 2,000 | | | | 2,070,856 | |
New Jersey (State of) Health Care Facilities Financing Authority; | | | | | | | | | | | | | | | | |
Series 2013, Ref. RB(f)(g) | | | 5.00 | % | | | 08/15/2023 | | | | 1,960 | | | | 1,975,739 | |
Series 2017, Ref. RB | | | 5.00 | % | | | 10/01/2038 | | | | 2,000 | | | | 2,077,959 | |
| | | | |
New Jersey (State of) Health Care Facilities Financing Authority (AHS Hospital Corp.);
Series 2008 B, VRD RB (LOC - Bank Of America N.A.)(i)(j) | | | 2.73 | % | | | 07/01/2036 | | | | 8,940 | | | | 8,940,000 | |
| | | | |
New Jersey (State of) Health Care Facilities Financing Authority (Barnabas Health Obligated Group); Series 2014, Ref. RB | | | 5.00 | % | | | 07/01/2044 | | | | 3,000 | | | | 3,032,482 | |
| | | | |
New Jersey (State of) Health Care Facilities Financing Authority (Marlboro Psychiatric Hospital); Series 2013, RB | | | 5.00 | % | | | 09/15/2029 | | | | 5,000 | | | | 5,046,575 | |
| | | | |
New Jersey (State of) Health Care Facilities Financing Authority (RWJ Barnabas Health Obligated Group); Series 2021, RB | | | 4.00 | % | | | 07/01/2045 | | | | 3,000 | | | | 2,819,021 | |
| | | | |
New Jersey (State of) Health Care Facilities Financing Authority (University Hospital); Series 2015 A, RB (INS - AGM)(a) | | | 5.00 | % | | | 07/01/2046 | | | | 2,000 | | | | 2,016,316 | |
| | | | |
New Jersey (State of) Health Care Facilities Financing Authority (Valley Health System Obligated Group); Series 2019, RB | | | 5.00 | % | | | 07/01/2030 | | | | 1,250 | | | | 1,392,242 | |
New Jersey (State of) Higher Education Student Assistance Authority; | | | | | | | | | | | | | | | | |
Series 2013 1B, RB(d) | | | 4.75 | % | | | 12/01/2043 | | | | 2,000 | | | | 1,919,856 | |
Series 2019 C, Ref. RB(d) | | | 3.63 | % | | | 12/01/2049 | | | | 1,000 | | | | 788,191 | |
Series 2021 C, RB(d) | | | 3.25 | % | | | 12/01/2051 | | | | 500 | | | | 353,545 | |
See accompanying Notes to Financial Statements which are an integral part of the financial statements.
| | |
| 9 | | Invesco New Jersey Municipal Fund |
| | | | | | | | | | | | | | | | |
| | | Interest
Rate | | | Maturity
Date | | | Principal
Amount
(000) | | | Value | |
New Jersey–(continued) | | | | | | | | | | | | | | | | |
| | | | |
New Jersey (State of) Housing & Mortgage Finance Agency; | | | | | | | | | | | | | | | | |
Series 2018 A, Ref. RB | | | 3.95 | % | | | 11/01/2043 | | | $ | 870 | | | $ | 807,826 | |
Series 2018 BB, Ref. RB(d) | | | 3.80 | % | | | 10/01/2032 | | | | 765 | | | | 730,427 | |
Series 2019 A, Ref. RB | | | 3.00 | % | | | 11/01/2044 | | | | 510 | | | | 392,901 | |
Series 2019 A, Ref. RB | | | 3.05 | % | | | 11/01/2049 | | | | 865 | | | | 639,517 | |
Series 2020 E, Ref. RB | | | 2.45 | % | | | 10/01/2050 | | | | 530 | | | | 382,358 | |
| | | | |
New Jersey (State of) Housing & Mortgage Finance Agency (Social Bonds);
Series 2022 I, RB | | | 5.00 | % | | | 10/01/2053 | | | | 3,000 | | | | 3,118,389 | |
New Jersey (State of) Transportation Trust Fund Authority; | | | | | | | | | | | | | | | | |
Series 2008 A, RB (INS - BAM)(a)(c) | | | 0.00 | % | | | 12/15/2037 | | | | 2,000 | | | | 1,042,061 | |
Series 2008 A, RB(c) | | | 0.00 | % | | | 12/15/2038 | | | | 2,000 | | | | 953,117 | |
Series 2010 A, RB (INS - BAM)(a)(c) | | | 0.00 | % | | | 12/15/2028 | | | | 1,200 | | | | 975,975 | |
Series 2013 AA, RB | | | 5.25 | % | | | 06/15/2033 | | | | 1,335 | | | | 1,341,622 | |
Series 2013 AA, RB (INS - BAM)(a) | | | 5.25 | % | | | 06/15/2033 | | | | 2,530 | | | | 2,542,550 | |
Series 2013 AA, RB | | | 5.50 | % | | | 06/15/2039 | | | | 1,750 | | | | 1,756,068 | |
Series 2018 A, Ref. RB | | | 4.25 | % | | | 12/15/2038 | | | | 7,790 | | | | 7,771,285 | |
Series 2018 A, Ref. RN | | | 5.00 | % | | | 06/15/2031 | | | | 3,540 | | | | 3,717,557 | |
Series 2019 BB, RB | | | 4.00 | % | | | 06/15/2050 | | | | 5,930 | | | | 5,374,226 | |
Series 2022, RB | | | 4.00 | % | | | 06/15/2046 | | | | 2,000 | | | | 1,822,828 | |
Series 2022, RB | | | 5.50 | % | | | 06/15/2050 | | | | 1,500 | | | | 1,611,852 | |
New Jersey (State of) Turnpike Authority; | | | | | | | | | | | | | | | | |
Series 2019 A, RB | | | 5.00 | % | | | 01/01/2048 | | | | 2,000 | | | | 2,101,164 | |
Series 2021 A, RB | | | 4.00 | % | | | 01/01/2042 | | | | 5,975 | | | | 5,811,427 | |
Series 2022 B, RB | | | 5.25 | % | | | 01/01/2052 | | | | 3,000 | | | | 3,262,980 | |
Newark (City of), NJ; | | | | | | | | | | | | | | | | |
Series 2015 A, GO Bonds | | | 5.00 | % | | | 07/15/2029 | | | | 3,000 | | | | 3,117,048 | |
Series 2015 B, GO Bonds (CEP - Oregon School Bond Guaranty) | | | 5.00 | % | | | 07/15/2029 | | | | 430 | | | | 446,777 | |
Series 2020 C, Ref. GO Bonds (INS - AGM)(a) | | | 4.00 | % | | | 10/01/2039 | | | | 305 | | | | 295,722 | |
Newark (City of), NJ Housing Authority; | | | | | | | | | | | | | | | | |
Series 2007, Ref. RB (INS - NATL)(a) | | | 5.00 | % | | | 01/01/2032 | | | | 760 | | | | 824,222 | |
Series 2017, Ref. RB | | | 4.00 | % | | | 01/01/2037 | | | | 1,000 | | | | 1,004,202 | |
Passaic (County of), NJ Improvement Authority (The) (Paterson Arts & Science Charter School); | | | | | | | | | | | | | | | | |
Series 2023, RB | | | 5.38 | % | | | 07/01/2053 | | | | 1,000 | | | | 1,006,311 | |
Series 2023, RB | | | 5.50 | % | | | 07/01/2058 | | | | 1,000 | | | | 1,007,938 | |
Rutgers The State University of New Jersey; | | | | | | | | | | | | | | | | |
Series 2013 J, Ref. RB(f)(g) | | | 5.00 | % | | | 05/01/2023 | | | | 5,380 | | | | 5,396,290 | |
Series 2013 L, Ref. RB(f)(g) | | | 5.00 | % | | | 05/01/2023 | | | | 4,000 | | | | 4,012,111 | |
Series 2013 L, Ref. RB(f)(g) | | | 5.00 | % | | | 05/01/2023 | | | | 6,330 | | | | 6,349,166 | |
| | | | |
Salem (County of), NJ Improvement Authority (Finlaw State Office Building);
Series 2021, Ref. RB (INS - AGM)(a) | | | 4.00 | % | | | 08/15/2048 | | | | 1,905 | | | | 1,728,438 | |
| | | | |
Salem (County of), NJ Pollution Control Financing Authority (Chambers); Series 2014 A, PCR(d)(f) | | | 5.00 | % | | | 12/01/2023 | | | | 650 | | | | 655,391 | |
South Jersey Transportation Authority; | | | | | | | | | | | | | | | | |
Series 2014 A, Ref. RB | | | 5.00 | % | | | 11/01/2039 | | | | 3,650 | | | | 3,648,222 | |
Series 2020 A, RB | | | 5.00 | % | | | 11/01/2045 | | | | 2,000 | | | | 2,044,860 | |
Series 2022, RB | | | 4.63 | % | | | 11/01/2047 | | | | 1,000 | | | | 965,346 | |
Series 2022, RB | | | 5.25 | % | | | 11/01/2052 | | | | 2,000 | | | | 2,055,717 | |
Tobacco Settlement Financing Corp.; | | | | | | | | | | | | | | | | |
Series 2018 A, Ref. RB | | | 5.00 | % | | | 06/01/2046 | | | | 4,000 | | | | 4,079,912 | |
Series 2018 A, Ref. RB | | | 5.25 | % | | | 06/01/2046 | | | | 1,000 | | | | 1,033,691 | |
Series 2018 B, Ref. RB | | | 5.00 | % | | | 06/01/2046 | | | | 3,400 | | | | 3,366,075 | |
Union (County of), NJ Improvement Authority; Series 1998 A, RB (INS - NATL)(a)(d) | | | 5.00 | % | | | 03/01/2028 | | | | 55 | | | | 55,092 | |
| | | | | | | | | | | | | | | | 239,946,193 | |
| | | | |
Puerto Rico–8.45% | | | | | | | | | | | | | | | | |
| | | | |
Children’s Trust Fund; Series 2002, RB | | | 5.63 | % | | | 05/15/2043 | | | | 15,000 | | | | 15,150,804 | |
| | | | |
Corp. Para El Financiamiento Publico de Puerto Rico; Series 2011, RB | | | 6.00 | % | | | 08/01/2026 | | | | 5,235 | | | | 137,419 | |
See accompanying Notes to Financial Statements which are an integral part of the financial statements.
| | |
| 10 | | Invesco New Jersey Municipal Fund |
| | | | | | | | | | | | | | | | |
| | | Interest
Rate | | | Maturity
Date | | | Principal
Amount
(000) | | | Value | |
Puerto Rico–(continued) | | | | | | | | | | | | | | | | |
Puerto Rico (Commonwealth of); | | | | | | | | | | | | | | | | |
| | | | |
Series 2021 A, GO Bonds(c) | | | 0.00 | % | | | 07/01/2024 | | | $ | 71 | | | $ | 66,568 | |
| | | | |
Series 2021 A, GO Bonds(c) | | | 0.00 | % | | | 07/01/2033 | | | | 273 | | | | 155,532 | |
| | | | |
Series 2021 A-1, GO Bonds | | | 5.25 | % | | | 07/01/2023 | | | | 118 | | | | 118,791 | |
| | | | |
Series 2021 A-1, GO Bonds | | | 5.38 | % | | | 07/01/2025 | | | | 236 | | | | 239,859 | |
| | | | |
Series 2021 A-1, GO Bonds | | | 5.63 | % | | | 07/01/2027 | | | | 234 | | | | 241,829 | |
| | | | |
Series 2021 A-1, GO Bonds | | | 5.63 | % | | | 07/01/2029 | | | | 230 | | | | 240,295 | |
| | | | |
Series 2021 A-1, GO Bonds | | | 5.75 | % | | | 07/01/2031 | | | | 224 | | | | 235,455 | |
| | | | |
Series 2021 A-1, GO Bonds | | | 4.00 | % | | | 07/01/2033 | | | | 212 | | | | 190,069 | |
| | | | |
Series 2021 A-1, GO Bonds | | | 4.00 | % | | | 07/01/2035 | | | | 191 | | | | 167,002 | |
| | | | |
Series 2021 A-1, GO Bonds | | | 4.00 | % | | | 07/01/2037 | | | | 164 | | | | 139,946 | |
| | | | |
Series 2021 A-1, GO Bonds | | | 4.00 | % | | | 07/01/2041 | | | | 222 | | | | 183,789 | |
| | | | |
Series 2021 A-1, GO Bonds | | | 4.00 | % | | | 07/01/2046 | | | | 231 | | | | 184,251 | |
| | | | |
Subseries 2022, RN | | | 0.00 | % | | | 11/01/2043 | | | | 1,001 | | | | 431,520 | |
| | | | |
Subseries 2022, RN | | | 0.00 | % | | | 11/01/2051 | | | | 5,558 | | | | 1,903,503 | |
Puerto Rico (Commonwealth of) Electric Power Authority; | | | | | | | | | | | | | | | | |
| | | | |
Series 2010 AAA, RB(h) | | | 5.25 | % | | | 07/01/2030 | | | | 500 | | | | 350,000 | |
| | | | |
Series 2010 AAA, RB(h) | | | 5.25 | % | | | 07/01/2031 | | | | 550 | | | | 385,000 | |
| | | | |
Series 2012 A, RB(h) | | | 5.05 | % | | | 07/01/2042 | | | | 45 | | | | 31,388 | |
Puerto Rico (Commonwealth of) Industrial, Tourist, Educational, Medical & Environmental Control Facilities Financing Authority; Series 2000, RB(d) | | | 6.63 | % | | | 06/01/2026 | | | | 160 | | | | 162,500 | |
Puerto Rico Sales Tax Financing Corp.; | | | | | | | | | | | | | | | | |
| | | | |
Series 2018 A-1, RB(c) | | | 0.00 | % | | | 07/01/2051 | | | | 6,271 | | | | 1,183,212 | |
| | | | |
Series 2018 A-1, RB | | | 5.00 | % | | | 07/01/2058 | | | | 1,371 | | | | 1,272,014 | |
| | | | |
Series 2019 A-2, RB | | | 4.54 | % | | | 07/01/2053 | | | | 60 | | | | 51,887 | |
Series 2019 A-2B, RB | | | 4.55 | % | | | 07/01/2040 | | | | 304 | | | | 283,897 | |
| | | | | | | | | | | | | | | | 23,506,530 | |
| | | | |
New York–3.63% | | | | | | | | | | | | | | | | |
New York & New Jersey (States of) Port Authority; | | | | | | | | | | | | | | | | |
| | | | |
Series 2019 220, RB(d) | | | 4.00 | % | | | 11/01/2059 | | | | 2,000 | | | | 1,753,383 | |
| | | | |
Series 2019, RB(d) | | | 5.00 | % | | | 11/01/2049 | | | | 1,500 | | | | 1,551,266 | |
| | | | |
Series 2020, RB(d) | | | 4.00 | % | | | 07/15/2039 | | | | 4,250 | | | | 4,089,595 | |
| | | | |
Series 2021, Ref. RB(d) | | | 4.00 | % | | | 07/15/2040 | | | | 1,350 | | | | 1,288,740 | |
| | | | |
Series 2022, Ref. RB(d) | | | 5.50 | % | | | 08/01/2052 | | | | 500 | | | | 539,439 | |
Two Hundred Sixth Series 2017, Ref. RB(d) | | | 5.00 | % | | | 11/15/2037 | | | | 850 | | | | 882,992 | |
| | | | | | | | | | | | | | | | 10,105,415 | |
| | | | |
Guam–0.69% | | | | | | | | | | | | | | | | |
| | | | |
Guam (Territory of); Series 2021 F, Ref. RB | | | 4.00 | % | | | 01/01/2036 | | | | 2,000 | | | | 1,921,323 | |
Guam Housing Corp.; Series 1998 A, RB (CEP - FHLMC)(d) | | | 5.75 | % | | | 09/01/2031 | | | | 10 | | | | 10,025 | |
| | | | | | | | | | | | | | | | 1,931,348 | |
| | | | |
Virgin Islands–0.67% | | | | | | | | | | | | | | | | |
Tobacco Settlement Financing Corp.; | | | | | | | | | | | | | | | | |
| | | | |
Series 2006, RB(c) | | | 0.00 | % | | | 05/15/2035 | | | | 1,100 | | | | 479,581 | |
| | | | |
Series 2006, RB(c) | | | 0.00 | % | | | 05/15/2035 | | | | 3,100 | | | | 1,243,602 | |
Virgin Islands (Government of) Water & Power Authority (Electric System); | | | | | | | | | | | | | | | | |
| | | | |
Series 2007 A, RB | | | 5.00 | % | | | 07/01/2024 | | | | 50 | | | | 48,489 | |
| | | | |
Series 2007 A, RB | | | 5.00 | % | | | 07/01/2026 | | | | 15 | | | | 14,255 | |
Series 2007 A, RB | | | 5.00 | % | | | 07/01/2027 | | | | 85 | | | | 80,313 | |
| | | | | | | | | | | | | | | | 1,866,240 | |
See accompanying Notes to Financial Statements which are an integral part of the financial statements.
| | |
| 11 | | Invesco New Jersey Municipal Fund |
| | | | | | | | | | | | | | | | |
| | | Interest
Rate | | | Maturity
Date | | | Principal
Amount
(000) | | | Value | |
Northern Mariana Islands–0.39% | | | | | | | | | | | | | | | | |
| | | | |
Northern Mariana Islands (Commonwealth of) Ports Authority; Series 1998 A, RB(d) | | | 6.25 | % | | | 03/15/2028 | | | $ | 1,135 | | | $ | 1,090,682 | |
TOTAL INVESTMENTS IN SECURITIES(k) –100.06% (Cost $284,162,546) | | | | | | | | | | | | | | | 278,446,408 | |
FLOATING RATE NOTE OBLIGATIONS–(1.35)% | | | | | | | | | | | | | | | | |
Note with an interest and fee rate of 4.11% at 02/28/2023 and a contractual maturity of collateral of 06/01/2028 (See Note 1J)(l) | | | | | | | | | | | | | | | (3,750,000 | ) |
OTHER ASSETS LESS LIABILITIES–1.29% | | | | | | | | | | | | | | | 3,569,607 | |
NET ASSETS–100.00% | | | | | | | | | | | | | | $ | 278,266,015 | |
| | |
| Investment Abbreviations: |
| |
| AGM | | – Assured Guaranty Municipal Corp. |
| AMBAC | | – American Municipal Bond Assurance Corp. |
| BAM | | – Build America Mutual Assurance Co. |
| CEP | | – Credit Enhancement Provider |
| FHLMC | | – Federal Home Loan Mortgage Corp. |
| GO | | – General Obligation |
| INS | | – Insurer |
| LOC | | – Letter of Credit |
| NATL | | – National Public Finance Guarantee Corp. |
| PCR | | – Pollution Control Revenue Bonds |
| RB | | – Revenue Bonds |
| Ref. | | – Refunding |
| RN | | – Revenue Notes |
| SGI | | – Syncora Guarantee, Inc. |
| VRD | | – Variable Rate Demand |
Notes to Schedule of Investments:
| (a) | Principal and/or interest payments are secured by the bond insurance company listed. |
| (b) | Security purchased or received in a transaction exempt from registration under the Securities Act of 1933, as amended (the “1933 Act”). The security may be resold pursuant to an exemption from registration under the 1933 Act, typically to qualified institutional buyers. The aggregate value of these securities at February 28, 2023 was $10,588,901, which represented 3.81% of the Fund’s Net Assets. |
| (c) | Zero coupon bond issued at a discount. |
| (d) | Security subject to the alternative minimum tax. |
| (e) | Underlying security related to TOB Trusts entered into by the Fund. See Note 1J. |
| (f) | Advance refunded; secured by an escrow fund of U.S. Government obligations or other highly rated collateral. |
| (g) | Security has an irrevocable call by the issuer or mandatory put by the holder. Maturity date reflects such call or put. |
| (h) | Defaulted security. Currently, the issuer is in default with respect to principal and/or interest payments. The aggregate value of these securities at February 28, 2023 was $1,678,413, which represented less than 1% of the Fund’s Net Assets. |
| (i) | Demand security payable upon demand by the Fund at specified time intervals no greater than thirteen months. Interest rate is redetermined periodically by the issuer or agent based on current market conditions. Rate shown is the rate in effect on February 28, 2023. |
| (j) | Principal and interest payments are fully enhanced by a letter of credit from the bank listed or a predecessor bank, branch or subsidiary. |
| (k) | Entities may either issue, guarantee, back or otherwise enhance the credit quality of a security. The entities are not primarily responsible for the issuer’s obligations but may be called upon to satisfy issuer’s obligations. No concentration of any single entity was greater than 5% each. |
| (l) | Floating rate note obligations related to securities held. The interest and fee rates shown reflect the rates in effect at February 28, 2023. At February 28, 2023, the Fund’s investments with a value of $5,426,900 are held by TOB Trusts and serve as collateral for the $3,750,000 in the floating rate note obligations outstanding at that date. |
See accompanying Notes to Financial Statements which are an integral part of the financial statements.
| | |
| 12 | | Invesco New Jersey Municipal Fund |
Statement of Assets and Liabilities
February 28, 2023
| | | | |
Assets: | | | | |
| |
Investments in unaffiliated securities, at value
(Cost $284,162,546) | | $ | 278,446,408 | |
|
| |
Cash | | | 1,985,623 | |
|
| |
Receivable for: | | | | |
Investments sold | | | 190,000 | |
|
| |
Fund shares sold | | | 387,309 | |
|
| |
Interest | | | 3,305,860 | |
|
| |
Investments matured, at value (Cost $776,457) | | | 563,902 | |
|
| |
Investment for trustee deferred compensation and
retirement plans | | | 39,734 | |
|
| |
Other assets | | | 92,905 | |
|
| |
Total assets | | | 285,011,741 | |
|
| |
| |
Liabilities: | | | | |
Floating rate note obligations | | | 3,750,000 | |
|
| |
Payable for: | | | | |
Investments purchased | | | 1,966,160 | |
|
| |
Dividends | | | 378,318 | |
|
| |
Fund shares reacquired | | | 401,056 | |
|
| |
Accrued fees to affiliates | | | 111,652 | |
|
| |
Accrued interest expense | | | 2,507 | |
|
| |
Accrued trustees’ and officers’ fees and benefits | | | 22,663 | |
|
| |
Accrued other operating expenses | | | 73,636 | |
|
| |
Trustee deferred compensation and retirement plans | | | 39,734 | |
|
| |
Total liabilities | | | 6,745,726 | |
|
| |
Net assets applicable to shares outstanding | | $ | 278,266,015 | |
|
| |
| | | | |
Net assets consist of: | | | | |
| |
Shares of beneficial interest | | $ | 452,099,186 | |
|
| |
Distributable earnings (loss) | | | (173,833,171 | ) |
|
| |
| | $ | 278,266,015 | |
|
| |
| |
Net Assets: | | | | |
| |
Class A | | $ | 191,327,648 | |
|
| |
| |
Class C | | $ | 20,605,558 | |
|
| |
| |
Class Y | | $ | 66,287,579 | |
|
| |
| |
Class R6 | | $ | 45,230 | |
|
| |
|
Shares outstanding, no par value, with an unlimited number of shares authorized: | |
| |
Class A | | | 21,753,309 | |
|
| |
| |
Class C | | | 2,339,300 | |
|
| |
| |
Class Y | | | 7,528,181 | |
|
| |
| |
Class R6 | | | 5,142 | |
|
| |
| |
Class A:
Net asset value per share | | $ | 8.80 | |
|
| |
Maximum offering price per share
(Net asset value of $8.80 ÷ 95.75%) | | $ | 9.19 | |
|
| |
| |
Class C:
Net asset value and offering price per share | | $ | 8.81 | |
|
| |
| |
Class Y:
Net asset value and offering price per share | | $ | 8.81 | |
|
| |
| |
Class R6:
Net asset value and offering price per share | | $ | 8.80 | |
|
| |
See accompanying Notes to Financial Statements which are an integral part of the financial statements.
| | |
| 13 | | Invesco New Jersey Municipal Fund |
Statement of Operations
For the year ended February 28, 2023
| | | | |
Investment income: | | | | |
| |
Interest | | $ | 11,150,073 | |
|
| |
| |
Expenses: | | | | |
| |
Advisory fees | | | 1,538,169 | |
|
| |
| |
Administrative services fees | | | 38,808 | |
|
| |
| |
Custodian fees | | | 3,036 | |
|
| |
Distribution fees: | | | | |
Class A | | | 482,974 | |
|
| |
Class C | | | 181,545 | |
|
| |
Interest, facilities and maintenance fees | | | 188,288 | |
|
| |
Transfer agent fees - A, C and Y | | | 195,641 | |
|
| |
Transfer agent fees - R6 | | | 2 | |
|
| |
Trustees’ and officers’ fees and benefits | | | 19,685 | |
|
| |
Registration and filing fees | | | 53,153 | |
|
| |
Reports to shareholders | | | 14,464 | |
|
| |
Professional services fees | | | 75,859 | |
|
| |
Other | | | 14,913 | |
|
| |
Total expenses | | | 2,806,537 | |
|
| |
Less: Expense offset arrangement(s) | | | (696 | ) |
|
| |
Net expenses | | | 2,805,841 | |
|
| |
Net investment income | | | 8,344,232 | |
|
| |
| |
Realized and unrealized gain (loss) from: | | | | |
Net realized gain (loss) from unaffiliated investment securities (includes net gains (losses) from securities sold to affiliates of $(92,812)) | | | (16,644,174 | ) |
|
| |
Change in net unrealized appreciation (depreciation) of unaffiliated investment securities | | | (8,985,037 | ) |
|
| |
Net realized and unrealized gain (loss) | | | (25,629,211 | ) |
|
| |
Net increase (decrease) in net assets resulting from operations | | $ | (17,284,979 | ) |
|
| |
See accompanying Notes to Financial Statements which are an integral part of the financial statements.
| | |
| 14 | | Invesco New Jersey Municipal Fund |
Statement of Changes in Net Assets
For the years ended February 28, 2023 and 2022
| | | | | | | | |
| | | 2023 | | | 2022 | |
|
| |
Operations: | | | | | | | | |
| | |
Net investment income | | $ | 8,344,232 | | | $ | 7,309,946 | |
|
| |
Net realized gain (loss) | | | (16,644,174 | ) | | | (476,984 | ) |
|
| |
Change in net unrealized appreciation (depreciation) | | | (8,985,037 | ) | | | (842,220 | ) |
|
| |
Net increase (decrease) in net assets resulting from operations | | | (17,284,979 | ) | | | 5,990,742 | |
|
| |
| | |
Distributions to shareholders from distributable earnings: | | | | | | | | |
| | |
Class A | | | (7,978,982 | ) | | | (7,755,989 | ) |
|
| |
| | |
Class C | | | (690,323 | ) | | | (677,910 | ) |
|
| |
| | |
Class Y | | | (2,309,913 | ) | | | (1,547,373 | ) |
|
| |
| | |
Class R6 | | | (479 | ) | | | (417 | ) |
|
| |
Total distributions from distributable earnings | | | (10,979,697 | ) | | | (9,981,689 | ) |
|
| |
| | |
Share transactions–net: | | | | | | | | |
Class A | | | (1,967,147 | ) | | | 21,626,969 | |
|
| |
Class C | | | 591,648 | | | | 1,793,154 | |
|
| |
Class Y | | | 26,779,497 | | | | 13,646,233 | |
|
| |
Class R6 | | | 36,826 | | | | – | |
|
| |
Net increase in net assets resulting from share transactions | | | 25,440,824 | | | | 37,066,356 | |
|
| |
Net increase (decrease) in net assets | | | (2,823,852 | ) | | | 33,075,409 | |
|
| |
| | |
Net assets: | | | | | | | | |
| | |
Beginning of year | | | 281,089,867 | | | | 248,014,458 | |
|
| |
End of year | | $ | 278,266,015 | | | $ | 281,089,867 | |
|
| |
See accompanying Notes to Financial Statements which are an integral part of the financial statements.
| | |
| 15 | | Invesco New Jersey Municipal Fund |
Financial Highlights
The following schedule presents financial highlights for a share of the Fund outstanding throughout the periods indicated.
| | | | | | | | | | | | | | | | | | | | | | | | | | | | | | | | | | | | | | | | | | | | | | | | | | | | | | | | | | | | | | | | | |
| | | Net asset value, beginning of period | | Net investment income(a) | | Net gains (losses) on securities (both realized and unrealized) | | Total from investment operations | | Dividends from net investment income | | Net asset
value,
end of
period | | Total return(b) | | Net assets, end of period (000’s omitted) | | Ratio of expenses to average net assets with
fee waivers and/or expenses absorbed | | Ratio of expenses to average net assets without fee waivers and/or expenses absorbed | | Supplemental
ratio of
expenses to average net assets
with fee waivers
(excluding
interest,
facilities and
maintenance
fees) | | Ratio of net investment income to average net assets | | Portfolio
turnover (c) |
Class A | | | | | | | | | | | | | | | | | | | | | | | | | | | | | | | | | | | | | | | | | | | | | | | | | | | | | | | | | | | | | | | | | |
Year ended 02/28/23 | | | $ | 9.75 | | | | $ | 0.28 | | | | $ | (0.86 | ) | | | $ | (0.58 | ) | | | $ | (0.37 | ) | | | $ | 8.80 | | �� | | | (5.96 | )% | | | $ | 191,328 | | | | | 1.04 | % | | | | 1.04 | % | | | | 0.97 | % | | | | 3.11 | % | | | | 31 | % |
Year ended 02/28/22 | | | | 9.86 | | | | | 0.28 | | | | | (0.02 | ) | | | | 0.26 | | | | | (0.37 | ) | | | | 9.75 | | | | | 2.63 | | | | | 214,469 | | | | | 1.08 | | | | | 1.09 | | | | | 0.98 | | | | | 2.73 | | | | | 9 | |
Year ended 02/28/21 | | | | 10.27 | | | | | 0.32 | | | | | (0.31 | ) | | | | 0.01 | | | | | (0.42 | ) | | | | 9.86 | | | | | 0.25 | | | | | 195,684 | | | | | 1.11 | | | | | 1.16 | | | | | 0.97 | | | | | 3.32 | | | | | 27 | |
Seven months ended 02/29/20 | | | | 9.85 | | | | | 0.19 | | | | | 0.40 | | | | | 0.59 | | | | | (0.17 | ) | | | | 10.27 | | | | | 6.00 | | | | | 197,732 | | | | | 1.18 | (d) | | | | 1.21 | (d) | | | | 1.00 | (d) | | | | 3.30 | (d) | | | | 12 | |
Year ended 07/31/19 | | | | 9.19 | | | | | 0.39 | | | | | 0.54 | | | | | 0.93 | | | | | (0.27 | ) | | | | 9.85 | | | | | 10.29 | | | | | 191,704 | | | | | 1.36 | | | | | 1.37 | | | | | 1.01 | | | | | 4.08 | | | | | 17 | |
Year ended 07/31/18 | | | | 9.02 | | | | | 0.29 | | | | | 0.16 | | | | | 0.45 | | | | | (0.28 | ) | | | | 9.19 | | | | | 5.22 | | | | | 162,955 | | | | | 1.30 | | | | | 1.30 | | | | | 1.07 | | | | | 3.36 | | | | | 23 | |
Class C | | | | | | | | | | | | | | | | | | | | | | | | | | | | | | | | | | | | | | | | | | | | | | | | | | | | | | | | | | | | | | | | | |
Year ended 02/28/23 | | | | 9.77 | | | | | 0.22 | | | | | (0.87 | ) | | | | (0.65 | ) | | | | (0.31 | ) | | | | 8.81 | | | | | (6.67 | )(e) | | | | 20,606 | | | | | 1.69 | (e) | | | | 1.69 | (e) | | | | 1.62 | (e) | | | | 2.46 | (e) | | | | 31 | |
Year ended 02/28/22 | | | | 9.88 | | | | | 0.21 | | | | | (0.01 | ) | | | | 0.20 | | | | | (0.31 | ) | | | | 9.77 | | | | | 1.97 | | | | | 22,184 | | | | | 1.73 | | | | | 1.74 | | | | | 1.63 | | | | | 2.08 | | | | | 9 | |
Year ended 02/28/21 | | | | 10.28 | | | | | 0.26 | | | | | (0.31 | ) | | | | (0.05 | ) | | | | (0.35 | ) | | | | 9.88 | | | | | (0.33 | ) | | | | 20,687 | | | | | 1.76 | | | | | 1.81 | | | | | 1.62 | | | | | 2.67 | | | | | 27 | |
Seven months ended 02/29/20 | | | | 9.87 | | | | | 0.15 | | | | | 0.39 | | | | | 0.54 | | | | | (0.13 | ) | | | | 10.28 | | | | | 5.54 | | | | | 35,355 | | | | | 1.83 | (d) | | | | 1.86 | (d) | | | | 1.65 | (d) | | | | 2.64 | (d) | | | | 12 | |
Year ended 07/31/19 | | | | 9.20 | | | | | 0.32 | | | | | 0.56 | | | | | 0.88 | | | | | (0.21 | ) | | | | 9.87 | | | | | 9.66 | | | | | 38,798 | | | | | 2.02 | | | | | 2.02 | | | | | 1.66 | | | | | 3.42 | | | | | 17 | |
Year ended 07/31/18 | | | | 9.04 | | | | | 0.24 | | | | | 0.15 | | | | | 0.39 | | | | | (0.23 | ) | | | | 9.20 | | | | | 4.41 | | | | | 71,388 | | | | | 1.96 | | | | | 1.96 | | | | | 1.73 | | | | | 2.70 | | | | | 23 | |
Class Y | | | | | | | | | | | | | | | | | | | | | | | | | | | | | | | | | | | | | | | | | | | | | | | | | | | | | | | | | | | | | | | | | |
Year ended 02/28/23 | | | | 9.76 | | | | | 0.30 | | | | | (0.86 | ) | | | | (0.56 | ) | | | | (0.39 | ) | | | | 8.81 | | | | | (5.72 | ) | | | | 66,288 | | | | | 0.79 | | | | | 0.79 | | | | | 0.72 | | | | | 3.36 | | | | | 31 | |
Year ended 02/28/22 | | | | 9.88 | | | | | 0.30 | | | | | (0.02 | ) | | | | 0.28 | | | | | (0.40 | ) | | | | 9.76 | | | | | 2.78 | | | | | 44,427 | | | | | 0.84 | | | | | 0.84 | | | | | 0.74 | | | | | 2.97 | | | | | 9 | |
Year ended 02/28/21 | | | | 10.28 | | | | | 0.35 | | | | | (0.30 | ) | | | | 0.05 | | | | | (0.45 | ) | | | | 9.88 | | | | | 0.62 | | | | | 31,634 | | | | | 0.87 | | | | | 0.91 | | | | | 0.73 | | | | | 3.56 | | | | | 27 | |
Seven months ended 02/29/20 | | | | 9.87 | | | | | 0.21 | | | | | 0.38 | | | | | 0.59 | | | | | (0.18 | ) | | | | 10.28 | | | | | 6.04 | | | | | 32,117 | | | | | 0.94 | (d) | | | | 0.97 | (d) | | | | 0.76 | (d) | | | | 3.54 | (d) | | | | 12 | |
Year ended 07/31/19 | | | | 9.20 | | | | | 0.41 | | | | | 0.55 | | | | | 0.96 | | | | | (0.29 | ) | | | | 9.87 | | | | | 10.65 | | | | | 28,415 | | | | | 1.13 | | | | | 1.13 | | | | | 0.77 | | | | | 4.32 | | | | | 17 | |
Year ended 07/31/18 | | | | 9.04 | | | | | 0.32 | | | | | 0.14 | | | | | 0.46 | | | | | (0.30 | ) | | | | 9.20 | | | | | 5.35 | | | | | 21,970 | | | | | 1.06 | | | | | 1.06 | | | | | 0.83 | | | | | 3.61 | | | | | 23 | |
Class R6 | | | | | | | | | | | | | | | | | | | | | | | | | | | | | | | | | | | | | | | | | | | | | | | | | | | | | | | | | | | | | | | | | |
Year ended 02/28/23 | | | | 9.76 | | | | | 0.30 | | | | | (0.86 | ) | | | | (0.56 | ) | | | | (0.40 | ) | | | | 8.80 | | | | | (5.76 | ) | | | | 45 | | | | | 0.74 | | | | | 0.74 | | | | | 0.67 | | | | | 3.41 | | | | | 31 | |
Year ended 02/28/22 | | | | 9.86 | | | | | 0.31 | | | | | 0.00 | | | | | 0.31 | | | | | (0.41 | ) | | | | 9.76 | | | | | 3.06 | | | | | 10 | | | | | 0.72 | | | | | 0.77 | | | | | 0.62 | | | | | 3.09 | | | | | 9 | |
Year ended 02/28/21 | | | | 10.27 | | | | | 0.35 | | | | | (0.31 | ) | | | | 0.04 | | | | | (0.45 | ) | | | | 9.86 | | | | | 0.61 | | | | | 10 | | | | | 0.77 | | | | | 0.91 | | | | | 0.63 | | | | | 3.66 | | | | | 27 | |
Seven months ended 02/29/20 | | | | 9.85 | | | | | 0.21 | | | | | 0.40 | | | | | 0.61 | | | | | (0.19 | ) | | | | 10.27 | | | | | 6.21 | | | | | 11 | | | | | 0.84 | (d) | | | | 0.94 | (d) | | | | 0.73 | (d) | | | | 3.64 | (d) | | | | 12 | |
Period ended 07/31/19(f) | | | | 9.74 | | | | | 0.08 | | | | | 0.08 | | | | | 0.16 | | | | | (0.05 | ) | | | | 9.85 | | | | | 1.73 | | | | | 10 | | | | | 0.99 | (d) | | | | 1.07 | (d) | | | | 0.71 | (d) | | | | 4.46 | (d) | | | | 17 | |
| (a) | Calculated using average shares outstanding. |
| (b) | Includes adjustments in accordance with accounting principles generally accepted in the United States of America and as such, the net asset value for financial reporting purposes and the returns based upon those net asset values may differ from the net asset value and returns for shareholder transactions. Does not include sales charges and is not annualized for periods less than one year, if applicable. |
| (c) | Portfolio turnover is calculated at the fund level and is not annualized for periods less than one year, if applicable. |
| (e) | The total return, ratio of expenses to average net assets and ratio of net investment income to average net assets reflect actual 12b-1 fees of 0.90% for the year ended February 28, 2023. |
| (f) | Commencement date after the close of business on May 24, 2019. |
See accompanying Notes to Financial Statements which are an integral part of the financial statements.
| | |
| 16 | | Invesco New Jersey Municipal Fund |
Notes to Financial Statements
February 28, 2023
NOTE 1–Significant Accounting Policies
Invesco New Jersey Municipal Fund (the “Fund”) is a series portfolio of AIM Tax-Exempt Funds (Invesco Tax-Exempt Funds) (the “Trust”). The Trust is a Delaware statutory trust registered under the Investment Company Act of 1940, as amended (the “1940 Act”), as an open-end series management investment company authorized to issue an unlimited number of shares of beneficial interest. Information presented in these financial statements pertains only to the Fund. Matters affecting the Fund or each class will be voted on exclusively by the shareholders of the Fund or each class.
The Fund’s investment objective is to seek tax-free income.
The Fund currently consists of four different classes of shares: Class A, Class C, Class Y and Class R6. Class Y shares are available only to certain investors. Class A shares are sold with a front-end sales charge unless certain waiver criteria are met. Under certain circumstances, load waived shares may be subject to contingent deferred sales charges (“CDSC”). Class C shares are sold with a CDSC. Class Y and Class R6 shares are sold at net asset value. Class C shares held for eight years after purchase are eligible for automatic conversion into Class A shares of the same Fund (the “Conversion Feature”). The automatic conversion pursuant to the Conversion Feature will generally occur at the end of the month following the eighth anniversary after a purchase of Class C shares.
The Fund is an investment company and accordingly follows the investment company accounting and reporting guidance in accordance with Financial Accounting Standards Board Accounting Standards Codification Topic 946, Financial Services – Investment Companies.
The following is a summary of the significant accounting policies followed by the Fund in the preparation of its financial statements.
| A. | Security Valuations – Securities, including restricted securities, are valued according to the following policy. |
Securities generally are valued on the basis of prices provided by independent pricing services. Prices provided by the pricing service may be determined without exclusive reliance on quoted prices, and may reflect appropriate factors such as institution-size trading in similar groups of securities, developments related to specific securities, dividend rate (for unlisted equities), yield (for debt obligations), quality, type of issue, coupon rate (for debt obligations), maturity (for debt obligations), individual trading characteristics and other market data. Pricing services generally value debt obligations assuming orderly transactions of institutional round lot size, but a fund may hold or transact in the same securities in smaller, odd lot sizes. Odd lots often trade at lower prices than institutional round lots, and their value may be adjusted accordingly. Debt obligations are subject to interest rate and credit risks. In addition, all debt obligations involve some risk of default with respect to interest and/or principal payments.
Securities for which market quotations are not readily available are fair valued by Invesco Advisers, Inc. (the “Adviser” or “Invesco”) in accordance with Board-approved policies and related Adviser procedures (“Valuation Procedures”). If a fair value price provided by a pricing service is not representative of market value in the Adviser’s judgment (“unreliable”), the Adviser will fair value the security using the Valuation Procedures. Some of the factors which may be considered in determining fair value are fundamental analytical data relating to the investment; the nature and duration of any restrictions on transferability or disposition; trading in similar securities by the same issuer or comparable companies; relevant political, economic or issuer specific news; and other relevant factors under the circumstances.
The Fund may invest in securities that are subject to interest rate risk, meaning the risk that the prices will generally fall as interest rates rise and, conversely, the prices will generally rise as interest rates fall. Specific securities differ in their sensitivity to changes in interest rates depending on their individual characteristics. Changes in interest rates may result in increased market volatility, which may affect the value and/or liquidity of certain Fund investments.
Valuations change in response to many factors including the historical and prospective earnings of the issuer, the value of the issuer’s assets, general market conditions which are not specifically related to the particular issuer, such as real or perceived adverse economic conditions, changes in the general outlook for revenues or corporate earnings, changes in interest or currency rates, regional or global instability, natural or environmental disasters, widespread disease or other public health issues, war, acts of terrorism, significant governmental actions or adverse investor sentiment generally and market liquidity. Because of the inherent uncertainties of valuation, the values reflected in the financial statements may materially differ from the value received upon actual sale of those investments.
The price the Fund could receive upon the sale of any investment may differ from the Adviser’s valuation of the investment, particularly for securities that are valued using a fair valuation technique. When fair valuation techniques are applied, the Adviser uses available information, including both observable and unobservable inputs and assumptions, to determine a methodology that will result in a valuation that the Adviser believes approximates market value. Fund securities that are fair valued may be subject to greater fluctuation in their value from one day to the next than would be the case if market quotations were used. Because of the inherent uncertainties of valuation, and the degree of subjectivity in such decisions, the Fund could realize a greater or lesser than expected gain or loss upon the sale of the investment.
| B. | Securities Transactions and Investment Income – Securities transactions are accounted for on a trade date basis. Realized gains or losses on sales are computed on the basis of specific identification of the securities sold. Interest income (net of withholding tax, if any) is recorded on an accrual basis from settlement date and includes coupon interest and amortization of premium and accretion of discount on debt securities as applicable. Pay-in-kind interest income and non-cash dividend income received in the form of securities in-lieu of cash are recorded at the fair value of the securities received. Dividend income (net of withholding tax, if any) is recorded on the ex-dividend date. |
The Fund may periodically participate in litigation related to Fund investments. As such, the Fund may receive proceeds from litigation settlements.Any proceeds received are included in the Statement of Operations as realized gain (loss) for investments no longer held and as unrealized gain (loss) for investments still held.
Brokerage commissions and mark ups are considered transaction costs and are recorded as an increase to the cost basis of securities purchased and/or a reduction of proceeds on a sale of securities. Such transaction costs are included in the determination of net realized and unrealized gain (loss) from investment securities reported in the Statement of Operations and the Statement of Changes in Net Assets and the net realized and unrealized gains (losses) on securities per share in the Financial Highlights. Transaction costs are included in the calculation of the Fund’s net asset value and, accordingly, they reduce the Fund’s total returns. These transaction costs are not considered operating expenses and are not reflected in net investment income reported in the Statement of Operations and the Statement of Changes in Net Assets, or the net investment income per share and the ratios of expenses and net investment income reported in the Financial Highlights, nor are they limited by any expense limitation arrangements between the Fund and the investment adviser.
The Fund allocates realized and unrealized capital gains and losses to a class based on the relative net assets of each class. The Fund allocates income to a class based on the relative value of the settled shares of each class.
| C. | Country Determination – For the purposes of making investment selection decisions and presentation in the Schedule of Investments, the investment adviser may determine the country in which an issuer is located and/or credit risk exposure based on various factors. These factors include the laws of the country under which the issuer is organized, where the issuer maintains a principal office, the country in which the issuer derives 50% or more of its total revenues, the country that has the primary market for the issuer’s securities and its “country of risk” as determined by a third party service provider, as well as other criteria. Among the other criteria that may be evaluated for making this determination are the country in which the issuer maintains 50% or more of its assets, the type of security, financial guarantees and enhancements, the nature of the collateral and the sponsor organization. Country of issuer and/or credit risk exposure has been determined to be the United States of America, unless otherwise noted. |
| D. | Distributions – Distributions from net investment income, if any, are declared daily and paid monthly. Distributions from net realized capital gain, if any, are |
| | |
| 17 | | Invesco New Jersey Municipal Fund |
| | generally declared and paid annually and recorded on the ex-dividend date. The Fund may elect to treat a portion of the proceeds from redemptions as distributions for federal income tax purposes. |
| E. | Federal Income Taxes – The Fund intends to comply with the requirements of Subchapter M of the Internal Revenue Code of 1986, as amended (the “Internal Revenue Code”), necessary to qualify as a regulated investment company and to distribute substantially all of the Fund’s taxable and tax-exempt earnings to shareholders. As such, the Fund will not be subject to federal income taxes on otherwise taxable income (including net realized capital gain) that is distributed to shareholders. Therefore, no provision for federal income taxes is recorded in the financial statements. |
The Fund recognizes the tax benefits of uncertain tax positions only when the position is more likely than not to be sustained. Management has analyzed the Fund’s uncertain tax positions and concluded that no liability for unrecognized tax benefits should be recorded related to uncertain tax positions. Management is not aware of any tax positions for which it is reasonably possible that the total amounts of unrecognized tax benefits will change materially in the next 12 months.
In addition, the Fund intends to invest in such municipal securities to allow it to qualify to pay shareholders “exempt-interest dividends”, as defined in the Internal Revenue Code.
The Fund files tax returns in the U.S. Federal jurisdiction and certain other jurisdictions. Generally, the Fund is subject to examinations by such taxing authorities for up to three years after the filing of the return for the tax period.
| F. | Expenses – Fees provided for under the Rule 12b-1 plan of a particular class of the Fund are charged to the operations of such class. Transfer agency fees and expenses and other shareholder recordkeeping fees and expenses attributable to Class R6 are charged to such class. Transfer agency fees and expenses and other shareholder recordkeeping fees and expenses relating to all other classes are allocated among those classes based on relative net assets. All other expenses are allocated among the classes based on relative net assets. |
| G. | Interest, Facilities and Maintenance Fees – Interest, Facilities and Maintenance Fees include interest and related borrowing costs such as commitment fees, administrative expenses and other expenses associated with establishing and maintaining the line of credit. In addition, interest and administrative expenses related to establishing and maintaining floating rate note obligations, if any, are included. |
| H. | Accounting Estimates – The preparation of financial statements in conformity with accounting principles generally accepted in the United States of America (“GAAP”) requires management to make estimates and assumptions that affect the reported amounts of assets and liabilities at the date of the financial statements and the reported amounts of revenues and expenses during the reporting period including estimates and assumptions related to taxation. Actual results could differ from those estimates by a significant amount. In addition, the Fund monitors for material events or transactions that may occur or become known after the period-end date and before the date the financial statements are released to print. |
| I. | Indemnifications – Under the Trust’s organizational documents, each Trustee, officer, employee or other agent of the Trust is indemnified against certain liabilities that may arise out of the performance of their duties to the Fund. Additionally, in the normal course of business, the Fund enters into contracts, including the Fund’s servicing agreements, that contain a variety of indemnification clauses. The Fund’s maximum exposure under these arrangements is unknown as this would involve future claims that may be made against the Fund that have not yet occurred. The risk of material loss as a result of such indemnification claims is considered remote. |
| J. | Floating Rate Note Obligations – The Fund invests in inverse floating rate securities, such as Tender Option Bonds (“TOBs”), for investment purposes and to enhance the yield of the Fund. Such securities may be purchased in the secondary market without first owning an underlying bond but generally are created through the sale of fixed rate bonds by the Fund to special purpose trusts established by a broker dealer or by the Fund (“TOB Trusts”) in exchange for cash and residual interests in the TOB Trusts’ assets and cash flows, which are in the form of inverse floating rate securities. The TOB Trusts finance the purchases of the fixed rate bonds by issuing floating rate notes to third parties and allowing the Fund to retain residual interests in the bonds. The floating rate notes issued by the TOB Trusts have interest rates that reset weekly and the floating rate note holders have the option to tender their notes to the TOB Trusts for redemption at par at each reset date. The residual interests held by the Fund (inverse floating rate securities) include the right of the Fund (1) to cause the holders of the floating rate notes to tender their notes at par at the next interest rate reset date, and (2) to transfer the municipal bond from the TOB Trust to the Fund, thereby collapsing the TOB Trust. Inverse floating rate securities tend to underperform the market for fixed rate bonds in a rising interest rate environment, but tend to outperform the market for fixed rate bonds when interest rates decline or remain relatively stable. |
The Fund generally invests in inverse floating rate securities that include embedded leverage, thus exposing the Fund to greater risks and increased costs. The primary risks associated with inverse floating rate securities are varying degrees of liquidity and decreases in the value of such securities in response to changes in interest rates to a greater extent than fixed rate securities having similar credit quality, redemption provisions and maturity, which may cause the Fund’s net asset value to be more volatile than if it had not invested in inverse floating rate securities. In certain instances, the short-term floating rate notes created by the TOB Trust may not be able to be sold to third parties or, in the case of holders tendering (or putting) such notes for repayment of principal, may not be able to be remarketed to third parties. In such cases, the TOB Trust holding the fixed rate bonds may be collapsed with the entity that contributed the fixed rate bonds to the TOB Trust. In the case where a TOB Trust is collapsed with the Fund, the Fund will be required to repay the principal amount of the tendered securities, which may require the Fund to sell other portfolio holdings to raise cash to meet that obligation. The Fund could therefore be required to sell other portfolio holdings at a disadvantageous time or price to raise cash to meet this obligation, which risk will be heightened during times of market volatility, illiquidity or uncertainty. The embedded leverage in the TOB Trust could cause the Fund to lose more money than the value of the asset it has contributed to the TOB Trust and greater levels of leverage create the potential for greater losses. In addition, a Fund may enter into reimbursement agreements with the liquidity provider of certain TOB transactions in connection with certain residuals held by the Fund. These agreements commit a Fund to reimburse the liquidity provider to the extent that the liquidity provider must provide cash to a TOB Trust, including following the termination of a TOB Trust resulting from a mandatory tender event (“liquidity shortfall”). The reimbursement agreement will effectively make the Fund liable for the amount of the negative difference, if any, between the liquidation value of the underlying security and the purchase price of the floating rate notes issued by the TOB Trust.
The Fund accounts for the transfer of fixed rate bonds to the TOB Trusts as secured borrowings, with the securities transferred remaining in the Fund’s investment assets, and the related floating rate notes reflected as Fund liabilities under the caption Floating rate note obligations on the Statement of Assets and Liabilities. The carrying amount of the Fund’s floating rate note obligations as reported on the Statement of Assets and Liabilities approximates its fair value. The Fund records the interest income from the fixed rate bonds under the caption Interest and records the expenses related to floating rate obligations and any administrative expenses of the TOB Trusts as a component of Interest, facilities and maintenance fees on the Statement of Operations.
Final rules implementing section 619 of the Dodd-Frank Wall Street Reform and Consumer Protection Act (the “Volcker Rule”) prohibit banking entities from engaging in proprietary trading of certain instruments and limit such entities’ investments in, and relationships with, “covered funds”, as defined in the rules. These rules preclude banking entities and their affiliates from sponsoring and/or providing services for existing TOB Trusts. A new TOB structure is being utilized by the Fund wherein the Fund, as holder of the residuals, will perform certain duties previously performed by banking entities as “sponsors” of TOB Trusts. These duties may be performed by a third-party service provider. The Fund’s expanded role under the new TOB structure may increase its operational and regulatory risk. The new structure is substantially similar to the previous structure; however, pursuant to the Volcker Rule, the remarketing agent would not be able to repurchase tendered floaters for its own account upon a failed remarketing. In the event of a failed remarketing, a banking entity serving as liquidity provider may loan the necessary funds to the TOB Trust to purchase the tendered floaters. The TOB Trust, not the Fund, would be the borrower and the loan from the liquidity provider will be secured by the purchased floaters now held by the TOB Trust. However, as previously described, the Fund would bear the risk of loss with respect to any liquidity shortfall to the extent it entered into a reimbursement agreement with the liquidity provider.
Further, the SEC and various banking agencies have adopted rules implementing credit risk retention requirements for asset-backed securities (the “Risk Retention Rules”). The Risk Retention Rules require the sponsor of a TOB Trust to retain at least 5% of the credit risk of the underlying assets supporting the TOB
| | |
| 18 | | Invesco New Jersey Municipal Fund |
Trust’s municipal bonds. The Fund has adopted policies intended to comply with the Risk Retention Rules. The Risk Retention Rules may adversely affect the Fund’s ability to engage in TOB Trust transactions or increase the costs of such transactions in certain circumstances.
There can be no assurances that the new TOB structure will continue to be a viable form of leverage. Further, there can be no assurances that alternative forms of leverage will be available to the Fund in order to maintain current levels of leverage. Any alternative forms of leverage may be less advantageous to the Fund, and may adversely affect the Fund’s net asset value, distribution rate and ability to achieve its investment objective.
TOBs are presently classified as private placement securities. Private placement securities are subject to restrictions on resale because they have not been registered under the Securities Act of 1933, as amended (the “1933 Act”), or are otherwise not readily marketable. As a result of the absence of a public trading market for these securities, they may be less liquid than publicly traded securities. Although atypical, these securities may be resold in privately negotiated transactions, the prices realized from these sales could be less than those originally paid by the Fund or less than what may be considered the fair value of such securities.
| K. | Other Risks - The value of, payment of interest on, repayment of principal for and the ability to sell a municipal security may be affected by constitutional amendments, legislative enactments, executive orders, administrative regulations, voter initiatives and the economics of the regions in which the issuers are located. Since many municipal securities are issued to finance similar projects, especially those relating to education, health care, transportation and utilities, conditions in those sectors can affect the overall municipal securities market and the Fund’s investments in municipal securities. There is some risk that a portion or all of the interest received from certain tax-free municipal securities could become taxable as a result of determinations by the Internal Revenue Service. |
Increases in the federal funds and equivalent foreign rates or other changes to monetary policy or regulatory actions may expose fixed income markets to heightened volatility and reduced liquidity for certain fixed income investments, particularly those with longer maturities. It is difficult to predict the impact of interest rate changes on various markets. In addition, decreases in fixed income dealer market-making capacity may also potentially lead to heightened volatility and reduced liquidity in the fixed income markets. As a result, the value of the Fund’s investments and share price may decline. Changes in central bank policies could also result in higher than normal redemptions by shareholders, which could potentially increase the Fund’s portfolio turnover rate and transaction costs.
Policy changes by the U.S. government or its regulatory agencies and political events within the U.S. and abroad may, among other things, affect investor and consumer confidence and increase volatility in the financial markets, perhaps suddenly and to a significant degree, which may adversely impact the Fund’s operations, universe of potential investment options, and return potential.
The Fund may invest in lower-quality debt securities, i.e., “junk bonds”. Investments in lower-rated securities or unrated securities of comparable quality tend to be more sensitive to economic conditions than higher rated securities. Junk bonds involve a greater risk of default by the issuer because such securities are generally unsecured and are often subordinated to other creditors’ claims. Junk bonds are less liquid than investment grade debt securities and their prices tend to be more volatile.
The municipal issuers in which the Fund invests may be located in the same geographic area or may pay their interest obligations from revenue of similar projects, such as hospitals, airports, utility systems and housing finance agencies. This may make the Fund’s investments more susceptible to similar social, economic, political or regulatory occurrences, making the Fund more susceptible to experience a drop in its share price than if the Fund had been more diversified across issuers that did not have similar characteristics.
| L. | COVID-19 Risk - The COVID-19 strain of coronavirus has resulted in instances of market closures and dislocations, extreme volatility, liquidity constraints and increased trading costs. Efforts to contain its spread have resulted in travel restrictions, disruptions of healthcare systems, business operations (including business closures) and supply chains, layoffs, lower consumer demand and employee availability, and defaults and credit downgrades, among other significant economic impacts that have disrupted global economic activity across many industries. Such economic impacts may exacerbate other pre-existing political, social and economic risks locally or globally and cause general concern and uncertainty. The full economic impact and ongoing effects of COVID-19 (or other future epidemics or pandemics) at the macro-level and on individual businesses are unpredictable and may result in significant and prolonged effects on the Fund’s performance. |
NOTE 2–Advisory Fees and Other Fees Paid to Affiliates
The Trust has entered into a master investment advisory agreement with the Adviser. Under the terms of the investment advisory agreement, the Fund accrues daily and pays monthly an advisory fee to the Adviser based on the annual rate of the Fund’s average daily net assets as follows:
| | |
| Average Daily Net Assets | | Rate* |
|
|
First $ 200 million | | 0.600% |
|
|
Next $100 million | | 0.550% |
|
|
Next $200 million | | 0.500% |
|
|
Next $250 million | | 0.450% |
|
|
Next $250 million | | 0.400% |
|
|
Over $1 billion | | 0.350% |
|
|
| * | The advisory fee paid by the Fund shall be reduced by any amounts paid by the Fund under the administrative services agreement with the Adviser. |
For the year ended February 28, 2023, the effective advisory fee rate incurred by the Fund was 0.57%.
Under the terms of a master sub-advisory agreement between the Adviser and each of Invesco Asset Management Deutschland GmbH, Invesco Asset Management Limited, Invesco Asset Management (Japan) Limited, Invesco Hong Kong Limited, Invesco Senior Secured Management, Inc. and Invesco Canada Ltd. and separate sub-advisory agreements with Invesco Capital Management LLC and Invesco Asset Management (India) Private Limited (collectively, the “Affiliated Sub-Advisers”) the Adviser, not the Fund, will pay 40% of the fees paid to the Adviser to any such Affiliated Sub-Adviser(s) that provide(s) discretionary investment management services to the Fund based on the percentage of assets allocated to such Affiliated Sub-Adviser(s). Invesco has also entered into a sub-advisory agreement with OppenheimerFunds, Inc. to provide discretionary management services to the Fund.
Effective July 1, 2022 through at least June 30, 2023, the Adviser has contractually agreed, to waive advisory fees and/or reimburse expenses to the extent necessary to limit total annual fund operating expenses after fee waiver and/or expense reimbursement (excluding certain items discussed below) of Class A, Class C, Class Y and Class R6 to 1.50%, 2.15%, 1.25% and 1.25%, respectively, of the Fund’s average daily net assets (the “expense limits”). Prior to July 1, 2022, the Adviser had contractually agreed, to waive advisory fees and/or reimburse expenses to the extent necessary to limit total annual fund operating expenses after fee waiver and/or expense reimbursement (excluding certain items discussed below) of Class A, Class C, Class Y and Class R6 to 0.98%, 1.63%, 0.73% and 0.73%, respectively, of the Fund’s average daily net assets (the “expense limits”). In determining the Adviser’s obligation to waive advisory fees and/or reimburse expenses, the following expenses are not taken into account, and could cause the total annual fund operating expenses after fee waiver and/or reimbursement to exceed the numbers reflected above: (1) interest; (2) taxes; (3) dividend expense on short sales; (4) extraordinary or non-routine items, including litigation expenses; and (5) expenses that the Fund has incurred but did not actually pay because of an expense offset arrangement. Unless Invesco continues the fee waiver agreement, it will terminate on June 30, 2023. During its term, the fee waiver agreement cannot be terminated or amended to increase the expense limits or reduce the advisory fee waivers without approval of the Board of Trustees. The Adviser did not waive fees and/or reimburse expenses during the period under these expense limits.
| | |
| 19 | | Invesco New Jersey Municipal Fund |
The Trust has entered into a master administrative services agreement with Invesco pursuant to which the Fund has agreed to pay Invesco for certain administrative costs incurred in providing accounting services to the Fund. For the year ended February 28, 2023, expenses incurred under the agreement are shown in the Statement of Operations as Administrative services fees. Invesco has entered into a sub-administration agreement whereby State Street Bank and Trust Company (“SSB”) serves as fund accountant and provides certain administrative services to the Fund. Pursuant to a custody agreement with the Trust on behalf of the Fund, SSB also serves as the Fund’s custodian.
The Trust has entered into a transfer agency and service agreement with Invesco Investment Services, Inc. (“IIS”) pursuant to which the Fund has agreed to pay IIS a fee for providing transfer agency and shareholder services to the Fund and reimburse IIS for certain expenses incurred by IIS in the course of providing such services. IIS may make payments to intermediaries that provide omnibus account services, sub-accounting services and/or networking services. All fees payable by IIS to intermediaries that provide omnibus account services or sub-accounting services are charged back to the Fund, subject to certain limitations approved by the Trust’s Board of Trustees. For the year ended February 28, 2023, expenses incurred under the agreement are shown in the Statement of Operations as Transfer agent fees.
The Trust has entered into master distribution agreements with Invesco Distributors, Inc. (“IDI”) to serve as the distributor for the Class A, Class C, Class Y and Class R6 shares of the Fund. The Trust has adopted plans pursuant to Rule 12b-1 under the 1940 Act with respect to the Fund’s Class A and Class C shares (collectively, the “Plans”). The Fund, pursuant to the Class A Plan, reimburses IDI for its allocated share of expenses incurred for the period, up to a maximum annual rate of 0.25% of the average daily net assets of Class A shares. The Fund pursuant to the Class C Plan, pays IDI compensation at the annual rate of 0.90% of the average daily net assets of Class C shares. The fees are accrued daily and paid monthly. Of the Plan payments, up to 0.25% of the average daily net assets of each class of shares may be paid to furnish continuing personal shareholder services to customers who purchase and own shares of such classes. Any amounts not paid as a service fee under the Plans would constitute an asset-based sales charge. Rules of the Financial Industry Regulatory Authority (“FINRA”) impose a cap on the total sales charges, including asset-based sales charges, that may be paid by any class of shares of the Fund. For the year ended February 28, 2023, expenses incurred under the Plans are shown in the Statement of Operations as Distribution fees.
Front-end sales commissions and CDSC (collectively, the “sales charges”) are not recorded as expenses of the Fund. Front-end sales commissions are deducted from proceeds from the sales of Fund shares prior to investment in Class A shares of the Fund. CDSC are deducted from redemption proceeds prior to remittance to the shareholder. During the year ended February 28, 2023, IDI advised the Fund that IDI retained $11,905 in front-end sales commissions from the sale of Class A shares and $18,654 and $2,730 from Class A and Class C shares, respectively, for CDSC imposed upon redemptions by shareholders.
Certain officers and trustees of the Trust are officers and directors of the Adviser, IIS and/or IDI.
NOTE 3–Additional Valuation Information
GAAP defines fair value as the price that would be received to sell an asset or paid to transfer a liability in an orderly transaction between market participants at the measurement date, under current market conditions. GAAP establishes a hierarchy that prioritizes the inputs to valuation methods, giving the highest priority to readily available unadjusted quoted prices in an active market for identical assets (Level 1) and the lowest priority to significant unobservable inputs (Level 3), generally when market prices are not readily available. Based on the valuation inputs, the securities or other investments are tiered into one of three levels. Changes in valuation methods may result in transfers in or out of an investment’s assigned level:
| | |
| Level 1 – | | Prices are determined using quoted prices in an active market for identical assets. |
| Level 2 – | | Prices are determined using other significant observable inputs. Observable inputs are inputs that other market participants may use in pricing a security. These may include quoted prices for similar securities, interest rates, prepayment speeds, credit risk, yield curves, loss severities, default rates, discount rates, volatilities and others. |
| Level 3 – | | Prices are determined using significant unobservable inputs. In situations where quoted prices or observable inputs are unavailable (for example, when there is little or no market activity for an investment at the end of the period), unobservable inputs may be used. Unobservable inputs reflect the Adviser’s assumptions about the factors market participants would use in determining fair value of the securities or instruments and would be based on the best available information. |
The following is a summary of the tiered valuation input levels, as of February 28, 2023. The level assigned to the securities valuations may not be an indication of the risk or liquidity associated with investing in those securities. Because of the inherent uncertainties of valuation, the values reflected in the financial statements may materially differ from the value received upon actual sale of those investments.
| | | | | | | | | | | | | | | | |
| | | Level 1 | | | Level 2 | | | Level 3 | | | Total | |
|
| |
Investments in Securities | | | | | | | | | | | | | | | | |
|
| |
Municipal Obligations | | | $– | | | $ | 278,446,408 | | | | $– | | | $ | 278,446,408 | |
|
| |
Other Investments - Assets | | | | | | | | | | | | | | | | |
|
| |
Investments Matured | | | – | | | | 563,902 | | | | – | | | | 563,902 | |
|
| |
Total Investments | | | $– | | | $ | 279,010,310 | | | | $– | | | $ | 279,010,310 | |
|
| |
NOTE 4–Security Transactions with Affiliated Funds
The Fund is permitted to purchase securities from or sell securities to certain other affiliated funds under specified conditions outlined in procedures adopted by the Board of Trustees of the Trust. The procedures have been designed to ensure that any purchase or sale of securities by the Fund from or to another fund that is or could be considered an “affiliated person” by virtue of having a common investment adviser (or affiliated investment advisers), common Trustees and/or common officers is made in reliance on Rule 17a-7 of the 1940 Act and, to the extent applicable, related SEC staff positions. Each such transaction is effected at the security’s “current market price”, as provided for in these procedures and Rule 17a-7. Pursuant to these procedures, for the year ended February 28, 2023, the Fund engaged in securities purchases of $38,793,882 and securities sales of $22,579,293, which resulted in net realized gains (losses) of $(92,812).
NOTE 5–Expense Offset Arrangement(s)
The expense offset arrangement is comprised of transfer agency credits which result from balances in demand deposit accounts used by the transfer agent for clearing shareholder transactions. For the year ended February 28, 2023, the Fund received credits from this arrangement, which resulted in the reduction of the Fund’s total expenses of $696.
NOTE 6–Trustees’ and Officers’ Fees and Benefits
Trustees’ and Officers’ Fees and Benefits include amounts accrued by the Fund to pay remuneration to certain Trustees and Officers of the Fund. Trustees have the option to defer compensation payable by the Fund, and Trustees’ and Officers’ Fees and Benefits also include amounts accrued by the Fund to fund such deferred compensation amounts. Those Trustees who defer compensation have the option to select various Invesco Funds in which their deferral accounts shall be deemed to be invested. Finally, certain current Trustees were eligible to participate in a retirement plan that provided for benefits to be paid upon retirement to Trustees over a
| | |
| 20 | | Invesco New Jersey Municipal Fund |
period of time based on the number of years of service. The Fund may have certain former Trustees who also participate in a retirement plan and receive benefits under such plan. Trustees’ and Officers’ Fees and Benefits include amounts accrued by the Fund to fund such retirement benefits. Obligations under the deferred compensation and retirement plans represent unsecured claims against the general assets of the Fund.
NOTE 7–Cash Balances and Borrowings
The Fund has entered into a revolving credit and security agreement, which enables the Fund to participate with certain other Invesco Funds in a committed secured borrowing facility that permits borrowings up to $2.5 billion, collectively by certain Invesco Funds, and which will expire on February 22, 2024. The revolving credit and security agreement is secured by the assets of the Fund. The Fund is subject to certain covenants relating to the revolving credit and security agreement. Failure to comply with these restrictions could cause the acceleration of the repayment of the amount outstanding under the revolving credit and security agreement.
During the year ended February 28, 2023, the average daily balance of borrowing under the revolving credit and security agreement was $54,396 with an average interest rate of 3.62%. The carrying amount of the Fund’s payable for borrowings as reported on the Statement of Assets and Liabilities approximates its fair value. Expenses under the revolving credit and security agreement are shown in the Statement of Operations as Interest, facilities and maintenance fees.
Additionally, the Fund is permitted to temporarily carry a negative or overdrawn balance in its account with SSB, the custodian bank. Such balances, if any at period-end, are shown in the Statement of Assets and Liabilities under the payable caption Amount due custodian. To compensate the custodian bank for such overdrafts, the overdrawn Fund may either (1) leave funds as a compensating balance in the account so the custodian bank can be compensated by earning the additional interest; or (2) compensate by paying the custodian bank at a rate agreed upon by the custodian bank and Invesco, not to exceed the contractually agreed upon rate. The Fund may not purchase additional securities when any borrowings from banks or broker-dealers exceed 5% of the Fund’s total assets, or when any borrowings from an Invesco Fund are outstanding.
Inverse floating rate obligations resulting from the transfer of bonds to TOB Trusts are accounted for as secured borrowings. The average floating rate notes outstanding and average annual interest and fee rate related to inverse floating rate note obligations during the year ended February 28, 2023 were $3,750,000 and 2.44%, respectively.
NOTE 8–Distributions to Shareholders and Tax Components of Net Assets
Tax Character of Distributions to Shareholders Paid During the Fiscal Years Ended February 28, 2023 and 2022:
| | | | | | | | | | | | |
| | | 2023 | | | | | | 2022 | |
|
| |
Ordinary income* | | $ | 88,761 | | | | | | | $ | 16,829 | |
|
| |
Ordinary income-tax-exempt | | | 10,890,936 | | | | | | | | 9,964,860 | |
|
| |
Total distributions | | $ | 10,979,697 | | | | | | | $ | 9,981,689 | |
|
| |
| * | Includes short-term capital gain distributions, if any. |
Tax Components of Net Assets at Period-End:
| | | | |
| | | 2023 | |
|
| |
Undistributed tax-exempt income | | $ | 1,507,047 | |
|
| |
Net unrealized appreciation (depreciation) — investments | | | (5,593,112 | ) |
|
| |
Temporary book/tax differences | | | (58,809 | ) |
|
| |
Capital loss carryforward | | | (169,688,297 | ) |
|
| |
Shares of beneficial interest | | | 452,099,186 | |
|
| |
Total net assets | | $ | 278,266,015 | |
|
| |
The difference between book-basis and tax-basis unrealized appreciation (depreciation) is due to differences in the timing of recognition of gains and losses on investments for tax and book purposes. The Fund’s net unrealized appreciation (depreciation) difference is attributable primarily to wash sales, amortization and accretion on debt securities and defaulted bonds.
The temporary book/tax differences are a result of timing differences between book and tax recognition of income and/or expenses. The Fund’s temporary book/tax differences are the result of the trustee deferral of compensation and retirement plan benefits.
Capital loss carryforward is calculated and reported as of a specific date. Results of transactions and other activity after that date may affect the amount of capital loss carryforward actually available for the Fund to utilize. The ability to utilize capital loss carryforward in the future may be limited under the Internal Revenue Code and related regulations based on the results of future transactions.
The Fund has a capital loss carryforward as of February 28, 2023, as follows:
| | | | | | | | | | | | | | | | |
| | | Capital Loss Carryforward* | | | | | | | | | | |
|
| |
| Expiration | | | | | Short-Term | | | Long-Term | | | Total | |
|
| |
Not subject to expiration | | | | | | | $20,659,196 | | | | $149,029,101 | | | | $169,688,297 | |
|
| |
| * | Capital loss carryforward is reduced for limitations, if any, to the extent required by the Internal Revenue Code and may be further limited depending upon a variety of factors, including the realization of net unrealized gains or losses as of the date of any reorganization. |
NOTE 9–Investment Transactions
The aggregate amount of investment securities (other than short-term securities, U.S. Government obligations and money market funds, if any) purchased and sold by the Fund during the year ended February 28, 2023 was $108,074,711 and $81,246,632, respectively. Cost of investments, including any derivatives, on a tax basis includes the adjustments for financial reporting purposes as of the most recently completed federal income tax reporting period-end.
Unrealized Appreciation (Depreciation) of Investments on a Tax Basis
| | | | |
|
| |
Aggregate unrealized appreciation of investments | | $ | 4,730,852 | |
|
| |
Aggregate unrealized (depreciation) of investments | | | (10,323,964 | ) |
|
| |
Net unrealized appreciation (depreciation) of investments | | $ | (5,593,112 | ) |
|
| |
| | |
| 21 | | Invesco New Jersey Municipal Fund |
Cost of investments for tax purposes is $284,603,422.
NOTE 10–Reclassification of Permanent Differences
Primarily as a result of differing book/tax treatment of defaulted bonds, on February 28, 2023, undistributed net investment income was increased by $2,529,653, undistributed net realized gain (loss) was decreased by $2,367,605 and shares of beneficial interest was decreased by $162,048. This reclassification had no effect on the net assets of the Fund.
NOTE 11–Share Information
| | | | | | | | | | | | | | | | |
| | | Summary of Share Activity | |
|
| |
| | |
| | | Year ended | | | Year ended | |
| | | February 28, 2023(a) | | | February 28, 2022 | |
| | | Shares | | | Amount | | | Shares | | | Amount | |
|
| |
Sold: | | | | | | | | | | | | | | | | |
Class A | | | 2,896,418 | | | $ | 26,051,148 | | | | 3,587,004 | | | $ | 36,028,005 | |
|
| |
Class C | | | 723,328 | | | | 6,481,812 | | | | 595,943 | | | | 6,017,394 | |
|
| |
Class Y | | | 5,229,988 | | | | 46,964,060 | | | | 2,205,140 | | | | 22,232,581 | |
|
| |
Class R6 | | | 4,107 | | | | 36,754 | | | | – | | | | – | |
|
| |
| | | | |
Issued as reinvestment of dividends: | | | | | | | | | | | | | | | | |
Class A | | | 523,167 | | | | 4,674,690 | | | | 450,974 | | | | 4,525,170 | |
|
| |
Class C | | | 51,339 | | | | 459,417 | | | | 45,643 | | | | 458,707 | |
|
| |
Class Y | | | 159,794 | | | | 1,426,384 | | | | 97,799 | | | | 981,583 | |
|
| |
Class R6 | | | 8 | | | | 72 | | | | – | | | | – | |
|
| |
| | | | |
Automatic conversion of Class C shares to Class A shares: | | | | | | | | | | | | | | | | |
Class A | | | 167,972 | | | | 1,513,718 | | | | 253,848 | | | | 2,550,974 | |
|
| |
Class C | | | (167,751 | ) | | | (1,513,718 | ) | | | (253,509 | ) | | | (2,550,974 | ) |
|
| |
| | | | |
Reacquired: | | | | | | | | | | | | | | | | |
Class A | | | (3,823,857 | ) | | | (34,206,703 | ) | | | (2,140,304 | ) | | | (21,477,180 | ) |
|
| |
Class C | | | (539,024 | ) | | | (4,835,863 | ) | | | (210,930 | ) | | | (2,131,973 | ) |
|
| |
Class Y | | | (2,411,456 | ) | | | (21,610,947 | ) | | | (956,381 | ) | | | (9,567,931 | ) |
|
| |
Net increase in share activity | | | 2,814,033 | | | $ | 25,440,824 | | | | 3,675,227 | | | $ | 37,066,356 | |
|
| |
| (a) | There are entities that are record owners of more than 5% of the outstanding shares of the Fund and in the aggregate own 60% of the outstanding shares of the Fund. IDI has an agreement with these entities to sell Fund shares. The Fund, Invesco and/or Invesco affiliates may make payments to these entities, which are considered to be related to the Fund, for providing services to the Fund, Invesco and/or Invesco affiliates including but not limited to services such as securities brokerage, distribution, third party record keeping and account servicing. The Fund has no knowledge as to whether all or any portion of the shares owned of record by these entities are also owned beneficially. |
| | |
| 22 | | Invesco New Jersey Municipal Fund |
Report of Independent Registered Public Accounting Firm
To the Board of Trustees of AIM Tax-Exempt Funds (Invesco Tax-Exempt Funds) and Shareholders of Invesco New Jersey Municipal Fund
Opinion on the Financial Statements
We have audited the accompanying statement of assets and liabilities, including the schedule of investments, of Invesco New Jersey Municipal Fund (one of the funds constituting AIM Tax-Exempt Funds (Invesco Tax-Exempt Funds), referred to hereafter as the “Fund”) as of February 28, 2023, the related statement of operations for the year ended February 28, 2023, the statement of changes in net assets for each of the two years in the period ended February 28, 2023, including the related notes, and the financial highlights for each of the periods indicated in the table below (collectively referred to as the “financial statements”). In our opinion, the financial statements present fairly, in all material respects, the financial position of the Fund as of February 28, 2023, the results of its operations for the year then ended, the changes in its net assets for each of the two years in the period ended February 28, 2023 and the financial highlights for each of the periods indicated in the table below, in conformity with accounting principles generally accepted in the United States of America.
|
| Financial Highlights |
For each of the three years in the period ended February 28, 2023, the seven months ended February 29, 2020 and the year ended July 31, 2019 for Class A, Class C and Class Y. For each of the three years in the period ended February 28, 2023, the seven months ended February 29, 2020 and the period May 24, 2019 (commencement date) through July 31, 2019 for Class R6. |
The financial statements of Oppenheimer Rochester® New Jersey Municipal Fund (subsequently renamed Invesco New Jersey Municipal Fund) as of and for the year ended July 31, 2018 and the financial highlights for the year ended July 31, 2018 (not presented herein, other than the financial highlights) were audited by other auditors whose report dated September 27, 2018 expressed an unqualified opinion on those financial statements and financial highlights.
Basis for Opinion
These financial statements are the responsibility of the Fund’s management. Our responsibility is to express an opinion on the Fund’s financial statements based on our audits. We are a public accounting firm registered with the Public Company Accounting Oversight Board (United States) (PCAOB) and are required to be independent with respect to the Fund in accordance with the U.S. federal securities laws and the applicable rules and regulations of the Securities and Exchange Commission and the PCAOB.
We conducted our audits of these financial statements in accordance with the standards of the PCAOB. Those standards require that we plan and perform the audit to obtain reasonable assurance about whether the financial statements are free of material misstatement, whether due to error or fraud.
Our audits included performing procedures to assess the risks of material misstatement of the financial statements, whether due to error or fraud, and performing procedures that respond to those risks. Such procedures included examining, on a test basis, evidence regarding the amounts and disclosures in the financial statements. Our audits also included evaluating the accounting principles used and significant estimates made by management, as well as evaluating the overall presentation of the financial statements. Our procedures included confirmation of securities owned as of February 28, 2023 by correspondence with the custodian and brokers. We believe that our audits provide a reasonable basis for our opinion.
/s/PricewaterhouseCoopers LLP
Houston, Texas
April 21, 2023
We have served as the auditor of one or more of the investment companies in the Invesco group of investment companies since at least 1995. We have not been able to determine the specific year we began serving as auditor.
| | |
| 23 | | Invesco New Jersey Municipal Fund |
Calculating your ongoing Fund expenses
Example
As a shareholder of the Fund, you incur two types of costs: (1) transaction costs, which may include sales charges (loads) on purchase payments or contingent deferred sales charges on redemptions, if any; and (2) ongoing costs, including management fees, distribution and/or service (12b-1) fees, and other Fund expenses. This example is intended to help you understand your ongoing costs (in dollars) of investing in the Fund and to compare these costs with ongoing costs of investing in other mutual funds. The example is based on an investment of $1,000 invested at the beginning of the period and held for the entire period September 1, 2022 through February 28, 2023.
Actual expenses
The table below provides information about actual account values and actual expenses. You may use the information in this table, together with the amount you invested, to estimate the expenses that you paid over the period. Simply divide your account value by $1,000 (for example, an $8,600 account value divided by $1,000 = 8.6), then multiply the result by the number in the table under the heading entitled “Actual Expenses Paid During Period” to estimate the expenses you paid on your account during this period.
Hypothetical example for comparison purposes
The table below also provides information about hypothetical account values and hypothetical expenses based on the Fund’s actual expense ratio and an assumed rate of return of 5% per year before expenses, which is not the Fund’s actual return.
The hypothetical account values and expenses may not be used to estimate the actual ending account balance or expenses you paid for the period. You may use this information to compare the ongoing costs of investing in the Fund and other funds. To do so, compare this 5% hypothetical example with the 5% hypothetical examples that appear in the shareholder reports of the other funds.
Please note that the expenses shown in the table are meant to highlight your ongoing costs only and do not reflect any transaction costs, such as sales charges (loads) on purchase payments or contingent deferred sales charges on redemptions, if any. Therefore, the hypothetical information is useful in comparing ongoing costs only, and will not help you determine the relative total costs of owning different funds. In addition, if these transaction costs were included, your costs would have been higher.
| | | | | | | | | | | | | | | | | | | | | | | | | | | | | | |
| | | | | ACTUAL | | HYPOTHETICAL
(5% annual return before expenses) | | |
| | Beginning
Account Value
(09/01/22) | | Ending
Account Value
(02/28/23)1 | | Expenses
Paid During
Period2 | | Ending
Account Value
(02/28/23) | | Expenses
Paid During
Period2 | | Annualized
Expense Ratio |
Class A | | | $ | 1,000.00 | | | | $ | 1,001.90 | | | | $ | 5.26 | | | | $ | 1,019.54 | | | | $ | 5.31 | | | | | 1.06 | % |
Class C | | | | 1,000.00 | | | | | 998.60 | | | | | 8.47 | | | | | 1,016.31 | | | | | 8.55 | | | | | 1.71 | |
Class Y | | | | 1,000.00 | | | | | 1,003.20 | | | | | 4.02 | | | | | 1,020.78 | | | | | 4.06 | | | | | 0.81 | |
Class R6 | | | | 1,000.00 | | | | | 1,003.40 | | | | | 3.73 | | | | | 1,021.08 | | | | | 3.76 | | | | | 0.75 | |
| 1 | The actual ending account value is based on the actual total return of the Fund for the period September 1, 2022 through February 28, 2023, after actual expenses and will differ from the hypothetical ending account value which is based on the Fund’s expense ratio and a hypothetical annual return of 5% before expenses. |
| 2 | Expenses are equal to the Fund’s annualized expense ratio as indicated above multiplied by the average account value over the period, multiplied by 181/365 to reflect the most recent fiscal half year. |
| | |
| 24 | | Invesco New Jersey Municipal Fund |
Tax Information
Form 1099-DIV, Form 1042-S and other year–end tax information provide shareholders with actual calendar year amounts that should be included in their tax returns. Shareholders should consult their tax advisers.
The following distribution information is being provided as required by the Internal Revenue Code or to meet a specific state’s requirement.
The Fund designates the following amounts or, if subsequently determined to be different, the maximum amount allowable for its fiscal year ended February 28, 2023:
| | | | | | |
| | | Federal and State Income Tax | | | |
| | Qualified Dividend Income* | | | 0.00 | % |
| | Corporate Dividends Received Deduction* | | | 0.00 | % |
| | U.S. Treasury Obligations* | | | 0.00 | % |
| | Qualified Business Income* | | | 0.00 | % |
| | Business Interest Income* | | | 0.00 | % |
| | Tax-Exempt Interest Dividends* | | | 99.19 | % |
| | * | The above percentages are based on ordinary income dividends paid to shareholders during the Fund’s fiscal year. |
| | |
| 25 | | Invesco New Jersey Municipal Fund |
Trustees and Officers
The address of each trustee and officer is AIM Tax-Exempt Funds (Invesco Tax-Exempt Funds) (the “Trust”), 11 Greenway Plaza, Suite 1000, Houston, Texas 77046-1173. The trustees serve for the life of the Trust, subject to their earlier death, incapacitation, resignation, retirement or removal as more specifically provided in the Trust’s organizational documents. Each officer serves for a one year term or until their successors are elected and qualified. Column two below includes length of time served with predecessor entities, if any.
| | | | | | | | |
Name, Year of Birth and Position(s) Held with the Trust | | Trustee and/or
Officer Since | | Principal Occupation(s) During Past 5 Years | | Number of Funds in Fund Complex
Overseen by
Trustee | | Other Directorship(s) Held by Trustee
During Past 5 Years |
| Interested Trustee | | | | | | | | |
| Martin L. Flanagan1 – 1960 Trustee and Vice Chair | | 2007 | | Executive Director, Chief Executive Officer and President, Invesco Ltd. (ultimate parent of Invesco and a global investment management firm); Trustee and Vice Chair, The Invesco Funds; Vice Chair, Investment Company Institute; and Member of Executive Board, SMU Cox School of Business Formerly: Advisor to the Board, Invesco Advisers, Inc. (formerly known as Invesco Institutional (N.A.), Inc.); Chairman and Chief Executive Officer, Invesco Advisers, Inc. (registered investment adviser); Director, Chairman, Chief Executive Officer and President, Invesco Holding Company (US), Inc. (formerly IVZ Inc.) (holding company), Invesco Group Services, Inc. (service provider) and Invesco North American Holdings, Inc. (holding company); Director, Chief Executive Officer and President, Invesco Holding Company Limited (parent of Invesco and a global investment management firm); Director, Invesco Ltd.; Chairman, Investment Company Institute and President, Co-Chief Executive Officer, Co-President, Chief Operating Officer and Chief Financial Officer, Franklin Resources, Inc. (global investment management organization) | | 175 | | None |
| 1 | Mr. Flanagan is considered an interested person (within the meaning of Section 2(a)(19) of the 1940 Act) of the Trust because he is an officer of the Adviser to the Trust, and an officer and a director of Invesco Ltd., ultimate parent of the Adviser. |
| | |
| T-1 | | Invesco New Jersey Municipal Fund |
Trustees and Officers–(continued)
| | | | | | | | |
Name, Year of Birth and
Position(s) Held with the Trust | | Trustee and/or Officer Since | | Principal Occupation(s) During Past 5 Years | | Number of Funds in Fund Complex
Overseen by
Trustee | | Other Directorship(s) Held by Trustee During Past 5 Years |
| Independent Trustees | | | | | | |
| Beth Ann Brown – 1968 Trustee (2019) and Chair (August 2022) | | 2019 | | Independent Consultant Formerly: Head of Intermediary Distribution, Managing Director, Strategic Relations, Managing Director, Head of National Accounts, Senior Vice President, National Account Manager and Senior Vice President, Key Account Manager, Columbia Management Investment Advisers LLC; Vice President, Key Account Manager, Liberty Funds Distributor, Inc.; and Trustee of certain Oppenheimer Funds | | 175 | | Director, Board of Directors of Caron Engineering Inc.; Advisor, Board of Advisors of Caron Engineering Inc.; President and Director, Acton Shapleigh Youth Conservation Corps (non-profit) Formerly: President and Director Director of Grahamtastic Connection (non-profit) |
| Cynthia Hostetler – 1962 Trustee | | 2017 | | Non-Executive Director and Trustee of a number of public and private business corporations Formerly: Director, Aberdeen Investment Funds (4 portfolios); Director, Artio Global Investment LLC (mutual fund complex); Director, Edgen Group, Inc. (specialized energy and infrastructure products distributor); Director, Genesee & Wyoming, Inc. (railroads); Head of Investment Funds and Private Equity, Overseas Private Investment Corporation; President, First Manhattan Bancorporation, Inc.; and Attorney, Simpson Thacher & Bartlett LLP | | 175 | | Resideo Technologies, Inc. (smart home technology); Vulcan Materials Company (construction materials company); Trilinc Global Impact Fund; Textainer Group Holdings, (shipping container leasing company); Investment Company Institute (professional organization); and Independent Directors Council (professional organization) |
Eli Jones – 1961 Trustee | | 2016 | | Professor and Dean Emeritus, Mays Business School – Texas A&M University Formerly: Dean of Mays Business School-Texas A&M University; Professor and Dean, Walton College of Business, University of Arkansas and E.J. Ourso College of Business, Louisiana State University; and Director, Arvest Bank | | 175 | | Insperity, Inc. (formerly known as Administaff) (human resources provider); Board Member of the regional board, First Financial Bank Texas; and Boad Member, First Financial Bankshares, Inc. Texas (FFIN) |
Elizabeth Krentzman – 1959
Trustee | | 2019 | | Formerly: Principal and Chief Regulatory Advisor for Asset Management Services and U.S. Mutual Fund Leader of Deloitte & Touche LLP; General Counsel of the Investment Company Institute (trade association); National Director of the Investment Management Regulatory Consulting Practice, Principal, Director and Senior Manager of Deloitte & Touche LLP; Assistant Director of the Division of Investment Management – Office of Disclosure and Investment Adviser Regulation of the U.S. Securities and Exchange Commission and various positions with the Division of Investment Management – Office of Regulatory Policy of the U.S. Securities and Exchange Commission; Associate at Ropes & Gray LLP; and Trustee of certain Oppenheimer Funds | | 175 | | Formerly: Member of the Cartica Funds Board of Directors (private investment fund); Trustee of the University of Florida National Board Foundation; and Member of the University of Florida Law Center Association, Inc. Board of Trustees, Audit Committee and Membership Committee |
| Anthony J. LaCava, Jr. – 1956 Trustee | | 2019 | | Formerly: Director and Member of the Audit Committee, Blue Hills Bank (publicly traded financial institution) and Managing Partner, KPMG LLP | | 175 | | Blue Hills Bank; Member and Chairman, Bentley University, Business School Advisory Council; and Nominating Committee, KPMG LLP |
| Prema Mathai-Davis – 1950 Trustee | | 1998 | | Retired Formerly: Co-Founder & Partner of Quantalytics Research, LLC, (a FinTech Investment Research Platform for the Self-Directed Investor); Trustee of YWCA Retirement Fund; CEO of YWCA of the USA; Board member of the NY Metropolitan Transportation Authority; Commissioner of the NYC Department of Aging; and Board member of Johns Hopkins Bioethics Institute | | 175 | | Member of Board of Positive Planet US (non-profit) and HealthCare Chaplaincy Network (non-profit) |
| | |
| T-2 | | Invesco New Jersey Municipal Fund |
Trustees and Officers–(continued)
| | | | | | | | |
Name, Year of Birth and
Position(s) Held with the Trust | | Trustee and/or Officer Since | | Principal Occupation(s) During Past 5 Years | | Number of Funds in Fund Complex
Overseen by
Trustee | | Other Directorship(s) Held by Trustee During Past 5 Years |
| Independent Trustees–(continued) | | | | |
Joel W. Motley – 1952 Trustee | | 2019 | | Director of Office of Finance, Federal Home Loan Bank System; Managing Director of Carmona Motley Inc. (privately held financial advisor); Member of the Council on Foreign Relations and its Finance and Budget Committee; Chairman Emeritus of Board of Human Rights Watch and Member of its Investment Committee; and Member of Investment Committee Board of Historic Hudson Valley (non-profit cultural organization); Member of the Board, Blue Ocean Acquisition Corp.; and Member of the Vestry and the Investment Committee of Trinity Church Wall Street. Formerly: Managing Director of Public Capital Advisors, LLC (privately held financial advisor); Managing Director of Carmona Motley Hoffman, Inc. (privately held financial advisor); Trustee of certain Oppenheimer Funds; and Director of Columbia Equity Financial Corp. (privately held financial advisor) | | 175 | | Member of Board of Trust for Mutual Understanding (non-profit promoting the arts and environment); Member of Board of Greenwall Foundation (bioethics research foundation) and its Investment Committee; Member of Board of Friends of the LRC (non- profit legal advocacy); and Board Member and Investment Committee Member of Pulitzer Center for Crisis Reporting (non-profit journalism) |
Teresa M. Ressel – 1962 Trustee | | 2017 | | Non-executive director and trustee of a number of public and private business corporations Formerly: Chief Executive Officer, UBS Securities LLC (investment banking); Chief Operating Officer, UBS AG Americas (investment banking); Sr. Management Team Olayan America, The Olayan Group (international investor/commercial/industrial); and Assistant Secretary for Management & Budget and Designated Chief Financial Officer, U.S. Department of Treasury | | 175 | | None |
Robert C. Troccoli – 1949 Trustee | | 2016 | | Retired Formerly: Adjunct Professor, University of Denver – Daniels College of Business; and Managing Partner, KPMG LLP | | 175 | | None |
Daniel S. Vandivort – 1954 Trustee | | 2019 | | President, Flyway Advisory Services LLC (consulting and property management) Formerly: President and Chief Investment Officer, previously Head of Fixed Income, Weiss Peck and Greer/Robeco Investment Management; Trustee and Chair, Weiss Peck and Greer Funds Board; and various capacities at CS First Boston including Head of Fixed Income at First Boston Asset Management. | | 175 | | Formerly: Trustee and Governance Chair, Oppenheimer Funds; Treasurer, Chairman of the Audit and Finance Committee, Huntington Disease Foundation of America |
| | |
| T-3 | | Invesco New Jersey Municipal Fund |
Trustees and Officers–(continued)
| | | | | | | | |
Name, Year of Birth and
Position(s)
Held with the Trust | | Trustee and/or
Officer Since | | Principal Occupation(s) During Past 5 Years | | Number of Funds in Fund Complex
Overseen by
Trustee | | Other Directorship(s) Held by Trustee During Past 5
Years |
| Officers | | | | | | | | |
| Sheri Morris – 1964 President and Principal Executive Officer | | 1999 | | Director, Invesco Trust Company; Head of Global Fund Services, Invesco Ltd.; President and Principal Executive Officer, The Invesco Funds; Vice President, Invesco Exchange-Traded Fund Trust, Invesco Exchange-Traded Fund Trust II, Invesco India Exchange-Traded Fund Trust, Invesco Actively Managed Exchange-Traded Fund Trust, Invesco Actively Managed Exchange-Traded Commodity Fund Trust and Invesco Exchange-Traded Self-Indexed Fund Trust; and Vice President, OppenheimerFunds, Inc. Formerly: Vice President, Treasurer and Principal Financial Officer, The Invesco Funds; Vice President, Invesco AIM Advisers, Inc., Invesco AIM Capital Management, Inc. and Invesco AIM Private Asset Management, Inc.; Assistant Vice President and Assistant Treasurer, The Invesco Funds; Vice President and Assistant Vice President, Invesco Advisers, Inc.; Assistant Vice President, Invesco AIM Capital Management, Inc. and Invesco AIM Private Asset Management, Inc.; Treasurer, Invesco Exchange-Traded Fund Trust, Invesco Exchange-Traded Fund Trust II, Invesco India Exchange-Traded Fund Trust and Invesco Actively Managed Exchange-Traded Fund Trust; and Senior Vice President, Invesco Advisers, Inc. (formerly known as Invesco Institutional (N.A.), Inc.) (registered investment adviser) | | N/A | | N/A |
| Melanie Ringold – 1975 Senior Vice President, Chief Legal Officer and Secretary | | 2023 | | Head of Legal of the Americas, Invesco Ltd.; Senior Vice President and Secretary, Invesco Advisers, Inc. (formerly known as Invesco Institutional (N.A.), Inc.) (registered investment adviser); Secretary, Invesco Distributors, Inc. (formerly known as Invesco AIM Distributors, Inc.); Secretary, Invesco Investment Services, Inc. (formerly known as Invesco AIM Investment Services, Inc.); Senior Vice President, Chief Legal Officer and Secretary, The Invesco Funds; Secretary, Invesco Investment Advisers LLC, Invesco Capital Markets, Inc.; Chief Legal Officer, Invesco Exchange-Traded Fund Trust, Invesco Exchange-Traded Fund Trust II, Invesco India Exchange-Traded Fund Trust, Invesco Actively Managed Exchange-Traded Fund Trust, Invesco Actively Managed Exchange-Traded Commodity Fund Trust and Invesco Exchange-Traded Self-Indexed Fund Trust;Secretary and Vice President, Harbourview Asset Management Corporation; Secretary and Senior Vice President, OppenheimerFunds, Inc. and Invesco Managed Accounts, LLC; Secretary and Senior Vice President, OFI SteelPath, Inc.; Secretary and Senior Vice President, Oppenheimer Acquisition Corp.; Secretary, SteelPath Funds Remediation LLC; and Secretary and Senior Vice President, Trinity Investment Management Corporation Formerly: Assistant Secretary, Invesco Distributors, Inc.; Invesco Advisers, Inc. Invesco Investment Services, Inc., Invesco Capital Markets, Inc., Invesco Capital Management LLC and Invesco Investment Advisers LLC; and Assistant Secretary and Investment Vice President, Invesco Funds | | N/A | | N/A |
Andrew R. Schlossberg – 1974 Senior Vice President | | 2019 | | Senior Vice President, Invesco Group Services, Inc.; Head of the Americas and Senior Managing Director, Invesco Ltd.; Director and Senior Vice President, Invesco Advisers, Inc. (formerly known as Invesco Institutional (N.A.), Inc.) (registered investment adviser); Director and Chairman, Invesco Investment Services, Inc. (formerly known as Invesco AIM Investment Services, Inc.) (registered transfer agent); Senior Vice President, The Invesco Funds; and Director, Invesco Investment Advisers LLC (formerly known as Van Kampen Asset Management) Formerly: Director, President and Chairman, Invesco Insurance Agency, Inc.; Director, Invesco UK Limited; Director and Chief Executive, Invesco Asset Management Limited and Invesco Fund Managers Limited; Assistant Vice President, The Invesco Funds; Senior Vice President, Invesco Advisers, Inc. (formerly known as Invesco Institutional (N.A.), Inc.) (registered investment adviser); Director and Chief Executive, Invesco Administration Services Limited and Invesco Global Investment Funds Limited; Director, Invesco Distributors, Inc.; Head of EMEA, Invesco Ltd.; President, Invesco Actively Managed Exchange-Traded Commodity Fund Trust, Invesco Actively Managed Exchange-Traded Fund Trust, Invesco Exchange-Traded Fund Trust, Invesco Exchange-Traded Fund Trust II and Invesco India Exchange-Traded Fund Trust; and Managing Director and Principal Executive Officer, Invesco Capital Management LLC | | N/A | | N/A |
| | |
| T-4 | | Invesco New Jersey Municipal Fund |
Trustees and Officers–(continued)
| | | | | | | | |
Name, Year of Birth and
Position(s) Held with the Trust | | Trustee and/or Officer Since | | Principal Occupation(s) During Past 5 Years | | Number of Funds in Fund Complex
Overseen by
Trustee | | Other Directorship(s) Held by Trustee During Past 5 Years |
| Officers–(continued) | | | | | | | | |
John M. Zerr – 1962
Senior Vice President | | 2006 | | Chief Operating Officer of the Americas; Senior Vice President, Invesco Advisers, Inc. (formerly known as Invesco Institutional (N.A.), Inc.) (registered investment adviser); Senior Vice President, Invesco Distributors, Inc. (formerly known as Invesco AIM Distributors, Inc.); Director and Vice President, Invesco Investment Services, Inc. (formerly known as Invesco AIM Investment Services, Inc.) Senior Vice President, The Invesco Funds; Managing Director, Invesco Capital Management LLC; Director, Invesco Investment Advisers LLC (formerly known as Van Kampen Asset Management); Senior Vice President, Invesco Capital Markets, Inc. (formerly known as Van Kampen Funds Inc.); Manager, Invesco Indexing LLC; Manager, Invesco Specialized Products, LLC; Member, Invesco Canada Funds Advisory Board; Director, President and Chief Executive Officer, Invesco Corporate Class Inc. (corporate mutual fund company); and Director, Chairman, President and Chief Executive Officer, Invesco Canada Ltd. (formerly known as Invesco Trimark Ltd./Invesco Trimark Ltèe) (registered investment adviser and registered transfer agent); President, Invesco, Inc.; President, Invesco Global Direct Real Estate Feeder GP Ltd.; President, Invesco IP Holdings (Canada) Ltd; President, Invesco Global Direct Real Estate GP Ltd.; President, Invesco Financial Services Ltd. / Services Financiers Invesco Ltée; and Director and Chairman, Invesco Trust Company Formerly: President, Trimark Investments Ltd/Services Financiers Invesco Ltee; Director and Senior Vice President, Invesco Insurance Agency, Inc.; Director and Senior Vice President, Invesco Management Group, Inc. (formerly known as Invesco AIM Management Group, Inc.); Secretary and General Counsel, Invesco Management Group, Inc. (formerly known as Invesco AIM Management Group, Inc.); Secretary, Invesco Investment Services, Inc. (formerly known as Invesco AIM Investment Services, Inc.); Chief Legal Officer and Secretary, The Invesco Funds; Secretary and General Counsel, Invesco Investment Advisers LLC (formerly known as Van Kampen Asset Management); Secretary and General Counsel, Invesco Capital Markets, Inc. (formerly known as Van Kampen Funds Inc.); Chief Legal Officer, Invesco Exchange-Traded Fund Trust, Invesco Exchange-Traded Fund Trust II, Invesco India Exchange-Traded Fund Trust, Invesco Actively Managed Exchange-Traded Fund Trust, Invesco Actively Managed Exchange-Traded Commodity Fund Trust and Invesco Exchange-Traded Self-Indexed Fund Trust; Secretary, Invesco Indexing LLC; Director, Secretary, General Counsel and Senior Vice President, Van Kampen Exchange Corp.; Director, Vice President and Secretary, IVZ Distributors, Inc. (formerly known as INVESCO Distributors, Inc.); Director and Vice President, INVESCO Funds Group, Inc.; Director and Vice President, Van Kampen Advisors Inc.; Director, Vice President, Secretary and General Counsel, Van Kampen Investor Services Inc.;Director and Secretary, Invesco Distributors, Inc. (formerly known as Invesco AIM Distributors, Inc.); Director, Senior Vice President, General Counsel and Secretary, Invesco AIM Advisers, Inc. and Van Kampen Investments Inc.; Director, Vice President and Secretary, Fund Management Company; Director, Senior Vice President, Secretary, General Counsel and Vice President, Invesco AIM Capital Management, Inc.; and Chief Operating Officer and General Counsel, Liberty Ridge Capital, Inc. (an investment adviser) | | N/A | | N/A |
| Gregory G. McGreevey – 1962 Senior Vice President | | 2012 | | Senior Managing Director, Invesco Ltd.; Director, Chairman, President, and Chief Executive Officer, Invesco Advisers, Inc. (formerly known as Invesco Institutional (N.A.), Inc.) (registered investment adviser); Director, Invesco Mortgage Capital, Inc. and Invesco Senior Secured Management, Inc.; Senior Vice President, The Invesco Funds; President, SNW Asset Management Corporation and Invesco Managed Accounts, LLC; Chairman and Director, Invesco Private Capital, Inc.; Chairman and Director, INVESCO Private Capital Investments, Inc.; Chairman and Director, INVESCO Realty, Inc.; and Senior Vice President, Invesco Group Services, Inc. Formerly: Senior Vice President, Invesco Management Group, Inc. and Invesco Advisers, Inc.; Assistant Vice President, The Invesco Funds | | N/A | | N/A |
| Adrien Deberghes – 1967 Principal Financial Officer, Treasurer and Vice President | | 2020 | | Head of the Fund Office of the CFO and Fund Administration; Vice President, Invesco Advisers, Inc.; Principal Financial Officer, Treasurer and Vice President, The Invesco Funds; Vice President, Invesco Exchange-Traded Fund Trust, Invesco Exchange-Traded Fund Trust II, Invesco India Exchange-Traded Fund Trust, Invesco Actively Managed Exchange-Traded Fund Trust, Invesco Actively Managed Exchange-Traded Commodity Fund Trust and Invesco Exchange-Traded Self-Indexed Fund Trust Formerly: Senior Vice President and Treasurer, Fidelity Investments | | N/A | | N/A |
| Crissie M. Wisdom – 1969 Anti-Money Laundering Compliance Officer | | 2013 | | Anti-Money Laundering and OFAC Compliance Officer for Invesco U.S. entities including: Invesco Advisers, Inc. and its affiliates, Invesco Capital Markets, Inc., Invesco Distributors, Inc., Invesco Investment Services, Inc., The Invesco Funds, Invesco Capital Management, LLC, Invesco Trust Company; and Fraud Prevention Manager for Invesco Investment Services, Inc. | | N/A | | N/A |
| | |
| T-5 | | Invesco New Jersey Municipal Fund |
Trustees and Officers–(continued)
| | | | | | | | |
Name, Year of Birth and
Position(s) Held with the Trust | | Trustee and/or Officer Since | | Principal Occupation(s) During Past 5 Years | | Number of Funds in Fund Complex
Overseen by
Trustee | | Other Directorship(s) Held by Trustee During Past 5 Years |
| Officers–(continued) | | | | | | | | |
Todd F. Kuehl – 1969 Chief Compliance Officer and Senior Vice President | | 2020 | | Chief Compliance Officer, Invesco Advisers, Inc. (registered investment adviser); and Chief Compliance Officer and Senior Vice President, The Invesco Funds Formerly: Managing Director and Chief Compliance Officer, Legg Mason (Mutual Funds); Chief Compliance Officer, Legg Mason Private Portfolio Group (registered investment adviser) | | N/A | | N/A |
James Bordewick, Jr. – 1959 Senior Vice President and Senior Officer | | 2022 | | Senior Vice President and Senior Officer, The Invesco Funds Formerly: Chief Legal Officer, KingsCrowd, Inc. (research and analytical platform for investment in private capital markets); Chief Operating Officer and Head of Legal and Regulatory, Netcapital (private capital investment platform); Managing Director, General Counsel of asset management and Chief Compliance Officer for asset management and private banking, Bank of America Corporation; Chief Legal Officer, Columbia Funds and BofA Funds; Senior Vice President and Associate General Counsel, MFS Investment Management; Chief Legal Officer, MFS Funds; Associate, Ropes & Gray; and Associate, Gaston Snow & Ely Bartlett | | N/A | | N/A |
The Statement of Additional Information of the Trust includes additional information about the Fund’s Trustees and is available upon request, without charge, by calling 1.800.959.4246. Please refer to the Fund’s Statement of Additional Information for information on the Fund’s sub-advisers.
| | | | | | |
| Office of the Fund | | Investment Adviser | | Distributor | | Auditors |
| 11 Greenway Plaza, Suite 1000 | | Invesco Advisers, Inc. | | Invesco Distributors, Inc. | | PricewaterhouseCoopers LLP |
| Houston, TX 77046-1173 | | 1331 Spring Street, NW, Suite 2500 | | 11 Greenway Plaza, Suite 1000 | | 1000 Louisiana Street, Suite 5800 |
| | Atlanta, GA 30309 | | Houston, TX 77046-1173 | | Houston, TX 77002-5021 |
| | | |
| Counsel to the Fund | | Counsel to the Independent Trustees | | Transfer Agent | | Custodian |
| Stradley Ronon Stevens & Young, LLP | | Sidley Austin LLP | | Invesco Investment Services, Inc. | | State Street Bank and Trust Company |
| 2005 Market Street, Suite 2600 | | 787 Seventh Avenue | | 11 Greenway Plaza, Suite 1000 | | 225 Franklin Street |
| Philadelphia, PA 19103-7018 | | New York, NY 10019 | | Houston, TX 77046-1173 | | Boston, MA 02110-2801 |
| | |
| T-6 | | Invesco New Jersey Municipal Fund |

Go paperless with eDelivery
Visit invesco.com/edelivery to enjoy the convenience and security of anytime electronic access to your investment documents.
With eDelivery, you can elect to have any or all of the following materials delivered straight to your inbox to download, save and print from your own computer:
| ∎ | | Fund reports and prospectuses |
Invesco mailing information
Send general correspondence to Invesco Investment Services, Inc., P.O. Box 219078, Kansas City, MO 64121-9078.
Important notice regarding delivery of security holder documents
To reduce Fund expenses, only one copy of most shareholder documents may be mailed to shareholders with multiple accounts at the same address (Householding). Mailing of your shareholder documents may be householded indefinitely unless you instruct us otherwise. If you do not want the mailing of these documents to be combined with those for other members of your household, please contact Invesco Investment Services, Inc. at 800 959 4246 or contact your financial institution. We will begin sending you individual copies for each account within 30 days after receiving your request.
Fund holdings and proxy voting information
The Fund provides a complete list of its portfolio holdings four times each year, at the end of each fiscal quarter. For the second and fourth quarters, the list appears, respectively, in the Fund’s semiannual and annual reports to shareholders. For the first and third quarters, the Fund files the list with the Securities and Exchange Commission (SEC) as an exhibit to its reports on Form N-PORT. The most recent list of portfolio holdings is available at invesco.com/completeqtrholdings. Shareholders can also look up the Fund’s Form N-PORT filings on the SEC website, sec.gov. The SEC file numbers for the Fund are shown below.
A description of the policies and procedures that the Fund uses to determine how to vote proxies relating to portfolio securities is available without charge, upon request, from our Client Services department at 800 959 4246, or at invesco.com/ corporate/about-us/esg. The information is also available on the SEC website, sec.gov.
Information regarding how the Fund voted proxies related to its portfolio securities during the most recent 12-month period ended June 30 is available at invesco.com/proxysearch. This information is also available on the SEC website, sec.gov.
Invesco Advisers, Inc. is an investment adviser; it provides investment advisory services to individual and institutional clients and does not sell securities. Invesco Distributors, Inc. is the US distributor for Invesco Ltd.’s retail mutual funds, exchange-traded funds and institutional money market funds. Both are wholly owned, indirect subsidiaries of Invesco Ltd.

| | | | |
| SEC file number(s): 811-07890 and 033-66242 | | Invesco Distributors, Inc. | | O-RONJM-AR-1 |

| | |
| | |
| Annual Report to Shareholders | | February 28, 2023 |
Invesco Pennsylvania Municipal Fund
Nasdaq:
A: OPATX ∎ C: OPACX ∎ Y: OPAYX ∎ R6: IORPX
Management’s Discussion of Fund Performance
| | | | |
| | |
Performance summary | | | | |
For the fiscal year ended February 28, 2023, Class A shares of Invesco Pennsylvania Municipal Fund (the Fund), at net asset value (NAV), outperformed the S&P Municipal Bond Pennsylvania 5+ Year Investment Grade Index. | |
Your Fund’s long-term performance appears later in this report. | |
|
| Fund vs. Indexes | |
| Total returns, 2/28/22 to 2/28/23, at net asset value (NAV). Performance shown does not include applicable contingent deferred sales charges (CDSC) or front-end sales charges, which would have reduced performance. | |
Class A Shares | | | -7.04 | % |
Class C Shares | | | -7.72 | |
Class Y Shares | | | -6.89 | |
Class R6 Shares | | | -6.84 | |
S&P Municipal Bond Pennsylvania 5+ Year Investment Grade Index▼ | | | -6.50 | |
U.S. Consumer Price Index∎ | | | 6.04 | |
Source(s): ▼RIMES Technologies Corp.; ∎Bloomberg LP | | | | |
Market conditions and your Fund
Pennsylvania benefits from a highly diversified economy that tends to track the national economy but with less volatility. During periods of US economic contraction, Pennsylvania will often outperform the US in real Gross State Product (GSP), real personal income and employment. However, during periods of economic expansion, Pennsylvania will often trend behind the rate of growth of the national economy.1
In 2021, Pennsylvania’s real GSP growth rate was 4.4%, dropping to 1.5% in 2022.2 Forward looking growth projections for GSP for calendar year 2023 are expected to be flat and up 1.2% for calendar year 2024.2
Historically, Pennsylvania’s population growth rate has lagged that of the country, growing only 1% between 2015 and 2021 to 12.9 million.3 As of December 2022, the Keystone State was ahead of the pack on unemployment with a rate of 3.5% compared to the national level of 3.9%.4 Notably, the most recent unemployment rate as of February 28, 2023, is lower than it was pre-pandemic.4
For Pennsylvania’s fiscal year ending June 30, 2022, revenue collections outpaced estimates by 15%, led by the outperformance of the commonwealth’s two major tax revenue streams, personal income taxes and sales and use taxes.2 The better-than-expected revenue collections and remaining federal aid has bolstered the commonwealth’s reserves which have historically been a drag on its credit rating.1 As of fiscal year-end 2022 the general fund balance was $18 billion, up from $3.3 billion at fiscal year-end 2020.5 Additionally, the commonwealth has strong access to liquidity through the State Treasurer.6
At the close of the Fund’s fiscal year, Pennsylvania’s general obligation bonds were rated A+ by Standard & Poor’s (S&P); AA- by Fitch Ratings (Fitch); and Aa3 by Moody’s.† S&P and Moody’s have stable outlooks. Fitch revised their outlook from stable to positive in
April 2022, citing the state’s better-than-expected revenue performance and increases in reserves.†
At the beginning of the fiscal year, investors were hopeful in anticipation of a return to normalcy as COVID-19 cases declined and pandemic-related restrictions were reduced or lifted. This allowed policymakers to turn their attention to the high inflation levels; however, on February 24, 2022, Russia began a full-scale invasion of Ukraine, which exacerbated inflationary pressures by driving up commodity prices. Against this backdrop, the fiscal year was plagued by volatility and uncertainty. The municipal market set multiple record lows in 2022, making it one of the most challenging years in history for municipal markets.
Investment grade municipal bonds returned -5.10%, high yield municipal bonds returned -9.35% and taxable municipal bonds returned -12.96% during the fiscal year.7
While municipal funds had experienced record inflows of $101.7 billion in 2021, flows quickly turned negative in the first quarter of 2022, perpetuating the Bloomberg Municipal Bond Index’s worst quarterly return in 40 years. Municipal bonds enjoyed a short respite in late May and early June 2022 with increased demand from crossover buyers like hedge funds, banks and insurance companies; however, the May 2022 Consumer Price Index report quoted inflation rising to a 40-year high. This sent the 10-year Treasury yield to a new 52-week high of nearly 3.50%, pushing municipal mutual fund flows back into negative territory.8 According to Lipper, net outflows from municipal bond funds totaled over -$110 billion for the fiscal year.9
On March 16, 2022, the US Federal Reserve (the Fed) raised the federal funds target rate 0.25% for the first time in more than three years in hopes of containing inflation.10 This was the first of eight consecutive increases during the fiscal year as the Fed announced its plan for a quantitative tightening campaign in an attempt to rein in inflation
without harming employment or the overall economy. Rate increases as high as 0.75% followed, the Fed’s most aggressive monetary policy since the 1980s, bringing the target rate to 4.75% as of the end of the fiscal year.10
The AAA municipal yield curve made history after the Fed’s December 2022 meeting when the curve inverted between one- and 10-year maturities. Any inversion is noteworthy, but this was a first for municipal bonds. On January 31, 2023, policymakers indicated that future rate increases were likely to be “appropriate,” suggesting they were not yet convinced inflation was contained, which increased uncertainty about when the current tightening cycle might end. The fiscal year ended with an increase of 0.25% on February 1, 2023. We expect additional rate hikes in 2023, although not with the same pace or vigor as in 2022.
New municipal issuance for the fiscal year totaled $354 billion, down 27% from the previous fiscal year’s $484 billion.11 Issuers, with cash on their balance sheets, have been reluctant to issue at higher interest rates. While taxable issuance continued to account for a significant portion of new issuance, at 14% of the total, this figure is down from 18% from the previous fiscal year because of higher interest rates.11
Puerto Rico continued to make develop-ments in its ongoing debt restructuring throughout the fiscal year. The territory restructured its outstanding general obligation and other government-guaranteed debt in March 2022 and began paying bondholders on the new restructured bonds. Puerto Rico’s weight in the Bloomberg High Yield Municipal Bond Index increased from 13% to 20% as the new bonds were included.7 The Financial Oversight and Management Board for Puerto Rico, the Puerto Rican government, bond-holders and other interested parties continued to negotiate the restructuring of bonds issued by the Puerto Rico Electric Power Authority, the territory’s largest remaining unresolved debt, as the fiscal year closed.
Municipal credits have a long history of low defaults as many provide essential services to all Americans. This continues to be the case as evidenced by S&P rating changes - upgrades exceeded downgrades by a ratio of 2.5:1 through December 2022.12 This positive dynamic, which we believe will continue, likely stems from benefits of the various federal stimulus measures including the American Rescue Plan Act, the Infrastructure Investment and Jobs Act and the Inflation Reduction Act, as well as higher revenues collected by state and local governments.
We believe the valuable benefits of municipal bonds will prevail over current market volatility and economic uncertainty. We continue to rely on our experienced portfolio managers and credit analysts to weather the
2 Invesco Pennsylvania Municipal Fund
challenges while identifying marketplace opportunities to add long-term value for shareholders.
During the fiscal year, security selection in AA- and A- rated bonds† contributed to the Fund’s performance relative to its benchmark. At the sector level, an underweight exposure and security selection for state and local general obligation bonds contributed to the Fund’s relative performance.
An overweight allocation to higher coupon bonds (6.00% and higher) was detractive to relative results. An overweight allocation to medium duration bonds (9.00-14.99 years specifically) detracted from the Fund’s performance relative to its benchmark over the fiscal year. Security selection and an overweight allocation among the healthcare sector detracted from the Fund’s performance relative to the benchmark during the fiscal year.
During the fiscal year, leverage contributed to the Fund’s performance relative to its benchmark. The Fund achieved a leveraged position through the use of inverse floating rate securities or tender option bonds. The Fund uses leverage because we believe that, over time, leveraging provides opportunities for additional income and total return for shareholders. However, the use of leverage also can expose shareholders to additional volatility. For more information about the Fund’s use of leverage, see the Notes to Financial Statements later in this report.
We wish to remind you that the Fund is subject to interest rate risk, meaning when interest rates rise, the value of fixed income securities tends to fall. The degree to which the value of fixed income securities may decline due to rising interest rates may vary depending on the speed and magnitude of the increase in interest rates, as well as individual security characteristics, such as price, maturity, duration and coupon and market forces, such as supply and demand for similar securities. We are monitoring interest rates, as well as the market, economic and geopolitical factors that may impact the direction, speed and magnitude of changes to interest rates across the maturity spectrum, including the potential impact of monetary policy changes by the Fed and certain foreign central banks. If interest rates rise or fall faster than expected, markets may experience increased volatility, which may affect the value and/or liquidity of certain of the Fund’s investments.
Thank you for investing in Invesco Pennsylvania Municipal Fund and for sharing our long-term investment horizon.
| 1 | Source: Commonwealth of Pennsylvania, Governor’s Office of the Budget |
| 2 | Source: Independent Fiscal Office |
| 3 | Source: US Census Bureau |
| 4 | Source: US Bureau of Labor Statistics |
| 5 | Source: Pennsylvania Transparency Portal |
| 6 | Source: Moody’s, Credit Opinion: Pennsylvania (Commonwealth of) |
| 10 | Source: US Federal Reserve |
| 12 | Source: Standard & Poor’s |
† Sources: A credit rating is an assessment provided by a nationally recognized statistical rating organization (NRSRO) of the creditworthiness of an issuer with respect to debt obligations, including specific securities, money market instruments or other debts. Ratings are measured on a scale that generally ranges from AAA (highest) to D (lowest); ratings are subject to change without notice. For more information on rating methodology, please visit www.spglobal.com and select “Understanding Credit Ratings” under About Ratings on the homepage; www.fitchratings.com and select “Understanding Credit Ratings” from the drop-down menu on the homepage; and www.moodys.com and select “Methodology,” then “Rating Methodologies” under Research Type on the left-hand side.
Portfolio manager(s):
Josh Cooney
Elizabeth Mossow
Tim O’Reilly
Mark Paris
Julius Williams
The views and opinions expressed in management’s discussion of Fund performance are those of Invesco Advisers, Inc. and its affiliates. These views and opinions are subject to change at any time based on factors such as market and economic conditions. These views and opinions may not be relied upon as investment advice or recommendations, or as an offer for a particular security. The information is not a complete analysis of every aspect of any market, country, industry, security or the Fund. Statements of fact are from sources considered reliable, but Invesco Advisers, Inc. makes no representation or warranty as to their completeness or accuracy. Although historical performance is no guarantee of future results, these insights may help you understand our investment management philosophy.
See important Fund and, if applicable, index disclosures later in this report.
3 Invesco Pennsylvania Municipal Fund
Your Fund’s Long-Term Performance
Results of a $10,000 Investment – Oldest Share Class(es)
Fund and index data from 2/28/13
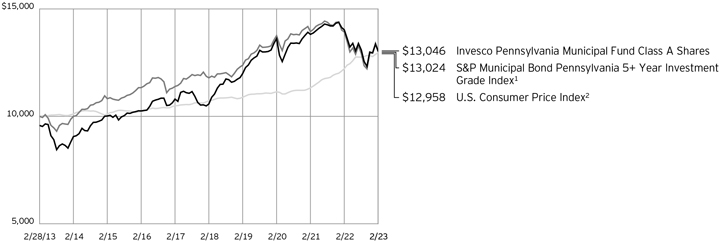
1 Source: RIMES Technologies Corp.
2 Source: Bloomberg LP
Past performance cannot guarantee future results.
The data shown in the chart include reinvested distributions, applicable sales charges and Fund expenses including management
fees. Index results include reinvested dividends, but they do not reflect sales charges. Performance of the peer group, if applicable, reflects Fund expenses and management fees; performance of a market index does
not. Performance shown in the chart does not reflect deduction of taxes a shareholder would pay on Fund distributions or sale of Fund shares.
4 Invesco Pennsylvania Municipal Fund
| | | | |
| |
Average Annual Total Returns | |
As of 2/28/23, including maximum applicable sales charges | |
| |
Class A Shares | | | | |
Inception (9/18/89) | | | 5.05 | % |
10 Years | | | 2.69 | |
5 Years | | | 3.38 | |
1 Year | | | -10.98 | |
| |
Class C Shares | | | | |
Inception (8/29/95) | | | 4.50 | % |
10 Years | | | 2.56 | |
5 Years | | | 3.58 | |
1 Year | | | -8.62 | |
| |
Class Y Shares | | | | |
Inception (11/29/10) | | | 4.55 | % |
10 Years | | | 3.34 | |
5 Years | | | 4.51 | |
1 Year | | | -6.89 | |
| |
Class R6 Shares | | | | |
10 Years | | | 3.24 | % |
5 Years | | | 4.49 | |
1 Year | | | -6.84 | |
Effective May 24, 2019, Class A, Class C and Class Y shares of the Oppenheimer Rochester Pennsylvania Municipal Fund, (the predecessor fund), were reorganized into Class A, Class C and Class Y shares, respectively, of the Invesco Oppenheimer Rochester® Pennsylvania Municipal Fund. The Fund was subsequently renamed the Invesco Pennsylvania Municipal Fund (the Fund). Returns shown above, for periods ending on or prior to May 24, 2019, for Class A, Class C and Class Y shares are those for Class A, Class C and Class Y shares of the predecessor fund. Share class returns will differ from the predecessor fund because of different expenses.
Class R6 shares incepted on May 24, 2019. Performance shown on and prior to that date is that of the predecessor fund’s Class A shares at net asset value and includes the 12b-1 fees applicable to Class A shares.
The performance data quoted represent past performance and cannot guarantee future results; current performance may be lower or higher. Please visit invesco.com/ performance for the most recent month-end performance. Performance figures reflect reinvested distributions, changes in net asset value and the effect of the maximum sales charge unless otherwise stated. Performance figures do not reflect deduction of taxes a shareholder would pay on Fund distributions or sale of Fund shares. Investment return and principal value will fluctuate so that you may have a gain or loss when you sell shares.
Class A share performance reflects the maximum 4.25% sales charge, and Class C share performance reflects the applicable contingent deferred sales charge (CDSC) for the period involved. The CDSC on
Class C shares is 1% for the first year after purchase. Class Y and Class R6 shares do not have a front-end sales charge or a CDSC; therefore, performance is at net asset value.
The performance of the Fund’s share classes will differ primarily due to different sales charge structures and class expenses.
Fund performance reflects any applicable fee waivers and/or expense reimbursements. Had the adviser not waived fees and/or reimbursed expenses currently or in the past, returns would have been lower. See current prospectus for more information.
5 Invesco Pennsylvania Municipal Fund
Supplemental Information
Invesco Pennsylvania Municipal Fund’s investment objective is to seek tax-free income.
| ∎ | | Unless otherwise stated, information presented in this report is as of February 28, 2023, and is based on total net assets. |
| ∎ | | Unless otherwise noted, all data is provided by Invesco. |
| ∎ | | To access your Fund’s reports/prospectus, visit invesco.com/fundreports. |
About indexes used in this report
| ∎ | | The S&P Municipal Bond Pennsylvania 5+ Year Investment Grade Index tracks the performance of the investment-grade, Pennsylvania-issued US municipals with maturities equal to or greater than five years. |
| ∎ | | The U.S. Consumer Price Index is a measure of change in consumer prices as determined by the US Bureau of Labor Statistics. |
| ∎ | | The Fund is not managed to track the performance of any particular index, including the index(es) described here, and consequently, the performance of the Fund may deviate significantly from the performance of the index(es). |
| ∎ | | A direct investment cannot be made in an index. Unless otherwise indicated, index results include reinvested dividends, and they do not reflect sales charges. Performance of the peer group, if applicable, reflects fund expenses; performance of a market index does not. |
| | |
This report must be accompanied or preceded by a currently effective Fund prospectus, which contains more complete information, including sales charges and expenses. Investors should read it carefully before investing. | | |
| | |
| NOT FDIC INSURED | MAY LOSE VALUE | NO BANK GUARANTEE | | |
6 Invesco Pennsylvania Municipal Fund
Fund Information
| | | | |
| Portfolio Composition | | |
| |
| By credit sector | | % of total investments |
Revenue Bonds | | 82.78% |
General Obligation Bonds | | 15.83 |
Pre-Refunded Bonds | | 1.00 |
Other | | 0.39 |
Top Five Debt Holdings
| | | | |
| | |
| | | | | % of total net assets |
| 1. | | Children’s Trust Fund, Series 2008 A, RB | | 3.56% |
| 2. | | Philadelphia (City of), PA, Series 2017 B, Ref. RB | | 2.58 |
| 3. | | Philadelphia (City of), PA Authority for Industrial Development (Thomas Jefferson University), Series 2017 A, Ref. RB | | 2.31 |
| 4. | | Children’s Trust Fund, Series 2002, RB | | 2.20 |
| 5. | | Geisinger Authority (Geisinger Health System), Series 2017 A-1, Ref. RB | | 2.19 |
The Fund’s holdings are subject to change, and there is no assurance that the Fund will continue to hold any particular security.
Data presented here are as of February 28, 2023.
7 Invesco Pennsylvania Municipal Fund
Schedule of Investments
February 28, 2023
| | | | | | | | | | | | | | | | |
| | | Interest
Rate | | | Maturity
Date | | | Principal
Amount
(000) | | | Value | |
Municipal Obligations–99.69% | | | | | | | | | | | | | | | | |
Pennsylvania–85.75% | | | | | | | | | | | | | | | | |
Aliquippa School District; Series 2018, Ref. GO Bonds (INS - BAM)(a) | | | 4.00% | | | | 12/01/2041 | | | $ | 1,750 | | | $ | 1,717,463 | |
Allegheny (County of), PA; | | | | | | | | | | | | | | | | |
Series 2016 C-76, GO Bonds | | | 5.00% | | | | 11/01/2041 | | | | 14,320 | | | | 15,010,740 | |
Series 2018 C-77, GO Bonds | | | 5.00% | | | | 11/01/2043 | | | | 4,960 | | | | 5,293,392 | |
Series 2020 C-78, GO Bonds | | | 4.00% | | | | 11/01/2049 | | | | 1,080 | | | | 992,311 | |
Allegheny (County of), PA Airport Authority; Series 2021 A, RB(b) | | | 4.00% | | | | 01/01/2056 | | | | 6,500 | | | | 5,607,365 | |
Allegheny (County of), PA Higher Education Building Authority (Chatham University); Series 2022, Ref. RB | | | 5.25% | | | | 09/01/2034 | | | | 535 | | | | 545,223 | |
Series 2022, Ref. RB | | | 5.25% | | | | 09/01/2035 | | | | 540 | | | | 544,628 | |
Allegheny (County of), PA Higher Education Building Authority (Robert Morris University); | | | | | | | | | | | | | | | | |
Series 1998 A, Ref. RB (INS - ACA)(a) | | | 6.00% | | | | 05/01/2028 | | | | 140 | | | | 146,672 | |
Series 2017, RB | | | 5.00% | | | | 10/15/2037 | | | | 615 | | | | 612,578 | |
Series 2017, RB | | | 5.00% | | | | 10/15/2047 | | | | 1,500 | | | | 1,407,584 | |
Allegheny (County of), PA Hospital Development Authority (Allegheny Health Network Obligated Group Issue); Series 2018 A, Ref. RB | | | 5.00% | | | | 04/01/2047 | | | | 15,615 | | | | 15,832,798 | |
Allegheny (County of), PA Hospital Development Authority (University of Pittsburgh Medical Center); | | | | | | | | | | | | | | | | |
Series 2007 A-1, RB (67% of 3 mo. USD LIBOR + 0.82%)(c) | | | 4.05% | | | | 02/01/2037 | | | | 495 | | | | 485,096 | |
Series 2019 A, Ref. RB | | | 4.00% | | | | 07/15/2038 | | | | 1,035 | | | | 1,000,232 | |
Allegheny (County of), PA Industrial Development Authority (Propel Charter School - Sunrise); Series 2013, RB | | | 6.00% | | | | 07/15/2038 | | | | 1,500 | | | | 1,509,366 | |
Allegheny (County of), PA Redevelopment Authority (Pittsburgh Mills); Series 2004, RB (Acquired 04/18/2006-08/16/2018; Cost $6,213,959)(d)(e) | | | 5.60% | | | | 07/01/2023 | | | | 6,362 | | | | 5,725,894 | |
Allegheny (County of), PA Residential Finance Authority (Allegheny Independence House Apartments); Series 2007 B, RB (CEP - GNMA)(b) | | | 6.10% | | | | 01/20/2043 | | | | 1,115 | | | | 1,117,024 | |
Allegheny (County of), PA Sanitary Authority;
Series 2015, RB(f) | | | 5.00% | | | | 12/01/2045 | | | | 2,120 | | | | 2,184,761 | |
Series 2022, RB | | | 5.75% | | | | 06/01/2052 | | | | 3,250 | | | | 3,695,497 | |
Allentown (City of), PA Neighborhood Improvement Zone Development Authority; Series 2022, Ref. RB | | | 5.00% | | | | 05/01/2042 | | | | 2,000 | | | | 1,971,037 | |
Allentown (City of), PA Neighborhood Improvement Zone Development Authority (City Center); | | | | | | | | | | | | | | | | |
Series 2018, RB(g) | | | 5.00% | | | | 05/01/2042 | | | | 615 | | | | 597,359 | |
Series 2018, RB(g) | | | 5.38% | | | | 05/01/2042 | | | | 4,000 | | | | 3,964,278 | |
Allentown City School District; | | | | | | | | | | | | | | | | |
Series 2018 B, GO Bonds (INS - BAM)(a) | | | 5.00% | | | | 06/01/2036 | | | | 1,250 | | | | 1,307,672 | |
Series 2018 B, GO Bonds (INS - BAM)(a) | | | 5.00% | | | | 06/01/2037 | | | | 1,255 | | | | 1,311,724 | |
Berks (County of), PA Industrial Development Authority (Highlands at Wyomissing (The)); | | | | | | | | | | | | | | | | |
Series 2017 A, Ref. RB | | | 5.00% | | | | 05/15/2037 | | | | 1,125 | | | | 1,087,168 | |
Series 2017 A, Ref. RB | | | 5.00% | | | | 05/15/2042 | | | | 500 | | | | 462,720 | |
Series 2017 A, Ref. RB | | | 5.00% | | | | 05/15/2047 | | | | 600 | | | | 542,985 | |
Series 2017 C, RB | | | 5.00% | | | | 05/15/2047 | | | | 475 | | | | 435,673 | |
Series 2017, RB | | | 5.00% | | | | 05/15/2042 | | | | 600 | | | | 565,327 | |
Berks (County of), PA Industrial Development Authority (Tower Health); Series 2017, Ref. RB | | | 5.00% | | | | 11/01/2050 | | | | 8,480 | | | | 5,607,906 | |
Berks (County of), PA Municipal Authority (Reading Hospital Medical Center); Series 2012 A, RB | | | 5.00% | | | | 11/01/2040 | | | | 1,000 | | | | 696,115 | |
Bethlehem Area School District; Series 2015 A, GO Bonds (INS - BAM)(a) | | | 5.00% | | | | 08/01/2035 | | | | 3,000 | | | | 3,109,748 | |
Bucks (County of), PA Industrial Development Authority (Pennswood Village); Series 2018, Ref. RB | | | 5.00% | | | | 10/01/2037 | | | | 270 | | | | 266,416 | |
Cheltenham (Township of), PA; | | | | | | | | | | | | | | | | |
Series 2018, GO Bonds(h)(i) | | | 4.00% | | | | 07/01/2023 | | | | 170 | | | | 170,437 | |
Series 2018, GO Bonds | | | 4.00% | | | | 07/01/2048 | | | | 2,660 | | | | 2,507,199 | |
Chester (County of), PA Health & Education Facilities Authority (Main Line Health System); Series 2017 A, Ref. RB | | | 5.00% | | | | 10/01/2052 | | | | 2,000 | | | | 2,058,079 | |
Chester (County of), PA Health & Education Facilities Authority (Simpson Senior Services); | | | | | | | | | | | | | | | | |
Series 2019, Ref. RB | | | 3.25% | | | | 12/01/2029 | | | | 155 | | | | 130,470 | |
Series 2019, Ref. RB | | | 4.00% | | | | 12/01/2039 | | | | 305 | | | | 232,507 | |
Series 2019, Ref. RB | | | 5.00% | | | | 12/01/2051 | | | | 8,000 | | | | 6,589,466 | |
Chester (County of), PA Industrial Development Authority (Avon Grove Charter School); Series 2017 A, Ref. RB | | | 5.00% | | | | 12/15/2051 | | | | 770 | | | | 759,435 | |
See accompanying Notes to Financial Statements which are an integral part of the financial statements.
8 Invesco Pennsylvania Municipal Fund
| | | | | | | | | | | | | | | | |
| | | Interest
Rate | | | Maturity
Date | | | Principal
Amount
(000) | | | Value | |
Pennsylvania–(continued) | | | | | | | | | | | | | | | | |
Chester (County of), PA Industrial Development Authority (Collegium Charter School); Series 2017 A, RB | | | 5.25% | | | | 10/15/2047 | | | $ | 695 | | | $ | 624,644 | |
Chester (County of), PA Industrial Development Authority (Longwood Gardens); Series 2019, RB | | | 5.00% | | | | 12/01/2044 | | | | 1,440 | | | | 1,551,755 | |
Chester (County of), PA Industrial Development Authority (Renaissance Academy Charter School); Series 2014, RB | | | 5.00% | | | | 10/01/2044 | | | | 2,215 | | | | 2,075,798 | |
Chester (County of), PA Industrial Development Authority (Sustainability Bonds); Series 2021, RB | | | 4.00% | | | | 12/01/2051 | | | | 9,840 | | | | 8,853,801 | |
Chester (County of), PA Industrial Development Authority (University Student Housing, LLC at West Chester University of Pennsylvania);
Series 2013 A, RB | | | 5.00% | | | | 08/01/2035 | | | | 1,000 | | | | 984,522 | |
Series 2013, RB | | | 5.00% | | | | 08/01/2045 | | | | 750 | | | | 702,886 | |
Clairton (City of), PA Municipal Authority; Series 2012 B, RB | | | 5.00% | | | | 12/01/2037 | | | | 3,000 | | | | 3,001,799 | |
Clarion (County of), PA Industrial Development Authority (Clarion University Foundation, Inc. Student Housing at Clarion University of Pennsylvania); | | | | | | | | | | | | | | | | |
Series 2014 A, RB | | | 5.00% | | | | 07/01/2034 | | | | 2,310 | | | | 2,359,022 | |
Series 2014 A, RB | | | 5.00% | | | | 07/01/2045 | | | | 1,000 | | | | 1,007,898 | |
Series 2014, Ref. RB | | | 5.00% | | | | 07/01/2024 | | | | 1,220 | | | | 1,244,836 | |
Series 2014, Ref. RB | | | 5.00% | | | | 07/01/2029 | | | | 2,430 | | | | 2,491,733 | |
Series 2014, Ref. RB | | | 5.00% | | | | 07/01/2033 | | | | 3,500 | | | | 3,582,066 | |
Coatesville School District; | | | | | | | | | | | | | | | | |
Series 2020 A, GO Bonds (INS - BAM)(a)(j) | | | 0.00% | | | | 10/01/2034 | | | | 300 | | | | 184,313 | |
Series 2020 A, GO Bonds (INS - BAM)(a)(j) | | | 0.00% | | | | 10/01/2038 | | | | 2,700 | | | | 1,269,033 | |
Series 2020 B, Ref. GO Bonds (INS - BAM)(a)(j) | | | 0.00% | | | | 10/01/2033 | | | | 500 | | | | 322,824 | |
Series 2020 B, Ref. GO Bonds (INS - BAM)(a)(j) | | | 0.00% | | | | 10/01/2034 | | | | 980 | | | | 602,089 | |
Series 2020 C, Ref. GO Bonds (INS - BAM)(a)(j) | | | 0.00% | | | | 10/01/2033 | | | | 640 | | | | 413,215 | |
Commonwealth Financing Authority; | | | | | | | | | | | | | | | | |
Series 2018, RB(f) | | | 5.00% | | | | 06/01/2034 | | | | 2,500 | | | | 2,667,993 | |
Series 2018, RB(f) | | | 5.00% | | | | 06/01/2035 | | | | 500 | | | | 530,545 | |
Cumberland (County of), PA Municipal Authority (Diakon Lutheran); | | | | | | | | | | | | | | | | |
Series 2015, Ref. RB(h)(i) | | | 5.00% | | | | 01/01/2025 | | | | 515 | | | | 531,627 | |
Series 2015, Ref. RB | | | 5.00% | | | | 01/01/2038 | | | | 630 | | | | 632,799 | |
Cumberland (County of), PA Municipal Authority (Messiah Village); | | | | | | | | | | | | | | | | |
Series 2018, Ref. RB | | | 5.00% | | | | 07/01/2031 | | | | 1,565 | | | | 1,512,131 | |
Series 2018, Ref. RB | | | 5.00% | | | | 07/01/2035 | | | | 3,210 | | | | 3,020,802 | |
Dallas Area Municipal Authority (Misericordia University); | | | | | | | | | | | | | | | | |
Series 2019, Ref. RB | | | 5.00% | | | | 05/01/2039 | | | | 1,050 | | | | 1,000,257 | |
Series 2019, Ref. RB | | | 5.00% | | | | 05/01/2048 | | | | 4,000 | | | | 3,679,312 | |
Dauphin (County of), PA General Authority (Pinnacle Health System); Series 2016 A, Ref. RB | | | 5.00% | | | | 06/01/2034 | | | | 510 | | | | 529,723 | |
Delaware (County of), PA Authority (Eastern University); Series 2012, RB | | | 5.25% | | | | 10/01/2032 | | | | 5,215 | | | | 5,215,433 | |
Delaware (County of), PA Authority (Elywn); | | | | | | | | | | | | | | | | |
Series 2017, Ref. RB | | | 5.00% | | | | 06/01/2027 | | | | 410 | | | | 403,968 | |
Series 2017, Ref. RB | | | 5.00% | | | | 06/01/2037 | | | | 3,500 | | | | 3,164,492 | |
Delaware (County of), PA Authority (Mercy Health Corp.); Series 1993 A, RB(h) | | | 5.38% | | | | 11/15/2023 | | | | 10 | | | | 10,248 | |
Delaware (County of), PA Authority (Neumann University); | | | | | | | | | | | | | | | | |
Series 2016, Ref. RB | | | 5.00% | | | | 10/01/2031 | | | | 1,425 | | | | 1,446,688 | |
Series 2016, Ref. RB | | | 5.00% | | | | 10/01/2035 | | | | 2,305 | | | | 2,325,614 | |
Delaware (County of), PA Authority (Villanova University); Series 2015, RB | | | 5.00% | | | | 08/01/2045 | | | | 215 | | | | 220,306 | |
Delaware (County of), PA Industrial Development Authority (Mercy Health Corp. of Southeastern PA); Series 2016 A, RB(g) | | | 5.13% | | | | 06/01/2046 | | | | 2,080 | | | | 1,929,322 | |
Delaware (State of) River Port Authority; Series 2013, RB | | | 5.00% | | | | 01/01/2040 | | | | 2,510 | | | | 2,539,708 | |
Delaware Valley Regional Finance Authority; Series 2002, RB | | | 5.75% | | | | 07/01/2032 | | | | 1,000 | | | | 1,211,302 | |
Doylestown (City of), PA Hospital Authority; Series 2019 A, RB | | | 4.00% | | | | 07/01/2045 | | | | 250 | | | | 173,251 | |
DuBois (City of), PA Hospital Authority (Penn Highlands Healthcare); Series 2018, Ref. RB | | | 5.00% | | | | 07/15/2048 | | | | 650 | | | | 661,840 | |
East Hempfield (Township of), PA Industrial Development Authority (Student Services, Inc. Student Housing at Millersville University of Pennsylvania); | | | | | | | | | | | | | | | | |
Series 2013, RB(h)(i) | | | 5.00% | | | | 07/01/2023 | | | | 1,750 | | | | 1,758,165 | |
Series 2014, RB(h)(i) | | | 5.00% | | | | 07/01/2024 | | | | 250 | | | | 255,581 | |
East Hempfield (Township of), PA Industrial Development Authority (Willow Valley Communities); | | | | | | | | | | | | | | | | |
Series 2016, Ref. RB | | | 5.00% | | | | 12/01/2030 | | | | 630 | | | | 654,699 | |
Series 2016, Ref. RB | | | 5.00% | | | | 12/01/2039 | | | | 370 | | | | 378,220 | |
Erie (City & County of), PA Water Authority; Series 2018 A, Ref. RB (INS - AGM)(a) | | | 5.00% | | | | 12/01/2043 | | | | 1,280 | | | | 1,352,219 | |
See accompanying Notes to Financial Statements which are an integral part of the financial statements.
9 Invesco Pennsylvania Municipal Fund
| | | | | | | | | | | | | | | | |
| | | Interest
Rate | | | Maturity
Date | | | Principal
Amount
(000) | | | Value | |
Pennsylvania–(continued) | | | | | | | | | | | | | | | | |
Erie (City of), PA Higher Education Building Authority (AICUP Financing Program); | | | | | | | | | | | | | | | | |
Series 2021, RB | | | 4.00% | | | | 05/01/2036 | | | $ | 200 | | | $ | 180,950 | |
Series 2021, RB | | | 4.00% | | | | 05/01/2041 | | | | 730 | | | | 612,057 | |
Series 2021, RB | | | 5.00% | | | | 05/01/2047 | | | | 330 | | | | 311,537 | |
Erie (City of), PA Higher Education Building Authority (Gannon University); Series 2013, RB | | | 5.00% | | | | 05/01/2038 | | | | 7,840 | | | | 7,797,791 | |
Franklin (County of), PA Industrial Development Authority (Menno-Haven, Inc.); | | | | | | | | | | | | | | | | |
Series 2018, Ref. RB | | | 5.00% | | | | 12/01/2043 | | | | 475 | | | | 392,064 | |
Series 2018, Ref. RB | | | 5.00% | | | | 12/01/2053 | | | | 700 | | | | 550,238 | |
Series 2019, RB | | | 5.00% | | | | 12/01/2039 | | | | 755 | | | | 639,015 | |
Series 2019, RB | | | 5.00% | | | | 12/01/2054 | | | | 3,000 | | | | 2,335,661 | |
Geisinger Authority (Geisinger Health System); | | | | | | | | | | | | | | | | |
Series 2017 A-1, Ref. RB | | | 5.00% | | | | 02/15/2045 | | | | 16,655 | | | | 16,954,449 | |
Series 2017 A-1, Ref. RB | | | 4.00% | | | | 02/15/2047 | | | | 5,000 | | | | 4,473,852 | |
Lancaster (City of), PA Industrial Development Authority (Landis Homes Retirement Community); Series 2021, Ref. RB | | | 4.00% | | | | 07/01/2056 | | | | 1,800 | | | | 1,307,776 | |
Lancaster (City of), PA Industrial Development Authority (Willow Valley Communities); Series 2019, RB | | | 5.00% | | | | 12/01/2049 | | | | 5,005 | | | | 5,124,650 | |
Lancaster (County of), PA Hospital Authority (Brethren Village); Series 2017, Ref. RB | | | 5.13% | | | | 07/01/2037 | | | | 1,135 | | | | 1,056,849 | |
Lancaster (County of), PA Hospital Authority (Landis Homes Retirement Community); Series 2015, Ref. RB | | | 5.00% | | | | 07/01/2045 | | | | 625 | | | | 574,512 | |
Lancaster (County of), PA Hospital Authority (Masonic Villages); Series 2015, Ref. RB | | | 5.00% | | | | 11/01/2035 | | | | 210 | | | | 213,085 | |
Lancaster (County of), PA Hospital Authority (Penn State Health); Series 2021, RB | | | 5.00% | | | | 11/01/2051 | | | | 1,550 | | | | 1,588,645 | |
Lancaster School District; Series 2020, GO Bonds (INS - AGM)(a) | | | 4.00% | | | | 06/01/2034 | | | | 900 | | | | 934,835 | |
Latrobe (City of), PA Industrial Development Authority (Seton Hill University); | | | | | | | | | | | | | | | | |
Series 2021, Ref. RB | | | 4.00% | | | | 03/01/2046 | | | | 485 | | | | 386,735 | |
Series 2021, Ref. RB | | | 4.00% | | | | 03/01/2051 | | | | 485 | | | | 372,521 | |
Lehigh (County of), PA (Lehigh Valley Health Network); | | | | | | | | | | | | | | | | |
Series 2019 A, Ref. RB | | | 5.00% | | | | 07/01/2044 | | | | 1,000 | | | | 1,026,626 | |
Series 2019, Ref. RB | | | 4.00% | | | | 07/01/2049 | | | | 8,500 | | | | 7,699,609 | |
Lehigh (County of), PA General Purpose Authority (Kidspeace Obligation Group); | | | | | | | | | | | | | | | | |
Series 2014 A, RB | | | 7.50% | | | | 02/01/2044 | | | | 5,059 | | | | 4,542,020 | |
Series 2014 B, RB(k) | | | 7.50% | | | | 02/01/2044 | | | | 3,735 | | | | 1,935,476 | |
Series 2014 C, RB(j)(l) | | | 0.00% | | | | 02/01/2044 | | | | 3,238 | | | | 16,919 | |
Lehigh (County of), PA General Purpose Authority (Lehigh Valley Academy); Series 2022, RB | | | 4.00% | | | | 06/01/2052 | | | | 3,750 | | | | 3,089,868 | |
Maxatawny (Township of), PA Municipal Authority (Diakon Lutheran Social); | | | | | | | | | | | | | | | | |
Series 2022 A, RB | | | 5.00% | | | | 01/01/2042 | | | | 930 | | | | 896,948 | |
Series 2022 A, RB | | | 4.50% | | | | 01/01/2045 | | | | 800 | | | | 706,405 | |
Mckeesport Area School District; Series 2021 A, Ref. GO Bonds (INS - AGM)(a) | | | 4.00% | | | | 10/01/2035 | | | | 5,505 | | | | 5,675,772 | |
Montgomery (County of), PA Higher Education & Health Authority (Holy Redeemer Health System); Series 2014, Ref. RB | | | 5.00% | | | | 10/01/2027 | | | | 390 | | | | 391,479 | |
Montgomery (County of), PA Higher Education & Health Authority (Philadelphia Presbytery Homes, Inc.); | | | | | | | | | | | | | | | | |
Series 2017, Ref. RB | | | 5.00% | | | | 12/01/2037 | | | | 750 | | | | 742,233 | |
Series 2017, Ref. RB | | | 5.00% | | | | 12/01/2047 | | | | 1,000 | | | | 940,463 | |
Montgomery (County of), PA Higher Education & Health Authority (Thomas Jefferson University); Series 2019, Ref. RB | | | 4.00% | | | | 09/01/2049 | | | | 6,500 | | | | 5,813,144 | |
Montgomery (County of), PA Industrial Development Authority (ACTS Retirement-Life Communities, Inc.); | | | | | | | | | | | | | | | | |
Series 2016, Ref. RB | | | 5.00% | | | | 11/15/2036 | | | | 15,000 | | | | 15,013,939 | |
Series 2020 C, RB | | | 4.00% | | | | 11/15/2043 | | | | 350 | | | | 288,586 | |
Series 2020 C, RB | | | 5.00% | | | | 11/15/2045 | | | | 675 | | | | 642,403 | |
Montgomery (County of), PA Industrial Development Authority (Germantown Academy); Series 2021, Ref. RB | | | 4.00% | | | | 10/01/2046 | | | | 2,740 | | | | 2,230,548 | |
Montgomery (County of), PA Industrial Development Authority (Haverford School); Series 2019, Ref. RB | | | 4.00% | | | | 03/01/2049 | | | | 3,250 | | | | 2,875,094 | |
Montgomery (County of), PA Industrial Development Authority (Waverly Heights Ltd.); Series 2019, Ref. RB | | | 5.00% | | | | 12/01/2049 | | | | 1,000 | | | | 1,012,794 | |
Northampton (County of), PA General Purpose Authority (LaFayette College); Series 2017, Ref. RB | | | 5.00% | | | | 11/01/2047 | | | | 6,135 | | | | 6,380,790 | |
Northampton (County of), PA General Purpose Authority (Moravian College); Series 2016, Ref. RB | | | 5.00% | | | | 10/01/2036 | | | | 2,250 | | | | 2,282,463 | |
See accompanying Notes to Financial Statements which are an integral part of the financial statements.
10 Invesco Pennsylvania Municipal Fund
| | | | | | | | | | | | | | | | |
| | | Interest
Rate | | | Maturity
Date | | | Principal
Amount
(000) | | | Value | |
Pennsylvania–(continued) | | | | | | | | | | | | | | | | |
Northampton (County of), PA General Purpose Authority (St. Luke’s University Health Network); | | | | | | | | | | | | | | | | |
Series 2016, Ref. RB | | | 5.00 | % | | | 08/15/2036 | | | $ | 330 | | | $ | 340,271 | |
Series 2016, Ref. RB | | | 5.00 | % | | | 08/15/2046 | | | | 1,170 | | | | 1,174,980 | |
Series 2018 A, Ref. RB | | | 4.00 | % | | | 08/15/2048 | | | | 8,430 | | | | 7,447,117 | |
Northampton (County of), PA Industrial Development Authority; | | | | | | | | | | | | | | | | |
Series 2013 A, RB (Acquired 04/03/2013; Cost $13,041,003)(d)(e)(m) | | | 5.00 | % | | | 12/31/2023 | | | | 14,827 | | | | 2,668,790 | |
Series 2013, RB(d)(m) | | | 5.00 | % | | | 12/31/2023 | | | | 6,896 | | | | 1,241,280 | |
Northampton (County of), PA Industrial Development Authority (Morningstar Senior Living, Inc.);
| | | | | | | | | | | | | | | | |
Series 2019, Ref. RB | | | 5.00 | % | | | 11/01/2039 | | | | 500 | | | | 452,140 | |
Series 2019, Ref. RB | | | 5.00 | % | | | 11/01/2044 | | | | 950 | | | | 829,340 | |
Series 2019, Ref. RB | | | 5.00 | % | | | 11/01/2049 | | | | 1,050 | | | | 891,405 | |
Northeastern Pennsylvania (Commonwealth of) Hospital & Education Authority (Kings College); Series 2019, RB | | | 5.00 | % | | | 05/01/2044 | | | | 1,000 | | | | 984,448 | |
Penn Hills School District; Series 2020, Ref. GO Bonds (INS - BAM)(a) | | | 3.00 | % | | | 10/01/2042 | | | | 4,000 | | | | 3,221,426 | |
Pennsylvania (Commonwealth of); | | | | | | | | | | | | | | | | |
First Series 2014, GO Bonds(f) | | | 5.00 | % | | | 06/15/2034 | | | | 3,000 | | | | 3,059,280 | |
First Series 2020, GO Bonds | | | 2.13 | % | | | 05/01/2040 | | | | 2,500 | | | | 1,684,464 | |
Series 2018 A, Ref. COP | | | 4.00 | % | | | 07/01/2046 | | | | 540 | | | | 492,505 | |
Series 2022, GO Bonds | | | 5.00 | % | | | 10/01/2042 | | | | 2,000 | | | | 2,199,780 | |
Pennsylvania (Commonwealth of) (Municipal Real Estate Funding, LLC); Series 2018 A, Ref. COP | | | 5.00 | % | | | 07/01/2043 | | | | 5,590 | | | | 5,846,029 | |
Pennsylvania (Commonwealth of) Economic Development Financing Authority (Capital Region Parking System); | | | | | | | | | | | | | | | | |
Series 2013 C, RB (INS - AGM)(a)(j) | | | 0.00 | % | | | 01/01/2044 | | | | 775 | | | | 255,910 | |
Series 2013, RB | | | 6.00 | % | | | 07/01/2053 | | | | 920 | | | | 924,960 | |
Pennsylvania (Commonwealth of) Economic Development Financing Authority (Covanta Holding Corp.) (Green Bonds); Series 2019 A, RB(b)(g) | | | 3.25 | % | | | 08/01/2039 | | | | 1,250 | | | | 921,895 | |
Pennsylvania (Commonwealth of) Economic Development Financing Authority (National Gypson Co.); Series 2014, Ref. RB(b) | | | 5.50 | % | | | 11/01/2044 | | | | 635 | | | | 637,749 | |
Pennsylvania (Commonwealth of) Economic Development Financing Authority (PA Bridges Finco L.P.); Series 2015, RB(b) | | | 5.00 | % | | | 12/31/2034 | | | | 1,420 | | | | 1,434,199 | |
Pennsylvania (Commonwealth of) Economic Development Financing Authority (Penndot Major Bridges); Series 2022, RB(b) | | | 5.25 | % | | | 06/30/2053 | | | | 2,600 | | | | 2,650,050 | |
Pennsylvania (Commonwealth of) Economic Development Financing Authority (Pennsylvania Rapid Bridge Replacement); | | | | | | | | | | | | | | | | |
Series 2015, RB(b) | | | 5.00 | % | | | 12/31/2038 | | | | 460 | | | | 459,939 | |
Series 2015, RB(b) | | | 5.00 | % | | | 06/30/2042 | | | | 11,750 | | | | 11,396,634 | |
Pennsylvania (Commonwealth of) Economic Development Financing Authority (Presbyterian Senior Living); | | | | | | | | | | | | | | | | |
Series 2021, Ref. RB | | | 4.00 | % | | | 07/01/2041 | | | | 700 | | | | 594,077 | |
Series 2021, Ref. RB | | | 4.00 | % | | | 07/01/2046 | | | | 2,000 | | | | 1,619,537 | |
Pennsylvania (Commonwealth of) Economic Development Financing Authority (UPMC); | | | | | | | | | | | | | | | | |
Series 2020 A-1, RB | | | 4.00 | % | | | 04/15/2050 | | | | 1,500 | | | | 1,353,420 | |
Series 2022 A, Ref. RB | | | 4.00 | % | | | 02/15/2052 | | | | 1,500 | | | | 1,331,731 | |
Pennsylvania (Commonwealth of) Higher Educational Facilities Authority (Holy Family University); Series 2013 A, RB(h) | | | 6.25 | % | | | 09/01/2033 | | | | 320 | | | | 324,674 | |
Pennsylvania (Commonwealth of) Higher Educational Facilities Authority (La Salle University); Series 2012, RB | | | 5.00 | % | | | 05/01/2042 | | | | 1,180 | | | | 1,015,280 | |
Pennsylvania (Commonwealth of) Higher Educational Facilities Authority (Thomas Jefferson University); Series 2015, Ref. RB | | | 5.25 | % | | | 09/01/2050 | | | | 1,070 | | | | 1,081,570 | |
Pennsylvania (Commonwealth of) Higher Educational Facilities Authority (Trustees University of Pennsylvania); Series 2017, RB(f) | | | 5.00 | % | | | 08/15/2046 | | | | 2,200 | | | | 2,311,357 | |
Pennsylvania (Commonwealth of) Higher Educational Facilities Authority (University of Pennsylvania Health System); | | | | | | | | | | | | | | | | |
Series 2017 A, RB | | | 5.00 | % | | | 08/15/2042 | | | | 1,075 | | | | 1,111,827 | |
Series 2019, RB | | | 4.00 | % | | | 08/15/2044 | | | | 10,000 | | | | 9,447,204 | |
Pennsylvania (Commonwealth of) Higher Educational Facilities Authority (Widener College); Series 2014, Ref. RB | | | 5.00 | % | | | 07/15/2038 | | | | 1,000 | | | | 1,006,244 | |
Pennsylvania (Commonwealth of) Housing Finance Agency; Series 2019-131 A, RB | | | 3.10 | % | | | 10/01/2044 | | | | 2,500 | | | | 1,943,797 | |
Pennsylvania (Commonwealth of) Housing Finance Agency (Social bonds); Series 2023 141-A, RB | | | 5.75 | % | | | 10/01/2053 | | | | 1,000 | | | | 1,077,500 | |
Pennsylvania (Commonwealth of) Public School Building Authority (Harrisburg School); Series 2016 A, Ref. RB (INS - AGM)(a) | | | 5.00 | % | | | 12/01/2030 | | | | 910 | | | | 949,894 | |
See accompanying Notes to Financial Statements which are an integral part of the financial statements.
11 Invesco Pennsylvania Municipal Fund
| | | | | | | | | | | | | | | | |
| | | Interest
Rate | | | Maturity
Date | | | Principal
Amount
(000) | | | Value | |
Pennsylvania–(continued) | | | | | | | | | | | | | | | | |
Pennsylvania (Commonwealth of) Public School Building Authority (Philadelphia School District); | | | | | | | | | | | | | | | | |
Series 2016 A, Ref. RB | | | 5.00% | | | | 06/01/2027 | | | $ | 3,750 | | | $ | 3,935,817 | |
Series 2016 A, Ref. RB (INS - AGM)(a) | | | 5.00% | | | | 06/01/2032 | | | | 9,520 | | | | 9,954,309 | |
Series 2016, Ref. RB(h)(i) | | | 5.00% | | | | 12/01/2026 | | | | 5 | | | | 5,384 | |
Series 2016, Ref. RB | | | 5.00% | | | | 06/01/2036 | | | | 4,795 | | | | 4,949,286 | |
Pennsylvania (Commonwealth of) Turnpike Commission; | | | | | | | | | | | | | | | | |
Series 2009 C, RB (INS - AGM)(a) | | | 6.25% | | | | 06/01/2033 | | | | 2,000 | | | | 2,210,174 | |
Series 2009 E, RB | | | 6.38% | | | | 12/01/2038 | | | | 11,435 | | | | 12,887,016 | |
Series 2009 E, RB (INS - AGM)(a) | | | 6.38% | | | | 12/01/2038 | | | | 2,500 | | | | 2,829,144 | |
Series 2014 A-1, RB | | | 5.00% | | | | 12/01/2032 | | | | 2,000 | | | | 2,063,079 | |
Series 2015 B, RB | | | 5.00% | | | | 12/01/2030 | | | | 500 | | | | 527,256 | |
Series 2015 B, RB | | | 5.00% | | | | 12/01/2031 | | | | 1,000 | | | | 1,054,171 | |
Series 2017 A, RB | | | 5.50% | | | | 12/01/2042 | | | | 5,000 | | | | 5,231,873 | |
Series 2017 A-1, RB | | | 5.00% | | | | 12/01/2035 | | | | 1,050 | | | | 1,125,801 | |
Series 2017 B-1, RB | | | 5.25% | | | | 06/01/2047 | | | | 1,630 | | | | 1,692,789 | |
Series 2018 A-2, RB | | | 5.00% | | | | 12/01/2043 | | | | 535 | | | | 564,339 | |
Series 2018 A-2, RB | | | 5.00% | | | | 12/01/2048 | | | | 6,000 | | | | 6,209,249 | |
Series 2019 A, RB | | | 5.00% | | | | 12/01/2044 | | | | 1,000 | | | | 1,055,496 | |
Series 2019 A, RB (INS - AGM)(a) | | | 4.00% | | | | 12/01/2049 | | | | 3,800 | | | | 3,719,304 | |
Series 2019 A, RB | | | 5.00% | | | | 12/01/2049 | | | | 9,660 | | | | 10,039,366 | |
Series 2021 A, RB | | | 4.00% | | | | 12/01/2050 | | | | 11,500 | | | | 10,440,957 | |
Series 2022 B, Ref. RB | | | 5.25% | | | | 12/01/2052 | | | | 3,000 | | | | 3,256,134 | |
Pennsylvania Higher Education Assistance Agency; | | | | | | | | | | | | | | | | |
Series 2021 A, RB(b) | | | 5.00% | | | | 06/01/2030 | | | | 400 | | | | 429,559 | |
Series 2021 A, RB(b) | | | 2.63% | | | | 06/01/2042 | | | | 2,000 | | | | 1,680,628 | |
Pennsylvania State University (The); | | | | | | | | | | | | | | | | |
Series 2016 A, RB | | | 5.00% | | | | 09/01/2041 | | | | 1,430 | | | | 1,484,348 | |
Series 2017 A, RB | | | 5.00% | | | | 09/01/2047 | | | | 2,500 | | | | 2,629,554 | |
Series 2019 A, RB | | | 5.00% | | | | 09/01/2044 | | | | 1,330 | | | | 1,422,651 | |
Philadelphia (City of), PA; | | | | | | | | | | | | | | | | |
Series 2017 15, Ref. RB | | | 5.00% | | | | 08/01/2047 | | | | 3,620 | | | | 3,707,975 | |
Series 2017 A, RB | | | 5.00% | | | | 10/01/2052 | | | | 1,895 | | | | 1,955,596 | |
Series 2017 A, RB(f) | | | 5.25% | | | | 10/01/2052 | | | | 2,070 | | | | 2,157,537 | |
Series 2017 A, Ref. GO Bonds (INS - AGM)(a) | | | 5.00% | | | | 08/01/2035 | | | | 3,500 | | | | 3,749,598 | |
Series 2017 A, Ref. GO Bonds | | | 5.00% | | | | 08/01/2036 | | | | 700 | | | | 739,916 | |
Series 2017 B, Ref. RB(b) | | | 5.00% | | | | 07/01/2047 | | | | 19,700 | | | | 19,929,866 | |
Series 2017, Ref. GO Bonds | | | 5.00% | | | | 08/01/2041 | | | | 1,000 | | | | 1,050,083 | |
Series 2018 A, RB | | | 5.00% | | | | 10/01/2053 | | | | 7,000 | | | | 7,262,093 | |
Series 2019 B, GO Bonds | | | 5.00% | | | | 02/01/2037 | | | | 145 | | | | 154,382 | |
Series 2019 B, RB | | | 5.00% | | | | 11/01/2049 | | | | 4,635 | | | | 4,839,670 | |
Series 2019 B, RB | | | 5.00% | | | | 11/01/2054 | | | | 11,030 | | | | 11,479,874 | |
Series 2020 A, RB (INS - AGM)(a) | | | 5.00% | | | | 08/01/2050 | | | | 5,000 | | | | 5,266,543 | |
Series 2020 A, RB | | | 5.00% | | | | 11/01/2050 | | | | 1,250 | | | | 1,313,498 | |
Series 2020 C, Ref. RB(b) | | | 4.00% | | | | 07/01/2050 | | | | 3,725 | | | | 3,301,492 | |
Series 2021 A, GO Bonds | | | 5.00% | | | | 05/01/2034 | | | | 1,420 | | | | 1,580,392 | |
Series 2021 A, GO Bonds | | | 4.00% | | | | 05/01/2042 | | | | 2,500 | | | | 2,332,437 | |
Series 2021, Ref. RB (INS - AGM)(a)(b) | | | 4.00% | | | | 07/01/2039 | | | | 1,000 | | | | 951,044 | |
Philadelphia (City of), PA Authority for Industrial Development (Architecture & Design Charter High School); Series 2013, RB(h)(i) | | | 6.13% | | | | 03/15/2023 | | | | 3,085 | | | | 3,088,140 | |
Philadelphia (City of), PA Authority for Industrial Development (Children’s Hospital of Philadelphia); Series 2014 A, RB(f)(h)(i) | | | 5.00% | | | | 07/01/2024 | | | | 1,500 | | | | 1,534,472 | |
Philadelphia (City of), PA Authority for Industrial Development (Cultural and Commercials Corridors); Series 2016, Ref. RB | | | 5.00% | | | | 12/01/2031 | | | | 840 | | | | 868,543 | |
Philadelphia (City of), PA Authority for Industrial Development (First Philadelphia Preparatory Charter School); Series 2014 A, RB | | | 7.00% | | | | 06/15/2033 | | | | 875 | | | | 907,851 | |
Philadelphia (City of), PA Authority for Industrial Development (Independence Charter School - West); | | | | | | | | | | | | | | | | |
Series 2019, RB | | | 4.00% | | | | 06/15/2029 | | | | 350 | | | | 333,113 | |
Series 2019, RB | | | 5.00% | | | | 06/15/2050 | | | | 350 | | | | 314,481 | |
See accompanying Notes to Financial Statements which are an integral part of the financial statements.
12 Invesco Pennsylvania Municipal Fund
| | | | | | | | | | | | | | |
| | | Interest
Rate | | Maturity
Date | | | Principal
Amount
(000) | | | Value | |
Pennsylvania–(continued) | | | | | | | | | | | | | | |
Philadelphia (City of), PA Authority for Industrial Development (International Apartments at Temple University); | | | | | | | | | | | | | | |
Series 2010 A, IDR | | 5.38% | | | 06/15/2030 | | | $ | 1,730 | | | $ | 1,724,184 | |
Series 2010 A, IDR | | 5.63% | | | 06/15/2042 | | | | 4,000 | | | | 3,772,898 | |
Philadelphia (City of), PA Authority for Industrial Development (Kipp Philadelphia Charter School); Series 2016 B, RB | | 5.00% | | | 04/01/2046 | | | | 640 | | | | 582,090 | |
Philadelphia (City of), PA Authority for Industrial Development (MaST I Charter School); Series 2016 A, Ref. RB | | 5.25% | | | 08/01/2046 | | | | 1,500 | | | | 1,518,895 | |
Philadelphia (City of), PA Authority for Industrial Development (PresbyHomes Germantown/ Morrisville); Series 2005 A, RB | | 5.63% | | | 07/01/2035 | | | | 2,354 | | | | 2,401,588 | |
Philadelphia (City of), PA Authority for Industrial Development (Richard Allen Preparatory Charter School); Series 2006, RB | | 6.25% | | | 05/01/2033 | | | | 1,640 | | | | 1,510,002 | |
Philadelphia (City of), PA Authority for Industrial Development (St. Joseph’s University); | | | | | | | | | | | | | | |
Series 2020 A, Ref. RB | | 4.00% | | | 11/01/2045 | | | | 1,900 | | | | 1,668,947 | |
Series 2022, RB | | 5.25% | | | 11/01/2052 | | | | 2,000 | | | | 2,114,130 | |
Philadelphia (City of), PA Authority for Industrial Development (Tacony Academy Charter School); | | | | | | | | | | | | | | |
Series 2013 A-1, RB | | 6.75% | | | 06/15/2033 | | | | 2,000 | | | | 2,016,446 | |
Series 2013 A-1, RB | | 7.00% | | | 06/15/2043 | | | | 3,090 | | | | 3,114,536 | |
Philadelphia (City of), PA Authority for Industrial Development (Temple University); First Series 2015, Ref. RB | | 5.00% | | | 04/01/2045 | | | | 530 | | | | 534,995 | |
Philadelphia (City of), PA Authority for Industrial Development (Thomas Jefferson University); Series 2017 A, Ref. RB | | 5.00% | | | 09/01/2047 | | | | 17,635 | | | | 17,840,203 | |
Philadelphia (City of), PA Authority for Industrial Development (University of the Arts); Series 2017, Ref. RB(g) | | 5.00% | | | 03/15/2045 | | | | 540 | | | | 428,237 | |
Philadelphia (City of), PA Authority for Industrial Development (University Square Apartments); | | | | | | | | | | | | | | |
Series 2017, RB | | 4.00% | | | 12/01/2047 | | | | 1,600 | | | | 1,422,613 | |
Series 2017, RB | | 5.00% | | | 12/01/2058 | | | | 10,000 | | | | 10,019,938 | |
Philadelphia (City of), PA Authority for Industrial Development (Wesley Enhanced Living Obligated Group); | | | | | | | | | | | | | | |
Series 2017, Ref. RB | | 5.00% | | | 07/01/2042 | | | | 1,000 | | | | 841,800 | |
Series 2017, Ref. RB | | 5.00% | | | 07/01/2049 | | | | 500 | | | | 404,624 | |
Philadelphia (City of), PA Hospitals & Higher Education Facilities Authority (Temple University Health System); Series 2017, Ref. RB | | 5.00% | | | 07/01/2032 | | | | 1,000 | | | | 1,029,663 | |
Philadelphia (City of), PA Housing Authority (PHA Headquarters); | | | | | | | | | | | | | | |
Series 2017, RB | | 5.00% | | | 05/01/2039 | | | | 1,300 | | | | 1,343,104 | |
Series 2017, RB | | 5.00% | | | 05/01/2042 | | | | 2,415 | | | | 2,480,637 | |
Series 2017, RB | | 5.00% | | | 05/01/2047 | | | | 3,335 | | | | 3,401,608 | |
Philadelphia (City of), PA Parking Authority; Series 1999 A, RB (INS - AMBAC)(a) | | 5.25% | | | 02/15/2029 | | | | 25 | | | | 25,044 | |
Philadelphia School District (The); | | | | | | | | | | | | | | |
Series 2007 A, Ref. GO Bonds (INS - NATL)(a) | | 5.00% | | | 06/01/2025 | | | | 535 | | | | 552,137 | |
Series 2016 F, Ref. GO Bonds | | 5.00% | | | 09/01/2028 | | | | 10,000 | | | | 10,540,765 | |
Series 2016 F, Ref. GO Bonds | | 5.00% | | | 09/01/2029 | | | | 10,000 | | | | 10,534,009 | |
Series 2016 F, Ref. GO Bonds | | 5.00% | | | 09/01/2032 | | | | 1,000 | | | | 1,041,996 | |
Series 2019 A, GO Bonds | | 4.00% | | | 09/01/2037 | | | | 7,050 | | | | 7,017,325 | |
Series 2019 A, GO Bonds | | 5.00% | | | 09/01/2044 | | | | 1,000 | | | | 1,054,924 | |
Series 2021 A, GO Bonds | | 4.00% | | | 09/01/2046 | | | | 2,000 | | | | 1,815,224 | |
Pittsburgh (City of), PA; | | | | | | | | | | | | | | |
Series 2021, GO Bonds | | 4.00% | | | 09/01/2040 | | | | 500 | | | | 488,811 | |
Series 2021, GO Bonds | | 4.00% | | | 09/01/2041 | | | | 600 | | | | 578,097 | |
Series 2022, GO Bonds | | 5.00% | | | 09/01/2042 | | | | 1,250 | | | | 1,332,038 | |
Pittsburgh (City of), PA Urban Redevelopment Authority (Marian Plaza); Series 2007, RB (CEP - GNMA)(b) | | 6.13% | | | 01/20/2043 | | | | 2,450 | | | | 2,452,244 | |
Pittsburgh (City of), PA Water & Sewer Authority; | | | | | | | | | | | | | | |
Series 2013 A, Ref. RB | | 5.00% | | | 09/01/2031 | | | | 500 | | | | 503,187 | |
Series 2019 A, RB (INS - AGM)(a) | | 5.00% | | | 09/01/2044 | | | | 1,200 | | | | 1,268,720 | |
Series 2020 B, RB (INS - AGM)(a) | | 4.00% | | | 09/01/2045 | | | | 1,000 | | | | 974,289 | |
Series 2020 B, RB (INS - AGM)(a) | | 4.00% | | | 09/01/2050 | | | | 4,350 | | | | 4,160,651 | |
Pottsville (City of), PA Hospital Authority (Lehigh Valley); Series 2016 B, Ref. RB | | 5.00% | | | 07/01/2041 | | | | 4,000 | | | | 4,085,323 | |
Reading School District; | | | | | | | | | | | | | | |
Series 2017, Ref. GO Bonds (INS - AGM)(a) | | 5.00% | | | 03/01/2037 | | | | 1,500 | | | | 1,571,879 | |
Series 2017, Ref. GO Bonds (INS - AGM)(a) | | 5.00% | | | 03/01/2038 | | | | 1,500 | | | | 1,568,401 | |
See accompanying Notes to Financial Statements which are an integral part of the financial statements.
13 Invesco Pennsylvania Municipal Fund
| | | | | | | | | | | | | | |
| | | Interest
Rate | | Maturity
Date | | | Principal
Amount
(000) | | | Value | |
Pennsylvania–(continued) | | | | | | | | | | | | | | |
Scranton School District; | | | | | | | | | | | | | | |
Series 2017 E, Ref. GO Bonds (INS - BAM)(a) | | 5.00% | | | 12/01/2034 | | | $ | 820 | | | $ | 887,480 | |
Series 2017 E, Ref. GO Bonds (INS - BAM)(a) | | 5.00% | | | 12/01/2035 | | | | 750 | | | | 806,873 | |
Southcentral Pennsylvania General Authority (Hanover Hospital, Inc.); Series 2015, Ref. RB | | 5.00% | | | 12/01/2029 | | | | 1,000 | | | | 1,038,712 | |
Southcentral Pennsylvania General Authority (WellSpan Health Obligated Group); Series 2019 A, Ref. RB | | 5.00% | | | 06/01/2049 | | | | 750 | | | | 769,697 | |
Southeastern Pennsylvania Transportation Authority; Series 2022, RB | | 5.25% | | | 06/01/2052 | | | | 4,000 | | | | 4,411,036 | |
Susquehanna Area Regional Airport Authority; Series 2017, Ref. RB(b) | | 5.00% | | | 01/01/2038 | | | | 1,350 | | | | 1,381,839 | |
Swarthmore (Borough of), PA Authority (Swarthmore College); Series 2021 B, Ref. RB | | 4.00% | | | 09/15/2041 | | | | 3,000 | | | | 2,973,881 | |
Tender Option Bond Trust Receipts/Certificates; Series 2022, VRD RB(g)(n) | | 3.10% | | | 12/01/2066 | | | | 3,000 | | | | 3,000,000 | |
Trinity Area School District; Series 2021, GO Bonds (INS - AGM)(a) | | 4.00% | | | 11/01/2051 | | | | 1,485 | | | | 1,417,092 | |
Washington (County of), PA Redevelopment Authority (Victory Centre); Series 2018, Ref. RB | | 5.00% | | | 07/01/2028 | | | | 500 | | | | 497,887 | |
West Shore School District; Series 2020, GO Bonds | | 4.00% | | | 11/15/2048 | | | | 2,000 | | | | 1,841,657 | |
Westmoreland (County of), PA Industrial Development Authority (Excela Health); Series 2020 A, Ref. RB | | 4.00% | | | 07/01/2037 | | | | 1,400 | | | | 1,278,047 | |
Westmoreland (County of), PA Municipal Authority; Series 2016, Ref. RB (INS - BAM)(a) | | 5.00% | | | 08/15/2038 | | | | 2,000 | | | | 2,045,261 | |
Wilkes-Barre Area School District; | | | | | | | | | | | | | | |
Series 2016 B, GO Bonds (INS - BAM)(a) | | 5.00% | | | 08/01/2034 | | | | 2,600 | | | | 2,806,388 | |
Series 2016 B, GO Bonds (INS - BAM)(a) | | 5.00% | | | 08/01/2036 | | | | 2,125 | | | | 2,272,623 | |
| | | | | | | | | | | | | | 662,655,283 | |
| | | | |
Puerto Rico–12.67% | | | | | | | | | | | | | | |
Children’s Trust Fund; | | | | | | | | | | | | | | |
Series 2002, RB | | 5.38% | | | 05/15/2033 | | | | 5 | | | | 5,002 | |
Series 2002, RB | | 5.50% | | | 05/15/2039 | | | | 17,000 | | | | 17,000,988 | |
Series 2005 A, RB(j) | | 0.00% | | | 05/15/2050 | | | | 53,320 | | | | 9,357,116 | |
Series 2008 A, RB(j) | | 0.00% | | | 05/15/2057 | | | | 415,530 | | | | 27,488,307 | |
Corp. Para El Financiamiento Publico de Puerto Rico; Series 2011, RB | | 5.50% | | | 08/01/2031 | | | | 5,725 | | | | 150,281 | |
Puerto Rico (Commonwealth of); | | | | | | | | | | | | | | |
Series 2021 A, GO Bonds(j) | | 0.00% | | | 07/01/2024 | | | | 434 | | | | 407,361 | |
Series 2021 A, GO Bonds(j) | | 0.00% | | | 07/01/2033 | | | | 2,000 | | | | 1,139,544 | |
Series 2021 A-1, GO Bonds | | 5.25% | | | 07/01/2023 | | | | 725 | | | | 726,943 | |
Series 2021 A-1, GO Bonds | | 5.38% | | | 07/01/2025 | | | | 1,446 | | | | 1,467,815 | |
Series 2021 A-1, GO Bonds | | 5.63% | | | 07/01/2027 | | | | 1,433 | | | | 1,479,869 | |
Series 2021 A-1, GO Bonds | | 5.63% | | | 07/01/2029 | | | | 1,409 | | | | 1,470,480 | |
Series 2021 A-1, GO Bonds | | 5.75% | | | 07/01/2031 | | | | 1,369 | | | | 1,440,861 | |
Series 2021 A-1, GO Bonds | | 4.00% | | | 07/01/2033 | | | | 1,298 | | | | 1,163,130 | |
Series 2021 A-1, GO Bonds | | 4.00% | | | 07/01/2035 | | | | 1,167 | | | | 1,021,971 | |
Series 2021 A-1, GO Bonds | | 4.00% | | | 07/01/2037 | | | | 1,001 | | | | 856,404 | |
Series 2021 A-1, GO Bonds | | 4.00% | | | 07/01/2041 | | | | 1,361 | | | | 1,124,695 | |
Series 2021 A-1, GO Bonds | | 4.00% | | | 07/01/2046 | | | | 1,416 | | | | 1,127,527 | |
Subseries 2022, RN | | 0.00% | | | 11/01/2043 | | | | 6,771 | | | | 2,920,040 | |
Subseries 2022, RN | | 0.00% | | | 11/01/2051 | | | | 189 | | | | 64,769 | |
Subseries 2022, RN | | 0.00% | | | 11/01/2051 | | | | 198 | | | | 86,838 | |
Subseries 2022, RN | | 0.00% | | | 11/01/2051 | | | | 73 | | | | 70,299 | |
Puerto Rico (Commonwealth of) Aqueduct & Sewer Authority; | | | | | | | | | | | | | | |
Series 2008 A, RB | | 6.13% | | | 07/01/2024 | | | | 740 | | | | 751,871 | |
Series 2022 A, Ref. RB(g) | | 5.00% | | | 07/01/2033 | | | | 2,000 | | | | 2,005,688 | |
Puerto Rico (Commonwealth of) Electric Power Authority; | | | | | | | | | | | | | | |
Series 2005 SS, Ref. RB (INS - NATL)(a) | | 5.00% | | | 07/01/2025 | | | | 6,000 | | | | 6,005,664 | |
Series 2007 TT, RB(l) | | 5.00% | | | 07/01/2032 | | | | 1,450 | | | | 1,011,375 | |
Series 2010 AAA, RB(l) | | 5.25% | | | 07/01/2024 | | | | 1,435 | | | | 999,119 | |
Series 2010 XX, RB(l) | | 5.25% | | | 07/01/2040 | | | | 2,445 | | | | 1,717,612 | |
Puerto Rico (Commonwealth of) Highway & Transportation Authority; | | | | | | | | | | | | | | |
Series 2022 A, RB | | 5.00% | | | 07/01/2062 | | | | 414 | | | | 383,693 | |
Series 2022 B, RB(j) | | 0.00% | | | 07/01/2032 | | | | 269 | | | | 168,024 | |
Series 2022 C, RB(k) | | 5.00% | | | 07/01/2053 | | | | 460 | | | | 255,309 | |
See accompanying Notes to Financial Statements which are an integral part of the financial statements.
14 Invesco Pennsylvania Municipal Fund
| | | | | | | | | | | | | | |
| | | Interest
Rate | | Maturity
Date | | | Principal
Amount
(000) | | | Value | |
Puerto Rico–(continued) | | | | | | | | | | | | | | |
Puerto Rico Sales Tax Financing Corp.; | | | | | | | | | | | | | | |
Series 2018 A-1, RB(j) | | 0.00% | | | 07/01/2046 | | | $ | 3,912 | | | $ | 1,002,567 | |
Series 2018 A-1, RB(j) | | 0.00% | | | 07/01/2051 | | | | 7,242 | | | | 1,366,421 | |
Series 2018 A-1, RB | | 5.00% | | | 07/01/2058 | | | | 5,537 | | | | 5,137,229 | |
Series 2019 A-2, RB | | 4.54% | | | 07/01/2053 | | | | 91 | | | | 78,696 | |
Series 2019 A-2, RB | | 4.78% | | | 07/01/2058 | | | | 1,216 | | | | 1,086,938 | |
Series 2019 A-2B, RB | | 4.55% | | | 07/01/2040 | | | | 1,063 | | | | 992,706 | |
University of Puerto Rico; | | | | | | | | | | | | | | |
Series 2006 P, Ref. RB | | 5.00% | | | 06/01/2030 | | | | 3,235 | | | | 3,142,822 | |
Series 2006 Q, RB | | 5.00% | | | 06/01/2030 | | | | 1,300 | | | | 1,262,958 | |
| | | | | | | | | | | | | | 97,938,932 | |
| | | | |
Virgin Islands–1.01% | | | | | | | | | | | | | | |
Tobacco Settlement Financing Corp.; | | | | | | | | | | | | | | |
Series 2001, RB | | 5.00% | | | 05/15/2031 | | | | 340 | | | | 340,359 | |
Series 2006, RB(j) | | 0.00% | | | 05/15/2035 | | | | 4,150 | | | | 1,683,903 | |
Series 2006, RB(j) | | 0.00% | | | 05/15/2035 | | | | 2,195 | | | | 956,983 | |
Series 2006, RB(j) | | 0.00% | | | 05/15/2035 | | | | 7,000 | | | | 2,808,133 | |
Virgin Islands (Government of) Public Finance Authority (Virgin Islands Gross Receipts Taxes Loan Note); Series 2014 C, Ref. RB(g) | | 5.00% | | | 10/01/2039 | | | | 2,500 | | | | 2,018,672 | |
| | | | | | | | | | | | | | 7,808,050 | |
| | | | |
Northern Mariana Islands–0.14% | | | | | | | | | | | | | | |
Northern Mariana Islands (Commonwealth of) Ports Authority; | | | | | | | | | | | | | | |
Series 1998 A, RB(b) | | 6.25% | | | 03/15/2028 | | | | 655 | | | | 629,425 | |
Series 1998 A, RB(b) | | 6.60% | | | 03/15/2028 | | | | 495 | | | | 477,691 | |
| | | | | | | | | | | | | | 1,107,116 | |
Guam–0.12% | | | | | | | | | | | | | | |
Guam (Territory of) Waterworks Authority; Series 2014 A, Ref. RB | | 5.00% | | | 07/01/2029 | | | | 285 | | | | 288,110 | |
Guam Housing Corp.; Series 1998 A, RB (CEP - FHLMC)(b) | | 5.75% | | | 09/01/2031 | | | | 615 | | | | 616,555 | |
| | | | | | | | | | | | | | 904,665 | |
TOTAL INVESTMENTS IN SECURITIES(o)-99.69% (Cost $826,925,475) | | | | | | | | | | | | | 770,414,046 | |
FLOATING RATE NOTE OBLIGATIONS-(1.23)% | | | | | | | | | | | | | | |
Notes with interest and fee rates ranging from 3.97% to 4.01% at 02/28/2023 and contractual maturities of collateral ranging from 06/01/2034 to 10/01/2052
(See Note 1K)(p) | | | | | | | | | | | | | (9,505,000 | ) |
| |
OTHER ASSETS LESS LIABILITIES-1.54% | | | | | | | | | | | | | 11,892,575 | |
NET ASSETS-100.00% | | | | | | | | | | | | $ | 772,801,621 | |
Investment Abbreviations:
| | |
| ACA | | - ACA Financial Guaranty Corp. |
| AGM | | - Assured Guaranty Municipal Corp. |
| AMBAC | | - American Municipal Bond Assurance Corp. |
| BAM | | - Build America Mutual Assurance Co. |
| CEP | | - Credit Enhancement Provider |
| COP | | - Certificates of Participation |
| FHLMC | | - Federal Home Loan Mortgage Corp. |
| GNMA | | - Government National Mortgage Association |
| GO | | - General Obligation |
| IDR | | - Industrial Development Revenue Bonds |
| INS | | - Insurer |
| LIBOR | | - London Interbank Offered Rate |
| NATL | | - National Public Finance Guarantee Corp. |
| RB | | - Revenue Bonds |
| Ref. | | - Refunding |
| RN | | - Revenue Notes |
| USD | | - U.S. Dollar |
| VRD | | - Variable Rate Demand |
See accompanying Notes to Financial Statements which are an integral part of the financial statements.
15 Invesco Pennsylvania Municipal Fund
Notes to Schedule of Investments:
| (a) | Principal and/or interest payments are secured by the bond insurance company listed. |
| (b) | Security subject to the alternative minimum tax. |
| (c) | Interest or dividend rate is redetermined periodically. Rate shown is the rate in effect on February 28, 2023. |
| (d) | The issuer is paying less than stated interest, but is not in default on principal because scheduled principal payments have not yet begun. |
| (e) | Restricted security. The aggregate value of these securities at February 28, 2023 was $8,394,684, which represented 1.09% of the Fund’s Net Assets. |
| (f) | Underlying security related to TOB Trusts entered into by the Fund. See Note 1K. |
| (g) | Security purchased or received in a transaction exempt from registration under the Securities Act of 1933, as amended (the “1933 Act”). The security may be resold pursuant to an exemption from registration under the 1933 Act, typically to qualified institutional buyers. The aggregate value of these securities at February 28, 2023 was $14,865,451, which represented 1.92% of the Fund’s Net Assets. |
| (h) | Advance refunded; secured by an escrow fund of U.S. Government obligations or other highly rated collateral. |
| (i) | Security has an irrevocable call by the issuer or mandatory put by the holder. Maturity date reflects such call or put. |
| (j) | Zero coupon bond issued at a discount. |
| (k) | Convertible capital appreciation bond. The interest rate shown represents the coupon rate at which the bond will accrue at a specified future date. |
| (l) | Defaulted security. Currently, the issuer is in default with respect to principal and/or interest payments. The aggregate value of these securities at February 28, 2023 was $3,745,025, which represented less than 1% of the Fund’s Net Assets. |
| (m) | Security valued using significant unobservable inputs (Level 3). See Note 3. |
| (n) | Demand security payable upon demand by the Fund at specified time intervals no greater than thirteen months. Interest rate is redetermined periodically by the issuer or agent based on current market conditions. Rate shown is the rate in effect on February 28, 2023. |
| (o) | This table provides a listing of those entities that have either issued, guaranteed, backed or otherwise enhanced the credit quality of more than 5% of the securities held in the portfolio. In instances where the entity has guaranteed, backed or otherwise enhanced the credit quality of a security, it is not primarily responsible for the issuer’s obligations but may be called upon to satisfy the issuer’s obligations. |
| | |
| Entity | | Percent |
| Assured Guaranty Municipal Corp. | | 6.34% |
| (p) | Floating rate note obligations related to securities held. The interest and fee rates shown reflect the rates in effect at February 28, 2023. At February 28, 2023, the Fund’s investments with a value of $14,445,944 are held by TOB Trusts and serve as collateral for the $9,505,000 in the floating rate note obligations outstanding at that date. |
See accompanying Notes to Financial Statements which are an integral part of the financial statements.
16 Invesco Pennsylvania Municipal Fund
Statement of Assets and Liabilities
February 28, 2023
| | | | |
| |
Assets: | | | | |
Investments in unaffiliated securities, at value (Cost $826,925,475) | | $ | 770,414,046 | |
Cash | | | 3,547,771 | |
Receivable for: | | | | |
Investments sold | | | 225,000 | |
Fund shares sold | | | 250,799 | |
Interest | | | 9,451,524 | |
Investment for trustee deferred compensation and retirement plans | | | 83,064 | |
Other assets | | | 252,196 | |
Total assets | | | 784,224,400 | |
Liabilities: | | | | |
Floating rate note obligations | | | 9,505,000 | |
Payable for: | | | | |
Dividends | | | 925,283 | |
Fund shares reacquired | | | 468,194 | |
Accrued fees to affiliates | | | 300,799 | |
Accrued interest expense | | | 8,961 | |
Accrued trustees’ and officers’ fees and benefits | | | 37,736 | |
Accrued other operating expenses | | | 87,336 | |
Trustee deferred compensation and retirement plans | | | 89,470 | |
Total liabilities | | | 11,422,779 | |
Net assets applicable to shares outstanding | | $ | 772,801,621 | |
| | | | |
| |
Net assets consist of: | | | | |
Shares of beneficial interest | | $ | 956,529,156 | |
Distributable earnings (loss) | | | (183,727,535 | ) |
| | | $ | 772,801,621 | |
| |
Net Assets: | | | | |
Class A | | $ | 565,421,858 | |
Class C | | $ | 62,564,393 | |
Class Y | | $ | 143,676,885 | |
Class R6 | | $ | 1,138,485 | |
|
Shares outstanding, no par value, with an unlimited number of shares authorized: | |
Class A | | | 55,612,781 | |
Class C | | | 6,173,493 | |
Class Y | | | 14,121,227 | |
Class R6 | | | 112,021 | |
Class A: | | | | |
Net asset value per share | | $ | 10.17 | |
Maximum offering price per share
(Net asset value of $10.17 ÷ 95.75%) | | $ | 10.62 | |
Class C: | | | | |
Net asset value and offering price per share | | $ | 10.13 | |
Class Y: | | | | |
Net asset value and offering price per share | | $ | 10.17 | |
Class R6: | | | | |
Net asset value and offering price per share | | $ | 10.16 | |
See accompanying Notes to Financial Statements which are an integral part of the financial statements.
17 Invesco Pennsylvania Municipal Fund
Statement of Operations
For the year ended February 28, 2023
| | | | |
Investment income: | | | | |
Interest | | $ | 35,173,335 | |
| |
| |
Expenses: | | | | |
Advisory fees | | | 3,660,665 | |
| |
Administrative services fees | | | 115,547 | |
| |
Custodian fees | | | 5,834 | |
| |
Distribution fees:
Class A | | | 1,463,716 | |
| |
Class C | | | 622,638 | |
| |
Interest, facilities and maintenance fees | | | 587,443 | |
| |
Transfer agent fees – A, C and Y | | | 588,391 | |
| |
Transfer agent fees – R6 | | | 179 | |
| |
Trustees’ and officers’ fees and benefits | | | 24,996 | |
| |
Registration and filing fees | | | 57,105 | |
| |
Reports to shareholders | | | 21,031 | |
| |
Professional services fees | | | 100,068 | |
| |
Other | | | 17,419 | |
| |
Total expenses | | | 7,265,032 | |
| |
Less: Expense offset arrangement(s) | | | (2,677 | ) |
| |
Net expenses | | | 7,262,355 | |
| |
Net investment income | | | 27,910,980 | |
| |
| |
Realized and unrealized gain (loss) from: | | | | |
Net realized gain (loss) from unaffiliated investment securities (includes net gains (losses) from securities sold to affiliates of $(2,151,421)) | | | (9,925,282 | ) |
| |
Change in net unrealized appreciation (depreciation) of unaffiliated investment securities | | | (80,912,318 | ) |
| |
Net realized and unrealized gain (loss) | | | (90,837,600 | ) |
| |
Net increase (decrease) in net assets resulting from operations | | $ | (62,926,620 | ) |
| |
See accompanying Notes to Financial Statements which are an integral part of the financial statements.
18 Invesco Pennsylvania Municipal Fund
Statement of Changes in Net Assets
For the years ended February 28, 2023 and 2022
| | | | | | | | |
| | | 2023 | | | 2022 | |
| |
Operations: | | | | | | | | |
Net investment income | | $ | 27,910,980 | | | $ | 25,258,827 | |
| |
Net realized gain (loss) | | | (9,925,282 | ) | | | (2,370,883 | ) |
| |
Change in net unrealized appreciation (depreciation) | | | (80,912,318 | ) | | | (9,805,889 | ) |
| |
Net increase (decrease) in net assets resulting from operations | | | (62,926,620 | ) | | | 13,082,055 | |
| |
| | |
Distributions to shareholders from distributable earnings: | | | | | | | | |
Class A | | | (19,237,292 | ) | | | (20,788,556 | ) |
| |
Class C | | | (1,825,247 | ) | | | (2,045,019 | ) |
| |
Class Y | | | (4,547,589 | ) | | | (4,132,230 | ) |
| |
Class R6 | | | (41,586 | ) | | | (31,758 | ) |
| |
Total distributions from distributable earnings | | | (25,651,714 | ) | | | (26,997,563 | ) |
| |
| | |
Share transactions–net: | | | | | | | | |
Class A | | | (39,113,796 | ) | | | 6,549,547 | |
| |
Class C | | | (13,658,636 | ) | | | 2,050,384 | |
| |
Class Y | | | 21,992,444 | | | | 24,843,566 | |
| |
Class R6 | | | 190,421 | | | | 236,098 | |
| |
Net increase (decrease) in net assets resulting from share transactions | | | (30,589,567 | ) | | | 33,679,595 | |
| |
Net increase (decrease) in net assets | | | (119,167,901 | ) | | | 19,764,087 | |
| |
| | |
Net assets: | | | | | | | | |
Beginning of year | | | 891,969,522 | | | | 872,205,435 | |
| |
End of year | | $ | 772,801,621 | | | $ | 891,969,522 | |
| |
See accompanying Notes to Financial Statements which are an integral part of the financial statements.
19 Invesco Pennsylvania Municipal Fund
Financial Highlights
The following schedule presents financial highlights for a share of the Fund outstanding throughout the periods indicated.
| | | | | | | | | | | | | | | | | | | | | | | | | | | | | | | | | | | | | | | | | | | | | | | | | | | | |
| | | Net asset
value,
beginning
of period | | | Net investment income(a) | | | Net gains
(losses) on securities
(both realized and unrealized) | | | Total from investment operations | | | Dividends from net investment income | | | Net asset value, end of period | | | Total return(b) | | | Net assets,
end of period (000’s omitted) | | | Ratio of
expenses
to average
net assets
with fee waivers
and/or
expenses absorbed | | | Ratio of
expenses
to average net
assets without fee waivers
and/or
expenses
absorbed | | | Supplemental
ratio of
expenses
to average
net assets
with fee waivers
(excluding
interest,
facilities and
maintenance
fees) | | | Ratio of net
investment
income to average net assets | | | Portfolio turnover(c) | |
Class A | | | | | | | | | | | | | | | | | | | | | | | | | | | | | | | | | | | | | | | | | | | | | | | | | | | | |
Year ended 02/28/23 | | | $11.30 | | | | $0.37 | | | | $(1.16 | ) | | | $(0.79 | ) | | | $(0.34 | ) | | | $10.17 | | | | (7.04 | )%(d) | | | $565,422 | | | | 0.89 | %(d) | | | 0.89 | %(d) | | | 0.82 | %(d) | | | 3.51 | %(d) | | | 19 | % |
Year ended 02/28/22 | | | 11.47 | | | | 0.33 | | | | (0.15 | ) | | | 0.18 | | | | (0.35 | ) | | | 11.30 | | | | 1.53 | (d) | | | 671,015 | | | | 0.87 | (d) | | | 0.87 | (d) | | | 0.82 | (d) | | | 2.82 | (d) | | | 8 | |
Year ended 02/28/21 | | | 11.68 | | | | 0.37 | | | | (0.21 | ) | | | 0.16 | | | | (0.37 | ) | | | 11.47 | | | | 1.48 | (d) | | | 674,756 | | | | 0.92 | (d) | | | 0.92 | (d) | | | 0.84 | (d) | | | 3.27 | (d) | | | 14 | |
Seven months ended 02/29/20 | | | 11.19 | | | | 0.23 | | | | 0.47 | | | | 0.70 | | | | (0.21 | ) | | | 11.68 | | | | 6.36 | | | | 534,700 | | | | 0.88 | (e) | | | 1.03 | (e) | | | 0.88 | (e) | | | 3.54 | (e) | | | 6 | |
Year ended 07/31/19 | | | 10.40 | | | | 0.46 | | | | 0.69 | | | | 1.15 | | | | (0.36 | ) | | | 11.19 | | | | 11.32 | | | | 498,743 | | | | 0.91 | | | | 1.19 | | | | 0.91 | | | | 4.30 | | | | 21 | |
Year ended 07/31/18 | | | 10.44 | | | | 0.41 | | | | (0.03 | ) | | | 0.38 | | | | (0.42 | ) | | | 10.40 | | | | 3.84 | | | | 423,210 | | | | 0.97 | | | | 1.18 | | | | 0.97 | | | | 4.09 | | | | 13 | |
Class C | | | | | | | | | | | | | | | | | | | | | | | | | | | | | | | | | | | | | | | | | | | | | | | | | | | | |
Year ended 02/28/23 | | | 11.27 | | | | 0.30 | | | | (1.17 | ) | | | (0.87 | ) | | | (0.27 | ) | | | 10.13 | | | | (7.72 | )(d) | | | 62,564 | | | | 1.53 | (d) | | | 1.53 | (d) | | | 1.46 | (d) | | | 2.87 | (d) | | | 19 | |
Year ended 02/28/22 | | | 11.43 | | | | 0.25 | | | | (0.14 | ) | | | 0.11 | | | | (0.27 | ) | | | 11.27 | | | | 0.96 | (d) | | | 84,383 | | | | 1.53 | (d) | | | 1.53 | (d) | | | 1.48 | (d) | | | 2.16 | (d) | | | 8 | |
Year ended 02/28/21 | | | 11.65 | | | | 0.30 | | | | (0.22 | ) | | | 0.08 | | | | (0.30 | ) | | | 11.43 | | | | 0.76 | (d) | | | 83,646 | | | | 1.53 | (d) | | | 1.53 | (d) | | | 1.45 | (d) | | | 2.66 | (d) | | | 14 | |
Seven months ended 02/29/20 | | | 11.15 | | | | 0.19 | | | | 0.48 | | | | 0.67 | | | | (0.17 | ) | | | 11.65 | | | | 6.07 | | | | 110,395 | | | | 1.54 | (e) | | | 1.69 | (e) | | | 1.54 | (e) | | | 2.88 | (e) | | | 6 | |
Year ended 07/31/19 | | | 10.37 | | | | 0.39 | | | | 0.68 | | | | 1.07 | | | | (0.29 | ) | | | 11.15 | | | | 10.52 | | | | 110,166 | | | | 1.57 | | | | 1.85 | | | | 1.57 | | | | 3.64 | | | | 21 | |
Year ended 07/31/18 | | | 10.42 | | | | 0.34 | | | | (0.04 | ) | | | 0.30 | | | | (0.35 | ) | | | 10.37 | | | | 3.07 | | | | 161,664 | | | | 1.62 | | | | 1.83 | | | | 1.62 | | | | 3.43 | | | | 13 | |
Class Y | | | | | | | | | | | | | | | | | | | | | | | | | | | | | | | | | | | | | | | | | | | | | | | | | | | | |
Year ended 02/28/23 | | | 11.31 | | | | 0.39 | | | | (1.17 | ) | | | (0.78 | ) | | | (0.36 | ) | | | 10.17 | | | | (6.89 | ) | | | 143,677 | | | | 0.65 | | | | 0.65 | | | | 0.57 | | | | 3.75 | | | | 19 | |
Year ended 02/28/22 | | | 11.47 | | | | 0.36 | | | | (0.14 | ) | | | 0.22 | | | | (0.38 | ) | | | 11.31 | | | | 1.87 | | | | 135,503 | | | | 0.63 | | | | 0.63 | | | | 0.58 | | | | 3.06 | | | | 8 | |
Year ended 02/28/21 | | | 11.69 | | | | 0.40 | | | | (0.22 | ) | | | 0.18 | | | | (0.40 | ) | | | 11.47 | | | | 1.64 | | | | 112,953 | | | | 0.68 | | | | 0.68 | | | | 0.60 | | | | 3.51 | | | | 14 | |
Seven months ended 02/29/20 | | | 11.19 | | | | 0.25 | | | | 0.48 | | | | 0.73 | | | | (0.23 | ) | | | 11.69 | | | | 6.60 | | | | 84,030 | | | | 0.64 | (e) | | | 0.79 | (e) | | | 0.64 | (e) | | | 3.78 | (e) | | | 6 | |
Year ended 07/31/19 | | | 10.40 | | | | 0.49 | | | | 0.69 | | | | 1.18 | | | | (0.39 | ) | | | 11.19 | | | | 11.58 | | | | 71,769 | | | | 0.67 | | | | 0.95 | | | | 0.67 | | | | 4.54 | | | | 21 | |
Year ended 07/31/18 | | | 10.45 | | | | 0.44 | | | | (0.05 | ) | | | 0.39 | | | | (0.44 | ) | | | 10.40 | | | | 3.98 | | | | 49,843 | | | | 0.72 | | | | 0.93 | | | | 0.72 | | | | 4.33 | | | | 13 | |
Class R6 | | | | | | | | | | | | | | | | | | | | | | | | | | | | | | | | | | | | | | | | | | | | | | | | | | | | |
Year ended 02/28/23 | | | 11.29 | | | | 0.40 | | | | (1.16 | ) | | | (0.76 | ) | | | (0.37 | ) | | | 10.16 | | | | (6.76 | ) | | | 1,138 | | | | 0.59 | | | | 0.59 | | | | 0.52 | | | | 3.81 | | | | 19 | |
Year ended 02/28/22 | | | 11.46 | | | | 0.36 | | | | (0.14 | ) | | | 0.22 | | | | (0.39 | ) | | | 11.29 | | | | 1.86 | | | | 1,068 | | | | 0.55 | | | | 0.55 | | | | 0.50 | | | | 3.14 | | | | 8 | |
Year ended 02/28/21 | | | 11.68 | | | | 0.40 | | | | (0.21 | ) | | | 0.19 | | | | (0.41 | ) | | | 11.46 | | | | 1.70 | | | | 850 | | | | 0.61 | | | | 0.61 | | | | 0.53 | | | | 3.58 | | | | 14 | |
Seven months ended 02/29/20 | | | 11.18 | | | | 0.25 | | | | 0.48 | | | | 0.73 | | | | (0.23 | ) | | | 11.68 | | | | 6.63 | | | | 732 | | | | 0.62 | (e) | | | 0.77 | (e) | | | 0.62 | (e) | | | 3.83 | (e) | | | 6 | |
Period ended 07/31/19(f) | | | 11.05 | | | | 0.10 | | | | 0.10 | | | | 0.20 | | | | (0.07 | ) | | | 11.18 | | | | 1.86 | | | | 10 | | | | 0.62 | (e) | | | 0.90 | (e) | | | 0.62 | (e) | | | 4.59 | (e) | | | 21 | |
| (a) | Calculated using average shares outstanding. |
| (b) | Includes adjustments in accordance with accounting principles generally accepted in the United States of America and as such, the net asset value for financial reporting purposes and the returns based upon those net asset values may differ from the net asset value and returns for shareholder transactions. Does not include sales charges and is not annualized for periods less than one year, if applicable. |
| (c) | Portfolio turnover is calculated at the fund level and is not annualized for periods less than one year, if applicable. For the year ended February 28, 2021, the portfolio turnover calculation excludes the value of securities purchased of $134,448,765 in connection with the acquisition of Invesco Pennsylvania Tax Free Fund into the Fund. |
| (d) | The total return, ratio of expenses to average net assets and ratio of net investment income to average net assets reflect actual 12b-1 fees of 0.24% for Class A for the year ended February 28, 2023, 2022 and 2021, respectively. The total return, ratio of expenses to average net assets and ratio of net investment income to average net assets reflect actual 12b-1 fees of 0.89% and 0.85% for Class C for the year ended February 28, 2023 and 2021. |
| (f) | Commencement date after the close of business on May 24, 2019. |
See accompanying Notes to Financial Statements which are an integral part of the financial statements.
20 Invesco Pennsylvania Municipal Fund
Notes to Financial Statements
February 28, 2023
NOTE 1–Significant Accounting Policies
Invesco Pennsylvania Municipal Fund (the “Fund”) is a series portfolio of AIM Tax-Exempt Funds (Invesco Tax-Exempt Funds) (the “Trust”). The Trust is a Delaware statutory trust registered under the Investment Company Act of 1940, as amended (the “1940 Act”), as an open-end series management investment company authorized to issue an unlimited number of shares of beneficial interest. Information presented in these financial statements pertains only to the Fund. Matters affecting the Fund or each class will be voted on exclusively by the shareholders of the Fund or each class.
The Fund’s investment objective is to seek tax-free income.
The Fund currently consists of four different classes of shares: Class A, Class C, Class Y and Class R6. Class Y shares are available only to certain investors. Class A shares are sold with a front-end sales charge unless certain waiver criteria are met. Under certain circumstances, load waived shares may be subject to contingent deferred sales charges (“CDSC”). Class C shares are sold with a CDSC. Class Y and Class R6 shares are sold at net asset value. Class C shares held for eight years after purchase are eligible for automatic conversion into Class A shares of the same Fund (the “Conversion Feature”). The automatic conversion pursuant to the Conversion Feature will generally occur at the end of the month following the eighth anniversary after a purchase of Class C shares.
The Fund is an investment company and accordingly follows the investment company accounting and reporting guidance in accordance with Financial Accounting Standards Board Accounting Standards Codification Topic 946, Financial Services - Investment Companies.
The following is a summary of the significant accounting policies followed by the Fund in the preparation of its financial statements.
| A. | Security Valuations - Securities, including restricted securities, are valued according to the following policy. |
Securities generally are valued on the basis of prices provided by independent pricing services. Prices provided by the pricing service may be determined without exclusive reliance on quoted prices, and may reflect appropriate factors such as institution-size trading in similar groups of securities, developments related to specific securities, dividend rate (for unlisted equities), yield (for debt obligations), quality, type of issue, coupon rate (for debt obligations), maturity (for debt obligations), individual trading characteristics and other market data. Pricing services generally value debt obligations assuming orderly transactions of institutional round lot size, but a fund may hold or transact in the same securities in smaller, odd lot sizes. Odd lots often trade at lower prices than institutional round lots, and their value may be adjusted accordingly. Debt obligations are subject to interest rate and credit risks. In addition, all debt obligations involve some risk of default with respect to interest and/or principal payments.
Securities for which market quotations are not readily available are fair valued by Invesco Advisers, Inc. (the “Adviser” or “Invesco”) in accordance with Board-approved policies and related Adviser procedures (“Valuation Procedures”). If a fair value price provided by a pricing service is not representative of market value in the Adviser’s judgment (“unreliable”), the Adviser will fair value the security using the Valuation Procedures. Some of the factors which may be considered in determining fair value are fundamental analytical data relating to the investment; the nature and duration of any restrictions on transferability or disposition; trading in similar securities by the same issuer or comparable companies; relevant political, economic or issuer specific news; and other relevant factors under the circumstances.
The Fund may invest in securities that are subject to interest rate risk, meaning the risk that the prices will generally fall as interest rates rise and, conversely, the prices will generally rise as interest rates fall. Specific securities differ in their sensitivity to changes in interest rates depending on their individual characteristics. Changes in interest rates may result in increased market volatility, which may affect the value and/or liquidity of certain Fund investments.
Valuations change in response to many factors including the historical and prospective earnings of the issuer, the value of the issuer’s assets, general market conditions which are not specifically related to the particular issuer, such as real or perceived adverse economic conditions, changes in the general outlook for revenues or corporate earnings, changes in interest or currency rates, regional or global instability, natural or environmental disasters, widespread disease or other public health issues, war, acts of terrorism, significant governmental actions or adverse investor sentiment generally and market liquidity. Because of the inherent uncertainties of valuation, the values reflected in the financial statements may materially differ from the value received upon actual sale of those investments.
The price the Fund could receive upon the sale of any investment may differ from the Adviser’s valuation of the investment, particularly for securities that are valued using a fair valuation technique. When fair valuation techniques are applied, the Adviser uses available information, including both observable and unobservable inputs and assumptions, to determine a methodology that will result in a valuation that the Adviser believes approximates market value. Fund securities that are fair valued may be subject to greater fluctuation in their value from one day to the next than would be the case if market quotations were used. Because of the inherent uncertainties of valuation, and the degree of subjectivity in such decisions, the Fund could realize a greater or lesser than expected gain or loss upon the sale of the investment.
| B. | Securities Transactions and Investment Income - Securities transactions are accounted for on a trade date basis. Realized gains or losses on sales are computed on the basis of specific identification of the securities sold. Interest income (net of withholding tax, if any) is recorded on an accrual basis from settlement date and includes coupon interest and amortization of premium and accretion of discount on debt securities as applicable. Pay-in-kind interest income and non-cash dividend income received in the form of securities in-lieu of cash are recorded at the fair value of the securities received. Dividend income (net of withholding tax, if any) is recorded on the ex-dividend date. |
The Fund may periodically participate in litigation related to Fund investments. As such, the Fund may receive proceeds from litigation settlements.Any proceeds received are included in the Statement of Operations as realized gain (loss) for investments no longer held and as unrealized gain (loss) for investments still held.
Brokerage commissions and mark ups are considered transaction costs and are recorded as an increase to the cost basis of securities purchased and/or a reduction of proceeds on a sale of securities. Such transaction costs are included in the determination of net realized and unrealized gain (loss) from investment securities reported in the Statement of Operations and the Statement of Changes in Net Assets and the net realized and unrealized gains (losses) on securities per share in the Financial Highlights. Transaction costs are included in the calculation of the Fund’s net asset value and, accordingly, they reduce the Fund’s total returns. These transaction costs are not considered operating expenses and are not reflected in net investment income reported in the Statement of Operations and the Statement of Changes in Net Assets, or the net investment income per share and the ratios of expenses and net investment income reported in the Financial Highlights, nor are they limited by any expense limitation arrangements between the Fund and the investment adviser.
The Fund allocates realized and unrealized capital gains and losses to a class based on the relative net assets of each class. The Fund allocates income to a class based on the relative value of the settled shares of each class.
| C. | Country Determination - For the purposes of making investment selection decisions and presentation in the Schedule of Investments, the investment adviser may determine the country in which an issuer is located and/or credit risk exposure based on various factors. These factors include the laws of the country under which the issuer is organized, where the issuer maintains a principal office, the country in which the issuer derives 50% or more of its total revenues, the country that has the primary market for the issuer’s securities and its “country of risk” as determined by a third party service provider, as well as other criteria. Among the other criteria that may be evaluated for making this determination are the country in which the issuer maintains 50% or more of its assets, the type of security, financial guarantees and enhancements, the nature of the collateral and the sponsor organization. Country of issuer and/or credit risk exposure has been determined to be the United States of America, unless otherwise noted. |
| D. | Distributions - Distributions from net investment income, if any, are declared daily and paid monthly. Distributions from net realized capital gain, if any, are |
21 Invesco Pennsylvania Municipal Fund
| | generally declared and paid annually and recorded on the ex-dividend date. The Fund may elect to treat a portion of the proceeds from redemptions as distributions for federal income tax purposes. |
| E. | Federal Income Taxes - The Fund intends to comply with the requirements of Subchapter M of the Internal Revenue Code of 1986, as amended (the “Internal Revenue Code”), necessary to qualify as a regulated investment company and to distribute substantially all of the Fund’s taxable and tax-exempt earnings to shareholders. As such, the Fund will not be subject to federal income taxes on otherwise taxable income (including net realized capital gain) that is distributed to shareholders. Therefore, no provision for federal income taxes is recorded in the financial statements. |
The Fund recognizes the tax benefits of uncertain tax positions only when the position is more likely than not to be sustained. Management has analyzed the Fund’s uncertain tax positions and concluded that no liability for unrecognized tax benefits should be recorded related to uncertain tax positions. Management is not aware of any tax positions for which it is reasonably possible that the total amounts of unrecognized tax benefits will change materially in the next 12 months.
In addition, the Fund intends to invest in such municipal securities to allow it to qualify to pay shareholders “exempt-interest dividends”, as defined in the Internal Revenue Code.
The Fund files tax returns in the U.S. Federal jurisdiction and certain other jurisdictions. Generally, the Fund is subject to examinations by such taxing authorities for up to three years after the filing of the return for the tax period.
| F. | Expenses - Fees provided for under the Rule 12b-1 plan of a particular class of the Fund are charged to the operations of such class. Transfer agency fees and expenses and other shareholder recordkeeping fees and expenses attributable to Class R6 are charged to such class. Transfer agency fees and expenses and other shareholder recordkeeping fees and expenses relating to all other classes are allocated among those classes based on relative net assets. All other expenses are allocated among the classes based on relative net assets. |
| G. | Interest, Facilities and Maintenance Fees - Interest, Facilities and Maintenance Fees include interest and related borrowing costs such as commitment fees, administrative expenses and other expenses associated with establishing and maintaining the line of credit. In addition, interest and administrative expenses related to establishing and maintaining floating rate note obligations, if any, are included. |
| H. | Accounting Estimates - The preparation of financial statements in conformity with accounting principles generally accepted in the United States of America (“GAAP”) requires management to make estimates and assumptions that affect the reported amounts of assets and liabilities at the date of the financial statements and the reported amounts of revenues and expenses during the reporting period including estimates and assumptions related to taxation. Actual results could differ from those estimates by a significant amount. In addition, the Fund monitors for material events or transactions that may occur or become known after the period-end date and before the date the financial statements are released to print. |
| I. | Indemnifications - Under the Trust’s organizational documents, each Trustee, officer, employee or other agent of the Trust is indemnified against certain liabilities that may arise out of the performance of their duties to the Fund. Additionally, in the normal course of business, the Fund enters into contracts, including the Fund’s servicing agreements, that contain a variety of indemnification clauses. The Fund’s maximum exposure under these arrangements is unknown as this would involve future claims that may be made against the Fund that have not yet occurred. The risk of material loss as a result of such indemnification claims is considered remote. |
| J. | Securities Purchased on a When-Issued and Delayed Delivery Basis - The Fund may purchase and sell interests in corporate loans and corporate debt securities and other portfolio securities on a when-issued and delayed delivery basis, with payment and delivery scheduled for a future date. No income accrues to the Fund on such interests or securities in connection with such transactions prior to the date the Fund actually takes delivery of such interests or securities. These transactions are subject to market fluctuations and are subject to the risk that the value at delivery may be more or less than the trade date purchase price. Although the Fund will generally purchase these securities with the intention of acquiring such securities, they may sell such securities prior to the settlement date. |
| K. | Floating Rate Note Obligations - The Fund invests in inverse floating rate securities, such as Tender Option Bonds (“TOBs”), for investment purposes and to enhance the yield of the Fund. Such securities may be purchased in the secondary market without first owning an underlying bond but generally are created through the sale of fixed rate bonds by the Fund to special purpose trusts established by a broker dealer or by the Fund (“TOB Trusts”) in exchange for cash and residual interests in the TOB Trusts’ assets and cash flows, which are in the form of inverse floating rate securities. The TOB Trusts finance the purchases of the fixed rate bonds by issuing floating rate notes to third parties and allowing the Fund to retain residual interests in the bonds. The floating rate notes issued by the TOB Trusts have interest rates that reset weekly and the floating rate note holders have the option to tender their notes to the TOB Trusts for redemption at par at each reset date. The residual interests held by the Fund (inverse floating rate securities) include the right of the Fund (1) to cause the holders of the floating rate notes to tender their notes at par at the next interest rate reset date, and (2) to transfer the municipal bond from the TOB Trust to the Fund, thereby collapsing the TOB Trust. Inverse floating rate securities tend to underperform the market for fixed rate bonds in a rising interest rate environment, but tend to outperform the market for fixed rate bonds when interest rates decline or remain relatively stable. |
The Fund generally invests in inverse floating rate securities that include embedded leverage, thus exposing the Fund to greater risks and increased costs. The primary risks associated with inverse floating rate securities are varying degrees of liquidity and decreases in the value of such securities in response to changes in interest rates to a greater extent than fixed rate securities having similar credit quality, redemption provisions and maturity, which may cause the Fund’s net asset value to be more volatile than if it had not invested in inverse floating rate securities. In certain instances, the short-term floating rate notes created by the TOB Trust may not be able to be sold to third parties or, in the case of holders tendering (or putting) such notes for repayment of principal, may not be able to be remarketed to third parties. In such cases, the TOB Trust holding the fixed rate bonds may be collapsed with the entity that contributed the fixed rate bonds to the TOB Trust. In the case where a TOB Trust is collapsed with the Fund, the Fund will be required to repay the principal amount of the tendered securities, which may require the Fund to sell other portfolio holdings to raise cash to meet that obligation. The Fund could therefore be required to sell other portfolio holdings at a disadvantageous time or price to raise cash to meet this obligation, which risk will be heightened during times of market volatility, illiquidity or uncertainty. The embedded leverage in the TOB Trust could cause the Fund to lose more money than the value of the asset it has contributed to the TOB Trust and greater levels of leverage create the potential for greater losses. In addition, a Fund may enter into reimbursement agreements with the liquidity provider of certain TOB transactions in connection with certain residuals held by the Fund. These agreements commit a Fund to reimburse the liquidity provider to the extent that the liquidity provider must provide cash to a TOB Trust, including following the termination of a TOB Trust resulting from a mandatory tender event (“liquidity shortfall”). The reimbursement agreement will effectively make the Fund liable for the amount of the negative difference, if any, between the liquidation value of the underlying security and the purchase price of the floating rate notes issued by the TOB Trust.
The Fund accounts for the transfer of fixed rate bonds to the TOB Trusts as secured borrowings, with the securities transferred remaining in the Fund’s investment assets, and the related floating rate notes reflected as Fund liabilities under the caption Floating rate note obligations on the Statement of Assets and Liabilities. The carrying amount of the Fund’s floating rate note obligations as reported on the Statement of Assets and Liabilities approximates its fair value. The Fund records the interest income from the fixed rate bonds under the caption Interest and records the expenses related to floating rate obligations and any administrative expenses of the TOB Trusts as a component of Interest, facilities and maintenance fees on the Statement of Operations.
Final rules implementing section 619 of the Dodd-Frank Wall Street Reform and Consumer Protection Act (the “Volcker Rule”) prohibit banking entities from engaging in proprietary trading of certain instruments and limit such entities’ investments in, and relationships with, “covered funds”, as defined in the rules. These rules preclude banking entities and their affiliates from sponsoring and/or providing services for existing TOB Trusts. A new TOB structure is being utilized by the Fund wherein the Fund, as holder of the residuals, will perform certain duties previously performed by banking entities as “sponsors” of TOB Trusts. These duties may be performed by a third-party service provider. The Fund’s expanded role under the new TOB structure may increase its operational and regulatory risk. The new structure is substantially similar to the previous structure; however, pursuant to the Volcker Rule, the remarketing agent would not be able to repurchase
22 Invesco Pennsylvania Municipal Fund
tendered floaters for its own account upon a failed remarketing. In the event of a failed remarketing, a banking entity serving as liquidity provider may loan the necessary funds to the TOB Trust to purchase the tendered floaters. The TOB Trust, not the Fund, would be the borrower and the loan from the liquidity provider will be secured by the purchased floaters now held by the TOB Trust. However, as previously described, the Fund would bear the risk of loss with respect to any liquidity shortfall to the extent it entered into a reimbursement agreement with the liquidity provider.
Further, the SEC and various banking agencies have adopted rules implementing credit risk retention requirements for asset-backed securities (the “Risk Retention Rules”). The Risk Retention Rules require the sponsor of a TOB Trust to retain at least 5% of the credit risk of the underlying assets supporting the TOB Trust’s municipal bonds. The Fund has adopted policies intended to comply with the Risk Retention Rules. The Risk Retention Rules may adversely affect the Fund’s ability to engage in TOB Trust transactions or increase the costs of such transactions in certain circumstances.
There can be no assurances that the new TOB structure will continue to be a viable form of leverage. Further, there can be no assurances that alternative forms of leverage will be available to the Fund in order to maintain current levels of leverage. Any alternative forms of leverage may be less advantageous to the Fund, and may adversely affect the Fund’s net asset value, distribution rate and ability to achieve its investment objective.
TOBs are presently classified as private placement securities. Private placement securities are subject to restrictions on resale because they have not been registered under the Securities Act of 1933, as amended (the “1933 Act”), or are otherwise not readily marketable. As a result of the absence of a public trading market for these securities, they may be less liquid than publicly traded securities. Although atypical, these securities may be resold in privately negotiated transactions, the prices realized from these sales could be less than those originally paid by the Fund or less than what may be considered the fair value of such securities.
| L. | Collateral –To the extent the Fund has designated or segregated a security as collateral and that security is subsequently sold, it is the Fund’s practice to replace such collateral no later than the next business day. |
| M. | Other Risks - The value of, payment of interest on, repayment of principal for and the ability to sell a municipal security may be affected by constitutional amendments, legislative enactments, executive orders, administrative regulations, voter initiatives and the economics of the regions in which the issuers are located. Since many municipal securities are issued to finance similar projects, especially those relating to education, health care, transportation and utilities, conditions in those sectors can affect the overall municipal securities market and the Fund’s investments in municipal securities. There is some risk that a portion or all of the interest received from certain tax-free municipal securities could become taxable as a result of determinations by the Internal Revenue Service. |
Increases in the federal funds and equivalent foreign rates or other changes to monetary policy or regulatory actions may expose fixed income markets to heightened volatility and reduced liquidity for certain fixed income investments, particularly those with longer maturities. It is difficult to predict the impact of interest rate changes on various markets. In addition, decreases in fixed income dealer market-making capacity may also potentially lead to heightened volatility and reduced liquidity in the fixed income markets. As a result, the value of the Fund’s investments and share price may decline. Changes in central bank policies could also result in higher than normal redemptions by shareholders, which could potentially increase the Fund’s portfolio turnover rate and transaction costs.
Policy changes by the U.S. government or its regulatory agencies and political events within the U.S. and abroad may, among other things, affect investor and consumer confidence and increase volatility in the financial markets, perhaps suddenly and to a significant degree, which may adversely impact the Fund’s operations, universe of potential investment options, and return potential.
The Fund may invest in lower-quality debt securities, i.e., “junk bonds”. Investments in lower-rated securities or unrated securities of comparable quality tend to be more sensitive to economic conditions than higher rated securities. Junk bonds involve a greater risk of default by the issuer because such securities are generally unsecured and are often subordinated to other creditors’ claims. Junk bonds are less liquid than investment grade debt securities and their prices tend to be more volatile.
The municipal issuers in which the Fund invests may be located in the same geographic area or may pay their interest obligations from revenue of similar projects, such as hospitals, airports, utility systems and housing finance agencies. This may make the Fund’s investments more susceptible to similar social, economic, political or regulatory occurrences, making the Fund more susceptible to experience a drop in its share price than if the Fund had been more diversified across issuers that did not have similar characteristics.
| N. | COVID-19 Risk - The COVID-19 strain of coronavirus has resulted in instances of market closures and dislocations, extreme volatility, liquidity constraints and increased trading costs. Efforts to contain its spread have resulted in travel restrictions, disruptions of healthcare systems, business operations (including business closures) and supply chains, layoffs, lower consumer demand and employee availability, and defaults and credit downgrades, among other significant economic impacts that have disrupted global economic activity across many industries. Such economic impacts may exacerbate other pre-existing political, social and economic risks locally or globally and cause general concern and uncertainty. The full economic impact and ongoing effects of COVID-19 (or other future epidemics or pandemics) at the macro-level and on individual businesses are unpredictable and may result in significant and prolonged effects on the Fund’s performance. |
NOTE 2–Advisory Fees and Other Fees Paid to Affiliates
The Trust has entered into a master investment advisory agreement with the Adviser. Under the terms of the investment advisory agreement, the Fund accrues daily and pays monthly an advisory fee to the Adviser based on the annual rate of the Fund’s average daily net assets as follows:
| | |
| Average Daily Net Assets | | Rate* |
|
First $ 500 million | | 0.510% |
|
Next $250 million | | 0.410% |
|
Next $250 million | | 0.400% |
|
Next $1 billion | | 0.380% |
|
Next $3 billion | | 0.345% |
|
Over $5 billion | | 0.330% |
|
| * | The advisory fee paid by the Fund shall be reduced by any amounts paid by the Fund under the administrative services agreement with the Adviser. |
For the year ended February 28, 2023, the effective advisory fee rate incurred by the Fund was 0.46%.
Under the terms of a master sub-advisory agreement between the Adviser and each of Invesco Asset Management Deutschland GmbH, Invesco Asset Management Limited, Invesco Asset Management (Japan) Limited, Invesco Hong Kong Limited, Invesco Senior Secured Management, Inc. and Invesco Canada Ltd. and separate sub-advisory agreements with Invesco Capital Management LLC and Invesco Asset Management (India) Private Limited (collectively, the “Affiliated Sub-Advisers”) the Adviser, not the Fund, will pay 40% of the fees paid to the Adviser to any such Affiliated Sub-Adviser(s) that provide(s) discretionary investment management services to the Fund based on the percentage of assets allocated to such Affiliated Sub-Adviser(s). Invesco has also entered into a sub-advisory agreement with OppenheimerFunds, Inc. to provide discretionary management services to the Fund.
The Adviser has contractually agreed, through at least June 30, 2023, to waive advisory fees and/or reimburse expenses to the extent necessary to limit total annual fund operating expenses after fee waiver and/or expense reimbursement (excluding certain items discussed below) of Class A, Class C, Class Y and Class R6 to 1.50%, 2.15%, 1.25% and 1.25%, respectively, of the Fund’s average daily net assets (the “expense limits”). In determining the Adviser’s obligation to waive
23 Invesco Pennsylvania Municipal Fund
advisory fees and/or reimburse expenses, the following expenses are not taken into account, and could cause the total annual fund operating expenses after fee waiver and/or reimbursement to exceed the numbers reflected above: (1) interest; (2) taxes; (3) dividend expense on short sales; (4) extraordinary or non-routine items, including litigation expenses; and (5) expenses that the Fund has incurred but did not actually pay because of an expense offset arrangement. Unless Invesco continues the fee waiver agreement, it will terminate on June 30, 2023. During its term, the fee waiver agreement cannot be terminated or amended to increase the expense limits or reduce the advisory fee waivers without approval of the Board of Trustees. The Adviser did not waive fees and/or reimburse expenses during the period under these expense limits.
The Trust has entered into a master administrative services agreement with Invesco pursuant to which the Fund has agreed to pay Invesco for certain administrative costs incurred in providing accounting services to the Fund. For the year ended February 28, 2023, expenses incurred under the agreement are shown in the Statement of Operations as Administrative services fees. Invesco has entered into a sub-administration agreement whereby State Street Bank and Trust Company (“SSB”) serves as fund accountant and provides certain administrative services to the Fund. Pursuant to a custody agreement with the Trust on behalf of the Fund, SSB also serves as the Fund’s custodian.
The Trust has entered into a transfer agency and service agreement with Invesco Investment Services, Inc. (“IIS”) pursuant to which the Fund has agreed to pay IIS a fee for providing transfer agency and shareholder services to the Fund and reimburse IIS for certain expenses incurred by IIS in the course of providing such services. IIS may make payments to intermediaries that provide omnibus account services, sub-accounting services and/or networking services. All fees payable by IIS to intermediaries that provide omnibus account services or sub-accounting services are charged back to the Fund, subject to certain limitations approved by the Trust’s Board of Trustees. For the year ended February 28, 2023, expenses incurred under the agreement are shown in the Statement of Operations as Transfer agent fees.
The Trust has entered into master distribution agreements with Invesco Distributors, Inc. (“IDI”) to serve as the distributor for the Class A, Class C, Class Y and Class R6 shares of the Fund. The Trust has adopted plans pursuant to Rule 12b-1 under the 1940 Act with respect to the Fund’s Class A and Class C shares (collectively, the “Plans”). The Fund, pursuant to the Plans, reimburses IDI for its allocated share of expenses incurred for the period, up to a maximum annual rate of 0.25% of the average daily net assets of Class A shares and up to a maximum annual rate of 0.90% of the average daily net assets of Class C shares. The fees are accrued daily and paid monthly. Of the Plan payments, up to 0.25% of the average daily net assets of each class of shares may be paid to furnish continuing personal shareholder services to customers who purchase and own shares of such classes. Any amounts not paid as a service fee under the Plans would constitute an asset-based sales charge. Rules of the Financial Industry Regulatory Authority (“FINRA”) impose a cap on the total sales charges, including asset-based sales charges, that may be paid by any class of shares of the Fund. For the year ended February 28, 2023, expenses incurred under the Plans are shown in the Statement of Operations as Distribution fees.
Front-end sales commissions and CDSC (collectively, the “sales charges”) are not recorded as expenses of the Fund. Front-end sales commissions are deducted from proceeds from the sales of Fund shares prior to investment in Class A shares of the Fund. CDSC are deducted from redemption proceeds prior to remittance to the shareholder. During the year ended February 28, 2023, IDI advised the Fund that IDI retained $32,850 in front-end sales commissions from the sale of Class A shares and $1,228 and $11,827 from Class A and Class C shares, respectively, for CDSC imposed upon redemptions by shareholders.
Certain officers and trustees of the Trust are officers and directors of the Adviser, IIS and/or IDI.
NOTE 3–Additional Valuation Information
GAAP defines fair value as the price that would be received to sell an asset or paid to transfer a liability in an orderly transaction between market participants at the measurement date, under current market conditions. GAAP establishes a hierarchy that prioritizes the inputs to valuation methods, giving the highest priority to readily available unadjusted quoted prices in an active market for identical assets (Level 1) and the lowest priority to significant unobservable inputs (Level 3), generally when market prices are not readily available. Based on the valuation inputs, the securities or other investments are tiered into one of three levels. Changes in valuation methods may result in transfers in or out of an investment’s assigned level:
| | | | |
| | Level 1 - | | Prices are determined using quoted prices in an active market for identical assets. |
| | Level 2 - | | Prices are determined using other significant observable inputs. Observable inputs are inputs that other market participants may use in pricing a security. These may include quoted prices for similar securities, interest rates, prepayment speeds, credit risk, yield curves, loss severities, default rates, discount rates, volatilities and others. |
| | Level 3 - | | Prices are determined using significant unobservable inputs. In situations where quoted prices or observable inputs are unavailable (for example, when there is little or no market activity for an investment at the end of the period), unobservable inputs may be used. Unobservable inputs reflect the Adviser’s assumptions about the factors market participants would use in determining fair value of the securities or instruments and would be based on the best available information. |
The following is a summary of the tiered valuation input levels, as of February 28, 2023. The level assigned to the securities valuations may not be an indication of the risk or liquidity associated with investing in those securities. Because of the inherent uncertainties of valuation, the values reflected in the financial statements may materially differ from the value received upon actual sale of those investments.
| | | | | | | | | | | | | | |
| | | Level 1 | | Level 2 | | | Level 3 | | | Total | |
| | | | |
Investments in Securities | | | | | | | | | | | | | | |
| |
Municipal Obligations | | $– | | | $766,503,976 | | | | $3,910,070 | | | | $770,414,046 | |
| |
NOTE 4–Security Transactions with Affiliated Funds
The Fund is permitted to purchase securities from or sell securities to certain other affiliated funds under specified conditions outlined in procedures adopted by the Board of Trustees of the Trust. The procedures have been designed to ensure that any purchase or sale of securities by the Fund from or to another fund that is or could be considered an “affiliated person” by virtue of having a common investment adviser (or affiliated investment advisers), common Trustees and/or common officers is made in reliance on Rule 17a-7 of the 1940 Act and, to the extent applicable, related SEC staff positions. Each such transaction is effected at the security’s “current market price”, as provided for in these procedures and Rule 17a-7. Pursuant to these procedures, for the year ended February 28, 2023, the Fund engaged in securities purchases of $31,656,498 and securities sales of $23,398,151, which resulted in net realized gains (losses) of $(2,151,421).
NOTE 5–Expense Offset Arrangement(s)
The expense offset arrangement is comprised of transfer agency credits which result from balances in demand deposit accounts used by the transfer agent for clearing shareholder transactions. For the year ended February 28, 2023, the Fund received credits from this arrangement, which resulted in the reduction of the Fund’s total expenses of $2,677.
NOTE 6–Trustees’ and Officers’ Fees and Benefits
Trustees’ and Officers’ Fees and Benefits include amounts accrued by the Fund to pay remuneration to certain Trustees and Officers of the Fund. Trustees have the option to defer compensation payable by the Fund, and Trustees’ and Officers’ Fees and Benefits also include amounts accrued by the Fund to fund such deferred
24 Invesco Pennsylvania Municipal Fund
compensation amounts. Those Trustees who defer compensation have the option to select various Invesco Funds in which their deferral accounts shall be deemed to be invested. Finally, certain current Trustees were eligible to participate in a retirement plan that provided for benefits to be paid upon retirement to Trustees over a period of time based on the number of years of service. The Fund may have certain former Trustees who also participate in a retirement plan and receive benefits under such plan. Trustees’ and Officers’ Fees and Benefits include amounts accrued by the Fund to fund such retirement benefits. Obligations under the deferred compensation and retirement plans represent unsecured claims against the general assets of the Fund.
NOTE 7–Cash Balances and Borrowings
The Fund has entered into a revolving credit and security agreement, which enables the Fund to participate with certain other Invesco Funds in a committed secured borrowing facility that permits borrowings up to $2.5 billion, collectively by certain Invesco Funds, and which will expire on February 22, 2024. The revolving credit and security agreement is secured by the assets of the Fund. The Fund is subject to certain covenants relating to the revolving credit and security agreement. Failure to comply with these restrictions could cause the acceleration of the repayment of the amount outstanding under the revolving credit and security agreement.
During the year ended February 28, 2023, the average daily balance of borrowing under the revolving credit and security agreement was $543,956 with an average interest rate of 3.91%. The carrying amount of the Fund’s payable for borrowings as reported on the Statement of Assets and Liabilities approximates its fair value. Expenses under the revolving credit and security agreement are shown in the Statement of Operations as Interest, facilities and maintenance fees. At February 28, 2023, the Fund had no borrowings outstanding under this agreement.
Additionally, the Fund is permitted to temporarily carry a negative or overdrawn balance in its account with SSB, the custodian bank. Such balances, if any at period-end, are shown in the Statement of Assets and Liabilities under the payable caption Amount due custodian. To compensate the custodian bank for such overdrafts, the overdrawn Fund may either (1) leave funds as a compensating balance in the account so the custodian bank can be compensated by earning the additional interest; or (2) compensate by paying the custodian bank at a rate agreed upon by the custodian bank and Invesco, not to exceed the contractually agreed upon rate. The Fund may not purchase additional securities when any borrowings from banks or broker-dealers exceed 5% of the Fund’s total assets, or when any borrowings from an Invesco Fund are outstanding.
Inverse floating rate obligations resulting from the transfer of bonds to TOB Trusts are accounted for as secured borrowings. The average floating rate notes outstanding and average annual interest and fee rate related to inverse floating rate note obligations during the year ended February 28, 2023 were $9,505,000 and 2.33%, respectively.
NOTE 8–Distributions to Shareholders and Tax Components of Net Assets
| | | | | | | | |
| Tax Character of Distributions to Shareholders Paid During the Fiscal Years Ended February 28, 2023 and 2022: | |
| | | 2023 | | | 2022 | |
| |
Ordinary income* | | $ | 731,014 | | | $ | 210,405 | |
| |
Ordinary income-tax-exempt | | | 24,920,700 | | | | 26,787,158 | |
| |
Total distributions | | $ | 25,651,714 | | | $ | 26,997,563 | |
| |
* Includes short-term capital gain distributions, if any. | | | | | | | | |
| | | | |
Tax Components of Net Assets at Period-End: | | | | |
| | | 2023 | |
| |
Undistributed tax-exempt income | | $ | 12,670,018 | |
| |
Net unrealized appreciation (depreciation) – investments | | | (51,162,455 | ) |
| |
Temporary book/tax differences | | | (117,845 | ) |
| |
Capital loss carryforward | | | (145,117,253 | ) |
| |
Shares of beneficial interest | | | 956,529,156 | |
| |
Total net assets | | $ | 772,801,621 | |
| |
The difference between book-basis and tax-basis unrealized appreciation (depreciation) is due to differences in the timing of recognition of gains and losses on investments for tax and book purposes. The Fund’s net unrealized appreciation (depreciation) difference is attributable primarily to amortization and accretion on debt securities and defaulted bonds.
The temporary book/tax differences are a result of timing differences between book and tax recognition of income and/or expenses. The Fund’s temporary book/tax differences are the result of the trustee deferral of compensation and retirement plan benefits.
Capital loss carryforward is calculated and reported as of a specific date. Results of transactions and other activity after that date may affect the amount of capital loss carryforward actually available for the Fund to utilize. The ability to utilize capital loss carryforward in the future may be limited under the Internal Revenue Code and related regulations based on the results of future transactions.
The Fund has a capital loss carryforward as of February 28, 2023, as follows:
| | | | | | | | | | | | |
| Capital Loss Carryforward* | |
| |
| Expiration | | Short-Term | | | Long-Term | | | Total | |
| |
Not subject to expiration | | $ | 14,051,405 | | | $ | 131,065,848 | | | $ | 145,117,253 | |
| |
| * | Capital loss carryforward is reduced for limitations, if any, to the extent required by the Internal Revenue Code and may be further limited depending upon a variety of factors, including the realization of net unrealized gains or losses as of the date of any reorganization. |
25 Invesco Pennsylvania Municipal Fund
NOTE 9–Investment Transactions
The aggregate amount of investment securities (other than short-term securities, U.S. Government obligations and money market funds, if any) purchased and sold by the Fund during the year ended February 28, 2023 was $164,761,111 and $143,958,263, respectively. Cost of investments, including any derivatives, on a tax basis includes the adjustments for financial reporting purposes as of the most recently completed federal income tax reporting period-end.
| | | | |
| Unrealized Appreciation (Depreciation) of Investments on a Tax Basis | |
| |
Aggregate unrealized appreciation of investments | | $ | 10,198,256 | |
| |
Aggregate unrealized (depreciation) of investments | | | (61,360,711 | ) |
| |
Net unrealized appreciation (depreciation) of investments | | $ | (51,162,455 | ) |
| |
Cost of investments for tax purposes is $821,576,501.
NOTE 10–Reclassification of Permanent Differences
Primarily as a result of differing book/tax treatment of market discounts, defaulted bonds and amortization and accretion on debt securities, on February 28, 2023, undistributed net investment income was increased by $3,786,216 and undistributed net realized gain (loss) was decreased by $3,786,216. These reclassifications had no effect on the net assets or the distributable earnings (loss) of the Fund.
NOTE 11–Share Information
| | | | | | | | | | | | | | | | |
| | | | Summary of Share Activity | |
| |
| | | Year ended
February 28, 2023(a) | | | Year ended
February 28, 2022 | |
| | | Shares | | | Amount | | | Shares | | | Amount | |
| |
Sold: | | | | | | | | | | | | | | | | |
Class A | | | 5,103,247 | | | $ | 53,075,063 | | | | 5,420,549 | | | $ | 62,844,073 | |
| |
Class C | | | 820,575 | | | | 8,466,741 | | | | 1,747,755 | | | | 20,212,251 | |
| |
Class Y | | | 7,112,127 | | | | 73,561,836 | | | | 3,367,055 | | | | 39,027,180 | |
| |
Class R6 | | | 24,607 | | | | 265,261 | | | | 20,574 | | | | 238,082 | |
| |
| | | | |
Issued as reinvestment of dividends: | | | | | | | | | | | | | | | | |
Class A | | | 1,117,278 | | | | 11,567,481 | | | | 1,079,381 | | | | 12,483,446 | |
| |
Class C | | | 118,279 | | | | 1,221,126 | | | | 116,407 | | | | 1,342,651 | |
| |
Class Y | | | 250,945 | | | | 2,597,672 | | | | 208,009 | | | | 2,407,001 | |
| |
Class R6 | | | 1,077 | | | | 11,105 | | | | 608 | | | | 7,018 | |
| |
| | | | |
Automatic conversion of Class C shares to Class A shares: | | | | | | | | | | | | | | | | |
Class A | | | 542,070 | | | | 5,641,107 | | | | 836,207 | | | | 9,686,810 | |
| |
Class C | | | (543,592 | ) | | | (5,641,107 | ) | | | (838,510 | ) | | | (9,686,810 | ) |
| |
| | | | |
Reacquired: | | | | | | | | | | | | | | | | |
Class A | | | (10,544,662 | ) | | | (109,397,447 | ) | | | (6,788,621 | ) | | | (78,464,782 | ) |
| |
Class C | | | (1,711,567 | ) | | | (17,705,396 | ) | | | (851,095 | ) | | | (9,817,708 | ) |
| |
Class Y | | | (5,227,131 | ) | | | (54,167,064 | ) | | | (1,433,517 | ) | | | (16,590,615 | ) |
| |
Class R6 | | | (8,268 | ) | | | (85,945 | ) | | | (773 | ) | | | (9,002 | ) |
| |
Net increase (decrease) in share activity | | | (2,945,015 | ) | | $ | (30,589,567 | ) | | | 2,884,029 | | | $ | 33,679,595 | |
| |
| (a) | There are entities that are record owners of more than 5% of the outstanding shares of the Fund and in the aggregate own 53% of the outstanding shares of the Fund. IDI has an agreement with these entities to sell Fund shares. The Fund, Invesco and/or Invesco affiliates may make payments to these entities, which are considered to be related to the Fund, for providing services to the Fund, Invesco and/or Invesco affiliates including but not limited to services such as securities brokerage, distribution, third party record keeping and account servicing. The Fund has no knowledge as to whether all or any portion of the shares owned of record by these entities are also owned beneficially. |
26 Invesco Pennsylvania Municipal Fund
Report of Independent Registered Public Accounting Firm
To the Board of Trustees of AIM Tax-Exempt Funds (Invesco Tax-Exempt Funds) and Shareholders of Invesco Pennsylvania Municipal Fund
Opinion on the Financial Statements
We have audited the accompanying statement of assets and liabilities, including the schedule of investments, of Invesco Pennsylvania Municipal Fund (one of the funds constituting AIM Tax-Exempt Funds (Invesco Tax-Exempt Funds), referred to hereafter as the “Fund”) as of February 28, 2023, the related statement of operations for the year ended February 28, 2023, the statement of changes in net assets for each of the two years in the period ended February 28, 2023, including the related notes, and the financial highlights for each of the periods indicated in the table below (collectively referred to as the “financial statements”). In our opinion, the financial statements present fairly, in all material respects, the financial position of the Fund as of February 28, 2023, the results of its operations for the year then ended, the changes in its net assets for each of the two years in the period ended February 28, 2023 and the financial highlights for each of the periods indicated in the table below, in conformity with accounting principles generally accepted in the United States of America.
|
| |
| Financial Highlights |
| |
| For each of the three years in the period ended February 28, 2023, the seven months ended February 29, 2020 and the year ended July 31, 2019 for Class A, Class C and Class Y. |
| |
| For each of the three years in the period ended February 28, 2023, the seven months ended February 29, 2020 and the period May 24, 2019 (commencement date) through July 31, 2019 for Class R6. |
The financial statements of Oppenheimer Rochester® Pennsylvania Municipal Fund (subsequently renamed Invesco Pennsylvania Municipal Fund) for the year ended July 31, 2018 and the financial highlights for the year ended July 31, 2018 (not presented herein, other than the financial highlights) were audited by other auditors whose report dated September 27, 2018 expressed an unqualified opinion on those financial statements and financial highlights.
Basis for Opinion
These financial statements are the responsibility of the Fund’s management. Our responsibility is to express an opinion on the Fund’s financial statements based on our audits. We are a public accounting firm registered with the Public Company Accounting Oversight Board (United States) (PCAOB) and are required to be independent with respect to the Fund in accordance with the U.S. federal securities laws and the applicable rules and regulations of the Securities and Exchange Commission and the PCAOB.
We conducted our audits of these financial statements in accordance with the standards of the PCAOB. Those standards require that we plan and perform the audit to obtain reasonable assurance about whether the financial statements are free of material misstatement, whether due to error or fraud.
Our audits included performing procedures to assess the risks of material misstatement of the financial statements, whether due to error or fraud, and performing procedures that respond to those risks. Such procedures included examining, on a test basis, evidence regarding the amounts and disclosures in the financial statements. Our audits also included evaluating the accounting principles used and significant estimates made by management, as well as evaluating the overall presentation of the financial statements. Our procedures included confirmation of securities owned as of February 28, 2023 by correspondence with the custodian and brokers. We believe that our audits provide a reasonable basis for our opinion.
/s/PricewaterhouseCoopers LLP
Houston, Texas
April 21, 2023
We have served as the auditor of one or more of the investment companies in the Invesco group of investment companies since at least 1995. We have not been able to determine the specific year we began serving as auditor.
27 Invesco Pennsylvania Municipal Fund
Calculating your ongoing Fund expenses
Example
As a shareholder of the Fund, you incur two types of costs: (1) transaction costs, which may include sales charges (loads) on purchase payments or contingent deferred sales charges on redemptions, if any; and (2) ongoing costs, including management fees, distribution and/or service (12b-1) fees, and other Fund expenses. This example is intended to help you understand your ongoing costs (in dollars) of investing in the Fund and to compare these costs with ongoing costs of investing in other mutual funds. The example is based on an investment of $1,000 invested at the beginning of the period and held for the entire period September 1, 2022 through February 28, 2023.
Actual expenses
The table below provides information about actual account values and actual expenses. You may use the information in this table, together with the amount you invested, to estimate the expenses that you paid over the period. Simply divide your account value by $1,000 (for example, an $8,600 account value divided by $1,000 = 8.6), then multiply the result by the number in the table under the heading entitled “Actual Expenses Paid During Period” to estimate the expenses you paid on your account during this period.
Hypothetical example for comparison purposes
The table below also provides information about hypothetical account values and hypothetical expenses based on the Fund’s actual expense ratio and an assumed rate of return of 5% per year before expenses, which is not the Fund’s actual return.
The hypothetical account values and expenses may not be used to estimate the actual ending account balance or expenses you paid for the period. You may use this information to compare the ongoing costs of investing in the Fund and other funds. To do so, compare this 5% hypothetical example with the 5% hypothetical examples that appear in the shareholder reports of the other funds.
Please note that the expenses shown in the table are meant to highlight your ongoing costs only and do not reflect any transaction costs, such as sales charges (loads) on purchase payments or contingent deferred sales charges on redemptions, if any. Therefore, the hypothetical information is useful in comparing ongoing costs only, and will not help you determine the relative total costs of owning different funds. In addition, if these transaction costs were included, your costs would have been higher.
| | | | | | | | | | | | |
| | | Beginning
Account Value
(09/01/22) | | ACTUAL | | HYPOTHETICAL (5% annual return before expenses) | | |
| | Ending Account Value
(02/28/23)1 | | Expenses Paid During
Period2 | | Ending Account Value
(02/28/23) | | Expenses Paid During
Period2 | | Annualized
Expense Ratio |
Class A | | $1,000.00 | | $996.60 | | $4.50 | | $1,020.28 | | $4.56 | | 0.91% |
Class C | | 1,000.00 | | 992.70 | | 8.10 | | 1,016.66 | | 8.20 | | 1.64 |
Class Y | | 1,000.00 | | 997.80 | | 3.32 | | 1,021.47 | | 3.36 | | 0.67 |
Class R6 | | 1,000.00 | | 998.10 | | 3.02 | | 1,021.77 | | 3.06 | | 0.61 |
| 1 | The actual ending account value is based on the actual total return of the Fund for the period September 1, 2022 through February 28, 2023, after actual expenses and will differ from the hypothetical ending account value which is based on the Fund’s expense ratio and a hypothetical annual return of 5% before expenses. |
| 2 | Expenses are equal to the Fund’s annualized expense ratio as indicated above multiplied by the average account value over the period, multiplied by 181/365 to reflect the most recent fiscal half year. |
28 Invesco Pennsylvania Municipal Fund
Tax Information
Form 1099-DIV, Form 1042-S and other year–end tax information provide shareholders with actual calendar year amounts that should be included in their tax returns. Shareholders should consult their tax advisers.
The following distribution information is being provided as required by the Internal Revenue Code or to meet a specific state’s requirement.
The Fund designates the following amounts or, if subsequently determined to be different, the maximum amount allowable for its fiscal year ended February 28, 2023:
| | | | | | | | |
| | Federal and State Income Tax | | | | | | |
| | Qualified Dividend Income* | | | 0.00 | % |
| | Corporate Dividends Received Deduction* | | | 0.00 | % |
| | U.S. Treasury Obligations* | | | 0.00 | % |
| | Qualified Business Income* | | | 0.00 | % |
| | Business Interest Income* | | | 0.00 | % |
| | Tax-Exempt Interest Dividends* | | | 97.15 | % |
| | * | The above percentages are based on ordinary income dividends paid to shareholders during the Fund’s fiscal year. |
29 Invesco Pennsylvania Municipal Fund
Trustees and Officers
The address of each trustee and officer is AIM Tax-Exempt Funds (Invesco Tax-Exempt Funds) (the “Trust”), 11 Greenway Plaza, Suite 1000, Houston, Texas 77046-1173. The trustees serve for the life of the Trust, subject to their earlier death, incapacitation, resignation, retirement or removal as more specifically provided in the Trust’s organizational documents. Each officer serves for a one year term or until their successors are elected and qualified. Column two below includes length of time served with predecessor entities, if any.
| | | | | | | | |
Name, Year of Birth and
Position(s) Held with the Trust | | Trustee and/or Officer Since | | Principal Occupation(s) During Past 5 Years | | Number of
Funds in Fund Complex
Overseen by
Trustee | | Other Directorship(s) Held by Trustee
During Past 5 Years |
| Interested Trustee | | | | | | | | |
Martin L. Flanagan1 – 1960
Trustee and Vice Chair | | 2007 | | Executive Director, Chief Executive Officer and President, Invesco Ltd. (ultimate parent of Invesco and a global investment management firm); Trustee and Vice Chair, The Invesco Funds; Vice Chair, Investment Company Institute; and Member of Executive Board, SMU Cox School of Business Formerly: Advisor to the Board, Invesco Advisers, Inc. (formerly known as Invesco Institutional (N.A.), Inc.); Chairman and Chief Executive Officer, Invesco Advisers, Inc. (registered investment adviser); Director, Chairman, Chief Executive Officer and President, Invesco Holding Company (US), Inc. (formerly IVZ Inc.) (holding company), Invesco Group Services, Inc. (service provider) and Invesco North American Holdings, Inc. (holding company); Director, Chief Executive Officer and President, Invesco Holding Company Limited (parent of Invesco and a global investment management firm); Director, Invesco Ltd.; Chairman, Investment Company Institute and President, Co-Chief Executive Officer, Co-President, Chief Operating Officer and Chief Financial Officer, Franklin Resources, Inc. (global investment management organization) | | 175 | | None |
| 1 | Mr. Flanagan is considered an interested person (within the meaning of Section 2(a)(19) of the 1940 Act) of the Trust because he is an officer of the Adviser to the Trust, and an officer and a director of Invesco Ltd., ultimate parent of the Adviser. |
T-1 Invesco Pennsylvania Municipal Fund
Trustees and Officers–(continued)
| | | | | | | | |
Name, Year of Birth and
Position(s) Held with the Trust | | Trustee and/or Officer Since | | Principal Occupation(s) During Past 5 Years | | Number of
Funds in Fund Complex
Overseen by
Trustee | | Other Directorship(s) Held by Trustee
During Past 5 Years |
| Independent Trustees | | | | | | | | |
Beth Ann Brown – 1968 Trustee (2019) and Chair (August 2022) | | 2019 | | Independent Consultant Formerly: Head of Intermediary Distribution, Managing Director, Strategic Relations, Managing Director, Head of National Accounts, Senior Vice President, National Account Manager and Senior Vice President, Key Account Manager, Columbia Management Investment Advisers LLC; Vice President, Key Account Manager, Liberty Funds Distributor, Inc.; and Trustee of certain Oppenheimer Funds | | 175 | | Director, Board of Directors of Caron Engineering Inc.; Advisor, Board of Advisors of Caron Engineering Inc.; President and Director, Acton Shapleigh Youth Conservation Corps (non-profit) Formerly: President and Director Director of Grahamtastic Connection (non-profit) |
Cynthia Hostetler – 1962 Trustee | | 2017 | | Non-Executive Director and Trustee of a number of public and private business corporations Formerly: Director, Aberdeen Investment Funds (4 portfolios); Director, Artio Global Investment LLC (mutual fund complex); Director, Edgen Group, Inc. (specialized energy and infrastructure products distributor); Director, Genesee & Wyoming, Inc. (railroads); Head of Investment Funds and Private Equity, Overseas Private Investment Corporation; President, First Manhattan Bancorporation, Inc.; and Attorney, Simpson Thacher & Bartlett LLP | | 175 | | Resideo Technologies, Inc. (smart home technology); Vulcan Materials Company (construction materials company); Trilinc Global Impact Fund; Textainer Group Holdings, (shipping container leasing company); Investment Company Institute (professional organization); and Independent Directors Council (professional organization) |
Eli Jones – 1961 Trustee | | 2016 | | Professor and Dean Emeritus, Mays Business School - Texas A&M University Formerly: Dean of Mays Business School-Texas A&M University; Professor and Dean, Walton College of Business, University of Arkansas and E.J. Ourso College of Business, Louisiana State University; and Director, Arvest Bank | | 175 | | Insperity, Inc. (formerly known as Administaff) (human resources provider); Board Member of the regional board, First Financial Bank Texas; and Boad Member, First Financial Bankshares, Inc. Texas (FFIN) |
Elizabeth Krentzman – 1959 Trustee | | 2019 | | Formerly: Principal and Chief Regulatory Advisor for Asset Management Services and U.S. Mutual Fund Leader of Deloitte & Touche LLP; General Counsel of the Investment Company Institute (trade association); National Director of the Investment Management Regulatory Consulting Practice, Principal, Director and Senior Manager of Deloitte & Touche LLP; Assistant Director of the Division of Investment Management - Office of Disclosure and Investment Adviser Regulation of the U.S. Securities and Exchange Commission and various positions with the Division of Investment Management – Office of Regulatory Policy of the U.S. Securities and Exchange Commission; Associate at Ropes & Gray LLP; and Trustee of certain Oppenheimer Funds | | 175 | | Formerly: Member of the Cartica Funds Board of Directors (private investment fund); Trustee of the University of Florida National Board Foundation; and Member of the University of Florida Law Center Association, Inc. Board of Trustees, Audit Committee and Membership Committee |
Anthony J. LaCava, Jr. – 1956 Trustee | | 2019 | | Formerly: Director and Member of the Audit Committee, Blue Hills Bank (publicly traded financial institution) and Managing Partner, KPMG LLP | | 175 | | Blue Hills Bank; Member and Chairman, Bentley University, Business School Advisory Council; and Nominating Committee, KPMG LLP |
Prema Mathai-Davis – 1950 Trustee | | 1998 | | Retired Formerly: Co-Founder & Partner of Quantalytics Research, LLC, (a FinTech Investment Research Platform for the Self-Directed Investor); Trustee of YWCA Retirement Fund; CEO of YWCA of the USA; Board member of the NY Metropolitan Transportation Authority; Commissioner of the NYC Department of Aging; and Board member of Johns Hopkins Bioethics Institute | | 175 | | Member of Board of Positive Planet US (non-profit) and HealthCare Chaplaincy Network (non-profit) |
T-2 Invesco Pennsylvania Municipal Fund
Trustees and Officers–(continued)
| | | | | | | | |
Name, Year of Birth and
Position(s) Held with the Trust | | Trustee and/or Officer Since | | Principal Occupation(s) During Past 5 Years | | Number of
Funds in Fund Complex
Overseen by
Trustee | | Other Directorship(s) Held by Trustee
During Past 5 Years |
| Independent Trustees–(continued) | | | | |
Joel W. Motley – 1952 Trustee | | 2019 | | Director of Office of Finance, Federal Home Loan Bank System; Managing Director of Carmona Motley Inc. (privately held financial advisor); Member of the Council on Foreign Relations and its Finance and Budget Committee; Chairman Emeritus of Board of Human Rights Watch and Member of its Investment Committee; and Member of Investment Committee Board of Historic Hudson Valley (non-profit cultural organization); Member of the Board, Blue Ocean Acquisition Corp.; and Member of the Vestry and the Investment Committee of Trinity Church Wall Street. Formerly: Managing Director of Public Capital Advisors, LLC (privately held financial advisor); Managing Director of Carmona Motley Hoffman, Inc. (privately held financial advisor); Trustee of certain Oppenheimer Funds; and Director of Columbia Equity Financial Corp. (privately held financial advisor) | | 175 | | Member of Board of Trust for Mutual Understanding (non-profit promoting the arts and environment); Member of Board of Greenwall Foundation (bioethics research foundation) and its Investment Committee; Member of Board of Friends of the LRC (non-profit legal advocacy); and Board Member and Investment Committee Member of Pulitzer Center for Crisis Reporting (non-profit journalism) |
Teresa M. Ressel – 1962 Trustee | | 2017 | | Non-executive director and trustee of a number of public and private business corporations Formerly: Chief Executive Officer, UBS Securities LLC (investment banking); Chief Operating Officer, UBS AG Americas (investment banking); Sr. Management Team Olayan America, The Olayan Group (international investor/commercial/industrial); and Assistant Secretary for Management & Budget and Designated Chief Financial Officer, U.S. Department of Treasury | | 175 | | None |
Robert C. Troccoli – 1949 Trustee | | 2016 | | Retired Formerly: Adjunct Professor, University of Denver - Daniels College of Business; and Managing Partner, KPMG LLP | | 175 | | None |
Daniel S. Vandivort –1954 Trustee | | 2019 | | President, Flyway Advisory Services LLC (consulting and property management) Formerly: President and Chief Investment Officer, previously Head of Fixed Income, Weiss Peck and Greer/Robeco Investment Management; Trustee and Chair, Weiss Peck and Greer Funds Board; and various capacities at CS First Boston including Head of Fixed Income at First Boston Asset Management. | | 175 | | Formerly: Trustee and Governance Chair, Oppenheimer Funds; Treasurer, Chairman of the Audit and Finance Committee, Huntington Disease Foundation of America |
T-3 Invesco Pennsylvania Municipal Fund
Trustees and Officers–(continued)
| | | | | | | | |
Name, Year of Birth and
Position(s) Held with the Trust | | Trustee and/or Officer Since | | Principal Occupation(s) During Past 5 Years | | Number of
Funds in
Fund Complex
Overseen by
Trustee | | Other Directorship(s) Held by Trustee
During Past 5 Years |
| Officers | | | | |
Sheri Morris – 1964 President and Principal Executive Officer | | 1999 | | Director, Invesco Trust Company; Head of Global Fund Services, Invesco Ltd.; President and Principal Executive Officer, The Invesco Funds; Vice President, Invesco Exchange-Traded Fund Trust, Invesco Exchange-Traded Fund Trust II, Invesco India Exchange-Traded Fund Trust, Invesco Actively Managed Exchange-Traded Fund Trust, Invesco Actively Managed Exchange-Traded Commodity Fund Trust and Invesco Exchange-Traded Self-Indexed Fund Trust; and Vice President, OppenheimerFunds, Inc. Formerly: Vice President, Treasurer and Principal Financial Officer, The Invesco Funds; Vice President, Invesco AIM Advisers, Inc., Invesco AIM Capital Management, Inc. and Invesco AIM Private Asset Management, Inc.; Assistant Vice President and Assistant Treasurer, The Invesco Funds; Vice President and Assistant Vice President, Invesco Advisers, Inc.; Assistant Vice President, Invesco AIM Capital Management, Inc. and Invesco AIM Private Asset Management, Inc.; Treasurer, Invesco Exchange-Traded Fund Trust, Invesco Exchange-Traded Fund Trust II, Invesco India Exchange-Traded Fund Trust and Invesco Actively Managed Exchange-Traded Fund Trust; and Senior Vice President, Invesco Advisers, Inc. (formerly known as Invesco Institutional (N.A.), Inc.) (registered investment adviser) | | N/A | | N/A |
Melanie Ringold – 1975 Senior Vice President, Chief Legal Officer and Secretary | | 2023 | | Head of Legal of the Americas, Invesco Ltd.; Senior Vice President and Secretary, Invesco Advisers, Inc. (formerly known as Invesco Institutional (N.A.), Inc.) (registered investment adviser); Secretary, Invesco Distributors, Inc. (formerly known as Invesco AIM Distributors, Inc.); Secretary, Invesco Investment Services, Inc. (formerly known as Invesco AIM Investment Services, Inc.); Senior Vice President, Chief Legal Officer and Secretary, The Invesco Funds; Secretary, Invesco Investment Advisers LLC, Invesco Capital Markets, Inc.; Chief Legal Officer, Invesco Exchange-Traded Fund Trust, Invesco Exchange-Traded Fund Trust II, Invesco India Exchange-Traded Fund Trust, Invesco Actively Managed Exchange-Traded Fund Trust, Invesco Actively Managed Exchange-Traded Commodity Fund Trust and Invesco Exchange-Traded Self-Indexed Fund Trust;Secretary and Vice President, Harbourview Asset Management Corporation; Secretary and Senior Vice President, OppenheimerFunds, Inc. and Invesco Managed Accounts, LLC; Secretary and Senior Vice President, OFI SteelPath, Inc.; Secretary and Senior Vice President, Oppenheimer Acquisition Corp.; Secretary, SteelPath Funds Remediation LLC; and Secretary and Senior Vice President, Trinity Investment Management Corporation Formerly: Assistant Secretary, Invesco Distributors, Inc.; Invesco Advisers, Inc. Invesco Investment Services, Inc., Invesco Capital Markets, Inc., Invesco Capital Management LLC and Invesco Investment Advisers LLC; and Assistant Secretary and Investment Vice President, Invesco Funds | | N/A | | N/A |
Andrew R. Schlossberg – 1974 Senior Vice President | | 2019 | | Senior Vice President, Invesco Group Services, Inc.; Head of the Americas and Senior Managing Director, Invesco Ltd.; Director and Senior Vice President, Invesco Advisers, Inc. (formerly known as Invesco Institutional (N.A.), Inc.) (registered investment adviser); Director and Chairman, Invesco Investment Services, Inc. (formerly known as Invesco AIM Investment Services, Inc.) (registered transfer agent); Senior Vice President, The Invesco Funds; and Director, Invesco Investment Advisers LLC (formerly known as Van Kampen Asset Management) Formerly: Director, President and Chairman, Invesco Insurance Agency, Inc.; Director, Invesco UK Limited; Director and Chief Executive, Invesco Asset Management Limited and Invesco Fund Managers Limited; Assistant Vice President, The Invesco Funds; Senior Vice President, Invesco Advisers, Inc. (formerly known as Invesco Institutional (N.A.), Inc.) (registered investment adviser); Director and Chief Executive, Invesco Administration Services Limited and Invesco Global Investment Funds Limited; Director, Invesco Distributors, Inc.; Head of EMEA, Invesco Ltd.; President, Invesco Actively Managed Exchange-Traded Commodity Fund Trust, Invesco Actively Managed Exchange-Traded Fund Trust, Invesco Exchange-Traded Fund Trust, Invesco Exchange-Traded Fund Trust II and Invesco India Exchange-Traded Fund Trust; and Managing Director and Principal Executive Officer, Invesco Capital Management LLC | | N/A | | N/A |
T-4 Invesco Pennsylvania Municipal Fund
Trustees and Officers–(continued)
| | | | | | | | |
Name, Year of Birth and
Position(s) Held with the Trust | | Trustee and/or Officer Since | | Principal Occupation(s) During Past 5 Years | | Number of
Funds in
Fund Complex
Overseen by
Trustee | | Other Directorship(s) Held by Trustee
During Past 5 Years |
| Officers–(continued) | | | | | | |
John M. Zerr – 1962 Senior Vice President | | 2006 | | Chief Operating Officer of the Americas; Senior Vice President, Invesco Advisers, Inc. (formerly known as Invesco Institutional (N.A.), Inc.) (registered investment adviser); Senior Vice President, Invesco Distributors, Inc. (formerly known as Invesco AIM Distributors, Inc.); Director and Vice President, Invesco Investment Services, Inc. (formerly known as Invesco AIM Investment Services, Inc.) Senior Vice President, The Invesco Funds; Managing Director, Invesco Capital Management LLC; Director, Invesco Investment Advisers LLC (formerly known as Van Kampen Asset Management); Senior Vice President, Invesco Capital Markets, Inc. (formerly known as Van Kampen Funds Inc.); Manager, Invesco Indexing LLC; Manager, Invesco Specialized Products, LLC; Member, Invesco Canada Funds Advisory Board; Director, President and Chief Executive Officer, Invesco Corporate Class Inc. (corporate mutual fund company); and Director, Chairman, President and Chief Executive Officer, Invesco Canada Ltd. (formerly known as Invesco Trimark Ltd./Invesco Trimark Ltèe) (registered investment adviser and registered transfer agent); President, Invesco, Inc.; President, Invesco Global Direct Real Estate Feeder GP Ltd.; President, Invesco IP Holdings (Canada) Ltd; President, Invesco Global Direct Real Estate GP Ltd.; President, Invesco Financial Services Ltd. / Services Financiers Invesco Ltée; and Director and Chairman, Invesco Trust Company Formerly: President, Trimark Investments Ltd/Services Financiers Invesco Ltee; Director and Senior Vice President, Invesco Insurance Agency, Inc.; Director and Senior Vice President, Invesco Management Group, Inc. (formerly known as Invesco AIM Management Group, Inc.); Secretary and General Counsel, Invesco Management Group, Inc. (formerly known as Invesco AIM Management Group, Inc.); Secretary, Invesco Investment Services, Inc. (formerly known as Invesco AIM Investment Services, Inc.); Chief Legal Officer and Secretary, The Invesco Funds; Secretary and General Counsel, Invesco Investment Advisers LLC (formerly known as Van Kampen Asset Management); Secretary and General Counsel, Invesco Capital Markets, Inc. (formerly known as Van Kampen Funds Inc.); Chief Legal Officer, Invesco Exchange-Traded Fund Trust, Invesco Exchange-Traded Fund Trust II, Invesco India Exchange-Traded Fund Trust, Invesco Actively Managed Exchange-Traded Fund Trust, Invesco Actively Managed Exchange-Traded Commodity Fund Trust and Invesco Exchange-Traded Self-Indexed Fund Trust; Secretary, Invesco Indexing LLC; Director, Secretary, General Counsel and Senior Vice President, Van Kampen Exchange Corp.; Director, Vice President and Secretary, IVZ Distributors, Inc. (formerly known as INVESCO Distributors, Inc.); Director and Vice President, INVESCO Funds Group, Inc.; Director and Vice President, Van Kampen Advisors Inc.; Director, Vice President, Secretary and General Counsel, Van Kampen Investor Services Inc.;Director and Secretary, Invesco Distributors, Inc. (formerly known as Invesco AIM Distributors, Inc.); Director, Senior Vice President, General Counsel and Secretary, Invesco AIM Advisers, Inc. and Van Kampen Investments Inc.; Director, Vice President and Secretary, Fund Management Company; Director, Senior Vice President, Secretary, General Counsel and Vice President, Invesco AIM Capital Management, Inc.; and Chief Operating Officer and General Counsel, Liberty Ridge Capital, Inc. (an investment adviser) | | N/A | | N/A |
Gregory G. McGreevey – 1962
Senior Vice President | | 2012 | | Senior Managing Director, Invesco Ltd.; Director, Chairman, President, and Chief Executive Officer, Invesco Advisers, Inc. (formerly known as Invesco Institutional (N.A.), Inc.) (registered investment adviser); Director, Invesco Mortgage Capital, Inc. and Invesco Senior Secured Management, Inc.; Senior Vice President, The Invesco Funds; President, SNW Asset Management Corporation and Invesco Managed Accounts, LLC; Chairman and Director, Invesco Private Capital, Inc.; Chairman and Director, INVESCO Private Capital Investments, Inc.; Chairman and Director, INVESCO Realty, Inc.; and Senior Vice President, Invesco Group Services, Inc. Formerly: Senior Vice President, Invesco Management Group, Inc. and Invesco Advisers, Inc.; Assistant Vice President, The Invesco Funds | | N/A | | N/A |
| Adrien Deberghes – 1967 Principal Financial Officer, Treasurer and Vice President | | 2020 | | Head of the Fund Office of the CFO and Fund Administration; Vice President, Invesco Advisers, Inc.; Principal Financial Officer, Treasurer and Vice President, The Invesco Funds; Vice President, Invesco Exchange-Traded Fund Trust, Invesco Exchange-Traded Fund Trust II, Invesco India Exchange-Traded Fund Trust, Invesco Actively Managed Exchange-Traded Fund Trust, Invesco Actively Managed Exchange-Traded Commodity Fund Trust and Invesco Exchange-Traded Self-Indexed Fund Trust Formerly: Senior Vice President and Treasurer, Fidelity Investments | | N/A | | N/A |
Crissie M. Wisdom – 1969 Anti-Money Laundering Compliance Officer | | 2013 | | Anti-Money Laundering and OFAC Compliance Officer for Invesco U.S. entities including: Invesco Advisers, Inc. and its affiliates, Invesco Capital Markets, Inc., Invesco Distributors, Inc., Invesco Investment Services, Inc., The Invesco Funds, Invesco Capital Management, LLC, Invesco Trust Company; and Fraud Prevention Manager for Invesco Investment Services, Inc. | | N/A | | N/A |
T-5 Invesco Pennsylvania Municipal Fund
Trustees and Officers–(continued)
| | | | | | | | |
Name, Year of Birth and
Position(s) Held with the Trust | | Trustee and/or Officer Since | | Principal Occupation(s) During Past 5 Years | | Number of
Funds in
Fund Complex
Overseen by
Trustee | | Other Directorship(s) Held by Trustee
During Past 5 Years |
| Officers–(continued) | | | | | | | | |
Todd F. Kuehl – 1969 Chief Compliance Officer and Senior Vice President | | 2020 | | Chief Compliance Officer, Invesco Advisers, Inc. (registered investment adviser); and Chief Compliance Officer and Senior Vice President, The Invesco Funds Formerly: Managing Director and Chief Compliance Officer, Legg Mason (Mutual Funds); Chief Compliance Officer, Legg Mason Private Portfolio Group (registered investment adviser) | | N/A | | N/A |
James Bordewick, Jr. – 1959 Senior Vice President and Senior Officer | | 2022 | | Senior Vice President and Senior Officer, The Invesco Funds Formerly: Chief Legal Officer, KingsCrowd, Inc. (research and analytical platform for investment in private capital markets); Chief Operating Officer and Head of Legal and Regulatory, Netcapital (private capital investment platform); Managing Director, General Counsel of asset management and Chief Compliance Officer for asset management and private banking, Bank of America Corporation; Chief Legal Officer, Columbia Funds and BofA Funds; Senior Vice President and Associate General Counsel, MFS Investment Management; Chief Legal Officer, MFS Funds; Associate, Ropes & Gray; and Associate, Gaston Snow & Ely Bartlett | | N/A | | N/A |
The Statement of Additional Information of the Trust includes additional information about the Fund’s Trustees and is available upon request, without charge, by calling 1.800.959.4246. Please refer to the Fund’s Statement of Additional Information for information on the Fund’s sub-advisers.
| | | | | | |
| Office of the Fund | | Investment Adviser | | Distributor | | Auditors |
| 11 Greenway Plaza, Suite 1000 | | Invesco Advisers, Inc. | | Invesco Distributors, Inc. | | PricewaterhouseCoopers LLP |
| Houston, TX 77046-1173 | | 1331 Spring Street, NW, Suite 2500 | | 11 Greenway Plaza, Suite 1000 | | 1000 Louisiana Street, Suite 5800 |
| | Atlanta, GA 30309 | | Houston, TX 77046-1173 | | Houston, TX 77002-5021 |
| | | |
| Counsel to the Fund | | Counsel to the Independent Trustees | | Transfer Agent | | Custodian |
| Stradley Ronon Stevens & Young, LLP | | Sidley Austin LLP | | Invesco Investment Services, Inc. | | State Street Bank and Trust Company |
| 2005 Market Street, Suite 2600 | | 787 Seventh Avenue | | 11 Greenway Plaza, Suite 1000 | | 225 Franklin Street |
| Philadelphia, PA 19103-7018 | | New York, NY 10019 | | Houston, TX 77046-1173 | | Boston, MA 02110-2801 |
T-6 Invesco Pennsylvania Municipal Fund

Go paperless with eDelivery
Visit invesco.com/edelivery to enjoy the convenience and security of anytime electronic access to your investment documents.
With eDelivery, you can elect to have any or all of the following materials delivered straight to your inbox to download, save and print from your own computer:
| ∎ | | Fund reports and prospectuses |
Invesco mailing information
Send general correspondence to Invesco Investment Services, Inc., P.O. Box 219078, Kansas City, MO 64121-9078.
Important notice regarding delivery of security holder documents
To reduce Fund expenses, only one copy of most shareholder documents may be mailed to shareholders with multiple accounts at the same address (Householding). Mailing of your shareholder documents may be householded indefinitely unless you instruct us otherwise. If you do not want the mailing of these documents to be combined with those for other members of your household, please contact Invesco Investment Services, Inc. at 800 959 4246 or contact your financial institution. We will begin sending you individual copies for each account within 30 days after receiving your request.
Fund holdings and proxy voting information
The Fund provides a complete list of its portfolio holdings four times each year, at the end of each fiscal quarter. For the second and fourth quarters, the list appears, respectively, in the Fund’s semiannual and annual reports to shareholders. For the first and third quarters, the Fund files the list with the Securities and Exchange Commission (SEC) as an exhibit to its reports on Form N-PORT. The most recent list of portfolio holdings is available at invesco.com/completeqtrholdings. Shareholders can also look up the Fund’s Form N-PORT filings on the SEC website, sec.gov. The SEC file numbers for the Fund are shown below.
A description of the policies and procedures that the Fund uses to determine how to vote proxies relating to portfolio securities is available without charge, upon request, from our Client Services department at 800 959 4246, or at invesco.com/ corporate/about-us/esg. The information is also available on the SEC website, sec.gov.
Information regarding how the Fund voted proxies related to its portfolio securities during the most recent 12-month period ended June 30 is available at invesco.com/proxysearch. This information is also available on the SEC website, sec.gov.
Invesco Advisers, Inc. is an investment adviser; it provides investment advisory services to individual and institutional clients and does not sell securities. Invesco Distributors, Inc. is the US distributor for Invesco Ltd.’s retail mutual funds, exchange-traded funds and institutional money market funds. Both are wholly owned, indirect subsidiaries of Invesco Ltd.
| | | | | | |
 | | | | | | |
| | | |
| SEC file number(s): 811-07890 and 033-66242 | | Invesco Distributors, Inc. | | O-ROPAM-AR-1 | | |

| | |
|
| Annual Report to Shareholders | | February 28, 2023 |
|
| | |
| Invesco Rochester® AMT-Free New York Municipal Fund |
| | |
| Nasdaq: | | |
| A: OPNYX ∎ C: ONYCX ∎ Y: ONYYX ∎ R6: IORNX |
Management’s Discussion of Fund Performance
| | | | |
| Performance summary | |
For the fiscal year ended February 28, 2023, Class A shares of Invesco Rochester® AMT-Free New York Municipal Fund (the Fund), at net asset value (NAV), un- derperformed the S&P Municipal Bond New York 5+ Year Investment Grade Index. | |
Your Fund’s long-term performance appears later in this report. | |
| Fund vs. Indexes | |
Total returns, 2/28/22 to 2/28/23, at net asset value (NAV). Performance shown does not include applicable contingent deferred sales charges (CDSC) or front-end sales charges, which would have reduced performance. | |
Class A Shares | | | -8.39 | % |
Class C Shares | | | -9.17 | |
Class Y Shares | | | -8.23 | |
Class R6 Shares | | | -8.17 | |
S&P Municipal Bond New York 5+ Year Investment Grade Index▼ | | | -6.15 | |
U.S. Consumer Price Index∎ | | | 6.04 | |
Source(s): ▼RIMES Technologies Corp.; ∎Bloomberg LP | | | | |
Market conditions and your Fund
The COVID-19 pandemic caused a dramatic and sudden disruption in the New York State economy. However, thanks to federal relief funding and a fast recovery in tax collections, the state was able to quickly stabilize its finances.
The Empire State has historically benefited from a robust and wealthy economy, adequate resources and budget flexibility, factors that helped mitigate the adverse economic impact of the global pandemic, further. Demonstrating strong management practices, New York officials quickly identified gap-closing measures to balance fiscal years 2021 and 2022 state budgets, setting aside reserves to offset the expected phasing out of federal aid. Moderate leverage levels allowed the state to issue debt as an alternative to additional expenditure reductions.
Employment numbers reflect how New York suffered a larger economic impact than most other states, but recent data indicates significant improvement in the job sector. New York’s unemployment rate went from 12.5% in August 2020 to 4.3% in December 2022, while the national average went from 8.4% to 3.5% during the same period.1 Following easing of lockdown orders, Gross Domestic Product (GDP) started to recover in all states with the hospitality industry and information and professional services being the lead contributors. Most recently available reports show New York’s GDP increased 2.5% during the third quarter of 2022 while the US increased at a rate of 3.2%.2
While the state will likely continue to face long-term challenges, including a negative population trend, we believe the silver lining is the pension system, which is well funded. Additional pressure from Medicaid spending is likely to present a challenge as budget officials anticipate state-share Medicaid costs will continue to grow. For fiscal year 2023 these costs account for approximately 21% of budgeted state operating spending.3
At the beginning of the fiscal year, investors were hopeful in anticipation of a return to normalcy as COVID-19 cases declined and pandemic-related restrictions were reduced or lifted. This allowed policymakers to turn their attention to the high inflation levels; however, on February 24, 2022, Russia began a full-scale invasion of Ukraine, which exacerbated inflationary pressures by driving up commodity prices. Against this backdrop, the fiscal year was plagued by volatility and uncertainty. The municipal market set multiple record lows in 2022, making it one of the most challenging years in history for municipal markets.
Investment grade municipal bonds returned -5.10%, high yield municipal bonds returned -9.35% and taxable municipal bonds returned -12.96% during the fiscal year.4
While municipal funds had experienced record inflows of $101.7 billion in 2021, flows quickly turned negative in the first quarter of 2022, perpetuating the Bloomberg Municipal Bond Index’s worst quarterly return in 40 years. Municipal bonds enjoyed a short respite in late May and early June 2022 with increased demand from crossover buyers like hedge funds, banks and insurance companies; however, the May 2022 Consumer Price Index report quoted inflation rising to a 40-year high. This sent the 10-year Treasury yield to a new 52-week high of nearly 3.50%, pushing municipal mutual fund flows back into negative territory.5 According to Lipper, net outflows from municipal bond funds totaled over -$110 billion for the fiscal year.6
On March 16, 2022, the US Federal Reserve (the Fed) raised the federal funds target rate 0.25% for the first time in more than three years in hopes of containing inflation.7 This was the first of eight consecutive increases during the fiscal year as the Fed announced its plan for a quantitative tightening campaign in an attempt to rein in inflation without harming employment or the overall economy. Rate increases as high as 0.75% followed, the Fed’s most aggressive monetary
policy since the 1980s, bringing the target rate to 4.75% as of the end of the fiscal year.7
The AAA municipal yield curve made history after the Fed’s December 2022 meeting when the curve inverted between one- and 10-year maturities. Any inversion is noteworthy, but this was a first for municipal bonds. On January 31, 2023, policymakers indicated that future rate increases were likely to be “appropriate,” suggesting they were not yet convinced inflation was contained, which increased uncertainty about when the current tightening cycle might end. The fiscal year ended with an increase of 0.25% on February 1, 2023. We expect additional rate hikes in 2023, although not with the same pace or vigor as in 2022.
New municipal issuance for the fiscal year totaled $354 billion, down 27% from the previous fiscal year’s $484 billion.8 Issuers, with cash on their balance sheets, have been reluctant to issue at higher interest rates. While taxable issuance continued to account for a significant portion of new issuance, at 14% of the total, this figure is down from 18% from the previous fiscal year because of higher interest rates.8
Puerto Rico continued to make developments in its ongoing debt restructuring throughout the fiscal year. The territory restructured its outstanding general obligation and other government-guaranteed debt in March 2022 and began paying bondholders on the new restructured bonds. Puerto Rico’s weight in the Bloomberg High Yield Municipal Bond Index increased from 13% to 20% as the new bonds were included.4 The Financial Oversight and Management Board for Puerto Rico, the Puerto Rican government, bond-holders and other interested parties continued to negotiate the restructuring of bonds issued by the Puerto Rico Electric Power Authority, the territory’s largest remaining unresolved debt, as the fiscal year closed.
Municipal credits have a long history of low defaults as many provide essential services to all Americans. This continues to be the case as evidenced by S&P rating changes – upgrades exceeded downgrades by a ratio of 2.5:1 for calendar year 2022.9 This positive dynamic, which we believe will continue, likely stems from benefits of the various federal stimulus measures including the American Rescue Plan Act, the Infrastructure Investment and Jobs Act and the Inflation Reduction Act, as well as higher revenues collected by state and local governments.
We believe the valuable benefits of municipal bonds will prevail over current market volatility and economic uncertainty. We continue to rely on our experienced portfolio managers and credit analysts to weather the challenges while identifying marketplace opportunities to add long-term value for shareholders.
During the fiscal year, an underweight sector allocation to AA-rated bonds† contributed
2 Invesco Rochester® AMT-Free New York Municipal Fund
to the Fund’s performance relative to its benchmark. At the sector level, security selection and underweight exposure among the housing sector contributed to the Fund’s relative performance.
An overweight allocation to non-rated bonds detracted from the Fund’s performance relative to its benchmark during the fiscal year. An overweight exposure to medium duration bonds (10.00-14.99 years specifically) was also detractive from relative results. An overweight allocation to the industrial development revenue/pollution control revenue sector detracted from the Fund’s performance relative to the benchmark during the fiscal year.
During the fiscal year, leverage contributed to the Fund’s performance relative to its benchmark. The Fund achieved a leveraged position through the use of inverse floating rate securities or tender option bonds. The Fund uses leverage because we believe that, over time, leveraging provides opportunities for additional income and total return for shareholders. However, the use of leverage also can expose shareholders to additional volatility. For more information about the Fund’s use of leverage, see the Notes to Financial Statements later in this report.
We wish to remind you that the Fund is subject to interest rate risk, meaning when interest rates rise, the value of fixed income securities tends to fall. The degree to which the value of fixed income securities may decline due to rising interest rates may vary depending on the speed and magnitude of the increase in interest rates, as well as individual security characteristics, such as price, maturity, duration and coupon and market forces, such as supply and demand for similar securities. We are monitoring interest rates, as well as the market, economic and geopolitical factors that may impact the direction, speed and magnitude of changes to interest rates across the maturity spectrum, including the potential impact of monetary policy changes by the Fed and certain foreign central banks. If interest rates rise or fall faster than expected, markets may experience increased volatility, which may affect the value and/or liquidity of certain of the Fund’s investments.
Thank you for investing in Invesco Rochester® AMT-Free New York Municipal Fund and for sharing our long-term investment horizon.
| 1 | Source: New York Department of Labor, January 20, 2022; Bureau of Labor Statistics, January 2023 |
| 2 | Source: Bureau of Economic Analysis, US Department of Commerce, December 23, 2022 |
| 3 | Source: New York State, Fiscal Year 2024 Budget |
| 7 | Source: US Federal Reserve |
| 9 | Source: Standard & Poor’s |
† Sources: A credit rating is an assessment provided by a nationally recognized statistical
rating organization (NRSRO) of the creditworthiness of an issuer with respect to debt obligations, including specific securities, money market instruments or other debts. Ratings are measured on a scale that generally ranges from AAA (highest) to D (lowest); ratings are subject to change without notice. For more information on rating methodology, please visit www.spglobal.com and select “Understanding Credit Ratings” under About Ratings on the homepage; www.fitchratings.com and select “Understanding Credit Ratings” from the drop-down menu on the homepage; and www.moodys.com and select “Methodology,” then “Rating Methodologies” under Research Type on the left-hand side
Portfolio manager(s):
Michael Camarella
Scott Cottier
Mark DeMitry
Tim O’Reilly
Mark Paris
Julius Williams
The views and opinions expressed in management’s discussion of Fund performance are those of Invesco Advisers, Inc. and its affiliates. These views and opinions are subject to change at any time based on factors such as market and economic conditions. These views and opinions may not be relied upon as investment advice or recommendations, or as an offer for a particular security. The information is not a complete analysis of every aspect of any market, country, industry, security or the Fund. Statements of fact are from sources considered reliable, but Invesco Advisers, Inc. makes no representation or warranty as to their completeness or accuracy. Although historical performance is no guarantee of future results, these insights may help you understand our investment management philosophy.
See important Fund and, if applicable, index disclosures later in this report.
3 Invesco Rochester® AMT-Free New York Municipal Fund
Your Fund’s Long-Term Performance
Results of a $10,000 Investment – Oldest Share Class(es)
Fund and index data from 2/28/13
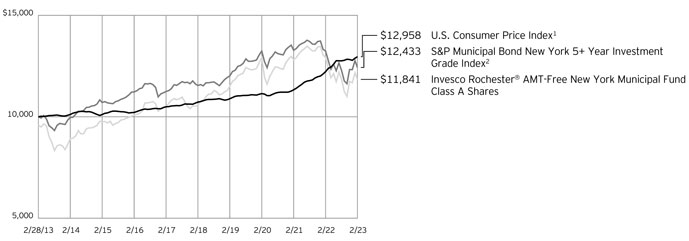
1 Source: Bloomberg LP
2 Source: RIMES Technologies Corp.
Past performance cannot guarantee future results.
The data shown in the chart include reinvested distributions, applicable sales charges and Fund expenses including management
fees. Index results include reinvested dividends, but they do not reflect sales charges. Performance of the peer group, if applicable, reflects fund expenses and management fees;
performance of a market index does not. Performance shown in the chart does not reflect deduction of taxes a shareholder would pay on Fund distributions or sale of Fund shares.
4 Invesco Rochester® AMT-Free New York Municipal Fund
| | | | |
Average Annual Total Returns | |
| As of 2/28/23, including maximum applicable sales charges | |
| |
Class A Shares | | | | |
Inception (8/16/84) | | | 5.72 | % |
10 Years | | | 1.70 | |
5 Years | | | 1.41 | |
1 Year | | | -12.29 | |
| |
Class C Shares | | | | |
Inception (8/29/95) | | | 4.12 | % |
10 Years | | | 1.52 | |
5 Years | | | 1.51 | |
1 Year | | | -10.06 | |
| |
Class Y Shares | | | | |
Inception (1/31/11) | | | 4.58 | % |
10 Years | | | 2.38 | |
5 Years | | | 2.52 | |
1 Year | | | -8.23 | |
| |
Class R6 Shares | | | | |
10 Years | | | 2.27 | % |
5 Years | | | 2.55 | |
1 Year | | | -8.17 | |
Effective May 24, 2019, Class A, Class C and Class Y shares of the Oppenheimer Rochester AMT-Free New York Municipal Fund, (the predecessor fund), were reorganized into Class A, Class C and Class Y shares, respectively, of the Invesco Oppen-heimer Rochester® AMT-Free New York Municipal Fund. The Fund was subsequently renamed the Invesco Rochester® AMT-Free New York Municipal Fund (the Fund). Returns shown above, for periods ending on or prior to May 24, 2019, for Class A, Class C and Class Y shares are those for Class A, Class C and Class Y shares of the predecessor fund. Share class returns will differ from the predecessor fund because of different expenses.
Class R6 shares incepted on May 24, 2019. Performance shown on and prior to that date is that of the predecessor fund’s Class A shares at net asset value and includes the 12b-1 fees applicable to Class A shares.
The performance data quoted represent past performance and cannot guarantee future results; current performance may be lower or higher. Please visit invesco.com/ performance for the most recent month-end performance. Performance figures reflect reinvested distributions, changes in net asset value and the effect of the maximum sales charge unless otherwise stated. Performance figures do not reflect deduction of taxes a shareholder would pay on Fund distributions or sale of Fund shares. Investment return and principal value will fluctuate so that you may have a gain or loss when you sell shares.
Class A share performance reflects the maximum 4.25% sales charge, and Class C share performance reflects the applicable contingent deferred sales charge (CDSC)
for the period involved. The CDSC on Class C shares is 1% for the first year after purchase. Class Y and Class R6 shares do not have a front-end sales charge or a CDSC; therefore, performance is at net asset value.
The performance of the Fund’s share classes will differ primarily due to different sales charge structures and class expenses.
Fund performance reflects any applicable fee waivers and/or expense reimbursements. Had the adviser not waived fees and/or reimbursed expenses currently or in the past, returns would have been lower. See current prospectus for more information.
5 Invesco Rochester® AMT-Free New York Municipal Fund
Supplemental Information
Invesco Rochester® AMT-Free New York Municipal Fund’s investment objective is to seek tax-free income.
| ∎ | | Unless otherwise stated, information presented in this report is as of February 28, 2023, and is based on total net assets. |
| ∎ | | Unless otherwise noted, all data is provided by Invesco. |
| ∎ | | To access your Fund’s reports/prospectus, visit invesco.com/fundreports. |
About indexes used in this report
| ∎ | | The S&P Municipal Bond New York 5+ Year Investment Grade Index seeks to measure the performance of investment-grade, New York-issued US municipals with maturities equal to or greater than five years. |
| ∎ | | The U.S. Consumer Price Index is a measure of change in consumer prices as determined by the US Bureau of Labor Statistics. |
| ∎ | | The Fund is not managed to track the performance of any particular index, including the index(es) described here, and consequently, the performance of the Fund may deviate significantly from the performance of the index(es). |
| ∎ | | A direct investment cannot be made in an index. Unless otherwise indicated, index results include reinvested dividends, and they do not reflect sales charges. Performance of the peer group, if applicable, reflects fund expenses; performance of a market index does not. |
| | |
| This report must be accompanied or preceded by a currently effective Fund prospectus, which contains more complete information, including sales charges and expenses. Investors should read it carefully before investing. | | |
| | | |
| NOT FDIC INSURED | MAY LOSE VALUE | NO BANK GUARANTEE | | |
6 Invesco Rochester® AMT-Free New York Municipal Fund
Fund Information
| | | | |
Portfolio Composition | | | | |
| By credit sector | | % of total investments | |
Revenue Bonds | | | 95.26% | |
General Obligation Bonds | | | 4.50 | |
Pre-Refunded Bonds | | | 0.24 | |
Top Five Debt Holdings
| | | | |
| | |
| | | | | % of total net assets |
| 1. | | Hudson Yards Infrastructure Corp., Series 2017-XF0551, Revenue Ctfs. | | 3.97% |
| 2. | | New York Liberty Development Corp. (Goldman Sachs Headquarters), Series 2005, Ref. RB | | 2.59 |
| 3. | | MTA Hudson Rail Yards Trust Obligations, Series 2016 A, RB | | 2.47 |
| 4. | | New York (State of) Utility Debt Securitization Authority, Series 2017, RB | | 2.38 |
| 5. | | Triborough Bridge & Tunnel Authority (MTA Bridges & Tunnels), Series 2022 A, Ref. RB | | 1.77 |
The Fund’s holdings are subject to change, and there is no assurance that the Fund will continue to hold any particular security.
Data presented here are as of February 28, 2023.
7 Invesco Rochester® AMT-Free New York Municipal Fund
Schedule of Investments
February 28, 2023
| | | | | | | | | | | | | | |
| | | Interest
Rate | | Maturity
Date | | | Principal
Amount
(000) | | | Value | |
Municipal Obligations–106.01% | | | | | | | | | | | | | | |
New York–98.87% | | | | | | | | | | | | | | |
Albany (County of), NY Industrial Development Agency (Sage Colleges); Series 1999 A, RB | | 5.30% | | | 04/01/2029 | | | $ | 2,860 | | | $ | 2,539,715 | |
Albany Capital Resource Corp. (Empire Commons Student Housing, Inc.); | | | | | | | | | | | | | | |
Series 2016 A, Ref. RB | | 5.00% | | | 05/01/2027 | | | | 200 | | | | 208,414 | |
Series 2016 A, Ref. RB | | 5.00% | | | 05/01/2032 | | | | 200 | | | | 206,840 | |
Amherst Development Corp. (Daemen College); Series 2018, Ref. RB | | 5.00% | | | 10/01/2024 | | | | 570 | | | | 572,611 | |
Brookhaven Local Development Corp. (Jefferson’s Ferry); | | | | | | | | | | | | | | |
Series 2016, Ref. RB | | 5.25% | | | 11/01/2036 | | | | 215 | | | | 218,201 | |
Series 2020 B, RB | | 4.00% | | | 11/01/2055 | | | | 1,250 | | | | 971,639 | |
Brooklyn Arena Local Development Corp. (Barclays Center); Series 2016 A, Ref. RB | | 5.00% | | | 07/15/2042 | | | | 4,000 | | | | 3,960,606 | |
Broome County Local Development Corp. (Good Shepherd Village at Endwell); Series 2021, Ref. RB | | 4.00% | | | 07/01/2036 | | | | 640 | | | | 532,450 | |
Buffalo & Erie County Industrial Land Development Corp. (Charter School for Applied Technology); Series 2017 A, Ref. RB | | 5.00% | | | 06/01/2035 | | | | 160 | | | | 163,442 | |
Buffalo & Erie County Industrial Land Development Corp. (Medaille College); | | | | | | | | | | | | | | |
Series 2013, Ref. RB | | 5.25% | | | 04/01/2035 | | | | 4,300 | | | | 4,125,227 | |
Series 2018, Ref. RB(a) | | 5.00% | | | 10/01/2038 | | | | 1,200 | | | | 1,078,434 | |
Build NYC Resource Corp. (Children’s Aid Society (The)); Series 2019, RB | | 4.00% | | | 07/01/2044 | | | | 450 | | | | 410,780 | |
Build NYC Resource Corp. (Consortium for Worker Education, Inc.); Series 2020, RB(a) | | 5.00% | | | 12/01/2049 | | | | 1,360 | | | | 1,065,594 | |
Build NYC Resource Corp. (Grand Concourse Academy Charter School); Series 2022 A, RB | | 5.00% | | | 07/01/2052 | | | | 150 | | | | 148,757 | |
Build NYC Resource Corp. (KIPP NYC Public School) (Social Bonds); Series 2023, RB | | 5.25% | | | 07/01/2052 | | | | 1,500 | | | | 1,530,498 | |
Build NYC Resource Corp. (Manhattan College); | | | | | | | | | | | | | | |
Series 2017, Ref. RB | | 5.00% | | | 08/01/2032 | | | | 170 | | | | 180,749 | |
Series 2017, Ref. RB | | 5.00% | | | 08/01/2036 | | | | 290 | | | | 303,281 | |
Series 2017, Ref. RB | | 5.00% | | | 08/01/2047 | | | | 600 | | | | 611,928 | |
Build NYC Resource Corp. (New Dawn Charter Schools); | | | | | | | | | | | | | | |
Series 2019, RB(a) | | 5.63% | | | 02/01/2039 | | | | 190 | | | | 190,722 | |
Series 2019, RB(a) | | 5.75% | | | 02/01/2049 | | | | 230 | | | | 230,231 | |
Build NYC Resource Corp. (New York Law School); Series 2016, Ref. RB | | 5.00% | | | 07/01/2041 | | | | 650 | | | | 644,011 | |
Build NYC Resource Corp. (Special Needs Facilities Pooled Program); | | | | | | | | | | | | | | |
Series 2013 A-1, RB | | 5.25% | | | 07/01/2023 | | | | 250 | | | | 248,544 | |
Series 2013 A-1, RB | | 5.38% | | | 07/01/2028 | | | | 1,490 | | | | 1,358,285 | |
Series 2013 A-1, RB | | 5.75% | | | 07/01/2033 | | | | 790 | | | | 678,472 | |
Build NYC Resource Corp. (Whin Music Community Charter School); Series 2022, RB(a) | | 6.50% | | | 07/01/2052 | | | | 3,100 | | | | 3,049,789 | |
Canandaigua & Bristol (Towns of), NY; | | | | | | | | | | | | | | |
Series 2007, GO Bonds | | 5.00% | | | 12/15/2027 | | | | 25 | | | | 25,037 | |
Series 2007, GO Bonds | | 5.00% | | | 12/15/2028 | | | | 30 | | | | 30,035 | |
Series 2007, GO Bonds | | 5.00% | | | 12/15/2029 | | | | 30 | | | | 30,025 | |
Series 2007, GO Bonds | | 5.00% | | | 12/15/2030 | | | | 30 | | | | 30,019 | |
Series 2007, GO Bonds | | 5.00% | | | 12/15/2031 | | | | 35 | | | | 35,018 | |
Series 2007, GO Bonds | | 5.00% | | | 12/15/2032 | | | | 35 | | | | 35,016 | |
Series 2007, GO Bonds | | 5.00% | | | 12/15/2033 | | | | 35 | | | | 35,013 | |
Series 2007, GO Bonds | | 5.00% | | | 12/15/2034 | | | | 40 | | | | 40,021 | |
Series 2007, GO Bonds | | 5.00% | | | 12/15/2035 | | | | 40 | | | | 40,023 | |
Series 2007, GO Bonds | | 5.00% | | | 12/15/2036 | | | | 45 | | | | 45,026 | |
Series 2007, GO Bonds | | 5.00% | | | 12/15/2037 | | | | 45 | | | | 45,025 | |
Series 2007, GO Bonds | | 5.00% | | | 12/15/2038 | | | | 50 | | | | 50,025 | |
Series 2007, GO Bonds | | 5.00% | | | 12/15/2039 | | | | 50 | | | | 50,015 | |
Series 2007, GO Bonds | | 5.00% | | | 12/15/2040 | | | | 55 | | | | 55,013 | |
Series 2007, GO Bonds | | 5.00% | | | 12/15/2041 | | | | 55 | | | | 55,009 | |
Series 2007, GO Bonds | | 5.00% | | | 12/15/2042 | | | | 60 | | | | 59,631 | |
Cattaraugus (County of), NY (St. Bonaventure University); | | | | | | | | | | | | | | |
Series 2014, RB | | 5.00% | | | 05/01/2034 | | | | 100 | | | | 101,849 | |
Series 2014, RB | | 5.00% | | | 05/01/2039 | | | | 100 | | | | 101,196 | |
Dutchess County Local Development Corp. (Health Quest Systems, Inc.); | | | | | | | | | | | | | | |
Series 2016 B, RB | | 5.00% | | | 07/01/2046 | | | | 12,200 | | | | 11,881,531 | |
Series 2019 B, Ref. RB | | 4.00% | | | 07/01/2044 | | | | 120 | | | | 104,354 | |
See accompanying Notes to Financial Statements which are an integral part of the financial statements.
8 Invesco Rochester® AMT-Free New York Municipal Fund
| | | | | | | | | | | | | | | | |
| | | Interest
Rate | | | Maturity
Date | | | Principal
Amount
(000) | | | Value | |
New York–(continued) | | | | | | | | | | | | | | | | |
Dutchess County Local Development Corp. (Marist College); Series 2022, RB | | | 4.00% | | | | 07/01/2049 | | | $ | 1,500 | | | $ | 1,376,373 | |
Dutchess County Local Development Corp. (Nuvance Health); Series 2019 B, Ref. RB | | | 4.00% | | | | 07/01/2049 | | | | 300 | | | | 252,397 | |
Dutchess County Local Development Corp. (Vassar College); | | | | | | | | | | | | | | | | |
Series 2017, Ref. RB | | | 5.00% | | | | 07/01/2034 | | | | 160 | | | | 171,471 | |
Series 2017, Ref. RB | | | 5.00% | | | | 07/01/2036 | | | | 160 | | | | 169,742 | |
Series 2017, Ref. RB | | | 5.00% | | | | 07/01/2037 | | | | 235 | | | | 248,073 | |
Series 2017, Ref. RB | | | 5.00% | | | | 07/01/2042 | | | | 500 | | | | 521,109 | |
Erie Tobacco Asset Securitization Corp.; | | | | | | | | | | | | | | | | |
Series 2005 A, RB | | | 5.00% | | | | 06/01/2031 | | | | 75 | | | | 73,115 | |
Series 2005 A, RB | | | 5.00% | | | | 06/01/2038 | | | | 5,000 | | | | 4,783,562 | |
Series 2005 D, RB(b) | | | 0.00% | | | | 06/01/2055 | | | | 74,000 | | | | 4,604,191 | |
Genesee County Funding Corp. (The) (Rochester Regional Health Obligated Group); Series 2022 A, Ref. RB | | | 5.25% | | | | 12/01/2052 | | | | 4,950 | | | | 5,004,548 | |
Glen Cove Local Economic Assistance Corp. (Garvies Point Public Improvement); Series 2016 B, RB(b) | | | 0.00% | | | | 01/01/2045 | | | | 18,435 | | | | 4,562,340 | |
Glen Cove Local Economic Assistance Corp. (Tiegerman School); Series 2018 A-2, RB (Acquired 06/26/2018; Cost $965,000)(a)(c) | | | 5.50% | | | | 07/01/2044 | | | | 965 | | | | 859,148 | |
Guilderland (Town of), NY Industrial Development Agency; Series 2017 A, RB(a)(d) | | | 5.88% | | | | 01/01/2052 | | | | 5,000 | | | | 3,750,000 | |
Hempstead Town Local Development Corp. (Evergreen Charter School); Series 2019, Ref. RB(a) | | | 6.80% | | | | 12/01/2044 | | | | 1,640 | | | | 1,662,821 | |
Hempstead Town Local Development Corp. (Molloy College); | | | | | | | | | | | | | | | | |
Series 2014, RB | | | 5.00% | | | | 07/01/2029 | | | | 300 | | | | 305,143 | |
Series 2014, RB | | | 5.00% | | | | 07/01/2034 | | | | 300 | | | | 304,136 | |
Series 2014, RB | | | 5.00% | | | | 07/01/2039 | | | | 250 | | | | 251,859 | |
Series 2014, RB | | | 5.00% | | | | 07/01/2044 | | | | 200 | | | | 201,161 | |
Series 2017, Ref. RB | | | 5.00% | | | | 07/01/2029 | | | | 100 | | | | 104,484 | |
Series 2017, Ref. RB | | | 5.00% | | | | 07/01/2030 | | | | 80 | | | | 83,337 | |
Series 2017, Ref. RB | | | 5.00% | | | | 07/01/2031 | | | | 75 | | | | 78,030 | |
Series 2017, Ref. RB | | | 5.00% | | | | 07/01/2032 | | | | 135 | | | | 140,195 | |
Series 2017, Ref. RB | | | 5.00% | | | | 07/01/2035 | | | | 135 | | | | 138,962 | |
Series 2017, Ref. RB | | | 5.00% | | | | 07/01/2036 | | | | 110 | | | | 112,647 | |
Series 2017, Ref. RB | | | 5.00% | | | | 07/01/2038 | | | | 80 | | | | 81,299 | |
Hudson Yards Infrastructure Corp.; | | | | | | | | | | | | | | | | |
Series 2017 A, Ref. RB(e) | | | 5.00% | | | | 02/15/2045 | | | | 5,000 | | | | 5,192,564 | |
Series 2017-XF0551, Revenue Ctfs.(e) | | | 5.00% | | | | 02/15/2042 | | | | 25,765 | | | | 26,851,920 | |
Hudson Yards Infrastructure Corp. (Green Bonds); Series 2021 A, Ref. RB | | | 4.00% | | | | 02/15/2040 | | | | 5,845 | | | | 5,805,517 | |
Huntington Local Development Corp.; Series 2016, RB(a) | | | 6.50% | | | | 12/01/2046 | | | | 2,150 | | | | 1,611,536 | |
Long Island (City of), NY Power Authority; | | | | | | | | | | | | | | | | |
Series 2014 A, Ref. RB | | | 5.00% | | | | 09/01/2039 | | | | 1,185 | | | | 1,202,199 | |
Series 2014 A, Ref. RB | | | 5.00% | | | | 09/01/2044 | | | | 2,970 | | | | 2,995,049 | |
Series 2016 B, Ref. RB | | | 5.00% | | | | 09/01/2036 | | | | 1,250 | | | | 1,300,829 | |
Series 2016 B, Ref. RB | | | 5.00% | | | | 09/01/2046 | | | | 1,485 | | | | 1,520,913 | |
Series 2017, RB | | | 5.00% | | | | 09/01/2042 | | | | 4,000 | | | | 4,213,804 | |
Series 2018, RB | | | 5.00% | | | | 09/01/2034 | | | | 5,000 | | | | 5,513,567 | |
Series 2018, RB | | | 5.00% | | | | 09/01/2039 | | | | 1,000 | | | | 1,070,098 | |
Series 2021 A, Ref. RB | | | 4.00% | | | | 09/01/2039 | | | | 3,000 | | | | 3,021,602 | |
Metropolitan Transportation Authority; | | | | | | | | | | | | | | | | |
Series 2014 B, RB | | | 5.25% | | | | 11/15/2039 | | | | 900 | | | | 902,002 | |
Series 2014 B, RB | | | 5.00% | | | | 11/15/2044 | | | | 2,000 | | | | 1,990,022 | |
Series 2016 B, Ref. RB | | | 5.00% | | | | 11/15/2035 | | | | 2,000 | | | | 2,035,514 | |
Series 2016 B, Ref. RB | | | 5.00% | | | | 11/15/2037 | | | | 7,000 | | | | 7,100,442 | |
Series 2016 C-1, RB | | | 5.25% | | | | 11/15/2056 | | | | 11,760 | | | | 11,745,120 | |
Metropolitan Transportation Authority (Bidding Group 2); Series 2022 A, RB | | | 4.00% | | | | 11/15/2052 | | | | 4,570 | | | | 4,221,745 | |
Metropolitan Transportation Authority (Green Bonds); | | | | | | | | | | | | | | | | |
Series 2016 A-1, RB | | | 5.25% | | | | 11/15/2056 | | | | 5,715 | | | | 5,708,083 | |
Series 2017 A-1, RB | | | 5.25% | | | | 11/15/2057 | | | | 2,565 | | | | 2,561,612 | |
Series 2017 B-1, RB | | | 5.25% | | | | 11/15/2057 | | | | 10,000 | | | | 10,469,178 | |
Monroe County Industrial Development Corp. (Monroe Community College); | | | | | | | | | | | | | | | | |
Series 2014, Ref. RB (INS - AGM)(f) | | | 5.00% | | | | 01/15/2028 | | | | 350 | | | | 355,955 | |
Series 2014, Ref. RB (INS - AGM)(f) | | | 5.00% | | | | 01/15/2029 | | | | 500 | | | | 508,900 | |
Series 2014, Ref. RB (INS - AGM)(f) | | | 5.00% | | | | 01/15/2038 | | | | 150 | | | | 152,304 | |
See accompanying Notes to Financial Statements which are an integral part of the financial statements.
9 Invesco Rochester® AMT-Free New York Municipal Fund
| | | | | | | | | | | | | | | | |
| | | Interest
Rate | | | Maturity
Date | | | Principal
Amount
(000) | | | Value | |
New York–(continued) | | | | | | | | | | | | | | | | |
Monroe County Industrial Development Corp. (Rochester General Hospital (The)); | | | | | | | | | | | | | | | | |
Series 2013 A, Ref. RB | | | 5.00% | | | | 12/01/2032 | | | $ | 1,450 | | | $ | 1,451,450 | |
Series 2017, RB | | | 5.00% | | | | 12/01/2036 | | | | 1,400 | | | | 1,432,793 | |
Monroe County Industrial Development Corp. (Rochester Regional Health); Series 2020, Ref. RB | | | 4.00% | | | | 12/01/2046 | | | | 1,000 | | | | 840,486 | |
Monroe County Industrial Development Corp. (St. Ann’s Community); Series 2019, Ref. RB | | | 5.00% | | | | 01/01/2050 | | | | 3,000 | | | | 2,374,651 | |
Monroe County Industrial Development Corp. (St. John Fisher College); | | | | | | | | | | | | | | | | |
Series 2011, RB | | | 5.63% | | | | 06/01/2026 | | | | 125 | | | | 125,198 | |
Series 2011, RB | | | 6.00% | | | | 06/01/2034 | | | | 250 | | | | 250,517 | |
Series 2014 A, RB | | | 5.00% | | | | 06/01/2029 | | | | 100 | | | | 101,889 | |
Series 2014 A, RB | | | 5.50% | | | | 06/01/2034 | | | | 180 | | | | 184,340 | |
Series 2014 A, RB | | | 5.00% | | | | 06/01/2044 | | | | 285 | | | | 287,964 | |
Montgomery County Capital Resource Corp.; | | | | | | | | | | | | | | | | |
Series 2020 A-1, RB | | | 4.95% | | | | 07/01/2030 | | | | 760 | | | | 641,440 | |
Series 2020 A-2, RB | | | 5.40% | | | | 07/01/2050 | | | | 5,625 | | | | 3,964,008 | |
Series 2020 B, RB | | | 5.38% | | | | 07/01/2025 | | | | 225 | | | | 214,545 | |
MTA Hudson Rail Yards Trust Obligations; | | | | | | | | | | | | | | | | |
Series 2016 A, RB | | | 5.00% | | | | 11/15/2051 | | | | 1,000 | | | | 990,769 | |
Series 2016 A, RB | | | 5.00% | | | | 11/15/2056 | | | | 17,000 | | | | 16,702,760 | |
Nassau (County of), NY; | | | | | | | | | | | | | | | | |
Series 2018 B, GO Bonds (INS - AGM)(f) | | | 5.00% | | | | 07/01/2049 | | | | 3,930 | | | | 4,089,659 | |
Series 2019 A, GO Bonds (INS - AGM)(f) | | | 5.00% | | | | 04/01/2043 | | | | 1,490 | | | | 1,568,547 | |
Nassau (County of), NY Industrial Development Agency; Series 2003 A-C, RB | | | 7.00% | | | | 09/01/2028 | | | | 885 | | | | 855,901 | |
Nassau (County of), NY Industrial Development Agency (Amsterdam at Harborside); | | | | | | | | | | | | | | | | |
Series 2021, RB (Acquired 11/14/2014-10/16/2018; Cost $3,191,296)(c) | | | 5.00% | | | | 01/01/2058 | | | | 3,133 | | | | 1,509,670 | |
Series 2021, Ref. RB (Acquired 09/07/2021; Cost $1,540,000)(a)(c) | | | 9.00% | | | | 01/01/2041 | | | | 1,540 | | | | 1,273,090 | |
Nassau County Local Economic Assistance Corp. (Hispanic Counseling Center, Inc.); Series 2018 A-2, Ref. RB | | | 5.20% | | | | 12/01/2037 | | | | 290 | | | | 219,438 | |
Nassau County Tobacco Settlement Corp.; | | | | | | | | | | | | | | | | |
Series 2006 A-2, RB | | | 5.25% | | | | 06/01/2026 | | | | 2,929 | | | | 2,876,728 | |
Series 2006 D, RB(b) | | | 0.00% | | | | 06/01/2060 | | | | 60,000 | | | | 3,258,084 | |
New Rochelle (City of), NY (70 Nardozzi/City DPW); Series 2018 A-2, RB | | | 5.13% | | | | 08/01/2050 | | | | 3,095 | | | | 2,094,423 | |
New Rochelle (City of), NY (Iona College); | | | | | | | | | | | | | | | | |
Series 2015 A, Ref. RB | | | 5.00% | | | | 07/01/2032 | | | | 350 | | | | 361,385 | |
Series 2015 A, Ref. RB | | | 5.00% | | | | 07/01/2033 | | | | 565 | | | | 582,596 | |
Series 2015 A, Ref. RB | | | 5.00% | | | | 07/01/2034 | | | | 450 | | | | 463,206 | |
Series 2015 A, Ref. RB | | | 5.00% | | | | 07/01/2040 | | | | 200 | | | | 202,860 | |
Series 2015 A, Ref. RB | | | 5.00% | | | | 07/01/2045 | | | | 225 | | | | 227,063 | |
New York & New Jersey (States of) Port Authority; Two Hundred Fifth Series 2017, Ref. RB(e) | | | 5.25% | | | | 11/15/2057 | | | | 11,300 | | | | 11,919,798 | |
New York (City of), NY; | | | | | | | | | | | | | | | | |
Series 1997 C, GO Bonds(g) | | | 5.50% | | | | 11/15/2037 | | | | 15 | | | | 15,029 | |
Series 2020 D-1, GO Bonds | | | 5.00% | | | | 03/01/2038 | | | | 1,400 | | | | 1,529,280 | |
Series 2020 D-1, GO Bonds | | | 4.00% | | | | 03/01/2042 | | | | 2,600 | | | | 2,506,580 | |
Series 2020 D-1, GO Bonds | | | 4.00% | | | | 03/01/2050 | | | | 2,000 | | | | 1,876,523 | |
Series 2021 A-1, GO Bonds | | | 4.00% | | | | 08/01/2050 | | | | 1,500 | | | | 1,405,121 | |
Series 2021 F-1, GO Bonds | | | 3.00% | | | | 03/01/2041 | | | | 1,585 | | | | 1,291,549 | |
Series 2021 F-1, GO Bonds | | | 5.00% | | | | 03/01/2044 | | | | 5,000 | | | | 5,356,774 | |
Subseries 2019 A-1, GO Bonds | | | 4.00% | | | | 08/01/2044 | | | | 5,000 | | | | 4,785,567 | |
Subseries 2022 D-1, GO Bonds | | | 5.25% | | | | 05/01/2043 | | | | 3,225 | | | | 3,574,980 | |
New York (City of), NY Industrial Development Agency (Comprehensive Care Management); | | | | | | | | | | | | | | | | |
Series 2005 C-2, RB | | | 6.00% | | | | 05/01/2026 | | | | 75 | | | | 68,279 | |
Series 2005 E-2, RB | | | 6.13% | | | | 11/01/2035 | | | | 250 | | | | 186,086 | |
New York (City of), NY Industrial Development Agency (The Child School); Series 2003, RB | | | 7.55% | | | | 06/01/2033 | | | | 3,335 | | | | 3,350,848 | |
New York (City of), NY Industrial Development Agency (Yankee Stadium); | | | | | | | | | | | | | | | | |
Series 2020, Ref. RB | | | 4.00% | | | | 03/01/2045 | | | | 1,300 | | | | 1,157,620 | |
Series 2020, Ref. RB (INS - AGM)(f) | | | 4.00% | | | | 03/01/2045 | | | | 800 | | | | 744,502 | |
See accompanying Notes to Financial Statements which are an integral part of the financial statements.
10 Invesco Rochester® AMT-Free New York Municipal Fund
| | | | | | | | | | | | | | | | |
| | | Interest
Rate | | | Maturity
Date | | | Principal
Amount
(000) | | | Value | |
New York–(continued) | | | | | | | | | | | | | | | | |
New York (City of), NY Municipal Water Finance Authority; | | | | | | | | | | | | | | | | |
Series 2019 CC-1, RB | | | 4.00% | | | | 06/15/2040 | | | $ | 950 | | | $ | 936,493 | |
Series 2019 CC-1, RB | | | 4.00% | | | | 06/15/2049 | | | | 1,050 | | | | 997,203 | |
Series 2020 AA-1, Ref. RB | | | 4.00% | | | | 06/15/2050 | | | | 10,250 | | | | 9,700,754 | |
Series 2020, Ref. RB | | | 5.00% | | | | 06/15/2050 | | | | 1,500 | | | | 1,592,558 | |
New York (City of), NY Transitional Finance Authority; | | | | | | | | | | | | | | | | |
Series 2015 S, RB | | | 5.00% | | | | 07/15/2034 | | | | 1,395 | | | | 1,436,211 | |
Series 2017 C, Ref. RB | | | 5.00% | | | | 11/01/2030 | | | | 920 | | | | 992,626 | |
Series 2017 C, Ref. RB | | | 5.00% | | | | 11/01/2032 | | | | 1,470 | | | | 1,585,006 | |
Series 2018 S-1, RB | | | 5.00% | | | | 07/15/2043 | | | | 8,085 | | | | 8,538,332 | |
Series 2019 B-1, RB | | | 4.00% | | | | 11/01/2042 | | | | 10,000 | | | | 9,722,005 | |
Series 2019 B-1, RB | | | 4.00% | | | | 11/01/2043 | | | | 6,000 | | | | 5,815,930 | |
Series 2020 C-1, RB | | | 4.00% | | | | 05/01/2036 | | | | 300 | | | | 303,836 | |
Series 2020 C-1, RB | | | 4.00% | | | | 05/01/2037 | | | | 550 | | | | 552,156 | |
Series 2020 C-1, RB | | | 4.00% | | | | 05/01/2038 | | | | 600 | | | | 597,906 | |
Series 2020 C-1, RB | | | 4.00% | | | | 05/01/2039 | | | | 520 | | | | 514,862 | |
Series 2020, RB | | | 4.00% | | | | 05/01/2044 | | | | 10,000 | | | | 9,638,412 | |
Series 2021 E-1, RB | | | 4.00% | | | | 02/01/2043 | | | | 1,000 | | | | 970,049 | |
Series 2022 F-1, RB | | | 5.00% | | | | 02/01/2044 | | | | 2,500 | | | | 2,699,311 | |
Subseries 2019 S1B, RB | | | 4.00% | | | | 07/15/2041 | | | | 3,335 | | | | 3,222,173 | |
New York (City of), NY Trust for Cultural Resources (Juilliard School (The)); | | | | | | | | | | | | | | | | |
Series 2018 A, Ref. RB | | | 5.00% | | | | 01/01/2033 | | | | 290 | | | | 324,596 | |
Series 2018 A, Ref. RB | | | 5.00% | | | | 01/01/2037 | | | | 400 | | | | 435,498 | |
Series 2018 A, Ref. RB | | | 5.00% | | | | 01/01/2038 | | | | 300 | | | | 325,335 | |
Series 2018 A, Ref. RB | | | 4.00% | | | | 01/01/2039 | | | | 1,100 | | | | 1,088,024 | |
New York (City of), NY Trust for Cultural Resources (Wildlife Conservation Society); Series 2013 A, RB(g)(h) | | | 5.00% | | | | 08/01/2023 | | | | 1,000 | | | | 1,007,986 | |
New York (State of) Dormitory Authority; | | | | | | | | | | | | | | | | |
Series 2015 A-1, Ref. RB(a) | | | 4.80% | | | | 12/01/2023 | | | | 530 | | | | 518,716 | |
Series 2016 A, Ref. RB | | | 5.00% | | | | 07/01/2036 | | | | 1,000 | | | | 1,040,580 | |
Series 2018 A, RB | | | 5.00% | | | | 07/01/2048 | | | | 1,110 | | | | 1,176,574 | |
Series 2020 A, Ref. RB | | | 4.00% | | | | 03/15/2046 | | | | 935 | | | | 887,178 | |
Series 2022 A, Ref. RB | | | 4.00% | | | | 03/15/2040 | | | | 880 | | | | 863,415 | |
New York (State of) Dormitory Authority (Alliance Long Island AGYS, Inc.); | | | | | | | | | | | | | | | | |
Series 2015 A-2, Ref. RB(a) | | | 5.35% | | | | 12/01/2035 | | | | 5,985 | | | | 4,616,140 | |
Series 2015 B-1, Ref. RB(a) | | | 6.18% | | | | 12/01/2031 | | | | 1,665 | | | | 1,372,533 | |
New York (State of) Dormitory Authority (Catholic Health System Obligated Group); | | | | | | | | | | | | | | | | |
Series 2012 A, RB | | | 4.75% | | | | 07/01/2039 | | | | 1,250 | | | | 1,002,661 | |
Series 2012 B, RB | | | 5.00% | | | | 07/01/2032 | | | | 125 | | | | 109,866 | |
Series 2012 B, RB | | | 4.75% | | | | 07/01/2039 | | | | 300 | | | | 240,639 | |
New York (State of) Dormitory Authority (Fashion Institute of Technology Student Housing Corp.); | | | | | | | | | | | | | | | | |
Series 2007, RB (INS - NATL)(f) | | | 5.25% | | | | 07/01/2027 | | | | 6,425 | | | | 6,633,088 | |
Series 2007, RB (INS - NATL)(f) | | | 5.25% | | | | 07/01/2028 | | | | 3,765 | | | | 3,909,096 | |
New York (State of) Dormitory Authority (Fordham University); | | | | | | | | | | | | | | | | |
Series 2014, RB | | | 5.00% | | | | 07/01/2030 | | | | 100 | | | | 102,294 | |
Series 2016 A, Ref. RB | | | 5.00% | | | | 07/01/2041 | | | | 765 | | | | 786,015 | |
Series 2020, RB | | | 4.00% | | | | 07/01/2050 | | | | 2,000 | | | | 1,820,076 | |
New York (State of) Dormitory Authority (Montefiore Obligated Group); | | | | | | | | | | | | | | | | |
Series 2018 A, Ref. RB | | | 5.00% | | | | 08/01/2035 | | | | 480 | | | | 481,517 | |
Series 2020 A, Ref. RB | | | 4.00% | | | | 09/01/2050 | | | | 1,200 | | | | 974,831 | |
New York (State of) Dormitory Authority (New School (The)); | | | | | | | | | | | | | | | | |
Series 2015, Ref. RB(g)(h) | | | 5.00% | | | | 07/01/2025 | | | | 30 | | | | 31,271 | |
Series 2015, Ref. RB | | | 5.00% | | | | 07/01/2040 | | | | 370 | | | | 376,277 | |
Series 2016 A, Ref. RB | | | 5.00% | | | | 07/01/2035 | | | | 1,855 | | | | 1,932,261 | |
Series 2016 A, Ref. RB | | | 5.00% | | | | 07/01/2036 | | | | 1,915 | | | | 1,985,570 | |
Series 2016 A, Ref. RB | | | 5.00% | | | | 07/01/2037 | | | | 1,265 | | | | 1,307,634 | |
Series 2016 A, Ref. RB | | | 5.00% | | | | 07/01/2041 | | | | 595 | | | | 608,745 | |
Series 2016 A, Ref. RB | | | 5.00% | | | | 07/01/2046 | | | | 6,650 | | | | 6,748,141 | |
Series 2022 A, Ref. RB | | | 4.00% | | | | 07/01/2052 | | | | 1,375 | | | | 1,166,932 | |
See accompanying Notes to Financial Statements which are an integral part of the financial statements.
11 Invesco Rochester® AMT-Free New York Municipal Fund
| | | | | | | | | | | | | | | | |
| | | Interest
Rate | | | Maturity
Date | | | Principal
Amount
(000) | | | Value | |
New York–(continued) | | | | | | | | | | | | | | | | |
New York (State of) Dormitory Authority (New York University); | | | | | | | | | | | | | | | | |
Series 2016 A, RB | | | 5.00% | | | | 07/01/2035 | | | $ | 5,000 | | | $ | 5,284,410 | |
Series 2019 A, RB | | | 5.00% | | | | 07/01/2042 | | | | 740 | | | | 793,430 | |
Series 2019 A, RB | | | 5.00% | | | | 07/01/2049 | | | | 5,860 | | | | 6,217,665 | |
Series 2021 A, Ref. RB | | | 3.00% | | | | 07/01/2041 | | | | 1,215 | | | | 980,472 | |
Series 2021 A, Ref. RB | | | 5.00% | | | | 07/01/2051 | | | | 1,140 | | | | 1,214,970 | |
New York (State of) Dormitory Authority (NYU Hospitals Center); Series 2014, Ref. RB | | | 5.00% | | | | 07/01/2028 | | | | 645 | | | | 660,958 | |
New York (State of) Dormitory Authority (Orange Regional Medical Center); | | | | | | | | | | | | | | | | |
Series 2017, Ref. RB(a) | | | 5.00% | | | | 12/01/2029 | | | | 600 | | | | 605,952 | |
Series 2017, Ref. RB(a) | | | 5.00% | | | | 12/01/2030 | | | | 400 | | | | 403,946 | |
Series 2017, Ref. RB(a) | | | 5.00% | | | | 12/01/2032 | | | | 300 | | | | 301,593 | |
Series 2017, Ref. RB(a) | | | 5.00% | | | | 12/01/2033 | | | | 300 | | | | 301,022 | |
Series 2017, Ref. RB(a) | | | 5.00% | | | | 12/01/2035 | | | | 300 | | | | 296,590 | |
Series 2017, Ref. RB(a) | | | 5.00% | | | | 12/01/2036 | | | | 200 | | | | 195,047 | |
Series 2017, Ref. RB(a) | | | 5.00% | | | | 12/01/2037 | | | | 200 | | | | 193,388 | |
New York (State of) Dormitory Authority (Ozanam Hall of Queens Nursing Home, Inc.); Series 2006, RB (LOC - Allied Irish Banks PLC)(i) | | | 5.00% | | | | 11/01/2026 | | | | 265 | | | | 268,584 | |
New York (State of) Dormitory Authority (Pratt Institute); Series 2016, Ref. RB | | | 5.00% | | | | 07/01/2046 | | | | 500 | | | | 508,027 | |
New York (State of) Dormitory Authority (Rochester Institute of Technology); | | | | | | | | | | | | | | | | |
Series 2019 A, RB | | | 4.00% | | | | 07/01/2044 | | | | 5,790 | | | | 5,382,842 | |
Series 2019 A, RB | | | 5.00% | | | | 07/01/2049 | | | | 800 | | | | 845,610 | |
New York (State of) Dormitory Authority (Rockefeller University) (Green Bonds); Series 2019 B, RB | | | 5.00% | | | | 07/01/2050 | | | | 5,045 | | | | 5,366,040 | |
New York (State of) Dormitory Authority (St. John’s University); Series 2015 A, Ref. RB | | | 5.00% | | | | 07/01/2034 | | | | 100 | | | | 103,569 | |
New York (State of) Dormitory Authority (State University of New York Dormitory Facilities); Series 2019 A, RB | | | 4.00% | | | | 07/01/2049 | | | | 850 | | | | 777,986 | |
New York (State of) Dormitory Authority (United Cerebral Palsy Association); | | | | | | | | | | | | | | | | |
Series 2017 A, RB(a) | | | 5.50% | | | | 12/01/2047 | | | | 3,030 | | | | 2,068,474 | |
Series 2017 A-2, RB(a) | | | 5.38% | | | | 09/01/2050 | | | | 4,800 | | | | 3,288,968 | |
Series 2017 A-2, Ref. RB (Acquired 10/25/2017; Cost $1,425,000)(a)(c) | | | 5.38% | | | | 10/01/2042 | | | | 1,425 | | | | 1,067,947 | |
New York (State of) Dormitory Authority (Wagner College); Series 2022, Ref. RB | | | 5.00% | | | | 07/01/2047 | | | | 3,620 | | | | 3,536,358 | |
New York (State of) Power Authority (Green Bonds); Series 2020 A, Ref. RB | | | 4.00% | | | | 11/15/2060 | | | | 7,050 | | | | 6,496,475 | |
New York (State of) Power Authority (Green Transmission); | | | | | | | | | | | | | | | | |
Series 2022, RB (INS - AGM)(f) | | | 4.00% | | | | 11/15/2047 | | | | 2,650 | | | | 2,470,555 | |
Series 2022, RB (INS - AGM)(f) | | | 4.00% | | | | 11/15/2052 | | | | 5,000 | | | | 4,581,432 | |
New York (State of) Thruway Authority; | | | | | | | | | | | | | | | | |
Series 2018 L, Ref. RB | | | 5.00% | | | | 01/01/2033 | | | | 190 | | | | 208,131 | |
Series 2018 L, Ref. RB | | | 5.00% | | | | 01/01/2034 | | | | 340 | | | | 371,262 | |
Series 2018 L, Ref. RB | | | 5.00% | | | | 01/01/2035 | | | | 385 | | | | 417,567 | |
Series 2019 B, RB | | | 4.00% | | | | 01/01/2050 | | | | 10,000 | | | | 9,155,536 | |
Series 2021 O, Ref. RB | | | 4.00% | | | | 01/01/2049 | | | | 3,025 | | | | 2,817,362 | |
New York (State of) Thruway Authority (Bidding Group 5); Series 2021 A-1, Ref. RB | | | 4.00% | | | | 03/15/2059 | | | | 5,715 | | | | 5,227,771 | |
New York (State of) Thruway Authority (Green Bonds) (Bidding Group 1); Series 2022 C, RB | | | 5.00% | | | | 03/15/2053 | | | | 6,000 | | | | 6,442,769 | |
New York (State of) Thruway Authority (Group 2); Series 2020 N, RB | | | 4.00% | | | | 01/01/2045 | | | | 3,280 | | | | 3,094,267 | |
New York (State of) Utility Debt Securitization Authority; | | | | | | | | | | | | | | | | |
Series 2017, RB | | | 5.00% | | | | 12/15/2038 | | | | 8,460 | | | | 9,137,967 | |
Series 2017, RB | | | 5.00% | | | | 12/15/2040 | | | | 15,000 | | | | 16,136,662 | |
Series 2022, Ref. RB | | | 5.00% | | | | 12/15/2049 | | | | 1,000 | | | | 1,105,727 | |
Series 2022, Ref. RB | | | 5.00% | | | | 09/15/2052 | | | | 750 | | | | 827,196 | |
New York City Health and Hospitals Corp.; Series 2021 A, Ref. RB | | | 4.00% | | | | 02/15/2045 | | | | 500 | | | | 466,307 | |
New York City Housing Development Corp.; Series 1999 E, RB | | | 6.25% | | | | 05/01/2036 | | | | 5 | | | | 5,011 | |
New York Counties Tobacco Trust I; Series 2000 A, RB | | | 6.50% | | | | 06/01/2035 | | | | 695 | | | | 695,331 | |
New York Counties Tobacco Trust II; | | | | | | | | | | | | | | | | |
Series 2001, RB | | | 5.63% | | | | 06/01/2035 | | | | 690 | | | | 703,770 | |
Series 2001, RB | | | 5.75% | | | | 06/01/2043 | | | | 15 | | | | 15,300 | |
New York Counties Tobacco Trust IV; | | | | | | | | | | | | | | | | |
Series 2005 A, RB | | | 5.00% | | | | 06/01/2038 | | | | 845 | | | | 808,422 | |
Series 2010 A, RB(a) | | | 6.25% | | | | 06/01/2041 | | | | 2,175 | | | | 2,175,806 | |
See accompanying Notes to Financial Statements which are an integral part of the financial statements.
12 Invesco Rochester® AMT-Free New York Municipal Fund
| | | | | | | | | | | | | | | | |
| | | Interest
Rate | | | Maturity
Date | | | Principal
Amount
(000) | | | Value | |
New York–(continued) | | | | | | | | | | | | | | | | |
New York Counties Tobacco Trust V; | | | | | | | | | | | | | | | | |
Series 2005 S-3, RB(b) | | | 0.00% | | | | 06/01/2055 | | | $ | 84,200 | | | $ | 6,210,280 | |
Series 2005 S4B, RB(a)(b) | | | 0.00% | | | | 06/01/2060 | | | | 155,400 | | | | 5,541,284 | |
New York Counties Tobacco Trust VI; | | | | | | | | | | | | | | | | |
Series 2016 A, Ref. RB | | | 5.63% | | | | 06/01/2035 | | | | 10,600 | | | | 10,906,240 | |
Series 2016 A, Ref. RB | | | 6.00% | | | | 06/01/2043 | | | | 2,230 | | | | 2,266,875 | |
Series 2016 A-1, Ref. RB | | | 5.75% | | | | 06/01/2043 | | | | 2,085 | | | | 2,158,742 | |
Series 2016 A-2, Ref. RB | | | 5.00% | | | | 06/01/2051 | | | | 1,125 | | | | 1,041,689 | |
New York Liberty Development Corp. (Goldman Sachs Headquarters); | | | | | | | | | | | | | | | | |
Series 2005, Ref. RB | | | 5.25% | | | | 10/01/2035 | | | | 15,580 | | | | 17,495,344 | |
Series 2007, RB | | | 5.50% | | | | 10/01/2037 | | | | 5,025 | | | | 5,704,986 | |
New York Liberty Development Corp. (Green Bonds); | | | | | | | | | | | | | | | | |
Series 2021 A, Ref. RB | | | 2.75% | | | | 11/15/2041 | | | | 3,845 | | | | 2,835,984 | |
Series 2021 A, Ref. RB | | | 2.88% | | | | 11/15/2046 | | | | 6,155 | | | | 4,308,779 | |
New York State Urban Development Corp.; Series 2020 A, RB | | | 4.00% | | | | 03/15/2045 | | | | 3,065 | | | | 2,906,477 | |
New York Transportation Development Corp. (Terminal 4 JFK International Airport); Series 2020, Ref. RB | | | 5.00% | | | | 12/01/2038 | | | | 1,500 | | | | 1,584,599 | |
Niagara Area Development Corp. (Catholic Health System, Inc.); Series 2022, RB | | | 5.00% | | | | 07/01/2052 | | | | 450 | | | | 338,922 | |
Oneida County Local Development Corp. (Mohawk Valley Health System); | | | | | | | | | | | | | | | | |
Series 2019, Ref. RB (INS - AGM)(f) | | | 4.00% | | | | 12/01/2038 | | | | 180 | | | | 169,646 | |
Series 2019, Ref. RB (INS - AGM)(f) | | | 4.00% | | | | 12/01/2049 | | | | 580 | | | | 524,940 | |
Onondaga (County of), NY Trust for Cultural Resources (Abby Lane Housing Corp.); | | | | | | | | | | | | | | | | |
Series 2017, Ref. RB | | | 5.00% | | | | 05/01/2033 | | | | 280 | | | | 286,954 | |
Series 2017, Ref. RB | | | 5.00% | | | | 05/01/2034 | | | | 200 | | | | 204,432 | |
Series 2017, Ref. RB | | | 5.00% | | | | 05/01/2037 | | | | 250 | | | | 254,493 | |
Series 2017, Ref. RB | | | 5.00% | | | | 05/01/2040 | | | | 150 | | | | 151,957 | |
Onondaga (County of), NY Trust for Cultural Resources (Syracuse University); | | | | | | | | | | | | | | | | |
Series 2019, Ref. RB | | | 4.00% | | | | 12/01/2047 | | | | 1,150 | | | | 1,070,272 | |
Series 2019, Ref. RB | | | 4.00% | | | | 12/01/2049 | | | | 1,500 | | | | 1,384,239 | |
Onondaga Civic Development Corp.; | | | | | | | | | | | | | | | | |
Series 2015, Ref. RB | | | 5.00% | | | | 10/01/2030 | | | | 1,060 | | | | 1,042,256 | |
Series 2015, Ref. RB | | | 5.00% | | | | 10/01/2040 | | | | 2,345 | | | | 2,147,068 | |
Orange County Funding Corp.; Series 2013, RB | | | 6.50% | | | | 01/01/2046 | | | | 715 | | | | 571,807 | |
Rockland Tobacco Asset Securitization Corp.; | | | | | | | | | | | | | | | | |
Series 2001, RB | | | 5.63% | | | | 08/15/2035 | | | | 850 | | | | 864,060 | |
Series 2001, RB | | | 5.75% | | | | 08/15/2043 | | | | 3,160 | | | | 3,212,270 | |
Schenectady Metroplex Development Authority; Series 2014 A, RB (INS - AGM)(f) | | | 5.50% | | | | 08/01/2033 | | | | 1,000 | | | | 1,009,195 | |
St. Johns (County of), FL Industrial Development Authority (St. Lawrence University); | | | | | | | | | | | | | | | | |
Series 2022, Ref. RB | | | 5.25% | | | | 07/01/2039 | | | | 400 | | | | 439,781 | |
Series 2022, Ref. RB | | | 5.25% | | | | 07/01/2040 | | | | 265 | | | | 289,806 | |
Suffolk County Economic Development Corp.; Series 2010 A, RB | | | 7.38% | | | | 12/01/2040 | | | | 255 | | | | 224,890 | |
Sullivan (County of), NY (Adelaar Infratructure); | | | | | | | | | | | | | | | | |
Series 2016 A-2, RB(a) | | | 5.35% | | | | 11/01/2049 | | | | 8,220 | | | | 7,326,268 | |
Series 2016 B-2, RB(a) | | | 5.35% | | | | 11/01/2049 | | | | 1,175 | | | | 1,047,246 | |
Series 2016 C-2, RB(a) | | | 5.35% | | | | 11/01/2049 | | | | 1,160 | | | | 1,033,877 | |
Series 2016 D-2, RB(a) | | | 5.35% | | | | 11/01/2049 | | | | 760 | | | | 677,368 | |
Tender Option Bond Trust Receipts/Certificates; Series 2023, RB(e) | | | 4.00% | | | | 06/15/2051 | | | | 11,000 | | | | 10,374,970 | |
Tompkins County Development Corp. (Tompkins Cortland Community College Foundation, Inc.); | | | | | | | | | | | | | | | | |
Series 2013 A, RB(d) | | | 5.00% | | | | 07/01/2032 | | | | 330 | | | | 163,350 | |
Series 2013 A, RB(d) | | | 5.00% | | | | 07/01/2038 | | | | 2,785 | | | | 1,378,575 | |
See accompanying Notes to Financial Statements which are an integral part of the financial statements.
13 Invesco Rochester® AMT-Free New York Municipal Fund
| | | | | | | | | | | | | | | | |
| | | Interest
Rate | | | Maturity
Date | | | Principal
Amount
(000) | | | Value | |
New York–(continued) | | | | | | | | | | | | | | | | |
Triborough Bridge & Tunnel Authority; | | | | | | | | | | | | | | | | |
Series 2012 B, Ref. RB(g)(h) | | | 5.00% | | | | 03/16/2023 | | | $ | 400 | | | $ | 400,269 | |
Series 2013 A, Ref. RB(g)(h) | | | 5.00% | | | | 05/15/2023 | | | | 300 | | | | 301,065 | |
Series 2016 A, Ref. RB | | | 5.00% | | | | 11/15/2046 | | | | 1,260 | | | | 1,294,876 | |
Series 2017 A, RB | | | 5.00% | | | | 11/15/2038 | | | | 300 | | | | 318,146 | |
Series 2017 A, RB | | | 5.00% | | | | 11/15/2047 | | | | 1,000 | | | | 1,041,125 | |
Series 2017 B, Ref. RB | | | 5.00% | | | | 11/15/2032 | | | | 875 | | | | 942,953 | |
Series 2017 B, Ref. RB | | | 5.00% | | | | 11/15/2033 | | | | 900 | | | | 968,490 | |
Series 2017 B, Ref. RB | | | 5.00% | | | | 11/15/2034 | | | | 575 | | | | 617,348 | |
Series 2017 B, Ref. RB | | | 5.00% | | | | 11/15/2038 | | | | 1,900 | | | | 2,014,924 | |
Series 2021 A-1, Ref. RB | | | 4.00% | | | | 05/15/2046 | | | | 1,950 | | | | 1,812,032 | |
Triborough Bridge & Tunnel Authority (Green Bonds); Series 2022 D-2, RB | | | 5.25% | | | | 05/15/2047 | | | | 9,625 | | | | 10,586,175 | |
Triborough Bridge & Tunnel Authority (MTA Brdiges & Tunnels); Subseries 2022 D-2, RB | | | 5.50% | | | | 05/15/2052 | | | | 800 | | | | 907,094 | |
Triborough Bridge & Tunnel Authority (MTA Bridges & Tunnels); | | | | | | | | | | | | | | | | |
Series 2019 A, RB | | | 5.00% | | | | 11/15/2049 | | | | 2,200 | | | | 2,321,942 | |
Series 2020 A, RB | | | 5.00% | | | | 11/15/2054 | | | | 2,900 | | | | 3,078,833 | |
Series 2021 A, RB | | | 5.00% | | | | 11/15/2056 | | | | 700 | | | | 742,526 | |
Series 2022 A, Ref. RB | | | 4.00% | | | | 05/15/2051 | | | | 13,085 | | | | 11,984,579 | |
Series 2022, RB(e) | | | 5.25% | | | | 05/15/2057 | | | | 10,000 | | | | 10,904,988 | |
TSASC, Inc.; | | | | | | | | | | | | | | | | |
Series 2016 B, Ref. RB | | | 5.00% | | | | 06/01/2045 | | | | 8,000 | | | | 7,421,800 | |
Series 2017 A, Ref. RB | | | 5.00% | | | | 06/01/2030 | | | | 3,275 | | | | 3,433,198 | |
Series 2017 A, Ref. RB | | | 5.00% | | | | 06/01/2034 | | | | 5,000 | | | | 5,201,170 | |
Series 2017 A, Ref. RB | | | 5.00% | | | | 06/01/2035 | | | | 3,000 | | | | 3,105,587 | |
Series 2017 A, Ref. RB | | | 5.00% | | | | 06/01/2036 | | | | 3,000 | | | | 3,091,048 | |
Westchester County Healthcare Corp.; | | | | | | | | | | | | | | | | |
Series 2010 B, RB | | | 6.13% | | | | 11/01/2037 | | | | 325 | | | | 325,850 | |
Series 2014 A, RB | | | 5.00% | | | | 11/01/2044 | | | | 2,247 | | | | 2,250,227 | |
Westchester County Local Development Corp. (Kendal on Hudson); Series 2022, Ref. RB | | | 4.25% | | | | 01/01/2045 | | | | 835 | | | | 697,463 | |
Westchester County Local Development Corp. (Wartburg Senior Housing); Series 2015 A, Ref. RB(a) | | | 5.00% | | | | 06/01/2030 | | | | 500 | | | | 458,772 | |
Westchester County Local Development Corp. (Westchester Medical Center Obligated Group); | | | | | | | | | | | | | | | | |
Series 2016, Ref. RB | | | 5.00% | | | | 11/01/2029 | | | | 1,000 | | | | 1,012,640 | |
Series 2016, Ref. RB | | | 5.00% | | | | 11/01/2032 | | | | 1,500 | | | | 1,518,284 | |
Westchester Tobacco Asset Securitization Corp.; Series 2016 C, Ref. RB | | | 5.00% | | | | 06/01/2045 | | | | 7,050 | | | | 7,054,145 | |
Western Regional Off-Track Betting Corp.; Series 2021, Ref. RB(a) | | | 4.13% | | | | 12/01/2041 | | | | 715 | | | | 527,428 | |
Yonkers Economic Development Corp. (Charter School Education Excellence); | | | | | | | | | | | | | | | | |
Series 2019 A, RB | | | 5.00% | | | | 10/15/2039 | | | | 420 | | | | 390,796 | |
Series 2019 A, RB | | | 5.00% | | | | 10/15/2049 | | | | 640 | | | | 573,339 | |
| | | | | | | | | | | | | | | | 669,045,534 | |
| | | | |
Puerto Rico–7.14% | | | | | | | | | | | | | | | | |
Children’s Trust Fund; | | | | | | | | | | | | | | | | |
Series 2002, RB | | | 5.38% | | | | 05/15/2033 | | | | 15 | | | | 15,005 | |
Series 2002, RB | | | 5.50% | | | | 05/15/2039 | | | | 3,455 | | | | 3,455,201 | |
Series 2002, RB | | | 5.63% | | | | 05/15/2043 | | | | 9,700 | | | | 9,797,520 | |
Series 2005 A, RB(b) | | | 0.00% | | | | 05/15/2050 | | | | 6,300 | | | | 1,105,586 | |
Corp. Para El Financiamiento Publico de Puerto Rico; Series 2011, RB | | | 5.50% | | | | 08/01/2031 | | | | 4,055 | | | | 106,444 | |
PRIFA Custodial Trust; | | | | | | | | | | | | | | | | |
Series 2005 A, RB | | | 0.00% | | | | 03/15/2049 | | | | 623 | | | | 380,976 | |
Series 2022, RB | | | 0.00% | | | | 03/15/2049 | | | | 3,658 | | | | 1,605,012 | |
See accompanying Notes to Financial Statements which are an integral part of the financial statements.
14 Invesco Rochester® AMT-Free New York Municipal Fund
| | | | | | | | | | | | | | | | |
| | | Interest
Rate | | | Maturity
Date | | | Principal
Amount
(000) | | | Value | |
Puerto Rico–(continued) | | | | | | | | | | | | | | | | |
Puerto Rico (Commonwealth of); | | | | | | | | | | | | | | | | |
Series 2021 A, GO Bonds(b) | | | 0.00% | | | | 07/01/2024 | | | $ | 123 | | | $ | 115,425 | |
Series 2021 A, GO Bonds(b) | | | 0.00% | | | | 07/01/2033 | | | | 473 | | | | 269,683 | |
Series 2021 A-1, GO Bonds | | | 5.25% | | | | 07/01/2023 | | | | 205 | | | | 205,977 | |
Series 2021 A-1, GO Bonds | | | 5.38% | | | | 07/01/2025 | | | | 410 | | | | 415,901 | |
Series 2021 A-1, GO Bonds | | | 5.63% | | | | 07/01/2027 | | | | 406 | | | | 419,316 | |
Series 2021 A-1, GO Bonds | | | 5.63% | | | | 07/01/2029 | | | | 399 | | | | 416,657 | |
Series 2021 A-1, GO Bonds | | | 5.75% | | | | 07/01/2031 | | | | 388 | | | | 408,265 | |
Series 2021 A-1, GO Bonds | | | 4.00% | | | | 07/01/2033 | | | | 768 | | | | 687,996 | |
Series 2021 A-1, GO Bonds | | | 4.00% | | | | 07/01/2035 | | | | 331 | | | | 289,573 | |
Series 2021 A-1, GO Bonds | | | 4.00% | | | | 07/01/2037 | | | | 284 | | | | 242,659 | |
Series 2021 A-1, GO Bonds | | | 4.00% | | | | 07/01/2041 | | | | 386 | | | | 318,680 | |
Series 2021 A-1, GO Bonds | | | 4.00% | | | | 07/01/2046 | | | | 0 | | | | 3 | |
Subseries 2022, RN | | | 0.00% | | | | 11/01/2043 | | | | 2,029 | | | | 874,888 | |
Subseries 2022, RN | | | 0.00% | | | | 11/01/2051 | | | | 4,424 | | | | 1,935,530 | |
Subseries 2022, RN | | | 0.00% | | | | 11/01/2051 | | | | 230 | | | | 221,542 | |
Subseries 2022, RN | | | 0.00% | | | | 11/01/2051 | | | | 267 | | | | 35,118 | |
Puerto Rico (Commonwealth of) Aqueduct & Sewer Authority; Series 2008 A, RB | | | 6.13% | | | | 07/01/2024 | | | | 3,115 | | | | 3,164,973 | |
Puerto Rico (Commonwealth of) Electric Power Authority; Series 2005 RR, RB (INS - SGI)(f) | | | 5.00% | | | | 07/01/2027 | | | | 1,000 | | | | 1,003,870 | |
Puerto Rico (Commonwealth of) Highway & Transportation Authority; | | | | | | | | | | | | | | | | |
Series 2022 A, RB | | | 5.00% | | | | 07/01/2062 | | | | 1,901 | | | | 1,763,683 | |
Series 2022 B, RB(b) | | | 0.00% | | | | 07/01/2032 | | | | 1,236 | | | | 772,342 | |
Series 2022 C, RB(j) | | | 5.00% | | | | 07/01/2053 | | | | 2,114 | | | | 1,173,551 | |
Puerto Rico (Commonwealth of) Industrial, Tourist, Educational, Medical & Environmental Control | | | | | | | | | | | | | | | | |
Facilities Financing Authority (University of the Sacred Heart Project); | | | | | | | | | | | | | | | | |
Series 2012, Ref. RB | | | 5.00% | | | | 10/01/2031 | | | | 100 | | | | 100,143 | |
Series 2012, Ref. RB | | | 5.00% | | | | 10/01/2042 | | | | 150 | | | | 150,347 | |
Puerto Rico Sales Tax Financing Corp.; | | | | | | | | | | | | | | | | |
Series 2018 A-1, RB | | | 4.50% | | | | 07/01/2034 | | | | 475 | | | | 470,986 | |
Series 2018 A-1, RB | | | 4.55% | | | | 07/01/2040 | | | | 199 | | | | 185,840 | |
Series 2018 A-1, RB(b) | | | 0.00% | | | | 07/01/2046 | | | | 9,897 | | | | 2,536,403 | |
Series 2018 A-1, RB | | | 4.75% | | | | 07/01/2053 | | | | 1,455 | | | | 1,304,236 | |
Series 2018 A-1, RB | | | 5.00% | | | | 07/01/2058 | | | | 6,182 | | | | 5,735,660 | |
Series 2019 A-2, RB | | | 4.54% | | | | 07/01/2053 | | | | 71 | | | | 61,400 | |
Series 2019 A-2, RB | | | 4.78% | | | | 07/01/2058 | | | | 953 | | | | 851,852 | |
Series 2019 A-2B, RB | | | 4.55% | | | | 07/01/2040 | | | | 1,898 | | | | 1,772,488 | |
University of Puerto Rico; | | | | | | | | | | | | | | | | |
Series 2006 Q, RB | | | 5.00% | | | | 06/01/2025 | | | | 1,000 | | | | 988,301 | |
Series 2006 Q, RB | | | 5.00% | | | | 06/01/2030 | | | | 3,000 | | | | 2,914,518 | |
| | | | | | | | | | | | | | | | 48,273,550 | |
Total Municipal Obligations (Cost $768,352,185) | | | | | | | | | | | | | | | 717,319,084 | |
| | | | | | | | |
| | | Shares | | | | |
Common Stocks & Other Equity Interests–0.02% | | | | | | | | |
New York–0.02% | | | | | | | | |
CMS Liquidating Trust;
(Cost $3,170,389)(k)(l) | | | 3,100 | | | | 155,000 | |
TOTAL INVESTMENTS IN SECURITIES(m) –106.03% (Cost $771,522,574) | | | | | | | 717,474,084 | |
FLOATING RATE NOTE OBLIGATIONS–(6.31)%
Notes with interest and fee rates ranging from 3.97% to 3.99% at 02/28/2023 and contractual maturities of collateral ranging from 02/15/2042 to 11/15/2057 (See Note 1K)(n) | | | | | | | (42,670,000 | ) |
BORROWINGS–(0.78)% | | | | | | | (5,300,000 | ) |
OTHER ASSETS LESS LIABILITIES–1.06% | | | | | | | 7,166,524 | |
NET ASSETS–100.00% | | | | | | $ | 676,670,608 | |
See accompanying Notes to Financial Statements which are an integral part of the financial statements.
15 Invesco Rochester® AMT-Free New York Municipal Fund
Investment Abbreviations:
| | |
| AGM | | – Assured Guaranty Municipal Corp. |
| Ctfs. | | – Certificates |
| GO | | – General Obligation |
| INS | | – Insurer |
| LOC | | – Letter of Credit |
| NATL | | – National Public Finance Guarantee Corp. |
| RB | | – Revenue Bonds |
| Ref. | | – Refunding |
| RN | | – Revenue Notes |
| SGI | | – Syncora Guarantee, Inc. |
Notes to Schedule of Investments:
| (a) | Security purchased or received in a transaction exempt from registration under the Securities Act of 1933, as amended (the “1933 Act”). The security may be resold pursuant to an exemption from registration under the 1933 Act, typically to qualified institutional buyers. The aggregate value of these securities at February 28, 2023 was $48,789,730, which represented 7.21% of the Fund’s Net Assets. |
| (b) | Zero coupon bond issued at a discount. |
| (c) | Restricted security. The aggregate value of these securities at February 28, 2023 was $4,709,855, which represented less than1% of the Fund’s Net Assets. |
| (d) | Defaulted security. Currently, the issuer is in default with respect to principal and/or interest payments. The aggregate value of these securities at February 28, 2023 was $5,291,925, which represented less than1% of the Fund’s Net Assets. |
| (e) | Underlying security related to TOB Trusts entered into by the Fund. See Note 1K. |
| (f) | Principal and/or interest payments are secured by the bond insurance company listed. |
| (g) | Advance refunded; secured by an escrow fund of U.S. Government obligations or other highly rated collateral. |
| (h) | Security has an irrevocable call by the issuer or mandatory put by the holder. Maturity date reflects such call or put. |
| (i) | Principal and interest payments are fully enhanced by a letter of credit from the bank listed or a predecessor bank, branch or subsidiary. |
| (j) | Convertible capital appreciation bond. The interest rate shown represents the coupon rate at which the bond will accrue at a specified future date. |
| (k) | Non-income producing security. |
| (l) | Security valued using significant unobservable inputs (Level 3). See Note 3. |
| (m) | Entities may either issue, guarantee, back or otherwise enhance the credit quality of a security. The entities are not primarily responsible for the issuer’s obligations but may be called upon to satisfy issuer’s obligations. No concentration of any single entity was greater than 5% each. |
| (n) | Floating rate note obligations related to securities held. The interest and fee rates shown reflect the rates in effect at February 28, 2023. At February 28, 2023, the Fund’s investments with a value of $65,244,307 are held by TOB Trusts and serve as collateral for the $42,670,000 in the floating rate note obligations outstanding at that date. |
See accompanying Notes to Financial Statements which are an integral part of the financial statements.
16 Invesco Rochester® AMT-Free New York Municipal Fund
Statement of Assets and Liabilities
February 28, 2023
| | | | |
Assets: | | | | |
Investments in unaffiliated securities, at value
(Cost $771,522,574) | | $ | 717,474,084 | |
| |
Cash | | | 518,639 | |
| |
Receivable for:
Investments sold | | | 500,000 | |
| |
Fund shares sold | | | 12,949 | |
| |
Interest | | | 8,423,122 | |
| |
Investment for trustee deferred compensation and retirement plans | | | 74,809 | |
| |
Other assets | | | 232,993 | |
| |
Total assets | | | 727,236,596 | |
| |
| |
Liabilities: | | | | |
Floating rate note obligations | | | 42,670,000 | |
| |
Payable for:
Borrowings | | | 5,300,000 | |
| |
Dividends | | | 884,819 | |
| |
Fund shares reacquired | | | 1,219,392 | |
| |
Accrued fees to affiliates | | | 260,329 | |
| |
Accrued interest expense | | | 30,396 | |
| |
Accrued trustees’ and officers’ fees and benefits | | | 48,448 | |
| |
Accrued other operating expenses | | | 77,795 | |
| |
Trustee deferred compensation and retirement plans | | | 74,809 | |
| |
Total liabilities | | | 50,565,988 | |
| |
Net assets applicable to shares outstanding | | $ | 676,670,608 | |
| |
| | | | |
Net assets consist of: | | | | |
Shares of beneficial interest | | $ | 871,574,559 | |
| |
Distributable earnings (loss) | | | (194,903,951 | ) |
| |
| | $ | 676,670,608 | |
| |
| |
Net Assets: | | | | |
Class A | | $ | 577,076,666 | |
| |
Class C | | $ | 15,519,729 | |
| |
Class Y | | $ | 84,065,403 | |
| |
Class R6 | | $ | 8,810 | |
| |
|
Shares outstanding, no par value, with an unlimited number of shares authorized: | |
Class A | | | 55,645,611 | |
| |
Class C | | | 1,495,865 | |
| |
Class Y | | | 8,095,487 | |
| |
Class R6 | | | 849 | |
| |
Class A:
Net asset value per share | | $ | 10.37 | |
| |
Maximum offering price per share (Net asset value of $10.37 ÷ 95.75%) | | $ | 10.83 | |
| |
Class C:
Net asset value and offering price per share | | $ | 10.38 | |
| |
Class Y:
Net asset value and offering price per share | | $ | 10.38 | |
| |
Class R6:
Net asset value and offering price per share | | $ | 10.38 | |
| |
See accompanying Notes to Financial Statements which are an integral part of the financial statements.
17 Invesco Rochester® AMT-Free New York Municipal Fund
Statement of Operations
For the year ended February 28, 2023
| | | | |
Investment income: | | | | |
Interest | | $ | 31,883,721 | |
| |
| |
Expenses: | | | | |
Advisory fees | | | 3,659,019 | |
| |
Administrative services fees | | | 104,641 | |
| |
Custodian fees | | | 8,788 | |
| |
Distribution fees: | | | | |
Class A | | | 1,465,545 | |
| |
Class C | | | 178,573 | |
| |
Interest, facilities and maintenance fees | | | 1,591,966 | |
| |
Transfer agent fees – A, C and Y | | | 413,175 | |
| |
Trustees’ and officers’ fees and benefits | | | 26,135 | |
| |
Registration and filing fees | | | 56,368 | |
| |
Reports to shareholders | | | 11,306 | |
| |
Professional services fees | | | 86,086 | |
| |
Other | | | 17,171 | |
| |
Total expenses | | | 7,618,773 | |
| |
Less: Expense offset arrangement(s) | | | (2,205 | ) |
| |
Net expenses | | | 7,616,568 | |
| |
Net investment income | | | 24,267,153 | |
| |
| |
Realized and unrealized gain (loss) from: | | | | |
Net realized gain (loss) from unaffiliated investment securities | | | (43,837,108 | ) |
| |
Change in net unrealized appreciation (depreciation) of unaffiliated investment securities | | | (51,028,501 | ) |
| |
Net realized and unrealized gain (loss) | | | (94,865,609 | ) |
| |
Net increase (decrease) in net assets resulting from operations | | $ | (70,598,456 | ) |
| |
See accompanying Notes to Financial Statements which are an integral part of the financial statements.
18 Invesco Rochester® AMT-Free New York Municipal Fund
Statement of Changes in Net Assets
For the years ended February 28, 2023 and 2022
| | | | | | | | |
| | | 2023 | | | 2022 | |
| |
Operations: | | | | | | | | |
Net investment income | | $ | 24,267,153 | | | $ | 22,170,982 | |
| |
Net realized gain (loss) | | | (43,837,108 | ) | | | 192,441 | |
| |
Change in net unrealized appreciation (depreciation) | | | (51,028,501 | ) | | | (13,946,009 | ) |
| |
Net increase (decrease) in net assets resulting from operations | | | (70,598,456 | ) | | | 8,417,414 | |
| |
| | |
Distributions to shareholders from distributable earnings: | | | | | | | | |
Class A | | | (20,752,114 | ) | | | (21,481,328 | ) |
| |
Class C | | | (458,904 | ) | | | (508,146 | ) |
| |
Class Y | | | (3,187,048 | ) | | | (2,992,711 | ) |
| |
Class R6 | | | (331 | ) | | | (317 | ) |
| |
Total distributions from distributable earnings | | | (24,398,397 | ) | | | (24,982,502 | ) |
| |
| | |
Share transactions–net: | | | | | | | | |
Class A | | | (69,508,036 | ) | | | (25,312,850 | ) |
| |
Class C | | | (3,865,628 | ) | | | (3,883,026 | ) |
| |
Class Y | | | (3,797,344 | ) | | | 15,209,324 | |
| |
Net increase (decrease) in net assets resulting from share transactions | | | (77,171,008 | ) | | | (13,986,552 | ) |
| |
Net increase (decrease) in net assets | | | (172,167,861 | ) | | | (30,551,640 | ) |
| |
| | |
Net assets: | | | | | | | | |
Beginning of year | | | 848,838,469 | | | | 879,390,109 | |
| |
End of year | | $ | 676,670,608 | | | $ | 848,838,469 | |
| |
See accompanying Notes to Financial Statements which are an integral part of the financial statements.
19 Invesco Rochester® AMT-Free New York Municipal Fund
Financial Highlights
The following schedule presents financial highlights for a share of the Fund outstanding throughout the periods indicated.
| | | | | | | | | | | | | | | | | | | | | | | | | | | | | | | | | | | | | | | | | | | | | | | | | | | | |
| | | Net asset
value,
beginning
of period | | | Net
investment income(a) | | | Net gains (losses)
on securities
(both
realized and
unrealized) | | | Total from investment
operations | | | Dividends
from net investment income | | | Net asset value, end
of period | | | Total return(b) | | | Net assets,
end of period
(000’s omitted) | | | Ratio of expenses to average net assets with fee waivers and/or expenses absorbed | | | Ratio of expenses to average net assets without fee waivers and/or expenses absorbed | | | Supplemental ratio of expenses to average net assets with
fee waivers (excluding interest, facilities and maintenance fees) | | | Ratio of net investment income to average net assets | | | Portfolio turnover (c) | |
Class A | | | | | | | | | | | | | | | | | | | | | | | | | | | | | | | | | | | | | | | | | | | | | | | | | | | | |
Year ended 02/28/23 | | | $11.71 | | | | $0.35 | | | | $(1.33 | ) | | | $(0.98 | ) | | | $(0.36 | ) | | | $10.37 | | | | (8.39 | )%(d) | | | $577,077 | | | | 1.06 | %(d) | | | 1.06 | %(d) | | | 0.84 | %(d) | | | 3.34 | %(d) | | | 44 | % |
Year ended 02/28/22 | | | 11.94 | | | | 0.30 | | | | (0.19 | ) | | | 0.11 | | | | (0.34 | ) | | | 11.71 | | | | 0.86 | (d) | | | 727,823 | | | | 0.88 | (d) | | | 0.88 | (d) | | | 0.81 | (d) | | | 2.48 | (d) | | | 10 | |
Year ended 02/28/21 | | | 12.41 | | | | 0.34 | | | | (0.45 | ) | | | (0.11 | ) | | | (0.36 | ) | | | 11.94 | | | | (0.81 | )(d) | | | 767,102 | | | | 0.95 | (d) | | | 0.97 | (d) | | | 0.83 | (d) | | | 2.89 | (d) | | | 15 | |
Five months ended 02/29/20 | | | 12.03 | | | | 0.15 | | | | 0.38 | | | | 0.53 | | | | (0.15 | ) | | | 12.41 | | | | 4.43 | | | | 827,596 | | | | 1.02 | (e) | | | 1.02 | (e) | | | 0.83 | (e) | | | 2.98 | (e) | | | 11 | |
Year ended 09/30/19 | | | 11.26 | | | | 0.45 | | | | 0.67 | | | | 1.12 | | | | (0.35 | ) | | | 12.03 | | | | 10.11 | | | | 807,767 | | | | 1.17 | | | | 1.17 | | | | 0.85 | | | | 3.86 | | | | 15 | |
Year ended 09/30/18 | | | 11.11 | | | | 0.39 | | | | 0.09 | | | | 0.48 | | | | (0.33 | ) | | | 11.26 | | | | 4.46 | | | | 739,216 | | | | 1.28 | | | | 1.28 | | | | 0.92 | | | | 3.58 | | | | 15 | |
Class C | | | | | | | | | | | | | | | | | | | | | | | | | | | | | | | | | | | | | | | | | | | | | | | | | | | | |
Year ended 02/28/23 | | | 11.72 | | | | 0.27 | | | | (1.34 | ) | | | (1.07 | ) | | | (0.27 | ) | | | 10.38 | | | | (9.08 | ) | | | 15,520 | | | | 1.82 | | | | 1.82 | | | | 1.60 | | | | 2.58 | | | | 44 | |
Year ended 02/28/22 | | | 11.95 | | | | 0.21 | | | | (0.19 | ) | | | 0.02 | | | | (0.25 | ) | | | 11.72 | | | | 0.09 | | | | 21,840 | | | | 1.64 | | | | 1.64 | | | | 1.57 | | | | 1.72 | | | | 10 | |
Year ended 02/28/21 | | | 12.42 | | | | 0.25 | | | | (0.45 | ) | | | (0.20 | ) | | | (0.27 | ) | | | 11.95 | | | | (1.54 | ) | | | 26,100 | | | | 1.71 | | | | 1.74 | | | | 1.59 | | | | 2.13 | | | | 15 | |
Five months ended 02/29/20 | | | 12.04 | | | | 0.11 | | | | 0.38 | | | | 0.49 | | | | (0.11 | ) | | | 12.42 | | | | 4.09 | | | | 50,011 | | | | 1.78 | (e) | | | 1.78 | (e) | | | 1.59 | (e) | | | 2.22 | (e) | | | 11 | |
Year ended 09/30/19 | | | 11.26 | | | | 0.36 | | | | 0.68 | | | | 1.04 | | | | (0.26 | ) | | | 12.04 | | | | 9.36 | | | | 51,593 | | | | 1.94 | | | | 1.94 | | | | 1.62 | | | | 3.09 | | | | 15 | |
Year ended 09/30/18 | | | 11.12 | | | | 0.31 | | | | 0.08 | | | | 0.39 | | | | (0.25 | ) | | | 11.26 | | | | 3.57 | | | | 84,896 | | | | 2.05 | | | | 2.05 | | | | 1.69 | | | | 2.81 | | | | 15 | |
Class Y | | | | | | | | | | | | | | | | | | | | | | | | | | | | | | | | | | | | | | | | | | | | | | | | | | | | |
Year ended 02/28/23 | | | 11.73 | | | | 0.38 | | | | (1.35 | ) | | | (0.97 | ) | | | (0.38 | ) | | | 10.38 | | | | (8.23 | ) | | | 84,065 | | | | 0.82 | | | | 0.82 | | | | 0.60 | | | | 3.58 | | | | 44 | |
Year ended 02/28/22 | | | 11.96 | | | | 0.33 | | | | (0.19 | ) | | | 0.14 | | | | (0.37 | ) | | | 11.73 | | | | 1.10 | | | | 99,166 | | | | 0.64 | | | | 0.64 | | | | 0.57 | | | | 2.72 | | | | 10 | |
Year ended 02/28/21 | | | 12.43 | | | | 0.37 | | | | (0.45 | ) | | | (0.08 | ) | | | (0.39 | ) | | | 11.96 | | | | (0.57 | ) | | | 86,177 | | | | 0.71 | | | | 0.73 | | | | 0.59 | | | | 3.13 | | | | 15 | |
Five months ended 02/29/20 | | | 12.05 | | | | 0.16 | | | | 0.38 | | | | 0.54 | | | | (0.16 | ) | | | 12.43 | | | | 4.52 | | | | 83,905 | | | | 0.78 | (e) | | | 0.78 | (e) | | | 0.59 | (e) | | | 3.22 | (e) | | | 11 | |
Year ended 09/30/19 | | | 11.27 | | | | 0.47 | | | | 0.68 | | | | 1.15 | | | | (0.37 | ) | | | 12.05 | | | | 10.45 | | | | 72,698 | | | | 0.93 | | | | 0.93 | | | | 0.61 | | | | 4.09 | | | | 15 | |
Year ended 09/30/18 | | | 11.13 | | | | 0.42 | | | | 0.08 | | | | 0.50 | | | | (0.36 | ) | | | 11.27 | | | | 4.61 | | | | 59,045 | | | | 1.05 | | | | 1.05 | | | | 0.69 | | | | 3.82 | | | | 15 | |
Class R6 | | | | | | | | | | | | | | | | | | | | | | | | | | | | | | | | | | | | | | | | | | | | | | | | | | | | |
Year ended 02/28/23 | | | 11.72 | | | | 0.39 | | | | (1.34 | ) | | | (0.95 | ) | | | (0.39 | ) | | | 10.38 | | | | (8.09 | ) | | | 9 | | | | 0.76 | | | | 0.76 | | | | 0.54 | | | | 3.64 | | | | 44 | |
Year ended 02/28/22 | | | 11.96 | | | | 0.33 | | | | (0.20 | ) | | | 0.13 | | | | (0.37 | ) | | | 11.72 | | | | 1.05 | | | | 10 | | | | 0.62 | | | | 0.62 | | | | 0.56 | | | | 2.74 | | | | 10 | |
Year ended 02/28/21 | | | 12.41 | | | | 0.38 | | | | (0.43 | ) | | | (0.05 | ) | | | (0.40 | ) | | | 11.96 | | | | (0.31 | ) | | | 10 | | | | 0.62 | | | | 0.72 | | | | 0.49 | | | | 3.22 | | | | 15 | |
Five months ended 02/29/20 | | | 12.03 | | | | 0.17 | | | | 0.38 | | | | 0.55 | | | | (0.17 | ) | | | 12.41 | | | | 4.56 | | | | 74 | | | | 0.68 | (e) | | | 0.78 | (e) | | | 0.59 | (e) | | | 3.32 | (e) | | | 11 | |
Period ended 09/30/19(f) | | | 11.78 | | | | 0.18 | | | | 0.20 | | | | 0.38 | | | | (0.13 | ) | | | 12.03 | | | | 3.25 | | | | 10 | | | | 0.81 | (e) | | | 0.87 | (e) | | | 0.55 | (e) | | | 4.20 | (e) | | | 15 | |
| (a) | Calculated using average shares outstanding. |
| (b) | Includes adjustments in accordance with accounting principles generally accepted in the United States of America and as such, the net asset value for financial reporting purposes and the returns based upon those net asset values may differ from the net asset value and returns for shareholder transactions. Does not include sales charges and is not annualized for periods less than one year, if applicable. |
| (c) | Portfolio turnover is calculated at the fund level and is not annualized for periods less than one year, if applicable. |
| (d) | The total return, ratio of expenses to average net assets and ratio of net investment income to average net assets reflect actual 12b-1 fees of 0.24% for Class A for the years ended February 28, 2023, 2022 and 2021, respectively. |
| (f) | Commencement date after the close of business on May 24, 2019. |
See accompanying Notes to Financial Statements which are an integral part of the financial statements.
20 Invesco Rochester® AMT-Free New York Municipal Fund
Notes to Financial Statements
February 28, 2023
NOTE 1–Significant Accounting Policies
Invesco Rochester® AMT-Free New York Municipal Fund (the “Fund”) is a series portfolio of AIM Tax-Exempt Funds (Invesco Tax-Exempt Funds) (the “Trust”). The Trust is a Delaware statutory trust registered under the Investment Company Act of 1940, as amended (the “1940 Act”), as an open-end series management investment company authorized to issue an unlimited number of shares of beneficial interest. Information presented in these financial statements pertains only to the Fund. Matters affecting the Fund or each class will be voted on exclusively by the shareholders of the Fund or each class.
The Fund’s investment objective is to seek tax-free income.
The Fund currently consists of four different classes of shares: Class A, Class C, Class Y and Class R6. Class Y shares are available only to certain investors. Class A shares are sold with a front-end sales charge unless certain waiver criteria are met. Under certain circumstances, load waived shares may be subject to contingent deferred sales charges (“CDSC”). Class C shares are sold with a CDSC. Class Y and Class R6 shares are sold at net asset value. Class C shares held for eight years after purchase are eligible for automatic conversion into Class A shares of the same Fund (the “Conversion Feature”). The automatic conversion pursuant to the Conversion Feature will generally occur at the end of the month following the eighth anniversary after a purchase of Class C shares.
The Fund is an investment company and accordingly follows the investment company accounting and reporting guidance in accordance with Financial Accounting Standards Board Accounting Standards Codification Topic 946, Financial Services - Investment Companies.
The following is a summary of the significant accounting policies followed by the Fund in the preparation of its financial statements.
| A. | Security Valuations - Securities, including restricted securities, are valued according to the following policy. |
Securities generally are valued on the basis of prices provided by independent pricing services. Prices provided by the pricing service may be determined without exclusive reliance on quoted prices, and may reflect appropriate factors such as institution-size trading in similar groups of securities, developments related to specific securities, dividend rate (for unlisted equities), yield (for debt obligations), quality, type of issue, coupon rate (for debt obligations), maturity (for debt obligations), individual trading characteristics and other market data. Pricing services generally value debt obligations assuming orderly transactions of institutional round lot size, but a fund may hold or transact in the same securities in smaller, odd lot sizes. Odd lots often trade at lower prices than institutional round lots, and their value may be adjusted accordingly. Debt obligations are subject to interest rate and credit risks. In addition, all debt obligations involve some risk of default with respect to interest and/or principal payments.
Securities for which market quotations are not readily available are fair valued by Invesco Advisers, Inc. (the “Adviser” or “Invesco”) in accordance with Board-approved policies and related Adviser procedures (“Valuation Procedures”). If a fair value price provided by a pricing service is not representative of market value in the Adviser’s judgment (“unreliable”), the Adviser will fair value the security using the Valuation Procedures. Some of the factors which may be considered in determining fair value are fundamental analytical data relating to the investment; the nature and duration of any restrictions on transferability or disposition; trading in similar securities by the same issuer or comparable companies; relevant political, economic or issuer specific news; and other relevant factors under the circumstances.
The Fund may invest in securities that are subject to interest rate risk, meaning the risk that the prices will generally fall as interest rates rise and, conversely, the prices will generally rise as interest rates fall. Specific securities differ in their sensitivity to changes in interest rates depending on their individual characteristics. Changes in interest rates may result in increased market volatility, which may affect the value and/or liquidity of certain Fund investments.
Valuations change in response to many factors including the historical and prospective earnings of the issuer, the value of the issuer’s assets, general market conditions which are not specifically related to the particular issuer, such as real or perceived adverse economic conditions, changes in the general outlook for revenues or corporate earnings, changes in interest or currency rates, regional or global instability, natural or environmental disasters, widespread disease or other public health issues, war, acts of terrorism, significant governmental actions or adverse investor sentiment generally and market liquidity. Because of the inherent uncertainties of valuation, the values reflected in the financial statements may materially differ from the value received upon actual sale of those investments.
The price the Fund could receive upon the sale of any investment may differ from the Adviser’s valuation of the investment, particularly for securities that are valued using a fair valuation technique. When fair valuation techniques are applied, the Adviser uses available information, including both observable and unobservable inputs and assumptions, to determine a methodology that will result in a valuation that the Adviser believes approximates market value. Fund securities that are fair valued may be subject to greater fluctuation in their value from one day to the next than would be the case if market quotations were used. Because of the inherent uncertainties of valuation, and the degree of subjectivity in such decisions, the Fund could realize a greater or lesser than expected gain or loss upon the sale of the investment.
| B. | Securities Transactions and Investment Income - Securities transactions are accounted for on a trade date basis. Realized gains or losses on sales are computed on the basis of specific identification of the securities sold. Interest income (net of withholding tax, if any) is recorded on an accrual basis from settlement date and includes coupon interest and amortization of premium and accretion of discount on debt securities as applicable. Pay-in-kind interest income and non-cash dividend income received in the form of securities in-lieu of cash are recorded at the fair value of the securities received. Dividend income (net of withholding tax, if any) is recorded on the ex-dividend date. |
The Fund may periodically participate in litigation related to Fund investments. As such, the Fund may receive proceeds from litigation settlements.Any proceeds received are included in the Statement of Operations as realized gain (loss) for investments no longer held and as unrealized gain (loss) for investments still held.
Brokerage commissions and mark ups are considered transaction costs and are recorded as an increase to the cost basis of securities purchased and/or a reduction of proceeds on a sale of securities. Such transaction costs are included in the determination of net realized and unrealized gain (loss) from investment securities reported in the Statement of Operations and the Statement of Changes in Net Assets and the net realized and unrealized gains (losses) on securities per share in the Financial Highlights. Transaction costs are included in the calculation of the Fund’s net asset value and, accordingly, they reduce the Fund’s total returns. These transaction costs are not considered operating expenses and are not reflected in net investment income reported in the Statement of Operations and the Statement of Changes in Net Assets, or the net investment income per share and the ratios of expenses and net investment income reported in the Financial Highlights, nor are they limited by any expense limitation arrangements between the Fund and the investment adviser.
The Fund allocates realized and unrealized capital gains and losses to a class based on the relative net assets of each class. The Fund allocates income to a class based on the relative value of the settled shares of each class.
| C. | Country Determination - For the purposes of making investment selection decisions and presentation in the Schedule of Investments, the investment adviser may determine the country in which an issuer is located and/or credit risk exposure based on various factors. These factors include the laws of the country under which the issuer is organized, where the issuer maintains a principal office, the country in which the issuer derives 50% or more of its total revenues, the country that has the primary market for the issuer’s securities and its “country of risk” as determined by a third party service provider, as well as other criteria. Among the other criteria that may be evaluated for making this determination are the country in which the issuer maintains 50% or more of its assets, the type of security, financial guarantees and enhancements, the nature of the collateral and the sponsor organization. Country of issuer and/or credit risk exposure has been determined to be the United States of America, unless otherwise noted. |
| D. | Distributions - Distributions from net investment income, if any, are declared daily and paid monthly. Distributions from net realized capital gain, if any, are |
21 Invesco Rochester® AMT-Free New York Municipal Fund
| | generally declared and paid annually and recorded on the ex-dividend date. The Fund may elect to treat a portion of the proceeds from redemptions as distributions for federal income tax purposes. |
| E. | Federal Income Taxes - The Fund intends to comply with the requirements of Subchapter M of the Internal Revenue Code of 1986, as amended (the “Internal Revenue Code”), necessary to qualify as a regulated investment company and to distribute substantially all of the Fund’s taxable and tax-exempt earnings to shareholders. As such, the Fund will not be subject to federal income taxes on otherwise taxable income (including net realized capital gain) that is distributed to shareholders. Therefore, no provision for federal income taxes is recorded in the financial statements. |
The Fund recognizes the tax benefits of uncertain tax positions only when the position is more likely than not to be sustained. Management has analyzed the Fund’s uncertain tax positions and concluded that no liability for unrecognized tax benefits should be recorded related to uncertain tax positions. Management is not aware of any tax positions for which it is reasonably possible that the total amounts of unrecognized tax benefits will change materially in the next 12 months.
In addition, the Fund intends to invest in such municipal securities to allow it to qualify to pay shareholders “exempt-interest dividends”, as defined in the Internal Revenue Code.
The Fund files tax returns in the U.S. Federal jurisdiction and certain other jurisdictions. Generally, the Fund is subject to examinations by such taxing authorities for up to three years after the filing of the return for the tax period.
| F. | Expenses - Fees provided for under the Rule 12b-1 plan of a particular class of the Fund are charged to the operations of such class. Transfer agency fees and expenses and other shareholder recordkeeping fees and expenses attributable to Class R6 are charged to such class. Transfer agency fees and expenses and other shareholder recordkeeping fees and expenses relating to all other classes are allocated among those classes based on relative net assets. All other expenses are allocated among the classes based on relative net assets. |
| G. | Interest, Facilities and Maintenance Fees - Interest, Facilities and Maintenance Fees include interest and related borrowing costs such as commitment fees, administrative expenses and other expenses associated with establishing and maintaining the line of credit. In addition, interest and administrative expenses related to establishing and maintaining floating rate note obligations, if any, are included. |
| H. | Accounting Estimates - The preparation of financial statements in conformity with accounting principles generally accepted in the United States of America (“GAAP”) requires management to make estimates and assumptions that affect the reported amounts of assets and liabilities at the date of the financial statements and the reported amounts of revenues and expenses during the reporting period including estimates and assumptions related to taxation. Actual results could differ from those estimates by a significant amount. In addition, the Fund monitors for material events or transactions that may occur or become known after the period-end date and before the date the financial statements are released to print. |
| I. | Indemnifications - Under the Trust’s organizational documents, each Trustee, officer, employee or other agent of the Trust is indemnified against certain liabilities that may arise out of the performance of their duties to the Fund. Additionally, in the normal course of business, the Fund enters into contracts, including the Fund’s servicing agreements, that contain a variety of indemnification clauses. The Fund’s maximum exposure under these arrangements is unknown as this would involve future claims that may be made against the Fund that have not yet occurred. The risk of material loss as a result of such indemnification claims is considered remote. |
| J. | Securities Purchased on a When-Issued and Delayed Delivery Basis - The Fund may purchase and sell interests in corporate loans and corporate debt securities and other portfolio securities on a when-issued and delayed delivery basis, with payment and delivery scheduled for a future date. No income accrues to the Fund on such interests or securities in connection with such transactions prior to the date the Fund actually takes delivery of such interests or securities. These transactions are subject to market fluctuations and are subject to the risk that the value at delivery may be more or less than the trade date purchase price. Although the Fund will generally purchase these securities with the intention of acquiring such securities, they may sell such securities prior to the settlement date. |
| K. | Floating Rate Note Obligations - The Fund invests in inverse floating rate securities, such as Tender Option Bonds (“TOBs”), for investment purposes and to enhance the yield of the Fund. Such securities may be purchased in the secondary market without first owning an underlying bond but generally are created through the sale of fixed rate bonds by the Fund to special purpose trusts established by a broker dealer or by the Fund (“TOB Trusts”) in exchange for cash and residual interests in the TOB Trusts’ assets and cash flows, which are in the form of inverse floating rate securities. The TOB Trusts finance the purchases of the fixed rate bonds by issuing floating rate notes to third parties and allowing the Fund to retain residual interests in the bonds. The floating rate notes issued by the TOB Trusts have interest rates that reset weekly and the floating rate note holders have the option to tender their notes to the TOB Trusts for redemption at par at each reset date. The residual interests held by the Fund (inverse floating rate securities) include the right of the Fund (1) to cause the holders of the floating rate notes to tender their notes at par at the next interest rate reset date, and (2) to transfer the municipal bond from the TOB Trust to the Fund, thereby collapsing the TOB Trust. Inverse floating rate securities tend to underperform the market for fixed rate bonds in a rising interest rate environment, but tend to outperform the market for fixed rate bonds when interest rates decline or remain relatively stable. |
The Fund generally invests in inverse floating rate securities that include embedded leverage, thus exposing the Fund to greater risks and increased costs. The primary risks associated with inverse floating rate securities are varying degrees of liquidity and decreases in the value of such securities in response to changes in interest rates to a greater extent than fixed rate securities having similar credit quality, redemption provisions and maturity, which may cause the Fund’s net asset value to be more volatile than if it had not invested in inverse floating rate securities. In certain instances, the short-term floating rate notes created by the TOB Trust may not be able to be sold to third parties or, in the case of holders tendering (or putting) such notes for repayment of principal, may not be able to be remarketed to third parties. In such cases, the TOB Trust holding the fixed rate bonds may be collapsed with the entity that contributed the fixed rate bonds to the TOB Trust. In the case where a TOB Trust is collapsed with the Fund, the Fund will be required to repay the principal amount of the tendered securities, which may require the Fund to sell other portfolio holdings to raise cash to meet that obligation. The Fund could therefore be required to sell other portfolio holdings at a disadvantageous time or price to raise cash to meet this obligation, which risk will be heightened during times of market volatility, illiquidity or uncertainty. The embedded leverage in the TOB Trust could cause the Fund to lose more money than the value of the asset it has contributed to the TOB Trust and greater levels of leverage create the potential for greater losses. In addition, a Fund may enter into reimbursement agreements with the liquidity provider of certain TOB transactions in connection with certain residuals held by the Fund. These agreements commit a Fund to reimburse the liquidity provider to the extent that the liquidity provider must provide cash to a TOB Trust, including following the termination of a TOB Trust resulting from a mandatory tender event (“liquidity shortfall”). The reimbursement agreement will effectively make the Fund liable for the amount of the negative difference, if any, between the liquidation value of the underlying security and the purchase price of the floating rate notes issued by the TOB Trust.
The Fund accounts for the transfer of fixed rate bonds to the TOB Trusts as secured borrowings, with the securities transferred remaining in the Fund’s investment assets, and the related floating rate notes reflected as Fund liabilities under the caption Floating rate note obligations on the Statement of Assets and Liabilities. The carrying amount of the Fund’s floating rate note obligations as reported on the Statement of Assets and Liabilities approximates its fair value. The Fund records the interest income from the fixed rate bonds under the caption Interest and records the expenses related to floating rate obligations and any administrative expenses of the TOB Trusts as a component of Interest, facilities and maintenance fees on the Statement of Operations.
Final rules implementing section 619 of the Dodd-Frank Wall Street Reform and Consumer Protection Act (the “Volcker Rule”) prohibit banking entities from engaging in proprietary trading of certain instruments and limit such entities’ investments in, and relationships with, “covered funds”, as defined in the rules. These rules preclude banking entities and their affiliates from sponsoring and/or providing services for existing TOB Trusts. A new TOB structure is being utilized by the Fund wherein the Fund, as holder of the residuals, will perform certain duties previously performed by banking entities as “sponsors” of TOB Trusts. These duties may be performed by a third-party service provider. The Fund’s expanded role under the new TOB structure may increase its operational and regulatory risk. The new structure is substantially similar to the previous structure; however, pursuant to the Volcker Rule, the remarketing agent would not be able to repurchase
22 Invesco Rochester® AMT-Free New York Municipal Fund
tendered floaters for its own account upon a failed remarketing. In the event of a failed remarketing, a banking entity serving as liquidity provider may loan the necessary funds to the TOB Trust to purchase the tendered floaters. The TOB Trust, not the Fund, would be the borrower and the loan from the liquidity provider will be secured by the purchased floaters now held by the TOB Trust. However, as previously described, the Fund would bear the risk of loss with respect to any liquidity shortfall to the extent it entered into a reimbursement agreement with the liquidity provider.
Further, the SEC and various banking agencies have adopted rules implementing credit risk retention requirements for asset-backed securities (the “Risk Retention Rules”). The Risk Retention Rules require the sponsor of a TOB Trust to retain at least 5% of the credit risk of the underlying assets supporting the TOB Trust’s municipal bonds. The Fund has adopted policies intended to comply with the Risk Retention Rules. The Risk Retention Rules may adversely affect the Fund’s ability to engage in TOB Trust transactions or increase the costs of such transactions in certain circumstances.
There can be no assurances that the new TOB structure will continue to be a viable form of leverage. Further, there can be no assurances that alternative forms of leverage will be available to the Fund in order to maintain current levels of leverage. Any alternative forms of leverage may be less advantageous to the Fund, and may adversely affect the Fund’s net asset value, distribution rate and ability to achieve its investment objective.
TOBs are presently classified as private placement securities. Private placement securities are subject to restrictions on resale because they have not been registered under the Securities Act of 1933, as amended (the “1933 Act”), or are otherwise not readily marketable. As a result of the absence of a public trading market for these securities, they may be less liquid than publicly traded securities. Although atypical, these securities may be resold in privately negotiated transactions, the prices realized from these sales could be less than those originally paid by the Fund or less than what may be considered the fair value of such securities.
| L. | Other Risks - The municipal issuers in which the Fund invests may be located in the same geographic area or may pay their interest obligations from revenue of similar projects, such as hospitals, airports, utility systems and housing finance agencies. This may make the Fund’s investments more susceptible to similar social, economic, political or regulatory occurrences, making the Fund more susceptible to experience a drop in its share price than if the Fund had been more diversified across issuers that did not have similar characteristics. |
There is a possibility that the credit rating of a municipal security may be downgraded after purchase, which may occur quickly and without advanced warning following sudden market downturns or unexpected developments involving an issuer, and which may adversely affect the liquidity and value of the security.
| M. | COVID-19 Risk - The COVID-19 strain of coronavirus has resulted in instances of market closures and dislocations, extreme volatility, liquidity constraints and increased trading costs. Efforts to contain its spread have resulted in travel restrictions, disruptions of healthcare systems, business operations (including business closures) and supply chains, layoffs, lower consumer demand and employee availability, and defaults and credit downgrades, among other significant economic impacts that have disrupted global economic activity across many industries. Such economic impacts may exacerbate other pre-existing political, social and economic risks locally or globally and cause general concern and uncertainty. The full economic impact and ongoing effects of COVID-19 (or other future epidemics or pandemics) at the macro-level and on individual businesses are unpredictable and may result in significant and prolonged effects on the Fund’s performance. |
NOTE 2–Advisory Fees and Other Fees Paid to Affiliates
The Trust has entered into a master investment advisory agreement with the Adviser. Under the terms of the investment advisory agreement, the Fund accrues daily and pays monthly an advisory fee to the Adviser based on the annual rate of the Fund’s average daily net assets as follows:
| | |
| Average Daily Net Assets | | Rate* |
|
First $ 200 million | | 0.600% |
|
Next $100 million | | 0.550% |
|
Next $200 million | | 0.500% |
|
Next $250 million | | 0.450% |
|
Next $250 million | | 0.400% |
|
Next $4 billion | | 0.350% |
|
Over $5 billion | | 0.330% |
|
| * | The advisory fee paid by the Fund shall be reduced by any amounts paid by the Fund under the administrative services agreement with the Adviser. |
For the year ended February 28, 2023, the effective advisory fee rate incurred by the Fund was 0.50%.
Under the terms of a master sub-advisory agreement between the Adviser and each of Invesco Asset Management Deutschland GmbH, Invesco Asset Management Limited, Invesco Asset Management (Japan) Limited, Invesco Hong Kong Limited, Invesco Senior Secured Management, Inc. and Invesco Canada Ltd. and separate sub-advisory agreements with Invesco Capital Management LLC and Invesco Asset Management (India) Private Limited (collectively, the “Affiliated Sub-Advisers”) the Adviser, not the Fund, will pay 40% of the fees paid to the Adviser to any such Affiliated Sub-Adviser(s) that provide(s) discretionary investment management services to the Fund based on the percentage of assets allocated to such Affiliated Sub-Adviser(s). Invesco has also entered into a sub-advisory agreement with OppenheimerFunds, Inc. to provide discretionary management services to the Fund.
The Adviser has contractually agreed, through at least June 30, 2023, the Adviser has contractually agreed to waive advisory fees and/or reimburse expenses of all shares to the extent necessary to limit total annual fund operating expenses after fee waiver and/or expense reimbursement (excluding certain items discussed below) of Class A, Class C, Class Y and Class R6 shares to 1.50%, 2.25%, 1.25% and 1.25%, respectively, of the Fund’s average daily net assets (the “expense limits”). In determining the Adviser’s obligation to waive advisory fees and/or reimburse expenses, the following expenses are not taken into account, and could cause the total annual fund operating expenses after fee waiver and/or expense reimbursement to exceed the numbers reflected above: (1) interest, facilities and maintenance fees; (2) taxes; (3) dividend expense on short sales; (4) extraordinary or non-routine items, including litigation expenses; and (5) expenses that the Fund has incurred but did not actually pay because of an expense offset arrangement. Unless Invesco continues the fee waiver agreement, it will terminate on June 30, 2023. During its term, the fee waiver agreement cannot be terminated or amended to increase the expense limits or reduce the advisory fee waiver without approval of the Board of Trustees. The Adviser did not waive fees and/or reimburse expenses during the period under these expense limits.
The Trust has entered into a master administrative services agreement with Invesco pursuant to which the Fund has agreed to pay Invesco for certain administrative costs incurred in providing accounting services to the Fund. For the year ended February 28, 2023, expenses incurred under the agreement are shown in the Statement of Operations as Administrative services fees. Invesco has entered into a sub-administration agreement whereby State Street Bank and Trust Company (“SSB”) serves as fund accountant and provides certain administrative services to the Fund. Pursuant to a custody agreement with the Trust on behalf of the Fund, SSB also serves as the Fund’s custodian.
The Trust has entered into a transfer agency and service agreement with Invesco Investment Services, Inc. (“IIS”) pursuant to which the Fund has agreed to pay IIS a fee for providing transfer agency and shareholder services to the Fund and reimburse IIS for certain expenses incurred by IIS in the course of providing such services. IIS may make payments to intermediaries that provide omnibus account services, sub-accounting services and/or networking services. All fees payable by IIS to intermediaries that provide omnibus account services or sub-accounting services are charged back to the Fund, subject to certain limitations approved by the Trust’s Board of Trustees. For the year ended February 28, 2023, expenses incurred under the agreement are shown in the Statement of Operations as Transfer agent fees.
23 Invesco Rochester® AMT-Free New York Municipal Fund
The Trust has entered into master distribution agreements with Invesco Distributors, Inc. (“IDI”) to serve as the distributor for the Class A, Class C, Class Y and Class R6 shares of the Fund. The Trust has adopted plans pursuant to Rule 12b-1 under the 1940 Act with respect to the Fund’s Class A and Class C shares (collectively, the “Plans”). The Fund, pursuant to the Class A Plan, reimburses IDI for its allocated share of expenses incurred for the period, up to a maximum annual rate of 0.25% of the average daily net assets of Class A shares. The Fund pursuant to the Class C Plan, pays IDI compensation at the annual rate of 1.00% of the average daily net assets of Class C shares. The fees are accrued daily and paid monthly. Of the Plan payments, up to 0.25% of the average daily net assets of each class of shares may be paid to furnish continuing personal shareholder services to customers who purchase and own shares of such classes. Any amounts not paid as a service fee under the Plans would constitute an asset-based sales charge. Rules of the Financial Industry Regulatory Authority (“FINRA”) impose a cap on the total sales charges, including asset-based sales charges, that may be paid by any class of shares of the Fund. For the year ended February 28, 2023, expenses incurred under the Plans are shown in the Statement of Operations as Distribution fees.
Front-end sales commissions and CDSC (collectively, the “sales charges”) are not recorded as expenses of the Fund. Front-end sales commissions are deducted from proceeds from the sales of Fund shares prior to investment in Class A shares of the Fund. CDSC are deducted from redemption proceeds prior to remittance to the shareholder. During the year ended February 28, 2023, IDI advised the Fund that IDI retained $9,732 in front-end sales commissions from the sale of Class A shares and $16,575 and $905 from Class A and Class C shares, respectively, for CDSC imposed upon redemptions by shareholders.
Certain officers and trustees of the Trust are officers and directors of the Adviser, IIS and/or IDI.
NOTE 3–Additional Valuation Information
GAAP defines fair value as the price that would be received to sell an asset or paid to transfer a liability in an orderly transaction between market participants at the measurement date, under current market conditions. GAAP establishes a hierarchy that prioritizes the inputs to valuation methods, giving the highest priority to readily available unadjusted quoted prices in an active market for identical assets (Level 1) and the lowest priority to significant unobservable inputs (Level 3), generally when market prices are not readily available. Based on the valuation inputs, the securities or other investments are tiered into one of three levels. Changes in valuation methods may result in transfers in or out of an investment’s assigned level:
| | | | |
| | Level 1 - | | Prices are determined using quoted prices in an active market for identical assets. |
| | Level 2 - | | Prices are determined using other significant observable inputs. Observable inputs are inputs that other market participants may use in pricing a security. These may include quoted prices for similar securities, interest rates, prepayment speeds, credit risk, yield curves, loss severities, default rates, discount rates, volatilities and others. |
| | Level 3 - | | Prices are determined using significant unobservable inputs. In situations where quoted prices or observable inputs are unavailable (for example, when there is little or no market activity for an investment at the end of the period), unobservable inputs may be used. Unobservable inputs reflect the Adviser’s assumptions about the factors market participants would use in determining fair value of the securities or instruments and would be based on the best available information. |
The following is a summary of the tiered valuation input levels, as of February 28, 2023. The level assigned to the securities valuations may not be an indication of the risk or liquidity associated with investing in those securities. Because of the inherent uncertainties of valuation, the values reflected in the financial statements may materially differ from the value received upon actual sale of those investments.
| | | | | | | | | | | | | | | | |
| | | Level 1 | | Level 2 | | Level 3 | | Total | |
| |
Investments in Securities | |
Municipal Obligations | | | $– | | | | $717,319,084 | | | | $ – | | | | $717,319,084 | |
| |
Common Stocks & Other Equity Interests | | | – | | | | – | | | | 155,000 | | | | 155,000 | |
| |
Total Investments | | | $– | | | | $717,319,084 | | | | $155,000 | | | | $717,474,084 | |
| |
NOTE 4–Security Transactions with Affiliated Funds
The Fund is permitted to purchase securities from or sell securities to certain other affiliated funds under specified conditions outlined in procedures adopted by the Board of Trustees of the Trust. The procedures have been designed to ensure that any purchase or sale of securities by the Fund from or to another fund that is or could be considered an “affiliated person” by virtue of having a common investment adviser (or affiliated investment advisers), common Trustees and/or common officers is made in reliance on Rule 17a-7 of the 1940 Act and, to the extent applicable, related SEC staff positions. Each such transaction is effected at the security’s “current market price”, as provided for in these procedures and Rule 17a-7. Pursuant to these procedures, for the year ended February 28, 2023, the Fund engaged in securities purchases of $1,220,166.
NOTE 5–Expense Offset Arrangement(s)
The expense offset arrangement is comprised of transfer agency credits which result from balances in demand deposit accounts used by the transfer agent for clearing shareholder transactions. For the year ended February 28, 2023, the Fund received credits from this arrangement, which resulted in the reduction of the Fund’s total expenses of $2,205.
NOTE 6–Trustees’ and Officers’ Fees and Benefits
Trustees’ and Officers’ Fees and Benefits include amounts accrued by the Fund to pay remuneration to certain Trustees and Officers of the Fund. Trustees have the option to defer compensation payable by the Fund, and Trustees’ and Officers’ Fees and Benefits also include amounts accrued by the Fund to fund such deferred compensation amounts. Those Trustees who defer compensation have the option to select various Invesco Funds in which their deferral accounts shall be deemed to be invested. Finally, certain current Trustees were eligible to participate in a retirement plan that provided for benefits to be paid upon retirement to Trustees over a period of time based on the number of years of service. The Fund may have certain former Trustees who also participate in a retirement plan and receive benefits under such plan. Trustees’ and Officers’ Fees and Benefits include amounts accrued by the Fund to fund such retirement benefits. Obligations under the deferred compensation and retirement plans represent unsecured claims against the general assets of the Fund.
NOTE 7–Cash Balances and Borrowings
The Fund has entered into a revolving credit and security agreement, which enables the Fund to participate with certain other Invesco Funds in a committed secured borrowing facility that permits borrowings up to $2.5 billion, collectively by certain Invesco Funds, and which will expire on February 22, 2024. The revolving credit and security agreement is secured by the assets of the Fund. The Fund is subject to certain covenants relating to the revolving credit and security agreement. Failure to comply with these restrictions could cause the acceleration of the repayment of the amount outstanding under the revolving credit and security agreement.
24 Invesco Rochester® AMT-Free New York Municipal Fund
During the year ended February 28, 2023, the average daily balance of borrowing under the revolving credit and security agreement was $12,519,726 with an average interest rate of 2.62%. The carrying amount of the Fund’s payable for borrowings as reported on the Statement of Assets and Liabilities approximates its fair value. Expenses under the revolving credit and security agreement are shown in the Statement of Operations as Interest, facilities and maintenance fees.
Additionally, the Fund is permitted to temporarily carry a negative or overdrawn balance in its account with SSB, the custodian bank. Such balances, if any at period-end, are shown in the Statement of Assets and Liabilities under the payable caption Amount due custodian. To compensate the custodian bank for such overdrafts, the overdrawn Fund may either (1) leave funds as a compensating balance in the account so the custodian bank can be compensated by earning the additional interest; or (2) compensate by paying the custodian bank at a rate agreed upon by the custodian bank and Invesco, not to exceed the contractually agreed upon rate. The Fund may not purchase additional securities when any borrowings from banks or broker-dealers exceed 5% of the Fund’s total assets, or when any borrowings from an Invesco Fund are outstanding.
Inverse floating rate obligations resulting from the transfer of bonds to TOB Trusts are accounted for as secured borrowings. The average floating rate notes outstanding and average annual interest and fee rate related to inverse floating rate note obligations during the year ended February 28, 2023 were $32,804,615 and 2.47%, respectively.
NOTE 8–Distributions to Shareholders and Tax Components of Net Assets
Tax Character of Distributions to Shareholders Paid During the Fiscal Years Ended February 28, 2023 and 2022:
| | | | | | | | |
| | | 2023 | | | 2022 | |
Ordinary income* | | $ | 1,817,581 | | | $ | 419,991 | |
Ordinary income-tax-exempt | | | 22,580,816 | | | | 24,562,511 | |
Total distributions | | $ | 24,398,397 | | | $ | 24,982,502 | |
| * | Includes short-term capital gain distributions, if any. |
Tax Components of Net Assets at Period-End:
| | | | |
| | | 2023 | |
| |
Undistributed tax-exempt income | | $ | 17,371,107 | |
| |
Net unrealized appreciation (depreciation) – investments | | | (57,149,110 | ) |
| |
Temporary book/tax differences | | | (118,830 | ) |
| |
Capital loss carryforward | | | (155,007,118 | ) |
| |
Shares of beneficial interest | | | 871,574,559 | |
| |
Total net assets | | $ | 676,670,608 | |
| |
The difference between book-basis and tax-basis unrealized appreciation (depreciation) is due to differences in the timing of recognition of gains and losses on investments for tax and book purposes. The Fund’s net unrealized appreciation (depreciation) difference is attributable primarily to wash sales, amortization and accretion on debt securities, defaulted bonds, inverse floaters and grantor trusts.
The temporary book/tax differences are a result of timing differences between book and tax recognition of income and/or expenses. The Fund’s temporary book/tax differences are the result of the trustee deferral of compensation and retirement plan benefits.
Capital loss carryforward is calculated and reported as of a specific date. Results of transactions and other activity after that date may affect the amount of capital loss carryforward actually available for the Fund to utilize. The ability to utilize capital loss carryforward in the future may be limited under the Internal Revenue Code and related regulations based on the results of future transactions.
The Fund has a capital loss carryforward as of February 28, 2023, as follows:
| | | | | | | | | | | | | | |
| | | Capital Loss Carryforward* | | | | | | | | | |
| |
| Expiration | | | | Short-Term | | | Long-Term | | | Total | |
| |
Not subject to expiration | | | | $ | 40,292,019 | | | $ | 114,715,099 | | | $ | 155,007,118 | |
| |
| * | Capital loss carryforward is reduced for limitations, if any, to the extent required by the Internal Revenue Code and may be further limited depending upon a variety of factors, including the realization of net unrealized gains or losses as of the date of any reorganization. |
NOTE 9–Investment Transactions
The aggregate amount of investment securities (other than short-term securities, U.S. Government obligations and money market funds, if any) purchased and sold by the Fund during the year ended February 28, 2023 was $333,499,003 and $380,501,598, respectively. Cost of investments, including any derivatives, on a tax basis includes the adjustments for financial reporting purposes as of the most recently completed federal income tax reporting period-end.
| | | | |
| Unrealized Appreciation (Depreciation) of Investments on a Tax Basis | |
| |
Aggregate unrealized appreciation of investments | | $ | 3,773,841 | |
| |
Aggregate unrealized (depreciation) of investments | | | (60,922,951 | ) |
| |
Net unrealized appreciation (depreciation) of investments | | $ | (57,149,110 | ) |
| |
Cost of investments for tax purposes is $774,623,194.
NOTE 10–Reclassification of Permanent Differences
Primarily as a result of differing book/tax treatment of market discounts, defaulted bonds and dirt bonds, on February 28, 2023, undistributed net investment income was increased by $7,299,469, undistributed net realized gain (loss) was decreased by $7,108,576 and shares of beneficial interest was decreased by $190,893. This reclassification had no effect on the net assets of the Fund.
25 Invesco Rochester® AMT-Free New York Municipal Fund
NOTE 11–Share Information
| | | | | | | | | | | | | | | | |
| | | Summary of Share Activity | |
| |
| | | Year ended
February 28, 2023(a) | | | Year ended
February 28, 2022 | |
| | | Shares | | | Amount | | | Shares | | | Amount | |
| |
Sold: | | | | | | | | | | | | | | | | |
Class A | | | 4,655,618 | | | $ | 48,234,018 | | | | 2,249,524 | | | | $27,442,084 | |
| |
Class C | | | 201,702 | | | | 2,106,982 | | | | 257,799 | | | | 3,156,763 | |
| |
Class Y | | | 6,010,382 | | | | 62,692,575 | | | | 2,234,458 | | | | 27,166,393 | |
| |
| | | | |
Issued as reinvestment of dividends: | | | | | | | | | | | | | | | | |
Class A | | | 1,153,817 | | | | 12,121,541 | | | | 1,033,123 | | | | 12,550,837 | |
| |
Class C | | | 30,824 | | | | 324,031 | | | | 29,982 | | | | 364,465 | |
| |
Class Y | | | 162,968 | | | | 1,718,946 | | | | 149,767 | | | | 1,821,576 | |
| |
| | | | |
Automatic conversion of Class C shares to Class A shares: | | | | | | | | | | | | | | | | |
Class A | | | 242,260 | | | | 2,540,646 | | | | 346,576 | | | | 4,219,938 | |
| |
Class C | | | (242,179 | ) | | | (2,540,646 | ) | | | (346,452 | ) | | | (4,219,938 | ) |
| |
| | | | |
Reacquired: | | | | | | | | | | | | | | | | |
Class A | | | (12,542,723 | ) | | | (132,404,241 | ) | | | (5,720,318 | ) | | | (69,525,709 | ) |
| |
Class C | | | (358,336 | ) | | | (3,755,995 | ) | | | (261,973 | ) | | | (3,184,316 | ) |
| |
Class Y | | | (6,532,031 | ) | | | (68,208,865 | ) | | | (1,135,216 | ) | | | (13,778,645 | ) |
| |
Net increase (decrease) in share activity | | | (7,217,698 | ) | | $ | (77,171,008 | ) | | | (1,162,730 | ) | | $ | (13,986,552 | ) |
| |
| (a) | There are entities that are record owners of more than 5% of the outstanding shares of the Fund and in the aggregate own 53% of the outstanding shares of the Fund. IDI has an agreement with these entities to sell Fund shares. The Fund, Invesco and/or Invesco affiliates may make payments to these entities, which are considered to be related to the Fund, for providing services to the Fund, Invesco and/or Invesco affiliates including but not limited to services such as securities brokerage, distribution, third party record keeping and account servicing. The Fund has no knowledge as to whether all or any portion of the shares owned of record by these entities are also owned beneficially. |
26 Invesco Rochester® AMT-Free New York Municipal Fund
Report of Independent Registered Public Accounting Firm
To the Board of Trustees of AIM Tax-Exempt Funds (Invesco Tax-Exempt Funds) and Shareholders of Invesco Rochester® AMT-Free New York Municipal Fund
Opinion on the Financial Statements
We have audited the accompanying statement of assets and liabilities, including the schedule of investments, of Invesco Rochester® AMT-Free New York Municipal Fund (one of the funds constituting AIM Tax-Exempt Funds (Invesco Tax-Exempt Funds), referred to hereafter as the “Fund”) as of February 28, 2023, the related statement of operations for the year ended February 28, 2023, the statement of changes in net assets for each of the two years in the period ended February 28, 2023, including the related notes, and the financial highlights for each of the periods indicated in the table below (collectively referred to as the “financial statements”). In our opinion, the financial statements present fairly, in all material respects, the financial position of the Fund as of February 28, 2023, the results of its operations for the year then ended, the changes in its net assets for each of the two years in the period ended February 28, 2023 and the financial highlights for each of the periods indicated in the table below, in conformity with accounting principles generally accepted in the United States of America.
|
| |
| Financial Highlights |
| |
| For each of the three years in the period ended February 28, 2023, the five months ended February 29, 2020 and the year ended September 30, 2019 for Class A, Class C and Class Y. |
| |
| For each of the three years in the period ended February 28, 2023, the five months ended February 29, 2020 and the period May 24, 2019 (commencement date) through September 30, 2019 for Class R6. |
The financial statements of Oppenheimer Rochester® AMT-Free New York Municipal Fund (subsequently renamed Invesco Rochester® AMT-Free New York Municipal Fund) as of and for the year ended September 30, 2018 and the financial highlights for the year ended September 30, 2018 (not presented herein, other than the financial highlights) were audited by other auditors whose report dated November 21, 2018 expressed an unqualified opinion on those financial statements and financial highlights.
Basis for Opinion
These financial statements are the responsibility of the Fund’s management. Our responsibility is to express an opinion on the Fund’s financial statements based on our audits. We are a public accounting firm registered with the Public Company Accounting Oversight Board (United States) (PCAOB) and are required to be independent with respect to the Fund in accordance with the U.S. federal securities laws and the applicable rules and regulations of the Securities and Exchange Commission and the PCAOB.
We conducted our audits of these financial statements in accordance with the standards of the PCAOB. Those standards require that we plan and perform the audit to obtain reasonable assurance about whether the financial statements are free of material misstatement, whether due to error or fraud.
Our audits included performing procedures to assess the risks of material misstatement of the financial statements, whether due to error or fraud, and performing procedures that respond to those risks. Such procedures included examining, on a test basis, evidence regarding the amounts and disclosures in the financial statements. Our audits also included evaluating the accounting principles used and significant estimates made by management, as well as evaluating the overall presentation of the financial statements. Our procedures included confirmation of securities owned as of February 28, 2023 by correspondence with the custodian and broker. We believe that our audits provide a reasonable basis for our opinion.
/s/ PricewaterhouseCoopers LLP
Houston, Texas
April 21, 2023
We have served as the auditor of one or more of the investment companies in the Invesco group of investment companies since at least 1995. We have not been able to determine the specific year we began serving as auditor.
27 Invesco Rochester® AMT-Free New York Municipal Fund
Calculating your ongoing Fund expenses
Example
As a shareholder of the Fund, you incur two types of costs: (1) transaction costs, which may include sales charges (loads) on purchase payments or contingent deferred sales charges on redemptions, if any; and (2) ongoing costs, including management fees, distribution and/or service (12b-1) fees, and other Fund expenses. This example is intended to help you understand your ongoing costs (in dollars) of investing in the Fund and to compare these costs with ongoing costs of investing in other mutual funds. The example is based on an investment of $1,000 invested at the beginning of the period and held for the entire period September 1, 2022 through February 28, 2023.
Actual expenses
The table below provides information about actual account values and actual expenses. You may use the information in this table, together with the amount you invested, to estimate the expenses that you paid over the period. Simply divide your account value by $1,000 (for example, an $8,600 account value divided by $1,000 = 8.6), then multiply the result by the number in the table under the heading entitled “Actual Expenses Paid During Period” to estimate the expenses you paid on your account during this period.
Hypothetical example for comparison purposes
The table below also provides information about hypothetical account values and hypothetical expenses based on the Fund’s actual expense ratio and an assumed rate of return of 5% per year before expenses, which is not the Fund’s actual return.
The hypothetical account values and expenses may not be used to estimate the actual ending account balance or expenses you paid for the period. You may use this information to compare the ongoing costs of investing in the Fund and other funds. To do so, compare this 5% hypothetical example with the 5% hypothetical examples that appear in the shareholder reports of the other funds.
Please note that the expenses shown in the table are meant to highlight your ongoing costs only and do not reflect any transaction costs, such as sales charges (loads) on purchase payments or contingent deferred sales charges on redemptions, if any. Therefore, the hypothetical information is useful in comparing ongoing costs only, and will not help you determine the relative total costs of owning different funds. In addition, if these transaction costs were included, your costs would have been higher.
| | | | | | | | | | | | |
| | | Beginning
Account Value
(09/01/22) | | ACTUAL | | HYPOTHETICAL (5% annual return before expenses) | | Annualized
Expense Ratio |
| | Ending
Account Value
(02/28/23)1 | | Expenses
Paid During
Period2 | | Ending
Account Value
(02/28/23) | | Expenses
Paid During
Period2 |
Class A | | $1,000.00 | | $999.30 | | $5.80 | | $1,018.99 | | $5.86 | | 1.17% |
Class C | | 1,000.00 | | 995.50 | | 9.60 | | 1,015.17 | | 9.69 | | 1.94 |
Class Y | | 1,000.00 | | 1,000.50 | | 4.61 | | 1,020.18 | | 4.66 | | 0.93 |
Class R6 | | 1,000.00 | | 1,000.90 | | 4.32 | | 1,020.48 | | 4.36 | | 0.87 |
| 1 | The actual ending account value is based on the actual total return of the Fund for the period September 1, 2022 through February 28, 2023, after actual expenses and will differ from the hypothetical ending account value which is based on the Fund’s expense ratio and a hypothetical annual return of 5% before expenses. |
| 2 | Expenses are equal to the Fund’s annualized expense ratio as indicated above multiplied by the average account value over the period, multiplied by 181/365 to reflect the most recent fiscal half year. |
28 Invesco Rochester® AMT-Free New York Municipal Fund
Tax Information
Form 1099-DIV, Form 1042-S and other year–end tax information provide shareholders with actual calendar year amounts that should be included in their tax returns. Shareholders should consult their tax advisers.
The following distribution information is being provided as required by the Internal Revenue Code or to meet a specific state’s requirement.
The Fund designates the following amounts or, if subsequently determined to be different, the maximum amount allowable for its fiscal year ended February 28, 2023:
| | | | |
Federal and State Income Tax | | | |
Qualified Dividend Income* | | | 0.00 | % |
Corporate Dividends Received Deduction* | | | 0.00 | % |
U.S. Treasury Obligations* | | | 0.00 | % |
Qualified Business Income* | | | 0.00 | % |
Business Interest Income* | | | 0.00 | % |
Tax-Exempt Interest Dividends* | | | 92.55 | % |
|
* The above percentages are based on ordinary income dividends paid to shareholders during the Fund’s fiscal year. | |
29 Invesco Rochester® AMT-Free New York Municipal Fund
Trustees and Officers
The address of each trustee and officer is AIM Tax-Exempt Funds (Invesco Tax-Exempt Funds) (the “Trust”), 11 Greenway Plaza, Suite 1000, Houston, Texas 77046-1173. The trustees serve for the life of the Trust, subject to their earlier death, incapacitation, resignation, retirement or removal as more specifically provided in the Trust’s organizational documents. Each officer serves for a one year term or until their successors are elected and qualified. Column two below includes length of time served with predecessor entities, if any.
| | | | | | | | |
Name, Year of Birth and Position(s) Held with the Trust | | Trustee and/or Officer Since | | Principal Occupation(s) During Past 5 Years | | Number of Funds in Fund Complex Overseen by Trustee | | Other Directorship(s) Held by Trustee During Past 5 Years |
| Interested Trustee | | | | | | | | |
Martin L. Flanagan1 – 1960 Trustee and Vice Chair | | 2007 | | Executive Director, Chief Executive Officer and President, Invesco Ltd. (ultimate parent of Invesco and a global investment management firm); Trustee and Vice Chair, The Invesco Funds; Vice Chair, Investment Company Institute; and Member of Executive Board, SMU Cox School of Business Formerly: Advisor to the Board, Invesco Advisers, Inc. (formerly known as Invesco Institutional (N.A.), Inc.); Chairman and Chief Executive Officer, Invesco Advisers, Inc. (registered investment adviser); Director, Chairman, Chief Executive Officer and President, Invesco Holding Company (US), Inc. (formerly IVZ Inc.) (holding company), Invesco Group Services, Inc. (service provider) and Invesco North American Holdings, Inc. (holding company); Director, Chief Executive Officer and President, Invesco Holding Company Limited (parent of Invesco and a global investment management firm); Director, Invesco Ltd.; Chairman, Investment Company Institute and President, Co-Chief Executive Officer, Co-President, Chief Operating Officer and Chief Financial Officer, Franklin Resources, Inc. (global investment management organization) | | 175 | | None |
1 Mr. Flanagan is considered an interested person (within the meaning of Section 2(a)(19) of the 1940 Act) of the Trust because he is an officer of the Adviser to the Trust, and an officer and a director of Invesco Ltd., ultimate parent of the Adviser. |
T-1 Invesco Rochester® AMT-Free New York Municipal Fund
Trustees and Officers–(continued)
| | | | | | | | |
Name, Year of Birth and Position(s) Held with the Trust | | Trustee and/or Officer Since | | Principal Occupation(s) During Past 5 Years | | Number of
Funds in
Fund Complex
Overseen by
Trustee | | Other Directorship(s) Held by Trustee During Past 5 Years |
Independent Trustees | | | | | | | | |
| Beth Ann Brown – 1968 Trustee (2019) and Chair (August 2022) | | 2019 | | Independent Consultant Formerly: Head of Intermediary Distribution, Managing Director, Strategic Relations, Managing Director, Head of National Accounts, Senior Vice President, National Account Manager and Senior Vice President, Key Account Manager, Columbia Management Investment Advisers LLC; Vice President, Key Account Manager, Liberty Funds Distributor, Inc.; and Trustee of certain Oppenheimer Funds | | 175 | | Director, Board of Directors of Caron Engineering Inc.; Advisor, Board of Advisors of Caron Engineering Inc.; President and Director, Acton Shapleigh Youth Conservation Corps (non-profit) Formerly: President and Director Director of Grahamtastic Connection (non-profit) |
| Cynthia Hostetler – 1962 Trustee | | 2017 | | Non-Executive Director and Trustee of a number of public and private business corporations Formerly: Director, Aberdeen Investment Funds (4 portfolios); Director, Artio Global Investment LLC (mutual fund complex); Director, Edgen Group, Inc. (specialized energy and infrastructure products distributor); Director, Genesee & Wyoming, Inc. (railroads); Head of Investment Funds and Private Equity, Overseas Private Investment Corporation; President, First Manhattan Bancorporation, Inc.; and Attorney, Simpson Thacher & Bartlett LLP | | 175 | | Resideo Technologies, Inc. (smart home technology); Vulcan Materials Company (construction materials company); Trilinc Global Impact Fund; Textainer Group Holdings, (shipping container leasing company); Investment Company Institute (professional organization); and Independent Directors Council (professional organization) |
| Eli Jones – 1961 Trustee | | 2016 | | Professor and Dean Emeritus, Mays Business School - Texas A&M University Formerly: Dean of Mays Business School-Texas A&M University; Professor and Dean, Walton College of Business, University of Arkansas and E.J. Ourso College of Business, Louisiana State University; and Director, Arvest Bank | | 175 | | Insperity, Inc. (formerly known as Administaff) (human resources provider); Board Member of the regional board, First Financial Bank Texas; and Boad Member, First Financial Bankshares, Inc. Texas (FFIN) |
| Elizabeth Krentzman – 1959 Trustee | | 2019 | | Formerly: Principal and Chief Regulatory Advisor for Asset Management Services and U.S. Mutual Fund Leader of Deloitte & Touche LLP; General Counsel of the Investment Company Institute (trade association); National Director of the Investment Management Regulatory Consulting Practice, Principal, Director and Senior Manager of Deloitte & Touche LLP; Assistant Director of the Division of Investment Management - Office of Disclosure and Investment Adviser Regulation of the U.S. Securities and Exchange Commission and various positions with the Division of Investment Management – Office of Regulatory Policy of the U.S. Securities and Exchange Commission; Associate at Ropes & Gray LLP; and Trustee of certain Oppenheimer Funds | | 175 | | Formerly: Member of the Cartica Funds Board of Directors (private investment fund); Trustee of the University of Florida National Board Foundation; and Member of the University of Florida Law Center Association, Inc. Board of Trustees, Audit Committee and Membership Committee |
| Anthony J. LaCava, Jr. – 1956 Trustee | | 2019 | | Formerly: Director and Member of the Audit Committee, Blue Hills Bank (publicly traded financial institution) and Managing Partner, KPMG LLP | | 175 | | Blue Hills Bank; Member and Chairman, Bentley University, Business School Advisory Council; and Nominating Committee, KPMG LLP |
| Prema Mathai-Davis – 1950 Trustee | | 1998 | | Retired Formerly: Co-Founder & Partner of Quantalytics Research, LLC, (a FinTech Investment Research Platform for the Self-Directed Investor); Trustee of YWCA Retirement Fund; CEO of YWCA of the USA; Board member of the NY Metropolitan Transportation Authority; Commissioner of the NYC Department of Aging; and Board member of Johns Hopkins Bioethics Institute | | 175 | | Member of Board of Positive Planet US (non-profit) and HealthCare Chaplaincy Network (non-profit) |
T-2 Invesco Rochester® AMT-Free New York Municipal Fund
Trustees and Officers–(continued)
| | | | | | | | |
Name, Year of Birth and Position(s) Held with the Trust | | Trustee and/or Officer Since | | Principal Occupation(s) During Past 5 Years | | Number of
Funds in
Fund Complex
Overseen by
Trustee | | Other Directorship(s) Held by Trustee During Past 5 Years |
Independent Trustees–(continued) | | | | | | |
| Joel W. Motley – 1952 Trustee | | 2019 | | Director of Office of Finance, Federal Home Loan Bank System; Managing Director of Carmona Motley Inc. (privately held financial advisor); Member of the Council on Foreign Relations and its Finance and Budget Committee; Chairman Emeritus of Board of Human Rights Watch and Member of its Investment Committee; and Member of Investment Committee Board of Historic Hudson Valley (non-profit cultural organization); Member of the Board, Blue Ocean Acquisition Corp.; and Member of the Vestry and the Investment Committee of Trinity Church Wall Street. Formerly: Managing Director of Public Capital Advisors, LLC (privately held financial advisor); Managing Director of Carmona Motley Hoffman, Inc. (privately held financial advisor); Trustee of certain Oppenheimer Funds; and Director of Columbia Equity Financial Corp. (privately held financial advisor) | | 175 | | Member of Board of Trust for Mutual Understanding (non-profit promoting the arts and environment); Member of Board of Greenwall Foundation (bioethics research foundation) and its Investment Committee; Member of Board of Friends of the LRC (non- profit legal advocacy); and Board Member and Investment Committee Member of Pulitzer Center for Crisis Reporting (non-profit journalism) |
| Teresa M. Ressel – 1962 Trustee | | 2017 | | Non-executive director and trustee of a number of public and private business corporations Formerly: Chief Executive Officer, UBS Securities LLC (investment banking); Chief Operating Officer, UBS AG Americas (investment banking); Sr. Management Team Olayan America, The Olayan Group (international investor/commercial/industrial); and Assistant Secretary for Management & Budget and Designated Chief Financial Officer, U.S. Department of Treasury | | 175 | | None |
| Robert C. Troccoli – 1949 Trustee | | 2016 | | Retired Formerly: Adjunct Professor, University of Denver – Daniels College of Business; and Managing Partner, KPMG LLP | | 175 | | None |
| Daniel S. Vandivort – 1954 Trustee | | 2019 | | President, Flyway Advisory Services LLC (consulting and property management) Formerly: President and Chief Investment Officer, previously Head of Fixed Income, Weiss Peck and Greer/Robeco Investment Management; Trustee and Chair, Weiss Peck and Greer Funds Board; and various capacities at CS First Boston including Head of Fixed Income at First Boston Asset Management. | | 175 | | Formerly: Trustee and Governance Chair, Oppenheimer Funds; Treasurer, Chairman of the Audit and Finance Committee, Huntington Disease Foundation of America |
T-3 Invesco Rochester® AMT-Free New York Municipal Fund
Trustees and Officers–(continued)
| | | | | | | | |
Name, Year of Birth and Position(s) Held with the Trust | | Trustee and/or Officer Since | | Principal Occupation(s) During Past 5 Years | | Number of
Funds in
Fund Complex
Overseen by
Trustee | | Other
Directorship(s)
Held by Trustee
During Past 5 Years |
Officers | | | | | | | | |
Sheri Morris – 1964 President and Principal Executive Officer | | 1999 | | Director, Invesco Trust Company; Head of Global Fund Services, Invesco Ltd.; President and Principal Executive Officer, The Invesco Funds; Vice President, Invesco Exchange-Traded Fund Trust, Invesco Exchange-Traded Fund Trust II, Invesco India Exchange-Traded Fund Trust, Invesco Actively Managed Exchange-Traded Fund Trust, Invesco Actively Managed Exchange-Traded Commodity Fund Trust and Invesco Exchange-Traded Self-Indexed Fund Trust; and Vice President, OppenheimerFunds, Inc. Formerly: Vice President, Treasurer and Principal Financial Officer, The Invesco Funds; Vice President, Invesco AIM Advisers, Inc., Invesco AIM Capital Management, Inc. and Invesco AIM Private Asset Management, Inc.; Assistant Vice President and Assistant Treasurer, The Invesco Funds; Vice President and Assistant Vice President, Invesco Advisers, Inc.; Assistant Vice President, Invesco AIM Capital Management, Inc. and Invesco AIM Private Asset Management, Inc.; Treasurer, Invesco Exchange-Traded Fund Trust, Invesco Exchange-Traded Fund Trust II, Invesco India Exchange-Traded Fund Trust and Invesco Actively Managed Exchange-Traded Fund Trust; and Senior Vice President, Invesco Advisers, Inc. (formerly known as Invesco Institutional (N.A.), Inc.) (registered investment adviser) | | N/A | | N/A |
Melanie Ringold – 1975 Senior Vice President, Chief Legal Officer and Secretary | | 2023 | | Head of Legal of the Americas, Invesco Ltd.; Senior Vice President and Secretary, Invesco Advisers, Inc. (formerly known as Invesco Institutional (N.A.), Inc.) (registered investment adviser); Secretary, Invesco Distributors, Inc. (formerly known as Invesco AIM Distributors, Inc.); Secretary, Invesco Investment Services, Inc. (formerly known as Invesco AIM Investment Services, Inc.); Senior Vice President, Chief Legal Officer and Secretary, The Invesco Funds; Secretary, Invesco Investment Advisers LLC, Invesco Capital Markets, Inc.; Chief Legal Officer, Invesco Exchange-Traded Fund Trust, Invesco Exchange-Traded Fund Trust II, Invesco India Exchange-Traded Fund Trust, Invesco Actively Managed Exchange-Traded Fund Trust, Invesco Actively Managed Exchange-Traded Commodity Fund Trust and Invesco Exchange-Traded Self-Indexed Fund Trust;Secretary and Vice President, Harbourview Asset Management Corporation; Secretary and Senior Vice President, OppenheimerFunds, Inc. and Invesco Managed Accounts, LLC; Secretary and Senior Vice President, OFI SteelPath, Inc.; Secretary and Senior Vice President, Oppenheimer Acquisition Corp.; Secretary, SteelPath Funds Remediation LLC; and Secretary and Senior Vice President, Trinity Investment Management Corporation Formerly: Assistant Secretary, Invesco Distributors, Inc.; Invesco Advisers, Inc. Invesco Investment Services, Inc., Invesco Capital Markets, Inc., Invesco Capital Management LLC and Invesco Investment Advisers LLC; and Assistant Secretary and Investment Vice President, Invesco Funds | | N/A | | N/A |
Andrew R. Schlossberg – 1974 Senior Vice President | | 2019 | | Senior Vice President, Invesco Group Services, Inc.; Head of the Americas and Senior Managing Director, Invesco Ltd.; Director and Senior Vice President, Invesco Advisers, Inc. (formerly known as Invesco Institutional (N.A.), Inc.) (registered investment adviser); Director and Chairman, Invesco Investment Services, Inc. (formerly known as Invesco AIM Investment Services, Inc.) (registered transfer agent); Senior Vice President, The Invesco Funds; and Director, Invesco Investment Advisers LLC (formerly known as Van Kampen Asset Management) Formerly: Director, President and Chairman, Invesco Insurance Agency, Inc.; Director, Invesco UK Limited; Director and Chief Executive, Invesco Asset Management Limited and Invesco Fund Managers Limited; Assistant Vice President, The Invesco Funds; Senior Vice President, Invesco Advisers, Inc. (formerly known as Invesco Institutional (N.A.), Inc.) (registered investment adviser); Director and Chief Executive, Invesco Administration Services Limited and Invesco Global Investment Funds Limited; Director, Invesco Distributors, Inc.; Head of EMEA, Invesco Ltd.; President, Invesco Actively Managed Exchange-Traded Commodity Fund Trust, Invesco Actively Managed Exchange-Traded Fund Trust, Invesco Exchange-Traded Fund Trust, Invesco Exchange-Traded Fund Trust II and Invesco India Exchange-Traded Fund Trust; and Managing Director and Principal Executive Officer, Invesco Capital Management LLC | | N/A | | N/A |
T-4 Invesco Rochester® AMT-Free New York Municipal Fund
Trustees and Officers–(continued)
| | | | | | | | |
Name, Year of Birth and Position(s) Held with the Trust | | Trustee and/or Officer Since | | Principal Occupation(s) During Past 5 Years | | Number of
Funds in
Fund Complex
Overseen by
Trustee | | Other
Directorship(s)
Held by Trustee
During Past 5 Years |
Officers–(continued) | | | | | | | | |
John M. Zerr – 1962 Senior Vice President | | 2006 | | Chief Operating Officer of the Americas; Senior Vice President, Invesco Advisers, Inc. (formerly known as Invesco Institutional (N.A.), Inc.) (registered investment adviser); Senior Vice President, Invesco Distributors, Inc. (formerly known as Invesco AIM Distributors, Inc.); Director and Vice President, Invesco Investment Services, Inc. (formerly known as Invesco AIM Investment Services, Inc.) Senior Vice President, The Invesco Funds; Managing Director, Invesco Capital Management LLC; Director, Invesco Investment Advisers LLC (formerly known as Van Kampen Asset Management); Senior Vice President, Invesco Capital Markets, Inc. (formerly known as Van Kampen Funds Inc.); Manager, Invesco Indexing LLC; Manager, Invesco Specialized Products, LLC; Member, Invesco Canada Funds Advisory Board; Director, President and Chief Executive Officer, Invesco Corporate Class Inc. (corporate mutual fund company); and Director, Chairman, President and Chief Executive Officer, Invesco Canada Ltd. (formerly known as Invesco Trimark Ltd./Invesco Trimark Ltèe) (registered investment adviser and registered transfer agent); President, Invesco, Inc.; President, Invesco Global Direct Real Estate Feeder GP Ltd.; President, Invesco IP Holdings (Canada) Ltd; President, Invesco Global Direct Real Estate GP Ltd.; President, Invesco Financial Services Ltd. / Services Financiers Invesco Ltée; and Director and Chairman, Invesco Trust Company Formerly: President, Trimark Investments Ltd/Services Financiers Invesco Ltee; Director and Senior Vice President, Invesco Insurance Agency, Inc.; Director and Senior Vice President, Invesco Management Group, Inc. (formerly known as Invesco AIM Management Group, Inc.); Secretary and General Counsel, Invesco Management Group, Inc. (formerly known as Invesco AIM Management Group, Inc.); Secretary, Invesco Investment Services, Inc. (formerly known as Invesco AIM Investment Services, Inc.); Chief Legal Officer and Secretary, The Invesco Funds; Secretary and General Counsel, Invesco Investment Advisers LLC (formerly known as Van Kampen Asset Management); Secretary and General Counsel, Invesco Capital Markets, Inc. (formerly known as Van Kampen Funds Inc.); Chief Legal Officer, Invesco Exchange-Traded Fund Trust, Invesco Exchange-Traded Fund Trust II, Invesco India Exchange-Traded Fund Trust, Invesco Actively Managed Exchange-Traded Fund Trust, Invesco Actively Managed Exchange-Traded Commodity Fund Trust and Invesco Exchange-Traded Self-Indexed Fund Trust; Secretary, Invesco Indexing LLC; Director, Secretary, General Counsel and Senior Vice President, Van Kampen Exchange Corp.; Director, Vice President and Secretary, IVZ Distributors, Inc. (formerly known as INVESCO Distributors, Inc.); Director and Vice President, INVESCO Funds Group, Inc.; Director and Vice President, Van Kampen Advisors Inc.; Director, Vice President, Secretary and General Counsel, Van Kampen Investor Services Inc.;Director and Secretary, Invesco Distributors, Inc. (formerly known as Invesco AIM Distributors, Inc.); Director, Senior Vice President, General Counsel and Secretary, Invesco AIM Advisers, Inc. and Van Kampen Investments Inc.; Director, Vice President and Secretary, Fund Management Company; Director, Senior Vice President, Secretary, General Counsel and Vice President, Invesco AIM Capital Management, Inc.; and Chief Operating Officer and General Counsel, Liberty Ridge Capital, Inc. (an investment adviser) | | N/A | | N/A |
Gregory G. McGreevey – 1962 Senior Vice President | | 2012 | | Senior Managing Director, Invesco Ltd.; Director, Chairman, President, and Chief Executive Officer, Invesco Advisers, Inc. (formerly known as Invesco Institutional (N.A.), Inc.) (registered investment adviser); Director, Invesco Mortgage Capital, Inc. and Invesco Senior Secured Management, Inc.; Senior Vice President, The Invesco Funds; President, SNW Asset Management Corporation and Invesco Managed Accounts, LLC; Chairman and Director, Invesco Private Capital, Inc.; Chairman and Director, INVESCO Private Capital Investments, Inc.; Chairman and Director, INVESCO Realty, Inc.; and Senior Vice President, Invesco Group Services, Inc. Formerly: Senior Vice President, Invesco Management Group, Inc. and Invesco Advisers, Inc.; Assistant Vice President, The Invesco Funds | | N/A | | N/A |
Adrien Deberghes – 1967 Principal Financial Officer, Treasurer and Vice President | | 2020 | | Head of the Fund Office of the CFO and Fund Administration; Vice President, Invesco Advisers, Inc.; Principal Financial Officer, Treasurer and Vice President, The Invesco Funds; Vice President, Invesco Exchange-Traded Fund Trust, Invesco Exchange-Traded Fund Trust II, Invesco India Exchange-Traded Fund Trust, Invesco Actively Managed Exchange-Traded Fund Trust, Invesco Actively Managed Exchange-Traded Commodity Fund Trust and Invesco Exchange-Traded Self-Indexed Fund Trust Formerly: Senior Vice President and Treasurer, Fidelity Investments | | N/A | | N/A |
Crissie M. Wisdom – 1969 Anti-Money Laundering Compliance Officer | | 2013 | | Anti-Money Laundering and OFAC Compliance Officer for Invesco U.S. entities including: Invesco Advisers, Inc. and its affiliates, Invesco Capital Markets, Inc., Invesco Distributors, Inc., Invesco Investment Services, Inc., The Invesco Funds, Invesco Capital Management, LLC, Invesco Trust Company; and Fraud Prevention Manager for Invesco Investment Services, Inc. | | N/A | | N/A |
T-5 Invesco Rochester® AMT-Free New York Municipal Fund
Trustees and Officers–(continued)
| | | | | | | | |
Name, Year of Birth and
Position(s) Held with the Trust | | Trustee and/or Officer Since | | Principal Occupation(s) During Past 5 Years | | Number of
Funds in
Fund Complex
Overseen by
Trustee | | Other Directorship(s) Held by Trustee
During Past 5 Years |
Officers–(continued) | | | | | | | | |
Todd F. Kuehl – 1969 Chief Compliance Officer and Senior Vice President | | 2020 | | Chief Compliance Officer, Invesco Advisers, Inc. (registered investment adviser); and Chief Compliance Officer and Senior Vice President, The Invesco Funds Formerly: Managing Director and Chief Compliance Officer, Legg Mason (Mutual Funds); Chief Compliance Officer, Legg Mason Private Portfolio Group (registered investment adviser) | | N/A | | N/A |
James Bordewick, Jr. – 1959 Senior Vice President and Senior Officer | | 2022 | | Senior Vice President and Senior Officer, The Invesco Funds Formerly: Chief Legal Officer, KingsCrowd, Inc. (research and analytical platform for investment in private capital markets); Chief Operating Officer and Head of Legal and Regulatory, Netcapital (private capital investment platform); Managing Director, General Counsel of asset management and Chief Compliance Officer for asset management and private banking, Bank of America Corporation; Chief Legal Officer, Columbia Funds and BofA Funds; Senior Vice President and Associate General Counsel, MFS Investment Management; Chief Legal Officer, MFS Funds; Associate, Ropes & Gray; and Associate, Gaston Snow & Ely Bartlett | | N/A | | N/A |
The Statement of Additional Information of the Trust includes additional information about the Fund’s Trustees and is available upon request, without charge, by calling 1.800.959.4246.
Please refer to the Fund’s Statement of Additional Information for information on the Fund’s sub-advisers.
| | | | | | |
| Office of the Fund | | Investment Adviser | | Distributor | | Auditors |
| 11 Greenway Plaza, Suite 1000 | | Invesco Advisers, Inc. | | Invesco Distributors, Inc. | | PricewaterhouseCoopers LLP |
| Houston, TX 77046-1173 | | 1331 Spring Street, NW, Suite 2500 | | 11 Greenway Plaza, Suite 1000 | | 1000 Louisiana Street, Suite 5800 |
| | Atlanta, GA 30309 | | Houston, TX 77046-1173 | | Houston, TX 77002-5021 |
| | | |
| Counsel to the Fund | | Counsel to the Independent Trustees | | Transfer Agent | | Custodian |
| Stradley Ronon Stevens & Young, LLP | | Sidley Austin LLP | | Invesco Investment Services, Inc. | | State Street Bank and Trust Company |
| 2005 Market Street, Suite 2600 | | 787 Seventh Avenue | | 11 Greenway Plaza, Suite 1000 | | 225 Franklin Street |
| Philadelphia, PA 19103-7018 | | New York, NY 10019 | | Houston, TX 77046-1173 | | Boston, MA 02110-2801 |
T-6 Invesco Rochester® AMT-Free New York Municipal Fund

Go paperless with eDelivery
Visit invesco.com/edelivery to enjoy the convenience and security of anytime electronic access to your investment documents.
With eDelivery, you can elect to have any or all of the following materials delivered straight to your inbox to download, save and print from your own computer:
| ∎ | | Fund reports and prospectuses |
Invesco mailing information
Send general correspondence to Invesco Investment Services, Inc., P.O. Box 219078, Kansas City, MO 64121-9078.
Important notice regarding delivery of security holder documents
To reduce Fund expenses, only one copy of most shareholder documents may be mailed to shareholders with multiple accounts at the same address (Householding). Mailing of your shareholder documents may be householded indefinitely unless you instruct us otherwise. If you do not want the mailing of these documents to be combined with those for other members of your household, please contact Invesco Investment Services, Inc. at 800 959 4246 or contact your financial institution. We will begin sending you individual copies for each account within 30 days after receiving your request.
Fund holdings and proxy voting information
The Fund provides a complete list of its portfolio holdings four times each year, at the end of each fiscal quarter. For the second and fourth quarters, the list appears, respectively, in the Fund’s semiannual and annual reports to shareholders. For the first and third quarters, the Fund files the list with the Securities and Exchange Commission (SEC) as an exhibit to its reports on Form N-PORT. The most recent list of portfolio holdings is available at invesco.com/completeqtrholdings. Shareholders can also look up the Fund’s Form N-PORT filings on the SEC website, sec.gov. The SEC file numbers for the Fund are shown below.
A description of the policies and procedures that the Fund uses to determine how to vote proxies relating to portfolio securities is available without charge, upon request, from our Client Services department at 800 959 4246, or at invesco.com/ corporate/about-us/esg. The information is also available on the SEC website, sec.gov.
Information regarding how the Fund voted proxies related to its portfolio securities during the most recent 12-month period ended June 30 is available at invesco.com/proxysearch. This information is also available on the SEC website, sec.gov.
Invesco Advisers, Inc. is an investment adviser; it provides investment advisory services to individual and institutional clients and does not sell securities. Invesco Distributors, Inc. is the US distributor for Invesco Ltd.’s retail mutual funds, exchange-traded funds and institutional money market funds. Both are wholly owned, indirect subsidiaries of Invesco Ltd.

| | | | |
| SEC file number(s): 811-07890 and 033-66242 | | Invesco Distributors, Inc. | | O-ROAFNYM-AR-1 |

| | |
| | |
| Annual Report to Shareholders | | February 28, 2023 |
Invesco Rochester® Limited Term New York Municipal Fund
Nasdaq:
A: LTNYX ∎ C: LTNCX ∎ Y: LTBYX ∎ R6: IORMX
Management’s Discussion of Fund Performance
| | | | |
| |
Performance summary | |
For the fiscal year ended February 28, 2023, Class A shares of Invesco Rochester® Limited Term New York Municipal Fund (the Fund), at net asset value (NAV), underperformed the S&P Municipal New York Investment Grade 4-7 Years Bond Index. | |
Your Fund’s long-term performance appears later in this report. | |
| | |
Fund vs. Indexes | | | | |
Total returns, 2/28/22 to 2/28/23, at net asset value (NAV). Performance shown does not include applicable contingent deferred sales charges (CDSC) or front-end sales charges, which would have reduced performance. | |
Class A Shares | | | -4.16 | % |
Class C Shares | | | -5.26 | |
Class Y Shares | | | -4.24 | |
Class R6 Shares | | | -4.20 | |
S&P Municipal Bond 2-17 Years Investment Grade Index▼ | | | -3.39 | |
S&P Municipal New York Investment Grade 4-7 Years Bond Index▼ | | | -2.15 | |
Source(s): ▼RIMES Technologies Corp. | | | | |
Market conditions and your Fund
The COVID-19 pandemic caused a dramatic and sudden disruption in the New York State economy. However, thanks to federal relief funding and a fast recovery in tax collections, the state was able to quickly stabilize its finances.
The Empire State has historically benefited from a robust and wealthy economy, adequate resources and budget flexibility, factors that helped mitigate the adverse economic impact of the global pandemic, further. Demonstrating strong management practices, New York officials quickly identified gap-closing measures to balance fiscal years 2021 and 2022 state budgets, setting aside reserves to offset the expected phasing out of federal aid. Moderate leverage levels allowed the state to issue debt as an alternative to additional expenditure reductions.
Employment numbers reflect how New York suffered a larger economic impact than most other states, but recent data indicates significant improvement in the job sector. New York’s unemployment rate went from 12.5% in August 2020 to 4.3% in December 2022, while the national average went from 8.4% to 3.5% during the same period.1 Following easing of lockdown orders, Gross Domestic Product (GDP) started to recover in all states with the hospitality industry and information and professional services being the lead contributors. Most recently available reports show New York’s GDP increased 2.5% during the third quarter of 2022 while the US increased at a rate of 3.2%.2
While the state will likely continue to face long-term challenges, including a negative population trend, we believe the silver lining is the pension system, which is well funded. Additional pressure from Medicaid spending is likely to present a challenge as budget officials anticipate state-share Medicaid costs will continue to grow. For fiscal year 2023 these
costs account for approximately 21% of budgeted state operating spending.3
At the beginning of the fiscal year, investors were hopeful in anticipation of a return to normalcy as COVID-19 cases declined and pandemic-related restrictions were reduced or lifted. This allowed policymakers to turn their attention to the high inflation levels; however, on February 24, 2022, Russia began a full-scale invasion of Ukraine, which exacerbated inflationary pressures by driving up commodity prices. Against this backdrop, the fiscal year was plagued by volatility and uncertainty. The municipal market set multiple record lows in 2022, making it one of the most challenging years in history for municipal markets.
Investment grade municipal bonds returned -5.10%, high yield municipal bonds returned -9.35% and taxable municipal bonds returned -12.96% during the fiscal year.4
While municipal funds had experienced record inflows of $101.7 billion in 2021, flows quickly turned negative in the first quarter of 2022, perpetuating the Bloomberg Municipal Bond Index’s worst quarterly return in 40 years. Municipal bonds enjoyed a short respite in late May and early June 2022 with increased demand from crossover buyers like hedge funds, banks and insurance companies; however, the May 2022 Consumer Price Index report quoted inflation rising to a 40-year high. This sent the 10-year Treasury yield to a new 52-week high of nearly 3.50%, pushing municipal mutual fund flows back into negative territory.5 According to Lipper, net outflows from municipal bond funds totaled over -$110 billion for the fiscal year.6
On March 16, 2022, the US Federal Reserve (the Fed) raised the federal funds target rate 0.25% for the first time in more than three years in hopes of containing inflation.7 This was the first of eight consecutive increases during the fiscal year as the Fed announced its plan for a quantitative tightening campaign in an attempt to rein in inflation
without harming employment or the overall economy. Rate increases as high as 0.75% followed, the Fed’s most aggressive monetary policy since the 1980s, bringing the target rate to 4.75% as of the end of the fiscal year.7
The AAA municipal yield curve made history after the Fed’s December 2022 meeting when the curve inverted between one- and 10-year maturities. Any inversion is noteworthy, but this was a first for municipal bonds. On January 31, 2023, policymakers indicated that future rate increases were likely to be “appropriate,” suggesting they were not yet convinced inflation was contained, which increased uncertainty about when the current tightening cycle might end. The fiscal year ended with an increase of 0.25% on February 1, 2023. We expect additional rate hikes in 2023, although not with the same pace or vigor as in 2022.
New municipal issuance for the fiscal year totaled $354 billion, down 27% from the previous fiscal year’s $484 billion.8 Issuers, with cash on their balance sheets, have been reluctant to issue at higher interest rates. While taxable issuance continued to account for a significant portion of new issuance, at 14% of the total, this figure is down from 18% from the previous fiscal year because of higher interest rates.8
Puerto Rico continued to make developments in its ongoing debt restructuring throughout the fiscal year. The territory restructured its outstanding general obligation and other government-guaranteed debt in March 2022 and began paying bondholders on the new restructured bonds. Puerto Rico’s weight in the Bloomberg High Yield Municipal Bond Index increased from 13% to 20% as the new bonds were included.4 The Financial Oversight and Management Board for Puerto Rico, the Puerto Rican government, bond-holders and other interested parties continued to negotiate the restructuring of bonds issued by the Puerto Rico Electric Power Authority, the territory’s largest remaining unresolved debt, as the fiscal year closed.
Municipal credits have a long history of low defaults as many provide essential services to all Americans. This continues to be the case as evidenced by S&P rating changes – upgrades exceeded downgrades by a ratio of 2.5:1 for calendar year 2022.9 This positive dynamic, which we believe will continue, likely stems from benefits of the various federal stimulus measures including the American Rescue Plan Act, the Infrastructure Investment and Jobs Act and the Inflation Reduction Act, as well as higher revenues collected by state and local governments.
We believe the valuable benefits of municipal bonds will prevail over current market volatility and economic uncertainty. We continue to rely on our experienced portfolio managers and credit analysts to weather the
| | |
| 2 | | Invesco Rochester® Limited Term New York Municipal Fund |
challenges while identifying marketplace opportunities to add long-term value for shareholders.
During the fiscal year, security selection and an overweight allocation to non-rated bonds† contributed to the Fund’s performance relative to its benchmark. At the sector level, sector allocation and underweight exposure among the appropriation sector contributed to the Fund’s relative performance.
Sector allocation among medium duration bonds (6.00-14.99 years specifically) detracted from the Fund’s performance relative to its benchmark during the fiscal year. An overweight exposure to 4.00-4.49% coupon bonds was also detractive from relative return. An underweight allocation to the dedicated tax sector detracted from the Fund’s performance relative to the benchmark during the fiscal year.
During the fiscal year, leverage contributed to the Fund’s performance relative to its benchmark. The Fund achieved a leveraged position through the use of inverse floating rate securities or tender option bonds. The Fund uses leverage because we believe that, over time, leveraging provides opportunities for additional income and total return for shareholders. However, the use of leverage also can expose shareholders to additional volatility. For more information about the Fund’s use of leverage, see the Notes to Financial Statements later in this report.
We wish to remind you that the Fund is subject to interest rate risk, meaning when interest rates rise, the value of fixed income securities tends to fall. The degree to which the value of fixed income securities may decline due to rising interest rates may vary depending on the speed and magnitude of the increase in interest rates, as well as individual security characteristics, such as price, maturity, duration and coupon and market forces, such as supply and demand for similar securities. We are monitoring interest rates, as well as the market, economic and geopolitical factors that may impact the direction, speed and magnitude of changes to interest rates across the maturity spectrum, including the potential impact of monetary policy changes by the Fed and certain foreign central banks. If interest rates rise or fall faster than expected, markets may experience increased volatility, which may affect the value and/or liquidity of certain of the Fund’s investments.
Thank you for investing in Invesco Rochester® Limited Term New York Municipal Fund and for sharing our long-term investment horizon.
| 1 | Source: New York Department of Labor, January 20, 2022; Bureau of Labor Statistics, January 2023 |
| 2 | Source: Bureau of Economic Analysis, US Department of Commerce, December 23, 2022 |
| 3 | Source: New York State, Fiscal Year 2024 Budget |
| 7 | Source: US Federal Reserve |
| 9 | Source: Standard & Poor’s |
† Sources: A credit rating is an assessment provided by a nationally recognized statistical rating organization (NRSRO) of the creditworthiness of an issuer with respect to debt obligations, including specific securities, money market instruments or other debts. Ratings are measured on a scale that generally ranges from AAA (highest) to D (lowest); ratings are subject to change without notice. For more information on rating methodology, please visit www.spglobal.com and select “Understanding Credit Ratings” under About Ratings on the homepage; www.fitchratings.com and select “Understanding Credit Ratings” from the drop-down menu on the homepage; and www.moodys.com and select “Methodology,” then “Rating Methodologies” under Research Type on the left-hand side.
Portfolio manager(s):
Michael Camarella
Scott Cottier
Mark DeMitry
Tim O’Reilly
Mark Paris
Julius Williams
The views and opinions expressed in management’s discussion of Fund performance are those of Invesco Advisers, Inc. and its affiliates. These views and opinions are subject to change at any time based on factors such as market and economic conditions. These views and opinions may not be relied upon as investment advice or recommendations, or as an offer for a particular security. The information is not a complete analysis of every aspect of any market, country, industry, security or the Fund. Statements of fact are from sources considered reliable, but Invesco Advisers, Inc. makes no representation or warranty as to their completeness or accuracy. Although historical performance is no guarantee of future results, these insights may help you understand our investment management philosophy.
See important Fund and, if applicable, index disclosures later in this report.
| | |
| 3 | | Invesco Rochester® Limited Term New York Municipal Fund |
Your Fund’s Long-Term Performance
Results of a $10,000 Investment – Oldest Share Class(es)
Fund and index data from 2/28/13
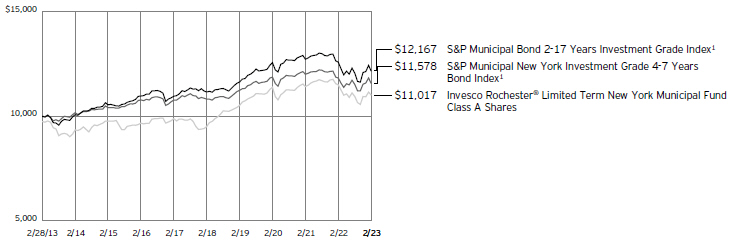
1 Source: RIMES Technologies Corp.
Past performance cannot guarantee future results.
The data shown in the chart include reinvested distributions, applicable sales charges and Fund expenses including management
fees. Index results include reinvested dividends, but they do not reflect sales charges. Performance of the peer group, if applicable, reflects Fund expenses and management fees; performance of a market index does
not. Performance shown in the chart does not reflect deduction of taxes a shareholder would pay on Fund distributions or sale of Fund shares.
| | |
| 4 | | Invesco Rochester® Limited Term New York Municipal Fund |
| | | | |
| |
Average Annual Total Returns | |
As of 2/28/23, including maximum applicable sales charges | |
Class A Shares | | | | |
Inception (9/18/91) | | | 3.99 | % |
10 Years | | | 0.97 | |
5 Years | | | 2.50 | |
1 Year | | | -6.67 | |
Class C Shares | | | | |
Inception (5/1/97) | | | 3.20 | % |
10 Years | | | 0.63 | |
5 Years | | | 2.24 | |
1 Year | | | -6.19 | |
Class Y Shares | | | | |
Inception (3/30/11) | | | 2.51 | % |
10 Years | | | 1.48 | |
5 Years | | | 3.26 | |
1 Year | | | -4.24 | |
Class R6 Shares | | | | |
10 Years | | | 1.35 | % |
5 Years | | | 3.23 | |
1 Year | | | -4.20 | |
Effective May 24, 2019, Class A, Class C and Class Y shares of the Oppenheimer Rochester Limited Term New York Municipal Fund, (the predecessor fund), were reorganized into Class A, Class C and Class Y shares, respectively, of the Invesco Oppenheimer Rochester® Limited Term New York Municipal Fund. The Fund was subsequently renamed the Invesco Rochester® Limited Term New York Municipal Fund (the Fund). Returns shown above, for periods ending on or prior to May 24, 2019, for Class A, Class C, and Class Y shares are those for Class A, Class C and Class Y shares of the predecessor fund. Share class returns will differ from the predecessor fund because of different expenses.
Class R6 shares incepted on May 24, 2019. Performance shown on and prior to that date is that of the predecessor fund’s Class A shares at net asset value and includes the 12b-1 fees applicable to Class A shares.
The performance data quoted represent past performance and cannot guarantee future results; current performance may be lower or higher. Please visit invesco.com/ performance for the most recent month-end performance. Performance figures reflect reinvested distributions, changes in net asset value and the effect of the maximum sales charge unless otherwise stated. Performance figures do not reflect deduction of taxes a shareholder would pay on Fund distributions or sale of Fund shares. Investment return and principal value will fluctuate so that you may have a gain or loss when you sell shares.
Class A share performance reflects the maximum 2.50% sales charge, and Class C share performance reflects the applicable contingent deferred sales charge (CDSC)
for the period involved. The CDSC on Class C shares is 1% for the first year after purchase. Class Y and Class R6 shares do not have a front-end sales charge or a CDSC; therefore, performance is at net asset value.
The performance of the Fund’s share classes will differ primarily due to different sales charge structures and class expenses.
Fund performance reflects any applicable fee waivers and/or expense reimbursements. Had the adviser not waived fees and/or reimbursed expenses currently or in the past, returns would have been lower. See current prospectus for more information.
| | |
| 5 | | Invesco Rochester® Limited Term New York Municipal Fund |
Supplemental Information
Invesco Rochester® Limited Term New York Municipal Fund’s investment objective is to seek tax-free income.
| ∎ | Unless otherwise stated, information presented in this report is as of February 28, 2023, and is based on total net assets. |
| ∎ | Unless otherwise noted, all data is provided by Invesco. |
| ∎ | To access your Fund’s reports/prospectus, visit invesco.com/fundreports. |
About indexes used in this report
| ∎ | The S&P Municipal Bond 2-17 Years Investment Grade Index seeks to measure the performance of investment-grade US municipals with maturities between two and 17 years. |
| ∎ | The S&P Municipal New York Investment Grade 4-7 Years Bond Index consists of bonds issued in the State of New York with maturities between four and seven years that are rated at least BBB- by S&P Global Ratings, Baa3 by Moody’s or BBB- by Fitch Ratings. |
| ∎ | The Fund is not managed to track the performance of any particular index, including the index(es) described here, and consequently, the performance of the Fund may deviate significantly from the performance of the index(es). |
| ∎ | A direct investment cannot be made in an index. Unless otherwise indicated, index results include reinvested dividends, and they do not reflect sales charges. Performance of the peer group, if applicable, reflects fund expenses; performance of a market index does not. |
|
|
This report must be accompanied or preceded by a currently effective Fund prospectus, which contains more complete information, including sales charges and expenses. Investors should read it carefully before investing. |
|
| |
| NOT FDIC INSURED | MAY LOSE VALUE | NO BANK GUARANTEE |
| | |
| 6 | | Invesco Rochester® Limited Term New York Municipal Fund |
Fund Information
Portfolio Composition
| | | | | |
| By credit sector | | % of total investments |
| |
Revenue Bonds | | | | 83.20 | % |
| |
General Obligation Bonds | | | | 11.15 | |
| |
Pre-Refunded Bonds | | | | 5.65 | |
Top Five Debt Holdings
| | | | | | | |
| | | | | % of total net assets |
| | |
1. | | Children’s Trust Fund, Series 2002, RB | | | | 2.52 | % |
| | |
2. | | Puerto Rico (Commonwealth of), Series 2021 A-1, GO Bonds | | | | 1.86 | |
| | |
3. | | New York (City of), NY, Subseries 2013 D-3, GO Bonds | | | | 1.78 | |
| | |
4. | | New York (City of), NY, Series 2013 D, GO Bonds | | | | 1.55 | |
| | |
5. | | Erie Tobacco Asset Securitization Corp., Series 2005 A, RB | | | | 1.52 | |
The Fund’s holdings are subject to change, and there is no assurance that the Fund will continue to hold any particular security.
Data presented here are as of February 28, 2023.
| | |
| 7 | | Invesco Rochester® Limited Term New York Municipal Fund |
Schedule of Investments
February 28, 2023
| | | | | | | | | | | | | | |
| | | Interest Rate | | | Maturity Date | | | Principal Amount (000) | | | Value |
Municipal Obligations–103.23% | | | | | | | | | | | | | | |
New York–90.11% | | | | | | | | | | | | | | |
Albany (County of), NY Airport Authority; | | | | | | | | | | | | | | |
Series 2018 A, RB | | | 5.00% | | | | 12/15/2035 | | | $ | 745 | | | $ 789,110 |
Series 2018 A, RB | | | 5.00% | | | | 12/15/2036 | | | | 780 | | | 821,600 |
Series 2018 A, RB | | | 5.00% | | | | 12/15/2037 | | | | 820 | | | 860,718 |
Series 2018 A, RB | | | 5.00% | | | | 12/15/2038 | | | | 500 | | | 524,501 |
Series 2018 B, RB(a) | | | 5.00% | | | | 12/15/2030 | | | | 240 | | | 255,221 |
Series 2018 B, RB(a) | | | 5.00% | | | | 12/15/2031 | | | | 300 | | | 318,809 |
Series 2018 B, RB(a) | | | 5.00% | | | | 12/15/2032 | | | | 320 | | | 339,780 |
Albany Capital Resource Corp. (Albany Law School of Union University); | | | | | | | | | | | | | | |
Series 2017 A, Ref. RB | | | 5.00% | | | | 07/01/2029 | | | | 1,500 | | | 1,577,037 |
Series 2017 A, Ref. RB | | | 5.00% | | | | 07/01/2031 | | | | 1,520 | | | 1,593,745 |
Albany Capital Resource Corp. (Brighter Choice Elementary); | | | | | | | | | | | | | | |
Series 2021, RB | | | 3.25% | | | | 04/01/2023 | | | | 345 | | | 344,144 |
Series 2021, Ref. RB | | | 3.25% | | | | 04/01/2031 | | | | 5,890 | | | 5,168,388 |
Albany Capital Resource Corp. (College of Siant Rose (The)); | | | | | | | | | | | | | | |
Series 2021, Ref. RB | | | 4.00% | | | | 07/01/2025 | | | | 1,025 | | | 972,230 |
Series 2021, Ref. RB | | | 4.00% | | | | 07/01/2026 | | | | 1,065 | | | 988,433 |
Series 2021, Ref. RB | | | 4.00% | | | | 07/01/2027 | | | | 1,105 | | | 1,002,868 |
Series 2021, Ref. RB | | | 4.00% | | | | 07/01/2036 | | | | 7,295 | | | 5,549,071 |
Albany Capital Resource Corp. (Empire Commons Student Housing, Inc.); | | | | | | | | | | | | | | |
Series 2016 A, Ref. RB | | | 5.00% | | | | 05/01/2024 | | | | 400 | | | 407,225 |
Series 2016 A, Ref. RB | | | 5.00% | | | | 05/01/2025 | | | | 300 | | | 309,285 |
Series 2016 A, Ref. RB | | | 5.00% | | | | 05/01/2026 | | | | 300 | | | 313,170 |
Allegany County Capital Resource Corp. (Houghton College); Series 2022 A, Ref. RB | | | 5.00% | | | | 12/01/2037 | | | | 1,525 | | | 1,551,365 |
Amherst Development Corp. (Daemen College); | | | | | | | | | | | | | | |
Series 2018, Ref. RB | | | 5.00% | | | | 10/01/2027 | | | | 655 | | | 669,336 |
Series 2018, Ref. RB | | | 5.00% | | | | 10/01/2028 | | | | 690 | | | 708,975 |
Series 2018, Ref. RB | | | 5.00% | | | | 10/01/2029 | | | | 730 | | | 749,616 |
Series 2018, Ref. RB | | | 5.00% | | | | 10/01/2030 | | | | 760 | | | 779,674 |
Series 2018, Ref. RB | | | 5.00% | | | | 10/01/2031 | | | | 805 | | | 824,302 |
Series 2018, Ref. RB | | | 5.00% | | | | 10/01/2043 | | | | 540 | | | 522,869 |
Brookhaven Local Development Corp. (Jefferson’s Ferry); | | | | | | | | | | | | | | |
Series 2016, Ref. RB | | | 5.25% | | | | 11/01/2027 | | | | 500 | | | 512,529 |
Series 2016, Ref. RB | | | 5.25% | | | | 11/01/2028 | | | | 1,000 | | | 1,024,332 |
Series 2016, Ref. RB | | | 5.25% | | | | 11/01/2029 | | | | 1,000 | | | 1,022,638 |
Series 2016, Ref. RB | | | 5.25% | | | | 11/01/2030 | | | | 650 | | | 663,396 |
Series 2016, Ref. RB | | | 5.25% | | | | 11/01/2031 | | | | 650 | | | 662,080 |
Broome County Local Development Corp. (Good Shepherd Village at Endwell); Series 2021, Ref. RB | | | 4.00% | | | | 07/01/2031 | | | | 1,350 | | | 1,208,506 |
Broome County Local Development Corp. (United Health Services Hospital); | | | | | | | | | | | | | | |
Series 2020, Ref. RB (INS - AGM)(b) | | | 4.00% | | | | 04/01/2038 | | | | 1,500 | | | 1,443,850 |
Series 2020, Ref. RB (INS - AGM)(b) | | | 4.00% | | | | 04/01/2040 | | | | 2,900 | | | 2,731,871 |
Buffalo & Erie County Industrial Land Development Corp. (Catholic Health System, Inc.); Series 2015, RB | | | 5.00% | | | | 07/01/2025 | | | | 3,170 | | | 3,027,683 |
Buffalo & Erie County Industrial Land Development Corp. (Global Concepts Charter School Program); | | | | | | | | | | | | | | |
Series 2018, Ref. RB | | | 5.00% | | | | 10/01/2026 | | | | 150 | | | 154,095 |
Series 2018, Ref. RB | | | 5.00% | | | | 10/01/2027 | | | | 150 | | | 155,673 |
Series 2018, Ref. RB | | | 5.00% | | | | 10/01/2028 | | | | 165 | | | 172,859 |
Series 2018, Ref. RB | | | 5.00% | | | | 10/01/2029 | | | | 175 | | | 183,758 |
Series 2018, Ref. RB | | | 5.00% | | | | 10/01/2030 | | | | 200 | | | 209,298 |
Series 2018, Ref. RB | | | 5.00% | | | | 10/01/2031 | | | | 200 | | | 209,008 |
Series 2018, Ref. RB | | | 5.00% | | | | 10/01/2033 | | | | 100 | | | 104,152 |
Build NYC Resource Corp. (Academic Leadership Charter School); Series 2021, RB | | | 4.00% | | | | 06/15/2036 | | | | 365 | | | 338,300 |
Build NYC Resource Corp. (Bronx Lighthouse Charter School); | | | | | | | | | | | | | | |
Series 2018, RB | | | 4.00% | | | | 06/01/2028 | | | | 1,125 | | | 1,109,224 |
Series 2018, RB | | | 5.00% | | | | 06/01/2033 | | | | 1,190 | | | 1,229,517 |
See accompanying Notes to Financial Statements which are an integral part of the financial statements.
| | |
| 8 | | Invesco Rochester® Limited Term New York Municipal Fund |
| | | | | | | | | | | | |
| | | Interest Rate | | Maturity Date | | | Principal Amount (000) | | | Value |
New York–(continued) | | | | | | | | | | | | |
| | | | |
Build NYC Resource Corp. (Brooklyn Navy Yard); Series 2019, Ref. RB(a)(c) | | 5.25% | | | 12/31/2033 | | | $ | 5,000 | | | $ 4,588,188 |
Build NYC Resource Corp. (Children’s Aid Society (The)); | | | | | | | | | | | | |
Series 2019, RB | | 4.00% | | | 07/01/2036 | | | | 125 | | | 124,876 |
Series 2019, RB | | 4.00% | | | 07/01/2037 | | | | 150 | | | 149,198 |
Series 2019, RB | | 4.00% | | | 07/01/2038 | | | | 150 | | | 147,870 |
| | | | |
Build NYC Resource Corp. (Consortium for Worker Education, Inc.); Series 2020, RB(c) | | 5.00% | | | 12/01/2039 | | | | 1,885 | | | 1,597,126 |
Build NYC Resource Corp. (Manhattan College); | | | | | | | | | | | | |
Series 2017, Ref. RB | | 5.00% | | | 08/01/2025 | | | | 465 | | | 479,613 |
Series 2017, Ref. RB | | 5.00% | | | 08/01/2028 | | | | 600 | | | 638,292 |
Series 2017, Ref. RB | | 5.00% | | | 08/01/2030 | | | | 1,140 | | | 1,213,133 |
Series 2017, Ref. RB | | 3.00% | | | 08/01/2031 | | | | 1,000 | | | 938,698 |
Series 2017, Ref. RB | | 5.00% | | | 08/01/2032 | | | | 635 | | | 675,152 |
| | | | |
Build NYC Resource Corp. (New Dawn Charter Schools); Series 2019, RB(c) | | 5.00% | | | 02/01/2033 | | | | 1,110 | | | 1,076,206 |
| | | | |
Build NYC Resource Corp. (New York Law School); Series 2016, Ref. RB | | 5.00% | | | 07/01/2036 | | | | 1,010 | | | 1,016,487 |
| | | | |
Build NYC Resource Corp. (NY Preparatory Charter School); Series 2021 A, RB | | 4.00% | | | 06/15/2031 | | | | 325 | | | 305,045 |
| | | | |
Build NYC Resource Corp. (Richmond Prep Charter School); Series 2021 A, RB(c) | | 5.00% | | | 06/01/2036 | | | | 525 | | | 515,981 |
| | | | |
Build NYC Resource Corp. (Royal Charter Properties, Inc. - New York & Presbyterian Hospital | | | | | | | | | | | | |
| | | | |
Leasehold); Series 2012, RB (INS - AGM)(b) | | 4.75% | | | 12/15/2026 | | | | 1,845 | | | 1,845,884 |
| | | | |
Build NYC Resource Corp. (Seton Education Partners-Brilla); Series 2021 A, RB(c) | | 4.00% | | | 11/01/2031 | | | | 1,270 | | | 1,173,915 |
Cattaraugus (County of), NY (St. Bonaventure University); | | | | | | | | | | | | |
Series 2016 A, Ref. RB | | 5.00% | | | 05/01/2023 | | | | 365 | | | 365,741 |
Series 2016 A, Ref. RB | | 5.00% | | | 05/01/2024 | | | | 380 | | | 385,580 |
Series 2016 A, Ref. RB | | 5.00% | | | 05/01/2025 | | | | 400 | | | 410,987 |
Series 2016 A, Ref. RB | | 5.00% | | | 05/01/2026 | | | | 415 | | | 432,568 |
Series 2016 A, Ref. RB | | 5.00% | | | 05/01/2027 | | | | 445 | | | 465,299 |
Series 2016 A, Ref. RB | | 5.00% | | | 05/01/2028 | | | | 465 | | | 487,889 |
Series 2016 A, Ref. RB | | 5.00% | | | 05/01/2029 | | | | 485 | | | 509,306 |
| | | | |
Dobbs Ferry Local Development Corp. (Mercy College); Series 2014, RB | | 5.00% | | | 07/01/2039 | | | | 2,125 | | | 2,156,739 |
| | | | |
Dutchess County Local Development Corp. (Culinary Institute); Series 2021, Ref. RB | | 5.00% | | | 07/01/2032 | | | | 325 | | | 347,305 |
Dutchess County Local Development Corp. (Health Quest Systems, Inc.); | | | | | | | | | | | | |
Series 2016 B, RB | | 5.00% | | | 07/01/2030 | | | | 8,600 | | | 8,886,497 |
Series 2016 B, RB | | 5.00% | | | 07/01/2035 | | | | 1,185 | | | 1,207,491 |
| | | | |
Dutchess County Local Development Corp. (Nuvance Health); Series 2019 B, Ref. RB | | 5.00% | | | 07/01/2025 | | | | 1,290 | | | 1,315,772 |
| | | | |
Dutchess County Local Development Corp. (Vassar College); Series 2020, Ref. RB | | 5.00% | | | 07/01/2045 | | | | 8,710 | | | 9,214,089 |
Elmira (City of), NY; | | | | | | | | | | | | |
Series 2020, GO Bonds | | 5.00% | | | 07/01/2026 | | | | 815 | | | 836,182 |
Series 2020, GO Bonds | | 5.00% | | | 07/01/2035 | | | | 1,500 | | | 1,620,189 |
Erie (County of), NY Industrial Development Agency (The) (City of Buffalo School District); | | | | | | | | | | | | |
Series 2013 A, RB | | 5.00% | | | 05/01/2028 | | | | 500 | | | 501,265 |
Series 2013, RB | | 5.00% | | | 05/01/2026 | | | | 7,365 | | | 7,384,240 |
Erie Tobacco Asset Securitization Corp.; Series 2005 A, RB | | 5.00% | | | 06/01/2031 | | | | 26,345 | | | 25,683,032 |
Essex County Capital Resource Corp. (North Country Community College Association, Inc.); | | | | | | | | | | | | |
Series 2017, Ref. RB | | 5.00% | | | 06/01/2024 | | | | 155 | | | 156,126 |
Series 2017, Ref. RB | | 5.00% | | | 06/01/2026 | | | | 175 | | | 177,451 |
Series 2017, Ref. RB | | 5.00% | | | 06/01/2027 | | | | 100 | | | 102,310 |
Series 2017, Ref. RB | | 5.00% | | | 06/01/2028 | | | | 100 | | | 102,449 |
Series 2017, Ref. RB | | 5.00% | | | 06/01/2031 | | | | 320 | | | 326,818 |
Series 2017, Ref. RB | | 5.00% | | | 06/01/2035 | | | | 255 | | | 257,828 |
Essex County Capital Resource Corp. (North Country Community College Foundation, Inc.); | | | | | | | | | | | | |
Series 2017, Ref. RB | | 5.00% | | | 06/01/2023 | | | | 250 | | | 250,561 |
Series 2017, Ref. RB | | 5.00% | | | 06/01/2024 | | | | 255 | | | 258,005 |
Series 2017, Ref. RB | | 5.00% | | | 06/01/2025 | | | | 270 | | | 276,124 |
Franklin (County of), NY Solid Waste Management Authority; | | | | | | | | | | | | |
Series 2012, RB | | 5.00% | | | 06/01/2027 | | | | 835 | | | 836,134 |
Series 2015 A, RB(a) | | 5.00% | | | 06/01/2023 | | | | 270 | | | 270,929 |
Series 2015 A, RB(a) | | 5.00% | | | 06/01/2024 | | | | 285 | | | 289,680 |
Series 2019, RB(a) | | 4.00% | | | 06/01/2023 | | | | 845 | | | 845,854 |
Series 2019, RB(a) | | 4.00% | | | 06/01/2024 | | | | 875 | | | 878,804 |
See accompanying Notes to Financial Statements which are an integral part of the financial statements.
| | |
| 9 | | Invesco Rochester® Limited Term New York Municipal Fund |
| | | | | | | | | | | | |
| | | Interest Rate | | Maturity Date | | | Principal Amount (000) | | | Value |
New York–(continued) | | | | | | | | | | | | |
Franklin County Civic Development Corp. (North Country Community College Foundation, Inc.); | | | | | | | | | | | | |
Series 2017, Ref. RB | | 5.00% | | | 06/01/2023 | | | $ | 185 | | | $ 185,415 |
Series 2017, Ref. RB | | 5.00% | | | 06/01/2024 | | | | 195 | | | 197,298 |
Series 2017, Ref. RB | | 5.00% | | | 06/01/2025 | | | | 205 | | | 209,649 |
Genesee County Funding Corp. (The) (Rochester Regional Health Obligated Group); | | | | | | | | | | | | |
Series 2022 A, Ref. RB | | 5.00% | | | 12/01/2035 | | | | 600 | | | 633,524 |
Series 2022 A, Ref. RB | | 5.00% | | | 12/01/2039 | | | | 2,070 | | | 2,109,248 |
Series 2022 A, Ref. RB | | 5.00% | | | 12/01/2040 | | | | 2,170 | | | 2,200,720 |
| | | | |
Glen Cove Local Economic Assistance Corp. (Tiegerman School); Series 2018 A-1, RB (Acquired 06/26/2018; Cost $1,190,000)(c)(d) | | 4.75% | | | 07/01/2028 | | | | 1,190 | | | 1,135,677 |
| | | | |
Hempstead Town Local Development Corp. (Adelphi University); Series 2013, RB | | 5.00% | | | 09/01/2043 | | | | 5,000 | | | 5,014,248 |
| | | | |
Hempstead Town Local Development Corp. (Evergreen Charter School); Series 2019, Ref. RB(c) | | 6.15% | | | 12/01/2029 | | | | 2,470 | | | 2,501,409 |
Hempstead Town Local Development Corp. (Molloy College); | | | | | | | | | | | | |
Series 2014, RB | | 5.00% | | | 07/01/2034 | | | | 1,800 | | | 1,824,814 |
Series 2017, Ref. RB | | 5.00% | | | 07/01/2029 | | | | 200 | | | 208,968 |
Series 2017, Ref. RB | | 5.00% | | | 07/01/2030 | | | | 170 | | | 177,091 |
Series 2017, Ref. RB | | 5.00% | | | 07/01/2031 | | | | 150 | | | 156,061 |
Series 2017, Ref. RB | | 5.00% | | | 07/01/2032 | | | | 275 | | | 285,582 |
Hudson Yards Infrastructure Corp.; | | | | | | | | | | | | |
Series 2017 A, Ref. RB | | 5.00% | | | 02/15/2042 | | | | 2,125 | | | 2,214,651 |
Series 2017 A, Ref. RB | | 4.00% | | | 02/15/2044 | | | | 4,000 | | | 3,740,366 |
Series 2017 A, Ref. RB (INS - AGM)(b) | | 4.00% | | | 02/15/2047 | | | | 6,000 | | | 5,533,303 |
Hudson Yards Infrastructure Corp. (Green Bonds); | | | | | | | | | | | | |
Series 2021 A, Ref. RB | | 4.00% | | | 02/15/2041 | | | | 10,000 | | | 9,877,095 |
Series 2021 A, Ref. RB | | 4.00% | | | 02/15/2042 | | | | 6,500 | | | 6,382,093 |
Long Island (City of), NY Power Authority; | | | | | | | | | | | | |
Series 2014 A, Ref. RB | | 5.00% | | | 09/01/2034 | | | | 1,000 | | | 1,018,303 |
Series 2014 A, Ref. RB | | 5.00% | | | 09/01/2044 | | | | 17,000 | | | 17,143,376 |
Series 2016 B, Ref. RB | | 5.00% | | | 09/01/2034 | | | | 6,635 | | | 6,960,264 |
Series 2018, RB | | 5.00% | | | 09/01/2035 | | | | 11,000 | | | 12,023,153 |
Series 2020 A, Ref. RB | | 4.00% | | | 09/01/2039 | | | | 1,650 | | | 1,660,676 |
Series 2020 A, Ref. RB | | 4.00% | | | 09/01/2040 | | | | 215 | | | 215,378 |
Series 2021 B, Ref. RB(e) | | 1.50% | | | 09/01/2026 | | | | 1,750 | | | 1,617,799 |
Metropolitan Transportation Authority; | | | | | | | | | | | | |
Series 2008 B-1, Ref. RB | | 5.00% | | | 11/15/2029 | | | | 1,500 | | | 1,515,960 |
Series 2012 B, RB | | 4.25% | | | 11/15/2039 | | | | 340 | | | 319,916 |
Series 2013 B, RB | | 5.00% | | | 11/15/2033 | | | | 5,055 | | | 5,059,223 |
Series 2013 B, RB | | 5.00% | | | 11/15/2038 | | | | 5,000 | | | 4,985,698 |
Series 2013 E, RB | | 5.00% | | | 11/15/2038 | | | | 5,385 | | | 5,369,597 |
| | | | |
Metropolitan Transportation Authority (Green Bonds); Series 2017 B-2, RB | | 5.00% | | | 11/15/2034 | | | | 1,875 | | | 2,024,561 |
| | | | |
Monroe County Industrial Development Corp. (Highland Hospital of Rochester); Series 2015, Ref. RB | | 5.00% | | | 07/01/2026 | | | | 350 | | | 360,962 |
| | | | |
Monroe County Industrial Development Corp. (Nazareth College of Rochester); Series 2017, Ref. RB | | 4.00% | | | 10/01/2034 | | | | 600 | | | 585,241 |
Monroe County Industrial Development Corp. (Rochester General Hospital (The)); | | | | | | | | | | | | |
Series 2013 A, Ref. RB | | 5.00% | | | 12/01/2026 | | | | 400 | | | 400,401 |
Series 2013 A, Ref. RB | | 5.00% | | | 12/01/2027 | | | | 345 | | | 345,359 |
Series 2013 A, Ref. RB | | 5.00% | | | 12/01/2028 | | | | 1,315 | | | 1,316,425 |
Series 2013 A, Ref. RB | | 5.00% | | | 12/01/2037 | | | | 1,100 | | | 1,100,560 |
Series 2013 A, Ref. RB | | 5.00% | | | 12/01/2042 | | | | 4,385 | | | 4,385,713 |
Series 2017, RB | | 5.00% | | | 12/01/2029 | | | | 1,000 | | | 1,044,064 |
Series 2017, RB | | 5.00% | | | 12/01/2034 | | | | 1,100 | | | 1,137,845 |
Series 2017, RB | | 5.00% | | | 12/01/2035 | | | | 1,055 | | | 1,084,959 |
Series 2017, RB | | 5.00% | | | 12/01/2036 | | | | 1,125 | | | 1,151,351 |
Monroe County Industrial Development Corp. (Rochester Regional Health); | | | | | | | | | | | | |
Series 2020, Ref. RB | | 5.00% | | | 12/01/2032 | | | | 535 | | | 576,657 |
Series 2020, Ref. RB | | 5.00% | | | 12/01/2033 | | | | 1,815 | | | 1,950,027 |
Series 2020, Ref. RB | | 5.00% | | | 12/01/2034 | | | | 1,000 | | | 1,065,967 |
| | | | |
Monroe County Industrial Development Corp. (Rochester Schools Modernization); Series 2013, RB | | 5.00% | | | 05/01/2028 | | | | 1,000 | | | 1,002,646 |
| | | | |
Monroe County Industrial Development Corp. (St. Ann’s Community); Series 2019, Ref. RB | | 4.00% | | | 01/01/2030 | | | | 4,600 | | | 4,102,190 |
See accompanying Notes to Financial Statements which are an integral part of the financial statements.
| | |
| 10 | | Invesco Rochester® Limited Term New York Municipal Fund |
| | | | | | | | | | | | |
| | | Interest Rate | | Maturity Date | | | Principal Amount (000) | | | Value |
New York–(continued) | | | | | | | | | | | | |
Monroe County Industrial Development Corp. (St. John Fisher College); | | | | | | | | | | | | |
Series 2012 A, Ref. RB | | 5.00% | | | 06/01/2023 | | | $ | 615 | | | $ 615,709 |
Series 2014 A, RB | | 5.50% | | | 06/01/2039 | | | | 1,500 | | | 1,526,940 |
Nassau (County of), NY; | | | | | | | | | | | | |
Series 2016 C, GO Bonds | | 5.00% | | | 04/01/2029 | | | | 3,160 | | | 3,314,184 |
Series 2017 B, GO Bonds | | 5.00% | | | 04/01/2031 | | | | 365 | | | 393,718 |
Series 2018 B, GO Bonds (INS - AGM)(b) | | 5.00% | | | 07/01/2036 | | | | 5,850 | | | 6,313,724 |
Series 2018 B, GO Bonds (INS - AGM)(b) | | 5.00% | | | 07/01/2038 | | | | 5,450 | | | 5,786,774 |
Series 2018 B, GO Bonds (INS - AGM)(b) | | 5.00% | | | 07/01/2039 | | | | 4,775 | | | 5,052,741 |
Series 2018 B, GO Bonds (INS - AGM)(b) | | 5.00% | | | 07/01/2045 | | | | 4,000 | | | 4,174,918 |
Series 2019 B, GO Bonds (INS - AGM)(b) | | 5.00% | | | 04/01/2039 | | | | 2,895 | | | 3,138,018 |
Series 2021 A, GO Bonds (INS - AGM)(b) | | 4.00% | | | 04/01/2040 | | | | 5,725 | | | 5,555,487 |
Series 2021 A, GO Bonds (INS - AGM)(b) | | 4.00% | | | 04/01/2041 | | | | 5,960 | | | 5,739,896 |
Series 2021 A, GO Bonds (INS - AGM)(b) | | 4.00% | | | 04/01/2042 | | | | 6,205 | | | 5,853,530 |
Series 2021 A, GO Bonds (INS - AGM)(b) | | 4.00% | | | 04/01/2043 | | | | 6,460 | | | 6,060,866 |
Nassau County Local Economic Assistance Corp. (Catholic Health Services of Long Island Obligated Group); | | | | | | | | | | | | |
Series 2014, RB | | 5.00% | | | 07/01/2030 | | | | 1,500 | | | 1,531,062 |
Series 2014, RB | | 5.00% | | | 07/01/2032 | | | | 660 | | | 672,976 |
| | | | |
Nassau County Local Economic Assistance Corp. (Hispanic Counseling Center, Inc.); Series 2018 A-2, Ref. RB | | 4.70% | | | 12/01/2028 | | | | 1,320 | | | 1,145,334 |
| | | | |
Nassau County Tobacco Settlement Corp.; Series 2006 A-2, RB | | 5.25% | | | 06/01/2026 | | | | 1,808 | | | 1,775,758 |
| | | | |
New Rochelle (City of), NY (70 Nardozzi/City DPW); Series 2018 A-1, RB(c) | | 4.20% | | | 08/01/2028 | | | | 2,690 | | | 2,286,818 |
New Rochelle (City of), NY (Iona College); | | | | | | | | | | | | |
Series 2015 A, Ref. RB | | 5.00% | | | 07/01/2025 | | | | 325 | | | 334,262 |
Series 2015 A, Ref. RB | | 5.00% | | | 07/01/2029 | | | | 1,100 | | | 1,138,210 |
New York & New Jersey (States of) Port Authority; | | | | | | | | | | | | |
One Hudred Eighty Four Series 2014, RB | | 5.00% | | | 09/01/2039 | | | | 2,500 | | | 2,537,013 |
One Hundred Eighty Third Series 2014, RB | | 5.00% | | | 12/15/2026 | | | | 850 | | | 869,061 |
One Hundred Eighty Third Series 2014, RB | | 4.00% | | | 12/15/2040 | | | | 10,000 | | | 9,719,683 |
One Ninety Third Series 2015, Ref. RB(a) | | 5.00% | | | 10/15/2033 | | | | 5,000 | | | 5,099,836 |
One Seventy Eighth Series 2013, RB(a) | | 5.00% | | | 12/01/2031 | | | | 10,000 | | | 10,079,156 |
Series 2012, RB | | 5.00% | | | 07/15/2030 | | | | 1,250 | | | 1,251,862 |
Series 2012, RB | | 4.50% | | | 07/15/2031 | | | | 220 | | | 220,276 |
Series 2012, RB | | 4.50% | | | 07/15/2036 | | | | 1,500 | | | 1,501,228 |
Series 2012, RB | | 4.00% | | | 07/15/2037 | | | | 1,000 | | | 993,221 |
Series 2012, RB | | 4.00% | | | 07/15/2038 | | | | 200 | | | 196,595 |
Series 2013 178, RB(a) | | 5.00% | | | 12/01/2032 | | | | 10,000 | | | 10,077,684 |
Series 2013 178, RB(a) | | 5.00% | | | 12/01/2033 | | | | 5,000 | | | 5,038,106 |
Series 2013 178, RB(a) | | 5.00% | | | 12/01/2038 | | | | 4,890 | | | 4,907,197 |
Series 2013 179, RB | | 5.00% | | | 12/01/2027 | | | | 275 | | | 278,661 |
Series 2014 185, RB(a) | | 5.00% | | | 09/01/2026 | | | | 12,500 | | | 12,750,731 |
Series 2014 186, Ref. RB(a) | | 5.00% | | | 10/15/2031 | | | | 3,775 | | | 3,833,505 |
Series 2015, Ref. RB(a) | | 5.00% | | | 10/15/2034 | | | | 2,305 | | | 2,344,727 |
Series 2016, Ref. RB(a) | | 5.00% | | | 04/01/2036 | | | | 10,230 | | | 10,400,333 |
Series 2018 207, Ref. RB(a) | | 5.00% | | | 09/15/2030 | | | | 3,385 | | | 3,601,419 |
Series 2018 207, Ref. RB(a) | | 5.00% | | | 09/15/2032 | | | | 1,555 | | | 1,649,667 |
Series 2019 217, RB | | 4.00% | | | 11/01/2039 | | | | 3,750 | | | 3,663,343 |
Series 2019 218, RB(a) | | 5.00% | | | 11/01/2039 | | | | 9,000 | | | 9,481,747 |
Two Hundred Second Series 2017, Ref. RB(a) | | 5.00% | | | 04/15/2037 | | | | 12,235 | | | 12,658,709 |
Two Hundred Sixth Series 2017, Ref. RB(a) | | 5.00% | | | 11/15/2042 | | | | 5,000 | | | 5,119,701 |
See accompanying Notes to Financial Statements which are an integral part of the financial statements.
| | |
| 11 | | Invesco Rochester® Limited Term New York Municipal Fund |
| | | | | | | | | | | | | | |
| | | Interest Rate | | | Maturity Date | | | Principal Amount (000) | | | Value |
New York–(continued) | | | | | | | | | | | | | | |
New York (City of), NY; | | | | | | | | | | | | | | |
Series 1990 I, GO Bonds | | | 7.75% | | | | 08/15/2027 | | | $ | 45 | | | $ 45,995 |
Series 1996 J, GO Bonds | | | 5.50% | | | | 02/15/2026 | | | | 5 | | | 5,010 |
Series 1996 J, GO Bonds (INS - FGIC)(b) | | | 5.50% | | | | 02/15/2026 | | | | 10 | | | 10,021 |
Series 1997 C, GO Bonds (INS - NATL)(b) | | | 5.50% | | | | 11/15/2037 | | | | 10 | | | 10,019 |
Series 2002 D, GO Bonds | | | 5.50% | | | | 06/01/2028 | | | | 5 | | | 5,009 |
Series 2005 O, GO Bonds | | | 5.00% | | | | 06/01/2023 | | | | 5 | | | 5,007 |
Series 2012 B, GO Bonds | | | 5.00% | | | | 08/01/2024 | | | | 500 | | | 500,750 |
Series 2012 B, GO Bonds | | | 5.00% | | | | 08/01/2025 | | | | 325 | | | 325,527 |
Series 2012 I, GO Bonds(e)(f) | | | 5.00% | | | | 04/13/2023 | | | | 1,055 | | | 1,057,091 |
Series 2012 I, GO Bonds | | | 5.00% | | | | 08/01/2023 | | | | 3,120 | | | 3,124,592 |
Series 2013 D, GO Bonds(e)(f) | | | 5.00% | | | | 04/13/2023 | | | | 5,000 | | | 5,009,910 |
Series 2013 D, GO Bonds(e)(f) | | | 5.00% | | | | 04/13/2023 | | | | 26,090 | | | 26,141,710 |
Series 2013 E, GO Bonds(e)(f) | | | 5.00% | | | | 04/13/2023 | | | | 13,000 | | | 13,025,766 |
Series 2013 E, GO Bonds(e)(f) | | | 5.00% | | | | 04/13/2023 | | | | 18,760 | | | 18,797,182 |
Series 2016 B-1, GO Bonds | | | 5.00% | | | | 12/01/2041 | | | | 7,775 | | | 8,060,751 |
Subseries 2013 A-1, GO Bonds | | | 5.00% | | | | 08/01/2029 | | | | 6,455 | | | 6,496,414 |
Subseries 2013 A-1, GO Bonds | | | 5.25% | | | | 08/01/2030 | | | | 250 | | | 251,879 |
Subseries 2013 A-1, GO Bonds | | | 5.00% | | | | 08/01/2037 | | | | 15,240 | | | 15,320,822 |
Subseries 2013 D-3, GO Bonds | | | 5.00% | | | | 08/01/2038 | | | | 30,000 | | | 30,138,120 |
New York (City of), NY Educational Construction Fund; | | | | | | | | | | | | | | |
Series 2021 A, Ref. RB | | | 4.00% | | | | 04/01/2039 | | | | 6,560 | | | 6,472,680 |
Series 2021 A, Ref. RB | | | 4.00% | | | | 04/01/2040 | | | | 6,825 | | | 6,704,245 |
Series 2021 A, Ref. RB | | | 4.00% | | | | 04/01/2041 | | | | 7,095 | | | 6,962,839 |
New York (City of), NY Industrial Development Agency (Yankee Stadium); | | | | | | | | | | | | | | |
Series 2006, RB (CPI Rate + 0.85%)(g) | | | 7.26% | | | | 03/01/2023 | | | | 6,550 | | | 6,550,000 |
Series 2006, RB (CPI Rate + 0.86%) (INS - NATL)(b)(g) | | | 7.27% | | | | 03/01/2024 | | | | 195 | | | 197,515 |
Series 2006, RB (CPI Rate + 0.87%) (INS - FGIC)(b)(g) | | | 7.28% | | | | 03/01/2025 | | | | 200 | | | 201,460 |
Series 2006, RB (CPI Rate + 0.88%) (INS - FGIC)(b)(g) | | | 7.29% | | | | 03/01/2026 | | | | 985 | | | 998,795 |
Series 2006, RB (CPI Rate + 0.89%) (INS - FGIC)(b)(g) | | | 7.30% | | | | 03/01/2027 | | | | 1,000 | | | 1,020,587 |
Series 2020, Ref. RB (INS - AGM)(b) | | | 4.00% | | | | 03/01/2045 | | | | 7,930 | | | 7,379,877 |
New York (City of), NY Municipal Water Finance Authority; | | | | | | | | | | | | | | |
Series 2013 DD, RB | | | 5.00% | | | | 06/15/2034 | | | | 11,225 | | | 11,268,865 |
Series 2013 DD, RB | | | 5.00% | | | | 06/15/2038 | | | | 12,000 | | | 12,043,446 |
Series 2013 EE, RB | | | 5.00% | | | | 06/15/2035 | | | | 90 | | | 90,334 |
Series 2015 FF, Ref. RB | | | 5.00% | | | | 06/15/2039 | | | | 10,950 | | | 11,276,557 |
Series 2018 DD-2, Ref. RB | | | 5.00% | | | | 06/15/2040 | | | | 4,000 | | | 4,268,386 |
Series 2019 CC-1, RB | | | 4.00% | | | | 06/15/2040 | | | | 7,150 | | | 7,048,344 |
Series 2019 DD, RB | | | 5.00% | | | | 06/15/2025 | | | | 225 | | | 228,097 |
Series 2020 AA-2, RB | | | 4.00% | | | | 06/15/2043 | | | | 2,330 | | | 2,271,747 |
Series 2020 EE, Ref. RB | | | 4.00% | | | | 06/15/2042 | | | | 6,585 | | | 6,446,809 |
Subseries 2019 FF-2, Ref. RB | | | 4.00% | | | | 06/15/2037 | | | | 12,245 | | | 12,280,016 |
New York (City of), NY Transitional Finance Authority; | | | | | | | | | | | | | | |
Series 2013 I, RB(e)(f) | | | 5.00% | | | | 05/01/2023 | | | | 18,575 | | | 18,629,698 |
Series 2013 I, RB(e)(f) | | | 5.00% | | | | 05/01/2023 | | | | 500 | | | 501,472 |
Series 2014 D1, RB | | | 5.00% | | | | 02/01/2036 | | | | 10,000 | | | 10,137,256 |
Series 2014 D1, RB | | | 5.00% | | | | 02/01/2038 | | | | 10,000 | | | 10,118,332 |
Series 2014 D1, RB | | | 5.00% | | | | 02/01/2040 | | | | 18,300 | | | 18,501,737 |
Series 2014, RB | | | 5.00% | | | | 02/01/2033 | | | | 1,000 | | | 1,015,171 |
Series 2015 S, RB | | | 5.00% | | | | 07/15/2040 | | | | 15,815 | | | 16,203,023 |
Series 2015 S-1, RB | | | 5.00% | | | | 07/15/2040 | | | | 7,185 | | | 7,316,188 |
Series 2016 A-1, RB | | | 5.00% | | | | 05/01/2037 | | | | 3,085 | | | 3,224,058 |
Series 2017 A-E-1, RB | | | 5.00% | | | | 02/01/2038 | | | | 7,980 | | | 8,404,904 |
Series 2017 F-1, RB | | | 5.00% | | | | 05/01/2042 | | | | 21,840 | | | 22,900,419 |
Series 2018 C-2, RB | | | 5.00% | | | | 05/01/2038 | | | | 5,000 | | | 5,338,949 |
Series 2018 S-1, RB | | | 5.00% | | | | 07/15/2043 | | | | 8,465 | | | 8,939,638 |
Series 2018 S-3, RB | | | 5.00% | | | | 07/15/2037 | | | | 2,450 | | | 2,643,010 |
Series 2019, RB | | | 4.00% | | | | 11/01/2040 | | | | 11,590 | | | 11,394,230 |
See accompanying Notes to Financial Statements which are an integral part of the financial statements.
| | |
| 12 | | Invesco Rochester® Limited Term New York Municipal Fund |
| | | | | | | | | | | | |
| | | Interest Rate | | Maturity Date | | | Principal Amount (000) | | | Value |
New York–(continued) | | | | | | | | | | | | |
Subseries 2013 F-1, RB(e)(f) | | 5.00% | | | 03/30/2023 | | | $ | 1,775 | | | $ 1,777,468 |
Subseries 2016 E-1, RB | | 5.00% | | | 02/01/2037 | | | | 3,905 | | | 4,064,681 |
Subseries 2018 A-1, RB | | 5.00% | | | 08/01/2037 | | | | 1,655 | | | 1,786,156 |
Subseries 2018 A-1, RB | | 5.00% | | | 08/01/2038 | | | | 10,000 | | | 10,707,887 |
Subseries 2018 A-1, RB | | 5.00% | | | 08/01/2040 | | | | 1,760 | | | 1,874,347 |
Subseries 2018 S-3, Ref. RB | | 5.00% | | | 07/15/2036 | | | | 15,000 | | | 16,247,595 |
| | | | |
New York (City of), NY Trust for Cultural Resources (American Museum of Natural History); Series 2014 A, Ref. RB | | 5.00% | | | 07/01/2041 | | | | 1,000 | | | 1,013,319 |
| | | | |
New York (City of), NY Trust for Cultural Resources (Lincoln Center for Performing Arts); Series 2020 A, Ref. RB | | 4.00% | | | 12/01/2035 | | | | 300 | | | 303,907 |
New York (State of) Dormitory Authority; | | | | | | | | | | | | |
Series 2012 F, RB (INS - AGM)(b) | | 5.00% | | | 10/01/2025 | | | | 110 | | | 110,150 |
Series 2012 F, RB (INS - AGM)(b) | | 5.00% | | | 10/01/2027 | | | | 35 | | | 35,046 |
Series 2012 F, RB (INS - AGM)(b) | | 5.00% | | | 10/01/2028 | | | | 5 | | | 5,007 |
Series 2012 G, RB(e)(f) | | 5.00% | | | 04/01/2023 | | | | 315 | | | 315,441 |
Series 2012, RB | | 5.00% | | | 10/01/2026 | | | | 140 | | | 140,186 |
Series 2012, RB | | 5.00% | | | 10/01/2026 | | | | 120 | | | 120,132 |
Series 2012, RB | | 5.00% | | | 10/01/2027 | | | | 65 | | | 65,071 |
Series 2012, RB | | 5.00% | | | 10/01/2028 | | | | 50 | | | 50,054 |
Series 2013, RB | | 5.75% | | | 07/01/2043 | | | | 7,055 | | | 7,088,458 |
Series 2014 E, Ref. RB (INS - AGM)(b) | | 5.00% | | | 10/01/2034 | | | | 1,000 | | | 1,026,361 |
Series 2015 A-1, Ref. RB(c) | | 4.80% | | | 12/01/2023 | | | | 445 | | | 435,526 |
Series 2015 B-C, RB | | 5.00% | | | 03/15/2036 | | | | 12,045 | | | 12,536,743 |
Series 2015 B-C, RB | | 5.00% | | | 03/15/2039 | | | | 5,000 | | | 5,179,457 |
Series 2015 B-C, RB | | 5.00% | | | 03/15/2040 | | | | 12,640 | | | 13,078,133 |
Series 2015 B-C, RB | | 5.00% | | | 03/15/2041 | | | | 10,520 | | | 10,871,738 |
Series 2015, Ref. RB(c) | | 5.00% | | | 12/01/2029 | | | | 1,000 | | | 1,004,615 |
Series 2016, Ref. RB(c) | | 5.00% | | | 12/01/2026 | | | | 4,910 | | | 4,890,553 |
Series 2018 A, RB | | 5.00% | | | 07/01/2040 | | | | 4,250 | | | 4,554,080 |
Series 2018 E, Ref. RB | | 5.00% | | | 03/15/2037 | | | | 8,000 | | | 8,661,111 |
Series 2018 E, Ref. RB | | 5.00% | | | 03/15/2039 | | | | 10,000 | | | 10,731,293 |
Series 2018 E, Ref. RB | | 5.00% | | | 03/15/2040 | | | | 5,000 | | | 5,349,657 |
Series 2020 A, Ref. RB | | 4.00% | | | 03/15/2043 | | | | 11,750 | | | 11,304,535 |
Series 2020 D, Ref. RB | | 4.00% | | | 02/15/2038 | | | | 2,000 | | | 1,993,145 |
Series 2020 D, Ref. RB | | 4.00% | | | 02/15/2039 | | | | 4,415 | | | 4,371,897 |
| | | | |
New York (State of) Dormitory Authority (Bidding Group 1); Series 2018 C, Ref. RB | | 5.00% | | | 03/15/2036 | | | | 2,000 | | | 2,162,069 |
| | | | |
New York (State of) Dormitory Authority (Bidding Group 3); Series 2018 A, RB | | 5.00% | | | 03/15/2038 | | | | 3,500 | | | 3,748,683 |
| | | | |
New York (State of) Dormitory Authority (Cerebral Palsy Affiliates Program - Jawonio, Inc.); Series 2017 A, RB(c) | | 4.63% | | | 12/01/2027 | | | | 1,030 | | | 899,411 |
New York (State of) Dormitory Authority (Cerebral Palsy Affiliates Program - United Cerebral Palsy Associations of New York State, Inc.); | | | | | | | | | | | | |
| | | | |
Series 2017 A-1, RB(c) | | 4.88% | | | 09/01/2027 | | | | 2,710 | | | 2,401,277 |
Series 2017 A-2, Ref. RB (Acquired 10/25/2017; Cost $1,370,000)(c)(d) | | 4.63% | | | 10/01/2027 | | | | 1,370 | | | 1,246,936 |
| | | | |
New York (State of) Dormitory Authority (Icahn School of Medicine at Mount Sinai); Series 2015 A, Ref. RB | | 5.00% | | | 07/01/2035 | | | | 2,395 | | | 2,446,087 |
New York (State of) Dormitory Authority (Maimonides Medical Center); | | | | | | | | | | | | |
Series 2020, RB (CEP - Federal Housing Administration) | | 4.00% | | | 02/01/2038 | | | | 300 | | | 303,497 |
Series 2020, RB (CEP - Federal Housing Administration) | | 4.00% | | | 02/01/2039 | | | | 400 | | | 401,536 |
Series 2020, RB (CEP - Federal Housing Administration) | | 4.00% | | | 02/01/2040 | | | | 400 | | | 398,754 |
| | | | |
New York (State of) Dormitory Authority (Memorial Sloan Kettering Cancer); Series 2017, Ref. RB | | 5.00% | | | 07/01/2042 | | | | 4,825 | | | 5,028,705 |
New York (State of) Dormitory Authority (Montefiore Obligated Group); | | | | | | | | | | | | |
Series 2018 A, Ref. RB | | 5.00% | | | 08/01/2025 | | | | 1,035 | | | 1,048,157 |
Series 2018 A, Ref. RB | | 5.00% | | | 08/01/2027 | | | | 1,000 | | | 1,024,570 |
Series 2018 A, Ref. RB | | 5.00% | | | 08/01/2028 | | | | 1,000 | | | 1,028,643 |
Series 2018 A, Ref. RB | | 5.00% | | | 08/01/2029 | | | | 1,000 | | | 1,026,996 |
Series 2018 A, Ref. RB | | 5.00% | | | 08/01/2033 | | | | 4,275 | | | 4,364,613 |
See accompanying Notes to Financial Statements which are an integral part of the financial statements.
| | |
| 13 | | Invesco Rochester® Limited Term New York Municipal Fund |
| | | | | | | | | | | | |
| | | Interest Rate | | Maturity Date | | | Principal Amount (000) | | | Value |
New York–(continued) | | | | | | | | | | | | |
New York (State of) Dormitory Authority (New School (The)); | | | | | | | | | | | | |
Series 2016 A, Ref. RB | | 5.00% | | | 07/01/2029 | | | $ | 1,000 | | | $ 1,052,403 |
Series 2016 A, Ref. RB | | 5.00% | | | 07/01/2030 | | | | 1,800 | | | 1,892,524 |
Series 2022 A, Ref. RB | | 5.00% | | | 07/01/2037 | | | | 710 | | | 768,254 |
Series 2022 A, Ref. RB | | 5.00% | | | 07/01/2038 | | | | 1,150 | | | 1,230,380 |
Series 2022 A, Ref. RB | | 5.00% | | | 07/01/2039 | | | | 750 | | | 792,691 |
Series 2022 A, Ref. RB | | 5.00% | | | 07/01/2040 | | | | 1,000 | | | 1,051,287 |
| | | | |
New York (State of) Dormitory Authority (New York University); Series 2017 A, Ref. RB | | 5.00% | | | 07/01/2043 | | | | 260 | | | 278,299 |
| | | | |
New York (State of) Dormitory Authority (NYU Hospitals Center); Series 2015, Ref. RB | | 5.00% | | | 07/01/2028 | | | | 140 | | | 143,464 |
New York (State of) Dormitory Authority (Orange Regional Medical Center); | | | | | | | | | | | | |
Series 2017, Ref. RB(c) | | 5.00% | | | 12/01/2023 | | | | 2,800 | | | 2,803,926 |
Series 2017, Ref. RB(c) | | 5.00% | | | 12/01/2025 | | | | 1,300 | | | 1,304,998 |
Series 2017, Ref. RB(c) | | 5.00% | | | 12/01/2026 | | | | 1,500 | | | 1,508,341 |
Series 2017, Ref. RB(c) | | 5.00% | | | 12/01/2027 | | | | 1,300 | | | 1,308,790 |
Series 2017, Ref. RB(c) | | 5.00% | | | 12/01/2036 | | | | 1,300 | | | 1,267,808 |
New York (State of) Dormitory Authority (Rochester Institute of Technology); | | | | | | | | | | | | |
Series 2019 A, RB | | 4.00% | | | 07/01/2044 | | | | 4,000 | | | 3,718,716 |
Series 2019 A, RB | | 5.00% | | | 07/01/2049 | | | | 5,000 | | | 5,285,060 |
New York (State of) Dormitory Authority (Rockefeller University); | | | | | | | | | | | | |
Series 2022 A, Ref. RB | | 5.00% | | | 07/01/2036 | | | | 1,250 | | | 1,414,869 |
Series 2022 A, Ref. RB | | 5.00% | | | 07/01/2037 | | | | 800 | | | 897,498 |
New York (State of) Dormitory Authority (School Districts Revenue Bond Financing Program); | | | | | | | | | | | | |
Series 2013 A, RB (INS - AGM)(b) | | 5.00% | | | 10/01/2026 | | | | 2,740 | | | 2,768,163 |
Series 2013 A, RB (INS - AGM)(b) | | 5.00% | | | 10/01/2027 | | | | 2,485 | | | 2,510,542 |
Series 2013 C, RB | | 5.00% | | | 10/01/2026 | | | | 1,665 | | | 1,682,018 |
Series 2013 C, RB | | 5.00% | | | 10/01/2027 | | | | 1,885 | | | 1,904,266 |
Series 2013 E, RB (INS - AGM)(b) | | 5.00% | | | 10/01/2026 | | | | 3,190 | | | 3,222,788 |
| | | | |
New York (State of) Dormitory Authority (St. John’s University); Series 2015 A, Ref. RB | | 5.00% | | | 07/01/2037 | | | | 4,245 | | | 4,355,472 |
New York (State of) Dormitory Authority (St. Joseph’s College); | | | | | | | | | | | | |
Series 2021, RB | | 5.00% | | | 07/01/2023 | | | | 60 | | | 60,171 |
Series 2021, RB | | 5.00% | | | 07/01/2024 | | | | 100 | | | 101,163 |
Series 2021, RB | | 5.00% | | | 07/01/2025 | | | | 90 | | | 91,959 |
Series 2021, RB | | 5.00% | | | 07/01/2026 | | | | 100 | | | 103,289 |
Series 2021, RB | | 5.00% | | | 07/01/2027 | | | | 120 | | | 124,923 |
Series 2021, RB | | 5.00% | | | 07/01/2028 | | | | 75 | | | 78,805 |
Series 2021, RB | | 5.00% | | | 07/01/2029 | | | | 100 | | | 105,916 |
Series 2021, RB | | 5.00% | | | 07/01/2030 | | | | 75 | | | 79,959 |
Series 2021, RB | | 4.00% | | | 07/01/2035 | | | | 200 | | | 190,982 |
New York (State of) Dormitory Authority (State University of New York Dormitory Facilities); | | | | | | | | | | | | |
Series 2018 A, RB | | 5.00% | | | 07/01/2036 | | | | 3,060 | | | 3,299,465 |
Series 2018 A, RB | | 5.00% | | | 07/01/2038 | | | | 1,850 | | | 1,974,462 |
New York (State of) Dormitory Authority (Wagner College); | | | | | | | | | | | | |
Series 2022, Ref. RB | | 5.00% | | | 07/01/2034 | | | | 1,330 | | | 1,395,405 |
Series 2022, Ref. RB | | 5.00% | | | 07/01/2036 | | | | 735 | | | 756,363 |
| | | | |
New York (State of) Housing Finance Agency; Series 2020 C, RB (CEP - Federal Housing Administration) | | 4.10% | | | 11/01/2041 | | | | 8,950 | | | 8,492,855 |
| | | | |
New York (State of) Housing Finance Agency (Division Street); Series 2006 A, RB(a) | | 5.00% | | | 02/15/2026 | | | | 150 | | | 150,159 |
| | | | |
New York (State of) Housing Finance Agency (Secured Mortgage Program); Series 2001 A, RB(a) | | 5.60% | | | 08/15/2033 | | | | 1,145 | | | 1,146,742 |
New York (State of) Housing Finance Agency (Sustainability Bonds); | | | | | | | | | | | | |
Series 2019, RB | | 1.63% | | | 05/01/2023 | | | | 1,040 | | | 1,036,703 |
Series 2021 D-2, RB(e) | | 0.65% | | | 11/01/2025 | | | | 4,000 | | | 3,639,115 |
| | | | |
New York (State of) Housing Finance Agency (Tri-Senior Development Housing); Series 2007 A, RB (LOC - Fannie Mae)(a)(h) | | 5.10% | | | 11/15/2023 | | | | 290 | | | 294,604 |
| | | | |
New York (State of) Power Authority (Green Transmission); Series 2022, RB (INS - AGM)(b) | | 4.00% | | | 11/15/2042 | | | | 5,000 | | | 4,758,036 |
New York (State of) Thruway Authority; | | | | | | | | | | | | |
Series 2016 A, RB | | 5.00% | | | 01/01/2041 | | | | 5,455 | | | 5,594,460 |
Series 2018 L, Ref. RB | | 5.00% | | | 01/01/2035 | | | | 3,995 | | | 4,332,933 |
Series 2022, RB(i)(j) | | 4.00% | | | 03/15/2043 | | | | 24,500 | | | 23,539,262 |
See accompanying Notes to Financial Statements which are an integral part of the financial statements.
| | |
| 14 | | Invesco Rochester® Limited Term New York Municipal Fund |
| | | | | | | | | | | | |
| | | Interest Rate | | Maturity Date | | | Principal Amount (000) | | | Value |
New York–(continued) | | | | | | | | | | | | |
New York (State of) Utility Debt Securitization Authority; | | | | | | | | | | | | |
Series 2013 TE, RB | | 5.00% | | | 12/15/2026 | | | $ | 2,500 | | | $ 2,531,875 |
Series 2013 TE, RB | | 5.00% | | | 12/15/2029 | | | | 1,500 | | | 1,519,826 |
Series 2015, Ref. RB | | 5.00% | | | 12/15/2032 | | | | 15,000 | | | 15,705,469 |
Series 2015, Ref. RB | | 5.00% | | | 12/15/2036 | | | | 5,230 | | | 5,441,947 |
Series 2017, RB | | 5.00% | | | 12/15/2040 | | | | 13,260 | | | 14,264,810 |
New York City Health and Hospitals Corp.; | | | | | | | | | | | | |
Series 2021 A, Ref. RB | | 5.00% | | | 02/15/2038 | | | | 690 | | | 748,795 |
Series 2021 A, Ref. RB | | 5.00% | | | 02/15/2040 | | | | 1,615 | | | 1,726,854 |
New York City Housing Development Corp.; | | | | | | | | | | | | |
Series 1999 E, RB | | 6.25% | | | 05/01/2036 | | | | 35 | | | 35,075 |
Series 2013 L-2-A, RB | | 3.60% | | | 11/01/2033 | | | | 2,445 | | | 2,403,822 |
Series 2014 E, RB | | 3.40% | | | 11/01/2029 | | | | 685 | | | 681,791 |
| | | | |
New York City Housing Development Corp. (Ocean Gate Development); Series 2007 B, RB(a) | | 5.35% | | | 06/01/2025 | | | | 1,095 | | | 1,100,213 |
| | | | |
New York City Housing Development Corp. (Sustainable development Bonds); Series 2022 F-2A, RB(e) | | 3.40% | | | 12/22/2026 | | | | 7,500 | | | 7,378,960 |
New York City Housing Development Corp. (Sustainable Neighborhood); | | | | | | | | | | | | |
Series 2017 E, RB | | 3.05% | | | 11/01/2032 | | | | 2,000 | | | 1,856,981 |
Series 2018 L, RB(e) | | 2.75% | | | 12/29/2023 | | | | 1,885 | | | 1,872,993 |
| | | | |
New York Convention Center Development Corp. (Hotel Unit Fee Secured); Series 2015, Ref. RB | | 5.00% | | | 11/15/2040 | | | | 16,005 | | | 16,362,707 |
New York Counties Tobacco Trust I; | | | | | | | | | | | | |
Series 2000 A, RB | | 6.50% | | | 06/01/2035 | | | | 1,580 | | | 1,580,752 |
Series 2000 A, RB | | 6.63% | | | 06/01/2042 | | | | 3,295 | | | 3,296,346 |
New York Counties Tobacco Trust II; | | | | | | | | | | | | |
Series 2001, RB | | 5.63% | | | 06/01/2035 | | | | 25 | | | 25,499 |
Series 2001, RB | | 5.75% | | | 06/01/2043 | | | | 135 | | | 137,698 |
New York Counties Tobacco Trust IV; | | | | | | | | | | | | |
Series 2005 A, RB | | 4.75% | | | 06/01/2026 | | | | 1,465 | | | 1,443,706 |
Series 2010 A, RB(c) | | 6.25% | | | 06/01/2041 | | | | 5,005 | | | 5,006,855 |
New York Counties Tobacco Trust VI; | | | | | | | | | | | | |
Series 2016 A, Ref. RB | | 5.63% | | | 06/01/2035 | | | | 370 | | | 380,690 |
Series 2016 A, Ref. RB | | 6.75% | | | 06/01/2035 | | | | 7,085 | | | 7,173,576 |
Series 2016 A, Ref. RB | | 6.45% | | | 06/01/2040 | | | | 830 | | | 850,127 |
Series 2016 A, Ref. RB | | 6.00% | | | 06/01/2043 | | | | 8,065 | | | 8,198,361 |
Series 2016 A-1, Ref. RB | | 5.75% | | | 06/01/2043 | | | | 2,095 | | | 2,169,096 |
| | | | |
New York Liberty Development Corp.; Series 2021 1, Ref. RB | | 4.00% | | | 02/15/2043 | | | | 5,000 | | | 4,671,283 |
| | | | |
New York Liberty Development Corp. (Green Bonds) (4 World Trade Center); Series 2021 A, Ref. RB | | 1.90% | | | 11/15/2031 | | | | 2,500 | | | 1,995,184 |
New York State Environmental Facilities Corp.; | | | | | | | | | | | | |
Series 2004, RB | | 4.50% | | | 06/15/2024 | | | | 100 | | | 100,110 |
Series 2012 B, RB | | 5.00% | | | 08/15/2024 | | | | 2,355 | | | 2,358,558 |
Series 2013 A, RB | | 5.00% | | | 06/15/2031 | | | | 745 | | | 748,769 |
Series 2014, RB | | 5.00% | | | 11/15/2031 | | | | 5,000 | | | 5,111,031 |
| | | | |
New York State Environmental Facilities Corp. (Green Bonds); Series 2020, Ref. RB | | 4.00% | | | 10/15/2045 | | | | 4,100 | | | 3,976,328 |
New York State Environmental Facilities Corp. (New York City Municipal Water Finance Authority Projects - 2nd Resolution Bonds); | | | | | | | | | | | | |
Series 2004 C, RB | | 4.50% | | | 06/15/2030 | | | | 15 | | | 15,021 |
Series 2017 E, RB | | 5.00% | | | 06/15/2042 | | | | 12,375 | | | 13,224,690 |
Series 2018 B, RB | | 5.00% | | | 06/15/2038 | | | | 2,755 | | | 2,992,800 |
| | | | |
New York State Environmental Facilities Corp. (NYC Municipal Water Finance Authority); Series 2013 A, RB | | 5.00% | | | 06/15/2027 | | | | 5,060 | | | 5,085,596 |
| | | | |
New York State Environmental Facilities Corp. (State Clean Water & Drinking Water); Series 2021, RB | | 4.00% | | | 06/15/2039 | | | | 8,000 | | | 7,977,085 |
New York State Urban Development Corp.; | | | | | | | | | | | | |
Series 2013 A-1, RB(e)(f) | | 5.00% | | | 03/15/2023 | | | | 890 | | | 890,590 |
Series 2013 A-1, RB | | 5.00% | | | 03/15/2028 | | | | 250 | | | 250,280 |
Series 2013 C, RB | | 5.00% | | | 03/15/2032 | | | | 2,350 | | | 2,353,423 |
Series 2020 A, RB | | 4.00% | | | 03/15/2040 | | | | 1,695 | | | 1,659,001 |
Series 2020 C, Ref. RB | | 4.00% | | | 03/15/2037 | | | | 8,500 | | | 8,515,376 |
See accompanying Notes to Financial Statements which are an integral part of the financial statements.
| | |
| 15 | | Invesco Rochester® Limited Term New York Municipal Fund |
| | | | | | | | | | | | |
| | | Interest Rate | | Maturity Date | | | Principal Amount (000) | | | Value |
New York–(continued) | | | | | | | | | | | | |
New York State Urban Development Corp. (Bidding Group 3); | | | | | | | | | | | | |
Series 2021, Ref. RB | | 4.00% | | | 03/15/2043 | | | $ | 5,000 | | | $ 4,830,037 |
Series 2021, Ref. RB | | 4.00% | | | 03/15/2044 | | | | 5,000 | | | 4,799,885 |
New York Transportation Development Corp. (American Airlines, Inc.); | | | | | | | | | | | | |
Series 2016, Ref. RB(a) | | 5.00% | | | 08/01/2026 | | | | 14,785 | | | 14,791,464 |
Series 2016, Ref. RB(a) | | 5.00% | | | 08/01/2031 | | | | 2,500 | | | 2,502,291 |
Series 2021, Ref. RB(a) | | 2.25% | | | 08/01/2026 | | | | 3,255 | | | 3,033,798 |
New York Transportation Development Corp. (Delta Air Lines, Inc. LaGuardia Airport Terminals C&D Redevelopment); | | | | | | | | | | | | |
Series 2016 A, RB(a) | | 5.00% | | | 07/01/2034 | | | | 4,250 | | | 4,298,676 |
Series 2018, RB(a) | | 5.00% | | | 01/01/2034 | | | | 3,370 | | | 3,466,504 |
Series 2020, RB(a) | | 5.00% | | | 10/01/2035 | | | | 5,000 | | | 5,133,032 |
New York Transportation Development Corp. (LaGuardia Airport Terminal B Redevelopment); | | | | | | | | | | | | |
Series 2016 A, RB(a) | | 5.00% | | | 07/01/2030 | | | | 1,000 | | | 1,013,018 |
Series 2016 A, RB(a) | | 4.00% | | | 07/01/2033 | | | | 4,000 | | | 3,886,641 |
New York Transportation Development Corp. (Terminal 4 JFK International Airport); | | | | | | | | | | | | |
Series 2020 A, Ref. RB(a) | | 5.00% | | | 12/01/2034 | | | | 900 | | | 952,606 |
Series 2020 A, Ref. RB(a) | | 5.00% | | | 12/01/2036 | | | | 900 | | | 933,010 |
Series 2020 A, Ref. RB(a) | | 4.00% | | | 12/01/2038 | | | | 1,000 | | | 916,334 |
Series 2020, Ref. RB | | 5.00% | | | 12/01/2031 | | | | 1,100 | | | 1,208,591 |
Series 2020, Ref. RB | | 5.00% | | | 12/01/2035 | | | | 1,000 | | | 1,070,006 |
Series 2020, Ref. RB | | 5.00% | | | 12/01/2037 | | | | 1,000 | | | 1,057,414 |
Series 2022, RB(a) | | 5.00% | | | 12/01/2039 | | | | 10,000 | | | 10,307,703 |
| | | | |
Newburgh (City of), NY Industrial Development Agency (Bourne & Kenney Redevelopment Co. LLC); Series 1999 A, RB(a) | | 5.75% | | | 02/01/2032 | | | | 2,110 | | | 2,117,320 |
Niagara Falls (City of), NY; | | | | | | | | | | | | |
Series 2016, Ref. GO Bonds (INS - BAM)(b) | | 5.00% | | | 05/15/2028 | | | | 750 | | | 792,920 |
Series 2016, Ref. GO Bonds (INS - BAM)(b) | | 5.00% | | | 05/15/2029 | | | | 850 | | | 897,048 |
Niagara Frontier Transportation Authority (Buffalo Niagara International Airport); | | | | | | | | | | | | |
Series 2014, Ref. RB(a) | | 5.00% | | | 04/01/2026 | | | | 1,000 | | | 1,010,549 |
Series 2019, Ref. RB(a) | | 5.00% | | | 04/01/2023 | | | | 1,500 | | | 1,501,360 |
Series 2019, Ref. RB(a) | | 5.00% | | | 04/01/2024 | | | | 3,285 | | | 3,326,480 |
Series 2019, Ref. RB(a) | | 5.00% | | | 04/01/2031 | | | | 700 | | | 746,410 |
Series 2019, Ref. RB(a) | | 5.00% | | | 04/01/2033 | | | | 725 | | | 771,510 |
| | | | |
Niagara Tobacco Asset Securitization Corp.; Series 2014, Ref. RB | | 4.00% | | | 05/15/2029 | | | | 2,035 | | | 2,004,141 |
Oneida County Local Development Corp. (Mohawk Valley Health System); | | | | | | | | | | | | |
Series 2019, Ref. RB (INS - AGM)(b) | | 4.00% | | | 12/01/2034 | | | | 1,000 | | | 998,056 |
Series 2019, Ref. RB (INS - AGM)(b) | | 4.00% | | | 12/01/2035 | | | | 1,000 | | | 981,170 |
Series 2019, Ref. RB (INS - AGM)(b) | | 4.00% | | | 12/01/2036 | | | | 1,250 | | | 1,195,081 |
Series 2019, Ref. RB (INS - AGM)(b) | | 4.00% | | | 12/01/2037 | | | | 1,000 | | | 948,967 |
Oneida County Local Development Corp. (Utica College); | | | | | | | | | | | | |
Series 2019, Ref. RB | | 5.00% | | | 07/01/2024 | | | | 170 | | | 170,948 |
Series 2019, Ref. RB | | 5.00% | | | 07/01/2025 | | | | 355 | | | 357,848 |
Series 2019, Ref. RB | | 5.00% | | | 07/01/2026 | | | | 755 | | | 765,460 |
Onondaga (County of), NY Resource Recovery Agency; | | | | | | | | | | | | |
Series 2019, RB (INS - AGM)(a)(b) | | 5.00% | | | 05/01/2029 | | | | 780 | | | 836,281 |
Series 2019, RB (INS - AGM)(a)(b) | | 5.00% | | | 05/01/2030 | | | | 275 | | | 294,558 |
Series 2019, RB (INS - AGM)(a)(b) | | 5.00% | | | 05/01/2031 | | | | 350 | | | 374,776 |
Series 2019, RB (INS - AGM)(a)(b) | | 5.00% | | | 05/01/2032 | | | | 455 | | | 486,693 |
Series 2019, RB (INS - AGM)(a)(b) | | 5.00% | | | 05/01/2033 | | | | 475 | | | 507,822 |
Series 2019, RB (INS - AGM)(a)(b) | | 5.00% | | | 05/01/2034 | | | | 500 | | | 533,938 |
Onondaga (County of), NY Trust for Cultural Resources (Abby Lane Housing Corp.); | | | | | | | | | | | | |
Series 2017, Ref. RB | | 5.00% | | | 05/01/2027 | | | | 450 | | | 468,305 |
Series 2017, Ref. RB | | 5.00% | | | 05/01/2028 | | | | 600 | | | 623,939 |
Series 2017, Ref. RB | | 5.00% | | | 05/01/2029 | | | | 450 | | | 468,305 |
Series 2017, Ref. RB | | 5.00% | | | 05/01/2030 | | | | 835 | | | 867,016 |
Series 2017, Ref. RB | | 5.00% | | | 05/01/2032 | | | | 600 | | | 616,974 |
| | | | |
Onondaga Civic Development Corp.; Series 2015, Ref. RB | | 5.00% | | | 10/01/2025 | | | | 115 | | | 115,188 |
See accompanying Notes to Financial Statements which are an integral part of the financial statements.
| | |
| 16 | | Invesco Rochester® Limited Term New York Municipal Fund |
| | | | | | | | | | | | |
| | | Interest Rate | | Maturity Date | | | Principal Amount (000) | | | Value |
New York–(continued) | | | | | | | | | | | | |
Onondaga Civic Development Corp. (Le Moyne College); | | | | | | | | | | | | |
Series 2021, RB | | 4.00% | | | 07/01/2038 | | | $ | 150 | | | $ 139,847 |
Series 2021, RB | | 4.00% | | | 07/01/2041 | | | | 220 | | | 198,262 |
Otsego County Capital Resource Corp. (Hartwick College); | | | | | | | | | | | | |
Series 2015 A, Ref. RB | | 5.00% | | | 10/01/2023 | | | | 700 | | | 695,050 |
Series 2015 A, Ref. RB | | 5.00% | | | 10/01/2024 | | | | 660 | | | 647,440 |
| | | | |
Poughkeepsie (City of), NY; Series 2019, Ref. GO Bonds | | 5.00% | | | 06/01/2031 | | | | 600 | | | 625,264 |
| | | | |
Ramapo Local Development Corp.; Series 2013, Ref. RB | | 5.00% | | | 03/15/2028 | | | | 295 | | | 285,495 |
| | | | |
Rensselaer (County of), NY Industrial Development Agency (Franciscan Heights, L.P.); Series 2004 A, IDR (LOC - JP Morgan Chase Bank)(a)(h) | | 5.38% | | | 12/01/2025 | | | | 655 | | | 655,877 |
Rockland (County of), NY Solid Waste Management Authority (Green Bonds); | | | | | | | | | | | | |
Series 2021 A, RB(a) | | 5.00% | | | 12/15/2029 | | | | 675 | | | 741,778 |
Series 2021 A, RB(a) | | 5.00% | | | 12/15/2030 | | | | 585 | | | 648,584 |
Series 2021 A, RB(a) | | 5.00% | | | 12/15/2031 | | | | 235 | | | 263,297 |
Series 2021 A, RB(a) | | 5.00% | | | 12/15/2032 | | | | 750 | | | 832,099 |
Series 2021 A, RB(a) | | 5.00% | | | 12/15/2033 | | | | 750 | | | 836,790 |
| | | | |
Rockland Tobacco Asset Securitization Corp.; Series 2001, RB | | 5.63% | | | 08/15/2035 | | | | 45 | | | 45,744 |
| | | | |
Saratoga County Capital Resource Corp. (Skidmore College); Series 2014 B, Ref. RB | | 5.00% | | | 07/01/2024 | | | | 195 | | | 199,097 |
| | | | |
Schenectady County Capital Resource Corp. (Union College); Series 2017, Ref. RB | | 5.00% | | | 01/01/2040 | | | | 1,000 | | | 1,037,822 |
Spring Valley (Village of), NY; | | | | | | | | | | | | |
Series 2005, GO Bonds (INS - NATL)(a)(b) | | 5.00% | | | 05/01/2023 | | | | 335 | | | 335,447 |
Series 2005, GO Bonds (INS - NATL)(a)(b) | | 5.00% | | | 05/01/2024 | | | | 350 | | | 350,869 |
Series 2005, GO Bonds (INS - NATL)(a)(b) | | 5.00% | | | 05/01/2025 | | | | 365 | | | 365,577 |
St. Lawrence (County of), NY Industrial Development Agency (Clarkson University); | | | | | | | | | | | | |
Series 2017, Ref. RB | | 5.00% | | | 09/01/2028 | | | | 500 | | | 527,499 |
Series 2017, Ref. RB | | 5.00% | | | 09/01/2031 | | | | 690 | | | 726,535 |
Series 2021, Ref. RB | | 5.00% | | | 09/01/2030 | | | | 125 | | | 135,551 |
Series 2021, Ref. RB | | 5.00% | | | 09/01/2032 | | | | 120 | | | 129,974 |
Series 2021, Ref. RB | | 5.00% | | | 09/01/2034 | | | | 210 | | | 225,448 |
St. Lawrence (County of), NY Industrial Development Agency (St. Lawrence University); | | | | | | | | | | | | |
Series 2012, RB | | 5.00% | | | 07/01/2043 | | | | 8,870 | | | 8,881,449 |
Series 2016 A, Ref. RB | | 5.00% | | | 07/01/2028 | | | | 300 | | | 316,680 |
Series 2016 A, Ref. RB | | 5.00% | | | 07/01/2030 | | | | 785 | | | 828,469 |
Series 2016 A, Ref. RB | | 5.00% | | | 07/01/2031 | | | | 450 | | | 474,303 |
Suffern (Village of), NY; | | | | | | | | | | | | |
Series 2016, GO Bonds | | 5.00% | | | 03/15/2023 | | | | 310 | | | 310,200 |
Series 2016, GO Bonds | | 5.00% | | | 03/15/2026 | | | | 475 | | | 475,750 |
| | | | |
Suffolk County Economic Development Corp. (Family Residences and Essential Enterprises, Inc.); Series 2012 B-A, RB(c) | | 6.75% | | | 06/01/2027 | | | | 305 | | | 273,436 |
Sullivan (County of), NY (Adelaar Infratructure); | | | | | | | | | | | | |
Series 2016 A-1, RB(c) | | 4.85% | | | 11/01/2031 | | | | 12,075 | | | 11,335,912 |
Series 2016 B-1, RB(c) | | 4.85% | | | 11/01/2031 | | | | 1,735 | | | 1,628,804 |
Series 2016 C-1, RB(c) | | 4.85% | | | 11/01/2031 | | | | 1,690 | | | 1,586,558 |
Series 2016 D-1, RB(c) | | 4.85% | | | 11/01/2031 | | | | 1,110 | | | 1,042,059 |
Triborough Bridge & Tunnel Authority; | | | | | | | | | | | | |
Series 2012 A, RB(e)(f) | | 5.00% | | | 03/16/2023 | | | | 800 | | | 800,539 |
Series 2012 B, Ref. RB(e)(f) | | 5.00% | | | 03/16/2023 | | | | 275 | | | 275,185 |
Series 2012 B, Ref. RB | | 5.00% | | | 11/15/2023 | | | | 225 | | | 225,152 |
Series 2012 B, Ref. RB | | 5.00% | | | 11/15/2024 | | | | 1,000 | | | 1,000,674 |
Series 2013 A, Ref. RB(e)(f) | | 4.00% | | | 05/15/2023 | | | | 400 | | | 400,621 |
Series 2013 A, Ref. RB(e)(f) | | 5.00% | | | 05/15/2023 | | | | 1,000 | | | 1,003,549 |
Series 2013 B, Ref. RB | | 5.00% | | | 11/15/2027 | | | | 670 | | | 677,927 |
Series 2013 B, Ref. RB | | 5.00% | | | 11/15/2030 | | | | 3,000 | | | 3,035,495 |
Series 2013 C, RB(e)(f) | | 5.00% | | | 05/15/2023 | | | | 10,000 | | | 10,035,487 |
Series 2014 A, RB | | 5.00% | | | 11/15/2039 | | | | 20,135 | | | 20,424,610 |
Series 2014 A, RB | | 5.00% | | | 11/15/2044 | | | | 10,000 | | | 10,129,702 |
Series 2017 B, Ref. RB | | 5.00% | | | 11/15/2036 | | | | 11,110 | | | 11,840,435 |
Series 2021 C-1A, RB | | 5.00% | | | 05/15/2040 | | | | 4,000 | | | 4,403,909 |
Series 2021 C-1A, RB | | 5.00% | | | 05/15/2041 | | | | 2,000 | | | 2,189,161 |
See accompanying Notes to Financial Statements which are an integral part of the financial statements.
| | |
| 17 | | Invesco Rochester® Limited Term New York Municipal Fund |
| | | | | | | | | | | | |
| | | Interest Rate | | Maturity Date | | | Principal Amount (000) | | | Value |
New York–(continued) | | | | | | | | | | | | |
Series 2021 C-1A, RB | | 4.00% | | | 05/15/2042 | | | $ | 5,000 | | | $ 4,736,717 |
Triborough Bridge & Tunnel Authority (MTA Bridges & Tunnels); | | | | | | | | | | | | |
Series 2018 C, Ref. RB | | 5.00% | | | 11/15/2038 | | | | 5,000 | | | 5,389,636 |
Series 2022 A, Ref. RB | | 4.00% | | | 05/15/2040 | | | | 1,500 | | | 1,444,664 |
Series 2022 A, Ref. RB | | 4.00% | | | 05/15/2041 | | | | 1,500 | | | 1,433,058 |
Series 2022 A, Ref. RB | | 4.00% | | | 05/15/2042 | | | | 1,620 | | | 1,534,696 |
Series 2022 A, Ref. RB | | 5.00% | | | 05/15/2043 | | | | 1,500 | | | 1,634,505 |
Series 2022 A, Ref. RB | | 5.00% | | | 05/15/2044 | | | | 3,000 | | | 3,257,622 |
Series 2022, RB | | 5.00% | | | 05/15/2026 | | | | 9,500 | | | 10,070,462 |
Troy Capital Resource Corp. (Rensselaer Polytechnic Institute); | | | | | | | | | | | | |
Series 2020, Ref. RB | | 5.00% | | | 09/01/2025 | | | | 1,150 | | | 1,184,951 |
Series 2020, Ref. RB | | 5.00% | | | 09/01/2036 | | | | 5,000 | | | 5,301,469 |
Series 2020, Ref. RB | | 5.00% | | | 09/01/2039 | | | | 7,500 | | | 7,831,597 |
TSASC, Inc.; | | | | | | | | | | | | |
Series 2016 B, Ref. RB | | 5.00% | | | 06/01/2045 | | | | 3,130 | | | 2,903,779 |
Series 2017 A, Ref. RB | | 5.00% | | | 06/01/2030 | | | | 5,000 | | | 5,241,523 |
Series 2017 A, Ref. RB | | 5.00% | | | 06/01/2031 | | | | 5,000 | | | 5,236,780 |
Series 2017 A, Ref. RB | | 5.00% | | | 06/01/2032 | | | | 5,000 | | | 5,229,008 |
Series 2017 A, Ref. RB | | 5.00% | | | 06/01/2033 | | | | 5,000 | | | 5,216,573 |
| | | | |
Westchester County Local Development Corp.; Series 2021, Ref. RB(c) | | 2.88% | | | 07/01/2026 | | | | 10,000 | | | 9,547,889 |
| | | | |
Westchester County Local Development Corp. (Kendal on Hudson); Series 2022, Ref. RB | | 5.00% | | | 01/01/2027 | | | | 325 | | | 331,553 |
| | | | |
Western Regional Off-Track Betting Corp.; Series 2021, Ref. RB(c) | | 3.00% | | | 12/01/2026 | | | | 1,055 | | | 958,048 |
| | | | |
White Plains Housing Development Corp. (Battle Hill Houses, Section 8 Assisted); Series 1996 A, Ref. RB (CEP - Federal Housing Administration) | | 6.65% | | | 02/01/2025 | | | | 20 | | | 20,323 |
| | | | |
Yonkers (City of), NY Industrial Development Agency (Monastery Manor Associates, L.P.); Series 2005, RB(a) | | 5.00% | | | 04/01/2025 | | | | 915 | | | 915,859 |
| | | | |
Yonkers Economic Development Corp. (Lamartine/Warburton LLC - Charter School of Educational Excellence); Series 2019 A, RB | | 4.00% | | | 10/15/2029 | | | | 200 | | | 186,907 |
| | | | |
| | | | | | | | | | | | | 1,524,322,301 |
| | | | |
Puerto Rico–12.01% | | | | | | | | | | | | |
Children’s Trust Fund; | | | | | | | | | | | | |
Series 2002, RB | | 5.38% | | | 05/15/2033 | | | | 860 | | | 860,287 |
Series 2002, RB | | 5.50% | | | 05/15/2039 | | | | 42,695 | | | 42,697,510 |
| | | | |
Corp. Para El Financiamiento Publico de Puerto Rico; Series 2011, RB | | 6.50% | | | 08/01/2028 | | | | 105,030 | | | 2,757,037 |
| | | | |
PRCCDA Custodial Trust; Series A | | 2.18% | | | 03/15/2049 | | | | 123 | | | 55,284 |
| | | | |
PRHTA Custodial Trust; Series 2022, RB(k) | | 5.25% | | | 12/06/2049 | | | | 42 | | | 13,939 |
Puerto Rico (Commonwealth of); | | | | | | | | | | | | |
Series 2021 A, GO Bonds(l) | | 0.00% | | | 07/01/2024 | | | | 10,467 | | | 9,823,800 |
Series 2021 A, GO Bonds(l) | | 0.00% | | | 07/01/2033 | | | | 941 | | | 536,409 |
Series 2021 A-1, GO Bonds | | 5.25% | | | 07/01/2023 | | | | 31,287 | | | 31,377,433 |
Series 2021 A-1, GO Bonds | | 5.38% | | | 07/01/2025 | | | | 19,085 | | | 19,377,274 |
Series 2021 A-1, GO Bonds | | 5.63% | | | 07/01/2027 | | | | 2,539 | | | 2,623,232 |
Series 2021 A-1, GO Bonds | | 5.63% | | | 07/01/2029 | | | | 794 | | | 828,742 |
Series 2021 A-1, GO Bonds | | 5.75% | | | 07/01/2031 | | | | 771 | | | 812,049 |
Series 2021 A-1, GO Bonds | | 4.00% | | | 07/01/2033 | | | | 1,524 | | | 1,365,208 |
Series 2021 A-1, GO Bonds | | 4.00% | | | 07/01/2035 | | | | 658 | | | 575,970 |
Series 2021 A-1, GO Bonds | | 4.00% | | | 07/01/2037 | | | | 564 | | | 482,655 |
Series 2021 A-1, GO Bonds | | 4.00% | | | 07/01/2041 | | | | 767 | | | 633,863 |
Series 2021 A-1, GO Bonds | | 4.00% | | | 07/01/2046 | | | | 0 | | | 4 |
Subseries 2022, RN(l) | | 0.00% | | | 11/01/2043 | | | | 4,286 | | | 1,848,177 |
Subseries 2022, RN(l) | | 0.00% | | | 11/01/2051 | | | | 546 | | | 187,112 |
Subseries 2022, RN(l) | | 0.00% | | | 11/01/2051 | | | | 15,917 | | | 6,963,906 |
Subseries 2022, RN(l) | | 0.00% | | | 11/01/2051 | | | | 6,882 | | | 903,265 |
Puerto Rico (Commonwealth of) Aqueduct & Sewer Authority; | | | | | | | | | | | | |
Series 2020 A, Ref. RB(c) | | 5.00% | | | 07/01/2025 | | | | 5,000 | | | 5,085,415 |
Series 2021 B, RB(c) | | 5.00% | | | 07/01/2024 | | | | 6,250 | | | 6,316,110 |
See accompanying Notes to Financial Statements which are an integral part of the financial statements.
| | |
| 18 | | Invesco Rochester® Limited Term New York Municipal Fund |
| | | | | | | | | | | | |
| | | Interest Rate | | Maturity Date | | | Principal Amount (000) | | | Value |
Puerto Rico–(continued) | | | | | | | | | | | | |
Puerto Rico (Commonwealth of) Electric Power Authority; | | | | | | | | | | | | |
Series 2004 PP, Ref. RB (INS - NATL)(b) | | 5.00% | | | 07/01/2024 | | | $ | 500 | | | $ 500,472 |
Series 2005 RR, RB (INS - NATL)(b) | | 5.00% | | | 07/01/2024 | | | | 280 | | | 280,264 |
Series 2005 SS, Ref. RB (INS - NATL)(b) | | 5.00% | | | 07/01/2023 | | | | 830 | | | 829,999 |
Series 2008 WW, RB(m) | | 5.25% | | | 07/01/2025 | | | | 5,000 | | | 3,481,250 |
Puerto Rico (Commonwealth of) Highway & Transportation Authority; | | | | | | | | | | | | |
Series 2022 A, RB | | 5.00% | | | 07/01/2062 | | | | 2,505 | | | 2,323,307 |
Series 2022 B, RB(l) | | 0.00% | | | 07/01/2032 | | | | 1,628 | | | 1,017,409 |
Series 2022 C, RB(n) | | 5.00% | | | 07/01/2053 | | | | 2,785 | | | 1,545,924 |
| | | | |
Puerto Rico (Commonwealth of) Industrial, Tourist, Educational, Medical & Environmental Control Facilities Financing Authority; Series 2000, RB(a) | | 6.63% | | | 06/01/2026 | | | | 18,370 | | | 18,657,015 |
Puerto Rico (Commonwealth of) Municipal Finance Agency; | | | | | | | | | | | | |
Series 2002 A, RB (INS - AGM)(b) | | 5.00% | | | 08/01/2027 | | | | 455 | | | 458,075 |
Series 2005 A, RB | | 5.25% | | | 08/01/2024 | | | | 10,000 | | | 10,001,861 |
Puerto Rico Sales Tax Financing Corp.; | | | | | | | | | | | | |
Series 2018 A-1, RB(l) | | 0.00% | | | 07/01/2024 | | | | 170 | | | 160,262 |
Series 2018 A-1, RB(l) | | 0.00% | | | 07/01/2027 | | | | 5,930 | | | 4,860,929 |
Series 2018 A-1, RB(l) | | 0.00% | | | 07/01/2031 | | | | 10,000 | | | 6,664,993 |
Series 2018 A-1, RB(l) | | 0.00% | | | 07/01/2033 | | | | 665 | | | 397,252 |
Series 2018 A-1, RB | | 4.50% | | | 07/01/2034 | | | | 487 | | | 482,885 |
Series 2018 A-1, RB | | 4.55% | | | 07/01/2040 | | | | 246 | | | 229,732 |
Series 2018 A-1, RB(l) | | 0.00% | | | 07/01/2046 | | | | 1 | | | 256 |
Series 2018 A-1, RB(l) | | 0.00% | | | 07/01/2051 | | | | 1 | | | 189 |
Series 2018 A-1, RB | | 4.75% | | | 07/01/2053 | | | | 1,809 | | | 1,621,555 |
Series 2018 A-1, RB | | 5.00% | | | 07/01/2058 | | | | 2,074 | | | 1,924,257 |
Series 2019 A-2, RB | | 4.33% | | | 07/01/2040 | | | | 2,504 | | | 2,275,390 |
Series 2019 A-2, RB | | 4.54% | | | 07/01/2053 | | | | 75 | | | 64,859 |
Series 2019 A-2, RB | | 4.78% | | | 07/01/2058 | | | | 1,004 | | | 897,439 |
Series 2019 A-2B, RB | | 4.55% | | | 07/01/2040 | | | | 672 | | | 627,562 |
University of Puerto Rico; | | | | | | | | | | | | |
Series 2006 Q, RB | | 5.00% | | | 06/01/2023 | | | | 7,410 | | | 7,397,078 |
Series 2006 Q, RB | | 5.00% | | | 06/01/2030 | | | | 300 | | | 291,452 |
| | | | |
| | | | | | | | | | | | | 203,116,347 |
| | | | |
Virgin Islands–0.71% | | | | | | | | | | | | |
| | | | |
Tobacco Settlement Financing Corp.; Series 2001, RB | | 5.00% | | | 05/15/2031 | | | | 220 | | | 220,233 |
| | | | |
Virgin Islands (Government of) Public Finance Authority (Federal Highway Grant Anticipation Revenue Loan Note) (Garvee); Series 2015, RB(c) | | 5.00% | | | 09/01/2033 | | | | 1,500 | | | 1,530,558 |
Virgin Islands (Government of) Public Finance Authority (Virgin Islands Gross Receipts Taxes Loan Note); | | | | | | | | | | | | |
Series 2006, RB (INS - NATL)(b) | | 5.00% | | | 10/01/2023 | | | | 3,380 | | | 3,417,318 |
Series 2006, RB (INS - NATL)(b) | | 5.00% | | | 10/01/2024 | | | | 850 | | | 859,456 |
Series 2006, RB (INS - NATL)(b) | | 5.00% | | | 10/01/2025 | | | | 3,760 | | | 3,802,246 |
Series 2006, RB (INS - NATL)(b) | | 5.00% | | | 10/01/2026 | | | | 1,715 | | | 1,734,458 |
Series 2006, RB (INS - NATL)(b) | | 5.00% | | | 10/01/2027 | | | | 50 | | | 50,572 |
Series 2006, RB (INS - NATL)(b) | | 5.00% | | | 10/01/2028 | | | | 280 | | | 283,222 |
| | | | |
Virgin Islands (Government of) Water & Power Authority (Electric System); Series 2003, RB (INS - AMBAC)(b) | | 4.50% | | | 07/01/2028 | | | | 125 | | | 125,182 |
| | | | |
| | | | | | | | | | | | | 12,023,245 |
| | | | |
Northern Mariana Islands–0.24% | | | | | | | | | | | | |
| | | | |
Northern Mariana Islands (Commonwealth of); Series 2007 A, Ref. GO Bonds(c) | | 5.00% | | | 06/01/2030 | | | | 4,455 | | | 4,038,062 |
| | | | |
Guam–0.16% | | | | | | | | | | | | |
| | | | |
Guam (Territory of); Series 2021 F, Ref. RB | | 4.00% | | | 01/01/2036 | | | | 2,840 | | | 2,728,278 |
| | | | |
Total Municipal Obligations (Cost $1,802,845,339) | | | | | | | | | | | | 1,746,228,233 |
See accompanying Notes to Financial Statements which are an integral part of the financial statements.
| | |
| 19 | | Invesco Rochester® Limited Term New York Municipal Fund |
| | | | | | | | |
| | | Shares | | | Value | |
|
| |
Common Stocks & Other Equity Interests–0.01% | | | | | | | | |
New York–0.01% | | | | | | | | |
CMS Liquidating Trust;
(Cost $2,185,523)(k)(o) | | | 2,137 | | | $ | 106,850 | |
|
| |
TOTAL INVESTMENTS IN SECURITIES(p)–103.24% (Cost $1,805,030,862) | | | | | | | 1,746,335,083 | |
|
| |
FLOATING RATE NOTE OBLIGATIONS–(1.09)% | | | | | | | | |
Note with an interest and fee rate of 2.22% at 02/28/2023 and a contractual maturity of collateral of 03/15/2043 (See Note 1J)(q) | | | | | | | (18,375,000 | ) |
|
| |
BORROWINGS–(3.49)% | | | | | | | (59,100,000 | ) |
|
| |
OTHER ASSETS LESS LIABILITIES–1.34% | | | | | | | 22,747,709 | |
|
| |
NET ASSETS–100.00% | | | | | | $ | 1,691,607,792 | |
|
| |
Investment Abbreviations:
| | |
| AGM | | – Assured Guaranty Municipal Corp. |
| AMBAC | | – American Municipal Bond Assurance Corp. |
| BAM | | – Build America Mutual Assurance Co. |
| CEP | | – Credit Enhancement Provider |
| CPI | | – Consumer Price Index |
| FGIC | | – Financial Guaranty Insurance Company |
| GO | | – General Obligation |
| IDR | | – Industrial Development Revenue Bonds |
| INS | | – Insurer |
| LOC | | – Letter of Credit |
| NATL | | – National Public Finance Guarantee Corp. |
| RB | | – Revenue Bonds |
| Ref. | | – Refunding |
| RN | | – Revenue Notes |
Notes to Schedule of Investments:
| (a) | Security subject to the alternative minimum tax. |
| (b) | Principal and/or interest payments are secured by the bond insurance company listed. |
| (c) | Security purchased or received in a transaction exempt from registration under the Securities Act of 1933, as amended (the “1933 Act”). The security may be resold pursuant to an exemption from registration under the 1933 Act, typically to qualified institutional buyers. The aggregate value of these securities at February 28, 2023 was $82,297,207, which represented 4.87% of the Fund’s Net Assets. |
| (d) | Restricted security. The aggregate value of these securities at February 28, 2023 was $2,382,613, which represented less than 1% of the Fund’s Net Assets. |
| (e) | Security has an irrevocable call by the issuer or mandatory put by the holder. Maturity date reflects such call or put. |
| (f) | Advance refunded; secured by an escrow fund of U.S. Government obligations or other highly rated collateral. |
| (g) | Interest or dividend rate is redetermined periodically. Rate shown is the rate in effect on February 28, 2023. |
| (h) | Principal and interest payments are fully enhanced by a letter of credit from the bank listed or a predecessor bank, branch or subsidiary. |
| (i) | Security is subject to a reimbursement agreement which may require the Fund to pay amounts to a counterparty in the event of a significant decline in the market value of the security underlying the TOB Trusts. In case of a shortfall, the maximum potential amount of payments the Fund could ultimately be required to make under the agreement is $18,375,000. However, such shortfall payment would be reduced by the proceeds from the sale of the security underlying the TOB Trusts. |
| (j) | Underlying security related to TOB Trusts entered into by the Fund. See Note 1J. |
| (k) | Security valued using significant unobservable inputs (Level 3). See Note 3. |
| (l) | Zero coupon bond issued at a discount. |
| (m) | Defaulted security. Currently, the issuer is in default with respect to principal and/or interest payments. The aggregate value of these securities at February 28, 2023 was $3,481,250, which represented less than 1% of the Fund’s Net Assets. |
| (n) | Convertible capital appreciation bond. The interest rate shown represents the coupon rate at which the bond will accrue at a specified future date. |
| (o) | Non-income producing security. |
| (p) | This table provides a listing of those entities that have either issued, guaranteed, backed or otherwise enhanced the credit quality of more than 5% of the securities held in the portfolio. In instances where the entity has guaranteed, backed or otherwise enhanced the credit quality of a security, it is not primarily responsible for the issuer’s obligations but may be called upon to satisfy the issuer’s obligations. |
| | | | |
| Entity | | Percent | |
|
| |
Assured Guaranty Municipal Corp. | | | 5.08% | |
|
| |
| (q) | Floating rate note obligations related to securities held. The interest and fee rates shown reflect the rates in effect at February 28, 2023. At February 28, 2023, the Fund’s investments with a value of $23,539,262 are held by TOB Trusts and serve as collateral for the $18,375,000 in the floating rate note obligations outstanding at that date. |
See accompanying Notes to Financial Statements which are an integral part of the financial statements.
| | |
| 20 | | Invesco Rochester® Limited Term New York Municipal Fund |
Statement of Assets and Liabilities
February 28, 2023
| | | | |
Assets: | | | | |
Investments in unaffiliated securities, at value
(Cost $1,805,030,862) | | $ | 1,746,335,083 | |
|
| |
Receivable for: | | | | |
Investments sold | | | 645,000 | |
|
| |
Fund shares sold | | | 694,891 | |
|
| |
Interest | | | 20,389,762 | |
|
| |
Investments matured, at value
(Cost $8,110,025) | | | 5,882,937 | |
|
| |
Investment for trustee deferred compensation and retirement plans | | | 240,971 | |
|
| |
Other assets | | | 407,068 | |
|
| |
Total assets | | | 1,774,595,712 | |
|
| |
| |
Liabilities: | | | | |
Floating rate note obligations | | | 18,375,000 | |
|
| |
Payable for: | | | | |
Borrowings | | | 59,100,000 | |
|
| |
Dividends | | | 1,461,473 | |
|
| |
Fund shares reacquired | | | 2,448,305 | |
|
| |
Amount due custodian | | | 283,149 | |
|
| |
Accrued fees to affiliates | | | 591,382 | |
|
| |
Accrued interest expense | | | 246,791 | |
|
| |
Accrued trustees’ and officers’ fees and benefits | | | 2,614 | |
|
| |
Accrued other operating expenses | | | 92,353 | |
|
| |
Trustee deferred compensation and retirement plans | | | 386,853 | |
|
| |
Total liabilities | | | 82,987,920 | |
|
| |
Net assets applicable to shares outstanding | | $ | 1,691,607,792 | |
|
| |
| | | | |
Net assets consist of: | | | | |
| |
Shares of beneficial interest | | $ | 2,309,811,601 | |
|
| |
Distributable earnings (loss) | | | (618,203,809 | ) |
|
| |
| | $ | 1,691,607,792 | |
|
| |
Net Assets: | | | | |
| |
Class A | | $ | 1,287,116,894 | |
|
| |
Class C | | $ | 70,719,774 | |
|
| |
Class Y | | $ | 333,026,730 | |
|
| |
Class R6 | | $ | 744,394 | |
|
| |
|
Shares outstanding, no par value, with an unlimited number of shares authorized: | |
| |
Class A | | | 463,446,522 | |
|
| |
Class C | | | 25,623,435 | |
|
| |
Class Y | | | 119,914,553 | |
|
| |
Class R6 | | | 267,773 | |
|
| |
Class A: | | | | |
Net asset value per share | | $ | 2.78 | |
|
| |
Maximum offering price per share
(Net asset value of $2.78 ÷ 97.50%) | | $ | 2.85 | |
|
| |
Class C: | | | | |
Net asset value and offering price per share | | $ | 2.76 | |
|
| |
Class Y: | | | | |
Net asset value and offering price per share | | $ | 2.78 | |
|
| |
Class R6: | | | | |
Net asset value and offering price per share | | $ | 2.78 | |
|
| |
See accompanying Notes to Financial Statements which are an integral part of the financial statements.
| | |
| 21 | | Invesco Rochester® Limited Term New York Municipal Fund |
Statement of Operations
For the year ended February 28, 2023
| | | | |
Investment income: | | | | |
| |
Interest | | $ | 63,002,025 | |
|
| |
| |
Expenses: | | | | |
| |
Advisory fees | | | 6,989,495 | |
|
| |
Administrative services fees | | | 255,207 | |
|
| |
Custodian fees | | | 21,271 | |
|
| |
Distribution fees: | | | | |
Class A | | | 3,343,204 | |
|
| |
Class C | | | 794,925 | |
|
| |
Interest, facilities and maintenance fees | | | 2,887,911 | |
|
| |
Transfer agent fees – A, C and Y | | | 1,159,311 | |
|
| |
Transfer agent fees – R6 | | | 80 | |
|
| |
Trustees’ and officers’ fees and benefits | | | 42,870 | |
|
| |
Registration and filing fees | | | 64,116 | |
|
| |
Reports to shareholders | | | 48,859 | |
|
| |
Professional services fees | | | 153,964 | |
|
| |
Other | | | 26,197 | |
|
| |
Total expenses | | | 15,787,410 | |
|
| |
Less: Expense offset arrangement(s) | | | (3,817 | ) |
|
| |
Net expenses | | | 15,783,593 | |
|
| |
Net investment income | | | 47,218,432 | |
|
| |
| |
Realized and unrealized gain (loss) from: | | | | |
| |
Net realized gain (loss) from unaffiliated investment securities | | | (168,777,443 | ) |
|
| |
Change in net unrealized appreciation of unaffiliated investment securities | | | 36,019,745 | |
|
| |
Net realized and unrealized gain (loss) | | | (132,757,698 | ) |
|
| |
Net increase (decrease) in net assets resulting from operations | | $ | (85,539,266 | ) |
|
| |
See accompanying Notes to Financial Statements which are an integral part of the financial statements.
| | |
| 22 | | Invesco Rochester® Limited Term New York Municipal Fund |
Statement of Changes in Net Assets
For the years ended February 28, 2023 and 2022
| | | | | | | | |
| | | 2023 | | | 2022 | |
|
| |
Operations: | | | | | | | | |
| | |
Net investment income | | $ | 47,218,432 | | | $ | 37,976,171 | |
|
| |
Net realized gain (loss) | | | (168,777,443 | ) | | | (2,949,801 | ) |
|
| |
Change in net unrealized appreciation (depreciation) | | | 36,019,745 | | | | (21,739,934 | ) |
|
| |
Net increase (decrease) in net assets resulting from operations | | | (85,539,266 | ) | | | 13,286,436 | |
|
| |
| | |
Distributions to shareholders from distributable earnings: | | | | | | | | |
| | |
Class A | | | (36,332,499 | ) | | | (40,441,493 | ) |
|
| |
Class C | | | (1,522,492 | ) | | | (1,813,175 | ) |
|
| |
Class Y | | | (9,787,143 | ) | | | (9,022,984 | ) |
|
| |
Class R6 | | | (17,354 | ) | | | (7,199 | ) |
|
| |
Total distributions from distributable earnings | | | (47,659,488 | ) | | | (51,284,851 | ) |
|
| |
| | |
Share transactions–net: | | | | | | | | |
| | |
Class A | | | (101,237,697 | ) | | | 109,383,054 | |
|
| |
Class C | | | (13,379,069 | ) | | | 103,636 | |
|
| |
Class Y | | | 17,988,477 | | | | 85,753,281 | |
|
| |
Class R6 | | | 413,370 | | | | 195,538 | |
|
| |
Net increase (decrease) in net assets resulting from share transactions | | | (96,214,919 | ) | | | 195,435,509 | |
|
| |
Net increase (decrease) in net assets | | | (229,413,673 | ) | | | 157,437,094 | |
|
| |
| | |
Net assets: | | | | | | | | |
| | |
Beginning of year | | | 1,921,021,465 | | | | 1,763,584,371 | |
|
| |
End of year | | $ | 1,691,607,792 | | | $ | 1,921,021,465 | |
|
| |
See accompanying Notes to Financial Statements which are an integral part of the financial statements.
| | |
| 23 | | Invesco Rochester® Limited Term New York Municipal Fund |
Financial Highlights
The following schedule presents financial highlights for a share of the Fund outstanding throughout the periods indicated.
| | | | | | | | | | | | | | | | | | | | | | | | | | | | | | | | | | | | | | | | | | | | | | | | | | | | | | | | | | | | | | | | | |
| | | Net asset value, beginning of period | | Net investment income(a) | | Net gains (losses) on securities (both realized and unrealized) | | Total from investment operations | | Dividends from net investment income | | Net asset value, end of period | | Total return(b) | | Net assets, end of period (000’s omitted) | | Ratio of expenses to average net assets with fee waivers and/or expenses absorbed | | Ratio of expenses to average net assets without fee waivers and/or expenses absorbed | | Supplemental ratio of expenses to average net assets with fee waivers (excluding interest, facilities and maintenance fees) | | Ratio of net investment income to average net assets | | Portfolio turnover (c) |
Class A | | | | | | | | | | | | | | | | | | | | | | | | | | | | | | | | | | | | | | | | | | | | | | | | | | | | | | | | | | | | | | | | | |
Year ended 02/28/23 | | | | $2.98 | | | | | $0.07 | | | | | $(0.19 | ) | | | | $(0.12 | ) | | | | $(0.08 | ) | | | | $2.78 | | | | | (4.16 | )% | | | | $1,287,117 | | | | | 0.91 | % | | | | 0.91 | % | | | | 0.75 | % | | | | 2.65 | % | | | | 60 | % |
Year ended 02/28/22 | | | | 3.04 | | | | | 0.06 | | | | | (0.04 | ) | | | | 0.02 | | | | | (0.08 | ) | | | | 2.98 | | | | | 0.74 | | | | | 1,491,165 | | | | | 0.78 | | | | | 0.78 | | | | | 0.74 | | | | | 2.01 | | | | | 12 | |
Year ended 02/28/21 | | | | 3.12 | | | | | 0.08 | | | | | (0.07 | ) | | | | 0.01 | | | | | (0.09 | ) | | | | 3.04 | | | | | 0.29 | (d) | | | | 1,411,111 | | | | | 0.87 | (d) | | | | 0.87 | (d) | | | | 0.76 | (d) | | | | 2.75 | (d) | | | | 17 | |
Two months ended 02/29/20 | | | | 3.06 | | | | | 0.01 | | | | | 0.07 | | | | | 0.08 | | | | | (0.02 | ) | | | | 3.12 | | | | | 2.45 | | | | | 1,370,661 | | | | | 0.76 | (e) | | | | 0.90 | (e) | | | | 0.76 | (e) | | | | 2.67 | (e) | | | | 1 | |
Year ended 12/31/19 | | | | 2.95 | | | | | 0.09 | | | | | 0.12 | | | | | 0.21 | | | | | (0.10 | ) | | | | 3.06 | | | | | 7.27 | | | | | 1,338,074 | | | | | 0.75 | | | | | 0.90 | | | | | 0.75 | | | | | 2.91 | | | | | 11 | |
Year ended 12/31/18 | | | | 2.76 | | | | | 0.08 | | | | | 0.20 | | | | | 0.28 | | | | | (0.09 | ) | | | | 2.95 | | | | | 10.38 | | | | | 1,168,856 | | | | | 0.85 | | | | | 1.03 | | | | | 0.85 | | | | | 2.77 | | | | | 36 | |
Class C | | | | | | | | | | | | | | | | | | | | | | | | | | | | | | | | | | | | | | | | | | | | | | | | | | | | | | | | | | | | | | | | | |
Year ended 02/28/23 | | | | 2.97 | | | | | 0.05 | | | | | (0.21 | ) | | | | (0.16 | ) | | | | (0.05 | ) | | | | 2.76 | | | | | (5.26 | ) | | | | 70,720 | | | | | 1.66 | | | | | 1.66 | | | | | 1.50 | | | | | 1.90 | | | | | 60 | |
Year ended 02/28/22 | | | | 3.02 | | | | | 0.04 | | | | | (0.03 | ) | | | | 0.01 | | | | | (0.06 | ) | | | | 2.97 | | | | | 0.31 | | | | | 90,290 | | | | | 1.53 | | | | | 1.53 | | | | | 1.49 | | | | | 1.26 | | | | | 12 | |
Year ended 02/28/21 | | | | 3.10 | | | | | 0.06 | | | | | (0.07 | ) | | | | (0.01 | ) | | | | (0.07 | ) | | | | 3.02 | | | | | (0.47 | ) | | | | 91,938 | | | | | 1.63 | | | | | 1.63 | | | | | 1.52 | | | | | 1.99 | | | | | 17 | |
Two months ended 02/29/20 | | | | 3.04 | | | | | 0.01 | | | | | 0.06 | | | | | 0.07 | | | | | (0.01 | ) | | | | 3.10 | | | | | 2.34 | | | | | 195,347 | | | | | 1.51 | (e) | | | | 1.65 | (e) | | | | 1.51 | (e) | | | | 1.92 | (e) | | | | 1 | |
Year ended 12/31/19 | | | | 2.93 | | | | | 0.06 | | | | | 0.13 | | | | | 0.19 | | | | | (0.08 | ) | | | | 3.04 | | | | | 6.51 | | | | | 197,113 | | | | | 1.51 | | | | | 1.66 | | | | | 1.51 | | | | | 2.15 | | | | | 11 | |
Year ended 12/31/18 | | | | 2.74 | | | | | 0.06 | | | | | 0.20 | | | | | 0.26 | | | | | (0.07 | ) | | | | 2.93 | | | | | 9.63 | | | | | 377,338 | | | | | 1.61 | | | | | 1.79 | | | | | 1.61 | | | | | 2.02 | | | | | 36 | |
Class Y | | | | | | | | | | | | | | | | | | | | | | | | | | | | | | | | | | | | | | | | | | | | | | | | | | | | | | | | | | | | | | | | | |
Year ended 02/28/23 | | | | 2.99 | | | | | 0.08 | | | | | (0.21 | ) | | | | (0.13 | ) | | | | (0.08 | ) | | | | 2.78 | | | | | (4.24 | ) | | | | 333,027 | | | | | 0.66 | | | | | 0.66 | | | | | 0.50 | | | | | 2.90 | | | | | 60 | |
Year ended 02/28/22 | | | | 3.04 | | | | | 0.07 | | | | | (0.03 | ) | | | | 0.04 | | | | | (0.09 | ) | | | | 2.99 | | | | | 1.33 | | | | | 339,209 | | | | | 0.53 | | | | | 0.53 | | | | | 0.49 | | | | | 2.26 | | | | | 12 | |
Year ended 02/28/21 | | | | 3.12 | | | | | 0.09 | | | | | (0.07 | ) | | | | 0.02 | | | | | (0.10 | ) | | | | 3.04 | | | | | 0.53 | | | | | 260,365 | | | | | 0.63 | | | | | 0.63 | | | | | 0.52 | | | | | 2.99 | | | | | 17 | |
Two months ended 02/29/20 | | | | 3.06 | | | | | 0.01 | | | | | 0.07 | | | | | 0.08 | | | | | (0.02 | ) | | | | 3.12 | | | | | 2.49 | | | | | 235,989 | | | | | 0.51 | (e) | | | | 0.65 | (e) | | | | 0.51 | (e) | | | | 2.92 | (e) | | | | 1 | |
Year ended 12/31/19 | | | | 2.95 | | | | | 0.10 | | | | | 0.12 | | | | | 0.22 | | | | | (0.11 | ) | | | | 3.06 | | | | | 7.53 | | | | | 224,615 | | | | | 0.51 | | | | | 0.66 | | | | | 0.51 | | | | | 3.15 | | | | | 11 | |
Year ended 12/31/18 | | | | 2.76 | | | | | 0.09 | | | | | 0.20 | | | | | 0.29 | | | | | (0.10 | ) | | | | 2.95 | | | | | 10.65 | | | | | 170,457 | | | | | 0.60 | | | | | 0.78 | | | | | 0.60 | | | | | 3.02 | | | | | 36 | |
Class R6 | | | | | | | | | | | | | | | | | | | | | | | | | | | | | | | | | | | | | | | | | | | | | | | | | | | | | | | | | | | | | | | | | |
Year ended 02/28/23 | | | | 2.99 | | | | | 0.08 | | | | | (0.21 | ) | | | | (0.13 | ) | | | | (0.08 | ) | | | | 2.78 | | | | | (4.20 | ) | | | | 744 | | | | | 0.60 | | | | | 0.60 | | | | | 0.44 | | | | | 2.96 | | | | | 60 | |
Year ended 02/28/22 | | | | 3.04 | | | | | 0.07 | | | | | (0.03 | ) | | | | 0.04 | | | | | (0.09 | ) | | | | 2.99 | | | | | 1.36 | | | | | 357 | | | | | 0.50 | | | | | 0.50 | | | | | 0.46 | | | | | 2.29 | | | | | 12 | |
Year ended 02/28/21 | | | | 3.12 | | | | | 0.09 | | | | | (0.07 | ) | | | | 0.02 | | | | | (0.10 | ) | | | | 3.04 | | | | | 0.59 | | | | | 170 | | | | | 0.57 | | | | | 0.57 | | | | | 0.46 | | | | | 3.05 | | | | | 17 | |
Two months ended 02/29/20 | | | | 3.06 | | | | | 0.02 | | | | | 0.06 | | | | | 0.08 | | | | | (0.02 | ) | | | | 3.12 | | | | | 2.50 | | | | | 128 | | | | | 0.48 | (e) | | | | 0.62 | (e) | | | | 0.48 | (e) | | | | 2.95 | (e) | | | | 1 | |
Period ended 12/31/19(f) | | | | 3.05 | | | | | 0.06 | | | | | 0.02 | | | | | 0.08 | | | | | (0.07 | ) | | | | 3.06 | | | | | 2.79 | | | | | 125 | | | | | 0.47 | (e) | | | | 0.62 | (e) | | | | 0.47 | (e) | | | | 3.20 | (e) | | | | 11 | |
| (a) | Calculated using average shares outstanding. |
| (b) | Includes adjustments in accordance with accounting principles generally accepted in the United States of America and as such, the net asset value for financial reporting purposes and the returns based upon those net asset values may differ from the net asset value and returns for shareholder transactions. Does not include sales charges and is not annualized for periods less than one year, if applicable. |
| (c) | Portfolio turnover is calculated at the fund level and is not annualized for periods less than one year, if applicable. |
| (d) | The total return, ratio of expenses to average net assets and ratio of net investment income to average net assets reflect actual 12b-1 fees of 0.24% for the year ended February 28, 2021. |
| (f) | Commencement date after the close of business on May 24, 2019. |
See accompanying Notes to Financial Statements which are an integral part of the financial statements.
| | |
| 24 | | Invesco Rochester® Limited Term New York Municipal Fund |
Notes to Financial Statements
February 28, 2023
NOTE 1–Significant Accounting Policies
Invesco Rochester® Limited Term New York Municipal Fund (the “Fund”) is a series portfolio of AIM Tax-Exempt Funds (Invesco Tax-Exempt Funds) (the “Trust”). The Trust is a Delaware statutory trust registered under the Investment Company Act of 1940, as amended (the “1940 Act”), as an open-end series management investment company authorized to issue an unlimited number of shares of beneficial interest. Information presented in these financial statements pertains only to the Fund. Matters affecting the Fund or each class will be voted on exclusively by the shareholders of the Fund or each class.
The Fund’s investment objective is to seek tax-free income.
The Fund currently consists of four different classes of shares: Class A, Class C, Class Y and Class R6. Class Y shares are available only to certain investors. Class A shares are sold with a front-end sales charge unless certain waiver criteria are met. Under certain circumstances, load waived shares may be subject to contingent deferred sales charges (“CDSC”). Class C shares are sold with a CDSC. Class Y and Class R6 shares are sold at net asset value. Class C shares held for eight years after purchase are eligible for automatic conversion into Class A shares of the same Fund (the “Conversion Feature”). The automatic conversion pursuant to the Conversion Feature will generally occur at the end of the month following the eighth anniversary after a purchase of Class C shares.
The Fund is an investment company and accordingly follows the investment company accounting and reporting guidance in accordance with Financial Accounting Standards Board Accounting Standards Codification Topic 946, Financial Services – Investment Companies.
The following is a summary of the significant accounting policies followed by the Fund in the preparation of its financial statements.
| A. | Security Valuations – Securities, including restricted securities, are valued according to the following policy. |
Securities generally are valued on the basis of prices provided by independent pricing services. Prices provided by the pricing service may be determined without exclusive reliance on quoted prices, and may reflect appropriate factors such as institution-size trading in similar groups of securities, developments related to specific securities, dividend rate (for unlisted equities), yield (for debt obligations), quality, type of issue, coupon rate (for debt obligations), maturity (for debt obligations), individual trading characteristics and other market data. Pricing services generally value debt obligations assuming orderly transactions of institutional round lot size, but a fund may hold or transact in the same securities in smaller, odd lot sizes. Odd lots often trade at lower prices than institutional round lots, and their value may be adjusted accordingly. Debt obligations are subject to interest rate and credit risks. In addition, all debt obligations involve some risk of default with respect to interest and/or principal payments.
Securities for which market quotations are not readily available are fair valued by Invesco Advisers, Inc. (the “Adviser” or “Invesco”) in accordance with Board-approved policies and related Adviser procedures (“Valuation Procedures”). If a fair value price provided by a pricing service is not representative of market value in the Adviser’s judgment (“unreliable”), the Adviser will fair value the security using the Valuation Procedures. Some of the factors which may be considered in determining fair value are fundamental analytical data relating to the investment; the nature and duration of any restrictions on transferability or disposition; trading in similar securities by the same issuer or comparable companies; relevant political, economic or issuer specific news; and other relevant factors under the circumstances.
The Fund may invest in securities that are subject to interest rate risk, meaning the risk that the prices will generally fall as interest rates rise and, conversely, the prices will generally rise as interest rates fall. Specific securities differ in their sensitivity to changes in interest rates depending on their individual characteristics. Changes in interest rates may result in increased market volatility, which may affect the value and/or liquidity of certain Fund investments.
Valuations change in response to many factors including the historical and prospective earnings of the issuer, the value of the issuer’s assets, general market conditions which are not specifically related to the particular issuer, such as real or perceived adverse economic conditions, changes in the general outlook for revenues or corporate earnings, changes in interest or currency rates, regional or global instability, natural or environmental disasters, widespread disease or other public health issues, war, acts of terrorism, significant governmental actions or adverse investor sentiment generally and market liquidity. Because of the inherent uncertainties of valuation, the values reflected in the financial statements may materially differ from the value received upon actual sale of those investments.
The price the Fund could receive upon the sale of any investment may differ from the Adviser’s valuation of the investment, particularly for securities that are valued using a fair valuation technique. When fair valuation techniques are applied, the Adviser uses available information, including both observable and unobservable inputs and assumptions, to determine a methodology that will result in a valuation that the Adviser believes approximates market value. Fund securities that are fair valued may be subject to greater fluctuation in their value from one day to the next than would be the case if market quotations were used. Because of the inherent uncertainties of valuation, and the degree of subjectivity in such decisions, the Fund could realize a greater or lesser than expected gain or loss upon the sale of the investment.
| B. | Securities Transactions and Investment Income – Securities transactions are accounted for on a trade date basis. Realized gains or losses on sales are computed on the basis of specific identification of the securities sold. Interest income (net of withholding tax, if any) is recorded on an accrual basis from settlement date and includes coupon interest and amortization of premium and accretion of discount on debt securities as applicable. Pay-in-kind interest income and non-cash dividend income received in the form of securities in-lieu of cash are recorded at the fair value of the securities received. Dividend income (net of withholding tax, if any) is recorded on the ex-dividend date. |
The Fund may periodically participate in litigation related to Fund investments. As such, the Fund may receive proceeds from litigation settlements. Any proceeds received are included in the Statement of Operations as realized gain (loss) for investments no longer held and as unrealized gain (loss) for investments still held.
Brokerage commissions and mark ups are considered transaction costs and are recorded as an increase to the cost basis of securities purchased and/or a reduction of proceeds on a sale of securities. Such transaction costs are included in the determination of net realized and unrealized gain (loss) from investment securities reported in the Statement of Operations and the Statement of Changes in Net Assets and the net realized and unrealized gains (losses) on securities per share in the Financial Highlights. Transaction costs are included in the calculation of the Fund’s net asset value and, accordingly, they reduce the Fund’s total returns. These transaction costs are not considered operating expenses and are not reflected in net investment income reported in the Statement of Operations and the Statement of Changes in Net Assets, or the net investment income per share and the ratios of expenses and net investment income reported in the Financial Highlights, nor are they limited by any expense limitation arrangements between the Fund and the investment adviser.
The Fund allocates realized and unrealized capital gains and losses to a class based on the relative net assets of each class. The Fund allocates income to a class based on the relative value of the settled shares of each class.
| C. | Country Determination – For the purposes of making investment selection decisions and presentation in the Schedule of Investments, the investment adviser may determine the country in which an issuer is located and/or credit risk exposure based on various factors. These factors include the laws of the country under which the issuer is organized, where the issuer maintains a principal office, the country in which the issuer derives 50% or more of its total revenues, the country that has the primary market for the issuer’s securities and its “country of risk” as determined by a third party service provider, as well as other criteria. Among the other criteria that may be evaluated for making this determination are the country in which the issuer maintains 50% or more of its assets, the type of security, financial guarantees and enhancements, the nature of the collateral and the sponsor organization. Country of issuer and/or credit risk exposure has been determined to be the United States of America, unless otherwise noted. |
| D. | Distributions – Distributions from net investment income, if any, are declared daily and paid monthly. Distributions from net realized capital gain, if any, are |
| | |
| 25 | | Invesco Rochester® Limited Term New York Municipal Fund |
| | generally declared and paid annually and recorded on the ex-dividend date. The Fund may elect to treat a portion of the proceeds from redemptions as distributions for federal income tax purposes. |
| E. | Federal Income Taxes – The Fund intends to comply with the requirements of Subchapter M of the Internal Revenue Code of 1986, as amended (the “Internal Revenue Code”), necessary to qualify as a regulated investment company and to distribute substantially all of the Fund’s taxable and tax-exempt earnings to shareholders. As such, the Fund will not be subject to federal income taxes on otherwise taxable income (including net realized capital gain) that is distributed to shareholders. Therefore, no provision for federal income taxes is recorded in the financial statements. |
The Fund recognizes the tax benefits of uncertain tax positions only when the position is more likely than not to be sustained. Management has analyzed the Fund’s uncertain tax positions and concluded that no liability for unrecognized tax benefits should be recorded related to uncertain tax positions. Management is not aware of any tax positions for which it is reasonably possible that the total amounts of unrecognized tax benefits will change materially in the next 12 months.
In addition, the Fund intends to invest in such municipal securities to allow it to qualify to pay shareholders “exempt-interest dividends”, as defined in the Internal Revenue Code.
The Fund files tax returns in the U.S. Federal jurisdiction and certain other jurisdictions. Generally, the Fund is subject to examinations by such taxing authorities for up to three years after the filing of the return for the tax period.
| F. | Expenses – Fees provided for under the Rule 12b-1 plan of a particular class of the Fund are charged to the operations of such class. Transfer agency fees and expenses and other shareholder recordkeeping fees and expenses attributable to Class R6 are charged to such class. Transfer agency fees and expenses and other shareholder recordkeeping fees and expenses relating to all other classes are allocated among those classes based on relative net assets. All other expenses are allocated among the classes based on relative net assets. |
| G. | Interest, Facilities and Maintenance Fees – Interest, Facilities and Maintenance Fees include interest and related borrowing costs such as commitment fees, administrative expenses and other expenses associated with establishing and maintaining the line of credit. In addition, interest and administrative expenses related to establishing and maintaining floating rate note obligations, if any, are included. |
| H. | Accounting Estimates – The preparation of financial statements in conformity with accounting principles generally accepted in the United States of America (“GAAP”) requires management to make estimates and assumptions that affect the reported amounts of assets and liabilities at the date of the financial statements and the reported amounts of revenues and expenses during the reporting period including estimates and assumptions related to taxation. Actual results could differ from those estimates by a significant amount. In addition, the Fund monitors for material events or transactions that may occur or become known after the period-end date and before the date the financial statements are released to print. |
| I. | Indemnifications – Under the Trust’s organizational documents, each Trustee, officer, employee or other agent of the Trust is indemnified against certain liabilities that may arise out of the performance of their duties to the Fund. Additionally, in the normal course of business, the Fund enters into contracts, including the Fund’s servicing agreements, that contain a variety of indemnification clauses. The Fund’s maximum exposure under these arrangements is unknown as this would involve future claims that may be made against the Fund that have not yet occurred. The risk of material loss as a result of such indemnification claims is considered remote. |
| J. | Floating Rate Note Obligations – The Fund invests in inverse floating rate securities, such as Tender Option Bonds (“TOBs”), for investment purposes and to enhance the yield of the Fund. Such securities may be purchased in the secondary market without first owning an underlying bond but generally are created through the sale of fixed rate bonds by the Fund to special purpose trusts established by a broker dealer or by the Fund (“TOB Trusts”) in exchange for cash and residual interests in the TOB Trusts’ assets and cash flows, which are in the form of inverse floating rate securities. The TOB Trusts finance the purchases of the fixed rate bonds by issuing floating rate notes to third parties and allowing the Fund to retain residual interests in the bonds. The floating rate notes issued by the TOB Trusts have interest rates that reset weekly and the floating rate note holders have the option to tender their notes to the TOB Trusts for redemption at par at each reset date. The residual interests held by the Fund (inverse floating rate securities) include the right of the Fund (1) to cause the holders of the floating rate notes to tender their notes at par at the next interest rate reset date, and (2) to transfer the municipal bond from the TOB Trust to the Fund, thereby collapsing the TOB Trust. Inverse floating rate securities tend to underperform the market for fixed rate bonds in a rising interest rate environment, but tend to outperform the market for fixed rate bonds when interest rates decline or remain relatively stable. |
The Fund generally invests in inverse floating rate securities that include embedded leverage, thus exposing the Fund to greater risks and increased costs. The primary risks associated with inverse floating rate securities are varying degrees of liquidity and decreases in the value of such securities in response to changes in interest rates to a greater extent than fixed rate securities having similar credit quality, redemption provisions and maturity, which may cause the Fund’s net asset value to be more volatile than if it had not invested in inverse floating rate securities. In certain instances, the short-term floating rate notes created by the TOB Trust may not be able to be sold to third parties or, in the case of holders tendering (or putting) such notes for repayment of principal, may not be able to be remarketed to third parties. In such cases, the TOB Trust holding the fixed rate bonds may be collapsed with the entity that contributed the fixed rate bonds to the TOB Trust. In the case where a TOB Trust is collapsed with the Fund, the Fund will be required to repay the principal amount of the tendered securities, which may require the Fund to sell other portfolio holdings to raise cash to meet that obligation. The Fund could therefore be required to sell other portfolio holdings at a disadvantageous time or price to raise cash to meet this obligation, which risk will be heightened during times of market volatility, illiquidity or uncertainty. The embedded leverage in the TOB Trust could cause the Fund to lose more money than the value of the asset it has contributed to the TOB Trust and greater levels of leverage create the potential for greater losses. In addition, a Fund may enter into reimbursement agreements with the liquidity provider of certain TOB transactions in connection with certain residuals held by the Fund. These agreements commit a Fund to reimburse the liquidity provider to the extent that the liquidity provider must provide cash to a TOB Trust, including following the termination of a TOB Trust resulting from a mandatory tender event (“liquidity shortfall”). The reimbursement agreement will effectively make the Fund liable for the amount of the negative difference, if any, between the liquidation value of the underlying security and the purchase price of the floating rate notes issued by the TOB Trust.
The Fund accounts for the transfer of fixed rate bonds to the TOB Trusts as secured borrowings, with the securities transferred remaining in the Fund’s investment assets, and the related floating rate notes reflected as Fund liabilities under the caption Floating rate note obligations on the Statement of Assets and Liabilities. The carrying amount of the Fund’s floating rate note obligations as reported on the Statement of Assets and Liabilities approximates its fair value. The Fund records the interest income from the fixed rate bonds under the caption Interest and records the expenses related to floating rate obligations and any administrative expenses of the TOB Trusts as a component of Interest, facilities and maintenance fees on the Statement of Operations.
Final rules implementing section 619 of the Dodd-Frank Wall Street Reform and Consumer Protection Act (the “Volcker Rule”) prohibit banking entities from engaging in proprietary trading of certain instruments and limit such entities’ investments in, and relationships with, “covered funds”, as defined in the rules. These rules preclude banking entities and their affiliates from sponsoring and/or providing services for existing TOB Trusts. A new TOB structure is being utilized by the Fund wherein the Fund, as holder of the residuals, will perform certain duties previously performed by banking entities as “sponsors” of TOB Trusts. These duties may be performed by a third-party service provider. The Fund’s expanded role under the new TOB structure may increase its operational and regulatory risk. The new structure is substantially similar to the previous structure; however, pursuant to the Volcker Rule, the remarketing agent would not be able to repurchase tendered floaters for its own account upon a failed remarketing. In the event of a failed remarketing, a banking entity serving as liquidity provider may loan the necessary funds to the TOB Trust to purchase the tendered floaters. The TOB Trust, not the Fund, would be the borrower and the loan from the liquidity provider will be secured by the purchased floaters now held by the TOB Trust. However, as previously described, the Fund would bear the risk of loss with respect to any liquidity shortfall to the extent it entered into a reimbursement agreement with the liquidity provider.
Further, the SEC and various banking agencies have adopted rules implementing credit risk retention requirements for asset-backed securities (the “Risk Retention Rules”). The Risk Retention Rules require the sponsor of a TOB Trust to retain at least 5% of the credit risk of the underlying assets supporting the TOB
| | |
| 26 | | Invesco Rochester® Limited Term New York Municipal Fund |
| | Trust’s municipal bonds. The Fund has adopted policies intended to comply with the Risk Retention Rules. The Risk Retention Rules may adversely affect the Fund’s ability to engage in TOB Trust transactions or increase the costs of such transactions in certain circumstances. |
There can be no assurances that the new TOB structure will continue to be a viable form of leverage. Further, there can be no assurances that alternative forms of leverage will be available to the Fund in order to maintain current levels of leverage. Any alternative forms of leverage may be less advantageous to the Fund, and may adversely affect the Fund’s net asset value, distribution rate and ability to achieve its investment objective.
TOBs are presently classified as private placement securities. Private placement securities are subject to restrictions on resale because they have not been registered under the Securities Act of 1933, as amended (the “1933 Act”), or are otherwise not readily marketable. As a result of the absence of a public trading market for these securities, they may be less liquid than publicly traded securities. Although atypical, these securities may be resold in privately negotiated transactions, the prices realized from these sales could be less than those originally paid by the Fund or less than what may be considered the fair value of such securities.
| K. | Other Risks – Increases in the federal funds and equivalent foreign rates or other changes to monetary policy or regulatory actions may expose fixed income markets to heightened volatility and reduced liquidity for certain fixed income investments, particularly those with longer maturities. It is difficult to predict the impact of interest rate changes on various markets. In addition, decreases in fixed income dealer market-making capacity may also potentially lead to heightened volatility and reduced liquidity in the fixed income markets. As a result, the value of the Fund’s investments and share price may decline. Changes in central bank policies could also result in higher than normal redemptions by shareholders, which could potentially increase the Fund’s portfolio turnover rate and transaction costs. |
Policy changes by the U.S. government or its regulatory agencies and political events within the U.S. and abroad may, among other things, affect investor and consumer confidence and increase volatility in the financial markets, perhaps suddenly and to a significant degree, which may adversely impact the Fund’s operations, universe of potential investment options, and return potential.
The Fund may invest in lower-quality debt securities, i.e., “junk bonds”. Investments in lower-rated securities or unrated securities of comparable quality tend to be more sensitive to economic conditions than higher rated securities. Junk bonds involve a greater risk of default by the issuer because such securities are generally unsecured and are often subordinated to other creditors’ claims. Junk bonds are less liquid than investment grade debt securities and their prices tend to be more volatile.
The value of, payment of interest on, repayment of principal for and the ability to sell a municipal security may be affected by constitutional amendments, legislative enactments, executive orders, administrative regulations, voter initiatives and the economics of the regions in which the issuers are located. Since many municipal securities are issued to finance similar projects, especially those relating to education, health care, transportation and utilities, conditions in those sectors can affect the overall municipal securities market and the Fund’s investments in municipal securities. There is some risk that a portion or all of the interest received from certain tax-free municipal securities could become taxable as a result of determinations by the Internal Revenue Service.
| L. | COVID-19 Risk – The COVID-19 strain of coronavirus has resulted in instances of market closures and dislocations, extreme volatility, liquidity constraints and increased trading costs. Efforts to contain its spread have resulted in travel restrictions, disruptions of healthcare systems, business operations (including business closures) and supply chains, layoffs, lower consumer demand and employee availability, and defaults and credit downgrades, among other significant economic impacts that have disrupted global economic activity across many industries. Such economic impacts may exacerbate other pre-existing political, social and economic risks locally or globally and cause general concern and uncertainty. The full economic impact and ongoing effects of COVID-19 (or other future epidemics or pandemics) at the macro-level and on individual businesses are unpredictable and may result in significant and prolonged effects on the Fund’s performance. |
NOTE 2–Advisory Fees and Other Fees Paid to Affiliates
The Trust has entered into a master investment advisory agreement with the Adviser. Under the terms of the investment advisory agreement, the Fund accrues daily and pays monthly an advisory fee to the Adviser based on the annual rate of the Fund’s average daily net assets as follows:
| | | | |
| Average Daily Net Assets | | Rate* | |
|
| |
First $ 100 million | | | 0.500% | |
|
| |
Next $150 million | | | 0.450% | |
|
| |
Next $1.75 billion | | | 0.400% | |
|
| |
Next $3 billion | | | 0.390% | |
|
| |
Next $5 billion | | | 0.380% | |
|
| |
Over $10 billion | | | 0.370% | |
|
| |
| * | The advisory fee paid by the Fund shall be reduced by any amounts paid by the Fund under the administrative services agreement with the Adviser. |
For the year ended February 28, 2023, the effective advisory fee rate incurred by the Fund was 0.40%.
Under the terms of a master sub-advisory agreement between the Adviser and each of Invesco Asset Management Deutschland GmbH, Invesco Asset Management Limited, Invesco Asset Management (Japan) Limited, Invesco Hong Kong Limited, Invesco Senior Secured Management, Inc. and Invesco Canada Ltd. and separate sub-advisory agreements with Invesco Capital Management LLC and Invesco Asset Management (India) Private Limited (collectively, the “Affiliated Sub-Advisers”) the Adviser, not the Fund, will pay 40% of the fees paid to the Adviser to any such Affiliated Sub-Adviser(s) that provide(s) discretionary investment management services to the Fund based on the percentage of assets allocated to such Affiliated Sub-Adviser(s).
The Adviser has contractually agreed, through at least June 30, 2023, to waive advisory fees and/or reimburse expenses of all shares to the extent necessary to limit total annual fund operating expenses after fee waiver and/or expense reimbursement (excluding certain items discussed below) of Class A, Class C, Class Y and Class R6 shares to 1.50%, 2.25%, 1.25% and 1.25%, respectively, of the Fund’s average daily net assets (the “expense limits”). In determining the Adviser’s obligation to waive advisory fees and/or reimburse expenses, the following expenses are not taken into account, and could cause the total annual fund operating expenses after fee waiver and/or expense reimbursement to exceed the numbers reflected above: (1) interest, facilities and maintenance fees; (2) taxes; (3) dividend expense on short sales; (4) extraordinary or non-routine items, including litigation expenses; and (5) expenses that the Fund has incurred but did not actually pay because of an expense offset arrangement. Unless Invesco continues the fee waiver agreement, it will terminate on June 30, 2023. During its term, the fee waiver agreement cannot be terminated or amended to increase the expense limits or reduce the advisory fee waiver without approval of the Board of Trustees. The Adviser did not waive fees and/or reimburse expenses during the period under these expense limits.
The Trust has entered into a master administrative services agreement with Invesco pursuant to which the Fund has agreed to pay Invesco for certain administrative costs incurred in providing accounting services to the Fund. For the year ended February 28, 2023, expenses incurred under the agreement are shown in the Statement of Operations as Administrative services fees. Invesco has entered into a sub-administration agreement whereby State Street Bank and Trust Company (“SSB”) serves as fund accountant and provides certain administrative services to the Fund. Pursuant to a custody agreement with the Trust on behalf of the Fund, SSB also serves as the Fund’s custodian.
| | |
| 27 | | Invesco Rochester® Limited Term New York Municipal Fund |
The Trust has entered into a transfer agency and service agreement with Invesco Investment Services, Inc. (“IIS”) pursuant to which the Fund has agreed to pay IIS a fee for providing transfer agency and shareholder services to the Fund and reimburse IIS for certain expenses incurred by IIS in the course of providing such services. IIS may make payments to intermediaries that provide omnibus account services, sub-accounting services and/or networking services. All fees payable by IIS to intermediaries that provide omnibus account services or sub-accounting services are charged back to the Fund, subject to certain limitations approved by the Trust’s Board of Trustees. For the year ended February 28, 2023, expenses incurred under the agreement are shown in the Statement of Operations as Transfer agent fees.
The Trust has entered into master distribution agreements with Invesco Distributors, Inc. (“IDI”) to serve as the distributor for the Class A, Class C, Class Y and Class R6 shares of the Fund. The Trust has adopted plans pursuant to Rule 12b-1 under the 1940 Act with respect to the Fund’s Class A and Class C shares (collectively, the “Plans”). The Fund, pursuant to the Class A Plan, reimburses IDI for its allocated share of expenses incurred for the period, up to a maximum annual rate of 0.25% of the average daily net assets of Class A shares. The Fund pursuant to the Class C Plan, pays IDI compensation at the annual rate of 1.00% of the average daily net assets of Class C shares. The fees are accrued daily and paid monthly. Of the Plan payments, up to 0.25% of the average daily net assets of each class of shares may be paid to furnish continuing personal shareholder services to customers who purchase and own shares of such classes. Any amounts not paid as a service fee under the Plans would constitute an asset-based sales charge. Rules of the Financial Industry Regulatory Authority (“FINRA”) impose a cap on the total sales charges, including asset-based sales charges, that may be paid by any class of shares of the Fund. For the year ended February 28, 2023, expenses incurred under the Plans are shown in the Statement of Operations as Distribution fees.
Front-end sales commissions and CDSC (collectively, the “sales charges”) are not recorded as expenses of the Fund. Front-end sales commissions are deducted from proceeds from the sales of Fund shares prior to investment in Class A shares of the Fund. CDSC are deducted from redemption proceeds prior to remittance to the shareholder. During the year ended February 28, 2023, IDI advised the Fund that IDI retained $12,486 in front-end sales commissions from the sale of Class A shares and $136,122 and $9,363 from Class A and Class C shares, respectively, for CDSC imposed upon redemptions by shareholders.
Certain officers and trustees of the Trust are officers and directors of the Adviser, IIS and/or IDI.
NOTE 3–Additional Valuation Information
GAAP defines fair value as the price that would be received to sell an asset or paid to transfer a liability in an orderly transaction between market participants at the measurement date, under current market conditions. GAAP establishes a hierarchy that prioritizes the inputs to valuation methods, giving the highest priority to readily available unadjusted quoted prices in an active market for identical assets (Level 1) and the lowest priority to significant unobservable inputs (Level 3), generally when market prices are not readily available. Based on the valuation inputs, the securities or other investments are tiered into one of three levels. Changes in valuation methods may result in transfers in or out of an investment’s assigned level:
| | |
| Level 1 - | | Prices are determined using quoted prices in an active market for identical assets. |
| Level 2 - | | Prices are determined using other significant observable inputs. Observable inputs are inputs that other market participants may use in pricing a security. These may include quoted prices for similar securities, interest rates, prepayment speeds, credit risk, yield curves, loss severities, default rates, discount rates, volatilities and others. |
| Level 3 - | | Prices are determined using significant unobservable inputs. In situations where quoted prices or observable inputs are unavailable (for example, when there is little or no market activity for an investment at the end of the period), unobservable inputs may be used. Unobservable inputs reflect the Adviser’s assumptions about the factors market participants would use in determining fair value of the securities or instruments and would be based on the best available information. |
The following is a summary of the tiered valuation input levels, as of February 28, 2023. The level assigned to the securities valuations may not be an indication of the risk or liquidity associated with investing in those securities. Because of the inherent uncertainties of valuation, the values reflected in the financial statements may materially differ from the value received upon actual sale of those investments.
| | | | | | | | | | | | | | | | | | | | |
| | | Level 1 | | Level 2 | | Level 3 | | Total |
Investments in Securities | | | | | | | | | | | | | | | | | | | | |
Municipal Obligations | | | $ | – | | | | $ | 1,746,214,294 | | | | | $13,939 | | | | $ | 1,746,228,233 | |
Common Stocks & Other Equity Interests | | | | – | | | | | – | | | | | 106,850 | | | | | 106,850 | |
Total Investments in Securities | | | | – | | | | | 1,746,214,294 | | | | | 120,789 | | | | | 1,746,335,083 | |
| | | | |
Other Investments - Assets | | | | | | | | | | | | | | | | | | | | |
Investments Matured | | | | – | | | | | 5,882,937 | | | | | – | | | | | 5,882,937 | |
Total Investments | | | $ | – | | | | $ | 1,752,097,231 | | | | | $120,789 | | | | $ | 1,752,218,020 | |
NOTE 4–Security Transactions with Affiliated Funds
The Fund is permitted to purchase securities from or sell securities to certain other affiliated funds under specified conditions outlined in procedures adopted by the Board of Trustees of the Trust. The procedures have been designed to ensure that any purchase or sale of securities by the Fund from or to another fund that is or could be considered an “affiliated person” by virtue of having a common investment adviser (or affiliated investment advisers), common Trustees and/or common officers is made in reliance on Rule 17a-7 of the 1940 Act and, to the extent applicable, related SEC staff positions. Each such transaction is effected at the security’s “current market price”, as provided for in these procedures and Rule 17a-7. Pursuant to these procedures, for the year ended February 28, 2023, the Fund engaged in securities purchases of $17,573,441.
NOTE 5–Expense Offset Arrangement(s)
The expense offset arrangement is comprised of transfer agency credits which result from balances in demand deposit accounts used by the transfer agent for clearing shareholder transactions. For the year ended February 28, 2023, the Fund received credits from this arrangement, which resulted in the reduction of the Fund’s total expenses of $3,817.
NOTE 6–Trustees’ and Officers’ Fees and Benefits
Trustees’ and Officers’ Fees and Benefits include amounts accrued by the Fund to pay remuneration to certain Trustees and Officers of the Fund. Trustees have the option to defer compensation payable by the Fund, and Trustees’ and Officers’ Fees and Benefits also include amounts accrued by the Fund to fund such deferred compensation amounts. Those Trustees who defer compensation have the option to select various Invesco Funds in which their deferral accounts shall be deemed to be invested. Finally, certain current Trustees were eligible to participate in a retirement plan that provided for benefits to be paid upon retirement to Trustees over a period of time based on the number of years of service. The Fund may have certain former Trustees who also participate in a retirement plan and receive benefits under
| | |
| 28 | | Invesco Rochester® Limited Term New York Municipal Fund |
such plan. Trustees’ and Officers’ Fees and Benefits include amounts accrued by the Fund to fund such retirement benefits. Obligations under the deferred compensation and retirement plans represent unsecured claims against the general assets of the Fund.
NOTE 7–Cash Balances and Borrowings
The Fund has entered into a revolving credit and security agreement, which enables the Fund to participate with certain other Invesco Funds in a committed secured borrowing facility that permits borrowings up to $2.5 billion, collectively by certain Invesco Funds, and which will expire on February 22, 2024. The revolving credit and security agreement is secured by the assets of the Fund. The Fund is subject to certain covenants relating to the revolving credit and security agreement. Failure to comply with these restrictions could cause the acceleration of the repayment of the amount outstanding under the revolving credit and security agreement.
During the year ended February 28, 2023, the average daily balance of borrowing under the revolving credit and security agreement was $45,235,068 with an average interest rate of 2.57%. The carrying amount of the Fund’s payable for borrowings as reported on the Statement of Assets and Liabilities approximates its fair value. Expenses under the revolving credit and security agreement are shown in the Statement of Operations as Interest, facilities and maintenance fees. At February 28, 2023, the Fund had no borrowings outstanding under this agreement.
Additionally, the Fund is permitted to temporarily carry a negative or overdrawn balance in its account with SSB, the custodian bank. Such balances, if any at period-end, are shown in the Statement of Assets and Liabilities under the payable caption Amount due custodian. To compensate the custodian bank for such overdrafts, the overdrawn Fund may either (1) leave funds as a compensating balance in the account so the custodian bank can be compensated by earning the additional interest; or (2) compensate by paying the custodian bank at a rate agreed upon by the custodian bank and Invesco, not to exceed the contractually agreed upon rate. The Fund may not purchase additional securities when any borrowings from banks or broker-dealers exceed 5% of the Fund’s total assets, or when any borrowings from an Invesco Fund are outstanding.
Inverse floating rate obligations resulting from the transfer of bonds to TOB Trusts are accounted for as secured borrowings. The average floating rate notes outstanding and average annual interest and fee rate related to inverse floating rate note obligations during the year ended February 28, 2023 were $16,961,538 and 4.61%, respectively.
NOTE 8–Distributions to Shareholders and Tax Components of Net Assets
Tax Character of Distributions to Shareholders Paid During the Fiscal Years Ended February 28, 2023 and 2022:
| | | | | | | | |
| | | 2023 | | | 2022 | |
|
| |
Ordinary income* | | $ | 1,158,710 | | | $ | 299,464 | |
|
| |
Ordinary income-tax-exempt | | | 46,500,778 | | | | 50,985,387 | |
|
| |
Total distributions | | $ | 47,659,488 | | | $ | 51,284,851 | |
|
| |
| * | Includes short-term capital gain distributions, if any. |
Tax Components of Net Assets at Period-End:
| | | | |
| | | 2023 | |
|
| |
Undistributed tax-exempt income | | $ | 27,004,069 | |
|
| |
Net unrealized appreciation (depreciation) – investments | | | (60,235,666 | ) |
|
| |
Temporary book/tax differences | | | (383,628 | ) |
|
| |
Capital loss carryforward | | | (584,588,584 | ) |
|
| |
Shares of beneficial interest | | | 2,309,811,601 | |
|
| |
Total net assets | | $ | 1,691,607,792 | |
|
| |
The difference between book-basis and tax-basis unrealized appreciation (depreciation) is due to differences in the timing of recognition of gains and losses on investments for tax and book purposes. The Fund’s net unrealized appreciation (depreciation) difference is attributable primarily to wash sales ,amortization and accretion on debt securities, defaulted bonds and grantor trusts.
The temporary book/tax differences are a result of timing differences between book and tax recognition of income and/or expenses. The Fund’s temporary book/tax differences are the result of the trustee deferral of compensation and retirement plan benefits.
Capital loss carryforward is calculated and reported as of a specific date. Results of transactions and other activity after that date may affect the amount of capital loss carryforward actually available for the Fund to utilize. The ability to utilize capital loss carryforward in the future may be limited under the Internal Revenue Code and related regulations based on the results of future transactions.
The Fund has a capital loss carryforward as of February 28, 2023, as follows:
| | | | | | | | | | | | | | |
| Capital Loss Carryforward* | |
|
| |
| Expiration | | | | Short-Term | | | Long-Term | | | Total | |
|
| |
Not subject to expiration | | | | $ | 50,682,187 | | | $ | 533,906,397 | | | $ | 584,588,584 | |
|
| |
| * | Capital loss carryforward is reduced for limitations, if any, to the extent required by the Internal Revenue Code and may be further limited depending upon a variety of factors, including the realization of net unrealized gains or losses as of the date of any reorganization. |
NOTE 9–Investment Transactions
The aggregate amount of investment securities (other than short-term securities, U.S. Government obligations and money market funds, if any) purchased and sold by the Fund during the year ended February 28, 2023 was $1,076,399,154 and $1,068,916,129, respectively. Cost of investments, including any derivatives, on a tax basis includes the adjustments for financial reporting purposes as of the most recently completed federal income tax reporting period-end.
| | | | |
| Unrealized Appreciation (Depreciation) of Investments on a Tax Basis | |
|
| |
Aggregate unrealized appreciation of investments | | $ | 5,906,482 | |
|
| |
Aggregate unrealized (depreciation) of investments | | | (66,142,148 | ) |
|
| |
Net unrealized appreciation (depreciation) of investments | | $ | (60,235,666 | ) |
|
| |
| | |
| 29 | | Invesco Rochester® Limited Term New York Municipal Fund |
Cost of investments for tax purposes is $1,812,453,686.
NOTE 10–Reclassification of Permanent Differences
Primarily as a result of differing book/tax treatment of defaulted securities, on February 28, 2023, undistributed net investment income was increased by $15,872,428, undistributed net realized gain (loss) was decreased by $13,956,408 and shares of beneficial interest was decreased by $1,916,020. This reclassification had no effect on the net assets of the Fund.
NOTE 11–Share Information
| | | | | | | | | | | | | | | | |
| | | Summary of Share Activity | |
|
| |
| | |
| | | Year ended | | | Year ended | |
| | | February 28, 2023(a) | | | February 28, 2022 | |
| | | Shares | | | Amount | | | Shares | | | Amount | |
|
| |
Sold: | | | | | | | | | | | | | | | | |
Class A | | | 56,380,149 | | | $ | 158,078,706 | | | | 83,000,870 | | | $ | 253,944,918 | |
|
| |
Class C | | | 6,520,367 | | | | 18,169,984 | | | | 9,246,181 | | | | 28,133,355 | |
|
| |
Class Y | | | 76,054,917 | | | | 213,499,943 | | | | 45,690,848 | | | | 139,622,882 | |
|
| |
Class R6 | | | 145,158 | | | | 404,394 | | | | 100,534 | | | | 309,343 | |
|
| |
| | | | |
Issued as reinvestment of dividends: | | | | | | | | | | | | | | | | |
Class A | | | 8,345,011 | | | | 23,356,482 | | | | 8,477,779 | | | | 25,886,899 | |
|
| |
Class C | | | 382,040 | | | | 1,062,265 | | | | 419,124 | | | | 1,272,164 | |
|
| |
Class Y | | | 2,233,726 | | | | 6,246,977 | | | | 1,828,376 | | | | 5,582,094 | |
|
| |
Class R6 | | | 3,212 | | | | 8,976 | | | | 1,357 | | | | 4,142 | |
|
| |
| | | | |
Automatic conversion of Class C shares to Class A shares: | | | | | | | | | | | | | | | | |
Class A | | | 3,621,945 | | | | 10,121,334 | | | | 4,663,408 | | | | 14,272,392 | |
|
| |
Class C | | | (3,645,979 | ) | | | (10,121,334 | ) | | | (4,692,568 | ) | | | (14,272,392 | ) |
|
| |
| | | | |
Reacquired: | | | | | | | | | | | | | | | | |
Class A | | | (104,496,403 | ) | | | (292,794,219 | ) | | | (60,457,166 | ) | | | (184,721,155 | ) |
|
| |
Class C | | | (8,075,841 | ) | | | (22,489,984 | ) | | | (4,949,553 | ) | | | (15,029,491 | ) |
|
| |
Class Y | | | (72,000,035 | ) | | | (201,758,443 | ) | | | (19,476,624 | ) | | | (59,451,695 | ) |
|
| |
Class R6 | | | - | | | | - | | | | (38,434 | ) | | | (117,947 | ) |
|
| |
Net increase (decrease) in share activity | | | (34,531,733 | ) | | $ | (96,214,919 | ) | | | 63,814,132 | | | $ | 195,435,509 | |
|
| |
| (a) | There are entities that are record owners of more than 5% of the outstanding shares of the Fund and in the aggregate own 63% of the outstanding shares of the Fund. IDI has an agreement with these entities to sell Fund shares. The Fund, Invesco and/or Invesco affiliates may make payments to these entities, which are considered to be related to the Fund, for providing services to the Fund, Invesco and/or Invesco affiliates including but not limited to services such as securities brokerage, distribution, third party record keeping and account servicing. The Fund has no knowledge as to whether all or any portion of the shares owned of record by these entities are also owned beneficially. |
| | |
| 30 | | Invesco Rochester® Limited Term New York Municipal Fund |
Report of Independent Registered Public Accounting Firm
To the Board of Trustees of AIM Tax-Exempt Funds (Invesco Tax-Exempt Funds) and Shareholders of Invesco Rochester® Limited Term New York Municipal Fund
Opinion on the Financial Statements
We have audited the accompanying statement of assets and liabilities, including the schedule of investments, of Invesco Rochester® Limited Term New York Municipal Fund (one of the funds constituting AIM Tax-Exempt Funds (Invesco Tax-Exempt Funds), referred to hereafter as the “Fund”) as of February 28, 2023, the related statement of operations for the year ended February 28, 2023, the statement of changes in net assets for each of the two years in the period ended February 28, 2023, including the related notes, and the financial highlights for each of the periods indicated in the table below (collectively referred to as the “financial statements”). In our opinion, the financial statements present fairly, in all material respects, the financial position of the Fund as of February 28, 2023, the results of its operations for the year then ended, the changes in its net assets for each of the two years in the period ended February 28, 2023 and the financial highlights for each of the periods indicated in the table below, in conformity with accounting principles generally accepted in the United States of America.
|
| Financial Highlights |
For each of the three years in the period ended February 28, 2023, the two months ended February 29, 2020 and the year ended December 31, 2019 for Class A, Class C and Class Y. For each of the three years in the period ended February 28, 2023, the two months ended February 29, 2020 and the period May 24, 2019 (commencement date) through December 31, 2019 for Class R6. |
The financial statements of Oppenheimer Rochester® Limited Term New York Municipal Fund (subsequently renamed Invesco Rochester® Limited Term New York Municipal Fund) as of and for the year ended December 31, 2018 and the financial highlights for the year ended December 31, 2018 (not presented herein, other than the financial highlights) were audited by other auditors whose report dated February 22, 2019 expressed an unqualified opinion on those financial statements and financial highlights.
Basis for Opinion
These financial statements are the responsibility of the Fund’s management. Our responsibility is to express an opinion on the Fund’s financial statements based on our audits. We are a public accounting firm registered with the Public Company Accounting Oversight Board (United States) (PCAOB) and are required to be independent with respect to the Fund in accordance with the U.S. federal securities laws and the applicable rules and regulations of the Securities and Exchange Commission and the PCAOB.
We conducted our audits of these financial statements in accordance with the standards of the PCAOB. Those standards require that we plan and perform the audit to obtain reasonable assurance about whether the financial statements are free of material misstatement, whether due to error or fraud.
Our audits included performing procedures to assess the risks of material misstatement of the financial statements, whether due to error or fraud, and performing procedures that respond to those risks. Such procedures included examining, on a test basis, evidence regarding the amounts and disclosures in the financial statements. Our audits also included evaluating the accounting principles used and significant estimates made by management, as well as evaluating the overall presentation of the financial statements. Our procedures included confirmation of securities owned as of February 28, 2023 by correspondence with the custodian and broker. We believe that our audits provide a reasonable basis for our opinion.
/s/PricewaterhouseCoopers LLP
Houston, Texas
April 21, 2023
We have served as the auditor of one or more of the investment companies in the Invesco group of investment companies since at least 1995. We have not been able to determine the specific year we began serving as auditor.
| | |
| 31 | | Invesco Rochester® Limited Term New York Municipal Fund |
Calculating your ongoing Fund expenses
Example
As a shareholder of the Fund, you incur two types of costs: (1) transaction costs, which may include sales charges (loads) on purchase payments or contingent deferred sales charges on redemptions, if any; and (2) ongoing costs, including management fees, distribution and/or service (12b-1) fees, and other Fund expenses. This example is intended to help you understand your ongoing costs (in dollars) of investing in the Fund and to compare these costs with ongoing costs of investing in other mutual funds. The example is based on an investment of $1,000 invested at the beginning of the period and held for the entire period September 1, 2022 through February 28, 2023.
Actual expenses
The table below provides information about actual account values and actual expenses. You may use the information in this table, together with the amount you invested, to estimate the expenses that you paid over the period. Simply divide your account value by $1,000 (for example, an $8,600 account value divided by $1,000 = 8.6), then multiply the result by the number in the table under the heading entitled “Actual Expenses Paid During Period” to estimate the expenses you paid on your account during this period.
Hypothetical example for comparison purposes
The table below also provides information about hypothetical account values and hypothetical expenses based on the Fund’s actual expense ratio and an assumed rate of return of 5% per year before expenses, which is not the Fund’s actual return.
The hypothetical account values and expenses may not be used to estimate the actual ending account balance or expenses you paid for the period. You may use this information to compare the ongoing costs of investing in the Fund and other funds. To do so, compare this 5% hypothetical example with the 5% hypothetical examples that appear in the shareholder reports of the other funds.
Please note that the expenses shown in the table are meant to highlight your ongoing costs only and do not reflect any transaction costs, such as sales charges (loads) on purchase payments or contingent deferred sales charges on redemptions, if any. Therefore, the hypothetical information is useful in comparing ongoing costs only, and will not help you determine the relative total costs of owning different funds. In addition, if these transaction costs were included, your costs would have been higher.
| | | | | | | | | | | | |
| | | | | ACTUAL | | HYPOTHETICAL (5% annual return before expenses) | | |
| | | Beginning Account Value (09/01/22) | | Ending Account Value (02/28/23)1 | | Expenses Paid During Period2 | | Ending Account Value (02/28/23) | | Expenses Paid During Period2 | | Annualized Expense Ratio |
Class A | | $1,000.00 | | $1,007.20 | | $4.68 | | $1,020.13 | | $4.71 | | 0.94% |
Class C | | 1,000.00 | | 1,003.30 | | 8.39 | | 1,016.41 | | 8.45 | | 1.69 |
Class Y | | 1,000.00 | | 1,008.40 | | 3.44 | | 1,021.37 | | 3.46 | | 0.69 |
Class R6 | | 1,000.00 | | 1,005.10 | | 3.13 | | 1,021.67 | | 3.16 | | 0.63 |
| 1 | The actual ending account value is based on the actual total return of the Fund for the period September 1, 2022 through February 28, 2023, after actual expenses and will differ from the hypothetical ending account value which is based on the Fund’s expense ratio and a hypothetical annual return of 5% before expenses. |
| 2 | Expenses are equal to the Fund’s annualized expense ratio as indicated above multiplied by the average account value over the period, multiplied by 181/365 to reflect the most recent fiscal half year. |
| | |
| 32 | | Invesco Rochester® Limited Term New York Municipal Fund |
Tax Information
Form 1099-DIV, Form 1042-S and other year–end tax information provide shareholders with actual calendar year amounts that should be included in their tax returns. Shareholders should consult their tax advisers.
The following distribution information is being provided as required by the Internal Revenue Code or to meet a specific state’s requirement.
The Fund designates the following amounts or, if subsequently determined to be different, the maximum amount allowable for its fiscal year ended February 28, 2023:
| | | | | | | | |
Federal and State Income Tax | | | | | | |
Qualified Dividend Income* | | | 0.00 | % | | | | |
Corporate Dividends Received Deduction* | | | 0.00 | % | | | | |
U.S. Treasury Obligations* | | | 0.00 | % | | | | |
Qualified Business Income* | | | 0.00 | % | | | | |
Business Interest Income* | | | 0.00 | % | | | | |
Tax-Exempt Interest Dividends* | | | 97.57 | % | | | | |
|
| * The above percentages are based on ordinary income dividends paid to shareholders during the Fund’s fiscal year. | |
| | |
| 33 | | Invesco Rochester® Limited Term New York Municipal Fund |
Trustees and Officers
The address of each trustee and officer is AIM Tax-Exempt Funds (Invesco Tax-Exempt Funds) (the “Trust”), 11 Greenway Plaza, Suite 1000, Houston, Texas 77046-1173. The trustees serve for the life of the Trust, subject to their earlier death, incapacitation, resignation, retirement or removal as more specifically provided in the Trust’s organizational documents. Each officer serves for a one year term or until their successors are elected and qualified. Column two below includes length of time served with predecessor entities, if any.
| | | | | | | | |
Name, Year of Birth and Position(s) Held with the Trust | | Trustee and/or
Officer Since | | Principal Occupation(s) During Past 5 Years | | Number of
Funds in Fund Complex Overseen by Trustee | | Other Directorship(s) Held by Trustee During Past 5 Years |
| Interested Trustee | | | | | | | | |
Martin L. Flanagan1 - 1960 Trustee and Vice Chair | | 2007 | | Executive Director, Chief Executive Officer and President, Invesco Ltd. (ultimate parent of Invesco and a global investment management firm); Trustee and Vice Chair, The Invesco Funds; Vice Chair, Investment Company Institute; and Member of Executive Board, SMU Cox School of Business Formerly: Advisor to the Board, Invesco Advisers, Inc. (formerly known as Invesco Institutional (N.A.), Inc.); Chairman and Chief Executive Officer, Invesco Advisers, Inc. (registered investment adviser); Director, Chairman, Chief Executive Officer and President, Invesco Holding Company (US), Inc. (formerly IVZ Inc.) (holding company), Invesco Group Services, Inc. (service provider) and Invesco North American Holdings, Inc. (holding company); Director, Chief Executive Officer and President, Invesco Holding Company Limited (parent of Invesco and a global investment management firm); Director, Invesco Ltd.; Chairman, Investment Company Institute and President, Co-Chief Executive Officer, Co-President, Chief Operating Officer and Chief Financial Officer, Franklin Resources, Inc. (global investment management organization) | | 175 | | None |
| 1 | Mr. Flanagan is considered an interested person (within the meaning of Section 2(a)(19) of the 1940 Act) of the Trust because he is an officer of the Adviser to the Trust, and an officer and a director of Invesco Ltd., ultimate parent of the Adviser. |
| | |
| T-1 | | Invesco Rochester® Limited Term New York Municipal Fund |
Trustees and Officers–(continued)
| | | | | | | | |
Name, Year of Birth and Position(s) Held with the Trust | | Trustee and/or Officer Since | | Principal Occupation(s) During Past 5 Years | | Number of Funds in Fund Complex Overseen by Trustee | | Other Directorship(s) Held by Trustee During Past 5 Years |
| Independent Trustees | | | | | | | | |
Beth Ann Brown - 1968 Trustee (2019) and Chair (August 2022) | | 2019 | | Independent Consultant Formerly: Head of Intermediary Distribution, Managing Director, Strategic Relations, Managing Director, Head of National Accounts, Senior Vice President, National Account Manager and Senior Vice President, Key Account Manager, Columbia Management Investment Advisers LLC; Vice President, Key Account Manager, Liberty Funds Distributor, Inc.; and Trustee of certain Oppenheimer Funds | | 175 | | Director, Board of Directors of Caron Engineering Inc.; Advisor, Board of Advisors of Caron Engineering Inc.; President and Director, Acton Shapleigh Youth Conservation Corps (non-profit) Formerly: President and Director Director of Grahamtastic Connection (non-profit) |
Cynthia Hostetler - 1962 Trustee | | 2017 | | Non-Executive Director and Trustee of a number of public and private business corporations Formerly: Director, Aberdeen Investment Funds (4 portfolios); Director, Artio Global Investment LLC (mutual fund complex); Director, Edgen Group, Inc. (specialized energy and infrastructure products distributor); Director, Genesee & Wyoming, Inc. (railroads); Head of Investment Funds and Private Equity, Overseas Private Investment Corporation; President, First Manhattan Bancorporation, Inc.; and Attorney, Simpson Thacher & Bartlett LLP | | 175 | | Resideo Technologies, Inc. (smart home technology); Vulcan Materials Company (construction materials company); Trilinc Global Impact Fund; Textainer Group Holdings, (shipping container leasing company); Investment Company Institute (professional organization); and Independent Directors Council (professional organization) |
Eli Jones - 1961 Trustee | | 2016 | | Professor and Dean Emeritus, Mays Business School - Texas A&M University Formerly: Dean of Mays Business School-Texas A&M University; Professor and Dean, Walton College of Business, University of Arkansas and E.J. Ourso College of Business, Louisiana State University; and Director, Arvest Bank | | 175 | | Insperity, Inc. (formerly known as Administaff) (human resources provider); Board Member of the regional board, First Financial Bank Texas; and Boad Member, First Financial Bankshares, Inc. Texas (FFIN) |
Elizabeth Krentzman - 1959 Trustee | | 2019 | | Formerly: Principal and Chief Regulatory Advisor for Asset Management Services and U.S. Mutual Fund Leader of Deloitte & Touche LLP; General Counsel of the Investment Company Institute (trade association); National Director of the Investment Management Regulatory Consulting Practice, Principal, Director and Senior Manager of Deloitte & Touche LLP; Assistant Director of the Division of Investment Management - Office of Disclosure and Investment Adviser Regulation of the U.S. Securities and Exchange Commission and various positions with the Division of Investment Management – Office of Regulatory Policy of the U.S. Securities and Exchange Commission; Associate at Ropes & Gray LLP; and Trustee of certain Oppenheimer Funds | | 175 | | Formerly: Member of the Cartica Funds Board of Directors (private investment fund); Trustee of the University of Florida National Board Foundation; and Member of the University of Florida Law Center Association, Inc. Board of Trustees, Audit Committee and Membership Committee |
Anthony J. LaCava, Jr. - 1956 Trustee | | 2019 | | Formerly: Director and Member of the Audit Committee, Blue Hills Bank (publicly traded financial institution) and Managing Partner, KPMG LLP | | 175 | | Blue Hills Bank; Member and Chairman, Bentley University, Business School Advisory Council; and Nominating Committee, KPMG LLP |
Prema Mathai-Davis - 1950 Trustee | | 1998 | | Retired Formerly: Co-Founder & Partner of Quantalytics Research, LLC, (a FinTech Investment Research Platform for the Self-Directed Investor); Trustee of YWCA Retirement Fund; CEO of YWCA of the USA; Board member of the NY Metropolitan Transportation Authority; Commissioner of the NYC Department of Aging; and Board member of Johns Hopkins Bioethics Institute | | 175 | | Member of Board of Positive Planet US (non-profit) and HealthCare Chaplaincy Network (non-profit) |
| | |
| T-2 | | Invesco Rochester® Limited Term New York Municipal Fund |
Trustees and Officers–(continued)
| | | | | | | | |
Name, Year of Birth and Position(s) Held with the Trust | | Trustee and/or Officer Since | | Principal Occupation(s) During Past 5 Years | | Number of Funds in Fund Complex Overseen by Trustee | | Other Directorship(s) Held by Trustee During Past 5 Years |
| Independent Trustees–(continued) | | | | | | |
Joel W. Motley - 1952 Trustee | | 2019 | | Director of Office of Finance, Federal Home Loan Bank System; Managing Director of Carmona Motley Inc. (privately held financial advisor); Member of the Council on Foreign Relations and its Finance and Budget Committee; Chairman Emeritus of Board of Human Rights Watch and Member of its Investment Committee; and Member of Investment Committee Board of Historic Hudson Valley (non-profit cultural organization); Member of the Board, Blue Ocean Acquisition Corp.; and Member of the Vestry and the Investment Committee of Trinity Church Wall Street. Formerly: Managing Director of Public Capital Advisors, LLC (privately held financial advisor); Managing Director of Carmona Motley Hoffman, Inc. (privately held financial advisor); Trustee of certain Oppenheimer Funds; and Director of Columbia Equity Financial Corp. (privately held financial advisor) | | 175 | | Member of Board of Trust for Mutual Understanding (non-profit promoting the arts and environment); Member of Board of Greenwall Foundation (bioethics research foundation) and its Investment Committee; Member of Board of Friends of the LRC (non-profit legal advocacy); and Board Member and Investment Committee Member of Pulitzer Center for Crisis Reporting (non-profit journalism) |
Teresa M. Ressel - 1962 Trustee | | 2017 | | Non-executive director and trustee of a number of public and private business corporations Formerly: Chief Executive Officer, UBS Securities LLC (investment banking); Chief Operating Officer, UBS AG Americas (investment banking); Sr. Management Team Olayan America, The Olayan Group (international investor/commercial/industrial); and Assistant Secretary for Management & Budget and Designated Chief Financial Officer, U.S. Department of Treasury | | 175 | | None |
Robert C. Troccoli - 1949 Trustee | | 2016 | | Retired Formerly: Adjunct Professor, University of Denver – Daniels College of Business; and Managing Partner, KPMG LLP | | 175 | | None |
Daniel S. Vandivort - 1954 Trustee | | 2019 | | President, Flyway Advisory Services LLC (consulting and property management) Formerly: President and Chief Investment Officer, previously Head of Fixed Income, Weiss Peck and Greer/Robeco Investment Management; Trustee and Chair, Weiss Peck and Greer Funds Board; and various capacities at CS First Boston including Head of Fixed Income at First Boston Asset Management. | | 175 | | Formerly: Trustee and Governance Chair, Oppenheimer Funds; Treasurer, Chairman of the Audit and Finance Committee, Huntington Disease Foundation of America |
| | |
| T-3 | | Invesco Rochester® Limited Term New York Municipal Fund |
Trustees and Officers–(continued)
| | | | | | | | |
Name, Year of Birth and Position(s) Held with the Trust | | Trustee and/or Officer Since | | Principal Occupation(s) During Past 5 Years | | Number of Funds in Fund Complex Overseen by Trustee | | Other Directorship(s) Held by Trustee During Past 5 Years |
| Officers | | | | | | | | |
Sheri Morris - 1964 President and Principal Executive Officer | | 1999 | | Director, Invesco Trust Company; Head of Global Fund Services, Invesco Ltd.; President and Principal Executive Officer, The Invesco Funds; Vice President, Invesco Exchange-Traded Fund Trust, Invesco Exchange-Traded Fund Trust II, Invesco India Exchange-Traded Fund Trust, Invesco Actively Managed Exchange-Traded Fund Trust, Invesco Actively Managed Exchange-Traded Commodity Fund Trust and Invesco Exchange-Traded Self-Indexed Fund Trust; and Vice President, OppenheimerFunds, Inc. Formerly: Vice President, Treasurer and Principal Financial Officer, The Invesco Funds; Vice President, Invesco AIM Advisers, Inc., Invesco AIM Capital Management, Inc. and Invesco AIM Private Asset Management, Inc.; Assistant Vice President and Assistant Treasurer, The Invesco Funds; Vice President and Assistant Vice President, Invesco Advisers, Inc.; Assistant Vice President, Invesco AIM Capital Management, Inc. and Invesco AIM Private Asset Management, Inc.; Treasurer, Invesco Exchange-Traded Fund Trust, Invesco Exchange-Traded Fund Trust II, Invesco India Exchange-Traded Fund Trust and Invesco Actively Managed Exchange-Traded Fund Trust; and Senior Vice President, Invesco Advisers, Inc. (formerly known as Invesco Institutional (N.A.), Inc.) (registered investment adviser) | | N/A | | N/A |
Melanie Ringold - 1975 Senior Vice President, Chief Legal Officer and Secretary | | 2023 | | Head of Legal of the Americas, Invesco Ltd.; Senior Vice President and Secretary, Invesco Advisers, Inc. (formerly known as Invesco Institutional (N.A.), Inc.) (registered investment adviser); Secretary, Invesco Distributors, Inc. (formerly known as Invesco AIM Distributors, Inc.); Secretary, Invesco Investment Services, Inc. (formerly known as Invesco AIM Investment Services, Inc.); Senior Vice President, Chief Legal Officer and Secretary, The Invesco Funds; Secretary, Invesco Investment Advisers LLC, Invesco Capital Markets, Inc.; Chief Legal Officer, Invesco Exchange-Traded Fund Trust, Invesco Exchange-Traded Fund Trust II, Invesco India Exchange-Traded Fund Trust, Invesco Actively Managed Exchange-Traded Fund Trust, Invesco Actively Managed Exchange-Traded Commodity Fund Trust and Invesco Exchange-Traded Self-Indexed Fund Trust; Secretary and Vice President, Harbourview Asset Management Corporation; Secretary and Senior Vice President, OppenheimerFunds, Inc. and Invesco Managed Accounts, LLC; Secretary and Senior Vice President, OFI SteelPath, Inc.; Secretary and Senior Vice President, Oppenheimer Acquisition Corp.; Secretary, SteelPath Funds Remediation LLC; and Secretary and Senior Vice President, Trinity Investment Management Corporation Formerly: Assistant Secretary, Invesco Distributors, Inc.; Invesco Advisers, Inc. Invesco Investment Services, Inc., Invesco Capital Markets, Inc., Invesco Capital Management LLC and Invesco Investment Advisers LLC; and Assistant Secretary and Investment Vice President, Invesco Funds | | N/A | | N/A |
Andrew R. Schlossberg - 1974 Senior Vice President | | 2019 | | Senior Vice President, Invesco Group Services, Inc.; Head of the Americas and Senior Managing Director, Invesco Ltd.; Director and Senior Vice President, Invesco Advisers, Inc. (formerly known as Invesco Institutional (N.A.), Inc.) (registered investment adviser); Director and Chairman, Invesco Investment Services, Inc. (formerly known as Invesco AIM Investment Services, Inc.) (registered transfer agent); Senior Vice President, The Invesco Funds; and Director, Invesco Investment Advisers LLC (formerly known as Van Kampen Asset Management) Formerly: Director, President and Chairman, Invesco Insurance Agency, Inc.; Director, Invesco UK Limited; Director and Chief Executive, Invesco Asset Management Limited and Invesco Fund Managers Limited; Assistant Vice President, The Invesco Funds; Senior Vice President, Invesco Advisers, Inc. (formerly known as Invesco Institutional (N.A.), Inc.) (registered investment adviser); Director and Chief Executive, Invesco Administration Services Limited and Invesco Global Investment Funds Limited; Director, Invesco Distributors, Inc.; Head of EMEA, Invesco Ltd.; President, Invesco Actively Managed Exchange-Traded Commodity Fund Trust, Invesco Actively Managed Exchange-Traded Fund Trust, Invesco Exchange-Traded Fund Trust, Invesco Exchange-Traded Fund Trust II and Invesco India Exchange-Traded Fund Trust; and Managing Director and Principal Executive Officer, Invesco Capital Management LLC | | N/A | | N/A |
| | |
| T-4 | | Invesco Rochester® Limited Term New York Municipal Fund |
Trustees and Officers–(continued)
| | | | | | | | |
Name, Year of Birth and Position(s) Held with the Trust | | Trustee and/or Officer Since | | Principal Occupation(s) During Past 5 Years | | Number of Funds in Fund Complex Overseen by Trustee | | Other Directorship(s) Held by Trustee During Past 5 Years |
| Officers-(continued) | | | | | | | | |
John M. Zerr - 1962 Senior Vice President | | 2006 | | Chief Operating Officer of the Americas; Senior Vice President, Invesco Advisers, Inc. (formerly known as Invesco Institutional (N.A.), Inc.) (registered investment adviser); Senior Vice President, Invesco Distributors, Inc. (formerly known as Invesco AIM Distributors, Inc.); Director and Vice President, Invesco Investment Services, Inc. (formerly known as Invesco AIM Investment Services, Inc.) Senior Vice President, The Invesco Funds; Managing Director, Invesco Capital Management LLC; Director, Invesco Investment Advisers LLC (formerly known as Van Kampen Asset Management); Senior Vice President, Invesco Capital Markets, Inc. (formerly known as Van Kampen Funds Inc.); Manager, Invesco Indexing LLC; Manager, Invesco Specialized Products, LLC; Member, Invesco Canada Funds Advisory Board; Director, President and Chief Executive Officer, Invesco Corporate Class Inc. (corporate mutual fund company); and Director, Chairman, President and Chief Executive Officer, Invesco Canada Ltd. (formerly known as Invesco Trimark Ltd./Invesco Trimark Ltèe) (registered investment adviser and registered transfer agent); President, Invesco, Inc.; President, Invesco Global Direct Real Estate Feeder GP Ltd.; President, Invesco IP Holdings (Canada) Ltd; President, Invesco Global Direct Real Estate GP Ltd.; President, Invesco Financial Services Ltd. / Services Financiers Invesco Ltée; and Director and Chairman, Invesco Trust Company Formerly: President, Trimark Investments Ltd/Services Financiers Invesco Ltee; Director and Senior Vice President, Invesco Insurance Agency, Inc.; Director and Senior Vice President, Invesco Management Group, Inc. (formerly known as Invesco AIM Management Group, Inc.); Secretary and General Counsel, Invesco Management Group, Inc. (formerly known as Invesco AIM Management Group, Inc.); Secretary, Invesco Investment Services, Inc. (formerly known as Invesco AIM Investment Services, Inc.); Chief Legal Officer and Secretary, The Invesco Funds; Secretary and General Counsel, Invesco Investment Advisers LLC (formerly known as Van Kampen Asset Management); Secretary and General Counsel, Invesco Capital Markets, Inc. (formerly known as Van Kampen Funds Inc.); Chief Legal Officer, Invesco Exchange-Traded Fund Trust, Invesco Exchange-Traded Fund Trust II, Invesco India Exchange-Traded Fund Trust, Invesco Actively Managed Exchange-Traded Fund Trust, Invesco Actively Managed Exchange-Traded Commodity Fund Trust and Invesco Exchange-Traded Self-Indexed Fund Trust; Secretary, Invesco Indexing LLC; Director, Secretary, General Counsel and Senior Vice President, Van Kampen Exchange Corp.; Director, Vice President and Secretary, IVZ Distributors, Inc. (formerly known as INVESCO Distributors, Inc.); Director and Vice President, INVESCO Funds Group, Inc.; Director and Vice President, Van Kampen Advisors Inc.; Director, Vice President, Secretary and General Counsel, Van Kampen Investor Services Inc.;Director and Secretary, Invesco Distributors, Inc. (formerly known as Invesco AIM Distributors, Inc.); Director, Senior Vice President, General Counsel and Secretary, Invesco AIM Advisers, Inc. and Van Kampen Investments Inc.; Director, Vice President and Secretary, Fund Management Company; Director, Senior Vice President, Secretary, General Counsel and Vice President, Invesco AIM Capital Management, Inc.; and Chief Operating Officer and General Counsel, Liberty Ridge Capital, Inc. (an investment adviser) | | N/A | | N/A |
Gregory G. McGreevey - 1962 Senior Vice President | | 2012 | | Senior Managing Director, Invesco Ltd.; Director, Chairman, President, and Chief Executive Officer, Invesco Advisers, Inc. (formerly known as Invesco Institutional (N.A.), Inc.) (registered investment adviser); Director, Invesco Mortgage Capital, Inc. and Invesco Senior Secured Management, Inc.; Senior Vice President, The Invesco Funds; President, SNW Asset Management Corporation and Invesco Managed Accounts, LLC; Chairman and Director, Invesco Private Capital, Inc.; Chairman and Director, INVESCO Private Capital Investments, Inc.; Chairman and Director, INVESCO Realty, Inc.; and Senior Vice President, Invesco Group Services, Inc. Formerly: Senior Vice President, Invesco Management Group, Inc. and Invesco Advisers, Inc.; Assistant Vice President, The Invesco Funds | | N/A | | N/A |
Adrien Deberghes - 1967 Principal Financial Officer, Treasurer and Vice President | | 2020 | | Head of the Fund Office of the CFO and Fund Administration; Vice President, Invesco Advisers, Inc.; Principal Financial Officer, Treasurer and Vice President, The Invesco Funds; Vice President, Invesco Exchange-Traded Fund Trust, Invesco Exchange-Traded Fund Trust II, Invesco India Exchange-Traded Fund Trust, Invesco Actively Managed Exchange-Traded Fund Trust, Invesco Actively Managed Exchange-Traded Commodity Fund Trust and Invesco Exchange-Traded Self-Indexed Fund Trust Formerly: Senior Vice President and Treasurer, Fidelity Investments | | N/A | | N/A |
Crissie M. Wisdom - 1969 Anti-Money Laundering Compliance Officer | | 2013 | | Anti-Money Laundering and OFAC Compliance Officer for Invesco U.S. entities including: Invesco Advisers, Inc. and its affiliates, Invesco Capital Markets, Inc., Invesco Distributors, Inc., Invesco Investment Services, Inc., The Invesco Funds, Invesco Capital Management, LLC, Invesco Trust Company; and Fraud Prevention Manager for Invesco Investment Services, Inc. | | N/A | | N/A |
| | |
| T-5 | | Invesco Rochester® Limited Term New York Municipal Fund |
Trustees and Officers–(continued)
| | | | | | | | |
Name, Year of Birth and Position(s) Held with the Trust | | Trustee and/or Officer Since | | Principal Occupation(s) During Past 5 Years | | Number of Funds in Fund Complex Overseen by Trustee | | Other Directorship(s) Held by Trustee During Past 5 Years |
| Officers-(continued) | | | | | | | | |
| Todd F. Kuehl - 1969 Chief Compliance Officer and Senior Vice President | | 2020 | | Chief Compliance Officer, Invesco Advisers, Inc. (registered investment adviser); and Chief Compliance Officer and Senior Vice President, The Invesco Funds Formerly: Managing Director and Chief Compliance Officer, Legg Mason (Mutual Funds); Chief Compliance Officer, Legg Mason Private Portfolio Group (registered investment adviser) | | N/A | | N/A |
| James Bordewick, Jr. - 1959 Senior Vice President and Senior Officer | | 2022 | | Senior Vice President and Senior Officer, The Invesco Funds Formerly: Chief Legal Officer, KingsCrowd, Inc. (research and analytical platform for investment in private capital markets); Chief Operating Officer and Head of Legal and Regulatory, Netcapital (private capital investment platform); Managing Director, General Counsel of asset management and Chief Compliance Officer for asset management and private banking, Bank of America Corporation; Chief Legal Officer, Columbia Funds and BofA Funds; Senior Vice President and Associate General Counsel, MFS Investment Management; Chief Legal Officer, MFS Funds; Associate, Ropes & Gray; and Associate, Gaston Snow & Ely Bartlett | | N/A | | N/A |
The Statement of Additional Information of the Trust includes additional information about the Fund’s Trustees and is available upon request, without charge, by calling 1.800.959.4246. Please refer to the Fund’s Statement of Additional Information for information on the Fund’s sub-advisers.
| | | | | | |
| Office of the Fund | | Investment Adviser | | Distributor | | Auditors |
| 11 Greenway Plaza, Suite 1000 | | Invesco Advisers, Inc. | | Invesco Distributors, Inc. | | PricewaterhouseCoopers LLP |
| Houston, TX 77046-1173 | | 1331 Spring Street, NW, Suite 2500 | | 11 Greenway Plaza, Suite 1000 | | 1000 Louisiana Street, Suite 5800 |
| | Atlanta, GA 30309 | | Houston, TX 77046-1173 | | Houston, TX 77002-5021 |
| | | |
| Counsel to the Fund | | Counsel to the Independent Trustees | | Transfer Agent | | Custodian |
| Stradley Ronon Stevens & Young, LLP | | Sidley Austin LLP | | Invesco Investment Services, Inc. | | State Street Bank and Trust Company |
| 2005 Market Street, Suite 2600 | | 787 Seventh Avenue | | 11 Greenway Plaza, Suite 1000 | | 225 Franklin Street |
| Philadelphia, PA 19103-7018 | | New York, NY 10019 | | Houston, TX 77046-1173 | | Boston, MA 02110-2801 |
| | |
| T-6 | | Invesco Rochester® Limited Term New York Municipal Fund |

Go paperless with eDelivery
Visit invesco.com/edelivery to enjoy the convenience and security of anytime electronic access to your investment documents.
With eDelivery, you can elect to have any or all of the following materials delivered straight to your inbox to download, save and print from your own computer:
∎ Fund reports and prospectuses
∎ Quarterly statements
∎ Daily confirmations
∎ Tax forms
Invesco mailing information
Send general correspondence to Invesco Investment Services, Inc., P.O. Box 219078, Kansas City, MO 64121-9078.
Important notice regarding delivery of security holder documents
To reduce Fund expenses, only one copy of most shareholder documents may be mailed to shareholders with multiple accounts at the same address (Householding). Mailing of your shareholder documents may be householded indefinitely unless you instruct us otherwise. If you do not want the mailing of these documents to be combined with those for other members of your household, please contact Invesco Investment Services, Inc. at 800 959 4246 or contact your financial institution. We will begin sending you individual copies for each account within 30 days after receiving your request.
Fund holdings and proxy voting information
The Fund provides a complete list of its portfolio holdings four times each year, at the end of each fiscal quarter. For the second and fourth quarters, the list appears, respectively, in the Fund’s semiannual and annual reports to shareholders. For the first and third quarters, the Fund files the list with the Securities and Exchange Commission (SEC) as an exhibit to its reports on Form N-PORT. The most recent list of portfolio holdings is available at invesco.com/completeqtrholdings. Shareholders can also look up the Fund’s Form N-PORT filings on the SEC website, sec.gov. The SEC file numbers for the Fund are shown below.
A description of the policies and procedures that the Fund uses to determine how to vote proxies relating to portfolio securities is available without charge, upon request, from our Client Services department at 800 959 4246, or at invesco.com/ corporate/about-us/esg. The information is also available on the SEC website, sec.gov.
Information regarding how the Fund voted proxies related to its portfolio securities during the most recent 12-month period ended June 30 is available at invesco.com/proxysearch. This information is also available on the SEC website, sec.gov.
Invesco Advisers, Inc. is an investment adviser; it provides investment advisory services to individual and institutional clients and does not sell securities. Invesco Distributors, Inc. is the US distributor for Invesco Ltd.’s retail mutual funds, exchange-traded funds and institutional money market funds. Both are wholly owned, indirect subsidiaries of Invesco Ltd.
| | | | |
| SEC file number(s): 811-07890 and 033-66242 | | Invesco Distributors, Inc. | | O-ROLTNYM-AR-1 |

| | |
| | |
| Annual Report to Shareholders | | February 28, 2023 |
Invesco Rochester® Municipal Opportunities Fund
Nasdaq:
A: ORNAX ∎ C: ORNCX ∎ Y: ORNYX ∎ R5: IORHX ∎ R6: IORYX
Management’s Discussion of Fund Performance
| | |
Performance summary |
For the fiscal year ended February 28, 2023, Class A shares of Invesco Rochester® Municipal Opportunities Fund (the Fund), at net asset value (NAV), underperformed the Custom Invesco Rochester Municipal Opportunities Index. Your Fund’s long-term performance appears later in this report. |
| | |
Fund vs. Indexes | | |
Total returns, 2/28/22 to 2/28/23, at net asset value (NAV). Performance shown does not include applicable contingent deferred sales charges (CDSC) or front-end sales charges, which would have reduced performance. | | |
| |
Class A Shares | | -9.41% |
Class C Shares | | -9.94 |
Class Y Shares | | -9.19 |
Class R5 Shares | | -9.19 |
Class R6 Shares | | -9.00 |
S&P Municipal Bond High Yield Indexq | | -8.57 |
Custom Invesco Rochester Municipal Opportunities Index∎ | | -7.77 |
|
Source(s): qRIMES Technologies Corp.; ∎Invesco, RIMES Technologies Corp. |
Market conditions and your Fund
At the beginning of the fiscal year, investors were hopeful in anticipation of a return to normalcy as COVID-19 cases declined and pandemic-related restrictions were reduced or lifted. This allowed policymakers to turn their attention to the high inflation levels; however, on February 24, 2022, Russia began a full-scale invasion of Ukraine, which exacerbated inflationary pressures by driving up commodity prices. Against this backdrop, the fiscal year was plagued by volatility and uncertainty. The municipal market set multiple record lows in 2022, making it one of the most challenging years in history for municipal markets.
Investment grade municipal bonds returned -5.10%, high yield municipal bonds returned -9.35% and taxable municipal bonds returned -12.96% during the fiscal year.1
While municipal funds had experienced record inflows of $101.7 billion in 2021, flows quickly turned negative in the first quarter of 2022, perpetuating the Bloomberg Municipal Bond Index’s worst quarterly return in 40 years. Municipal bonds enjoyed a short respite in late May and early June 2022 with increased demand from crossover buyers like hedge funds, banks and insurance companies; however, the May 2022 Consumer Price Index report quoted inflation rising to a 40-year high. This sent the 10-year Treasury yield to a new 52-week high of nearly 3.50%, pushing municipal mutual fund flows back into negative territory.2 According to Lipper, net outflows from municipal bond funds totaled over -$110 billion for the fiscal year.3
On March 16, 2022, the US Federal Reserve (the Fed) raised the federal funds target rate 0.25% for the first time in more than three years in hopes of containing inflation.4 This was the first of eight consecutive increases during the fiscal year as the Fed announced its plan for a quantitative tightening campaign in an attempt to rein in inflation
without harming employment or the overall economy. Rate increases as high as 0.75% followed, the Fed’s most aggressive monetary policy since the 1980s, bringing the target rate to 4.75% as of the end of the fiscal year.4
The AAA municipal yield curve made history after the Fed’s December 2022 meeting when the curve inverted between one-and 10-year maturities. Any inversion is noteworthy, but this was a first for municipal bonds. On January 31, 2023, policymakers indicated that future rate increases were likely to be “appropriate,” suggesting they were not yet convinced inflation was contained, which increased uncertainty about when the current tightening cycle might end.4 The fiscal year ended with an increase of 0.25% on February 1, 2023. We expect additional rate hikes in 2023, although not with the same pace or vigor as in 2022.
New municipal issuance for the fiscal year totaled $354 billion, down 27% from the previous fiscal year’s $484 billion.5 Issuers, with cash on their balance sheets, have been reluctant to issue at higher interest rates. While taxable issuance continued to account for a significant portion of new issuance, at 14% of the total, this figure is down from 18% from the previous fiscal year because of higher interest rates.5
Puerto Rico continued to make developments in its ongoing debt restructuring throughout the fiscal year. The territory restructured its outstanding general obligation and other government-guaranteed debt in March 2022 and began paying bondholders on the new restructured bonds. Puerto Rico’s weight in the Bloomberg High Yield Municipal Bond Index increased from 13% to 20% as the new bonds were included.1 The Financial Oversight and Management Board for Puerto Rico, the Puerto Rican government, bond-holders and other interested parties continued to negotiate the restructuring of bonds issued by the Puerto Rico Electric Power
Authority, the territory’s largest remaining unresolved debt, as the fiscal year closed.
Municipal credits have a long history of low defaults as many provide essential services to all Americans. This continues to be the case as evidenced by S&P rating changes – upgrades exceeded downgrades by a ratio of 2.5:1 through December 2022.6 This positive dynamic, which we believe will continue, likely stems from benefits of the various federal stimulus measures including the American Rescue Plan Act, the Infrastructure Investment and Jobs Act and the Inflation Reduction Act, as well as higher revenues collected by state and local governments.
We believe the valuable benefits of municipal bonds will prevail over current market volatility and economic uncertainty. We continue to rely on our experienced portfolio managers and credit analysts to weather the challenges while identifying marketplace opportunities to add long-term value for shareholders.
During the fiscal year, security selection and an underweight allocation to non-rated bonds contributed to the Fund’s performance relative to its benchmark. At the sector level, security selection and underweight exposure among the healthcare sector contributed to the Fund’s relative performance. On the state level, an underweight exposure to Puerto Rico bonds contributed to relative performance.
An overweight allocation to bonds AAA through A-rated† detracted from the Fund’s performance relative to its benchmark during the fiscal year. Overweight exposure among the airport sector detracted from the Fund’s performance relative to the benchmark during the fiscal year. On the state level, an overweight exposure to New York domiciled bonds was detractive from relative results.
During the fiscal year, leverage contributed to the Fund’s performance relative to its benchmark. The Fund achieved a leveraged position through the use of inverse floating rate securities or tender option bonds. The Fund uses leverage because we believe that, over time, leveraging provides opportunities for additional income and total return for shareholders. However, the use of leverage also can expose shareholders to additional volatility. For more information about the Fund’s use of leverage, see the Notes to Financial Statements later in this report.
We wish to remind you that the Fund is subject to interest rate risk, meaning when interest rates rise, the value of fixed income securities tends to fall. The degree to which the value of fixed income securities may decline due to rising interest rates may vary depending on the speed and magnitude of the increase in interest rates, as well as individual security characteristics, such as price, maturity, duration and coupon and market forces, such as supply and demand for similar securities. We are monitoring interest rates, as well as the market, economic and geopolitical factors that may impact the direction, speed and
2 Invesco Rochester® Municipal Opportunities Fund
magnitude of changes to interest rates across the maturity spectrum, including the potential impact of monetary policy changes by the Fed and certain foreign central banks. If interest rates rise or fall faster than expected, markets may experience increased volatility, which may affect the value and/or liquidity of certain of the Fund’s investments.
Thank you for investing in Invesco Roches-ter® Municipal Opportunities Fund and for sharing our long-term investment horizon.
1 Source: Bloomberg LP
2 Source: Refinitiv TM3
3 Source: Lipper Inc.
4 Source: US Federal Reserve
5 Source: JP Morgan
6 Source: Standard & Poor’s
† Sources: A credit rating is an assessment provided by a nationally recognized statistical rating organization (NRSRO) of the creditworthiness of an issuer with respect to debt obligations, including specific securities, money market instruments or other debts. Ratings are measured on a scale that generally ranges from AAA (highest) to D (lowest); ratings are subject to change without notice. For more information on rating methodology, please visit www.spglobal.com and select “Understanding Credit Ratings” under About Ratings on the homepage; www.fitchratings.com and select “Understanding Credit Ratings” from the drop-down menu on the homepage; and www.moodys.com and select “Methodology,” then “Rating Methodologies” under Research Type on the left-hand side.
Portfolio manager(s):
Michael Camarella
Scott Cottier
Mark DeMitry
Tim O’Reilly
Mark Paris
Julius Williams
The views and opinions expressed in management’s discussion of Fund performance are those of Invesco Advisers, Inc. and its affiliates. These views and opinions are subject to change at any time based on factors such as market and economic conditions. These views and opinions may not be relied upon as investment advice or recommendations, or as an offer for a particular security. The information is not a complete analysis of every aspect of any market, country, industry, security or the Fund. Statements of fact are from sources considered reliable, but Invesco Advisers, Inc. makes no representation or warranty as to their completeness or accuracy. Although historical performance is no guarantee of future results, these insights may help you understand our investment management philosophy.
3 Invesco Rochester® Municipal Opportunities Fund
Your Fund’s Long-Term Performance
Results of a $10,000 Investment — Oldest Share Class(es)
Fund and index data from 2/28/13
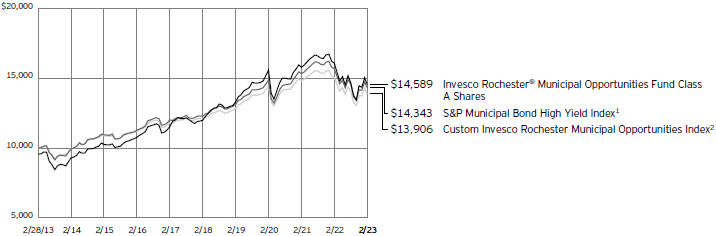
1 Source: RIMES Technologies Corp.
2 Source: Invesco, RIMES Technologies Corp.
Past performance cannot guarantee future results.
The data shown in the chart include reinvested distributions, applicable sales charges and Fund expenses including management
fees. Index results include reinvested dividends, but they do not reflect sales charges. Performance of the peer group, if applicable, reflects Fund expenses and management fees; performance of a market index does
not. Performance shown in the chart does not reflect deduction of taxes a shareholder would pay on Fund distributions or sale of Fund shares.
4 �� Invesco Rochester® Municipal Opportunities Fund
| | | | |
Average Annual Total Returns | |
As of 2/28/23, including maximum applicable sales charges | |
| Class A Shares | | | |
Inception (10/1/93) | | | 4.28 | % |
10 Years | | | 3.85 | |
5 Years | | | 3.09 | |
1 Year | | | -13.30 | |
| |
| Class C Shares | | | |
Inception (8/29/95) | | | 4.27 | % |
10 Years | | | 3.72 | |
5 Years | | | 3.32 | |
1 Year | | | -10.81 | |
| |
| Class Y Shares | | | |
Inception (11/29/10) | | | 6.04 | % |
10 Years | | | 4.52 | |
5 Years | | | 4.26 | |
1 Year | | | -9.19 | |
| |
| Class R5 Shares | | | |
10 Years | | | 4.43 | % |
5 Years | | | 4.25 | |
1 Year | | | -9.19 | |
| |
| Class R6 Shares | | | |
10 Years | | | 4.42 | % |
5 Years | | | 4.24 | |
1 Year | | | -9.00 | |
Effective May 24, 2019, Class A, Class C and Class Y shares of the Oppenheimer Rochester High Yield Municipal Fund, (the predecessor fund), were reorganized into Class A, Class C and Class Y shares, respectively, of the Invesco Oppenheimer Rochester® High Yield Municipal Fund. The Fund was subsequently renamed the Invesco Rochester® Municipal Opportunities Fund (the Fund). Returns shown above, for periods ending on or prior to May 24, 2019, for Class A, Class C, and Class Y shares are those for Class A, Class C and Class Y shares of the predecessor fund. Share class returns will differ from the predecessor fund because of different expenses.
Class R5 shares incepted on May 24, 2019. Performance shown on and prior to that date is that of the predecessor fund’s Class A shares at net asset value and includes the 12b-1 fees applicable to Class A shares.
Class R6 shares incepted on May 24, 2019. Performance shown on and prior to that date is that of the predecessor fund’s Class A shares at net asset value and includes the 12b-1 fees applicable to Class A shares.
The performance data quoted represent past performance and cannot guarantee future results; current performance may be lower or higher. Please visit invesco.com/performance for the most recent month-end performance. Performance figures reflect reinvested distributions, changes in net asset value and the effect of the maximum sales charge unless otherwise stated. Performance figures do not reflect
deduction of taxes a shareholder would pay on Fund distributions or sale of Fund shares. Investment return and principal value will fluctuate so that you may have a gain or loss when you sell shares.
Class A share performance reflects the maximum 4.25% sales charge, and Class C share performance reflects the applicable contingent deferred sales charge (CDSC) for the period involved. The CDSC on Class C shares is 1% for the first year after purchase. Class Y, Class R5 and Class R6 shares do not have a front-end sales charge or a CDSC; therefore, performance is at net asset value.
The performance of the Fund’s share classes will differ primarily due to different sales charge structures and class expenses.
Fund performance reflects any applicable fee waivers and/or expense reimbursements. Had the adviser not waived fees and/or reimbursed expenses currently or in the past, returns would have been lower. See current prospectus for more information.
5 Invesco Rochester® Municipal Opportunities Fund
Supplemental Information
Invesco Rochester® Municipal Opportunities Fund’s investment objective is to seek tax-free income.
| ∎ | | Unless otherwise stated, information presented in this report is as of February 28, 2023, and is based on total net assets. |
| ∎ | | Unless otherwise noted, all data is provided by Invesco. |
| ∎ | | To access your Fund’s reports/prospectus, visit invesco.com/fundreports. |
About indexes used in this report
| ∎ | | The S&P Municipal Bond High Yield Index is an unmanaged index considered representative of municipal bonds that are not rated or are rated below investment grade. |
| ∎ | | The Custom Invesco Rochester Municipal Opportunities Index is composed of 80% S&P Municipal Bond High Yield Index and 20% S&P Municipal Bond Investment Grade Index. The S&P Municipal Bond Investment Grade Index consists of bonds in the S&P Municipal Bond Index that are rated investment grade by Standard & Poor’s, Moody’s and/or Fitch. |
| ∎ | | The Fund is not managed to track the performance of any particular index, including the index(es) described here, and consequently, the performance of the Fund may deviate significantly from the performance of the index(es). |
| ∎ | | A direct investment cannot be made in an index. Unless otherwise indicated, index results include reinvested dividends, and they do not reflect sales charges. Performance of the peer group, if applicable, reflects fund expenses; performance of a market index does not. |
|
This report must be accompanied or preceded by a currently effective Fund prospectus, which contains more complete information, including sales charges and expenses. Investors should read it carefully before investing. |
| | |
| | |
| NOT FDIC INSURED | MAY LOSE VALUE | NO BANK GUARANTEE | | |
6 Invesco Rochester® Municipal Opportunities Fund
Fund Information
Portfolio Composition
| | | | | |
| By credit sector | | % of total investments |
| |
Revenue Bonds | | | | 85.13 | % |
General Obligation Bonds | | | | 13.55 | |
Pre-Refunded Bonds | | | | 1.32 | |
Top Five Debt Holdings
| | | | | | | |
| | | | | % of total net assets |
| | |
1. | | Buckeye Tobacco Settlement Financing Authority, Series 2020 B-2, Ref. RB | | | | 1.56 | % |
| | |
2. | | Children’s Trust Fund, Series 2002, RB | | | | 1.39 | |
| | |
3. | | Triborough Bridge & Tunnel Authority, Series 2022-XF1332, RB | | | | 1.32 | |
| | |
4. | | California (State of) County Tobacco Securitization Agency, Series 2006 A, RB | | | | 1.26 | |
| | |
5. | | District of Columbia Tobacco Settlement Financing Corp., Series 2006 C, RB | | | | 1.01 | |
The Fund’s holdings are subject to change, and there is no assurance that the Fund will continue to hold any particular security.
Data presented here are as of February 28, 2023.
7 Invesco Rochester® Municipal Opportunities Fund
Schedule of Investments
February 28, 2023
| | | | | | | | | | | | | | |
| | | Interest
Rate | | | Maturity
Date | | | Principal
Amount
(000) | | | Value |
Municipal Obligations–113.25%(a) | | | | | | | | | | | | | | |
Alabama–4.22% | | | | | | | | | | | | | | |
Birmingham (City of) & Jefferson (County of), AL Civic Center Authority; | | | | | | | | | | | | | | |
Series 2018 A, RB | | | 4.00% | | | | 07/01/2043 | | | $ | 7,040 | | | $ 6,742,699 |
Series 2018 A, RB | | | 5.00% | | | | 07/01/2048 | | | | 28,620 | | | 29,526,252 |
Series 2018 D, RB | | | 5.00% | | | | 05/01/2035 | | | | 1,365 | | | 1,470,627 |
Series 2018 D, RB | | | 5.00% | | | | 05/01/2036 | | | | 1,170 | | | 1,252,457 |
Series 2018, RB | | | 5.00% | | | | 05/01/2048 | | | | 12,870 | | | 13,411,231 |
Birmingham (City of), AL; Series 2018 B, GO Wts. | | | 5.00% | | | | 12/01/2036 | | | | 1,700 | | | 1,816,609 |
Homewood (City of), AL Educational Building Authority (Samford University); Series 2017 A, Ref. RB | | | 5.00% | | | | 12/01/2047 | | | | 4,500 | | | 4,586,248 |
Hoover (City of), AL Industrial Development Board (United States Steel Corp.); Series 2019, RB(b) | | | 5.75% | | | | 10/01/2049 | | | | 15,000 | | | 15,530,067 |
Jefferson (County of), AL; | | | | | | | | | | | | | | |
Series 2013 C, Revenue Wts. (INS - AGM)(c)(d) | | | 6.75% | | | | 10/01/2046 | | | | 20,045 | | | 20,456,570 |
Series 2013 C, Revenue Wts. (INS - AGM)(c)(d) | | | 6.90% | | | | 10/01/2050 | | | | 17,500 | | | 17,848,927 |
Series 2013 D, Revenue Wts. | | | 7.00% | | | | 10/01/2051 | | | | 25,000 | | | 26,670,760 |
Series 2013 D, Revenue Wts. | | | 6.50% | | | | 10/01/2053 | | | | 31,500 | | | 33,506,528 |
Series 2013 F, Revenue Wts.(c) | | | 7.50% | | | | 10/01/2039 | | | | 21,895 | | | 22,501,273 |
Series 2013 F, Revenue Wts.(c) | | | 7.75% | | | | 10/01/2046 | | | | 30,000 | | | 30,790,326 |
Series 2013 F, Revenue Wts.(c) | | | 7.90% | | | | 10/01/2050 | | | | 49,050 | | | 50,312,758 |
Mobile (City of), AL Improvement District (McGowin Park); | | | | | | | | | | | | | | |
Series 2016 A, RB | | | 5.25% | | | | 08/01/2030 | | | | 500 | | | 475,366 |
Series 2016 A, RB | | | 5.50% | | | | 08/01/2035 | | | | 1,300 | | | 1,205,992 |
Mobile (County of), AL (Gomessa); Series 2020, Revenue Wts.(e) | | | 4.00% | | | | 11/01/2045 | | | | 2,570 | | | 2,229,985 |
Muscle Shoals, Sheffield & Tuscumbia Solid Waste Disposal Authority (Cherokee Industrial Landfill); | | | | | | | | | | | | | | |
Series 2020 A, RB(b)(e) | | | 6.00% | | | | 05/01/2040 | | | | 6,000 | | | 5,781,771 |
Series 2020 B, RB(e) | | | 8.00% | | | | 05/01/2029 | | | | 1,690 | | | 1,569,477 |
Southeast Energy Authority A Cooperative District (No. 2); | | | | | | | | | | | | | | |
Series 2021 B, RB | | | 4.00% | | | | 06/01/2031 | | | | 1,850 | | | 1,821,518 |
Series 2021 B, RB(f) | | | 4.00% | | | | 12/01/2031 | | | | 4,275 | | | 4,166,622 |
Tuscaloosa (County of), AL Industrial Development Authority (Hunt Refining); Series 2019 A, Ref. IDR(e) | | | 5.25% | | | | 05/01/2044 | | | | 43,365 | | | 37,623,014 |
| | | | | | | | | | | | | | | 331,297,077 |
| | | | |
Alaska–0.00% | | | | | | | | | | | | | | |
Alaska (State of) Industrial Development & Export Authority (Boys & Girls Home & Family Services, Inc.); | | | | | | | | | | | | | | |
Series 2007 C, RB(g) | | | 5.88% | | | | 12/01/2027 | | | | 1,650 | | | 4,290 |
Series 2007 C, RB(g) | | | 6.00% | | | | 12/01/2036 | | | | 500 | | | 1,300 |
University of Alaska; Series 2015 T, RB | | | 5.00% | | | | 10/01/2039 | | | | 200 | | | 203,506 |
| | | | | | | | | | | | | | | 209,096 |
| | | | |
Arizona–2.07% | | | | | | | | | | | | | | |
Arizona (State of) Health Facilities Authority (Scottsdale Lincoln Hospital); Series 2014, Ref. RB | | | 5.00% | | | | 12/01/2039 | | | | 13,550 | | | 13,774,792 |
Arizona (State of) Industrial Development Authority (Academies of Math & Science); | | | | | | | | | | | | | | |
Series 2018 B, RB(e) | | | 5.50% | | | | 07/01/2038 | | | | 1,165 | | | 1,179,325 |
Series 2018 B, RB(e) | | | 5.63% | | | | 07/01/2048 | | | | 2,250 | | | 2,254,022 |
Series 2018 B, RB(e) | | | 5.75% | | | | 07/01/2053 | | | | 3,500 | | | 3,517,566 |
Arizona (State of) Industrial Development Authority (ACCEL Schools); | | | | | | | | | | | | | | |
Series 2018 A, RB(e) | | | 5.13% | | | | 08/01/2038 | | | | 2,515 | | | 2,390,116 |
Series 2018 A, RB(e) | | | 5.25% | | | | 08/01/2048 | | | | 3,945 | | | 3,556,685 |
Arizona (State of) Industrial Development Authority (Franklin Phonetic Charter School); | | | | | | | | | | | | | | |
Series 2017, Ref. RB(e) | | | 5.50% | | | | 07/01/2037 | | | | 580 | | | 566,476 |
Series 2017, Ref. RB(e) | | | 5.75% | | | | 07/01/2047 | | | | 680 | | | 647,482 |
Series 2017, Ref. RB(e) | | | 5.88% | | | | 07/01/2052 | | | | 645 | | | 617,603 |
Arizona (State of) Industrial Development Authority (Leman Academy-Parker Colorado); Series 2019, RB(e) | | | 5.00% | | | | 07/01/2054 | | | | 3,000 | | | 2,578,199 |
See accompanying Notes to Financial Statements which are an integral part of the financial statements.
8 Invesco Rochester® Municipal Opportunities Fund
| | | | | | | | | | | | | | |
| | | Interest
Rate | | | Maturity
Date | | | Principal
Amount
(000) | | | Value |
Arizona–(continued) | | | | | | | | | | | | | | |
Arizona (State of) Industrial Development Authority (Mater Academy of Nevada Mountain Vista Campus Project); | | | | | | | | | | | | | | |
Series 2018 A, RB(e) | | | 5.25% | | | | 12/15/2038 | | | $ | 1,415 | | | $ 1,420,661 |
Series 2018 A, RB(e) | | | 5.50% | | | | 12/15/2048 | | | | 2,260 | | | 2,247,462 |
Arizona (State of) Industrial Development Authority (Provident Group-NCCU Properties LLC); Series 2019 A, RB (INS - BAM)(d) | | | 5.00% | | | | 06/01/2049 | | | | 2,250 | | | 2,402,429 |
Cadence Community Facilities District (Assessment District No. 1); Series 2019, RB | | | 4.50% | | | | 07/01/2043 | | | | 445 | | | 390,415 |
East San Luis (City of), AZ Community Facilities District (Assessment Area One); Series 2007, RB(h) | | | 6.38% | | | | 01/01/2028 | | | | 550 | | | 507,753 |
East San Luis (City of), AZ Community Facilities District (Assessment Area Two); Series 2009, Ref. RB(g)(h) | | | 8.50% | | | | 01/01/2028 | | | | 140 | | | 91,000 |
Glendale (City of), AZ Industrial Development Authority (The Beatitudes Campus); Series 2017, Ref. RB | | | 5.00% | | | | 11/15/2045 | | | | 3,100 | | | 2,558,123 |
La Paz (County of), AZ Industrial Development Authority (Charter School Solutions- Harmony Public Schools); | | | | | | | | | | | | | | |
Series 2018 A, RB | | | 5.00% | | | | 02/15/2038 | | | | 500 | | | 502,805 |
Series 2018 A, RB | | | 5.00% | | | | 02/15/2048 | | | | 1,200 | | | 1,172,012 |
Maricopa (County of), AZ Industrial Development Authority (Christian Care Surprise, Inc.); Series 2016, RB(e) | | | 6.00% | | | | 01/01/2048 | | | | 11,475 | | | 8,035,479 |
Maricopa (County of), AZ Industrial Development Authority (GreatHearts Arizona); | | | | | | | | | | | | | | |
Series 2017 C, RB | | | 5.00% | | | | 07/01/2037 | | | | 220 | | | 227,772 |
Series 2017 C, RB | | | 5.00% | | | | 07/01/2048 | | | | 405 | | | 411,792 |
Merrill Ranch Community Facilities District No. 1 (Assessment Area One); Series 2006, RB | | | 5.25% | | | | 07/01/2024 | | | | 93 | | | 93,025 |
Merrill Ranch Community Facilities District No. 2; Series 2016, GO Bonds | | | 5.25% | | | | 07/15/2040 | | | | 810 | | | 841,184 |
Merrill Ranch Community Facilities District No. 2 (Assessment Area One); | | | | | | | | | | | | | | |
Series 2006, RB | | | 5.25% | | | | 07/01/2024 | | | | 86 | | | 86,023 |
Series 2006, RB | | | 5.30% | | | | 07/01/2030 | | | | 397 | | | 396,975 |
Parkway Community Facilities District No. 1 Prescott Valley; | | | | | | | | | | | | | | |
Series 2006, GO Bonds | | | 5.30% | | | | 07/15/2025 | | | | 265 | | | 247,386 |
Series 2006, GO Bonds | | | 5.35% | | | | 07/15/2031 | | | | 350 | | | 279,502 |
Phoenix (City of), AZ Industrial Development Authority (Espiritu Community Development Corp. Charter School); Series 2006 A, RB | | | 6.25% | | | | 07/01/2036 | | | | 1,545 | | | 1,456,911 |
Phoenix (City of), AZ Industrial Development Authority (Freedom Academy, Inc.); Series 2016, RB(e) | | | 5.50% | | | | 07/01/2046 | | | | 4,135 | | | 4,175,938 |
Phoenix (City of), AZ Industrial Development Authority (Gourmet Boutique West LLC); Series 2007 B, IDR (Acquired 03/01/2007-03/20/2019; Cost $2,325,000)(b)(i) | | | 5.88% | | | | 11/01/2037 | | | | 2,485 | | | 1,872,774 |
Phoenix (City of), AZ Industrial Development Authority (The) (Downtown Phoenix Student Housing, LLC- Arizona State University); Series 2018 A, Ref. RB | | | 5.00% | | | | 07/01/2042 | | | | 1,000 | | | 979,305 |
Phoenix (City of), AZ Industrial Development Authority (The) (Overland Crossing); Series 2022, RB(e) | | | 9.50% | | | | 04/01/2052 | | | | 7,900 | | | 7,103,058 |
Phoenix (City of), AZ Industrial Development Authority (Vista College Preparatory); Series 2018 A, RB | | | 5.00% | | | | 07/01/2048 | | | | 1,185 | | | 1,224,803 |
Phoenix Civic Improvement Corp.; Series 2018, RB(b) | | | 5.00% | | | | 07/01/2048 | | | | 10,000 | | | 10,168,983 |
Pima (County of), AZ Industrial Development Authority; | | | | | | | | | | | | | | |
Series 2021, RB(e) | | | 5.00% | | | | 07/01/2056 | | | | 2,285 | | | 1,945,506 |
Series 2022, RB(e) | | | 6.88% | | | | 11/15/2052 | | | | 7,500 | | | 7,623,587 |
Series 2022, RB(e) | | | 7.00% | | | | 11/15/2057 | | | | 3,975 | | | 4,038,704 |
Pima (County of), AZ Industrial Development Authority (American Leadership Academy); Series 2015, Ref. RB(e) | | | 5.63% | | | | 06/15/2045 | | | | 2,250 | | | 2,251,932 |
Pima (County of), AZ Industrial Development Authority (Arizona Charter Schools Ref.); Series 2013 Q, Ref. RB | | | 5.38% | | | | 07/01/2031 | | | | 2,565 | | | 2,510,104 |
Pima (County of), AZ Industrial Development Authority (Christian Care Tuscon, Inc.); | | | | | | | | | | | | | | |
Series 2017 A, Ref. RB(f)(j) | | | 5.00% | | | | 06/15/2025 | | | | 1,550 | | | 1,618,271 |
Series 2017 C, RB(f)(j) | | | 5.00% | | | | 06/15/2025 | | | | 2,830 | | | 2,954,650 |
Pima (County of), AZ Industrial Development Authority (Excalibur Charter School (The)); Series 2016, Ref. RB(e) | | | 5.50% | | | | 09/01/2046 | | | | 2,400 | | | 2,166,187 |
Pima (County of), AZ Industrial Development Authority (Milestones Charter School Refunding); Series 2017 A, Ref. RB(e) | | | 6.50% | | | | 11/01/2047 | | | | 5,530 | | | 4,963,027 |
Pima (County of), AZ Industrial Development Authority (P.L.C. Charter Schools); | | | | | | | | | | | | | | |
Series 2016, Ref. RB(e) | | | 6.00% | | | | 12/01/2036 | | | | 3,315 | | | 3,351,121 |
Series 2016, Ref. RB(e) | | | 6.00% | | | | 12/01/2046 | | | | 6,310 | | | 6,246,287 |
See accompanying Notes to Financial Statements which are an integral part of the financial statements.
9 Invesco Rochester® Municipal Opportunities Fund
| | | | | | | | | | | | | | |
| | | Interest
Rate | | | Maturity
Date | | | Principal
Amount
(000) | | | Value |
Arizona–(continued) | | | | | | | | | | | | | | |
Pima (County of), AZ Industrial Development Authority (Paideia Academies (The)); | | | | | | | | | | | | | | |
Series 2015, RB(e) | | | 6.00% | | | | 07/01/2035 | | | $ | 1,025 | | | $ 1,036,644 |
Series 2015, RB(e) | | | 6.13% | | | | 07/01/2045 | | | | 3,310 | | | 3,317,829 |
Series 2019, RB | | | 5.13% | | | | 07/01/2039 | | | | 650 | | | 606,637 |
Series 2019, RB | | | 5.25% | | | | 07/01/2049 | | | | 810 | | | 722,196 |
Pinal (County of), AZ Industrial Development Authority; Series 2021 C, RB(b)(e) | | | 5.50% | | | | 10/01/2033 | | | | 20,560 | | | 19,454,176 |
Pinal (County of), AZ Industrial Development Authority (Green Bonds); Series 2021 B, RB(b)(c) | | | 5.50% | | | | 10/01/2033 | | | | 5,853 | | | 5,538,195 |
Pinal (County of), AZ Industrial Development Authority (San Manuel Facility); Series 2006, RB(b) | | | 6.25% | | | | 06/01/2026 | | | | 355 | | | 354,513 |
Show Low Bluff Community Facilities District (Assessment Area One); Series 2007, RB(e) | | | 5.60% | | | | 07/01/2031 | | | | 181 | | | 162,651 |
Southside Community Facilities District No. 1; Series 2008, RB(h) | | | 7.25% | | | | 07/01/2032 | | | | 929 | | | 732,453 |
Tempe (City of), AZ Industrial Development Authority; Series 2022 A, RB(e) | | | 6.50% | | | | 08/01/2048 | | | | 3,640 | | | 3,721,148 |
Tempe (City of), AZ Industrial Development Authority (Mirabella at ASU); | | | | | | | | | | | | | | |
Series 2017 A, RB(e) | | | 6.00% | | | | 10/01/2037 | | | | 1,010 | | | 854,779 |
Series 2017 A, RB(e) | | | 6.13% | | | | 10/01/2047 | | | | 2,300 | | | 1,782,674 |
Series 2017 A, RB(e) | | | 6.13% | | | | 10/01/2052 | | | | 2,360 | | | 1,790,971 |
Verrado Community Facilities District No. 1; | | | | | | | | | | | | | | |
Series 2013 A, Ref. GO Bonds(e) | | | 6.00% | | | | 07/15/2027 | | | | 1,800 | | | 1,804,295 |
Series 2013 B, GO Bonds(e) | | | 5.70% | | | | 07/15/2029 | | | | 675 | | | 675,783 |
Series 2013 B, GO Bonds(e) | | | 6.00% | | | | 07/15/2033 | | | | 610 | | | 610,541 |
| | | | | | | | | | | | | | | 162,810,697 |
| | | | |
Arkansas–0.10% | | | | | | | | | | | | | | |
Cave Springs Municipal Property Owners’ Improvement District No. 3; Series 2007, GO Bonds(h) | | | 6.25% | | | | 02/01/2038 | | | | 4,455 | | | 4,455,000 |
Crystal Valley Metropolitan District No. 2; Series 2022, GO Bonds(e) | | | 7.25% | | | | 12/01/2052 | | | | 3,600 | | | 3,402,205 |
| | | | | | | | | | | | | | | 7,857,205 |
| | | | |
California–12.66% | | | | | | | | | | | | | | |
Blythe (City of), CA Redevelopment Agency Successor Agency (Project No. 1); Series 2000 A, RB | | | 6.20% | | | | 05/01/2031 | | | | 145 | | | 145,282 |
California (State of); | | | | | | | | | | | | | | |
Series 2019, GO Bonds | | | 5.00% | | | | 04/01/2049 | | | | 3,200 | | | 3,417,095 |
Series 2021, GO Bonds(k) | | | 4.00% | | | | 10/01/2039 | | | | 8,105 | | | 8,167,562 |
Series 2021, Ref. GO Bonds | | | 4.00% | | | | 10/01/2041 | | | | 65 | | | 65,015 |
Series 2021, Ref. GO Bonds(k) | | | 4.00% | | | | 10/01/2041 | | | | 6,500 | | | 6,501,472 |
Series 2022, GO Bonds(k) | | | 5.00% | | | | 04/01/2047 | | | | 27,035 | | | 29,598,529 |
Series 2022, GO Bonds | | | 4.00% | | | | 04/01/2049 | | | | 13,000 | | | 12,594,434 |
Series 2022, Ref. GO Bonds | | | 4.00% | | | | 09/01/2042 | | | | 11,080 | | | 11,070,184 |
California (State of) County Tobacco Securitization Agency; | | | | | | | | | | | | | | |
Series 2006 A, RB(l) | | | 0.00% | | | | 06/01/2050 | | | | 520,920 | | | 98,703,401 |
Series 2006 B, RB(l) | | | 0.00% | | | | 06/01/2050 | | | | 107,400 | | | 17,690,004 |
California (State of) County Tobacco Securitization Agency (Alameda County Tobacco Asset Securitization Corp.); | | | | | | | | | | | | | | |
Series 2002, RB | | | 5.88% | | | | 06/01/2035 | | | | 1,345 | | | 1,367,248 |
Series 2002, RB | | | 6.00% | | | | 06/01/2042 | | | | 19,120 | | | 19,436,266 |
Series 2006 C, RB(l) | | | 0.00% | | | | 06/01/2055 | | | | 212,950 | | | 18,918,776 |
California (State of) County Tobacco Securitization Agency (Fresno County Tobacco Funding Corp.); | | | | | | | | | | | | | | |
Series 2002, RB | | | 6.13% | | | | 06/01/2038 | | | | 5,000 | | | 5,003,133 |
Series 2006 A, RB(l) | | | 0.00% | | | | 06/01/2046 | | | | 127,310 | | | 28,788,241 |
Series 2006 B, RB(l) | | | 0.00% | | | | 06/01/2046 | | | | 33,920 | | | 7,413,416 |
Series 2006 C, RB(l) | | | 0.00% | | | | 06/01/2055 | | | | 215,100 | | | 21,707,742 |
California (State of) County Tobacco Securitization Agency (Stanislaus County Tobacco Funding Corp.); Series 2002 A, RB | | | 5.88% | | | | 06/01/2043 | | | | 4,515 | | | 4,515,125 |
California (State of) Housing Finance Agency; Series 2019 A-1, RB | | | 4.25% | | | | 01/15/2035 | | | | 575 | | | 573,093 |
California (State of) Infrastructure & Economic Development Bank; Series 2019, RB(k) | | | 5.00% | | | | 05/15/2052 | | | | 31,530 | | | 32,989,905 |
California (State of) Municipal Finance Authority (Linxs APM); | | | | | | | | | | | | | | |
Series 2018 A, RB(b) | | | 5.00% | | | | 12/31/2047 | | | | 13,845 | | | 13,713,016 |
Series 2018 B, RB(b) | | | 5.00% | | | | 06/01/2048 | | | | 2,575 | | | 2,543,081 |
California (State of) Pollution Control Financing Authority (Aemerge Redpak Services Southern California LLC); Series 2017, RB(b)(e)(g) | | | 8.00% | | | | 12/01/2027 | | | | 3,000 | | | 180,000 |
See accompanying Notes to Financial Statements which are an integral part of the financial statements.
10 Invesco Rochester® Municipal Opportunities Fund
| | | | | | | | | | | | | | |
| | | Interest
Rate | | | Maturity
Date | | | Principal
Amount
(000) | | | Value |
California–(continued) | | | | | | | | | | | | | | |
California (State of) Pollution Control Financing Authority (CalPlant I) (Green Bonds); | | | | | | | | | | | | | | |
Series 2017, RB(b)(e)(g) | | | 7.50% | | | | 07/01/2032 | | | $ | 6,075 | | | $ 303,750 |
Series 2017, RB(b)(e)(g) | | | 8.00% | | | | 07/01/2039 | | | | 14,995 | | | 749,750 |
Series 2020, RB (Acquired 10/06/2020; Cost $2,531,287)(b)(e)(g)(i) | | | 7.50% | | | | 07/01/2032 | | | | 2,650 | | | 344,500 |
California (State of) Public Finance Authority (Kendal at Ventura); Series 2023 A-C, RB(e) | | | 10.00% | | | | 05/15/2028 | | | | 3,000 | | | 2,977,700 |
California (State of) School Finance Authority (Escuela Popular); Series 2017, RB(e) | | | 6.50% | | | | 07/01/2050 | | | | 4,130 | | | 4,148,026 |
California (State of) School Finance Authority (Grimmway Schools Obligated Group); Series 2016 A, RB(e) | | | 5.25% | | | | 07/01/2051 | | | | 5,945 | | | 5,858,317 |
California (State of) School Finance Authority (Kepler Neighborhood School); | | | | | | | | | | | | | | |
Series 2017 A, RB (CEP - Colorado Higher Education Intercept Program)(e) | | | 5.00% | | | | 05/01/2027 | | | | 345 | | | 341,914 |
Series 2017 A, RB (CEP - Colorado Higher Education Intercept Program)(e) | | | 5.75% | | | | 05/01/2037 | | | | 900 | | | 904,211 |
Series 2017 A, RB (CEP - Colorado Higher Education Intercept Program)(e) | | | 5.88% | | | | 05/01/2047 | | | | 1,230 | | | 1,208,859 |
California (State of) School Finance Authority (Rocketship Education); | | | | | | | | | | | | | | |
Series 2017 A, RB(e) | | | 5.13% | | | | 06/01/2047 | | | | 595 | | | 547,360 |
Series 2017 A, RB(e) | | | 5.25% | | | | 06/01/2052 | | | | 665 | | | 614,600 |
California (State of) Statewide Communities Development Authority (NCCD-Hooper Street LLC-California College of the Arts); Series 2019, RB(e) | | | 5.25% | | | | 07/01/2052 | | | | 1,450 | | | 1,261,251 |
California (State of) Statewide Communities Development Authority (Yucaipa Valley Water Reservoir); Series 2014, RB | | | 6.00% | | | | 09/02/2044 | | | | 7,200 | | | 7,267,568 |
California (State of) Statewide Financing Authority (Pooled Tobacco Securitization Program); | | | | | | | | | | | | | | |
Series 2002 A, RB | | | 6.00% | | | | 05/01/2037 | | | | 3,615 | | | 3,678,007 |
Series 2002 B, RB | | | 6.00% | | | | 05/01/2043 | | | | 12,035 | | | 12,244,996 |
Series 2002, RB | | | 6.00% | | | | 05/01/2043 | | | | 100 | | | 101,745 |
Del Mar Race Track Authority; Series 2015, Ref. RB | | | 5.00% | | | | 10/01/2038 | | | | 4,075 | | | 3,875,712 |
Fresno Unified School District; Series 2016 B, Ref. GO Bonds(l) | | | 0.00% | | | | 08/01/2042 | | | | 7,780 | | | 3,288,829 |
Lathrop (City of), CA (Community Facilities District No. 03-2); Series 2003, RB | | | 7.00% | | | | 09/01/2033 | | | | 965 | | | 967,599 |
Long Beach (City of), CA (Green Bonds); Series 2017 B, RB(b) | | | 5.00% | | | | 05/15/2043 | | | | 4,000 | | | 4,082,656 |
Los Angeles (City of), CA Department of Airports; | | | | | | | | | | | | | | |
Series 2018, RB(b)(k) | | | 5.00% | | | | 05/15/2043 | | | | 25,000 | | | 25,868,463 |
Series 2020 C, RB(b) | | | 4.00% | | | | 05/15/2050 | | | | 34,780 | | | 32,237,749 |
Series 2021 A, Ref. RB(b) | | | 5.00% | | | | 05/15/2051 | | | | 8,150 | | | 8,414,639 |
Series 2021 D, Ref. RB(b) | | | 4.00% | | | | 05/15/2051 | | | | 25,375 | | | 22,978,588 |
Series 2022 A, RB(b) | | | 4.00% | | | | 05/15/2049 | | | | 18,575 | | | 17,068,452 |
Series 2022 H, RB(b) | | | 5.25% | | | | 05/15/2047 | | | | 8,000 | | | 8,506,113 |
Series 2022 H, RB(b) | | | 5.00% | | | | 05/15/2052 | | | | 4,490 | | | 4,642,045 |
Series 2022, RB(b)(k) | | | 5.00% | | | | 05/15/2047 | | | | 25,205 | | | 25,587,085 |
Series 2022, RB(b)(k) | | | 5.00% | | | | 05/15/2048 | | | | 30,000 | | | 30,773,961 |
Los Angeles (City of), CA Department of Airports (Green Bonds); Series 2022 G, RB(b) | | | 5.00% | | | | 05/15/2052 | | | | 4,485 | | | 4,636,876 |
Los Angeles (City of), CA Department of Airports (Los Angeles International Airport); | | | | | | | | | | | | | | |
Series 2018 A, RB(b) | | | 5.00% | | | | 05/15/2035 | | | | 1,000 | | | 1,056,088 |
Series 2018 A, RB(b) | | | 5.00% | | | | 05/15/2036 | | | | 1,385 | | | 1,453,406 |
Los Angeles County Facilities, Inc. (Vermont Corridor County Administration Building); | | | | | | | | | | | | | | |
Series 2018 A, RB(f)(j) | | | 5.00% | | | | 12/01/2028 | | | | 3,075 | | | 3,451,459 |
Series 2018 A, RB | | | 5.00% | | | | 12/01/2051 | | | | 18,145 | | | 19,219,429 |
Morongo Band of Mission Indians (The); Series 2018 A, RB(e) | | | 5.00% | | | | 10/01/2042 | | | | 4,500 | | | 4,467,060 |
Placer (County of), CA (Placer Corporate Center Assessment District No. 1); Series 2000, RB | | | 6.50% | | | | 09/02/2030 | | | | 45 | | | 45,511 |
Placer (County of), CA Community Facilities District; | | | | | | | | | | | | | | |
Series 2021, RB | | | 4.00% | | | | 09/01/2046 | | | | 2,450 | | | 2,121,538 |
Series 2021, RB | | | 4.00% | | | | 09/01/2051 | | | | 3,270 | | | 2,749,533 |
Regents of the University of California Medical Center; | | | | | | | | | | | | | | |
Series 2022 P, RB | | | 5.00% | | | | 05/15/2047 | | | | 15,000 | | | 16,207,605 |
Series 2022 P, RB(k)(m) | | | 5.00% | | | | 05/15/2047 | | | | 40,000 | | | 43,220,280 |
Series 2022 P, RB | | | 4.00% | | | | 05/15/2053 | | | | 9,500 | | | 8,765,182 |
Regional Airports Improvement Corp. (Los Angeles International Airport - Continental Airlines, Inc. Cargo Facilities); Series 1994, RB(b) | | | 9.25% | | | | 08/01/2024 | | | | 3,040 | | | 3,054,641 |
Rialto (City of), CA Redevelopment Agency Successor Agency; Series 2018, Ref. RB | | | 5.00% | | | | 09/01/2037 | | | | 3,975 | | | 4,242,100 |
Sacramento (City of), CA (Convention Center Complex); Series 2018 A, RB | | | 5.00% | | | | 06/01/2048 | | | | 10,000 | | | 10,393,041 |
See accompanying Notes to Financial Statements which are an integral part of the financial statements.
11 Invesco Rochester® Municipal Opportunities Fund
| | | | | | | | | | | | | | |
| | | Interest
Rate | | | Maturity
Date | | | Principal
Amount
(000) | | | Value |
California–(continued) | | | | | | | | | | | | | | |
San Diego (County of), CA Regional Airport Authority; | | | | | | | | | | | | | | |
Series 2021 A, RB | | | 5.00% | | | | 07/01/2051 | | | $ | 7,000 | | | $ 7,359,252 |
Series 2021 A, RB | | | 4.00% | | | | 07/01/2056 | | | | 14,000 | | | 12,935,658 |
Series 2021 B, RB(b) | | | 5.00% | | | | 07/01/2051 | | | | 15,000 | | | 15,336,570 |
Series 2021 B, RB(b) | | | 4.00% | | | | 07/01/2056 | | | | 33,985 | | | 29,796,967 |
San Francisco (City & County of), CA Airport Commission (San Francisco International Airport); | | | | | | | | | | | | | | |
Second Series 2022 A, Ref. RB(b) | | | 4.00% | | | | 05/01/2052 | | | | 5,750 | | | 5,221,095 |
Series 2016, RB(b) | | | 5.00% | | | | 05/01/2046 | | | | 20,630 | | | 20,884,997 |
Series 2019 A, RB(b) | | | 5.00% | | | | 05/01/2049 | | | | 4,700 | | | 4,786,583 |
Series 2019 E, RB(b) | | | 5.00% | | | | 05/01/2050 | | | | 58,000 | | | 59,022,070 |
Silicon Valley Tobacco Securitization Authority (Santa Clara); | | | | | | | | | | | | | | |
Series 2007 A, RB(l) | | | 0.00% | | | | 06/01/2036 | | | | 60,785 | | | 29,157,440 |
Series 2007 A, RB(l) | | | 0.00% | | | | 06/01/2047 | | | | 58,990 | | | 14,471,592 |
Series 2007 B, RB(l) | | | 0.00% | | | | 06/01/2047 | | | | 13,505 | | | 3,336,805 |
Series 2007 C, RB(l) | | | 0.00% | | | | 06/01/2056 | | | | 61,600 | | | 5,571,338 |
Stockton Unified School District (Election of 2008); | | | | | | | | | | | | | | |
Series 2011 D, GO Bonds (INS - AGM)(d)(l) | | | 0.00% | | | | 08/01/2037 | | | | 6,245 | | | 3,482,356 |
Series 2011 D, GO Bonds (INS - AGM)(d)(l) | | | 0.00% | | | | 08/01/2038 | | | | 12,115 | | | 6,419,840 |
Series 2011 D, GO Bonds (INS - AGM)(d)(l) | | | 0.00% | | | | 08/01/2041 | | | | 14,735 | | | 6,621,695 |
Series 2011 D, GO Bonds (INS - AGM)(d)(l) | | | 0.00% | | | | 08/01/2043 | | | | 17,145 | | | 6,937,016 |
Sweetwater Union High School District; Series 2022, GO Bonds(k) | | | 5.00% | | | | 08/01/2052 | | | | 47,500 | | | 51,140,011 |
University of California; Series 2021 BH, Ref. RB | | | 4.00% | | | | 05/15/2051 | | | | 3,000 | | | 2,857,660 |
Vacaville Unified School District; Series 2020 D, GO Bonds | | | 4.00% | | | | 08/01/2045 | | | | 1,850 | | | 1,800,619 |
West County Facilities Financing Authority (Green Bonds); Series 2021, RB | | | 4.00% | | | | 06/01/2051 | | | | 7,000 | | | 6,612,126 |
| | | | | | | | | | | | | | | 994,781,904 |
| | | | |
Colorado–8.91% | | | | | | | | | | | | | | |
3rd and Havana Metropolitan District; | | | | | | | | | | | | | | |
Series 2020 A, GO Bonds | | | 4.50% | | | | 12/01/2030 | | | | 2,485 | | | 2,270,942 |
Series 2020 A, GO Bonds | | | 5.25% | | | | 12/01/2049 | | | | 5,200 | | | 4,334,417 |
Series 2020 B, GO Bonds | | | 7.75% | | | | 12/15/2049 | | | | 1,925 | | | 1,724,363 |
Amber Creek Metropolitan District; | | | | | | | | | | | | | | |
Series 2017 A, Ref. GO Bonds | | | 5.13% | | | | 12/01/2047 | | | | 1,029 | | | 914,796 |
Series 2017 B, GO Bonds | | | 7.75% | | | | 12/15/2047 | | | | 464 | | | 426,383 |
Arista Metropolitan District; | | | | | | | | | | | | | | |
Series 2018 A, Ref. GO Bonds | | | 5.00% | | | | 12/01/2038 | | | | 1,240 | | | 1,187,688 |
Series 2018 A, Ref. GO Bonds | | | 5.13% | | | | 12/01/2048 | | | | 3,500 | | | 3,212,774 |
Aspen Street Metropolitan District; Series 2021 A, GO Bonds | | | 5.13% | | | | 12/01/2050 | | | | 1,075 | | | 847,117 |
Aurora Crossroads Metropolitan District No. 2; | | | | | | | | | | | | | | |
Series 2020 A, GO Bonds | | | 5.00% | | | | 12/01/2050 | | | | 2,625 | | | 2,277,425 |
Series 2020 B, GO Bonds | | | 7.75% | | | | 12/15/2050 | | | | 4,500 | | | 4,111,698 |
Aurora Highlands Community Authority Board; Series 2021 A, Ref. RB | | | 5.75% | | | | 12/01/2051 | | | | 25,000 | | | 22,284,382 |
Banning Lewis Ranch Metropolitan District No. 4; Series 2018 A, GO Bonds | | | 5.75% | | | | 12/01/2048 | | | | 3,259 | | | 3,237,017 |
Banning Lewis Ranch Metropolitan District No. 5; | | | | | | | | | | | | | | |
Series 2018 A, GO Bonds | | | 5.75% | | | | 12/01/2048 | | | | 2,195 | | | 2,179,822 |
Series 2018 B, GO Bonds | | | 8.00% | | | | 12/15/2048 | | | | 500 | | | 471,827 |
Base Village Metropolitan District No. 2; | | | | | | | | | | | | | | |
Series 2016 A, Ref. GO Bonds | | | 5.75% | | | | 12/01/2046 | | | | 3,100 | | | 3,103,093 |
Series 2016 B, Ref. GO Bonds | | | 6.50% | | | | 12/15/2048 | | | | 3,500 | | | 2,341,687 |
Baseline Metropolitan District No. 1; Series 2021 B, GO Bonds | | | 7.50% | | | | 12/15/2051 | | | | 2,190 | | | 1,938,988 |
Bella Mesa Metropolitan District; Series 2020 A, GO Bonds(c)(e) | | | 6.75% | | | | 12/01/2049 | | | | 3,785 | | | 3,147,985 |
Belleview Village Metropolitan District; Series 2020, GO Bonds | | | 4.95% | | | | 12/01/2050 | | | | 870 | | | 711,955 |
Berthoud-Heritage Metropolitan District No. 1; Series 2019, RB | | | 5.63% | | | | 12/01/2048 | | | | 3,000 | | | 2,844,904 |
Blue Lake Metropolitan District No. 3; Series 2018 A, GO Bonds | | | 5.25% | | | | 12/01/2048 | | | | 1,722 | | | 1,530,918 |
BNC Metropolitan District No. 1; Series 2017 B, GO Bonds | | | 7.38% | | | | 12/15/2047 | | | | 461 | | | 430,578 |
Board of Governors of Colorado State University System; Series 2015 A, RB | | | 4.13% | | | | 03/01/2055 | | | | 6,300 | | | 5,792,653 |
Brighton Crossing Metropolitan District No. 4; Series 2017 B, GO Bonds | | | 7.00% | | | | 12/15/2047 | | | | 670 | | | 612,345 |
Brighton Crossing Metropolitan District No. 6; Series 2020 A, GO Bonds | | | 5.00% | | | | 12/01/2050 | | | | 2,000 | | | 1,683,724 |
Bristol Metropolitan District; Series 2022, GO Bonds | | | 7.50% | | | | 12/15/2050 | | | | 766 | | | 746,579 |
See accompanying Notes to Financial Statements which are an integral part of the financial statements.
12 Invesco Rochester® Municipal Opportunities Fund
| | | | | | | | | | | | | | |
| | | Interest
Rate | | | Maturity
Date | | | Principal
Amount
(000) | | | Value |
Colorado–(continued) | | | | | | | | | | | | | | |
Broadway Station Metropolitan District No. 3; Series 2019, GO Bonds | | | 5.00% | | | | 12/01/2049 | | | $ | 1,750 | | | $ 1,457,444 |
Bromley Park Metropolitan District No. 2; Series 2018 B, Ref. GO Bonds | | | 6.38% | | | | 12/15/2047 | | | | 1,000 | | | 965,808 |
Buffalo Ridge Metropolitan District; Series 2018 B, GO Bonds | | | 7.38% | | | | 12/15/2047 | | | | 2,695 | | | 2,561,316 |
Canyons Metropolitan District No. 3; Series 2021, GO Bonds | | | 5.50% | | | | 12/01/2051 | | | | 15,270 | | | 12,835,994 |
Canyons Metropolitan District No. 5; Series 2017 A, Ref. GO Bonds | | | 6.13% | | | | 12/01/2047 | | | | 4,500 | | | 4,346,770 |
Canyons Metropolitan District No. 6; Series 2017 A, Ref. GO Bonds | | | 6.13% | | | | 12/01/2047 | | | | 2,000 | | | 1,931,898 |
Castleview Metropolitan District No. 1; Series 2021 A, GO Bonds | | | 5.00% | | | | 12/01/2050 | | | | 4,720 | | | 3,728,856 |
Centerra Metropolitan District No. 1 (In the City of Loveland); | | | | | | | | | | | | | | |
Series 2020 A, Ref. GO Bonds | | | 5.00% | | | | 12/01/2051 | | | | 4,000 | | | 3,430,302 |
Series 2022, RB | | | 6.50% | | | | 12/01/2053 | | | | 6,850 | | | 6,861,482 |
Cherrylane Metropolitan District; | | | | | | | | | | | | | | |
Series 2018 A, GO Bonds | | | 5.25% | | | | 12/01/2047 | | | | 1,308 | | | 1,218,845 |
Series 2018 B, GO Bonds | | | 7.38% | | | | 12/15/2047 | | | | 574 | | | 523,601 |
Cielo Metropolitan District; Series 2021, GO Bonds | | | 5.25% | | | | 12/01/2050 | | | | 2,500 | | | 2,005,356 |
City Center West Commercial Metropolitan District; | | | | | | | | | | | | | | |
Series 2020 A, Ref. GO Bonds | | | 7.00% | | | | 12/01/2049 | | | | 3,995 | | | 3,932,731 |
Series 2020 B, GO Bonds | | | 9.00% | | | | 12/15/2049 | | | | 581 | | | 572,574 |
Clear Creek Station Metropolitan District No. 2; Series 2017 B, GO Bonds | | | 7.38% | | | | 12/15/2047 | | | | 500 | | | 464,990 |
Clear Creek Transit Metropolitan District No. 2; | | | | | | | | | | | | | | |
Series 2021 A, GO Bonds | | | 5.00% | | | | 12/01/2041 | | | | 575 | | | 519,035 |
Series 2021 A, GO Bonds | | | 5.00% | | | | 12/01/2050 | | | | 1,000 | | | 852,342 |
Series 2021 B, GO Bonds | | | 7.90% | | | | 12/15/2050 | | | | 1,165 | | | 1,042,448 |
Colliers Hill Metropolitan District No. 1; Series 2019 B, Ref. GO Bonds | | | 8.00% | | | | 12/15/2048 | | | | 1,500 | | | 1,385,373 |
Colliers Hill Metropolitan District No. 2; Series 2022, Ref. GO Bonds | | | 5.75% | | | | 12/15/2047 | | | | 2,250 | | | 2,104,073 |
Colorado (State of) Health Facilities Authority (Aberdeen Ridge); | | | | | | | | | | | | | | |
Series 2021 A, RB | | | 5.00% | | | | 05/15/2049 | | | | 1,500 | | | 1,176,199 |
Series 2021 A, RB | | | 5.00% | | | | 05/15/2058 | | | | 3,250 | | | 2,420,101 |
Colorado (State of) Health Facilities Authority (CommonSpirit Health); Series 2019 A-2, Ref. RB | | | 5.00% | | | | 08/01/2044 | | | | 5,190 | | | 5,286,463 |
Colorado (State of) Health Facilities Authority (Intermountain Healthcare); Series 2022 A, Ref. RB | | | 4.00% | | | | 05/15/2052 | | | | 22,500 | | | 20,666,698 |
Colorado (State of) Health Facilities Authority (SCL Health System); | | | | | | | | | | | | | | |
Series 2019 A, Ref. RB | | | 4.00% | | | | 01/01/2037 | | | | 3,050 | | | 3,083,925 |
Series 2019 B, Ref. RB | | | 4.00% | | | | 01/01/2040 | | | | 3,000 | | | 2,933,169 |
Colorado (State of) Health Facilities Authority (Volunteers of America Care); Series 2007 A, RB | | | 5.30% | | | | 07/01/2037 | | | | 510 | | | 404,817 |
Colorado (State of) International Center Metropolitan District No. 3; Series 2018 B, GO Bonds | | | 7.50% | | | | 12/15/2038 | | | | 943 | | | 897,892 |
Colorado (State of) International Center Metropolitan District No. 8; Series 2020, GO Bonds | | | 6.50% | | | | 12/01/2050 | | | | 15,000 | | | 13,562,697 |
Colorado Crossing Metropolitan District No. 2; | | | | | | | | | | | | | | |
Series 2020 A-2, GO Bonds | | | 5.00% | | | | 12/01/2050 | | | | 7,705 | | | 6,613,695 |
Series 2020 B, GO Bonds(e) | | | 7.50% | | | | 12/15/2050 | | | | 3,490 | | | 3,096,824 |
Copper Ridge Metropolitan District; | | | | | | | | | | | | | | |
Series 2019, RB | | | 5.00% | | | | 12/01/2039 | | | | 4,250 | | | 3,882,898 |
Series 2019, RB | | | 5.00% | | | | 12/01/2043 | | | | 2,750 | | | 2,422,878 |
Country Club Highlands Metropolitan District; Series 2007, GO Bonds(h) | | | 7.25% | | | | 12/01/2037 | | | | 1,025 | | | 943,000 |
Creekside Village Metropolitan District; | | | | | | | | | | | | | | |
Series 2019 A, GO Bonds | | | 5.00% | | | | 12/01/2039 | | | | 1,260 | | | 1,191,517 |
Series 2019 A, GO Bonds | | | 5.00% | | | | 12/01/2049 | | | | 2,118 | | | 1,894,744 |
Series 2019, GO Bonds | | | 7.75% | | | | 12/15/2049 | | | | 568 | | | 515,484 |
Dacono Urban Renewal Authority; Series 2020, RB | | | 6.25% | | | | 12/01/2039 | | | | 2,632 | | | 2,466,589 |
Denver (City & County of), CO; | | | | | | | | | | | | | | |
Series 2018 A, Ref. RB(b) | | | 5.00% | | | | 12/01/2035 | | | | 1,010 | | | 1,056,501 |
Series 2018 A, Ref. RB(b) | | | 5.25% | | | | 12/01/2048 | | | | 7,410 | | | 7,628,719 |
Series 2021 A, RB | | | 4.00% | | | | 08/01/2051 | | | | 10,000 | | | 9,173,589 |
Series 2022 A, RB(b) | | | 5.50% | | | | 11/15/2038 | | | | 1,795 | | | 2,011,093 |
Series 2022 A, RB(b) | | | 5.00% | | | | 11/15/2047 | | | | 7,500 | | | 7,793,255 |
Series 2022 A, RB(b) | | | 4.13% | | | | 11/15/2053 | | | | 7,000 | | | 6,413,933 |
Series 2022 A, RB(b) | | | 5.50% | | | | 11/15/2053 | | | | 7,250 | | | 7,821,022 |
Series 2022 D, Ref. RB(b) | | | 5.75% | | | | 11/15/2045 | | | | 10,000 | | | 11,141,591 |
Series 2022, RB(k) | | | 4.00% | | | | 08/01/2051 | | | | 18,990 | | | 17,420,646 |
Series 2022, RB(b)(k) | | | 5.00% | | | | 11/15/2053 | | | | 13,500 | | | 13,865,955 |
See accompanying Notes to Financial Statements which are an integral part of the financial statements.
13 Invesco Rochester® Municipal Opportunities Fund
| | | | | | | | | | | | | | |
| | | Interest
Rate | | | Maturity
Date | | | Principal
Amount
(000) | | | Value |
Colorado–(continued) | | | | | | | | | | | | | | |
Denver (City & County of), CO (United Airlines, Inc.); Series 2017, Ref. RB(b) | | | 5.00% | | | | 10/01/2032 | | | $ | 12,500 | | | $ 12,217,947 |
Denver Gateway Center Metropolitan District; | | | | | | | | | | | | | | |
Series 2018 A, GO Bonds | | | 5.50% | | | | 12/01/2038 | | | | 1,355 | | | 1,325,570 |
Series 2018 A, GO Bonds | | | 5.63% | | | | 12/01/2048 | | | | 2,130 | | | 2,023,036 |
Denver International Business Center Metropolitan District No. 1; Series 2019 B, GO Bonds | | | 6.00% | | | | 12/01/2048 | | | | 2,290 | | | 2,249,583 |
Deutsche Bank Spears/Lifers Trust; Series 2013, RB(f)(j)(k) | | | 5.00% | | | | 01/01/2024 | | | | 14,350 | | | 14,547,971 |
Dinosaur Ridge Metropolitan District; Series 2019 A, Ref. RB | | | 5.00% | | | | 06/01/2049 | | | | 1,205 | | | 1,078,725 |
Dominion Water & Sanitation District; Series 2022, Ref. RB | | | 5.88% | | | | 12/01/2052 | | | | 20,000 | | | 19,322,474 |
Dublin North Metropolitan District No. 2; Series 2018 A, GO Bonds(f)(j) | | | 5.13% | | | | 12/01/2023 | | | | 1,637 | | | 1,706,754 |
E-86 Metropolitan District; Series 2021 A, GO Bonds | | | 5.13% | | | | 12/01/2051 | | | | 1,015 | | | 822,212 |
Eagle County School District No. Re50J; Series 2021, COP (INS - AGM)(d) | | | 4.00% | | | | 12/01/2051 | | | | 7,105 | | | 6,347,243 |
Eagle River Water and Sanitation District; Series 2020 A, RB (INS - AGM)(d) | | | 4.00% | | | | 12/01/2045 | | | | 1,250 | | | 1,196,551 |
Elbert & Highway 86 Commercial Metropolitan District; | | | | | | | | | | | | | | |
Series 2021 A, Ref. GO Bonds(e) | | | 5.00% | | | | 12/01/2041 | | | | 1,700 | | | 1,514,687 |
Series 2021 A, Ref. GO Bonds(e) | | | 5.00% | | | | 12/01/2051 | | | | 2,000 | | | 1,647,480 |
Series 2021 B, GO Bonds(e) | | | 8.00% | | | | 12/15/2051 | | | | 1,910 | | | 1,695,085 |
Elbert (County of), CO Highway 86 Metropolitan District; Series 2016, Ref. GO Bonds(e) | | | 5.75% | | | | 12/01/2046 | | | | 2,600 | | | 2,531,487 |
Erie Commons Metropolitan District No. 2; Series 2019 B, Ref. GO Bonds | | | 6.95% | | | | 12/15/2054 | | | | 3,100 | | | 2,818,382 |
Evan’s Place Metropolitan District; Series 2020 A, GO Bonds | | | 5.00% | | | | 12/01/2050 | | | | 1,575 | | | 1,349,111 |
First Creek Village Metropolitan District; Series 2019 B, GO Bonds | | | 6.75% | | | | 08/01/2049 | | | | 515 | | | 503,013 |
Fitzsimons Village Metropolitan District No. 1; Series 2020, Ref. GO Bonds | | | 5.00% | | | | 12/01/2049 | | | | 1,036 | | | 892,362 |
Fitzsimons Village Metropolitan District No. 3; Series 2021 A-2, GO Bonds | | | 7.00% | | | | 12/01/2041 | | | | 7,875 | | | 6,271,143 |
Flying Horse Metropolitan District No. 3; Series 2019, Ref. GO Bonds(e) | | | 6.00% | | | | 12/01/2049 | | | | 2,965 | | | 2,782,406 |
Forest Trace Metropolitan District No. 3; Series 2020 B, GO Bonds | | | 7.88% | | | | 12/15/2049 | | | | 933 | | | 906,568 |
Geos Neighborhood Metropolitan District; Series 2021, GO Bonds(c) | | | 6.13% | | | | 12/01/2050 | | | | 3,075 | | | 2,473,651 |
Grand Junction (City of), CO Dos Rios General Improvement District; Series 2021, RB(e) | | | 4.75% | | | | 12/01/2051 | | | | 3,000 | | | 2,271,062 |
Green Valley Ranch East Metropolitan District No. 6; Series 2020 A, GO Bonds | | | 5.88% | | | | 12/01/2050 | | | | 3,325 | | | 3,152,090 |
Haskins Station Metropolitan District; Series 2019 A, GO Bonds | | | 5.00% | | | | 12/01/2049 | | | | 925 | | | 787,884 |
Highlands-Mead Metropolitan District; | | | | | | | | | | | | | | |
Series 2020 B, GO Bonds(e) | | | 7.75% | | | | 12/15/2050 | | | | 515 | | | 468,468 |
Series 2020, GO Bonds | | | 5.13% | | | | 12/01/2050 | | | | 1,395 | | | 1,218,421 |
HM Metropolitan District No. 2; Series 2021, GO Bonds(c) | | | 5.75% | | | | 12/01/2051 | | | | 24,038 | | | 11,627,159 |
Home Place Metropolitan District; Series 2020 A, GO Bonds | | | 5.75% | | | | 12/01/2050 | | | | 2,340 | | | 2,234,453 |
Hunters Overlook Metropolitan District No. 5; Series 2019 B, GO Bonds | | | 8.50% | | | | 12/15/2049 | | | | 1,825 | | | 1,689,720 |
Hunting Hill Metropolitan District; Series 2018, Ref. GO Bonds | | | 5.63% | | | | 12/01/2048 | | | | 5,015 | | | 4,831,228 |
Interpark Metropolitan District; Series 2018, GO Bonds(e) | | | 5.50% | | | | 12/01/2048 | | | | 1,614 | | | 1,525,889 |
Interquest South Business Improvement District; Series 2017, GO Bonds | | | 5.00% | | | | 12/01/2047 | | | | 1,365 | | | 1,231,683 |
Jefferson (County of), CO Center Metropolitan District No. 1; Series 2020 B, Ref. RB | | | 5.75% | | | | 12/15/2050 | | | | 9,909 | | | 9,442,281 |
Johnstown North Metropolitan District No. 2; | | | | | | | | | | | | | | |
Series 2022 A, GO Bonds | | | 7.00% | | | | 08/15/2052 | | | | 3,015 | | | 3,045,901 |
Series 2022 B, GO Bonds | | | 9.13% | | | | 09/01/2052 | | | | 2,000 | | | 2,032,335 |
Jones District Community Authority Board; Series 2020 A, RB(c) | | | 5.75% | | | | 12/01/2050 | | | | 6,800 | | | 5,575,723 |
Karl’s Farm Metropolitan District No. 2; Series 2020 A, GO Bonds(e) | | | 5.63% | | | | 12/01/2050 | | | | 1,695 | | | 1,547,579 |
Karl’s Farm Metropolitan District No. 3; Series 2021, GO Bonds | | | 5.75% | | | | 12/01/2051 | | | | 6,295 | | | 5,356,431 |
Kinston Metropolitan District No. 5; | | | | | | | | | | | | | | |
Series 2020 A, GO Bonds | | | 5.13% | | | | 12/01/2050 | | | | 3,900 | | | 3,077,038 |
Series 2020 B, GO Bonds | | | 7.50% | | | | 12/15/2052 | | | | 3,850 | | | 3,412,095 |
Ledge Rock Center Commercial Metropolitan District; | | | | | | | | | | | | | | |
Series 2022, GO Bonds(e) | | | 7.00% | | | | 11/01/2052 | | | | 7,000 | | | 6,887,397 |
Series 2022, GO Bonds(e) | | | 7.38% | | | | 11/01/2052 | | | | 10,830 | | | 10,661,870 |
Series 2022, GO Bonds(e) | | | 9.25% | | | | 12/01/2052 | | | | 9,189 | | | 9,135,900 |
Leyden Ranch Metropolitan District; | | | | | | | | | | | | | | |
Series 2017 B, GO Bonds | | | 7.00% | | | | 12/15/2047 | | | | 500 | | | 454,959 |
Series 2017 C, GO Bonds | | | 11.00% | | | | 12/15/2050 | | | | 600 | | | 556,553 |
Littleton Village Metropolitan District No. 2; Series 2018, Ref. GO Bonds | | | 7.63% | | | | 12/15/2028 | | | | 1,140 | | | 1,119,329 |
Lochbuie Station Residential Metropolitan District; | | | | | | | | | | | | | | |
Series 2020 A, GO Bonds | | | 5.75% | | | | 12/01/2050 | | | | 1,185 | | | 1,133,422 |
Series 2020 B, GO Bonds | | | 8.00% | | | | 12/15/2050 | | | | 521 | | | 479,237 |
See accompanying Notes to Financial Statements which are an integral part of the financial statements.
14 Invesco Rochester® Municipal Opportunities Fund
| | | | | | | | | | | | | | |
| | | Interest
Rate | | | Maturity
Date | | | Principal
Amount
(000) | | | Value |
Colorado–(continued) | | | | | | | | | | | | | | |
Meadowlark Metropolitan District; | | | | | | | | | | | | | | |
Series 2020 A, GO Bonds | | | 5.13% | | | | 12/01/2050 | | | $ | 750 | | | $ 646,076 |
Series 2020 B, GO Bonds | | | 7.63% | | | | 12/15/2050 | | | | 607 | | | 551,860 |
Millers Landing Business Improvement District; | | | | | | | | | | | | | | |
Series 2018 A, RB(e) | | | 6.00% | | | | 12/01/2048 | | | | 7,960 | | | 7,371,361 |
Series 2018 B, RB(e) | | | 8.00% | | | | 12/01/2048 | | | | 2,185 | | | 2,007,628 |
Mirabelle Metropolitan District No. 2; Series 2020 B, GO Bonds | | | 7.38% | | | | 12/15/2049 | | | | 1,473 | | | 1,325,542 |
Morgan Hill Metropolitan District No. 3; Series 2021 B, GO Bonds | | | 6.38% | | | | 12/15/2051 | | | | 1,460 | | | 1,322,073 |
Mountain Shadows Metropolitan District; Series 2016, Ref. GO Bonds | | | 5.00% | | | | 12/01/2046 | | | | 1,000 | | | 909,434 |
Mountain Sky Metropolitan District; Series 2020 A, GO Bonds | | | 5.00% | | | | 12/01/2049 | | | | 980 | | | 869,423 |
Mulberry Metropolitan District No. 2; | | | | | | | | | | | | | | |
Series 2022 B, GO Bonds | | | 9.00% | | | | 12/15/2052 | | | | 2,500 | | | 2,532,364 |
Series 2022, RB | | | 7.00% | | | | 12/01/2034 | | | | 5,000 | | | 5,068,422 |
Murata Farms Residential Metropolitan District; Series 2022, GO Bonds | | | 6.13% | | | | 12/01/2051 | | | | 4,205 | | | 3,736,473 |
North Holly Metropolitan District; Series 2018 A, GO Bonds | | | 5.50% | | | | 12/01/2048 | | | | 1,760 | | | 1,672,752 |
North Range Metropolitan District No. 3; Series 2020 A, GO Bonds | | | 5.25% | | | | 12/01/2050 | | | | 7,320 | | | 6,581,720 |
Painted Prairie Public Improvement Authority; Series 2019, RB | | | 5.00% | | | | 12/01/2049 | | | | 17,000 | | | 15,140,669 |
Penrith Park Metropolitan District; | | | | | | | | | | | | | | |
Series 2019 A, GO Bonds | | | 5.00% | | | | 12/01/2049 | | | | 1,705 | | | 1,525,278 |
Series 2019 B, GO Bonds | | | 8.75% | | | | 12/15/2049 | | | | 900 | | | 833,540 |
Pinon Pines Metropolitan District No. 2; Series 2020, GO Bonds | | | 5.00% | | | | 12/01/2050 | | | | 1,195 | | | 1,040,503 |
Powhaton Road Metropolitan District No. 2; Series 2019 A, GO Bonds(f)(j) | | | 5.63% | | | | 12/01/2023 | | | | 2,290 | | | 2,392,447 |
Prairie Farm Metropolitan District; | | | | | | | | | | | | | | |
Series 2018 A, GO Bonds | | | 5.25% | | | | 12/01/2048 | | | | 2,290 | | | 2,298,224 |
Series 2018 B, GO Bonds | | | 7.38% | | | | 12/15/2048 | | | | 1,270 | | | 1,237,515 |
Pronghorn Valley Metropolitan District; Series 2021 A, GO Bonds | | | 4.00% | | | | 12/01/2051 | | | | 650 | | | 477,121 |
Pueblo Urban Renewal Authority (Evraz); Series 2021, RB(e) | | | 4.75% | | | | 12/01/2045 | | | | 3,375 | | | 1,522,949 |
PV-ERU Holding Trust; Series 2019, RB(l) | | | 0.00% | | | | 02/14/2039 | | | | 12,585 | | | 2,642,850 |
Raindance Metropolitan District No. 2; Series 2019 B, GO Bonds | | | 7.50% | | | | 12/15/2049 | | | | 2,285 | | | 2,060,603 |
Remuda Ranch Metropolitan District; | | | | | | | | | | | | | | |
Series 2020 A, GO Bonds | | | 5.00% | | | | 12/01/2050 | | | | 2,300 | | | 2,010,359 |
Series 2020 B, GO Bonds | | | 7.63% | | | | 12/15/2050 | | | | 573 | | | 517,607 |
Rendezvous Metropolitan District No. 4; Series 2018 A, GO Bonds | | | 5.63% | | | | 12/01/2048 | | | | 4,340 | | | 4,180,963 |
Ridgeline Vista Metropolitan District; Series 2021 A, GO Bonds | | | 5.25% | | | | 12/01/2060 | | | | 1,000 | | | 939,115 |
Ritoro Metropolitan District; Series 2019 A, GO Bonds | | | 5.00% | | | | 12/01/2049 | | | | 2,000 | | | 1,819,020 |
Riverwalk Metropolitan District No. 2; | | | | | | | | | | | | | | |
Series 2022 A, RB | | | 5.00% | | | | 12/01/2052 | | | | 4,000 | | | 3,395,391 |
Series 2022 B, RB | | | 7.75% | | | | 12/15/2052 | | | | 5,000 | | | 4,549,901 |
Rudolph Farms Metropolitan District No. 6; Series 2022 A, GO Bonds | | | 6.50% | | | | 06/01/2052 | | | | 23,575 | | | 22,678,853 |
Sabell Metropolitan District; | | | | | | | | | | | | | | |
Series 2020 A, GO Bonds(e) | | | 5.00% | | | | 12/01/2050 | | | | 1,060 | | | 907,890 |
Series 2020 B-3, GO Bonds(e) | | | 8.25% | | | | 12/15/2050 | | | | 605 | | | 553,152 |
Second Creek Farm Metropolitan District No. 3; | | | | | | | | | | | | | | |
Series 2019 A, GO Bonds | | | 5.00% | | | | 12/01/2049 | | | | 6,195 | | | 5,541,991 |
Series 2019 B, GO Bonds | | | 7.63% | | | | 12/15/2049 | | | | 1,696 | | | 1,538,528 |
Series 2021 C, GO Bonds(e) | | | 7.63% | | | | 12/15/2052 | | | | 8,288 | | | 7,319,604 |
Settler’s Crossing Metropolitan District No. 1; Series 2020 B, GO Bonds | | | 7.63% | | | | 12/15/2050 | | | | 598 | | | 543,678 |
Settler’s Crossing Metropolitan District No. 1 (Senior Bonds); Series 2020 A, GO Bonds(e) | | | 5.13% | | | | 12/01/2050 | | | | 1,630 | | | 1,418,430 |
Sheridan Station West Metropolitan District; Series 2022 B3, GO Bonds | | | 7.00% | | | | 12/15/2051 | | | | 1,614 | | | 1,548,300 |
Sky Ranch Community Authority Board; | | | | | | | | | | | | | | |
Series 2019 B, RB | | | 7.63% | | | | 12/15/2049 | | | | 806 | | | 840,647 |
Series 2019, RB | | | 5.00% | | | | 12/01/2049 | | | | 2,835 | | | 2,702,225 |
Series 2022 A, RB | | | 5.75% | | | | 12/01/2052 | | | | 5,000 | | | 4,625,610 |
Series 2022 B, GO Bonds | | | 8.75% | | | | 12/15/2052 | | | | 6,367 | | | 6,098,888 |
South Aurora Regional Improvement Authority; Series 2018, RB | | | 6.25% | | | | 12/01/2057 | | | | 2,815 | | | 2,634,036 |
South Timnath Metropolitan District No. 1; | | | | | | | | | | | | | | |
Series 2019 A, GO Bonds | | | 5.50% | | | | 12/01/2048 | | | | 1,000 | | | 915,220 |
Series 2019 B, GO Bonds | | | 8.00% | | | | 12/15/2048 | | | | 2,208 | | | 2,045,569 |
Southglenn Metropolitan District; Series 2016, Ref. GO Bonds | | | 5.00% | | | | 12/01/2036 | | | | 810 | | | 784,118 |
See accompanying Notes to Financial Statements which are an integral part of the financial statements.
15 Invesco Rochester® Municipal Opportunities Fund
| | | | | | | | | | | | | | |
| | | Interest
Rate | | | Maturity
Date | | | Principal
Amount
(000) | | | Value |
Colorado–(continued) | | | | | | | | | | | | | | |
Spring Hill Metropolitan District No. 3; Series 2022 B, GO Bonds(e) | | | 9.50% | | | | 12/15/2045 | | | $ | 3,464 | | | $ 3,494,608 |
Spring Valley Metropolitan District No. 3; | | | | | | | | | | | | | | |
Series 2020 A, GO Bonds | | | 5.00% | | | | 12/01/2049 | | | | 1,360 | | | 1,218,024 |
Series 2020 B, GO Bonds | | | 8.50% | | | | 12/15/2049 | | | | 656 | | | 605,568 |
Spring Valley Metropolitan District No. 4; | | | | | | | | | | | | | | |
Series 2020 A, GO Bonds | | | 5.13% | | | | 12/01/2050 | | | | 1,775 | | | 1,507,078 |
Series 2020 B, GO Bonds | | | 7.63% | | | | 12/15/2050 | | | | 2,810 | | | 2,508,329 |
STC Metropolitan District No. 2; Series 2019 B, GO Bonds | | | 8.00% | | | | 12/15/2049 | | | | 3,954 | | | 3,633,956 |
Sterling Ranch Community Authority Board; | | | | | | | | | | | | | | |
Series 2020 B, RB | | | 7.13% | | | | 12/15/2050 | | | | 741 | | | 701,226 |
Series 2022 A, Ref. RB | | | 6.75% | | | | 12/01/2053 | | | | 27,225 | | | 27,400,364 |
Stone Creek Metropolitan District; | | | | | | | | | | | | | | |
Series 2018 A, GO Bonds | | | 5.63% | | | | 12/01/2047 | | | | 1,995 | | | 1,926,466 |
Series 2018, GO Bonds | | | 7.88% | | | | 12/15/2047 | | | | 600 | | | 560,821 |
Sweetgrass Metropolitan District No. 2; Series 2022 B, Ref. GO Bonds | | | 7.50% | | | | 12/15/2049 | | | | 1,175 | | | 1,137,845 |
Tailholt Metropolitan District No. 3; Series 2018 A, GO Bonds | | | 6.00% | | | | 12/01/2048 | | | | 7,550 | | | 7,253,123 |
Tallyn’s Reach Metropolitan District No. 3; Series 2013, Ref. GO Bonds(e)(f)(j) | | | 5.00% | | | | 12/01/2023 | | | | 274 | | | 277,403 |
Talon Pointe Metropolitan District; Series 2019 A, Ref. GO Bonds | | | 5.25% | | | | 12/01/2051 | | | | 2,150 | | | 1,667,490 |
Three Springs Metropolitan District No. 1; Series 2020 B, Ref. GO Bonds | | | 7.13% | | | | 12/15/2050 | | | | 1,685 | | | 1,498,559 |
Timnath Ranch Metropolitan District No. 4; | | | | | | | | | | | | | | |
Series 2018 A, GO Bonds | | | 5.25% | | | | 12/01/2037 | | | | 1,500 | | | 1,467,942 |
Series 2018 A, GO Bonds | | | 5.38% | | | | 12/01/2047 | | | | 1,900 | | | 1,779,599 |
Series 2018 B, GO Bonds | | | 7.75% | | | | 12/15/2047 | | | | 953 | | | 889,676 |
Trails at Crowfoot Metropolitan District No. 3; Series 2019 A, GO Bonds | | | 5.00% | | | | 12/01/2049 | | | | 2,000 | | | 1,786,224 |
Trails Metropolitan District; Series 2021, GO Bonds | | | 5.00% | | | | 12/01/2051 | | | | 6,999 | | | 5,707,677 |
Transport Metropolitan District No. 3; | | | | | | | | | | | | | | |
Series 2021 A-1, GO Bonds | | | 5.00% | | | | 12/01/2051 | | | | 4,000 | | | 3,166,990 |
Series 2021 A-2, GO Bonds(c) | | | 5.50% | | | | 12/01/2051 | | | | 3,000 | | | 2,195,392 |
Two Bridges Metropolitan District; | | | | | | | | | | | | | | |
Series 2018 A, GO Bonds | | | 5.63% | | | | 08/01/2048 | | | | 1,605 | | | 1,552,352 |
Series 2018 B, GO Bonds | | | 7.88% | | | | 08/01/2048 | | | | 508 | | | 470,035 |
Village at Dry Creek Metropolitan District No. 2 (The); Series 2019, GO Bonds | | | 4.38% | | | | 12/01/2044 | | | | 1,295 | | | 1,069,885 |
Village at Southgate Metropolitan District; Series 2018 A, GO Bonds(e) | | | 5.63% | | | | 12/01/2048 | | | | 1,375 | | | 1,318,970 |
Waterfall Metropolitan District No. 1; Series 2022 B, Ref. GO Bonds | | | 8.25% | | | | 12/01/2052 | | | | 985 | | | 949,761 |
Westcreek Metropolitan District No. 2; Series 2019 A, GO Bonds | | | 5.38% | | | | 12/01/2048 | | | | 1,300 | | | 1,214,199 |
White Buffalo Metropolitan District No. 3; Series 2020, GO Bonds | | | 5.50% | | | | 12/01/2050 | | | | 2,785 | | | 2,544,869 |
Wild Plum Metropolitan District; | | | | | | | | | | | | | | |
Series 2019 A, GO Bonds(f)(j) | | | 5.00% | | | | 12/01/2024 | | | | 600 | | | 630,806 |
Series 2019 B, GO Bonds(e)(f)(j) | | | 7.75% | | | | 12/01/2024 | | | | 504 | | | 553,570 |
Willow Bend Metropolitan District; Series 2019 B, GO Bonds | | | 7.63% | | | | 12/15/2049 | | | | 755 | | | 682,485 |
Willow Springs Metropolitan District; Series 2019 B, GO Bonds | | | 7.75% | | | | 12/15/2049 | | | | 650 | | | 588,115 |
Woodmen Heights Metropolitan District No. 2; Series 2020 B-1, Ref. GO Bonds | | | 6.25% | | | | 12/15/2040 | | | | 1,793 | | | 1,674,981 |
| | | | | | | | | | | | | | | 699,583,050 |
| | | | |
Connecticut–0.11% | | | | | | | | | | | | | | |
Connecticut (State of) Health & Educational Facilities Authority (Nuvance Health); | | | | | | | | | | | | | | |
Series 2019 A, Ref. RB | | | 4.00% | | | | 07/01/2041 | | | | 3,870 | | | 3,435,620 |
Series 2019 A, Ref. RB | | | 4.00% | | | | 07/01/2049 | | | | 3,000 | | | 2,504,930 |
Georgetown (City of), CT Special Taxing District; Series 2006 A, GO Bonds(g)(h) | | | 5.13% | | | | 10/01/2036 | | | | 470 | | | 56,400 |
Mashantucket Western Pequot Tribe; Series 2013, RB(g) | | | 6.05% | | | | 07/01/2031 | | | | 13,420 | | | 2,985,951 |
| | | | | | | | | | | | | | | 8,982,901 |
| | | | |
District of Columbia–2.84% | | | | | | | | | | | | | | |
District of Columbia (Green Bonds); Series 2022 A, RB(b) | | | 5.50% | | | | 02/28/2037 | | | | 1,850 | | | 1,946,319 |
District of Columbia Tobacco Settlement Financing Corp.; | | | | | | | | | | | | | | |
Series 2001, RB | | | 6.75% | | | | 05/15/2040 | | | | 32,955 | | | 33,926,507 |
Series 2006 C, RB(l) | | | 0.00% | | | | 06/15/2055 | | | | 850,680 | | | 79,161,473 |
Series 2006 D, RB(l) | | | 0.00% | | | | 06/15/2055 | | | | 555,000 | | | 43,553,181 |
See accompanying Notes to Financial Statements which are an integral part of the financial statements.
16 Invesco Rochester® Municipal Opportunities Fund
| | | | | | | | | | | | | | |
| | | Interest
Rate | | | Maturity
Date | | | Principal
Amount
(000) | | | Value |
District of Columbia–(continued) | | | | | | | | | | | | | | |
Metropolitan Washington Airports Authority; | | | | | | | | | | | | | | |
Series 2018 A, Ref. RB(b) | | | 5.00% | | | | 10/01/2048 | | | $ | 1,810 | | | $ 1,841,895 |
Series 2019 A, RB(b)(k) | | | 4.00% | | | | 10/01/2035 | | | | 11,530 | | | 11,398,534 |
Series 2019 A, Ref. RB(b) | | | 5.00% | | | | 10/01/2044 | | | | 3,500 | | | 3,616,578 |
Series 2019 A, Ref. RB(b) | | | 5.00% | | | | 10/01/2049 | | | | 16,585 | | | 16,965,309 |
Series 2020 A, Ref. RB(b) | | | 4.00% | | | | 10/01/2038 | | | | 5,570 | | | 5,399,624 |
Series 2020 A, Ref. RB(b) | | | 4.00% | | | | 10/01/2039 | | | | 2,385 | | | 2,291,484 |
Series 2021 A, Ref. RB(b) | | | 4.00% | | | | 10/01/2051 | | | | 15,800 | | | 14,252,004 |
Metropolitan Washington Airports Authority (Dulles Metrorail and Capital Improvement); Series 2019 B, Ref. RB | | | 4.00% | | | | 10/01/2053 | | | | 10,000 | | | 8,812,875 |
| | | | | | | | | | | | | | | 223,165,783 |
| | | | |
Florida–11.09% | | | | | | | | | | | | | | |
Amelia Concourse Community Development District; | | | | | | | | | | | | | | |
Series 2007, RB(g)(h) | | | 5.75% | | | | 05/01/2038 | | | | 3,865 | | | 3,749,050 |
Series 2016, RB | | | 6.00% | | | | 05/01/2047 | | | | 1,850 | | | 1,870,483 |
Series 2019 B-2, RB | | | 7.25% | | | | 05/01/2029 | | | | 55 | | | 52,332 |
Amelia Concourse Community Development District (Capital Improvement); Series 2019 A, RB | | | 5.65% | | | | 05/01/2049 | | | | 2,500 | | | 2,494,799 |
Arlington Ridge Community Development District; Series 2006 A, RB | | | 5.50% | | | | 05/01/2036 | | | | 1,710 | | | 1,710,254 |
Avenir Community Development District (Assessment Area No. 3 - Master Infrastructure); | | | | | | | | | | | | | | |
Series 2023, RB | | | 5.38% | | | | 05/01/2043 | | | | 3,235 | | | 3,083,601 |
Series 2023, RB | | | 5.63% | | | | 05/01/2054 | | | | 4,000 | | | 3,806,522 |
Babcock Ranch Community Independent Special District; | | | | | | | | | | | | | | |
Series 2022, RB | | | 5.00% | | | | 05/01/2042 | | | | 2,000 | | | 1,898,475 |
Series 2022, RB | | | 5.00% | | | | 05/01/2053 | | | | 1,500 | | | 1,380,932 |
Black Creek Community Development District (Expansion Area); Series 2022, RB | | | 5.63% | | | | 06/15/2052 | | | | 1,500 | | | 1,482,871 |
Broward (County of), FL; | | | | | | | | | | | | | | |
Series 2019 A, RB | | | 5.00% | | | | 09/01/2049 | | | | 8,605 | | | 8,863,815 |
Series 2019 A, RB(b) | | | 4.00% | | | | 10/01/2049 | | | | 12,505 | | | 11,286,548 |
Series 2019 A, RB(b) | | | 5.00% | | | | 10/01/2049 | | | | 24,805 | | | 25,289,122 |
Series 2019 B, RB(b) | | | 4.00% | | | | 09/01/2049 | | | | 15,500 | | | 13,796,429 |
Broward (County of), FL (Convention Center Expansion); Series 2021, RB | | | 4.00% | | | | 09/01/2051 | | | | 25,000 | | | 22,003,593 |
Buckeye Park Community Development District; Series 2008 A, RB | | | 7.88% | | | | 05/01/2038 | | | | 910 | | | 904,827 |
Capital Trust Agency, Inc. (Advantage Academy of Hillsborough); | | | | | | | | | | | | | | |
Series 2019 A, RB | | | 5.00% | | | | 12/15/2049 | | | | 1,545 | | | 1,546,199 |
Series 2019 A, RB | | | 5.00% | | | | 12/15/2054 | | | | 1,085 | | | 1,078,278 |
Capital Trust Agency, Inc. (Atlantic Housing Foundation Property); Series 2017 B, RB | | | 6.00% | | | | 07/01/2042 | | | | 2,820 | | | 2,312,298 |
Capital Trust Agency, Inc. (Elim Senior Housing, Inc.); | | | | | | | | | | | | | | |
Series 2017, RB(e) | | | 5.63% | | | | 08/01/2037 | | | | 1,025 | | | 806,301 |
Series 2017, RB(e) | | | 5.88% | | | | 08/01/2052 | | | | 3,925 | | | 2,791,784 |
Capital Trust Agency, Inc. (Florida Charter Educational Foundation, Inc.); | | | | | | | | | | | | | | |
Series 2018 A, RB(e) | | | 5.38% | | | | 06/15/2038 | | | | 850 | | | 821,142 |
Series 2018 A, RB(e) | | | 5.38% | | | | 06/15/2048 | | | | 1,590 | | | 1,449,837 |
Capital Trust Agency, Inc. (Franklin Academy); | | | | | | | | | | | | | | |
Series 2020, RB(e) | | | 5.00% | | | | 12/15/2050 | | | | 3,955 | | | 3,366,415 |
Series 2020, RB(e) | | | 5.00% | | | | 12/15/2055 | | | | 2,845 | | | 2,378,821 |
Capital Trust Agency, Inc. (Paragon Academy of Technology and Sunshine Elementary Charter School); | | | | | | | | | | | | | | |
Series 2019 A, RB(e) | | | 5.75% | | | | 06/01/2054 | | | | 3,735 | | | 3,272,516 |
Series 2019 B, RB(e) | | | 6.00% | | | | 06/01/2028 | | | | 360 | | | 336,928 |
Capital Trust Agency, Inc. (Viera Charter Schools, Inc.); | | | | | | | | | | | | | | |
Series 2017 A, RB(e) | | | 5.00% | | | | 10/15/2047 | | | | 1,100 | | | 994,665 |
Series 2017 A, RB(e) | | | 5.00% | | | | 10/15/2052 | | | | 755 | | | 668,991 |
Carlton Lakes Community Development District; | | | | | | | | | | | | | | |
Series 2015, RB | | | 5.63% | | | | 11/01/2036 | | | | 760 | | | 772,617 |
Series 2015, RB | | | 5.75% | | | | 11/01/2047 | | | | 1,855 | | | 1,864,466 |
CFM Community Development District; Series 2004 A, RB(g)(h) | | | 6.25% | | | | 05/01/2035 | | | | 1,987 | | | 20 |
Chapel Creek Community Development District; Series 2006 A, RB(g)(h) | | | 5.50% | | | | 05/01/2038 | | | | 7,075 | | | 4,740,250 |
See accompanying Notes to Financial Statements which are an integral part of the financial statements.
17 Invesco Rochester® Municipal Opportunities Fund
| | | | | | | | | | | | | | |
| | | Interest
Rate | | | Maturity
Date | | | Principal
Amount
(000) | | | Value |
Florida–(continued) | | | | | | | | | | | | | | |
Charlotte (County of), FL Industrial Development Authority (Town & Country Utilities); | | | | | | | | | | | | | | |
Series 2021, RB(b)(e) | | | 4.00% | | | | 10/01/2041 | | | $ | 1,500 | | | $ 1,214,891 |
Series 2021, RB(b)(e) | | | 4.00% | | | | 10/01/2051 | | | | 5,000 | | | 3,744,787 |
City of South Miami Health Facilities Authority, Inc.; Series 2018, RB(k) | | | 4.00% | | | | 08/15/2036 | | | | 14,000 | | | 14,082,230 |
Clearwater Cay Community Development District; Series 2006 A, RB(g)(h) | | | 5.50% | | | | 05/01/2037 | | | | 13,074 | | | 7,452,213 |
Collier (County of), FL Industrial Development Authority (Gulf Coast Academy South); | | | | | | | | | | | | | | |
Series 2017 A, RB(e) | | | 5.00% | | | | 12/01/2037 | | | | 1,150 | | | 1,076,865 |
Series 2017 A, RB(e) | | | 5.00% | | | | 12/01/2047 | | | | 1,875 | | | 1,643,419 |
County of Miami-Dade FL Transit System; Series 2023, RB(k) | | | 5.00% | | | | 07/01/2052 | | | | 25,475 | | | 27,228,223 |
Creekside Community Development District; Series 2006, RB(g)(h) | | | 5.20% | | | | 05/01/2038 | | | | 1,690 | | | 760,500 |
CrossCreek Community Development District; | | | | | | | | | | | | | | |
Series 2007 A, RB | | | 5.60% | | | | 05/01/2039 | | | | 10 | | | 9,791 |
Series 2016 A, RB | | | 5.60% | | | | 05/01/2037 | | | | 85 | | | 83,039 |
Escambia (County of), FL Health Facilities Authority; Series 2020, Ref. RB | | | 4.00% | | | | 08/15/2050 | | | | 7,000 | | | 6,115,173 |
Florida (State of); | | | | | | | | | | | | | | |
Series 2018, GO Bonds(k) | | | 4.00% | | | | 07/01/2037 | | | | 3,725 | | | 3,792,933 |
Series 2018, GO Bonds(k) | | | 4.00% | | | | 07/01/2038 | | | | 4,030 | | | 4,058,596 |
Series 2018, GO Bonds(k) | | | 4.00% | | | | 07/01/2039 | | | | 4,195 | | | 4,163,126 |
Series 2018, GO Bonds(k) | | | 4.00% | | | | 07/01/2040 | | | | 4,360 | | | 4,287,302 |
Florida (State of) Department of Transportation; Series 2013 A, RB | | | 4.00% | | | | 07/01/2037 | | | | 9,510 | | | 9,503,735 |
Florida Development Finance Corp. (Central Charter School); Series 2022, Ref. RB(e) | | | 6.00% | | | | 08/15/2057 | | | | 3,250 | | | 2,994,180 |
Florida Development Finance Corp. (Florida Charter Foundation, Inc.); Series 2016 A, RB(e) | | | 5.00% | | | | 07/15/2046 | | | | 6,045 | | | 5,619,687 |
Florida Development Finance Corp. (Learning Gate Community School); | | | | | | | | | | | | | | |
Series 2018 A, Ref. RB | | | 5.00% | | | | 02/15/2038 | | | | 300 | | | 301,945 |
Series 2018 A, Ref. RB | | | 5.00% | | | | 02/15/2048 | | | | 985 | | | 986,378 |
Florida Development Finance Corp. (Virgin Trains USA Passenger Rail); | | | | | | | | | | | | | | |
Series 2019 A, Ref. RB(b)(e)(f) | | | 6.38% | | | | 01/01/2026 | | | | 13,000 | | | 12,076,364 |
Series 2019 A, Ref. RB(b)(e)(f) | | | 6.50% | | | | 01/01/2029 | | | | 14,305 | | | 13,150,245 |
Glades Correctional Development Corp.; | | | | | | | | | | | | | | |
Series 2017 A, RB (Acquired 03/07/2006-12/12/2011; Cost $4,209,209)(i) | | | 7.00% | | | | 03/01/2030 | | | | 4,209 | | | 2,913,932 |
Series 2017 B, RB (Acquired 03/07/2006-12/12/2011; Cost $59,638)(i) | | | 1.00% | | | | 03/01/2030 | | | | 2,393 | | | 478,587 |
Greater Orlando Aviation Authority; | | | | | | | | | | | | | | |
Series 2017 A, RB(b) | | | 4.00% | | | | 10/01/2052 | | | | 7,500 | | | 6,727,179 |
Series 2019 A, RB(b) | | | 4.00% | | | | 10/01/2044 | | | | 10,180 | | | 9,480,634 |
Series 2019 A, RB(b) | | | 5.00% | | | | 10/01/2044 | | | | 3,370 | | | 3,482,248 |
Series 2019 A, RB(b) | | | 4.00% | | | | 10/01/2049 | | | | 16,490 | | | 14,953,462 |
Series 2019 A, RB(b) | | | 5.00% | | | | 10/01/2049 | | | | 9,980 | | | 10,208,850 |
Series 2019 A, RB(b) | | | 5.00% | | | | 10/01/2054 | | | | 8,000 | | | 8,143,788 |
Series 2022 A, RB(b) | | | 5.00% | | | | 10/01/2046 | | | | 18,985 | | | 19,689,687 |
Highland Meadows Community Development District; Series 2006 A, RB | | | 5.50% | | | | 05/01/2036 | | | | 285 | | | 285,044 |
Hillsborough (County of), FL Aviation Authority; Series 2022, RB(b)(k) | | | 5.00% | | | | 10/01/2047 | | | | 10,000 | | | 10,354,154 |
Hillsborough (County of), FL Aviation Authority (Tampa International Airport); | | | | | | | | | | | | | | |
Series 2018 A, RB(b) | | | 5.00% | | | | 10/01/2048 | | | | 11,500 | | | 11,657,499 |
Series 2018 E, RB(b) | | | 5.00% | | | | 10/01/2043 | | | | 3,120 | | | 3,200,189 |
Series 2022 A, RB(b) | | | 4.00% | | | | 10/01/2052 | | | | 9,510 | | | 8,544,163 |
Hillsborough (County of), FL Port District (Tamp Port Authority); Series 2018 B, RB(b) | | | 5.00% | | | | 06/01/2046 | | | | 9,700 | | | 9,831,528 |
Indigo Community Development District; Series 2005, RB(h) | | | 5.75% | | | | 05/01/2036 | | | | 4,775 | | | 3,199,250 |
Lake (County of), FL (Imagine South Lake Charter School Program); | | | | | | | | | | | | | | |
Series 2019, RB(e) | | | 5.00% | | | | 01/15/2049 | | | | 820 | | | 736,650 |
Series 2019, RB(e) | | | 5.00% | | | | 01/15/2054 | | | | 635 | | | 559,891 |
Lake (County of), FL (Lakeside at Waterman Village); Series 2020 A, Ref. RB | | | 5.75% | | | | 08/15/2055 | | | | 2,000 | | | 1,687,735 |
Lake (County of), FL (Village Veranda at Lady Lake); Series 2017 A-1, RB(e) | | | 7.13% | | | | 01/01/2052 | | | | 21,000 | | | 16,380,000 |
Lake Helen (City of), FL (Ivy Hawn Charter School of the Arts); | | | | | | | | | | | | | | |
Series 2018 A, RB(e) | | | 5.50% | | | | 07/15/2048 | | | | 1,685 | | | 1,498,721 |
Series 2018 A, RB(e) | | | 5.75% | | | | 07/15/2053 | | | | 1,830 | | | 1,710,730 |
Lakeland (City of), FL (Lakeland Regional Health); | | | | | | | | | | | | | | |
Series 2015, RB | | | 5.00% | | | | 11/15/2040 | | | | 7,845 | | | 7,917,649 |
Series 2015, RB | | | 5.00% | | | | 11/15/2045 | | | | 9,000 | | | 9,046,314 |
See accompanying Notes to Financial Statements which are an integral part of the financial statements.
18 Invesco Rochester® Municipal Opportunities Fund
| | | | | | | | | | | | | | |
| | | Interest
Rate | | | Maturity
Date | | | Principal
Amount
(000) | | | Value |
Florida–(continued) | | | | | | | | | | | | | | |
Lee (County of), FL; | | | | | | | | | | | | | | |
Series 2021 B, RB(b) | | | 5.00% | | | | 10/01/2046 | | | $ | 20,500 | | | $ 21,040,374 |
Series 2021 B, RB(b) | | | 4.00% | | | | 10/01/2051 | | | | 26,000 | | | 23,001,053 |
Lee (County of), FL Industrial Development Authority (Preserve (The)); Series 2017 A, RB(e) | | | 5.75% | | | | 12/01/2052 | | | | 1,785 | | | 1,238,695 |
Legends Bay Community Development District; Series 2007 A, RB | | | 5.88% | | | | 05/01/2038 | | | | 2,385 | | | 2,386,128 |
Magnolia Creek Community Development District; Series 2007 A, RB(g)(h) | | | 5.90% | | | | 05/01/2039 | | | | 590 | | | 324,500 |
Magnolia West Community Development District; Series 2017, RB | | | 5.35% | | | | 05/01/2037 | | | | 170 | | | 171,092 |
Miami (City of) & Dade (County of), FL School Board; Series 2015 A, Ref. COP | | | 5.00% | | | | 05/01/2032 | | | | 10 | | | 10,327 |
Miami-Dade (County of), FL; | | | | | | | | | | | | | | |
Series 2014 A, Ref. RB(b) | | | 5.00% | | | | 10/01/2036 | | | | 9,265 | | | 9,378,648 |
Series 2017 B, Ref. RB(b) | | | 5.00% | | | | 10/01/2040 | | | | 5,020 | | | 5,138,243 |
Series 2019 A, RB(b) | | | 5.00% | | | | 10/01/2044 | | | | 6,170 | | | 6,304,784 |
Series 2019 B, RB | | | 4.00% | | | | 10/01/2049 | | | | 80,000 | | | 73,401,992 |
Series 2021, RB | | | 4.00% | | | | 10/01/2051 | | | | 7,845 | | | 7,105,663 |
Series 2022 A, Ref. RB(b) | | | 5.25% | | | | 10/01/2052 | | | | 24,500 | | | 25,578,860 |
Subseries 2021 B-1, Ref. RB(b) | | | 4.00% | | | | 10/01/2046 | | | | 16,935 | | | 15,257,488 |
Subseries 2021 B-1, Ref. RB(b) | | | 4.00% | | | | 10/01/2050 | | | | 35,880 | | | 32,060,535 |
Miami-Dade (County of), FL Expressway Authority; | | | | | | | | | | | | | | |
Series 2010 A, RB | | | 5.00% | | | | 07/01/2040 | | | | 8,420 | | | 8,424,593 |
Series 2014 A, RB | | | 5.00% | | | | 07/01/2044 | | | | 11,410 | | | 11,472,180 |
Miami-Dade (County of), FL Transit System; | | | | | | | | | | | | | | |
Series 2018, RB | | | 4.00% | | | | 07/01/2045 | | | | 11,000 | | | 10,405,394 |
Series 2022, RB | | | 5.00% | | | | 07/01/2048 | | | | 8,835 | | | 9,518,906 |
Series 2022, RB(k) | | | 5.00% | | | | 07/01/2050 | | | | 14,210 | | | 15,253,467 |
Series 2022, RB(k) | | | 5.00% | | | | 07/01/2051 | | | | 40,980 | | | 43,909,254 |
Nassau (County of), FL (Nassau Care Centers, Inc.); Series 2008, RB (Acquired 12/27/2007; Cost $8,600,000)(i) | | | 6.90% | | | | 01/01/2038 | | | | 8,600 | | | 7,215,833 |
Naturewalk Community Development District; Series 2007 A, RB(g)(h) | | | 5.50% | | | | 05/01/2038 | | | | 4,345 | | | 1,390,400 |
Palm Beach (County of), FL Health Facilities Authority (Baptist Health South Florida); Series 2019, RB | | | 4.00% | | | | 08/15/2049 | | | | 5,000 | | | 4,514,072 |
Palm Beach (County of), FL Health Facilities Authority (Toby & Leon Cooperman Sinai Residences of Boca Raton Expanison); Series 2020, RB | | | 5.00% | | | | 06/01/2055 | | | | 2,000 | | | 1,754,487 |
Palm Coast Park Community Development District; Series 2006, RB | | | 5.70% | | | | 05/01/2037 | | | | 9,280 | | | 9,283,564 |
Pinellas (County of), FL Industrial Development Authority (2017 Foundation for Global Understanding); Series 2019, RB | | | 5.00% | | | | 07/01/2039 | | | | 1,750 | | | 1,692,213 |
Polk (County of), FL Industrial Development Authority (Carpenter’s Home Estates); Series 2019, Ref. IDR | | | 5.00% | | | | 01/01/2055 | | | | 800 | | | 673,066 |
Polk (County of), FL Industrial Development Authority (Mineral Development LLC); Series 2020, RB(b)(e) | | | 5.88% | | | | 01/01/2033 | | | | 23,500 | | | 23,593,514 |
Portofino Isles Community Development District (Portofino Court); Series 2005, RB(g)(h) | | | 5.60% | | | | 05/01/2036 | | | | 5,905 | | | 3,661,100 |
Reunion East Community Development District; | | | | | | | | | | | | | | |
Series 2002 A-2, RB(g)(h) | | | 7.38% | | | | 05/01/2033 | | | | 1,425 | | | 14 |
Series 2005, RB(g)(h) | | | 5.80% | | | | 05/01/2036 | | | | 3,420 | | | 34 |
Ridgewood Trails Community Development District; Series 2007 A, RB | | | 5.65% | | | | 05/01/2038 | | | | 120 | | | 120,033 |
Seminole (County of), FL; Series 2022, Ref. RB | | | 5.00% | | | | 10/01/2052 | | | | 13,850 | | | 14,555,365 |
Seminole (County of), FL Industrial Development Authority (Progressive Healthcare Providers/Fern Park, LLC Facility); Series 2005 A, RB | | | 7.50% | | | | 03/01/2035 | | | | 3,265 | | | 2,965,502 |
South Bay Community Development District; | | | | | | | | | | | | | | |
Series 2005 A, RB(g)(h) | | | 5.95% | | | | 05/01/2036 | | | | 5,110 | | | 51 |
Series 2005 A-1, Ref. RB | | | 5.95% | | | | 05/01/2036 | | | | 5,860 | | | 5,783,032 |
Series 2005 A-2, Ref. RB(g)(h) | | | 6.60% | | | | 05/01/2036 | | | | 3,800 | | | 1,900,000 |
Series 2005 B-2, Ref. RB(g)(h) | | | 6.60% | | | | 05/01/2025 | | | | 3,240 | | | 1,620,005 |
Tern Bay Community Development District; Series 2005 A, RB | | | 5.38% | | | | 05/01/2037 | | | | 540 | | | 540,068 |
Town Center at Palm Coast Community Development District; Series 2005, RB | | | 6.00% | | | | 05/01/2036 | | | | 10,435 | | | 10,437,000 |
Treeline Preserve Community Development District; Series 2007 A, RB(g)(h) | | | 6.80% | | | | 05/01/2039 | | | | 4,950 | | | 693,000 |
Villages of Avignon Community Development District (The); Series 2007 A, RB(g)(h) | | | 5.40% | | | | 05/01/2037 | | | | 755 | | | 37,750 |
See accompanying Notes to Financial Statements which are an integral part of the financial statements.
19 Invesco Rochester® Municipal Opportunities Fund
| | | | | | | | | | | | | | |
| | | Interest
Rate | | | Maturity
Date | | | Principal
Amount
(000) | | | Value |
Florida–(continued) | | | | | | | | | | | | | | |
Villages of Glen Creek Community Development District; | | | | | | | | | | | | | | |
Series 2016 A-1, RB | | | 4.75% | | | | 05/01/2026 | | | $ | 295 | | | $ 294,239 |
Series 2016 A-1, RB | | | 5.25% | | | | 05/01/2036 | | | | 1,080 | | | 1,075,859 |
Series 2016 A-1, RB | | | 5.38% | | | | 05/01/2046 | | | | 1,815 | | | 1,748,322 |
Series 2016 A-2, RB | | | 5.38% | | | | 05/01/2046 | | | | 1,945 | | | 1,873,546 |
Waterford Estates Community Development District; Series 2006 A, RB | | | 5.50% | | | | 05/01/2037 | | | | 2,255 | | | 2,255,365 |
Waterstone Community Development District; | | | | | | | | | | | | | | |
Series 2007 A, RB(c)(h) | | | 6.88% | | | | 05/01/2037 | | | | 1,214 | | | 777,943 |
Series 2007 B, RB(h)(l) | | | 0.00% | | | | 11/01/2028 | | | | 7,342 | | | 4,413,860 |
West Villages Improvement District; | | | | | | | | | | | | | | |
Series 2005 A-1, RB | | | 5.75% | | | | 05/01/2036 | | | | 7,970 | | | 7,974,271 |
Series 2005 A-2, RB(g)(h) | | | 5.75% | | | | 05/01/2036 | | | | 7,610 | | | 4,413,800 |
West Villages Improvement District (Development Unit No. 8); | | | | | | | | | | | | | | |
Series 2022, RB | | | 5.38% | | | | 05/01/2042 | | | | 1,500 | | | 1,482,214 |
Series 2022, RB | | | 5.50% | | | | 05/01/2053 | | | | 2,500 | | | 2,431,675 |
Westridge Community Development District; Series 2005, RB | | | 5.80% | | | | 05/01/2037 | | | | 1,465 | | | 1,465,219 |
Westside Community Development District; | | | | | | | | | | | | | | |
Series 2019 2, RB(g) | | | 5.65% | | | | 05/01/2037 | | | | 1,010 | | | 675,711 |
Series 2019 2, RB | | | 7.20% | | | | 05/01/2038 | | | | 520 | | | 348,604 |
Wildwood (City of), FL Utility Dependent District (South Sumter Utility); Series 2021, RB (INS - BAM)(d) | | | 5.00% | | | | 10/01/2052 | | | | 4,750 | | | 4,881,914 |
Zephyr Ridge Community Development District; Series 2006 A, RB(g)(h) | | | 5.63% | | | | 05/01/2037 | | | | 2,635 | | | 1,317,238 |
| | | | | | | | | | | | | | | 871,150,746 |
| | | | |
Georgia–2.29% | | | | | | | | | | | | | | |
Atlanta (City of), GA Department of Aviation; | | | | | | | | | | | | | | |
Series 2022 A, RB | | | 4.00% | | | | 07/01/2052 | | | | 10,000 | | | 9,275,648 |
Series 2022, RB(b)(k) | | | 5.00% | | | | 07/01/2044 | | | | 23,280 | | | 24,029,248 |
Conyers (City of), GA (Salem Gate); Series 2021, RB | | | 5.00% | | | | 03/01/2045 | | | | 5,485 | | | 4,256,480 |
Development Authority of Lagrange (College); Series 2021, Ref. RB | | | 5.00% | | | | 10/15/2052 | | | | 21,350 | | | 18,863,161 |
Floyd (County of), GA Development Authority (The Spires at Berry College); | | | | | | | | | | | | | | |
Series 2018 A, RB | | | 5.75% | | | | 12/01/2033 | | | | 3,100 | | | 2,979,655 |
Series 2018 A, RB | | | 6.00% | | | | 12/01/2038 | | | | 6,850 | | | 6,586,385 |
Series 2018 A, RB | | | 6.25% | | | | 12/01/2048 | | | | 19,530 | | | 18,547,754 |
Series 2018 A, RB | | | 6.50% | | | | 12/01/2053 | | | | 13,210 | | | 12,765,930 |
Gainesville (City of) & Hall (County of), GA Development Authority (Riverside Military Academy); | | | | | | | | | | | | | | |
Series 2017, Ref. RB | | | 5.00% | | | | 03/01/2027 | | | | 1,860 | | | 1,741,430 |
Series 2017, Ref. RB | | | 5.00% | | | | 03/01/2037 | | | | 6,885 | | | 5,610,197 |
Series 2017, Ref. RB | | | 5.00% | | | | 03/01/2047 | | | | 8,860 | | | 6,520,412 |
Series 2017, Ref. RB | | | 5.13% | | | | 03/01/2052 | | | | 3,475 | | | 2,517,365 |
George L Smith II Congress Center Authority (Convention Center Hotel); | | | | | | | | | | | | | | |
Series 2021, RB | | | 4.00% | | | | 01/01/2054 | | | | 6,800 | | | 5,395,822 |
Series 2021, RB(e) | | | 5.00% | | | | 01/01/2054 | | | | 4,750 | | | 3,728,435 |
Georgia (State of) Municipal Electric Authority (Plant Vogtle Units 3 & 4); Series 2019, RB (INS - BAM)(d) | | | 4.00% | | | | 01/01/2049 | | | | 4,000 | | | 3,563,755 |
Georgia (State of) Ports Authority; | | | | | | | | | | | | | | |
Series 2022, RB | | | 4.00% | | | | 07/01/2047 | | | | 5,000 | | | 4,791,288 |
Series 2022, RB | | | 4.00% | | | | 07/01/2052 | | | | 7,000 | | | 6,558,366 |
Georgia (State of) Road & Tollway Authority; | | | | | | | | | | | | | | |
Series 2014 A, RB(e)(j)(l) | | | 0.00% | | | | 06/01/2024 | | | | 1,305 | | | 1,237,212 |
Series 2014 A, RB(e)(f)(j)(l) | | | 0.00% | | | | 06/01/2024 | | | | 3,750 | | | 1,946,015 |
Series 2014 B, RB(c)(e)(f)(j) | | | 7.00% | | | | 06/01/2024 | | | | 13,600 | | | 13,706,438 |
Main Street Natural Gas, Inc.; | | | | | | | | | | | | | | |
Series 2019 A, RB | | | 5.00% | | | | 05/15/2043 | | | | 3,400 | | | 3,393,877 |
Series 2023 A, RB(f) | | | 5.00% | | | | 06/01/2030 | | | | 11,000 | | | 11,447,408 |
See accompanying Notes to Financial Statements which are an integral part of the financial statements.
20 Invesco Rochester® Municipal Opportunities Fund
| | | | | | | | | | | | | | |
| | | Interest
Rate | | | Maturity
Date | | | Principal
Amount
(000) | | | Value |
Georgia–(continued) | | | | | | | | | | | | | | |
Oconee (County of), GA Industrial Development Authority (Presbyterian Village Athens); | | | | | | | | | | | | | | |
Series 2018 A-1, RB | | | 6.13% | | | | 12/01/2038 | | | $ | 2,635 | | | $ 2,398,052 |
Series 2018 A-1, RB | | | 6.25% | | | | 12/01/2048 | | | | 3,675 | | | 3,146,591 |
Series 2018 A-1, RB | | | 6.38% | | | | 12/01/2053 | | | | 3,090 | | | 2,638,530 |
Series 2018 A-2, RB(f) | | | 5.50% | | | | 12/01/2028 | | | | 2,090 | | | 1,892,006 |
| | | | | | | | | | | | | | | 179,537,460 |
| | | | |
Hawaii–0.48% | | | | | | | | | | | | | | |
Hawaii (State of); | | | | | | | | | | | | | | |
Series 2020 A, Ref. RB(b) | | | 4.00% | | | | 07/01/2033 | | | | 2,250 | | | 2,281,906 |
Series 2020 A, Ref. RB(b) | | | 4.00% | | | | 07/01/2036 | | | | 600 | | | 589,986 |
Series 2020 C, Ref. RB | | | 4.00% | | | | 07/01/2037 | | | | 600 | | | 604,574 |
Series 2020 C, Ref. RB | | | 4.00% | | | | 07/01/2038 | | | | 750 | | | 752,912 |
Series 2020 C, Ref. RB | | | 4.00% | | | | 07/01/2040 | | | | 425 | | | 413,412 |
Series 2022-XX1217, RB (INS - BAM)(b)(d)(k)(m) | | | 5.00% | | | | 07/01/2051 | | | | 32,450 | | | 33,223,686 |
| | | | | | | | | | | | | | | 37,866,476 |
| | | | |
Idaho–0.15% | | | | | | | | | | | | | | |
Boise City (City of), ID (Public Parking Facilities); | | | | | | | | | | | | | | |
Series 2021 A, Ref. RB | | | 5.00% | | | | 09/01/2046 | | | | 4,000 | | | 4,278,677 |
Series 2021 A, Ref. RB | | | 5.00% | | | | 09/01/2051 | | | | 5,125 | | | 5,449,044 |
Idaho (State of) Health Facilities Authority (Valley Vista Care Corp.); Series 2017 A, Ref. RB | | | 5.25% | | | | 11/15/2047 | | | | 960 | | | 710,912 |
Idaho (State of) Housing & Finance Association (Compass Public Charter School, Inc.); | | | | | | | | | | | | | | |
Series 2018 A, RB(e) | | | 6.00% | | | | 07/01/2039 | | | | 370 | | | 389,570 |
Series 2018 A, RB(e) | | | 6.00% | | | | 07/01/2054 | | | | 1,135 | | | 1,177,774 |
Nampa Local Improvement District No. 148; Series 2010, RB | | | 6.63% | | | | 09/01/2030 | | | | 67 | | | 67,067 |
| | | | | | | | | | | | | | | 12,073,044 |
| | | | |
Illinois–3.09% | | | | | | | | | | | | | | |
Chicago (City of), IL (Cottage View Terrace Apartments); Series 2000 A, RB (CEP - GNMA)(b) | | | 6.13% | | | | 02/20/2042 | | | | 30 | | | 30,017 |
Chicago (City of), IL (O’Hare International Airport); | | | | | | | | | | | | | | |
Series 2013, RB | | | 5.50% | | | | 01/01/2026 | | | | 1,680 | | | 1,682,835 |
Series 2017 D, RB(b) | | | 5.00% | | | | 01/01/2042 | | | | 14,115 | | | 14,335,644 |
Series 2017 D, RB(b) | | | 5.00% | | | | 01/01/2047 | | | | 2,500 | | | 2,526,077 |
Series 2017 D, RB(b) | | | 5.00% | | | | 01/01/2052 | | | | 5,000 | | | 5,038,803 |
Series 2018 A, Ref. RB(b) | | | 5.00% | | | | 01/01/2048 | | | | 5,000 | | | 5,091,434 |
Series 2018 B, RB | | | 5.00% | | | | 01/01/2053 | | | | 16,890 | | | 17,414,975 |
Series 2018, RB(b) | | | 5.00% | | | | 07/01/2048 | | | | 3,750 | | | 3,714,014 |
Series 2022 A, RB(b) | | | 5.50% | | | | 01/01/2055 | | | | 20,000 | | | 21,234,980 |
Chicago (City of), IL Board of Education; | | | | | | | | | | | | | | |
Series 2016 A, Ref. GO Bonds | | | 7.00% | | | | 12/01/2044 | | | | 7,000 | | | 7,379,055 |
Series 2016 B, GO Bonds | | | 6.50% | | | | 12/01/2046 | | | | 1,500 | | | 1,574,757 |
Series 2016, RB | | | 6.00% | | | | 04/01/2046 | | | | 5,700 | | | 5,886,751 |
Series 2018, RB | | | 5.00% | | | | 04/01/2046 | | | | 7,555 | | | 7,312,050 |
Chicago (City of), IL Midway International Airport; Series 2014 A, Ref. RB(b) | | | 5.00% | | | | 01/01/2033 | | | | 3,000 | | | 3,023,137 |
Du Page (County of), IL Special Service Area No. 31 (Monarch Landing, Inc.); Series 2006, RB | | | 5.63% | | | | 03/01/2036 | | | | 814 | | | 796,360 |
Evanston (City of), IL (Roycemore School); Series 2021, RB(e) | | | 4.63% | | | | 04/01/2051 | | | | 1,250 | | | 885,499 |
Gilberts (Village of), IL Special Service Area No. 24 (The Conservancy); Subseries 2014 A, RB | | | 5.38% | | | | 03/01/2034 | | | | 2,070 | | | 1,846,497 |
Harvey (City of), IL; | | | | | | | | | | | | | | |
Series 2007 A, Ref. GO Bonds (Acquired 09/02/2009; Cost $ 4,913,092)(g)(i) | | | 5.50% | | | | 12/01/2027 | | | | 6,165 | | | 5,648,681 |
Series 2007 A, Ref. GO Bonds (Acquired 09/03/2009; Cost $ 1,365,806)(g)(i) | | | 5.63% | | | | 12/01/2032 | | | | 1,800 | | | 1,649,250 |
Illinois (State of); | | | | | | | | | | | | | | |
Series 2006, GO Bonds | | | 5.50% | | | | 01/01/2029 | | | | 5,000 | | | 5,418,939 |
Series 2014, GO Bonds | | | 5.00% | | | | 02/01/2039 | | | | 2,865 | | | 2,877,676 |
Series 2017 C, GO Bonds | | | 5.00% | | | | 11/01/2029 | | | | 625 | | | 653,642 |
Series 2018 A, Ref. GO Bonds | | | 5.00% | | | | 10/01/2029 | | | | 6,500 | | | 6,851,855 |
Series 2018 A, Ref. GO Bonds | | | 5.00% | | | | 10/01/2033 | | | | 3,360 | | | 3,501,577 |
Series 2018 B, Ref. GO Bonds | | | 5.00% | | | | 10/01/2030 | | | | 3,000 | | | 3,154,025 |
Illinois (State of) (Rebuild Illinois Program); Series 2019 B, GO Bonds | | | 4.00% | | | | 11/01/2035 | | | | 1,930 | | | 1,857,128 |
See accompanying Notes to Financial Statements which are an integral part of the financial statements.
21 Invesco Rochester® Municipal Opportunities Fund
| | | | | | | | | | | | | | |
| | | Interest
Rate | | | Maturity
Date | | | Principal
Amount
(000) | | | Value |
Illinois–(continued) | | | | | | | | | | | | | | |
Illinois (State of) Development Finance Authority (CITGO Petroleum Corp.); Series 2002, RB(b) | | | 8.00% | | | | 06/01/2032 | | | $ | 2,940 | | | $ 2,942,460 |
Illinois (State of) Finance Authority; | | | | | | | | | | | | | | |
Series 2006, RB(b) | | | 6.50% | | | | 12/01/2037 | | | | 8,445 | | | 6,583,157 |
Series 2017, Ref. RB (Acquired 06/05/2018; Cost $2,020,241)(i) | | | 5.00% | | | | 02/15/2027 | | | | 2,000 | | | 900,000 |
Series 2017, Ref. RB (Acquired 04/03/2019; Cost $6,022,965)(i) | | | 5.00% | | | | 02/15/2037 | | | | 7,000 | | | 3,150,000 |
Series 2017, Ref. RB | | | 5.13% | | | | 05/15/2038 | | | | 1,000 | | | 714,650 |
Series 2017, Ref. RB | | | 5.25% | | | | 05/15/2042 | | | | 3,220 | | | 2,200,104 |
Series 2017, Ref. RB | | | 5.00% | | | | 08/01/2042 | | | | 575 | | | 572,224 |
Series 2017, Ref. RB (Acquired 05/07/2019; Cost $2,764,639)(i) | | | 5.13% | | | | 02/15/2045 | | | | 3,120 | | | 1,404,000 |
Series 2017, Ref. RB | | | 5.25% | | | | 05/15/2054 | | | | 3,825 | | | 2,400,204 |
Illinois (State of) Finance Authority (DePaul College Prep Foundation); Series 2023, Ref. RB(e) | | | 5.63% | | | | 08/01/2053 | | | | 3,500 | | | 3,412,752 |
Illinois (State of) Finance Authority (Dominican University); | | | | | | | | | | | | | | |
Series 2022, Ref. RB | | | 5.00% | | | | 03/01/2047 | | | | 1,100 | | | 1,044,403 |
Series 2022, Ref. RB | | | 5.00% | | | | 03/01/2052 | | | | 1,080 | | | 1,006,013 |
Illinois (State of) Finance Authority (Lutheran Communities Obligated Group); Series 2019 A, Ref. RB | | | 5.00% | | | | 11/01/2049 | | | | 2,450 | | | 1,992,398 |
Illinois (State of) Finance Authority (Northshore University Health); | | | | | | | | | | | | | | |
Series 2020, Ref. RB | | | 4.00% | | | | 08/15/2040 | | | | 4,000 | | | 3,787,726 |
Series 2020, Ref. RB | | | 4.00% | | | | 08/15/2041 | | | | 1,750 | | | 1,648,966 |
Illinois (State of) Finance Authority (Rogers Park Montessori School); | | | | | | | | | | | | | | |
Series 2014, Ref. RB | | | 6.00% | | | | 02/01/2034 | | | | 575 | | | 578,870 |
Series 2014, Ref. RB | | | 6.13% | | | | 02/01/2045 | | | | 1,310 | | | 1,316,082 |
Illinois (State of) Finance Authority (Rosalind Franklin University); Series 2017, Ref. RB | | | 5.00% | | | | 08/01/2047 | | | | 700 | | | 685,718 |
Illinois (State of) Finance Authority (Villa St. Benedict); | | | | | | | | | | | | | | |
Series 2015, Ref. RB | | | 6.13% | | | | 11/15/2035 | | | | 3,330 | | | 3,371,288 |
Series 2015, Ref. RB | | | 6.38% | | | | 11/15/2043 | | | | 4,400 | | | 4,452,118 |
Illinois (State of) Housing Development Authority (Stonebridge of Gurnee); | | | | | | | | | | | | | | |
Series 2016 A, RB(e) | | | 5.45% | | | | 01/01/2046 | | | | 1,640 | | | 1,184,186 |
Series 2016 A, RB(e) | | | 5.60% | | | | 01/01/2056 | | | | 1,775 | | | 1,235,887 |
Illinois (State of) Metropolitan Pier & Exposition Authority (McCormick Place Expansion); | | | | | | | | | | | | | | |
Series 2002 A, RB (INS - AGM)(d)(l) | | | 0.00% | | | | 12/15/2040 | | | | 15,000 | | | 6,502,309 |
Series 2010 B, Ref. RB (INS - AGM)(d)(l) | | | 0.00% | | | | 06/15/2046 | | | | 15,000 | | | 4,745,508 |
Series 2010 B-1, Ref. RB (INS - AGM)(d)(l) | | | 0.00% | | | | 06/15/2044 | | | | 17,055 | | | 6,034,832 |
Series 2010 B-1, Ref. RB (INS - AGM)(d)(l) | | | 0.00% | | | | 06/15/2047 | | | | 31,755 | | | 9,508,454 |
Series 2012 B, RB (INS - AGM)(d)(l) | | | 0.00% | | | | 12/15/2041 | | | | 5,000 | | | 2,044,584 |
Series 2017, Ref. RB (INS - AGM)(d)(l) | | | 0.00% | | | | 12/15/2056 | | | | 22,000 | | | 3,962,075 |
Illinois (State of) Toll Highway Authority; Series 2013 A, RB | | | 5.00% | | | | 01/01/2038 | | | | 9,765 | | | 9,773,220 |
Matteson (Village of), IL; Series 2015, RB | | | 6.50% | | | | 12/01/2035 | | | | 1,200 | | | 1,232,660 |
Morton Grove (Village of), IL (Sawmill Station Redevelopment); Series 2019, RB | | | 5.00% | | | | 01/01/2039 | | | | 2,000 | | | 1,810,540 |
Mundelein (Village of), IL; Series 2019, GO Bonds (INS - AGM)(d) | | | 4.00% | | | | 12/15/2044 | | | | 4,500 | | | 4,296,389 |
Plano (City of), IL Special Service Area No. 5 (Lakewood Springs Club); Series 2006, RB | | | 6.00% | | | | 03/01/2036 | | | | 1,172 | | | 1,131,505 |
Quad Cities Regional Economic Development Authority (Pheasant Ridge Apartments); Series 2005, RB(b) | | | 6.38% | | | | 08/01/2040 | | | | 4,875 | | | 3,089,208 |
Robbins (Village of), IL; Series 1999 C, RB(b) | | | 7.25% | | | | 10/15/2024 | | | | 0 | | | 155 |
Sales Tax Securitization Corp.; Series 2018 A, Ref. RB | | | 5.00% | | | | 01/01/2048 | | | | 4,000 | | | 4,108,929 |
Southwestern Illinois Development Authority; Series 2006, RB(g) | | | 5.63% | | | | 11/01/2026 | | | | 2,795 | | | 1,677,000 |
Villa Park (Village of), IL (Garden Station Redevelopment); Series 2021, RB | | | 4.50% | | | | 12/31/2038 | | | | 1,915 | | | 1,402,415 |
Volo (Village of), IL Special Service Area No. 17; Series 2017, Ref. RB | | | 5.50% | | | | 03/01/2047 | | | | 1,188 | | | 1,170,410 |
Will (County of), IL; Series 2019, GO Bonds | | | 4.00% | | | | 11/15/2047 | | | | 2,000 | | | 1,918,733 |
| | | | | | | | | | | | | | | 242,377,790 |
| | | | |
Indiana–1.44% | | | | | | | | | | | | | | |
Allen (County of), IN (Evergreen Village Fort Wayne); Series 2019, RB | | | 6.38% | | | | 02/01/2039 | | | | 10,000 | | | 9,496,869 |
Anderson (City of), IN (Sweet Galilee at the Wigwam); Series 2020, RB(e) | | | 5.38% | | | | 01/01/2040 | | | | 2,745 | | | 2,232,829 |
Columbus (City of), IN (Vivera Senior Living); Series 2019, RB | | | 5.63% | | | | 05/01/2039 | | | | 11,925 | | | 9,907,753 |
Evansville (City of), IN (Silver Birch of Evansville); Series 2017, RB | | | 5.45% | | | | 01/01/2038 | | | | 3,430 | | | 2,777,645 |
Fort Wayne (City of), IN (Silver Birch at Cook Road); Series 2018, RB(e) | | | 5.63% | | | | 01/01/2038 | | | | 7,000 | | | 5,886,132 |
See accompanying Notes to Financial Statements which are an integral part of the financial statements.
22 Invesco Rochester® Municipal Opportunities Fund
| | | | | | | | | | | | | | |
| | | Interest
Rate | | | Maturity
Date | | | Principal
Amount
(000) | | | Value |
Indiana–(continued) | | | | | | | | | | | | | | |
Fort Wayne (City of), IN (Silver Birch of Fort Wayne); | | | | | | | | | | | | | | |
Series 2017, RB | | | 5.13% | | | | 01/01/2032 | | | $ | 510 | | | $ 442,576 |
Series 2017, RB | | | 5.35% | | | | 01/01/2038 | | | | 3,850 | | | 3,143,079 |
Goshen (City of), IN (Green Oaks of Goshen); Series 2021 A, RB(e) | | | 5.00% | | | | 08/01/2041 | | | | 4,065 | | | 3,109,079 |
Indiana (State of) Finance Authority; Series 2017, Ref. RB | | | 5.38% | | | | 07/01/2047 | | | | 2,050 | | | 1,939,534 |
Indiana (State of) Finance Authority (Irvington Community School); | | | | | | | | | | | | | | |
Series 2018 A, Ref. RB(e) | | | 5.90% | | | | 07/01/2038 | | | | 770 | | | 761,517 |
Series 2018 A, Ref. RB(e) | | | 6.00% | | | | 07/01/2048 | | | | 1,185 | | | 1,147,449 |
Indiana (State of) Housing & Community Development Authority; | | | | | | | | | | | | | | |
Series 2016 A, RB | | | 5.75% | | | | 01/01/2036 | | | | 6,225 | | | 5,424,617 |
Series 2016, RB | | | 5.50% | | | | 01/01/2037 | | | | 3,740 | | | 3,136,529 |
Indiana (State of) Housing & Community Development Authority (Glasswater Creek of Whitestown); Series 2020, RB(e) | | | 5.38% | | | | 10/01/2040 | | | | 7,000 | | | 5,665,101 |
Indiana (State of) Housing & Community Development Authority (Lake Meadows Assisted Living); Series 2019 A, RB(e) | | | 5.00% | | | | 01/01/2039 | | | | 3,365 | | | 2,595,255 |
Indiana (State of) Housing & Community Development Authority (Vita of Marion); | | | | | | | | | | | | | | |
Series 2021 A, RB(e) | | | 5.00% | | | | 04/01/2031 | | | | 660 | | | 576,575 |
Series 2021 A, RB(e) | | | 5.25% | | | | 04/01/2041 | | | | 4,000 | | | 3,190,444 |
Jeffersonville (City of), IN (Vivera Senior Living); Series 2020 A, RB(e) | | | 5.25% | | | | 11/01/2040 | | | | 4,500 | | | 3,584,397 |
Kokomo (City of), IN (Silver Birch at KOKOMO); | | | | | | | | | | | | | | |
Series 2017, RB | | | 5.75% | | | | 01/01/2034 | | | | 1,095 | | | 976,859 |
Series 2017, RB | | | 5.88% | | | | 01/01/2037 | | | | 4,540 | | | 3,989,180 |
Lafayette (City of), IN (Glasswater Creek of Lafayette); | | | | | | | | | | | | | | |
Series 2017, RB | | | 5.60% | | | | 01/01/2033 | | | | 925 | | | 823,690 |
Series 2017, RB | | | 5.80% | | | | 01/01/2037 | | | | 5,160 | | | 4,500,580 |
Merrillville (Town of), IN (Belvedere Housing); Series 2016, RB | | | 5.75% | | | | 04/01/2036 | | | | 4,965 | | | 4,319,345 |
Mishawaka (City of), IN; Series 2018, RB | | | 5.75% | | | | 10/01/2038 | | | | 17,405 | | | 13,638,836 |
Mishawaka (City of), IN (Silver Birch of Mishwaka); | | | | | | | | | | | | | | |
Series 2017, RB(e) | | | 5.10% | | | | 01/01/2032 | | | | 455 | | | 394,113 |
Series 2017, RB(e) | | | 5.38% | | | | 01/01/2038 | | | | 5,475 | | | 4,481,894 |
Plainfield (Town of), IN (Glasswater Creek of Plainfield); Series 2018, RB | | | 5.38% | | | | 09/01/2038 | | | | 7,955 | | | 6,477,736 |
Terre Haute (City of), IN (Silver Birch of Terre Haute); Series 2017, RB | | | 5.35% | | | | 01/01/2038 | | | | 3,880 | | | 3,167,571 |
Valparaiso (City of), IN (Green Oaks of Valparaiso); Series 2021, RB(e) | | | 5.38% | | | | 12/01/2041 | | | | 3,600 | | | 2,802,931 |
Vincennes (City of), IN; Series 2016, Ref. RB(e) | | | 6.25% | | | | 01/01/2029 | | | | 2,530 | | | 2,253,972 |
| | | | | | | | | | | | | | | 112,844,087 |
| | | | |
Iowa–0.25% | | | | | | | | | | | | | | |
Clear Lake (City of), IA (Timbercrest Apartments, LLC); | | | | | | | | | | | | | | |
Series 2018, RB | | | 6.00% | | | | 10/01/2043 | | | | 1,405 | | | 1,287,155 |
Series 2018, RB | | | 6.00% | | | | 10/01/2048 | | | | 2,780 | | | 2,472,038 |
Iowa (State of) Finance Authority; Series 2007, RB(g) | | | 5.90% | | | | 12/01/2028 | | | | 1,160 | | | 3,016 |
Iowa (State of) Finance Authority (PHS Council Bluffs, Inc.); | | | | | | | | | | | | | | |
Series 2018, RB | | | 5.00% | | | | 08/01/2038 | | | | 750 | | | 620,998 |
Series 2018, RB | | | 5.13% | | | | 08/01/2048 | | | | 1,750 | | | 1,347,436 |
Series 2018, RB | | | 5.25% | | | | 08/01/2055 | | | | 2,500 | | | 1,901,132 |
Iowa (State of) Finance Authority (Riserville Holdings); Series 2021, RB(b)(e) | | | 5.00% | | | | 12/01/2051 | | | | 5,960 | | | 4,521,741 |
Iowa (State of) Finance Authority (Wedum Walnut Ridge LLC); Series 2007 B, RB | | | 5.38% | | | | 06/01/2025 | | | | 285 | | | 279,247 |
Iowa (State of) Tobacco Settlement Authority; | | | | | | | | | | | | | | |
Series 2021 A-2, Ref. RB | | | 4.00% | | | | 06/01/2049 | | | | 250 | | | 218,290 |
Series 2021 B-1, Ref. RB | | | 4.00% | | | | 06/01/2049 | | | | 850 | | | 832,218 |
Series 2021 B-2, Ref. RB(l) | | | 0.00% | | | | 06/01/2065 | | | | 54,300 | | | 5,859,312 |
| | | | | | | | | | | | | | | 19,342,583 |
| | | | |
Kansas–0.15% | | | | | | | | | | | | | | |
Ellis County Unified School District No. 489 Hays; | | | | | | | | | | | | | | |
Series 2022 B, Ref. GO Bonds (INS - AGM)(d) | | | 5.00% | | | | 09/01/2042 | | | | 2,250 | | | 2,431,115 |
Series 2022 B, Ref. GO Bonds (INS - AGM)(d) | | | 5.00% | | | | 09/01/2047 | | | | 2,750 | | | 2,928,630 |
Series 2022 B, Ref. GO Bonds (INS - AGM)(d) | | | 4.00% | | | | 09/01/2052 | | | | 4,000 | | | 3,699,192 |
Goddard (City of), KS (Olympic Park Star Bond); Series 2021, RB | | | 3.50% | | | | 06/01/2034 | | | | 1,420 | | | 1,238,369 |
Olathe (City of), KS; Series 2006, RB(h)(n) | | | 5.00% | | | | 03/01/2026 | | | | 2,555 | | | 1,124,173 |
See accompanying Notes to Financial Statements which are an integral part of the financial statements.
23 Invesco Rochester® Municipal Opportunities Fund
| | | | | | | | | | | | | | |
| | | Interest
Rate | | | Maturity
Date | | | Principal
Amount
(000) | | | Value |
Kansas–(continued) | | | | | | | | | | | | | | |
Pittsburgh (City of), KS; Series 2006, RB | | | 4.90% | | | | 04/01/2024 | | | $ | 135 | | | $ 135,178 |
| | | | | | | | | | | | | | | 11,556,657 |
| | | | |
Kentucky–0.10% | | | | | | | | | | | | | | |
Kentucky (Commonwealth of) Economic Development Finance Authority (Owensboro Health, Inc.); Series 2017 A, Ref. RB | | | 5.00% | | | | 06/01/2045 | | | | 1,000 | | | 1,002,282 |
Kentucky (Commonwealth of) Property & Building Commission (No. 119); | | | | | | | | | | | | | | |
Series 2018, RB (INS - BAM)(d) | | | 5.00% | | | | 05/01/2033 | | | | 900 | | | 984,459 |
Series 2018, RB (INS - BAM)(d) | | | 5.00% | | | | 05/01/2034 | | | | 800 | | | 869,871 |
Kentucky (Commonwealth of) Public Energy Authority; Series 2022 A-1, RB(f) | | | 4.00% | | | | 08/01/2030 | | | | 4,220 | | | 4,131,309 |
Kuttawa (City of), KY; Series 1999, RB | | | 6.75% | | | | 03/01/2029 | | | | 1,120 | | | 1,036,783 |
| | | | | | | | | | | | | | | 8,024,704 |
| | | | |
Louisiana–0.45% | | | | | | | | | | | | | | |
Louisiana (State of) Local Government Environmental Facilities & Community Development Authority; | | | | | | | | | | | | | | |
Series 2018 A, RB(b)(e) | | | 5.25% | | | | 05/01/2043 | | | | 1,220 | | | 1,119,877 |
Series 2019, RB(e) | | | 4.40% | | | | 11/01/2044 | | | | 3,190 | | | 2,978,355 |
Louisiana (State of) Local Government Environmental Facilities & Community Development Authority (Glen Retirement System); | | | | | | | | | | | | | | |
Series 2019 A, RB | | | 5.00% | | | | 01/01/2049 | | | | 16,535 | | | 11,572,861 |
Series 2019 A, RB | | | 5.00% | | | | 01/01/2055 | | | | 12,000 | | | 8,068,146 |
Louisiana (State of) Local Government Environmental Facilities & Community Development Authority (Green Bonds); Series 2018, RB(e) | | | 5.38% | | | | 11/01/2038 | | | | 2,280 | | | 2,368,228 |
Louisiana (State of) Local Government Environmental Facilities & Community Development Authority (St. Tammany Parish Gomesa); Series 2020, RB(e) | | | 3.88% | | | | 11/01/2045 | | | | 4,250 | | | 3,565,054 |
St. James (Parish of), LA (Nustar Logistics, L.P.); | | | | | | | | | | | | | | |
Series 2010, RB(e) | | | 6.35% | | | | 07/01/2040 | | | | 5,115 | | | 5,520,332 |
Series 2010, RB(e) | | | 6.35% | | | | 10/01/2040 | | | | 440 | | | 474,867 |
| | | | | | | | | | | | | | | 35,667,720 |
| | | | |
Maine–0.18% | | | | | | | | | | | | | | |
Maine (State of) Finance Authority; Series 2015 R-2, RB(b)(e)(f) | | | 4.38% | | | | 08/01/2025 | | | | 2,000 | | | 1,957,187 |
Rumford (Town of), ME (Boise Cascade Corp.); Series 2001, Ref. RB(b) | | | 6.88% | | | | 10/01/2026 | | | | 12,265 | | | 12,292,280 |
| | | | | | | | | | | | | | | 14,249,467 |
| | | | |
Maryland–1.15% | | | | | | | | | | | | | | |
Baltimore (City of), MD (Centerwest Development); | | | | | | | | | | | | | | |
Series 2017 A, RB | | | 5.38% | | | | 06/01/2036 | | | | 1,100 | | | 1,108,528 |
Series 2017 A, RB | | | 5.50% | | | | 06/01/2043 | | | | 1,360 | | | 1,369,420 |
Baltimore (City of), MD (Convention Center Hotel); | | | | | | | | | | | | | | |
Series 2017, Ref. RB | | | 5.00% | | | | 09/01/2027 | | | | 2,780 | | | 2,778,545 |
Series 2017, Ref. RB | | | 5.00% | | | | 09/01/2028 | | | | 4,350 | | | 4,373,776 |
Series 2017, Ref. RB | | | 5.00% | | | | 09/01/2029 | | | | 3,630 | | | 3,666,137 |
Series 2017, Ref. RB | | | 5.00% | | | | 09/01/2031 | | | | 1,210 | | | 1,223,246 |
Series 2017, Ref. RB | | | 5.00% | | | | 09/01/2033 | | | | 1,000 | | | 1,008,689 |
Series 2017, Ref. RB | | | 5.00% | | | | 09/01/2034 | | | | 1,105 | | | 1,110,670 |
Series 2017, Ref. RB | | | 5.00% | | | | 09/01/2035 | | | | 2,250 | | | 2,250,508 |
Series 2017, Ref. RB | | | 5.00% | | | | 09/01/2036 | | | | 3,525 | | | 3,484,429 |
Baltimore (County of), MD; Series 2018, GO Bonds(k) | | | 4.00% | | | | 03/01/2040 | | | | 9,525 | | | 9,495,476 |
Maryland (State of) Stadium Authority; Series 2018, RB(j)(k) | | | 5.00% | | | | 05/01/2047 | | | | 45,950 | | | 48,099,697 |
Maryland Economic Development Corp. (Purple Line) (Green Bonds); Series 2022 B, RB(b) | | | 5.25% | | | | 06/30/2055 | | | | 10,000 | | | 10,014,720 |
| | | | | | | | | | | | | | | 89,983,841 |
| | | | |
Massachusetts–1.38% | | | | | | | | | | | | | | |
Massachusetts (Commonwealth of); | | | | | | | | | | | | | | |
Series 2020 E, GO Bonds | | | 5.00% | | | | 11/01/2050 | | | | 6,810 | | | 7,280,126 |
Series 2022 E, GO Bonds | | | 5.00% | | | | 11/01/2052 | | | | 45,020 | | | 48,694,276 |
Massachusetts (Commonwealth of) (Rail Enhancement & Accelerated Bridge Program); Series 2019 A, RB | | | 5.00% | | | | 06/01/2049 | | | | 1,000 | | | 1,060,887 |
See accompanying Notes to Financial Statements which are an integral part of the financial statements.
24 Invesco Rochester® Municipal Opportunities Fund
| | | | | | | | | | | | | | |
| | | Interest
Rate | | | Maturity
Date | | | Principal
Amount
(000) | | | Value |
Massachusetts–(continued) | | | | | | | | | | | | | | |
Massachusetts (Commonwealth of) Development Finance Agency (Linden Ponds, Inc. Facility); Series 2018, RB(e) | | | 5.13% | | | | 11/15/2046 | | | $ | 4,565 | | | $ 4,625,696 |
Massachusetts (Commonwealth of) Development Finance Agency (Merrimack College); Series 2014, RB | | | 5.13% | | | | 07/01/2044 | | | | 4,000 | | | 4,018,818 |
Massachusetts (Commonwealth of) Development Finance Agency (Williams College); Series 2013 P, RB | | | 5.00% | | | | 07/01/2043 | | | | 4,200 | | | 4,201,875 |
Massachusetts (Commonwealth of) Port Authority; | | | | | | | | | | | | | | |
Series 2019 A, Ref. RB(b) | | | 5.00% | | | | 07/01/2038 | | | | 5,000 | | | 5,265,324 |
Series 2019 A, Ref. RB(b) | | | 5.00% | | | | 07/01/2039 | | | | 6,000 | | | 6,296,803 |
Series 2022, RB(b)(k) | | | 5.00% | | | | 07/01/2046 | | | | 15,000 | | | 15,564,119 |
Massachusetts (Commonwealth of) Transportation Fund (Sustainability Bonds); Series 2022, RB | | | 5.00% | | | | 06/01/2050 | | | | 1,045 | | | 1,124,843 |
Saugus (Town of), MA; | | | | | | | | | | | | | | |
Series 2018, GO Bonds(k) | | | 4.00% | | | | 03/01/2039 | | | | 2,240 | | | 2,240,628 |
Series 2018, GO Bonds(k) | | | 4.00% | | | | 03/01/2040 | | | | 2,500 | | | 2,480,088 |
Series 2018, GO Bonds(k) | | | 4.00% | | | | 03/01/2041 | | | | 2,670 | | | 2,627,148 |
Series 2018, GO Bonds(k) | | | 4.00% | | | | 03/01/2042 | | | | 2,750 | | | 2,678,882 |
| | | | | | | | | | | | | | | 108,159,513 |
| | | | |
Michigan–1.77% | | | | | | | | | | | | | | |
Academy of Warren; Series 2020 A, RB(e) | | | 5.50% | | | | 05/01/2050 | | | | 1,000 | | | 802,349 |
Advanced Technology Academy; | | | | | | | | | | | | | | |
Series 2019, Ref. RB | | | 5.00% | | | | 11/01/2034 | | | | 400 | | | 380,274 |
Series 2019, Ref. RB | | | 5.00% | | | | 11/01/2044 | | | | 1,175 | | | 1,058,465 |
American Montessori Academy; Series 2017, RB | | | 7.00% | | | | 12/01/2046 | | | | 1,515 | | | 1,444,205 |
Charyl Stockwell Academy; | | | | | | | | | | | | | | |
Series 2015, Ref. RB | | | 5.50% | | | | 10/01/2035 | | | | 2,740 | | | 2,615,398 |
Series 2015, Ref. RB | | | 5.75% | | | | 10/01/2045 | | | | 4,140 | | | 3,848,599 |
Detroit (City of), MI; Series 2003, GO Bonds (INS - SGI)(d) | | | 5.25% | | | | 04/01/2023 | | | | 15 | | | 15,505 |
Detroit City School District; Series 2013, GO Bonds (INS - AGM)(d)(k) | | | 6.00% | | | | 05/01/2029 | | | | 10,100 | | | 11,175,355 |
Grand Rapids Economic Development Corp. (Clark Retirement Community, Inc.); | | | | | | | | | | | | | | |
Series 2019 A, Ref. RB | | | 5.50% | | | | 04/01/2039 | | | | 4,365 | | | 3,325,348 |
Series 2019 A, Ref. RB | | | 5.75% | | | | 04/01/2049 | | | | 19,320 | | | 13,858,168 |
Series 2019 A, Ref. RB | | | 5.75% | | | | 04/01/2054 | | | | 13,990 | | | 9,724,530 |
Series 2019 B, RB | | | 6.00% | | | | 04/01/2027 | | | | 4,090 | | | 3,860,447 |
Haslett Public Schools; Series 2018, GO Bonds | | | 5.00% | | | | 05/01/2048 | | | | 3,150 | | | 3,330,534 |
Michigan (State of) Building Authority (Facilities Program); Series 2022 I, RB | | | 4.00% | | | | 10/15/2052 | | | | 4,250 | | | 4,001,535 |
Michigan (State of) Finance Authority; | | | | | | | | | | | | | | |
Series 2005 A, RB | | | 6.00% | | | | 12/01/2035 | | | | 1,400 | | | 1,321,276 |
Series 2007, RB | | | 6.50% | | | | 12/01/2037 | | | | 535 | | | 531,925 |
Series 2008 C, RB(l) | | | 0.00% | | | | 06/01/2058 | | | | 804,975 | | | 31,918,225 |
Series 2014, Ref. RB (Acquired 10/29/2018-09/28/2021; Cost $16,505,428)(e)(i) | | | 6.75% | | | | 07/01/2044 | | | | 16,465 | | | 15,851,895 |
Michigan (State of) Finance Authority (Henry Ford Health System); Series 2016, Ref. RB | | | 5.00% | | | | 11/15/2041 | | | | 200 | | | 203,177 |
Michigan (State of) Finance Authority (Old Redforf Academy); Series 2010 A, RB | | | 5.90% | | | | 12/01/2030 | | | | 1,180 | | | 1,153,394 |
Michigan (State of) Finance Authority (Universal Learning Academy); Series 2018, Ref. RB | | | 5.75% | | | | 11/01/2040 | | | | 2,000 | | | 2,001,732 |
Pontiac (City of), MI Arts & Technology Academy; Series 2016, Ref. RB | | | 6.00% | | | | 11/01/2046 | | | | 3,465 | | | 2,779,999 |
Troy School District; Series 2023, GO Bonds | | | 5.00% | | | | 05/01/2052 | | | | 10,000 | | | 10,702,866 |
Wayne (County of), MI; Series 1999, RB(b) | | | 6.00% | | | | 12/01/2029 | | | | 13,160 | | | 13,167,705 |
| | | | | | | | | | | | | | | 139,072,906 |
| | | | |
Minnesota–0.79% | | | | | | | | | | | | | | |
Bethel (City of), MN (Benedictine Health System - St. Peter Communities); Series 2018 A, Ref. RB | | | 5.50% | | | | 12/01/2048 | | | | 3,330 | | | 2,690,364 |
Bethel (City of), MN (Birchwood Landing At The Lakes At Stillwater Project); Series 2019, RB | | | 5.00% | | | | 05/01/2054 | | | | 2,610 | | | 2,121,981 |
Bethel (City of), MN (The Lodge At The Lakes At Stillwater); | | | | | | | | | | | | | | |
Series 2018, RB | | | 5.00% | | | | 06/01/2053 | | | | 600 | | | 493,708 |
Series 2018, RB | | | 5.25% | | | | 06/01/2058 | | | | 1,625 | | | 1,350,894 |
Brooklyn Center (City of), MN (Sanctuary at at Brooklyn Center); | | | | | | | | | | | | | | |
Series 2016 A, RB | | | 5.50% | | | | 11/01/2035 | | | | 8,895 | | | 5,337,000 |
Series 2016 B, RB | | | 6.50% | | | | 11/01/2035 | | | | 3,060 | | | 1,836,000 |
See accompanying Notes to Financial Statements which are an integral part of the financial statements.
25 Invesco Rochester® Municipal Opportunities Fund
| | | | | | | | | | | | | | |
| | | Interest
Rate | | | Maturity
Date | | | Principal
Amount
(000) | | | Value |
Minnesota–(continued) | | | | | | | | | | | | | | |
Cottonwood (City of), MN (Extreme Holdings LLC); | | | | | | | | | | | | | | |
Series 2021 A, RB(b)(e) | | | 5.00% | | | | 12/01/2050 | | | $ | 6,630 | | | $ 4,875,532 |
Series 2021 B, RB(e) | | | 6.50% | | | | 12/01/2026 | | | | 510 | | | 477,945 |
Dakota (County of), MN Community Development Agency (Sanctuary at West St. Paul); Series 2015, RB (Acquired 01/18/2019; Cost $5,682,650)(i) | | | 6.00% | | | | 08/01/2035 | | | | 5,735 | | | 4,383,003 |
Duluth (City of), MN Economic Development Authority (Cambia Hills of Wast Bethel); | | | | | | | | | | | | | | |
Series 2018, RB(g) | | | 5.45% | | | | 12/01/2046 | | | | 380 | | | 83,600 |
Series 2018, RB(g) | | | 5.63% | | | | 12/01/2055 | | | | 1,000 | | | 220,000 |
Independence (City of), MN (Spero Academy); | | | | | | | | | | | | | | |
Series 2021 A, RB | | | 5.00% | | | | 07/01/2056 | | | | 13,325 | | | 9,215,687 |
Series 2021 B, RB | | | 6.00% | | | | 07/01/2028 | | | | 625 | | | 572,983 |
International Falls (City of), MN (Boise Cascade Corp.); Series 1999, Ref. RB(b) | | | 6.85% | | | | 12/01/2029 | | | | 6,570 | | | 6,585,027 |
Minneapolis & St. Paul (Cities of), MN Metropolitan Airports Commission; | | | | | | | | | | | | | | |
Series 2022 B, Ref. RB(b) | | | 5.00% | | | | 01/01/2047 | | | | 4,000 | | | 4,109,700 |
Series 2022 B, Ref. RB(b) | | | 5.25% | | | | 01/01/2047 | | | | 3,775 | | | 3,946,326 |
Minneapolis (City of), MN (Kipp North Star); Series 2020 A, RB | | | 5.75% | | | | 07/01/2055 | | | | 3,000 | | | 2,935,087 |
Minneapolis (City of), MN (Riverton Community Housing); Series 2018, RB(e) | | | 5.00% | | | | 08/01/2053 | | | | 500 | | | 475,704 |
Minneapolis (City of), MN (Spero Academy); | | | | | | | | | | | | | | |
Series 2017 A, RB(e) | | | 6.25% | | | | 07/01/2037 | | | | 1,075 | | | 1,090,724 |
Series 2017 A, RB(e) | | | 6.50% | | | | 07/01/2048 | | | | 4,740 | | | 4,799,927 |
Red Wing (City of), MN; Series 2018 A, RB | | | 5.00% | | | | 08/01/2053 | | | | 515 | | | 416,567 |
St. Paul (City of), MN Housing & Redevelopment Authority; Series 2004, RB | | | 6.25% | | | | 03/01/2029 | | | | 1,388 | | | 1,243,062 |
St. Paul (City of), MN Housing & Redevelopment Authority (Great River School); Series 2017 A, RB(e) | | | 5.50% | | | | 07/01/2052 | | | | 1,075 | | | 1,056,472 |
St. Paul (City of), MN Housing & Redevelopment Authority (Twin Cities German Immersion School); | | | | | | | | | | | | | | |
Series 2019, RB | | | 5.00% | | | | 07/01/2049 | | | | 1,000 | | | 888,905 |
Series 2019, RB | | | 5.00% | | | | 07/01/2055 | | | | 1,000 | | | 866,797 |
| | | | | | | | | | | | | | | 62,072,995 |
| | | | |
Mississippi–0.35% | | | | | | | | | | | | | | |
Mississippi (State of) Development Bank (Jackson Convention Center); Series 2013 A, Ref. RB (INS - BAM)(d) | | | 5.00% | | | | 03/01/2036 | | | | 10,000 | | | 11,290,909 |
Mississippi State University Educational Building Corp.; Series 2018, RB(k) | | | 4.00% | | | | 08/01/2043 | | | | 13,015 | | | 12,306,911 |
Stonebridge Public Improvement District; Series 2007, RB(g) | | | 7.50% | | | | 10/01/2042 | | | | 16,410 | | | 2,576,370 |
Tunica (County of), MS; Series 2019, Ref. RB | | | 6.00% | | | | 10/01/2040 | | | | 1,350 | | | 1,189,295 |
| | | | | | | | | | | | | | | 27,363,485 |
| | | | |
Missouri–1.58% | | | | | | | | | | | | | | |
Branson (City of), MO Commerce Park Community Improvement District; Series 2007 A, RB(g) | | | 5.75% | | | | 06/01/2026 | | | | 4,900 | | | 980,000 |
Branson (City of), MO Industrial Development Authority (Branson Hills Redevelopment); | | | | | | | | | | | | | | |
Series 2005 A, RB(h) | | | 7.05% | | | | 05/01/2027 | | | | 10,480 | | | 8,906,465 |
Series 2007 A, RB(h) | | | 5.75% | | | | 05/01/2026 | | | | 1,980 | | | 1,702,812 |
Branson (City of), MO Industrial Development Authority (Branson Landing Retail); Series 2005, RB | | | 5.50% | | | | 06/01/2029 | | | | 2,580 | | | 2,384,082 |
Broadway-Fairview Transportation Development District; Series 2006 A, RB(h) | | | 6.13% | | | | 12/01/2036 | | | | 570 | | | 357,675 |
Callaway (County of), MO Industrial Development Authority (Westminster College); Series 2021 C, RB | | | 5.25% | | | | 10/01/2051 | | | | 3,590 | | | 2,986,201 |
Chesterfield Valley Transportation Development District; Series 2018, RB(c) | | | 5.50% | | | | 05/15/2046 | | | | 5,000 | | | 2,899,934 |
Chillicothe (City of), MO (South U.S. 65); Series 2006, RB(h) | | | 5.63% | | | | 04/01/2027 | | | | 3,100 | | | 2,602,711 |
Dardenne Town Square Transportation Development District; | | | | | | | | | | | | | | |
Series 2006 A, RB(h)(n) | | | 5.00% | | | | 05/01/2026 | | | | 3,020 | | | 1,389,200 |
Series 2006 A, RB(h)(n) | | | 5.00% | | | | 05/01/2036 | | | | 3,825 | | | 1,759,500 |
Grindstone Plaza Transportation Development District; | | | | | | | | | | | | | | |
Series 2006 A, RB | | | 5.40% | | | | 10/01/2026 | | | | 335 | | | 334,970 |
Series 2006 A, RB | | | 5.55% | | | | 10/01/2036 | | | | 115 | | | 112,212 |
I-470 Western Gateway Transportation Development District; Series 2019 A, RB(e) | | | 5.25% | | | | 12/01/2048 | | | | 4,900 | | | 4,851,787 |
Kansas City (City of), MO Industrial Development Authority; Series 2019, RB(e) | | | 5.00% | | | | 07/01/2040 | | | | 5,505 | | | 4,704,537 |
See accompanying Notes to Financial Statements which are an integral part of the financial statements.
26 Invesco Rochester® Municipal Opportunities Fund
| | | | | | | | | | | | | | |
| | | Interest
Rate | | | Maturity
Date | | | Principal
Amount
(000) | | | Value |
Missouri–(continued) | | | | | | | | | | | | | | |
Kansas City (City of), MO Industrial Development Authority (Kansas City International Airport); | | | | | | | | | | | | | | |
Series 2019 B, RB (INS - AGM)(b)(d) | | | 5.00% | | | | 03/01/2049 | | | $ | 5,000 | | | $ 5,090,250 |
Series 2019 B, RB(b) | | | 5.00% | | | | 03/01/2054 | | | | 41,155 | | | 41,603,392 |
Series 2019 B, RB (INS - AGM)(b)(d) | | | 5.00% | | | | 03/01/2055 | | | | 16,490 | | | 16,721,134 |
Kansas City (City of), MO Industrial Development Authority (Ward Parkway Center Community Improvement District); Series 2016 A, Ref. RB(e) | | | 5.00% | | | | 04/01/2046 | | | | 1,890 | | | 1,627,949 |
Lee’s Summit (City of), MO Industrial Development Authority; Series 2007, RB(g)(h) | | | 5.75% | | | | 03/01/2029 | | | | 750 | | | 435,000 |
Lee’s Summit (City of), MO Industrial Development Authority (Summit Fair Community Improvement District); Series 2012, RB | | | 6.00% | | | | 05/01/2042 | | | | 2,800 | | | 2,517,565 |
Move Rolla Transportation Development District; Series 2017, RB | | | 4.63% | | | | 06/01/2042 | | | | 2,095 | | | 1,947,284 |
Northwoods Transportation Development District; Series 2006 A, RB | | | 5.85% | | | | 02/01/2031 | | | | 557 | | | 485,715 |
Rock Hill (City of), MO Industrial Development Authority (Market at McKnight Redevelopment); Series 2015 A, RB | | | 4.50% | | | | 11/01/2028 | | | | 675 | | | 616,341 |
St. Charles (County of), MO Industrial Development Authority (Suemandy/Mid-Rivers Community Improvement District); Series 2016, RB(e) | | | 5.00% | | | | 10/01/2046 | | | | 2,750 | | | 2,238,622 |
St. Louis (City of), MO; Series 2007, RB(h)(n) | | | 6.30% | | | | 04/01/2027 | | | | 3,043 | | | 699,890 |
St. Louis (City of), MO (Abbey Condominiums); Series 2007, RB(h) | | | 5.50% | | | | 05/29/2028 | | | | 2,031 | | | 858,778 |
St. Louis (City of), MO Industrial Development Authority; Series 2010 A, RB(g)(h) | | | 8.00% | | | | 04/27/2033 | | | | 4,580 | | | 137,400 |
St. Louis (City of), MO Land Clearance for Redevelopment Authority; | | | | | | | | | | | | | | |
Series 2018 A, RB | | | 5.00% | | | | 04/01/2038 | | | | 4,000 | | | 4,155,111 |
Series 2018 B, RB | | | 6.38% | | | | 04/01/2043 | | | | 2,000 | | | 1,638,972 |
St. Louis (City of), MO Land Clearance for Redevelopment Authority (Scottrade Center); Series 2018 A, RB | | | 5.00% | | | | 04/01/2048 | | | | 1,955 | | | 1,999,247 |
St. Louis (County of), MO; Series 2007 A, RB(h) | | | 5.50% | | | | 09/02/2028 | | | | 1,108 | | | 321,320 |
St. Louis (County of), MO (Printers Lofts Tax Increment Financing); Series 2006, RB(h)(n) | | | 6.00% | | | | 08/21/2026 | | | | 1,660 | | | 265,600 |
St. Louis (County of), MO (Washington Park Redevelopment); | | | | | | | | | | | | | | |
Series 2006, RB(h)(n) | | | 6.00% | | | | 08/21/2026 | | | | 2,442 | | | 537,240 |
Series 2007 A, RB(h) | | | 5.50% | | | | 01/20/2028 | | | | 2,196 | | | 922,320 |
Series 2007 B, RB(h)(n) | | | 5.50% | | | | 01/20/2028 | | | | 1,510 | | | 75,500 |
St. Louis (County of), MO Industrial Development Authority; Series 2019 A, Ref. RB(e) | | | 5.88% | | | | 03/01/2033 | | | | 3,100 | | | 2,829,446 |
Stone Canyon Community Improvement District; Series 2007, RB(g)(h) | | | 5.75% | | | | 04/01/2027 | | | | 975 | | | 253,500 |
| | | | | | | | | | �� | | | | | 123,949,662 |
| | | | |
Montana–0.01% | | | | | | | | | | | | | | |
Hardin (City of), MT; Series 2006, RB(h)(n) | | | 6.25% | | | | 09/01/2031 | | | | 5,935 | | | 1,068,300 |
| | | | |
Nevada–0.53% | | | | | | | | | | | | | | |
Clark (County of), NV; Series 2018 A, GO Bonds(k) | | | 5.00% | | | | 05/01/2048 | | | | 27,500 | | | 28,898,389 |
Clark (County of), NV (Special Improvement District No. 128); | | | | | | | | | | | | | | |
Series 2007 A, RB | | | 5.00% | | | | 02/01/2026 | | | | 595 | | | 596,727 |
Series 2007 A, RB | | | 5.05% | | | | 02/01/2031 | | | | 730 | | | 731,321 |
Clark (County of), NV (Stadium Improvement Bonds); Series 2018 A, GO Bonds | | | 5.00% | | | | 06/01/2043 | | | | 7,160 | | | 7,574,036 |
Las Vegas (City of), NV Special Improvement District No. 815; Series 2020, RB | | | 5.00% | | | | 12/01/2049 | | | | 1,000 | | | 932,952 |
Mesquite (City of), NV; Series 2005, RB | | | 5.50% | | | | 08/01/2025 | | | | 90 | | | 90,388 |
Reno (City of), NV (ReTRAC - Reno Transportation Rail Access Corridor); Series 2018 C, Ref. RB(e)(l) | | | 0.00% | | | | 07/01/2058 | | | | 23,500 | | | 2,915,960 |
| | | | | | | | | | | | | | | 41,739,773 |
| | | | |
New Hampshire–0.53% | | | | | | | | | | | | | | |
New Hampshire (State of) Business Finance Authority; Series 2020-1A, RB | | | 4.13% | | | | 01/20/2034 | | | | 7,164 | | | 7,053,123 |
New Hampshire (State of) Business Finance Authority (Social Bonds); Series 2022-2A, RB | | | 4.00% | | | | 10/20/2036 | | | | 25,870 | | | 24,162,448 |
New Hampshire (State of) Business Finance Authority (Vista (The)); | | | | | | | | | | | | | | |
Series 2019 A, RB(e) | | | 5.25% | | | | 07/01/2039 | | | | 1,400 | | | 1,280,623 |
Series 2019 A, RB(e) | | | 5.63% | | | | 07/01/2046 | | | | 770 | | | 705,078 |
Series 2019 A, RB(e) | | | 5.75% | | | | 07/01/2054 | | | | 5,430 | | | 4,947,797 |
See accompanying Notes to Financial Statements which are an integral part of the financial statements.
27 Invesco Rochester® Municipal Opportunities Fund
| | | | | | | | | | | | | | |
| | | Interest
Rate | | | Maturity
Date | | | Principal
Amount
(000) | | | Value |
New Hampshire–(continued) | | | | | | | | | | | | | | |
New Hampshire (State of) Health and Education Facilities Authority (Hillside Village); | | | | | | | | | | | | | | |
Series 2017 A, RB (Acquired 02/13/2020; Cost $983,197)(e)(g)(i) | | | 5.25% | | | | 07/01/2027 | | | $ | 918 | | | $ 202,018 |
Series 2017 A, RB (Acquired 06/12/2017; Cost $1,440,007)(e)(g)(i) | | | 6.13% | | | | 07/01/2037 | | | | 1,440 | | | 316,802 |
Series 2017 A, RB (Acquired 06/12/2017; Cost $722,090)(e)(g)(i) | | | 6.25% | | | | 07/01/2042 | | | | 722 | | | 158,860 |
Series 2017 A, RB (Acquired 06/12/2017-04/28/2020; Cost $10,400,706)(e)(g)(i) | | | 6.13% | | | | 07/01/2052 | | | | 12,000 | | | 2,640,013 |
| | | | | | | | | | | | | | | 41,466,762 |
| | | | |
New Jersey–1.82% | | | | | | | | | | | | | | |
New Jersey (State of) Economic Development Authority; Series 2019 B, RB(e) | | | 5.75% | | | | 10/01/2026 | | | | 765 | | | 722,591 |
New Jersey (State of) Economic Development Authority (Black Horse EHT Urban Renewal LLC); Series 2019 A, RB(e) | | | 5.00% | | | | 10/01/2039 | | | | 6,000 | | | 4,478,600 |
New Jersey (State of) Economic Development Authority (Continental Airlines, Inc.); | | | | | | | | | | | | | | |
Series 1999, RB(b) | | | 5.13% | | | | 09/15/2023 | | | | 5,415 | | | 5,412,967 |
Series 2000 B, RB(b) | | | 5.63% | | | | 11/15/2030 | | | | 8,550 | | | 8,607,151 |
Series 2003, RB(b) | | | 5.50% | | | | 06/01/2033 | | | | 8,000 | | | 7,952,169 |
Series 2012, RB(b) | | | 5.75% | | | | 09/15/2027 | | | | 15,925 | | | 15,923,965 |
New Jersey (State of) Economic Development Authority (Golden Door Charter School); Series 2018 A, RB(e) | | | 6.50% | | | | 11/01/2052 | | | | 690 | | | 720,739 |
New Jersey (State of) Economic Development Authority (Katikvah International Academy Charter School); Series 2017 A, RB(e) | | | 5.38% | | | | 07/01/2047 | | | | 1,865 | | | 1,653,650 |
New Jersey (State of) Economic Development Authority (Leap Academy University Charter School, Inc.); | | | | | | | | | | | | | | |
Series 2014 A, RB(e) | | | 6.00% | | | | 10/01/2034 | | | | 565 | | | 569,360 |
Series 2014 A, RB(e) | | | 6.20% | | | | 10/01/2044 | | | | 750 | | | 754,200 |
Series 2014 A, RB(e) | | | 6.30% | | | | 10/01/2049 | | | | 500 | | | 503,170 |
New Jersey (State of) Economic Development Authority (Marion P. Thomas Charter School); Series 2018 A, RB(e) | | | 5.38% | | | | 10/01/2050 | | | | 5,000 | | | 4,562,120 |
New Jersey (State of) Economic Development Authority (Newark Downtown District Management Corp.); Series 2019, Ref. RB | | | 5.13% | | | | 06/15/2037 | | | | 2,955 | | | 3,152,402 |
New Jersey (State of) Economic Development Authority (North Star Academy Charter School of Newark, Inc.); Series 2017, RB | | | 5.00% | | | | 07/15/2047 | | | | 1,875 | | | 1,877,263 |
New Jersey (State of) Economic Development Authority (Paterson Charter School for Science and Technology, Inc.); Series 2012 A, RB | | | 6.10% | | | | 07/01/2044 | | | | 1,000 | | | 1,000,582 |
New Jersey (State of) Economic Development Authority (State House); Series 2017 B, RB | | | 5.00% | | | | 06/15/2035 | | | | 2,050 | | | 2,180,622 |
New Jersey (State of) Economic Development Authority (Teaneck Community Charter School); Series 2017 A, Ref. RB(e) | | | 5.13% | | | | 09/01/2052 | | | | 2,055 | | | 1,862,802 |
New Jersey (State of) Economic Development Authority (University Heights Charter School); Series 2018 A, RB(e)(g) | | | 5.75% | | | | 09/01/2050 | | | | 2,521 | | | 2,219,718 |
New Jersey (State of) Educational Facilities Authority (College of St. Elizabeth (The)); Series 2016 D, Ref. RB | | | 5.00% | | | | 07/01/2046 | | | | 5,000 | | | 4,444,886 |
New Jersey (State of) Health Care Facilities Financing Authority; Series 2018, RB (Acquired 09/14/2018; Cost $4,970,000)(e)(i) | | | 5.75% | | | | 10/01/2038 | | | | 4,970 | | | 3,822,610 |
New Jersey (State of) Transportation Trust Fund Authority; | | | | | | | | | | | | | | |
Series 2008 A, RB (INS - BAM)(d)(l) | | | 0.00% | | | | 12/15/2037 | | | | 10,000 | | | 5,210,306 |
Series 2018 A, Ref. RN | | | 5.00% | | | | 06/15/2031 | | | | 3,300 | | | 3,465,519 |
Newark (City of), NJ; Series 2015 A, GO Bonds | | | 5.00% | | | | 07/15/2029 | | | | 3,583 | | | 3,722,794 |
Tobacco Settlement Financing Corp.; | | | | | | | | | | | | | | |
Series 2018 A, Ref. RB | | | 5.00% | | | | 06/01/2046 | | | | 18,650 | | | 19,022,590 |
Series 2018 B, Ref. RB | | | 5.00% | | | | 06/01/2046 | | | | 39,350 | | | 38,957,370 |
| | | | | | | | | | | | | | | 142,800,146 |
| | | | |
New Mexico–0.12% | | | | | | | | | | | | | | |
Boulders Public Improvement District; Series 2015, RB | | | 5.75% | | | | 10/01/2044 | | | | 615 | | | 557,882 |
Farmington (City of), NM (San Juan and Four Corners); Series 2016 A, Ref. RB | | | 2.15% | | | | 04/01/2033 | | | | 7,355 | | | 5,957,264 |
Mariposa East Public Improvement District; | | | | | | | | | | | | | | |
Series 2015 A, RB | | | 5.90% | | | | 09/01/2032 | | | | 50 | | | 46,657 |
Series 2015 B, RB | | | 5.90% | | | | 09/01/2032 | | | | 320 | | | 302,868 |
Series 2015 C, RB | | | 5.90% | | | | 09/01/2032 | | | | 420 | | | 385,064 |
Series 2015 D, RB(l) | | | 0.00% | | | | 03/01/2032 | | | | 330 | | | 153,144 |
Trails Public Improvement District; Series 2008, RB | | | 7.75% | | | | 10/01/2038 | | | | 1,770 | | | 1,769,879 |
| | | | | | | | | | | | | | | 9,172,758 |
See accompanying Notes to Financial Statements which are an integral part of the financial statements.
28 Invesco Rochester® Municipal Opportunities Fund
| | | | | | | | | | | | | | |
| | | Interest
Rate | | | Maturity
Date | | | Principal
Amount
(000) | | | Value |
New York–21.34% | | | | | | | | | | | | | | |
Build NYC Resource Corp. (Brooklyn Navy Yard); Series 2019, Ref. RB(b)(e) | | | 5.50% | | | | 12/31/2040 | | | $ | 9,655 | | | $ 8,359,472 |
Erie Tobacco Asset Securitization Corp.; Series 2005 D, RB(l) | | | 0.00% | | | | 06/01/2055 | | | | 17,700 | | | 1,101,273 |
Essex (County of), NY Industrial Development Agency; Series 2017, RB (Acquired 05/11/2017; Cost $4,025,000)(b)(i) | | | 6.25% | | | | 06/01/2047 | | | | 4,025 | | | 3,083,920 |
Guilderland (Town of), NY Industrial Development Agency; Series 2017 A, RB(e)(g) | | | 5.88% | | | | 01/01/2052 | | | | 5,400 | | | 4,050,000 |
Long Island (City of), NY Power Authority; Series 2017, RB | | | 5.00% | | | | 09/01/2047 | | | | 5,000 | | | 5,169,116 |
Metropolitan Transportation Authority; | | | | | | | | | | | | | | |
Series 2013 D, RB(f)(j) | | | 5.25% | | | | 11/15/2023 | | | | 900 | | | 913,333 |
Series 2013 D, RB(f)(j) | | | 5.25% | | | | 11/15/2023 | | | | 900 | | | 913,333 |
Series 2016 C-1, RB | | | 5.25% | | | | 11/15/2056 | | | | 5,005 | | | 4,998,667 |
Series 2017 D, Ref. RB | | | 4.00% | | | | 11/15/2042 | | | | 4,680 | | | 4,178,582 |
Series 2020 A-1, RB | | | 4.00% | | | | 11/15/2052 | | | | 12,000 | | | 10,111,356 |
Metropolitan Transportation Authority (Green Bonds); | | | | | | | | | | | | | | |
Series 2017 B-1, RB | | | 5.00% | | | | 11/15/2042 | | | | 3,000 | | | 3,168,053 |
Series 2017 B-1, RB | | | 5.25% | | | | 11/15/2057 | | | | 10,000 | | | 10,469,178 |
Series 2020 A-1, RB | | | 4.00% | | | | 11/15/2045 | | | | 13,000 | | | 11,388,118 |
Series 2020 A-1, RB | | | 5.00% | | | | 11/15/2049 | | | | 22,270 | | | 22,440,994 |
Series 2020 C-1, RB | | | 4.75% | | | | 11/15/2045 | | | | 27,000 | | | 26,534,145 |
Series 2020 C-1, RB | | | 5.00% | | | | 11/15/2050 | | | | 30,115 | | | 30,311,895 |
Subseries 2016 B-1, RB | | | 5.00% | | | | 11/15/2051 | | | | 10,470 | | | 10,712,209 |
Monroe County Industrial Development Corp. (St. John Fisher College); Series 2011, RB | | | 6.00% | | | | 06/01/2030 | | | | 1,000 | | | 1,002,208 |
Monroe County Industrial Development Corp. (University of Rochester); Series 2020 A, RB | | | 4.00% | | | | 07/01/2050 | | | | 16,715 | | | 15,265,136 |
Nassau (County of), NY Industrial Development Agency (Amsterdam at Harborside); | | | | | | | | | | | | | | |
Series 2021, RB (Acquired 11/18/2014-01/24/2018; Cost $8,001,683)(i) | | | 5.00% | | | | 01/01/2058 | | | | 8,272 | | | 3,986,131 |
Series 2021, Ref. RB (Acquired 09/07/2021; Cost $3,970,000)(e)(i) | | | 9.00% | | | | 01/01/2041 | | | | 3,970 | | | 3,281,926 |
New York & New Jersey (States of) Port Authority; | | | | | | | | | | | | | | |
Series 2017, Ref. RB | | | 5.00% | | | | 04/15/2057 | | | | 10 | | | 10,369 |
Series 2018 206, RB(b)(k) | | | 5.00% | | | | 11/15/2042 | | | | 2,000 | | | 2,047,881 |
Series 2018-XF0683, Revenue Ctfs.(b)(k) | | | 5.00% | | | | 11/15/2047 | | | | 9,725 | | | 9,888,231 |
Series 2019 220, RB(b) | | | 4.00% | | | | 11/01/2059 | | | | 25,765 | | | 22,587,959 |
Series 2019, RB(b) | | | 5.00% | | | | 11/01/2049 | | | | 33,555 | | | 34,701,819 |
Series 2020 221, RB(b) | | | 4.00% | | | | 07/15/2045 | | | | 4,000 | | | 3,667,288 |
Series 2020 221, RB(b) | | | 4.00% | | | | 07/15/2055 | | | | 17,230 | | | 15,292,650 |
Series 2020 221, RB(b) | | | 4.00% | | | | 07/15/2060 | | | | 62,090 | | | 54,291,421 |
Series 2021, Ref. RB(b) | | | 4.00% | | | | 07/15/2046 | | | | 1,850 | | | 1,688,704 |
Series 2021, Ref. RB(b) | | | 4.00% | | | | 07/15/2051 | | | | 10,450 | | | 9,388,330 |
Series 2021, Ref. RB(b) | | | 4.00% | | | | 07/15/2061 | | | | 14,595 | | | 12,724,880 |
Series 2022, Ref. RB(b) | | | 5.25% | | | | 08/01/2047 | | | | 7,000 | | | 7,422,493 |
Series 2022, Ref. RB(b) | | | 5.50% | | | | 08/01/2052 | | | | 9,215 | | | 9,941,864 |
Two Hundred Fifth Series 2017, Ref. RB | | | 5.00% | | | | 11/15/2047 | | | | 14,610 | | | 15,385,113 |
Two Hundred Sixth Series 2017, Ref. RB(b) | | | 5.00% | | | | 11/15/2047 | | | | 10,000 | | | 10,167,847 |
Two Hundredth Series 2017, Ref. RB | | | 5.00% | | | | 10/15/2047 | | | | 10,000 | | | 10,458,076 |
New York (City of), NY; | | | | | | | | | | | | | | |
Series 2020 D-1, GO Bonds | | | 4.00% | | | | 03/01/2050 | | | | 5,000 | | | 4,691,307 |
Series 2021 CC-1, RB(k) | | | 4.00% | | | | 06/15/2051 | | | | 15,000 | | | 14,147,687 |
Series 2021 F-1, GO Bonds | | | 5.00% | | | | 03/01/2023 | | | | 200 | | | 200,000 |
Series 2021 F-1, GO Bonds | | | 4.00% | | | | 03/01/2047 | | | | 6,545 | | | 6,187,662 |
Series 2022-XF1336, RB(k) | | | 5.00% | | | | 06/15/2051 | | | | 25,000 | | | 26,618,445 |
Subseries 2018 F-1, GO Bonds | | | 5.00% | | | | 04/01/2039 | | | | 1,975 | | | 2,101,926 |
New York (City of), NY Municipal Water Finance Authority; | | | | | | | | | | | | | | |
Series 2020 DD-1, RB | | | 4.00% | | | | 06/15/2050 | | | | 7,685 | | | 7,273,199 |
Series 2021 AA-1, RB | | | 4.00% | | | | 06/15/2051 | | | | 10,460 | | | 9,865,653 |
Series 2022 CC-1, RB | | | 4.00% | | | | 06/15/2052 | | | | 13,375 | | | 12,594,851 |
Series 2022-XF1336, RB(k) | | | 5.00% | | | | 06/15/2052 | | | | 10,000 | | | 10,669,946 |
See accompanying Notes to Financial Statements which are an integral part of the financial statements.
29 Invesco Rochester® Municipal Opportunities Fund
| | | | | | | | | | | | | | |
| | | Interest
Rate | | | Maturity
Date | | | Principal
Amount
(000) | | | Value |
New York–(continued) | | | | | | | | | | | | | | |
New York (City of), NY Transitional Finance Authority; | | | | | | | | | | | | | | |
Series 2018 A-3, RB(k) | | | 5.00% | | | | 08/01/2041 | | | $ | 53,425 | | | $ 56,345,269 |
Series 2018 B-1, RB(k) | | | 5.00% | | | | 08/01/2045 | | | | 20,140 | | | 21,073,128 |
Series 2018 C-3, RB(k) | | | 5.00% | | | | 05/01/2041 | | | | 16,810 | | | 17,805,759 |
Series 2018 S-3, RB(k) | | | 5.00% | | | | 07/15/2035 | | | | 25,000 | | | 27,286,263 |
Series 2018, RB(k) | | | 5.00% | | | | 08/01/2042 | | | | 13,000 | | | 13,763,697 |
Series 2021 E-1, RB | | | 4.00% | | | | 02/01/2049 | | | | 16,865 | | | 15,973,504 |
Series 2022 C-1, RB | | | 4.00% | | | | 02/01/2051 | | | | 10,000 | | | 9,435,866 |
Series 2022 F-1, RB | | | 4.00% | | | | 02/01/2051 | | | | 2,500 | | | 2,358,966 |
Series 2022 F-1, RB | | | 5.00% | | | | 02/01/2051 | | | | 5,000 | | | 5,344,235 |
Series 2022, RB(k) | | | 5.00% | | | | 08/01/2045 | | | | 16,000 | | | 17,171,133 |
Series 2022, RB(k) | | | 5.00% | | | | 02/01/2047 | | | | 15,500 | | | 16,631,139 |
Series 2022, RB(k) | | | 5.00% | | | | 02/01/2051 | | | | 12,000 | | | 12,826,164 |
Subseries 2018 A-1, RB | | | 5.00% | | | | 08/01/2040 | | | | 2,450 | | | 2,609,176 |
New York (State of) Dormitory Authority; | | | | | | | | | | | | | | |
Series 2018 A, RB(k) | | | 5.00% | | | | 03/15/2044 | | | | 15,000 | | | 15,672,774 |
Series 2018 E, RB(k) | | | 5.00% | | | | 03/15/2041 | | | | 10,000 | | | 10,667,309 |
Series 2018 E, Ref. RB | | | 5.00% | | | | 03/15/2042 | | | | 5,000 | | | 5,322,907 |
Series 2020 D, Ref. RB | | | 4.00% | | | | 02/15/2047 | | | | 5,000 | | | 4,728,720 |
Series 2021 E, Ref. RB | | | 4.00% | | | | 03/15/2047 | | | | 26,075 | | | 24,657,576 |
Series 2021 E, Ref. RB | | | 4.00% | | | | 03/15/2049 | | | | 25,000 | | | 23,489,742 |
Series 2022, RB(k) | | | 4.00% | | | | 03/15/2048 | | | | 54,290 | | | 51,114,458 |
Series 2022-XF2996, RB(k) | | | 5.00% | | | | 03/15/2042 | | | | 38,270 | | | 40,741,530 |
New York (State of) Dormitory Authority (Bidding Group 4); Series 2021 E, Ref. RB | | | 4.00% | | | | 03/15/2045 | | | | 10,645 | | | 10,137,915 |
New York (State of) Dormitory Authority (Rockefeller University); Series 2019 C, Ref. RB | | | 4.00% | | | | 07/01/2049 | | | | 10,000 | | | 9,332,695 |
New York (State of) Power Authority (Green Bonds); | | | | | | | | | | | | | | |
Series 2020 A, Ref. RB | | | 4.00% | | | | 11/15/2050 | | | | 25,500 | | | 24,360,443 |
Series 2020 A, Ref. RB | | | 4.00% | | | | 11/15/2060 | | | | 28,550 | | | 26,308,420 |
New York (State of) Thruway Authority; | | | | | | | | | | | | | | |
Series 2019 B, RB | | | 4.00% | | | | 01/01/2050 | | | | 19,250 | | | 17,624,407 |
Series 2020 N, RB | | | 4.00% | | | | 01/01/2046 | | | | 3,360 | | | 3,155,587 |
Series 2021 A-1, Ref. RB | | | 4.00% | | | | 03/15/2045 | | | | 12,080 | | | 11,488,079 |
Series 2022, RB(k) | | | 4.00% | | | | 03/15/2051 | | | | 36,050 | | | 33,679,922 |
Series 2022-XX1212, RB(k)(m) | | | 4.00% | | | | 03/15/2057 | | | | 59,635 | | | 54,865,613 |
New York (State of) Thruway Authority (Bidding Group 3); Series 2022, Ref. RB | | | 4.00% | | | | 03/15/2044 | | | | 20,965 | | | 20,041,844 |
New York (State of) Thruway Authority (Bidding Group 4); | | | | | | | | | | | | | | |
Series 2021 A-1, Ref. RB | | | 4.00% | | | | 03/15/2052 | | | | 10,500 | | | 9,792,217 |
Series 2021 A-1, Ref. RB | | | 4.00% | | | | 03/15/2053 | | | | 18,165 | | | 16,906,313 |
Series 2021 A-1, Ref. RB | | | 4.00% | | | | 03/15/2054 | | | | 37,075 | | | 34,406,505 |
New York (State of) Thruway Authority (Group 5); Series 2021 A-1, Ref. RB | | | 4.00% | | | | 03/15/2057 | | | | 17,075 | | | 15,709,405 |
New York Counties Tobacco Trust V; Series 2005 S4B, RB(e)(l) | | | 0.00% | | | | 06/01/2060 | | | | 234,000 | | | 8,344,019 |
New York State Urban Development Corp.; | | | | | | | | | | | | | | |
Series 2020 C, Ref. RB | | | 5.00% | | | | 03/15/2050 | | | | 10,000 | | | 10,627,212 |
Series 2022-XF1334, RB(k) | | | 5.00% | | | | 03/15/2041 | | | | 14,060 | | | 15,089,409 |
Series 2023, RB(k) | | | 5.00% | | | | 03/15/2050 | | | | 15,000 | | | 16,122,012 |
New York Transportation Development Corp. (American Airlines, Inc. John F. Kennedy International Airport); | | | | | | | | | | | | | | |
Series 2020, Ref. RB(b) | | | 5.25% | | | | 08/01/2031 | | | | 13,930 | | | 14,186,081 |
Series 2020, Ref. RB(b) | | | 5.38% | | | | 08/01/2036 | | | | 9,800 | | | 9,902,796 |
New York Transportation Development Corp. (American Airlines, Inc.); | | | | | | | | | | | | | | |
Series 2016, Ref. RB(b) | | | 5.00% | | | | 08/01/2026 | | | | 49,805 | | | 49,826,775 |
Series 2016, Ref. RB(b) | | | 5.00% | | | | 08/01/2031 | | | | 43,220 | | | 43,259,598 |
New York Transportation Development Corp. (Delta Air Lines, Inc. LaGuardia Airport Terminals C&D Redevelopment); | | | | | | | | | | | | | | |
Series 2016 A, RB(b) | | | 4.00% | | | | 07/01/2031 | | | | 2,525 | | | 2,476,851 |
Series 2016 A, RB(b) | | | 5.00% | | | | 07/01/2034 | | | | 2,500 | | | 2,528,633 |
Series 2020, RB(b) | | | 5.00% | | | | 10/01/2040 | | | | 20,000 | | | 19,975,968 |
Series 2020, RB(b) | | | 4.38% | | | | 10/01/2045 | | | | 6,500 | | | 5,912,683 |
See accompanying Notes to Financial Statements which are an integral part of the financial statements.
30 Invesco Rochester® Municipal Opportunities Fund
| | | | | | | | | | | | | | |
| | | Interest
Rate | | | Maturity
Date | | | Principal
Amount
(000) | | | Value |
New York–(continued) | | | | | | | | | | | | | | |
New York Transportation Development Corp. (LaGuardia Airport Terminal B Redevelopment); Series 2016 A, RB(b) | | | 5.00% | | | | 07/01/2046 | | | $ | 2,500 | | | $ 2,461,320 |
Triborough Bridge & Tunnel Authority; | | | | | | | | | | | | | | |
Series 2020 A, RB(k) | | | 5.00% | | | | 11/15/2049 | | | | 31,720 | | | 33,799,655 |
Series 2021 C-3, RB | | | 4.00% | | | | 05/15/2051 | | | | 10,000 | | | 9,159,021 |
Series 2022, RB(k) | | | 4.00% | | | | 05/15/2046 | | | | 17,800 | | | 16,540,600 |
Series 2022, RB(k) | | | 5.00% | | | | 11/15/2054 | | | | 25,750 | | | 27,337,915 |
Series 2022-XF1332, RB(k) | | | 5.25% | | | | 05/15/2052 | | | | 94,835 | | | 103,468,978 |
Triborough Bridge & Tunnel Authority (Green Bonds); Series 2022 D-2, RB | | | 5.25% | | | | 05/15/2047 | | | | 16,700 | | | 18,367,700 |
Triborough Bridge & Tunnel Authority (MTA Bridges & Tunnels); | | | | | | | | | | | | | | |
Series 2021 A, RB | | | 4.00% | | | | 11/15/2056 | | | | 5,000 | | | 4,618,004 |
Series 2022, RB(k) | | | 5.25% | | | | 05/15/2052 | | | | 25,000 | | | 27,398,353 |
Series 2022, RB(k) | | | 5.25% | | | | 05/15/2057 | | | | 20,000 | | | 21,809,976 |
Series 2022, RB(k) | | | 5.25% | | | | 05/15/2062 | | | | 31,400 | | | 34,110,684 |
Yonkers Economic Development Corp. (Charter School Education Excellence); Series 2019 A, RB | | | 5.00% | | | | 10/15/2054 | | | | 465 | | | 410,741 |
| | | | | | | | | | | | | | | 1,676,018,310 |
| | | | |
North Carolina–0.28% | | | | | | | | | | | | | | |
Charlotte (City of), NC; Series 2019 B, Ref. COP | | | 4.00% | | | | 06/01/2039 | | | | 750 | | | 746,084 |
North Carolina (State of) Housing Finance Agency (Social Bonds); Series 2022, RB (CEP - GNMA) | | | 5.00% | | | | 07/01/2047 | | | | 5,000 | | | 5,102,989 |
North Carolina (State of) Medical Care Commission (Forest at Duke (The)); Series 2021, RB | | | 4.00% | | | | 09/01/2051 | | | | 1,025 | | | 794,037 |
North Carolina (State of) Medical Care Commission (Novant Health Obligated Group); Series 2019, RB | | | 4.00% | | | | 11/01/2052 | | | | 16,500 | | | 15,505,357 |
| | | | | | | | | | | | | | | 22,148,467 |
| | | | |
North Dakota–0.18% | | | | | | | | | | | | | | |
Grand Forks (County of), ND (Green Bonds); | | | | | | | | | | | | | | |
Series 2021, RB(b)(e)(g) | | | 6.63% | | | | 12/15/2031 | | | | 3,000 | | | 1,650,000 |
Series 2021, RB(b)(e)(g) | | | 7.00% | | | | 12/15/2043 | | | | 23,500 | | | 12,925,000 |
| | | | | | | | | | | | | | | 14,575,000 |
| | | | |
Northern Mariana Islands–0.25% | | | | | | | | | | | | | | |
Northern Mariana Islands (Commonwealth of); Series 2007 B, Ref. GO Bonds(e) | | | 5.00% | | | | 10/01/2033 | | | | 22,710 | | | 19,847,032 |
| | | | |
Ohio–3.15% | | | | | | | | | | | | | | |
Buckeye Tobacco Settlement Financing Authority; | | | | | | | | | | | | | | |
Series 2020 A-2, Ref. RB | | | 4.00% | | | | 06/01/2048 | | | | 8,735 | | | 7,648,620 |
Series 2020 B-2, Ref. RB | | | 5.00% | | | | 06/01/2055 | | | | 135,035 | | | 122,806,174 |
Series 2020 B-3, Ref. RB(l) | | | 0.00% | | | | 06/01/2057 | | | | 104,895 | | | 12,208,268 |
Cleveland (City of) & Cuyahoga (County of), OH Port Authority (Flats East Bank); Series 2021, Ref. RB(e) | | | 4.50% | | | | 12/01/2055 | | | | 725 | | | 617,645 |
Cleveland (City of) & Cuyahoga (County of), OH Port Authority (Playhouse Square Foundation); | | | | | | | | | | | | | | |
Series 2018, Ref. RB | | | 5.25% | | | | 12/01/2038 | | | | 815 | | | 825,816 |
Series 2018, Ref. RB | | | 5.50% | | | | 12/01/2043 | | | | 735 | | | 747,594 |
Series 2018, Ref. RB | | | 5.50% | | | | 12/01/2053 | | | | 2,900 | | | 2,928,154 |
Cuyahoga (County of), OH (MetroHealth System); | | | | | | | | | | | | | | |
Series 2017, Ref. RB | | | 5.50% | | | | 02/15/2052 | | | | 10,000 | | | 10,225,938 |
Series 2017, Ref. RB | | | 5.50% | | | | 02/15/2057 | | | | 4,900 | | | 5,001,039 |
Darke (County of), OH (Wayne Healthcare); | | | | | | | | | | | | | | |
Series 2019 A, RB | | | 4.00% | | | | 09/01/2040 | | | | 1,000 | | | 860,596 |
Series 2019 A, RB | | | 4.00% | | | | 09/01/2045 | | | | 1,750 | | | 1,451,506 |
FirstEnergy Solutions Corp.; | | | | | | | | | | | | | | |
Class A3(h) | | | 3.75% | | | | 12/01/2023 | | | | 7,750 | | | 28,234 |
Class B5(h) | | | 3.10% | | | | 03/01/2023 | | | | 2,000 | | | 7,286 |
Greater Cincinnati (Port of), OH Development Authority; | | | | | | | | | | | | | | |
Series 2004, RB | | | 6.30% | | | | 02/15/2024 | | | | 280 | | | 279,343 |
Series 2004, RB | | | 6.40% | | | | 02/15/2034 | | | | 2,500 | | | 2,421,655 |
Hardin (County of), OH (Ohio Northern University); Series 2020, Ref. RB | | | 5.50% | | | | 05/01/2050 | | | | 3,000 | | | 2,609,111 |
Hickory Chase Community Authority (Senior Bonds); Series 2019, Ref. RB(e) | | | 5.00% | | | | 12/01/2040 | | | | 1,805 | | | 1,620,996 |
Lorain (County of), OH Port Authority; Series 2005 A, RB(b) | | | 6.00% | | | | 11/15/2025 | | | | 100 | | | 97,716 |
See accompanying Notes to Financial Statements which are an integral part of the financial statements.
31 Invesco Rochester® Municipal Opportunities Fund
| | | | | | | | | | | | | | |
| | | Interest
Rate | | | Maturity
Date | | | Principal
Amount
(000) | | | Value |
Ohio–(continued) | | | | | | | | | | | | | | |
Marion (County of), OH (United Church Homes, Inc.); | | | | | | | | | | | | | | |
Series 2019, Ref. RB | | | 5.00% | | | | 12/01/2039 | | | $ | 1,150 | | | $ 1,035,061 |
Series 2019, Ref. RB | | | 5.13% | | | | 12/01/2049 | | | | 6,000 | | | 5,155,462 |
Norwood (City of), OH (Central Park); Series 2017, RB | | | 6.00% | | | | 12/01/2046 | | | | 1,045 | | | 924,716 |
Ohio (State of) (Portsmouth Bypass); Series 2015, RB(b) | | | 5.00% | | | | 06/30/2053 | | | | 4,530 | | | 4,346,286 |
Ohio (State of) Air Quality Development Authority (AMG Vanadium Project); Series 2019, RB(b)(e) | | | 5.00% | | | | 07/01/2049 | | | | 10,000 | | | 8,719,615 |
Ohio (State of) Higher Educational Facility Commission (Denison University); Series 2019, RB | | | 5.00% | | | | 11/01/2044 | | | | 10,960 | | | 11,700,557 |
Ohio (State of) Higher Educational Facility Commission (Hiram College); Series 2015, Ref. RB | | | 6.00% | | | | 10/01/2041 | | | | 23,000 | | | 23,249,904 |
Ohio (State of) Higher Educational Facility Commission (Menorah Park Obligated Group); Series 2018, Ref. RB | | | 5.25% | | | | 01/01/2048 | | | | 6,750 | | | 5,340,988 |
Ohio (State of) Housing Finance Agency (Sanctuary at Springboro); Series 2017, RB(e) | | | 5.45% | | | | 01/01/2038 | | | | 5,400 | | | 4,169,100 |
Warren (County of), OH Port Authority; | | | | | | | | | | | | | | |
Series 2019 D, RB(e) | | | 4.00% | | | | 12/01/2039 | | | | 2,305 | | | 2,023,082 |
Series 2019 D, RB(e) | | | 5.00% | | | | 12/01/2052 | | | | 3,670 | | | 3,535,551 |
Series 2019, RB(e) | | | 5.25% | | | | 12/01/2052 | | | | 6,105 | | | 5,182,658 |
| | | | | | | | | | | | | | | 247,768,671 |
| | | | |
Oklahoma–0.41% | | | | | | | | | | | | | | |
Atoka (County of), OK Health Care Authority (Atoka Memorial Hospital); Series 2007, RB (Acquired 08/30/2007-03/01/2016; Cost $4,050,000)(i) | | | 6.63% | | | | 10/01/2037 | | | | 4,330 | | | 3,889,758 |
Oklahoma (State of) Ordnance Works Authority (Ralston Purina Co.); Series 1996, PCR(b) | | | 6.50% | | | | 09/01/2026 | | | | 100 | | | 100,248 |
Tulsa (City of), OK Airports Improvement Trust (American Airlines Group, Inc.); Series 2015, Ref. RB(b)(f) | | | 5.00% | | | | 06/01/2025 | | | | 25,905 | | | 25,935,705 |
Tulsa (City of), OK Authority for Economic Opportunity (Vast Bank); Series 2021, RB(e) | | | 4.00% | | | | 12/01/2043 | | | | 2,550 | | | 1,969,304 |
| | | | | | | | | | | | | | | 31,895,015 |
| | | | |
Oregon–0.99% | | | | | | | | | | | | | | |
Clackamas (County of), OR Hospital Facility Authority (Rose Villa); | | | | | | | | | | | | | | |
Series 2020 A, Ref. RB | | | 5.25% | | | | 11/15/2050 | | | | 1,000 | | | 886,934 |
Series 2020 A, Ref. RB | | | 5.38% | | | | 11/15/2055 | | | | 1,000 | | | 887,440 |
Oregon (State of) Facilities Authority; | | | | | | | | | | | | | | |
Series 2015 A, RB(e) | | | 5.75% | | | | 06/15/2046 | | | | 1,740 | | | 1,726,591 |
Series 2016 A, RB | | | 5.25% | | | | 06/15/2051 | | | | 2,625 | | | 2,335,475 |
Port of Portland OR Airport Revenue; Series 2023-XF1493, RB(b)(k) | | | 4.00% | | | | 07/01/2042 | | | | 12,385 | | | 11,592,111 |
Portland (Port of), OR; | | | | | | | | | | | | | | |
Series 2020 A, RB(b) | | | 4.00% | | | | 07/01/2050 | | | | 10,000 | | | 9,047,636 |
Series 2022, RB(b)(k) | | | 5.00% | | | | 07/01/2052 | | | | 30,000 | | | 30,822,219 |
Portland (Port of), OR (Portland International Airport); Series 28, RB(b)(k) | | | 4.00% | | | | 07/01/2047 | | | | 22,220 | | | 20,286,951 |
| | | | | | | | | | | | | | | 77,585,357 |
| | | | |
Pennsylvania–1.48% | | | | | | | | | | | | | | |
Allegheny (County of), PA Airport Authority; | | | | | | | | | | | | | | |
Series 2021 A, RB(b) | | | 5.00% | | | | 01/01/2051 | | | | 1,885 | | | 1,920,231 |
Series 2021 A, RB(b) | | | 5.00% | | | | 01/01/2056 | | | | 1,320 | | | 1,342,250 |
Allegheny (County of), PA Sanitary Authority; Series 2022, RB | | | 5.00% | | | | 06/01/2053 | | | | 7,125 | | | 7,530,303 |
Allentown (City of), PA Neighborhood Improvement Zone Development Authority (615 Waterfront); Series 2021, RB(e) | | | 6.00% | | | | 05/01/2042 | | | | 4,005 | | | 4,056,130 |
Allentown (City of), PA Neighborhood Improvement Zone Development Authority (City Center); | | | | | | | | | | | | | | |
Series 2018, RB(e) | | | 5.38% | | | | 05/01/2042 | | | | 8,000 | | | 7,928,556 |
Series 2022, RB(e) | | | 5.25% | | | | 05/01/2042 | | | | 3,750 | | | 3,648,166 |
Chester (County of), PA Industrial Development Authority (Hickman (The)); | | | | | | | | | | | | | | |
Series 2016, RB | | | 5.25% | | | | 01/01/2037 | | | | 1,710 | | | 1,374,539 |
Series 2016, RB | | | 5.50% | | | | 01/01/2052 | | | | 11,080 | | | 8,171,352 |
Chester (County of), PA Industrial Development Authority (Woodlands at Greystone); | | | | | | | | | | | | | | |
Series 2018, RB(e) | | | 5.00% | | | | 03/01/2038 | | | | 462 | | | 445,899 |
Series 2018, RB(e) | | | 5.13% | | | | 03/01/2048 | | | | 887 | | | 815,498 |
Crawford (County of), PA Hospital Authority; | | | | | | | | | | | | | | |
Series 2016 A, Ref. RB | | | 6.00% | | | | 06/01/2046 | | | | 2,750 | | | 2,795,509 |
Series 2016 A, Ref. RB | | | 6.00% | | | | 06/01/2051 | | | | 4,310 | | | 4,354,904 |
Dauphin (County of), PA Industrial Development Authority (Dauphin Construction Water Supply); | | | | | | | | | | | | | | |
Series 1992 A, RB(b) | | | 6.90% | | | | 06/01/2024 | | | | 3,400 | | | 3,537,231 |
See accompanying Notes to Financial Statements which are an integral part of the financial statements.
32 Invesco Rochester® Municipal Opportunities Fund
| | | | | | | | | | | | | | |
| | | Interest
Rate | | | Maturity
Date | | | Principal
Amount
(000) | | | Value |
Pennsylvania–(continued) | | | | | | | | | | | | | | |
Lancaster (City of), PA; Series 2018, GO Bonds (INS - BAM)(d) | | | 4.00% | | | | 11/01/2040 | | | $ | 5 | | | $ 4,987 |
Montgomery (County of), PA Higher Education & Health Authority (Pennsylvania LTC, Inc.); | | | | | | | | | | | | | | |
Series 2017, Ref. RB (Acquired 10/25/2017-02/13/2019; Cost $1,250,272)(i) | | | 5.00% | | | | 12/01/2032 | | | | 1,260 | | | 993,508 |
Series 2017, Ref. RB (Acquired 10/25/2017; Cost $1,705,000)(i) | | | 5.25% | | | | 12/01/2037 | | | | 1,705 | | | 1,256,558 |
Series 2017, Ref. RB (Acquired 10/25/2017; Cost $487,605)(i) | | | 5.30% | | | | 12/01/2038 | | | | 500 | | | 364,171 |
Series 2017, Ref. RB (Acquired 10/25/2017-10/26/2017; Cost $3,128,288)(i) | | | 5.38% | | | | 12/01/2047 | | | | 3,140 | | | 2,110,955 |
Northampton (County of), PA Industrial Development Authority; | | | | | | | | | | | | | | |
Series 2013 A, RB (Acquired 04/03/2013; Cost $7,245,256)(h)(i)(n) | | | 5.00% | | | | 12/31/2023 | | | | 8,238 | | | 1,482,958 |
Series 2013, RB(h)(n) | | | 5.00% | | | | 12/31/2023 | | | | 3,832 | | | 689,737 |
Pennsylvania (Commonwealth of) Economic Development Financing Authority (Penndot Major Bridges); | | | | | | | | | | | | | | |
Series 2022, RB(b) | | | 5.75% | | | | 06/30/2048 | | | | 12,140 | | | 12,939,247 |
Series 2022, RB(b) | | | 5.25% | | | | 06/30/2053 | | | | 10,000 | | | 10,192,500 |
Series 2022, RB (INS - AGM)(b)(d) | | | 5.00% | | | | 12/31/2057 | | | | 3,750 | | | 3,793,320 |
Series 2022, RB(b) | | | 6.00% | | | | 06/30/2061 | | | | 9,750 | | | 10,610,723 |
Pennsylvania (Commonwealth of) Housing Finance Agency; Series 2018, RB (CEP - FNMA) | | | 3.60% | | | | 08/01/2035 | | | | 13 | | | 12,359 |
Pennsylvania (Commonwealth of) Turnpike Commission; Series 2014 B, RB | | | 5.25% | | | | 12/01/2044 | | | | 560 | | | 570,141 |
Philadelphia (City of), PA; Series 2021, Ref. RB(b) | | | 5.00% | | | | 07/01/2051 | | | | 5,485 | | | 5,592,896 |
Philadelphia (City of), PA Authority for Industrial Development (Architecture & Design Charter High School); Series 2013, RB(f)(j) | | | 6.13% | | | | 03/15/2023 | | | | 1,500 | | | 1,501,527 |
Philadelphia (City of), PA Authority for Industrial Development (Green Woods Charter school); | | | | | | | | | | | | | | |
Series 2022 A, Ref. RB | | | 5.25% | | | | 06/15/2052 | | | | 1,000 | | | 916,294 |
Series 2022 A, Ref. RB | | | 5.38% | | | | 06/15/2057 | | | | 1,000 | | | 909,459 |
Philadelphia (City of), PA Authority for Industrial Development (University of the Arts); Series 2017, Ref. RB(e) | | | 5.00% | | | | 03/15/2045 | | | | 8,430 | | | 6,685,261 |
Southcentral Pennsylvania General Authority (WellSpan Health Obligated Group); Series 2019 A, Ref. RB | | | 5.00% | | | | 06/01/2049 | | | | 7,500 | | | 7,696,969 |
| | | | | | | | | | | | | | | 116,244,138 |
| | | | |
Puerto Rico–8.37% | | | | | | | | | | | | | | |
Children’s Trust Fund; | | | | | | | | | | | | | | |
Series 2002, RB | | | 5.38% | | | | 05/15/2033 | | | | 220 | | | 220,073 |
Series 2002, RB | | | 5.50% | | | | 05/15/2039 | | | | 40,925 | | | 40,927,378 |
Series 2002, RB | | | 5.63% | | | | 05/15/2043 | | | | 108,400 | | | 109,489,810 |
Series 2005 A, RB(l) | | | 0.00% | | | | 05/15/2050 | | | | 28,000 | | | 4,913,714 |
Series 2005 B, RB(l) | | | 0.00% | | | | 05/15/2055 | | | | 127,450 | | | 12,862,025 |
Corp. Para El Financiamiento Publico de Puerto Rico; Series 2011, RB | | | 5.50% | | | | 08/01/2031 | | | | 49,020 | | | 1,286,775 |
HTA Trust; Series 2022 L, RB | | | 5.25% | | | | 07/01/2038 | | | | 36 | | | 35,462 |
PRHTA Custodial Trust; Series 2022, RB(h) | | | 5.75% | | | | 12/06/2049 | | | | 170 | | | 61,274 |
Puerto Rico (Commonwealth of); | | | | | | | | | | | | | | |
Series 2021 A, GO Bonds(l) | | | 0.00% | | | | 07/01/2024 | | | | 4,861 | | | 4,562,627 |
Series 2021 A, GO Bonds(l) | | | 0.00% | | | | 07/01/2033 | | | | 18,710 | | | 10,660,318 |
Series 2021 A-1, GO Bonds | | | 5.63% | | | | 07/01/2027 | | | | 16,045 | | | 16,575,191 |
Series 2021 A-1, GO Bonds | | | 5.63% | | | | 07/01/2029 | | | | 15,785 | | | 16,470,055 |
Series 2021 A-1, GO Bonds | | | 5.75% | | | | 07/01/2031 | | | | 35,332 | | | 37,190,326 |
Series 2021 A-1, GO Bonds | | | 4.00% | | | | 07/01/2033 | | | | 0 | | | 47 |
Series 2021 A-1, GO Bonds | | | 4.00% | | | | 07/01/2035 | | | | 0 | | | 239 |
Series 2021 A-1, GO Bonds | | | 4.00% | | | | 07/01/2037 | | | | 11,216 | | | 9,592,109 |
Series 2021 A-1, GO Bonds | | | 4.00% | | | | 07/01/2041 | | | | 59,950 | | | 49,522,254 |
Series 2021 A-1, GO Bonds | | | 4.00% | | | | 07/01/2046 | | | | 15,859 | | | 12,628,813 |
Subseries 2022, RN | | | 0.00% | | | | 11/01/2043 | | | | 76,212 | | | 32,866,353 |
Subseries 2022, RN | | | 0.00% | | | | 11/01/2051 | | | | 5,603 | | | 1,919,096 |
Subseries 2022, RN | | | 0.00% | | | | 11/01/2051 | | | | 362 | | | 158,268 |
Subseries 2022, RN | | | 0.00% | | | | 11/01/2051 | | | | 1,351 | | | 1,301,908 |
Subseries 2022, RN | | | 0.00% | | | | 11/01/2051 | | | | 1,639 | | | 215,160 |
See accompanying Notes to Financial Statements which are an integral part of the financial statements.
33 Invesco Rochester® Municipal Opportunities Fund
| | | | | | | | | | | | | | |
| | | Interest
Rate | | | Maturity
Date | | | Principal
Amount
(000) | | | Value |
Puerto Rico–(continued) | | | | | | | | | | | | | | |
Puerto Rico (Commonwealth of) Aqueduct & Sewer Authority; | | | | | | | | | | | | | | |
Series 2021 A, RB(e) | | | 5.00% | | | | 07/01/2025 | | | $ | 315 | | | $ 320,381 |
Series 2021 A, RB(e) | | | 5.00% | | | | 07/01/2033 | | | | 900 | | | 902,371 |
Series 2021 A, RB(e) | | | 5.00% | | | | 07/01/2037 | | | | 450 | | | 442,291 |
Series 2021 A, RB(e) | | | 4.00% | | | | 07/01/2042 | | | | 1,250 | | | 1,072,507 |
Series 2021 B, RB(e) | | | 5.00% | | | | 07/01/2033 | | | | 5,000 | | | 5,013,171 |
Series 2022 A, Ref. RB(e) | | | 5.00% | | | | 07/01/2033 | | | | 4,000 | | | 4,011,375 |
Series 2022 A, Ref. RB(e) | | | 5.00% | | | | 07/01/2037 | | | | 6,000 | | | 5,897,216 |
Puerto Rico (Commonwealth of) Electric Power Authority; | | | | | | | | | | | | | | |
Series 2003 NN, RB(g) | | | 5.50% | | | | 12/01/2049 | | | | 15 | | | 10,313 |
Series 2007 TT, RB(g) | | | 5.00% | | | | 07/01/2024 | | | | 15 | | | 10,406 |
Series 2007 TT, RB(g) | | | 5.00% | | | | 07/01/2026 | | | | 895 | | | 622,025 |
Series 2007 TT, RB(g) | | | 5.00% | | | | 07/01/2027 | | | | 1,990 | | | 1,383,050 |
Series 2007 TT, RB(g) | | | 5.00% | | | | 07/01/2032 | | | | 3,680 | | | 2,566,800 |
Series 2007 UU, Ref. RB (INS - AGC)(d) | | | 5.00% | | | | 07/01/2026 | | | | 7,905 | | | 7,958,424 |
Series 2007 VV, Ref. RB (INS - NATL)(d) | | | 5.25% | | | | 07/01/2026 | | | | 175 | | | 175,771 |
Series 2007 VV, Ref. RB (INS - NATL)(d) | | | 5.25% | | | | 07/01/2033 | | | | 22,000 | | | 22,060,982 |
Series 2007 VV, Ref. RB (INS - NATL)(d) | | | 5.25% | | | | 07/01/2035 | | | | 465 | | | 466,473 |
Series 2008 WW, RB(g) | | | 5.38% | | | | 07/01/2024 | | | | 390 | | | 272,025 |
Series 2008 WW, RB(g) | | | 5.25% | | | | 07/01/2033 | | | | 415 | | | 291,538 |
Series 2008 WW, RB(g) | | | 5.50% | | | | 07/01/2038 | | | | 605 | | | 428,038 |
Series 2010 AAA, RB(g) | | | 5.25% | | | | 07/01/2023 | | | | 10 | | | 6,963 |
Series 2010 AAA, RB(g) | | | 5.25% | | | | 07/01/2026 | | | | 4,570 | | | 3,187,575 |
Series 2010 AAA, RB(g) | | | 5.25% | | | | 07/01/2028 | | | | 2,600 | | | 1,813,500 |
Series 2010 AAA, RB(g) | | | 5.25% | | | | 07/01/2029 | | | | 445 | | | 310,388 |
Series 2010 AAA, RB(g) | | | 5.25% | | | | 07/01/2030 | | | | 95 | | | 66,500 |
Series 2010 CCC, RB(g) | | | 5.00% | | | | 07/01/2024 | | | | 35 | | | 24,281 |
Series 2010 CCC, RB(g) | | | 5.00% | | | | 07/01/2027 | | | | 285 | | | 198,075 |
Series 2010 CCC, RB(g) | | | 5.00% | | | | 07/01/2028 | | | | 540 | | | 375,300 |
Series 2010 XX, RB(g) | | | 5.25% | | | | 07/01/2026 | | | | 10 | | | 6,975 |
Series 2010 XX, RB(g) | | | 5.25% | | | | 07/01/2027 | | | | 845 | | | 589,388 |
Series 2010 XX, RB(g) | | | 5.25% | | | | 07/01/2035 | | | | 2,660 | | | 1,868,650 |
Series 2010 XX, RB(g) | | | 5.75% | | | | 07/01/2036 | | | | 18,575 | | | 13,141,812 |
Series 2010 XX, RB(g) | | | 5.25% | | | | 07/01/2040 | | | | 28,430 | | | 19,972,075 |
Series 2010 ZZ, Ref. RB(g) | | | 5.00% | | | | 07/01/2024 | | | | 215 | | | 149,156 |
Series 2010 ZZ, Ref. RB(g) | | | 4.63% | | | | 07/01/2025 | | | | 190 | | | 131,338 |
Series 2010 ZZ, Ref. RB(g) | | | 5.25% | | | | 07/01/2025 | | | | 275 | | | 191,469 |
Series 2010 ZZ, Ref. RB(g) | | | 5.00% | | | | 07/01/2026 | | | | 10 | | | 6,950 |
Series 2010 ZZ, Ref. RB(g) | | | 5.25% | | | | 07/01/2026 | | | | 1,135 | | | 791,663 |
Series 2012 A, RB(g) | | | 5.00% | | | | 07/02/2029 | | | | 3,100 | | | 2,154,500 |
Series 2012 A, RB(g) | | | 5.05% | | | | 07/01/2042 | | | | 11,925 | | | 8,317,688 |
Series 2013 A, RB(g) | | | 7.25% | | | | 07/01/2030 | | | | 160 | | | 115,200 |
Series 2013 A, RB(g) | | | 7.00% | | | | 07/01/2040 | | | | 480 | | | 346,800 |
Series 2013 A, RB(g) | | | 7.00% | | | | 07/01/2043 | | | | 9,080 | | | 6,560,300 |
Puerto Rico (Commonwealth of) Highway & Transportation Authority; | | | | | | | | | | | | | | |
Series 2022 A, RB | | | 5.00% | | | | 07/01/2062 | | | | 7,140 | | | 6,622,309 |
Series 2022 B, RB(l) | | | 0.00% | | | | 07/01/2032 | | | | 4,640 | | | 2,900,004 |
Series 2022 C, RB(c) | | | 5.00% | | | | 07/01/2053 | | | | 7,937 | | | 4,406,472 |
Puerto Rico (Commonwealth of) Industrial, Tourist, Educational, Medical & Environmental Control Facilities Financing Authority; Series 2000, RB(b) | | | 6.63% | | | | 06/01/2026 | | | | 5,040 | | | 5,118,745 |
See accompanying Notes to Financial Statements which are an integral part of the financial statements.
34 Invesco Rochester® Municipal Opportunities Fund
| | | | | | | | | | | | | | |
| | | Interest
Rate | | | Maturity
Date | | | Principal
Amount
(000) | | | Value |
Puerto Rico–(continued) | | | | | | | | | | | | | | |
Puerto Rico Sales Tax Financing Corp.; | | | | | | | | | | | | | | |
Series 2018 A-1, RB(l) | | | 0.00% | | | | 07/01/2029 | | | $ | 11 | | | $ 8,158 |
Series 2018 A-1, RB | | | 4.50% | | | | 07/01/2034 | | | | 11 | | | 10,907 |
Series 2018 A-1, RB | | | 4.55% | | | | 07/01/2040 | | | | 3,337 | | | 3,116,330 |
Series 2018 A-1, RB(l) | | | 0.00% | | | | 07/01/2046 | | | | 157,376 | | | 40,332,321 |
Series 2018 A-1, RB(l) | | | 0.00% | | | | 07/01/2051 | | | | 103,344 | | | 19,498,946 |
Series 2018 A-1, RB | | | 4.75% | | | | 07/01/2053 | | | | 34,576 | | | 30,993,307 |
Series 2018 A-1, RB | | | 5.00% | | | | 07/01/2058 | | | | 40,948 | | | 37,991,554 |
Series 2019 A-2, RB | | | 4.54% | | | | 07/01/2053 | | | | 4,576 | | | 3,957,278 |
Series 2019 A-2, RB | | | 4.78% | | | | 07/01/2058 | | | | 14,781 | | | 13,212,195 |
Series 2019 A-2B, RB | | | 4.55% | | | | 07/01/2040 | | | | 5,542 | | | 5,175,517 |
University of Puerto Rico; | | | | | | | | | | | | | | |
Series 2006 P, Ref. RB | | | 5.00% | | | | 06/01/2030 | | | | 5,260 | | | 5,110,121 |
Series 2006 Q, RB | | | 5.00% | | | | 06/01/2036 | | | | 1,025 | | | 987,418 |
| | | | | | | | | | | | | | | 657,132,560 |
| | | | |
Rhode Island–0.10% | | | | | | | | | | | | | | |
Central Falls Detention Facility Corp.; Series 2005, Ref. RB (Acquired 06/23/2005; Cost $43,767,323)(g)(i) | | | 7.25% | | | | 07/15/2035 | | | | 44,240 | | | 7,963,200 |
| | | | |
South Carolina–0.46% | | | | | | | | | | | | | | |
Lancaster (County of), SC School District; Series 2018 XF252, GO Bonds(k) | | | 4.00% | | | | 03/01/2036 | | | | 12,555 | | | 12,703,704 |
South Carolina (State of) Jobs-Economic Development Authority (Green Bonds); | | | | | | | | | | | | | | |
Series 2019 A, RB(b)(e) | | | 7.00% | | | | 05/01/2039 | | | | 5,000 | | | 3,844,915 |
Series 2021, RB(b)(e) | | | 6.00% | | | | 06/01/2031 | | | | 1,000 | | | 843,770 |
Series 2021, RB(b)(e) | | | 6.25% | | | | 06/01/2040 | | | | 1,000 | | | 754,128 |
Series 2021, RB(b)(e) | | | 6.50% | | | | 06/01/2051 | | | | 2,750 | | | 1,974,692 |
South Carolina (State of) Jobs-Economic Development Authority (Kiawah Life Plan Village, Inc.); Series 2021, RB(e) | | | 8.75% | | | | 07/01/2025 | | | | 785 | | | 831,331 |
South Carolina (State of) Ports Authority; Series 2018, RB(b) | | | 5.00% | | | | 07/01/2055 | | | | 3,750 | | | 3,798,943 |
South Carolina (State of) Public Service Authority; | | | | | | | | | | | | | | |
Series 2014 A, RB | | | 5.00% | | | | 12/01/2049 | | | | 5,000 | | | 4,976,519 |
Series 2016 B, Ref. RB | | | 5.00% | | | | 12/01/2046 | | | | 6,250 | | | 6,280,499 |
| | | | | | | | | | | | | | | 36,008,501 |
| | | | |
South Dakota–0.06% | | | | | | | | | | | | | | |
South Dakota (State of) Health & Educational Facilities Authority (Sanford Obligated Group); Series 2014 B, RB | | | 5.00% | | | | 11/01/2044 | | | | 5,000 | | | 5,038,493 |
| | | | |
Tennessee–0.75% | | | | | | | | | | | | | | |
Chattanooga (City of), TN Health, Educational & Housing Facility Board (CommonSpirit Health); | | | | | | | | | | | | | | |
Series 2019 A-1, Ref. RB | | | 4.00% | | | | 08/01/2038 | | | | 775 | | | 732,183 |
Series 2019 A-1, Ref. RB | | | 4.00% | | | | 08/01/2044 | | | | 1,545 | | | 1,390,145 |
Series 2019 A-2, Ref. RB | | | 5.00% | | | | 08/01/2044 | | | | 1,160 | | | 1,178,346 |
Series 2019 A-2, Ref. RB | | | 5.00% | | | | 08/01/2049 | | | | 1,545 | | | 1,555,749 |
Knox County Industrial Development Board (Green Bonds) (Tompaul Knoxville, LLC Recycling); Series 2022, RB(b)(e) | | | 9.50% | | | | 11/01/2052 | | | | 10,000 | | | 10,013,125 |
Memphis (City of) & Shelby (County of), TN Airport Authority; Series 2021 A, RB(b) | | | 5.00% | | | | 07/01/2045 | | | | 1,500 | | | 1,541,272 |
Memphis (City of), TN; Series 2018, GO Bonds | | | 4.00% | | | | 06/01/2047 | | | | 10,765 | | | 10,207,370 |
Metropolitan Development and Housing Agency (Fifth + Broadway Development); Series 2018, RB(e) | | | 5.13% | | | | 06/01/2036 | | | | 600 | | | 606,134 |
Nashville (City of) & Davidson (County of), TN Metropolitan Government; Series 2022 A, GO Bonds | | | 4.00% | | | | 01/01/2042 | | | | 2,475 | | | 2,411,251 |
Shelby (County of), TN Health, Educational & Housing Facilities Board (Trezevant Manor); | | | | | | | | | | | | | | |
Series 2013 A, Ref. RB | | | 5.50% | | | | 09/01/2047 | | | | 9,000 | | | 7,487,994 |
Series 2013 B, Ref. RB(g) | | | 8.00% | | | | 09/01/2044 | | | | 6,350 | | | 317,500 |
Tennessee Energy Acquisition Corp.; Series 2021 A, RB(f) | | | 5.00% | | | | 11/01/2031 | | | | 20,865 | | | 21,858,635 |
| | | | | | | | | | | | | | | 59,299,704 |
See accompanying Notes to Financial Statements which are an integral part of the financial statements.
35 Invesco Rochester® Municipal Opportunities Fund
| | | | | | | | | | | | | | |
| | | Interest
Rate | | | Maturity
Date | | | Principal
Amount
(000) | | | Value |
Texas–9.67% | | | | | | | | | | | | | | |
Argyle (Town of), TX (The Highlands of Argyle Public Improvement District No. 1); | | | | | | | | | | | | | | |
Series 2017, RB | | | 5.00% | | | | 09/01/2037 | | | $ | 890 | | | $ 877,975 |
Series 2017, RB | | | 5.25% | | | | 09/01/2047 | | | | 1,475 | | | 1,451,036 |
Arlington Higher Education Finance Corp.; | | | | | | | | | | | | | | |
Series 2020, RB (CEP - Texas Permanent School Fund) | | | 4.00% | | | | 08/15/2045 | | | | 1,100 | | | 1,015,452 |
Series 2020, RB (CEP - Texas Permanent School Fund) | | | 4.00% | | | | 08/15/2050 | | | | 2,500 | | | 2,230,497 |
Arlington Higher Education Finance Corp. (Great Hearts America); | | | | | | | | | | | | | | |
Series 2020 A, RB (CEP - Texas Permanent School Fund) | | | 4.00% | | | | 08/15/2045 | | | | 1,500 | | | 1,384,708 |
Series 2020 A, RB (CEP - Texas Permanent School Fund) | | | 4.00% | | | | 08/15/2055 | | | | 3,175 | | | 2,787,094 |
Arlington Higher Education Finance Corp. (UME Preparatory Academy); Series 2017 A, RB | | | 5.00% | | | | 08/15/2053 | | | | 785 | | | 689,613 |
Arlington Higher Education Finance Corp. (Winfree Academy Charter School); Series 2019, Ref. RB | | | 5.75% | | | | 08/15/2043 | | | | 4,345 | | | 4,273,074 |
Aubrey (City of), TX (Jackson Ridge Public Improvement District Phase No. 1); Series 2015, RB | | | 7.25% | | | | 09/01/2045 | | | | 645 | | | 668,066 |
Aubrey Independent School District; | | | | | | | | | | | | | | |
Series 2022, GO Bonds (CEP - Texas Permanent School Fund)(k) | | | 4.00% | | | | 02/15/2047 | | | | 20,500 | | | 19,395,298 |
Series 2022, GO Bonds (CEP - Texas Permanent School Fund) | | | 4.00% | | | | 02/15/2052 | | | | 23,000 | | | 21,320,004 |
Austin (City of), TX; Series 2022, RB(b) | | | 5.00% | | | | 11/15/2043 | | | | 3,450 | | | 3,594,192 |
Birdville Independent School District; Series 2023, GO Bonds | | | 4.00% | | | | 02/15/2048 | | | | 15,000 | | | 13,743,786 |
Brazoria County Industrial Development Corp. (Aleon Renewable); Series 2022, RB(b)(e)(f) | | | 10.00% | | | | 06/01/2023 | | | | 6,000 | | | 5,922,338 |
Brazoria County Industrial Development Corp. (Gladieux Metals Recycling LLC); Series 2019, RB(b) | | | 7.00% | | | | 03/01/2039 | | | | 20,600 | | | 19,055,377 |
Cambridge Student Housing Financing Co. L.P.; | | | | | | | | | | | | | | |
Series 2004 C, RB(g) | | | 9.70% | | | | 11/01/2039 | | | | 4,502 | | | 1,351 |
Series 2004 D, RB(g) | | | 1.00% | | | | 11/01/2039 | | | | 3,659 | | | 732 |
Celina (City of), TX; | | | | | | | | | | | | | | |
Series 2015, RB | | | 6.25% | | | | 09/01/2045 | | | | 1,720 | | | 1,741,409 |
Series 2015, RB | | | 7.25% | | | | 09/01/2045 | | | | 940 | | | 967,563 |
Series 2015, RB | | | 7.50% | | | | 09/01/2045 | | | | 3,765 | | | 3,825,210 |
Central Texas Regional Mobility Authority; Series 2020 E, RB | | | 4.00% | | | | 01/01/2050 | | | | 10,000 | | | 9,070,789 |
Cleveland Independent School District; Series 2020 A, GO Bonds (CEP - Texas Permanent School Fund) | | | 4.00% | | | | 02/15/2052 | | | | 5,855 | | | 5,379,768 |
Clifton Higher Education Finance Corp. (International Leadership of Texas); Series 2018 D, RB | | | 6.00% | | | | 08/15/2038 | | | | 5,000 | | | 5,061,032 |
Corpus Christi Independent School District; Series 2022, GO Bonds (CEP - Texas Permanent School Fund) | | | 4.00% | | | | 08/15/2052 | | | | 8,000 | | | 7,350,915 |
Crandall (City of), TX; | | | | | | | | | | | | | | |
Series 2021, RB(e) | | | 4.75% | | | | 09/15/2031 | | | | 100 | | | 92,460 |
Series 2021, RB(e) | | | 4.25% | | | | 09/15/2041 | | | | 250 | | | 216,201 |
Series 2021, RB(e) | | | 5.00% | | | | 09/15/2041 | | | | 500 | | | 464,520 |
Series 2021, RB(e) | | | 4.50% | | | | 09/15/2051 | | | | 500 | | | 420,246 |
Series 2021, RB(e) | | | 5.25% | | | | 09/15/2051 | | | | 500 | | | 461,849 |
Dallas & Fort Worth (Cities of), TX (Dallas/Fort Worth International Airport); Series 2022 B, Ref. RB | | | 4.00% | | | | 11/01/2045 | | | | 15,000 | | | 14,148,754 |
Dallas (City of), TX Area Rapid Transit; Series 2021 B, Ref. RB | | | 4.00% | | | | 12/01/2051 | | | | 31,180 | | | 29,296,242 |
DeSoto (City of), TX (Danieldale Homestead); Series 2023, RB(e) | | | 5.50% | | | | 09/15/2050 | | | | 1,500 | | | 1,428,559 |
Edinburg Economic Development Corp.; Series 2019, RB(e) | | | 5.00% | | | | 08/15/2044 | | | | 1,645 | | | 1,523,822 |
El Paso (City of), TX; Series 2021 B, GO Bonds | | | 4.00% | | | | 08/15/2047 | | | | 6,000 | | | 5,598,656 |
Fort Worth Independent School District; Series 2023, GO Bonds (CEP - Texas Permanent School Fund) | | | 4.00% | | | | 02/15/2048 | | | | 7,000 | | | 6,621,775 |
Galveston (City of), TX; | | | | | | | | | | | | | | |
Series 2014, RB | | | 5.63% | | | | 09/01/2028 | | | | 1,180 | | | 977,193 |
Series 2014, RB | | | 6.00% | | | | 09/01/2038 | | | | 3,325 | | | 2,319,755 |
Series 2014, RB | | | 6.13% | | | | 09/01/2044 | | | | 3,125 | | | 2,111,339 |
Godley Independent School District; Series 2022, GO Bonds (CEP - Texas Permanent School Fund) | | | 5.00% | | | | 02/15/2054 | | | | 7,375 | | | 7,914,459 |
Grand Parkway Transportation Corp.; | | | | | | | | | | | | | | |
Series 2015 XF2034, Revenue Ctfs.(f)(j)(k) | | | 5.00% | | | | 10/01/2023 | | | | 10,000 | | | 10,106,248 |
Series 2018 XF2669, Revenue Ctfs.(k) | | | 5.00% | | | | 10/01/2048 | | | | 32,525 | | | 33,737,594 |
Gulf Coast Industrial Development Authority; Series 1998, RB(b) | | | 8.00% | | | | 04/01/2028 | | | | 20 | | | 20,017 |
Harris (County of), TX Toll Road Authority (The); Series 2021, Ref. RB | | | 4.00% | | | | 08/15/2045 | | | | 18,050 | | | 17,260,087 |
See accompanying Notes to Financial Statements which are an integral part of the financial statements.
36 Invesco Rochester® Municipal Opportunities Fund
| | | | | | | | | | | | | | |
| | | Interest
Rate | | | Maturity
Date | | | Principal
Amount
(000) | | | Value |
Texas–(continued) | | | | | | | | | | | | | | |
Hays (County of), TX (La Cima Public Improvement District); | | | | | | | | | | | | | | |
Series 2022, RB(e) | | | 5.50% | | | | 09/15/2042 | | | $ | 2,000 | | | $ 1,995,204 |
Series 2022, RB(e) | | | 5.75% | | | | 09/15/2052 | | | | 3,550 | | | 3,524,953 |
Highway 380 Municipal Management District No. 1; Series 2022, GO Bonds (INS - BAM)(d) | | | 4.00% | | | | 05/01/2044 | | | | 2,355 | | | 2,066,644 |
Hitchcock Independent School District; Series 2022, GO Bonds (CEP - Texas Permanent School Fund) | | | 4.00% | | | | 02/15/2048 | | | | 7,250 | | | 6,944,165 |
Houston (City of), TX; | | | | | | | | | | | | | | |
Series 2020 C, Ref. RB | | | 4.00% | | | | 11/15/2049 | | | | 3,500 | | | 3,277,006 |
Series 2021 A, RB(b) | | | 4.00% | | | | 07/01/2046 | | | | 6,400 | | | 5,816,429 |
Series 2021 A, RB(b) | | | 4.00% | | | | 07/01/2048 | | | | 5 | | | 4,514 |
Houston (City of), TX Airport System (United Airlines, Inc. Terminal E); | | | | | | | | | | | | | | |
Series 2014, Ref. RB(b) | | | 5.00% | | | | 07/01/2029 | | | | 1,000 | | | 985,611 |
Series 2020 A, Ref. RB(b) | | | 5.00% | | | | 07/01/2027 | | | | 1,250 | | | 1,249,518 |
Houston (City of), TX Airport System (United Airlines, Inc.); | | | | | | | | | | | | | | |
Series 2018, RB(b) | | | 5.00% | | | | 07/15/2028 | | | | 8,250 | | | 8,244,848 |
Series 2020 B-2, Ref. RB(b) | | | 5.00% | | | | 07/15/2027 | | | | 1,750 | | | 1,749,217 |
Series 2021 B-1, RB(b) | | | 4.00% | | | | 07/15/2041 | | | | 15,000 | | | 12,929,751 |
Humble Independent School District; Series 2023, GO Bonds (CEP - Texas Permanent School Fund)(k) | | | 4.00% | | | | 02/15/2052 | | | | 20,500 | | | 19,408,678 |
Krum Independent School District; Series 2022, GO Bonds (CEP - Texas Permanent School Fund) | | | 4.00% | | | | 08/15/2052 | | | | 2,500 | | | 2,316,586 |
Lamar Consolidated Independent School District; | | | | | | | | | | | | | | |
Series 2023, GO Bonds(k) | | | 4.00% | | | | 02/15/2048 | | | | 37,500 | | | 35,734,305 |
Series 2023, GO Bonds(k) | | | 4.00% | | | | 02/15/2053 | | | | 35,000 | | | 32,802,469 |
Laredo (City of), TX; Series 2020 A, RB | | | 4.00% | | | | 03/01/2050 | | | | 5,975 | | | 5,396,176 |
Little Elm (Town of), TX; Series 2022, RB(e) | | | 6.88% | | | | 09/01/2052 | | | | 2,700 | | | 2,806,763 |
Mclendon-Chisholm (City of), TX (Sonoma Public Improvement); Series 2022, RB(e) | | | 5.75% | | | | 09/15/2052 | | | | 2,500 | | | 2,420,646 |
Midlothian (City of), TX (Westside Preserve Public Improvement District); | | | | | | | | | | | | | | |
Series 2022, RB(e) | | | 5.25% | | | | 09/15/2042 | | | | 1,500 | | | 1,422,732 |
Series 2022, RB(e) | | | 5.38% | | | | 09/15/2052 | | | | 2,500 | | | 2,352,269 |
Mission Economic Development Corp. (Natgasoline); Series 2018, Ref. RB(b)(e) | | | 4.63% | | | | 10/01/2031 | | | | 25,000 | | | 24,436,582 |
New Hope Cultural Education Facilities Finance Corp. (Buckingham Senior Living Community); | | | | | | | | | | | | | | |
Series 2021 A-1, RB | | | 7.50% | | | | 11/15/2037 | | | | 150 | | | 119,265 |
Series 2021 A-2, RB | | | 7.50% | | | | 11/15/2036 | | | | 2,100 | | | 1,761,114 |
Series 2021, RB | | | 2.00% | | | | 11/15/2061 | | | | 3,883 | | | 1,690,121 |
New Hope Cultural Education Facilities Finance Corp. (Cardinal Bay, Inc. - Village on the Park/Carriage Inn); Series 2016 A-1, RB | | | 5.00% | | | | 07/01/2031 | | | | 350 | | | 233,625 |
New Hope Cultural Education Facilities Finance Corp. (Cardinal Bay, Inc.); | | | | | | | | | | | | | | |
Series 2016, RB | | | 5.00% | | | | 07/02/2046 | | | | 1,750 | | | 1,168,125 |
Series 2016, RB | | | 5.00% | | | | 07/03/2051 | | | | 1,750 | | | 1,168,125 |
New Hope Cultural Education Facilities Finance Corp. (CHF - Collegiate Housing Denton, LLC - Texas Woman’s University); | | | | | | | | | | | | | | |
Series 2018 A-1, RB (INS - AGM)(d) | | | 5.00% | | | | 07/01/2038 | | | | 500 | | | 510,287 |
Series 2018 A-1, RB (INS - AGM)(d) | | | 5.00% | | | | 07/01/2048 | | | | 1,750 | | | 1,759,538 |
Series 2018 A-1, RB (INS - AGM)(d) | | | 5.00% | | | | 07/01/2058 | | | | 2,400 | | | 2,408,282 |
New Hope Cultural Education Facilities Finance Corp. (CHF - Collegiate Housing San Antonio I, LLC - Texas A&M University); Series 2016 A, RB(f)(j) | | | 5.00% | | | | 04/01/2026 | | | | 2,315 | | | 2,437,672 |
New Hope Cultural Education Facilities Finance Corp. (CHF - Stephenville, LLC - Tarleton State University); | | | | | | | | | | | | | | |
Series 2013 A, RB(f)(j) | | | 5.88% | | | | 04/01/2023 | | | | 785 | | | 786,585 |
Series 2013 A, RB(f)(j) | | | 6.00% | | | | 04/01/2023 | | | | 1,950 | | | 1,954,097 |
New Hope Cultural Education Facilities Finance Corp. (Cumberland Academy); | | | | | | | | | | | | | | |
Series 2020 A, RB(e) | | | 5.00% | | | | 08/15/2040 | | | | 2,390 | | | 2,254,385 |
Series 2020 A, RB(e) | | | 5.00% | | | | 08/15/2050 | | | | 2,220 | | | 2,002,739 |
New Hope Cultural Education Facilities Finance Corp. (Legacy Midtown Park); Series 2018 A, RB | | | 5.50% | | | | 07/01/2054 | | | | 8,250 | | | 6,380,747 |
New Hope Cultural Education Facilities Finance Corp. (Legacy Preparatory Charter Academy); | | | | | | | | | | | | | | |
Series 2018 A, RB(e) | | | 6.00% | | | | 08/15/2037 | | | | 1,000 | | | 1,027,048 |
Series 2018 A, RB(e) | | | 6.00% | | | | 08/15/2047 | | | | 13,435 | | | 13,612,100 |
See accompanying Notes to Financial Statements which are an integral part of the financial statements.
37 Invesco Rochester® Municipal Opportunities Fund
| | | | | | | | | | | | | | |
| | | Interest
Rate | | | Maturity
Date | | | Principal
Amount
(000) | | | Value |
Texas–(continued) | | | | | | | | | | | | | | |
New Hope Cultural Education Facilities Finance Corp. (MRC Senior Living-The Langford); | | | | | | | | | | | | | | |
Series 2016 A, RB | | | 5.38% | | | | 11/15/2036 | | | $ | 400 | | | $ 354,229 |
Series 2016 A, RB | | | 5.50% | | | | 11/15/2046 | | | | 650 | | | 540,515 |
Series 2016 A, RB | | | 5.50% | | | | 11/15/2052 | | | | 3,425 | | | 2,774,940 |
New Hope Cultural Education Facilities Finance Corp. (Outlook at Windhaven (The)); | | | | | | | | | | | | | | |
Series 2022 A, RB | | | 6.63% | | | | 10/01/2043 | | | | 12,185 | | | 11,805,671 |
Series 2022 A, RB | | | 6.75% | | | | 10/01/2052 | | | | 8,935 | | | 8,613,772 |
Series 2022 A, RB | | | 6.88% | | | | 10/01/2057 | | | | 13,410 | | | 12,921,989 |
New Hope Cultural Education Facilities Finance Corp. (Presbyterian Village North); | | | | | | | | | | | | | | |
Series 2018, Ref. RB | | | 5.25% | | | | 10/01/2049 | | | | 2,500 | | | 2,095,877 |
Series 2020, RB | | | 5.25% | | | | 10/01/2055 | | | | 12,390 | | | 10,132,375 |
New Hope Cultural Education Facilities Finance Corp. (Wesleyan Homes, Inc.); Series 2014, RB | | | 5.50% | | | | 01/01/2049 | | | | 1,300 | | | 1,063,099 |
North Central Texas Housing Finance Corp. (Village of Kaufman Apartments); Series 2012, RB(f) | | | 6.15% | | | | 01/01/2029 | | | | 1,445 | | | 1,446,017 |
North Parkway Municipal Management District No. 1; | | | | | | | | | | | | | | |
Series 2021, RB(e) | | | 4.00% | | | | 09/15/2041 | | | | 500 | | | 428,094 |
Series 2021, RB(e) | | | 4.25% | | | | 09/15/2051 | | | | 1,000 | | | 834,841 |
North Parkway Municipal Management District No. 1 (Major Improvements); | | | | | | | | | | | | | | |
Series 2021, RB(e) | | | 4.75% | | | | 09/15/2041 | | | | 2,000 | | | 1,857,710 |
Series 2021, RB(e) | | | 5.00% | | | | 09/15/2051 | | | | 3,500 | | | 3,206,632 |
Pilot Point (City of), TX (Creekview Public Improvement District Zone A); | | | | | | | | | | | | | | |
Series 2022, RB(e) | | | 5.75% | | | | 09/15/2032 | | | | 340 | | | 338,513 |
Series 2022, RB(e) | | | 5.50% | | | | 09/15/2042 | | | | 800 | | | 783,115 |
Series 2022, RB(e) | | | 5.63% | | | | 09/15/2052 | | | | 1,450 | | | 1,415,294 |
Series 2022, RB(e) | | | 6.13% | | | | 09/15/2052 | | | | 2,070 | | | 2,088,259 |
Pilot Point (City of), TX (Creekview Public Improvement District Zone B); | | | | | | | | | | | | | | |
Series 2022, RB(e) | | | 5.50% | | | | 09/15/2042 | | | | 750 | | | 734,171 |
Series 2022, RB(e) | | | 5.63% | | | | 09/15/2052 | | | | 1,300 | | | 1,268,885 |
Pilot Point (City of), TX (Mobberly Public Area No. 2); | | | | | | | | | | | | | | |
Series 2022, RB(e) | | | 5.38% | | | | 09/15/2027 | | | | 350 | | | 350,276 |
Series 2022, RB(e) | | | 5.63% | | | | 09/15/2032 | | | | 400 | | | 403,429 |
Series 2022, RB(e) | | | 6.00% | | | | 09/15/2052 | | | | 4,000 | | | 4,028,232 |
Pilot Point (City of), TX (Mobberly Public Improvement District); | | | | | | | | | | | | | | |
Series 2022, RB(e) | | | 5.50% | | | | 09/15/2048 | | | | 2,000 | | | 1,962,300 |
Series 2022, RB(e) | | | 6.50% | | | | 09/15/2052 | | | | 1,484 | | | 1,506,923 |
Pottsboro Higher Education Finance Corp. (Imagine International Academy of North Texas LLC); | | | | | | | | | | | | | | |
Series 2016 A, RB | | | 5.00% | | | | 08/15/2036 | | | | 655 | | | 625,932 |
Series 2016 A, RB | | | 5.00% | | | | 08/15/2046 | | | | 1,000 | | | 908,830 |
Princeton (City of), TX (Eastridge Public Improvement District); | | | | | | | | | | | | | | |
Series 2022, RB(e) | | | 5.13% | | | | 09/01/2042 | | | | 845 | | | 819,836 |
Series 2022, RB(e) | | | 5.25% | | | | 09/01/2052 | | | | 1,375 | | | 1,304,015 |
Red River Education Finance Corp. (Houston Baptist University); Series 2017, Ref. RB | | | 5.50% | | | | 10/01/2046 | | | | 9,620 | | | 9,742,849 |
Red River Health Facilities Development Corp. (MRC Crossing); Series 2014 A, RB(f)(j) | | | 8.00% | | | | 11/15/2024 | | | | 3,000 | | | 3,227,499 |
Rowlett (City of), TX (Bayside Public Improvement District North Improvement Area); Series 2016, RB | | | 6.00% | | | | 09/15/2046 | | | | 455 | | | 452,960 |
Sabine Neches Housing Finance Corp. (Fox Run Apartments); Series 2012, RB(f) | | | 6.15% | | | | 01/01/2029 | | | | 1,725 | | | 1,725,334 |
San Antonio (City of), TX; | | | | | | | | | | | | | | |
Series 2021 A, RB(k) | | | 5.00% | | | | 02/01/2046 | | | | 10,000 | | | 10,579,255 |
Series 2021 A, RB(k) | | | 5.00% | | | | 02/01/2049 | | | | 3,605 | | | 3,799,434 |
San Antonio Municipal Facilities Corp. (City Tower Renovation); Series 2021, RB | | | 4.00% | | | | 08/01/2048 | | | | 13,000 | | | 12,660,911 |
San Antonio Water System; Series 2023, RB(k) | | | 4.00% | | | | 05/15/2051 | | | | 20,000 | | | 18,427,780 |
Sanger Industrial Development Corp. (Texas Pellets); Series 2012 C, RB (Acquired 08/31/2012; Cost $26,820,000)(b)(g)(h)(i) | | | 7.50% | | | | 07/01/2038 | | | | 26,820 | | | 6,705,000 |
Tarrant County Cultural Education Facilities Finance Corp. (Baylor Health Care System); Series 2013 A, RB(f)(j) | | | 4.00% | | | | 05/15/2023 | | | | 585 | | | 585,921 |
Tarrant County Cultural Education Facilities Finance Corp. (Buckner Senior Living - Ventana); | | | | | | | | | | | | | | |
Series 2017, RB | | | 6.75% | | | | 11/15/2047 | | | | 3,500 | | | 3,518,535 |
Series 2017, RB | | | 6.75% | | | | 11/15/2052 | | | | 2,100 | | | 2,105,029 |
See accompanying Notes to Financial Statements which are an integral part of the financial statements.
38 Invesco Rochester® Municipal Opportunities Fund
| | | | | | | | | | | | | | |
| | | Interest
Rate | | | Maturity
Date | | | Principal
Amount
(000) | | | Value |
Texas–(continued) | | | | | | | | | | | | | | |
Tarrant County Cultural Education Facilities Finance Corp. (C.C. Young Memorial Home); | | | | | | | | | | | | | | |
Series 2017 A, RB (Acquired 06/12/2020; Cost $4,646,513)(g)(i) | | | 6.38% | | | | 02/15/2048 | | | $ | 5,710 | | | $ 3,140,500 |
Series 2017 A, RB (Acquired 06/12/2020; Cost $2,441,250)(g)(i) | | | 6.38% | | | | 02/15/2052 | | | | 3,000 | | | 1,650,000 |
Series 2017, RB (Acquired 06/12/2020; Cost $1,688,531)(g)(i) | | | 6.38% | | | | 02/15/2041 | | | | 2,075 | | | 1,141,250 |
Tarrant County Cultural Education Facilities Finance Corp. (MRC Stevenson Oaks); | | | | | | | | | | | | | | |
Series 2020, Ref. RB | | | 6.25% | | | | 11/15/2031 | | | | 500 | | | 485,280 |
Series 2020, Ref. RB | | | 6.63% | | | | 11/15/2041 | | | | 2,000 | | | 1,896,275 |
Series 2020, Ref. RB | | | 6.75% | | | | 11/15/2051 | | | | 3,000 | | | 2,755,510 |
Series 2020, Ref. RB | | | 6.88% | | | | 11/15/2055 | | | | 3,555 | | | 3,292,967 |
Texas (State of) Transportation Commission (Central Texas Turnpike System); Series 2015 C, Ref. RB | | | 5.00% | | | | 08/15/2042 | | | | 18,825 | | | 18,947,893 |
Texas (State of) Water Development Board; | | | | | | | | | | | | | | |
Series 2018, RB(k) | | | 5.00% | | | | 10/15/2053 | | | | 13,515 | | | 14,161,662 |
Series 2021, RB | | | 4.00% | | | | 10/15/2056 | | | | 15,000 | | | 13,929,558 |
Texas State Student Housing Corp.; Series 2001, RB(g) | | | 6.85% | | | | 07/01/2031 | | | | 215 | | | 210,700 |
Texas State Technical College; | | | | | | | | | | | | | | |
Series 2022, RB (INS - AGM)(d)(k) | | | 5.50% | | | | 08/01/2042 | | | | 12,500 | | | 14,084,930 |
Series 2022, RB (INS - AGM)(d)(k) | | | 6.00% | | | | 08/01/2054 | | | | 6,000 | | | 6,898,459 |
Vintage Township Public Facilities Corp.; Series 2008 A, RB | | | 7.38% | | | | 10/01/2038 | | | | 1,896 | | | 1,898,220 |
Waxahachie (City of), TX; Series 2015, RB | | | 6.00% | | | | 08/15/2045 | | | | 6,125 | | | 6,072,579 |
Williamson (County of), TX Municipal Utility District No. 28; | | | | | | | | | | | | | | |
Series 2022, GO Bonds (INS - AGM)(d) | | | 4.25% | | | | 10/01/2044 | | | | 1,360 | | | 1,316,125 |
Series 2022, GO Bonds (INS - AGM)(d) | | | 4.25% | | | | 10/01/2047 | | | | 1,540 | | | 1,478,220 |
Series 2022, GO Bonds (INS - AGM)(d) | | | 4.38% | | | | 10/01/2048 | | | | 1,805 | | | 1,762,869 |
Series 2022, GO Bonds (INS - AGM)(d) | | | 4.50% | | | | 10/01/2050 | | | | 1,510 | | | 1,500,070 |
Ysleta Independent School District; | | | | | | | | | | | | | | |
Series 2020, GO Bonds (CEP - Texas Permanent School Fund) | | | 4.00% | | | | 08/15/2050 | | | | 8,700 | | | 8,039,770 |
Series 2022, GO Bonds (CEP - Texas Permanent School Fund)(k) | | | 5.00% | | | | 08/15/2056 | | | | 17,340 | | | 18,730,222 |
| | | | | | | | | | | | | | | 759,223,313 |
| | | | |
Utah–1.01% | | | | | | | | | | | | | | |
Black Desert Public Infrastructure District; Series 2021 B, GO Bonds(e) | | | 7.38% | | | | 09/15/2051 | | | | 5,500 | | | 4,473,129 |
Downtown East Streetcar Sewer Public Infrastructure District; | | | | | | | | | | | | | | |
Series 2022 A, GO Bonds(e) | | | 6.00% | | | | 03/01/2053 | | | | 6,500 | | | 6,412,490 |
Series 2022 B, GO Bonds(e) | | | 9.00% | | | | 03/15/2053 | | | | 1,239 | | | 1,226,357 |
Gateway at Sand Hollow Public Infrastructure District No. 1; Series 2021 A, GO Bonds(e) | | | 5.50% | | | | 03/01/2051 | | | | 11,500 | | | 8,709,876 |
Hideout (Town of), UT Local District No. 1; | | | | | | | | | | | | | | |
Series 2014, RB | | | 7.75% | | | | 08/01/2024 | | | | 80 | | | 80,277 |
Series 2014, RB | | | 8.25% | | | | 08/01/2034 | | | | 610 | | | 600,229 |
Pine View Public Infrastructure District No. 1; Series 2021 A, GO Bonds(e) | | | 6.00% | | | | 03/01/2051 | | | | 13,815 | | | 10,814,534 |
Red Bridge Public Infrastructure District No. 1; | | | | | | | | | | | | | | |
Series 2021 A, GO Bonds(e) | | | 4.38% | | | | 02/01/2051 | | | | 1,000 | | | 740,130 |
Series 2021 B, GO Bonds(e) | | | 7.38% | | | | 08/15/2051 | | | | 600 | | | 481,260 |
Salt Lake City (City of), UT; | | | | | | | | | | | | | | |
Series 2017 A, RB(b) | | | 5.00% | | | | 07/01/2047 | | | | 5,000 | | | 5,058,341 |
Series 2018 A, RB(b) | | | 5.00% | | | | 07/01/2048 | | | | 4,000 | | | 4,052,512 |
Series 2021 A, RB (INS - AGM)(b)(d) | | | 4.00% | | | | 07/01/2051 | | | | 9,475 | | | 8,592,162 |
Utah (State of) Charter School Finance Authority (Endeavour Hall); | | | | | | | | | | | | | | |
Series 2012, RB | | | 6.00% | | | | 07/15/2032 | | | | 1,750 | | | 1,749,975 |
Series 2012, RB | | | 6.25% | | | | 07/15/2042 | | | | 3,870 | | | 3,861,030 |
Utah (State of) Charter School Finance Authority (Esperanza Elementary School); | | | | | | | | | | | | | | |
Series 2018 A, RB(e) | | | 5.00% | | | | 10/15/2038 | | | | 2,330 | | | 2,234,728 |
Series 2018 A, RB(e) | | | 5.25% | | | | 10/15/2048 | | | | 2,205 | | | 2,046,851 |
Utah (State of) Charter School Finance Authority (Leadership Learning Academy); Series 2019 A, RB(e) | | | 5.00% | | | | 06/15/2050 | | | | 2,000 | | | 1,759,618 |
Utah (State of) Charter School Finance Authority (Merit Preparatory Academy); Series 2019 A, RB(e) | | | 5.38% | | | | 06/15/2049 | | | | 3,645 | | | 3,270,055 |
Utah (State of) Charter School Finance Authority (Reagan Academy); Series 2016 A, Ref. RB(e) | | | 5.00% | | | | 02/15/2046 | | | | 855 | | | 796,460 |
See accompanying Notes to Financial Statements which are an integral part of the financial statements.
39 Invesco Rochester® Municipal Opportunities Fund
| | | | | | | | | | | | | | |
| | | Interest
Rate | | | Maturity
Date | | | Principal
Amount
(000) | | | Value |
Utah–(continued) | | | | | | | | | | | | | | |
Utah (State of) Charter School Finance Authority (The Freedom Academy Foundation); | | | | | | | | | | | | | | |
Series 2017, Ref. RB(e) | | | 5.25% | | | | 06/15/2037 | | | $ | 4,810 | | | $ 4,659,299 |
Series 2017, Ref. RB(e) | | | 5.38% | | | | 06/15/2048 | | | | 8,415 | | | 7,806,317 |
| | | | | | | | | | | | | | | 79,425,630 |
| | | | |
Vermont–0.08% | | | | | | | | | | | | | | |
East Central Vermont Telecommunications District; | | | | | | | | | | | | | | |
Series 2018 A, RB(e) | | | 5.75% | | | | 12/01/2036 | | | | 1,450 | | | 1,455,954 |
Series 2018 A, RB(e) | | | 5.60% | | | | 12/01/2043 | | | | 960 | | | 950,190 |
Series 2019 A, RB(e) | | | 5.00% | | | | 12/01/2048 | | | | 4,330 | | | 3,797,646 |
| | | | | | | | | | | | | | | 6,203,790 |
| | | | |
Virgin Islands–0.17% | | | | | | | | | | | | | | |
Tobacco Settlement Financing Corp.; Series 2006 A, RB(l) | | | 0.00% | | | | 05/15/2035 | | | | 28,550 | | | 13,475,032 |
| | | | |
Virginia–0.41% | | | | | | | | | | | | | | |
Celebrate North Community Development Authority; Series 2003 B, RB(g)(h) | | | 6.75% | | | | 03/01/2034 | | | | 1,294 | | | 841,100 |
Lewistown (City of), VA Commerce Center Community Development Authority; | | | | | | | | | | | | | | |
Series 2014 A, RB | | | 6.05% | | | | 03/01/2044 | | | | 919 | | | 709,890 |
Series 2014 B, RB | | | 6.05% | | | | 03/01/2044 | | | | 2,607 | | | 2,181,555 |
Series 2014 C, RB(g) | | | 6.05% | | | | 03/01/2054 | | | | 2,183 | | | 1,091,507 |
Norfolk (City of), VA Redevelopment & Housing Authority (Fort Norfolk Retirement Community, Inc. - Harbor’s Edge); Series 2019 A, RB | | | 5.25% | | | | 01/01/2054 | | | | 3,300 | | | 2,653,888 |
Peninsula Town Center Community Development Authority; Series 2018, Ref. RB(e) | | | 5.00% | | | | 09/01/2045 | | | | 1,000 | | | 880,774 |
Richmond (City of), VA Redevelopment & Housing Authority; Series 2017, RB(e) | | | 5.55% | | | | 01/01/2037 | | | | 2,100 | | | 1,884,214 |
Roanoke (City of), VA Economic Development Authority (Richfield Living); | | | | | | | | | | | | | | |
Series 2020, RB (Acquired 01/23/2020-09/15/2020; Cost $3,715,000)(i) | | | 5.00% | | | | 09/01/2050 | | | | 3,910 | | | 2,484,686 |
Series 2020, RB (Acquired 01/23/2020-09/15/2020; Cost $2,749,000)(i) | | | 5.13% | | | | 09/01/2055 | | | | 2,920 | | | 1,846,753 |
Roanoke (County of), VA Economic Development Authority; | | | | | | | | | | | | | | |
Series 2019 A, Ref. RB (Acquired 04/11/2019; Cost $14,405,820)(i) | | | 5.25% | | | | 09/01/2049 | | | | 14,735 | | | 9,725,387 |
Series 2019 A, Ref. RB (Acquired 04/11/2019; Cost $7,074,524)(i) | | | 5.38% | | | | 09/01/2054 | | | | 7,215 | | | 4,689,840 |
Tobacco Settlement Financing Corp.; Series 2007 B-1, RB | | | 5.00% | | | | 06/01/2047 | | | | 1,515 | | | 1,414,099 |
Virginia (Commonwealth of) Small Business Financing Authority (Covanta); Series 2018, RB(b)(e)(f) | | | 5.00% | | | | 07/01/2038 | | | | 1,690 | | | 1,574,915 |
| | | | | | | | | | | | | | | 31,978,608 |
| | | | |
Washington–1.57% | | | | | | | | | | | | | | |
Kalispel Tribe of Indians; | | | | | | | | | | | | | | |
Series 2018 A, RB(e) | | | 5.00% | | | | 01/01/2032 | | | | 2,185 | | | 2,256,062 |
Series 2018 A, RB(e) | | | 5.25% | | | | 01/01/2038 | | | | 3,000 | | | 3,097,520 |
Series 2018 B, RB(e) | | | 5.00% | | | | 01/01/2032 | | | | 500 | | | 516,261 |
Series 2018 B, RB(e) | | | 5.25% | | | | 01/01/2038 | | | | 1,000 | | | 1,032,507 |
Kelso (City of), WA Housing Authority (Chinook & Columbia Apartments); Series 1998, RB | | | 5.60% | | | | 03/01/2028 | | | | 110 | | | 109,988 |
Kitsap (County of), WA Consolidated Housing Authority; Series 2001 A, RB(b) | | | 6.10% | | | | 10/01/2031 | | | | 45 | | | 43,743 |
Port of Seattle Industrial Development Corp. (Delta Airlines); Series 2012, Ref. RB(b) | | | 5.00% | | | | 04/01/2030 | | | | 2,125 | | | 2,126,127 |
Seattle (Port of), WA; | | | | | | | | | | | | | | |
Series 2021 C, Ref. RB(b) | | | 5.00% | | | | 08/01/2046 | | | | 12,000 | | | 12,480,929 |
Series 2022 B, Ref. RB(b) | | | 4.00% | | | | 08/01/2047 | | | | 3,000 | | | 2,646,660 |
Series 2022 B, Ref. RB(b) | | | 5.00% | | | | 08/01/2047 | | | | 6,500 | | | 6,723,003 |
Series 2022 B, Ref. RB(b) | | | 5.50% | | | | 08/01/2047 | | | | 2,500 | | | 2,690,545 |
Series 2022, RB(b)(k) | | | 5.00% | | | | 04/01/2044 | | | | 25,295 | | | 26,149,733 |
Tacoma (City of), WA Consolidated Local Improvement Districts; Series 2013, RB | | | 5.75% | | | | 04/01/2043 | | | | 2,079 | | | 1,982,362 |
Washington (State of) Economic Development Finance Authority (Columbia Pulp I, LLC); Series 2017 A, RB (Acquired 07/25/2017-06/21/2019; Cost $26,279,409)(b)(e)(g)(i) | | | 7.50% | | | | 01/01/2032 | | | | 26,355 | | | 15,813,000 |
Washington (State of) Economic Development Finance Authority (Green Bonds); Series 2020 A, RB(b)(e) | | | 5.63% | | | | 12/01/2040 | | | | 8,000 | | | 7,776,293 |
Washington (State of) Economic Development Finance Authority (North Pacific Paper); Series 2020 B, Ref. RB(e) | | | 9.00% | | | | 12/01/2036 | | | | 16,050 | | | 15,447,353 |
Washington (State of) Housing Finance Commission (Heron’s Key Senior Living); | | | | | | | | | | | | | | |
Series 2015 A, RB(e)(f)(j) | | | 7.00% | | | | 07/01/2025 | | | | 1,000 | | | 1,070,427 |
Series 2015 A, RB(e)(f)(j) | | | 7.00% | | | | 07/01/2025 | | | | 1,700 | | | 1,819,725 |
See accompanying Notes to Financial Statements which are an integral part of the financial statements.
40 Invesco Rochester® Municipal Opportunities Fund
| | | | | | | | | | | | | | |
| | | Interest
Rate | | | Maturity
Date | | | Principal
Amount
(000) | | | Value |
Washington–(continued) | | | | | | | | | | | | | | |
Washington (State of) Housing Finance Commission (Social Certificates); Series 2021-1A, Revenue Ctfs. | | | 3.50% | | | | 12/20/2035 | | | $ | 21,053 | | | $ 19,281,064 |
| | | | | | | | | | | | | | | 123,063,302 |
| | | | |
West Virginia–0.67% | | | | | | | | | | | | | | |
Harrison (County of), WV Commission (Charles Pointe No. 2); Series 2013,
Ref. RB(e)(g) | | | 7.00% | | | | 06/01/2035 | | | | 27,145 | | | 13,572,500 |
Harrison (County of), WV County Commission (Charles Pointe Economic Opportunity Development District); | | | | | | | | | | | | | | |
Series 2019 A, RB(e) | | | 5.75% | | | | 06/01/2042 | | | | 19,000 | | | 13,865,569 |
Series 2019 B, Ref. RB(e) | | | 7.50% | | | | 06/01/2042 | | | | 6,140 | | | 4,792,249 |
Monongalia (County of), WV Commission Special District (University Town Centre Economic Opportunity Development District); | | | | | | | | | | | | | | |
Series 2017 A, Ref. RB(e) | | | 5.75% | | | | 06/01/2043 | | | | 3,435 | | | 3,481,061 |
Series 2020, Ref. RB(e) | | | 7.50% | | | | 06/01/2043 | | | | 9,060 | | | 9,456,318 |
Ohio (County of), WV Development Authority (Sports Complex); Series 2018, RB | | | 5.00% | | | | 09/01/2048 | | | | 10,465 | | | 7,501,178 |
| | | | | | | | | | | | | | | 52,668,875 |
| | | | |
Wisconsin–1.24% | | | | | | | | | | | | | | |
Gillett (City of), WI; Series 2021 A, RB(b)(e) | | | 5.50% | | | | 12/01/2032 | | | | 4,600 | | | 3,782,135 |
Wisconsin (State of) Health & Educational Facilities Authority (Camillus Health System); | | | | | | | | | | | | | | |
Series 2019, Ref. RB | | | 5.00% | | | | 11/01/2039 | | | | 1,950 | | | 1,677,948 |
Series 2019, Ref. RB | | | 5.00% | | | | 11/01/2046 | | | | 2,100 | | | 1,700,232 |
Series 2019, Ref. RB | | | 5.00% | | | | 11/01/2054 | | | | 3,500 | | | 2,721,824 |
Wisconsin (State of) Health & Educational Facilities Authority (Clement Manor, Inc.); Series 2019, Ref. RB | | | 5.00% | | | | 08/01/2049 | | | | 2,750 | | | 1,884,303 |
Wisconsin (State of) Public Finance Authority; | | | | | | | | | | | | | | |
Series 2005 A-1, RB (Acquired 09/08/2005-10/06/2005; Cost $ 16,925)(e)(i)(l) | | | 0.00% | | | | 01/01/2047 | | | | 156 | | | 3,301 |
Series 2005 A-1, RB (Acquired 09/08/2005-10/06/2005; Cost $ 14,460)(e)(i)(l) | | | 0.00% | | | | 01/01/2048 | | | | 136 | | | 2,748 |
Series 2005 A-1, RB (Acquired 09/08/2005-10/06/2005; Cost $ 13,902)(e)(i)(l) | | | 0.00% | | | | 01/01/2049 | | | | 134 | | | 2,563 |
Series 2005 A-1, RB (Acquired 09/08/2005-10/06/2005; Cost $ 13,141)(e)(i)(l) | | | 0.00% | | | | 01/01/2050 | | | | 129 | | | 2,313 |
Series 2005 A-1, RB (Acquired 09/08/2005-10/06/2005; Cost $ 12,620)(e)(i)(l) | | | 0.00% | | | | 01/01/2051 | | | | 127 | | | 2,164 |
Series 2005 A-1, RB(e)(l) | | | 0.00% | | | | 01/01/2052 | | | | 165 | | | 2,625 |
Series 2005 A-1, RB(e)(l) | | | 0.00% | | | | 01/01/2053 | | | | 163 | | | 2,466 |
Series 2005 A-1, RB(e)(l) | | | 0.00% | | | | 01/01/2054 | | | | 158 | | | 2,252 |
Series 2005 A-1, RB(e)(l) | | | 0.00% | | | | 01/01/2055 | | | | 154 | | | 2,094 |
Series 2005 A-1, RB(e)(l) | | | 0.00% | | | | 01/01/2056 | | | | 151 | | | 1,958 |
Series 2005 A-1, RB(e)(g) | | | 5.50% | | | | 07/01/2056 | | | | 8,230 | | | 4,605,044 |
Series 2005 A-1, RB(e)(l) | | | 0.00% | | | | 01/01/2057 | | | | 168 | | | 2,050 |
Series 2005 A-1, RB(e)(l) | | | 0.00% | | | | 01/01/2058 | | | | 163 | | | 1,896 |
Series 2005 A-1, RB(e)(l) | | | 0.00% | | | | 01/01/2059 | | | | 159 | | | 1,761 |
Series 2005 A-1, RB(e)(l) | | | 0.00% | | | | 01/01/2060 | | | | 156 | | | 1,624 |
Series 2005 A-1, RB(e)(l) | | | 0.00% | | | | 01/01/2061 | | | | 153 | | | 1,514 |
Series 2005 A-1, RB(e)(l) | | | 0.00% | | | | 01/01/2062 | | | | 149 | | | 1,395 |
Series 2005 A-1, RB(e)(l) | | | 0.00% | | | | 01/01/2063 | | | | 146 | | | 1,300 |
Series 2005 A-1, RB(e)(l) | | | 0.00% | | | | 01/01/2064 | | | | 143 | | | 1,214 |
Series 2005 A-1, RB(e)(l) | | | 0.00% | | | | 01/01/2065 | | | | 140 | | | 1,125 |
Series 2005 A-1, RB(e)(l) | | | 0.00% | | | | 01/01/2066 | | | | 151 | | | 1,125 |
Series 2005 A-1, RB (Acquired 09/08/2005-10/06/2005; Cost $ 126,636)(e)(i)(l) | | | 0.00% | | | | 01/01/2067 | | | | 1,821 | | | 12,290 |
Series 2012 C, Ref. RB(b) | | | 5.25% | | | | 07/01/2028 | | | | 1,500 | | | 1,501,234 |
Series 2012, RB | | | 6.00% | | | | 09/01/2045 | | | | 5,875 | | | 5,510,493 |
Series 2015 A, RB | | | 6.00% | | | | 02/01/2045 | | | | 1,910 | | | 1,864,428 |
Series 2016 A, RB(e) | | | 5.25% | | | | 05/01/2046 | | | | 2,500 | | | 2,163,060 |
Series 2016 A, RB | | | 5.25% | | | | 01/01/2052 | | | | 10,960 | | | 8,452,424 |
Series 2018, RB (INS - AGM)(d) | | | 5.00% | | | | 07/01/2058 | | | | 7,900 | | | 8,111,692 |
Series 2019, RB(e) | | | 5.00% | | | | 06/15/2054 | | | | 455 | | | 396,227 |
Wisconsin (State of) Public Finance Authority (21st Century Public Academy); | | | | | | | | | | | | | | |
Series 2020 A, RB(e) | | | 5.00% | | | | 06/01/2040 | | | | 760 | | | 670,757 |
Series 2020 A, RB(e) | | | 5.00% | | | | 06/01/2049 | | | | 1,340 | | | 1,101,377 |
Wisconsin (State of) Public Finance Authority (American Dream at Meadowlands); Series 2017, RB(e)(g) | | | 6.75% | | | | 08/01/2031 | | | | 22,000 | | | 12,100,000 |
See accompanying Notes to Financial Statements which are an integral part of the financial statements.
41 Invesco Rochester® Municipal Opportunities Fund
| | | | | | | | | | | | | | | | |
| | | Interest
Rate | | | Maturity
Date | | | Principal
Amount
(000) | | | Value | |
| |
Wisconsin–(continued) | | | | | | | | | | | | | | | | |
Wisconsin (State of) Public Finance Authority (Bancroft Neurohealth); Series 2016 A, RB(e) | | | 5.13% | | | | 06/01/2048 | | | $ | 2,075 | | | $ | 1,855,053 | |
| |
Wisconsin (State of) Public Finance Authority (Capitol Encore Academy (The)); | | | | | | | | | | | | | | | | |
Series 2019 A, RB(e) | | | 4.75% | | | | 06/01/2029 | | | | 250 | | | | 238,907 | |
| |
Series 2019 A, RB(e) | | | 5.25% | | | | 06/01/2039 | | | | 750 | | | | 685,510 | |
| |
Series 2019 A, RB(e) | | | 5.50% | | | | 06/01/2049 | | | | 1,940 | | | | 1,732,704 | |
| |
Wisconsin (State of) Public Finance Authority (Dreamhouse); | | | | | | | | | | | | | | | | |
Series 2022 A, RB(e) | | | 5.75% | | | | 06/01/2025 | | | | 16,975 | | | | 17,040,057 | |
| |
Series 2022 B, RB(e) | | | 7.50% | | | | 06/01/2025 | | | | 1,970 | | | | 1,904,255 | |
| |
Wisconsin (State of) Public Finance Authority (Explore Knowledge Foundation); | | | | | | | | | | | | | | | | |
Series 2012 A, RB | | | 5.75% | | | | 07/15/2032 | | | | 930 | | | | 930,548 | |
| |
Series 2012 A, RB | | | 6.00% | | | | 07/15/2042 | | | | 1,345 | | | | 1,345,659 | |
| |
Wisconsin (State of) Public Finance Authority (North Carolina Leadership Academy); Series 2019, RB(e) | | | 5.00% | | | | 06/15/2049 | | | | 520 | | | | 460,995 | |
| |
Wisconsin (State of) Public Finance Authority (Rider University); | | | | | | | | | | | | | | | | |
Series 2021 A, Ref. RB(e) | | | 4.50% | | | | 07/01/2048 | | | | 5,000 | | | | 3,974,389 | |
| |
Series 2021 B, RB(e) | | | 6.00% | | | | 07/01/2031 | | | | 7,040 | | | | 6,035,263 | |
| |
Wisconsin (State of) Public Finance Authority (Traders Point Christian Schools); | | | | | | | | | | | | | | | | |
Series 2019 A, RB(e) | | | 5.38% | | | | 06/01/2044 | | | | 1,480 | | | | 1,317,544 | |
| |
Series 2019 A, RB(e) | | | 5.50% | | | | 06/01/2054 | | | | 1,840 | | | | 1,601,661 | |
| |
| | | | | | | | | | | | | | | 97,417,501 | |
| |
Total Municipal Obligations (Cost $9,578,758,260) | | | | | | | | | | | | | | | 8,895,209,087 | |
| |
| | | | |
U.S. Dollar Denominated Bonds & Notes–0.41% | | | | | | | | | | | | | | | | |
California–0.15% | | | | | | | | | | | | | | | | |
CalPlant I LLC; | | | | | | | | | | | | | | | | |
Series 21A(e)(h) | | | 9.50% | | | | 06/05/2023 | | | | 1,005 | | | | 1,005,000 | |
| |
Series 21B(e)(h) | | | 9.50% | | | | 06/05/2023 | | | | 3,820 | | | | 3,820,000 | |
| |
Series 22A(e)(h) | | | 9.50% | | | | 06/05/2023 | | | | 2,105 | | | | 2,105,000 | |
| |
Series 22B(e)(h) | | | 9.50% | | | | 06/05/2023 | | | | 180 | | | | 180,000 | |
| |
Series 22C(e)(h) | | | 9.50% | | | | 06/05/2023 | | | | 1,380 | | | | 1,380,000 | |
| |
Series 22X(e) | | | 9.50% | | | | 03/31/2023 | | | | 2,075 | | | | 2,086,226 | |
| |
Series 23A(e)(h) | | | 9.50% | | | | 03/31/2023 | | | | 730 | | | | 730,000 | |
| |
Series 23B(e) | | | 9.50% | | | | 03/31/2023 | | | | 650 | | | | 650,000 | |
| |
| | | | | | | | | | | | | | | 11,956,226 | |
| |
| | | | |
Louisiana–0.17% | | | | | | | | | | | | | | | | |
Nola Oil Terminal LLC; Series 2021(e) | | | 12.00% | | | | 03/15/2023 | | | | 13,000 | | | | 12,996,750 | |
| |
| | | | |
West Virginia–0.09% | | | | | | | | | | | | | | | | |
Empire South Terminal of West Virginia LLC(e) | | | 14.00% | | | | 11/01/2023 | | | | 6,850 | | | | 7,209,008 | |
| |
Total U.S. Dollar Denominated Bonds & Notes (Cost $31,795,000) | | | | | | | | | | | | | | | 32,161,984 | |
| |
| | | | |
| | | | | | | | | Shares | | | | |
Common Stocks & Other Equity Interests–0.36% | | | | | | | | | | | | | | | | |
Delta Air Lines, Inc.(o) | | | | | | | | | | | 7,679 | | | | 294,413 | |
| |
General Motors Co. | | | | | | | | | | | 2,919 | | | | 113,082 | |
| |
Energy Harbor Corp.(o) | | | | | | | | | | | 363,120 | | | | 27,960,240 | |
| |
Total Common Stocks & Other Equity Interests (Cost $11,063,438) | | | | | | | | | | | | | | | 28,367,735 | |
| |
TOTAL INVESTMENTS IN SECURITIES(p)–114.02% (Cost $9,621,616,698) | | | | | | | | | | | | | | | 8,955,738,806 | |
| |
FLOATING RATE NOTE OBLIGATIONS–(15.58)% | | | | | | | | | | | | | | | | |
Notes with interest and fee rates ranging from 3.96% to 4.14% at 02/28/2023 and contractual maturities of collateral ranging from 05/01/2029 to 05/15/2062 (See Note 1K)(q) | | | | | | | | | | | | | | | (1,224,095,000 | ) |
| |
BORROWINGS–(0.12)% | | | | | | | | | | | | | | | (9,400,000 | ) |
| |
OTHER ASSETS LESS LIABILITIES–1.68% | | | | | | | | | | | | | | | 132,236,458 | |
| |
NET ASSETS–100.00% | | | | | | | | | | | | | | $ | 7,854,480,264 | |
| |
See accompanying Notes to Financial Statements which are an integral part of the financial statements.
42 Invesco Rochester® Municipal Opportunities Fund
Investment Abbreviations:
| | |
| AGC | | - Assured Guaranty Corp. |
| AGM | | - Assured Guaranty Municipal Corp. |
| BAM | | - Build America Mutual Assurance Co. |
| CEP | | - Credit Enhancement Provider |
| CHF | | - Swiss Franc |
| COP | | - Certificates of Participation |
| Ctfs. | | - Certificates |
| FNMA | | - Federal National Mortgage Association |
| GNMA | | - Government National Mortgage Association |
| GO | | - General Obligation |
| IDR | | - Industrial Development Revenue Bonds |
| INS | | - Insurer |
| NATL | | - National Public Finance Guarantee Corp. |
| PCR | | - Pollution Control Revenue Bonds |
| RB | | - Revenue Bonds |
| Ref. | | - Refunding |
| RN | | - Revenue Notes |
| SGI | | - Syncora Guarantee, Inc. |
| Wts. | | - Warrants |
Notes to Schedule of Investments:
| (a) | Calculated as a percentage of net assets. Amounts in excess of 100% are due to the Fund’s use of leverage. |
| (b) | Security subject to the alternative minimum tax. |
| (c) | Convertible capital appreciation bond. The interest rate shown represents the coupon rate at which the bond will accrue at a specified future date. |
| (d) | Principal and/or interest payments are secured by the bond insurance company listed. |
| (e) | Security purchased or received in a transaction exempt from registration under the Securities Act of 1933, as amended (the “1933 Act”). The security may be resold pursuant to an exemption from registration under the 1933 Act, typically to qualified institutional buyers. The aggregate value of these securities at February 28, 2023 was $1,031,518,971, which represented 13.13% of the Fund’s Net Assets. |
| (f) | Security has an irrevocable call by the issuer or mandatory put by the holder. Maturity date reflects such call or put. |
| (g) | Defaulted security. Currently, the issuer is in default with respect to principal and/or interest payments. The aggregate value of these securities at February 28, 2023 was $210,342,930, which represented 2.68% of the Fund’s Net Assets. |
| (h) | Security valued using significant unobservable inputs (Level 3). See Note 3. |
| (i) | Restricted security. The aggregate value of these securities at February 28, 2023 was $128,587,638, which represented 1.64% of the Fund’s Net Assets. |
| (j) | Advance refunded; secured by an escrow fund of U.S. Government obligations or other highly rated collateral. |
| (k) | Underlying security related to TOB Trusts entered into by the Fund. See Note 1K. |
| (l) | Zero coupon bond issued at a discount. |
| (m) | Security is subject to a reimbursement agreement which may require the Fund to pay amounts to a counterparty in the event of a significant decline in the market value of the security underlying the TOB Trusts. In case of a shortfall, the maximum potential amount of payments the Fund could ultimately be required to make under the agreement is $99,060,000. However, such shortfall payment would be reduced by the proceeds from the sale of the security underlying the TOB Trusts. |
| (n) | The issuer is paying less than stated interest, but is not in default on principal because scheduled principal payments have not yet begun. |
| (o) | Non-income producing security. |
| (p) | Entities may either issue, guarantee, back or otherwise enhance the credit quality of a security. The entities are not primarily responsible for the issuer’s obligations but may be called upon to satisfy the issuer’s obligations. No concentration of any single entity was greater than 5% each. |
| (q) | Floating rate note obligations related to securities held. The interest and fee rates shown reflect the rates in effect at February 28, 2023. At February 28, 2023, the Fund’s investments with a value of $1,719,144,268 are held by TOB Trusts and serve as collateral for the $1,224,095,000 in the floating rate note obligations outstanding at that date. |
See accompanying Notes to Financial Statements which are an integral part of the financial statements.
43 Invesco Rochester® Municipal Opportunities Fund
Statement of Assets and Liabilities
February 28, 2023
| | | | |
Assets: | | | | |
Investments in unaffiliated securities, at value
(Cost $9,621,616,698) | | $ | 8,955,738,806 | |
Cash | | | 726,453 | |
Receivable for: | | | | |
Investments sold | | | 109,394,028 | |
Fund shares sold | | | 9,781,546 | |
Interest | | | 130,322,301 | |
Investments matured, at value
(Cost $73,872,145) | | | 27,732,330 | |
Investment for trustee deferred compensation and retirement plans | | | 326,741 | |
Other assets | | | 3,301,441 | |
Total assets | | | 9,237,323,646 | |
| |
Liabilities: | | | | |
Floating rate note obligations | | | 1,224,095,000 | |
Payable for: | | | | |
Borrowings | | | 9,400,000 | |
Investments purchased | | | 117,188,309 | |
Dividends | | | 16,882,172 | |
Fund shares reacquired | | | 11,454,540 | |
Due to broker | | | 220,163 | |
Accrued fees to affiliates | | | 2,763,762 | |
Accrued interest expense | | | 205,959 | |
Accrued trustees’ and officers’ fees and benefits | | | 186,605 | |
Accrued other operating expenses | | | 120,131 | |
Trustee deferred compensation and retirement plans | | | 326,741 | |
Total liabilities | | | 1,382,843,382 | |
Net assets applicable to shares outstanding | | $ | 7,854,480,264 | |
| | | | |
Net assets consist of: | | | | |
Shares of beneficial interest | | $ | 10,575,344,941 | |
| |
Distributable earnings (loss) | | | (2,720,864,677 | ) |
| |
| | $ | 7,854,480,264 | |
| |
| |
Net Assets: | | | | |
Class A | | $ | 3,822,401,786 | |
| |
Class C | | $ | 553,464,676 | |
| |
Class Y | | $ | 3,394,428,806 | |
| |
Class R5 | | $ | 18,425 | |
| |
Class R6 | | $ | 84,166,571 | |
| |
|
Shares outstanding, no par value, with an unlimited number of shares authorized: | |
Class A | | | 567,317,717 | |
| |
Class C | | | 82,495,780 | |
| |
Class Y | | | 504,427,193 | |
| |
Class R5 | | | 2,738 | |
| |
Class R6 | | | 12,492,401 | |
| |
Class A: | | | | |
Net asset value per share | | $ | 6.74 | |
| |
Maximum offering price per share (Net asset value of $6.74 ÷ 95.75%) | | $ | 7.04 | |
| |
Class C: | | | | |
Net asset value and offering price per share | | $ | 6.71 | |
| |
Class Y: | | | | |
Net asset value and offering price per share | | $ | 6.73 | |
| |
Class R5: | | | | |
Net asset value and offering price per share | | $ | 6.73 | |
| |
Class R6: | | | | |
Net asset value and offering price per share | | $ | 6.74 | |
| |
See accompanying Notes to Financial Statements which are an integral part of the financial statements.
44 Invesco Rochester® Municipal Opportunities Fund
Statement of Operations
For the year ended February 28, 2023
| | | | |
Investment income: | |
Interest | | $ | 444,997,901 | |
| |
|
Expenses: | |
Advisory fees | | | 27,538,006 | |
| |
Administrative services fees | | | 1,125,701 | |
| |
Custodian fees | | | 93,967 | |
| |
Distribution fees: | | | | |
Class A | | | 9,756,235 | |
| |
Class C | | | 5,474,402 | |
| |
Interest, facilities and maintenance fees | | | 44,912,877 | |
| |
Transfer agent fees - A, C and Y | | | 5,998,010 | |
| |
Transfer agent fees - R5 | | | 1,115 | |
| |
Transfer agent fees - R6 | | | 10,403 | |
| |
Trustees’ and officers’ fees and benefits | | | 93,935 | |
| |
Registration and filing fees | | | 382,898 | |
| |
Reports to shareholders | | | 133,644 | |
| |
Professional services fees | | | 837,270 | |
| |
Other | | | 87,539 | |
| |
Total expenses | | | 96,446,002 | |
| |
Less: Expense offset arrangement(s) | | | (7,313 | ) |
| |
Net expenses | | | 96,438,689 | |
| |
Net investment income | | | 348,559,212 | |
| |
|
Realized and unrealized gain (loss) from: | |
Net realized gain (loss) from unaffiliated investment securities (includes net gains (losses) from securities sold to affiliates of $(783,730)) | | | (480,004,669 | ) |
| |
Change in net unrealized appreciation (depreciation) of unaffiliated investment securities | | | (738,146,217 | ) |
| |
Net realized and unrealized gain (loss) | | | (1,218,150,886 | ) |
| |
Net increase (decrease) in net assets resulting from operations | | $ | (869,591,674 | ) |
| |
See accompanying Notes to Financial Statements which are an integral part of the financial statements.
45 Invesco Rochester® Municipal Opportunities Fund
Statement of Changes in Net Assets
For the years ended February 28, 2023 and 2022
| | | | | | | | |
| | | 2023 | | | 2022 | |
| |
Operations: | | | | | | | | |
Net investment income | | $ | 348,559,212 | | | $ | 306,456,807 | |
| |
Net realized gain (loss) | | | (480,004,669 | ) | | | (48,128,773 | ) |
| |
Change in net unrealized appreciation (depreciation) | | | (738,146,217 | ) | | | (126,819,297 | ) |
| |
Net increase (decrease) in net assets resulting from operations | | | (869,591,674 | ) | | | 131,508,737 | |
| |
| | |
Distributions to shareholders from distributable earnings: | | | | | | | | |
Class A | | | (183,944,640 | ) | | | (197,176,010 | ) |
| |
Class C | | | (24,427,594 | ) | | | (27,325,893 | ) |
| |
Class Y | | | (158,331,163 | ) | | | (168,679,774 | ) |
| |
Class R5 | | | (61,264 | ) | | | (343,882 | ) |
| |
Class R6 | | | (3,596,973 | ) | | | (2,811,732 | ) |
| |
Total distributions from distributable earnings | | | (370,361,634 | ) | | | (396,337,291 | ) |
| |
| | |
Share transactions–net: | | | | | | | | |
Class A | | | (155,678,826 | ) | | | 394,739,158 | |
| |
Class C | | | (101,725,735 | ) | | | 56,577,568 | |
| |
Class Y | | | 234,126,867 | | | | 775,526,402 | |
| |
Class R5 | | | (5,216,319 | ) | | | (1,524,206 | ) |
| |
Class R6 | | | 41,544,059 | | | | 43,616,518 | |
| |
Net increase in net assets resulting from share transactions | | | 13,050,046 | | | | 1,268,935,440 | |
| |
Net increase (decrease) in net assets | | | (1,226,903,262 | ) | | | 1,004,106,886 | |
| |
| | |
Net assets: | | | | | | | | |
Beginning of year | | | 9,081,383,526 | | | | 8,077,276,640 | |
| |
End of year | | $ | 7,854,480,264 | | | $ | 9,081,383,526 | |
| |
See accompanying Notes to Financial Statements which are an integral part of the financial statements.
46 Invesco Rochester® Municipal Opportunities Fund
Statement of Cash Flows
For the year ended February 28, 2023
| | | | |
Cash provided by operating activities: | | | | |
Net increase (decrease) in net assets resulting from operations | | $ | (869,591,674 | ) |
| |
| |
Adjustments to reconcile the change in net assets from operations to net cash provided by operating activities: | | | | |
Purchases of investments | | | (4,097,254,438 | ) |
| |
Proceeds from sales of investments | | | 4,032,706,158 | |
| |
Proceeds from sales of short-term investments, net | | | (98,516,200 | ) |
| |
Amortization of premium on investment securities | | | 53,634,753 | |
| |
Accretion of discount on investment securities | | | (51,805,833 | ) |
| |
Net realized loss from investment securities | | | 480,004,669 | |
| |
Net change in unrealized depreciation on investment securities | | | 738,146,217 | |
| |
Change in operating assets and liabilities: | | | | |
| |
Increase in receivables and other assets | | | (13,048,665 | ) |
| |
Decrease in accrued expenses and other payables | | | (372,103 | ) |
| |
Net cash provided by operating activities | | | 173,902,884 | |
| |
Cash provided by (used in) financing activities: | | | | |
Dividends paid to shareholders from distributable earnings | | | (190,043,281 | ) |
| |
Decrease in payable for amount due custodian | | | (2,486,754 | ) |
| |
Proceeds from shares of beneficial interest sold | | | 4,200,896,663 | |
| |
Proceeds of TOB Trusts | | | 947,405,000 | |
| |
Repayments of TOB Trusts | | | (770,970,000 | ) |
| |
Proceeds from borrowings | | | 1,000,000 | |
| |
Disbursements from shares of beneficial interest reacquired | | | (4,359,198,222 | ) |
| |
Net cash provided by (used in) financing activities | | | (173,396,594 | ) |
| |
Net increase in cash and cash equivalents | | | 506,290 | |
| |
Cash and cash equivalents at beginning of period | | | - | |
| |
Cash and cash equivalents at end of period | | $ | 506,290 | |
| |
| |
Non-cash financing activities: | | | | |
Value of shares of beneficial interest issued in reinvestment of dividends paid to shareholders | | $ | 179,184,248 | |
| |
| |
Supplemental disclosure of cash flow information: | | | | |
| |
Cash paid during the period for interest, facilities and maintenance fees | | $ | 44,988,133 | |
| |
See accompanying Notes to Financial Statements which are an integral part of the financial statements.
47 Invesco Rochester® Municipal Opportunities Fund
Financial Highlights
The following schedule presents financial highlights for a share of the Fund outstanding throughout the periods indicated.
| | | | | | | | | | | | | | | | | | | | | | | | | | | | | | | | | | | | | | | | | | | | | | | | | | | | | | | | | | | | | | | | | |
| | | | | | | | | | | | | | | | | | | | | | | Supplemental | | | | |
| | | | | | | | | | | | | | | | | | | | | | | ratio of | | | | |
| | | | | | | | | | | | | | | | | | | Ratio of | | | | expenses | | | | |
| | | | | | | | | | | | | | | | | | | expenses | | Ratio of | | to average | | | | |
| | | | | | | | | | | | | | | | | | | to average | | expenses | | net assets | | | | |
| | | | | | | Net gains | | | | | | | | | | | | net assets | | to average net | | with fee waivers | | | | |
| | | | | | | (losses) | | | | | | | | | | | | with | | assets without | | (excluding | | Ratio of net | | |
| | | Net asset | | | | on securities | | | | Dividends | | | | | | | | fee waivers | | fee waivers | | interest, | | investment | | |
| | | value, | | Net | | (both | | Total from | | from net | | Net asset | | | | Net assets, | | and/or | | and/or | | facilities and | | income | | |
| | | beginning | | investment | | realized and | | investment | | investment | | value, end | | Total | | end of period | | expenses | | expenses | | maintenance | | to average | | Portfolio |
| | | of period | | income(a) | | unrealized) | | operations | | income | | of period | | return(b) | | (000’s omitted) | | absorbed | | absorbed | | fees) | | net assets | | turnover (c) |
Class A | | | | | | | | | | | | | | | | | | | | | | | | | | | | | | | | | | | | | | | | | | | | | | | | | | | | | | | | | | | | | | | | | |
Year ended 02/28/23 | | | $ | 7.80 | | | | $ | 0.31 | | | | $ | (1.04 | ) | | | $ | (0.73 | ) | | | $ | (0.33 | ) | | | $ | 6.74 | | | | | (9.41 | )% | | | $ | 3,822,402 | | | | | 1.30 | % | | | | 1.30 | % | | | | 0.72 | % | | | | 4.41 | % | | | | 47 | % |
Year ended 02/28/22 | | | | 7.98 | | | | | 0.26 | | | | | (0.10 | ) | | | | 0.16 | | | | | (0.34 | ) | | | | 7.80 | | | | | 1.95 | | | | | 4,596,751 | | | | | 0.85 | | | | | 0.85 | | | | | 0.69 | | | | | 3.24 | | | | | 22 | |
Year ended 02/28/21 | | | | 8.30 | | | | | 0.30 | | | | | (0.23 | ) | | | | 0.07 | | | | | (0.39 | ) | | | | 7.98 | | | | | 1.13 | | | | | 4,323,667 | | | | | 0.95 | | | | | 0.95 | | | | | 0.77 | | | | | 3.87 | | | | | 28 | |
Seven months ended 02/29/20 | | | | 7.81 | | | | | 0.20 | | | | | 0.48 | | | | | 0.68 | | | | | (0.19 | ) | | | | 8.30 | | | | | 8.87 | | | | | 4,389,039 | | | | | 0.95 | (d) | | | | 0.95 | (d) | | | | 0.69 | (d) | | | | 4.26 | (d) | | | | 9 | |
Year ended 07/31/19 | | | | 7.34 | | | | | 0.35 | | | | | 0.45 | | | | | 0.80 | | | | | (0.33 | ) | | | | 7.81 | | | | | 11.26 | | | | | 3,825,646 | | | | | 1.20 | | | | | 1.20 | | | | | 0.76 | | | | | 4.64 | | | | | 34 | |
Year ended 07/31/18 | | | | 7.27 | | | | | 0.36 | | | | | 0.08 | | | | | 0.44 | | | | | (0.37 | ) | | | | 7.34 | | | | | 6.34 | | | | | 3,164,888 | | | | | 1.04 | | | | | 1.04 | | | | | 0.81 | | | | | 4.94 | | | | | 34 | |
Class C | | | | | | | | | | | | | | | | | | | | | | | | | | | | | | | | | | | | | | | | | | | | | | | | | | | | | | | | | | | | | | | | | |
Year ended 02/28/23 | | | | 7.76 | | | | | 0.26 | | | | | (1.03 | ) | | | | (0.77 | ) | | | | (0.28 | ) | | | | 6.71 | | | | | (9.94 | )(e) | | | | 553,465 | | | | | 1.95 | (e) | | | | 1.95 | (e) | | | | 1.37 | (e) | | | | 3.76 | (e) | | | | 47 | |
Year ended 02/28/22 | | | | 7.95 | | | | | 0.21 | | | | | (0.11 | ) | | | | 0.10 | | | | | (0.29 | ) | | | | 7.76 | | | | | 1.15 | (e) | | | | 754,439 | | | | | 1.50 | (e) | | | | 1.50 | (e) | | | | 1.34 | (e) | | | | 2.59 | (e) | | | | 22 | |
Year ended 02/28/21 | | | | 8.26 | | | | | 0.25 | | | | | (0.23 | ) | | | | 0.02 | | | | | (0.33 | ) | | | | 7.95 | | | | | 0.54 | | | | | 717,496 | | | | | 1.60 | | | | | 1.60 | | | | | 1.42 | | | | | 3.22 | | | | | 28 | |
Seven months ended 02/29/20 | | | | 7.77 | | | | | 0.17 | | | | | 0.48 | | | | | 0.65 | | | | | (0.16 | ) | | | | 8.26 | | | | | 8.51 | | | | | 1,020,424 | | | | | 1.61 | (d) | | | | 1.61 | (d) | | | | 1.35 | (d) | | | | 3.61 | (d) | | | | 9 | |
Year ended 07/31/19 | | | | 7.31 | | | | | 0.30 | | | | | 0.45 | | | | | 0.75 | | | | | (0.29 | ) | | | | 7.77 | | | | | 10.45 | | | | | 1,019,084 | | | | | 1.86 | | | | | 1.86 | | | | | 1.42 | | | | | 3.99 | | | | | 34 | |
Year ended 07/31/18 | | | | 7.24 | | | | | 0.31 | | | | | 0.09 | | | | | 0.40 | | | | | (0.33 | ) | | | | 7.31 | | | | | 5.68 | | | | | 1,231,057 | | | | | 1.69 | | | | | 1.69 | | | | | 1.46 | | | | | 4.29 | | | | | 34 | |
Class Y | | | | | | | | | | | | | | | | | | | | | | | | | | | | | | | | | | | | | | | | | | | | | | | | | | | | | | | | | | | | | | | | | |
Year ended 02/28/23 | | | | 7.79 | | | | | 0.32 | | | | | (1.04 | ) | | | | (0.72 | ) | | | | (0.34 | ) | | | | 6.73 | | | | | (9.19 | ) | | | | 3,394,429 | | | | | 1.05 | | | | | 1.05 | | | | | 0.47 | | | | | 4.66 | | | | | 47 | |
Year ended 02/28/22 | | | | 7.97 | | | | | 0.28 | | | | | (0.10 | ) | | | | 0.18 | | | | | (0.36 | ) | | | | 7.79 | | | | | 2.20 | | | | | 3,674,521 | | | | | 0.60 | | | | | 0.60 | | | | | 0.44 | | | | | 3.49 | | | | | 22 | |
Year ended 02/28/21 | | | | 8.29 | | | | | 0.32 | | | | | (0.23 | ) | | | | 0.09 | | | | | (0.41 | ) | | | | 7.97 | | | | | 1.40 | | | | | 3,018,845 | | | | | 0.70 | | | | | 0.70 | | | | | 0.52 | | | | | 4.12 | | | | | 28 | |
Seven months ended 02/29/20 | | | | 7.80 | | | | | 0.21 | | | | | 0.49 | | | | | 0.70 | | | | | (0.21 | ) | | | | 8.29 | | | | | 9.04 | | | | | 2,968,456 | | | | | 0.71 | (d) | | | | 0.71 | (d) | | | | 0.45 | (d) | | | | 4.51 | (d) | | | | 9 | |
Year ended 07/31/19 | | | | 7.33 | | | | | 0.37 | | | | | 0.45 | | | | | 0.82 | | | | | (0.35 | ) | | | | 7.80 | | | | | 11.55 | | | | | 2,430,627 | | | | | 0.95 | | | | | 0.95 | | | | | 0.51 | | | | | 4.89 | | | | | 34 | |
Year ended 07/31/18 | | | | 7.26 | | | | | 0.38 | | | | | 0.08 | | | | | 0.46 | | | | | (0.39 | ) | | | | 7.33 | | | | | 6.61 | | | | | 1,824,770 | | | | | 0.79 | | | | | 0.79 | | | | | 0.56 | | | | | 5.19 | | | | | 34 | |
Class R5 | | | | | | | | | | | | | | | | | | | | | | | | | | | | | | | | | | | | | | | | | | | | | | | | | | | | | | | | | | | | | | | | | |
Year ended 02/28/23 | | | | 7.79 | | | | | 0.34 | | | | | (1.06 | ) | | | | (0.72 | ) | | | | (0.34 | ) | | | | 6.73 | | | | | (9.19 | ) | | | | 18 | | | | | 1.05 | | | | | 1.05 | | | | | 0.47 | | | | | 4.66 | | | | | 47 | |
Year ended 02/28/22 | | | | 7.98 | | | | | 0.28 | | | | | (0.11 | ) | | | | 0.17 | | | | | (0.36 | ) | | | | 7.79 | | | | | 2.06 | | | | | 5,625 | | | | | 0.65 | | | | | 0.65 | | | | | 0.49 | | | | | 3.44 | | | | | 22 | |
Year ended 02/28/21 | | | | 8.29 | | | | | 0.32 | | | | | (0.22 | ) | | | | 0.10 | | | | | (0.41 | ) | | | | 7.98 | | | | | 1.58 | | | | | 7,290 | | | | | 0.67 | | | | | 0.67 | | | | | 0.49 | | | | | 4.15 | | | | | 28 | |
Seven months ended 02/29/20 | | | | 7.80 | | | | | 0.22 | | | | | 0.51 | | | | | 0.73 | | | | | (0.24 | ) | | | | 8.29 | | | | | 9.49 | | | | | 4,697 | | | | | 0.64 | (d) | | | | 0.64 | (d) | | | | 0.38 | (d) | | | | 4.57 | (d) | | | | 9 | |
Period ended 07/31/19(f) | | | | 7.71 | | | | | 0.07 | | | | | 0.08 | | | | | 0.15 | | | | | (0.06 | ) | | | | 7.80 | | | | | 2.03 | | | | | 10 | | | | | 0.91 | (d) | | | | 0.91 | (d) | | | | 0.47 | (d) | | | | 4.93 | (d) | | | | 34 | |
Class R6 | | | | | | | | | | | | | | | | | | | | | | | | | | | | | | | | | | | | | | | | | | | | | | | | | | | | | | | | | | | | | | | | | |
Year ended 02/28/23 | | | | 7.79 | | | | | 0.33 | | | | | (1.03 | ) | | | | (0.70 | ) | | | | (0.35 | ) | | | | 6.74 | | | | | (9.00 | ) | | | | 84,167 | | | | | 0.98 | | | | | 0.98 | | | | | 0.40 | | | | | 4.73 | | | | | 47 | |
Year ended 02/28/22 | | | | 7.99 | | | | | 0.29 | | | | | (0.12 | ) | | | | 0.17 | | | | | (0.37 | ) | | | | 7.79 | | | | | 2.02 | | | | | 50,048 | | | | | 0.57 | | | | | 0.57 | | | | | 0.41 | | | | | 3.52 | | | | | 22 | |
Year ended 02/28/21 | | | | 8.29 | | | | | 0.33 | | | | | (0.21 | ) | | | | 0.12 | | | | | (0.42 | ) | | | | 7.99 | | | | | 1.76 | | | | | 9,977 | | | | | 0.58 | | | | | 0.58 | | | | | 0.40 | | | | | 4.24 | | | | | 28 | |
Seven months ended 02/29/20 | | | | 7.80 | | | | | 0.21 | | | | | 0.49 | | | | | 0.70 | | | | | (0.21 | ) | | | | 8.29 | | | | | 9.05 | | | | | 13,146 | | | | | 0.67 | (d) | | | | 0.67 | (d) | | | | 0.41 | (d) | | | | 4.54 | (d) | | | | 9 | |
Period ended 07/31/19(f) | | | | 7.71 | | | | | 0.07 | | | | | 0.08 | | | | | 0.15 | | | | | (0.06 | ) | | | | 7.80 | | | | | 2.04 | | | | | 10 | | | | | 0.91 | (d) | | | | 0.91 | (d) | | | | 0.47 | (d) | | | | 4.93 | (d) | | | | 34 | |
| (a) | Calculated using average shares outstanding. |
| (b) | Includes adjustments in accordance with accounting principles generally accepted in the United States of America and as such, the net asset value for financial reporting purposes and the returns based upon those net asset values may differ from the net asset value and returns for shareholder transactions. Does not include sales charges and is not annualized for periods less than one year, if applicable. |
| (c) | Portfolio turnover is calculated at the fund level and is not annualized for periods less than one year, if applicable. |
| (e) | The total return, ratio of expenses to average net assets and ratio of net investment income (loss) to average net assets reflect actual 12b-1 fees of 0.90% for the year ended February 28, 2023 and 2022. |
| (f) | Commencement date after the close of business on May 24, 2019. |
See accompanying Notes to Financial Statements which are an integral part of the financial statements.
48 Invesco Rochester® Municipal Opportunities Fund
Notes to Financial Statements
February 28, 2023
NOTE 1–Significant Accounting Policies
Invesco Rochester® Municipal Opportunities Fund (the “Fund”) is a series portfolio of AIM Tax-Exempt Funds (Invesco Tax-Exempt Funds) (the “Trust”). The Trust is a Delaware statutory trust registered under the Investment Company Act of 1940, as amended (the “1940 Act”), as an open-end series management investment company authorized to issue an unlimited number of shares of beneficial interest. Information presented in these financial statements pertains only to the Fund. Matters affecting the Fund or each class will be voted on exclusively by the shareholders of the Fund or each class.
The Fund’s investment objective is to seek tax-free income.
The Fund currently consists of five different classes of shares: Class A, Class C, Class Y, Class R5 and Class R6. Class Y shares are available only to certain investors. Class A shares are sold with a front-end sales charge unless certain waiver criteria are met. Under certain circumstances, load waived shares may be subject to contingent deferred sales charges (“CDSC”). Class C shares are sold with a CDSC. Class Y, Class R5 and Class R6 shares are sold at net asset value. Class C shares held for eight years after purchase are eligible for automatic conversion into Class A shares of the same Fund (the “Conversion Feature”). The automatic conversion pursuant to the Conversion Feature will generally occur at the end of the month following the eighth anniversary after a purchase of Class C shares.
The Fund is an investment company and accordingly follows the investment company accounting and reporting guidance in accordance with Financial Accounting Standards Board Accounting Standards Codification Topic 946, Financial Services – Investment Companies.
The following is a summary of the significant accounting policies followed by the Fund in the preparation of its financial statements.
| A. | Security Valuations - Securities, including restricted securities, are valued according to the following policy. |
Securities generally normally are valued on the basis of prices provided by independent pricing services. Prices provided by the pricing service may be determined without exclusive reliance on quoted prices, and may reflect appropriate factors such as institution-size trading in similar groups of securities, developments related to specific securities, dividend rate (for unlisted equities), yield (for debt obligations), quality, type of issue, coupon rate (for debt obligations), maturity (for debt obligations), individual trading characteristics and other market data. Pricing services generally value debt obligations assuming orderly transactions of institutional round lot size, but a fund may hold or transact in the same securities in smaller, odd lot sizes. Odd lots often trade at lower prices than institutional round lots, and their value may be adjusted accordingly. Debt obligations are subject to interest rate and credit risks. In addition, all debt obligations involve some risk of default with respect to interest and/or principal payments.
A security listed or traded on an exchange is generally valued at its trade price or official closing price that day as of the close of the exchange where the security is principally traded, or lacking any sales or official closing price on a particular day, the security may be valued at the closing bid price on that day. Securities traded in the over-the-counter market are valued based on prices furnished by independent pricing services or market makers. When such securities are valued using prices provided by an independent pricing service they may be considered fair valued. Futures contracts are valued at the daily settlement price set by an exchange on which they are principally traded. U.S. exchange-traded options are valued at the mean between the last bid and asked prices from the exchange on which they are principally traded. Non-U.S. exchange-traded options are valued at the final settlement price set by the exchange on which they trade. Options not listed on an exchange and swaps generally are valued using pricing provided from independent pricing services.
Securities for which market quotations are not readily available are fair valued by Invesco Advisers, Inc. (the “Adviser” or “Invesco”) in accordance with Board-approved policies and related Adviser procedures (“Valuation Procedures”). If a fair value price provided by a pricing service is not representative of market value in the Adviser’s judgment (“unreliable”), the Adviser will fair value the security using the Valuation Procedures. Issuer specific events, market trends, bid/asked quotes of brokers and information providers and other market data may be reviewed in the course of making a good faith determination of a security’s fair value.
The Fund may invest in securities that are subject to interest rate risk, meaning the risk that the prices will generally fall as interest rates rise and, conversely, the prices will generally rise as interest rates fall. Specific securities differ in their sensitivity to changes in interest rates depending on their individual characteristics. Changes in interest rates may result in increased market volatility, which may affect the value and/or liquidity of certain Fund investments.
Valuations change in response to many factors including the historical and prospective earnings of the issuer, the value of the issuer’s assets, general market conditions which are not specifically related to the particular issuer, such as real or perceived adverse economic conditions, changes in the general outlook for revenues or corporate earnings, changes in interest or currency rates, regional or global instability, natural or environmental disasters, widespread disease or other public health issues, war, acts of terrorism, significant governmental actions or adverse investor sentiment generally and market liquidity. Because of the inherent uncertainties of valuation, the values reflected in the financial statements may materially differ from the value received upon actual sale of those investments.
The price the Fund could receive upon the sale of any investment may differ from the Adviser’s valuation of the investment, particularly for securities that are valued using a fair valuation technique. When fair valuation techniques are applied, the Adviser uses available information, including both observable and unobservable inputs and assumptions, to determine a methodology that will result in a valuation that the Adviser believes approximates market value. Fund securities that are fair valued may be subject to greater fluctuation in their value from one day to the next than would be the case if market quotations were used. Because of the inherent uncertainties of valuation, and the degree of subjectivity in such decisions, the Fund could realize a greater or lesser than expected gain or loss upon the sale of the investment.
| B. | Securities Transactions and Investment Income - Securities transactions are accounted for on a trade date basis. Realized gains or losses on sales are computed on the basis of specific identification of the securities sold. Interest income (net of withholding tax, if any) is recorded on an accrual basis from settlement date and includes coupon interest and amortization of premium and accretion of discount on debt securities as applicable. Pay-in-kind interest income and non-cash dividend income received in the form of securities in-lieu of cash are recorded at the fair value of the securities received. Paydown gains and losses on mortgage and asset-backed securities are recorded as adjustments to interest income. Dividend income (net of withholding tax, if any) is recorded on the ex-dividend date. |
The Fund may periodically participate in litigation related to Fund investments. As such, the Fund may receive proceeds from litigation settlements. Any proceeds received are included in the Statement of Operations as realized gain (loss) for investments no longer held and as unrealized gain (loss) for investments still held.
Brokerage commissions and mark ups are considered transaction costs and are recorded as an increase to the cost basis of securities purchased and/or a reduction of proceeds on a sale of securities. Such transaction costs are included in the determination of net realized and unrealized gain (loss) from investment securities reported in the Statement of Operations and the Statement of Changes in Net Assets and the net realized and unrealized gains (losses) on securities per share in the Financial Highlights. Transaction costs are included in the calculation of the Fund’s net asset value and, accordingly, they reduce the Fund’s total returns. These transaction costs are not considered operating expenses and are not reflected in net investment income reported in the Statement of Operations and the Statement of Changes in Net Assets, or the net investment income per share and the ratios of expenses and net investment income reported in the Financial Highlights, nor are they limited by any expense limitation arrangements between the Fund and the investment adviser.
The Fund allocates realized and unrealized capital gains and losses to a class based on the relative net assets of each class. The Fund allocates income to a class based on the relative value of the settled shares of each class.
| C. | Country Determination - For the purposes of making investment selection decisions and presentation in the Schedule of Investments, the investment adviser |
49 Invesco Rochester® Municipal Opportunities Fund
| | may determine the country in which an issuer is located and/or credit risk exposure based on various factors. These factors include the laws of the country under which the issuer is organized, where the issuer maintains a principal office, the country in which the issuer derives 50% or more of its total revenues, the country that has the primary market for the issuer’s securities and its “country of risk” as determined by a third party service provider, as well as other criteria. Among the other criteria that may be evaluated for making this determination are the country in which the issuer maintains 50% or more of its assets, the type of security, financial guarantees and enhancements, the nature of the collateral and the sponsor organization. Country of issuer and/or credit risk exposure has been determined to be the United States of America, unless otherwise noted. |
| D. | Distributions - Distributions from net investment income, if any, are declared daily and paid monthly. Distributions from net realized capital gain, if any, are generally declared and paid annually and recorded on the ex-dividend date. The Fund may elect to treat a portion of the proceeds from redemptions as distributions for federal income tax purposes. |
| E. | Federal Income Taxes - The Fund intends to comply with the requirements of Subchapter M of the Internal Revenue Code of 1986, as amended (the “Internal Revenue Code”), necessary to qualify as a regulated investment company and to distribute substantially all of the Fund’s taxable and tax-exempt earnings to shareholders. As such, the Fund will not be subject to federal income taxes on otherwise taxable income (including net realized capital gain) that is distributed to shareholders. Therefore, no provision for federal income taxes is recorded in the financial statements. |
The Fund recognizes the tax benefits of uncertain tax positions only when the position is more likely than not to be sustained. Management has analyzed the Fund’s uncertain tax positions and concluded that no liability for unrecognized tax benefits should be recorded related to uncertain tax positions. Management is not aware of any tax positions for which it is reasonably possible that the total amounts of unrecognized tax benefits will change materially in the next 12 months.
In addition, the Fund intends to invest in such municipal securities to allow it to qualify to pay shareholders “exempt-interest dividends”, as defined in the Internal Revenue Code.
The Fund files tax returns in the U.S. Federal jurisdiction and certain other jurisdictions. Generally, the Fund is subject to examinations by such taxing authorities for up to three years after the filing of the return for the tax period.
| F. | Expenses - Fees provided for under the Rule 12b-1 plan of a particular class of the Fund are charged to the operations of such class. Transfer agency fees and expenses and other shareholder recordkeeping fees and expenses attributable to Class R5 and Class R6 are allocated based on relative net assets of Class R5 and Class R6. Sub-accounting fees attributable to Class R5 are charged to the operations of the class. Transfer agency fees and expenses and other shareholder recordkeeping fees and expenses relating to all other classes are allocated among those classes based on relative net assets. All other expenses are allocated among the classes based on relative net assets. |
| G. | Interest, Facilities and Maintenance Fees - Interest, Facilities and Maintenance Fees include interest and related borrowing costs such as commitment fees, administrative expenses and other expenses associated with establishing and maintaining the line of credit. In addition, interest and administrative expenses related to establishing and maintaining floating rate note obligations, if any, are included. |
| H. | Accounting Estimates - The preparation of financial statements in conformity with accounting principles generally accepted in the United States of America (“GAAP”) requires management to make estimates and assumptions that affect the reported amounts of assets and liabilities at the date of the financial statements and the reported amounts of revenues and expenses during the reporting period including estimates and assumptions related to taxation. Actual results could differ from those estimates by a significant amount. In addition, the Fund monitors for material events or transactions that may occur or become known after the period-end date and before the date the financial statements are released to print. |
| I. | Indemnifications - Under the Trust’s organizational documents, each Trustee, officer, employee or other agent of the Trust is indemnified against certain liabilities that may arise out of the performance of their duties to the Fund. Additionally, in the normal course of business, the Fund enters into contracts, including the Fund’s servicing agreements, that contain a variety of indemnification clauses. The Fund’s maximum exposure under these arrangements is unknown as this would involve future claims that may be made against the Fund that have not yet occurred. The risk of material loss as a result of such indemnification claims is considered remote. |
| J. | Securities Purchased on a When-Issued and Delayed Delivery Basis - The Fund may purchase and sell interests in corporate loans and corporate debt securities and other portfolio securities on a when-issued and delayed delivery basis, with payment and delivery scheduled for a future date. No income accrues to the Fund on such interests or securities in connection with such transactions prior to the date the Fund actually takes delivery of such interests or securities. These transactions are subject to market fluctuations and are subject to the risk that the value at delivery may be more or less than the trade date purchase price. Although the Fund will generally purchase these securities with the intention of acquiring such securities, they may sell such securities prior to the settlement date. |
| K. | Floating Rate Note Obligations - The Fund invests in inverse floating rate securities, such as Tender Option Bonds (“TOBs”), for investment purposes and to enhance the yield of the Fund. Such securities may be purchased in the secondary market without first owning an underlying bond but generally are created through the sale of fixed rate bonds by the Fund to special purpose trusts established by a broker dealer or by the Fund (“TOB Trusts”) in exchange for cash and residual interests in the TOB Trusts’ assets and cash flows, which are in the form of inverse floating rate securities. The TOB Trusts finance the purchases of the fixed rate bonds by issuing floating rate notes to third parties and allowing the Fund to retain residual interests in the bonds. The floating rate notes issued by the TOB Trusts have interest rates that reset weekly and the floating rate note holders have the option to tender their notes to the TOB Trusts for redemption at par at each reset date. The residual interests held by the Fund (inverse floating rate securities) include the right of the Fund (1) to cause the holders of the floating rate notes to tender their notes at par at the next interest rate reset date, and (2) to transfer the municipal bond from the TOB Trust to the Fund, thereby collapsing the TOB Trust. Inverse floating rate securities tend to underperform the market for fixed rate bonds in a rising interest rate environment, but tend to outperform the market for fixed rate bonds when interest rates decline or remain relatively stable. |
The Fund generally invests in inverse floating rate securities that include embedded leverage, thus exposing the Fund to greater risks and increased costs. The primary risks associated with inverse floating rate securities are varying degrees of liquidity and decreases in the value of such securities in response to changes in interest rates to a greater extent than fixed rate securities having similar credit quality, redemption provisions and maturity, which may cause the Fund’s net asset value to be more volatile than if it had not invested in inverse floating rate securities. In certain instances, the short-term floating rate notes created by the TOB Trust may not be able to be sold to third parties or, in the case of holders tendering (or putting) such notes for repayment of principal, may not be able to be remarketed to third parties. In such cases, the TOB Trust holding the fixed rate bonds may be collapsed with the entity that contributed the fixed rate bonds to the TOB Trust. In the case where a TOB Trust is collapsed with the Fund, the Fund will be required to repay the principal amount of the tendered securities, which may require the Fund to sell other portfolio holdings to raise cash to meet that obligation. The Fund could therefore be required to sell other portfolio holdings at a disadvantageous time or price to raise cash to meet this obligation, which risk will be heightened during times of market volatility, illiquidity or uncertainty. The embedded leverage in the TOB Trust could cause the Fund to lose more money than the value of the asset it has contributed to the TOB Trust and greater levels of leverage create the potential for greater losses. In addition, a Fund may enter into reimbursement agreements with the liquidity provider of certain TOB transactions in connection with certain residuals held by the Fund. These agreements commit a Fund to reimburse the liquidity provider to the extent that the liquidity provider must provide cash to a TOB Trust, including following the termination of a TOB Trust resulting from a mandatory tender event (“liquidity shortfall”). The reimbursement agreement will effectively make the Fund liable for the amount of the negative difference, if any, between the liquidation value of the underlying security and the purchase price of the floating rate notes issued by the TOB Trust.
The Fund accounts for the transfer of fixed rate bonds to the TOB Trusts as secured borrowings, with the securities transferred remaining in the Fund’s investment assets, and the related floating rate notes reflected as Fund liabilities under the caption Floating rate note obligations on the Statement of Assets and Liabilities. The carrying amount of the Fund’s floating rate note obligations as reported on the Statement of Assets and Liabilities approximates its fair value. The
50 Invesco Rochester® Municipal Opportunities Fund
Fund records the interest income from the fixed rate bonds under the caption Interest and records the expenses related to floating rate obligations and any administrative expenses of the TOB Trusts as a component of Interest, facilities and maintenance fees on the Statement of Operations.
Final rules implementing section 619 of the Dodd-Frank Wall Street Reform and Consumer Protection Act (the “Volcker Rule”) prohibit banking entities from engaging in proprietary trading of certain instruments and limit such entities’ investments in, and relationships with, “covered funds”, as defined in the rules. These rules preclude banking entities and their affiliates from sponsoring and/or providing services for existing TOB Trusts. A new TOB structure is being utilized by the Fund wherein the Fund, as holder of the residuals, will perform certain duties previously performed by banking entities as “sponsors” of TOB Trusts. These duties may be performed by a third-party service provider. The Fund’s expanded role under the new TOB structure may increase its operational and regulatory risk. The new structure is substantially similar to the previous structure; however, pursuant to the Volcker Rule, the remarketing agent would not be able to repurchase tendered floaters for its own account upon a failed remarketing. In the event of a failed remarketing, a banking entity serving as liquidity provider may loan the necessary funds to the TOB Trust to purchase the tendered floaters. The TOB Trust, not the Fund, would be the borrower and the loan from the liquidity provider will be secured by the purchased floaters now held by the TOB Trust. However, as previously described, the Fund would bear the risk of loss with respect to any liquidity shortfall to the extent it entered into a reimbursement agreement with the liquidity provider.
Further, the SEC and various banking agencies have adopted rules implementing credit risk retention requirements for asset-backed securities (the “Risk Retention Rules”). The Risk Retention Rules require the sponsor of a TOB Trust to retain at least 5% of the credit risk of the underlying assets supporting the TOB Trust’s municipal bonds. The Fund has adopted policies intended to comply with the Risk Retention Rules. The Risk Retention Rules may adversely affect the Fund’s ability to engage in TOB Trust transactions or increase the costs of such transactions in certain circumstances.
There can be no assurances that the new TOB structure will continue to be a viable form of leverage. Further, there can be no assurances that alternative forms of leverage will be available to the Fund in order to maintain current levels of leverage. Any alternative forms of leverage may be less advantageous to the Fund, and may adversely affect the Fund’s net asset value, distribution rate and ability to achieve its investment objective.
TOBs are presently classified as private placement securities. Private placement securities are subject to restrictions on resale because they have not been registered under the Securities Act of 1933, as amended (the “1933 Act”), or are otherwise not readily marketable. As a result of the absence of a public trading market for these securities, they may be less liquid than publicly traded securities. Although atypical, these securities may be resold in privately negotiated transactions, the prices realized from these sales could be less than those originally paid by the Fund or less than what may be considered the fair value of such securities.
| L. | Other Risks - The Fund may invest in lower-quality debt securities, i.e., “junk bonds”. Investments in lower-rated securities or unrated securities of comparable quality tend to be more sensitive to economic conditions than higher rated securities. Junk bonds involve a greater risk of default by the issuer because such securities are generally unsecured and are often subordinated to other creditors’ claims. Junk bonds are less liquid than investment grade debt securities and their prices tend to be more volatile. |
The municipal issuers in which the Fund invests may be located in the same geographic area or may pay their interest obligations from revenue of similar projects, such as hospitals, airports, utility systems and housing finance agencies. This may make the Fund’s investments more susceptible to similar social, economic, political or regulatory occurrences, making the Fund more susceptible to experience a drop in its share price than if the Fund had been more diversified across issuers that did not have similar characteristics.
| M. | COVID-19 Risk - The COVID-19 strain of coronavirus has resulted in instances of market closures and dislocations, extreme volatility, liquidity constraints and increased trading costs. Efforts to contain its spread have resulted in travel restrictions, disruptions of healthcare systems, business operations (including business closures) and supply chains, layoffs, lower consumer demand and employee availability, and defaults and credit downgrades, among other significant economic impacts that have disrupted global economic activity across many industries. Such economic impacts may exacerbate other pre-existing political, social and economic risks locally or globally and cause general concern and uncertainty. The full economic impact and ongoing effects of COVID-19 (or other future epidemics or pandemics) at the macro-level and on individual businesses are unpredictable and may result in significant and prolonged effects on the Fund’s performance. |
NOTE 2–Advisory Fees and Other Fees Paid to Affiliates
The Trust has entered into a master investment advisory agreement with the Adviser. Under the terms of the investment advisory agreement, the Fund accrues daily and pays monthly an advisory fee to the Adviser based on the annual rate of the Fund’s average daily net assets as follows:
| | | | |
Average Daily Net Assets | | | Rate* | |
First to $200 million | | | 0.600 | % |
Next $100 million | | | 0.550 | % |
Next $200 million | | | 0.500 | % |
Next $250 million | | | 0.450 | % |
Next $250 million | | | 0.400 | % |
Next $10 billion | | | 0.350 | % |
Over $11 billion | | | 0.340 | % |
| * | The advisory fee paid by the Fund shall be reduced by any amounts paid by the Fund under the administrative services agreement with the Adviser. |
For the year ended February 28, 2023, the effective advisory fee rate incurred by the Fund was 0.35%.
Under the terms of a master sub-advisory agreement between the Adviser and each of Invesco Asset Management Deutschland GmbH, Invesco Asset Management Limited, Invesco Asset Management (Japan) Limited, Invesco Hong Kong Limited, Invesco Senior Secured Management, Inc. and Invesco Canada Ltd. and separate sub-advisory agreements with Invesco Capital Management LLC and Invesco Asset Management (India) Private Limited (collectively, the “Affiliated Sub-Advisers”) the Adviser, not the Fund, will pay 40% of the fees paid to the Adviser to any such Affiliated Sub-Adviser(s) that provide(s) discretionary investment management services to the Fund based on the percentage of assets allocated to such Affiliated Sub-Adviser(s).
The Adviser has contractually agreed, through at least June 30, 2023, to waive advisory fees and/or reimburse expenses of all shares to the extent necessary to limit total annual fund operating expenses after fee waiver and/or expense reimbursement (excluding certain items discussed below) of Class A, Class C, Class Y, Class R5 and Class R6 shares to 1.50%, 2.15%, 1.25%, 1.25% and 1.25%, respectively, of the Fund’s average daily net assets (the “expense limits”). In determining the Adviser’s obligation to waive advisory fees and/or reimburse expenses, the following expenses are not taken into account, and could cause the total annual fund operating expenses after fee waiver and/or expense reimbursement to exceed the numbers reflected above: (1) interest, facilities and maintenance fees; (2) taxes; (3) dividend expense on short sales; (4) extraordinary or non-routine items, including litigation expenses; and (5) expenses that the Fund has incurred but did not actually pay because of an expense offset arrangement. Unless Invesco continues the fee waiver agreement, it will terminate on June 30, 2023. During its term, the fee waiver agreement cannot be terminated or amended to increase the expense limits or reduce the advisory fee waiver without approval of the Board of Trustees. The Adviser did not waive fees and/or reimburse expenses during the reporting period under these expense limits.
51 Invesco Rochester® Municipal Opportunities Fund
The Trust has entered into a master administrative services agreement with Invesco pursuant to which the Fund has agreed to pay Invesco for certain administrative costs incurred in providing accounting services to the Fund. For the year ended February 28, 2023, expenses incurred under the agreement are shown in the Statement of Operations as Administrative services fees. Invesco has entered into a sub-administration agreement whereby State Street Bank and Trust Company (“SSB”) serves as fund accountant and provides certain administrative services to the Fund. Pursuant to a custody agreement with the Trust on behalf of the Fund, SSB also serves as the Fund’s custodian.
The Trust has entered into a transfer agency and service agreement with Invesco Investment Services, Inc. (“IIS”) pursuant to which the Fund has agreed to pay IIS a fee for providing transfer agency and shareholder services to the Fund and reimburse IIS for certain expenses incurred by IIS in the course of providing such services. IIS may make payments to intermediaries that provide omnibus account services, sub-accounting services and/or networking services. All fees payable by IIS to intermediaries that provide omnibus account services or sub-accounting services are charged back to the Fund, subject to certain limitations approved by the Trust’s Board of Trustees. For the year ended February 28, 2023, expenses incurred under the agreement are shown in the Statement of Operations as Transfer agent fees.
The Trust has entered into master distribution agreements with Invesco Distributors, Inc. (“IDI”) to serve as the distributor for the Class A, Class C, Class Y and Class R6 shares of the Fund. The Trust has adopted plans pursuant to Rule 12b-1 under the 1940 Act with respect to the Fund’s Class A and Class C shares (collectively, the “Plans”). The Fund, pursuant to the Class A Plan, reimburses IDI for its allocated share of expenses incurred for the period, up to a maximum annual rate of 0.25% of the average daily net assets of Class A shares. The Fund pursuant to the Class C Plan, pays IDI compensation at the annual rate of 0.90% of the average daily net assets of Class C shares. The fees are accrued daily and paid monthly. Of the Plan payments, up to 0.25% of the average daily net assets of each class of shares may be paid to furnish continuing personal shareholder services to customers who purchase and own shares of such classes. Any amounts not paid as a service fee under the Plans would constitute an asset-based sales charge. Rules of the Financial Industry Regulatory Authority (“FINRA”) impose a cap on the total sales charges, including asset-based sales charges, that may be paid by any class of shares of the Fund. For the year ended February 28, 2023, expenses incurred under the Plans are shown in the Statement of Operations as Distribution fees.
Front-end sales commissions and CDSC (collectively, the “sales charges”) are not recorded as expenses of the Fund. Front-end sales commissions are deducted from proceeds from the sales of Fund shares prior to investment in Class A shares of the Fund. CDSC are deducted from redemption proceeds prior to remittance to the shareholder. During the year ended February 28, 2023, IDI advised the Fund that IDI retained $227,881 in front-end sales commissions from the sale of Class A shares and $494,756 and $142,792 from Class A and Class C shares, respectively, for CDSC imposed upon redemptions by shareholders.
Certain officers and trustees of the Trust are officers and directors of the Adviser, IIS and/or IDI.
NOTE 3–Additional Valuation Information
GAAP defines fair value as the price that would be received to sell an asset or paid to transfer a liability in an orderly transaction between market participants at the measurement date, under current market conditions. GAAP establishes a hierarchy that prioritizes the inputs to valuation methods, giving the highest priority to readily available unadjusted quoted prices in an active market for identical assets (Level 1) and the lowest priority to significant unobservable inputs (Level 3), generally when market prices are not readily available. Based on the valuation inputs, the securities or other investments are tiered into one of three levels. Changes in valuation methods may result in transfers in or out of an investment’s assigned level:
| | |
| Level 1 - | | Prices are determined using quoted prices in an active market for identical assets. |
| Level 2 - | | Prices are determined using other significant observable inputs. Observable inputs are inputs that other market participants may use in pricing a security. These may include quoted prices for similar securities, interest rates, prepayment speeds, credit risk, yield curves, loss severities, default rates, discount rates, volatilities and others. |
| Level 3 - | | Prices are determined using significant unobservable inputs. In situations where quoted prices or observable inputs are unavailable (for example, when there is little or no market activity for an investment at the end of the period), unobservable inputs may be used. Unobservable inputs reflect the Adviser’s assumptions about the factors market participants would use in determining fair value of the securities or instruments and would be based on the best available information. |
The following is a summary of the tiered valuation input levels, as of February 28, 2023. The level assigned to the securities valuations may not be an indication of the risk or liquidity associated with investing in those securities. Because of the inherent uncertainties of valuation, the values reflected in the financial statements may materially differ from the value received upon actual sale of those investments.
| | | | | | | | | | | | | | | | | | | | | | | | | | | | |
| | | Level 1 | | | | | | Level 2 | | | | | | Level 3 | | | | | | Total | |
|
| |
Investments in Securities | | | | | | | | | | | | | | | | | | | | | | | | | | | | |
|
| |
Municipal Obligations | | $ | – | | | | | | | $ | 8,814,739,530 | | | | | | | $ | 80,469,557 | | | | | | | $ | 8,895,209,087 | |
|
| |
U.S. Dollar Denominated Bonds & Notes | | | – | | | | | | | | 22,941,984 | | | | | | | | 9,220,000 | | | | | | | | 32,161,984 | |
|
| |
Common Stocks & Other Equity Interests | | | 28,367,735 | | | | | | | | – | | | | | | | | – | | | | | | | | 28,367,735 | |
|
| |
Total Investments in Securities | | | 28,367,735 | | | | | | | | 8,837,681,514 | | | | | | | | 89,689,557 | | | | | | | | 8,955,738,806 | |
|
| |
| | | | | | | |
Other Investments - Assets | | | | | | | | | | | | | | | | | | | | | | | | | | | | |
|
| |
Investments Matured | | | – | | | | | | | | 7,802,588 | | | | | | | | 19,929,742 | | | | | | | | 27,732,330 | |
|
| |
Total Investments | | | $28,367,735 | | | | | | | $ | 8,845,484,102 | | | | | | | $ | 109,619,299 | | | | | | | $ | 8,983,471,136 | |
|
| |
A reconciliation of Level 3 investments is presented when the Fund had a significant amount of Level 3 investments at the beginning and/or end of the reporting period in relation to net assets.
The following is a reconciliation of the fair valuations using significant unobservable inputs (Level 3) during the year ended February 28, 2023:
| | | | | | | | | | | | | | | | | | | | | | | | | | | | | | | | | | | | |
| | | Value 02/28/22* | | | Purchases at Cost | | | Proceeds from Sales | | | Accrued
Discounts/
Premiums | | | Realized Gain (Loss) | | | Change in Unrealized Appreciation | | | Transfers into Level 3 | | | Transfers out of Level 3 | | | Value 02/28/23 | |
Municipal Obligations | | $ | 93,480,874 | | | $ | 587,475 | | | $ | (6,290,195 | ) | | $ | 160,659 | | | $ | (35,545,865 | ) | | $ | 33,219,127 | | | $ | 845,000 | | | $ | (5,987,518 | ) | | $ | 80,469,557 | |
Investments Matured | | | 24,533,829 | | | | 54,500 | | | | (1,262,410 | ) | | | (32,619 | ) | | | (12,114,270 | ) | | | 8,750,472 | | | | 240 | | | | – | | | | 19,929,742 | |
U.S. Dollar Denominated Bonds & Notes | | | 13,881,545 | | | | 4,395,000 | | | | (1,300,500 | ) | | | – | | | | (17,949,500 | ) | | | 18,358,691 | | | | 4,821,309 | | | | (12,986,545 | ) | | | 9,220,000 | |
Total | | $ | 131,896,248 | | | $ | 5,036,975 | | | $ | (8,853,105 | ) | | $ | 128,040 | | | $ | (65,609,635 | ) | | $ | 60,328,290 | | | $ | 5,666,549 | | | $ | (18,974,063 | ) | | $ | 109,619,299 | |
| * | Prior year balances have been adjusted for a change in security classification. |
Securities determined to be Level 3 at the end of the reporting period were valued primarily by utilizing evaluated prices from a third-party vendor pricing service. A significant change in third-party pricing information could result in a lower or higher value in Level 3 investments.
52 Invesco Rochester® Municipal Opportunities Fund
NOTE 4–Security Transactions with Affiliated Funds
The Fund is permitted to purchase securities from or sell securities to certain other affiliated funds under specified conditions outlined in procedures adopted by the Board of Trustees of the Trust. The procedures have been designed to ensure that any purchase or sale of securities by the Fund from or to another fund that is or could be considered an “affiliated person” by virtue of having a common investment adviser (or affiliated investment advisers), common Trustees and/or common officers is made in reliance on Rule 17a-7 of the 1940 Act and, to the extent applicable, related SEC staff positions. Each such transaction is effected at the security’s “current market price”, as provided for in these procedures and Rule 17a-7. Pursuant to these procedures, for the year ended February 28, 2023, the Fund engaged in securities sales of $49,835,298, which resulted in net realized gains (losses) of $(783,730).
NOTE 5–Expense Offset Arrangement(s)
The expense offset arrangement is comprised of transfer agency credits which result from balances in demand deposit accounts used by the transfer agent for clearing shareholder transactions. For the year ended February 28, 2023, the Fund received credits from this arrangement, which resulted in the reduction of the Fund’s total expenses of $7,313.
NOTE 6–Trustees’ and Officers’ Fees and Benefits
Trustees’ and Officers’ Fees and Benefits include amounts accrued by the Fund to pay remuneration to certain Trustees and Officers of the Fund. Trustees have the option to defer compensation payable by the Fund, and Trustees’ and Officers’ Fees and Benefits also include amounts accrued by the Fund to fund such deferred compensation amounts. Those Trustees who defer compensation have the option to select various Invesco Funds in which their deferral accounts shall be deemed to be invested. Finally, certain current Trustees were eligible to participate in a retirement plan that provided for benefits to be paid upon retirement to Trustees over a period of time based on the number of years of service. The Fund may have certain former Trustees who also participate in a retirement plan and receive benefits under such plan. Trustees’ and Officers’ Fees and Benefits include amounts accrued by the Fund to fund such retirement benefits. Obligations under the deferred compensation and retirement plans represent unsecured claims against the general assets of the Fund.
NOTE 7–Cash Balances and Borrowings
The Fund has entered into a revolving credit and security agreement, which enables the Fund to participate with certain other Invesco Funds in a committed secured borrowing facility that permits borrowings up to $2.5 billion, collectively by certain Invesco Funds, and which will expire on February 22, 2024. The revolving credit and security agreement is secured by the assets of the Fund. The Fund is subject to certain covenants relating to the revolving credit and security agreement. Failure to comply with these restrictions could cause the acceleration of the repayment of the amount outstanding under the revolving credit and security agreement.
During the year ended February 28, 2023, the average daily balance of borrowing under the revolving credit and security agreement was $115,993,407 with an average interest rate of 2.03%. The carrying amount of the Fund’s payable for borrowings as reported on the Statement of Assets and Liabilities approximates its fair value. Expenses under the revolving credit and security agreement are shown in the Statement of Operations as Interest, facilities and maintenance fees.
Additionally, the Fund is permitted to temporarily carry a negative or overdrawn balance in its account with SSB, the custodian bank. Such balances, if any at period-end, are shown in the Statement of Assets and Liabilities under the payable caption Amount due custodian. To compensate the custodian bank for such overdrafts, the overdrawn Fund may either (1) leave funds as a compensating balance in the account so the custodian bank can be compensated by earning the additional interest; or (2) compensate by paying the custodian bank at a rate agreed upon by the custodian bank and Invesco, not to exceed the contractually agreed upon rate. The Fund may not purchase additional securities when any borrowings from banks or broker-dealers exceed 5% of the Fund’s total assets, or when any borrowings from an Invesco Fund are outstanding.
Inverse floating rate obligations resulting from the transfer of bonds to TOB Trusts are accounted for as secured borrowings. The average floating rate notes outstanding and average annual interest and fee rate related to inverse floating rate note obligations during the year ended February 28, 2023 were $1,142,437,692 and 3.25%, respectively.
NOTE 8–Distributions to Shareholders and Tax Components of Net Assets
Tax Character of Distributions to Shareholders Paid During the Fiscal Years Ended February 28, 2023 and 2022:
| | | | | | | | |
| | |
| | | 2023 | | | 2022 | |
| | |
Ordinary income* | | $ | 21,004,668 | | | $ | 7,057,408 | |
| | |
Ordinary income-tax-exempt | | | 349,356,966 | | | | 389,279,883 | |
| | |
Total distributions | | $ | 370,361,634 | | | $ | 396,337,291 | |
| * | Includes short-term capital gain distributions, if any. |
Tax Components of Net Assets at Period-End:
| | | | |
| | | 2023 | |
| |
Undistributed tax-exempt income | | $ | 153,616,435 | |
| |
Net unrealized appreciation (depreciation) – investments | | | (782,668,486 | ) |
| |
Temporary book/tax differences | | | (497,479 | ) |
| |
Capital loss carryforward | | | (2,091,315,147 | ) |
| |
Shares of beneficial interest | | | 10,575,344,941 | |
| |
Total net assets | | $ | 7,854,480,264 | |
| |
The difference between book-basis and tax-basis unrealized appreciation (depreciation) is due to differences in the timing of recognition of gains and losses on investments for tax and book purposes. The Fund’s net unrealized appreciation (depreciation) difference is attributable primarily to wash sales, defaulted bonds and amortization and accretion on debt securities.
The temporary book/tax differences are a result of timing differences between book and tax recognition of income and/or expenses. The Fund’s temporary book/tax differences are the result of the trustee deferral of compensation and retirement plan benefits.
53 Invesco Rochester® Municipal Opportunities Fund
Capital loss carryforward is calculated and reported as of a specific date. Results of transactions and other activity after that date may affect the amount of capital loss carryforward actually available for the Fund to utilize. The ability to utilize capital loss carryforward in the future may be limited under the Internal Revenue Code and related regulations based on the results of future transactions.
The Fund has a capital loss carryforward as of February 28, 2023, as follows:
| | | | | | | | | | | | | | | | | | | | |
Capital Loss Carryforward* | |
| Expiration | | Short-Term | | | | | | Long-Term | | | | | | Total | |
|
| |
Not subject to expiration | | $ | 369,756,281 | | | | | | | $ | 1,721,558,866 | | | | | | | $ | 2,091,315,147 | |
|
| |
| * | Capital loss carryforward is reduced for limitations, if any, to the extent required by the Internal Revenue Code and may be further limited depending upon a variety of factors, including the realization of net unrealized gains or losses as of the date of any reorganization. |
NOTE 9–Investment Transactions
The aggregate amount of investment securities (other than short-term securities, U.S. Government obligations and money market funds, if any) purchased and sold by the Fund during the year ended February 28, 2023 was $4,099,153,231 and $4,081,295,477, respectively. Cost of investments, including any derivatives, on a tax basis includes the adjustments for financial reporting purposes as of the most recently completed federal income tax reporting period-end.
| | | | |
Unrealized Appreciation (Depreciation) of Investments on a Tax Basis | |
Aggregate unrealized appreciation of investments | | $ | 178,262,643 | |
|
| |
Aggregate unrealized (depreciation) of investments | | | (960,931,129 | ) |
|
| |
Net unrealized appreciation (depreciation) of investments | | $ | (782,668,486 | ) |
|
| |
Cost of investments for tax purposes is $9,766,139,622.
NOTE 10–Reclassification of Permanent Differences
Primarily as a result of differing book/tax treatment of market discounts and defaulted bonds, on February 28, 2023, undistributed net investment income was increased by $74,560,919, undistributed net realized gain (loss) was decreased by $79,370,039 and shares of beneficial interest was increased by $4,809,120. This reclassification had no effect on the net assets of the Fund.
NOTE 11–Share Information
| | | | | | | | | | | | | | | | |
| | | Summary of Share Activity | |
|
| |
| | |
| | | Year ended | | | Year ended | |
| | | February 28, 2023(a) | | | February 28, 2022 | |
| | | Shares | | | Amount | | | Shares | | | Amount | |
|
| |
Sold: | | | | | | | | | | | | | | | | |
Class A | | | 146,689,767 | | | $ | 1,017,506,298 | | | | 134,785,886 | | | $ | 1,095,971,789 | |
|
| |
Class C | | | 17,343,945 | | | | 119,979,909 | | | | 26,026,851 | | | | 210,841,344 | |
|
| |
Class Y | | | 412,578,057 | | | | 2,855,699,579 | | | | 290,348,459 | | | | 2,357,332,982 | |
|
| |
Class R5 | | | - | | | | - | | | | 221,690 | | | | 1,806,015 | |
|
| |
Class R6 | | | 29,368,434 | | | | 202,587,945 | | | | 20,360,728 | | | | 166,479,305 | |
|
| |
| | | | |
Issued as reinvestment of dividends: | | | | | | | | | | | | | | | | |
Class A | | | 12,032,176 | | | | 82,948,684 | | | | 11,182,501 | | | | 90,628,869 | |
|
| |
Class C | | | 2,053,630 | | | | 14,113,566 | | | | 1,951,706 | | | | 15,743,146 | |
|
| |
Class Y | | | 11,745,225 | | | | 80,892,681 | | | | 11,071,301 | | | | 89,594,872 | |
|
| |
Class R5 | | | 5,940 | | | | 41,746 | | | | 40,291 | | | | 326,685 | |
|
| |
Class R6 | | | 172,729 | | | | 1,187,571 | | | | 166,508 | | | | 1,353,115 | |
|
| |
| | | | |
Automatic conversion of Class C shares to Class A shares: | | | | | | | | | | | | | | | | |
Class A | | | 7,116,547 | | | | 49,511,990 | | | | 7,376,104 | | | | 59,857,827 | |
|
| |
Class C | | | (7,147,445 | ) | | | (49,511,990 | ) | | | (7,409,768 | ) | | | (59,857,827 | ) |
|
| |
| | | | |
Reacquired: | | | | | | | | | | | | | | | | |
Class A | | | (187,995,073 | ) | | | (1,305,645,798 | ) | | | (105,504,006 | ) | | | (851,719,327 | ) |
|
| |
Class C | | | (26,924,140 | ) | | | (186,307,220 | ) | | | (13,678,047 | ) | | | (110,149,095 | ) |
|
| |
Class Y | | | (391,679,127 | ) | | | (2,702,465,393 | ) | | | (208,273,929 | ) | | | (1,671,401,452 | ) |
|
| |
Class R5 | | | (725,242 | ) | | | (5,258,065 | ) | | | (453,880 | ) | | | (3,656,906 | ) |
|
| |
Class R6 | | | (23,470,538 | ) | | | (162,231,457 | ) | | | (15,354,740 | ) | | | (124,215,902 | ) |
|
| |
Net increase in share activity | | | 1,164,885 | | | $ | 13,050,046 | | | | 152,857,655 | | | $ | 1,268,935,440 | |
|
| |
| (a) | There are entities that are record owners of more than 5% of the outstanding shares of the Fund and in the aggregate own 64% of the outstanding shares of the Fund. IDI has an agreement with these entities to sell Fund shares. The Fund, Invesco and/or Invesco affiliates may make payments to these entities, which are considered to be related to the Fund, for providing services to the Fund, Invesco and/or Invesco affiliates including but not limited to services such as securities brokerage, distribution, third party record keeping and account servicing. The Fund has no knowledge as to whether all or any portion of the shares owned of record by these entities are also owned beneficially. |
54 Invesco Rochester® Municipal Opportunities Fund
Report of Independent Registered Public Accounting Firm
To the Board of Trustees of AIM Tax-Exempt Funds (Invesco Tax-Exempt Funds) and Shareholders of Invesco Rochester® Municipal Opportunities Fund
Opinion on the Financial Statements
We have audited the accompanying statement of assets and liabilities, including the schedule of investments, of Invesco Rochester® Municipal Opportunities Fund (one of the funds constituting AIM Tax-Exempt Funds (Invesco Tax-Exempt Funds), referred to hereafter as the “Fund”) as of February 28, 2023, the related statement of operations for the year ended February 28, 2023, the statement of changes in net assets for each of the two years in the period ended February 28, 2023, including the related notes, and the financial highlights for each of the periods indicated in the table below (collectively referred to as the “financial statements”). In our opinion, the financial statements present fairly, in all material respects, the financial position of the Fund as of February 28, 2023, the results of its operations for the year then ended, the changes in its net assets for each of the two years in the period ended February 28, 2023 and the financial highlights for each of the periods indicated in the table below, in conformity with accounting principles generally accepted in the United States of America.
Financial Highlights
For each of the three years in the period ended February 28, 2023, the seven months ended February 29, 2020 and the year ended July 31, 2019 for Class A, Class C and Class Y.
For each of the three years in the period ended February 28, 2023, the seven months ended February 29, 2020 and the period May 24, 2019 (commencement date) through July 31, 2019 for Class R5 and Class R6.
The financial statements of Oppenheimer Rochester® High Yield Municipal Fund (subsequently renamed Invesco Rochester® Municipal Opportunities Fund) as of and for the year ended July 31, 2018 and the financial highlights for the year ended July 31, 2018 (not presented herein, other than the financial highlights) were audited by other auditors whose report dated September 27, 2018 expressed an unqualified opinion on those financial statements and financial highlights.
Basis for Opinion
These financial statements are the responsibility of the Fund’s management. Our responsibility is to express an opinion on the Fund’s financial statements based on our audits. We are a public accounting firm registered with the Public Company Accounting Oversight Board (United States) (PCAOB) and are required to be independent with respect to the Fund in accordance with the U.S. federal securities laws and the applicable rules and regulations of the Securities and Exchange Commission and the PCAOB.
We conducted our audits of these financial statements in accordance with the standards of the PCAOB. Those standards require that we plan and perform the audit to obtain reasonable assurance about whether the financial statements are free of material misstatement, whether due to error or fraud.
Our audits included performing procedures to assess the risks of material misstatement of the financial statements, whether due to error or fraud, and performing procedures that respond to those risks. Such procedures included examining, on a test basis, evidence regarding the amounts and disclosures in the financial statements. Our audits also included evaluating the accounting principles used and significant estimates made by management, as well as evaluating the overall presentation of the financial statements. Our procedures included confirmation of securities owned as of February 28, 2023 by correspondence with the custodian, portfolio company investees and brokers. We believe that our audits provide a reasonable basis for our opinion.
/s/PricewaterhouseCoopers LLP
Houston, Texas
April 21, 2023
We have served as the auditor of one or more of the investment companies in the Invesco group of investment companies since at least 1995. We have not been able to determine the specific year we began serving as auditor.
55 Invesco Rochester® Municipal Opportunities Fund
Calculating your ongoing Fund expenses
Example
As a shareholder of the Fund, you incur two types of costs: (1) transaction costs, which may include sales charges (loads) on purchase payments or contingent deferred sales charges on redemptions, if any; and (2) ongoing costs, including management fees, distribution and/or service (12b-1) fees, and other Fund expenses. This example is intended to help you understand your ongoing costs (in dollars) of investing in the Fund and to compare these costs with ongoing costs of investing in other mutual funds. The example is based on an investment of $1,000 invested at the beginning of the period and held for the entire period September 1, 2022 through February 28, 2023.
Actual expenses
The table below provides information about actual account values and actual expenses. You may use the information in this table, together with the amount you invested, to estimate the expenses that you paid over the period. Simply divide your account value by $1,000 (for example, an $8,600 account value divided by $1,000 = 8.6), then multiply the result by the number in the table under the heading entitled “Actual Expenses Paid During Period” to estimate the expenses you paid on your account during this period.
Hypothetical example for comparison purposes
The table below also provides information about hypothetical account values and hypothetical expenses based on the Fund’s actual expense ratio and an assumed rate of return of 5% per year before expenses, which is not the Fund’s actual return.
The hypothetical account values and expenses may not be used to estimate the actual ending account balance or expenses you paid for the period. You may use this information to compare the ongoing costs of investing in the Fund and other funds. To do so, compare this 5% hypothetical example with the 5% hypothetical examples that appear in the shareholder reports of the other funds.
Please note that the expenses shown in the table are meant to highlight your ongoing costs only and do not reflect any transaction costs, such as sales charges (loads) on purchase payments or contingent deferred sales charges on redemptions, if any. Therefore, the hypothetical information is useful in comparing ongoing costs only, and will not help you determine the relative total costs of owning different funds. In addition, if these transaction costs were included, your costs would have been higher.
| | | | | | | | | | | | |
| | | | | ACTUAL | | HYPOTHETICAL (5% annual return before expenses) | | |
| | | Beginning
Account Value
(09/01/22) | | Ending
Account Value
(02/28/23)1 | | Expenses
Paid During
Period2 | | Ending
Account Value
(02/28/23) | | Expenses
Paid During
Period2 | | Annualized
Expense Ratio |
Class A | | $1,000.00 | | $994.40 | | $7.12 | | $1,017.65 | | $7.20 | | 1.44% |
Class C | | 1,000.00 | | 991.00 | | 10.32 | | 1,014.43 | | 10.44 | | 2.09 |
Class Y | | 1,000.00 | | 995.60 | | 5.89 | | 1,018.89 | | 5.96 | | 1.19 |
Class R5 | | 1,000.00 | | 995.70 | | 5.89 | | 1,018.89 | | 5.96 | | 1.19 |
Class R6 | | 1,000.00 | | 995.90 | | 5.54 | | 1,019.24 | | 5.61 | | 1.12 |
| 1 | The actual ending account value is based on the actual total return of the Fund for the period September 1, 2022 through February 28, 2023, after actual expenses and will differ from the hypothetical ending account value which is based on the Fund’s expense ratio and a hypothetical annual return of 5% before expenses. |
| 2 | Expenses are equal to the Fund’s annualized expense ratio as indicated above multiplied by the average account value over the period, multiplied by 181/365 to reflect the most recent fiscal half year. |
56 Invesco Rochester® Municipal Opportunities Fund
Tax Information
Form 1099-DIV, Form 1042-S and other year–end tax information provide shareholders with actual calendar year amounts that should be included in their tax returns. Shareholders should consult their tax advisers.
The following distribution information is being provided as required by the Internal Revenue Code or to meet a specific state’s requirement.
The Fund designates the following amounts or, if subsequently determined to be different, the maximum amount allowable for its fiscal year ended February 28, 2023:
| | | | | | | | |
Federal and State Income Tax | | | | | | |
Qualified Dividend Income* | | | 0.00 | % | | | | |
Corporate Dividends Received Deduction* | | | 0.00 | % | | | | |
U.S. Treasury Obligations* | | | 0.00 | % | | | | |
Qualified Business Income* | | | 0.00 | % | | | | |
Business Interest Income* | | | 0.00 | % | | | | |
Tax-Exempt Interest Dividends* | | | 94.33 | % | | | | |
* The above percentages are based on ordinary income dividends paid to shareholders during the Fund’s fiscal year.
57 Invesco Rochester® Municipal Opportunities Fund
Trustees and Officers
The address of each trustee and officer is AIM Tax-Exempt Funds (Invesco Tax-Exempt Funds) (the “Trust”), 11 Greenway Plaza, Suite 1000, Houston, Texas 77046-1173. The trustees serve for the life of the Trust, subject to their earlier death, incapacitation, resignation, retirement or removal as more specifically provided in the Trust’s organizational documents. Each officer serves for a one year term or until their successors are elected and qualified. Column two below includes length of time served with predecessor entities, if any.
| | | | | | | | |
Name, Year of Birth and Position(s) Held with the Trust | | Trustee and/or Officer Since | | Principal Occupation(s) During Past 5 Years | | Number of Funds in Fund Complex Overseen by Trustee | | Other Directorship(s) Held by Trustee During Past 5 Years |
| Interested Trustee | | | | | | | | |
Martin L. Flanagan1 – 1960 Trustee and Vice Chair | | 2007 | | Executive Director, Chief Executive Officer and President, Invesco Ltd. (ultimate parent of Invesco and a global investment management firm); Trustee and Vice Chair, The Invesco Funds; Vice Chair, Investment Company Institute; and Member of Executive Board, SMU Cox School of Business Formerly: Advisor to the Board, Invesco Advisers, Inc. (formerly known as Invesco Institutional (N.A.), Inc.); Chairman and Chief Executive Officer, Invesco Advisers, Inc. (registered investment adviser); Director, Chairman, Chief Executive Officer and President, Invesco Holding Company (US), Inc. (formerly IVZ Inc.) (holding company), Invesco Group Services, Inc. (service provider) and Invesco North American Holdings, Inc. (holding company); Director, Chief Executive Officer and President, Invesco Holding Company Limited (parent of Invesco and a global investment management firm); Director, Invesco Ltd.; Chairman, Investment Company Institute and President, Co-Chief Executive Officer, Co-President, Chief Operating Officer and Chief Financial Officer, Franklin Resources, Inc. (global investment management organization) | | 175 | | None |
| 1 | Mr. Flanagan is considered an interested person (within the meaning of Section 2(a)(19) of the 1940 Act) of the Trust because he is an officer of the Adviser to the Trust, and an officer and a director of Invesco Ltd., ultimate parent of the Adviser. |
T-1 Invesco Rochester® Municipal Opportunities Fund
Trustees and Officers–(continued)
| | | | | | | | |
Name, Year of Birth and Position(s) Held with the Trust | | Trustee and/or Officer Since | | Principal Occupation(s) During Past 5 Years | | Number of Funds in Fund Complex Overseen by Trustee | | Other Directorship(s) Held by Trustee During Past 5 Years |
| Independent Trustees | | | | | | | | |
Beth Ann Brown – 1968 Trustee (2019) and Chair (August 2022) | | 2019 | | Independent Consultant Formerly: Head of Intermediary Distribution, Managing Director, Strategic Relations, Managing Director, Head of National Accounts, Senior Vice President, National Account Manager and Senior Vice President, Key Account Manager, Columbia Management Investment Advisers LLC; Vice President, Key Account Manager, Liberty Funds Distributor, Inc.; and Trustee of certain Oppenheimer Funds | | 175 | | Director, Board of Directors of Caron Engineering Inc.; Advisor, Board of Advisors of Caron Engineering Inc.; President and Director, Acton Shapleigh Youth Conservation Corps (non-profit) Formerly: President and Director Director of Grahamtastic Connection (non-profit) |
| Cynthia Hostetler –1962 Trustee | | 2017 | | Non-Executive Director and Trustee of a number of public and private business corporations Formerly: Director, Aberdeen Investment Funds (4 portfolios); Director, Artio Global Investment LLC (mutual fund complex); Director, Edgen Group, Inc. (specialized energy and infrastructure products distributor); Director, Genesee & Wyoming, Inc. (railroads); Head of Investment Funds and Private Equity, Overseas Private Investment Corporation; President, First Manhattan Bancorporation, Inc.; and Attorney, Simpson Thacher & Bartlett LLP | | 175 | | Resideo Technologies, Inc. (smart home technology); Vulcan Materials Company (construction materials company); Trilinc Global Impact Fund; Textainer Group Holdings, (shipping container leasing company); Investment Company Institute (professional organization); and Independent Directors Council (professional organization) |
Eli Jones – 1961 Trustee | | 2016 | | Professor and Dean Emeritus, Mays Business School - Texas A&M University Formerly: Dean of Mays Business School-Texas A&M University; Professor and Dean, Walton College of Business, University of Arkansas and E.J. Ourso College of Business, Louisiana State University; and Director, Arvest Bank | | 175 | | Insperity, Inc. (formerly known as Administaff) (human resources provider); Board Member of the regional board, First Financial Bank Texas; and Boad Member, First Financial Bankshares, Inc. Texas (FFIN) |
Elizabeth Krentzman – 1959 Trustee | | 2019 | | Formerly: Principal and Chief Regulatory Advisor for Asset Management Services and U.S. Mutual Fund Leader of Deloitte & Touche LLP; General Counsel of the Investment Company Institute (trade association); National Director of the Investment Management Regulatory Consulting Practice, Principal, Director and Senior Manager of Deloitte & Touche LLP; Assistant Director of the Division of Investment Management - Office of Disclosure and Investment Adviser Regulation of the U.S. Securities and Exchange Commission and various positions with the Division of Investment Management – Office of Regulatory Policy of the U.S. Securities and Exchange Commission; Associate at Ropes & Gray LLP; and Trustee of certain Oppenheimer Funds | | 175 | | Formerly: Member of the Cartica Funds Board of Directors (private investment fund); Trustee of the University of Florida National Board Foundation; and Member of the University of Florida Law Center Association, Inc. Board of Trustees, Audit Committee and Membership Committee |
Anthony J. LaCava, Jr. – 1956 Trustee | | 2019 | | Formerly: Director and Member of the Audit Committee, Blue Hills Bank (publicly traded financial institution) and Managing Partner, KPMG LLP | | 175 | | Blue Hills Bank; Member and Chairman, Bentley University, Business School Advisory Council; and Nominating Committee, KPMG LLP |
Prema Mathai-Davis – 1950 Trustee | | 1998 | | Retired Formerly: Co-Founder & Partner of Quantalytics Research, LLC, (a FinTech Investment Research Platform for the Self-Directed Investor); Trustee of YWCA Retirement Fund; CEO of YWCA of the USA; Board member of the NY Metropolitan Transportation Authority; Commissioner of the NYC Department of Aging; and Board member of Johns Hopkins Bioethics Institute | | 175 | | Member of Board of Positive Planet US (non-profit) and HealthCare Chaplaincy Network (non-profit) |
T-2 Invesco Rochester® Municipal Opportunities Fund
Trustees and Officers–(continued)
| | | | | | | | |
Name, Year of Birth and Position(s) Held with the Trust | | Trustee and/or Officer Since | | Principal Occupation(s) During Past 5 Years | | Number of Funds in Fund Complex Overseen by
Trustee | | Other Directorship(s) Held by Trustee During Past 5 Years |
| Independent Trustees–(continued) | | | | |
Joel W. Motley – 1952 Trustee | | 2019 | | Director of Office of Finance, Federal Home Loan Bank System; Managing Director of Carmona Motley Inc. (privately held financial advisor); Member of the Council on Foreign Relations and its Finance and Budget Committee; Chairman Emeritus of Board of Human Rights Watch and Member of its Investment Committee; and Member of Investment Committee Board of Historic Hudson Valley (non-profit cultural organization); Member of the Board, Blue Ocean Acquisition Corp.; and Member of the Vestry and the Investment Committee of Trinity Church Wall Street. Formerly: Managing Director of Public Capital Advisors, LLC (privately held financial advisor); Managing Director of Carmona Motley Hoffman, Inc. (privately held financial advisor); Trustee of certain Oppenheimer Funds; and Director of Columbia Equity Financial Corp. (privately held financial advisor) | | 175 | | Member of Board of Trust for Mutual Understanding (non-profit promoting the arts and environment); Member of Board of Greenwall Foundation (bioethics research foundation) and its Investment Committee; Member of Board of Friends of the LRC (non-profit legal advocacy); and Board Member and Investment Committee Member of Pulitzer Center for Crisis Reporting (non-profit journalism) |
Teresa M. Ressel – 1962 Trustee | | 2017 | | Non-executive director and trustee of a number of public and private business corporations Formerly: Chief Executive Officer, UBS Securities LLC (investment banking); Chief Operating Officer, UBS AG Americas (investment banking); Sr. Management Team Olayan America, The Olayan Group (international investor/commercial/industrial); and Assistant Secretary for Management & Budget and Designated Chief Financial Officer, U.S. Department of Treasury | | 175 | | None |
Robert C. Troccoli – 1949 Trustee | | 2016 | | Retired Formerly: Adjunct Professor, University of Denver – Daniels College of Business; and Managing Partner, KPMG LLP | | 175 | | None |
Daniel S. Vandivort –1954 Trustee | | 2019 | | President, Flyway Advisory Services LLC (consulting and property management) Formerly: President and Chief Investment Officer, previously Head of Fixed Income, Weiss Peck and Greer/Robeco Investment Management; Trustee and Chair, Weiss Peck and Greer Funds Board; and various capacities at CS First Boston including Head of Fixed Income at First Boston Asset Management. | | 175 | | Formerly: Trustee and Governance Chair, Oppenheimer Funds; Treasurer, Chairman of the Audit and Finance Committee, Huntington Disease Foundation of America |
T-3 Invesco Rochester® Municipal Opportunities Fund
Trustees and Officers–(continued)
| | | | | | | | |
Name, Year of Birth and Position(s) Held with the Trust | | Trustee and/or Officer Since | | Principal Occupation(s) During Past 5 Years | | Number of
Funds in Fund Complex Overseen by Trustee | | Other Directorship(s) Held by Trustee During Past 5 Years |
| Officers | | | | | | | | |
Sheri Morris – 1964 President and Principal Executive Officer | | 1999 | | Director, Invesco Trust Company; Head of Global Fund Services, Invesco Ltd.; President and Principal Executive Officer, The Invesco Funds; Vice President, Invesco Exchange-Traded Fund Trust, Invesco Exchange-Traded Fund Trust II, Invesco India Exchange-Traded Fund Trust, Invesco Actively Managed Exchange-Traded Fund Trust, Invesco Actively Managed Exchange-Traded Commodity Fund Trust and Invesco Exchange-Traded Self-Indexed Fund Trust; and Vice President, OppenheimerFunds, Inc. Formerly: Vice President, Treasurer and Principal Financial Officer, The Invesco Funds; Vice President, Invesco AIM Advisers, Inc., Invesco AIM Capital Management, Inc. and Invesco AIM Private Asset Management, Inc.; Assistant Vice President and Assistant Treasurer, The Invesco Funds; Vice President and Assistant Vice President, Invesco Advisers, Inc.; Assistant Vice President, Invesco AIM Capital Management, Inc. and Invesco AIM Private Asset Management, Inc.; Treasurer, Invesco Exchange-Traded Fund Trust, Invesco Exchange-Traded Fund Trust II, Invesco India Exchange-Traded Fund Trust and Invesco Actively Managed Exchange-Traded Fund Trust; and Senior Vice President, Invesco Advisers, Inc. (formerly known as Invesco Institutional (N.A.), Inc.) (registered investment adviser) | | N/A | | N/A |
Melanie Ringold - 1975 Senior Vice President, Chief Legal Officer and Secretary | | 2023 | | Head of Legal of the Americas, Invesco Ltd.; Senior Vice President and Secretary, Invesco Advisers, Inc. (formerly known as Invesco Institutional (N.A.), Inc.) (registered investment adviser); Secretary, Invesco Distributors, Inc. (formerly known as Invesco AIM Distributors, Inc.); Secretary, Invesco Investment Services, Inc. (formerly known as Invesco AIM Investment Services, Inc.); Senior Vice President, Chief Legal Officer and Secretary, The Invesco Funds; Secretary, Invesco Investment Advisers LLC, Invesco Capital Markets, Inc.; Chief Legal Officer, Invesco Exchange-Traded Fund Trust, Invesco Exchange-Traded Fund Trust II, Invesco India Exchange-Traded Fund Trust, Invesco Actively Managed Exchange-Traded Fund Trust, Invesco Actively Managed Exchange-Traded Commodity Fund Trust and Invesco Exchange-Traded Self-Indexed Fund Trust;Secretary and Vice President, Harbourview Asset Management Corporation; Secretary and Senior Vice President, OppenheimerFunds, Inc. and Invesco Managed Accounts, LLC; Secretary and Senior Vice President, OFI SteelPath, Inc.; Secretary and Senior Vice President, Oppenheimer Acquisition Corp.; Secretary, SteelPath Funds Remediation LLC; and Secretary and Senior Vice President, Trinity Investment Management Corporation Formerly: Assistant Secretary, Invesco Distributors, Inc.; Invesco Advisers, Inc. Invesco Investment Services, Inc., Invesco Capital Markets, Inc., Invesco Capital Management LLC and Invesco Investment Advisers LLC; and Assistant Secretary and Investment Vice President, Invesco Funds | | N/A | | N/A |
Andrew R. Schlossberg – 1974 Senior Vice President | | 2019 | | Senior Vice President, Invesco Group Services, Inc.; Head of the Americas and Senior Managing Director, Invesco Ltd.; Director and Senior Vice President, Invesco Advisers, Inc. (formerly known as Invesco Institutional (N.A.), Inc.) (registered investment adviser); Director and Chairman, Invesco Investment Services, Inc. (formerly known as Invesco AIM Investment Services, Inc.) (registered transfer agent); Senior Vice President, The Invesco Funds; and Director, Invesco Investment Advisers LLC (formerly known as Van Kampen Asset Management) Formerly: Director, President and Chairman, Invesco Insurance Agency, Inc.; Director, Invesco UK Limited; Director and Chief Executive, Invesco Asset Management Limited and Invesco Fund Managers Limited; Assistant Vice President, The Invesco Funds; Senior Vice President, Invesco Advisers, Inc. (formerly known as Invesco Institutional (N.A.), Inc.) (registered investment adviser); Director and Chief Executive, Invesco Administration Services Limited and Invesco Global Investment Funds Limited; Director, Invesco Distributors, Inc.; Head of EMEA, Invesco Ltd.; President, Invesco Actively Managed Exchange-Traded Commodity Fund Trust, Invesco Actively Managed Exchange-Traded Fund Trust, Invesco Exchange-Traded Fund Trust, Invesco Exchange-Traded Fund Trust II and Invesco India Exchange-Traded Fund Trust; and Managing Director and Principal Executive Officer, Invesco Capital Management LLC | | N/A | | N/A |
T-4 Invesco Rochester® Municipal Opportunities Fund
Trustees and Officers–(continued)
| | | | | | | | |
Name, Year of Birth and Position(s) Held with the Trust | | Trustee and/or Officer Since | | Principal Occupation(s) During Past 5 Years | | Number of Funds in Fund Complex Overseen by Trustee | | Other Directorship(s) Held by Trustee During Past 5 Years |
| Officers–(continued) | | | | | | | | |
John M. Zerr – 1962 Senior Vice President | | 2006 | | Chief Operating Officer of the Americas; Senior Vice President, Invesco Advisers, Inc. (formerly known as Invesco Institutional (N.A.), Inc.) (registered investment adviser); Senior Vice President, Invesco Distributors, Inc. (formerly known as Invesco AIM Distributors, Inc.); Director and Vice President, Invesco Investment Services, Inc. (formerly known as Invesco AIM Investment Services, Inc.) Senior Vice President, The Invesco Funds; Managing Director, Invesco Capital Management LLC; Director, Invesco Investment Advisers LLC (formerly known as Van Kampen Asset Management); Senior Vice President, Invesco Capital Markets, Inc. (formerly known as Van Kampen Funds Inc.); Manager, Invesco Indexing LLC; Manager, Invesco Specialized Products, LLC; Member, Invesco Canada Funds Advisory Board; Director, President and Chief Executive Officer, Invesco Corporate Class Inc. (corporate mutual fund company); and Director, Chairman, President and Chief Executive Officer, Invesco Canada Ltd. (formerly known as Invesco Trimark Ltd./Invesco Trimark Ltèe) (registered investment adviser and registered transfer agent); President, Invesco, Inc.; President, Invesco Global Direct Real Estate Feeder GP Ltd.; President, Invesco IP Holdings (Canada) Ltd; President, Invesco Global Direct Real Estate GP Ltd.; President, Invesco Financial Services Ltd. / Services Financiers Invesco Ltée; and Director and Chairman, Invesco Trust Company Formerly: President, Trimark Investments Ltd/Services Financiers Invesco Ltee; Director and Senior Vice President, Invesco Insurance Agency, Inc.; Director and Senior Vice President, Invesco Management Group, Inc. (formerly known as Invesco AIM Management Group, Inc.); Secretary and General Counsel, Invesco Management Group, Inc. (formerly known as Invesco AIM Management Group, Inc.); Secretary, Invesco Investment Services, Inc. (formerly known as Invesco AIM Investment Services, Inc.); Chief Legal Officer and Secretary, The Invesco Funds; Secretary and General Counsel, Invesco Investment Advisers LLC (formerly known as Van Kampen Asset Management); Secretary and General Counsel, Invesco Capital Markets, Inc. (formerly known as Van Kampen Funds Inc.); Chief Legal Officer, Invesco Exchange-Traded Fund Trust, Invesco Exchange-Traded Fund Trust II, Invesco India Exchange-Traded Fund Trust, Invesco Actively Managed Exchange-Traded Fund Trust, Invesco Actively Managed Exchange-Traded Commodity Fund Trust and Invesco Exchange-Traded Self-Indexed Fund Trust; Secretary, Invesco Indexing LLC; Director, Secretary, General Counsel and Senior Vice President, Van Kampen Exchange Corp.; Director, Vice President and Secretary, IVZ Distributors, Inc. (formerly known as INVESCO Distributors, Inc.); Director and Vice President, INVESCO Funds Group, Inc.; Director and Vice President, Van Kampen Advisors Inc.; Director, Vice President, Secretary and General Counsel, Van Kampen Investor Services Inc.;Director and Secretary, Invesco Distributors, Inc. (formerly known as Invesco AIM Distributors, Inc.); Director, Senior Vice President, General Counsel and Secretary, Invesco AIM Advisers, Inc. and Van Kampen Investments Inc.; Director, Vice President and Secretary, Fund Management Company; Director, Senior Vice President, Secretary, General Counsel and Vice President, Invesco AIM Capital Management, Inc.; and Chief Operating Officer and General Counsel, Liberty Ridge Capital, Inc. (an investment adviser) | | N/A | | N/A |
Gregory G. McGreevey - 1962 Senior Vice President | | 2012 | | Senior Managing Director, Invesco Ltd.; Director, Chairman, President, and Chief Executive Officer, Invesco Advisers, Inc. (formerly known as Invesco Institutional (N.A.), Inc.) (registered investment adviser); Director, Invesco Mortgage Capital, Inc. and Invesco Senior Secured Management, Inc.; Senior Vice President, The Invesco Funds; President, SNW Asset Management Corporation and Invesco Managed Accounts, LLC; Chairman and Director, Invesco Private Capital, Inc.; Chairman and Director, INVESCO Private Capital Investments, Inc.; Chairman and Director, INVESCO Realty, Inc.; and Senior Vice President, Invesco Group Services, Inc. Formerly: Senior Vice President, Invesco Management Group, Inc. and Invesco Advisers, Inc.; Assistant Vice President, The Invesco Funds | | N/A | | N/A |
Adrien Deberghes- 1967 Principal Financial Officer, Treasurer and Vice President | | 2020 | | Head of the Fund Office of the CFO and Fund Administration; Vice President, Invesco Advisers, Inc.; Principal Financial Officer, Treasurer and Vice President, The Invesco Funds; Vice President, Invesco Exchange-Traded Fund Trust, Invesco Exchange-Traded Fund Trust II, Invesco India Exchange-Traded Fund Trust, Invesco Actively Managed Exchange-Traded Fund Trust, Invesco Actively Managed Exchange-Traded Commodity Fund Trust and Invesco Exchange-Traded Self-Indexed Fund Trust Formerly: Senior Vice President and Treasurer, Fidelity Investments | | N/A | | N/A |
Crissie M. Wisdom – 1969 Anti-Money Laundering Compliance Officer | | 2013 | | Anti-Money Laundering and OFAC Compliance Officer for Invesco U.S. entities including: Invesco Advisers, Inc. and its affiliates, Invesco Capital Markets, Inc., Invesco Distributors, Inc., Invesco Investment Services, Inc., The Invesco Funds, Invesco Capital Management, LLC, Invesco Trust Company; and Fraud Prevention Manager for Invesco Investment Services, Inc. | | N/A | | N/A |
T-5 Invesco Rochester® Municipal Opportunities Fund
Trustees and Officers–(continued)
| | | | | | | | |
Name, Year of Birth and Position(s) Held with the Trust | | Trustee and/or Officer Since | | Principal Occupation(s) During Past 5 Years | | Number of
Funds in Fund
Complex
Overseen by
Trustee | | Other Directorship(s)
Held by Trustee
During Past 5 Years |
| Officers–(continued) | | | | | | | | |
Todd F. Kuehl – 1969 Chief Compliance Officer and Senior Vice President | | 2020 | | Chief Compliance Officer, Invesco Advisers, Inc. (registered investment adviser); and Chief Compliance Officer and Senior Vice President, The Invesco Funds Formerly: Managing Director and Chief Compliance Officer, Legg Mason (Mutual Funds); Chief Compliance Officer, Legg Mason Private Portfolio Group (registered investment adviser) | | N/A | | N/A |
James Bordewick, Jr. – 1959 Senior Vice President and Senior Officer | | 2022 | | Senior Vice President and Senior Officer, The Invesco Funds Formerly: Chief Legal Officer, KingsCrowd, Inc. (research and analytical platform for investment in private capital markets); Chief Operating Officer and Head of Legal and Regulatory, Netcapital (private capital investment platform); Managing Director, General Counsel of asset management and Chief Compliance Officer for asset management and private banking, Bank of America Corporation; Chief Legal Officer, Columbia Funds and BofA Funds; Senior Vice President and Associate General Counsel, MFS Investment Management; Chief Legal Officer, MFS Funds; Associate, Ropes & Gray; and Associate, Gaston Snow & Ely Bartlett | | N/A | | N/A |
The Statement of Additional Information of the Trust includes additional information about the Fund’s Trustees and is available upon request, without charge, by calling 1.800.959.4246. Please refer to the Fund’s Statement of Additional Information for information on the Fund’s sub-advisers.
| | | | | | |
| Office of the Fund | | Investment Adviser | | Distributor | | Auditors |
| 11 Greenway Plaza, Suite 1000 | | Invesco Advisers, Inc. | | Invesco Distributors, Inc. | | PricewaterhouseCoopers LLP |
| Houston, TX 77046-1173 | | 1331 Spring Street, NW, Suite 2500 | | 11 Greenway Plaza, Suite 1000 | | 1000 Louisiana Street, Suite 5800 |
| | Atlanta, GA 30309 | | Houston, TX 77046-1173 | | Houston, TX 77002-5021 |
| | | |
| Counsel to the Fund | | Counsel to the Independent Trustees | | Transfer Agent | | Custodian |
| Stradley Ronon Stevens & Young, LLP | | Sidley Austin LLP | | Invesco Investment Services, Inc. | | State Street Bank and Trust Company |
| 2005 Market Street, Suite 2600 | | 787 Seventh Avenue | | 11 Greenway Plaza, Suite 1000 | | 225 Franklin Street |
| Philadelphia, PA 19103-7018 | | New York, NY 10019 | | Houston, TX 77046-1173 | | Boston, MA 02110-2801 |
T-6 Invesco Rochester® Municipal Opportunities Fund

Go paperless with eDelivery
Visit invesco.com/edelivery to enjoy the convenience and security of anytime electronic access to your investment documents.
With eDelivery, you can elect to have any or all of the following materials delivered straight to your inbox to download, save and print from your own computer:
∎ Fund reports and prospectuses
∎ Quarterly statements
∎ Daily confirmations
∎ Tax forms
Invesco mailing information
Send general correspondence to Invesco Investment Services, Inc., P.O. Box 219078, Kansas City, MO 64121-9078.
Important notice regarding delivery of security holder documents
To reduce Fund expenses, only one copy of most shareholder documents may be mailed to shareholders with multiple accounts at the same address (Householding). Mailing of your shareholder documents may be householded indefinitely unless you instruct us otherwise. If you do not want the mailing of these documents to be combined with those for other members of your household, please contact Invesco Investment Services, Inc. at 800 959 4246 or contact your financial institution. We will begin sending you individual copies for each account within 30 days after receiving your request.
Fund holdings and proxy voting information
The Fund provides a complete list of its portfolio holdings four times each year, at the end of each fiscal quarter. For the second and fourth quarters, the list appears, respectively, in the Fund’s semiannual and annual reports to shareholders. For the first and third quarters, the Fund files the list with the Securities and Exchange Commission (SEC) as an exhibit to its reports on Form N-PORT. The most recent list of portfolio holdings is available at invesco.com/completeqtrholdings. Shareholders can also look up the Fund’s Form N-PORT filings on the SEC website, sec.gov. The SEC file numbers for the Fund are shown below.
A description of the policies and procedures that the Fund uses to determine how to vote proxies relating to portfolio securities is available without charge, upon request, from our Client Services department at 800 959 4246, or at invesco.com/ corporate/about-us/esg. The information is also available on the SEC website, sec.gov.
Information regarding how the Fund voted proxies related to its portfolio securities during the most recent 12-month period ended June 30 is available at invesco.com/proxysearch. This information is also available on the SEC website, sec.gov.
Invesco Advisers, Inc. is an investment adviser; it provides investment advisory services to individual and institutional clients and does not sell securities. Invesco Distributors, Inc. is the US distributor for Invesco Ltd.’s retail mutual funds, exchange-traded funds and institutional money market funds. Both are wholly owned, indirect subsidiaries of Invesco Ltd.
| | | | |
| SEC file number(s): 811-07890 and 033-66242 | | Invesco Distributors, Inc. | | O-ROHYM-AR-1 |

| | |
| Annual Report to Shareholders | | February 28, 2023 |
Invesco Rochester® New York Municipals Fund
Nasdaq:
A: RMUNX ∎ C: RMUCX ∎ Y: RMUYX ∎ R6: IORUX
Management’s Discussion of Fund Performance
| | | | |
Performance summary | |
For the fiscal year ended February 28, 2023, Class A shares of Invesco Rochester® New York Municipals Fund (the Fund), at net asset value (NAV), underperformed the S&P Municipal Bond New York 5+ Year Investment Grade Index. | |
Your Fund’s long-term performance appears later in this report. | |
| | | | |
Fund vs. Indexes | | | | |
Total returns, 2/28/22 to 2/28/23, at net asset value (NAV). Performance shown does not include applicable contingent deferred sales charges (CDSC) or front-end sales charges, which would have reduced performance. | |
Class A Shares | | | -9.76% | |
Class C Shares | | | -10.46 | |
Class Y Shares | | | -9.59 | |
Class R6 Shares | | | -9.53 | |
S&P Municipal Bond New York 5+ Year Investment Grade Indexq | | | -6.15 | |
U.S. Consumer Price Index∎ | | | 6.04 | |
|
Source(s): qRIMES Technologies Corp.; ∎Bloomberg LP | |
| | |
Market conditions and your Fund The COVID-19 pandemic caused a dramatic and sudden disruption in the New York State economy. However, thanks to federal relief funding and a fast recovery in tax collections, the state was able to quickly stabilize its finances. The Empire State has historically benefited from a robust and wealthy economy, adequate resources and budget flexibility, factors that helped mitigate the adverse economic impact of the global pandemic, further. Demonstrating strong management practices, New York officials quickly identified gap-closing measures to balance fiscal years 2021 and 2022 state budgets, setting aside reserves to offset the expected phasing out of federal aid. Moderate leverage levels allowed the state to issue debt as an alternative to additional expenditure reductions. Employment numbers reflect how New York suffered a larger economic impact than most other states, but recent data indicates significant improvement in the job sector. New York’s unemployment rate went from 12.5% in August 2020 to 4.3% in December 2022, while the national average went from 8.4% to 3.5% during the same period.1 Following easing of lockdown orders, Gross Domestic Product (GDP) started to recover in all states with the hospitality industry and information and professional services being the lead contributors. Most recently available reports show New York’s GDP increased 2.5% during the third quarter of 2022 while the US increased at a rate of 3.2%.2 While the state will likely continue to face long-term challenges, including a negative population trend, we believe the silver lining is the pension system, which is well funded. Additional pressure from Medicaid spending is likely to present a challenge as budget officials anticipate state-share Medicaid costs will continue to grow. For fiscal year 2023 these costs account for approximately 21% of budgeted state operating spending.3 | | At the beginning of the fiscal year, investors were hopeful in anticipation of a return to normalcy as COVID-19 cases declined and pandemic-related restrictions were reduced or lifted. This allowed policymakers to turn their attention to the high inflation levels; however, on February 24, 2022, Russia began a full-scale invasion of Ukraine, which exacerbated inflationary pressures by driving up commodity prices. Against this backdrop, the fiscal year was plagued by volatility and uncertainty. The municipal market set multiple record lows in 2022, making it one of the most challenging years in history for municipal markets. Investment grade municipal bonds returned -5.10%, high yield municipal bonds returned -9.35% and taxable municipal bonds returned -12.96% during the fiscal year.4 While municipal funds had experienced record inflows of $101.7 billion in 2021, flows quickly turned negative in the first quarter of 2022, perpetuating the Bloomberg Municipal Bond Index’s worst quarterly return in 40 years. Municipal bonds enjoyed a short respite in late May and early June 2022 with increased demand from crossover buyers like hedge funds, banks and insurance companies; however, the May 2022 Consumer Price Index report quoted inflation rising to a 40-year high. This sent the 10-year Treasury yield to a new 52-week high of nearly 3.50%, pushing municipal mutual fund flows back into negative territory.5 According to Lipper, net outflows from municipal bond funds totaled over -$110 billion for the fiscal year.6 On March 16, 2022, the US Federal Reserve (the Fed) raised the federal funds target rate 0.25% for the first time in more than three years in hopes of containing inflation.7 This was the first of eight consecutive increases during the fiscal year as the Fed announced its plan for a quantitative tightening campaign in an attempt to rein in inflation without harming employment or the overall economy. Rate increases as high as 0.75% followed, the Fed’s most aggressive monetary |
policy since the 1980s, bringing the target rate to 4.75% as of the end of the fiscal year.7
The AAA municipal yield curve made history after the Fed’s December 2022 meeting when the curve inverted between one- and 10-year maturities. Any inversion is noteworthy, but this was a first for municipal bonds. On January 31, 2023, policymakers indicated that future rate increases were likely to be “appropriate,” suggesting they were not yet convinced inflation was contained, which increased uncertainty about when the current tightening cycle might end. The fiscal year ended with an increase of 0.25% on February 1, 2023. We expect additional rate hikes in 2023, although not with the same pace or vigor as in 2022.
New municipal issuance for the fiscal year totaled $354 billion, down 27% from the previous fiscal year’s $484 billion.8 Issuers, with cash on their balance sheets, have been reluctant to issue at higher interest rates. While taxable issuance continued to account for a significant portion of new issuance, at 14% of the total, this figure is down from 18% from the previous fiscal year because of higher interest rates.8
Puerto Rico continued to make developments in its ongoing debt restructuring throughout the fiscal year. The territory restructured its outstanding general obligation and other government-guaranteed debt in March 2022 and began paying bondholders on the new restructured bonds. Puerto Rico’s weight in the Bloomberg High Yield Municipal Bond Index increased from 13% to 20% as the new bonds were included.4 The Financial Oversight and Management Board for Puerto Rico, the Puerto Rican government, bondholders and other interested parties continued to negotiate the restructuring of bonds issued by the Puerto Rico Electric Power Authority, the territory’s largest remaining unresolved debt, as the fiscal year closed.
Municipal credits have a long history of low defaults as many provide essential services to all Americans. This continues to be the case as evidenced by S&P rating changes – upgrades exceeded downgrades by a ratio of 2.5:1 for calendar year 2022.9 This positive dynamic, which we believe will continue, likely stems from benefits of the various federal stimulus measures including the American Rescue Plan Act, the Infrastructure Investment and Jobs Act and the Inflation Reduction Act, as well as higher revenues collected by state and local governments.
We believe the valuable benefits of municipal bonds will prevail over current market volatility and economic uncertainty. We continue to rely on our experienced portfolio managers and credit analysts to weather the challenges while identifying marketplace opportunities to add long-term value for shareholders.
2 Invesco Rochester® New York Municipals Fund
During the fiscal year, sector allocation and an underweight weight allocation to AAA-rated bonds† contributed to the Fund’s performance relative to its benchmark. At the sector level, security selection and an underweight allocation in the housing sector contributed to the Fund’s relative performance.
Sector allocation and overweight allocation to the education sector detracted from the Fund’s performance relative to the benchmark during the fiscal year. An overweight exposure to bonds with a duration of 10-14.99 years were detractive from relative return. An overweight exposure to non-rated bonds detracted from the Fund’s performance relative to its benchmark over the fiscal year.
During the fiscal year, leverage contributed to the Fund’s performance relative to its benchmark. The Fund achieved a leveraged position through the use of inverse floating rate securities or tender option bonds. The Fund uses leverage because we believe that, over time, leveraging provides opportunities for additional income and total return for shareholders. However, the use of leverage also can expose shareholders to additional volatility. For more information about the Fund’s use of leverage, see the Notes to Financial Statements later in this report.
We wish to remind you that the Fund is subject to interest rate risk, meaning when interest rates rise, the value of fixed income securities tends to fall. The degree to which the value of fixed income securities may decline due to rising interest rates may vary depending on the speed and magnitude of the increase in interest rates, as well as individual security characteristics, such as price, maturity, duration and coupon and market forces, such as supply and demand for similar securities. We are monitoring interest rates, as well as the market, economic and geopolitical factors that may impact the direction, speed and magnitude of changes to interest rates across the maturity spectrum, including the potential impact of monetary policy changes by the Fed and certain foreign central banks. If interest rates rise or fall faster than expected, markets may experience increased volatility, which may affect the value and/or liquidity of certain of the Fund’s investments.
Thank you for investing in Invesco Rochester® New York Municipals Fund and for sharing our long-term investment horizon.
| 1 | Source: New York Department of Labor, January 20, 2022; Bureau of Labor Statistics, January 2023 |
| 2 | Source: Bureau of Economic Analysis, US Department of Commerce, December 23, 2022 |
| 3 | Source: New York State, Fiscal Year 2024 Budget |
| 7 | Source: US Federal Reserve |
| 9 | Source: Standard & Poor’s |
† Sources: A credit rating is an assessment provided by a nationally recognized statistical rating organization (NRSRO) of the creditworthiness of an issuer with respect to debt obligations, including specific securities, money market instruments or other debts. Ratings are measured on a scale that generally ranges from AAA (highest) to D (lowest); ratings are subject to change without notice. For more information on rating methodology, please visit www.spglobal.com and select “Understanding Credit Ratings” under About Ratings on the homepage; www.fitchratings.com and select “Understanding Credit Ratings” from the drop-down menu on the homepage; and www.moodys.com and select “Methodology,” then “Rating Methodologies” under Research Type on the left-hand side.
Portfolio manager(s):
Michael Camarella
Scott Cottier
Mark DeMitry
Tim O’Reilly
Mark Paris
Julius Williams
The views and opinions expressed in management’s discussion of Fund performance are those of Invesco Advisers, Inc. and its affiliates. These views and opinions are subject to change at any time based on factors such as market and economic conditions. These views and opinions may not be relied upon as investment advice or recommendations, or as an offer for a particular security. The information is not a complete analysis of every aspect of any market, country, industry, security or the Fund. Statements of fact are from sources considered reliable, but Invesco Advisers, Inc. makes no representation or warranty as to their completeness or accuracy. Although historical performance is no guarantee of future results, these insights may help you understand our investment management philosophy.
See important Fund and, if applicable, index disclosures later in this report.
3 Invesco Rochester® New York Municipals Fund
Your Fund’s Long-Term Performance
Results of a $10,000 Investment – Oldest Share Class(es)
Fund and index data from 2/28/13
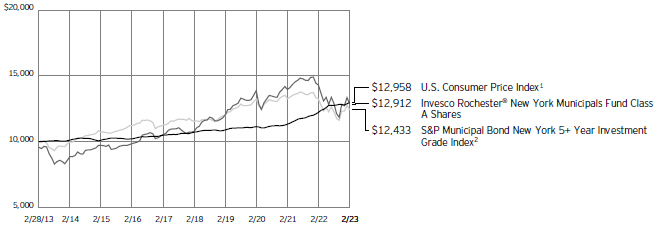
1 Source: Bloomberg LP
2 Source: RIMES Technologies Corp.
Past performance cannot guarantee future results.
The data shown in the chart include reinvested distributions, applicable sales charges and Fund expenses including management
fees. Index results include reinvested dividends, but they do not reflect sales charges. Performance of the peer group, if applicable, reflects Fund expenses and management fees; performance of a market index does
not. Performance shown in the chart does not reflect deduction of taxes a shareholder would pay on Fund distributions or sale of Fund shares.
| | |
| 4 Invesco Rochester® New York Municipals Fund |
| | | | |
| |
Average Annual Total Returns | |
As of 2/28/23, including maximum applicable sales charges | |
Class A Shares | | | | |
Inception (5/15/86) | | | 5.68 | % |
10 Years | | | 2.59 | |
5 Years | | | 2.77 | |
1 Year | | | -13.58 | |
| |
Class C Shares | | | | |
Inception (3/17/97) | | | 4.47 | % |
10 Years | | | 2.39 | |
5 Years | | | 2.90 | |
1 Year | | | -11.33 | |
| |
Class Y Shares | | | | |
Inception (4/28/00) | | | 5.00 | % |
10 Years | | | 3.25 | |
5 Years | | | 3.92 | |
1 Year | | | -9.59 | |
| |
Class R6 Shares | | | | |
10 Years | | | 3.15 | % |
5 Years | | | 3.90 | |
1 Year | | | -9.53 | |
Effective May 24, 2019, Class A, Class C and Class Y shares of the Oppenheimer Rochester Fund Municipals, (the predecessor fund), were reorganized into Class A, Class C and Class Y shares, respectively, of the Invesco Oppenheimer Rochester® New York Municipals Fund. The Fund was subsequently renamed the Invesco Rochester® New York Municipals Fund (the Fund). Returns shown above, for periods ending on or prior to May 24, 2019, for Class A, Class C, and Class Y shares are those for Class A, Class C and Class Y shares of the predecessor fund. Share class returns will differ from the predecessor fund because of different expenses.
Class R6 shares incepted on May 24, 2019. Performance shown on and prior to that date is that of the predecessor fund’s Class A shares at net asset value and includes the 12b-1 fees applicable to Class A shares.
The performance data quoted represent past performance and cannot guarantee future results; current performance may be lower or higher. Please visit invesco.com/ performance for the most recent month-end performance. Performance figures reflect reinvested distributions, changes in net asset value and the effect of the maximum sales charge unless otherwise stated. Performance figures do not reflect deduction of taxes a shareholder would pay on Fund distributions or sale of Fund shares. Investment return and principal value will fluctuate so that you may have a gain or loss when you sell shares.
Class A share performance reflects the maximum 4.25% sales charge, and Class C share performance reflects the applicable contingent deferred sales charge (CDSC) for the period involved. The CDSC on
Class C shares is 1% for the first year after purchase. Class Y and Class R6 shares do not have a front-end sales charge or a CDSC; therefore, performance is at net asset value.
The performance of the Fund’s share classes will differ primarily due to different sales charge structures and class expenses.
Fund performance reflects any applicable fee waivers and/or expense reimbursements. Had the adviser not waived fees and/or reimbursed expenses currently or in the past, returns would have been lower. See current prospectus for more information.
| | |
| 5 Invesco Rochester® New York Municipals Fund |
Supplemental Information
Invesco Rochester® New York Municipals Fund investment objective is to seek tax-free income.
| ∎ | Unless otherwise stated, information presented in this report is as of February 28, 2023, and is based on total net assets. |
| ∎ | Unless otherwise noted, all data is provided by Invesco. |
| ∎ | To access your Fund’s reports/prospectus, visit invesco.com/fundreports. |
About indexes used in this report
| ∎ | The S&P Municipal Bond New York 5+ Year Investment Grade Index seeks to measure the performance of investment-grade, New York-issued US municipals with maturities equal to or greater than five years. |
| ∎ | The U.S. Consumer Price Index is a measure of change in consumer prices as determined by the US Bureau of Labor Statistics. |
| ∎ | The Fund is not managed to track the performance of any particular index, including the index(es) described here, and consequently, the performance of the Fund may deviate significantly from the performance of the index(es). |
| ∎ | A direct investment cannot be made in an index. Unless otherwise indicated, index results include reinvested dividends, and they do not reflect sales charges. Performance of the peer group, if applicable, reflects fund expenses; performance of a market index does not. |
|
|
This report must be accompanied or preceded by a currently effective Fund prospectus, which contains more complete information, including sales charges and expenses. Investors should read it carefully before investing. |
|
| NOT FDIC INSURED | MAY LOSE VALUE | NO BANK GUARANTEE |
| | |
| 6 Invesco Rochester® New York Municipals Fund |
Fund Information
| | |
| Portfolio Composition | | |
| |
| By credit sector | | % of total investments |
| |
Revenue Bonds | | 93.88% |
| |
General Obligation Bonds | | 6.00 |
| |
Pre-Refunded Bonds | | 0.12 |
Top Five Debt Holdings
| | | | |
| | | | | % of total net assets |
| | |
1. | | New York Liberty Development Corp. (Goldman Sachs Headquarters), Series 2005, Ref. RB | | 1.91% |
| | |
2. | | MTA Hudson Rail Yards Trust Obligations, Series 2016 A, RB | | 1.71 |
| | |
3. | | Hudson Yards Infrastructure Corp., Series 2017 A, Ref. RB | | 1.44 |
| | |
4. | | University of Puerto Rico, Series 2006 Q, RB | | 1.44 |
| | |
5. | | Triborough Bridge & Tunnel Authority, Series 2021 A-1, Ref. RB | | 1.25 |
The Fund’s holdings are subject to change, and there is no assurance that the Fund will continue to hold any particular security.
Data presented here are as of February 28, 2023.
| | |
| 7 Invesco Rochester® New York Municipals Fund |
Schedule of Investments
February 28, 2023
| | | | | | | | | | | | | | |
| | | Interest
Rate | | | Maturity
Date | | | Principal
Amount
(000) | | | Value |
Municipal Obligations–106.99% | | | | | | | | | | | | | | |
New York–98.36% | | | | | | | | | | | | | | |
Albany (County of), NY Airport Authority; | | | | | | | | | | | | | | |
Series 2018 A, RB | | | 5.00% | | | | 12/15/2043 | | | $ | 1,750 | | | $ 1,809,904 |
Series 2018 A, RB | | | 5.00% | | | | 12/15/2048 | | | | 2,585 | | | 2,654,374 |
Series 2018 B, RB(a) | | | 5.00% | | | | 12/15/2033 | | | | 335 | | | 354,783 |
Series 2018 B, RB(a) | | | 5.00% | | | | 12/15/2034 | | | | 250 | | | 263,378 |
Albany (County of), NY Industrial Development Agency (Rehabilitation Support Services, Inc. (The)); Series 1993 A, RB | | | 8.38% | | | | 06/01/2023 | | | | 90 | | | 89,934 |
Albany (County of), NY Industrial Development Agency (Sage Colleges); Series 1999 A, RB | | | 5.30% | | | | 04/01/2029 | | | | 1,340 | | | 1,189,936 |
Albany (County of), NY Parking Authority; Series 2018 A, Ref. RB (INS - AGM)(b) | | | 5.00% | | | | 07/15/2025 | | | | 315 | | | 326,341 |
Albany Capital Resource Corp. (Brighter Choice Elementary); Series 2021, Ref. RB | | | 4.00% | | | | 04/01/2037 | | | | 2,070 | | | 1,770,174 |
Albany Capital Resource Corp. (College of Siant Rose (The)); | | | | | | | | | | | | | | |
Series 2021, Ref. RB | | | 4.00% | | | | 07/01/2029 | | | | 1,195 | | | 1,041,305 |
Series 2021, Ref. RB | | | 4.00% | | | | 07/01/2030 | | | | 1,245 | | | 1,063,060 |
Series 2021, Ref. RB | | | 4.00% | | | | 07/01/2031 | | | | 1,295 | | | 1,081,765 |
Series 2021, Ref. RB | | | 4.00% | | | | 07/01/2051 | | | | 17,805 | | | 11,274,870 |
Albany Capital Resource Corp. (Empire Commons Student Housing, Inc.); | | | | | | | | | | | | | | |
Series 2016 A, Ref. RB | | | 5.00% | | | | 05/01/2027 | | | | 300 | | | 312,622 |
Series 2016 A, Ref. RB | | | 5.00% | | | | 05/01/2028 | | | | 400 | | | 416,100 |
Series 2016 A, Ref. RB | | | 5.00% | | | | 05/01/2029 | | | | 550 | | | 571,970 |
Series 2016 A, Ref. RB | | | 5.00% | | | | 05/01/2030 | | | | 350 | | | 363,344 |
Series 2016 A, Ref. RB | | | 5.00% | | | | 05/01/2031 | | | | 350 | | | 362,709 |
Series 2016 A, Ref. RB | | | 5.00% | | | | 05/01/2032 | | | | 200 | | | 206,840 |
Allegany County Capital Resource Corp. (Houghton College); | | | | | | | | | | | | | | |
Series 2022 A, Ref. RB | | | 5.00% | | | | 12/01/2042 | | | | 1,600 | | | 1,588,190 |
Series 2022 A, Ref. RB | | | 5.00% | | | | 12/01/2052 | | | | 5,000 | | | 4,795,039 |
Amherst Development Corp. (Daemen College); | | | | | | | | | | | | | | |
Series 2018, Ref. RB | | | 4.00% | | | | 10/01/2037 | | | | 2,575 | | | 2,260,509 |
Series 2018, Ref. RB | | | 5.00% | | | | 10/01/2043 | | | | 4,060 | | | 3,931,203 |
Series 2018, Ref. RB | | | 5.00% | | | | 10/01/2048 | | | | 3,235 | | | 3,074,948 |
Amherst Development Corp. (UBF Faculty-Student Housing Corp. - Greiner & Hadley Refunding Projects at SUNY Buffalo); Series 2017 A, Ref. RB (INS - AGM)(b) | | | 5.00% | | | | 10/01/2045 | | | | 1,000 | | | 1,051,797 |
Brookhaven Local Development Corp. (Jefferson’s Ferry); | | | | | | | | | | | | | | |
Series 2016, Ref. RB | | | 5.25% | | | | 11/01/2036 | | | | 1,725 | | | 1,750,680 |
Series 2020 B, RB | | | 4.00% | | | | 11/01/2045 | | | | 1,500 | | | 1,232,377 |
Series 2020 B, RB | | | 4.00% | | | | 11/01/2055 | | | | 6,400 | | | 4,974,794 |
Brooklyn Arena Local Development Corp. (Barclays Center); | | | | | | | | | | | | | | |
Series 2009, RB(c) | | | 0.00% | | | | 07/15/2034 | | | | 3,685 | | | 2,209,481 |
Series 2016 A, Ref. RB | | | 5.00% | | | | 07/15/2042 | | | | 27,330 | | | 27,060,838 |
Broome County Local Development Corp. (Good Shepherd Village at Endwell); | | | | | | | | | | | | | | |
Series 2021, Ref. RB | | | 4.00% | | | | 07/01/2036 | | | | 1,000 | | | 831,953 |
Series 2021, Ref. RB | | | 4.00% | | | | 07/01/2041 | | | | 1,550 | | | 1,205,151 |
Series 2021, Ref. RB | | | 4.00% | | | | 01/01/2047 | | | | 1,500 | | | 1,091,117 |
Broome County Local Development Corp. (United Health Services Hospital); Series 2020, Ref. RB (INS - AGM)(b) | | | 4.00% | | | | 04/01/2050 | | | | 3,500 | | | 3,076,706 |
Buffalo & Erie County Industrial Land Development Corp. (Catholic Health System, Inc.); Series 2015, RB | | | 5.25% | | | | 07/01/2035 | | | | 1,500 | | | 1,311,260 |
Buffalo & Erie County Industrial Land Development Corp. (Charter School for Applied Technology); | | | | | | | | | | | | | | |
Series 2017 A, Ref. RB | | | 4.50% | | | | 06/01/2027 | | | | 1,500 | | | 1,506,319 |
Series 2017 A, Ref. RB | | | 5.00% | | | | 06/01/2035 | | | | 840 | | | 858,070 |
Buffalo & Erie County Industrial Land Development Corp. (Global Concepts Charter School Program); | | | | | | | | | | | | | | |
Series 2018, Ref. RB | | | 5.00% | | | | 10/01/2032 | | | | 140 | | | 146,043 |
Series 2018, Ref. RB | | | 5.00% | | | | 10/01/2033 | | | | 150 | | | 156,228 |
Series 2018, Ref. RB | | | 5.00% | | | | 10/01/2037 | | | | 500 | | | 509,595 |
Buffalo & Erie County Industrial Land Development Corp. (Orchard Park); Series 2015, Ref. RB | | | 5.00% | | | | 11/15/2037 | | | | 1,035 | | | 1,039,334 |
Buffalo & Erie County Industrial Land Development Corp. (Tapestry Charter School); Series 2017 A, RB | | | 5.00% | | | | 08/01/2037 | | | | 825 | | | 798,619 |
See accompanying Notes to Financial Statements which are an integral part of the financial statements.
| | |
| 8 Invesco Rochester® New York Municipals Fund |
| | | | | | | | | | | | | | |
| | | Interest
Rate | | | Maturity
Date | | | Principal
Amount
(000) | | | Value |
New York–(continued) | | | | | | | | | | | | | | |
Buffalo (City of), NY Municipal Water Finance Authority; | | | | | | | | | | | | | | |
Series 2015 A, Ref. RB | | | 5.00% | | | | 07/01/2029 | | | $ | 300 | | | $ 311,337 |
Series 2015 A, Ref. RB | | | 5.00% | | | | 07/01/2030 | | | | 150 | | | 155,566 |
Series 2015 A, Ref. RB | | | 5.00% | | | | 07/01/2031 | | | | 210 | | | 217,697 |
Series 2015 A, Ref. RB | | | 5.00% | | | | 07/01/2032 | | | | 245 | | | 253,812 |
Build NYC Resource Corp. (Albert Einstein School of Medicine, Inc.); Series 2015, RB(d) | | | 5.50% | | | | 09/01/2045 | | | | 3,200 | | | 3,200,286 |
Build NYC Resource Corp. (Bronx Charter School for Excellence); Series 2013 A, RB | | | 5.00% | | | | 04/01/2033 | | | | 500 | | | 500,270 |
Build NYC Resource Corp. (Bronx Lighthouse Charter School); | | | | | | | | | | | | | | |
Series 2018, RB | | | 5.00% | | | | 06/01/2038 | | | | 1,525 | | | 1,544,042 |
Series 2018, RB | | | 5.00% | | | | 06/01/2048 | | | | 2,415 | | | 2,421,482 |
Build NYC Resource Corp. (Chapin School); Series 2017, Ref. RB | | | 5.00% | | | | 11/01/2047 | | | | 8,000 | | | 8,980,125 |
Build NYC Resource Corp. (Children’s Aid Society (The)); | | | | | | | | | | | | | | |
Series 2019, RB | | | 4.00% | | | | 07/01/2044 | | | | 555 | | | 506,629 |
Series 2019, RB | | | 4.00% | | | | 07/01/2049 | | | | 1,300 | | | 1,159,656 |
Build NYC Resource Corp. (East Harlem Scholars Academy Charter School) (Social Bonds); | | | | | | | | | | | | | | |
Series 2022, RB(d) | | | 5.75% | | | | 06/01/2052 | | | | 1,250 | | | 1,266,116 |
Series 2022, RB(d) | | | 5.75% | | | | 06/01/2062 | | | | 3,250 | | | 3,272,624 |
Build NYC Resource Corp. (Grand Concourse Academy Charter School); | | | | | | | | | | | | | | |
Series 2022 A, RB | | | 5.00% | | | | 07/01/2052 | | | | 550 | | | 545,444 |
Series 2022 A, RB | | | 5.00% | | | | 07/01/2056 | | | | 450 | | | 436,562 |
Build NYC Resource Corp. (KIPP NYC Public School) (Social Bonds); | | | | | | | | | | | | | | |
Series 2023, RB | | | 5.25% | | | | 07/01/2057 | | | | 3,750 | | | 3,799,744 |
Series 2023, RB | | | 5.25% | | | | 07/01/2062 | | | | 6,500 | | | 6,538,191 |
Build NYC Resource Corp. (Manhattan College); | | | | | | | | | | | | | | |
Series 2017, Ref. RB | | | 5.00% | | | | 08/01/2032 | | | | 880 | | | 935,644 |
Series 2017, Ref. RB | | | 5.00% | | | | 08/01/2036 | | | | 1,500 | | | 1,568,696 |
Series 2017, Ref. RB | | | 5.00% | | | | 08/01/2047 | | | | 4,430 | | | 4,518,066 |
Build NYC Resource Corp. (Methodist Hospital); | | | | | | | | | | | | | | |
Series 2014, Ref. RB(e)(f) | | | 5.00% | | | | 07/01/2024 | | | | 500 | | | 511,162 |
Series 2014, Ref. RB(e)(f) | | | 5.00% | | | | 07/01/2024 | | | | 1,100 | | | 1,124,557 |
Build NYC Resource Corp. (Metropolitan Lighthouse Charter School); Series 2017 A, RB(d) | | | 5.00% | | | | 06/01/2047 | | | | 1,250 | | | 1,144,870 |
Build NYC Resource Corp. (New Dawn Charter Schools); | | | | | | | | | | | | | | |
Series 2019, RB(d) | | | 5.63% | | | | 02/01/2039 | | | | 1,100 | | | 1,104,183 |
Series 2019, RB(d) | | | 5.75% | | | | 02/01/2049 | | | | 1,330 | | | 1,331,333 |
Build NYC Resource Corp. (NY Preparatory Charter School); | | | | | | | | | | | | | | |
Series 2021 A, RB | | | 4.00% | | | | 06/15/2041 | | | | 610 | | | 500,372 |
Series 2021 A, RB | | | 4.00% | | | | 06/15/2051 | | | | 735 | | | 549,644 |
Series 2021 A, RB | | | 4.00% | | | | 06/15/2056 | | | | 530 | | | 385,127 |
Build NYC Resource Corp. (Pratt Paper, Inc.); | | | | | | | | | | | | | | |
Series 2014, Ref. RB(a)(d) | | | 4.50% | | | | 01/01/2025 | | | | 640 | | | 644,181 |
Series 2014, Ref. RB(a)(d) | | | 5.00% | | | | 01/01/2035 | | | | 4,350 | | | 4,416,588 |
Build NYC Resource Corp. (Richmond Prep Charter School); | | | | | | | | | | | | | | |
Series 2021 A, RB(d) | | | 5.00% | | | | 06/01/2051 | | | | 1,500 | | | 1,334,099 |
Series 2021 A, RB(d) | | | 5.00% | | | | 06/01/2056 | | | | 1,250 | | | 1,086,796 |
Build NYC Resource Corp. (Seton Education Partners-Brilla); | | | | | | | | | | | | | | |
Series 2021 A, RB(d) | | | 4.00% | | | | 11/01/2041 | | | | 1,775 | | | 1,436,230 |
Series 2021 A, RB(d) | | | 4.00% | | | | 11/01/2051 | | | | 1,000 | | | 742,040 |
Build NYC Resource Corp. (The Children’s Aid Society); Series 2015, RB | | | 5.00% | | | | 07/01/2045 | | | | 1,160 | | | 1,170,638 |
Build NYC Resource Corp. (Whin Music Community Charter School); | | | | | | | | | | | | | | |
Series 2022, RB(d) | | | 6.50% | | | | 07/01/2052 | | | | 9,820 | | | 9,660,945 |
Series 2022, RB(d) | | | 6.50% | | | | 07/01/2057 | | | | 10,430 | | | 10,081,995 |
Build NYC Resource Corp. (Young Adult Institute, Inc.); | | | | | | | | | | | | | | |
Series 2020 A, Ref. RB | | | 5.00% | | | | 07/01/2030 | | | | 1,095 | | | 1,068,045 |
Series 2020 A, Ref. RB | | | 5.00% | | | | 07/01/2045 | | | | 4,145 | | | 3,350,698 |
Cattaraugus (County of), NY (St. Bonaventure University); | | | | | | | | | | | | | | |
Series 2014, RB | | | 5.00% | | | | 05/01/2034 | | | | 200 | | | 203,697 |
Series 2014, RB | | | 5.00% | | | | 05/01/2039 | | | | 250 | | | 252,990 |
Series 2016 A, Ref. RB | | | 5.00% | | | | 05/01/2030 | | | | 510 | | | 534,375 |
Series 2016 A, Ref. RB | | | 5.00% | | | | 05/01/2031 | | | | 540 | | | 564,848 |
See accompanying Notes to Financial Statements which are an integral part of the financial statements.
| | |
| 9 Invesco Rochester® New York Municipals Fund |
| | | | | | | | | | | | | | |
| | | Interest
Rate | | | Maturity
Date | | | Principal
Amount
(000) | | | Value |
New York–(continued) | | | | | | | | | | | | | | |
Chautauqua (City & County of), NY Utility District; | | | | | | | | | | | | | | |
Series 2006, GO Bonds | | | 5.00% | | | | 06/01/2023 | | | $ | 95 | | | $ 95,101 |
Series 2006, GO Bonds | | | 5.00% | | | | 06/01/2025 | | | | 105 | | | 105,162 |
Chemung (County of), NY Industrial Development Agency (Hathorn Redevelopment Co.); | | | | | | | | | | | | | | |
Series 2001 A, IDR(a) | | | 4.85% | | | | 07/01/2023 | | | | 65 | | | 65,116 |
Series 2001 A, IDR(a) | | | 5.00% | | | | 07/01/2033 | | | | 1,515 | | | 1,517,433 |
Dutchess (County of), NY Water & Wastewater Authority; Series 1998 1, RB(c) | | | 0.00% | | | | 06/01/2027 | | | | 1,000 | | | 871,813 |
Dutchess County Local Development Corp. (Bard College); | | | | | | | | | | | | | | |
Series 2020 A, Ref. RB(d) | | | 5.00% | | | | 07/01/2040 | | | | 1,000 | | | 990,784 |
Series 2020 A, Ref. RB(d) | | | 5.00% | | | | 07/01/2045 | | | | 4,550 | | | 4,360,715 |
Series 2020 A, Ref. RB(d) | | | 5.00% | | | | 07/01/2051 | | | | 4,500 | | | 4,215,249 |
Dutchess County Local Development Corp. (Culinary Institute); | | | | | | | | | | | | | | |
Series 2021, Ref. RB | | | 5.00% | | | | 07/01/2034 | | | | 1,135 | | | 1,205,398 |
Series 2021, Ref. RB | | | 4.00% | | | | 07/01/2036 | | | | 1,040 | | | 979,041 |
Series 2021, Ref. RB | | | 4.00% | | | | 07/01/2038 | | | | 1,170 | | | 1,071,491 |
Dutchess County Local Development Corp. (Health Quest Systems, Inc.); | | | | | | | | | | | | | | |
Series 2014 A, RB(e)(f) | | | 5.00% | | | | 07/01/2024 | | | | 1,195 | | | 1,224,035 |
Series 2016 A, Ref. RB | | | 5.00% | | | | 07/01/2030 | | | | 1,255 | | | 1,296,809 |
Series 2016 B, RB | | | 4.00% | | | | 07/01/2034 | | | | 6,410 | | | 6,237,362 |
Series 2016 B, RB | | | 5.00% | | | | 07/01/2035 | | | | 2,715 | | | 2,766,531 |
Series 2016 B, RB | | | 5.00% | | | | 07/01/2046 | | | | 25,775 | | | 25,102,169 |
Series 2019 B, Ref. RB | | | 4.00% | | | | 07/01/2044 | | | | 2,430 | | | 2,113,164 |
Dutchess County Local Development Corp. (Marist College); | | | | | | | | | | | | | | |
Series 2015 A, RB | | | 5.00% | | | | 07/01/2036 | | | | 2,335 | | | 2,406,689 |
Series 2022, RB | | | 4.00% | | | | 07/01/2049 | | | | 9,370 | | | 8,597,741 |
Dutchess County Local Development Corp. (Nuvance Health); Series 2019 B, Ref. RB | | | 4.00% | | | | 07/01/2049 | | | | 3,570 | | | 3,003,527 |
Dutchess County Local Development Corp. (Vassar College); | | | | | | | | | | | | | | |
Series 2017, Ref. RB | | | 5.00% | | | | 07/01/2034 | | | | 840 | | | 900,223 |
Series 2017, Ref. RB | | | 5.00% | | | | 07/01/2036 | | | | 840 | | | 891,145 |
Series 2017, Ref. RB | | | 5.00% | | | | 07/01/2037 | | | | 1,205 | | | 1,272,035 |
Series 2017, Ref. RB | | | 5.00% | | | | 07/01/2042 | | | | 2,535 | | | 2,642,024 |
Series 2020, Ref. RB | | | 5.00% | | | | 07/01/2045 | | | | 5,000 | | | 5,289,373 |
Series 2020, Ref. RB | | | 4.00% | | | | 07/01/2049 | | | | 5,000 | | | 4,571,719 |
East Rochester Housing Authority (Jefferson Park Association L.P.); Series 1999, RB(a) | | | 6.75% | | | | 03/01/2030 | | | | 1,040 | | | 926,855 |
Elmira (City of), NY Housing Authority (Eastgate Apartments L.P.); Series 2007, RB(a) | | | 6.25% | | | | 06/01/2044 | | | | 2,140 | | | 2,001,613 |
Erie Tobacco Asset Securitization Corp.; | | | | | | | | | | | | | | |
Series 2005 A, RB | | | 5.00% | | | | 06/01/2038 | | | | 5,000 | | | 4,783,562 |
Series 2005 A, RB | | | 5.00% | | | | 06/01/2045 | | | | 1,275 | | | 1,197,818 |
Series 2005 D, RB(c) | | | 0.00% | | | | 06/01/2055 | | | | 194,300 | | | 12,089,113 |
Series 2006 A, RB(c)(d) | | | 0.00% | | | | 06/01/2060 | | | | 200,000 | | | 10,962,740 |
Franklin (County of), NY Solid Waste Management Authority; | | | | | | | | | | | | | | |
Series 2015 A, RB(a) | | | 5.00% | | | | 06/01/2025 | | | | 300 | | | 307,454 |
Series 2019, RB(a) | | | 4.00% | | | | 06/01/2025 | | | | 910 | | | 913,204 |
Series 2019, RB(a) | | | 4.00% | | | | 06/01/2026 | | | | 950 | | | 957,640 |
Series 2019, RB(a) | | | 4.00% | | | | 06/01/2027 | | | | 985 | | | 995,848 |
Genesee County Funding Corp. (The) (Rochester Regional Health Obligated Group); Series 2022 A, Ref. RB | | | 5.25% | | | | 12/01/2052 | | | | 20,375 | | | 20,599,526 |
Glen Cove Local Economic Assistance Corp. (Tiegerman School); Series 2018 A-2, RB (Acquired 06/26/2018; Cost $5,495,000)(d)(g) | | | 5.50% | | | | 07/01/2044 | | | | 5,495 | | | 4,892,248 |
Hempstead Town Local Development Corp. (Adelphi University); Series 2019, Ref. RB | | | 4.00% | | | | 02/01/2039 | | | | 1,800 | | | 1,699,904 |
Hempstead Town Local Development Corp. (Evergreen Charter School); Series 2019, Ref. RB(d) | | | 6.80% | | | | 12/01/2044 | | | | 9,530 | | | 9,662,611 |
See accompanying Notes to Financial Statements which are an integral part of the financial statements.
| | |
| 10 Invesco Rochester® New York Municipals Fund |
| | | | | | | | | | | | | | |
| | | Interest
Rate | | | Maturity
Date | | | Principal
Amount
(000) | | | Value |
New York–(continued) | | | | | | | | | | | | | | |
Hempstead Town Local Development Corp. (Molloy College); | | | | | | | | | | | | | | |
Series 2014, RB | | | 5.00% | | | | 07/01/2029 | | | $ | 1,700 | | | $ 1,729,144 |
Series 2014, RB | | | 5.00% | | | | 07/01/2034 | | | | 1,500 | | | 1,520,679 |
Series 2014, RB | | | 5.00% | | | | 07/01/2039 | | | | 1,250 | | | 1,259,294 |
Series 2014, RB | | | 5.00% | | | | 07/01/2044 | | | | 1,000 | | | 1,005,804 |
Series 2017, Ref. RB | | | 5.00% | | | | 07/01/2029 | | | | 475 | | | 496,300 |
Series 2017, Ref. RB | | | 5.00% | | | | 07/01/2030 | | | | 425 | | | 442,727 |
Series 2017, Ref. RB | | | 5.00% | | | | 07/01/2031 | | | | 390 | | | 405,758 |
Series 2017, Ref. RB | | | 5.00% | | | | 07/01/2032 | | | | 700 | | | 726,937 |
Series 2017, Ref. RB | | | 5.00% | | | | 07/01/2035 | | | | 730 | | | 751,424 |
Series 2017, Ref. RB | | | 5.00% | | | | 07/01/2036 | | | | 570 | | | 583,717 |
Series 2017, Ref. RB | | | 5.00% | | | | 07/01/2038 | | | | 650 | | | 660,558 |
Hudson Yards Infrastructure Corp.; | | | | | | | | | | | | | | |
Series 2017 A, Ref. RB | | | 5.00% | | | | 02/15/2042 | | | | 62,200 | | | 64,824,125 |
Series 2017 A, Ref. RB (INS - BAM)(b) | | | 5.00% | | | | 02/15/2042 | | | | 11,000 | | | 11,464,073 |
Series 2017 A, Ref. RB | | | 4.00% | | | | 02/15/2044 | | | | 26,535 | | | 24,812,656 |
Series 2017 A, Ref. RB | | | 5.00% | | | | 02/15/2045 | | | | 50,630 | | | 52,579,903 |
Series 2017 A, Ref. RB (INS - AGM)(b) | | | 4.00% | | | | 02/15/2047 | | | | 28,445 | | | 26,232,465 |
Hudson Yards Infrastructure Corp. (Green Bonds); | | | | | | | | | | | | | | |
Series 2021 A, Ref. RB | | | 4.00% | | | | 02/15/2037 | | | | 3,420 | | | 3,451,886 |
Series 2021 A, Ref. RB | | | 4.00% | | | | 02/15/2039 | | | | 8,720 | | | 8,685,491 |
Series 2021 A, Ref. RB | | | 4.00% | | | | 02/15/2043 | | | | 2,095 | | | 2,054,366 |
Huntington Local Development Corp. (Fountaingate Garden); Series 2021 A, RB | | | 5.25% | | | | 07/01/2056 | | | | 1,000 | | | 765,804 |
Jefferson Civic Facility Development Corp. (Samaritan Medical Center); | | | | | | | | | | | | | | |
Series 2017 A, Ref. RB | | | 5.00% | | | | 11/01/2037 | | | | 4,000 | | | 3,753,398 |
Series 2017 A, Ref. RB | | | 4.00% | | | | 11/01/2047 | | | | 555 | | | 433,303 |
Livingston (County of), NY Industrial Development Agency (Nicholas H. Noyes Memorial Hospital); Series 2005, RB | | | 6.00% | | | | 07/01/2030 | | | | 1,000 | | | 1,001,813 |
Lockport (City of), NY; | | | | | | | | | | | | | | |
Series 2014, GO Bonds | | | 5.00% | | | | 10/15/2023 | | | | 505 | | | 508,052 |
Series 2014, GO Bonds | | | 5.00% | | | | 10/15/2024 | | | | 530 | | | 538,630 |
Long Island (City of), NY Power Authority; | | | | | | | | | | | | | | |
Series 2014 A, Ref. RB | | | 5.00% | | | | 09/01/2039 | | | | 12,315 | | | 12,493,744 |
Series 2014 A, Ref. RB | | | 5.00% | | | | 09/01/2044 | | | | 14,530 | | | 14,652,545 |
Series 2016 B, Ref. RB | | | 5.00% | | | | 09/01/2036 | | | | 4,405 | | | 4,584,123 |
Series 2016 B, Ref. RB | | | 5.00% | | | | 09/01/2041 | | | | 12,335 | | | 12,734,459 |
Series 2016, Ref. RB | | | 5.00% | | | | 09/01/2035 | | | | 6,280 | | | 6,564,702 |
Series 2017, RB | | | 5.00% | | | | 09/01/2029 | | | | 750 | | | 819,218 |
Series 2017, RB | | | 5.00% | | | | 09/01/2037 | | | | 3,405 | | | 3,645,061 |
Series 2017, RB (INS - BAM)(b) | | | 5.00% | | | | 09/01/2042 | | | | 14,000 | | | 14,807,761 |
Series 2017, RB | | | 5.00% | | | | 09/01/2047 | | | | 12,925 | | | 13,362,165 |
Series 2017, RB (INS - BAM)(b) | | | 5.00% | | | | 09/01/2047 | | | | 25,000 | | | 25,939,000 |
Series 2018, RB | | | 5.00% | | | | 09/01/2036 | | | | 2,000 | | | 2,167,657 |
Series 2018, RB | | | 5.00% | | | | 09/01/2037 | | | | 7,000 | | | 7,539,010 |
Series 2018, RB | | | 5.00% | | | | 09/01/2038 | | | | 5,000 | | | 5,369,365 |
Series 2018, RB | | | 5.00% | | | | 09/01/2039 | | | | 4,000 | | | 4,280,393 |
Series 2019 A, RB | | | 4.00% | | | | 09/01/2038 | | | | 1,000 | | | 1,005,308 |
Series 2020 A, Ref. RB | | | 4.00% | | | | 09/01/2039 | | | | 5,250 | | | 5,283,970 |
Series 2021 A, Ref. RB | | | 4.00% | | | | 09/01/2039 | | | | 3,000 | | | 3,021,602 |
Series 2021 A, Ref. RB | | | 3.00% | | | | 09/01/2040 | | | | 2,000 | | | 1,656,822 |
Series 2021 A, Ref. RB | | | 4.00% | | | | 09/01/2042 | | | | 3,000 | | | 2,963,062 |
See accompanying Notes to Financial Statements which are an integral part of the financial statements.
| | |
| 11 Invesco Rochester® New York Municipals Fund |
| | | | | | | | | | | | | | |
| | | Interest
Rate | | | Maturity
Date | | | Principal
Amount
(000) | | | Value |
New York–(continued) | | | | | | | | | | | | | | |
Metropolitan Transportation Authority; | | | | | | | | | | | | | | |
Series 2013 C, RB | | | 5.00% | | | | 11/15/2038 | | | $ | 4,000 | | | $ 3,988,559 |
Series 2014 B, RB | | | 5.25% | | | | 11/15/2039 | | | | 5,135 | | | 5,146,422 |
Series 2015 A-2, RB(f) | | | 5.00% | | | | 05/15/2030 | | | | 18,000 | | | 19,090,417 |
Series 2015 B, RB | | | 5.25% | | | | 11/15/2055 | | | | 9,000 | | | 8,990,869 |
Series 2016 C-1, RB | | | 5.00% | | | | 11/15/2056 | | | | 16,170 | | | 16,048,785 |
Series 2016 C-1, RB | | | 5.25% | | | | 11/15/2056 | | | | 20,830 | | | 20,803,644 |
Series 2017 D, Ref. RB | | | 5.00% | | | | 11/15/2033 | | | | 2,295 | | | 2,377,838 |
Series 2017 D, Ref. RB | | | 5.00% | | | | 11/15/2035 | | | | 5,695 | | | 5,887,120 |
Subseries 2015 C-1, Ref. RB | | | 5.25% | | | | 11/15/2030 | | | | 6,540 | | | 6,674,360 |
Metropolitan Transportation Authority (Bidding Group 2); Series 2022 A, RB | | | 4.00% | | | | 11/15/2050 | | | | 23,835 | | | 22,170,278 |
Metropolitan Transportation Authority (Green Bonds); | | | | | | | | | | | | | | |
Series 2016 A-1, RB | | | 5.25% | | | | 11/15/2056 | | | | 23,860 | | | 23,831,122 |
Series 2017 B-1, RB | | | 5.25% | | | | 11/15/2057 | | | | 15,505 | | | 16,232,460 |
Series 2017 C-1, Ref. RB (INS - BAM)(b) | | | 5.00% | | | | 11/15/2031 | | | | 18,000 | | | 19,225,532 |
Series 2017 C-1, Ref. RB (INS - BAM)(b) | | | 5.00% | | | | 11/15/2034 | | | | 24,700 | | | 26,164,735 |
Series 2017 C-2, Ref. RB(c) | | | 0.00% | | | | 11/15/2040 | | | | 3,750 | | | 1,522,997 |
Series 2019 A-2, RB (INS - AGM)(b) | | | 5.00% | | | | 11/15/2044 | | | | 7,900 | | | 8,153,328 |
Series 2019 C, RB (INS - AGM)(b) | | | 4.00% | | | | 11/15/2045 | | | | 560 | | | 523,392 |
Series 2020 C-1, RB | | | 5.25% | | | | 11/15/2055 | | | | 15,000 | | | 15,366,384 |
Subseries 2016 B-1, RB | | | 5.00% | | | | 11/15/2036 | | | | 3,955 | | | 4,136,001 |
Subseries 2016 B-1, RB | | | 5.00% | | | | 11/15/2056 | | | | 10,345 | | | 10,552,378 |
Monroe County Industrial Development Corp. (Highland Hospital of Rochester); Series 2015, Ref. RB | | | 5.00% | | | | 07/01/2034 | | | | 375 | | | 385,921 |
Monroe County Industrial Development Corp. (Monroe Community College); Series 2014, Ref. RB (INS - AGM)(b) | | | 5.00% | | | | 01/15/2038 | | | | 890 | | | 903,667 |
Monroe County Industrial Development Corp. (Rochester General Hospital (The)); | | | | | | | | | | | | | | |
Series 2013 A, Ref. RB | | | 5.00% | | | | 12/01/2037 | | | | 50 | | | 50,025 |
Series 2013 A, Ref. RB | | | 5.00% | | | | 12/01/2042 | | | | 2,010 | | | 2,010,327 |
Monroe County Industrial Development Corp. (Rochester Regional Health); Series 2020, Ref. RB | | | 4.00% | | | | 12/01/2046 | | | | 5,700 | | �� | 4,790,772 |
Monroe County Industrial Development Corp. (Rochester Schools Modernization); | | | | | | | | | | | | | | |
Series 2005 A, RB(a) | | | 6.50% | | | | 12/01/2042 | | | | 2,085 | | | 1,709,363 |
Series 2015, RB | | | 5.00% | | | | 05/01/2030 | | | | 1,000 | | | 1,035,061 |
Series 2015, RB | | | 5.00% | | | | 05/01/2031 | | | | 1,500 | | | 1,551,320 |
Monroe County Industrial Development Corp. (Social Bond); | | | | | | | | | | | | | | |
Series 2022, RB(d) | | | 5.88% | | | | 07/01/2052 | | | | 1,000 | | | 967,361 |
Series 2022, RB(d) | | | 6.00% | | | | 07/01/2057 | | | | 1,000 | | | 966,101 |
Monroe County Industrial Development Corp. (St. Ann’s Community); Series 2019, Ref. RB | | | 5.00% | | | | 01/01/2040 | | | | 4,455 | | | 3,813,511 |
Monroe County Industrial Development Corp. (St. John Fisher College); | | | | | | | | | | | | | | |
Series 2011, RB | | | 5.63% | | | | 06/01/2026 | | | | 695 | | | 696,098 |
Series 2011, RB | | | 6.00% | | | | 06/01/2034 | | | | 1,495 | | | 1,498,091 |
Series 2014 A, RB | | | 5.00% | | | | 06/01/2029 | | | | 500 | | | 509,444 |
Series 2014 A, RB | | | 5.50% | | | | 06/01/2034 | | | | 960 | | | 983,144 |
Series 2014 A, RB | | | 5.00% | | | | 06/01/2044 | | | | 1,515 | | | 1,530,755 |
Monroe County Industrial Development Corp. (University of Rochester); | | | | | | | | | | | | | | |
Series 2015 A, Ref. RB | | | 5.00% | | | | 07/01/2028 | | | | 180 | | | 187,213 |
Series 2015 A, Ref. RB | | | 5.00% | | | | 07/01/2032 | | | | 1,500 | | | 1,552,590 |
Series 2015 A, Ref. RB | | | 5.00% | | | | 07/01/2033 | | | | 1,785 | | | 1,844,341 |
Series 2017 C, Ref. RB | | | 4.00% | | | | 07/01/2043 | | | | 3,175 | | | 2,982,540 |
Series 2020 A, RB | | | 4.00% | | | | 07/01/2050 | | | | 51,550 | | | 47,078,538 |
Monroe Tobacco Asset Securitization Corp.; Series 2006 A, RB(c)(d) | | | 0.00% | | | | 06/01/2061 | | | | 400,000 | | | 15,342,560 |
MTA Hudson Rail Yards Trust Obligations; | | | | | | | | | | | | | | |
Series 2016 A, RB | | | 5.00% | | | | 11/15/2051 | | | | 21,780 | | | 21,578,958 |
Series 2016 A, RB | | | 5.00% | | | | 11/15/2056 | | | | 78,245 | | | 76,876,910 |
See accompanying Notes to Financial Statements which are an integral part of the financial statements.
| | |
| 12 Invesco Rochester® New York Municipals Fund |
| | | | | | | | | | | | | | |
| | | Interest
Rate | | | Maturity
Date | | | Principal
Amount
(000) | | | Value |
New York–(continued) | | | | | | | | | | | | | | |
Nassau (County of), NY; | | | | | | | | | | | | | | |
Series 2016 A, Ref. GO Bonds | | | 5.00% | | | | 01/01/2038 | | | $ | 1,000 | | | $ 1,029,884 |
Series 2018 A, GO Bonds (INS - AGM)(b) | | | 5.00% | | | | 04/01/2040 | | | | 3,335 | | | 3,503,225 |
Series 2018 B, GO Bonds (INS - AGM)(b) | | | 5.00% | | | | 07/01/2049 | | | | 22,435 | | | 23,346,440 |
Series 2019 A, GO Bonds (INS - AGM)(b) | | | 5.00% | | | | 04/01/2043 | | | | 8,510 | | | 8,958,614 |
Series 2019 A, GO Bonds (INS - AGM)(b) | | | 5.00% | | | | 04/01/2049 | | | | 11,600 | | | 12,130,027 |
Series 2019 B, GO Bonds (INS - AGM)(b) | | | 5.00% | | | | 04/01/2049 | | | | 5,000 | | | 5,279,745 |
Nassau (County of), NY Industrial Development Agency (Amsterdam at Harborside); | | | | | | | | | | | | | | |
Series 2021, RB (Acquired 12/14/2007-02/28/2018; Cost $634,149)(g) | | | 5.00% | | | | 01/01/2058 | | | | 546 | | | 263,123 |
Series 2021, Ref. RB (Acquired 09/07/2021; Cost $270,000)(d)(g) | | | 9.00% | | | | 01/01/2041 | | | | 270 | | | 223,204 |
Nassau County Local Economic Assistance Corp. (Catholic Health Services of Long Island Obligated Group); Series 2014, RB | | | 5.00% | | | | 07/01/2033 | | | | 300 | | | 306,286 |
Nassau County Local Economic Assistance Corp. (Hispanic Counseling Center, Inc.); Series 2018 A-2, Ref. RB | | | 5.20% | | | | 12/01/2037 | | | | 1,585 | | | 1,199,341 |
Nassau County Tobacco Settlement Corp.; | | | | | | | | | | | | | | |
Series 2006 A-2, RB | | | 5.25% | | | | 06/01/2026 | | | | 904 | | | 887,879 |
Series 2006 A-3, RB | | | 5.00% | | | | 06/01/2035 | | | | 750 | | | 698,467 |
Series 2006 A-3, RB | | | 5.13% | | | | 06/01/2046 | | | | 615 | | | 568,214 |
Series 2006 C, RB(c) | | | 0.00% | | | | 06/01/2046 | | | | 105,975 | | | 19,264,814 |
Series 2006 D, RB(c) | | | 0.00% | | | | 06/01/2060 | | | | 623,215 | | | 33,841,447 |
Series 2006 E, RB(c) | | | 0.00% | | | | 06/01/2060 | | | | 40,000 | | | 1,990,536 |
New Rochelle (City of), NY (70 Nardozzi/City DPW); Series 2018 A-2, RB | | | 5.13% | | | | 08/01/2050 | | | | 17,100 | | | 11,571,773 |
New Rochelle (City of), NY (Iona College); Series 2015 A, Ref. RB | | | 5.00% | | | | 07/01/2040 | | | | 1,250 | | | 1,267,878 |
New York & New Jersey (States of) Port Authority; | | | | | | | | | | | | | | |
One Hundred Ninty Eight Series 2016, Ref. RB | | | 5.25% | | | | 11/15/2056 | | | | 6,825 | | | 7,068,440 |
Series 2012, RB | | | 4.00% | | | | 01/15/2042 | | | | 720 | | | 690,544 |
Series 2016 197, Ref. RB(a) | | | 5.00% | | | | 11/15/2035 | | | | 7,000 | | | 7,134,930 |
Series 2018 207, Ref. RB(a) | | | 4.00% | | | | 03/15/2035 | | | | 10,000 | | | 10,092,788 |
Series 2018 211, Ref. RB | | | 4.00% | | | | 09/01/2038 | | | | 1,700 | | | 1,670,952 |
Series 2019 220, RB(a) | | | 4.00% | | | | 11/01/2059 | | | | 20,660 | | | 18,112,448 |
Series 2019, RB | | | 4.00% | | | | 11/01/2041 | | | | 600 | | | 577,987 |
Series 2019, RB(a) | | | 4.00% | | | | 11/01/2047 | | | | 25,350 | | | 23,036,739 |
Series 2020 221, RB(a) | | | 4.00% | | | | 07/15/2045 | | | | 5,000 | | | 4,584,110 |
Series 2020 221, RB(a) | | | 4.00% | | | | 07/15/2060 | | | | 21,175 | | | 18,515,395 |
Series 2020 222, Ref. RB | | | 4.00% | | | | 07/15/2038 | | | | 6,455 | | | 6,345,106 |
Series 2020, RB(a) | | | 4.00% | | | | 07/15/2040 | | | | 2,180 | | | 2,081,077 |
Series 2021, Ref. RB(a) | | | 4.00% | | | | 07/15/2051 | | | | 8,395 | | | 7,542,108 |
Series 2021, Ref. RB(a) | | | 5.00% | | | | 07/15/2056 | | | | 2,000 | | | 2,060,719 |
Two Hundred Eleventh Series 2018, Ref. RB | | | 5.00% | | | | 09/01/2048 | | | | 12,475 | | | 13,187,803 |
Two Hundred Forteenth Series 2019, RB(a) | | | 4.00% | | | | 09/01/2043 | | | | 7,990 | | | 7,390,895 |
Two Hundred Thirty First Series 2022, Ref. RB(a) | | | 5.00% | | | | 08/01/2037 | | | | 22,990 | | | 24,712,489 |
Two Hundredth Series 2017, Ref. RB | | | 5.00% | | | | 10/15/2047 | | | | 3,000 | | | 3,137,423 |
Two Hundredth Series 2017, Ref. RB | | | 5.25% | | | | 10/15/2057 | | | | 3,120 | | | 3,270,393 |
New York (City of), NY; | | | | | | | | | | | | | | |
Series 1990 I, GO Bonds | | | 7.75% | | | | 08/15/2028 | | | | 5 | | | 5,111 |
Series 1997 C, GO Bonds (INS - NATL)(b) | | | 5.50% | | | | 11/15/2037 | | | | 10 | | | 10,019 |
Series 2002 D, GO Bonds | | | 5.25% | | | | 06/01/2027 | | | | 230 | | | 230,411 |
Series 2002 D, GO Bonds | | | 5.38% | | | | 06/01/2032 | | | | 380 | | | 380,648 |
Series 2003 F, GO Bonds | | | 5.32% | | | | 01/15/2028 | | | | 5 | | | 5,009 |
Series 2012 I, GO Bonds | | | 5.00% | | | | 08/01/2023 | | | | 3,120 | | | 3,124,592 |
Series 2017 B-1, GO Bonds | | | 5.00% | | | | 10/01/2037 | | | | 3,000 | | | 3,213,063 |
Series 2018 E-1, GO Bonds | | | 5.25% | | | | 03/01/2035 | | | | 1,000 | | | 1,099,333 |
Series 2018 E-1, GO Bonds | | | 5.00% | | | | 03/01/2044 | | | | 25,000 | | | 26,352,975 |
Series 2019 B-1, GO Bonds | | | 5.00% | | | | 10/01/2042 | | | | 595 | | | 634,107 |
Series 2020 C, GO Bonds | | | 4.00% | | | | 08/01/2041 | | | | 3,800 | | | 3,689,146 |
Series 2020 D-1, GO Bonds | | | 4.00% | | | | 03/01/2042 | | | | 3,650 | | | 3,518,853 |
Series 2020 D-1, GO Bonds | | | 4.00% | | | | 03/01/2050 | | | | 12,000 | | | 11,259,138 |
Series 2021 F-1, GO Bonds | | | 3.00% | | | | 03/01/2041 | | | | 5,000 | | | 4,074,287 |
See accompanying Notes to Financial Statements which are an integral part of the financial statements.
| | |
| 13 Invesco Rochester® New York Municipals Fund |
| | | | | | | | | | | | | | |
| | | Interest
Rate | | | Maturity
Date | | | Principal
Amount
(000) | | | Value |
New York–(continued) | | | | | | | | | | | | | | |
Series 2022, GO Bonds(h)(i) | | | 4.00% | | | | 03/01/2047 | | | $ | 18,000 | | | $ 17,017,252 |
Series 2022, GO Bonds (INS - BAM)(b)(h)(i) | | | 4.00% | | | | 03/01/2050 | | | | 28,830 | | | 27,224,365 |
Series 2022, GO Bonds(h)(i) | | | 4.00% | | | | 08/01/2050 | | | | 10,000 | | | 9,367,472 |
Subseries 2018 F-1, GO Bonds | | | 5.00% | | | | 04/01/2045 | | | | 10,000 | | | 10,531,549 |
Subseries 2019 A-1, GO Bonds | | | 4.00% | | | | 08/01/2040 | | | | 2,000 | | | 1,955,157 |
Subseries 2019 A-1, GO Bonds | | | 5.00% | | | | 08/01/2045 | | | | 880 | | | 932,499 |
Subseries 2021 F-1, GO Bonds(i) | | | 5.00% | | | | 03/01/2050 | | | | 10,000 | | | 10,624,839 |
Subseries 2022 B-1, GO Bonds | | | 5.25% | | | | 10/01/2047 | | | | 11,000 | | | 12,105,801 |
Subseries 2022 D-1, GO Bonds | | | 5.25% | | | | 05/01/2040 | | | | 2,500 | | | 2,805,875 |
Subseries 2022 D-1, GO Bonds | | | 5.25% | | | | 05/01/2041 | | | | 3,900 | | | 4,354,037 |
Subseries 2022 D-1, GO Bonds | | | 5.25% | | | | 05/01/2043 | | | | 4,705 | | | 5,215,590 |
Subseries 2022 D-1, GO Bonds | | | 5.50% | | | | 05/01/2044 | | | | 2,250 | | | 2,541,561 |
Subseries 2022 D-1, GO Bonds | | | 5.50% | | | | 05/01/2045 | | | | 2,960 | | | 3,334,511 |
Subseries 2022 D-1, GO Bonds | | | 5.50% | | | | 05/01/2046 | | | | 5,250 | | | 5,903,019 |
New York (City of), NY Industrial Development Agency (1996 Comprehensive Care Management Corp.); | | | | | | | | | | | | | | |
Series 1998 C, RB | | | 6.38% | | | | 11/01/2028 | | | | 695 | | | 606,219 |
Series 1998, RB | | | 6.38% | | | | 11/01/2028 | | | | 1,735 | | | 1,511,652 |
New York (City of), NY Industrial Development Agency (Comprehensive Care Management); | | | | | | | | | | | | | | |
Series 2005 C-2, RB | | | 6.00% | | | | 05/01/2026 | | | | 525 | | | 477,950 |
Series 2005 E-2, RB | | | 6.13% | | | | 11/01/2035 | | | | 2,455 | | | 1,827,364 |
New York (City of), NY Industrial Development Agency (Cool Wind Ventilation Corp.); Series 2007 A-2, IDR(a) | | | 6.08% | | | | 11/01/2027 | | | | 3,245 | | | 3,073,374 |
New York (City of), NY Industrial Development Agency (MediSys Health Network, Inc.); Series 1999, RB | | | 6.25% | | | | 03/15/2024 | | | | 3,580 | | | 3,453,686 |
New York (City of), NY Industrial Development Agency (Special Needs Facilities Pooled Program); Series 1999 A-1, RB | | | 6.65% | | | | 07/01/2023 | | | | 140 | | | 139,519 |
New York (City of), NY Industrial Development Agency (The Child School); Series 2003, RB | | | 7.55% | | | | 06/01/2033 | | | | 6,550 | | | 6,581,126 |
New York (City of), NY Industrial Development Agency (Yankee Stadium); Series 2020, Ref. RB | | | 4.00% | | | | 03/01/2045 | | | | 16,450 | | | 14,648,352 |
New York (City of), NY Municipal Water Finance Authority; | | | | | | | | | | | | | | |
Subseries 2023 AA-1, RB | | | 5.25% | | | | 06/15/2052 | | | | 14,980 | | | 16,554,713 |
Series 2017 CC-1, RB | | | 5.00% | | | | 06/15/2048 | | | | 1,000 | | | 1,044,694 |
Series 2017 EE, Ref. RB | | | 5.00% | | | | 06/15/2037 | | | | 515 | | | 548,696 |
Series 2019 BB-1, RB | | | 4.00% | | | | 06/15/2049 | | | | 4,800 | | | 4,558,640 |
Series 2019 CC-1, RB | | | 4.00% | | | | 06/15/2040 | | | | 2,305 | | | 2,272,228 |
Series 2019 DD-1, RB | | | 4.00% | | | | 06/15/2049 | | | | 9,885 | | | 9,387,950 |
Series 2019 DD-1, RB | | | 5.25% | | | | 06/15/2049 | | | | 5,000 | | | 5,363,362 |
Series 2020 BB-1, RB | | | 4.00% | | | | 06/15/2050 | | | | 9,750 | | | 9,227,546 |
Series 2020 BB-2, Ref. RB | | | 4.00% | | | | 06/15/2042 | | | | 3,545 | | | 3,470,606 |
Series 2020 EE, Ref. RB | | | 4.00% | | | | 06/15/2042 | | | | 15,815 | | | 15,483,111 |
Series 2020, Ref. RB | | | 5.00% | | | | 06/15/2050 | | | | 8,500 | | | 9,024,496 |
Series 2021 AA-1, RB | | | 4.00% | | | | 06/15/2051 | | | | 10,000 | | | 9,431,791 |
Series 2022 CC-1, RB | | | 4.00% | | | | 06/15/2052 | | | | 15,055 | | | 14,176,858 |
Subseries 2018 DD-1, RB(i) | | | 5.00% | | | | 06/15/2048 | | | | 20,000 | | | 21,006,898 |
Subseries 2023 AA-1, RB(i) | | | 5.25% | | | | 06/15/2052 | | | | 15,000 | | | 16,576,815 |
Subseries 2023 CC-1, RB(i) | | | 4.00% | | | | 06/15/2052 | | | | 35,000 | | | 32,958,489 |
New York (City of), NY Transitional Finance Authority; | | | | | | | | | | | | | | |
Series 2016 S-1, RB | | | 5.00% | | | | 07/15/2029 | | | | 650 | | | 684,240 |
Series 2018 S-1, RB | | | 5.00% | | | | 07/15/2043 | | | | 24,000 | | | 25,345,697 |
Series 2018 S-1, RB | | | 5.00% | | | | 07/15/2045 | | | | 10,000 | | | 10,523,970 |
Series 2018 S-3, RB | | | 5.00% | | | | 07/15/2043 | | | | 885 | | | 934,623 |
Series 2018 S-3, RB | | | 5.25% | | | | 07/15/2045 | | | | 11,475 | | | 12,208,257 |
Series 2019 B-1, RB | | | 4.00% | | | | 11/01/2042 | | | | 7,325 | | | 7,121,369 |
Series 2019 B-1, RB | | | 4.00% | | | | 11/01/2045 | | | | 8,795 | | | 8,429,991 |
Series 2019 B-1, RB | | | 4.00% | | | | 11/01/2047 | | | | 5,875 | | | 5,584,851 |
Series 2020 A-3, RB | | | 4.00% | | | | 05/01/2044 | | | | 11,000 | | | 10,602,253 |
Series 2020 C-1, RB | | | 4.00% | | | | 05/01/2037 | | | | 3,375 | | | 3,388,229 |
Series 2020 C-1, RB | | | 4.00% | | | | 05/01/2038 | | | | 3,565 | | | 3,552,560 |
Series 2020 C-1, RB | | | 4.00% | | | | 05/01/2039 | | | | 3,165 | | | 3,133,725 |
See accompanying Notes to Financial Statements which are an integral part of the financial statements.
| | |
| 14 Invesco Rochester® New York Municipals Fund |
| | | | | | | | | | | | | | |
| | | Interest
Rate | | | Maturity
Date | | | Principal
Amount
(000) | | | Value |
New York–(continued) | | | | | | | | | | | | | | |
Series 2020 C-1, RB | | | 4.00% | | | | 05/01/2040 | | | $ | 1,415 | | | $ 1,391,563 |
Series 2020 D, RB | | | 4.00% | | | | 11/01/2043 | | | | 9,575 | | | 9,281,255 |
Series 2020, RB | | | 4.00% | | | | 05/01/2042 | | | | 8,000 | | | 7,781,288 |
Series 2020, RB | | | 4.00% | | | | 05/01/2045 | | | | 2,000 | | | 1,918,096 |
Series 2020, RB | | | 4.00% | | | | 05/01/2046 | | | | 23,000 | | | 21,948,382 |
Series 2020, RB | | | 4.00% | | | | 05/01/2047 | | | | 7,000 | | | 6,658,277 |
Series 2021 B-1, RB | | | 4.00% | | | | 08/01/2048 | | | | 3,925 | | | 3,722,285 |
Series 2021 E-1, RB | | | 4.00% | | | | 02/01/2046 | | | | 12,855 | | | 12,271,185 |
Series 2022 F-1, RB | | | 5.00% | | | | 02/01/2044 | | | | 2,500 | | | 2,699,311 |
Series 2022 F-1, RB | | | 5.00% | | | | 02/01/2047 | | | | 24,500 | | | 26,287,929 |
Series 2022, RB(i) | | | 4.00% | | | | 11/01/2042 | | | | 11,000 | | | 10,694,206 |
Series 2022, RB(i) | | | 4.00% | | | | 11/01/2043 | | | | 19,000 | | | 18,417,112 |
Series 2022, RB | | | 5.00% | | | | 02/01/2047 | | | | 9,955 | | | 10,681,483 |
Subseries 2021 C-1, RB(h)(i) | | | 4.00% | | | | 05/01/2043 | | | | 23,055 | | | 22,358,582 |
Subseries 2021 S-1, Ref. RB | | | 4.00% | | | | 07/15/2040 | | | | 1,000 | | | 973,626 |
Subseries 2022 F-1, RB(i) | | | 5.00% | | | | 02/01/2047 | | | | 24,575 | | | 26,368,402 |
New York (City of), NY Trust for Cultural Resources (American Museum of Natural History); Series 2014 A, Ref. RB | | | 5.00% | | | | 07/01/2041 | | | | 1,000 | | | 1,013,319 |
New York (City of), NY Trust for Cultural Resources (Carnegie Hall); | | | | | | | | | | | | | | |
Series 2019, Ref. RB | | | 5.00% | | | | 12/01/2034 | | | | 300 | | | 335,410 |
Series 2019, Ref. RB | | | 5.00% | | | | 12/01/2036 | | | | 700 | | | 770,337 |
New York (City of), NY Trust for Cultural Resources (Juilliard School (The)); Series 2018 A, Ref. RB | | | 4.00% | | | | 01/01/2039 | | | | 6,370 | | | 6,300,648 |
New York (City of), NY Trust for Cultural Resources (Lincoln Center for Performing Arts); Series 2020 A, Ref. RB | | | 4.00% | | | | 12/01/2035 | | | | 950 | | | 962,373 |
New York (State of) Bridge Authority; | | | | | | | | | | | | | | |
Series 2021 A, RB | | | 4.00% | | | | 01/01/2038 | | | | 200 | | | 197,116 |
Series 2021 A, RB | | | 4.00% | | | | 01/01/2039 | | | | 275 | | | 269,181 |
Series 2021 A, RB | | | 4.00% | | | | 01/01/2040 | | | | 350 | | | 339,730 |
Series 2021 A, RB | | | 4.00% | | | | 01/01/2041 | | | | 220 | | | 211,903 |
Series 2021 A, RB | | | 4.00% | | | | 01/01/2046 | | | | 725 | | | 674,590 |
Series 2021 A, RB | | | 4.00% | | | | 01/01/2051 | | | | 1,085 | | | 991,286 |
New York (State of) Dormitory Authority; | | | | | | | | | | | | | | |
Series 2009 C, RB (INS - AGC)(b) | | | 5.00% | | | | 10/01/2024 | | | | 115 | | | 115,203 |
Series 2015 A-1, Ref. RB(d) | | | 4.80% | | | | 12/01/2023 | | | | 795 | | | 778,074 |
Series 2015 B, RB(e)(f) | | | 5.00% | | | | 02/15/2025 | | | | 5 | | | 5,173 |
Series 2016 A, Ref. RB | | | 5.00% | | | | 10/01/2033 | | | | 600 | | | 632,707 |
Series 2016 A, Ref. RB | | | 5.00% | | | | 07/01/2036 | | | | 275 | | | 286,159 |
Series 2017 A, RB | | | 5.00% | | | | 03/15/2041 | | | | 2,970 | | | 3,118,345 |
Series 2017 A, RB | | | 4.00% | | | | 03/15/2046 | | | | 15,965 | | | 15,081,787 |
Series 2017 B, Ref. RB(e)(f) | | | 5.00% | | | | 08/15/2027 | | | | 10 | | | 10,893 |
Series 2017, Ref. RB | | | 5.00% | | | | 02/15/2037 | | | | 2,145 | | | 2,259,898 |
Series 2018 A, RB | | | 5.00% | | | | 07/01/2048 | | | | 5,890 | | | 6,243,262 |
Series 2019 A, RB | | | 5.00% | | | | 10/01/2034 | | | | 820 | | | 888,908 |
Series 2019 A, RB | | | 4.00% | | | | 07/01/2045 | | | | 15,280 | | | 14,609,055 |
Series 2019 D, RB(i) | | | 4.00% | | | | 02/15/2049 | | | | 20,000 | | | 18,793,804 |
Series 2020 A, RB(i) | | | 4.00% | | | | 03/15/2046 | | | | 30,485 | | | 28,925,793 |
Series 2020 D, Ref. RB | | | 4.00% | | | | 02/15/2047 | | | | 13,575 | | | 12,838,475 |
Series 2021 A, Ref. RB | | | 4.00% | | | | 03/15/2043 | | | | 5,000 | | | 4,810,440 |
Series 2021 A, Ref. RB | | | 4.00% | | | | 03/15/2047 | | | | 26,305 | | | 24,875,073 |
Series 2021 E, Ref. RB | | | 4.00% | | | | 03/15/2047 | | | | 4,575 | | | 4,326,305 |
Series 2022 A, RB (INS - BAM)(b) | | | 4.25% | | | | 10/01/2051 | | | | 5,500 | | | 5,356,922 |
Series 2022, RB(h)(i) | | | 4.00% | | | | 03/15/2049 | | | | 46,305 | | | 43,507,701 |
Series 2022, RB(i) | | | 4.00% | | | | 07/01/2049 | | | | 22,500 | | | 20,998,564 |
New York (State of) Dormitory Authority (Alliance Long Island AGYS, Inc.); | | | | | | | | | | | | | | |
Series 2015 A-2, Ref. RB(d) | | | 5.35% | | | | 12/01/2035 | | | | 10,325 | | | 7,963,516 |
Series 2015 B-1, Ref. RB(d) | | | 6.18% | | | | 12/01/2031 | | | | 4,010 | | | 3,305,619 |
See accompanying Notes to Financial Statements which are an integral part of the financial statements.
| | |
| 15 Invesco Rochester® New York Municipals Fund |
| | | | | | | | | | | | | | |
| | | Interest
Rate | | | Maturity
Date | | | Principal
Amount
(000) | | | Value |
New York–(continued) | | | | | | | | | | | | | | |
New York (State of) Dormitory Authority (Barnard College); | | | | | | | | | | | | | | |
Series 2020 A, Ref. RB | | | 4.00% | | | | 07/01/2038 | | | $ | 680 | | | $ 630,227 |
Series 2020 A, Ref. RB | | | 4.00% | | | | 07/01/2040 | | | | 675 | | | 613,845 |
Series 2020 A, Ref. RB | | | 4.00% | | | | 07/01/2045 | | | | 1,275 | | | 1,139,036 |
Series 2020 A, Ref. RB | | | 4.00% | | | | 07/01/2049 | | | | 1,350 | | | 1,183,267 |
New York (State of) Dormitory Authority (Bidding Group 3); Series 2017 B, Ref. RB | | | 5.00% | | | | 02/15/2041 | | | | 6,015 | | | 6,333,897 |
New York (State of) Dormitory Authority (Bidding Group 4); | | | | | | | | | | | | | | |
Series 2018 A, RB | | | 5.00% | | | | 03/15/2044 | | | | 12,830 | | | 13,571,255 |
Series 2018 C, Ref. RB | | | 4.00% | | | | 03/15/2044 | | | | 11,385 | | | 10,823,194 |
New York (State of) Dormitory Authority (Bidding Group 5); Series 2020 A, Ref. RB | | | 4.00% | | | | 03/15/2047 | | | | 9,000 | | | 8,510,764 |
New York (State of) Dormitory Authority (Catholic Health System Obligated Group); | | | | | | | | | | | | | | |
Series 2012 A, RB | | | 5.00% | | | | 07/01/2032 | | | | 500 | | | 439,466 |
Series 2012 B, RB | | | 5.00% | | | | 07/01/2032 | | | | 260 | | | 228,522 |
Series 2019 A, Ref. RB | | | 4.00% | | | | 07/01/2045 | | | | 750 | | | 515,762 |
New York (State of) Dormitory Authority (Cerebral Palsy Affiliates Pooled Loan Program); Series 2005 A, RB (INS - AGC)(b) | | | 5.00% | | | | 07/01/2034 | | | | 20 | | | 20,004 |
New York (State of) Dormitory Authority (City of New York); | | | | | | | | | | | | | | |
Series 2005 A, RB (INS - AMBAC)(b) | | | 5.50% | | | | 05/15/2027 | | | | 710 | | | 783,104 |
Series 2005 A, RB (INS - AMBAC)(b) | | | 5.50% | | | | 05/15/2030 | | | | 750 | | | 882,175 |
Series 2005 A, RB (INS - AMBAC)(b) | | | 5.50% | | | | 05/15/2031 | | | | 555 | | | 664,055 |
New York (State of) Dormitory Authority (Columbia University); Series 2015, RB | | | 5.00% | | | | 10/01/2045 | | | | 115 | | | 130,002 |
New York (State of) Dormitory Authority (Cornell University); Series 2020 A, Ref. RB | | | 4.00% | | | | 07/01/2050 | | | | 10,000 | | | 9,327,150 |
New York (State of) Dormitory Authority (Educational Housing Services - CUNY Student Housing); Series 2005, RB (INS - AMBAC)(b) | | | 5.25% | | | | 07/01/2030 | | | | 25 | | | 26,283 |
New York (State of) Dormitory Authority (Fashion Institute of Technology Student Housing Corp.); Series 2007, RB (INS - NATL)(b) | | | 5.25% | | | | 07/01/2028 | | | | 935 | | | 970,785 |
New York (State of) Dormitory Authority (Fordham University); | | | | | | | | | | | | | | |
Series 2014, RB | | | 5.00% | | | | 07/01/2030 | | | | 200 | | | 204,588 |
Series 2016 A, Ref. RB | | | 5.00% | | | | 07/01/2041 | | | | 1,200 | | | 1,232,964 |
Series 2017, Ref. RB | | | 5.00% | | | | 07/01/2030 | | | | 650 | | | 694,994 |
Series 2017, Ref. RB | | | 4.00% | | | | 07/01/2033 | | | | 415 | | | 426,909 |
Series 2020, RB | | | 4.00% | | | | 07/01/2046 | | | | 1,555 | | | 1,436,193 |
Series 2020, RB | | | 4.00% | | | | 07/01/2050 | | | | 37,360 | | | 33,999,012 |
Series 2021 A, Ref. RB | | | 3.00% | | | | 07/01/2038 | | | | 9,455 | | | 7,688,863 |
New York (State of) Dormitory Authority (General Purpose); Series 2018 A, Ref. RB | | | 5.25% | | | | 03/15/2038 | | | | 1,500 | | | 1,631,005 |
New York (State of) Dormitory Authority (Group 4); Series 2019 A, Ref. RB | | | 4.00% | | | | 03/15/2049 | | | | 7,935 | | | 7,455,644 |
New York (State of) Dormitory Authority (Icahn School of Medicine at Mount Sinai); | | | | | | | | | | | | | | |
Series 2015 A, Ref. RB | | | 5.00% | | | | 07/01/2034 | | | | 150 | | | 153,626 |
Series 2015 A, Ref. RB | | | 5.00% | | | | 07/01/2040 | | | | 2,800 | | | 2,835,090 |
Series 2015, Ref. RB | | | 5.00% | | | | 07/01/2045 | | | | 1,165 | | | 1,173,891 |
New York (State of) Dormitory Authority (Iona College); | | | | | | | | | | | | | | |
Series 2021 A, RB | | | 5.00% | | | | 07/01/2046 | | | | 500 | | | 511,809 |
Series 2021 A, RB | | | 5.00% | | | | 07/01/2051 | | | | 1,250 | | | 1,272,864 |
New York (State of) Dormitory Authority (Maimonides Medical Center); Series 2020, RB (CEP - Federal Housing Administration) | | | 4.00% | | | | 08/01/2043 | | | | 1,000 | | | 961,622 |
New York (State of) Dormitory Authority (Memorial Sloan Kettering Cancer); Series 1998, RB (INS - NATL)(b) | | | 5.50% | | | | 07/01/2023 | | | | 445 | | | 448,302 |
New York (State of) Dormitory Authority (Montefiore Obligated Group); | | | | | | | | | | | | | | |
Series 2018 A, Ref. RB | | | 5.00% | | | | 08/01/2035 | | | | 6,695 | | | 6,716,166 |
Series 2018 A, Ref. RB | | | 4.00% | | | | 08/01/2036 | | | | 5,570 | | | 4,989,756 |
Series 2018 A, Ref. RB | | | 4.00% | | | | 08/01/2037 | | | | 2,050 | | | 1,822,046 |
Series 2020 A, Ref. RB | | | 4.00% | | | | 09/01/2045 | | | | 8,205 | | | 6,908,906 |
Series 2020 A, Ref. RB | | | 4.00% | | | | 09/01/2050 | | | | 51,475 | | | 41,816,174 |
New York (State of) Dormitory Authority (Municipal Health Facilities Improvement Program); Series 2006 A, RB (INS - NATL)(b) | | | 4.50% | | | | 05/15/2036 | | | | 30 | | | 30,019 |
See accompanying Notes to Financial Statements which are an integral part of the financial statements.
| | |
| 16 Invesco Rochester® New York Municipals Fund |
| | | | | | | | | | | | | | |
| | | Interest
Rate | | | Maturity
Date | | | Principal
Amount
(000) | | | Value |
New York–(continued) | | | | | | | | | | | | | | |
New York (State of) Dormitory Authority (New School (The)); | | | | | | | | | | | | | | |
Series 2015, Ref. RB(e)(f) | | | 5.00% | | | | 07/01/2025 | | | $ | 145 | | | $ 151,142 |
Series 2015, Ref. RB | | | 5.00% | | | | 07/01/2040 | | | | 1,955 | | | 1,988,165 |
Series 2016 A, Ref. RB | | | 5.00% | | | | 07/01/2030 | | | | 1,545 | | | 1,624,417 |
Series 2016 A, Ref. RB | | | 5.00% | | | | 07/01/2035 | | | | 3,490 | | | 3,635,360 |
Series 2016 A, Ref. RB | | | 5.00% | | | | 07/01/2036 | | | | 2,490 | | | 2,581,760 |
Series 2016 A, Ref. RB | | | 5.00% | | | | 07/01/2037 | | | | 6,535 | | | 6,755,248 |
Series 2016 A, Ref. RB | | | 5.00% | | | | 07/01/2041 | | | | 2,905 | | | 2,972,108 |
Series 2016 A, Ref. RB | | | 4.00% | | | | 07/01/2043 | | | | 5,050 | | | 4,494,235 |
Series 2016 A, Ref. RB | | | 5.00% | | | | 07/01/2046 | | | | 6,330 | | | 6,423,419 |
Series 2022 A, Ref. RB | | | 4.00% | | | | 07/01/2052 | | | | 9,050 | | | 7,680,535 |
New York (State of) Dormitory Authority (New York University); | | | | | | | | | | | | | | |
Series 2001 1, RB (INS - BHAC)(b) | | | 5.50% | | | | 07/01/2031 | | | | 1,070 | | | 1,212,890 |
Series 2016 A, RB | | | 4.00% | | | | 07/01/2039 | | | | 625 | | | 618,779 |
Series 2017 A, Ref. RB | | | 4.00% | | | | 07/01/2036 | | | | 5,000 | | | 5,032,956 |
Series 2019 A, RB | | | 5.00% | | | | 07/01/2042 | | | | 4,260 | | | 4,567,583 |
Series 2019 A, RB | | | 5.00% | | | | 07/01/2049 | | | | 8,600 | | | 9,124,901 |
Series 2021 A, Ref. RB | | | 3.00% | | | | 07/01/2041 | | | | 7,785 | | | 6,282,283 |
Series 2021 A, Ref. RB | | | 4.00% | | | | 07/01/2046 | | | | 6,000 | | | 5,707,541 |
New York (State of) Dormitory Authority (Northwell Health Obligated Group); Series 2015 A, Ref. RB | | | 5.00% | | | | 05/01/2033 | | | | 1,515 | | | 1,568,532 |
New York (State of) Dormitory Authority (NYU Hospitals Center); Series 2014, Ref. RB | | | 5.00% | | | | 07/01/2036 | | | | 2,475 | | | 2,519,751 |
New York (State of) Dormitory Authority (Orange Regional Medical Center); | | | | | | | | | | | | | | |
Series 2015, Ref. RB(d) | | | 5.00% | | | | 12/01/2045 | | | | 425 | | | 404,574 |
Series 2017, Ref. RB(d) | | | 5.00% | | | | 12/01/2029 | | | | 3,200 | | | 3,231,744 |
Series 2017, Ref. RB(d) | | | 5.00% | | | | 12/01/2030 | | | | 1,900 | | | 1,918,742 |
Series 2017, Ref. RB(d) | | | 5.00% | | | | 12/01/2032 | | | | 1,200 | | | 1,206,373 |
Series 2017, Ref. RB(d) | | | 5.00% | | | | 12/01/2033 | | | | 1,700 | | | 1,705,793 |
Series 2017, Ref. RB(d) | | | 5.00% | | | | 12/01/2035 | | | | 1,300 | | | 1,285,224 |
Series 2017, Ref. RB(d) | | | 5.00% | | | | 12/01/2036 | | | | 2,100 | | | 2,047,998 |
Series 2017, Ref. RB(d) | | | 5.00% | | | | 12/01/2037 | | | | 800 | | | 773,550 |
New York (State of) Dormitory Authority (Pace University); | | | | | | | | | | | | | | |
Series 2013 A, RB(e)(f) | | | 5.00% | | | | 05/01/2023 | | | | 20 | | | 20,057 |
Series 2013 A, RB | | | 5.00% | | | | 05/01/2029 | | | | 980 | | | 981,396 |
New York (State of) Dormitory Authority (Pratt Institute); | | | | | | | | | | | | | | |
Series 2016, Ref. RB | | | 5.00% | | | | 07/01/2039 | | | | 500 | | | 512,381 |
Series 2016, Ref. RB | | | 5.00% | | | | 07/01/2046 | | | | 500 | | | 508,027 |
New York (State of) Dormitory Authority (Rochester Institute of Technology); | | | | | | | | | | | | | | |
Series 2019 A, RB | | | 4.00% | | | | 07/01/2044 | | | | 13,835 | | | 12,862,110 |
Series 2019 A, RB | | | 5.00% | | | | 07/01/2049 | | | | 5,640 | | | 5,961,548 |
New York (State of) Dormitory Authority (Rockefeller University); | | | | | | | | | | | | | | |
Series 2019 C, Ref. RB | | | 4.00% | | | | 07/01/2049 | | | | 3,500 | | | 3,266,443 |
Series 2020 A, Ref. RB | | | 5.00% | | | | 07/01/2053 | | | | 3,500 | | | 3,709,151 |
Series 2022 A, Ref. RB | | | 4.00% | | | | 07/01/2042 | | | | 3,305 | | | 3,171,833 |
New York (State of) Dormitory Authority (Rockefeller University) (Green Bonds); Series 2019 B, RB | | | 5.00% | | | | 07/01/2050 | | | | 21,625 | | | 23,001,111 |
New York (State of) Dormitory Authority (St. John’s University); Series 2015 A, Ref. RB | | | 5.00% | | | | 07/01/2034 | | | | 400 | | | 414,275 |
New York (State of) Dormitory Authority (St. Joseph’s College); | | | | | | | | | | | | | | |
Series 2021, RB | | | 4.00% | | | | 07/01/2040 | | | | 225 | | | 202,121 |
Series 2021, RB | | | 5.00% | | | | 07/01/2051 | | | | 750 | | | 748,727 |
New York (State of) Dormitory Authority (State University of New York Dormitory Facilities); Series 2019 A, RB | | | 4.00% | | | | 07/01/2049 | | | | 5,180 | | | 4,741,136 |
New York (State of) Dormitory Authority (United Cerebral Palsy Association); | | | | | | | | | | | | | | |
Series 2017 A, RB(d) | | | 5.50% | | | | 12/01/2047 | | | | 16,140 | | | 11,018,208 |
Series 2017 A-2, RB(d) | | | 5.38% | | | | 09/01/2050 | | | | 25,010 | | | 17,136,892 |
Series 2017 A-2, Ref. RB (Acquired 10/25/2017; Cost $7,540,000)(d)(g) | | | 5.38% | | | | 10/01/2042 | | | | 7,540 | | | 5,650,752 |
New York (State of) Dormitory Authority (Wagner College); | | | | | | | | | | | | | | |
Series 2022, Ref. RB | | | 5.00% | | | | 07/01/2047 | | | | 2,000 | | | 1,953,789 |
Series 2022, Ref. RB | | | 5.00% | | | | 07/01/2057 | | | | 12,000 | | | 11,380,392 |
New York (State of) Dormitory Authority (Yeshiva University); Series 2022 A, Ref. RB | | | 5.00% | | | | 07/15/2050 | | | | 4,000 | | | 3,914,216 |
See accompanying Notes to Financial Statements which are an integral part of the financial statements.
| | |
| 17 Invesco Rochester® New York Municipals Fund |
| | | | | | | | | | | | | | |
| | | Interest
Rate | | | Maturity
Date | | | Principal
Amount
(000) | | | Value |
New York–(continued) | | | | | | | | | | | | | | |
New York (State of) Housing Finance Agency; | | | | | | | | | | | | | | |
Series 2014 C, RB | | | 4.00% | | | | 11/01/2046 | | | $ | 7,340 | | | $ 6,685,098 |
Series 2014 G, RB (CEP - GNMA) | | | 4.00% | | | | 05/01/2047 | | | | 3,080 | | | 2,771,474 |
Series 2015 C, RB | | | 4.15% | | | | 05/01/2048 | | | | 2,295 | | | 2,088,549 |
Series 2020 C, RB (CEP - Federal Housing Administration) | | | 4.20% | | | | 11/01/2054 | | | | 25,590 | | | 22,877,606 |
New York (State of) Housing Finance Agency (Horizons at Wawayanda); Series 2007 A, RB (CEP - FHLMC)(a) | | | 5.15% | | | | 11/01/2040 | | | | 110 | | | 110,090 |
New York (State of) Housing Finance Agency (Tiffany Gardens); Series 2005 A, RB(a) | | | 5.13% | | | | 08/15/2037 | | | | 310 | | | 310,894 |
New York (State of) Power Authority (Green Bonds); | | | | | | | | | | | | | | |
Series 2020 A, RB(h)(i) | | | 4.00% | | | | 11/15/2060 | | | | 39,155 | | | 36,080,776 |
Series 2020 A, Ref. RB | | | 4.00% | | | | 11/15/2050 | | | | 25,620 | | | 24,475,081 |
New York (State of) Power Authority (Green Transmission); | | | | | | | | | | | | | | |
Series 2022, RB (INS - AGM)(b) | | | 4.00% | | | | 11/15/2047 | | | | 5,000 | | | 4,661,424 |
Series 2022, RB (INS - AGM)(b) | | | 4.00% | | | | 11/15/2052 | | | | 11,170 | | | 10,234,919 |
Series 2022, RB (INS - AGM)(b) | | | 4.00% | | | | 11/15/2061 | | | | 10,000 | | | 8,921,609 |
New York (State of) Thruway Authority; | | | | | | | | | | | | | | |
Series 2022 C, RB(i) | | | 5.00% | | | | 03/15/2054 | | | | 38,340 | | | 41,137,931 |
Series 2014 J, RB | | | 5.00% | | | | 01/01/2034 | | | | 1,620 | | | 1,642,083 |
Series 2016 A, RB | | | 5.00% | | | | 01/01/2051 | | | | 27,580 | | | 27,916,774 |
Series 2019 B, RB | | | 4.00% | | | | 01/01/2045 | | | | 21,185 | | | 19,731,868 |
Series 2019 B, RB | | | 4.00% | | | | 01/01/2050 | | | | 13,815 | | | 12,648,373 |
Series 2019 B, RB (INS - AGM)(b) | | | 4.00% | | | | 01/01/2050 | | | | 45,000 | | | 41,184,990 |
Series 2020 N, RB | | | 5.00% | | | | 01/01/2040 | | | | 11,555 | | | 12,313,462 |
Series 2020 N, RB | | | 4.00% | | | | 01/01/2044 | | | | 11,465 | | | 10,879,723 |
Series 2021 O, Ref. RB | | | 4.00% | | | | 01/01/2043 | | | | 15,000 | | | 14,324,634 |
Series 2021 O, Ref. RB | | | 4.00% | | | | 01/01/2049 | | | | 7,210 | | | 6,715,101 |
New York (State of) Thruway Authority (Bidding Group 1); | | | | | | | | | | | | | | |
Series 2022 A, Ref. RB | | | 4.00% | | | | 03/15/2049 | | | | 4,200 | | | 3,940,076 |
Series 2022 C, RB | | | 5.00% | | | | 03/15/2055 | | | | 8,750 | | | 9,381,396 |
New York (State of) Thruway Authority (Bidding Group 4); | | | | | | | | | | | | | | |
Series 2021 A-1, Ref. RB | | | 4.00% | | | | 03/15/2052 | | | | 8,500 | | | 7,927,033 |
Series 2021 A-1, Ref. RB | | | 4.00% | | | | 03/15/2053 | | | | 15,000 | | | 13,960,621 |
New York (State of) Thruway Authority (Group 2); | | | | | | | | | | | | | | |
Series 2020 N, RB | | | 4.00% | | | | 01/01/2045 | | | | 5,000 | | | 4,716,870 |
Series 2021 O, Ref. RB | | | 4.00% | | | | 01/01/2048 | | | | 12,500 | | | 11,670,217 |
New York (State of) Utility Debt Securitization Authority; | | | | | | | | | | | | | | |
Series 2022, Ref. RB | | | 5.00% | | | | 12/15/2049 | | | | 7,000 | | | 7,740,089 |
Series 2022, Ref. RB | | | 5.00% | | | | 09/15/2052 | | | | 5,000 | | | 5,514,639 |
New York City Health and Hospitals Corp.; | | | | | | | | | | | | | | |
Series 2021 A, Ref. RB | | | 4.00% | | | | 02/15/2045 | | | | 1,250 | | | 1,165,767 |
Series 2021 A, Ref. RB | | | 4.00% | | | | 02/15/2048 | | | | 1,000 | | | 920,939 |
New York City Housing Development Corp.; Series 2014 C-1-A, RB | | | 4.30% | | | | 11/01/2047 | | | | 5,030 | | | 4,670,176 |
New York Convention Center Development Corp. (Hotel Unit Fee Secured); | | | | | | | | | | | | | | |
Series 2015, Ref. RB | | | 5.00% | | | | 11/15/2040 | | | | 8,435 | | | 8,623,520 |
Series 2015, Ref. RB | | | 5.00% | | | | 11/15/2045 | | | | 8,190 | | | 8,324,309 |
Series 2016 A, RB | | | 5.00% | | | | 11/15/2041 | | | | 4,220 | | | 4,313,009 |
Series 2016 B, RB(c) | | | 0.00% | | | | 11/15/2044 | | | | 3,270 | | | 1,079,905 |
New York Counties Tobacco Trust I; | | | | | | | | | | | | | | |
Series 2000 A, RB | | | 6.50% | | | | 06/01/2035 | | | | 2,260 | | | 2,261,075 |
Series 2000 A, RB | | | 6.63% | | | | 06/01/2042 | | | | 19,230 | | | 19,237,857 |
New York Counties Tobacco Trust II; | | | | | | | | | | | | | | |
Series 2001, RB | | | 5.63% | | | | 06/01/2035 | | | | 910 | | | 928,161 |
Series 2001, RB | | | 5.75% | | | | 06/01/2043 | | | | 8,890 | | | 9,067,639 |
New York Counties Tobacco Trust IV; | | | | | | | | | | | | | | |
Series 2005 D, RB(c) | | | 0.00% | | | | 06/01/2050 | | | | 66,335 | | | 13,604,320 |
Series 2005 E, RB(c) | | | 0.00% | | | | 06/01/2055 | | | | 165,210 | | | 11,668,419 |
Series 2010 A, RB(d) | | | 6.25% | | | | 06/01/2041 | | | | 13,700 | | | 13,705,077 |
See accompanying Notes to Financial Statements which are an integral part of the financial statements.
| | |
| 18 Invesco Rochester® New York Municipals Fund |
| | | | | | | | | | | | | | |
| | | Interest
Rate | | | Maturity
Date | | | Principal
Amount
(000) | | | Value |
New York–(continued) | | | | | | | | | | | | | | |
New York Counties Tobacco Trust V; | | | | | | | | | | | | | | |
Series 2005 S-1, RB(c) | | | 0.00% | | | | 06/01/2038 | | | $ | 3,430 | | | $ 1,366,434 |
Series 2005 S-2, RB(c) | | | 0.00% | | | | 06/01/2050 | | | | 6,770 | | | 920,610 |
Series 2005 S-3, RB(c) | | | 0.00% | | | | 06/01/2055 | | | | 219,195 | | | 16,167,012 |
Series 2005 S4B, RB(c)(d) | | | 0.00% | | | | 06/01/2060 | | | | 715,900 | | | 25,527,705 |
New York Counties Tobacco Trust VI; | | | | | | | | | | | | | | |
Series 2016 A, Ref. RB | | | 6.45% | | | | 06/01/2040 | | | | 3,005 | | | 3,077,870 |
Series 2016 A, Ref. RB | | | 6.00% | | | | 06/01/2043 | | | | 2,515 | | | 2,556,588 |
Series 2016 A-1, Ref. RB | | | 5.75% | | | | 06/01/2043 | | | | 4,000 | | | 4,141,472 |
Series 2016 A-2, Ref. RB | | | 5.00% | | | | 06/01/2051 | | | | 13,875 | | | 12,847,492 |
Series 2016 A-2B, Ref. RB | | | 5.00% | | | | 06/01/2045 | | | | 3,750 | | | 3,533,662 |
Series 2016 B, Ref. RB | | | 5.00% | | | | 06/01/2036 | | | | 1,000 | | | 1,016,300 |
Series 2016 B, Ref. RB | | | 5.00% | | | | 06/01/2041 | | | | 870 | | | 880,325 |
New York Liberty Development Corp. (3 World Trade Center); | | | | | | | | | | | | | | |
Series 2014, Class 1, Ref. RB(d) | | | 5.00% | | | | 11/15/2044 | | | | 1,505 | | | 1,448,945 |
Series 2014, Class 3, Ref. RB(d) | | | 7.25% | | | | 11/15/2044 | | | | 415 | | | 419,286 |
New York Liberty Development Corp. (7 World Trade Center); | | | | | | | | | | | | | | |
Series 2022, Ref. RB | | | 3.00% | | | | 09/15/2043 | | | | 10,000 | | | 7,826,812 |
Series 2022, Ref. RB | | | 3.25% | | | | 09/15/2052 | | | | 7,500 | | | 5,592,601 |
New York Liberty Development Corp. (Goldman Sachs Headquarters); | | | | | | | | | | | | | | |
Series 2005, Ref. RB | | | 5.25% | | | | 10/01/2035 | | | | 76,200 | | | 85,567,752 |
Series 2007, RB | | | 5.50% | | | | 10/01/2037 | | | | 11,445 | | | 12,993,744 |
New York Liberty Development Corp. (Green Bonds); | | | | | | | | | | | | | | |
Series 2021 A, Ref. RB | | | 2.75% | | | | 11/15/2041 | | | | 13,660 | | | 10,075,305 |
Series 2021 A, Ref. RB | | | 2.88% | | | | 11/15/2046 | | | | 21,990 | | | 15,393,996 |
Series 2021 A, Ref. RB | | | 3.00% | | | | 11/15/2051 | | | | 15,000 | | | 10,389,588 |
New York State Environmental Facilities Corp.; Series 2017, RB | | | 5.00% | | | | 06/15/2047 | | | | 29,900 | | | 31,635,710 |
New York State Environmental Facilities Corp. (2010 Master Financing Program) (Green Bonds); | | | | | | | | | | | | | | |
Series 2017 C, RB | | | 5.00% | | | | 08/15/2047 | | | | 5,000 | | | 5,305,100 |
Series 2022 B, RB(i) | | | 5.00% | | | | 09/15/2047 | | | | 20,000 | | | 21,942,468 |
Series 2022 B, RB(i) | | | 5.25% | | | | 09/15/2052 | | | | 18,000 | | | 20,080,406 |
New York State Environmental Facilities Corp. (NYC Municipal Water Finance Authority); | | | | | | | | | | | | | | |
Series 2016 A, Ref. RB | | | 5.00% | | | | 06/15/2032 | | | | 1,000 | | | 1,064,387 |
Series 2022, Ref. RB | | | 4.00% | | | | 06/15/2047 | | | | 3,890 | | | 3,750,575 |
New York State Environmental Facilities Corp. (Pooled Financing Program); Series 2005 B, RB(e) | | | 5.50% | | | | 04/15/2035 | | | | 615 | | | 750,299 |
New York State Urban Development Corp.; | | | | | | | | | | | | | | |
Series 2020 C, Ref. RB | | | 4.00% | | | | 03/15/2037 | | | | 5,100 | | | 5,109,226 |
Series 2020, Ref. RB | | | 3.00% | | | | 03/15/2040 | | | | 5,000 | | | 4,171,688 |
Series 2022 A, Ref. RB | | | 5.00% | | | | 03/15/2046 | | | | 11,435 | | | 12,349,290 |
Series 2022 A, Ref. RB | | | 5.00% | | | | 03/15/2047 | | | | 8,565 | | | 9,233,168 |
New York State Urban Development Corp. (Bidding Group 2); Series 2021 A, Ref. RB | | | 3.00% | | | | 03/15/2041 | | | | 16,515 | | | 13,603,121 |
New York State Urban Development Corp. (Bidding Group 3); | | | | | | | | | | | | | | |
Series 2019 A, Ref. RB | | | 4.00% | | | | 03/15/2046 | | | | 1,500 | | | 1,427,475 |
Series 2021, Ref. RB | | | 4.00% | | | | 03/15/2044 | | | | 20,125 | | | 19,319,535 |
Series 2021, Ref. RB | | | 4.00% | | | | 03/15/2046 | | | | 38,000 | | | 36,162,711 |
Series 2021, Ref. RB | | | 4.00% | | | | 03/15/2047 | | | | 10,000 | | | 9,484,958 |
New York State Urban Development Corp. (Bidding Group 4); Series 2020 E-2, Ref. RB | | | 3.00% | | | | 03/15/2040 | | | | 11,245 | | | 9,382,126 |
New York Transportation Development Corp. (American Airlines, Inc.); | | | | | | | | | | | | | | |
Series 2016, Ref. RB(a) | | | 5.00% | | | | 08/01/2026 | | | | 5,465 | | | 5,467,389 |
Series 2016, Ref. RB(a) | | | 5.00% | | | | 08/01/2031 | | | | 14,505 | | | 14,518,289 |
Series 2021, Ref. RB(a) | | | 2.25% | | | | 08/01/2026 | | | | 4,475 | | | 4,170,889 |
Series 2021, Ref. RB(a) | | | 3.00% | | | | 08/01/2031 | | | | 3,200 | | | 2,856,385 |
New York Transportation Development Corp. (Delta Air Lines, Inc. LaGuardia Airport Terminals C&D Redevelopment); | | | | | | | | | | | | | | |
Series 2018, RB(a) | | | 5.00% | | | | 01/01/2036 | | | | 7,610 | | | 7,734,729 |
Series 2020, RB(a) | | | 5.00% | | | | 10/01/2040 | | | | 10,000 | | | 9,987,984 |
See accompanying Notes to Financial Statements which are an integral part of the financial statements.
| | |
| 19 Invesco Rochester® New York Municipals Fund |
| | | | | | | | | | | | | | |
| | | Interest
Rate | | | Maturity
Date | | | Principal
Amount
(000) | | | Value |
New York–(continued) | | | | | | | | | | | | | | |
New York Transportation Development Corp. (LaGuardia Airport Terminal B Redevelopment); | | | | | | | | | | | | | | |
Series 2016 A, RB (INS - AGM)(a)(b) | | | 4.00% | | | | 07/01/2035 | | | $ | 6,255 | | | $ 6,059,451 |
Series 2016 A, RB (INS - AGM)(a)(b) | | | 4.00% | | | | 07/01/2036 | | | | 8,845 | | | 8,437,034 |
Series 2016 A, RB (INS - AGM)(a)(b) | | | 4.00% | | | | 07/01/2037 | | | | 11,875 | | | 11,264,453 |
Series 2016 A, RB(a) | | | 5.00% | | | | 07/01/2041 | | | | 8,250 | | | 8,250,772 |
Series 2016 A, RB(a) | | | 5.00% | | | | 07/01/2046 | | | | 16,000 | | | 15,752,446 |
Series 2016 A, RB(a) | | | 5.25% | | | | 01/01/2050 | | | | 37,970 | | | 37,877,486 |
Series 2016 A, RB (INS - AGM)(a)(b) | | | 4.00% | | | | 01/01/2051 | | | | 8,900 | | | 7,848,713 |
New York Transportation Development Corp. (New York State Thruway); Series 2021, RB(a) | | | 4.00% | | | | 10/31/2034 | | | | 600 | | | 581,948 |
New York Transportation Development Corp. (Terminal 4 JFK International Airport); | | | | | | | | | | | | | | |
Series 2020 A, Ref. RB(a) | | | 5.00% | | | | 12/01/2031 | | | | 1,000 | | | 1,072,085 |
Series 2020 A, Ref. RB(a) | | | 4.00% | | | | 12/01/2041 | | | | 1,380 | | | 1,218,305 |
Series 2020, Ref. RB | | | 5.00% | | | | 12/01/2032 | | | | 1,505 | | | 1,646,462 |
Series 2020, Ref. RB | | | 5.00% | | | | 12/01/2033 | | | | 1,600 | | | 1,740,239 |
Series 2020, Ref. RB | | | 5.00% | | | | 12/01/2035 | | | | 2,000 | | | 2,140,012 |
Series 2020, Ref. RB | | | 5.00% | | | | 12/01/2036 | | | | 1,610 | | | 1,710,257 |
Series 2020, Ref. RB | | | 5.00% | | | | 12/01/2038 | | | | 3,000 | | | 3,169,198 |
Series 2022, RB(a) | | | 5.00% | | | | 12/01/2039 | | | | 3,000 | | | 3,092,311 |
Series 2022, RB(a) | | | 5.00% | | | | 12/01/2041 | | | | 19,000 | | | 19,384,784 |
Series 2022, RB(a) | | | 5.00% | | | | 12/01/2042 | | | | 5,000 | | | 5,077,177 |
Niagara Area Development Corp. (Catholic Health System, Inc.); Series 2022, RB | | | 5.00% | | | | 07/01/2052 | | | | 6,350 | | | 4,782,563 |
Niagara Area Development Corp. (Covanta); Series 2018 A, Ref. RB(a)(d) | | | 4.75% | | | | 11/01/2042 | | | | 790 | | | 685,866 |
Niagara Frontier Transportation Authority (Buffalo Niagara International Airport); | | | | | | | | | | | | | | |
Series 2014 A, Ref. RB(a) | | | 5.00% | | | | 04/01/2029 | | | | 725 | | | 731,894 |
Series 2019, Ref. RB(a) | | | 5.00% | | | | 04/01/2035 | | | | 780 | | | 822,052 |
Series 2019, Ref. RB(a) | | | 5.00% | | | | 04/01/2037 | | | | 750 | | | 780,471 |
Series 2019, Ref. RB(a) | | | 5.00% | | | | 04/01/2039 | | | | 720 | | | 744,599 |
Niagara Tobacco Asset Securitization Corp.; Series 2014, Ref. RB | | | 5.25% | | | | 05/15/2040 | | | | 275 | | | 276,083 |
North Syracuse Central School District; Series 2007, Ref. GO Bonds (INS - NATL)(b) | | | 5.00% | | | | 06/15/2023 | | | | 935 | | | 939,703 |
Oneida County Local Development Corp. (Mohawk Valley Health System); | | | | | | | | | | | | | | |
Series 2019, Ref. RB (INS - AGM)(b) | | | 4.00% | | | | 12/01/2038 | | | | 2,860 | | | 2,695,480 |
Series 2019, Ref. RB (INS - AGM)(b) | | | 4.00% | | | | 12/01/2049 | | | | 4,920 | | | 4,452,938 |
Series 2021 A, RB (INS - AGM)(b) | | | 4.00% | | | | 12/01/2046 | | | | 1,355 | | | 1,243,015 |
Series 2021 A, RB (INS - AGM)(b) | | | 4.00% | | | | 12/01/2051 | | | | 11,710 | | | 10,507,676 |
Oneida County Local Development Corp. (Utica College); | | | | | | | | | | | | | | |
Series 2019, Ref. RB | | | 5.00% | | | | 07/01/2026 | | | | 100 | | | 101,385 |
Series 2019, Ref. RB | | | 5.00% | | | | 07/01/2028 | | | | 1,050 | | | 1,077,347 |
Series 2019, Ref. RB | | | 5.00% | | | | 07/01/2030 | | | | 1,160 | | | 1,194,696 |
Series 2019, Ref. RB | | | 5.00% | | | | 07/01/2031 | | | | 1,215 | | | 1,249,161 |
Series 2019, Ref. RB | | | 5.00% | | | | 07/01/2032 | | | | 775 | | | 794,742 |
Series 2019, Ref. RB | | | 5.00% | | | | 07/01/2033 | | | | 1,340 | | | 1,369,597 |
Series 2019, Ref. RB | | | 5.00% | | | | 07/01/2034 | | | | 1,410 | | | 1,434,981 |
Series 2019, Ref. RB | | | 4.00% | | | | 07/01/2039 | | | | 760 | | | 645,916 |
Series 2019, Ref. RB | | | 5.00% | | | | 07/01/2049 | | | | 3,250 | | | 3,020,156 |
Onondaga (County of), NY Trust for Cultural Resources (Abby Lane Housing Corp.); | | | | | | | | | | | | | | |
Series 2017, Ref. RB | | | 5.00% | | | | 05/01/2033 | | | | 1,300 | | | 1,332,288 |
Series 2017, Ref. RB | | | 5.00% | | | | 05/01/2034 | | | | 840 | | | 858,615 |
Series 2017, Ref. RB | | | 5.00% | | | | 05/01/2037 | | | | 1,150 | | | 1,170,668 |
Series 2017, Ref. RB | | | 5.00% | | | | 05/01/2040 | | | | 650 | | | 658,482 |
Onondaga (County of), NY Trust for Cultural Resources (Syracuse University); | | | | | | | | | | | | | | |
Series 2019, Ref. RB | | | 4.00% | | | | 12/01/2041 | | | | 1,055 | | | 1,023,326 |
Series 2019, Ref. RB | | | 5.00% | | | | 12/01/2045 | | | | 18,650 | | | 19,995,413 |
Series 2019, Ref. RB | | | 4.00% | | | | 12/01/2049 | | | | 14,240 | | | 13,141,044 |
Onondaga Civic Development Corp. (Le Moyne College); | | | | | | | | | | | | | | |
Series 2021, RB | | | 5.00% | | | | 07/01/2046 | | | | 450 | | | 454,127 |
Series 2021, RB | | | 5.00% | | | | 07/01/2051 | | | | 600 | | | 601,547 |
Orange (County of), NY Industrial Development Agency (Cornwall Hospital (The)); Series 2001 B, RB (INS - AGC)(b) | | | 5.38% | | | | 12/01/2026 | | | | 1,310 | | | 1,311,942 |
See accompanying Notes to Financial Statements which are an integral part of the financial statements.
| | |
| 20 Invesco Rochester® New York Municipals Fund |
| | | | | | | | | | | | | | |
| | | Interest
Rate | | | Maturity
Date | | | Principal
Amount
(000) | | | Value |
New York–(continued) | | | | | | | | | | | | | | |
Orange (County of), NY Industrial Development Agency (St. Luke’s Hospital of Newburgh, New York); Series 2001 A, RB (INS - AGC)(b) | | | 5.38% | | | | 12/01/2026 | | | $ | 3,695 | | | $ 3,701,147 |
Orange County Funding Corp.; Series 2013, RB | | | 6.50% | | | | 01/01/2046 | | | | 3,955 | | | 3,162,932 |
Orange County Funding Corp. (Mount St. Mary College); | | | | | | | | | | | | | | |
Series 2012 A, RB | | | 5.00% | | | | 07/01/2037 | | | | 1,320 | | | 1,309,263 |
Series 2012 A, RB | | | 5.00% | | | | 07/01/2042 | | | | 1,435 | | | 1,370,039 |
Otsego County Capital Resource Corp. (Hartwick College); | | | | | | | | | | | | | | |
Series 2015 A, Ref. RB | | | 5.00% | | | | 10/01/2030 | | | | 3,205 | | | 2,984,171 |
Series 2015 A, Ref. RB | | | 5.00% | | | | 10/01/2035 | | | | 2,000 | | | 1,757,294 |
Series 2015 A, Ref. RB | | | 5.00% | | | | 10/01/2045 | | | | 8,065 | | | 6,424,860 |
Oyster Bay (Town of), NY; | | | | | | | | | | | | | | |
Series 2018 B, GO Bonds (INS - AGM)(b) | | | 3.25% | | | | 02/01/2031 | | | | 10,805 | | | 10,929,676 |
Series 2018 B, GO Bonds (INS - AGM)(b) | | | 3.25% | | | | 02/01/2032 | | | | 5,000 | | | 5,010,674 |
Series 2018 B, GO Bonds (INS - AGM)(b) | | | 4.00% | | | | 02/01/2033 | | | | 9,585 | | | 9,829,044 |
Poughkeepsie (City of), NY Industrial Development Agency (Eastman & Bixby Redevelopment Co. LLC); Series 2000 A, RB(a) | | | 6.00% | | | | 08/01/2032 | | | | 2,330 | | | 2,335,952 |
Ramapo Local Development Corp.; Series 2013, Ref. RB | | | 5.00% | | | | 03/15/2033 | | | | 2,525 | | | 2,423,947 |
Rensselaer (County of), NY Industrial Development Agency (Franciscan Heights, L.P.); Series 2004 A, IDR (LOC - JP Morgan Chase Bank)(a)(j) | | | 5.38% | | | | 12/01/2036 | | | | 2,500 | | | 2,504,441 |
Riverhead (City of), NY Industrial Development Agency; Series 2013, RB | | | 7.00% | | | | 08/01/2048 | | | | 1,300 | | | 1,314,044 |
Rockland (County of), NY Solid Waste Management Authority (Green Bonds); | | | | | | | | | | | | | | |
Series 2021 A, RB(a) | | | 4.00% | | | | 12/15/2046 | | | | 3,780 | | | 3,447,639 |
Series 2021 A, RB(a) | | | 4.00% | | | | 12/15/2051 | | | | 5,025 | | | 4,464,372 |
Rockland Tobacco Asset Securitization Corp.; | | | | | | | | | | | | | | |
Series 2001, RB | | | 5.75% | | | | 08/15/2043 | | | | 720 | | | 731,910 |
Series 2005 A, RB(c)(d) | | | 0.00% | | | | 08/15/2045 | | | | 3,855 | | | 1,050,359 |
Series 2005 C, RB(c)(d) | | | 0.00% | | | | 08/15/2060 | | | | 25,000 | | | 1,516,092 |
Saratoga County Capital Resource Corp. (Skidmore College); | | | | | | | | | | | | | | |
Series 2018, RB | | | 5.00% | | | | 07/01/2048 | | | | 3,515 | | | 3,684,254 |
Series 2020 A, RB | | | 4.00% | | | | 07/01/2050 | | | | 1,985 | | | 1,809,840 |
Schenectady County Capital Resource Corp. (Union College); | | | | | | | | | | | | | | |
Series 2017, Ref. RB | | | 5.00% | | | | 01/01/2047 | | | | 10,720 | | | 11,020,913 |
Series 2022, Ref. RB | | | 5.25% | | | | 07/01/2052 | | | | 1,000 | | | 1,074,391 |
St. Lawrence (County of), NY Industrial Development Agency (Clarkson University); | | | | | | | | | | | | | | |
Series 2021, Ref. RB | | | 5.00% | | | | 09/01/2039 | | | | 520 | | | 539,913 |
Series 2021, Ref. RB | | | 5.00% | | | | 09/01/2041 | | | | 200 | | | 206,751 |
St. Lawrence (County of), NY Industrial Development Agency (St. Lawrence University); | | | | | | | | | | | | | | |
Series 2016 A, Ref. RB | | | 5.00% | | | | 07/01/2036 | | | | 540 | | | 562,429 |
Series 2022, Ref. RB | | | 5.25% | | | | 07/01/2041 | | | | 440 | | | 480,404 |
Series 2022, Ref. RB | | | 5.25% | | | | 07/01/2042 | | | | 425 | | | 463,279 |
Series 2022, Ref. RB | | | 5.25% | | | | 07/01/2047 | | | | 1,820 | | | 1,963,619 |
Series 2022, Ref. RB | | | 5.25% | | | | 07/01/2052 | | | | 2,500 | | | 2,676,043 |
Suffolk (County of), NY Industrial Development Agency (Alliance of Long Island Agencies, Inc./Adults and Children with Learning and Developmental Disabilities, Inc. Civic Facility); Series 2006 A-D2, RB | | | 6.00% | | | | 10/01/2031 | | | | 210 | | | 185,782 |
Suffolk County Economic Development Corp.; Series 2010 A, RB | | | 7.38% | | | | 12/01/2040 | | | | 3,910 | | | 3,448,309 |
Suffolk County Economic Development Corp. (Catholic Health Services); Series 2014 C, RB | | | 5.00% | | | | 07/01/2032 | | | | 415 | | | 423,268 |
Suffolk County Economic Development Corp. (Family Residences and Essential Enterprises, Inc.); Series 2012 B-A, RB(d) | | | 6.75% | | | | 06/01/2027 | | | | 350 | | | 313,779 |
Suffolk Tobacco Asset Securitization Corp.; Series 2021, Ref. RB | | | 4.00% | | | | 06/01/2050 | | | | 2,000 | | | 1,941,671 |
Sullivan (County of), NY (Adelaar Infratructure); | | | | | | | | | | | | | | |
Series 2016 A-2, RB(d) | | | 5.35% | | | | 11/01/2049 | | | | 40,865 | | | 36,421,892 |
Series 2016 B-2, RB(d) | | | 5.35% | | | | 11/01/2049 | | | | 5,830 | | | 5,196,125 |
Series 2016 C-2, RB(d) | | | 5.35% | | | | 11/01/2049 | | | | 5,760 | | | 5,133,735 |
Series 2016 D-2, RB(d) | | | 5.35% | | | | 11/01/2049 | | | | 3,780 | | | 3,369,014 |
Tompkins County Development Corp. (Tompkins Cortland Community College Foundation, Inc.); Series 2013 A, RB(k) | | | 5.00% | | | | 07/01/2032 | | | | 3,125 | | | 1,546,875 |
See accompanying Notes to Financial Statements which are an integral part of the financial statements.
| | |
| 21 Invesco Rochester® New York Municipals Fund |
| | | | | | | | | | | | | | |
| | | Interest
Rate | | | Maturity
Date | | | Principal
Amount
(000) | | | Value |
New York–(continued) | | | | | | | | | | | | | | |
Triborough Bridge & Tunnel Authority; | | | | | | | | | | | | | | |
Series 2012 B, Ref. RB(e)(f) | | | 5.00% | | | | 03/16/2023 | | | $ | 400 | | | $ 400,269 |
Series 2013 A, Ref. RB(e)(f) | | | 5.00% | | | | 05/15/2023 | | | | 1,500 | | | 1,505,323 |
Series 2016 A, Ref. RB | | | 5.00% | | | | 11/15/2046 | | | | 20,500 | | | 21,067,428 |
Series 2017 A, RB | | | 5.00% | | | | 11/15/2037 | | | | 4,455 | | | 4,732,987 |
Series 2017 A, RB | | | 5.00% | | | | 11/15/2038 | | | | 1,515 | | | 1,606,637 |
Series 2017 A, RB | | | 5.00% | | | | 11/15/2047 | | | | 17,095 | | | 17,798,039 |
Series 2017 B, Ref. RB | | | 5.00% | | | | 11/15/2038 | | | | 9,100 | | | 9,650,427 |
Series 2018, RB | | | 5.00% | | | | 11/15/2045 | | | | 10,000 | | | 10,571,866 |
Series 2021 A-1, Ref. RB | | | 5.00% | | | | 05/15/2051 | | | | 52,685 | | | 56,256,200 |
Subseries 2021 B-1, Ref. RB | | | 4.00% | | | | 05/15/2056 | | | | 15,800 | | | 14,221,247 |
Triborough Bridge & Tunnel Authority (MTA Brdiges & Tunnels); Subseries 2022 D-2, RB | | | 5.50% | | | | 05/15/2052 | | | | 5,350 | | | 6,066,190 |
Triborough Bridge & Tunnel Authority (MTA Bridges & Tunnels); | | | | | | | | | | | | | | |
Series 2019 A, RB | | | 5.00% | | | | 11/15/2049 | | | | 17,800 | | | 18,786,618 |
Series 2019 C, RB | | | 4.00% | | | | 11/15/2041 | | | | 1,500 | | | 1,456,168 |
Series 2019 C, RB(i) | | | 4.00% | | | | 11/15/2043 | | | | 21,500 | | | 20,638,579 |
Series 2020 A, RB | | | 5.00% | | | | 11/15/2049 | | | | 11,730 | | | 12,499,053 |
Series 2020 A, RB | | | 4.00% | | | | 11/15/2054 | | | | 5,975 | | | 5,550,048 |
Series 2020 A, RB | | | 5.00% | | | | 11/15/2054 | | | | 4,850 | | | 5,149,083 |
Series 2021 A, RB | | | 5.00% | | | | 11/15/2051 | | | | 27,570 | | | 29,418,949 |
Series 2021 A, RB | | | 5.00% | | | | 11/15/2056 | | | | 4,100 | | | 4,349,082 |
Series 2022 A, Ref. RB | | | 4.00% | | | | 05/15/2051 | | | | 16,800 | | | 15,387,155 |
Series 2022, RB(i) | | | 5.25% | | | | 05/15/2057 | | | | 20,000 | | | 21,809,976 |
Series 2022, RB(i) | | | 5.25% | | | | 05/15/2062 | | | | 30,000 | | | 32,589,825 |
TSASC, Inc.; | | | | | | | | | | | | | | |
Series 2016 B, Ref. RB | | | 5.00% | | | | 06/01/2045 | | | | 10,930 | | | 10,140,034 |
Series 2016 B, Ref. RB | | | 5.00% | | | | 06/01/2048 | | | | 14,195 | | | 12,978,521 |
Series 2017 A, Ref. RB | | | 5.00% | | | | 06/01/2036 | | | | 1,345 | | | 1,385,820 |
Series 2017 A, Ref. RB | | | 5.00% | | | | 06/01/2041 | | | | 16,855 | | | 17,163,310 |
Westchester (County of), NY Industrial Development Agency (Clearview School (The)); Series 2005 B, RB | | | 7.25% | | | | 01/01/2035 | | | | 720 | | | 575,801 |
Westchester (County of), NY Industrial Development Agency (Million Air Two LLC General Aviation Facilities); Series 2017 A, RB(a)(d) | | | 7.00% | | | | 06/01/2046 | | | | 470 | | | 412,028 |
Westchester County Healthcare Corp.; Series 2014 A, RB | | | 5.00% | | | | 11/01/2044 | | | | 4,063 | | | 4,068,366 |
Westchester County Local Development Corp. (Betheal Methodist); | | | | | | | | | | | | | | |
Series 2020 A, Ref. RB | | | 5.00% | | | | 07/01/2040 | | | | 2,235 | | | 1,866,794 |
Series 2020 A, Ref. RB | | | 5.13% | | | | 07/01/2055 | | | | 7,690 | | | 5,980,312 |
Series 2020 B, Ref. RB | | | 5.88% | | | | 07/01/2030 | | | | 4,720 | | | 4,296,577 |
Westchester County Local Development Corp. (Kendal on Hudson); | | | | | | | | | | | | | | |
Series 2022, Ref. RB | | | 5.00% | | | | 01/01/2032 | | | | 500 | | | 504,333 |
Series 2022, Ref. RB | | | 5.00% | | | | 01/01/2037 | | | | 525 | | | 517,806 |
Series 2022, Ref. RB | | | 5.00% | | | | 01/01/2041 | | | | 520 | | | 503,039 |
Series 2022, Ref. RB | | | 4.25% | | | | 01/01/2045 | | | | 1,670 | | | 1,394,926 |
Series 2022, Ref. RB | | | 5.00% | | | | 01/01/2051 | | | | 2,500 | | | 2,321,084 |
Westchester County Local Development Corp. (Sarah Lawrence College); | | | | | | | | | | | | | | |
Series 2016 A, Ref. RB | | | 4.00% | | | | 06/01/2030 | | | | 2,165 | | | 2,163,271 |
Series 2016 A, Ref. RB | | | 4.00% | | | | 06/01/2031 | | | | 2,190 | | | 2,186,500 |
Westchester County Local Development Corp. (Wartburg Senior Housing); Series 2015 A, Ref. RB(d) | | | 5.00% | | | | 06/01/2030 | | | | 1,500 | | | 1,376,317 |
Westchester County Local Development Corp. (Westchester Medical Center Obligated Group); Series 2016, Ref. RB | | | 5.00% | | | | 11/01/2046 | | | | 30,515 | | | 29,350,926 |
Westchester County Local Development Corp.(Purchase Senior Learning Community Inc); Series 2021, Ref. RB(d) | | | 5.00% | | | | 07/01/2056 | | | | 5,000 | | | 3,695,028 |
Westchester Tobacco Asset Securitization Corp.; | | | | | | | | | | | | | | |
Series 2016 C, Ref. RB | | | 5.00% | | | | 06/01/2045 | | | | 14,450 | | | 14,458,497 |
Series 2016 C, Ref. RB | | | 5.13% | | | | 06/01/2051 | | | | 1,295 | | | 1,311,397 |
Western Nassau County Water Authority (Green Bonds); | | | | | | | | | | | | | | |
Series 2021 A, RB | | | 3.00% | | | | 04/01/2039 | | | | 1,000 | | | 837,959 |
Series 2021 A, RB | | | 4.00% | | | | 04/01/2046 | | | | 1,400 | | | 1,295,996 |
Series 2021 A, RB | | | 4.00% | | | | 04/01/2051 | | | | 3,750 | | | 3,396,343 |
See accompanying Notes to Financial Statements which are an integral part of the financial statements.
| | |
| 22 Invesco Rochester® New York Municipals Fund |
| | | | | | | | | | | | | | |
| | | Interest
Rate | | | Maturity
Date | | | Principal
Amount
(000) | | | Value |
New York–(continued) | | | | | | | | | | | | | | |
Western Regional Off-Track Betting Corp.; Series 2021, Ref. RB(d) | | | 4.13% | | | | 12/01/2041 | | | $ | 5,140 | | | $ 3,791,582 |
Yonkers (City of), NY; | | | | | | | | | | | | | | |
Series 2022 F, GO Bonds (INS - BAM)(b) | | | 5.00% | | | | 11/15/2040 | | | | 1,680 | | | 1,811,753 |
Series 2022 F, GO Bonds (INS - BAM)(b) | | | 5.00% | | | | 11/15/2042 | | | | 1,105 | | | 1,183,987 |
Yonkers Economic Development Corp. (Charter School Education Excellence); | | | | | | | | | | | | | | |
Series 2019 A, RB | | | 5.00% | | | | 10/15/2039 | | | | 420 | | | 390,796 |
Series 2019 A, RB | | | 5.00% | | | | 10/15/2049 | | | | 640 | | | 573,339 |
Series 2019 A, RB | | | 5.00% | | | | 10/15/2054 | | | | 465 | | | 410,741 |
| | | | | | | | | | | | | | | 4,415,520,230 |
| | | | |
Puerto Rico–8.21% | | | | | | | | | | | | | | |
Children’s Trust Fund; | | | | | | | | | | | | | | |
Series 2002, RB | | | 5.38% | | | | 05/15/2033 | | | | 5 | | | 5,002 |
Series 2008 A, RB(c) | | | 0.00% | | | | 05/15/2057 | | | | 633,850 | | | 41,930,699 |
Series 2008 B, RB(c) | | | 0.00% | | | | 05/15/2057 | | | | 574,600 | | | 31,165,040 |
Corp. Para El Financiamiento Publico de Puerto Rico; Series 2011, RB | | | 5.50% | | | | 08/01/2031 | | | | 11,810 | | | 310,013 |
PRHTA Custodial Trust; Series 2022 L, RB(l) | | | 5.25% | | | | 12/06/2049 | | | | 771 | | | 609,418 |
Puerto Rico (Commonwealth of); | | | | | | | | | | | | | | |
Series 2021 A, GO Bonds(c) | | | 0.00% | | | | 07/01/2024 | | | | 890 | | | 835,009 |
Series 2021 A, GO Bonds(c) | | | 0.00% | | | | 07/01/2033 | | | | 3,424 | | | 1,950,952 |
Series 2021 A-1, GO Bonds | | | 5.25% | | | | 07/01/2023 | | | | 1,486 | | | 1,490,090 |
Series 2021 A-1, GO Bonds | | | 5.38% | | | | 07/01/2025 | | | | 2,963 | | | 3,008,727 |
Series 2021 A-1, GO Bonds | | | 5.63% | | | | 07/01/2027 | | | | 2,936 | | | 3,033,437 |
Series 2021 A-1, GO Bonds | | | 5.63% | | | | 07/01/2029 | | | | 2,889 | | | 3,014,197 |
Series 2021 A-1, GO Bonds | | | 5.75% | | | | 07/01/2031 | | | | 2,806 | | | 2,953,485 |
Series 2021 A-1, GO Bonds | | | 4.00% | | | | 07/01/2033 | | | | 5,543 | | | 4,966,643 |
Series 2021 A-1, GO Bonds | | | 4.00% | | | | 07/01/2035 | | | | 2,391 | | | 2,094,837 |
Series 2021 A-1, GO Bonds | | | 4.00% | | | | 07/01/2037 | | | | 2,053 | | | 1,755,458 |
Series 2021 A-1, GO Bonds | | | 4.00% | | | | 07/01/2041 | | | | 2,791 | | | 2,305,404 |
Subseries 2022, RN | | | 0.00% | | | | 11/01/2043 | | | | 14,117 | | | 6,088,024 |
Subseries 2022, RN | | | 0.00% | | | | 11/01/2051 | | | | 62,448 | | | 21,388,325 |
Subseries 2022, RN | | | 0.00% | | | | 11/01/2051 | | | | 26,532 | | | 11,607,987 |
Subseries 2022, RN | | | 0.00% | | | | 11/01/2051 | | | | 361 | | | 347,629 |
Subseries 2022, RN | | | 0.00% | | | | 11/01/2051 | | | | 7,378 | | | 968,357 |
Puerto Rico (Commonwealth of) Aqueduct & Sewer Authority; | | | | | | | | | | | | | | |
Series 2008 A, RB | | | 6.13% | | | | 07/01/2024 | | | | 8,470 | | | 8,605,881 |
Series 2022 A, Ref. RB(d) | | | 5.00% | | | | 07/01/2033 | | | | 1,000 | | | 1,002,844 |
Series 2022 A, Ref. RB(d) | | | 5.00% | | | | 07/01/2037 | | | | 2,500 | | | 2,457,174 |
Puerto Rico (Commonwealth of) Electric Power Authority; Series 2005 RR, RB (INS - NATL)(b) | | | 5.00% | | | | 07/01/2024 | | | | 510 | | | 510,481 |
Puerto Rico (Commonwealth of) Highway & Transportation Authority; | | | | | | | | | | | | | | |
Series 2022 A, RB | | | 5.00% | | | | 07/01/2062 | | | | 6,067 | | | 5,626,850 |
Series 2022 B, RB(c) | | | 0.00% | | | | 07/01/2032 | | | | 3,942 | | | 2,464,077 |
Series 2022 C, RB(m) | | | 5.00% | | | | 07/01/2053 | | | | 6,744 | | | 3,744,095 |
Puerto Rico (Commonwealth of) Industrial, Tourist, Educational, Medical & Environmental Control Facilities Financing Authority; Series 2000, RB(a) | | | 6.63% | | | | 06/01/2026 | | | | 700 | | | 710,937 |
Puerto Rico (Commonwealth of) Industrial, Tourist, Educational, Medical & Environmental Control Facilities Financing Authority (University of the Sacred Heart Project); | | | | | | | | | | | | | | |
Series 2012, Ref. RB | | | 5.00% | | | | 10/01/2031 | | | | 650 | | | 650,933 |
Series 2012, Ref. RB | | | 5.00% | | | | 10/01/2042 | | | | 200 | | | 200,463 |
Puerto Rico (Commonwealth of) Industrial, Tourist, Educational, Medical & Environmental Control Facilities Financing Authority (University Plaza); Series 2000 A, RB (INS - NATL)(b) | | | 5.00% | | | | 07/01/2033 | | | | 5,145 | | | 5,085,834 |
See accompanying Notes to Financial Statements which are an integral part of the financial statements.
| | |
| 23 Invesco Rochester® New York Municipals Fund |
| | | | | | | | | | | | | | | | |
| | | Interest
Rate | | | Maturity
Date | | | Principal
Amount
(000) | | | Value | |
|
| |
Puerto Rico–(continued) | | | | | | | | | | | | | | | | |
Puerto Rico Sales Tax Financing Corp.; | | | | | | | | | | | | | | | | |
Series 2018 A-1, RB | | | 4.55% | | | | 07/01/2040 | | | $ | 4,327 | | | $ | 4,040,863 | |
|
| |
Series 2018 A-1, RB(c) | | | 0.00% | | | | 07/01/2046 | | | | 28,000 | | | | 7,175,840 | |
|
| |
Series 2018 A-1, RB(c) | | | 0.00% | | | | 07/01/2051 | | | | 50,840 | | | | 9,592,491 | |
|
| |
Series 2018 A-1, RB | | | 4.75% | | | | 07/01/2053 | | | | 13,361 | | | | 11,976,561 | |
|
| |
Series 2018 A-1, RB | | | 5.00% | | | | 07/01/2058 | | | | 37,456 | | | | 34,751,677 | |
|
| |
Series 2019 A-2, RB | | | 4.33% | | | | 07/01/2040 | | | | 16,000 | | | | 14,539,237 | |
|
| |
Series 2019 A-2, RB | | | 4.54% | | | | 07/01/2053 | | | | 976 | | | | 844,035 | |
|
| |
Series 2019 A-2, RB | | | 4.78% | | | | 07/01/2058 | | | | 13,060 | | | | 11,673,856 | |
|
| |
Series 2019 A-2B, RB | | | 4.55% | | | | 07/01/2040 | | | | 1,276 | | | | 1,191,620 | |
|
| |
University of Puerto Rico; | | | | | | | | | | | | | | | | |
Series 2006 P, Ref. RB | | | 5.00% | | | | 06/01/2030 | | | | 7,280 | | | | 7,072,563 | |
|
| |
Series 2006 Q, RB | | | 5.00% | | | | 06/01/2026 | | | | 4,555 | | | | 4,481,168 | |
|
| |
Series 2006 Q, RB | | | 5.00% | | | | 06/01/2030 | | | | 24,375 | | | | 23,680,456 | |
|
| |
Series 2006 Q, RB | | | 5.00% | | | | 06/01/2036 | | | | 67,190 | | | | 64,726,425 | |
|
| |
| | | | | | | | | | | | | | | 368,635,094 | |
|
| |
| | | | |
Northern Mariana Islands–0.17% | | | | | | | | | | | | | | | | |
Northern Mariana Islands (Commonwealth of); Series 2007 A, Ref. GO Bonds(d) | | | 5.00% | | | | 06/01/2030 | | | | 4,890 | | | | 4,432,351 | |
|
| |
Northern Mariana Islands (Commonwealth of) Ports Authority; Series 1998 A, RB(a) | | | 6.25% | | | | 03/15/2028 | | | | 3,415 | | | | 3,281,657 | |
|
| |
| | | | | | | | | | | | | | | 7,714,008 | |
|
| |
| | | | |
Guam–0.13% | | | | | | | | | | | | | | | | |
Guam (Territory of); | | | | | | | | | | | | | | | | |
Series 2015 D, Ref. RB | | | 5.00% | | | | 11/15/2039 | | | | 750 | | | | 753,448 | |
|
| |
Series 2021 F, Ref. RB | | | 4.00% | | | | 01/01/2042 | | | | 2,880 | | | | 2,570,345 | |
|
| |
Guam (Territory of) Waterworks Authority; | | | | | | | | | | | | | | | | |
Series 2013, RB (INS - NATL)(b) | | | 5.25% | | | | 07/01/2025 | | | | 1,735 | | | | 1,744,285 | |
|
| |
Series 2014 A, Ref. RB | | | 5.00% | | | | 07/01/2029 | | | | 325 | | | | 328,546 | |
|
| |
Guam Housing Corp.; Series 1998 A, RB (CEP - FHLMC)(a) | | | 5.75% | | | | 09/01/2031 | | | | 300 | | | | 300,759 | |
|
| |
| | | | | | | | | | | | | | | 5,697,383 | |
|
| |
| | | | |
Virgin Islands–0.12% | | | | | | | | | | | | | | | | |
Virgin Islands (Government of) Port Authority; Series 2014 A, Ref. RB(a) | | | 5.00% | | | | 09/01/2029 | | | | 665 | | | | 634,738 | |
|
| |
Virgin Islands (Government of) Public Finance Authority (Federal Highway Grant Anticipation Revenue Loan Note) (Garvee); Series 2015, RB(d) | | | 5.00% | | | | 09/01/2033 | | | | 1,500 | | | | 1,530,558 | |
|
| |
Virgin Islands (Government of) Public Finance Authority (Garvee); Series 2015, RB(d) | | | 5.00% | | | | 09/01/2030 | | | | 770 | | | | 784,085 | |
|
| |
Virgin Islands (Government of) Public Finance Authority (Virgin Islands Gross Receipts Taxes Loan Note); Series 2012 A, Ref. RB (INS - AGM)(b) | | | 5.00% | | | | 10/01/2032 | | | | 2,405 | | | | 2,406,522 | |
|
| |
| | | | | | | | | | | | | | | 5,355,903 | |
|
| |
Total Municipal Obligations (Cost $5,146,975,954) | | | | | | | | | | | | | | | 4,802,922,618 | |
|
| |
| | | | |
| | | | | | | | | Shares | | | | |
Common Stocks & Other Equity Interests–0.00% | | | | | | | | | | | | | | | | |
New York–0.00% | | | | | | | | | | | | | | | | |
CMS Liquidating Trust;
(Cost $1,432,811)(l)(n) | | | | | | | | | | | 1,401 | | | | 70,050 | |
|
| |
TOTAL INVESTMENTS IN SECURITIES(o)–106.99% (Cost $5,148,408,765) | | | | | | | | | | | | | | | 4,802,992,668 | |
|
| |
FLOATING RATE NOTE OBLIGATIONS–(7.97)% | | | | | | | | | | | | | | | | |
Notes with interest and fee rates ranging from 3.96% to 3.98% at 02/28/2023 and contractual maturities of collateral ranging from 11/01/2042 to 05/15/2062 (See Note 1J)(p) | | | | | | | | | | | | | | | (357,885,000 | ) |
|
| |
BORROWINGS–(0.14)% | | | | | | | | | | | | | | | (6,200,000 | ) |
|
| |
OTHER ASSETS LESS LIABILITIES–1.12% | | | | | | | | | | | | | | | 50,449,970 | |
|
| |
NET ASSETS–100.00% | | | | | | | | | | | | | | $ | 4,489,357,638 | |
|
| |
See accompanying Notes to Financial Statements which are an integral part of the financial statements.
| | |
| 24 Invesco Rochester® New York Municipals Fund |
Investment Abbreviations:
| | |
| AGC | | - Assured Guaranty Corp. |
| AGM | | - Assured Guaranty Municipal Corp. |
| AMBAC | | - American Municipal Bond Assurance Corp. |
| BAM | | - Build America Mutual Assurance Co. |
| BHAC | | - Berkshire Hathaway Assurance Corp. |
| CEP | | - Credit Enhancement Provider |
| FHLMC | | - Federal Home Loan Mortgage Corp. |
| GNMA | | - Government National Mortgage Association |
| GO | | - General Obligation |
| IDR | | - Industrial Development Revenue Bonds |
| INS | | - Insurer |
| LOC | | - Letter of Credit |
| NATL | | - National Public Finance Guarantee Corp. |
| RB | | - Revenue Bonds |
| Ref. | | - Refunding |
| RN | | - Revenue Notes |
Notes to Schedule of Investments:
| (a) | Security subject to the alternative minimum tax. |
| (b) | Principal and/or interest payments are secured by the bond insurance company listed. |
| (c) | Zero coupon bond issued at a discount. |
| (d) | Security purchased or received in a transaction exempt from registration under the Securities Act of 1933, as amended (the “1933 Act”). The security may be resold pursuant to an exemption from registration under the 1933 Act, typically to qualified institutional buyers. The aggregate value of these securities at February 28, 2023 was $266,002,760, which represented 5.93% of the Fund’s Net Assets. |
| (e) | Advance refunded; secured by an escrow fund of U.S. Government obligations or other highly rated collateral. |
| (f) | Security has an irrevocable call by the issuer or mandatory put by the holder. Maturity date reflects such call or put. |
| (g) | Restricted security. The aggregate value of these securities at February 28, 2023 was $11,029,327, which represented less than 1% of the Fund’s Net Assets. |
| (h) | Security is subject to a reimbursement agreement which may require the Fund to pay amounts to a counterparty in the event of a significant decline in the market value of the security underlying the TOB Trusts. In case of a shortfall, the maximum potential amount of payments the Fund could ultimately be required to make under the agreement is $89,435,000. However, such shortfall payment would be reduced by the proceeds from the sale of the security underlying the TOB Trusts. |
| (i) | Underlying security related to TOB Trusts entered into by the Fund. See Note 1J. |
| (j) | Principal and interest payments are fully enhanced by a letter of credit from the bank listed or a predecessor bank, branch or subsidiary. |
| (k) | Defaulted security. Currently, the issuer is in default with respect to principal and/or interest payments. The aggregate value of these securities at February 28, 2023 was $1,546,875, which represented less than 1% of the Fund’s Net Assets. |
| (l) | Security valued using significant unobservable inputs (Level 3). See Note 3. |
| (m) | Convertible capital appreciation bond. The interest rate shown represents the coupon rate at which the bond will accrue at a specified future date. |
| (n) | Non-income producing security. |
| (o) | Entities may either issue, guarantee, back or otherwise enhance the credit quality of a security. The entities are not primarily responsible for the issuer’s obligations but may be called upon to satisfy issuer’s obligations. No concentration of any single entity was greater than 5% each. |
| (p) | Floating rate note obligations related to securities held. The interest and fee rates shown reflect the rates in effect at February 28, 2023. At February 28, 2023, the Fund’s investments with a value of $519,120,255 are held by TOB Trusts and serve as collateral for the $357,885,000 in the floating rate note obligations outstanding at that date. |
See accompanying Notes to Financial Statements which are an integral part of the financial statements.
| | |
| 25 Invesco Rochester® New York Municipals Fund |
Statement of Assets and Liabilities
February 28, 2023
| | | | |
Assets: | | | | |
Investments in unaffiliated securities, at value
(Cost $5,148,408,765) | | $ | 4,802,992,668 | |
|
| |
Cash | | | 45,406 | |
|
| |
Receivable for: | | | | |
Investments sold | | | 2,440,000 | |
|
| |
Fund shares sold | | | 1,868,006 | |
|
| |
Interest | | | 54,171,897 | |
|
| |
Investments matured, at value
(Cost $3,695,000) | | | 2,719,326 | |
|
| |
Investment for trustee deferred compensation and retirement plans | | | 526,507 | |
|
| |
Other assets | | | 1,907,237 | |
|
| |
Total assets | | | 4,866,671,047 | |
|
| |
| |
Liabilities: | | | | |
Floating rate note obligations | | | 357,885,000 | |
|
| |
Payable for: | | | | |
Borrowings | | | 6,200,000 | |
|
| |
Investments purchased | | | 1,961,882 | |
|
| |
Dividends | | | 6,192,799 | |
|
| |
Fund shares reacquired | | | 2,195,498 | |
|
| |
Accrued fees to affiliates | | | 1,728,010 | |
|
| |
Accrued interest expense | | | 94,949 | |
|
| |
Accrued trustees’ and officers’ fees and benefits | | | 5,127 | |
|
| |
Accrued other operating expenses | | | 139,219 | |
|
| |
Trustee deferred compensation and retirement plans | | | 910,925 | |
|
| |
Total liabilities | | | 377,313,409 | |
|
| |
Net assets applicable to shares outstanding | | $ | 4,489,357,638 | |
|
| |
| | | | |
Net assets consist of: | | | | |
Shares of beneficial interest | | $ | 5,900,943,523 | |
|
| |
Distributable earnings (loss) | | | (1,411,585,885 | ) |
|
| |
| | $ | 4,489,357,638 | |
|
| |
| |
Net Assets: | | | | |
Class A | | $ | 3,578,633,743 | |
|
| |
Class C | | $ | 209,043,440 | |
|
| |
Class Y | | $ | 700,660,029 | |
|
| |
Class R6 | | $ | 1,020,426 | |
|
| |
|
Shares outstanding, no par value, with an unlimited number of shares authorized: | |
Class A | | | 242,646,956 | |
|
| |
Class C | | | 14,213,269 | |
|
| |
Class Y | | | 47,492,030 | |
|
| |
Class R6 | | | 69,133 | |
|
| |
Class A: | | | | |
Net asset value per share | | $ | 14.75 | |
|
| |
Maximum offering price per share
(Net asset value of $14.75 ÷ 95.75%) | | $ | 15.40 | |
|
| |
Class C: | | | | |
Net asset value and offering price per share | | $ | 14.71 | |
|
| |
Class Y: | | | | |
Net asset value and offering price per share | | $ | 14.75 | |
|
| |
Class R6: | | | | |
Net asset value and offering price per share | | $ | 14.76 | |
|
| |
See accompanying Notes to Financial Statements which are an integral part of the financial statements.
| | |
| 26 Invesco Rochester® New York Municipals Fund |
Statement of Operations
For the year ended February 28, 2023
| | | | |
Investment income: | | | | |
Interest | | $ | 215,743,909 | |
|
| |
| |
Expenses: | | | | |
Advisory fees | | | 20,995,288 | |
|
| |
Administrative services fees | | | 683,565 | |
|
| |
Custodian fees | | | 50,638 | |
|
| |
Distribution fees: | | | | |
Class A | | | 9,241,409 | |
|
| |
Class C | | | 2,338,734 | |
|
| |
Interest, facilities and maintenance fees | | | 17,142,425 | |
|
| |
Transfer agent fees – A, C and Y | | | 3,189,599 | |
|
| |
Transfer agent fees – R6 | | | 226 | |
|
| |
Trustees’ and officers’ fees and benefits | | | 82,602 | |
|
| |
Registration and filing fees | | | 82,255 | |
|
| |
Reports to shareholders | | | 90,710 | |
|
| |
Professional services fees | | | 225,350 | |
|
| |
Other | | | 52,660 | |
|
| |
Total expenses | | | 54,175,461 | |
|
| |
Less: Expense offset arrangement(s) | | | (8,951 | ) |
|
| |
Net expenses | | | 54,166,510 | |
|
| |
Net investment income | | | 161,577,399 | |
|
| |
| |
Realized and unrealized gain (loss) from: | | | | |
Net realized gain (loss) from unaffiliated investment securities (includes net gains (losses) from securities sold to affiliates of $(2,390,392)) | | | (367,128,343 | ) |
|
| |
Change in net unrealized appreciation (depreciation) of unaffiliated investment securities | | | (334,761,886 | ) |
|
| |
Net realized and unrealized gain (loss) | | | (701,890,229 | ) |
|
| |
Net increase (decrease) in net assets resulting from operations | | $ | (540,312,830 | ) |
|
| |
See accompanying Notes to Financial Statements which are an integral part of the financial statements.
| | |
| 27 Invesco Rochester® New York Municipals Fund |
Statement of Changes in Net Assets
For the years ended February 28, 2023 and 2022
| | | | | | | | |
| | | 2023 | | | 2022 | |
|
| |
Operations: | | | | | | | | |
Net investment income | | $ | 161,577,399 | | | $ | 138,665,872 | |
|
| |
Net realized gain (loss) | | | (367,128,343 | ) | | | (86,558,388 | ) |
|
| |
Change in net unrealized appreciation (depreciation) | | | (334,761,886 | ) | | | 83,111,252 | |
|
| |
Net increase (decrease) in net assets resulting from operations | | | (540,312,830 | ) | | | 135,218,736 | |
|
| |
| | |
Distributions to shareholders from distributable earnings: | | | | | | | | |
Class A | | | (134,497,768 | ) | | | (147,461,900 | ) |
|
| |
Class C | | | (6,588,627 | ) | | | (8,031,273 | ) |
|
| |
Class Y | | | (26,860,800 | ) | | | (26,600,213 | ) |
|
| |
Class R6 | | | (54,558 | ) | | | (57,862 | ) |
|
| |
Total distributions from distributable earnings | | | (168,001,753 | ) | | | (182,151,248 | ) |
|
| |
| | |
Share transactions–net: | | | | | | | | |
Class A | | | (294,864,626 | ) | | | (18,116,165 | ) |
|
| |
Class C | | | (54,481,172 | ) | | | (33,788,941 | ) |
|
| |
Class Y | | | 2,287,710 | | | | 122,496,300 | |
|
| |
Class R6 | | | (700,812 | ) | | | 75,215 | |
|
| |
Net increase (decrease) in net assets resulting from share transactions | | | (347,758,900 | ) | | | 70,666,409 | |
|
| |
Net increase (decrease) in net assets | | | (1,056,073,483 | ) | | | 23,733,897 | |
|
| |
| | |
Net assets: | | | | | | | | |
Beginning of year | | | 5,545,431,121 | | | | 5,521,697,224 | |
|
| |
End of year | | $ | 4,489,357,638 | | | $ | 5,545,431,121 | |
|
| |
See accompanying Notes to Financial Statements which are an integral part of the financial statements.
| | |
| 28 Invesco Rochester® New York Municipals Fund |
Financial Highlights
The following schedule presents financial highlights for a share of the Fund outstanding throughout the periods indicated.
| | | | | | | | | | | | | | | | | | | | | | | | | | | | | | | | | | | | | | | | | | | | | | | | | | | | | | | | | | | | | | | | | |
| | | Net asset
value,
beginning
of period | | Net
investment
income(a) | | Net gains
(losses)
on securities
(both
realized and
unrealized) | | Total from
investment
operations | | Dividends
from net
investment
income | | Net asset
value, end
of period | | Total return(b) | | Net assets,
end of period
(000’s omitted) | | Ratio of
expenses
to average
net assets
with
fee waivers
and/or
expenses
absorbed | | Ratio of
expenses
to average net
assets without
fee waivers and/
or expenses
absorbed | | Supplemental
ratio of expenses
to average
net assets
with fee waivers
(excluding
interest, facilities
and maintenance
fees) | | Ratio of net
investment
income
to average
net assets | | Portfolio
turnover (c) |
Class A | | | | | | | | | | | | | | | | | | | | | | | | | | | | | | | | | | | | | | | | | | | | | | | | | | | | | | | | | | | | | | | | | |
Year ended 02/28/23 | | | $ | 16.94 | | | | $ | 0.52 | | | | $ | (2.17 | ) | | | $ | (1.65 | ) | | | $ | (0.54 | ) | | | $ | 14.75 | | | | | (9.76 | )%(d) | | | $ | 3,578,634 | | | | | 1.14 | %(d) | | | | 1.14 | %(d) | | | | 0.78 | %(d) | | | | 3.41 | %(d) | | | | 50 | % |
Year ended 02/28/22 | | | | 17.07 | | | | | 0.43 | | | | | 0.00 | | | | | 0.43 | | | | | (0.56 | ) | | | | 16.94 | | | | | 2.45 | (d) | | | | 4,442,658 | | | | | 0.85 | (d) | | | | 0.85 | (d) | | | | 0.78 | (d) | | | | 2.43 | (d) | | | | 17 | |
Year ended 02/28/21 | | | | 17.55 | | | | | 0.51 | | | | | (0.42 | ) | | | | 0.09 | | | | | (0.57 | ) | | | | 17.07 | | | | | 0.65 | (d) | | | | 4,495,785 | | | | | 0.92 | (d) | | | | 0.92 | (d) | | | | 0.80 | (d) | | | | 3.04 | (d) | | | | 24 | |
Two months ended 02/29/20 | | | | 16.78 | | | | | 0.08 | | | | | 0.79 | | | | | 0.87 | | | | | (0.10 | ) | | | | 17.55 | | | | | 5.18 | | | | | 4,625,668 | | | | | 0.79 | (e) | | | | 0.92 | (e) | | | | 0.79 | (e) | | | | 2.92 | (e) | | | | 2 | |
Year ended 12/31/19 | | | | 15.35 | | | | | 0.62 | | | | | 1.35 | | | | | 1.97 | | | | | (0.54 | ) | | | | 16.78 | | | | | 12.97 | | | | | 4,407,000 | | | | | 0.80 | | | | | 1.06 | | | | | 0.80 | | | | | 3.78 | | | | | 25 | |
Year ended 12/31/18 | | | | 14.59 | | | | | 0.55 | | | | | 0.73 | | | | | 1.28 | | | | | (0.52 | ) | | | | 15.35 | | | | | 8.88 | | | | | 3,807,000 | | | | | 0.87 | | | | | 1.21 | | | | | 0.87 | | | | | 3.64 | | | | | 26 | |
Class C | | | | | | | | | | | | | | | | | | | | | | | | | | | | | | | | | | | | | | | | | | | | | | | | | | | | | | | | | | | | | | | | | |
Year ended 02/28/23 | | | | 16.89 | | | | | 0.40 | | | | | (2.16 | ) | | | | (1.76 | ) | | | | (0.42 | ) | | | | 14.71 | | | | | (10.40 | )(f) | | | | 209,043 | | | | | 1.89 | (f) | | | | 1.89 | (f) | | | | 1.53 | (f) | | | | 2.66 | (f) | | | | 50 | |
Year ended 02/28/22 | | | | 17.03 | | | | | 0.29 | | | | | 0.00 | | | | | 0.29 | | | | | (0.43 | ) | | | | 16.89 | | | | | 1.63 | | | | | 301,046 | | | | | 1.61 | | | | | 1.61 | | | | | 1.54 | | | | | 1.67 | | | | | 17 | |
Year ended 02/28/21 | | | | 17.50 | | | | | 0.39 | | | | | (0.41 | ) | | | | (0.02 | ) | | | | (0.45 | ) | | | | 17.03 | | | | | (0.01 | )(f) | | | | 336,381 | | | | | 1.63 | (f) | | | | 1.63 | (f) | | | | 1.51 | (f) | | | | 2.33 | (f) | | | | 24 | |
Two months ended 02/29/20 | | | | 16.73 | | | | | 0.06 | | | | | 0.79 | | | | | 0.85 | | | | | (0.08 | ) | | | | 17.50 | | | | | 5.07 | | | | | 489,818 | | | | | 1.54 | (e) | | | | 1.67 | (e) | | | | 1.54 | (e) | | | | 2.16 | (e) | | | | 2 | |
Year ended 12/31/19 | | | | 15.31 | | | | | 0.49 | | | | | 1.35 | | | | | 1.84 | | | | | (0.42 | ) | | | | 16.73 | | | | | 12.10 | | | | | 472,000 | | | | | 1.56 | | | | | 1.82 | | | | | 1.56 | | | | | 3.02 | | | | | 25 | |
Year ended 12/31/18 | | | | 14.55 | | | | | 0.44 | | | | | 0.73 | | | | | 1.17 | | | | | (0.41 | ) | | | | 15.31 | | | | | 8.09 | | | | | 705,000 | | | | | 1.62 | | | | | 1.96 | | | | | 1.62 | | | | | 2.88 | | | | | 26 | |
Class Y | | | | | | | | | | | | | | | | | | | | | | | | | | | | | | | | | | | | | | | | | | | | | | | | | | | | | | | | | | | | | | | | | |
Year ended 02/28/23 | | | | 16.95 | | | | | 0.55 | | | | | (2.18 | ) | | | | (1.63 | ) | | | | (0.57 | ) | | | | 14.75 | | | | | (9.59 | ) | | | | 700,660 | | | | | 0.90 | | | | | 0.90 | | | | | 0.54 | | | | | 3.65 | | | | | 50 | |
Year ended 02/28/22 | | | | 17.08 | | | | | 0.47 | | | | | 0.00 | | | | | 0.47 | | | | | (0.60 | ) | | | | 16.95 | | | | | 2.70 | | | | | 799,750 | | | | | 0.61 | | | | | 0.61 | | | | | 0.54 | | | | | 2.67 | | | | | 17 | |
Year ended 02/28/21 | | | | 17.55 | | | | | 0.55 | | | | | (0.41 | ) | | | | 0.14 | | | | | (0.61 | ) | | | | 17.08 | | | | | 0.99 | | | | | 687,608 | | | | | 0.68 | | | | | 0.68 | | | | | 0.56 | | | | | 3.28 | | | | | 24 | |
Two months ended 02/29/20 | | | | 16.78 | | | | | 0.09 | | | | | 0.79 | | | | | 0.88 | | | | | (0.11 | ) | | | | 17.55 | | | | | 5.23 | | | | | 658,644 | | | | | 0.54 | (e) | | | | 0.67 | (e) | | | | 0.54 | (e) | | | | 3.16 | (e) | | | | 2 | |
Year ended 12/31/19 | | | | 15.35 | | | | | 0.66 | | | | | 1.35 | | | | | 2.01 | | | | | (0.58 | ) | | | | 16.78 | | | | | 13.25 | | | | | 610,000 | | | | | 0.56 | | | | | 0.82 | | | | | 0.56 | | | | | 4.02 | | | | | 25 | |
Year ended 12/31/18 | | | | 14.60 | | | | | 0.59 | | | | | 0.72 | | | | | 1.31 | | | | | (0.56 | ) | | | | 15.35 | | | | | 9.07 | | | | | 421,000 | | | | | 0.62 | | | | | 0.96 | | | | | 0.62 | | | | | 3.88 | | | | | 26 | |
Class R6 | | | | | | | | | | | | | | | | | | | | | | | | | | | | | | | | | | | | | | | | | | | | | | | | | | | | | | | | | | | | | | | | | |
Year ended 02/28/23 | | | | 16.96 | | | | | 0.56 | | | | | (2.18 | ) | | | | (1.62 | ) | | | | (0.58 | ) | | | | 14.76 | | | | | (9.53 | ) | | | | 1,020 | | | | | 0.85 | | | | | 0.85 | | | | | 0.48 | | | | | 3.70 | | | | | 50 | |
Year ended 02/28/22 | | | | 17.08 | | | | | 0.48 | | | | | 0.01 | | | | | 0.49 | | | | | (0.61 | ) | | | | 16.96 | | | | | 2.82 | | | | | 1,978 | | | | | 0.56 | | | | | 0.56 | | | | | 0.49 | | | | | 2.72 | | | | | 17 | |
Year ended 02/28/21 | | | | 17.55 | | | | | 0.56 | | | | | (0.41 | ) | | | | 0.15 | | | | | (0.62 | ) | | | | 17.08 | | | | | 1.00 | | | | | 1,923 | | | | | 0.59 | | | | | 0.59 | | | | | 0.47 | | | | | 3.37 | | | | | 24 | |
Two months ended 02/29/20 | | | | 16.78 | | | | | 0.09 | | | | | 0.79 | | | | | 0.88 | | | | | (0.11 | ) | | | | 17.55 | | | | | 5.23 | | | | | 5,181 | | | | | 0.51 | (e) | | | | 0.64 | (e) | | | | 0.51 | (e) | | | | 3.20 | (e) | | | | 2 | |
Period ended 12/31/19(g) | | | | 16.44 | | | | | 0.40 | | | | | 0.29 | | | | | 0.69 | | | | | (0.35 | ) | | | | 16.78 | | | | | 4.20 | | | | | 5,000 | | | | | 0.54 | (e) | | | | 0.80 | (e) | | | | 0.54 | (e) | | | | 4.07 | (e) | | | | 25 | |
| (a) | Calculated using average shares outstanding. |
| (b) | Includes adjustments in accordance with accounting principles generally accepted in the United States of America and as such, the net asset value for financial reporting purposes and the returns based upon those net asset values may differ from the net asset value and returns for shareholder transactions. Does not include sales charges and is not annualized for periods less than one year, if applicable. |
| (c) | Portfolio turnover is calculated at the fund level and is not annualized for periods less than one year, if applicable. For the year ended February 28, 2021, the portfolio turnover calculation excludes the value of securities purchased of $142,218,871 in connection with the acquisition of Invesco New York Tax Free Income Fund into the Fund. |
| (d) | The total return, ratio of expenses to average net assets and ratio of net investment income to average net assets reflect actual 12b-1 fees of 0.24% for the years ended February 28, 2023, 2022 and 2021, respectively. |
| (f) | The total return, ratio of expenses to average net assets and ratio of net investment income to average net assets reflect actual 12b-1 fees of 0.99% and 0.95% for the years ended February 28, 2023 and 2021, respectively. |
| (g) | Commencement date after the close of business on May 24, 2019. |
See accompanying Notes to Financial Statements which are an integral part of the financial statements.
| | |
| 29 Invesco Rochester® New York Municipals Fund |
Notes to Financial Statements
February 28, 2023
NOTE 1–Significant Accounting Policies
Invesco Rochester® New York Municipals Fund (the “Fund”) is a series portfolio of AIM Tax-Exempt Funds (Invesco Tax-Exempt Funds) (the “Trust”). The Trust is a Delaware statutory trust registered under the Investment Company Act of 1940, as amended (the “1940 Act”), as an open-end series management investment company authorized to issue an unlimited number of shares of beneficial interest. Information presented in these financial statements pertains only to the Fund. Matters affecting the Fund or each class will be voted on exclusively by the shareholders of the Fund or each class.
The Fund’s investment objective is to seek tax-free income.
The Fund currently consists of four different classes of shares: Class A, Class C, Class Y and Class R6. Class Y shares are available only to certain investors. Class A shares are sold with a front-end sales charge unless certain waiver criteria are met. Under certain circumstances, load waived shares may be subject to contingent deferred sales charges (“CDSC”). Class C shares are sold with a CDSC. Class Y and Class R6 shares are sold at net asset value. Class C shares held for eight years after purchase are eligible for automatic conversion into Class A shares of the same Fund (the “Conversion Feature”). The automatic conversion pursuant to the Conversion Feature will generally occur at the end of the month following the eighth anniversary after a purchase of Class C shares.
The Fund is an investment company and accordingly follows the investment company accounting and reporting guidance in accordance with Financial Accounting Standards Board Accounting Standards Codification Topic 946, Financial Services – Investment Companies.
The following is a summary of the significant accounting policies followed by the Fund in the preparation of its financial statements.
| A. | Security Valuations - Securities, including restricted securities, are valued according to the following policy. |
Securities generally are valued on the basis of prices provided by independent pricing services. Prices provided by the pricing service may be determined without exclusive reliance on quoted prices, and may reflect appropriate factors such as institution-size trading in similar groups of securities, developments related to specific securities, dividend rate (for unlisted equities), yield (for debt obligations), quality, type of issue, coupon rate (for debt obligations), maturity (for debt obligations), individual trading characteristics and other market data. Pricing services generally value debt obligations assuming orderly transactions of institutional round lot size, but a fund may hold or transact in the same securities in smaller, odd lot sizes. Odd lots often trade at lower prices than institutional round lots, and their value may be adjusted accordingly. Debt obligations are subject to interest rate and credit risks. In addition, all debt obligations involve some risk of default with respect to interest and/or principal payments.
Securities for which market quotations are not readily available are fair valued by Invesco Advisers, Inc. (the “Adviser” or “Invesco”) in accordance with Board-approved policies and related Adviser procedures (“Valuation Procedures”). If a fair value price provided by a pricing service is not representative of market value in the Adviser’s judgment (“unreliable”), the Adviser will fair value the security using the Valuation Procedures. Some of the factors which may be considered in determining fair value are fundamental analytical data relating to the investment; the nature and duration of any restrictions on transferability or disposition; trading in similar securities by the same issuer or comparable companies; relevant political, economic or issuer specific news; and other relevant factors under the circumstances.
The Fund may invest in securities that are subject to interest rate risk, meaning the risk that the prices will generally fall as interest rates rise and, conversely, the prices will generally rise as interest rates fall. Specific securities differ in their sensitivity to changes in interest rates depending on their individual characteristics. Changes in interest rates may result in increased market volatility, which may affect the value and/or liquidity of certain Fund investments.
Valuations change in response to many factors including the historical and prospective earnings of the issuer, the value of the issuer’s assets, general market conditions which are not specifically related to the particular issuer, such as real or perceived adverse economic conditions, changes in the general outlook for revenues or corporate earnings, changes in interest or currency rates, regional or global instability, natural or environmental disasters, widespread disease or other public health issues, war, acts of terrorism, significant governmental actions or adverse investor sentiment generally and market liquidity. Because of the inherent uncertainties of valuation, the values reflected in the financial statements may materially differ from the value received upon actual sale of those investments.
The price the Fund could receive upon the sale of any investment may differ from the Adviser’s valuation of the investment, particularly for securities that are valued using a fair valuation technique. When fair valuation techniques are applied, the Adviser uses available information, including both observable and unobservable inputs and assumptions, to determine a methodology that will result in a valuation that the Adviser believes approximates market value. Fund securities that are fair valued may be subject to greater fluctuation in their value from one day to the next than would be the case if market quotations were used. Because of the inherent uncertainties of valuation, and the degree of subjectivity in such decisions, the Fund could realize a greater or lesser than expected gain or loss upon the sale of the investment.
| B. | Securities Transactions and Investment Income - Securities transactions are accounted for on a trade date basis. Realized gains or losses on sales are computed on the basis of specific identification of the securities sold. Interest income (net of withholding tax, if any) is recorded on an accrual basis from settlement date and includes coupon interest and amortization of premium and accretion of discount on debt securities as applicable. Pay-in-kind interest income and non-cash dividend income received in the form of securities in-lieu of cash are recorded at the fair value of the securities received. Dividend income (net of withholding tax, if any) is recorded on the ex-dividend date. |
The Fund may periodically participate in litigation related to Fund investments. As such, the Fund may receive proceeds from litigation settlements. Any proceeds received are included in the Statement of Operations as realized gain (loss) for investments no longer held and as unrealized gain (loss) for investments still held.
Brokerage commissions and mark ups are considered transaction costs and are recorded as an increase to the cost basis of securities purchased and/or a reduction of proceeds on a sale of securities. Such transaction costs are included in the determination of net realized and unrealized gain (loss) from investment securities reported in the Statement of Operations and the Statement of Changes in Net Assets and the net realized and unrealized gains (losses) on securities per share in the Financial Highlights. Transaction costs are included in the calculation of the Fund’s net asset value and, accordingly, they reduce the Fund’s total returns. These transaction costs are not considered operating expenses and are not reflected in net investment income reported in the Statement of Operations and the Statement of Changes in Net Assets, or the net investment income per share and the ratios of expenses and net investment income reported in the Financial Highlights, nor are they limited by any expense limitation arrangements between the Fund and the investment adviser.
The Fund allocates realized and unrealized capital gains and losses to a class based on the relative net assets of each class. The Fund allocates income to a class based on the relative value of the settled shares of each class.
| C. | Country Determination - For the purposes of making investment selection decisions and presentation in the Schedule of Investments, the investment adviser may determine the country in which an issuer is located and/or credit risk exposure based on various factors. These factors include the laws of the country under which the issuer is organized, where the issuer maintains a principal office, the country in which the issuer derives 50% or more of its total revenues, the country that has the primary market for the issuer’s securities and its “country of risk” as determined by a third party service provider, as well as other criteria. Among the other criteria that may be evaluated for making this determination are the country in which the issuer maintains 50% or more of its assets, the type of security, financial guarantees and enhancements, the nature of the collateral and the sponsor organization. Country of issuer and/or credit risk exposure has been determined to be the United States of America, unless otherwise noted. |
| D. | Distributions - Distributions from net investment income, if any, are declared daily and paid monthly. Distributions from net realized capital gain, if any, are |
| | |
| 30 Invesco Rochester® New York Municipals Fund |
| | generally declared and paid annually and recorded on the ex-dividend date. The Fund may elect to treat a portion of the proceeds from redemptions as distributions for federal income tax purposes. |
| E. | Federal Income Taxes - The Fund intends to comply with the requirements of Subchapter M of the Internal Revenue Code of 1986, as amended (the “Internal Revenue Code”), necessary to qualify as a regulated investment company and to distribute substantially all of the Fund’s taxable and tax-exempt earnings to shareholders. As such, the Fund will not be subject to federal income taxes on otherwise taxable income (including net realized capital gain) that is distributed to shareholders. Therefore, no provision for federal income taxes is recorded in the financial statements. |
The Fund recognizes the tax benefits of uncertain tax positions only when the position is more likely than not to be sustained. Management has analyzed the Fund’s uncertain tax positions and concluded that no liability for unrecognized tax benefits should be recorded related to uncertain tax positions. Management is not aware of any tax positions for which it is reasonably possible that the total amounts of unrecognized tax benefits will change materially in the next 12 months.
In addition, the Fund intends to invest in such municipal securities to allow it to qualify to pay shareholders “exempt-interest dividends”, as defined in the Internal Revenue Code.
The Fund files tax returns in the U.S. Federal jurisdiction and certain other jurisdictions. Generally, the Fund is subject to examinations by such taxing authorities for up to three years after the filing of the return for the tax period.
| F. | Expenses - Fees provided for under the Rule 12b-1 plan of a particular class of the Fund are charged to the operations of such class. Transfer agency fees and expenses and other shareholder recordkeeping fees and expenses attributable to Class R6 are charged to such class. Transfer agency fees and expenses and other shareholder recordkeeping fees and expenses relating to all other classes are allocated among those classes based on relative net assets. All other expenses are allocated among the classes based on relative net assets. |
| G. | Interest, Facilities and Maintenance Fees - Interest, Facilities and Maintenance Fees include interest and related borrowing costs such as commitment fees, administrative expenses and other expenses associated with establishing and maintaining the line of credit. In addition, interest and administrative expenses related to establishing and maintaining floating rate note obligations, if any, are included. |
| H. | Accounting Estimates - The preparation of financial statements in conformity with accounting principles generally accepted in the United States of America (“GAAP”) requires management to make estimates and assumptions that affect the reported amounts of assets and liabilities at the date of the financial statements and the reported amounts of revenues and expenses during the reporting period including estimates and assumptions related to taxation. Actual results could differ from those estimates by a significant amount. In addition, the Fund monitors for material events or transactions that may occur or become known after the period-end date and before the date the financial statements are released to print. |
| I. | Indemnifications - Under the Trust’s organizational documents, each Trustee, officer, employee or other agent of the Trust is indemnified against certain liabilities that may arise out of the performance of their duties to the Fund. Additionally, in the normal course of business, the Fund enters into contracts, including the Fund’s servicing agreements, that contain a variety of indemnification clauses. The Fund’s maximum exposure under these arrangements is unknown as this would involve future claims that may be made against the Fund that have not yet occurred. The risk of material loss as a result of such indemnification claims is considered remote. |
| J. | Floating Rate Note Obligations - The Fund invests in inverse floating rate securities, such as Tender Option Bonds (“TOBs”), for investment purposes and to enhance the yield of the Fund. Such securities may be purchased in the secondary market without first owning an underlying bond but generally are created through the sale of fixed rate bonds by the Fund to special purpose trusts established by a broker dealer or by the Fund (“TOB Trusts”) in exchange for cash and residual interests in the TOB Trusts’ assets and cash flows, which are in the form of inverse floating rate securities. The TOB Trusts finance the purchases of the fixed rate bonds by issuing floating rate notes to third parties and allowing the Fund to retain residual interests in the bonds. The floating rate notes issued by the TOB Trusts have interest rates that reset weekly and the floating rate note holders have the option to tender their notes to the TOB Trusts for redemption at par at each reset date. The residual interests held by the Fund (inverse floating rate securities) include the right of the Fund (1) to cause the holders of the floating rate notes to tender their notes at par at the next interest rate reset date, and (2) to transfer the municipal bond from the TOB Trust to the Fund, thereby collapsing the TOB Trust. Inverse floating rate securities tend to underperform the market for fixed rate bonds in a rising interest rate environment, but tend to outperform the market for fixed rate bonds when interest rates decline or remain relatively stable. |
The Fund generally invests in inverse floating rate securities that include embedded leverage, thus exposing the Fund to greater risks and increased costs. The primary risks associated with inverse floating rate securities are varying degrees of liquidity and decreases in the value of such securities in response to changes in interest rates to a greater extent than fixed rate securities having similar credit quality, redemption provisions and maturity, which may cause the Fund’s net asset value to be more volatile than if it had not invested in inverse floating rate securities. In certain instances, the short-term floating rate notes created by the TOB Trust may not be able to be sold to third parties or, in the case of holders tendering (or putting) such notes for repayment of principal, may not be able to be remarketed to third parties. In such cases, the TOB Trust holding the fixed rate bonds may be collapsed with the entity that contributed the fixed rate bonds to the TOB Trust. In the case where a TOB Trust is collapsed with the Fund, the Fund will be required to repay the principal amount of the tendered securities, which may require the Fund to sell other portfolio holdings to raise cash to meet that obligation. The Fund could therefore be required to sell other portfolio holdings at a disadvantageous time or price to raise cash to meet this obligation, which risk will be heightened during times of market volatility, illiquidity or uncertainty. The embedded leverage in the TOB Trust could cause the Fund to lose more money than the value of the asset it has contributed to the TOB Trust and greater levels of leverage create the potential for greater losses. In addition, a Fund may enter into reimbursement agreements with the liquidity provider of certain TOB transactions in connection with certain residuals held by the Fund. These agreements commit a Fund to reimburse the liquidity provider to the extent that the liquidity provider must provide cash to a TOB Trust, including following the termination of a TOB Trust resulting from a mandatory tender event (“liquidity shortfall”). The reimbursement agreement will effectively make the Fund liable for the amount of the negative difference, if any, between the liquidation value of the underlying security and the purchase price of the floating rate notes issued by the TOB Trust.
The Fund accounts for the transfer of fixed rate bonds to the TOB Trusts as secured borrowings, with the securities transferred remaining in the Fund’s investment assets, and the related floating rate notes reflected as Fund liabilities under the caption Floating rate note obligations on the Statement of Assets and Liabilities. The carrying amount of the Fund’s floating rate note obligations as reported on the Statement of Assets and Liabilities approximates its fair value. The Fund records the interest income from the fixed rate bonds under the caption Interest and records the expenses related to floating rate obligations and any administrative expenses of the TOB Trusts as a component of Interest, facilities and maintenance fees on the Statement of Operations.
Final rules implementing section 619 of the Dodd-Frank Wall Street Reform and Consumer Protection Act (the “Volcker Rule”) prohibit banking entities from engaging in proprietary trading of certain instruments and limit such entities’ investments in, and relationships with, “covered funds”, as defined in the rules. These rules preclude banking entities and their affiliates from sponsoring and/or providing services for existing TOB Trusts. A new TOB structure is being utilized by the Fund wherein the Fund, as holder of the residuals, will perform certain duties previously performed by banking entities as “sponsors” of TOB Trusts. These duties may be performed by a third-party service provider. The Fund’s expanded role under the new TOB structure may increase its operational and regulatory risk. The new structure is substantially similar to the previous structure; however, pursuant to the Volcker Rule, the remarketing agent would not be able to repurchase tendered floaters for its own account upon a failed remarketing. In the event of a failed remarketing, a banking entity serving as liquidity provider may loan the necessary funds to the TOB Trust to purchase the tendered floaters. The TOB Trust, not the Fund, would be the borrower and the loan from the liquidity provider will be secured by the purchased floaters now held by the TOB Trust. However, as previously described, the Fund would bear the risk of loss with respect to any liquidity shortfall to the extent it entered into a reimbursement agreement with the liquidity provider.
Further, the SEC and various banking agencies have adopted rules implementing credit risk retention requirements for asset-backed securities (the “Risk Retention Rules”). The Risk Retention Rules require the sponsor of a TOB Trust to retain at least 5% of the credit risk of the underlying assets supporting the TOB
| | |
| 31 Invesco Rochester® New York Municipals Fund |
Trust’s municipal bonds. The Fund has adopted policies intended to comply with the Risk Retention Rules. The Risk Retention Rules may adversely affect the Fund’s ability to engage in TOB Trust transactions or increase the costs of such transactions in certain circumstances.
There can be no assurances that the new TOB structure will continue to be a viable form of leverage. Further, there can be no assurances that alternative forms of leverage will be available to the Fund in order to maintain current levels of leverage. Any alternative forms of leverage may be less advantageous to the Fund, and may adversely affect the Fund’s net asset value, distribution rate and ability to achieve its investment objective.
TOBs are presently classified as private placement securities. Private placement securities are subject to restrictions on resale because they have not been registered under the Securities Act of 1933, as amended (the “1933 Act”), or are otherwise not readily marketable. As a result of the absence of a public trading market for these securities, they may be less liquid than publicly traded securities. Although atypical, these securities may be resold in privately negotiated transactions, the prices realized from these sales could be less than those originally paid by the Fund or less than what may be considered the fair value of such securities.
| K. | Other Risks - The value of, payment of interest on, repayment of principal for and the ability to sell a municipal security may be affected by constitutional amendments, legislative enactments, executive orders, administrative regulations, voter initiatives and the economics of the regions in which the issuers are located. Since many municipal securities are issued to finance similar projects, especially those relating to education, health care, transportation and utilities, conditions in those sectors can affect the overall municipal securities market and the Fund’s investments in municipal securities. There is some risk that a portion or all of the interest received from certain tax-free municipal securities could become taxable as a result of determinations by the Internal Revenue Service. |
Increases in the federal funds and equivalent foreign rates or other changes to monetary policy or regulatory actions may expose fixed income markets to heightened volatility and reduced liquidity for certain fixed income investments, particularly those with longer maturities. It is difficult to predict the impact of interest rate changes on various markets. In addition, decreases in fixed income dealer market-making capacity may also potentially lead to heightened volatility and reduced liquidity in the fixed income markets. As a result, the value of the Fund’s investments and share price may decline. Changes in central bank policies could also result in higher than normal redemptions by shareholders, which could potentially increase the Fund’s portfolio turnover rate and transaction costs.
Policy changes by the U.S. government or its regulatory agencies and political events within the U.S. and abroad may, among other things, affect investor and consumer confidence and increase volatility in the financial markets, perhaps suddenly and to a significant degree, which may adversely impact the Fund’s operations, universe of potential investment options, and return potential.
The municipal issuers in which the Fund invests may be located in the same geographic area or may pay their interest obligations from revenue of similar projects, such as hospitals, airports, utility systems and housing finance agencies. This may make the Fund’s investments more susceptible to similar social, economic, political or regulatory occurrences, making the Fund more susceptible to experience a drop in its share price than if the Fund had been more diversified across issuers that did not have similar characteristics.
The Fund may invest in lower-quality debt securities, i.e., “junk bonds”. Investments in lower-rated securities or unrated securities of comparable quality tend to be more sensitive to economic conditions than higher rated securities. Junk bonds involve a greater risk of default by the issuer because such securities are generally unsecured and are often subordinated to other creditors’ claims. Junk bonds are less liquid than investment grade debt securities and their prices tend to be more volatile.
| L. | COVID-19 Risk - The COVID-19 strain of coronavirus has resulted in instances of market closures and dislocations, extreme volatility, liquidity constraints and increased trading costs. Efforts to contain its spread have resulted in travel restrictions, disruptions of healthcare systems, business operations (including business closures) and supply chains, layoffs, lower consumer demand and employee availability, and defaults and credit downgrades, among other significant economic impacts that have disrupted global economic activity across many industries. Such economic impacts may exacerbate other pre-existing political, social and economic risks locally or globally and cause general concern and uncertainty. The full economic impact and ongoing effects of COVID-19 (or other future epidemics or pandemics) at the macro-level and on individual businesses are unpredictable and may result in significant and prolonged effects on the Fund’s performance. |
NOTE 2–Advisory Fees and Other Fees Paid to Affiliates
The Trust has entered into a master investment advisory agreement with the Adviser. Under the terms of the investment advisory agreement, the Fund accrues daily and pays monthly an advisory fee to the Adviser based on the annual rate of the Fund’s average daily net assets as follows:
| | |
| Average Daily Net Assets | | Rate* |
First $ 500 million | | 0.480% |
Next $4.5 billion | | 0.455% |
Next $3 billion | | 0.450% |
Next $6 billion | | 0.440% |
Over $14 billion | | 0.420% |
| * | The advisory fee paid by the Fund shall be reduced by any amounts paid by the Fund under the administrative services agreement with the Adviser. |
For the year ended February 28, 2023, the effective advisory fee rate incurred by the Fund was 0.44%.
Under the terms of a master sub-advisory agreement between the Adviser and each of Invesco Asset Management Deutschland GmbH, Invesco Asset Management Limited, Invesco Asset Management (Japan) Limited, Invesco Hong Kong Limited, Invesco Senior Secured Management, Inc. and Invesco Canada Ltd. (collectively, the “Affiliated Sub-Advisers”) the Adviser, not the Fund, will pay 40% of the fees paid to the Adviser to any such Affiliated Sub-Adviser(s) that provide(s) discretionary investment management services to the Fund based on the percentage of assets allocated to such Affiliated Sub-Adviser(s). Invesco has also entered into a sub-advisory agreement with OppenheimerFunds, Inc. to provide discretionary management services to the Fund.
The Adviser has contractually agreed, through at least June 30, 2023, to waive advisory fees and/or reimburse expenses of all shares to the extent necessary to limit total annual fund operating expenses after fee waiver and/or expense reimbursement (excluding certain items discussed below) of Class A, Class C, Class Y and Class R6 shares to 1.50%, 2.25% 1.25% and 1.25%, respectively, of the Fund’s average daily net assets (the “expense limits”). In determining the Adviser’s obligation to waive advisory fees and/or reimburse expenses, the following expenses are not taken into account, and could cause the total annual fund operating expenses after fee waiver and/or expense reimbursement to exceed the numbers reflected above: (1) interest, facilities and maintenance fees; (2) taxes; (3) dividend expense on short sales; (4) extraordinary or non-routine items, including litigation expenses; and (5) expenses that the Fund has incurred but did not actually pay because of an expense offset arrangement. Unless Invesco continues the fee waiver agreement, it will terminate on June 30, 2023. During its term, the fee waiver agreement cannot be terminated or amended to increase the expense limits or reduce the advisory fee waiver without approval of the Board of Trustees. The Adviser did not waive fees and/or reimburse expenses during the period under these expense limits.
The Trust has entered into a master administrative services agreement with Invesco pursuant to which the Fund has agreed to pay Invesco for certain administrative costs incurred in providing accounting services to the Fund. For the year ended February 28, 2023, expenses incurred under the agreement are shown in the Statement of Operations as Administrative services fees. Invesco has entered into a sub-administration agreement whereby State Street Bank and Trust Company
| | |
| 32 Invesco Rochester® New York Municipals Fund |
(“SSB”) serves as fund accountant and provides certain administrative services to the Fund. Pursuant to a custody agreement with the Trust on behalf of the Fund, SSB also serves as the Fund’s custodian.
The Trust has entered into a transfer agency and service agreement with Invesco Investment Services, Inc. (“IIS”) pursuant to which the Fund has agreed to pay IIS a fee for providing transfer agency and shareholder services to the Fund and reimburse IIS for certain expenses incurred by IIS in the course of providing such services. IIS may make payments to intermediaries that provide omnibus account services, sub-accounting services and/or networking services. All fees payable by IIS to intermediaries that provide omnibus account services or sub-accounting services are charged back to the Fund, subject to certain limitations approved by the Trust’s Board of Trustees. For the year ended February 28, 2023, expenses incurred under the agreement are shown in the Statement of Operations as Transfer agent fees.
The Trust has entered into master distribution agreements with Invesco Distributors, Inc. (“IDI”) to serve as the distributor for the Class A, Class C, Class Y and Class R6 shares of the Fund. The Trust has adopted plans pursuant to Rule 12b-1 under the 1940 Act with respect to the Fund’s Class A and Class C shares (collectively, the “Plans”). The Fund, pursuant to the Class A Plan, reimburses IDI in an amount up to an annual rate of 0.25% of the average daily net assets of Class A shares. The Fund, pursuant to the Class C Plan, reimburses IDI in an amount up to an annual rate of 1.00% of the average daily net assets of Class C shares. The fees are accrued daily and paid monthly. Of the Plan payments, up to 0.25% of the average daily net assets of each class of shares may be paid to furnish continuing personal shareholder services to customers who purchase and own shares of such classes. Any amounts not paid as a service fee under the Plans would constitute an asset-based sales charge. Rules of the Financial Industry Regulatory Authority (“FINRA”) impose a cap on the total sales charges, including asset-based sales charges, that may be paid by any class of shares of the Fund. For the year ended February 28, 2023, expenses incurred under the Plans are shown in the Statement of Operations as Distribution fees.
Front-end sales commissions and CDSC (collectively, the “sales charges”) are not recorded as expenses of the Fund. Front-end sales commissions are deducted from proceeds from the sales of Fund shares prior to investment in Class A shares of the Fund. CDSC are deducted from redemption proceeds prior to remittance to the shareholder. During the year ended February 28, 2023, IDI advised the Fund that IDI retained $102,894 in front-end sales commissions from the sale of Class A shares and $60,407 and $22,049 from Class A and Class C shares, respectively, for CDSC imposed upon redemptions by shareholders.
Certain officers and trustees of the Trust are officers and directors of the Adviser, IIS and/or IDI.
NOTE 3–Additional Valuation Information
GAAP defines fair value as the price that would be received to sell an asset or paid to transfer a liability in an orderly transaction between market participants at the measurement date, under current market conditions. GAAP establishes a hierarchy that prioritizes the inputs to valuation methods, giving the highest priority to readily available unadjusted quoted prices in an active market for identical assets (Level 1) and the lowest priority to significant unobservable inputs (Level 3), generally when market prices are not readily available. Based on the valuation inputs, the securities or other investments are tiered into one of three levels. Changes in valuation methods may result in transfers in or out of an investment’s assigned level:
| | |
| Level 1 - | | Prices are determined using quoted prices in an active market for identical assets. |
| Level 2 - | | Prices are determined using other significant observable inputs. Observable inputs are inputs that other market participants may use in pricing a security. These may include quoted prices for similar securities, interest rates, prepayment speeds, credit risk, yield curves, loss severities, default rates, discount rates, volatilities and others. |
| Level 3 - | | Prices are determined using significant unobservable inputs. In situations where quoted prices or observable inputs are unavailable (for example, when there is little or no market activity for an investment at the end of the period), unobservable inputs may be used. Unobservable inputs reflect the Adviser’s assumptions about the factors market participants would use in determining fair value of the securities or instruments and would be based on the best available information. |
The following is a summary of the tiered valuation input levels, as of February 28, 2023. The level assigned to the securities valuations may not be an indication of the risk or liquidity associated with investing in those securities. Because of the inherent uncertainties of valuation, the values reflected in the financial statements may materially differ from the value received upon actual sale of those investments.
| | | | | | | | | | | | | | | | | | | | | | | | | | | | |
| | | Level 1 | | | | | | Level 2 | | | | | | Level 3 | | | | | | Total | |
|
| |
Investments in Securities | | | | | | | | | | | | | | | | | | | | | | | | | | | | |
|
| |
Municipal Obligations | | | $– | | | | | | | $ | 4,802,313,200 | | | | | | | $ | 609,418 | | | | | | | $ | 4,802,922,618 | |
|
| |
Common Stocks & Other Equity Interests | | | – | | | | | | | | – | | | | | | | | 70,050 | | | | | | | | 70,050 | |
|
| |
Total Investments in Securities | | | – | | | | | | | | 4,802,313,200 | | | | | | | | 679,468 | | | | | | | | 4,802,992,668 | |
|
| |
| | | | | | | |
Other Investments - Assets | | | | | | | | | | | | | | | | | | | | | | | | | | | | |
|
| |
Investments Matured | | | – | | | | | | | | 2,541,875 | | | | | | | | 177,451 | | | | | | | | 2,719,326 | |
|
| |
Total Investments | | | $– | | | | | | | $ | 4,804,855,075 | | | | | | | $ | 856,919 | | | | | | | $ | 4,805,711,994 | |
|
| |
NOTE 4–Security Transactions with Affiliated Funds
The Fund is permitted to purchase securities from or sell securities to certain other affiliated funds under specified conditions outlined in procedures adopted by the Board of Trustees of the Trust. The procedures have been designed to ensure that any purchase or sale of securities by the Fund from or to another fund that is or could be considered an “affiliated person” by virtue of having a common investment adviser (or affiliated investment advisers), common Trustees and/or common officers is made in reliance on Rule 17a-7 of the 1940 Act and, to the extent applicable, related SEC staff positions. Each such transaction is effected at the security’s “current market price”, as provided for in these procedures and Rule 17a-7. Pursuant to these procedures, for the year ended February 28, 2023, the Fund engaged in securities purchases of $945,522 and securities sales of $18,602,716, which resulted in net realized gains (losses) of $(2,390,392).
NOTE 5–Expense Offset Arrangement(s)
The expense offset arrangement is comprised of transfer agency credits which result from balances in demand deposit accounts used by the transfer agent for clearing shareholder transactions. For the year ended February 28, 2023, the Fund received credits from this arrangement, which resulted in the reduction of the Fund’s total expenses of $8,951.
NOTE 6–Trustees’ and Officers’ Fees and Benefits
Trustees’ and Officers’ Fees and Benefits include amounts accrued by the Fund to pay remuneration to certain Trustees and Officers of the Fund. Trustees have the option to defer compensation payable by the Fund, and Trustees’ and Officers’ Fees and Benefits also include amounts accrued by the Fund to fund such deferred compensation amounts. Those Trustees who defer compensation have the option to select various Invesco Funds in which their deferral accounts shall be deemed to be invested. Finally, certain current Trustees were eligible to participate in a retirement plan that provided for benefits to be paid upon retirement to Trustees over a
| | |
| 33 Invesco Rochester® New York Municipals Fund |
period of time based on the number of years of service. The Fund may have certain former Trustees who also participate in a retirement plan and receive benefits under such plan. Trustees’ and Officers’ Fees and Benefits include amounts accrued by the Fund to fund such retirement benefits. Obligations under the deferred compensation and retirement plans represent unsecured claims against the general assets of the Fund.
NOTE 7–Cash Balances and Borrowings
The Fund has entered into a revolving credit and security agreement, which enables the Fund to participate with certain other Invesco Funds in a committed secured borrowing facility that permits borrowings up to $2.5 billion, collectively by certain Invesco Funds, and which will expire on February 22, 2024. The revolving credit and security agreement is secured by the assets of the Fund. The Fund is subject to certain covenants relating to the revolving credit and security agreement. Failure to comply with these restrictions could cause the acceleration of the repayment of the amount outstanding under the revolving credit and security agreement.
During the year ended February 28, 2023, the average daily balance of borrowing under the revolving credit and security agreement was $55,861,864 with an average interest rate of 2.21%. The carrying amount of the Fund’s payable for borrowings as reported on the Statement of Assets and Liabilities approximates its fair value. Expenses under the revolving credit and security agreement are shown in the Statement of Operations as Interest, facilities and maintenance fees.
Additionally, the Fund is permitted to temporarily carry a negative or overdrawn balance in its account with SSB, the custodian bank. Such balances, if any at period-end, are shown in the Statement of Assets and Liabilities under the payable caption Amount due custodian. To compensate the custodian bank for such overdrafts, the overdrawn Fund may either (1) leave funds as a compensating balance in the account so the custodian bank can be compensated by earning the additional interest; or (2) compensate by paying the custodian bank at a rate agreed upon by the custodian bank and Invesco, not to exceed the contractually agreed upon rate. The Fund may not purchase additional securities when any borrowings from banks or broker-dealers exceed 5% of the Fund’s total assets, or when any borrowings from an Invesco Fund are outstanding.
Inverse floating rate obligations resulting from the transfer of bonds to TOB Trusts are accounted for as secured borrowings. The average floating rate notes outstanding and average annual interest and fee rate related to inverse floating rate note obligations during the year ended February 28, 2023 were $320,053,077 and 4.11%, respectively.
NOTE 8–Distributions to Shareholders and Tax Components of Net Assets
Tax Character of Distributions to Shareholders Paid During the Fiscal Years Ended February 28, 2023 and 2022:
| | | | | | | | |
| | | 2023 | | | 2022 | |
|
| |
Ordinary income* | | $ | 3,344,822 | | | $ | 2,056,400 | |
|
| |
Ordinary income-tax-exempt | | | 164,656,931 | | | | 180,094,848 | |
|
| |
Total distributions | | $ | 168,001,753 | | | $ | 182,151,248 | |
|
| |
| * | Includes short-term capital gain distributions, if any. |
Tax Components of Net Assets at Period-End:
| | | | |
| | | 2023 | |
|
| |
Undistributed tax-exempt income | | $ | 45,005,094 | |
|
| |
Net unrealized appreciation (depreciation) – investments | | | (339,252,763 | ) |
|
| |
Temporary book/tax differences | | | (899,499 | ) |
|
| |
Capital loss carryforward | | | (1,116,438,717 | ) |
|
| |
Shares of beneficial interest | | | 5,900,943,523 | |
|
| |
Total net assets | | $ | 4,489,357,638 | |
|
| |
The difference between book-basis and tax-basis unrealized appreciation (depreciation) is due to differences in the timing of recognition of gains and losses on investments for tax and book purposes. The Fund’s net unrealized appreciation (depreciation) difference is attributable primarily to wash sales, inverse floaters, amortization and accretion on debt securities.
The temporary book/tax differences are a result of timing differences between book and tax recognition of income and/or expenses. The Fund’s temporary book/tax differences are the result of the trustee deferral of compensation and retirement plan benefits.
Capital loss carryforward is calculated and reported as of a specific date. Results of transactions and other activity after that date may affect the amount of capital loss carryforward actually available for the Fund to utilize. The ability to utilize capital loss carryforward in the future may be limited under the Internal Revenue Code and related regulations based on the results of future transactions.
The Fund has a capital loss carryforward as of February 28, 2023, as follows:
| | | | | | | | | | | | | | | | | | | | |
Capital Loss Carryforward* | |
| Expiration | | Short-Term | | | | | | Long-Term | | | | | | Total | |
|
| |
Not subject to expiration | | $ | 275,273,588 | | | | | | | $ | 841,165,129 | | | | | | | $ | 1,116,438,717 | |
|
| |
| * | Capital loss carryforward is reduced for limitations, if any, to the extent required by the Internal Revenue Code and may be further limited depending upon a variety of factors, including the realization of net unrealized gains or losses as of the date of any reorganization. |
NOTE 9–Investment Transactions
The aggregate amount of investment securities (other than short-term securities, U.S. Government obligations and money market funds, if any) purchased and sold by the Fund during the year ended February 28, 2023 was $2,518,894,534 and $2,844,842,782, respectively. Cost of investments, including any derivatives, on a tax basis includes the adjustments for financial reporting purposes as of the most recently completed federal income tax reporting period-end.
| | | | |
Unrealized Appreciation (Depreciation) of Investments on a Tax Basis | |
Aggregate unrealized appreciation of investments | | | $ 31,074,926 | |
|
| |
Aggregate unrealized (depreciation) of investments | | | (370,327,689 | ) |
|
| |
Net unrealized appreciation (depreciation) of investments | | | $(339,252,763 | ) |
|
| |
| | |
| 34 Invesco Rochester® New York Municipals Fund |
Cost of investments for tax purposes is $5,144,964,757.
NOTE 10–Reclassification of Permanent Differences
Primarily as a result of differing book/tax treatment of market discounts, defaulted bonds and amortization and accretion on debt securities, on February 28, 2023, undistributed net investment income was increased by $18,981,317, undistributed net realized gain (loss) was decreased by $18,697,628 and shares of beneficial interest was decreased by $283,689. This reclassification had no effect on the net assets of the Fund.
NOTE 11–Share Information
| | | | | | | | | | | | | | | | |
| | | Summary of Share Activity | |
|
| |
| | |
| | | Year ended | | | Year ended | |
| | | February 28, 2023(a) | | | February 28, 2022 | |
| | | Shares | | | Amount | | | Shares | | | Amount | |
|
| |
Sold: | | | | | | | | | | | | | | | | |
Class A | | | 18,417,782 | | | $ | 276,297,492 | | | | 15,410,511 | | | $ | 270,757,558 | |
|
| |
Class C | | | 2,176,459 | | | | 32,560,812 | | | | 2,246,036 | | | | 39,413,720 | |
|
| |
Class Y | | | 21,516,978 | | | | 318,894,385 | | | | 13,306,436 | | | | 234,067,701 | |
|
| |
Class R6 | | | 2,434 | | | | 36,001 | | | | 54,224 | | | | 960,942 | |
|
| |
| | | | |
Issued as reinvestment of dividends: | | | | | | | | | | | | | | | | |
Class A | | | 4,926,829 | | | | 73,798,609 | | | | 4,571,790 | | | | 80,097,242 | |
|
| |
Class C | | | 281,263 | | | | 4,204,002 | | | | 293,302 | | | | 5,125,242 | |
|
| |
Class Y | | | 992,821 | | | | 14,871,383 | | | | 845,209 | | | | 14,811,475 | |
|
| |
Class R6 | | | 1,364 | | | | 20,472 | | | | 1,513 | | | | 26,514 | |
|
| |
| | | | |
Automatic conversion of Class C shares to Class A shares: | | | | | | | | | | | | | | | | |
Class A | | | 1,970,397 | | | | 29,766,370 | | | | 1,932,051 | | | | 33,954,139 | |
|
| |
Class C | | | (1,975,537 | ) | | | (29,766,370 | ) | | | (1,937,351 | ) | | | (33,954,139 | ) |
|
| |
| | | | |
Reacquired: | | | | | | | | | | | | | | | | |
Class A | | | (44,914,827 | ) | | | (674,727,097 | ) | | | (23,014,834 | ) | | | (402,925,104 | ) |
|
| |
Class C | | | (4,087,873 | ) | | | (61,479,616 | ) | | | (2,538,492 | ) | | | (44,373,764 | ) |
|
| |
Class Y | | | (22,211,321 | ) | | | (331,478,058 | ) | | | (7,222,385 | ) | | | (126,382,876 | ) |
|
| |
Class R6 | | | (51,303 | ) | | | (757,285 | ) | | | (51,662 | ) | | | (912,241 | ) |
|
| |
Net increase (decrease) in share activity | | | (22,954,534 | ) | | $ | (347,758,900 | ) | | | 3,896,348 | | | $ | 70,666,409 | |
|
| |
| (a) | There are entities that are record owners of more than 5% of the outstanding shares of the Fund and in the aggregate own 60% of the outstanding shares of the Fund. IDI has an agreement with these entities to sell Fund shares. The Fund, Invesco and/or Invesco affiliates may make payments to these entities, which are considered to be related to the Fund, for providing services to the Fund, Invesco and/or Invesco affiliates including but not limited to services such as securities brokerage, distribution, third party record keeping and account servicing. The Fund has no knowledge as to whether all or any portion of the shares owned of record by these entities are also owned beneficially. |
| | |
| 35 Invesco Rochester® New York Municipals Fund |
Report of Independent Registered Public Accounting Firm
To the Board of Trustees of AIM Tax-Exempt Funds (Invesco Tax-Exempt Funds) and Shareholders of Invesco Rochester® New York Municipals Fund
Opinion on the Financial Statements
We have audited the accompanying statement of assets and liabilities, including the schedule of investments, of Invesco Rochester® New York Municipals Fund (one of the funds constituting AIM Tax-Exempt Funds (Invesco Tax-Exempt Funds), referred to hereafter as the “Fund”) as of February 28, 2023, the related statement of operations for the year ended February 28, 2023, the statement of changes in net assets for each of the two years in the period ended February 28, 2023, including the related notes, and the financial highlights for each of the periods indicated in the table below (collectively referred to as the “financial statements”). In our opinion, the financial statements present fairly, in all material respects, the financial position of the Fund as of February 28, 2023, the results of its operations for the year then ended, the changes in its net assets for each of the two years in the period ended February 28, 2023 and the financial highlights for each of the periods indicated in the table below, in conformity with accounting principles generally accepted in the United States of America.
Financial Highlights
For each of the three years in the period ended February 28, 2023, the two months ended February 29, 2020 and the year ended December 31, 2019 for Class A, Class C and Class Y.
For each of the three years in the period ended February 28, 2023, the two months ended February 29, 2020 and the period May 24, 2019 (commencement date) through December 31, 2019 for Class R6.
The financial statements of Oppenheimer Rochester® Municipals Fund (subsequently renamed Invesco Rochester® New York Municipals Fund) as of and for the year ended December 31, 2018 and the financial highlights for the year ended December 31, 2018 (not presented herein, other than the financial highlights) were audited by other auditors whose report dated February 22, 2019 expressed an unqualified opinion on those financial statements and financial highlights.
Basis for Opinion
These financial statements are the responsibility of the Fund’s management. Our responsibility is to express an opinion on the Fund’s financial statements based on our audits. We are a public accounting firm registered with the Public Company Accounting Oversight Board (United States) (PCAOB) and are required to be independent with respect to the Fund in accordance with the U.S. federal securities laws and the applicable rules and regulations of the Securities and Exchange Commission and the PCAOB.
We conducted our audits of these financial statements in accordance with the standards of the PCAOB. Those standards require that we plan and perform the audit to obtain reasonable assurance about whether the financial statements are free of material misstatement, whether due to error or fraud.
Our audits included performing procedures to assess the risks of material misstatement of the financial statements, whether due to error or fraud, and performing procedures that respond to those risks. Such procedures included examining, on a test basis, evidence regarding the amounts and disclosures in the financial statements. Our audits also included evaluating the accounting principles used and significant estimates made by management, as well as evaluating the overall presentation of the financial statements. Our procedures included confirmation of securities owned as of February 28, 2023 by correspondence with the custodian and brokers; when replies were not received from brokers, we performed other auditing procedures. We believe that our audits provide a reasonable basis for our opinion.
|
| /s/PricewaterhouseCoopers LLP |
|
| Houston, Texas |
| April 21, 2023 |
We have served as the auditor of one or more of the investment companies in the Invesco group of investment companies since at least 1995. We have not been able to determine the specific year we began serving as auditor.
| | |
| 36 Invesco Rochester® New York Municipals Fund |
Calculating your ongoing Fund expenses
Example
As a shareholder of the Fund, you incur two types of costs: (1) transaction costs, which may include sales charges (loads) on purchase payments or contingent deferred sales charges on redemptions, if any; and (2) ongoing costs, including management fees, distribution and/or service (12b-1) fees, and other Fund expenses. This example is intended to help you understand your ongoing costs (in dollars) of investing in the Fund and to compare these costs with ongoing costs of investing in other mutual funds. The example is based on an investment of $1,000 invested at the beginning of the period and held for the entire period September 1, 2022 through February 28, 2023.
Actual expenses
The table below provides information about actual account values and actual expenses. You may use the information in this table, together with the amount you invested, to estimate the expenses that you paid over the period. Simply divide your account value by $1,000 (for example, an $8,600 account value divided by $1,000 = 8.6), then multiply the result by the number in the table under the heading entitled “Actual Expenses Paid During Period” to estimate the expenses you paid on your account during this period.
Hypothetical example for comparison purposes
The table below also provides information about hypothetical account values and hypothetical expenses based on the Fund’s actual expense ratio and an assumed rate of return of 5% per year before expenses, which is not the Fund’s actual return.
The hypothetical account values and expenses may not be used to estimate the actual ending account balance or expenses you paid for the period. You may use this information to compare the ongoing costs of investing in the Fund and other funds. To do so, compare this 5% hypothetical example with the 5% hypothetical examples that appear in the shareholder reports of the other funds.
Please note that the expenses shown in the table are meant to highlight your ongoing costs only and do not reflect any transaction costs, such as sales charges (loads) on purchase payments or contingent deferred sales charges on redemptions, if any. Therefore, the hypothetical information is useful in comparing ongoing costs only, and will not help you determine the relative total costs of owning different funds. In addition, if these transaction costs were included, your costs would have been higher.
| | | | | | | | | | | | |
| | | | | ACTUAL | | HYPOTHETICAL (5% annual return before expenses) | | |
| | | Beginning
Account Value
(09/01/22) | | Ending
Account Value
(02/28/23)1 | | Expenses
Paid During
Period2 | | Ending
Account Value
(02/28/23) | | Expenses
Paid During
Period2 | | Annualized
Expense Ratio |
Class A | | $1,000.00 | | $1,001.40 | | $6.20 | | $1,018.60 | | $6.26 | | 1.25% |
Class C | | 1,000.00 | | 997.80 | | 10.11 | | 1,014.68 | | 10.19 | | 2.04 |
Class Y | | 1,000.00 | | 1,002.60 | | 4.97 | | 1,019.84 | | 5.01 | | 1.00 |
Class R6 | | 1,000.00 | | 1,002.90 | | 4.82 | | 1,019.98 | | 4.86 | | 0.97 |
| 1 | The actual ending account value is based on the actual total return of the Fund for the period September 1, 2022 through February 28, 2023, after actual expenses and will differ from the hypothetical ending account value which is based on the Fund’s expense ratio and a hypothetical annual return of 5% before expenses. |
| 2 | Expenses are equal to the Fund’s annualized expense ratio as indicated above multiplied by the average account value over the period, multiplied by 181/365 to reflect the most recent fiscal half year. |
| | |
| 37 Invesco Rochester® New York Municipals Fund |
Tax Information
Form 1099-DIV, Form 1042-S and other year–end tax information provide shareholders with actual calendar year amounts that should be included in their tax returns. Shareholders should consult their tax advisers.
The following distribution information is being provided as required by the Internal Revenue Code or to meet a specific state’s requirement.
The Fund designates the following amounts or, if subsequently determined to be different, the maximum amount allowable for its fiscal year ended February 28, 2023:
| | | | | | | | |
Federal and State Income Tax | | | | | | |
Qualified Dividend Income* | | | 0.00 | % | | | | |
Corporate Dividends Received Deduction* | | | 0.00 | % | | | | |
U.S. Treasury Obligations* | | | 0.00 | % | | | | |
Qualified Business Income* | | | 0.00 | % | | | | |
Business Interest Income* | | | 0.00 | % | | | | |
Tax-Exempt Interest Dividends* | | | 98.01 | % | | | | |
|
| * The above percentages are based on ordinary income dividends paid to shareholders during the Fund’s fiscal year. | |
| | |
| 38 Invesco Rochester® New York Municipals Fund |
Trustees and Officers
The address of each trustee and officer is AIM Tax-Exempt Funds (Invesco Tax-Exempt Funds) (the “Trust”), 11 Greenway Plaza, Suite 1000, Houston, Texas 77046-1173. The trustees serve for the life of the Trust, subject to their earlier death, incapacitation, resignation, retirement or removal as more specifically provided in the Trust’s organizational documents. Each officer serves for a one year term or until their successors are elected and qualified. Column two below includes length of time served with predecessor entities, if any.
| | | | | | | | |
Name, Year of Birth and
Position(s) Held with the Trust | | Trustee and/or Officer Since | | Principal Occupation(s) During Past 5 Years | | Number of Funds in Fund Complex Overseen by Trustee | | Other Directorship(s) Held by Trustee During Past 5 Years |
| Interested Trustee | | | | | | | | |
Martin L. Flanagan1 - 1960 Trustee and Vice Chair | | 2007 | | Executive Director, Chief Executive Officer and President, Invesco Ltd. (ultimate parent of Invesco and a global investment management firm); Trustee and Vice Chair, The Invesco Funds; Vice Chair, Investment Company Institute; and Member of Executive Board, SMU Cox School of Business Formerly: Advisor to the Board, Invesco Advisers, Inc. (formerly known as Invesco Institutional (N.A.), Inc.); Chairman and Chief Executive Officer, Invesco Advisers, Inc. (registered investment adviser); Director, Chairman, Chief Executive Officer and President, Invesco Holding Company (US), Inc. (formerly IVZ Inc.) (holding company), Invesco Group Services, Inc. (service provider) and Invesco North American Holdings, Inc. (holding company); Director, Chief Executive Officer and President, Invesco Holding Company Limited (parent of Invesco and a global investment management firm); Director, Invesco Ltd.; Chairman, Investment Company Institute and President, Co-Chief Executive Officer, Co-President, Chief Operating Officer and Chief Financial Officer, Franklin Resources, Inc. (global investment management organization) | | 175 | | None |
| 1 | Mr. Flanagan is considered an interested person (within the meaning of Section 2(a)(19) of the 1940 Act) of the Trust because he is an officer of the Adviser to the Trust, and an officer and a director of Invesco Ltd., ultimate parent of the Adviser. |
| | |
| T-1 Invesco Rochester® New York Municipals Fund |
Trustees and Officers–(continued)
| | | | | | | | |
Name, Year of Birth and Position(s) Held with the Trust | | Trustee and/or Officer Since | | Principal Occupation(s) During Past 5 Years | | Number of Funds in Fund Complex Overseen by Trustee | | Other Directorship(s) Held by Trustee During Past 5 Years |
| Independent Trustees | | | | | | | | |
Beth Ann Brown - 1968 Trustee (2019) and Chair (August 2022) | | 2019 | | Independent Consultant Formerly: Head of Intermediary Distribution, Managing Director, Strategic Relations, Managing Director, Head of National Accounts, Senior Vice President, National Account Manager and Senior Vice President, Key Account Manager, Columbia Management Investment Advisers LLC; Vice President, Key Account Manager, Liberty Funds Distributor, Inc.; and Trustee of certain Oppenheimer Funds | | 175 | | Director, Board of Directors of Caron Engineering Inc.; Advisor, Board of Advisors of Caron Engineering Inc.; President and Director, Acton Shapleigh Youth Conservation Corps (non-profit) Formerly: President and Director Director of Grahamtastic Connection (non-profit) |
Cynthia Hostetler -1962 Trustee | | 2017 | | Non-Executive Director and Trustee of a number of public and private business corporations Formerly: Director, Aberdeen Investment Funds (4 portfolios); Director, Artio Global Investment LLC (mutual fund complex); Director, Edgen Group, Inc. (specialized energy and infrastructure products distributor); Director, Genesee & Wyoming, Inc. (railroads); Head of Investment Funds and Private Equity, Overseas Private Investment Corporation; President, First Manhattan Bancorporation, Inc.; and Attorney, Simpson Thacher & Bartlett LLP | | 175 | | Resideo Technologies, Inc. (smart home technology); Vulcan Materials Company (construction materials company); Trilinc Global Impact Fund; Textainer Group Holdings, (shipping container leasing company); Investment Company Institute (professional organization); and Independent Directors Council (professional organization) |
Eli Jones - 1961 Trustee | | 2016 | | Professor and Dean Emeritus, Mays Business School - Texas A&M University Formerly: Dean of Mays Business School-Texas A&M University; Professor and Dean, Walton College of Business, University of Arkansas and E.J. Ourso College of Business, Louisiana State University; and Director, Arvest Bank | | 175 | | Insperity, Inc. (formerly known as Administaff) (human resources provider); Board Member of the regional board, First Financial Bank Texas; and Boad Member, First Financial Bankshares, Inc. Texas (FFIN) |
Elizabeth Krentzman - 1959 Trustee | | 2019 | | Formerly: Principal and Chief Regulatory Advisor for Asset Management Services and U.S. Mutual Fund Leader of Deloitte & Touche LLP; General Counsel of the Investment Company Institute (trade association); National Director of the Investment Management Regulatory Consulting Practice, Principal, Director and Senior Manager of Deloitte & Touche LLP; Assistant Director of the Division of Investment Management - Office of Disclosure and Investment Adviser Regulation of the U.S. Securities and Exchange Commission and various positions with the Division of Investment Management – Office of Regulatory Policy of the U.S. Securities and Exchange Commission; Associate at Ropes & Gray LLP; and Trustee of certain Oppenheimer Funds | | 175 | | Formerly: Member of the Cartica Funds Board of Directors (private investment fund); Trustee of the University of Florida National Board Foundation; and Member of the University of Florida Law Center Association, Inc. Board of Trustees, Audit Committee and Membership Committee |
Anthony J. LaCava, Jr. - 1956 Trustee | | 2019 | | Formerly: Director and Member of the Audit Committee, Blue Hills Bank (publicly traded financial institution) and Managing Partner, KPMG LLP | | 175 | | Blue Hills Bank; Member and Chairman, Bentley University, Business School Advisory Council; and Nominating Committee, KPMG LLP |
Prema Mathai-Davis - 1950 Trustee | | 1998 | | Retired Formerly: Co-Founder & Partner of Quantalytics Research, LLC, (a FinTech Investment Research Platform for the Self-Directed Investor); Trustee of YWCA Retirement Fund; CEO of YWCA of the USA; Board member of the NY Metropolitan Transportation Authority; Commissioner of the NYC Department of Aging; and Board member of Johns Hopkins Bioethics Institute | | 175 | | Member of Board of Positive Planet US (non-profit) and HealthCare Chaplaincy Network (non-profit) |
| | |
| T-2 Invesco Rochester® New York Municipals Fund |
Trustees and Officers–(continued)
| | | | | | | | |
Name, Year of Birth and Position(s) Held with the Trust | | Trustee and/or Officer Since | | Principal Occupation(s) During Past 5 Years | | Number of Funds in Fund Complex Overseen by Trustee | | Other Directorship(s) Held by Trustee During Past 5 Years |
| Independent Trustees–(continued) | | | | | | |
Joel W. Motley - 1952 Trustee | | 2019 | | Director of Office of Finance, Federal Home Loan Bank System; Managing Director of Carmona Motley Inc. (privately held financial advisor); Member of the Council on Foreign Relations and its Finance and Budget Committee; Chairman Emeritus of Board of Human Rights Watch and Member of its Investment Committee; and Member of Investment Committee Board of Historic Hudson Valley (non-profit cultural organization); Member of the Board, Blue Ocean Acquisition Corp.; and Member of the Vestry and the Investment Committee of Trinity Church Wall Street. Formerly: Managing Director of Public Capital Advisors, LLC (privately held financial advisor); Managing Director of Carmona Motley Hoffman, Inc. (privately held financial advisor); Trustee of certain Oppenheimer Funds; and Director of Columbia Equity Financial Corp. (privately held financial advisor) | | 175 | | Member of Board of Trust for Mutual Understanding (non-profit promoting the arts and environment); Member of Board of Greenwall Foundation (bioethics research foundation) and its Investment Committee; Member of Board of Friends of the LRC (non- profit legal advocacy); and Board Member and Investment Committee Member of Pulitzer Center for Crisis Reporting (non-profit journalism) |
Teresa M. Ressel - 1962 Trustee | | 2017 | | Non-executive director and trustee of a number of public and private business corporations Formerly: Chief Executive Officer, UBS Securities LLC (investment banking); Chief Operating Officer, UBS AG Americas (investment banking); Sr. Management Team Olayan America, The Olayan Group (international investor/commercial/industrial); and Assistant Secretary for Management & Budget and Designated Chief Financial Officer, U.S. Department of Treasury | | 175 | | None |
Robert C. Troccoli - 1949 Trustee | | 2016 | | Retired Formerly: Adjunct Professor, University of Denver – Daniels College of Business; and Managing Partner, KPMG LLP | | 175 | | None |
Daniel S. Vandivort - 1954 Trustee | | 2019 | | President, Flyway Advisory Services LLC (consulting and property management) Formerly: President and Chief Investment Officer, previously Head of Fixed Income, Weiss Peck and Greer/Robeco Investment Management; Trustee and Chair, Weiss Peck and Greer Funds Board; and various capacities at CS First Boston including Head of Fixed Income at First Boston Asset Management. | | 175 | | Formerly: Trustee and Governance Chair, Oppenheimer Funds; Treasurer, Chairman of the Audit and Finance Committee, Huntington Disease Foundation of America |
| | |
| T-3 Invesco Rochester® New York Municipals Fund |
Trustees and Officers–(continued)
| | | | | | | | |
Name, Year of Birth and Position(s) Held with the Trust | | Trustee and/or Officer Since | | Principal Occupation(s) During Past 5 Years | | Number of Funds in Fund Complex Overseen by Trustee | | Other Directorship(s) Held by Trustee During Past 5 Years |
| Officers | | | | | | | | |
Sheri Morris - 1964 President and Principal Executive Officer | | 1999 | | Director, Invesco Trust Company; Head of Global Fund Services, Invesco Ltd.; President and Principal Executive Officer, The Invesco Funds; Vice President, Invesco Exchange-Traded Fund Trust, Invesco Exchange-Traded Fund Trust II, Invesco India Exchange-Traded Fund Trust, Invesco Actively Managed Exchange-Traded Fund Trust, Invesco Actively Managed Exchange-Traded Commodity Fund Trust and Invesco Exchange-Traded Self-Indexed Fund Trust; and Vice President, OppenheimerFunds, Inc. Formerly: Vice President, Treasurer and Principal Financial Officer, The Invesco Funds; Vice President, Invesco AIM Advisers, Inc., Invesco AIM Capital Management, Inc. and Invesco AIM Private Asset Management, Inc.; Assistant Vice President and Assistant Treasurer, The Invesco Funds; Vice President and Assistant Vice President, Invesco Advisers, Inc.; Assistant Vice President, Invesco AIM Capital Management, Inc. and Invesco AIM Private Asset Management, Inc.; Treasurer, Invesco Exchange-Traded Fund Trust, Invesco Exchange-Traded Fund Trust II, Invesco India Exchange-Traded Fund Trust and Invesco Actively Managed Exchange-Traded Fund Trust; and Senior Vice President, Invesco Advisers, Inc. (formerly known as Invesco Institutional (N.A.), Inc.) (registered investment adviser) | | N/A | | N/A |
Melanie Ringold - 1975 Senior Vice President, Chief Legal Officer and Secretary | | 2023 | | Head of Legal of the Americas, Invesco Ltd.; Senior Vice President and Secretary, Invesco Advisers, Inc. (formerly known as Invesco Institutional (N.A.), Inc.) (registered investment adviser); Secretary, Invesco Distributors, Inc. (formerly known as Invesco AIM Distributors, Inc.); Secretary, Invesco Investment Services, Inc. (formerly known as Invesco AIM Investment Services, Inc.); Senior Vice President, Chief Legal Officer and Secretary, The Invesco Funds; Secretary, Invesco Investment Advisers LLC, Invesco Capital Markets, Inc.; Chief Legal Officer, Invesco Exchange-Traded Fund Trust, Invesco Exchange-Traded Fund Trust II, Invesco India Exchange-Traded Fund Trust, Invesco Actively Managed Exchange-Traded Fund Trust, Invesco Actively Managed Exchange-Traded Commodity Fund Trust and Invesco Exchange-Traded Self-Indexed Fund Trust;Secretary and Vice President, Harbourview Asset Management Corporation; Secretary and Senior Vice President, OppenheimerFunds, Inc. and Invesco Managed Accounts, LLC; Secretary and Senior Vice President, OFI SteelPath, Inc.; Secretary and Senior Vice President, Oppenheimer Acquisition Corp.; Secretary, SteelPath Funds Remediation LLC; and Secretary and Senior Vice President, Trinity Investment Management Corporation Formerly: Assistant Secretary, Invesco Distributors, Inc.; Invesco Advisers, Inc. Invesco Investment Services, Inc., Invesco Capital Markets, Inc., Invesco Capital Management LLC and Invesco Investment Advisers LLC; and Assistant Secretary and Investment Vice President, Invesco Funds | | N/A | | N/A |
Andrew R. Schlossberg - 1974 Senior Vice President | | 2019 | | Senior Vice President, Invesco Group Services, Inc.; Head of the Americas and Senior Managing Director, Invesco Ltd.; Director and Senior Vice President, Invesco Advisers, Inc. (formerly known as Invesco Institutional (N.A.), Inc.) (registered investment adviser); Director and Chairman, Invesco Investment Services, Inc. (formerly known as Invesco AIM Investment Services, Inc.) (registered transfer agent); Senior Vice President, The Invesco Funds; and Director, Invesco Investment Advisers LLC (formerly known as Van Kampen Asset Management) Formerly: Director, President and Chairman, Invesco Insurance Agency, Inc.; Director, Invesco UK Limited; Director and Chief Executive, Invesco Asset Management Limited and Invesco Fund Managers Limited; Assistant Vice President, The Invesco Funds; Senior Vice President, Invesco Advisers, Inc. (formerly known as Invesco Institutional (N.A.), Inc.) (registered investment adviser); Director and Chief Executive, Invesco Administration Services Limited and Invesco Global Investment Funds Limited; Director, Invesco Distributors, Inc.; Head of EMEA, Invesco Ltd.; President, Invesco Actively Managed Exchange-Traded Commodity Fund Trust, Invesco Actively Managed Exchange-Traded Fund Trust, Invesco Exchange-Traded Fund Trust, Invesco Exchange-Traded Fund Trust II and Invesco India Exchange-Traded Fund Trust; and Managing Director and Principal Executive Officer, Invesco Capital Management LLC | | N/A | | N/A |
| | |
| T-4 Invesco Rochester® New York Municipals Fund |
Trustees and Officers–(continued)
| | | | | | | | |
Name, Year of Birth and Position(s) Held with the Trust | | Trustee and/or Officer Since | | Principal Occupation(s) During Past 5 Years | | Number of Funds in Fund Complex Overseen by Trustee | | Other Directorship(s) Held by Trustee During Past 5 Years |
| Officers–(continued) | | | | | | | | |
John M. Zerr - 1962 Senior Vice President | | 2006 | | Chief Operating Officer of the Americas; Senior Vice President, Invesco Advisers, Inc. (formerly known as Invesco Institutional (N.A.), Inc.) (registered investment adviser); Senior Vice President, Invesco Distributors, Inc. (formerly known as Invesco AIM Distributors, Inc.); Director and Vice President, Invesco Investment Services, Inc. (formerly known as Invesco AIM Investment Services, Inc.) Senior Vice President, The Invesco Funds; Managing Director, Invesco Capital Management LLC; Director, Invesco Investment Advisers LLC (formerly known as Van Kampen Asset Management); Senior Vice President, Invesco Capital Markets, Inc. (formerly known as Van Kampen Funds Inc.); Manager, Invesco Indexing LLC; Manager, Invesco Specialized Products, LLC; Member, Invesco Canada Funds Advisory Board; Director, President and Chief Executive Officer, Invesco Corporate Class Inc. (corporate mutual fund company); and Director, Chairman, President and Chief Executive Officer, Invesco Canada Ltd. (formerly known as Invesco Trimark Ltd./Invesco Trimark Ltèe) (registered investment adviser and registered transfer agent); President, Invesco, Inc.; President, Invesco Global Direct Real Estate Feeder GP Ltd.; President, Invesco IP Holdings (Canada) Ltd; President, Invesco Global Direct Real Estate GP Ltd.; President, Invesco Financial Services Ltd. / Services Financiers Invesco Ltée; and Director and Chairman, Invesco Trust Company Formerly: President, Trimark Investments Ltd/Services Financiers Invesco Ltee; Director and Senior Vice President, Invesco Insurance Agency, Inc.; Director and Senior Vice President, Invesco Management Group, Inc. (formerly known as Invesco AIM Management Group, Inc.); Secretary and General Counsel, Invesco Management Group, Inc. (formerly known as Invesco AIM Management Group, Inc.); Secretary, Invesco Investment Services, Inc. (formerly known as Invesco AIM Investment Services, Inc.); Chief Legal Officer and Secretary, The Invesco Funds; Secretary and General Counsel, Invesco Investment Advisers LLC (formerly known as Van Kampen Asset Management); Secretary and General Counsel, Invesco Capital Markets, Inc. (formerly known as Van Kampen Funds Inc.); Chief Legal Officer, Invesco Exchange-Traded Fund Trust, Invesco Exchange-Traded Fund Trust II, Invesco India Exchange-Traded Fund Trust, Invesco Actively Managed Exchange-Traded Fund Trust, Invesco Actively Managed Exchange-Traded Commodity Fund Trust and Invesco Exchange-Traded Self-Indexed Fund Trust; Secretary, Invesco Indexing LLC; Director, Secretary, General Counsel and Senior Vice President, Van Kampen Exchange Corp.; Director, Vice President and Secretary, IVZ Distributors, Inc. (formerly known as INVESCO Distributors, Inc.); Director and Vice President, INVESCO Funds Group, Inc.; Director and Vice President, Van Kampen Advisors Inc.; Director, Vice President, Secretary and General Counsel, Van Kampen Investor Services Inc.;Director and Secretary, Invesco Distributors, Inc. (formerly known as Invesco AIM Distributors, Inc.); Director, Senior Vice President, General Counsel and Secretary, Invesco AIM Advisers, Inc. and Van Kampen Investments Inc.; Director, Vice President and Secretary, Fund Management Company; Director, Senior Vice President, Secretary, General Counsel and Vice President, Invesco AIM Capital Management, Inc.; and Chief Operating Officer and General Counsel, Liberty Ridge Capital, Inc. (an investment adviser) | | N/A | | N/A |
Gregory G. McGreevey - 1962 Senior Vice President | | 2012 | | Senior Managing Director, Invesco Ltd.; Director, Chairman, President, and Chief Executive Officer, Invesco Advisers, Inc. (formerly known as Invesco Institutional (N.A.), Inc.) (registered investment adviser); Director, Invesco Mortgage Capital, Inc. and Invesco Senior Secured Management, Inc.; Senior Vice President, The Invesco Funds; President, SNW Asset Management Corporation and Invesco Managed Accounts, LLC; Chairman and Director, Invesco Private Capital, Inc.; Chairman and Director, INVESCO Private Capital Investments, Inc.; Chairman and Director, INVESCO Realty, Inc.; and Senior Vice President, Invesco Group Services, Inc. Formerly: Senior Vice President, Invesco Management Group, Inc. and Invesco Advisers, Inc.; Assistant Vice President, The Invesco Funds | | N/A | | N/A |
Adrien Deberghes - 1967 Principal Financial Officer, Treasurer and Vice President | | 2020 | | Head of the Fund Office of the CFO and Fund Administration; Vice President, Invesco Advisers, Inc.; Principal Financial Officer, Treasurer and Vice President, The Invesco Funds; Vice President, Invesco Exchange-Traded Fund Trust, Invesco Exchange-Traded Fund Trust II, Invesco India Exchange-Traded Fund Trust, Invesco Actively Managed Exchange-Traded Fund Trust, Invesco Actively Managed Exchange-Traded Commodity Fund Trust and Invesco Exchange-Traded Self-Indexed Fund Trust Formerly: Senior Vice President and Treasurer, Fidelity Investments | | N/A | | N/A |
Crissie M. Wisdom - 1969 Anti-Money Laundering Compliance Officer | | 2013 | | Anti-Money Laundering and OFAC Compliance Officer for Invesco U.S. entities including: Invesco Advisers, Inc. and its affiliates, Invesco Capital Markets, Inc., Invesco Distributors, Inc., Invesco Investment Services, Inc., The Invesco Funds, Invesco Capital Management, LLC, Invesco Trust Company; and Fraud Prevention Manager for Invesco Investment Services, Inc. | | N/A | | N/A |
| | |
| T-5 Invesco Rochester® New York Municipals Fund |
Trustees and Officers–(continued)
| | | | | | | | |
Name, Year of Birth and Position(s) Held with the Trust | | Trustee and/or Officer Since | | Principal Occupation(s) During Past 5 Years | | Number of Funds in Fund Complex Overseen by Trustee | | Other Directorship(s) Held by Trustee During Past 5 Years |
| Officers–(continued) | | | | | | | | |
Todd F. Kuehl - 1969 Chief Compliance Officer and Senior Vice President | | 2020 | | Chief Compliance Officer, Invesco Advisers, Inc. (registered investment adviser); and Chief Compliance Officer and Senior Vice President, The Invesco Funds Formerly: Managing Director and Chief Compliance Officer, Legg Mason (Mutual Funds); Chief Compliance Officer, Legg Mason Private Portfolio Group (registered investment adviser) | | N/A | | N/A |
James Bordewick, Jr. - 1959 Senior Vice President and Senior Officer | | 2022 | | Senior Vice President and Senior Officer, The Invesco Funds Formerly: Chief Legal Officer, KingsCrowd, Inc. (research and analytical platform for investment in private capital markets); Chief Operating Officer and Head of Legal and Regulatory, Netcapital (private capital investment platform); Managing Director, General Counsel of asset management and Chief Compliance Officer for asset management and private banking, Bank of America Corporation; Chief Legal Officer, Columbia Funds and BofA Funds; Senior Vice President and Associate General Counsel, MFS Investment Management; Chief Legal Officer, MFS Funds; Associate, Ropes & Gray; and Associate, Gaston Snow & Ely Bartlett | | N/A | | N/A |
The Statement of Additional Information of the Trust includes additional information about the Fund’s Trustees and is available upon request, without charge, by calling 1.800.959.4246. Please refer to the Fund’s Statement of Additional Information for information on the Fund’s sub-advisers.
Office of the Fund
11 Greenway Plaza, Suite 1000
Houston, TX 77046-1173
Counsel to the Fund
Stradley Ronon Stevens & Young, LLP
2005 Market Street, Suite 2600
Philadelphia, PA 19103-7018
Investment Adviser
Invesco Advisers, Inc.
1331 Spring Street, NW, Suite 2500
Atlanta, GA 30309
Counsel to the Independent Trustees
Sidley Austin LLP
787 Seventh Avenue
New York, NY 10019
Distributor
Invesco Distributors, Inc.
11 Greenway Plaza, Suite 1000
Houston, TX 77046-1173
Transfer Agent
Invesco Investment Services, Inc.
11 Greenway Plaza, Suite 1000
Houston, TX 77046-1173
Auditors
PricewaterhouseCoopers LLP
1000 Louisiana Street, Suite 5800
Houston, TX 77002-5021
Custodian
State Street Bank and Trust Company
225 Franklin Street
Boston, MA 02110-2801
| | |
| T-6 Invesco Rochester® New York Municipals Fund |
(This page intentionally left blank)
(This page intentionally left blank)
(This page intentionally left blank)

Go paperless with eDelivery
Visit invesco.com/edelivery to enjoy the convenience and security of anytime electronic access to your investment documents.
With eDelivery, you can elect to have any or all of the following materials delivered straight to your inbox to download, save and print from your own computer:
∎ Fund reports and prospectuses
∎ Quarterly statements
∎ Daily confirmations
∎ Tax forms
Invesco mailing information
Send general correspondence to Invesco Investment Services, Inc., P.O. Box 219078, Kansas City, MO 64121-9078.
Important notice regarding delivery of security holder documents
To reduce Fund expenses, only one copy of most shareholder documents may be mailed to shareholders with multiple accounts at the same address (Householding). Mailing of your shareholder documents may be householded indefinitely unless you instruct us otherwise. If you do not want the mailing of these documents to be combined with those for other members of your household, please contact Invesco Investment Services, Inc. at 800 959 4246 or contact your financial institution. We will begin sending you individual copies for each account within 30 days after receiving your request.
Fund holdings and proxy voting information
The Fund provides a complete list of its portfolio holdings four times each year, at the end of each fiscal quarter. For the second and fourth quarters, the list appears, respectively, in the Fund’s semiannual and annual reports to shareholders. For the first and third quarters, the Fund files the list with the Securities and Exchange Commission (SEC) as an exhibit to its reports on Form N-PORT. The most recent list of portfolio holdings is available at invesco.com/completeqtrholdings. Shareholders can also look up the Fund’s Form N-PORT filings on the SEC website, sec.gov. The SEC file numbers for the Fund are shown below.
A description of the policies and procedures that the Fund uses to determine how to vote proxies relating to portfolio securities is available without charge, upon request, from our Client Services department at 800 959 4246, or at invesco.com/corporate/about-us/esg. The information is also available on the SEC website, sec.gov.
Information regarding how the Fund voted proxies related to its portfolio securities during the most recent 12-month period ended June 30 is available at invesco.com/proxysearch. This information is also available on the SEC website, sec.gov.
Invesco Advisers, Inc. is an investment adviser; it provides investment advisory services to individual and institutional clients and does not sell securities. Invesco Distributors, Inc. is the US distributor for Invesco Ltd.’s retail mutual funds, exchange-traded funds and institutional money market funds. Both are wholly owned, indirect subsidiaries of Invesco Ltd.
| | | | |
| SEC file number(s): 811-07890 and 033-66242 | | Invesco Distributors, Inc. | | O-ROM-AR-1 |
There were no amendments to the Code of Ethics (the “Code”) that applies to the Registrant’s Principal Executive Officer (“PEO”) and Principal Financial Officer (“PFO”) during the period covered by the report. The Registrant did not grant any waivers, including implicit waivers, from any provisions of the Code to the PEO or PFO during the period covered by this report.
| ITEM 3. | AUDIT COMMITTEE FINANCIAL EXPERT. |
The Board of Trustees has determined that the Registrant has at least one audit committee financial expert serving on its Audit Committee. The Audit Committee financial experts are Cynthia Hostetler, Anthony J. LaCava, Jr., and Robert C. Troccoli. Cynthia Hostetler, Anthony J. LaCava, Jr., and Robert C. Troccoli are “independent” within the meaning of that term as used in Form N-CSR.
| ITEM 4. | PRINCIPAL ACCOUNTANT FEES AND SERVICES. |
Pursuant to PCAOB Rule 3526, Communication with Audit Committees Concerning Independence, PricewaterhouseCoopers LLC (“PwC”) advised the Registrant’s Audit Committee of the following two matters identified since the previous annual Form N-CSR filing that may be reasonably thought to bear on PwC’s independence. PwC advised the Audit Committee that one PwC Partner held a financial interest directly in an investment company within the complex that includes the Funds as well as all registered investment companies advised by the Adviser and its affiliates, including other subsidiaries of the Adviser’s parent company, Invesco Ltd. (collectively the “Invesco Funds Investment Company Complex”) that was inconsistent with the requirements of Rule 2-01(c)(1) of SEC Regulation S-X. In reporting the matter to the Audit Committee, PwC noted, among other things, that the impermissible holding was disposed of by the individual, the individual was not in the chain of command of the audit or the audit partners of the Funds, the financial interest was not material to the net worth of the individual or his or her respective immediate family members and the Funds’ audit engagement team was unaware of the impermissible holdings until after the matter was confirmed to be an independence exception . In addition, PwC considered that the PwC Partner provided non-audit services that were not relied upon by the audit engagement team in the audits of the financial statements of the Funds. Based on the mitigating factors noted above, PwC advised the Audit Committee that it concluded that its objectivity and impartiality with respect to all issues encompassed within the audit engagement has not been impaired and it believes that a reasonable investor with knowledge of all relevant facts and circumstances for the violations would conclude PwC is capable of exercising objective and impartial judgment on all issues encompassed within the audits of the financial statements of the Funds in the Registrant for the impacted periods.
(a) to (d)
Fees Billed by PwC Related to the Registrant
PwC billed the Registrant aggregate fees for services rendered to the Registrant for the last two fiscal years as shown in the following table. The Audit Committee pre-approved all audit and non-audit services provided to the Registrant.
| | | | |
| | | Fees Billed for
Services Rendered
to the Registrant for
fiscal year end 2023 | | Fees Billed for
Services Rendered
to the Registrant for
fiscal year end 2022 |
| | | | | |
Audit Fees | | $ 703,127 | | $ 679,351 |
Audit-Related Fees(1) | | $ 69,000 | | $ 46,000 |
Tax Fees(2) | | $ 202,839 | | $ 229,287 |
All Other Fees | | $ 0 | | $ 0 |
Total Fees | | $ 974,966 | | $ 954,638 |
| | (1) | Audit-Related Fees for the fiscal years ended February 28, 2023 and February 28, 2022 includes fees billed for reviewing regulatory filings. |
| | (2) | Tax Fees for the fiscal years ended February 28, 2023 and February 28, 2022 includes fees billed for preparation of U.S. Tax Returns and Taxable Income calculations, including excise tax and year-to-date estimates for various book-to-tax differences. |
Fees Billed by PwC Related to Invesco and Invesco Affiliates
PwC billed Invesco Advisers, Inc. (“Invesco”), the Registrant’s adviser, and any entity controlling, controlled by or under common control with Invesco that provides ongoing services to the Registrant (“Invesco Affiliates”) aggregate fees for pre-approved non-audit services rendered to Invesco and Invesco Affiliates for the last two fiscal years as shown in the following table. The Audit Committee pre-approved all non-audit services provided to Invesco and Invesco Affiliates that were required to be pre-approved.
| | | | |
| | | Fees Billed for Non- Audit Services
Rendered to Invesco and
Invesco Affiliates for
fiscal year end 2023
That Were Required to be Pre-Approved by the Registrant’s Audit Committee | | Fees Billed for Non-Audit
Services Rendered to
Invesco and Invesco
Affiliates for fiscal year end
2022 That Were Required to be Pre-Approved by the Registrant’s Audit Committee |
Audit-Related Fees(1) | | $ 874,000 | | $ 801,000 |
Tax Fees | | $ 0 | | $ 0 |
All Other Fees | | $ 0 | | $ 0 |
Total Fees | | $ 874,000 | | $ 801,000 |
(1) Audit-Related Fees for the fiscal years ended 2023 and 2022 include fees billed related to reviewing controls at a service organization.
(e)(1)
PRE-APPROVAL OF AUDIT AND NON-AUDIT SERVICES
POLICIES AND PROCEDURES
As adopted by the Audit Committees
of the Invesco Funds (the “Funds”)
Last Amended March 29, 2017
| | I. | Statement of Principles |
The Audit Committees (the “Audit Committee”) of the Boards of Trustees of the Funds (the “Board”) have adopted these policies and procedures (the “Procedures”) with respect to the pre-approval of audit and non-audit services to be provided by the Funds’ independent auditor (the “Auditor”) to the Funds, and to the Funds’ investment adviser(s) and any entity controlling, controlled by, or under common control with the investment adviser(s) that provides ongoing services to the Funds (collectively, “Service Affiliates”).
Under Section 202 of the Sarbanes-Oxley Act of 2002, all audit and non-audit services provided to the Funds by the Auditor must be preapproved by the Audit Committee. Rule 2-01 of Regulation S-X requires that the Audit Committee also pre-approve a Service Affiliate’s engagement of the Auditor for non-audit services if the engagement relates directly to the operations and financial reporting of the Funds (a “Service Affiliate’s Covered Engagement”).
These Procedures set forth the procedures and the conditions pursuant to which the Audit Committee may pre-approve audit and non-audit services for the Funds and a Service Affiliate’s Covered Engagement pursuant to rules and regulations of the Securities and Exchange Commission (“SEC”) and other organizations and regulatory bodies applicable to the Funds (“Applicable Rules”).1 They address both general pre-approvals without consideration of specific case-by-case services (“general pre-approvals”) and pre-approvals on a case-by-case basis (“specific pre-approvals”). Any services requiring pre-approval that are not within the scope of general pre-approvals hereunder are subject to specific pre-approval. These Procedures also address the delegation by the Audit Committee of pre-approval authority to the Audit Committee Chair or Vice Chair.
| | II. | Pre-Approval of Fund Audit Services |
The annual Fund audit services engagement, including terms and fees, is subject to specific pre-approval by the Audit Committee. Audit services include the annual financial statement audit and other procedures required to be performed by an independent auditor to be able to form an opinion on the Funds’ financial statements. The Audit Committee will receive, review and consider sufficient information concerning a proposed Fund audit engagement to make a reasonable evaluation of the Auditor’s qualifications and independence. The Audit Committee will oversee the Fund audit services engagement as necessary, including approving any changes in terms, audit scope, conditions and fees.
In addition to approving the Fund audit services engagement at least annually and specifically approving any changes, the Audit Committee may generally or specifically pre-approve engagements for other audit services, which are those services that only an independent auditor reasonably can provide. Other audit
1 Applicable Rules include, for example, New York Stock Exchange (“NYSE”) rules applicable to closed-end funds managed by Invesco and listed on NYSE.
| | III. | General and Specific Pre-Approval of Non-Audit Fund Services |
The Audit Committee will consider, at least annually, the list of General Pre-Approved Non-Audit Services which list may be terminated or modified at any time by the Audit Committee. To inform the Audit Committee’s review and approval of General Pre-Approved Non-Audit Services, the Funds’ Treasurer (or his or her designee) and Auditor shall provide such information regarding independence or other matters as the Audit Committee may request.
Any services or fee ranges that are not within the scope of General Pre-Approved Non-Audit Services have not received general pre-approval and require specific pre-approval. Each request for specific pre-approval by the Audit Committee for services to be provided by the Auditor to the Funds must be submitted to the Audit Committee by the Funds’ Treasurer (or his or her designee) and must include detailed information about the services to be provided, the fees or fee ranges to be charged, and other relevant information sufficient to allow the Audit Committee to consider whether to pre-approve such engagement, including evaluating whether the provision of such services will impair the independence of the Auditor and is otherwise consistent with Applicable Rules.
| | IV. | Non-Audit Service Types |
The Audit Committee may provide either general or specific pre-approval of audit-related, tax or other services, each as described in more detail below.
“Audit-related services” are assurance and related services that are reasonably related to the performance of the audit or review of the Fund’s financial statements or that are traditionally performed by an independent auditor. Audit-related services include, among others, accounting consultations related to accounting, financial reporting or disclosure matters not classified as “Audit services”; assistance with understanding and implementing new accounting and financial reporting guidance from rulemaking authorities; services related to mergers, acquisitions or dispositions; compliance with ratings agency requirements and interfund lending activities; and assistance with internal control reporting requirements.
“Tax services” include, but are not limited to, the review and signing of the Funds’ federal tax returns, the review of required distributions by the Funds and consultations regarding tax matters such as the tax treatment of new investments or the impact of new regulations. The Audit Committee will not approve proposed services of the Auditor which the Audit Committee believes are to be provided in connection with a service or transaction initially recommended by the Auditor, the sole business purpose of which may be tax avoidance and the tax treatment of which may not be supported in the Internal Revenue Code and related regulations. The Audit Committee will consult with the Funds’ Treasurer (or his or her designee) and may consult with outside counsel or advisers as necessary to ensure the consistency of tax services rendered by the Auditor with the foregoing policy. The Auditor shall not represent any Fund or any Service Affiliate before a tax court, district court or federal court of claims.
Each request to provide tax services under either the general or specific pre-approval of the Audit Committee will include a description from the Auditor in writing of (i) the scope of the service, the fee structure for the engagement, and any side letter or other amendment to the engagement letter, or any other agreement (whether oral, written, or otherwise) between the Auditor and the Funds, relating to the service; and (ii) any compensation arrangement or other agreement, such as a referral agreement, a referral fee or fee-sharing arrangement, between the Auditor (or an affiliate of the Auditor) and any person (other than the
Funds or Service Affiliates receiving the services) with respect to the promoting, marketing, or recommending of a transaction covered by the service. The Auditor will also discuss with the Audit Committee the potential effects of the services on the independence of the Auditor, and document the substance of its discussion with the Audit Committee.
The Audit Committee may pre-approve other non-audit services so long as the Audit Committee believes that the service will not impair the independence of the Auditor. Appendix I includes a list of services that the Auditor is prohibited from performing by the SEC rules. Appendix I also includes a list of services that would impair the Auditor’s independence unless the Audit Committee reasonably concludes that the results of the services will not be subject to audit procedures during an audit of the Funds’ financial statements.
| | V. | Pre-Approval of Service Affiliate’s Covered Engagements |
Rule 2-01 of Regulation S-X requires that the Audit Committee pre-approve a Service Affiliate’s engagement of the Auditor for non-audit services if the engagement relates directly to the operations and financial reporting of the Funds, defined above as a “Service Affiliate’s Covered Engagement”.
The Audit Committee may provide either general or specific pre-approval of any Service Affiliate’s Covered Engagement, including for audit-related, tax or other services, as described above, if the Audit Committee believes that the provision of the services to a Service Affiliate will not impair the independence of the Auditor with respect to the Funds. Any Service Affiliate’s Covered Engagements that are not within the scope of General Pre-Approved Non-Audit Services have not received general pre-approval and require specific pre-approval.
Each request for specific pre-approval by the Audit Committee of a Service Affiliate’s Covered Engagement must be submitted to the Audit Committee by the Funds’ Treasurer (or his or her designee) and must include detailed information about the services to be provided, the fees or fee ranges to be charged, a description of the current status of the pre-approval process involving other audit committees in the Invesco investment company complex (as defined in Rule 2-201 of Regulation S-X) with respect to the proposed engagement, and other relevant information sufficient to allow the Audit Committee to consider whether the provision of such services will impair the independence of the Auditor from the Funds. Additionally, the Funds’ Treasurer (or his or her designee) and the Auditor will provide the Audit Committee with a statement that the proposed engagement requires pre-approval by the Audit Committee, the proposed engagement, in their view, will not impair the independence of the Auditor and is consistent with Applicable Rules, and the description of the proposed engagement provided to the Audit Committee is consistent with that presented to or approved by the Invesco audit committee.
Information about all Service Affiliate engagements of the Auditor for non-audit services, whether or not subject to pre-approval by the Audit Committee, shall be provided to the Audit Committee at least quarterly, to allow the Audit Committee to consider whether the provision of such services is compatible with maintaining the Auditor’s independence from the Funds. The Funds’ Treasurer and Auditor shall provide the Audit Committee with sufficiently detailed information about the scope of services provided and the fees for such services, to ensure that the Audit Committee can adequately consider whether the provision of such services is compatible with maintaining the Auditor’s independence from the Fund
| | VI. | Pre-Approved Fee Levels or Established Amounts |
Pre-approved fee levels or ranges for audit and non-audit services to be provided by the Auditor to the Funds, and for a Service Affiliate’s Covered Engagement, under general pre-approval or specific pre-approval will be set periodically by the Audit Committee. Any proposed fees exceeding 110% of the maximum pre-approved fee levels or ranges for such services or engagements will be promptly presented to the Audit Committee and will require specific pre-approval by the Audit Committee before payment of any additional fees is made.
The Audit Committee hereby delegates, subject to the dollar limitations set forth below, specific authority to its Chair, or in his or her absence, Vice Chair, to pre-approve audit and non-audit services proposed to be provided by the Auditor to the Funds and/or a Service Affiliate’s Covered Engagement, between Audit Committee meetings. Such delegation does not preclude the Chair or Vice Chair from declining, on a case by case basis, to exercise his or her delegated authority and instead convening the Audit Committee to consider and pre-approve any proposed services or engagements.
Notwithstanding the foregoing, the Audit Committee must pre-approve: (a) any non-audit services to be provided to the Funds for which the fees are estimated to exceed $500,000; (b) any Service Affiliate’s Covered Engagement for which the fees are estimated to exceed $500,000; or (c) any cost increase to any previously approved service or engagement that exceeds the greater of $250,000 or 50% of the previously approved fees up to a maximum increase of $500,000.
| | VIII. | Compliance with Procedures |
Notwithstanding anything herein to the contrary, failure to pre-approve any services or engagements that are not required to be pre-approved pursuant to the de minimis exception provided for in Rule 2-01(c)(7)(i)(C) of Regulation S-X shall not constitute a violation of these Procedures. The Audit Committee has designated the Funds’ Treasurer to ensure services and engagements are pre-approved in compliance with these Procedures. The Funds’ Treasurer will immediately report to the Chair of the Audit Committee, or the Vice Chair in his or her absence, any breach of these Procedures that comes to the attention of the Funds’ Treasurer or any services or engagements that are not required to be pre-approved pursuant to the de minimis exception provided for in Rule 2-01(c)(7)(i)(C) of Regulation S-X.
On at least an annual basis, the Auditor will provide the Audit Committee with a summary of all non-audit services provided to any entity in the investment company complex (as defined in section 2-01(f)(14) of Regulation S-X, including the Funds and Service Affiliates) that were not pre-approved, including the nature of services provided and the associated fees.
| | IX. | Amendments to Procedures |
All material amendments to these Procedures must be approved in advance by the Audit Committee. Non-material amendments to these Procedures may be made by the Legal and Compliance Departments and will be reported to the Audit Committee at the next regularly scheduled meeting of the Audit Committee.
Appendix I
Non-Audit Services That May Impair the Auditor’s Independence
The Auditor is not independent if, at any point during the audit and professional engagement, the Auditor provides the following non-audit services:
| | ● | | Broker-dealer, investment adviser, or investment banking services ; |
| | ● | | Expert services unrelated to the audit; |
| | ● | | Any service or product provided for a contingent fee or a commission; |
| | ● | | Services related to marketing, planning, or opining in favor of the tax treatment of confidential transactions or aggressive tax position transactions, a significant purpose of which is tax avoidance; |
| | ● | | Tax services for persons in financial reporting oversight roles at the Fund; and |
| | ● | | Any other service that the Public Company Oversight Board determines by regulation is impermissible. |
An Auditor is not independent if, at any point during the audit and professional engagement, the Auditor provides the following non-audit services unless it is reasonable to conclude that the results of the services will not be subject to audit procedures during an audit of the Funds’ financial statements:
| | ● | | Bookkeeping or other services related to the accounting records or financial statements of the audit client; |
| | ● | | Financial information systems design and implementation; |
| | ● | | Appraisal or valuation services, fairness opinions, or contribution-in-kind reports; |
| | ● | | Actuarial services; and |
| | ● | | Internal audit outsourcing services. |
(e)(2) There were no amounts that were pre-approved by the Audit Committee pursuant to the de minimus exception under Rule 2-01 of Regulation S-X.
(f) Not applicable.
(g) In addition to the amounts shown in the tables above, PwC billed Invesco and Invesco Affiliates aggregate fees of $8,440,000 for the fiscal year ended February 28, 2023 and $5,931,000 for the fiscal year ended February 28, 2022. In total, PwC billed the Registrant, Invesco and Invesco Affiliates aggregate non-audit fees of $9,516,839 for the fiscal year ended February 28, 2023 and $6,961,287 for the fiscal year ended February 28, 2022.
PwC provided audit services to the Investment Company complex of approximately $32 million.
(h) The Audit Committee also has considered whether the provision of non-audit services that were rendered to Invesco and Invesco Affiliates that were not required to be pre-approved pursuant to SEC regulations, if any, is compatible with maintaining PwC’s independence.
| ITEM 5. | AUDIT COMMITTEE OF LISTED REGISTRANTS. |
Not applicable.
| ITEM 6. | SCHEDULE OF INVESTMENTS. |
Investments in securities of unaffiliated issuers is included as part of the reports to stockholders filed under Item 1 of this Form.
| ITEM 7. | DISCLOSURE OF PROXY VOTING POLICIES AND PROCEDURES FOR CLOSED-END MANAGEMENT INVESTMENT COMPANIES. |
Not applicable.
| ITEM 8. | PORTFOLIO MANAGERS OF CLOSED-END MANAGEMENT COMPANIES. |
Not applicable.
| ITEM 9. | PURCHASES OF EQUITY SECURITIES BY CLOSED-END MANAGEMENT |
| | INVESTMENT COMPANY AND AFFILIATED PURCHASERS. |
Not applicable.
| ITEM 10. | SUBMISSION OF MATTERS TO A VOTE OF SECURITY HOLDERS. |
None.
| ITEM 11. | CONTROLS AND PROCEDURES. |
| | (a) | As of April 19, 2023, an evaluation was performed under the supervision and with the participation of the officers of the Registrant, including the PEO and PFO, to assess the effectiveness of the Registrant’s disclosure controls and procedures, as that term is defined in Rule 30a-3(c) under the Investment Company Act of 1940 (the “Act”), as amended. Based on that evaluation, the Registrant’s officers, including the PEO and PFO, concluded that, as of April 19, 2023, the Registrant’s disclosure controls and procedures were reasonably designed to ensure: (1) that information required to be disclosed by the Registrant on Form N-CSR is recorded, processed, summarized and reported within the time periods specified by the rules and forms of the Securities and Exchange Commission; and (2) that material information |
| | relating to the Registrant is made known to the PEO and PFO as appropriate to allow timely decisions regarding required disclosure. |
| | (b) | There have been no changes in the Registrant’s internal control over financial reporting (as defined in Rule 30a-3(d) under the Act) that occurred during the period covered by this report that have materially affected, or are reasonably likely to materially affect, the Registrant’s internal control over financial reporting. |
| ITEM 12. | DISCLOSURE OF SECURITIES LENDING ACTIVITIES FOR CLOSED-END MANAGEMENT INVESTMENT COMPANIES. |
Not applicable.
SIGNATURES
Pursuant to the requirements of the Securities Exchange Act of 1934 and the Investment Company Act of 1940, the Registrant has duly caused this report to be signed on its behalf by the undersigned, thereunto duly authorized.
Registrant: AIM Tax-Exempt Funds (Invesco Tax-Exempt Funds)
| | | | |
| | By: | | /s/ Sheri Morris |
| | | | Sheri Morris |
| | | | Principal Executive Officer |
| | |
| | Date: | | May 3, 2023 |
Pursuant to the requirements of the Securities and Exchange Act of 1934 and the Investment Company Act of 1940, this report has been signed below by the following persons on behalf of the Registrant and in the capacities and on the dates indicated.
| | | | |
| | By: | | /s/ Sheri Morris |
| | | | Sheri Morris |
| | | | Principal Executive Officer |
| | |
| | Date: | | May 3, 2023 |
| | |
| | By: | | /s/ Adrien Deberghes |
| | | | Adrien Deberghes |
| | | | Principal Financial Officer |
| | |
| | Date: | | May 3, 2023 |